124
Annual Report 2016
| Date post: | 02-Jan-2019 |
| Category: |
Documents |
| Upload: | hoangkhanh |
| View: | 215 times |
| Download: | 0 times |
Annual Report 2016
Tabcorp Holdings Limited ABN 66 063 780 709
6 Operating and Financial Review
6 FY16 strategic achievements
7 FY17 priorities
8 Financial performance
10 Financial benefits to stakeholders
12 Chairman’s and Managing Director’s message
14 Wagering and Media business
18 Gaming Services business
20 Keno business
22 Sustainability
22 Responsible gambling
24 Community
26 People
28 Governance
28 Board of Directors
30 Executives
32 Corporate governance
34 Directors’ Report
45 Remuneration Report
73 Financial Report
114 Independent auditor’s report
At the back
116 Five year review
117 Major announcements
118 Shareholder information
120 Online shareholder services
121 Company directory
121 Key dates
Notice of meetingThe Annual General Meeting of Tabcorp Holdings Limited will be held at The Grand Ballroom, The Westin Sydney, 1 Martin Place, Sydney, on Tuesday, 25 October 2016 at 10.00am (AEDT).
Elect not to receive a hard copyShareholders can elect not to receive a hard copy Annual Report by updating their communications preferences with the share registry – go online at linkmarketservices.com.au or call 1300 665 661.
About the Annual ReportTabcorp has evolved its Annual Report into one document. Previously it consisted of two documents – the Concise Annual Report and the Financial Report. The move to a single document enables Tabcorp to publish its Annual Report earlier, on the day it releases its full year results, therefore providing information to stakeholders in a more timely and efficient manner. Shareholders who previously elected to receive a Concise Annual Report or the Full Annual Report now receive the one Annual Report document. A copy of the Annual Report is available, free of charge, on request. Current and past Annual Reports are available from the Company’s website at www.tabcorp.com.au.
Sustainability ReportTabcorp will release a separate Sustainability Report later this year. Therefore, detailed sustainability related disclosures have been transferred from the Annual Report and will be published in the Sustainability Report.
Contents
Tabcorp is a top 100 ASX listed company, and one of the world’s largest publicly listed gambling companies.
It is the biggest financial contributor to the Australian racing industry.
Through our strong connections with our industry partners, customers, community groups, and employees, we create sustainable value and benefits that are shared with our stakeholders.
1Tabcorp Annual Report 2016
2Tabcorp Annual Report 2016
2Tabcorp Annual Report 2016
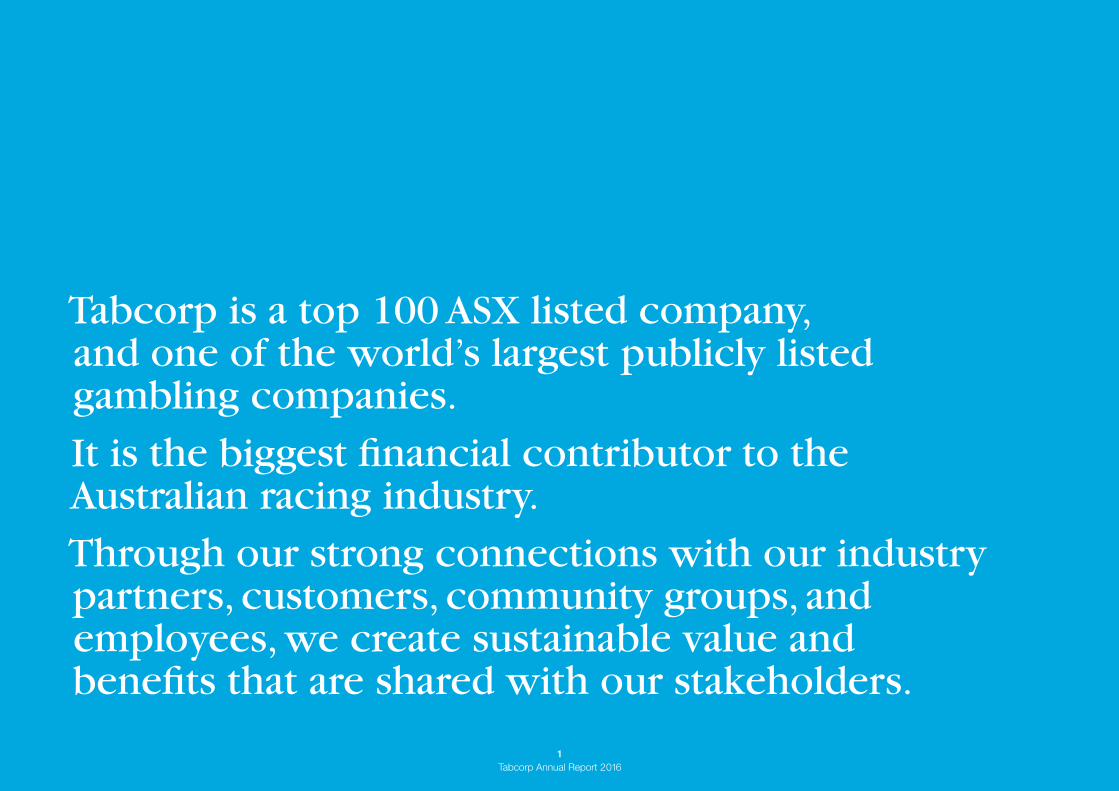
“No other organisation supports the industry to the same extent Tabcorp does.”
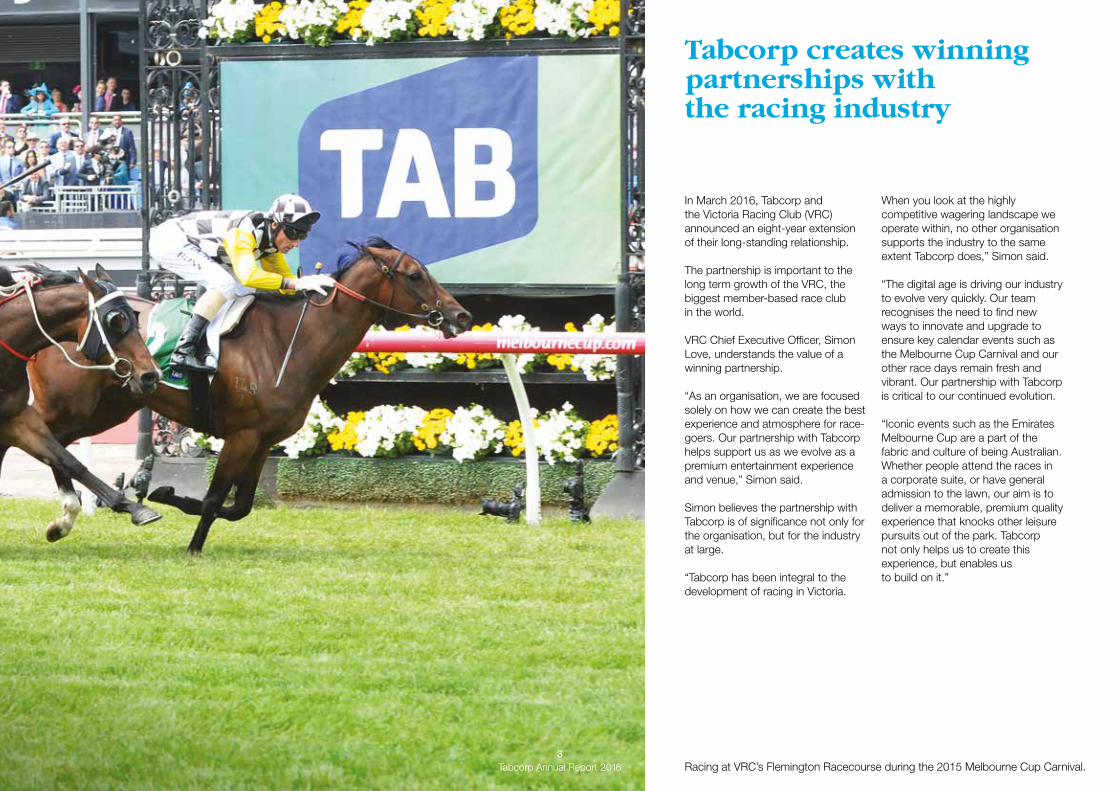
Tabcorp creates winning partnerships with the racing industry
In March 2016, Tabcorp and the Victoria Racing Club (VRC) announced an eight-year extension of their long-standing relationship.
The partnership is important to the long term growth of the VRC, the biggest member-based race club in the world.
VRC Chief Executive Officer, Simon Love, understands the value of a winning partnership.
“As an organisation, we are focused solely on how we can create the best experience and atmosphere for race-goers. Our partnership with Tabcorp helps support us as we evolve as a premium entertainment experience and venue,” Simon said.
Simon believes the partnership with Tabcorp is of significance not only for the organisation, but for the industry at large.
“Tabcorp has been integral to the development of racing in Victoria.
When you look at the highly competitive wagering landscape we operate within, no other organisation supports the industry to the same extent Tabcorp does,” Simon said.
“The digital age is driving our industry to evolve very quickly. Our team recognises the need to find new ways to innovate and upgrade to ensure key calendar events such as the Melbourne Cup Carnival and our other race days remain fresh and vibrant. Our partnership with Tabcorp is critical to our continued evolution.
“Iconic events such as the Emirates Melbourne Cup are a part of the fabric and culture of being Australian. Whether people attend the races in a corporate suite, or have general admission to the lawn, our aim is to deliver a memorable, premium quality experience that knocks other leisure pursuits out of the park. Tabcorp not only helps us to create this experience, but enables us to build on it.”
Racing at VRC’s Flemington Racecourse during the 2015 Melbourne Cup Carnival.3
Tabcorp Annual Report 20162
Tabcorp Annual Report 20162
Tabcorp Annual Report 2016

In 2015, Tabcorp announced a three-year partnership with the National Jockeys Trust (NJT), which includes a $120,000 donation.
Over the past 12 years, the NJT has proudly supported those who show immense bravery every time they compete in a race. During this time, the NJT has provided financial relief to more than 260 jockeys, apprentice jockeys and their families when faced with serious injury, illness and even death.
NJT Chairman, Paul Innes AO said as Australia’s largest wagering operator, Tabcorp is an important contributor to the racing industry. “We’re very grateful for Tabcorp’s partnership with the National Jockeys Trust as it helps us provide meaningful support to jockeys and their families,” he said.
Mr Innes said jockeys risk severe injury or even death on a daily basis doing the job they love.
“There are times when badly injured riders and families of riders we have lost need financial support,” he said. “Recently, we received a call from a female jockey who was seriously injured in a fall more than 20 years ago, and was in need of financial assistance. The Trust was able to assist her and her family through a difficult time. We would not be able to provide the same level of support without Tabcorp’s contribution.”
Emma Goring, whose husband, Mark died after a race fall in 2003, said the National Jockey’s Trust continues to play an integral role in her family’s life following the accident. “The Trust was established a year after Mark’s fall, and the assistance we’ve received from them over the past 12 years has helped our family immensely,” she said.
As part of the agreement, Tabcorp was an official partner for National Jockeys Celebration Day in August 2015 and the National Jockeys Trust T20 Cricket match in January 2016.
Ms Goring’s son joined the Jockey’s Team at this year’s match in honor of his father. “The opportunity for him to participate in the match and play against the All Stars Team means a lot to our family in remembrance of Mark and other jockeys whom we have lost,” she said. “On behalf of myself and my children, I want to pass on a massive thanks to Tabcorp for its support of the National Jockey’s Trust.”
Tabcorp supports jockeys with three-year partnership
4Tabcorp Annual Report 2016
4Tabcorp Annual Report 2016
5Tabcorp Annual Report 2016
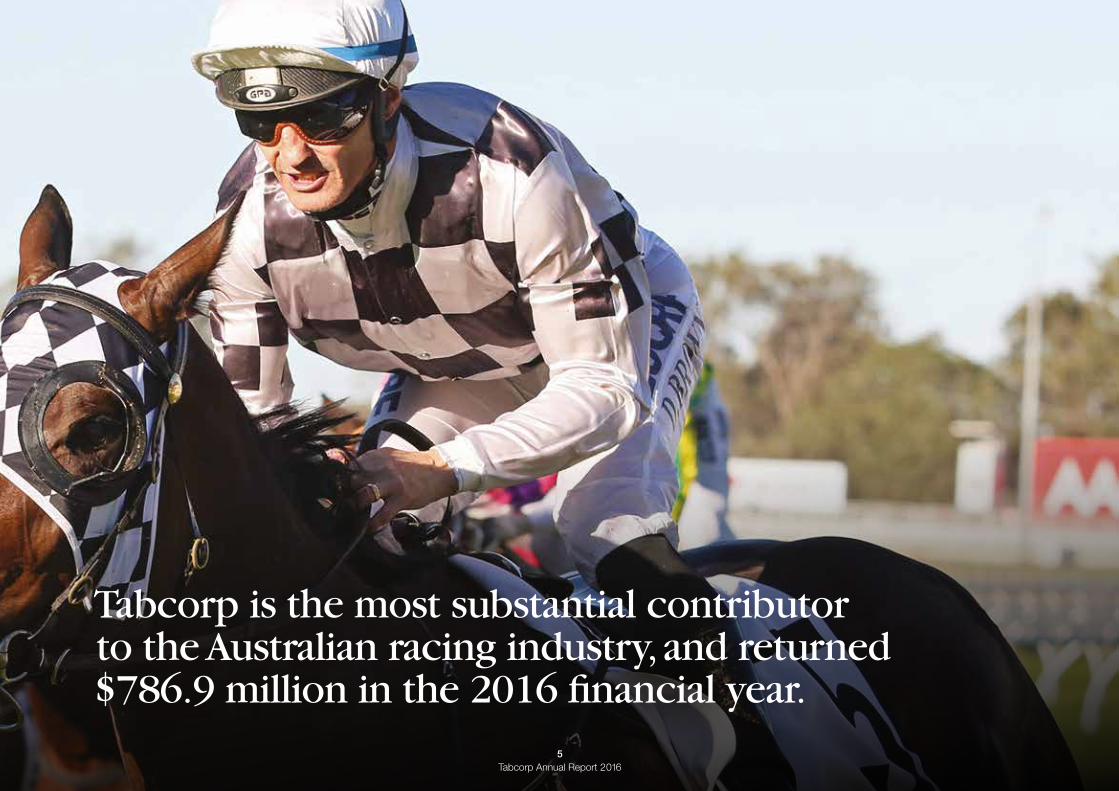
Tabcorp is the most substantial contributor to the Australian racing industry, and returned $786.9 million in the 2016 financial year.

ACTTAB integration completed successfully
Secured five-year agreement for Victorian thoroughbred media rights
Sky Thoroughbred Central commenced high definition broadcasting of Australian racing
Investment in technology platforms and digital development capabilities
Sun Bets, a new online wagering and gaming business, established in the UK
NSW Keno licence extended to 2050
Significant investment in risk and compliance capability
Federal Government response to Illegal Offshore Wagering Review welcomed
FY16 strategic achievements
6Tabcorp Annual Report 2016
Op
erating &
Finan
cial Review
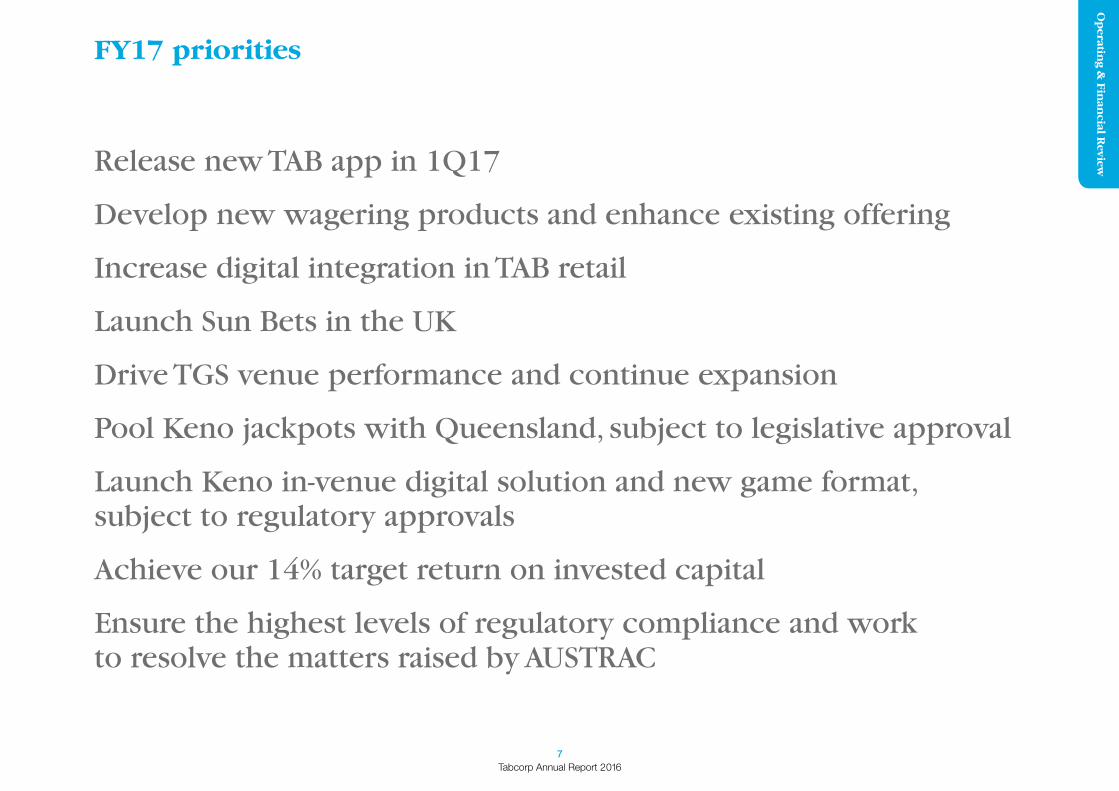
FY17 priorities
Release new TAB app in 1Q17
Develop new wagering products and enhance existing offering
Increase digital integration in TAB retail
Launch Sun Bets in the UK
Drive TGS venue performance and continue expansion
Pool Keno jackpots with Queensland, subject to legislative approval
Launch Keno in-venue digital solution and new game format, subject to regulatory approvals
Achieve our 14% target return on invested capital
Ensure the highest levels of regulatory compliance and work to resolve the matters raised by AUSTRAC
6Tabcorp Annual Report 2016
7Tabcorp Annual Report 2016
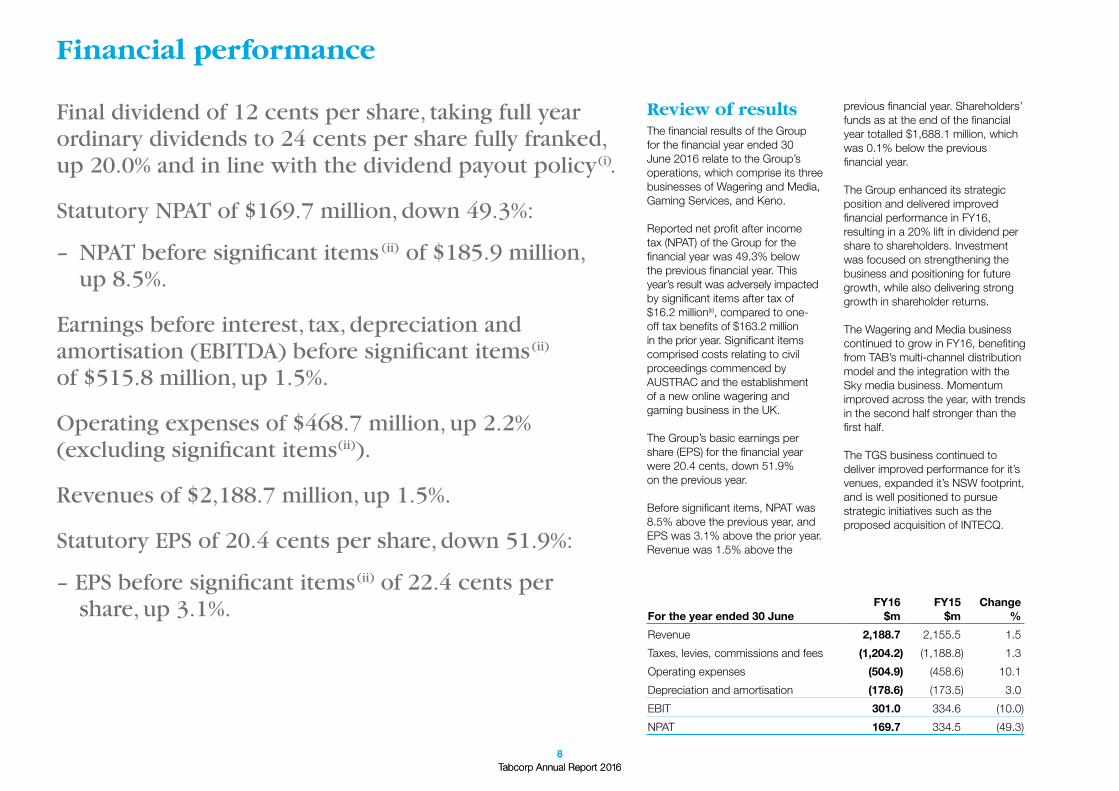
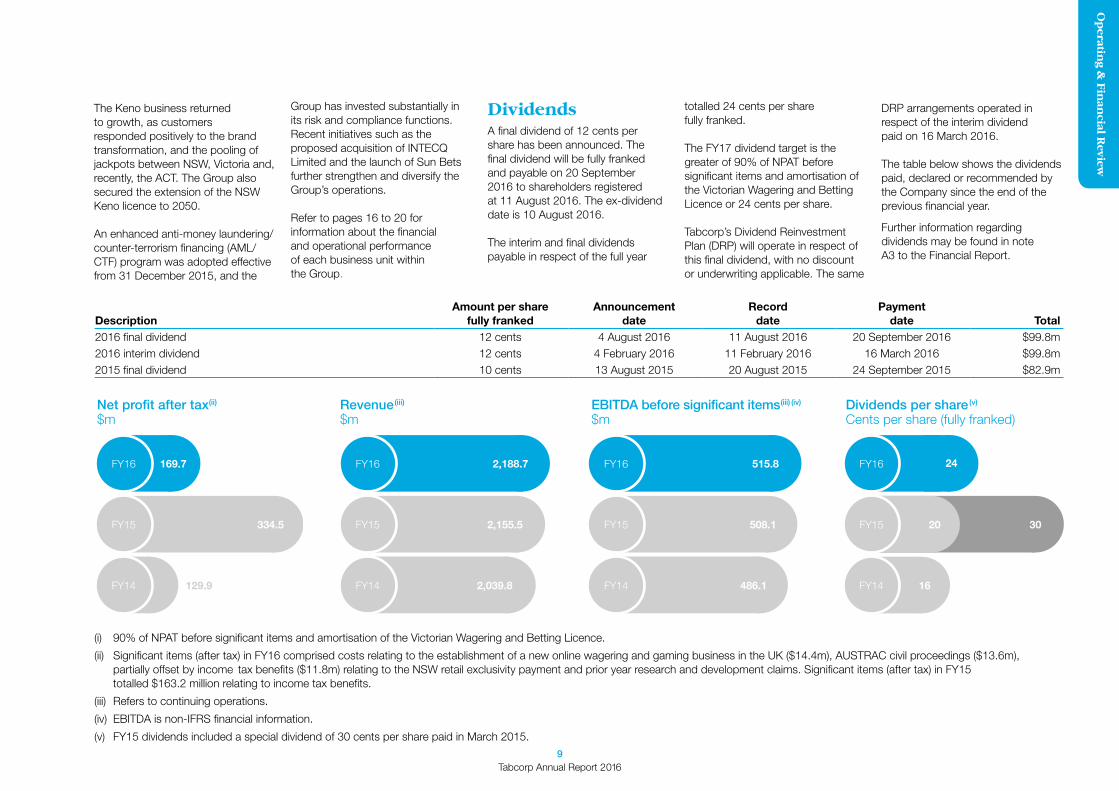
Final dividend of 12 cents per share, taking full year ordinary dividends to 24 cents per share fully franked, up 20.0% and in line with the dividend payout policy(i).
Statutory NPAT of $169.7 million, down 49.3%:
– NPAT before significant items (ii) of $185.9 million, up 8.5%.
Earnings before interest, tax, depreciation and amortisation (EBITDA) before significant items(ii) of $515.8 million, up 1.5%.
Operating expenses of $468.7 million, up 2.2% (excluding significant items(ii)).
Revenues of $2,188.7 million, up 1.5%.
Statutory EPS of 20.4 cents per share, down 51.9%:
– EPS before significant items(ii) of 22.4 cents per share, up 3.1%.
Financial performance
Review of resultsThe financial results of the Group for the financial year ended 30 June 2016 relate to the Group’s operations, which comprise its three businesses of Wagering and Media, Gaming Services, and Keno.
Reported net profit after income tax (NPAT) of the Group for the financial year was 49.3% below the previous financial year. This year’s result was adversely impacted by significant items after tax of $16.2 million(ii), compared to one-off tax benefits of $163.2 million in the prior year. Significant items comprised costs relating to civil proceedings commenced by AUSTRAC and the establishment of a new online wagering and gaming business in the UK. The Group’s basic earnings per share (EPS) for the financial year were 20.4 cents, down 51.9% on the previous year. Before significant items, NPAT was 8.5% above the previous year, and EPS was 3.1% above the prior year.Revenue was 1.5% above the
previous financial year. Shareholders’ funds as at the end of the financial year totalled $1,688.1 million, which was 0.1% below the previous financial year. The Group enhanced its strategic position and delivered improved financial performance in FY16, resulting in a 20% lift in dividend per share to shareholders. Investment was focused on strengthening the business and positioning for future growth, while also delivering strong growth in shareholder returns. The Wagering and Media business continued to grow in FY16, benefiting from TAB’s multi-channel distribution model and the integration with the Sky media business. Momentum improved across the year, with trends in the second half stronger than the first half.
The TGS business continued to deliver improved performance for it’s venues, expanded it’s NSW footprint, and is well positioned to pursue strategic initiatives such as the proposed acquisition of INTECQ.
For the year ended 30 June FY16
$mFY15
$mChange
%
Revenue 2,188.7 2,155.5 1.5
Taxes, levies, commissions and fees (1,204.2) (1,188.8) 1.3
Operating expenses (504.9) (458.6) 10.1
Depreciation and amortisation (178.6) (173.5) 3.0
EBIT 301.0 334.6 (10.0)
NPAT 169.7 334.5 (49.3)
8Tabcorp Annual Report 2016
8Tabcorp Annual Report 2016
The Keno business returned to growth, as customers responded positively to the brand transformation, and the pooling of jackpots between NSW, Victoria and, recently, the ACT. The Group also secured the extension of the NSW Keno licence to 2050.
An enhanced anti-money laundering/ counter-terrorism financing (AML/CTF) program was adopted effective from 31 December 2015, and the
Group has invested substantially in its risk and compliance functions.Recent initiatives such as the proposed acquisition of INTECQ Limited and the launch of Sun Bets further strengthen and diversify the Group’s operations.
Refer to pages 16 to 20 for information about the financial and operational performance of each business unit within the Group.
DividendsA final dividend of 12 cents per share has been announced. The final dividend will be fully franked and payable on 20 September 2016 to shareholders registered at 11 August 2016. The ex-dividend date is 10 August 2016.
The interim and final dividends payable in respect of the full year
totalled 24 cents per share fully franked.
The FY17 dividend target is the greater of 90% of NPAT before significant items and amortisation of the Victorian Wagering and Betting Licence or 24 cents per share.
Tabcorp’s Dividend Reinvestment Plan (DRP) will operate in respect of this final dividend, with no discount or underwriting applicable. The same
DRP arrangements operated in respect of the interim dividend paid on 16 March 2016.
The table below shows the dividends paid, declared or recommended by the Company since the end of the previous financial year.
Further information regarding dividends may be found in note A3 to the Financial Report.
DescriptionAmount per share
fully frankedAnnouncement
dateRecord
datePayment
date Total2016 final dividend 12 cents 4 August 2016 11 August 2016 20 September 2016 $99.8m2016 interim dividend 12 cents 4 February 2016 11 February 2016 16 March 2016 $99.8m2015 final dividend 10 cents 13 August 2015 20 August 2015 24 September 2015 $82.9m
Op
erating &
Finan
cial Review
Net profit after tax(ii) $m
EBITDA before significant items(iii) (iv) $m
Revenue(iii) $m
Dividends per share(v) Cents per share (fully franked)
169.7FY16
334.5FY15
129.9FY14
2,188.7FY16
2,155.5 FY15
2,039.8FY14
515.8FY16
508.1FY15
486.1FY14
FY16
16FY14
FY15 30
24
20
(i) 90% of NPAT before significant items and amortisation of the Victorian Wagering and Betting Licence.
(ii) Significant items (after tax) in FY16 comprised costs relating to the establishment of a new online wagering and gaming business in the UK ($14.4m), AUSTRAC civil proceedings ($13.6m), partially offset by income tax benefits ($11.8m) relating to the NSW retail exclusivity payment and prior year research and development claims. Significant items (after tax) in FY15 totalled $163.2 million relating to income tax benefits.
(iii) Refers to continuing operations.
(iv) EBITDA is non-IFRS financial information.
(v) FY15 dividends included a special dividend of 30 cents per share paid in March 2015.
8Tabcorp Annual Report 2016
8Tabcorp Annual Report 2016
9Tabcorp Annual Report 2016
Financial benefits to stakeholders
Taxes on gambling paid $428.6 million.
Returns to the racing industry of $786.9 million, up 1.8%:
• Victorian racing industry received $331.2 million.
• NSW racing industry received $290.8 million.
• Race field fees of $94.8 million.
• Broadcast rights and international contributions of $70.1 million.
Income taxes paid and payable of $61.4 million.
Tabcorp’s businesses generated more than $1.2 billion in gambling taxes and racing industry funding in FY16, highlighting the value that Tabcorp’s operations provide to stakeholders.
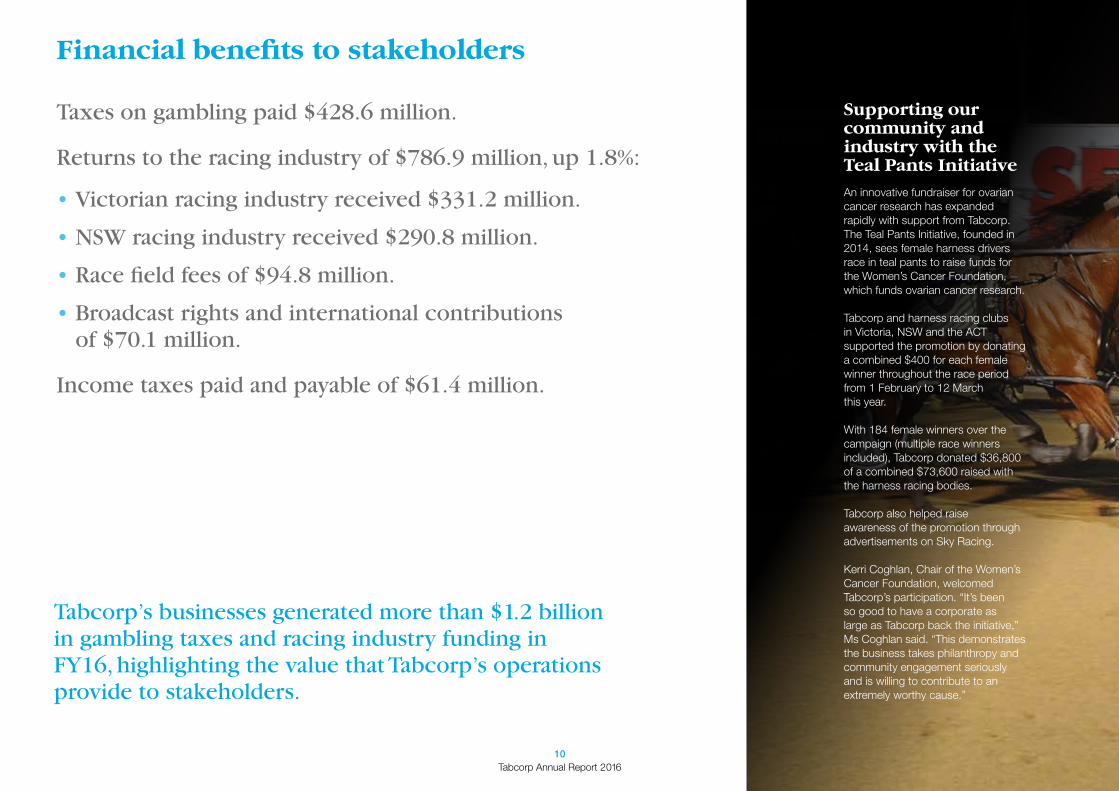
Supporting our community and industry with the Teal Pants InitiativeAn innovative fundraiser for ovarian cancer research has expanded rapidly with support from Tabcorp. The Teal Pants Initiative, founded in 2014, sees female harness drivers race in teal pants to raise funds for the Women’s Cancer Foundation, which funds ovarian cancer research.
Tabcorp and harness racing clubs in Victoria, NSW and the ACT supported the promotion by donating a combined $400 for each female winner throughout the race period from 1 February to 12 March this year.
With 184 female winners over the campaign (multiple race winners included), Tabcorp donated $36,800 of a combined $73,600 raised with the harness racing bodies.
Tabcorp also helped raise awareness of the promotion through advertisements on Sky Racing.
Kerri Coghlan, Chair of the Women’s Cancer Foundation, welcomed Tabcorp’s participation. “It’s been so good to have a corporate as large as Tabcorp back the initiative,” Ms Coghlan said. “This demonstrates the business takes philanthropy and community engagement seriously and is willing to contribute to an extremely worthy cause.”
10Tabcorp Annual Report 2016
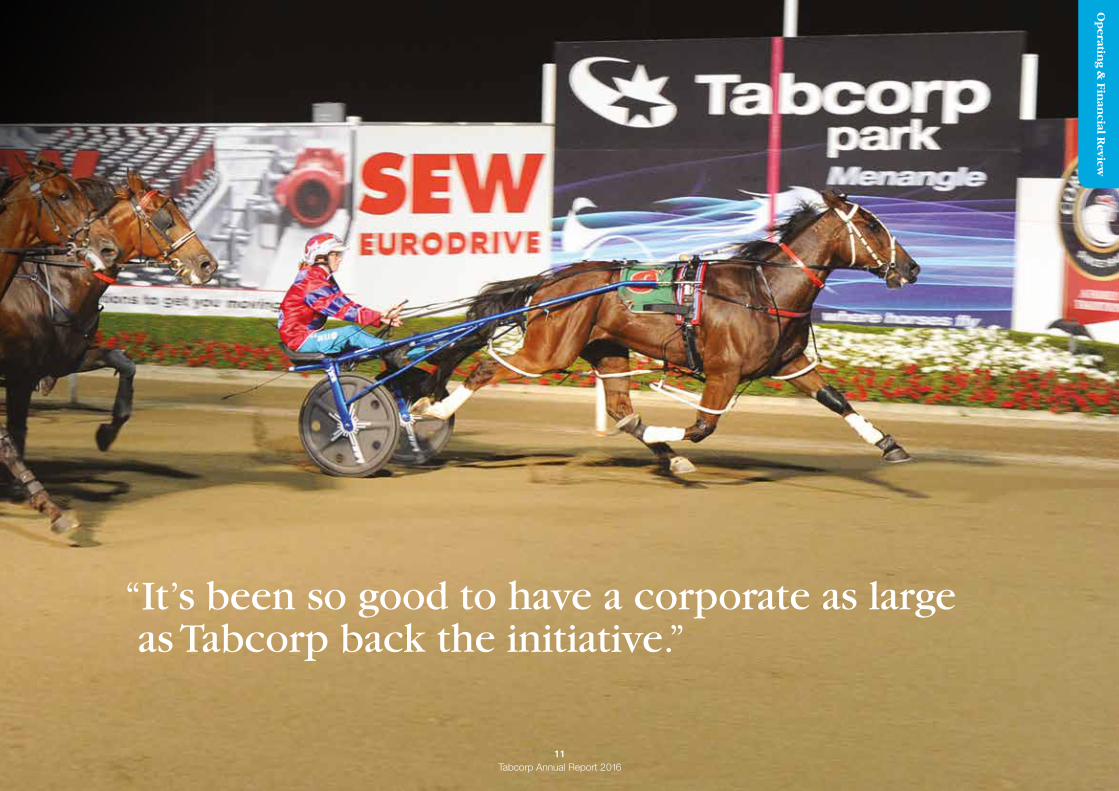
“It’s been so good to have a corporate as large as Tabcorp back the initiative.”
Op
erating &
Finan
cial Review
10Tabcorp Annual Report 2016
11Tabcorp Annual Report 2016

Chairman’s and Managing Director’s message
Tabcorp is an Australian gambling entertainment company. We are a leader in the Australian market and one of the world’s largest publicly listed gambling companies. We are one of the few integrated gambling and entertainment companies in the world through our retail, our digital and our Sky media platforms. We have a rich racing heritage built on strong partnerships and integrity.
This has been an important year for Tabcorp.
In a volatile environment Tabcorp made significant progress, both in terms of our commitment to operating to the highest standards and in terms of strategic achievements.
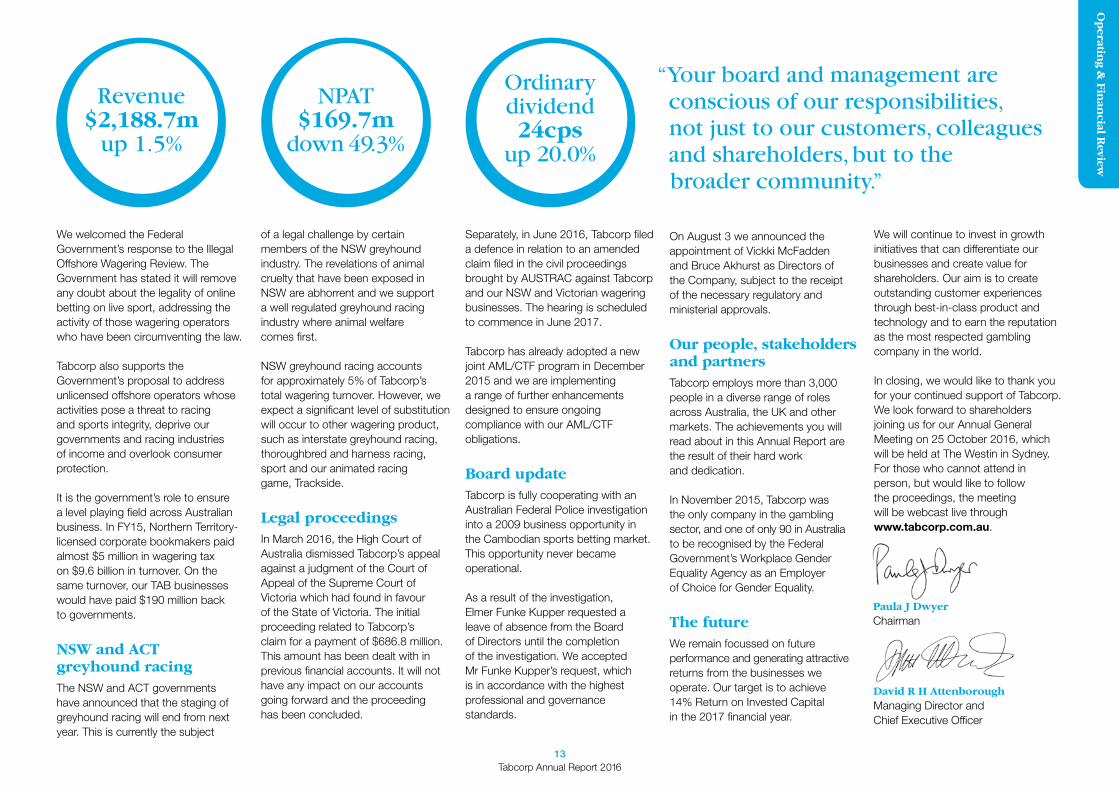
We hold an important role in a large, heavily regulated industry which is enjoyed by over 70% of the adult population. We have millions of customers and a presence in 4,000 venues from TAB agencies, to clubs and hotels. And we are a large employer. Your board and management are conscious of our responsibilities, not just to our customers, colleagues and shareholders, but to the broader community.
Taxes are just one part of the contribution we make to communities. In FY16 we paid close to $500 million in gambling taxes and income taxes.
This year we faced up to some challenges to our values. We are committed to achieving the highest standards of regulatory compliance and in December adopted a new joint anti-money laundering/counter-terrorism financing (AML/CTF) program.
Tabcorp has continued to take steps to promote responsible gambling, provide the highest levels of customer care and ensure that value created is shared with the community. These measures are core to Tabcorp’s future as a sustainable gambling-led company as we work to be the most respected and most trusted by our customers, shareholders, regulatory authorities, partners and governments.
Financial performance and shareholder returnsOver the last year, we enhanced the strategic position of our businesses, delivered improved financial performance and invested in a number of attractive growth opportunities.
Tabcorp reported Net Profit (After Tax) of $169.7 million, down 49.3% on the prior corresponding period (pcp). However, the reported performance was impacted by significant items after tax of $16.2 million and one-off tax benefits of $163.2 million in the pcp. NPAT before significant items was $185.9 million, up 8.5%.
Group revenues were $2,188.7 million, up 1.5%.
We announced a fully-franked, full year ordinary dividend of 24 cents per share, up 20.0% on the pcp, with a final dividend of 12 cents per share. This reflects our commitment to delivering strong, sustainable shareholder returns.
Advancing our strategic agendaWe are building a profitable and resilient business for our shareholders, our partners and our employees, with a focus on developing our three core businesses: Wagering and Media, Keno and Gaming Services.
The Wagering and Media business is the biggest contributor to the group’s earnings. During the year, the integration of the ACT TAB business was successfully completed and is now an important part of our portfolio of long-dated and attractive licences. Our racing broadcaster, Sky Racing secured media rights for Victorian thoroughbred racing. As a result, TAB account holders have digital access to all Australian racing vision, which is unique to Tabcorp and differentiates us from our competitors. Keno returned to growth during the year, benefiting from a number of initiatives which have enhanced the customer experience. These included a relaunch of the brand and the
commencement of jackpot pooling between NSW and Victoria. The ACT’s Keno pools also joined the jackpot pools in July 2016.
The New South Wales Government extended our exclusive NSW Keno licence until 2050. The licence enhancements include digital play in-venue, subject to regulatory approvals. The extension adds longevity to Tabcorp’s portfolio of Keno licences and approvals, with the Victorian licence expiring in 2022, Queensland in 2047 and ACT in 2064.
Our Gaming Services business, TGS, has continued to grow following our expansion into NSW. Six new venues were signed this year and we now have 800 electronic gaming machines under contract in NSW, in addition to more than 8,800 in Victoria.
Internationally, after gaining the necessary licences and approvals, we have launched Sun Bets. This is a new online wagering and gaming business in the United Kingdom and Ireland, which has been established in partnership with News UK.
A champion of racing and community funding Tabcorp has its origins in racing and we are the largest supporter of the Australian racing industry.
Almost 70% of the revenue generated by Tabcorp’s businesses is returned to the racing industry, venue partners and the community.
This year, racing industry returns from Tabcorp totalled $786.9 million. This is the racing industry’s primary source of income and ensures racing, particularly in NSW and Victoria, is very well-funded by global standards.
Additionally, we extended important partnerships with industry bodies such as the Australian Trainers’ Association and the National Jockeys Trust.
Online wagering reform This year has been characterised by legitimate debate about the role of gambling, particularly with the continuing growth of online gambling.
Paula DwyerChairman
David AttenboroughManaging Director andChief Executive Officer
12Tabcorp Annual Report 2016
We welcomed the Federal Government’s response to the Illegal Offshore Wagering Review. The Government has stated it will remove any doubt about the legality of online betting on live sport, addressing the activity of those wagering operators who have been circumventing the law.
Tabcorp also supports the Government’s proposal to address unlicensed offshore operators whose activities pose a threat to racing and sports integrity, deprive our governments and racing industries of income and overlook consumer protection.
It is the government’s role to ensure a level playing field across Australian business. In FY15, Northern Territory-licensed corporate bookmakers paid almost $5 million in wagering tax on $9.6 billion in turnover. On the same turnover, our TAB businesses would have paid $190 million back to governments.
NSW and ACT greyhound racingThe NSW and ACT governments have announced that the staging of greyhound racing will end from next year. This is currently the subject
of a legal challenge by certain members of the NSW greyhound industry. The revelations of animal cruelty that have been exposed in NSW are abhorrent and we support a well regulated greyhound racing industry where animal welfare comes first.
NSW greyhound racing accounts for approximately 5% of Tabcorp’s total wagering turnover. However, we expect a significant level of substitution will occur to other wagering product, such as interstate greyhound racing, thoroughbred and harness racing, sport and our animated racing game, Trackside.
Legal proceedings In March 2016, the High Court of Australia dismissed Tabcorp’s appeal against a judgment of the Court of Appeal of the Supreme Court of Victoria which had found in favour of the State of Victoria. The initial proceeding related to Tabcorp’s claim for a payment of $686.8 million. This amount has been dealt with in previous financial accounts. It will not have any impact on our accounts going forward and the proceeding has been concluded.
Separately, in June 2016, Tabcorp filed a defence in relation to an amended claim filed in the civil proceedings brought by AUSTRAC against Tabcorp and our NSW and Victorian wagering businesses. The hearing is scheduled to commence in June 2017.
Tabcorp has already adopted a new joint AML/CTF program in December 2015 and we are implementing a range of further enhancements designed to ensure ongoing compliance with our AML/CTF obligations.
Board update Tabcorp is fully cooperating with an Australian Federal Police investigation into a 2009 business opportunity in the Cambodian sports betting market. This opportunity never became operational.
As a result of the investigation, Elmer Funke Kupper requested a leave of absence from the Board of Directors until the completion of the investigation. We accepted Mr Funke Kupper’s request, which is in accordance with the highest professional and governance standards.
On August 3 we announced the appointment of Vickki McFadden and Bruce Akhurst as Directors of the Company, subject to the receipt of the necessary regulatory and ministerial approvals.
Our people, stakeholders and partnersTabcorp employs more than 3,000 people in a diverse range of roles across Australia, the UK and other markets. The achievements you will read about in this Annual Report are the result of their hard work and dedication.
In November 2015, Tabcorp was the only company in the gambling sector, and one of only 90 in Australia to be recognised by the Federal Government’s Workplace Gender Equality Agency as an Employer of Choice for Gender Equality.
The future We remain focussed on future performance and generating attractive returns from the businesses we operate. Our target is to achieve 14% Return on Invested Capital in the 2017 financial year.
We will continue to invest in growth initiatives that can differentiate our businesses and create value for shareholders. Our aim is to create outstanding customer experiences through best-in-class product and technology and to earn the reputation as the most respected gambling company in the world.
In closing, we would like to thank you for your continued support of Tabcorp. We look forward to shareholders joining us for our Annual General Meeting on 25 October 2016, which will be held at The Westin in Sydney. For those who cannot attend in person, but would like to follow the proceedings, the meeting will be webcast live through www.tabcorp.com.au.
David R H AttenboroughManaging Director and Chief Executive Officer
Paula J DwyerChairman
Revenue $2,188.7m
up 1.5%
NPAT $169.7m
down 49.3%
Ordinary dividend 24cps
up 20.0%
Op
erating &
Finan
cial Review
“Your board and management are conscious of our responsibilities, not just to our customers, colleagues and shareholders, but to the broader community.”
12Tabcorp Annual Report 2016
13Tabcorp Annual Report 2016
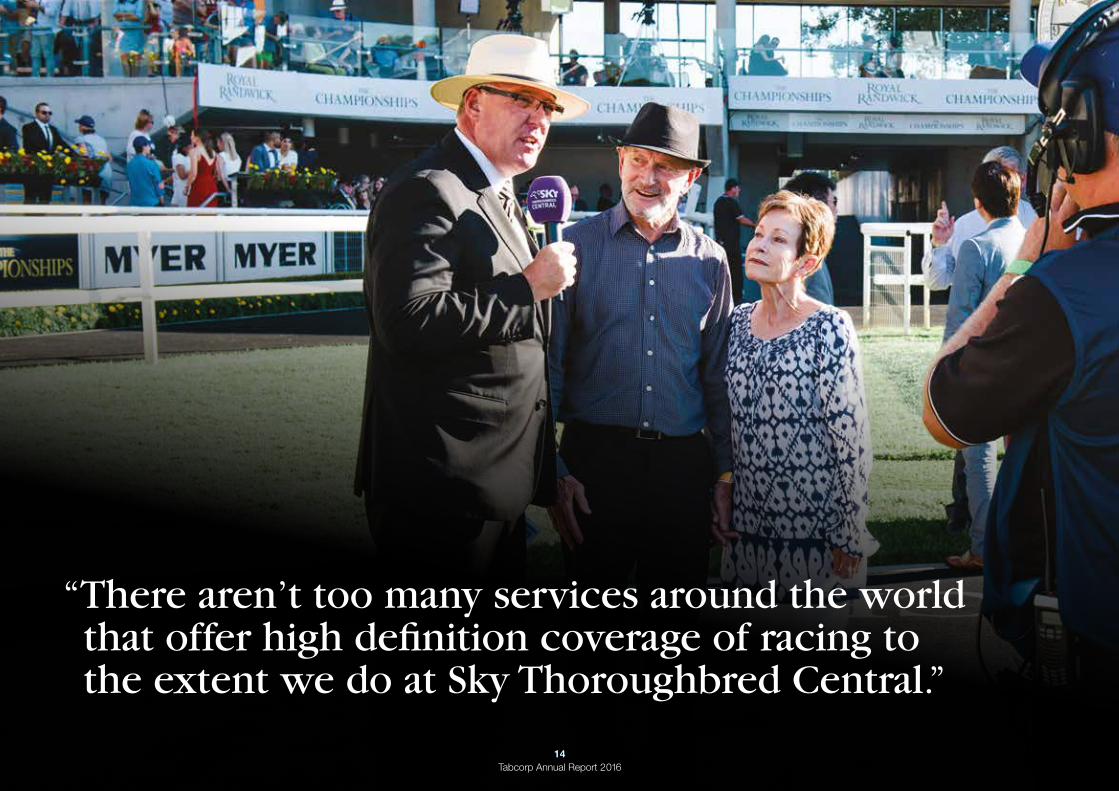
“There aren’t too many services around the world that offer high definition coverage of racing to the extent we do at Sky Thoroughbred Central.”
14Tabcorp Annual Report 2016
14Tabcorp Annual Report 2016
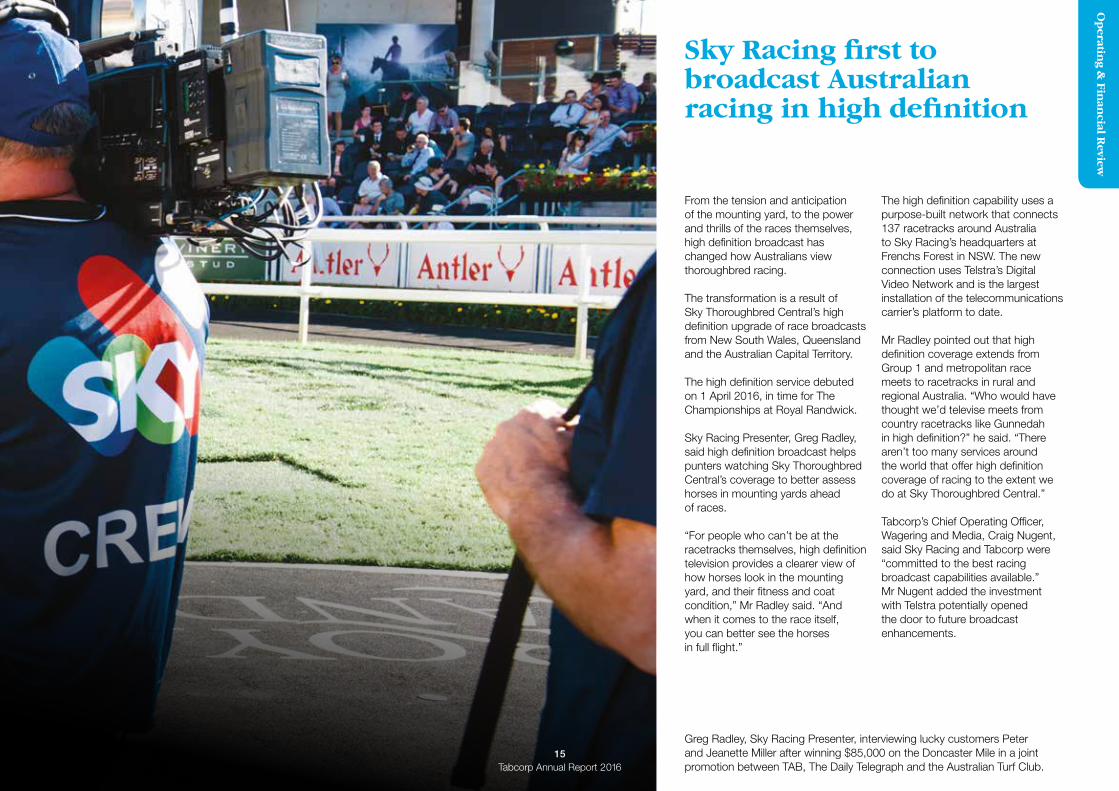
Sky Racing first to broadcast Australian racing in high definition
From the tension and anticipation of the mounting yard, to the power and thrills of the races themselves, high definition broadcast has changed how Australians view thoroughbred racing.
The transformation is a result of Sky Thoroughbred Central’s high definition upgrade of race broadcasts from New South Wales, Queensland and the Australian Capital Territory.
The high definition service debuted on 1 April 2016, in time for The Championships at Royal Randwick.
Sky Racing Presenter, Greg Radley, said high definition broadcast helps punters watching Sky Thoroughbred Central’s coverage to better assess horses in mounting yards ahead of races.
“For people who can’t be at the racetracks themselves, high definition television provides a clearer view of how horses look in the mounting yard, and their fitness and coat condition,” Mr Radley said. “And when it comes to the race itself, you can better see the horses in full flight.”
The high definition capability uses a purpose-built network that connects 137 racetracks around Australia to Sky Racing’s headquarters at Frenchs Forest in NSW. The new connection uses Telstra’s Digital Video Network and is the largest installation of the telecommunications carrier’s platform to date.
Mr Radley pointed out that high definition coverage extends from Group 1 and metropolitan race meets to racetracks in rural and regional Australia. “Who would have thought we’d televise meets from country racetracks like Gunnedah in high definition?” he said. “There aren’t too many services around the world that offer high definition coverage of racing to the extent we do at Sky Thoroughbred Central.”
Tabcorp’s Chief Operating Officer, Wagering and Media, Craig Nugent, said Sky Racing and Tabcorp were “committed to the best racing broadcast capabilities available.” Mr Nugent added the investment with Telstra potentially opened the door to future broadcast enhancements.
Greg Radley, Sky Racing Presenter, interviewing lucky customers Peter and Jeanette Miller after winning $85,000 on the Doncaster Mile in a joint promotion between TAB, The Daily Telegraph and the Australian Turf Club.
Op
erating &
Finan
cial Review
15Tabcorp Annual Report 2016
14Tabcorp Annual Report 2016
14Tabcorp Annual Report 2016

Operations• Network of TAB agencies,
hotels and clubs, and on-course totalisators in Victoria, NSW and the ACT.
• Wagering channels include retail, internet, mobile devices, phone and pay TV.
• Totalisator and fixed odds betting offered on racing and sporting events.
• Luxbet offers a racing, sport and novelty product bookmaking service by phone, internet and mobile devices.
• New Sun Bets business will provide online wagering and gaming services to UK and Ireland residents.
• Trackside, a computer simulated racing product, operating in Victoria, NSW and the ACT, and licensed in other Australian and overseas jurisdictions.
• International wagering and pooling through Premier Gateway International (PGI) joint venture in the Isle of Man (50% interest).
• Three Sky Racing television channels broadcasting thoroughbred, harness and greyhound racing and other sports to audiences in TAB outlets, hotels, clubs, other licensed venues, and into homes to pay TV subscribers.
• Sky Sports Radio network in NSW and the ACT, and advertising and sponsorship arrangements with Radio Sport National.
• Broadcasting Australian racing to 52 countries and importing overseas racing to Australia.
• 2,900 TAB retail outlets (approx).
• Mobile devices represent 63% of digital wagering turnover (up 9%).
• Sky Racing available in 2.6 million Australian homes (approx).
• Broadcasting to 5,400 Australian outlets.
Licences/approvals• Victorian Wagering and Betting
Licence expires in August 2024, and may be extended for a further two year period.
• NSW Wagering Licence expires in March 2097, with retail exclusivity period expiring in June 2033.
• ACT Totalisator Licence expires in October 2064.
• ACT Sports Bookmaking Licence expires in October 2029, with further rolling extensions to October 2064.
• ACT Approval to Conduct Trackside expires in October 2064.
• Luxbet’s Northern Territory licence expires in June 2020.
• Sun Bets operates under a UK Remote Operating licence with no expiry, and an Irish Remote Bookmaker’s Licence expiring in June 2017.
• Luxbet Europe’s UK Combined Remote Operating Licence has no expiry, and its Isle of Man licence expires in January 2019.
FY16 highlights• Established new Sun Bets
business in the UK.
• 12.0% growth in turnover from digital channels.
• 16.4% growth in fixed odds revenue.
• TAB Sports turnover up 7.2%.
• ACTTAB integration successfully completed.
• TAB launched its Fixed Odds Partial Cash Out product in January 2016, an example of ongoing product innovation.
• Expanded distribution of Australian and New Zealand racing to foreign markets and international co-mingling, with the addition of the German Tote.
• Active TAB account customers now exceed 430,000, up 6%.
• Agreements in place for Victorian and NSW thoroughbred media rights.
Future objectives• Launch Sun Bets, the new online
wagering and gaming business in the UK.
• Introduce new TAB app ahead of the footy finals and the 2016 Spring Racing Carnival.
• Drive digital growth by utilising exclusive media assets and retail presence.
• Revitalise TAB customer experience across retail channels.
• Further integrate TAB with Sky media assets.
• Develop new products and enhance existing offering.
• Implement Longitude software to deliver enhanced pari-mutuel betting options (subject to regulatory approval).
• Maintain market leadership and support industry transformation.
• Be the partner of choice for racing and sporting bodies.
Wagering and Media business
16Tabcorp Annual Report 2016
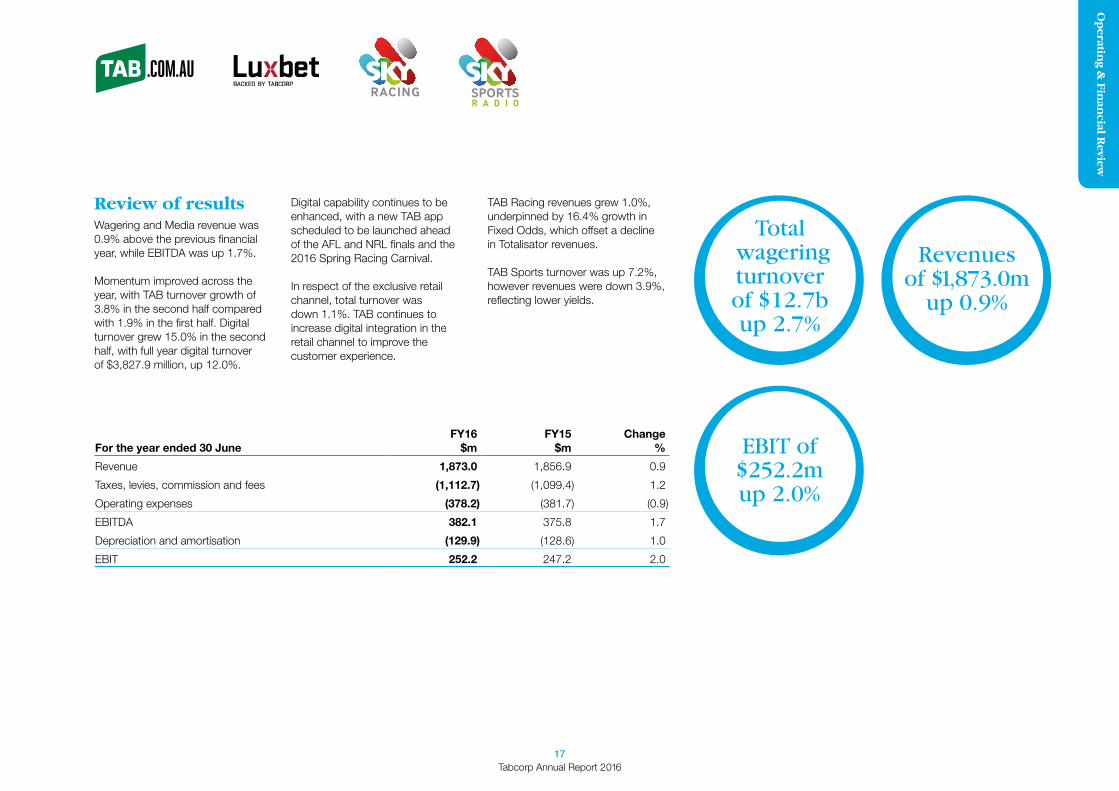
Review of resultsWagering and Media revenue was 0.9% above the previous financial year, while EBITDA was up 1.7%.
Momentum improved across the year, with TAB turnover growth of 3.8% in the second half compared with 1.9% in the first half. Digital turnover grew 15.0% in the second half, with full year digital turnover of $3,827.9 million, up 12.0%.
Digital capability continues to be enhanced, with a new TAB app scheduled to be launched ahead of the AFL and NRL finals and the 2016 Spring Racing Carnival.
In respect of the exclusive retail channel, total turnover was down 1.1%. TAB continues to increase digital integration in the retail channel to improve the customer experience.
TAB Racing revenues grew 1.0%, underpinned by 16.4% growth in Fixed Odds, which offset a decline in Totalisator revenues.
TAB Sports turnover was up 7.2%, however revenues were down 3.9%, reflecting lower yields.
For the year ended 30 JuneFY16
$mFY15
$mChange
%
Revenue 1,873.0 1,856.9 0.9
Taxes, levies, commission and fees (1,112.7) (1,099.4) 1.2
Operating expenses (378.2) (381.7) (0.9)
EBITDA 382.1 375.8 1.7
Depreciation and amortisation (129.9) (128.6) 1.0
EBIT 252.2 247.2 2.0
Total wagering turnover of $12.7b up 2.7%
EBIT of $252.2mup 2.0%
Revenues of $1,873.0m
up 0.9%
Op
erating &
Finan
cial Review
16Tabcorp Annual Report 2016
17Tabcorp Annual Report 2016
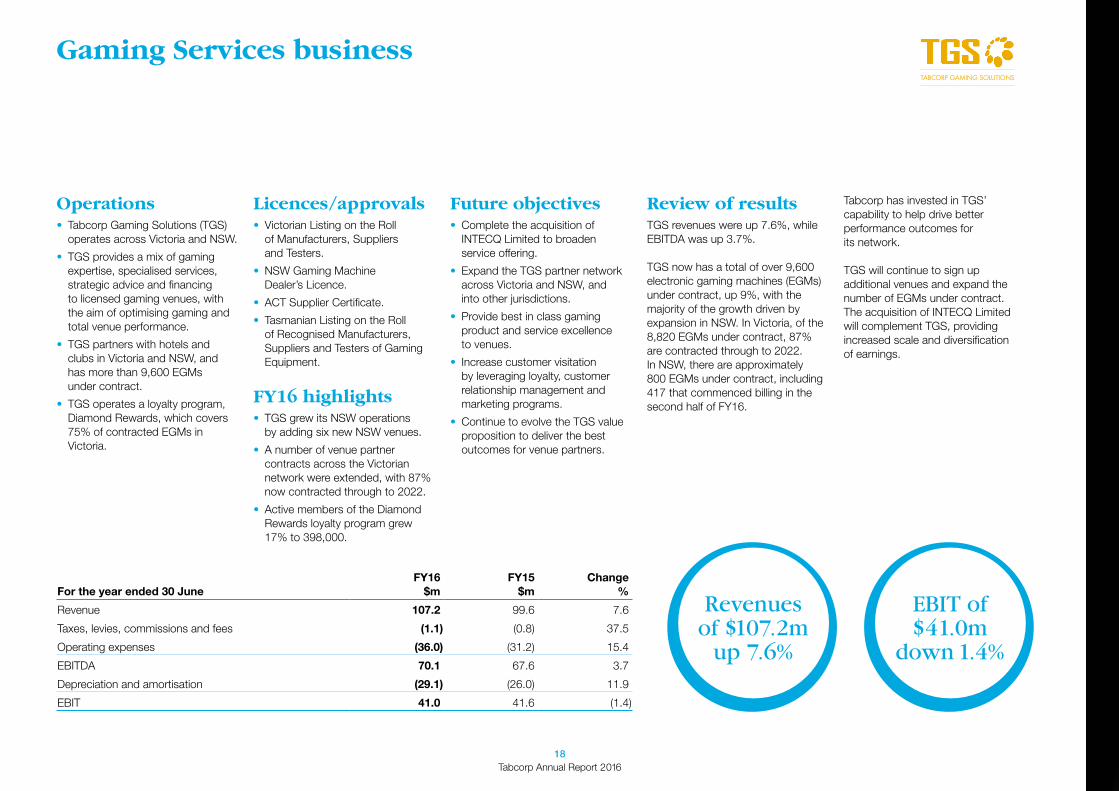
Operations• Tabcorp Gaming Solutions (TGS)
operates across Victoria and NSW.
• TGS provides a mix of gaming expertise, specialised services, strategic advice and financing to licensed gaming venues, with the aim of optimising gaming and total venue performance.
• TGS partners with hotels and clubs in Victoria and NSW, and has more than 9,600 EGMs under contract.
• TGS operates a loyalty program, Diamond Rewards, which covers 75% of contracted EGMs in Victoria.
Licences/approvals• Victorian Listing on the Roll
of Manufacturers, Suppliers and Testers.
• NSW Gaming Machine Dealer’s Licence.
• ACT Supplier Certificate.
• Tasmanian Listing on the Roll of Recognised Manufacturers, Suppliers and Testers of Gaming Equipment.
FY16 highlights• TGS grew its NSW operations
by adding six new NSW venues.
• A number of venue partner contracts across the Victorian network were extended, with 87% now contracted through to 2022.
• Active members of the Diamond Rewards loyalty program grew 17% to 398,000.
Future objectives• Complete the acquisition of
INTECQ Limited to broaden service offering.
• Expand the TGS partner network across Victoria and NSW, and into other jurisdictions.
• Provide best in class gaming product and service excellence to venues.
• Increase customer visitation by leveraging loyalty, customer relationship management and marketing programs.
• Continue to evolve the TGS value proposition to deliver the best outcomes for venue partners.
Review of resultsTGS revenues were up 7.6%, while EBITDA was up 3.7%.
TGS now has a total of over 9,600 electronic gaming machines (EGMs) under contract, up 9%, with the majority of the growth driven by expansion in NSW. In Victoria, of the 8,820 EGMs under contract, 87% are contracted through to 2022. In NSW, there are approximately 800 EGMs under contract, including 417 that commenced billing in the second half of FY16.
Tabcorp has invested in TGS’ capability to help drive better performance outcomes for its network.
TGS will continue to sign up additional venues and expand the number of EGMs under contract.The acquisition of INTECQ Limited will complement TGS, providing increased scale and diversification of earnings.
Gaming Services business
Revenues of $107.2m
up 7.6%
EBIT of $41.0m
down 1.4%
For the year ended 30 JuneFY16
$mFY15
$mChange
%
Revenue 107.2 99.6 7.6
Taxes, levies, commissions and fees (1.1) (0.8) 37.5
Operating expenses (36.0) (31.2) 15.4
EBITDA 70.1 67.6 3.7
Depreciation and amortisation (29.1) (26.0) 11.9
EBIT 41.0 41.6 (1.4)
18Tabcorp Annual Report 2016

Op
erating &
Finan
cial Review
Image is positional
“The support from TGS enabled our club to complete a revamp that has been very well received by both members and visitors.” Scott Miles, General Manager Steelers Club, Wollongong
19Tabcorp Annual Report 2016
18Tabcorp Annual Report 2016

Operations• Keno is a random number game
that is played every 3 minutes with the chance for customers to win instant prizes and life-changing jackpots.
• Keno is distributed to 3,568 venues across clubs, hotels and TABs in Victoria, Queensland and ACT, and in clubs and hotels in NSW.
• Keno is available online in the ACT.
• 100.0m tickets sold in FY16 up 1.4%
• Average ticket size in FY16 of $11.2, up 1.8%
Licences/approvals• Victorian Keno Licence expires
in April 2022.
• NSW Keno Licence expires in April 2050.
• In NSW Tabcorp operates Keno under a management agreement with ClubKENO Holdings Pty Ltd.
• Queensland Keno Licence expires in June 2047.
• ACT Approval to Conduct Keno expires in October 2064.
FY16 highlights• Total Keno network turnover
was up 4.1%.
• NSW Keno Licence extended to 2050.
• Business performance improved through brand transformation and jackpot pooling which commenced between NSW, Victoria and the ACT.
Future objectives• Roll out of a digital in-venue
offering in NSW to enhance the Keno retail experience, subject to regulatory approvals.
• Extend Keno’s product offer and launch new products.
• Expand Keno jackpot pooling to include Queensland, subject to legislative approval.
Review of resultsThe return to growth reflects the repositioning of the business through an extensive Keno brand transformation program. The pooling of jackpots between NSW, ACT and Victoria has also enhanced the game’s appeal.
As a result of the positive customer response to these initiatives, total Keno network turnover was up 4.1%, and the Keno business revenue was up 4.8%. Revenue performance was up 20.4% in Victoria, up 7.4% in NSW, and up 0.8% in Queensland. EBITDA was up 5.9%.
The progress of the initiatives during FY16, as well as initiatives planned for the coming year, provide confidence that Keno will continue to grow.
Keno business
Total Keno turnoverup 4.1%
EBIT of $50.7m up 6.7%
Revenues of $208.5m
up 4.8%
For the year ended 30 JuneFY16
$mFY15
$mChange
%
Revenue 208.5 199.0 4.8
Taxes, levies, commissions and fees (90.4) (88.6) 2.0
Operating expenses (47.8) (44.0) 8.6
EBITDA 70.3 66.4 5.9
Depreciation and amortisation (19.6) (18.9) 3.7
EBIT 50.7 47.5 6.7
20Tabcorp Annual Report 2016

Keno is a fun, social game that provides customers with a chance to win $1 million every 3 minutes.
Op
erating &
Finan
cial Review
20Tabcorp Annual Report 2016
21Tabcorp Annual Report 2016

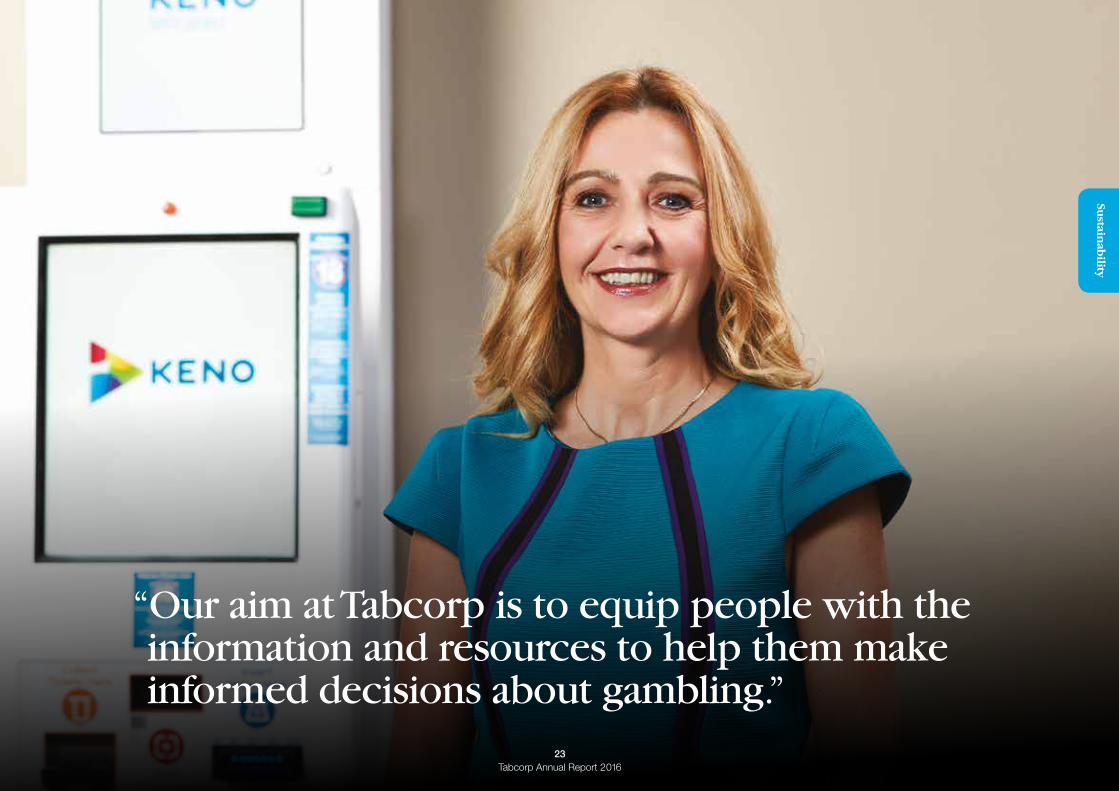
“Doing the right thing” for Tabcorp, customers and the community is what motivates Mandy Tervit-Veasey, Responsible Gambling and Compliance Manager for the business.
“Our aim at Tabcorp is to equip people with the information and resources to help them make informed decisions about gambling,” said Ms Tervit-Veasey, whose role includes managing Tabcorp’s responsible gambling program to comply with various state, territory and Commonwealth regulatory and legislative regimes and codes of conduct.
Tabcorp has been acknowledged in the Dow Jones Sustainability Index assessment as an industry leader in responsible gambling. However, Ms Tervit-Veasey said, “there are always opportunities to do more”. Tabcorp continues to work to improve its systems and processes in this area.
Mandy also regularly attends conferences to gain insights into how other businesses and regulatory bodies manage gambling issues.
One of Ms Tervit-Veasey’s tasks is to participate on the steering committee for Victoria’s Responsible Gambling Awareness Week (RGAW). Held in October 2015, RGAW featured a range of events hosted by local councils, sporting clubs, venues and Gamblers’ Help agencies.
Ms Tervit-Veasey said there was a particular 2015 RGAW event in Victoria that was one of the best initiatives she has attended since she started her role seven years ago. “The event provided a deep insight into the impact of problem gambling on a range of culturally diverse groups,” she said. “It also demonstrated that counsellors needed to be sensitive to cultural differences in order to develop effective strategies to reduce problem gambling across different groups.”
Ms Tervit-Veasey is proud of Tabcorp’s relationships with bodies such as the Victorian Responsible Gambling Foundation (VRGF). “The VRGF recently asked us to help review an updated best practices guide for its counsellors, which shows how we can work together,” she said. “We hope to continue to deepen our relationships with the VRGF and similar bodies in other jurisdictions as part of our continued commitment to responsible gambling.”
Promoting responsible gambling to enable informed decisions
Mandy Tervit-Veasey, Tabcorp Responsible Gambling & Compliance Manager
22Tabcorp Annual Report 2016
Sustain
ability
“Our aim at Tabcorp is to equip people with the information and resources to help them make informed decisions about gambling.”
22Tabcorp Annual Report 2016
23Tabcorp Annual Report 2016
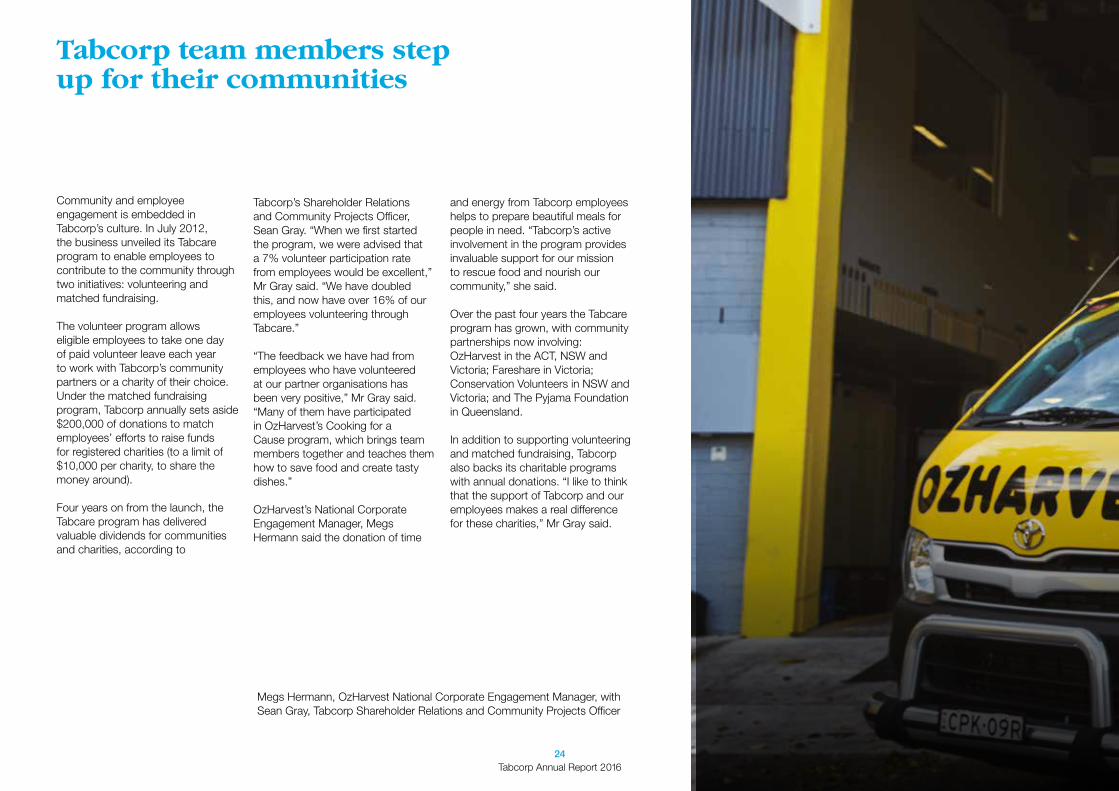
Community and employee engagement is embedded in Tabcorp’s culture. In July 2012, the business unveiled its Tabcare program to enable employees to contribute to the community through two initiatives: volunteering and matched fundraising.
The volunteer program allows eligible employees to take one day of paid volunteer leave each year to work with Tabcorp’s community partners or a charity of their choice. Under the matched fundraising program, Tabcorp annually sets aside $200,000 of donations to match employees’ efforts to raise funds for registered charities (to a limit of $10,000 per charity, to share the money around).
Four years on from the launch, the Tabcare program has delivered valuable dividends for communities and charities, according to
Tabcorp’s Shareholder Relations and Community Projects Officer, Sean Gray. “When we first started the program, we were advised that a 7% volunteer participation rate from employees would be excellent,” Mr Gray said. “We have doubled this, and now have over 16% of our employees volunteering through Tabcare.”
“The feedback we have had from employees who have volunteered at our partner organisations has been very positive,” Mr Gray said. “Many of them have participated in OzHarvest’s Cooking for a Cause program, which brings team members together and teaches them how to save food and create tasty dishes.”
OzHarvest’s National Corporate Engagement Manager, Megs Hermann said the donation of time
and energy from Tabcorp employees helps to prepare beautiful meals for people in need. “Tabcorp’s active involvement in the program provides invaluable support for our mission to rescue food and nourish our community,” she said.
Over the past four years the Tabcare program has grown, with community partnerships now involving: OzHarvest in the ACT, NSW and Victoria; Fareshare in Victoria; Conservation Volunteers in NSW and Victoria; and The Pyjama Foundation in Queensland.
In addition to supporting volunteering and matched fundraising, Tabcorp also backs its charitable programs with annual donations. “I like to think that the support of Tabcorp and our employees makes a real difference for these charities,” Mr Gray said.
Tabcorp team members step up for their communities
Megs Hermann, OzHarvest National Corporate Engagement Manager, with Sean Gray, Tabcorp Shareholder Relations and Community Projects Officer
24Tabcorp Annual Report 2016

Sustain
ability
Sustain
ability
“Tabcorp’s active involvement in the program provides invaluable support for our mission to rescue food and nourish our community.”
24Tabcorp Annual Report 2016
25Tabcorp Annual Report 2016

“Tabcorp really supports diversity, and provided me with mentoring, training, and opportunities to advance my career.”
26Tabcorp Annual Report 2016
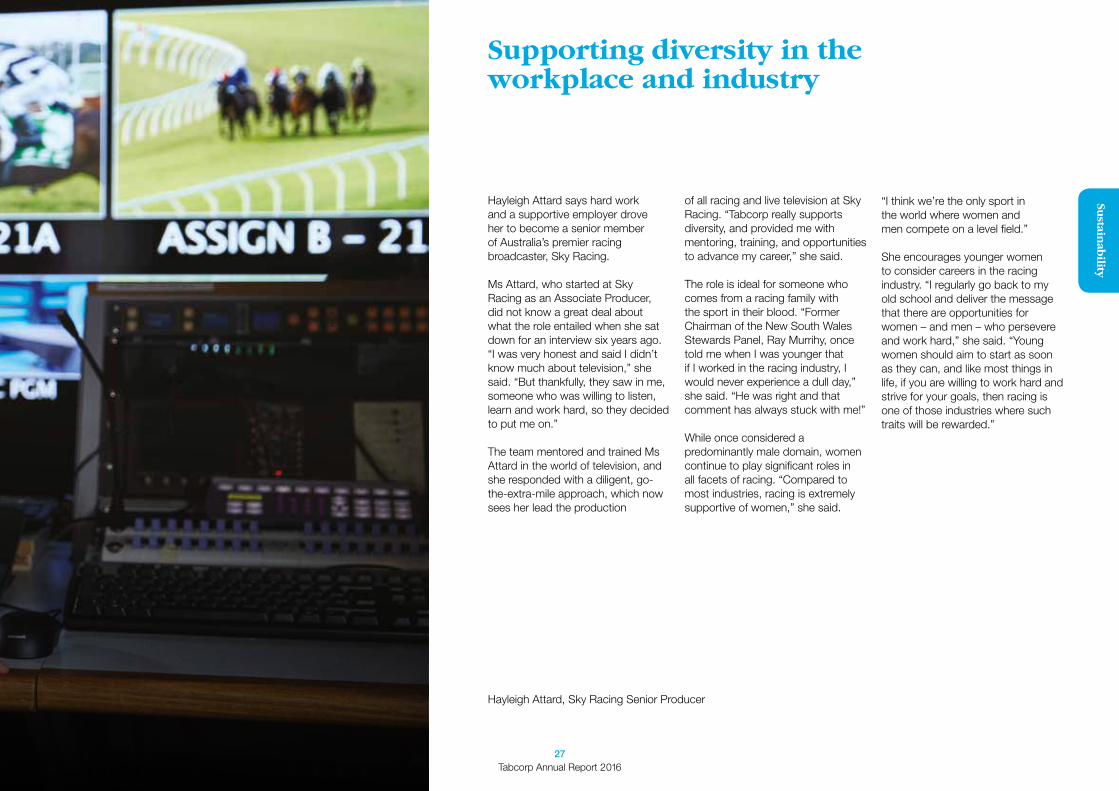
Hayleigh Attard says hard work and a supportive employer drove her to become a senior member of Australia’s premier racing broadcaster, Sky Racing.
Ms Attard, who started at Sky Racing as an Associate Producer, did not know a great deal about what the role entailed when she sat down for an interview six years ago. “I was very honest and said I didn’t know much about television,” she said. “But thankfully, they saw in me, someone who was willing to listen, learn and work hard, so they decided to put me on.”
The team mentored and trained Ms Attard in the world of television, and she responded with a diligent, go-the-extra-mile approach, which now sees her lead the production
of all racing and live television at Sky Racing. “Tabcorp really supports diversity, and provided me with mentoring, training, and opportunities to advance my career,” she said.
The role is ideal for someone who comes from a racing family with the sport in their blood. “Former Chairman of the New South Wales Stewards Panel, Ray Murrihy, once told me when I was younger that if I worked in the racing industry, I would never experience a dull day,” she said. “He was right and that comment has always stuck with me!”
While once considered a predominantly male domain, women continue to play significant roles in all facets of racing. “Compared to most industries, racing is extremely supportive of women,” she said.
“I think we’re the only sport in the world where women and men compete on a level field.”
She encourages younger women to consider careers in the racing industry. “I regularly go back to my old school and deliver the message that there are opportunities for women – and men – who persevere and work hard,” she said. “Young women should aim to start as soon as they can, and like most things in life, if you are willing to work hard and strive for your goals, then racing is one of those industries where such traits will be rewarded.”
Supporting diversity in the workplace and industry
Sustain
ability
Hayleigh Attard, Sky Racing Senior Producer
27Tabcorp Annual Report 2016
26Tabcorp Annual Report 2016
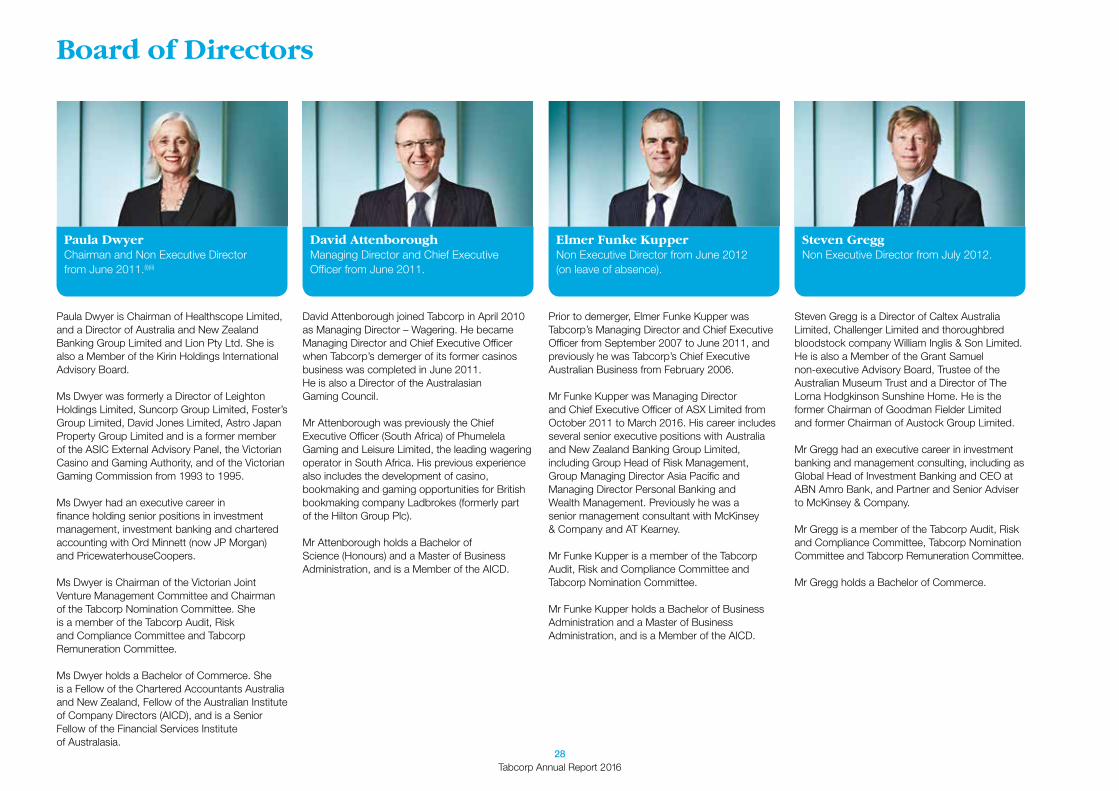
Board of Directors
Paula DwyerChairman and Non Executive Director from June 2011.(i)(ii)
David AttenboroughManaging Director and Chief Executive Officer from June 2011.
Elmer Funke KupperNon Executive Director from June 2012 (on leave of absence).
Steven GreggNon Executive Director from July 2012.
Paula Dwyer is Chairman of Healthscope Limited, and a Director of Australia and New Zealand Banking Group Limited and Lion Pty Ltd. She is also a Member of the Kirin Holdings International Advisory Board.
Ms Dwyer was formerly a Director of Leighton Holdings Limited, Suncorp Group Limited, Foster’s Group Limited, David Jones Limited, Astro Japan Property Group Limited and is a former member of the ASIC External Advisory Panel, the Victorian Casino and Gaming Authority, and of the Victorian Gaming Commission from 1993 to 1995.
Ms Dwyer had an executive career in finance holding senior positions in investment management, investment banking and chartered accounting with Ord Minnett (now JP Morgan) and PricewaterhouseCoopers.
Ms Dwyer is Chairman of the Victorian Joint Venture Management Committee and Chairman of the Tabcorp Nomination Committee. She is a member of the Tabcorp Audit, Risk and Compliance Committee and Tabcorp Remuneration Committee.
Ms Dwyer holds a Bachelor of Commerce. She is a Fellow of the Chartered Accountants Australia and New Zealand, Fellow of the Australian Institute of Company Directors (AICD), and is a Senior Fellow of the Financial Services Institute of Australasia.
David Attenborough joined Tabcorp in April 2010 as Managing Director – Wagering. He became Managing Director and Chief Executive Officer when Tabcorp’s demerger of its former casinos business was completed in June 2011. He is also a Director of the Australasian Gaming Council.
Mr Attenborough was previously the Chief Executive Officer (South Africa) of Phumelela Gaming and Leisure Limited, the leading wagering operator in South Africa. His previous experience also includes the development of casino, bookmaking and gaming opportunities for British bookmaking company Ladbrokes (formerly part of the Hilton Group Plc).
Mr Attenborough holds a Bachelor of Science (Honours) and a Master of Business Administration, and is a Member of the AICD.
Prior to demerger, Elmer Funke Kupper was Tabcorp’s Managing Director and Chief Executive Officer from September 2007 to June 2011, and previously he was Tabcorp’s Chief Executive Australian Business from February 2006.
Mr Funke Kupper was Managing Director and Chief Executive Officer of ASX Limited from October 2011 to March 2016. His career includes several senior executive positions with Australia and New Zealand Banking Group Limited, including Group Head of Risk Management, Group Managing Director Asia Pacific and Managing Director Personal Banking and Wealth Management. Previously he was a senior management consultant with McKinsey & Company and AT Kearney.
Mr Funke Kupper is a member of the Tabcorp Audit, Risk and Compliance Committee and Tabcorp Nomination Committee.
Mr Funke Kupper holds a Bachelor of Business Administration and a Master of Business Administration, and is a Member of the AICD.
Steven Gregg is a Director of Caltex Australia Limited, Challenger Limited and thoroughbred bloodstock company William Inglis & Son Limited. He is also a Member of the Grant Samuel non-executive Advisory Board, Trustee of the Australian Museum Trust and a Director of The Lorna Hodgkinson Sunshine Home. He is the former Chairman of Goodman Fielder Limited and former Chairman of Austock Group Limited.
Mr Gregg had an executive career in investment banking and management consulting, including as Global Head of Investment Banking and CEO at ABN Amro Bank, and Partner and Senior Adviser to McKinsey & Company.
Mr Gregg is a member of the Tabcorp Audit, Risk and Compliance Committee, Tabcorp Nomination Committee and Tabcorp Remuneration Committee.
Mr Gregg holds a Bachelor of Commerce.
28Tabcorp Annual Report 2016
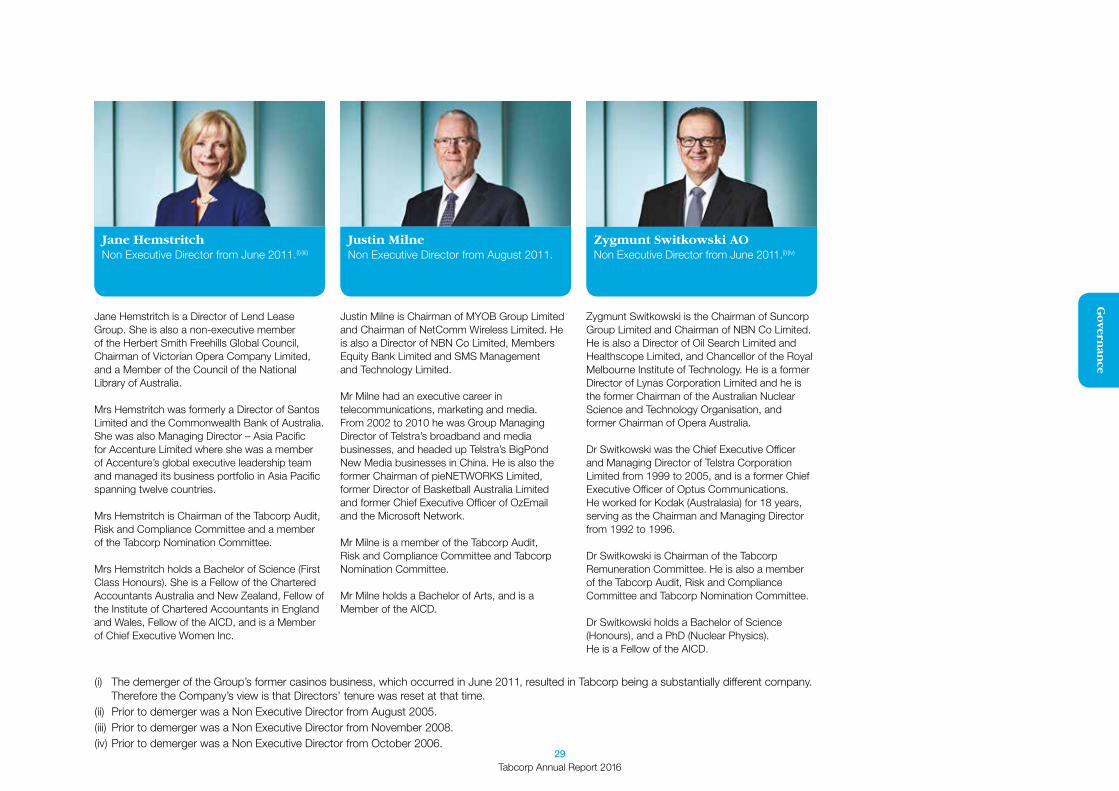
Jane HemstritchNon Executive Director from June 2011.(i) (iii)
Justin MilneNon Executive Director from August 2011.
Zygmunt Switkowski AONon Executive Director from June 2011.(i)(iv)
Jane Hemstritch is a Director of Lend Lease Group. She is also a non-executive member of the Herbert Smith Freehills Global Council, Chairman of Victorian Opera Company Limited, and a Member of the Council of the National Library of Australia.
Mrs Hemstritch was formerly a Director of Santos Limited and the Commonwealth Bank of Australia. She was also Managing Director – Asia Pacific for Accenture Limited where she was a member of Accenture’s global executive leadership team and managed its business portfolio in Asia Pacific spanning twelve countries.
Mrs Hemstritch is Chairman of the Tabcorp Audit, Risk and Compliance Committee and a member of the Tabcorp Nomination Committee.
Mrs Hemstritch holds a Bachelor of Science (First Class Honours). She is a Fellow of the Chartered Accountants Australia and New Zealand, Fellow of the Institute of Chartered Accountants in England and Wales, Fellow of the AICD, and is a Member of Chief Executive Women Inc.
Justin Milne is Chairman of MYOB Group Limited and Chairman of NetComm Wireless Limited. He is also a Director of NBN Co Limited, Members Equity Bank Limited and SMS Management and Technology Limited.
Mr Milne had an executive career in telecommunications, marketing and media. From 2002 to 2010 he was Group Managing Director of Telstra’s broadband and media businesses, and headed up Telstra’s BigPond New Media businesses in China. He is also the former Chairman of pieNETWORKS Limited, former Director of Basketball Australia Limited and former Chief Executive Officer of OzEmail and the Microsoft Network.
Mr Milne is a member of the Tabcorp Audit, Risk and Compliance Committee and Tabcorp Nomination Committee.
Mr Milne holds a Bachelor of Arts, and is a Member of the AICD.
Zygmunt Switkowski is the Chairman of Suncorp Group Limited and Chairman of NBN Co Limited. He is also a Director of Oil Search Limited and Healthscope Limited, and Chancellor of the Royal Melbourne Institute of Technology. He is a former Director of Lynas Corporation Limited and he is the former Chairman of the Australian Nuclear Science and Technology Organisation, and former Chairman of Opera Australia.
Dr Switkowski was the Chief Executive Officer and Managing Director of Telstra Corporation Limited from 1999 to 2005, and is a former Chief Executive Officer of Optus Communications. He worked for Kodak (Australasia) for 18 years, serving as the Chairman and Managing Director from 1992 to 1996.
Dr Switkowski is Chairman of the Tabcorp Remuneration Committee. He is also a member of the Tabcorp Audit, Risk and Compliance Committee and Tabcorp Nomination Committee.
Dr Switkowski holds a Bachelor of Science (Honours), and a PhD (Nuclear Physics). He is a Fellow of the AICD.
Go
vernan
ce
(i) The demerger of the Group’s former casinos business, which occurred in June 2011, resulted in Tabcorp being a substantially different company. Therefore the Company’s view is that Directors’ tenure was reset at that time.
(ii) Prior to demerger was a Non Executive Director from August 2005.(iii) Prior to demerger was a Non Executive Director from November 2008.(iv) Prior to demerger was a Non Executive Director from October 2006.
28Tabcorp Annual Report 2016
29Tabcorp Annual Report 2016

Executives
Damien Johnston Chief Financial Officer
Julian Hoskins Group General Counsel (Acting)
Merryl Dooley Executive General Manager – People, Culture & Communications
Doug Freeman Executive General Manager – Commercial Development
Clinton Lollback Chief Risk Officer
Damien joined Tabcorp in September 2003. He was Tabcorp’s Deputy Chief Financial Officer, being responsible for Tabcorp’s Corporate Finance function including Treasury and Investor Relations, and became Chief Financial Officer upon implementation of the Tabcorp demerger in June 2011.
He previously had a 21 year career with BHP Billiton with key finance roles in both Australia and Asia. These included both operational finance and corporate roles.
Damien holds a Bachelor of Commerce and is a Member of CPA Australia.
Julian joined Tabcorp in September 2008 as General Counsel, Corporate, and held several General Counsel roles within Tabcorp until being appointed as Acting Group General Counsel in December 2015. Prior to joining Tabcorp, he was in the Mergers and Acquisitions Team at Mallesons Stephens Jaques (now King and Wood Mallesons), and held several senior positions in other large law firms in Australia and Europe. Julian holds a Bachelor of Laws (Honours) and a Master of Laws. He is a Member of ACC Australia (ACLA) GC100 and a Member of AICD.
Merryl commenced with Tabcorp in October 1990 and has held numerous positions across a range of discipline areas including human resources, training and development, communications and sales. She became Executive General Manager – Human Resources in June 2011 following the implementation of the Tabcorp demerger, and Executive General Manager – People, Culture & Communications in March 2016.
Merryl holds a Master of Business Administration (Executive) and a Bachelor of Arts, and has attended the Senior Executive Program at the London Business School. She is a Member of AICD.
Since joining Tabcorp in June 2005, Doug has held several senior finance and strategy roles within Tabcorp’s wagering and media businesses. Most recently, Doug was Executive General Manager Strategy and Business Development before commencing his current role in July 2013.
He previously held senior finance and general management roles in medium to large multinational organisations in the service and manufacturing industries, including George Weston Foods Limited, Optus Group, and Alexander & Alexander Group.
Doug holds a Bachelor of Commerce and is a Member of the Institute of Chartered Accountants.
Clinton joined Tabcorp in January 2016. Prior to joining Tabcorp, he was the Head of Operational Risk at Macquarie Group, a role he established and led for 10 years.
Clinton has extensive risk management experience in the banking and finance industry, including roles with Westpac, JP Morgan, and Coopers & Lybrand.
Clinton holds a Bachelor of Business and is a Member of the Institute of Chartered Accountants.
30Tabcorp Annual Report 2016
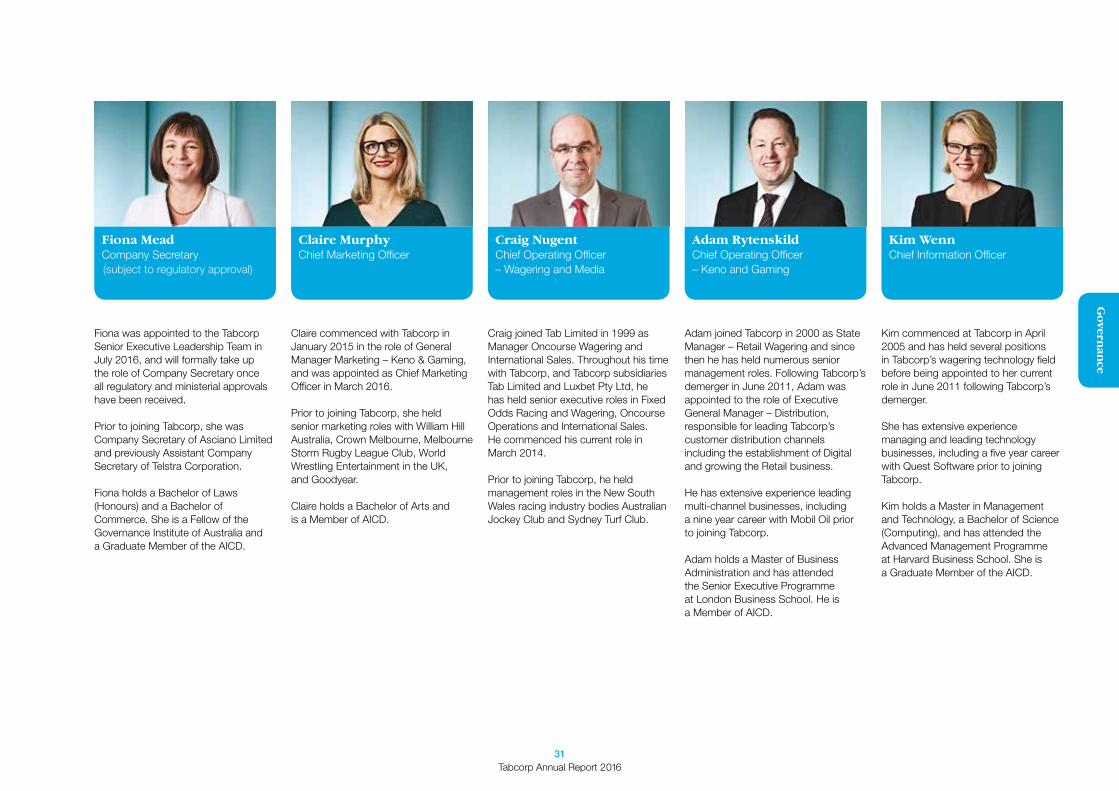
Fiona Mead Company Secretary (subject to regulatory approval)
Claire Murphy Chief Marketing Officer
Craig Nugent Chief Operating Officer – Wagering and Media
Adam Rytenskild Chief Operating Officer – Keno and Gaming
Kim Wenn Chief Information Officer
Fiona was appointed to the Tabcorp Senior Executive Leadership Team in July 2016, and will formally take up the role of Company Secretary once all regulatory and ministerial approvals have been received. Prior to joining Tabcorp, she was Company Secretary of Asciano Limited and previously Assistant Company Secretary of Telstra Corporation. Fiona holds a Bachelor of Laws (Honours) and a Bachelor of Commerce. She is a Fellow of the Governance Institute of Australia and a Graduate Member of the AICD.
Claire commenced with Tabcorp in January 2015 in the role of General Manager Marketing – Keno & Gaming, and was appointed as Chief Marketing Officer in March 2016.
Prior to joining Tabcorp, she held senior marketing roles with William Hill Australia, Crown Melbourne, Melbourne Storm Rugby League Club, World Wrestling Entertainment in the UK, and Goodyear.
Claire holds a Bachelor of Arts and is a Member of AICD.
Craig joined Tab Limited in 1999 as Manager Oncourse Wagering and International Sales. Throughout his time with Tabcorp, and Tabcorp subsidiaries Tab Limited and Luxbet Pty Ltd, he has held senior executive roles in Fixed Odds Racing and Wagering, Oncourse Operations and International Sales. He commenced his current role in March 2014.
Prior to joining Tabcorp, he held management roles in the New South Wales racing industry bodies Australian Jockey Club and Sydney Turf Club.
Adam joined Tabcorp in 2000 as State Manager – Retail Wagering and since then he has held numerous senior management roles. Following Tabcorp’s demerger in June 2011, Adam was appointed to the role of Executive General Manager – Distribution, responsible for leading Tabcorp’s customer distribution channels including the establishment of Digital and growing the Retail business.
He has extensive experience leading multi-channel businesses, including a nine year career with Mobil Oil prior to joining Tabcorp.
Adam holds a Master of Business Administration and has attended the Senior Executive Programme at London Business School. He is a Member of AICD.
Kim commenced at Tabcorp in April 2005 and has held several positions in Tabcorp’s wagering technology field before being appointed to her current role in June 2011 following Tabcorp’s demerger.
She has extensive experience managing and leading technology businesses, including a five year career with Quest Software prior to joining Tabcorp.
Kim holds a Master in Management and Technology, a Bachelor of Science (Computing), and has attended the Advanced Management Programme at Harvard Business School. She is a Graduate Member of the AICD.
Go
vernan
ce
30Tabcorp Annual Report 2016
31Tabcorp Annual Report 2016
IntroductionTabcorp is committed to operating with integrity and maintaining high standards of ethical behaviour. To support this commitment, Tabcorp has in place corporate governance practices and policies which are reviewed regularly and enhanced where necessary to ensure they continue to meet the needs of the Company and represent best practice.
Throughout the 2016 financial year, and to the date of this report, the Group complied with the Corporate Governance Principles and Recommendations, 3rd Edition published by the ASX.
Tabcorp’s Corporate Governance Statement 2016, Appendix 4G, and other governance related information are available from the Corporate Governance section of Tabcorp’s website at www.tabcorp.com.au.
The following is a summary of the key corporate governance developments which Tabcorp introduced since the start of the 2016 financial year.
Board skills matrixThe disclosure in the Corporate Governance Statement 2016 of the Board skills matrix was enhanced to show the Board’s assessment of its Directors’ relevant skills and experiences. Following a self-evaluation against the matrix, the Board determined that all seven Directors exhibited the skills/experiences relevant to seven of the thirteen criteria, and there was generally a high prevalence exhibited for all criteria.
Further details are set out in section 2.2 of the Corporate Governance Statement, and Directors’ biographical details can be found on pages 28 and 29 of the Annual Report.
Director tenureThe Company considers that Directors’ tenure was reset when the demerger of the Group’s former casinos business occurred in June 2011, which resulted in Tabcorp being a substantially different company.
Tabcorp does not consider that the length of service on the Board should be considered as a factor affecting a Director’s independence and the ability to act in the best interests of the Group.
Tabcorp maintains a balanced Board with a good mix of longer serving Directors and more recent appointments.
Further details are set out in section 2.4 of the Corporate Governance Statement. Directors’ biographical details can be found on pages 28 and 29 of the Annual Report.
Directors’ Shareholdings Policy The Board approved changes to the Directors’ Shareholding Policy to strengthen the alignment between the interests of Non Executive Directors and the interests of the Group and shareholders.
Under the policy, Non Executive Directors are encouraged to acquire and hold a minimum shareholding in Tabcorp. Non Executive Directors are encouraged to reach the applicable threshold within three years from appointment, with current Non Executive Directors having three years from FY16 to acquire additional shares to meet the threshold.
Further details are set out in section 5.8 of the Corporate Governance Statement. Directors’ interests in Tabcorp securities can be found on page 41 of the Annual Report. The policy is available from the Corporate Governance section of Tabcorp’s website at www.tabcorp.com.au.
Corporate governance
32Tabcorp Annual Report 2016
Executives’ Shareholdings Policy Tabcorp introduced the Executives’ Shareholdings Policy which sets mandatory minimum shareholding requirements applicable to members of the Senior Executive Leadership Team. The aim of the policy is to ensure that there is an adequate level of alignment between the interests of executives, the Group and shareholders, through equity ownership.
Under the policy, executives will be required to hold a minimum shareholding in Tabcorp. The minimum shareholding must be achieved within five years from 1 July 2016 or from the date the executive is appointed into their role.
The policy is available from the Corporate Governance section of Tabcorp’s website at www.tabcorp.com.au.
Securities Trading Policy The Board approved changes to the Tabcorp Securities Trading Policy. The key changes were the introduction of an additional Blackout Period prior to the Annual General Meeting, the additional requirement for Senior Executive Leadership Team members to seek written approval from the Chairman prior to trading (following approval from the Managing Director and Chief Executive Officer, or the Company Secretary), and the inclusion of prohibitions on short selling and engaging in speculative short term investing of Tabcorp securities.
Under the policy, the applicable Blackout Periods commence on:
• 1 January and end on the day Tabcorp announces its half year results inclusively;
• 1 July and end on the day Tabcorp announces its preliminary final year results inclusively; and
• 1 October and end on the day of Tabcorp’s Annual General Meeting inclusively.
The Tabcorp Board, Chairman, Managing Director and Chief Executive Officer, or Company Secretary may also decide other Blackout Periods at any time.
Further details are set out in section 5.7 of the Corporate Governance Statement, and the policy is available from the Corporate Governance section of Tabcorp’s website at www.tabcorp.com.au.
Anti-Bribery and Corruption PolicyTabcorp launched its new Anti-Bribery and Corruption Policy which was approved by the Board. The policy prohibits all forms of bribery, facilitation payments, paying or receiving secret commissions, and fraud. It also sets the standards required of employees when dealing with third parties, and the offering and acceptance of gifts and hospitality.
Further details are set out in section 5.5 of the Corporate Governance Statement, and the policy is available from the Corporate Governance section of Tabcorp’s website at www.tabcorp.com.au.
New Chief Risk Officer function Tabcorp created the new role of Chief Risk Officer to lead the Group’s overall risk, financial crime/AML and compliance activities, including responsible gambling. The Chief Risk Officer team strengthens the Group’s focus on managing risk and regulatory compliance in an increasingly global context. The creation of the Chief Risk Officer function follows best practice in the financial services sector and we understand is a first for a gambling company in Australia.
Refer to section 4 of the Corporate Governance Statement for further details about the risk management and controls applicable to the Group.
Go
vernan
ce
32Tabcorp Annual Report 2016
33Tabcorp Annual Report 2016

Directors’ Report
Contents
1. Principal activities 35
2. Operating and financial review of the Group 35
3. Significant changes in the state of affairs 35
4. Significant events after the end of the financial year 36
5. Business strategies 36
6. Likely developments and expected results 36
7. Key risks and uncertainties 36
8. Directors 40
9. Directorships of other listed companies 40
10. Directors’ interests in Tabcorp securities 41
11. Directors’ interests in contracts 41
12. Board and Committee meeting attendance 42
13. Indemnification and insurance of Directors and Officers 42
14. Company Secretaries 42
15. Corporate governance 43
16. Environmental regulation and performance 43
17. Other matters 43
18. Auditors 43
19. Non-statutory audit and other services 43
20. Auditor’s independence declaration 44
21. Rounding of amounts 44
22. Remuneration Report 44
34Tabcorp Annual Report 2016
The Directors of Tabcorp Holdings Limited (the Company) submit their report for the consolidated entity comprising the Company and its subsidiaries (the Group) and the Group’s interests in joint arrangements in respect of the financial year ended 30 June 2016.
1. Principal activitiesThe principal activities of the Group during the financial year comprised the provision of gambling and entertainment services. The Group’s principal activities remain unchanged from the previous financial year, except as disclosed elsewhere in this report.
2. Operating and financial review of the GroupThe financial results of the Group for the financial year ended 30 June 2016 comprise its three businesses of Wagering and Media, Gaming Services, and Keno. The activities and financial performance of the Group and each of its operating businesses for the financial year are set out on pages 6 to 21.
3. Significant changes in the state of affairsThe following events, which may be considered to be significant changes in the state of affairs of the Group, have occurred since the commencement of the financial year on 1 July 2015.
3.1 Sun Bets businessDuring the year, Tabcorp has been establishing Sun Bets, a new online wagering and gaming business to compete in the UK and Irish online gambling markets. This business will operate in partnership with News UK, where Tabcorp is the wagering operator and holder of the relevant gambling licences, and News UK provides marketing and promotional services to customers.
3.2 NSW Keno LicenceTabcorp was issued a new NSW Keno Licence during the year, extending approval to operate the exclusive NSW Keno business until 2050. The new licence offers exciting enhancements to the current game, including digital play in-venue, subject to regulatory approvals. Tabcorp paid $25.0 million to the NSW Government, and will pay an annual fee on the anniversary of licence commencement of $3.0 million, indexed at 2.5% per annum, increasing to $4.5 million in 2022, thereafter indexed at 2.5% per annum for the remainder of the licence term.
3.3 Media rightsOn 7 August 2015, Tabcorp announced that its Sky Racing business had reached agreement on a media rights deal for Victorian thoroughbred racing. The arrangements, which expire in 2020, include domestic, digital and international rights for Victorian thoroughbred racing (except for MRC international rights which ceased in July 2016). This followed an earlier announcement that Tabcorp’s Sky Racing business had secured the broadcasting rights for all New South Wales thoroughbred racing, and that Sky Racing’s thoroughbred showcase channel, Sky Thoroughbred Central, would be included on FOXTEL’s base tier.
These long term media rights arrangements deliver certainty for Tabcorp, the racing industry, retail venue partners and wagering customers.
All Australian racing vision is available on the Sky Racing broadcast and TAB digital platforms.
3.4 Other significant changes in the state of affairsThere were no significant changes in the state of affairs of the Group that occurred during the financial year other than as set out in this Directors’ report.
Directo
rs’ Rep
ort
35Tabcorp Annual Report 2016
34Tabcorp Annual Report 2016
4. Significant events after the end of the financial yearOn 1 August 2016, Tabcorp announced that it will acquire INTECQ Limited (INTECQ) through a Scheme of Arrangement. The acquisition is subject to certain terms and conditions which are contained in the Scheme Implementation Agreement, including approval from INTECQ’s shareholders, the Australian Securities and Investments Commission, the Court, gaming regulators and other regulatory approvals including the Australian Competition and Consumer Commission approval. INTECQ is a leading Australian gaming systems company, providing integrated gaming technology solutions, gaming management systems and Licensed Monitoring Operator services to gaming venues and other businesses. Tabcorp’s proposed acquisition of INTECQ will provide increased scale and diversification to the Tabcorp Gaming Solutions business. Under the terms of the Scheme Implementation Agreement, INTECQ shareholders will receive $7.15 cash for each INTECQ share held, which implies an expected enterprise value of $115 million. Tabcorp intends to fund the acquisition from existing cash and bank facilities.
No other matters or circumstances have arisen since the end of the financial year, which are not otherwise dealt with in this report or in the Financial Report, that have significantly affected or may significantly affect the operations of the Group, the results of those operations or the state of affairs of the Group in subsequent financial years. Refer also to note A6 to the Financial Report.
5. Business strategies The Group is one of Australia’s leading gambling entertainment companies and seeks to deliver sustainable superior returns to its shareholders through the delivery of financial, operational and leadership excellence. To achieve these outcomes, the Group continues to focus on a number of key priorities, which are set out on page 7. The priorities and strategies of the Group’s operating businesses are set out on pages 16 to 20.
6. Likely developments and expected resultsEach year the Board undertakes a formal strategic planning process to provide guidance to management about the Group’s strategic direction. The Group plans to continue with its business strategies, as set out in this report. The execution of these strategies is expected to result in improved financial performance over the coming financial years.
The achievement of the expected results in future financial years is dependent on a range of factors, and may be adversely affected by any number of events, and are subject to, among other things, the key risks and uncertainties described in section 7.
The Directors have excluded from this report any further information on the likely developments in the operations of the Group and the expected results of those operations in future financial years, as the Directors have reasonable grounds to believe that to include such information will be likely to result in unreasonable prejudice to the Group.
7. Key risks and uncertaintiesThe Group has a structured and proactive approach to understanding and managing risk. The key focus of the risk management approach is to ensure alignment of strategy, processes, people, technology and knowledge, and evaluate and manage the uncertainties and opportunities faced by the Group. Overviews of the Group’s risk management processes and internal control framework are disclosed in the Company’s Corporate Governance Statement available on Tabcorp’s website.
Set out below are summaries of the key risks which may materially impact the execution and achievement of the business strategies and prospects for the Group in future financial years. These key risks should not be taken to be a complete or exhaustive list of the risks and uncertainties associated with the Group. Many of the risks are outside the control of the Directors. There can be no guarantee that Tabcorp will achieve its stated objectives, that it will meet trading performance or financial results guidance that it may provide to the market, or that any forward looking statements contained in this report will be realised or otherwise eventuate.
Directors’ Report
36Tabcorp Annual Report 2016
7.1 Regulation and changes to the regulatory environment The activities of the Group are conducted in highly regulated industries. The gambling activities that members of the Group conduct, and will conduct, and the level of competition that they experience, and will experience, depend to a significant extent on:
• the licences granted to the Group and to third parties; and
• government policy and the manner in which the relevant governments exercise their broad powers in relation to the manner in which the relevant businesses are conducted.
Changes in legislation, regulation or government policy may have an adverse impact on the Group’s operational and financial performance. Court decisions concerning the constitutionality or interpretation of such legislation, regulations or government policy may have an adverse effect on the operational and financial performance of the Group. Potential changes, which would potentially negatively affect the value of the licences granted to members of the Group, and potentially the Group’s financial performance, include:
• changes in state wagering, Keno or other gambling tax rates and levies;
• changes or decisions concerning race fields and sports product fees, advertising restrictions and the distribution of gambling products, including through particular channels;
• changes impacting on aspects of retail exclusivity;
• variations to permitted deduction rates and returns to players;
• variations to arrangements for racing industry funding in Victoria, NSW and the ACT;
• changes to the conditions in which venues offering products of members of the Group must operate;
• the introduction of additional legislation to guard against money laundering;
• the introduction of further legislation to implement further responsible gambling measures;
• changes or decisions by government or industry concerning wagering, Keno or other forms of gambling; and
• any other legislative change.
Any non-renewal of licences currently held by members of the Group, or the issue of additional wagering, Keno or other gambling licences to third parties, would potentially result in the Group not generating the revenue it currently generates from its licences, which could adversely impact the Group’s financial performance and financial position.
Changes to the regulatory environment in some of the jurisdictions in which the Group operates which have been made or foreshadowed and which may have an adverse effect on the operational and financial performance of the Group include the expansion throughout Australia of sports product fees or increases in those fees for sports betting operators. This risk, and the similar race fields fee risk, are detailed below.
The rapid deregulation of the national wagering market has seen a dramatic growth in market share by the corporate bookmakers, mostly located in the Northern Territory, and the introduction of race fields fees legislation across Australia (which allows racing codes in a state or territory to charge wagering operators for the use of race fields information, irrespective of the domicile of the operator). This rapid deregulation has the potential to have an adverse impact on the Group’s earnings in the short term as market changes continue. Tabcorp continually adjusts its wagering business model to take account of the changed market dynamics and to mitigate the adverse consequences of deregulation.
As a leader in the Australian gambling industry, the Group takes a proactive approach to engaging with relevant regulators and governments, and lodges submissions in respect of changes to the industry which may impact the Group and its stakeholders.
The Group operates a diverse portfolio of businesses spread across a number of jurisdictions, business segments and customer categories which reduces the reliance on any one specific business or jurisdiction. The Group maintains long term gambling licences, and seeks new licences and to extend existing licences where possible. During the financial year, the Group was successful in extending its approval to operate Keno in NSW until 2050 through the grant of a new NSW Keno Licence.
Directo
rs’ Rep
ort
36Tabcorp Annual Report 2016
37Tabcorp Annual Report 2016

7.2 Disciplinary action and cancellation of licences In certain situations (including if the Group fails to meet the terms and conditions of its licences or other compliance requirements), the authorities that regulate the licences and authorisations that have been granted to members of the Group (including the Victorian Wagering and Betting Licence; the Victorian, NSW and Queensland Keno Licences; the ACT Keno authorisation, the NSW and ACT totalisator and sports bookmaking licences; and the Northern Territory sports bookmaking licence) may take disciplinary action against relevant members of the Group.
The disciplinary action that may be taken includes the issue of a letter of censure, the imposition of fines, the variation of the terms of, or imposition of new terms on, a licence or authorisation and the suspension, termination or cancellation of a licence or authorisation.
The suspension, cancellation or termination of any of the key licences or authorisations held by a member of the Group would potentially result in a loss of revenue and profit for the Group, which would adversely affect the Group’s financial performance and financial position.
Certain licences held by members of the Group, including the Victorian Wagering and Betting Licence, impose conditions requiring the licensee to comply with applicable laws, a breach of which is grounds for disciplinary action.
7.3 Competition In a broad sense, gambling activities compete with other consumer products for consumers’ discretionary expenditure and, in particular, with other forms of leisure and entertainment including cinema, restaurants, sporting events, the internet and pay television.
Further, the Group’s Wagering and Media business currently competes with bookmakers in Victoria and NSW, and other interstate and international wagering operators who accept bets over the telephone or internet (such as corporate bookmakers based in the Northern Territory and betting exchanges). The internet and other new forms of distribution have allowed new competitors to enter the Group’s traditional markets of Victoria and NSW without those competitors being licensed in those states. Furthermore, court decisions, the relaxation of advertising laws (or the way in which they have been administered) and the increasing application of competition policy have allowed other wagering operators to gain greater freedom to compete nationally.
Competition from interstate and international operators may extend to the Group’s retail wagering network.
The Group’s Keno and Gaming Services businesses also face competition in their respective industries.
If the Group does not adequately respond to the competition which it faces, there may be a change in consumer spending patterns which may have an adverse effect on the operational and financial performance of the Group.
The Group adopts a range of strategies, including leveraging its exclusive retail network, expanding its TAB customer loyalty program, enhancing its customer service and relationship management, and driving digital excellence across its multi-channel network.
The Group also explores new business opportunities, and during the year established Sun Bets, a new online wagering and gaming business in the UK.
Directors’ Report
38Tabcorp Annual Report 2016
7.4 Racing productsThe Group’s Wagering and Media business is reliant on the Victorian, NSW and other racing industries in Australia and overseas providing a program of events for the purposes of wagering. A significant decline in the quality or number of horses or greyhounds, or number of events, or the occurrence of an event which adversely impacts on the Australian racing industry or any State or Territory racing industry, or which otherwise disrupts the scheduled racing program (such as an outbreak of equine influenza or other equine pandemic), would have a significant adverse effect on wagering revenue and may have an adverse effect on the operational and financial performance of the Group. The Group engages and works closely with racing bodies and industry stakeholders to optimise racing schedules and broadcasts to provide the best racing product available to customers and ameliorate the potential for adverse impacts which may result from a decline in racing product. In addition, the Group has business continuity plans to help manage and respond to significant events which may impact upon the supply of racing product.
7.5 Race field and sports product feesEach State and Territory of Australia has implemented race fields arrangements, under which each State or Territory or its racing industry charges wagering operators product fees for use of that industry’s race fields information (or otherwise charges fees in respect of the operator’s race betting operations in that State or Territory). Consequently, the Group is required to pay product fees to the relevant racing controlling body. Similarly, legislation has been introduced in various jurisdictions to support the imposition by sports controlling bodies of fees payable by wagering operators betting on relevant sporting events. There is the potential that fees will increase, or new fees will be introduced, and such fees may have an adverse effect on the operational and financial performance of the Group. However, the Group has mitigation strategies to partly ameliorate such impacts, including that members of the Group currently have contracts that the Group considers will allow them to offset some of the fees or obtain damages under contract. Members of the Group may in the future disagree with various racing industry bodies regarding the application of certain aspects of the race fields regimes or contracts that govern product fees. Such disagreements may lead to litigation or other dispute resolution processes, including negotiated settlement.
7.6 Sky Channel broadcast arrangements Sky Channel requires and holds rights to broadcast various race meetings and other sporting events held throughout Australia and internationally. The Group has in place contracts in respect of Victorian thoroughbred racing broadcast rights which expire in 2020, and NSW thoroughbred racing broadcast rights which expire in 2025. These long term media rights arrangements deliver certainty for the Group, the racing industry, retail venue partners and wagering customers. If, for any reason, the Group is unable to renegotiate any of its key broadcast arrangements or to renegotiate them on materially the same or similar terms, then this may adversely impact the operational and financial performance of the Group’s Wagering and Media business. The Group has alternative business plans to mitigate potential adverse impacts should they arise. In addition, the Group continues to expand the export of Australian racing vision to more countries around the world and import racing content to Australian customers.
7.7 Technology security risks The Group’s businesses rely on the successful operation of technology infrastructure. A technology security failure, such as a cyber attack, could impact upon the Group’s technology systems and equipment, or result in the loss or exposure of information assets, which may potentially adversely impact the reputation, operations or financial performance of the Group. Significant resources are allocated to managing the Group’s information technology portfolio, including specialist resources dedicated to information security and responding to cyber risks. The Group’s information security management system has been certified to ISO 27001 standard. The Group continues to evolve and strengthen its practices to effectively manage technology security risks.
Directo
rs’ Rep
ort
38Tabcorp Annual Report 2016
39Tabcorp Annual Report 2016
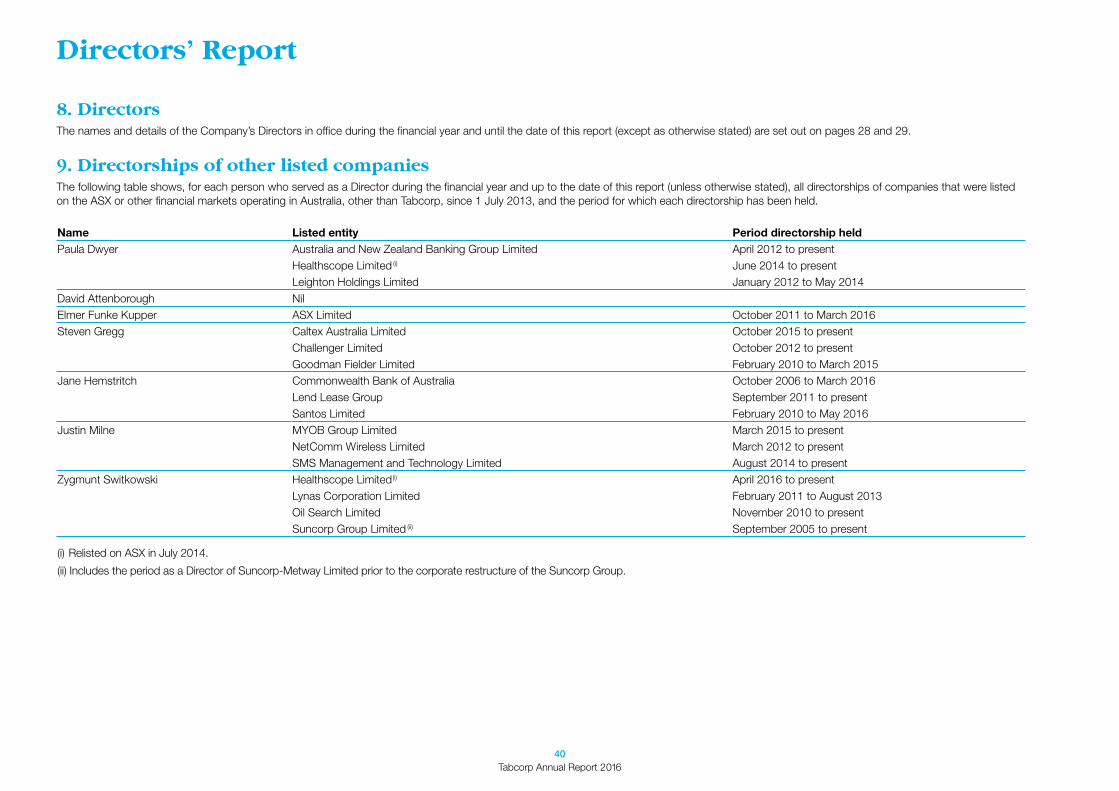
8. DirectorsThe names and details of the Company’s Directors in office during the financial year and until the date of this report (except as otherwise stated) are set out on pages 28 and 29.
9. Directorships of other listed companiesThe following table shows, for each person who served as a Director during the financial year and up to the date of this report (unless otherwise stated), all directorships of companies that were listed on the ASX or other financial markets operating in Australia, other than Tabcorp, since 1 July 2013, and the period for which each directorship has been held.
Name Listed entity Period directorship heldPaula Dwyer Australia and New Zealand Banking Group Limited April 2012 to present
Healthscope Limited (i) June 2014 to presentLeighton Holdings Limited January 2012 to May 2014
David Attenborough NilElmer Funke Kupper ASX Limited October 2011 to March 2016Steven Gregg Caltex Australia Limited October 2015 to present
Challenger Limited October 2012 to presentGoodman Fielder Limited February 2010 to March 2015
Jane Hemstritch Commonwealth Bank of Australia October 2006 to March 2016Lend Lease Group September 2011 to presentSantos Limited February 2010 to May 2016
Justin Milne MYOB Group Limited March 2015 to presentNetComm Wireless Limited March 2012 to presentSMS Management and Technology Limited August 2014 to present
Zygmunt Switkowski Healthscope Limited(i) April 2016 to presentLynas Corporation Limited February 2011 to August 2013Oil Search Limited November 2010 to presentSuncorp Group Limited (ii) September 2005 to present
(i) Relisted on ASX in July 2014.
(ii) Includes the period as a Director of Suncorp-Metway Limited prior to the corporate restructure of the Suncorp Group.
Directors’ Report
40Tabcorp Annual Report 2016
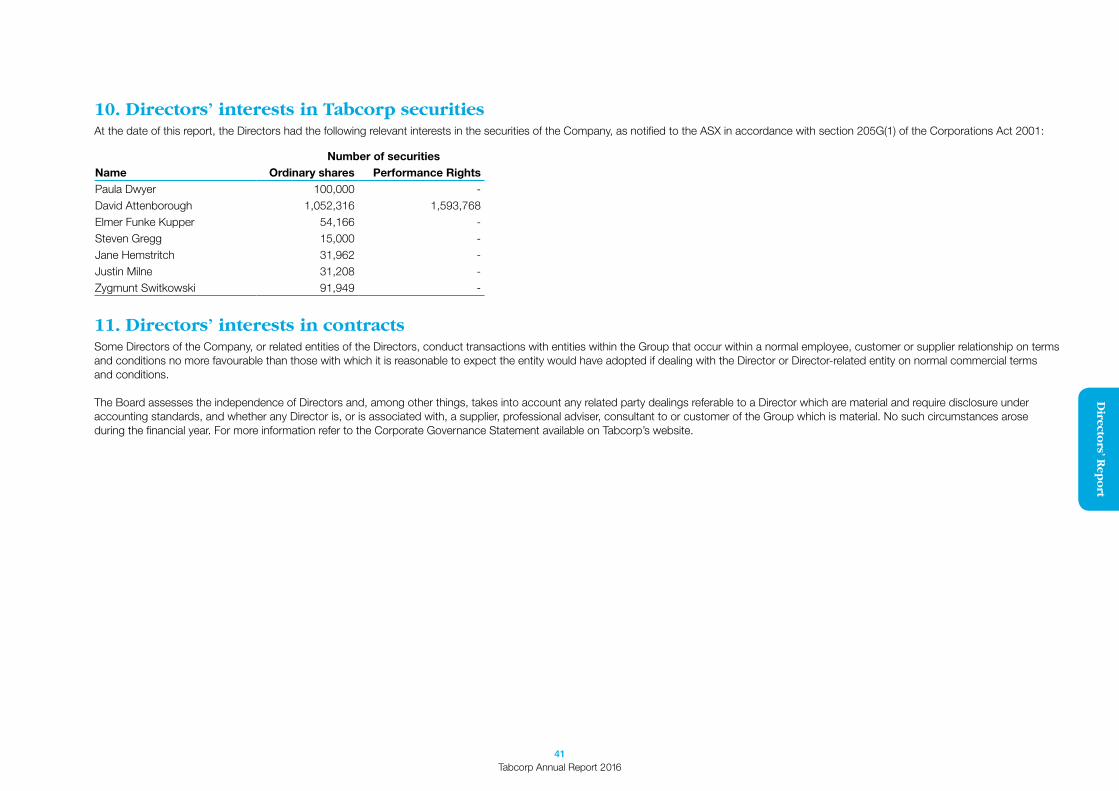
10. Directors’ interests in Tabcorp securitiesAt the date of this report, the Directors had the following relevant interests in the securities of the Company, as notified to the ASX in accordance with section 205G(1) of the Corporations Act 2001:
Number of securitiesName Ordinary shares Performance RightsPaula Dwyer 100,000 -David Attenborough 1,052,316 1,593,768Elmer Funke Kupper 54,166 -Steven Gregg 15,000 -Jane Hemstritch 31,962 -Justin Milne 31,208 -Zygmunt Switkowski 91,949 -
11. Directors’ interests in contractsSome Directors of the Company, or related entities of the Directors, conduct transactions with entities within the Group that occur within a normal employee, customer or supplier relationship on terms and conditions no more favourable than those with which it is reasonable to expect the entity would have adopted if dealing with the Director or Director-related entity on normal commercial terms and conditions.
The Board assesses the independence of Directors and, among other things, takes into account any related party dealings referable to a Director which are material and require disclosure under accounting standards, and whether any Director is, or is associated with, a supplier, professional adviser, consultant to or customer of the Group which is material. No such circumstances arose during the financial year. For more information refer to the Corporate Governance Statement available on Tabcorp’s website.
Directo
rs’ Rep
ort
40Tabcorp Annual Report 2016
41Tabcorp Annual Report 2016
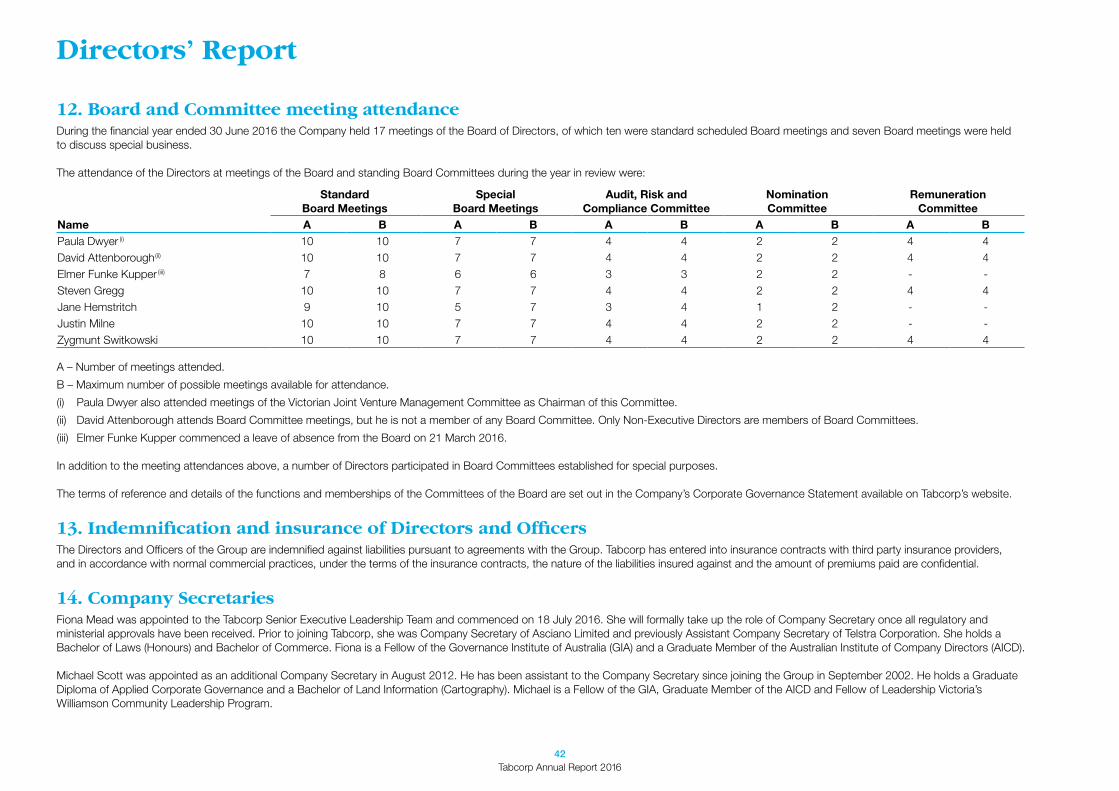
12. Board and Committee meeting attendanceDuring the financial year ended 30 June 2016 the Company held 17 meetings of the Board of Directors, of which ten were standard scheduled Board meetings and seven Board meetings were held to discuss special business.
The attendance of the Directors at meetings of the Board and standing Board Committees during the year in review were:
StandardBoard Meetings
Special Board Meetings
Audit, Risk and Compliance Committee
Nomination Committee
Remuneration Committee
Name A B A B A B A B A BPaula Dwyer (i) 10 10 7 7 4 4 2 2 4 4David Attenborough(ii) 10 10 7 7 4 4 2 2 4 4Elmer Funke Kupper (iii) 7 8 6 6 3 3 2 2 - -Steven Gregg 10 10 7 7 4 4 2 2 4 4Jane Hemstritch 9 10 5 7 3 4 1 2 - -Justin Milne 10 10 7 7 4 4 2 2 - -Zygmunt Switkowski 10 10 7 7 4 4 2 2 4 4
A – Number of meetings attended.
B – Maximum number of possible meetings available for attendance.
(i) Paula Dwyer also attended meetings of the Victorian Joint Venture Management Committee as Chairman of this Committee.
(ii) David Attenborough attends Board Committee meetings, but he is not a member of any Board Committee. Only Non-Executive Directors are members of Board Committees.
(iii) Elmer Funke Kupper commenced a leave of absence from the Board on 21 March 2016.
In addition to the meeting attendances above, a number of Directors participated in Board Committees established for special purposes.
The terms of reference and details of the functions and memberships of the Committees of the Board are set out in the Company’s Corporate Governance Statement available on Tabcorp’s website.
13. Indemnification and insurance of Directors and OfficersThe Directors and Officers of the Group are indemnified against liabilities pursuant to agreements with the Group. Tabcorp has entered into insurance contracts with third party insurance providers, and in accordance with normal commercial practices, under the terms of the insurance contracts, the nature of the liabilities insured against and the amount of premiums paid are confidential.
14. Company SecretariesFiona Mead was appointed to the Tabcorp Senior Executive Leadership Team and commenced on 18 July 2016. She will formally take up the role of Company Secretary once all regulatory and ministerial approvals have been received. Prior to joining Tabcorp, she was Company Secretary of Asciano Limited and previously Assistant Company Secretary of Telstra Corporation. She holds a Bachelor of Laws (Honours) and Bachelor of Commerce. Fiona is a Fellow of the Governance Institute of Australia (GIA) and a Graduate Member of the Australian Institute of Company Directors (AICD).
Michael Scott was appointed as an additional Company Secretary in August 2012. He has been assistant to the Company Secretary since joining the Group in September 2002. He holds a Graduate Diploma of Applied Corporate Governance and a Bachelor of Land Information (Cartography). Michael is a Fellow of the GIA, Graduate Member of the AICD and Fellow of Leadership Victoria’s Williamson Community Leadership Program.
Directors’ Report
42Tabcorp Annual Report 2016
15. Corporate governanceThe Directors of the Company support and adhere to the ASX Corporate Governance Principles and Recommendations, 3rd Edition, recognising the need for maintaining high standards of corporate behaviour and accountability. Refer to pages 32 and 33 for further information. The Company’s Corporate Governance Statement is available under the corporate governance section of the Company’s website at www.tabcorp.com.au/about_governance.aspx.
16. Environmental regulation and performanceThe Group’s environmental obligations and waste discharge quotas are regulated under both state and federal laws. The Group has a record of complying with, and in most cases exceeding, its environmental performance obligations. No environmental breaches have been notified to the Group by any government agency.
17. Other mattersIn July 2015 the Australian Transaction Reports and Analysis Centre (AUSTRAC) commenced civil proceedings against Tabcorp Holdings Limited and the Group’s NSW and Victorian wagering businesses alleging certain breaches of the Anti-Money Laundering and Counter-Terrorism Financing Act 2006. The hearing is scheduled to commence in June 2017. The Company takes its regulatory compliance obligations extremely seriously. The Company acknowledges the matters raised by AUSTRAC and is committed to ensuring they are resolved. At this stage it is not possible to determine the extent of any potential financial impact to the Group. In March 2016, Tabcorp was advised by the Australian Federal Police that an investigation had commenced into claims raised in media articles in relation to a payment concerning a Cambodian business opportunity. The Company explored a business opportunity in relation to the Cambodian sports betting market in 2009/2010. At that time, some Asian countries were considering deregulating sports betting. The Company chose not to pursue the opportunity. Mr Elmer Funke Kupper is on leave of absence from the Board of Directors until the completion of this investigation. The Company is cooperating fully with the Australian Federal Police. Also in March 2016, the High Court of Australia handed down its judgment which dismissed the Company’s appeal against the judgment of the Court of Appeal of the Supreme Court of Victoria delivered in December 2014. The initial proceeding related to the Company’s claim for a payment from the State of Victoria of an estimated $686.8 million in relation to the State of Victoria’s obligation to make the payment in August 2012, when the Company’s Gaming and Wagering Licences expired and new licences were granted. As a result of the Victorian Government’s decision in 2008 that the Company was not entitled to the payment, the Company incurred charges against its earnings in previous financial years. The Company has therefore dealt with the original announcement in its financial accounts in prior years.
18. AuditorsThe Group’s external auditor is Ernst & Young. The Group’s internal audit function is fully resourced by Tabcorp, with specialist independent external support where necessary. More information relating to the audit functions can be found in the Company’s Corporate Governance Statement.
19. Non-statutory audit and other servicesErnst & Young, the external auditor to the Company and the Group, provided non-statutory audit services to the Company during the financial year ended 30 June 2016. The Directors are satisfied that the provision of non-statutory audit services during this period was compatible with the general standard of independence for auditors imposed by the Corporations Act 2001. The nature and scope of each type of non-statutory audit service provided means that auditor independence was not compromised.
The Company’s Board Audit, Risk and Compliance Committee reviews the activities of the independent external auditor and reviews the auditor’s performance on an annual basis. The Chairman of the Board Audit, Risk and Compliance Committee must approve all non-statutory audit and other work to be undertaken by the auditor (if any). Further details relating to the Board Audit, Risk and Compliance Committee and the engagement of auditors are available in the Company’s Corporate Governance Statement available on the Tabcorp website.
Directo
rs’ Rep
ort
42Tabcorp Annual Report 2016
43Tabcorp Annual Report 2016

19. Non-statutory audit and other services (continued)Ernst & Young, acting as the Company’s external auditor, received or are due to receive $478,000 in relation to the provision of non-statutory audit services to the Company.
Amounts paid or payable by the Company for audit and non-statutory audit services are disclosed in note E5 to the Financial Report.
20. Auditor’s independence declarationShown opposite is a copy of the auditor’s independence declaration provided under section 307C of the Corporations Act 2001 in relation to the audit for the financial year ended 30 June 2016. This auditor’s independence declaration forms part of this Directors’ Report.
21. Rounding of amountsDollar amounts in the Financial Report and the Directors’ Report have been rounded to the nearest hundred thousand unless specifically stated to be otherwise, in accordance with the Australian Securities and Investments Commission Corporations (Rounding in Financial/Directors’ Reports) Instrument 2016/191.
22. Remuneration ReportThe Remuneration Report for the financial year ended 30 June 2016 forms part of this Directors’ Report, and can be found on pages 45 to 72.
This Directors’ Report has been signed in accordance with a resolution of Directors.
Paula J DwyerChairman
Melbourne4 August 2016
Directors’ Report
A member firm of Ernst & Young Global LimitedLiability limited by a scheme approved under Professional Standards Legislation
Ernst & Young8 Exhibition Street Melbourne VIC 3000 AustraliaGPO Box 67 Melbourne VIC 3001
Tel: +61 3 9288 8000Fax: +61 3 8650 7777ey.com/au
Auditor’s Independence Declaration to the Directors of Tabcorp Holdings Limited
As lead auditor for the audit of Tabcorp Holdings Limited for the financial year ended 30 June 2016, I declare to the best of my knowledge and belief, there have been:
a) no contraventions of the auditor independence requirements of the Corporations Act 2001 inrelation to the audit; and
b) no contraventions of any applicable code of professional conduct in relation to the audit.
This declaration is in respect of Tabcorp Holdings Limited and the entities it controlled during the financial year.
Ernst & Young
Tony Johnson Partner 4 August 2016
44Tabcorp Annual Report 2016

Remuneration ReportR
emu
neratio
n R
epo
rt
Contents
1. Purpose 46
2. Remuneration philosophy 46
3. Governance 47
4. Remuneration summary of the year ended 30 June 2016 47
5. Proposed remuneration changes from 1 July 2016 48
6. Key management personnel (KMP) 49
7. Senior management remuneration (including the MD & CEO) 50
7.1 Remuneration framework 50
7.2 Target reward mix 51
7.3 Fixed remuneration 51
7.4 Variable (at risk) remuneration 52
(a) Short term incentive (STI) 52
(b) Long term incentive (LTI) 56
(c) Appointment/retention incentives 64
(d) Policy prohibiting hedging 64
7.5 MD & CEO current remuneration arrangements 64
(a) Current remuneration 64
(b) Changes for the 2017 financial year 66
7.6 Contracts – executive KMP (including the MD & CEO) 66
7.7 Remuneration – executive KMP (including the MD & CEO) 67
8. Non Executive Director remuneration 69
8.1 Remuneration framework 69
8.2 Structure 69
8.3 Current annual fees 70
9. KMP shareholdings 72
45Tabcorp Annual Report 2016
44Tabcorp Annual Report 2016
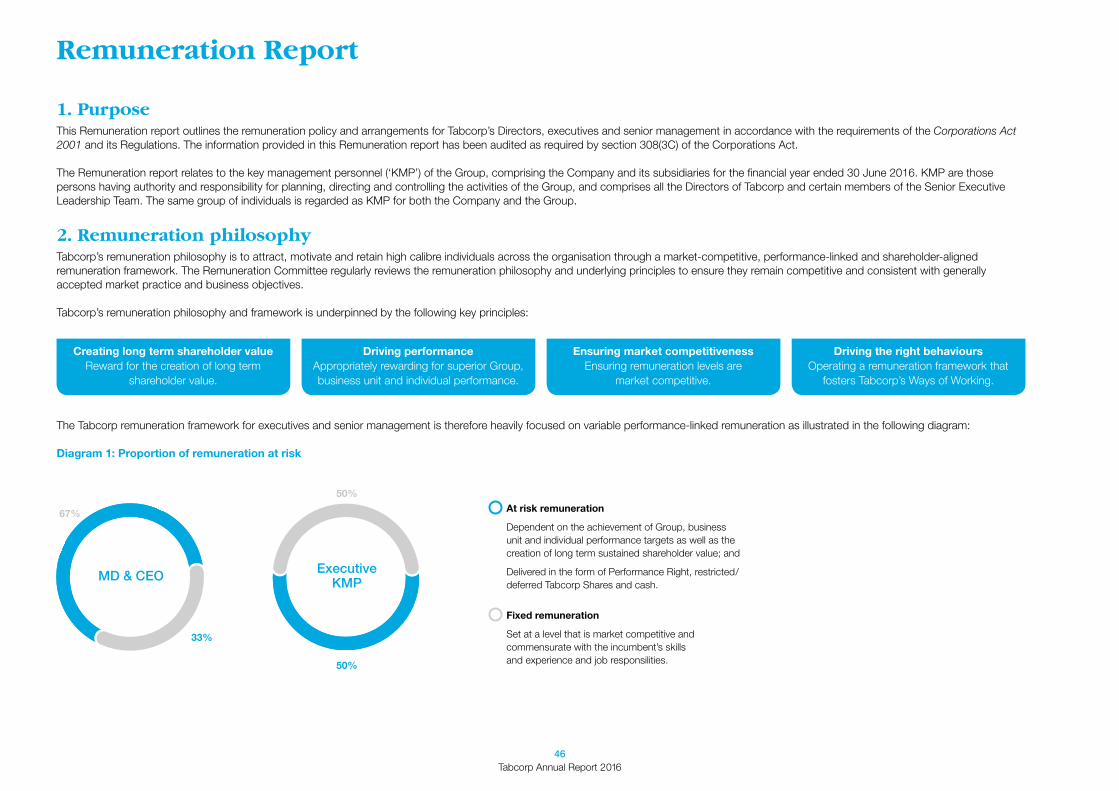
MD & CEO
1. PurposeThis Remuneration report outlines the remuneration policy and arrangements for Tabcorp’s Directors, executives and senior management in accordance with the requirements of the Corporations Act 2001 and its Regulations. The information provided in this Remuneration report has been audited as required by section 308(3C) of the Corporations Act.
The Remuneration report relates to the key management personnel (‘KMP’) of the Group, comprising the Company and its subsidiaries for the financial year ended 30 June 2016. KMP are those persons having authority and responsibility for planning, directing and controlling the activities of the Group, and comprises all the Directors of Tabcorp and certain members of the Senior Executive Leadership Team. The same group of individuals is regarded as KMP for both the Company and the Group.
2. Remuneration philosophyTabcorp’s remuneration philosophy is to attract, motivate and retain high calibre individuals across the organisation through a market-competitive, performance-linked and shareholder-aligned remuneration framework. The Remuneration Committee regularly reviews the remuneration philosophy and underlying principles to ensure they remain competitive and consistent with generally accepted market practice and business objectives.
Tabcorp’s remuneration philosophy and framework is underpinned by the following key principles:
The Tabcorp remuneration framework for executives and senior management is therefore heavily focused on variable performance-linked remuneration as illustrated in the following diagram:
Diagram 1: Proportion of remuneration at risk
Remuneration Report
Creating long term shareholder valueReward for the creation of long term
shareholder value.
Driving performanceAppropriately rewarding for superior Group, business unit and individual performance.
Ensuring market competitivenessEnsuring remuneration levels are
market competitive.
Driving the right behavioursOperating a remuneration framework that
fosters Tabcorp’s Ways of Working.
At risk remuneration
Dependent on the achievement of Group, business unit and individual performance targets as well as the creation of long term sustained shareholder value; and
Delivered in the form of Performance Right, restricted/deferred Tabcorp Shares and cash.
Fixed remuneration
Set at a level that is market competitive and commensurate with the incumbent’s skills and experience and job responsilities.
67%
33%
50%
50%
Executive KMP
46Tabcorp Annual Report 2016

3. GovernanceThe Remuneration Committee assists the Board in the oversight of Tabcorp’s remuneration strategy and framework by:
• Establishing and maintaining competitive, reasonable and equitable remuneration policies and practices;
• Reviewing the Group’s remuneration framework (including incentive plans) and recommending to the Board the appropriate remuneration arrangements for KMP (including the MD & CEO); and
• Agreeing remuneration levels and incentive outcomes for executive KMP and the Group and making recommendations to the Board regarding the MD & CEO.
In exercising its responsibilities, the Remuneration Committee regularly assesses the appropriateness of the nature and amount of remuneration of Directors and executives by reference to relevant employment market conditions with the overall objective of ensuring maximum stakeholder benefit from the retention of a high quality and high performing Board and executive team. To assist with this, the Remuneration Committee may receive independent advice on matters such as remuneration strategies, mix and structure, as appropriate. During the year ended 30 June 2016 and to the date of this report, no remuneration consultant provided a remuneration recommendation in respect of any KMP.
Tabcorp is committed to ensuring that all employees are remunerated fairly and equitably. As such, pay equity reviews are conducted annually and presented to the MD & CEO and the Remuneration Committee. Although no significant gaps were identified during the year ended 30 June 2016, variances have been addressed (where appropriate).
The Board Remuneration Committee is governed by its Terms of Reference, which are available on Tabcorp’s website at www.tabcorp.com.au under the About Us – Corporate Governance section.
4. Remuneration summary of the year ended 30 June 2016Table 1: Summary of the year ended 30 June 2016
Area Summary Reference
Reward mix Following a comprehensive remuneration review, the Remuneration Committee elected to adjust the reward mix for the MD & CEO, the Chief Operating Officer Wagering and Media, and the Chief Operating Officer Keno and Gaming, effective 1 July 2015. This results in better market alignment and a greater proportion of the remuneration for these KMP being in the form of variable ‘at risk’ pay.
Section 7.2Diagram 3
LTI grants During the year, allocations of Performance Rights were made to eight members of the Senior Executive Leadership Team (including the MD & CEO, following shareholder approval at the 2015 Tabcorp AGM).
In addition, an allocation of Performance Rights was made to selected members of the senior management team to further drive shareholder value creation, align the interests of these senior managers with the interests of shareholders (through the allocation of equity) and to retain key senior talent.
Section 7.4(b) Table 10
LTI vesting An LTI test date occurred on 20 September 2015 for the 2012 LTI grant. The relative TSR ranking at the test date for this grant placed Tabcorp just over the 82nd percentile when compared to the peer group. As a result 100% of the Performance Rights for this grant vested.
Section 7.4(b)Table 14
Rem
un
eration
Rep
ort
46Tabcorp Annual Report 2016
47Tabcorp Annual Report 2016
4. Remuneration summary of the year ended 30 June 2016 (continued)
Table 1: Summary of the year ended 30 June 2016 (continued)
Area Summary Reference
MD & CEO remuneration
For the year ended 30 June 2016, Mr Attenborough’s fixed remuneration remained unchanged.
As communicated in the 2015 Remuneration Report, to better align Mr Attenborough’s total remuneration package with comparable roles in the market and to recognise his responsibility as MD & CEO of a globally expanding business, an increase to his target STI opportunity (from $750,000 to $1,100,000) and his target LTI opportunity (from $950,000 to $1,100,000) was applied effective 1 July 2015. As a result, two thirds of Mr Attenborough’s total remuneration package is now ‘at risk’ and subject to both short and long term performance conditions.
Section 7.5
Chief Operating Officer Keno and Gaming
A comprehensive market benchmarking exercise was undertaken with respect to the remuneration package of the Chief Operating Officer Keno and Gaming. To ensure that Mr Rytenskild continues to be competitively remunerated for the level of his responsibility in his role, the Remuneration Committee approved an increase to his fixed remuneration (equating to 10.9%). This was in addition to his approved annual remuneration increase of 3.0%.
Table 17Table 18
Non Executive Director fees
Following a review of the Non Executive Director fees during the year, the base Board fees were increased for both the Chairman (from $410,000 to $425,000 per annum) and the Non Executive Directors (from $140,000 to $145,000 per annum). There were no increases to Board Committee fees for the year.
Section 8.3
Employee Share grant
Grants of $1,000 worth of ‘free’ Tabcorp shares were made to eligible employees (excluding the Senior Executive Leadership Team) in recognition of their contribution to strong Group performance in the preceding financial year. This grant helps align the interests of employees (who are now shareholders) with external shareholders and reinforces Tabcorp’s philosophy of rewarding employees for the achievement of strong Group performance results.
Directors’ Shareholding Policy
The Board approved changes to the Directors’ Shareholding Policy. Under the Policy, Non Executive Directors are encouraged to acquire and hold a minimum shareholding in Tabcorp approximately equivalent to the annual Non Executive Director base fee (for Non Executive Directors) or two times the annual Non Executive Director base fee (for the Chairman of the Board).
5. Proposed remuneration changes from 1 July 2016Table 2: Proposed changes from 1 July 2016
Area Summary
Executive Shareholding Policy
The Board has approved a Mandatory Shareholding Policy for Executives (effective 1 July 2016) which aims to ensure that there is an adequate level of alignment between Executives, the Group and shareholders, through equity ownership. Under the Policy, the MD & CEO will be required to hold the equivalent of a minimum of two times his fixed remuneration in Tabcorp shares (one times fixed remuneration for the remainder of the Senior Executive Leadership Team, including Executive KMP). The minimum shareholding must be achieved within five years from 1 July 2016 or from the date the Executive is appointed into their role.
LTI allocation methodology
To further improve transparency and reduce volatility in the number of Performance Rights allocated each year under the LTI, a face value allocation methodology will be utilised for future LTI allocations. This replaces the fair value allocation methodology and will be effective from the 2016 LTI Offers. The number of Performance Rights to be allocated in future, will be based on a five-day trading Volume Weighted Average Price (VWAP) of the Group’s shares trading on the ASX up to but not including the grant date.
Remuneration Report
48Tabcorp Annual Report 2016

6. Key management personnel (KMP)Table 3: List of KMP for the year ended 30 June 2016
Name Position held Period in position if less than full yearExecutive DirectorDavid Attenborough Managing Director and Chief Executive Officer (MD & CEO)Current ExecutivesDamien Johnston Chief Financial OfficerCraig Nugent Chief Operating Officer Wagering and MediaAdam Rytenskild Chief Operating Officer Keno and GamingFormer ExecutiveKerry Willcock Executive General Manager, Corporate, Legal and Regulatory Until 19 February 2016Non Executive DirectorsPaula Dwyer Chairman and Director (Non Executive)
Elmer Funke Kupper(i) Director (Non Executive)Steven Gregg Director (Non Executive)Jane Hemstritch Director (Non Executive)Justin Milne Director (Non Executive)Zygmunt Switkowski Director (Non Executive)
(i) Effective 21 March 2016, Mr Elmer Funke Kupper was granted a leave of absence from the Board of Directors until the completion of the investigation by the Australian Federal Police into Tabcorp’s activities in relation to a business opportunity in Cambodia in 2010. Mr Funke Kupper does not receive any Tabcorp Board fees whilst on this leave of absence.
Details of Director qualifications, experience and other responsibilities are set out on pages 28 and 29.
Rem
un
eration
Rep
ort
48Tabcorp Annual Report 2016
49Tabcorp Annual Report 2016
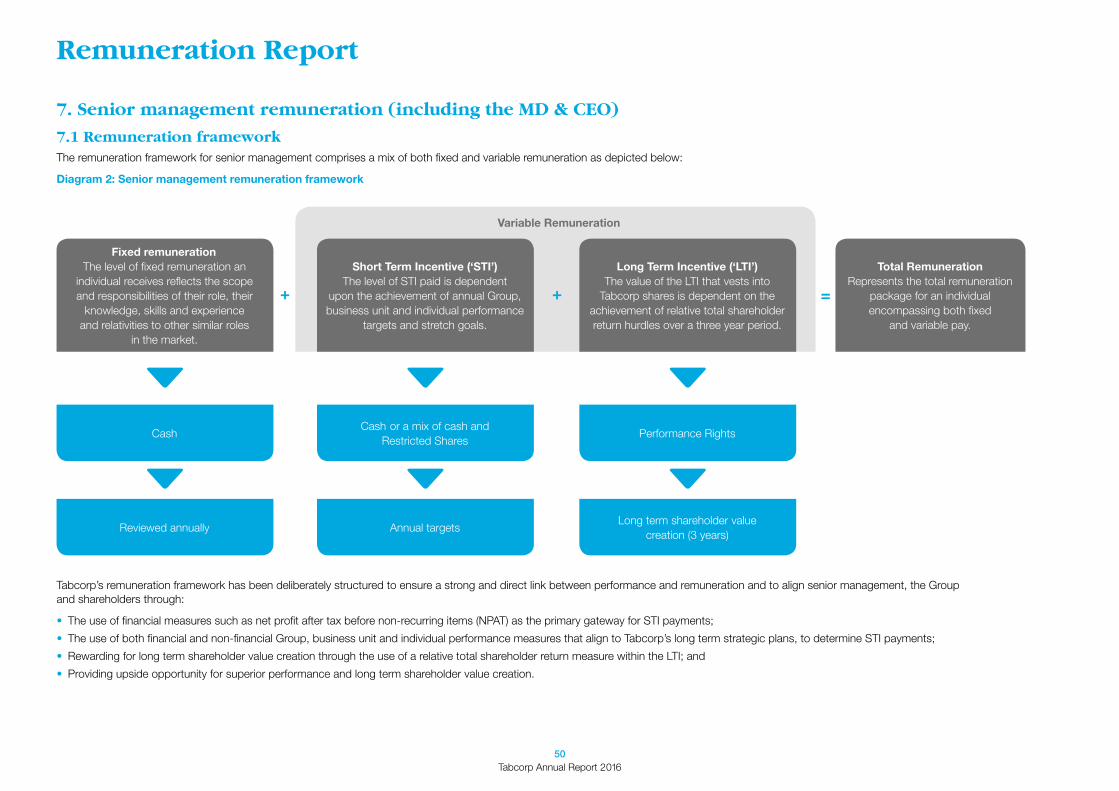
7. Senior management remuneration (including the MD & CEO)
7.1 Remuneration frameworkThe remuneration framework for senior management comprises a mix of both fixed and variable remuneration as depicted below:
Diagram 2: Senior management remuneration framework
Tabcorp’s remuneration framework has been deliberately structured to ensure a strong and direct link between performance and remuneration and to align senior management, the Group and shareholders through:
• The use of financial measures such as net profit after tax before non-recurring items (NPAT) as the primary gateway for STI payments;
• The use of both financial and non-financial Group, business unit and individual performance measures that align to Tabcorp’s long term strategic plans, to determine STI payments;
• Rewarding for long term shareholder value creation through the use of a relative total shareholder return measure within the LTI; and
• Providing upside opportunity for superior performance and long term shareholder value creation.
Remuneration Report
Cash
Fixed remunerationThe level of fixed remuneration an
individual receives reflects the scope and responsibilities of their role, their
knowledge, skills and experience and relativities to other similar roles
in the market.
Short Term Incentive (‘STI’)The level of STI paid is dependent
upon the achievement of annual Group, business unit and individual performance
targets and stretch goals.
Long Term Incentive (‘LTI’)The value of the LTI that vests into
Tabcorp shares is dependent on the achievement of relative total shareholder return hurdles over a three year period.
Total RemunerationRepresents the total remuneration
package for an individual encompassing both fixed
and variable pay.
Cash or a mix of cash and Restricted Shares
Performance Rights
Reviewed annually Annual targetsLong term shareholder value
creation (3 years)
Variable Remuneration
+ + =
50Tabcorp Annual Report 2016
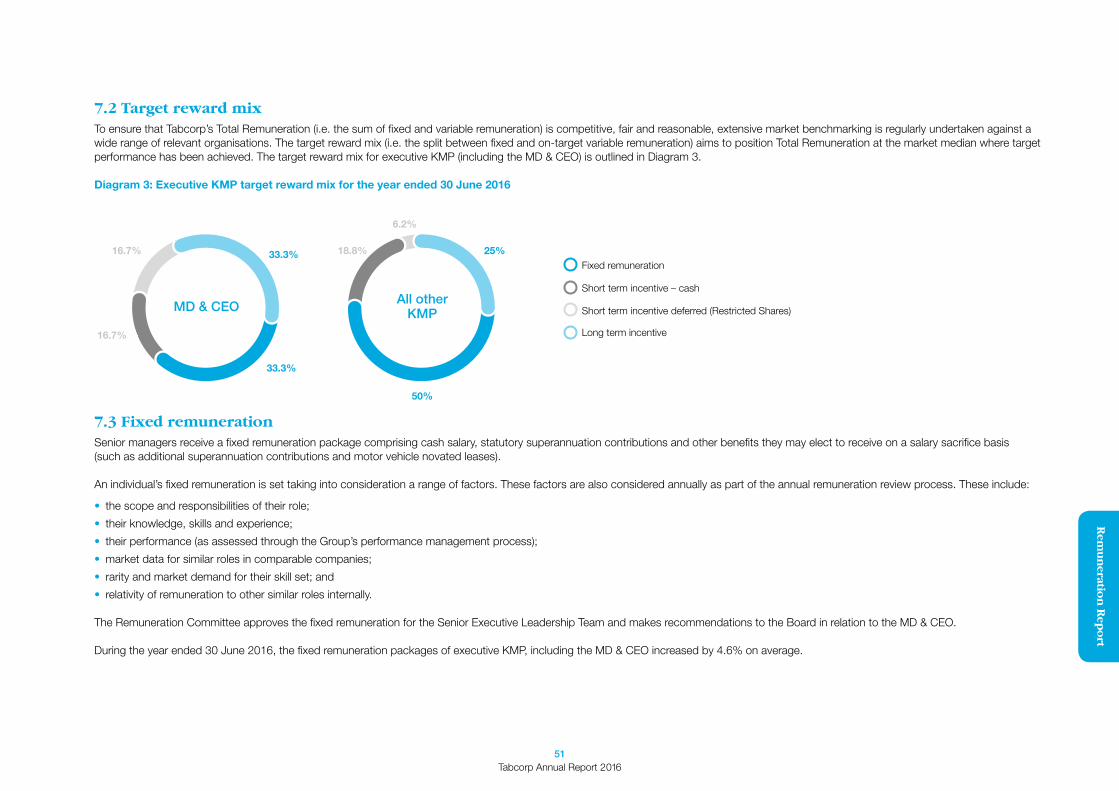
7.2 Target reward mixTo ensure that Tabcorp’s Total Remuneration (i.e. the sum of fixed and variable remuneration) is competitive, fair and reasonable, extensive market benchmarking is regularly undertaken against a wide range of relevant organisations. The target reward mix (i.e. the split between fixed and on-target variable remuneration) aims to position Total Remuneration at the market median where target performance has been achieved. The target reward mix for executive KMP (including the MD & CEO) is outlined in Diagram 3.
Diagram 3: Executive KMP target reward mix for the year ended 30 June 2016
7.3 Fixed remunerationSenior managers receive a fixed remuneration package comprising cash salary, statutory superannuation contributions and other benefits they may elect to receive on a salary sacrifice basis (such as additional superannuation contributions and motor vehicle novated leases).
An individual’s fixed remuneration is set taking into consideration a range of factors. These factors are also considered annually as part of the annual remuneration review process. These include:
• the scope and responsibilities of their role;
• their knowledge, skills and experience;
• their performance (as assessed through the Group’s performance management process);
• market data for similar roles in comparable companies;
• rarity and market demand for their skill set; and
• relativity of remuneration to other similar roles internally.
The Remuneration Committee approves the fixed remuneration for the Senior Executive Leadership Team and makes recommendations to the Board in relation to the MD & CEO.
During the year ended 30 June 2016, the fixed remuneration packages of executive KMP, including the MD & CEO increased by 4.6% on average.
MD & CEO
Fixed remuneration
Short term incentive – cash
Short term incentive deferred (Restricted Shares)
Long term incentive
16.7%
16.7%
33.3%
33.3%
50%
25%
All other KMP
6.2%
18.8%
Rem
un
eration
Rep
ort
50Tabcorp Annual Report 2016
51Tabcorp Annual Report 2016

7.4 Variable (at risk) remuneration
(a) Short term incentive (STI)
Overview
The STI is designed to reward employees for the achievement of Group, business unit and individual performance goals over the relevant 12 month period, which are aligned to the Group’s annual objectives for each financial year.
Eligibility
The Senior Executive Leadership Team (including executive KMP), senior managers and mid-level managers are eligible to participate in the STI plan.
The STI pool (Group Funding Multiplier)
During each financial year, the Remuneration Committee reviews Tabcorp’s performance against net profit after tax (NPAT) before non-recurring items and other financial targets. At the end of the financial year, the Board determines the Group Funding Multiplier (GFM) depending on NPAT performance (adjusted for non-recurring items), which sets the size of the STI pool:
• if the Group’s NPAT target is achieved for the year, 100% of the STI pool will generally be funded (i.e. a GFM of 1). To achieve the target, a level of stretch performance is required;
• if the Group’s NPAT performance for the year is below target, a smaller STI pool may be funded (at the Board’s discretion) or the Board may elect to have no STI pool (i.e. a GFM range of 0 to <1), in which case no STI payments would be made; and
• if the Group’s NPAT performance for the year is above target, a larger STI pool may be funded, capped at a maximum of 125% of the target pool (i.e. a GFM of >1 but <=1.25).
The Board has discretion to adjust the GFM (and thus the STI pool) if it feels it is necessary, taking into consideration a range of financial and non-financial business factors. The GFM has a range of 0 to 1.25 (maximum).
The Board considers NPAT to be an appropriate performance measure to determine the STI pool as it aligns to the Group’s remuneration philosophy of creating shareholder value, it is directly linked to driving business results and it is within senior management’s scope of influence.
NPAT and EPS performance over the past five financial years
(i) Includes $163.2 million as a result of receiving income tax benefits relating to the Victorian wagering and gaming licences payment and the NSW Trackside payment and associated interest income.
Taking the above performance and overall Group results into consideration, the Board determined that a maximum Group Funding Multiplier of 0.9 (i.e. 90%) should be applied for the year.
Remuneration Report
Diagram 4: NPAT performance Net profit after tax ($m)
Diagram 5: EPS (basic) performance Earnings per share (cents)
169.7FY16
334.5(i)
129.9
126.6
340.0
FY15
FY14
FY13
FY12
20.4
17.2
17.2
42.4
47.6
FY16
FY15
FY14
FY13
FY12
52Tabcorp Annual Report 2016

The STI calculation
An individual’s short term incentive is calculated by taking three key factors into account:
Diagram 6: STI calculation
(i) The STI Award is comprised of cash (50% for the MD & CEO and 75% for all other executive KMP) and Restricted Shares (50% for the MD & CEO and 25% for all other executive KMP) which are restricted for a two year period.
(ii) The sum of the STI payments cannot exceed the STI pool which is capped at a maximum of 125% of the target pool.
Table 4: Components of the STI calculation
Component Definition How is it calculated?Target STI ($) Each participant in the STI plan is eligible to receive an on-target STI Award upon the
achievement of target Group, business unit and individual performance.The Target STI ($) is calculated as a percentage of an individual’s Total Remuneration (see Diagram 3) and is determined with reference to market benchmarks and the nature of the role.
Divisional Multiplier The Divisional Multiplier aims to reward STI participants for delivering superior business unit performance and to recognise each business unit’s contribution to the overall Group results. There are three Divisional Multipliers – Wagering and Media, Keno and Gaming, and Corporate.
The Divisional Multiplier is based on the contribution to NPAT of each business unit and applies to all participants who are employed within that business unit.
Individual Performance Multiplier
Individual performance is assessed using a balanced scorecard of financial and non-financial measures that are reflective of the Group’s annual objectives and aligned to creating superior shareholder returns (see Table 5). In addition to the balanced scorecard measures, key strategic priorities are also set and assessed annually.
The Board sets the performance objectives for the MD & CEO at the start of each financial year. The MD & CEO works with the Remuneration Committee and the Senior Executive Leadership Team to set the executives’ objectives which are then cascaded down the organisation.
At the end of the financial year, each participant undergoes a performance review in line with Tabcorp’s performance management process. Objectives are assessed and an overall performance rating is assigned (taking into consideration performance against objectives as well as behaviours (Ways of Working)).
The performance rating translates into an Individual Performance Multiplier which scales up or down and can range from 0 (for below expectation performance) up to a maximum of 2 (for exceptional performance).
The Divisional Multipliers and Individual Multipliers are set with reference to the overall STI pool to ensure that the total STI payout does not exceed the defined pool.
Target STI ($) Divisional Multiplier Individual Performance Multiplier STI Awards(i),(ii)X X =
Rem
un
eration
Rep
ort
52Tabcorp Annual Report 2016
53Tabcorp Annual Report 2016
Remuneration Report
Delivery
The STI is delivered in cash, or a mix of cash and Restricted Shares (see Diagram 3). Restricted Shares are subject to a two year service condition during which time the Restricted Shares may not be traded, however participants have full entitlement to dividends and voting rights. All Restricted Shares will be forfeited immediately upon cessation of employment during the restriction period. However, the Remuneration Committee has discretion in special circumstances to determine that the Restricted Shares remain on foot (in full or on a pro rata basis) and the terms applicable. Special circumstances include events such as retirement, redundancy, death and permanent disability.
The STI deferral element promotes the building of share ownership in Tabcorp (further aligning the interests of senior managers with shareholders), reduces long term risk and assists with the retention of key senior managers (providing increased continuity for the business).
Claw back
Restricted Shares are subject to claw back if the Board considers this to be appropriate having regard to any information which has come to light after the delivery of the Restricted Shares to participants, including but not limited to misconduct or any material misstatement or omission in Tabcorp’s prior financial statements.
The Board has the capacity to introduce further terms and conditions which may specify additional circumstances in which a participant’s Restricted Shares may be subject to claw back.
STI performance
For the year ended 30 June 2016, STI measures and targets were derived from the Board approved strategic corporate plan which comprised financial and non-financial objectives. These objectives were subsequently included in the balanced scorecards for the Senior Executive Leadership Team. A list of these measures is included in Table 5 including a summary of key achievements during the year.
54Tabcorp Annual Report 2016
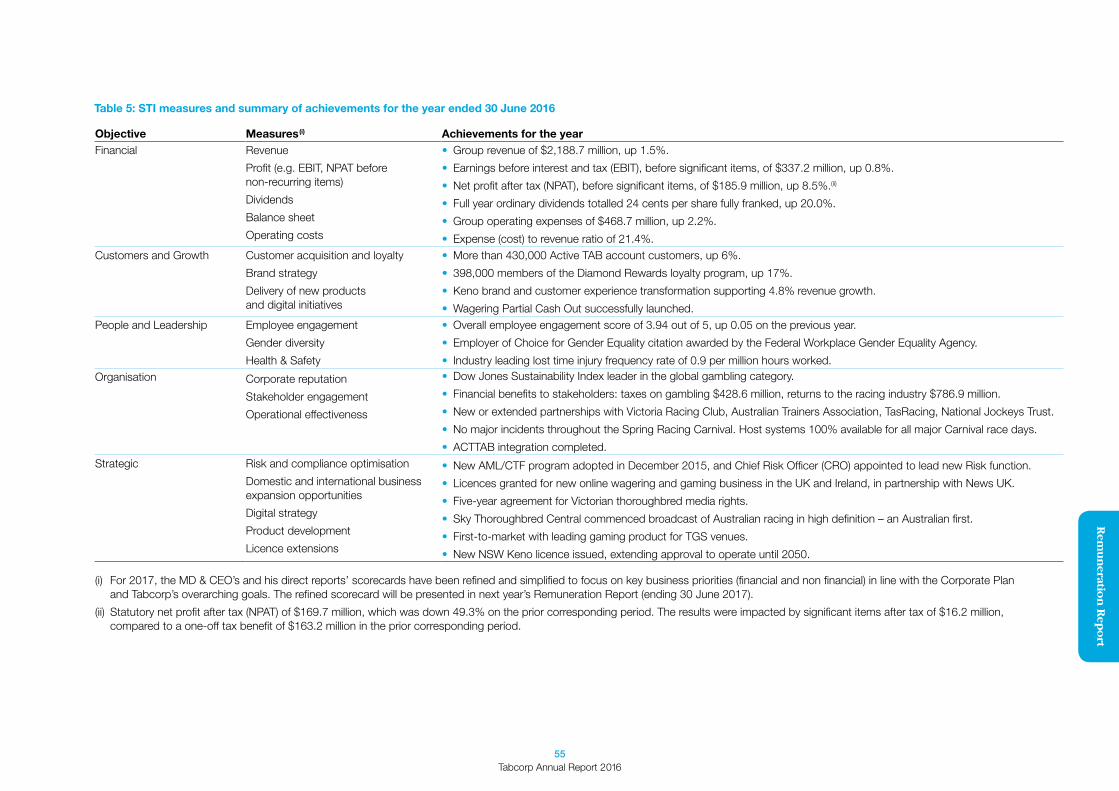
Table 5: STI measures and summary of achievements for the year ended 30 June 2016
Objective Measures(i) Achievements for the yearFinancial Revenue
Profit (e.g. EBIT, NPAT before non-recurring items)
Dividends
Balance sheet
Operating costs
• Group revenue of $2,188.7 million, up 1.5%.
• Earnings before interest and tax (EBIT), before significant items, of $337.2 million, up 0.8%.
• Net profit after tax (NPAT), before significant items, of $185.9 million, up 8.5%.(ii)
• Full year ordinary dividends totalled 24 cents per share fully franked, up 20.0%.
• Group operating expenses of $468.7 million, up 2.2%.
• Expense (cost) to revenue ratio of 21.4%.Customers and Growth Customer acquisition and loyalty
Brand strategy
Delivery of new products and digital initiatives
• More than 430,000 Active TAB account customers, up 6%.
• 398,000 members of the Diamond Rewards loyalty program, up 17%.
• Keno brand and customer experience transformation supporting 4.8% revenue growth.
• Wagering Partial Cash Out successfully launched.People and Leadership Employee engagement
Gender diversity
Health & Safety
• Overall employee engagement score of 3.94 out of 5, up 0.05 on the previous year.
• Employer of Choice for Gender Equality citation awarded by the Federal Workplace Gender Equality Agency.
• Industry leading lost time injury frequency rate of 0.9 per million hours worked.Organisation Corporate reputation
Stakeholder engagement
Operational effectiveness
• Dow Jones Sustainability Index leader in the global gambling category.
• Financial benefits to stakeholders: taxes on gambling $428.6 million, returns to the racing industry $786.9 million.
• New or extended partnerships with Victoria Racing Club, Australian Trainers Association, TasRacing, National Jockeys Trust.
• No major incidents throughout the Spring Racing Carnival. Host systems 100% available for all major Carnival race days.
• ACTTAB integration completed.Strategic Risk and compliance optimisation
Domestic and international business expansion opportunities
Digital strategy
Product development
Licence extensions
• New AML/CTF program adopted in December 2015, and Chief Risk Officer (CRO) appointed to lead new Risk function.
• Licences granted for new online wagering and gaming business in the UK and Ireland, in partnership with News UK.
• Five-year agreement for Victorian thoroughbred media rights.
• Sky Thoroughbred Central commenced broadcast of Australian racing in high definition – an Australian first.
• First-to-market with leading gaming product for TGS venues.
• New NSW Keno licence issued, extending approval to operate until 2050.
(i) For 2017, the MD & CEO’s and his direct reports’ scorecards have been refined and simplified to focus on key business priorities (financial and non financial) in line with the Corporate Plan and Tabcorp’s overarching goals. The refined scorecard will be presented in next year’s Remuneration Report (ending 30 June 2017).
(ii) Statutory net profit after tax (NPAT) of $169.7 million, which was down 49.3% on the prior corresponding period. The results were impacted by significant items after tax of $16.2 million, compared to a one-off tax benefit of $163.2 million in the prior corresponding period.
Rem
un
eration
Rep
ort
54Tabcorp Annual Report 2016
55Tabcorp Annual Report 2016

Remuneration Report
Table 6: STI Awards achieved
Actual STI Achieved
KMP YearCash portion
$(i)
Restricted portion $(ii)
Total $
Actual STI achieved as a % of target STI
STI forfeited as a % of target STI
Actual STI achieved as a % of maximum STI
Current executivesDavid Attenborough 2016 495,000 495,000 990,000 90% 10% 36%
2015 425,000 425,000 850,000 113% 0% 45%Damien Johnston 2016 226,600 75,533 302,133 90% 10% 36%
2015 275,000 91,666 366,666 113% 0% 45%Craig Nugent 2016 187,718 62,572 250,290 72% 28% 29%
2015 271,338 90,446 361,784 107% 0% 43%Adam Rytenskild 2016 302,402 100,801 403,203 134% 0% 54%
2015 157,650 52,550 210,200 80% 20% 32%Former executiveKerry Willcock 2016 - - - 0% 100% 0%
2015 134,379 44,793 179,172 63% 37% 25%
(i) 75% (50% for the MD & CEO) of the actual STI achieved is paid as cash, and is included in remuneration of the current financial year.
(ii) 25% (50% for the MD & CEO) of the actual STI achieved is deferred in the form of Restricted Shares which are subject to a two year service restriction from the grant date. The Restricted Shares will be granted after the end of the financial year, and the value will be reflected in remuneration during the vesting period.
(b) Long term incentive (LTI)
Overview
The Tabcorp LTI is designed to reward senior management for contributing to the creation of long term shareholder value and to retain key critical talent within the organisation.
Table 7: Summary of the Tabcorp LTI plan for the year ended 30 June 2016
What is the purpose of the LTI Plan?
To drive long term business performance and shareholder value creation, to align senior management and shareholder interests (through the use of equity) and to retain high performing and skilled senior managers.
Who is eligible to participate in the LTI Plan?
The Senior Executive Leadership Team (including executive KMP) and certain key senior managers.
How is LTI delivered? Participants in the LTI plan are allocated a maximum number of Performance Rights at the beginning of the performance period. Performance Rights provide the right to receive Tabcorp shares subject to meeting performance conditions, at no cost to the participant. They do not attract dividends nor provide voting rights.
How long is the performance period?
Vesting is dependent on meeting the minimum performance hurdle at the third anniversary of the date of the allocation (i.e. a three year performance period).
During the year, the Remuneration Committee reviewed the length of the performance period. Following careful consideration, the Committee elected to retain the current three year performance period, taking into consideration a number of factors, including Tabcorp’s rapidly changing industry, the nature of the Group’s business operations and market benchmarks.
56Tabcorp Annual Report 2016

Are Performance Rights forfeitable?
All unvested Performance Rights will lapse immediately upon cessation of employment. However, the Remuneration Committee has discretion in special circumstances to determine the number of Performance Rights retained and the terms applicable. Special circumstances include events such as retirement, redundancy, death and permanent disability.
Can Performance Rights be clawed back?
Performance Rights are subject to claw back if the Board considers this to be appropriate having regard to any information which has come to light after the grant of the Performance Rights to participants, including but not limited to misconduct or any material misstatement or omission in Tabcorp’s prior financial statements. The Board has the capacity to introduce further terms and conditions which may specify additional circumstances in which a participant’s Performance Rights may be subject to claw back.
What is the performance measure?
The performance measure is relative total shareholder return (relative TSR). Relative TSR measures the return received by shareholders (capital returns, dividends and share price movement) over a specific period relative to a peer group of companies. Tabcorp engages an external consultant to calculate relative TSR.
During the year ended 30 June 2016, the Remuneration Committee considered adopting a second performance measure within the LTI. Taking into consideration a number of factors, the Committee elected not to introduce a second LTI measure. The Committee will review the LTI performance measures again in 2017.
The Board considers relative TSR to be an appropriate performance measure as it reflects the Group’s remuneration philosophy of creating shareholder value relative to a peer group, over the long term.
Which companies are included in the peer group?
The peer group used for assessing Tabcorp’s relative TSR performance is the S&P/ASX 100 index excluding property trusts, infrastructure groups and mining companies (represented by the S&P Global Industry Classification Standards (GICS) of Metals & Mining, Oil and Gas, Transportation, Infrastructure, Utilities and Real Estate Investment Trusts).
The Remuneration Committee reviewed the peer group during the year. This peer group was deemed appropriate and retained, as it contains organisations of comparable size to that of Tabcorp as well as organisations that exhibit similar operational structures in comparable industries. In addition, the constituent companies represent competitors for similar executive talent.
The composition of the peer group may change as a result of specific external events, such as mergers and acquisitions, capital returns, delistings and capital reconstruction. The Remuneration Committee has agreed guidelines for adjusting the peer group following such events, and has the discretion to determine any adjustment to the peer group of companies.
What are the relative TSR performance hurdles?
Tabcorp’s relative TSR ranking Percentage of Performance Rights that will vest Value of LTI reward
Below 50th percentile 0% Zero
At 50th percentile 50% Target
Above 50th percentile and below 75th percentile Pro-rata between 50% (at 50th percentile) and 100% (at 75th percentile)
Between Target and Outperformance
At or above the 75th percentile 100% Outperformance (two times Target)
This testing schedule and vesting criteria are common practice adopted by companies in the S&P/ASX100 index, which is consistent with Tabcorp’s remuneration philosophy (refer to Section 2) and senior management remuneration framework (refer to Section 7.1).
If Performance Rights vest, the Company will issue or transfer ordinary shares to the participant, with full voting and dividend rights corresponding to the rights of all other holders of ordinary shares.
Performance Rights that have not vested after testing will lapse (there is no retesting).
Rem
un
eration
Rep
ort
56Tabcorp Annual Report 2016
57Tabcorp Annual Report 2016

Remuneration Report
Allocations
The Performance Rights granted under the LTI are generally allocated annually, subject to Board and shareholder (for the MD & CEO only) approval. Historically, for each LTI offer, Tabcorp allocated a number of Performance Rights to LTI participants on the basis of a fair market value allocation methodology (aligned to AASB 2 Share-based Payment rules). Under this methodology, the target LTI value (see Diagram 3) was divided by a discounted Tabcorp share price (discounted for a number of factors including share price volatility and the probability of vesting) to determine the number of Performance Rights to allocate. In future, all LTI allocations will be made using a face value methodology. This will improve LTI transparency and reduce the volatility in the number of Performance Rights allocated annually.
Historically, the fair market value of each Performance Right under the LTI Plan, was calculated to be approximately 50% of the prevailing share price at the date of allocation (independently calculated by PriceWaterhouseCoopers). This meant that the effective maximum value (face value) of the LTI allocated, which would be realised for outperformance, equated to approximately twice the fair market value. As such, this ‘outperformance’ value will be utilised in future to ensure that LTI participants are not disadvantaged/advantaged by the transition to the new allocation methodology (i.e. they are receiving no more or less value than they would have under the previous methodology). Diagram 7 below summarises both the historical methodology and the future methodology.
Diagram 7: Summary of the operation of fair and face value allocation methodologies within Tabcorp
(i) Under the fair value allocation methodology, the ‘Target’ LTI value (see Diagram 3) was used as the basis for making allocations. Under the face value allocation methodology, the Outperformance value will be utilised going forward as the basis for making allocations.
(ii) Historically, the fair value (which equated to approximately 50% of the face value) was used to calculate the number of Performance Rights granted. Under the face value methodology, Tabcorp’s share price will be used to calculate the number of Performance Rights allocated.
(iii) The number of Performance Rights allocated should be approximately the same under both methodologies.
(iv) The value realised by the participant should be approximately equivalent under both methodologies for the same level of performance outcome.
Fair value allocation
methodology (historical)
Face value allocation
methodology (future)
LTI Opportunity(i)
Target
Outperformance (Two times Target)
Fair value – Approximately 50% of Tabcorp’s share
price at the date of allocation
>=75th Percentile
100% of the Performance
Rights
Twice the Target value
50th Percentile
50% of the Performance
RightsTarget
<50thPercentile
Nil Performance
RightsNil
X
Five-day Tabcorp VWAP (approximately
twice the fair value)
Value Per Performance Right(ii)
Relative TSR ranking
Number ofPerformance
Rights vesting
Approximate value(iv)
Number of Performance Rights allocated(iii)
÷
÷
=
58Tabcorp Annual Report 2016
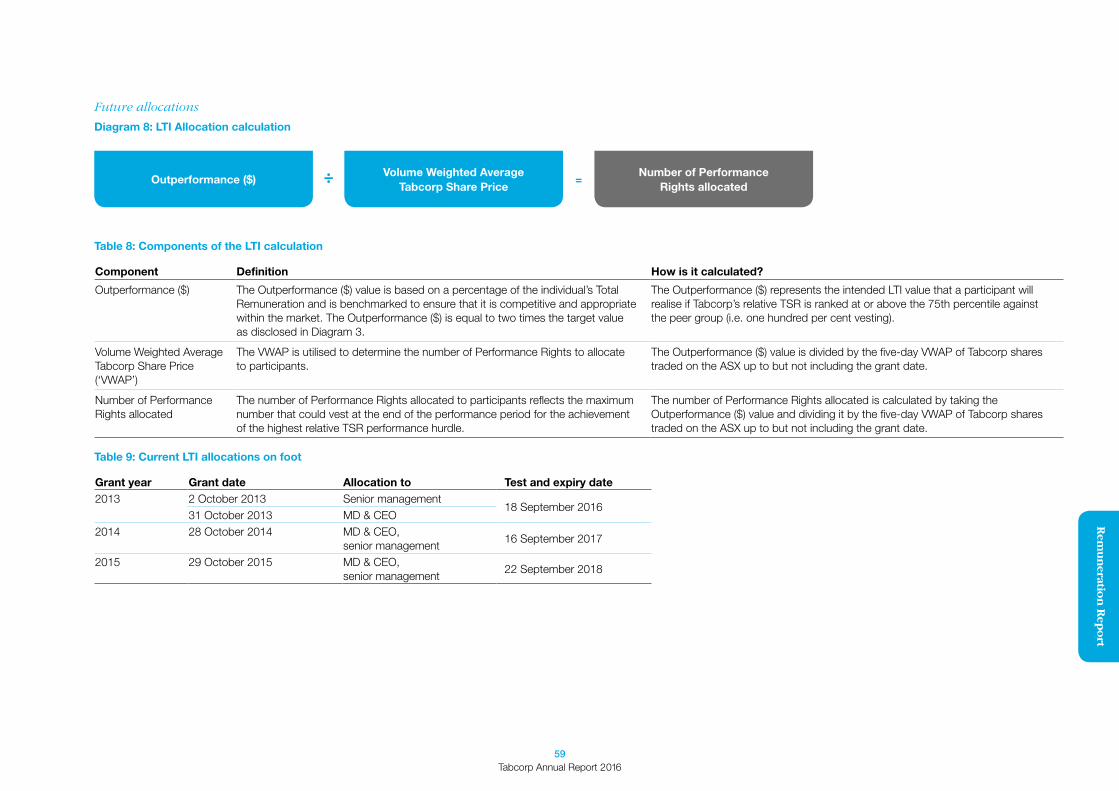
Future allocations
Diagram 8: LTI Allocation calculation
Table 8: Components of the LTI calculation
Component Definition How is it calculated?
Outperformance ($) The Outperformance ($) value is based on a percentage of the individual’s Total Remuneration and is benchmarked to ensure that it is competitive and appropriate within the market. The Outperformance ($) is equal to two times the target value as disclosed in Diagram 3.
The Outperformance ($) represents the intended LTI value that a participant will realise if Tabcorp’s relative TSR is ranked at or above the 75th percentile against the peer group (i.e. one hundred per cent vesting).
Volume Weighted Average Tabcorp Share Price (‘VWAP’)
The VWAP is utilised to determine the number of Performance Rights to allocate to participants.
The Outperformance ($) value is divided by the five-day VWAP of Tabcorp shares traded on the ASX up to but not including the grant date.
Number of Performance Rights allocated
The number of Performance Rights allocated to participants reflects the maximum number that could vest at the end of the performance period for the achievement of the highest relative TSR performance hurdle.
The number of Performance Rights allocated is calculated by taking the Outperformance ($) value and dividing it by the five-day VWAP of Tabcorp shares traded on the ASX up to but not including the grant date.
Table 9: Current LTI allocations on foot
Grant year Grant date Allocation to Test and expiry date2013 2 October 2013 Senior management
18 September 201631 October 2013 MD & CEO
2014 28 October 2014 MD & CEO, senior management
16 September 2017
2015 29 October 2015 MD & CEO, senior management
22 September 2018
Outperformance ($)Volume Weighted Average
Tabcorp Share PriceNumber of Performance
Rights allocated÷ =
Rem
un
eration
Rep
ort
58Tabcorp Annual Report 2016
59Tabcorp Annual Report 2016
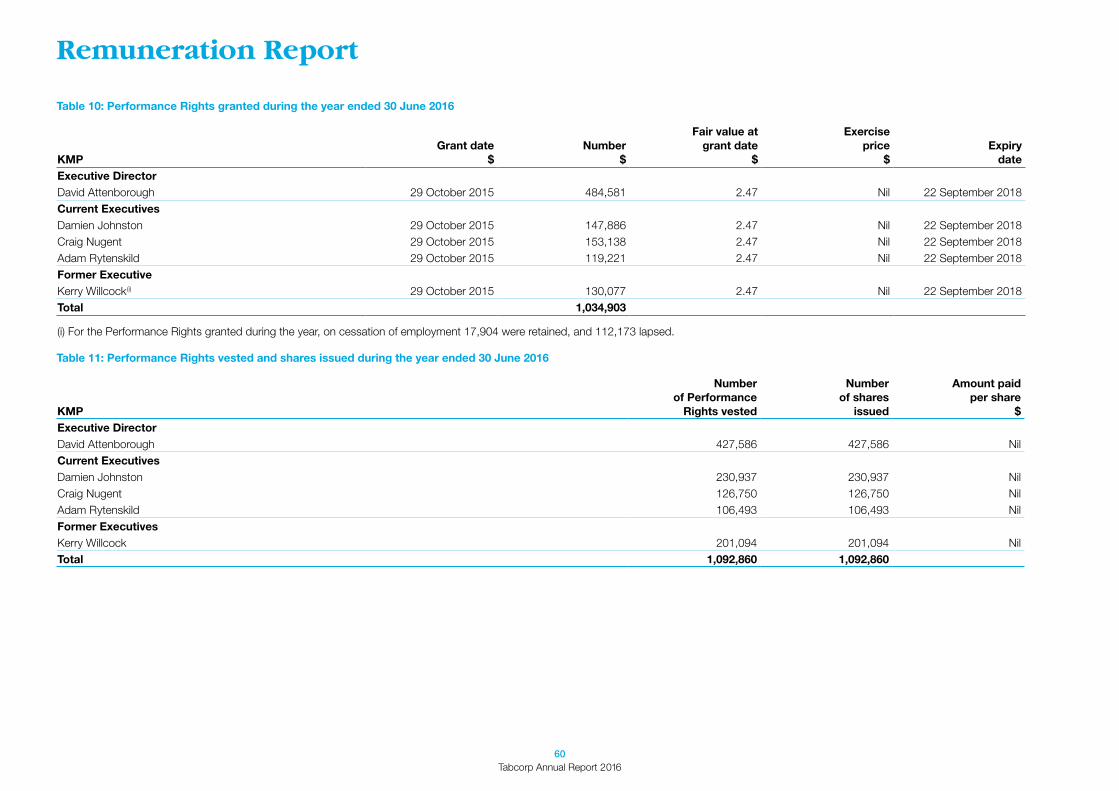
Remuneration Report
Table 10: Performance Rights granted during the year ended 30 June 2016
KMPGrant date
$Number
$
Fair value at grant date
$
Exercise price
$Expiry
dateExecutive DirectorDavid Attenborough 29 October 2015 484,581 2.47 Nil 22 September 2018Current ExecutivesDamien Johnston 29 October 2015 147,886 2.47 Nil 22 September 2018Craig Nugent 29 October 2015 153,138 2.47 Nil 22 September 2018Adam Rytenskild 29 October 2015 119,221 2.47 Nil 22 September 2018Former ExecutiveKerry Willcock(i) 29 October 2015 130,077 2.47 Nil 22 September 2018Total 1,034,903
(i) For the Performance Rights granted during the year, on cessation of employment 17,904 were retained, and 112,173 lapsed.
Table 11: Performance Rights vested and shares issued during the year ended 30 June 2016
KMP
Number of Performance
Rights vested
Number of shares
issued
Amount paid per share
$Executive DirectorDavid Attenborough 427,586 427,586 NilCurrent ExecutivesDamien Johnston 230,937 230,937 NilCraig Nugent 126,750 126,750 NilAdam Rytenskild 106,493 106,493 NilFormer ExecutivesKerry Willcock 201,094 201,094 NilTotal 1,092,860 1,092,860
60Tabcorp Annual Report 2016

Table 12: Value of Performance Rights granted as part of remuneration – granted and exercised during the year ended 30 June 2016
KMPGranted(i)
$Exercised(ii)
$As a % of
remuneration(iii) Executive DirectorDavid Attenborough 1,196,915 1,954,068 37%Current Executives
Damien Johnston 365,278 1,055,382 28%
Craig Nugent 378,251 579,248 21%
Adam Rytenskild 294,476 486,673 18%Former ExecutivesKerry Willcock 321,290 919,000 32%Total 2,556,210 4,994,371
(i) Represents the value of Performance Rights granted during the year. For details on the valuation of the Performance Rights, including models and assumptions used, refer to Note E1 of the Tabcorp Financial Report.
(ii) Represents the value of Performance Rights exercised during the year. The value is calculated based on the market value of Tabcorp shares at the date of exercise.
(iii) Represents the fair value of Performance Rights expensed during the year as a percentage of total remuneration, excluding termination payments. Total remuneration includes share based payments.
Rem
un
eration
Rep
ort
60Tabcorp Annual Report 2016
61Tabcorp Annual Report 2016
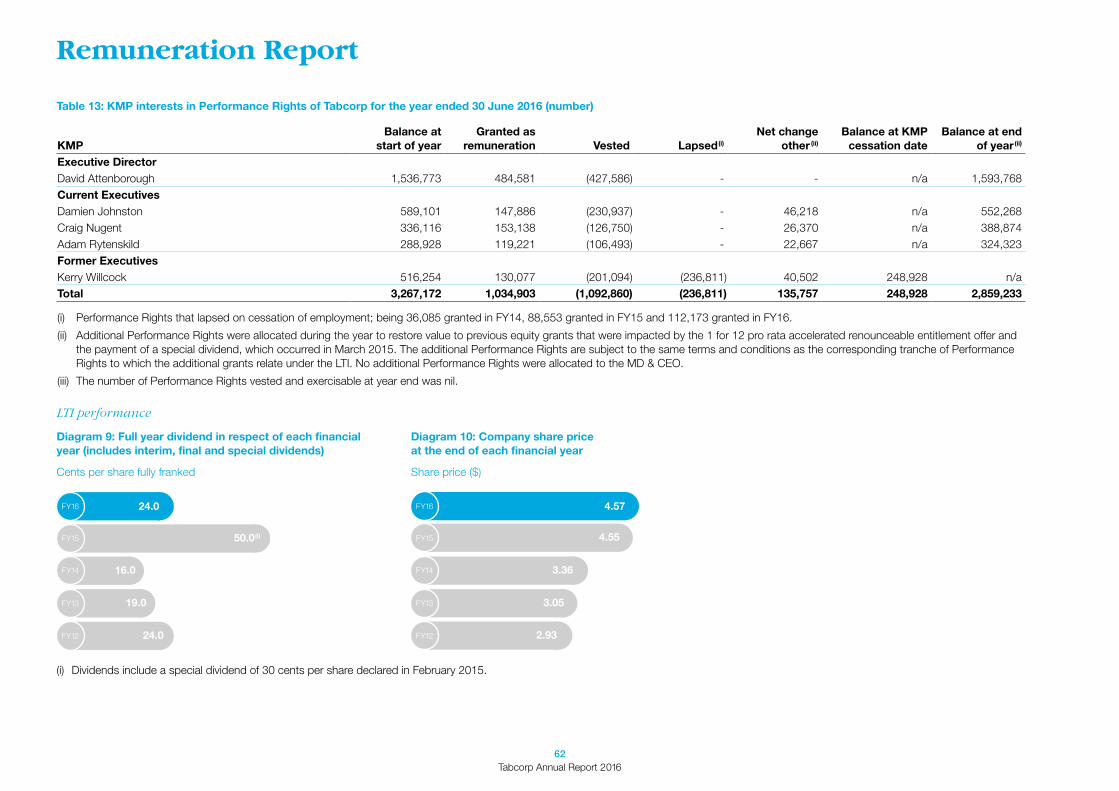
Remuneration Report
Table 13: KMP interests in Performance Rights of Tabcorp for the year ended 30 June 2016 (number)
KMPBalance at
start of yearGranted as
remuneration Vested Lapsed(i)
Net change other (ii)
Balance at KMP cessation date
Balance at end of year(ii)
Executive DirectorDavid Attenborough 1,536,773 484,581 (427,586) - - n/a 1,593,768Current ExecutivesDamien Johnston 589,101 147,886 (230,937) - 46,218 n/a 552,268Craig Nugent 336,116 153,138 (126,750) - 26,370 n/a 388,874Adam Rytenskild 288,928 119,221 (106,493) - 22,667 n/a 324,323Former ExecutivesKerry Willcock 516,254 130,077 (201,094) (236,811) 40,502 248,928 n/aTotal 3,267,172 1,034,903 (1,092,860) (236,811) 135,757 248,928 2,859,233
(i) Performance Rights that lapsed on cessation of employment; being 36,085 granted in FY14, 88,553 granted in FY15 and 112,173 granted in FY16.
(ii) Additional Performance Rights were allocated during the year to restore value to previous equity grants that were impacted by the 1 for 12 pro rata accelerated renounceable entitlement offer and the payment of a special dividend, which occurred in March 2015. The additional Performance Rights are subject to the same terms and conditions as the corresponding tranche of Performance Rights to which the additional grants relate under the LTI. No additional Performance Rights were allocated to the MD & CEO.
(iii) The number of Performance Rights vested and exercisable at year end was nil.
LTI performance
(i) Dividends include a special dividend of 30 cents per share declared in February 2015.
Diagram 10: Company share price at the end of each financial year
Share price ($)
24.0
50.0(i)
16.0
19.0
24.0
FY16
FY15
FY14
FY13
FY12
4.57
3.36
3.05
4.55
2.93
FY16
FY15
FY14
FY13
FY12
Diagram 9: Full year dividend in respect of each financial year (includes interim, final and special dividends)
Cents per share fully franked
62Tabcorp Annual Report 2016

Diagram 11: Tabcorp Total Shareholder Return(i)
Indexed to 100 at 1 July 2011
(i) Excludes the value of franking credits.Source: Bloomberg.
In the year ended 30 June 2016, there was one test date on 20 September 2015 for the 2012 allocation under the LTI. The relative TSR percentile ranking of this allocation at the test date was a little over the 82nd percentile, and accordingly 100% of the Performance Rights vested.
Table 14: LTI testing results
% of Performance Rights
Grant year Grant date Allocation to Test dateTSR result
at test date Vested Lapsed2011 23 September 2011 Senior management 23 September 2014 69.2 percentile 88% 12%
26 October 2011 MD & CEO2012 4 October 2012 Senior management 20 September 2015 82.4 percentile 100% -
31 October 2012 MD & CEO
250
225
200
175
150
125
100
75
Tabcorp
S&P/ASX 100 Accumulation Index
July 2011 July 2012 July 2013 July 2014 July 2015 July 2016
Rem
un
eration
Rep
ort
62Tabcorp Annual Report 2016
63Tabcorp Annual Report 2016
Remuneration Report
(c) Appointment/retention incentives
Restricted Shares may be issued to senior managers as an incentive upon appointment (either on joining Tabcorp or transfer to a new position internally) or for retention. These are ordinary shares in the Company, and in order to act as a retention mechanism are subject to time based restrictions of up to three years.
Additionally, senior managers may also be issued Performance Rights upon appointment. These instruments are issued under the LTI and are subject to the same performance hurdles and vesting conditions (refer Section 7.4(b)).
No appointment or retention incentives were provided to executive KMP during the year ended 30 June 2016.
(d) Policy prohibiting hedging
Participants in the incentive plans (STI and LTI) are restricted from hedging the value of Restricted Shares and unvested Performance Rights, and must not enter into a derivative arrangement in respect of the equity instruments granted under these plans. Breaches of the restriction will result in equity instruments being forfeited.
These prohibitions are included in Tabcorp’s Securities Trading Policy, available from the Corporate Governance section of Tabcorp’s website at www.tabcorp.com.au, and in the terms and conditions of the incentive plans.
Equity instruments granted under the incentive plans can only be registered in the name of the participant, are identified as non tradable on the share register, and cannot be traded or transferred to another party until vested or until any trading restriction period has expired (where applicable).
The Board at its discretion can request a senior manager to provide a statutory declaration that the senior manager has complied with this policy. During the year, the Board did not require any such declarations.
7.5 MD & CEO current remuneration arrangements
(a) Current remuneration
Mr Attenborough receives fixed remuneration and the opportunity to receive variable remuneration through STI and LTI arrangements. As communicated in the 2015 Remuneration report, changes implemented in the current financial year in relation to Mr Attenborough’s remuneration have resulted in an increase in both the target short term incentive opportunity and the target long term incentive opportunity, with his fixed remuneration remaining unchanged. This overall increase in remuneration recognises Mr Attenborough’s success in leading the transformation of Tabcorp to drive sustained performance, improves alignment with comparable roles in the market, and provides greater alignment with shareholder interests. 67% of Mr Attenborough’s remuneration is now `at risk’ and subject to the achievement of both Group and individual performance outcomes.
Fixed remuneration
There was no change to Mr Attenborough’s fixed remuneration which has remained at $1,100,000.
64Tabcorp Annual Report 2016
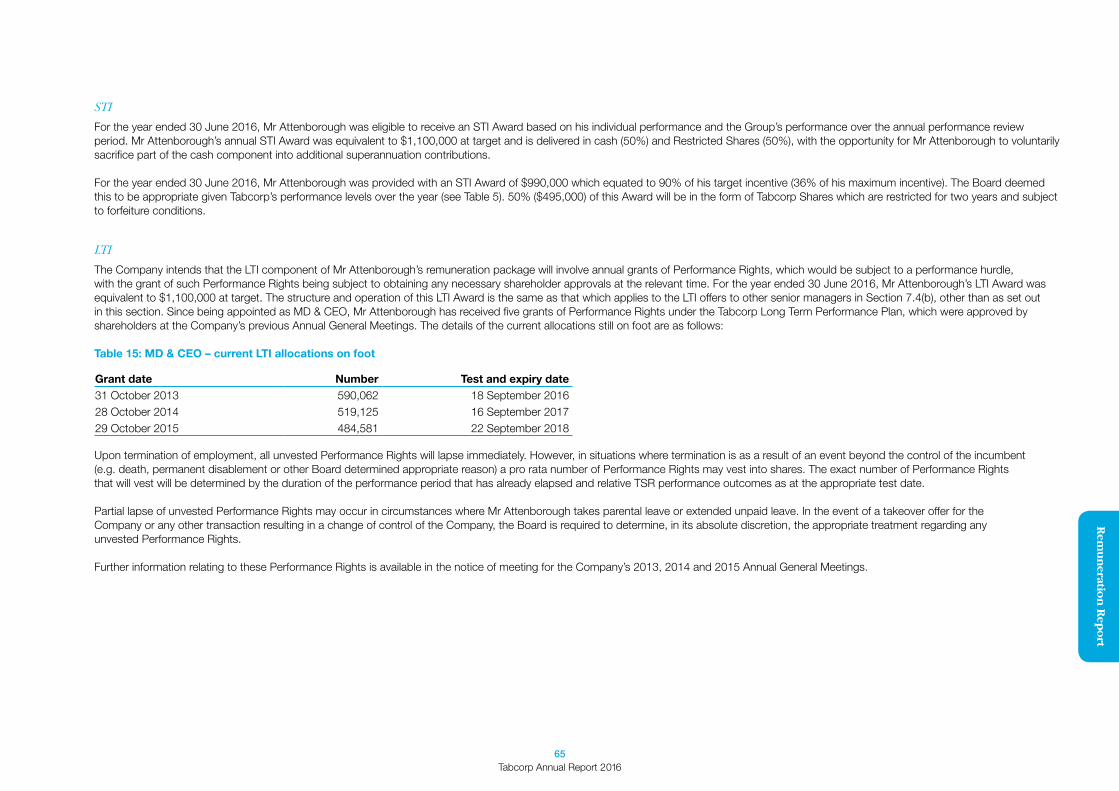
STI
For the year ended 30 June 2016, Mr Attenborough was eligible to receive an STI Award based on his individual performance and the Group’s performance over the annual performance review period. Mr Attenborough’s annual STI Award was equivalent to $1,100,000 at target and is delivered in cash (50%) and Restricted Shares (50%), with the opportunity for Mr Attenborough to voluntarily sacrifice part of the cash component into additional superannuation contributions.
For the year ended 30 June 2016, Mr Attenborough was provided with an STI Award of $990,000 which equated to 90% of his target incentive (36% of his maximum incentive). The Board deemed this to be appropriate given Tabcorp’s performance levels over the year (see Table 5). 50% ($495,000) of this Award will be in the form of Tabcorp Shares which are restricted for two years and subject to forfeiture conditions.
LTI
The Company intends that the LTI component of Mr Attenborough’s remuneration package will involve annual grants of Performance Rights, which would be subject to a performance hurdle, with the grant of such Performance Rights being subject to obtaining any necessary shareholder approvals at the relevant time. For the year ended 30 June 2016, Mr Attenborough’s LTI Award was equivalent to $1,100,000 at target. The structure and operation of this LTI Award is the same as that which applies to the LTI offers to other senior managers in Section 7.4(b), other than as set out in this section. Since being appointed as MD & CEO, Mr Attenborough has received five grants of Performance Rights under the Tabcorp Long Term Performance Plan, which were approved by shareholders at the Company’s previous Annual General Meetings. The details of the current allocations still on foot are as follows: Table 15: MD & CEO – current LTI allocations on foot
Grant date Number Test and expiry date31 October 2013 590,062 18 September 201628 October 2014 519,125 16 September 201729 October 2015 484,581 22 September 2018
Upon termination of employment, all unvested Performance Rights will lapse immediately. However, in situations where termination is as a result of an event beyond the control of the incumbent (e.g. death, permanent disablement or other Board determined appropriate reason) a pro rata number of Performance Rights may vest into shares. The exact number of Performance Rights that will vest will be determined by the duration of the performance period that has already elapsed and relative TSR performance outcomes as at the appropriate test date.
Partial lapse of unvested Performance Rights may occur in circumstances where Mr Attenborough takes parental leave or extended unpaid leave. In the event of a takeover offer for the Company or any other transaction resulting in a change of control of the Company, the Board is required to determine, in its absolute discretion, the appropriate treatment regarding any unvested Performance Rights.
Further information relating to these Performance Rights is available in the notice of meeting for the Company’s 2013, 2014 and 2015 Annual General Meetings.
Rem
un
eration
Rep
ort
64Tabcorp Annual Report 2016
65Tabcorp Annual Report 2016
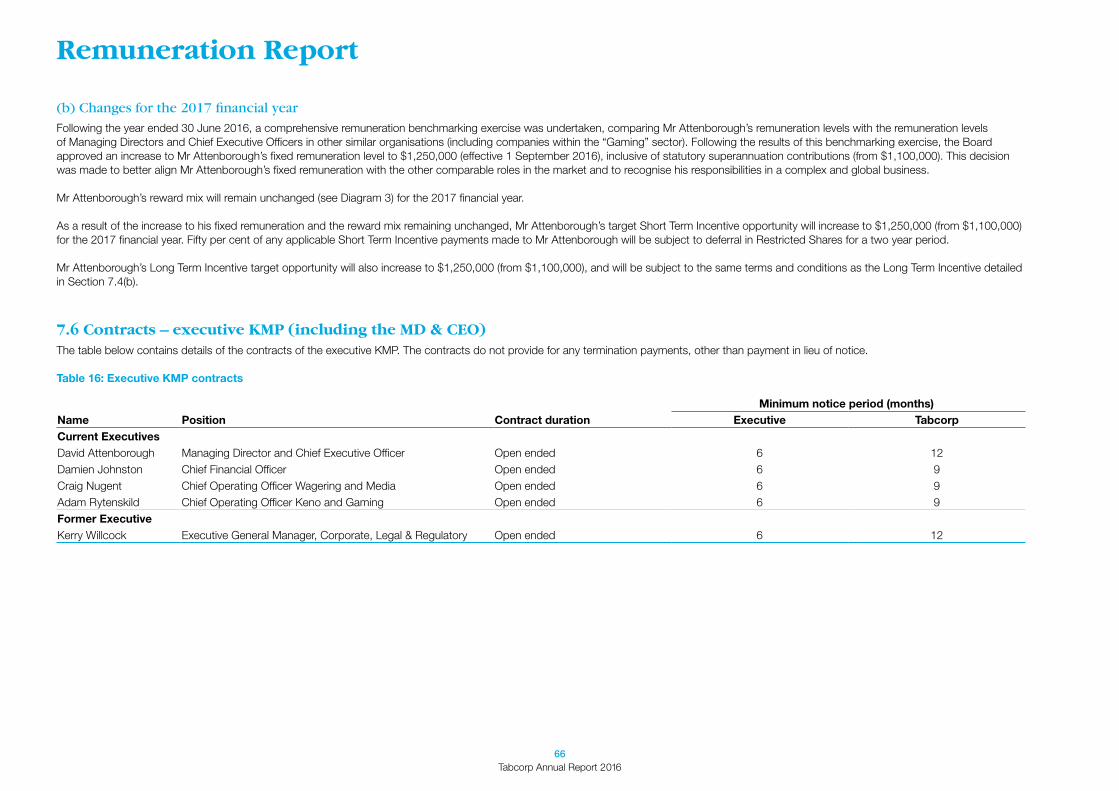
Remuneration Report
(b) Changes for the 2017 financial year
Following the year ended 30 June 2016, a comprehensive remuneration benchmarking exercise was undertaken, comparing Mr Attenborough’s remuneration levels with the remuneration levels of Managing Directors and Chief Executive Officers in other similar organisations (including companies within the “Gaming” sector). Following the results of this benchmarking exercise, the Board approved an increase to Mr Attenborough’s fixed remuneration level to $1,250,000 (effective 1 September 2016), inclusive of statutory superannuation contributions (from $1,100,000). This decision was made to better align Mr Attenborough’s fixed remuneration with the other comparable roles in the market and to recognise his responsibilities in a complex and global business. Mr Attenborough’s reward mix will remain unchanged (see Diagram 3) for the 2017 financial year. As a result of the increase to his fixed remuneration and the reward mix remaining unchanged, Mr Attenborough’s target Short Term Incentive opportunity will increase to $1,250,000 (from $1,100,000) for the 2017 financial year. Fifty per cent of any applicable Short Term Incentive payments made to Mr Attenborough will be subject to deferral in Restricted Shares for a two year period. Mr Attenborough’s Long Term Incentive target opportunity will also increase to $1,250,000 (from $1,100,000), and will be subject to the same terms and conditions as the Long Term Incentive detailed in Section 7.4(b).
7.6 Contracts – executive KMP (including the MD & CEO)The table below contains details of the contracts of the executive KMP. The contracts do not provide for any termination payments, other than payment in lieu of notice.
Table 16: Executive KMP contracts
Minimum notice period (months)Name Position Contract duration Executive TabcorpCurrent ExecutivesDavid Attenborough Managing Director and Chief Executive Officer Open ended 6 12Damien Johnston Chief Financial Officer Open ended 6 9Craig Nugent Chief Operating Officer Wagering and Media Open ended 6 9Adam Rytenskild Chief Operating Officer Keno and Gaming Open ended 6 9Former ExecutiveKerry Willcock Executive General Manager, Corporate, Legal & Regulatory Open ended 6 12
66Tabcorp Annual Report 2016

7.7 Remuneration – executive KMP (including the MD & CEO)Table 17: Executive KMP remuneration
Short termLong term
Post employment
Charge for share based allocations(iv)
KMP Year
Salary & fees(i)
$
Cash bonus(ii)
$
Non-monetary benefits(iii)
$
Accrued leave
benefits$
Super-annuation
$
Total excluding
charge for share based
allocations
Restricted Shares
$
Performance Rights
$Total
$
Performance related(v)
%
Termination benefits
$Executive DirectorDavid AttenboroughManaging Director and Chief Executive Officer
2016 1,080,692 495,000 - 36,320 19,308 1,631,320 382,377 1,173,742 3,187,439 64% -2015 1,056,300 425,000 1,145 44,337 18,783 1,545,565 214,837 968,936 2,729,338 59% -
Current ExecutivesDamien JohnstonChief Financial Officer
2016 648,839 226,600 - (13,801) 19,308 880,946 95,832 372,960 1,349,738 52% -2015 630,158 275,000 - 13,554 18,783 937,495 67,869 335,281 1,340,645 51% -
Craig NugentChief Operating Officer Wagering and Media
2016 672,567 187,718 - 24,234 19,308 903,827 86,508 259,940 1,250,275 43% -2015 637,488 271,338 1,380 16,984 18,783 945,973 63,141 191,514 1,200,628 44% -
Adam RytenskildChief Operating Officer Keno and Gaming
2016 543,803 302,402 - 43,521 19,308 909,034 83,070 215,579 1,207,683 50% -2015 506,717 157,650 - (16,602) 18,783 666,548 47,601 163,374 877,523 42% -
Former ExecutivesKerry Willcock (vi)
EGM Corporate, Legal and Regulatory
2016 363,901 - - 23,723 12,872 400,496 69,931 218,044 688,471 42% 594,0032015 552,008 134,379 - 34,562 18,783 739,732 48,093 293,958 1,081,783 44% -
Total 2016 3,309,802 1,211,720 - 113,997 90,104 4,725,623 717,718 2,240,265 7,683,606 594,0032015 3,382,671 1,263,367 2,525 92,835 93,915 4,835,313 441,541 1,953,063 7,229,917 -
(i) Comprises salary and salary sacrificed benefits (including superannuation and motor vehicle novated leases where applicable).
(ii) Cash bonus reflects 75% (50% for the MD & CEO) of the STI achieved in the year. The remaining 25% (50% for the MD & CEO) of the STI is deferred into Restricted Shares, and is reflected in remuneration during the vesting period.
(iii) Comprises the cost to the Company for providing car parking, where applicable.
(iv) Represents the fair value of share based payments expensed by the Company. Value only accrues to the KMP when conditions have been met.
(v) Represents the sum of cash bonus, Restricted Shares and Performance Rights as a percentage of total remuneration, excluding termination payments.
(vi) Ceased employment and as a KMP on 19 February 2016. Termination payment includes $594,003 payment in lieu of notice. In addition to the amounts disclosed above, payment on cessation of annual leave amounted to $52,280 and long service leave amounted to $161,149.
Rem
un
eration
Rep
ort
66Tabcorp Annual Report 2016
67Tabcorp Annual Report 2016

Remuneration Report
7.7 Remuneration – executive KMP (including the MD & CEO) (continued)Table 17 is prepared in accordance with the Corporations Act requirements. The amounts that appear under the heading ‘charge for share based allocations’ are the amounts expensed by the Company in accordance with the required Accounting Standards in respect of current and past incentive allocations of Restricted Shares and Performance Rights. These amounts are therefore not amounts actually received by Executives during the year. Whether Executives receive any value from the allocation of long term incentives in the future will depend on the performance of the Company relative to a peer group of listed companies. The mechanism which determines whether or not long term incentives vest in the future is described in Section 7.4(b).
An overview of the actual value of remuneration received by KMP during the year is outlined in Table 18. This information is provided as it is considered to be of interest to users of the Remuneration Report.
Table 18: Actual value of remuneration received by current Executive KMP
KMP Year
Salary and fees(i)
$
Cash bonus(ii)
$Superannuation
$
Value of STI vested(iii)
$
Value of LTI vested(iv)
$Total
$Executive DirectorDavid Attenborough 2016 1,080,692 425,000 19,308 - 1,954,068 3,479,068
2015 1,056,300 506,250 18,783 - 1,446,086 3,027,419Current ExecutivesDamien Johnston 2016 648,839 275,000 19,308 - 1,055,382 1,998,529
2015 630,158 249,638 18,783 - 723,041 1,621,620Craig Nugent 2016 672,567 271,338 19,308 - 579,248 1,542,461
2015 637,488 221,288 18,783 - 383,427 1,260,986Adam Rytenskild 2016 543,803 157,650 19,308 - 486,673 1,207,434
2015 506,717 200,025 18,783 - 268,398 993,923Total 2016 2,945,901 1,128,988 77,232 - 4,075,371 8,227,492
2015 2,830,663 1,177,201 75,132 - 2,820,952 6,903,948
(i) Comprises salary and salary sacrificed benefits as calculated in Table 17.
(ii) Cash bonus reflects the 75% (50% for the MD & CEO) of the previous year’s STI, which was paid during the year.
(iii) Value of Restricted Shares vesting during the year as part of the STI, calculated based on the market value of Tabcorp shares at the date of vesting.
(iv) Value of shares issued during the year on the vesting of Performance Rights as part of the LTI, calculated based on the market value of Tabcorp shares at the date of vesting.
68Tabcorp Annual Report 2016

8. Non Executive Director remuneration
8.1 Remuneration frameworkThe Remuneration Committee has responsibility for annually reviewing and recommending to the Board appropriate remuneration arrangements for Non Executive Directors, taking into consideration factors including, the Group’s remuneration philosophy (see Section 2), the level of fees paid to Board members of other publicly listed Australian companies, operational and regulatory complexity, the responsibilities and workload requirements of each Board member and advice from independent remuneration consultants, where appropriate.
The current aggregate annual limit (including superannuation contributions) is set at $2 million, as approved by shareholders at the Annual General Meeting on 28 November 2005.
Non Executive Directors do not receive any performance or incentive payments and are not eligible to participate in any of Tabcorp’s incentive plans. This aligns with the principle that Non Executive Directors act independently and impartially.
8.2 StructureNon Executive Directors receive a base Board fee and a fee for each Board Committee that they are members of. The Board Chairman receives a fixed single fee which is inclusive of services on all Board Committees. In addition, Superannuation Guarantee Contributions are payable on all fees.
Some Directors may receive additional remuneration and associated superannuation (where applicable) for:
• Chairmanship of the Victorian Joint Venture Management Committee, receiving a fee equivalent to Chairman of the Board Remuneration Committee – Paula Dwyer was Chairman of this Committee throughout the year;
• Observer fees, equivalent to the applicable Board and Committee fees (for attending Board and Committee meetings and induction whilst awaiting regulatory approval) – no Observer fees were paid during the year; or
• Membership of other Committees, which may be required from time to time – no additional Committee fees were paid during the year.
Board fees are structured by having regard to the responsibilities of each position within the Board. Board Committee fees are structured to recognise the differing responsibilities and workload associated with each Committee, and the additional responsibilities of each Committee Chairman. Board fees are not paid to the MD & CEO, or to executives for directorships of any subsidiaries.
Rem
un
eration
Rep
ort
68Tabcorp Annual Report 2016
69Tabcorp Annual Report 2016
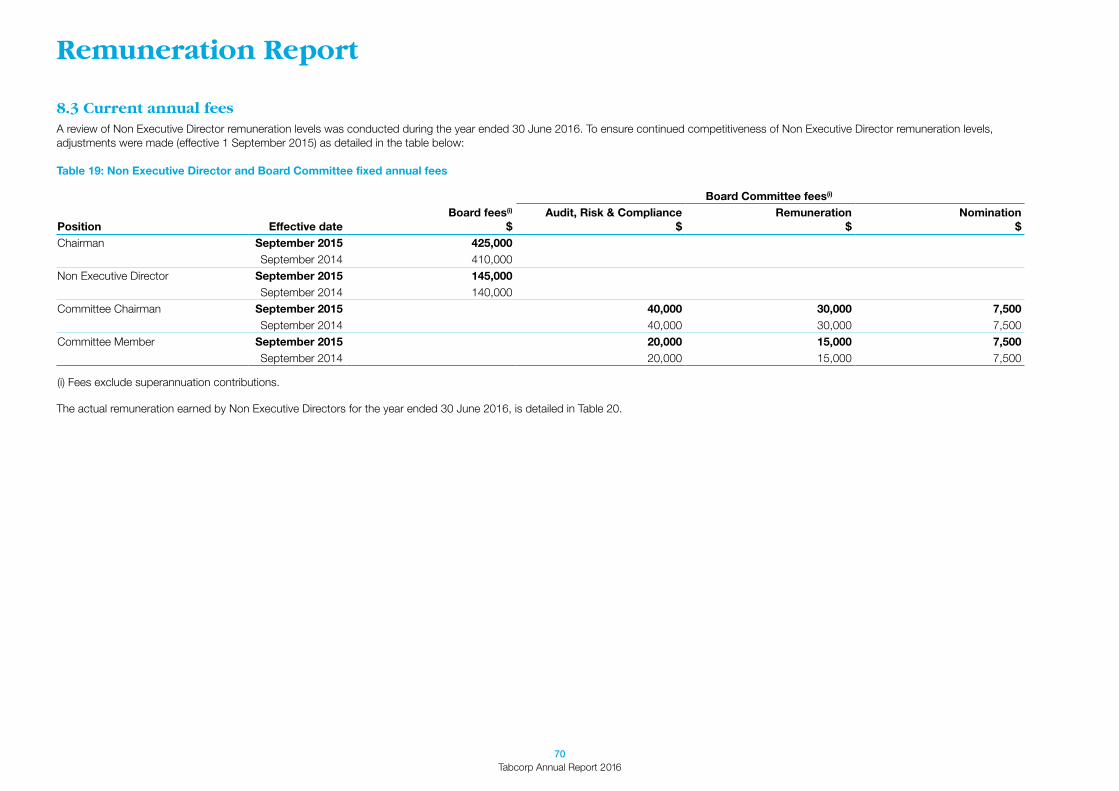
Remuneration Report
8.3 Current annual feesA review of Non Executive Director remuneration levels was conducted during the year ended 30 June 2016. To ensure continued competitiveness of Non Executive Director remuneration levels, adjustments were made (effective 1 September 2015) as detailed in the table below:
Table 19: Non Executive Director and Board Committee fixed annual fees
Board Committee fees(i)
Position Effective dateBoard fees(i)
$Audit, Risk & Compliance
$Remuneration
$Nomination
$Chairman September 2015 425,000
September 2014 410,000Non Executive Director September 2015 145,000
September 2014 140,000Committee Chairman September 2015 40,000 30,000 7,500
September 2014 40,000 30,000 7,500Committee Member September 2015 20,000 15,000 7,500
September 2014 20,000 15,000 7,500
(i) Fees exclude superannuation contributions.
The actual remuneration earned by Non Executive Directors for the year ended 30 June 2016, is detailed in Table 20.
70Tabcorp Annual Report 2016
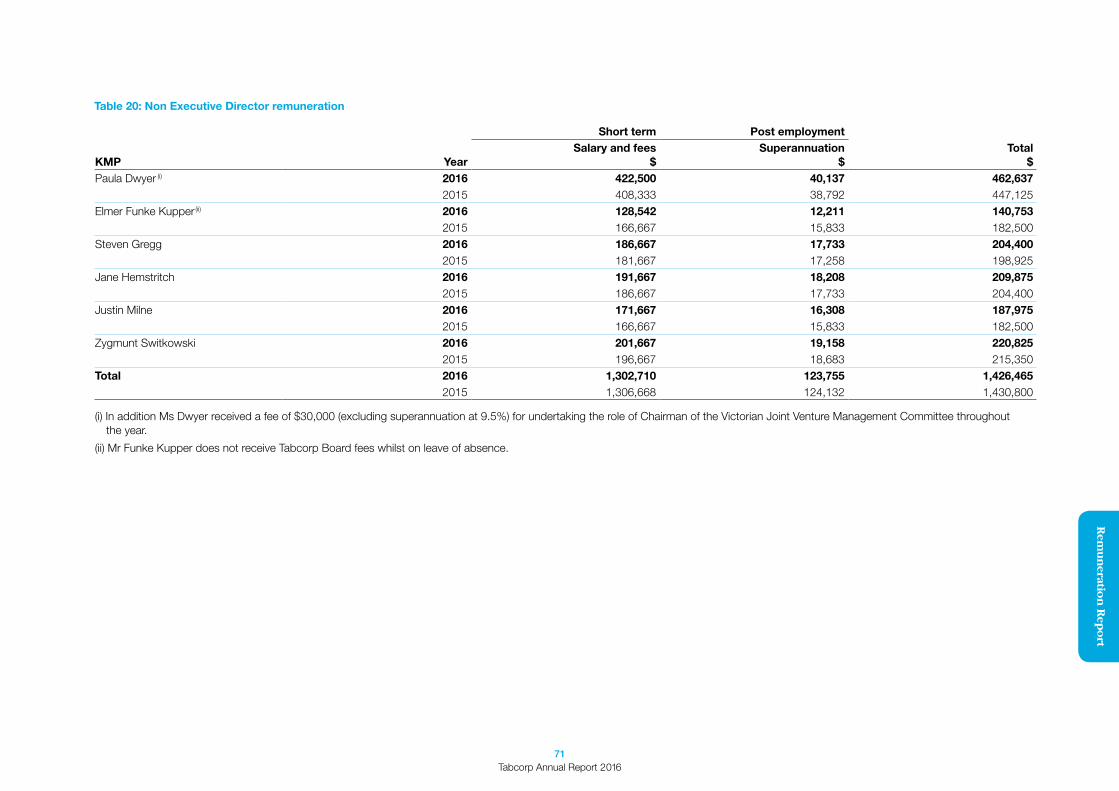
Table 20: Non Executive Director remuneration
Short term Post employment
KMP YearSalary and fees
$Superannuation
$Total
$Paula Dwyer (i) 2016 422,500 40,137 462,637
2015 408,333 38,792 447,125Elmer Funke Kupper(ii) 2016 128,542 12,211 140,753
2015 166,667 15,833 182,500Steven Gregg 2016 186,667 17,733 204,400
2015 181,667 17,258 198,925Jane Hemstritch 2016 191,667 18,208 209,875
2015 186,667 17,733 204,400Justin Milne 2016 171,667 16,308 187,975
2015 166,667 15,833 182,500Zygmunt Switkowski 2016 201,667 19,158 220,825
2015 196,667 18,683 215,350Total 2016 1,302,710 123,755 1,426,465
2015 1,306,668 124,132 1,430,800
(i) In addition Ms Dwyer received a fee of $30,000 (excluding superannuation at 9.5%) for undertaking the role of Chairman of the Victorian Joint Venture Management Committee throughout the year.
(ii) Mr Funke Kupper does not receive Tabcorp Board fees whilst on leave of absence.
Rem
un
eration
Rep
ort
70Tabcorp Annual Report 2016
71Tabcorp Annual Report 2016
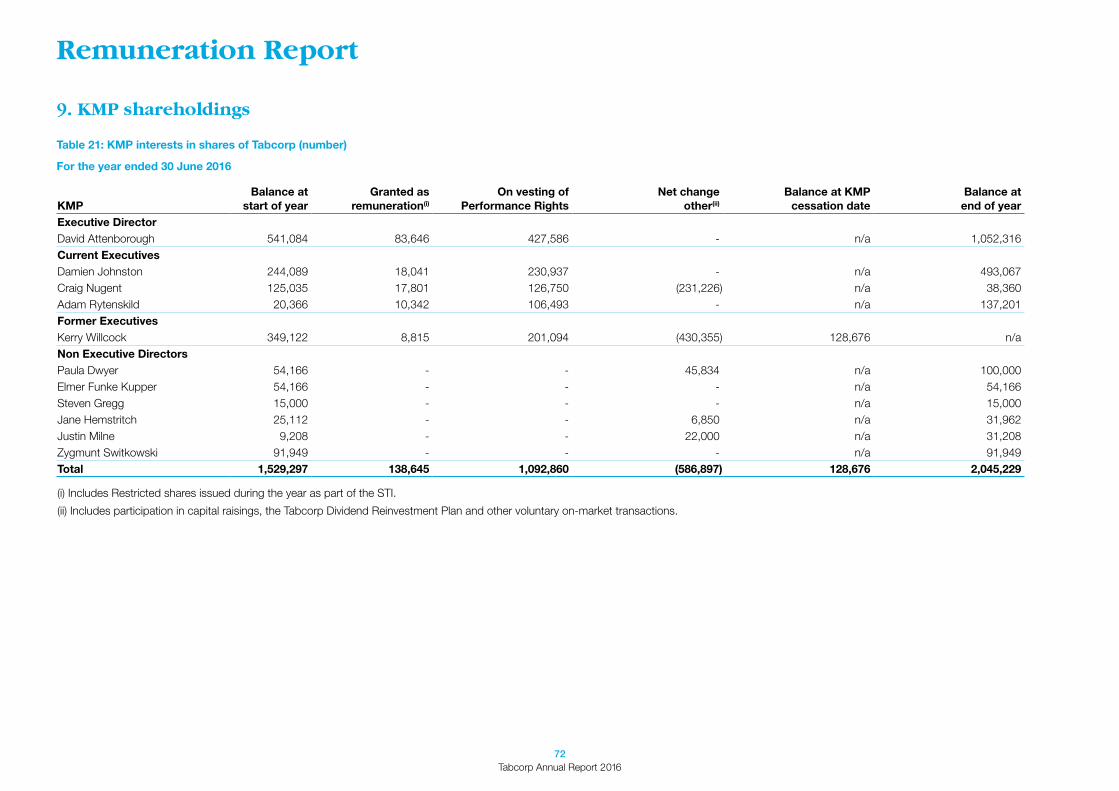
Remuneration Report
9. KMP shareholdings
Table 21: KMP interests in shares of Tabcorp (number)
For the year ended 30 June 2016
KMPBalance at
start of yearGranted as
remuneration(i)
On vesting of Performance Rights
Net change other(ii)
Balance at KMP cessation date
Balance at end of year
Executive DirectorDavid Attenborough 541,084 83,646 427,586 - n/a 1,052,316Current ExecutivesDamien Johnston 244,089 18,041 230,937 - n/a 493,067Craig Nugent 125,035 17,801 126,750 (231,226) n/a 38,360Adam Rytenskild 20,366 10,342 106,493 - n/a 137,201Former ExecutivesKerry Willcock 349,122 8,815 201,094 (430,355) 128,676 n/aNon Executive DirectorsPaula Dwyer 54,166 - - 45,834 n/a 100,000Elmer Funke Kupper 54,166 - - - n/a 54,166Steven Gregg 15,000 - - - n/a 15,000Jane Hemstritch 25,112 - - 6,850 n/a 31,962Justin Milne 9,208 - - 22,000 n/a 31,208Zygmunt Switkowski 91,949 - - - n/a 91,949Total 1,529,297 138,645 1,092,860 (586,897) 128,676 2,045,229
(i) Includes Restricted shares issued during the year as part of the STI.
(ii) Includes participation in capital raisings, the Tabcorp Dividend Reinvestment Plan and other voluntary on-market transactions.
72Tabcorp Annual Report 2016
Financial Report
Contents
Income statement 74
Balance sheet 75
Cash flow statement 76
Statement of changes in equity 77
Notes to the financial statements 78
About this report 78
Section A – Group performance 79
Section B – Capital and risk management 85
Section C – Operating assets and liabilities 93
Section D – Group structure 101
Section E – Other disclosures 107
Directors’ declaration 113
Independent auditor’s report 114
Fin
ancial R
epo
rt
72Tabcorp Annual Report 2016
73Tabcorp Annual Report 2016
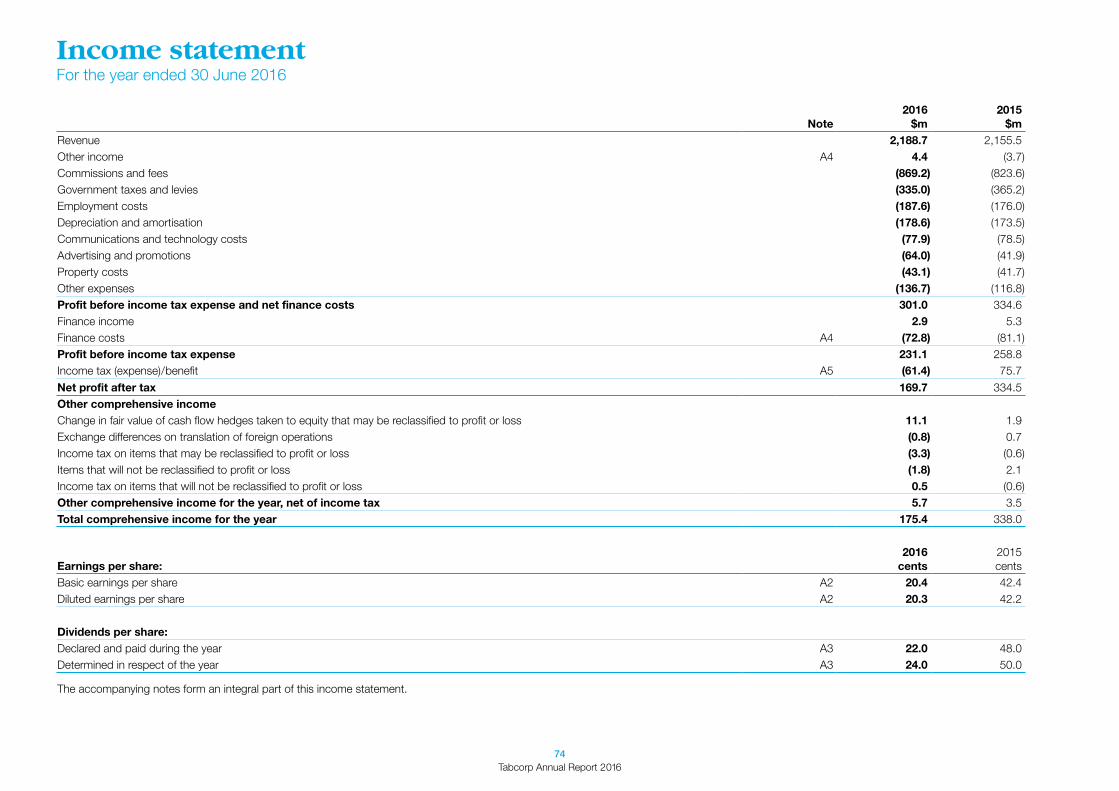
Income statementFor the year ended 30 June 2016
Note 2016
$m 2015 $m
Revenue 2,188.7 2,155.5Other income A4 4.4 (3.7)Commissions and fees (869.2) (823.6)Government taxes and levies (335.0) (365.2)Employment costs (187.6) (176.0)Depreciation and amortisation (178.6) (173.5)Communications and technology costs (77.9) (78.5)Advertising and promotions (64.0) (41.9)Property costs (43.1) (41.7)Other expenses (136.7) (116.8)Profit before income tax expense and net finance costs 301.0 334.6Finance income 2.9 5.3Finance costs A4 (72.8) (81.1)Profit before income tax expense 231.1 258.8Income tax (expense)/benefit A5 (61.4) 75.7
Net profit after tax 169.7 334.5Other comprehensive income Change in fair value of cash flow hedges taken to equity that may be reclassified to profit or loss 11.1 1.9Exchange differences on translation of foreign operations (0.8) 0.7Income tax on items that may be reclassified to profit or loss (3.3) (0.6)Items that will not be reclassified to profit or loss (1.8) 2.1Income tax on items that will not be reclassified to profit or loss 0.5 (0.6)Other comprehensive income for the year, net of income tax 5.7 3.5Total comprehensive income for the year 175.4 338.0
Earnings per share: 2016 cents
2015cents
Basic earnings per share A2 20.4 42.4Diluted earnings per share A2 20.3 42.2
Dividends per share:Declared and paid during the year A3 22.0 48.0Determined in respect of the year A3 24.0 50.0
The accompanying notes form an integral part of this income statement.
74Tabcorp Annual Report 2016
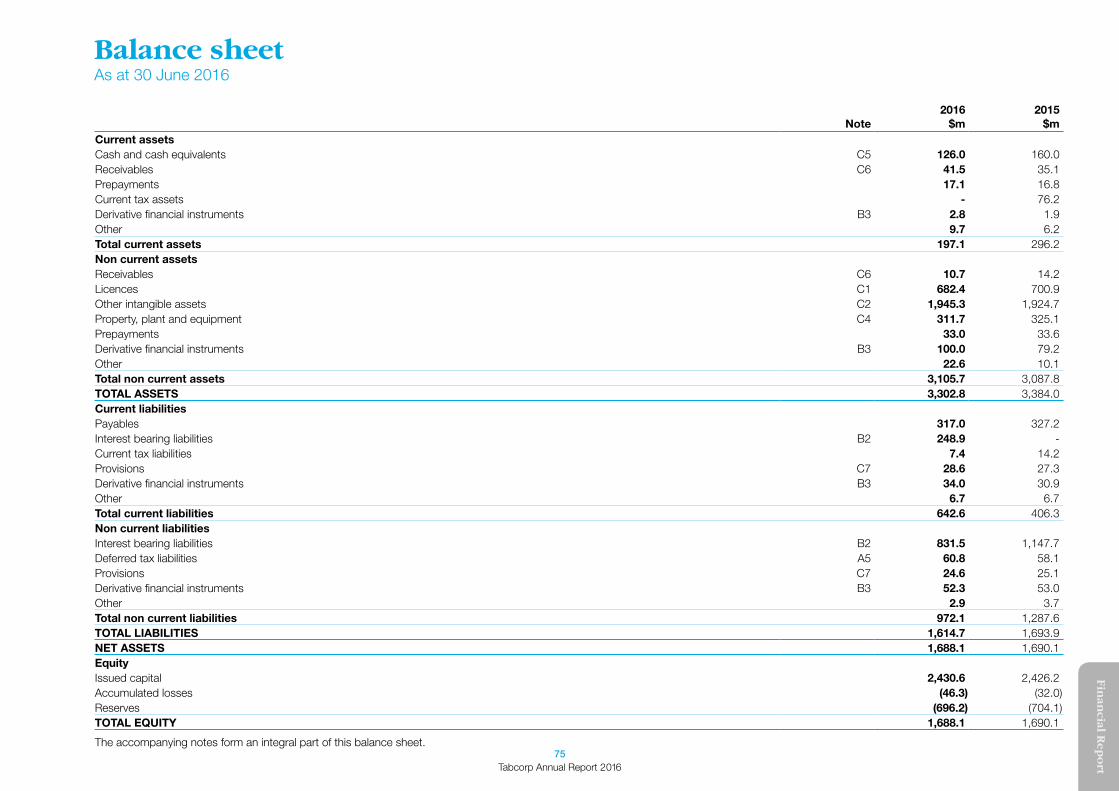
Note2016
$m 2015 $m
Current assetsCash and cash equivalents C5 126.0 160.0Receivables C6 41.5 35.1Prepayments 17.1 16.8Current tax assets - 76.2Derivative financial instruments B3 2.8 1.9Other 9.7 6.2Total current assets 197.1 296.2Non current assetsReceivables C6 10.7 14.2Licences C1 682.4 700.9Other intangible assets C2 1,945.3 1,924.7Property, plant and equipment C4 311.7 325.1Prepayments 33.0 33.6Derivative financial instruments B3 100.0 79.2Other 22.6 10.1Total non current assets 3,105.7 3,087.8TOTAL ASSETS 3,302.8 3,384.0Current liabilitiesPayables 317.0 327.2Interest bearing liabilities B2 248.9 -Current tax liabilities 7.4 14.2Provisions C7 28.6 27.3Derivative financial instruments B3 34.0 30.9Other 6.7 6.7Total current liabilities 642.6 406.3Non current liabilitiesInterest bearing liabilities B2 831.5 1,147.7Deferred tax liabilities A5 60.8 58.1Provisions C7 24.6 25.1Derivative financial instruments B3 52.3 53.0Other 2.9 3.7Total non current liabilities 972.1 1,287.6TOTAL LIABILITIES 1,614.7 1,693.9NET ASSETS 1,688.1 1,690.1EquityIssued capital 2,430.6 2,426.2Accumulated losses (46.3) (32.0)Reserves (696.2) (704.1)TOTAL EQUITY 1,688.1 1,690.1
The accompanying notes form an integral part of this balance sheet.
Balance sheet As at 30 June 2016
Fin
ancial R
epo
rt
74Tabcorp Annual Report 2016
75Tabcorp Annual Report 2016
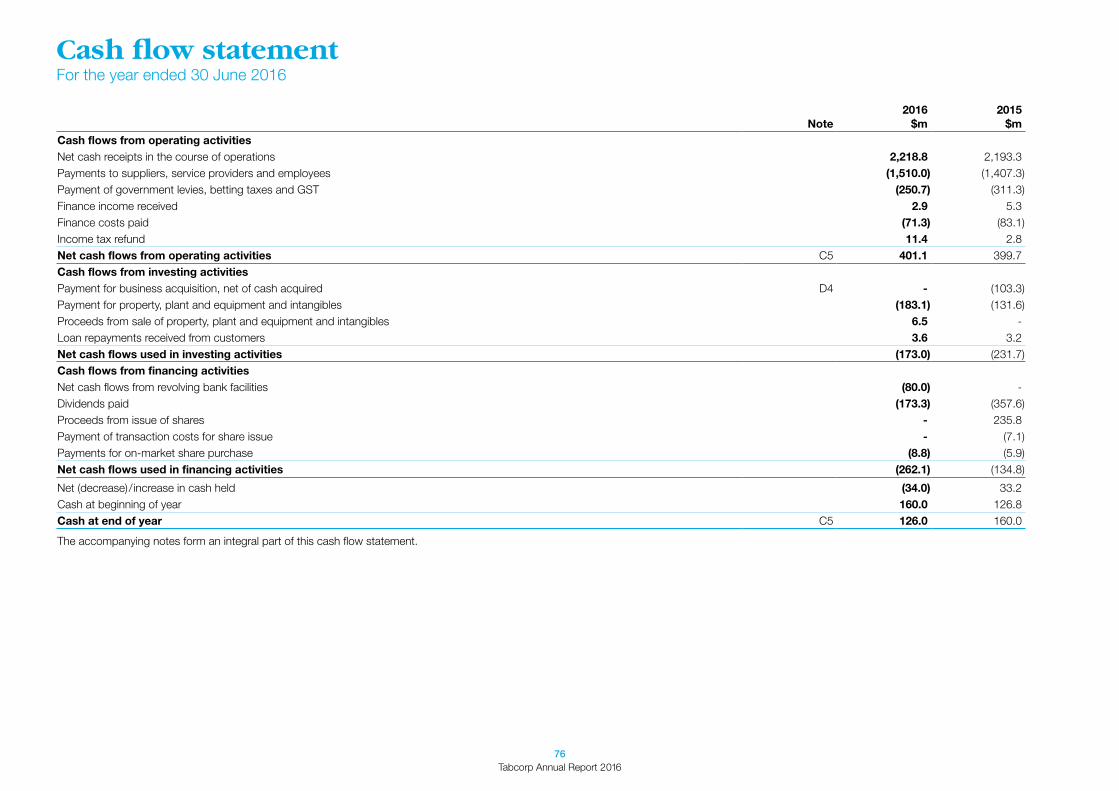
Note 2016
$m2015
$mCash flows from operating activitiesNet cash receipts in the course of operations 2,218.8 2,193.3Payments to suppliers, service providers and employees (1,510.0) (1,407.3)Payment of government levies, betting taxes and GST (250.7) (311.3)Finance income received 2.9 5.3Finance costs paid (71.3) (83.1)Income tax refund 11.4 2.8Net cash flows from operating activities C5 401.1 399.7Cash flows from investing activitiesPayment for business acquisition, net of cash acquired D4 - (103.3)Payment for property, plant and equipment and intangibles (183.1) (131.6)Proceeds from sale of property, plant and equipment and intangibles 6.5 - Loan repayments received from customers 3.6 3.2Net cash flows used in investing activities (173.0) (231.7)Cash flows from financing activitiesNet cash flows from revolving bank facilities (80.0) - Dividends paid (173.3) (357.6)Proceeds from issue of shares - 235.8Payment of transaction costs for share issue - (7.1)Payments for on-market share purchase (8.8) (5.9)Net cash flows used in financing activities (262.1) (134.8)
Net (decrease)/increase in cash held (34.0) 33.2Cash at beginning of year 160.0 126.8Cash at end of year C5 126.0 160.0
The accompanying notes form an integral part of this cash flow statement.
Cash flow statementFor the year ended 30 June 2016
76Tabcorp Annual Report 2016

Issued capital ReservesNumber of
ordinary sharesm
Ordinary shares
$m
Treasury shares
$m
Accumulated losses
$mHedging
$mDemerger
$mOther
$m
Total equity
$m2016Balance at beginning of year 829.4 2,427.0 (0.8) (32.0) (39.2) (669.9) 5.0 1,690.1Profit for the year - - - 169.7 - - - 169.7Other comprehensive income - - - (1.3) 7.8 - (0.8) 5.7Total comprehensive income - - - 168.4 7.8 - (0.8) 175.4Dividends paid - - - (182.7) - - - (182.7)Dividend reinvestment plan 2.1 9.4 - - - - - 9.4Transfers - 2.0 - - - - (2.0) -Restricted shares issued - - (1.6) - - - - (1.6)Share based payments expense - - 1.8 - - - 2.9 4.7Net outlay to purchase shares - (7.2) - - - - - (7.2)Balance at end of year 831.5 2,431.2 (0.6) (46.3) (31.4) (669.9) 5.1 1,688.1
Total issued capital 2,430.6 Total reserves (696.2)2015Balance at beginning of year 763.0 2,189.2 (0.5) (0.7) (40.5) (669.9) 3.8 1,481.4Profit for the year - - - 334.5 - - - 334.5Other comprehensive income - - - 1.5 1.3 - 0.7 3.5Total comprehensive income - - - 336.0 1.3 - 0.7 338.0Dividends paid - - - (367.3) - - - (367.3)Dividend reinvestment plan 2.7 9.7 - - - - - 9.7Accelerated renounceable entitlement offer 63.7 235.8 - - - - - 235.8Transaction costs for share issue - (5.0) - - - - - (5.0)Transfers - 2.1 - - - - (2.1) - Restricted shares issued - - (1.1) - - - - (1.1)Share based payments expense - - 0.8 - - - 2.6 3.4Net outlay to purchase shares - (4.8) - - - - - (4.8)Balance at end of year 829.4 2,427.0 (0.8) (32.0) (39.2) (669.9) 5.0 1,690.1
Total issued capital 2,426.2 Total reserves (704.1)
Statement of changes in equityFor the year ended 30 June 2016
Issued capital – Ordinary shares are issued and fully paid. They carry one vote per share and hold the rights to dividends. Issued capital is recognised at the fair value of the consideration received. When issued capital is repurchased, the amount of the consideration paid, including directly attributable costs, is recognised as a deduction from total issued capital. Any transaction costs directly attributable to the issue of ordinary shares are recognised directly in equity, net of tax, as a reduction of the share proceeds received. Treasury shares represent the unvested portion of Restricted Shares issued to executives as an incentive, on appointment or for retention, which is recognised as a reduction in issued capital. The amount which has been credited to the employee equity benefit reserve is transferred to issued capital to the extent the relevant Performance Rights vest or have been treated as vested.
Nature of reserves Hedging reserve represents hedging gains and losses recognised on the effective portion of cash flow hedges. Demerger reserve arose on the demerger of The Star Entertainment Group (previously the Echo Entertainment Group) in 2011. It represents the difference between the fair value of The Star Entertainment Group shares (being the distribution liability arising on demerger), the amount allocated as a capital reduction and any transfers to retained earnings. Other reserves contain the employee equity benefit reserve and the foreign currency translation reserve.
The accompanying notes form an integral part of this statement of changes in equity.
Fin
ancial R
epo
rt
76Tabcorp Annual Report 2016
77Tabcorp Annual Report 2016
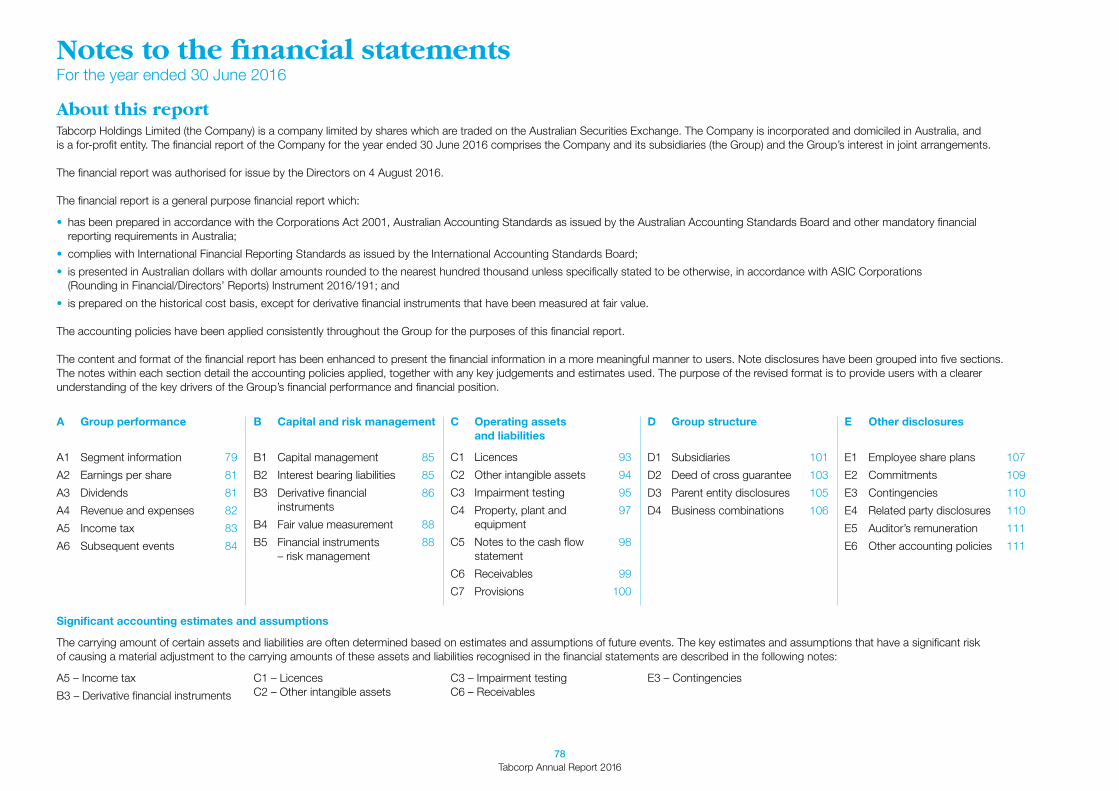
About this reportTabcorp Holdings Limited (the Company) is a company limited by shares which are traded on the Australian Securities Exchange. The Company is incorporated and domiciled in Australia, and is a for-profit entity. The financial report of the Company for the year ended 30 June 2016 comprises the Company and its subsidiaries (the Group) and the Group’s interest in joint arrangements. The financial report was authorised for issue by the Directors on 4 August 2016. The financial report is a general purpose financial report which:
• has been prepared in accordance with the Corporations Act 2001, Australian Accounting Standards as issued by the Australian Accounting Standards Board and other mandatory financial reporting requirements in Australia;
• complies with International Financial Reporting Standards as issued by the International Accounting Standards Board;
• is presented in Australian dollars with dollar amounts rounded to the nearest hundred thousand unless specifically stated to be otherwise, in accordance with ASIC Corporations (Rounding in Financial/Directors’ Reports) Instrument 2016/191; and
• is prepared on the historical cost basis, except for derivative financial instruments that have been measured at fair value.
The accounting policies have been applied consistently throughout the Group for the purposes of this financial report. The content and format of the financial report has been enhanced to present the financial information in a more meaningful manner to users. Note disclosures have been grouped into five sections. The notes within each section detail the accounting policies applied, together with any key judgements and estimates used. The purpose of the revised format is to provide users with a clearer understanding of the key drivers of the Group’s financial performance and financial position.
Notes to the financial statements For the year ended 30 June 2016
A Group performance
A1 Segment information 79
A2 Earnings per share 81
A3 Dividends 81
A4 Revenue and expenses 82
A5 Income tax 83
A6 Subsequent events 84
B Capital and risk management
B1 Capital management 85
B2 Interest bearing liabilities 85
B3 Derivative financial 86 instruments
B4 Fair value measurement 88
B5 Financial instruments 88 – risk management
C Operating assets and liabilities
C1 Licences 93
C2 Other intangible assets 94
C3 Impairment testing 95
C4 Property, plant and 97 equipment
C5 Notes to the cash flow 98 statement
C6 Receivables 99
C7 Provisions 100
D Group structure
D1 Subsidiaries 101
D2 Deed of cross guarantee 103
D3 Parent entity disclosures 105
D4 Business combinations 106
E Other disclosures
E1 Employee share plans 107
E2 Commitments 109
E3 Contingencies 110
E4 Related party disclosures 110
E5 Auditor’s remuneration 111
E6 Other accounting policies 111
Significant accounting estimates and assumptions
The carrying amount of certain assets and liabilities are often determined based on estimates and assumptions of future events. The key estimates and assumptions that have a significant risk of causing a material adjustment to the carrying amounts of these assets and liabilities recognised in the financial statements are described in the following notes:
A5 – Income tax
B3 – Derivative financial instruments
C1 – Licences C2 – Other intangible assets
C3 – Impairment testing C6 – Receivables
E3 – Contingencies
78Tabcorp Annual Report 2016
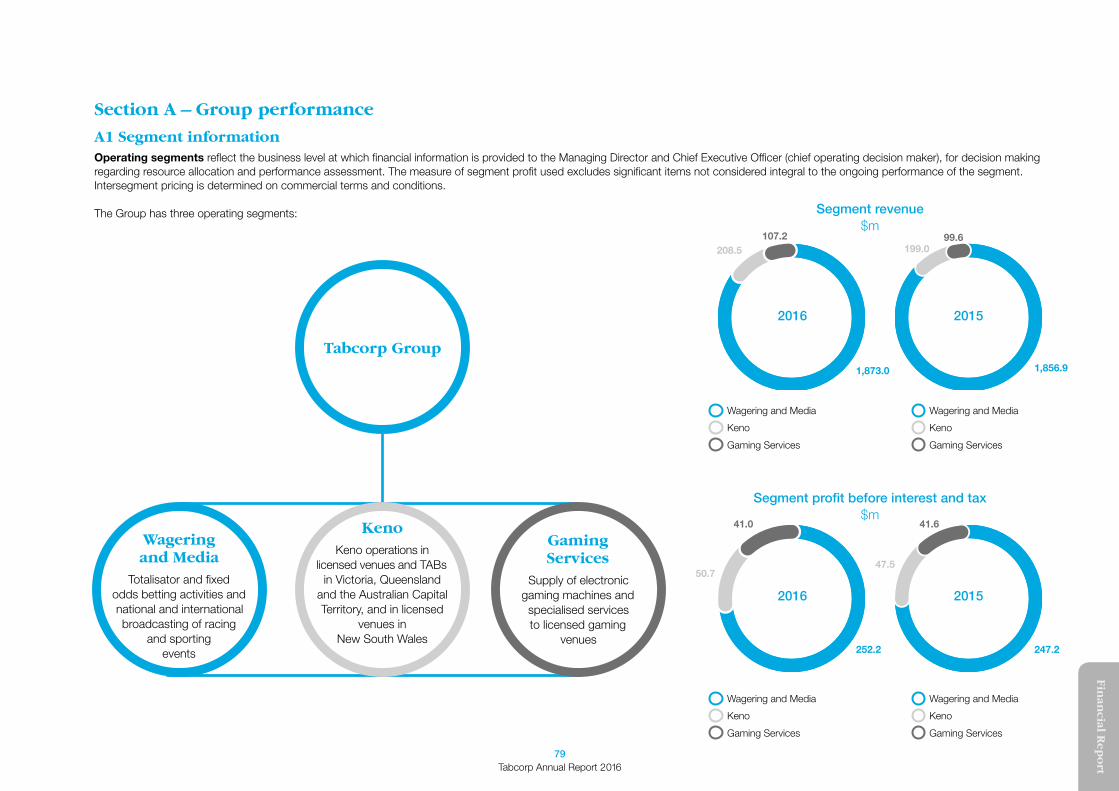
Section A – Group performance
A1 Segment informationOperating segments reflect the business level at which financial information is provided to the Managing Director and Chief Executive Officer (chief operating decision maker), for decision making regarding resource allocation and performance assessment. The measure of segment profit used excludes significant items not considered integral to the ongoing performance of the segment. Intersegment pricing is determined on commercial terms and conditions.
The Group has three operating segments:
Wagering and Media
Totalisator and fixed odds betting activities and national and international broadcasting of racing
and sporting events
Tabcorp Group
Segment revenue $m
Segment profit before interest and tax $m
Wagering and Media Wagering and Media
KenoKeno
Gaming ServicesGaming Services
Wagering and Media
Keno
Gaming Services
Wagering and Media
Keno
Gaming Services
20152016
2016 2015
1,856.9
199.099.6
247.2252.2
1,873.0
47.550.7
208.5
41.641.0
107.2
KenoKeno operations in
licensed venues and TABs in Victoria, Queensland
and the Australian Capital Territory, and in licensed
venues in New South Wales
Gaming Services
Supply of electronic gaming machines and
specialised services to licensed gaming
venues
Fin
ancial R
epo
rt
78Tabcorp Annual Report 2016
79Tabcorp Annual Report 2016

Notes to the financial statements: Group performanceFor the year ended 30 June 2016
A1 Segment information (continued)
Wagering and Media
$mKeno
$m
Gaming Services
$mTotal
$m2016Revenue 1,873.0 208.5 107.2 2,188.7Segment profit before interest and tax 252.2 50.7 41.0 343.9Depreciation and amortisation 129.9 19.6 29.1 178.6
Capital expenditure (i) 82.4 19.1 50.2 151.7
2015Revenue 1,856.9 199.0 99.6 2,155.5Segment profit before interest and tax 247.2 47.5 41.6 336.3Depreciation and amortisation 128.6 18.9 26.0 173.5Capital expenditure (i) 79.2 16.6 46.9 142.7
(i) Capital expenditure excludes the acquisition of licences and assets acquired via business combinations (refer note D4). 2016
$m2015
$mReconciliation of segment profitSegment profit before interest and tax 343.9 336.3Unallocated items:– finance income 2.9 5.3– finance costs (72.8) (81.1)– significant items(i) (36.2) - – other (6.7) (1.7)Profit before income tax expense 231.1 258.8
(i) Significant items comprise costs relating to the AUSTRAC civil proceedings ($19.4m) and the establishment of a new online wagering and gaming business in the UK ($16.8m).
Revenue is recognised to the extent that it is probable that the economic benefits will flow to the Group and the revenue can be reliably measured. The following specific criteria must also be met before revenue is recognised:
Wagering revenue is recognised as the residual value after deducting the return to customers from wagering turnover. Fixed odds betting revenue is recognised as the net win or loss on an event. The amounts bet on an event are recognised as a liability until the outcome of the event is determined, at which time the revenue is brought to account. Open betting positions are carried at fair value and gains and losses arising on these positions are recognised in revenue.
The Group operates loyalty programmes enabling customers to accumulate award credits for wagering spend. A portion of the spend, equal to the fair value of the award credits earned, is treated as deferred revenue. Revenue from the award credits is recognised when the award is redeemed or expires.
Media revenue includes subscription income and advertising revenue, and is recognised once the service has been rendered. Subscriptions received relating to future periods are treated as deferred revenue.
Keno revenue is recognised as the residual value after deducting the return to customers from Keno turnover.
Gaming services revenue is recognised once the service has been rendered.
80Tabcorp Annual Report 2016

A2 Earnings per share
2016 $m
2015$m
Earnings used in calculation of earnings per share (EPS) 169.7 334.5
2016Number (m)
2015Number (m)
Weighted average number of ordinary shares used in calculating basic EPS 831.1 789.7Effect of dilution from Performance Rights 3.6 3.8Weighted average number of ordinary shares used in calculating diluted EPS 834.7 793.5
Basic EPS is calculated as net profit after tax divided by the weighted average number of ordinary shares outstanding during the year.
Diluted EPS is calculated on the same basis as basic EPS except that it reflects the impact of any potential commitments the Group has to issue shares in the future, for example shares to be issued upon vesting of Performance Rights.
A3 Dividends 2016
Cents per share
2015 Cents
per share 2016
$m2015
$mFully franked dividends declared and paid during the year:Prior year final dividend 10.0 8.0 82.9 61.0Interim dividend 12.0 10.0 99.8 76.6Special dividend - 30.0 - 229.7
22.0 48.0 182.7 367.3
Fully franked dividends determined in respect of the year:Interim dividend 12.0 10.0 99.8 76.6Final dividend 12.0 10.0 99.8 82.9Special dividend - 30.0 - 229.7
24.0 50.0 199.6 389.2
Dividends declared after balance date to be recognised in subsequent year:Final dividend 12.0 10.0 99.8 82.9
Franking credits available at the 30% company tax rate after allowing for tax payable or receivable 140.4 162.7
Fin
ancial R
epo
rt
80Tabcorp Annual Report 2016
81Tabcorp Annual Report 2016
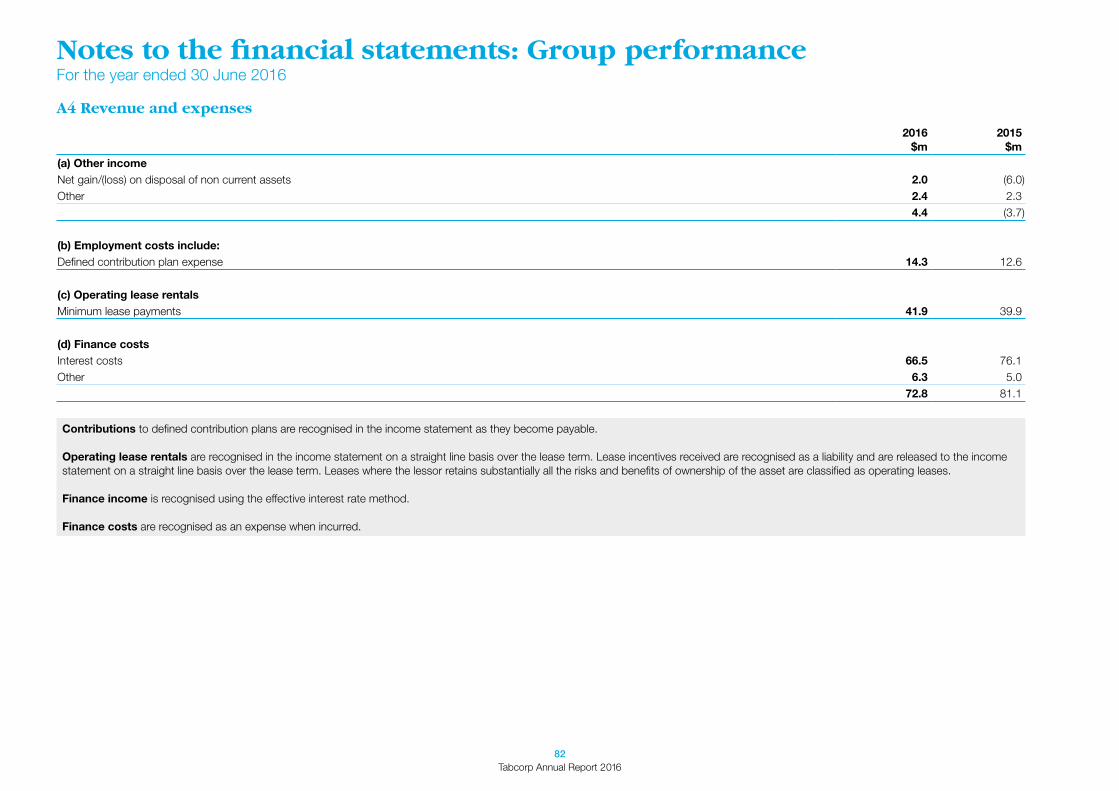
Notes to the financial statements: Group performanceFor the year ended 30 June 2016
A4 Revenue and expenses
2016 $m
2015$m
(a) Other incomeNet gain/(loss) on disposal of non current assets 2.0 (6.0)Other 2.4 2.3
4.4 (3.7)
(b) Employment costs include:Defined contribution plan expense 14.3 12.6
(c) Operating lease rentalsMinimum lease payments 41.9 39.9
(d) Finance costsInterest costs 66.5 76.1Other 6.3 5.0
72.8 81.1
Contributions to defined contribution plans are recognised in the income statement as they become payable. Operating lease rentals are recognised in the income statement on a straight line basis over the lease term. Lease incentives received are recognised as a liability and are released to the income statement on a straight line basis over the lease term. Leases where the lessor retains substantially all the risks and benefits of ownership of the asset are classified as operating leases. Finance income is recognised using the effective interest rate method.
Finance costs are recognised as an expense when incurred.
82Tabcorp Annual Report 2016
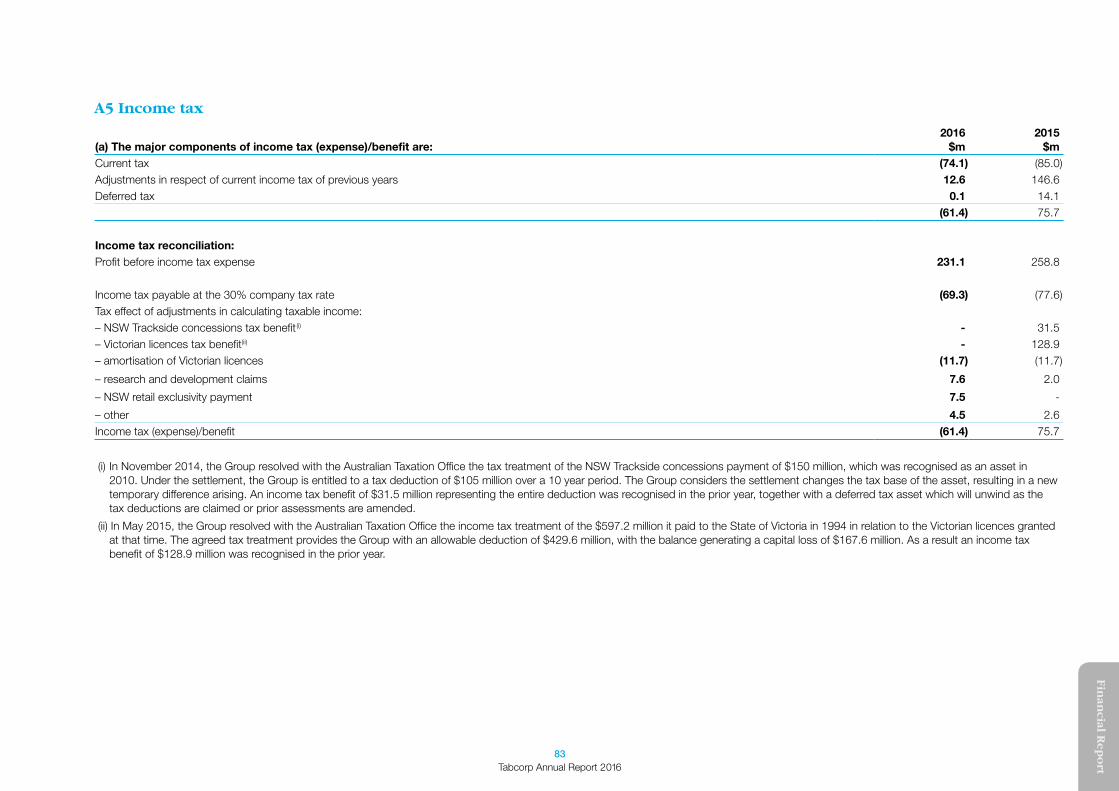
A5 Income tax
(a) The major components of income tax (expense)/benefit are: 2016
$m 2015
$m Current tax (74.1) (85.0)Adjustments in respect of current income tax of previous years 12.6 146.6Deferred tax 0.1 14.1
(61.4) 75.7
Income tax reconciliation:Profit before income tax expense 231.1 258.8
Income tax payable at the 30% company tax rate (69.3) (77.6)Tax effect of adjustments in calculating taxable income:– NSW Trackside concessions tax benefit(i) - 31.5– Victorian licences tax benefit(ii) - 128.9– amortisation of Victorian licences (11.7) (11.7)
– research and development claims 7.6 2.0
– NSW retail exclusivity payment 7.5 -
– other 4.5 2.6Income tax (expense)/benefit (61.4) 75.7
(i) In November 2014, the Group resolved with the Australian Taxation Office the tax treatment of the NSW Trackside concessions payment of $150 million, which was recognised as an asset in 2010. Under the settlement, the Group is entitled to a tax deduction of $105 million over a 10 year period. The Group considers the settlement changes the tax base of the asset, resulting in a new temporary difference arising. An income tax benefit of $31.5 million representing the entire deduction was recognised in the prior year, together with a deferred tax asset which will unwind as the tax deductions are claimed or prior assessments are amended.
(ii) In May 2015, the Group resolved with the Australian Taxation Office the income tax treatment of the $597.2 million it paid to the State of Victoria in 1994 in relation to the Victorian licences granted at that time. The agreed tax treatment provides the Group with an allowable deduction of $429.6 million, with the balance generating a capital loss of $167.6 million. As a result an income tax benefit of $128.9 million was recognised in the prior year.
Fin
ancial R
epo
rt
82Tabcorp Annual Report 2016
83Tabcorp Annual Report 2016
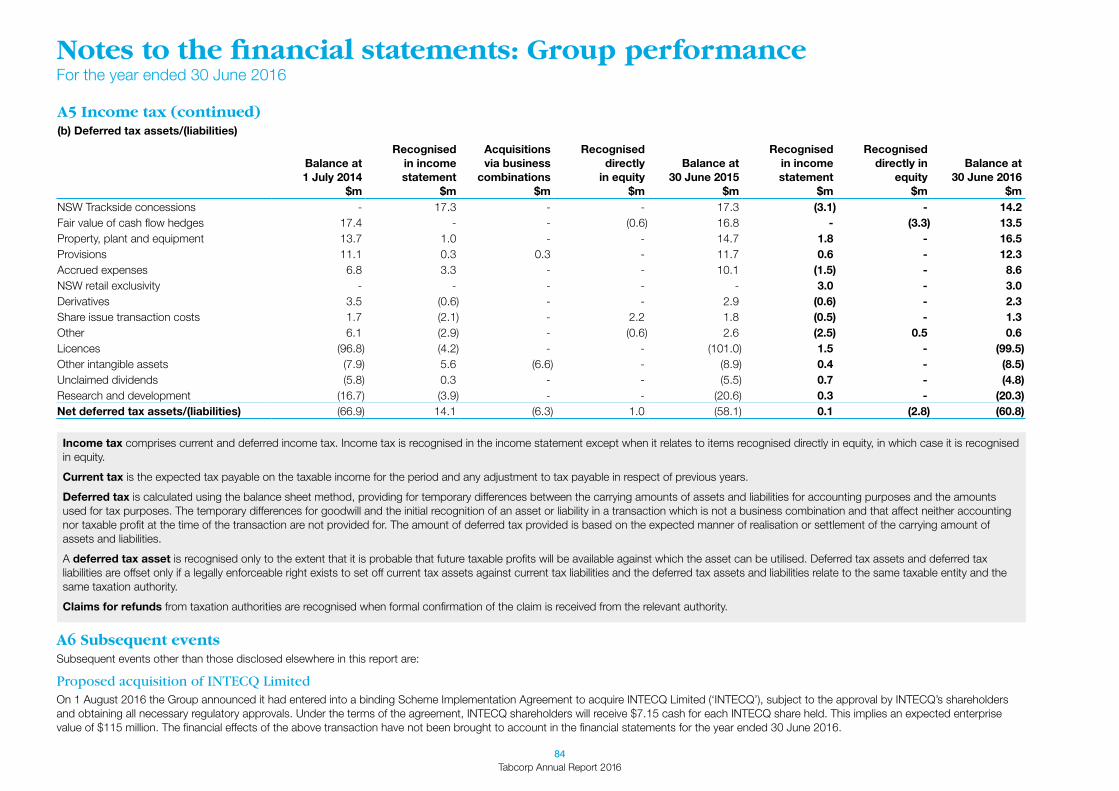
Notes to the financial statements: Group performanceFor the year ended 30 June 2016
A5 Income tax (continued)(b) Deferred tax assets/(liabilities)
Balance at 1 July 2014
$m
Recognised in income statement
$m
Acquisitions via business
combinations $m
Recognised directly
in equity$m
Balance at 30 June 2015
$m
Recognised in income statement
$m
Recognised directly in
equity $m
Balance at 30 June 2016
$mNSW Trackside concessions - 17.3 - - 17.3 (3.1) - 14.2Fair value of cash flow hedges 17.4 - - (0.6) 16.8 - (3.3) 13.5Property, plant and equipment 13.7 1.0 - - 14.7 1.8 - 16.5Provisions 11.1 0.3 0.3 - 11.7 0.6 - 12.3Accrued expenses 6.8 3.3 - - 10.1 (1.5) - 8.6NSW retail exclusivity - - - - - 3.0 - 3.0Derivatives 3.5 (0.6) - - 2.9 (0.6) - 2.3Share issue transaction costs 1.7 (2.1) - 2.2 1.8 (0.5) - 1.3Other 6.1 (2.9) - (0.6) 2.6 (2.5) 0.5 0.6Licences (96.8) (4.2) - - (101.0) 1.5 - (99.5)Other intangible assets (7.9) 5.6 (6.6) - (8.9) 0.4 - (8.5)Unclaimed dividends (5.8) 0.3 - - (5.5) 0.7 - (4.8)Research and development (16.7) (3.9) - - (20.6) 0.3 - (20.3)Net deferred tax assets/(liabilities) (66.9) 14.1 (6.3) 1.0 (58.1) 0.1 (2.8) (60.8)
A6 Subsequent eventsSubsequent events other than those disclosed elsewhere in this report are:
Proposed acquisition of INTECQ LimitedOn 1 August 2016 the Group announced it had entered into a binding Scheme Implementation Agreement to acquire INTECQ Limited (‘INTECQ’), subject to the approval by INTECQ’s shareholders and obtaining all necessary regulatory approvals. Under the terms of the agreement, INTECQ shareholders will receive $7.15 cash for each INTECQ share held. This implies an expected enterprise value of $115 million. The financial effects of the above transaction have not been brought to account in the financial statements for the year ended 30 June 2016.
Income tax comprises current and deferred income tax. Income tax is recognised in the income statement except when it relates to items recognised directly in equity, in which case it is recognised in equity.
Current tax is the expected tax payable on the taxable income for the period and any adjustment to tax payable in respect of previous years. Deferred tax is calculated using the balance sheet method, providing for temporary differences between the carrying amounts of assets and liabilities for accounting purposes and the amounts used for tax purposes. The temporary differences for goodwill and the initial recognition of an asset or liability in a transaction which is not a business combination and that affect neither accounting nor taxable profit at the time of the transaction are not provided for. The amount of deferred tax provided is based on the expected manner of realisation or settlement of the carrying amount of assets and liabilities.
A deferred tax asset is recognised only to the extent that it is probable that future taxable profits will be available against which the asset can be utilised. Deferred tax assets and deferred tax liabilities are offset only if a legally enforceable right exists to set off current tax assets against current tax liabilities and the deferred tax assets and liabilities relate to the same taxable entity and the same taxation authority.
Claims for refunds from taxation authorities are recognised when formal confirmation of the claim is received from the relevant authority.
84Tabcorp Annual Report 2016
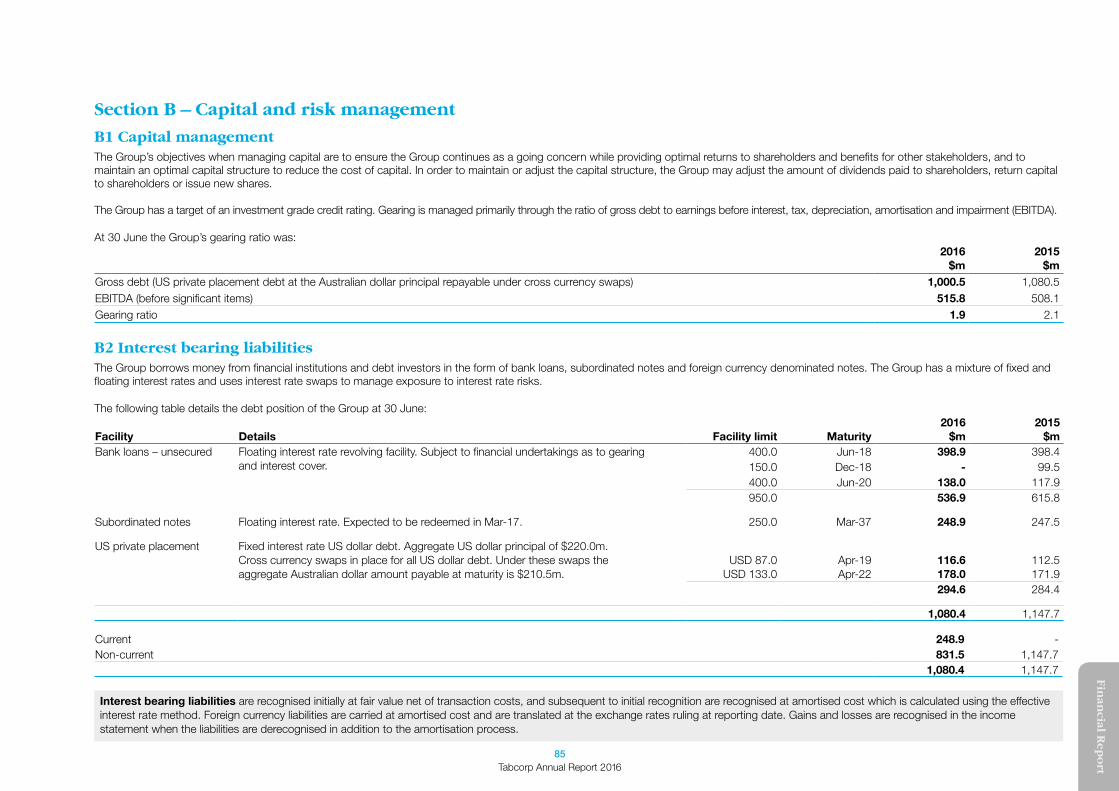
Section B – Capital and risk management
B1 Capital managementThe Group’s objectives when managing capital are to ensure the Group continues as a going concern while providing optimal returns to shareholders and benefits for other stakeholders, and to maintain an optimal capital structure to reduce the cost of capital. In order to maintain or adjust the capital structure, the Group may adjust the amount of dividends paid to shareholders, return capital to shareholders or issue new shares. The Group has a target of an investment grade credit rating. Gearing is managed primarily through the ratio of gross debt to earnings before interest, tax, depreciation, amortisation and impairment (EBITDA). At 30 June the Group’s gearing ratio was:
2016 $m
2015 $m
Gross debt (US private placement debt at the Australian dollar principal repayable under cross currency swaps) 1,000.5 1,080.5EBITDA (before significant items) 515.8 508.1Gearing ratio 1.9 2.1
B2 Interest bearing liabilitiesThe Group borrows money from financial institutions and debt investors in the form of bank loans, subordinated notes and foreign currency denominated notes. The Group has a mixture of fixed and floating interest rates and uses interest rate swaps to manage exposure to interest rate risks.
The following table details the debt position of the Group at 30 June:
Facility Details Facility limit Maturity 2016
$m 2015 $m
Bank loans – unsecured Floating interest rate revolving facility. Subject to financial undertakings as to gearing and interest cover.
400.0 Jun-18 398.9 398.4150.0 Dec-18 - 99.5400.0 Jun-20 138.0 117.9950.0 536.9 615.8
Subordinated notes Floating interest rate. Expected to be redeemed in Mar-17. 250.0 Mar-37 248.9 247.5
US private placement Fixed interest rate US dollar debt. Aggregate US dollar principal of $220.0m. Cross currency swaps in place for all US dollar debt. Under these swaps the aggregate Australian dollar amount payable at maturity is $210.5m.
USD 87.0USD 133.0
Apr-19Apr-22
116.6178.0
112.5171.9
294.6 284.4
1,080.4 1,147.7
Current 248.9 -Non-current 831.5 1,147.7
1,080.4 1,147.7
Interest bearing liabilities are recognised initially at fair value net of transaction costs, and subsequent to initial recognition are recognised at amortised cost which is calculated using the effective interest rate method. Foreign currency liabilities are carried at amortised cost and are translated at the exchange rates ruling at reporting date. Gains and losses are recognised in the income statement when the liabilities are derecognised in addition to the amortisation process.
Fin
ancial R
epo
rt
84Tabcorp Annual Report 2016
85Tabcorp Annual Report 2016
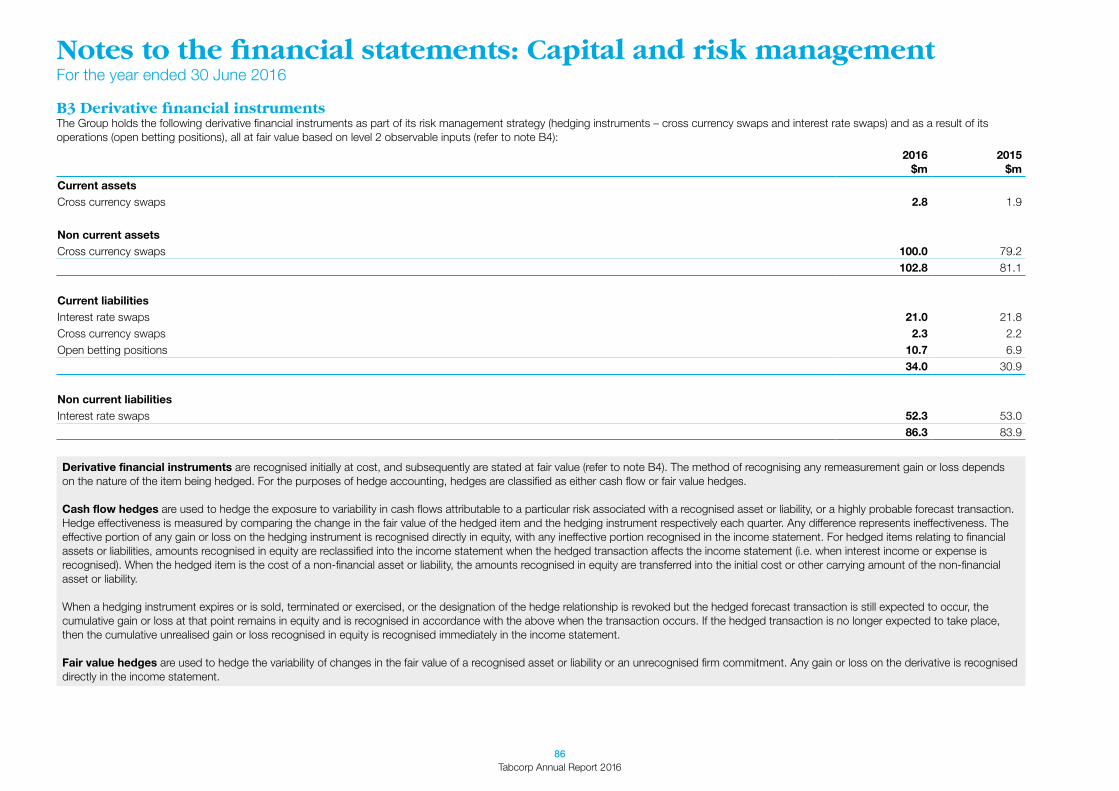
Notes to the financial statements: Capital and risk managementFor the year ended 30 June 2016
B3 Derivative financial instruments The Group holds the following derivative financial instruments as part of its risk management strategy (hedging instruments – cross currency swaps and interest rate swaps) and as a result of its operations (open betting positions), all at fair value based on level 2 observable inputs (refer to note B4):
2016$m
2015$m
Current assetsCross currency swaps 2.8 1.9
Non current assetsCross currency swaps 100.0 79.2
102.8 81.1
Current liabilitiesInterest rate swaps 21.0 21.8Cross currency swaps 2.3 2.2Open betting positions 10.7 6.9
34.0 30.9
Non current liabilitiesInterest rate swaps 52.3 53.0
86.3 83.9 Derivative financial instruments are recognised initially at cost, and subsequently are stated at fair value (refer to note B4). The method of recognising any remeasurement gain or loss depends on the nature of the item being hedged. For the purposes of hedge accounting, hedges are classified as either cash flow or fair value hedges.
Cash flow hedges are used to hedge the exposure to variability in cash flows attributable to a particular risk associated with a recognised asset or liability, or a highly probable forecast transaction. Hedge effectiveness is measured by comparing the change in the fair value of the hedged item and the hedging instrument respectively each quarter. Any difference represents ineffectiveness. The effective portion of any gain or loss on the hedging instrument is recognised directly in equity, with any ineffective portion recognised in the income statement. For hedged items relating to financial assets or liabilities, amounts recognised in equity are reclassified into the income statement when the hedged transaction affects the income statement (i.e. when interest income or expense is recognised). When the hedged item is the cost of a non-financial asset or liability, the amounts recognised in equity are transferred into the initial cost or other carrying amount of the non-financial asset or liability.
When a hedging instrument expires or is sold, terminated or exercised, or the designation of the hedge relationship is revoked but the hedged forecast transaction is still expected to occur, the cumulative gain or loss at that point remains in equity and is recognised in accordance with the above when the transaction occurs. If the hedged transaction is no longer expected to take place, then the cumulative unrealised gain or loss recognised in equity is recognised immediately in the income statement. Fair value hedges are used to hedge the variability of changes in the fair value of a recognised asset or liability or an unrecognised firm commitment. Any gain or loss on the derivative is recognised directly in the income statement.
86Tabcorp Annual Report 2016
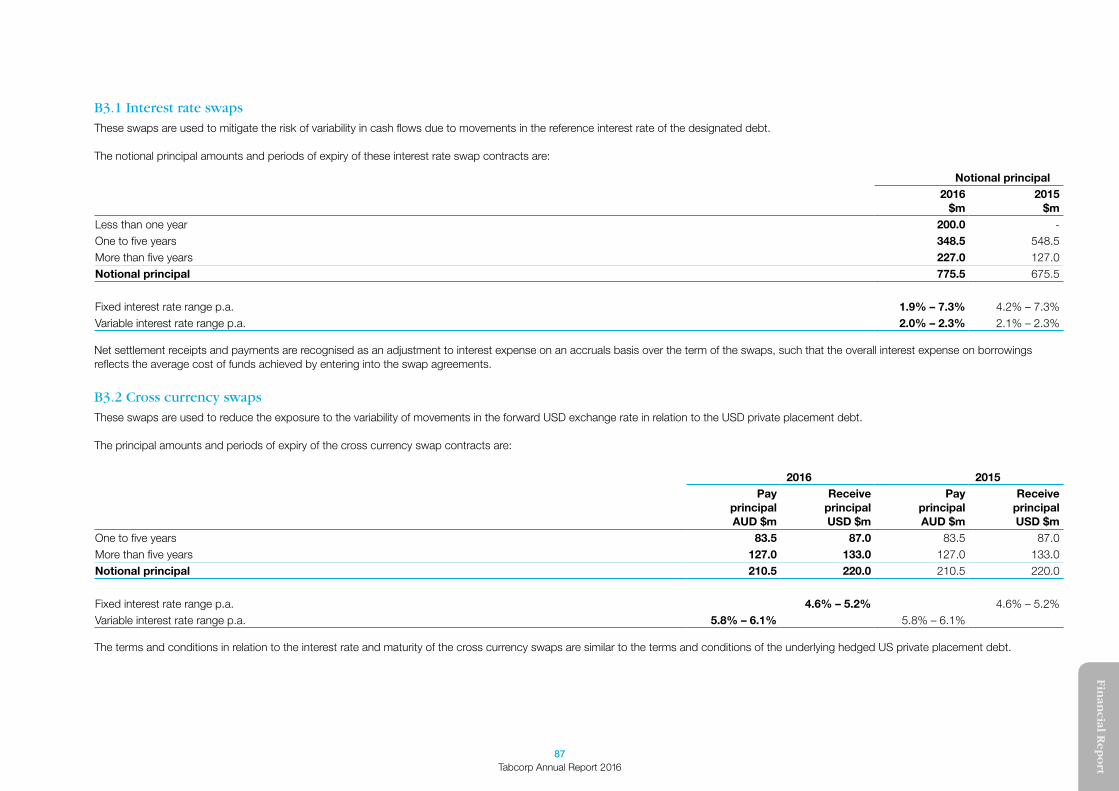
B3.1 Interest rate swaps
These swaps are used to mitigate the risk of variability in cash flows due to movements in the reference interest rate of the designated debt. The notional principal amounts and periods of expiry of these interest rate swap contracts are:
Notional principal 2016
$m 2015
$m Less than one year 200.0 - One to five years 348.5 548.5More than five years 227.0 127.0Notional principal 775.5 675.5
Fixed interest rate range p.a. 1.9% – 7.3% 4.2% – 7.3% Variable interest rate range p.a. 2.0% – 2.3% 2.1% – 2.3% Net settlement receipts and payments are recognised as an adjustment to interest expense on an accruals basis over the term of the swaps, such that the overall interest expense on borrowings reflects the average cost of funds achieved by entering into the swap agreements.
B3.2 Cross currency swaps
These swaps are used to reduce the exposure to the variability of movements in the forward USD exchange rate in relation to the USD private placement debt.
The principal amounts and periods of expiry of the cross currency swap contracts are:
2016 2015 Pay
principalAUD $m
Receive principalUSD $m
PayprincipalAUD $m
Receive principalUSD $m
One to five years 83.5 87.0 83.5 87.0More than five years 127.0 133.0 127.0 133.0Notional principal 210.5 220.0 210.5 220.0
Fixed interest rate range p.a. 4.6% – 5.2% 4.6% – 5.2% Variable interest rate range p.a. 5.8% – 6.1% 5.8% – 6.1% The terms and conditions in relation to the interest rate and maturity of the cross currency swaps are similar to the terms and conditions of the underlying hedged US private placement debt. F
inan
cial Rep
ort
86Tabcorp Annual Report 2016
87Tabcorp Annual Report 2016
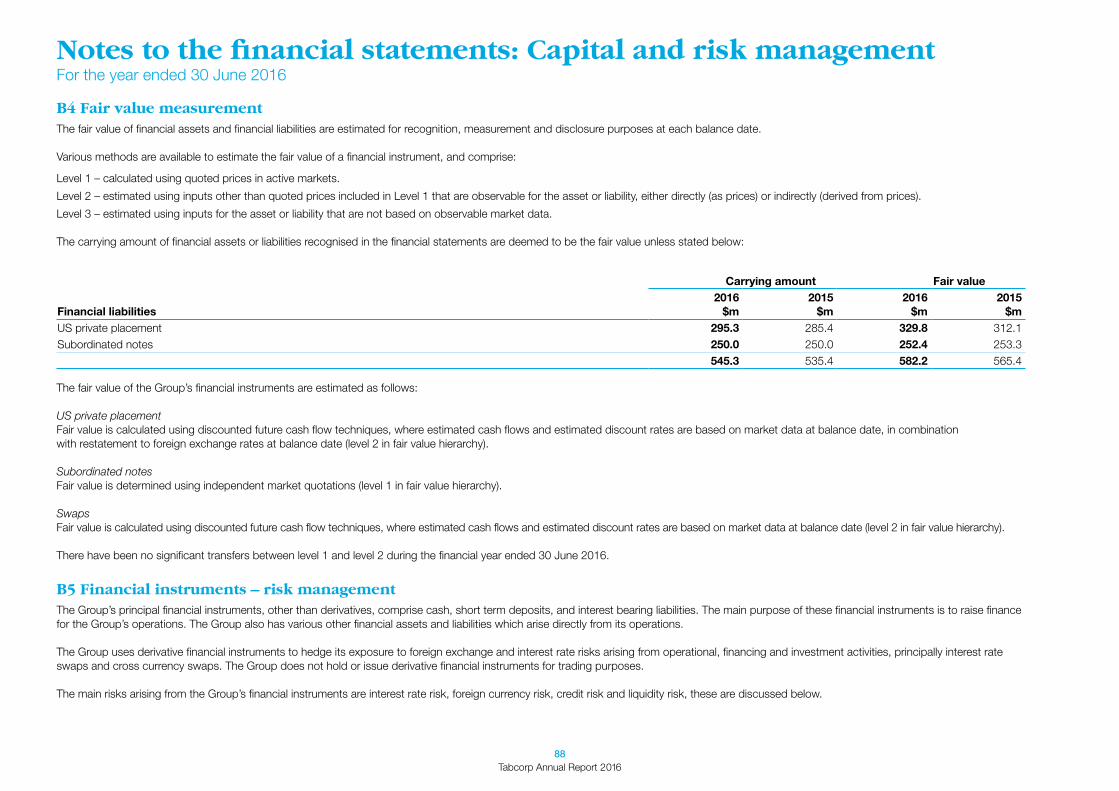
Notes to the financial statements: Capital and risk managementFor the year ended 30 June 2016
B4 Fair value measurementThe fair value of financial assets and financial liabilities are estimated for recognition, measurement and disclosure purposes at each balance date. Various methods are available to estimate the fair value of a financial instrument, and comprise:
Level 1 – calculated using quoted prices in active markets.
Level 2 – estimated using inputs other than quoted prices included in Level 1 that are observable for the asset or liability, either directly (as prices) or indirectly (derived from prices).
Level 3 – estimated using inputs for the asset or liability that are not based on observable market data. The carrying amount of financial assets or liabilities recognised in the financial statements are deemed to be the fair value unless stated below:
Carrying amount Fair value
Financial liabilities2016
$m2015
$m2016
$m2015
$mUS private placement 295.3 285.4 329.8 312.1Subordinated notes 250.0 250.0 252.4 253.3
545.3 535.4 582.2 565.4 The fair value of the Group’s financial instruments are estimated as follows: US private placement Fair value is calculated using discounted future cash flow techniques, where estimated cash flows and estimated discount rates are based on market data at balance date, in combination with restatement to foreign exchange rates at balance date (level 2 in fair value hierarchy). Subordinated notes Fair value is determined using independent market quotations (level 1 in fair value hierarchy). Swaps Fair value is calculated using discounted future cash flow techniques, where estimated cash flows and estimated discount rates are based on market data at balance date (level 2 in fair value hierarchy).
There have been no significant transfers between level 1 and level 2 during the financial year ended 30 June 2016.
B5 Financial instruments – risk management The Group’s principal financial instruments, other than derivatives, comprise cash, short term deposits, and interest bearing liabilities. The main purpose of these financial instruments is to raise finance for the Group’s operations. The Group also has various other financial assets and liabilities which arise directly from its operations. The Group uses derivative financial instruments to hedge its exposure to foreign exchange and interest rate risks arising from operational, financing and investment activities, principally interest rate swaps and cross currency swaps. The Group does not hold or issue derivative financial instruments for trading purposes. The main risks arising from the Group’s financial instruments are interest rate risk, foreign currency risk, credit risk and liquidity risk, these are discussed below.
88Tabcorp Annual Report 2016
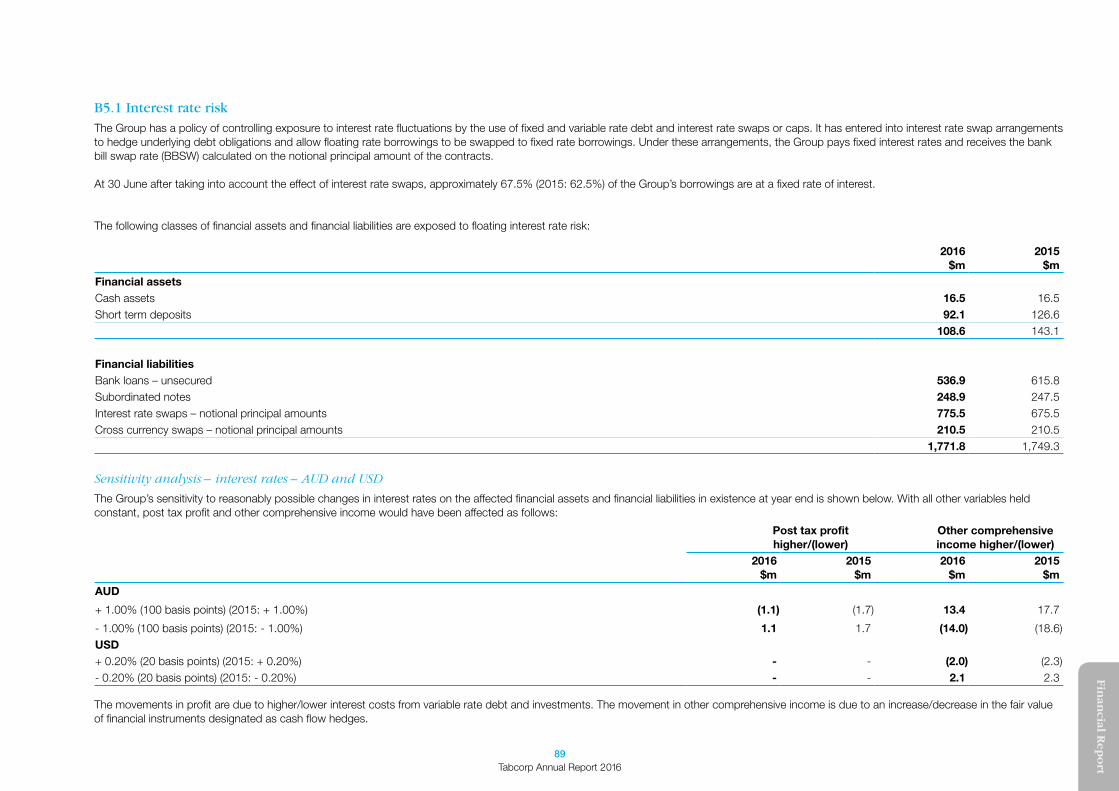
B5.1 Interest rate risk
The Group has a policy of controlling exposure to interest rate fluctuations by the use of fixed and variable rate debt and interest rate swaps or caps. It has entered into interest rate swap arrangements to hedge underlying debt obligations and allow floating rate borrowings to be swapped to fixed rate borrowings. Under these arrangements, the Group pays fixed interest rates and receives the bank bill swap rate (BBSW) calculated on the notional principal amount of the contracts. At 30 June after taking into account the effect of interest rate swaps, approximately 67.5% (2015: 62.5%) of the Group’s borrowings are at a fixed rate of interest. The following classes of financial assets and financial liabilities are exposed to floating interest rate risk:
2016 $m
2015$m
Financial assetsCash assets 16.5 16.5Short term deposits 92.1 126.6
108.6 143.1
Financial liabilitiesBank loans – unsecured 536.9 615.8Subordinated notes 248.9 247.5Interest rate swaps – notional principal amounts 775.5 675.5Cross currency swaps – notional principal amounts 210.5 210.5
1,771.8 1,749.3
Sensitivity analysis – interest rates – AUD and USD
The Group’s sensitivity to reasonably possible changes in interest rates on the affected financial assets and financial liabilities in existence at year end is shown below. With all other variables held constant, post tax profit and other comprehensive income would have been affected as follows:
Post tax profit higher/(lower)
Other comprehensive income higher/(lower)
2016 $m
2015$m
2016 $m
2015$m
AUD
+ 1.00% (100 basis points) (2015: + 1.00%) (1.1) (1.7) 13.4 17.7
- 1.00% (100 basis points) (2015: - 1.00%) 1.1 1.7 (14.0) (18.6)USD+ 0.20% (20 basis points) (2015: + 0.20%) - - (2.0) (2.3)- 0.20% (20 basis points) (2015: - 0.20%) - - 2.1 2.3 The movements in profit are due to higher/lower interest costs from variable rate debt and investments. The movement in other comprehensive income is due to an increase/decrease in the fair value of financial instruments designated as cash flow hedges.
Fin
ancial R
epo
rt
88Tabcorp Annual Report 2016
89Tabcorp Annual Report 2016
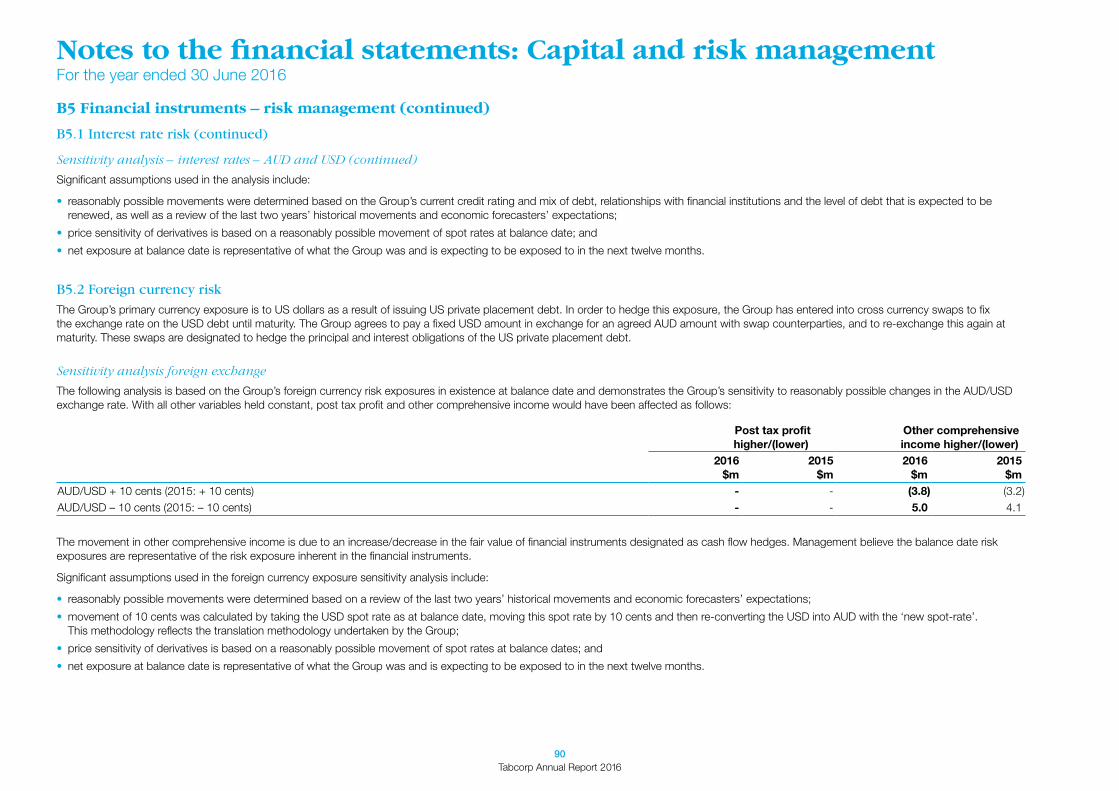
Notes to the financial statements: Capital and risk managementFor the year ended 30 June 2016
B5 Financial instruments – risk management (continued)
B5.1 Interest rate risk (continued)
Sensitivity analysis – interest rates – AUD and USD (continued)
Significant assumptions used in the analysis include:
• reasonably possible movements were determined based on the Group’s current credit rating and mix of debt, relationships with financial institutions and the level of debt that is expected to be renewed, as well as a review of the last two years’ historical movements and economic forecasters’ expectations;
• price sensitivity of derivatives is based on a reasonably possible movement of spot rates at balance date; and
• net exposure at balance date is representative of what the Group was and is expecting to be exposed to in the next twelve months.
B5.2 Foreign currency risk
The Group’s primary currency exposure is to US dollars as a result of issuing US private placement debt. In order to hedge this exposure, the Group has entered into cross currency swaps to fix the exchange rate on the USD debt until maturity. The Group agrees to pay a fixed USD amount in exchange for an agreed AUD amount with swap counterparties, and to re-exchange this again at maturity. These swaps are designated to hedge the principal and interest obligations of the US private placement debt.
Sensitivity analysis foreign exchange
The following analysis is based on the Group’s foreign currency risk exposures in existence at balance date and demonstrates the Group’s sensitivity to reasonably possible changes in the AUD/USD exchange rate. With all other variables held constant, post tax profit and other comprehensive income would have been affected as follows:
Post tax profit higher/(lower)
Other comprehensive income higher/(lower)
2016$m
2015$m
2016$m
2015$m
AUD/USD + 10 cents (2015: + 10 cents) - - (3.8) (3.2)AUD/USD – 10 cents (2015: – 10 cents) - - 5.0 4.1
The movement in other comprehensive income is due to an increase/decrease in the fair value of financial instruments designated as cash flow hedges. Management believe the balance date risk exposures are representative of the risk exposure inherent in the financial instruments.
Significant assumptions used in the foreign currency exposure sensitivity analysis include:
• reasonably possible movements were determined based on a review of the last two years’ historical movements and economic forecasters’ expectations;
• movement of 10 cents was calculated by taking the USD spot rate as at balance date, moving this spot rate by 10 cents and then re-converting the USD into AUD with the ‘new spot-rate’. This methodology reflects the translation methodology undertaken by the Group;
• price sensitivity of derivatives is based on a reasonably possible movement of spot rates at balance dates; and
• net exposure at balance date is representative of what the Group was and is expecting to be exposed to in the next twelve months.
90Tabcorp Annual Report 2016
B5.3 Credit risk
The Group’s credit risk arises in relation to cash and cash equivalents, receivables, financial liabilities and liabilities under financial guarantees. Credit risk on financial assets which have been recognised on the balance sheet, is the carrying amount less any allowance for non recovery.
Credit risk is managed by:
• adherence to a strict cash management policy;
• use of a risk assessment process for customers requesting credit using credit checks, bank opinions and trade references;
• conducting all investment and financial instrument activity with approved counterparties with investment grade credit ratings; and
• reviewing compliance with counterparty exposure limits on a continuous basis, and spreading the aggregate value of transactions amongst the approved counterparties.
Credit risk associated with financial liabilities arises from the potential failure of counterparties to meet their obligations under the contract or arrangement. The Group’s maximum credit risk exposure in respect of derivative contracts is detailed in the liquidity risk table in note B5.4.
Credit risk includes liabilities under financial guarantees. For financial guarantee contract liabilities the fair value at initial recognition is determined using a probability weighted discounted cash flow approach. The fair value of financial guarantee contract liabilities has been assessed as nil (2015: nil), as the possibility of an outflow occurring is considered remote. Details of the financial guarantee contracts at balance date are outlined below:
Deed of cross guarantee
The Company has entered into a deed of cross guarantee as outlined in note D2.
Guarantees and indemnities
Entities in the Group are called upon to give in the ordinary course of business, guarantees and indemnities in respect of the performance of their contractual and financial obligations. The maximum amount of these guarantees and indemnities is $19.2 million (2015: $18.3 million).
B5.4 Liquidity risk
Liquidity risk arises from the financial liabilities of the Group and the Group’s subsequent ability to meet its obligations to repay its financial liabilities as and when they fall due. The Group’s objective is to maintain a balance between continuity of funding and flexibility through the use of bank loans and notes. To help reduce liquidity risk, the Group targets a minimum level of cash and cash equivalents to be maintained, and has sufficient undrawn funds available.
The Group’s policy is that not more than 33% of debt facilities should mature in any financial year within the next four years. At 30 June 2016, no debt facilities mature in less than one year (2015: nil).
Due to the measures in place for managing liquidity and access to capital markets, this risk is not considered significant.
Fin
ancial R
epo
rt
90Tabcorp Annual Report 2016
91Tabcorp Annual Report 2016
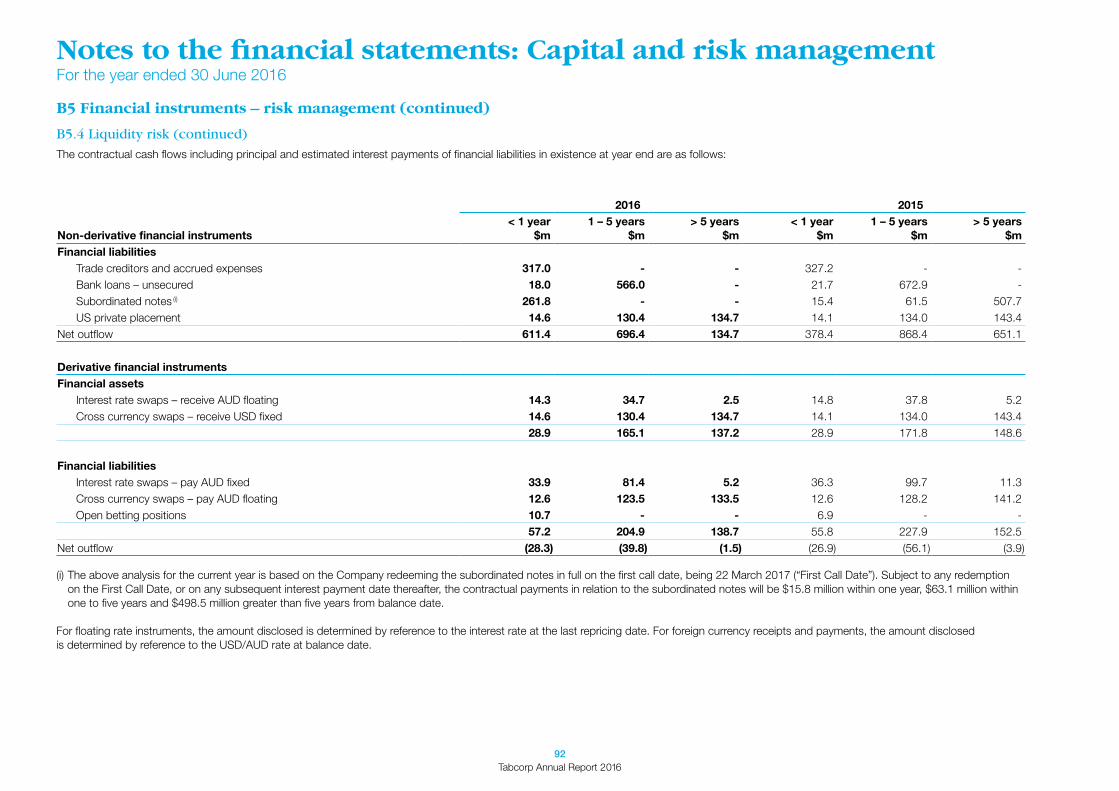
Notes to the financial statements: Capital and risk managementFor the year ended 30 June 2016
B5 Financial instruments – risk management (continued)
B5.4 Liquidity risk (continued)
The contractual cash flows including principal and estimated interest payments of financial liabilities in existence at year end are as follows:
2016 2015
Non-derivative financial instruments< 1 year
$m1 – 5 years
$m> 5 years
$m< 1 year
$m 1 – 5 years
$m> 5 years
$mFinancial liabilities Trade creditors and accrued expenses 317.0 - - 327.2 - - Bank loans – unsecured 18.0 566.0 - 21.7 672.9 - Subordinated notes (i) 261.8 - - 15.4 61.5 507.7 US private placement 14.6 130.4 134.7 14.1 134.0 143.4Net outflow 611.4 696.4 134.7 378.4 868.4 651.1
Derivative financial instrumentsFinancial assets Interest rate swaps – receive AUD floating 14.3 34.7 2.5 14.8 37.8 5.2 Cross currency swaps – receive USD fixed 14.6 130.4 134.7 14.1 134.0 143.4
28.9 165.1 137.2 28.9 171.8 148.6
Financial liabilities Interest rate swaps – pay AUD fixed 33.9 81.4 5.2 36.3 99.7 11.3 Cross currency swaps – pay AUD floating 12.6 123.5 133.5 12.6 128.2 141.2 Open betting positions 10.7 - - 6.9 - -
57.2 204.9 138.7 55.8 227.9 152.5Net outflow (28.3) (39.8) (1.5) (26.9) (56.1) (3.9) (i) The above analysis for the current year is based on the Company redeeming the subordinated notes in full on the first call date, being 22 March 2017 (“First Call Date”). Subject to any redemption
on the First Call Date, or on any subsequent interest payment date thereafter, the contractual payments in relation to the subordinated notes will be $15.8 million within one year, $63.1 million within one to five years and $498.5 million greater than five years from balance date.
For floating rate instruments, the amount disclosed is determined by reference to the interest rate at the last repricing date. For foreign currency receipts and payments, the amount disclosed is determined by reference to the USD/AUD rate at balance date.
92Tabcorp Annual Report 2016
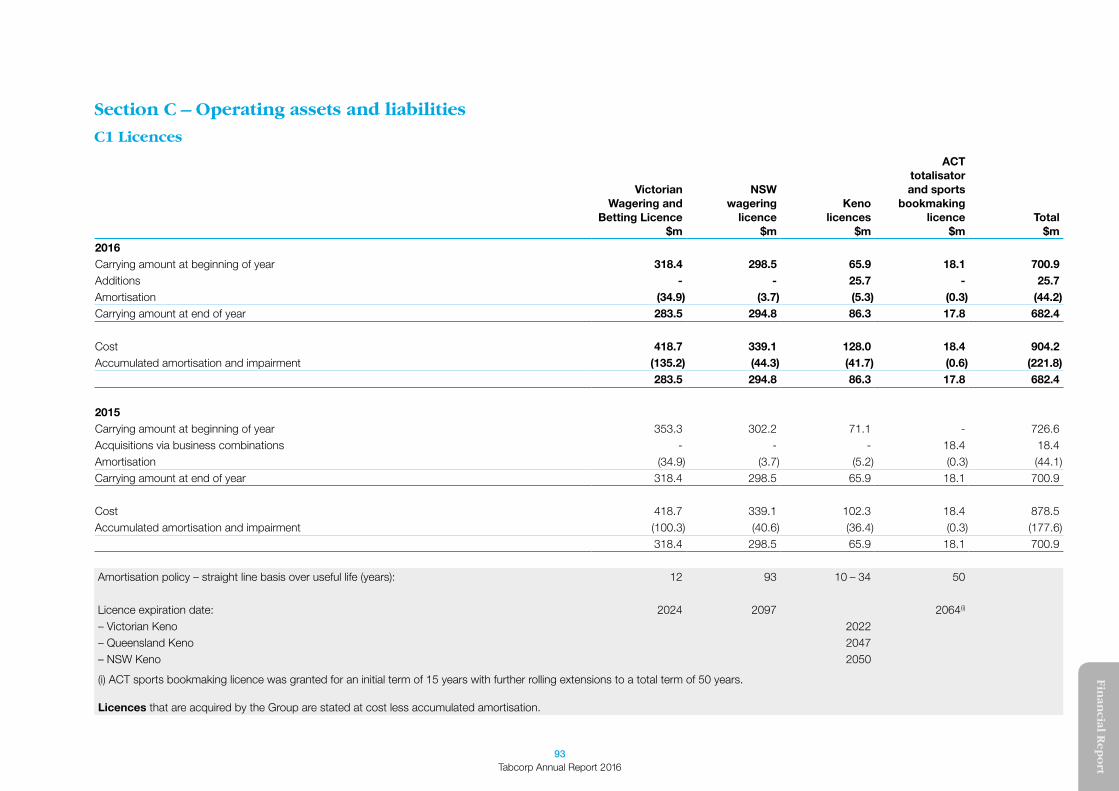
Section C – Operating assets and liabilities
C1 Licences
Victorian Wagering and
Betting Licence$m
NSW wagering
licence$m
Keno licences
$m
ACT totalisator and sports
bookmaking licence
$mTotal
$m2016Carrying amount at beginning of year 318.4 298.5 65.9 18.1 700.9Additions - - 25.7 - 25.7Amortisation (34.9) (3.7) (5.3) (0.3) (44.2)Carrying amount at end of year 283.5 294.8 86.3 17.8 682.4
Cost 418.7 339.1 128.0 18.4 904.2Accumulated amortisation and impairment (135.2) (44.3) (41.7) (0.6) (221.8)
283.5 294.8 86.3 17.8 682.4
2015Carrying amount at beginning of year 353.3 302.2 71.1 - 726.6Acquisitions via business combinations - - - 18.4 18.4Amortisation (34.9) (3.7) (5.2) (0.3) (44.1)Carrying amount at end of year 318.4 298.5 65.9 18.1 700.9
Cost 418.7 339.1 102.3 18.4 878.5Accumulated amortisation and impairment (100.3) (40.6) (36.4) (0.3) (177.6)
318.4 298.5 65.9 18.1 700.9
Amortisation policy – straight line basis over useful life (years): 12 93 10 – 34 50
Licence expiration date: 2024 2097 2064(i)
– Victorian Keno 2022– Queensland Keno 2047– NSW Keno 2050
(i) ACT sports bookmaking licence was granted for an initial term of 15 years with further rolling extensions to a total term of 50 years.
Licences that are acquired by the Group are stated at cost less accumulated amortisation.
Fin
ancial R
epo
rt
92Tabcorp Annual Report 2016
93Tabcorp Annual Report 2016

Notes to the financial statements: Operating assets and liabilitiesFor the year ended 30 June 2016
C2 Other intangible assets
Goodwill$m
NSW Trackside concessions
$m
NSW retail exclusivity
$m
Brand names
$m
Media content and broadcast
rights$m
Other$m
Software$m
Total$m
2016Carrying amount at beginning of year 1,431.7 142.2 46.2 110.0 30.6 4.9 159.1 1,924.7Additions:– acquired - - - - - - 18.9 18.9– internally developed - - - - - - 56.4 56.4Amortisation - (1.7) (2.6) - - (0.8) (48.4) (53.5)Disposals - - - - - - (1.3) (1.3)Other 0.1 - - - - - - 0.1Carrying amount at end of year 1,431.8 140.5 43.6 110.0 30.6 4.1 184.7 1,945.3
Cost 2,136.7 150.0 51.3 110.0 30.6 11.5 493.9 2,984.0Accumulated amortisation and impairment (704.9) (9.5) (7.7) - - (7.4) (309.2) (1,038.7)
1,431.8 140.5 43.6 110.0 30.6 4.1 184.7 1,945.3Includes capital works in progress of: 45.7 45.7
2015Carrying amount at beginning of year 1,348.4 143.9 48.8 105.5 30.6 5.8 150.9 1,833.9Additions:– acquired - - - - - - 31.6 31.6– internally developed - - - - - - 21.1 21.1Acquisitions via business combinations 82.0 - - 4.5 - - 0.3 86.8Amortisation - (1.7) (2.6) - - (0.9) (41.9) (47.1)Disposals - - - - - - (2.9) (2.9)Other 1.3 - - - - - - 1.3Carrying amount at end of year 1,431.7 142.2 46.2 110.0 30.6 4.9 159.1 1,924.7
Cost 2,136.6 150.0 51.3 110.0 30.6 11.5 426.8 2,916.8Accumulated amortisation and impairment (704.9) (7.8) (5.1) - - (6.6) (267.7) (992.1)
1,431.7 142.2 46.2 110.0 30.6 4.9 159.1 1,924.7Includes capital works in progress of: 36.0 36.0
Amortisation policy – straight line basis over useful life (years): 87 20 Indefinite Indefinite 12 –15 3 –10
Expiration date 2097 2033
94Tabcorp Annual Report 2016
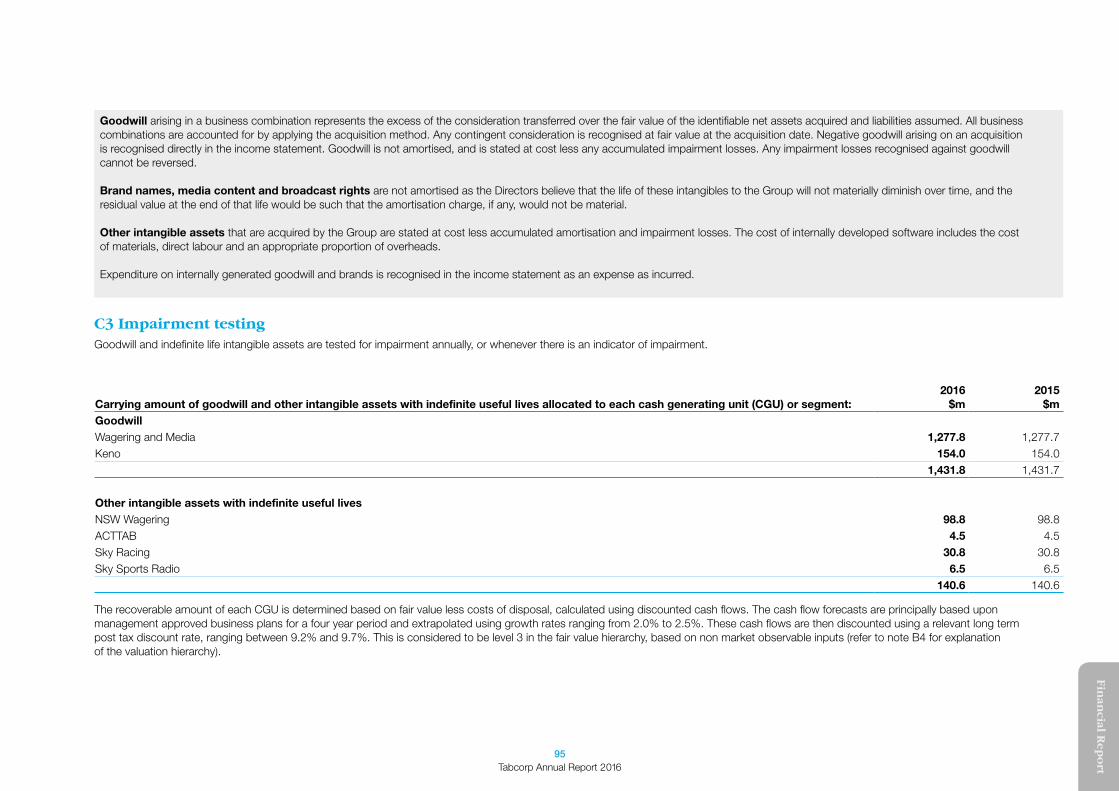
Goodwill arising in a business combination represents the excess of the consideration transferred over the fair value of the identifiable net assets acquired and liabilities assumed. All business combinations are accounted for by applying the acquisition method. Any contingent consideration is recognised at fair value at the acquisition date. Negative goodwill arising on an acquisition is recognised directly in the income statement. Goodwill is not amortised, and is stated at cost less any accumulated impairment losses. Any impairment losses recognised against goodwill cannot be reversed.
Brand names, media content and broadcast rights are not amortised as the Directors believe that the life of these intangibles to the Group will not materially diminish over time, and the residual value at the end of that life would be such that the amortisation charge, if any, would not be material.
Other intangible assets that are acquired by the Group are stated at cost less accumulated amortisation and impairment losses. The cost of internally developed software includes the cost of materials, direct labour and an appropriate proportion of overheads.
Expenditure on internally generated goodwill and brands is recognised in the income statement as an expense as incurred.
C3 Impairment testing Goodwill and indefinite life intangible assets are tested for impairment annually, or whenever there is an indicator of impairment.
Carrying amount of goodwill and other intangible assets with indefinite useful lives allocated to each cash generating unit (CGU) or segment:2016
$m 2015
$m GoodwillWagering and Media 1,277.8 1,277.7Keno 154.0 154.0
1,431.8 1,431.7
Other intangible assets with indefinite useful livesNSW Wagering 98.8 98.8ACTTAB 4.5 4.5Sky Racing 30.8 30.8Sky Sports Radio 6.5 6.5
140.6 140.6
The recoverable amount of each CGU is determined based on fair value less costs of disposal, calculated using discounted cash flows. The cash flow forecasts are principally based upon management approved business plans for a four year period and extrapolated using growth rates ranging from 2.0% to 2.5%. These cash flows are then discounted using a relevant long term post tax discount rate, ranging between 9.2% and 9.7%. This is considered to be level 3 in the fair value hierarchy, based on non market observable inputs (refer to note B4 for explanation of the valuation hierarchy).
Fin
ancial R
epo
rt
94Tabcorp Annual Report 2016
95Tabcorp Annual Report 2016

Notes to the financial statements: Operating assets and liabilitiesFor the year ended 30 June 2016
C3 Impairment testing (continued)Key assumptions on which management has based its cash flow projections:
• State tax regimes and the regulatory environment in which the Group currently operates remain largely unchanged.
• Exclusive retail wagering licences in Victoria, NSW and the ACT are assumed to be retained. The wagering business competes with bookmakers in Victoria, NSW and the ACT, and other interstate and international wagering operators who accept bets over the phone and the internet. There is a possibility that competition from the interstate and international operators may extend further to the Group’s retail wagering network in the future.
• Race fields arrangements implemented in each State and Territory of Australia remain largely unchanged.
• Growth rates used to extrapolate cash flows are either in line with or do not exceed the long term average growth rate for the industry in which the CGU operates.
• Discount rates applied are based on the post tax weighted average cost of capital applicable to the relevant CGU.
• Terminal growth rate used is in line with the forecast long term underlying growth rate in Consumer Price Index. The key estimates and assumptions used to determine the fair value less costs of disposal of a CGU are based on management’s current expectations after considering past experience and external information, and are considered to be reasonably achievable. However, significant changes in any of these key estimates and assumptions may result in a CGU’s carrying value exceeding its recoverable value requiring an impairment charge to be recognised at a future date. At each balance date, in addition to goodwill and intangible assets with indefinite useful lives, all non-current assets are reviewed for impairment if events or changes in circumstances indicate they may be impaired. When an indicator of impairment exists, the Group makes a formal assessment of recoverable amount. An impairment loss is recognised in the income statement for the amount by which the asset’s carrying amount exceeds its recoverable amount.
Recoverable amount is the greater of fair value less costs of disposal and value in use. It is determined for an individual asset, unless the asset’s recoverable value cannot be estimated as it does not generate cash inflows that are largely independent of those from other assets or groups of assets. In this case, the recoverable amount is determined for the CGU, being assets grouped at the lowest levels for which there are separately identifiable cash flows.
Goodwill and intangible assets with indefinite useful lives (brand names, broadcast rights and media content) acquired through business combinations have been allocated to each CGU or group of CGUs expected to benefit from the business combination’s synergies for impairment testing.
96Tabcorp Annual Report 2016
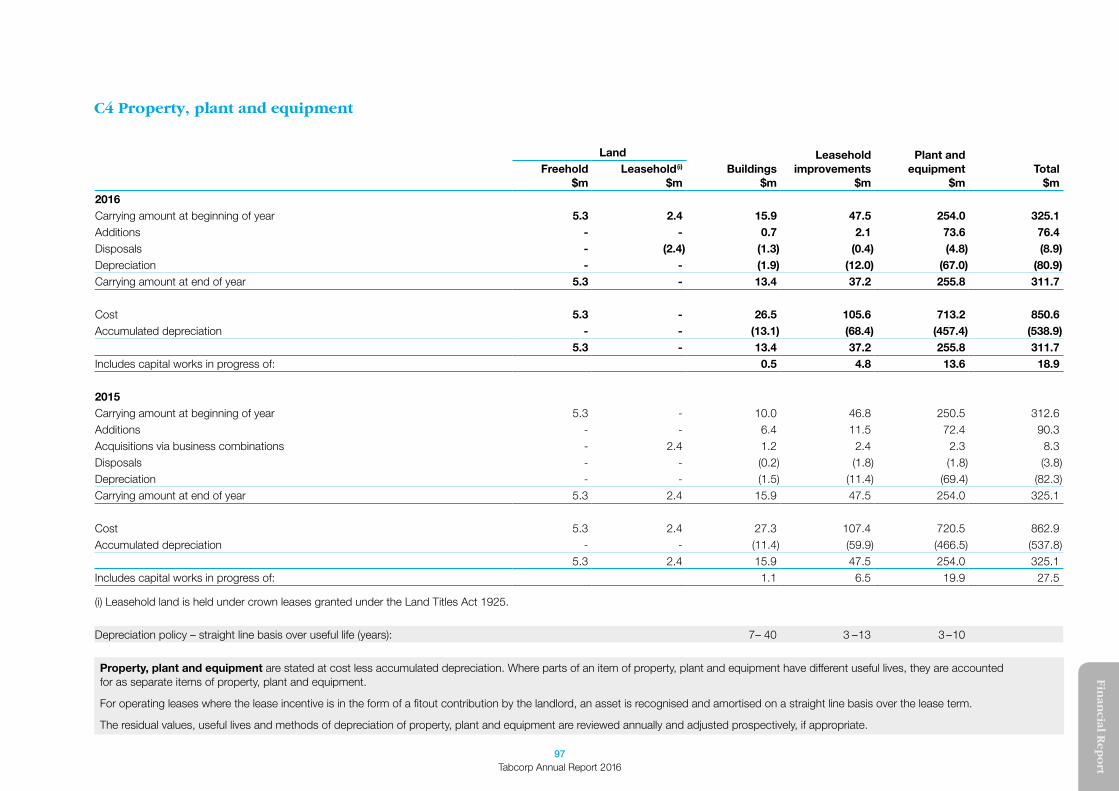
C4 Property, plant and equipment
LandBuildings
$m
Leasehold improvements
$m
Plant andequipment
$mTotal
$mFreehold
$mLeasehold(i)
$m2016Carrying amount at beginning of year 5.3 2.4 15.9 47.5 254.0 325.1Additions - - 0.7 2.1 73.6 76.4Disposals - (2.4) (1.3) (0.4) (4.8) (8.9)Depreciation - - (1.9) (12.0) (67.0) (80.9)Carrying amount at end of year 5.3 - 13.4 37.2 255.8 311.7
Cost 5.3 - 26.5 105.6 713.2 850.6Accumulated depreciation - - (13.1) (68.4) (457.4) (538.9)
5.3 - 13.4 37.2 255.8 311.7Includes capital works in progress of: 0.5 4.8 13.6 18.9
2015Carrying amount at beginning of year 5.3 - 10.0 46.8 250.5 312.6Additions - - 6.4 11.5 72.4 90.3Acquisitions via business combinations - 2.4 1.2 2.4 2.3 8.3Disposals - - (0.2) (1.8) (1.8) (3.8)Depreciation - - (1.5) (11.4) (69.4) (82.3)Carrying amount at end of year 5.3 2.4 15.9 47.5 254.0 325.1
Cost 5.3 2.4 27.3 107.4 720.5 862.9Accumulated depreciation - - (11.4) (59.9) (466.5) (537.8)
5.3 2.4 15.9 47.5 254.0 325.1Includes capital works in progress of: 1.1 6.5 19.9 27.5
(i) Leasehold land is held under crown leases granted under the Land Titles Act 1925.
Depreciation policy – straight line basis over useful life (years): 7– 40 3 –13 3 –10
Property, plant and equipment are stated at cost less accumulated depreciation. Where parts of an item of property, plant and equipment have different useful lives, they are accounted for as separate items of property, plant and equipment.
For operating leases where the lease incentive is in the form of a fitout contribution by the landlord, an asset is recognised and amortised on a straight line basis over the lease term.
The residual values, useful lives and methods of depreciation of property, plant and equipment are reviewed annually and adjusted prospectively, if appropriate.
Fin
ancial R
epo
rt
96Tabcorp Annual Report 2016
97Tabcorp Annual Report 2016
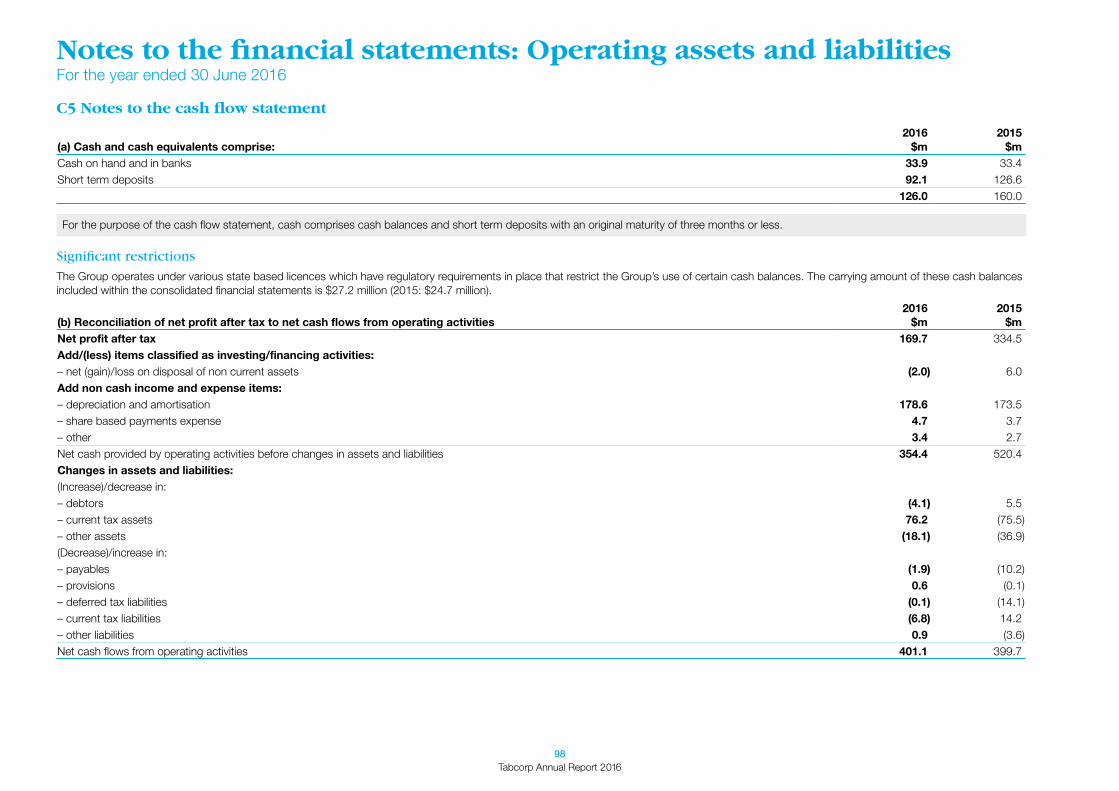
Notes to the financial statements: Operating assets and liabilitiesFor the year ended 30 June 2016
C5 Notes to the cash flow statement
(a) Cash and cash equivalents comprise:2016
$m2015
$mCash on hand and in banks 33.9 33.4Short term deposits 92.1 126.6
126.0 160.0 For the purpose of the cash flow statement, cash comprises cash balances and short term deposits with an original maturity of three months or less.
Significant restrictions
The Group operates under various state based licences which have regulatory requirements in place that restrict the Group’s use of certain cash balances. The carrying amount of these cash balances included within the consolidated financial statements is $27.2 million (2015: $24.7 million).
(b) Reconciliation of net profit after tax to net cash flows from operating activities2016
$m 2015
$mNet profit after tax 169.7 334.5Add/(less) items classified as investing/financing activities:– net (gain)/loss on disposal of non current assets (2.0) 6.0Add non cash income and expense items:– depreciation and amortisation 178.6 173.5– share based payments expense 4.7 3.7– other 3.4 2.7Net cash provided by operating activities before changes in assets and liabilities 354.4 520.4Changes in assets and liabilities:(Increase)/decrease in:– debtors (4.1) 5.5– current tax assets 76.2 (75.5)– other assets (18.1) (36.9)(Decrease)/increase in:– payables (1.9) (10.2)– provisions 0.6 (0.1)– deferred tax liabilities (0.1) (14.1)– current tax liabilities (6.8) 14.2– other liabilities 0.9 (3.6)Net cash flows from operating activities 401.1 399.7
98Tabcorp Annual Report 2016
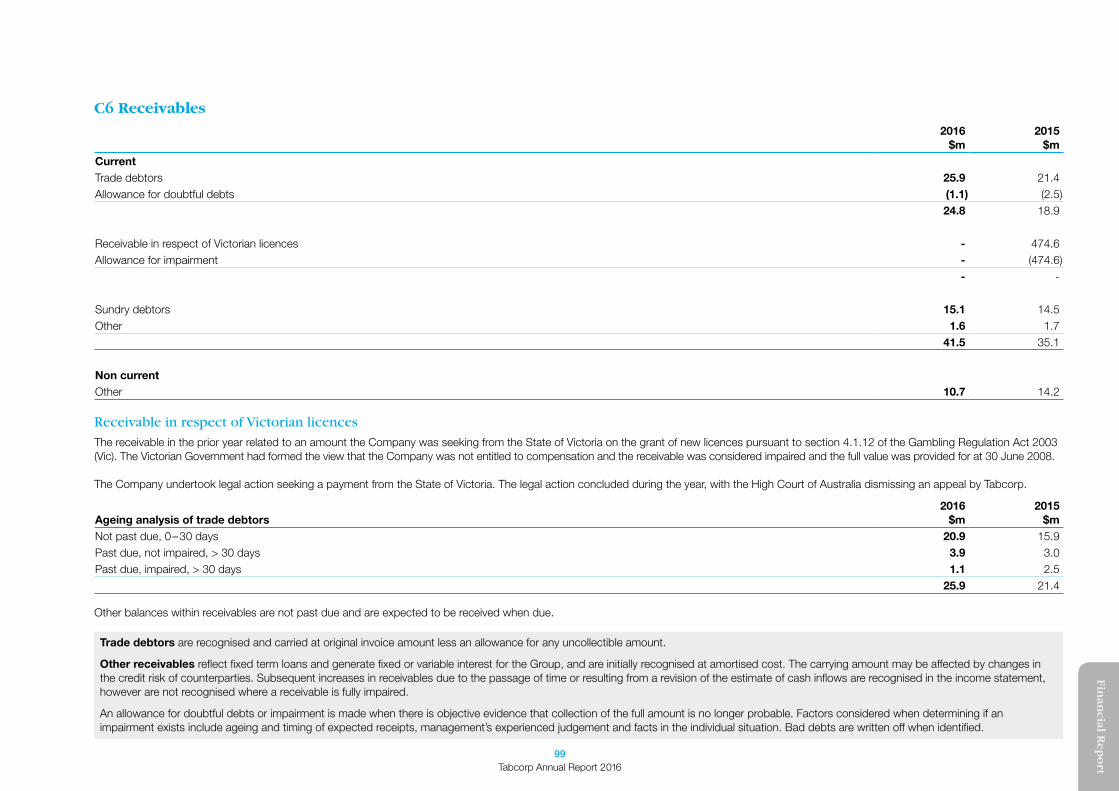
C6 Receivables2016
$m 2015
$mCurrentTrade debtors 25.9 21.4Allowance for doubtful debts (1.1) (2.5)
24.8 18.9
Receivable in respect of Victorian licences - 474.6Allowance for impairment - (474.6)
- -
Sundry debtors 15.1 14.5Other 1.6 1.7
41.5 35.1
Non currentOther 10.7 14.2
Receivable in respect of Victorian licences
The receivable in the prior year related to an amount the Company was seeking from the State of Victoria on the grant of new licences pursuant to section 4.1.12 of the Gambling Regulation Act 2003 (Vic). The Victorian Government had formed the view that the Company was not entitled to compensation and the receivable was considered impaired and the full value was provided for at 30 June 2008. The Company undertook legal action seeking a payment from the State of Victoria. The legal action concluded during the year, with the High Court of Australia dismissing an appeal by Tabcorp.
Ageing analysis of trade debtors2016
$m2015
$mNot past due, 0–30 days 20.9 15.9Past due, not impaired, > 30 days 3.9 3.0Past due, impaired, > 30 days 1.1 2.5
25.9 21.4
Other balances within receivables are not past due and are expected to be received when due. Trade debtors are recognised and carried at original invoice amount less an allowance for any uncollectible amount.
Other receivables reflect fixed term loans and generate fixed or variable interest for the Group, and are initially recognised at amortised cost. The carrying amount may be affected by changes in the credit risk of counterparties. Subsequent increases in receivables due to the passage of time or resulting from a revision of the estimate of cash inflows are recognised in the income statement, however are not recognised where a receivable is fully impaired.
An allowance for doubtful debts or impairment is made when there is objective evidence that collection of the full amount is no longer probable. Factors considered when determining if an impairment exists include ageing and timing of expected receipts, management’s experienced judgement and facts in the individual situation. Bad debts are written off when identified.
Fin
ancial R
epo
rt
98Tabcorp Annual Report 2016
99Tabcorp Annual Report 2016

Notes to the financial statements: Operating assets and liabilitiesFor the year ended 30 June 2016
C7 Provisions
2016 $m
2015 $m
CurrentEmployee benefits 23.7 23.2Premises 4.4 1.6Other 0.5 2.5
28.6 27.3Non currentEmployee benefits 3.8 3.6Premises 20.8 21.5
24.6 25.1
Movement in premises and other provisions during the year are set out below:Premises
$m Other
$m Carrying amount at beginning of year 23.1 2.5Provisions made during year 3.1 0.5Provisions used during year (1.0) (1.6)Provisions reversed during year - (0.9)Carrying amount at end of year 25.2 0.5 Premises provisions comprise:
• lease rental and lease incentives amortised on a straight-line basis over the term of the lease;
• make good provisions for leasehold properties requiring remedial work at the end of the lease arrangement; and
• surplus lease space provisions.
A provision is recognised in the balance sheet when the Group has a present legal or constructive obligation as a result of a past event, and it is probable that an outflow of economic benefits will be required to settle the obligation and the amount can be reliably estimated. If the effect is material, provisions are determined by discounting the expected future cash flows at a pre tax rate that reflects current market assessments of the time value of money and, where appropriate, the risks specific to the liability. Where discounting is used, the increase in the provision due to the passage of time is recorded as a finance cost.
Employee benefits (short term) are expensed as the related service is provided. A liability is recognised for the amount expected to be paid if the Group has a present legal or constructive obligation to pay this amount as a result of past service provided and the obligation can be estimated reliably. Employee benefits (long term) – the Group’s net obligation is the amount of future benefit that employees have earned in return for their service in the current and prior periods. The obligation is discounted to determine its present value. Remeasurements are recognised in the income statement in the period in which they arise. This excludes pension plans.
100Tabcorp Annual Report 2016

Section D – Group structure
D1 Subsidiaries The ultimate parent entity within the Group is Tabcorp Holdings Limited.
The consolidated financial statements incorporate the assets, liabilities and results of Tabcorp Holdings Limited and the following controlled entities:
100% owned Australian subsidiaries in a deed of cross guarantee with Tabcorp Holdings Limited (refer to note D2)
Tabcorp Assets Pty LtdLuxbet Pty Ltd Tabcorp Participant Pty LtdTabcorp ACT Pty Ltd
Tabcorp Wagering (Vic) Pty LtdTabcorp Wagering Participant (Vic) Pty LtdTabcorp Wagering Assets (Vic) Pty LtdTabcorp Investments No.4 Pty Ltd
Tab LimitedSky Channel Pty Ltd2KY Broadcasters Pty LtdTabcorp Services Pty Ltd
Tabcorp Training Pty LtdTabcorp International Pty Ltd Tabcorp International No.4 Pty Ltd
100% owned Australian subsidiaries
Tabcorp Manager Pty LtdTabcorp Wagering Manager (Vic) Pty LtdTabcorp Investments Pty LtdTabcorp Investments No.2 Pty LtdTabcorp Investments No.5 Pty LtdTabcorp Investments No.6 Pty LtdTabcorp Investments No.9 Pty Ltd
Tabcorp Investments No.10 Pty Ltd (i)
Tabcorp Employee Share Administration Pty Ltd (ii)
Showboat Australia Pty LtdTabcorp Wagering Holdings Pty LtdOneTab Holdings Pty LtdOneTab Australia Pty LtdCOPL Pty Ltd
Tabcorp International No.5 Pty Ltd Tabcorp International No.6 Pty LtdSky Channel Marketing Pty LtdSky Australia International Racing Pty LtdTabcorp Gaming Holdings Pty LtdKeno (Qld) Pty Ltd Tabcorp Gaming Solutions Pty Ltd
Tabcorp Gaming Solutions (NSW) Pty Ltd Tabcorp Gaming Solutions (Qld) Pty Ltd Tabcorp Gaming Solutions (ACT) Pty Ltd TAHAL Pty LtdKeno (NSW) Pty Ltd Club Gaming Systems (Holdings) Pty Ltd
International subsidiaries
Name Country of incorporation % equity interestTabcorp Europe Holdings Limited Isle of Man 100Premier Gateway International Limited Isle of Man 50Premier Gateway Services Limited Isle of Man 50Tabcorp Europe Limited Isle of Man 100Luxbet Europe Limited Isle of Man 100Luxbet Europe Services Limited Isle of Man 100Tukcorp Limited (iii) United Kingdom 100Tabcorp Canada Limited Canada 100Sky Racing World Holdco, LLC United States of America 100Sky Racing World, LLC United States of America 100Tabusa, LLC (iv) United States of America 100
Equity interest in all controlled entities at 30 June 2015 was consistent with 30 June 2016 other than:
(i) Company joined the Group on 20 November 2015.
(ii) Equity interest at 30 June 2015 was 33.3%, with remaining equity acquired on 24 July 2015.
(iii) Company joined the Group on 16 November 2015.
(iv) Company joined the Group on 23 February 2016.
Fin
ancial R
epo
rt
100Tabcorp Annual Report 2016
101Tabcorp Annual Report 2016
Notes to the financial statements: Group structureFor the year ended 30 June 2016
D1 Subsidiaries (continued)
D1 Subsidiaries (continued)Subsidiaries are entities controlled by the Company. The Group controls an entity if and only if the Group has:
• power over the entity;
• exposure, or rights, to variable returns from its involvement with the entity; and
• the ability to use its power over the entity to affect its returns.
The financial statements of subsidiaries are included in the consolidated financial report from the date control commences until the date control ceases. On consolidation, the assets and liabilities of foreign operations are translated into Australian Dollars at the rate of the exchange prevailing at balance date, and their income statements are translated at exchange rates prevailing at the dates of the transactions. The exchange differences arising on translation for consolidation are recognised in other comprehensive income.
Elimination of intragroup balances, and any unrealised gains and losses or income and expenses arising from intragroup transactions, are undertaken in preparing the consolidated financial statements. All investments are initially recognised at cost, being the fair value of the consideration given, and if acquired prior to 1 July 2009 included acquisition charges associated with the investment. Subsequently investments are carried at cost less any impairment losses.
A joint arrangement is an arrangement over which the Group has joint control with other parties and is bound by a contractual arrangement. A joint arrangement is classified as either a joint operation or a joint venture depending upon the rights and obligations of the parties to the arrangement.
• A joint operation is where the parties have rights to the assets and obligations for the liabilities, relating to the arrangement. The Group recognises in relation to its interest in a joint operation its assets, including its share of assets held jointly; its liabilities, including its share of any liabilities incurred jointly; its revenue including its share of revenue from the sale of the output by the joint operation; and its expenses, including its share of any expenses incurred jointly.
• A joint venture is where the parties have rights to the net assets of the arrangement. Investments in joint ventures are accounted for using the equity method. Under the equity method, the investment in a joint venture is initially recognised at cost. The carrying amount of the investment is adjusted to recognise changes in the Group’s share of net assets of the joint venture since acquisition date.
102Tabcorp Annual Report 2016
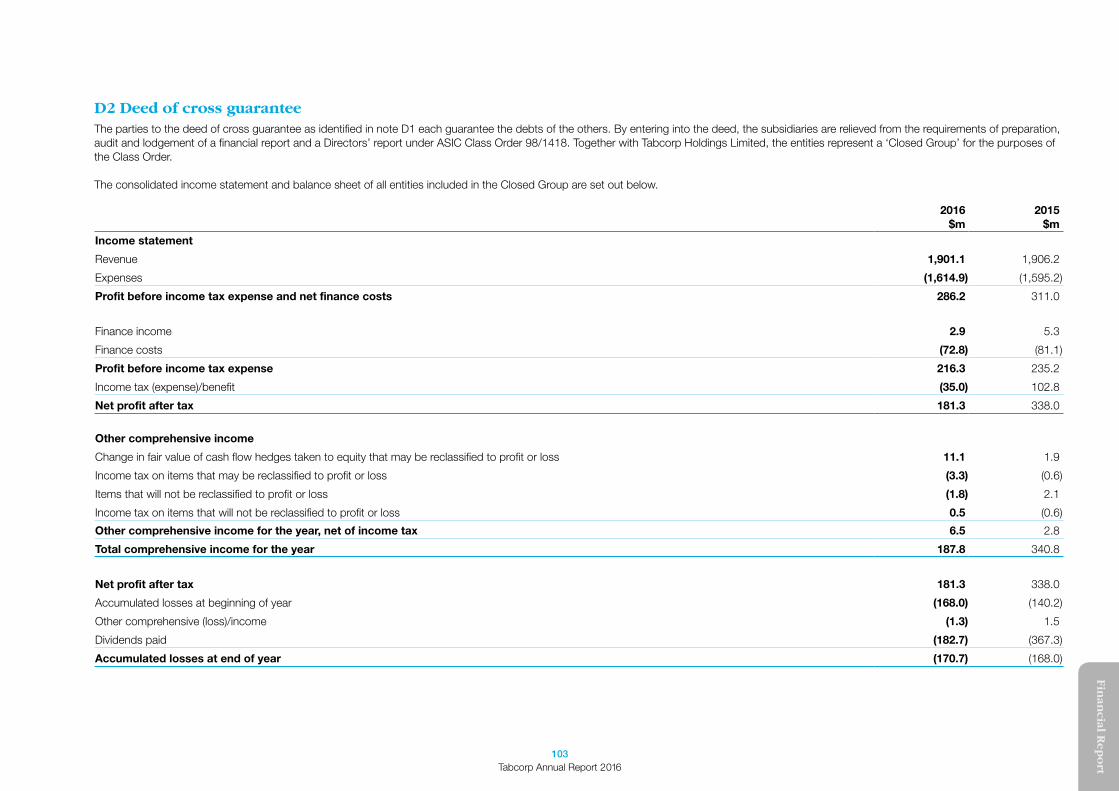
D2 Deed of cross guarantee The parties to the deed of cross guarantee as identified in note D1 each guarantee the debts of the others. By entering into the deed, the subsidiaries are relieved from the requirements of preparation, audit and lodgement of a financial report and a Directors’ report under ASIC Class Order 98/1418. Together with Tabcorp Holdings Limited, the entities represent a ‘Closed Group’ for the purposes of the Class Order. The consolidated income statement and balance sheet of all entities included in the Closed Group are set out below.
2016 $m
2015$m
Income statement
Revenue 1,901.1 1,906.2
Expenses (1,614.9) (1,595.2)
Profit before income tax expense and net finance costs 286.2 311.0
Finance income 2.9 5.3
Finance costs (72.8) (81.1)
Profit before income tax expense 216.3 235.2
Income tax (expense)/benefit (35.0) 102.8
Net profit after tax 181.3 338.0
Other comprehensive income
Change in fair value of cash flow hedges taken to equity that may be reclassified to profit or loss 11.1 1.9
Income tax on items that may be reclassified to profit or loss (3.3) (0.6)
Items that will not be reclassified to profit or loss (1.8) 2.1
Income tax on items that will not be reclassified to profit or loss 0.5 (0.6)
Other comprehensive income for the year, net of income tax 6.5 2.8
Total comprehensive income for the year 187.8 340.8
Net profit after tax 181.3 338.0
Accumulated losses at beginning of year (168.0) (140.2)
Other comprehensive (loss)/income (1.3) 1.5
Dividends paid (182.7) (367.3)
Accumulated losses at end of year (170.7) (168.0)
Fin
ancial R
epo
rt
102Tabcorp Annual Report 2016
103Tabcorp Annual Report 2016
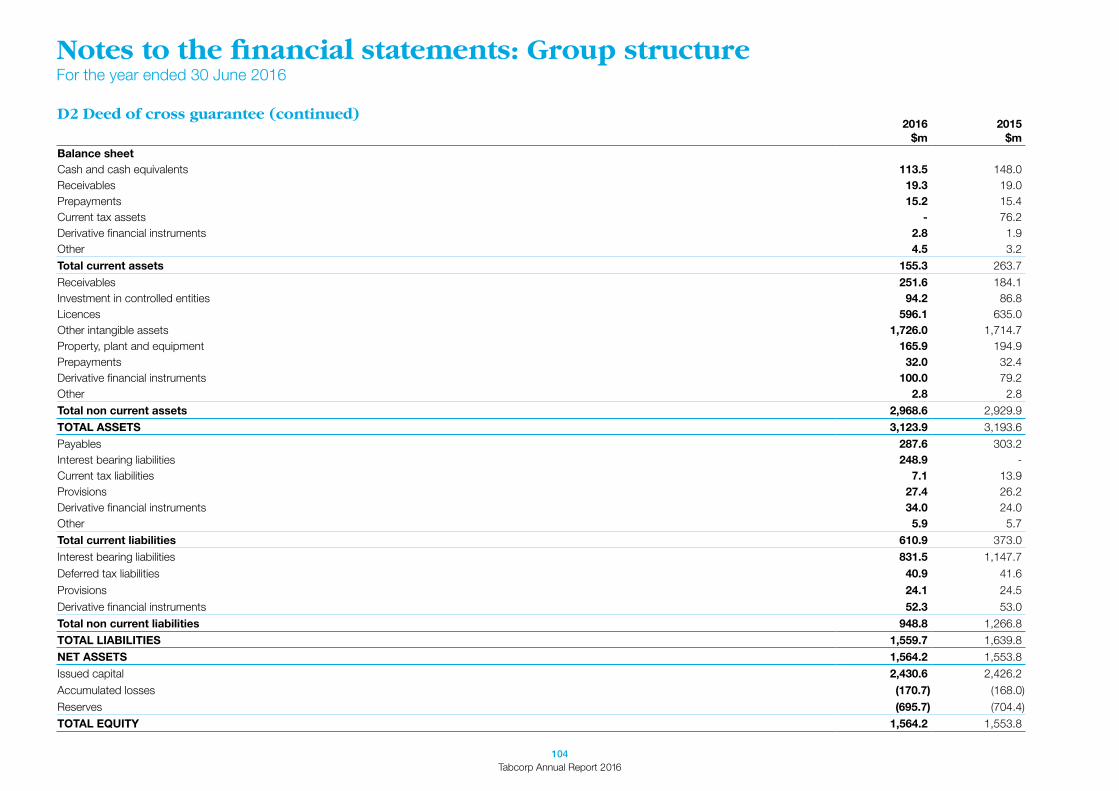
Notes to the financial statements: Group structureFor the year ended 30 June 2016
D2 Deed of cross guarantee (continued) 2016
$m2015
$mBalance sheetCash and cash equivalents 113.5 148.0Receivables 19.3 19.0Prepayments 15.2 15.4Current tax assets - 76.2Derivative financial instruments 2.8 1.9Other 4.5 3.2
Total current assets 155.3 263.7
Receivables 251.6 184.1Investment in controlled entities 94.2 86.8Licences 596.1 635.0Other intangible assets 1,726.0 1,714.7Property, plant and equipment 165.9 194.9Prepayments 32.0 32.4Derivative financial instruments 100.0 79.2Other 2.8 2.8
Total non current assets 2,968.6 2,929.9
TOTAL ASSETS 3,123.9 3,193.6
Payables 287.6 303.2Interest bearing liabilities 248.9 -Current tax liabilities 7.1 13.9Provisions 27.4 26.2Derivative financial instruments 34.0 24.0Other 5.9 5.7
Total current liabilities 610.9 373.0
Interest bearing liabilities 831.5 1,147.7
Deferred tax liabilities 40.9 41.6
Provisions 24.1 24.5
Derivative financial instruments 52.3 53.0
Total non current liabilities 948.8 1,266.8
TOTAL LIABILITIES 1,559.7 1,639.8
NET ASSETS 1,564.2 1,553.8
Issued capital 2,430.6 2,426.2
Accumulated losses (170.7) (168.0)
Reserves (695.7) (704.4)
TOTAL EQUITY 1,564.2 1,553.8
104Tabcorp Annual Report 2016
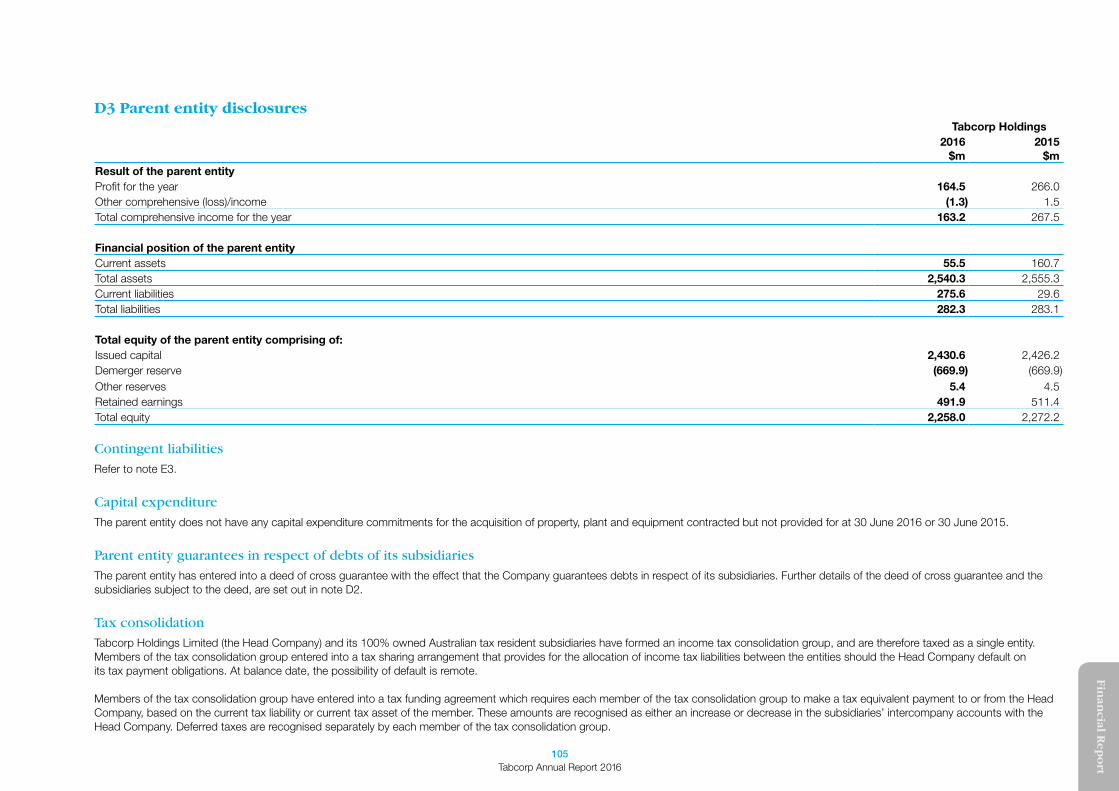
D3 Parent entity disclosures Tabcorp Holdings
2016 $m
2015$m
Result of the parent entity Profit for the year 164.5 266.0Other comprehensive (loss)/income (1.3) 1.5Total comprehensive income for the year 163.2 267.5
Financial position of the parent entity Current assets 55.5 160.7Total assets 2,540.3 2,555.3Current liabilities 275.6 29.6Total liabilities 282.3 283.1
Total equity of the parent entity comprising of:Issued capital 2,430.6 2,426.2Demerger reserve (669.9) (669.9)Other reserves 5.4 4.5Retained earnings 491.9 511.4Total equity 2,258.0 2,272.2
Contingent liabilities
Refer to note E3.
Capital expenditure
The parent entity does not have any capital expenditure commitments for the acquisition of property, plant and equipment contracted but not provided for at 30 June 2016 or 30 June 2015.
Parent entity guarantees in respect of debts of its subsidiaries
The parent entity has entered into a deed of cross guarantee with the effect that the Company guarantees debts in respect of its subsidiaries. Further details of the deed of cross guarantee and the subsidiaries subject to the deed, are set out in note D2.
Tax consolidation
Tabcorp Holdings Limited (the Head Company) and its 100% owned Australian tax resident subsidiaries have formed an income tax consolidation group, and are therefore taxed as a single entity. Members of the tax consolidation group entered into a tax sharing arrangement that provides for the allocation of income tax liabilities between the entities should the Head Company default on its tax payment obligations. At balance date, the possibility of default is remote. Members of the tax consolidation group have entered into a tax funding agreement which requires each member of the tax consolidation group to make a tax equivalent payment to or from the Head Company, based on the current tax liability or current tax asset of the member. These amounts are recognised as either an increase or decrease in the subsidiaries’ intercompany accounts with the Head Company. Deferred taxes are recognised separately by each member of the tax consolidation group.
Fin
ancial R
epo
rt
104Tabcorp Annual Report 2016
105Tabcorp Annual Report 2016

Notes to the financial statements: Group structureFor the year ended 30 June 2016
D4 Business combinations
Acquisition of ACTTAB in the prior year
On 14 October 2014, the Group acquired the ACTTAB business. The acquisition provided the Group with long life licences that complemented the existing Wagering and Keno businesses. ACTTAB provides totalisator and fixed odds wagering, Keno and Trackside products within the ACT through a network of retail outlets, in addition to telephone and online platforms.
(a) Identifiable assets acquired and liabilities assumed
The fair values of the identifiable assets and liabilities of ACTTAB at the date of acquisition were:
$mCash and cash equivalents 0.3Other assets 0.9Licences 18.4Other intangible assets 4.8Property, plant and equipment 8.3Deferred tax liabilities (6.3)Payables (2.4)Provisions (2.4)Net identifiable assets acquired 21.6Goodwill arising on acquisition(i) 82.0Purchase consideration transferred (cash) 103.6 (i) Goodwill recognised is primarily attributable to the expected synergies and other benefits from combining the assets and activities of ACTTAB with those of the Group.
The goodwill is not deductible for tax purposes.
The cash outflow on acquisition was:
– Net cash acquired 0.3– Cash paid (103.6)Net cash outflow (103.3)
(b) Acquisition costs
Transaction costs of $2.8 million were expensed and included in other expenses in the income statement in the prior year.
(c) Revenue and profit contribution
In the prior year, the Group’s profit before income tax expense includes revenue of $20.9 million and a loss of $3.0 million, including $5.8 million of one-off acquisition and integration costs relating to the ACTTAB business since the date of acquisition (a period of 8.5 months). If the acquisition had taken place at the beginning of the prior year, the Group’s revenue and profit before income tax expense in the prior year would have been $2,163.3 million and $259.5 million respectively.
106Tabcorp Annual Report 2016
Section E – Other disclosures
E1 Employee share plans The Company operates share plans which provide equity instruments to senior executives and management as a component of their remuneration.
Long Term Performance Plan (LTPP)
The LTPP is available at the most senior executive levels. Under the LTPP employees may become entitled to Performance Rights in the Company. The fair value of Performance Rights is measured at grant date and is recognised as an employee expense (with a corresponding increase in equity) over three years irrespective of whether the Performance Rights vest to the holder. A reversal of the expense is only recognised in the event the instruments lapse due to cessation of employment within the three year period. The fair value of the Performance Rights is determined by an external valuer and takes into account the terms and conditions upon which they were granted. The dilutive effect, if any, of outstanding Performance Rights is reflected in the computation of diluted earnings per share.
Short Term Performance Plan (STPP)
For senior management it is mandatory to defer 25% (50% for the Managing Director and Chief Executive Officer) of their STPP into Restricted Shares, which are subject to a two year service condition.
The cost of the Restricted Shares is based on the market price at grant date and is recognised over the vesting period. The maximum number of shares that can be outstanding at any time under these plans is limited to 5% of the Company’s issued capital. The share based payments expense in respect of the equity instruments granted is recognised in the income statement for the period. Further explanation of the share plans is disclosed in the Remuneration report.
Fin
ancial R
epo
rt
106Tabcorp Annual Report 2016
107Tabcorp Annual Report 2016
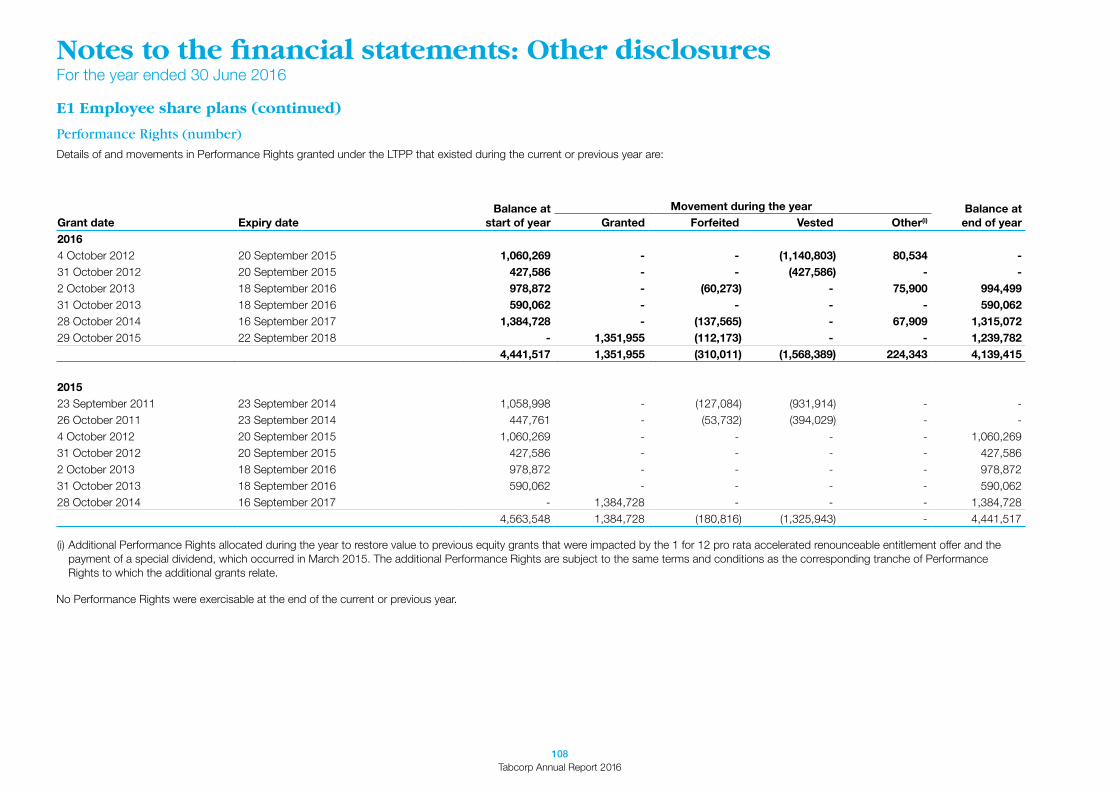
Notes to the financial statements: Other disclosuresFor the year ended 30 June 2016
E1 Employee share plans (continued)
Performance Rights (number)
Details of and movements in Performance Rights granted under the LTPP that existed during the current or previous year are:
Grant date Expiry dateBalance at
start of yearMovement during the year Balance at
end of yearGranted Forfeited Vested Other(i)
20164 October 2012 20 September 2015 1,060,269 - - (1,140,803) 80,534 -31 October 2012 20 September 2015 427,586 - - (427,586) - -2 October 2013 18 September 2016 978,872 - (60,273) - 75,900 994,49931 October 2013 18 September 2016 590,062 - - - - 590,06228 October 2014 16 September 2017 1,384,728 - (137,565) - 67,909 1,315,07229 October 2015 22 September 2018 - 1,351,955 (112,173) - - 1,239,782
4,441,517 1,351,955 (310,011) (1,568,389) 224,343 4,139,415
201523 September 2011 23 September 2014 1,058,998 - (127,084) (931,914) - - 26 October 2011 23 September 2014 447,761 - (53,732) (394,029) - - 4 October 2012 20 September 2015 1,060,269 - - - - 1,060,26931 October 2012 20 September 2015 427,586 - - - - 427,5862 October 2013 18 September 2016 978,872 - - - - 978,87231 October 2013 18 September 2016 590,062 - - - - 590,06228 October 2014 16 September 2017 - 1,384,728 - - - 1,384,728
4,563,548 1,384,728 (180,816) (1,325,943) - 4,441,517
(i) Additional Performance Rights allocated during the year to restore value to previous equity grants that were impacted by the 1 for 12 pro rata accelerated renounceable entitlement offer and the payment of a special dividend, which occurred in March 2015. The additional Performance Rights are subject to the same terms and conditions as the corresponding tranche of Performance Rights to which the additional grants relate.
No Performance Rights were exercisable at the end of the current or previous year.
108Tabcorp Annual Report 2016

Fair value of equity instruments
Performance Rights have been independently valued at the date of grant using a modified form of Monte-Carlo simulation-based model. The weighted average fair value of Performance Rights granted during the year was $2.47 (2015: $2.42). The assumptions underlying the Performance Rights valuations are:
Grant date Expiry date
Share price at date of grant
$
Expected volatility in
share price(i) %
Expected dividend yield(ii)
%
Risk free interest rate(iii)
%
Value per performance
right$
23 September 2011 23 September 2014 2.61 24.00 7.00 3.46 1.34 26 October 2011 23 September 2014 2.87 24.00 7.00 3.73 1.49 4 October 2012 20 September 2015 2.86 22.00 6.00 2.40 1.37 31 October 2012 20 September 2015 2.84 22.00 6.00 2.57 1.31 2 October 2013 18 September 2016 3.27 22.00 5.50 2.92 1.73 31 October 2013 18 September 2016 3.60 22.00 5.50 3.00 2.07 28 October 2014 16 September 2017 4.03 22.00 5.00 2.52 2.42 29 October 2015 22 September 2018 4.73 25.00 5.00 1.80 2.47
(i) Reflects the assumption that the historical volatility is indicative of future trends.
(ii) Reflects the assumption that the current payout ratio will continue with no anticipated increases.
(iii) Represents the zero coupon interest rate derived from government bond market interest rates on the valuation date and vary according to each maturity date.
E2 Commitments
2016$m
2015$m
(a) Capital expenditure commitmentsProperty, plant and equipment 11.7 10.3Software 3.6 1.4
15.3 11.7
(b) Operating lease commitmentsContracted but not provided for and payable:Not later than one year 38.6 39.0Later than one year but not later than five years 81.0 85.9Later than five years 57.4 67.0
177.0 191.9 The Group leases property under operating leases expiring from 1 to 12 years. Leases generally provide the Group with a right of renewal at which time all terms are renegotiated. Lease payments comprise a base amount plus an incremental contingent rental. Contingent rentals are based on either movements in the Consumer Price Index or are subject to market rate review. For leases relating to the Victorian wagering operations, 50% of the cost is recoverable from VicRacing Pty Ltd.
Fin
ancial R
epo
rt
108Tabcorp Annual Report 2016
109Tabcorp Annual Report 2016
Notes to the financial statements: Other disclosuresFor the year ended 30 June 2016
E3 ContingenciesDetails of contingencies where the probability of future payments is not considered remote are set out below as well as details of contingencies, which although considered remote, the Directors consider should be disclosed as they are not disclosed elsewhere in the notes to the financial statements.
Contingent liabilities
(a) Charge
A controlled entity, Tabcorp Wagering Participant (Vic) Pty Ltd, which is a participant in the joint venture outlined in note E4(a), has entered into a deed of cross charge with its joint venture partner to cover the non payment of a called sum in the event of the joint venture incurring a loss. The charge is over undistributed and future earnings of the joint venture to the level of the unpaid call.
(b) Legal challenges
There are outstanding legal actions between controlled entities and third parties at 30 June 2016. It is expected that any liabilities arising from such legal action would not have a material adverse effect on the Group’s financial position, other than as outlined below.
(c) Civil proceedings
In July 2015 the Australian Transaction Reports and Analysis Centre commenced civil proceedings against Tabcorp Holdings Limited, Tab Limited and Tabcorp Wagering (Vic) Pty Ltd alleging certain breaches of the Anti-Money Laundering and Counter-Terrorism Financing Act 2006. The hearing is scheduled to commence in June 2017. As previously announced, the Company is contesting many of the allegations made against it. However, in some instances the Company will not contest allegations. At this stage it is not possible to determine the extent of any potential financial impact to the Group.
E4 Related party disclosures
(a) Transactions with joint arrangements
The Group conducts an unincorporated joint venture with VicRacing Pty Ltd in Victoria (‘the joint venture’). The principal activity of the joint venture is the organisation, conduct, promotion and development of wagering and betting in Victoria. The Group receives 50% of the revenue and expenses of the joint venture, which is accounted for as a joint operation.
The Group charges the joint venture for the provision of employee, management and asset services. On consolidation, 50% of the charges eliminate (being the Group’s interest in the joint venture). Charges for the remaining 50% of $76.3 million were received by the Group in 2016 (2015: $72.5 million).
110Tabcorp Annual Report 2016

(b) Director and executive disclosures
(i) Compensation of Key Management Personnel (KMP)
2016 $
2015 $
Short term 5,824,232 5,955,231
Other long term 113,997 92,835
Post employment 213,859 218,047Share based payments 2,957,983 2,394,604
Termination benefits 594,003 -9,704,074 8,660,717
E5 Auditor’s remuneration
2016$000
2015$000
Amounts received or due and receivable by Ernst and Young for:– audit and review of the financial report of the Group 948 961– other assurance services in relation to the Group (i) 478 375
1,426 1,336
(i) Other services comprise other audit services for Group subsidiaries, regulatory audit services and other assurance work.
E6 Other accounting policies
(a) Statement of compliance
(i) Changes in accounting policy and disclosures
A number of new and amended accounting standards became mandatorily applicable for the Group for the first time in the current financial year. The adoption of these new and amended standards had no impact on the financial position or performance of the Group, or the disclosures included in this financial report.
(ii) New Australian Accounting Standards or International Financial Reporting Standards issued but not yet effective
The following new and amended accounting standards and interpretations have been recently issued by the Australian Accounting Standards Board but not yet effective, are considered relevant to the Group. They are available for early adoption but have not been applied by the Group in this financial report: AASB 9 Financial Instruments is applicable to the Group from 1 July 2018. It includes revised guidance on classification and measurement of financial instruments and new hedge accounting requirements including changes to hedge effectiveness testing, treatment of hedging costs, risk components that can be hedged and disclosures.
Fin
ancial R
epo
rt
110Tabcorp Annual Report 2016
111Tabcorp Annual Report 2016
Notes to the financial statements: Other disclosuresFor the year ended 30 June 2016
E6 Other accounting policies (continued)
(a) Statement of compliance (continued)
(ii) New Australian Accounting Standards or International Financial Reporting Standards issued but not yet effective (continued)
AASB 15 Revenue from Contracts with Customers is applicable to the Group from 1 July 2018. It establishes a framework for determining whether, how much and when the revenue is recognised. The core principle is that revenue must be recognised when the goods or services are transferred to the customer, at the transaction price.
AASB 16 Leases is applicable to the Group from 1 July 2019. It introduces a single lessee accounting model and requires a lessee to recognise assets and liabilities for all leases with a term of more than 12 months, unless the underlying asset is of low value. A lessee will recognise a right-of-use asset representing its right to use the underlying leased asset and a lease liability representing its obligation to make lease payments. Depreciation of the asset and interest on the liability will be recognised.
The Group has not yet completed its assessment of the impact of these new standards on the financial report.
(b) Goods and services taxRevenues, expenses, assets and liabilities are recognised net of the amount of GST except:
• when the GST incurred on a purchase of goods and services is not recoverable from the taxation authority, in which case the GST is recognised as part of the cost of acquisition of the asset or as part of the expense item as applicable;
• wagering and certain Keno revenues, due to the GST being offset against government taxes; and
• receivables and payables, which are stated with the amount of GST included. The net amount of GST recoverable from, or payable to, the taxation authority is included as part of receivables or payables in the balance sheet. Cash flows are included in the cash flow statement on a gross basis and the GST component of cash flows arising from investing and financing activities, which is recoverable from, or payable to, the taxation authority are classified as operating cash flows.
Commitments and contingencies are disclosed net of the amount of GST recoverable from, or payable to, the taxation authority.
(c) Foreign currency translation and balances
Transactions in foreign currencies are translated at the foreign exchange rate ruling at the date of the transaction.
Monetary assets and liabilities denominated in foreign currencies at balance date are translated to Australian Dollars at the foreign exchange rate ruling at that date. Foreign exchange differences arising on translation are recognised in the income statement with the exception of differences on foreign currency borrowings that are in an effective hedge relationship. These are taken directly to equity until the liability is extinguished at which time they are recognised in the income statement. Refer to note B3 for further detail. Non monetary assets and liabilities that are measured in terms of historical cost in a foreign currency are translated using the exchange rate at the date of the transaction. Non monetary assets and liabilities denominated in foreign currencies that are stated at fair value are translated to Australian Dollars at foreign exchange rates ruling at the dates the fair value was determined.
112Tabcorp Annual Report 2016
In the opinion of the Directors of Tabcorp Holdings Limited (the Company):
(a) the financial statements and notes of the Group are in accordance with the Corporations Act 2001, including:
(i) giving a true and fair view of the Group’s financial position as at 30 June 2016 and of its performance for the year ended on that date; and
(ii) complying with Accounting Standards and Corporations Regulations 2001;
(b) the financial statements and notes also comply with International Financial Reporting Standards; and
(c) there are reasonable grounds to believe that the Company will be able to pay its debts as and when they become due and payable.
This declaration has been made after receiving the declarations required to be made to the Directors by the Chief Executive Officer and Chief Financial Officer in accordance with section 295A of the Corporations Act 2001 for the financial year ended 30 June 2016.
In the opinion of the Directors, as at the date of this declaration, there are reasonable grounds to believe that the members of the Closed Group identified in note D2 will be able to meet any obligations or liabilities to which they are or may become subject, by virtue of the Deed of Cross Guarantee.
Signed in accordance with a resolution of Directors.
Paula J DwyerChairman
David R H AttenboroughManaging Director and Chief Executive Officer
Melbourne4 August 2016
Directors’ declarationFin
ancial R
epo
rt
112Tabcorp Annual Report 2016
113Tabcorp Annual Report 2016
Independent auditor’s report
A member firm of Ernst & Young Global LimitedLiability limited by a scheme approved under Professional Standards Legislation
Ernst & Young8 Exhibition StreetMelbourne VIC 3000 AustraliaGPO Box 67 Melbourne VIC 3001
Tel: +61 3 9288 8000Fax: +61 3 8650 7777ey.com/au
Independent auditor's report to the members of Tabcorp Holdings Limited
Report on the financial reportWe have audited the accompanying financial report of Tabcorp Holdings Limited, which comprises the consolidated statement of financial position as at 30 June2016, the consolidated statement of comprehensive income, the consolidated statement of changes in equity and the consolidated statement of cash flows forthe year then ended, notes comprising a summary of significant accounting policies and other explanatory information, and the directors' declaration of theconsolidated entity comprising the company and the entities it controlled at the year's end or from time to time during the financial year.
Directors' responsibility for the financial reportThe directors of the company are responsible for the preparation of the financial report that gives a true and fair view in accordance with Australian AccountingStandards and the Corporations Act 2001 and for such internal controls as the directors determine are necessary to enable the preparation of the financialreport that is free from material misstatement, whether due to fraud or error. In the notes to the financial statements, the directors also state, in accordancewith Accounting Standard AASB 101 Presentation of Financial Statements, that the financial statements comply with International Financial ReportingStandards.
Auditor's responsibilityOur responsibility is to express an opinion on the financial report based on our audit. We conducted our audit in accordance with Australian Auditing Standards.Those standards require that we comply with relevant ethical requirements relating to audit engagements and plan and perform the audit to obtain reasonableassurance about whether the financial report is free from material misstatement.
An audit involves performing procedures to obtain audit evidence about the amounts and disclosures in the financial report. The procedures selected depend onthe auditor's judgment, including the assessment of the risks of material misstatement of the financial report, whether due to fraud or error. In making those riskassessments, the auditor considers internal controls relevant to the entity's preparation and fair presentation of the financial report in order to design auditprocedures that are appropriate in the circumstances, but not for the purpose of expressing an opinion on the effectiveness of the entity's internal controls. Anaudit also includes evaluating the appropriateness of accounting policies used and the reasonableness of accounting estimates made by the directors, as well asevaluating the overall presentation of the financial report.
We believe that the audit evidence we have obtained is sufficient and appropriate to provide a basis for our audit opinion.
IndependenceIn conducting our audit we have complied with the independence requirements of the Corporations Act 2001. We have given to the directors of the company awritten Auditor’s Independence Declaration, a copy of which is included in the directors’ report.
114Tabcorp Annual Report 2016
Fin
ancial R
epo
rt
A member firm of Ernst & Young Global LimitedLiability limited by a scheme approved under Professional Standards Legislation
OpinionIn our opinion:
a. the financial report of Tabcorp Holdings Limited is in accordance with the Corporations Act 2001, including:
i. giving a true and fair view of the consolidated entity's financial position as at 30 June 2016 and of its performance for the year ended on that date;and
ii. complying with Australian Accounting Standards and the Corporations Regulations 2001; and
b. the financial report also complies with International Financial Reporting Standards as disclosed in the notes to the financial statements.
Report on the remuneration reportWe have audited the Remuneration Report included in the directors' report for the year ended 30 June 2016. The directors of the company are responsible forthe preparation and presentation of the Remuneration Report in accordance with section 300A of the Corporations Act 2001. Our responsibility is to express anopinion on the Remuneration Report, based on our audit conducted in accordance with Australian Auditing Standards.
OpinionIn our opinion, the Remuneration Report of Tabcorp Holdings Limited for the year ended 30 June 2016, complies with section 300A of the CorporationsAct 2001.
Ernst & Young
Tony JohnsonPartner4 August 2016
114Tabcorp Annual Report 2016
115Tabcorp Annual Report 2016
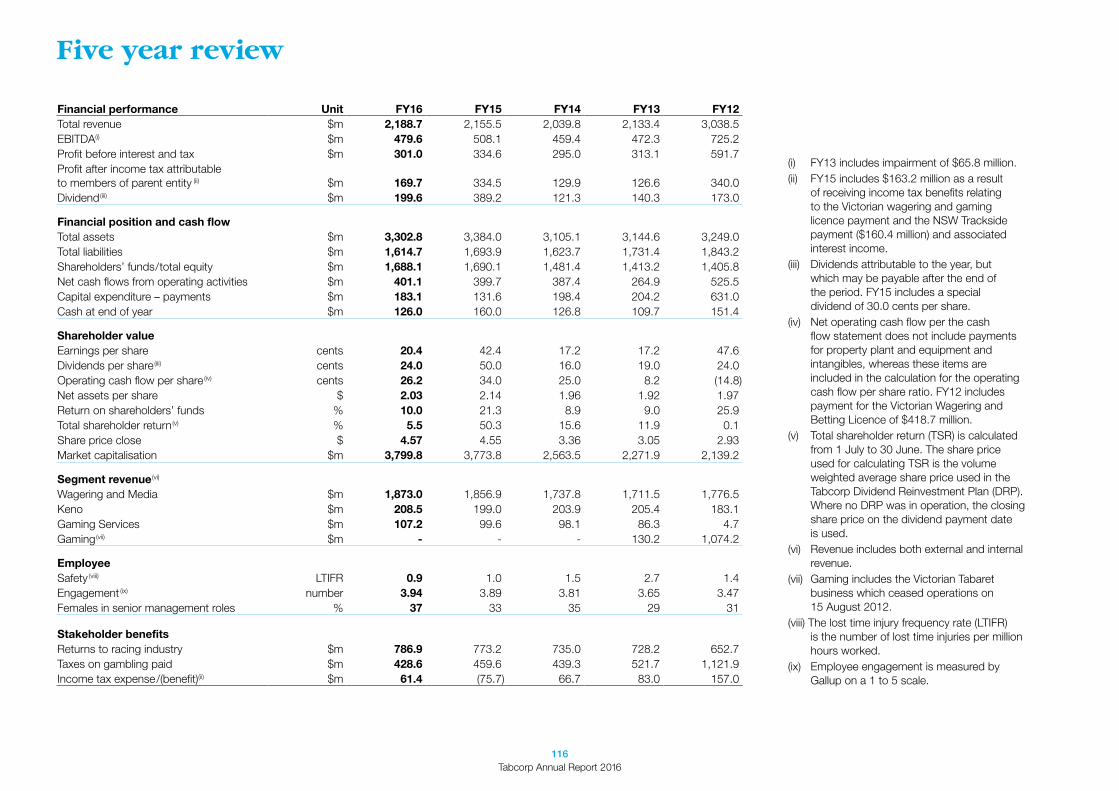
Financial performance Unit FY16 FY15 FY14 FY13 FY12Total revenue $m 2,188.7 2,155.5 2,039.8 2,133.4 3,038.5EBITDA(i) $m 479.6 508.1 459.4 472.3 725.2Profit before interest and tax $m 301.0 334.6 295.0 313.1 591.7Profit after income tax attributable to members of parent entity (ii) $m 169.7 334.5 129.9 126.6 340.0Dividend(iii) $m 199.6 389.2 121.3 140.3 173.0
Financial position and cash flowTotal assets $m 3,302.8 3,384.0 3,105.1 3,144.6 3,249.0Total liabilities $m 1,614.7 1,693.9 1,623.7 1,731.4 1,843.2Shareholders’ funds/total equity $m 1,688.1 1,690.1 1,481.4 1,413.2 1,405.8Net cash flows from operating activities $m 401.1 399.7 387.4 264.9 525.5Capital expenditure – payments $m 183.1 131.6 198.4 204.2 631.0Cash at end of year $m 126.0 160.0 126.8 109.7 151.4
Shareholder valueEarnings per share cents 20.4 42.4 17.2 17.2 47.6Dividends per share(iii) cents 24.0 50.0 16.0 19.0 24.0Operating cash flow per share(iv) cents 26.2 34.0 25.0 8.2 (14.8)Net assets per share $ 2.03 2.14 1.96 1.92 1.97Return on shareholders’ funds % 10.0 21.3 8.9 9.0 25.9Total shareholder return(v) % 5.5 50.3 15.6 11.9 0.1Share price close $ 4.57 4.55 3.36 3.05 2.93Market capitalisation $m 3,799.8 3,773.8 2,563.5 2,271.9 2,139.2
Segment revenue (vi)
Wagering and Media $m 1,873.0 1,856.9 1,737.8 1,711.5 1,776.5Keno $m 208.5 199.0 203.9 205.4 183.1Gaming Services $m 107.2 99.6 98.1 86.3 4.7Gaming(vii) $m - - - 130.2 1,074.2
EmployeeSafety (viii) LTIFR 0.9 1.0 1.5 2.7 1.4Engagement (ix) number 3.94 3.89 3.81 3.65 3.47Females in senior management roles % 37 33 35 29 31
Stakeholder benefitsReturns to racing industry $m 786.9 773.2 735.0 728.2 652.7Taxes on gambling paid $m 428.6 459.6 439.3 521.7 1,121.9Income tax expense/(benefit)(ii) $m 61.4 (75.7) 66.7 83.0 157.0
Five year review
(i) FY13 includes impairment of $65.8 million. (ii) FY15 includes $163.2 million as a result
of receiving income tax benefits relating to the Victorian wagering and gaming licence payment and the NSW Trackside payment ($160.4 million) and associated interest income.
(iii) Dividends attributable to the year, but which may be payable after the end of the period. FY15 includes a special dividend of 30.0 cents per share.
(iv) Net operating cash flow per the cash flow statement does not include payments for property plant and equipment and intangibles, whereas these items are included in the calculation for the operating cash flow per share ratio. FY12 includes payment for the Victorian Wagering and Betting Licence of $418.7 million.
(v) Total shareholder return (TSR) is calculated from 1 July to 30 June. The share price used for calculating TSR is the volume weighted average share price used in the Tabcorp Dividend Reinvestment Plan (DRP). Where no DRP was in operation, the closing share price on the dividend payment date is used.
(vi) Revenue includes both external and internal revenue.
(vii) Gaming includes the Victorian Tabaret business which ceased operations on 15 August 2012.
(viii) The lost time injury frequency rate (LTIFR) is the number of lost time injuries per million hours worked.
(ix) Employee engagement is measured by Gallup on a 1 to 5 scale.
116Tabcorp Annual Report 2016

Tabcorp’s major announcements since the previous annual report are listed below. These announcements are available on the Company’s website at www.tabcorp.com.au following their release to the Australian Securities Exchange.
2016
3 August Tabcorp appoints Bruce Akhurst and Vickki McFadden to its Board of Directors1 August Tabcorp to expand its Gaming Services business through the acquisition of INTECQ7 July NSW Government announced the cessation of greyhound racing as of 1 July 201723 June Tabcorp filed its defence to AUSTRAC amended statement of claim4 May Tabcorp and the Australian Trainers Association extended and upgraded their sponsorship agreement2 May Trading update for the third quarter of the 2016 financial year28 April Tabcorp welcomed the Federal Government’s response to the Illegal Offshore Wagering Review20 April AUSTRAC granted leave to file an amended statement of claim 13 April Tabcorp and Tasracing announced new three-year sponsorship agreement1 April Sky Racing to broadcast Australian racing in high definition for the first time21 March Mr Elmer Funke Kupper granted a leave of absence from the Board of Directors15 March Australian Federal Police investigation in relation to a payment concerning a Cambodian business opportunity in 200911 March Tabcorp and the Victoria Racing Club announced a new eight-year sponsorship agreement2 March High Court of Australia dismissed Tabcorp’s appeal in relation to Tabcorp’s claim for approximately $686 million from the State of Victoria12 February New NSW Keno Licence to be issued, extending Tabcorp’s approval to operate NSW Keno until 20504 February Half year results – statutory net profit after tax of $81.9 million, down 33.1%21 January German Tote joined Tabcorp’s wagering pools
201510 December Tabcorp and News UK partner to launch new online wagering and gaming business in the UK8 December Tabcorp and Thoroughbred Breeders Victoria announced a new partnership19 November Tabcorp made a submission to the Federal Government’s Review into the Impact of Illegal Offshore Wagering16 November Tabcorp confirmed merger discussions with Tatts Group, but companies were unable to agree mutually acceptable terms and discussions ended5 November Tabcorp recognised as one of Australia’s leading promoters of workplace diversity after being named an Employer of Choice for Gender Equality29 October Annual General Meeting addresses and presentations by the Chairman and Managing Director29 October Trading update for the first quarter of the 2016 financial year13 October Tabcorp filed defence to AUSTRAC statement of claim10 September Tabcorp once again topped global sustainability ranking in the Dow Jones Sustainability Index
Major announcements
116Tabcorp Annual Report 2016
117Tabcorp Annual Report 2016
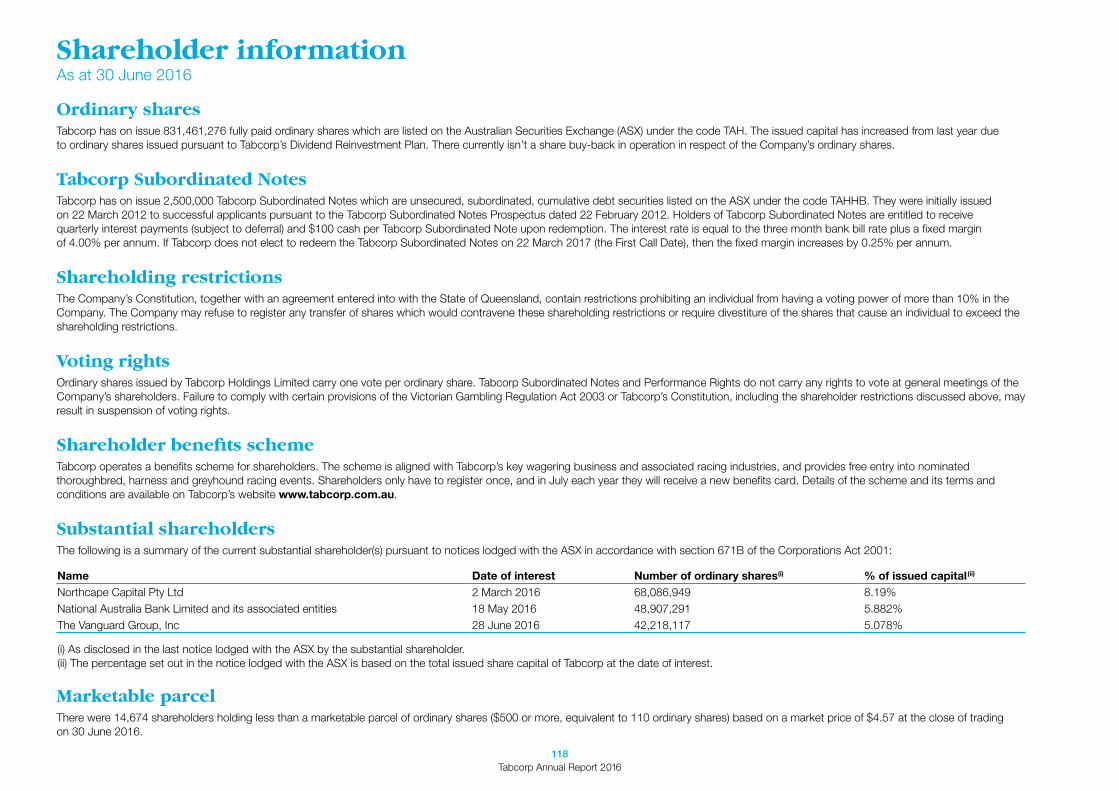
Ordinary sharesTabcorp has on issue 831,461,276 fully paid ordinary shares which are listed on the Australian Securities Exchange (ASX) under the code TAH. The issued capital has increased from last year due to ordinary shares issued pursuant to Tabcorp’s Dividend Reinvestment Plan. There currently isn’t a share buy-back in operation in respect of the Company’s ordinary shares.
Tabcorp Subordinated NotesTabcorp has on issue 2,500,000 Tabcorp Subordinated Notes which are unsecured, subordinated, cumulative debt securities listed on the ASX under the code TAHHB. They were initially issued on 22 March 2012 to successful applicants pursuant to the Tabcorp Subordinated Notes Prospectus dated 22 February 2012. Holders of Tabcorp Subordinated Notes are entitled to receive quarterly interest payments (subject to deferral) and $100 cash per Tabcorp Subordinated Note upon redemption. The interest rate is equal to the three month bank bill rate plus a fixed margin of 4.00% per annum. If Tabcorp does not elect to redeem the Tabcorp Subordinated Notes on 22 March 2017 (the First Call Date), then the fixed margin increases by 0.25% per annum.
Shareholding restrictionsThe Company’s Constitution, together with an agreement entered into with the State of Queensland, contain restrictions prohibiting an individual from having a voting power of more than 10% in the Company. The Company may refuse to register any transfer of shares which would contravene these shareholding restrictions or require divestiture of the shares that cause an individual to exceed the shareholding restrictions.
Voting rightsOrdinary shares issued by Tabcorp Holdings Limited carry one vote per ordinary share. Tabcorp Subordinated Notes and Performance Rights do not carry any rights to vote at general meetings of the Company’s shareholders. Failure to comply with certain provisions of the Victorian Gambling Regulation Act 2003 or Tabcorp’s Constitution, including the shareholder restrictions discussed above, may result in suspension of voting rights.
Shareholder benefits schemeTabcorp operates a benefits scheme for shareholders. The scheme is aligned with Tabcorp’s key wagering business and associated racing industries, and provides free entry into nominated thoroughbred, harness and greyhound racing events. Shareholders only have to register once, and in July each year they will receive a new benefits card. Details of the scheme and its terms and conditions are available on Tabcorp’s website www.tabcorp.com.au.
Substantial shareholdersThe following is a summary of the current substantial shareholder(s) pursuant to notices lodged with the ASX in accordance with section 671B of the Corporations Act 2001:
Name Date of interest Number of ordinary shares(i) % of issued capital(ii)
Northcape Capital Pty Ltd 2 March 2016 68,086,949 8.19%National Australia Bank Limited and its associated entities 18 May 2016 48,907,291 5.882%The Vanguard Group, Inc 28 June 2016 42,218,117 5.078%
(i) As disclosed in the last notice lodged with the ASX by the substantial shareholder.(ii) The percentage set out in the notice lodged with the ASX is based on the total issued share capital of Tabcorp at the date of interest.
Marketable parcelThere were 14,674 shareholders holding less than a marketable parcel of ordinary shares ($500 or more, equivalent to 110 ordinary shares) based on a market price of $4.57 at the close of trading on 30 June 2016.
Shareholder informationAs at 30 June 2016
118Tabcorp Annual Report 2016
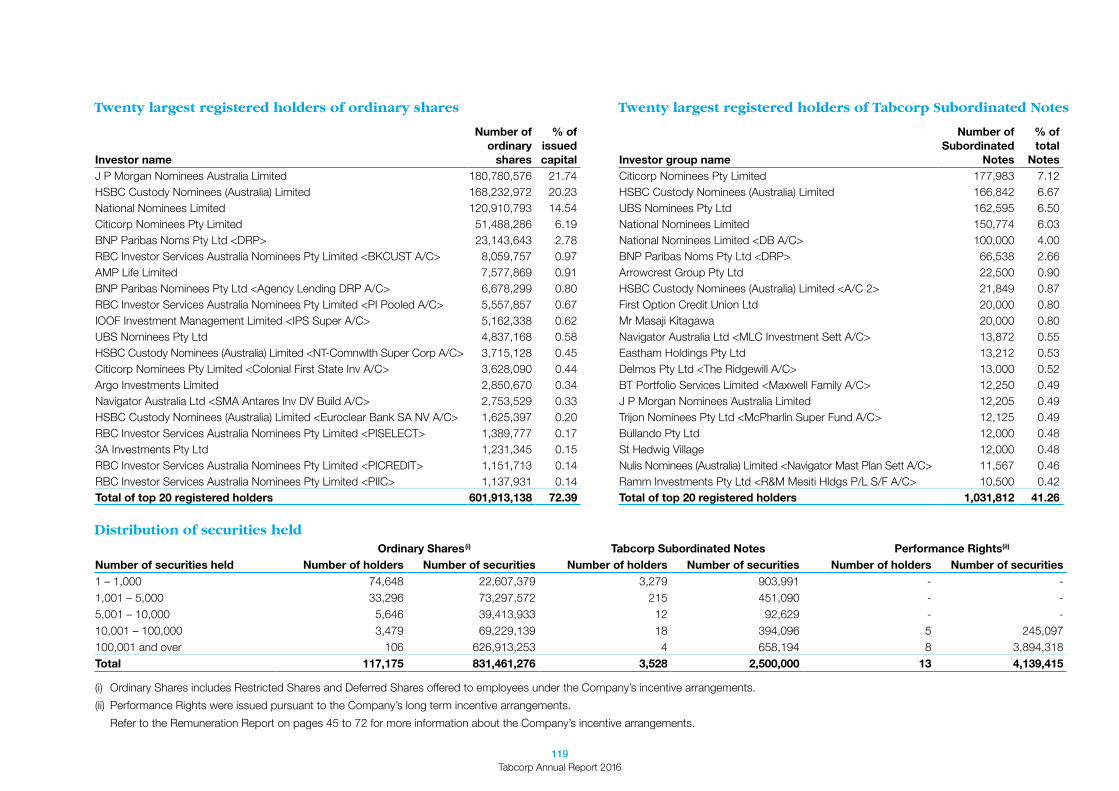
Twenty largest registered holders of ordinary shares
Investor name
Number of ordinary
shares
% of issued capital
J P Morgan Nominees Australia Limited 180,780,576 21.74HSBC Custody Nominees (Australia) Limited 168,232,972 20.23National Nominees Limited 120,910,793 14.54Citicorp Nominees Pty Limited 51,488,286 6.19BNP Paribas Noms Pty Ltd <DRP> 23,143,643 2.78RBC Investor Services Australia Nominees Pty Limited <BKCUST A/C> 8,059,757 0.97AMP Life Limited 7,577,869 0.91BNP Paribas Nominees Pty Ltd <Agency Lending DRP A/C> 6,678,299 0.80RBC Investor Services Australia Nominees Pty Limited <PI Pooled A/C> 5,557,857 0.67IOOF Investment Management Limited <IPS Super A/C> 5,162,338 0.62UBS Nominees Pty Ltd 4,837,168 0.58HSBC Custody Nominees (Australia) Limited <NT-Comnwlth Super Corp A/C> 3,715,128 0.45Citicorp Nominees Pty Limited <Colonial First State Inv A/C> 3,628,090 0.44Argo Investments Limited 2,850,670 0.34Navigator Australia Ltd <SMA Antares Inv DV Build A/C> 2,753,529 0.33HSBC Custody Nominees (Australia) Limited <Euroclear Bank SA NV A/C> 1,625,397 0.20RBC Investor Services Australia Nominees Pty Limited <PISELECT> 1,389,777 0.173A Investments Pty Ltd 1,231,345 0.15RBC Investor Services Australia Nominees Pty Limited <PICREDIT> 1,151,713 0.14RBC Investor Services Australia Nominees Pty Limited <PIIC> 1,137,931 0.14Total of top 20 registered holders 601,913,138 72.39
Twenty largest registered holders of Tabcorp Subordinated Notes
Investor group name
Number of Subordinated
Notes
% of total
NotesCiticorp Nominees Pty Limited 177,983 7.12HSBC Custody Nominees (Australia) Limited 166,842 6.67UBS Nominees Pty Ltd 162,595 6.50National Nominees Limited 150,774 6.03National Nominees Limited <DB A/C> 100,000 4.00BNP Paribas Noms Pty Ltd <DRP> 66,538 2.66Arrowcrest Group Pty Ltd 22,500 0.90HSBC Custody Nominees (Australia) Limited <A/C 2> 21,849 0.87First Option Credit Union Ltd 20,000 0.80Mr Masaji Kitagawa 20,000 0.80Navigator Australia Ltd <MLC Investment Sett A/C> 13,872 0.55Eastham Holdings Pty Ltd 13,212 0.53Delmos Pty Ltd <The Ridgewill A/C> 13,000 0.52BT Portfolio Services Limited <Maxwell Family A/C> 12,250 0.49J P Morgan Nominees Australia Limited 12,205 0.49Trijon Nominees Pty Ltd <McPharlin Super Fund A/C> 12,125 0.49Bullando Pty Ltd 12,000 0.48St Hedwig Village 12,000 0.48Nulis Nominees (Australia) Limited <Navigator Mast Plan Sett A/C> 11,567 0.46Ramm Investments Pty Ltd <R&M Mesiti Hldgs P/L S/F A/C> 10,500 0.42Total of top 20 registered holders 1,031,812 41.26
Distribution of securities heldOrdinary Shares(i) Tabcorp Subordinated Notes Performance Rights(ii)
Number of securities held Number of holders Number of securities Number of holders Number of securities Number of holders Number of securities1 – 1,000 74,648 22,607,379 3,279 903,991 - -1,001 – 5,000 33,296 73,297,572 215 451,090 - -5,001 – 10,000 5,646 39,413,933 12 92,629 - -10,001 – 100,000 3,479 69,229,139 18 394,096 5 245,097100,001 and over 106 626,913,253 4 658,194 8 3,894,318Total 117,175 831,461,276 3,528 2,500,000 13 4,139,415
(i) Ordinary Shares includes Restricted Shares and Deferred Shares offered to employees under the Company’s incentive arrangements.
(ii) Performance Rights were issued pursuant to the Company’s long term incentive arrangements.
Refer to the Remuneration Report on pages 45 to 72 for more information about the Company’s incentive arrangements.
118Tabcorp Annual Report 2016
119Tabcorp Annual Report 2016

Use the internet to easily manage your shareholdingShareholders can use the online share registry facility available on the Company’s website www.tabcorp.com.au, or on the share registry’s website www.linkmarketservices.com.au to conduct standard shareholding enquiries and transactions, including:
• Download dividend statements
• Update registered address
• Check current and previous shareholding balances
• Appoint a proxy to vote at the Annual General Meeting
• Lodge or update banking details
• Participate in the Dividend Reinvestment Plan
• Notify Tax File Number/Australian Business Number
Dividend paymentsAll dividends paid by Tabcorp to shareholders with a registered address in Australia are paid by direct credit into a nominated bank account with an Australian financial institution. Payments are electronically credited on payment date, allowing shareholders to utilise their funds immediately without any mailing or handling delays. There are also no misplaced or un-deposited cheques, and reduces the likelihood of mail fraud. Shareholders can provide and update their bank account details by using the online share registry facility or by contacting the share registry.
Dividend Reinvestment Plan (DRP)Tabcorp operates a DRP which enables participants to reinvest their dividends into acquiring additional Tabcorp ordinary shares without incurring any brokerage or handling costs. To elect to participate in the Company’s DRP, use the online share registry facility or contact the share registry.
Annual ReportTabcorp’s interactive Annual Reports are available online from the Company’s website, www.tabcorp.com.au. Annual Reports are sent to those shareholders who have requested to receive a copy. Shareholders who no longer wish to receive a hard copy of the Annual Report or wish to receive the Annual Report electronically should make their election by using the online share registry facility or contacting the share registry.
Electronic CommunicationsShareholders can elect to receive all their communications electronically, including dividend statements, Annual Report, Notice of Meeting and proxy form. This enables shareholders to receive their communications promptly and securely, and helps minimise the costs of printing and mailing. Shareholders can update their communication preferences by using the online share registry facility or by contacting the share registry.
Online shareholder services
Go to the online share registry facility
120Tabcorp Annual Report 2016

Company directory Key dates
Registered office
Tabcorp Holdings Limited5 Bowen CrescentMelbourne VIC 3004Australia
Telephone 03 9868 2100Facsimile 03 9868 2300Email [email protected]
Website
www.tabcorp.com.au
New South Wales office
Level 31680 George StreetSydney NSW 2000Telephone 02 9218 1000
Sky Racing/Sky Sports Radio
79 Frenchs Forest RoadFrenchs Forest NSW 2086Telephone 02 9451 0888
Queensland office
Level 1615 Adelaide StreetBrisbane QLD 4000Telephone 07 3243 4100
London office
3 London Bridge StreetLondon SE1 9SGENGLAND
Share Registry
Link Market Services LimitedLocked Bag A14Sydney South NSW 1235AustraliaTelephone 1300 665 661 Telephone 02 8280 7418Facsimile 02 9287 0303Facsimile 02 9287 0309 (proxy forms only)Email [email protected] www.linkmarketservices.com.au
Corporate information
The Company is a company limited by shares that is incorporated and domiciled in Australia.
Stock exchange listings
The Company’s securities are quoted on the Australian Securities Exchange (ASX) under the codes TAH for ordinary shares and TAHHB for Tabcorp Subordinated Notes.
Copyright
Information in this report has been prepared by Tabcorp, unless otherwise indicated. Information may be reproduced provided it is reproduced accurately and not in a misleading context. Where the material is being published or issued to others, the sources and copyright status should be acknowledged.
Investment warning
Past performance of shares is not necessarily a guide to future performance. The value of investments and any income from them is not guaranteed and can fall as well as rise. Tabcorp recommends investors seek independent professional advice before making investment decisions.
Privacy
Tabcorp respects the privacy of its stakeholders. Tabcorp’s Privacy Policy is available on the Company’s website at www.tabcorp.com.au.
Currency
References to currency are in Australian dollars unless otherwise stated.
2016Annual General Meeting (The Westin Sydney) 25 October
2017*Half year results announcement 2 FebruaryEx-dividend for interim dividend 7 FebruaryRecord date for interim dividend 8 FebruaryInterim dividend payment 15 MarchEnd of financial year 30 JuneFull year results announcement 4 AugustEx-dividend for final dividend 11 AugustRecord date for final dividend 14 AugustFinal dividend payment 18 SeptemberAnnual General Meeting (Melbourne) 23 October
* These are proposed dates.
See the Company’s website for updates (if any).
121Tabcorp Annual Report 2016

www.tabcorp.com.au


![30 March 2009 [REDACTED] - Productivity Commission · 30 March 2009 [REDACTED] ... 10.2 Comparison of the ACTTAB 2005 Agreement and the ... Tabcorp entered into a similar agreement](https://static.documents.pub/doc/80x56/5af551667f8b9a154c8f851f/30-march-2009-redacted-productivity-march-2009-redacted-102-comparison.jpg)


![[PUBLIC VERSION] - Australian Competition · PDF fileIN THE AUSTRALIAN COMPETITION TRIBUNAL ACT 1 of 2017 Re: Application by Tabcorp Holdings Limited under section 95AU of](https://static.documents.pub/doc/80x56/5a6fa2987f8b9aa2538b482c/public-version-australian-competition-tribunalwwwcompetitiontribunalgovaudocumentsact1-2017-tcostainpdfpdf.jpg)


