76
Annual Report 2018 ACN: 115 927 681 For personal use only
Annual Report2018
ACN: 115 927 681
For
per
sona
l use
onl
y
1 About Us
1 Highlights in 2018
2 Chairman’s Letter
4 Operation’s Review
10 Directors’ report
22 Auditor’s Independence Declaration
23 Financial statements
61 Directors’ Declaration
62 Independent Auditor’s Report
68 Additional Information
71 Tenement Report
DIRECTORSPeter Reeve - Executive ChairmanBob Beeson - Non-Executive Director Brett Fraser - Non-Executive Director Julian Perkins - Non-Executive Director
COMPANY SECRETARYJohn Madden
REGISTERED OFFICEAura EnergyLevel 1, 34-36 Punt RoadWindsor VIC 3181Telephone: +61 3 9516 6500Facsimile: +61 3 9516 6565Website: www.auraenergy.com.au
SHARE REGISTRYComputershare Investor Services Pty LtdLevel 2, Reserve Bank Building45 St Georges TerracePerth, WA 6000Telephone: 1300 557 010Facsimile: 08 9323 2033Email: [email protected]
NOMINATED ADVISOR AND AIM BROKERWH Ireland Limited24 Martin LaneLondon, England
AUDITORBentleys London HouseLevel 3, 216 St Georges TcePerth, WA 6000
SOLICITORSSteinepreis PaganinLevel 4, The Read Building16 Milligan StreetPerth, WA 6000
Corporate Directory
CONTENTS
AURA ENERGY LIMITED ANNUAL REPORT 201876
For
per
sona
l use
onl
y
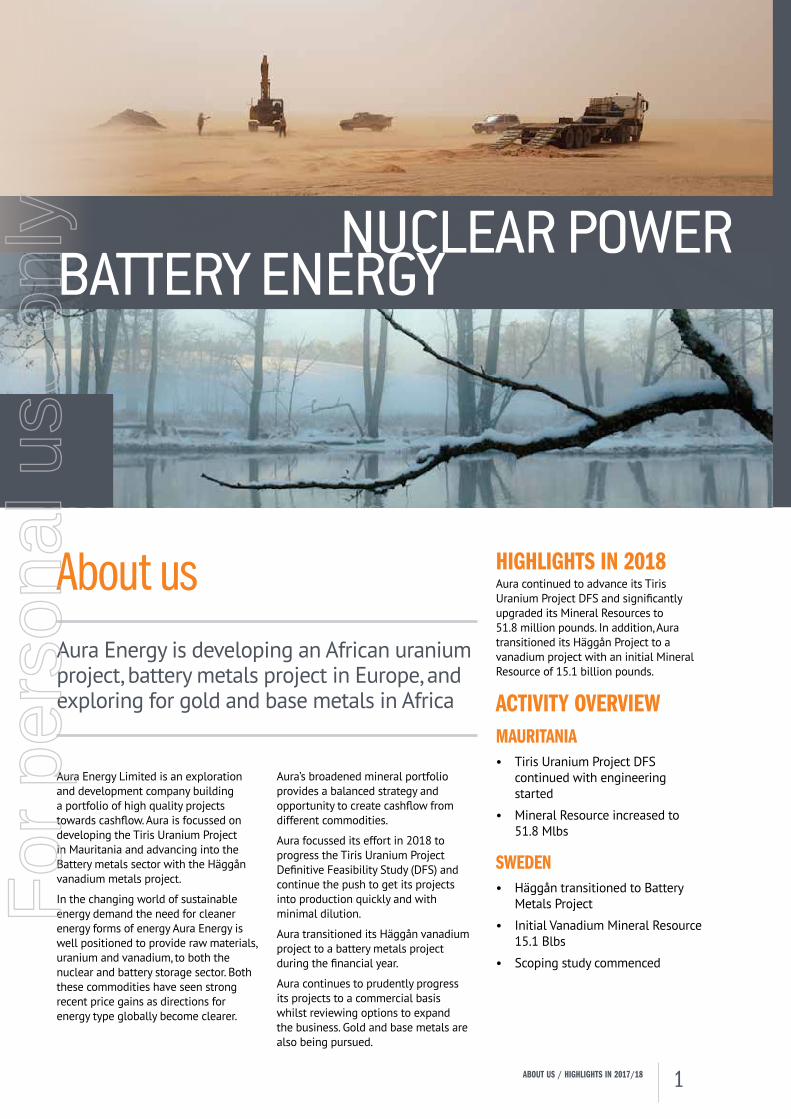
HIGHLIGHTS IN 2018Aura continued to advance its Tiris Uranium Project DFS and significantly upgraded its Mineral Resources to 51.8 million pounds. In addition, Aura transitioned its Häggån Project to a vanadium project with an initial Mineral Resource of 15.1 billion pounds.
ACTIVITY OVERVIEWMAURITANIA• Tiris Uranium Project DFS
continued with engineering started
• Mineral Resource increased to 51.8 Mlbs
SWEDEN• Häggån transitioned to Battery
Metals Project
• Initial Vanadium Mineral Resource 15.1 Blbs
• Scoping study commenced
About usAura Energy is developing an African uranium project, battery metals project in Europe, and exploring for gold and base metals in Africa
Aura Energy Limited is an exploration and development company building a portfolio of high quality projects towards cashflow. Aura is focussed on developing the Tiris Uranium Project in Mauritania and advancing into the Battery metals sector with the Häggån vanadium metals project.
In the changing world of sustainable energy demand the need for cleaner energy forms of energy Aura Energy is well positioned to provide raw materials, uranium and vanadium, to both the nuclear and battery storage sector. Both these commodities have seen strong recent price gains as directions for energy type globally become clearer.
Aura’s broadened mineral portfolio provides a balanced strategy and opportunity to create cashflow from different commodities.
Aura focussed its effort in 2018 to progress the Tiris Uranium Project Definitive Feasibility Study (DFS) and continue the push to get its projects into production quickly and with minimal dilution.
Aura transitioned its Häggån vanadium project to a battery metals project during the financial year.
Aura continues to prudently progress its projects to a commercial basis whilst reviewing options to expand the business. Gold and base metals are also being pursued.
NUCLEAR POWERBATTERY ENERGY
ABOUT US / HIGHLIGHTS IN 2017/18 1
For
per
sona
l use
onl
y
Aura Energy Limited has continued its push during 2018 to develop two projects, the Tiris Uranium Project in Mauritania and the Häggån Battery Metals Project in Sweden. Aura believes cashflow from projects is the best course to the creation of value for shareholders.
The broader conditions for resource companies and junior miners remained challenging for much of the year with subdued commodity pricing and legislative changes in Sweden to restrict uranium mining.
Aura however continues to adapt to the changing business circumstances and innovates to create visible paths to mining development. This is the case with the changes to the Häggån Battery Metals Project and the continued pursuit of it gold and base metals tenements in Mauritania.
Despite the weak uranium price for most of 2018, Aura continued to advance the Definitive Feasibility Study (DFS) for the Tiris Uranium Project but tempered the pace of that study. With improvement in the price towards the end of the financial year, the DFS is again at full pace. At the time of writing the uranium price has risen 25% from its low and is showing resilience at that level.
With the Tiris Uranium Project cash cost at a low $19.40/lb U3O8 the uranium price rise puts the competitiveness of Tiris in firm view and Aura is entertaining much new enquiry from potential new shareholders.
During the year Aura conducted significant field activities including drilling and large-scale bulk sample work. A significant outcome of this work was the declaration of a Measured and Indicated Resource of 17 million pounds U3O8. This resource upgrade greatly exceeded expectations.
The large-scale bulk-sampling work was required for metallurgical test work and understanding the geo-metallurgical domains within the orebody. It also provided significant anecdotal understanding of mining conditions and dust management issues.
Aura continues to target completion of the DFS around year end with report finalisation in to early next year. Aura will then proceed to financing and construction and expects first production in early 2020.
During the year, the Swedish Parliament passed legislation to ban uranium mining to align mining with their no-nuclear target by 2040.
In line with Aura’s internal innovation stance the company had commenced transitioning Häggån to development and production of a broader metal suite. With metal price changes it soon emerged that Häggån’s greatest value lay in its vanadium content.
As a result, Aura re-estimated its Häggån Resource at various vanadium cut-off grades and highlighted a 15.1 billion pound vanadium Inferred Resource. Importantly, within that large resource, a near-surface high grade zone at 0.42% V2O5 was defined containing 430 million lbs V2O5. This resource is within 20 metres of surface and no deeper than 100 metres and therefore ideally positioned for a compact small-scale operation.
Subsequent to year end Aura, had commenced a re-statement of the Häggån Scoping Study and commissioned independent engineers to estimate capital and operating costs.
Vanadium is primarily used in treatment of steel however is an emerging metal in the Battery Metal and energy storage market. Vanadium Redox Flow Batteries (VRFB’s) are now recognised as the only legitimate batteries suitable for large scale industrial battery storage.
Aura Energy Limited is developing two projects, the Tiris Uranium Project and the Häggån Battery Metals Project which collectively contain significant Mineral Resources and a broad suit of metals. Aura believes shareholders are best served pursuing production and cashflow.
Chairman’s Letter
2 AURA ENERGY LIMITED ANNUAL REPORT 2018
For
per
sona
l use
onl
y

ChAiRmAn's LetteR
In order to expedite development of the Häggån Battery Metals Project and maximise the value of the project to Aura shareholders, a process to separately list the project has commenced. An international stock exchange has been targeted and preliminary investor discussions have been undertaken.
Aura plans to initially to retain 70-80% of the separately listed vehicle and progressively sell down over time as the considerable inherent value of this asset is realised.
Aura’s good fortune on the commodity front continued with the vanadium price also rising 25% over the last 2 months of the year. This was primarily driven by changes in the Chinese rebar specifications which will now require higher levels of vanadium for strength and corrosion resistance in concrete structures.
The potential for higher vanadium demand for the growing VFRB sector has also driven speculation in the vanadium price.
Aura continues to press the Mauritanian Government regarding its gold and base metal tenement applications in Mauritania. Whilst the delays in these grants are frustrating,
their very promising geological potential is enticing for Aura and the potential for discovery and success is high.
Aura continues to pursue a future with operating projects producing strong cashflow as this will deliver maximum benefits to Aura shareholders.
Aura will continue to review new regions and prospects for its next growth area.
In June this year, Aura completed a Private Placement which resulted in the company raising $3.7 million (before costs) to advance its projects and, particularly, the separate listing of the Häggån Battery Metals Project.
I would like to thank shareholders, again for their support during 2018.
I would also like to thank our staff and board for their efforts in our achievements during the year.
Peter Reeve
Executive Chairman
Dated this Thursday, 27 September 2018
3CHAIRMAN'S LETTER
For
per
sona
l use
onl
y
During the financial year Aura continued to advance its Tiris Uranium Project DFS and transition its Häggån Project to a battery metals project under light market conditions for raising new equity.
TIRIS URANIUM PROJECT – 100%, MAURITANIAThe Tiris Uranium Project envisages an operation with an average life of mine production rate of approximately 800,000 pounds U3O8 over 15 years. Internal expansion case studies suggest there is potential for Aura to produce 3 million pounds U3O8 per annum.
GEOLOGY PROGRAMMEField activities focused primarily on the Tiris uranium project where an extensive drilling program was conducted in order to upgrade a substantial part of the Inferred uranium resource to Measured and Indicated Resource categories, within the Hippolyte and Lazare deposits, where it is proposed that mining will commence.
In addition, new resource zones were established at Hippolyte South.
This program involved:
• Aircore drilling: 7,900 metres drilling in 1,428 drillholes
• Diamond drilling: 52 diamond drillhole were completed to provide validation of downhole gamma logging results and to provide density information
• Downhole gamma logging: all drillhole were logged to record gamma radiation in order to estimate uranium grade.
The data from these programs was used to provide a new resource estimate. This was carried out by resource consultants H&S Consultants Pty Ltd, and resulted in the delineation of Measured and Indicated resources of 17 million pounds U3O8 within a total resource of 51.8 million pounds U3O8 (at a 100 ppm U3O8 cut-off).
A water drilling program, focused on the basal sedimentary units of the Taoudeni Basin, commenced.
A weather station was installed onsite, recording key weather data at 10-minute intervals.
Operations Review
4 AURA ENERGY LIMITED ANNUAL REPORT 2018
For
per
sona
l use
onl
y
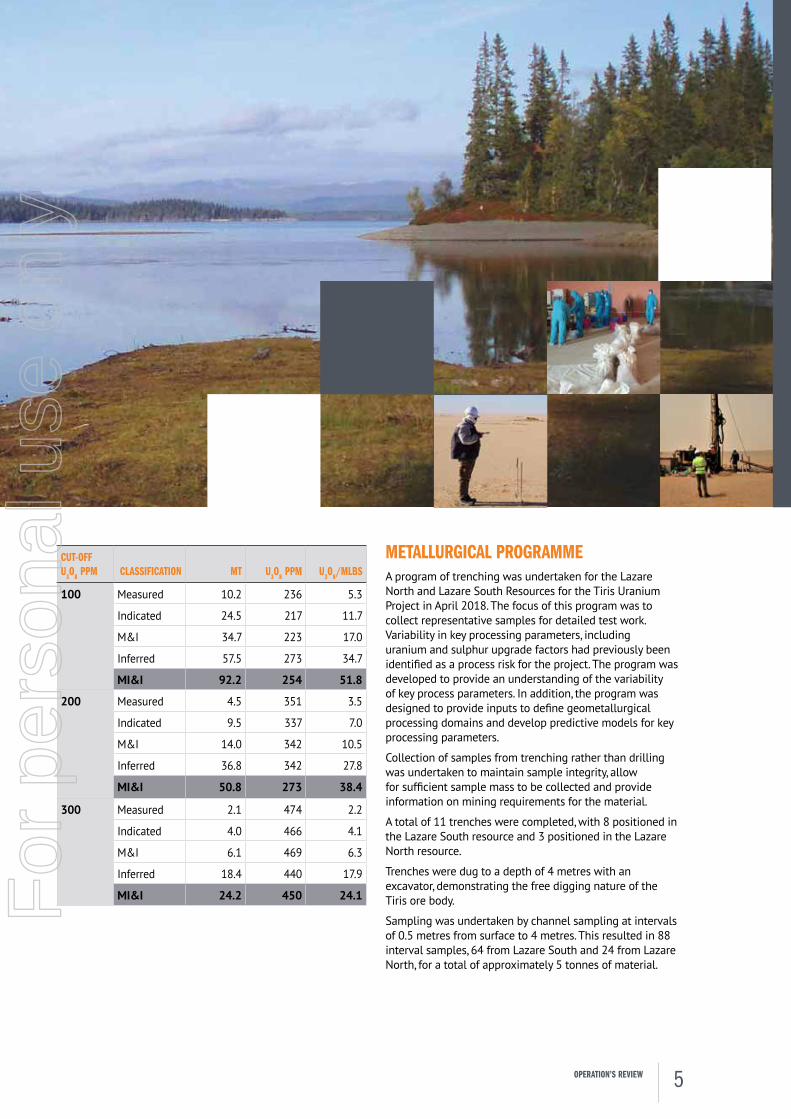
CUT-OFF U3O8 PPM CLASSIFICATION MT U3O8 PPM U3O8/MLBS
100 Measured 10.2 236 5.3
Indicated 24.5 217 11.7
M&I 34.7 223 17.0
Inferred 57.5 273 34.7
MI&I 92.2 254 51.8
200 Measured 4.5 351 3.5
Indicated 9.5 337 7.0
M&I 14.0 342 10.5
Inferred 36.8 342 27.8
MI&I 50.8 273 38.4
300 Measured 2.1 474 2.2
Indicated 4.0 466 4.1
M&I 6.1 469 6.3
Inferred 18.4 440 17.9
MI&I 24.2 450 24.1
METALLURGICAL PROGRAMMEA program of trenching was undertaken for the Lazare North and Lazare South Resources for the Tiris Uranium Project in April 2018. The focus of this program was to collect representative samples for detailed test work. Variability in key processing parameters, including uranium and sulphur upgrade factors had previously been identified as a process risk for the project. The program was developed to provide an understanding of the variability of key process parameters. In addition, the program was designed to provide inputs to define geometallurgical processing domains and develop predictive models for key processing parameters.
Collection of samples from trenching rather than drilling was undertaken to maintain sample integrity, allow for sufficient sample mass to be collected and provide information on mining requirements for the material.
A total of 11 trenches were completed, with 8 positioned in the Lazare South resource and 3 positioned in the Lazare North resource.
Trenches were dug to a depth of 4 metres with an excavator, demonstrating the free digging nature of the Tiris ore body.
Sampling was undertaken by channel sampling at intervals of 0.5 metres from surface to 4 metres. This resulted in 88 interval samples, 64 from Lazare South and 24 from Lazare North, for a total of approximately 5 tonnes of material.
5OPERATION’S REVIEW
For
per
sona
l use
onl
y

Interval samples were further processed at Aura’s laboratory in Nouakchott, Mauritania. All samples were scrubbed and screened at 75 µm and 150 µm to determine uranium recovery and upgrade factor, along with rejection of reagent consuming minerals to the beneficiated product. The analysis was performed on all interval samples to provide a model for variability in beneficiation behaviour.
Once completed, the results will provide a model for variability in process behaviour across the Lazare South and Lazare North resources. This information will be used to compile representative process behaviour based domains for use in detailed feasibility test work.
As part of ongoing DFS, Aura has conducted a review of the potential for recovery of valuable by-products. A strategic target for Aura is the production of vanadium and the potential for vanadium recovery was included in the review.
Vanadium in the Tiris resources occurs with uranium in carnotite, potassium uranium vanadate (K2(UO2)2(VO4)2·3H2O), the host mineral for uranium in the Tiris Project. Vanadium is extracted from carnotite along with uranium in the alkaline leach.
As part of the battery metal development, Aura is to initiate studies and test work investigating the economic viability of adding a vanadium ion exchange and purification circuit to the Tiris Project. Aura will investigate options to incorporate a vanadium recovery circuit within the uranium ion exchange circuit. Vanadium would then be recovered to vanadium pentoxide (V2O5) through a standard precipitation and purification process.
Allowing for only recovery of vanadium hosted in carnotite Aura would target production of 250,000 lb/a V2O5. This provides the opportunity for near term production of vanadium pentoxide (V2O5), with entry to the vanadium market while Aura’s world class Häggån Battery Metals Project is under development.
ENGINEERING PROGRAMMEThe company retained a project engineer in June 2017 with specific responsibility for the advancement of the Tiris project feasibility study. During the financial year, work commenced on general and process design criteria, with agreed capacities and expected process outcomes.
Mincore was retained to produce a desktop study, capital estimate and 3D CAD models for 6 options of RoM ore beneficiation up to the input to leaching with the final study provided towards the end of 2018.
Following a peer review, the project design criteria was revised down to 1 million tonnes per annum RoM ore throughput as the project basis. The company then reviewed the optimum central location for the processing plant, based on reducing trucking costs from the uranium deposits. The conclusion was to have the front end of the plant (attrition/screening/pumping) transportable and located adjacent to the current operating open pit. This outcome was refined further, the process plant location being confirmed at the centre of the high-grade Lazare resources.
Estimates were determined for electrical power and water requirements, and sought budget pricing for diesel fuel delivery, hybrid diesel and solar power generation, and water pumping and pipeline costs for the site.
To advance site work, a satellite survey was commissioned from the Vancouver based survey company during the financial year. The company obtained survey results for the 59 km2 site area centred on the Lazare resource and identified possible plant sites close to the centre of the high-grade Lazare resource and airstrip.
A Senegalese geotechnical company was retained in April 2018, to carry out site investigations with an excavator digging pits on the 3 possible sites.
Cost estimates were obtained from two major Mauritanian construction companies labour and equipment hire rates, concrete and steel pricing. Mauritanian trucking quotes were also obtained for bulk construction transport.
Equipment requirements and cost estimates were obtained from suppliers of screens and rotary drums, precipitation, drying and drumming plant for U3O8. Cost estimates were also obtained for a complete plant communications system covering the 4 sites of the process plant, camp, transportable front end/mine, and the remote water supply plant.
6 AURA ENERGY LIMITED ANNUAL REPORT 2018
For
per
sona
l use
onl
y
EXPLOITATION LICENCESAura lodged Exploitation Licence applications with the Ministry of Petroleum, Energy and Mines Ministry of Mines in May 2017. The Company seeks to secure three exploitation licences to cover an area of 433 km2.
The applications are currently under review by relevant government authorities.
LITHIUM AND SODA-ASH SEARCH PROGRAMMEThe extensive salt lakes in Mauritania, known locally as sabkhas, are a potential source for sodium carbonate or soda ash which is a reagent required for the leaching of uranium from Tiris ore. This environment is also a potential source of other valuable substances, notably lithium.
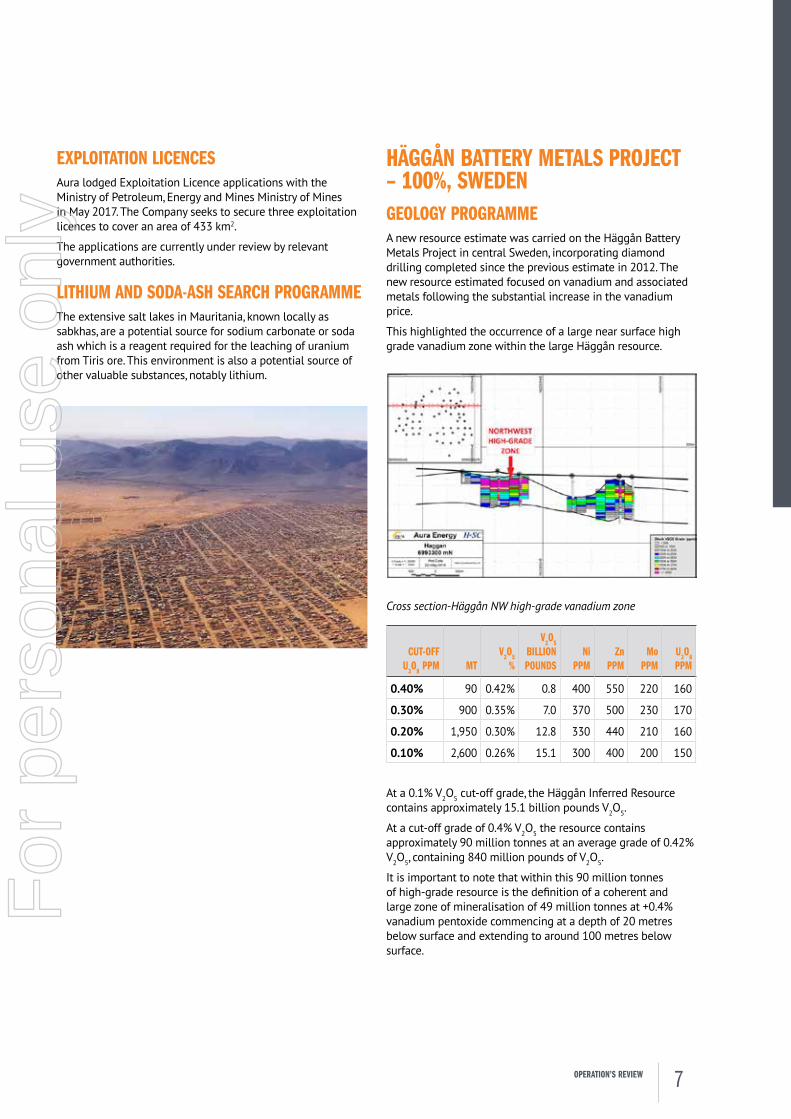
HÄGGÅN BATTERY METALS PROJECT – 100%, SWEDENGEOLOGY PROGRAMMEA new resource estimate was carried on the Häggån Battery Metals Project in central Sweden, incorporating diamond drilling completed since the previous estimate in 2012. The new resource estimated focused on vanadium and associated metals following the substantial increase in the vanadium price.
This highlighted the occurrence of a large near surface high grade vanadium zone within the large Häggån resource.
Cross section-Häggån NW high-grade vanadium zone
CUT-OFF U3O8 PPM MT
V2O5 %
V2O5 BILLION POUNDS
Ni PPM
Zn PPM
Mo PPM
U3O8 PPM
0.40% 90 0.42% 0.8 400 550 220 160
0.30% 900 0.35% 7.0 370 500 230 170
0.20% 1,950 0.30% 12.8 330 440 210 160
0.10% 2,600 0.26% 15.1 300 400 200 150
At a 0.1% V2O5 cut-off grade, the Häggån Inferred Resource contains approximately 15.1 billion pounds V2O5.
At a cut-off grade of 0.4% V2O5 the resource contains approximately 90 million tonnes at an average grade of 0.42% V2O5, containing 840 million pounds of V2O5.
It is important to note that within this 90 million tonnes of high-grade resource is the definition of a coherent and large zone of mineralisation of 49 million tonnes at +0.4% vanadium pentoxide commencing at a depth of 20 metres below surface and extending to around 100 metres below surface.
7OPERATION’S REVIEW
For
per
sona
l use
onl
y

METALLURGICAL PROGRAMMETo support development of Aura’s Häggån Battery Metals Project, a detailed review of historic test work was undertaken. This review focused on vanadium with the purpose to technically define process options for vanadium recovery.
This review identified that vanadium was most likely hosted in vanadium rich mica minerals and would require oxidation for efficient recovery. The review identified that a beneficiation upgrade of 1.3x could be achieved with 73% V recovery. The most promising option for leach recovery of vanadium was identified as acid pressure leaching.
Following the review of Häggån test work it was identified that beneficiation of the Häggån ore was possible and desirable to minimise mass of material to leach. A program of test work was commissioned with ALS Laboratories, Burnie to examine flotation response of vanadium rich Häggån drill core samples. This test work focused on testing amenability of the material to beneficiation by gravity and classification methods. In addition, the flotation of pyrite and vanadium bearing mica was examined, with rejection of acid consuming calcite.
Supported by the test work a program was commissioned to examine process flow sheet options for vanadium and by-product recovery. METS Engineering, Perth was commissioned to examined flowsheet options. Two core options were included. The first included beneficiation followed by acid pressure leaching of the beneficiated material. The second included beneficiation followed by oxidative calcination and atmospheric acid leach. The results of this study are expected early in FY17/18.
These findings showed that considerable work had been completed on vanadium extraction. While this testwork had not been optimised for vanadium recovery it did indicate that the recovery of vanadium is feasible from the Häggån resource.
Aura commenced a Scoping Study for the Häggån Battery Metals Project in late June 2018 focusing on vanadium.
METS Engineering was engaged to assist with process flowsheet development, based on historic test work inputs, with capital and operating cost estimates. The program was initiated in late June 2018 with two flowsheet options agreed as initial targets.
TASIAST SOUTH GOLD PROSPECTAs previously advised, Aura secured the rights to acquire 175 km2 of prospective gold tenements covering three under-explored mineralised greenstone belts in Mauritania. The areas lie along strike from Kinross’ giant 21 Moz Tasiast gold mine and also from Algold’s Tijirit gold project. The areas are currently held under exploration permit applications and whilst the leases were expected to be granted quickly at year end the grants were still outstanding.
The grant of the exploration licenses, usually a straightforward process, has been hampered by the goal of the government to relocate artisan miners off ground subject to formal applications.
These highly prospective gold areas cover lightly explored Archean greenstone belts and favourably located 200 km from Nouakchott, 60 km from the coast, and can be managed efficiently within the company’s existing management resources without distraction from Aura’s core uranium focus.
Previous exploration for gold on these permit areas also located strongly anomalous nickel values in several areas, associated with ultramafic rocks. In parts of the tenements high nickel values are associated with anomalous copper highlighting potential for nickel-copper sulphide mineralisation, as occurs in the greenstone belts of Australia and Canada. At this stage there has been no follow-up work carried out on these nickel targets.
Aura’s Tasiast South project area has the following attributes:
• Tenements over two lightly explored greenstone belts covering 175 km2
• The 20 Moz Tasiast gold mine is nearby on the same greenstone belt and highlights the potential for major deposits in the region
• $3 million has been expended by the previous explorer on airborne geophysics, reverse circulation and air-core drilling, and sampling
• Broad zones of gold mineralisation have been identified with strong similarities to the Tasiast gold mine mineralisation and alteration
• No testing deeper than 150m with most previous holes less than 100m
• High grade drill intersections have been reported by others in the district from both past and current programme, including one programmes in progress with Algold Resources (a TSX-listed entity), which highlight the current interest and potential in these poorly tested belts
Next steps following grant of the tenements at the Tasiast South project are:
• Ground electrical geophysics to locate the strongest zones of disseminated sulphide development for drill targeting
• Additional bedrock sampling by air-core or auger-drilling to better define the high nickel ultramafics and zones of copper/nickel for follow up drilling
• Deep drill testing of targets defined
8 AURA ENERGY LIMITED ANNUAL REPORT 2018
For
per
sona
l use
onl
y

URANIUM MARKETSpot prices appear to have bottomed out with spot prices now average around $26 per pound.
Uranium use is projected to grow from 85,000 tonnes in 2018 to 94,300 tonnes by 2020. This will be driven in large part by China, which completed its Sanmen nuclear plant in the June quarter and has several other reactors within months of completion. Approvals for future plant constructions in China are also picking up following a slackening in 2017.
Demand is also rising in Japan, which re-connected unit 4 of its Ohi nuclear plant in May, and its Genkai 4 unit in June. South Korea, which currently has almost half of its nuclear fleet offline for maintenance, is expected to increase its demand in 2019. Russia has also completed its floating Akademik Lomonosov plant, which is capable of providing mobile power generation and desalination to virtually any coastal location.
New markets also appear to be emerging for nuclear power in the Middle East. Russia’s State Atomic Energy Corporation has recently signed a contract to construct four 1200 MW reactors in Egypt. This follows an earlier announcement of four 1400 MW units to be constructed in the United Arab Emirates by South Korean companies. Turkey has announced plans to build a huge 4800 MW nuclear project. It is likely that 11,000 MW of new nuclear capacity will be constructed in the Middle East by 2030.
In the US, Terrestrial Energy USA and Energy Northwest have signed a memorandum of understanding on constructing the world’s first Integral Molten Salt Reactor (IMSR). IMSRs use a liquid fuel mix which is incapable of melting down. The elimination of meltdown risk removes the need for the expensive reactor shields and cooling facilities used in traditional reactors. IMSRs could be commercialised by the 2020s.
Mine production is expected to rebound slightly, following significant cuts in output from large mines in Canada, Niger, and Kazakhstan. These cuts reduced overall world production sharply to 60,600 tonnes in 2018.
Some of these cuts are scheduled to wind back over the outlook period, leading to a rise in mine production to 69,700 tonnes by 2020. Supply is also expected to be supported by higher secondary output (which encompasses material entering the market from sources other than mines). This added secondary output includes higher inventory run-down by large utilities and sales from the United States Enrichment Corporation.
Although supply is likely to grow moderately over time, it is expected that overall output and demand will move much nearer to parity over the next two years.
VANADIUM MARKETVanadium is a metalliferous element, number 23 on the periodic table of elements. In its native state, vanadium is a silvery-grey, ductile, and malleable transition metal. A number of recent structural market changes have resulted in the vanadium price increasing dramatically over the past three years, from a 2016 base in the low USD$3/lb range for vanadium pentoxide (V2O5) to hitting a peak of over US$19/lb V2O5 during 2018.
Vanadium is used principally in the production of metal alloys, such as full alloy steel, high-strength-low-alloy steel (‘HSLA’) and specialty alloys for use in the aerospace industry. Secondary uses are as catalysts for the chemical industry, and in ceramics, glass, pigments and energy storage. Over 90% of the demand for vanadium emanates from the production of high-strength steel, hence vanadium consumption trends are heavily influenced by trends in steel production. Vanadium has been declared a ‘critical mineral resource’ by the US Geological Survey.
The size of the vanadium market in 2017 was approximately 80,000 tonnes (V) with, according to industry group Vanitec, demand estimated as outstripping supply by up to approximately 8,000 tonnes.
In addition to its primary use as an alloying agent, a future major potential use of vanadium is in the energy storage industry, as an electrolyte in vanadium redox flow batteries (“VRBs”) and also in lithium-vanadium batteries. VRBs have the potential to provide large-scale energy storage for grid-size applications. It is estimated that VRBs accounted for around 2% of the vanadium demand in 2017, with some market players predicting this to increase to over 20% by 2030.
The recent strength of the vanadium market is believed to have been caused by a combination of the strength in demand from alloyed steel production and the burgeoning energy storage market, which is predicted to grow exponentially over the near/mid-term; as well as the reduction in production from less environmentally-focussed producers in China, where over 50% of the global vanadium is produced. In addition, Chinese construction standards have recently been tightened, requiring higher levels of vanadium use in steel rebar adding to demand.
9OPERATION’S REVIEW
For
per
sona
l use
onl
y
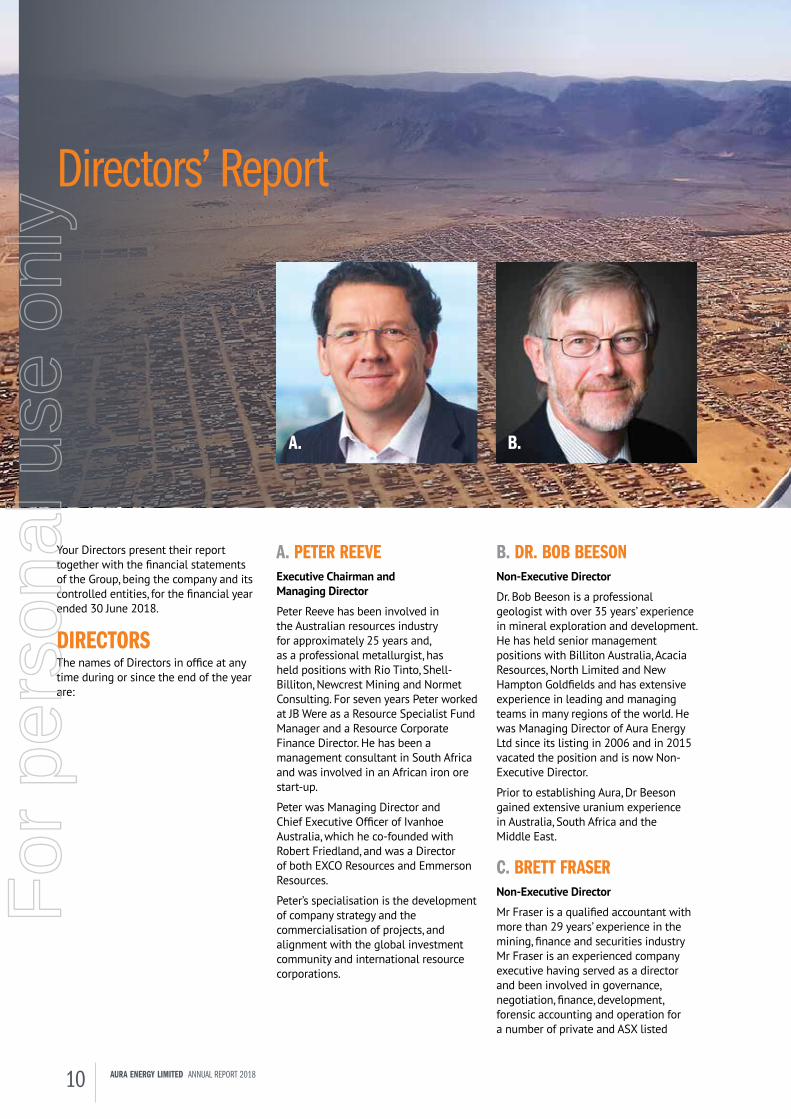
A. PETER REEVEExecutive Chairman and Managing Director
Peter Reeve has been involved in the Australian resources industry for approximately 25 years and, as a professional metallurgist, has held positions with Rio Tinto, Shell-Billiton, Newcrest Mining and Normet Consulting. For seven years Peter worked at JB Were as a Resource Specialist Fund Manager and a Resource Corporate Finance Director. He has been a management consultant in South Africa and was involved in an African iron ore start-up.
Peter was Managing Director and Chief Executive Officer of Ivanhoe Australia, which he co-founded with Robert Friedland, and was a Director of both EXCO Resources and Emmerson Resources.
Peter’s specialisation is the development of company strategy and the commercialisation of projects, and alignment with the global investment community and international resource corporations.
B. DR. BOB BEESONNon-Executive Director
Dr. Bob Beeson is a professional geologist with over 35 years’ experience in mineral exploration and development. He has held senior management positions with Billiton Australia, Acacia Resources, North Limited and New Hampton Goldfields and has extensive experience in leading and managing teams in many regions of the world. He was Managing Director of Aura Energy Ltd since its listing in 2006 and in 2015 vacated the position and is now Non-Executive Director.
Prior to establishing Aura, Dr Beeson gained extensive uranium experience in Australia, South Africa and the Middle East.
C. BRETT FRASERNon-Executive Director
Mr Fraser is a qualified accountant with more than 29 years’ experience in the mining, finance and securities industry Mr Fraser is an experienced company executive having served as a director and been involved in governance, negotiation, finance, development, forensic accounting and operation for a number of private and ASX listed
Your Directors present their report together with the financial statements of the Group, being the company and its controlled entities, for the financial year ended 30 June 2018.
DIRECTORSThe names of Directors in office at any time during or since the end of the year are:
A. B.
Directors’ Report
10 AURA ENERGY LIMITED ANNUAL REPORT 2018
For
per
sona
l use
onl
y

companies. As the founder or officer of businesses in mining, securities trading, the beverage industry, media, leisure health and corporate finance Mr Fraser has extensive knowledge and skills in company operations. Mr Fraser is the Non-Executive Chairman of Blina Minerals, former Chairman of Doray Minerals Ltd and the Securities Institute Education, WA chapter, and also a former director of Gage Roads Brewing Co and Brainytoys Limited. Mr Fraser holds a Bachelor of Business degree, is a Fellow of Certified Practising Accountants, is a Fellow of the Financial Services Institute of Australasia and has completed post graduate studies in finance and marketing.
D. JULIAN PERKINSNon-Executive Director
Mr Julian Perkins has over 40 years’ experience in the global minerals industry. He has held senior technical management positions in Australia for AngloGold Ashanti Ltd, Acacia Resources Ltd, Shell Australia, and prior to that for Billiton International Metals (part of the Shell Group) in the Netherlands. He has degrees in mining and metallurgical
C. D.
E.
engineering, with operational experience in underground mining in South Africa and the metallurgical operations at Nchanga on the Zambian Copperbelt. He is a Graduate of the Australian Institute of Company Directors.
Mr Perkins has extensive experience in research and development. He was head of the mineral processing department at the Arnhem metals research centre of Shell Research in the Netherlands for three years. In Australia he was Chairman of the Board of Parker Centre Ltd, which managed the A J Parker Cooperative Research Centre (CRC) for Hydrometallurgy from 2006 to 2012, having been a director prior to that. He has also been a director on the boards of the Cooperative Research Centre for Mining and the Australian Centre for Mining Environmental Research. He designed and managed the early metallurgical testwork and flowsheet design for both of Aura’s projects. He has been a non-executive director of Aura Energy Limited since 2011.
Directors have been in office since the start of the financial year to the date of this report unless otherwise stated.
E. JOHN MADDENCompany Secretary
John started his career with Rio Tinto Limited (formerly CRA Limited) and held a number of positions in accounting, planning, business analysis and taxation as well as the acquisitions group. Between 1996 and 2000, John was the Manager- Finance for Rio Tinto at the Grasberg copper-gold project in West Papua. On leaving Rio Tinto in 2000, John worked in Papua New Guinea for three years on the Hidden Valley/Wafi gold projects feasibility studies and for five years on the Tampakan copper-gold project in the Philippines where he was the General Manager- Commercial and Company Secretary for Indophil Resources NL.
John has provided strategic and commercial advice as well as specialist financial modelling services to OK Tedi Mining Limited, Intrepid Mines Limited, the Australian Iron Ore Joint Venture and Mesa Minerals Limited from 2008 to 2011.
John has extensive commercial and legal experience in Francophone Africa as he co-founded Indian Pacific Resources Limited, a Madagascar-based iron ore explorer and served as an executive officer from 2011 to 2015.
11DIRECTORS' REPORT
For
per
sona
l use
onl
y
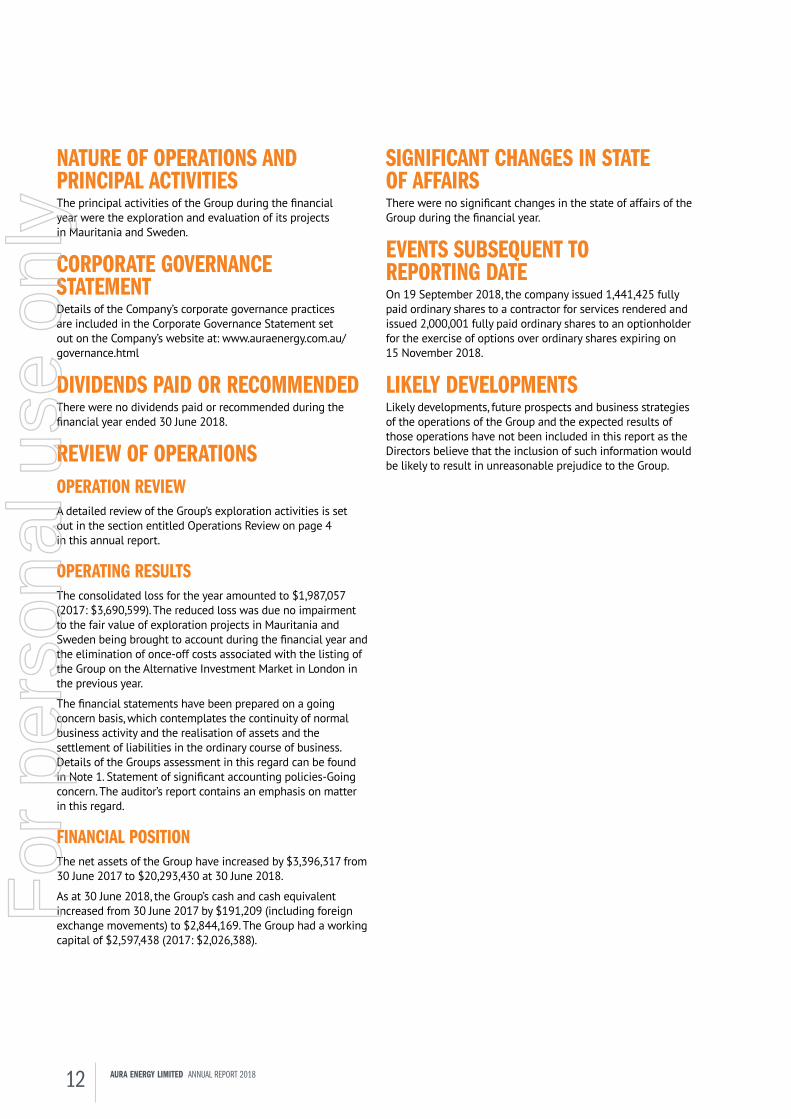
NATURE OF OPERATIONS AND PRINCIPAL ACTIVITIESThe principal activities of the Group during the financial year were the exploration and evaluation of its projects in Mauritania and Sweden.
CORPORATE GOVERNANCE STATEMENTDetails of the Company’s corporate governance practices are included in the Corporate Governance Statement set out on the Company’s website at: www.auraenergy.com.au/governance.html
DIVIDENDS PAID OR RECOMMENDEDThere were no dividends paid or recommended during the financial year ended 30 June 2018.
REVIEW OF OPERATIONSOPERATION REVIEWA detailed review of the Group’s exploration activities is set out in the section entitled Operations Review on page 4 in this annual report.
OPERATING RESULTSThe consolidated loss for the year amounted to $1,987,057 (2017: $3,690,599). The reduced loss was due no impairment to the fair value of exploration projects in Mauritania and Sweden being brought to account during the financial year and the elimination of once-off costs associated with the listing of the Group on the Alternative Investment Market in London in the previous year.
The financial statements have been prepared on a going concern basis, which contemplates the continuity of normal business activity and the realisation of assets and the settlement of liabilities in the ordinary course of business. Details of the Groups assessment in this regard can be found in Note 1. Statement of significant accounting policies-Going concern. The auditor’s report contains an emphasis on matter in this regard.
FINANCIAL POSITIONThe net assets of the Group have increased by $3,396,317 from 30 June 2017 to $20,293,430 at 30 June 2018.
As at 30 June 2018, the Group’s cash and cash equivalent increased from 30 June 2017 by $191,209 (including foreign exchange movements) to $2,844,169. The Group had a working capital of $2,597,438 (2017: $2,026,388).
SIGNIFICANT CHANGES IN STATE OF AFFAIRSThere were no significant changes in the state of affairs of the Group during the financial year.
EVENTS SUBSEQUENT TO REPORTING DATEOn 19 September 2018, the company issued 1,441,425 fully paid ordinary shares to a contractor for services rendered and issued 2,000,001 fully paid ordinary shares to an optionholder for the exercise of options over ordinary shares expiring on 15 November 2018.
LIKELY DEVELOPMENTSLikely developments, future prospects and business strategies of the operations of the Group and the expected results of those operations have not been included in this report as the Directors believe that the inclusion of such information would be likely to result in unreasonable prejudice to the Group.
12 AURA ENERGY LIMITED ANNUAL REPORT 2018
For
per
sona
l use
onl
y
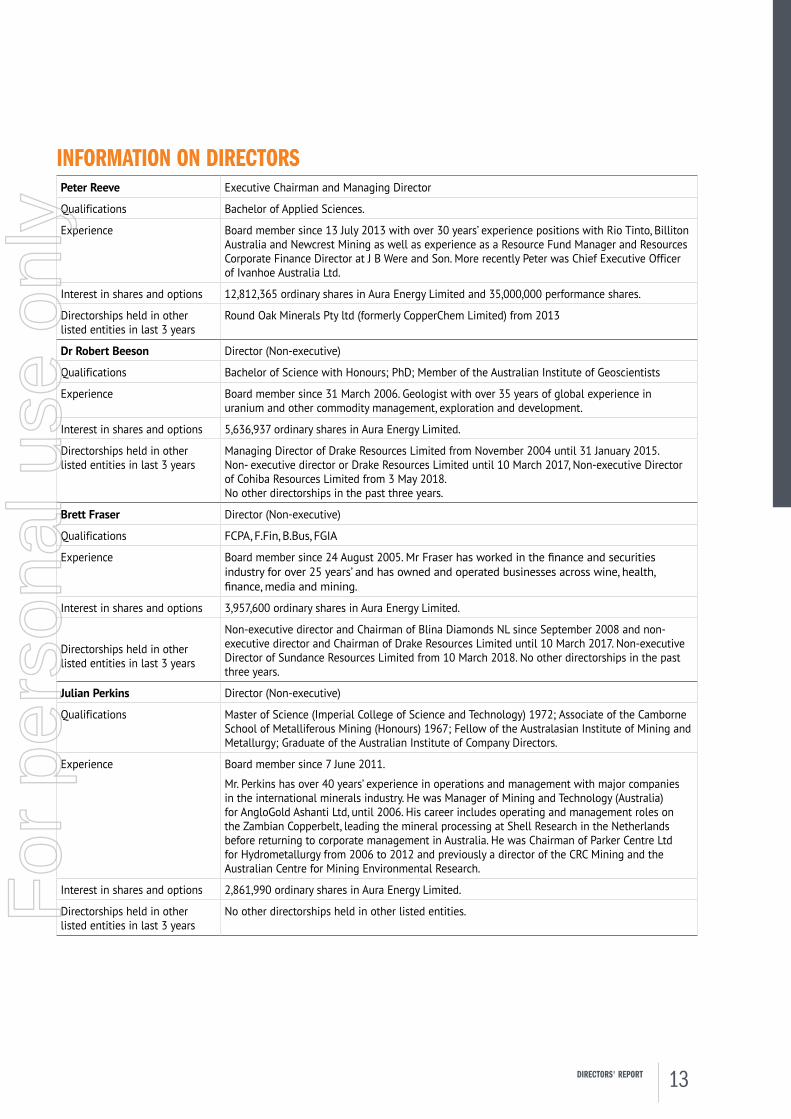
INFORMATION ON DIRECTORSPeter Reeve Executive Chairman and Managing Director
Qualifications Bachelor of Applied Sciences.
Experience Board member since 13 July 2013 with over 30 years’ experience positions with Rio Tinto, Billiton Australia and Newcrest Mining as well as experience as a Resource Fund Manager and Resources Corporate Finance Director at J B Were and Son. More recently Peter was Chief Executive Officer of Ivanhoe Australia Ltd.
Interest in shares and options 12,812,365 ordinary shares in Aura Energy Limited and 35,000,000 performance shares.
Directorships held in other listed entities in last 3 years
Round Oak Minerals Pty ltd (formerly CopperChem Limited) from 2013
Dr Robert Beeson Director (Non-executive)
Qualifications Bachelor of Science with Honours; PhD; Member of the Australian Institute of Geoscientists
Experience Board member since 31 March 2006. Geologist with over 35 years of global experience in uranium and other commodity management, exploration and development.
Interest in shares and options 5,636,937 ordinary shares in Aura Energy Limited.
Directorships held in other listed entities in last 3 years
Managing Director of Drake Resources Limited from November 2004 until 31 January 2015. Non- executive director or Drake Resources Limited until 10 March 2017, Non-executive Director of Cohiba Resources Limited from 3 May 2018. No other directorships in the past three years.
Brett Fraser Director (Non-executive)
Qualifications FCPA, F.Fin, B.Bus, FGIA
Experience Board member since 24 August 2005. Mr Fraser has worked in the finance and securities industry for over 25 years’ and has owned and operated businesses across wine, health, finance, media and mining.
Interest in shares and options 3,957,600 ordinary shares in Aura Energy Limited.
Directorships held in other listed entities in last 3 years
Non-executive director and Chairman of Blina Diamonds NL since September 2008 and non- executive director and Chairman of Drake Resources Limited until 10 March 2017. Non-executive Director of Sundance Resources Limited from 10 March 2018. No other directorships in the past three years.
Julian Perkins Director (Non-executive)
Qualifications Master of Science (Imperial College of Science and Technology) 1972; Associate of the Camborne School of Metalliferous Mining (Honours) 1967; Fellow of the Australasian Institute of Mining and Metallurgy; Graduate of the Australian Institute of Company Directors.
Experience Board member since 7 June 2011.
Mr. Perkins has over 40 years’ experience in operations and management with major companies in the international minerals industry. He was Manager of Mining and Technology (Australia) for AngloGold Ashanti Ltd, until 2006. His career includes operating and management roles on the Zambian Copperbelt, leading the mineral processing at Shell Research in the Netherlands before returning to corporate management in Australia. He was Chairman of Parker Centre Ltd for Hydrometallurgy from 2006 to 2012 and previously a director of the CRC Mining and the Australian Centre for Mining Environmental Research.
Interest in shares and options 2,861,990 ordinary shares in Aura Energy Limited.
Directorships held in other listed entities in last 3 years
No other directorships held in other listed entities.
13DIRECTORS' REPORT
For
per
sona
l use
onl
y

MEETINGS OF DIRECTORSDuring the financial year the board of directors held seven meetings (including committees of directors) with the remainder of meetings conducted by way of written resolution. Attendances by each director during the year were as follows:
COMMITTEE MEETINGS
DIRECTORS’ MEETINGS REMUNERATION COMMITTEE AUDIT COMMITTEE
NUMBER ELIGIBLE TO ATTEND NUMBER ATTENDED
NUMBER ELIGIBLE TO ATTEND NUMBER ATTENDED
NUMBER ELIGIBLE TO ATTEND NUMBER ATTENDED
PD Reeve 7 7 - - - -
Dr R Beeson 7 5 2 2 2 2
BF Fraser 7 7 2 2 2 2
JC Perkins 7 7 2 2 2 1
NON-AUDIT SERVICESDuring the year ended 30 June 2018, AIM listing and taxation consulting services were provided to the Company by a party related to the auditors, Bentleys. These services amounted to $894 (2017: $10,550). Details of remuneration paid to the auditor can be found within the financial statements at Note 4 Auditor’s remuneration.
The directors are satisfied that the provision of non-audit services during the year by Bentleys (or by another person or firm on Bentley’s behalf) is compatible with the general standard of independence for auditors imposed by the Corporations Act 2001 (Cth).
INDEMNIFYING OFFICERS OR AUDITORDuring or since the end of the financial year the Company has given an indemnity or entered into an agreement to indemnify, or paid or agreed to pay insurance premiums as follows:
• The Company has entered into agreements to indemnify all directors and provide access to documents, against any liability arising from a claim brought by a third party against the Company. The agreement provides for the Company to pay all damages and costs which may be awarded against the directors.
• The Company has paid premiums to insure each of the directors against liabilities for costs and expenses incurred by them in defending any legal proceedings arising out of their conduct while acting in the capacity of director of the company, other than conduct involving a willful breach of duty in relation to the Company. The amount of the premium was $31,959 (2017: $19,360).
• No indemnity has been paid to auditors of the Group.
ENVIRONMENTAL REGULATIONSThe Company is commencing exploration and evaluation activities in Mauritania and Sweden. Both countries have environmental regulation for the conduct of exploration activities. The Company has complied with these environmental regulations in the conduct of all field activities.
The directors have considered the enacted National Greenhouse and Energy Reporting Act 2007 (the NGER Act) which introduced a single national reporting framework for the reporting and dissemination of information about the greenhouse gas emissions, greenhouse gas projects, and energy use and production of corporations. At the current stage of development, the directors have determined that the NGER Act has no effect on the Company for the current, nor subsequent, financial year. The directors will reassess this position as and when the need arises.
14 AURA ENERGY LIMITED ANNUAL REPORT 2018
For
per
sona
l use
onl
y

OPTIONSAt the date of this report, the unissued ordinary shares of Aura Energy Limited under option (listed and unlisted) are as follows:
GRANT DATE DATE OF EXPIRY EXERCISE PRICE NUMBER UNDER OPTION
12 September 2017 11 September 2019 $0.0200 6,578,699
15 November 2017 15 November 2018 $0.0200 18,408,333
14 June 2018 30 September 2019 $0.0330 97,368,421
14 June 2018 30 September 2019 $0.0330 5,000,000
14 June 2018 30 September 2019 $0.0330 2,747,788
14 June 2018 30 September 2019 $0.0330 1,172,566
131,275,807
No person entitled to exercise the option has or has any right by virtue of the option to participate in any share issue of any other body corporate.
PROCEEDINGS ON BEHALF OF THE COMPANYNo person has applied for leave of Court to bring proceedings on behalf of the Company or intervene in any proceedings to which the Company is a party for the purpose of taking responsibility on behalf of the Company for all or any part of those proceedings.
The Company was not a party to any such proceedings during the year.
AUDITOR’S INDEPENDENCE DECLARATIONThe lead auditor’s independence declaration for the year ended 30 June 2018 has been received and can be found in the annual report.
REMUNERATION REPORT (AUDITED)REMUNERATION POLICYThe remuneration policy of the Group has been designed to align director and management objectives with shareholder and business objectives by providing a fixed remuneration component, and offering specific long-term incentives based on key performance areas affecting the Group’s financial results. The board of directors believes the remuneration policy to be appropriate and effective in its ability to attract and retain the best management and directors to run and manage the Group, as well as create goal congruence between directors, executives and shareholders.
The policy of the board of directors for determining the nature and amount of remuneration for board members and senior executives of the Group is described in the following paragraphs.
The remuneration policy of the Group sets the terms and conditions for executive directors and other senior executives. Due to the rapidly changing circumstances of the Group in recent years, the policy is reviewed annually by the board of directors with the purpose of maintaining alignment of the board and management with the Group’s strategic objectives. Management is also entitled to participate in employee share and option arrangements. All executives receive a base salary which takes into account such factors as length of service and experience, superannuation and share based incentive such as options. The board of directors review executive packages annually by reference to the performance of the Group, individual executives and relevant comparable remuneration data from similar listed companies and appropriate industry sectors. Independent expert advice is sought as required.
15DIRECTORS' REPORT
For
per
sona
l use
onl
y
REMUNERATION POLICY (CONT)The total amount of non-executive directors’ remuneration is proposed by the board of directors from time to time at the Annual General Meeting and is subject to formal approval by shareholders. Within this limit, the board of directors presently remunerates non-executive directors at around the average of those obtained from relevant comparable data from similar listed companies and appropriate industry sectors. A measure of longer-term incentive is provided by the allocation of options to non-executive directors. The board of directors determines remuneration to individual non-executive directors, working within the limit set by shareholders, and taking into account any special duties or accountability. Payments to non-executive directors are not linked to Company performance but in order to align their interest with those of shareholders, non-executive directors are encouraged to hold shares in Aura Energy Limited.
Executives and non-executive directors have received a superannuation guarantee contribution as required by law, which increased to 9.5% on 1 July 2014, but do not receive any other retirement benefits.
All remuneration paid to non-executive directors and executives is valued at the cost to the Company and is expensed. Options over ordinary shares granted to directors and employees are valued using the Black-Scholes methodology. Details of directors’ and executives’ interests in options as at 30 June 2018 are provided in the Remuneration Report of the financial statements.
The Chairman became Executive Chairman and Managing Director of the Company with effect on 1 January 2015 and accordingly, is a fulltime employee. The Executive Chairman and Managing Director had agreed to settle 20% of his salary by way of fully paid ordinary shares in the Company. In November 2017 the above arrangement was varied by the Company and the Executive Chairman and Managing Director to convert the sharebased remuneration to a cash based remuneration.
Under clause 14.7 of the Constitution of the Company, approved by shareholders at the annual general meeting on 30 November 2017, the total aggregate amount fixed sum per annum to be paid to non- executive directors is $300,000. The Company proposes to put to shareholders a resolution to raise this total aggregate fixed sum to $300,000. This is the first time the total aggregate fixed term will have been raised since incorporation.
At the annual general meeting on 30 November 2017, 75.1% of votes cast for the adoption of the remuneration report voted in favour of the resolution. The number of votes cast in favour of the resolution totaled 36,629,089.
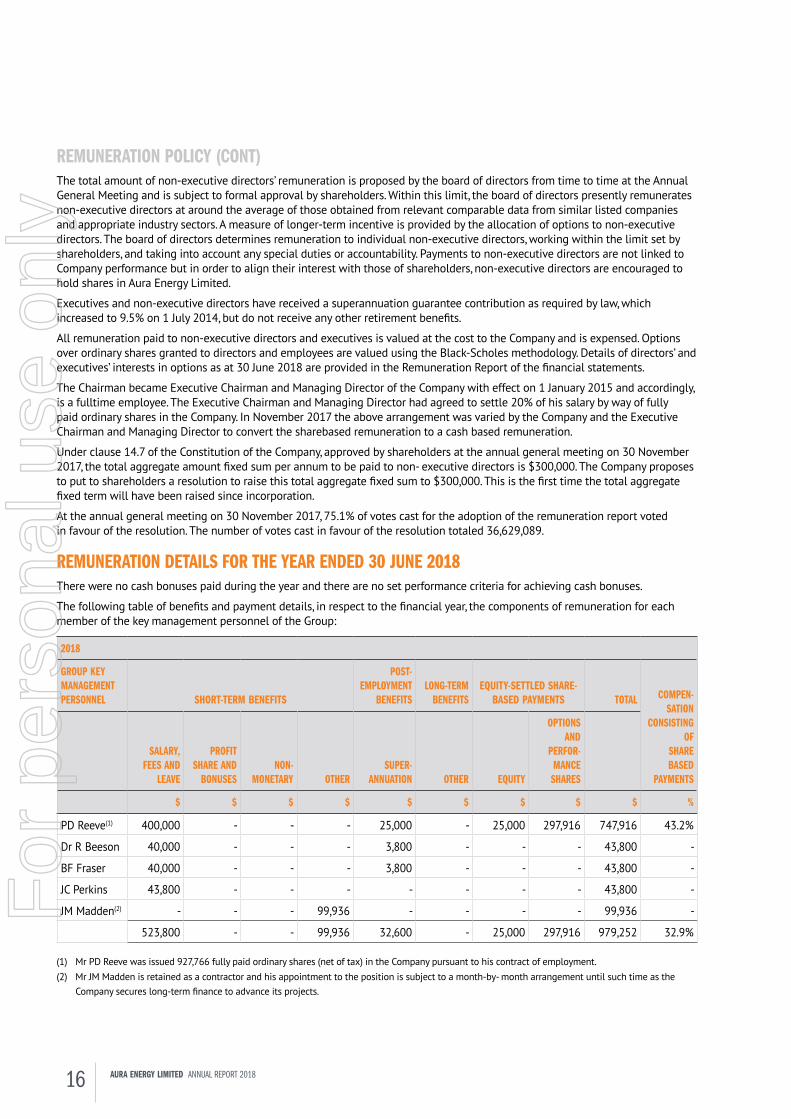
REMUNERATION DETAILS FOR THE YEAR ENDED 30 JUNE 2018There were no cash bonuses paid during the year and there are no set performance criteria for achieving cash bonuses.
The following table of benefits and payment details, in respect to the financial year, the components of remuneration for each member of the key management personnel of the Group:
2018
GROUP KEY MANAGEMENT PERSONNEL SHORT-TERM BENEFITS
POST- EMPLOYMENT
BENEFITSLONG-TERM
BENEFITSEQUITY-SETTLED SHARE-
BASED PAYMENTS TOTAL COMPEN- SATION
CONSISTING OF
SHARE BASED
PAYMENTS
SALARY, FEES AND
LEAVE
PROFIT SHARE AND
BONUSESNON-
MONETARY OTHERSUPER-
ANNUATION OTHER EQUITY
OPTIONS AND
PERFOR- MANCE SHARES
$ $ $ $ $ $ $ $ $ %
PD Reeve(1) 400,000 - - - 25,000 - 25,000 297,916 747,916 43.2%
Dr R Beeson 40,000 - - - 3,800 - - - 43,800 -
BF Fraser 40,000 - - - 3,800 - - - 43,800 -
JC Perkins 43,800 - - - - - - - 43,800 -
JM Madden(2) - - - 99,936 - - - - 99,936 -
523,800 - - 99,936 32,600 - 25,000 297,916 979,252 32.9%
(1) Mr PD Reeve was issued 927,766 fully paid ordinary shares (net of tax) in the Company pursuant to his contract of employment.(2) Mr JM Madden is retained as a contractor and his appointment to the position is subject to a month-by- month arrangement until such time as the
Company secures long-term finance to advance its projects.
16 AURA ENERGY LIMITED ANNUAL REPORT 2018
For
per
sona
l use
onl
y
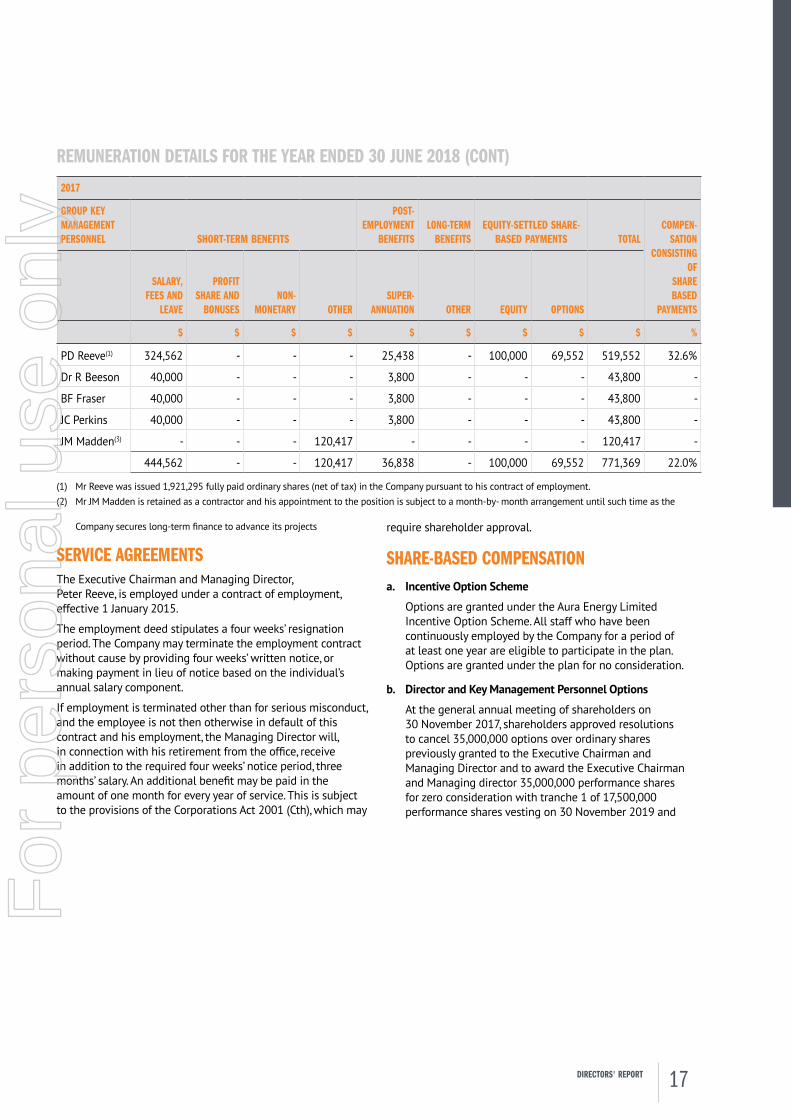
REMUNERATION DETAILS FOR THE YEAR ENDED 30 JUNE 2018 (CONT)2017
GROUP KEY MANAGEMENT PERSONNEL SHORT-TERM BENEFITS
POST- EMPLOYMENT
BENEFITSLONG-TERM
BENEFITSEQUITY-SETTLED SHARE-
BASED PAYMENTS TOTALCOMPEN-
SATION CONSISTING
OFSHARE BASED
PAYMENTS
SALARY, FEES AND
LEAVE
PROFIT SHARE AND
BONUSESNON-
MONETARY OTHERSUPER-
ANNUATION OTHER EQUITY OPTIONS
$ $ $ $ $ $ $ $ $ %
PD Reeve(1) 324,562 - - - 25,438 - 100,000 69,552 519,552 32.6%
Dr R Beeson 40,000 - - - 3,800 - - - 43,800 -
BF Fraser 40,000 - - - 3,800 - - - 43,800 -
JC Perkins 40,000 - - - 3,800 - - - 43,800 -
JM Madden(3) - - - 120,417 - - - - 120,417 -
444,562 - - 120,417 36,838 - 100,000 69,552 771,369 22.0%
(1) Mr Reeve was issued 1,921,295 fully paid ordinary shares (net of tax) in the Company pursuant to his contract of employment.(2) Mr JM Madden is retained as a contractor and his appointment to the position is subject to a month-by- month arrangement until such time as the
Company secures long-term finance to advance its projects
SERVICE AGREEMENTSThe Executive Chairman and Managing Director, Peter Reeve, is employed under a contract of employment, effective 1 January 2015.
The employment deed stipulates a four weeks’ resignation period. The Company may terminate the employment contract without cause by providing four weeks’ written notice, or making payment in lieu of notice based on the individual’s annual salary component.
If employment is terminated other than for serious misconduct, and the employee is not then otherwise in default of this contract and his employment, the Managing Director will, in connection with his retirement from the office, receive in addition to the required four weeks’ notice period, three months’ salary. An additional benefit may be paid in the amount of one month for every year of service. This is subject to the provisions of the Corporations Act 2001 (Cth), which may
require shareholder approval.
SHARE-BASED COMPENSATIONa. Incentive Option Scheme
Options are granted under the Aura Energy Limited Incentive Option Scheme. All staff who have been continuously employed by the Company for a period of at least one year are eligible to participate in the plan. Options are granted under the plan for no consideration.
b. Director and Key Management Personnel Options
At the general annual meeting of shareholders on 30 November 2017, shareholders approved resolutions to cancel 35,000,000 options over ordinary shares previously granted to the Executive Chairman and Managing Director and to award the Executive Chairman and Managing director 35,000,000 performance shares for zero consideration with tranche 1 of 17,500,000 performance shares vesting on 30 November 2019 and
17DIRECTORS' REPORT
For
per
sona
l use
onl
y
Tranche 2 of 17,500,000 performance shares vesting on 30 November 2020.
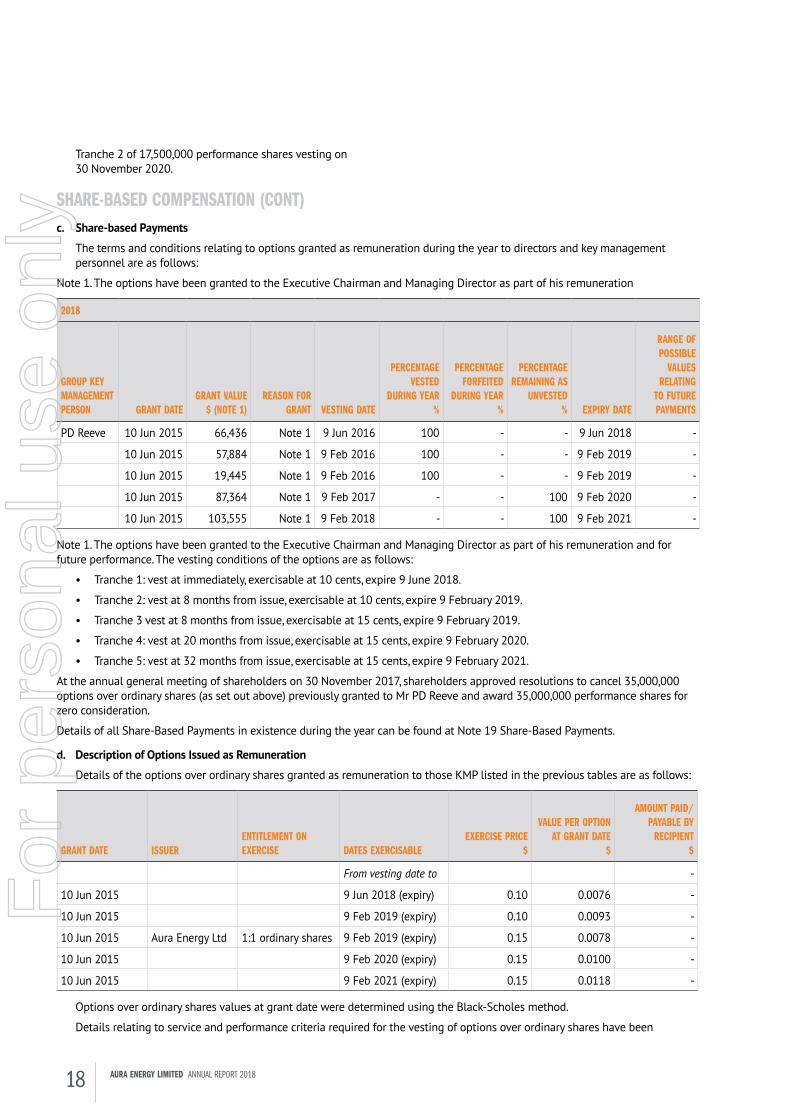
SHARE-BASED COMPENSATION (CONT)c. Share-based Payments
The terms and conditions relating to options granted as remuneration during the year to directors and key management personnel are as follows:
Note 1. The options have been granted to the Executive Chairman and Managing Director as part of his remuneration
2018
GROUP KEY MANAGEMENT PERSON GRANT DATE
GRANT VALUE$ (NOTE 1)
REASON FOR GRANT VESTING DATE
PERCENTAGE VESTED
DURING YEAR%
PERCENTAGE FORFEITED
DURING YEAR%
PERCENTAGE REMAINING AS
UNVESTED% EXPIRY DATE
RANGE OF POSSIBLE
VALUES RELATING
TO FUTURE PAYMENTS
PD Reeve 10 Jun 2015 66,436 Note 1 9 Jun 2016 100 - - 9 Jun 2018 -
10 Jun 2015 57,884 Note 1 9 Feb 2016 100 - - 9 Feb 2019 -
10 Jun 2015 19,445 Note 1 9 Feb 2016 100 - - 9 Feb 2019 -
10 Jun 2015 87,364 Note 1 9 Feb 2017 - - 100 9 Feb 2020 -
10 Jun 2015 103,555 Note 1 9 Feb 2018 - - 100 9 Feb 2021 -
Note 1. The options have been granted to the Executive Chairman and Managing Director as part of his remuneration and for future performance. The vesting conditions of the options are as follows:
• Tranche 1: vest at immediately, exercisable at 10 cents, expire 9 June 2018.
• Tranche 2: vest at 8 months from issue, exercisable at 10 cents, expire 9 February 2019.
• Tranche 3 vest at 8 months from issue, exercisable at 15 cents, expire 9 February 2019.
• Tranche 4: vest at 20 months from issue, exercisable at 15 cents, expire 9 February 2020.
• Tranche 5: vest at 32 months from issue, exercisable at 15 cents, expire 9 February 2021.
At the annual general meeting of shareholders on 30 November 2017, shareholders approved resolutions to cancel 35,000,000 options over ordinary shares (as set out above) previously granted to Mr PD Reeve and award 35,000,000 performance shares for zero consideration.
Details of all Share-Based Payments in existence during the year can be found at Note 19 Share-Based Payments.
d. Description of Options Issued as Remuneration
Details of the options over ordinary shares granted as remuneration to those KMP listed in the previous tables are as follows:
GRANT DATE ISSUERENTITLEMENT ON EXERCISE DATES EXERCISABLE
EXERCISE PRICE$
VALUE PER OPTION AT GRANT DATE
$
AMOUNT PAID/ PAYABLE BY
RECIPIENT$
From vesting date to -
10 Jun 2015 9 Jun 2018 (expiry) 0.10 0.0076 -
10 Jun 2015 9 Feb 2019 (expiry) 0.10 0.0093 -
10 Jun 2015 Aura Energy Ltd 1:1 ordinary shares 9 Feb 2019 (expiry) 0.15 0.0078 -
10 Jun 2015 9 Feb 2020 (expiry) 0.15 0.0100 -
10 Jun 2015 9 Feb 2021 (expiry) 0.15 0.0118 -
Options over ordinary shares values at grant date were determined using the Black-Scholes method.
Details relating to service and performance criteria required for the vesting of options over ordinary shares have been
18 AURA ENERGY LIMITED ANNUAL REPORT 2018
For
per
sona
l use
onl
y
provided in the within the financial statements at Note 19. Share-based payments.
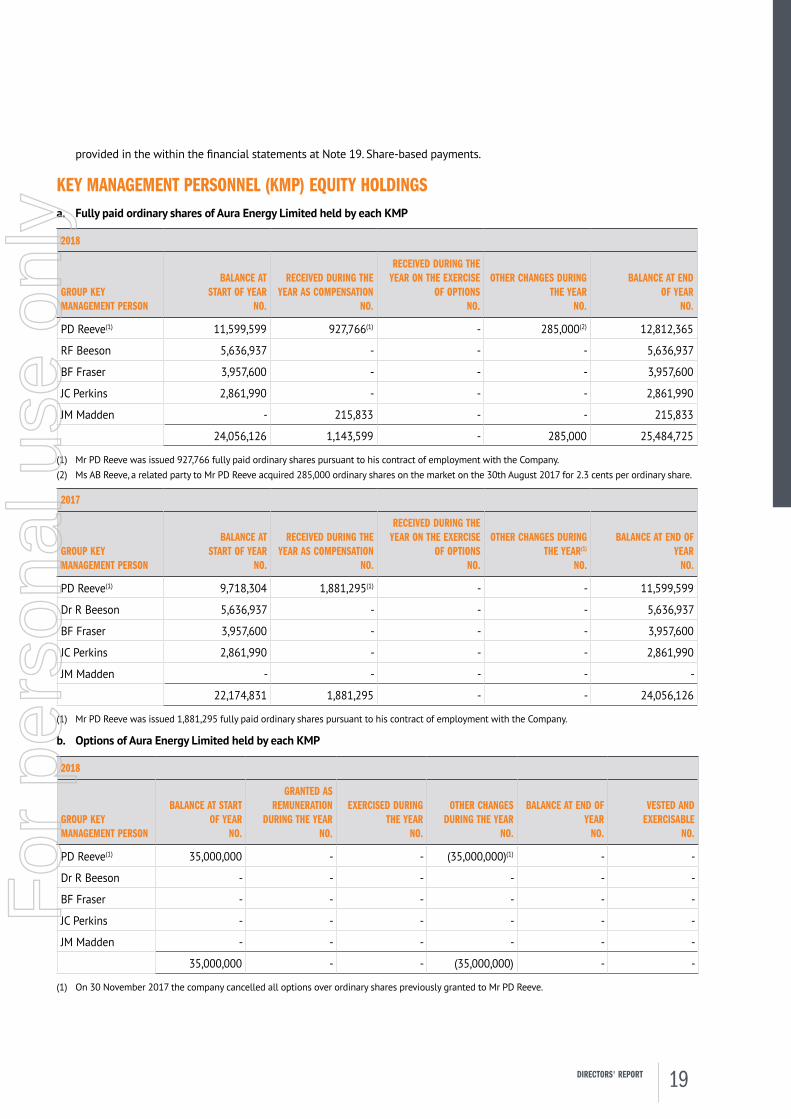
KEY MANAGEMENT PERSONNEL (KMP) EQUITY HOLDINGSa. Fully paid ordinary shares of Aura Energy Limited held by each KMP
2018
GROUP KEY MANAGEMENT PERSON
BALANCE AT START OF YEAR
NO.
RECEIVED DURING THE YEAR AS COMPENSATION
NO.
RECEIVED DURING THE YEAR ON THE EXERCISE
OF OPTIONS NO.
OTHER CHANGES DURING THE YEAR
NO.
BALANCE AT END OF YEAR
NO.
PD Reeve(1) 11,599,599 927,766(1) - 285,000(2) 12,812,365
RF Beeson 5,636,937 - - - 5,636,937
BF Fraser 3,957,600 - - - 3,957,600
JC Perkins 2,861,990 - - - 2,861,990
JM Madden - 215,833 - - 215,833
24,056,126 1,143,599 - 285,000 25,484,725
(1) Mr PD Reeve was issued 927,766 fully paid ordinary shares pursuant to his contract of employment with the Company.(2) Ms AB Reeve, a related party to Mr PD Reeve acquired 285,000 ordinary shares on the market on the 30th August 2017 for 2.3 cents per ordinary share.
2017
GROUP KEY MANAGEMENT PERSON
BALANCE AT START OF YEAR
NO.
RECEIVED DURING THE YEAR AS COMPENSATION
NO.
RECEIVED DURING THE YEAR ON THE EXERCISE
OF OPTIONS NO.
OTHER CHANGES DURING THE YEAR(1)
NO.
BALANCE AT END OF YEAR
NO.
PD Reeve(1) 9,718,304 1,881,295(1) - - 11,599,599
Dr R Beeson 5,636,937 - - - 5,636,937
BF Fraser 3,957,600 - - - 3,957,600
JC Perkins 2,861,990 - - - 2,861,990
JM Madden - - - - -
22,174,831 1,881,295 - - 24,056,126
(1) Mr PD Reeve was issued 1,881,295 fully paid ordinary shares pursuant to his contract of employment with the Company.
b. Options of Aura Energy Limited held by each KMP
2018
GROUP KEY MANAGEMENT PERSON
BALANCE AT START OF YEAR
NO.
GRANTED AS REMUNERATION
DURING THE YEAR NO.
EXERCISED DURING THE YEAR
NO.
OTHER CHANGES DURING THE YEAR
NO.
BALANCE AT END OF YEAR
NO.
VESTED AND EXERCISABLE
NO.
PD Reeve(1) 35,000,000 - - (35,000,000)(1) - -
Dr R Beeson - - - - - -
BF Fraser - - - - - -
JC Perkins - - - - - -
JM Madden - - - - - -
35,000,000 - - (35,000,000) - -
(1) On 30 November 2017 the company cancelled all options over ordinary shares previously granted to Mr PD Reeve.
19DIRECTORS' REPORT
For
per
sona
l use
onl
y
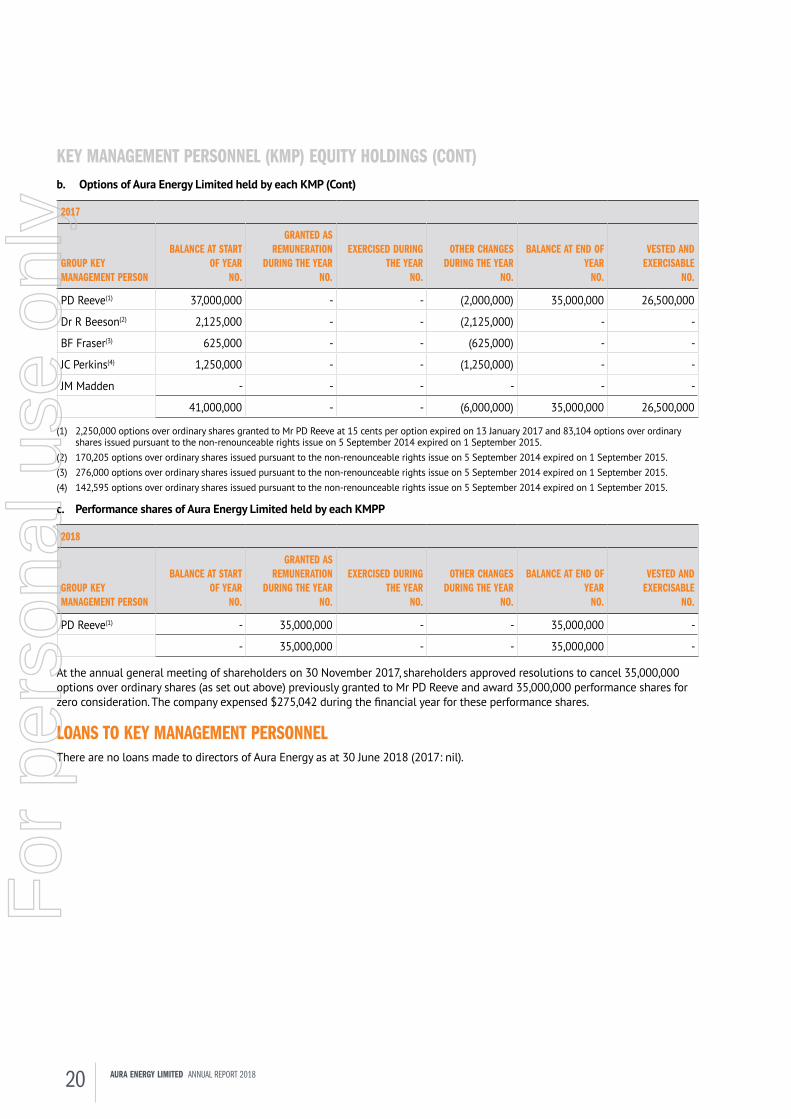
KEY MANAGEMENT PERSONNEL (KMP) EQUITY HOLDINGS (CONT)b. Options of Aura Energy Limited held by each KMP (Cont)
2017
GROUP KEY MANAGEMENT PERSON
BALANCE AT START OF YEAR
NO.
GRANTED AS REMUNERATION
DURING THE YEAR NO.
EXERCISED DURING THE YEAR
NO.
OTHER CHANGES DURING THE YEAR
NO.
BALANCE AT END OF YEAR
NO.
VESTED AND EXERCISABLE
NO.
PD Reeve(1) 37,000,000 - - (2,000,000) 35,000,000 26,500,000
Dr R Beeson(2) 2,125,000 - - (2,125,000) - -
BF Fraser(3) 625,000 - - (625,000) - -
JC Perkins(4) 1,250,000 - - (1,250,000) - -
JM Madden - - - - - -
41,000,000 - - (6,000,000) 35,000,000 26,500,000
(1) 2,250,000 options over ordinary shares granted to Mr PD Reeve at 15 cents per option expired on 13 January 2017 and 83,104 options over ordinary shares issued pursuant to the non-renounceable rights issue on 5 September 2014 expired on 1 September 2015.
(2) 170,205 options over ordinary shares issued pursuant to the non-renounceable rights issue on 5 September 2014 expired on 1 September 2015.(3) 276,000 options over ordinary shares issued pursuant to the non-renounceable rights issue on 5 September 2014 expired on 1 September 2015.(4) 142,595 options over ordinary shares issued pursuant to the non-renounceable rights issue on 5 September 2014 expired on 1 September 2015.
c. Performance shares of Aura Energy Limited held by each KMPP
2018
GROUP KEY MANAGEMENT PERSON
BALANCE AT START OF YEAR
NO.
GRANTED AS REMUNERATION
DURING THE YEAR NO.
EXERCISED DURING THE YEAR
NO.
OTHER CHANGES DURING THE YEAR
NO.
BALANCE AT END OF YEAR
NO.
VESTED AND EXERCISABLE
NO.
PD Reeve(1) - 35,000,000 - - 35,000,000 -
- 35,000,000 - - 35,000,000 -
At the annual general meeting of shareholders on 30 November 2017, shareholders approved resolutions to cancel 35,000,000 options over ordinary shares (as set out above) previously granted to Mr PD Reeve and award 35,000,000 performance shares for zero consideration. The company expensed $275,042 during the financial year for these performance shares.
LOANS TO KEY MANAGEMENT PERSONNELThere are no loans made to directors of Aura Energy as at 30 June 2018 (2017: nil).
20 AURA ENERGY LIMITED ANNUAL REPORT 2018
For
per
sona
l use
onl
y
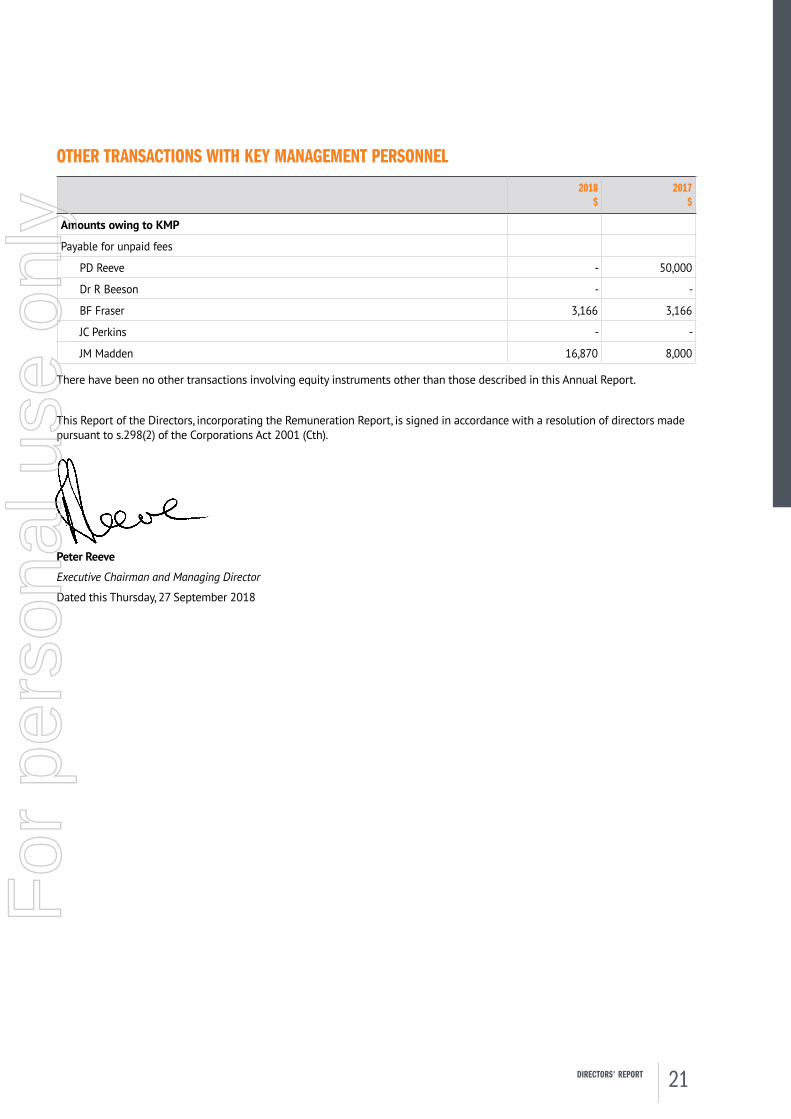
OTHER TRANSACTIONS WITH KEY MANAGEMENT PERSONNEL2018
$2017
$
Amounts owing to KMP
Payable for unpaid fees
PD Reeve - 50,000
Dr R Beeson - -
BF Fraser 3,166 3,166
JC Perkins - -
JM Madden 16,870 8,000
There have been no other transactions involving equity instruments other than those described in this Annual Report.
This Report of the Directors, incorporating the Remuneration Report, is signed in accordance with a resolution of directors made pursuant to s.298(2) of the Corporations Act 2001 (Cth).
Peter Reeve
Executive Chairman and Managing Director
Dated this Thursday, 27 September 2018
21DIRECTORS' REPORT
For
per
sona
l use
onl
y
Auditor’s independence Declaration
To The Board of Directors
Auditor’s Independence Declaration under Section 307C of the Corporations Act 2001
As lead audit Partner for the audit of the financial statements of Aura Energy Limited for the financial year ended 30 June 2018, I declare that to the best of my knowledge and belief, there have been no contraventions of:
the auditor independence requirements of the Corporations Act 2001 in relation to the audit; and
any applicable code of professional conduct in relation to the audit.
Yours faithfully
BENTLEYS MARK DELAURENTIS CA
Chartered Accountants Partner
Dated at Perth this 27th day of September 2018
22 AURA ENERGY LIMITED ANNUAL REPORT 2018
For
per
sona
l use
onl
y
Financial statementsFOR THE YEAR ENDED 30 JUNE 2018
23FINANCIAL STATEMENTS
For
per
sona
l use
onl
y
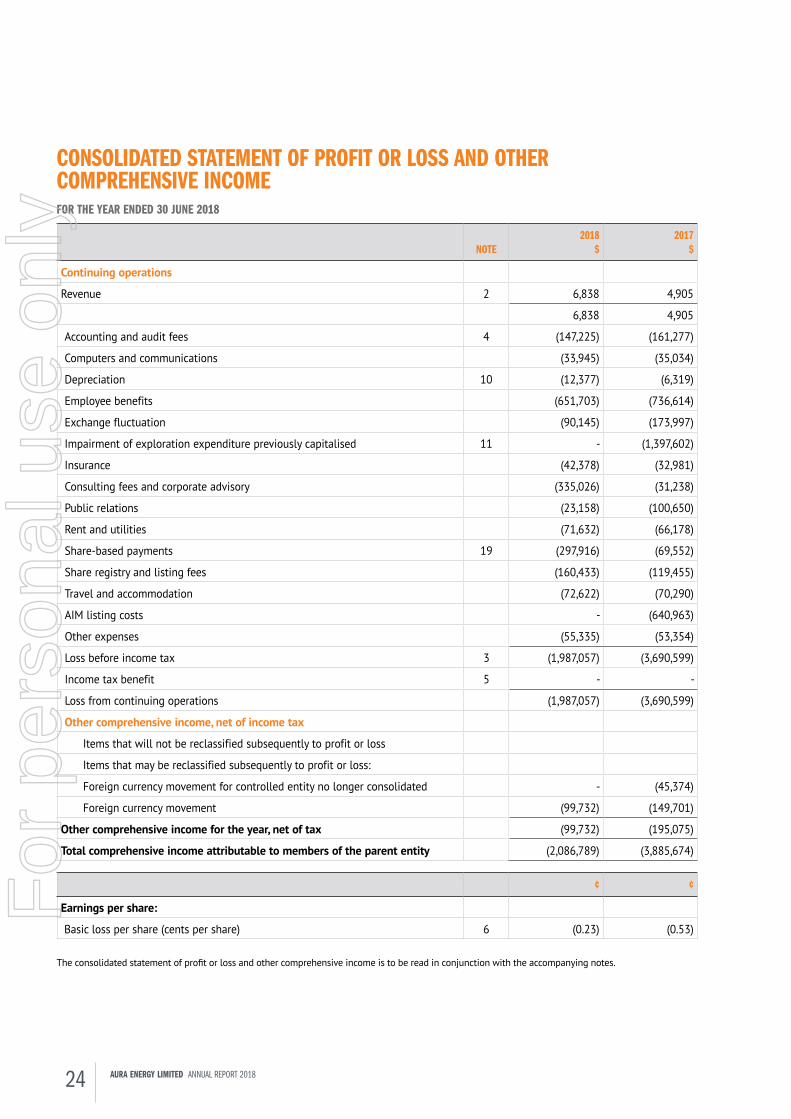
CONSOLIDATED STATEMENT OF PROFIT OR LOSS AND OTHER COMPREHENSIVE INCOMEFOR THE YEAR ENDED 30 JUNE 2018
NOTE2018
$2017
$
Continuing operations
Revenue 2 6,838 4,905
6,838 4,905
Accounting and audit fees 4 (147,225) (161,277)
Computers and communications (33,945) (35,034)
Depreciation 10 (12,377) (6,319)
Employee benefits (651,703) (736,614)
Exchange fluctuation (90,145) (173,997)
Impairment of exploration expenditure previously capitalised 11 - (1,397,602)
Insurance (42,378) (32,981)
Consulting fees and corporate advisory (335,026) (31,238)
Public relations (23,158) (100,650)
Rent and utilities (71,632) (66,178)
Share-based payments 19 (297,916) (69,552)
Share registry and listing fees (160,433) (119,455)
Travel and accommodation (72,622) (70,290)
AIM listing costs - (640,963)
Other expenses (55,335) (53,354)
Loss before income tax 3 (1,987,057) (3,690,599)
Income tax benefit 5 - -
Loss from continuing operations (1,987,057) (3,690,599)
Other comprehensive income, net of income tax
Items that will not be reclassified subsequently to profit or loss
Items that may be reclassified subsequently to profit or loss:
Foreign currency movement for controlled entity no longer consolidated - (45,374)
Foreign currency movement (99,732) (149,701)
Other comprehensive income for the year, net of tax (99,732) (195,075)
Total comprehensive income attributable to members of the parent entity (2,086,789) (3,885,674)
¢ ¢
Earnings per share:
Basic loss per share (cents per share) 6 (0.23) (0.53)
The consolidated statement of profit or loss and other comprehensive income is to be read in conjunction with the accompanying notes.
24 AURA ENERGY LIMITED ANNUAL REPORT 2018
For
per
sona
l use
onl
y
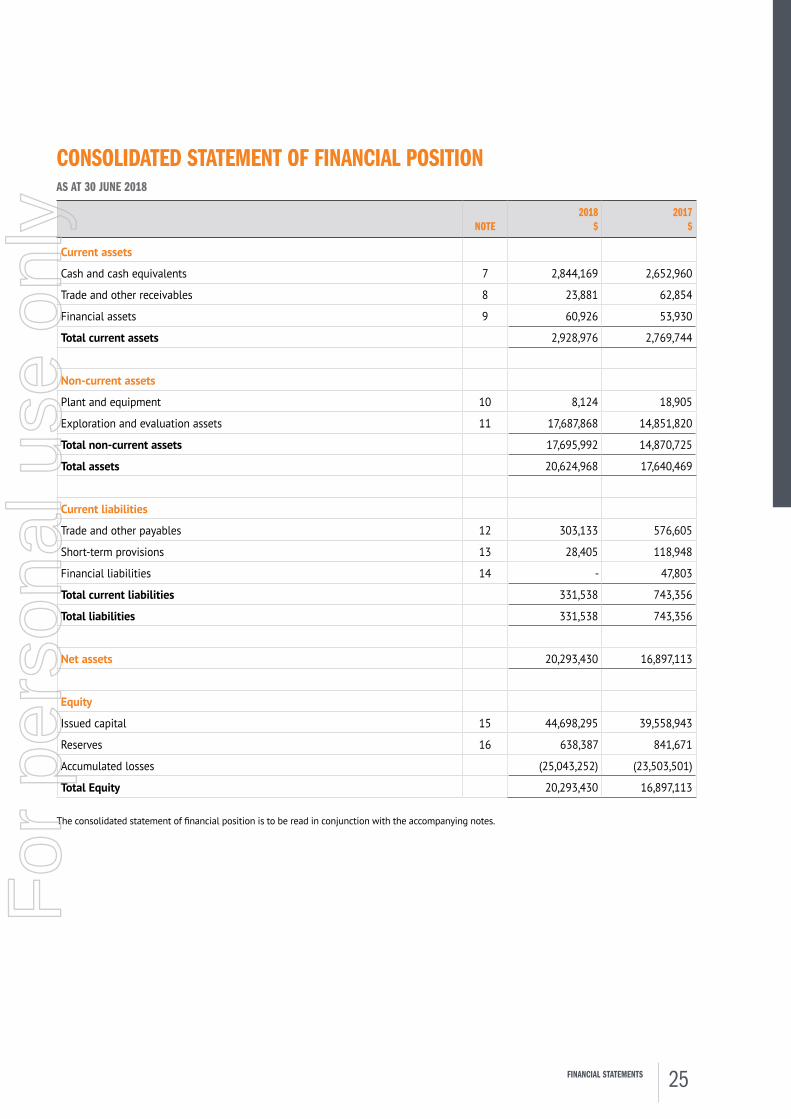
CONSOLIDATED STATEMENT OF FINANCIAL POSITIONAS AT 30 JUNE 2018
NOTE2018
$2017
$
Current assets
Cash and cash equivalents 7 2,844,169 2,652,960
Trade and other receivables 8 23,881 62,854
Financial assets 9 60,926 53,930
Total current assets 2,928,976 2,769,744
Non-current assets
Plant and equipment 10 8,124 18,905
Exploration and evaluation assets 11 17,687,868 14,851,820
Total non-current assets 17,695,992 14,870,725
Total assets 20,624,968 17,640,469
Current liabilities
Trade and other payables 12 303,133 576,605
Short-term provisions 13 28,405 118,948
Financial liabilities 14 - 47,803
Total current liabilities 331,538 743,356
Total liabilities 331,538 743,356
Net assets 20,293,430 16,897,113
Equity
Issued capital 15 44,698,295 39,558,943
Reserves 16 638,387 841,671
Accumulated losses (25,043,252) (23,503,501)
Total Equity 20,293,430 16,897,113
The consolidated statement of financial position is to be read in conjunction with the accompanying notes.
25FINANCIAL STATEMENTS
For
per
sona
l use
onl
y
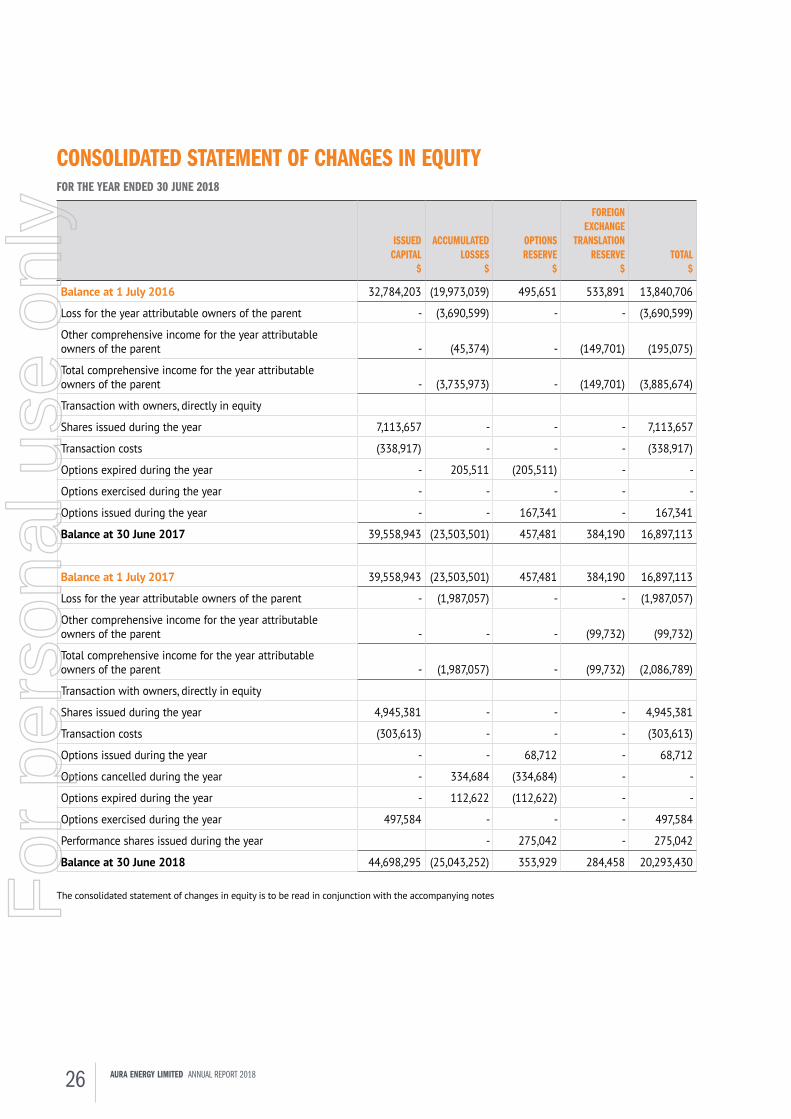
CONSOLIDATED STATEMENT OF CHANGES IN EQUITYFOR THE YEAR ENDED 30 JUNE 2018
ISSUED CAPITAL
$
ACCUMULATEDLOSSES
$
OPTIONS RESERVE
$
FOREIGN EXCHANGE
TRANSLATIONRESERVE
$TOTAL
$
Balance at 1 July 2016 32,784,203 (19,973,039) 495,651 533,891 13,840,706
Loss for the year attributable owners of the parent - (3,690,599) - - (3,690,599)
Other comprehensive income for the year attributable owners of the parent - (45,374) - (149,701) (195,075)
Total comprehensive income for the year attributable owners of the parent - (3,735,973) - (149,701) (3,885,674)
Transaction with owners, directly in equity
Shares issued during the year 7,113,657 - - - 7,113,657
Transaction costs (338,917) - - - (338,917)
Options expired during the year - 205,511 (205,511) - -
Options exercised during the year - - - - -
Options issued during the year - - 167,341 - 167,341
Balance at 30 June 2017 39,558,943 (23,503,501) 457,481 384,190 16,897,113
Balance at 1 July 2017 39,558,943 (23,503,501) 457,481 384,190 16,897,113
Loss for the year attributable owners of the parent - (1,987,057) - - (1,987,057)
Other comprehensive income for the year attributable owners of the parent - - - (99,732) (99,732)
Total comprehensive income for the year attributable owners of the parent - (1,987,057) - (99,732) (2,086,789)
Transaction with owners, directly in equity
Shares issued during the year 4,945,381 - - - 4,945,381
Transaction costs (303,613) - - - (303,613)
Options issued during the year - - 68,712 - 68,712
Options cancelled during the year - 334,684 (334,684) - -
Options expired during the year - 112,622 (112,622) - -
Options exercised during the year 497,584 - - - 497,584
Performance shares issued during the year - 275,042 - 275,042
Balance at 30 June 2018 44,698,295 (25,043,252) 353,929 284,458 20,293,430
The consolidated statement of changes in equity is to be read in conjunction with the accompanying notes
26 AURA ENERGY LIMITED ANNUAL REPORT 2018
For
per
sona
l use
onl
y
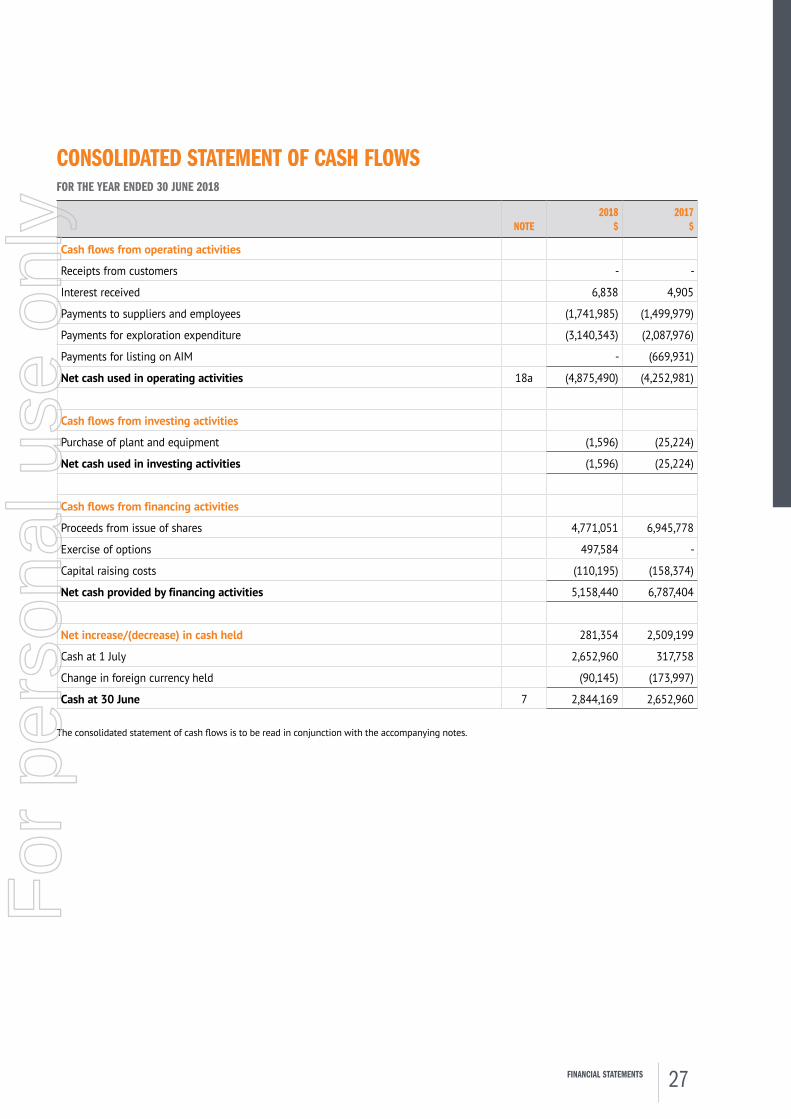
CONSOLIDATED STATEMENT OF CASH FLOWSFOR THE YEAR ENDED 30 JUNE 2018
NOTE2018
$2017
$
Cash flows from operating activities
Receipts from customers - -
Interest received 6,838 4,905
Payments to suppliers and employees (1,741,985) (1,499,979)
Payments for exploration expenditure (3,140,343) (2,087,976)
Payments for listing on AIM - (669,931)
Net cash used in operating activities 18a (4,875,490) (4,252,981)
Cash flows from investing activities
Purchase of plant and equipment (1,596) (25,224)
Net cash used in investing activities (1,596) (25,224)
Cash flows from financing activities
Proceeds from issue of shares 4,771,051 6,945,778
Exercise of options 497,584 -
Capital raising costs (110,195) (158,374)
Net cash provided by financing activities 5,158,440 6,787,404
Net increase/(decrease) in cash held 281,354 2,509,199
Cash at 1 July 2,652,960 317,758
Change in foreign currency held (90,145) (173,997)
Cash at 30 June 7 2,844,169 2,652,960
The consolidated statement of cash flows is to be read in conjunction with the accompanying notes.
27FINANCIAL STATEMENTS
For
per
sona
l use
onl
y

NOTES TO THE CONSOLIDATED FINANCIAL STATEMENTSFOR THE YEAR ENDED 30 JUNE 2018NOTE 1. STATEMENT OF SIGNIFICANT ACCOUNTING POLICIESThese are the consolidated financial statements and notes of Aura Energy Limited and controlled entities (“Consolidated Group” or “Group”). Aura Energy Limited is a company limited by shares, domiciled and incorporated in Australia.
The separate financial statements of the parent entity, Aura Energy Limited, have not been presented with this financial report as permitted by the Corporations Act 2001 (Cth).
a. Basis of preparation
i. Statement of compliance
The financial statements are general purpose financial statements that have been prepared in accordance with Australian Accounting Standards, including
Australian Accounting Interpretations, other authoritative pronouncements of the Australian Accounting Standards Board and the Corporations Act 2001 (Cth).
Australian Accounting Standards set out accounting policies that the AASB has concluded would result in a financial report containing relevant and reliable information about transactions, events and conditions to which they apply. Compliance with Australian Accounting Standards ensures that the financial statements and notes also comply with International Financial Reporting Standards as issued by the IASB. Material accounting policies adopted in the preparation of these financial statements are presented below. They have been consistently applied unless otherwise stated.
The financial statements were authorised for issue on 27 September 2018 by the directors of the Company.
ii. Financial position
The financial statements have been prepared on an accruals basis and are based on historical costs
modified, where applicable, by the measurement at fair value of selected non-current assets, financial assets and financial liabilities.
iii. Going concern
The financial statements have been prepared on a going concern basis, which contemplates the continuity of normal business activity and the realisation of assets and the settlement of liabilities in the ordinary course of business.
The Group incurred a loss for the year of $1,987,057 (2017: $3,690,599 and a net cash out-flow from operating activities of $4,875,490 (2017: $4,252,981)
As at 30 June 2018, the Group had working capital of $2,597,438 (2017: $2,026,388).
The ability of the Group to continue as a going concern is principally dependent upon the ability of the Group to secure funds by raising capital from equity markets or by other means, and by managing cash flows
in line with available funds, and/or the successful development of the Group’s exploration assets. These conditions indicate a material uncertainty that may cast doubt about the ability of the Group to continue as a going concern.
Based upon cash flow forecasts and other factors referred to above, the directors are satisfied that the going concern basis of preparation is appropriate, including the meeting of exploration commitments. In addition, given the Group’s history of raising funds to date, the directors are confident of the Group’s ability to raise additional funds as and when they are required.
Should the Group be unable to continue as a going concern it may be required to realise its assets and extinguish its liabilities other than in the normal course of business and at amounts different to those stated in the financial statements.
The financial statements do not include any adjustments relating to the recoverability and classification of asset carrying amounts or to the amount and classification of liabilities that might result should the Group be unable to continue as a going concern and meet its debts as and when they fall due.
iv. Use of estimates and judgements
The preparation of financial statements requires management to make judgements, estimates and assumptions that affect the application of policies and reported amounts of assets and liabilities, income and expenses. These estimates and associated assumptions are based on historical experience and various
factors that are believed to be reasonable under the circumstances, the results of which form the basis of making the judgements about carrying values of assets and liabilities that are not readily apparent from other sources. Actual results may differ from these estimates.
Estimates and underlying assumptions are reviewed on an ongoing basis. Revisions to accounting estimates are recognised in the period in which the estimate is revised and in any future periods affected.
Judgements made by management in the application of Australian Accounting Standards that have significant effect on the financial statements and estimates with a significant risk of material adjustment in the next year are discussed in Note 1r Critical accounting estimates and judgments.
v. Comparative figures
Where required by Accounting Standards comparative figures have been adjusted to conform with changes in presentation for the current financial year.
28 AURA ENERGY LIMITED ANNUAL REPORT 2018
For
per
sona
l use
onl
y

NOTE 1. STATEMENT OF SIGNIFICANT ACCOUNTING POLICIES (CONT)b. Principles of consolidation
A controlled entity is any entity over which Aura Energy Limited has the power to govern the financial and operating policies so as to obtain benefits from its activities. In assessing the power to govern, the
existence and effect of holdings of actual and potential voting rights are considered. A list of controlled entities is contained in Note 17 Controlled entities in the financial statements.
All inter-group balances and transactions between entities in the Consolidated Group, including any unrealised profits or losses, have been eliminated on consolidation. Accounting policies of subsidiaries have been changed where necessary to ensure consistency with those adopted by the parent entity.
As at reporting date, the assets and liabilities of all controlled entities have been incorporated into the consolidated financial statements as well as their results for the year then ended. Where controlled entities have entered (left) the Consolidated Group during the year, their operating results have been included (excluded) from the date control was obtained (ceased).
i. Business combinations
Business combinations occur when an acquirer obtains control over one or more businesses.
A business combination is accounted for by applying the acquisition method, unless it is a combination involving entities or businesses under common control. The business combination will be accounted for from the date that control is attained, whereby the fair
value of the identifiable assets acquired and liabilities (including contingent liabilities) assumed is recognised (subject to certain limited exemptions).
When measuring the consideration transferred in the business combination, any asset or liability resulting from a contingent consideration arrangement is
also included. Subsequent to initial recognition, contingent consideration classified as an asset or liability is remeasured each reporting period to fair value, recognising any change to fair value in profit or loss, unless the change in value can be identified as existing at acquisition date.
All transaction costs incurred in relation to the business combination are expensed to the statement of profit or loss and comprehensive income.
The acquisition of a business may result in the recognition of goodwill or a gain from a bargain purchase.
c. Exploration and development expenditure
i. Recognition and measurement
Exploration, evaluation, and development expenditure incurred is accumulated in respect of each identifiable area of interest. These costs are only carried forward to the extent that they are expected to be recouped through the successful development of the area or where activities in the area have not yet reached a stage that permits reasonable assessment of the existence of economically recoverable reserves.
ii. Subsequent measurement
Accumulated costs in relation to an abandoned area are written off in full against profit in the year in which the decision to abandon the area is made.
When production commences, the accumulated costs for the relevant area of interest will be amortised over the life of the area according to the rate of depletion of the economically recoverable reserves.
A regular review is undertaken of each area of interest to determine the appropriateness of continuing to capitalise costs in relation to that area of interest.
iii. Site restoration and rehabilitation
Costs of site restoration will be provided over the life of the project, when such costs are incurred or the Group becomes liable pursuant to a development agreement with government agencies. In the exploration and evaluation phase, all drill holes are collared and any site disturbance is restored with the costs incorporated in the costs of exploration and evaluation. Site restoration costs will include the dismantling and removal of mining plant, equipment and building structures, waste removal, and rehabilitation of the site in accordance with clauses of the mining permits. Such costs have been determined using estimates of future costs, current legal requirements and technology on an undiscounted basis.
Any changes in the estimates for the costs are accounted on a prospective basis. In determining the costs of site restoration, there is uncertainty regarding the nature and extent of the restoration
due to community expectations and future legislation. Accordingly the costs have been determined on the basis that the restoration will be completed within one year of abandoning the site.
d. Income tax
Current income tax expense charged to the profit or loss is the tax payable on taxable income calculated using applicable income tax rates enacted, or substantially enacted, as at reporting date. Current tax liabilities (assets) are therefore measured at the amounts expected to be paid to (recovered from) the relevant taxation authority.
29FINANCIAL STATEMENTS
For
per
sona
l use
onl
y

NOTE 1. STATEMENT OF SIGNIFICANT ACCOUNTING POLICIES (CONT)
Deferred income tax expense reflects movements in deferred tax asset and deferred tax liability balances during the year as well as unused tax losses.
Current and deferred income tax expense (income) is charged or credited outside profit or loss when the tax relates to items recognised outside profit or loss.
Deferred tax assets and liabilities are ascertained based on temporary differences arising between the tax bases of assets and liabilities and their carrying amounts in the financial statements. Deferred tax assets also result where amounts have been fully expensed but future tax deductions are available. No deferred income tax will be recognised from the initial recognition of an asset or liability, excluding a business combination, where there is no effect on accounting or taxable profit or loss.
Deferred tax assets and liabilities are calculated at the tax rates that are expected to apply to the period when the asset is realised or the liability is settled, based on tax rates enacted or substantively enacted at reporting date.
Their measurement also reflects the manner in which management expects to recover or settle the carrying amount of the related asset or liability.
Deferred tax assets relating to temporary differences and unused tax losses are recognised only to the extent that it is probable that future taxable profit will be available against which the benefits of the deferred tax asset can be utilised.
Where temporary differences exist in relation to investments in subsidiaries, branches, associates, and joint ventures, deferred tax assets and liabilities are not recognised where the timing of the reversal of the temporary difference can be controlled and it is not probable that the reversal will occur in the foreseeable future.
Current tax assets and liabilities are offset where a legally enforceable right of set-off exists and it is intended that net settlement or simultaneous realisation and settlement of the respective asset and liability will occur. Deferred tax assets and liabilities are offset where a legally enforceable right of set-off exists, the deferred tax assets and liabilities relate to income taxes levied by the same taxation authority on either the same taxable entity or different taxable entities where it is intended that net settlement or simultaneous realisation and settlement of the respective asset and liability will occur in future periods in which significant amounts of deferred tax assets or liabilities are expected to be recovered or settled.
Where the Group receives the Australian Government’s Research and Development Tax Incentive, The Group accounts for the refundable tax offset under AASB 112. Funds are received as a rebate through the parent company’s income tax return and disclosed as such in Note 5 Income tax.
e. Plant and equipment
i. Recognition and measurement
Each class of plant and equipment is measured at cost or fair value less, where applicable, any accumulated depreciation and impairment losses.
The carrying amount of plant and equipment is reviewed annually by directors to ensure it is not in excess of the recoverable amount from these assets. The recoverable amount is assessed on the basis of the expected net cash flows that will be received from the assets employment and subsequent disposal. The expected net cash flows have not been discounted to their present values in determining recoverable amounts.
Items of property, plant and equipment are measured at cost less accumulated depreciation (see below) and impairment losses (see Note 1m Impairment of non- financial assets and Note 1c Exploration and development expenditure).
ii. Depreciation
The depreciable amount of all fixed assets including building and capitalised lease assets, but excluding freehold land, is depreciated on a straight line basis over their useful lives to the Consolidated Group commencing from the time the asset is held ready for use. Leasehold improvements are depreciated over the shorter of either the unexpired period of the lease or the estimated useful lives of the improvements.
The depreciation rates used for each class of depreciable assets are:
Plant and equipment 20.00%
Computers 33.00%
The assets’ residual values and useful lives are reviewed, and adjusted if appropriate, at the end of each reporting period. An asset’s carrying amount is written down immediately to its recoverable amount if the asset’s carrying amount is greater than its estimated recoverable amount.
Gains and losses on disposals are determined by comparing proceeds with the carrying amount. These gains and losses are included in the statement of comprehensive income. When re-valued assets are sold, amounts included in the revaluation reserve relating to that asset are transferred to retained earnings.
30 AURA ENERGY LIMITED ANNUAL REPORT 2018
For
per
sona
l use
onl
y
NOTE 1. STATEMENT OF SIGNIFICANT ACCOUNTING POLICIES (CONT)f. Employee benefits
For the period ending 30 June 2018 the Company has three employees.
i. Defined contribution superannuation funds
A defined contribution plan is a post-employment benefit plan under which an entity pays fixed contributions onto a separate entity and will have no legal or constructive obligation to pay further amounts. Obligations for contributions to defined contribution superannuation funds are recognised as an expense in the income statement as incurred. Prepaid contributions are recognised as an asset to the extent that a cash refund or a reduction in future payments is available.
ii. Short-term benefits
Liabilities for employee benefits for wages, salaries and annual leave that are expected to be settled within 12 months of the reporting date represent present obligations resulting from employees’ services provided to the reporting date and are calculated at undiscounted amounts based on remuneration wage and salary rates that the Company expects to pay at the reporting date including related on-costs, such as workers compensation insurance and payroll tax.
Non-accumulating non-monetary benefits, such as medical care, housing, cars and free or subsidised goods and services, are expensed based on the net marginal cost to the Company as the benefits are taken by the employees.
iii. Other long-term benefits
Employee benefits payable later than one year have been measured at the present value of the estimated future cash outflows to be made for those benefits.
g. Equity-settled compensation
The Group operates an employee share ownership scheme. Share-based payments to employees are measured at the fair value of the instruments issued and amortised over the vesting periods. Share-based payments to non-employees are measured at the fair value of goods or services received or the fair value of the equity instruments issued, if it is determined the fair value of the goods or services cannot be reliably measured, and are recorded at the date the goods or services are received. The corresponding amount is recorded to the option reserve. The fair value of options is determined using the Black-Scholes pricing model. The number of shares and options expected to vest is reviewed and adjusted at the end of each reporting period such that the amount recognised for services received as consideration for the equity instruments granted is based on the number of equity instruments that eventually vest.
.
h. Revenue and other income
Interest revenue is recognised on a proportional basis taking into account the interest rates applicable to the financial assets.
Management fees are recognised on portion of completion basis.
Gain on disposal of tenements, and revenue from equipment chargebacks, are recognised on receipt of compensation.
All revenue is stated net of the amount of value added taxes (see Note 1i Value-added taxes).
i. Value-added taxes
Value-added taxes (VAT) is the generic term for the broad-based consumption taxes that the Group is exposed to such as: Australia (GST); Sweden (MOMS); and in Mauritanian (VAT).
Revenues, expenses, and assets are recognised net of the amount of VAT, except where the amount of VAT incurred is not recoverable from the relevant country’s taxation authority. In these circumstances the VAT is recognised as part of the cost of acquisition of the asset or as part of an item of the expense. Receivables and payables in the statement of financial position are shown inclusive of VAT.
Cash flows are presented in the statement of cash flows on a gross basis, except for the VAT component of investing and financing activities, which are disclosed as operating cash flows.
Commitments and contingencies are disclosed net of the amount of VAT recoverable from, or payable to, the taxation authority.
j. Leases
Leases of fixed assets where substantially all the risks and benefits incidental to the ownership of the asset, but not the legal ownership, are transferred to entities in the Group are classified as finance leases.
Leased assets are depreciated on a straight-line basis over their estimated useful lives where it is likely that the Group will obtain ownership of the asset or over the term of the lease.
Lease payments for operating leases, where substantially all the risks and benefits remain with the lessor, are charged as expenses in the periods in which they are incurred.
Lease incentives under operating leases are recognised as a liability and amortised on a straight-line basis over the life of the lease term.
31FINANCIAL STATEMENTS
For
per
sona
l use
onl
y
NOTE 1. STATEMENT OF SIGNIFICANT ACCOUNTING POLICIES (CONT)k. Financial instruments
i. Initial recognition and measurement
Financial instruments, incorporating financial assets and financial liabilities, are recognised when the entity becomes a party to the contractual provisions of the instrument. Trade date accounting is adopted for financial assets that are delivered within timeframes established by marketplace convention.
Financial instruments are initially measured at fair value plus transactions costs where the instrument is not classified as at fair value through profit or loss.
Transaction costs related to instruments classified as at fair value through profit or loss are expensed to profit or loss immediately.
The Group does not designate any interests in subsidiaries, associates or joint venture entities as being subject to the requirements of accounting standards specifically applicable to financial instruments.
ii. Non-derivative financial instruments
Non-derivative financial instruments comprise investments in equity securities, trade and other receivables, cash and cash equivalents and trade and other payables.
Non-derivative financial instruments are recognised initially at fair value plus, for instruments not at fair value through profit or loss, any directly attributable transactions costs. Subsequent to initial recognition non-derivative financial instruments are measured as described below.
iii. Classification and subsequent measurement
(1) Cash and cash equivalents
Cash and cash equivalents includes cash on hand, deposits held at call with banks, other short-term highly liquid investments with original maturities of three months or less, and bank overdrafts. Bank overdrafts are shown within short-borrowings in current liabilities on the Statement of financial position.
(2) Loans
Loans are non-derivative financial assets with fixed or determinable payments that are not quoted in an active market and are subsequently measured at
amortised cost. Gains or losses are recognised in profit or loss through the amortisation process and when the financial asset is derecognised.
Loans are included in current assets, except for those which are not expected to mature within 12 months after the end of the reporting period.
(3) Trade and other receivables
Trade and other receivables are stated at amortised cost. Receivables are usually settled within 30 to 90 days.
Collectability of trade and other debtors is reviewed on an ongoing basis. An impairment loss is recognised for debts which are known to be uncollectible. An impairment provision is raised for any doubtful amounts.
(4) Trade and other payables
Trade payables and other payable are recognised when the Group becomes obligated to make future payments resulting from the purchase of goods and services which are unpaid and stated at their amortised cost. The amounts are unsecured and are generally settled on 30 day terms.
(5) Financial liabilities
Non-derivative financial liabilities (excluding financial guarantees) are subsequently measured at amortised cost.
(6) Share capital
Ordinary issued capital is recorded at the consideration received. Incremental costs directly attributable to the issue of ordinary shares and share options are recognised as a deduction from equity, net of any related income tax benefit. Ordinary issued capital bears no special terms or conditions affecting income or capital entitlements of the shareholders.
iv. Amortised cost
Amortised cost is calculated as the amount at which the financial asset or financial liability is measured at initial recognition less principal repayments and any reduction for impairment, and adjusted for any cumulative amortisation of the difference between that initial amount and the maturity amount calculated using the effective interest method.
v. Fair value
Fair value is determined based on current bid prices for all quoted investments. Valuation techniques are applied to determine the fair value for all unlisted securities, including recent arm’s length transactions, reference to similar instruments and option pricing models.
vi. Effective interest method
The effective interest method is used to allocate interest income or interest expense over the relevant period and is equivalent to the rate that discounts estimated future cash payments or receipts (including fees, transaction costs and other premiums or discounts) over the expected life (or when this cannot be reliably predicted, the contractual term) of the financial instrument to the net carrying amount of the financial asset or financial liability. Revisions to expected future net cash flows will necessitate
32 AURA ENERGY LIMITED ANNUAL REPORT 2018
For
per
sona
l use
onl
y

NOTE 1. STATEMENT OF SIGNIFICANT ACCOUNTING POLICIES (CONT)
an adjustment to the carrying amount with a consequential recognition of an income or expense item in profit or loss.
vii. Impairment
A financial asset is assessed at each reporting date to determine whether there is any objective evidence that it is impaired. A financial asset is considered to be impaired if objective evidence indicates that one or more events have had a negative effect on the estimated future cash flows of that asset.
An impairment loss in respect of a financial asset measured at amortised cost is calculated as the difference between its carrying amount, and the present value of the estimated future cash flows discounted at the original effective interest rate.
Individually significant financial assets are tested for impairment on an individual basis. The remaining financial assets are assessed collectively in Groups that share similar credit risk characteristics.
All impairment losses are recognised in the income statement.
An impairment loss is reversed if the reversal can be related objectively to an event occurring after the impairment loss was recognised. For financial assets measured at amortised cost the reversal is recognised in the income statement.
viii. Derecognition
Financial assets are derecognised where the contractual rights to cash flow expires or the asset is transferred to another party whereby the entity no longer has any significant continuing involvement in the risks and benefits associated with the asset. Financial liabilities are derecognised where the related obligations are either discharged, cancelled
or expired. The difference between the carrying value of the financial liability extinguished or transferred to another party and the fair value of consideration paid, including the transfer of non-cash assets or liabilities assumed, is recognised in profit or loss.
ix. Financial income and expenses
Finance income comprises interest income on funds invested (including available-for-sale financial assets), gains on the disposal of available-for-sale financial assets and changes in the fair value of financial assets at fair value through profit or loss. Interest income is recognised as it accrues in profit or loss, using the effective interest method.
Financial expenses comprise interest expense on borrowings calculated using the effective interest method, unwinding of discounts on provisions, changes in the fair value of financial assets at fair value through profit or loss and impairment losses recognised on
financial assets. All borrowing costs are recognised in profit or loss using the effective interest method.
Borrowing costs directly attributable to the acquisition, construction or production of assets that necessarily take a substantial period of time to prepare for their intended use or sale, are added to the cost of those assets, until such time as the assets are substantially ready for their intended use or sale. All other borrowing costs are recognised in income in the period in which they are incurred.
Foreign currency gains and losses are reported on a net basis.
l. Earnings per share
i. Basic earnings per share
Basic earnings (or loss) per share is determined by dividing the profit or loss attributable to equity holders of the parent company, excluding any costs of service equity other than ordinary shares, by the weighted average number of ordinary shares outstanding during the financial year, adjusted for bonus elements in ordinary shares issued during the year.
ii. Diluted earnings per share
Diluted earnings (or loss) per share is determined by adjusting the profit or loss attributable to ordinary shareholders and the weighted average number of ordinary shares outstanding for the effects of all dilutive potential ordinary shares which comprise share options granted as share-based payments.
The Group does not report diluted earnings per share, as dilution is not applied to annual losses generated by the Group.
m. Impairment of non-financial assets
The carrying amounts of the Company’s non-financial assets, other than deferred tax assets (Note 1d Income tax) and exploration and evaluation assets (Note
1c Exploration and development expenditure) are reviewed at each reporting date to determine whether there is any indication of impairment. If any such indication exists then the asset’s recoverable amount is estimated.
An impairment loss is recognised if the carrying amount of an asset or its cash-generating unit exceeds its recoverable amount. A cash-generating unit is the smallest identifiable asset Group that generates cash flows that largely are independent from other assets and Groups. Impairment losses are recognised in the income statement, unless the asset has previously been revalued, in which case the impairment loss is recognised as a reversal to the extent of that previous revaluation with any excess recognised through the income statement. Impairment losses recognised in respect of cash-generating units are allocated first to reduce the carrying amount of any goodwill allocated to the units and then to reduce the carrying amount of the other assets in the unit on a pro rata basis.
33FINANCIAL STATEMENTS
For
per
sona
l use
onl
y
NOTE 1. STATEMENT OF SIGNIFICANT ACCOUNTING POLICIES (CONT)
The recoverable amount of an asset or cash-generating unit is the greater of its fair value less costs to sell and value in use. In assessing value in use, the estimated future cash flows are discounted to their present value using a pre-tax discount rate that reflects current market assessments of the time value of money and the risks specific to the asset. For an asset that does not generate largely independent cash inflows, the recoverable amount is determined for the cash- generating unit to which the asset belongs.
Impairment losses recognised in prior periods are assessed at each reporting date for any indications that the loss has decreased or no longer exists. An impairment loss is reversed if there has been a change in the estimates used to determine the recoverable amount. An impairment loss is reversed only to the extent that the asset’s carrying amount does not exceed the carrying amount that would have been determined, net of depreciation and amortisation, if no impairment loss had been recognised.
n. Provisions
Provisions are recognised when the Group has a legal or constructive obligation, as a result of past events, for which it is probable that an outflow of economic benefits will results and that outflow can be reliably measured.
o. Foreign currency transactions and balances
i. Functional and presentation currency
The functional currency of each of the Group’s entities is measured using the currency of the primary economic environment in which that entity operates. The consolidated financial statements are presented in Australian dollars which is the parent entity’s functional and presentation currency.
ii. Transaction and balances
Foreign currency transactions are translated into functional currency using the exchange rates prevailing at the date of the transaction. Foreign currency monetary items are translated at the year- end exchange rate. Non-monetary items measured at historical cost continue to be carried at the exchange rate at the date of the transaction. Non-monetary items measured at fair value are reported at the exchange rate at the date when fair values were determined.
Exchange differences arising on the translation of monetary items are recognised in the profit or loss except where deferred in equity as a qualifying cash flow or net investment hedge.
Exchange differences arising on the translation of non-monetary items are recognised directly in other comprehensive income to the extent that the gain or loss is directly recognised in other comprehensive income, otherwise the exchange difference is recognised in the profit or loss.
iii. Group companies
The financial results and position of foreign operations whose functional currency is different from the Group’s presentation currency are translated as follows:
Assets and liabilities are translated at year-end exchange rates prevailing at that reporting date.
Income and expenses are translated at average exchange rates for the period.
Retained earnings are translated at the exchange rates prevailing at the date of the transaction.
Exchange differences arising on translation of foreign operations are transferred directly to the Group’s foreign currency translation reserve in the statement of financial position. These differences are recognised in the profit or loss in the period in which the operation is disposed.
p. Fair value estimation
A number of the Group’s accounting policies and disclosures require the determination of fair value, for both financial and non-financial assets and liabilities. Information about the assumptions made in determining fair values of assets and liabilities is disclosed in the notes specific to that asset or liability.
q. Fair value of assets and liabilities
The Group measures some of its assets and liabilities at fair value on either a recurring or non-recurring basis, depending on the requirements of the applicable Accounting Standard.
Fair value is the price the Group would receive to sell an asset or would have to pay to transfer a liability
in an orderly (i.e. unforced) transaction between independent, knowledgeable and willing market participants at the measurement date.
As fair value is a market-based measure, the closest equivalent observable market pricing information is used to determine fair value. Adjustments to market values may be made having regard to the
characteristics of the specific asset or liability. The fair values of assets and liabilities that are not traded in an active market are determined using one or more valuation techniques. These valuation techniques maximise, to the extent possible, the use of observable market data.
To the extent possible, market information is extracted from either the principal market for the asset or liability (i.e. the market with the greatest volume and level of activity for the asset or liability) or, in the absence of such a market, the most advantageous market available to the entity at the end of the reporting period (i.e. the market that maximises the receipts from the sale of the asset or minimises the payments made to transfer the liability, after taking into account transaction costs and transport costs).
34 AURA ENERGY LIMITED ANNUAL REPORT 2018
For
per
sona
l use
onl
y
NOTE 1. STATEMENT OF SIGNIFICANT ACCOUNTING POLICIES (CONT)
For non-financial assets, the fair value measurement also takes into account a market participant’s ability to use the asset in its highest and best use or to sell it to another market participant that would use the asset in its highest and best use.
The fair value of liabilities and the entity’s own equity instruments (excluding those related to share-based payment arrangements) may be valued, where there is no observable market price in relation to the transfer of such financial instruments, by reference to observable market information where such instruments are held as assets. Where this information is not available, other valuation techniques are adopted and, where significant, are detailed in the respective note to the financial statements.
i. Valuation techniques
In the absence of an active market for an identical asset or liability, the Group selects and uses one or more valuation techniques to measure the fair value of the asset or liability, the Group selects a valuation technique that is appropriate in the circumstances and for which sufficient data is available to measure fair value. The availability of sufficient and relevant data primarily depends on the specific characteristics of the asset or liability being measured. The valuation techniques selected by the Group are consistent with one or more of the following valuation approaches:
(1) Market approach: valuation techniques that use prices and other relevant information generated by market transactions for identical or similar assets or liabilities.
(2) Income approach: valuation techniques that convert estimated future cash flows or income and expenses into a single discounted present value.
(3) Cost approach: valuation techniques that reflect the current replacement cost of an asset at its current service capacity.
Each valuation technique requires inputs that reflect the assumptions that buyers and sellers would
use when pricing the asset or liability, including assumptions about risks. When selecting a valuation technique, the Group gives priority to those techniques that maximise the use of observable inputs and minimise the use of unobservable inputs. Inputs that are developed using market data (such as publicly available information on actual transactions) and reflect the assumptions that buyers and sellers would generally use when pricing the asset or liability are considered observable, whereas inputs for which market data is not available and therefore are developed using the best information available about such assumptions are considered unobservable.
ii. Fair value hierarchy
AASB 13 requires the disclosure of fair value information by level of the fair value hierarchy, which categorises fair value measurements into one of three possible levels based on the lowest level that an input that is significant to the measurement can be categorised into as follows:
(1) Level 1
Measurements based on quoted prices (unadjusted) in active markets for identical assets or liabilities that the entity can access at the measurement date.
(2) Level 2
Measurements based on inputs other than quoted prices included in Level 1 that are observable for the asset or liability, either directly or indirectly.
(3) Level 3
Measurements based on unobservable inputs for the asset or liability.
The fair values of assets and liabilities that are not traded in an active market are determined using one or more valuation techniques. These valuation techniques maximise, to the extent possible, the use of observable market data. If all significant inputs required to measure fair value are observable, the asset or liability is included in Level 2. If one or more significant inputs are not based on observable market data, the asset or liability is included in Level 3.
The Group would change the categorisation within the fair value hierarchy only in the following circumstances:
• if a market that was previously considered active (Level 1) became inactive (Level 2 or Level 3) or vice versa or
• if significant inputs that were previously unobservable (Level 3) became observable (Level 2) or vice versa.
When a change in the categorisation occurs, the Group recognises transfers between levels of the fair value hierarchy (i.e. transfers into and out of each level of the fair value hierarchy) on the date the event or change in circumstances occurred.
r. Critical accounting estimates and judgements
The directors evaluate estimates and judgements incorporated into the financial report based on historical knowledge and best available current information.
Estimates assume a reasonable expectation of future events and are based on current trends and economic data, obtained both externally and within the Group.
35FINANCIAL STATEMENTS
For
per
sona
l use
onl
y
NOTE 1. STATEMENT OF SIGNIFICANT ACCOUNTING POLICIES (CONT)
i. Key Judgements – Exploration and evaluation expenditure
Exploration and evaluation costs are carried forward where right of tenure of the area of interest is current. These costs are carried forward in respect of an area that has not at reporting date reached a stage that permits reasonable assessment of the existence
of economically recoverable reserves, refer to the accounting policy stated in Note 1c Exploration and development expenditure.
The carrying value of capitalised expenditure at reporting date is $17,687,868 (2017: $14,851,820).
During the financial year, the Group undertook assessment of its tenement assets, as a result of this assessment, the Group decided to impair some of its exploration assets. Refer to Note 11 Exploration and evaluation assets.
ii. Key Judgements – Environmental issues
Balances disclosed in the financial statements and notes thereto are not adjusted for any pending or enacted environmental legislation, and the directors understanding thereof. At the current stage of the Company’s development and its current environmental impact, the directors believe such treatment is reasonable and appropriate.
iii. Key Estimate – Taxation
Balances disclosed in the financial statements and the notes thereto, related to taxation, are based on the best estimates of directors. These estimates take into account both the financial performance and position of the Company as they pertain to current income taxation legislation, and the directors understanding thereof.
No adjustment has been made for pending or future taxation legislation. The current income tax position represents that directors’ best estimate, pending an assessment by tax authorities in relevant jurisdictions. Refer to Note 5 Income tax.
iv. Key Estimate — Impairment
The Group assesses impairment at each reporting date by evaluating conditions specific to the Group that may lead to impairment of assets. Where an impairment trigger exists, the recoverable amount of the asset is determined.
v. Key Estimate – Share-based payments
The Group measures the cost of equity-settled transactions with employees by reference to the fair value of the equity instruments at the date at which they are granted. The fair value is determined by an internal valuation using a Black-Scholes option pricing model, using the assumptions detailed in Note 19 Share-based payments.
s. New standards, interpretations and amendments adopted by the Group
A number of new standards, amendments to standards and interpretations issued by the AASB which are not yet mandatorily applicable to the Group have not been applied in preparing these financial statements. Those which may be relevant to the Group are set out below. The Group does not plan to adopt these standards early
i. AASB 9 Financial Instruments and associated Amending Standards (applicable for annual reporting period commencing 1 January 2018)
The Standard will be applicable retrospectively (subject to the comment on hedge accounting below) and includes revised requirements for the classification and measurement of financial instruments, revised recognition and derecognition requirements for financial instruments and simplified requirements for hedge accounting.
Key changes made to this standard that may affect the Group on initial application include certain simplifications to the classification of financial assets, simplifications to the accounting of embedded derivatives, and the irrevocable election to recognise gains and losses on investments in equity instruments that are not held for trading in other comprehensive income.
The Directors anticipate that the adoption of AASB 9 will not have a material impact on the Group’s financial instruments.
ii. AASB 15 Revenue from Contracts with Customers (applicable to annual reporting periods commencing on or after 1 January 2018).
When effective, this Standard will replace the current accounting requirements applicable to revenue with a single, principles-based model. Except for a limited number of exceptions, including leases, the new revenue model in AASB 15 will apply to all contracts with customers as well as non-monetary exchanges between entities in the same line of business to facilitate sales to customers and potential customers.
The core principle of the Standard is that an entity will recognise revenue to depict the transfer of promised goods or services to customers in an amount that reflects the consideration to which the entity expects to be entitled in exchange for the goods or services. To achieve this objective, AASB 15 provides the following five-step process:
(1) Identify the contract(s) with a customer;
(2) Identify the performance obligations in the contract(s);
(3) Determine the transaction price;
(4) Allocate the transaction price to the performance obligations in the contract(s); and
(5) Recognise revenue when (or as) the performance obligations are satisfied.
This Standard will require retrospective restatement, as well as enhanced disclosures regarding revenue.
The Directors anticipate that the adoption of AASB 15 will not have a material impact on the Group’s revenue recognition and disclosures.
36 AURA ENERGY LIMITED ANNUAL REPORT 2018
For
per
sona
l use
onl
y
iii. AASB 16: Leases (applicable to annual reporting periods commencing on or after 1 January 2019).
AASB 16 removes the classification of leases as either operating leases or finance leases for the lessee effectively treating all leases as finance leases. Short term leases (less than 12 months) and leases of a low value are exempt from the lease accounting requirements. Lessor accounting remains similar to current practice.
The Directors has have still assessing the likely impact.
iv. AASB 2016-1 Amendments to Australian Accounting Standards – Recognition of Deferred Tax Assets for Unrealised Losses
The amendments clarify that an entity needs to consider whether tax law restricts the sources of taxable profits against which it may make deductions on the reversal of deductible temporary difference related to unrealised losses. Furthermore, the amendments provide guidance on how an entity should determine future taxable profits and explain the circumstances in which taxable profit may include the recovery of some assets for more than their carrying amount. The Group applied amendments retrospectively.
However, their application has no effect on the Group’s financial position and performance as the Group has no deductible temporary differences or assets that are in the scope of the amendments.
v. AASB 2016-2 Amendments to Australian Accounting Standards – Disclosure Initiative: Amendments to AASB 107
The amendments require entities to provide disclosure of changes in their liabilities arising from financing activities, including both changes arising from cash flows and non-cash changes (such as foreign exchange gains or losses).
However, their application has no effect on the Group’s financial position and performance as the Group has no deductible temporary differences or assets that are in the scope of the amendments.
vi. AASB 2017-2 Amendments to Australian Accounting Standards – Further Annual Improvements 2014-2016 Cycle
The amendments clarify that the disclosure requirements in AASB 12, other than those in paragraphs B10–B16, apply to an entity’s interest in a subsidiary, a joint venture or an associate (or a portion of its interest in a joint venture or an associate) that is classified (or included in a disposal group that is classified) as held for sale.
However, their application has no effect on the Group’s financial position and performance as the Group has no deductible temporary differences or assets that are in the scope of the amendments.
NOTE 2. REVENUE AND OTHER INCOME2018
$2017
$
Revenue
Interest received from financial institutions 6,838 4.905
Total Revenue 6,838 4,905
NOTE 3. LOSS BEFORE INCOME TAX2018
$2017
$
The following significant expense items are relevant in explaining the financial performance:
Superannuation expense 61,597 36,838
NOTE 4. AUDITOR’S REMUNERATION2018
$2017
$
Remuneration of the auditor of the Group for:
Auditing or reviewing the financial reports 44,605 40,860
Taxation services provided by a related practice of the auditor 894 1,550
Other services - 9,000
45,499 51,410
37FINANCIAL STATEMENTS
For
per
sona
l use
onl
y
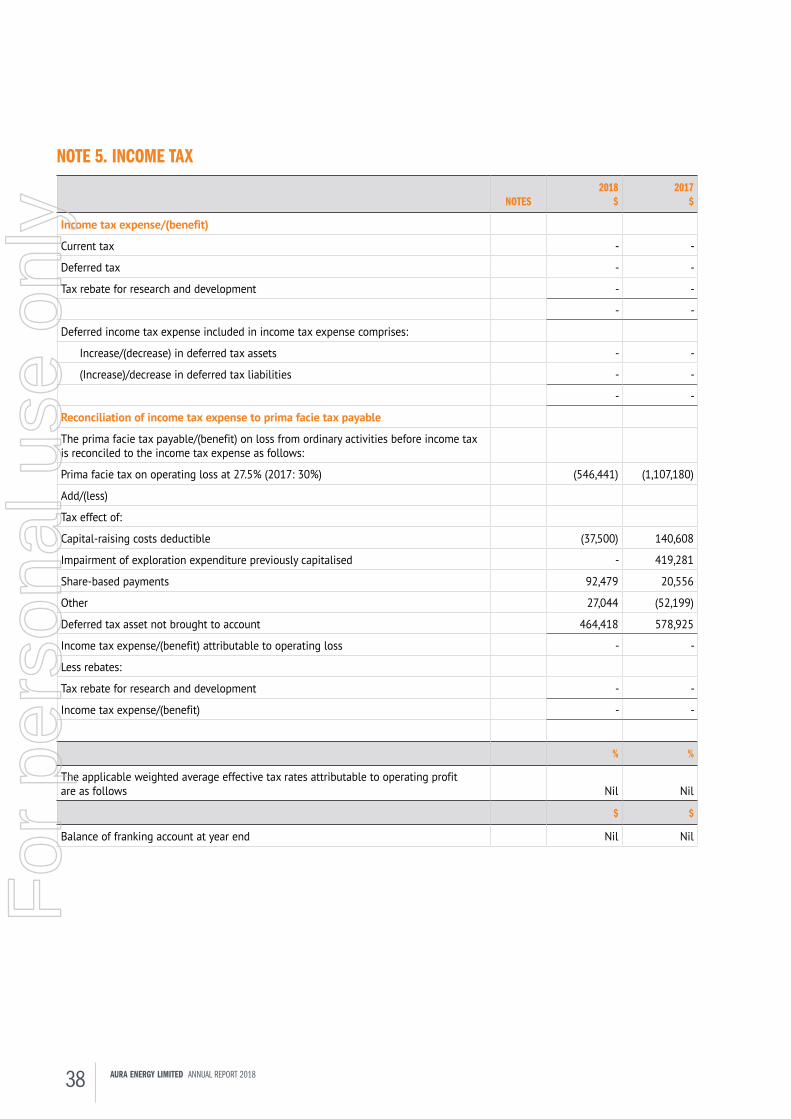
NOTE 5. INCOME TAX
NOTES2018
$2017
$
Income tax expense/(benefit)
Current tax - -
Deferred tax - -
Tax rebate for research and development - -
- -
Deferred income tax expense included in income tax expense comprises:
Increase/(decrease) in deferred tax assets - -
(Increase)/decrease in deferred tax liabilities - -
- -
Reconciliation of income tax expense to prima facie tax payable
The prima facie tax payable/(benefit) on loss from ordinary activities before income tax is reconciled to the income tax expense as follows:
Prima facie tax on operating loss at 27.5% (2017: 30%) (546,441) (1,107,180)
Add/(less)
Tax effect of:
Capital-raising costs deductible (37,500) 140,608
Impairment of exploration expenditure previously capitalised - 419,281
Share-based payments 92,479 20,556
Other 27,044 (52,199)
Deferred tax asset not brought to account 464,418 578,925
Income tax expense/(benefit) attributable to operating loss - -
Less rebates:
Tax rebate for research and development - -
Income tax expense/(benefit) - -
% %
The applicable weighted average effective tax rates attributable to operating profit are as follows Nil Nil
$ $
Balance of franking account at year end Nil Nil
38 AURA ENERGY LIMITED ANNUAL REPORT 2018
For
per
sona
l use
onl
y

NOTE 5. INCOME TAX (CONT)
NOTE2018
$2017
$
Deferred tax assets
Tax losses 4,697,290 4,174,499
Provisions and accruals (7,066) 21,697
Other (57,797) 99,869
4,632,427 4,296,065
Set-off deferred tax liabilities - -
Net deferred tax assets 4,632,427 4,296,065
Less deferred tax assets not recognised (4,632,427) (4,296,065)
Net tax assets - -
Deferred tax liabilities
Exploration expenditure - -
- -
Set-off deferred tax assets - -
Net deferred tax liabilities - -
Tax losses
Unused tax losses for which no deferred tax asset has been recognised, that may be utilised to offset tax liabilities:
Revenue losses 15,935,730 14,345,219
Capital losses 2,083,905 2,083,905
18,019,635 16,429,124
Potential deferred tax assets attributable to tax losses and exploration expenditure carried forward have not been brought to account at 30 June 2018 because the directors do not believe it is appropriate to regard realisation of the deferred tax assets as probable at this point in time. These benefits will only be obtained if:
i. The Group derives future assessable income of a nature and of an amount sufficient to enable the benefit from the deductions for the loss and exploration expenditure to be realised.
ii. The Group continues to comply with conditions for deductibility imposed by law.
iii. No changes in tax legislation adversely affect the Group in realising the benefit from the deductions for the loss and exploration expenditure.
39FINANCIAL STATEMENTS
For
per
sona
l use
onl
y

NOTE 6. EARNINGS PER SHARE
NOTE2018
$2017
$
a. Loss from continuing operations for the year (1,987,057) (3,690,599)
2018NO.
2017NO.
b. Weighted average number of ordinary shares outstanding during the year used in calculation of basic EPS 865,506,202 692,642,263
2018¢
2017¢
c. Basic and diluted earnings per share (cents per share) (0.23) (0.53)
i. The Group is in a loss making position and it is unlikely that the conversion to, calling of, or subscription for, ordinary share capital in respect of potential ordinary shares would lead to diluted earnings per share that shows an inferior view of the earnings per share. Therefore in the event the Company has dilutionary equity instruments on issue, the diluted loss per share for the year ended 30 June 2018 is the same as basic loss per share, whilst the Company remains loss making.
ii. There are 131,275,807 (2017: 80,803,189) options over ordinary shares that have vested.
NOTE 7. CASH AND CASH EQUIVALENTS
NOTE2018
$2017
$
Cash at bank 2,529,005 2,614,749
Short-term bank deposits 7a 315,164 38,211
2,844,169 2,652,960
a. The Group’s exposure to interest rate risk and a sensitivity analysis for financial assets and liabilities are disclosed in Note 24 Financial risk management.
NOTE 8. TRADE AND OTHER RECEIVABLES
NOTE2018
$2017
$
Current
Value-added tax receivable 8a 23,221 62,854
Other 660 -
23,881 62,854
a. Value-added tax (VAT) is a generic term for the broad-based consumption taxes that the Group is exposed to such as: Australia (GST); Sweden (MOMS); and in Mauritanian (VAT).
b. The Group’s exposure to interest rate risk and a sensitivity analysis for financial assets and liabilities are disclosed in Note 24 Financial risk management.
40 AURA ENERGY LIMITED ANNUAL REPORT 2018
For
per
sona
l use
onl
y

NOTE 9. FINANCIAL ASSETS2018
$2017
$
Current
Bonds and prepayments 60,926 80,897
60,926 80,897
NOTE 10. PLANT AND EQUIPMENT2018
$2017
$
Non-current
Plant and equipment 25,224 25,224
Accumulated depreciation (6,319) (6,319)
18,905 18,905
Total plant and equipment 18,905 18,905
Movements in carrying amounts
Balance at the beginning of year 18,905 -
Additions 1,596 25,224
Depreciation expense (12,377) (6,319)
Carrying amount at the end of year 8,124 18,905
NOTE 11. EXPLORATION AND EVALUATION ASSETS
NOTE2018
$2017
$
Non-current
Exploration expenditure capitalised:
Exploration and evaluation phase at cost 17,782,996 16,442,768
Add: Effect of exchange rate changes on exploration and evaluation assets (95,128) (193,346)
Less: Exploration expenditure impairment 11b - (1,397,602)
Net carrying value 11a,b 17,687,868 14,851,820
a. The value of the Group interest in exploration expenditure is dependent upon:
• The continuance of the Group’s rights to tenure of the areas of interest.
• The results of future exploration.
• The recoupment of costs through successful development and exploitation of the areas of interest, or alternatively, by their sale.
The Group’s exploration properties may be subjected to claim(s) under Native Title (or jurisdictional equivalent), or contain sacred sites, or sites of significance to the indigenous people of Sweden and Mauritania.
As a result, exploration properties or areas within the tenements may be subject to exploration restrictions, mining restrictions and/or claims for compensation. At this time, it is not possible to quantify whether such claims exist, or the quantum of such claims.
The Company has lodged exploitation applications for Ain Seder, Oued El Foule Est and Oum Ferkik. The Company is awaiting the completion by the government of its review of the applications. The carrying value of these three tenements in the accounts is $11,314,581.
41FINANCIAL STATEMENTS
For
per
sona
l use
onl
y

NOTE 11. EXPLORATION AND EVALUATION ASSETS (CONT)b. The Group has not recorded an impairment to the carrying value of its Mauritanian and Swedish tenements for the financial
year ended 30 June 2018 of $ Nil (2017: $1,397,602).
The impairment in the previous year arose from the group relinquishing tenements in Mauritania $495,433 and Sweden $897,368. The Group also recorded an impairment of $4,801 on an entity it placed into voluntary liquidation.
NOTE 12. TRADE AND OTHER PAYABLES
NOTE2018
$2017
$
Current
Unsecured
Trade payables 12a 60,112 333, 684
Accrued expenses 193,350 165,282
Other taxes payable 49,671 77,639
303,133 576,605
a. Trade payables are non-interest bearing and arise from the usual operating activities of the Group. Trade payables and other payables and accruals, except directors’ fees, are usually settled within the lower of terms of trade or 30 days.
b. The Group’s exposure to interest rate risk and a sensitivity analysis for financial assets and liabilities are disclosed in Note 24 Financial risk management.
NOTE 13. SHORT-TERM PROVISIONS2018
$2017
$
Current
Employee benefits 28,405 118,948
28,405 118,948
2018NO.
2017NO.
Number of employees at year end 4 4
NOTE 14. OTHER FINANCIAL LIABILITIES2018
$2017
$
Current
Share Sale Facility - 47,803
- 47,803
On 10 February 2017 the Company established a Share Sale facility which enabled shareholders with unmarketable parcels to sell their shares with the Company bearing the costs of the sale. At balance date, the Company held $47,803 in proceeds from the Share sale facility which was distributed to shareholders on 21 July 2017.
42 AURA ENERGY LIMITED ANNUAL REPORT 2018
For
per
sona
l use
onl
y
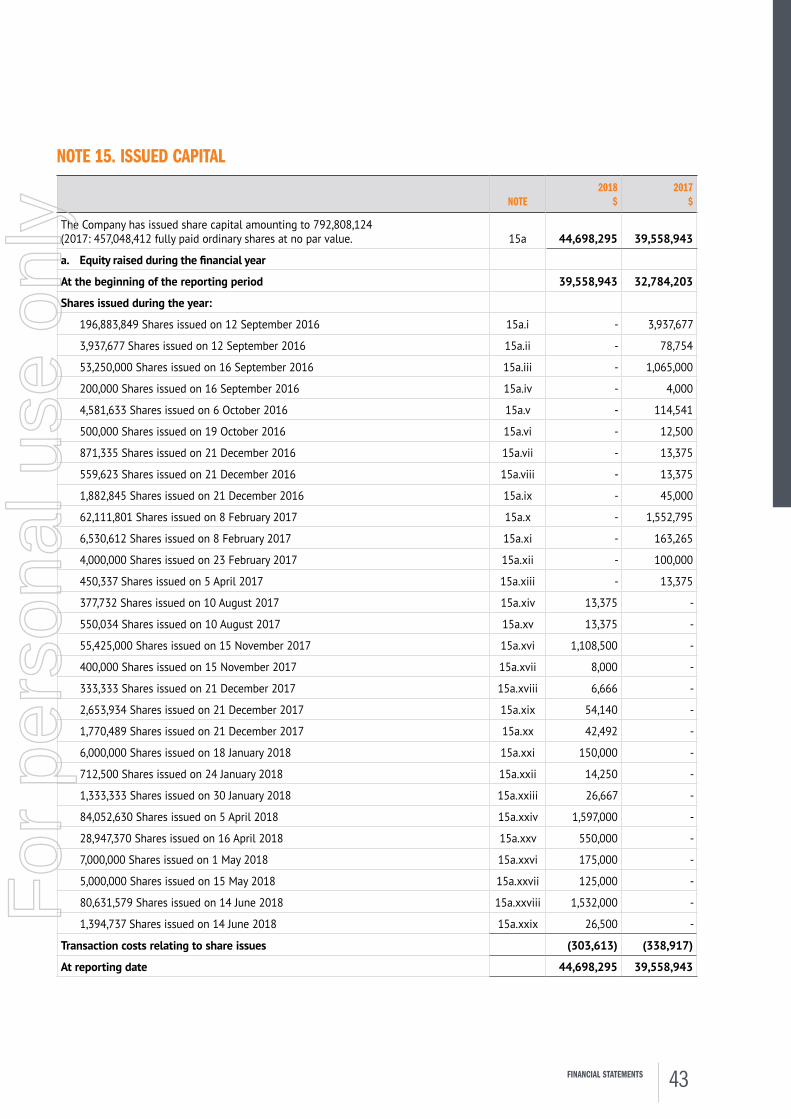
NOTE 15. ISSUED CAPITAL
NOTE2018
$2017
$
The Company has issued share capital amounting to 792,808,124 (2017: 457,048,412 fully paid ordinary shares at no par value. 15a 44,698,295 39,558,943
a. Equity raised during the financial year
At the beginning of the reporting period 39,558,943 32,784,203
Shares issued during the year:
196,883,849 Shares issued on 12 September 2016 15a.i - 3,937,677
3,937,677 Shares issued on 12 September 2016 15a.ii - 78,754
53,250,000 Shares issued on 16 September 2016 15a.iii - 1,065,000
200,000 Shares issued on 16 September 2016 15a.iv - 4,000
4,581,633 Shares issued on 6 October 2016 15a.v - 114,541
500,000 Shares issued on 19 October 2016 15a.vi - 12,500
871,335 Shares issued on 21 December 2016 15a.vii - 13,375
559,623 Shares issued on 21 December 2016 15a.viii - 13,375
1,882,845 Shares issued on 21 December 2016 15a.ix - 45,000
62,111,801 Shares issued on 8 February 2017 15a.x - 1,552,795
6,530,612 Shares issued on 8 February 2017 15a.xi - 163,265
4,000,000 Shares issued on 23 February 2017 15a.xii - 100,000
450,337 Shares issued on 5 April 2017 15a.xiii - 13,375
377,732 Shares issued on 10 August 2017 15a.xiv 13,375 -
550,034 Shares issued on 10 August 2017 15a.xv 13,375 -
55,425,000 Shares issued on 15 November 2017 15a.xvi 1,108,500 -
400,000 Shares issued on 15 November 2017 15a.xvii 8,000 -
333,333 Shares issued on 21 December 2017 15a.xviii 6,666 -
2,653,934 Shares issued on 21 December 2017 15a.xix 54,140 -
1,770,489 Shares issued on 21 December 2017 15a.xx 42,492 -
6,000,000 Shares issued on 18 January 2018 15a.xxi 150,000 -
712,500 Shares issued on 24 January 2018 15a.xxii 14,250 -
1,333,333 Shares issued on 30 January 2018 15a.xxiii 26,667 -
84,052,630 Shares issued on 5 April 2018 15a.xxiv 1,597,000 -
28,947,370 Shares issued on 16 April 2018 15a.xxv 550,000 -
7,000,000 Shares issued on 1 May 2018 15a.xxvi 175,000 -
5,000,000 Shares issued on 15 May 2018 15a.xxvii 125,000 -
80,631,579 Shares issued on 14 June 2018 15a.xxviii 1,532,000 -
1,394,737 Shares issued on 14 June 2018 15a.xxix 26,500 -
Transaction costs relating to share issues (303,613) (338,917)
At reporting date 44,698,295 39,558,943
43FINANCIAL STATEMENTS
For
per
sona
l use
onl
y

NOTE 15. ISSUED CAPITAL (CONT)
NOTE2018
NO.2017
NO.
At the beginning of the reporting period 792,808,124 457,048,412
Ordinary shares issued during the financial year:
196,883,849 Shares issued on 12 September 2016 15a.i - 196,883,849
3,937,677 Shares issued on 12 September 2016 15a.ii - 3,937,677
53,250,000 Shares issued on 16 September 2016 15a.iii - 53,250,000
200,000 Shares issued on 16 September 2016 15a.iv - 200,000
4,581,633 Shares issued on 6 October 2016 15a.v - 4,581,633
500,000 Shares issued on 19 October 2016 15a.vi - 500,000
871,335 Shares issued on 21 December 2016 15a.vii - 871,335
559,623 Shares issued on 21 December 2016 15a.viii - 559,623
1,882,845 Shares issued on 21 December 2016 15a.ix - 1,882,845
62,111,801 Shares issued on 8 February 2017 15a.x - 62,111,801
6,530,612 Shares issued on 8 February 2017 15a.xi - 6,530,612
4,000,000 Shares issued on 23 February 2017 15a.xii - 4,000,000
450,337 Shares issued on 5 April 2017 15a.xiii - 450,337
377,732 Shares issued on 10 August 2017 15a.xiv 377,732 -
550,034 Shares issued on 10 August 2017 15a.xv 550,034 -
55,425,000 Shares issued on 15 November 2017 15a.xvi 55,425,000 -
400,000 Shares issued on 15 November 2017 15a.xvii 400,000 -
333,333 Shares issued on 21 December 2017 15a.xviii 333,333 -
2,653,934 Shares issued on 21 December 2017 15a.xix 2,653,934 -
1,770,489 Shares issued on 21 December 2017 15a.xx 1,770,489 -
6,000,000 Shares issued on 18 January 2018 15a.xxi 6,000,000 -
712,500 Shares issued on 24 January 2018 15a.xxii 712,500 -
1,333,333 Shares issued on 30 January 2018 15a.xxiii 1,333,333 -
84,052,630 Shares issued on 5 April 2018 15a.xxiv 84,052,630 -
28,947,370 Shares issued on 16 April 2018 15a.xxv 28,947,370 -
7,000,000 Shares issued on 1 May 2018 15a.xxvi 7,000,000 -
5,000,000 Shares issued on 15 May 2018 15a.xxvii 5,000,000 -
80,631,579 Shares issued on 14 June 2018 15a.xxviii 80,631,579 -
1,394,737 Shares issued on 14 June 2018 15a.xxix 1,394,737 -
1,069,390,795 792,808,124
44 AURA ENERGY LIMITED ANNUAL REPORT 2018
For
per
sona
l use
onl
y
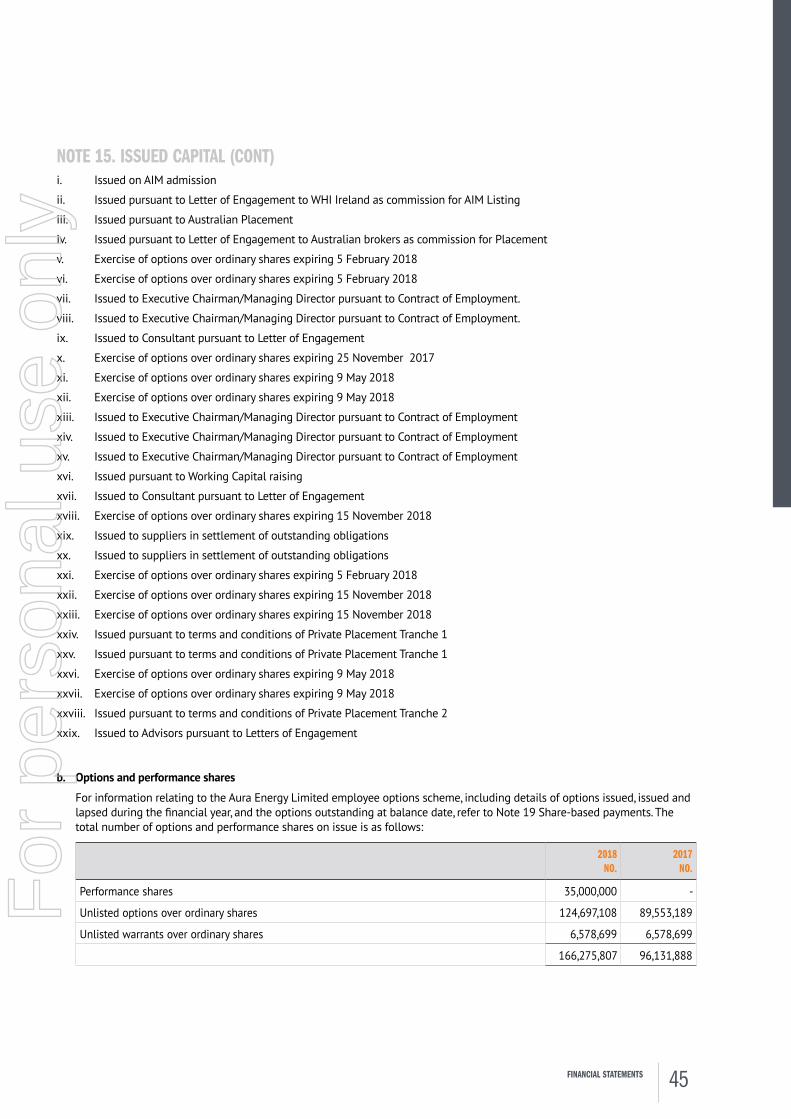
NOTE 15. ISSUED CAPITAL (CONT)i. Issued on AIM admission
ii. Issued pursuant to Letter of Engagement to WHI Ireland as commission for AIM Listing
iii. Issued pursuant to Australian Placement
iv. Issued pursuant to Letter of Engagement to Australian brokers as commission for Placement
v. Exercise of options over ordinary shares expiring 5 February 2018
vi. Exercise of options over ordinary shares expiring 5 February 2018
vii. Issued to Executive Chairman/Managing Director pursuant to Contract of Employment.
viii. Issued to Executive Chairman/Managing Director pursuant to Contract of Employment.
ix. Issued to Consultant pursuant to Letter of Engagement
x. Exercise of options over ordinary shares expiring 25 November 2017
xi. Exercise of options over ordinary shares expiring 9 May 2018
xii. Exercise of options over ordinary shares expiring 9 May 2018
xiii. Issued to Executive Chairman/Managing Director pursuant to Contract of Employment
xiv. Issued to Executive Chairman/Managing Director pursuant to Contract of Employment
xv. Issued to Executive Chairman/Managing Director pursuant to Contract of Employment
xvi. Issued pursuant to Working Capital raising
xvii. Issued to Consultant pursuant to Letter of Engagement
xviii. Exercise of options over ordinary shares expiring 15 November 2018
xix. Issued to suppliers in settlement of outstanding obligations
xx. Issued to suppliers in settlement of outstanding obligations
xxi. Exercise of options over ordinary shares expiring 5 February 2018
xxii. Exercise of options over ordinary shares expiring 15 November 2018
xxiii. Exercise of options over ordinary shares expiring 15 November 2018
xxiv. Issued pursuant to terms and conditions of Private Placement Tranche 1
xxv. Issued pursuant to terms and conditions of Private Placement Tranche 1
xxvi. Exercise of options over ordinary shares expiring 9 May 2018
xxvii. Exercise of options over ordinary shares expiring 9 May 2018
xxviii. Issued pursuant to terms and conditions of Private Placement Tranche 2
xxix. Issued to Advisors pursuant to Letters of Engagement
b. Options and performance shares
For information relating to the Aura Energy Limited employee options scheme, including details of options issued, issued and lapsed during the financial year, and the options outstanding at balance date, refer to Note 19 Share-based payments. The total number of options and performance shares on issue is as follows:
2018NO.
2017NO.
Performance shares 35,000,000 -
Unlisted options over ordinary shares 124,697,108 89,553,189
Unlisted warrants over ordinary shares 6,578,699 6,578,699
166,275,807 96,131,888
45FINANCIAL STATEMENTS
For
per
sona
l use
onl
y

NOTE 15. ISSUED CAPITAL (CONT)c. Capital Management
i. Capital management policy
The directors’ objectives when managing capital are to ensure that the Group can fund its operations and continue as a going concern, so that they may continue to provide returns for shareholders and benefits for other stakeholders.
Due to the nature of the Group’s activities, being mineral exploration, the Group does not have ready access to credit facilities, with the primary source of funding being equity raisings. Therefore, the focus of the Group’s capital risk management is the current working capital position against the requirements of the Group to meet exploration programmes and corporate overheads.
The Group’s strategy is to ensure appropriate liquidity is maintained to meet anticipated operating requirements, with a view to initiating appropriate capital raisings as required.
ii. Current ratio
The current ratio the Group at 30 June 2018 and 30 June 2017 was as follows:
NOTE2018
NO.2017
NO.
Current ratio 12.72 3.76
iii. Working capital position
The working capital position of the Group at 30 June 2018 and 30 June 2017 was as follows:
NOTE2018
NO.2017
NO.
Cash and cash equivalents 7 2,844,169 2,652,960
Trade and other receivables 8 23,881 62,854
Financial assets 9 60,926 80,897
Trade and other payables 12 (303,133) (576,605)
Financial liabilities 14 - (47,803)
Short-term provisions 13 (28,405) (118,948)
Working capital surplus / (deficit) 2,597,438 2,053,355
NOTE 16. RESERVES
NOTE2018
$2017
$
Option reserve 16a 353,929 457,481
Foreign exchange reserve 16b 284,458 384,190
638,387 841,671
a. Option reserve
The option reserve records items recognised as expenses on the value of employee and consultant share options.
b. Foreign exchange translation reserve
The foreign exchange reserve records exchange differences arising on translation of foreign controlled subsidiary.
46 AURA ENERGY LIMITED ANNUAL REPORT 2018
For
per
sona
l use
onl
y
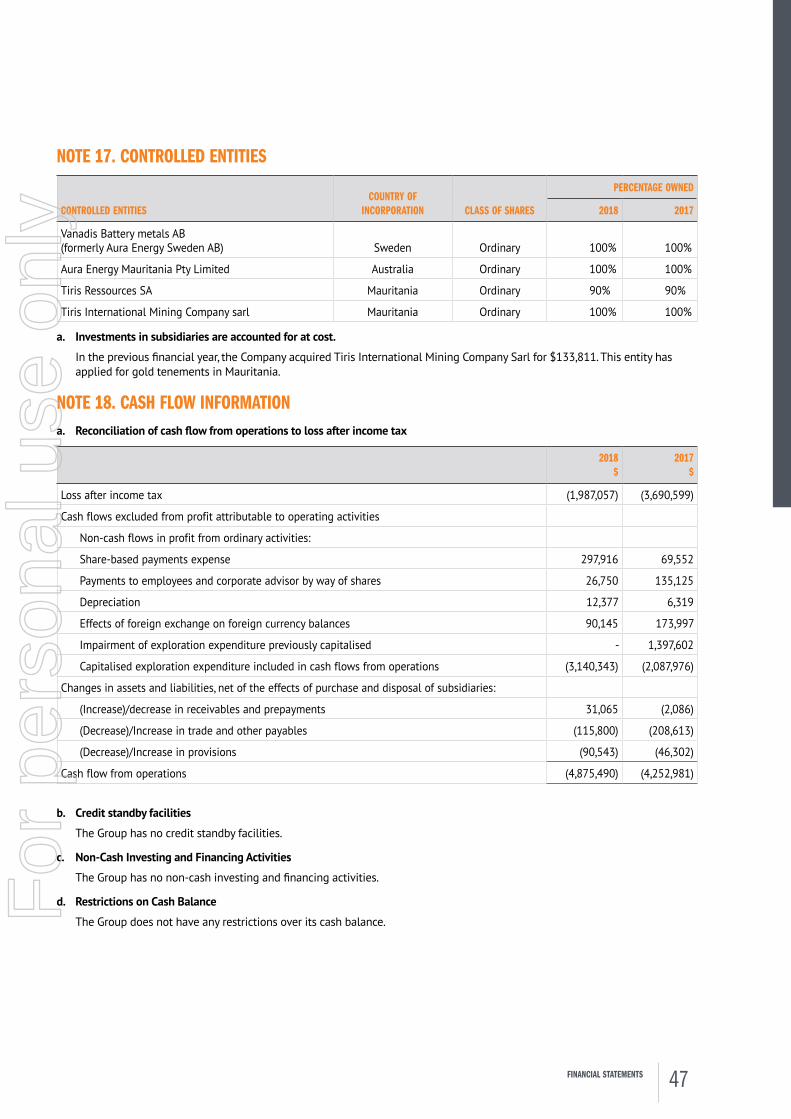
NOTE 17. CONTROLLED ENTITIES
CONTROLLED ENTITIESCOUNTRY OF
INCORPORATION CLASS OF SHARES
PERCENTAGE OWNED
2018 2017
Vanadis Battery metals AB (formerly Aura Energy Sweden AB) Sweden Ordinary 100% 100%
Aura Energy Mauritania Pty Limited Australia Ordinary 100% 100%
Tiris Ressources SA Mauritania Ordinary 90% 90%
Tiris International Mining Company sarl Mauritania Ordinary 100% 100%
a. Investments in subsidiaries are accounted for at cost.
In the previous financial year, the Company acquired Tiris International Mining Company Sarl for $133,811. This entity has applied for gold tenements in Mauritania.
NOTE 18. CASH FLOW INFORMATIONa. Reconciliation of cash flow from operations to loss after income tax
2018$
2017 $
Loss after income tax (1,987,057) (3,690,599)
Cash flows excluded from profit attributable to operating activities
Non-cash flows in profit from ordinary activities:
Share-based payments expense 297,916 69,552
Payments to employees and corporate advisor by way of shares 26,750 135,125
Depreciation 12,377 6,319
Effects of foreign exchange on foreign currency balances 90,145 173,997
Impairment of exploration expenditure previously capitalised - 1,397,602
Capitalised exploration expenditure included in cash flows from operations (3,140,343) (2,087,976)
Changes in assets and liabilities, net of the effects of purchase and disposal of subsidiaries:
(Increase)/decrease in receivables and prepayments 31,065 (2,086)
(Decrease)/Increase in trade and other payables (115,800) (208,613)
(Decrease)/Increase in provisions (90,543) (46,302)
Cash flow from operations (4,875,490) (4,252,981)
b. Credit standby facilities
The Group has no credit standby facilities.
c. Non-Cash Investing and Financing Activities
The Group has no non-cash investing and financing activities.
d. Restrictions on Cash Balance
The Group does not have any restrictions over its cash balance.
47FINANCIAL STATEMENTS
For
per
sona
l use
onl
y
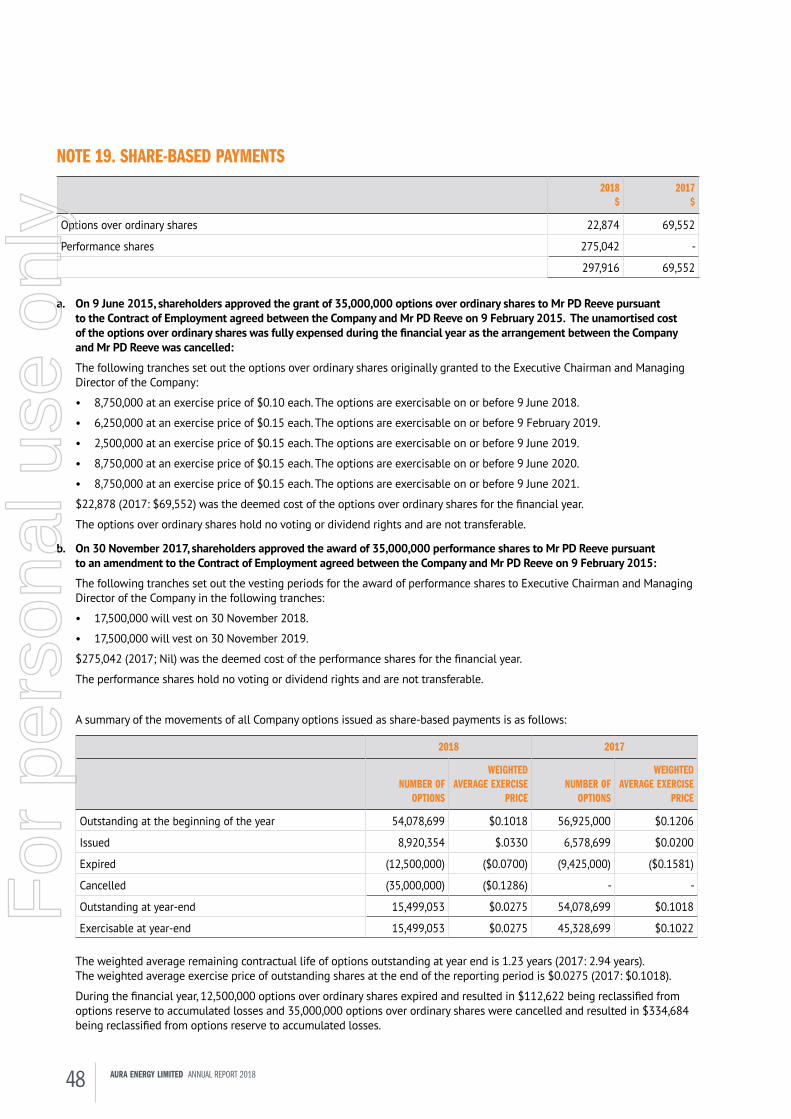
NOTE 19. SHARE-BASED PAYMENTS2018
$2017
$
Options over ordinary shares 22,874 69,552
Performance shares 275,042 -
297,916 69,552
a. On 9 June 2015, shareholders approved the grant of 35,000,000 options over ordinary shares to Mr PD Reeve pursuant to the Contract of Employment agreed between the Company and Mr PD Reeve on 9 February 2015. The unamortised cost of the options over ordinary shares was fully expensed during the financial year as the arrangement between the Company and Mr PD Reeve was cancelled:
The following tranches set out the options over ordinary shares originally granted to the Executive Chairman and Managing Director of the Company:
• 8,750,000 at an exercise price of $0.10 each. The options are exercisable on or before 9 June 2018.
• 6,250,000 at an exercise price of $0.15 each. The options are exercisable on or before 9 February 2019.
• 2,500,000 at an exercise price of $0.15 each. The options are exercisable on or before 9 June 2019.
• 8,750,000 at an exercise price of $0.15 each. The options are exercisable on or before 9 June 2020.
• 8,750,000 at an exercise price of $0.15 each. The options are exercisable on or before 9 June 2021.
$22,878 (2017: $69,552) was the deemed cost of the options over ordinary shares for the financial year.
The options over ordinary shares hold no voting or dividend rights and are not transferable.
b. On 30 November 2017, shareholders approved the award of 35,000,000 performance shares to Mr PD Reeve pursuant to an amendment to the Contract of Employment agreed between the Company and Mr PD Reeve on 9 February 2015:
The following tranches set out the vesting periods for the award of performance shares to Executive Chairman and Managing Director of the Company in the following tranches:
• 17,500,000 will vest on 30 November 2018.
• 17,500,000 will vest on 30 November 2019.
$275,042 (2017; Nil) was the deemed cost of the performance shares for the financial year.
The performance shares hold no voting or dividend rights and are not transferable.
A summary of the movements of all Company options issued as share-based payments is as follows:
2018 2017
NUMBER OF OPTIONS
WEIGHTED AVERAGE EXERCISE
PRICENUMBER OF
OPTIONS
WEIGHTED AVERAGE EXERCISE
PRICE
Outstanding at the beginning of the year 54,078,699 $0.1018 56,925,000 $0.1206
Issued 8,920,354 $.0330 6,578,699 $0.0200
Expired (12,500,000) ($0.0700) (9,425,000) ($0.1581)
Cancelled (35,000,000) ($0.1286) - -
Outstanding at year-end 15,499,053 $0.0275 54,078,699 $0.1018
Exercisable at year-end 15,499,053 $0.0275 45,328,699 $0.1022
The weighted average remaining contractual life of options outstanding at year end is 1.23 years (2017: 2.94 years). The weighted average exercise price of outstanding shares at the end of the reporting period is $0.0275 (2017: $0.1018).
During the financial year, 12,500,000 options over ordinary shares expired and resulted in $112,622 being reclassified from options reserve to accumulated losses and 35,000,000 options over ordinary shares were cancelled and resulted in $334,684 being reclassified from options reserve to accumulated losses.
48 AURA ENERGY LIMITED ANNUAL REPORT 2018
For
per
sona
l use
onl
y
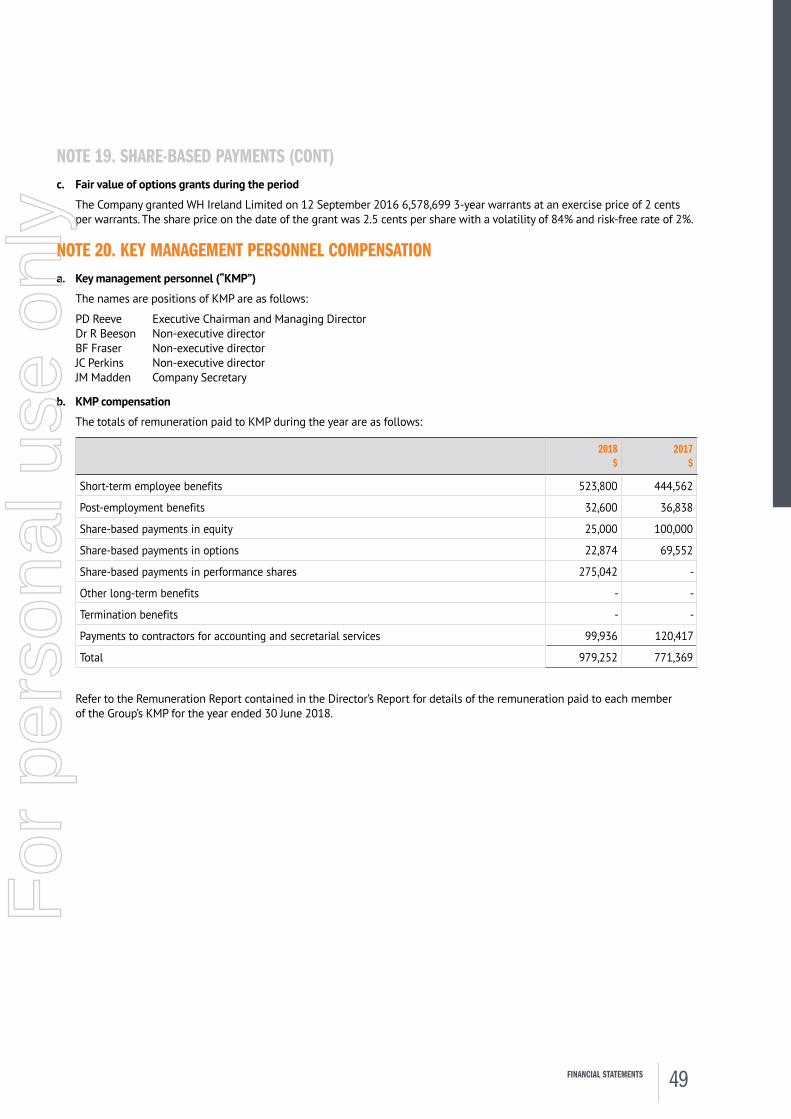
NOTE 19. SHARE-BASED PAYMENTS (CONT)c. Fair value of options grants during the period
The Company granted WH Ireland Limited on 12 September 2016 6,578,699 3-year warrants at an exercise price of 2 cents per warrants. The share price on the date of the grant was 2.5 cents per share with a volatility of 84% and risk-free rate of 2%.
NOTE 20. KEY MANAGEMENT PERSONNEL COMPENSATIONa. Key management personnel (“KMP”)
The names are positions of KMP are as follows:
PD Reeve Executive Chairman and Managing Director Dr R Beeson Non-executive director BF Fraser Non-executive director JC Perkins Non-executive director JM Madden Company Secretary
b. KMP compensation
The totals of remuneration paid to KMP during the year are as follows:
2018$
2017$
Short-term employee benefits 523,800 444,562
Post-employment benefits 32,600 36,838
Share-based payments in equity 25,000 100,000
Share-based payments in options 22,874 69,552
Share-based payments in performance shares 275,042 -
Other long-term benefits - -
Termination benefits - -
Payments to contractors for accounting and secretarial services 99,936 120,417
Total 979,252 771,369
Refer to the Remuneration Report contained in the Director’s Report for details of the remuneration paid to each member of the Group’s KMP for the year ended 30 June 2018.
49FINANCIAL STATEMENTS
For
per
sona
l use
onl
y
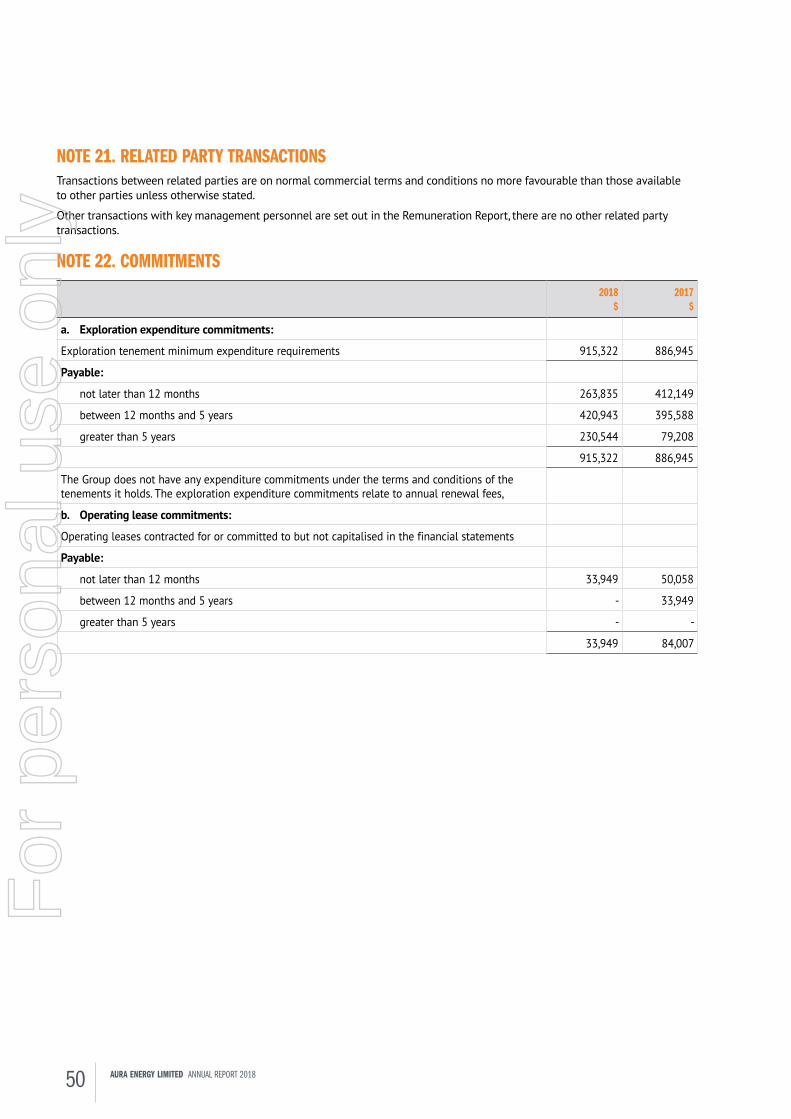
NOTE 21. RELATED PARTY TRANSACTIONSTransactions between related parties are on normal commercial terms and conditions no more favourable than those available to other parties unless otherwise stated.
Other transactions with key management personnel are set out in the Remuneration Report, there are no other related party transactions.
NOTE 22. COMMITMENTS2018
$2017
$
a. Exploration expenditure commitments:
Exploration tenement minimum expenditure requirements 915,322 886,945
Payable:
not later than 12 months 263,835 412,149
between 12 months and 5 years 420,943 395,588
greater than 5 years 230,544 79,208
915,322 886,945
The Group does not have any expenditure commitments under the terms and conditions of the tenements it holds. The exploration expenditure commitments relate to annual renewal fees,
b. Operating lease commitments:
Operating leases contracted for or committed to but not capitalised in the financial statements
Payable:
not later than 12 months 33,949 50,058
between 12 months and 5 years - 33,949
greater than 5 years - -
33,949 84,007
50 AURA ENERGY LIMITED ANNUAL REPORT 2018
For
per
sona
l use
onl
y
NOTE 23. OPERATING SEGMENTSa. Identification of reportable segments
The Group operates predominantly in the mining industry. This comprises exploration and evaluation of uranium projects. Inter- segment transactions are priced at cost to the Consolidated Group.
The Group has identified its operating segments based on the internal reports that are provided to the Board of Directors on a monthly basis. Management has identified the operating segments based on the two principal locations of its projects – Sweden and Mauritania. The Group also maintains a corporate function primarily responsible for overall management of the operating segments, raising capital and distributing funds to operating segments.
Corporate expenses include administration and regulatory expenses arising from operating an ASX listed entity.
Segment assets include the costs to acquire tenements and the capitalised exploration costs of those tenements Financial assets including cash and cash equivalents, and investments in financial assets, are reported in the Treasury segment.
b. Basis of accounting for purposes of reporting by operating segments
i. Accounting policies adopted
Unless stated otherwise, all amounts reported to the board of directors, being the chief decision maker with respect to operating segments, are determined in accordance with accounting policies that are consistent to those adopted in the annual financial statements of the Group.
ii. Inter-segment transactions
An internally determined transfer price is set for all inter-segment sales. This price is reset quarterly and is based on what would be realised in the event the sale was made to an external party at arm’s length. All such transactions are eliminated on consolidation of the Group’s financial statements.
Corporate charges are allocated to reporting segments based on the segments’ overall proportion of revenue generation within the Group. The board of directors believes this is representative of likely consumption of head office expenditure that should be used in assessing segment performance and cost recoveries.
Inter-segment loans payable and receivable are initially recognised at the consideration received/to be received net of transaction costs. If inter-segment loans receivable and payable are not on commercial terms, these are not adjusted to fair value based on market interest rates. This policy represents a departure from that applied to the statutory financial statements.
iii. Segment assets
Where an asset is used across multiple segments, the asset is allocated to that segment that receives majority economic value from that asset. In the majority of instances, segment assets are clearly identifiable on the basis of their nature and physical location.
iv. Segment liabilities
Liabilities are allocated to segments where there is a direct nexus between the incurrence of the liability and the operations of the segment. Borrowings and tax liabilities are generally considered to relate to the Group as a whole and are not allocated. Segment liabilities include trade and other payables and certain direct borrowings.
v. Unallocated items
The following items of revenue, expenses, assets and liabilities are not allocated to operating segments as they are not considered part of the core operations of any segment:
• Non-exploration impairment of assets and other non-recurring items of revenue or expense
• Income tax expense
• Deferred tax assets and liabilities
• Current tax liabilities
• Other financial liabilities
51FINANCIAL STATEMENTS
For
per
sona
l use
onl
y

NOTE 23. OPERATING SEGMENTS (CONT)
FOR THE YEAR TO 30 JUNE 2018
MAURITANIA EXPLORATION
$
SWEDEN EXPLORATION
$CORPORATE
$TOTAL
$
Segment revenue - - 6,838 6,838
Segment results - (14,328) 6,838 (7,490)
Amounts not included in segment results but reviewed by Board:
Expenses not directly allocable to identifiable segments or areas of interest
Accounting and audit fees (144,541)
Computers and communications (33,945)
Depreciation (12,377)
Employee benefits expense (651,703)
Exchange fluctuation (90,145)
Insurance (42,378)
Consulting fees and corporate advisory (335,026)
Public relations (40,332)
Rent and utilities (64,299)
Share-based payment expenses (297,916)
Share registry and listing fees (160,433)
Travel and accommodation (72,622)
Other expenses (33,850)
Loss after income tax (1,987,057)
AS AT 30 JUNE 2018
Segment assets 11,940,312 5,747,556 2,844,169 20,532,037
Unallocated assets:
Trade and other receivables 84,807
Plant and equipment 8,124
Other non-current assets -
Total assets 20,624,968
Segment asset increases for the period:
Capital expenditure-exploration 2,625,573 286,805 - 2,912,378
Less: Write-off of exploration assets - - - -
2,625,573 247,510 - 2,912,378
Segment liabilities 98,783 31,360 - 130,143
Unallocated liabilities:
Trade and other payables 172,990
Short-term provisions 28,405
Financial liabilities -
Total liabilities 331,538
52 AURA ENERGY LIMITED ANNUAL REPORT 2018
For
per
sona
l use
onl
y

NOTE 23. OPERATING SEGMENTS (CONT)
FOR THE YEAR TO 30 JUNE 2017
MAURITANIA EXPLORATION
$
SWEDEN EXPLORATION
$CORPORATE
$TOTAL
$
Segment revenue - - 4,905 4,905
Segment results (495,433) (894,800) 103 (1,390,130)
Amounts not included in segment results but reviewed by Board:
Expenses not directly allocable to identifiable segments or areas of interest
Accounting and audit fees (161,277)
Computers and communications (35,034)
Depreciation (6,319)
Employee benefits expense (736,614)
Finance costs (173,997)
Insurance (32,981)
Consulting fees and corporate advisory (31,238)
Public relations (100,650)
Rent and utilities (66,178)
Share-based payment expenses (69,552)
Share registry and listing fees (119,455)
Travel and accommodation (70,290)
AIM Listing costs (640,963)
Other expenses (55,921)
Loss after income tax (3,690,599)
AS AT 30 JUNE 2017
Segment assets 9,383,768 5,685,455 2,490,644 17,559,867
Unallocated assets:
Trade and other receivables 61,697
Plant and equipment 18,905
Total assets 17,640,469
Segment asset increases for the period:
Capital expenditure-exploration 2,030,513 206,431 - 2,236,944
Less: Write-off of exploration assets (495,433) (897,367) (4,802) (1,397,602)
1,535,080 (690,936) (4,802) 839,342
Segment liabilities 225,765 24,608 - 250,373
Unallocated Liabilities:
Trade and other payables 326,232
Short term provisions 118,948
Financial liabilities 47,803
Total liabilities 743,356
53FINANCIAL STATEMENTS
For
per
sona
l use
onl
y
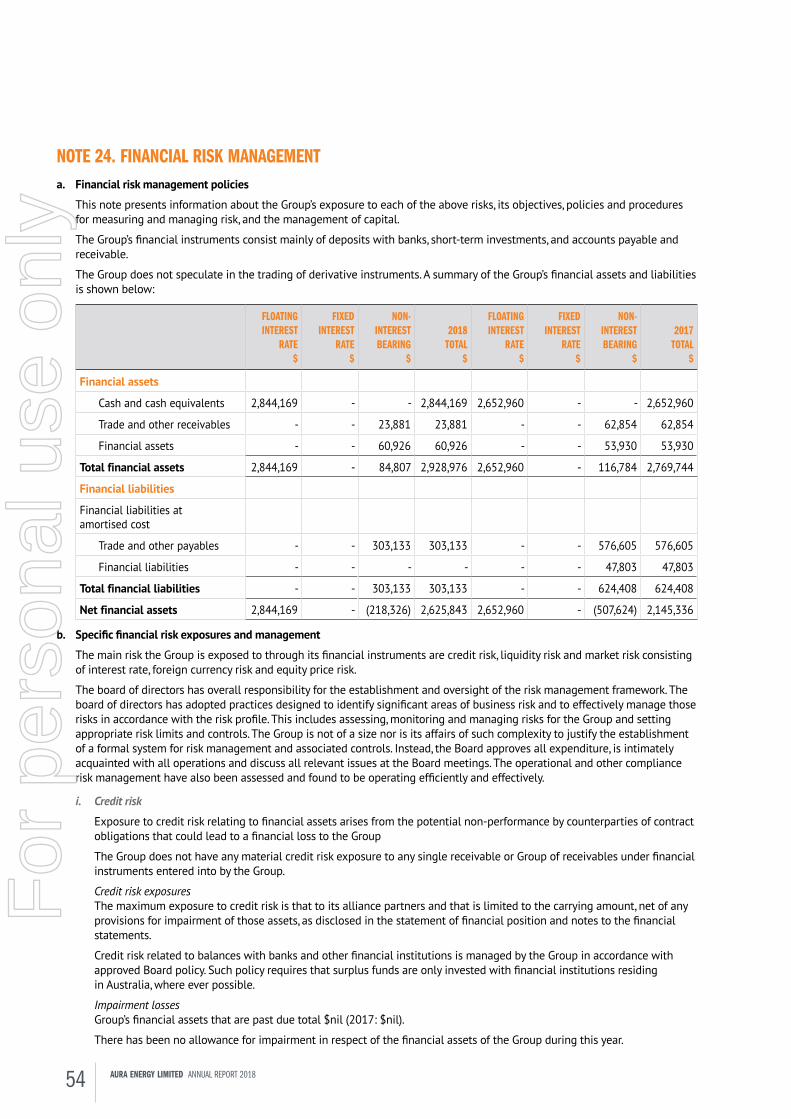
NOTE 24. FINANCIAL RISK MANAGEMENTa. Financial risk management policies
This note presents information about the Group’s exposure to each of the above risks, its objectives, policies and procedures for measuring and managing risk, and the management of capital.
The Group’s financial instruments consist mainly of deposits with banks, short-term investments, and accounts payable and receivable.
The Group does not speculate in the trading of derivative instruments. A summary of the Group’s financial assets and liabilities is shown below:
FLOATING INTEREST
RATE$
FIXED INTEREST
RATE$
NON- INTEREST BEARING
$
2018TOTAL
$
FLOATING INTEREST
RATE$
FIXED INTEREST
RATE$
NON- INTEREST BEARING
$
2017TOTAL
$
Financial assets
Cash and cash equivalents 2,844,169 - - 2,844,169 2,652,960 - - 2,652,960
Trade and other receivables - - 23,881 23,881 - - 62,854 62,854
Financial assets - - 60,926 60,926 - - 53,930 53,930
Total financial assets 2,844,169 - 84,807 2,928,976 2,652,960 - 116,784 2,769,744
Financial liabilities
Financial liabilities at amortised cost
Trade and other payables - - 303,133 303,133 - - 576,605 576,605
Financial liabilities - - - - - - 47,803 47,803
Total financial liabilities - - 303,133 303,133 - - 624,408 624,408
Net financial assets 2,844,169 - (218,326) 2,625,843 2,652,960 - (507,624) 2,145,336
b. Specific financial risk exposures and management
The main risk the Group is exposed to through its financial instruments are credit risk, liquidity risk and market risk consisting of interest rate, foreign currency risk and equity price risk.
The board of directors has overall responsibility for the establishment and oversight of the risk management framework. The board of directors has adopted practices designed to identify significant areas of business risk and to effectively manage those risks in accordance with the risk profile. This includes assessing, monitoring and managing risks for the Group and setting appropriate risk limits and controls. The Group is not of a size nor is its affairs of such complexity to justify the establishment of a formal system for risk management and associated controls. Instead, the Board approves all expenditure, is intimately acquainted with all operations and discuss all relevant issues at the Board meetings. The operational and other compliance risk management have also been assessed and found to be operating efficiently and effectively.
i. Credit risk
Exposure to credit risk relating to financial assets arises from the potential non-performance by counterparties of contract obligations that could lead to a financial loss to the Group
The Group does not have any material credit risk exposure to any single receivable or Group of receivables under financial instruments entered into by the Group.
Credit risk exposuresThe maximum exposure to credit risk is that to its alliance partners and that is limited to the carrying amount, net of any provisions for impairment of those assets, as disclosed in the statement of financial position and notes to the financial statements.
Credit risk related to balances with banks and other financial institutions is managed by the Group in accordance with approved Board policy. Such policy requires that surplus funds are only invested with financial institutions residing in Australia, where ever possible.
Impairment lossesGroup’s financial assets that are past due total $nil (2017: $nil).
There has been no allowance for impairment in respect of the financial assets of the Group during this year.
54 AURA ENERGY LIMITED ANNUAL REPORT 2018
For
per
sona
l use
onl
y

NOTE 24. FINANCIAL RISK MANAGEMENT (CONT)ii. Liquidity risk
Liquidity risk arises from the possibility that the Group might encounter difficulty in settling its debts or otherwise meeting its obligations related to financial liabilities.
The Group manages liquidity risk by continuously monitoring forecast and actual cash flows and ensuring sufficient cash and marketable securities are available to meet the current and future commitments of the Group. Due to the nature of the Group’s activities, being mineral exploration, the Group does not have ready access to credit facilities, with the primary source of funding being equity raisings. The board of directors constantly monitor the state of equity markets in conjunction with the Group’s current and future funding requirements, with a view to initiating appropriate capital raisings as required. Any surplus funds are invested with major financial institutions.
The financial liabilities of the Group are confined to trade and other payables as disclosed in the statement of financial position. All trade and other payables are non-interest bearing and due within 30 days of the reporting date.
iii. Market risk
Market risk is the risk that changes in market prices, such as foreign exchange rates, interest rates and equity prices will affect the Group’s income or the value of its holdings of financial instruments. The objective of market risk management is to manage and control market risk exposures within acceptable parameters, while optimising the return.
The Board meets on a regular basis and considers the Group’s exposure currency and interest rate risk.
(1) Interest rate risk
Exposure to interest rate risk arises on financial assets and financial liabilities recognised at the end of the reporting period whereby a future change in interest rates will affect future cash flows or the fair value of fixed rate financial instruments. The Group is also exposed to earnings volatility on floating rate instruments.
Interest rate risk is not material to the Group as no debt arrangements have been entered into, and movement in interest rates on the Group’s financial assets is not material.
(2) Foreign exchange risk
Exposure to foreign exchange risk may result in the fair value or future cash flows of a financial instrument fluctuating due to movement in foreign exchange rates of currencies in which the Group holds financial instruments which are other than the Australian dollars functional currency of the Group.
With instruments being held by overseas operations, fluctuations in foreign currencies may impact on the Group’s financial results. The Group’s exposure to foreign exchange risk is minimal; however the Board continues to review this exposure regularly.
(3) Price risk
Price risk relates to the risk that the fair value or future cash flows of a financial instrument will fluctuate because of changes in market prices.
The Group is exposed to securities price risk on investments held for trading or for medium to longer terms.
The investment in listed equities has been valued at the market price prevailing at balance date. Management of this investment’s price risk is by ongoing monitoring of the value with respect to any impairment.
At balance date, the Group does not hold financial instruments that would give rise to price risk.
55FINANCIAL STATEMENTS
For
per
sona
l use
onl
y

NOTE 24. FINANCIAL RISK MANAGEMENT (CONT)iv. Sensitivity analyses
(1) Interest rates
The following table illustrates sensitivities to the Group’s exposures to changes in interest rates. The table indicates the impact on how profit and equity values reported at balance sheet date would have been affected by changes in the relevant risk variable that management considers to be reasonably possible. These sensitivities assume that the movement in a particular variable is independent of other variables.
A change of 100 basis points in the interest rates at the reporting date would have increased/(decreased) equity and profit or loss by the amounts shown below. The analysis was performed on a change of 100 basis points for 2018.
PROFIT$
EQUITY$
Year ended 30 June 2018
± 100 basis points change in interest rates ±10,938 ±10,938
Year ended 30 June 2017
± 100 basis points change in interest rates ±26,250 ±26,250
(2) Foreign exchange
The Group has exposure to foreign currency risk to Swedish Krona (SEK) for assets the Group holds through its Swedish subsidiary, Aura Energy Sweden AB. The following table illustrates sensitivities to the Group’s exposures to changes in the SEK rate. The table indicates the impact on how profit and equity values reported at balance sheet date would have been affected by changes in the relevant risk variable that management considers to be reasonably possible. These sensitivities assume that the movement in a particular variable is independent of other variables.
PROFIT$
EQUITY$
Year ended 30 June 2018
± 10% of Australian dollar strengthening/weakening against the SEK Nil
+92,822
-45,855
Year ended 30 June 2017
± 10% of Australian dollar strengthening/weakening against the SEK Nil
+23,681
-46,199
The Group has exposure to foreign currency risk in relation to US dollars for assets the Group holds in Mauritania. The following table illustrates sensitivities to the Group’s exposures to changes in the AUD/USD exchange rate. The table indicates the impact on how profit and equity values reported at balance sheet date would have been affected by changes in the relevant risk variable that management considers to be reasonably possible. These sensitivities assume that the movement in a particular variable is independent of other variables.
PROFIT$
EQUITY$
Year ended 30 June 2018
± 10% of Australian dollar strengthening/weakening against the US dollar Nil
+151,041
-540,863
Year ended 30 June 2017
± 10% of Australian dollar strengthening/weakening against the US dollar Nil
+93,568
-78,084
56 AURA ENERGY LIMITED ANNUAL REPORT 2018
For
per
sona
l use
onl
y
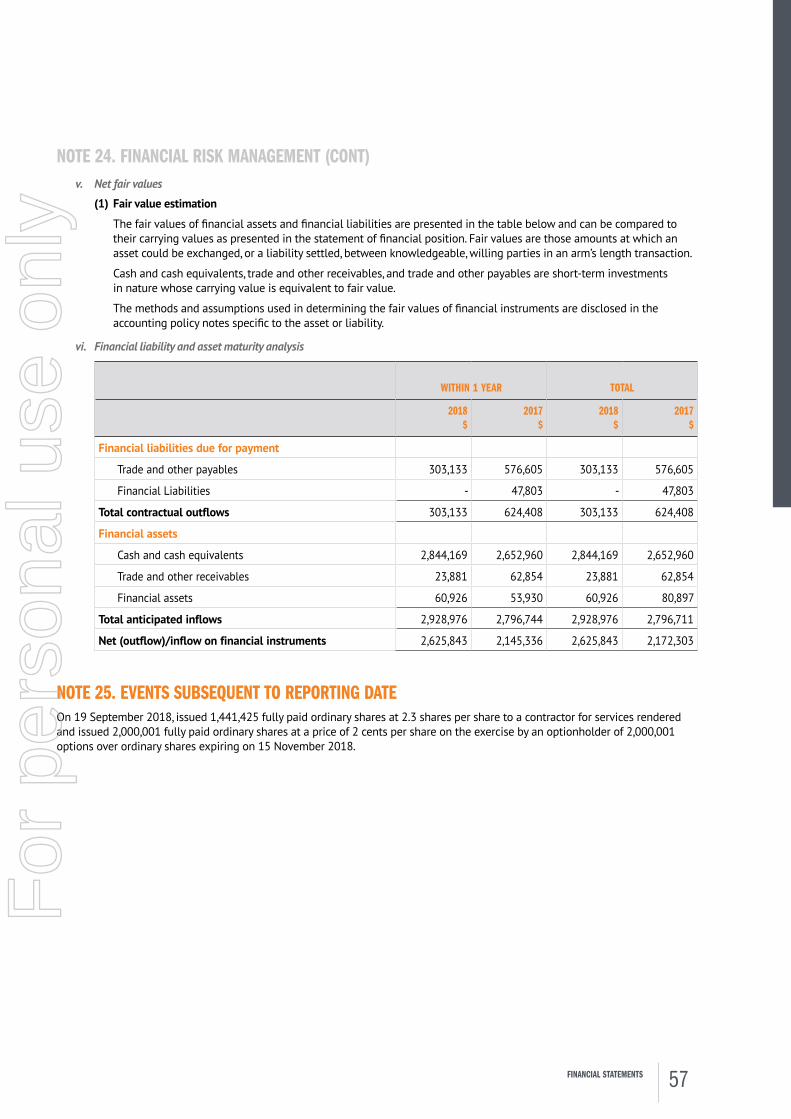
NOTE 24. FINANCIAL RISK MANAGEMENT (CONT)v. Net fair values
(1) Fair value estimation
The fair values of financial assets and financial liabilities are presented in the table below and can be compared to their carrying values as presented in the statement of financial position. Fair values are those amounts at which an asset could be exchanged, or a liability settled, between knowledgeable, willing parties in an arm’s length transaction.
Cash and cash equivalents, trade and other receivables, and trade and other payables are short-term investments in nature whose carrying value is equivalent to fair value.
The methods and assumptions used in determining the fair values of financial instruments are disclosed in the accounting policy notes specific to the asset or liability.
vi. Financial liability and asset maturity analysis
WITHIN 1 YEAR TOTAL
2018$
2017$
2018$
2017$
Financial liabilities due for payment
Trade and other payables 303,133 576,605 303,133 576,605
Financial Liabilities - 47,803 - 47,803
Total contractual outflows 303,133 624,408 303,133 624,408
Financial assets
Cash and cash equivalents 2,844,169 2,652,960 2,844,169 2,652,960
Trade and other receivables 23,881 62,854 23,881 62,854
Financial assets 60,926 53,930 60,926 80,897
Total anticipated inflows 2,928,976 2,796,744 2,928,976 2,796,711
Net (outflow)/inflow on financial instruments 2,625,843 2,145,336 2,625,843 2,172,303
NOTE 25. EVENTS SUBSEQUENT TO REPORTING DATEOn 19 September 2018, issued 1,441,425 fully paid ordinary shares at 2.3 shares per share to a contractor for services rendered and issued 2,000,001 fully paid ordinary shares at a price of 2 cents per share on the exercise by an optionholder of 2,000,001 options over ordinary shares expiring on 15 November 2018.
57FINANCIAL STATEMENTS
For
per
sona
l use
onl
y

NOTE 26. PARENT ENTITY DISCLOSURESa. Financial position of Aura Energy Limited
NOTE2018
$2017
$
Current assets
Cash and cash equivalents 2,662,849 2,490,644
Trade and other receivables 6,378 7,763
Financial assets 60,926 80,897
Total current assets 2,730,153 2,579,304
Non-current assets
Plant and equipment 8,124 18,905
Financial assets 26b 6,146,034 5,996,451
Other assets 11,740,657 9,021,201
Total non-current assets 17,894,815 15,036,557
Total assets 20,624,968 17,615,861
Current liabilities
Trade and other payables 303,133 551,997
Short-term provisions 28,405 118,948
Financial liabilities - 47,803
Total current liabilities 331,538 718,748
Total liabilities 331,538 718,748
Net assets 20,293,430 16,897,113
Equity
Issued capital 44,698,295 39,558,943
Option reserve 353,929 522,221
Accumulated losses (24,758,794) (23,184,051)
Total equity 20,293,430 16,897,113
b. Financial assets
Loans to subsidiaries 26b.i 5,878,772 5,729,189
Shares in controlled entities at cost 267,262 267,262
Net carrying value 6,146,034 5,996,451
i. Loans are provided by the parent entity to its controlled entities to fund their activities. The eventual recovery of loans and investments will be dependent upon the successful commercial application of these projects or their sale to third parties.
58 AURA ENERGY LIMITED ANNUAL REPORT 2018
For
per
sona
l use
onl
y
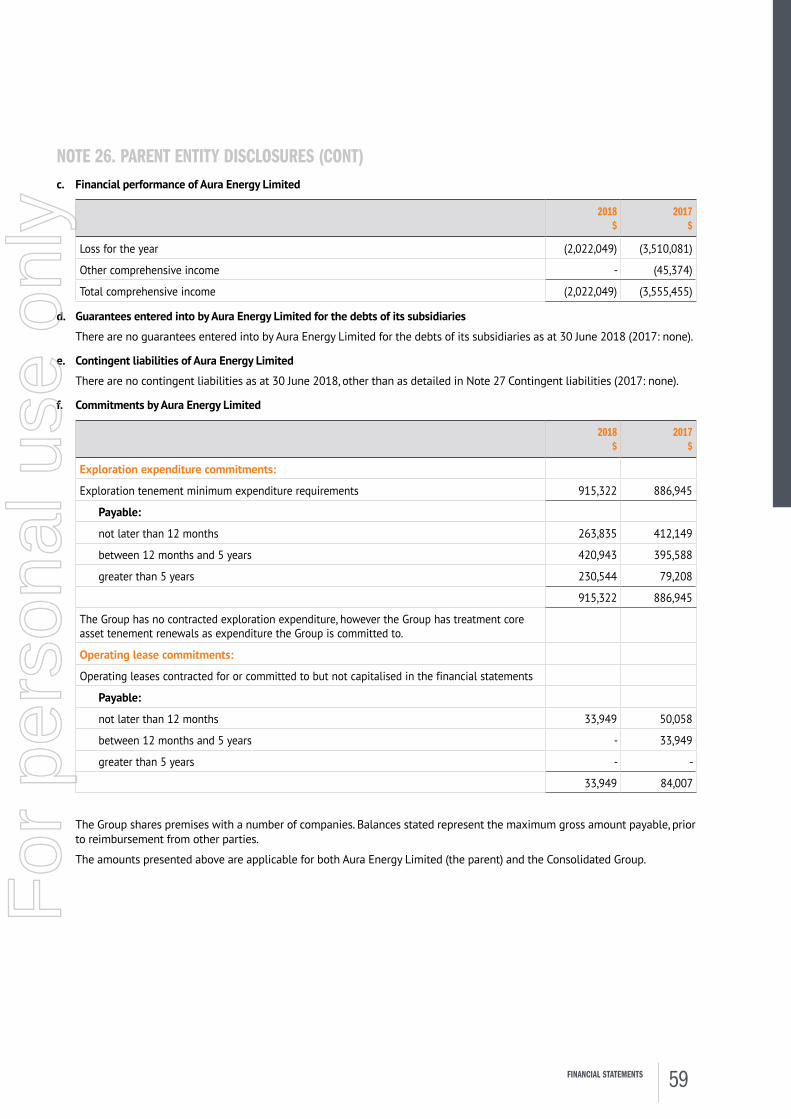
NOTE 26. PARENT ENTITY DISCLOSURES (CONT)c. Financial performance of Aura Energy Limited
2018$
2017$
Loss for the year (2,022,049) (3,510,081)
Other comprehensive income - (45,374)
Total comprehensive income (2,022,049) (3,555,455)
d. Guarantees entered into by Aura Energy Limited for the debts of its subsidiaries
There are no guarantees entered into by Aura Energy Limited for the debts of its subsidiaries as at 30 June 2018 (2017: none).
e. Contingent liabilities of Aura Energy Limited
There are no contingent liabilities as at 30 June 2018, other than as detailed in Note 27 Contingent liabilities (2017: none).
f. Commitments by Aura Energy Limited
2018$
2017$
Exploration expenditure commitments:
Exploration tenement minimum expenditure requirements 915,322 886,945
Payable:
not later than 12 months 263,835 412,149
between 12 months and 5 years 420,943 395,588
greater than 5 years 230,544 79,208
915,322 886,945
The Group has no contracted exploration expenditure, however the Group has treatment core asset tenement renewals as expenditure the Group is committed to.
Operating lease commitments:
Operating leases contracted for or committed to but not capitalised in the financial statements
Payable:
not later than 12 months 33,949 50,058
between 12 months and 5 years - 33,949
greater than 5 years - -
33,949 84,007
The Group shares premises with a number of companies. Balances stated represent the maximum gross amount payable, prior to reimbursement from other parties.
The amounts presented above are applicable for both Aura Energy Limited (the parent) and the Consolidated Group.
59FINANCIAL STATEMENTS
For
per
sona
l use
onl
y
NOTE 27. CONTINGENT LIABILITIESOn 15 October 2010, the Company and Global Coal Management plc entered into a Share Sale and Purchase Agreement which resulted in the Company acquiring all the shares on issue in GCM Africa Uranium, the entity which held the beneficial interest of GCM in the above- mentioned research permits in Mauritania.
The Company paid GCM US$100,000 on execution of the Share Sale and Purchase Agreement; US$472,183 in cash plus 2,000,000 fully paid ordinary shares in the Company on completion (due diligence); and, US$500,000 on the first anniversary of completion.
The Company also agreed to pay a contingent consideration:
• US$2,000,000 (in cash and shares as determine by the Company) on the delineation of 75 million pounds or more Initial Resource (not defined in the Letter Agreement) under the Australasian Code for the Reporting of Exploration Results, Mineral Resources and Ore Reserves; and
• US$400,000 in cash and 400,000 fully paid ordinary shares in the Company for each Subsequent Resource of 6,500,000 pounds up to a maximum of US$4,000,000 in cash and 4,000,000 in fully paid ordinary shares.
The obligations to make the contingent consideration payments are held by the Company and the contingent consideration is only payable if the Initial Resource and Subsequent Resource are achieved within 10 years of the date of the Share Sale and Purchase Agreement. Accordingly, the obligation to pay the contingent consideration expires on 15 October 2020.
There are no other contingent liabilities as at 30 June 2018.
NOTE 28. COMPANY DETAILSThe registered office and principal place of the Company is:
Address: Level 1, 34-36 Punt Road, Windsor Victoria 3181Telephone: +61 (0)3 9516 6500Facsimile: +61 (0)3 9516 6565Website: www.auraenergy.com.auE-mail: [email protected]
60 AURA ENERGY LIMITED ANNUAL REPORT 2018
For
per
sona
l use
onl
y
The directors of the Company declare that:
1. The financial statements and notes to the accounts are in accordance with the Corporations Act 2001 (Cth) and:
(a) Comply with Accounting Standards.
(b) Are in accordance with International Financial Reporting Standards issued by the International Accounting Standards Board, as stated in Note 1 to the financial statements.
(c) Give a true and fair view of the financial position as at 30 June 2018 and of the performance for the year ended on that date of the Company and Consolidated Group.
2. The Chief Executive Officer and Chief Finance Officer have each declared that:
(a) The financial records of the Company for the financial year have been properly maintained in accordance with s.286 of the Corporations Act 2001 (Cth).
(b) The financial statements and notes for the financial year comply with the Accounting Standards.
(c) The financial statements and notes for the financial year give a true and fair view.
3. In the directors’ opinion there are reasonable grounds to believe that the Company will be able to pay its debts as and when they become due and payable.
This declaration is made in accordance with a resolution of the Board of Directors pursuant to s.295(5) and is signed for and on behalf of the directors by:
Peter Reeve
Chairman
Dated this Thursday, 27 September 2018
Directors’ declaration
61DIRECTORS’ DECLARATION
For
per
sona
l use
onl
y

independent Auditor’s Report
Independent Auditor's Report
To the Members of Aura Energy Limited
Report on the Audit of the Financial Report
Opinion
We have audited the financial report of Aura Energy Limited (“the Company”) and its subsidiaries (“the Consolidated Entity”), which comprises the consolidated statement of financial position as at 30 June 2018, the consolidated statement of profit or loss and other comprehensive income, the consolidated statement of changes in equity and the consolidated statement of cash flows for the year then ended, and notes to the financial statements, including a summary of significant accounting policies, and the directors’ declaration.
In our opinion:
a. the accompanying financial report of the Consolidated Entity is in accordance with the Corporations Act 2001, including:
(i) giving a true and fair view of the Consolidated Entity’s financial position as at 30 June 2018 and of its financial performance for the year then ended; and
(ii) complying with Australian Accounting Standards and the Corporations Regulations 2001.
b. the financial report also complies with International Financial Reporting Standards as disclosed in Note 1(a)(i).
Basis for Opinion
We conducted our audit in accordance with Australian Auditing Standards. Those standards require that we comply with relevant ethical requirements relating to audit engagements and plan and perform the audit to obtain reasonable assurance about whether the financial report is free from material misstatement. Our responsibilities under those standards are further described in the Auditor’s Responsibilities for the Audit of the Financial Report section of our report. We are independent of the Consolidated Entity in accordance with the auditor independence requirements of the Corporations Act 2001and the ethical requirements of the Accounting Professional and Ethical Standards Board’s APES 110 Code of Ethics for Professional Accountants (the Code) that are relevant to our audit of the financial report in Australia. We have also fulfilled our other ethical responsibilities in accordance with the Code.
We believe that the audit evidence we have obtained is sufficient and appropriate to provide a basis for our opinion.
62 AURA ENERGY LIMITED ANNUAL REPORT 2018
For
per
sona
l use
onl
y

Independent Auditor’s ReportTo the Members of Aura Energy Limited (Continued)
Material Uncertainty Related to Going Concern
We draw attention to Note 1(a)(iii) in the financial report which indicates that the Consolidated Entity incurred a net loss of $1,987,057 during the year ended 30 June 2018. As stated in Note1(a)(iii) , these events or conditions, along with other matters as set forth in Note 1(a)(iii) , indicate that a material uncertainty exists that may cast significant doubt on the Consolidated Entity’s ability to continue as a going concern. Our opinion is not modified in this respect of this matter.
Key Audit Matters
Key audit matters are those matters that, in our professional judgement, were of most significance in our audit of the financial report of the current period. These matters were addressed in the context of our audit of the financial report as a whole, and in forming our opinion thereon, and we do not provide a separate opinion on these matters.
Key audit matter How our audit addressed the key audit matter
Exploration and Evaluation Expenditure –$17,687,868
(Refer to Note 11)
Exploration and evaluation is a key audit matter due to:
− The significance of the balance to the Consolidated Entity’s consolidated financial position;
− The level of judgement required in evaluating management’s application of the requirements of AASB 6 Exploration for and Evaluation of Mineral Resources. AASB 6 is an industry specific accounting standard requiring the application of significant judgements, estimates and industry knowledge. This includes specific requirements for expenditure to be capitalised as an asset and subsequent requirements which must be complied with for capitalised expenditure to continue to be carried as an asset.
− The assessment of impairment of exploration and evaluation expenditure being inherently difficult.
Our procedures included, amongst others:
− Assessing management’s determination of its areas of interest for consistency with the definition in AASB 6. This involved analysing the tenements in which the consolidated entity holds an interest and the exploration programmes planned for those tenements;
− For each area of interest, we assessed the Consolidated Entity’s rights to tenure by corroborating to government registries and evaluating agreements in place with other parties as applicable;
− We tested the additions to capitalised expenditure for the year by evaluating a sample of recorded expenditure for consistency to underlying records, the capitalisation requirements of the Consolidated Entity’s accounting policy and the requirements of AASB 6;
− We considered the activities in each area of interest to date and assessed the planned future activities for each area of interest by evaluating budgets for each area of interest.
63INDEPENDENT AUDITOR’S REPORT
For
per
sona
l use
onl
y
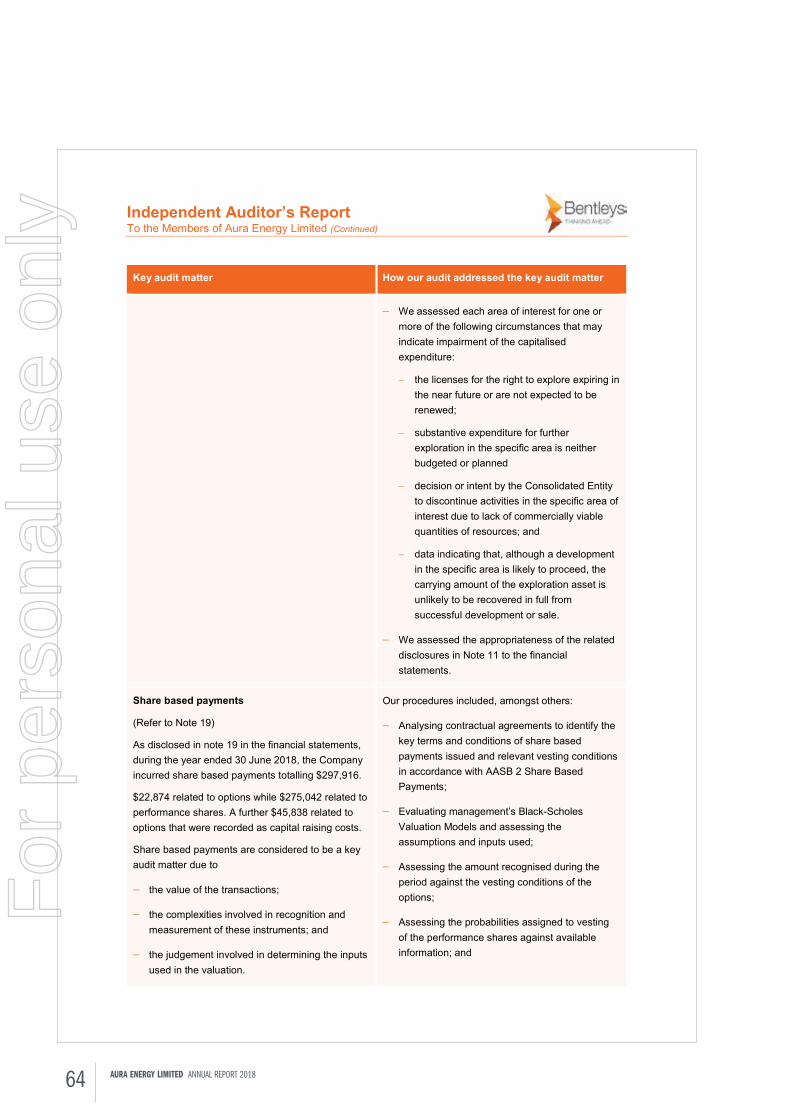
Independent Auditor’s ReportTo the Members of Aura Energy Limited (Continued)
Key audit matter How our audit addressed the key audit matter
− We assessed each area of interest for one or more of the following circumstances that may indicate impairment of the capitalised expenditure:
− the licenses for the right to explore expiring in the near future or are not expected to be renewed;
− substantive expenditure for further exploration in the specific area is neither budgeted or planned
− decision or intent by the Consolidated Entity to discontinue activities in the specific area of interest due to lack of commercially viable quantities of resources; and
− data indicating that, although a development in the specific area is likely to proceed, the carrying amount of the exploration asset is unlikely to be recovered in full from successful development or sale.
− We assessed the appropriateness of the related disclosures in Note 11 to the financial statements.
Share based payments
(Refer to Note 19)
As disclosed in note 19 in the financial statements, during the year ended 30 June 2018, the Company incurred share based payments totalling $297,916.
$22,874 related to options while $275,042 related to performance shares. A further $45,838 related to options that were recorded as capital raising costs.
Share based payments are considered to be a key audit matter due to
− the value of the transactions;
− the complexities involved in recognition and measurement of these instruments; and
− the judgement involved in determining the inputs used in the valuation.
Our procedures included, amongst others:
− Analysing contractual agreements to identify the key terms and conditions of share based payments issued and relevant vesting conditions in accordance with AASB 2 Share BasedPayments;
− Evaluating management’s Black-Scholes Valuation Models and assessing the assumptions and inputs used;
− Assessing the amount recognised during the period against the vesting conditions of the options;
− Assessing the probabilities assigned to vesting of the performance shares against available information; and
64 AURA ENERGY LIMITED ANNUAL REPORT 2018
For
per
sona
l use
onl
y

Independent Auditor’s ReportTo the Members of Aura Energy Limited (Continued)
Key audit matter How our audit addressed the key audit matter
Management used the Black-Scholes option valuation model to determine the fair value of the options granted. This process involved significant estimation and judgement required to determine the fair value of the equity instruments granted.
− Assessing the adequacy of the disclosures included in the financial report.
Other Information
The directors are responsible for the other information. The other information comprises the information included in the Consolidated Entity’s annual report for the year ended 30 June 2018, but does not include the financial report and our auditor’s report thereon.
Our opinion on the financial report does not cover the other information and accordingly we do not express any form of assurance conclusion thereon.
In connection with our audit of the financial report, our responsibility is to read the other information and, in doing so, consider whether the other information is materially inconsistent with the financial report or our knowledge obtained in the audit or otherwise appears to be materially misstated.
If, based on the work we have performed, we conclude that there is a material misstatement of this other information, we are required to report that fact. We have nothing to report in this regard.
Responsibilities of the Directors for the Financial Report
The directors of the Company are responsible for the preparation of the financial report that gives a true and fair view in accordance with Australian Accounting Standards and the Corporations Act 2001 and for such internal control as the directors determine is necessary to enable the preparation of the financial report that gives a true and fair view and is free from material misstatement, whether due to fraud or error. In Note 1(a)(i),the directors also state in accordance with Australian Accounting Standard AASB 101 Presentation of Financial Statements, that the financial report complies with International Financial Reporting Standards.
In preparing the financial report, the directors are responsible for assessing the Consolidated Entity’s ability to continue as a going concern, disclosing, as applicable, matters related to going concern and using the going concern basis of accounting unless the directors either intend to liquidate the Consolidated Entity or to cease operations, or has no realistic alternative but to do so.
Auditor’s Responsibilities for the Audit of the Financial Report
Our responsibility is to express an opinion on the financial report based on our audit. Our objectives are to obtain reasonable assurance about whether the financial report as a whole is free from material misstatement, whether due to fraud or error, and to issue an auditor’s report that includes our opinion. Reasonable assurance is a high level of assurance, but is not a guarantee that an audit conducted in accordance with the Australian Auditing Standards will always detect a material misstatement when it exists. Misstatements can arise from fraud or error and are considered material if, individually or in the aggregate, they could reasonably be expected to influence the economic decisions of users taken on the basis of this financial report.
65INDEPENDENT AUDITOR’S REPORT
For
per
sona
l use
onl
y

Independent Auditor’s ReportTo the Members of Aura Energy Limited (Continued)
As part of an audit in accordance with the Australian Auditing Standards, we exercise professional judgement and maintain professional scepticism throughout the audit. We also:
Identify and assess the risks of material misstatement of the financial report, whether due to fraud or error, design and perform audit procedures responsive to those risks, and obtain audit evidence that is sufficient and appropriate to provide a basis for our opinion. The risk of not detecting a material misstatement resulting from fraud is higher than for one resulting from error, as fraud may involve collusion, forgery, intentional omissions, misrepresentations, or the override of internal control.
Obtain an understanding of internal control relevant to the audit in order to design audit procedures that are appropriate in the circumstances, but not for the purpose of expressing an opinion on the effectiveness of the Consolidated Entity’s internal control.
Evaluate the appropriateness of accounting policies used and the reasonableness of accounting estimates and related disclosures made by the directors.
Conclude on the appropriateness of the directors’ use of the going concern basis of accounting and, based on the audit evidence obtained, whether a material uncertainty exists related to events or conditions that may cast significant doubt on the Consolidated Entity’s ability to continue as a going concern. If we conclude that a material uncertainty exists, we are required to draw attention in our auditor’s report to the related disclosures in the financial report or, if such disclosures are inadequate, to modify our opinion. Our conclusions are based on the audit evidence obtained up to the date of our auditor’s report. However, future events or conditions may cause the Consolidated Entity to cease to continue as a going concern.
Evaluate the overall presentation, structure and content of the financial report, including the disclosures, and whether the financial report represents the underlying transactions and events in a manner that achieves fair presentation.
Obtain sufficient appropriate audit evidence regarding the financial information of the entities or business activities within the Consolidated Entity to express an opinion on the financial report. We are responsible for the direction, supervision and performance of the Consolidated Entity audit. We remain solely responsible for our audit opinion.
We communicate with the directors regarding, among other matters, the planned scope and timing of the audit and significant audit findings, including any significant deficiencies in internal control that we identify during our audit.
We also provide the directors with a statement that we have complied with relevant ethical requirements regarding independence, and to communicate with them all relationships and other matters that may reasonably be thought to bear on our independence, and where applicable, related safeguards.
From the matters communicated with the directors, we determine those matters that were of most significance in the audit of the financial report of the current period and are therefore the key audit matters. We describe these matters in our auditor’s report unless law or regulation precludes public disclosure about the matter or when, in extremely rare circumstances, we determine that a matter should not be communicated in our report because the adverse consequences of doing so would reasonably be expected to outweigh the public interest benefits of such communication.
66 AURA ENERGY LIMITED ANNUAL REPORT 2018
For
per
sona
l use
onl
y
Independent Auditor’s ReportTo the Members of Aura Energy Limited (Continued)
Report on the Remuneration Report
We have audited the Remuneration Report included in the directors’ report for the year ended 30 June 2018.The directors of the Company are responsible for the preparation and presentation of the remuneration report in accordance with s 300A of the Corporations Act 2001. Our responsibility is to express an opinion on the remuneration report, based on our audit conducted in accordance with Australian Auditing Standards.
Auditor’s Opinion
In our opinion, the Remuneration Report of the Company, for the year ended 30 June 2018, complies with section 300A of the Corporations Act 2001.
BENTLEYS MARK DELAURENTIS CA
Chartered Accountants Partner
Dated at Perth this 27th day of September 2018
67ADDITIONAL INFORMATION
For
per
sona
l use
onl
y
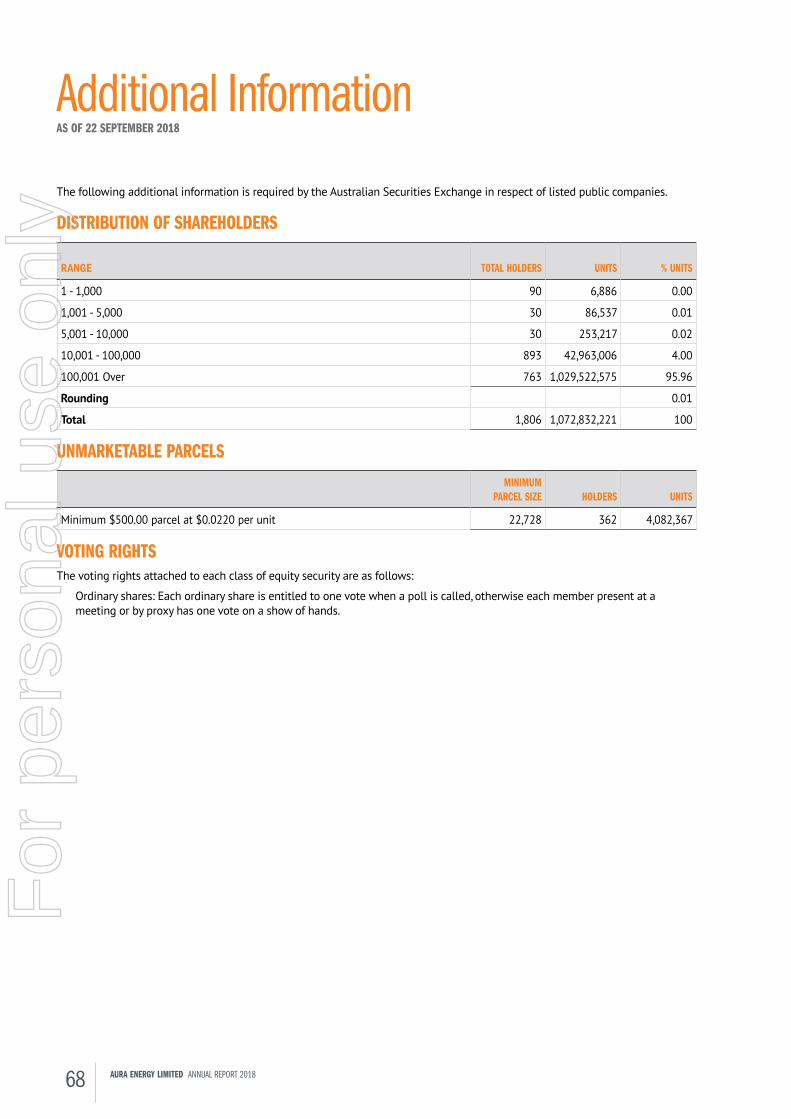
The following additional information is required by the Australian Securities Exchange in respect of listed public companies.
DISTRIBUTION OF SHAREHOLDERS
RANGE TOTAL HOLDERS UNITS % UNITS
1 - 1,000 90 6,886 0.00
1,001 - 5,000 30 86,537 0.01
5,001 - 10,000 30 253,217 0.02
10,001 - 100,000 893 42,963,006 4.00
100,001 Over 763 1,029,522,575 95.96
Rounding 0.01
Total 1,806 1,072,832,221 100
UNMARKETABLE PARCELSMINIMUM
PARCEL SIZE HOLDERS UNITS
Minimum $500.00 parcel at $0.0220 per unit 22,728 362 4,082,367
VOTING RIGHTSThe voting rights attached to each class of equity security are as follows:
Ordinary shares: Each ordinary share is entitled to one vote when a poll is called, otherwise each member present at a meeting or by proxy has one vote on a show of hands.
Additional informationAS OF 22 SEPTEMBER 2018
68 AURA ENERGY LIMITED ANNUAL REPORT 2018
For
per
sona
l use
onl
y
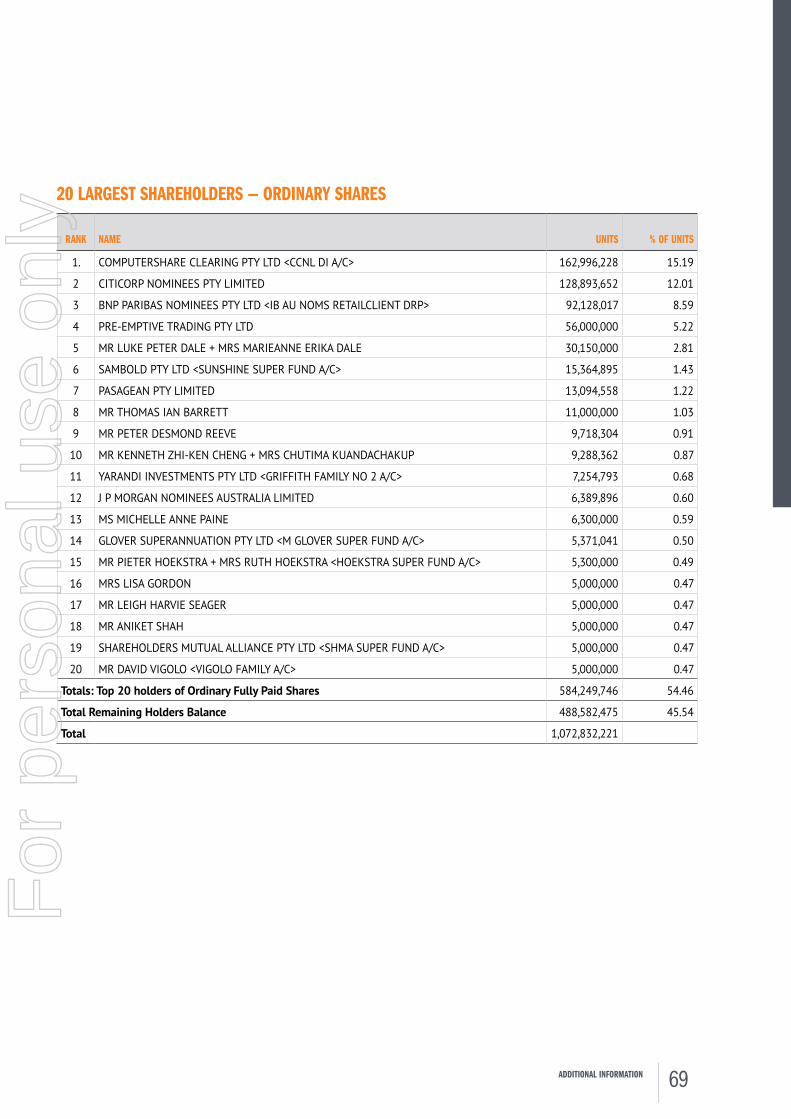
20 LARGEST SHAREHOLDERS — ORDINARY SHARES
RANK NAME UNITS % OF UNITS
1. COMPUTERSHARE CLEARING PTY LTD <CCNL DI A/C> 162,996,228 15.19
2 CITICORP NOMINEES PTY LIMITED 128,893,652 12.01
3 BNP PARIBAS NOMINEES PTY LTD <IB AU NOMS RETAILCLIENT DRP> 92,128,017 8.59
4 PRE-EMPTIVE TRADING PTY LTD 56,000,000 5.22
5 MR LUKE PETER DALE + MRS MARIEANNE ERIKA DALE 30,150,000 2.81
6 SAMBOLD PTY LTD <SUNSHINE SUPER FUND A/C> 15,364,895 1.43
7 PASAGEAN PTY LIMITED 13,094,558 1.22
8 MR THOMAS IAN BARRETT 11,000,000 1.03
9 MR PETER DESMOND REEVE 9,718,304 0.91
10 MR KENNETH ZHI-KEN CHENG + MRS CHUTIMA KUANDACHAKUP 9,288,362 0.87
11 YARANDI INVESTMENTS PTY LTD <GRIFFITH FAMILY NO 2 A/C> 7,254,793 0.68
12 J P MORGAN NOMINEES AUSTRALIA LIMITED 6,389,896 0.60
13 MS MICHELLE ANNE PAINE 6,300,000 0.59
14 GLOVER SUPERANNUATION PTY LTD <M GLOVER SUPER FUND A/C> 5,371,041 0.50
15 MR PIETER HOEKSTRA + MRS RUTH HOEKSTRA <HOEKSTRA SUPER FUND A/C> 5,300,000 0.49
16 MRS LISA GORDON 5,000,000 0.47
17 MR LEIGH HARVIE SEAGER 5,000,000 0.47
18 MR ANIKET SHAH 5,000,000 0.47
19 SHAREHOLDERS MUTUAL ALLIANCE PTY LTD <SHMA SUPER FUND A/C> 5,000,000 0.47
20 MR DAVID VIGOLO <VIGOLO FAMILY A/C> 5,000,000 0.47
Totals: Top 20 holders of Ordinary Fully Paid Shares 584,249,746 54.46
Total Remaining Holders Balance 488,582,475 45.54
Total 1,072,832,221
69ADDITIONAL INFORMATION
For
per
sona
l use
onl
y
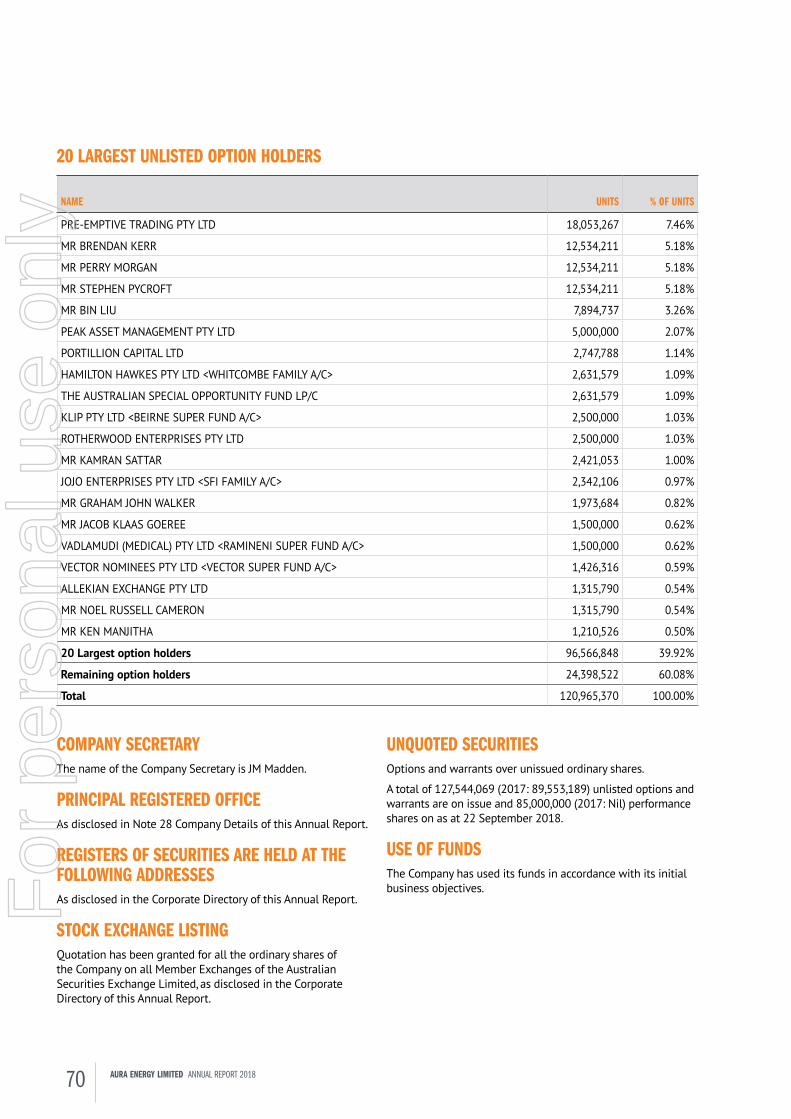
20 LARGEST UNLISTED OPTION HOLDERS
NAME UNITS % OF UNITS
PRE-EMPTIVE TRADING PTY LTD 18,053,267 7.46%
MR BRENDAN KERR 12,534,211 5.18%
MR PERRY MORGAN 12,534,211 5.18%
MR STEPHEN PYCROFT 12,534,211 5.18%
MR BIN LIU 7,894,737 3.26%
PEAK ASSET MANAGEMENT PTY LTD 5,000,000 2.07%
PORTILLION CAPITAL LTD 2,747,788 1.14%
HAMILTON HAWKES PTY LTD <WHITCOMBE FAMILY A/C> 2,631,579 1.09%
THE AUSTRALIAN SPECIAL OPPORTUNITY FUND LP/C 2,631,579 1.09%
KLIP PTY LTD <BEIRNE SUPER FUND A/C> 2,500,000 1.03%
ROTHERWOOD ENTERPRISES PTY LTD 2,500,000 1.03%
MR KAMRAN SATTAR 2,421,053 1.00%
JOJO ENTERPRISES PTY LTD <SFI FAMILY A/C> 2,342,106 0.97%
MR GRAHAM JOHN WALKER 1,973,684 0.82%
MR JACOB KLAAS GOEREE 1,500,000 0.62%
VADLAMUDI (MEDICAL) PTY LTD <RAMINENI SUPER FUND A/C> 1,500,000 0.62%
VECTOR NOMINEES PTY LTD <VECTOR SUPER FUND A/C> 1,426,316 0.59%
ALLEKIAN EXCHANGE PTY LTD 1,315,790 0.54%
MR NOEL RUSSELL CAMERON 1,315,790 0.54%
MR KEN MANJITHA 1,210,526 0.50%
20 Largest option holders 96,566,848 39.92%
Remaining option holders 24,398,522 60.08%
Total 120,965,370 100.00%
COMPANY SECRETARYThe name of the Company Secretary is JM Madden.
PRINCIPAL REGISTERED OFFICEAs disclosed in Note 28 Company Details of this Annual Report.
REGISTERS OF SECURITIES ARE HELD AT THE FOLLOWING ADDRESSESAs disclosed in the Corporate Directory of this Annual Report.
STOCK EXCHANGE LISTINGQuotation has been granted for all the ordinary shares of the Company on all Member Exchanges of the Australian Securities Exchange Limited, as disclosed in the Corporate Directory of this Annual Report.
UNQUOTED SECURITIESOptions and warrants over unissued ordinary shares.
A total of 127,544,069 (2017: 89,553,189) unlisted options and warrants are on issue and 85,000,000 (2017: Nil) performance shares on as at 22 September 2018.
USE OF FUNDSThe Company has used its funds in accordance with its initial business objectives.
70 AURA ENERGY LIMITED ANNUAL REPORT 2018
For
per
sona
l use
onl
y

COUNTRYTENEMENT NUMBER NAME
DATE OF GRANT/APPLICATION EXPIRY DATE SQ KMS HOLDER
EQUITY INTEREST
Mauritania 561 Oum Ferkik 16-Apr-08
Subject to application for Exploration Licence 60 Aura Energy Limited 100%
563 Oued El Foule Est 16-Apr-08
Subject to application for Exploration Licence 313 Aura Energy Limited 100%
564 Ain Sder 16-Apr-08
Subject to application for Exploration Licence 330 Aura Energy Limited 100%
1482 Oum Ferkik Sud 17-Jan-17 17-Jan-20 476 Aura Energy Limited 100%
2002 Aguelet 17-Jan-17 17-Jan-20 100 Aura Energy Limited 100%
2365 Oued El Foule Sud 19-Feb-18 19-Feb-21 224 Aura Energy Limited 100%
2366 Agouyame 19-Feb-18 19-Feb-21 34 Aura Energy Limited 100%
2457 Hadeibet Bella 1-Mar-16 (Application) 41 TIMCO 100%
2458 Touerig Taet 1-Mar-16 (Application) 134 TIMCO 100%
Sweden 2007:243 Haggan nr 1 28-Aug-07 28-Aug-22 18.3 Aura Energy Sweden AB 100%
2009:23 Koborgsmyren nr 1 23-Jan-09 23-Jan-19 5.4 Aura Energy Sweden AB 100%
2018:7 Skallbole nr 1 20-Jan-16 20-Jan-19 7.8 Aura Energy Sweden AB 100%
2018:9 Mockelasen nr 1 21-Jan-16 21-Jan-19 17.6 Aura Energy Sweden AB 100%
tenement Report
71ADDITIONAL INFORMATION
For
per
sona
l use
onl
y

this PAGe hAs Been LeFt BLAnK intentiOnALLY
72 AURA ENERGY LIMITED ANNUAL REPORT 2018
For
per
sona
l use
onl
y

For
per
sona
l use
onl
y

ACN: 115 927 681
For
per
sona
l use
onl
y


