52
Annual Report 2018 haasinstitute.berkeley.edu 2018 Inclusiveness Index Measuring Global Inclusion and Marginality
Annual Report 2018
haasinstitute.berkeley.edu
2018 Inclusiveness IndexMeasuring Global Inclusion and Marginality
2 haasinstitute.berkeley.edu2018 Inclusiveness Index Annual Report
About the AuthorsStephen Menendian is the Assistant Director and Director of Research at the Haas Institute for a Fair and Inclusive Society, and oversees the Institute’s burgeoning research initiatives and ongoing projects. In particular, Stephen leads the Inclusiveness Index initiative, fair housing policy and opportunity mapping project with the Equity Metrics team. Stephen’s research focuses on the mechanisms of inter-group inequality, “othering,” structural racism, and the design of effective equity interventions as permitted by law.
Elsadig Elsheikh is the Global Justice Program Director at the Haas Institute. Elsadig’s research and writings are on the themes and social dynamics relating to Africa’s large-scale land deals, financialization, global food system, global health, human and indigenous peoples rights, state and citizenship, and structural racialization.
Samir Gambhir is a Geographic Information Systems (GIS) researcher and manager of the Equity Metrics program at the Haas Institute. He has more than fourteen years of experience in the field of mapping, spatial analysis and web-GIS. He has research experience in the areas of social justice, racial equity, planning, health and business, with a focus on human geography.
This report is published by the Haas Institute for a Fair and Inclusive Society at UC Berkeley
Copyeditors Sara Grossman Marc Abizeid
Contributors
Wendy Ake Miranda Simes
Design & Layout
Al Nelson
Maps, Charts, and Infographics
Samir Gambhir
Interactive Mapping Application
Arthur Gailes
Acknowledgements
We appreciate the feedback we received from the following individuals:
Kevin Dunn, Western Sydney University, Australia
Lidija Knuth, Federal Ministry for Economic Cooperation and Development, Germany
Hiram José Irizarry Osorio, Ph.D., Universitat Autònoma de Barcelona
Supplemental Content
Additional info on methodology, case studies, maps, videos, infographics, and the entire data set is available at haasinstitute.berkeley.edu/inclusivenessindex.
The full report and database are online at haasinstitute.berkeley.edu/inclusivenessindex.
Citation
Stephen Menendian, Elsadig Elsheikh and Samir Gambhir, 2018 Inclusiveness Index: Measuring Global Inclusion and Marginality (Berkeley, CA: Haas Institute for a Fair and Inclusive Society, 2018), haasinstitute.berkeley.edu/inclusivenessindex
Contact
460 Stephens Hall Berkeley, CA 94720-2330 Tel 510-642-3326 [email protected]
PUBLISHED DECEMBER 2018
Contents Introduction 4
Inclusiveness Indicators 5
Global Inclusiveness Index 8
Global Inclusiveness Map ................................................................................................ 8Global Inclusiveness Rankings .....................................................................................10Observations on Changes .............................................................................................12Global Themes and Findings ........................................................................................13
Global Water Crisis ............................................................................................................... 13Global Gender Inequality and Gender Gap .................................................................... 15The Rights of Non-Citizens .................................................................................................. 18
The Rohingya in Myanmar ........................................................................................................ 19
Palestinian Refugees ................................................................................................................. 20
Bengali Muslims in Assam, India ............................................................................................ 20
Roma People in Europe ............................................................................................................ 21
Undocumented Immigrants in the USA ................................................................................ 22
Conclusion ................................................................................................................................... 23
United States Inclusiveness Index 24
US Inclusiveness Map ....................................................................................................24US Inclusiveness Rankings ...........................................................................................25Observations on Changes .............................................................................................26US Themes and Findings ...............................................................................................27
US Water Crisis ......................................................................................................................27#MeToo .................................................................................................................................... 32Immigrant Family Separations ............................................................................................. 33
Endnotes 35
Appendices 42
Appendix A: Methodology ..............................................................................................42Appendix B: Data Sets and Indicators ........................................................................44Appendix C: New Indicators or Measures .................................................................50
4 haasinstitute.berkeley.edu2018 Inclusiveness Index Annual Report
Introduction
THE POLITICAL CRISES sweeping the globe have brought greater attention to the fundamental issue of inclusivity. To what extent do societies, nations, and communities, polarized along lines of race, ethnicity, religion, caste, tribe, gender, and sexual orientation, successfully bridge these cleavages with inclusive policies and narratives? This report tries to answer this question, not simply by reference to particular policies or initiatives, but by examining the data to track how marginalized populations actually fare relative to dominant groups.
The Haas Institute Inclusiveness Index is one of the first indices that measures equity without regard to wealth or economic conditions. One of the challenges in measuring inclusivity is that it is difficult to disentangle policies aimed at inclusivity from the investments and resources available to marginalized communities. They are often the same, and can be conflated. We surmount this challenge by focusing on policies, laws, and outcomes rather than government expenditures or investments. Our Inclusiveness Index is uniquely focused on the degree of inclusion and marginality rather than a more general assessment of group-based well-being.
In addition to assessing how inclusive various societies are, the Inclusiveness Index serves as a diagnostic tool that helps us identify places and societies that are improving in terms of developing a more inclusive polity and set of institutions, and those places where societies are fracturing and becoming more divided along these lines. The data tells the main story, but we also seek to surface stories and trends that lie beneath the data.
In our conception, inclusiveness entails access to power and public and private resources, and improves the way society views marginalized group members. Inclusivity is realized when historically or currently marginalized groups feel valued, when differences are respected, and when basic and fundamental needs and rights—relative to those societies' dominant groups—are met and recognized. Our Index focuses on social groups rather than individuals, as marginality often occurs as a result of group membership.
We operationalize this definition of inclusivity, however, by focusing primarily on the performance of groups that span salient social cleavages, such as gender, race, ethnicity, religion, and sexual orientation. We realize that such an approach cannot fully account for the unquantifiable or more qualitative aspects of belonging and inclusivity. For that reason, each version of our Inclusiveness Index report highlights stories and themes that go beyond the data.
Thus, our “Findings & Themes” sections looks for patterns or stories that lie behind the data and touch on issues of inclusivity both across the globe and within the United States. Our 2016 report examined the global migrant crisis, while our 2017 report focused on the rise of ethno-nationalism. This report takes a closer look at the global water crisis, the rights of non-citizens, and the appalling policy of family separations used along the US-Mexico border.
As always, a word of caution: Our rankings are not the final say on inclusivity nor a definitive assessment of any national or state performance. Rather, they are intended to spark a conversation and generate further inquiry into how and why some places, communities, and nations are more inclusive than others. Please be sure to send us your suggestions, feedback, and ideas.
Additional information about this project, including past reports and complete downloadable data files, is available at haasinstitute.berkeley.edu/inclusivenessindex.
5haasinstitute.berkeley.edu 2018 Inclusiveness Index Annual Report
Inclusiveness Indicators
DEVELOPING AN INDEX that is capable of measuring inclusivity and marginality across many of the full range of human differences is an immense challenge. Our Inclusiveness Index attempts to meet this challenge by selecting universal indicators that reflect group-based marginality in any context. In addition, the Inclusiveness Index relies on data sets for those indicators that can be measured across a range of social groupings.
In developing this Index, we were guided by the conviction that multi-factor indices paint a more vivid portrait of underlying structural conditions and forms of advantage and disadvantage experienced by marginalized groups than any single indicator, such as poverty or per capita GDP. Single indicator metrics fail to capture the myriad of inputs that shape individual and group life chances.1 As a multi-factor index that incorporates six core indicators of inclusivity, each indicator is given a pre-assigned weight within the Inclusiveness Index.
Another practical criterion for inclusion was that each indicator had to be scalable to the global level. Developing a global country ranking would not be possible if similar data sets did not exist for a sufficient number of countries to justify a global ranking. Not only are there a multiplicity of measures across nations for similar information, but some countries track and collect data sets that others do not. We were also limited by data sets that were commensurate or comparable across geographies and national boundaries.
Finally, we wanted our indicators to reflect cultural norms, policies, laws, and institutional practices rather than economic strength or tax base capacity. Otherwise, any measure or ranking of inclusivity risks becoming a function of national wealth. In the Inclusiveness Index, the poorest nations on the planet are capable of faring best in terms of inclusivity, while the wealthiest are capable of faring the worst. Insofar as possible, the indicators are non-economic, and not proxies for governmental expenditures or investments in human capital, but rather reflect legal and institutional regimes.
In reviewing the range of possible indicators for our Inclusiveness Index, we ultimately selected the following domains that we believe reflect the inclusivity or exclusion of marginalized populations. Within these domains, we selected indicators that measure how various demographic subgroups fare, including: gender, LGBTQ populations, people with disabilities, and racial, ethnic, and religious subgroups.
6 haasinstitute.berkeley.edu2018 Inclusiveness Index Annual Report
Outgroup Violence
Outgroup violence is a direct indicator of group marginalization and oppression. Disproportionate violence suffered by discrete social groups reflects animus towards those groups as well as group vulnerability. For example, in the United States, lynching of African Americans in the early twentieth century or assaults on LGBT people in more recent decades reflect both animus as well as vulnerability. This is also true internationally, where ethnic or religious conflict may result in violence and fatalities, with genocide being an extreme expression.2
Political Representation
Political representation and the extent to which citizens are able to participate in governance is another strong indicator of group-based marginality or relative inclusion. In democratic societies, ethnic, racial, or religious majorities are capable of outvoting minority groups in electoral politics. This can result in underrepresentation of minority groups. Similarly, if certain groups are marginalized within a society, even if they are not a numerical minority, we might also expect members of those groups to be underrepresented in electoral politics. If members of certain groups, such as women or religious or racial minorities, are consistently under-represented in elected groups, that is often suggestive of marginality. Although there may be limited choices ideologically or between political affiliation and party membership in some nations, there may still be a choice among social group membership. Political representation among appointed representatives is less indicative of marginality than representation among elected representatives because, in the case of appointments, democratic majorities lack direct say.
Income Inequality
Group-level income inequality is a revealing indicator of group-based marginality. It not only reflects discrimination in the provision of educational resources, investment in human capital, and employment opportunities, but may also be indicative of discrimination in private markets and segregation in social networks.3 The degree of income inequality within a nation or state is not dependent upon the size of the economy or the wealth of a nation, but is rather a function of political institutions, cultural norms, and law.4 In other words, group-level income inequality does not depend on the size of the economic pie, but the distribution of that pie among groups.
7haasinstitute.berkeley.edu 2018 Inclusiveness Index Annual Report
Anti-Discrimination Laws
The presence of anti-discrimination laws protecting marginalized groups is another direct indicator of institutional inclusion. Examples of such laws include laws that prohibit government and private discrimination on the basis of race, national origin, disability, religion, gender, or sexual orientation. Explicit protections for marginalized populations and social groups through anti-discrimination laws reflect not only of a society’s commitment to equality norms for minority or marginalized groups, but also the presence of a discriminatory problem requiring a policy and legal response. Enacting anti-discrimination laws is not an easy task, especially in a country where a marginalized group is an unpopular minority or lacks political clout or influence.5 Such laws often reflect broad consensus about the moral and practical necessity of enacting such protections.
Rates of Incarceration
Marginality and inclusivity are often most dramatically evident in a nation’s use of criminal law enforcement and differential rates of incarceration. Criminal law reflects the cultural norms and values of the dominant group, and its enforcement through incarceration and other forms of criminal punishment are often inflected with social biases. Even in the absence of state oppression against minority or marginalized populations, incarceration rates may reflect cultural or social prejudices that disparately impact marginalized groups. Rates of incarceration more broadly reflect institutional and legal structures that impede inclusivity. Rates of incarceration vary dramatically from state to state domestically and country to country globally. Lower rates of incarceration are sometimes reflective of more inclusive cultural norms generally, and an emphasis on rehabilitation and reentry over retribution and punishment. Differential rates of incarceration across subgroups serve as an indirect measure of cultural perceptions of those subgroups and their relative social position within a society. For especially marginalized social groups, criminal law is a tool of social control that may result in higher rates of incarceration and punishment.
Immigration/Asylum Policies
Another indicator of a society’s degree of inclusiveness and group-based marginality within it is the society or nation’s immigration or asylum policies. These policies are reflective of the values and perspectives of the society vis-à-vis the marginalized group, and how welcoming or tolerant the dominant group is of outgroups. For example, Uganda has made hosting refugees a core national policy, making it “one of the most welcoming countries in the world."6 As an example of exclusionary immigration policies, the United States infamously enacted the Chinese Exclusion Act, and later imposed quotas on many ethnic and racial groups. Strains of nativism and xenophobia tend to not only reflect the openness of a society with respect to the immigrant group, but also the degree of inclusivity within a society.
Each of these indicators reveals something distinctive about a nation or state’s inclusiveness. Finding data sources and measures for each indicator among many nations is a challenge, but not an impossibility. A complete list of measures used for each indicator and a description of sources is provided in the Appendices at the end of this report along with a more detailed explanation of the index calculation methodology.
8 haasinstitute.berkeley.edu2018 Inclusiveness Index Annual Report
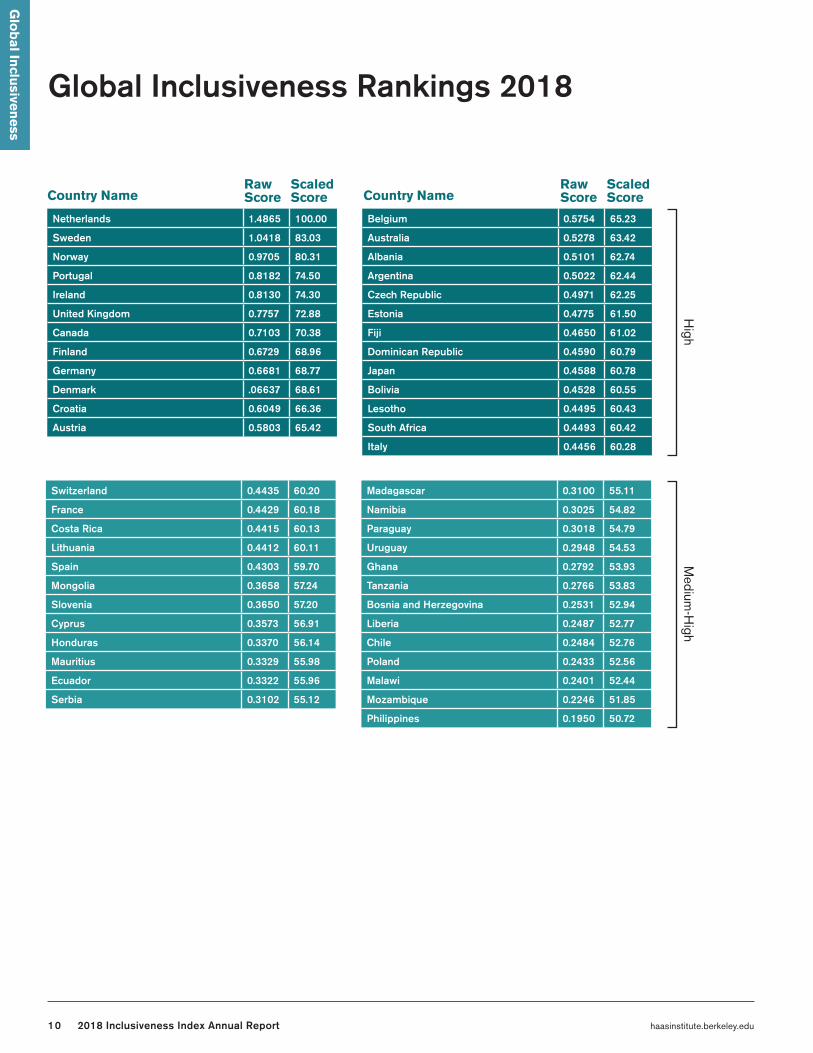
Global Inclusiveness Rankings 2018
Glo
bal In
clusiven
ess
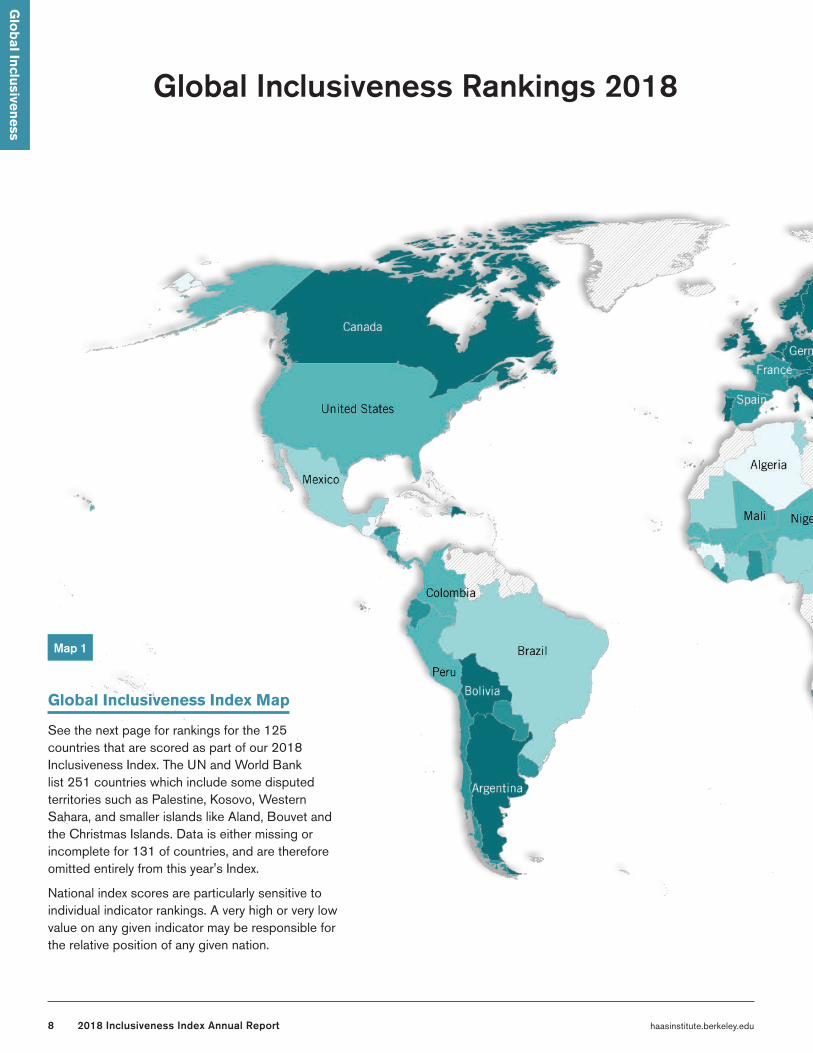
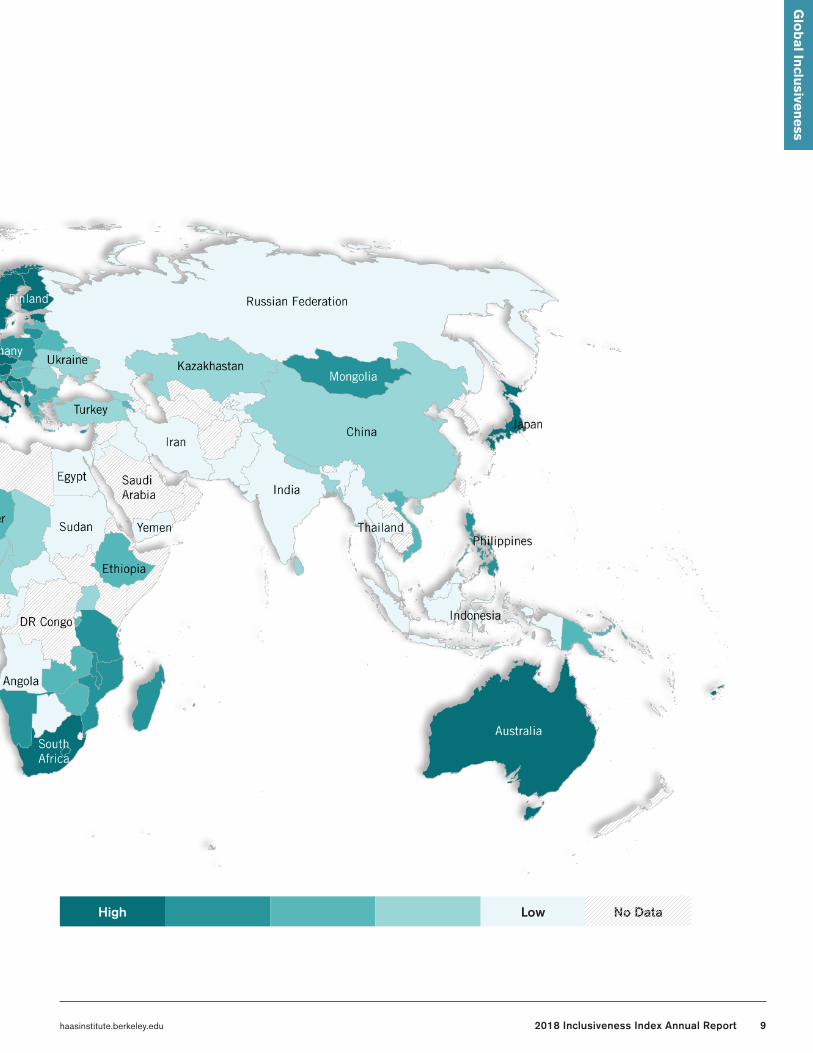
Global Inclusiveness Index Map
See the next page for rankings for the 125 countries that are scored as part of our 2018 Inclusiveness Index. The UN and World Bank list 251 countries which include some disputed territories such as Palestine, Kosovo, Western Sahara, and smaller islands like Aland, Bouvet and the Christmas Islands. Data is either missing or incomplete for 131 of countries, and are therefore omitted entirely from this year's Index.
National index scores are particularly sensitive to individual indicator rankings. A very high or very low value on any given indicator may be responsible for the relative position of any given nation.
Map 1
9haasinstitute.berkeley.edu 2018 Inclusiveness Index Annual Report
High Low No Data
Glo
bal In
clusiven
ess
10 haasinstitute.berkeley.edu2018 Inclusiveness Index Annual Report
Netherlands 1.4865 100.00
Sweden 1.0418 83.03
Norway 0.9705 80.31
Portugal 0.8182 74.50
Ireland 0.8130 74.30
United Kingdom 0.7757 72.88
Canada 0.7103 70.38
Finland 0.6729 68.96
Germany 0.6681 68.77
Denmark .06637 68.61
Croatia 0.6049 66.36
Austria 0.5803 65.42
Belgium 0.5754 65.23
Australia 0.5278 63.42
Albania 0.5101 62.74
Argentina 0.5022 62.44
Czech Republic 0.4971 62.25
Estonia 0.4775 61.50
Fiji 0.4650 61.02
Dominican Republic 0.4590 60.79
Japan 0.4588 60.78
Bolivia 0.4528 60.55
Lesotho 0.4495 60.43
South Africa 0.4493 60.42
Italy 0.4456 60.28
Global Inclusiveness Rankings 2018
Country NameScaled ScoreCountry Name
Scaled Score
Raw Score
Raw Score
Switzerland 0.4435 60.20
France 0.4429 60.18
Costa Rica 0.4415 60.13
Lithuania 0.4412 60.11
Spain 0.4303 59.70
Mongolia 0.3658 57.24
Slovenia 0.3650 57.20
Cyprus 0.3573 56.91
Honduras 0.3370 56.14
Mauritius 0.3329 55.98
Ecuador 0.3322 55.96
Serbia 0.3102 55.12
Madagascar 0.3100 55.11
Namibia 0.3025 54.82
Paraguay 0.3018 54.79
Uruguay 0.2948 54.53
Ghana 0.2792 53.93
Tanzania 0.2766 53.83
Bosnia and Herzegovina 0.2531 52.94
Liberia 0.2487 52.77
Chile 0.2484 52.76
Poland 0.2433 52.56
Malawi 0.2401 52.44
Mozambique 0.2246 51.85
Philippines 0.1950 50.72
High
Medium
-High
Glo
bal In
clusiven
ess
11haasinstitute.berkeley.edu 2018 Inclusiveness Index Annual Report
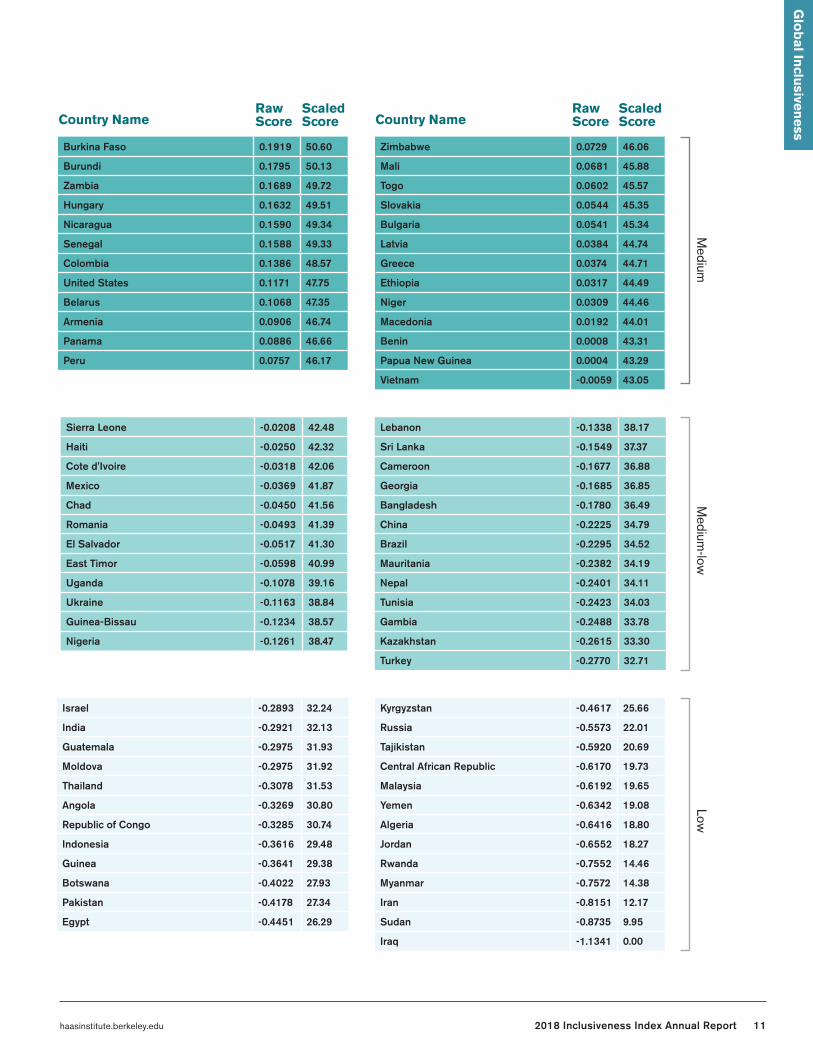
Burkina Faso 0.1919 50.60
Burundi 0.1795 50.13
Zambia 0.1689 49.72
Hungary 0.1632 49.51
Nicaragua 0.1590 49.34
Senegal 0.1588 49.33
Colombia 0.1386 48.57
United States 0.1171 47.75
Belarus 0.1068 47.35
Armenia 0.0906 46.74
Panama 0.0886 46.66
Peru 0.0757 46.17
Sierra Leone -0.0208 42.48
Haiti -0.0250 42.32
Cote d'Ivoire -0.0318 42.06
Mexico -0.0369 41.87
Chad -0.0450 41.56
Romania -0.0493 41.39
El Salvador -0.0517 41.30
East Timor -0.0598 40.99
Uganda -0.1078 39.16
Ukraine -0.1163 38.84
Guinea-Bissau -0.1234 38.57
Nigeria -0.1261 38.47
Israel -0.2893 32.24
India -0.2921 32.13
Guatemala -0.2975 31.93
Moldova -0.2975 31.92
Thailand -0.3078 31.53
Angola -0.3269 30.80
Republic of Congo -0.3285 30.74
Indonesia -0.3616 29.48
Guinea -0.3641 29.38
Botswana -0.4022 27.93
Pakistan -0.4178 27.34
Egypt -0.4451 26.29
Zimbabwe 0.0729 46.06
Mali 0.0681 45.88
Togo 0.0602 45.57
Slovakia 0.0544 45.35
Bulgaria 0.0541 45.34
Latvia 0.0384 44.74
Greece 0.0374 44.71
Ethiopia 0.0317 44.49
Niger 0.0309 44.46
Macedonia 0.0192 44.01
Benin 0.0008 43.31
Papua New Guinea 0.0004 43.29
Vietnam -0.0059 43.05
Lebanon -0.1338 38.17
Sri Lanka -0.1549 37.37
Cameroon -0.1677 36.88
Georgia -0.1685 36.85
Bangladesh -0.1780 36.49
China -0.2225 34.79
Brazil -0.2295 34.52
Mauritania -0.2382 34.19
Nepal -0.2401 34.11
Tunisia -0.2423 34.03
Gambia -0.2488 33.78
Kazakhstan -0.2615 33.30
Turkey -0.2770 32.71
Kyrgyzstan -0.4617 25.66
Russia -0.5573 22.01
Tajikistan -0.5920 20.69
Central African Republic -0.6170 19.73
Malaysia -0.6192 19.65
Yemen -0.6342 19.08
Algeria -0.6416 18.80
Jordan -0.6552 18.27
Rwanda -0.7552 14.46
Myanmar -0.7572 14.38
Iran -0.8151 12.17
Sudan -0.8735 9.95
Iraq -1.1341 0.00
Medium
Medium
-lowLow
Glo
bal In
clusiven
ess
Country NameScaled Score
Raw Score Country Name
Scaled Score
Raw Score
12 haasinstitute.berkeley.edu2018 Inclusiveness Index Annual Report
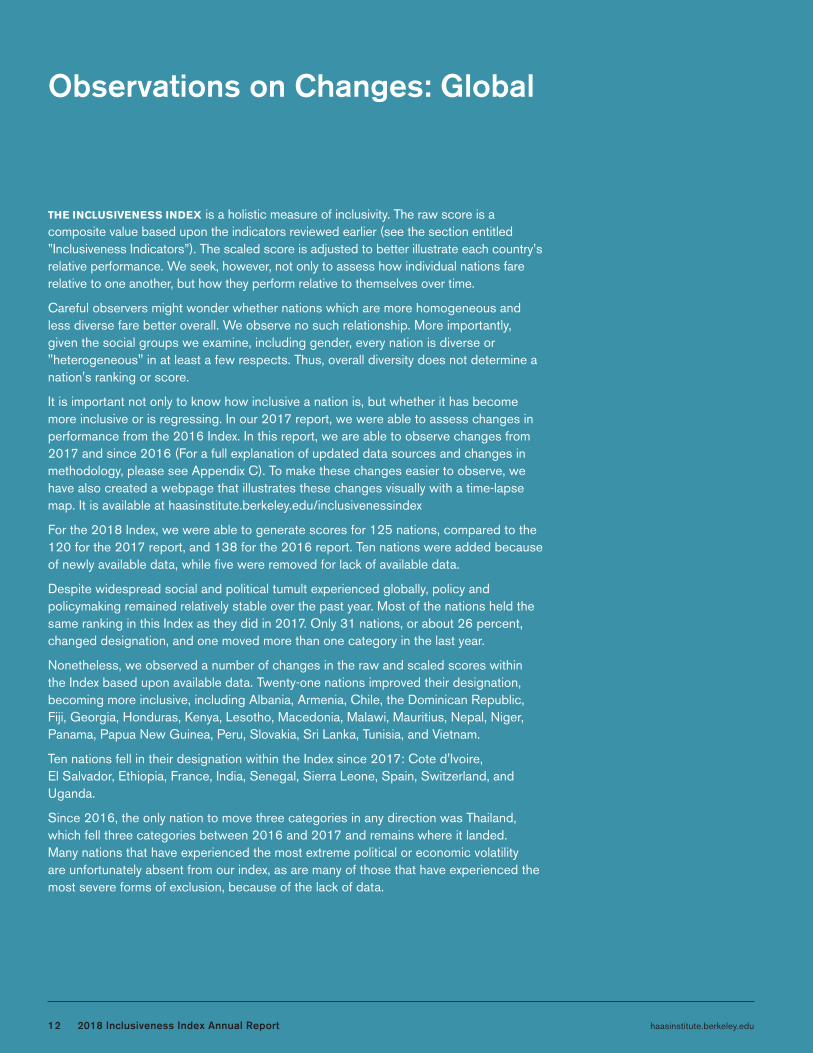
Observations on Changes: Global
THE INCLUSIVENESS INDEX is a holistic measure of inclusivity. The raw score is a composite value based upon the indicators reviewed earlier (see the section entitled ”Inclusiveness Indicators”). The scaled score is adjusted to better illustrate each country’s relative performance. We seek, however, not only to assess how individual nations fare relative to one another, but how they perform relative to themselves over time.
Careful observers might wonder whether nations which are more homogeneous and less diverse fare better overall. We observe no such relationship. More importantly, given the social groups we examine, including gender, every nation is diverse or "heterogeneous" in at least a few respects. Thus, overall diversity does not determine a nation's ranking or score.
It is important not only to know how inclusive a nation is, but whether it has become more inclusive or is regressing. In our 2017 report, we were able to assess changes in performance from the 2016 Index. In this report, we are able to observe changes from 2017 and since 2016 (For a full explanation of updated data sources and changes in methodology, please see Appendix C). To make these changes easier to observe, we have also created a webpage that illustrates these changes visually with a time-lapse map. It is available at haasinstitute.berkeley.edu/inclusivenessindex
For the 2018 Index, we were able to generate scores for 125 nations, compared to the 120 for the 2017 report, and 138 for the 2016 report. Ten nations were added because of newly available data, while five were removed for lack of available data.
Despite widespread social and political tumult experienced globally, policy and policymaking remained relatively stable over the past year. Most of the nations held the same ranking in this Index as they did in 2017. Only 31 nations, or about 26 percent, changed designation, and one moved more than one category in the last year.
Nonetheless, we observed a number of changes in the raw and scaled scores within the Index based upon available data. Twenty-one nations improved their designation, becoming more inclusive, including Albania, Armenia, Chile, the Dominican Republic, Fiji, Georgia, Honduras, Kenya, Lesotho, Macedonia, Malawi, Mauritius, Nepal, Niger, Panama, Papua New Guinea, Peru, Slovakia, Sri Lanka, Tunisia, and Vietnam.
Ten nations fell in their designation within the Index since 2017: Cote d'Ivoire, El Salvador, Ethiopia, France, India, Senegal, Sierra Leone, Spain, Switzerland, and Uganda.
Since 2016, the only nation to move three categories in any direction was Thailand, which fell three categories between 2016 and 2017 and remains where it landed. Many nations that have experienced the most extreme political or economic volatility are unfortunately absent from our index, as are many of those that have experienced the most severe forms of exclusion, because of the lack of data.
12 haasinstitute.berkeley.edu2018 Inclusiveness Index Annual Report
13haasinstitute.berkeley.edu 2018 Inclusiveness Index Annual Report
Global Water Crisis
IN THE LAST several years, lack of access to clean water and sanitation has grown to alarming proportions, with consequences for gender equality, economic opportunity, public health safety, education, and food security primarily in countries of the Global South. Globally, 844 million people live without access to safe water, 2.3 billion people without access to proper sanitation,7 and 4 billion people face severe water scarcity.8 Additionally, the global, rural and urban poor, and other marginalized communities bear the burden of accessing water and proper sanitation systems.
Globally, the water shortages continue to present serious challenges for the design of inclusive public policies across many domains of social policies, ecosystem fragility, and developmental infrastructures.9 The solutions proposed by water resources managers and planners10 don’t seem to provide any practical answers for these challenges.11 For example, environmental pressures, climate change,12 urbanization,13 altered flows,14 and draining wetlands constitute significant challenges to water accessibility and intensify water crises on national and global levels.15
Additionally, lack of access to clean water and proper sanitation have enormous negative impacts on gender equality, education, societal health, economic opportunities, and other factors for the progress of social and human development.16 For example, women in the Global South are disproportionately affected by the water crisis as they are often responsible for collecting water, which takes time away from work, school, and caring for family.
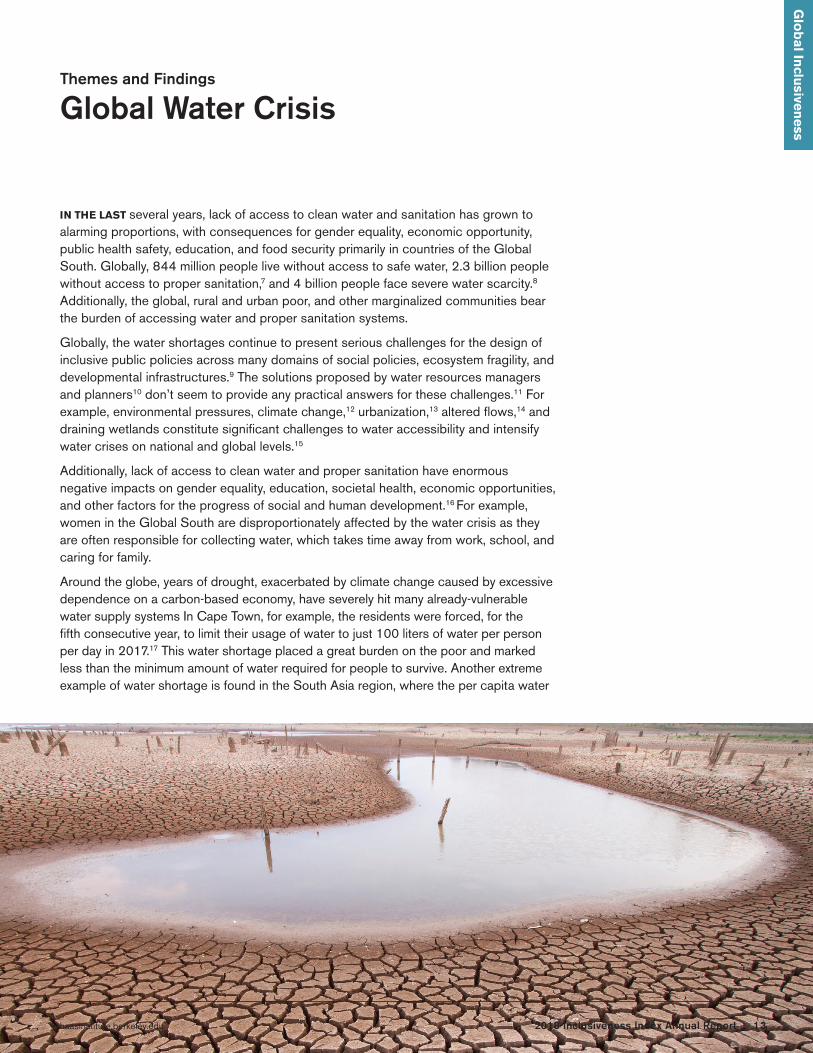
Around the globe, years of drought, exacerbated by climate change caused by excessive dependence on a carbon-based economy, have severely hit many already-vulnerable water supply systems In Cape Town, for example, the residents were forced, for the fifth consecutive year, to limit their usage of water to just 100 liters of water per person per day in 2017.17 This water shortage placed a great burden on the poor and marked less than the minimum amount of water required for people to survive. Another extreme example of water shortage is found in the South Asia region, where the per capita water
Glo
bal In
clusiven
essG
lob
al Inclu
siveness
13haasinstitute.berkeley.edu 2018 Inclusiveness Index Annual Report
Themes and Findings
14 haasinstitute.berkeley.edu2018 Inclusiveness Index Annual Report
availability is already below the world average.18 The region is on the brink of a looming water crisis with the impoverished population facing widespread water scarcity—less than 1,000 cubic meters available per person. In particular, metropolitan cities like Bangalore in India, Kabul in Afghanistan, and Karachi in Pakistan are among the most vulnerable cities concerning water scarcity in the region.19 Such water scarcity would create even worse scenarios for political and economic stability in the larger region.
Ultimately, the consequences of water shortages and improper sanitation systems continue to hamper any genuine progress towards the advancement of globally sustainable development goals.20
The global and national water crises, which include challenges like water restrictions, unaffordable water prices, and improper sanitation systems, are related in many ways to human-induced climate change, politics of austerity,21 failing infrastructures, and the mismanagement of water resources. Globally, water resources managers and planners—while encountering new environmental risks and vulnerabilities—cannot adequately address the crises within existing political choices and in the context of austerity. These economic and political choices present barriers to employing the most efficient and adaptive strategies to tackle these water crises head-on. To alleviate the burden of water scarcity and improper sanitation systems experienced by the urban poor and marginalized rural communities and to strengthen water resources management in the face of dire water shortages, it is necessary to move away from the politics of austerity. Additionally, countries need to act on concrete plans to enhance the resilience of their ecosystem and watersheds and ultimately combat the larger impacts of climate change.
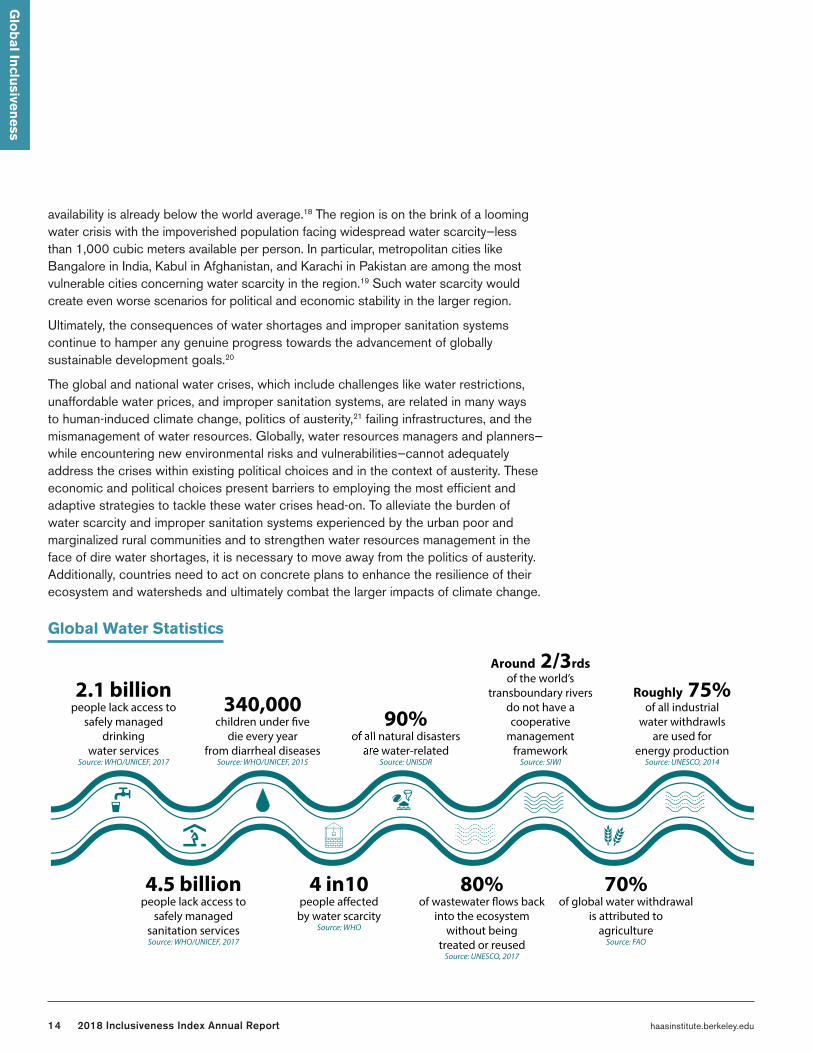
Global Water Statistics
4.5 billionpeople lack access to
safely managedsanitation servicesSource: WHO/UNICEF, 2017
2.1 billionpeople lack access to
safely manageddrinking
water servicesSource: WHO/UNICEF, 2017
340,000die every year
from diarrheal diseasesSource: WHO/UNICEF, 2015
4 in10by water scarcity
Source: WHO
90%of all natural disasters
are water-relatedSource: UNISDR
80%into the ecosystem
without beingtreated or reused
Source: UNESCO, 2017
Around 2/3rdsof the world’s
transboundary riversdo not have acooperative
managementframework
Source: SIWI
70%of global water withdrawal
is attributed toagriculture
Source: FAO
Roughly 75%of all industrial
water withdrawlsare used for
energy productionSource: UNESCO, 2014
Glo
bal In
clusiven
ess
15haasinstitute.berkeley.edu 2018 Inclusiveness Index Annual Report
Glo
bal In
clusiven
ess
AT A TIME WHEN gender equality is more widely recognized as a central policy objective by governments and international organizations than ever before, it has become particularly imperative to reflect on the challenges that continue to delay materializing this objective. In cumulative terms, the world has made recognizable strides in closing the universal gender gap in educational attainment, health and safety, access to economic opportunities, and political representation. Nonetheless, global and national gender inequality, which has incarnated in various social, political, and cultural institutions, remains persistent, and continues to influence many social policies and attitudes such as those regarding reproductive health,23 education,24 labor force participation,25 violence against women,26 inclusive working practices, and political participation.
The global governance institutions (such as the World Bank, International Monetary Fund, Economic World Forum, among others) that prioritize economic growth over social progress, coupled with gender rigidity in countries and institutions with dominant male institutions, continue to impact broader quests for gender equity27, 28 in education, welfare, health, political participation,29 and physical and psychological security.30
The top echelons of global health, higher education,31 and political representation32 are still nearly an exclusively male domain.33 For example, only half of the 140 global institutions that play a prominent role in financing, governing, and delivering global health make an explicit commitment to gender equality,34 which in itself impedes the goal of reducing wealth and income inequality between and among nations because these institutions are the same thought leaders who design the global agenda for the development of countries in the Global South. Worldwide, men participate in the labor force at 76.1 percent while women’s participation remains at 49.4 percent, representing a 26.7 percent gender gap.35 More so, the average global compensations for the same job for men and women remain tenaciously unequal. Ultimately, to achieve overall global gender parity, we need to close 32 percent of the overall global gender gap in education, reproductive health, economic opportunity, and job markets; however, in the economic realm, the gap remains even greater, at 42 percent worldwide.36
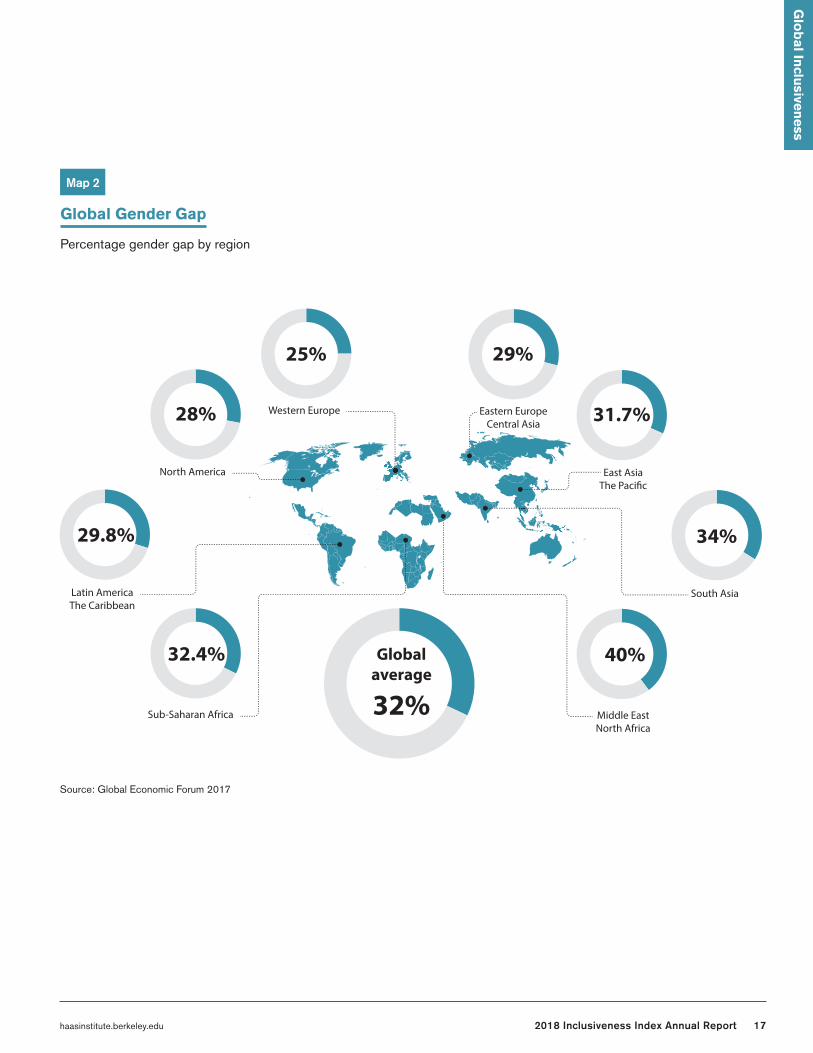
Many regions of the world have made substantial progress in attempting to close these gender gaps, yet some experts say that closing the gender gap at the rate we are currently doing business would take about 100 years.37 For example, the current overall gender gap stands at 25 percent for Western Europe, 28 percent for North America, 29 percent for Eastern Europe and Central Asia, 29.8 percent for Latin America and the Caribbean, 31.7 percent for East Asia and the Pacific, 32.4 percent for Sub-Saharan Africa, 34 percent for South Asia, and slightly less than 40 percent for the Middle East and North Africa.38
Global Gender Inequality and Gender Gap
Themes and Findings
This section adopts a binary gender definition of male/female (due to data availability) to document the specific inequity to gender gap that operates within this perceived gender binary. We acknowledge the fluidity and various definitions of gender and wish to encourage national and global research to expand data collection that identify gender outside of this binary representation.
16 haasinstitute.berkeley.edu2018 Inclusiveness Index Annual Report
Many of the global institutions that aim to reduce the gender gap argue that economic growth can have a positive impact on closing this gap. This argument misses the complexity of what has caused gender inequality in the first place.22 According to multiple studies,39 the fiscal impact of cumulative economic and national GDP growth over the past several decades has not achieved the goal of closing the gender gap in either equal access to job opportunities or equal pay. For example, the fact that women are more likely to be employed in industries with lower wages than men runs counter to long-term strategies for gender parity.40 Moreover, while the global average annual pay for women was $12,000 in 2017, men received $21,00041—almost a 1:2 ratio.
Finding strategies to address structural and institutional conditions of gender inequality presents a tremendous opportunity for political, economic, cultural and social transformation worldwide. However, focusing only on strategies to improve women's capabilities and access to opportunity is not enough. We also need to focus on challenging systemic resistance against institutional transformation. Furthermore, to move from aspirations to action, there is an urgent need for global and national commitments to act on at least three fronts. Firstly, implementing policies that expand educational and empowerment opportunities for girls and women; Secondly, monitoring the implementation of policies that unlock the multiplier effects of equal pay for the same job; And thirdly, adopting enforceable mechanisms of collecting and publishing data on men and women’s employment percentages, leadership positions, and salaries for all public and private sectors. These policy interventions will not only build substantial steps towards closing gender gaps, but are also vital to benefit societal transformation and inclusivity at large.
Glo
bal In
clusiven
ess
17haasinstitute.berkeley.edu 2018 Inclusiveness Index Annual Report
Glo
bal In
clusiven
ess
Global Gender Gap
Percentage gender gap by region
Map 2
Eastern EuropeCentral Asia
East Asia
South Asia
Middle EastNorth Africa
29%
31.7%
34%
40%
Western Europe
North America
Latin AmericaThe Caribbean
Sub-Saharan Africa
25%
28%
29.8%
32.4% Globalaverage
32%
Source: Global Economic Forum 2017
18 haasinstitute.berkeley.edu2018 Inclusiveness Index Annual Report
CITIZENSHIP HAS HAD different meanings throughout history, but the most contemporary definition revolves around specific rights, such as civil, cultural, economic, political, and social rights, to those who inhabit the national boundary of a state or territory.42 In general, those who are considered citizens are those who were born in the country, born to a non-citizen immigrant, have gone through a process of naturalization, or a combination of these approaches. Citizenship is guaranteed by state law, i.e., a constitution, and guarded by government policy. A non-citizen is a person who isn’t afforded the opportunity to enjoy such rights by the country where they live. Around the world, more than 191 million individuals43 fall under this category.44
Most modern nation-states and territories have imbricated the concept and designation of a citizen with legal status, designating those who are not considered citizens, and are not present on the basis of a visa or permission of the government, as "illegal." However, non-citizenship is more expansive than that; it takes into account the difference between who is considered a legal and illegal citizen and afforded the enjoyment of citizenship privileges. Thus, it dehumanizes those who, for whatever reason, are not legal citizens and stripped away their rights to enjoy any aspect of political, economic, social, and cultural citizenship within the society despite the contributions to the society in which they work and live.42
Citizenship is a global standard and practiced by nations worldwide. It refers to equal treatment by the rule of law, with all members of a society sharing equal rights and responsibilities. However, when people speak of "second-class citizens," they are referring to those who have been stripped away of their rights and responsibilities in a significant way. While non-citizens include refugees, asylum-seekers, and immigrants, who might enjoy certain reorganizations and rights, others, such as stateless and forced undocumented migrants, do not have access to these rights.45 Precisely, and due to the severity of marginality and exclusion, we designate the term of non-citizens to groups like stateless populations as well. Today, we find such groups all around the world, such as the Roma people in Europe, Palestinians in the occupied territories and the diaspora, the Rohingya in Myanmar, and undocumented immigrants in the United States, among others.
Furthermore, ethno-nationalism and xenophobia have worsened worldwide making legal recognition of non-citizens even more difficult to materialize. This lack of legal recognition is also a constitutive element of what it means to be subject to marginality.46
One example in the United States—the presence of over 11 million undocumented immigrants—links lack of legal status with a systemic process of explicit and implicit bias and discrimination.47 Another example is in Myanmar, where over 1.2 million Rohingya who have lived in Rakhine state for over a millennium are attacked for resisting assimilation into the larger Buddhist social and cultural social fabric, and implicit attacks on their cultural and linguistic difference. Both explicit and implicit discrimination led to the denial of equal rights for the Rohingya and justifications of their mistreatment, which has included murder, rape, displacement, and genocide.48
The Rights of Non-Citizens
Glo
bal In
clusiven
ess
Themes and Findings
19haasinstitute.berkeley.edu 2018 Inclusiveness Index Annual Report
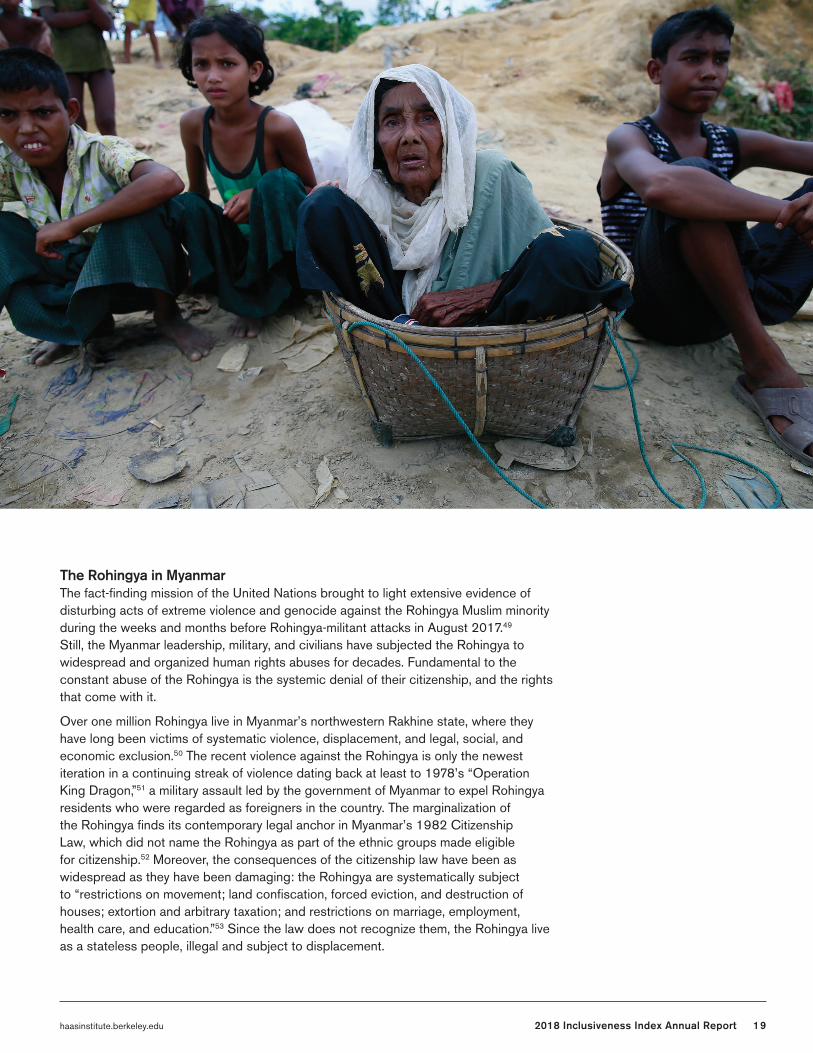
The Rohingya in MyanmarThe fact-finding mission of the United Nations brought to light extensive evidence of disturbing acts of extreme violence and genocide against the Rohingya Muslim minority during the weeks and months before Rohingya-militant attacks in August 2017.49 Still, the Myanmar leadership, military, and civilians have subjected the Rohingya to widespread and organized human rights abuses for decades. Fundamental to the constant abuse of the Rohingya is the systemic denial of their citizenship, and the rights that come with it.
Over one million Rohingya live in Myanmar’s northwestern Rakhine state, where they have long been victims of systematic violence, displacement, and legal, social, and economic exclusion.50 The recent violence against the Rohingya is only the newest iteration in a continuing streak of violence dating back at least to 1978’s “Operation King Dragon,”51 a military assault led by the government of Myanmar to expel Rohingya residents who were regarded as foreigners in the country. The marginalization of the Rohingya finds its contemporary legal anchor in Myanmar’s 1982 Citizenship Law, which did not name the Rohingya as part of the ethnic groups made eligible for citizenship.52 Moreover, the consequences of the citizenship law have been as widespread as they have been damaging: the Rohingya are systematically subject to “restrictions on movement; land confiscation, forced eviction, and destruction of houses; extortion and arbitrary taxation; and restrictions on marriage, employment, health care, and education.”53 Since the law does not recognize them, the Rohingya live as a stateless people, illegal and subject to displacement.
Glo
bal In
clusiven
ess
20 haasinstitute.berkeley.edu2018 Inclusiveness Index Annual Report
Palestinian RefugeesFor over 70 years, Palestinians have made up the largest refugee population in the world. Since 1948, the establishment of the state of Israel has led to massive expulsions of the Palestinian population from their lands, removals that continue to this day. Although international law upholds the right of Palestinian refugees to return to Palestine, Palestinians continue to be systematically denied this right and remain a stateless people. Their numbers continue to grow in refugee camps in Jordan, Syria, Lebanon, and the occupied Palestinian territories of the West Bank and Gaza. The lack of protections for Palestinians has been exacerbated by Israel's decades-long military occupation and the recent conflicts in the region. For example, the regional conflicts that continue to sweep across Iraq and Syria have impacted the Palestinian refugees, who were formerly protected in these nations but now find themselves once again seeking refuge in foreign lands. These regional conflicts have ultimately hindered these Palestinians' access to proper refugee protection and access to citizenship status.
According to the United Nations Relief and Works Agency for Palestine Refugees in the Near East (UNRWA), the Palestinians are the only refugees that fall under its mandate and not the mandate of the UNHCR. The UNRWA is the only UN agency explicitly created for a particular region or conflict. Significantly, the UNRWA does not share the same policies with the UNHCR, including its mandated mission to eliminate refugee status with resettlement, integration, or repatriation of refugees. As a result, over 5 million Palestinian refugees will remain internally and externally displaced and without legal protection.
The ongoing occupation of Palestine continues to create severe consequences for Palestinian refugees, who are forced to endure multiple displacements, without any sufficient legal protections or final status agreements in sight.
The Palestinian refugees, given their lack of status, have been blocked from legal pathways for asylum in other countries. In Syria for example, the Palestinian refugees have not been granted citizenship, so they remain without nationality. More than half of the Palestinians in Syria have been displaced both internally and beyond Syria's borders. In Greece, the asylum cases of Palestinians from Syria have been frozen, although their condition of statelessness makes them some of the most vulnerable of displaced populations in the world.
Bengali Muslims in Assam, IndiaOn December 31, 2017, the Assam state’s National Register of Citizens (NRC) updated its citizens records, leaving out more than 4 million people (or 15 percent of the total population of 31 million) who are predominantly Muslims. The authorities in Assam argued that it had taken this step to determine the citizenship of Indian citizens of Assam before March 25, 197154 and to ensure that the state has an accurate record of who is considered to be a citizen of the state and thus of India.55 However, many human rights observers accused the authorities of unfairly cracking down on the
Glo
bal In
clusiven
ess
21haasinstitute.berkeley.edu 2018 Inclusiveness Index Annual Report
Muslim minority of Bengali origin by contesting their legal citizenship56 as the required documents to determine the citizenship status is difficult to obtain for more than 4 million residents of Assam state.57 For those people, the difficulty arises because their ancestors did not have the material means or knowledge to register themselves as citizens with the NRC authorities when India just gained its independence from Britain in 1947.
The new NRC update targets the Bengali-origin migrants whose ancestors come into Assam from the Bengal region, predating India’s independence in 1947 and during and after the 1971 Bangladesh war of independence (Bangladesh was formerly known as East Bengal) to secede from Pakistan. During the 1971 war an estimated 300,000 to three million people were killed and several million people took refuge in neighboring India.58 At the time of the war of independence, the Indian government was supporting the secession of Bangladesh from Pakistan.
The current campaign of the Assam state’s National Register of Citizens (NRC), led by the Hindu nationalist Bharatiya Janata Party (BJP), which rules the Assam state, is not the first time that the Assam authorities have systematically attempted to strip citizenship rights away from the Bengali Muslim minority there. For example, on February, 18, 1983, the Assam authorities turned a blind eye to an orchestrated massacre led by a statewide student group, the All Assam Students Union (AASU), in central Assam, where over 2,000 (unofficial figures run at more than 5,000)59 Muslim men, women, children, and infants were brutally killed.60 The violence against the Bengali minority was one of the most horrific massacres committed in the contemporary history of India.61
The case of the Muslim minority of Bengali origin in Assam offers close similarities to the situation of the Rohingya people in Myanmar. Both groups were at first victims of bias and exclusion concerning their legal citizenship status, and then became victims of systematic violence, and later systemic genocide and displacement. If the authorities in Assam succeed in their plan to strip away citizenship, the Assamese Muslims might experience similar treatment to that of the Rohingya people at the hands of the Myanmar authorities—systematic harassment, violence, detentions, killings, and ultimately displacement.
Roma People in EuropeThe Roma people originate from Rajasthan and Punjab, in India's northern region. Entering Europe sometime between the eighth and tenth Centuries, Roma people are the most significant ethnic minority in Europe with an estimated population of 10-12 million. The Roma are a nomadic people that live in various European nations.62 It is worth noting that collecting data on the Roma is exceptionally challenging because many European states prohibit data collection by ethnicity.63 Nevertheless, the data that does exist on the Roma give us a glimpse into their legal and political situation. Most of
Glo
bal In
clusiven
ess
22 haasinstitute.berkeley.edu2018 Inclusiveness Index Annual Report
the Roma live in Bulgaria, Macedonia, Slovakia, Romania, Serbia, and Hungary, where they comprise 7-10 percent of the population. In other European states, their population hovers around 1 percent of the population, if not less.
From the founding of the Wallachian and Moldavian principalities in the thirteenth and fourteenth centuries, slavery existed in the territory that is now Romania and many of those slaves were Roma people.64 It was only until the mid-nineteenth century that slavery was abolished in the territories. Still, the Roma faced significant discrimination.
The Roma have been treated as “illegal” citizens in Europe for as long as they have been on the continent, and are "Europe's unwanted people.”65 The name Roma, which derives from the multi-dialectic spoken language “Romani language” of the group, provides a vital window into their exclusion.66 In earlier times, the Roma were called “Gypsies” because Europeans mistook them as coming from Egypt and saw them as "outsiders." The term is derided by some as pejorative, as it evokes notions of illegality and second-class citizenship.67 Such a designation is an indication of their subjugated position that has existed for centuries. The Holocaust, most known for the mass murder of 6 million Jews, is also known for the genocide of peoples deemed subhuman; the Roma were among the people so labeled. The subjugation of the Roma continued well into the twenty-first century, as they still face dehumanization, exclusion, and marginality.
Undocumented Immigrants in the USAAccording to the United States Department of Homeland Security, 11.7 immigrants reside in the US without proper documentation.69 Mexicans make up over half of all undocumented immigrants, despite their numbers declining in recent years. However, the number of undocumented immigrants from countries other than Mexico increased by 325,000 since 2009. As of 2014, two-thirds of undocumented immigrant adults have resided in the United States for over a decade; this is a sharp increase from the 41 percent who had lived for that long in 2005. Further, the US civilian workforce includes 8 million undocumented immigrants, accounting for 5 percent of those who were working or unemployed and looking for work. Workers who do not have legal status are particularly vulnerable to exploitation through long hours, stolen or low pay, and psychological abuse that manifests itself in superiors leveraging the fear of deportation.
While undocumented immigrants contribute to economic growth and enhance the welfare of American citizens by contributing more in tax revenue than they collect, reducing the desire of American companies to ship jobs overseas, and benefiting consumers by reducing the prices of goods and services,70 they have become scapegoats for economic, social, and political failures in the country. Riding on xenophobic rhetoric, President Donald Trump ascended to the presidency in 2016 on a platform that disparaged Mexicans, immigrants, and Muslims, and questioned their worth as citizens, among other groups.71 On January 27, 2017, President Trump signed an executive order that banned people from seven Muslim-majority countries from entering the United States.72 While the decision was met with vehement opposition, widely decried by protesters, lawyers, and public figures nationwide,73 the US Supreme Court upheld the policy.
Glo
bal In
clusiven
ess
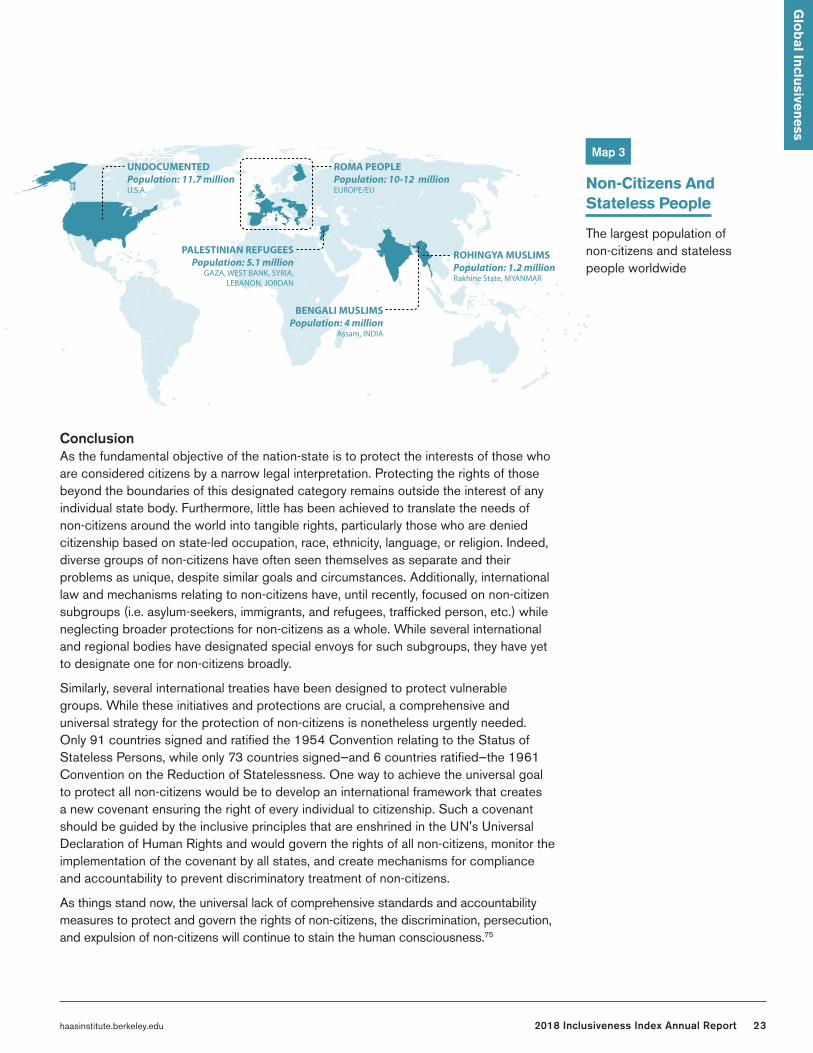
ROHINGYA MUSLIMSPopulation: 1.2 millionRakhine State, MYANMAR
BENGALI MUSLIMSPopulation: 4 million
Assam, INDIA
ROMA PEOPLEPopulation: 10-12 millionEUROPE/EU
PALESTINIAN REFUGEESPopulation: 5.1 million
GAZA, WEST BANK, SYRIA, LEBANON, JORDAN
UNDOCUMENTEDPopulation: 11.7 millionU.S.A.
NON-CITIZENS AND STATELESS PEOPLEThe largest population of non-citizens and stateless people worldwide
23haasinstitute.berkeley.edu 2018 Inclusiveness Index Annual Report
ConclusionAs the fundamental objective of the nation-state is to protect the interests of those who are considered citizens by a narrow legal interpretation. Protecting the rights of those beyond the boundaries of this designated category remains outside the interest of any individual state body. Furthermore, little has been achieved to translate the needs of non-citizens around the world into tangible rights, particularly those who are denied citizenship based on state-led occupation, race, ethnicity, language, or religion. Indeed, diverse groups of non-citizens have often seen themselves as separate and their problems as unique, despite similar goals and circumstances. Additionally, international law and mechanisms relating to non-citizens have, until recently, focused on non-citizen subgroups (i.e. asylum-seekers, immigrants, and refugees, trafficked person, etc.) while neglecting broader protections for non-citizens as a whole. While several international and regional bodies have designated special envoys for such subgroups, they have yet to designate one for non-citizens broadly.
Similarly, several international treaties have been designed to protect vulnerable groups. While these initiatives and protections are crucial, a comprehensive and universal strategy for the protection of non-citizens is nonetheless urgently needed. Only 91 countries signed and ratified the 1954 Convention relating to the Status of Stateless Persons, while only 73 countries signed—and 6 countries ratified—the 1961 Convention on the Reduction of Statelessness. One way to achieve the universal goal to protect all non-citizens would be to develop an international framework that creates a new covenant ensuring the right of every individual to citizenship. Such a covenant should be guided by the inclusive principles that are enshrined in the UN's Universal Declaration of Human Rights and would govern the rights of all non-citizens, monitor the implementation of the covenant by all states, and create mechanisms for compliance and accountability to prevent discriminatory treatment of non-citizens.
As things stand now, the universal lack of comprehensive standards and accountability measures to protect and govern the rights of non-citizens, the discrimination, persecution, and expulsion of non-citizens will continue to stain the human consciousness.75
Glo
bal In
clusiven
ess
ROHINGYA MUSLIMSPopulation: 1.2 millionRakhine State, MYANMAR
BENGALI MUSLIMSPopulation: 4 million
Assam, INDIA
ROMA PEOPLEPopulation: 10-12 millionEUROPE/EU
PALESTINIAN REFUGEESPopulation: 5.1 million
GAZA, WEST BANK, SYRIA, LEBANON, JORDAN
UNDOCUMENTEDPopulation: 11.7 millionU.S.A.
NON-CITIZENS AND STATELESS PEOPLEThe largest population of non-citizens and stateless people worldwide
Non-Citizens And Stateless People
The largest population of non-citizens and stateless people worldwide
Map 3
24 haasinstitute.berkeley.edu2018 Inclusiveness Index Annual Report
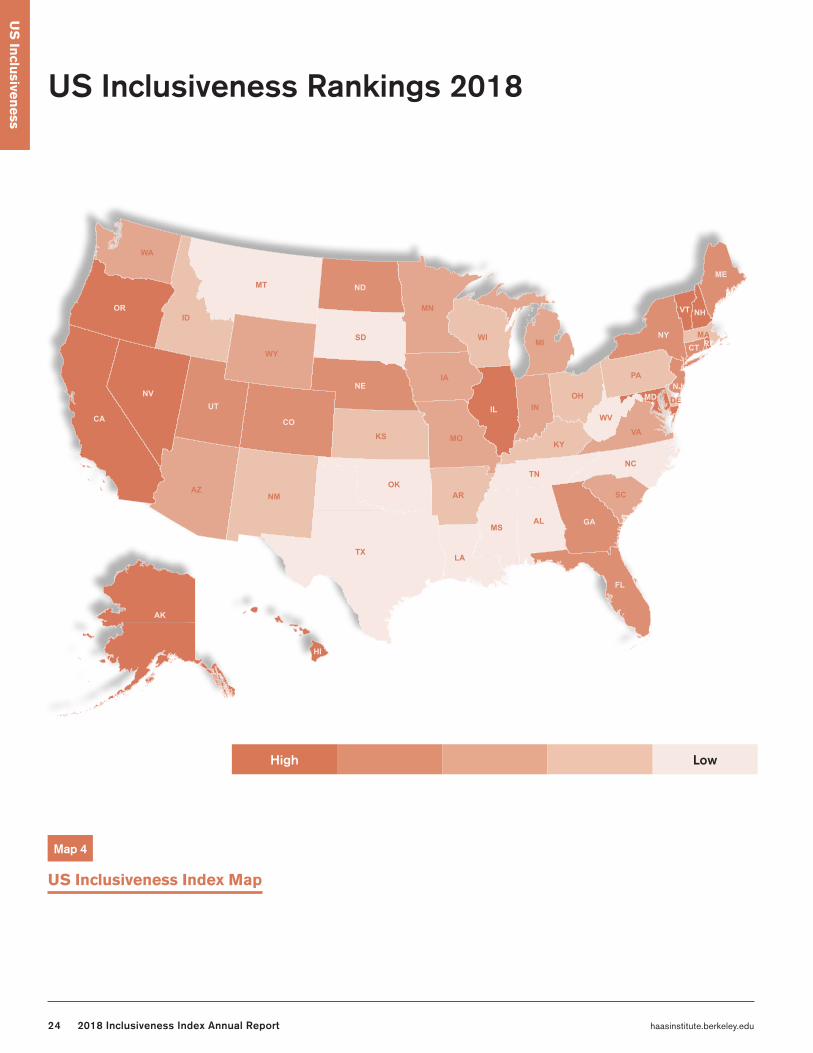
US Inclusiveness Index Map
Map 4
High Low
US Inclusiveness Rankings 2018
US
Inclu
siveness
TX
CA
MT
AZ
ID
NV
NM
CO
OR
UT
WY
IL
KS
SD
NE
MN
IA
ND
OK
FL
WI
MO
WA
GAAL
AR
MI
LA
IN
PA
NC
NY
MS
TN
VAKY
OH
SC
ME
WV
VT NH
MDNJ
MA
AK
HI
CT
DE
RI
25haasinstitute.berkeley.edu 2018 Inclusiveness Index Annual Report
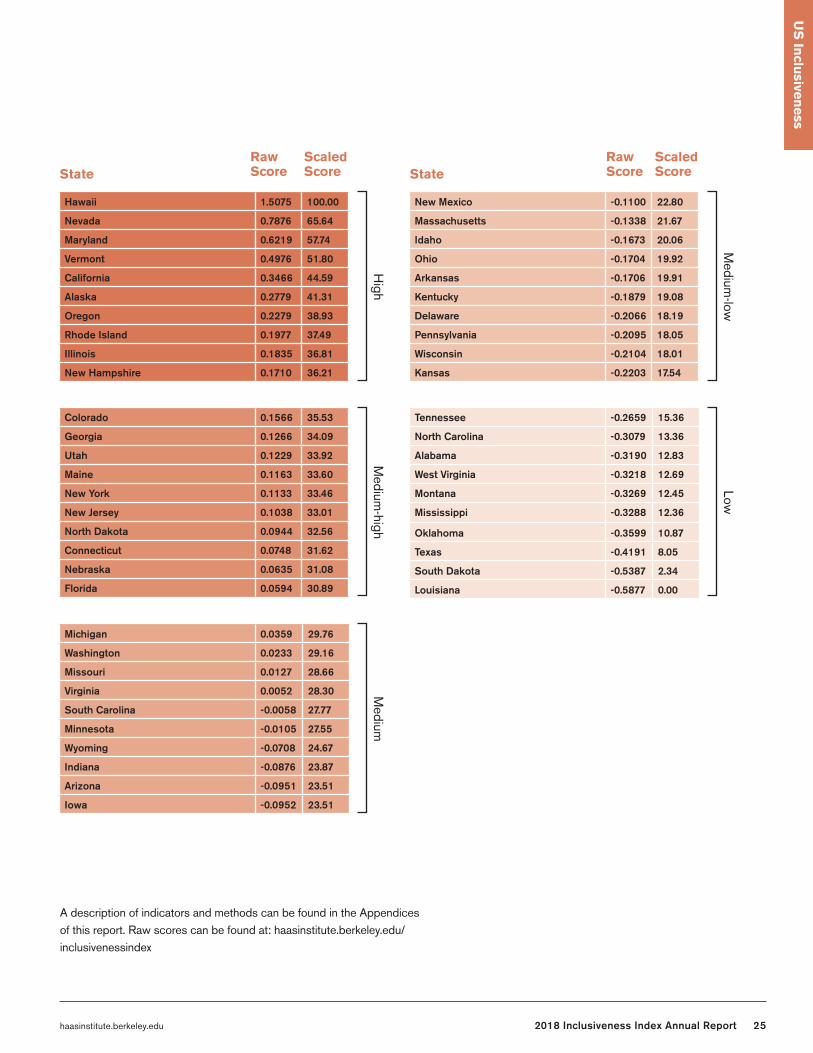
A description of indicators and methods can be found in the Appendices of this report. Raw scores can be found at: haasinstitute.berkeley.edu/inclusivenessindex
US
Inclu
siveness
Hawaii 1.5075 100.00
Nevada 0.7876 65.64
Maryland 0.6219 57.74
Vermont 0.4976 51.80
California 0.3466 44.59
Alaska 0.2779 41.31
Oregon 0.2279 38.93
Rhode Island 0.1977 37.49
Illinois 0.1835 36.81
New Hampshire 0.1710 36.21
Colorado 0.1566 35.53
Georgia 0.1266 34.09
Utah 0.1229 33.92
Maine 0.1163 33.60
New York 0.1133 33.46
New Jersey 0.1038 33.01
North Dakota 0.0944 32.56
Connecticut 0.0748 31.62
Nebraska 0.0635 31.08
Florida 0.0594 30.89
Michigan 0.0359 29.76
Washington 0.0233 29.16
Missouri 0.0127 28.66
Virginia 0.0052 28.30
South Carolina -0.0058 27.77
Minnesota -0.0105 27.55
Wyoming -0.0708 24.67
Indiana -0.0876 23.87
Arizona -0.0951 23.51
Iowa -0.0952 23.51
New Mexico -0.1100 22.80
Massachusetts -0.1338 21.67
Idaho -0.1673 20.06
Ohio -0.1704 19.92
Arkansas -0.1706 19.91
Kentucky -0.1879 19.08
Delaware -0.2066 18.19
Pennsylvania -0.2095 18.05
Wisconsin -0.2104 18.01
Kansas -0.2203 17.54
Tennessee -0.2659 15.36
North Carolina -0.3079 13.36
Alabama -0.3190 12.83
West Virginia -0.3218 12.69
Montana -0.3269 12.45
Mississippi -0.3288 12.36
Oklahoma -0.3599 10.87
Texas -0.4191 8.05
South Dakota -0.5387 2.34
Louisiana -0.5877 0.00
State StateScaled Score
Scaled Score
Raw Score
Raw Score
High
Medium
-highM
edium
Medium
-lowLow
26 haasinstitute.berkeley.edu2018 Inclusiveness Index Annual Report
Observations on Changes in the US
THE UNITED STATES has been no exception to the various crises and public mobilizations that have erupted worldwide in the last year, including the #MeToo movement and the immigrant separation policy, which are both profiled herein. Given the number of states involved and varying leadership within them, it is not surprising that a number of states have both improved and regressed in terms of inclusivity during this time. With updated data, we have recalculated Inclusiveness Index scores for every state for 2018 as indicated on the preceding pages.
Overall, 23 states improved or regressed over the last year, while 27 states earned the same designation they had in our 2017 index. The most dramatic changes were Delaware, Florida, New Mexico, Massachusetts, and Idaho. Idaho fell three categories from the highest level of inclusivity in 2017 to low in 2018. Meanwhile, Delaware, New Mexico, and Massachusetts fell two categories. In contrast, Florida rose two categories from low to high inclusivity.
Seventeen states moved just one category, a more nuanced shift. Of those, the states that fell included Colorado, Maine, Tennessee, Washington, and Wisconsin. More hopefully, twelve states improved their designation: Colorado, Connecticut, Georgia, Illinois, Indiana, Kansas, Missouri, North Dakota, Rhode Island, South Carolina, Utah, and Wyoming. Their final designations are reflected on the table and maps on the immediately preceding pages.
27haasinstitute.berkeley.edu 2018 Inclusiveness Index Annual Report
Themes and Findings
US Water Crisis
ACCESS TO WATER has recently emerged as a prominent challenge in the US—often entangled with access to sanitation and adequate sewer services. International law asserts a right to water and sanitation and defines access to these services as access to sufficient, safe, acceptable, physically accessible, and affordable. Throughout the United States, access to water and sewer services—in all of these dimensions—are increasingly insecure. Dominant solutions to this challenge are often inadequate and marked by an extreme application of austerity. Ultimately, genuine solutions must demonstrate both technical correctness and true radical democratic control—a term that suggests deeper and more meaningful democratic participation than that which is provided by current systems of governance.
Many US cities face extreme problems in accessing potable water and adequate sewer services as water and wastewater systems are often in need of renewal and repair, having operated for over a century—and public health and environmental standards are necessary and costly to achieve. Older system pipes can contaminate local water supplies for two reasons. Firstly, older pipes can contain lead and other toxic substances that can enter the water supply if the water corrodes the pipes.76 Secondly, the systems’ source of water is usually treated with chemicals that include anti-corrosive chemicals, often necessary because of chemical pollutants in the water from agricultural runoff or industrial sources.77 For example, in 2001 Washington, DC experienced a lead water contamination problem of equivalent or greater scale than the most recent Flint water contamination. Other lead water contamination stories have occurred in Cleveland, Baltimore, Detroit city schools, and other places.78
Affordability is another threat to water access. It is important to note that we should consider affordability on two scales: costs that residential users are expected to pay and the costs that a public utility system has to meet for operation, management, replacement, repair, and upgrades.79
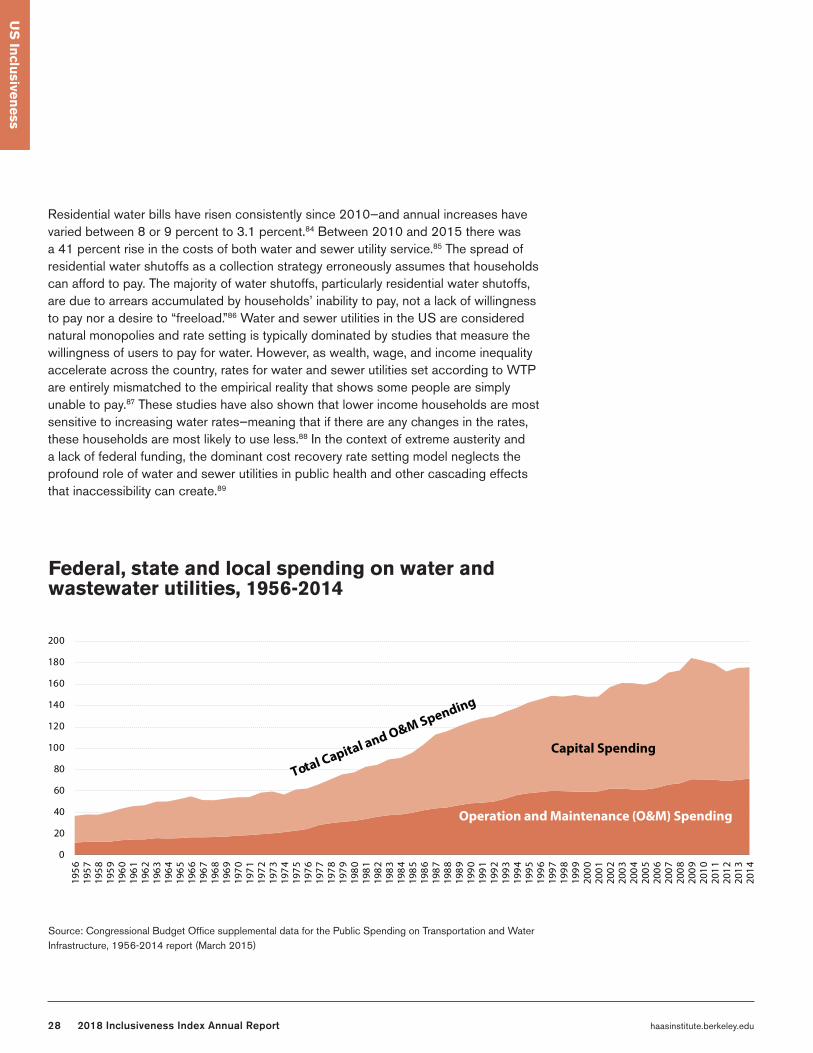
The costs of running the system falls disproportionately to local governments and the public utility.80 Between 2010 and 2014, state and local government spending constituted between 92.1 and 96.2 percent of overall public investment in the nation’s drinking water and wastewater systems.81
During this period, state and local government spending constituted between 81.9 and 91.4 percent of total capital spending. The federal government funds only one-third of the nation’s water utility capital needs that are estimated to be $123 billion per year over the next 10 years.82 The great demand for investment is clear and many utility systems face difficulty in financing necessary improvements. The extreme needs for revenue and investment can be hindered by circumstances that are increasingly common across the US: unfair fees or credit ratings associated with municipal bond markets, declining population numbers in service areas, and decreasing household financial health.83
US
Inclu
siveness
28 haasinstitute.berkeley.edu2018 Inclusiveness Index Annual Report
Residential water bills have risen consistently since 2010—and annual increases have varied between 8 or 9 percent to 3.1 percent.84 Between 2010 and 2015 there was a 41 percent rise in the costs of both water and sewer utility service.85 The spread of residential water shutoffs as a collection strategy erroneously assumes that households can afford to pay. The majority of water shutoffs, particularly residential water shutoffs, are due to arrears accumulated by households’ inability to pay, not a lack of willingness to pay nor a desire to “freeload.”86 Water and sewer utilities in the US are considered natural monopolies and rate setting is typically dominated by studies that measure the willingness of users to pay for water. However, as wealth, wage, and income inequality accelerate across the country, rates for water and sewer utilities set according to WTP are entirely mismatched to the empirical reality that shows some people are simply unable to pay.87 These studies have also shown that lower income households are most sensitive to increasing water rates—meaning that if there are any changes in the rates, these households are most likely to use less.88 In the context of extreme austerity and a lack of federal funding, the dominant cost recovery rate setting model neglects the profound role of water and sewer utilities in public health and other cascading effects that inaccessibility can create.89
Federal, state and local spending on water and wastewater utilities, 1956-2014
0
20
40
60
80
100
120
140
160
180
200
1956
1957
1958
1959
1960
1961
1962
1963
1964
1965
1966
1967
1968
1969
1970
1971
1972
1973
1974
1975
1976
1977
1978
1979
1980
1981
1982
1983
1984
1985
1986
1987
1988
1989
1990
1991
1992
1993
1994
1995
1996
1997
1998
1999
2000
2001
2002
2003
2004
2005
2006
2007
2008
2009
2010
2011
2012
2013
2014
Operation and Maintenance (O&M) Spending
Capital Spending
Total Capital and O&M Spending
Source: Congressional Budget Office supplemental data for the Public Spending on Transportation and Water Infrastructure, 1956-2014 report (March 2015)
US
Inclu
siveness
29haasinstitute.berkeley.edu 2018 Inclusiveness Index Annual Report
US
Inclu
siveness
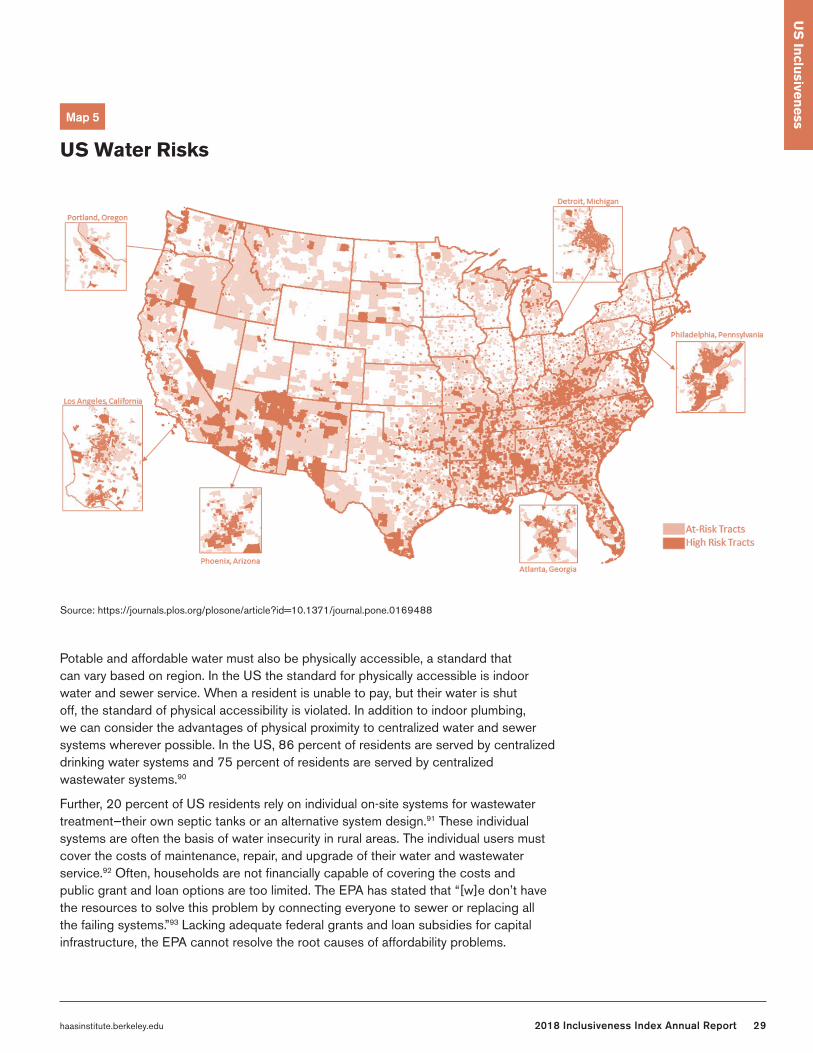
Potable and affordable water must also be physically accessible, a standard that can vary based on region. In the US the standard for physically accessible is indoor water and sewer service. When a resident is unable to pay, but their water is shut off, the standard of physical accessibility is violated. In addition to indoor plumbing, we can consider the advantages of physical proximity to centralized water and sewer systems wherever possible. In the US, 86 percent of residents are served by centralized drinking water systems and 75 percent of residents are served by centralized wastewater systems.90
Further, 20 percent of US residents rely on individual on-site systems for wastewater treatment—their own septic tanks or an alternative system design.91 These individual systems are often the basis of water insecurity in rural areas. The individual users must cover the costs of maintenance, repair, and upgrade of their water and wastewater service.92 Often, households are not financially capable of covering the costs and public grant and loan options are too limited. The EPA has stated that “[w]e don’t have the resources to solve this problem by connecting everyone to sewer or replacing all the failing systems.”93 Lacking adequate federal grants and loan subsidies for capital infrastructure, the EPA cannot resolve the root causes of affordability problems.
US Water Risks
Map 5
Source: https://journals.plos.org/plosone/article?id=10.1371/journal.pone.0169488
30 haasinstitute.berkeley.edu2018 Inclusiveness Index Annual Report
US
Inclu
siveness
Instead, the agency offers practicable strategies adapted for an environment of government austerity.94 Research has found that water and sewer insecurity in urban and rural US and globally is associated with increased incidence of infectious and parasitic diseases.95 In some places, residents have not raised their concerns to local government because they can be subject to arrest.96 Alabama, for example, has cited residents for unsanitary sewerage systems since 1999. In 2002 the state threatened to arrest 37 residents due to a state law requiring adequate sewage collection systems.97
The role of state, local, and federal government looms large in US water and sewer infrastructure—as does the role of corporations. It is suggested that failing drinking and wastewater systems and/or increasingly expensive and unaffordable service is an effect of governments being forced to “tighten their belts” and exercise more “disciplined spending.” Instead, deliberate austerity policies create the need for investments that are not forthcoming from the government. In the absence of government investment, private investment can seem like an advantageous solution. Water and sewer infrastructure is one of the most valuable public assets of local governments. Residents are interested in these systems’ exceptional value in the provisioning of public goods. Private firms are interested in these systems’ exceptional market value and the potential to hold more assets of this type.
Every year there are an increasing number of private purchases of public water and sewer systems in the form of outright investor-owned utility firms, operation and maintenance contracts, or long-term lease agreements.98 The number of contracts for private firms to operate publicly owned water and sewer systems tripled between 1997 and 2002.99 In 2017, American Water, a subsidiary of the multinational Suez firm, anticipated closing on 17 private investor-owned utility acquisitions in 2017—gaining 33,000 “customers.”100 In the same period Aqua America anticipated closing four municipal acquisitions that added 9,000 customers to its 3 million customer base.101
Creating water and sewer security in the most robust sense will rely on federal government spending. However, a decades-long trend of austerity policy at the federal level has perpetuated a decline in federal funding since the 1970s.102 Due to working within the parameters of what is fiscally possible in present circumstances, attention has been turned to green infrastructure. Green infrastructure comes with a lower price tag and could simultaneously address the environmental damage that has affected drinking water and wastewater systems. The need for traditional “grey”—concrete and steel—infrastructure investments persists, in part due to planning for resilience in light of climate change. However, many communities cannot afford necessary grey system
31haasinstitute.berkeley.edu 2018 Inclusiveness Index Annual Report
upgrades even with existing federal funding opportunities. In either case, through massive federal investment or immediately practicable green infrastructure design, community mobilization is fundamental to any intervention for water and sewer security.
Water and sewer sovereignty, borrowing principles from food sovereignty, is a framework that requires technically correct and adequate changes. Critically, it also requires changes that be predicated upon community mobilization and power. Only this version of community participation ensures that important decisions about drinking and wastewater systems are most immediately determined by the needs of those served by the systems. This type of leadership and influence can enable a much more diverse group of people to be served by water sovereignty’s contributions to environmental quality and public health.
Consider the mobilization and community power asserted across 72 water and wastewater systems acquired by Aqua America in 2004 for $18 million.103 In Chuluota, Florida, the average monthly water bill went from $186 to $95. While still a high rate, this change represented a victory for residents’ community organizing and their political influence.104 However, the end-goal of community mobilization extended beyond this win. Eventually, in 2013, Aqua America sold 71 water and wastewater utility systems to FUGA for $50 million—an amount financed by the systems taking on bonded debt in three separate issuances.105 In a 2012 letter from Aqua America in which it offered its Florida assets to FUGA for $95 million, they reflected on the motivation for their interest to sell: “[t]he result of our efforts to seek justified infrastructure recovery has been a relationship with our customers that is less than ideal and does not represent the positive relationships we enjoy with our customers elsewhere.”106 Florida’s relationship with Aqua America offers a successful example of how residents can meaningfully influence and determine the administration of water and sewer utilities—even in the case where those assets are held by private corporations entangled with a government placed between public accountability and austere environments.107
US
Inclu
siveness
32 haasinstitute.berkeley.edu2018 Inclusiveness Index Annual Report
AFTER A LEAKED recording of then-candidate Donald Trump bragging about sexual assault became a flashpoint in the 2016 presidential campaign, questions around the treatment of women, misogyny, and the extent of unaddressed sexual violence rose to the forefront of the national consciousness.108 The day after Trump’s inauguration, millions of Americans joined a nationwide “Women’s March” to advocate for legislation to protect women’s rights, but also as a symbolic protest against Trump.
In early October 2017, the New York Times and New Yorker published reports of sexual assault and harassment by powerful Hollywood studio mogul Harvey Weinstein dating back to the 1990s.109 Following the publication of these stories a number of high profile actresses made public statements saying that they, too, had been harassed by Weinstein. On October 15, 2017, actress Alyssa Milano tweeted, “If you’ve been sexually harassed or assaulted write ‘me too’ as a reply to this tweet.”110 The tweet, which received over 67,000 replies, helped popularize and galvanize a movement started years earlier by the activist Tarana Burke for survivors of sexual violence, and the hashtag #MeToo became shorthand for a reference to sexual assault and harassment.
What followed was a series of revelations against major media, political, cultural, and business leaders accused of sexual harassment and assault. Along with Weinstein, other prominent figures to resign or be fired as a result of these public disclosures included television anchors Matt Lauer and Bill O’Reilly, Senator Al Franken, comedian Louis CK, radio host Garrison Keillor, and dozens of other men.
What was ultimately revealed by the #MeToo movement was the limitations of existing mechanisms and norms for rooting out and redressing sexual harassment and assault. In many cases, monetary settlements between victims and harassers prevented victims from speaking out, and thus made it possible for harassers to continue their predatory behavior.111
In his 2017 state of the judiciary report to Congress, conservative Supreme Court Chief Justice John Roberts seemed to acknowledge the underlying problem: that existing mechanisms were insufficient.112 Following the resignation of federal judge Alex Kozinski, Chief Justice Roberts wrote that, “Events in recent months have illuminated the depth of the problem of sexual harassment in the workplace, and events in the past few weeks have made clear that the judicial branch is not immune.” Furthermore, he asserted that, “The judiciary will begin 2018 by undertaking a careful evaluation of whether its standards of conduct and its procedures for investigating and correcting inappropriate behavior are adequate to ensure an exemplary workplace for every judge and every court employee.”
This movement has revealed not only the extent of the problem, but the failure of existing laws and enforcement efforts to curb it. This story is ongoing, but is yet another reminder of gender inequality in the United States, and indeed the world.
Themes and Findings
#MeToo
US
Inclu
siveness
33haasinstitute.berkeley.edu 2018 Inclusiveness Index Annual Report
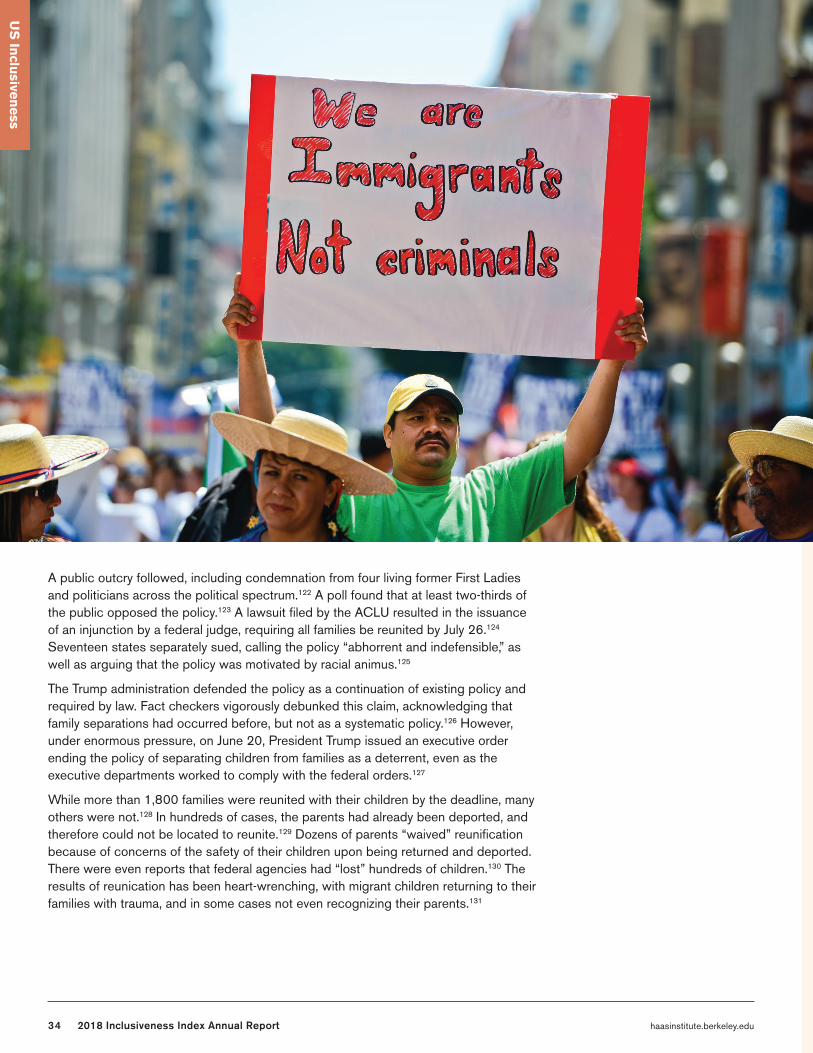
IN APRIL 2018, the Trump administration announced a “zero-tolerance policy” for unauthorized immigration. Under the direction of Attorney General Jeff Sessions, the Department of Justice issued guidance to all US Attorneys offices to prosecute every unauthorized immigrant apprehended for “improper entry” into the United States to the maximum extent practicable.113 Sessions' directive described this as an “escalated effort” to deter unauthorized entry into the United States, which included bringing criminal charges against such individuals.114 This policy led to an immediate 30 percent increase in such prosecutions, dramatically magnifying the burden on courts to process these cases, and public defenders to handle them.115 This represents a dramatic shift from the historical policy of treating such cases as civil matters.116
One of the most heart-wrenching consequences of this policy, however, is that migrants referred for prosecution were separated from their children. By late May, more than 650 children of migrants referred for prosecution were sent to foster homes, detention centers, or other sponsors, including more than 100 children aged 4 and younger.117 Since then, as many as 3,000 children were separated from their parents.118
Human rights groups condemned the policy as a violation of international law and as child abuse.119 Many of the children were not only traumatized by the separation, but the detention centers were described by some as “concentration” or “internment camps” for children. Lawmakers seeking to visit the facilities to ascertain the conditions were either shocked and appalled or denied entry. Senator Cory Booker, for example, reported that children were dehydrated and mistreated in some of the facilities.120 Other members of Congress reported meeting with tearful and terrified parents and guardians who were forcibly separated without explanation or notification of when they would be reunited.121
Themes and Findings
Immigrant Family Separations
US
Inclu
siveness
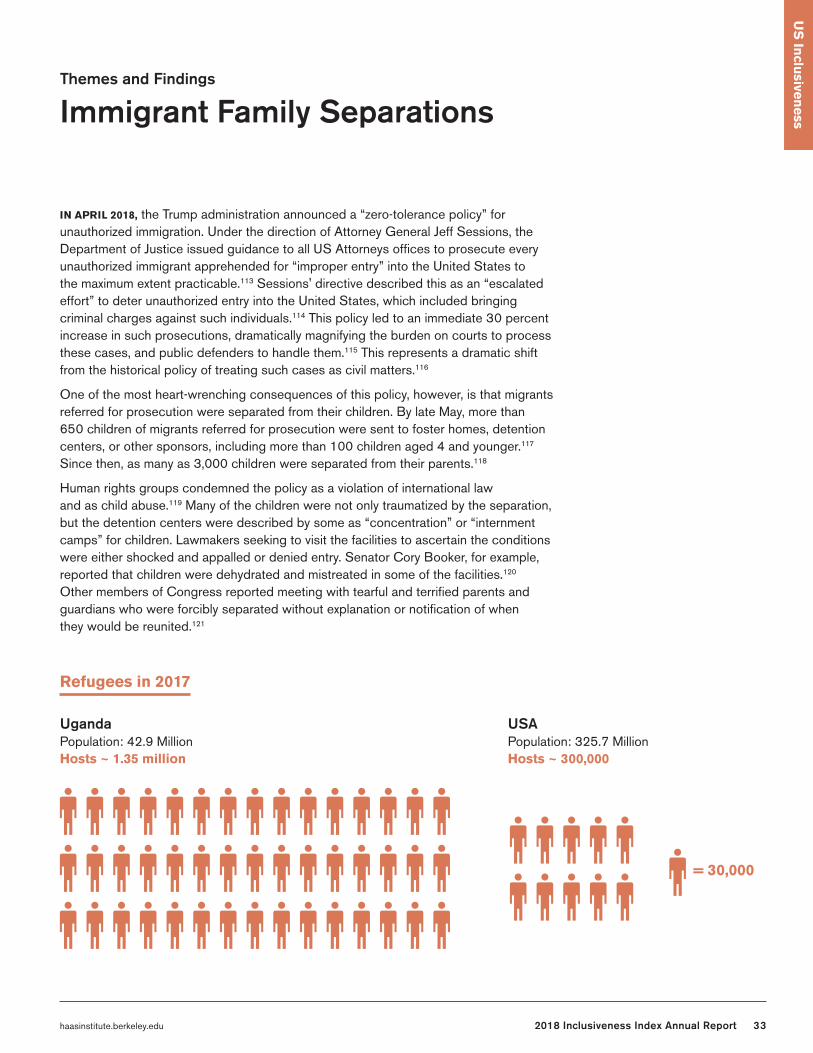
Refugees in 2017
UgandaPopulation: 42.9 Million Hosts ~ 1.35 million
USAPopulation: 325.7 Million Hosts ~ 300,000
= 30,000
34 haasinstitute.berkeley.edu2018 Inclusiveness Index Annual Report
A public outcry followed, including condemnation from four living former First Ladies and politicians across the political spectrum.122 A poll found that at least two-thirds of the public opposed the policy.123 A lawsuit filed by the ACLU resulted in the issuance of an injunction by a federal judge, requiring all families be reunited by July 26.124 Seventeen states separately sued, calling the policy “abhorrent and indefensible,” as well as arguing that the policy was motivated by racial animus.125
The Trump administration defended the policy as a continuation of existing policy and required by law. Fact checkers vigorously debunked this claim, acknowledging that family separations had occurred before, but not as a systematic policy.126 However, under enormous pressure, on June 20, President Trump issued an executive order ending the policy of separating children from families as a deterrent, even as the executive departments worked to comply with the federal orders.127
While more than 1,800 families were reunited with their children by the deadline, many others were not.128 In hundreds of cases, the parents had already been deported, and therefore could not be located to reunite.129 Dozens of parents “waived” reunification because of concerns of the safety of their children upon being returned and deported. There were even reports that federal agencies had “lost” hundreds of children.130 The results of reunication has been heart-wrenching, with migrant children returning to their families with trauma, and in some cases not even recognizing their parents.131
US
Inclu
siveness
35haasinstitute.berkeley.edu 2018 Inclusiveness Index Annual Report
Endnotes
1. Lampmann, “Seeking Belongingness.”; john a. powell and Stephen Menendian, “Fisher V. Texas: The Limits of Exhaustion and the Future of Race-Conscious University Admissions,” University of Michigan Journal of Law Reform 47, no. 4 (2014): 917, http:// repository.law.umich.edu/cgi/viewcontent. cgi?article=1114&context=mjlr.
2. For example, see “20 Years Endnotes Since the Srebrenica Massacre,” The Atlantic, 2016, accessed July 19, 2016, http://www.theatlantic.com/photo/2015/07/20-yearssince-the-srebrenica-massacre/398135/.
3. Rachel G. Kleit, “Neighborhood Segregation, Personal Networks, and Access to Social Resources,” in Segregation: The Rising Costs for America, ed. James H. Carr and Nandinee K. Kitty (New York: Routledge, 2008), 236-60. Wealth inequality may also perform this function, but there we have fewer ways of reliably measuring wealth as compared to income.
4. For the importance of institutional arrangements on economic and political outcomes, see Thomas Piketty and Arthur Goldhammer, Capital in the Twenty-First Century (United States: The Belknap Press of Harvard University Press, 2014).
5. To some extent, these indicators overlaps with the political representation indicator. Where marginalized groups or minority populations are denied the right to vote, political leaders may prove less responsive to their needs. Until the 19th Amendment to the United States Constitution, ratified in 1920, women in the
United States, although not a demographic minority, were not generally permitted to vote.
6. Goldstein, Joseph, “As Rich Nations Close the Door on Refugees, Uganda Welcomes Them,” New York Times, Oct. 28, 2018, https://www.nytimes. com/2018/10/28/world/africa/ uganda-refugees.html.
7. Water Crisis, water.org <https://water.org/>
8. Mesfin Mekonnen and Arjen Hoekstra (2016), Four billion people facing severe water scarcity. Science Advances, vol. 2, no. 2, e1500323
9. The United Nations Sustainable Development Goals, (2018). “SDG 6 Synthesis Report 2018 on Water and Sanitation”, http://www.unwater.org/publication_categories/sdg-6-synthesis-report-2018-on-water-and-sanitation/.
10. Water mismanagement in India’s Silicon valley parched (May 16, 2018), Associated Press, <https://www.businessinsider.com/ap-water-mismanagement-leaves-indias-silicon-valley-parched-2018-5?r=UK&IR=T>
11. The Flint Water Crisis: Systemic Racism Through the Lens of Flint (2017). Report of the Michigan Civil Rights Commission, <https://www.michigan.gov/documents/mdcr/VFlintCrisisRep-F-Edited3-13-17_554317_7.pdf>.
12. Floods, and droughts are the most frequent natural disasters that strike many regions around the globe. They are both natural phenomena; however, landscape change and climate change can
alter the intensity and frequency of these phenomena and lead to more significant losses of water.
13. The United Nations Conference on Housing and Sustainable Urban Development-Habitat III (2017). “New Urban Agenda” <http://habitat3.org/wp-content/uploads/NUA-English.pdf>.
14. Many rivers and watersheds, particularly in the Global South, have experienced flow alterations due to developmental plans, and were noticeable flow changes of rivers and watersheds in terms of scale, frequency, duration of change, which also change the natural paths of water and severely hampered access to, lead to water shortages.
15. Maggie Black and Jannet King (2009, second edition), The Atlas of Water: Mapping the world’s most critical resource. University of California Press.
16. UN-Water, Water Facts < http://www.unwater.org/water-facts/>.
17. News24, the City of Cape Town approves Level 4 water restrictions, May 31, 2017
18. World Bank Group (2016), "High and Dry: Climate Change, Water, and the Economy," http://www.worldbank.org/en/topic/water/publication/high-and-dry-climate-change-water-and-the-economy.
19. According to a study by Mark Fischetti (2012), “How Much Water Do Nations Consumes?. Scientific American (May 21, 2012), the global annual average per capita is 1,385 cubic meters. <https://www.scientificamerican.com/article/graphic-science-how-much-water-nations-consume/>.
36 haasinstitute.berkeley.edu2018 Inclusiveness Index Annual Report
20. UN Sustainable Development Goals: Knowledge Platform, see Targets & Indicators <https://sustainabledevelopment.un.org/sdg6>, and High-Level Panel on Water < https://sustainabledevelopment.un.org/HLPWater>.
21. The United Nations Sustainable Development Goals, (2018). “SDG 6 Synthesis Report 2018 on Water and Sanitation”, http://www.unwater.org/publication_categories/sdg-6-synthesis-report-2018-on-water-and-sanitation/.
22. The United Nations’ Millennium Development Goals (2000): Millennium Declaration Resolution adopted by the General Assembly (A/55/L.2) on 18 September, 2000; and The United Nations’ Sustainable Development Goals (2015): Resolution adopted by the General Assembly on 25 September 2015.
23. The World Health Organization, "Global and regional estimates of violence against women: Prevalence and health effects of intimate partner violence and non-partner sexual violence," 2013, <http://www.who.int/reproductivehealth/publications/violence/9789241564625/en/>.
24. UNESCO Institute for Statistics, “UNESCO eAtlas of Gender Inequality in Education," 2017, <https://www.tellmaps.com/uis/gender/?lang=en#!/topic/GENDER>.
25. International Labour Organization, “World Employment Social Outlook: Trends for Women 2017”, 2017, <https://www.ilo.org/global/research/global-reports/weso/trends-for-women2017/WCMS_557077/lang--en/index.htm>.
26. World Health Organization (2017), “Violence against Women: Key Facts," <http://www.who.int/news-room/fact-sheets/detail/violence-against-women>.
27. N. Forsythe, R. P. Korzeniewicz, and V. Durrant (2000), “Gender Inequalities and Economic Growth: A Longitudinal Evaluation. Economic Development and Cultural Change, University of Chicago Press, vol. 48(3), pp. 573-617.
28. Zafiris Tzannatos (1999), Women and Labor Markets Changes in the Global Economy: Growth Helps, Inequalities Hurt and Public Policy Matters. World Development, Vol. 27, Issue 3, March 1999, pp. 551-569,
29. United Nations Development Programme, “2016 Human Development Report”, 2016, <http://hdr.undp.org/en/2016-report>.
30. United Nations Security-General’s Campaign to End Violence against Women (UNiTE), Human Rights Violation, <http://www.un.org/en/women/endviolence/situation.shtml>.
31. Accountability in Education: Meeting our commitments (2017)political representation. The UNESCO, Global Education Monitoring Report < http://gem-report-2017.unesco.org/en/current-report/>.
32. Fact and Figures, United Nations Women: Leadership and political participation-women in parliaments.
33. International Labour Organization, “The gender gap in employment: What’s holding women back?”, December 2017, <https://www.ilo.org/infostories/en-GB/Stories/Employment/barriers-women#header>.
34. The Global Health 50/50 Report: How gender-responsive are the world’s most influential global health organizations? (2018). The Global Health 50/50 initiative, <www.globalhealth5050.org>.
35. International Labour Organization, "World Employment Social Outlook: Trends for women," (June 2017). International Labour Organization, Geneva, <https://
www.ilo.org/global/research/global-reports/weso/trends-for-women2017/WCMS_557245/lang--en/index.htm>.
36. World Economic Forum, “The Global Gender Gap Report 2017”, November 2017, <https://www.weforum.org/reports/the-global-gender-gap-report-2017>.
37. Ibid.
38. Ibid.
39. See studies done by Andre Gunder Frank (1969). Capitalism and Underdevelopment in Latin America: Historical studies of Chile and Brazil, revised & edited edition. New York: Monthly Review Press; Samir Amin (1976). Unequal Development: An Essay on the Social Formations of Peripheral Capitalism. Harvester Press, Sussex, England; Maria, Mies, Veronika Bennholdt-Thomsen & Claudia von Werlhof (1988). Women: The Last Colony. London: Zed Books; Amartya Sen (2000). Development as Freedom. Anchor; Reprint edition; and Nalini Visvanathan, et al.; editors (2011, second edition). The Women, Gender and Development Reader. Zed Books, London, UK.
40. Ibid.
41. World Economic Forum, “The Global Gender Gap Report 2017”, November 2017, <https://www.weforum.org/reports/the-global-gender-gap-report-2017>.
42. Office of the High Commissioner for Human Rights: CERD General Recommendation XXX on Discrimination Against Non Citizens, adopted on 1 October 2002.
43. The number includes all individuals who reside in a country other than where they were born. Moreover, including refugees, asylum-seekers, trafficked persons, people who granted temporary permission to remain in a foreign country, those who live under occupation, and those who are living in the country where they born but do
37haasinstitute.berkeley.edu 2018 Inclusiveness Index Annual Report
not afford citizenship status due to race, ethnicity, religion, or national origin.
44. David Weissbrodt (2008), The Human Rights of Non-citizens. Oxford University Press, New York.
45. Office of the United Nations High Commissioner for Human Rights (2006), The Rights of Non-Citizens. United Nations, New York and Geneva, <https://www.ohchr.org/documents/publications/noncitizensen.pdf>.
46. john powell and Stephen Menendian (2016), The Problem of Othering: Toward Inclusiveness and Belonging, Issue 1, Summer 2016, Haas Institute for a Fair and Inclusive Society, University of California, Berkeley, CA. Berkeley, CA < http://www.otheringandbelonging.org/the-problem-of-othering/>
47. Stephen Menendian, Lupe Victoria Aguirre, et al. (2016), We Too Belong: A Resource Guide of Inclusive Practices in Immigration & Incarceration Law and Policy. Haas Institute for a Fair and Inclusive Society, University of California, Berkeley. Berkeley, CA <http://haasinstitute.berkeley.edu/sites/default/files/haasinstitute_wetoobelong_immigrationincarceration_release_may19.pdf>.
48. UN News (27 August 2018) Fact-Finding Mission to Myanmar.
49. Fortify Rights. "They Gave Them Long Swords”: Preparations for genocide and crimes against humanity against Rohingya Muslims in Rakhine State, Myanmar, July 2018. <http://www.fortifyrights.org/downloads/Fortify_Rights_Long_Swords_July_2018.pdf>.
50. United Nations Human Rights Council. "Report of Independent International Fact-Finding Mission on Myanmar." August 2018. <https://www.ohchr.org/EN/HRBodies/HRC/MyanmarFFM/Pages/ReportoftheMyanmarFFM.aspx.>
51. Constantine, Greg. "Bangladesh: The Plight of the Rohingya." Pulitzer Center. March 05, 2018. <http://pulitzercenter.org/reporting/bangladesh-plight-rohingya.>
52. Zawacki, Benjamin. "Defining Myanmar's "Rohingya Problem." Human Rights Brief: 18-25. Accessed April 15, 2017.
53. Ibid.
54. "Final Draft of NRC to Be Released Today Amid Security." News18. July 30, 2018. <https://www.news18.com/news/india/final-draft-of-nrc-to-be-released-tomorrow-amid-security-1827181.html.>
55. Kai Schultz "As India Clamps Down on Migration, Millions May Lose Citizenship," July 30, 2018, The New York Times.<https://www.nytimes.com/2018/07/30/world/asia/india-citizenship-assam-muslim.html?smid=nytcore-ipad-share&smprod=nytcore-ipad>.
56. Chakravarty, Ipsita. "Assam's Search for Its 'original Inhabitants' Returns a Key Question: Who Is Assamese, Anyway?" Scroll.in. February 18, 2016. <https://scroll.in/article/803509/assams-search-of-its-original-inhabitants-returns-a-key-question-who-is-assamese-anyway.>
57. "India: Assam's Citizen Identification Can Exclude 4 Million People." Human Rights Watch. July 31, 2018. <https://www.hrw.org/news/2018/07/31/india-assams-citizen-identification-can-exclude-4-million-people.>
58. "Bangladesh Sets up War Crimes Court." GCC News | Al Jazeera. March 25, 2010. <https://www.aljazeera.com/news/asia/2010/03/2010325151839747356.html.>
59. "83 Polls Were a Mistake: KPS Gill." The Assam Tribune. February 19, 1983. <https://web.archive.org/web/20120207000801/http://www.assamtribune.com/scripts/details.asp?id=feb1908/at02.>
60. Ibid.
61. Mander, Harsh. "It's Time We Listened to the Plight of Assam's 'foreigners'." GCC News | Al Jazeera. August 04, 2018. <https://www.aljazeera.com/indepth/opinion/time-listened-plight-assam-foreigners-180803143309823.html.>
62. Brown, Phillip. "Who Are the Roma People?" New Internationalist. October 28, 2013. <https://newint.org/blog/2013/10/28/roma-minority-prejudice/.>
63. Ibid.
64. Marsh, Adrian. "Gypsies, Roma, Travellers: An Animated History." Open Society Foundations. June 5, 2013. <https://www.opensocietyfoundations.org/voices/gypsies-roma-travellers-animated-history.>
65. Der Spiegel Staff. "The Plight of the Roma: Europe's Unwanted People." Der Spiegel International Online. January 7, 2014. <http://www.spiegel.de/international/europe/europe-failing-to-protect-roma-from-discrimination-and-poverty-a-942057.html>.
66. The Roma were being called "Gypsies" because Europeans mistook them as coming from Egypt. "Zigeuner," the German word for "Gypsy," derives from a Greek root (tsganis) meaning “untouchable. "Roma (Gypsies) in Prewar Europe." United States Holocaust Memorial Museum. <https://www.ushmm.org/wlc/en/article.php?ModuleId=10005395>.European Union Agency for Fundamental Rights (FRA): Roma Holocaust Day-Learning from the past. <http://fra.europa.eu/en/news/2018/roma-holocaust-day-learning-past>.
67. Gonzalez-Barrera, Ana, and Jens Manuel Krogstad. "What We Know about Illegal Immigration from Mexico." Pew Research Center. March 02, 2017. <http://
38 haasinstitute.berkeley.edu2018 Inclusiveness Index Annual Report
www.pewresearch.org/fact-tank/2017/03/02/what-we-know-about-illegal-immigration-from-mexico/.>
68. National Academies of Sciences, Engineering, and Medicine. The Economic and Fiscal Consequences of Immigration. Washington, DC: The National Academies Press, 2017. <https://doi.org/10.17226/23550>.
69. Diamond, Jeremy. "Donald Trump: Ban All Muslim Travel to U.S. - CNNPolitics." CNN. December 08, 2015. <https://www.cnn.com/2015/12/07/politics/donald-trump-muslim-ban-immigration/index.html.>
70. Calamur, Krishnadev. "What Trump's Executive Order on Immigration Does-and Doesn't Do." The Atlantic. December 14, 2017. <https://www.theatlantic.com/news/archive/2017/01/trump-immigration-order-muslims/514844/.>
71. Wang, Hansi Lo. "Protesters Gather At Airports Around The Country." NPR. January 29, 2017. <http://www.npr.org/2017/01/29/512268658/protesters-gather-at-airports-around-the-country>.
72. In Big Win For White House, Supreme Court Upholds President Trump’s Travel Ban. NPR, June 26, 2018. <https://www.npr.org/2018/06/26/606481548/supreme-court-upholds-trump-travel-ban>.
73. "Roma." European Union Agency for Fundamental Rights. June 01, 2015. http://fra.europa.eu/en/theme/roma.
74. Environmental Protection Agency. Ground Water and Drinking Water, “Basic Information about Lead in Drinking Water.” Website. <https://www.epa.gov/ground-water-and-drinking-water/basic-information-about-lead-drinking-water>
75. "Lead and Copper Rule." EPA. March 15, 2017. <https://www.epa.gov/dwreginfo/lead-and-copper-rule.>
76. Flint study on lack of anti-corrosive treatment ingredient, study on Flint R. water pollution, Page citation from What The Eyes Can’t See (on file); "Electronic Code of Federal Regulations: Subpart I—Control of Lead and Copper." ECFR - Code of Federal Regulations. <https://www.ecfr.gov/cgi-bin/text-idx?SID=531617f923c3de 2cbf5d12ae4663f56d&mc =true&node=sp40.23.141. i&rgn=div6.>; The lead and copper rule’s application to Flint, MI : "Clarification of Lead and Copper Rule Compliance Monitoring Requirements." Letter to Mr. Oswald and Mr. Bincsik. July 24, 2018. <https://www.epa.gov/sites/production/files/2018-08/documents/7-24-2018_letter_from_epa_to_mdeq_and_flint_re_lcr_compliance_monitoring_plan_with_enclosure_1.pdf.>
77. Levin, Josh. "Plumbing the Depths." Washington City Paper. October 18, 2002. <https://www.washingtoncitypaper.com/news/article/13025198/plumbing-the-depths.>; First of which was published January 2004 in The Washington Post: Nakamura, David. "Water in D.C. Exceeds EPA Lead Limit." The Washington Post. January 31, 2004. <https://www.washingtonpost.com/archive/politics/2004/01/31/ water-in-dc-exceeds-epa- lead-limit/1e54ff9b- a393-4f0a-a2dd-7e8cee dd1e91/?noredirect=on&utm_term=.1a49ed3d8c41.>; Roy, Siddhartha. "Results from a Lead Sampling Study in the Detroit Service Area in Jan 2016: A Baseline If Corrosion Control Had Not Been Interrupted in Flint." Flint Water Study Updates. February 12, 2016. <http://flintwaterstudy.org/2016/02/results-from-a-lead-sampling-study-in-the-detroit-service-area-in-jan-2016-a-baseline-had-uninterrupted-corrosion-control-been-practiced-in-flint/.>
78. Hayward, David L. Valuing a Water Utility. 4th ed. Leucadia, CA: Hayward Consulting Group, 2000.; Hayward, David L. Water Utility Costs, Values, Rates, and Subsidies A Practical Guide for Regulators and Economists. Infinity Pub, 2012.
79. Congressional Budget Office. “Public Spending on Transportation and Water Infrastructure, 1956-2014.” March 2, 2015. <https://www.cbo.gov/publication/49910>
80. Anderson, Richard F. "Local Government Investment in Water and Sewer, 2000-2015." United States Conference of Mayors, Environment, Mayors Water Council. January 10, 2018. <https://www.usmayors.org/2018/01/10/local-government-investment-in-water-and-sewer-2000-2015/.>
81. Value of Water Campaign. "The Economic Benefits of Investing in Water Infrastructure." 2017. <http://thevalueofwater.org/sites/default/files/Economic Impact of Investing in Water Infrastructure_VOW_FINAL_pages.pdf.>
82. Joffe, Marc. “Doubly Bound: The cost of credit ratings.” Berkeley, CA: Haas Institute for a Fair and Inclusive Society, University of California, Berkeley, 2017. <http://haasinstitute.berkeley.edu/sites/default/files/haasinstitute_doublybound_creditratings_april11_publish.pdf> Joffe, Marc. “Doubly Bound: The cost of issuing bonds.” Berkeley, CA: Haas Institute for a Fair and Inclusive Society, University of California, Berkeley, 2017.
83. Walton, Brett. "Water Pricing." Circle of Blue. June 27, 2018. <https://www.circleofblue.org/waterpricing/.>; Bureau of Labor Statistics. US Department of Labor. "Consumer Price Index - March 2015." News release, April 17, 2015. <https://www.circleofblue.org/wp-content/uploads/2015/04/BLS_CPImarch15.pdf.>; Walton, Brett. "Price of Water 2015:
39haasinstitute.berkeley.edu 2018 Inclusiveness Index Annual Report
Up 6 Percent in 30 Major U.S. Cities; 41 Percent Rise Since 2010." Circle of Blue. April 22, 2015. <https://www.circleofblue.org/2015/world/price-of-water-2015-up-6-percent-in-30-major-u-s-cities-41-percent-rise-since-2010/.>
84. Walton, Brett. "Water Pricing." (2018)
85. Lister, Ruth. "Water Poverty." Journal of the Royal Society of Health 115, no. 2 (1995): 80-83. doi:10.1177/14664240 9511500204
86. World Health Organization. “Global costs and benefits of drinking-water supply and sanitation interventions to reach the MDG target and universal coverage.” World Health Organization. 2012. P24 <https://www.who.int/water_sanitation_health/publications/2012/globalcosts.pdf> Hutton, Guy. “Economic evaluation and priority setting in water and sanitation interventions.” UNICEF. 2001. p339 < http://www.who.int/water_sanitation_health/dwq/iwachap15.>
87. Forthcoming, Zarella, Rick & Wendy Ake “Measuring Water Affordability: Existing and alternative place-based local metrics,” (2018) Case study mapping the geography at the local level for alternative metrics applied in the service area of the DWSD system.
88. Cascading effects use Wrase article..Lister, RtMack, Elizabeth A., Sarah Wrase. “A Burgeoning Crisis? A nationwide assessment of the geography of water affordability in the United States.” PLOS ONE 12 no.4 (2017) https://doi.org/10.1371/journal.pone.0176645
89. Maupin, Molly A., Joan F. Kenny, Susan S. Hutson, John K. lovelace, Nancy L. Barber, and Kristin S. Linsey. “Estimated use of water in the United States in 2010.” 2014. https://pubs.usgs.gov/circ/1405/ Shifrin, Neil, Environmental
Perspectives: A brief overview of selected topics(New York: Springer, 2014).
90. Elliott, Mark, Kevin White, Robert Jones, Parnab Das, Matthew Price, Zachary Stevens, and Yeuhan Lu. "Direct Discharge of Household Wastewater in Rural Alabama - Scope and Impacts." 2017. <https://www.epa.gov/sites/production/files/2017-08/documents/presentation_epa-decentralizedww_webinar_elliott_2017_03_28_final.pdf>
91. Ibid.
92. Walton, Brett. "New Civil Rights Movement Emerges around Septic System Pollution." Circle of Blue. December 17, 2015. <https://www.circleofblue.org/2015/water-quality/sanitation-health/hookworm-infections-and-sanitation-failures-plague-rural-alabama/.>
93. These strategies include “education and outreach to homeowners, forming committee to study and report on the feasibility of alternatives, and pursuing exemption for gray water discharge to surface in specific situations.” Elliott, Mark, Kevin White, Robert Jones, Parnab Das, Matthew Price, Zachary Stevens, and Yeuhan Lu. "Direct Discharge of Household Wastewater in Rural Alabama - Scope and Impacts." 2017. <https://www.epa.gov/sites/production/files/2017-08/documents/presentation_epa-decentralizedww_webinar_elliott_2017_03_28_final.pdf>
94. Mckenna, Megan L., Shannon Mcatee, Peter J. Hotez, Patricia E. Bryan, Rebecca Jeun, Maria E. Bottazzi, Catherine C. Flowers, Tabitha Ward, Jacob Kraus, and Rojelio Mejia. "Human Intestinal Parasite Burden and Poor Sanitation in Rural Alabama." The American Journal of Tropical Medicine and Hygiene 97, no. 5 (November 08, 2017): 1623-628. doi:10.4269/ajtmh.17-0396.; See also media coverage: Flowers, Catherine. "A County Where the Sewer Is Your Lawn."
The New York Times. May 22, 2018. <https://www.nytimes.com/2018/05/22/opinion/alabama-poverty-sewers.html.>; Pilkington, Ed. "Hookworm, a Disease of Extreme Poverty, Is Thriving in the US South. Why?" The Guardian. September 05, 2017. <https://www.theguardian.com/us-news/2017/sep/05/hookworm-lowndes-county-alabama-water-waste-treatment-poverty.>; UN Special Rapporteur on Poverty and another visit on Water and Sanitation; Greenfield, Nicole. "It's 2018-Alabamans Shouldn't Have to Worry About Hookworms." NRDC. July 31, 2018. <https://www.nrdc.org/stories/its-2018-alabamans-shouldnt-have-worry-about-hookworms.>; Walton, Brett. "New Civil Rights Movement Emerges around Septic System Pollution." 2015.
95. Vock, Daniel C. "'People Are Literally Being Poisoned': How Sewage Problems in Alabama Got So Bad -- and Why Other States Should Worry." Governing Magazine: State and Local Government News for America's Leaders. July 17, 2018. <http://www.governing.com/topics/transportation-infrastructure/gov-alabama-hookworm-sewage.html.>; The Associated Press. "Septic Tank Prosecutions Stir Anger." News release. <http://web.cecs.pdx.edu/~fishw/UO-SepticTankPoverty.pdf.>
96. Ibid; Vock, Daniel C. "'People Are Literally Being Poisoned' 2018.
97. Moody’s Investor Service, 14 Aug 2017, Sector In-Depth, “Local government and regulated water utilities.” <http://pittsburghpa.gov/mayor/The%20Briefing%20Book%20-%20Blue%20Ribbon%20Panel%20-%20PWSA.pdf>
98. Infrastructure Management Group. "The Briefing Book on PWSA Restructuring Options." News release, August 28, 2017. Page 3.
40 haasinstitute.berkeley.edu2018 Inclusiveness Index Annual Report
<http://pittsburghpa.gov/mayor/The Briefing Book - Blue Ribbon Panel - PWSA.pdf.>
99. Ibid
100. Ibid; "About Aqua." Aqua. 2018. <https://www.aquaamerica.com/about-aqua/overview.aspx.>; See also: "Aqua America Subsidiary Acquires Ohio Water System." Water Online.< https://www.wateronline.com/doc/aqua-america-subsidiary-acquires-ohio-water-s-0001.> and "Aqua Ohio Buys Water System in Auburn Lakes for $400,000." Vindy. August 18, 2007. <http://www.vindy.com/news/2007/aug/18/aqua-ohio-buys-water-system-in-auburn-lakes-for/?newswatch.> detailing their 2007 acquisition Auburn Lakes system in Geauga County, Ohio for $400,000. “"Aqua Ohio Offers $50M for Youngstown Water System." Business Journal Daily. December 15, 2017. <https://businessjournaldaily.com/aqua-ohio-offers-50m-for-youngstown-water-system/.>; Aqua America Strategies of a Water Profiteer. Report. September 2008. Page 12. <https://www.foodandwaterwatch.org/sites/default/files/Aqua America Report Oct 2008.pdf.>
101. Eskaf, Shadi. "Four Trends in Government Spending on Water & Wastewater." UNC Environmental Finance Blog. September 09, 2015. <http://efc.web.unc.edu/2015/09/09/four-trends-government-spending-water/.>
102. Aqua America PR “Aqua America announces acquisition of 63 Florida water and wastewater systems; enhances Florida footprint”: Aqua America, Inc. "Aqua America Announces Acquisition of 63 Florida Water and Wastewater Systems; Acquisition Will Be Accretive; Enhances Florida Footprint." News release, April 23, 2004. <http://ir.aquaamerica.com/static-files/963f888a-0d01-439c-b324-ba73e9ef63b0.>
103. Aqua America Strategies of a Water Profiteer. 2008.
104. "Florida Governmental Utility Authority Adds 71 Water and Wastewater Systems." CISION PR Newswire. March 28, 2018. <https://www.prnewswire.com/news-releases/florida-governmental-utility-authority-adds-71-water-and-wastewater-systems-200443581.html.>
105. Franklin, Christopher. “Memorandum to Florida Governmental Utility Authority by President and Chief Operating Officer of Regulated Operations of Aqua America, Inc.” Sumter County Florida, September 20, 2012. Agenda Center. <https://www.sumtercountyfl.gov/AgendaCenter/ViewFile/Item/1715?fileID=3738.>; “Florida Governmental Utility Authority Considers $95 Million Investment: Board and Local Governments to Consider Transfer of Private Facilities to Local Control.” Business Wire, September 25, 2012. <https://www.businesswire.com/news/home/20120925006361/en/Florida-Governmental-Utility-Authority-Considers-95-Million.>
106. FlowFlorida. “Study Committee on Investor-Owned Water and Wastewater Utility Systems,” February 15, 2013. <http://www.flowflorida.com/wp-content/uploads/2012/05/Study-Committee-on-Investor-Owned-Water-and-Wastewater-Utility-Systems-Function-and-Background.pdf.>; “Florida Public Service Commission, Fact Sheet.” Aqua Utilities Florida, Inc., 2012. <http://www.psc.state.fl.us/Files/PDF/About/Decisions/Aqua_Fact_Sheet.pdf.>
107. Fahrenthold, David A. “Trump Recorded Having Extremely Lewd Conversation About Women in 2005.” The Washington Post, October 8, 2016. <https://www.washingtonpost.com/politics/trump-recorded-having-extremely-lewd-conversation-about-women-in-2005/2016/10/07/3b9ce776-
8cb4-11e6-bf8a-3d26847eeed4_story.html?utm_term=.7cefe795fb0b.>
108. Victor, Daniel. “How the Harvey Weinstein Story Has Unfolded.” The New York Times, January 20, 2018, sec. Business. <https://www.nytimes.com/2017/10/18/business/harvey-weinstein.html.>
109. Milano, Alyssa. “If You’ve Been Sexually Harassed or Assaulted Write ‘Me Too’ as a Reply to This Tweet.” Tweet. @Alyssa_Milano (blog), October 15, 2017.< https://twitter.com/Alyssa_Milano/status/919659438700670976.>
110. Patten, Dominic. “Fox News Costs 21CF $50M In Sexual Harassment Settlements & Expenses In Fiscal 2017.” Deadline, August 15, 2017. <https://deadline.com/2017/08/fox-news-harassment-discrimination-settlements-costs-21st-century-fox-roger-ailes-1202148755/.>; Steel, Emily. “How Bill O’Reilly Silenced His Accusers.” The New York Times, April 5, 2018, sec. Business. <https://www.nytimes.com/2018/04/04/business/media/how-bill-oreilly-silenced-his-accusers.html.>
111. Barnes, Robert. “Chief Justice Roberts Says Courts Will Examine Protections Against Sexual Harassment.” The Washington Post, December 31, 2017. https://www.washingtonpost.com/politics/chief-justice-roberts-says-courts-will-examine-protections-against-sexual-harassment/2017/12/31/ 94a55d00-ee40-11e7-97bf-bba379b809ab_story.html? utm_term=.b9d32080bf78.
112. “Attorney General Announces Zero-Tolerance Policy for Criminal Illegal Entry.” US Department of Justice, Office of Public Affairs, April 6, 2018. 18-417. https://www.justice.gov/opa/pr/attorney-general-announces-zero-tolerance-policy-criminal-illegal-entry.
41haasinstitute.berkeley.edu 2018 Inclusiveness Index Annual Report
113. Improper Entry by Alien, 8 US Code § 1325 §. Accessed November 11, 2018. https://www.law.cornell.edu/uscode/text/8/1325.
114. Echenique, Martín. “Watch Immigrant Prosecutions Spike to Their Highest Level Under Trump.” CityLab, June 5, 2018. https://www.citylab.com/equity/2018/06/watch-immigrant-prosecutions-spike-to-their-highest-level-under-trump/562046/.
115. Brennan, Liam. “Sessions Is Criminalizing Immigration Violations. That Upends Centuries of History.” The Washington Post, May 10, 2018. https://www.washingtonpost.com/news/posteverything/wp/2018/05/10/sessions-is-criminalizing-immigration-violations-that-upends-centuries-of-history/?utm_term=.46ef06eb50e0.
116. Valverde, Miriam. “What You Need to Know About the Trump Administration’s Zero-Tolerance Immigration Policy.” PolitiFact, June 6, 2018. https://www.politifact.com/truth-o-meter/article/2018/jun/06/what-you-need-know-about-trump-administrations-zer/. Dickerson, Caitlin. “Hundreds of Immigrant Children Have Been Taken From Parents at US Border.” The New York Times, April 20, 2018. https://www.nytimes.com/2018/04/20/us/immigrant-children-separation-ice.html.
117. Serrano, Alfonso. “Immigrant Family Reunification By The Numbers.” Colorlines, July 27, 2018. https://www.colorlines.com/articles/immigrant-family-reunification-numbers.
118. Lanard, Noah. “UN Human Rights Chief: Family Separations Forced by Trump Administration Are Child Abuse.” Mother Jones, June 18, 2018. https://www.motherjones.com/politics/2018/06/un-human-rights-chief-family-separations-forced-by-trump-administration-are-child-abuse/.
119. Booker, Cory. “Cory Booker: I Went to the US-Mexico Border. What I Saw There Horrified Me.” Vox, July 19, 2018. https://www.vox.com/first-person/2018/7/19/17587888/cory-booker-family-separation-border-immigrants-asylum-seekers.
120. “Members of Congress Return From Visit to Detention Center, Border Patrol Processing Center & Port of Entry in Texas.” US Representative of Washington’s 7th District, Pramila Jayapal, July 23, 2018. https://jayapal.house.gov/media/press-releases/members-congress-return-visit-detention-center-border-patrol-processing-center.
121. Perrigo, Billy. “Here Are the Republicans Who Criticized the Family Separation Policy.” Time. Accessed November 11, 2018. http://time.com/5314681/republicans-criticized-trump-family-separation-border/. Stevens, Matt, and Sarah Mervosh. “The 4 Former First Ladies Condemn Trump’s Border Policy.” The New York Times, July 18, 2018, sec. US https://www.nytimes.com/2018/06/19/us/politics/first-ladies-trump-family-separation.html.
122. “Stop Taking The Kids, 66 Percent Of US Voters Say, Quinnipiac University National Poll Finds; Support For Dreamers Is 79 Percent.” Quinnipiac University Poll, June 18, 2018. https://poll.qu.edu/national/release-detail?ReleaseID=2550.
123. Cheng, Amrit. “Family Separation in Court: What You Need to Know.” American Civil Liberties Union, July 10, 2018. https://www.aclu.org/blog/immigrants-rights/immigrants-rights-and-detention/family-separation-court-what-you-need-know.
124. Gerstein, Josh. “17 States Sue Over Trump Family Separations.” Politico, June 26, 2018. https://politi.co/2K9clSk.
125. Rizzo, Salvador. “The Facts About Trump’s Policy of Separating Families at the Border.” The Washington Post, June 19, 2018. https://www.washingtonpost.com/news/fact-checker/wp/2018/06/19/the-facts-about-trumps-policy-of-separating-families-at-the-border/?utm_term=.79b1915a9d6e.
126. Shear, Michael D., Abby Goodnough, and Maggie Haberman. “Trump Retreats on Separating Families, but Thousands May Remain Apart.” The New York Times, July 16, 2018, sec. US https://www.nytimes.com/2018/06/20/us/politics/trump-immigration-children-executive-order.html.
127. Jordan, Miriam. “Migrant Families Have Been Reunited. Now, a Scramble to Prevent Deportations.” The New York Times, July 31, 2018, sec. US https://www.nytimes.com/2018/07/30/us/migrant-families-deportations.html.
128. Ainsley, Julia, and Jacob Soboroff. “Just Over Half of Separated Children Have Been Reunited with Families Ahead of Deadline.” NBC News, July 26, 2018. https://www.nbcnews.com/politics/immigration/just-over-half-separated-children-have-been-reunited-families-ahead-n895116.
129. Nixon, Ron. “Federal Agencies Lost Track of Nearly 1,500 Migrant Children Placed With Sponsors.” The New York Times, April 28, 2018, sec. US https://www.nytimes.com/2018/04/26/us/politics/migrant-children-missing.html.
130. Jordan, Miriam, Katie Benner, Ron Nixon, and Caitlin Dickerson. “As Migrant Families Are Reunited, Some Children Don’t Recognize Their Mothers.” The New York Times, November 6, 2018, sec. US https://www.nytimes.com/2018/07/10/us/politics/trump-administration-catch-and-release-migrants.html.
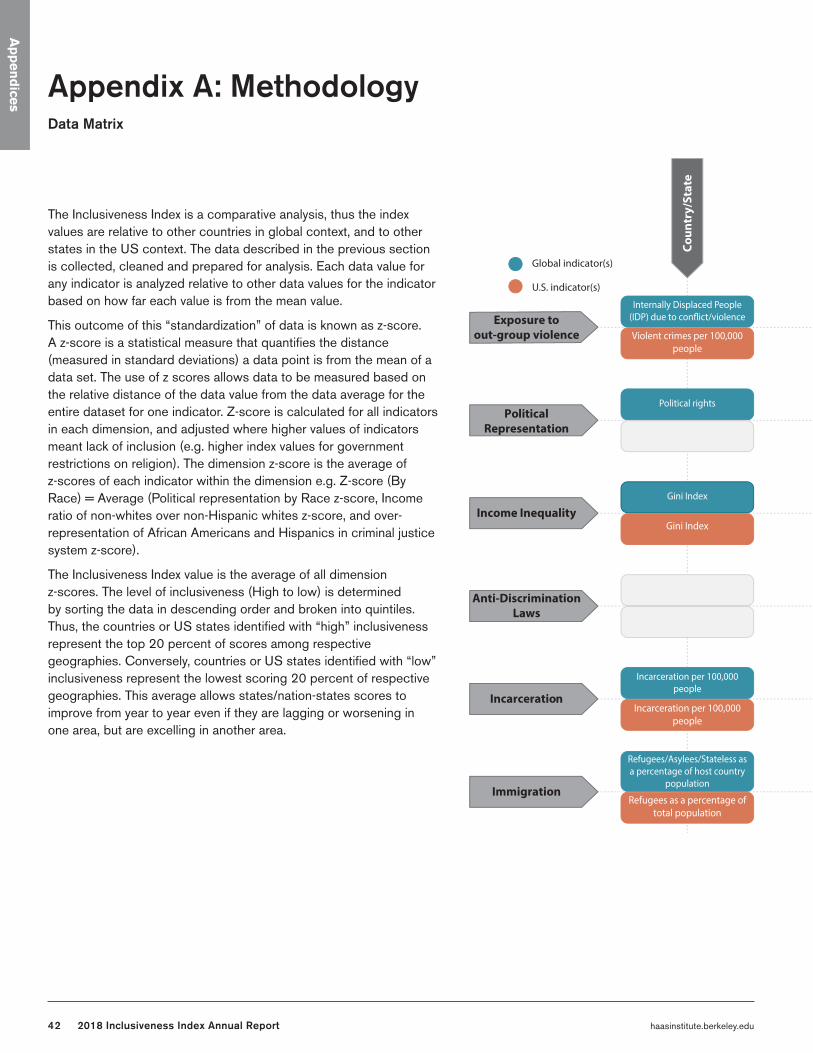
42 haasinstitute.berkeley.edu2018 Inclusiveness Index Annual Report
Ap
pen
dices
Appendix A: MethodologyData Matrix
The Inclusiveness Index is a comparative analysis, thus the index values are relative to other countries in global context, and to other states in the US context. The data described in the previous section is collected, cleaned and prepared for analysis. Each data value for any indicator is analyzed relative to other data values for the indicator based on how far each value is from the mean value.
This outcome of this “standardization” of data is known as z-score. A z-score is a statistical measure that quantifies the distance (measured in standard deviations) a data point is from the mean of a data set. The use of z scores allows data to be measured based on the relative distance of the data value from the data average for the entire dataset for one indicator. Z-score is calculated for all indicators in each dimension, and adjusted where higher values of indicators meant lack of inclusion (e.g. higher index values for government restrictions on religion). The dimension z-score is the average of z-scores of each indicator within the dimension e.g. Z-score (By Race) = Average (Political representation by Race z-score, Income ratio of non-whites over non-Hispanic whites z-score, and over-representation of African Americans and Hispanics in criminal justice system z-score).
The Inclusiveness Index value is the average of all dimension z-scores. The level of inclusiveness (High to low) is determined by sorting the data in descending order and broken into quintiles. Thus, the countries or US states identified with “high” inclusiveness represent the top 20 percent of scores among respective geographies. Conversely, countries or US states identified with “low” inclusiveness represent the lowest scoring 20 percent of respective geographies. This average allows states/nation-states scores to improve from year to year even if they are lagging or worsening in one area, but are excelling in another area.
Exposure toout-group violence
PoliticalRepresentation
Income Inequality
Anti-DiscriminationLaws
Immigration
Incarceration
Global indicator(s)
U.S. indicator(s)
Coun
try/
Stat
e
Refugees/Asylees/Stateless as a percentage of host country
population
Incarceration per 100,000 people
Gini Index
Political rights
Internally Displaced People
Refugees as a percentage of total population
Incarceration per 100,000 people
Gini Index
Violent crimes per 100,000 people
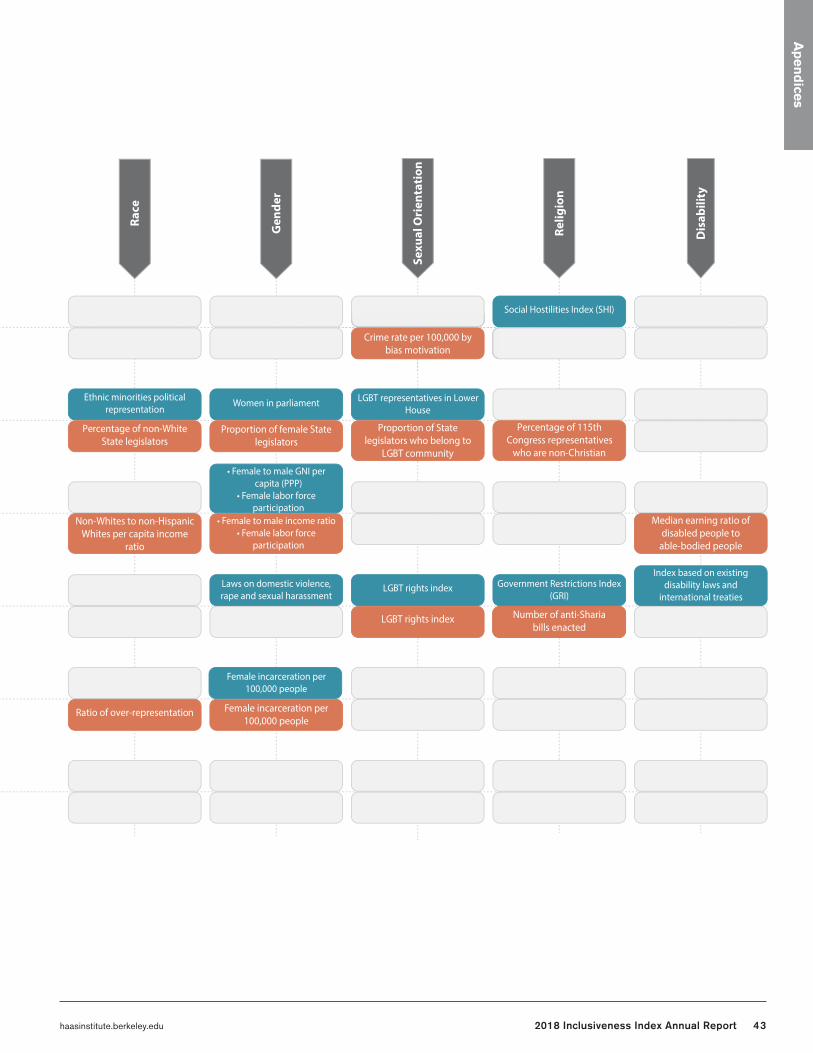
43haasinstitute.berkeley.edu 2018 Inclusiveness Index Annual Report
Ap
end
ices
Race
Gen
der
Sexu
al O
rien
tati
on
Relig
ion
Dis
abili
ty
Female incarceration per 100,000 people
Laws on domestic violence, rape and sexual harassment
LGBT rights index Government Restrictions Index (GRI)
Index based on existing disability laws and
international treaties
• Female to male GNI per capita (PPP)
• Female labor force participation
Ethnic minorities political representation
Women in parliament LGBT representatives in Lower House
Social Hostilities Index (SHI)
Ratio of over-representation Female incarceration per 100,000 people
LGBT rights index Number of anti-Sharia bills inacted
Non-Whites to non-Hispanic Whites per capita income
ratio
Median earning ratio of disabled people to
able-bodied people
• Female to male income ratio• Female labor force
participation
Percentage of non-White State legislators
Proportion of female State legislators
Proportion of State legislators who belong to
LGBT community
Percentage of 115th Congress representatives
who are non-Christian
Crime rate per 100,000 by bias motivation
Number of anti-Sharia bills enacted
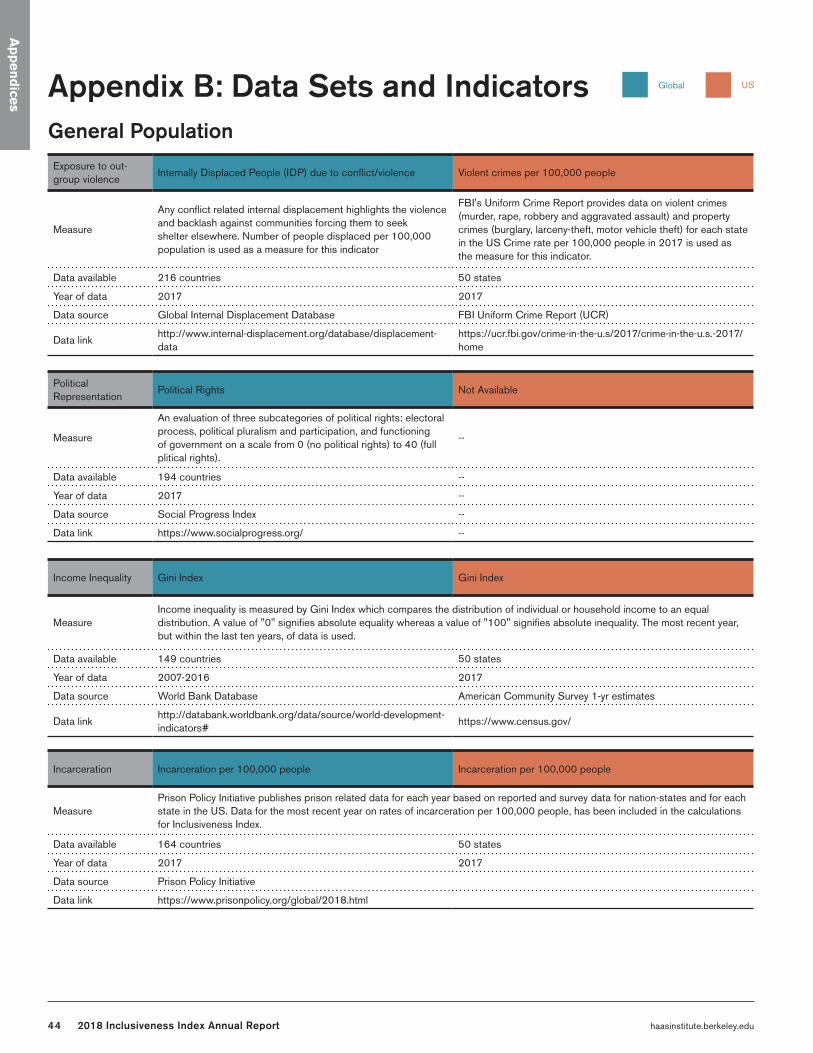
44 haasinstitute.berkeley.edu2018 Inclusiveness Index Annual Report
Ap
pen
dices
Exposure to out-group violence
Internally Displaced People (IDP) due to conflict/violence Violent crimes per 100,000 people
Measure
Any conflict related internal displacement highlights the violence and backlash against communities forcing them to seek shelter elsewhere. Number of people displaced per 100,000 population is used as a measure for this indicator
FBI's Uniform Crime Report provides data on violent crimes (murder, rape, robbery and aggravated assault) and property crimes (burglary, larceny-theft, motor vehicle theft) for each state in the US Crime rate per 100,000 people in 2017 is used as the measure for this indicator.
Data available 216 countries 50 states
Year of data 2017 2017
Data source Global Internal Displacement Database FBI Uniform Crime Report (UCR)
Data linkhttp://www.internal-displacement.org/database/displacement-data
https://ucr.fbi.gov/crime-in-the-u.s/2017/crime-in-the-u.s.-2017/home
Political Representation
Political Rights Not Available
Measure
An evaluation of three subcategories of political rights: electoral process, political pluralism and participation, and functioning of government on a scale from 0 (no political rights) to 40 (full plitical rights).
--
Data available 194 countries --
Year of data 2017 --
Data source Social Progress Index --
Data link https://www.socialprogress.org/ --
Income Inequality Gini Index Gini Index
MeasureIncome inequality is measured by Gini Index which compares the distribution of individual or household income to an equal distribution. A value of "0" signifies absolute equality whereas a value of "100" signifies absolute inequality. The most recent year, but within the last ten years, of data is used.
Data available 149 countries 50 states
Year of data 2007-2016 2017
Data source World Bank Database American Community Survey 1-yr estimates
Data linkhttp://databank.worldbank.org/data/source/world-development-indicators#
https://www.census.gov/
Appendix B: Data Sets and IndicatorsGeneral Population
Incarceration Incarceration per 100,000 people Incarceration per 100,000 people
MeasurePrison Policy Initiative publishes prison related data for each year based on reported and survey data for nation-states and for each state in the US. Data for the most recent year on rates of incarceration per 100,000 people, has been included in the calculations for Inclusiveness Index.
Data available 164 countries 50 states
Year of data 2017 2017
Data source Prison Policy Initiative
Data link https://www.prisonpolicy.org/global/2018.html
USGlobal
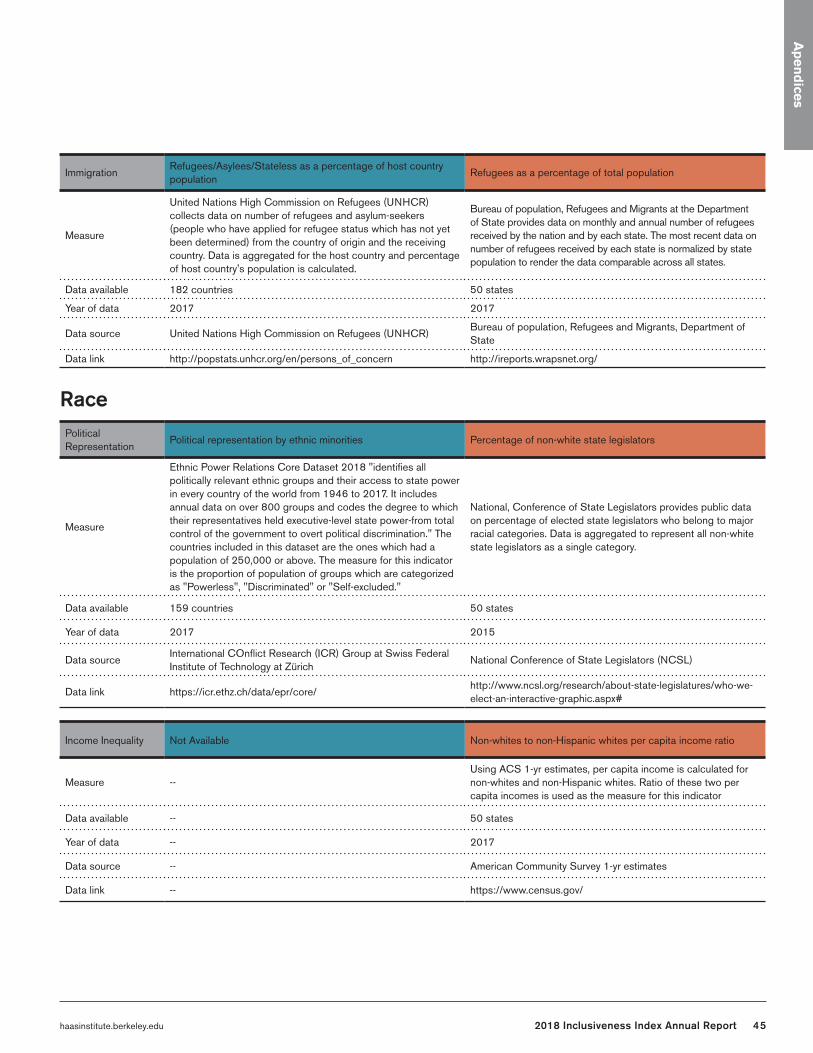
45haasinstitute.berkeley.edu 2018 Inclusiveness Index Annual Report
ImmigrationRefugees/Asylees/Stateless as a percentage of host country population
Refugees as a percentage of total population
Measure
United Nations High Commission on Refugees (UNHCR) collects data on number of refugees and asylum-seekers (people who have applied for refugee status which has not yet been determined) from the country of origin and the receiving country. Data is aggregated for the host country and percentage of host country's population is calculated.
Bureau of population, Refugees and Migrants at the Department of State provides data on monthly and annual number of refugees received by the nation and by each state. The most recent data on number of refugees received by each state is normalized by state population to render the data comparable across all states.
Data available 182 countries 50 states
Year of data 2017 2017
Data source United Nations High Commission on Refugees (UNHCR)Bureau of population, Refugees and Migrants, Department of State
Data link http://popstats.unhcr.org/en/persons_of_concern http://ireports.wrapsnet.org/
Ap
end
ices
RacePolitical Representation
Political representation by ethnic minorities Percentage of non-white state legislators
Measure
Ethnic Power Relations Core Dataset 2018 "identifies all politically relevant ethnic groups and their access to state power in every country of the world from 1946 to 2017. It includes annual data on over 800 groups and codes the degree to which their representatives held executive-level state power-from total control of the government to overt political discrimination." The countries included in this dataset are the ones which had a population of 250,000 or above. The measure for this indicator is the proportion of population of groups which are categorized as "Powerless", "Discriminated" or "Self-excluded."
National, Conference of State Legislators provides public data on percentage of elected state legislators who belong to major racial categories. Data is aggregated to represent all non-white state legislators as a single category.
Data available 159 countries 50 states
Year of data 2017 2015
Data sourceInternational COnflict Research (ICR) Group at Swiss Federal Institute of Technology at Zürich
National Conference of State Legislators (NCSL)
Data link https://icr.ethz.ch/data/epr/core/http://www.ncsl.org/research/about-state-legislatures/who-we-elect-an-interactive-graphic.aspx#
Income Inequality Not Available Non-whites to non-Hispanic whites per capita income ratio
Measure --Using ACS 1-yr estimates, per capita income is calculated for non-whites and non-Hispanic whites. Ratio of these two per capita incomes is used as the measure for this indicator
Data available -- 50 states
Year of data -- 2017
Data source -- American Community Survey 1-yr estimates
Data link -- https://www.census.gov/
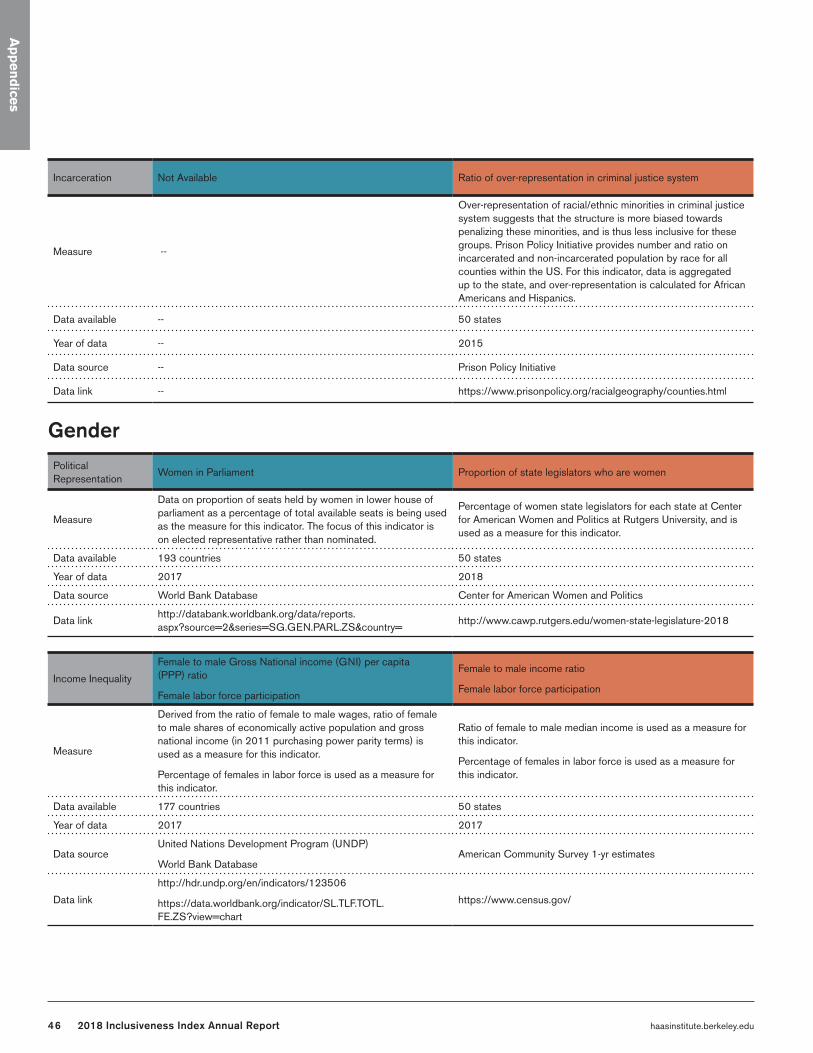
46 haasinstitute.berkeley.edu2018 Inclusiveness Index Annual Report
Ap
pen
dices
Incarceration Not Available Ratio of over-representation in criminal justice system
Measure --
Over-representation of racial/ethnic minorities in criminal justice system suggests that the structure is more biased towards penalizing these minorities, and is thus less inclusive for these groups. Prison Policy Initiative provides number and ratio on incarcerated and non-incarcerated population by race for all counties within the US. For this indicator, data is aggregated up to the state, and over-representation is calculated for African Americans and Hispanics.
Data available -- 50 states
Year of data -- 2015
Data source -- Prison Policy Initiative
Data link -- https://www.prisonpolicy.org/racialgeography/counties.html
Political Representation
Women in Parliament Proportion of state legislators who are women
Measure
Data on proportion of seats held by women in lower house of parliament as a percentage of total available seats is being used as the measure for this indicator. The focus of this indicator is on elected representative rather than nominated.
Percentage of women state legislators for each state at Center for American Women and Politics at Rutgers University, and is used as a measure for this indicator.
Data available 193 countries 50 states
Year of data 2017 2018
Data source World Bank Database Center for American Women and Politics
Data linkhttp://databank.worldbank.org/data/reports.aspx?source=2&series=SG.GEN.PARL.ZS&country=
http://www.cawp.rutgers.edu/women-state-legislature-2018
Income Inequality
Female to male Gross National income (GNI) per capita (PPP) ratio
Female labor force participation
Female to male income ratio
Female labor force participation
Measure
Derived from the ratio of female to male wages, ratio of female to male shares of economically active population and gross national income (in 2011 purchasing power parity terms) is used as a measure for this indicator.
Percentage of females in labor force is used as a measure for this indicator.
Ratio of female to male median income is used as a measure for this indicator.
Percentage of females in labor force is used as a measure for this indicator.
Data available 177 countries 50 states
Year of data 2017 2017
Data sourceUnited Nations Development Program (UNDP)
World Bank DatabaseAmerican Community Survey 1-yr estimates
Data link
http://hdr.undp.org/en/indicators/123506
https://data.worldbank.org/indicator/SL.TLF.TOTL.FE.ZS?view=chart
https://www.census.gov/
Gender
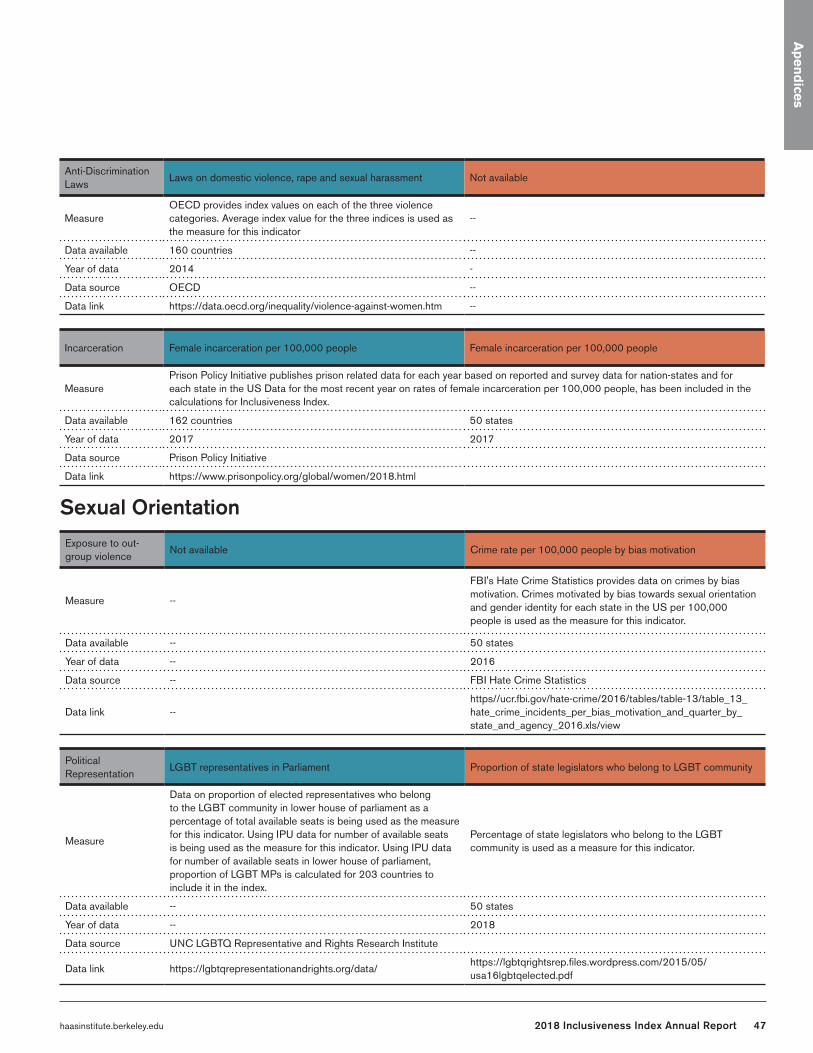
47haasinstitute.berkeley.edu 2018 Inclusiveness Index Annual Report
Anti-Discrimination Laws
Laws on domestic violence, rape and sexual harassment Not available
MeasureOECD provides index values on each of the three violence categories. Average index value for the three indices is used as the measure for this indicator
--
Data available 160 countries --
Year of data 2014 -
Data source OECD --
Data link https://data.oecd.org/inequality/violence-against-women.htm --
Incarceration Female incarceration per 100,000 people Female incarceration per 100,000 people
MeasurePrison Policy Initiative publishes prison related data for each year based on reported and survey data for nation-states and for each state in the US Data for the most recent year on rates of female incarceration per 100,000 people, has been included in the calculations for Inclusiveness Index.
Data available 162 countries 50 states
Year of data 2017 2017
Data source Prison Policy Initiative
Data link https://www.prisonpolicy.org/global/women/2018.html
Ap
end
ices
Sexual OrientationExposure to out-group violence
Not available Crime rate per 100,000 people by bias motivation
Measure --
FBI's Hate Crime Statistics provides data on crimes by bias motivation. Crimes motivated by bias towards sexual orientation and gender identity for each state in the US per 100,000 people is used as the measure for this indicator.
Data available -- 50 states
Year of data -- 2016
Data source -- FBI Hate Crime Statistics
Data link --https//ucr.fbi.gov/hate-crime/2016/tables/table-13/table_13_hate_crime_incidents_per_bias_motivation_and_quarter_by_state_and_agency_2016.xls/view
Political Representation
LGBT representatives in Parliament Proportion of state legislators who belong to LGBT community
Measure
Data on proportion of elected representatives who belong to the LGBT community in lower house of parliament as a percentage of total available seats is being used as the measure for this indicator. Using IPU data for number of available seats is being used as the measure for this indicator. Using IPU data for number of available seats in lower house of parliament, proportion of LGBT MPs is calculated for 203 countries to include it in the index.
Percentage of state legislators who belong to the LGBT community is used as a measure for this indicator.
Data available -- 50 states
Year of data -- 2018
Data source UNC LGBTQ Representative and Rights Research Institute
Data link https://lgbtqrepresentationandrights.org/data/https://lgbtqrightsrep.files.wordpress.com/2015/05/usa16lgbtqelected.pdf
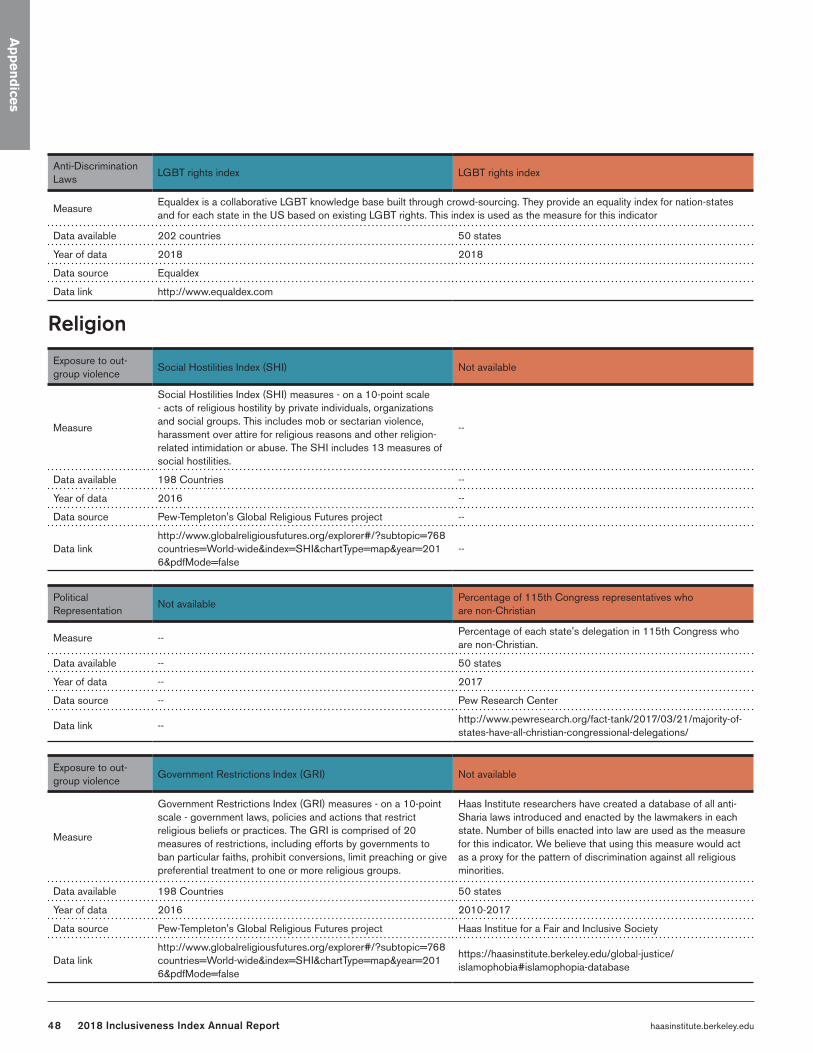
48 haasinstitute.berkeley.edu2018 Inclusiveness Index Annual Report
Ap
pen
dices
Anti-Discrimination Laws
LGBT rights index LGBT rights index
MeasureEqualdex is a collaborative LGBT knowledge base built through crowd-sourcing. They provide an equality index for nation-states and for each state in the US based on existing LGBT rights. This index is used as the measure for this indicator
Data available 202 countries 50 states
Year of data 2018 2018
Data source Equaldex
Data link http://www.equaldex.com
Exposure to out-group violence
Social Hostilities Index (SHI) Not available
Measure
Social Hostilities Index (SHI) measures - on a 10-point scale - acts of religious hostility by private individuals, organizations and social groups. This includes mob or sectarian violence, harassment over attire for religious reasons and other religion-related intimidation or abuse. The SHI includes 13 measures of social hostilities.
--
Data available 198 Countries --
Year of data 2016 --
Data source Pew-Templeton's Global Religious Futures project --
Data linkhttp://www.globalreligiousfutures.org/explorer#/?subtopic=768countries=World-wide&index=SHI&chartType=map&year=2016&pdfMode=false
--
Political Representation
Not availablePercentage of 115th Congress representatives who are non-Christian
Measure --Percentage of each state's delegation in 115th Congress who are non-Christian.
Data available -- 50 states
Year of data -- 2017
Data source -- Pew Research Center
Data link --http://www.pewresearch.org/fact-tank/2017/03/21/majority-of-states-have-all-christian-congressional-delegations/
Exposure to out-group violence
Government Restrictions Index (GRI) Not available
Measure
Government Restrictions Index (GRI) measures - on a 10-point scale - government laws, policies and actions that restrict religious beliefs or practices. The GRI is comprised of 20 measures of restrictions, including efforts by governments to ban particular faiths, prohibit conversions, limit preaching or give preferential treatment to one or more religious groups.
Haas Institute researchers have created a database of all anti-Sharia laws introduced and enacted by the lawmakers in each state. Number of bills enacted into law are used as the measure for this indicator. We believe that using this measure would act as a proxy for the pattern of discrimination against all religious minorities.
Data available 198 Countries 50 states
Year of data 2016 2010-2017
Data source Pew-Templeton's Global Religious Futures project Haas Institue for a Fair and Inclusive Society
Data linkhttp://www.globalreligiousfutures.org/explorer#/?subtopic=768countries=World-wide&index=SHI&chartType=map&year=2016&pdfMode=false
https://haasinstitute.berkeley.edu/global-justice/islamophobia#islamophopia-database
Religion
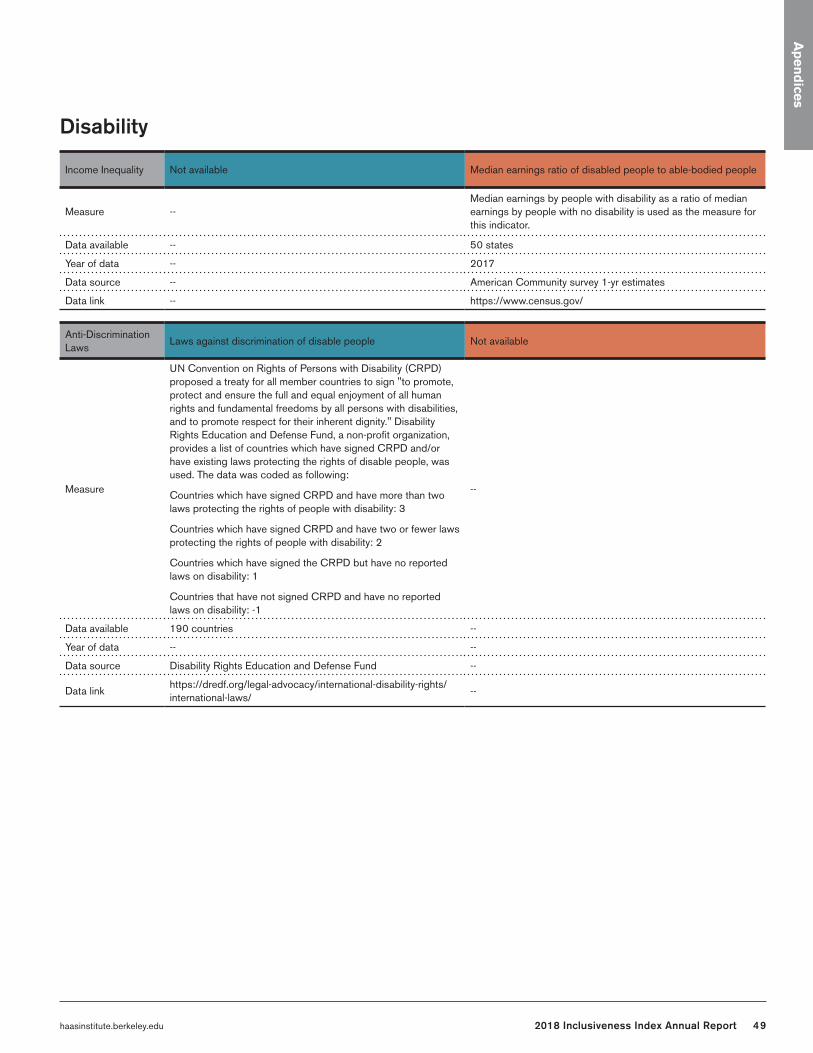
49haasinstitute.berkeley.edu 2018 Inclusiveness Index Annual Report
Ap
end
ices
Disability
Income Inequality Not available Median earnings ratio of disabled people to able-bodied people
Measure --Median earnings by people with disability as a ratio of median earnings by people with no disability is used as the measure for this indicator.
Data available -- 50 states
Year of data -- 2017
Data source -- American Community survey 1-yr estimates
Data link -- https://www.census.gov/
Anti-Discrimination Laws
Laws against discrimination of disable people Not available
Measure
UN Convention on Rights of Persons with Disability (CRPD) proposed a treaty for all member countries to sign "to promote, protect and ensure the full and equal enjoyment of all human rights and fundamental freedoms by all persons with disabilities, and to promote respect for their inherent dignity." Disability Rights Education and Defense Fund, a non-profit organization, provides a list of countries which have signed CRPD and/or have existing laws protecting the rights of disable people, was used. The data was coded as following:
Countries which have signed CRPD and have more than two laws protecting the rights of people with disability: 3
Countries which have signed CRPD and have two or fewer laws protecting the rights of people with disability: 2
Countries which have signed the CRPD but have no reported laws on disability: 1
Countries that have not signed CRPD and have no reported laws on disability: -1
--
Data available 190 countries --
Year of data -- --
Data source Disability Rights Education and Defense Fund --
Data linkhttps://dredf.org/legal-advocacy/international-disability-rights/international-laws/
--
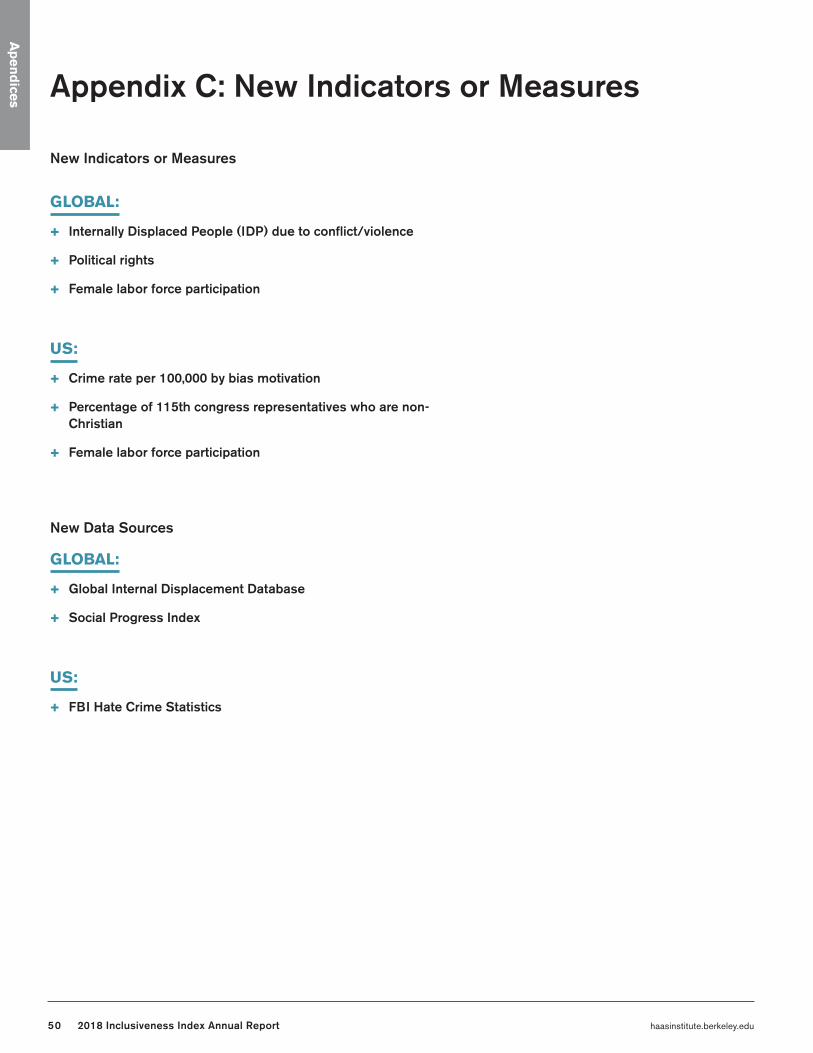
50 haasinstitute.berkeley.edu2018 Inclusiveness Index Annual Report
Appendix C: New Indicators or Measures
New Indicators or Measures
GLOBAL:
Internally Displaced People (IDP) due to conflict/violence
Political rights
Female labor force participation
US:
Crime rate per 100,000 by bias motivation
Percentage of 115th congress representatives who are non-Christian
Female labor force participation
New Data Sources
GLOBAL:
Global Internal Displacement Database
Social Progress Index
US:
FBI Hate Crime Statistics
Ap
end
ices
Download this annual report and explore more about the Inclusiveness Index at haasinstitute.berkeley.edu/inclusivenessindex
52 haasinstitute.berkeley.edu2018 Inclusiveness Index Annual Report
The Haas Institute for a Fair and Inclusive Society brings together researchers, community stakeholders, and policymakers to identify and challenge the barriers to an inclusive, just, and sustainable society in order to create transformative change.


