66
CVR no. 27528449 ANNUAL REPORT 2018 ELF Development A | S

CVR no. 27528449
ANNUAL REPORT 2018
ELF Development A|S

CONTENTS
A QUICK OVERVIEW
3 ELF Development at a glance
4 Financial overview
5 Successful year
6 Geographical overview
8 Business model
10 Highlights of 2018
MANAGEMENT’S REVIEW
13 Core business activities
14 Market overview
15 Review of 2018 and follow-up on last year’s forecast
28 Risk factors
32 CSR
39 Financial highlights for the group
FINANCIAL STATEMENTS 2018
42 Income statement
43 Balance sheet
45 Statement of changes in equity
46 Cashflowstatement
47 Notes
56 Accounting policies
STATEMENTS
62 Statement by the management
63 Independent auditors’ report
65 Company details
2MANAGEMENT’S REVIEW ANNUAL REPORT 2018 ELF DEVELOPMENTCONTENTS
CONTENTS
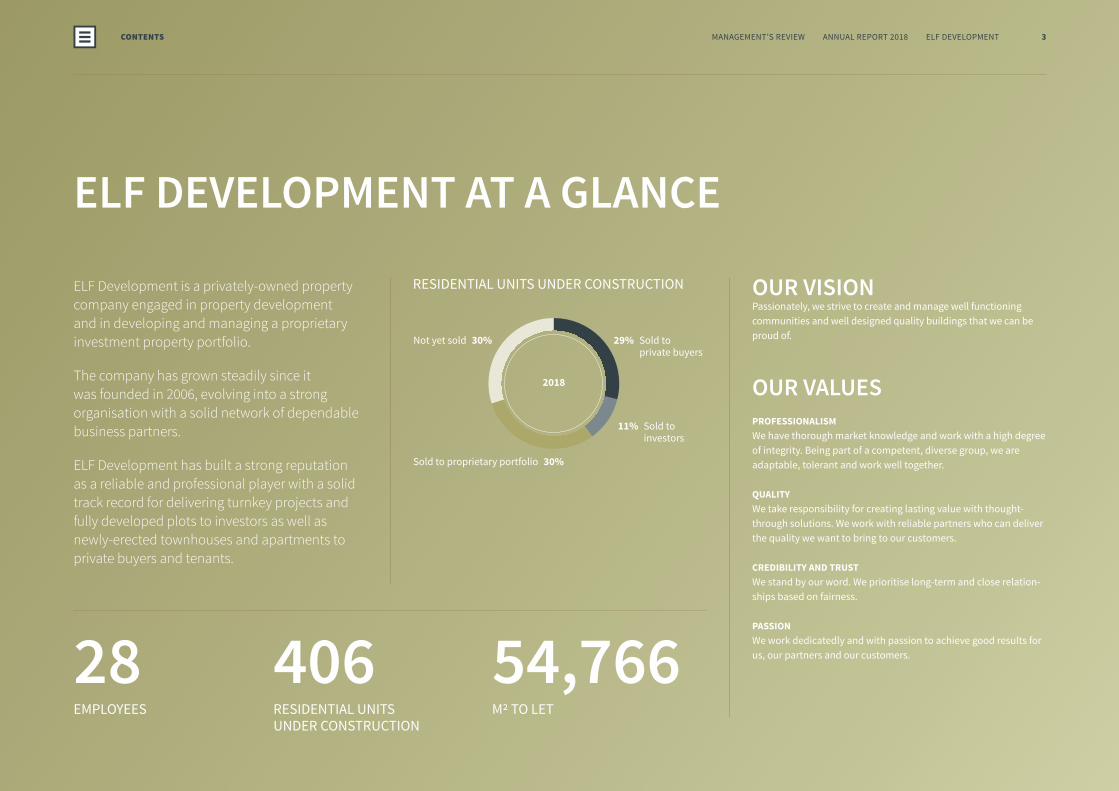
29% Sold to private buyers
11% Sold to investors
Sold to proprietary portfolio 30%
Not yet sold 30%
2018
ELF DEVELOPMENT AT A GLANCE
ELF Development is a privately-owned property company engaged in property development and in developing and managing a proprietary investment property portfolio.
The company has grown steadily since it was founded in 2006, evolving into a strong organisation with a solid network of dependable business partners.
ELF Development has built a strong reputation as a reliable and professional player with a solid track record for delivering turnkey projects and fully developed plots to investors as well as newly-erected townhouses and apartments to private buyers and tenants.
OUR VISIONPassionately, we strive to create and manage well functioning communities and well designed quality buildings that we can be proud of.
M2 TO LET
54,766EMPLOYEES
28RESIDENTIAL UNITS UNDER CONSTRUCTION
406
RESIDENTIAL UNITS UNDER CONSTRUCTION
OUR VALUESPROFESSIONALISMWe have thorough market knowledge and work with a high degree of integrity. Being part of a competent, diverse group, we are adaptable, tolerant and work well together.
QUALITYWe take responsibility for creating lasting value with thought-through solutions. We work with reliable partners who can deliver the quality we want to bring to our customers.
CREDIBILITY AND TRUST We stand by our word. We prioritise long-term and close relation-ships based on fairness.
PASSIONWe work dedicatedly and with passion to achieve good results for us, our partners and our customers.
CONTENTS 3MANAGEMENT’S REVIEW ANNUAL REPORT 2018 ELF DEVELOPMENT
AT A GLANCE

2014 2015 2016 2017 20180
200
400
600
800
1000
2014 2015 2016 2017 20180
500
1000
1500
2000
2500
2014 2015 2016 2017 20180
10
20
30
40
50
60
FINANCIAL OVERVIEW
REVENUE
421 M.DKK.TOTAL ASSETS
2.145 M.DKK.RETURN ON EQUITY
31 %
EBIT
231 M.DKK.EQUITY
634 M.DKK.EQUITY RATIO
30 %
REVENUEM.DKK.
TOTAL ASSETS AND EQUITYM.DKK.
RETURN ON EQUITY%
Revenue EBIT Assets Equity Return on equity Equity ratio
CONTENTS 4MANAGEMENT’S REVIEW ANNUAL REPORT 2018 ELF DEVELOPMENT
FINANCIAL OVERVIEW
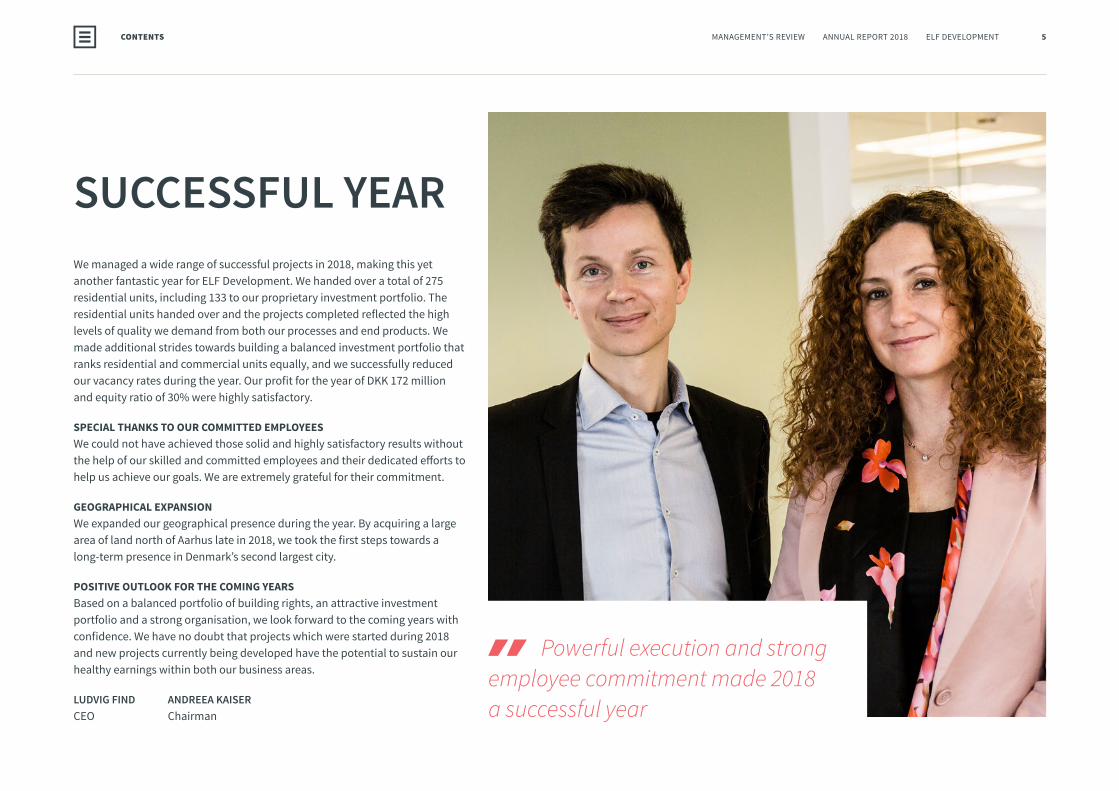
SUCCESSFUL YEAR We managed a wide range of successful projects in 2018, making this yet another fantastic year for ELF Development. We handed over a total of 275 residential units, including 133 to our proprietary investment portfolio. The residential units handed over and the projects completed reflected the high levels of quality we demand from both our processes and end products. We made additional strides towards building a balanced investment portfolio that ranks residential and commercial units equally, and we successfully reduced our vacancy rates during the year. Our profit for the year of DKK 172 million and equity ratio of 30% were highly satisfactory.
SPECIAL THANKS TO OUR COMMITTED EMPLOYEESWe could not have achieved those solid and highly satisfactory results without the help of our skilled and committed employees and their dedicated efforts to help us achieve our goals. We are extremely grateful for their commitment.
GEOGRAPHICAL EXPANSIONWe expanded our geographical presence during the year. By acquiring a large area of land north of Aarhus late in 2018, we took the first steps towards a long-term presence in Denmark’s second largest city.
POSITIVE OUTLOOK FOR THE COMING YEARSBased on a balanced portfolio of building rights, an attractive investment portfolio and a strong organisation, we look forward to the coming years with confidence. We have no doubt that projects which were started during 2018 and new projects currently being developed have the potential to sustain our healthy earnings within both our business areas.
LUDVIG FIND ANDREEA KAISERCEO Chairman
Powerful execution and strong employee commitment made 2018 a successful year
CONTENTS 5MANAGEMENT’S REVIEW ANNUAL REPORT 2018 ELF DEVELOPMENT
SUCCESSFUL YEAR

GEOGRAPHICAL OVERVIEW
AARHUS
COPENHAGEN
READ MORE ABOUT
AMAGER STRANDPARK– an attractive residential area in Copenhagen with unique waterfront locations at Amager Strand facing Oresund
PAGE 16
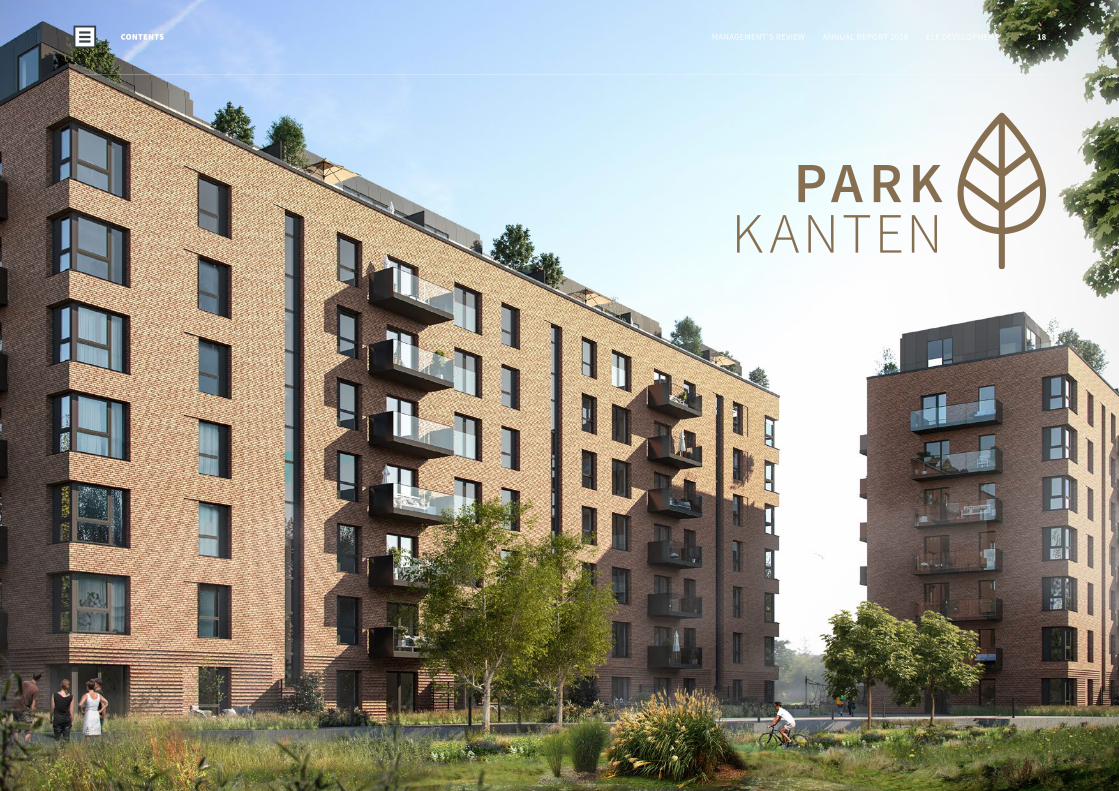
PARKKANTEN– the final area being developed at IrmaByen with unobstructed park views – where city meets park
PAGE 18
NJALSGADEKOMPLEKSET– highly attractive and central location at Islands Brygge only a few hundred metres from the waterfront
PAGE 22
DEN GRØNNE FATNING– a new residential area in Herlev inspired by Copenhagen’s charming inner city district
PAGE 24
Development pipeline
Investment portfolio
Combination of both
CONTENTS 6MANAGEMENT’S REVIEW ANNUAL REPORT 2018 ELF DEVELOPMENT
GEOGRAPHICAL OVERVIEW

7MANAGEMENT’S REVIEW ANNUAL REPORT 2018 ELF DEVELOPMENTCONTENTS
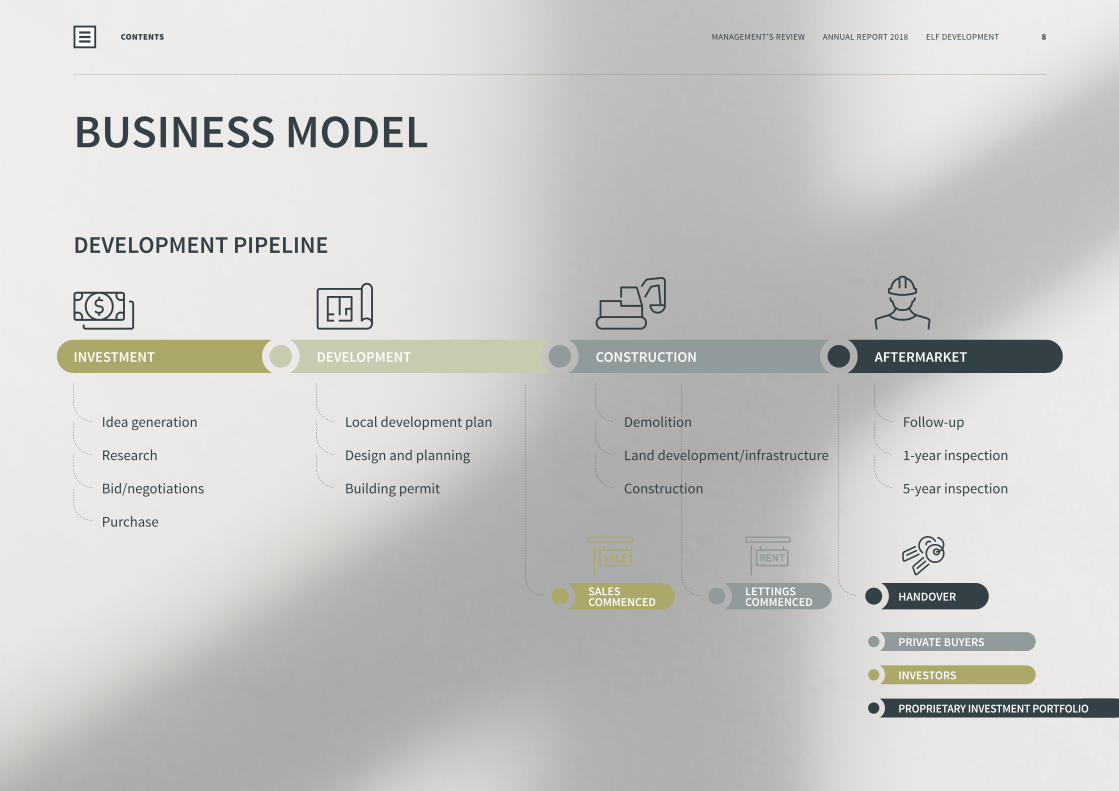
BUSINESS MODEL
DEVELOPMENT PIPELINE
INVESTMENT DEVELOPMENT CONSTRUCTION AFTERMARKET
Local development plan
Design and planning
Building permit
Follow-up
1-year inspection
5-year inspection
Demolition
Land development/infrastructure
Construction
Idea generation
Research
Bid/negotiations
Purchase
SALES COMMENCED
PRIVATE BUYERS
INVESTORS
PROPRIETARY INVESTMENT PORTFOLIO
HANDOVERLETTINGS COMMENCED
CONTENTS 8MANAGEMENT’S REVIEW ANNUAL REPORT 2018 ELF DEVELOPMENT
BUSINESS MODEL
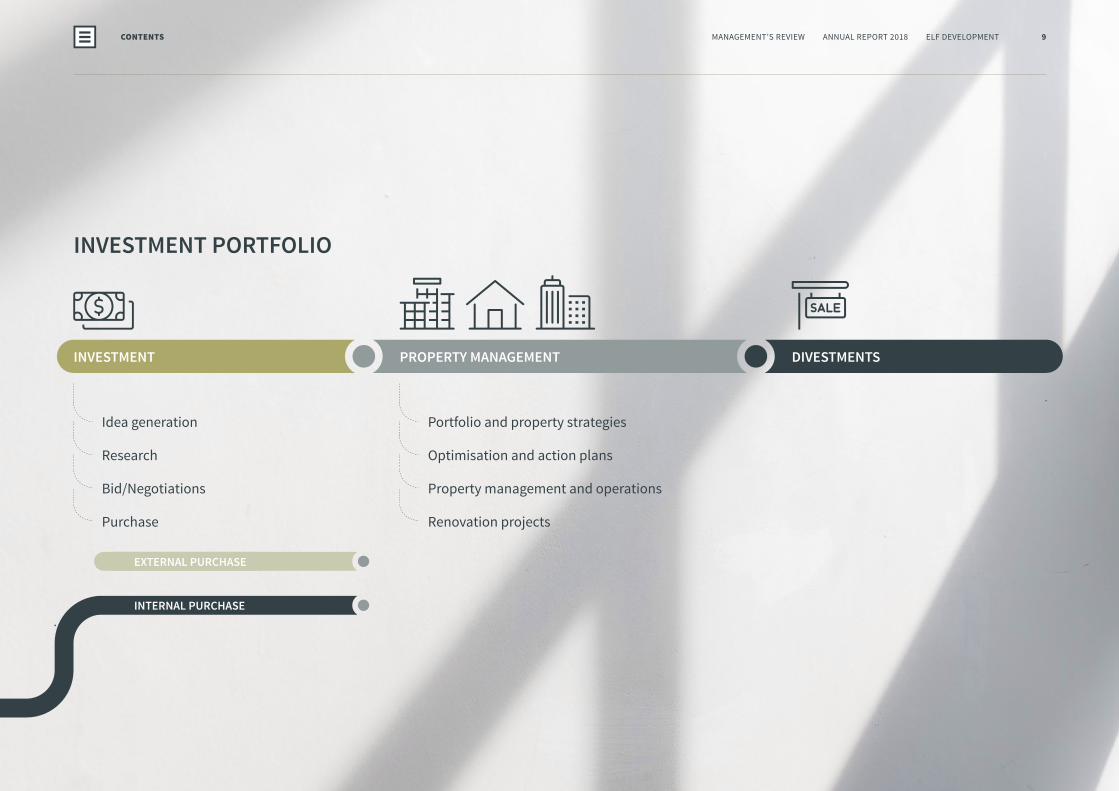
INVESTMENT PORTFOLIO
INVESTMENT PROPERTY MANAGEMENT DIVESTMENTS
Idea generation
Research
Bid/Negotiations
Purchase
Portfolio and property strategies
Optimisation and action plans
Property management and operations
Renovation projects
EXTERNAL PURCHASE
INTERNAL PURCHASE
CONTENTS 9MANAGEMENT’S REVIEW ANNUAL REPORT 2018 ELF DEVELOPMENT
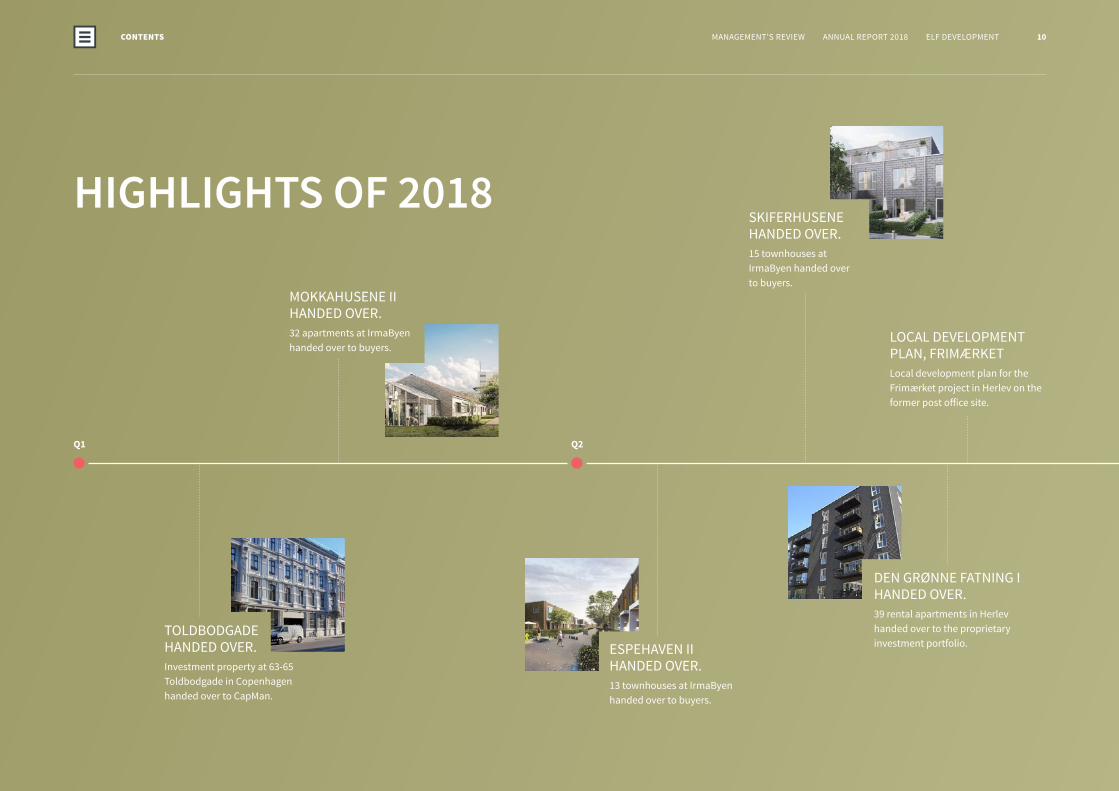
HIGHLIGHTS OF 2018
ESPEHAVEN II HANDED OVER.13 townhouses at IrmaByen handed over to buyers.
TOLDBODGADE HANDED OVER.Investment property at 63-65 Toldbodgade in Copenhagen handed over to CapMan.
SKIFERHUSENE HANDED OVER.15 townhouses at IrmaByen handed over to buyers.
MOKKAHUSENE II HANDED OVER.32 apartments at IrmaByen handed over to buyers.
DEN GRØNNE FATNING I HANDED OVER.39 rental apartments in Herlev handed over to the proprietary investment portfolio.
LOCAL DEVELOPMENT PLAN, FRIMÆRKETLocal development plan for the Frimærket project in Herlev on the former post office site.
Q1 Q2
10MANAGEMENT’S REVIEW ANNUAL REPORT 2018 ELF DEVELOPMENTCONTENTS
HIGHLIGHTS OF 2018

FRIMÆRKET CONSTRUCTION STARTED.Construction of 90 rental apartments for proprietary investment portfolio begun.
PARKKANTEN CONSTRUCTION STARTED.Construction of 98 owner-occupied apartments at IrmaByen begun.
DEN GRØNNE FATNING II HANDED OVER.58 rental apartments in Herlev handed over to the proprietary investment portfolio.
BARISTARÆKKERNE CONSTRUCTION STARTED.Construction of 16 townhouses at IrmaByen begun.
IRMABYEN 9 HANDED OVER.Turnkey project consisting of 82 apartments handed over to Catella.
AMAGER STRANDPARK CONSTRUCTION STARTED.Construction of 33 townhouses and 12 apartments at Amager Strand begun.
LAND ACQUIRED IN AARHUS N.Initial investment after expansion of geographical focus.
LOCAL DEVELOPMENT PLAN, TRONGÅRDENLocal development plan for the Trongården area in Kgs. Lyngby. Acquisition became unconditional on the legal takeover of the area effective 1 January 2019.
DEN GRØNNE FATNING III HANDED OVER.36 rental apartments in Herlev handed over to the proprietary investment portfolio.
Q3 Q4
11MANAGEMENT’S REVIEW ANNUAL REPORT 2018 ELF DEVELOPMENTCONTENTS

MANAGEMENT’S REVIEW2018
CONTENTS
MANAGEMENTS REVIEW

CORE BUSINESS ACTIVITIES
Our property development projects generally involve residen-tial properties. We sell our projects to private buyers, either individually or to professional investors buying one or more properties in a single transaction. We may also build residen-tial units for our proprietary investment portfolio (transferred in-house from one core activity to the other). Our develop-ment projects may also involve commercial properties that either form an integral part of a residential project (typically retail space) or constitute the entire project, such as an office building, serviced/multi-tenant office facility or similar.
Our portfolio of investment properties consists of a combina-tion of residential and commercial properties. The portfolio is reviewed and adjusted on a regular basis through additions, divestments, optimising operations or extensive renovations. As an alternative to external acquisitions, we also add proper-ties constructed by ELF Development to the portfolio.
For more information on our business model, go to pages 8 and 9.
ELF DEVELOPMENT’S TWO CORE BUSINESS ACTIVITIES:
DEVELOPING AND MANAGING PROPRIETARY INVESTMENT PROPERTY PORTFOLIO
PROPERTY DEVELOPMENT
CONTENTS 13MANAGEMENT’S REVIEW ANNUAL REPORT 2018 ELF DEVELOPMENT
CORE BUSINESS ACTIVITIES
0
200
400
600
800
1000
2014 2015 2016 2017 20180
50
100
150
200
250
2014 2015 2016 2017 20180
1000
2000
3000
4000
5000
2014 2015 2016 2017 2018
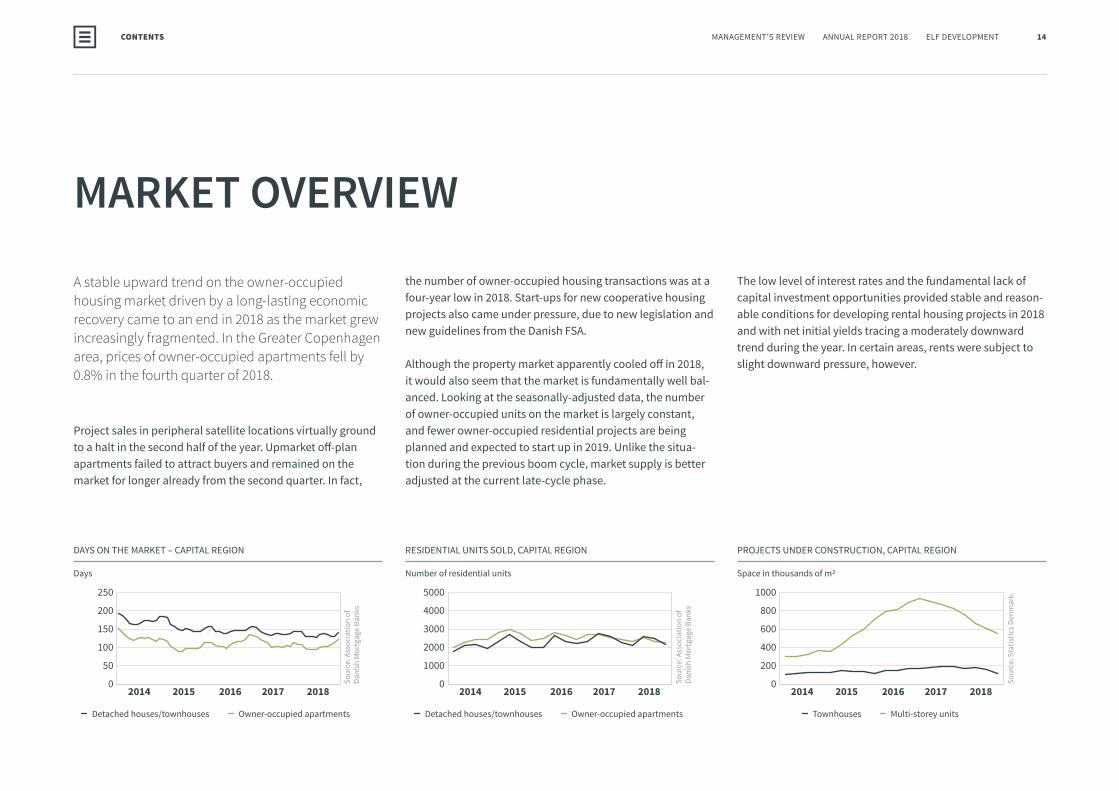
A stable upward trend on the owner-occupied housing market driven by a long-lasting economic recovery came to an end in 2018 as the market grew increasingly fragmented. In the Greater Copenhagen area, prices of owner-occupied apartments fell by 0.8% in the fourth quarter of 2018.
Project sales in peripheral satellite locations virtually ground to a halt in the second half of the year. Upmarket off-plan apartments failed to attract buyers and remained on the market for longer already from the second quarter. In fact,
MARKET OVERVIEW
the number of owner-occupied housing transactions was at a four-year low in 2018. Start-ups for new cooperative housing projects also came under pressure, due to new legislation and new guidelines from the Danish FSA.
Although the property market apparently cooled off in 2018, it would also seem that the market is fundamentally well bal-anced. Looking at the seasonally-adjusted data, the number of owner-occupied units on the market is largely constant, and fewer owner-occupied residential projects are being planned and expected to start up in 2019. Unlike the situa-tion during the previous boom cycle, market supply is better adjusted at the current late-cycle phase.
RESIDENTIAL UNITS SOLD, CAPITAL REGION
Number of residential units
PROJECTS UNDER CONSTRUCTION, CAPITAL REGION
Space in thousands of m2
DAYS ON THE MARKET – CAPITAL REGION
Days
Detached houses/townhouses Owner-occupied apartments Detached houses/townhouses Owner-occupied apartments Townhouses Multi-storey units
The low level of interest rates and the fundamental lack of capital investment opportunities provided stable and reason-able conditions for developing rental housing projects in 2018 and with net initial yields tracing a moderately downward trend during the year. In certain areas, rents were subject to slight downward pressure, however.
Sour
ce: A
ssoc
iatio
n of
Da
nish
Mor
tgag
e Ba
nks
Sour
ce: A
ssoc
iatio
n of
Da
nish
Mor
tgag
e Ba
nks
Sour
ce: S
tatis
tics D
enm
ark.
CONTENTS 14MANAGEMENT’S REVIEW ANNUAL REPORT 2018 ELF DEVELOPMENT
MARKET OVERVIEW
REVIEW OF 2018 AND FOLLOW-UP ON LAST YEAR’S FORECASTThe two business areas and the organisation in gen-eralperformedverywellin2018,asreflectedinourstrong earnings and the increase in our equity ratio.
PROPERTY DEVELOPMENT PORTFOLIOELF Development signed two purchase agreements in 2017, both of which were subject to a finalised local plan. One involved the purchase of an area of land centrally located in the suburb of Herlev, the other a large area in the Trongården district of Lyngby. In both cases, the local plans were given approval in 2018, and both purchases are now final. As a result, the purchase prices were recognised in the balance sheet at 31 December. During 2018, we also signed an unconditional agree-ment for the purchase of a large area of land north of Aarhus; a long-term investment with big potential. The purchase price was recognised in the balance sheet at 31 December.
During the course of the year, construction began for 249 residential units distributed on four projects: Baristarækkerne (16 townhouses) at IrmaByen, Parkkanten (98 apartments) at IrmaByen, Amager Strand (33 townhouses) and Amager Strandpark (12 apartments) all targeting the owner-occupied housing market. The fourth project, Frimærket in Herlev (90
apartments), consists of rental units that will form part of our proprietary investment portfolio. Handover of the residential units of the four projects is scheduled for 2019 and 2020.
A total of 142 residential units were handed over in 2018, all part of projects at IrmaByen, with 82 residential units (turnkey rental properties) handed over to an international investor and the remaining 60 units sold to private buyers. In addition, we ar-ranged the in-house handover of three of four apartment blocks making up Den Grønne Fatning in Herlev. Accordingly, a total of 133 residential rental units were transferred from the project development portfolio to the proprietary investment portfolio.
We sold a total of 119 residential units during the year, all of them to private buyers. A total of 406 residential units were under construction at the end of the year, of which 90 are being built for our proprietary investment portfolio, 43 have been sold to an investor, 119 have been sold to private inves-tors and 123 remain unsold.
At 31 December, the property development portfolio repre-sented floor space of about 75,000 m2, but it has much greater potential. Four of the original 20 building plots at IrmaByen in Rødovre remain to be developed. One of these plots was at a relatively advanced stage of development at year end. All but
one of the original 13 projects at Amager Strand, a 4,600 m2 office building, have been handed over. The work on the local plan for the area Kornblomstvej/Sundholmsvej at Amager is progressing according to plan. On the other hand, the process to develop the Sophienberg Slot estate is taking longer than anticipated. We continue to work closely with the local authorities and the Danish Agency for Culture and Palaces to further the development of this project.
The project development portfolio represented assets of DKK 722 million at 31 December 2018 (2017: DKK 538 million). This amount does not include residential rental units being built for the proprietary investment portfolio.
For a small number of housing projects completed in prior years, the residential units handed over have failed to meet buyer expectations. In the vast majority of these cases, ELF Development concurs in the issues brought forward, and we are working diligently to rectify the problems. In some instances, however, ELF Development disagrees with the issues raised. While we generally try to resolve such matters in dialogue with the buyer, some cases can only be solved by legal means. Accordingly, ELF development is a party to a small number of legal disputes. The estimated financial risk related to these matters has been fully recognised in the financial statements.
CONTENTS 15MANAGEMENT’S REVIEW ANNUAL REPORT 2018 ELF DEVELOPMENT
REVIEW OF 2018 AND FOLLOW UP

16MANAGEMENT’S REVIEW ANNUAL REPORT 2018 ELF DEVELOPMENTCONTENTS
AMAGER STRANDPARK
AMAGER STRANDPARK
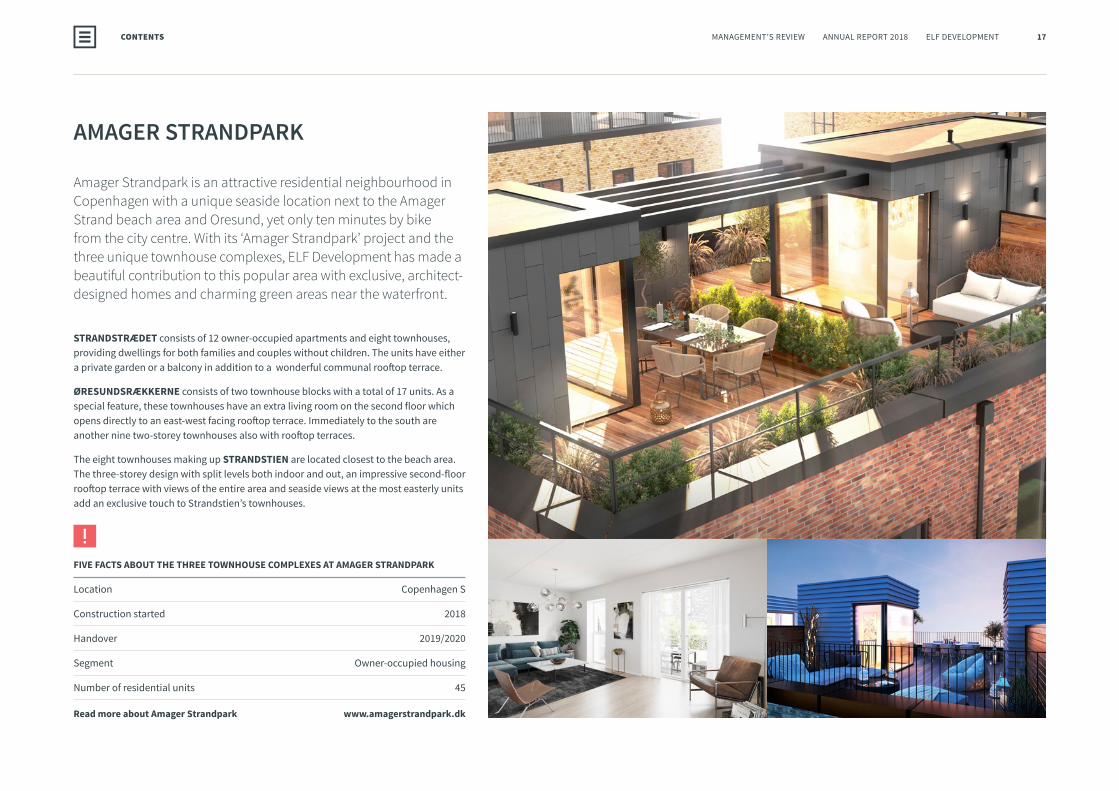
Amager Strandpark is an attractive residential neighbourhood in Copenhagen with a unique seaside location next to the Amager Strand beach area and Oresund, yet only ten minutes by bike from the city centre. With its ‘Amager Strandpark’ project and the three unique townhouse complexes, ELF Development has made a beautiful contribution to this popular area with exclusive, architect- designed homes and charming green areas near the waterfront.
STRANDSTRÆDET consists of 12 owner-occupied apartments and eight townhouses, providing dwellings for both families and couples without children. The units have either a private garden or a balcony in addition to a wonderful communal rooftop terrace.
ØRESUNDSRÆKKERNE consists of two townhouse blocks with a total of 17 units. As a special feature, these townhouses have an extra living room on the second floor which opens directly to an east-west facing rooftop terrace. Immediately to the south are another nine two-storey townhouses also with rooftop terraces.
The eight townhouses making up STRANDSTIEN are located closest to the beach area. The three-storey design with split levels both indoor and out, an impressive second-floor rooftop terrace with views of the entire area and seaside views at the most easterly units add an exclusive touch to Strandstien’s townhouses.
FIVE FACTS ABOUT THE THREE TOWNHOUSE COMPLEXES AT AMAGER STRANDPARK
Location Copenhagen S
Construction started 2018
Handover 2019/2020
Segment Owner-occupied housing
Number of residential units 45
Read more about Amager Strandpark www.amagerstrandpark.dk
CONTENTS 17MANAGEMENT’S REVIEW ANNUAL REPORT 2018 ELF DEVELOPMENT
18MANAGEMENT’S REVIEW ANNUAL REPORT 2018 ELF DEVELOPMENTCONTENTS
PARK KANTEN

PARKKANTEN AT IRMABYEN
Thishousingblockisthefinalareatobedevelopedat IrmaByen with unrestricted park views – where city meets park. Outdoor spaces and views over-looking the IrmaByen park are important features of the architecture and design of Parkkanten.
Apartments on the first to sixt floor feature deep west-facing balco-nies perfect for soaking up the afternoon and setting sun and have east-facing terraces or inward opening French doors that are ideal for taking in the morning sun. Ground floor apartments feature large terraces leading out to the lush, green park. PARKKANTEN’s sixth floor is dedicated to two-storey penthouse apartments complete with attractive, private roof-top terraces.
These stylish apartments feature top quality materials with large window sections, glass surfaces and under-floor heating throughout. The light, solid wood floors provide a Nordic ambience and practical spaciousness. The apartments range in size from 88 to 155 m2.
FIVE FACTS ABOUT PARKKANTEN AT IRMABYEN
Location Rødovre
Construction started 2018
Handover 2020
Segment Owner-occupied housing
Number of residential units 98
Read more about Parkkanten at Irmabyen www.irmabyen.dk/parkkanten/
CONTENTS 19MANAGEMENT’S REVIEW ANNUAL REPORT 2018 ELF DEVELOPMENT

74% Commercial leases
Residential leases 26%
2018
69% Commercial leases
Residential leases 31%
2018
9% F3-loans
3% F5-loans1% 15-year fixed rate
9% Cibor 6
24% 20-year fixed rate30-year fixed rate 54%
2018
INVESTMENT PORTFOLIOThe property in Toldbodgade (abt. 1,900 m2 and sold in 2017) was handed over to the buyer on 1 January 2018. As the property was valued and recognised at the net selling price at 31 December 2017, this transaction did not affect the financial results for 2018. We added three apartment blocks at Den Grønne Fatning, 133 rental units built by ELF Development (total floor space 12,591 m2) and in the second and fourth quarters of 2018, handed over to the investment portfolio. Other than as set out above, the property composition of the investment portfolio at 31 December 2018 remained un-changed from 31 December 2017.
Investment properties currently under construction comprise the fourth and final apartment block at Den Grønne Fat-ning (2,872 m2; handover expected in first half of 2019) and Frimærket in Herlev (8,597 m2); construction began in the sec-ond half of 2018 and handover to the investment portfolio is expected in 2020). As was the case with Den Grønne Fatning, starting the construction of Frimærket was a natural next step towards building a more balanced and efficient portfolio.
Maintenance work and minor renovation jobs for the individ-ual properties were carried out according to plans made for each property. As in 2017, we undertook major renovation works at our flagship property, the Njalsgade complex, during the year.
The investment portfolio’s overall vacancy rate was at an ac-ceptable level at year end. The retail space at Amager Strand, which forms an integral part of previously finished owner-oc-cupied residential projects, continues to have relatively high vacancy rates, but the level of activity did improve significant-ly during the year. Vacancy rates are quite low in the remain-ing properties.
The investment portfolio represented a value of DKK 1,230 million in the balance sheet at 31 December 2018 (31 De-cember 2017: DKK 864 million), of which accumulated value adjustments account for DKK 286 million (31 December 2017: DKK 185 million).
Investment properties currently under construction repre-sented assets of DKK 100 million at 31 December 2018 (31 December 2017: DKK 174 million).
Commercial leases still represented the predominant part of the portfolio at year end but the proportion of residential leases grew during the year, for a better residential/com-mercial split at 31 December 2018. In terms of floor space, residential leases represented 31%, while commercial leases accounted for 69% of the portfolio. Measured by rental income, the distribution is residential 26% and commercial 74%. The financing of the investment portfolio is based exclu-sively on mortgage loans and equity. The investment portfolio had a loan-to-value ratio of 40% at 31 December 2018. Loan duration at 31 December 2018 was 7.4 years.
A simulated effect of a 1 percentage point increase in interest rates was approximately DKK 51 million, while a 1 percentage point drop in interest rates would have a simulated effect of DKK 26 million.
MORTGAGE DEBT – LOAN TYPES
%
ASSET CLASSES – RENTAL INCOME
%
ASSET CLASSES, M2
%
CONTENTS 20MANAGEMENT’S REVIEW ANNUAL REPORT 2018 ELF DEVELOPMENT

CONTENTS 21MANAGEMENT’S REVIEW ANNUAL REPORT 2018 ELF DEVELOPMENT
THE NJALSGADE COMPLEX
22MANAGEMENT’S REVIEW ANNUAL REPORT 2018 ELF DEVELOPMENTCONTENTS
THE NJALSGADE
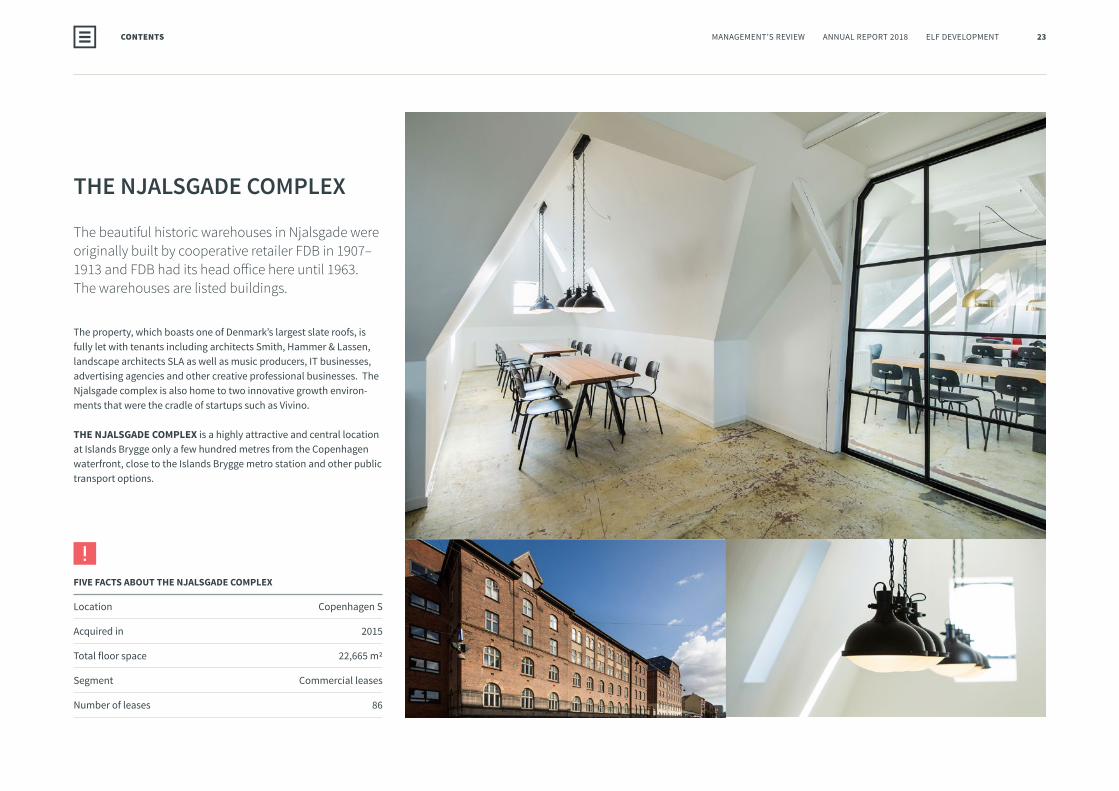
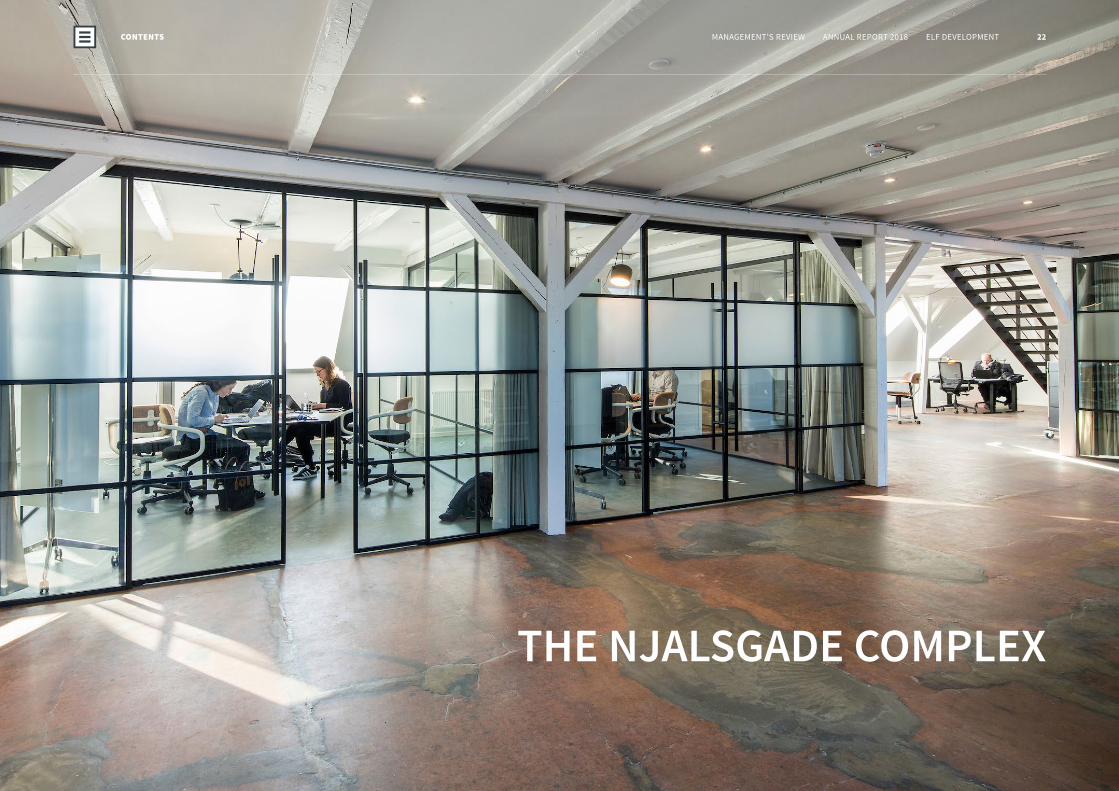
THE NJALSGADE COMPLEX
The beautiful historic warehouses in Njalsgade were originally built by cooperative retailer FDB in 1907–1913andFDBhaditsheadofficehereuntil1963.The warehouses are listed buildings.
The property, which boasts one of Denmark’s largest slate roofs, is fully let with tenants including architects Smith, Hammer & Lassen, landscape architects SLA as well as music producers, IT businesses, advertising agencies and other creative professional businesses. The Njalsgade complex is also home to two innovative growth environ-ments that were the cradle of startups such as Vivino.
THE NJALSGADE COMPLEX is a highly attractive and central location at Islands Brygge only a few hundred metres from the Copenhagen waterfront, close to the Islands Brygge metro station and other public transport options.
FIVE FACTS ABOUT THE NJALSGADE COMPLEX
Location Copenhagen S
Acquired in 2015
Total floor space 22,665 m2
Segment Commercial leases
Number of leases 86
CONTENTS 23MANAGEMENT’S REVIEW ANNUAL REPORT 2018 ELF DEVELOPMENT

24MANAGEMENT’S REVIEW ANNUAL REPORT 2018 ELF DEVELOPMENTCONTENTS
DEN GRØNNE FATNING
DEN GRØNNE FATNING
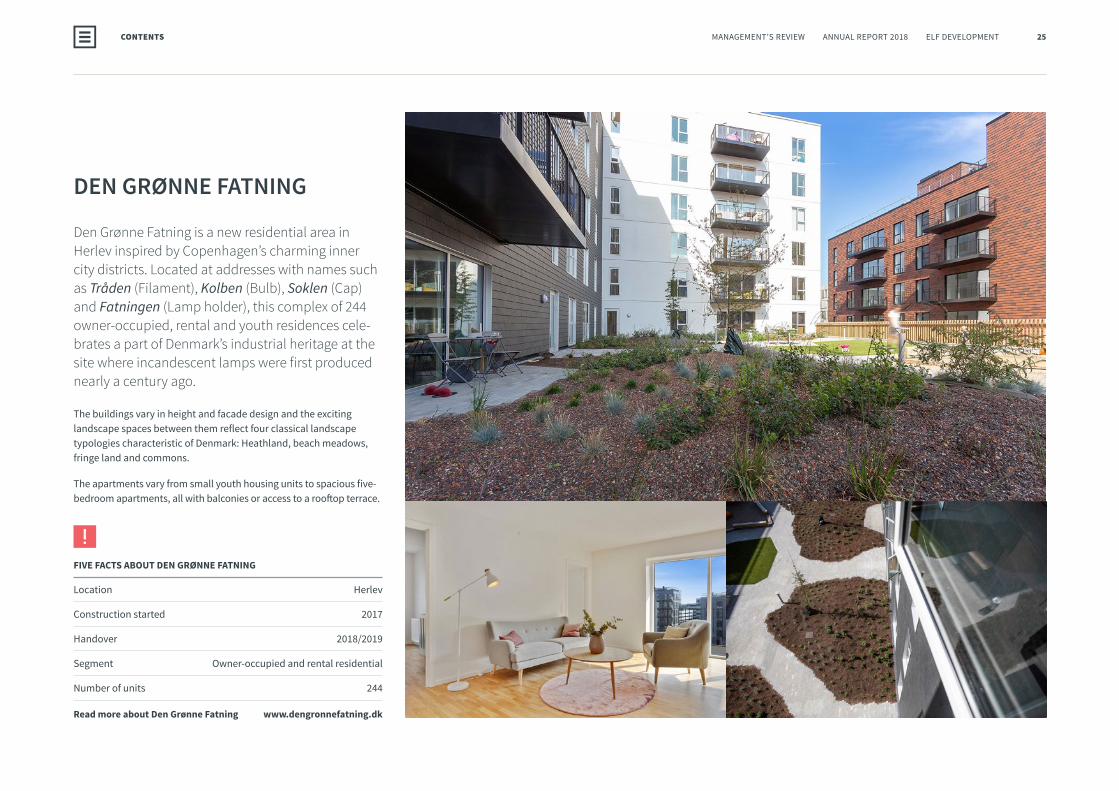
Den Grønne Fatning is a new residential area in Herlev inspired by Copenhagen’s charming inner city districts. Located at addresses with names such as Tråden (Filament), Kolben (Bulb), Soklen (Cap) and Fatningen (Lamp holder), this complex of 244 owner-occupied, rental and youth residences cele-brates a part of Denmark’s industrial heritage at the sitewhereincandescentlampswerefirstproducednearly a century ago.
The buildings vary in height and facade design and the exciting landscape spaces between them reflect four classical landscape typologies characteristic of Denmark: Heathland, beach meadows, fringe land and commons.
The apartments vary from small youth housing units to spacious five- bedroom apartments, all with balconies or access to a rooftop terrace.
FIVE FACTS ABOUT DEN GRØNNE FATNING
Location Herlev
Construction started 2017
Handover 2018/2019
Segment Owner-occupied and rental residential
Number of units 244
Read more about Den Grønne Fatning www.dengronnefatning.dk
CONTENTS 25MANAGEMENT’S REVIEW ANNUAL REPORT 2018 ELF DEVELOPMENT

57%
5%
34%
Other assets 4%
2018
Investment propertiesunder construction
Investment properties
Developmentprojects
53%
2018
14% Investment portfolio
33% Development pipeline
Value adjustments
89% Development
Portfolio 11%
2018
REVENUE BROKEN DOWN BY ACTIVITY:
%
EBIT CONTRIBUTION
%
ORGANISATIONThe ELF Development organisation is divided into four busi-ness areas; Development, Sales, Construction and Property Management. Our business areas are supported by corporate functions in the following disciplines: Finance, IT, Legal, HR and Office Management. In 2018, we made efforts to strength-en our organisation in various ways, both in our business areas and corporate functions. We grew our organisation to a total of 28 employees from 25 at the end of 2017.
EARNINGS AND EQUITYRevenue amounted to DKK 421 million in 2018 (DKK 863 million in 2017), of which DKK 376 million is attributable to the property development portfolio and DKK 45 million to the proprietary investment portfolio. The revenue decline from 2017 to 2018 was not the result of a lower level of activity, but was caused by the fact that the volume of proprietary resi-dential rental units is not reflected in revenue, which would
be the case for an external sale. The number of units handed over (including in-house handovers) was at the same level as in 2017. If the units had been sold to an external investor, revenue for the year would have been comparable to the year before. Moreover, revenue from the development portfolio in 2017 was affected by the divestment of two large land areas located outside ELF Development’s geographical focus. Rev-enue from the investment portfolio was down by about DKK 2 million relative to 2017. The reason for the decline was that rental income from portfolio additions was unable to offset the rental income from the two large rental properties sold in 2018 and handed over at the end of 2017 and at the beginning of 2018, respectively.
Value adjustments amounted to DKK 123 million (DKK 114 million in 2017). The amount includes adjustments relating to the three blocks constructed by ELF Development at Den Grønne Fatning.
Gross profit after value adjustments amounted to DKK 245 million (DKK 315 million in 2017) for a gross margin of 58%. Before value adjustments, the gross margin was 26%.
Distribution costs, comprising sales and marketing costs, were DKK 8 million (DKK 24 million in 2017). The cost reduc-tion was attributable to the fact that the projects handed over in 2018 involved notably lower sales and marketing costs than those handed over in 2017.
Profit before financial items and tax (EBIT) amounted to DKK 231 million (DKK 287 million in 2017). Of this amount, DKK 77 million related to the development portfolio, DKK 31 million to investment portfolio operations and DKK 123 million to value adjustments of the investment portfolio. The gross margin was 55%. Before value adjustments, the gross margin was 26%.
COMPOSITION OF ASSETS
%
CONTENTS 26MANAGEMENT’S REVIEW ANNUAL REPORT 2018 ELF DEVELOPMENT
30% Equity
6% Provisions
54%
Other payables 6%Creditors 5%
2018
Mortgage andbank debt
CAPITAL STRUCTURE
%
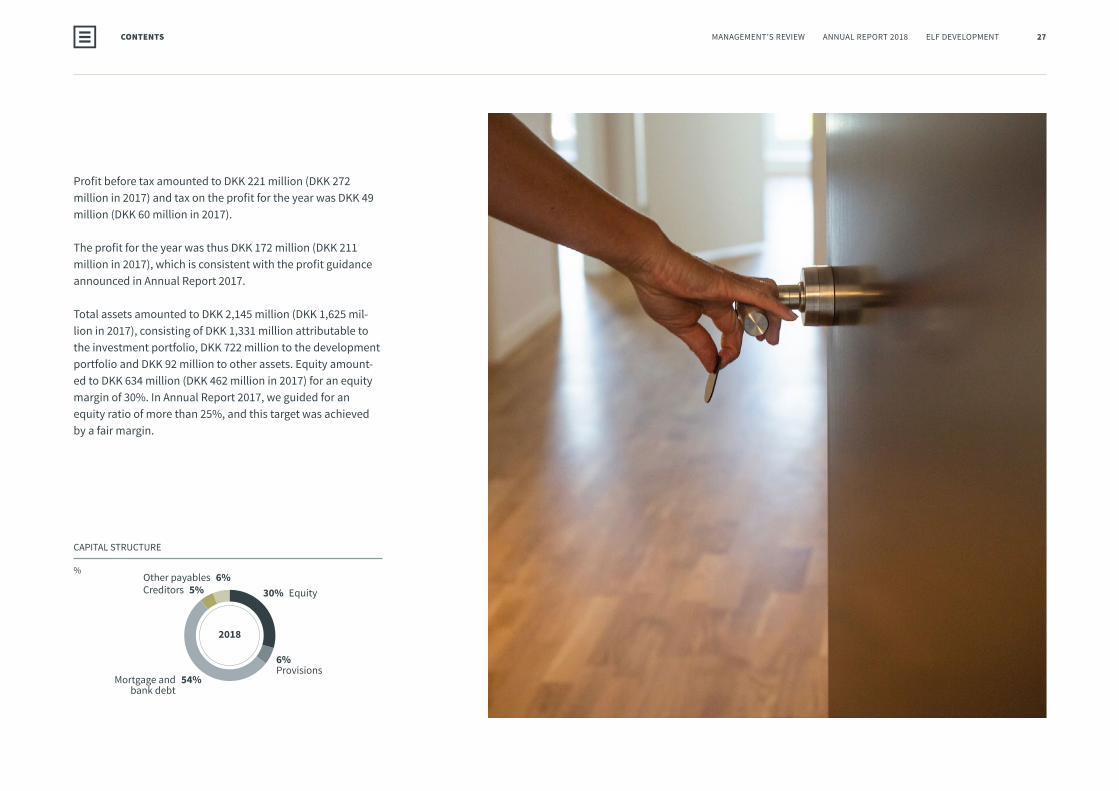
Profit before tax amounted to DKK 221 million (DKK 272 million in 2017) and tax on the profit for the year was DKK 49 million (DKK 60 million in 2017).
The profit for the year was thus DKK 172 million (DKK 211 million in 2017), which is consistent with the profit guidance announced in Annual Report 2017.
Total assets amounted to DKK 2,145 million (DKK 1,625 mil-lion in 2017), consisting of DKK 1,331 million attributable to the investment portfolio, DKK 722 million to the development portfolio and DKK 92 million to other assets. Equity amount-ed to DKK 634 million (DKK 462 million in 2017) for an equity margin of 30%. In Annual Report 2017, we guided for an equity ratio of more than 25%, and this target was achieved by a fair margin.
CONTENTS 27MANAGEMENT’S REVIEW ANNUAL REPORT 2018 ELF DEVELOPMENT
RISK FACTORS
KEY RISK FACTORSThe principal risks relating to ELF Development’s business activities involve macroeconomic conditions.
MACROECONOMIC RISKSDemographic factors like population growth and migration affect the demand for housing. ELF Development’s business activities focus on towns and regions which meet a number of criteria – not least distinct demographic growth and favoura-ble economic preconditions.
Economic growth generally impacts the demand for new residential builds as well as the demand for commercial units. Demand for and prices of new residential properties corre-late with consumer purchasing power, employment levels and other factors directly or indirectly affecting consumer confidence. In growing towns and cities, a slump in demand for new owner-occupied units due to impaired economic conditions or changes in market sentiment will trigger greater demand for residential rental units. Weaker demand in one business area, the sale of owner-occupied units, may thus be absorbed by greater demand in another business area, residential rental. This correlation creates a natural hedge for ELF Development relative to the cyclicality of the property market. In terms of demand for commercial premises, ELF
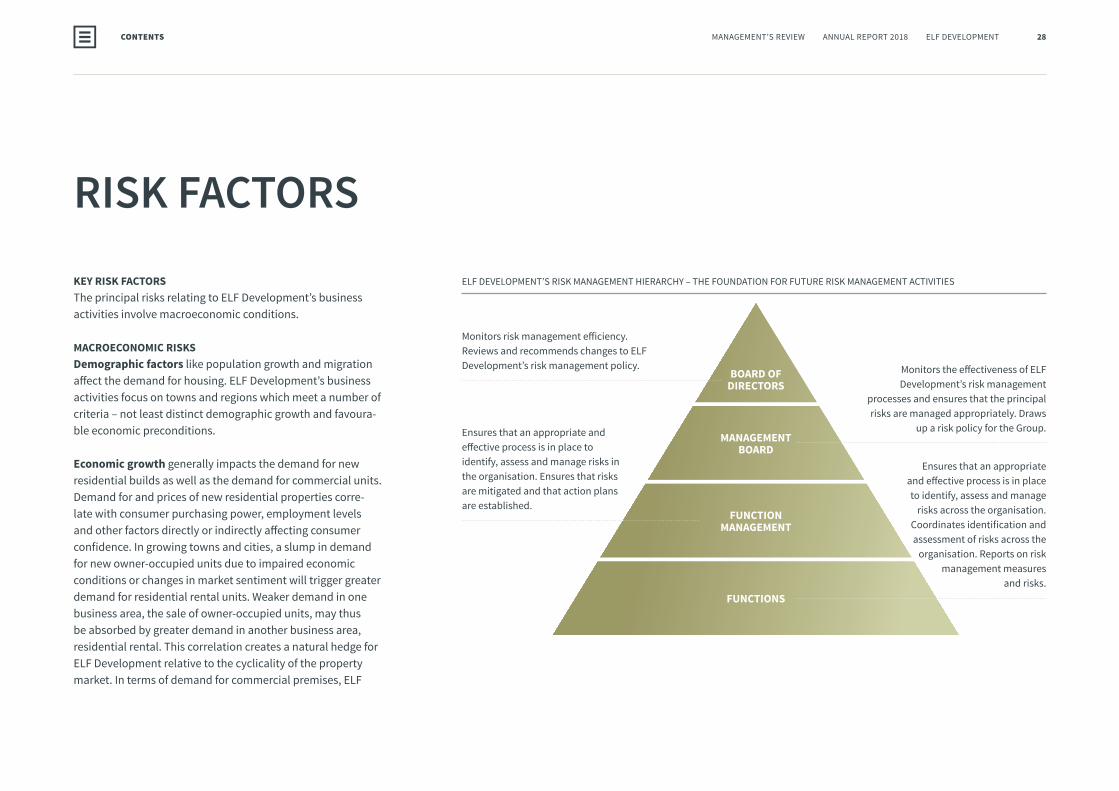
Monitors risk management efficiency. Reviews and recommends changes to ELF Development’s risk management policy. Monitors the effectiveness of ELF
Development’s risk management processes and ensures that the principal risks are managed appropriately. Draws
up a risk policy for the Group.
Ensures that an appropriate and effective process is in place to identify, assess and manage
risks across the organisation. Coordinates identification and assessment of risks across the
organisation. Reports on risk management measures
and risks.
Ensures that an appropriate and effective process is in place to identify, assess and manage risks in the organisation. Ensures that risks are mitigated and that action plans are established.
BOARD OF DIRECTORS
MANAGEMENT BOARD
FUNCTION MANAGEMENT
FUNCTIONS
ELF DEVELOPMENT’S RISK MANAGEMENT HIERARCHY – THE FOUNDATION FOR FUTURE RISK MANAGEMENT ACTIVITIES
CONTENTS 28MANAGEMENT’S REVIEW ANNUAL REPORT 2018 ELF DEVELOPMENT
RISK FACTORS
Development aims to create attractive and unique settings which are hard to copy and to create well-balanced diversity with regard to tenants and contracts.
Political risks relate to decisions that directly or indirectly may change the preconditions for the activities pursued in ELF Development’s business areas. Examples of political risks include changes in personal taxation, property taxes, corporate taxes, rent legislation and mortgage legislation, but also changes to infrastructure and municipal planning. ELF Development is actively monitoring the political landscape to swiftly respond to changes that may affect its business operations.
BUSINESS RISKSReduced potential of the portfolio of building rights pri-marily relates to a lower-than-expected outcome of adopted local plans. ELF Development endeavours to mitigate this risk by entering into purchase agreements subject to a given outcome of local plans and by assuming an active role in local plan procedures.
Rising project costs during the construction period is gen-erally a risk that relates primarily to construction costs. ELF Development collaborates with reliable and stable business partners and works exclusively on a design-and-build con-tract basis. All contracts are signed prior to construction start, and the amount of the contract is therefore fixed. Ongoing projects are closely monitored and subject to a thorough and frequent process in terms of controlling and reporting.
Unsold units at the end of the construction period will adversely affect cash flows and may also, to a varying degree, reduce earnings. For development activities, construction will generally not commence before a certain pre-sale require-ment has been fulfilled. As an alternative to lowering prices and, as a result, reducing earnings, ELF Development has the option of transferring unsold units from the development portfolio to the investment portfolio for letting purposes. This will provide a stable cash flow until such time as a sale can be completed on satisfactory terms.
The risk of falling housing prices during the construction period relates to the above and will be handled accordingly.
FINANCIAL RISKSThe risk that ELF Development’s customers are unable to meet their payment obligations, credit risk, is generally in-significant. Immediately after a buyer – whether a retail buyer or an investor – signs an agreement to purchase a residential unit or an investment property, the full purchase price must be secured through a combination of down payments and a bank guarantee. As protection is offered by the Danish Rent Act, prepaid rent, deposits and a thorough follow-up process for unpaid rent, the only financial impact will typically be small cash flow fluctuations as a result of late payments.
Any changes in market rates will affect earnings and cash flows. Rising interest rates will have an adverse impact on earnings from both development activities and the invest-ment property portfolio. Interest expenses on credit facilities
related to land purchases and construction will inevitably increase with a resulting negative impact on the development portfolio. Investment property yields will be pushed upwards, creating a downward pressure on valuations. In relation to fi-nancing, interest expenses will - generally speaking - increase. However, as a consequence of ELF Development’s financing strategy for its investment portfolio, the risk exposure is limited. The market value of mortgage debt will decrease if interest rates increase.
Funding risk relates primarily to a potential weakening of the possibilities to obtain approval for new credit facilities to buy plots and commence construction. ELF Development has established strong relationships with a number of Denmark’s largest banks and has substantially increased its equity ratio in recent years. These factors combined with a detailed and risk-focused business approach ought to reduce the funding risk to a manageable level.
The risk of ELF Development being unable to meet its pay-ment obligations, liquidity risk, is managed through in-depth management of bank deposits and similar assets. A well-im-plemented cash-flow forecast process ensures that ELF Devel-opment has access to the required liquidity at all times.
As ELF Development has very limited foreign currency trans-actions, its currency risk is considered insignificant.
CONTENTS 29MANAGEMENT’S REVIEW ANNUAL REPORT 2018 ELF DEVELOPMENT
ELF Development conducts its development ac-tivities in a traditionally cyclical market. However, the company's long-term focus on value creation extends far beyond a full business cycle.
A very well-defined business process, in-depth analyses and active risk management allow ELF Development to act systematically and opportunistically in terms of pursuing business opportunities across markets and asset classes. This is achieved through purchasing, developing, building, letting and selling real property. In other words, the company avoids restricting its activities to a pre-defined geographical area, customer segment or product mix. On the contrary, it may adapt its strategic focus on an ongoing basis with due consideration to the long-term supply and demand situation and market changes as such.
In the coming years, activities will remain focused on develop-ing housing projects in the mid-market segment – primarily in and around the Greater Copenhagen area, but to some extent also in and around Aarhus.
A key factor in developing the residential projects is extensive focus on creating well-functioning neighbourhoods. The qual-ity of the dwellings, both in terms of design and function, and
the surroundings must provide a unique experience in order to facilitate a high quality of life with easy access to social interaction.
The investment portfolio represents a long-term investment of which the aim is for the annual operating cash flow to fund ELF Development's organisation as a whole.
In order to ensure portfolio diversity, the aim is for residential and commercial leases to account for approximately 50% each of the portfolio. With respect to the commercial leases, the intention is for the vast majority to be office space, with the remainder being retail. Potentially, the portfolio may also include logistics properties and hotel properties in the longer term. Future investments will centre on large residential prop-erties in well-established areas, offering good infrastructure and proximity to significant facilities and on prime-location commercial properties with potential for stable earnings and growth.
Rooted in a strategy plan for every property, we consistently work to optimise operations, ensuring ongoing maintenance and that refurbishment initiatives are carried out in a struc-tured manner and in accordance with an overall, long-term plan. Properties will be divested from time to time if warrant-ed by considerations for the composition of the investment portfolio and subject to appropriate market conditions.
GOALS AND STRATEGY
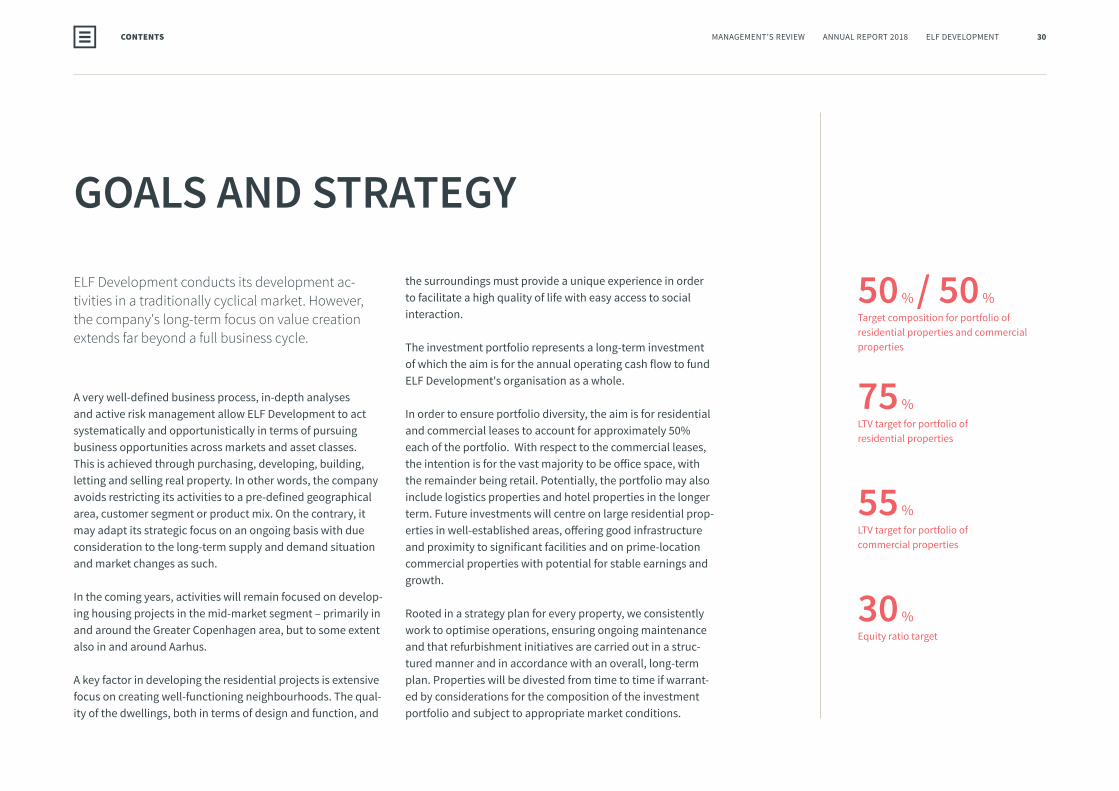
50 % / 50 %Target composition for portfolio of residential properties and commercial properties
75 %LTV target for portfolio of residential properties
55 %LTV target for portfolio of commercial properties
30 %Equity ratio target
CONTENTS 30MANAGEMENT’S REVIEW ANNUAL REPORT 2018 ELF DEVELOPMENT

The portfolio target is an LTV of 75% for residential properties and 55% for commercial properties. The terms of the individual loans should ideally match the investment horizons of the indi-vidual properties. The investment portfolio is funded exclusively by Danish mortgage loans with the aim being that approximate-ly 80% should be long-term loans (20–30 years). Swaps are used to hedge interest rate risks. Relative to the loan portfolio, swaps may not generally account for more than 15%. Swaps are not used for purposes other than interest rate hedging. As the loan portfolio consists exclusively of loans in Danish kroner, there is no exchange rate exposure.
In addition to activities in the two principal business areas, ELF Development will start to phase in greater strategic focus on investment opportunities in property-related technology development (PropTech).
In recent years, our organisation has grown to a size that automatically leads to greater demands for processes, struc-tures and system platforms, and we have launched a number of initiatives to accommodate these demands. The initiatives are expected to be fully implemented in 2020. In terms of our organisation, we will focus on further strengthening our de-velopment department in 2019, which will involve recruiting at least one employee to commence operations in Aarhus. At the end of 2019, we expect our organisation to employ around 30 people.
As prospects for 2019 are good, we expect a stable level of ac-tivity and another year of solid earnings and a high equity ratio. However, profit for the year after tax will most likely be slightly lower than in the preceding years. We expect to maintain our solvency ratio at a level close to the updated target of 30%.
CONTENTS 31MANAGEMENT’S REVIEW ANNUAL REPORT 2018 ELF DEVELOPMENT

CORPORATE SOCIAL RESPONSIBILITY
ELF Development is a property developer but also fosters new ideas about how properties should be built to make them sus-tainable and designed for the future. In that process, we focus on the six of the UN’s 17 Sustainable Development Goals (SDGs) whereourcompanycanmakethebiggestdifference:
CONTENTS 32MANAGEMENT’S REVIEW ANNUAL REPORT 2018 ELF DEVELOPMENT
CSR

CLIMATE AND THE ENVIRONMENT ELF Development wants to take responsibility for the future and makes active contributions to preventing pollution and minimising the climate footprint of its business activities.
In our support for better sustainability, we are taking steps to implement an ambitious climate and environmental policy. Based on carefully planned construction, we make extensive efforts to minimise our climate and environmental impact. Specifically, we seek to apply intelligent solutions in our projects that will optimise energy consumption, support the recycling of building materials and require efficient use of resources at construction sites.
WALK THE TALKAt IrmaByen, for example, the demolition of existing buildings was carried out with a specific focus on recycling materials and on minimising the environmental impact. In addition, an environmental clean-up was not a requirement but it was performed in all common areas.
On a smaller scale, ELF Development has taken the initia-tive to reduce the consumption of power, paper, plastic and other consumables in its day-to-day operations. We took this initiative not least for the purposes of emphasising to each in-dividual employee the importance of changing your mindset and considering sustainability in all our activities, private and commercial. This applies both to our office environments and our construction sites.
SUSTAINABLE CONSTRUCTION
Development projects are designed and implemented in col-laboration with various major advisers and construction busi-nesses. In its role as an employer, ELF Development is able to influence the guidelines for the way the company’s business partners and suppliers work with climate and environmental issues. By demanding sustainability, we hope to inspire other construction industry players to create visionary construction projects based on a philosophy similar to ours.
COMMON GUIDELINESThe vast majority of ELF Development’s contracts include a separate section with requirements that the parties to a construction project comply with the principles on sustaina-bility as described in the New Nordic Charter. Its requirements include:
• that buildings are designed for the optimum energy class• that the indoor environment supports healthy living spaces
by incorporating intelligent solutions focused on the inflow of daylight, natural heating and a minimum of energy- efficient temperature regulation
• that the building materials used have a minimal environ-mental impact.
• that contractors have a binding responsibility to minimise their energy consumption during the construction phase
• that water is discharged and waste is disposed of in a sus-tainable manner that has a minimal environmental impact and supports recycling
CERTIFIED CONSTRUCTION
ELF Development is working to continuously develop its building standards in order to make future construction pro-jects more sustainable.
The guidelines for sustainable construction applied by ELF Development are defined in the New Nordic Charter and by the DGNB principles. In 2018, we took steps to implement the charter and the principles in our future construction projects.
ELF Development is also planning its first Swan-certified construction project in company history, which will be at Trongaarden in Lyngby.The Swan certification will be the third leg of our future guidelines for sustainable construction.
The goal for 2019 is to increase the proportion of certified con-struction projects in the project development portfolio along with the proportion of eco-friendly and certified properties in the management portfolio. The steps that we have taken to embrace the necessary environmental transition are just the be-ginning, and over time, we will endeavour to implement much more fundamental changes to our business and our industry.
CONTENTS 33MANAGEMENT’S REVIEW ANNUAL REPORT 2018 ELF DEVELOPMENT

CONTENTS 34MANAGEMENT’S REVIEW ANNUAL REPORT 2018 ELF DEVELOPMENT
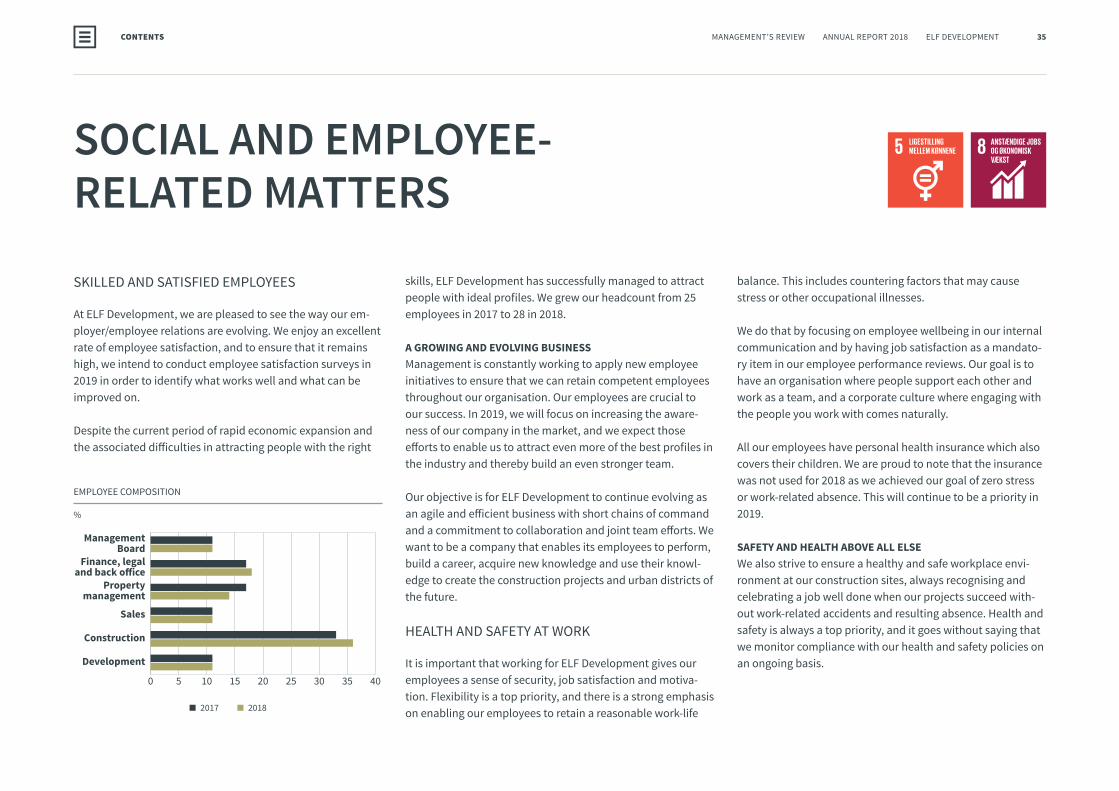
0 5 10 15 20 25 30 35 40
ManagementBoard
Development
Construction
Sales
Propertymanagement
Finance, legaland back office
EMPLOYEE COMPOSITION
%
2017 2018
SOCIAL AND EMPLOYEE- RELATED MATTERS
SKILLED AND SATISFIED EMPLOYEES
At ELF Development, we are pleased to see the way our em-ployer/employee relations are evolving. We enjoy an excellent rate of employee satisfaction, and to ensure that it remains high, we intend to conduct employee satisfaction surveys in 2019 in order to identify what works well and what can be improved on.
Despite the current period of rapid economic expansion and the associated difficulties in attracting people with the right
skills, ELF Development has successfully managed to attract people with ideal profiles. We grew our headcount from 25 employees in 2017 to 28 in 2018.
A GROWING AND EVOLVING BUSINESSManagement is constantly working to apply new employee initiatives to ensure that we can retain competent employees throughout our organisation. Our employees are crucial to our success. In 2019, we will focus on increasing the aware-ness of our company in the market, and we expect those efforts to enable us to attract even more of the best profiles in the industry and thereby build an even stronger team.
Our objective is for ELF Development to continue evolving as an agile and efficient business with short chains of command and a commitment to collaboration and joint team efforts. We want to be a company that enables its employees to perform, build a career, acquire new knowledge and use their knowl-edge to create the construction projects and urban districts of the future.
HEALTH AND SAFETY AT WORK
It is important that working for ELF Development gives our employees a sense of security, job satisfaction and motiva-tion. Flexibility is a top priority, and there is a strong emphasis on enabling our employees to retain a reasonable work-life
balance. This includes countering factors that may cause stress or other occupational illnesses.
We do that by focusing on employee wellbeing in our internal communication and by having job satisfaction as a mandato-ry item in our employee performance reviews. Our goal is to have an organisation where people support each other and work as a team, and a corporate culture where engaging with the people you work with comes naturally.
All our employees have personal health insurance which also covers their children. We are proud to note that the insurance was not used for 2018 as we achieved our goal of zero stress or work-related absence. This will continue to be a priority in 2019.
SAFETY AND HEALTH ABOVE ALL ELSEWe also strive to ensure a healthy and safe workplace envi-ronment at our construction sites, always recognising and celebrating a job well done when our projects succeed with-out work-related accidents and resulting absence. Health and safety is always a top priority, and it goes without saying that we monitor compliance with our health and safety policies on an ongoing basis.
CONTENTS 35MANAGEMENT’S REVIEW ANNUAL REPORT 2018 ELF DEVELOPMENT
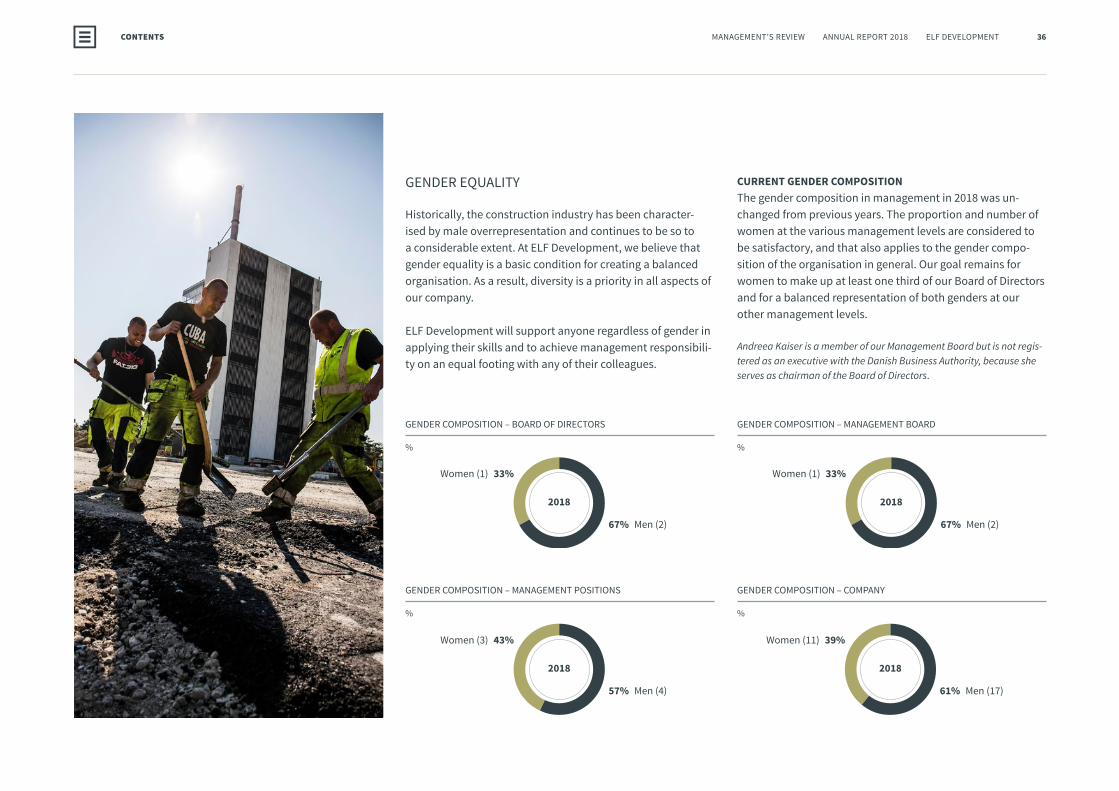
67% Men (2)
Women (1) 33%
2018
67% Men (2)
Women (1) 33%
2018
57% Men (4)
Women (3) 43%
2018
61% Men (17)
Women (11) 39%
2018
GENDER EQUALITY
Historically, the construction industry has been character-ised by male overrepresentation and continues to be so to a considerable extent. At ELF Development, we believe that gender equality is a basic condition for creating a balanced organisation. As a result, diversity is a priority in all aspects of our company.
ELF Development will support anyone regardless of gender in applying their skills and to achieve management responsibili-ty on an equal footing with any of their colleagues.
CURRENT GENDER COMPOSITIONThe gender composition in management in 2018 was un-changed from previous years. The proportion and number of women at the various management levels are considered to be satisfactory, and that also applies to the gender compo-sition of the organisation in general. Our goal remains for women to make up at least one third of our Board of Directors and for a balanced representation of both genders at our other management levels.
Andreea Kaiser is a member of our Management Board but is not regis-tered as an executive with the Danish Business Authority, because she serves as chairman of the Board of Directors.
GENDER COMPOSITION – BOARD OF DIRECTORS
%
GENDER COMPOSITION – MANAGEMENT POSITIONS
%
GENDER COMPOSITION – MANAGEMENT BOARD
%
GENDER COMPOSITION – COMPANY
%
CONTENTS 36MANAGEMENT’S REVIEW ANNUAL REPORT 2018 ELF DEVELOPMENT
HUMAN RIGHTS
It goes without saying that human rights must be respected and upheld. ELF Development has never experienced anyone within the organisation or employed by the company’s busi-ness partners who has failed to act in accordance with these principles. Ensuring consistent performance in this matter is a natural and strong priority for us going forward.
It is ELF Development’s policy that we recognise and respect the right to freedom of movement, the right to assemble and the right to collective bargaining. We will not tolerate discrimination or any inappropriate conduct that may impact our employees’ dignity or harm the environments or societies that we have any level of contact with.
DEMANDS ON OUR BUSINESS PARTNERSNeither ELF Development nor any of its business partners may contribute to or encourage the acceptance of any kind of work that does not as a minimum comply with the pay and working conditions applying to Danish collective agreements in the relevant field. We also reserve the right to require documentation of compliance with collective agreements and current legislation.
We require and expect our business partners to respect and uphold our company values, and we will take firm and prompt action on any perceived instance of discrimination, whether on the basis of age, gender, race, religion, political conviction or any other matters relating to basic human rights.
CONTENTS 37MANAGEMENT’S REVIEW ANNUAL REPORT 2018 ELF DEVELOPMENT

ANTI-CORRUPTION AND BRIBERYAt ELF Development, we emphasise and expect honest and fair competition, and integrity is a cornerstone of the way we do business. This means that we reject any kind of corruption or bribery and that we make every effort to avoid corruption in our organisation, with our business partners and in the environments and societies where we operate.
We have never experienced that our company or our business partners have acted contrary to our policy on anti-corruption and bribery, and we expect this to apply going forward.
ELF Development must never offer, authorise, pay or accept a bribe or exert extortion.
We must never offer, give or receive gifts, entertainment or other benefits that might raise doubts about the independ-ence of our company or any individual employee.
ELF Development has strict guidelines on how gifts may be received in compliance with the above policy.
CONTENTS 38MANAGEMENT’S REVIEW ANNUAL REPORT 2018 ELF DEVELOPMENT
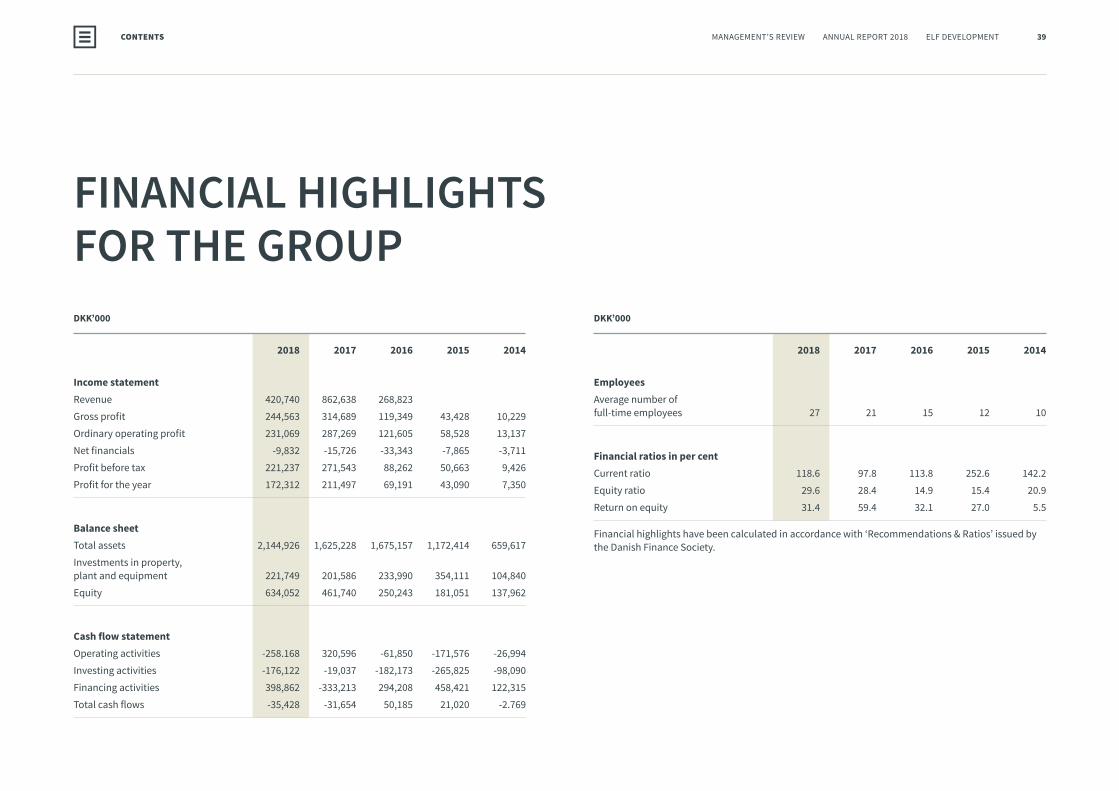
FINANCIAL HIGHLIGHTS FOR THE GROUPDKK’000
2018 2017 2016 2015 2014
Income statementRevenue 420,740 862,638 268,823
Gross profit 244,563 314,689 119,349 43,428 10,229
Ordinary operating profit 231,069 287,269 121,605 58,528 13,137
Net financials -9,832 -15,726 -33,343 -7,865 -3,711
Profit before tax 221,237 271,543 88,262 50,663 9,426
Profit for the year 172,312 211,497 69,191 43,090 7,350
Balance sheetTotal assets 2,144,926 1,625,228 1,675,157 1,172,414 659,617
Investments in property, plant and equipment 221,749 201,586 233,990 354,111 104,840
Equity 634,052 461,740 250,243 181,051 137,962
Cash flow statementOperating activities -258.168 320,596 -61,850 -171,576 -26,994
Investing activities -176,122 -19,037 -182,173 -265,825 -98,090
Financing activities 398,862 -333,213 294,208 458,421 122,315
Total cash flows -35,428 -31,654 50,185 21,020 -2.769
DKK’000
2018 2017 2016 2015 2014
EmployeesAverage number of full-time employees 27 21 15 12 10
Financial ratios in per centCurrent ratio 118.6 97.8 113.8 252.6 142.2
Equity ratio 29.6 28.4 14.9 15.4 20.9
Return on equity 31.4 59.4 32.1 27.0 5.5
Financial highlights have been calculated in accordance with ‘Recommendations & Ratios’ issued by the Danish Finance Society.
CONTENTS 39MANAGEMENT’S REVIEW ANNUAL REPORT 2018 ELF DEVELOPMENT
FINANCIAL HIGHLIGHTS FOR THE GROUP
CONTENTS 40MANAGEMENT’S REVIEW ANNUAL REPORT 2018 ELF DEVELOPMENT
FINANCIAL STATEMENTS2018
CONTENTS
FINANCIAL STATEMENTS
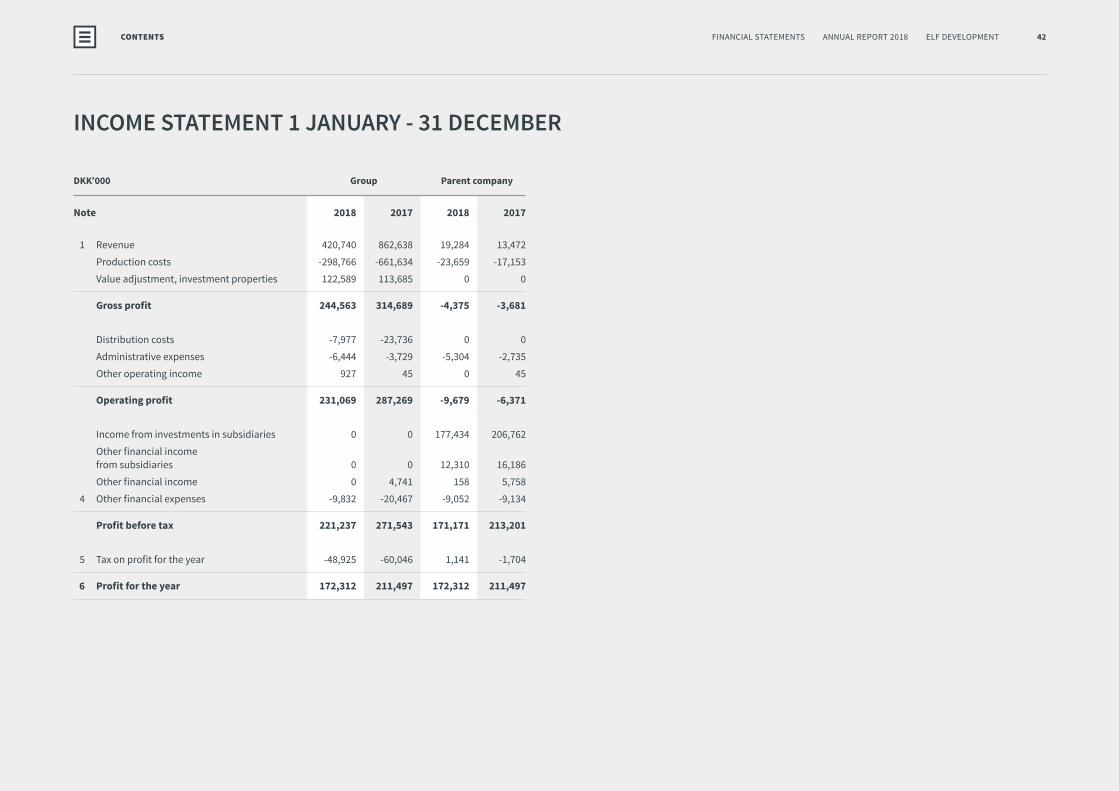
INCOME STATEMENT 1 JANUARY - 31 DECEMBER
DKK’000 Group Parent company
Note 2018 2017 2018 2017
1 Revenue 420,740 862,638 19,284 13,472
Production costs -298,766 -661,634 -23,659 -17,153
Value adjustment, investment properties 122,589 113,685 0 0
Gross profit 244,563 314,689 -4,375 -3,681
Distribution costs -7,977 -23,736 0 0
Administrative expenses -6,444 -3,729 -5,304 -2,735
Other operating income 927 45 0 45
Operating profit 231,069 287,269 -9,679 -6,371
Income from investments in subsidiaries 0 0 177,434 206,762
Other financial income from subsidiaries 0 0 12,310 16,186
Other financial income 0 4,741 158 5,758
4 Other financial expenses -9,832 -20,467 -9,052 -9,134
Profit before tax 221,237 271,543 171,171 213,201
5 Tax on profit for the year -48,925 -60,046 1,141 -1,704
6 Profit for the year 172,312 211,497 172,312 211,497
42FINANCIAL STATEMENTS ANNUAL REPORT 2018 ELF DEVELOPMENTCONTENTS
INCOME STATEMENT
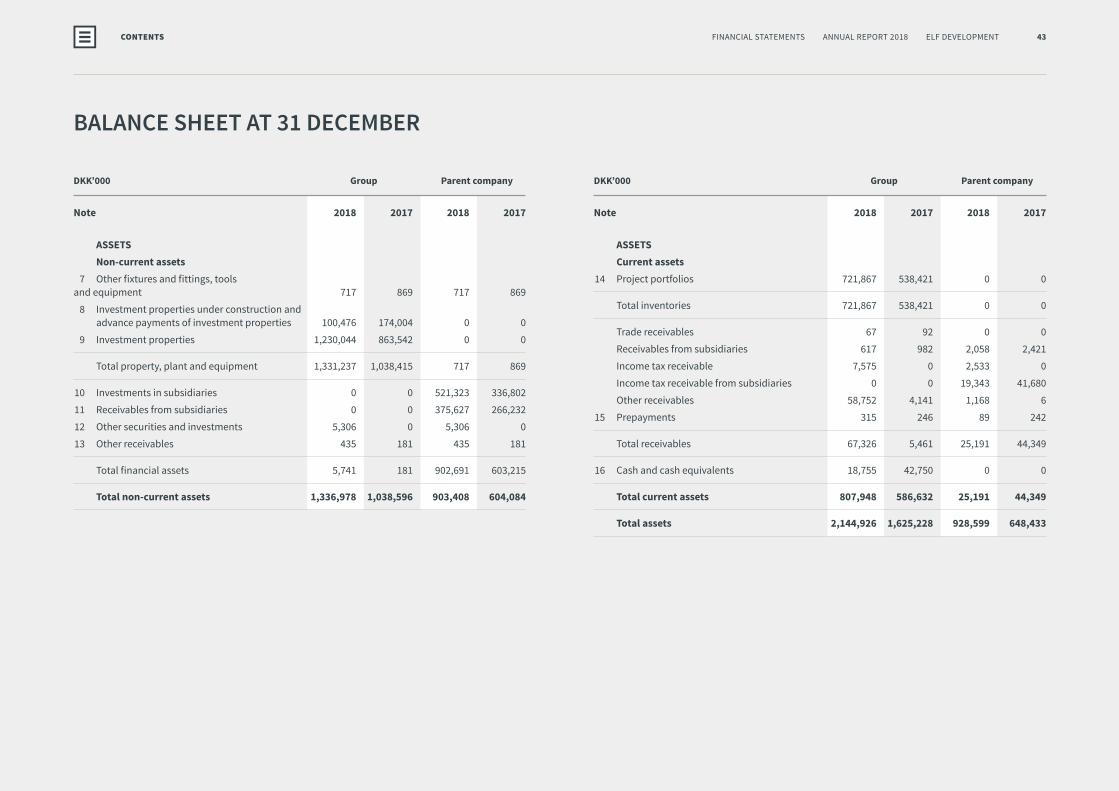
BALANCE SHEET AT 31 DECEMBER
DKK’000 Group Parent company
Note 2018 2017 2018 2017
ASSETS Non-current assets 7 Other fixtures and fittings, tools and equipment 717 869 717 869
8 Investment properties under construction and advance payments of investment properties 100,476 174,004 0 0
9 Investment properties 1,230,044 863,542 0 0
Total property, plant and equipment 1,331,237 1,038,415 717 869
10 Investments in subsidiaries 0 0 521,323 336,802
11 Receivables from subsidiaries 0 0 375,627 266,232
12 Other securities and investments 5,306 0 5,306 0
13 Other receivables 435 181 435 181
Total financial assets 5,741 181 902,691 603,215
Total non-current assets 1,336,978 1,038,596 903,408 604,084
DKK’000 Group Parent company
Note 2018 2017 2018 2017
ASSETS Current assets 14 Project portfolios 721,867 538,421 0 0
Total inventories 721,867 538,421 0 0
Trade receivables 67 92 0 0
Receivables from subsidiaries 617 982 2,058 2,421
Income tax receivable 7,575 0 2,533 0
Income tax receivable from subsidiaries 0 0 19,343 41,680
Other receivables 58,752 4,141 1,168 6
15 Prepayments 315 246 89 242
Total receivables 67,326 5,461 25,191 44,349
16 Cash and cash equivalents 18,755 42,750 0 0
Total current assets 807,948 586,632 25,191 44,349
Total assets 2,144,926 1,625,228 928,599 648,433
43FINANCIAL STATEMENTS ANNUAL REPORT 2018 ELF DEVELOPMENTCONTENTS
BALANCE SHEET
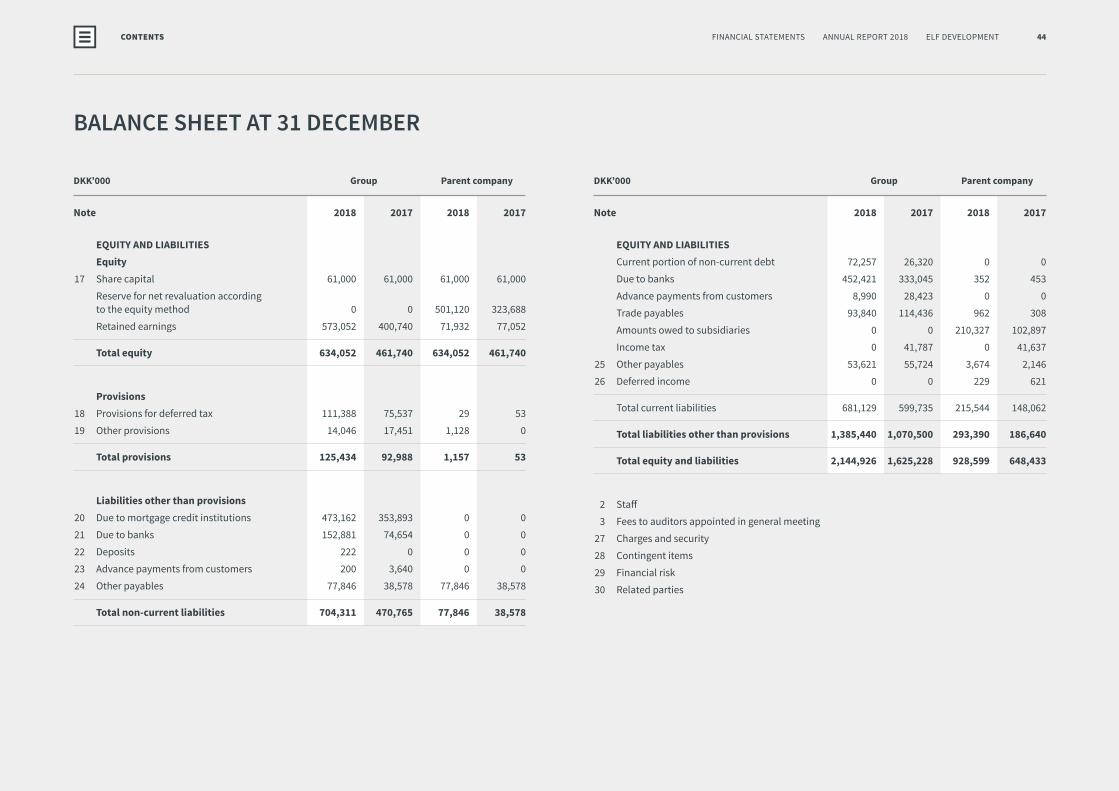
DKK’000 Group Parent company
Note 2018 2017 2018 2017
EQUITY AND LIABILITIES Equity 17 Share capital 61,000 61,000 61,000 61,000
Reserve for net revaluation according to the equity method 0 0 501,120 323,688
Retained earnings 573,052 400,740 71,932 77,052
Total equity 634,052 461,740 634,052 461,740
Provisions 18 Provisions for deferred tax 111,388 75,537 29 53
19 Other provisions 14,046 17,451 1,128 0
Total provisions 125,434 92,988 1,157 53
Liabilities other than provisions 20 Due to mortgage credit institutions 473,162 353,893 0 0
21 Due to banks 152,881 74,654 0 0
22 Deposits 222 0 0 0
23 Advance payments from customers 200 3,640 0 0
24 Other payables 77,846 38,578 77,846 38,578
Total non-current liabilities 704,311 470,765 77,846 38,578
DKK’000 Group Parent company
Note 2018 2017 2018 2017
EQUITY AND LIABILITIES Current portion of non-current debt 72,257 26,320 0 0
Due to banks 452,421 333,045 352 453
Advance payments from customers 8,990 28,423 0 0
Trade payables 93,840 114,436 962 308
Amounts owed to subsidiaries 0 0 210,327 102,897
Income tax 0 41,787 0 41,637
25 Other payables 53,621 55,724 3,674 2,146
26 Deferred income 0 0 229 621
Total current liabilities 681,129 599,735 215,544 148,062
Total liabilities other than provisions 1,385,440 1,070,500 293,390 186,640
Total equity and liabilities 2,144,926 1,625,228 928,599 648,433
2 Staff
3 Fees to auditors appointed in general meeting
27 Charges and security
28 Contingent items
29 Financial risk
30 Related parties
BALANCE SHEET AT 31 DECEMBER
44FINANCIAL STATEMENTS ANNUAL REPORT 2018 ELF DEVELOPMENTCONTENTS
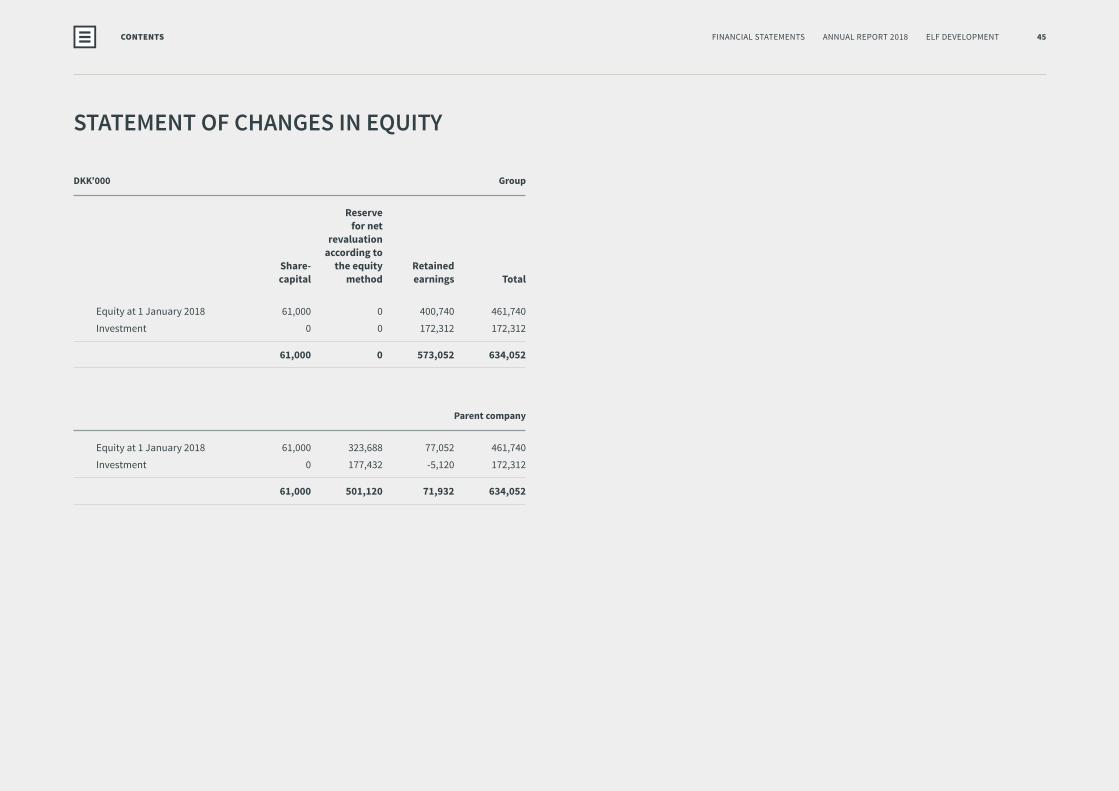
DKK’000 Group
Reserve for net revaluation according to Share- the equity Retained capital method earnings Total
Equity at 1 January 2018 61,000 0 400,740 461,740
Investment 0 0 172,312 172,312
61,000 0 573,052 634,052
Parent company
Equity at 1 January 2018 61,000 323,688 77,052 461,740
Investment 0 177,432 -5,120 172,312
61,000 501,120 71,932 634,052
STATEMENT OF CHANGES IN EQUITY
45FINANCIAL STATEMENTS ANNUAL REPORT 2018 ELF DEVELOPMENTCONTENTS
STATEMENT OF CHANGES IN EQUITY

DKK’000 Group
Note 2018 2017
Profit for the year 172,312 211,497
31 Adjustments -63,505 -18,504
32 Change in working capital -294,707 168,023
Cash flow from operating activities before net financials -185,900 361,016
Interest received and similar items 0 4,741
Interest paid and similar items -9,832 -20,467
Cash flow from ordinary activities -195,732 345,290
Income tax paid -62,436 -24,694
Cash flows from operating activities -258,168 320,596
Purchase of property, plant and equipment -8,924 -78,790
Sale of property, plant and equipment 51,188 178,150
Purchase and transfers of property plant and equipment under constructionand advance payments of property plant and equipment -212,826 -118,397
Purchase of financial assets -5,560 0
Cash flows from investing activities -176,122 -19,037
DKK’000 Group
Note 2018 2017
Raising of non-current debt 322,045 0
Repayment of non-current debt -42,560 -402,882
Change in short-term bank debt 119,377 69,669
Cash flows from financing activities 398,862 -333,213
Change in cash and cash equivalents -35,428 -31,654 Cash and cash equivalents, beginning of year 42,750 74,404
Cash and cash equivalents, end of year 7,322 42,750
Cash and cash equivalents Cash 7,322 42,750
Cash and cash equivalents, end of year 7,322 42,750
CASH FLOW STATEMENT 1 JANUARY - 31 DECEMBER
46FINANCIAL STATEMENTS ANNUAL REPORT 2018 ELF DEVELOPMENTCONTENTS
CASH FLOW STATEMENT

NOTES
DKK’000 Group Parent company
Note 2018 2017 2018 2017
3. FEES TO AUDITORS APPOINTED IN GENERAL MEETING
Total fee paid to Redmark, Statsautoriseret Revisionspartnerselskab 1,113 941 209 137
Statutory audit fee 832 709 125 82
Tax advice 21 14 21 14
Other services 260 218 63 41
1,113 941 209 137
4. OTHER FINANCIAL EXPENSES
Financial expenses, subsidiaries 0 0 6,492 890
Other financial expenses 9,832 20,467 2,560 8,244
9,832 20,467 9,052 9,134
5. TAX ON PROFIT FOR THE YEAR
Tax on profit for the year 18,310 49,575 -1,070 1,533
Adjustment of deferred tax 30,662 10,438 -24 171
Prior-year tax adjustments -47 33 -47 0
48,925 60,046 -1,141 1,704
DKK’000 Group Parent company
Note 2018 2017 2018 2017
1. REVENUE
Revenue 0 0 19,284 13,472
Revenue regarding projects 374,763 814,229 0 0
Rental income 45,977 48,409 0 0
420,740 862,638 19,284 13,472
2. STAFF
Wages and salaries 22,070 15,168 22,070 15,168
Pensions 726 497 726 497
Other social security costs 153 101 153 101
Other staff costs 2,271 1,221 2,271 1,221
25,220 16,987 25,220 16,987
Management Board 2,476 477 2,476 477
Board of Directors 25 25 25 25
2,501 502 2,501 502
Average number of full-time employees 27 21 27 21
47FINANCIAL STATEMENTS ANNUAL REPORT 2018 ELF DEVELOPMENTCONTENTS
NOTES
NOTES
DKK’000 Group Parent company
Note 2018 2017 2018 2017
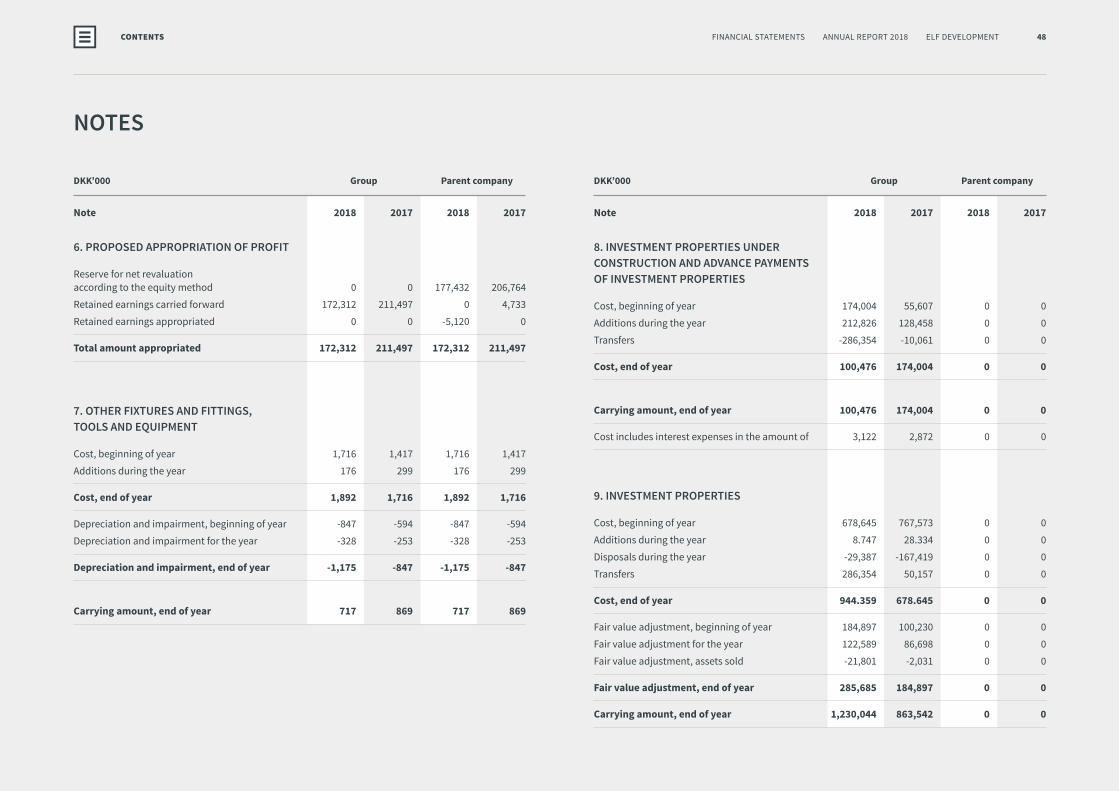
8. INVESTMENT PROPERTIES UNDER CONSTRUCTION AND ADVANCE PAYMENTS OF INVESTMENT PROPERTIES
Cost, beginning of year 174,004 55,607 0 0
Additions during the year 212,826 128,458 0 0
Transfers -286,354 -10,061 0 0
Cost, end of year 100,476 174,004 0 0
Carrying amount, end of year 100,476 174,004 0 0
Cost includes interest expenses in the amount of 3,122 2,872 0 0
9. INVESTMENT PROPERTIES
Cost, beginning of year 678,645 767,573 0 0
Additions during the year 8.747 28.334 0 0
Disposals during the year -29,387 -167,419 0 0
Transfers 286,354 50,157 0 0
Cost, end of year 944.359 678.645 0 0
Fair value adjustment, beginning of year 184,897 100,230 0 0
Fair value adjustment for the year 122,589 86,698 0 0
Fair value adjustment, assets sold -21,801 -2,031 0 0
Fair value adjustment, end of year 285,685 184,897 0 0
Carrying amount, end of year 1,230,044 863,542 0 0
DKK’000 Group Parent company
Note 2018 2017 2018 2017
6. PROPOSED APPROPRIATION OF PROFIT
Reserve for net revaluation according to the equity method 0 0 177,432 206,764
Retained earnings carried forward 172,312 211,497 0 4,733
Retained earnings appropriated 0 0 -5,120 0
Total amount appropriated 172,312 211,497 172,312 211,497
7. OTHER FIXTURES AND FITTINGS, TOOLS AND EQUIPMENT
Cost, beginning of year 1,716 1,417 1,716 1,417
Additions during the year 176 299 176 299
Cost, end of year 1,892 1,716 1,892 1,716
Depreciation and impairment, beginning of year -847 -594 -847 -594
Depreciation and impairment for the year -328 -253 -328 -253
Depreciation and impairment, end of year -1,175 -847 -1,175 -847
Carrying amount, end of year 717 869 717 869
48FINANCIAL STATEMENTS ANNUAL REPORT 2018 ELF DEVELOPMENTCONTENTS
NOTES
DKK’000 Parent company
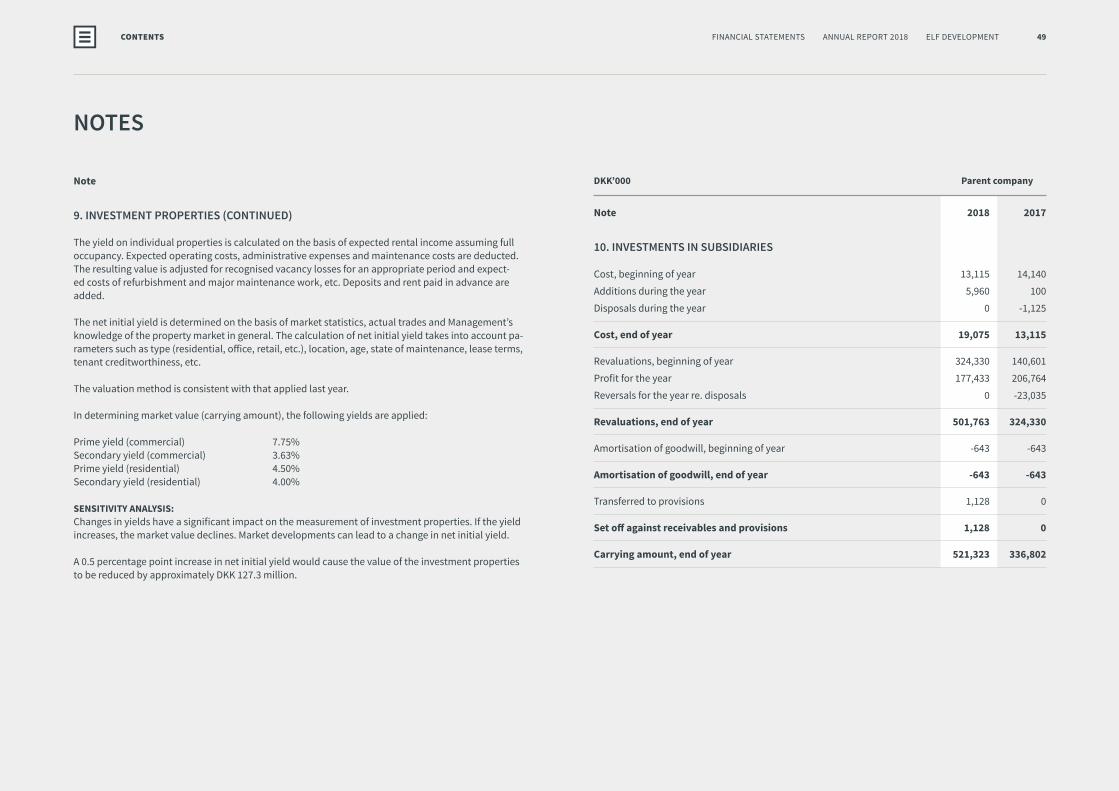
Note 2018 2017
10. INVESTMENTS IN SUBSIDIARIES
Cost, beginning of year 13,115 14,140
Additions during the year 5,960 100
Disposals during the year 0 -1,125
Cost, end of year 19,075 13,115
Revaluations, beginning of year 324,330 140,601
Profit for the year 177,433 206,764
Reversals for the year re. disposals 0 -23,035
Revaluations, end of year 501,763 324,330
Amortisation of goodwill, beginning of year -643 -643
Amortisation of goodwill, end of year -643 -643
Transferred to provisions 1,128 0
Set off against receivables and provisions 1,128 0
Carrying amount, end of year 521,323 336,802
Note
9. INVESTMENT PROPERTIES (CONTINUED)
The yield on individual properties is calculated on the basis of expected rental income assuming full occupancy. Expected operating costs, administrative expenses and maintenance costs are deducted. The resulting value is adjusted for recognised vacancy losses for an appropriate period and expect-ed costs of refurbishment and major maintenance work, etc. Deposits and rent paid in advance are added.
The net initial yield is determined on the basis of market statistics, actual trades and Management’s knowledge of the property market in general. The calculation of net initial yield takes into account pa-rameters such as type (residential, office, retail, etc.), location, age, state of maintenance, lease terms, tenant creditworthiness, etc.
The valuation method is consistent with that applied last year.
In determining market value (carrying amount), the following yields are applied:
Prime yield (commercial) 7.75%Secondary yield (commercial) 3.63%Prime yield (residential) 4.50%Secondary yield (residential) 4.00%
SENSITIVITY ANALYSIS:Changes in yields have a significant impact on the measurement of investment properties. If the yield increases, the market value declines. Market developments can lead to a change in net initial yield.
A 0.5 percentage point increase in net initial yield would cause the value of the investment properties to be reduced by approximately DKK 127.3 million.
49FINANCIAL STATEMENTS ANNUAL REPORT 2018 ELF DEVELOPMENTCONTENTS
NOTES
Ownership Note Domicile interest
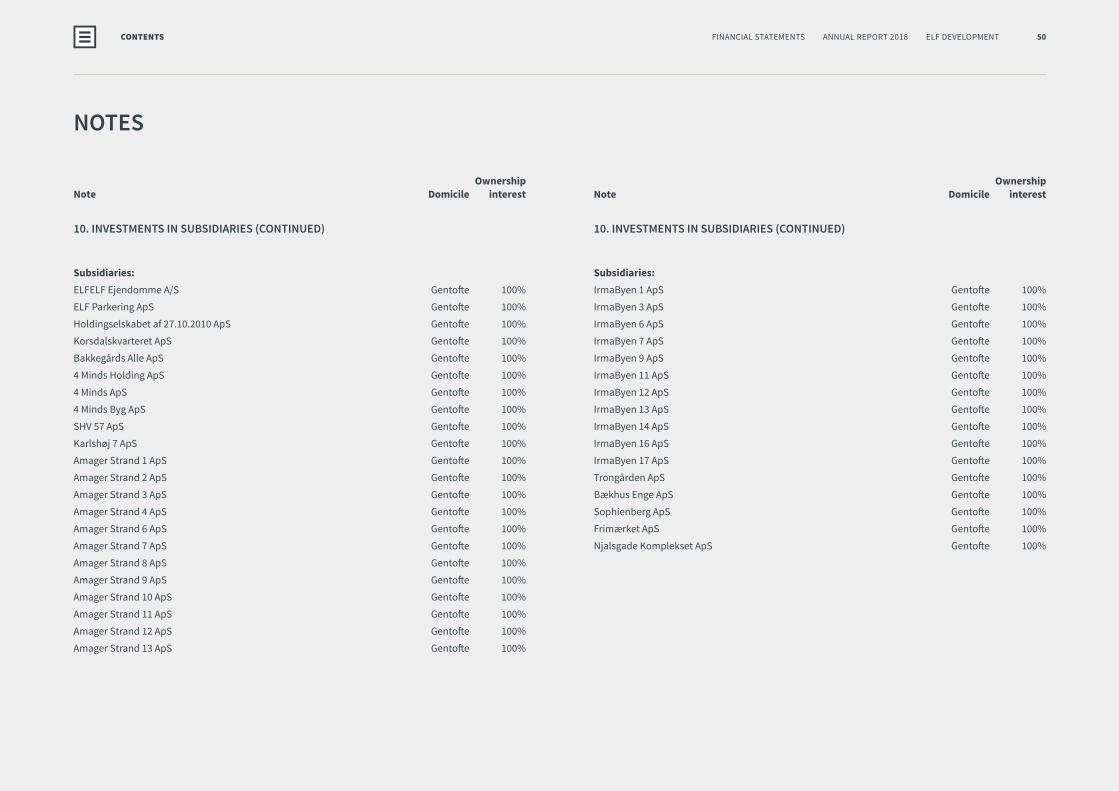
10. INVESTMENTS IN SUBSIDIARIES (CONTINUED)
Subsidiaries:IrmaByen 1 ApS Gentofte 100%
IrmaByen 3 ApS Gentofte 100%
IrmaByen 6 ApS Gentofte 100%
IrmaByen 7 ApS Gentofte 100%
IrmaByen 9 ApS Gentofte 100%
IrmaByen 11 ApS Gentofte 100%
IrmaByen 12 ApS Gentofte 100%
IrmaByen 13 ApS Gentofte 100%
IrmaByen 14 ApS Gentofte 100%
IrmaByen 16 ApS Gentofte 100%
IrmaByen 17 ApS Gentofte 100%
Trongården ApS Gentofte 100%
Bækhus Enge ApS Gentofte 100%
Sophienberg ApS Gentofte 100%
Frimærket ApS Gentofte 100%
Njalsgade Komplekset ApS Gentofte 100%
Ownership Note Domicile interest
10. INVESTMENTS IN SUBSIDIARIES (CONTINUED)
Subsidiaries:ELFELF Ejendomme A/S Gentofte 100%
ELF Parkering ApS Gentofte 100%
Holdingselskabet af 27.10.2010 ApS Gentofte 100%
Korsdalskvarteret ApS Gentofte 100%
Bakkegårds Alle ApS Gentofte 100%
4 Minds Holding ApS Gentofte 100%
4 Minds ApS Gentofte 100%
4 Minds Byg ApS Gentofte 100%
SHV 57 ApS Gentofte 100%
Karlshøj 7 ApS Gentofte 100%
Amager Strand 1 ApS Gentofte 100%
Amager Strand 2 ApS Gentofte 100%
Amager Strand 3 ApS Gentofte 100%
Amager Strand 4 ApS Gentofte 100%
Amager Strand 6 ApS Gentofte 100%
Amager Strand 7 ApS Gentofte 100%
Amager Strand 8 ApS Gentofte 100%
Amager Strand 9 ApS Gentofte 100%
Amager Strand 10 ApS Gentofte 100%
Amager Strand 11 ApS Gentofte 100%
Amager Strand 12 ApS Gentofte 100%
Amager Strand 13 ApS Gentofte 100%
50FINANCIAL STATEMENTS ANNUAL REPORT 2018 ELF DEVELOPMENTCONTENTS

NOTES
DKK’000 Group Parent company
Note 2018 2017 2018 2017
13. OTHER RECEIVABLES
Cost, beginning of year 181 181 181 181
Additions during the year 254 0 254 0
Cost, end of year 435 181 435 181
Carrying amount, end of year 435 181 435 181
14. PROJECT PORTFOLIOS
Project portfolios 721,867 538,421 0 0
721,867 538,421 0 0
Capitalised financial expenses constitute DKK 14,813 thousand (2017: DKK 11,879 thousand) of the project portfolio.
15. PREPAYMENTS
Prepayments comprise costs incurred in relation to subsequent years, including project costs paid in advance.
16. CASH AND CASH AND CASH EQUIVALENTS
Of cash and cash equivalents, amounts held in escrow constitute DKK 11.4 million (2017: DKK 35.6 million)
17. SHARE CAPITAL
The share capital consists of 2,440 shares of DKK 25 each and multiples thereof. The share capital is not divided into share classes.
DKK’000 Group Parent company
Note 2018 2017 2018 2017
11. RECEIVABLES FROM SUBSIDIARIES
Cost, beginning of year 266,231 273,077
Additions during the year 357,613 369,664
Disposals during the year -248,217 -376,509
Cost, end of year 375,627 266,232
Impairment losses, beginning of year 0 -10,461
Reversed impairment losses 0 10,461
Carrying amount, end of year 375,627 266,232
12. OTHER SECURITIES AND INVESTMENTS
Additions 5,306 0 5,306 0
Cost, end of year 5,306 0 5,306 0
Carrying amount, end of year 5,306 0 5,306 0
51FINANCIAL STATEMENTS ANNUAL REPORT 2018 ELF DEVELOPMENTCONTENTS
NOTES
DKK’000 Group
Note 2018 2017
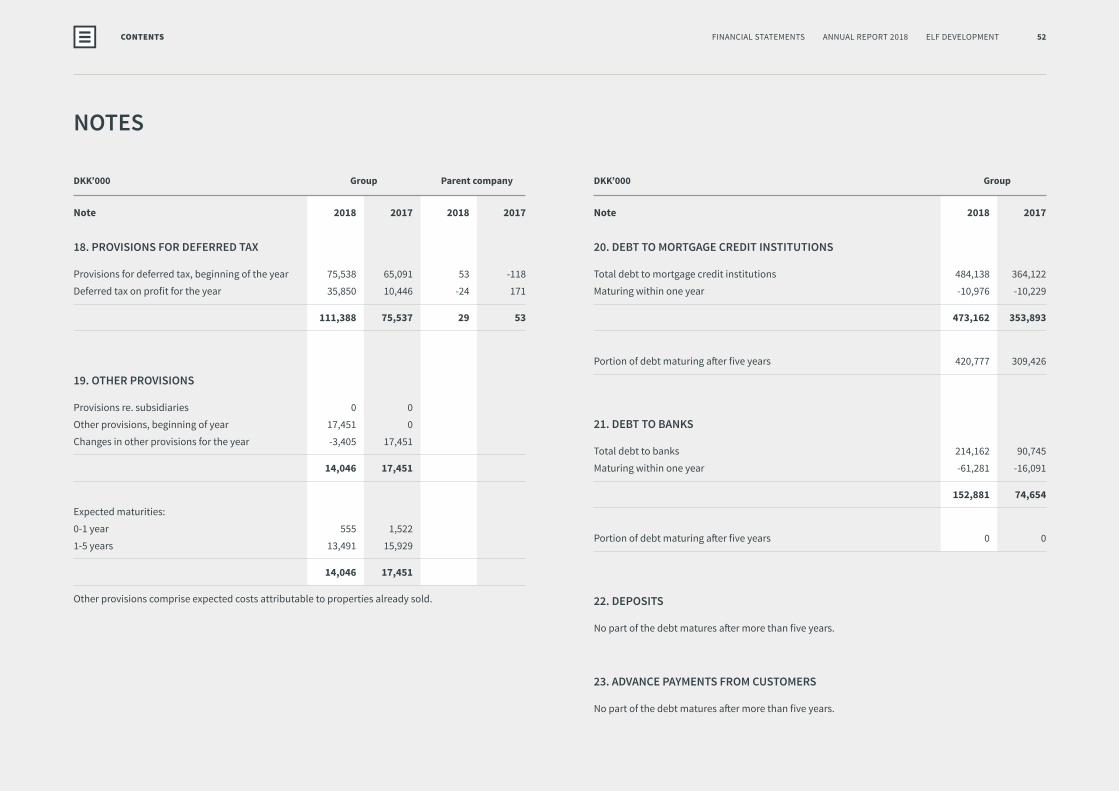
20. DEBT TO MORTGAGE CREDIT INSTITUTIONS
Total debt to mortgage credit institutions 484,138 364,122
Maturing within one year -10,976 -10,229
473,162 353,893
Portion of debt maturing after five years 420,777 309,426
21. DEBT TO BANKS
Total debt to banks 214,162 90,745
Maturing within one year -61,281 -16,091
152,881 74,654
Portion of debt maturing after five years 0 0
22. DEPOSITS
No part of the debt matures after more than five years.
23. ADVANCE PAYMENTS FROM CUSTOMERS
No part of the debt matures after more than five years.
DKK’000 Group Parent company
Note 2018 2017 2018 2017
18. PROVISIONS FOR DEFERRED TAX
Provisions for deferred tax, beginning of the year 75,538 65,091 53 -118
Deferred tax on profit for the year 35,850 10,446 -24 171
111,388 75,537 29 53
19. OTHER PROVISIONS
Provisions re. subsidiaries 0 0
Other provisions, beginning of year 17,451 0
Changes in other provisions for the year -3,405 17,451
14,046 17,451
Expected maturities:
0-1 year 555 1,522
1-5 years 13,491 15,929
14,046 17,451
Other provisions comprise expected costs attributable to properties already sold.
52FINANCIAL STATEMENTS ANNUAL REPORT 2018 ELF DEVELOPMENTCONTENTS
NOTES
DKK’000 Group Parent company
Note 2018 2017 2018 2017
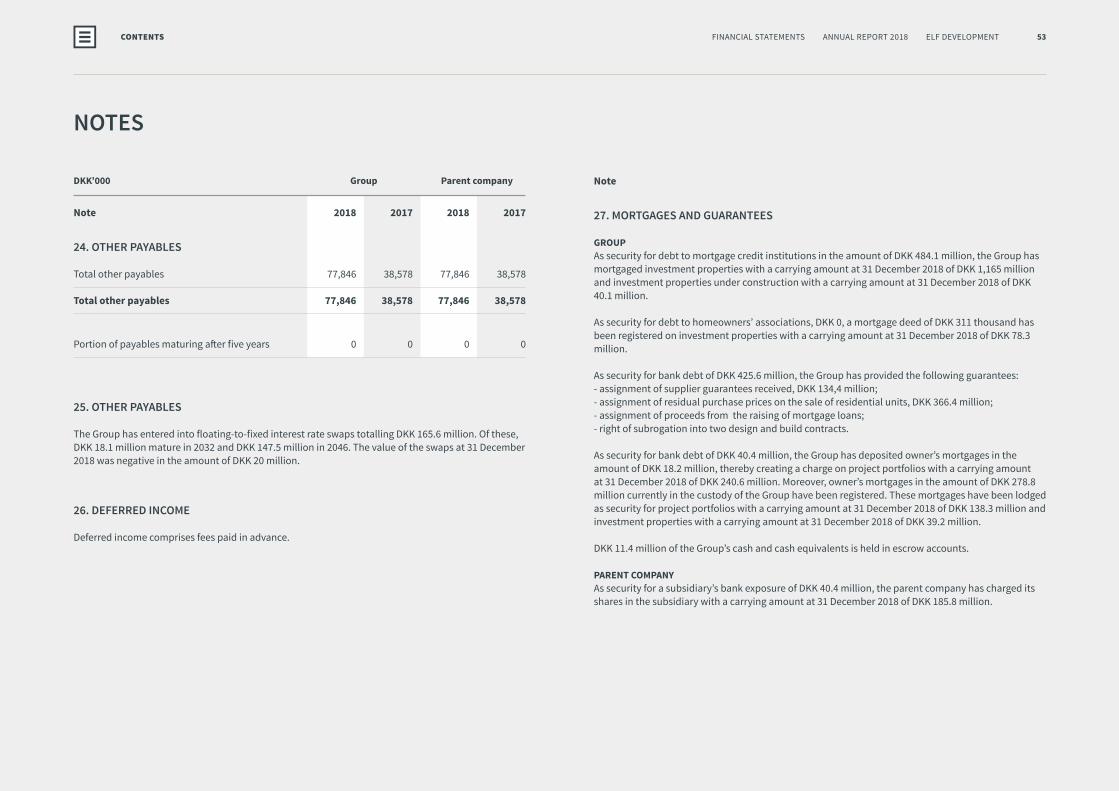
24. OTHER PAYABLES
Total other payables 77,846 38,578 77,846 38,578
Total other payables 77,846 38,578 77,846 38,578
Portion of payables maturing after five years 0 0 0 0
25. OTHER PAYABLES
The Group has entered into floating-to-fixed interest rate swaps totalling DKK 165.6 million. Of these, DKK 18.1 million mature in 2032 and DKK 147.5 million in 2046. The value of the swaps at 31 December 2018 was negative in the amount of DKK 20 million.
26. DEFERRED INCOME
Deferred income comprises fees paid in advance.
Note
27. MORTGAGES AND GUARANTEES
GROUPAs security for debt to mortgage credit institutions in the amount of DKK 484.1 million, the Group has mortgaged investment properties with a carrying amount at 31 December 2018 of DKK 1,165 million and investment properties under construction with a carrying amount at 31 December 2018 of DKK 40.1 million.
As security for debt to homeowners’ associations, DKK 0, a mortgage deed of DKK 311 thousand has been registered on investment properties with a carrying amount at 31 December 2018 of DKK 78.3 million.
As security for bank debt of DKK 425.6 million, the Group has provided the following guarantees:- assignment of supplier guarantees received, DKK 134,4 million;- assignment of residual purchase prices on the sale of residential units, DKK 366.4 million;- assignment of proceeds from the raising of mortgage loans;- right of subrogation into two design and build contracts.
As security for bank debt of DKK 40.4 million, the Group has deposited owner’s mortgages in the amount of DKK 18.2 million, thereby creating a charge on project portfolios with a carrying amount at 31 December 2018 of DKK 240.6 million. Moreover, owner’s mortgages in the amount of DKK 278.8 million currently in the custody of the Group have been registered. These mortgages have been lodged as security for project portfolios with a carrying amount at 31 December 2018 of DKK 138.3 million and investment properties with a carrying amount at 31 December 2018 of DKK 39.2 million.
DKK 11.4 million of the Group’s cash and cash equivalents is held in escrow accounts.
PARENT COMPANYAs security for a subsidiary’s bank exposure of DKK 40.4 million, the parent company has charged its shares in the subsidiary with a carrying amount at 31 December 2018 of DKK 185.8 million.
53FINANCIAL STATEMENTS ANNUAL REPORT 2018 ELF DEVELOPMENTCONTENTS
NOTES
Note
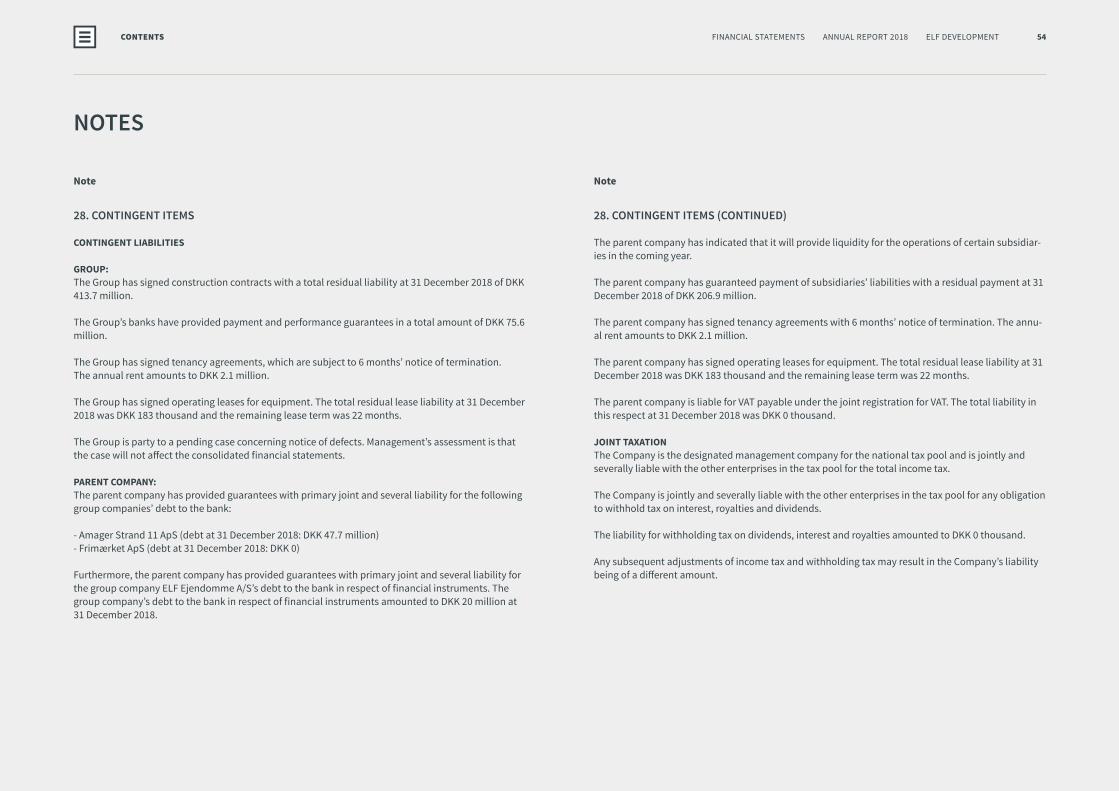
28. CONTINGENT ITEMS (CONTINUED)
The parent company has indicated that it will provide liquidity for the operations of certain subsidiar-ies in the coming year.
The parent company has guaranteed payment of subsidiaries’ liabilities with a residual payment at 31 December 2018 of DKK 206.9 million.
The parent company has signed tenancy agreements with 6 months’ notice of termination. The annu-al rent amounts to DKK 2.1 million.
The parent company has signed operating leases for equipment. The total residual lease liability at 31 December 2018 was DKK 183 thousand and the remaining lease term was 22 months.
The parent company is liable for VAT payable under the joint registration for VAT. The total liability in this respect at 31 December 2018 was DKK 0 thousand.
JOINT TAXATIONThe Company is the designated management company for the national tax pool and is jointly and severally liable with the other enterprises in the tax pool for the total income tax.
The Company is jointly and severally liable with the other enterprises in the tax pool for any obligation to withhold tax on interest, royalties and dividends.
The liability for withholding tax on dividends, interest and royalties amounted to DKK 0 thousand.
Any subsequent adjustments of income tax and withholding tax may result in the Company’s liability being of a different amount.
Note
28. CONTINGENT ITEMS
CONTINGENT LIABILITIES
GROUP:The Group has signed construction contracts with a total residual liability at 31 December 2018 of DKK 413.7 million.
The Group’s banks have provided payment and performance guarantees in a total amount of DKK 75.6 million.
The Group has signed tenancy agreements, which are subject to 6 months’ notice of termination. The annual rent amounts to DKK 2.1 million.
The Group has signed operating leases for equipment. The total residual lease liability at 31 December 2018 was DKK 183 thousand and the remaining lease term was 22 months.
The Group is party to a pending case concerning notice of defects. Management’s assessment is that the case will not affect the consolidated financial statements.
PARENT COMPANY:The parent company has provided guarantees with primary joint and several liability for the following group companies’ debt to the bank:
- Amager Strand 11 ApS (debt at 31 December 2018: DKK 47.7 million) - Frimærket ApS (debt at 31 December 2018: DKK 0)
Furthermore, the parent company has provided guarantees with primary joint and several liability for the group company ELF Ejendomme A/S’s debt to the bank in respect of financial instruments. The group company’s debt to the bank in respect of financial instruments amounted to DKK 20 million at 31 December 2018.
54FINANCIAL STATEMENTS ANNUAL REPORT 2018 ELF DEVELOPMENTCONTENTS
NOTES
DKK’000 Group
Note 2018 2017
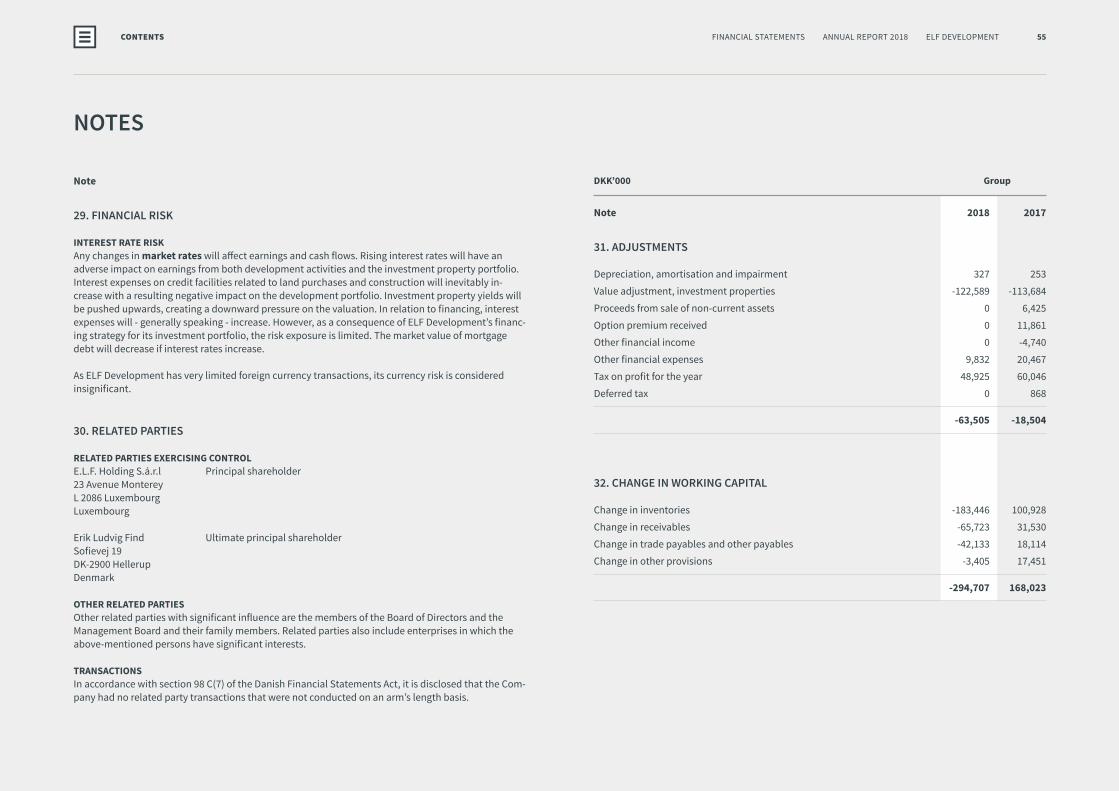
31. ADJUSTMENTS
Depreciation, amortisation and impairment 327 253
Value adjustment, investment properties -122,589 -113,684
Proceeds from sale of non-current assets 0 6,425
Option premium received 0 11,861
Other financial income 0 -4,740
Other financial expenses 9,832 20,467
Tax on profit for the year 48,925 60,046
Deferred tax 0 868
-63,505 -18,504
32. CHANGE IN WORKING CAPITAL
Change in inventories -183,446 100,928
Change in receivables -65,723 31,530
Change in trade payables and other payables -42,133 18,114
Change in other provisions -3,405 17,451
-294,707 168,023
Note
29. FINANCIAL RISK
INTEREST RATE RISKAny changes in market rates will affect earnings and cash flows. Rising interest rates will have an adverse impact on earnings from both development activities and the investment property portfolio. Interest expenses on credit facilities related to land purchases and construction will inevitably in-crease with a resulting negative impact on the development portfolio. Investment property yields will be pushed upwards, creating a downward pressure on the valuation. In relation to financing, interest expenses will - generally speaking - increase. However, as a consequence of ELF Development’s financ-ing strategy for its investment portfolio, the risk exposure is limited. The market value of mortgage debt will decrease if interest rates increase.
As ELF Development has very limited foreign currency transactions, its currency risk is considered insignificant.
30. RELATED PARTIES
RELATED PARTIES EXERCISING CONTROLE.L.F. Holding S.á.r.l Principal shareholder23 Avenue MontereyL 2086 LuxembourgLuxembourg
Erik Ludvig Find Ultimate principal shareholderSofievej 19DK-2900 Hellerup Denmark
OTHER RELATED PARTIESOther related parties with significant influence are the members of the Board of Directors and the Management Board and their family members. Related parties also include enterprises in which the above-mentioned persons have significant interests.
TRANSACTIONSIn accordance with section 98 C(7) of the Danish Financial Statements Act, it is disclosed that the Com-pany had no related party transactions that were not conducted on an arm’s length basis.
55FINANCIAL STATEMENTS ANNUAL REPORT 2018 ELF DEVELOPMENTCONTENTS
The annual report of ELF Development A/S is presented in accordance with the provisions of the Danish Financial Statements Act for class C enterprises.
The accounting policies are consistent with those applied in last year's annual report. The presentation currency is DKK.
RECOGNITION AND MEASUREMENTIncome is recognised in the income statement as earned. This includes the recognition of value adjustments of financial assets and liabilities. Also recognised in the income statement are all costs, in-cluding depreciation, amortisation, impairment losses and provisions as well as reversals due to changed accounting estimates of amounts previously recognised in the income statement.
Assets are recognised in the balance sheet when it is probable that future economic benefits will flow to the Group and the value of the asset can be reliably measured.
Liabilities are recognised in the balance sheet when it is probable that future economic benefits will flow from the Group and the value of the liability can be reliably measured.
On initial recognition, assets and liabilities are measured at cost. Subsequently, assets and liabilities are measured as described below for each item.
Certain financial assets and liabilities are measured at amortised cost, implying the recognition of a constant effective rate of interest to maturity. Amortised cost is calculated as initial cost minus any principal repayments and plus or minus accumulated amortisation of any difference between cost and nominal amount. This method allo-cates capital gains and losses over the term of the asset or liability.
Recognition and measurement take into account predictable losses and risks occurring before the presentation of the annual report which relate to matters existing at the balance sheet date.
DERIVATIVE FINANCIAL INSTRUMENTSDerivative financial instruments are initially recognised in the balance sheet at cost and subsequently measured at fair value. Positive and negative fair values of derivative financial instruments are recognised in other receivables and other payables, respectively.
Changes in the fair value of derivative financial instruments that are designated as a hedge of the fair value of a recognised asset or liabil-ity are recognised through profit or loss together with any changes in the fair value of the hedged asset or liability.
Changes in the fair value of derivative financial instruments designat-ed as and qualifying for recognition as a hedge of future cash flows are recognised as other receivables or other payables and in equity.
If a future transaction results in the recognition of assets or liabilities, amounts previously recognised in equity are transferred to the cost of the asset or liability, respectively. If a future transaction results in income or expenses, amounts previously recognised in equity are transferred to the income statement in the period in which the hedged transaction affects the income statement.
For derivative financial instruments that do not qualify for hedge accounting, changes in fair value are recognised in the income state-ment as they occur.
CONSOLIDATED FINANCIAL STATEMENTSThe financial statements consolidate the parent company, ELF Devel-opment A/S, and subsidiaries in which ELF Development A/S directly or indirectly holds more than 50% of the voting rights or otherwise exercises control. Entities in which the Group holds between 20% and 50% of the voting rights and exercises significant influence but not control are regarded as associates, see the Group overview.
On consolidation, intra-group income and expenses, equity invest-ments, balances and dividends as well as realised and unrealised
gains and losses on transactions between the consolidated entities are eliminated.
Investments in subsidiaries are set off against the proportionate share of the subsidiaries’ market value of net assets and liabilities at the acquisition date.
Enterprises acquired or formed during the year are recognised in the consolidated financial statements from the date of acquisition. Enterprises divested or wound up are recognised in the consolidated income statement until the date of disposal. Comparative figures are not restated to reflect acquisitions, divestments or enterprises wound up.
Acquisitions are accounted for using the purchase method, according to which the identifiable assets and liabilities of acquired enterprises are measured at fair value at the date of acquisition. Restructur-ing costs that are recognised in the acquired enterprise before the acquisition date and were not scheduled as part of the acquisition are included in the pre-acquisition balance sheet and, accordingly, in the calculation of goodwill. Restructuring projects scheduled by the acquired enterprise are recognised in the income statement. The tax effect of revaluations is taken into account.
Positive differences (goodwill) between cost and fair value of identifi-able assets and liabilities acquired, including restructuring provisions, are recognised as intangible assets and amortised on a systematic basis in the income statement based on an individual assessment of the economic life of the asset. Negative differences (negative good-will) are recognised as income in the income statement at the date of acquisition when the general revenue recognition criteria are met.
Positive and negative goodwill from acquired enterprises may be adjusted until 12 months after the acquisition.
ACCOUNTING POLICIES
56FINANCIAL STATEMENTS ANNUAL REPORT 2018 ELF DEVELOPMENTCONTENTS
ACCOUNTING POLICIES

ACCOUNTING POLICIES
Gains or losses on disposal of subsidiaries and associates are stated as the difference between the selling price or disposal consideration and the carrying amount of net assets at the date of disposal, includ-ing unamortised goodwill, and expected disposal costs.
INCOME STATEMENT
REVENUERevenue is recognised in the income statement if delivery and transfer of risk to the buyer have taken place before the end of the year, and provided that the income can be measured reliably and is expected to be received. Revenue is recognised excluding VAT and taxes and net of discounts related to sales.
Rental income comprises income from the letting of properties and common charges and is recognised in the income statement in the period to which the rent pertains. Income relating to the heating accounts is recognised in the balance sheet as balances with tenants.
PRODUCTION COSTSProduction costs comprise costs, including wages and salaries and depreciation and amortisation, incurred in generating the revenue for the year. Enterprises engaged in trading recognise cost of sales and enterprises engaged in manufacturing recognise production costs corresponding to revenue for the year. This includes direct and indirect costs of raw materials and consumables, wages and salaries, rental and leasing as well as depreciation of production plant.
Production costs also comprise repair and maintenance costs, direct and indirect taxes and other costs in relation to investment prop-erties. Costs relating to the heating accounts are recognised in the balance sheet as balances with tenants.
Production costs furthermore comprise research costs and devel-opment costs not qualifying for capitalisation and amortisation of capitalised development costs.
Finally, provisions for anticipated losses on construction contracts are recognised.
DISTRIBUTION COSTSDistribution costs comprise costs incurred for distribution of goods sold during the year and for sales campaigns during the year. This includes the cost of sales staff, advertising and exhibition costs as well as depreciation.
ADMINISTRATIVE EXPENSESAdministrative expenses comprise expenses incurred during the year for management and administration, including expenses for admin-istrative staff, Management, office premises and office expenses and depreciation.
OTHER OPERATING INCOMEOther operating income comprises items secondary to the principal activities of the enterprise, including gains on disposal of intangible assets and property, plant and equipment.
VALUE ADJUSTMENT OF INVESTMENT PROPERTIESValue adjustment of investment properties comprises fair value ad-justment of properties and gains and losses on the sale of properties.
FINANCIAL INCOME AND EXPENSESFinancial income and expenses comprise interest income and expens-es, realised and unrealised market value gains and losses on financial assets and liabilities, amortisation of financial liabilities as well as surcharges and refunds under the on-account tax scheme etc. Finan-cial income and expenses are recognised in the income statement in the amounts relating to the financial year.
Interest expenses and other expenses on loans financing projects are recognised in the cost of the project portfolios.
INCOME FROM INVESTMENTS IN SUBSIDIARIESThe proportionate share of the profit or loss of subsidiaries after tax is recognised in the parent company income statement after full elimination of intra-group gains/losses and deduction of amortisation of goodwill on acquisition.
TAX ON PROFIT FOR THE YEARTax for the year consists of current tax for the year and changes in deferred tax for the year. The tax attributable to the profit for the year is recognised in the income statement, whereas the tax attributable to equity transactions is recognised directly in equity.
The Company is subject to the Danish rules on compulsory joint taxa-tion with subsidiaries. The Company is the designated management company for the tax pool and handles the settlement of all corpora-tion tax payments with the tax authorities.
The current Danish corporation tax is allocated by the settlement of a joint tax contribution between the enterprises in the tax pool in proportion to their respective taxable incomes. In connection with the settlement, enterprises with negative taxable incomes receive a joint tax contribution from enterprises that have been able to use this tax loss to reduce their own taxable income (full allocation).
BALANCE SHEET
PROPERTY, PLANT AND EQUIPMENTProperty, plant and equipment are measured at cost less accumulat-ed depreciation and impairment losses.
The basis of depreciation is cost less expected residual value at the end of the useful life. The depreciation period and the residual value are determined at the acquisition date and reassessed annually. Where the residual value exceeds the carrying amount, the asset ceases to be depreciated.
57FINANCIAL STATEMENTS ANNUAL REPORT 2018 ELF DEVELOPMENTCONTENTS
If the depreciation period or the residual value is changed, the effect on depreciation going forward is recognised as a change in account-ing estimates.
Cost comprises the purchase price and any costs directly attributable to the acquisition until the date when the asset is available for use.
Where individual components of an item of property, plant and equipment have different useful lives, they are accounted for as sepa-rate items, which are depreciated separately.
Straight-line depreciation is provided based on the estimated useful lives of the assets as follows:
Useful lifeOther fixtures and fittings, tools and equipment 3-5 years
Minor assets with expected useful lives of less than one year are rec-ognised as costs in the income statement in the year of acquisition.
Gains or losses on the sale of property, plant and equipment are stated as the difference between the selling price less costs to sell and the carrying amount at the date of disposal. Gains and losses are recognised in the income statement under other operating income or other operating expenses.
LEASESOn initial recognition, leases for property, plant and equipment under which the Group has all material risks and rewards of ownership (finance leases) are initially measured in the balance sheet at the lower of the fair value and the present value of future lease payments. The present value is calculated using the interest rate implicit in the lease or, alternatively, the enterprise’s borrowing rate as the discount factor. Assets held under finance leases are subsequently accounted for as other similar property, plant and equipment.
The capitalised residual lease liability is recognised in the balance sheet as a liability, and the interest element of the lease payment is recognised in the income statement over the lease term.
All other leases are considered operating leases. Payments in con-nection with operating leases and other leases are recognised in the income statement over the lease term. The Group's total liability with respect to operating leases and other leases is disclosed in contingent items.
IMPAIRMENT OF NON-CURRENT ASSETSThe carrying amount of intangible assets and property, plant and equipment and investments in subsidiaries and associates is re-viewed annually for impairment beyond what is reflected by normal amortisation and depreciation charges.
If there is evidence of impairment, each asset or group of assets is tested for impairment. If the recoverable amount of an asset is less than its carrying amount, the carrying amount of the asset is written down to its recoverable amount.
The recoverable amount is the higher of the net selling price and the value in use of an asset. The value in use is determined as the present value of the expected net cash flows from the use of the asset or the group of assets.
Previously recognised impairment losses are reversed when the moti-vation for the impairment write-down ceases to exist. Impairment of goodwill is not reversed.
INVESTMENT PROPERTIESOn initial recognition, investment properties are measured at cost, consisting of the acquisition price of the property and any directly associated costs.
If a reliable fair value cannot be determined, investment properties under construction are measured at cost.
Subsequently, investment properties are measured individually at their estimated fair value. Properties are measured using a yield-based model, under which the fair value of a property is based on expected future cash flows for the coming year and a net initial yield determined by an external valuation expert. The valuation method is consistent with that applied in the previous financial year.
Costs that add new or improved qualities to an investment property relative to its condition at the acquisition date and thus improve the future yield on the property are added to cost as an improvement. Costs that do not add new or improved qualities to an investment property are recognised in the income statement under “costs in relation to investment properties”.
Like other property, plant and equipment except land, investment properties have a definite useful life. The impairment of an invest-ment property as it ages over time is reflected in the regular fair value measurement of the investment property. Accordingly, investment properties are not systematically depreciated over their useful lives.
Fair value adjustment through profit or loss is recognised in the item “value adjustment of investment properties”.
FINANCIAL ASSETS
INVESTMENTS IN SUBSIDIARIESInvestments in subsidiaries are recognised in the balance sheet at the proportionate share of the subsidiaries’ equity value. This is calculat-ed in accordance with the parent company’s accounting policies with the deduction or addition of unrealised intra-group gains and losses and with the addition or deduction of the residual value of positive or negative goodwill calculated according to the purchase method.
ACCOUNTING POLICIES
58FINANCIAL STATEMENTS ANNUAL REPORT 2018 ELF DEVELOPMENTCONTENTS
Subsidiaries with a negative equity value are recognised at DKK nil, and any receivable amount from the subsidiary is written down by the parent company’s share of the negative equity value, to the extent it is deemed to be irrecoverable. If the negative equity value exceeds the amount receivable, the residual amount is recognised under provisions to the extent that the parent company has a legal or con-structive obligation to cover the subsidiary’s negative balance.
Net revaluation of investments in subsidiaries is taken to the reserve for net revaluation under equity according to the equity method to the extent that the carrying amount exceeds cost. Dividends from subsidiaries that are expected to be approved before the adoption of this annual report are not tied up in the revaluation reserve. The reserve is adjusted by other changes in the equity of subsidiaries.
Enterprises acquired or formed during the year are recognised in the financial statements from the date of acquisition. Enterprises sold or wound up are recognised in the financial statements until the date of disposal.
Gains and losses on the divestment of subsidiaries and associates are stated as the difference between the selling price and the carrying amount of the net assets at the date of divestment including unam-ortised goodwill and anticipated costs to sell or wind up. Gains and losses are recognised in the income statement under financial items.
Acquisitions of new subsidiaries and associates are accounted for using the purchase method, according to which the assets and liabil-ities of acquired enterprises are measured at fair value at the date of acquisition. A provision is recognised for costs relating to scheduled restructuring in the acquired enterprises in connection with the acquisition. The tax effect of revaluations is taken into account.
Positive differences (goodwill) between cost and the fair value of identifiable acquired assets and liabilities, including provisions for restructuring, are recognised under investments in subsidiaries and
amortised over the estimated useful life, determined on the basis of Management’s experience in the business area in question. The maximum amortisation period is 20 years, longest for strategically acquired enterprises with strong market positions and long-term earnings profiles. The carrying amount of goodwill is assessed regularly and is written down through the income statement if the carrying amount exceeds the anticipated future net income from the enterprise or operations to which the goodwill relates.
OTHER SECURITIES AND INVESTMENTSSecurities and investments recognised in non-current assets com-prise unlisted shares measured at cost. If the recoverable amount of an asset is lower than its carrying amount, the carrying amount of the asset is written down to its recoverable amount.
PROJECT PORTFOLIOSProject portfolios are measured at cost. Where the net realisable value is lower than cost, project portfolios are written down to this lower value.
The net realisable value of inventories is calculated as the selling price less completion costs and costs incurred in making the sale. The net realisable value is determined taking into account marketability, obsolescence and changes in the expected selling price.
RECEIVABLESReceivables are measured at amortised cost, which usually corre-sponds to nominal value. Receivables are written down to net realisa-ble value as a provision for bad debts.
PREPAYMENTSPrepayments comprise costs incurred that relate to subsequent financial years.
CASH AND CASH AND CASH EQUIVALENTSCash and cash equivalents comprise bank deposits.
EQUITY
RESERVE FOR NET REVALUATION ACCORDING TO THE EQUITY METHODReserve for net revaluation according to the equity method comprises net revaluation of investments in subsidiaries and associates relative to cost.
The reserve may be eliminated against losses, realisation of invest-ments or changes in accounting estimates.
The reserve cannot be negative.
INCOME TAX AND DEFERRED TAXCurrent tax receivable and payable is recognised in the balance sheet as tax computed on the taxable income for the year, adjusted for tax on the taxable income of prior years and for tax paid on account. Tax receivable and payable are presented as a net amount to the extent that the amounts can legally be offset against each other and the items are expected to be settled net or simultaneously.
Pursuant to the joint taxation rules, as the designated management company of the tax pool ELF Development A/S is jointly and severally liable to the tax authorities for corporation tax and tax deducted at source on interest, royalties and dividends arising within the tax pool.
Joint taxation contributions payable and receivable are recognised in the balance sheet as "Income tax receivable from subsidiaries" or "Income tax payable to subsidiaries", respectively.
Deferred tax constitutes tax on all temporary differences between the carrying amount and the tax base of assets and liabilities, calculated based on the planned use of the asset or settlement of the liability, respectively.
Deferred tax assets, including the tax base of tax losses carried forward, are measured at the expected value of their utilisation,
ACCOUNTING POLICIES
59FINANCIAL STATEMENTS ANNUAL REPORT 2018 ELF DEVELOPMENTCONTENTS
either as a set-off against tax on future earnings or as a set-off against deferred tax liabilities within the same legal tax entity. Any deferred net tax assets are measured at net realisable value.
Deferred tax is measured on the basis of the tax rules and tax rates that, according to the legislation in force at the balance sheet date, will apply at the time the deferred tax is expected to crystallise as current tax.
OTHER PROVISIONSProvisions comprise expected expenses relating to guarantee com-mitments and completion of projects sold and losses on projects in progress. Provisions are recognised when the Group has a legal or constructive obligation that arises from past events and it is probable that an outflow of financial resources will be required to settle the obligation.
Provisions are measured at net realisable value or fair value, where settlement is expected to be well into the future.
Guarantee commitments comprise obligations to perform repair work within a warranty period of 15 years. Provisions are measured at net realisable value and recognised on the basis of experience from guarantee work. Provisions expected to be maintained for more than one year from the balance sheet date are discounted at the average bond yield.
LIABILITIES OTHER THAN PROVISIONSFinancial liabilities are recognised at the time the loans are obtained in the amount of the proceeds after deduction of transaction costs. Subsequently, financial liabilities are recognised at amortised cost, equivalent to the capitalised value using the effective interest rate. The difference between the proceeds and the nominal value is thus recognised in the income statement over the term of the loan.
Debt to mortgage credit institution and credit institutions is thus measured at amortised cost, which in the case of cash loans corresponds to the outstanding debt. For bond loans, amortised cost corresponds to the outstanding debt calculated as the loan's underlying cash value at the date the loan was raised, adjusted over the repayment period by depreciation of the loan's value adjustment at the date the loan was raised.
Liabilities relating to investment properties are measured at amor-tised cost.
Other liabilities are measured at amortised cost, usually correspond-ing to nominal value.
DEFERRED INCOMEDeferred income comprises payments received relating to income in subsequent financial years.
CASH FLOW STATEMENT
The cash flow statement shows the ´Company's cash flows for the year, broken down into operating, investing and financing activities, changes in cash and cash equivalents for the year as well as the cash and cash equivalents at the beginning and end of the year.
Cash flows from acquisitions and divestments of enterprises are shown separately under cash flows from investing activities. Cash flows from acquisitions of enterprises are recognised in the cash flow statement from the date of acquisition. Cash flows from the disposal of enterprises are recognised up to the date of disposal.
CASH FLOWS FROM OPERATING ACTIVITIESCash flows from operating activities are calculated as the profit for the year adjusted for non-cash operating items, changes in working capital and income taxes paid.
CASH FLOWS FROM INVESTING ACTIVITIESCash flows from investing activities comprise payments made in con-nection with the acquisition and disposal of enterprises and activities and of intangible assets, property, plant and equipment and financial assets.
CASH FLOWS FROM FINANCING ACTIVITIESCash flows from financing activities comprise changes to the size or composition of share capital and associated costs. They also comprise the raising of loans, repayment of interest-bearing debt and payment of dividend to shareholders.
CASH AND CASH EQUIVALENTSCash and cash equivalents comprise cash and short-term marketable securities with a term of less than three months which are subject to an insignificant risk of changes in value.
ACCOUNTING POLICIES
60FINANCIAL STATEMENTS ANNUAL REPORT 2018 ELF DEVELOPMENTCONTENTS
STATEMENT BY THE MANAGEMENT AND INDEPENDENT AUDITORS’ REPORT
CONTENTS
STATEMENTS

STATEMENT BY THE MANAGEMENT
The Board of Directors and Management Board have today approved the annual report for 2018 of ELF Development A/S.
The annual report has been prepared in accordance with the Danish Financial Statements Act.
We consider the accounting policies to be appropriate. Accordingly, the consolidated and parent company finan-cial statements give a true and fair view of the Group’s and the Company’s assets, liabilities and financial position at 31 December 2018 and of the results of the Group’s and the Company’s activities and the consolidated cash flows for the financial year ended 31 December 2018.
In our opinion, the Management's review includes a fair review of the matters under review.
We recommend that the annual report be adopted at the annual general meeting.
Hellerup, 23 May 2019
MANAGEMENT BOARD
ERIK LUDVIG FIND JAN AARESTRUPCEO CFO
BOARD OF DIRECTORS
ANDREEA IOANA KAISER ERIK LUDVIG FIND CHRISTIAN HENRI LEROYChairman
CONTENTS 62MANAGEMENT’S REVIEW ANNUAL REPORT 2018 ELF DEVELOPMENT
STATEMENT BY THE MANAGEMENT
INDEPENDENT AUDITORS’ REPORT
TO THE SHAREHOLDER OF ELF DEVELOPMENT A/S
OPINIONWe have audited the consolidated annual accounts and the an-nual accounts of ELF Development A/S for the financial year 1 January to 31 December 2018, which comprise accounting pol-icies used, profit and loss account, balance sheet, statement of changes in equity and notes, consolidated and for the company respectively and consolidated cash flow statement. The consol-idated annual accounts and the annual accounts are prepared in accordance with the Danish Financial Statements Act.
In our opinion, the consolidated annual accounts and the annual accounts give a true and fair view of the assets, liabili-ties and financial position, consolidated and for the company respectively at 31 December 2018 and of the results of the company’s operations, consolidated and for the company respectively and of consolidated cash flows for the financial year 1 January to 31 December 2018 in accordance with the Danish Financial Statements Act.
BASIS FOR OPINIONWe conducted our audit in accordance with international standards on auditing and the additional requirements appli-cable in Denmark. Our responsibilities under those standards and requirements are further described in the below section “Auditor’s responsibilities for the audit of the consolidated
annual accounts and the annual accounts”. We are independ-ent of the company in accordance with international ethics standards for accountants (IESBA’s Code of Ethics) and the additional requirements applicable in Denmark, and we have fulfilled our other ethical responsibilities in accordance with these standards and requirements. We believe that the audit evidence obtained is sufficient and appropriate to provide a basis for our opinion.
THE MANAGEMENT’S RESPONSIBILITIES FOR THE CON-SOLIDATED ANNUAL ACCOUNTS AND THE ANNUAL ACCOUNTSThe management is responsible for the preparation of con-solidated annual accounts and annual accounts that give a true and fair view in accordance with the Danish Financial Statements Act. The management is also responsible for such internal control as the management determines is necessary to enable the preparation of consolidated annual accounts and annual accounts that are free from material misstate-ment, whether due to fraud or error.
In preparing the consolidated annual accounts and the an-nual accounts, the management is responsible for evaluating the group’s and the company’s ability to continue as a going concern, and, when relevant, disclosing matters related to going concern and using the going concern basis of account-ing when preparing the consolidated annual accounts and the annual accounts, unless the management either intends to
liquidate the group or the company or to cease operations, or if it has no realistic alternative but to do so.
AUDITOR’S RESPONSIBILITIES FOR THE AUDIT OF THE CON-SOLIDATED ANNUAL ACCOUNTS AND THE ANNUAL ACCOUNTSOur objectives are to obtain reasonable assurance about whether the consolidated annual accounts and the annual accounts as a whole are free from material misstatement, whether due to fraud or error, and to issue an auditor’s report including an opinion. Reasonable assurance is a high level of assurance, but is not a guarantee that an audit conducted in accordance with international standards on auditing and the additional requirements applicable in Denmark will always detect a mate-rial misstatement when it exists. Misstatements may arise due to fraud or error and may be considered material if, individually or in the aggregate, they could reasonably be expected to in-fluence the economic decisions made by users on the basis of the consolidated annual accounts and the annual accounts.
As part of an audit conducted in accordance with international standards on auditing and the additional requirements appli-cable in Denmark, we exercise professional evaluations and maintain professional scepticism throughout the audit. We also:
• Identify and assess the risks of material misstatement in the consolidated annual accounts and the annual accounts, whether due to fraud or error, design and perform audit
CONTENTS 63MANAGEMENT’S REVIEW ANNUAL REPORT 2018 ELF DEVELOPMENT
INDEPENDENT AUDITORS REPORT
procedures in response to those risks, and obtain audit evidence that is sufficient and appropriate to provide a basis for our opinion. The risk of not detecting a material misstatement resulting from fraud is higher than the risk of not detecting a misstatement resulting from error, as fraud may involve collusion, forgery, intentional omissions, misrepresentations, or the override of internal control.
• Obtain an understanding of the internal control relevant to the audit in order to design audit procedures that are appropriate in the circumstances, but not for the purpose of expressing an opinion on the effectiveness of the group’s and the company’s internal control.
• Evaluate the appropriateness of accounting policies used by the management and the reasonableness of accounting estimates and related disclosures made by the management.
• Conclude on the appropriateness of the management’s preparation of the consolidated annual accounts and the annual accounts being based on the going concern princi-ple and, based on the audit evidence obtained, whether a material uncertainty exists related to events or conditions that may raise significant doubt about the group’s and the company’s ability to continue as a going concern. If we conclude that a material uncertainty exists, we are required to draw attention in our auditor’s report to the related disclosures in the consolidated annual accounts and the annual accounts or, if such disclosures are inadequate, to modify our opinion. Our conclusions are based on the audit evidence obtained up to the date of our auditor’s report. However, future events or conditions may cause the group and the company to cease to continue as a going concern.
• Evaluate the overall presentation, structure and contents of the consolidated annual accounts and the annual accounts, including the disclosures in the notes, and whether the consolidated annual accounts and the annual accounts reflect the underlying transactions and events in a manner that gives a true and fair view.
• Obtain sufficient and appropriate audit evidence regarding the financial information of the entities or the business activities within the group to express an opinion on the consolidated annual accounts. We are responsible for the direction, supervision and performance of the group audit. We remain solely responsible for our audit opinion.
We communicate with those charged with governance re-garding, among other matters, the planned scope and timing of the audit and significant audit findings, including any significant deficiencies in the internal control that we identify during our audit.
STATEMENT ON THE MANAGEMENT’S REVIEWThe management is responsible for the management’s review.
Our opinion on the consolidated annual accounts and the annual accounts does not cover the management’s review, and we do not express any kind of assurance opinion on the management’s review.
In connection with our audit of the consolidated annual ac-counts and the annual accounts, our responsibility is to read the management’s review and in that connection consider whether the management’s review is materially inconsistent with the consolidated annual accounts or the annual ac-
counts or our knowledge obtained during the audit, or wheth-er it otherwise appears to contain material misstatement.
Furthermore, it is our responsibility to consider whether the management’s review provides the information required under the Danish Financial Statements Act.
Based on the work we have performed, we believe that the management’s review is in accordance with the consolidated annual accounts and the annual accounts and that it has been prepared in accordance with the requirements of the Danish Financial Statement Acts. We did not find any material misstatement in the management’s review.
Aalborg, 23 May 2019
REDMARKState Authorised Public AccountantsCompany reg. no. 29 44 27 89
STEEN JENSEN State Authorised Public Accountant mne27739
CONTENTS 64MANAGEMENT’S REVIEW ANNUAL REPORT 2018 ELF DEVELOPMENT
COMPANY DETAILS
COMPANY
ELF DEVELOPMENT A/SStrandvejen 70, 1st floorDK-2900 Hellerup Denmark
Tel.: +45 39200250Website: www.elfdevelopment.dkE-mail: [email protected]
Company reg. (CVR) no.: 27 52 84 49Founded: 1 July 2006Registered office: Gentofte, DenmarkFinancial year: 1 January – 31 December
BOARD OF DIRECTORS
Andreea Ioana Kaiser, ChairmanErik Ludvig FindChristian Henri Leroy
MANAGEMENT BOARD
Erik Ludvig Find, CEOJan Aarestrup, CFO
AUDITORS:
RedmarkStatsautoriseret RevisionspartnerselskabHasseris Bymidte 6DK-9000 Aalborg, Denmark
BANKERS:
Danske BankJyske Bank
PARENT COMPANY
E.L.F. Holding S.á.r.l
SUBSIDIARIES:
ELF Ejendomme A/S, GentofteELF Parkering ApS, GentofteHoldingselskabet af 27.10.2010 ApS, GentofteKorsdalskvarteret ApS, GentofteBakkegårds Alle ApS, Gentofte4 Minds Holding ApS, Gentofte4 Minds ApS, Gentofte4 Minds Byg ApS, GentofteSHV 57 ApS, GentofteKarlshøj 7 ApS, GentofteAmager Strand 1 ApS, GentofteAmager Strand 2 ApS, GentofteAmager Strand 3 ApS, GentofteAmager Strand 4 ApS, GentofteAmager Strand 6 ApS, GentofteAmager Strand 7 ApS, GentofteAmager Strand 8 ApS, GentofteAmager Strand 9 ApS, Gentofte
Amager Strand 10 ApS, GentofteAmager Strand 11 ApS, GentofteAmager Strand 12 ApS, GentofteAmager Strand 13 ApS, GentofteIrmaByen 1 ApS, GentofteIrmaByen 3 ApS, GentofteIrmaByen 6 ApS, GentofteIrmaByen 7 ApS, GentofteIrmaByen 9 ApS, GentofteIrmaByen 11 ApS, GentofteIrmaByen 12 ApS, GentofteIrmaByen 13 ApS, GentofteIrmaByen 14 ApS, GentofteIrmaByen 16 ApS, GentofteIrmaByen 17 ApS, GentofteTrongården ApS, GentofteBækhus Enge ApS, GentofteSophienberg ApS, GentofteFrimærket ApS, GentofteNjalsgade Komplekset ApS, Gentofte
CONTENTS 65MANAGEMENT’S REVIEW ANNUAL REPORT 2018 ELF DEVELOPMENT
COMPANY DETAILS
ELF DEVELOPMENT A/SStrandvejen 70, 1st floor
DK-2900 Hellerup Denmark
www.elfdevelopment.dk


