66
BETTER LIFE THROUGH CHEMISTRY Annual Report 20 19

BETTER LIFE THROUGH CHEMISTRY
Annual Report
2 0 1 9

1Annual Report 2019
02
03
04
05
06
07
08
09
10
12
16
18
19
22
27
59
62
Company Information
Vision and Mission Statement
Chairman’s Message
CEO’s Message
Our Performance
Wealth Generated and Distributed
Year at a Glance
Key Operating & Financial Data for Last Six Years
Core Business
Directors’ Report
Statement of Compliance CCG
Auditors’ Review Report to the Members CCG
Auditors’ Report to the Members
Financial Statements
Notes to the Financial Statements
Pattern of Shareholding
Notice of Annual General Meeting
Form of Proxy
TABLE OFCONTENTS

2 Nimir Resins Limited
COMPANYINFORMATION
Board of Directors
Sheikh Amar Hameed - Chairman Mr. Zafar Mahmood - Chief Executive Officer Mr. Muhammad Yahya KhanMr. Abdul Jalil Jamil Mr. Osman Hameed Mr. Tahir Jahangir Mr. Pervaiz Ahmad Khan
Executive ManagementMr. Zafar MahmoodMr. Khalid Mumtaz QaziMr. Imran AfzalMr. Umar IqbalMr. Aamir Jamil
Chief Financial OfficerSyed Sajid Nasim
Company SecretaryMr. Muhammad Inam-ur-Rahim
Head of Internal AuditMr. Nabeel Ahmad Khan
AuditorsHorwath Hussain Chaudhury & Co.Chartered Accountants
Audit CommitteeMr. Pervaiz Ahmad Khan - Chairman Mr. Abdul Jalil Jamil - Member Mr. Osman Hameed - Member
Human Resources &Remuneration CommitteeMr. Pervaiz Ahmad Khan - ChairmanSheikh Amar Hameed - MemberMr. Abdul Jalil Jamil - MemberMr. Zafar Mahmood - Member
Bankers
The Bank of PunjabHabib Bank LimitedMCB Bank LimitedHabib Metropolitan Bank LimitedBank Alfalah LimitedSoneri Bank LimitedAl Baraka Bank (Pakistan) Limited Pak Brunei Investment Company Limited Meezan Bank LimitedJS Bank Limited
Legal AdvisorsM/s Hassan & HassanAdvocates
Share RegistrarCorplink (Pvt.) LimitedWings Arcade, 1-K Commercial,Model Town, Lahore. Pakistan.Tel: +92 42 35916714 & 19Fax: +92 42 35869037www.corplink.com.pk
Registered Office / Plant - 114.5 Km, Lahore-Sheikhupura Road,Lahore, Pakistan.Tel : +92 42 37971512-14Fax: +92 42 37970229
Plant – 214.8 Km, Sheikhupura-Faisalabad Road,Bhikhi, Dist. Sheikhupura. Pakistan.Tel : +92 56 3883001 – 7Fax: +92 56 3883010
Lahore Office12-B, New Muslim Town,Lahore, Pakistan.Tel : +92 42 35926090-93Fax: +92 42 35926099
Web Sitewww.nimir.com.pk

3Annual Report 2019
OUR VISION &MISSION
Our VisionTo become an industry leader through a persistent commitment to customer focus, technical innovation, managerial excellence, entrepreneurial spirit and social responsibility.
Our MissionTo deliver unparalleled value to stakeholders and continually striving to exceed customer expectations by developing innovative industrial chemical solutions with special emphasis on workforce, health, safety, environment and contribution to the national economic development.

4 Nimir Resins Limited
The significant increase in interest rates and sharp devaluation of PKR has adversely affected the growth of the industrial sector. As a result, GDP growth in the FY 2018-19 reduced to 3.3% against a target of 6.2%. Similarly, industrial sector also witnessed sharp decline in growth.
The management of your Company has taken cautious approach and despite all the adversities recorded third year of consistent growth. After achieving 50% and 34% increase in FY 2017 and FY 2018 respectively, the Company recorded 37% in sale turnover during FY 2019. The bottom line of the Company also grew by 49%. The management and all other stakeholders of the company have contributed to this success in a highly competitive and difficult business environment. Everyone involved can be rightly proud of his performance.
It is unfortunate that the most of the profit earned during the year has gone to Government kitty as further advance tax. After vigorous follow-up the Government issued refund of Rs. 108.30 million in the form of Bonds, as on the date of Board meeting which are tradable on stock exchange. In the absence of any mechanism, the company cannot take any immediate advantage of these bonds to improve its cash flow.
With current economic slowdown and high interest cost together with money stuck with government, the coming years would be very difficult for the company. The board and management of the company are, however, committed to maximize the profitability in the coming year, Insha Allah.
Due to the fact that a large sum of company’s funds is stuck in tax refund and there is a continuous requirement of financing increasing working capital due to devaluing Rupee, it is not possible to give dividend this year.
My thanks are due to the board, the management and all other stakeholders for a remarkable turnaround over the last three years. May Allah continue to bless us. Ameen.
Sheikh Amar HameedChairman
CHAIRMAN’S MESSAGE
5Annual Report 2019
The business environment in Pakistan remained challenging during FY 2019. Due to devaluation of PKR, increase in interest rate and resultant higher inflation, businesses all over the country remained under pressure. Under these difficult situation, Nimir Resins Limited performed well and achieved an impressive growth of 36% in sale turnover and set new record of highest sale of Rs.4.9 billion. The increase in sale is attributed to higher volume and higher prices. The bottom line also showed impressive 38% growth and increased from Rs.103 million in FY 2018 to Rs.154 million in FY 2019.
The GDP growth in the current year has reduced to 3.3% against a target of 6.2%. The industrial sector growth remained at 1.40% against a target of 7.6%. The Government’s strategies and policies on curbing imports is bringing positive results and visible reduction has been seen in imports, which would help the Government in narrowing down the country’s balance of payment. This would somehow help local industry to compete against expensive imports and grow.
In the current budget, the Government has made some serious efforts for the documentation of the economy. With tough budgetary measures, high interest rate and rising inflation, the country is faced with an inevitable economic slowdown. Though it is very challenging but with consistent research and development on new products, advancement in the product range and maintaiing highest quality standards, we are committed to maximize Company’s turnover and improve profitability in the FY 2020, Insha’Allah.
I would like to thank our management, team and staff for their tireless efforts, without which none of the present and future success is possible.
Zafar MahmoodChief Executive Officer
CEO’S MESSAGE

6 Nimir Resins Limited
OUR PERFORMANCE 2014 2015 2016 2017 2018 2019 Rupees in millions
Sales Turnover 2,200 1,806 1,778 2,669 3,580 4,887 Gross Profit 185 155 234 297 330 504 Net Profit/(Loss) (69) (82) 53 74 103 154 EBITDA 91 67 154 210 196 375 Long term borrowings 179 121 99 2 5 5 Net Worth 323 249 584 910 1,011 1,166 Number of Shares (in Millions) 200 200 200 277 283 283 Breakup value per share-Rupees 1.62 1.25 1.51 3.18 3.54 4.09
Earning/(loss) per share-Rupees (0.35) (0.37) 0.24 0.26 0.36 0.54
1.621.25
1.51
3.183.54
4.09
- 0.501.001.502.002.503.003.504.00
2014 2015 2016 2017 2018 2019
BreakupValuePKRpershare
BeforeAcquisition AfterAcquisition
2,2001,806 1,778
2,669
3,580
4,887
- 500
1,0001,5002,0002,5003,0003,5004,0004,5005,000
2014 2015 2016 2017 2018 2019
SalesTurnoverPKRinmillion
BeforeAcquisition AfterAcquisition
179121 99
2 5 5
323 249
584
9101,011
1,166
0
200
400
600
800
1,000
1,200
2014 2015 2016 2017 2018 2019
Equity&LongtermBorrowingsPKRinmillion
LongTermLoans Equity
(69) (82)
5374
103
154
(120)(90) (60) (30) - 306090
120150180
2014 2015 2016 2017 2018 2019
NetProfit/(Loss)PKRinmillion
BeforeAcquisition AfterAcquisition
9167
154
210 196
375
- 50
100
150
200
250
300
350
400
2014 2015 2016 2017 2018 2019
EBITDAPKRinmillion
BeforeAcquisition AfterAcquisition
(0.35) (0.37)
0.24 0.260.36
0.54
(0.60)
(0.10)
0.40
2014 2015 2016 2017 2018 2019
Earning/(Loss)perShareRupees
BeforeAcquisition AfterAcquisition

7Annual Report 2019
Rs in million PercentageWealth Generated
Sales with sales Tax 5,424 99.8%
Other operating profit 13 0.2%
5,437 100.0%
Distribution of Wealth
Cost of materials & services 4,196 77.2%
Duties & taxes 746 13.7%
Employees 171 3.2%
Finance cost 168 3.1%
Wealth retained 155 2.8%
5,437 100.0%
WEALTH GENERATED AND DISTRIBUTEDFOR THE YEAR ENDED JUNE 30, 2019
Wealth retained2.8%
Cost of materials& services
77.2%
Employees3.2%
Finance cost3.1%
Duties & taxes13.7%

8 Nimir Resins Limited
2018 2019 Performance Parameters Rupess in Million
Sales 3,580 4,887
Gross Profit 330 504
Operating profit 236 389
Finance Cost 75 168
Profit before taxation 85 164
Profit after taxation 103 154
Current Ratio 1.29 1.34
Long term Borrowings to Equity Ratio 0.5 : 99.5 0.5 : 99.5
Earning per share-Rupees 0.36 0.54
Breakup value per share- Rupees 3.54 4.09
Financial Highlights
YEAR AT A GLANCE 2018-2019
Sales
Profit AfterTaxation
Break-up Value Per Share
Earning Per Share
Gross Profit Operating Profit
37%
49%
53%
15%
65%
49%
Up by
Up by
Up by
Up by
Up by
Up by
9Annual Report 2019
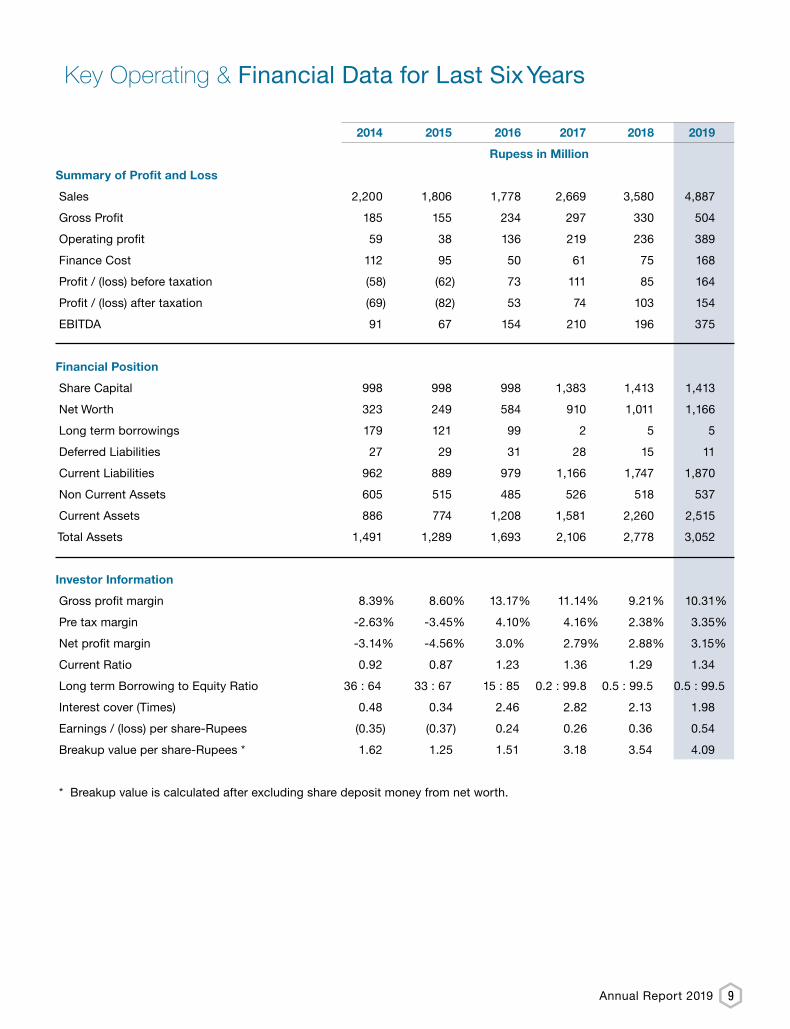
Key Operating & Financial Data for Last Six Years
2014 2015 2016 2017 2018 2019
Rupess in Million
Summary of Profit and Loss
Sales 2,200 1,806 1,778 2,669 3,580 4,887
Gross Profit 185 155 234 297 330 504
Operating profit 59 38 136 219 236 389
Finance Cost 112 95 50 61 75 168
Profit / (loss) before taxation (58) (62) 73 111 85 164
Profit / (loss) after taxation (69) (82) 53 74 103 154
EBITDA 91 67 154 210 196 375
Financial Position
Share Capital 998 998 998 1,383 1,413 1,413
Net Worth 323 249 584 910 1,011 1,166
Long term borrowings 179 121 99 2 5 5
Deferred Liabilities 27 29 31 28 15 11
Current Liabilities 962 889 979 1,166 1,747 1,870
Non Current Assets 605 515 485 526 518 537
Current Assets 886 774 1,208 1,581 2,260 2,515
Total Assets 1,491 1,289 1,693 2,106 2,778 3,052
Investor Information
Gross profit margin 8.39% 8.60% 13.17% 11.14% 9.21% 10.31%
Pre tax margin -2.63% -3.45% 4.10% 4.16% 2.38% 3.35%
Net profit margin -3.14% -4.56% 3.0% 2.79% 2.88% 3.15%
Current Ratio 0.92 0.87 1.23 1.36 1.29 1.34
Long term Borrowing to Equity Ratio 36 : 64 33 : 67 15 : 85 0.2 : 99.8 0.5 : 99.5 0.5 : 99.5
Interest cover (Times) 0.48 0.34 2.46 2.82 2.13 1.98
Earnings / (loss) per share-Rupees (0.35) (0.37) 0.24 0.26 0.36 0.54
Breakup value per share-Rupees * 1.62 1.25 1.51 3.18 3.54 4.09
* Breakup value is calculated after excluding share deposit money from net worth.

10 Nimir Resins Limited
CORE BUSINESSAT A GLANCE
Textile Chemicals
UnsaturatedPolyester Resins
Coatings & Emulsions
Pulp & Paper Chemicals
Adhesives
Complete range of specialility chemicals for pre-treatment and finishing fortextile industry including
. Textile Auxiliaries. . Optical Brightners. . Binders and PVAs.
A complete line of resin products for composites. • General purpose & Gel Coat Resins for Tanks, Ducts, Pipes, sheets & Articals.• Chemicals Resistant Resin.• Fillament Winding Resin, Pigment dispersion Resin & Accelerator catalyst.• Promoted & Non promoted Resins.
One of the Leading & Oldest manufacturer of Resins, Emulsions & Additivesfor the Coatings industry. Range include following products
• All types of Alkyd Resins & Modified Alkyds for Decorative, Refinish & OEM Paints.• Amino Resins, Saturated Polyesters, Eposxy ester & Urethane Alkyds.• Rosin modified Maleic & Phenolic Resins.• Thermo plastic, Thermo setting & Acrylic Polyol Resins.• Metal Driers (Cobalt, Zirconium & Calcium)• Acrylic, Styrene Acrylic & PVA Emulsion binders.• Weting Agent, Antifoam, Liquid polymeric Pigment & Emulsifiers.
Manufacturing all sizing solutions for paper industry including Alkaline,Neutral and Acidic sizing
• Coating Chemicals• Specialty Chemicals• Optical Brightening Agent
• Food grade packaging • Flexible packaging industry • Laminate glue
Coa
tings
, Em
ulsi
ons
& P
olye
ster
Text
ile, P
aper
& A
dhes
ives

11Annual Report 2019

12 Nimir Resins Limited
DIRECTORS’ REPORTThe Board of directors of the Company is pleased to submit the annual report along with the audited financial statements for the year ended June 30, 2019.
Your company stood strong against various challenges faced during the financial year ended June 30, 2019. The depreciation of Pak Rupee, steep escalation in interest rate and high inflation posted various challenges for overall businesses in the country. Nimir Resins Limited, however, recorded 37% growth in sales revenue and closed the year with turnover of Rs. 4.9 billion on back of higher volumes and better prices. With this growth in sales, the company posted gross profit of Rs. 504 million, operating profit of Rs. 389 million and profit after taxation of Rs.154 million showing year on year increase of 53%, a 65% and 49% respectively. During the year earning per share remained at Rs. 0.54.
The distribution cost witnessed an increase of 31%, despite a 36% increase in sales revenue. However administrative expenses increased by 11% while financial cost increased significantly by 123% mainly on account of hike in discount rate and increased business operations. The tax expenses for the year under review increased as compared to previous year mainly due to increased profitability.
Future Outlook
In the current budget 2019-2020, the government has taken serious steps for the documentation of economy. Hence tough decisions have been announced in the budget, which coupled with high interest rate and rising inflation, led the country to economic slowdown. We are vigilant to the situation and would continue to endeavour our best to minimize the negative impact on our business, Insha Allah.
Summary of Key operating and financial data of last six financial years
Summary of key operating and financial data of last six years is annexed.
Outstanding statutory payments
All outstanding payments are of nominal and of routine nature.
Retirement Benefit Schemes:
The Company operates a funded gratuity scheme for its employee as referred in Note-12 to the accounts.
Board of Directors
Currently the Board is comprising of Seven (7) male directors and there is no female director on the Board. Out of these Seven directors there are Four non-executive, One executive and Two are independent. During the year under review, Four (4) Board, Four (4) Audit Committee and Two (2) Human Resource & Remuneration Committee meetings were held. Attendance by each director is as follow:
Board of Audit HR & RName of Directors Directors Committee Committee
Sh. Amar Hameed 4 2Zafar Mahmood 4 2Muhammad Yahya Khan 4 Abdul Jalil Jamil 4 3 2Osman Hameed 4 4 Tahir Jahangir 2 Pervaiz Ahmad Khan 4 4
Leaves of absence were granted to directors who could not attend some of the meetings.
The board has two sub committees namely Audit Committee and Human Resource and Remuneration Committee. The composition of these two committees are as under:
Audit committee:
1. Pervaiz Ahmad Khan (Independent) Chairman2. Abdul Jalil Jamil (Non Executive) Member3. Osman Hameed (Non Executive) Member
Human Resource and Remuneration committee:
1. Pervaiz Ahmad Khan (Independent) Chairman2. Sh. Amar Hameed (Non Executive) Member3. Abdul Jalil Jamil (Non Executive) Member4. Zafar Mahmood (Executive) Member
Remuneration of Non Executive, Nominee and Independent Directors
Non-executive, nominee and independent directors are entitled only for fee for attending the meetings.
Corporate Governance
As required under Code of Corporate Governance incorporated in the Listing Rules of the stock Exchanges in the country, the board of Directors are pleased to state as follows:
• The Financial statements, prepared by the management of the Company, present fairly its state of affairs, the results of its operations, cash flows and changes in equity.
• Proper books of accounts of the Company have been maintained.
• Appropriate accounting policies have been consistently applied in preparation of the financial statements and accounting estimates are based on reasonable and prudent judgment.
• International Financial Reporting Standards (IFRS), as applicable in Pakistan, have been followed in the preparation of financial statements.

13Annual Report 2019
• The system of internal control is sound in design and has been effectively implemented and monitored.
• There is no significant doubt on the company’s ability to continue as a going concern.
• There has been no material departure from best practices of corporate governance, as detailed in the listing regulations.
• Key operating and financial data for the last 6 years is annexed.
• Outstanding taxes and levies are given in the notes to the financial statements
The management of the Company is committed towards good corporate governance, and taking all appropriate measures to comply with best practices and also continuously reviewing the system of internal control in the light of Companies Act 2017.
Internal Financial Control
The system of internal control is sound in design and has been effectively implemented and monitored.
Corporate Social Responsibilities
The Company recognizes its social responsibilities as a key member of the community. It is committed to contribute its resources for the better environment with an unprejudiced approach. Its safety, health and environmental (SHE) policies are geared towards betterment of employees and community.
The Company ensures environment friendly operations, products and services and promotes environmental awareness among its employee and the community. It inducts employees from the surrounding community and offer internship and apprenticeship opportunities to technical institutes. It also encourages visits by the students of different educational institutions and support needy children of the employees for studies to promote education in the country.
External Auditors
The present auditor’s M/s Horwath Hussain Chaudhury and Company, Chartered Accountant, retiring this year, being eligible, have offered themselves for re-appointment. The audit committee has recommended the re-appointment of M/s Horwath Hussain Chaudhury and Company, Chartered Accountant as external auditor of the Company for the year ending June 30, 2020.
Dividend
The Board after examining the financial position of the Company decided to keep the company liquid to the maximum possible level. Hence it has recommended not to give any dividend for the year June 30, 2019.
Pattern of Shareholding
A pattern of shareholding of the Company is annexed. There was no trading in the shares of the Company by the Directors, Chief Executive, Chief Financial Officer, Company Secretary, Company Executive and their spouses and minor children during the year except those which are mentioned in the annexed statement required under code of Code of Corporate Governance (CCG).
Necessary returns in this respect filed with the regulatory authorities besides informing the Board and the stock exchanges of the said transactions as required under the Code of Corporate Governance.
Acknowledgment
We are thankful to our valued stakeholders including regulators, customers, banks, suppliers, contractors and shareholders, for their excellent support and confidence. We also thank our employees for their focussed dedication and hard work throughout this period.
For and on behalf of the Board
_____________________ ______________________ Zafar Mahmood Muhammad Yahya KhanChief Executive Officer Director
Lahore,September 05, 2019

16 Nimir Resins Limited
Nimir Resins Limited (the “Company”) has complied therequirement of the Regulations in the following manner:
Note: The Board will be reconstituted after the election inDecember 2019.
1. The total number of directors is 07 as detailed below:
a. Male : 07 b. Female : 00 2. The composition of the board is as follows:
a. Executive Directors : 01 b. Independent Directors : 02 c. Other Non-Executive Directors : 04
Name Category
Sh. Amar Hameed Non- Executive Director Mr. Zafar Mahmood Executive Director Mr. Abdul Jalil Jamil Non- Executive Director Mr. Osman Hameed Non- Executive Director Mr. Muhammad Yahya Khan Non- Executive Director Mr. Pervaiz Ahmed Khan Independent Director Mr. Tahir Jahangir Independent Director
3. The directors have confirmed that none of them is serving as a director on more than five listed companies (as applicable), including this Company (excluding the listed subsidiaries of listed holding companies where applicable).
4. The Company has prepared a “Code of Conduct” and
has ensured that appropriate steps have been taken to disseminate it throughout the Company along with its supporting policies and procedures.
5. The board has developed a vision/mission statement,
overall corporate strategy and significant policies of the Company. A complete record of particulars of significant policies along with the dates on which they were approved or amended has been maintained.
6. All the powers of the board have been duly exercised
and decisions on relevant matters have been taken by the board/shareholders as empowered by the relevant provisions of the Companies Act, 2017 and these Regulations.
7. The meetings of the board were presided over by the Chairman and, in his absence, by a director elected by the board for this purpose. The board complied with
requirements of the Act and the Regulations with respect to frequency, recording and circulating minutes of the meeting of board.
8. The board of directors have a formal policy and transparent procedures for remuneration of directors in accordance with the Act and the Regulations.
9. During the year Sheikh Amar Hameed got trained under Directors’ Training Program.
10. The board has approved appointment of CFO including his remuneration and terms and conditions of employment and complied with relevant requirements of the Regulations. Company Secretary and Head of Internal Audit have remained unchanged during the year.
11. CFO and CEO duly endorsed the financial statements before approval of the board.
12. The Board has formed committees comprising of
members given below:
I. Audit Committee:
i. Mr. Pervaiz Amad Khan – Chairman ii. Mr. Abdul Jalil Jamil iii. Mr. Osman Hameed
II. HR and Remuneration Committee:
i. Mr. Pervaiz Amad Khan – Chairman ii. Sheikh Amar Hameed iii. Mr. Abdul Jalil Jamil iv. Mr. Zafar Mahmood
13. The terms of reference of the aforesaid committees have been formed, documented and advised to the committee for compliance.
14. The frequency of meetings (quarterly/half-yearly/yearly) of the committees were as per following:
I. Audit Committee
Four quarterly meetings were held during the financial year ending June 30, 2019.
II. HR & Remuneration Committee Two meetings were held during the financial year ending
June 30, 2019.
Statement of Compliance with the Listed Companies (Code of CorporateGovernance) Regulations, 2017 FOR THE YEAR ENDED JUNE 30, 2019

17Annual Report 2019
15. The board has set up an effective internal audit function, which is considered suitably qualified and experienced for the purpose and are conversant with the policies and procedures of the Company.
16. The statutory auditors of the Company have confirmed that they have been given a satisfactory rating under the quality control review program of the ICAP and registered with Audit Oversight Board of Pakistan, that they or any of the partners of the firm, their spouses and minor children do not hold shares of the Company and that the firm and all its partners are in compliance with International Federation of Accountants (IFAC) guidelines on code of ethics as adopted by the ICAP.
17. The statutory auditors or the persons associated with them have not been appointed to provide other services except in accordance with the Act, these regulations or any other requirement and the auditors have confirmed that they have observed IFAC guidelines in this regard.
18. We confirm that all other requirements of the Regulations have been complied with.
For Nimir Resins Limited
_____________________ _____________________ Sheikh Amar Hameed Zafar Mahmood Chairman Chief Executive Officer
Lahore,September 05, 2019

18 Nimir Resins Limited
INDEPENDENT AUDITORS’ REVIEW REPORT TO THE MEMBERSON STATEMENT OF COMPLIANCE WITH THE CCG
We have reviewed the enclosed Statement of Compliance
with the Listed Companies (Code of Corporate Governance)
Regulations, 2017 (“the Regulations’’) prepared by the Board
of Directors of Nimir Resins Limited (“the Company”) for the
year ended June 30, 2019 in accordance with the requirements
of regulation 40 of the Regulations.
The responsibility for compliance with the Regulations is that
of the Board of Directors of the Company. Our responsibility
is to review whether the Statement of Compliance reflects the
status of the Company’s compliance with the provisions of
the Regulations and report if it does not and to highlight any
non-compliance with the requirements of the Regulations.
A review is limited primarily to inquiries of the Company’s
personnel and review of various documents prepared by the
Company to comply with the Regulations.
As a part of our audit of the financial statements we are
required to obtain an understanding of the accounting and
internal control systems sufficient to plan the audit and
develop an effective audit approach. We are not required
to consider whether the Board of Directors’ statement on
internal control covers all risks and controls or to form an
opinion on the effectiveness of such internal controls, the
Company’s corporate governance procedures and risks.
The Regulations require the Company to place before the
Audit Committee, and upon recommendation of the Audit
Committee, place before the Board of Directors for their
review and approval, its related party transactions and also
ensure compliance with the requirements of section 208 of
the Companies Act, 2017. We are only required and have
ensured compliance of this requirement to the extent of the
approval of the related party transactions by the Board of
Directors upon recommendation of the Audit Committee. We
have not carried out procedures to assess and determine the
Company’s process for identification of related parties and
that whether the related party transactions were undertaken
at arm’s length price or not.
Based on our review, nothing has come to our attention which
causes us to believe that the Statement of Compliance does
not appropriately reflect the Company’s compliance, in all
material respects, with the Regulations as applicable to the
Company for the year ended June 30, 2019.
HORWATH HUSSAIN CHAUDHURY & CO.Chartered Accountants
LahoreSeptember 05, 2019

19Annual Report 2019
1. During the year, the Company has first time adopted IFRS 9 (Financial Instruments) and IFRS 15 (Revenue from Contracts with Customers).
As part of this first time adoption and transition to the requirements, the management performed an analysis to identify differences between the previous and the current applicable standards and as a result certain amendments relating to presentation and disclosures were made in the accompanying financial statements.
Any change in presentation or classification of items has been accounted for in accordance with IAS 8 ‘Accounting Policies, Changes in Accounting Estimates and Errors’ and comparative figures have been restated as disclosed in note 5 of the financial statements.
In view of the amendments and various new disclosures prepared and presented in the financial statements, we considered this as a key audit matter.
We reviewed and understood the requirements of IFRS 9 andIFRS 15. Our audit procedures included the following:
• Reviewed the management’s process to identify the additional disclosure requirements and related revisions (if any) as a result of first time adoption of IFRS 9 and IFRS 15;
• Obtained understanding of the recorded trade receivables by discussing with the management and making inquiries on the entire accounting process associated with the recording of trade receivables;
• Reviewed recording of provisions on the basis of expected credit loss on trade debts and contract assets as per the requirements of IFRS 9;
• Obtained relevant underlying supporting documents for ensuring that management has complied with the revenue recognition criteria as introduced by IFRS 15; and
• Obtained relevant underlying supporting documentation
on test basis for the additional disclosures and assessed their appropriateness for the sufficient audit evidence.
Opinion
We have audited the annexed financial statements of Nimir Resins Limited (the “Company”), which comprise the statement of financial position as at June 30, 2019, and the statement of profit or loss, the statement of comprehensive income, the statement of changes in equity, the statement of cash flows for the year then ended, and notes to the financial statements, including a summary of significant accounting policies and other explanatory information, and we state that we have obtained all the information and explanations which, to the best of our knowledge and belief, were necessary for the purposes of the audit.
In our opinion and to the best of our information and according to the explanations given to us, the statement of financial position, statement of profit or loss, statement of comprehensive income, the statement of changes in equity and the statement of cash flows together with the notes forming part thereof conform with the accounting and reporting standards as applicable in Pakistan and give the information required by the Companies Act, 2017 (XIX of 2017), in the manner so required and respectively give a true and fair view of the Company’s affairs as at June 30, 2019 and of the profit, its comprehensive income, the changes in equity and its cash flows for the year then ended.
Basis for Opinion
We conducted our audit in accordance with International Standards on Auditing (ISAs) as applicable in Pakistan. Our responsibilities under those standards are further described in the Auditors’ Responsibilities for the Audit of the Financial Statements section of our report. We are independent of the Company in accordance with the International Ethics Standard Board for Accountants’ Code of Ethics for Professional Accountants as adopted by the Institute of Chartered Accountants of Pakistan (the Code) and we have fulfilled our other ethical responsibilities in accordance with the Code. We believe that the audit evidence we have obtained is sufficient and appropriate to provide a basis for our opinion.
Key Audit Matters
Key audit matters are those matters that, in our professional judgment, were of most significance in our audit of the financial statements of the current period. These matters were addressed in the context of our audit of the financial statements as a whole, and in forming our opinion thereon, and we do not provide a separate opinion on these matters.
Following are the Key Audit Matters:
S.No. Key audit matters How the matter was addressed in our audit
First time adoption of International Financial Reporting Standard (IFRS) 9 ‘Financial Instruments’ and International Financial ReportingStandard (IFRS) 15 ‘Revenue from Contracts with Customers’.
INDEPENDENT AUDITORS’ REPORT TO THE MEMBERSFOR THE YEAR ENDED JUNE 30, 2019

20 Nimir Resins Limited
Trade Debts
2. Trade debts of the Company have shown a significant
increase as of June 30, 2019 as compared to the last year (note 23 to the financial statements). This increased level of trade debts was considered to be a key audit matter as these comprise a substantial portion of the current assets of the Company and require judgment based estimation for calculating the loss allowance against doubtful or impaired debts.
We performed the following audit procedures:
• Obtained understanding of the recorded trade debts by discussing with the management and making enquiries on the entire accounting process associated with the recording of receivables;
• Discussed with the management about the Company’s strategy regarding the calculation of loss allowance as well as about recovery of trade debts from the debtors;
• Performed tests of controls and tests of details; verified significant transactions and key account balances; circularized confirmations; reviewed the loss allowance created by the management and discussed their sufficiency; and assessed the subsequent status of trade debts and of the recoveries made; and
• Evaluated the presentation and disclosure of trade debts in the financial statements as required by the applicable reporting framework.
Information Other than the Financial Statements and Auditors’ Report Thereon
Management is responsible for the other information. The other information comprises the information included in the Annual Report 2019, but does not include the financial statements and our auditors’ report thereon.
Our opinion on the financial statements does not cover the other information and we do not express any form of assurance conclusion thereon.
In connection with our audit of the financial statements, our responsibility is to read the other information and, in doing so, consider whether the other information is materially inconsistent with the financial statements or our knowledge obtained in the audit or otherwise appears to be materially misstated. If, based on the work we have performed, we conclude that there is a material misstatement of this other information, we are required to report that fact. We have nothing to report in this regard.
Responsibilities of Management and Board of directors for the Financial Statements
Management is responsible for the preparation and fair presentation of the financial statements in accordance with the accounting and reporting standards as applicable in Pakistan and the requirements of Companies Act, 2017 (XIX of 2017) and for such internal control as management determines is necessary to enable the preparation of financial
statements that are free from material misstatement, whether due to fraud or error.
In preparing the financial statements, management is responsible for assessing the Company’s ability to continue as a going concern, disclosing, as applicable, matters related to going concern and using the going concern basis of accounting unless management either intends to liquidate the Company or to cease operations, or has no realistic alternative but to do so.
Board of directors are responsible for overseeing the Company’s financial reporting process.
Auditors’ Responsibilities for the Audit of the Financial Statements Our objectives are to obtain reasonable assurance about whether the financial statements as a whole are free from material misstatement, whether due to fraud or error, and to issue an auditors’ report that includes our opinion. Reasonable assurance is a high level of assurance, but is not a guarantee that an audit conducted in accordance with ISAs as applicable in Pakistan will always detect a material misstatement when it exists. Misstatements can arise from fraud or error and are considered material if, individually or in the aggregate, they could reasonably be expected to influence the economic decisions of users taken on the basis of these financial statements.
As part of an audit in accordance with ISAs as applicable in Pakistan, we exercise professional judgment and maintain professional skepticism throughout the audit. We also:
S.No. Key audit matters How the matter was addressed in our audit
21Annual Report 2019
• Identify and assess the risks of material misstatement of the financial statements, whether due to fraud or error, design and perform audit procedures responsive to those risks, and obtain audit evidence that is sufficient and appropriate to provide a basis for our opinion. The risk of not detecting a material misstatement resulting from fraud is higher than for one resulting from error, as fraud may involve collusion, forgery, intentional omissions, misrepresentations, or the override of internal control.
• Obtain an understanding of internal control relevant to the audit in order to design audit procedures that are appropriate in the circumstances, but not for the purpose of expressing an opinion on the effectiveness of the Company’s internal control.
• Evaluate the appropriateness of accounting policies used and the reasonableness of accounting estimates and related disclosures made by management.
• Conclude on the appropriateness of management’s use of the going concern basis of accounting and, based on the audit evidence obtained, whether a material uncertainty exists related to events or conditions that may cast significant doubt on the Company’s ability to continue as a going concern. If we conclude that a material uncertainty exists, we are required to draw attention in our auditor’s report to the related disclosures in the financial statements or, if such disclosures are inadequate, to modify our opinion. Our conclusions are based on the audit evidence obtained up to the date of our auditors’ report. However, future events or conditions may cause the Company to cease to continue as a going concern.
• Evaluate the overall presentation, structure and content of the financial statements, including the disclosures, and whether the financial statements represent the underlying transactions and events in a manner that achieves fair presentation.
We communicate with the board of directors regarding, among other matters, the planned scope and timing of the audit and significant audit findings, including any significant deficiencies in internal control that we identify during our audit. We also provide the board of directors with a statement that we have complied with relevant ethical requirements regarding independence, and to communicate with them all relationships and other matters that may reasonably be thought to bear on our independence, and where applicable, related safeguards. From the matters communicated with the board of directors, we determine those matters that were of most significance in the audit of the financial statements of the current period and are therefore the key audit matters. We describe these matters in our auditors’ report unless law or regulation precludes
public disclosure about the matter or when, in extremely rare circumstances, we determine that a matter should not be communicated in our report because the adverse consequences of doing so would reasonably be expected to outweigh the public interest benefits of such communication.
Report on Other Legal and Regulatory Requirements
Based on our audit, we further report that in our opinion:
a) proper books of account have been kept by the Company as required by the Companies Act, 2017 (XIX of 2017);
b) the statement of financial position, the statement of profit or loss, the statement of comprehensive income, the statement of changes in equity and the statement of cash flows together with the notes thereon have been drawn up in conformity with the Companies Act, 2017 (XIX of 2017) and are in agreement with the books of account and returns;
c) investments made, expenditure incurred and guarantees extended during the year were for the purpose of the Company’s business; and
d) no Zakat was deductible at source under the Zakat and Ushr Ordinance, 1980 (XVIII of 1980).
The engagement partner on the audit resulting in this independent auditors’ report is Amin Ali.
HORWATH HUSSAIN CHAUDHURY & CO.Chartered Accountants
LahoreSeptember 05, 2019

22 Nimir Resins Limited
2019 2018 Note Rupees Rupees EQUITY AND LIABILITIES Share Capital and Reserves Authorized share capital 300,000,000 (2018: 300,000,000) Ordinary shares of Rs. 5 each 1,500,000,000 1,500,000,000 Issued, subscribed and paid up share capital 6 1,413,210,640 1,413,210,640 Share deposit money 7 11,391,005 11,391,005 Sponsors’ interest free loans 107,000,000 107,000,000 Reserves 8 (450,086,731) (605,396,422)Surplus on revaluation of property, plant and equipment 9 84,357,351 84,744,209 1,165,872,265 1,010,949,432 Non Current Liabilities Diminishing musharaka finance 10 3,252,972 4,828,077 Long term financing 11 2,103,450 - Retirement benefits liability 12 10,952,455 7,617,553 Deferred tax liability 13 - 7,615,287 16,308,877 20,060,917 Current Liabilities Trade and other payables 14 288,834,895 476,855,842 Unclaimed dividends 292,819 292,819 Accrued mark up 34,837,595 14,224,345 Short term borrowings 15 1,484,828,855 1,212,177,290 Current portion of diminishing musharaka finance 10 1,575,105 1,445,876 Current portion of long term financing 11 682,200 - Provision for taxation 16 59,114,825 42,421,133 1,870,166,294 1,747,417,305 Contingencies and Commitments 17 - - Total Equity and Liabilities 3,052,347,436 2,778,427,654
ASSETS Non Current Assets Property, plant and equipment 18 523,723,347 506,364,678 Intangible assets 19 663,473 995,210 Long term deposits 20 9,335,693 10,739,956 Deferred tax asset 13 3,482,921 - 537,205,434 518,099,844 Current Assets Stores and spares 15,957,850 13,684,365 Stock in trade 21 857,165,513 984,001,076 Short term investment 22 46,700,000 - Trade debts 23 1,020,297,341 769,511,085 Loans and advances 24 33,064,755 69,879,343 Short term prepayments 327,235 3,590,336 Other receivables 25 12,571,616 1,109,000 Tax refunds due from the government 26 505,285,833 379,382,724 Cash and bank balances 27 23,771,859 39,169,881 2,515,142,002 2,260,327,810 Total Assets 3,052,347,436 2,778,427,654
The annexed notes from 1 to 47 form an integral part of these financial statements.
STATEMENT OF FINANCIAL POSITIONAS AT JUNE 30, 2019
Chief Executive Officer Director Chief Financial Officer
23Annual Report 2019
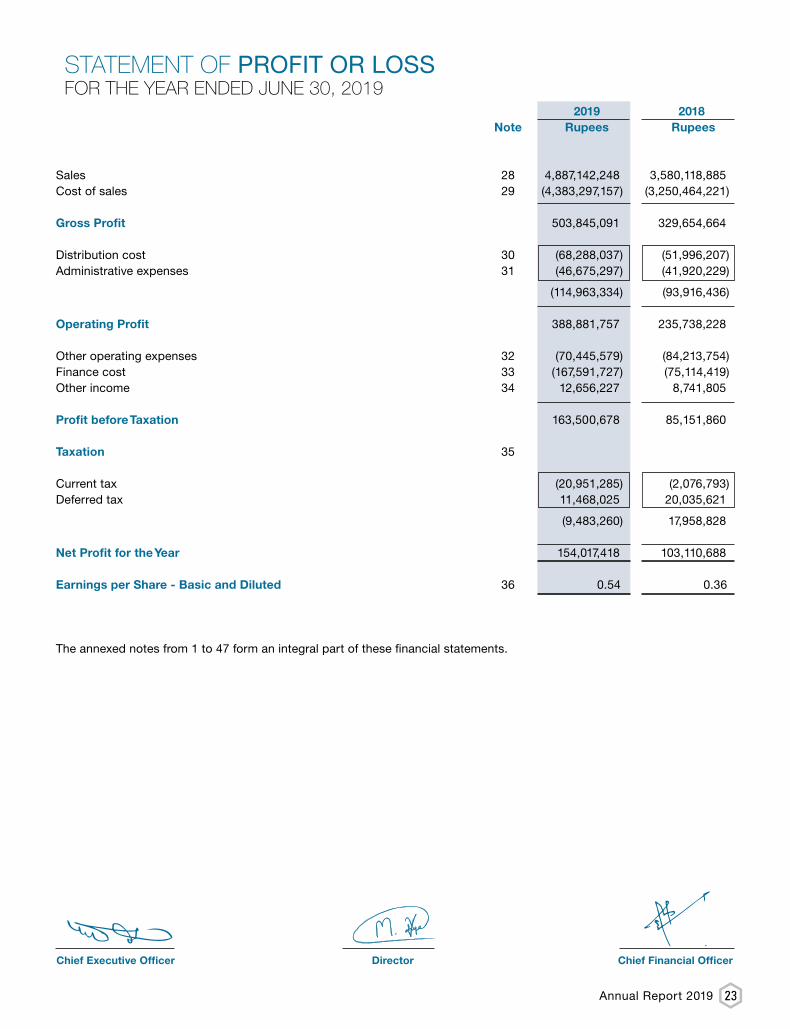
2019 2018 Note Rupees Rupees
Sales 28 4,887,142,248 3,580,118,885 Cost of sales 29 (4,383,297,157) (3,250,464,221) Gross Profit 503,845,091 329,654,664 Distribution cost 30 (68,288,037) (51,996,207)Administrative expenses 31 (46,675,297) (41,920,229)
(114,963,334) (93,916,436) Operating Profit 388,881,757 235,738,228 Other operating expenses 32 (70,445,579) (84,213,754)Finance cost 33 (167,591,727) (75,114,419)Other income 34 12,656,227 8,741,805 Profit before Taxation 163,500,678 85,151,860 Taxation 35 Current tax (20,951,285) (2,076,793)Deferred tax 11,468,025 20,035,621
(9,483,260) 17,958,828 Net Profit for the Year 154,017,418 103,110,688 Earnings per Share - Basic and Diluted 36 0.54 0.36 The annexed notes from 1 to 47 form an integral part of these financial statements.
STATEMENT OF PROFIT OR LOSSFOR THE YEAR ENDED JUNE 30, 2019
Chief Executive Officer Director Chief Financial Officer

24 Nimir Resins Limited
2019 2018 Rupees Rupees Net Profit for the Year 154,017,418 103,110,688 Other comprehensive income Items that will not be re-classified subsequently to the profit or loss Re-measurement of retirement benefits asset / (liability) 1,275,232 (2,709,205)Related tax impact (369,817) 785,669 Items that may be re-classified subsequently to profit or loss - - Other comprehensive income / (loss) for the year 905,415 (1,923,536) Total Comprehensive Income for the Year 154,922,833 101,187,152 The annexed notes from 1 to 47 form an integral part of these financial statements.
STATEMENT OF COMPREHENSIVE INCOMEFOR THE YEAR ENDED JUNE 30, 2019
Chief Executive Officer Director Chief Financial Officer
25Annual Report 2019
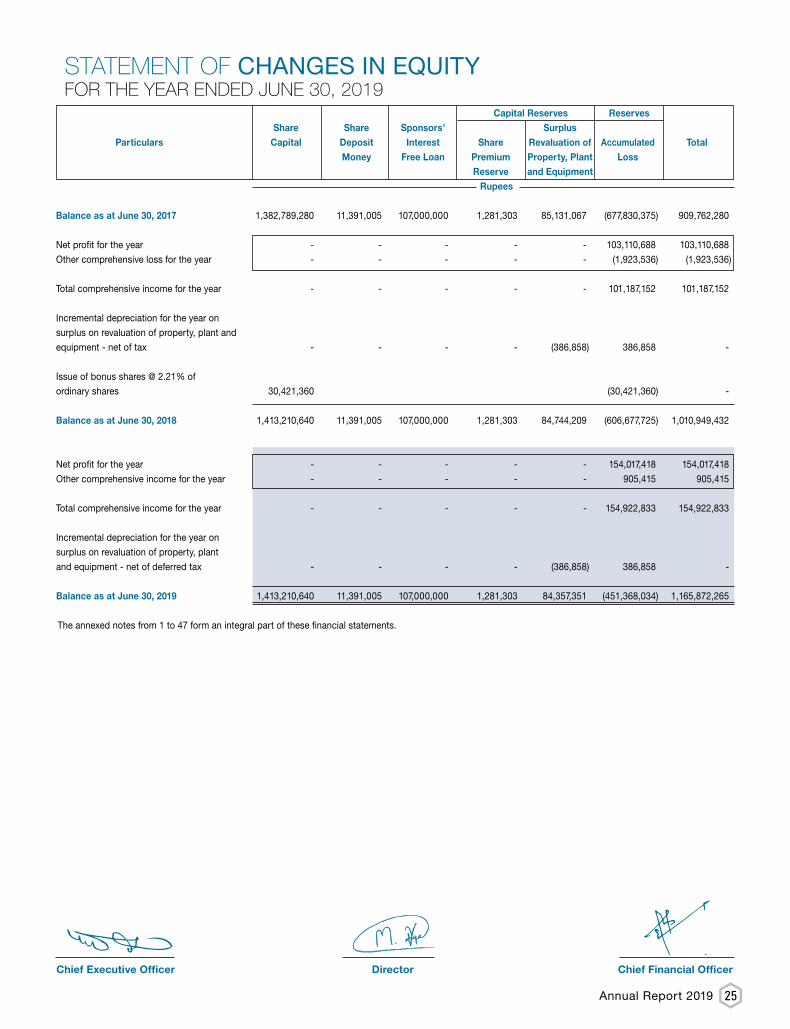
Capital Reserves Reserves Share Share Sponsors’ Surplus Particulars Capital Deposit Interest Share Revaluation of Accumulated Total Money Free Loan Premium Property, Plant Loss Reserve and Equipment Rupees
Balance as at June 30, 2017 1,382,789,280 11,391,005 107,000,000 1,281,303 85,131,067 (677,830,375) 909,762,280 Net profit for the year - - - - - 103,110,688 103,110,688 Other comprehensive loss for the year - - - - - (1,923,536) (1,923,536) Total comprehensive income for the year - - - - - 101,187,152 101,187,152 Incremental depreciation for the year on surplus on revaluation of property, plant and equipment - net of tax - - - - (386,858) 386,858 - Issue of bonus shares @ 2.21% of ordinary shares 30,421,360 (30,421,360) - Balance as at June 30, 2018 1,413,210,640 11,391,005 107,000,000 1,281,303 84,744,209 (606,677,725) 1,010,949,432 Net profit for the year - - - - - 154,017,418 154,017,418 Other comprehensive income for the year - - - - - 905,415 905,415 Total comprehensive income for the year - - - - - 154,922,833 154,922,833 Incremental depreciation for the year on surplus on revaluation of property, plant and equipment - net of deferred tax - - - - (386,858) 386,858 - Balance as at June 30, 2019 1,413,210,640 11,391,005 107,000,000 1,281,303 84,357,351 (451,368,034) 1,165,872,265 The annexed notes from 1 to 47 form an integral part of these financial statements.
STATEMENT OF CHANGES IN EQUITYFOR THE YEAR ENDED JUNE 30, 2019
Chief Executive Officer Director Chief Financial Officer

26 Nimir Resins Limited
2019 2018 Note Rupees Rupees CASH FLOWS FROM OPERATING ACTIVITIES Cash Used in Operations 37 (34,466,264) (222,655,326) Finance cost paid (145,089,474) (69,607,318)Income tax paid (41,661,506) (44,728,693)Gratuity paid (2,126,463) (1,143,068)Workers’ welfare fund paid (3,081,189) (3,372,598)Workers’ (profit) participation fund paid (4,620,000) (6,048,669)
(196,578,632) (124,900,346) Net Cash Used in Operating Activities (231,044,896) (347,555,672) CASH FLOWS FROM INVESTING ACTIVITIES Property, plant and equipment purchased (11,801,202) (6,872,413)Proceeds from disposal of property, plant and equipment 1,040,000 - Capital work in progress - property, plant and equipment (48,987,526) (16,839,995)Long term deposits 1,404,263 - Interest income received - 79,451 Net Cash Used in Investing Activities (58,344,465) (23,632,957) CASH FLOWS FROM FINANCING ACTIVITIES Amount received from long term financing 3,411,000 - Payments against long term financing (625,350) - Payments against diminishing musharaka finance (1,445,876) (1,675,870)Short term borrowings - net 272,651,565 395,898,592 Net Cash Generated from Financing Activities 273,991,339 394,222,722 Net (Decrease) / Increase in Cash and Cash Equivalents (15,398,022) 23,034,093 Cash and cash equivalents at the beginning of the year 39,169,881 16,135,788 Cash and Cash Equivalents at the End of the Year 23,771,859 39,169,881 The annexed notes from 1 to 47 form an integral part of these financial statements.
STATEMENT OF CASH FLOWFOR THE YEAR ENDED JUNE 30, 2019
Chief Executive Officer Director Chief Financial Officer

27Annual Report 2019
1 The Company and its Operations 1.1 Nimir Resins Limited (the Company) was initially incorporated in Pakistan on December 17, 1964 as a private
limited company under the repealed Companies Act, 1913 (now the Companies Act, 2017) and was converted into public limited company on August 19, 1991 with the name of Nimir Resins Limited. The name of the Company was changed to Descon Chemicals Limited on April 01, 2010 when the Company entered into a scheme of arrangement for merger / amalgamation with Descon Chemicals (Private) Limited. Subsequent to a change of management, the Board of Directors was reconstituted on January 05, 2016 and the name of the Company was changed to Nimir Resins Limited. The change was made effective on April 18, 2016.
1.2 The Company is a subsidiary of Nimir Management (Private) Limited whereas Nimir Industrial Chemicals Limited is the ultimate parent company of Nimir Resins Limited.
1.3 The shares of the Company are quoted on Pakistan Stock Exchange Limited. The Company is domiciled in Pakistan and its registered office is situated at 14.5 KM, Lahore-Sheikhupura Road, Lahore. The principal activity of the Company is to manufacture surface coating resins, polyesters for paint industry, optical brightener and textile auxiliaries for textile industry.
Corporate office of the Company is located at 14.5 KM, Lahore-Sheikhupura Road, Lahore. While the production plants of the Company are located at 14.5 KM, Lahore-Sheikhupura Road, Lahore and 14.8 KM, Sheikhupura Faisalabad Road, Sheikhupura.
2 Significant Transactions and Events Affecting the Company’s Financial Position and Performance 2.1 Summary of significant events and transactions in the current reporting period:
2019 Impact in Rupees - Refund bonds issued by the FBR against the sales tax refundable 46,700,000 - Procurement of raw material from a related party - Nimir Industrial Chemicals Limited 131,908,050 - Obtained further short term borrowings 272,651,565 - Addition in property, plant and equipment 53,266,824 - Increase in tax refunds - net 125,903,109 - Increase in revenue as compared to last year 1,307,023,363 - Exchange loss during the year 31,566,903 - Adjustment of current tax expense arising from prior year tax credits 38,163,540 - Assets written off - (Cost - Rs. 46,191,282 and Accumulated depreciation - Rs. 46,046,073) 145,209 - Increase in trade debt 250,786,256 - Finance cost of short term borrowings 158,765,826
3 Basis of Preparation 3.1 Statement of compliance
These financial statements have been prepared in accordance with the accounting and reporting standards as
applicable in Pakistan. The accounting and reporting standards applicable in Pakistan comprise of:
- International Financial Reporting Standards (IFRS) issued by the International Accounting Standards Board (IASB) as notified under the Companies Act, 2017; and
- Provisions of and directives issued under the Companies Act, 2017.
Where provisions of and directives issued under the Companies Act, 2017 differ from the IFRS, the provisions of and directives issued under the Companies Act, 2017 have been followed.
3.2 Basis of measurement
These financial statements have been prepared under the historical cost convention except to the extent of following:
Certain property, plant and equipment Note 18 (stated at Revalued / Fair value) Employee retirement benefits (Gratuity) Note 12 (stated at Present value)
NOTES TO AND FORMING PART OF THE FINANCIAL STATEMENTSFOR THE YEAR ENDED JUNE 30, 2019

28 Nimir Resins Limited
3.3 Functional and presentation currency
These financial statements are prepared and presented in Pak Rupees which is the Company’s functional and presentation currency. All the figures have been rounded off to the nearest Rupee, unless otherwise stated.
3.4 Use of estimates and judgments
The preparation of financial statements in conformity with approved accounting standards, as applicable in Pakistan, requires the use of certain critical accounting estimates. It also requires management to exercise its judgment in the process of applying the Company’s accounting policies. Estimates and judgments are continually evaluated and are based on the historical experience, including expectations of future events that are believed to be reasonable under the circumstances. These estimates and underlying assumptions are reviewed on an ongoing basis. Revisions to accounting estimates are recognized in the period in which the estimate is revised if the revision affects only that period or in the period of the revision and future periods if the revision affects both current and future periods.
These estimates and related assumptions are reviewed on an on-going basis. Significant management estimates in these financial statements are relating to the useful life and residual values of property, plant and equipment; provision for doubtful receivables; provisions for defined benefit plans; slow moving and obsolete inventory; recovery, trade debts and taxation.
The basis and associated assumptions underlying the accounting estimates used in the preparation of annual financial statement of the Company for the year ended June 30, 2019 have been consistent with previous year except for the provision for doubtful debt for the application of IFRS 9, Financial Instrument and contract liability for the application of IFRS 15.
3.5 Changes in accounting standards, interpretations and pronouncements
3.5.1 Standards, interpretations and amendments to approved accounting standards which became effective during the year
The following amendments to existing standards and interpretations have been published and are mandatory for accounting periods beginning on or after July 1, 2018 and are considered to be relevant to the Company’s financial statements:
IFRS 9 ‘Financial Instruments’ (effective for annual periods beginning on or after July 01, 2018). IASB has published the complete version of IFRS 9 which replaces the guidance in IAS 39. This final version includes requirements on the classification and measurement of financial assets and liabilities; it also includes an expected credit losses model that replaces the incurred loss impairment model used today.
IFRS 15 ‘Revenue from Contracts with Customers’ (effective for annual periods beginning on or after July 1, 2018) replaces IAS 18 Revenue, IAS 11 Construction Contracts, and other related interpretations on revenue recognition. IFRS 15 introduces a single five-step model for revenue recognition and establishes a comprehensive framework for recognition of revenue from contracts with customers based on a core principle that an entity should recognize revenue representing the transfer of promised goods or services to customers in an amount that reflects the consideration to which the entity expects to be entitled in exchange for those goods or services.
3.5.2 Standards, interpretation and amendments to approved accounting standards that are not yet effective
The following standards have been issued by the International Accounting Standards Board [IASB], which are yet to be notified by the Securities and Exchange Commission of Pakistan [SECP] for the purpose of their applicability in Pakistan. The Company intends to adopt these standards, if applicable, when they become effective.
Standard or Effective Date Interpretation (Period beginning on or after)
IAS 28 Long-term Interests in Associates and Joint Ventures — (Amendments) January 1, 2018
IAS 23 Borrowing costs January 1, 2019 IFRIC 23 Uncertainty over Income Tax Treatments January 1, 2019 IFRS 3 Business Combinations - Previously held Interests in a joint operation — (Amendments) January 1, 2019
IFRS 11 Joint Arrangements - Previously held Interests in a joint operation January 1, 2019 IFRS 17 Insurance Contracts January 1, 2021
IAS 19 Employee Benefits [Amendments] January 01, 2019 Conceptual Framework in IFRS Standards [Amendments] January 01, 2020 IAS 1 and IAS 8 [Amendments] January 01, 2020
29Annual Report 2019
IFRS 17 outlines the principles governing the recognition, measurement, presentation and disclosure of insurance contracts. The objective of the Standard is to ensure that the reporting entity provides relevant information that faithfully represents those insurance contracts. This information gives users of financial statements better insights into the effects that insurance contracts have on an entity’s net assets, financial position, results of operations and cash flows.
Amendments to IAS 19 specify the basis for determining the current service cost and the net interest expense / income for the period between a defined benefit retirement plan amendment, curtailment or settlement and the end of the reporting period.
The IASB has published a revised Conceptual Framework for Financial Reporting that will be used to develop new Standards and Interpretations in future. In particular, the definitions of assets and liabilities as well as the guidance on measurement and derecognition, presentation and disclosure were amended. This has not resulted in any technical amendments to current Standards to date. The amendments merely update the references to the Conceptual Framework in existing Standards. The Conceptual Framework itself is not subject of the endorsement procedure.
Amendments to IAS 1 & IAS 8 clarify the definition of “material”. Besides additional explanations, the definition of “material” in the Conceptual Framework as well as all Standards was aligned with the central definition in IAS 1.
The Company expects that such improvement to the standard will not have any material impact on the company’s financial statements in the period of initial application, except for IAS 19.
The following standards and amendments to published accounting standards were not effective during the year and have not been early adopted by the Company. The Company intends to adopt these standards, if applicable, when they become effective. Effective date [annual periods
beginning on or after]
IFRIC 23 Uncertainty over Income Tax Treatments January 01, 2019 IFRS 9 Financial Instruments [Amendments] January 01, 2019 IAS 28 Investments in Associates and Joint Ventures January 01, 2019 IFRS 16 Leases January 01, 2019
IFRIC 23 clarifies the requirements for measuring and recognizing uncertain income tax items. The interpretation must be applied to the determination of taxable profit / loss, tax bases, unused tax losses, unused tax credits and tax rates when there is uncertainty over income tax treatments under IAS 12.
Amendment to IFRS 9 clarifies how certain financial instruments with prepayment features with negative compensation are classified.
Amendment to IAS 28 clarifies that IFRS 9 must be applied to long-term interests that, in substance, form part of the net investment in an associate or joint venture to which the equity method is applied.
IFRS 16 ‘Leases’ (effective for annual periods beginning on or after 1 January 2019) is introduced during the year that aims to set out the principles for recognition, measurement, presentation and disclosure of leases. It introduces a single lessee accounting model and requires a lessee to recognize assets and liabilities for all the leases with a term of more than 12 months, unless the underlying asset is of low value. A lessee is required to recognize a right-of-use asset representing its right to use the underlying leased asset and a lease liability representing its obligation to make the lease payments. IFRS 16 substantially carries forward the lessor accounting requirements of IAS 17 Leases. Accordingly, a lessor continues to classify its leases as operating leases or finance leases, and to account for those two types of leases differently. IFRS 16 replaces IAS 17 Leases, IFRIC 4 Determining whether an arrangement contains a lease , SIC-15 Operating Leases-Incentives and SIC-27 Evaluating the Substance of Transactions Involving the Legal Form of a Lease.
The Company expects that such improvement to the standards will not have any material impact on the Company’s financial statements.
There are certain new standards, amendments to the approved accounting standards and new interpretations that are mandatory for accounting periods beginning on or after July 1, 2017, but are considered not to be relevant or have any significant effect on the Company’s reporting and are therefore, not disclosed in these financial statements.

30 Nimir Resins Limited
4 Significant Accounting Policies
The significant accounting policies adopted in the preparation of these financial statements are set out below. These policies have been consistently applied to all the periods presented except for the application of IFRS 15 revenue from contracts with customers (Note 4.14) and IFRS 9 ‘Financial Instruments’ (Note 4.16) adopted with effect from July 01, 2018. The effect of adoption of these new standards has been detailed in Note 5. 4.1 Property, plant and equipment
Owned
Property, plant and equipment are stated at cost / revalued amounts less accumulated depreciation and identified
impairment losses, if any, except freehold land and building on freehold land which are stated at revalued amount less accumulated depreciation and impairment loss. Cost of property, plant and equipment consists of historical cost, borrowing cost pertaining to the construction and erection period and directly attributable cost of bringing assets to their working condition.
Depreciation is charged to income on straight line method at the rates specified in Note 18. Full month’s depreciation is charged on additions during the month, whereas no depreciation is charged on assets disposed off during the month. Where an impairment loss is recognized, the depreciation charge is adjusted in future periods to allocate the asset’s revised carrying amount over its estimated useful life. Freehold land and buildings on freehold land are revalued every three years. Latest revaluation of land and buildings was carried out by an independent valuer as at June 19, 2017.
Any accumulated depreciation at the date of revaluation is eliminated against the gross carrying amount of the asset, and the net amount is restated to the revalued amount of the asset. Additions, subsequent to revaluation, are stated at cost less accumulated depreciation and any identified impairment loss.
Increases in the carrying amount arising on revaluation of assets are recognized, net of tax, in other comprehensive income and accumulated in reserves in shareholders’ equity. However, the increase is first recognized in profit or loss to the extent that the increase reverses a revaluation decrease of the same asset previously recognized in statement of profit or loss.
Each year the difference between depreciation based on revalued carrying amount of the asset (the depreciation charged to the statement of profit or loss) and depreciation based on the asset’s original cost - incremental depreciation on revalued assets is transferred from surplus on revaluation of property, plant and equipment to retained earnings. All transfers from surplus on revaluation of property, plant and equipment are net of applicable deferred taxation. Upon disposal, any revaluation surplus relating to the particular asset being sold is transferred to retained earnings.
Depreciation method, residual value and useful lives of assets are reviewed at least at each reporting date and adjusted if impact on depreciation is significant.
The Company assesses at each reporting date whether there is any indication that property, plant and equipment is impaired. If such indication exists, the carrying amounts of such assets are reviewed to assess whether they are recorded in excess of their recoverable amount. Where carrying amounts exceed the respective recoverable amount, assets are written down to their recoverable amounts and the resulting impairment loss is recognized in the statement of profit or loss . The recoverable amount is the higher of an asset’s fair value less cost to sell and value in use. Where an impairment loss is recognized, the depreciation charge is adjusted in future periods to allocate the asset’s revised carrying amount over its estimated useful life.
Maintenance and normal repairs are charged to income as and when incurred. Major renewals and replacements are capitalized. Gains or losses on disposal of property, plant and equipment are included in the current year’s income.
Capital work-in-progress
Capital work-in-progress is stated at cost less any identified impairment loss.
4.2 Intangible asset
An intangible asset is recognized as an asset if it is probable that future economic benefits attributable to the asset will flow to the Company and the cost of such asset can be measured reliably. Cost of intangible assets i.e. ERP software includes purchase cost and directly attributable expenses incidental to bring the software to its intended use.
Costs that are directly associated with identifiable software and have probable economic benefits beyond one year, are recognized as an intangible asset. However, costs associated with the maintenance of software are recognized as an expense.
All intangibles are measured initially at cost and subsequently stated at cost less accumulated amortization and identified impairment losses, if any. Amortization is charged to income using the straight line method so as to write off the cost of an asset over its estimated useful life. The amortization period and the amortization method for intangible assets are reviewed, at each reporting date, and adjusted if impact on amortization is significant. ERP software is being amortized over 5 years based on estimated useful life.

31Annual Report 2019
At each reporting date, the management reviews the functionality and legal permissions issues relating to the ERP software. Adjustments to the carrying value are incorporated as may be required under the circumstances.
4.3 Stores and spares
These are valued at lower of moving average cost and net realizable value; whilst items considered obsolete are carried at nil value. Cost of items in transit comprises invoice value plus incidental charges paid thereon.
4.4 Stock in trade
These are valued at lower of cost and net realizable value. Cost is determined as follows:
Raw and packing materials - Moving average cost Materials in transit - Invoice value plus incidental charges Work in process - Estimated manufacturing cost Finished goods - Average manufacturing cost Wastes - Net realizable value
Manufacturing cost in relation to work in process and finished goods comprises cost of material, labor and appropriate manufacturing overheads. Net realizable value signifies estimated selling price in the ordinary course of business less necessary costs to make the sale.
4.5 Trade debts
Trade debts are amounts due from customers for goods sold or services performed in the ordinary course of business. If collection is expected in one year or less (or in the normal operating cycle of the business, if longer), they are classified as current assets. If not, they are classified as non-current assets. Trade debts are carried at original invoice amount less expected credit loss based on a review of all outstanding amounts at the year end. Bad debts are written off when identified.
4.6 Cash and cash equivalents
Cash and cash equivalents are carried at cost. For the purpose of cash flow statement, cash and cash equivalents comprise cash in hand and cash at banks in current and savings accounts.
4.7 Provisions
A provision is recognized in the statement of financial position when the Company has a present legal or constructive obligation as a result of a past event and it is probable that an outflow of resources embodying economic benefits will be required to settle the obligation and a reliable estimate of the amount can be made. Provisions are reviewed at each reporting date and adjusted to reflect the current best estimate.
4.8 Staff retirement benefits
Defined benefits plan
The Company operates an approved funded defined benefit plan for all of its permanent employees. Under this plan, gratuity is paid to the retiring employees on the basis of their last drawn gross salary for each completed year of service.
Actuarial gains / (losses) arising from experience adjustments and changes in actuarial assumptions for the defined benefits plan are charged or credited to other comprehensive income in the period in which they arise. Past service costs are recognized immediately in the statement of profit or loss.
Provisions are made in the financial statements to cover obligations on the basis of actuarial valuation carried out at each reporting date.
4.9 Taxation
Income tax on the profit or loss for the year comprises current and deferred tax. Income tax expense is recognized in the statement of profit or loss except to the extent that relates to items recognized directly in other comprehensive income or equity, in which case it is recognized in other comprehensive income or equity.
Current
The charge for current tax is based on higher of corporate tax and alternate corporate tax and for the year determined in accordance with the prevailing laws of taxation. All tax credits and tax rebates are taken into account in calculating this charge. However, in case of taxable loss for the year, income tax expense is recognized on the basis of minimum tax liability on turnover of the Company in accordance with the provisions of the income tax law.
Deferred
Deferred tax is recognized using the balance sheet liability method on all temporary differences between the carrying amount of assets and liabilities and their tax bases.
32 Nimir Resins Limited
Deferred tax liabilities are recognized for all major taxable temporary differences.
Deferred tax assets are recognized for all major deductible temporary differences to the extent that it is probable that taxable profit will be available against which deductible temporary differences can be utilized.
Carrying amount of the deferred tax asset is reviewed at each reporting date and is recognized only to the extent that it is probable that future taxable profits will be available against which assets may be utilized. Deferred tax assets are reduced to the extent that it is no longer probable that the related tax benefit will be realized.
Unrecognized deferred tax assets are reassessed at each reporting date and are recognized to the extent of probable future taxable profit available that will allow deferred tax asset to be recovered.
Deferred tax assets and liabilities are measured at the tax rate that are expected to apply to the year when the asset is utilized or the liability is settled, based on the tax rates that have been enacted or have been notified for subsequent enactments at the reporting date.
4.10 Trade and other payables
Liabilities for trade and other amounts payable are carried at cost which is the fair value of the consideration to be paid or given in future for goods and services received or to be delivered or for any other amount, whether or not billed to the Company.
4.11 Contingent liabilities
Contingent liability is disclosed when there is a possible obligation that arises from past events and whose existence is confirmed only by the occurrence or non-occurrence of one or more uncertain future events not wholly within the control of the Company.
A contingent liability is also disclosed when there is a present obligation that arises from past events but it is not probable that an outflow of resources embodying economic benefits would be required to settle the obligation or the amount of the obligation cannot be measured with sufficient reliability.
4.12 Borrowing cost
Borrowing costs are charged to income as and when incurred except costs directly attributable to acquisition, construction or production of qualifying assets that are capitalized as part of the cost of assets.
4.13 Foreign currency transactions and translations
Transactions denominated in foreign currencies are initially recorded in Pak Rupees by applying the foreign exchange rate ruling on the date of transaction. All monetary assets and liabilities in foreign currencies are translated into Pak Rupees at exchange rate prevailing at the reporting date. Exchange differences are included in profit or loss.
4.14 Revenue recognition
Revenue is recognised either at a point in time or over time, when (or as) the Company satisfies performance obligations by transferring the promised goods or services to its customers. Any bundled goods or services that are distinct are separately recognized, and any discounts or rebates on the contract price are generally allocated to the separate elements.
Revenue is to be recognised in accordance with the aforementioned principle by applying the following steps:
i) Identify the contract with a customer. ii) Identify the performance obligation in the contract. iii) Determine the transaction price of the contract. iv) Allocate the transaction price to each of the separate performance obligations in the contract. v) Recognize the revenue when (or as) the entity satisfies a performance obligation.
4.15 Related party transactions
Transactions in relation to sales, purchases and services with related parties are made at arm’s length prices determined in accordance with the Company’s policy except for the allocation of expenses such as utilities, rental and common overheads shared with related parties, which are on actual basis.
4.16 Financial instruments
A financial instrument is any contract that gives rise to a financial asset of one entity and a financial liability or equity instrument of another entity.
The Company has applied IFRS 9 retrospectively, but has elected not to restate comparative information because the effect on the impairment of trade receivables calculated by expected credit loss approach was immaterial.
4.16.1 Financial assets
All financial assets are recognized at the time when the Company becomes a party to the contractual provisions

33Annual Report 2019
of the instrument. Regular purchases and sales of financial assets are recognized and derecognized, as applicable, using trade-date accounting or settlement date accounting.
4.16.1.1 Classification
The Company classifies its financial assets in the following categories: at amortized cost, at fair value through other comprehensive income and at fair value through profit or loss. The classification is based on the Company’s business model for managing the financial assets and the contractual cash flow characteristics of the financial asset. The management determines the classification of its financial assets at the time of initial recognition.
a) Financial assets at amortized cost
A financial asset is measured at amortized cost if the financial asset is held within a business model whose
objective is to hold financial assets in order to collect contractual cash flows and the contractual terms of the financial asset give rise on specified dates to cash flows that are solely payments of principal and interest on the principal amount outstanding.
b) Financial assets at fair value through other comprehensive income
A financial asset is measured at fair value through other comprehensive income if the financial asset is held within a business model whose objective is achieved by both collecting contractual cash flows and selling financial assets and the contractual terms of the financial asset give rise on specified dates to cash flows that are solely payments of principal and interest on the principal amount outstanding.
c) Financial assets at fair value through profit or loss
A financial asset is measured at fair value through profit or loss unless it is measured at amortized cost or at fair value through other comprehensive income. However, the Company can make an irrevocable election at initial recognition for particular investments in equity instruments that would otherwise be measured at fair value through profit or loss to present subsequent changes in fair value in other comprehensive income unless these are held for trading in which case these have to be measured at fair value through profit or loss. The equity investments of the Company held in short term investments are classified at fair value through profit or loss because they are frequently traded.
Reclassification
When the Company changes its business model for managing financial assets, it reclassifies all affected financial assets accordingly. The Company applies the reclassification prospectively from the reclassification date.
In case of reclassification out of the amortized cost measurement category to fair value through profit or loss
measurement category, fair value of the financial asset is measured at the reclassification date. Any gain or loss arising from a difference between the previous amortized cost and fair value is recognized in profit or loss.
In case of reclassification out of fair value through profit or loss measurement category to the amortized cost
measurement category, fair value of the financial asset at the reclassification date becomes its new gross carrying amount.
In case of reclassification out of the amortized cost measurement category to fair value through other comprehensive income measurement category, fair value of the financial asset is measured at the reclassification date. Any gain or loss arising from a difference between the previous amortized cost and fair value is recognized in other comprehensive income. The effective interest rate and the measurement of expected credit losses are not adjusted as a result of the reclassification.
In case of reclassification out of fair value through other comprehensive income measurement category to the amortized cost measurement category, the financial asset is reclassified at its fair value at the reclassification date. However, the cumulative gain or loss previously recognized in other comprehensive income is removed from equity and adjusted against the fair value of the financial asset at the reclassification date. The effective interest rate and the measurement of expected credit losses are not adjusted as a result of the reclassification.
In case of reclassification out of fair value through profit or loss measurement category to the fair value
through other comprehensive income measurement category, the financial asset continues to be measured at fair value.
In case of reclassification out of fair value through other comprehensive income measurement category to the fair value through profit or loss measurement category, the financial asset continues to be measured at fair value. The cumulative gain or loss previously recognized in other comprehensive income is reclassified from equity to profit or loss as a reclassification adjustment at the reclassification date.
4.16.1.2 Initial recognition and measurement
All financial assets are recognized at the time when the Company becomes a party to the contractual
34 Nimir Resins Limited
provisions of the instrument. Regular purchases and sales of investments are recognized on trade-date – the date on which the Company commits to purchase or sell the asset.
Except for trade receivables, financial assets are initially recognized at fair value plus transaction costs for all financial assets not carried at fair value through profit or loss. Financial assets carried at fair value through profit or loss are initially recognized at fair value and transaction costs are expensed in the profit and loss account. Dividend income from financial assets at fair value through profit or loss is recognized in the profit and loss account when the Company’s right to receive payments is established. Trade receivables are initially measured at the transaction price if these do not contain a significant financing component in accordance with IFRS 15. Where the Company uses settlement date accounting for an asset that is subsequently measured at amortized cost, the asset is recognized initially at its fair value on the trade debt.
4.16.1.3 Subsequent measurement
For the purpose of measuring financial assets after initial recognition, these are classified into the following categories:
- financial assets at amortized cost; - financial assets at fair value through other comprehensive income; and - financial assets at fair value through profit or loss. Financial assets carried at amortized cost are subsequently measured using the effective interest method.
Gain or loss on financial assets not part of hedging relationship is recognized in profit or loss when the financial asset is derecognized, reclassified, through the amortization process or in order to recognize impairment gains or losses.
When the contractual cash flows of a financial asset are renegotiated or otherwise modified and the renegotiation or modification does not result in the derecognition of that financial asset, the Company recalculates the gross carrying amount of the financial asset and recognizes a modification gain or loss in profit or loss.
Financial assets ‘at fair value through other comprehensive income’ are marked to market using the closing
market rates and are carried in the balance sheet at fair value. Net gains and losses arising on changes in fair values of these financial assets are recognized in other comprehensive income. Interest calculated using the effective interest rate method is credited to the statement of profit or loss. Dividends on equity instruments are credited to the statement of profit or loss when the Company’s right to receive payments is established.
Financial assets ‘at fair value through profit or loss’ are marked to market using the closing market rates and are carried in the balance sheet at fair value. Net gains and losses arising on changes in fair values of these financial assets are taken to the profit and loss account in the period in which these arise.
Fair values of quoted investments are based on current prices. If the market for a financial asset is not active (and for unlisted securities), the Company measures the investments at cost less impairment in value, if any.
4.16.1.4 Derecognition
Financial assets are derecognized when:
- the contractual rights to receive cash flows from the assets have expired; or - the Company has transferred its rights to receive cash flows from the asset or has assumed an obligation to pay the received cash flows in full without material delay to a third party under a ‘pass-through’ arrangement; and either:
a) the Company has transferred substantially all the risks and rewards of the asset; or b) the Company has neither transferred nor retained substantially all the risks and rewards of the asset, but has transferred control of the asset.
The difference between the carrying amount and the consideration received is recognized in profit or loss.
If the Company transfers a financial asset in a transfer that qualifies for derecognition in its entirety and retains the right to service the financial asset for a fee, it recognizes either a servicing asset or a servicing liability for that servicing contract.
When the Company has transferred its rights to receive cash flows from an asset or has entered into a pass through arrangement, it evaluates if, and to what extent, it has retained the risks and rewards of ownership. When it has neither transferred nor retained substantially all of the risks and rewards of the asset, nor transferred control of the asset, the Company continues to recognize the transferred asset to the extent of its continuing involvement. In that case, the Company also recognizes an associated liability which cannot be offset with the related asset. The transferred asset and the associated liability are measured on a basis that reflects the rights and obligations that the Company has retained.
Continuing involvement that takes the form of a guarantee over the transferred asset is measured at the lower of the original carrying amount of the asset and the maximum amount of consideration that the Company could be required to repay.

35Annual Report 2019
If the Company’s continuing involvement is in only a part of a financial asset, the Company allocates the previous carrying amount of the financial asset between the part it continues to recognize under continuing involvement, and the part it no longer recognizes on the basis of the relative fair values of those parts on the date of the transfer. The difference between the carrying amount allocated to the part that is no longer recognized and the consideration received for the part no longer recognized is recognized in profit or loss.
4.16.1.5 Impairment of financial assets
The Company directly reduces the gross carrying amount of a financial asset when the Company has no reasonable expectations of recovering a financial asset in its entirety or a portion thereof.
The Company recognizes a loss allowance for expected credit losses on a financial asset measured at amortized cost and through other comprehensive income, a lease receivable, a contract asset or a loan commitment and a financial guarantee contract. In case of financial assets measured at fair value through other comprehensive income, loss allowance is recognized in other comprehensive income and carrying amount of the financial asset in the statement of financial position is not reduced.
The Company measures, at each reporting date, the loss allowance for a financial instrument at an amount equal to the lifetime expected credit losses if the credit risk on that financial instrument has increased significantly since initial recognition. Where the credit risk on a financial instrument has not increased significantly since the initial recognition, the Company measures the loss allowance for that financial instrument at an amount equal to 12-month expected credit losses.
The Company always measures the loss allowance at an amount equal to lifetime expected credit losses for trade receivables or contract assets that result from transactions under IFRS 15 and lease receivables.
The Company recognizes the amount of expected credit losses (or reversal), that is required to adjust the loss allowance at the reporting date to the amount that is required to be recognized, in the profit or loss.
4.16.2 Financial liabilities
4.16.2.1 Initial recognition and measurement
All financial liabilities are recognized at the time when the Company becomes a party to the contractual provisions of the instrument.
Financial liabilities are classified, at initial recognition, as financial liabilities at amortized cost except for financial liabilities at fair value through profit or loss, financial liabilities that arise when a transfer of a financial asset does not qualify for derecognition or when the continuing involvement approach applies, financial guarantee contracts, commitments to provide a loan at a below-market interest rate and contingent consideration recognized in a business combination.
The Company does not reclassify any of its financial liabilities.
Financial liabilities are initially recognized at fair value minus transaction costs for all financial liabilities not carried at fair value through profit or loss. Financial liabilities carried at fair value through profit or loss are initially recognized at fair value and transaction costs are credited in the profit and loss account.
The Company’s financial liabilities include trade and other payables, loans and borrowings including Company overdrafts, financial guarantee contracts and derivative financial instruments.
4.16.2.2 Subsequent measurement
The measurement of financial liabilities depends on their classification, as described below:
Financial liabilities at fair value through profit or loss
Such liabilities, including derivatives that are liabilities, are subsequently measured at fair value.
Financial liabilities at fair value through profit or loss include financial liabilities held for trading and financial liabilities designated upon initial recognition as at fair value through profit or loss.
Financial liabilities are classified as held for trading if they are incurred for the purpose of repurchasing in the near term. This category also includes derivative financial instruments entered into by the Company that are not designated as hedging instruments in hedge relationships. Separated embedded derivatives are also classified as held for trading unless they are designated as effective hedging instruments.
The amount of change in the fair value that is attributable to changes in the credit risk of financial liability is presented in other comprehensive income and the remaining amount of change in the fair value of the liability is presented in profit or loss.
Financial liabilities designated upon initial recognition at fair value through profit or loss are designated at the initial date of recognition, and only if it eliminates or significantly reduces a measurement or recognition

36 Nimir Resins Limited
inconsistency or a group of financial liabilities is managed and its performance is evaluated on a fair value basis, in accordance with a documented risk management or investment strategy, and information about the group is provided internally on that basis to the Company’s key management personnel. The Company has not designated any financial liability as at fair value through profit or loss.
Financial guarantee contracts and commitments to provide a loan at a below-market interest rate
Financial guarantee contracts issued by the Company are those contracts that require a payment to be made to reimburse the holder for a loss it incurs because the specified debtor fails to make a payment when due in accordance with the terms of a debt instrument. Financial guarantee contracts and commitments to provide a loan at a below-market interest rate are recognized initially as a liability at fair value, adjusted for transaction costs that are directly attributable to the issuance of the guarantee. Subsequently, the liability is measured at the higher of the best estimate of the expenditure required to settle the present obligation at the reporting date and the amount recognized less cumulative amortization.
Contingent consideration recognized in a business combination
These are subsequently measured at fair value with changes recognized in profit or loss.
All other liabilities
All other financial liabilities are measured at amortized cost using the EIR method. Gains and losses are recognized in profit or loss when the liabilities are derecognized as well as through the EIR amortization process. Amortized cost is calculated by taking into account any discount or premium on acquisition and fees or costs that are an integral part of the EIR. The EIR amortization is included as finance costs in the statement of profit or loss.
4.16.2.3 Derecognition
A financial liability is derecognized when the obligation under the liability is discharged or cancelled or expired. Where an existing financial liability is replaced by another from the same lender on substantially different terms, or the terms of an existing liability are substantially modified, such an exchange or modification is treated as a derecognition of the original liability and the recognition of a new liability, and the difference in respective carrying amounts is recognized in the profit and loss account. The difference between the carrying amount of a financial liability extinguished or transferred to another party and the consideration paid, including any non-cash assets transferred or liabilities assumed, is recognized in profit or loss.
If the Company repurchases a part of a financial liability, the Company allocates the previous carrying amount of the financial liability between the part that continues to be recognized and the part that is derecognized based on the relative fair values of those parts on the date of the repurchase. The difference between the carrying amount allocated to the part derecognized and the consideration paid, including any non-cash assets transferred or liabilities assumed, for the part derecognized is recognized in profit or loss.
4.16.3 Offsetting of financial assets and liabilities
A financial asset and a financial liability is offset and the net amount is reported in the statement of financial position if the Company has a legally enforceable right to offset the recognized amounts and intends either to settle on a net basis or to realize the asset and settle the liability simultaneously.
4.17 Impairment
Carrying amounts of the Company’s assets are reviewed at each reporting date to determine whether there is any indication of impairment. If any such indication exists, the asset’s recoverable amount is estimated in order to determine the extent of the impairment loss, if any. The recoverable amount is the higher of fair value less costs to sell and value in use. In the absence of any information about the fair value, the recoverable amount is determined to be the value in use. Impairment losses are recognized as expense in the statement of profit or loss.
4.18 Segment reporting
Operating segments are reported in a manner consistent with the internal reporting provided to the Chief Operating Decision Maker (the Chief Executive Officer of the Company).
4.19 Dividend
Dividends are recognized as a liability in the period in which these are approved.
4.20 Fair value measurement
Fair value is the price that would be received to sell an asset or paid to transfer a liability in an orderly transaction between market participants at the measurement date in the principal, or in its absence, the most advantageous market to which the Company has access at that date. The fair value of a liability reflects its non-performance
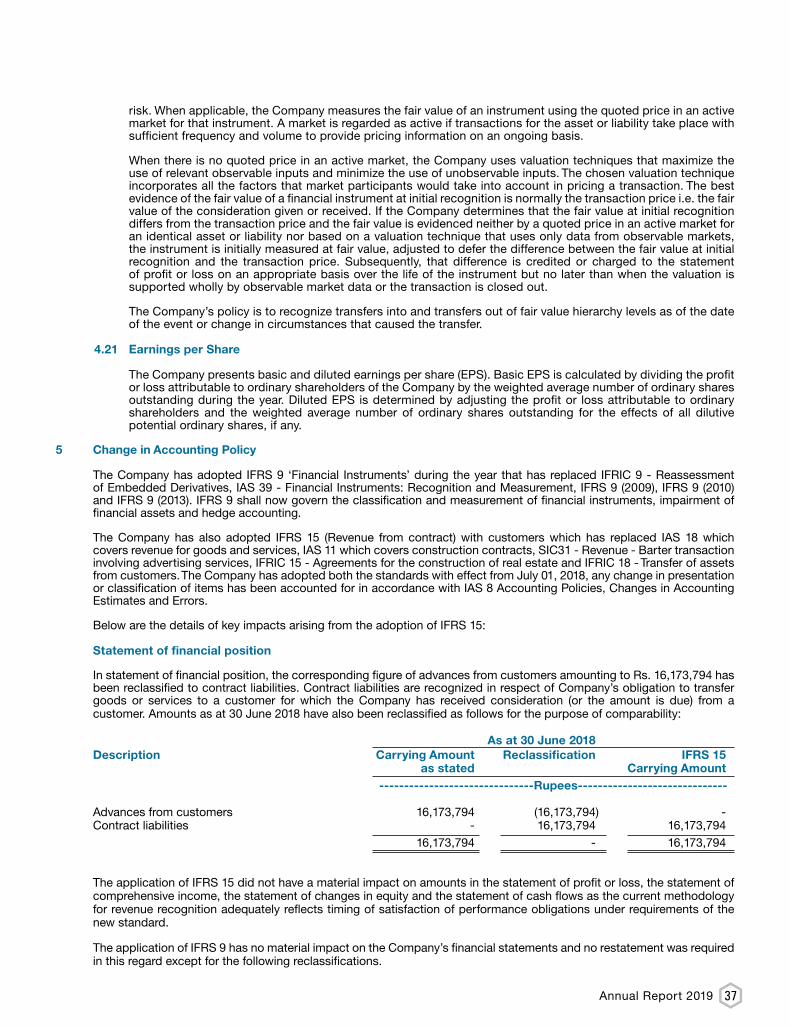
37Annual Report 2019
risk. When applicable, the Company measures the fair value of an instrument using the quoted price in an active market for that instrument. A market is regarded as active if transactions for the asset or liability take place with sufficient frequency and volume to provide pricing information on an ongoing basis.
When there is no quoted price in an active market, the Company uses valuation techniques that maximize the use of relevant observable inputs and minimize the use of unobservable inputs. The chosen valuation technique incorporates all the factors that market participants would take into account in pricing a transaction. The best evidence of the fair value of a financial instrument at initial recognition is normally the transaction price i.e. the fair value of the consideration given or received. If the Company determines that the fair value at initial recognition differs from the transaction price and the fair value is evidenced neither by a quoted price in an active market for an identical asset or liability nor based on a valuation technique that uses only data from observable markets, the instrument is initially measured at fair value, adjusted to defer the difference between the fair value at initial recognition and the transaction price. Subsequently, that difference is credited or charged to the statement of profit or loss on an appropriate basis over the life of the instrument but no later than when the valuation is supported wholly by observable market data or the transaction is closed out.
The Company’s policy is to recognize transfers into and transfers out of fair value hierarchy levels as of the date of the event or change in circumstances that caused the transfer.
4.21 Earnings per Share
The Company presents basic and diluted earnings per share (EPS). Basic EPS is calculated by dividing the profit or loss attributable to ordinary shareholders of the Company by the weighted average number of ordinary shares outstanding during the year. Diluted EPS is determined by adjusting the profit or loss attributable to ordinary shareholders and the weighted average number of ordinary shares outstanding for the effects of all dilutive potential ordinary shares, if any.
5 Change in Accounting Policy
The Company has adopted IFRS 9 ‘Financial Instruments’ during the year that has replaced IFRIC 9 - Reassessment of Embedded Derivatives, IAS 39 - Financial Instruments: Recognition and Measurement, IFRS 9 (2009), IFRS 9 (2010) and IFRS 9 (2013). IFRS 9 shall now govern the classification and measurement of financial instruments, impairment of financial assets and hedge accounting.
The Company has also adopted IFRS 15 (Revenue from contract) with customers which has replaced IAS 18 which covers revenue for goods and services, IAS 11 which covers construction contracts, SIC31 - Revenue - Barter transaction involving advertising services, IFRIC 15 - Agreements for the construction of real estate and IFRIC 18 - Transfer of assets from customers. The Company has adopted both the standards with effect from July 01, 2018, any change in presentation or classification of items has been accounted for in accordance with IAS 8 Accounting Policies, Changes in Accounting Estimates and Errors.
Below are the details of key impacts arising from the adoption of IFRS 15:
Statement of financial position
In statement of financial position, the corresponding figure of advances from customers amounting to Rs. 16,173,794 has been reclassified to contract liabilities. Contract liabilities are recognized in respect of Company’s obligation to transfer goods or services to a customer for which the Company has received consideration (or the amount is due) from a customer. Amounts as at 30 June 2018 have also been reclassified as follows for the purpose of comparability: As at 30 June 2018 Description Carrying Amount Reclassification IFRS 15
as stated Carrying Amount -------------------------------Rupees------------------------------
Advances from customers 16,173,794 (16,173,794) - Contract liabilities - 16,173,794 16,173,794 16,173,794 - 16,173,794
The application of IFRS 15 did not have a material impact on amounts in the statement of profit or loss, the statement of
comprehensive income, the statement of changes in equity and the statement of cash flows as the current methodology for revenue recognition adequately reflects timing of satisfaction of performance obligations under requirements of the new standard.
The application of IFRS 9 has no material impact on the Company’s financial statements and no restatement was required
in this regard except for the following reclassifications.

38 Nimir Resins Limited
June 30, 2018 Reclassified to IFRS 9 Categories
Loan and Fair value Fair value receivable through Amortized through
under IAS 39 profit or loss cost OCI ---------------------------------Rupees---------------------------------
Long term deposits 10,739,956 - 10,739,956 - Trade debts 769,511,085 - 769,511,085 - Other receivables 1,109,000 - 1,109,000 - Short term loans to employees 684,980 - 684,980 -
6 Issued, Subscribed and Paid up Capital
2019 2018 2019 2018 No. of Shares Rupees Rupees 100,825,648 100,825,648 Ordinary shares of Rs. 5 each fully paid in cash 504,128,240 504,128,240 33,550,588 33,550,588 Ordinary shares of Rs. 5 each issued at 60 % discount 167,752,940 167,752,940 2,699,247 2,699,247 Ordinary shares of Rs. 5 each issued for consideration other than cash - land 13,496,235 13,496,235 9,142,867 9,142,867 Ordinary shares of Rs. 5 each issued as fully paid bonus shares 45,714,335 45,714,335 143,689,875 143,689,875 Ordinary shares of Rs. 5 each issued pursuant to the scheme of amalgamation 718,449,375 718,449,375 (7,266,097) (7,266,097) Ordinary shares of Rs. 5 each cancelled pursuant to the scheme of amalgamation (36,330,485) (36,330,485)
282,642,128 282,642,128 1,413,210,640 1,413,210,640
6.1 Reconciliation of the number of shares outstanding as at the beginning and at the end of the year is as under:
Opening balance 282,642,128 276,557,856 Issued during the year - 6,084,272 Closing balance 282,642,128 282,642,128 6.2 As at the reporting date the shares of the Company as held by its holding company and associated Companies are
as under:
Nimir Management (Private) Limited 144,147,485 144,147,485 Nimir Holding (Private) Limited 32,876,612 32,876,612 Terranova Limited 12,892,775 12,892,775 189,916,872 189,916,872
7 Share Deposit Money
The balance in share deposit money account represents the excess subscription money received from directors andrelated parties for issuance of right shares.
8 Reserves
2019 2018 Rupees Rupees Capital reserves
Share premium reserve 1,281,303 1,281,303 Revenue reserves
Accumulated loss (451,368,034) (606,677,725)
(450,086,731) (605,396,422)
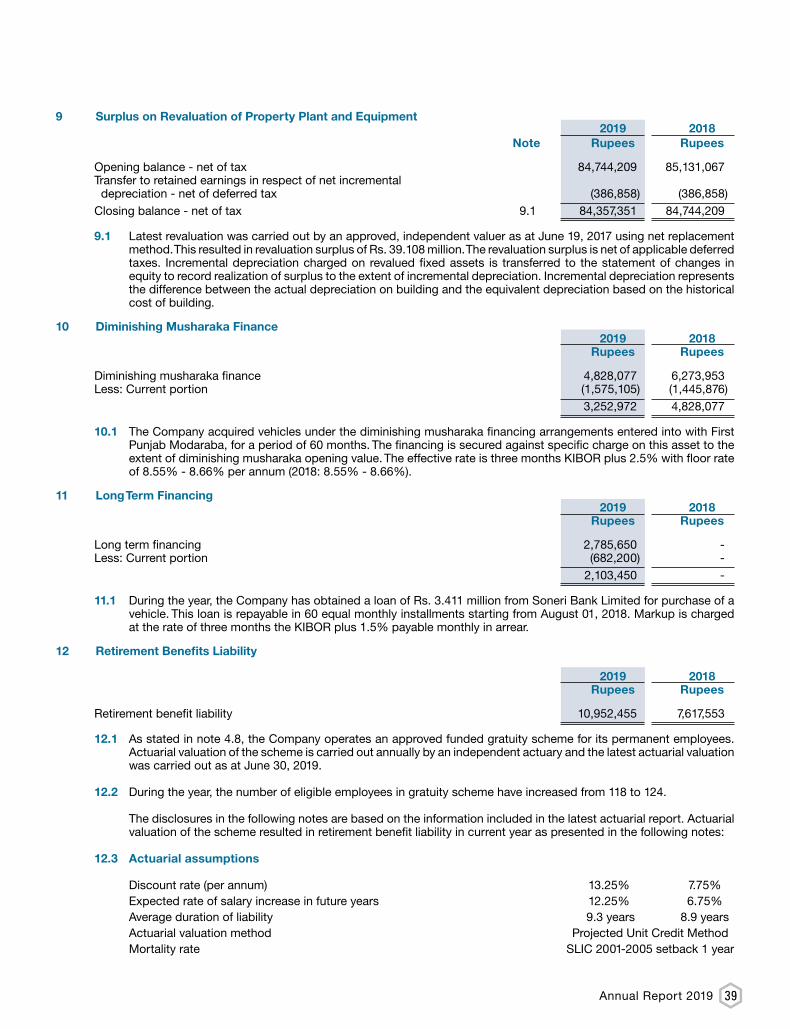
39Annual Report 2019
9 Surplus on Revaluation of Property Plant and Equipment 2019 2018 Note Rupees Rupees Opening balance - net of tax 84,744,209 85,131,067 Transfer to retained earnings in respect of net incremental depreciation - net of deferred tax (386,858) (386,858)Closing balance - net of tax 9.1 84,357,351 84,744,209 9.1 Latest revaluation was carried out by an approved, independent valuer as at June 19, 2017 using net replacement
method. This resulted in revaluation surplus of Rs. 39.108 million. The revaluation surplus is net of applicable deferred taxes. Incremental depreciation charged on revalued fixed assets is transferred to the statement of changes in equity to record realization of surplus to the extent of incremental depreciation. Incremental depreciation represents the difference between the actual depreciation on building and the equivalent depreciation based on the historical cost of building.
10 Diminishing Musharaka Finance 2019 2018 Rupees Rupees Diminishing musharaka finance 4,828,077 6,273,953 Less: Current portion (1,575,105) (1,445,876) 3,252,972 4,828,077
10.1 The Company acquired vehicles under the diminishing musharaka financing arrangements entered into with First Punjab Modaraba, for a period of 60 months. The financing is secured against specific charge on this asset to the extent of diminishing musharaka opening value. The effective rate is three months KIBOR plus 2.5% with floor rate of 8.55% - 8.66% per annum (2018: 8.55% - 8.66%).
11 Long Term Financing 2019 2018 Rupees Rupees Long term financing 2,785,650 - Less: Current portion (682,200) - 2,103,450 - 11.1 During the year, the Company has obtained a loan of Rs. 3.411 million from Soneri Bank Limited for purchase of a
vehicle. This loan is repayable in 60 equal monthly installments starting from August 01, 2018. Markup is charged at the rate of three months the KIBOR plus 1.5% payable monthly in arrear.
12 Retirement Benefits Liability
2019 2018 Rupees Rupees Retirement benefit liability 10,952,455 7,617,553 12.1 As stated in note 4.8, the Company operates an approved funded gratuity scheme for its permanent employees.
Actuarial valuation of the scheme is carried out annually by an independent actuary and the latest actuarial valuation was carried out as at June 30, 2019.
12.2 During the year, the number of eligible employees in gratuity scheme have increased from 118 to 124.
The disclosures in the following notes are based on the information included in the latest actuarial report. Actuarial valuation of the scheme resulted in retirement benefit liability in current year as presented in the following notes:
12.3 Actuarial assumptions
Discount rate (per annum) 13.25% 7.75% Expected rate of salary increase in future years 12.25% 6.75% Average duration of liability 9.3 years 8.9 years Actuarial valuation method Projected Unit Credit Method
Mortality rate SLIC 2001-2005 setback 1 year

40 Nimir Resins Limited
2019 2018 Note Rupees Rupees
12.3.1 Reconciliation of the funded status
Present value of defined benefit obligation 12.3.2 20,779,813 15,031,194 Fair value of plan assets 12.3.3 (9,827,358) (7,413,641) 10,952,455 7,617,553 12.3.2 Movement in present value of defined benefit obligation
Opening balance 15,031,194 9,319,363 Current service cost for the year 6,228,637 6,168,534 Interest on defined benefit liability 1,082,517 634,218 Benefits paid (2,126,463) (1,143,068) Actuarial losses 563,928 52,147 Closing balance 20,779,813 15,031,194 12.3.3 Movement in fair value of plan assets
Opening balance 7,413,641 10,494,362 Total contribution made during the year 2,126,463 - Interest income for the year 574,557 719,405 Benefits paid (2,126,463) (1,143,068) Return on plan assets excluding interest income 1,839,160 (2,657,058) Closing balance 12.3.6 9,827,358 7,413,641 12.3.4 Company’s liability
Opening balance of net defined benefit asset 7,617,553 (1,174,999) Remeasurements chargeable in statement of comprehensive income (1,275,232) 2,709,205 Expense chargeable to profit or loss 12.3.7 6,736,597 6,083,347 Contribution paid during the year (2,126,463) - Closing balance - net defined benefit liability / (asset) 10,952,455 7,617,553 12.3.5 Remeasurements chargeable in the other comprehensive income
Actuarial losses due to experience adjustments 563,928 52,147 Return on plan assets (1,839,160) 2,657,058 (1,275,232) 2,709,205
12.3.6 Plan assets composition
Investment in treasury bills 3,314,824 3,600,997 Investment in listed securities 6,223,088 3,812,535 Cash at bank 289,446 109 9,827,358 7,413,641
12.3.7 Charge for the year
Current service cost 6,228,637 6,168,534 Interest on defined benefit liability 1,082,517 634,218 Interest income for the year (574,557) (719,405) 6,736,597 6,083,347
202012.3.8 Estimated Charge for the year 2019-2020 Rupees Current service cost 6,602,752 Interest on defined benefit liability 2,753,325 Interest income for the year (761,620) 8,594,457 12.3.9 Year end sensitivity analysis on defined benefit obligation
Reasonably possible changes as at the reporting date to one of the relevant actuarial assumptions, holding other
assumptions constant, would have resulted in defined benefit obligation as stated below:

41Annual Report 2019
2019 Rupees Discount rate + 100 bps 18,888,601 Discount rate - 100 bps 22,988,183 Salary increase + 100 bps 22,988,183 Salary increase - 100 bps 18,857,152 12.3.10 Comparison of last five years
2019 2018 2017 2016 2015 Rupees Rupees Rupees Rupees Rupees Present value of defined benefit
obligation 20,779,813 15,031,194 9,319,363 8,080,671 6,435,881 Fair value of plan assets (9,827,358) (7,413,641) (10,494,362) (9,465,014) (8,873,969) Retirement benefit liability / (asset) 10,952,455 7,617,553 (1,174,999) (1,384,343) (2,438,088)
13 Deferred Tax Liability / (Asset)
2019 2018 Note Rupees Rupees Taxable temporary differences
- Accelerated tax depreciation 54,043,904 55,460,956 - Surplus on revaluation of property, plant and equipment 1,401,431 1,513,620 55,445,335 56,974,576
Deductible temporary differences
- Provisions and others (46,662,782) (49,359,289)- Minimum tax (12,265,474) - (3,482,921) 7,615,287 13.1 Reconciliation of deferred tax liabilities / (assets), net
Opening balance 7,615,287 28,436,577 Tax income during the year recognised in profit or loss (11,468,025) (20,035,621) Tax income / (expense) during the year recognised in other comprehensive income 369,817 (785,669) Closing balance (3,482,921) 7,615,287
14 Trade and Other Payables
Creditors:
- Unsecured 14.1 203,149,852 143,478,075 - Secured 32,996,819 284,264,210 236,146,671 427,742,285 Accrued liabilities 31,325,532 25,135,926 Contract liabilities 8,841,123 16,173,794 Workers’ (profit) participation fund 14.2 8,795,773 4,619,793 Workers’ welfare fund 14.3 3,725,796 3,184,044 288,834,895 476,855,842
14.1 This includes payable to Nimir Industrial Chemicals Limited on account of trade payable of Rs. 26,583,629 (2018: Rs. 20,382,248).
14.2 Opening balance 4,619,793 6,048,669 Add: Provision for the year 8,795,980 4,619,793 Less: Payments made during the year (4,620,000) (6,048,669) Closing balance 8,795,773 4,619,793 14.3 Opening balance 3,184,044 3,932,426 Add: Provision for the year 3,622,941 2,624,216 Less: Payments made during the year (3,081,189) (3,372,598) Closing balance 3,725,796 3,184,044
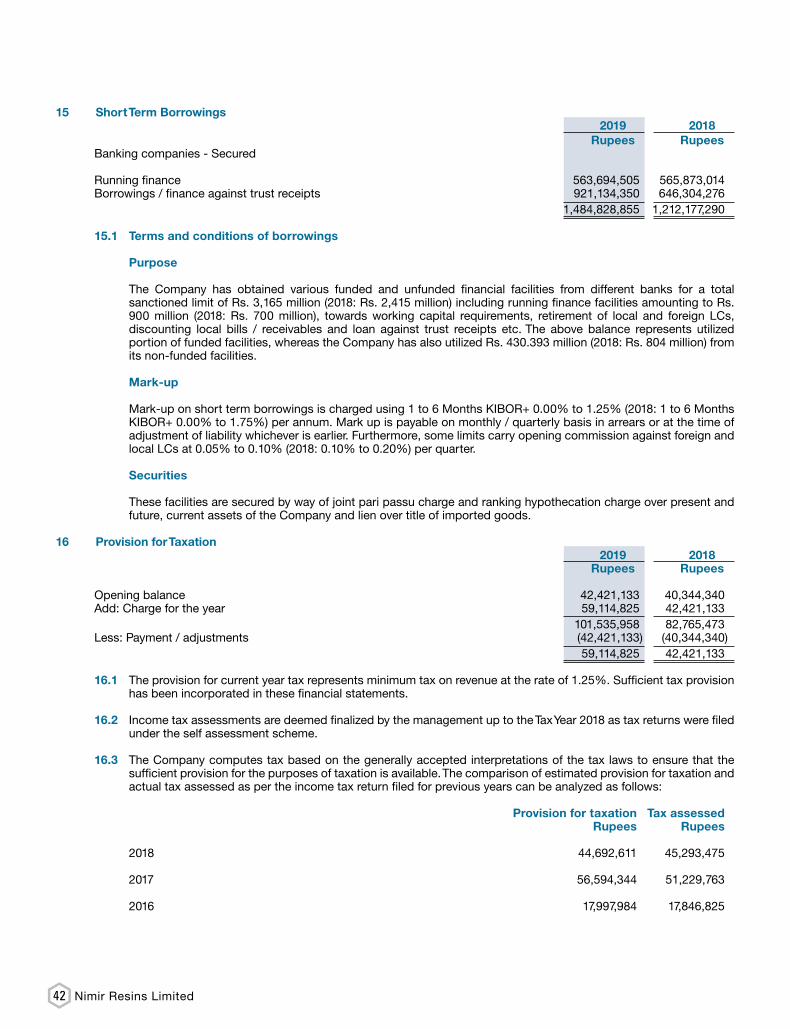
42 Nimir Resins Limited
15 Short Term Borrowings 2019 2018 Rupees RupeesBanking companies - Secured
Running finance 563,694,505 565,873,014 Borrowings / finance against trust receipts 921,134,350 646,304,276 1,484,828,855 1,212,177,290 15.1 Terms and conditions of borrowings
Purpose
The Company has obtained various funded and unfunded financial facilities from different banks for a total
sanctioned limit of Rs. 3,165 million (2018: Rs. 2,415 million) including running finance facilities amounting to Rs. 900 million (2018: Rs. 700 million), towards working capital requirements, retirement of local and foreign LCs, discounting local bills / receivables and loan against trust receipts etc. The above balance represents utilized portion of funded facilities, whereas the Company has also utilized Rs. 430.393 million (2018: Rs. 804 million) from its non-funded facilities.
Mark-up
Mark-up on short term borrowings is charged using 1 to 6 Months KIBOR+ 0.00% to 1.25% (2018: 1 to 6 Months KIBOR+ 0.00% to 1.75%) per annum. Mark up is payable on monthly / quarterly basis in arrears or at the time of adjustment of liability whichever is earlier. Furthermore, some limits carry opening commission against foreign and local LCs at 0.05% to 0.10% (2018: 0.10% to 0.20%) per quarter.
Securities
These facilities are secured by way of joint pari passu charge and ranking hypothecation charge over present and future, current assets of the Company and lien over title of imported goods.
16 Provision for Taxation 2019 2018 Rupees Rupees Opening balance 42,421,133 40,344,340 Add: Charge for the year 59,114,825 42,421,133 101,535,958 82,765,473 Less: Payment / adjustments (42,421,133) (40,344,340) 59,114,825 42,421,133 16.1 The provision for current year tax represents minimum tax on revenue at the rate of 1.25%. Sufficient tax provision
has been incorporated in these financial statements.
16.2 Income tax assessments are deemed finalized by the management up to the Tax Year 2018 as tax returns were filed under the self assessment scheme.
16.3 The Company computes tax based on the generally accepted interpretations of the tax laws to ensure that the sufficient provision for the purposes of taxation is available. The comparison of estimated provision for taxation and actual tax assessed as per the income tax return filed for previous years can be analyzed as follows: Provision for taxation Tax assessed
Rupees Rupees
2018 44,692,611 45,293,475 2017 56,594,344 51,229,763 2016 17,997,984 17,846,825

43Annual Report 2019
17 Contingencies and Commitments
17.1 Contingencies
17.1.1 In respect of tax year 2011, the Company was confronted for audit through random computer balloting. On production of records, the concerned Assistant Commissioner of Inland Revenue (ACIR) made additions of Rs. 61.702 million vide order dated October 30, 2017, whereas the Company had declared a tax loss of Rs. 147.994 million in its tax return. Against this order, the Company has initiated preferred appeal on January 11, 2018 with CIR(appeals) and such appeal is pending adjudication.
17.1.2 In respect of tax year 2014, the Company was confronted for audit through random computer balloting. On production of records, the concerned Assistant Commissioner of Inland Revenue (ACIR) has made additions of Rs. 27.828 million, whereas the Company had declared a tax loss of Rs. 55.554 million in its tax return. Against this order, the Company has initiated preferred appeal on October 25, 2017 with CIR(appeals) and such appeal is pending adjudication.
17.1.3 The Company has filed a suit in Civil Court, Lahore against M/s Chitral Ghee and Oil Mills Company for the recovery of balance of advance given to said vendor party, calculated at Rs. 22.17 million. In another suit before the Civil Court, Lahore the same party has demanded an amount of Rs. 5.860 million allegedly receivable from the Company on account of supplies of various products made to the Company. Both the matters are pending adjudication.
17.2 Guarantees
The Company has given counter-guarantees to different banks for their guarantees in favour of the following parties for amounts given hereunder: 2019 2018
Rupees Rupees Sui Northern Gas Pipelines Limited 3,090,000 3,090,000 Pakistan State Oil Company Limited 3,000,000 3,000,000 Total Parco Pakistan Limited 7,000,000 5,000,000 13,090,000 11,090,000 17.3 Commitments
Letters of credit 367,272,828 511,919,241

44 Nimir Resins Limited
18. Property, Plant and Equipment 2019 2018 Note Rupees Rupees Operating fixed assets 18.1 507,861,187 498,024,422
Capital work in progress 18.7 15,862,160 8,340,256
523,723,347 506,364,678 18.1 Operating fixed assets Year Ended June 30, 2019
Buildings Plant Office Description Freehold on freehold and equipment, IT Laboratory Vehicles and Total land land machinery furniture and equipment equipment carriers fixtures
Note Rupees Cost/Revalued Amount Balance as at July 01, 2018 222,114,500 109,065,252 564,117,168 21,999,166 38,369,135 19,644,988 21,412,213 996,722,422
Additions - 2,898,814 41,636,013 1,610,517 652,785 1,151,300 5,317,395 53,266,824
Disposals during the year 18.10 - - - - - - (1,541,671) (1,541,671)
Write off / scrapped during the year - - (12,002,622) (14,100,901) (17,153,642) (1,233,742) (1,700,375) (46,191,282)
Balance as at June 30, 2019 222,114,500 111,964,066 593,750,559 9,508,782 21,868,278 19,562,546 23,487,562 1,002,256,293
Accumulated depreciation
Balance as at July 01, 2018 - 8,024,509 415,886,133 15,201,270 34,429,948 14,236,422 10,919,718 498,698,000
Charge for the year - 7,897,286 23,627,147 4,536,255 3,160,359 1,322,094 2,741,709 43,284,850
Disposals during the year 18.10 - - - - - - (1,541,671) (1,541,671)
Write off / scrapped during the year - - (11,905,398) (14,053,309) (17,153,283) (1,233,711) (1,700,372) (46,046,073)
Balance as at June 30, 2019 - 15,921,795 427,607,882 5,684,216 20,437,024 14,324,805 10,419,384 494,395,106
Balance as at June 30, 2019 222,114,500 96,042,271 166,142,677 3,824,566 1,431,254 5,237,741 13,068,178 507,861,187
Depreciation rates - 7% to 10% 7% to 33% 20% to 50% 20% to 50% 13% to 50% 20%
Year Ended June 30, 2018
Buildings Plant Office Description Freehold on freehold and equipment, IT Laboratory Vehicles and Total land land machinery furniture and equipment equipment carriers fixtures
Rupees Cost/Revalued Amount
Balance as at July 01, 2017 222,114,500 105,843,819 541,402,393 19,462,553 37,046,858 18,269,818 14,603,758 958,743,699
Additions - 3,221,433 22,714,775 2,536,613 1,322,277 1,375,170 6,808,455 37,978,723
Balance as at June 30, 2018 222,114,500 109,065,252 564,117,168 21,999,166 38,369,135 19,644,988 21,412,213 996,722,422
Accumulated depreciation
Balance as at July 01, 2017 - 228,351 397,024,957 13,020,452 30,921,934 13,169,352 9,048,228 463,413,274
Charge for the year - 7,796,158 18,861,176 2,180,818 3,508,014 1,067,070 1,871,490 35,284,726
Balance as at June 30, 2018 - 8,024,509 415,886,133 15,201,270 34,429,948 14,236,422 10,919,718 498,698,000
Balance as at June 30, 2018 222,114,500 101,040,743 148,231,035 6,797,896 3,939,187 5,408,566 10,492,495 498,024,422
Depreciation rates - 7% to 20% 10% to 33% 20% to 50% 20% to 50% 20% to 33% 20%
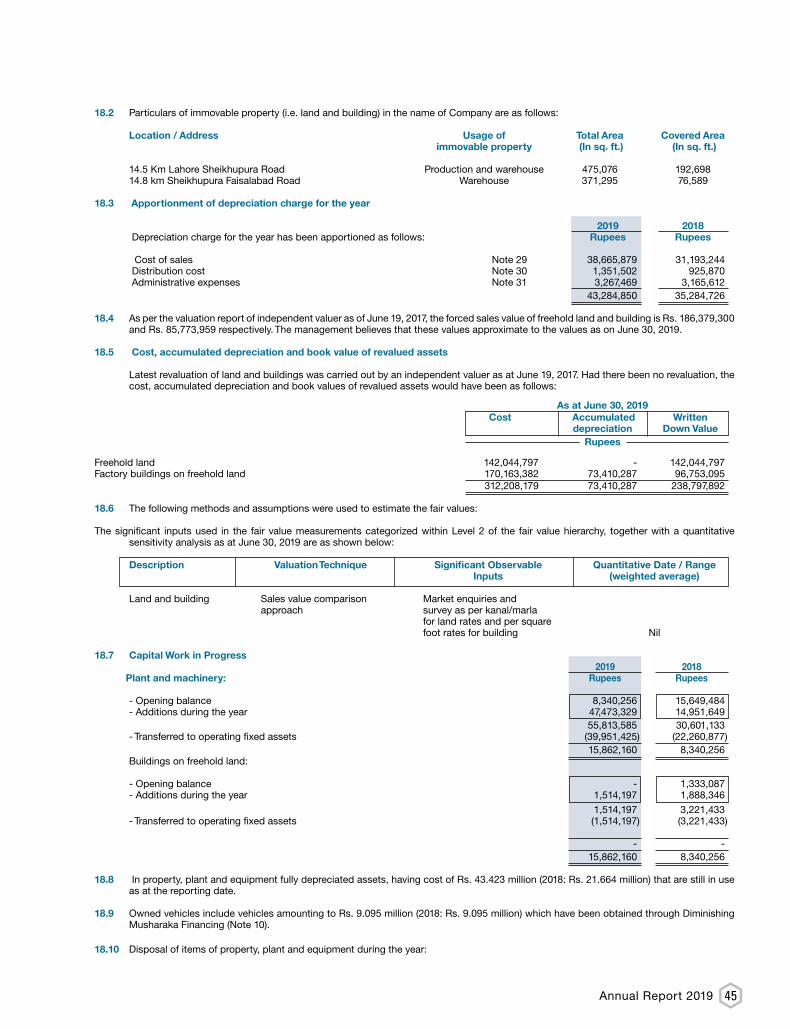
45Annual Report 2019
18.2 Particulars of immovable property (i.e. land and building) in the name of Company are as follows:
Location / Address Usage of Total Area Covered Area immovable property (In sq. ft.) (In sq. ft.)
14.5 Km Lahore Sheikhupura Road Production and warehouse 475,076 192,698 14.8 km Sheikhupura Faisalabad Road Warehouse 371,295 76,589 18.3 Apportionment of depreciation charge for the year
2019 2018
Depreciation charge for the year has been apportioned as follows: Rupees Rupees Cost of sales Note 29 38,665,879 31,193,244 Distribution cost Note 30 1,351,502 925,870 Administrative expenses Note 31 3,267,469 3,165,612 43,284,850 35,284,726 18.4 As per the valuation report of independent valuer as of June 19, 2017, the forced sales value of freehold land and building is Rs. 186,379,300
and Rs. 85,773,959 respectively. The management believes that these values approximate to the values as on June 30, 2019.
18.5 Cost, accumulated depreciation and book value of revalued assets
Latest revaluation of land and buildings was carried out by an independent valuer as at June 19, 2017. Had there been no revaluation, the cost, accumulated depreciation and book values of revalued assets would have been as follows: As at June 30, 2019 Cost Accumulated Written
depreciation Down Value Rupees
Freehold land 142,044,797 - 142,044,797 Factory buildings on freehold land 170,163,382 73,410,287 96,753,095 312,208,179 73,410,287 238,797,892
18.6 The following methods and assumptions were used to estimate the fair values:
The significant inputs used in the fair value measurements categorized within Level 2 of the fair value hierarchy, together with a quantitative sensitivity analysis as at June 30, 2019 are as shown below:
Description Valuation Technique Significant Observable Quantitative Date / Range Inputs (weighted average)
Land and building Sales value comparison Market enquiries and approach survey as per kanal/marla for land rates and per square foot rates for building Nil 18.7 Capital Work in Progress
2019 2018 Plant and machinery: Rupees Rupees
- Opening balance 8,340,256 15,649,484 - Additions during the year 47,473,329 14,951,649 55,813,585 30,601,133 - Transferred to operating fixed assets (39,951,425) (22,260,877) 15,862,160 8,340,256 Buildings on freehold land:
- Opening balance - 1,333,087 - Additions during the year 1,514,197 1,888,346 1,514,197 3,221,433 - Transferred to operating fixed assets (1,514,197) (3,221,433)
- - 15,862,160 8,340,256
18.8 In property, plant and equipment fully depreciated assets, having cost of Rs. 43.423 million (2018: Rs. 21.664 million) that are still in use
as at the reporting date.
18.9 Owned vehicles include vehicles amounting to Rs. 9.095 million (2018: Rs. 9.095 million) which have been obtained through Diminishing Musharaka Financing (Note 10).
18.10 Disposal of items of property, plant and equipment during the year:

46 Nimir Resins Limited
Particulars Sold to Cost Accumulated Book Sale Gain/loss Mode ofof assets depreciation value proceeds on disposal disposal Rupees Rupees Rupees Rupees Rupees
Suzuki Alto Zeeshan Haider Raza 790,000 790,000 - 460,000 460,000 NegotiationSuzuki Alto Muhammad Arshad Imam 751,671 751,671 - 580,000 580,000 Negotiation 1,541,671 1,541,671 - 1,040,000 1,040,000
19. Intangible Assets 2019 2018 Note Rupees Rupees
Net Carrying Value
Net carrying value - opening balance 995,210 1,326,947 Additions during the year - - 995,210 1,326,947 Amortization during the year 19.1 (331,737) (331,737) Net carrying value as at June 30, 663,473 995,210 Gross Carrying Value
Cost 1,658,684 1,658,684 Accumulated amortization (995,211) (663,474) Net book value 663,473 995,210 Amortization rate 20% 20% 19.1 Intangible assets represent the cost of ERP.
19.2 Amortization charge for the year has been allocated to administrative expenses (Note 31).
20. Long Term Deposits
Deposits with: - Utility companies 7,235,693 8,639,956
- Others 2,100,000 2,100,000 9,335,693 10,739,956
21. Stock in Trade
Raw and packing materials 535,694,991 441,136,363 Raw materials in transit 144,903,248 396,575,128 Finished goods 203,752,542 180,120,439 884,350,781 1,017,831,930 Less: Provision for obsolescence of stock 21.1 (27,185,268) (33,830,854) 857,165,513 984,001,076 21.1 Provision for obsolescence of stock
Opening balance 33,830,854 22,801,255 Provision for the year 10,035,974 11,029,599 43,866,828 33,830,854 Less: Obsolete stocks written off (16,681,560) - 27,185,268 33,830,854 21.2 As mentioned in Note 15, short term borrowings of the Company are secured by way of hypothecation charge on
present and future current assets of the Company (including stock in trade).
22. Short Term Investment 2019 2018 Note Rupees Rupees
Sales tax refund bond 22.1 46,700,000 -

47Annual Report 2019
22.1 During the year, the Company applied for sales tax refund amounting to Rs. 138,245,358 against which refund of Rs. 46,700,000 was received through Central Depository Company of Pakistan Limited (CDC) in form of government bonds, carrying markup @ 10% having maturity after three years. The bonds are freely transfer within Central Depository System (CDS). These can be sold/transferable to another bank, person or entity at any time.
23 Trade Debts 2019 2018 Note Rupees Rupees
Local - Unsecured Considered good 1,020,297,341 769,511,085 Considered doubtful 122,222,716 128,407,714 1,142,520,057 897,918,799 Less: Loss allowance 23.3 (122,222,716) (128,407,714) 1,020,297,341 769,511,085 23.1 Trade debts as at June 30, 2019 include an amount of Rs. 683,973 due from related party (2018: Nil).
23.2 The maximum aggregate amount due from the related party at the end of any month during the year was Rs.
683,973 (2018: Rs 358,767).
23.3 Loss allowance 2019 2018 Rupees Rupees
Opening balance 128,407,714 92,164,556 Loss allowance for the year 16,278,572 36,243,158 144,686,286 128,407,714 Less: Bad debts written off (22,463,570) - 122,222,716 128,407,714
23.4 Aging of outstanding balance of related party as at June 30, 2019, is as under:
Related party 2019 2018 1 to 30 days 31 to 180 days Total 1 to 30 days 31 to 180 days Total
Rupees Rupees Rupees Rupees Rupees Rupees Nimir IndustrialChemicals Limited 683,973 - 683,973 - - -
24 Loans and Advances 2019 2018 Note Rupees Rupees
Advances (Unsecured - Considered good):
- Suppliers and contractors 24.1 32,576,727 69,180,224 - Employees 24.2 87,200 14,139 Short term loans to employees (Unsecured - Considered good) 24.3 400,828 684,980 33,064,755 69,879,343 24.1 This includes an amount of Rs. 14.399 million (2018: Rs. 57.353 million) advanced to collectorate custom - Karachi
for clearing the shipment of imported raw materials.
24.2 Advances to employees do not include any amount given to directors or executives of the Company.
24.3 This represents interest-free loans given to employees as per the Company’s policy. These loans are recoverable from salary in monthly installments.

48 Nimir Resins Limited
25 Other Receivables 2019 2018 Note Rupees Rupees
Margin against letters of guarantees 1,309,000 1,109,000 Margin against letter of credit 11,262,616 - 12,571,616 1,109,000
26 Tax Refunds Due from the Government
Tax deducted at source and advance tax 267,971,922 230,568,009 Sales tax refundable - Net 237,313,911 148,814,715 505,285,833 379,382,724
27 Cash and Bank Balances
Cash in hand 11,688 151,864 Cash at banks in: - Current accounts 23,760,171 39,018,017 23,771,859 39,169,881
28 Sales
Local sales 5,423,909,160 4,066,713,550 Less: Sales tax 536,766,912 (486,594,665) 4,887,142,248 3,580,118,885
28.1 All the revenue is recognised at a point in time.
28.2 The Company’s net revenue disaggregated by major product lines is as follows:
Coating, Emulsion and Blending 3,482,542,140 2,650,066,870 Textile, Paper and Others 1,404,600,108 930,052,015 4,887,142,248 3,580,118,885
29 Cost of Sales Raw materials consumed 29.1 4,121,123,115 3,008,806,367 Stores and spares consumed 17,574,202 14,966,645 Fuel and power 88,895,324 71,173,461 Salaries, wages and benefits 29.2 114,882,992 97,261,617 Printing and stationery 911,851 674,926 Repairs and maintenance 3,561,590 2,475,362 Travelling, conveyance and entertainment 9,177,734 6,770,278 Insurance 4,051,652 3,809,878 Rent, rates and taxes 231,000 128,530 Product development charges 2,370,350 2,386,482 Communication 576,920 807,657 Fees and consultancy charges 4,564,707 4,165,305 Miscellaneous 341,944 290,997 Depreciation 18.3 38,665,879 31,193,244 4,406,929,260 3,244,910,749 Finished goods: Opening finished goods 180,120,439 185,673,911 Closing finished goods (203,752,542) (180,120,439) (23,632,103) 5,553,472 4,383,297,157 3,250,464,221

49Annual Report 2019
29.1 Raw materials consumed: 2019 2018 Note Rupees Rupees
Opening stock 441,136,363 270,465,376 Purchases 4,215,681,743 3,179,477,354 4,656,818,106 3,449,942,730 Closing stock (535,694,991) (441,136,363) 4,121,123,115 3,008,806,367 29.2 This includes Rs. 3,741,699 (2018: Rs. 3,959,772) in respect of employee benefits.
30 Distribution Cost
Salaries, wages and benefits 30.1 30,431,583 27,209,578 Packing, carriage and forwarding 26,534,652 17,994,595 Commission 3,904,834 451,085 Travelling, conveyance and entertainment 3,045,577 2,974,986 Printing and stationery 282,925 152,553 Sales promotion expenses 17,247 193,270 Insurance 1,660,889 1,201,891 Communication 340,035 389,448 Utilities 411,690 294,430 Repairs and maintenance 300,410 167,660 Depreciation 18.3 1,351,502 925,870 Miscellaneous 6,693 40,841 68,288,037 51,996,207 30.1 This includes Rs. 1,885,606 (2018: Rs. 1,121,648) in respect of employee benefits.
31 Administrative Expenses
Salaries, wages and benefits 31.1 28,620,617 24,918,645 Travelling, conveyance and entertainment 3,028,481 2,437,314 Repairs and maintenance 420,177 437,267 Printing and stationery 1,672,133 828,436 Communication 2,516,508 2,705,203 Fees and subscription 3,859,200 2,473,563 Advertisement 296,070 455,713 Legal and professional charges 885,215 2,290,750 Auditors’ remuneration 31.2 1,361,000 1,361,000 Utilities 411,690 307,550 Miscellaneous 5,000 207,439 Amortization 19.2 331,737 331,737 Depreciation 18.3 3,267,469 3,165,612 46,675,297 41,920,229 31.1 This includes Rs. 1,109,292 (2018: Rs. 1,000,927) in respect of employee benefits.
31.2 Auditors’ remuneration:
- Audit fee 800,000 800,000 - Half yearly review 385,000 385,000 - Other certifications 100,000 100,000 - Out of pocket expenses 76,000 76,000 1,361,000 1,361,000
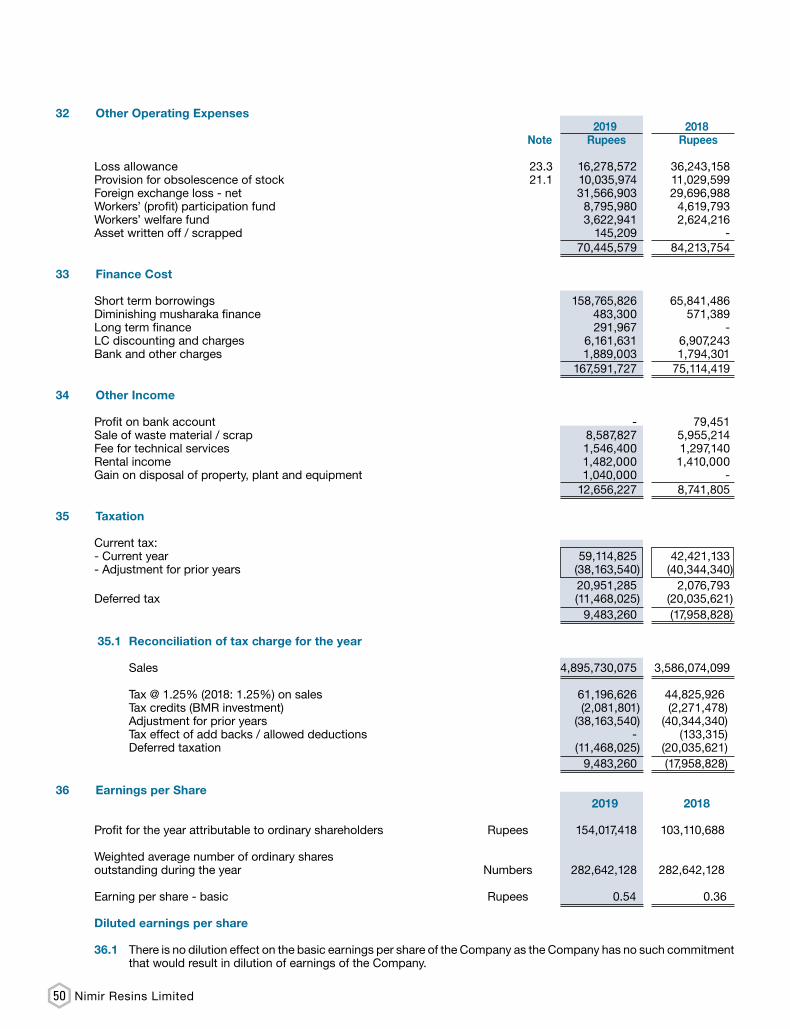
50 Nimir Resins Limited
32 Other Operating Expenses 2019 2018 Note Rupees Rupees
Loss allowance 23.3 16,278,572 36,243,158 Provision for obsolescence of stock 21.1 10,035,974 11,029,599 Foreign exchange loss - net 31,566,903 29,696,988 Workers’ (profit) participation fund 8,795,980 4,619,793 Workers’ welfare fund 3,622,941 2,624,216 Asset written off / scrapped 145,209 - 70,445,579 84,213,754
33 Finance Cost
Short term borrowings 158,765,826 65,841,486 Diminishing musharaka finance 483,300 571,389 Long term finance 291,967 - LC discounting and charges 6,161,631 6,907,243 Bank and other charges 1,889,003 1,794,301 167,591,727 75,114,419
34 Other Income
Profit on bank account - 79,451 Sale of waste material / scrap 8,587,827 5,955,214 Fee for technical services 1,546,400 1,297,140 Rental income 1,482,000 1,410,000 Gain on disposal of property, plant and equipment 1,040,000 - 12,656,227 8,741,805
35 Taxation
Current tax: - Current year 59,114,825 42,421,133 - Adjustment for prior years (38,163,540) (40,344,340) 20,951,285 2,076,793 Deferred tax (11,468,025) (20,035,621) 9,483,260 (17,958,828) 35.1 Reconciliation of tax charge for the year
Sales 4,895,730,075 3,586,074,099 Tax @ 1.25% (2018: 1.25%) on sales 61,196,626 44,825,926 Tax credits (BMR investment) (2,081,801) (2,271,478) Adjustment for prior years (38,163,540) (40,344,340) Tax effect of add backs / allowed deductions - (133,315) Deferred taxation (11,468,025) (20,035,621) 9,483,260 (17,958,828)
36 Earnings per Share 2019 2018
Profit for the year attributable to ordinary shareholders Rupees 154,017,418 103,110,688 Weighted average number of ordinary shares outstanding during the year Numbers 282,642,128 282,642,128 Earning per share - basic Rupees 0.54 0.36
Diluted earnings per share
36.1 There is no dilution effect on the basic earnings per share of the Company as the Company has no such commitment that would result in dilution of earnings of the Company.
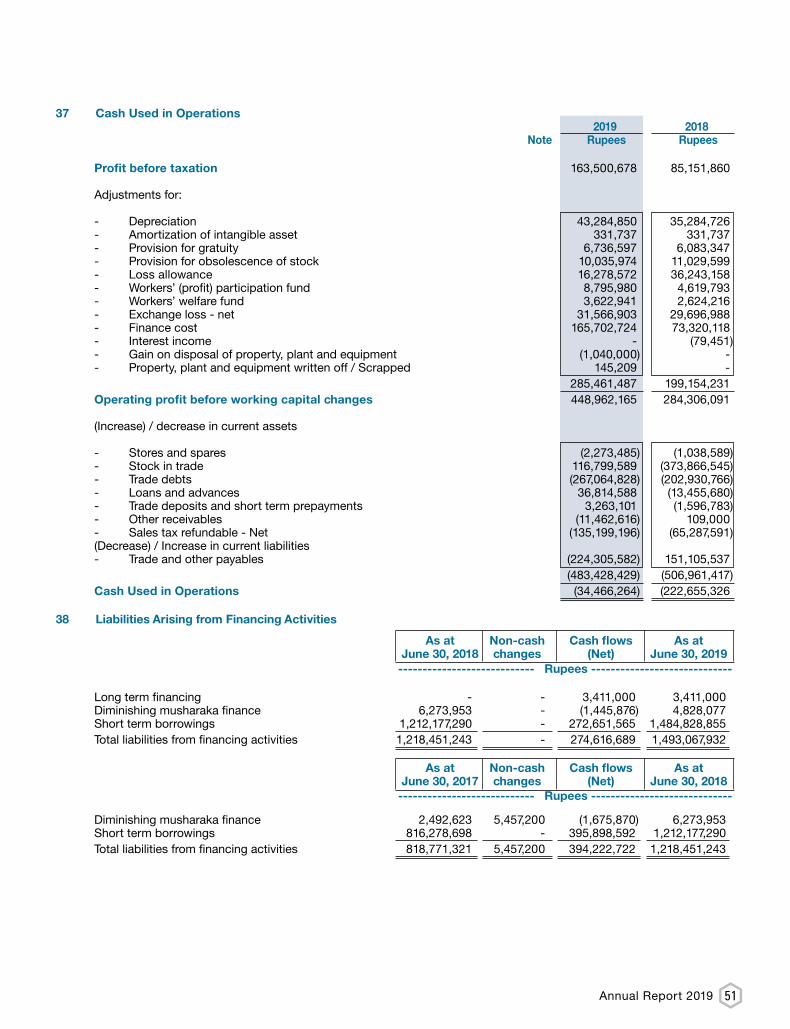
51Annual Report 2019
37 Cash Used in Operations 2019 2018 Note Rupees Rupees
Profit before taxation 163,500,678 85,151,860 Adjustments for:
- Depreciation 43,284,850 35,284,726 - Amortization of intangible asset 331,737 331,737 - Provision for gratuity 6,736,597 6,083,347 - Provision for obsolescence of stock 10,035,974 11,029,599 - Loss allowance 16,278,572 36,243,158 - Workers’ (profit) participation fund 8,795,980 4,619,793 - Workers’ welfare fund 3,622,941 2,624,216 - Exchange loss - net 31,566,903 29,696,988 - Finance cost 165,702,724 73,320,118 - Interest income - (79,451)- Gain on disposal of property, plant and equipment (1,040,000) - - Property, plant and equipment written off / Scrapped 145,209 - 285,461,487 199,154,231 Operating profit before working capital changes 448,962,165 284,306,091 (Increase) / decrease in current assets
- Stores and spares (2,273,485) (1,038,589)- Stock in trade 116,799,589 (373,866,545)- Trade debts (267,064,828) (202,930,766)- Loans and advances 36,814,588 (13,455,680)- Trade deposits and short term prepayments 3,263,101 (1,596,783)- Other receivables (11,462,616) 109,000 - Sales tax refundable - Net (135,199,196) (65,287,591)(Decrease) / Increase in current liabilities - Trade and other payables (224,305,582) 151,105,537 (483,428,429) (506,961,417)Cash Used in Operations (34,466,264) (222,655,326
38 Liabilities Arising from Financing Activities As at Non-cash Cash flows As at June 30, 2018 changes (Net) June 30, 2019
---------------------------- Rupees -----------------------------
Long term financing - - 3,411,000 3,411,000 Diminishing musharaka finance 6,273,953 - (1,445,876) 4,828,077 Short term borrowings 1,212,177,290 - 272,651,565 1,484,828,855 Total liabilities from financing activities 1,218,451,243 - 274,616,689 1,493,067,932
As at Non-cash Cash flows As at June 30, 2017 changes (Net) June 30, 2018
---------------------------- Rupees -----------------------------
Diminishing musharaka finance 2,492,623 5,457,200 (1,675,870) 6,273,953 Short term borrowings 816,278,698 - 395,898,592 1,212,177,290 Total liabilities from financing activities 818,771,321 5,457,200 394,222,722 1,218,451,243

52 Nimir Resins Limited
39 Remuneration of Chief Executive, Directors and Executives
The aggregate amounts charged in the financial statements for the year as remuneration and benefits to the chief executive, directors and executives of the Company are as follows:
Chief Executive Executive Director Non-Executive Directors Executives 2019 2018 2019 2018 2019 2018 2019 2018 Rupees in (000)
Managerial remuneration 1,548 1,548 - 4,387 - - 11,734 15,964 Housing and other allowances 697 697 - 1,974 - - 5,280 8,436 Utilities 155 155 - 439 - - 1,173 1,596 Bonus 500 200 - 696 - - 2,610 2,298 Retirement benefits - - - - - - 1,513 2,097 Meeting fee - - - - 480 420 - - 2,900 2,600 - 7,496 480 420 22,310 30,391 Number of persons 1 1 - 1 6 5 7 11
39.1 An executive is defined as an employee, other than the chief executive and directors, whose basic salary exceeds Rs. 1.2 million
in a financial year.
39.2 No directors were provided company maintained car (2018: one - executive director).
40 Balances and Transaction with Related Parties
Related parties comprise related group companies, associated companies, staff retirement funds, directors and key management personnel. The Company in the normal course of business carries out transactions with various related parties. The Company enters into transactions with related parties on the basis of mutually agreed terms. Outstanding balances at the year-end are unsecured and interest free and settlement occurs in cash. There have been no guarantees provided or received for any related party receivables or payables. Significant balances and transactions with related parties are as follows:
June 30, June 30, Related party Relationship Nature of Transaction 2019 2018 Rupees in (000)
Nimir Industrial Chemicals Ultimate Parent Company Purchase of goods 131,908 102,392 Limited Sale of goods 807 307 Services provided 2,928 2,730 Services received/acquired 3,907 3,683 Other expenses reimbursed 3,164 924 Nimir Management (Private)
Limited Holding company Bonus share issued - 15,515 Nimir Holding (Private) Limited Associate Bonus share issued - 3,539 Terranova Limited Associate Bonus share issued - 1,388 Directors Director Bonus share issued - 2,017 142,714 132,495
Balances outstanding as at June 30,
Due to holding company / related parties - unsecured
Directors Sponsors’ interest free loans 107,000 107,000 Nimir Management (Private) Limited Share deposit money 11,391 11,391 Nimir Industrial Chemicals Limited Trade creditors 26,584 20,382 Due from related party - unsecured
Nimir Industrial Chemicals Limited Trade debts 684 -

53Annual Report 2019
40.1 Following are the related parties with whom the Company had entered into transactions or have arrangement / agreement in place.
S. No. Company Name Basis of Relationship Aggregate % of Shareholding
1 Nimir Management (Private) Limited Holding company 51.0000% 2 Nimir Holding (Private) Limited Associate 11.6300% 3 Terranova Limited Associate 4.5600% 4 Mr. Amir Hameed Directorship 0.0005%
5 Mr. Zafar Mahmood Directorship 0.0005% 6 Mr. Abdul Jalil Jamil Directorship 0.0145% 7 Mr. Muhammad Yahya Khan Directorship 4.3335% 8 Mr. Osman Hameed Directorship 0.0005% 9 Mr. Pervaiz Ahmed Khan Directorship 0.0004% 10 Mr. Tahir Jahangir Directorship 0.0007%
11 Nimir Industrial Chemicals Limited Ultimate parent company Indirect holding
41 Segment Reporting 41.1 A business segment is a group of assets and operations engaged in providing products that are subject to risks and
returns that are different from those of other business segments. The management has determined its operating segments based on the information that is presented to the Chief Operating Decision Maker for allocation of resources and assessments of performance. Based on internal management reporting structure and products produced and sold, the Company is organized into the following three operating segments:
- Coating, Emulsion and Blending
- Textile, Paper and Others
The Chief Operating Decision Maker monitors the operating results of its business units separately for the purpose of making decision about resource allocation and performance assessment. Segment performance is generally evaluated based on certain key performance indicators including business volume, gross profit, profit from operations, reduction in operating cost and free cash flows.
Segment assets include all operating assets used by a segment and consist principally of receivables, inventories and property, plant and equipment, net of impairment and provisions but do not include deferred tax. Segment liabilities include all operating liabilities and consist principally of trade and bills payable.
41.2 Segment analysis
The segment information for the reportable segments for the year ended June 30, 2019 is as follows.
Coating, Textile, Emulsion and Paper and
Blending Others Total Rupees in (000)
Segment Results for the year ended June 30, 2019
Revenue 3,482,542 1,404,600 4,887,142 Segment results 202,843 186,039 388,882 Other operating expenses (70,446) Finance costs (167,592) Other income 12,656 Profit before taxation 163,500 Segment Results for the year ended June 30, 2018
Revenue 2,650,067 930,052 3,580,119 Segment results 124,593 111,145 235,738 Other operating expenses (84,214) Finance costs (75,114) Other income 8,742 Profit before taxation 85,152

54 Nimir Resins Limited
41.3 Entity-wide disclosures regarding reportable segment are as follows:
- Information about major customers
One customer of the Company accounts for 8.11% (2018: 9.77%) of total sales for the year. Revenue from such customer was Rs. 396.263 million (2018: Rs. 349.818 million).
- Information about geographical areas
- All non-current assets of the Company are located in Pakistan as at the reporting date.
- Revenue from export sale is Rs. 2.720 million (2018: Nil) attributed to foreign countries which is 0.056% of total sale of the company.
42.1 Financial risk factors
The Company’s activities expose it to a variety of financial risks: market risk (including currency risk, other price risk and interest rate risk), credit risk and liquidity risk. The Company’s overall risk management policies focus on the unpredictability of financial markets and seek to minimize potential adverse effects on the financial performance.
Risk management is carried out by the Board of Directors (the Board). The Board provides principles for overall risk management as well as policies covering specific areas such as currency risk, other price risk, interest rate risk, credit risk and liquidity risk.
(a) Market risk
Market risk is the risk that the fair value of future cash flows of a financial instrument will fluctuate because of changes in foreign currency, interest rate, commodity price and equity price that will effect the Company’s income or the value of its holdings of financial instruments.
(i) Currency risk
Currency risk is the risk that the fair value or future cash flows of a financial instrument will fluctuate because of changes in foreign exchange rates. Currency risk arises mainly from future commercial transactions or receivables and payables that exist due to transactions in foreign currencies.
The Company is exposed to currency risk arising from various currency exposures, primarily with respect to foreign payables. Currently, the Company’s foreign exchange risk exposure is restricted to:
2019 2018 Rupees Rupees
Creditors (Secured) 32,996,819 284,264,210 Letters of credit commitments 367,272,828 511,919,241 400,269,647 813,488,932 The following exchange rates were applied during the year:
Rupees per foreign currency rate
Average rate - Rupees per US Dollar 160.25 113.3 Reporting date rate - Rupees per US Dollar 161 121.6
If the functional currency, at reporting date, had weakened / strengthened by 1% against the foreign currencies with
all other variables held constant, the impact on profit before taxation for the year would have been Rs. 4.003 million (2018: Rs. 8.135 million) lower / higher, respectively, mainly as a result of exchange gains / losses on translation of foreign exchange denominated financial instruments.
(ii) Other price risk
Other price risk represents the risk that the fair value or future cash flows of a financial instrument will fluctuate because of changes in market prices (other than those arising from interest rate risk or currency risk), whether those changes are caused by factors specific to the individual financial instrument or its issuer, or factors affecting all similar financial instrument traded in the market. The Company is not exposed to equity price risk.
(iii) Interest rate risk
This represents the risk that the fair value or future cash flows of a financial instrument will fluctuate because of changes in market interest rates.
The Company has no significant interest-bearing asset except for profit bearing bank accounts. The Company has long term financing, diminishing musharika finance and short term borrowings as interest bearing liabilities.
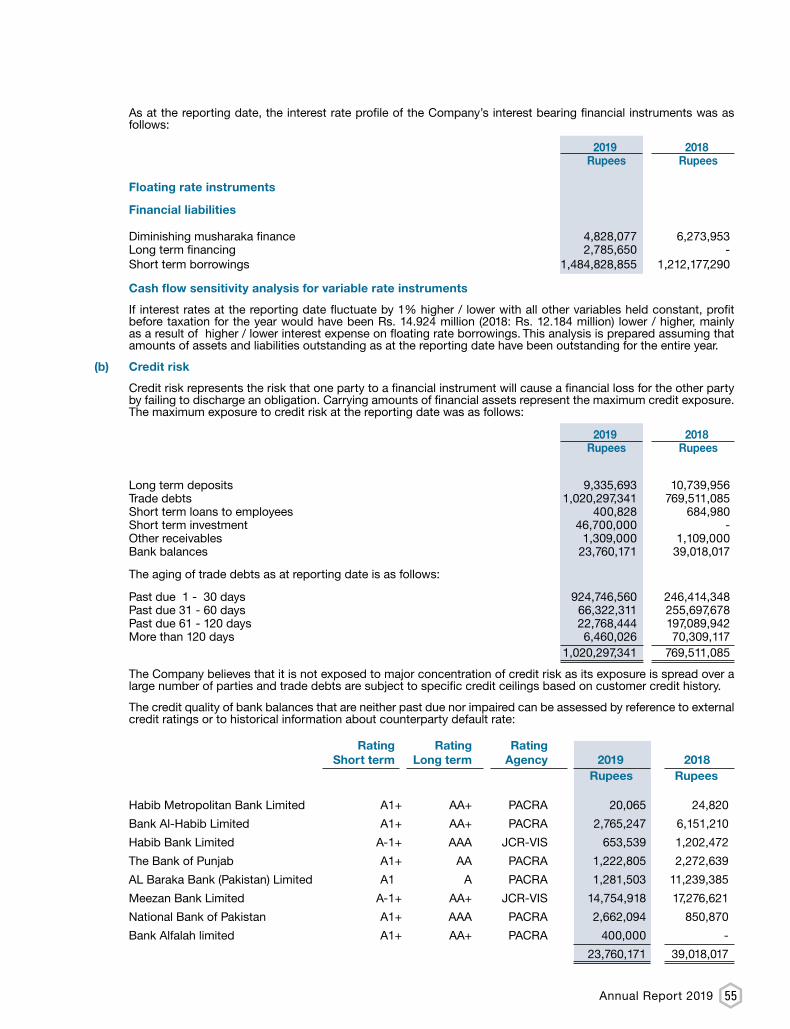
55Annual Report 2019
As at the reporting date, the interest rate profile of the Company’s interest bearing financial instruments was as follows:
2019 2018 Rupees Rupees
Floating rate instruments
Financial liabilities
Diminishing musharaka finance 4,828,077 6,273,953 Long term financing 2,785,650 - Short term borrowings 1,484,828,855 1,212,177,290 Cash flow sensitivity analysis for variable rate instruments
If interest rates at the reporting date fluctuate by 1% higher / lower with all other variables held constant, profit
before taxation for the year would have been Rs. 14.924 million (2018: Rs. 12.184 million) lower / higher, mainly as a result of higher / lower interest expense on floating rate borrowings. This analysis is prepared assuming that amounts of assets and liabilities outstanding as at the reporting date have been outstanding for the entire year.
(b) Credit risk
Credit risk represents the risk that one party to a financial instrument will cause a financial loss for the other party by failing to discharge an obligation. Carrying amounts of financial assets represent the maximum credit exposure. The maximum exposure to credit risk at the reporting date was as follows:
2019 2018 Rupees Rupees
Long term deposits 9,335,693 10,739,956 Trade debts 1,020,297,341 769,511,085 Short term loans to employees 400,828 684,980 Short term investment 46,700,000 - Other receivables 1,309,000 1,109,000 Bank balances 23,760,171 39,018,017 The aging of trade debts as at reporting date is as follows:
Past due 1 - 30 days 924,746,560 246,414,348 Past due 31 - 60 days 66,322,311 255,697,678 Past due 61 - 120 days 22,768,444 197,089,942 More than 120 days 6,460,026 70,309,117 1,020,297,341 769,511,085 The Company believes that it is not exposed to major concentration of credit risk as its exposure is spread over a
large number of parties and trade debts are subject to specific credit ceilings based on customer credit history.
The credit quality of bank balances that are neither past due nor impaired can be assessed by reference to external credit ratings or to historical information about counterparty default rate:
Rating Rating Rating Short term Long term Agency 2019 2018
Rupees Rupees
Habib Metropolitan Bank Limited A1+ AA+ PACRA 20,065 24,820
Bank Al-Habib Limited A1+ AA+ PACRA 2,765,247 6,151,210
Habib Bank Limited A-1+ AAA JCR-VIS 653,539 1,202,472
The Bank of Punjab A1+ AA PACRA 1,222,805 2,272,639
AL Baraka Bank (Pakistan) Limited A1 A PACRA 1,281,503 11,239,385
Meezan Bank Limited A-1+ AA+ JCR-VIS 14,754,918 17,276,621
National Bank of Pakistan A1+ AAA PACRA 2,662,094 850,870
Bank Alfalah limited A1+ AA+ PACRA 400,000 -
23,760,171 39,018,017
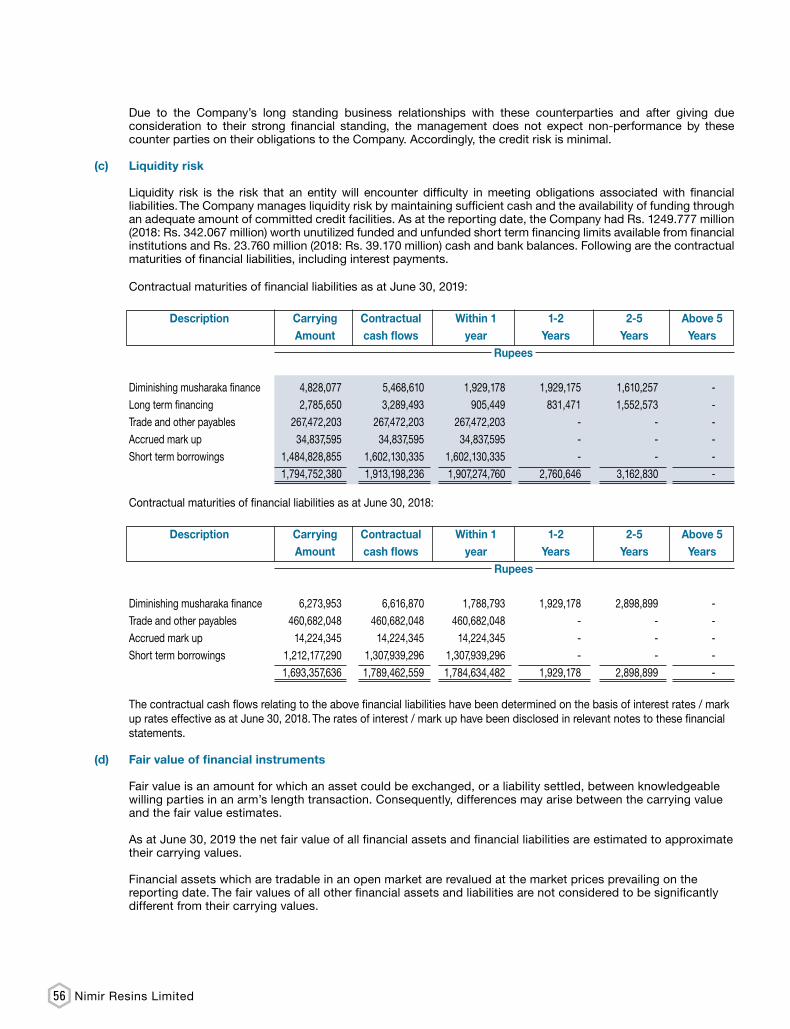
56 Nimir Resins Limited
Due to the Company’s long standing business relationships with these counterparties and after giving due consideration to their strong financial standing, the management does not expect non-performance by these counter parties on their obligations to the Company. Accordingly, the credit risk is minimal.
(c) Liquidity risk
Liquidity risk is the risk that an entity will encounter difficulty in meeting obligations associated with financial liabilities. The Company manages liquidity risk by maintaining sufficient cash and the availability of funding through an adequate amount of committed credit facilities. As at the reporting date, the Company had Rs. 1249.777 million (2018: Rs. 342.067 million) worth unutilized funded and unfunded short term financing limits available from financial institutions and Rs. 23.760 million (2018: Rs. 39.170 million) cash and bank balances. Following are the contractual maturities of financial liabilities, including interest payments.
Contractual maturities of financial liabilities as at June 30, 2019:
Description Carrying Contractual Within 1 1-2 2-5 Above 5 Amount cash flows year Years Years Years
Rupees
Diminishing musharaka finance 4,828,077 5,468,610 1,929,178 1,929,175 1,610,257 - Long term financing 2,785,650 3,289,493 905,449 831,471 1,552,573 - Trade and other payables 267,472,203 267,472,203 267,472,203 - - - Accrued mark up 34,837,595 34,837,595 34,837,595 - - - Short term borrowings 1,484,828,855 1,602,130,335 1,602,130,335 - - - 1,794,752,380 1,913,198,236 1,907,274,760 2,760,646 3,162,830 -
Contractual maturities of financial liabilities as at June 30, 2018:
Description Carrying Contractual Within 1 1-2 2-5 Above 5 Amount cash flows year Years Years Years
Rupees
Diminishing musharaka finance 6,273,953 6,616,870 1,788,793 1,929,178 2,898,899 - Trade and other payables 460,682,048 460,682,048 460,682,048 - - - Accrued mark up 14,224,345 14,224,345 14,224,345 - - - Short term borrowings 1,212,177,290 1,307,939,296 1,307,939,296 - - - 1,693,357,636 1,789,462,559 1,784,634,482 1,929,178 2,898,899 -
The contractual cash flows relating to the above financial liabilities have been determined on the basis of interest rates / mark
up rates effective as at June 30, 2018. The rates of interest / mark up have been disclosed in relevant notes to these financial statements.
(d) Fair value of financial instruments
Fair value is an amount for which an asset could be exchanged, or a liability settled, between knowledgeable willing parties in an arm’s length transaction. Consequently, differences may arise between the carrying value and the fair value estimates.
As at June 30, 2019 the net fair value of all financial assets and financial liabilities are estimated to approximate their carrying values.
Financial assets which are tradable in an open market are revalued at the market prices prevailing on the reporting date. The fair values of all other financial assets and liabilities are not considered to be significantly different from their carrying values.
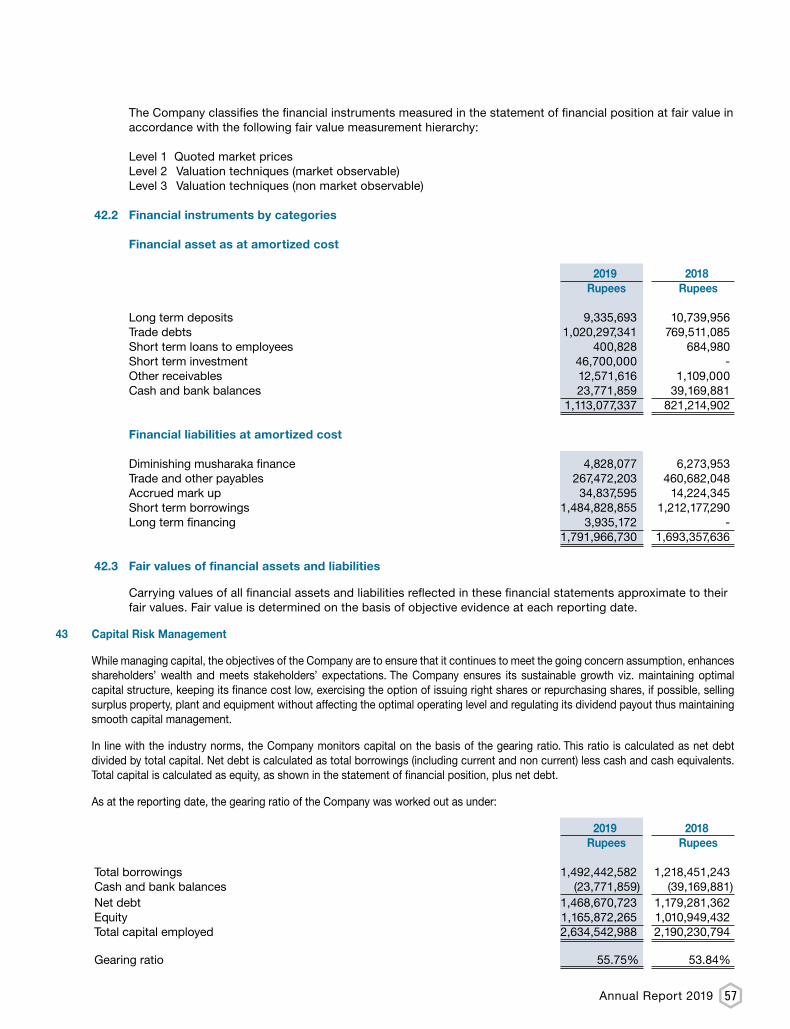
57Annual Report 2019
The Company classifies the financial instruments measured in the statement of financial position at fair value in accordance with the following fair value measurement hierarchy:
Level 1 Quoted market prices Level 2 Valuation techniques (market observable) Level 3 Valuation techniques (non market observable)
42.2 Financial instruments by categories
Financial asset as at amortized cost
2019 2018 Rupees Rupees
Long term deposits 9,335,693 10,739,956 Trade debts 1,020,297,341 769,511,085 Short term loans to employees 400,828 684,980 Short term investment 46,700,000 - Other receivables 12,571,616 1,109,000 Cash and bank balances 23,771,859 39,169,881 1,113,077,337 821,214,902 Financial liabilities at amortized cost
Diminishing musharaka finance 4,828,077 6,273,953 Trade and other payables 267,472,203 460,682,048 Accrued mark up 34,837,595 14,224,345 Short term borrowings 1,484,828,855 1,212,177,290 Long term financing 3,935,172 - 1,791,966,730 1,693,357,636
42.3 Fair values of financial assets and liabilities
Carrying values of all financial assets and liabilities reflected in these financial statements approximate to their fair values. Fair value is determined on the basis of objective evidence at each reporting date.
43 Capital Risk Management
While managing capital, the objectives of the Company are to ensure that it continues to meet the going concern assumption, enhances shareholders’ wealth and meets stakeholders’ expectations. The Company ensures its sustainable growth viz. maintaining optimal capital structure, keeping its finance cost low, exercising the option of issuing right shares or repurchasing shares, if possible, selling surplus property, plant and equipment without affecting the optimal operating level and regulating its dividend payout thus maintaining smooth capital management.
In line with the industry norms, the Company monitors capital on the basis of the gearing ratio. This ratio is calculated as net debt divided by total capital. Net debt is calculated as total borrowings (including current and non current) less cash and cash equivalents. Total capital is calculated as equity, as shown in the statement of financial position, plus net debt.
As at the reporting date, the gearing ratio of the Company was worked out as under:
2019 2018 Rupees Rupees
Total borrowings 1,492,442,582 1,218,451,243 Cash and bank balances (23,771,859) (39,169,881)Net debt 1,468,670,723 1,179,281,362 Equity 1,165,872,265 1,010,949,432 Total capital employed 2,634,542,988 2,190,230,794 Gearing ratio 55.75% 53.84%
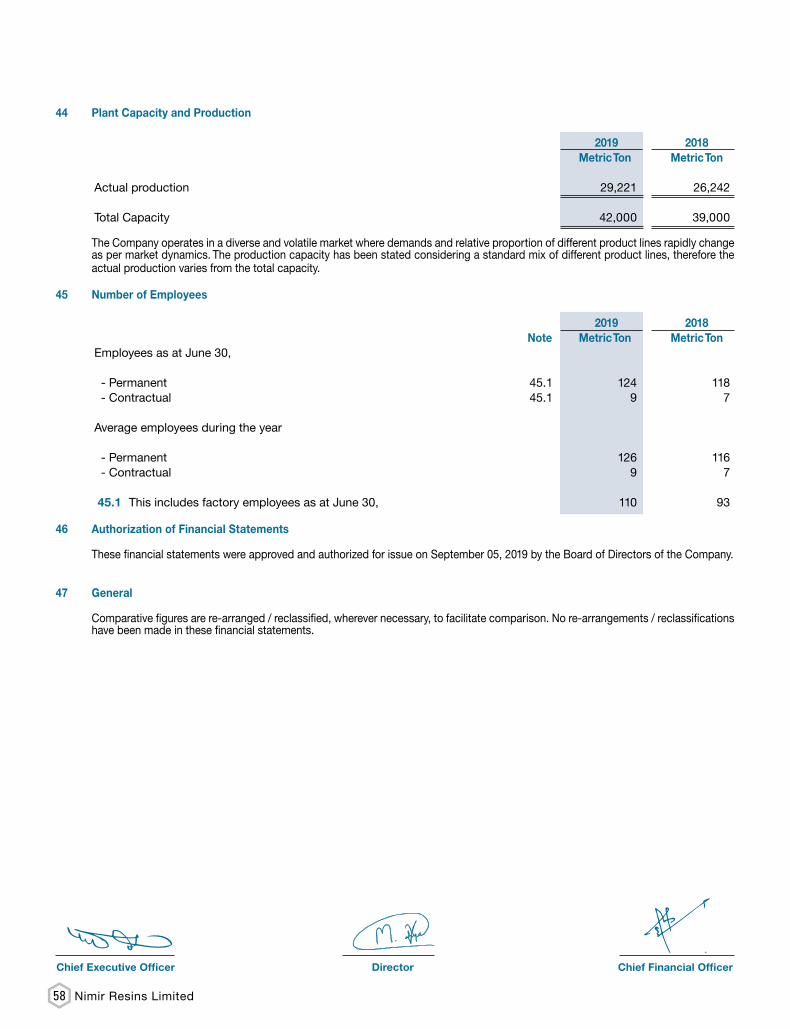
58 Nimir Resins Limited
44 Plant Capacity and Production
2019 2018 Metric Ton Metric Ton
Actual production 29,221 26,242 Total Capacity 42,000 39,000
The Company operates in a diverse and volatile market where demands and relative proportion of different product lines rapidly change as per market dynamics. The production capacity has been stated considering a standard mix of different product lines, therefore the actual production varies from the total capacity.
45 Number of Employees
2019 2018 Note Metric Ton Metric Ton
Employees as at June 30,
- Permanent 45.1 124 118 - Contractual 45.1 9 7 Average employees during the year
- Permanent 126 116 - Contractual 9 7 45.1 This includes factory employees as at June 30, 110 93
46 Authorization of Financial Statements
These financial statements were approved and authorized for issue on September 05, 2019 by the Board of Directors of the Company.
47 General
Comparative figures are re-arranged / reclassified, wherever necessary, to facilitate comparison. No re-arrangements / reclassifications have been made in these financial statements.
Chief Executive Officer Director Chief Financial Officer

59Annual Report 2019
------Shareholding------ No. of Shareholders From To Total Shares Held 967 1 100 30,839 879 101 500 271,625 853 501 1,000 693,488 1,683 1,001 5,000 4,328,916 589 5,001 10,000 4,443,187 265 10,001 15,000 3,243,174 150 15,001 20,000 2,724,615 126 20,001 25,000 2,945,704 69 25,001 30,000 1,941,071 43 30,001 35,000 1,384,522 44 35,001 40,000 1,689,573 27 40,001 45,000 1,157,455 54 45,001 50,000 2,665,346 32 50,001 55,000 1,657,013 14 55,001 60,000 814,135 16 60,001 65,000 1,015,961 9 65,001 70,000 614,940 19 70,001 75,000 1,391,242 12 75,001 80,000 941,512 6 80,001 85,000 495,093 8 85,001 90,000 700,259 2 90,001 95,000 183,177 24 95,001 100,000 2,392,527 10 100,001 105,000 1,022,213 7 105,001 110,000 758,848 6 110,001 115,000 675,654 3 115,001 120,000 357,131 4 120,001 125,000 498,636 3 125,001 130,000 383,099 1 130,001 135,000 134,000 4 135,001 140,000 554,183 7 140,001 145,000 993,039 7 145,001 150,000 1,048,551 4 150,001 155,000 604,726 3 155,001 160,000 472,289 7 160,001 165,000 1,138,833 1 165,001 170,000 167,500 1 170,001 175,000 175,000 4 175,001 180,000 708,180 2 180,001 185,000 365,500 1 185,001 190,000 189,000 3 190,001 195,000 580,604 6 195,001 200,000 1,200,000 2 200,001 205,000 406,308 4 205,001 210,000 833,168 1 210,001 215,000 215,000 1 215,001 220,000 220,000 2 220,001 225,000 445,590 3 225,001 230,000 683,659 2 255,001 260,000 515,318 1 265,001 270,000 266,500 1 275,001 280,000 280,000 2 285,001 290,000 572,291 3 295,001 300,000 900,000 2 305,001 310,000 612,770 2 330,001 335,000 647,789 2 335,001 340,000 674,105 1 350,001 355,000 353,000 1 375,001 380,000 378,500 2 395,001 400,000 800,000 1 410,001 415,000 414,022 2 425,001 430,000 859,006 2 445,001 450,000 897,525 1 455,001 460,000 456,578 1 465,001 470,000 469,000 1 470,001 475,000 475,000 1 495,001 500,000 500,000 1 520,001 525,000 523,500 1 550,001 555,000 551,286
PATTERN OF SHAREHOLDINGAS AT JUNE 30, 2019

60 Nimir Resins Limited
------Shareholding------ No. of Shareholders From To Total Shares Held
1 565,001 570,000 565,500 1 595,001 600,000 600,000 1 605,001 610,000 605,500 1 610,001 615,000 614,380 1 840,001 845,000 845,000 1 925,001 930,000 926,500 1 930,001 935,000 935,000 1 1,285,001 1,290,000 1,289,559 1 1,290,001 1,295,000 1,290,417 1 1,945,001 1,950,000 1,950,000 1 1,995,001 2,000,000 2,000,000 1 5,150,001 5,155,000 5,152,968 1 12,245,001 12,250,000 12,248,157 1 12,890,001 12,895,000 12,892,775 1 32,875,001 32,880,000 32,876,612 1 144,145,001 144,150,000 144,147,485 6,034 282,642,128
CATEGORIES OF SHAREHOLDERS AS AT JUNE 30, 2019
Sr. No. Categories of shareholders Shares held Percentage 2.3.1 Directors, Chief Executive Officers, and their spouse and minor childern 13,592,565 4.8091 2.3.2 Associated Companies, undertakings and related parties. ( Parent Company) 189,916,872 67.1934 2.3.3 NIT and ICP 9,718 0.0034 2.3.4 Banks Development Financial Institutions, Non Banking Financial Institutions. 2,553 0.0009 2.3.5 Insurance Companies - 0.0000 2.3.6 Modarabas and Mutual Funds 550,414 0.1947 2.3.7 Share holders holding 10% or more 177,024,097 62.6319 2.3.8 General Public 1 - Local 72,694,217 25.7195 2 - Foreign 16,824 0.0060 2.3.9 Others (to be specified) 1 - Joint Stock Companies 5,502,971 1.9470 2 - Government Holding 71,927 0.0254 3 - Investment Companies 812 0.0003 4 - Pension Funds 48,598 0.0172 5 - Foreign Companies 25,550 0.0090 6 - Others 209,107 0.0740
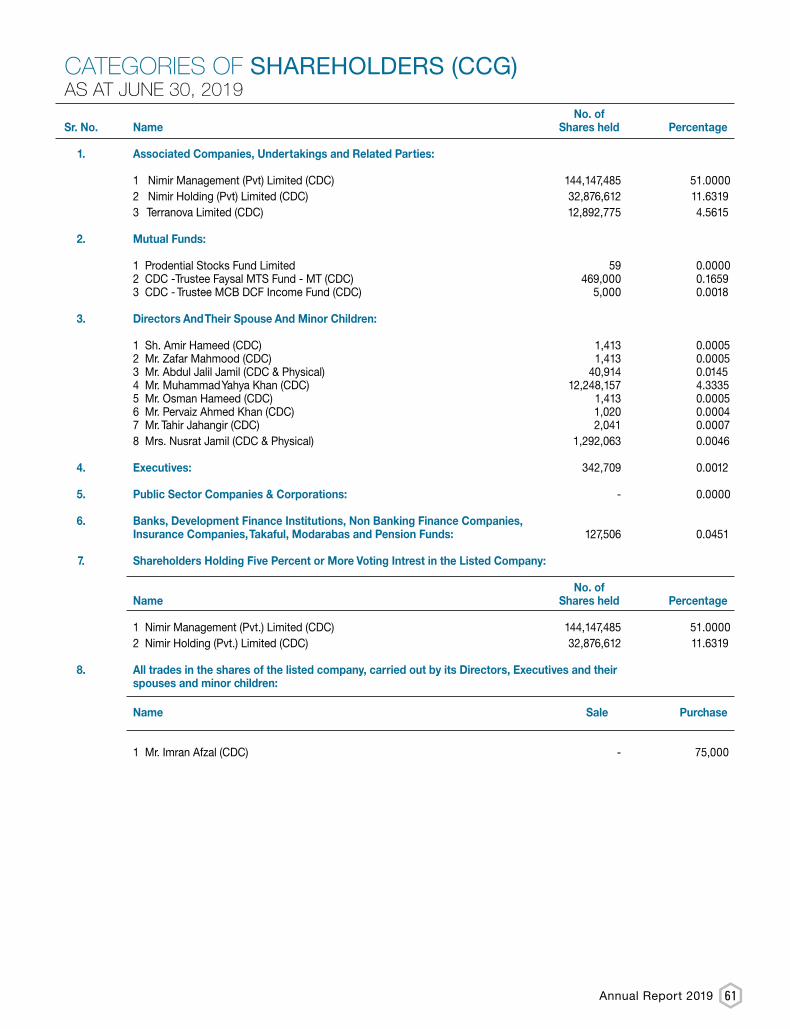
61Annual Report 2019
No. of Sr. No. Name Shares held Percentage 1. Associated Companies, Undertakings and Related Parties:
1 Nimir Management (Pvt) Limited (CDC) 144,147,485 51.0000 2 Nimir Holding (Pvt) Limited (CDC) 32,876,612 11.6319 3 Terranova Limited (CDC) 12,892,775 4.5615 2. Mutual Funds:
1 Prodential Stocks Fund Limited 59 0.0000 2 CDC -Trustee Faysal MTS Fund - MT (CDC) 469,000 0.1659 3 CDC - Trustee MCB DCF Income Fund (CDC) 5,000 0.0018 3. Directors And Their Spouse And Minor Children:
1 Sh. Amir Hameed (CDC) 1,413 0.0005 2 Mr. Zafar Mahmood (CDC) 1,413 0.0005 3 Mr. Abdul Jalil Jamil (CDC & Physical) 40,914 0.0145 4 Mr. Muhammad Yahya Khan (CDC) 12,248,157 4.3335 5 Mr. Osman Hameed (CDC) 1,413 0.0005 6 Mr. Pervaiz Ahmed Khan (CDC) 1,020 0.0004 7 Mr. Tahir Jahangir (CDC) 2,041 0.0007 8 Mrs. Nusrat Jamil (CDC & Physical) 1,292,063 0.0046 4. Executives: 342,709 0.0012 5. Public Sector Companies & Corporations: - 0.0000 6. Banks, Development Finance Institutions, Non Banking Finance Companies, Insurance Companies, Takaful, Modarabas and Pension Funds: 127,506 0.0451 7. Shareholders Holding Five Percent or More Voting Intrest in the Listed Company:
No. of Name Shares held Percentage 1 Nimir Management (Pvt.) Limited (CDC) 144,147,485 51.0000 2 Nimir Holding (Pvt.) Limited (CDC) 32,876,612 11.6319 8. All trades in the shares of the listed company, carried out by its Directors, Executives and their spouses and minor children: Name Sale Purchase
1 Mr. Imran Afzal (CDC) - 75,000
CATEGORIES OF SHAREHOLDERS (CCG)AS AT JUNE 30, 2019
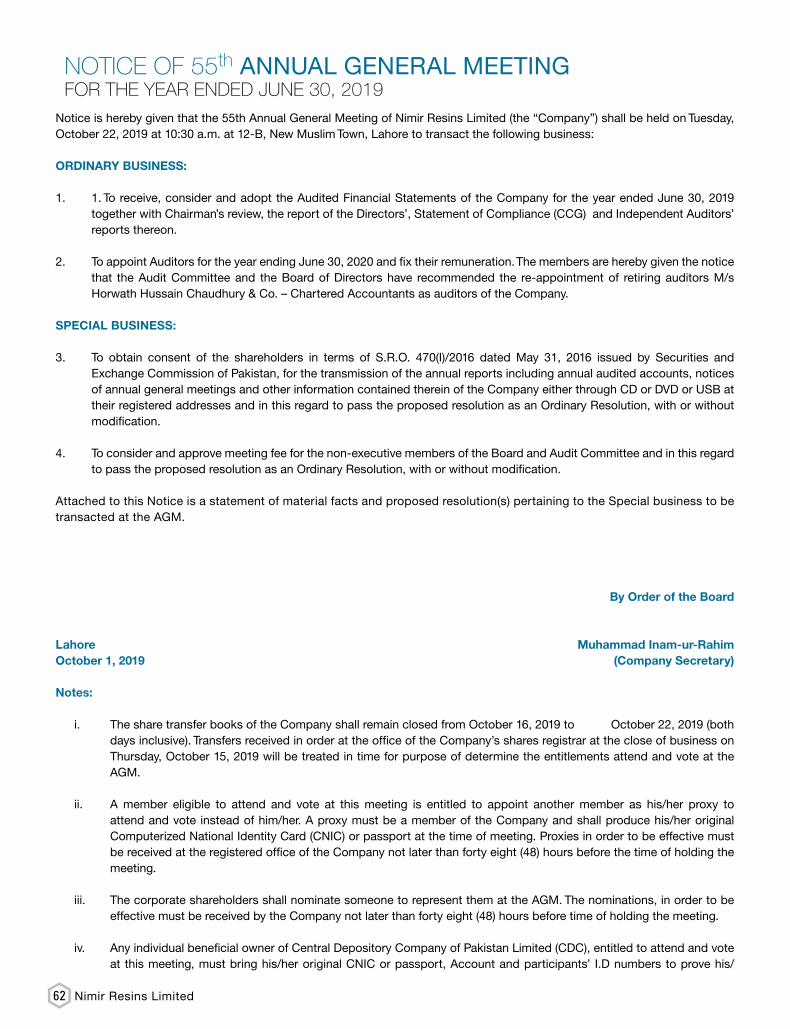
62 Nimir Resins Limited
Notice is hereby given that the 55th Annual General Meeting of Nimir Resins Limited (the “Company”) shall be held on Tuesday, October 22, 2019 at 10:30 a.m. at 12-B, New Muslim Town, Lahore to transact the following business:
ORDINARY BUSINESS:
1. 1. To receive, consider and adopt the Audited Financial Statements of the Company for the year ended June 30, 2019 together with Chairman’s review, the report of the Directors’, Statement of Compliance (CCG) and Independent Auditors’ reports thereon.
2. To appoint Auditors for the year ending June 30, 2020 and fix their remuneration. The members are hereby given the notice that the Audit Committee and the Board of Directors have recommended the re-appointment of retiring auditors M/s Horwath Hussain Chaudhury & Co. – Chartered Accountants as auditors of the Company.
SPECIAL BUSINESS:
3. To obtain consent of the shareholders in terms of S.R.O. 470(I)/2016 dated May 31, 2016 issued by Securities and Exchange Commission of Pakistan, for the transmission of the annual reports including annual audited accounts, notices of annual general meetings and other information contained therein of the Company either through CD or DVD or USB at their registered addresses and in this regard to pass the proposed resolution as an Ordinary Resolution, with or without modification.
4. To consider and approve meeting fee for the non-executive members of the Board and Audit Committee and in this regard to pass the proposed resolution as an Ordinary Resolution, with or without modification.
Attached to this Notice is a statement of material facts and proposed resolution(s) pertaining to the Special business to betransacted at the AGM.
By Order of the Board
Lahore Muhammad Inam-ur-RahimOctober 1, 2019 (Company Secretary)
Notes:
i. The share transfer books of the Company shall remain closed from October 16, 2019 to October 22, 2019 (both days inclusive). Transfers received in order at the office of the Company’s shares registrar at the close of business on Thursday, October 15, 2019 will be treated in time for purpose of determine the entitlements attend and vote at the AGM.
ii. A member eligible to attend and vote at this meeting is entitled to appoint another member as his/her proxy to attend and vote instead of him/her. A proxy must be a member of the Company and shall produce his/her original Computerized National Identity Card (CNIC) or passport at the time of meeting. Proxies in order to be effective must be received at the registered office of the Company not later than forty eight (48) hours before the time of holding the meeting.
iii. The corporate shareholders shall nominate someone to represent them at the AGM. The nominations, in order to be effective must be received by the Company not later than forty eight (48) hours before time of holding the meeting.
iv. Any individual beneficial owner of Central Depository Company of Pakistan Limited (CDC), entitled to attend and vote at this meeting, must bring his/her original CNIC or passport, Account and participants’ I.D numbers to prove his/
NOTICE OF 55th ANNUAL GENERAL MEETINGFOR THE YEAR ENDED JUNE 30, 2019
63Annual Report 2019
her identity, and in case of proxy must enclose an attested copy of his / her CNIC or passport. Representatives of corporate members should bring the, Board resolution/power of attorney with specimen signature (unless it had been provided earlier) along with the proxy form to the Company.
v. All shareholders who have not yet submitted the valid copies of CNIC and NTN Certificate(s) are requested to send the copies of the same to the Shares Registrar. Shareholders of the Company who holds shares in scrip-less form on CDC are requested to submit/send valid copies of CNIC and NTN Certificate(s) directly to their CDC participant (brokers)/CDC Investor Account Services.
vi. Shareholders are requested to immediately notify change in address, if any, to the Company’s Share Registrar, at the following address :
M/s Corplink (Pvt.) Limited Wings Arcade, 1-K (Commercial), Model Town, Lahore. Tel : 042 35916714, 35916719, 35839182. Fax : 042 35869037. www.corplink.com.pk
Submission of CNIC - (Mandatory)
With reference to the notification of Securities and Exchange Commission of Pakistan (SECP), SRO 779(I)/2011, dated August 18, 2011, the Members/Shareholders who have not yet submitted photocopy of their valid Computerized National Identity Card (CNIC) to the Company are required to send the same at the earliest directly of the Company’s Share Registrar, M/s Corplink (Pvt.) Limited.
Kindly comply with the request, in case of non-receipt of the copy of valid CNIC and non-compliance of the above mentioned SRO of SECP, the Company may be constrained to withhold dividends in the future.
Shareholders are requested to promptly notify any change of address to the Company’s Share Register (for Physical shares) or to their respective participant / broker (for CDS shares) as the case may be.
Video Conference Facility
Pursuant to the provisions of the Companies Act, 2017 the shareholders residing in city and holding at least 10% of the total paid up capital may demand the Company to provide the facility of video link for participation in the meeting. The demand for video-link facility shall be received at Shares Registrar address given hereinabove at least 7 days prior to the date of AGM.
Deposit of Physical Shares in to CDC Account:
As per Section 72 of the Companies Act, 2017 every existing listed company shall be required to replace its physical shares with book-entry form in a manner as may be specified and from the date notified by the Commission, within a period not exceeding four years from the commencement of this Act, i.e., May 30, 2017. The Shareholders having physical shareholding are encouraged to open CDC sub - account with any of the brokers or Investor Account directly with CDC to place their physical shares into scrip less form, this will facilitate them in many ways, including safe custody and sale of shares, any time they want, as the trading of physical shares is not permitted as per existing regulations of the Pakistan Stock Exchange.
Availability of Audited Financial Statements on Company’s Website
In accordance to Section 223 and 237 of the Company Act, 2017, the audited financial statements of the Company for the year ended June 30, 2019 have been made available on the Company’s website www.nimir.com.pk/nrl/financial_reports.html, in addition to annual and quarterly financial statements for the prior years.
The statement of material facts under section 134 (3) of the Companies Act, 2017 concerning the special business contained in item No. 3 & 4 of the Notice of Annual General Meeting (AGM).
64 Nimir Resins Limited
Circulation of Annual Reports through CD/DVD/USB
Securities and Exchange Commission of Pakistan has vide S.R.O 470(I)/2016 dated May 31, 2016 allowed the companies to circulate the annual reports including annual audited accounts, notices of annual general meetings and other information contained therein of the Company to its members through CD/DVD/USB subject to consent of the shareholders in the general meeting. This will save time and expenses incurred on printing of the annual report.
The Company shall supply the hard copies of the aforesaid document to the shareholders on demand, free of cost, within one week of such demand. After approval of the shareholders, the Company will place a Standard Request Form on its website to communicate their need of hard copies of the documents along with postal and email address of the Company Secretary/Share Registrar to whom such requests shall be made.
Accordingly, the directors have placed the matter before the shareholders for their approval and to pass the ordinary resolution as proposed in the notice of meeting. The directors are not interested, directly or indirectly, in the above business except to the extent of their investment as has been detailed in the pattern of shareholding annexed to the Directors Report.
Resolved that, “consent & approval of the members of Nimir Resins Limited (the “Company”) be and is hereby accorded for transmission of annual reports including annual audited accounts, notices of annual general meetings and other information contained therein of the Company to the members for future years commencing from the year ending on June 30, 2020 through CD or DVD or USB (in accordance with the SECP’s SRO 470(1) 2016 dated May 31, 2016) instead of transmitting the same in hard copies at their registered addresses.”; and
Resolved Further that, “Chief Executive Officer or Company Secretary of the Company be and is hereby singly authorized to do all acts, deeds and things, take or cause to be taken all necessary actions to comply with all legal formalities and requirements and file necessary documents as may be necessary or incidental for the purposes of implementing this resolution.”
Meeting Fee for Non-Executive directors
Resolved that, “consent & approval of the members of Nimir Resins Limited (the “Company”) be and is hereby accorded to fix the meeting fee for the non-executive members of the Board and Audit Committee for attending meeting at Rs. 30,000/- and Rs. 20,000/- per meeting respectively.”
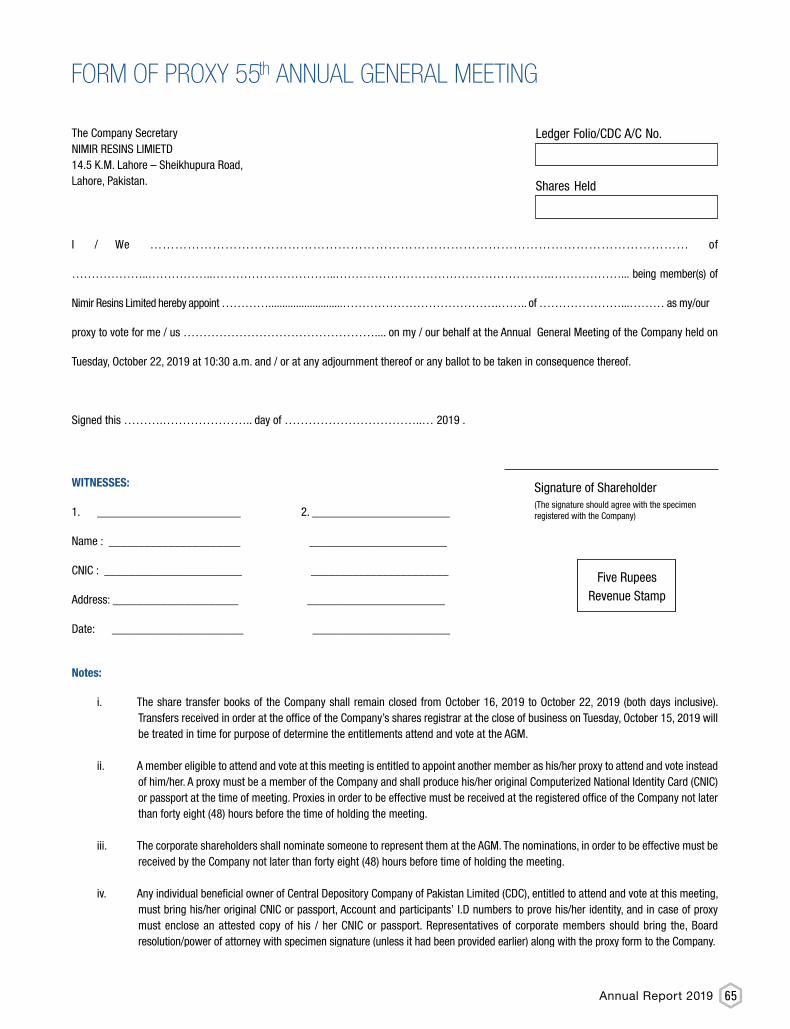
65Annual Report 2019
FORM OF PROXY 55th ANNUAL GENERAL MEETING
66 Nimir Resins Limited
Posted Stamp

NIMIR RESINS LIMIETD
14.5 K.M. Lahore – Sheikhupura Road,Lahore, Pakistan.Tel: +92 42 37971512-14 • Fax: +92 42 37970229
www.nimir.com.pk


