174
01 ANNUAL REPORT 2020

01ANNUAL REPORT 2020

02 ANNUAL REPORT 2020
01ANNUAL REPORT 2020
TABLE OFCONTENTS
040708
About us
03 Corporateinformation
Our vision,mission & values
10Communitycare initiatives
Our workin hepatology
Our work during theCOVID-19 pandemic12
16 Our state of the artmanufacturing facility
18202122233031
32
36
42
97
102154156167169
Key operating and financial data
Horizontal analysis
Vertical analysis
Chairperson’s review
Directors’ report
Dates and attendance of board meetings
Auditor‘s review report to the members onstatement of compliance with CCG
Statement of compliance with listed companies(CCG) regulations, 2019
Auditor’s report on unconsolidated financialstatements
Unconsolidated financial statements
Auditor’s report on consolidated financialstatements
Consolidated financial statements
Pattern of shareholding
Notice of annual general meeting
Directors’ report (urdu)
Form of proxy

02 ANNUAL REPORT 2020

03ANNUAL REPORT 2020
CORPORATEINFORMATIONBOARD OF DIRECTORSMrs. Akhter Khalid Waheed Non-Executive Director ChairpersonMr. Osman Khalid Waheed Executive Director Chief Executive OfficerMrs. Amna Piracha Khan Non-Executive DirectorMrs. Munize Azhar Peracha Non-Executive DirectorMr. Shahid Anwar Non-Executive DirectorMr. Arshad Saeed Husain Independent DirectorMr. Suleman Ghani Independent Director
AUDIT COMMITTEEMr. Arshad Saeed Husain ChairmanMrs. Amna Piracha Khan MemberMr. Shahid Anwar MemberMr. Suleman Ghani Member
INVESTMENT COMMITTEEMr. Suleman Ghani ChairmanMr. Osman Khalid Waheed MemberMr. Shahid Anwar Member
HR & REMUNERATIONCOMMITTEEMr. Arshad Saeed Husain ChairmanMr. Osman Khalid Waheed MemberMrs. Munize Azhar Peracha MemberMr. Shahid Anwar Member
COMPANY SECRETARYSyed Ghausuddin Saif
HEAD OF INTERNAL AUDITMr. Rizwan Hameed Butt
EXTERNAL AUDITORSKPMG Taseer Hadi & Co.Chartered Accountants
INTERNAL AUDITORSEY Ford Rhodes Chartered Accountants
REGISTERED OFFICEFerozsons Laboratories Limited197-A, The Mall Rawalpindi-46000, PakistanTelephone: +92-51-4252155-57Fax: +92-51-4252153Email: [email protected]
SALES OFFICE, LAHORE43-Al Noor BuildingBank Square, The Mall, Lahore, PakistanTelephone: +92-42-37358194Fax: +92-42-37313680
SALES OFFICE, KARACHIHouse No. 9, Block 7/8, Maqbool Cooperative Housing Society, Shahrah-e-Faisal, Karachi, PakistanTelephone: +92-21-34386852Fax: +92-21-34386754
BANKERSHabib Bank LimitedBank Al-Habib LimitedBank Alfalah LimitedHabib Metropolitan Bank LimitedMeezan Bank LimitedMCB Bank Limited Allied Bank Limited
SHARE REGISTRARCorpTec Associates (Pvt.) Limited503-E, Johar Town, Lahore, PakistanTelephone: +92-42-35170336-37Fax: +92-42-35170338
FACTORYP.O. FerozsonsAmangarh, Nowshera (KPK), PakistanTelephone: +92-923-614295, 610159Fax: +92-923-611302
HEAD OFFICE5 K.M - Sunder Raiwind RoadLahore, PakistanTelephone: +92-42-36026700Fax: +92-42-36026701
CHIEF FINANCIAL OFFICERMr. Muhammad Farhan Rafiq
LEGAL ADVISORSKhan & Piracha
03ANNUAL REPORT 2020

04 ANNUAL REPORT 2020
In 1960, we became the first Pakistani pharmaceutical company to be listed on the Pakistan Stock Exchange (formerly: Karachi Stock Exchange) Limited, and have a consistent record of financial performance. The company is a multiple time recipient of the KSE Top 25 Companies Award.
Through our range of branded generics and in-licensed products, the company has established a leading presence in the areas of cardiology, gastroenterology, hepatology, oncology, dermatology and anti-infective treatments, and is expanding in other key therapeutic areas where unmet needs exist such as pediatrics and women’s health. In addition to representing Gilead Sciences Inc., one of the world’s most innovative biotech companies in the viral hepatitis and HIV space, Ferozsons Laboratories Limited is the marketing and distribution partner in Pakistan for the Boston Scientific Corporation, USA for its range of interventional devices.
This partnership allows us to offer complete medical solutions in cardiology, oncology, urology and gastroenterology. In 2009, Ferozsons Laboratories Limited entered into a joint venture with the Bagó Group of Argentina to establish BF Biosciences Limited, Pakistan’s first biotech pharmaceutical company. Our other international partners include BioGaia of Sweden and Performance Health of USA in pharma and OTC products respectively.
Ferozsons Laboratories Limited has a fully current Good Manufacturing Practices (cGMP) compliant production facility in Nowshera, which is ISO 9001 certified and fully equipped with state-of-the-art manufacturing and testing equipment. Our production capabilities include the manufacturing of tablets, capsules, syrups, suspensions, creams and ointments.
The Company has recently undertaken major expansion in its manufacturing, adding a new production wing for the production of solid dosage forms, and offers an excellent manufacturing, marketing and distribution platform to principals for launching their products in the Pakistan market.
The foundations of the Ferozsons business group were laid in 1894 by Maulvi Ferozuddin Khan, who founded the Ferozsons publishing house. From the onset, the group’s corporate vision involved playing a meaningful role in the education and health of the underprivileged population of the sub-continent. Ferozsons Laboratories Limited was thus established in 1956 as one of the first Pharmaceutical manufacturing companies in Pakistan, and has now entered its seventh decade of serving the cause of health and well-being with a growing presence in a number of international markets.
ABOUT US
01 A N N U A L R E P O R T 2 0 2 0

05ANNUAL REPORT 2020

06 ANNUAL REPORT 2020

07ANNUAL REPORT 2020
OUR VISION
MISSION STATEMENT
OUR VALUES
OUR VISION,MISSION & VALUES
04A N N U A L R E P O R T 2 0 2 0
We will strive to attain market leadership by putting patients first and seeing every day as a new opportunity to earn trust and credibility.
We aim to improve the quality of life by providing innovative healthcare solutions, ensuring patient access to quality treatment and cure. In doing so we will;
• Enhance shareholder value• Lead in employee development• Collaborate for excellence• Be ethical and transparent
Putting Patients FirstOur purpose for existence and ultimate measure of success is our impact on the improvement of human lives.
TrustworthinessWe work hard every day to earn the trust of patients, healthcare providers, employees, business partners and stakeholders.
CollaborationNone of us is as smart as all of us. We come together, work together and win together.
ExcellenceWe are committed to a culture of excellence and raising the bar every time.

08 ANNUAL REPORT 2020
Our continued commitment to promoting a healthier and more productive society through support to the health and education sector results in a number of engagements each year. The projects that we fund regularly include contributions to The Citizens Foundation (TCF) schools for the underprivileged and scholarship support for deserving students at the Lahore University of Management Sciences (LUMS). Apart from these regular engagements, in FY 2020 we have funded various health sector organizations working for the benefit of patients in Pakistan. Our donations have helped patient organizations working in the field of hepatology, we have committed to help larger organizations such as The Indus Centre by donating ultrasound machines as well as free treatment for hundreds of Hepatitis C patients.
In addition to this, our work in the Northern areas of Pakistan as well as in Lahore has enabled institutions to treat a larger number of patients than before. Ferozsons has also significantly invested in hepatology education and awareness for physicians, patients and the community at large. A number of health awareness and educational activities were also supported by Ferozsons this year, as well as several health awareness and education sessions held at public schools and community events. Following are some highlights of our corporate social investments:
COMMUNITY CARE INITIATIVES
Ferozsons regularly supports events organized by TCF for fundraising. In addition to this, we continue to support the TCF Khalid Waheed Campus in Muzaffargarh since 2006. Over 360 students are currently enrolled in the campus.
TCF is committed to supporting the education of the underprivileged across Pakistan by managing schools providing quality education at low costs.
Ferozsons annually supports the National Outreach Programme (NOP) of the Lahore University of Management Sciences (LUMS). Our scholarship endowment fund supports need -based scholarships for NOP students at the Syed Babar Ali School of Science & Engineering and the Mushtaq Gurmani School of Humanities & Social Sciences at LUMS. The NOP Scholarships Programme is designed to fully fund the educational expenses of the undergraduate programmes at LUMS for students with exceptional credentials.
TCF SPONSORSHIPS
NATIONAL OUTREACH PROGRAMME
05 A N N U A L R E P O R T 2 0 2 0

09ANNUAL REPORT 2020

10 ANNUAL REPORT 2020
For nearly a decade, our work in the field of hepatology has been pivotal in changing the treatment landscape, initially through the local production of interferons, which reduced treatment costs by half, and subsequently through the introduction of Directly Acting Antivirals (DAAs) under a special access program in partnership with Gilead Sciences.
This year as well, we have worked with healthcare providers and medical societies on a number of programs raising awareness, and delivering education, screening and treatment in the field, including arranging medical education events that bring together top Hepatologists from Pakistan and global experts in the field from around the world. We intend to take medical education for the treatment and diagnosis of Hepatitis to the General Physicians in the next phase.
In an attempt to reach the wider community, we designed awareness and educational outreach programmes around hepatitis awareness and prevention in partnership with local NGOs and educational institutions. We plan to roll these out to other areas as well as creating alliances with NGOs to take these programmes to the next level.
In order to raise disease awareness on Hepatitis, a Facebook page has been launched disseminating information by medical experts. Through this platform, one of the key objectives would be to establish Ferozsons as a leader in public awareness and education.
Ferozsons is already known for its work in medical education. This initiative launched with the support of our partner, Gilead Sciences features video messages by Liver disease experts and educational videos on the disease.
HEPATITIS-FREEPAKISTAN
OUR WORKIN HEPATOLOGY
07 A N N U A L R E P O R T 2 0 2 0

11ANNUAL REPORT 2020
A Corporate Coalition for Viral Hepatitis Elimination in Pakistan (CCVHEP) has been established to support the Government of Pakistan’s effort to eliminate viral hepatitis in Pakistan by 2030. Viral hepatitis is a disease of epidemic proportions in Pakistan, impacting more than 7% of the entire population. The Coalition is founded in a partnership between Gilead Sciences and Ferozsons Laboratories Limited, and its founding members including;
Abacus Pakistan, Abbott Pakistan, Atlas Honda, Citibank Pakistan, Descon Oxychem Limited, InspecTest (Pvt) Limited, Jazz, Nestlé Pakistan, Packages Limited, PepsiCo Pakistan, Sapphire, Service Sales Corporation and Uber. The launch of CCVHEP, consisting of Pakistan’s most respected private sector employers is a very encouraging development.
Having employed a large number of people, CCVHEP recognizes that there is a need for the private sector to play its role in supporting Pakistan’s commitment to the Sustainable Development Goal of eliminating Viral Hepatitis as a public health threat by 2030. Moreover, this initiative is also in line with the World Health Assembly’s declaration to eliminate the disease as a public threat. Considered to be the first of its kind, this coalition between companies is formed to adopt a two-pronged approach of preventing new infections and treating existing patients to prevent liver cirrhosis and cancer.
Undoubtedly, this step will play a pivotal role in making the treatment of disease approachable and fulfilling the eventual goal.
CORPORATECOALITION FOR
VIRAL HEPATITISELIMINATION

12 ANNUAL REPORT 2020
It has been our privilege that Ferozsons, through our joint-venture subsidiary BF Biosciences Limited (BFBL), is one of five manufacturers to have entered into voluntary licensing agreements with Gilead Sciences Inc., to manufacture and supply Remdesivir in Pakistan and 126 other countries under Gilead’s Global Patient Solutions program.
Remdesivir has been granted Emergency Use Authorization (EUA) by the U.S. Food and Drug Administration (FDA) to treat hospitalized patients with severe COVID-19 disease. The optimal duration of treatment is still being studied in ongoing clinical trials. Under the EUA, both 5-day and 10-day treatment durations are suggested, based on the severity of disease.
Under the agreement, BFBL has received a technology transfer of the Gilead manufacturing process for Remdesivir to ensure product quality. This important step by Gilead once again underlines their unwavering commitment to global patient access, and is one of the reasons why, as a company committed to Putting Patients First, Ferozsons is proud to partner with them.
REMIDIA(REMDESIVIR)
While we search for effective treatments and vaccinations for COVID-19, hand hygiene remains one of the most important parts of preventing the spread of the Coronavirus.
To support the habit of maintaining good hand hygiene, we are proud to launch our liquid hand sanitizer brand 707.
707 is made by using an isopropyl alcohol (IPA) based formula that is recommended by the World Health Organisation (WHO).
707 HANDSANITIZER
NEW BRAND LAUNCHES
OUR WORK DURINGTHE COVID-19 PANDEMIC
In line with our commitment to give access to latest treatment and cure to a large number of patients in Pakistan, we have grown our portfolio significantly. To combat the COVID-19 pandemic effectively, we have launched a global innovative treatment, as well as a quality hygiene brand.
09 A N N U A L R E P O R T 2 0 2 0

13ANNUAL REPORT 2020
It has been our privilege that Ferozsons, through our joint-venture subsidiary BF Biosciences Limited (BFBL), is one of five manufacturers to have entered into voluntary licensing agreements with Gilead Sciences Inc., to manufacture and supply Remdesivir in Pakistan and 126 other countries under Gilead’s Global Patient Solutions program.
Remdesivir has been granted Emergency Use Authorization (EUA) by the U.S. Food and Drug Administration (FDA) to treat hospitalized patients with severe COVID-19 disease. The optimal duration of treatment is still being studied in ongoing clinical trials. Under the EUA, both 5-day and 10-day treatment durations are suggested, based on the severity of disease.
Under the agreement, BFBL has received a technology transfer of the Gilead manufacturing process for Remdesivir to ensure product quality. This important step by Gilead once again underlines their unwavering commitment to global patient access, and is one of the reasons why, as a company committed to Putting Patients First, Ferozsons is proud to partner with them.
REMIDIA(REMDESIVIR)
While we search for effective treatments and vaccinations for COVID-19, hand hygiene remains one of the most important parts of preventing the spread of the Coronavirus.
To support the habit of maintaining good hand hygiene, we are proud to launch our liquid hand sanitizer brand 707.
707 is made by using an isopropyl alcohol (IPA) based formula that is recommended by the World Health Organisation (WHO).
707 HANDSANITIZER
NEW BRAND LAUNCHES
OUR WORK DURINGTHE COVID-19 PANDEMIC
In line with our commitment to give access to latest treatment and cure to a large number of patients in Pakistan, we have grown our portfolio significantly. To combat the COVID-19 pandemic effectively, we have launched a global innovative treatment, as well as a quality hygiene brand.
09 A N N U A L R E P O R T 2 0 2 0

14 ANNUAL REPORT 2020
With the outbreak of the pandemic, our economy, society, and healthcare system have been completely altered. This crisis has presented Pakistan’s healthcare delivery system with unprecedented challenges, but has also catalyzed rapid adoption of telehealth and the entire spectrum of activities used to deliver care at a distance.
As part of our efforts to combat Covid-19, we have partnered with HospitALL (a NETSOL Technologies incubated Startup) to develop a cutting-edge Physician-Patient Virtual Counselling Platform.
The IT platform, named CliniCALL, is being developed to reduce the need for physical consultations (particularly in the case of follow-up visits) and facilitate patients and doctors by creating a simple, secure platform with chat, video, voice, and healthcare tools integrated into a single hub. Patients will be able to consult and share their reports with their physicians from the comfort of their homes, reducing the load and waiting times in clinics, and lowering the risk of acquiring infections from crowded waiting areas.
LAUNCH OF ACUTTING-EDGE
TELEHEALTHPLATFORM
Ferozsons Laboratories Limited is proud to support Umang Pakistan for a pilot project through an unrestricted grant to establish a free-of-cost Anxiety Helpline, run by experienced clinical psychologists.
Our mental health is critically important for our well-being, but too often remains ignored or unaddressed. Patients, frontline healthcare workers and first responders are exposed to numerous stresses. Helping patients and healthcare providers is critical to sustaining quality healthcare provision for the public.
UMANG ANXIETYHELPLINE
11 A N N U A L R E P O R T 2 0 2 0
A PROJECT TO TACKLETHE MENTAL HEALTH
EPIDEMIC

15ANNUAL REPORT 2020
16 ANNUAL REPORT 2020
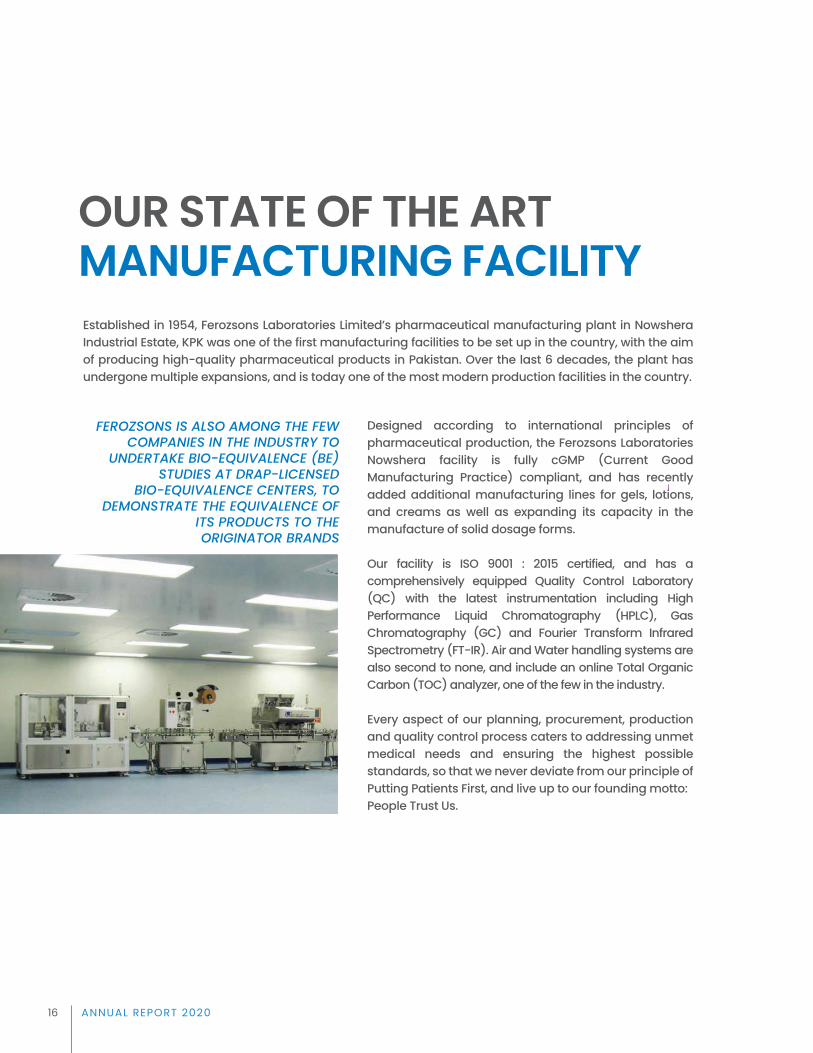
OUR STATE OF THE ART MANUFACTURING FACILITY
Designed according to international principles of pharmaceutical production, the Ferozsons Laboratories Nowshera facility is fully cGMP (Current Good Manufacturing Practice) compliant, and has recently added additional manufacturing lines for gels, lotions, and creams as well as expanding its capacity in the manufacture of solid dosage forms.
Our facility is ISO 9001 : 2015 certified, and has a comprehensively equipped Quality Control Laboratory (QC) with the latest instrumentation including High Performance Liquid Chromatography (HPLC), Gas Chromatography (GC) and Fourier Transform Infrared Spectrometry (FT-IR). Air and Water handling systems are also second to none, and include an online Total Organic Carbon (TOC) analyzer, one of the few in the industry.
Every aspect of our planning, procurement, production and quality control process caters to addressing unmet medical needs and ensuring the highest possible standards, so that we never deviate from our principle of Putting Patients First, and live up to our founding motto:People Trust Us.
Established in 1954, Ferozsons Laboratories Limited’s pharmaceutical manufacturing plant in Nowshera Industrial Estate, KPK was one of the first manufacturing facilities to be set up in the country, with the aim of producing high-quality pharmaceutical products in Pakistan. Over the last 6 decades, the plant has undergone multiple expansions, and is today one of the most modern production facilities in the country.
FEROZSONS IS ALSO AMONG THE FEW COMPANIES IN THE INDUSTRY TO
UNDERTAKE BIO-EQUIVALENCE (BE) STUDIES AT DRAP-LICENSED
BIO-EQUIVALENCE CENTERS, TO DEMONSTRATE THE EQUIVALENCE OF
ITS PRODUCTS TO THE ORIGINATOR BRANDS
13 A N N U A L R E P O R T 2 0 2 0

17ANNUAL REPORT 2020

18 ANNUAL REPORT 2020
DESCRIPTION FY 2020 FY 2019 FY 2018 FY 2017 FY 2016 FY 2015
UNCONSOLIDATED
Operating ResultsRevenue - net (Rs. Million) 5,394 5,181 4,409 4,311 10,186 4,439 Gross Profit (Rs. Million) 2,218 2,046 1,500 1,777 4,109 2,021 Profit Before Taxation (Rs. Million) 561 419 207 602 2,654 1,083 Profit After Taxation (Rs. Million) 396 251 95 394 2,104 749
Financial PositionShare Capital (Rs. Million) 302 302 302 302 302 302 Accumulated Profit (Rs. Million) 4,182 3,880 3,735 3,733 3,766 2,401 Non Current Assets (Rs. Million) 3,654 3,043 2,956 2,857 2,659 1,533 Non Current Liabiltiies (Rs. Million) 377 179 166 167 149 40 Curent Assets (Rs. Million) 3,871 3,160 3,009 2,921 3,043 2,856 Current Liabilties (Rs. Million) 1,528 1,086 972 767 652 1,275
Summary of Cashflow StatementCash generated from Operations (Rs. Million) 116 447 430 854 621 973 Net cash used in Investing activities (Rs. Million) (229) (216) (331) (516) (82) (223) Net cash used in Financing activities (Rs. Million) (22) (147) (132) (454) (743) (400)
Key Financial Ratios
Profitability RatiosGross Profit ratio (%) 41.1 39.5 34.0 41.2 40.3 45.5 Net Profit After Tax to Sales (%) 7.3 4.8 2.2 9.1 20.7 16.9 Return on Equity (%) 7.0 5.1 2.0 8.1 42.9 24.3 Return on Capital Employed (%) 10.3 9.0 4.5 12.8 54.4 35.7
Liquidity RatiosCurrent Ratio (Times) 2.5 2.9 3.1 3.8 4.7 2.2 Quick Ratio/Acid Test Ratio (Times) 1.3 1.8 1.8 1.8 1.8 1.3
Turnover RatiosDebtor Turnover Period (Days) 69 63 44 31 14 19 Inventory Turnover Period (Days) 211 136 153 223 112 184 Creditors Turnover Period (Days) 108 113 100 90 18 141 Working Capital Cycle (Days) 172 86 97 164 108 62 Non-Current Asset Turnover Ratio (Times) 1.5 1.7 1.5 1.5 3.8 2.9 Operating Cash Flow To Sales Ratio (%) 2.1 8.6 9.7 19.8 6.1 21.9
Investment/Market RatiosEarnings per Share (Basic & Diluted) (Rs.) 13.1 8.3 3.2 13.0 69.7 24.8 Cash Dividend per Share (Rs.) 4.0 6.0 2.0 7.0 22.0 19.0 Bonus Share Issued (%) 20.0 - - - - - Price Earning Ratio (Times) 22.9 13.4 61.6 29.6 14.8 25.8 Market Price per Share (Rs.) 300 112 195 387 1,031 640 Cash Dividend Payout Ratio (%) 30.5 72.1 63.3 53.7 31.6 76.6
Capital Structure RatiosInterest Cover (Times) 21.7 18.9 19.8 38.0 239.0 78.5
CONSOLIDATED
Operating ResultsRevenue - net (Rs. Million) 6,192 5,803 5,003 5,002 11,335 5,711 Gross Profit (Rs. Million) 2,318 2,041 1,519 1,911 4,594 2,597 Profit Before Taxation (Rs. Million) 592 338 86 591 2,859 1,360 Profit / (Loss) After Taxation (Rs. Million) 423 188 (17) 395 2,233 944
Financial PositionShare Capital (Rs. Million) 302 302 302 302 302 302 Accumulated Profit (Rs. Million) 4,645 4,305 4,195 4,265 4,280 2,811 Non Current Assets (Rs. Million) 4,090 3,117 3,168 3,096 3,025 1,751 Non Current Liabiltiies (Rs. Million) 526 217 223 246 269 101 Curent Assets (Rs. Million) 4,877 3,987 3,801 3,745 3,838 3,474 Current Liabilties (Rs. Million) 1,793 1,249 1,143 876 821 1,456
KEY OPERATING AND FINANCIAL DATA
FOR THE LAST SIX YEARS

19ANNUAL REPORT 2020
z
5,39
4
5,18
1
4,40
9
4,31
1
10,1
86
4,43
9
2,21
8
2,04
6
1,50
0
1,77
7
4,10
9
2,02
1
F Y 2 0 2 0 F Y 2 0 1 9 F Y 2 0 1 8 F Y 2 0 1 7 F Y 2 0 1 6 F Y 2 0 1 5
REVENUE & GROSS PROFIT (RS.MILLION)Revenue - net Rs. (Millions) Gross profit Rs. (Millions)
41% 39%34%
41% 40%46%
7% 5% 2%9%
21%17%
FY 2020 FY 2019 FY 2018 FY 2017 FY 2016 FY 2015
PROFITABILITY RATIOS (%)Gross profit ratio Net profit ratio
1.5 1.7 1.5 1.5
3.8 2.9 2.5
2.9 3.1 3.8
4.7 2.2
1.3 1.8 1.8 1.8
1.8
1.3
FY 2020 FY 2019 FY 2018 FY 2017 FY 2016 FY 2015
LIQUIDITY & ASSET TURNOVER RATIOS
Quick ratio (times) Current ratio (times) Non current asset turnover (times)
13.1 8.3
3.2 13.0
69.7
24.8
4.0 6.0 2.0
7.0
22.0 19.0
-
10.0
20.0
30.0
40.0
50.0
60.0 70.0 80.0
FY 2020 FY 2019 FY 2018 FY 2017 FY 2016 FY 2015
INVESTORS' RATIOS
Earning per share Rs. Cash dividend per share Rs.
21.7 18.9 19.8 38.0
239.0
78.5
FY 2020 FY 2019 FY 2018 FY 2017 FY 2016 FY 2015
INTEREST COVER (TIMES)Interest cover Times
7%5% 2% 8%
43%
24%10% 9%5%
13%
54%
36%
FY 2020 FY 2019 FY 2018 FY 2017 FY 2016 FY 2015
CAPITAL RETURN RATIOS
Return on equity % Return on capital employed %
9.7 17.0 17.8 17.1 17.8
38.2
NON CURRENT ASSETS TO NON CURRENT LIABILITIES(RATIO)
FY 2020 FY 2019 FY 2018 FY 2017 FY 2016 FY 2015
300
112 195
387
1,031
640 23 13
62
30
15 26
-
10
20
30
40
50
60
70
FY 2020 FY 2019 FY 2018 FY 2017 FY 2016 FY 2015 -
200
400
600
800
1,000
1,200
MARKET RATIOS
Market price per share (Rs./share) Price earning ratio (times)
20 ANNUAL REPORT 2020
2020 2019 2018 2017 2016 2015
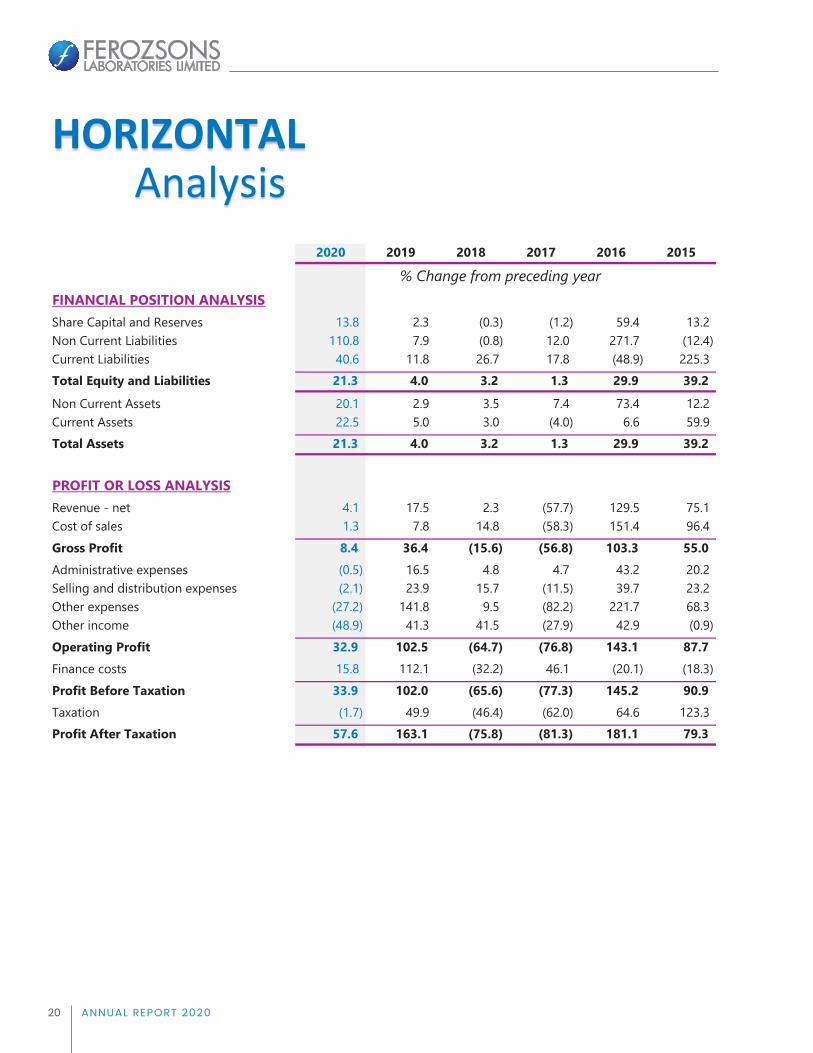
% Change from preceding yearFINANCIAL POSITION ANALYSISShare Capital and Reserves 13.8 2.3 (0.3) (1.2) 59.4 13.2 Non Current Liabilities 110.8 7.9 (0.8) 12.0 271.7 (12.4) Current Liabilities 40.6 11.8 26.7 17.8 (48.9) 225.3 Total Equity and Liabilities 21.3 4.0 3.2 1.3 29.9 39.2 Non Current Assets 20.1 2.9 3.5 7.4 73.4 12.2 Current Assets 22.5 5.0 3.0 (4.0) 6.6 59.9 Total Assets 21.3 4.0 3.2 1.3 29.9 39.2
PROFIT OR LOSS ANALYSISRevenue - net 4.1 17.5 2.3 (57.7) 129.5 75.1 Cost of sales 1.3 7.8 14.8 (58.3) 151.4 96.4 Gross Profit 8.4 36.4 (15.6) (56.8) 103.3 55.0 Administrative expenses (0.5) 16.5 4.8 4.7 43.2 20.2 Selling and distribution expenses (2.1) 23.9 15.7 (11.5) 39.7 23.2 Other expenses (27.2) 141.8 9.5 (82.2) 221.7 68.3 Other income (48.9) 41.3 41.5 (27.9) 42.9 (0.9) Operating Profit 32.9 102.5 (64.7) (76.8) 143.1 87.7 Finance costs 15.8 112.1 (32.2) 46.1 (20.1) (18.3) Profit Before Taxation 33.9 102.0 (65.6) (77.3) 145.2 90.9 Taxation (1.7) 49.9 (46.4) (62.0) 64.6 123.3 Profit After Taxation 57.6 163.1 (75.8) (81.3) 181.1 79.3
HORIZONTALAnalysis
21ANNUAL REPORT 2020
2020 2019 2018 2017 2016 2015
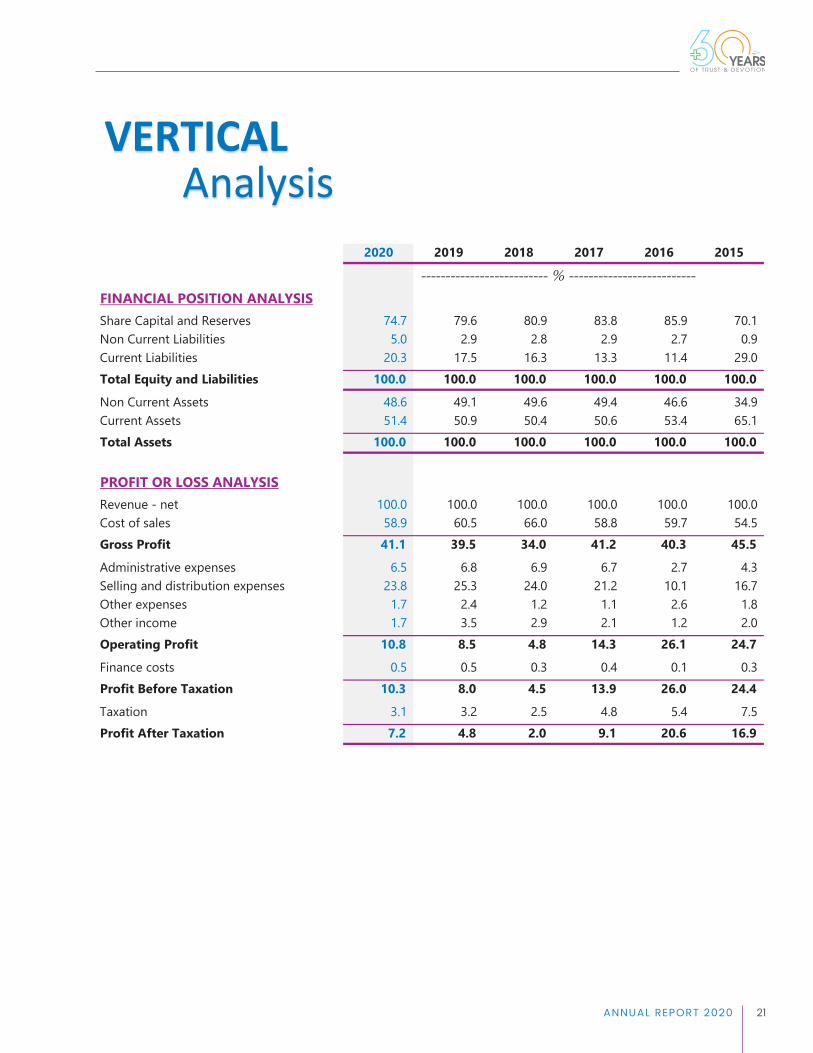
-------------------------- % --------------------------FINANCIAL POSITION ANALYSISShare Capital and Reserves 74.7 79.6 80.9 83.8 85.9 70.1 Non Current Liabilities 5.0 2.9 2.8 2.9 2.7 0.9 Current Liabilities 20.3 17.5 16.3 13.3 11.4 29.0 Total Equity and Liabilities 100.0 100.0 100.0 100.0 100.0 100.0 Non Current Assets 48.6 49.1 49.6 49.4 46.6 34.9 Current Assets 51.4 50.9 50.4 50.6 53.4 65.1 Total Assets 100.0 100.0 100.0 100.0 100.0 100.0
PROFIT OR LOSS ANALYSISRevenue - net 100.0 100.0 100.0 100.0 100.0 100.0 Cost of sales 58.9 60.5 66.0 58.8 59.7 54.5 Gross Profit 41.1 39.5 34.0 41.2 40.3 45.5 Administrative expenses 6.5 6.8 6.9 6.7 2.7 4.3 Selling and distribution expenses 23.8 25.3 24.0 21.2 10.1 16.7 Other expenses 1.7 2.4 1.2 1.1 2.6 1.8 Other income 1.7 3.5 2.9 2.1 1.2 2.0 Operating Profit 10.8 8.5 4.8 14.3 26.1 24.7 Finance costs 0.5 0.5 0.3 0.4 0.1 0.3 Profit Before Taxation 10.3 8.0 4.5 13.9 26.0 24.4 Taxation 3.1 3.2 2.5 4.8 5.4 7.5 Profit After Taxation 7.2 4.8 2.0 9.1 20.6 16.9
VERTICALAnalysis
22 ANNUAL REPORT 2020
CHAIRPERSON REVIEW REPORT TO THE SHAREHOLDERS FOR THE YEAR ENDED 30 JUNE 2020
It gives me great pleasure to present the Review Report to the shareholders on the Board’s overall performance and effectiveness in achieving the Company’s objectives.
Review of Overall Performance and Effectiveness of the Board
During the year under review, the Board has carried out its roles and responsibilities diligently and contributed to the strategic leadership of the Company.
The Board has reviewed the financial statements of the Company periodically along with all governance matters such as the transparencies of disclosures, policies, corporate plans, budgets, and compliance of all regulatory requirements.
Apart from reviewing other strategic and critical business matters, the Board has specifically assessed the impacts of the COVID-19 outbreak and its risks to the Company. Appropriate safeguards have been taken to minimize the impacts on the Company.
The composition of the Board of Directors reflects a mix of varied backgrounds to provide quality strategic direction to the management. The board has also formed subcommittees, including the Human Resource & Remuneration Committee, the Audit Committee and the Investments Committee. These sub-committees are operating effectively and within the framework of the law.
The Board has approved a risk management framework with a vision to implement a strong system of internal controls and provide an effective control environment for compliance with the best practices of Corporate Governance. The Board has also stressed on high standards of honesty and integrity pivotal for the success of the business and reputation of the Company.
As required under the Listed Companies (Code of Corporate Governance Regulations) 2019, an annual evaluation of the Board of Directors and its subcommittees have been carried out. The purpose of this evaluation is to ensure that the Board has the skills required to provide the strategic leadership of the Company. Improvement areas, if any, identified as part of the evaluation process are addressed accordingly. Based on the latest feedback received, the evaluation and performance of the Board is considered satisfactory.
Acknowledgement On behalf of the Board of Directors, I would like to extend my special gratitude towards all shareholders for their continued trust and support. I acknowledge with thanks the dedication and hard work of our employees at all levels and look forward to their continued support next year. I would also like to appreciate the commendable efforts and dedication of our Board Members and CEO in providing strategic leadership to the Company.
Mrs. Akhter Khalid Waheed Chairperson Lahore 24 September 2020
23ANNUAL REPORT 2020
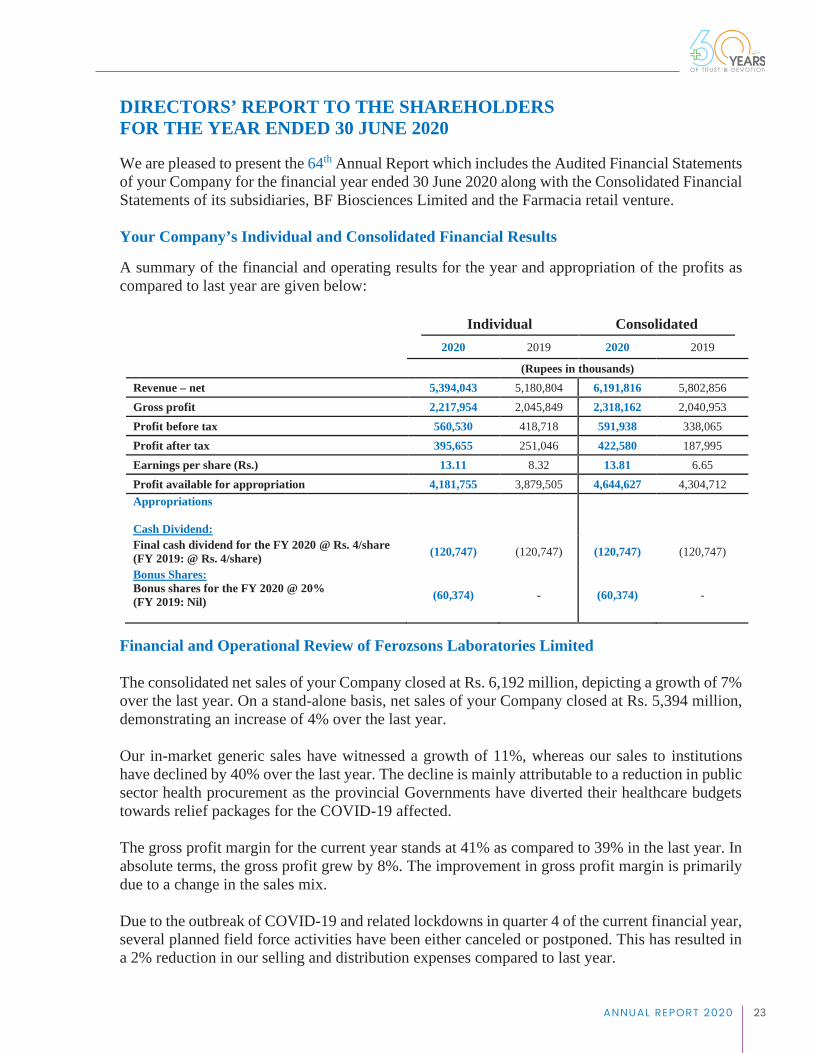
DIRECTORS’ REPORT TO THE SHAREHOLDERS FOR THE YEAR ENDED 30 JUNE 2020 We are pleased to present the 64th Annual Report which includes the Audited Financial Statements of your Company for the financial year ended 30 June 2020 along with the Consolidated Financial Statements of its subsidiaries, BF Biosciences Limited and the Farmacia retail venture. Your Company’s Individual and Consolidated Financial Results A summary of the financial and operating results for the year and appropriation of the profits as compared to last year are given below:
Individual Consolidated
2020 2019 2020 2019
(Rupees in thousands) Revenue – net 5,394,043 5,180,804 6,191,816 5,802,856 Gross profit 2,217,954 2,045,849 2,318,162 2,040,953 Profit before tax 560,530 418,718 591,938 338,065 Profit after tax 395,655 251,046 422,580 187,995 Earnings per share (Rs.) 13.11 8.32 13.81 6.65 Profit available for appropriation 4,181,755 3,879,505 4,644,627 4,304,712 Appropriations Cash Dividend:
Final cash dividend for the FY 2020 @ Rs. 4/share (FY 2019: @ Rs. 4/share)
(120,747) (120,747) (120,747) (120,747)
Bonus Shares: Bonus shares for the FY 2020 @ 20% (FY 2019: Nil)
(60,374) - (60,374) -
Financial and Operational Review of Ferozsons Laboratories Limited The consolidated net sales of your Company closed at Rs. 6,192 million, depicting a growth of 7% over the last year. On a stand-alone basis, net sales of your Company closed at Rs. 5,394 million, demonstrating an increase of 4% over the last year. Our in-market generic sales have witnessed a growth of 11%, whereas our sales to institutions have declined by 40% over the last year. The decline is mainly attributable to a reduction in public sector health procurement as the provincial Governments have diverted their healthcare budgets towards relief packages for the COVID-19 affected. The gross profit margin for the current year stands at 41% as compared to 39% in the last year. In absolute terms, the gross profit grew by 8%. The improvement in gross profit margin is primarily due to a change in the sales mix. Due to the outbreak of COVID-19 and related lockdowns in quarter 4 of the current financial year, several planned field force activities have been either canceled or postponed. This has resulted in a 2% reduction in our selling and distribution expenses compared to last year.
24 ANNUAL REPORT 2020
Other expenses have decreased by 31%, primarily due to lower exchange loss in the current year. The net profit after tax of your Company closed at Rs. 396 million against Rs. 251 million achieved last year. The effective tax rate for the year ended 30 June 2020 closed at 29% against 40% last year. The decrease in the effective tax rate is primarily due to the recording of certain provisions in the last year. Financial and Operational Review of BF Biosciences Limited (Subsidiary Company) Sales of the subsidiary Company BF Biosciences Limited closed at Rs. 628 million, depicting an increase of 40% over the last year. Net profit after tax for the year stands at Rs. 47 million against a net loss of Rs. 45 million last year. During the current year, the BF Biosciences successfully concluded its voluntary license agreement with Gilead Sciences, Inc. for the manufacture and sale of Remdesivir. The product has been registered by the Drug Regulatory Authority of Pakistan under the brand name of “Remidia”. Production and sales of Remidia have commenced in the subsequent period. BF Biosciences have also started production and sales of Omega (omeprazole) intravenous injections along with Eritrogen (erythropoietin) 10000 IU during the current year under review. However, a number of other biological and non-biological registrations are still pending with the Drug Regulatory Authority of Pakistan for approval. Once these applications are approved, the management is confident that these will further improve the top and bottom line of the subsidiary in the coming years. Key Operating and Financial Data A summary of key operating and financial data of the individual and consolidated financial statements for the last six years is annexed. Capital Expenditure In order to keep pace with the latest technologies in pharmaceutical industry, during the year under review your Company has invested Rs. 264 million for balancing and modernization of its manufacturing facilities. Subsequent Events No material changes affecting financial position of the Company have occurred between the balance sheet date and the date of this report. Earnings per Share Based on the net profit for the year ended 30 June 2020 the earnings per share (EPS) stands at Rs. 13.11 per share, compared to last year’s EPS of Rs. 8.32 per share on capital of Rs. 301.87 million. Consolidated EPS for the year under review closed at Rs. 13.81 per share against last year EPS of Rs. 6.65 per share.

25ANNUAL REPORT 2020
Dividend Announcement The directors have recommended a final cash dividend of 40% i.e. Rs. 4 per share, and bonus shares at the rate of 20% (i.e. twenty (20) shares for every hundred (100) shares) for the financial year ended 30 June 2020, subject to the approval by the shareholders at the Annual General Meeting to be held on 26 October 2020. These appropriations will be accounted for in the subsequent financial statements, in compliance with the Companies Act, 2017. Statement of Compliance with the Code of Corporate Governance The Company is fully complied with the requirements of the Listed Companies (Code of Corporate Governance) Regulations 2019, a statement to this effect along with Auditors’ report is annexed with our annual report. Corporate & Financial Reporting Framework The Board of Directors of your Company is committed to the principal of good corporate management practices. The Management of Company is continuing to comply with the provisions of best practices set out in the Code of Corporate Governance. • The financial statements prepared by the management of the Company fairly presents its state
of affairs, the results of its operations, cash flows and changes in equity.
• Proper books of account of the Company have been maintained.
• Appropriate accounting policies have been consistently applied in preparation of the financial statements. Accounting estimates are based on reasonable and prudent judgment.
• The International Financial Reporting Standards (IFRS), as applicable in Pakistan, have been
followed in preparation of financial statements and any departure there from has been adequately disclosed and explained.
• The systems of internal controls are sound in design and have been effectively implemented
by the management and monitored by the internal auditors as well as Board of Directors and the Audit Committee. The Board reviews the effectiveness of established internal controls through the Audit Committee and suggest, whenever required, further improvement in the internal control system.
• There are no significant doubts upon the Company’s ability to continue as a going concern.
• There has been no material departure from the best practices of Corporate Governance as
detailed in the Listing Regulations.
• Significant deviations from last year’s operating results have been explained in detail together with the reasons thereof in the Annual Report.

26 ANNUAL REPORT 2020
• The Company does not envisage corporate restructuring or discontinuation of its operations in the foreseeable future.
• All major Government levies in the normal course of business, payable as on 30 June 2020 have been cleared subsequent to the year end.
• The values of investments of employees’ provident fund based on latest audited accounts as of
30 June 2019 are Rs. 506 million. Contribution to National Exchequer During the current financial year out of the total wealth generated, your Company contributed approximately Rs. 399 million to the national exchequer in lieu of various levies including Income Tax, Custom Duty, Federal and Provincial Sales Taxes, WWF, WPPF and Central Research Fund. Cash Flow Management The Company’s cash flow management system projects cash inflows and outflows on a regular basis and monitors the cash position on a daily basis. Related Party Transactions Transactions with related parties during the year ended 30 June 2020 were placed before the audit committee and the board for their review and approval. These transactions were approved by the Board in their meetings held during the year. Detail of related party transactions is given in note 33 to the financial statements. Composition of Board of Directors, its Committees and Meetings The information regarding the composition of Board of Directors, its Committees and Meetings held along with the details of persons who, at any time during the financial year 2019-20 were directors of the Company is annexed. Pattern of Shareholding The pattern of shareholding as at 30 June 2020 is annexed. All trades in the shares of the Company, if any, carried out by the directors, CEO, CFO, Company Secretary and their spouses and minor children are also annexed. Corporate Social Responsibility In line with our Code of Business Conduct and Excellence Framework, we are committed to the protection of environment and investing in community’s health and education initiatives. Your Company contributed towards various CSR activities during the year under review, mainly with the following organizations:

27ANNUAL REPORT 2020
• Cancer Research and Treatment Foundation • The Citizens Foundation • National Management Foundation (LUMS)
Risk Management Our risk management approach is primarily based on understanding, identifying, assessing and then prioritizing risk areas in order to mitigate these risks through evolving operational strategies. The following are some of the primary risks being faced by our Company: • Economic and political risks: The ever changing economic and political condition in our
country has exposed our Company to this risk as well. In order to mitigate this risk, the management monitors the financial market conditions and political climate very closely and appropriate actions and strategies are discussed at the management level to counter unfavorable situations.
• Competition risks: Due to the weak regulatory controls over illegal and low quality products
in the market, the pharmaceutical industry in Pakistan is exposed to unhealthy competition risks. In order to mitigate these risks your Company along with other members of the Pakistan Pharmaceutical Manufacturers Association, is in continuous lobbying for improved Government regulations and policies.
• Supply chain risks: The supply chain process plays a pivotal role in day-to-day operations of
the Company. We are mitigating this risk through comprehensive production planning and integrating it with the sales forecasting and ordering systems.
• Information technology risks: The Company continues to invest in its IT infrastructure
keeping in mind its future needs.
• Financial risks: These are the risks that are directly attributable to the financial viability of the Company. These have been elaborated in detail in note 38 of the financial statements.
Remuneration Policy of Executive and Non-Executive Directors Except for chief executive officer (who is full time employed on the Company’s payroll), non-executive directors including the independent directors are entitled only for the fee and reimbursement of expenses for attending the meetings as mentioned in note 32 of the unconsolidated financial statements. Auditors The Auditors Messrs. KPMG Taseer Hadi & Co., Chartered Accountants retire and offer themselves for reappointment for the year 2020-21. The Board Audit Committee has recommended the appointment of KPMG Taseer Hadi & Co., Chartered Accountants as auditors of the Company for the year 2020-21. Accordingly, the Board
28 ANNUAL REPORT 2020
has recommended the same for the approval of the shareholders in the upcoming Annual General Meeting. Industry Review and Future Outlook
Pakistan’s pharmaceutical sector is valued at approximately Rs. 470 billion. The industry contributes significantly to the national economy and is the largest employer of university graduates in the country. In the last couple of years, the financial health of this vital industry has declined with the inflationary pressures on the economy, and a corresponding lack of price adjustment in the face of rising domestic inflation and the devaluation of the Pakistani rupee against the US Dollar. These issues have further exacerbated by the outbreak of COVID-19 in the current year.
The outbreak of COVID-19 has impacted the industry in several ways. The closure of hospital outpatient departments and private clinics, coupled with reduced footfall at pharmacies during the lockdown period had a detrimental impact on the sales of pharmaceutical as well as the medical devices business, since elective procedures nearly came to a standstill. The recent relaxation in lockdowns has helped the industry to resume its operations and return to positive growth. The management is continuously evaluating the impact of the pandemic outbreak and devising mitigating strategies including an increase in inventory levels and diversifying the supply chain to cope with the uncertainties posed by Covid-19, in case there is a second wave.
We would like to appreciate the proactive steps taken by the State Bank of Pakistan, in particular, to support the economy through a substantial reduction in the policy rate and reduced rate loan schemes for entities to pay salaries and wages of employees, as well as long-term facilities to facilitate investments in expansion projects in such challenging times.
The Provincial Governments also took several relief initiatives to combat COVID-19. However, these initiatives were mainly financed by diverting their healthcare budgets, leading to further liquidity problems and delayed payments to suppliers including the healthcare industry.
Your Company has also receivables of approximately Rs. 800 million from these government-owned health institutions. The delays in payments from these institutions are causing severe challenges to our supply chain and working capital. The government should urgently address the challenges faced by healthcare companies that have supplied to government institutions in good faith and continue to await their overdue payments.
To grow the topline of your Company, the management has planned several new launches in core therapeutic areas including Cardiovascular, Gastroenterology, Diabetes and anti-infectives. Depending upon market conditions, the management will begin launching these products in early to mid-2021.
The pharmaceutical industry in Pakistan has tremendous growth potentials both in local and export markets. However, in order to fully capitalize upon these opportunities, the industry desperately needs a balanced regulatory environment where the focus is on quality standards rather than arbitrary price controls.

29ANNUAL REPORT 2020
Acknowledgements
We would like to acknowledge the considerable efforts and dedication of our employees towards achievement of the Company’s objectives.
We would also like to thank our principals and business partners for their continuous support and confidence in our Company as well as our valued customers for their continued trust in our products. For and on behalf of the Board Mr. Osman Khalid Waheed Mrs. Akhter Khalid Waheed Chief Executive Officer Chairperson Lahore 24 September 2020

30 ANNUAL REPORT 2020
DATES AND ATTENDANCE OF BOARD MEETINGS HELD DURING THE YEAR ENDED 30 JUNE 2020 A total of Five Board Meetings were held during the Financial Year 2019-2020 on the following dates:
• 03 August 2019 • 21 September 2019 • 25 October 2019 • 28 February 2020 • 29 April 2020
Name of Directors Attendance
Board of Directors Meetings Mrs. Akhter Khalid Waheed 5 Mr. Osman Khalid Waheed 5 Mrs. Amna Piracha Khan 4 Mrs. Munize Azhar Peracha 5 Mr. Nihal Cassim 4 Mr. Shahid Anwar 5 Mr. Arshad Saeed Husain 4
Audit Committee Meetings Mr. Arshad Saeed Husain 3 Mrs. Amna Piracha Khan 4 Mr. Nihal Cassim 3 Mr. Shahid Anwar 4
HR&R Committee Meetings Mr. Shahid Anwar 1 Mr. Osman Khalid Waheed 1 Mr. Nihal Cassim 0 Mr. Arshad Saeed Husain 1 For and on behalf of the Board Mrs. Akhter Khalid Waheed Chairperson Lahore 24 September 2020

31ANNUAL REPORT 2020 31ANNUAL REPORT 2020
32 ANNUAL REPORT 2020
STATEMENT OF COMPLIANCE WITH LISTED COMPANIES (CODE OF CORPORATE GOVERNANCE) REGULATIONS, 2019 Name of Company: Ferozsons Laboratories Limited Year Ended: 30 June 2020 The Company has complied with the requirements of the Regulations in the following manner: 1. The total number of directors are 7 (seven) as per the following:
Gender Number
Male 04
Female 03
2. The composition of the Board is as follows:
Category Names
Independent Director Mr. Arshad Saeed Husain
Non-Executive Directors Mr. Nihal Cassim
Mr. Shahid Anwar
Executive Director Mr. Osman Khalid Waheed
Female Directors (Non-Executive)
Mrs. Akhter Khalid Waheed
Mrs. Amna Piracha Khan
Mrs. Munize Azhar Peracha Upon maturity of the Board of Directors’ current term, the election of directors has been held
after the year-end, whereby two independent directors are elected to comply with the provisions of Listed Companies (Code of Corporate Governance) Regulations, 2019.
3. The directors have confirmed that none of them is serving as a director on more than seven listed
companies, including this Company; 4. The Company has prepared a code of conduct and has ensured that appropriate steps have been
taken to disseminate it throughout the Company along with its supporting policies and procedures;
5. The Board has developed a vision/mission statement, overall corporate strategy and
significant policies of the Company. The Board has ensured that complete record of particulars of the significant policies along with their date of approval or updating is maintained by the Company;
6. All the powers of the Board have been duly exercised and decisions on relevant matters have
33ANNUAL REPORT 2020
been taken by the Board / shareholders as empowered by the relevant provisions of the Act and these Regulations;
7. The meetings of the Board were presided over by the Chairperson and, in her absence, by a
director elected by the Board for this purpose. The Board has complied with the requirements of Act and the Regulations with respect to frequency, recording and circulating minutes of meetings of the Board;
8. The Board have a formal policy and transparent procedures for remuneration of directors in
accordance with the Act and these Regulations; 9. All the directors have either attended the Directors Training Program or have minimum of 14
years of education and 15 years of experience on the Board of listed companies and therefore are exempt from the Directors Training Program;
10. In order to comply with the requirements of the Code, new Chief Financial Officer has been
appointed during the year under review. The Board has approved appointment of Chief Financial Officer, Company Secretary and Head of Internal Audit, including their remuneration and terms and conditions of employment and complied with relevant requirements of the Regulations;
11. Chief Financial Officer and Chief Executive Officer duly endorsed the financial statements
before approval of the Board; 12. The Board has formed committees comprising of members given below:
Audit Committee
Names Composition
Mr. Arshad Saeed Husain Chairman
Mrs. Amna Piracha Khan Member
Mr. Nihal Cassim Member
Mr. Shahid Anwar Member
HR and Remuneration Committee
Names Composition
Mr. Arshad Saeed Husain Chairman
Mr. Osman Khalid Waheed Member
Mr. Nihal Cassim Member
Mr. Shahid Anwar Member The Board has not formed the ‘Nomination Committee’ and ‘Risk Management Committee’ as

34 ANNUAL REPORT 2020
responsibilities of these committees are being taken care of at the Board level as and when required. Therefore, a need for the separate formation of these committees does not exist;
13. The terms of reference of the aforesaid committees have been formed, documented and advised
to the committees for compliance; 14. The frequency of meetings (quarterly / half yearly / yearly) of the committees were as per
following:
Meetings Frequency
Audit Committee 04
HR and Remuneration Committee 01 15. The Board has outsourced the internal audit function to M/S EY Ford Rhodes Chartered
Accountants, who are considered suitably qualified and experienced for the purpose and are conversant with the policies and procedures of the Company;
16. The statutory auditors of the Company have confirmed that they have been given a
satisfactory rating under the Quality Control Review program of the Institute of Chartered Accountants of Pakistan and registered with Audit Oversight Board of Pakistan, that they and all their partners are in compliance with International Federation of Accountants (IFAC) guidelines on code of ethics as adopted by the Institute of Chartered Accountants of Pakistan and that they and the partners of the firm involved in the audit are not a close relative (spouse, parent, dependent and non-dependent children) of the Chief Executive Officer, Chief Financial Officer, Head of Internal Audit, Company Secretary or Director of the Company;
17. The statutory auditors or the persons associated with them have not been appointed to provide
other services except in accordance with the Act, these Regulations or any other regulatory requirement and the auditors have confirmed that they have observed IFAC guidelines in this regard; and
18. We confirm that all requirements of regulations 3, 6, 7, 8, 27,32, 33 and 36 of the Regulations
have been complied with. Mrs. Akhter Khalid Waheed Chairperson

35ANNUAL REPORT 2020
OUR FINANCIALSTATEMENTS

36 ANNUAL REPORT 202036 ANNUAL REPORT 2020

37ANNUAL REPORT 2020 37ANNUAL REPORT 2020

38 ANNUAL REPORT 202038 ANNUAL REPORT 2020

39ANNUAL REPORT 2020 39ANNUAL REPORT 2020

40 ANNUAL REPORT 202040 ANNUAL REPORT 2020

41ANNUAL REPORT 2020 41ANNUAL REPORT 2020
42 ANNUAL REPORT 2020
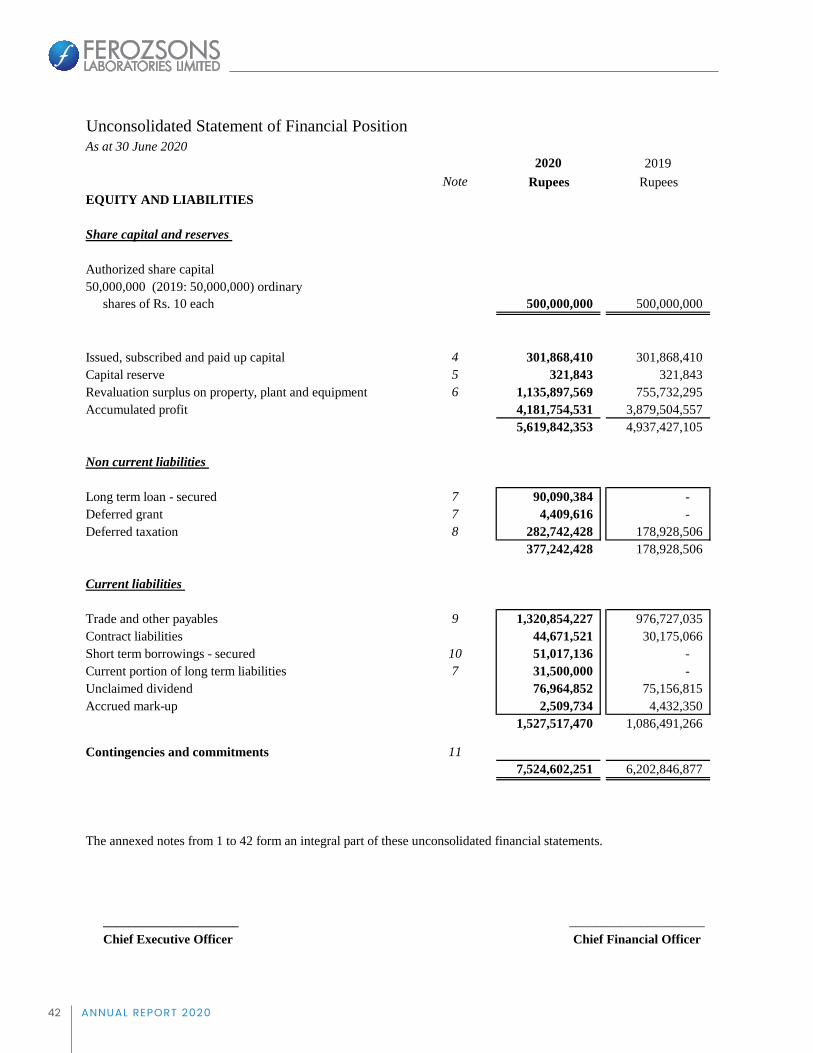
Ferozsons Laboratories LimitedUnconsolidated Statement of Financial PositionAs at 30 June 2020
2020 2019 2020 2019Note Rupees Rupees Note Rupees Rupees
EQUITY AND LIABILITIES ASSETS
Share capital and reserves Non current assets
Authorized share capital Property, plant and equipment 12 3,308,834,762 2,720,876,300 50,000,000 (2019: 50,000,000) ordinary Intangible assets 13 423,498 731,179
shares of Rs. 10 each 500,000,000 500,000,000 Long term investments - related parties 14 334,863,185 314,545,924 Long term deposits 9,787,325 7,086,325
3,653,908,770 3,043,239,728 Issued, subscribed and paid up capital 4 301,868,410 301,868,410 Capital reserve 5 321,843 321,843 Revaluation surplus on property, plant and equipment 6 1,135,897,569 755,732,295 Current assetsAccumulated profit 4,181,754,531 3,879,504,557
5,619,842,353 4,937,427,105 Stores, spare parts and loose tools 15 30,392,651 20,878,123 Stock in trade 16 1,833,184,796 1,170,925,851
Non current liabilities Trade debts - considered good 17 1,026,879,355 887,452,305 Loans and advances - considered good 18 42,851,733 24,399,746
Long term loan - secured 7 90,090,384 - Deposits and prepayments 19 155,899,633 151,088,839 Deferred grant 7 4,409,616 - Other receivables 20 38,117,556 67,564,290 Deferred taxation 8 282,742,428 178,928,506 Advance income tax - net 286,479,315 202,002,562
377,242,428 178,928,506 Short term investments 21 357,590,624 451,847,651 Cash and bank balances 22 99,297,818 183,447,782
Current liabilities 3,870,693,481 3,159,607,149
Trade and other payables 9 1,320,854,227 976,727,035 Contract liabilities 44,671,521 30,175,066 Short term borrowings - secured 10 51,017,136 - Current portion of long term liabilities 7 31,500,000 - Unclaimed dividend 76,964,852 75,156,815 Accrued mark-up 2,509,734 4,432,350
1,527,517,470 1,086,491,266
Contingencies and commitments 117,524,602,251 6,202,846,877 7,524,602,251 6,202,846,877
The annexed notes from 1 to 42 form an integral part of these unconsolidated financial statements.
_____________________ _______________________ ______________Chief Executive Officer Chief Financial Officer Director
Ferozsons Laboratories LimitedUnconsolidated Statement of Profit or Loss For the year ended 30 June 2020
2020 2019Note Rupees Rupees
Revenue - net 23 5,394,043,009 5,180,803,582 Cost of sales 24 (3,176,088,959) (3,134,954,617) Gross profit 2,217,954,050 2,045,848,965
Administrative expenses 25 (351,414,876) (353,172,864) Selling and distribution expenses 26 (1,282,275,582) (1,309,653,498) Other expenses 27 (89,734,107) (123,265,414) Other income 28 93,134,095 182,390,571 Profit from operations 587,663,580 442,147,760
Finance cost 29 (27,133,700) (23,429,965) Profit before taxation 560,529,880 418,717,795
Taxation 30 (164,874,799) (167,672,113) Profit after taxation 395,655,081 251,045,682
Earnings per share - basic and diluted 31 13.11 8.32
The annexed notes from 1 to 42 form an integral part of these unconsolidated financial statements.
_____________________ _____________________ ____________Chief Executive Officer Chief Financial Officer Director

43ANNUAL REPORT 2020
Ferozsons Laboratories LimitedUnconsolidated Statement of Profit or Loss For the year ended 30 June 2020
2020 2019Note Rupees Rupees
Revenue - net 23 5,394,043,009 5,180,803,582 Cost of sales 24 (3,176,088,959) (3,134,954,617) Gross profit 2,217,954,050 2,045,848,965
Administrative expenses 25 (351,414,876) (353,172,864) Selling and distribution expenses 26 (1,282,275,582) (1,309,653,498) Other expenses 27 (89,734,107) (123,265,414) Other income 28 93,134,095 182,390,571 Profit from operations 587,663,580 442,147,760
Finance cost 29 (27,133,700) (23,429,965) Profit before taxation 560,529,880 418,717,795
Taxation 30 (164,874,799) (167,672,113) Profit after taxation 395,655,081 251,045,682
Earnings per share - basic and diluted 31 13.11 8.32
The annexed notes from 1 to 42 form an integral part of these unconsolidated financial statements.
_____________________ _____________________ ____________Chief Executive Officer Chief Financial Officer Director
Ferozsons Laboratories LimitedUnconsolidated Statement of Financial PositionAs at 30 June 2020
2020 2019 2020 2019Note Rupees Rupees Note Rupees Rupees
EQUITY AND LIABILITIES ASSETS
Share capital and reserves Non current assets
Authorized share capital Property, plant and equipment 12 3,308,834,762 2,720,876,300 50,000,000 (2019: 50,000,000) ordinary Intangible assets 13 423,498 731,179
shares of Rs. 10 each 500,000,000 500,000,000 Long term investments - related parties 14 334,863,185 314,545,924 Long term deposits 9,787,325 7,086,325
3,653,908,770 3,043,239,728 Issued, subscribed and paid up capital 4 301,868,410 301,868,410 Capital reserve 5 321,843 321,843 Revaluation surplus on property, plant and equipment 6 1,135,897,569 755,732,295 Current assetsAccumulated profit 4,181,754,531 3,879,504,557
5,619,842,353 4,937,427,105 Stores, spare parts and loose tools 15 30,392,651 20,878,123 Stock in trade 16 1,833,184,796 1,170,925,851
Non current liabilities Trade debts - considered good 17 1,026,879,355 887,452,305 Loans and advances - considered good 18 42,851,733 24,399,746
Long term loan - secured 7 90,090,384 - Deposits and prepayments 19 155,899,633 151,088,839 Deferred grant 7 4,409,616 - Other receivables 20 38,117,556 67,564,290 Deferred taxation 8 282,742,428 178,928,506 Advance income tax - net 286,479,315 202,002,562
377,242,428 178,928,506 Short term investments 21 357,590,624 451,847,651 Cash and bank balances 22 99,297,818 183,447,782
Current liabilities 3,870,693,481 3,159,607,149
Trade and other payables 9 1,320,854,227 976,727,035 Contract liabilities 44,671,521 30,175,066 Short term borrowings - secured 10 51,017,136 - Current portion of long term liabilities 7 31,500,000 - Unclaimed dividend 76,964,852 75,156,815 Accrued mark-up 2,509,734 4,432,350
1,527,517,470 1,086,491,266
Contingencies and commitments 117,524,602,251 6,202,846,877 7,524,602,251 6,202,846,877
The annexed notes from 1 to 42 form an integral part of these unconsolidated financial statements.
_____________________ _______________________ ______________Chief Executive Officer Chief Financial Officer Director

44 ANNUAL REPORT 2020
Ferozsons Laboratories LimitedUnconsolidated Statement of Profit or Loss For the year ended 30 June 2020
2020 2019Note Rupees Rupees
Revenue - net 23 5,394,043,009 5,180,803,582 Cost of sales 24 (3,176,088,959) (3,134,954,617) Gross profit 2,217,954,050 2,045,848,965
Administrative expenses 25 (351,414,876) (353,172,864) Selling and distribution expenses 26 (1,282,275,582) (1,309,653,498) Other expenses 27 (89,734,107) (123,265,414) Other income 28 93,134,095 182,390,571 Profit from operations 587,663,580 442,147,760
Finance cost 29 (27,133,700) (23,429,965) Profit before taxation 560,529,880 418,717,795
Taxation 30 (164,874,799) (167,672,113) Profit after taxation 395,655,081 251,045,682
Earnings per share - basic and diluted 31 13.11 8.32
The annexed notes from 1 to 42 form an integral part of these unconsolidated financial statements.
_____________________ _____________________ ____________Chief Executive Officer Chief Financial Officer Director

45ANNUAL REPORT 2020
Ferozsons Laboratories LimitedUnconsolidated Statement of Profit or Loss For the year ended 30 June 2020
2020 2019Note Rupees Rupees
Revenue - net 23 5,394,043,009 5,180,803,582 Cost of sales 24 (3,176,088,959) (3,134,954,617) Gross profit 2,217,954,050 2,045,848,965
Administrative expenses 25 (351,414,876) (353,172,864) Selling and distribution expenses 26 (1,282,275,582) (1,309,653,498) Other expenses 27 (89,734,107) (123,265,414) Other income 28 93,134,095 182,390,571 Profit from operations 587,663,580 442,147,760
Finance cost 29 (27,133,700) (23,429,965) Profit before taxation 560,529,880 418,717,795
Taxation 30 (164,874,799) (167,672,113) Profit after taxation 395,655,081 251,045,682
Earnings per share - basic and diluted 31 13.11 8.32
The annexed notes from 1 to 42 form an integral part of these unconsolidated financial statements.
_____________________ _____________________ ____________Chief Executive Officer Chief Financial Officer Director
Ferozsons Laboratories LimitedUnconsolidated Statement of Comprehensive IncomeFor the year ended 30 June 2020
2020 2019Rupees Rupees
Profit after taxation 395,655,081 251,045,682
Items that will not be reclassified to profit or loss:
Surplus on revaluation of property, plant and equipment 520,492,028 - Related deferred tax on surplus (112,984,497) -
Total comprehensive income for the year 803,162,612 251,045,682
The annexed notes from 1 to 42 form an integral part of these unconsolidated financial statements.
_____________________ ___________________ __________Chief Executive Officer Chief Financial Officer Director
46 ANNUAL REPORT 2020
Ferozsons Laboratories LimitedUnconsolidated Statement of Cash FlowsFor the year ended 30 June 2020
2020 2019Note Rupees Rupees
Cash flow from operating activities
Profit before taxation 560,529,880 418,717,795 Adjustments for non - cash and other items
Depreciation on property, plant and equipment 12.4 325,560,923 285,495,105 Amortisation of intangible assets 588,017 1,285,093 Trade debts directly written off 26 - 38,876,781 Provision / (reversal) of loss allowance against trade debts 5,196,175 (5,235,513) Gain on disposal of property, plant and equipment 12.5 (23,123,459) (30,806,125) Finance cost 27,133,700 23,429,965 (Gain) / loss on re-measurement of short term investments to fair value (1,569,035) 11,014,902 (Gain) / loss on sale of short term investments (954,676) 1,376,020 Dividend income 28.1 (42,052,188) (45,219,772) Profit on bank deposits (2,549,824) (1,873,744) Share in profit of Farmacia 14.1 (20,317,261) (16,747,464) Workers' Profit Participation Fund 30,367,021 17,597,332 Central Research Fund 6,134,752 3,555,017 Workers' Welfare Fund 11,247,351 8,872,286
315,661,496 291,619,883 Cash generated from operations before working capital changes 876,191,376 710,337,678
Effect on cash flow due to working capital changes
(Increase) / decrease in current assetsStores, spare parts and loose tools (9,514,528) 25,340,064 Stock in trade (662,258,945) 48,928,069 Trade debts - considered good (144,623,225) (403,114,279) Loans and advances - considered good (18,451,987) 19,577,188 Deposits and prepayments (4,810,794) 23,871,796 Other receivables 17,044,066 28,386,249
(822,615,413) (257,010,913) Increase in current liabilities
Trade and other payables 353,301,818 211,173,052
Cash generated from operations 406,877,781 664,499,817
Taxes paid (258,522,072) (187,486,714) Workers' Profit Participation Fund paid 20.1 (17,597,332) (21,081,892) Workers' Welfare Fund paid (8,872,286) (7,090,508) Central Research Fund paid 9.1 (3,555,017) (2,283,549) Long term deposits - net (2,701,000) (20,000) Net cash generated from operating activities 115,630,074 446,537,154
Cash flow from investing activities
Acquisition of property, plant and equipment (404,778,226) (373,025,565) Acquisition of intangibles (280,336) - Dividend income received 42,052,188 11,335,727 Proceeds from sale of property, plant and equipment 12.5 34,874,319 46,676,391 Profit on bank deposits received 2,549,824 1,873,744 Short term investments - net 96,780,700 96,989,005 Net cash used in investing activities (228,801,531) (216,150,698)
Cash flow from financing activitiesLong term loan received 126,000,000 - Finance cost paid (29,056,316) (19,531,328) Dividend paid (118,939,327) (127,734,273)
Net cash used in financing activities (21,995,643) (147,265,601) Net (decrease) / increase in cash and cash equivalents (135,167,100) 83,120,855 Cash and cash equivalents at the beginning of the year 183,447,782 100,326,927 Cash and cash equivalents at the end of the year 48,280,682 183,447,782
Cash and cash equivalents comprise of the followingCash and bank balances 22 99,297,818 183,447,782 Running finance 10 (51,017,136) -
48,280,682 183,447,782
The annexed notes from 1 to 42 form an integral part of these unconsolidated financial statements.
_____________________ ______________________ _______________Chief Executive Officer Chief Financial Officer Director
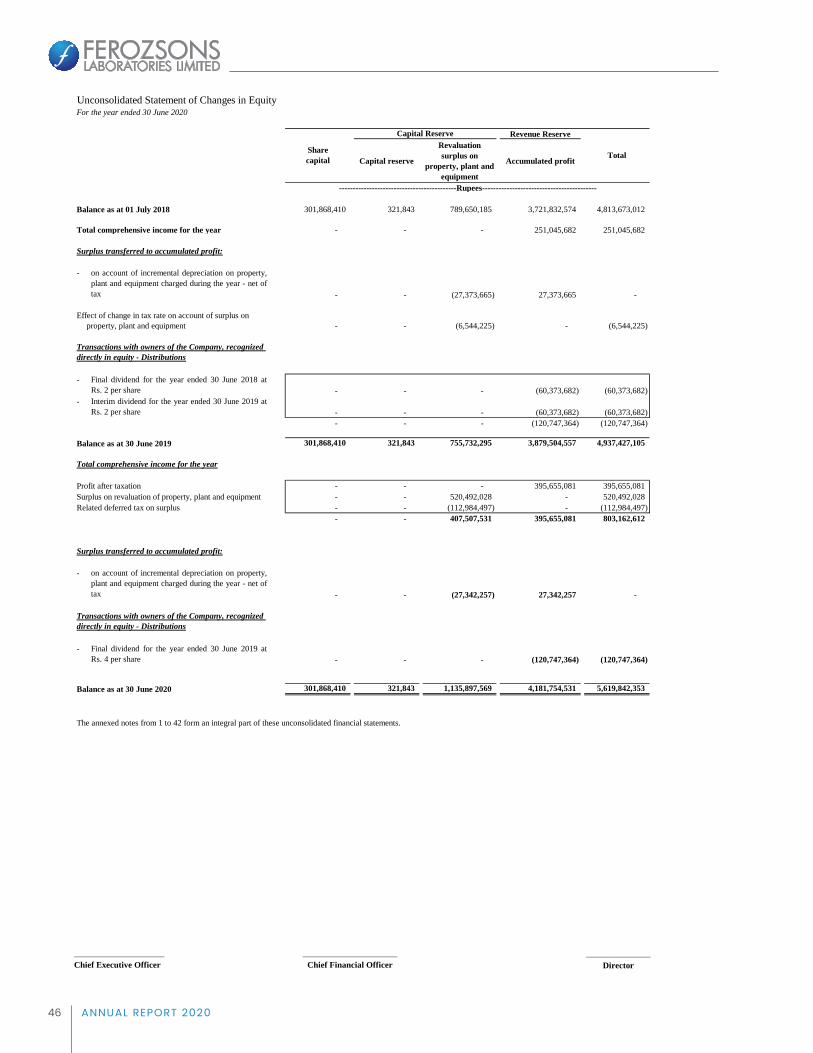
Ferozsons Laboratories LimitedUnconsolidated Statement of Changes in EquityFor the year ended 30 June 2020
Revenue Reserve
Capital reserve
Revaluation surplus on
property, plant and equipment
Accumulated profit
Balance as at 01 July 2018 301,868,410 321,843 789,650,185 3,721,832,574 4,813,673,012
Total comprehensive income for the year - - - 251,045,682 251,045,682
Surplus transferred to accumulated profit:
-
- - (27,373,665) 27,373,665 -
Effect of change in tax rate on account of surplus on property, plant and equipment - - (6,544,225) - (6,544,225)
-- - - (60,373,682) (60,373,682)
-- - - (60,373,682) (60,373,682) - - - (120,747,364) (120,747,364)
Balance as at 30 June 2019 301,868,410 321,843 755,732,295 3,879,504,557 4,937,427,105
Total comprehensive income for the year
Profit after taxation - - - 395,655,081 395,655,081 Surplus on revaluation of property, plant and equipment - - 520,492,028 - 520,492,028 Related deferred tax on surplus - - (112,984,497) - (112,984,497)
- - 407,507,531 395,655,081 803,162,612
Surplus transferred to accumulated profit:
-
- - (27,342,257) 27,342,257 -
-- - - (120,747,364) (120,747,364)
Balance as at 30 June 2020 301,868,410 321,843 1,135,897,569 4,181,754,531 5,619,842,353
The annexed notes from 1 to 42 form an integral part of these unconsolidated financial statements.
_____________________ ___________________ __________Chief Executive Officer Chief Financial Officer Director
Transactions with owners of the Company, recognized directly in equity - Distributions
-------------------------------------------Rupees------------------------------------------
Share capital Total
Capital Reserve
on account of incremental depreciation on property,plant and equipment charged during the year - net oftax
on account of incremental depreciation on property,plant and equipment charged during the year - net oftax
Transactions with owners of the Company, recognized directly in equity - Distributions
Final dividend for the year ended 30 June 2019 atRs. 4 per share
Final dividend for the year ended 30 June 2018 atRs. 2 per shareInterim dividend for the year ended 30 June 2019 atRs. 2 per share

47ANNUAL REPORT 2020
Ferozsons Laboratories LimitedUnconsolidated Statement of Cash FlowsFor the year ended 30 June 2020
2020 2019Note Rupees Rupees
Cash flow from operating activities
Profit before taxation 560,529,880 418,717,795 Adjustments for non - cash and other items
Depreciation on property, plant and equipment 12.4 325,560,923 285,495,105 Amortisation of intangible assets 588,017 1,285,093 Trade debts directly written off 26 - 38,876,781 Provision / (reversal) of loss allowance against trade debts 5,196,175 (5,235,513) Gain on disposal of property, plant and equipment 12.5 (23,123,459) (30,806,125) Finance cost 27,133,700 23,429,965 (Gain) / loss on re-measurement of short term investments to fair value (1,569,035) 11,014,902 (Gain) / loss on sale of short term investments (954,676) 1,376,020 Dividend income 28.1 (42,052,188) (45,219,772) Profit on bank deposits (2,549,824) (1,873,744) Share in profit of Farmacia 14.1 (20,317,261) (16,747,464) Workers' Profit Participation Fund 30,367,021 17,597,332 Central Research Fund 6,134,752 3,555,017 Workers' Welfare Fund 11,247,351 8,872,286
315,661,496 291,619,883 Cash generated from operations before working capital changes 876,191,376 710,337,678
Effect on cash flow due to working capital changes
(Increase) / decrease in current assetsStores, spare parts and loose tools (9,514,528) 25,340,064 Stock in trade (662,258,945) 48,928,069 Trade debts - considered good (144,623,225) (403,114,279) Loans and advances - considered good (18,451,987) 19,577,188 Deposits and prepayments (4,810,794) 23,871,796 Other receivables 17,044,066 28,386,249
(822,615,413) (257,010,913) Increase in current liabilities
Trade and other payables 353,301,818 211,173,052
Cash generated from operations 406,877,781 664,499,817
Taxes paid (258,522,072) (187,486,714) Workers' Profit Participation Fund paid 20.1 (17,597,332) (21,081,892) Workers' Welfare Fund paid (8,872,286) (7,090,508) Central Research Fund paid 9.1 (3,555,017) (2,283,549) Long term deposits - net (2,701,000) (20,000) Net cash generated from operating activities 115,630,074 446,537,154
Cash flow from investing activities
Acquisition of property, plant and equipment (404,778,226) (373,025,565) Acquisition of intangibles (280,336) - Dividend income received 42,052,188 11,335,727 Proceeds from sale of property, plant and equipment 12.5 34,874,319 46,676,391 Profit on bank deposits received 2,549,824 1,873,744 Short term investments - net 96,780,700 96,989,005 Net cash used in investing activities (228,801,531) (216,150,698)
Cash flow from financing activitiesLong term loan received 126,000,000 - Finance cost paid (29,056,316) (19,531,328) Dividend paid (118,939,327) (127,734,273)
Net cash used in financing activities (21,995,643) (147,265,601) Net (decrease) / increase in cash and cash equivalents (135,167,100) 83,120,855 Cash and cash equivalents at the beginning of the year 183,447,782 100,326,927 Cash and cash equivalents at the end of the year 48,280,682 183,447,782
Cash and cash equivalents comprise of the followingCash and bank balances 22 99,297,818 183,447,782 Running finance 10 (51,017,136) -
48,280,682 183,447,782
The annexed notes from 1 to 42 form an integral part of these unconsolidated financial statements.
_____________________ ______________________ _______________Chief Executive Officer Chief Financial Officer Director

48 ANNUAL REPORT 2020
Ferozsons Laboratories LimitedNotes to the Unconsolidated Financial Statements For the year ended 30 June 2020
1 Reporting entity
2 Basis of preparation
2.1 Separate financial statements
The Company has following major investments:
Name of the company / firm Shareholding
Subsidiaries
- BF Biosciences Limited 80%- Farmacia 98%
2.2 Statement of compliance
-
-
2.3
2.3.1
Ferozsons Laboratories Limited (“the Company”) was incorporated as a private limited company on 28 January1954 and was converted into a public limited company on 08 September 1960. The Company is listed onPakistan Stock Exchange and is primarily engaged in the imports, manufacture and sale of pharmaceuticalproducts and medical devices. Its registered office is situated at 197-A, The Mall, Rawalpindi and themanufacturing facility is located at Amangarh, Nowshera, Khyber Pakhtun Khwa.
These unconsolidated financial statements are the separate financial statements of the Company inwhich investments in subsidiaries and associates are accounted for on the basis of direct equityinterest rather than on the basis of reported results and net assets of the investees. Consolidatedfinancial statements of the Company are prepared separately.
These unconsolidated financial statements have been prepared in accordance with the accounting andreporting standards as applicable in Pakistan. The accounting and reporting standards applicable inPakistan comprise of:
Standards, amendments and interpretations and forth coming requirements
Standards, amendments or interpretations which became effective during the year
During the year certain amendments to standards or new interpretations became effective. However,the amendments or interpretations did not have any material effect on the unconsolidated financialstatements of the Company.
International Financial Reporting Standards (IFRS Standards) issued by the InternationalAccounting Standards Board (IASB) as notified under the Companies Act, 2017; and
Provisions of and directives issued under the Companies Act, 2017.
Where provisions of and directives issued under the Companies Act, 2017 differ from the IFRSStandards, the provisions of and directives issued under the Companies Act, 2017 have beenfollowed.

49ANNUAL REPORT 2020
2.3.2
-
-
-
-
The following International Financial Reporting Standards (IFRS Standards) as notified under theCompanies Act, 2017 and the amendments and interpretations thereto will be effective for accountingperiods beginning on or after 01 July 2020:
Amendment to IFRS 3 ‘Business Combinations’ – Definition of a Business (effective forbusiness combinations for which the acquisition date is on or after the beginning of annualperiod beginning on or after 01 January 2020). The IASB has issued amendments aiming toresolve the difficulties that arise when an entity determines whether it has acquired a business ora group of assets. The amendments clarify that to be considered a business, an acquired set ofactivities and assets must include, at a minimum, an input and a substantive process that togethersignificantly contribute to the ability to create outputs. The amendments include an election touse a concentration test. The standard is effective for transactions in the future and thereforewould not have an impact on past financial statements.
New and revised accounting standards, amendments to published accounting standards, andinterpretations that are not yet effective
Amendments to IAS 1 Presentation of Financial Statements and IAS 8 Accounting Policies,Changes in Accounting Estimates and Errors (effective for annual periods beginning on or after01 January 2020). The amendments are intended to make the definition of material in IAS 1easier to understand and are not intended to alter the underlying concept of materiality in IFRSStandards. In addition, the IASB has also issued guidance on how to make materialityjudgments when preparing their general purpose financial statements in accordance with IFRSStandards.
On 29 March 2018, the International Accounting Standards Board (the IASB) has issued arevised Conceptual Framework for Financial Reporting which is applicable immediatelycontains changes that will set a new direction for IFRS in the future. The Conceptual Frameworkprimarily serves as a tool for the IASB to develop standards and to assist the IFRSInterpretations Committee in interpreting them. It does not override the requirements ofindividual IFRSs and any inconsistencies with the revised Framework will be subject to theusual due process – this means that the overall impact on standard setting may take some time tocrystallize. The companies may use the Framework as a reference for selecting their accountingpolicies in the absence of specific IFRS requirements. In these cases, companies should reviewthose policies and apply the new guidance retrospectively as of 01 January 2020, unless the newguidance contains specific scope outs.
Interest Rate Benchmark Reform which amended IFRS 9, IAS 39 and IFRS 7 is applicable forannual financial periods beginning on or after 1 January 2020. The G20 asked the FinancialStability Board (FSB) to undertake a fundamental review of major interest rate benchmarks.Following the review, the FSB published a report setting out its recommended reforms of somemajor interest rate benchmarks such as IBORs. Public authorities in many jurisdictions havesince taken steps to implement those recommendations. This has in turn led to uncertainty aboutthe long-term viability of some interest rate benchmarks. In these amendments, the term 'interestrate benchmark reform' refers to the market-wide reform of an interest rate benchmark includingits replacement with an alternative benchmark rate, such as that resulting from the FSB'srecommendations set out in its July 2014 report 'Reforming Major Interest Rate Benchmarks'(the reform). The amendments made provide relief from the potential effects of the uncertaintycaused by the reform. A company shall apply the exceptions to all hedging relationships directlyaffected by interest rate benchmark reform.
50 ANNUAL REPORT 2020
-
-
-
-
-
-
-
Classification of liabilities as current or non-current (Amendments to IAS 1) effective for theannual period beginning on or after 01 January 2022. These amendments in the standards havebeen added to further clarify when a liability is classified as current. The standard also amendsthe aspect of classification of liability as non-current by requiring the assessment of the entity’sright at the end of the reporting period to defer the settlement of liability for at least twelvemonths after the reporting period. An entity shall apply those amendments retrospectively inaccordance with IAS 8.
the change in lease payments results in revised consideration for the lease that issubstantially the same as, or less than, the consideration for the lease immediately precedingthe change; any reduction in lease payments affects only payments originally due on or before 30 June2021; and there is no substantive change to the other terms and conditions of the lease.
Onerous Contracts – Cost of Fulfilling a Contract (Amendments to IAS 37) effective for theannual period beginning on or after 01 January 2022 amends IAS 1 by mainly addingparagraphs which clarifies what comprise the cost of fulfilling a contract, cost of fulfilling acontract is relevant when determining whether a contract is onerous. An entity is required toapply the amendments to contracts for which it has not yet fulfilled all its obligations at thebeginning of the annual reporting period in which it first applies the amendments (the date ofinitial application). Restatement of comparative information is not required, instead theamendments require an entity to recognize the cumulative effect of initially applying theamendments as an adjustment to the opening balance of retained earnings or other component ofequity, as appropriate, at the date of initial application.
Property, Plant and Equipment - Proceeds before Intended Use (Amendments to IAS 16)effective for the annual period beginning on or after 01 January 2022. Clarifies that salesproceeds and cost of items produced while bringing an item of property, plant and equipment tothe location and condition necessary for it to be capable of operating in the manner intended bymanagement e.g. when testing etc, are recognized in profit or loss in accordance with applicablestandards. The entity measures the cost of those items applying the measurement requirementsof IAS 2. The standard also removes the requirement of deducting the net sales proceeds fromcost of testing. An entity shall apply those amendments retrospectively, but only to items ofproperty, plant and equipment that are brought to the location and condition necessary for themto be capable of operating in the manner intended by management on or after the beginning ofthe earliest period presented in the financial statements in which the entity first applies theamendments. The entity shall recognize the cumulative effect of initially applying theamendments as an adjustment to the opening balance of retained earnings (or other componentof equity, as appropriate) at the beginning of that earliest period presented.
Amendments to IFRS-16 - IASB has issued amendments to IFRS 16 (the amendments) toprovide practical relief for lessees in accounting for rent concessions. The amendments areeffective for periods beginning on or after 01 June 2020, with earlier application permitted.Under the standard’s previous requirements, lessees assess whether rent concessions are leasemodifications and, if so, apply the specific guidance on accounting for lease modifications. Thisgenerally involves remeasuring the lease liability using the revised lease payments and a reviseddiscount rate. In light of the effects of the COVID-19 pandemic, and the fact that many lesseesare applying the standard for the first time in their financial statements, the Board has providedan optional practical expedient for lessees. Under the practical expedient, lessees are notrequired to assess whether eligible rent concessions are lease modifications, and instead arepermitted to account for them as if they were not lease modifications. Rent concessions areeligible for the practical expedient if they occur as a direct consequence of the COVID-19pandemic and if all the following criteria are met:
51ANNUAL REPORT 2020
-
-
-
2.4 Basis of measurement
2.5 Functional and presentation currency
2.6 Use of estimates and judgments
2.6.1 Property, plant and equipment
Judgments made by the management in the application of approved accounting standards that havesignificant effect on the unconsolidated financial statements and estimates with a significant risk ofmaterial adjustment in the subsequent year are discussed in the ensuing paragraphs.
The estimates and underlying assumptions are reviewed on a continuous basis. Revisions toaccounting estimates are recognized in the period in which estimates are revised if the revisionaffects only that period, or in the period of the revision and any future periods affected.
The Company reviews the useful lives and residual value of property, plant and equipment on regularbasis by considering expected pattern of economic benefits that the company expects to derive. Anychange in the estimates in future years might affect the carrying amounts of the respective items ofproperty, plant and equipment with a corresponding effect on the depreciation charge andimpairment.
These unconsolidated financial statements have been prepared on the historical cost conventionexcept for certain items of property, plant and equipment that are stated at revalued amounts andrevaluation of certain financial instruments at fair values. The methods used to measure fair valuesare discussed further in their respective policy notes.
These unconsolidated financial statements are presented in Pakistani Rupee ("Rs.") which is theCompany’s functional currency. All financial information presented in Rupees has been rounded offto the nearest rupee, unless otherwise stated.
The preparation of financial statements in conformity with the approved accounting standardsrequires management to make judgments, estimates and assumptions that affect the application ofpolicies and reported amounts of assets and liabilities, income and expenses. The estimates andassociated assumptions are based on historical experience and various other factors that are believedto be reasonable under the circumstances, the results of which form the basis of making judgmentabout carrying value of assets and liabilities that are not readily apparent from other sources. Actualresults may differ from these estimates.
IAS 41 – The amendment removes the requirement in paragraph 22 of IAS 41 for entities toexclude taxation cash flows when measuring the fair value of a biological asset using a presentvalue technique
The above amendments are effective from annual period beginning on or after 01 January 2022 andare not likely to have an impact on Company’s financial statements.
IFRS 16 – The amendment partially amends Illustrative Example 13 accompanying IFRS 16 byexcluding the illustration of reimbursement of leasehold improvements by the lessor. Theobjective of the amendment is to resolve any potential confusion that might arise in leaseincentives.
Annual Improvements to IFRS Standards 2018–2020 Cycle - the improvements address amendmentsto following approved accounting standards:
IFRS 9 – The amendment clarifies that an entity includes only fees paid or received between theentity (the borrower) and the lender, including fees paid or received by either the entity or thelender on the other’s behalf, when it applies the ‘10 per cent’ test in paragraph B3.3.6 of IFRS 9in assessing whether to derecognize a financial liability.

52 ANNUAL REPORT 2020
2.6.2 Intangibles
2.6.3
2.6.4 Stores, spare parts, loose tools and stock in trade
2.6.5 Provisions
2.6.6 Impairment
The Company reviews the stores, spare parts, loose tools and stock in trade for possible impairmenton an annual basis. Any change in the estimates in future years might affect the carrying amounts ofthe respective items of stores, spare parts, loose tools and stock in trade with a corresponding affecton the provision and net realizable value.
The Company reviews the rate of amortization and value of intangible assets for possible impairmenton an annual basis. Any change in the estimates in future years might affect the carrying amounts ofintangible assets with a corresponding affect on the amortization charge and impairment.
ECLs are based on the difference between the contractual cash flows due in accordance with thecontract and all the cash flows that the Company expects to receive. The shortfall is then discountedat an approximation to the assets’ original effective interest rate.
Expected credit loss (ECL) / Loss allowance against trade debts, deposits, advances and otherreceivables
The Company has elected to measure loss allowances for trade debts other than due from'Government of Pakistan' using IFRS 9 simplified approach and has calculated ECLs based onlifetime ECLs. The financial assets due from Government of Pakistan continues to be measuredunder IAS-39 due to the exemption given by the Securities and Exchange Commission of Pakistan(SECP) vide S.R.O. 985 (I)/2019 dated 02 September 2019. SECP has deferred the requirements ofIFRS 9 with respect to application of 'Expected Credit Loss Method' in respect of companies holdingfinancial assets due from the Government of Pakistan till 30 June 2021. The Company hasestablished a provision matrix that is based on the Company's historical credit loss experience,adjusted for forward-looking factors specific to the debtors and the economic environment. Whendetermining whether the credit risk of a financial asset has increased significantly since initialrecognition and when estimating ECLs, the Company considers reasonable and supportableinformation that is relevant and available without undue cost or effort. This includes both quantitativeand qualitative information and analysis, based on the Company's historical experience and informedcredit assessment including forward-looking information.
Estimates of the amount of provisions recognized are based on current legal and constructiverequirements. Because actual outflows can differ from estimates due to changes in laws, regulations,public expectations, technology, prices and conditions, and can take place many years in the future,the carrying amounts of provisions are regularly reviewed and adjusted to take account of suchchanges.
Net realizable value is the estimated selling price in the ordinary course of business less the estimatedcosts of completion and estimated costs necessary to make the sale.
The management of the Company reviews carrying amounts of its assets including cash generatingunits for possible impairment and makes formal estimates of recoverable amount if there is any suchindication.

53ANNUAL REPORT 2020
2.6.7 Fair value of investments
2.6.8 Taxation
2.6.9 Revaluation of property, plant and equipment
3 Significant accounting policies
3.1
3.1.1 IFRS 16 - Leases
As a lessee
Under IFRS 16, a contract is, or contains, a lease if the contract conveys a right to control the use ofan identified asset for a period of time in exchange for consideration.
On transition to IFRS 16, the Company elected to apply practical expedient to grandfather theassessment of which transactions are leases. The Company applied IFRS 16 only to contracts thatwere previously identified as leases. Contracts that were not identified as leases under IAS 17 andIFRIC 4 were not reassessed for whether there is a lease under IFRS 16. Therefore, the definition of alease under IFRS 16 was applied only to contracts entered into or changed on or after 01 July 2019.
As a lessee, the Company previously classified leases as operating or finance leases based on itsassessment of whether the lease transferred substantially all of the risks and rewards of ownership.Under IFRS 16, the Company recognizes right of use assets and lease liabilities for material leasesi.e. these leases are on balance sheet.
Revaluation of property, plant and equipment is carried out by independent professional valuer. Thefrequency of revaluations depends upon the changes in fair values of the items of property, plant andequipment being revalued. When the fair value of a revalued asset differs materially from its carryingamount, a further revaluation is required.
Changes in accounting policy
During the year, the Company has adopted IFRS 16 'Leases' from 01 July 2019. Due to the transitionmethods chosen by the Company in applying this standard, comparative information throughout theseunconsolidated financial statements has not been restated to reflect the requirements of the newstandard.
The detail of new significant accounting policy adopted and the nature and effect of the changes toprevious accounting policy are set out below:
The Company has initially applied IFRS 16 from 01 July 2019. IFRS 16 introduces a single, on-balance sheet lease accounting model for lessees. A lessee recognizes a right-of-use assetrepresenting its right to use the underlying asset and a lease liability representing its obligation tomake lease payments. There are recognition exemptions for short-term leases and leases of low-valueitems. Lessor accounting remains similar to the current standard i.e. lessors continue to classify leasesas finance or operating leases.
The Company regularly reviews the fair value of investments, the estimate of fair values are directlylinked to market value. Any change in estimate will effect the carrying value of investments with thecorresponding impact on unconsolidated statement of profit or loss.
The significant accounting policies set out below have been consistently applied to all periods presented in theseunconsolidated financial statements, except as disclosed in note 3.1.
The Company takes into account the current income tax laws and decisions taken by appellateauthorities. Instances where the Company's view differs from the view taken by the income taxdepartment at the assessment stage and the Company considers that its view on items of materialnature is in accordance with law, the amounts are shown as contingent liabilities.
54 ANNUAL REPORT 2020
Transition
-
-
Impact of financial statements
3.2 Employee benefits
3.2.1 Staff provident fund (Retirement benefit)
3.2.2 Compensated absences
3.3 Taxation
The Company presents right-of-use assets in ‘property, plant and equipment’, the same line item as itpresents underlying assets of the same nature that it owns.
The Company has presented non-current and current portion of related lease liabilities in thestatement of financial position considering their due dates for payment.
At commencement or on modification of a contract that contains a lease component, the Companyallocates the consideration in the contract to each lease component on the basis of its relative value.The Company has elected not to recognize right of use assets and liabilities for some leases of lowvalue assets (warehouse/sales offices). The Company recognizes the lease payments associated withthese leases as an expense on a straight line basis over the lease term. The Company's accountingpolicy relating to leases is explained in note 3.22 of these financial statements.
The Company used the following practical expedients when applying IFRS 16 to leases previouslyclassified as operating leases under IAS 17.
did not recognize right-of-use assets and liabilities for leases for which the lease term endswithin 12 months of the date of initial application;
did not recognize right-of-use assets and liabilities for leases of low value items;
excluded initial direct costs from measuring the right-of-use asset at the date of initialapplication; and
The Company has applied IFRS 16 using the modified retrospective approach. However none of theleases prior to 01 July 2019 have been considered as significant for the purpose of application ofIFRS 16 and accordingly the application of IFRS 16 has no impact on the opening retained earningsas at 01 July 2019. The comparative information presented for 2019 is not restated i.e. it is presentedas previously reported under IAS 17 and related interpretations.
-
Salaries, wages and benefits are accrued in the period in which the associated services are renderedby employees of the Company and measured on an undiscounted basis. The accounting policy foremployee retirement benefits is described below:
The Company provides for compensated absences for its employees on unavailed balance of leave inthe period in which leave is earned and the charge is recognized in the unconsolidated statement ofprofit or loss.
Income tax expense comprises current and deferred tax. Income tax expense is recognized in theunconsolidated statement of profit or loss, except to the extent that it relates to items recognizeddirectly in other comprehensive income or equity, in which case it is recognized in othercomprehensive income or equity respectively.
The Company operates a recognized provident fund as a defined contribution plan for employeeswho fulfil conditions laid down in the trust deed. Provision is made in the financial statements for theamount payable by the Company to the fund in this regard. Contribution is made to the fund equallyby the Company and the employees at the rate of 10% of basic salary.

55ANNUAL REPORT 2020
3.3.1 Current taxation
3.3.2 Deferred taxation
3.4 Property, plant and equipment
3.4.1 Owned
Property, plant and equipment of the Company other than freehold land, building on freehold landand plant and machinery are stated at cost less accumulated depreciation and impairment loss, if any.Freehold land is stated at revalued amount carried out by external valuers by reference to its currentmarket price less impairment loss, if any. Building on freehold land and plant and machinery arestated at revalued amount carried out by external valuers by reference to its current market price lessaccumulated depreciation and impairment loss, if any. Cost in relation to property, plant andequipment comprises acquisition and other directly attributable costs. Revaluation is carried outevery five years unless earlier revaluation is necessitated.
Deferred tax is accounted for using the balance sheet approach providing for temporary differencesbetween the carrying amounts of assets and liabilities for financial reporting purposes and theamounts used for tax purposes. In this regard, the effects on deferred taxation of the portion ofincome that is subject to final tax regime is also considered in accordance with the treatmentprescribed by the Institute of Chartered Accountants of Pakistan. Deferred tax is measured at ratesthat are expected to be applied to the temporary differences when they reverse, based on laws thathave been enacted or substantively enacted by the reporting date. A deferred tax liability isrecognized for all taxable temporary differences. A deferred tax asset is recognized for deductibletemporary differences to the extent that future taxable profits will be available against whichtemporary differences can be utilized. Deferred tax assets are reviewed at each reporting date and arereduced to the extent that it is no longer probable that the related tax benefit will be realized.
The amount of unpaid income tax in respect of the current and prior periods is recognized as liability.Any excess amount paid over what is due in respect of the current or prior periods is recognized as anasset.
In case of revalued assets, any accumulated depreciation at the date of revaluation is eliminatedagainst the gross carrying amount of the asset and the net amount restated at the revalued amount ofthe asset. Increases in the carrying amount arising on revaluation of property, plant and equipmentare credited to surplus on revaluation of property, plant and equipment. Decreases that offsetprevious increases of the same assets are charged against this surplus, all other decreases are chargedto unconsolidated statement of profit or loss. Each year the difference between depreciation based onthe revalued carrying amount of the asset, and depreciation based on the asset’s original cost istransferred to ‘retained earnings net of related deferred tax’. All transfers to / from surplus onrevaluation of property, plant and equipment are net of applicable deferred income tax.
Depreciation is provided on a straight line basis and charged to unconsolidated statement of profit orloss to write off the depreciable amount of each asset, except for freehold land, over its estimateduseful life at the rates specified in note 12 of these unconsolidated financial statements. Depreciationon depreciable assets is commenced from the date asset is available for use up to the date when assetis retired. The assets' residual values and useful lives are reviewed at each financial year-end andadjusted if impact on depreciation is significant. The Company’s estimate of the residual value of itsproperty, plant and equipment as at statement of financial position date has not required anyadjustment as its impact is considered insignificant.
Provision of current tax is based on the taxable income for the year determined in accordance withthe prevailing law for taxation of income. The charge for current tax is calculated using prevailing taxrates or tax rates expected to apply to the profit for the year if enacted after taking into account taxcredits, rebates and exemptions, if any. The charge for current tax also includes adjustments, whereconsidered necessary, to provision for tax made in previous years arising from assessments framedduring the year for such years.

56 ANNUAL REPORT 2020
3.4.2 Capital work in progress
3.5 Intangibles
3.6 Financial instruments
3.6.1 Recognition and initial measurement
3.6.2 Classification and subsequent measurement
Financial assets
Subsequent costs are included in the asset’s carrying amount or recognized as a separate asset, asappropriate, only when it is probable that future economic benefits associated with the item will flowto the Company and cost of the item can be measured reliably. All other repairs and maintenancecosts are charged to unconsolidated statement of profit or loss as and when incurred.
A financial asset (unless it is a trade receivable without a significant financing component) orfinancial liability is initially measured at fair value plus, for an item not at FVTPL, transaction coststhat are directly attributable to its acquisition or issue. A trade receivable without a significantfinancing component is initially measured at the transaction price.
On initial recognition, a financial asset is classified as measured at amortized cost, fair value throughother comprehensive income (FVOCI), fair value through profit or loss (FVTPL) and in case of anequity instrument it is classified as FVOCI or FVTPL.
All financial assets and financial liabilities are initially recognized when the Company becomes aparty to the contractual provisions of the instruments.
Capital work in progress is stated at cost less identified impairment loss, if any. It consists of allexpenditures and advances connected with specific assets incurred and made during installations andconstruction period. These are transferred to relevant property, plant and equipment as and whenassets are available for use.
The Securities and Exchange Commission of Pakistan (SECP) vide its S.R.O 985 (I)/2019 dated 02September 2019 has deferred the requirements of IFRS 9 with respect to application of ExpectedCredit Loss Method in respect of companies holding financial assets due from the Government ofPakistan till 30 June 2021. In this regard, the companies shall follow relevant requirements of IAS 39'Financial Instruments: Recognition and Measurement' during the exemption period.
Useful lives are determined by the management based on expected usage of assets, expected physicalwear and tear, technical and commercial obsolescence, legal and similar limits on the use of theassets and other similar factors.
Gain and loss on sale of an item of property, plant and equipment are determined by comparing theproceeds from sale with the carrying amount of property, plant and equipment, and are recognizednet within “other income / other expenses” in unconsolidated statement of profit or loss. Whenrevalued asset is sold, the amount included in the surplus on revaluation of property, plant andequipment, net of deferred tax, is transferred directly to retained earnings.
Expenditure incurred on intangible asset is capitalized and stated at cost less accumulatedamortization and any identified impairment loss. Intangible assets with finite useful life are amortizedusing the straight-line method over the estimated useful life of three years. Amortization of intangibleassets is commenced from the date an asset is capitalized.
Financial assets are not reclassified subsequent to their initial recognition unless the Companychanges its business model for managing financial assets in which case all affected financial assetsare reclassified on the first day of the first reporting period following the change in the businessmodel.
57ANNUAL REPORT 2020
Amortized cost
-
-
Debt Instrument - FVOCI
-
-
Equity Instrument - FVOCI
Fair value through profit or loss (FVTPL)
A financial asset is measured at amortized cost if it meets both of the following conditions and is notdesignated as at FVTPL:
it is held within a business model whose objective is to hold assets to collect contractual cashflows; and
its contractual terms give rise on specified dates to cash flows that are solely payments ofprincipal and interest on the principal amount outstanding.
These assets are subsequently measured at fair value. Dividends are recognized as income inunconsolidated statement of profit or loss unless the dividend clearly represents a recovery of part ofthe cost of the investment. Other net gains and losses are recognized in OCI and these investmentsare never reclassified to profit or loss. However, the Company has no such instrument at the reportingdate.
All financial assets not classified as measured at amortized cost or FVOCI as described above aremeasured at FVTPL.
On initial recognition, the Company may irrevocably designate a financial asset that otherwise meetsthe requirements to be measured at amortized cost or at FVOCI as at FVTPL if doing so eliminatesor significantly reduces an accounting mismatch that would otherwise arise.
it is held within a business model whose objective is achieved by both collecting contractualcash flows and selling financial assets; and
its contractual terms give rise on specified dates to cash flows that are solely payments ofprincipal and interest on the principal amount outstanding.
Financial assets measured at amortized cost comprise of cash and bank balances, deposits, tradedebts and other receivables.
On initial recognition of an equity investment that is not held for trading, the Company mayirrevocably elect to present subsequent changes in the investment’s fair value in OCI. This election ismade on an investment-by-investment basis.
These assets are subsequently measured at amortized cost using the effective interest method. Theamortized cost is reduced by impairment losses. Interest income, foreign exchange gains and lossesand impairment are recognized in unconsolidated statement of profit or loss. Any gain or loss onderecognition is recognized in unconsolidated statement of profit or loss.
A debt investment is measured at FVOCI if it meets both of the following conditions and is notdesignated as at FVTPL:
These assets are subsequently measured at fair value. Interest income calculated using the effectiveinterest method, foreign exchange gains and losses and impairment are recognized in unconsolidatedstatement of profit or loss. Other net gains and losses are recognized in OCI. On derecognition, gainsand losses accumulated in OCI are reclassified to unconsolidated statement of profit or loss.However, the Company has no such instrument at the reporting date.
58 ANNUAL REPORT 2020
Financial assets – Business model assessment
-
-
-
-
Financial liabilities
3.6.3 Derecognition
Financial assets
The Company derecognizes a financial asset when the contractual rights to the cash flows from thefinancial asset expire, or it transfers the rights to receive the contractual cash flows in a transaction inwhich substantially all of the risks and rewards of ownership of the financial asset are transferred orin which the Company neither transfers nor retains substantially all of the risks and rewards ofownership and it does not retain control of the financial asset.
The Company might enter into transactions whereby it transfers assets recognized in itsunconsolidated statement of financial position, but retains either all or substantially all of the risksand rewards of the transferred assets. In these cases, the transferred assets are not derecognized.
These assets are subsequently measured at fair value. Net gains and losses, including any interest ordividend income, are recognized in unconsolidated statement of profit or loss. The Company hasclassified its investments in mutual funds as at FVTPL.
contingent events that would change the amount or timing of cash flows;
For the purposes of the assessment, ‘principal’ is defined as the fair value of the financial asset oninitial recognition. ‘Interest’ is defined as consideration for the time value of money and for the creditrisk associated with the principal amount outstanding during a particular period of time and for otherbasic lending risks and costs (e.g. liquidity risk and administrative costs), as well as a profit margin.
In assessing whether the contractual cash flows are solely payments of principal and interest, theCompany considers the contractual terms of the instrument. This includes assessing whether thefinancial asset contains a contractual term that could change the timing or amount of contractual cashflows such that it would not meet this condition. In making this assessment, the Company considers:
terms that limit the Company’s claim to cash flows from specified assets (e.g. non-recoursefeatures).
prepayment and extension features; and
terms that may adjust the contractual coupon rate, including variable-rate features;
Financial liabilities are classified as measured at amortized cost or FVTPL. A financial liability isclassified as at FVTPL if it is classified as held-for-trading, it is a derivative or it is designated assuch on initial recognition. Financial liabilities at FVTPL are measured at fair value and net gainsand losses, including any interest expense, are recognized in unconsolidated statement of profit orloss. Other financial liabilities are subsequently measured at amortized cost using the effectiveinterest method, while the interest expense and foreign exchange gains and losses are recognized inunconsolidated statement of profit or loss. Any gain or loss on derecognition is also recognized inunconsolidated statement of profit or loss.
The Company's financial liabilities comprise trade and other payables, long term loan, short termborrowings, accrued markup and dividend payable.

59ANNUAL REPORT 2020
Financial liabilities
3.6.4 Trade debts - due from Government of Pakistan
3.6.5 Offsetting of financial instruments
3.7 Impairment
Financial assets
-
-
-
-
-
The Company derecognizes a financial liability when its contractual obligations are discharged,cancelled or expired. The Company also derecognizes a financial liability when its terms aremodified and the cash flows of the modified liability are substantially different, in which case a newfinancial liability based on the modified terms is recognized at fair value. On derecognition of afinancial liability, the difference between the carrying amount extinguished and the considerationpaid (including any non-cash assets transferred or liabilities assumed) is recognized inunconsolidated statement of profit or loss.
The Company measures loss allowances at an amount equal to lifetime ECLs, except for thefollowing, which are measured at 12-month ECLs:
debt securities that are determined to have low credit risk at the reporting date; and
The Company recognizes loss allowances for ECLs on:
Financial assets and financial liabilities are offset and the net amount is reported in theunconsolidated statement of financial position only when the Company has a legally enforceable rightto set off the recognized amounts and intends to either settle on a net basis or realize the asset andsettle the liability simultaneously.
other debt securities, bank balances and other receivables for which credit risk (i.e. the risk ofdefault occurring over the expected life of the financial instrument) has not increasedsignificantly since initial recognition.
12-month ECLs are the portion of ECLs that result from default events that are possible within the 12months after the reporting date (or a shorter period if the expected life of the instrument is less than12 months).
financial assets measured at amortized cost;
debt investments measured at FVOCI; and
contract assets.
The financial assets due from Government of Pakistan continue to be measured under IAS-39 due tothe exemption given by the Securities and Exchange Commission of Pakistan vide S.R.O. 985(I)/2019 dated 02 September 2019. The financial assets due from Government of Pakistan areassessed at each reporting date to determine whether there is any objective evidence of impairment.A financial asset due from Government of Pakistan is impaired if there is objective evidence ofimpairment as a result of one or more events that have occurred after the initial recognition of theasset, and that loss event(s) had an impact on the estimated future cash flows of that asset that can beestimated reliably.
The allowance for doubtful accounts is based on the Company's assessment of the collectability ofcounterparty accounts. The Company regularly reviews its trade debts that remain outstanding pasttheir applicable payment terms and establishes allowance and potential write-offs by consideringfacts such as historical experience, credit quality, age of the accounts receivable balances and currenteconomic conditions that may affect customers ability to pay.
Trade debts are stated initially at the fair value. Subsequent to initial recognition, these are stated attheir amortized cost as reduced by appropriate provision for impairment. Known impairedreceivables are written off, while receivables considered doubtful are fully provided for.
60 ANNUAL REPORT 2020
Non - financial assets
3.8 Investments in subsidiaries
3.9 Trade and other payables
The gross carrying amount of a financial asset is written off when the Company has no reasonableexpectations of recovering of a financial asset in its entirety or a portion thereof. The Companyindividually makes an assessment with respect to the timing and amount of write-off based onwhether there is a reasonable expectation of recovery. The Company expects no significant recoveryfrom the amount written off. However, financial assets that are written off could still be subject toenforcement activities in order to comply with the Company's procedures for recovery of amountsdue.
The carrying amount of the Company’s non-financial assets, other than inventories and deferred taxassets are reviewed at each reporting date to determine whether there is any indication of impairment.If any such indication exists, then the asset’s recoverable amount is estimated. The recoverableamount of an asset or cash generating unit is the greater of its value in use and its fair value less costto sell. In assessing value in use, the estimated future cash flows are discounted to their presentvalues using a pre-tax discount rate that reflects current market assessments of the time value ofmoney and the risks specific to the asset or cash generating unit.
Loss allowances for financial assets measured at amortized cost are deducted from the gross carryingamount of the assets.
An impairment loss is recognized if the carrying amount of the assets or its cash generating unitexceeds its estimated recoverable amount. Impairment losses are recognized in unconsolidatedstatement of profit or loss. Impairment losses recognized in respect of cash generating units areallocated to reduce the carrying amounts of the assets in a unit on a pro rata basis. Impairment lossesrecognized in prior periods are assessed at each reporting date for any indications that the loss hasdecreased or no longer exists. An impairment loss is reversed if there has been a change in theestimates used to determine the recoverable amount. An impairment loss is reversed only to thatextent that the asset’s carrying amount after the reversal does not exceed the carrying amount thatwould have been determined, net of depreciation and amortization, if no impairment loss had beenrecognized.
The Company assumes that the credit risk on a financial asset has increased significantly if it is morethan past due for a reasonable period of time. Loss allowances for trade receivables and contractassets are always measured at an amount equal to lifetime ECLs other than that are due fromGovernment (note 2.6.3). Lifetime ECLs are the ECLs that result from all possible default eventsover the expected life of a financial instrument. 12-month ECLs are the portion of ECLs that resultfrom default events that are possible within the 12 months after the reporting date (or a shorter periodif the expected life of the instrument is less than 12 months). The maximum period considered whenestimating ECLs is the maximum contractual period over which the Company is exposed to creditrisk.
Liabilities for trade and other amounts payable are carried at cost which is the fair value of theconsideration to be paid in future for goods or services received.
When determining whether the credit risk of a financial asset has increased significantly since initialrecognition and when estimating ECL, the Company considers reasonable and supportableinformation that is relevant and available without undue cost or effort. This includes both quantitativeand qualitative information and analysis, based on the Company’s historical experience and informedcredit assessment and including forward-looking information.
Investments in subsidiaries are initially valued at cost. At subsequent reporting dates, the Companyreviews the carrying amount of the investment to assess whether there is any indication that suchinvestments have suffered an impairment loss. If any such indication exists, the recoverable amount isestimated in order to determine the extent of the impairment loss, if any.

61ANNUAL REPORT 2020
3.10 Provisions
3.11 Foreign currency
3.12 Stores, spare parts and loose tools
3.13 Stocks in trade
Raw and Packing materials - at moving average cost;Work in process - at moving average cost;
- at moving average cost; andFinished goods for resale - at moving average cost of purchase
3.14 Cash and cash equivalents
Provisions are recognized when the Company has a present legal or constructive obligation as aresult of past events and it is probable that an outflow of resources embodying economic benefits willbe required to settle the obligation and a reliable estimate of the obligation can be made. However,provisions are reviewed at each reporting date and adjusted to reflect current best estimate.
Stores, spare parts and loose tools are valued at weighted average cost except for items in transitswhich are stated at cost incurred up to the reporting date less impairment, if any. For items which areslow moving and/or identified as surplus to the Company's requirements, adequate provision is madefor any excess book value over estimated net realizable value. The Company reviews the carryingamount of stores, spares parts and loose tools on a regular basis and provision is made forobsolescence.
All monetary assets and liabilities in foreign currencies are translated into rupees at exchange ratesprevailing at the reporting date. Transactions in foreign currencies are translated into rupees atexchange rates prevailing at the date of transaction. Non-monetary assets and liabilities that aremeasured in terms of historical cost in a foreign currency are translated into rupees at exchange ratesprevailing at the date of transaction. Non-monetary assets and liabilities denominated in foreigncurrency that are stated at fair value are translated into rupees at exchange rates prevailing at the datewhen fair values are determined. Exchange gains and losses are recognized in the unconsolidatedstatement of profit or loss.
Stocks are valued at the lower of average cost and net realizable value. Cost is determined as follows:
Cost of finished goods purchased for resale and raw and packing materials comprises of purchaseprice and other costs incurred in bringing the material to its present location and condition. Cost ofwork in progress comprises of cost of raw and packing materials. Cost of manufactured finishedgoods comprises of raw and packing materials and applicable overheads. Net realizable valuesignifies the estimated selling price in the ordinary course of business less estimated cost ofcompletion and estimated costs necessarily to be incurred in order to make a sale.
Cash and cash equivalents are carried in unconsolidated statement of financial position at cost. Forthe purpose of unconsolidated statement of cash flow, cash and cash equivalents comprise of cash inhand, cash at banks and outstanding balance of short term borrowing facilities.
Finished goods
Trade and other payables are obligations to pay for goods and services that have been acquired in theordinary course of business from suppliers. Account payables are classified as current liabilities ifamount is due within one year or less (or in the normal operating cycle of the business if longer). Ifnot, they are presented as non-current liabilities.
62 ANNUAL REPORT 2020
3.15 Borrowings
3.16 Revenue recognition
3.17 Other income
3.18 Contract liabilities
3.19 Borrowing costs
3.20 Earnings per share (EPS)
3.21 Dividend distribution
A contract liability is the obligation of the Company to transfer goods or services to a customer forwhich the Company has received consideration (or an amount of consideration is due) from thecustomer. If a customer pays consideration before the Company transfers goods or services to thecustomer, a contract liability is recognized when the payment is made or the payment is due(whichever is earlier). Contract liabilities are recognized as revenue when the Company performsunder the contract. It also includes refund liabilities arising out of customers‘ right to claim amountsfrom the Company on account of contractual delays in delivery of performance obligations andincentive on target achievements.
Loans and borrowings are classified as 'financial liabilities at amortized cost'. On initial recognition,these are measured at cost, being fair value at the date the liability is incurred, less attributabletransaction costs. Subsequent to initial recognition, these are measured at amortized cost with anydifference between cost and value at maturity recognized in the unconsolidated statement of profit orloss over the period of the borrowings on an effective interest basis.
Finance cost are accounted for on accrual basis and are reported under accrued markup to the extentof the amount remaining unpaid.
Gains and losses on sale of investments are accounted for on disposal of investments.
Basic EPS is calculated by dividing the profit or loss attributable to ordinary shareholders of theCompany by weighted average number of ordinary shares outstanding during the year.
Dividend distribution to the shareholders is recognized as a liability in these unconsolidated financialstatements in the period in which it is approved.
Revenue represents the fair value of the consideration received or receivable for sale of products, netof sales tax, sales returns and related discounts and commission. Revenue is recognized when or asperformance obligation is satisfied by transferring control of promised goods or services to acustomer and control either transfers overtime or point in time.
Dividend income and entitlement of bonus shares are recognized when the right to receive isestablished.
Borrowing costs directly attributable to the acquisition, construction or production of qualifyingassets, which are assets that necessarily take a substantial period of time to get ready for theirintended use or sale, are added to the cost of those assets, until such time as the assets aresubstantially ready for their intended use or sale. Investment income earned on the temporaryinvestment of specific borrowings pending their expenditure on qualifying asset is deducted from theborrowing costs eligible for capitalization. All other borrowing costs are recognized inunconsolidated statement of profit or loss as incurred.
Other income comprises income on funds invested, dividend income, exchange gain and changes inthe fair value of financial asset at fair value through profit or loss. Income on bank deposits isaccrued on a time proportion basis by reference to the principal outstanding and the applicable rate ofreturn. Foreign currency gains and losses are reported on a net basis.
Borrowings are classified as current liabilities unless the Company has as unconditional right to defersettlement of the liability for at least twelve months after the reporting date.

63ANNUAL REPORT 2020
3.22 Leases
Short term leases and leases of low value assets
3.23 Segment reporting
3.24 Government grant
At the inception of a contract, the Company assesses whether a contract is or contains lease. Acontract is, or contains, a lease if the contract conveys a right to control the use of an identified assetfor a period of time in exchange for consideration. To assess whether a contract conveys the right tocontrol the use of an identified asset, the Company uses the definition of a lease in IFRS 16.
The Company recognizes a right of use asset and a lease liability at the lease commencement date.The right of use asset is initially measured at cost which comprises the initial amount of the leaseliability adjusted for any lease payments made at or before the commencement date plus any initialdirect cost incurred less any lease incentive received. The right of use asset is subsequently measuredat cost less accumulated depreciation and impairment losses, and adjusted for certain re-measurements of the lease liability, if any. The right of use assets is depreciated using the straight line method from the commencement date to the end of the lease term, unless the lease transfersownership of the underlying asset to the Company by the end of the lease term or cost of the right ofuse asset reflects that the Company will exercise a purchase option. In that case the right of use assetwill be depreciated over the useful life of the underlying asset, which is determined on the same basisas those of property, plant and equipment.
The lease liability is initially measured at the present value of the lease payments that are not paid atthe commencement date, discounted using the interest rate implicit in the lease or if that rate cannotbe readily determined, the Company’s incremental borrowing rate. The Company has used itincremental borrowing rate as the discount rate for leases where rate is not readily available. Thelease liability is subsequently increased by the interest cost on the lease liability and decreased bylease payment made.
The lease liability is measured at amortized cost using the effective interest method. It is re-measuredwhen there is a change in future lease payments arising from a change in rate or a change in the termsof the lease arrangement, if there is change in the Company’s estimate of the amount expected to bepayable under a residual value guarantee, if the Company changes its assessment of whether it willexercise a purchase, extension or termination option or if there is a revised in-substance fixed leasepayment. When the lease liability is re-measured in this way, a corresponding adjustment is made tothe carrying amount of the right of use asset, or is recorded in statement of profit or loss if thecarrying amount of the right of use asset has been reduced to zero.
The Company has elected not to recognize right of use assets and liabilities for some leases of lowvalue assets (warehouse/sales offices). The Company recognizes the lease payments associated withthese leases as an expense on a straight line basis over the lease term.
Operating segments are reported in a manner consistent with the internal reporting provided to thechief operating decision maker. The chief operating decision maker, who is responsible for allocatingresources and accessing performance of the operating segments, has been identified as the ChiefExecutive Officer of the Company that make strategic decisions. These unconsolidated financialstatements are prepared on the basis of single reportable segment as the Chief Executive Officerviews the Company's operations as one reportable segment.
The Company recognizes the benefit of a government loan at a below-market rate of interest as aGovernment grant. The benefit of the below-market rate of interest shall be measured as thedifference between the initial carrying value of the loan determined in accordance with IFRS 9 andthe proceeds received and is presented as deferred grant. The recognition of government grants inprofit or loss is done on a systematic basis over the periods in which the expenses for which thegrants are intended to compensate.

64 ANNUAL REPORT 2020
2020 2019Rupees Rupees
4 Issued, subscribed and paid up capital
14,419,520 14,419,520
1,196,000 1,196,000
286,252,890 286,252,890 301,868,410 301,868,410
5 Capital reserve
2020 20196 Surplus on revaluation of property, plant and Rupees Rupees
equipment - net of tax
Revaluation surplus as at 01 July 818,939,882 856,971,311
Revaluation surplus recognized during the year on:- freehold land 118,500,000 - - building on freehold land 226,634,567 - - plant and machinery 175,357,461 -
520,492,028 -
Surplus transferred to accumulated profit on account of incremental depreciation charged during the year net of deferred tax (27,342,257) (27,373,665)
Related deferred tax liability (10,689,172) (10,657,764) (38,031,429) (38,031,429)
Revaluation surplus as at 30 June 1,301,400,481 818,939,882
Less: Related deferred tax liability:
- on revaluation surplus as at 01 July (63,207,587) (67,321,126) - deferred tax on surplus arise during the year (112,984,497) - - transferred on account of incremental depreciation
charged during the year 10,689,172 10,657,764 - tax rate adjustment - (6,544,225)
(165,502,912) (63,207,587)
Revaluation surplus as at 30 June 1,135,897,569 755,732,295
1,441,952 (2019: 1,441,952) ordinary shares of Rs. 10each fully paid in cash
119,600 (2019: 119,600) ordinary shares of Rs. 10 eachissued in lieu of NWF Industries Limited and Sargodha Oiland Flour Mills Limited since merged
28,625,289 (2019: 28,625,289) ordinary shares of Rs. 10each issued as fully paid bonus shares
KFW Factors (Private) Limited, an associated company holds 8,286,942 (2019: 8,286,942) ordinary shares ofRs. 10 each of the Company, representing 27.45% (2019: 27.45%) of the equity held.
This represents capital reserve which arose on conversion of shares of NWF Industries Limited and SargodhaOil and Flour Mills Limited, since merged.

65ANNUAL REPORT 2020
2020 20197 Long term loan - secured Note Rupees Rupees
Under markup / interest arrangementLong term loan - HBL 7.1 126,000,000 -
Less: amortization of loan as deferred grant (9,451,940) - Add: unwinding of loan 394,133 - Balance as at 30 June 2020 116,942,193 -
Less: current portion of long term loan presented under current liabilities (26,851,809) - 90,090,384 -
7.1
The unavailed finance facility available to the Company is Rs. 63 million ( 2019: Rs. nil).
7.1 Deferred grant 2020 2019Rupees Rupees
Balance as at 01 July - Transaction during the year 9,451,940 - Amortisation during the year (394,133) - Unamortised balance of deferred grant 9,057,807 - less: current maturity (4,648,191) - Balance as at 30 June 2020 4,409,616
The freehold land, building and plant and machinery were revalued by independent valuers in years 1976,1989, 2002, 2006, 2011, 2016 and 2020. The latest revaluation was conducted by M/s Asif Associates(Private) Limited (independent valuer and consultant) as at 30 June 2020, that resulted in a further surplus ofRs. 520 million. These revaluations had resulted in a cumulative surplus of Rs. 1,574 million, which has beenincluded in the carrying values of free hold land, building on free hold land and plant and machineryrespectively and credited to the surplus on revaluation of property plant and equipment. The surplus is adjustedon disposal of revalued assets, if any, and through incremental depreciation, net of deferred tax charged toretained earnings. The most significant input into this valuation approach is price per acre for land , price persquare foot for building and present operational condition and age (replacement cost) of plant and machinery.The surplus on revaluation is not available for distribution to the shareholders in accordance with section 241of the Companies Act, 2017.
The Company obtained term finance facility under "SBP refinance scheme for payment of wages andsalaries" introduced by Government of Pakistan in order to prevent entities from laying-off employeesduring COVID-19 outbreak. The Company obtained Rs. 126 million for paying salaries for the monthof April 2020 and May 2020 under this scheme in two installment amounting to Rs 63 million each ondraw down dates of 21 May 2020 and 30 June 2020. The facility carry mark-up at the rate specified byState Bank of Pakistan plus relevant bank's spread of 3%. The tenor of this facility is up to 01 October2022. The loan has been measured at its fair value in accordance with IFRS 9 (Financial Instruments)using effective interest rate of 9.40% and 8.44% and at draw down dates of 21 May 2020 and 30 June2020 respectively. The difference between fair value of loan and loan proceeds has been recognised asdeferred grant as per requirements of IAS 20 (Accounting for Government grants and disclosure ofGovernment assistance) and as per Circular 11/2020 issued by the Institute of Chartered Accountantsof Pakistan.
The facility is secured by first exclusive equitable mortgage charge of 252 million with 25% margin onland and building of head office of the company.
As per the financing arrangement, the company has to comply the certain covenants imposed by bankincluding bank prior consent for payouts if any.
Habib Bank Limited
Balance(Rupees)
Payment rests
Repayment date
Ending date Markup rate
1-Oct-22 SBP Rate (0%) + Spread (3%)
Number of installments
TotalLong term loan
126,000,000 8 Quarterly 1-Jan-21

66 ANNUAL REPORT 2020
Bal
ance
as a
t 01
Jul
yPr
ofit
or
loss
Equ
ity B
alan
ce a
s at
30 J
une
Bal
ance
as a
t 01
July
Prof
it or
lo
ssEq
uity
Bal
ance
as a
t 30
June
8D
efer
red
taxa
tion
Taxa
ble
tem
pora
ry d
iffer
ence
115,
910,
127
3,23
4,74
9
-
119,
144,
876
93,6
54,7
83
22,2
55,3
44
-
115,
910,
127
Surp
lus o
n re
valu
atio
n of
pro
perty
,
plan
t and
equ
ipm
ent
63,2
07,5
87
(10,
689,
172)
112,
984,
497
165,
502,
912
67,3
21,1
26
(10,
657,
764)
6,54
4,22
5
63,2
07,5
87
Unr
ealiz
ed g
ain
on sh
ort t
erm
inve
stm
ents
- m
utua
l fun
ds3,
509,
330
(2
55,7
07)
-
3,25
3,62
3
4,78
4,57
4
(1,2
75,2
44)
-
3,
509,
330
18
2,62
7,04
4
(7
,710
,130
)
112,
984,
497
287,
901,
411
165,
760,
483
10,3
22,3
36
6,54
4,22
5
182,
627,
044
Ded
ucta
ble
tem
pora
ry d
iffer
ence
Loss
allo
wan
ce a
gain
st tr
ade
debt
s(3
,698
,538
)
(1,4
60,4
45)
-
(5
,158
,983
)
-
1,46
7,17
8
(5,1
65,7
16)
(3
,698
,538
)
178,
928,
506
(9,1
70,5
75)
11
2,98
4,49
7
28
2,74
2,42
8
16
5,76
0,48
3
11
,789
,514
1,
378,
509
17
8,92
8,50
6
2019
(Rev
ersa
l fro
m) /
cha
rge
to
------
------
------
------
------
------
--- R
upee
s ----
------
------
------
------
------
------
--
2020
(Rev
ersa
l fro
m) /
cha
rge
to
------
------
------
------
------
------
--- R
upee
s ----
------
------
------
------
------
------
--
Acc
eler
ated
tax
depr
ecia
tion
allo
wan
ces

67ANNUAL REPORT 2020
2020 20199 Trade and other payables Note Rupees Rupees
Trade creditors 898,257,525 727,805,937 Accrued liabilities 303,965,714 160,295,680 Tax deducted at source 6,153,089 - Provision for compensated absences 30,760,061 26,145,098 Workers' Profit Participation Fund 20.1 367,021 - Central Research Fund 9.1 6,134,752 3,555,017 Workers' Welfare Fund 27 11,247,351 8,872,286 Advances from employees against
purchase of vehicles 63,945,893 49,267,061 Other payables 22,821 785,956
1,320,854,227 976,727,035
9.1 Central Research Fund
Balance as at 01 July 3,555,017 2,283,549 Provision for the year 27 6,134,752 3,555,017
9,689,769 5,838,566 Payments made during the year (3,555,017) (2,283,549) Balance as at 30 June 6,134,752 3,555,017
10 Short term borrowings
Short term running finance - secured 51,017,136 -
10.1 Particulars of borrowings
Interest / markup based financing 10.2 50,806,268 - Islamic mode of financing 10.3 210,868 -
51,017,136 -
10.2 Under Mark up arrangements
The Company has short term running finance facilities available from various commercial banksunder mark up arrangements having aggregate sanctioned limit of Rs. 750 million (2019: Rs. 750million). These facilities carry mark-up at the rates ranging from one to three months KIBORplus 0.1% to 1% (2019: one to three months KIBOR plus 0.1% to 1%) per annum on theoutstanding balances. Running finance facilities amounting to Rs. 450 million caninterchangeably be utilized as non-funded facilities. Out of the aggregate facilities, Rs. 450million (2019: Rs. 450 million) are secured by joint pari passu charge over present and futurecurrent assets of the Company and remaining Rs. 300 million (2019: Rs. 300 million) facility issecured by lien on Company's short term investments (money market/cash fund) which should be110% of the maximum limit allowed for utilization. Under this arrangement, short terminvestment of Rs. 333.33 million (2019: Rs. 333.33 million) is marked under lien. These facilitiesare renewable on annual basis latest by 31 December 2020.

68 ANNUAL REPORT 2020
10.3 Under Shariah compliant arrangements
11 Contingencies and commitments
11.1 Contingencies
11.2 Commitments
11.2.1 Letter of credits
11.2.1.1 Under Mark up arrangements
11.2.1.2 Under Shariah compliant arrangements
11.2.2 Guarantees issued by banks on behalf of the Company
11.2.2.1 Under Mark up arrangements
11.2.2.2 Under Shariah compliant arrangements
2020 201912 Property, plant and equipment Note Rupees Rupees
Operating fixed assets 12.1 3,227,904,469 2,716,578,574 Capital work in progress 12.6 80,930,293 4,297,726
3,308,834,762 2,720,876,300
The Company has short term borrowing facility i.e. Running Musharakah available from Islamicbank under profit arrangements having sanctioned limit of Rs. 200 million (2019: Rs. 200million). This facility carries profit rate of one month KIBOR plus 0.25% (2019: one month tothree months KIBOR plus 0.25% to 0.3%) per annum on the outstanding balance. This facilitycan interchangeably be utilized as non-funded. This facility is secured by joint pari passu chargeover current assets of the Company. This facility is renewable on annual basis latest by 30November 2020.
The Company has facility i.e. letter of guarantee of Rs. 25 million (2019: Rs. 25 million)available from Islamic bank, the amount utilized at 30 June 2020 was Rs. 6.45 million (2019: Rs.6.45 million).
The Company has facility i.e. letters of credit of Rs. 200 million (2019: Rs. 200 million)available from Islamic bank. The amount utilized as at 30 June 2020 for capital expenditure wasRs. 13.95 million (2019: Rs. 2.82 million) and for other than capital expenditure was Rs. 78.52million (2019: Rs. 100.52 million). Lien is also marked over import documents.
Out of the aggregate facility of Rs. 375 million (2019: Rs. 375 million) for letter of guarantees(which is the sublimit of running finance and letter of credits), the amount utilized as at 30 June2020 was Rs. 87.49 million (2019: Rs. 51.40 million).
There are no contingencies as of the reporting date.
Out of the aggregate facility of Rs. 700 million (2019: Rs. 700 million) for opening letters ofcredit, the amount utilized as at 30 June 2020 for capital expenditure was Rs. 5.05 million (2019:Rs. 131.27 million) and for other than capital expenditure was Rs. 62.95 million (2019: Rs. 77.38million). Out of these facilities, Rs. 300 million can interchangeably be utilized as runningfinance. These facilities are secured by joint pari passu charge (2019: joint pari passu charge)over all present and future current assets of the Company.

69ANNUAL REPORT 2020
12.1
Ope
ratin
g fix
ed a
sset
s
Free
hold
land
Bui
ldin
gs o
n fr
eeho
ld la
ndPl
ant a
nd
mac
hine
ryO
ffic
e eq
uipm
ent
Furn
iture
and
fit
tings
Com
pute
rsV
ehic
les
Tot
al
30 J
une
2020
Cos
t / r
eval
ued
amou
nt
Bala
nce
as a
t 01
July
201
9
7
10,0
00,0
00
835
,429
,979
1,3
33,0
29,1
94
98
,371
,799
97,9
72,0
24
43
,576
,209
4
09,7
08,2
84
3
,528
,087
,489
A
dditi
ons /
tran
sfer
s
-
7,6
04,8
53
205
,530
,956
9,6
83,5
01
5
,641
,121
10,4
60,1
42
89
,225
,077
3
28,1
45,6
50
Dis
posa
ls / w
rite
off
-
-
-
(717
,609
)
-
(1,1
37,5
69)
(57,
625,
347)
(59,
480,
525)
Rev
alua
tion
surp
lus
118
,500
,000
(7
0,03
4,83
2)
(23
4,96
4,38
5)
-
-
-
-
(
186,
499,
217)
Bal
ance
as a
t 30
June
202
0
8
28,5
00,0
00
773
,000
,000
1,3
03,5
95,7
65
107
,337
,691
1
03,6
13,1
45
52
,898
,782
4
41,3
08,0
14
3
,610
,253
,397
Dep
reci
atio
n
Bala
nce
as a
t 01
July
201
9
-
2
12,6
33,8
50
268
,273
,742
53,5
00,4
39
31
,842
,002
34,3
24,5
43
210
,934
,339
8
11,5
08,9
15
Cha
rge
for t
he y
ear
-
84,0
35,5
49
142,
048,
104
7,87
1,73
3
9,
150,
614
7,63
4,65
2
74
,820
,271
3
25,5
60,9
23
On
disp
osal
s
-
-
-
(5
47,2
06)
-
(1
,127
,320
)
(4
6,05
5,13
9)
(4
7,72
9,66
5)
-
(
296,
669,
399)
(
410,
321,
846)
-
-
-
-
(70
6,99
1,24
5)
Bal
ance
as a
t 30
June
202
0
-
-
-
60,8
24,9
66
40
,992
,616
40,8
31,8
75
239
,699
,471
3
82,3
48,9
28
Net
boo
k va
lue
as a
t 30
June
202
0
8
28,5
00,0
00
773
,000
,000
1,3
03,5
95,7
65
46
,512
,725
62,6
20,5
29
12
,066
,907
2
01,6
08,5
43
3
,227
,904
,469
30 J
une
2019
Cos
t / r
eval
ued
amou
nt
Bala
nce
as a
t 01
July
201
8
7
10,0
00,0
00
785
,869
,102
1,0
36,1
44,8
43
95
,907
,033
83,5
79,5
27
37
,998
,069
3
80,9
06,3
56
3
,130
,404
,930
A
dditi
ons /
tran
sfer
s
-
49,5
60,8
77
296
,884
,351
2,5
17,2
66
14
,392
,497
7,5
47,9
33
100
,718
,198
4
71,6
21,1
22
Dis
posa
ls / w
rite
off
-
-
-
(52
,500
)
-
(1,9
69,7
93)
(71,
916,
270)
(73,
938,
563)
Rev
alua
tion
surp
lus
-
-
-
-
-
-
-
-
Bal
ance
as a
t 30
June
201
9
7
10,0
00,0
00
835
,429
,979
1,3
33,0
29,1
94
98
,371
,799
97,9
72,0
24
43
,576
,209
4
09,7
08,2
84
3
,528
,087
,489
Dep
reci
atio
n
Bala
nce
as a
t 01
July
201
8
-
1
33,4
15,5
74
161
,284
,016
45,4
77,8
34
22
,762
,368
29,0
81,0
25
192
,061
,290
5
84,0
82,1
07
Cha
rge
for t
he y
ear
-
79
,218
,276
1
06,9
89,7
26
8
,033
,106
9,0
79,6
34
7
,199
,737
74,9
74,6
26
285
,495
,105
O
n di
spos
als
-
-
-
(10
,501
)
-
(1,9
56,2
19)
(56,
101,
577)
(58,
068,
297)
Rev
alua
tion
surp
lus
-
-
-
-
-
-
-
-
Bal
ance
as a
t 30
June
201
9
-
2
12,6
33,8
50
268
,273
,742
53,5
00,4
39
31
,842
,002
34,3
24,5
43
210
,934
,339
8
11,5
08,9
15
Net
boo
k va
lue
as a
t 30
June
201
9
7
10,0
00,0
00
622
,796
,129
1,0
64,7
55,4
52
44
,871
,360
66,1
30,0
22
9
,251
,666
1
98,7
73,9
45
2
,716
,578
,574
Dep
reci
atio
n R
ate
%
-
10
1010
1033
.33
20
Ow
ned
- - -
- - -
- - -
- - -
- - -
- - -
- - -
- - -
- - -
- - -
- - -
- - -
- - -
- - -
- - -
- - -
- - -
- - -
- - -
- - -
- - -
- - -
- - -
- - -
- - -
Rup
ees -
- - -
- - -
- - -
- - -
- - -
- - -
- - -
- - -
- - -
- - -
- - -
- - -
- - -
- - -
- - -
- - -
- - -
- - -
- - -
- - -
- - -
- - -
- - -
- - -
- -
Elim
inat
ion
of a
ccum
ulat
ed d
epre
ciat
ion
on
reva
luat
ion

70 ANNUAL REPORT 2020
12.1
.1Th
ese
incl
ude
fully
dep
reci
ated
ass
ets a
mou
ntin
g to
Rs.
127.
63 m
illio
n (2
019:
Rs.
97.3
0 m
illio
n).
12.1
.2
2020
2019
Rup
ees
Rup
ees
Free
hold
land
116,
611,
635
116,
611,
635
Bui
ldin
g on
free
hold
land
408,
101,
366
459,
246,
237
Plan
t and
mac
hine
ry1,
078,
982,
283
1,
002,
753,
827
1,
603,
695,
284
1,
578,
611,
699
12.2
Parti
cula
rs o
f im
mov
able
pro
perty
(i.e
. lan
d an
d bu
ildin
g) in
the
nam
e of
Com
pany
are
as f
ollo
ws:
Tot
al a
rea
(a
cres
) C
over
ed A
rea
(squ
are
feet
)
Mai
n G
.T R
oad,
Am
angh
ar, D
istric
t Now
sher
a, K
PK29
.81
33
6,22
2
5-
K.M
- Su
nder
Rai
win
d R
oad,
Rai
win
d La
hore
23
.59
26
,852
19
7-A
, The
Mal
l, R
awal
pind
i Can
tt, R
awal
pind
i0.
66
28
,749
Sh
op n
o. 2
, Gro
und
Floo
r, R
amza
n M
edic
al C
entre
, Lah
ore
0.01
351
Ph
ase
II Ex
tens
ion
Def
ence
Hou
se A
utho
rity,
Isla
mab
ad1.
03
N
/AH
ouse
No.
167
, Kha
nusp
ur A
yubi
a, K
PK0.
33
5,
000
12.3
2020
2019
12.4
Dep
reci
atio
n is
allo
cate
d as
und
er:
Not
eR
upee
sR
upee
s
Cos
t of s
ales
2422
4,48
3,36
9
18
4,60
1,84
3
A
dmin
istra
tive
expe
nses
2548
,536
,447
48
,550
,451
Se
lling
and
dist
ribut
ion
expe
nses
2652
,541
,116
52
,342
,811
32
5,56
0,93
2
28
5,49
5,10
5
Had
ther
e be
en n
o re
valu
atio
n, c
arry
ing
valu
e of
free
hold
land
, bui
ldin
g on
free
hol
d la
nd a
nd p
lant
and
mac
hine
ry w
ould
hav
e be
en a
s fol
low
s:
Loc
atio
nU
sage
of i
mm
ovab
le p
rope
rty
Man
ufac
turin
g fa
cilit
yH
ead
offic
eR
egist
ered
offi
ceV
acan
t sho
pV
acan
t plo
tG
uest
hous
e
As
expl
aine
din
note
6,th
ela
test
reva
luat
ion
was
carri
edas
at30
June
2020
.Asp
erth
ere
valu
atio
nre
port,
forc
edsa
leva
lue
offre
ehol
dla
nd,b
uild
ings
onfre
eho
ldla
ndan
dpl
anta
ndm
achi
nery
was
Rs.
741
mill
ion,
Rs.
652
mill
ion
and
Rs.
1,04
1 m
illio
n re
spec
tivel
y.

71ANNUAL REPORT 2020
12.5
Disp
osal
of p
rope
rty,
pla
nt a
nd e
quip
men
t
Part
icul
ars o
f ass
ets
Rel
atio
nshi
p w
ith
Com
pany
Cos
t / r
eval
ued
amou
ntN
et b
ook
valu
eSa
le p
roce
eds
Gai
n / (
loss
) on
disp
osal
Mod
e of
disp
osal
------
------
------
------
------
------
--Rup
ees-
------
------
------
------
------
------
---
Veh
icle
s
Hon
da C
ivic
Mr.
Ahm
er A
shra
fEm
ploy
ee2,
637,
000
1,
230,
600
1,
793,
160
56
2,56
0
C
ompa
ny P
olic
yTo
yota
Alti
s Gra
nde
Mr.
Syed
Nay
yer K
hurs
hid
Empl
oyee
2,40
0,50
0
920,
191
1,51
2,31
5
592,
124
Com
pany
Pol
icy
Toyo
ta C
orol
la G
LiM
r. M
uham
mad
Tal
ha K
ausa
rO
ther
s1,
770,
500
59
0,16
7
1,
925,
000
1,
334,
833
N
egot
iatio
nSu
zuki
Cul
tus
Mr.
Sika
ndar
Zam
anEm
ploy
ee1,
274,
550
70
1,00
2
94
3,16
7
24
2,16
5
C
ompa
ny P
olic
ySu
zuki
Meh
ran
Mr.
Tariq
Sae
edO
ther
s85
0,50
0
63
7,87
5
80
7,00
0
16
9,12
5
N
egot
iatio
nSu
zuki
Meh
ran
Mr.
Aam
ir K
han
Oth
ers
771,
700
565,
913
790,
000
224,
087
Neg
otia
tion
Suzu
ki M
ehra
n M
r. A
amir
Kha
nO
ther
s77
1,70
0
56
5,91
3
79
7,00
0
23
1,08
7
N
egot
iatio
nSu
zuki
Meh
ran
Mst.
Ays
ha A
liEm
ploy
ee75
1,29
5
53
8,42
7
65
8,80
0
12
0,37
3
C
ompa
ny P
olic
y
Var
ious
ass
ets h
avin
g ne
t boo
k va
lue
up to
Rs.
500,
000
each
41,3
16,5
69
5,
820,
123
25
,384
,877
19,5
64,7
54
52
,544
,314
11,5
70,2
11
34
,611
,319
23,0
41,1
08
C
ompu
ters
Var
ious
ass
ets h
avin
g ne
t boo
k va
lue
up to
Rs.
500,
000
each
1,13
7,56
9
10,2
46
181,
000
170,
754
Off
ice
equi
pmen
ts
Var
ious
ass
ets h
avin
g ne
t boo
k va
lue
up to
Rs.
500,
000
each
717,
609
170,
403
82,0
00
(88,
403)
Ass
ets w
ritte
n of
f:
Veh
icle
s - C
NG
Kits
5,08
1,03
3
-
-
-
Writ
ten
- off
2020
Rup
ees
59,4
80,5
25
11
,750
,860
34,8
74,3
19
23
,123
,459
2019
Rup
ees
73,9
38,5
63
15
,870
,266
46,6
76,3
91
30
,806
,125
Part
icul
ars o
f pur
chas
er

72 ANNUAL REPORT 2020
2020 2019Note Rupees Rupees
12.6 Capital work-in-progress
The movement in capital work in progress is as follows:
Balance as at 01 July 4,297,726 102,893,283 Additions during the year 298,661,795 261,324,271 Transfers during the year (222,029,228) (359,919,828) Balance as at 30 June 12.6.1 80,930,293 4,297,726
12.6.1 Capital work-in-progress comprises of:
Building and civil works 13,835,545 - Plant and machinery 12.6.1.1 57,564,748 - Advances to suppliers 12.6.1.2 9,530,000 4,297,726
80,930,293 4,297,726
12.6.1.1
12.6.1.2
2020 201913 Intangible assets Note Rupees Rupees
13.1 Computer softwares and software license fees
Cost
Balance as at 01 July 12,850,789 12,850,789 Addition during the year 280,336 - Balance as at 30 June 13.1.1 13,131,125 12,850,789
Amortisation
Balance as at 01 July 12,119,610 10,834,517 Amortisation for the year 25 588,017 1,285,093 Balance as at 30 June 12,707,627 12,119,610
Net book value 423,498 731,179
13.1.1
These represents plant and machinery and equipment in the course of development andinstallation.
These are interest free in the normal course of business for vehicles.
These include fully amortized assets amounting to Rs. 11.11 million (2019: Rs. 11.11 million).Intangibles are amortised at 33% (2019: 33%) on straight line basis.

73ANNUAL REPORT 2020
2020 201914 Long term investments - related parties Note Rupees Rupees
Related parties - at cost
Farmacia (Partnership firm):Capital held: 98% (2019: 98%) 14.1 182,863,225 162,545,964 Managing Partner - Osman Khalid Waheed
BF Biosciences Limited (unlisted subsidiary):15,199,996 (2019: 15,199,996) fully paidordinary shares of Rs. 10 each 14.2 151,999,960 151,999,960 Equity held: 80% (2019: 80%)Chief Executive Officer - Mrs. Akhter Khalid Waheed
334,863,185 314,545,924
14.1
14.2
2020 201915 Stores, spare parts and loose tools Note Rupees Rupees
Stores 13,202,021 9,774,650 Spare parts 14,978,954 10,936,504 Loose tools 206,840 166,969 Stores in transit 2,004,836 -
30,392,651 20,878,123
16 Stock in trade
Raw and packing materials 539,746,654 370,003,918 Work in process 93,642,720 58,928,282 Finished goods 16.1 1,007,744,405 587,932,285 Stock in transit 16.2 192,051,017 154,061,366
1,833,184,796 1,170,925,851
16.1
16.2 It includes raw and packing material in transit amounting to Rs. 143.89 million (2019: Rs. 49.45million) and finished goods in transit amounting to Rs. 48.16 million (2019: Rs. 104.61 million).
The amount charged to unconsolidated statement of profit or loss on account of write down offinished goods to net realizable value amounts to Rs. 1.90 million (2019: Rs. 81.01 million).
This represents Company's 98% share in "Farmacia", a subsidiary partnership duly registeredunder the Partnership Act, 1932 and engaged in operating retail pharmacy. Share of profit, ifany, for the year not withdrawn is reinvested in capital account of partnership. The head office ofthe Firm is situated at Fatima Memorial Hospital, Shadman, Lahore.
BF Biosciences Limited has been set up for establishing a Biotech Pharmaceutical Plant tomanufacture mainly Cancer and Hepatitis related medicines. The Company owns holds 80%(2019: 80%) of equity of the subsidiary and the remaining 20% is held by Grupo EmpresarialBagó S.A., Spain. The registered office of the Company is situated at 197-A, The Mall,Rawalpindi and the production facility is located at 5 KM- Sunder Raiwind Road Lahore. The netassets of the Subsidiary company as at 30 June 2020 were of Rs. 782.37 million (2019: Rs.735.26 million).

74 ANNUAL REPORT 2020
2020 2019Note Rupees Rupees
17 Trade debts - considered good
Exports - secured, considered good 6,127,128 12,367,064
Unsecured - Considered good- Exports 25,508,600 28,391,576
- Others 1,013,637,759 859,891,622 1,039,146,359 888,283,198
Loss allowance against trade debts 17.1 (18,394,132) (13,197,957)
1,026,879,355 887,452,305
17.1 Loss allowance against trade debts
Loss allowance as at 01 July 13,197,957 18,433,470 Loss allowance / (reversal) during the year 5,196,175 (5,235,513) Loss allowance as at 30 June 18,394,132 13,197,957
18 Loans and advances - considered good
Advances to employees - secured 18.1 21,236,358 19,962,155 Advances to suppliers - unsecured 18.2 20,503,236 4,168,886 Others 1,112,139 268,705
42,851,733 24,399,746
18.1
18.2 These are interest free in the ordinary course of business.
2020 201919 Deposits and prepayments Note Rupees Rupees
Deposits - considered goodEarnest Money 19.1 147,418,439 128,158,890 Security Margins 7,563,945 22,110,467
154,982,384 150,269,357 Prepayments 917,249 819,482
155,899,633 151,088,839
19.1 These are interest free and given in ordinary course of business for acquiring government tenders.
Advances given to staff are in accordance with the Company's policy and terms of employmentcontract. These advances are secured against provident fund. Advances to staff include amountdue from executives of the Company of Rs. 5.94 million (2019: Rs. 2.72 million).

75ANNUAL REPORT 2020
2020 2019Note Rupees Rupees
20 Other receivables
Sales tax refundable - net 2,687,308 10,858,662 Workers' profit participation fund 20.1 - 12,402,668 Export rebate 5,236,823 6,253,321 Others - unsecured, considered good 30,193,425 38,049,639
38,117,556 67,564,290
20.1 Workers' Profit Participation Fund
Balance receivable as at 01 July 12,402,668 8,918,108 Provision for the year (30,367,021) (17,597,332)
(17,964,353) (8,679,224)
Payments made during the year 17,597,332 21,081,892 Balance as at 30 June 9 (367,021) 12,402,668
21 Short term investments
Investments at fair value through profit or loss
Mutual fund 21.1 357,590,624 451,847,651
21.1 These investments are measured at 'fair value through Profit or Loss'
Fair value at 01 July 451,847,651 527,343,533 Acquisition / re-invested during the year 35,634,121 134,983,875 Redemption during the year (132,414,859) (198,088,835) Realized gain / (loss) on sale of investments during the year 954,676 (1,376,020) Unrealized gain / (loss) on re-measurement of investment
during the year 1,569,035 (11,014,902)
Fair value of investments at 30 June 21.1.1 357,590,624 451,847,651
21.1.1 Mutual fund wise detail is as follows:
2020 2019 2020 2019
HBL Money Market Fund 2,516,176 2,278,754 257,539,370 232,709,773 MCB Cash Management
Optimizer Fund 10,939 10,939 1,102,945 1,099,828 HBL Cash Fund 978,434 2,163,177 98,948,309 218,038,050
357,590,624 451,847,651
21.2
...…………….Rupees………………
Fair valueUnits
...…………….Number………………
Realized gain of Rs. 0.95 million (2019: Realized loss of Rs. 1.38 million) on sale of mutual funds hasbeen recorded in "Other income" (2019: Other expenses). Further, dividend income of Rs. 42.05 million(2019: 45.22) is also recorded in "Other income". These investments and related loss is from non shariahcompliant arrangement. These are marked under lien as mentioned in note 10.

76 ANNUAL REPORT 2020
2020 2019Note Rupees Rupees
22 Cash and bank balances
Cash in hand 4,971,375 6,993,384 Cash at bank:
Current accounts- foreign currency 14,272,043 13,281,893 - local currency 22.1 42,986,682 110,549,622
57,258,725 123,831,515
Deposit accounts - local currency 22.2 37,067,718 52,622,883 99,297,818 183,447,782
22.1
22.2
2020 2019Rupees Rupees
23 Revenue - net
Gross sales:Local 5,570,269,813 5,340,931,686 Export 209,166,945 164,585,921
5,779,436,758 5,505,517,607 Less:
Sales returns (47,544,874) (63,362,175) Discounts and commission (325,383,539) (239,647,838) Service charges on sales (7,688,636) (16,374,584) Sales tax (4,776,700) (5,329,428)
(385,393,749) (324,714,025) Revenue from contracts with customers 5,394,043,009 5,180,803,582
23.1
These include bank accounts of Rs. 0.002 million (2019: Rs. 0.003 million) maintained underShariah compliant arrangements.
These include deposit accounts of Rs. 37.07 million (2019: Rs. 52.62 million) under mark uparrangements, which carry interest rates ranging from 6.5% - 11.28% (2019: 4.5% - 10.25%) perannum.
These also include deposit account of Rs. 0.000079 million (2019: Rs. 0.000073 million) underShariah compliant arrangements, which carries profit rate from 3.25% - 7.06% (2019: 2.40% -6.26%) per annum.
This includes sale of both own manufactured and purchased products. Revenue from contracts withcustomers relates to both local (Pakistan) and foreign markets and it is recongised at the point intime.

77ANNUAL REPORT 2020
2020 2019Note Rupees Rupees
24 Cost of sales
Raw and packing materials consumed 24.1 1,124,417,922 1,036,405,023 Salaries, wages and other benefits 24.2 281,863,768 264,073,528 Fuel and power 41,350,477 30,244,432 Repair and maintenance 14,597,846 11,229,014 Stores, spare parts and loose tools consumed 72,704,635 79,864,829 Freight and forwarding 35,344,911 34,648,523 Packing charges 13,366,515 17,094,700 Rent, rates and taxes 4,646,646 4,847,632 Printing and stationery 3,986,987 3,945,307 Postage and telephone 4,401,804 4,793,318 Insurance 14,465,724 10,948,438 Travelling and conveyance 10,942,735 7,841,054 Canteen expenses 13,094,538 12,362,134 Depreciation on property, plant and equipment 12.4 224,483,369 184,601,843 Laboratory and other expenses 15,262,398 22,185,873
1,874,930,275 1,725,085,648 Work in process:
Opening 58,928,282 50,818,086 Closing (93,642,720) (58,928,282)
(34,714,438) (8,110,196) Cost of goods manufactured 1,840,215,837 1,716,975,452
Finished stock:
Opening 587,932,285 730,289,493 Purchases made during the year 1,755,685,242 1,275,621,957 Closing (1,007,744,405) (587,932,285)
1,335,873,122 1,417,979,165 3,176,088,959 3,134,954,617
24.1 Raw and packing materials consumed
Opening 370,003,918 338,718,490
Purchases made during the year 1,294,160,658 1,067,690,451 1,664,164,576 1,406,408,941
Closing (539,746,654) (370,003,918) 1,124,417,922 1,036,405,023
24.2 Salaries, wages and other benefits include Rs. 9.91 million (2019: Rs. 9.10 million) whichrepresents employer's contribution towards provident fund.

78 ANNUAL REPORT 2020
2020 2019Note Rupees Rupees
25 Administrative expenses
Salaries and other benefits 25.1 204,140,222 204,209,828 Directors fees and expenses 1,133,612 1,213,423 Rent, rates and taxes 745,214 861,470 Postage and telephone 8,299,397 8,615,730 Printing, stationery and office supplies 2,446,592 3,565,392 Travelling and conveyance 22,311,433 22,949,239 Transportation 7,556,600 9,554,338 Legal and professional charges 5,717,091 6,242,543 Fuel and power 5,741,991 4,882,548 Auditors' remuneration 25.2 2,305,293 1,403,066 Repair and maintenance 11,986,253 12,881,668 Fee and subscriptions 8,329,958 6,556,678 Donations 25.3 6,617,621 5,480,369 Insurance 5,595,908 5,724,430 Depreciation on property, plant and equipment 12.4 48,536,447 48,550,451 Amortisation of intangibles 588,044 1,285,093 Canteen expenses 6,848,581 6,955,082 Other expenses 2,514,619 2,241,516
351,414,876 353,172,864
25.1
2020 2019Rupees Rupees
25.2 Auditors' remuneration
Fee for annual audit 1,276,000 866,250 Audit of consolidated financial statements 78,500 78,500 Review of half yearly financial statements 290,000 117,750 Special certificates and others 464,000 206,700 Out-of-pocket expenses 196,793 133,866
2,305,293 1,403,066
25.3
Name of directorNature of interestin donee
2020Rupees
2019Rupees
Mr. Osman Khalid Waheed (Director) Trustee 3,050,443 3,428,034
2020Rupees
2019Rupees
Cancer Research and Treatment Foundation 1,500,000 1,500,000 500,000 -
The Pakistan Society of Health System Pharmacist 800,000 -
Donations to following organizations exceeds Rs 0.5 million:
American Business Forum
Salaries and other benefits include Rs. 8.62 million (2019: Rs. 8.03 million) which represents employer'scontribution towards provident fund.
Name of donee
National Management Foundation (LUMS)
Donations include the payment to following institution in which the director is interested:

79ANNUAL REPORT 2020
2020 2019Note Rupees Rupees
26 Selling and distribution expenses
Salaries and other benefits 26.1 598,419,131 580,067,437
Travelling and conveyance 253,726,462 261,905,641
Trade debts directly written off - 38,876,781
Earnest money written off 1,065,159 -
Fuel and power 7,356,843 6,096,866
Rent, rates and taxes 9,589,090 7,783,589
Sales promotion and advertisement 143,100,576 140,401,554
Printing and stationary 5,239,183 4,856,911
Postage and telephone 19,857,207 17,317,589
Fee and subscription 34,829,468 26,848,193
Insurance 22,268,779 23,527,082
Repairs and maintenance 23,087,228 15,413,801
Conferences, seminars and training 103,625,205 125,509,646
Medical research and patient care 6,830,016 8,313,833
Depreciation on property, plant and equipment 12.4 52,541,116 52,342,811
Other expenses 740,119 391,764
1,282,275,582 1,309,653,498
26.1
2020 2019Note Rupees Rupees
27 Other expenses
- Exchange loss - net 27.1 36,788,808 80,849,857 Workers' Profit Participation Fund 20.1 30,367,021 17,597,332 Workers' Welfare Fund 9 11,247,351 8,872,286 Central Research Fund 9.1 6,134,752 3,555,017 Unrealized loss on re-measurement of short
term investments to fair value 21.1 - 11,014,902 Loss allowance against trade debts 5,196,175 - Realized loss on sale of short term investments 21.1 - 1,376,020
89,734,107 123,265,414
27.1 Loss incurred during the year was due to currency fluctuation.
Salaries and other benefits include Rs. 21.13 million (2019: Rs. 18.75 million) which representsemployer's contribution towards provident fund.

80 ANNUAL REPORT 2020
2020 201928 Other income Note Rupees Rupees
From financial assets 28.1 47,125,723 52,329,029 From non financial assets 28.2 46,008,372 130,061,542
93,134,095 182,390,571
28.1 From financial assets
Profit on deposits with banks 28.1.1 2,549,824 1,873,744 Dividend income 21.2 42,052,188 45,219,772 Unrealized gain on re-measurement of short
term investments to fair value 21.1 1,569,035 - Realized gain on sale of short term investments 21.1 954,676 - Reversal of loss allowance against trade debts - 5,235,513
47,125,723 52,329,029
28.1.1
2020 201928.2 From non financial assets Note Rupees Rupees
From related party
Share in profit of Farmacia - 98% owned partnership firm 20,317,261 16,747,464
Others
Gain on sale of property, plant andequipment - net of write off 12.5 23,123,459 30,806,125
Export rebate 2,567,652 1,619,087 Commission income - 80,888,866
25,691,111 113,314,078
46,008,372 130,061,542
29 Finance cost
Mark-up on- short term borrowings 29.1 21,558,600 18,431,078 - long term loan 217,479 - Bank charges 5,357,621 4,998,887
27,133,700 23,429,965
These include profit of Rs. Nil (2019: Rs. 0.02 million) earned on deposit account maintainedunder Shariah compliant arrangements.
81ANNUAL REPORT 2020
29.1
2020 2019
Rupees Rupees30 Taxation
Current- For the year 173,031,919 146,192,481 - For prior years 1,013,455 9,690,119
Deferred- For the year (9,170,575) 10,238,666 - For prior years - 1,550,847
164,874,799 167,672,113
30.1 Tax charge reconciliation
Numerical reconciliation between tax expense and accounting profit:
2020 2019Rupees Rupees
Profit before taxation 560,529,880 418,717,795
Applicable tax rate as per Income Tax Ordinance, 2001 29% 29%
2020 2019Rupees Rupees
Tax on accounting profit 162,553,665 121,428,161
Effect of final tax regime (8,841,647) 23,778,314
Effect of tax credit - (14,844,218)
Not adjustable for tax purposes 10,149,326 14,281,486
Effect of super tax - 11,787,403
Effect of proration and tax rate adjustment - 1,550,847
Prior year tax adjustment 1,013,455 9,690,120 2,321,134 46,243,952 164,874,799 167,672,113
30.2
- - - - - (Percentage) - - - - -
This includes markup paid under Shariah compliant arrangements amounting to Rs. 5.68 million(2019: Rs. 5.46 million) against facilities of short term borrowings.
The provision for current taxation represent tax under the normal tax regime at the rate of 29% oftaxable income (2019: 29%) and final taxes paid under final tax regime under Income TaxOrdinance, 2001.
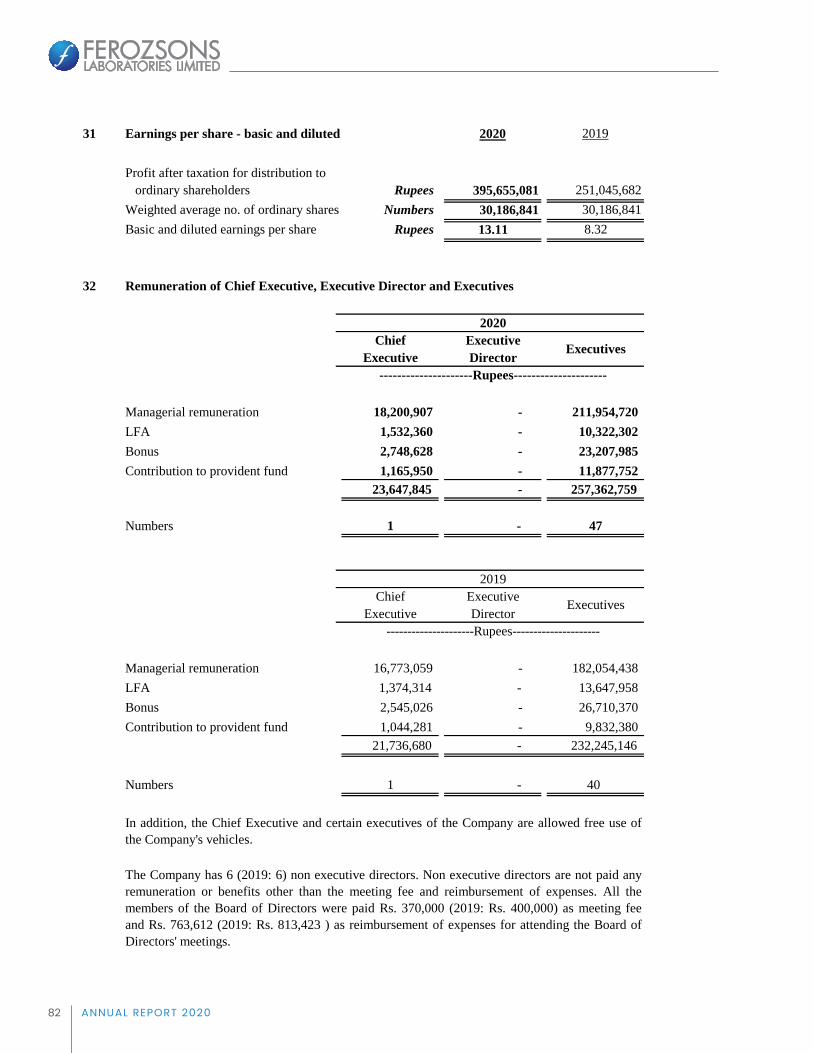
82 ANNUAL REPORT 2020
31 Earnings per share - basic and diluted 2020 2019
Profit after taxation for distribution to ordinary shareholders Rupees 395,655,081 251,045,682
Weighted average no. of ordinary shares Numbers 30,186,841 30,186,841Basic and diluted earnings per share Rupees 13.11 8.32
31.132 Remuneration of Chief Executive, Executive Director and Executives
Chief ExecutiveExecutive Director
Managerial remuneration 18,200,907 - 211,954,720 LFA 1,532,360 - 10,322,302 Bonus 2,748,628 - 23,207,985 Contribution to provident fund 1,165,950 - 11,877,752
23,647,845 - 257,362,759
Numbers 1 - 47
Chief ExecutiveExecutive Director
Managerial remuneration 16,773,059 - 182,054,438 LFA 1,374,314 - 13,647,958 Bonus 2,545,026 - 26,710,370 Contribution to provident fund 1,044,281 - 9,832,380
21,736,680 - 232,245,146
Numbers 1 - 40
The Company has 6 (2019: 6) non executive directors. Non executive directors are not paid anyremuneration or benefits other than the meeting fee and reimbursement of expenses. All themembers of the Board of Directors were paid Rs. 370,000 (2019: Rs. 400,000) as meeting feeand Rs. 763,612 (2019: Rs. 813,423 ) as reimbursement of expenses for attending the Board ofDirectors' meetings.
In addition, the Chief Executive and certain executives of the Company are allowed free use ofthe Company's vehicles.
---------------------Rupees---------------------
---------------------Rupees---------------------
2020
2019
There is no dilutive effect on the basic earnings per share as the Company has no
Executives
Executives
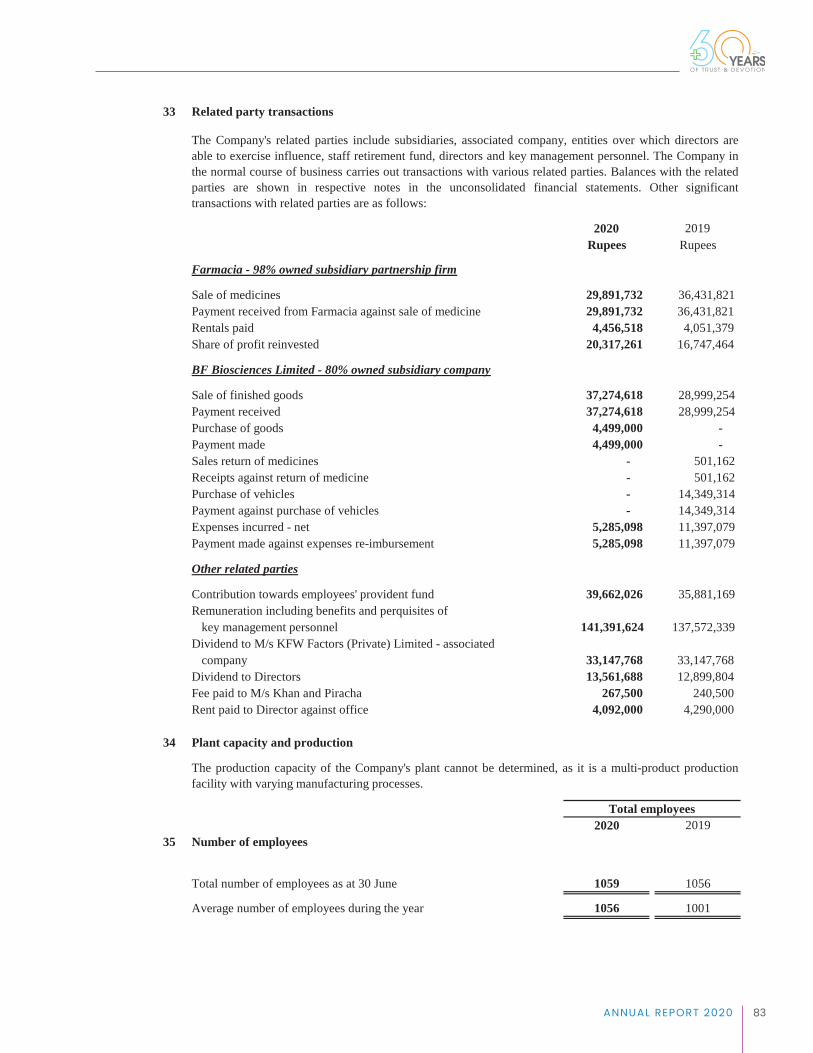
83ANNUAL REPORT 2020
33 Related party transactions
2020 2019Rupees Rupees
Farmacia - 98% owned subsidiary partnership firm
Sale of medicines 29,891,732 36,431,821 Payment received from Farmacia against sale of medicine 29,891,732 36,431,821Rentals paid 4,456,518 4,051,379Share of profit reinvested 20,317,261 16,747,464
BF Biosciences Limited - 80% owned subsidiary company
Sale of finished goods 37,274,618 28,999,254 Payment received 37,274,618 28,999,254 Purchase of goods 4,499,000 - Payment made 4,499,000 - Sales return of medicines - 501,162 Receipts against return of medicine - 501,162 Purchase of vehicles - 14,349,314 Payment against purchase of vehicles - 14,349,314 Expenses incurred - net 5,285,098 11,397,079 Payment made against expenses re-imbursement 5,285,098 11,397,079
Other related parties
Contribution towards employees' provident fund 39,662,026 35,881,169 Remuneration including benefits and perquisites of
key management personnel 141,391,624 137,572,339 Dividend to M/s KFW Factors (Private) Limited - associated
company 33,147,768 33,147,768 Dividend to Directors 13,561,688 12,899,804 Fee paid to M/s Khan and Piracha 267,500 240,500 Rent paid to Director against office 4,092,000 4,290,000
34 Plant capacity and production
2020 201935 Number of employees
Total number of employees as at 30 June 1059 1056
Average number of employees during the year 1056 1001
The Company's related parties include subsidiaries, associated company, entities over which directors areable to exercise influence, staff retirement fund, directors and key management personnel. The Company inthe normal course of business carries out transactions with various related parties. Balances with the relatedparties are shown in respective notes in the unconsolidated financial statements. Other significanttransactions with related parties are as follows:
The production capacity of the Company's plant cannot be determined, as it is a multi-product productionfacility with varying manufacturing processes.
Total employees
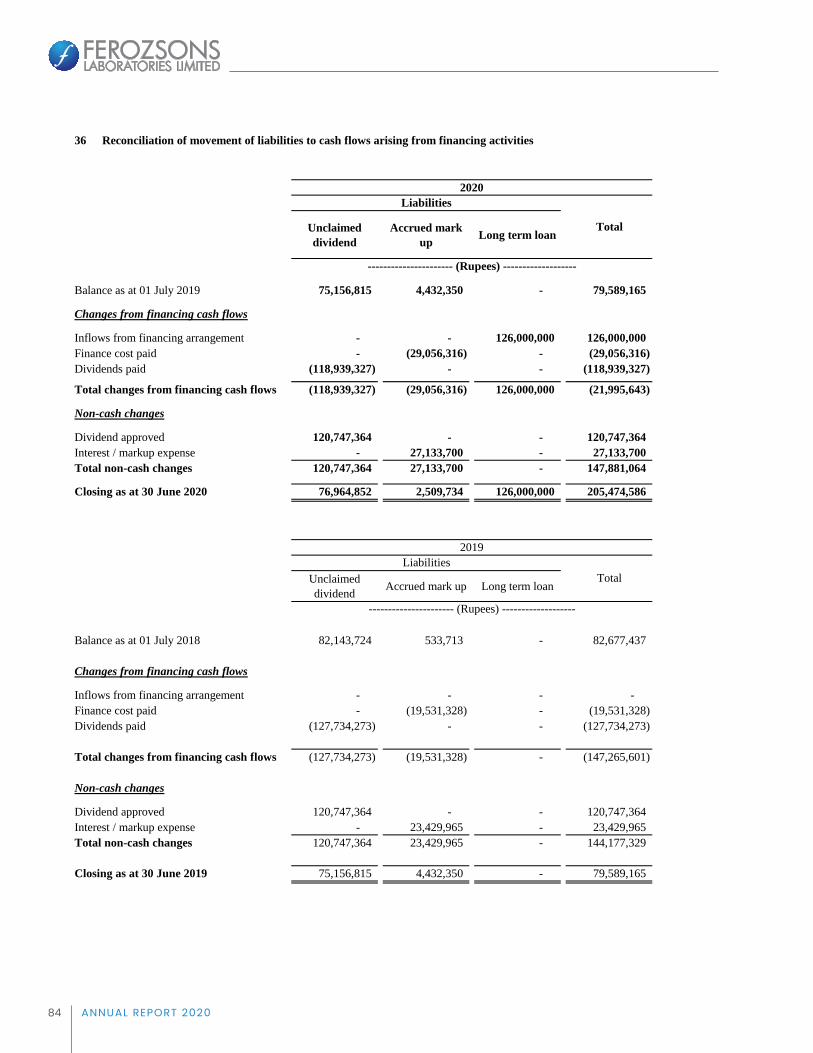
84 ANNUAL REPORT 2020
36 Reconciliation of movement of liabilities to cash flows arising from financing activities
Unclaimed dividend
Accrued mark up Long term loan
Balance as at 01 July 2019 75,156,815 4,432,350 - 79,589,165
Changes from financing cash flows
Inflows from financing arrangement - - 126,000,000 126,000,000 Finance cost paid - (29,056,316) - (29,056,316) Dividends paid (118,939,327) - - (118,939,327)
Total changes from financing cash flows (118,939,327) (29,056,316) 126,000,000 (21,995,643)
Non-cash changes
Dividend approved 120,747,364 - - 120,747,364 Interest / markup expense - 27,133,700 - 27,133,700 Total non-cash changes 120,747,364 27,133,700 - 147,881,064
Closing as at 30 June 2020 76,964,852 2,509,734 126,000,000 205,474,586
Unclaimed dividend Accrued mark up Long term loan
Balance as at 01 July 2018 82,143,724 533,713 - 82,677,437
Changes from financing cash flows
Inflows from financing arrangement - - - - Finance cost paid - (19,531,328) - (19,531,328) Dividends paid (127,734,273) - - (127,734,273)
Total changes from financing cash flows (127,734,273) (19,531,328) - (147,265,601)
Non-cash changes
Dividend approved 120,747,364 - - 120,747,364 Interest / markup expense - 23,429,965 - 23,429,965 Total non-cash changes 120,747,364 23,429,965 - 144,177,329
Closing as at 30 June 2019 75,156,815 4,432,350 - 79,589,165
Total
2019
Total
---------------------- (Rupees) -------------------
Liabilities
Liabilities
2020
---------------------- (Rupees) -------------------

85ANNUAL REPORT 2020
37 Disclosures relating to provident fund
% of Size of Fund
Rupees % of Size of Fund
Rupees
Ferozsons Laboratories Limited - Parent Company 81% 529,309,413 81% 428,921,024
BF Biosciences Limited - Subsidiary 17% 111,089,630 17% 91,006,094Farmacia - Partnership firm 2% 13,069,368 2% 10,608,830
100% 653,468,411 100% 530,535,948
38 Financial risk management
- Credit risk- Liquidity risk- Market risk
Risk management framework
38.1 Credit risk
The provident fund trust is a common fund for employees of the Group. Entity wise break up of the fund as on 30June is as follows:
Credit risk represents the risk of financial loss if a customer or counter party to a financial instrument failsto discharge its contractual obligations. The Company's credit risk arises from long term deposits, tradedebts, other receivables, loans and advances, deposits, short term investments and balances with banks.The Company has no significant concentration of credit risk as its exposure is spread over a large numberof counter parties.
Un-Audited 2020 Audited 2019
The Company has exposure to the following risks arising from financial instruments:
This note presents information about the Company’s exposure to each of the above risks, the Company’s objectives,policies and processes for measuring and managing risk, and the Company’s management of capital.
The Company's Board of Directors has overall responsibility for establishment and oversight of the Company's riskmanagement framework. The Board is responsible for developing and monitoring the Company’s risk managementpolicies.
The Company’s risk management policies are established to identify and analyze the risks faced by the Company, toset appropriate risk limits and controls, and to monitor risks and adherence to limits. Risk management policies andsystems are reviewed regularly to reflect changes in market conditions and the Company's activities. The Company,through its training and management standards and procedures, aims to develop a disciplined and constructivecontrol environment in which all employees understand their roles and obligations. The Board of Directors reviewsand agrees policies for managing each of these risks.
The Company's audit committee oversees how management monitors compliance with the Company’s riskmanagement policies and procedures and reviews the adequacy of the risk management framework in relation to therisks faced by the Company. Audit committee is assisted in its oversight role by internal audit department. Internalaudit department undertakes both regular and ad hoc reviews of risk management controls and procedures, theresults of which are reported to the audit committee.
Investments out of provident fund have been made in accordance with the provisions of Section 218 of theCompanies Act, 2017 and the rules formulated there under.
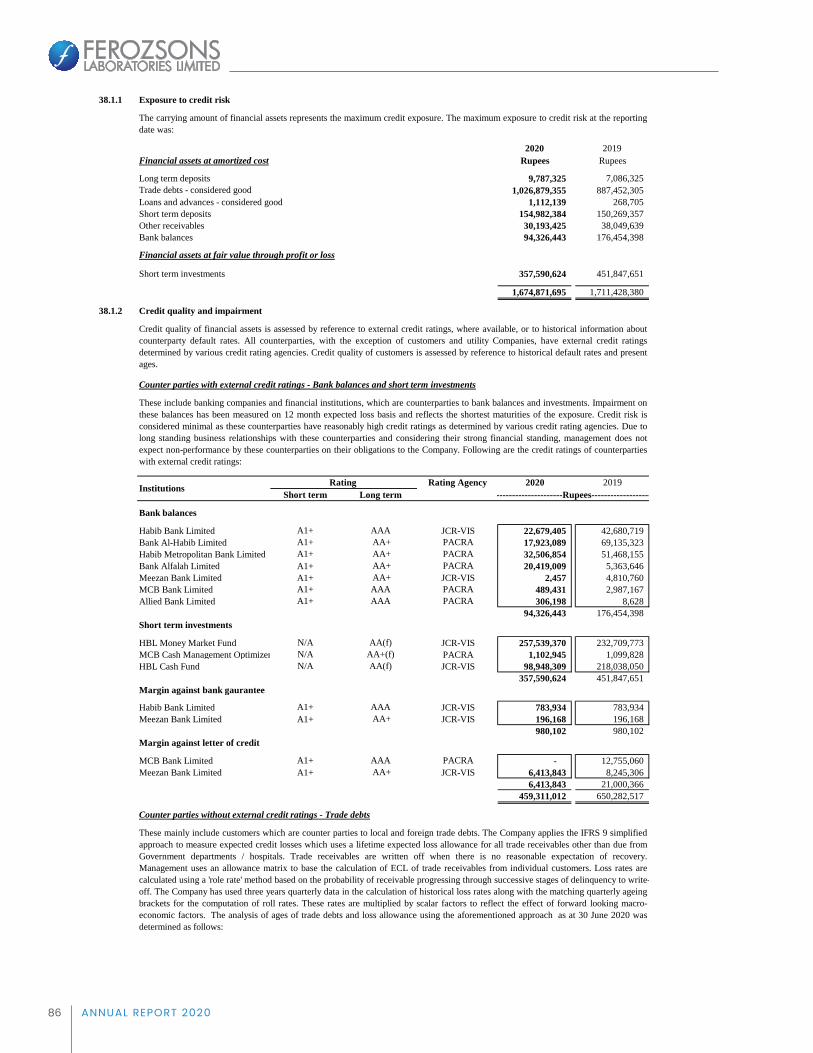
86 ANNUAL REPORT 2020
38.1.1 Exposure to credit risk
2020 2019Financial assets at amortized cost Rupees Rupees
Long term deposits 9,787,325 7,086,325 Trade debts - considered good 1,026,879,355 887,452,305 Loans and advances - considered good 1,112,139 268,705 Short term deposits 154,982,384 150,269,357 Other receivables 30,193,425 38,049,639 Bank balances 94,326,443 176,454,398
Financial assets at fair value through profit or loss
Short term investments 357,590,624 451,847,651
1,674,871,695 1,711,428,380
38.1.2 Credit quality and impairment
Counter parties with external credit ratings - Bank balances and short term investments
2020 2019Short term Long term
Bank balances
Habib Bank Limited A1+ AAA JCR-VIS 22,679,405 42,680,719 Bank Al-Habib Limited A1+ AA+ PACRA 17,923,089 69,135,323 Habib Metropolitan Bank Limited A1+ AA+ PACRA 32,506,854 51,468,155 Bank Alfalah Limited A1+ AA+ PACRA 20,419,009 5,363,646 Meezan Bank Limited A1+ AA+ JCR-VIS 2,457 4,810,760 MCB Bank Limited A1+ AAA PACRA 489,431 2,987,167 Allied Bank Limited A1+ AAA PACRA 306,198 8,628
94,326,443 176,454,398 Short term investments
HBL Money Market Fund N/A AA(f) JCR-VIS 257,539,370 232,709,773 MCB Cash Management Optimizer Fund N/A AA+(f) PACRA 1,102,945 1,099,828 HBL Cash Fund N/A AA(f) JCR-VIS 98,948,309 218,038,050
357,590,624 451,847,651 Margin against bank gaurantee
Habib Bank Limited A1+ AAA JCR-VIS 783,934 783,934 Meezan Bank Limited A1+ AA+ JCR-VIS 196,168 196,168
980,102 980,102 Margin against letter of credit
MCB Bank Limited A1+ AAA PACRA - 12,755,060 Meezan Bank Limited A1+ AA+ JCR-VIS 6,413,843 8,245,306
6,413,843 21,000,366 459,311,012 650,282,517
Counter parties without external credit ratings - Trade debts
The carrying amount of financial assets represents the maximum credit exposure. The maximum exposure to credit risk at the reportingdate was:
-------------------------Rupees-----------------------
Credit quality of financial assets is assessed by reference to external credit ratings, where available, or to historical information aboutcounterparty default rates. All counterparties, with the exception of customers and utility Companies, have external credit ratingsdetermined by various credit rating agencies. Credit quality of customers is assessed by reference to historical default rates and presentages.
Institutions
These mainly include customers which are counter parties to local and foreign trade debts. The Company applies the IFRS 9 simplifiedapproach to measure expected credit losses which uses a lifetime expected loss allowance for all trade receivables other than due fromGovernment departments / hospitals. Trade receivables are written off when there is no reasonable expectation of recovery.Management uses an allowance matrix to base the calculation of ECL of trade receivables from individual customers. Loss rates arecalculated using a 'role rate' method based on the probability of receivable progressing through successive stages of delinquency to write-off. The Company has used three years quarterly data in the calculation of historical loss rates along with the matching quarterly ageingbrackets for the computation of roll rates. These rates are multiplied by scalar factors to reflect the effect of forward looking macro-economic factors. The analysis of ages of trade debts and loss allowance using the aforementioned approach as at 30 June 2020 wasdetermined as follows:
These include banking companies and financial institutions, which are counterparties to bank balances and investments. Impairment onthese balances has been measured on 12 month expected loss basis and reflects the shortest maturities of the exposure. Credit risk isconsidered minimal as these counterparties have reasonably high credit ratings as determined by various credit rating agencies. Due tolong standing business relationships with these counterparties and considering their strong financial standing, management does notexpect non-performance by these counterparties on their obligations to the Company. Following are the credit ratings of counterpartieswith external credit ratings:
Rating Rating Agency

87ANNUAL REPORT 2020
The aging of trade debts at the reporting date was:
2020 2019
Not past due yet 184,318,570 435,633,234 Past due 61 - 90 days 157,892,132 54,196,466 Past due 91 - 180 days 178,117,743 146,970,683 Past due 181 - 365 days 193,395,779 216,880,636 More than 365 days 331,549,263 46,969,243 Less: Loss allowance on trade debts (18,394,132) (13,197,957)
1,026,879,355 887,452,305
38.1.3 Concentration of credit risk
38.2 Liquidity risk
Carryingamount
Less than one year
One to fiveyears
More than5 years
Financial liabilities
Long term loan - secured 126,000,000 31,500,000 94,500,000 - Trade and other payables 1,233,006,121 1,233,006,121 - - Unclaimed dividend 76,964,852 76,964,852 - - Short term borrowings - secured 51,017,136 51,017,136 - - Accrued mark-up 2,509,734 2,509,734 - -
1,489,497,843 1,394,997,843 94,500,000 -
Carryingamount
Less than one year
One to fiveyears
More than5 years
Financial liabilities
Long term loan - secured - - - - Trade and other payables 915,032,671 915,032,671 - - Unclaimed dividend 75,156,815 75,156,815 - - Short term borrowings - secured - - - - Accrued mark-up 4,432,350 4,432,350 - -
994,621,836 994,621,836 - -
38.3 Market risk
Deposits and other receivables are mostly due from Government Institutions, utility companies and a major supplier. Impairment onthese balances has been measured on 12 month expected loss basis and reflects the shortest maturities of the exposure. Based on pastexperience the management believes that no impairment allowance is necessary in respect of these financial assets. There are reasonablegrounds to believe that these amounts will be recovered in short course of time.
Concentration of credit risk exists when the changes in economic or industry factors similarly affect groups of counterparties whoseaggregate credit exposure is significant in relation to the Company's total credit exposure. The Company's portfolio of financialinstruments is broadly diversified and all other transactions are entered into with credit-worthy counterparties there-by mitigating anysignificant concentrations of credit risk.
Liquidity risk is the risk that the Company will not be able to meet its financial obligations as they fall due. The Company's approach tomanaging liquidity is to ensure as far as possible to always have sufficient liquidity to meet its liabilities when due. The Company is notmaterially exposed to liquidity risk as substantially all obligations / commitments of the Company are short term in nature and arerestricted to the extent of available liquidity.
The following are the contractual maturities of financial liabilities:
2020
---------------------------------------Rupees----------------------------------
2019
---------------------------------------Rupees----------------------------------
Market risk is the risk that the fair value of future cash flows of a financial instrument will fluctuate because of changes in foreigncurrency, interest rates and equity price that will effect the Company's income or the value of its holdings of financial instruments.
Export sales are majorly secured through letter of credit while majority of the local sales are made to Government departments /hospitals. Trade debts are essentially due from government departments / projects and the Company is actively pursuing for recovery ofdebts and the Company does not expect these companies to fail to meet their obligations.
--------------------------------------Rupees--------------------------------------
Others

88 ANNUAL REPORT 2020
Market risk comprises of three types of risks:
- currency risk. - interest rate risk- other price risk
38.3.1 Currency risk
- Transactional exposure in respect of non functional currency monetary items.- Transactional exposure in respect of non functional currency expenditure and revenues.
The potential currency exposures are discussed below:
Transactional exposure in respect of non functional currency monetary items
Transactional exposure in respect of non functional currency expenditure and revenues
Exposure to currency risk
The Company’s exposure to foreign currency risk at the reporting date was as follows:
Rupees US Dollars Euro UAE Dirham Pound Sterling
Cash and bank balances 16,900,754 81,666 13,089 4,125 2,515 Trade and other payables (798,085,521) (4,733,979) (12,912) (2,296) - Trade receivables 29,547,055 175,823 - - - Other receivables 30,749,117 182,976 - - - Gross financial position exposure (720,888,595) (4,293,514) 177 1,829 2,515
Rupees US Dollars Euro UAE Dirham Pound Sterling
Cash and bank balances 17,014,664 86,873 15,709 4,145 325 Trade and other payables (682,533,504) (4,248,166) (692) (57,112) - Trade receivables 40,758,653 254,662 - - - Other receivables 36,782,051 229,816 - - - Gross financial position exposure (587,978,136) (3,676,815) 15,017 (52,967) 325
The following significant exchange rates were applied during the year:
2020 2019 2020 2019
US Dollars 168.05 160.05 161.53 140.89Euro 188.61 182.32 179.29 160.89UAE Dirham 45.75 43.57 43.98 38.34Pound Sterling 206.50 203.01 201.97 181.27
Pakistani Rupee is the functional currency of the Company and exposure arises from transactions and balances in currencies other thanPakistani Rupee as foreign exchange rate fluctuations may create unwanted and unpredictable earnings and cash flow volatility. TheCompany's potential currency exposure comprises of:
2020
Monetary items, including financial assets and liabilities, denominated in currencies other than the functional currency of the Companyare periodically restated to rupee equivalent, and the associated gain or loss is taken to the unconsolidated statement of profit or loss.The foreign currency risk related to monetary items is managed as part of the risk management strategy.
Certain operating and capital expenditure is incurred by the Company in currency other than the functional currency. Certain salesrevenue is earned in currencies other than the functional currency of the Company. These currency risks are managed as a part of overall risk management strategy. The Company does not enter into forward exchange contracts.
2019
Average rateReporting date rate
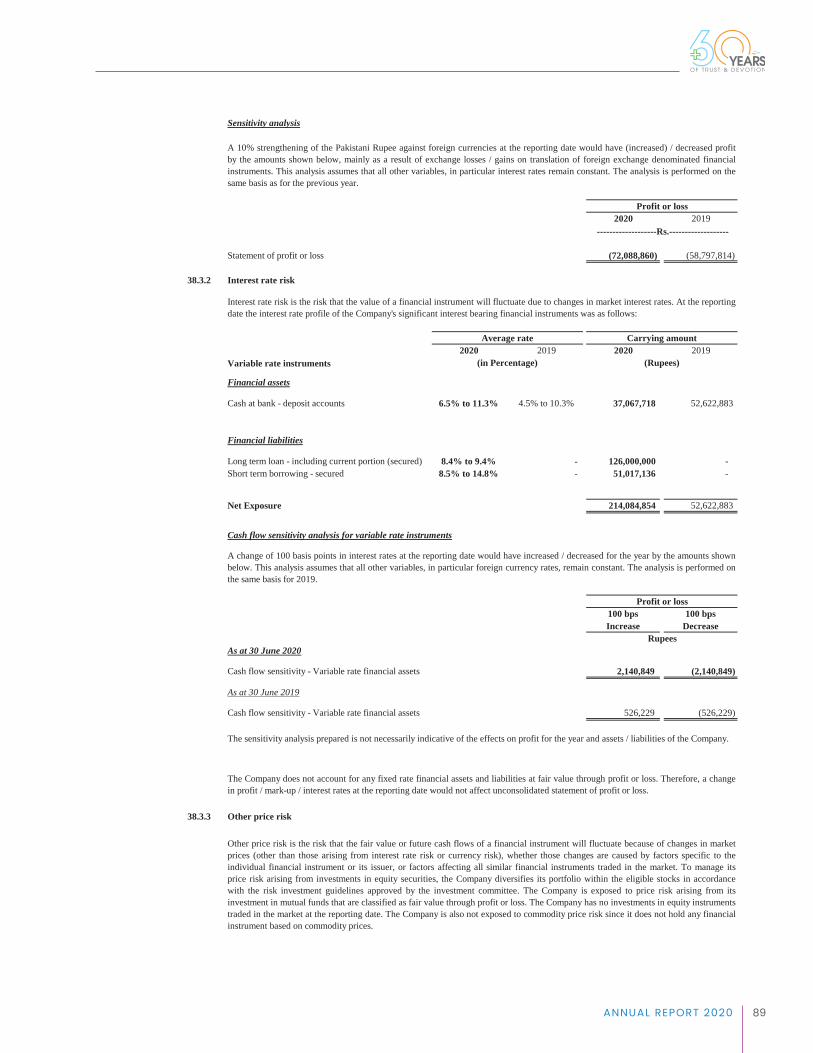
89ANNUAL REPORT 2020
Sensitivity analysis
2020 2019
Statement of profit or loss (72,088,860) (58,797,814)
38.3.2 Interest rate risk
2020 2019 2020 2019Variable rate instruments
Financial assets
Cash at bank - deposit accounts 6.5% to 11.3% 4.5% to 10.3% 37,067,718 52,622,883
Financial liabilities
Long term loan - including current portion (secured) 8.4% to 9.4% - 126,000,000 - Short term borrowing - secured 8.5% to 14.8% - 51,017,136 -
Net Exposure 214,084,854 52,622,883
Cash flow sensitivity analysis for variable rate instruments
100 bps 100 bpsIncrease Decrease
As at 30 June 2020
Cash flow sensitivity - Variable rate financial assets 2,140,849 (2,140,849)
As at 30 June 2019
Cash flow sensitivity - Variable rate financial assets 526,229 (526,229)
38.3.3 Other price risk
Profit or loss
Rupees
Average rate Carrying amount
(in Percentage)
The Company does not account for any fixed rate financial assets and liabilities at fair value through profit or loss. Therefore, a changein profit / mark-up / interest rates at the reporting date would not affect unconsolidated statement of profit or loss.
(Rupees)
Profit or loss
A 10% strengthening of the Pakistani Rupee against foreign currencies at the reporting date would have (increased) / decreased profitby the amounts shown below, mainly as a result of exchange losses / gains on translation of foreign exchange denominated financialinstruments. This analysis assumes that all other variables, in particular interest rates remain constant. The analysis is performed on thesame basis as for the previous year.
-------------------Rs.-------------------
The sensitivity analysis prepared is not necessarily indicative of the effects on profit for the year and assets / liabilities of the Company.
Interest rate risk is the risk that the value of a financial instrument will fluctuate due to changes in market interest rates. At the reportingdate the interest rate profile of the Company's significant interest bearing financial instruments was as follows:
Other price risk is the risk that the fair value or future cash flows of a financial instrument will fluctuate because of changes in marketprices (other than those arising from interest rate risk or currency risk), whether those changes are caused by factors specific to theindividual financial instrument or its issuer, or factors affecting all similar financial instruments traded in the market. To manage itsprice risk arising from investments in equity securities, the Company diversifies its portfolio within the eligible stocks in accordancewith the risk investment guidelines approved by the investment committee. The Company is exposed to price risk arising from itsinvestment in mutual funds that are classified as fair value through profit or loss. The Company has no investments in equity instrumentstraded in the market at the reporting date. The Company is also not exposed to commodity price risk since it does not hold any financialinstrument based on commodity prices.
A change of 100 basis points in interest rates at the reporting date would have increased / decreased for the year by the amounts shownbelow. This analysis assumes that all other variables, in particular foreign currency rates, remain constant. The analysis is performed onthe same basis for 2019.
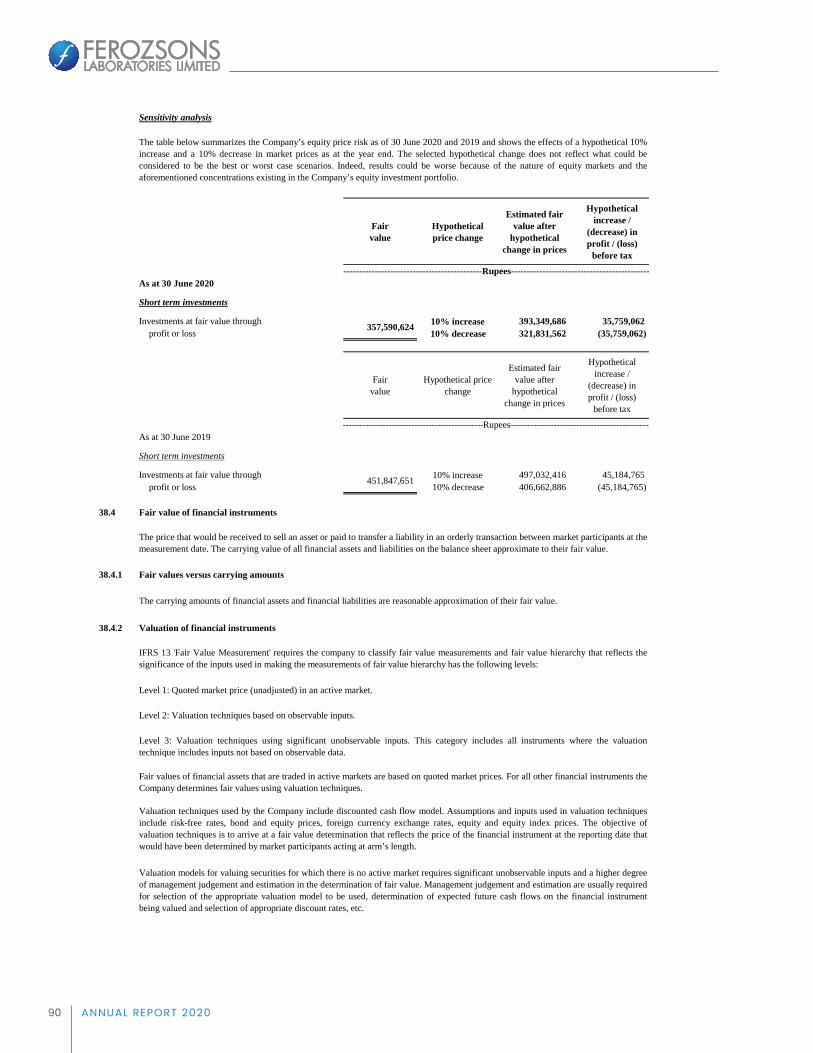
90 ANNUAL REPORT 2020
Sensitivity analysis
Fair value
Hypothetical price change
Estimated fair value after
hypothetical change in prices
Hypothetical increase /
(decrease) in profit / (loss)
before tax
As at 30 June 2020
Short term investments
Investments at fair value through 10% increase 393,349,686 35,759,062 profit or loss 10% decrease 321,831,562 (35,759,062)
Fair value
Hypothetical price change
Estimated fair value after
hypothetical change in prices
Hypothetical increase /
(decrease) in profit / (loss)
before tax
As at 30 June 2019
Short term investments
Investments at fair value through 10% increase 497,032,416 45,184,765 profit or loss 10% decrease 406,662,886 (45,184,765)
38.4 Fair value of financial instruments
38.4.1 Fair values versus carrying amounts
The carrying amounts of financial assets and financial liabilities are reasonable approximation of their fair value.
38.4.2 Valuation of financial instruments
Level 1: Quoted market price (unadjusted) in an active market.
Level 2: Valuation techniques based on observable inputs.
The price that would be received to sell an asset or paid to transfer a liability in an orderly transaction between market participants at themeasurement date. The carrying value of all financial assets and liabilities on the balance sheet approximate to their fair value.
The table below summarizes the Company’s equity price risk as of 30 June 2020 and 2019 and shows the effects of a hypothetical 10%increase and a 10% decrease in market prices as at the year end. The selected hypothetical change does not reflect what could beconsidered to be the best or worst case scenarios. Indeed, results could be worse because of the nature of equity markets and theaforementioned concentrations existing in the Company’s equity investment portfolio.
--------------------------------------------------Rupees--------------------------------------------------
357,590,624
--------------------------------------------------Rupees--------------------------------------------------
451,847,651
IFRS 13 'Fair Value Measurement' requires the company to classify fair value measurements and fair value hierarchy that reflects thesignificance of the inputs used in making the measurements of fair value hierarchy has the following levels:
Level 3: Valuation techniques using significant unobservable inputs. This category includes all instruments where the valuationtechnique includes inputs not based on observable data.
Fair values of financial assets that are traded in active markets are based on quoted market prices. For all other financial instruments theCompany determines fair values using valuation techniques.
Valuation techniques used by the Company include discounted cash flow model. Assumptions and inputs used in valuation techniquesinclude risk-free rates, bond and equity prices, foreign currency exchange rates, equity and equity index prices. The objective ofvaluation techniques is to arrive at a fair value determination that reflects the price of the financial instrument at the reporting date thatwould have been determined by market participants acting at arm’s length.
Valuation models for valuing securities for which there is no active market requires significant unobservable inputs and a higher degreeof management judgement and estimation in the determination of fair value. Management judgement and estimation are usually requiredfor selection of the appropriate valuation model to be used, determination of expected future cash flows on the financial instrumentbeing valued and selection of appropriate discount rates, etc.

91ANNUAL REPORT 2020
38.4
.3
Fair
val
ue
thro
ugh
prof
it or
lo
ss
Fina
ncia
l ass
ets
at a
mor
tised
cos
tO
ther
fina
ncia
l lia
bilit
ies
Tot
alLe
vel 1
Leve
l 2Le
vel 3
30 J
une
2020
Fina
ncia
l ass
ets m
easu
red
at fa
ir v
alue
:35
7,59
0,62
4
-
-
357,
590,
624
35
7,59
0,62
4
-
-
Fina
ncia
l ass
ets n
ot m
easu
red
at fa
ir v
alue
Long
term
dep
osits
and
pre
paym
ents
-
9,
787,
325
-
9,
787,
325
-
-
-
Tr
ade
debt
s - c
onsi
dere
d go
od-
1,02
6,87
9,35
5
-
1,02
6,87
9,35
5
-
-
-
Loan
s and
adv
ance
s - c
onsi
dere
d go
od-
22,3
48,4
97
-
22,3
48,4
97
-
-
-
Shor
t ter
m d
epos
its-
154,
982,
384
-
154,
982,
384
-
-
-
Oth
er re
ceiv
able
s-
30,1
93,4
25
-
30,1
93,4
25
-
-
-
Cash
and
ban
k ba
lanc
es-
99,2
97,8
18
-
99,2
97,8
18
-
-
-
-
1,
343,
488,
804
-
1,
343,
488,
804
-
-
-
Fina
ncia
l lia
bilit
ies m
easu
red
at fa
ir v
alue
-
-
-
-
-
-
-
Fina
ncia
l lia
bilit
ies n
ot m
easu
red
at fa
ir v
alue
Trad
e an
d ot
her p
ayab
les
-
-
1,23
3,00
6,12
1
1,
233,
006,
121
-
-
-
U
ncla
imed
div
iden
d-
-
76
,964
,852
76,9
64,8
52
-
-
-
Long
term
loan
s - se
cure
d-
-
12
6,00
0,00
0
126,
000,
000
Sh
ort t
erm
bor
row
ings
- se
cure
d-
-
51
,017
,136
51,0
17,1
36
-
-
-
Acc
rued
mar
k-up
-
-
2,50
9,73
4
2,
509,
734
-
-
-
-
-
1,
489,
497,
843
1,48
9,49
7,84
3
-
-
-
The
follo
win
gta
ble
show
sth
eca
rryi
ngam
ount
san
dfa
irva
lues
offin
anci
alas
sets
and
finan
cial
liabi
litie
s,in
clud
ing
thei
rlev
els
inth
efa
irva
lue
hier
arch
y.It
does
noti
nclu
defa
irva
lue
info
rmat
ion
for
finan
cial
ass
ets a
nd fi
nanc
ial l
iabi
litie
s not
mea
sure
d at
fair
valu
e if
the
carr
ying
am
ount
is a
reas
onab
le a
ppro
xim
atio
n of
fair
valu
e.
Fair
Val
ue
- - -
- - -
- - -
- - -
- - -
- - -
- - -
- - -
- - -
- - -
- - -
- - -
- - -
- - -
- - R
upee
s - -
- - -
- - -
- - -
- - -
- -- -
- - -
- - -
- - -
- - -
- --
- - -
- - -
- - -
- - -
- - -
-
Car
ryin
g A
mou
nt

92 ANNUAL REPORT 2020
Fair
Val
ue
thro
ugh
prof
it or
lo
ss
Fina
ncia
l ass
ets
at a
mor
tised
cos
tO
ther
fina
ncia
l lia
bilit
ies
Tot
alLe
vel 1
Leve
l 2Le
vel 3
30 J
une
2019
Fina
ncia
l ass
ets m
easu
red
at fa
ir va
lue:
451,
874,
651
-
-
45
1,87
4,65
1
451,
874,
651
-
-
Fina
ncia
l ass
ets n
ot m
easu
red
at fa
ir v
alue
Long
term
dep
osits
and
pre
paym
ents
-
7,
086,
325
-
7,
086,
325
-
-
-
Tr
ade
debt
s - c
onsi
dere
d go
od-
887,
452,
305
-
887,
452,
305
-
-
-
Loan
s and
adv
ance
s - c
onsi
dere
d go
od-
20,2
30,8
60
-
20,2
30,8
60
-
-
-
Shor
t ter
m d
epos
its-
150,
269,
357
-
150,
269,
357
-
-
-
Oth
er re
ceiv
able
s-
38,0
49,6
39
-
38,0
49,6
39
-
-
-
Cash
and
ban
k ba
lanc
es-
183,
447,
782
-
183,
447,
782
-
-
-
-
1,
286,
536,
268
-
1,
286,
536,
268
-
-
-
Fina
ncia
l lia
bilit
ies m
easu
red
at fa
ir va
lue:
-
-
-
-
-
-
-
Fina
ncia
l lia
bilit
ies n
ot m
easu
red
at fa
ir v
alue
Trad
e an
d ot
her p
ayab
les
-
-
915,
032,
671
91
5,03
2,67
1
-
-
-
U
ncla
imed
div
iden
d-
-
75
,156
,815
75,1
56,8
15
Lo
ng te
rm lo
ans -
secu
red
-
-
-
-
Shor
t ter
m b
orro
win
gs -
secu
red
-
-
-
-
-
-
-
A
ccru
ed m
ark-
up-
-
4,
432,
350
4,43
2,35
0
-
-
-
-
-
994,
621,
836
99
4,62
1,83
6
-
-
-
Fair
val
ue o
f pro
pert
y, p
lant
and
equ
ipm
ent
Free
hold
land
,bui
ldin
gson
freeh
old
land
and
plan
tand
mac
hine
ryha
vebe
enca
rrie
dat
reva
lued
amou
nts
dete
rmin
edby
prof
essi
onal
valu
ers
(leve
l3)
base
don
thei
ras
sess
men
tof
mar
ketv
alue
asdi
sclo
sed
inno
te6.
The
valu
atio
nsar
eco
nduc
ted
byth
eva
luat
ion
expe
rtsap
poin
ted
byth
eC
ompa
ny.T
heva
luat
ion
expe
rtsus
eda
mar
ketb
ased
appr
oach
toar
rive
atth
efa
irva
lue
ofth
eCo
mpa
ny's
prop
ertie
s.Th
isre
valu
atio
nw
asca
rrie
dou
tby
Asi
fAss
ocia
tes
(Priv
ate)
Lim
ited
(Ind
epen
dent
valu
ers
and
cons
ulta
nts)
.Fre
ehol
dla
ndw
asre
valu
edon
the
basi
sof
curr
entm
arke
tval
uew
here
asot
her
asse
tsw
ere
reva
lued
onth
eba
sis
ofde
prec
iate
dm
arke
tva
lues
.The
mos
tsi
gnifi
cant
inpu
tin
toth
isva
luat
ion
appr
oach
ispr
ice
per
acre
for
land
,pr
ice
per
squa
refo
otfo
rbu
ildin
gsan
dpr
esen
top
erat
iona
lco
nditi
onan
dag
eof
plan
tan
dm
achi
nery
and
othe
ras
sets
.The
effe
ctof
chan
ges
inth
eun
obse
rvab
lein
puts
used
inth
eva
luat
ions
cann
otbe
dete
rmin
edw
ithce
rtain
ty,a
ccor
ding
lya
qual
itativ
e di
sclo
sure
of s
ensi
tivity
has
not
bee
n pr
esen
ted
in th
ese
finan
cial
stat
emen
ts.
Fair
Val
ue
- - -
- - -
- - -
- - -
- - -
- - -
- - -
- - -
- - -
- - -
- - -
- - -
- - -
- - -
- - R
upee
s - -
- - -
- - -
- - -
- - -
- -- -
- - -
- - -
- - -
- - -
- --
- - -
- - -
- - -
- - -
- - -
-
Car
ryin
g A
mou
nt
93ANNUAL REPORT 2020
38.5 Capital management
The Company's objectives when managing capital are:
(i)
(ii) to provide an adequate return to shareholders.
39 Impact of COVID-19 (CORONAVIRUS)
40 Non adjusting events after the reporting date
The Board’s policy is to maintain an efficient capital base so as to maintain investor, creditorand market confidence and to sustain the future development of its business. The Board ofDirectors monitors the return on capital employed, which the Company defines as operatingincome divided by total capital employed. The Board of Directors also monitors the level ofdividends to ordinary shareholders.
to safeguard the entity's ability to continue as a going concern, so that it can continueto provide returns for shareholders and benefits for other stakeholders, and
The Company manages the capital structure in the context of economic conditions and therisk characteristics of the underlying assets. In order to maintain or adjust the capitalstructure, the Company may adjust the amount of dividends paid to shareholders, issue newshares, or sell assets to reduce debt.
Neither there were any changes in the Company’s approach to capital management during theyear nor the Company is subject to externally imposed capital requirements.
The Board of Directors of the Company in its meeting held on 24 September 2020 has proposed afinal cash dividend of Rs. 4 (2019: Rs. 4) per share and bonus shares at the rate of 20% (2019: Nil)subject to the approval of the members in the upcoming Annual General Meeting to be held on 26October 2020.
On 11 March 2020, COVID-19 (Coronavirus) was declared a pandemic by the World HealthOrganization. The pandemic of COVID-19 that has rapidly spread all across the world has not onlyendangered human lives but also adversely impacted the global economy. On 23 March 2020, theFederal and Provincial Governments of Pakistan announced a temporary lock down as a measure toreduce the spread of the COVID-19. However, being a Company in Pharmaceutical Sector, it wasexempt from lockdown measures. After implementing all the necessary Standard OperatingProcedures (SOPs) to ensure safety of employees, the Company continued to carry out its operationsand has taken all necessary steps to ensure smooth and adequate continuation of its business.Management believes that there is no significant accounting adverse impact of the effects of COVID-19 on the operations of the Company and on these unconsolidated financial statements. However,pursuant to relaxation announced by the State Bank of Pakistan in view of this pandemic, theCompany has availed long term loan under refinance scheme for payment of wages and salaries asfully explained in note 7 to these unconsolidated financial statements.

94 ANNUAL REPORT 2020
41 Corresponding figures
42 Date of authorization for issue
_______________________ _____________________ _____________Chief Executive Officer Chief Financial Officer Director
Corresponding figures have been re-arranged, wherever necessary, for the purpose of comparison andbetter presentation as per reporting framework.
These unconsolidated financial statements have been authorized for issue by the Board of Directors ofthe Company on 24 September 2020.

95ANNUAL REPORT 2020
CONSOLIDATEDFINANCIAL STATEMENTS

96 ANNUAL REPORT 2020

97ANNUAL REPORT 2020 97ANNUAL REPORT 2020
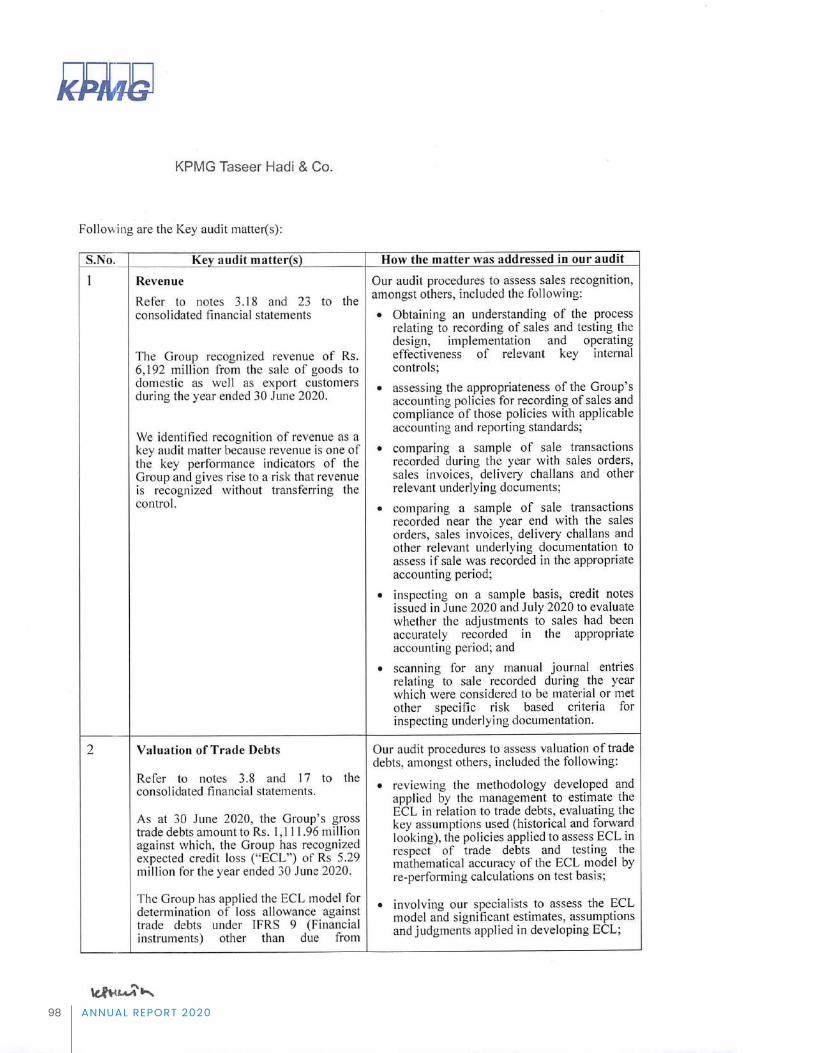
98 ANNUAL REPORT 202098 ANNUAL REPORT 2020

99ANNUAL REPORT 2020 99ANNUAL REPORT 2020

100 ANNUAL REPORT 2020100 ANNUAL REPORT 2020

101ANNUAL REPORT 2020 101ANNUAL REPORT 2020
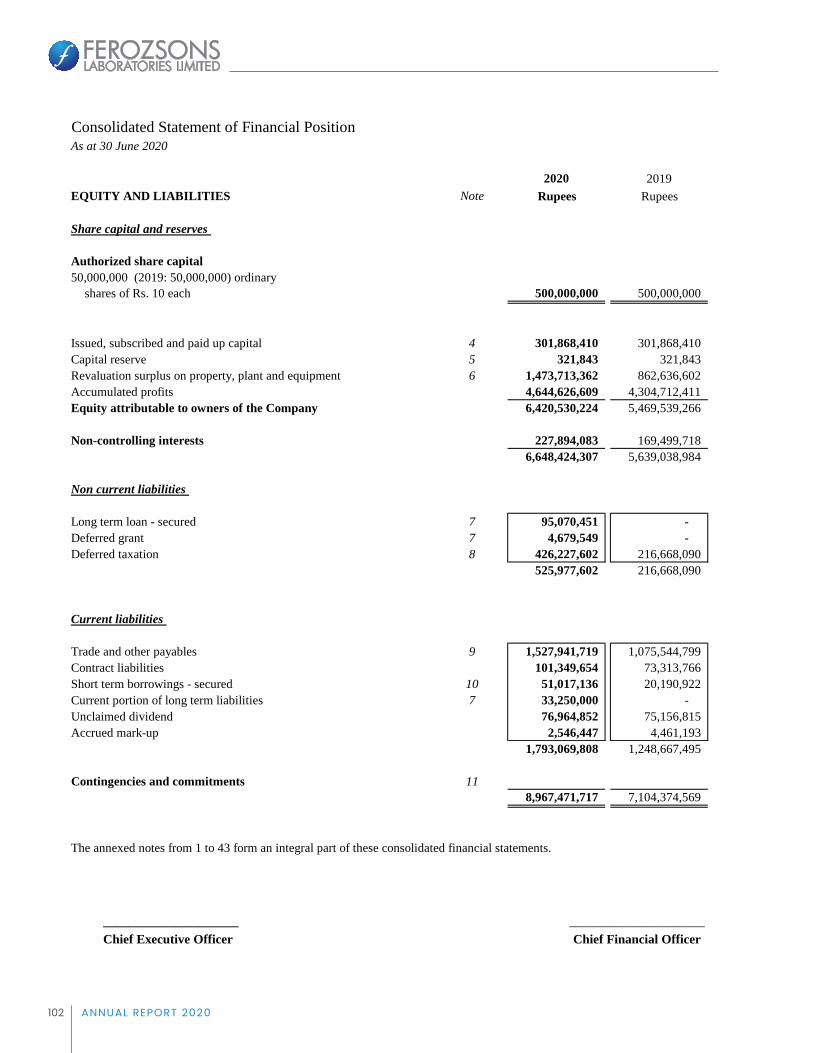
102 ANNUAL REPORT 2020
Ferozsons Laboratories LimitedConsolidated Statement of Financial PositionAs at 30 June 2020
2020 2019 2020 2019EQUITY AND LIABILITIES Note Rupees Rupees ASSETS Note Rupees Rupees
Share capital and reserves Non current assets
Authorized share capital Property, plant and equipment 12 3,995,871,086 3,025,689,113 50,000,000 (2019: 50,000,000) ordinary Intangible assets 13 423,507 731,188
shares of Rs. 10 each 500,000,000 500,000,000 Investment property 14 79,371,992 79,371,992 Long term deposits 14,334,325 11,633,325
4,090,000,910 3,117,425,618 Issued, subscribed and paid up capital 4 301,868,410 301,868,410 Capital reserve 5 321,843 321,843 Current assetsRevaluation surplus on property, plant and equipment 6 1,473,713,362 862,636,602 Accumulated profits 4,644,626,609 4,304,712,411 Stores, spare parts and loose tools 15 65,536,483 49,262,538 Equity attributable to owners of the Company 6,420,530,224 5,469,539,266 Stock in trade 16 2,049,992,236 1,328,150,326
Trade debts - considered good 17 1,092,779,921 950,788,444 Non-controlling interests 227,894,083 169,499,718 Loans and advances - considered good 18 66,263,891 27,608,454
6,648,424,307 5,639,038,984 Deposits and prepayments 19 276,619,444 166,564,200 Other receivables 20 38,070,462 67,402,845
Non current liabilities Advance income tax - net 376,107,745 264,373,526 Short term investments 21 760,707,781 864,945,037
Long term loan - secured 7 95,070,451 - Cash and bank balances 22 151,392,844 267,853,581 Deferred grant 7 4,679,549 - 4,877,470,807 3,986,948,951 Deferred taxation 8 426,227,602 216,668,090
525,977,602 216,668,090
Current liabilities
Trade and other payables 9 1,527,941,719 1,075,544,799 Contract liabilities 101,349,654 73,313,766 Short term borrowings - secured 10 51,017,136 20,190,922 Current portion of long term liabilities 7 33,250,000 - Unclaimed dividend 76,964,852 75,156,815 Accrued mark-up 2,546,447 4,461,193
1,793,069,808 1,248,667,495
Contingencies and commitments 11 8,967,471,717 7,104,374,569 8,967,471,717 7,104,374,569
The annexed notes from 1 to 43 form an integral part of these consolidated financial statements.
_____________________ ______________________ _______________Chief Executive Officer Chief Financial Officer Director
Ferozsons Laboratories LimitedUnconsolidated Statement of Profit or Loss For the year ended 30 June 2020
2020 2019Note Rupees Rupees
Revenue - net 23 5,394,043,009 5,180,803,582 Cost of sales 24 (3,176,088,959) (3,134,954,617) Gross profit 2,217,954,050 2,045,848,965
Administrative expenses 25 (351,414,876) (353,172,864) Selling and distribution expenses 26 (1,282,275,582) (1,309,653,498) Other expenses 27 (89,734,107) (123,265,414) Other income 28 93,134,095 182,390,571 Profit from operations 587,663,580 442,147,760
Finance cost 29 (27,133,700) (23,429,965) Profit before taxation 560,529,880 418,717,795
Taxation 30 (164,874,799) (167,672,113) Profit after taxation 395,655,081 251,045,682
Earnings per share - basic and diluted 31 13.11 8.32
The annexed notes from 1 to 42 form an integral part of these unconsolidated financial statements.
_____________________ _____________________ ____________Chief Executive Officer Chief Financial Officer Director

103ANNUAL REPORT 2020
Ferozsons Laboratories LimitedConsolidated Statement of Financial PositionAs at 30 June 2020
2020 2019 2020 2019EQUITY AND LIABILITIES Note Rupees Rupees ASSETS Note Rupees Rupees
Share capital and reserves Non current assets
Authorized share capital Property, plant and equipment 12 3,995,871,086 3,025,689,113 50,000,000 (2019: 50,000,000) ordinary Intangible assets 13 423,507 731,188
shares of Rs. 10 each 500,000,000 500,000,000 Investment property 14 79,371,992 79,371,992 Long term deposits 14,334,325 11,633,325
4,090,000,910 3,117,425,618 Issued, subscribed and paid up capital 4 301,868,410 301,868,410 Capital reserve 5 321,843 321,843 Current assetsRevaluation surplus on property, plant and equipment 6 1,473,713,362 862,636,602 Accumulated profits 4,644,626,609 4,304,712,411 Stores, spare parts and loose tools 15 65,536,483 49,262,538 Equity attributable to owners of the Company 6,420,530,224 5,469,539,266 Stock in trade 16 2,049,992,236 1,328,150,326
Trade debts - considered good 17 1,092,779,921 950,788,444 Non-controlling interests 227,894,083 169,499,718 Loans and advances - considered good 18 66,263,891 27,608,454
6,648,424,307 5,639,038,984 Deposits and prepayments 19 276,619,444 166,564,200 Other receivables 20 38,070,462 67,402,845
Non current liabilities Advance income tax - net 376,107,745 264,373,526 Short term investments 21 760,707,781 864,945,037
Long term loan - secured 7 95,070,451 - Cash and bank balances 22 151,392,844 267,853,581 Deferred grant 7 4,679,549 - 4,877,470,807 3,986,948,951 Deferred taxation 8 426,227,602 216,668,090
525,977,602 216,668,090
Current liabilities
Trade and other payables 9 1,527,941,719 1,075,544,799 Contract liabilities 101,349,654 73,313,766 Short term borrowings - secured 10 51,017,136 20,190,922 Current portion of long term liabilities 7 33,250,000 - Unclaimed dividend 76,964,852 75,156,815 Accrued mark-up 2,546,447 4,461,193
1,793,069,808 1,248,667,495
Contingencies and commitments 11 8,967,471,717 7,104,374,569 8,967,471,717 7,104,374,569
The annexed notes from 1 to 43 form an integral part of these consolidated financial statements.
_____________________ ______________________ _______________Chief Executive Officer Chief Financial Officer Director
Ferozsons Laboratories LimitedUnconsolidated Statement of Profit or Loss For the year ended 30 June 2020
2020 2019Note Rupees Rupees
Revenue - net 23 5,394,043,009 5,180,803,582 Cost of sales 24 (3,176,088,959) (3,134,954,617) Gross profit 2,217,954,050 2,045,848,965
Administrative expenses 25 (351,414,876) (353,172,864) Selling and distribution expenses 26 (1,282,275,582) (1,309,653,498) Other expenses 27 (89,734,107) (123,265,414) Other income 28 93,134,095 182,390,571 Profit from operations 587,663,580 442,147,760
Finance cost 29 (27,133,700) (23,429,965) Profit before taxation 560,529,880 418,717,795
Taxation 30 (164,874,799) (167,672,113) Profit after taxation 395,655,081 251,045,682
Earnings per share - basic and diluted 31 13.11 8.32
The annexed notes from 1 to 42 form an integral part of these unconsolidated financial statements.
_____________________ _____________________ ____________Chief Executive Officer Chief Financial Officer Director

104 ANNUAL REPORT 2020
Ferozsons Laboratories LimitedConsolidated Statement of Profit or Loss For the year ended 30 June 2020
2020 2019Note Rupees Rupees
Revenue - net 23 6,191,816,270 5,802,855,865 Cost of sales 24 (3,873,653,990) (3,761,902,459) Gross profit 2,318,162,280 2,040,953,406
Administrative expenses 25 (393,802,573) (393,604,529) Selling and distribution expenses 26 (1,326,696,536) (1,353,585,894) Other expenses 27 (99,849,746) (142,957,501) Other income 28 122,649,758 212,019,398 Profit from operations 620,463,183 362,824,880
Finance cost 29 (28,525,046) (24,760,408) Profit before taxation 591,938,137 338,064,472
Taxation 30 (169,358,407) (150,069,156) Profit after taxation 422,579,730 187,995,316
Attributable to:
Owners of the Group 416,969,060 200,775,867Non-controlling interests 5,610,670 (12,780,551)Profit after taxation 422,579,730 187,995,316
Earnings per share - basic and diluted 31 13.81 6.65
The annexed notes from 1 to 43 form an integral part of these consolidated financial statements.
____________________ _____________________ ____________Chief Executive Officer Chief Financial Officer Director
Ferozsons Laboratories LimitedConsolidated Statement of Comprehensive IncomeFor the year ended 30 June 2020
2020 2019Rupees Rupees
Profit after taxation 422,579,730 187,995,316
Items that will not be reclassified to profit or loss
Surplus on revaluation of property, plant and equipment 933,886,668 - Related deferred tax on surplus (226,333,713) -
Total comprehensive income for the year 1,130,132,686 187,995,316
Attributable to:
Owners of the Group 1,071,738,321 200,775,867 Non-controlling interests 58,394,365 (12,780,551)
1,130,132,686 187,995,316
The annexed notes from 1 to 43 form an integral part of these consolidated financial statements.
____________________ ___________________ __________Chief Executive Officer Chief Financial Officer Director

105ANNUAL REPORT 2020
Ferozsons Laboratories LimitedConsolidated Statement of Comprehensive IncomeFor the year ended 30 June 2020
2020 2019Rupees Rupees
Profit after taxation 422,579,730 187,995,316
Items that will not be reclassified to profit or loss
Surplus on revaluation of property, plant and equipment 933,886,668 - Related deferred tax on surplus (226,333,713) -
Total comprehensive income for the year 1,130,132,686 187,995,316
Attributable to:
Owners of the Group 1,071,738,321 200,775,867 Non-controlling interests 58,394,365 (12,780,551)
1,130,132,686 187,995,316
The annexed notes from 1 to 43 form an integral part of these consolidated financial statements.
____________________ ___________________ __________Chief Executive Officer Chief Financial Officer Director

106 ANNUAL REPORT 2020
Ferozsons Laboratories LimitedConsolidated Statement of Changes in EquityFor the year ended 30 June 2020
Revenue reserve
Share capital
Capital reserve
Revaluation surplus on
property, plant and equipment
Accumulated profits
Balance as at 01 July 2018 301,868,410 321,843 921,179,842 4,180,959,998 5,404,330,093 184,349,045 5,588,679,138
Total comprehensive income for the year - - - 200,775,867 200,775,867 (12,780,551) 187,995,316
Surplus transferred to accumulated profit:
- - - (43,723,910) 43,723,910 - - -
Effect of change in tax rate on account of surplus on property, plant and equipment - - (14,819,330) - (14,819,330) (2,068,776) (16,888,106)
Transactions with owners of the Company, recognized directly in equity - Distributions
- - - (60,373,682) (60,373,682) - (60,373,682)
- - - (60,373,682) (60,373,682) - (60,373,682) - - - (120,747,364) (120,747,364) - (120,747,364)
Balance as at 30 June 2019 301,868,410 321,843 862,636,602 4,304,712,411 5,469,539,266 169,499,718 5,639,038,984
Total comprehensive income for the year
Profit after taxation - - - 416,969,060 416,969,060 5,610,670 422,579,730 Surplus on revaluation of property, plant and equipment - - 861,384,347 - 861,384,347 72,502,322 933,886,669 Related deferred tax on surplus - - (206,615,085) - (206,615,085) (19,718,627) (226,333,712)
- - 654,769,262 416,969,060 1,071,738,322 58,394,365 1,130,132,687 Surplus transferred to accumulated profit:- -
- - (43,692,502) 43,692,502 - - -
Transactions with owners of the Company, recognized directly in equity - Distributions
-- - - (120,747,364) (120,747,364) - (120,747,364)
Balance as at 30 June 2020 301,868,410 321,843 1,473,713,362 4,644,626,609 6,420,530,224 227,894,083 6,648,424,307
The annexed notes from 1 to 43 form an integral part of these consolidated financial statements.
__________________________ ___________________ __________Chief Executive Officer Chief Financial Officer Director
Total TotalNon-controlling interest
Capital reserve
Attributable to Owners of the Company
Final dividend for the year ended 30 June 2019 at Rs. 4 pershare
- - - - - - - - - - - - - - - - - - - - - - - - - - - - - - - - - - - - - - - - - - Rupees - - - - - - - - - - - - - - - - - - - - - - - - - - - - - - - - - - - - - - - - - -
on account of incremental depreciation on property, plantand equipment charged during the year - net of tax
Final dividend for the year ended 30 June 2018 at Rs. 2 per share
on account of incremental depreciation on property, plant and equipment charged during the year - net of tax
Interim dividend for the year ended 30 June 2019 at Rs. 2 per share
Ferozsons Laboratories LimitedConsolidated Statement of Cash FlowsFor the year ended 30 June 2020
2020 2019Cash flow from operating activities Note Rupees Rupees
Profit before taxation 591,938,137 338,064,472 Adjustments for non - cash and other items
Depreciation on property, plant and equipment 12.4 378,938,054 394,892,304 Amortisation of intangible assets 588,017 1,626,444 Trade debts directly written off 26 - 39,920,925 Provision / (reversal) of loss allowance against trade debts 17.1 5,288,914 (5,121,922) Gain on disposal of property, plant and equipment 12.5 (23,778,459) (33,836,612) Finance cost 28,525,046 24,760,408 (Gain) / loss on re-measurement of short term investments to fair value (3,131,383) 14,284,164 (Gain) / loss on sale of short term investments (699,063) 8,603,276 Amortized gain on Government Securities - 6,154,627 Dividend income 28.1 (52,521,192) (64,022,513) Workers' Profit Participation Fund 33,586,141 17,597,332 Central Research Fund 6,785,079 3,555,017 Workers' Welfare Fund 12,470,617 8,872,286
386,051,771 417,285,736 Cash generated from operations before working capital changes 977,989,908 755,350,208 Effect on cash flow due to working capital changes(Increase) / decrease in current assets
Stores, spare parts and loose tools (16,273,945) 22,539,678 Stock in trade (721,841,910) 18,845,937 Trade debts - considered good (147,280,391) (400,135,764) Loans and advances - considered good (38,655,437) 20,617,402 Deposits and prepayments (110,055,244) 24,864,741 Other receivables 16,929,715 28,415,741
(1,017,177,212) (284,852,265) Increase in current liabilities
Trade and other payables 470,018,274 185,626,939
Cash generated from operations 430,830,970 656,124,882
Taxes paid (297,866,828) (219,099,841) Workers' Profit Participation Fund paid (17,597,332) (21,111,690) Workers' Welfare Fund paid (8,872,286) (7,090,508) Central Research Fund paid 9.1 (3,555,017) (2,283,549) Long term deposits - net (2,701,000) (20,000) Net cash generated from operating activities 100,238,507 406,519,294
Cash flow from investing activities
Acquisition of property, plant and equipment (426,984,217) (361,511,055) Acquisition of investment property - (826,351) Acquisition of intangibles (280,336) - Dividend income received 52,521,192 14,995,830 Proceeds from sale of property, plant and equipment 12.5 35,529,319 49,930,664 Short term investments - net 108,067,703 96,785,803 Net cash used in investing activities (231,146,339) (200,625,109)
Cash flow from financing activities
Long term loan received 133,000,000 - Finance cost paid (30,439,792) (20,838,839) Dividend paid (118,939,327) (127,734,273) Net cash used in financing activities (16,379,119) (148,573,112) Net (decrease) / increase in cash and cash equivalents (147,286,951) 57,321,073 Cash and cash equivalents at the beginning of the year 247,662,659 190,341,586 Cash and cash equivalents at the end of the year 100,375,708 247,662,659
Cash and cash equivalents comprise of the following:
Cash and bank balances 22 151,392,844 267,853,581 Running finance 10 (51,017,136) (20,190,922)
100,375,708 247,662,659
The annexed notes from 1 to 43 form an integral part of these consolidated financial statements.
___________________ ______________________ _______________Chief Executive Officer Chief Financial Officer Director

107ANNUAL REPORT 2020
Ferozsons Laboratories LimitedConsolidated Statement of Cash FlowsFor the year ended 30 June 2020
2020 2019Cash flow from operating activities Note Rupees Rupees
Profit before taxation 591,938,137 338,064,472 Adjustments for non - cash and other items
Depreciation on property, plant and equipment 12.4 378,938,054 394,892,304 Amortisation of intangible assets 588,017 1,626,444 Trade debts directly written off 26 - 39,920,925 Provision / (reversal) of loss allowance against trade debts 17.1 5,288,914 (5,121,922) Gain on disposal of property, plant and equipment 12.5 (23,778,459) (33,836,612) Finance cost 28,525,046 24,760,408 (Gain) / loss on re-measurement of short term investments to fair value (3,131,383) 14,284,164 (Gain) / loss on sale of short term investments (699,063) 8,603,276 Amortized gain on Government Securities - 6,154,627 Dividend income 28.1 (52,521,192) (64,022,513) Workers' Profit Participation Fund 33,586,141 17,597,332 Central Research Fund 6,785,079 3,555,017 Workers' Welfare Fund 12,470,617 8,872,286
386,051,771 417,285,736 Cash generated from operations before working capital changes 977,989,908 755,350,208 Effect on cash flow due to working capital changes(Increase) / decrease in current assets
Stores, spare parts and loose tools (16,273,945) 22,539,678 Stock in trade (721,841,910) 18,845,937 Trade debts - considered good (147,280,391) (400,135,764) Loans and advances - considered good (38,655,437) 20,617,402 Deposits and prepayments (110,055,244) 24,864,741 Other receivables 16,929,715 28,415,741
(1,017,177,212) (284,852,265) Increase in current liabilities
Trade and other payables 470,018,274 185,626,939
Cash generated from operations 430,830,970 656,124,882
Taxes paid (297,866,828) (219,099,841) Workers' Profit Participation Fund paid (17,597,332) (21,111,690) Workers' Welfare Fund paid (8,872,286) (7,090,508) Central Research Fund paid 9.1 (3,555,017) (2,283,549) Long term deposits - net (2,701,000) (20,000) Net cash generated from operating activities 100,238,507 406,519,294
Cash flow from investing activities
Acquisition of property, plant and equipment (426,984,217) (361,511,055) Acquisition of investment property - (826,351) Acquisition of intangibles (280,336) - Dividend income received 52,521,192 14,995,830 Proceeds from sale of property, plant and equipment 12.5 35,529,319 49,930,664 Short term investments - net 108,067,703 96,785,803 Net cash used in investing activities (231,146,339) (200,625,109)
Cash flow from financing activities
Long term loan received 133,000,000 - Finance cost paid (30,439,792) (20,838,839) Dividend paid (118,939,327) (127,734,273) Net cash used in financing activities (16,379,119) (148,573,112) Net (decrease) / increase in cash and cash equivalents (147,286,951) 57,321,073 Cash and cash equivalents at the beginning of the year 247,662,659 190,341,586 Cash and cash equivalents at the end of the year 100,375,708 247,662,659
Cash and cash equivalents comprise of the following:
Cash and bank balances 22 151,392,844 267,853,581 Running finance 10 (51,017,136) (20,190,922)
100,375,708 247,662,659
The annexed notes from 1 to 43 form an integral part of these consolidated financial statements.
___________________ ______________________ _______________Chief Executive Officer Chief Financial Officer Director
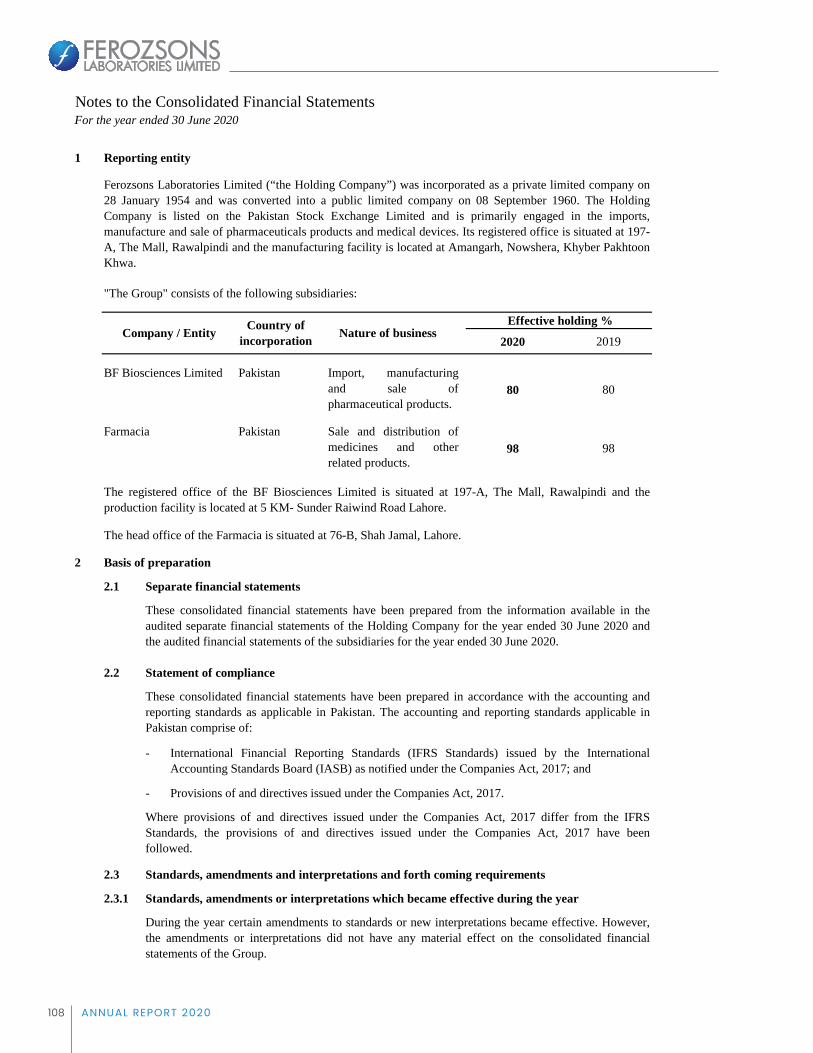
108 ANNUAL REPORT 2020
Ferozsons Laboratories LimitedNotes to the Consolidated Financial Statements For the year ended 30 June 2020
1 Reporting entity
"The Group" consists of the following subsidiaries:
2020 2019
Pakistan80 80
Farmacia Pakistan98 98
The head office of the Farmacia is situated at 76-B, Shah Jamal, Lahore.
2 Basis of preparation
2.1 Separate financial statements
2.2 Statement of compliance
-
-
2.3
2.3.1
International Financial Reporting Standards (IFRS Standards) issued by the InternationalAccounting Standards Board (IASB) as notified under the Companies Act, 2017; and
Provisions of and directives issued under the Companies Act, 2017.
Where provisions of and directives issued under the Companies Act, 2017 differ from the IFRSStandards, the provisions of and directives issued under the Companies Act, 2017 have beenfollowed.
Ferozsons Laboratories Limited (“the Holding Company”) was incorporated as a private limited company on28 January 1954 and was converted into a public limited company on 08 September 1960. The HoldingCompany is listed on the Pakistan Stock Exchange Limited and is primarily engaged in the imports,manufacture and sale of pharmaceuticals products and medical devices. Its registered office is situated at 197-A, The Mall, Rawalpindi and the manufacturing facility is located at Amangarh, Nowshera, Khyber PakhtoonKhwa.
These consolidated financial statements have been prepared from the information available in theaudited separate financial statements of the Holding Company for the year ended 30 June 2020 andthe audited financial statements of the subsidiaries for the year ended 30 June 2020.
These consolidated financial statements have been prepared in accordance with the accounting andreporting standards as applicable in Pakistan. The accounting and reporting standards applicable inPakistan comprise of:
Standards, amendments and interpretations and forth coming requirements
Standards, amendments or interpretations which became effective during the year
During the year certain amendments to standards or new interpretations became effective. However,the amendments or interpretations did not have any material effect on the consolidated financialstatements of the Group.
Company / Entity
BF Biosciences Limited
Nature of business
Import, manufacturingand sale ofpharmaceutical products.
Sale and distribution ofmedicines and otherrelated products.
Effective holding %
The registered office of the BF Biosciences Limited is situated at 197-A, The Mall, Rawalpindi and theproduction facility is located at 5 KM- Sunder Raiwind Road Lahore.
Country of incorporation
109ANNUAL REPORT 2020
2.3.2
-
-
-
-
New and revised accounting standards, amendments to published accounting standards, andinterpretations that are not yet effective
Amendment to IFRS 3 ‘Business Combinations’ – Definition of a Business (effective forbusiness combinations for which the acquisition date is on or after the beginning of annualperiod beginning on or after 01 January 2020). The IASB has issued amendments aiming toresolve the difficulties that arise when an entity determines whether it has acquired a business ora group of assets. The amendments clarify that to be considered a business, an acquired set ofactivities and assets must include, at a minimum, an input and a substantive process that togethersignificantly contribute to the ability to create outputs. The amendments include an election touse a concentration test. The standard is effective for transactions in the future and thereforewould not have an impact on past financial statements.
Amendments to IAS 1 Presentation of Financial Statements and IAS 8 Accounting Policies,Changes in Accounting Estimates and Errors (effective for annual periods beginning on or after01 January 2020). The amendments are intended to make the definition of material in IAS 1easier to understand and are not intended to alter the underlying concept of materiality in IFRSStandards. In addition, the IASB has also issued guidance on how to make materiality judgmentswhen preparing their general purpose financial statements in accordance with IFRS Standards.
On 29 March 2018, the International Accounting Standards Board (the IASB) has issued arevised Conceptual Framework for Financial Reporting which is applicable immediatelycontains changes that will set a new direction for IFRS in the future. The Conceptual Frameworkprimarily serves as a tool for the IASB to develop standards and to assist the IFRSInterpretations Committee in interpreting them. It does not override the requirements ofindividual IFRSs and any inconsistencies with the revised Framework will be subject to theusual due process – this means that the overall impact on standard setting may take some time tocrystallize. The companies may use the Framework as a reference for selecting their accountingpolicies in the absence of specific IFRS requirements. In these cases, companies should reviewthose policies and apply the new guidance retrospectively as of 01 January 2020, unless the newguidance contains specific scope outs.
The following International Financial Reporting Standards (IFRS Standards) as notified under theCompanies Act, 2017 and the amendments and interpretations thereto will be effective for accountingperiods beginning on or after 01 July 2020:
Interest Rate Benchmark Reform which amended IFRS 9, IAS 39 and IFRS 7 is applicable forannual financial periods beginning on or after 01 January 2020. The G20 asked the FinancialStability Board (FSB) to undertake a fundamental review of major interest rate benchmarks.Following the review, the FSB published a report setting out its recommended reforms of somemajor interest rate benchmarks such as IBORs. Public authorities in many jurisdictions havesince taken steps to implement those recommendations. This has in turn led to uncertainty aboutthe long-term viability of some interest rate benchmarks. In these amendments, the term 'interestrate benchmark reform' refers to the market-wide reform of an interest rate benchmark includingits replacement with an alternative benchmark rate, such as that resulting from the FSB'srecommendations set out in its July 2014 report 'Reforming Major Interest Rate Benchmarks'(the reform). The amendments made provide relief from the potential effects of the uncertaintycaused by the reform. A company shall apply the exceptions to all hedging relationships directlyaffected by interest rate benchmark reform.

110 ANNUAL REPORT 2020
-
i.
ii.
iii.
-
-
-
Classification of liabilities as current or non-current (Amendments to IAS 1) effective for theannual period beginning on or after 01 January 2022. These amendments in the standards havebeen added to further clarify when a liability is classified as current. The standard also amendsthe aspect of classification of liability as non-current by requiring the assessment of the entity’sright at the end of the reporting period to defer the settlement of liability for at least twelvemonths after the reporting period. An entity shall apply those amendments retrospectively inaccordance with IAS 8.
Onerous Contracts – Cost of Fulfilling a Contract (Amendments to IAS 37) effective for theannual period beginning on or after 01 January 2022 amends IAS 1 by mainly adding paragraphswhich clarifies what comprise the cost of fulfilling a contract, Cost of fulfilling a contract isrelevant when determining whether a contract is onerous. An entity is required to apply theamendments to contracts for which it has not yet fulfilled all its obligations at the beginning ofthe annual reporting period in which it first applies the amendments (the date of initialapplication). Restatement of comparative information is not required, instead the amendmentsrequire an entity to recognize the cumulative effect of initially applying the amendments as anadjustment to the opening balance of retained earnings or other component of equity, asappropriate, at the date of initial application.
Property, Plant and Equipment - Proceeds before Intended Use (Amendments to IAS 16)effective for the annual period beginning on or after 01 January 2022. Clarifies that salesproceeds and cost of items produced while bringing an item of property, plant and equipment tothe location and condition necessary for it to be capable of operating in the manner intended bymanagement e.g. when testing etc, are recognized in profit or loss in accordance with applicableStandards. The entity measures the cost of those items applying the measurement requirementsof IAS 2. The standard also removes the requirement of deducting the net sale proceeds fromcost of testing. An entity shall apply those amendments retrospectively, but only to items ofproperty, plant and equipment that are brought to the location and condition necessary for themto be capable of operating in the manner intended by management on or after the beginning ofthe earliest period presented in the financial statements in which the entity first applies theamendments. The entity shall recognize the cumulative effect of initially applying theamendments as an adjustment to the opening balance of retained earnings (or other componentof equity, as appropriate) at the beginning of that earliest period presented.
Amendments to IFRS-16 - IASB has issued amendments to IFRS 16 (the amendments) toprovide practical relief for lessees in accounting for rent concessions. The amendments areeffective for periods beginning on or after 01 June 2020, with earlier application permitted.Under the standard’s previous requirements, lessees assess whether rent concessions are leasemodifications and, if so, apply the specific guidance on accounting for lease modifications. Thisgenerally involves remeasuring the lease liability using the revised lease payments and a reviseddiscount rate. In light of the effects of the COVID-19 pandemic, and the fact that many lesseesare applying the standard for the first time in their financial statements, the Board has providedan optional practical expedient for lessees. Under the practical expedient, lessees are notrequired to assess whether eligible rent concessions are lease modifications, and instead arepermitted to account for them as if they were not lease modifications. Rent concessions areeligible for the practical expedient if they occur as a direct consequence of the COVID-19pandemic and if all the following criteria are met:
the change in lease payments results in revised consideration for the lease that issubstantially the same as, or less than, the consideration for the lease immediatelypreceding the change; any reduction in lease payments affects only payments originally due on or before 30June 2021; and there is no substantive change to the other terms and conditions of the lease.
111ANNUAL REPORT 2020
-
-
-
2.4 Basis of measurement
2.5 Functional and presentation currency
2.6 Use of estimates and judgments
Judgments made by the management in the application of approved accounting standards that havesignificant effect on the consolidated financial statements and estimates with a significant risk ofmaterial adjustment in the subsequent year are discussed in the ensuing paragraphs.
The estimates and underlying assumptions are reviewed on a continuous basis. Revisions toaccounting estimates are recognized in the period in which estimates are revised if the revision affectsonly that period, or in the period of the revision and any future periods affected.
These consolidated financial statements have been prepared on the historical cost convention exceptfor certain items of property, plant and equipment that are stated at revalued amounts and revaluationof certain financial instruments at fair values. The methods used to measure fair values are discussedfurther in their respective policy notes.
These consolidated financial statements are presented in Pakistani Rupee ("Rs.") which is the Group'sfunctional currency. All financial information presented in Rupees has been rounded off to the nearest rupee, unless otherwise stated.
IFRS 9 – The amendment clarifies that an entity includes only fees paid or received between theentity (the borrower) and the lender, including fees paid or received by either the entity or thelender on the other’s behalf, when it applies the ‘10 per cent’ test in paragraph B3.3.6 of IFRS 9in assessing whether to derecognize a financial liability.
The preparation of financial statements in conformity with the approved accounting standardsrequires management to make judgments, estimates and assumptions that affect the application ofpolicies and reported amounts of assets and liabilities, income and expenses. The estimates andassociated assumptions are based on historical experience and various other factors that are believedto be reasonable under the circumstances, the results of which form the basis of making judgmentabout carrying value of assets and liabilities that are not readily apparent from other sources. Actualresults may differ from these estimates.
IFRS 16 – The amendment partially amends Illustrative Example 13 accompanying IFRS 16 byexcluding the illustration of reimbursement of leasehold improvements by the lessor. Theobjective of the amendment is to resolve any potential confusion that might arise in leaseincentives.
IAS 41 – The amendment removes the requirement in paragraph 22 of IAS 41 for entities toexclude taxation cash flows when measuring the fair value of a biological asset using a presentvalue technique
Annual Improvements to IFRS Standards 2018–2020 Cycle - the improvements address amendmentsto following approved accounting standards:
The above amendments are effective from annual period beginning on or after 01 January 2022 andare not likely to have an impact on Group’s financial statements.
112 ANNUAL REPORT 2020
2.6.1 Property, plant and equipment
2.6.2 Intangibles
2.6.3 Stores, spare parts, loose tools and stock in trade
2.6.4
The Group reviews the stores, spare parts, loose tools and stock in trade for possible impairment onan annual basis. Any change in the estimates in future years might affect the carrying amounts of therespective items of stores, spare parts, loose tools and stock in trade with a corresponding affect onthe provision and net realizable value.
The Group reviews the useful lives and residual value of property, plant and equipment on regularbasis by considering expected pattern of economic benefits that the Group expects to derive. Anychange in the estimates in future years might affect the carrying amounts of the respective items ofproperty, plant and equipment with a corresponding effect on the depreciation charge andimpairment.
The Group reviews the rate of amortization and value of intangible assets for possible impairment, onan annual basis. Any change in the estimates in future years might affect the carrying amounts ofintangible assets with a corresponding affect on the amortization charge and impairment.
The Group has elected to measure loss allowances for trade debts other than due from 'Government ofPakistan' using IFRS 9 simplified approach and has calculated ECLs based on lifetime ECLs. Thefinancial assets due from Government of Pakistan continues to be measured under IAS-39 due to theexemption given by the Securities and Exchange Commission of Pakistan (SECP) vide S.R.O. 985(I)/2019 dated 02 September 2019. SECP has deferred the requirements of IFRS 9 with respect toapplication of 'Expected Credit Loss Method' in respect of companies holding financial assets duefrom the Government of Pakistan till 30 June 2021. The Group has established a provision matrix thatis based on the Group's historical credit loss experience, adjusted for forward-looking factors specificto the debtors and the economic environment. When determining whether the credit risk of a financialasset has increased significantly since initial recognition and when estimating ECLs, the Groupconsiders reasonable and supportable information that is relevant and available without undue cost oreffort. This includes both quantitative and qualitative information and analysis, based on the Group'shistorical experience and informed credit assessment including forward-looking information.
Net realizable value is the estimated selling price in the ordinary course of business less the estimatedcosts of completion and estimated costs necessary to make the sale.
Expected credit loss (ECL) / Loss allowance against trade debts, deposits, advances and otherreceivables
ECLs are based on the difference between the contractual cash flows due in accordance with thecontract and all the cash flows that the Group expects to receive. The shortfall is then discounted at anapproximation to the assets original effective interest rate.
The maximum period considered when estimating ECLs is the maximum contractual period overwhich the Group is exposed to credit risk. Loss allowances for financial assets measured at amortizedcost are deducted from the gross carrying amount of the assets.
The Group reviews the recoverability of its trade debts, deposits, advances and other receivables toassess amount of loss allowance required on an annual basis.
113ANNUAL REPORT 2020
2.6.5 Provisions
2.6.6 Impairment
2.6.7 Fair value of investments
2.6.8 Revaluation of property, plant and equipment
2.6.9 Taxation
3 Significant accounting policies
3.1 Changes in accounting policies
3.1.1 IFRS 16 - Leases
The Group has initially applied IFRS 16 from 01 July 2019. IFRS 16 introduces a single, on-balancesheet lease accounting model for lessees. A lessee recognizes a right-of-use asset representing its rightto use the underlying asset and a lease liability representing its obligation to make lease payments.There are recognition exemptions for short-term leases and leases of low-value items. Lessoraccounting remains similar to the current standard i.e. lessors continue to classify leases as finance oroperating leases.
During the year, the Group has adopted IFRS 16 'Leases' from 01 July 2019. Due to the transitionmethods chosen by the Group in applying this standard, comparative information throughout theseconsolidated financial statements has not been restated to reflect the requirements of the newstandard.
Estimates of the amount of provisions recognized are based on current legal and constructiverequirements. Because actual outflows can differ from estimates due to changes in laws, regulations,public expectations, technology, prices and conditions, and can take place many years in the future,the carrying amounts of provisions are regularly reviewed and adjusted to take account of suchchanges.
The Group regularly reviews the fair value of investments, the estimate of fair values are directlylinked to market value. Any change in estimate will effect the carrying value of investments with thecorresponding impact on consolidated statement of profit or loss.
The Group takes into account the current income tax laws and decisions taken by appellateauthorities. Instances where the Group's view differs from the view taken by the income taxdepartment at the assessment stage and the Group considers that its view on items of material natureis in accordance with law, the amounts are shown as contingent liabilities.
Revaluation of property, plant and equipment is carried out by independent professional valuer. Thefrequency of revaluations depends upon the changes in fair values of the items of property, plant andequipment being revalued. When the fair value of a revalued asset differs materially from its carryingamount, a further revaluation is required.
The detail of new significant accounting policy adopted and the nature and effect of the changes toprevious accounting policy are set out below:
The significant accounting policies set out below have been consistently applied to all to all periods presentedin these consolidated financial statements, except as disclosed in note 3.1.
The Group reviews carrying amounts of its assets including cash generating units for possibleimpairment and makes formal estimates of recoverable amount if there is any such indication.

114 ANNUAL REPORT 2020
As a lessee
Transition
-
-
Impact of financial statements
Under IFRS 16, a contract is, or contains, a lease if the contract conveys a right to control the use ofan identified asset for a period of time in exchange for consideration.
On transition to IFRS 16, the Group elected to apply practical expedient to grandfather the assessmentof which transactions are leases. The Group applied IFRS 16 only to contracts that were previouslyidentified as leases. Contracts that were not identified as leases under IAS 17 and IFRIC 4 were notreassessed for whether there is a lease under IFRS 16. Therefore, the definition of a lease under IFRS16 was applied only to contracts entered into or changed on or after 01 July 2019.
As a lessee, the Group previously classified leases as operating or finance leases based on itsassessment of whether the lease transferred substantially all of the risks and rewards of ownership.Under IFRS 16, the Group recognizes right of use assets and lease liabilities for material leases i.e.these leases are on balance sheet.
The Group presents right-of-use assets in ‘property, plant and equipment’, the same line item as itpresents underlying assets of the same nature that it owns.
The Group presents non-current and current portion of related lease liabilities in the consolidatedstatement of financial position considering their due dates for payment.
At commencement or on modification of a contract that contains a lease component, the Groupallocates the consideration in the contract to each lease component on the basis of its relative value.The Group has elected not to recognize right of use assets and liabilities for some leases of low valueassets (warehouse/sales offices). The Group recognizes the lease payments associated with theseleases as an expense on a straight line basis over the lease term. The Group's accounting policyrelating to leases is explained in note 3.21 of these financial statements.
The Group used the following practical expedients when applying IFRS 16 to leases previouslyclassified as operating leases under IAS 17.
did not recognize right-of-use assets and liabilities for leases for which the lease term endswithin 12 months of the date of initial application;
did not recognize right-of-use assets and liabilities for leases of low value items;
excluded initial direct costs from measuring the right-of-use asset at the date of initialapplication; and
-
The Group has applied IFRS 16 using the modified retrospective approach. However none of theleases prior to 01 July 2019 have been considered as significant for the purpose of application ofIFRS 16 and accordingly the application of IFRS 16 has no impact on the opening consolidatedretained earnings as at 01 July 2019. The comparative information presented for 2019 is not restatedi.e. it is presented as previously reported under IAS 17 and related interpretations.

115ANNUAL REPORT 2020
3.2 Basis of consolidation
3.2.1 Subsidiaries
3.2.2 Non-controlling interests
3.2.3 Loss of control
3.2.4 Transactions eliminated on consolidation
Non-controlling interests are measured at their proportionate share of the acquiree's identifiable netassets at the date of acquisition.
Changes in the Holding Company's interest in a subsidiary that do not result in a loss of control areaccounted for as a equity transactions.
On the loss of control, the Group derecognizes the assets and liabilities of the subsidiary, any noncontrolling interests and other components of equity related to the subsidiary. Any surplus or deficitarising on the loss of control is recognized in consolidated profit or loss. In addition, any amountpreviously recognized in other comprehensive income in respect of that subsidiary are reclassified tothe consolidated profit or loss. If the Group retains any interest in the previous subsidiary, then suchinterest is measured at fair value at the date that control is lost. Subsequently that retained interest isaccounted for as an equity-accounted investee, joint venture or as an available for sale financial assetdepending on the level of influence retained.
Intra-group balances and transactions and any unrealized income and expenses arising from intra-group transactions are eliminated.
Non-controlling interest is that part of net results of operations and of net assets of the subsidiarieswhich are not owned by the Holding Company either directly or indirectly. Non-controlling interest ispresented as a separate item in the consolidated financial statements.
The financial statements of the subsidiary companies have been consolidated on a line-by-line basisand the carrying values of the investments held by the Holding Company have been eliminatedagainst the shareholders' equity in the subsidiary companies. The financial statements of thesubsidiaries are prepared for the same reporting year as of the Holding Company, using consistentaccounting policies except where specified otherwise.
The consolidated financial statements include the financial statements of the Holding Company andits subsidiary companies.
Subsidiaries are all entities (including structured entities) over which the Group has control. TheGroup controls an entity when the Group is exposed to, or has rights to, variable returns from itsinvolvement with the entity and has the ability to affect those returns through its power to direct theactivities of the entity. The subsidiaries are fully consolidated from the date of acquisition, being thedate on which the Holding Company obtains control, and continue to be consolidated until the datethat such control ceases.

116 ANNUAL REPORT 2020
3.3 Employee benefits
3.3.1 Staff provident fund (Retirement benefit)
3.3.2 Compensated absences
3.4 Taxation
3.4.1 Current taxation
3.4.2 Deferred taxation
Provision of current tax is based on the taxable income for the year determined in accordance with theprevailing law for taxation of income. The charge for current tax is calculated using prevailing taxrates or tax rates expected to apply to the profit for the year if enacted after taking into account taxcredits, rebates and exemptions, if any. The charge for current tax also includes adjustments, whereconsidered necessary, to provision for tax made in previous years arising from assessments framedduring the year for such years.
Deferred tax is accounted for using the balance sheet approach providing for temporary differencesbetween the carrying amounts of assets and liabilities for financial reporting purposes and theamounts used for tax purposes. In this regard, the effects on deferred taxation of the portion ofincome that is subject to final tax regime is also considered in accordance with the treatmentprescribed by the Institute of Chartered Accountants of Pakistan. Deferred tax is measured at ratesthat are expected to be applied to the temporary differences when they reverse, based on laws thathave been enacted or substantively enacted by the reporting date. A deferred tax liability isrecognized for all taxable temporary differences. A deferred tax asset is recognized for deductibletemporary differences to the extent that future taxable profits will be available against whichtemporary differences can be utilized. Deferred tax assets are reviewed at each reporting date and arereduced to the extent that it is no longer probable that the related tax benefit will be realized.
Income tax expense comprises current and deferred tax. Income tax expense is recognized in theconsolidated profit or loss, except to the extent that it relates to items recognized directly in othercomprehensive income or equity, in which case it is recognized in other comprehensive income orequity respectively.
Salaries, wages and benefits are accrued in the period in which the associated services are rendered by employees of the Group and measured on an undiscounted basis. The accounting policy for employeeretirement benefits is described below:
The amount of unpaid income tax in respect of the current and prior periods is recognized as liability.Any excess amount paid over what is due in respect of the current or prior periods is recognized as anasset.
The Group operates a recognized provident fund as a defined contribution plan for employees whofulfil conditions laid down in the trust deed. Provision is made in the financial statements for theamount payable by the Group to the fund in this regard. Contribution is made to the fund equally bythe Group and the employees at the rate of 10% of basic salary.
The Group provides for compensated absences for its employees on unavailed balance of leave in theperiod in which leave is earned and the charge is recognized in the consolidated statement of profit orloss.
117ANNUAL REPORT 2020
3.5 Property, plant and equipment
3.5.1 Owned
3.5.2 Capital work in progress
Depreciation is provided on a straight line basis and charged to consolidated statement of profit orloss to write off the depreciable amount of each asset, except for freehold land, over its estimateduseful life at the rates specified in note 12 to these financial statements. Depreciation on depreciableassets is commenced from the date asset is available for use up to the date when asset is retired. Theassets' residual values and useful lives are reviewed at each financial year-end and adjusted if impacton depreciation is significant. The Group’s estimate of the residual value of its property, plant andequipment as at statement of financial position date has not required any adjustment as its impact isconsidered insignificant.
In case of revalued assets, any accumulated depreciation at the date of revaluation is eliminatedagainst the gross carrying amount of the asset and the net amount restated at the revalued amount ofthe asset. Increases in the carrying amount arising on revaluation of property, plant and equipment arecredited to surplus on revaluation of property, plant and equipment. Decreases that offset previousincreases of the same assets are charged against this surplus, all other decreases are charged toconsolidated statement of profit or loss. Each year the difference between depreciation based on therevalued carrying amount of the asset charged to the consolidated statement of profit or loss, anddepreciation based on the asset’s original cost is transferred to ‘retained earnings net of relateddeferred tax’. All transfers to / from surplus on revaluation of property, plant and equipment are netof applicable deferred income tax.
Subsequent costs are included in the asset’s carrying amount or recognized as a separate asset, asappropriate, only when it is probable that future economic benefits associated with the item will flowto the Group and cost of the item can be measured reliably. All other repairs and maintenance costsare charged to consolidated statement of profit or loss as and when incurred.
Property, plant and equipment of the Group other than freehold land, building on freehold land andplant and machinery are stated at cost less accumulated depreciation and impairment loss, if any.Freehold land is stated at revalued amount carried out by external valuers by reference to its currentmarket price less impairment loss, if any. Building on freehold land and plant and machinery arestated at revalued amount carried out by external valuers by reference to its current market price lessaccumulated depreciation and impairment loss, if any. Cost in relation to property, plant andequipment comprises acquisition and other directly attributable costs. Revaluation is carried out everyfive years unless earlier revaluation is necessitated.
Useful lives are determined by the management based on expected usage of assets, expected physicalwear and tear, technical and commercial obsolescence, legal and similar limits on the use of the assetsand other similar factors.
Capital work in progress is stated at cost less identified impairment loss, if any. It consists of allexpenditures and advances connected with specific assets incurred and made during installations andconstruction period. These are transferred to relevant property, plant and equipment as and whenassets are available for use.
Gain and loss on sale of an item of property, plant and equipment are determined by comparing theproceeds from sale with the carrying amount of property, plant and equipment, and are recognized netwithin “other income / other expenses” in consolidated statement of profit or loss. When revaluedasset is sold, the amount included in the surplus on revaluation of property, plant and equipment, netof deferred tax, is transferred directly to consolidated retained earnings.
118 ANNUAL REPORT 2020
3.6 Investment property
3.7 Intangibles
3.8 Financial instruments
3.8.1 Recognition and initial measurement
3.8.2 Classification and subsequent measurement
Financial assets
A financial asset (unless it is a trade receivable without a significant financing component) orfinancial liability is initially measured at fair value plus, for an item not at FVTPL, transaction coststhat are directly attributable to its acquisition or issue. A trade receivable without a significantfinancing component is initially measured at the transaction price.
The gain or loss on disposal or retirement of an asset represented by the difference between the saleproceeds and the carrying amount of the asset is recognized as an income or expense.
Property, comprising land, held to earn rentals or for capital appreciation or both are classified asinvestment property. These are not held for use in the production or supply of goods or services or foradministrative purposes. The Group's business model i.e. the Group's intentions regarding the use ofproperty is the primary criterion for classification as an investment property.
The investment property of the Group comprises of Land and is valued using the cost method.Investment property is initially measured at cost, being the fair value of the consideration given(including the transaction costs). Subsequent to initial recognition, these are stated at cost less anyaccumulated impairment loss.
On initial recognition, a financial asset is classified as measured at amortized cost, fair value throughother comprehensive income (FVOCI), fair value through profit or loss (FVTPL) and in case of anequity instrument it is classified as FVOCI or FVTPL.
The Securities and Exchange Commission of Pakistan (SECP) vide its S.R.O 985 (I)/2019 dated 02September 2019 has deferred the requirements of IFRS 9 with respect to application of ExpectedCredit Loss Method in respect of companies holding financial assets due from the Government ofPakistan till 30 June 2021. In this regard, the companies shall follow relevant requirements of IAS 39' Financial Instruments: Recognition and Measurement' during the exemption period.
Expenditure incurred on intangible asset is capitalized and stated at cost less accumulatedamortization and any identified impairment loss. Intangible assets with finite useful life are amortizedusing the straight-line method over the estimated useful life of three years. Amortization of intangibleassets is commenced from the date an asset is capitalized.
All financial assets and financial liabilities are initially recognized when the Group becomes a partyto the contractual provisions of the instruments.
Financial assets are not reclassified subsequent to their initial recognition unless the Group changesits business model for managing financial assets in which case all affected financial assets arereclassified on the first day of the first reporting period following the change in the business model.

119ANNUAL REPORT 2020
Amortized cost
-
-
Debt Instrument - FVOCI
-
-
Equity Instrument - FVOCI
Fair value through profit or loss (FVTPL)
its contractual terms give rise on specified dates to cash flows that are solely payments ofprincipal and interest on the principal amount outstanding.
These assets are subsequently measured at fair value. Interest income calculated using the effectiveinterest method, foreign exchange gains and losses and impairment are recognized in consolidatedstatement of profit or loss. Other net gains and losses are recognized in OCI. On derecognition, gainsand losses accumulated in OCI are reclassified to consolidated statement of profit or loss. However,the Group has no such instrument at the reporting date.
A financial asset is measured at amortized cost if it meets both of the following conditions and is notdesignated as at FVTPL:
it is held within a business model whose objective is to hold assets to collect contractual cashflows; and
its contractual terms give rise on specified dates to cash flows that are solely payments ofprincipal and interest on the principal amount outstanding.
The assets are subsequently measured at amortized cost using the effective interest method. Theamortized cost is reduced by impairment losses. Interest income, foreign exchange gains and lossesand impairment are recognized in consolidated statement of profit or loss. Any gain or loss onderecognition is recognized in consolidated statement of profit or loss.
Financial assets measured at amortized cost comprise of cash and bank balances, deposits, trade debtsand other receivables.
A debt investment is measured at FVOCI if it meets both of the following conditions and is notdesignated as at FVTPL:
it is held within a business model whose objective is achieved by both collecting contractualcash flows and selling financial assets; and
On initial recognition of an equity investment that is not held for trading, the Group may irrevocablyelect to present subsequent changes in the investment’s fair value in OCI. This election is made on aninvestment-by-investment basis.
These assets are subsequently measured at fair value. Dividends are recognized as income inconsolidated statement of profit or loss unless the dividend clearly represents a recovery of part of thecost of the investment. Other net gains and losses are recognized in OCI and these investments arenever reclassified to profit or loss. However, the Group has no such instrument at the reporting date.
All financial assets not classified as measured at amortized cost or FVOCI as described above aremeasured at FVTPL.
On initial recognition, the Group may irrevocably designate a financial asset that otherwise meets therequirements to be measured at amortized cost or at FVOCI as at FVTPL if doing so eliminates orsignificantly reduces an accounting mismatch that would otherwise arise.

120 ANNUAL REPORT 2020
Financial assets – Business model assessment
-
-
-
-
Financial liabilities
3.8.3 Derecognition
Financial assets
The Group's financial liabilities comprise trade and other payables, long term loan, short termborrowings, accrued markup and dividend payable.
The Group derecognizes a financial asset when the contractual rights to the cash flows from thefinancial asset expire, or it transfers the rights to receive the contractual cash flows in a transaction inwhich substantially all of the risks and rewards of ownership of the financial asset are transferred orin which the Group neither transfers nor retains substantially all of the risks and rewards of ownershipand it does not retain control of the financial asset.
The Group might enter into transactions whereby it transfers assets recognized in its consolidatedstatement of financial position, but retains either all or substantially all of the risks and rewards of thetransferred assets. In these cases, the transferred assets are not derecognized.
terms that may adjust the contractual coupon rate, including variable-rate features;
prepayment and extension features; and
terms that limit the Group’s claim to cash flows from specified assets (e.g. non-recoursefeatures).
For the purposes of the assessment, ‘principal’ is defined as the fair value of the financial asset oninitial recognition. ‘Interest’ is defined as consideration for the time value of money and for the creditrisk associated with the principal amount outstanding during a particular period of time and for otherbasic lending risks and costs (e.g. liquidity risk and administrative costs), as well as a profit margin.
In assessing whether the contractual cash flows are solely payments of principal and interest, theGroup considers the contractual terms of the instrument. This includes assessing whether the financialasset contains a contractual term that could change the timing or amount of contractual cash flowssuch that it would not meet this condition. In making this assessment, the Group considers:
contingent events that would change the amount or timing of cash flows;
Financial liabilities are classified as measured at amortized cost or FVTPL. A financial liability isclassified as at FVTPL if it is classified as held-for-trading, it is a derivative or it is designated as suchon initial recognition. Financial liabilities at FVTPL are measured at fair value and net gains andlosses, including any interest expense, are recognized in consolidated statement of profit or loss.Other financial liabilities are subsequently measured at amortized cost using the effective interestmethod, while the interest expense and foreign exchange gains and losses are recognized inconsolidated statement of profit or loss. Any gain or loss on derecognition is also recognized inconsolidated statement of profit or loss.
These assets are subsequently measured at fair value. Net gains and losses, including any interest ordividend income, are recognized in consolidated statement of profit or loss. The Group has classifiedits investments in mutual funds as at FVTPL.

121ANNUAL REPORT 2020
Financial liabilities
3.8.4 Trade debts - due from Government of Pakistan
3.9 Offsetting of financial instruments
3.10 Impairment
Financial assets
-
-
-
-
-
The Group derecognizes a financial liability when its contractual obligations are discharged,cancelled or expired. The Group also derecognizes a financial liability when its terms are modifiedand the cash flows of the modified liability are substantially different, in which case a new financialliability based on the modified terms is recognized at fair value. On derecognition of a financialliability, the difference between the carrying amount extinguished and the consideration paid(including any non-cash assets transferred or liabilities assumed) is recognized in consolidatedstatement of profit or loss.
financial assets measured at amortized cost;
debt investments measured at FVOCI; and
contract assets.
The Group recognizes loss allowances for ECLs on:
Trade debts are stated initially at the fair value. Subsequent to initial recognition, these are stated attheir amortized cost as reduced by appropriate provision for impairment. Known impaired receivablesare written off, while receivables considered doubtful are fully provided for.
The Group measures loss allowances at an amount equal to lifetime ECLs, except for the following,which are measured at 12-month ECLs:
debt securities that are determined to have low credit risk at the reporting date; and
other debt securities, bank balances and other receivables for which credit risk (i.e. the risk ofdefault occurring over the expected life of the financial instrument) has not increasedsignificantly since initial recognition.
12-month ECLs are the portion of ECLs that result from default events that are possible within the 12months after the reporting date (or a shorter period if the expected life of the instrument is less than12 months).
Financial assets and financial liabilities are offset and the net amount is reported in the consolidatedstatement of financial position only when the Group has a legally enforceable right to set off therecognized amounts and intends to either settle on a net basis or realize the asset and settle theliability simultaneously.
The allowance for doubtful accounts is based on the Group's assessment at the collectability ofcounterparty accounts. The Group regularly reviews its trade debts that remain outstanding past theirapplicable payment terms and establishes allowance and potential write-offs by considering facts suchas historical experience, credit quality, age of the accounts receivable balances and current economicconditions that may affect customers ability to pay.

122 ANNUAL REPORT 2020
Non - financial assets
The carrying amount of the Group’s non-financial assets, other than inventories and deferred taxassets are reviewed at each reporting date to determine whether there is any indication of impairment.If any such indication exists, then the asset’s recoverable amount is estimated. The recoverableamount of an asset or cash generating unit is the greater of its value in use and its fair value less costto sell. In assessing value in use, the estimated future cash flows are discounted to their present valuesusing a pre-tax discount rate that reflects current market assessments of the time value of money andthe risks specific to the asset or cash generating unit.
The Group assumes that the credit risk on a financial asset has increased significantly if it is morethan past due for a reasonable period of time. Loss allowances for trade receivables and contractassets are always measured at an amount equal to lifetime ECLs other than that are due fromGovernment (note 2.6.4). Lifetime ECLs are the ECLs that result from all possible default events overthe expected life of a financial instrument. 12-month ECLs are the portion of ECLs that result fromdefault events that are possible within the 12 months after the reporting date (or a shorter period if theexpected life of the instrument is less than 12 months). The maximum period considered whenestimating ECLs is the maximum contractual period over which the Group is exposed to credit risk.
Loss allowances for financial assets measured at amortized cost are deducted from the gross carryingamount of the assets.
The gross carrying amount of a financial asset is written off (either partially or in full) to the extentthat there is no realistic prospect of recovery. This is generally the case when the Group determinesthat the debtor does not have assets or sources of income that could generate sufficient cash flows torepay the amounts subject to the write-off. However, financial assets that are written off could still besubject to enforcement activities in order to comply with the Group’s procedures for recovery ofamounts due.
When determining whether the credit risk of a financial asset has increased significantly since initialrecognition and when estimating ECL, the Group considers reasonable and supportable informationthat is relevant and available without undue cost or effort. This includes both quantitative andqualitative information and analysis, based on the Group’s historical experience and informed creditassessment and including forward-looking information.
An impairment loss is recognized if the carrying amount of the assets or its cash generating unitexceeds its estimated recoverable amount. Impairment losses are recognized in consolidated statementof profit or loss. Impairment losses recognized in respect of cash generating units are allocated toreduce the carrying amounts of the assets in a unit on a pro rata basis. Impairment losses recognizedin prior periods are assessed at each reporting date for any indications that the loss has decreased orno longer exists. An impairment loss is reversed if there has been a change in the estimates used todetermine the recoverable amount. An impairment loss is reversed only to that extent that the asset’scarrying amount after the reversal does not exceed the carrying amount that would have beendetermined, net of depreciation and amortization, if no impairment loss had been recognized.
The financial assets due from Government of Pakistan continue to be measured under IAS-39 due tothe exemption given by the Securities and Exchange Commission of Pakistan vide S.R.O. 985(I)/2019 dated 02 September 2019. The financial assets due from Government of Pakistan areassessed at each reporting date to determine whether there is any objective evidence of impairment. Afinancial asset due from Government of Pakistan is impaired if there is objective evidence ofimpairment as a result of one or more events that have occurred after the initial recognition of theasset, and that loss event(s) had an impact on the estimated future cash flows of that asset that can beestimated reliably

123ANNUAL REPORT 2020
3.11 Trade and other payables
3.12 Provisions
3.13 Foreign currency
3.14 Stores, spare parts and loose tools
3.15 Stocks in trade
Raw and Packing materials - at moving average cost;Work in process - at moving average cost;
- at moving average cost; andFinished goods for resale - at moving average cost of purchase.Finished goods
Stocks are valued at the lower of average cost and net realizable value. Cost is determined as follows:
Liabilities for trade and other amounts payable are carried at cost which is the fair value of theconsideration to be paid in future for goods or services received.
Cost of finished goods purchased for resale and raw and packing materials comprises of purchaseprice and other costs incurred in bringing the material to its present location and condition. Cost ofmanufactured work in progress and finished goods comprises of raw and packing materials andapplicable overheads. Net realizable value signifies the estimated selling price in the ordinary courseof business less estimated cost of completion and estimated costs necessarily to be incurred in orderto make a sale.
Trade and other payables are obligations to pay for goods and services that have been acquired in theordinary course of business from suppliers. Account payables are classified as current liabilities ifamount is due within one year or less (or in the normal operating cycle of the business if longer). Ifnot, they are presented as non-current liabilities.
Provisions are recognized when the Group has a present legal or constructive obligation as a result ofpast events and it is probable that an outflow of resources embodying economic benefits will berequired to settle the obligation and a reliable estimate of the obligation can be made. However,provisions are reviewed at each reporting date and adjusted to reflect current best estimate.
Stores, spare parts and loose tools are valued at weighted average cost except for items in transitswhich are stated at cost incurred up to the reporting date less impairment, if any. For items which areslow moving and/or identified as surplus to the Group's requirements, adequate provision is made forany excess book value over estimated net realizable value. The Group reviews the carrying amount ofstores, spares parts and loose tools on a regular basis and provision is made for obsolescence.
All monetary assets and liabilities in foreign currencies are translated into rupees at exchange ratesprevailing at the reporting date. Transactions in foreign currencies are translated into rupees atexchange rates prevailing at the date of transaction. Non-monetary assets and liabilities that aremeasured in terms of historical cost in a foreign currency are translated into rupees at exchange ratesprevailing at the date of transaction. Non-monetary assets and liabilities denominated in foreigncurrency that are stated at fair value are translated into rupees at exchange rates prevailing at the datewhen fair values are determined. Exchange gains and losses are recognized in the consolidatedstatement of profit or loss.
124 ANNUAL REPORT 2020
3.16 Cash and cash equivalents
3.17 Borrowings
3.18 Revenue recognition
3.19 Other income
3.20 Contract liabilities
Loans and borrowings are classified as 'financial liabilities at amortized cost'. On initial recognition,these are measured at cost, being fair value at the date the liability is incurred, less attributabletransaction costs. Subsequent to initial recognition, these are measured at amortized cost with anydifference between cost and value at maturity recognized in the consolidated profit or loss over theperiod of the borrowings on an effective interest basis.
Finance cost are accounted for on accrual basis and are reported under accrued markup to the extentof the amount remaining unpaid.
Borrowings are classified as current liabilities unless the Group has as unconditional right to defersettlement of the liability for atleast twelve months after the reporting date.
Revenue represents the fair value of the consideration received or receivable for sale of products, netof sales tax, sales returns and related discounts and commission. Revenue is recognized when or asperformance obligation is satisfied by transferring control of promised goods or services to acustomer and control either transfers overtime or point in time.
Other income comprises interest income on funds invested, dividend income, exchange gain andchanges in the fair value of financial asset at fair value through profit or loss. Income on bankdeposits is accrued on a time proportion basis by reference to the principal outstanding and theapplicable rate of return. Foreign currency gains and losses are reported on a net basis.
Cash and cash equivalents are carried in consolidated statement of financial position at cost. For thepurpose of consolidated statement of cash flow, cash and cash equivalents comprise of cash in hand,cash at banks and outstanding balance of short term borrowing facilities.
Dividend income and entitlement of bonus shares are recognized when the right to receive isestablished.
Gains and losses on sale of investments are accounted for on disposal of investments.
A contract liability is the obligation of the Group to transfer goods or services to a customer forwhich the Group has received consideration (or an amount of consideration is due) from thecustomer. If a customer pays consideration before the Group transfers goods or services to thecustomer, a contract liability is recognized when the payment is made or the payment is due(whichever is earlier). Contract liabilities are recognized as revenue when the Group performs underthe contract. It also includes refund liabilities arising out of customers‘ right to claim amounts fromthe Group on account of contractual delays in delivery of performance obligations and incentive ontarget achievements.

125ANNUAL REPORT 2020
3.21 Borrowing costs
3.22 Dividend distribution
3.23 Leases
The Group recognizes a right of use asset and a lease liability at the lease commencement date. Theright of use asset is initially measured at cost which comprises the initial amount of the lease liabilityadjusted for any lease payments made at or before the commencement date plus any initial direct costincurred less any lease incentive received. The right of use asset is subsequently measured at cost lessaccumulated depreciation and impairment losses, and adjusted for certain re-measurements of thelease liability, if any. The right of use assets is depreciated using the straight line method from thecommencement date to the end of the lease term, unless the lease transfers ownership of theunderlying asset to the Group by the end of the lease term or cost of the right of use asset reflects thatthe Group will exercise a purchase option. In that case the right of use asset will be depreciated overthe useful life of the underlying asset, which is determined on the same basis as those of property,plant and equipment.
The lease liability is initially measured at the present value of the lease payments that are not paid atthe commencement date, discounted using the interest rate implicit in the lease or if that rate cannotbe readily determined, the Group’s incremental borrowing rate. The Group has used it incrementalborrowing rate as the discount rate for leases where rate is not readily available. The lease liability issubsequently increased by the interest cost on the lease liability and decreased by lease paymentmade.
The lease liability is measured at amortized cost using the effective interest method. It is re-measuredwhen there is a change in future lease payments arising from a change in rate or a change in the termsof the lease arrangement, if there is change in the Group’s estimate of the amount expected to bepayable under a residual value guarantee, if the Group changes its assessment of whether it willexercise a purchase, extension or termination option or if there is a revised in-substance fixed leasepayment. When the lease liability is re-measured in this way, a corresponding adjustment is made tothe carrying amount of the right of use asset, or is recorded in consolidated statement of profit or lossif the carrying amount of the right of use asset has been reduced to zero.
Borrowing costs directly attributable to the acquisition, construction or production of qualifyingassets, which are assets that necessarily take a substantial period of time to get ready for theirintended use or sale, are added to the cost of those assets, until such time as the assets aresubstantially ready for their intended use or sale. Investment income earned on the temporaryinvestment of specific borrowings pending their expenditure on qualifying asset is deducted from theborrowing costs eligible for capitalization. All other borrowing costs are recognized in consolidatedstatement of profit or loss as incurred.
Dividend distribution to the shareholders is recognized as a liability in these consolidated financialstatements in the period in which it is approved.
At the inception of a contract, the Group assesses whether a contract is or contains lease. A contractis, or contains, a lease if the contract conveys a right to control the use of an identified asset for aperiod of time in exchange for consideration. To assess whether a contract conveys the right tocontrol the use of an identified asset, the Group uses the definition of a lease in IFRS 16.

126 ANNUAL REPORT 2020
Short term leases and leases of low value assets
3.24 Segment reporting
3.25 Government grant
2020 20194 Issued, subscribed and paid up capital Rupees Rupees
14,419,520 14,419,520
1,196,000 1,196,000
286,252,890 286,252,890 301,868,410 301,868,410
5 Capital reserve
The Group recognizes the benefit of a government loan at a below-market rate of interest as aGovernment grant. The benefit of the below-market rate of interest shall be measured as thedifference between the initial carrying value of the loan determined in accordance with IFRS 9 andthe proceeds received and is presented as deferred grant. The recognition of government grants inconsolidated profit or loss is done on a systematic basis over the periods in which the expenses forwhich the grants are intended to compensate.
The Group has elected not to recognize right of use assets and liabilities for some leases of low valueassets (warehouse/sales offices). The Group recognizes the lease payments associated with theseleases as an expense on a straight line basis over the lease term.
KFW Factors (Private) Limited, an associated company holds 8,286,942 (2019: 8,286,942) ordinary shares ofRs. 10 each of the Holding Company.
1,441,952 (2019: 1,441,952) ordinary shares of Rs. 10each fully paid in cash
This represents capital reserve which arose on conversion of shares of NWF Industries Limited and SargodhaOil and Flour Mills Limited, since merged.
28,625,289 (2019: 28,625,289) ordinary shares of Rs. 10each issued as fully paid bonus shares
119,600 (2019: 119,600) ordinary shares of Rs. 10 eachissued in lieu of NWF Industries Limited and SargodhaOil and Flour Mills Limited since merged
Operating segments are reported in a manner consistent with the internal reporting provided to thechief operating decision maker. The chief operating decision maker, who is responsible for allocatingresources and accessing performance of the operating segments, has been identified as the Chiefexecutive officer of the Group that make strategic decisions. These consolidated financial statementsare prepared on the basis of single reportable segment as the Chief executive officer views theGroup's operations as one reportable segment. All non-current assets of the Group are located inPakistan and 100% of the revenue is derived from sale of pharmaceuticals products and medicaldevices.
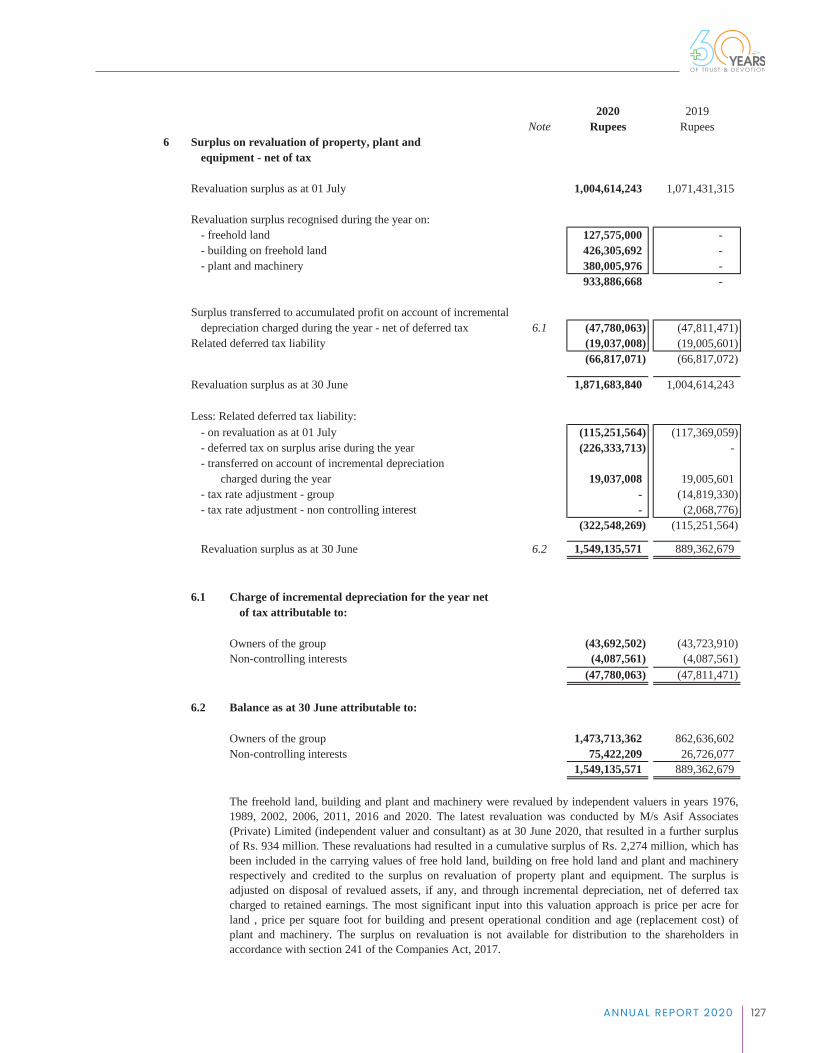
127ANNUAL REPORT 2020
2020 2019Note Rupees Rupees
6 Surplus on revaluation of property, plant and equipment - net of tax
Revaluation surplus as at 01 July 1,004,614,243 1,071,431,315
Revaluation surplus recognised during the year on:- freehold land 127,575,000 - - building on freehold land 426,305,692 - - plant and machinery 380,005,976 -
933,886,668 -
Surplus transferred to accumulated profit on account of incrementaldepreciation charged during the year - net of deferred tax 6.1 (47,780,063) (47,811,471)
Related deferred tax liability (19,037,008) (19,005,601) (66,817,071) (66,817,072)
Revaluation surplus as at 30 June 1,871,683,840 1,004,614,243
Less: Related deferred tax liability:- on revaluation as at 01 July (115,251,564) (117,369,059) - deferred tax on surplus arise during the year (226,333,713) - - transferred on account of incremental depreciation
charged during the year 19,037,008 19,005,601 - tax rate adjustment - group - (14,819,330) - tax rate adjustment - non controlling interest - (2,068,776)
(322,548,269) (115,251,564)
Revaluation surplus as at 30 June 6.2 1,549,135,571 889,362,679
6.1 Charge of incremental depreciation for the year net of tax attributable to:
Owners of the group (43,692,502) (43,723,910) Non-controlling interests (4,087,561) (4,087,561)
(47,780,063) (47,811,471)
6.2 Balance as at 30 June attributable to:
Owners of the group 1,473,713,362 862,636,602 Non-controlling interests 75,422,209 26,726,077
1,549,135,571 889,362,679
The freehold land, building and plant and machinery were revalued by independent valuers in years 1976,1989, 2002, 2006, 2011, 2016 and 2020. The latest revaluation was conducted by M/s Asif Associates(Private) Limited (independent valuer and consultant) as at 30 June 2020, that resulted in a further surplusof Rs. 934 million. These revaluations had resulted in a cumulative surplus of Rs. 2,274 million, which hasbeen included in the carrying values of free hold land, building on free hold land and plant and machineryrespectively and credited to the surplus on revaluation of property plant and equipment. The surplus isadjusted on disposal of revalued assets, if any, and through incremental depreciation, net of deferred taxcharged to retained earnings. The most significant input into this valuation approach is price per acre forland , price per square foot for building and present operational condition and age (replacement cost) ofplant and machinery. The surplus on revaluation is not available for distribution to the shareholders inaccordance with section 241 of the Companies Act, 2017.

128 ANNUAL REPORT 2020
7 Long term loan - secured2020 2019
Under markup / interest arrangement Note Rupees Rupees
Long term loans - HBL 7.1 133,000,000 - Less: amortization of loan as deferred grant (10,007,979) - Add: unwinding of loan 396,292 - Balance as at 30 June 2020 123,388,313 -
Less: current portion of long term loan presented under current liabilities (28,317,862) - 95,070,451 -
7.1
Payment rests Repayment date Ending date Markup rate
Quarterly 1-Jan-21 1-Oct-22 SBP Rate (0%) + Spread (2%- 3%)
7.2 Deferred grant2020 2019
Rupees Rupees
Balance as at 01 July - - Transaction during the year 10,007,979 - Amortisation during the year (396,292) - Unamortised balance of deferred grant 9,611,687 - less: current maturity (4,932,138) - Balance as at 30 June 2020 4,679,549 -
Opening Profit or loss Equity Closing8 Deferred taxation
Taxable temporary difference
102,787,623 2,842,433 - 105,630,056 115,251,564 (19,037,008) 226,333,713 322,548,269 2,692,015 952,195 - 3,644,210 220,731,202 (15,242,380) 226,333,713 431,822,535
Deductible temporary differences
Provisions (364,573) (71,377) - (435,950) Loss allowance against trade debts (3,698,539) (1,460,444) - (5,158,983)
(4,063,112) (1,531,821) - (5,594,933)
216,668,090 (16,774,201) 226,333,713 426,227,602
2020
---------------------------------------(Rupees)------------------------------------------
Accelerated tax depreciation allowancesSurplus on revaluation of property, plant and equipment
(Reversal from) / charge to
Unrealized gain on short term investments - mutual funds
The Group obtained term finance facility under "SBP refinance scheme for payment of wages and salaries" introduced by Government ofPakistan in order to prevent entities from laying-off employees during COVID-19 outbreak. The Group obtained Rs. 133 million forpaying salaries for the month of April 2020 and May 2020 under this scheme. The facility carry mark-up at the rate specified by StateBank of Pakistan plus relevant bank's spread of 2% / 3%. The tenor of this facility is up to 01 October 2022. The loan has been measuredat its fair value in accordance with IFRS 9 (Financial Instruments) using effective interest rate of 8.44% - 9.40% at respective draw downdates. The difference between fair value of loan and loan proceeds has been recognised as deferred grant as per requirements of IAS 20(Accounting for Government grants and disclosure of Government assistance) and as per Circular 11/2020 issued by the Institute ofChartered Accountants of Pakistan.
The facility is secured by first exclusive equitable mortgage charge of 252 million with 25% margin on land and building of head officeof the Holding Company and lien on the Group's investments in mutual funds placed in HBL Asset Management Company (only moneymarket and income funds) amounting to Rs. 7.53 million (note 21.1.1).
As per the financing arrangement, the Group has to comply the certain covenants imposed by bank including bank prior consent forpayouts if any.
The unavailed finance facility available to the Group is Rs. 70 million ( 2019: Rs. nil).
Number of installments
Total
Habib Bank Limited
Balance(Rupees)
Long term loans 133,000,000 8

129ANNUAL REPORT 2020
Opening Profit or loss Equity Closing
Taxable temporary difference
98,693,544 4,094,079 - 102,787,623 117,369,059 (19,005,601) 16,888,106 115,251,564
7,765,417 (5,073,402) - 2,692,015 223,828,020 (19,984,924) 16,888,106 220,731,202
Deductible temporary differences
Provisions (1,325,852) 961,279 - (364,573) Loss allowance against trade debts - 1,467,177 (5,165,716) (3,698,539)
(1,325,852) 2,428,456 (5,165,716) (4,063,112)
222,502,168 (17,556,468) 11,722,390 216,668,090
2020 2019Note Rupees Rupees
9 Trade and other payables
Trade creditors 998,524,764 793,410,817 Accrued liabilities 312,805,626 161,632,184 Tax deducted at source 8,913,925 380,912 Provision for compensated absences 33,275,396 28,382,413 Workers' Profit Participation Fund 20.1 3,586,141 - Central Research Fund 9.1 6,785,079 3,555,017 Workers' Welfare Fund 27 12,470,617 8,872,286 Advances from employees against purchase of vehicles 66,181,467 51,501,073 Due to related parties - unsecured 9.2 84,235,439 25,856,720 Other payables 1,163,265 1,953,377
1,527,941,719 1,075,544,799
9.1 Central Research Fund
Balance as at 01 July 3,555,017 2,283,549 Provision for the year 27 6,785,079 3,555,017
10,340,096 5,838,566 Payments made during the year (3,555,017) (2,283,549) Balance as at 30 June 6,785,079 3,555,017
9.2 Due to related parties - unsecured
Name of related party:Grupo Empresarial Bagó S.A 20,796,730 14,884,493 Bagó Laboratories Pte Ltd 63,438,709 10,972,227
84,235,439 25,856,720
10 Short term borrowings
Short term running finance - secured 51,017,136 20,190,922
10.1 Particulars of borrowings
Interest / markup based financing 10.2 50,806,268 20,190,922 Islamic mode of financing 10.3 210,868 -
51,017,136 20,190,922
Surplus on revaluation of property, plant and equipment
2019
---------------------------------------(Rupees)------------------------------------------
Accelerated tax depreciation allowances
(Reversal from) / charge to
Unrealized gain on short term investments - mutual funds
The Group has not recognized deferred tax asset on tax losses amounting to Rs. 61.15 million (2019: Rs. 108.40 million) related to a subsidiarycompany as sufficient taxable profits may not be available to the subsidiary to set these off in the foreseeable future.

130 ANNUAL REPORT 2020
10.2 Under Mark up arrangements
Holding Company
Subsidiary company
10.3 Under Shariah compliant arrangements
Holding Company
10.4
11 Contingencies and commitments
11.1 Contingencies
The Holding Company has short term borrowing facility i.e. Running Musharakah availablefrom Islamic bank under profit arrangements having sanctioned limit of Rs. 200 million (2019:Rs. 200 million). This facility carries profit rate of one month KIBOR plus 0.25% (2019: onemonth to three months KIBOR plus 0.25% to 0.3%) per annum on the outstanding balance.This facility can interchangeably be utilized as non-funded. This facility is secured by joint paripassu charge (2019: joint pari passu charge) over current assets of the Holding company. Thisfacility is renewable on annual basis latest by 30 November 2020.
As per the financing arrangements, the subsidiary company is required to comply with certainfinancial covenants and other conditions as imposed by the providers of finance.
The Holding company has short term running finance facilities available from variouscommercial banks under mark up arrangements having aggregate sanctioned limit of Rs. 750million (2019: Rs. 750 million). These facilities carry mark-up at the rates ranging from one tothree months KIBOR plus 0.1% to 1% (2019: one to three months KIBOR plus 0.1% to 1%) perannum on the outstanding balances. Running finance facilities amounting to Rs. 450 million caninterchangeably be utilized as non-funded facilities. Out of the aggregate facilities, Rs. 450million (2019: Rs. 450 million) are secured by joint pari passu charge over present and futurecurrent assets of the Holding company and remaining Rs. 300 million (2019: Rs. 300 million)facility is secured by lien on holding company's short term investments (money market/cashfund) which should be 110% of the maximum limit allowed for utilization. Under thisarrangement, short term investment of Rs. 333.33 million (2019: Rs. 333.33 million) is markedunder lien. These facilities are renewable on annual basis latest by 31 December 2020.
The subsidiary company has short term borrowing facilities available from various commercialbanks under mark-up arrangements having aggregate sanctioned limit of Rs. 550 million (2019:Rs. 125 million). These facilities carry mark-up at the rates ranging from one months KIBORplus 0.1% to 1% per annum (2019: one to three months KIBOR plus 0.9% to 1% ). Runningfinance facilities include interchange limits of non-funded facilities amounting to Rs. 200million. The aggregate short term borrowings are secured by first pari passu charge of Rs. 234million over current and future assets and lien on subsidiary company's investment in mutualfunds placed with Asset Management Companies with margin of 5%. These facilities arerenewable latest by 30 November 2020.
There are no contingencies as of the reporting date.

131ANNUAL REPORT 2020
11.2 Commitments
11.2.1 Letter of credits
11.2.1.1 Interest/ markup based arrangements
Holding Company
Subsidiary company
11.2.1.2 Under Shariah compliant arrangements
Holding Company
11.2.2 Guarantees issued by banks on behalf of the Group
11.2.2.1 Under Mark up arrangements
Holding Company
Subsidiary company
11.2.2.2 Under Shariah compliant arrangements
Holding Company
2020 2019Note Rupees Rupees
12 Property, plant and equipment
Operating assets 12.1 3,898,409,478 3,021,391,386 Capital work in progress 12.6 97,461,608 4,297,727
3,995,871,086 3,025,689,113
Out of the aggregate facility of Rs. 375 million (2019: Rs. 375 million) for letter of guarantees(which is the sublimit of running finance and letter of credits), the amount utilized as at 30 June2020 was Rs. 87.49 million (2019: Rs. 51.40 million).
Out of the aggregate facility of Rs. 700 million (2019: Rs. 700 million) for opening letters ofcredit, the amount utilized as at 30 June 2020 for capital expenditure was Rs. 5.05 million(2019: Rs. 131.27 million) and for other than capital expenditure was Rs. 62.95 million (2019:Rs. 77.38 million). Out of these facilities, Rs. 300 million can interchangeably be utilized asrunning finance. These facilities are secured by joint pari passu charge (2019: joint pari passucharge) over all present and future current assets of the Holding Company.
Out of aggregate facility of Rs. 565 million (2019: Rs. 75 million) for letter of credits, amountutilized at 30 June 2020 was Rs. 247.7 million (2019: Rs. Nil).
The Holding Company has facility i.e. letter of guarantee of Rs. 25 million (2019: Rs. 25million) available from Islamic bank, the amount utilized at 30 June 2020 was Rs. 6.45 million(2019: Rs. 6.45 million).
The Holding company has facility i.e. letters of credit of Rs. 200 million (2019: Rs. 200 million) available from Islamic bank. The amount utilized as at 30 June 2020 for capital expenditure wasRs. 13.95 million (2019: Rs. 2.82 million) and for other than capital expenditure was Rs. 78.52million (2019: Rs. 100.52 million). Lien is also marked over import documents.
Out of aggregate facility of Rs. 60 million (2019: Rs. 90 million) for letter of guarantees, theamount utilized at 30 June 2020 is Rs. 8.30 million (2019: Rs. 8.67 million).

132 ANNUAL REPORT 2020
12.1
Ope
ratin
g as
sets
Free
hold
land
Bui
ldin
gs o
n fr
eeho
ld la
ndPl
ant a
nd
mac
hine
ryO
ffic
e eq
uipm
ent
Furn
iture
and
fit
tings
Com
pute
rsV
ehic
les
Tot
al
30 J
une
2020
Cos
t / r
eval
ued
amou
nt
Bal
ance
as a
t 01
July
201
9
72
1,57
6,12
7
98
0,79
2,69
5
1,78
7,19
6,24
9
10
9,76
4,79
7
10
5,55
5,32
2
4
8,71
4,51
5
45
3,81
1,57
8
4,20
7,41
1,28
3 A
dditi
ons /
tran
sfer
s
-
7
,604
,853
20
8,80
8,43
3
9,9
22,0
52
6
,184
,330
1
0,73
7,50
7
9
0,56
3,16
2
33
3,82
0,33
7 D
ispo
sals
/ writ
e of
f
-
-
-
(717
,609
)
-
(1
,137
,569
)
(5
8,95
9,50
5)
(6
0,81
4,68
3)R
eval
uatio
n su
rplu
s
12
7,57
5,00
0
2
5,57
3,00
3
(30
0,13
3,91
7)
-
-
-
-
(14
6,98
5,91
4)
Bal
ance
as a
t 30
June
202
0
84
9,15
1,12
7
1,01
3,97
0,55
1
1,69
5,87
0,76
5
11
8,96
9,24
0
11
1,73
9,65
2
5
8,31
4,45
3
48
5,41
5,23
5
4,33
3,43
1,02
3
Dep
reci
atio
n
Bal
ance
as a
t 01
July
201
9
-
313,
709,
560
494,
614,
126
61,
310,
386
38,
075,
624
38,
763,
133
239,
547,
068
1,
186,
019,
897
Cha
rge
for t
he y
ear
-
9
0,55
3,43
9
18
1,99
5,45
8
8,8
34,3
45
9
,651
,740
8,0
95,8
01
79,
807,
271
378,
938,
054
On
disp
osal
s
-
-
-
(547
,206
)
-
(1
,127
,320
)
(4
7,38
9,29
7)
(4
9,06
3,82
3)
-
(40
4,26
2,99
9)
(67
6,60
9,58
4)
-
-
-
-
(
1,08
0,87
2,58
3)
Bal
ance
as a
t 30
June
202
0
-
-
-
69,
597,
525
47,
727,
364
45,
731,
614
271,
965,
042
435,
021,
545
Net
boo
k va
lue
as a
t 30
June
202
0
84
9,15
1,12
7
1,01
3,97
0,55
1
1,69
5,87
0,76
5
4
9,37
1,71
5
6
4,01
2,28
8
1
2,58
2,83
9
21
3,45
0,19
3
3,89
8,40
9,47
8
30 J
une
2019
Cos
t / r
eval
ued
amou
nt
Bal
ance
as a
t 01
July
201
8
72
1,57
6,12
7
93
1,23
1,81
8
1,48
9,54
0,07
7
10
7,30
0,03
1
9
1,16
2,82
5
4
3,05
1,88
1
44
1,61
6,42
0
3,82
5,47
9,17
9 A
dditi
ons /
tran
sfer
s
-
49,
560,
877
297,
656,
172
2
,517
,266
1
4,39
2,49
7
7,8
05,8
99
90,
416,
854
462,
349,
565
Dis
posa
ls / w
rite
off
-
-
-
(
52,5
00)
-
(2,1
43,2
65)
(78,
221,
696)
(80,
417,
461)
Bal
ance
as a
t 30
June
201
9
72
1,57
6,12
7
98
0,79
2,69
5
1,78
7,19
6,24
9
10
9,76
4,79
7
10
5,55
5,32
2
4
8,71
4,51
5
45
3,81
1,57
8
4,20
7,41
1,28
3
Dep
reci
atio
n
Bal
ance
as a
t 01
July
201
8
-
208,
300,
756
311,
977,
067
52,
156,
599
28,
291,
764
33,
126,
020
221,
598,
796
855,
451,
002
Cha
rge
for t
he y
ear
-
10
5,40
8,80
4
18
2,63
7,05
9
9,1
64,2
88
9
,783
,860
7,7
60,4
89
80,
137,
804
394,
892,
304
On
disp
osal
s
-
-
-
(10
,501
)
-
(2
,123
,376
)
(6
2,18
9,53
2)
(6
4,32
3,40
9)
Bal
ance
as a
t 30
June
201
9
-
313,
709,
560
494,
614,
126
61,
310,
386
38,
075,
624
38,
763,
133
239,
547,
068
1,
186,
019,
897
Net
boo
k va
lue
as a
t 30
June
201
9
72
1,57
6,12
7
66
7,08
3,13
5
1,29
2,58
2,12
3
4
8,45
4,41
1
6
7,47
9,69
8
9,9
51,3
82
214,
264,
510
3,
021,
391,
386
Dep
reci
atio
n R
ate
%
-
1010
1010
33.3
320
Ow
ned
- - -
- - -
- - -
- - -
- - -
- - -
- - -
- - -
- - -
- - -
- - -
- - -
- - -
- - -
- - -
- - -
- - -
- - -
- - -
- - -
- - -
- - -
- - -
- - -
- - -
Rup
ees -
- - -
- - -
- - -
- - -
- - -
- - -
- - -
- - -
- - -
- - -
- - -
- - -
- - -
- - -
- - -
- - -
- - -
- - -
- - -
- - -
- - -
- - -
- - -
- - -
- -
Elim
inat
ion
of a
ccum
ulat
ed d
epre
ciat
ion
on re
valu
atio
n

133ANNUAL REPORT 2020
12.1
.1Th
ese
incl
ude
fully
dep
reci
ated
ass
ets a
mou
ntin
g to
Rs.
706.
43 m
illio
n (2
019:
Rs.
666.
90 m
illio
n).
12.1
.2
2020
2019
Rup
ees
Rup
ees
Free
hold
land
129,
623,
262
129,
623,
262
Build
ing
on fr
eeho
ld la
nd42
2,69
3,75
1
47
7,18
9,12
8
Pl
ant a
nd m
achi
nery
1,13
4,70
6,01
6
1,06
9,81
4,75
1
1,68
7,02
3,02
9
1,67
6,62
7,14
1
12.2
Parti
cula
rs o
f im
mov
able
pro
perty
(i.e
. lan
d an
d bu
ildin
g) in
the
nam
e of
Hol
ding
Com
pany
and
its s
ubsid
iarie
s are
as f
ollo
ws:
Tot
al a
rea
(a
cres
) C
over
ed A
rea
(squ
are
feet
)
Mai
n G
.T R
oad,
Am
angh
ar, D
istric
t Now
sher
a, K
PK29
.81
336,
222
5-
K.M
- Su
nder
Rai
win
d Ro
ad, R
aiw
ind
Laho
re
25.6
5
88
,101
197-
A, T
he M
all,
Raw
alpi
ndi C
antt,
Raw
alpi
ndi
0.66
28,7
49
Sh
op n
o. 2
, Gro
und
Floo
r, Ra
mza
n M
edic
al C
entre
, Lah
ore
0.01
351
Ph
ase
II Ex
tens
ion
Def
ence
Hou
se A
utho
rity,
Isla
mab
ad1.
03
N
/AH
ouse
No.
167
, Kha
nusp
ur A
yubi
a, K
PK0.
33
5,
000
Shah
ra-e
-Fay
sal,
Kar
achi
0.23
6,65
0
12.3
2020
2019
12.4
Dep
reci
atio
n is
allo
cate
d as
und
er:
Note
Rup
ees
Rup
ees
Cost
of sa
les
2427
3,89
1,24
6
28
9,71
1,76
1
A
dmin
istra
tive
expe
nses
2550
,862
,169
51
,003
,815
Se
lling
and
dist
ribut
ion
expe
nses
2654
,184
,639
54
,176
,728
37
8,93
8,05
4
39
4,89
2,30
4
Had
ther
e be
en n
o re
valu
atio
n, c
arry
ing
valu
e of
free
hold
land
, bui
ldin
g on
free
hol
d la
nd a
nd p
lant
and
mac
hine
ry w
ould
hav
e be
en a
s fol
low
s:
Loca
tion
Usa
ge o
f im
mov
able
pro
pert
y
Man
ufac
turin
g fa
cilit
yH
ead
offic
e &
bio
tech
pla
ntRe
giste
red
offic
eV
acan
t sho
pV
acan
t plo
tsG
uest
hous
e
As
expl
aine
din
note
6,th
ela
test
reva
luat
ion
was
carr
ied
asat
30Ju
ne20
20.A
spe
rth
ere
valu
atio
nre
port,
forc
edsa
leva
lue
offr
eeho
ldla
nd,b
uild
ings
onfr
eeho
ldla
ndan
dpl
anta
ndm
achi
nery
was
Rs.
822
mill
ion,
Rs.
850
mill
ion
and
Rs.
1355
mill
ion
resp
ectiv
ely.
Sale
off
ice
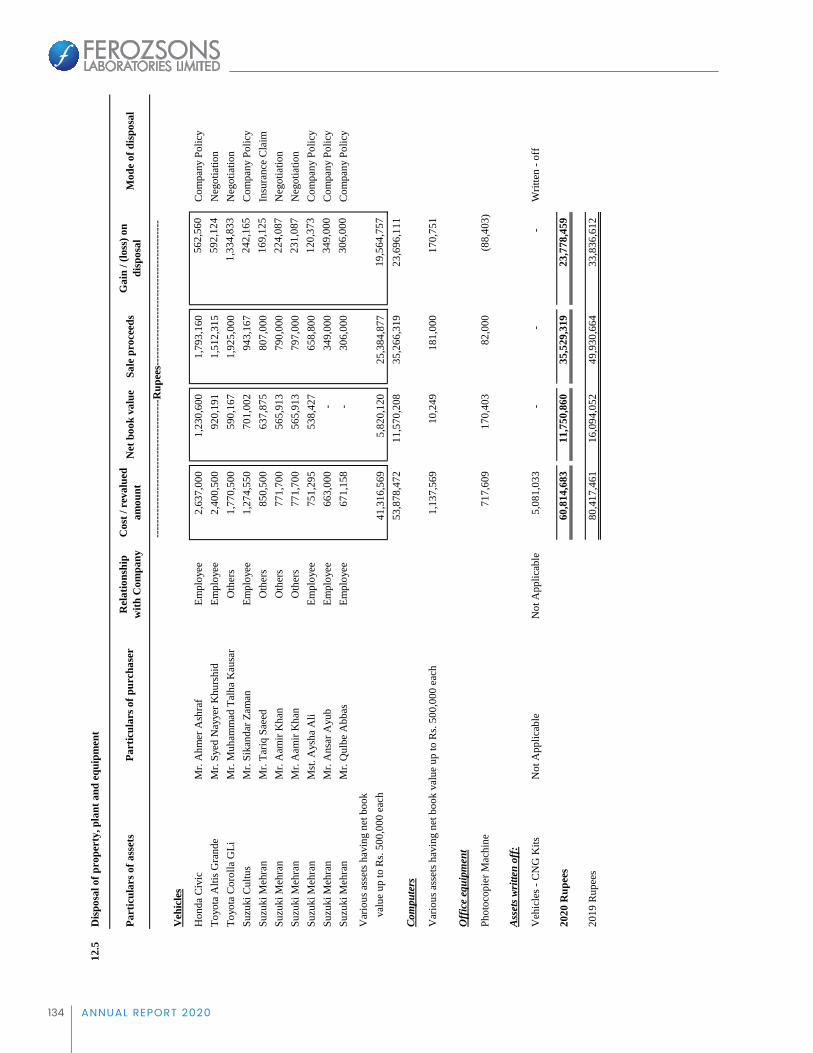
134 ANNUAL REPORT 2020
12.5
Disp
osal
of p
rope
rty,
pla
nt a
nd e
quip
men
t
Part
icul
ars o
f ass
ets
Rel
atio
nshi
p w
ith C
ompa
nyC
ost /
rev
alue
d am
ount
Net
boo
k va
lue
Sale
pro
ceed
sG
ain
/ (lo
ss) o
n di
spos
alM
ode
of d
ispo
sal
----
----
----
----
----
----
----
----
----
--R
upee
s---
----
----
----
----
----
----
----
----
----
-
Veh
icle
s
Hon
da C
ivic
Mr.
Ahm
er A
shra
fEm
ploy
ee2,
637,
000
1,
230,
600
1,
793,
160
56
2,56
0
C
ompa
ny P
olic
yTo
yota
Alti
s Gra
nde
Mr.
Syed
Nay
yer K
hurs
hid
Empl
oyee
2,40
0,50
0
920,
191
1,51
2,31
5
592,
124
Neg
otia
tion
Toyo
ta C
orol
la G
LiM
r. M
uham
mad
Tal
ha K
ausa
rO
ther
s1,
770,
500
59
0,16
7
1,
925,
000
1,
334,
833
N
egot
iatio
nSu
zuki
Cul
tus
Mr.
Sika
ndar
Zam
anEm
ploy
ee1,
274,
550
70
1,00
2
94
3,16
7
24
2,16
5
C
ompa
ny P
olic
ySu
zuki
Meh
ran
Mr.
Tariq
Sae
edO
ther
s85
0,50
0
63
7,87
5
80
7,00
0
16
9,12
5
In
sura
nce
Clai
mSu
zuki
Meh
ran
Mr.
Aam
ir K
han
Oth
ers
771,
700
565,
913
790,
000
224,
087
Neg
otia
tion
Suzu
ki M
ehra
n M
r. A
amir
Kha
nO
ther
s77
1,70
0
56
5,91
3
79
7,00
0
23
1,08
7
N
egot
iatio
nSu
zuki
Meh
ran
Mst
. Ays
ha A
liEm
ploy
ee75
1,29
5
53
8,42
7
65
8,80
0
12
0,37
3
C
ompa
ny P
olic
ySu
zuki
Meh
ran
Mr.
Ans
ar A
yub
Empl
oyee
663,
000
-
34
9,00
0
34
9,00
0
C
ompa
ny P
olic
ySu
zuki
Meh
ran
Mr.
Qul
be A
bbas
Empl
oyee
671,
158
-
30
6,00
0
30
6,00
0
C
ompa
ny P
olic
y
Var
ious
ass
ets h
avin
g ne
t boo
k va
lue
up to
Rs.
500,
000
each
41,3
16,5
69
5,
820,
120
25
,384
,877
19,5
64,7
57
53,8
78,4
72
11
,570
,208
35,2
66,3
19
23
,696
,111
Co
mpu
ters
Var
ious
ass
ets h
avin
g ne
t boo
k va
lue
up to
Rs.
500,
000
each
1,13
7,56
9
10,2
49
18
1,00
0
17
0,75
1
Off
ice
equi
pmen
t
Phot
ocop
ier M
achi
ne71
7,60
9
17
0,40
3
82
,000
(8
8,40
3)
Asse
ts wr
itten
off
:
Veh
icle
s - C
NG
Kits
Not
App
licab
leN
ot A
pplic
able
5,08
1,03
3
-
-
-
W
ritte
n - o
ff
2020
Rup
ees
60,8
14,6
83
11
,750
,860
35,5
29,3
19
23
,778
,459
2019
Rup
ees
80,4
17,4
61
16
,094
,052
49,9
30,6
64
33
,836
,612
Part
icul
ars o
f pur
chas
er

135ANNUAL REPORT 2020
2020 201912.6 Capital work-in-progress Note Rupees Rupees
The movement in capital work in progress is as follows:
Balance as at 01 July 4,297,727 105,136,237 Additions during the year 318,470,586 261,324,271 Transfers during the year (225,306,705) (362,162,781) Balance as at 30 June 12.6.1 97,461,608 4,297,727
12.6.1 Capital work-in-progress comprises of:
Building and civil works 13,835,545 - Plant and machinery 12.6.1.1 74,096,063 - Advances to suppliers 12.6.1.2 9,530,000 4,297,727
97,461,608 4,297,727
12.6.1.1
12.6.1.2
13 Intangible assets2020 2019
13.1 Computer softwares and software license fees Note Rupees Rupees
Cost
Balance as at 01 July 15,705,104 15,705,104 Addition during the year 280,336 - Balance as at 30 June 13.1.1 15,985,440 15,705,104
Amortisation
Balance as at 01 July 14,973,916 13,347,472 Amortisation for the year 25 588,017 1,626,444 Balance as at 30 June 15,561,933 14,973,916
Net book value 423,507 731,188
13.1.1
2020 201914 Investment property Note Rupees Rupees
Balance as at 01 July 79,371,992 78,545,641 Additions during the year - 826,351 Balance as at 30 June 14.1 79,371,992 79,371,992
14.1
These represents plant and machinery and equipment in the course of development and installation.
The are interest free in the normal course of business for vehicles.
It represents following pieces of land:
The value of these peices of land was determined by approved external, independent valuers i.e. M/S Aliand Ali Engineers and Valuers (Pakistan Banks Association approved valuer). The most significant inputinto this valuation is market value. The valuation is considered to be level 3 in the fair value heirarchy dueto non-observable inputs used in valuation. The different levels have been mentioned in note 38.4.2 (b).The forced sale value of these properties are Rs. 58.30 million.
- Plot number 69 measuring 177.77 square yards situated at Civic Centre, Gulberg Greens, Islamabad.
- Plot number 70 measuring 200 square yards situated at Civic Centre, Gulberg Greens, Islamabad.
These include fully amortized assets amounting to Rs. 13.96 million (2019: Rs. 13.96 million). Intangiblesare amortised at 33% (2019: 33%) on straight line basis.

136 ANNUAL REPORT 2020
2020 2019Note Rupees Rupees
15 Stores, spare parts and loose tools
Stores 23,533,408 16,454,605 Spare parts 29,770,546 23,907,437 Loose tools 10,227,693 8,900,496 Stores in transit 2,004,836 -
65,536,483 49,262,538
16 Stock in trade
Raw and packing materials 633,498,787 428,049,043 Work in process 154,578,524 94,961,552 Finished goods 16.1 1,061,494,872 644,180,004 Stock in transit 16.2 201,923,328 162,216,874 Provision for slow moving stock in trade 16.3 (1,503,275) (1,257,147)
2,049,992,236 1,328,150,326
16.1
16.2
2020 201916.3 Movement in Provision for slow moving stock in trade Rupees Rupees
Provision as at 01 July 1,257,147 - Provided during the year 246,128 1,257,147 Written off during the year - - Closing provision as at 30 June 1,503,275 1,257,147
2020 2019Note Rupees Rupees
17 Trade debts - considered good
Secured - Considered good- Exports 6,127,128 12,367,064
Unsecured - Considered good- Exports 28,316,312 30,972,382 - Others 1,077,519,472 921,343,075
1,105,835,784 952,315,457 Loss allowance against trade debts 17.1 (19,182,991) (13,894,077)
1,092,779,921 950,788,444
17.1 Loss allowance against trade debts
Loss allowance as at 01 July 13,894,077 19,015,999 Loss allowance / (reversal) during the year 5,288,914 (5,121,922) Loss allowance as at 30 June 19,182,991 13,894,077
It includes raw and packing material in transit amounting to Rs. 153.76 million (2019: Rs. 49.45 million)and finished goods in transit amounting to Rs. 48.16 million (2019: Rs. 112.77 million).
The amount charged to consolidated statement of profit and loss on account of write down of finishedgoods to net realizable value amounts to Rs. 4.02 million (2019: Rs. 88.98 million).

137ANNUAL REPORT 2020
2020 201918 Loans and advances - considered good Note Rupees Rupees
Advances to employees - secured 18.1 24,057,695 21,054,122 Advances to suppliers - unsecured 18.2 39,893,265 6,285,627 Others 2,312,931 268,705
66,263,891 27,608,454
18.1
18.2 These are interest free in the ordinary course of business.
2020 201919 Deposits and prepayments Note Rupees Rupees
Deposits - considered goodEarnest Money 19.1 167,879,986 143,397,751 Margins held with bank 107,822,209 22,346,967
275,702,195 165,744,718 Prepayments 917,249 819,482
276,619,444 166,564,200
19.1 These are interest free and given in ordinary course of business.
20 Other receivables
Sales tax refundable - net 2,640,214 10,697,217 Workers' profit participation fund 20.1 - 12,402,668 Export rebate 5,236,823 6,253,321 Others - unsecured, considered good 30,193,425 38,049,639
38,070,462 67,402,845
20.1 Workers' Profit Participation Fund
Balance receivable as at 01 July 12,402,668 8,888,310 Provision for the year (33,586,141) (17,597,332)
(21,183,473) (8,709,022)
Payments made during the year 17,597,332 21,111,690 Balance as at 30 June (3,586,141) 12,402,668
21 Short term investments
Investments at fair value through profit or loss
Mutual funds 21.1 760,707,781 490,830,304
Investments at amortized cost
Government Securities 21.3 - 374,114,733 760,707,781 864,945,037
21.1 These investments are measured at 'fair value through Profit or Loss'
Carrying value at 01 July 490,830,304 941,746,224 Acquisition / re-invested during the year 548,246,302 154,983,875 Redemption during the year (282,199,271) (583,012,355) Realized gain / (loss) on sale of investments during the year 699,063 (8,603,276) Unrealized gain / (loss) on re-measurement of investment during the year 3,131,383 (14,284,164)
Carrying and fair value of short term investments 21.1.1 760,707,781 490,830,304
Advances given to staff are in accordance with the Group's policy and terms of employment contract. Theseadvances are secured against provident fund. Advances to staff include amount due from executives of the HoldingCompany of Rs. 5.94 million (2019: Rs. 2.13 million).

138 ANNUAL REPORT 2020
2020
2019
2020
2019
21.1
.1M
utua
l fun
d w
ise
deta
il is
as f
ollo
ws:
HB
L M
oney
Mar
ket F
und
2,58
9,81
3
2,27
8,75
4
265,
076,
470
232,
709,
773
MC
B C
ash
Man
agem
ent O
ptim
izer
Fun
d22
2,73
0
20
9,85
4
22
,457
,873
21,0
99,8
28
H
BL
Cas
h Fu
nd3,
611,
640
2,
163,
177
36
5,24
2,58
9
21
8,03
8,05
0
A
BL
Cas
h Fu
nd10
,603
,390
101,
802
107,
930,
849
1,03
5,00
4
MC
B P
akis
tan
Stoc
k M
arke
t Fun
d-
206,
559
-
16
,381
,951
Fays
al S
avin
gs G
row
th F
und
-
8,
207
-
839,
748
Fays
al M
TS F
und
-
7,
207
-
725,
950
17,0
27,5
73
4,9
75,5
60
7
60,7
07,7
81
4
90,8
30,3
04
21.2
2020
2019
21.3
Thes
e in
vest
men
ts a
re m
easu
red
at a
mor
tized
cos
tN
ote
Rup
ees
Rup
ees
Gov
ernm
ent s
ecur
ities
- Mar
ket T
reas
ury
Bills
21.3
.1-
37
4,11
4,73
3
21.3
.1G
over
nmen
t sec
uriti
es -
Mar
ket T
reas
ury
Bill
s ("M
TB
s")
Issu
e da
te
11-A
pr-1
93
Mon
ths
1
10,0
00,0
00
-
110
,000
,000
-
-
-
-
9-
May
-19
3 M
onth
s
62
,000
,000
-
62,0
00,0
00
-
-
-
-
23-M
ay-1
93
Mon
ths
2
06,0
00,0
00
-
206
,000
,000
-
-
-
-
4-
Jul-1
93
Mon
ths
-
120
,000
,000
120
,000
,000
-
-
-
-
1-
Aug
-19
3 M
onth
s
-
70,0
00,0
00
70,0
00,0
00
-
-
-
-
16-A
ug-1
93
Mon
ths
-
215
,000
,000
215
,000
,000
-
-
-
-
26
-Sep
-19
3 M
onth
s
-
45,0
00,0
00
45,0
00,0
00
-
-
-
-
24-O
ct-1
93
Mon
ths
-
80
,000
,000
80
,000
,000
-
-
-
-
30
-Oct
-19
7 D
ays
-
20
,047
,453
20
,047
,453
-
-
-
-
7-
Nov
-19
3 M
onth
s
-
35,0
00,0
00
35,0
00,0
00
-
-
-
-
7-N
ov-1
96
Mon
ths
-
107
,000
,000
107
,000
,000
-
-
-
-
7-
Nov
-19
12 M
onth
s
-
1
13,0
00,0
00
1
13,0
00,0
00
-
-
-
-
17-J
an-2
03
Mon
ths
-
72
,000
,000
72
,000
,000
-
-
-
-
378
,000
,000
877
,047
,453
1
,255
,047
,453
-
-
-
-
Inve
stm
ents
inM
arke
tTre
asur
yB
ills
(MTB
s)ha
vebe
enre
deem
eddu
ring
the
year
and
proc
eeds
have
been
inve
sted
inm
utua
lfun
d.Th
ese
carr
yre
turn
from
11%
to13
.75%
(201
9:8.
30%
to12
.60%
) .
Car
ryin
g va
lue
Am
ortis
ed v
alue
App
reci
atio
n fr
om c
arry
ing
valu
e -
- - -
- - -
- - -
- - -
- - -
- - -
- - -
- - -
- - -
- - -
- - -
- - -
- - -
- - R
upee
s - -
- - -
- - -
- - -
- - -
- - -
- - -
- - -
- - -
- - -
- - -
- - -
- - -
- -
...…
……
……
.Rup
ees…
……
……
…
Fai
r va
lue
Rea
lized
gain
ofR
s.0.
70m
illio
n(2
019:
Rea
lized
loss
ofR
s.8.
60m
illio
n)on
sale
ofm
utua
lfun
dsha
sbe
enre
cord
edin
"Oth
erin
com
e"(2
019:
Oth
erex
pens
es).
Furth
er,d
ivid
end
inco
me
ofR
s.52
.52
mill
ion
(201
9:64
.02)
isal
sore
cord
edin
"Oth
erin
com
e".T
hese
inve
stm
ents
and
rela
ted
loss
isfro
mno
nsh
aria
hco
mpl
iant
arra
ngem
ent.
Thes
ear
em
arke
dun
derl
ien
asm
entio
ned
inno
te 7
and
not
e 11
.
As a
t 01
Jul
y 20
19Pu
rcha
se d
urin
g th
e pe
riod
Sale
s / m
atur
ed
duri
ng th
e pe
riod
As a
t30
Jun
e 20
20
...…
……
……
.Num
ber…
……
……
…
Uni
ts
Ten
ure
- Mon
ths
Face
val
ueB
alan
ce a
s at 3
0 Ju
ne 2
020

139ANNUAL REPORT 2020
2020 201922 Cash and bank balances Note Rupees Rupees
Cash in hand 9,639,405 12,054,957 Cash at bank:
Current accounts- foreign currency 20,278,967 19,640,915 - local currency 22.1 72,693,620 164,929,368
92,972,587 184,570,283
Deposit accounts - local currency 22.2 48,780,852 71,228,341 151,392,844 267,853,581
22.1
22.2
2020 201923 Revenue - net Note Rupees Rupees
Gross sales:Local 6,434,694,472 6,025,343,095 Export 235,270,721 181,508,566
6,669,965,193 6,206,851,661 Less:
Sales returns (66,193,194) (80,433,132) Discounts and commission (382,856,355) (283,649,193) Service charges on sales (20,526,181) (30,560,596) Sales tax (8,573,193) (9,352,875)
(478,148,923) (403,995,796) Revenue from contracts with customers 6,191,816,270 5,802,855,865
23.1
2020 201924 Cost of sales Note Rupees Rupees
Raw and packing materials consumed 24.1 1,369,566,717 1,221,716,568 Salaries, wages and other benefits 24.2 364,348,293 344,085,236 Fuel and power 104,566,464 69,059,469 Repair and maintenance 21,173,179 16,790,350 Stores, spare parts and loose tools consumed 84,926,667 89,602,579 Freight and forwarding 38,311,797 36,751,622 Packing charges 13,995,801 17,874,145 Rent, rates and taxes 4,646,646 4,847,632 Printing and stationery 3,986,987 3,945,307 Postage and telephone 4,869,643 5,476,363 Insurance 18,736,527 15,029,021 Travelling and conveyance 16,353,875 13,361,854 Canteen expenses 18,137,453 16,778,572 Depreciation on property, plant and equipment 12.4 273,891,246 289,711,761 Laboratory and other expenses 29,461,071 35,796,653
2,366,972,366 2,180,827,132 Work in process:
Opening 94,961,552 71,287,001 Closing (154,578,524) (94,961,552)
(59,616,972) (23,674,551) Cost of goods manufactured 2,307,355,394 2,157,152,581
Finished stock:Opening 644,180,006 773,414,600 Purchases made during the year 1,983,613,462 1,475,515,282 Closing (1,061,494,872) (644,180,004)
1,566,298,596 1,604,749,878 3,873,653,990 3,761,902,459
24.1 Raw and packing materials consumed
Opening 426,791,896 392,398,201 Purchases made during the year 1,574,770,333 1,256,110,263
2,001,562,229 1,648,508,464 Closing (631,995,512) (426,791,896)
1,369,566,717 1,221,716,568
24.2 Salaries, wages and other benefits include Rs. 12.78 million (2019: Rs. 12.00 million), which represents employer's contribution towardsprovident fund.
These include bank accounts of Rs. 0.002 million (2019: Rs. 0.003 million) maintained under Shariah compliant arrangements.
These include deposit accounts of Rs. 48.78 million (2019: Rs. 71.23 million) under mark up arrangements, which carry interest ratesranging from 6.5% - 11.28% (2019: 4.5% - 10.25%) per annum.
These also include deposit account of Rs. 0.000079 million (2019: Rs. 0.000073 million) under Shariah compliant arrangements, whichcarries profit rate of 3.25% - 7.06% (2019: 2.40% - 6.26%) per annum.
This includes sale of both own manufactured and purchased products. Revenue from contracts with customers relates to both local(Pakistan) and foreign markets and it is recongised at the point in time.
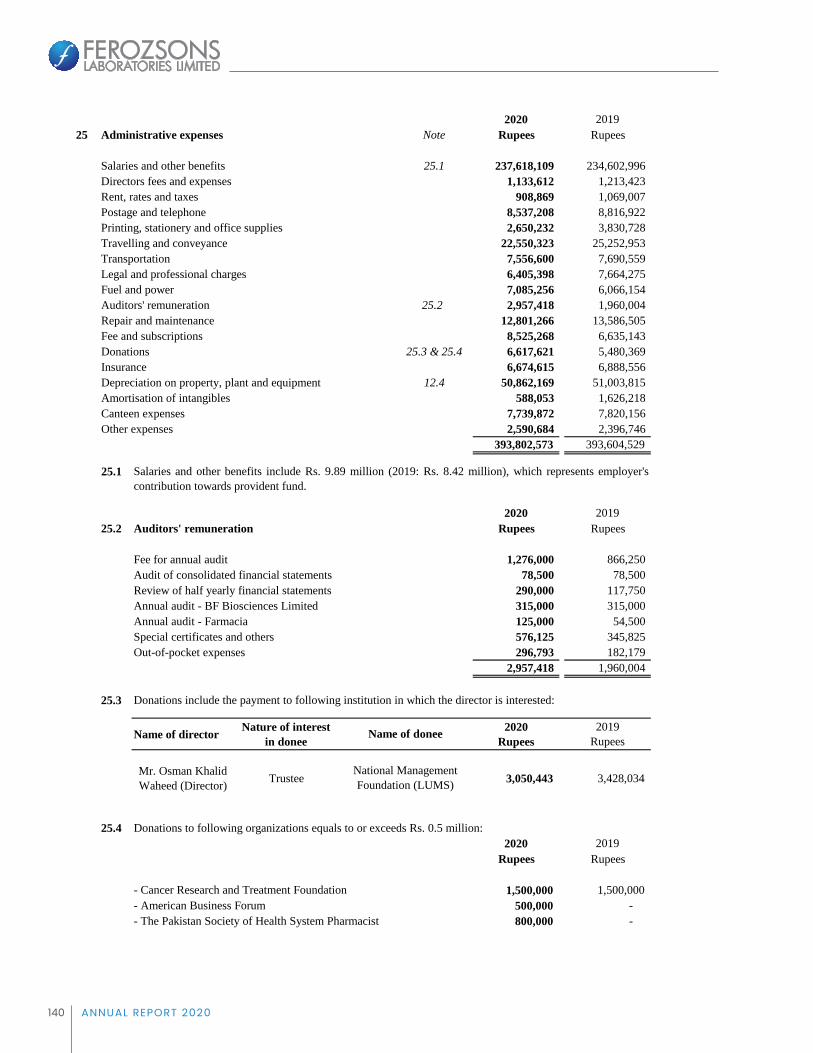
140 ANNUAL REPORT 2020
2020 201925 Administrative expenses Note Rupees Rupees
Salaries and other benefits 25.1 237,618,109 234,602,996 Directors fees and expenses 1,133,612 1,213,423 Rent, rates and taxes 908,869 1,069,007 Postage and telephone 8,537,208 8,816,922 Printing, stationery and office supplies 2,650,232 3,830,728 Travelling and conveyance 22,550,323 25,252,953 Transportation 7,556,600 7,690,559 Legal and professional charges 6,405,398 7,664,275 Fuel and power 7,085,256 6,066,154 Auditors' remuneration 25.2 2,957,418 1,960,004 Repair and maintenance 12,801,266 13,586,505 Fee and subscriptions 8,525,268 6,635,143 Donations 25.3 & 25.4 6,617,621 5,480,369 Insurance 6,674,615 6,888,556 Depreciation on property, plant and equipment 12.4 50,862,169 51,003,815 Amortisation of intangibles 588,053 1,626,218 Canteen expenses 7,739,872 7,820,156 Other expenses 2,590,684 2,396,746
393,802,573 393,604,529
25.1
2020 201925.2 Auditors' remuneration Rupees Rupees
Fee for annual audit 1,276,000 866,250 Audit of consolidated financial statements 78,500 78,500 Review of half yearly financial statements 290,000 117,750 Annual audit - BF Biosciences Limited 315,000 315,000 Annual audit - Farmacia 125,000 54,500 Special certificates and others 576,125 345,825 Out-of-pocket expenses 296,793 182,179
2,957,418 1,960,004
25.3
Name of director Nature of interestin donee
2020Rupees
2019Rupees
Mr. Osman Khalid Waheed (Director) Trustee 3,050,443 3,428,034
25.4 Donations to following organizations equals to or exceeds Rs. 0.5 million:2020 2019
Rupees Rupees
- Cancer Research and Treatment Foundation 1,500,000 1,500,000 - American Business Forum 500,000 - - The Pakistan Society of Health System Pharmacist 800,000 -
Salaries and other benefits include Rs. 9.89 million (2019: Rs. 8.42 million), which represents employer'scontribution towards provident fund.
Name of donee
National Management Foundation (LUMS)
Donations include the payment to following institution in which the director is interested:

141ANNUAL REPORT 2020
2020 201926 Selling and distribution expenses Note Rupees Rupees
Salaries and other benefits 26.1 624,336,072 603,095,712 Travelling and conveyance 256,897,398 264,930,574 Trade debts directly written off - 39,920,925 Earnest money written off 1,065,159 - Fuel and power 7,356,843 6,096,866 Rent, rates and taxes 6,281,110 7,451,558 Sales promotion and advertisement 147,303,895 143,387,890 Printing and stationary 5,508,903 5,232,024 Postage and telephone 20,642,321 18,172,933 Royalty, fee and subscription 41,267,177 33,841,232 Insurance 23,013,217 23,997,763 Repairs and maintenance 23,567,586 15,887,334 Conferences, seminars and training 107,114,475 128,081,474 Medical research and patient care 6,830,016 8,313,833 Depreciation on property, plant and equipment 12.4 54,184,639 54,176,728 Other expenses 1,327,725 999,048
1,326,696,536 1,353,585,894
26.1
2020 201927 Other expenses Note Rupees Rupees
Exchange loss 27.1 41,718,995 90,045,426 Unrealized loss on re-measurement of short term investments to fair value 21.1 - 14,284,164 Realized loss on sale of short term investments 21.1 - 8,603,276 Loss allowance against trade debts 17.1 5,288,914 - Workers' Profit Participation Fund 20.1 33,586,141 17,597,332 Workers' Welfare Fund 9 12,470,617 8,872,286 Central Research Fund 9.1 6,785,079 3,555,017
99,849,746 142,957,501
27.1 Loss incurred during the year was due to actual currency fluctuation.
28 Other income
From financial assets 28.1 95,129,324 95,597,012 From non financial assets 28.2 27,520,434 116,422,386
122,649,758 212,019,398
28.1 From financial assets
Profit on deposits with banks 28.1.1 5,279,302 3,658,402 Income on maturity of Government Securities 33,498,384 16,639,548 Amortized gain on Government Securities 21.3.1 - 6,154,627 Dividend income 52,521,192 64,022,513 Reversal of loss allowance against trade debts 17.1 - 5,121,922 Unrealized gain on re-measurement of short
term investments to fair value 21.1 3,131,383 - Realized gain on sale of short term investments 21.1 699,063 -
95,129,324 95,597,012
28.1.1
2020 201928.2 From non financial assets Note Rupees Rupees
Gain on sale of property, plant andequipment - net of write off 12.5 23,778,459 33,836,612
Export rebate 3,741,975 1,696,908 Commission income - 80,888,866
27,520,434 116,422,386
Salaries and other benefits include Rs. 21.64 million (2019: Rs. 19.95 million), which represents employer'scontribution towards provident fund.
These include profit of Rs. Nil million (2019: Rs. 0.02 million) earned on deposit account maintained under Shariah
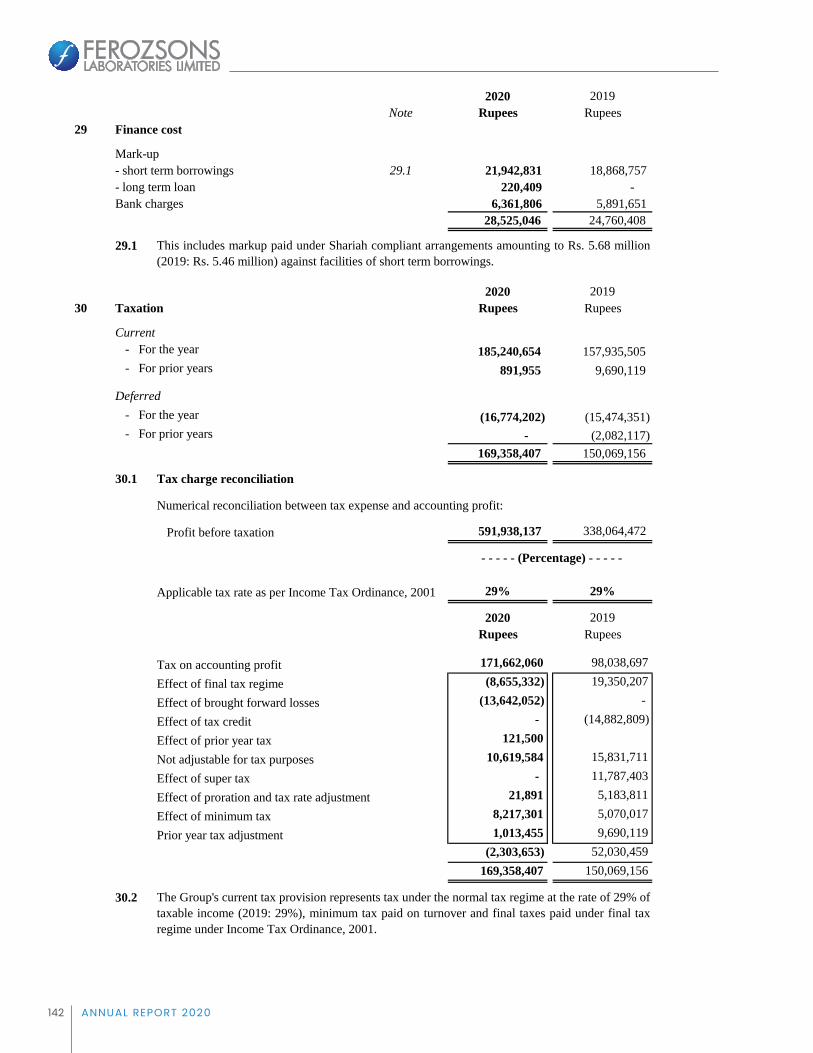
142 ANNUAL REPORT 2020
2020 2019Note Rupees Rupees
29 Finance cost
Mark-up- short term borrowings 29.1 21,942,831 18,868,757 - long term loan 220,409 - Bank charges 6,361,806 5,891,651
28,525,046 24,760,408
29.1
2020 201930 Taxation Rupees Rupees
Current- For the year 185,240,654 157,935,505 - For prior years 891,955 9,690,119
Deferred- For the year (16,774,202) (15,474,351) - For prior years - (2,082,117)
169,358,407 150,069,156
30.1 Tax charge reconciliation
Numerical reconciliation between tax expense and accounting profit:
Profit before taxation 591,938,137 338,064,472
Applicable tax rate as per Income Tax Ordinance, 2001 29% 29%
2020 2019Rupees Rupees
Tax on accounting profit 171,662,060 98,038,697
Effect of final tax regime (8,655,332) 19,350,207
Effect of brought forward losses (13,642,052) -
Effect of tax credit - (14,882,809)
Effect of prior year tax 121,500
Not adjustable for tax purposes 10,619,584 15,831,711
Effect of super tax - 11,787,403
Effect of proration and tax rate adjustment 21,891 5,183,811
Effect of minimum tax 8,217,301 5,070,017
Prior year tax adjustment 1,013,455 9,690,119 (2,303,653) 52,030,459 169,358,407 150,069,156
30.2
This includes markup paid under Shariah compliant arrangements amounting to Rs. 5.68 million(2019: Rs. 5.46 million) against facilities of short term borrowings.
The Group's current tax provision represents tax under the normal tax regime at the rate of 29% of taxable income (2019: 29%), minimum tax paid on turnover and final taxes paid under final taxregime under Income Tax Ordinance, 2001.
- - - - - (Percentage) - - - - -

143ANNUAL REPORT 2020
31 Earnings per share - basic and diluted 2020 2019
Profit for the year after taxation attributable to equity holders of the Holding Company Rupees 416,969,060 200,775,867
Weighted average number of ordinary shares Numbers 30,186,841 30,186,841 Earnings per share Rupees 13.81 6.65
31.1
32 Remuneration of Chief Executive, Executive Director and Executives
Chief Executive ExecutivesExecutive Director
Managerial remuneration 34,252,911 - 241,807,571 Utilities 1,337,667 - - LFA 3,660,467 - 11,714,229 Bonus 3,855,663 - 26,419,836 Contribution to provident fund 2,097,798 - 12,938,262
45,204,506 - 292,879,898
Numbers 2 - 53
Chief Executive ExecutivesExecutive Director
Managerial remuneration 31,365,791 - 212,180,919 Utilities 501,999 - - LFA 2,590,375 - 15,402,643 Bonus 2,545,026 - 30,271,389 Contribution to provident fund 2,050,675 - 10,966,796
39,053,866 - 268,821,747
Numbers 2 - 46
33 Related party transactions
2020 2019Rupees Rupees
Contribution towards employees' provident fund 45,165,257 41,295,173 Remuneration including benefits and perquisites of
key management personnel 178,261,056 169,203,570 Dividend to KFW Factors (Private) Limited - associated
company (27.45 % equity held) 33,147,768 33,147,768 Dividend to Directors 13,561,688 12,899,804 Fee paid to M/s Khan and Piracha 267,500 240,500 Rent paid to Director against office 4,092,000 4,290,000
The Group's related parties include entities over which directors are able to exercise influence, associated companies,staff retirement fund, directors and key management personnel. Balances with the related parties are shown else wherein the consolidated financial statements. The transactions with related parties are as follows:
In addition, the Chief Executive of the Holding Company and Subsidiary Company are allowed free use of the Group'svehicles. The directors and managing partner of the subsidiary companies are not paid any remuneration.
---------------------Rupees---------------------
---------------------Rupees---------------------
2020
2019
There is no dilutive effect on the basic earnings per share as the Group has no commitment for potentiallyissuable shares.
The Holding Company has 6 (2019: 6) non executive directors. Non executive directors are not paid any remunerationor benefits other than the meeting fee and reimbursement of expenses. All the members of the Board of Directors werepaid Rs. 370,000 (2019: Rs. 400,000) as meeting fee and Rs. 763,612 (2019: Rs. 813,423 ) as reimbursement ofexpenses for attending the Board of Directors' meetings.

144 ANNUAL REPORT 2020
34 Plant capacity and production
2020 201935 Number of employees
Total number of employees as at 30 June 1180 1172Average number of employees during the year 1175 1145
36 Reconciliation of movement of liabilities to cash flows arising from financing activities
Unclaimed dividend
Accrued mark-up
Long term loan - secured
Balance as at 01 July 2019 75,156,815 4,461,193 - 79,618,008
Changes from financing cash flows
Inflows from financing arrangement - - 133,000,000 133,000,000 Finance cost paid - (30,439,792) - (30,439,792) Dividends paid (118,939,327) - - (118,939,327) Total changes from financing
cash flows (118,939,327) (30,439,792) 133,000,000 (16,379,119)
Non-cash changes
Dividend approved 120,747,364 - 120,747,364 Interest / markup expense - 28,525,046 28,525,046 Total non-cash changes 120,747,364 28,525,046 - 149,272,410
Closing as at 30 June 2020 76,964,852 2,546,447 133,000,000 212,511,299
Unclaimed dividend
Accrued mark-up
Long term loan - secured
Balance as at 01 July 2018 82,143,724 539,624 - 82,683,348
Changes from financing cash flows
Finance cost paid - (20,838,839) - (20,838,839) Dividends paid (127,734,273) - - (127,734,273) Total changes from financing
cash flows (127,734,273) (20,838,839) - (148,573,112)
Non-cash changes
Dividend approved 120,747,364 - - 120,747,364 Interest / markup expense - 24,760,408 - 24,760,408 Total non-cash changes 120,747,364 24,760,408 - 145,507,772
Closing as at 30 June 2019 75,156,815 4,461,193 - 79,618,008
2019Liabilities
Total
-------------------------------------------------------------- (Rupees) -------------------------------------------------------------------
The production capacity of the Holding Company and subsidiary companies' plants cannot be determined, as it is amulti-product production facility with varying manufacturing processes.
-------------------------------------------------------------- (Rupees) -------------------------------------------------------------------
2020
Total
Total employees
Liabilities
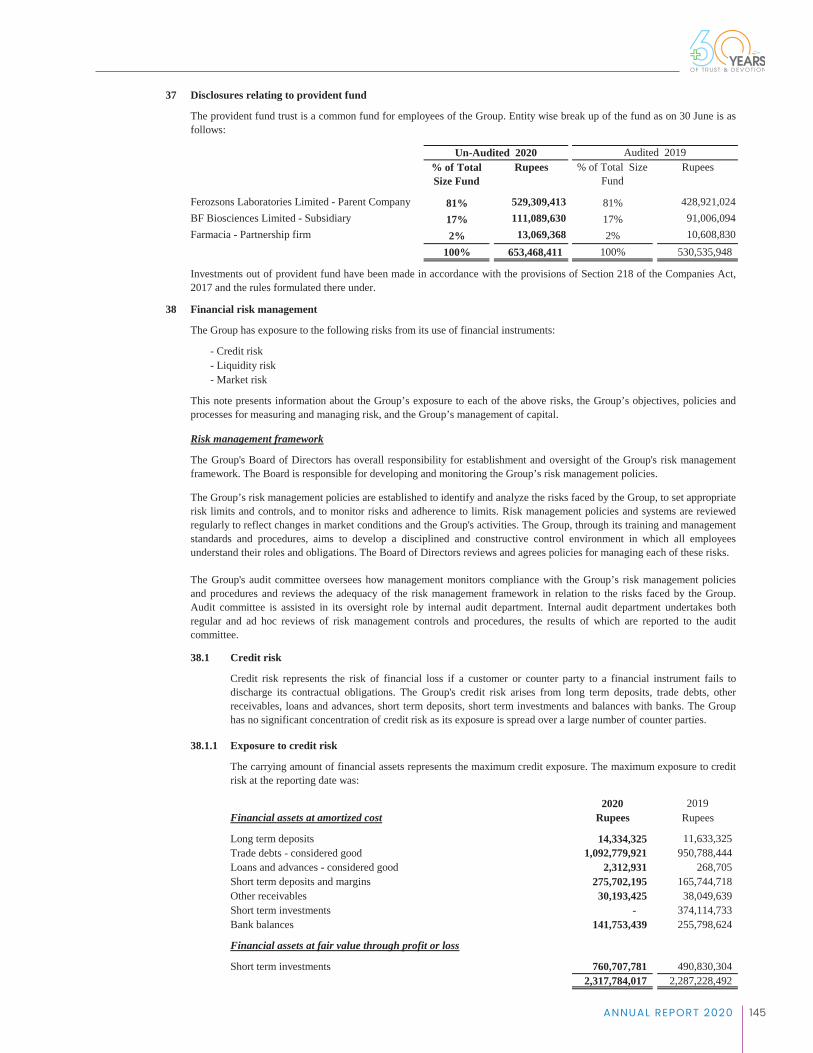
145ANNUAL REPORT 2020
37 Disclosures relating to provident fund
% of Total Size Fund
Rupees % of Total SizeFund
Rupees
Ferozsons Laboratories Limited - Parent Company 81% 529,309,413 81% 428,921,024BF Biosciences Limited - Subsidiary 17% 111,089,630 17% 91,006,094Farmacia - Partnership firm 2% 13,069,368 2% 10,608,830
100% 653,468,411 100% 530,535,948
38 Financial risk management
- Credit risk- Liquidity risk- Market risk
Risk management framework
38.1 Credit risk
38.1.1 Exposure to credit risk
2020 2019Financial assets at amortized cost Rupees Rupees
Long term deposits 14,334,325 11,633,325 Trade debts - considered good 1,092,779,921 950,788,444 Loans and advances - considered good 2,312,931 268,705 Short term deposits and margins 275,702,195 165,744,718 Other receivables 30,193,425 38,049,639 Short term investments - 374,114,733 Bank balances 141,753,439 255,798,624
Financial assets at fair value through profit or loss
Short term investments 760,707,781 490,830,304 2,317,784,017 2,287,228,492
Credit risk represents the risk of financial loss if a customer or counter party to a financial instrument fails todischarge its contractual obligations. The Group's credit risk arises from long term deposits, trade debts, otherreceivables, loans and advances, short term deposits, short term investments and balances with banks. The Grouphas no significant concentration of credit risk as its exposure is spread over a large number of counter parties.
The Group has exposure to the following risks from its use of financial instruments:
This note presents information about the Group’s exposure to each of the above risks, the Group’s objectives, policies andprocesses for measuring and managing risk, and the Group’s management of capital.
The Group's Board of Directors has overall responsibility for establishment and oversight of the Group's risk managementframework. The Board is responsible for developing and monitoring the Group’s risk management policies.
The Group’s risk management policies are established to identify and analyze the risks faced by the Group, to set appropriaterisk limits and controls, and to monitor risks and adherence to limits. Risk management policies and systems are reviewedregularly to reflect changes in market conditions and the Group's activities. The Group, through its training and managementstandards and procedures, aims to develop a disciplined and constructive control environment in which all employeesunderstand their roles and obligations. The Board of Directors reviews and agrees policies for managing each of these risks.
The Group's audit committee oversees how management monitors compliance with the Group’s risk management policiesand procedures and reviews the adequacy of the risk management framework in relation to the risks faced by the Group.Audit committee is assisted in its oversight role by internal audit department. Internal audit department undertakes bothregular and ad hoc reviews of risk management controls and procedures, the results of which are reported to the auditcommittee.
The carrying amount of financial assets represents the maximum credit exposure. The maximum exposure to creditrisk at the reporting date was:
Un-Audited 2020 Audited 2019
Investments out of provident fund have been made in accordance with the provisions of Section 218 of the Companies Act,2017 and the rules formulated there under.
The provident fund trust is a common fund for employees of the Group. Entity wise break up of the fund as on 30 June is asfollows:

146 ANNUAL REPORT 2020
38.1.2 Credit quality and impairment
Counter parties with external credit ratings - Bank balances and short term investments
2020 2019Short term Long term
Bank balances
Habib Bank Limited A1+ AAA JCR-VIS 26,250,227 87,718,822 Bank Al-Habib Limited A1+ AA+ PACRA 18,470,601 69,135,323 Habib Metropolitan Bank Limited A1+ AA+ PACRA 45,212,021 58,130,669 Bank Alfalah Limited A1+ AA+ PACRA 41,025,018 19,805,764 Meezan Bank Limited A1+ AA+ JCR-VIS 8,102,802 4,810,760 MCB Bank Limited A1+ AAA PACRA 1,208,054 3,076,887 Allied Bank Limited A1+ AAA PACRA 659,756 12,295,439 Faysal Bank Limited A1+ AA PACRA 824,960 824,960
141,753,439 255,798,624 Short term investments
HBL Money Market Fund N/A AA(f) JCR-VIS 265,076,470 232,709,773 MCB Cash Management Optimizer Fund N/A AA+(f) PACRA 22,457,873 21,099,828 HBL Cash Fund N/A AA(f) JCR-VIS 365,242,589 218,038,050 ABL Cash Fund N/A AA(f) PACRA 107,930,849 1,035,004 MCB Pakistan Stock Market Fund N/A AA+(f) PACRA - 16,381,951 Faysal Savings Growth Fund N/A AA-(f) PACRA - 839,748 Faysal MTS Fund N/A A+(f) PACRA - 725,950
760,707,781 490,830,304 Margin against bank gaurantee
Habib Bank Limited A1+ AAA JCR-VIS 783,934 783,934 Meezan Bank Limited A1+ AA+ JCR-VIS 196,168 196,168
980,102 980,102 Margin against letter of credit
MCB Bank Limited A1+ AAA PACRA - 12,755,060 Habib Bank Limited AAA A1+ JCR-VIS 12,754,148 - Allied Bank Limited AAA A1+ 70,760,157 - Meezan Bank Limited A1+ AA+ JCR-VIS 22,871,803 8,245,306
106,386,108 21,000,366 1,009,827,430 768,609,396
Trade debts
The aging of trade debts at the reporting date was:
2020 2019Rupees Rupees
Not past due yet 218,162,689 474,903,912 Past due 61 - 90 days 171,513,436 64,850,333 Past due 91 - 180 days 185,303,926 154,730,341 Past due 181 - 365 days 196,956,945 219,746,091 More than 365 days 340,025,916 50,451,845 Less: Loss allowance on trade debts (19,182,991) (13,894,077)
1,092,779,921 950,788,444
Credit quality of financial assets is assessed by reference to external credit ratings, where available, or to historical information about counterpartydefault rates. All counterparties, with the exception of customers and utility Companies, have external credit ratings determined by various credit ratingagencies. Credit quality of customers is assessed by reference to historical default rates and present ages.
These mainly include customers which are counter parties to local and foreign trade debts. The Group applies the IFRS 9 simplified approach tomeasure expected credit losses which uses a lifetime expected loss allowance for all trade receivables other than due from Government departments /hospitals. Trade receivables are written off when there is no reasonable expectation of recovery. On adoption of IFRS 9, management uses an provisionmatrix to base the calculation of ECL of trade receivables from individual customers. Loss rates are calculated using a 'role rate' method based on theprobability of receivable progressing through successive stages of delinquency to write-off. The Group has used three years quarterly data in thecalculation of historical loss rates along with the matching quarterly ageing brackets for the computation of roll rates. These rates are multiplied byscalar factors to reflect the effect of forward looking macro-economic factors. The analysis of ages of trade debts and loss allowance using theaforementioned approach as at 30 June 2020 was determined as follows:
This represents banking companies and financial institutions, which are counterparties to bank balances and investments. Short term investmentsincludes Rs Nil ( 2019: Rs 374.11 million) in government securities (MTB's) for which there is no credit risk as they are government secured bonds andaccordingly excluded from credit risk exposure. Impairment on these balances has been measured on 12 month expected loss basis and reflects theshortest maturities of the exposure. Credit risk is considered minimal as these counterparties have reasonably high credit ratings as determined byvarious credit rating agencies. Due to long standing business relationships with these counterparties and considering their strong financial standing,management does not expect non-performance by these counterparties on their obligations to the Group. Following are the credit ratings ofcounterparties with external credit ratings:
Rating Rating Agency-------------------------Rupees-----------------------
Institutions
PACRA
Export sales are majorly secured through letter of credit while majority of the local sales are made to Government departments / hospitals. Trade debtsare essentially due from government departments / projects and the Group is actively pursuing for recovery of debts and the Group does not expect thesecompanies to fail to meet their obligations.
Deposits and other receivables are mostly due from Government Institutions, utility companies and a major supplier. Impairment on these balances hasbeen measured on 12 month expected loss basis and reflects the shortest maturities of the exposure. Based on past experience the management believesthat no impairment allowance is necessary in respect of these financial assets. There are reasonable grounds to believe that these amounts will berecovered in short course of time.
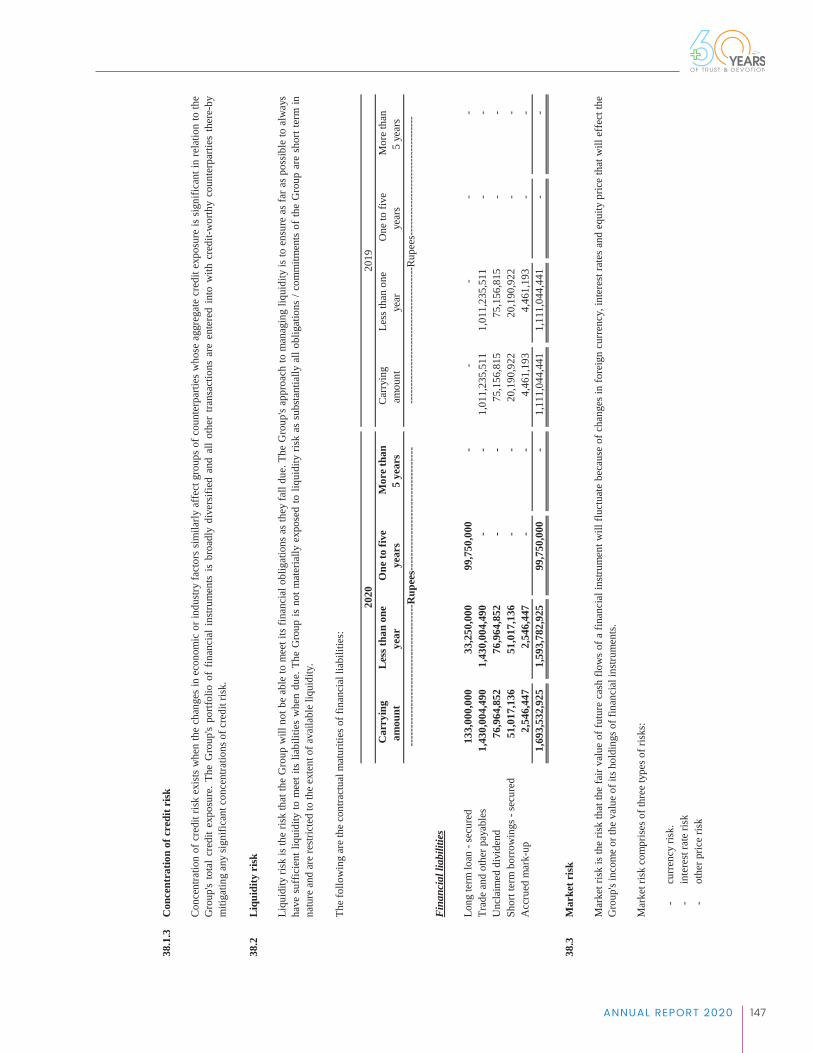
147ANNUAL REPORT 2020
38.1
.3C
once
ntra
tion
of c
redi
t risk
38.2
Liqu
idity
risk
Car
ryin
gam
ount
L
ess t
han
one
year
O
ne to
five
year
s M
ore
than
5 ye
ars
Car
ryin
gam
ount
L
ess t
han
one
year
O
ne to
five
year
s M
ore
than
5 ye
ars
Fina
ncia
l lia
bilit
ies
Long
term
loan
- se
cure
d13
3,00
0,00
0
33
,250
,000
99
,750
,000
-
-
-
-
-
Tr
ade
and
othe
r pay
able
s1,
430,
004,
490
1,
430,
004,
490
-
-
1,
011,
235,
511
1,
011,
235,
511
-
-
U
ncla
imed
div
iden
d76
,964
,852
76
,964
,852
-
-
75
,156
,815
75
,156
,815
-
-
Sh
ort t
erm
bor
row
ings
- se
cure
d51
,017
,136
51
,017
,136
-
-
20
,190
,922
20
,190
,922
-
-
A
ccru
ed m
ark-
up2,
546,
447
2,54
6,44
7
-
-
4,
461,
193
4,46
1,19
3
-
-
1,
693,
532,
925
1,
593,
782,
925
99
,750
,000
-
1,
111,
044,
441
1,
111,
044,
441
-
-
38.3
Mar
ket r
isk
Mar
ket r
isk c
ompr
ises o
f thr
ee ty
pes o
f risk
s:
- cu
rren
cy ri
sk.
- in
tere
st ra
te ri
sk-
othe
r pric
e ris
k
Mar
ketr
iskis
the
risk
that
the
fair
valu
eof
futu
reca
shflo
ws
ofa
finan
cial
instr
umen
twill
fluct
uate
beca
use
ofch
ange
sin
fore
ign
curr
ency
,int
eres
trat
esan
deq
uity
pric
eth
atw
illef
fect
the
Gro
up's
inco
me
or th
e va
lue
of it
s hol
ding
s of f
inan
cial
instr
umen
ts.
The
follo
win
g ar
e th
e co
ntra
ctua
l mat
uriti
es o
f fin
anci
al li
abili
ties:
2020
Liqu
idity
risk
isth
eris
kth
atth
eG
roup
will
notb
eab
leto
mee
tits
finan
cial
oblig
atio
nsas
they
fall
due.
The
Gro
up's
appr
oach
tom
anag
ing
liqui
dity
isto
ensu
reas
fara
spo
ssib
leto
alw
ays
have
suff
icie
ntliq
uidi
tyto
mee
tits
liabi
litie
sw
hen
due.
The
Gro
upis
notm
ater
ially
expo
sed
toliq
uidi
tyris
kas
subs
tant
ially
allo
blig
atio
ns/c
omm
itmen
tsof
the
Gro
upar
esh
ortt
erm
inna
ture
and
are
restr
icte
d to
the
exte
nt o
f ava
ilabl
e liq
uidi
ty.
----
----
----
----
----
----
----
----
----
---R
upee
s---
----
----
----
----
----
----
----
---
2019
------
------
------
------
------
------
---Ru
pees
------
------
------
------
------
----
Conc
entra
tion
ofcr
edit
risk
exist
sw
hen
the
chan
ges
inec
onom
icor
indu
stry
fact
ors
simila
rlyaf
fect
grou
psof
coun
terp
artie
sw
hose
aggr
egat
ecr
edit
expo
sure
issi
gnifi
cant
inre
latio
nto
the
Gro
up's
tota
lcre
dite
xpos
ure.
The
Gro
up's
portf
olio
offin
anci
alin
strum
ents
isbr
oadl
ydi
vers
ified
and
allo
ther
trans
actio
nsar
een
tere
din
tow
ithcr
edit-
wor
thy
coun
terp
artie
sth
ere-
bym
itiga
ting
any
signi
fican
t con
cent
ratio
ns o
f cre
dit r
isk.

148 ANNUAL REPORT 2020
38.3
.1C
urre
ncy
risk
-Tr
ansa
ctio
nal e
xpos
ure
in re
spec
t of n
on fu
nctio
nal c
urre
ncy
mon
etar
y ite
ms.
-Tr
ansa
ctio
nal e
xpos
ure
in re
spec
t of n
on fu
nctio
nal c
urre
ncy
expe
nditu
re a
nd re
venu
es.
The
pote
ntia
l cur
renc
y ex
posu
res a
re d
iscu
ssed
bel
ow:
Tran
sact
iona
l exp
osur
e in
resp
ect o
f non
func
tiona
l cur
renc
y m
onet
ary
item
s
Tran
sact
iona
l exp
osur
e in
resp
ect o
f non
func
tiona
l cur
renc
y ex
pend
iture
and
reve
nues
Exp
osur
e to
cur
renc
y ri
sk
The
Gro
up’s
exp
osur
e to
fore
ign
curre
ncy
risk
at th
e re
porti
ng d
ate
was
as f
ollo
ws:
Rup
ees
US
Dol
lars
Eur
oU
AE
Dir
ham
Pou
nd S
terl
ing
JPY
Aus
Dol
lars
Cas
h an
d ca
sh e
quiv
alen
ts25
,351
,854
81
,666
159,
089
45
,741
4,67
5
3,
410
1,00
0
Tr
ade
and
othe
r pay
able
s(9
27,8
77,4
26)
(4,7
33,9
79)
(1
2,91
2)
(774
,637
)
-
-
-
Tr
ade
rece
ivab
les
32,3
54,7
67
175,
823
-
16,7
08
-
-
-
Oth
er re
ceiv
able
s30
,749
,117
18
2,97
6
-
-
-
-
-
G
ross
fina
ncia
l pos
ition
exp
osur
e(8
39,4
21,6
88)
(4,2
93,5
14)
14
6,17
7
(712
,188
)
4,67
5
3,
410
1,00
0
Rup
ees
US
Dol
lars
Euro
UA
E D
irham
Pou
nd S
terli
ngJP
YA
us D
olla
rs
Cas
h an
d ca
sh e
quiv
alen
ts25
,456
,440
13
0,77
5
17,8
69
4,
145
3,73
5
14
6,00
0
1,00
0
Tr
ade
and
othe
r pay
able
s(7
30,1
03,3
07)
(4,5
44,3
02)
(1
,642
)
(5
7,11
2)
-
-
-
Tr
ade
rece
ivab
les
43,3
39,4
59
270,
787
-
-
-
-
-
Oth
er re
ceiv
able
s36
,782
,051
22
9,81
6
-
-
-
-
-
G
ross
fina
ncia
l pos
ition
exp
osur
e(6
24,5
25,3
57)
(3,9
12,9
24)
16
,227
(52,
967)
3,
735
146,
000
1,
000
Paki
stan
iRup
eeis
the
func
tiona
lcur
renc
yof
the
Gro
upan
dex
posu
rear
ises
from
trans
actio
nsan
dba
lanc
esin
curre
ncie
sot
hert
han
Paki
stan
iRup
eeas
fore
ign
exch
ange
rate
fluct
uatio
ns m
ay c
reat
e un
wan
ted
and
unpr
edic
tabl
e ea
rnin
gs a
nd c
ashf
low
vol
atili
ty. T
he G
roup
's po
tent
ial c
urre
ncy
expo
sure
com
pris
es o
f:
2019
2020
Mon
etar
yite
ms,
incl
udin
gfin
anci
alas
sets
and
liabi
litie
s,de
nom
inat
edin
curre
ncie
sot
hert
han
the
func
tiona
lcur
renc
yof
the
Gro
upar
epe
riodi
cally
rest
ated
toru
pee
equi
vale
nt,
and
the
asso
ciat
edga
inor
loss
ista
ken
toth
eco
nsol
idat
edst
atem
ent
ofpr
ofit
orlo
ss.
The
fore
ign
curre
ncy
risk
rela
ted
tom
onet
ary
item
sis
man
aged
aspa
rtof
the
risk
man
agem
ent s
trate
gy.
Cer
tain
oper
atin
gan
dca
pita
lexp
endi
ture
isin
curre
dby
the
Gro
upin
curre
ncy
othe
rth
anth
efu
nctio
nalc
urre
ncy.
Cer
tain
sale
sre
venu
eis
earn
edin
curre
ncie
sot
her
than
the
func
tiona
l cur
renc
y of
the
Gro
up. T
hese
cur
renc
y ris
ks a
re m
anag
ed a
s a p
art o
f ove
rall
risk
man
agem
ent s
trate
gy. T
he G
roup
doe
s not
ent
er in
to fo
rwar
d ex
chan
ge c
ontra
cts.

149ANNUAL REPORT 2020
38.3.2 The following significant exchange rates were applied during the year:
2020 2019 2020 2019
US Dollars 168.05 160.05 140.89 140.89Euro 188.61 182.32 160.89 160.89UAE Dirham 45.75 43.57 38.34 38.34Pound Sterling 206.50 203.01 181.27 181.27JPY 1.56 1.49 1.24 1.24Australian dollars 115.18 112.23 98.17 98.17
Sensitivity analysis
2020 2019
Statement of profit or loss (83,942,169) (62,452,536)
38.3.3 Interest rate risk
2020 2019 2020 2019
Variable rate instruments
Financial assets
Cash at bank - deposit accounts 6.5% to 11.3% 4.5 to 9.5 48,780,852 71,228,341
Financial liabilities
Long term loan - including current portion 8.4% to 9.4% - 133,000,000 - Short term borrowings secured 8.5% to 14.8% 9.5 (51,017,136) (20,190,922)
Net Exposure 130,763,716 51,037,419
Cash flow sensitivity analysis for variable rate instruments
100 bps 100 bpsIncrease Decrease
As at 30 June 2020
Cash flow sensitivity - Variable rate financial assets 1,307,637 (1,307,637)
As at 30 June 2019
Cash flow sensitivity - Variable rate financial assets 510,374 (510,374)
38.3.4 Other price risk
A change of 100 basis points in interest rates at the reporting date would have decreased / increased profit for the year by theamounts shown below. This analysis assumes that all other variables, in particular foreign currency rates, remain constant. Theanalysis is performed on the same basis for 2019.
Interest rate risk is the risk that the value of a financial instrument will fluctuate due to changes in market interest rates. At thereporting date the interest rate profile of the Group's significant interest bearing financial instruments was as follows:
Average rate Carrying amount(in Percentage) (Rupees)
Profit or loss
Rupees
Other price risk is the risk that the fair value or future cash flows of a financial instrument will fluctuate because of changes inmarket prices (other than those arising from interest rate risk or currency risk), whether those changes are caused by factorsspecific to the individual financial instrument or its issuer, or factors affecting all similar financial instruments traded in the market.To manage its price risk arising from investments in equity securities, the Group diversifies its portfolio within the eligible stocksin accordance with the risk investment guidelines approved by the investment committee. The Group is exposed to price riskarising from its investment in mutual funds that are classified as fair value through profit or loss. The Group has no investments inequity instruments traded in the market at the reporting date. The Group is also not exposed to commodity price risk since it doesnot hold any financial instrument based on commodity prices.
The sensitivity analysis prepared is not necessarily indicative of the effects on profit for the year and assets / liabilities of theGroup.
The Group does not account for any fixed rate financial assets and liabilities at fair value through profit or loss. Therefore, achange in profit / mark-up / interest rates at the reporting date would not affect consolidated statement of profit or loss.
Profit or loss
Average rate
A 10% strengthening of the Pakistani Rupee against foreign currencies at the reporting date would have (increased) / decreasedloss / profit by the amounts shown below, mainly as a result of exchange losses / gains on translation of foreign exchangedenominated financial instruments. This analysis assumes that all other variables, in particular interest rates remain constant. Theanalysis is performed on the same basis as for the previous year.
-------------------Rs.-------------------
Reporting date rate
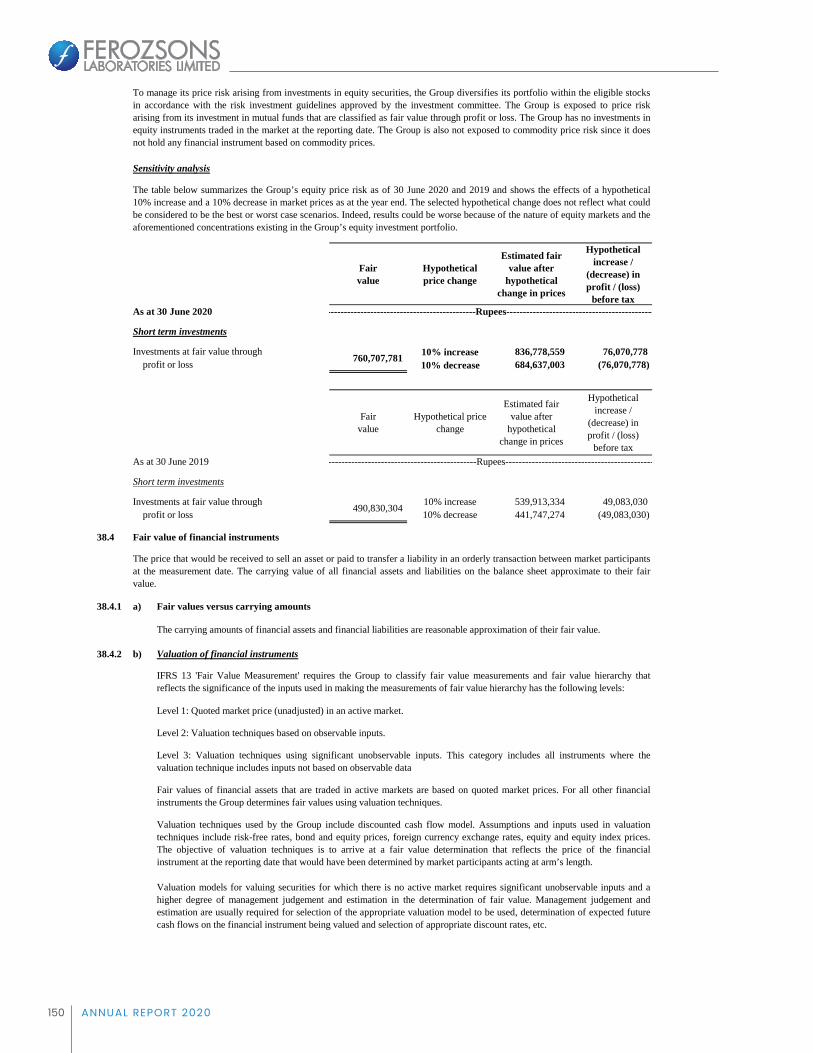
150 ANNUAL REPORT 2020
Sensitivity analysis
Fair value
Hypothetical price change
Estimated fair value after
hypothetical change in prices
Hypothetical increase /
(decrease) in profit / (loss)
before taxAs at 30 June 2020
Short term investments
Investments at fair value through 10% increase 836,778,559 76,070,778 profit or loss 10% decrease 684,637,003 (76,070,778)
Fair value
Hypothetical price change
Estimated fair value after
hypothetical change in prices
Hypothetical increase /
(decrease) in profit / (loss)
before taxAs at 30 June 2019
Short term investments
Investments at fair value through 10% increase 539,913,334 49,083,030 profit or loss 10% decrease 441,747,274 (49,083,030)
38.4 Fair value of financial instruments
38.4.1 a) Fair values versus carrying amounts
38.4.2 b) Valuation of financial instruments
The carrying amounts of financial assets and financial liabilities are reasonable approximation of their fair value.
Other price risk is the risk that the fair value or future cash flows of a financial instrument will fluctuate because of changes inmarket prices (other than those arising from interest rate risk or currency risk), whether those changes are caused by factorsspecific to the individual financial instrument or its issuer, or factors affecting all similar financial instruments traded in the market.To manage its price risk arising from investments in equity securities, the Group diversifies its portfolio within the eligible stocksin accordance with the risk investment guidelines approved by the investment committee. The Group is exposed to price riskarising from its investment in mutual funds that are classified as fair value through profit or loss. The Group has no investments inequity instruments traded in the market at the reporting date. The Group is also not exposed to commodity price risk since it doesnot hold any financial instrument based on commodity prices.
The table below summarizes the Group’s equity price risk as of 30 June 2020 and 2019 and shows the effects of a hypothetical10% increase and a 10% decrease in market prices as at the year end. The selected hypothetical change does not reflect what couldbe considered to be the best or worst case scenarios. Indeed, results could be worse because of the nature of equity markets and theaforementioned concentrations existing in the Group’s equity investment portfolio.
--------------------------------------------------Rupees--------------------------------------------------
--------------------------------------------------Rupees--------------------------------------------------
The price that would be received to sell an asset or paid to transfer a liability in an orderly transaction between market participantsat the measurement date. The carrying value of all financial assets and liabilities on the balance sheet approximate to their fairvalue.
490,830,304
760,707,781
Valuation techniques used by the Group include discounted cash flow model. Assumptions and inputs used in valuationtechniques include risk-free rates, bond and equity prices, foreign currency exchange rates, equity and equity index prices.The objective of valuation techniques is to arrive at a fair value determination that reflects the price of the financialinstrument at the reporting date that would have been determined by market participants acting at arm’s length.
Valuation models for valuing securities for which there is no active market requires significant unobservable inputs and ahigher degree of management judgement and estimation in the determination of fair value. Management judgement andestimation are usually required for selection of the appropriate valuation model to be used, determination of expected futurecash flows on the financial instrument being valued and selection of appropriate discount rates, etc.
IFRS 13 'Fair Value Measurement' requires the Group to classify fair value measurements and fair value hierarchy thatreflects the significance of the inputs used in making the measurements of fair value hierarchy has the following levels:
Level 1: Quoted market price (unadjusted) in an active market.
Level 2: Valuation techniques based on observable inputs.
Level 3: Valuation techniques using significant unobservable inputs. This category includes all instruments where thevaluation technique includes inputs not based on observable data
Fair values of financial assets that are traded in active markets are based on quoted market prices. For all other financialinstruments the Group determines fair values using valuation techniques.
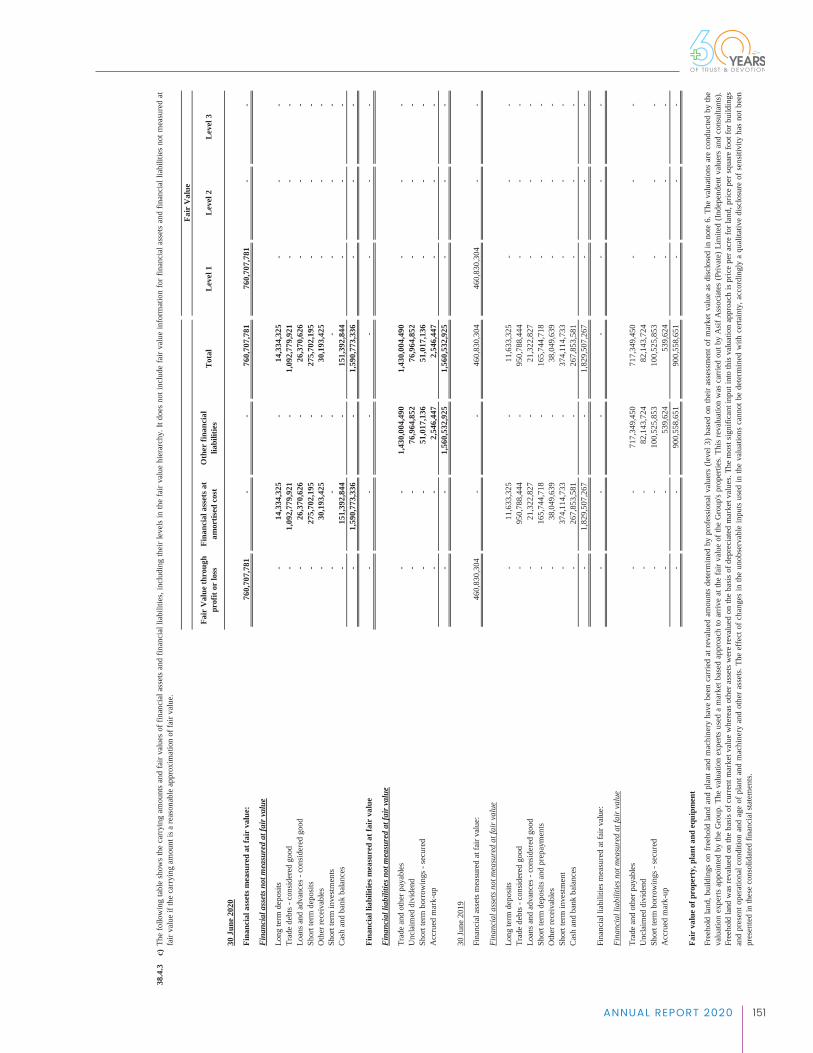
151ANNUAL REPORT 2020
38.4
.3c)
Fair
Val
ue th
roug
h pr
ofit
or lo
ssFi
nanc
ial a
sset
s at
amor
tised
cos
tO
ther
fina
ncia
l lia
bilit
ies
Tota
lLe
vel 1
Leve
l 2Le
vel 3
30 J
une
2020
Fina
ncia
l ass
ets m
easu
red
at fa
ir v
alue
:76
0,70
7,78
1
-
-
76
0,70
7,78
1
760,
707,
781
-
-
Fina
ncia
l ass
ets n
ot m
easu
red
at fa
ir va
lue
Long
term
dep
osits
-
14,3
34,3
25
-
14,3
34,3
25
-
-
-
Tr
ade
debt
s - c
onsid
ered
goo
d-
1,
092,
779,
921
-
1,
092,
779,
921
-
-
-
Loan
s and
adv
ance
s - c
onsid
ered
goo
d-
26
,370
,626
-
26
,370
,626
-
-
-
Shor
t ter
m d
epos
its-
27
5,70
2,19
5
-
27
5,70
2,19
5
-
-
-
Oth
er re
ceiv
able
s-
30
,193
,425
-
30
,193
,425
-
-
-
Shor
t ter
m in
vestm
ents
-
-
-
-
-
-
-
Ca
sh a
nd b
ank
bala
nces
-
151,
392,
844
-
151,
392,
844
-
-
-
-
1,
590,
773,
336
-
1,
590,
773,
336
-
-
-
Fina
ncia
l lia
bilit
ies m
easu
red
at fa
ir v
alue
-
-
-
-
-
-
-
Fina
ncia
l lia
bilit
ies n
ot m
easu
red
at fa
ir va
lue
Trad
e an
d ot
her p
ayab
les
-
-
1,43
0,00
4,49
0
1,43
0,00
4,49
0
-
-
-
U
ncla
imed
div
iden
d-
-
76
,964
,852
76
,964
,852
-
-
-
Shor
t ter
m b
orro
win
gs -
secu
red
-
-
51,0
17,1
36
51,0
17,1
36
-
-
-
A
ccru
ed m
ark-
up-
-
2,
546,
447
2,
546,
447
-
-
-
-
-
1,56
0,53
2,92
5
1,56
0,53
2,92
5
-
-
-
30 Ju
ne 2
019
Fina
ncia
l ass
ets m
easu
red
at fa
ir va
lue:
460,
830,
304
-
-
460,
830,
304
46
0,83
0,30
4
-
-
Fina
ncia
l ass
ets n
ot m
easu
red
at fa
ir va
lue
Long
term
dep
osits
-
11,6
33,3
25
-
11,6
33,3
25
-
-
-
Tr
ade
debt
s - c
onsid
ered
goo
d-
95
0,78
8,44
4
-
95
0,78
8,44
4
-
-
-
Loan
s and
adv
ance
s - c
onsid
ered
goo
d-
21
,322
,827
-
21
,322
,827
-
-
-
Shor
t ter
m d
epos
its a
nd p
repa
ymen
ts-
16
5,74
4,71
8
-
16
5,74
4,71
8
-
-
-
Oth
er re
ceiv
able
s-
38
,049
,639
-
38
,049
,639
-
-
-
Shor
t ter
m in
vestm
ent
-
374,
114,
733
-
374,
114,
733
-
-
-
Ca
sh a
nd b
ank
bala
nces
-
267,
853,
581
-
267,
853,
581
-
-
-
-
1,
829,
507,
267
-
1,
829,
507,
267
-
-
-
Fina
ncia
l lia
bilit
ies m
easu
red
at fa
ir va
lue:
-
-
-
-
-
-
-
Fina
ncia
l lia
bilit
ies n
ot m
easu
red
at fa
ir va
lue
Trad
e an
d ot
her p
ayab
les
-
-
717,
349,
450
717,
349,
450
-
-
-
U
ncla
imed
div
iden
d-
-
82
,143
,724
82
,143
,724
Shor
t ter
m b
orro
win
gs -
secu
red
-
-
100,
525,
853
100,
525,
853
-
-
-
A
ccru
ed m
ark-
up-
-
53
9,62
4
53
9,62
4
-
-
-
-
-
900,
558,
651
900,
558,
651
-
-
-
Fair
val
ue o
f pro
pert
y, p
lant
and
equ
ipm
ent
The
follo
win
gta
ble
show
sth
eca
rryi
ngam
ount
san
dfa
irva
lues
offin
anci
alas
sets
and
finan
cial
liabi
litie
s,in
clud
ing
thei
rlev
els
inth
efa
irva
lue
hier
arch
y.It
does
noti
nclu
defa
irva
lue
info
rmat
ion
forf
inan
cial
asse
tsan
dfin
anci
allia
bilit
ies
notm
easu
red
atfa
ir va
lue
if th
e ca
rryi
ng a
mou
nt is
a re
ason
able
app
roxi
mat
ion
of fa
ir va
lue.
Fair
Val
ue
Free
hold
land
,bui
ldin
gson
freeh
old
land
and
plan
tand
mac
hine
ryha
vebe
enca
rrie
dat
reva
lued
amou
nts
dete
rmin
edby
prof
essio
nalv
alue
rs(le
vel3
)bas
edon
thei
rass
essm
ento
fmar
ketv
alue
asdi
sclo
sed
inno
te6.
The
valu
atio
nsar
eco
nduc
ted
byth
eva
luat
ion
expe
rtsap
poin
ted
byth
eG
roup
.The
valu
atio
nex
perts
used
am
arke
tbas
edap
proa
chto
arriv
eat
the
fair
valu
eof
the
Gro
up's
prop
ertie
s.Th
isre
valu
atio
nw
asca
rrie
dou
tby
Asif
Ass
ocia
tes
(Priv
ate)
Lim
ited
(Inde
pend
entv
alue
rsan
dco
nsul
tant
s).
Free
hold
land
was
reva
lued
onth
eba
sisof
curr
entm
arke
tval
uew
here
asot
hera
sset
swer
ere
valu
edon
the
basis
ofde
prec
iate
dm
arke
tval
ues.
The
mos
tsig
nific
anti
nput
into
this
valu
atio
nap
proa
chis
pric
epe
racr
efo
rlan
d,pr
ice
pers
quar
efo
otfo
rbui
ldin
gsan
dpr
esen
tope
ratio
nalc
ondi
tion
and
age
ofpl
anta
ndm
achi
nery
and
othe
rass
ets.
The
effe
ctof
chan
ges
inth
eun
obse
rvab
lein
puts
used
inth
eva
luat
ions
cann
otbe
dete
rmin
edw
ithce
rtain
ty,a
ccor
ding
lya
qual
itativ
edi
sclo
sure
ofse
nsiti
vity
has
notb
een
pres
ente
d in
thes
e co
nsol
idat
ed fi
nanc
ial s
tate
men
ts.
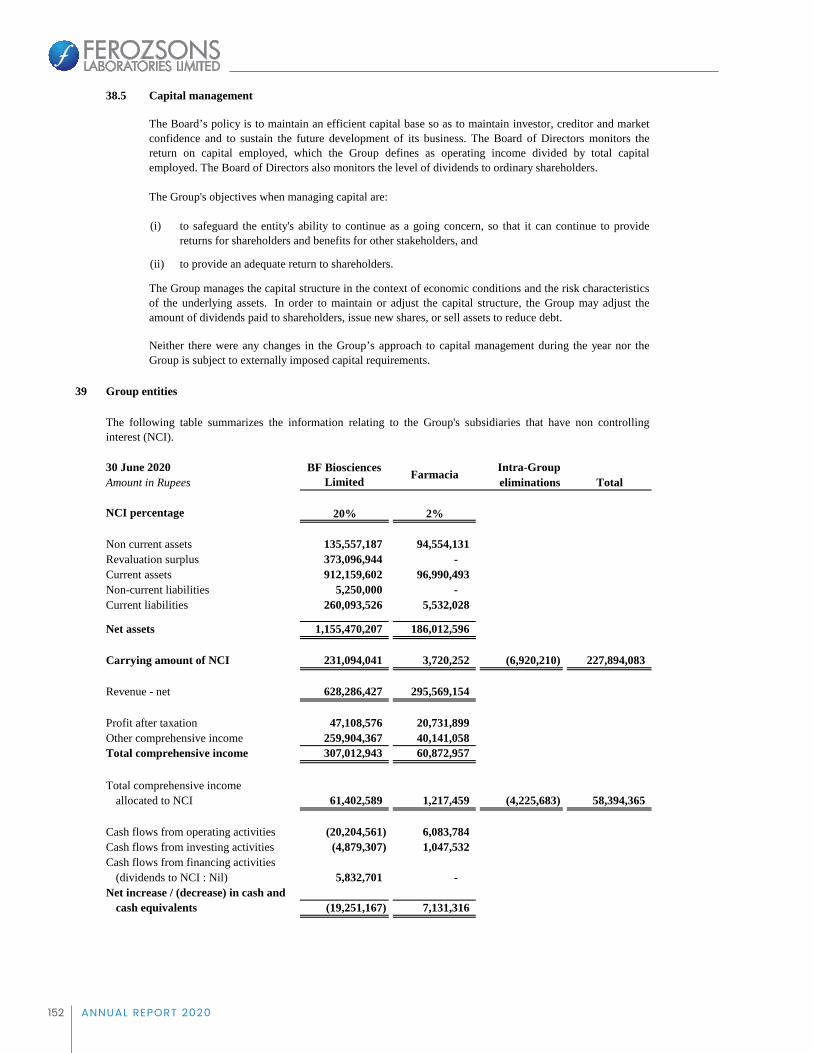
152 ANNUAL REPORT 2020
38.5 Capital management
The Group's objectives when managing capital are:
(i)
(ii) to provide an adequate return to shareholders.
39 Group entities
30 June 2020 Intra-GroupAmount in Rupees eliminations Total
NCI percentage 20% 2%
Non current assets 135,557,187 94,554,131 Revaluation surplus 373,096,944 - Current assets 912,159,602 96,990,493 Non-current liabilities 5,250,000 - Current liabilities 260,093,526 5,532,028
Net assets 1,155,470,207 186,012,596
Carrying amount of NCI 231,094,041 3,720,252 (6,920,210) 227,894,083
Revenue - net 628,286,427 295,569,154
Profit after taxation 47,108,576 20,731,899 Other comprehensive income 259,904,367 40,141,058 Total comprehensive income 307,012,943 60,872,957
Total comprehensive income allocated to NCI 61,402,589 1,217,459 (4,225,683) 58,394,365
Cash flows from operating activities (20,204,561) 6,083,784 Cash flows from investing activities (4,879,307) 1,047,532 Cash flows from financing activities
(dividends to NCI : Nil) 5,832,701 - Net increase / (decrease) in cash and
cash equivalents (19,251,167) 7,131,316
The following table summarizes the information relating to the Group's subsidiaries that have non controllinginterest (NCI).
BF Biosciences Limited Farmacia
The Board’s policy is to maintain an efficient capital base so as to maintain investor, creditor and marketconfidence and to sustain the future development of its business. The Board of Directors monitors thereturn on capital employed, which the Group defines as operating income divided by total capitalemployed. The Board of Directors also monitors the level of dividends to ordinary shareholders.
to safeguard the entity's ability to continue as a going concern, so that it can continue to providereturns for shareholders and benefits for other stakeholders, and
The Group manages the capital structure in the context of economic conditions and the risk characteristicsof the underlying assets. In order to maintain or adjust the capital structure, the Group may adjust theamount of dividends paid to shareholders, issue new shares, or sell assets to reduce debt.
Neither there were any changes in the Group’s approach to capital management during the year nor theGroup is subject to externally imposed capital requirements.
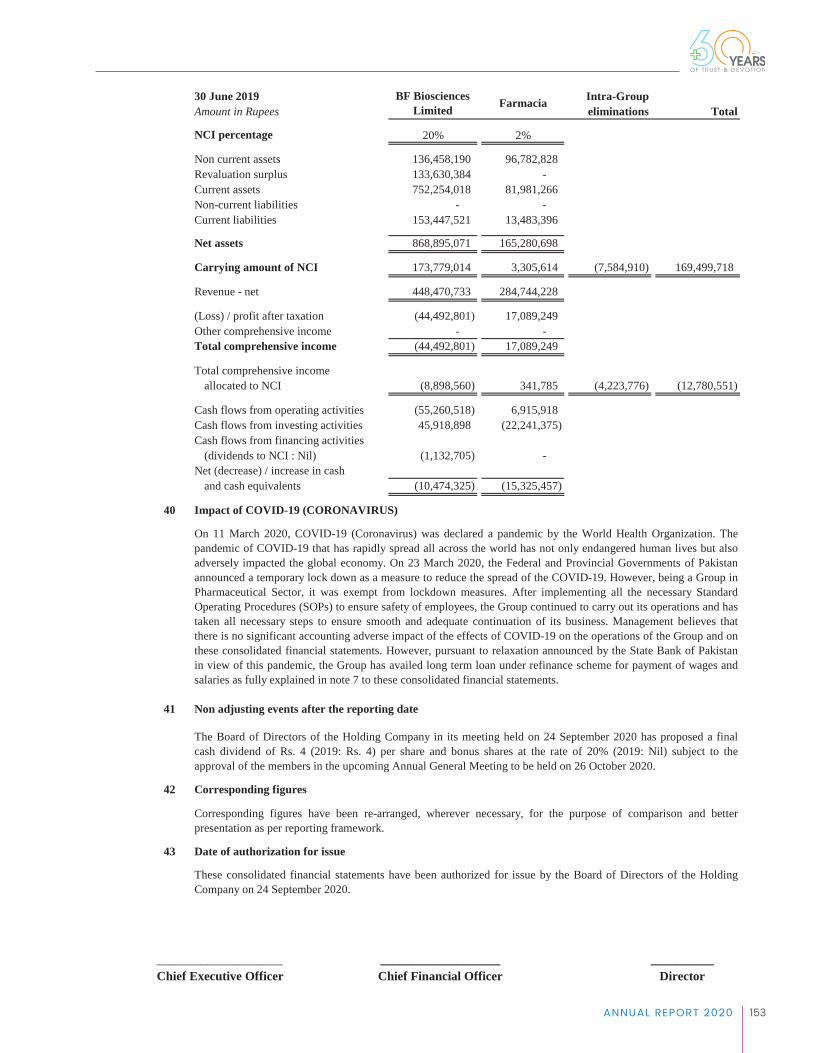
153ANNUAL REPORT 2020
30 June 2019 Intra-GroupAmount in Rupees eliminations Total
NCI percentage 20% 2%
Non current assets 136,458,190 96,782,828 Revaluation surplus 133,630,384 - Current assets 752,254,018 81,981,266 Non-current liabilities - - Current liabilities 153,447,521 13,483,396
Net assets 868,895,071 165,280,698
Carrying amount of NCI 173,779,014 3,305,614 (7,584,910) 169,499,718
Revenue - net 448,470,733 284,744,228
(Loss) / profit after taxation (44,492,801) 17,089,249 Other comprehensive income - - Total comprehensive income (44,492,801) 17,089,249
Total comprehensive income allocated to NCI (8,898,560) 341,785 (4,223,776) (12,780,551)
Cash flows from operating activities (55,260,518) 6,915,918 Cash flows from investing activities 45,918,898 (22,241,375) Cash flows from financing activities
(dividends to NCI : Nil) (1,132,705) - Net (decrease) / increase in cash
and cash equivalents (10,474,325) (15,325,457)
40 Impact of COVID-19 (CORONAVIRUS)
41 Non adjusting events after the reporting date
42 Corresponding figures
43 Date of authorization for issue
________________ ___________________ __________Chief Executive Officer Chief Financial Officer Director
These consolidated financial statements have been authorized for issue by the Board of Directors of the HoldingCompany on 24 September 2020.
BF Biosciences Limited Farmacia
The Board of Directors of the Holding Company in its meeting held on 24 September 2020 has proposed a finalcash dividend of Rs. 4 (2019: Rs. 4) per share and bonus shares at the rate of 20% (2019: Nil) subject to theapproval of the members in the upcoming Annual General Meeting to be held on 26 October 2020.
Corresponding figures have been re-arranged, wherever necessary, for the purpose of comparison and betterpresentation as per reporting framework.
On 11 March 2020, COVID-19 (Coronavirus) was declared a pandemic by the World Health Organization. Thepandemic of COVID-19 that has rapidly spread all across the world has not only endangered human lives but alsoadversely impacted the global economy. On 23 March 2020, the Federal and Provincial Governments of Pakistanannounced a temporary lock down as a measure to reduce the spread of the COVID-19. However, being a Group inPharmaceutical Sector, it was exempt from lockdown measures. After implementing all the necessary StandardOperating Procedures (SOPs) to ensure safety of employees, the Group continued to carry out its operations and hastaken all necessary steps to ensure smooth and adequate continuation of its business. Management believes thatthere is no significant accounting adverse impact of the effects of COVID-19 on the operations of the Group and onthese consolidated financial statements. However, pursuant to relaxation announced by the State Bank of Pakistanin view of this pandemic, the Group has availed long term loan under refinance scheme for payment of wages andsalaries as fully explained in note 7 to these consolidated financial statements.
Ferozsons Laboratories LimitedConsolidated Statement of Comprehensive IncomeFor the year ended 30 June 2020
2020 2019Rupees Rupees
Profit after taxation 422,579,730 187,995,316
Items that will not be reclassified to profit or loss
Surplus on revaluation of property, plant and equipment 933,886,668 - Related deferred tax on surplus (226,333,713) -
Total comprehensive income for the year 1,130,132,686 187,995,316
Attributable to:
Owners of the Group 1,071,738,321 200,775,867 Non-controlling interests 58,394,365 (12,780,551)
1,130,132,686 187,995,316
The annexed notes from 1 to 43 form an integral part of these consolidated financial statements.
____________________ ___________________ __________Chief Executive Officer Chief Financial Officer Director

154 ANNUAL REPORT 2020
From To1 1,940 1 100 86,405 2 1,663 101 500 521,629 3 826 501 1,000 674,577 4 927 1,001 5,000 2,189,022 5 167 5,001 10,000 1,240,283 6 42 10,001 15,000 532,204 7 32 15,001 20,000 569,925 8 19 20,001 25,000 431,233 9 7 25,001 30,000 195,481
10 6 30,001 35,000 197,433 11 4 35,001 40,000 148,760 12 7 40,001 45,000 299,948 13 7 45,001 50,000 340,913 14 2 50,001 55,000 102,700 15 2 55,001 60,000 116,698 16 5 60,001 65,000 314,249 17 1 65,001 70,000 69,300 18 1 80,001 85,000 83,400 19 1 85,001 90,000 85,654 20 2 95,001 100,000 196,111 21 2 105,001 110,000 215,100 22 2 150,001 155,000 308,374 23 1 155,001 160,000 157,142 24 2 160,001 165,000 324,644 25 1 180,001 185,000 180,235 26 1 215,001 220,000 217,503 27 1 280,001 285,000 284,458 28 1 295,001 300,000 295,463 29 1 330,001 335,000 333,473 30 1 350,001 355,000 352,690 31 1 355,001 360,000 359,116 32 1 360,001 365,000 362,314 33 1 365,001 370,000 369,531 34 1 380,001 385,000 384,955 35 1 410,001 415,000 410,979 36 1 430,001 435,000 434,941 37 1 435,001 440,000 437,416 38 1 560,001 565,000 560,041 39 1 650,001 655,000 651,347 40 1 900,001 905,000 904,934 41 1 1,070,001 1,075,000 1,073,164 42 1 1,505,001 1,510,000 1,506,491 43 1 1,635,001 1,640,000 1,639,875 44 1 1,825,001 1,830,000 1,825,442 45 1 8,200,001 8,205,000 8,201,288
Total 5,689 30,186,841
PATTERN OF SHAREHOLDINGAs at 30 June 2020
Total Shares HeldSr. No.ShareholdingsNo. of
Shareholders

155ANNUAL REPORT 2020
Directors, CEO, Their Spouse and Minor Childern 3,223,685 10.68 Associated Companies, Undertakings & Related Parties 8,286,942 27.45 NIT & ICP 1,640,452 5.43 Banks, DFIs, NBFIs 56,294 0.19 Insurance Companies 2,585,180 8.56 Modarabas and Mutual Funds 425,149 1.41
b) Foreign 376,454 1.25 Other Companies (Local) 601,509 1.99 Total 30,186,841 100
Shareholders holding 10% or more:The KFW Factors (Pvt.) Limited - Associate Company 8,286,942 27.45
Trades in the shares of the listed company, carried out by its Directors, CEO, CFO, Company Secretary and their spouses and minor children are as follows:Mrs. Munize Azhar Peracha - gift of shares Director 333,473 Mr. Osman Khalid Waheed - gift received Director 166,736
General Public a) Local
Categories of Shareholders Share Held Percentage
12,991,176 43.04

156 ANNUAL REPORT 2020
NOTICE OF ANNUAL GENERAL MEETING
Notice is hereby given that the 64th Annual General Meeting of FEROZSONS LABORATORIES LIMITED will be held on Monday, 26 October 2020 at 12:15 P.M. virtually through video-link (as permitted by Securities and Exchange Commission of Pakistan through Circular 25 of 2020). The instructions for participation in AGM through video-link are mentioned in the notes section. Ordinary Business: 1. To confirm the Minutes of the Extraordinary General Meeting held on 06 July 2020.
2. To receive, consider and adopt the Audited Financial Statements of the Company for the year
ended 30 June 2020 together with the Reports of the Directors, Chairperson and Auditors thereon.
3. To consider and approve the final cash dividend for the year ended 30 June 2020 at the rate of 40% (i.e. Rs. 4 per share) as recommended by the Board of Directors.
4. To appoint Auditors of the Company for the year ending 30 June 2021 and fix their remuneration.
The present auditors Messrs. KPMG Taseer Hadi & Co., Chartered Accountants, retire and being eligible, offer themselves for reappointment.
Special Business: 5. To consider and approve the bonus shares at the rate of 20% (i.e. 20 shares for every 100 shares) as
recommended by the Board of Directors. In this connection, the following ordinary resolutions (with or without modifications) are proposed to be passed:
Resolved that a sum of Rs. 60,373,690 be capitalized out of the free reserves of the Company for issuance of 6,037,369 ordinary shares of Rs. 10 each as fully paid bonus shares. Further resolved that the bonus shares shall rank pari passu in all aspects with the existing shares of the Company. However, these shares shall not be eligible for final cash dividend declared by the Company for the year ended 30 June 2020. Further resolved that fractional entitlements of the members shall be consolidated into whole shares and sold in the stock market and the sale proceeds shall be donated to a charitable institution.
6. To transact any other business with the permission of the Chair.
By order of the Board
Rawalpindi Syed Ghausuddin Saif 24 September 2020 Company Secretary
157ANNUAL REPORT 2020
NOTES:
1. CLOSURE OF SHARE TRANSFER BOOKS:
The Share Transfer Books of the Company will be closed from 17 October 2020 to 26 October 2020(both days inclusive). Transfers received at the Company’s Share Registrar, M/s CorpTec Associates(Pvt.) Limited, 503-E, Johar Town, Lahore, at the close of business on 16 October 2020 will betreated in time for the purpose of above entitlement to the transferees.
2. PARTICIPATION IN THE AGM THROUGH VIDEO LINK FACILITY:Due to current COVID-19 situation, the AGM proceedings shall be held through video link facility.Only those persons whose names appear in the Register of Members of the Company as at 16October 2020 are entitled to attend and vote at the Annual General Meeting.
A member entitled to attend and vote at this meeting is also entitled to appoint another member, as a proxy to attend and vote on his/her behalf. In order the proxy to be valid, the instrument of proxy and the power of attorney or any other authority, under which it is signed, must be shared through e-mail on [email protected] not less than 48 hours before the time of AGM. The Proxy form is annexed.
3. PROCEDURE FOR ATTENDING THE AGM THROUGH VIDEO LINK FACILITY:Shareholders interested to participate in the meeting through video link are requested to email theirName, Folio Number, Cell Number and Number of Shares held in their name with subject“Registration for Ferozsons Laboratories Limited AGM - 2020” along with valid copy of bothsides of Computerized National Identify Card (CNIC) at [email protected]. The video linkand login credentials will be shared with only those members/designated proxies whose emails,containing all the required particulars, are received at least 48 hours before the time of AGM.Shareholders can also provide their comments and questions for the agenda items of the AGM at theemail address [email protected].
4. GUIDELINES FOR CENTRAL DEPOSITORY COMPANY OF PAKISTAN LIMITED(‘CDC’) ACCOUNT HOLDERS:
CDC Account Holders will further have to follow the under mentioned guidelines as laid down inCircular 1 dated 26 January 2000 issued by the Securities and Exchange Commission of Pakistan(SECP).
A. For attending the AGM:
(i) In case of individuals, the account holders or sub-account holders whose securities and their registration details are uploaded as per the regulations, shall authenticate his / her identity by sharing a copy of his / her Computerized National Identity Card (CNIC) or Passport through e-mail (as mentioned in the notes) at least 48 hours before the time of the AGM.
(ii) In case of corporate entity, the Board of Directors’ resolution / power of attorney with specimen signature of the nominee shall be shared through e-mail (as mentioned in the notes) (unless it has been provided earlier) at least 48 hours before the time of the AGM.

158 ANNUAL REPORT 2020
B. For appointing proxies:
(i) In case of individuals, the account holder or sub account holder whose registration details are uploaded as per CDC regulations, shall submit the proxy form as per the above requirement.
(ii) The proxy form shall be witnessed by two persons whose names, address and CNIC number shall be mentioned on the form.
(iii) Attested copies of CNIC or the passport of the beneficial owners and the proxy shall be furnished with the proxy form.
(iv) The proxy shall share a copy of his / her Computerized National Identity Card (CNIC) or Passport through e-mail (as mentioned in the notes) at least 48 hours before the time of the AGM.
(v) In case of corporate entity, the Board of Directors’ resolution / power of attorney with specimen signature along with proxy form shall be shared through e-mail (as mentioned in the notes) (unless it has not been provided earlier) at least 48 hours before the time of the AGM.
5. WITHHOLDING TAX ON DIVIDEND:
The Government of Pakistan through Finance Act, 2020 under Section 150 of the Income TaxOrdinance, 2001 whereby following rates are prescribed for deduction of withholding tax on theamount of dividend paid by the companies. These rates are as under:
a. Persons appearing in the Active Tax Payers’ List (ATL) 15% b. Persons not appearing in the Active Tax Payers’ List (ATL) 30%
Members whose names are not entered into the Active Tax Payers List (ATL) provided on the website of the FBR, despite the fact that they are filers are advised to make sure that their names are entered into ATL to avoid higher tax deductions against any future payment of dividend.
In case of joint shareholders, each shareholder is to be treated individually as either a filer or non-filer and tax will be deducted on the basis of shareholding of each shareholder as may be notified by the shareholders, in writing as follows, to our share registrar or if no such notification is received, each shareholder shall be assumed to have an equal number of shares:
Folio/ CDS ID/ A/C #
Total Shares Principal Shareholder Joint Shareholder
Name and CNIC No.
Shareholding proportion (No. of Shares)
Name and CNIC No.
Shareholding proportion (No. of Shares)
The required information must reach the shares registrar of the Company by the close of business on 16 October 2020 otherwise it will be assumed that the shares are equally held by principal shareholder and Joint shareholders.
6. EXEMPTION FROM DEDUCTION OF INCOME TAX / ZAKAT:
Members seeking exemption from deduction of income tax or are eligible for deduction at a

159ANNUAL REPORT 2020
reduced rate, are requested to submit a valid tax exemption / reduced rate certificate or necessary documentary evidence as the case may be. Members desiring no deduction of zakat are also requested to submit a valid declaration for non-deduction of zakat.
7. ELECTRONIC DIVIDEND MANDATE:
Under the Section 242 of the Companies Act, 2017, it is mandatory for all listed Companies to paycash dividend to its shareholders through electronic mode directly into the bank account designatedby the entitled shareholders. In order to receive dividend directly into their bank account,shareholders are requested (if not already provided) to fill in Bank Mandate Form for ElectronicCredit of Cash Dividend available on the Company’s website and send it duly signed along with acopy of CNIC to the Share Registrar, M/s. CorpTec Associates (Pvt.) Limited in case of physicalshares.
In case of shares held in CDC then Electronic Dividend Mandate Form must be directly submittedto shareholder’s brokers / participant / CDC account services.
8. SUBMISSION OF VALID CNIC:
Pursuant to the SECP directives the dividend of shareholders whose valid CNICs are not availablewith the Share Registrar could be withheld. All shareholders having physical shareholding aretherefore advised to submit a photocopy of their valid CNIC immediately, if already not provided,to the Company’s Share Registrar without any further delay.
9. UNCLAIMED DIVIDEND:
Shareholders, who by any reason, could not claim their dividend, if any, are advised to contact ourShare Registrar, M/s. CorpTec Associates (Pvt.) Limited, 503-E, Johar Town, Lahore to collect /enquire about their unclaimed dividend.
10. TRANSFER OF PHYSICAL SHARES TO CDC ACCOUNT
Pursuant to the section 72 of the Companies Act, 2017 listed companies are required to replace itsphysical shares with book-entry form in a manner as may be specified and from the date notified bythe Commission, within a period not exceeding four years from the commencement of the Act, i.e.30 May 2017.
The Shareholders who hold physical shares are encouraged to open CDC sub- account with any ofthe brokers or Investor Account directly with CDC to place their physical shares into scrip lessform.
11. ELECTRONIC VOTING:
Members can exercise their right to demand a poll subject to meeting requirements of Section 143–145 of the Companies Act, 2017 and applicable clauses of the Companies (Postal Ballot)Regulations, 2018.
12. CONSENT FOR VIDEO CONFERENCING FACILITY:
Pursuant to Section 132(2) of the Companies Act, 2017, if the Company receives consent frommembers holding in aggregate 10% or more shareholding residing in a geographical location toparticipate in the meeting through video conference at least 7 days prior to the date of AnnualGeneral Meeting, the Company will arrange video conference facility in that city subject to

160 ANNUAL REPORT 2020
availability of such facility in that city. To avail this facility, please submit such request to the Company Secretary.
13. ELECTRONIC TRANSMISSION OF FINANCIAL STATEMENTS AND NOTICES:
Pursuant to notification vide SRO 787(1)/2014 dated 8 September 2014, the SECP has directed allcompanies to circulate annual financial statements and notices of annual/extraordinary generalmeetings through Email/CD/DVD or any other media to their shareholders at their registeredaddresses.
Shareholders, who wish to receive the hardcopy of the annual financial statements, shall email [email protected]. The same shall be provided to the shareholders free of cost within sevendays of receipt of such request.
14. PLACEMENT OF FINANCIAL STATEMENTS ON COMPANY’S WEBSITE:
The financial statements of the Company for the year ended 30 June 2020 have been placed on thewebsite of the Company: www.ferozsons-labs.com
STATEMENT UNDER SECTION 134(3) OF THE COMPANIES ACT, 2017
This statement sets out the material facts pertaining to the special business to be transacted at the upcoming Annual General Meeting of the Company, which is to be held on 26 October 2020.
ITEM NO. 5 OF THE AGENDA - ISSUE OF BONUS SHARES TO MEMBERS:
The Board of Directors in their meeting held on 24 September 2020, have recommended to issue 20% fully paid bonus shares (i.e. 20 shares for each 100 shares held by the members) by capitalizing a sum of Rs. 60,373,690 from free reserves of the Company. The directors are of the view that the Company’s financial position and its reserves justify the capitalization of free reserves.
The Directors of the Company are not directly or indirectly interested in this special business, except to the extent of entitlements of bonus shares on their shareholdings.
161ANNUAL REPORT 2020
نے انتظامیہ کیلئے اضافے میں فروخت کی میں کمپنی بنیادی شعبوں کے نئی علاج ہے مصنوعات کئی رکھی کر بندی کی منصوبہ کروانے میں متعارف شعبوں ان ،
زرو اینٹرولوجی)دل سے متعلقہ(کارڈیوویسکولریشن انتظامیہ مد نظر رکھتے ہوئے مارکیٹ کی صورتحال کو شامل ہیں۔ اینٹی انفیکش ، ذیابیطس، اور )معدہ اور آنتوں سے متعلقہ(، گی
شروع کر دے گی۔ کروانا متعارف کے آغاز یا درمیان میں 2021یہ مصنوعات
زبردست استعداد رکھتی ہے۔ تاہم ان مواقع سے پوری طرح فائدہ اٹھانے کیلئے ترقی کرنے کی کی مارکیٹوں میں بیرون ملک پاکستان کی فارما سیوٹیکل انڈسٹری مقامی اور
۔ ہومعیار کا کی بجائے کوالٹی کنٹرول قیمتوں کے بے قاعدہ توجہ کا مرکزجس میں انڈسٹری کو ایک متوازن قانونی ماحول کی اشد ضرورت ہے
ااعترعتراافف
ہم کمپنی کے مقاصد کے حصول کیلئے اپنے ملازمین کی بے انتہا کوششوں اور لگن کا اعتراف کرتے ہیں۔
ر اور کاروباری شراکت نچلز سینداروں کاشکریہ ادا کرتے ہیں، اور ہماری مصنوعات پ مسلسل اعتماد رکھنے کیلئے اپنے ہم مسلسل حمایت اور ہماری کمپنی پ اعتماد رکھنے کیلئے اپنے پن
ہکوں کا شکریہ بھی ادا کرتے ہیں۔قابل قدر گا
بورڈ کے جانب سے
مسزمسزااخترختر خاخالدلد ووحیحی مسٹرمسٹر عثماعثمانن خاخالدلد ووحیحی
ر پس چیف ایگزیکٹ آفیسر یئ جچ
لاہور
2020ستمبر 24

162 ANNUAL REPORT 2020
آآڈڈیٹریٹرزز
س ریٹائر ہوتے ہیں اور انھوں نے مالی سال KPMGآڈیٹرز میسرز ی نی کیلئے خود کو دوبارہ تقرری کیلئے پیش کیا ہے۔ 21-2020تاثیر ہادی اینڈ کمپنی چارٹرڈ اکاؤٹنی
س KPMGبورڈ کی آڈٹ کمیٹی نے ی نیہے۔ چنانچہ بورڈ نے بھی آئندہ کیلئے کمپنی کا آڈیٹر مقرر کرنے کی تجویز دی 21-2020کو سال تاثیر ہادی اینڈ کمپنی چارٹرڈ اکاؤٹنی
سالانہ اجلاسِ عام میں حصص داروں کی منظوری کیلئے انھی آڈیٹرز کو تجویز کیا ہے۔
ااوورر مستقبلمستقبل کےکے اامکامکاناناتت کاکا جاجائزئزہہ اانڈنڈسٹرسٹریی کاکا جاجائزئزہہ
اور ملک میں یونیورسٹی گریجویٹس کو سب سے یہ انڈسٹری قومی معیشت میں ایک بڑا حص رکھتی ہے ہے۔ ارب روپے 470تقریباً پاکستان کی فارماسیوٹیکل انڈسٹری کی قدر
ڈالر کے پچھلے کچھ سالوں میں مہنگائی کی وجہ اس اہم انڈسٹری کی مالیاتی حالت بگڑی ہے کیونکہ قومی سطح پ مہنگائی میں اضافے اور امریکی زیادہ ملازمتیں فراہم کرتی ہے۔
کے پھیلاؤ کی وجہ سے ان مسائل کی شدت اور COVID-19اس سال ۔ کے باوجود قیمتوں میں موافق تبدیلی نہیں کی گئی ہے میں پاکستانی روپے کی قدر میں کمی مقابلے
بھی بڑھ گئی ہے۔
COVID-19 اور پائیوٹ کلینک بند ہونے اور میڈیکل شعبہ آؤٹ ڈور لاک ڈاؤن کے دوران ہسپتالوں کے ۔ کے پھیلاؤ نے انڈسٹری کو کئی طرح سے متاثر کیا ہے
ہونا تقریباً اسکے ساتھ طبی آلات کا بزنس بھی متاثر ہوا کیونکہ اختیاری پوسیجرز اور ،ہے سٹورز پ گاہکوں کی تعداد میں کمی کے باعث فارماسیوٹیکل کی فروخت پ برا اثر پڑا
انتظامیہ عالمی وباء کے پھیلاؤ کے نشوونما دیکھنے کو مل رہی ہے۔ لاک ڈاؤن میں حالیہ نرمی سے انڈسٹری کے آپیشنز پھر سے شروع ہو رہے ہیں اور مثبتبالکل بند ہو گئے۔
(Inventory Levels)ذخیرہ کردہ مقدار مال کی ان حکمت عملیوں میں ہ لے رہی ہے اور اثرات کو کم کرنے کیلئے حکمتِ عملیاں تیار کر رہی ہے، اثرات کا مسلسل جائز
کی وجہ سے پیداہونے والے غیر COVID-19دوسری لہر کی صورت میں ،تاکہ پیدا کرنا شامل ہیں تنوعکے ذرائع میں )سپلائی چین( ، اور سلسلہ فراہمکرنا میں اضافہ
پایا جا سکے۔ یقینی حالات پ قابو
ملازمین کو ، پالیس ریٹ میں نمایاں کمی اقدامات کی تعریف کرناچاہیں گے ، ان اقدامات میں خاص طور پ معیشت کو سہارا دینے کیلئے ہم سٹیٹ بنک آف پاکستان کے بروقت
اس مشکل وقت میں توسیع کے منصوبوں پ سرمایہ کاری میں آسانی پیدا ساتھ ، اور اس کے دینے کی اسکیمیں کم شرح سود پ قرضہ اداروں کو کیلئے اہ اور اجرت دینے تنخو
۔ہیںکرنے کیلئے طویل مدتی سہولیات کی فراہم شامل
کے زر نقد صحت کا بجٹ استعمال کیا گیا جس سے زیادہ تر ۔ تاہم، ان اقدامات کیلئے کئے کئی امدادی اقدامات پ قابو پانے کیلئے COVID-19صوبائی حکومتوں نے بھی
۔ مؤخر ہو گئی کو ادائیگیاںانڈسٹری سمیت دیگر سپلائرز پیدا ہوئے اور صحت کی نگہداشت کی (Liquidity Problems)مسائل
سلسلہ ہمیں مال کے ان اداروں کی جانب سے ادائیگی میں تاخیر کی وجہ سے ملین روپے وصول کرنے ہیں۔ 800آپ کی کمپنی نے صحت کے ان حکومتی اداروں سے تقریباً
کی کمپنیوں ایسی کو چاہئے کہ صحت کی نگہداشت کی حکومت ۔ سے متعلق شدید مشکلات کا سامنا ہے (Working Capital)اور گردشی سرمایہ )سپلائی چین( فراہم
نیتی سے حکومتی اداروں کو ادویات اور مصنوعات مہیا کیں اور اب واجب الادا رقوم کی وصولی کی منتظر ہیں۔جنھوں نے نیک فوری طور پ حل کرے مشکلات کو
163ANNUAL REPORT 2020
رریی کمپنیکمپنی کیکی سماسماجیجی ذذمہمہ دداا
ور میں سرمایہ کاری کرنے کیلئے پُر عزم ہیں۔ ماحولیاتی تحفظ ، ہم کے عین مطابق فریم ورک امتیازی اپنے کاروباری ضابطہ ِ اخلاق ا ور تعلیم ور سماج کی صحت ا ا
پکی کمپنی نے اس سال سماجی ذمہ داری کی ں کے ساتھ کی گئی: میں (CSR activities)سرگرمیوں کئی آ ور یہ شرکت زیادہ تر درج ذیل تنظیمو شرکت کی ا
(Cancer Research and Treatment Foundation)کینسر ریسرچ اینڈ ٹریٹمنٹ فاؤنڈیشن •
(The Citizens Foundation)دی سٹیزنز فاؤنڈیشن •
(National Management Foundation – LUMS)فاؤنڈیشن )لمز( مینجمنٹنیشنل •
ااتت سےسے بچابچاؤؤ خطرخطر
ہے کرنا ی بند درجہ پ بنیاد کی ترجیح پھر ور ا پہچاننا سمجھنا، کو حصوں والے ے خطر پ طور بنیادی ر کا طریقہ ے ہمار کا بچنے سے ات کے خطر عملیوں حکمتِ آپیشنل جدید تاکہ
ات کو کم کیا جا سکے۔ ذریعے ان خطر
منا ہے: ات کا سا کو درج ذیل خطر بنیادی طور پ ہماری کمپنی
ااتت معامعا سیسی خطرخطر وورر سیاسیا انتظامیہ : شیشی اا کیلئے کرنے کم خطرہ یہ ہے۔ سامنا کا خطرات بھی کو کمپنی ہماری سے وجہ کی حالات سیاسی ور ا معاشی ہوتے تبدیل مسلسل میں مالی ملک
مینجمنٹ کیلئے کرنے ادراک کا حالات ورناسازگار ا ہے رکھتی نظر گہری پ منظرنامے سیاسی ور ا حالات کے جاتی مارکیٹ کی س ک ڈس �ں حکمت ور ا فعل مناسب پ سطح کی
ہیں۔
خطرخطرااتت:: کےکے بقتبقت مسا مسامسا دہ نقصان کو انڈسٹری فارماسیوٹیکل پاکستانی سے وجہ کی قانونی گرفت کمزور پ ادویات غیرمعیاری ور ا قانونی غیر میں خطرات کا ہماری مارکیٹ بقتی
کیلئے کرنے کم کو خطرے کو اس ہے۔ پاکستان سامنا کمپنی پکی کے آ کان ر ا دیگر کے ایشن یسوسی ا مینوفیکچررز کو فارماسیوٹیکل پالیسیوں ور ا قوانین کے گورنمنٹ کر مل ساتھ
بہتر بنانے کیلئے مسلسل لابنگ کر رہی ہے۔
فرفرااہمہم چینچین(( سلسلہسلسلہ ِِ خطرخطرااتت:: ))سپلاسپلائیئی فراہم کےکے سلسلہ ِ آپیشنز میں کے روزمرہ کے چین( کمپنی کرنے کیلئے )سپلائی کم کو خطرے اس ہے۔ حامل کا بہت اہمیت پوسیس کا
سسٹم کے ساتھ ہم آہنگ کرتے ہیں۔ ور آرڈرنگ اسے فروخت کی پیش بینی ا ور ہم پوڈکشن کی جامع منصوبہ بندی کرتے ہیں ا
ااتت اانفانفاررمیشنمیشن انفراسٹرکچر میں مسلسل سرمایہ کاری کرتی رہتی ہے۔ IT: مستقبل کی ضروریات کو مدنظر رکھتے ہوئے کمپنی ٹیکناٹیکنالولوجیجی کےکے خطرخطر
ااتت روں کے نوٹ نمبر مامالیالیاتیتی خطرخطر گوشوا کو مالیاتی سے بیان کیا گیا ہے۔ میں تفصیل 38: یہ وہ خطرات ہیں جو براہِ راست کمپنی کی مالیاتی بقا سے تعلق رکھتے ہیں۔ ان خطرات
یگزیگزیکٹیکٹ وورر اا ڈڈاائرئریکٹریکٹرزز کےکے معامعاووضےضے کیکی پاپالیسلیس نانانن اایگزیگزیکٹیکٹ اا
علاوہ آفیسرکے ایگزیکٹ کے چیف کمپنی ہے()جو ملازم پ ول کو نا پیر ڈائریکٹرز )انڈیپنڈنٹ( خودمختار بشمول ایگزیکٹڈائریکٹرز فیس صرف ن کی شرکت میں ور میٹنگز دیگر ا
جات دی گئی ہے۔میں32نوٹ نمبر کے انفرادی مالی بیاناٹ جن کی تفصیل ہیں جاتے ادا کیےاخرا

164 ANNUAL REPORT 2020
کمیٹی نے اس کی نگرانی کی ہے۔ اندرونی کنٹرولز کا نظام مستحکم ہے اورانتظامیہ نے اس کا مؤثر اطلاق کیا ہے ، اور اندرونی آڈیٹرز ، بورڈ آف ڈائریکٹرز اور آڈٹ •
مؤثر پن کا جائزہ لیتا ہے اور ، اگر ضروری ہو، اندرونی کنٹرول کے نظام میں مزید بہتری لانے کیلئے تجاویز دیتا بورڈ، آڈٹ کمیٹی کے ذریعے،اندرونی کنٹرولز کے
ہے۔
بطور ایک چلتے ادارے کمپنی کے کاروبار جاری رکھنے کی اہلیت پ کوئی قابلِ ذکر خدشات موجود نہیں ہیں۔ •
ضوابط میں بتائی گئی کارپوریٹ گورننس کی• بہترین روایات سے کوئی نمایاں انحراف نہیں کیا گیا۔ لسی ڈ
۔ ہیںسالانہ رپورٹ میں بیان کی گئی تفصیل اور وجوہات پچھلے سال کے مقابلے میں مالیاتی نتائ میں ہونے والی اہم تبدیلیوں کی •
غور نہیں کر رہی۔کمپنی قابلِ قیاس مستقبل کے دوران کسی کارپوریٹ تنظیمِ نو یا آپیشن کی بندش پ •
جا تک کے گورنمنٹ کے نافذ کردہ ایسے تمام محصولات ، جو عمومی کاروباری معاملات میں نافذ کئے جاتے ہیں، سال کے اختتام کے بعد ادا کئے 2020جوں 30 •
چکے ہیں۔
ملین روپے ہے۔ 506کی پوویڈنٹ فنڈ کی سرمایہ کاری کی قدر پ ملازمین 2019جون 30تازہ ترین آڈٹ شدہ اکاؤنٹس کے مطابق •
خزخزاانےنے میںمیں حصحص قوقومیمی
اور صوبائی سیلز ٹیکس وفاقی اور محصولات کی مد میں )جیسے کہ انکم ٹیکس، کسٹم ڈیوٹی، دوران، کمپنی نے مختلف ٹیکسوں ، ورکرز ویلفیئر فنڈ، ورکرز پافٹ اس مالی سال کے
نن فنڈ اور یس یسیچی یٹ روپے قومی خزانے میں جمع کروائے۔ ملین 399کردہ دولت میں سے اسنٹرل ریسرچ فنڈ( پید پار
پیسےپیسے کیکی ووصوصولیلی ااوورر اادداائیگیئیگی کاکا اانتظانتظامم
کی صورتحال پ روزانہ کی نقد رقم )کیش( کیلئے کمپنی باقاعدگی سے موصول ہونے والی رقم اور ادا کی جانے والی رقم کا تخمینہ لگاتی ہے اور کے انتظام پیسے کی وصولی اور ادائیگی
بنیاد پ نظر رکھتی ہے۔
متعلقہمتعلقہ پاپاررٹیٹی لینلین ددینین
بورڈ اور آڈٹ کمیٹی کے سامنے جائزے اور منظوری کیلئے پیش کئے گئے۔ سال کے پ اختتام شدہ سال کے دوران متعلقہ پارٹیوں سے ہونے والے معاملات 2020جون 30
میں دی گئی ہے۔ 33دوران ہونے والی میٹنگز میں بورڈ نے ان معاملات کی منظوری دی۔ متعلقہ پارٹی لین دین کی تفصیل مالیاتی گوشواروں کے نوٹ نمبر
بوبوررڈڈ آآفف ڈڈاائرئریکٹریکٹرزز ااوورر بوبوررڈڈ کمیٹیوکمیٹیوںں کیکی میٹنگزمیٹنگز
اور منعقد کردہ میٹنگز کے بارے معلومات اور ایسے افراد کے بارے معلومات ساتھ لف کری دی گئی ہیں جو مالی سال میں بورڈ آف ڈائریکٹرز کی تشکیل، بورڈکی کمیٹیوں
کے دوران کسی بھی وقت کمپنی کے ڈائریکٹر رہے ہیں۔ 2019-20
حصصحصص دداارریی کیکی ترترتیتی
، کمپنی سیکریٹری اور انکے شریک حیات یا چھوٹے بچوں کی جانب سے کی گئی CEO ،CFOڈائریکٹرز، حصص داری کی ترتی ساتھ لف کر دی گئی ہے۔ پ 2020جون 30
رز میں خریدوفروخت )اگر کوئی کی گئی ہو تو( کی معلومات بھی ساتھ لف کر دی گئی ہیں۔ یئ کمپنی کے ش
165ANNUAL REPORT 2020
سرسرمامایہیہ کاکارریی کےکے ااخرخرااجاجاتت
مینوفیکچرنگ آلات میں زیرِ جائزہ سال کے دوران نے جانے والی جدید ترین ٹیکنالوجی کے ساتھ ہم آہنگی رکھنے کیلئےآپکی کمپنی کرائی فارماسیوٹیکل انڈسٹری میں متعارف
ملین روپے کی سرمایہ کاری کی۔ 264توازن اور جدت کیلئے
ساسالل کےکے ااختتاختتامم کےکے بعدبعد ہوہونےنے وواالےلے ووااقعاقعاتت
ڑا ہو۔ فردِ میزان )� شیٹ( کی تاریخ اور اس رپورٹ کی تاریخ کے دوران ایسا واقعہ نہیں ہوا جس نے کمپنی کی مالیاتی حالت پ خاص اثر چھو
فیفی حصصحصص آآمدمدنن
جبکہ روپے فی حصص رہی، 13.11 (EPS)فی حصص آمدن ملین روپے کے سرمایہ کی مد میں 301.87 سال کے خال منافع کی بنیاد پ پ اختتام شدہ 2020جون 30
روپے تھی۔ 6.65سال روپے رہی جو کہ پچھلے 13.81انضمام کردہ فی حصص آمدن کی سال زیرِ جائزہ ۔ تھی روپے 8.32 (EPS)حصص آمدن فی پچھلے سال کی
ڈڈیویویڈیڈنڈنڈ کاکا ااعلاعلانن
ر( 4)حتمی نقد ڈیویڈنڈ %40سال کیلئے ڈائریکٹرز نے لی ماپ ختم ہونے والے 2020جون 30 یئ رز %20اور روپے فی ش ی
ئ رز کیلئے 100)ہر بونس ش ی
ئ رز( 20ش ی
ئ کی تجویز دی ش
رہولڈرز کی منظوری سے مشروط ہے۔ 2020اکتوبر 26ہے، جو یئ پ ہونے والے سالانہ اجلاس عام میں ش
پ عمل کرتےہوئےاس تقسیم کاری کا اندراج بعد کے مالیاتی گوشواروں میں کیا جائے گا۔ (Companies Act, 2017) 2017ایکٹ، �
آآفف کاکاررپوپورریٹیٹ گوگوررننسننس کیکی تعمیلتعمیل کاکا ااعلاعلامیہمیہ کوکوڈڈ
ر نزن ن یش )کوڈ آف کارپوریٹ گورننس( ریگولی �
کی شرائط پ کمپنی پوری طرح عمل پیرا ہے اور اس تعمیل کا اعلامیہ اور آڈیٹرز رپورٹ ہماری سالانہ رپورٹ میں 2019لسی ڈ
شامل ہیں۔
فرفریمیم ووررکک کاکا کاکاررپوپورریٹیٹ ااوورر مامالیالیاتیتی ررپوپوررٹنگٹنگ
رپوریٹ گورننس میں بتائی گئی کی کمپنی کا بورڈ آف ڈائریکٹرز کمپنی کو چلانے کی بہترین روایات کے اصولوں کی پیروی کیلئے پ عزم ہے۔ کمپنی کی انتظامیہ کوڈ آف کا آپ
بہترین روایات کی مسلسل تعمیل کر رہی ہے۔
اور ایکویٹی میں تبدیلیوں کی • منصفانہ عکاسی انتظامیہ کے تیار کردہ مالیاتی گوشوارے کمپنی کے معاملات کی صورتحال، سرگرمیوں کے نتائ، نقدی کے بہاؤ
کرتے ہیں۔
کمپنی کے اکاؤنٹس کے موزوں کھاتے تیار رکھے گئے ہیں۔ •
پ مبنی ہیں۔ معقول اور محتاط اندازوں ۔ اکاؤنٹنگ تخمینےاطلاق کیا گیا ہے تسلسل سے زوں پالیسیوں کا کمپنی کے مالیاتی گوشواروں کی تیاری میں اکاؤنٹنگ کی مو •
، اور ان معیارات سے کئے گئے (IFRS)ان مالیاتی گوشواروں کی تیاری میں پاکستان میں لاگو مالیاتی رپورٹنگ کے بین الاقوامی معیارات • کو اختیار کیا گیا ہے
کوئی ہو( کی مناسب انداز میں نشاندہی اور وضاحت کی گئی ہے۔ انحراف )اگر

166 ANNUAL REPORT 2020
رک مارکہ مصنوعات کی فروخت میں ین کمی %40پچھلے سال کے مقابلے میں فروخت میں کو ، جبکہ اداروں اضافہ ہوا %11پچھلے سال کے مقابلے میں مارکیٹ میں ہماری ج
سے COVID-19کیونکہ صوبائی حکومتوں نے صحت کا بجٹ سرکاری سطح پ صحت کے شعبے کیلئے خریداری میں کمی واقع ہونا ہےبڑی وجہ کمی کی فروخت میں واقع ہوئی۔
یکج چیپکیلئے استعمال کر لیا۔ فراہم کرنے متاثرہ لوگوں کو امدادی
، -تھی %39جو کہ پچھلے سال رہی %41کی شرح (GP)اس سال گراس منافع کی (GP)گراس منافع اضافہ ہوا۔ %8کی شرح میں (GP)گراس منافع حقیقی لحاظ سے
بنیادی وجہ تناسبِ فروخت کی تبدیلی ہے۔شرح میں بہتری کی
شدہ کئی سرگرمیاں منسوخ یا ملتوی کر دی گئی ہیں۔ افرادی قوت کیلئے طےوجہ سے کے پھیلنے اور متعلقہ لاک ڈاؤن کی COVID-19اس مالی سال کی چوتھی سہ ماہی میں
کمی واقع ہوئی ہے۔ %2پچھلے سال کی نسبت جس کے نتیجے میں ہمارے فروخت اور ڈسٹری بیوشن کے اخراجات میں
میں کمی ہے۔ (Exchange Loss)اس سال مبادلہ کے نقصان کمی واقع ہوئی جس کی بنیادی وجہ %31دیگر اخراجات میں پچھلے سال کی نسبت
رہی جو کہ پچھلے %29پ ختم ہونے والے مالی سال کیلئے مؤثر شرحِ ٹیکس 2020جون 30ملین روپے تھا۔ 251ملین روپے رہا جو کہ پچھلے سال 396 کمپنی کا بعد از ٹیکس منافع
ریکارڈ کی گئی تھیں۔ (Provisions) سال بعض تخمینہ کردہ لاگت تھی۔ مؤثر شرحِ ٹیکس میں فرق کی بنیادی وجہ یہ ہے کہ پچھلے %40سال
BBFF ذذیلییلی کمپنیکمپنی(( ااوورر آآپپیشنلیشنل جاجائزئزہہ:: کاکا مامالیالیاتیتی (( بابائیوئیو ساسائنسزئنسز لمیٹڈلمیٹڈ
ملین روپے رہا 47 منافع ۔ اس سال کا بعد از ٹیکس اضافہ ہوا %40ملین روپے رہی جس میں پچھلے سال کے مقابلے میں 628فروخت بائیو سائنسز لمیٹڈ کی BFذیلی کمپنی
۔تھا ملین روپے کا خسارہ 45جبکہ پچھلے سال
سائنسز کے ساتھ BFاس سال یڈ یہ دوا انہ لائسنس کا معاہدہ کامیابی کے ساتھ طے پا گیا۔ رضاکار کی تیاری اور فروخت کیلئے (Remdesivir)ریمڈیسویر بائیو سائنسز کا گلی
اتھارٹی آف پاکستان کے ساتھ ریمیڈیا نام کے تحت (Remidia)ڈرگ ریگولیٹری کے عرصہ میں ریمیڈیا اختتام کے بعد اس مالی سال کے رجسٹرڈ ہے۔ کے برانڈ
(Remidia) کی تیاری اور فروخت شروع ہو چکی ہے۔
رازول( اور ساتھ اریٹروجن )اریتھروپوئیٹن( BFزیرِ جائزہ سال کے دوران چ کی تیاری اور IU 10000بائیوسائنسز نے رگ میں لگائے جانے والے ٹیکے اومیگا )اومی
زیرِ التوا منظوری کیلئے بائیولوجیکل مصنوعات کی رجسٹریشن -تاہم، ڈرگ ریگولیٹری اتھارٹی آف پاکستان کے پاس کئی بائیولوجیکل اور نانفروخت بھی شروع کر دی ہے۔
مزید بہتری آئے گی۔ میں فروخت اور منافع انتظامیہ پُر اعتماد ہے کہ ان درخواستوں کی منظوری کے بعد آئندہ سالوں میں ذیلی کمپنی کی ہے۔
کلیدکلیدیی عملیعملی ااوورر مامالیالیاتیتی ااعدعدااددووشماشمارر
سال کے انفرادی اور انضمام کردہ مالیاتی گوشواروں سے لئے گئے کلیدی عملی اور مالیاتی اعدادوشمارکا خلاصہ ساتھ لف کیا گیا ہے۔ 6پچھلے

167ANNUAL REPORT 2020
رر ہوہولڈلڈررزز ییئئکیکی خدخدمتمت میںمیں ڈڈاائرئریکٹریکٹرزز کیکی ررپوپوررٹٹ شش
ساسالل سےسے متعلقمتعلق ااختتاختتامم شدشدہہ پپ 22002200جوجونن 3300
ختم ہونے والے پ 2020جون 30) مالیاتی گوشوارے کمپنی کے پڑتال شدہ )آڈٹ شدہ( آپ کی سالانہ رپورٹ پیش کرتے ہیں جس میں ویں 64ہم انتہائی مسرت سے
ر، کے BFان کے ساتھ ذیلی کمپنیوں، سال سے متعلق( شامل ہیں اور چن ا ریٹیل ویی ی کردہ مالیاتی گوشوارے بھی شامل ہیں۔ انضمامبائیو سائنسز لمیٹڈ اور فارمی
کرکرددہہ مامالیالیاتیتی نتانتائئ اانضمانضمامم آآپپ کیکی کمپنیکمپنی کےکے اانفرنفرااددیی ااوورر
نیچے دیا گیا ہے: ،اور منافع کی تقسیم کا خلاصہ اور پچھلے سال سے موازنہعملی نتائ نتائ، اس سال کے مالیاتی
اانضمانضمامم کرکرددہہ اانفرنفرااددیی
220022002019220022002019
))ہزہزاارر ررووپےپے((
8811665,802,856,,119911,,0044335,180,80466,,339944,,55خاخالل -- فرفرووختخت
1166222,040,953,,331188,,9955442,045,84922,,221177,,22گرگرااسس منامنافعفع
993388338,065,,553300418,718559911,,556600منامنافعفع قبلقبل اازز ٹیکسٹیکس
558800187,995,,665555251,046442222,,339955بعدبعد اازز ٹیکسٹیکس منامنافعفع
88116.65..11118.321133..1133فیفی حصصحصص آآمدمدنن ))ررووپےپے((
6622774,304,712,,664444,,7755553,879,50544,,118811,,44تقسیمتقسیم کیلئےکیلئے موموجوجودد منامنافعفع
:تقسیم
نقد ڈیویڈنڈ:
ررووپےپے فیفی حصصحصص 44@@نقدنقد ڈڈیویویڈیڈنڈنڈ حتمیحتمی کیلئےکیلئے 22002200مامالیالیاتیتی ساسالل
(( ررووپےپے فیفی حصصحصص 44 @@میںمیں 22001199))
رز: یئبونس ش
((112200,,774477)) (120,747) ((112200,,774477)) (120,747)
ررزز کیلئےکیلئے 22002200مامالیالیاتیتی ساسالل ییئئ میںمیں 22001199)) فیصدفیصد 2200 @@ بوبونسنس شش
کوکوئیئی نہیںنہیں((
((6600,,337744)) - ((6600,,337744)) -
:: جاجائزئزہہ آآپپیشنلیشنل ااوورر فیرفیرووزز سنزسنز لیبالیباررٹرٹریزیز لمیٹڈلمیٹڈ کاکا مامالیالیاتیتی
انفرادی طور پ، آپکی کمپنی کی خال فروخت زیادہ %7کے مقابلے میں ملین روپے رہی، جو کہ پچھلے سال 6,192اس سال کمپنی کی انضمام کردہ خال فروخت ہے۔
زیادہ ہے۔ %4کے مقابلے میں ملین روپے رہی جو کہ پچھلے سال 5,394

168 ANNUAL REPORT 2020

169ANNUAL REPORT 2020
FORM OF PROXY 64th Annual General Meeting
I/We, of _______
being a member of Ferozsons Laboratories Limited and holder of ______
ordinary Shares as per share register Folio/CDC Account No. ______ hereby
appoint Mr./Mrs. ____
Folio/CDC Account No. of CNIC No. or Passport No. ____
or failing him/her Mr./Mrs. _________________
Folio/CDC Account No. of CNIC No. or Passport No.______
who is also a member of the Company as my/our proxy to attend, speak and
vote for me/us and on my/our behalf at the 64th Annual General Meeting of the Company to be held on
Monday, 26 October 2020 at 12:15 P.M. or at any adjournment thereof.
_____________________
Signature of Shareholder (The signature should agree with the specimen
registered with the Company)
Dated this _____day of_________2020 Signature of Proxy________________
1. Witness: 2. Witness:
Signature: Signature:
Name: ________________ Name: _________________
Address: ________________ Address: ________________
________________ ________________
CNIC No. ________________ CNIC No. ________________
Note: Proxies, in order to be effective, the instrument of proxy and the power of attorney or any other authority, under which it is signed, must be shared through e-mail on [email protected] not less than 48 hours before the time of AGM.
CDC Shareholders and their Proxies are each requested to attach an attested photocopy of their CNIC or Passport with the proxy form before email to the Company.
Five Rupees
Revenue Stamp
CU
T H
ERE

170 ANNUAL REPORT 2020
ڈڈفیرفیرووززسنزسنز لیبالیباررٹرٹریزیزلمیٹلمیٹڈڈ
ڈڈنمانمائندئندگیگی کاکا فافاررمم ))پرپرااکسیکسی فافاررمم((ڈڈ
ڈڈساسالالانہنہ ااجلاجلاسسِِ عاعاممڈڈ ڈڈ ڈڈ ڈڈووااںں ڈڈ ڈڈ6644
ی ت رکن ڈ________________کا/کی ڈ________________________میں/ہم ڈحث بذریعہ حصص رجسٹرکے فولیو نمبر/سی ڈی سی اورڈ فیرفیرووززسنزسنز لیبالیباررٹرٹریزیز لمیٹلمیٹڈڈب
ڈ نمبر ڈ____________________اکاؤنٹ ڈ ڈ________________حامل حصص رکن عام دوسرے ایک کے کمپنی ،
نمبر_________________کا/کی____________________ سی/فولیو ڈی ڈسی ڈاکاؤنٹ ڈنمبر ڈ_____________ نمبر کارڈ شناختی
ڈ_________________________ ڈ نمبر پاسپورٹ ڈ_____________________یا رکن ڈ اور کے کمپنی دیگر بصورتِ یا ،
نمبر___________________کا/کیڈ___________________ ڈ/فولیو نمبر اکاؤنٹ سی ڈی ڈ_____________سی نمبر ڈ کارڈ شناختی
سالانہ اجلاسِ عام میں، ڈ ڈویں ڈ64ہماری غیر حاضری میں کمپنی کے ڈمیری / ڈ ڈ ڈکڈ، ڈ_____________________یا پاسپورٹ نمبر ڈ _________________________
اور حق رائے دہی کے استعمال کیلئے اپنا نمائندہ )پراکسی( ڈ، اظہارِ خیال ڈبجے منعقد ہو رہا ہے، یاکسی بھی ملتوی شدہ اجلاس میں حاضری ڈ ڈ ڈ12:15، دوپہر ڈ ڈ2020اکتوبر ڈ ڈ26بتاریخ ڈجو ڈ
کرتے ہیں۔ ڈ/ہوں مقرر کرتا
______________________________
ڈ دارڈحصص خ ت ڈکے دس
)دستخط کمپنی میں رجسٹرڈ نمونے سے مطابقت رکھتے ہونے چاہئے(
ڈ
ڈ
ڈپانچ روپے کی ریونیو سٹامڈ
ڈ
ڈ____________________نمائندہ کے دستخط: ڈڈڈ2020 _____________مہینڈ___________بتاریخ ڈ
ڈڈگوگوااہہڈڈ ڈڈ..22
ڈدستخط:
ڈ_______________________________نام:
_______________________________پتہ:
ڈ_________________________________
________________________شناختی کارڈ نمبر:
ڈگوگوااہہڈڈ ڈڈ11.
ڈدستخط:
ڈ_______________________________نام:
_______________________________پتہ:
ڈ_________________________________
________________________شناختی کارڈ نمبر:
ڈنوٹ:
، اور مختار نامہ یا دیگر دستاویز جس کے تحت اس پر دستخط کئے گئے ہوں، ای میل ایڈریس ڈ پر سالانہ اجلاسِ عام ڈ ڈlabs.com-cs@ferozsonsنمائندگی فارم )پراکسی فارم(
ڈبصورتِ دیگر یہ فارم موثر تصور نہیں کیا جائے گا۔ ، گھنٹے پہلے ای میل کے ذریعے بھجوا دیں 48کے وقت سے کم از کم ڈ
ک ڈ)پراکسی( سے درخواست ہے کہ نمائندگی فارم )پراکسی فارم( ڈ ڈنمائندوں ڈاور انکے ڈ ڈ ڈیافتگان ڈسی ڈی سی حصص ڈ یا ڈ ڈای میل کرنے ڈکمپنی سے پہلے اس کے ساتھ اپنے شناختی کارڈ
ڈپاسپورٹ کی تصدیق شدہ فوٹوکاپی لف کریں۔

171ANNUAL REPORT 2020

172 ANNUAL REPORT 2020
www.ferozsons-labs.com/ferozsonslabs


