129
2012 Annual Report Evolving Our AECOM
2012Annual Report
Evolving Our AECOM
Fiscal year 2012 marked a period of continued revenue growth as we serviced our clients’ evolving needs worldwide and maintained an intense focus on financial performance and operational excellence.
Our mix of global coverage, local operations, innovation and technical excellence in delivering solutions that create, enhance and sustain the world’s built, natural, and social environments still differentiates as we strive to make the world a better place.

Growth and financial performance
During fiscal year 2012, AECOM continued to evolve our services, organizational structure and capital allocation strategy to remain a trusted partner to our clients in more than 140 countries and a valuable investment to our shareholders. We have firmly positioned ourselves as thought leaders within our own industry and continue to achieve professional success and growth around the globe.
Despite key macroeconomic challenges in various parts of the world, our vision and diversified growth strategy have allowed us to bolster our strong positions in the transportation, facilities, government services, environment, and energy markets.
Our operating success is built upon our intense client focus and effective decision making, which position us well for the future. For fiscal year 2012, our revenue grew 2.2 percent from US$8.0 billion to US $8.2 billion, and our backlog expanded 3 percent from US$15.6 billion to US$16.0 billion.
In connection with our annual goodwill impairment testing, for the fiscal year 2012, we did record an impairment charge of US$336 million, which caused our earnings to be negative for the year. This write-down, however, was a non-cash item that has no impact on our liquidity, cash flow from operations or financial covenants.
In addition to continuing to integrate our previous acquisitions, which grow our footprint in new service areas and/or geographic regions, during fiscal year 2012 we were joined by CEC, a Taiwan-based engineering and environmental services firm.
As we continue to focus on shareholder value during fiscal year 2013, our capital allocation priorities are to:
- Pursue organic and acquisitive investments that further our strategy and present attractive long-term returns. We will continue to invest in our existing business and pursue acquisitions where it makes sense to add new services or further our geographic reach.
- Maintain ample liquidity and a strong balance sheet. We had a record free cash flow of US$370 million, equivalent to US$3.29 per share, for fiscal year 2012. Moreover, our total debt decreased by 8 percent from US$1.16 billion to US$1.07 billion, and net debt, which equals short- and long-term debt minus cash and cash equivalents, decreased by 33 percent from US$706 million to US$476 million.
- Deleverage when appropriate: A strong example of this tenet in action is our repayment of US$179 million in debt during the second half of fiscal year 2012.
- Opportunistically repurchase stock: During the 2012 fiscal year, we completed our first share-repurchase authorization of $200 million, and our Board of Directors authorized another $300 million worth of repurchases during August. All told, during the year, we spent US$160 million to repurchase 7.9 million shares. Clearly, our share repurchase program complements our strategy for balanced growth and sustainable returns.

Positioning for Success “Our AECOM”
Today, AECOM is a global enterprise, with more than 60 percent of our work being done outside the United States. Our teams of highly skilled professionals work to enhance AECOM’s diversified global growth strategy, which is the hallmark of our business model. This strategy positions us well to take advantage of opportunities in high-growth end markets and geographies, including naturally resource rich areas.
Given our intense focus on improving our profitability and our value as an investment, as well as expanding our services and geographic reach, we have identified six long-term objectives:
- Enhance shareholder value. We continue to advance our capital-allocation strategy and financial discipline.
- Increase profit margins. Evolve our services to improve our overall profitability, including the expansion of our construction management and oil and gas operations.
- Advance our organic growth. We intend to further integrate and invest in our existing service offerings as part of our end market focus.
- Adjust our mix of public and private sector clients. This objective is further bolstered by our knowledge of alternative delivery methods; our
relationships with Meridiam, which assists in the funding of public-private partnerships (P3s); and the creation of AECOM Capital — a fund that is intended to help jumpstart P3 projects that are smaller in scope that those aided by Meridiam.
- Increase our penetration of the top private and multi-national clients. Our diversification efforts enable us to be a desired partner with these key private sector clients.
- Increase our business in emerging markets. Africa, China, Eastern Europe, India, Latin America and the Middle East remain areas of focus for us. In fact, since the beginning of fiscal year 2013, we have completed the acquisition of BKS in Africa, which expands our core services in the region, and KPK in Asia, which enables us to now offer our project, cost, consulting services throughout the continent.
Since the founding of AECOM in 1990, we have built our company on a solid foundation of diversification and sound Core Values that have guided our business ever since. Our unwavering commitment to these Core Values in everything we do establishes our commitment to never compromise our integrity. For this reason, we were named by Ethisphere magazine as one of the World’s Most Ethical Companies for 2012 and 2011.
Throughout fiscal year 2012, we strove to align our mission, culture, spirit and passion across AECOM. We have worked hard to further intensify our client focus, streamline our internal processes and manage our costs, and will continue to do so during 2013. These efforts benefit the professional development and morale of our employees as well as the fiscal health of our firm.
There is no question that our industry is rapidly changing, but as AECOM moves into the next fiscal year, we will continue to foster our commitment to the highest performance standards. We believe our long term strategy of increasing sustainable returns on investments and maximizing shareholder value will only fuel success in the long run.
Social Responsibility Safety
Good corporate citizenship is a crucial part of AECOM’s business operations. Our global policies, practices and responsibilities reflect our commitment to doing what is right. During 2012, the collective energy and efforts of our employees around the world showed their commitment to care for the communities where they live and work. Our people gave their time and financial resources to Engineers Without Borders, Water for People, the International Committee of the Red Cross and its affiliates around the world, additional natural disaster relief efforts and a variety of other philanthropic organizations.
Safety is fundamental to our everyday culture. Whether working in the office or at a project site, we are dedicated to operating, and maintaining our projects, in a safe manner. Avidly championed by our leaders, our commitments are outlined in our Safety, Health and Environment (SH&E) policy statement and guiding principles. The policy statement establishes and maintains a framework for our overall SH&E program. This drives us to proactively incorporate these safety standards into everything we do.
We believe that there’s no “one size fits all” approach. As a global company, we realize that each region is different and our regional safety leaders ensure that safety remains a priority everywhere we operate. We abide by all applicable safety rules and regulations — no matter the location — and encourage our employees to make recommendations for improvements. During fiscal year 2012, we saw many successes with our safety programs as well as external recognition of our efforts. Following are some highlights:
- The San Francisco Public Utility Commission was honored with the 2012 Exceptional Performance in Safety recognition by the American Public Works Association. AECOM oversees the safety performance for the commission’s Water System Improvement Program, which has been coined as one of the largest and most complex construction programs in the United States.
- Kristine Brobst, our safety, health and environment manager based in Pittsburgh, Pennsylvania, United States, was named as one of the 2012 National Safety Council Rising Stars of Safety. This is the third consecutive year an AECOM employee has received this title.
- AECOM’s Steve Wood, director for SH&E in the Middle East, was elected chairman of the Middle East and North Africa chapter of the National Construction Safety Executives.
AECOM continues to be positioned well to meet our clients’ evolving needs. As we move forward, we will remain committed to delivering excellent service and innovative solutions to our clients, being the place to grow professionally for employees, and maintaining our status as a valuable investment for our shareholders.
Our capabilities Architecture
Building Engineering
Construction Services
Design + Planning
Economics
Energy
Environment
Government
Mining
Oil + Gas
Program, Cost, Consultancy
Program Management
Transportation
Water

UNITED STATESSECURITIES AND EXCHANGE COMMISSION
WASHINGTON, D.C. 20549
FORM 10-K(Mark one)
! ANNUAL REPORT PURSUANT TO SECTION 13 OR 15(d) OF THE SECURITIESEXCHANGE ACT OF 1934
FOR THE FISCAL YEAR ENDED SEPTEMBER 30, 2012
OR
" TRANSITION REPORT PURSUANT TO SECTION 13 OR 15(d) OF THE SECURITIESEXCHANGE ACT OF 1934
For the transition period from to
Commission file number 0-52423
AECOM TECHNOLOGY CORPORATION(Exact name of Registrant as specified in its charter)
Delaware 61-1088522(State or other jurisdiction of (I.R.S. Employerincorporation or organization) Identification No.)
555 South Flower Street, Suite 3700Los Angeles, California 90071
(Address of principal executive offices, including zip code)
(213) 593-8000(Registrant’s telephone number, including area code)
Securities registered pursuant to Section 12(b) of the Act:Title of Each Class Name of Exchange on Which Registered
Common Stock, par value $0.01 per share New York Stock Exchange
Securities registered pursuant to Section 12(g) of the Act: None
Indicate by check mark if the registrant is a well-known seasoned issuer, as defined in Rule 405 of the SecuritiesAct. ! Yes " No
Indicate by check mark if the registrant is not required to file reports pursuant to Section 13 or Section 15(d) of theAct. " Yes ! No
Indicate by check mark whether the registrant (1) has filed all reports required to be filed by Section 13 or 15(d) of theSecurities Exchange Act of 1934 during the preceding 12 months (or for such shorter period that the registrant was required to filesuch reports), and (2) has been subject to such filing requirements for the past 90 days. ! Yes " No
Indicate by check mark whether the registrant has submitted electronically and posted on its corporate Web site, if any, everyInteractive Data File required to be submitted and posted pursuant to Rule 405 of Regulation S-T (§ 232.405 of this chapter) duringthe preceding 12 months (or for such shorter period that the registrant was required to submit and post such files). ! Yes " No
Indicate by check mark if disclosure of delinquent filers pursuant to Item 405 of Regulation S-K is not contained herein, andwill not be contained to the best of registrant’s knowledge, in definitive proxy or information statements incorporated by referencein Part III of this Form 10-K or any amendment to this Form 10-K. "
Indicate by check mark whether the registrant is a large accelerated filer, an accelerated filer, a non-accelerated filer, or asmaller reporting company. See the definitions of ‘‘large accelerated filer,’’ ‘‘accelerated filer’’ and ‘‘smaller reporting company’’ inRule 12b-2 of the Exchange Act. (Check one):Large accelerated filer ! Accelerated filer " Non-accelerated filer " Smaller reporting company "
(Do not check if asmaller reporting company)
Indicate by check mark whether the registrant is a shell company (as defined in Rule 12b-2 of the ExchangeAct). " Yes ! No
The aggregate market value of registrant’s common stock held by non-affiliates on March 31, 2012 (the last business day of theregistrant’s most recently completed second fiscal quarter), based upon the closing price of a share of the registrant’s common stockon such date as reported on the New York Stock Exchange was approximately $2.10 billion.
Number of shares of the registrant’s common stock outstanding as of November 7, 2012: 108,078,563DOCUMENTS INCORPORATED BY REFERENCE
Part III incorporates information by reference from the registrant’s definitive proxy statement for the 2013 Annual Meeting ofStockholders, to be filed within 120 days of the registrant’s fiscal 2012 year end.
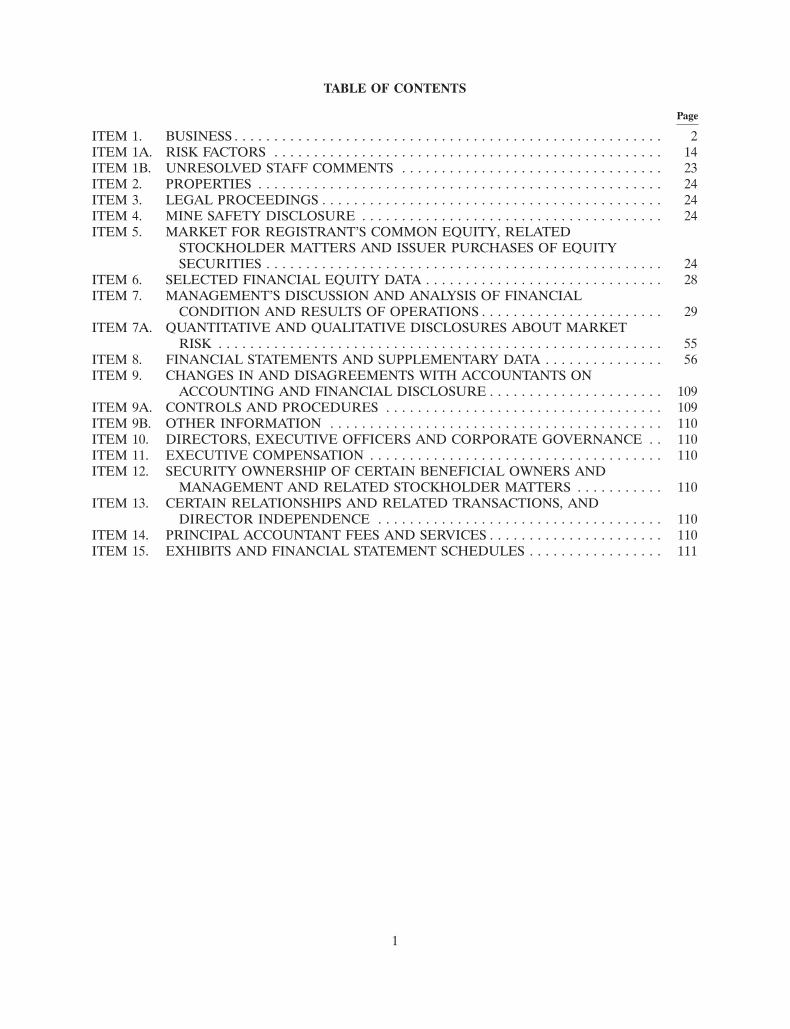
TABLE OF CONTENTS
Page
ITEM 1. BUSINESS . . . . . . . . . . . . . . . . . . . . . . . . . . . . . . . . . . . . . . . . . . . . . . . . . . . . . . 2ITEM 1A. RISK FACTORS . . . . . . . . . . . . . . . . . . . . . . . . . . . . . . . . . . . . . . . . . . . . . . . . . 14ITEM 1B. UNRESOLVED STAFF COMMENTS . . . . . . . . . . . . . . . . . . . . . . . . . . . . . . . . . 23ITEM 2. PROPERTIES . . . . . . . . . . . . . . . . . . . . . . . . . . . . . . . . . . . . . . . . . . . . . . . . . . . 24ITEM 3. LEGAL PROCEEDINGS . . . . . . . . . . . . . . . . . . . . . . . . . . . . . . . . . . . . . . . . . . . 24ITEM 4. MINE SAFETY DISCLOSURE . . . . . . . . . . . . . . . . . . . . . . . . . . . . . . . . . . . . . . 24ITEM 5. MARKET FOR REGISTRANT’S COMMON EQUITY, RELATED
STOCKHOLDER MATTERS AND ISSUER PURCHASES OF EQUITYSECURITIES . . . . . . . . . . . . . . . . . . . . . . . . . . . . . . . . . . . . . . . . . . . . . . . . . . 24
ITEM 6. SELECTED FINANCIAL EQUITY DATA . . . . . . . . . . . . . . . . . . . . . . . . . . . . . . 28ITEM 7. MANAGEMENT’S DISCUSSION AND ANALYSIS OF FINANCIAL
CONDITION AND RESULTS OF OPERATIONS . . . . . . . . . . . . . . . . . . . . . . . 29ITEM 7A. QUANTITATIVE AND QUALITATIVE DISCLOSURES ABOUT MARKET
RISK . . . . . . . . . . . . . . . . . . . . . . . . . . . . . . . . . . . . . . . . . . . . . . . . . . . . . . . . 55ITEM 8. FINANCIAL STATEMENTS AND SUPPLEMENTARY DATA . . . . . . . . . . . . . . . 56ITEM 9. CHANGES IN AND DISAGREEMENTS WITH ACCOUNTANTS ON
ACCOUNTING AND FINANCIAL DISCLOSURE . . . . . . . . . . . . . . . . . . . . . . 109ITEM 9A. CONTROLS AND PROCEDURES . . . . . . . . . . . . . . . . . . . . . . . . . . . . . . . . . . . 109ITEM 9B. OTHER INFORMATION . . . . . . . . . . . . . . . . . . . . . . . . . . . . . . . . . . . . . . . . . . 110ITEM 10. DIRECTORS, EXECUTIVE OFFICERS AND CORPORATE GOVERNANCE . . 110ITEM 11. EXECUTIVE COMPENSATION . . . . . . . . . . . . . . . . . . . . . . . . . . . . . . . . . . . . . 110ITEM 12. SECURITY OWNERSHIP OF CERTAIN BENEFICIAL OWNERS AND
MANAGEMENT AND RELATED STOCKHOLDER MATTERS . . . . . . . . . . . 110ITEM 13. CERTAIN RELATIONSHIPS AND RELATED TRANSACTIONS, AND
DIRECTOR INDEPENDENCE . . . . . . . . . . . . . . . . . . . . . . . . . . . . . . . . . . . . 110ITEM 14. PRINCIPAL ACCOUNTANT FEES AND SERVICES . . . . . . . . . . . . . . . . . . . . . . 110ITEM 15. EXHIBITS AND FINANCIAL STATEMENT SCHEDULES . . . . . . . . . . . . . . . . . 111
1
PART I
ITEM 1. BUSINESS
In this report, we use the terms ‘‘AECOM,’’ ‘‘the Company,’’ ‘‘we,’’ ‘‘us’’ and ‘‘our’’ to refer to AECOMTechnology Corporation and its consolidated subsidiaries. Unless otherwise noted, references to years are forfiscal years. Our fiscal year consists of 52 or 53 weeks, ending on the Friday closest to September 30. For clarityof presentation, we present all periods as if the year ended on September 30. We refer to the fiscal year endedSeptember 30, 2011, as ‘‘fiscal 2011’’ and the fiscal year ended September 30, 2012, as ‘‘fiscal 2012.’’
Overview
We are a leading global provider of professional technical and management support services for publicand private clients around the world. We provide planning, consulting, architectural and engineeringdesign, and program and construction management services for a broad range of projects, includinghighways, airports, bridges, mass transit systems, government and commercial buildings, water andwastewater facilities and power transmission and distribution. We also provide program and facilitiesmanagement and maintenance, training, logistics, security and other support services, primarily foragencies of the U.S. government.
Through our network of approximately 46,800 employees (as of September 30, 2012), we provide ourservices in a broad range of end markets, including the transportation, facilities, environmental, energy,water and government markets. According to Engineering News-Record’s (ENR’s) 2012 Design Survey, weare the largest general architectural and engineering design firm in the world, ranked by 2011 designrevenue. In addition, we are ranked by ENR as the leading firm in a number of design end markets,including transportation and general building.
We were formed in 1980 as Ashland Technology Company, a Delaware corporation and a wholly-owned subsidiary of Ashland, Inc., an oil and gas refining and distribution company. Since becomingindependent of Ashland Inc., we have grown by a combination of organic growth and strategic mergers andacquisitions from approximately 3,300 employees and $387 million in revenue in fiscal 1991, the first fullfiscal year of independent operations, to approximately 46,800 employees at September 30, 2012, and$8.2 billion in revenue for fiscal 2012. We completed the initial public offering of our common stock in May2007 and such shares are traded on the New York Stock Exchange.
We offer our services through two business segments: Professional Technical Services andManagement Support Services.
Professional Technical Services (PTS). Our PTS segment delivers planning, consulting, architecturaland engineering design, and program and construction management services to commercial andgovernment clients worldwide in major end markets such as transportation, facilities, environmental,energy, water and government markets. For example, we are providing program management servicesthrough a joint venture for the Second Avenue subway line in New York City, design and contractadministration services for the Hong Kong-Zhuhai-Macao Bridge’s Hong Kong Boundary CrossingFacilities and engineering and environmental management services to support global energy infrastructuredevelopment for a number of large petroleum and mining companies. Our PTS segment contributed$7.3 billion, or 89%, of our fiscal 2012 revenue.
Management Support Services (MSS). Our MSS segment provides program and facilitiesmanagement and maintenance, training, logistics, consulting, technical assistance and systems integrationservices, primarily for agencies of the U.S. government. For example, we oversee remote field experiments,multiple laboratory operations, waste management systems, and the design and fabrication of electronic,mechanical and structural systems at the U.S. Department of Energy’s Nevada Test Site. Our MSS segmentcontributed $0.9 billion, or 11%, of our fiscal 2012 revenue.
2
Our Business Strategy
Our business strategy focuses on leveraging our competitive strengths and leadership positions in ourcore markets while opportunistically entering new and emerging markets and geographies. Key elements ofour strategy include:
Expand our long-standing client relationships and provide our clients with a broad range of services
We have long-standing relationships with a number of large corporations, public and privateinstitutions and government agencies worldwide. We will continue to focus on client satisfaction along withopportunities to sell a greater range of services to clients and deliver full-service solutions for their needs.For example, as our environmental business has grown, we have provided environmental services fortransportation and other infrastructure projects where such services have in the past been subcontracted tothird parties.
By integrating and providing a broad range of services, we believe we deliver maximum value to ourclients at competitive costs. Also, by coordinating and consolidating our knowledge base, we believe wehave the ability to export our leading edge technical skills to any region in the world in which our clientsmay need them.
Capitalize on opportunities in our core markets
We intend to leverage our leading positions in the transportation, facilities, environmental, energy,water and government markets to continue to expand our services and revenue. We believe that the needfor infrastructure upgrades, environmental management and government outsourcing of support services,among other things, will result in continued opportunities in our core markets. With our track record andour global resources, we believe we are well positioned to compete for projects in these markets.
Continue to pursue our balanced capital allocation strategy
We intend to pursue a balanced capital allocation strategy that includes acquisitions. This approachhas served us well as we have strengthened and diversified our leadership positions geographically,technically and across end markets. We believe that the trend towards consolidation in our industry willcontinue to produce candidates that align with our acquisition strategy. We also have formed AECOMCapital, an investment fund to invest in public-private partnership and private-sector real estate projectsfor which we can potentially provide a fully integrated solution that includes equity capital, design,engineering and construction services.
Strengthen and support human capital
Our experienced employees and management team are our most valuable resources. Attracting andretaining key personnel has been and will remain critical to our success. We will continue to focus onproviding our personnel with training and other personal and professional growth opportunities,performance-based incentives, opportunities for stock ownership and other competitive benefits in orderto strengthen and support our human capital base. We believe that our employee stock ownership andother programs align the interests of our personnel with those of our clients and stockholders.
3
Our Business Segments
The following table sets forth the revenue attributable to our business segments for the periodsindicated(1):
Year Ended September 30,(in millions)
2012 2011 2010
Professional Technical Services (PTS) . . . . . . . . . . . . $7,276.9 $6,877.1 $5,393.7Management Support Services (MSS) . . . . . . . . . . . . 941.3 1,160.3 1,152.1Total . . . . . . . . . . . . . . . . . . . . . . . . . . . . . . . . . . . $8,218.2 $8,037.4 $6,545.8
Our Professional Technical Services Segment
Our PTS segment comprises a broad array of services, generally provided on a fee-for-service basis.These services include planning, consulting, architectural and engineering design, program managementand construction management for industrial, commercial, institutional and government clients worldwide.For each of these services, our technical expertise includes civil, structural, process, mechanical,geotechnical systems and electrical engineering, architectural, landscape and interior design, urban andregional planning, project economics, cost consulting and environmental, health and safety work.
With our technical and management expertise, we are able to provide our clients with a broadspectrum of services. For example, within our environmental management service offerings, we provideremediation, regulatory compliance planning and management, environmental modeling, environmentalimpact assessment and environmental permitting for major capital/infrastructure projects.
Our services may be sequenced over multiple phases. For example, in the area of programmanagement and construction management services, our work for a client may begin with a smallconsulting or planning contract, and may later develop into an overall management role for the project or aseries of projects, which we refer to as a program. Program and construction management contractstypically employ a staff of 10 to more than 100 and, in many cases, operate as an outsourcing arrangementwith our staff located at the project site. For example, since 1990, we have been managing renovation workat the Pentagon for the U.S. Department of Defense. Other examples include our constructionmanagement services for One World Trade Center, the tallest building in New York, and programmanagement services for Crossrail, the largest addition to the transit system in London and southeastEngland in half a century.
We provide the services in our PTS segment both directly and through joint ventures or similarpartner arrangements to the following key end markets:
Transportation.
• Transit and Rail. Projects include light rail, heavy rail (including high speed, commuter and freight)and multimodal transit projects. For example, we have provided engineering design services for thenew World Trade Center Terminal for PATH and the Second Avenue Subway (8.5-mile rail routeand 16 stations) in New York City, the Ma On Shan Rail (7-mile elevated railway) in Hong Kong,and Crossrail (74-mile railway) in the United Kingdom.
• Marine, Ports and Harbors. Projects include wharf facilities and container port facilities for privateand public port operators. For example, we have provided marine design and engineering servicesfor container facilities in Hong Kong, the Ports of Los Angeles, Long Beach, New York and New
(1) For additional financial information by segment, see Note 21 in the notes to our consolidated financialstatements.
4
Jersey, the new $7 billion Doha Port project in Qatar and waterfront transshipment facilities for oiland liquid natural gas.
• Highways, Bridges and Tunnels. Projects include interstate, primary and secondary urban and ruralhighway systems and bridge projects. For example, we have provided engineering services for theSH-130 Toll Road (49-mile ‘‘greenfield’’ highway project) in Austin, Texas, the Sydney OrbitalBypass (39 kilometer highway) in Sydney, Australia and the Padma bridge (5.58 kilometer span)crossing the Padma River in Bangladesh.
• Aviation. Projects include landside terminal and airside facilities and runways as well as taxiways.For example, we have provided program management services to a number of major U.S. airports,including O’Hare International in Chicago, Los Angeles International, John F. Kennedy and LaGuardia in New York City, Reagan National and Dulles International in Washington, D.C., andMiami International. We also have provided services to airports in Hong Kong, London, Cyprusand Qatar.
Facilities.
• Government. Projects include our emergency response services for the Department of HomelandSecurity, including the Federal Emergency Management Agency and engineering and programmanagement services for agencies of the Department of Defense. We also provide architectural andengineering services for several national laboratories, including the laboratories at Hanford,Washington and Los Alamos, New Mexico.
• Industrial. Projects include industrial facilities for a variety of niche end markets includingmanufacturing, distribution, aviation, aerospace, communications, media, pharmaceuticals,renewable energy, chemical, and food and beverage facilities.
• Urban Master Planning/Design. Projects include design services, landscape architecture, generalpolicy consulting and environmental planning projects for a variety of government, institutional andprivate sector clients. For example, we have provided planning and consulting services for theOlympic Games sites in Atlanta, Sydney, Beijing, Salt Lake City and London. We are providingstrategic planning and master planning services for new cities and major mixed use developments inChina, Southeast Asia, the Middle East, North Africa, the United Kingdom and the United States.
• Commercial and Leisure Facilities. Projects include corporate headquarters, high-rise office towers,historic buildings, hotels, leisure, sports and entertainment facilities, hospitals and healthcarefacilities and corporate campuses. For example, we provided electronic security programming andinstallation services for the renovation of Soldier Field in Chicago, construction management forthe renovation of Dodger Stadium in Los Angeles, design services for Barclays Center Arena inBrooklyn and building services, engineering, architectural lighting, advanced modeling,infrastructure and utilities engineering and advanced security for the headquarters of the BritishBroadcasting Company in London.
• Institutional. Projects include engineering services for college and university campuses, includingthe new Kennedy-King College in Chicago, Illinois. We also have undertaken assignments forOxford University in the United Kingdom, Pomona College and Loyola Marymount University inCalifornia.
• Health Care. Projects include design services for the Mayo Clinic Gonda Building in Rochester,Minnesota, University Hospital in Dubai Healthcare City and the Samsung Cancer Center in Seoul,Korea. We also have undertaken assignments for the Veterans Affairs Medical Center in Orlando,Florida, and the Minneapolis campus of Children’s Hospitals and Clinics of Minnesota.
5
• Correctional. Projects include the planning, design, and construction of detention and correctionfacilities throughout the world. For example, we provided construction management services for theconstruction of the California State Prison—Kern County Delano II, justice design and securityconsulting services for a multi-custody correctional complex for the Sultanate of Oman, RoyalPolice Force, architecture and engineering services for the Coleman Federal Correctional Complexin Florida and architecture services for the Grayville, Illinois Maximum Security CorrectionalCenter.
Environmental.
• Water and Wastewater. Projects include treatment facilities as well as supply, distribution andcollection systems, stormwater management, desalinization, and other water re-use technologies formetropolitan governments. We have provided services to the Metropolitan Water ReclamationDistrict of Greater Chicago’s Calumet and Stickney wastewater treatment plants, two of the largestsuch plants in the world. Currently, we are working with New York City on the Bowery Bay facilityreconstruction, and have had a major role in Hong Kong’s Harbor Area Treatment Scheme forVictoria Harbor.
• Environmental Management. Projects include remediation, waste handling, testing and monitoringof environmental conditions and environmental construction management for private sector clients.For example, we have provided environmental remediation, restoration of damaged wetlands, andservices associated with reduction of greenhouse gas emissions for large multinational corporations,and we also have provided permitting services for pipeline projects for major energy companies.
• Water Resources. Projects include regional-scale floodplain mapping and analysis for publicagencies, along with the analysis and development of protected groundwater resources forcompanies in the bottled water industry.
Energy/Power.
• Demand Side Management. Projects include energy efficient systems for public K-12 schools anduniversities, health care facilities, and courthouses and other public buildings, as well as energyconservation systems for utilities.
• Transmission and Distribution. Projects include power stations and electric transmissions anddistribution and co-generation systems, including enhanced electrical power generation in StungTreng, Cambodia. These projects utilize a wide range of services that include consulting, forecastingand surveying to detailed engineering design and construction management.
• Alternative/Renewable Energy. Projects include production facilities such as ethanol plants, windfarms and micro hydropower and geothermal subsections of regional power grids. We typicallyprovide site selection and permitting, engineering, procurement and construction management andrelated services.
• Hydropower/Dams. Projects include hydroelectric power stations, dams, spillways, and flood controlsystems including the Song Ba Ha Hydropower Project in Vietnam, the Pine Brook Dam in BoulderCounty, Colorado and the Peribonka Hydroelectric Power Plant in Quebec, Canada.
• Solar. Projects include performing environmental work for the solar photovoltaic BrocktonBrightfield project in New England, and environmental permitting services for the CaliforniaEnergy Commission to permit the development of a 250 MW solar thermal power plant in theMojave Desert of California.
6

Our Management Support Services Segment
Through our MSS segment, we offer program and facilities management and maintenance, training,logistics, consulting, technical assistance and systems integration services, primarily for agencies of the U.S.government.
We provide a wide array of services in our MSS segment, both directly and through joint ventures orsimilar partner arrangements, including:
Installation, Operations and Maintenance. Projects include Department of Defense and Departmentof Energy installations where we provide comprehensive services for the operation and maintenance ofcomplex government installations, including military bases, test ranges and equipment. We haveundertaken assignments in this category in the Middle East and the United States. We also provide servicesfor the operations and maintenance of the Department of Energy’s Nevada Test Site.
Logistics and Field Services. Projects include logistics support services for a number of Department ofDefense agencies and defense prime contractors focused on developing and managing integrated supplyand distribution networks. We oversee warehousing, packaging, delivery and traffic management for thedistribution of government equipment and materials.
Training. Projects include training applications in live, virtual and simulation training environments.We have conducted training at the U.S. Army’s Center for Security Training in Maryland for lawenforcement and military personnel. We have also supported the training of international police officersand peacekeepers for deployment in various locations around the world in the areas of maintainingelectronics and communications equipment.
Systems Support. Projects cover a diverse set of operational and support systems for themaintenance, operation and modernization of Department of Defense and Department of Energyinstallations. Our services in this area range from information technology and communications to life cycleoptimization and engineering, including environmental management services. Through projects such asour joint venture operation at the Nevada Test Site, our team is responsible for facility and infrastructuresupport for critical missions of the U.S. government in its nonproliferation efforts, emergency responsereadiness, and force support and sustainment. Enterprise network operations and information systemssupport, including remote location engineering and operation in classified environments, are alsospecialized services we provide.
Technical Personnel Placement. Projects include the placement of personnel in key functional areas ofmilitary and other government agencies, as these entities continue to outsource critical services tocommercial entities. We provide systems, processes and personnel in support of the Department ofJustice’s management of forfeited assets recovered by law enforcement agencies. We also support theDepartment of State in its enforcement programs by recruiting, training and supporting police officers forinternational and homeland security missions.
Field Services. Projects include maintaining, modifying and overhauling ground vehicles, armoredcarriers and associated support equipment both within and outside of the United States under contractswith the Department of Defense. We also maintain and repair telecommunications systems for military andcivilian entities.
7
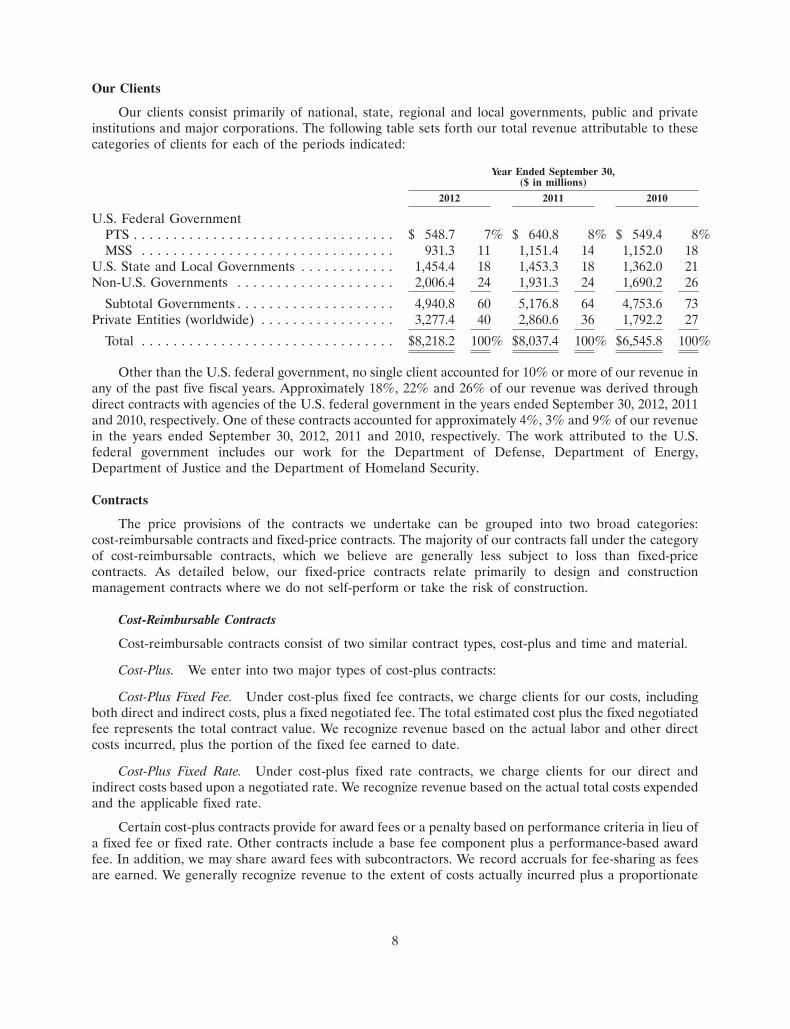
Our Clients
Our clients consist primarily of national, state, regional and local governments, public and privateinstitutions and major corporations. The following table sets forth our total revenue attributable to thesecategories of clients for each of the periods indicated:
Year Ended September 30,($ in millions)
2012 2011 2010
U.S. Federal GovernmentPTS . . . . . . . . . . . . . . . . . . . . . . . . . . . . . . . . . $ 548.7 7% $ 640.8 8% $ 549.4 8%MSS . . . . . . . . . . . . . . . . . . . . . . . . . . . . . . . . 931.3 11 1,151.4 14 1,152.0 18
U.S. State and Local Governments . . . . . . . . . . . . 1,454.4 18 1,453.3 18 1,362.0 21Non-U.S. Governments . . . . . . . . . . . . . . . . . . . . 2,006.4 24 1,931.3 24 1,690.2 26
Subtotal Governments . . . . . . . . . . . . . . . . . . . . 4,940.8 60 5,176.8 64 4,753.6 73Private Entities (worldwide) . . . . . . . . . . . . . . . . . 3,277.4 40 2,860.6 36 1,792.2 27
Total . . . . . . . . . . . . . . . . . . . . . . . . . . . . . . . . $8,218.2 100% $8,037.4 100% $6,545.8 100%
Other than the U.S. federal government, no single client accounted for 10% or more of our revenue inany of the past five fiscal years. Approximately 18%, 22% and 26% of our revenue was derived throughdirect contracts with agencies of the U.S. federal government in the years ended September 30, 2012, 2011and 2010, respectively. One of these contracts accounted for approximately 4%, 3% and 9% of our revenuein the years ended September 30, 2012, 2011 and 2010, respectively. The work attributed to the U.S.federal government includes our work for the Department of Defense, Department of Energy,Department of Justice and the Department of Homeland Security.
Contracts
The price provisions of the contracts we undertake can be grouped into two broad categories:cost-reimbursable contracts and fixed-price contracts. The majority of our contracts fall under the categoryof cost-reimbursable contracts, which we believe are generally less subject to loss than fixed-pricecontracts. As detailed below, our fixed-price contracts relate primarily to design and constructionmanagement contracts where we do not self-perform or take the risk of construction.
Cost-Reimbursable Contracts
Cost-reimbursable contracts consist of two similar contract types, cost-plus and time and material.
Cost-Plus. We enter into two major types of cost-plus contracts:
Cost-Plus Fixed Fee. Under cost-plus fixed fee contracts, we charge clients for our costs, includingboth direct and indirect costs, plus a fixed negotiated fee. The total estimated cost plus the fixed negotiatedfee represents the total contract value. We recognize revenue based on the actual labor and other directcosts incurred, plus the portion of the fixed fee earned to date.
Cost-Plus Fixed Rate. Under cost-plus fixed rate contracts, we charge clients for our direct andindirect costs based upon a negotiated rate. We recognize revenue based on the actual total costs expendedand the applicable fixed rate.
Certain cost-plus contracts provide for award fees or a penalty based on performance criteria in lieu ofa fixed fee or fixed rate. Other contracts include a base fee component plus a performance-based awardfee. In addition, we may share award fees with subcontractors. We record accruals for fee-sharing as feesare earned. We generally recognize revenue to the extent of costs actually incurred plus a proportionate
8
amount of the fee expected to be earned. We take the award fee or penalty on contracts into considerationwhen estimating revenue and profit rates, and record revenue related to the award fees when there issufficient information to assess anticipated contract performance. On contracts that represent higher thannormal risk or technical difficulty, we may defer all award fees until an award fee letter is received. Oncean award fee letter is received, the estimated or accrued fees are adjusted to the actual award amount.
Certain cost-plus contracts provide for incentive fees based on performance against contractualmilestones. The amount of the incentive fees varies, depending on whether we achieve above, at, or belowtarget results. We originally recognize revenue on these contracts based upon expected results. Theseestimates are revised when necessary based upon additional information that becomes available as thecontract progresses.
Time and Material. Time and material is common for smaller scale engineering and consultingservices. Under these types of contracts, we negotiate hourly billing rates and charge our clients basedupon actual hours expended on a project. Unlike cost-plus contracts, however, there is no predeterminedfee. In addition, any direct project expenditures are passed through to the client and are reimbursed. Thesecontracts may have a fixed-price element in the form of not-to-exceed or guaranteed maximum priceprovisions.
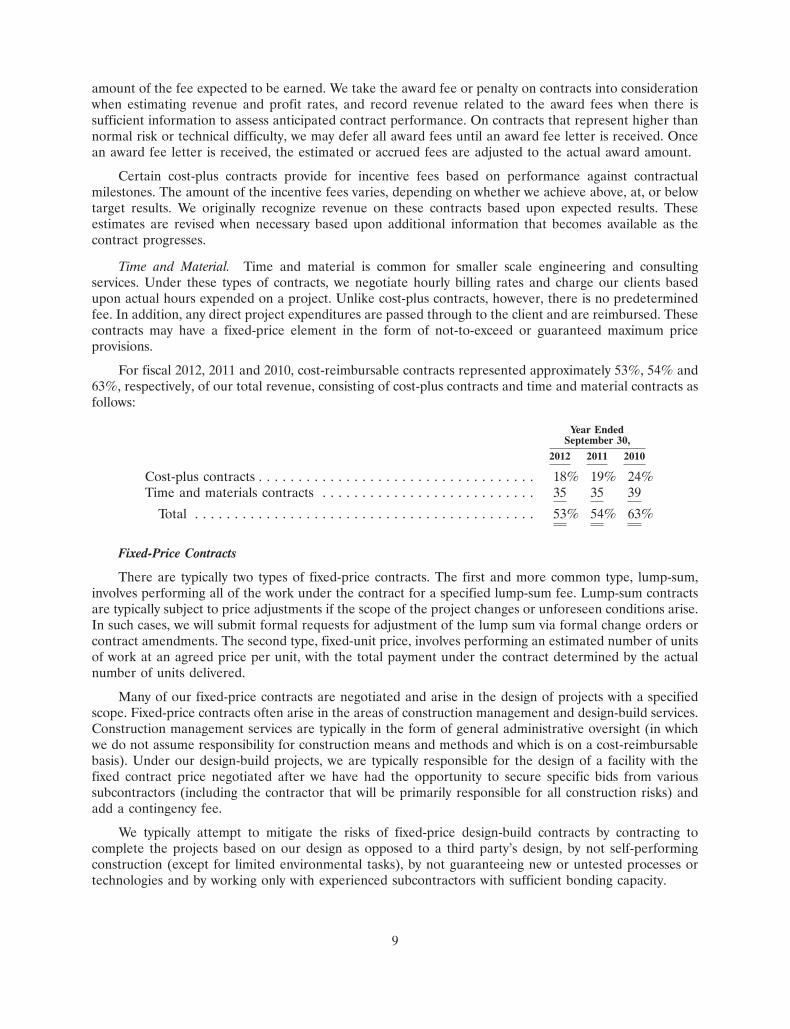
For fiscal 2012, 2011 and 2010, cost-reimbursable contracts represented approximately 53%, 54% and63%, respectively, of our total revenue, consisting of cost-plus contracts and time and material contracts asfollows:
Year EndedSeptember 30,
2012 2011 2010
Cost-plus contracts . . . . . . . . . . . . . . . . . . . . . . . . . . . . . . . . . . . 18% 19% 24%Time and materials contracts . . . . . . . . . . . . . . . . . . . . . . . . . . . 35 35 39
Total . . . . . . . . . . . . . . . . . . . . . . . . . . . . . . . . . . . . . . . . . . . 53% 54% 63%
Fixed-Price Contracts
There are typically two types of fixed-price contracts. The first and more common type, lump-sum,involves performing all of the work under the contract for a specified lump-sum fee. Lump-sum contractsare typically subject to price adjustments if the scope of the project changes or unforeseen conditions arise.In such cases, we will submit formal requests for adjustment of the lump sum via formal change orders orcontract amendments. The second type, fixed-unit price, involves performing an estimated number of unitsof work at an agreed price per unit, with the total payment under the contract determined by the actualnumber of units delivered.
Many of our fixed-price contracts are negotiated and arise in the design of projects with a specifiedscope. Fixed-price contracts often arise in the areas of construction management and design-build services.Construction management services are typically in the form of general administrative oversight (in whichwe do not assume responsibility for construction means and methods and which is on a cost-reimbursablebasis). Under our design-build projects, we are typically responsible for the design of a facility with thefixed contract price negotiated after we have had the opportunity to secure specific bids from varioussubcontractors (including the contractor that will be primarily responsible for all construction risks) andadd a contingency fee.
We typically attempt to mitigate the risks of fixed-price design-build contracts by contracting tocomplete the projects based on our design as opposed to a third party’s design, by not self-performingconstruction (except for limited environmental tasks), by not guaranteeing new or untested processes ortechnologies and by working only with experienced subcontractors with sufficient bonding capacity.
9
Some of our fixed-price contracts require us to provide performance bonds or parent companyguarantees to assure our clients that their project will be completed in accordance with the terms of thecontracts. In such cases, we typically require our primary subcontractors to provide similar bonds andguarantees and to be adequately insured, and we flow down the terms and conditions set forth in ouragreement on to our subcontractors.
For fiscal 2012, 2011 and 2010, fixed-price contracts represented approximately 47%, 46% and 37%,respectively, of our total revenue. There may be risks associated with completing these projects profitablyif we are not able to perform our professional services for the amount of the fixed fee. However, weattempt to mitigate these risks as described above.
Joint Ventures
Some of our larger contracts may operate under joint ventures or other arrangements under which weteam with other reputable companies, typically companies with which we have worked for many years. Thisis often done where the scale of the project dictates such an arrangement or when we want to strengtheneither our market position or our technical skills.
Backlog
Backlog is expressed in terms of gross revenue and therefore may include significant estimatedamounts of third party, or pass-through costs to subcontractors and other parties. Our total backlog iscomprised of contracted backlog and awarded backlog. Our contracted backlog includes revenue we expectto record in the future from signed contracts, and in the case of a public client, where the project has beenfunded. Our awarded backlog includes revenue we expect to record in the future where we have beenawarded the work, but the contractual agreement has not yet been signed. For non-government contracts,our backlog includes future revenue at contract rates, excluding contract renewals or extensions that are atthe discretion of the client. For contracts with a not-to-exceed maximum amount, we include revenue fromsuch contracts in backlog to the extent of the remaining estimated amount. We calculate backlog withoutregard to possible project reductions or expansions or potential cancellations until such changes orcancellations occur. No assurance can be given that we will ultimately realize our full backlog. Our backlogfor the year ended September 30, 2012, increased $0.4 billion, or 3%, to $16.0 billion as compared to$15.6 billion for the corresponding period last year.
10
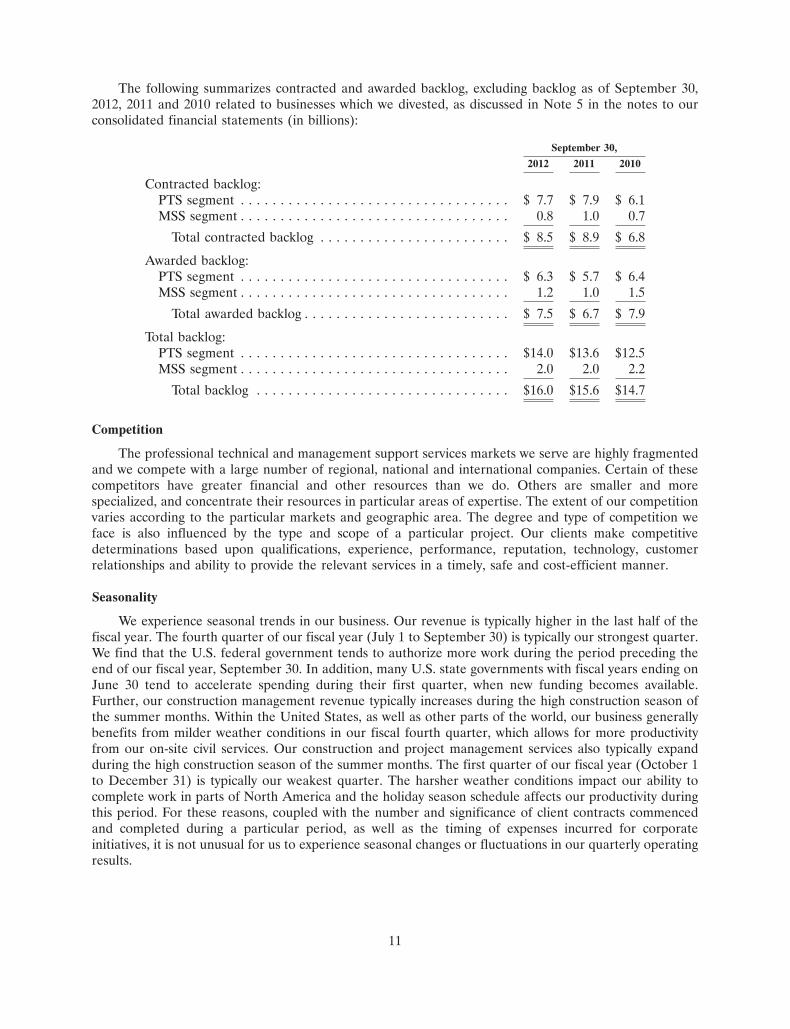
The following summarizes contracted and awarded backlog, excluding backlog as of September 30,2012, 2011 and 2010 related to businesses which we divested, as discussed in Note 5 in the notes to ourconsolidated financial statements (in billions):
September 30,2012 2011 2010
Contracted backlog:PTS segment . . . . . . . . . . . . . . . . . . . . . . . . . . . . . . . . . . $ 7.7 $ 7.9 $ 6.1MSS segment . . . . . . . . . . . . . . . . . . . . . . . . . . . . . . . . . . 0.8 1.0 0.7
Total contracted backlog . . . . . . . . . . . . . . . . . . . . . . . . $ 8.5 $ 8.9 $ 6.8
Awarded backlog:PTS segment . . . . . . . . . . . . . . . . . . . . . . . . . . . . . . . . . . $ 6.3 $ 5.7 $ 6.4MSS segment . . . . . . . . . . . . . . . . . . . . . . . . . . . . . . . . . . 1.2 1.0 1.5
Total awarded backlog . . . . . . . . . . . . . . . . . . . . . . . . . . $ 7.5 $ 6.7 $ 7.9
Total backlog:PTS segment . . . . . . . . . . . . . . . . . . . . . . . . . . . . . . . . . . $14.0 $13.6 $12.5MSS segment . . . . . . . . . . . . . . . . . . . . . . . . . . . . . . . . . . 2.0 2.0 2.2
Total backlog . . . . . . . . . . . . . . . . . . . . . . . . . . . . . . . . $16.0 $15.6 $14.7
Competition
The professional technical and management support services markets we serve are highly fragmentedand we compete with a large number of regional, national and international companies. Certain of thesecompetitors have greater financial and other resources than we do. Others are smaller and morespecialized, and concentrate their resources in particular areas of expertise. The extent of our competitionvaries according to the particular markets and geographic area. The degree and type of competition weface is also influenced by the type and scope of a particular project. Our clients make competitivedeterminations based upon qualifications, experience, performance, reputation, technology, customerrelationships and ability to provide the relevant services in a timely, safe and cost-efficient manner.
Seasonality
We experience seasonal trends in our business. Our revenue is typically higher in the last half of thefiscal year. The fourth quarter of our fiscal year (July 1 to September 30) is typically our strongest quarter.We find that the U.S. federal government tends to authorize more work during the period preceding theend of our fiscal year, September 30. In addition, many U.S. state governments with fiscal years ending onJune 30 tend to accelerate spending during their first quarter, when new funding becomes available.Further, our construction management revenue typically increases during the high construction season ofthe summer months. Within the United States, as well as other parts of the world, our business generallybenefits from milder weather conditions in our fiscal fourth quarter, which allows for more productivityfrom our on-site civil services. Our construction and project management services also typically expandduring the high construction season of the summer months. The first quarter of our fiscal year (October 1to December 31) is typically our weakest quarter. The harsher weather conditions impact our ability tocomplete work in parts of North America and the holiday season schedule affects our productivity duringthis period. For these reasons, coupled with the number and significance of client contracts commencedand completed during a particular period, as well as the timing of expenses incurred for corporateinitiatives, it is not unusual for us to experience seasonal changes or fluctuations in our quarterly operatingresults.
11
Insurance and Risk Management
We maintain insurance covering professional liability and claims involving bodily injury and propertydamage. We consider our present limits of coverage, deductibles, and reserves to be adequate. Whereverpossible, we endeavor to eliminate or reduce the risk of loss on a project through the use of qualityassurance/control, risk management, workplace safety and similar methods. A majority of our operatingsubsidiaries are quality certified under ISO 9001:2000 or an equivalent standard, and we plan to continueto obtain certification where applicable. ISO 9001:2000 refers to international quality standards developedby the International Organization for Standardization, or ISO.
Risk management is an integral part of our project management approach and our project executionprocess. We have an Office of Risk Management that reviews and oversees the risk profile of ouroperations. Also, pursuant to our internal delegations of authority, we have a formal process whereby agroup of senior members of our risk management team evaluate risk through internal risk analyses ofhigher-risk projects, contracts or other business decisions.
Regulation
We are regulated in a number of fields in which we operate. In the United States, we deal withnumerous U.S. government agencies and entities, including branches of the U.S. military, the Departmentof Defense, the Department of Energy, intelligence agencies and the Nuclear Regulatory Commission.When working with these and other U.S. government agencies and entities, we must comply with laws andregulations relating to the formation, administration and performance of contracts. These laws andregulations, among other things:
• require certification and disclosure of all cost or pricing data in connection with various contractnegotiations;
• impose procurement regulations that define allowable and unallowable costs and otherwise governour right to reimbursement under various cost-based U.S. government contracts; and
• restrict the use and dissemination of information classified for national security purposes and theexportation of certain products and technical data.
Internationally, we are subject to various government laws and regulations (including the U.S. ForeignCorrupt Practices Act, Arms Export Control Act, Department of Commerce Export and Anti BoycottRegulations, Proceeds of Crime Act, UK Bribery Act and other similar non-U.S. laws and regulations),local government regulations and procurement policies and practices and varying currency, political andeconomic risks.
To help ensure compliance with these laws and regulations, all of our employees are required tocomplete tailored ethics and other compliance training relevant to their position and our operations.
Compliance with federal, state, local and foreign laws enacted for the protection of the environmenthas to date had no significant effect on our capital expenditures, earnings, or competitive position. In thefuture, compliance with environmental laws could materially adversely affect us. We will continue tomonitor the impact of such laws on our business and will develop appropriate compliance programs.
Personnel
Our principal asset is our employees. A large percentage of our employees have technical andprofessional backgrounds and undergraduate and/or advanced degrees. We believe that we attract andretain talented employees by offering them the opportunity to work on highly visible and technicallychallenging projects in a stable work environment. The tables below identify our personnel by segment andgeographic region.
12
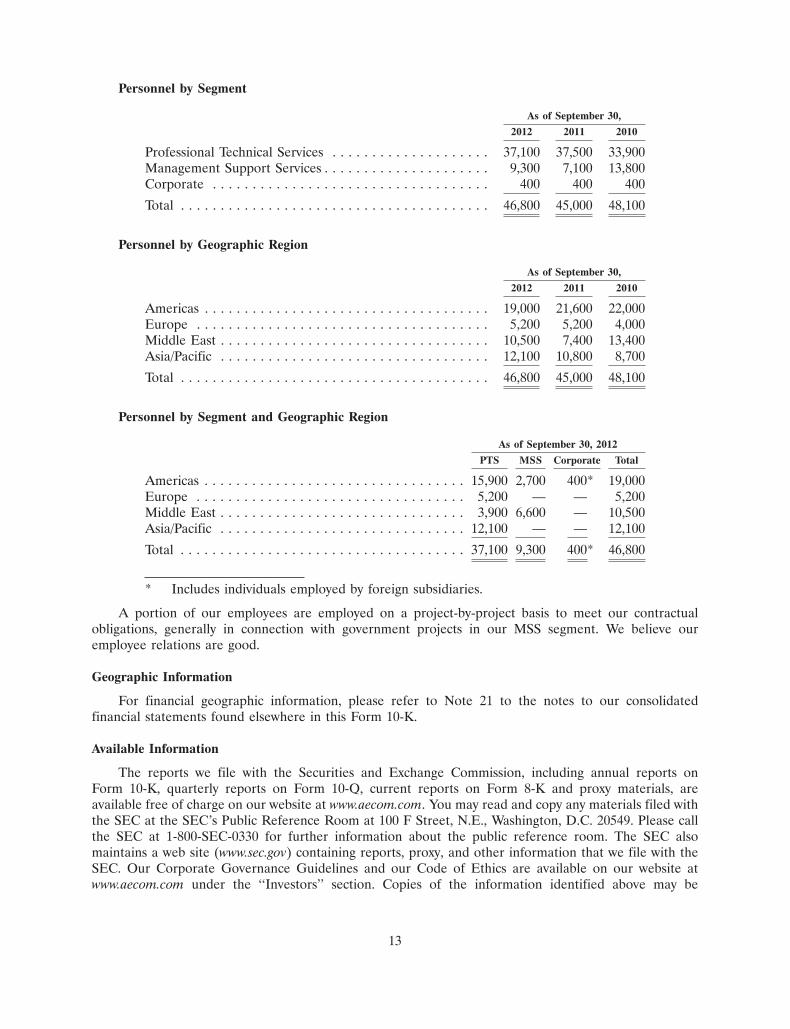
Personnel by Segment
As of September 30,2012 2011 2010
Professional Technical Services . . . . . . . . . . . . . . . . . . . . 37,100 37,500 33,900Management Support Services . . . . . . . . . . . . . . . . . . . . . 9,300 7,100 13,800Corporate . . . . . . . . . . . . . . . . . . . . . . . . . . . . . . . . . . . 400 400 400Total . . . . . . . . . . . . . . . . . . . . . . . . . . . . . . . . . . . . . . . 46,800 45,000 48,100
Personnel by Geographic Region
As of September 30,2012 2011 2010
Americas . . . . . . . . . . . . . . . . . . . . . . . . . . . . . . . . . . . . 19,000 21,600 22,000Europe . . . . . . . . . . . . . . . . . . . . . . . . . . . . . . . . . . . . . 5,200 5,200 4,000Middle East . . . . . . . . . . . . . . . . . . . . . . . . . . . . . . . . . . 10,500 7,400 13,400Asia/Pacific . . . . . . . . . . . . . . . . . . . . . . . . . . . . . . . . . . 12,100 10,800 8,700Total . . . . . . . . . . . . . . . . . . . . . . . . . . . . . . . . . . . . . . . 46,800 45,000 48,100
Personnel by Segment and Geographic Region
As of September 30, 2012PTS MSS Corporate Total
Americas . . . . . . . . . . . . . . . . . . . . . . . . . . . . . . . . . 15,900 2,700 400* 19,000Europe . . . . . . . . . . . . . . . . . . . . . . . . . . . . . . . . . . 5,200 — — 5,200Middle East . . . . . . . . . . . . . . . . . . . . . . . . . . . . . . . 3,900 6,600 — 10,500Asia/Pacific . . . . . . . . . . . . . . . . . . . . . . . . . . . . . . . 12,100 — — 12,100Total . . . . . . . . . . . . . . . . . . . . . . . . . . . . . . . . . . . . 37,100 9,300 400* 46,800
* Includes individuals employed by foreign subsidiaries.
A portion of our employees are employed on a project-by-project basis to meet our contractualobligations, generally in connection with government projects in our MSS segment. We believe ouremployee relations are good.
Geographic Information
For financial geographic information, please refer to Note 21 to the notes to our consolidatedfinancial statements found elsewhere in this Form 10-K.
Available Information
The reports we file with the Securities and Exchange Commission, including annual reports onForm 10-K, quarterly reports on Form 10-Q, current reports on Form 8-K and proxy materials, areavailable free of charge on our website at www.aecom.com. You may read and copy any materials filed withthe SEC at the SEC’s Public Reference Room at 100 F Street, N.E., Washington, D.C. 20549. Please callthe SEC at 1-800-SEC-0330 for further information about the public reference room. The SEC alsomaintains a web site (www.sec.gov) containing reports, proxy, and other information that we file with theSEC. Our Corporate Governance Guidelines and our Code of Ethics are available on our website atwww.aecom.com under the ‘‘Investors’’ section. Copies of the information identified above may be
13
obtained without charge from us by writing to AECOM Technology Corporation, 555 South Flower Street,Suite 3700, Los Angeles, California 90071, Attention: Corporate Secretary.
ITEM 1A. RISK FACTORS
We operate in a changing environment that involves numerous known and unknown risks anduncertainties that could materially adversely affect our operations. The risks described below highlight some ofthe factors that have affected, and in the future could affect our operations. Additional risks we do not yet knowof or that we currently think are immaterial may also affect our business operations. If any of the events orcircumstances described in the following risks actually occur, our business, financial condition or results ofoperations could be materially adversely affected.
We depend on long-term government contracts, some of which are only funded on an annual basis. If appropriationsfor funding are not made in subsequent years of a multiple-year contract, we may not be able to realize all of ouranticipated revenue and profits from that project.
A substantial majority of our revenue is derived from contracts with agencies and departments ofnational, state and local governments. During fiscal 2012, 2011 and 2010, approximately 60%, 64% and73%, respectively, of our revenue was derived from contracts with government entities.
Most government contracts are subject to the government’s budgetary approval process. Legislaturestypically appropriate funds for a given program on a year-by-year basis, even though contract performancemay take more than one year. As a result, at the beginning of a program, the related contract is onlypartially funded, and additional funding is normally committed only as appropriations are made in eachsubsequent fiscal year. These appropriations, and the timing of payment of appropriated amounts, may beinfluenced by, among other things, the state of the economy, competing priorities for appropriation,changes in administration or control of legislatures and the timing and amount of tax receipts and theoverall level of government expenditures. If appropriations are not made in subsequent years on ourgovernment contracts, then we will not realize all of our potential revenue and profit from that contract.
The Budget Control Act of 2011 could significantly reduce U.S. government spending for the services we provide.
Under the Budget Control Act of 2011, an automatic sequestration process, or across-the-boardbudget cuts, was triggered when the Joint Select Committee on Deficit Reduction, a committee of twelvemembers of Congress, failed to agree on a deficit reduction plan for the U.S. federal budget. Thesequestration is scheduled to begin on January 2, 2013, absent legislative or other remedial action, andrequires $1.2 trillion in reduced U.S. federal government spending over a ten-year period. Any significantreduction in federal government spending could reduce demand for our services, cancel or delay federalprojects, and result in the closure of federal facilities, and significant personnel reductions, which couldhave a material adverse effect on our results of operation and financial condition.
Governmental agencies may modify, curtail or terminate our contracts at any time prior to their completion and, ifwe do not replace them, we may suffer a decline in revenue.
Most government contracts may be modified, curtailed or terminated by the government either at itsdiscretion or upon the default of the contractor. If the government terminates a contract at its discretion,then we typically are able to recover only costs incurred or committed, settlement expenses and profit onwork completed prior to termination, which could prevent us from recognizing all of our potential revenueand profits from that contract. In addition, the U.S. government has announced its intention to scale backoutsourcing of services in favor of ‘‘insourcing’’ jobs to its employees, which could reduce the number ofcontracts awarded to us. The adoption of similar practices by other government entities could alsoadversely affect our revenues. If a government terminates a contract due to our default, we could be liablefor excess costs incurred by the government in obtaining services from another source.
14
Demand for our services is cyclical and may be vulnerable to sudden economic downturns and reductions ingovernment and private industry spending. If economic conditions remain weak and decline further, our revenueand profitability could be adversely affected.
Demand for our services is cyclical and may be vulnerable to sudden economic downturns andreductions in government and private industry spending, which may result in clients delaying, curtailing orcanceling proposed and existing projects. Economic conditions in the U.S. and a number of other countriesand regions, including the United Kingdom, are weak and may remain difficult for the foreseeable future.If global economic and financial market conditions remain weak and/or decline further, some of our clientsmay face considerable budget shortfalls that may limit their overall demand for our services. In addition,our clients may find it more difficult to raise capital in the future to fund their projects due to uncertaintyin the municipal and general credit markets. Also, the global demand for commodities has increased rawmaterial costs, which will cause our clients’ projects to increase in overall cost and may result in the morerapid depletion of the funds that are available to our clients to spend on projects.
Where economies are weakening, our clients may demand more favorable pricing or other termswhile their ability to pay our invoices or to pay them in a timely manner may be adversely affected. Ourgovernment clients may face budget deficits that prohibit them from funding proposed and existingprojects. If economic conditions remain uncertain and/or weaken and/or government spending is reduced,our revenue and profitability could be adversely affected.
Our contracts with governmental agencies are subject to audit, which could result in adjustments to reimbursablecontract costs or, if we are charged with wrongdoing, possible temporary or permanent suspension fromparticipating in government programs.
Our books and records are subject to audit by the various governmental agencies we serve and theirrepresentatives. These audits can result in adjustments to the amount of contract costs we believe arereimbursable by the agencies and the amount of our overhead costs allocated to the agencies. For example,as discussed elsewhere in this report, the U.S. Defense Contract Audit Agency (DCAA) issued a DCAAForm 1 questioning costs incurred during fiscal 2009 by Global Linguists Solutions, a joint venture thatincludes McNeil Technologies, Inc., in the performance of U.S. government contracts. In addition, the U.S.Attorney’s Office (USAO) has informed us that the USAO and the U.S. Environmental Protection Agencyare investigating potential criminal charges relating to one of our subsidiaries’ projects in the state ofHawaii. If such matters are not resolved in our favor, they could have a material adverse effect on ourbusiness. In addition, if one of our subsidiaries is charged with wrongdoing as a result of an audit, thatsubsidiary, and possibly our company as a whole, could be temporarily suspended or could be prohibitedfrom bidding on and receiving future government contracts for a period of time. Furthermore, as agovernment contractor, we are subject to an increased risk of investigations, criminal prosecution, civilfraud actions, whistleblower lawsuits and other legal actions and liabilities to which purely private sectorcompanies are not, the results of which could materially adversely impact our business.
Our operations worldwide expose us to legal, political and economic risks in different countries as well as currencyexchange rate fluctuations that could harm our business and financial results.
During fiscal 2012, revenue attributable to our services provided outside of the United States tonon-U.S. clients was approximately 42% of our total revenue. There are risks inherent in doing businessinternationally, including:
• imposition of governmental controls and changes in laws, regulations or policies;
• political and economic instability;
• civil unrest, acts of terrorism, force majeure, war, or other armed conflict;
• changes in U.S. and other national government trade policies affecting the markets for our services;
15
• changes in regulatory practices, tariffs and taxes;
• potential non-compliance with a wide variety of laws and regulations, including anti-corruption,export control and anti-boycott laws and similar non-U.S. laws and regulations;
• changes in labor conditions;
• logistical and communication challenges; and
• currency exchange rate fluctuations, devaluations and other conversion restrictions.
Any of these factors could have a material adverse effect on our business, results of operations orfinancial condition.
Political, economic and military conditions in the Middle East, Africa and other regions could negatively impact ourbusiness.
Last year, civil unrest, which initially began in Tunisia and Egypt, spread to other areas in the MiddleEast and beyond. Due to the civil unrest in Libya in February 2011, we ceased providing services as theprogram manager for the Libyan Housing and Infrastructure Board’s program to modernize the country’sinfrastructure. We cannot currently determine when or if we will resume services. This business disruptionresulted in an operating loss, primarily due to demobilization and shutdown costs, and certain asset write-downs. If civil unrest were to disrupt our business in other countries in the Middle East or other regions inwhich we operate, and particularly if political activities were to result in prolonged unrest or civil war, ourfinancial condition could be adversely affected.
We operate in many different jurisdictions and we could be adversely affected by violations of the U.S. ForeignCorrupt Practices Act and similar worldwide anti-corruption laws.
The U.S. Foreign Corrupt Practices Act (FCPA) and similar worldwide anti-corruption laws, includingthe U.K. Bribery Act of 2010, generally prohibit companies and their intermediaries from makingimproper payments to non-U.S. officials for the purpose of obtaining or retaining business. Our internalpolicies mandate compliance with these anti-corruption laws. We operate in many parts of the world thathave experienced governmental corruption to some degree and, in certain circumstances, strict compliancewith anti-corruption laws may conflict with local customs and practices. Despite our training andcompliance programs, we cannot assure that our internal control policies and procedures always willprotect us from reckless or criminal acts committed by our employees or agents. Our continued expansionoutside the U.S., including in developing countries, could increase the risk of such violations in the future.In addition, from time to time, government investigations of corruption in construction-related industriesaffect us and our peers. Violations of these laws, or allegations of such violations, could disrupt ourbusiness and result in a material adverse effect on our results of operations or financial condition.
We work in international locations where there are high security risks, which could result in harm to our employeesand contractors or material costs to us.
Some of our services are performed in high-risk locations, such as Afghanistan, and, until recently,Iraq and Libya, where the country or location is suffering from political, social or economic problems, orwar or civil unrest. In those locations where we have employees or operations, we may incur material coststo maintain the safety of our personnel. Despite these precautions, the safety of our personnel in theselocations may continue to be at risk. Acts of terrorism and threats of armed conflicts in or around variousareas in which we operate could limit or disrupt markets and our operations, including disruptionsresulting from the evacuation of personnel, cancellation of contracts, or the loss of key employees,contractors or assets. For example, as discussed above, we incurred losses related to demobilization andshutdown costs related to the cessation of our operations in Libya due to ongoing civil unrests.
16
Our business and operating results could be adversely affected by losses under fixed-price contracts.
Fixed-price contracts require us to either perform all work under the contract for a specifiedlump-sum or to perform an estimated number of units of work at an agreed price per unit, with the totalpayment determined by the actual number of units performed. In fiscal 2012, approximately 47% of ourrevenue was recognized under fixed-price contracts. Fixed-price contracts are more frequently usedoutside of the United States and, thus, the exposures resulting from fixed-price contracts may increase aswe increase our business operations outside of the United States. Fixed-price contracts expose us to anumber of risks not inherent in cost-plus and time and material contracts, including underestimation ofcosts, ambiguities in specifications, unforeseen costs or difficulties, problems with new technologies, delaysbeyond our control, failures of subcontractors to perform and economic or other changes that may occurduring the contract period. Losses under fixed-price contracts could be substantial and adversely impactour results of operations.
We conduct a portion of our operations through joint venture entities, over which we may have limited control.
Approximately 13% of our fiscal 2012 revenue was derived from our operations through joint venturesor similar partnership arrangements, where control may be shared with unaffiliated third parties. As withmost joint venture arrangements, differences in views among the joint venture participants may result indelayed decisions or disputes. We also cannot control the actions of our joint venture partners, and wetypically have joint and several liability with our joint venture partners under the applicable contracts forjoint venture projects. These factors could potentially adversely impact the business and operations of ajoint venture and, in turn, our business and operations.
Operating through joint ventures in which we are minority holders results in us having limited controlover many decisions made with respect to projects and internal controls relating to projects. Of the jointventures noted above, approximately 7% of our fiscal 2012 revenue was derived from our unconsolidatedjoint ventures where we generally do not have control of the joint venture. These joint ventures may not besubject to the same requirements regarding internal controls and internal control over financial reportingthat we follow. As a result, internal control problems may arise with respect to these joint ventures, whichcould have a material adverse effect on our financial condition and results of operations.
Misconduct by our employees or consultants or our failure to comply with laws or regulations applicable to ourbusiness could cause us to lose customers or lose our ability to contract with government agencies.
As a government contractor, misconduct, fraud or other improper activities caused by our employees’or consultants’ failure to comply with laws or regulations could have a significant negative impact on ourbusiness and reputation. Such misconduct could include the failure to comply with federal procurementregulations, regulations regarding the protection of sensitive government information, legislation regardingthe pricing of labor and other costs in government contracts, regulations on lobbying or similar activities,and anti-corruption, export control and other applicable laws or regulations. Our failure to comply withapplicable laws or regulations, misconduct by any of our employees or consultants or our failure to maketimely and accurate certifications to government agencies regarding misconduct or potential misconductcould subject us to fines and penalties, loss of government granted eligibility, cancellation of contracts andsuspension or debarment from contracting with government agencies, any of which may adversely affectour business.
Our defined benefit plans have significant deficits that could grow in the future and cause us to incur additionalcosts.
We have defined benefit pension plans for employees in the United States, United Kingdom,Australia, Ireland, and Canada. At September 30, 2012, our defined benefit pension plans had anaggregate deficit (the excess of projected benefit obligations over the fair value of plan assets) of
17
approximately $192.2 million. In the future, our pension deficits may increase or decrease depending onchanges in the levels of interest rates, pension plan performance and other factors. Because the currenteconomic environment has resulted in declining investment returns and interest rates, we may be requiredto make additional cash contributions to our pension plans and recognize further increases in our netpension cost to satisfy our funding requirements. If we are forced or elect to make up all or a portion of thedeficit for unfunded benefit plans, our results of operations could be materially and adversely affected.
New legal requirements could adversely affect our operating results.
Our business and results of operations could be adversely affected by the passage of U.S. health carereform, climate change, and other environmental legislation and regulations. Currently, we are assessingthe impact that health care reform could have on our employer-sponsored medical plans. Growingconcerns about climate change may result in the imposition of additional environmental regulations. Forexample, legislation, international protocols, regulation or other restrictions on emissions could increasethe costs of projects for our clients or, in some cases, prevent a project from going forward, therebypotentially reducing the need for our services. However, these changes could also increase the pace ofdevelopment of other projects, which could have a positive impact on our business. We cannot predictwhen or whether any of these various proposals may be enacted or what their effect will be on us or on ourcustomers.
Failure to successfully execute our acquisition strategy may inhibit our growth.
We have grown in part as a result of our acquisitions over the last several years, and we expectcontinued growth in the form of additional acquisitions and expansion into new markets. If we are unableto pursue suitable acquisition opportunities, as a result of global economic uncertainty or other factors, ourgrowth may be inhibited. We cannot assure that suitable acquisitions or investment opportunities willcontinue to be identified or that any of these transactions can be consummated on favorable terms or at all.Any future acquisitions will involve various inherent risks, such as:
• our ability to accurately assess the value, strengths, weaknesses, liabilities and potential profitabilityof acquisition candidates;
• the potential loss of key personnel of an acquired business;
• increased burdens on our staff and on our administrative, internal control and operating systems,which may hinder our legal and regulatory compliance activities;
• liabilities related to pre-acquisition activities of an acquired business and the burdens on our staffand resources to comply with, conduct or resolve investigations into such activities;
• post-acquisition integration challenges; and
• post-acquisition deterioration in an acquired business that could result in lower or negative earningscontribution and/or goodwill impairment charges.
Furthermore, during the acquisition process and thereafter, our management may need to assumesignificant transaction-related responsibilities, which may cause them to divert their attention from ourexisting operations. If our management is unable to successfully integrate acquired companies orimplement our growth strategy, our operating results could be harmed. Moreover, we cannot assure thatwe will continue to successfully expand or that growth or expansion will result in profitability.
Our ability to grow and to compete in our industry will be harmed if we do not retain the continued services of ourkey technical and management personnel and identify, hire, and retain additional qualified personnel.
There is strong competition for qualified technical and management personnel in the sectors in whichwe compete. We may not be able to continue to attract and retain qualified technical and management
18
personnel, such as engineers, architects and project managers, who are necessary for the development ofour business or to replace qualified personnel. Our planned growth may place increased demands on ourresources and will likely require the addition of technical and management personnel and the developmentof additional expertise by existing personnel. Also, some of our personnel hold government grantedeligibility that may be required to obtain certain government projects. If we were to lose some or all ofthese personnel, they would be difficult to replace. Loss of the services of, or failure to recruit, keytechnical and management personnel could limit our ability to successfully complete existing projects andcompete for new projects.
Our revenue and growth prospects may be harmed if we or our employees are unable to obtain government grantedeligibility or other qualifications we and they need to perform services for our customers.
A number of government programs require contractors to have certain kinds of government grantedeligibility. Depending on the project, eligibility can be difficult and time-consuming to obtain. If we or ouremployees are unable to obtain or retain the necessary eligibility, we may not be able to win new business,and our existing customers could terminate their contracts with us or decide not to renew them. To theextent we cannot obtain or maintain the required security clearances for our employees working on aparticular contract, we may not derive the revenue or profit anticipated from such contract.
Our industry is highly competitive and we may be unable to compete effectively, which could result in reducedrevenue, profitability and market share.
We are engaged in a highly competitive business. The professional technical and management supportservices markets we serve are highly fragmented and we compete with a large number of regional, nationaland international companies. Certain of these competitors have greater financial and other resources thanwe do. Others are smaller and more specialized, and concentrate their resources in particular areas ofexpertise. The extent of our competition varies according to the particular markets and geographic area.The degree and type of competition we face is also influenced by the type and scope of a particular project.Our clients make competitive determinations based upon qualifications, experience, performance,reputation, technology, customer relationships and ability to provide the relevant services in a timely, safeand cost-efficient manner. Increased competition may result in our inability to win bids for future projectsand loss of revenue, profitability and market share.
If we extend a significant portion of our credit to clients in a specific geographic area or industry, we may experiencedisproportionately high levels of collection risk and nonpayment if those clients are adversely affected by factorsparticular to their geographic area or industry.
Our clients include public and private entities that have been, and may continue to be, negativelyimpacted by the changing landscape in the global economy. While outside of the U.S. Federal Governmentno one client accounts for over 10% of our revenue, we face collection risk as a normal part of our businesswhere we perform services and subsequently bill our clients for such services. In the event that we haveconcentrated credit risk from clients in a specific geographic area or industry, continuing negative trends ora worsening in the financial condition of that specific geographic area or industry could make ussusceptible to disproportionately high levels of default by those clients. Such defaults could materiallyadversely impact our revenues and our results of operations.
Our services expose us to significant risks of liability and our insurance policies may not provide adequate coverage.
Our services involve significant risks of professional and other liabilities that may substantially exceedthe fees that we derive from our services. In addition, we sometimes contractually assume liability underindemnification agreements. We cannot predict the magnitude of potential liabilities from the operation ofour business.
19
Our professional liability policies cover only claims made during the term of the policy. Additionally,our insurance policies may not protect us against potential liability due to various exclusions in the policiesand self-insured retention amounts. Partially or completely uninsured claims, if successful and ofsignificant magnitude, could have a material adverse effect on our business.
Our backlog of uncompleted projects under contract is subject to unexpected adjustments and cancellations and,thus, may not accurately reflect future revenue and profits.
At September 30, 2012, our contracted backlog was approximately $8.5 billion and our awardedbacklog was approximately $7.5 billion for a total backlog of $16.0 billion. Our contracted backlog includesrevenue we expect to record in the future from signed contracts and, in the case of a public sector client,where the project has been funded. Our awarded backlog includes revenue we expect to record in thefuture where we have been awarded the work, but the contractual agreement has not yet been signed. Wecannot guarantee that future revenue will be realized from either category of backlog or, if realized, willresult in profits. Many projects may remain in our backlog for an extended period of time because of thesize or long-term nature of the contract. In addition, from time to time, projects are delayed, scaled back orcancelled. These types of backlog reductions adversely affect the revenue and profits that we ultimatelyreceive from contracts reflected in our backlog.
We have submitted claims to clients for work we performed beyond the initial scope of some of our contracts. If theseclients do not approve these claims, our results of operations could be adversely impacted.
We typically have pending claims submitted under some of our contracts for payment of workperformed beyond the initial contractual requirements for which we have already recorded revenue. Ingeneral, we cannot guarantee that such claims will be approved in whole, in part, or at all. If these claimsare not approved, our revenue may be reduced in future periods.
In conducting our business, we depend on other contractors and subcontractors. If these parties fail to satisfy theirobligations to us or other parties or if we are unable to maintain these relationships, our revenue, profitability andgrowth prospects could be adversely affected.
We depend on contractors and subcontractors in conducting our business. There is a risk that we mayhave disputes with our subcontractors arising from, among other things, the quality and timeliness of workperformed by the subcontractor, customer concerns about the subcontractor, or our failure to extendexisting task orders or issue new task orders under a subcontract. In addition, if any of our subcontractorsfail to deliver on a timely basis the agreed-upon supplies and/or perform the agreed-upon services, ourability to fulfill our obligations as a prime contractor may be jeopardized and/or we could be heldresponsible for such failures.
We also rely on relationships with other contractors when we act as their subcontractor or jointventure partner. Our future revenue and growth prospects could be adversely affected if other contractorseliminate or reduce their subcontracts or joint venture relationships with us, or if a government agencyterminates or reduces these other contractors’ programs, does not award them new contracts or refuses topay under a contract. In addition, due to ‘‘pay when paid’’ provisions that are common in subcontracts incertain countries, including the U.S., we could experience delays in receiving payment if the primecontractor experiences payment delays.
If clients use our reports or other work product without appropriate disclaimers or in a misleading or incompletemanner, our business could be adversely affected.
The reports and other work product we produce for clients sometimes include projections, forecastsand other forward-looking statements. Such information by its nature is subject to numerous risks anduncertainties, any of which could cause the information produced by us to ultimately prove inaccurate.
20
While we include appropriate disclaimers in the reports that we prepare for our clients, once we producesuch written work product, we have no ability to control the manner in which our clients use suchinformation. As a result, if our clients reproduce such information to solicit funds from investors forprojects without appropriate disclaimers and the information proves to be incorrect, or if our clientsreproduce such information for potential investors in a misleading or incomplete manner, our clients orsuch investors may threaten to or file suit against us for, among other things, securities law violations. If wewere found to be liable for any claims related to our client work product, our business could be adverselyaffected.
Our quarterly operating results may fluctuate significantly.
We experience seasonal trends in our business with our revenue typically being higher in the last halfof the fiscal year. Our fourth quarter (July 1 to September 30) typically is our strongest quarter, and ourfirst quarter is typically our weakest quarter. Our quarterly revenue, expenses and operating results mayfluctuate significantly because of a number of factors, including:
• the spending cycle of our public sector clients;
• employee hiring and utilization rates;
• the number and significance of client engagements commenced and completed during a quarter;
• the ability of clients to terminate engagements without penalties;
• the ability of our project managers to accurately estimate the percentage of the project completed;
• delays incurred as a result of weather conditions;
• delays incurred in connection with an engagement;
• the size and scope of engagements;
• the timing and magnitude of expenses incurred for, or savings realized from, corporate initiatives;
• changes in foreign currency rates;
• the seasonality of our business;
• the impairment of goodwill or other intangible assets; and
• general economic and political conditions.
Variations in any of these factors could cause significant fluctuations in our operating results fromquarter to quarter.
An impairment charge of goodwill could have a material adverse impact on our financial condition and results ofoperations.
Because we have grown in part through acquisitions, goodwill and intangible assets-net represent asubstantial portion of our assets. Goodwill and intangible assets-net were $1.9 billion as of September 30,2012. Under accounting principles generally accepted in the United States, we are required to test goodwillcarried in our Consolidated Balance Sheets for possible impairment on an annual basis based upon a fairvalue approach and whenever events occur that indicate impairment could exist. These events orcircumstances could include a significant change in the business climate, including a significant sustaineddecline in a reporting unit’s market value, legal factors, operating performance indicators, competition,sale or disposition of a significant portion of our business, a significant sustained decline in our marketcapitalization and other factors. In connection with our annual goodwill impairment testing for fiscal 2012,we recorded an impairment charge of $336 million due to market conditions and business trends within theEurope, Middle East, and Africa (EMEA) and MSS reporting units.
21
If the fair value of our reporting units is less than their carrying value, we could be required to recordan additional impairment charge. In addition, if a decrease in our stock price and market capitalizationcontinues over a sustained period, we would have to record an impairment charge in the future. Theamount of any impairment could be significant and could have a material adverse impact on our financialcondition and results of operations for the period in which the charge is taken.
If we are unable to continue to access credit on acceptable terms, our business may be adversely affected.
The state of the global credit markets could make it more difficult for us to access funds, refinance ourexisting indebtedness, enter into agreements for new indebtedness, replace our existing credit agreementon or before its expiration in 2016 or obtain funding through the issuance of our securities. We use creditfacilities to support our working capital and acquisition needs. There is no guarantee that we can continueto renew our credit facility on terms as favorable as those in our existing credit facility and, if we are unableto do so, our costs of borrowing and our business may be adversely affected.
Our debt agreements contain restrictive covenants and financial ratio tests that restrict or prohibit our ability toengage in or enter into a variety of transactions. If we fail to comply with these covenants or tests, our indebtednessunder these agreements could become accelerated, which could adversely affect us.
Our debt agreements, including our senior credit facility and the agreement governing our seniornotes, contain various covenants that may have the effect of limiting, among other things, our ability andthe ability of certain of our subsidiaries to: merge with other entities, enter into a transaction resulting in achange in control, create new liens, incur additional indebtedness, sell assets outside of the ordinary courseof business, enter into transactions with affiliates (other than subsidiaries) or substantially change thegeneral nature of our and our subsidiaries’ business, taken as a whole, and, in the case of our senior creditfacility, make certain investments, enter into restrictive agreements, or make certain dividends or otherdistributions. These restrictions could limit our ability to take advantage of financing, merger, acquisitionor other opportunities, to fund our business operations or to fully implement our current and futureoperating strategies.
All of our debt agreements relating to our unsecured revolving credit facility and unsecured termcredit agreements require us to maintain compliance with a maximum consolidated leverage ratio at theend of any fiscal quarter. The agreement governing our senior notes also requires us to maintain a networth above a calculated threshold. As of September 30, 2012, our consolidated leverage ratio was 2.15,which did not exceed our most restrictive maximum consolidated leverage ratio of 3.0. As of September 30,2012, our net worth was $2.2 billion, which exceeds the calculated threshold of $1.5 billion. Our ability tocontinue to meet these financial ratios and tests will be dependent upon our future performance and maybe affected by events beyond our control (including factors discussed in this ‘‘Risk Factors’’ section). If wefail to satisfy these requirements, our indebtedness under these agreements could become accelerated andpayable at a time when we are unable to pay them. This would adversely affect our ability to implementour operating strategies and would have a material adverse effect on our financial condition.
Systems and information technology interruption could adversely impact our ability to operate.
We rely heavily on computer, information and communications technology and related systems inorder to properly operate. From time to time, we experience occasional system interruptions and delays. Ifwe are unable to continually add software and hardware, effectively upgrade our systems and networkinfrastructure and take other steps to improve the efficiency of and protect our systems, the operation ofour systems could be interrupted or delayed. Our computer and communications systems and operationscould be damaged or interrupted by natural disasters, telecommunications failures, acts of war or terrorismand similar events or disruptions. Any of these or other events could cause system interruption, delays andloss of critical data, or delay or prevent operations, and adversely affect our operating results.
22

In addition, we face the threat to our computer systems of unauthorized access, computer hackers,computer viruses, malicious code, organized cyber attacks and other security problems and systemdisruptions, including possible unauthorized access to our and our clients’ proprietary or classifiedinformation. We rely on industry-accepted security measures and technology to securely maintain allconfidential and proprietary information on our information systems . We have devoted and will continueto devote significant resources to the security of our computer systems, but they may still be vulnerable tothese threats. A user who circumvents security measures could misappropriate confidential or proprietaryinformation or cause interruptions or malfunctions in operations. As a result, we may be required toexpend significant resources to protect against the threat of these system disruptions and security breachesor to alleviate problems caused by these disruptions and breaches. Any of these events could damage ourreputation and have a material adverse effect on our business, financial condition, results of operationsand cash flows.
Failure to adequately protect, maintain, or enforce our rights in our intellectual property may adversely limit ourcompetitive position.
Our success depends, in part, upon our ability to protect our intellectual property. We rely on acombination of intellectual property policies and other contractual arrangements to protect much of ourintellectual property where we do not believe that trademark, patent or copyright protection is appropriateor obtainable. Trade secrets are generally difficult to protect. Although our employees are subject toconfidentiality obligations, this protection may be inadequate to deter or prevent misappropriation of ourconfidential information and/or the infringement of our patents and copyrights. Further, we may be unableto detect unauthorized use of our intellectual property or otherwise take appropriate steps to enforce ourrights. Failure to adequately protect, maintain, or enforce our intellectual property rights may adverselylimit our competitive position.
Our charter documents contain provisions that may delay, defer or prevent a change of control.
Provisions of our certificate of incorporation and bylaws could make it more difficult for a third partyto acquire control of us, even if the change in control would be beneficial to stockholders. These provisionsinclude the following:
• division of our Board of Directors into three classes, with each class serving a staggered three-yearterm;
• removal of directors for cause only;
• ability of our Board of Directors to authorize the issuance of preferred stock in series withoutstockholder approval;
• two-thirds stockholder vote requirement to approve specified business combinations, which includea sale of substantially all of our assets;
• vesting of exclusive authority in our Board of Directors to determine the size of the board (subjectto limited exceptions) and to fill vacancies;
• advance notice requirements for stockholder proposals and nominations for election to our Boardof Directors; and
• prohibitions on our stockholders from acting by written consent and limitations on calling specialmeetings.
ITEM 1B. UNRESOLVED STAFF COMMENTS
None.
23
ITEM 2. PROPERTIES
Our corporate offices are located in approximately 78,000 square feet of space at 555 and 515 SouthFlower Street, Los Angeles, California. Our other offices consist of an aggregate of approximately7.7 million square feet worldwide. We also maintain smaller administrative or project offices. Virtually allof our offices are leased. See Note 14 in the notes to our consolidated financial statements for informationregarding our lease obligations. We believe our current properties are adequate for our businessoperations and are not currently underutilized. We may add additional facilities from time to time in thefuture as the need arises.
ITEM 3. LEGAL PROCEEDINGS
As a government contractor, we are subject to various laws and regulations that are more restrictivethan those applicable to non-government contractors. Intense government scrutiny of contractors’compliance with those laws and regulations through audits and investigations is inherent in governmentcontracting and, from time to time, we receive inquiries, subpoenas, and similar demands related to ourongoing business with government entities. Violations can result in civil or criminal liability as well assuspension or debarment from eligibility for awards of new government contracts or option renewals.
We are involved in various investigations, claims and lawsuits in the normal conduct of our business.Although the outcome of our legal proceedings cannot be predicted with certainty and no assurances canbe provided, in the opinion of our management, based upon current information and discussions withcounsel, none of the investigations, claims and lawsuits in which we are involved is expected to have amaterial adverse effect on our consolidated financial position, results of operations, cash flows or ourability to conduct business. See Note 20, ‘‘Commitments and Contingencies,’’ of this report for a discussionof certain matters to which we are a party. From time to time, we establish reserves for litigation when weconsider it probable that a loss will occur.
ITEM 4. MINE AND SAFETY DISCLOSURES
Not applicable.
PART II
ITEM 5. MARKET FOR REGISTRANT’S COMMON EQUITY, RELATED STOCKHOLDERMATTERS AND ISSUER PURCHASES OF EQUITY SECURITIES
Our common stock is listed on the New York Stock Exchange (NYSE). According to the records ofour transfer agent, there were 2,170 stockholders of record as of November 7, 2012. The following tablesets forth the low and high closing sales prices of a share of our common stock during each of the fiscalquarters presented, based upon quotations on the NYSE consolidated reporting system:
Low Sales High SalesPrice ($) Price ($)
Fiscal 2012:First quarter . . . . . . . . . . . . . . . . . . . . . . . . . . . . . . . . . . . 16.84 21.62Second quarter . . . . . . . . . . . . . . . . . . . . . . . . . . . . . . . . . . 20.80 24.06Third quarter . . . . . . . . . . . . . . . . . . . . . . . . . . . . . . . . . . . 14.91 22.68Fourth quarter . . . . . . . . . . . . . . . . . . . . . . . . . . . . . . . . . . 15.29 21.62
24

Low Sales High SalesPrice ($) Price ($)
Fiscal 2011:First quarter . . . . . . . . . . . . . . . . . . . . . . . . . . . . . . . . . . . 23.92 28.77Second quarter . . . . . . . . . . . . . . . . . . . . . . . . . . . . . . . . . . 26.15 29.93Third quarter . . . . . . . . . . . . . . . . . . . . . . . . . . . . . . . . . . . 25.82 28.67Fourth quarter . . . . . . . . . . . . . . . . . . . . . . . . . . . . . . . . . . 17.67 28.18
Our policy is to use cash flow from operations to fund future growth and pay down debt. Accordingly,we have not paid a cash dividend since our inception and we currently have no plans to pay cash dividendsin the foreseeable future. Additionally, our term credit agreement and revolving credit facility restrict ourability to pay cash dividends. Our debt agreements do not permit us to pay cash dividends unless at thetime of and immediately after giving effect to the dividend, (a) there is no default or event of default and(b) the leverage ratio (as defined in the debt agreements) is less than 3.00 to 1.00.
Equity Compensation Plans
The following table presents certain information about our equity compensation plans as ofSeptember 30, 2012:
Column A Column B Column CNumber of securities
remaining available forNumber of securities Weighted-average future issuance under
to be issued upon exercise price of equity compensationexercise of outstanding plans (excluding
outstanding options, options, warrants, securities reflected inPlan Category warrants, and rights and rights Column A)
Equity compensation plans not approved bystockholders: . . . . . . . . . . . . . . . . . . . . . . N/A N/A N/A
Equity compensation plans approved bystockholders:
AECOM Technology Corporation 2006 StockIncentive Plan . . . . . . . . . . . . . . . . . . . . . 2,490,765 $22.81 15,704,260
AECOM Technology Corporation EquityInvestment Plan . . . . . . . . . . . . . . . . . . . . N/A N/A 4,189,556
AECOM Technology Corporation EmployeeStock Purchase Plan . . . . . . . . . . . . . . . . . N/A N/A 6,764,162
AECOM Technology Corporation GlobalStock Program(a) . . . . . . . . . . . . . . . . . . . N/A N/A 22,716,027Total . . . . . . . . . . . . . . . . . . . . . . . . . . . . 2,490,765 $22.81 49,374,005
(a) The AECOM Technology Corporation Global Stock Program consists of our plans in Australia, HongKong, New Zealand, Singapore, United Arab Emirates/Qatar, and United Kingdom; and for NorthAmerica, the Retirement & Savings Plan and Equity Investment Plan.
25
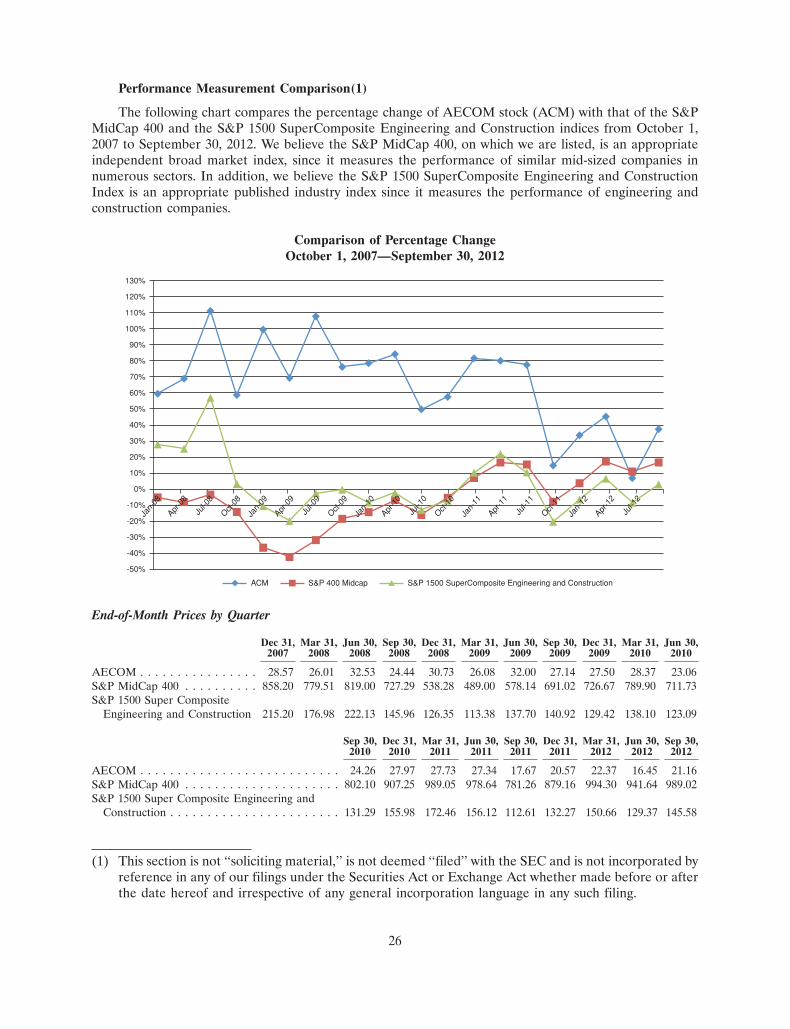
13NOV201223305512
Performance Measurement Comparison(1)
The following chart compares the percentage change of AECOM stock (ACM) with that of the S&PMidCap 400 and the S&P 1500 SuperComposite Engineering and Construction indices from October 1,2007 to September 30, 2012. We believe the S&P MidCap 400, on which we are listed, is an appropriateindependent broad market index, since it measures the performance of similar mid-sized companies innumerous sectors. In addition, we believe the S&P 1500 SuperComposite Engineering and ConstructionIndex is an appropriate published industry index since it measures the performance of engineering andconstruction companies.
Comparison of Percentage ChangeOctober 1, 2007—September 30, 2012
ACM S&P 1500 SuperComposite Engineering and ConstructionS&P 400 Midcap
130%
-50%
120%
110%
100%
90%
80%
70%
60%
50%
40%
30%
20%
10%
0%
-10%
-20%
-30%
-40%
Jul-1
2
Apr-0
8
Jul-0
8
Oct-08
Jan-
09
Apr-0
9
Jul-0
9
Oct-09
Jan-
10
Apr-1
0
Jul-1
0
Oct-10
Jan-
11
Apr-1
1
Jul-1
1
Oct-11
Jan-
12
Apr-1
2
Jan-
08
End-of-Month Prices by Quarter
Dec 31, Mar 31, Jun 30, Sep 30, Dec 31, Mar 31, Jun 30, Sep 30, Dec 31, Mar 31, Jun 30,2007 2008 2008 2008 2008 2009 2009 2009 2009 2010 2010
AECOM . . . . . . . . . . . . . . . . 28.57 26.01 32.53 24.44 30.73 26.08 32.00 27.14 27.50 28.37 23.06S&P MidCap 400 . . . . . . . . . . 858.20 779.51 819.00 727.29 538.28 489.00 578.14 691.02 726.67 789.90 711.73S&P 1500 Super Composite
Engineering and Construction 215.20 176.98 222.13 145.96 126.35 113.38 137.70 140.92 129.42 138.10 123.09
Sep 30, Dec 31, Mar 31, Jun 30, Sep 30, Dec 31, Mar 31, Jun 30, Sep 30,2010 2010 2011 2011 2011 2011 2012 2012 2012
AECOM . . . . . . . . . . . . . . . . . . . . . . . . . . . 24.26 27.97 27.73 27.34 17.67 20.57 22.37 16.45 21.16S&P MidCap 400 . . . . . . . . . . . . . . . . . . . . . 802.10 907.25 989.05 978.64 781.26 879.16 994.30 941.64 989.02S&P 1500 Super Composite Engineering and
Construction . . . . . . . . . . . . . . . . . . . . . . . 131.29 155.98 172.46 156.12 112.61 132.27 150.66 129.37 145.58
(1) This section is not ‘‘soliciting material,’’ is not deemed ‘‘filed’’ with the SEC and is not incorporated byreference in any of our filings under the Securities Act or Exchange Act whether made before or afterthe date hereof and irrespective of any general incorporation language in any such filing.
26
Stock Repurchase Program
In August 2011, our Board of Directors authorized a stock repurchase program, pursuant to which wecould purchase up to $200 million of our common stock. We completed the initial authorization topurchase $200 million of our common stock during the quarter ended June 30, 2012.
In August 2012, our Board of Directors authorized an additional $300 million to purchase ourcommon stock under the stock repurchase program. Share repurchases under this program may be madethrough open market purchases, unsolicited or solicited privately negotiated transactions or othermethods, including pursuant to a Rule 10b5-1 plan. The timing, nature and amount of purchases dependon a variety of factors, including market conditions and the volume limit defined by Rule 10b-18.Repurchased shares are retired, but remain authorized for registration and issuance in the future.
A summary of the repurchase activity for the three months ended September 30, 2012 is as follows:
Total Number of Maximum DollarShares Purchased Value that May
Total Number as Part of Publicly Yet Be Purchasedof Shares Average Price Announced Plans Under the Plans
Period Purchased Paid Per Share or Programs or Programs(Amounts in Millions, Except Per Share Amounts)
July 1 - 31, 2012 . . . . . . . . . . . . . . . . . . — $ — — $ —August 1 - 31, 2012 . . . . . . . . . . . . . . . . 0.5 19.43 0.5 290.7September 1 - 30, 2012 . . . . . . . . . . . . . 2.5 20.95 2.5 237.7Total . . . . . . . . . . . . . . . . . . . . . . . . . . 3.0 20.71 3.0 237.7
27
ITEM 6. SELECTED FINANCIAL DATA
SELECTED CONSOLIDATED FINANCIAL DATA
You should read the following selected consolidated financial data along with ‘‘Management’sDiscussion and Analysis of Financial Condition and Results of Operations’’ and our consolidated financialstatements and the accompanying notes, which are included in this Form 10-K. We derived the selectedconsolidated financial data from our audited consolidated financial statements.
Year Ended September 30,2012 2011 2010 2009 2008
(in millions, except per share data)Consolidated Statement of Operations Data:Revenue . . . . . . . . . . . . . . . . . . . . . . . . . . . . . . . . . . . . . $8,218 $8,037 $6,546 $6,119 $5,195Cost of revenue . . . . . . . . . . . . . . . . . . . . . . . . . . . . . . . 7,796 7,570 6,116 5,768 4,908
Gross profit . . . . . . . . . . . . . . . . . . . . . . . . . . . . . . . . 422 467 430 351 287Equity in earnings of joint ventures . . . . . . . . . . . . . . . . . 49 45 21 23 22General and administrative expenses . . . . . . . . . . . . . . . . (81) (91) (110) (87) (70)Goodwill impairment . . . . . . . . . . . . . . . . . . . . . . . . . . . (336) — — — —
Income from operations . . . . . . . . . . . . . . . . . . . . . . . . 54 421 341 287 239Other income . . . . . . . . . . . . . . . . . . . . . . . . . . . . . . . . . 9 3 10 2 (3)Interest expense—net . . . . . . . . . . . . . . . . . . . . . . . . . . . (45) (40) (10) (11) 1
Income from continuing operations before income taxexpense . . . . . . . . . . . . . . . . . . . . . . . . . . . . . . . . . . 18 384 341 278 237
Income tax expense . . . . . . . . . . . . . . . . . . . . . . . . . . . . . 75 100 92 77 77(Loss) income from continuing operations . . . . . . . . . . . . (57) 284 249 201 160Discontinued operations, net of tax . . . . . . . . . . . . . . . . . — — — 3 1
Net (loss) income . . . . . . . . . . . . . . . . . . . . . . . . . . . . (57) 284 249 204 161Noncontrolling interests in income of consolidated
subsidiaries, net of tax . . . . . . . . . . . . . . . . . . . . . . . . . (2) (8) (12) (14) (14)Net (loss) income attributable to AECOM . . . . . . . . . . $ (59) $ 276 $ 237 $ 190 $ 147
Net (loss) income attributable to AECOM per share:Basic
Continuing operations . . . . . . . . . . . . . . . . . . . . . . . $ (0.52) $ 2.35 $ 2.07 $ 1.73 $ 1.44Discontinued operations . . . . . . . . . . . . . . . . . . . . . . — — — .03 .01
$(0.52) $ 2.35 $ 2.07 $ 1.76 $ 1.45
DilutedContinuing operations . . . . . . . . . . . . . . . . . . . . . . . $ (0.52) $ 2.33 $ 2.05 $ 1.70 $ 1.41Discontinued operations . . . . . . . . . . . . . . . . . . . . . . — — — .03 —
$(0.52) $ 2.33 $ 2.05 $ 1.73 $ 1.41
Weighted average shares outstanding:Basic . . . . . . . . . . . . . . . . . . . . . . . . . . . . . . . . . . . . . 112 117 114 108 101Diluted . . . . . . . . . . . . . . . . . . . . . . . . . . . . . . . . . . . . 112 118 115 110 104
28
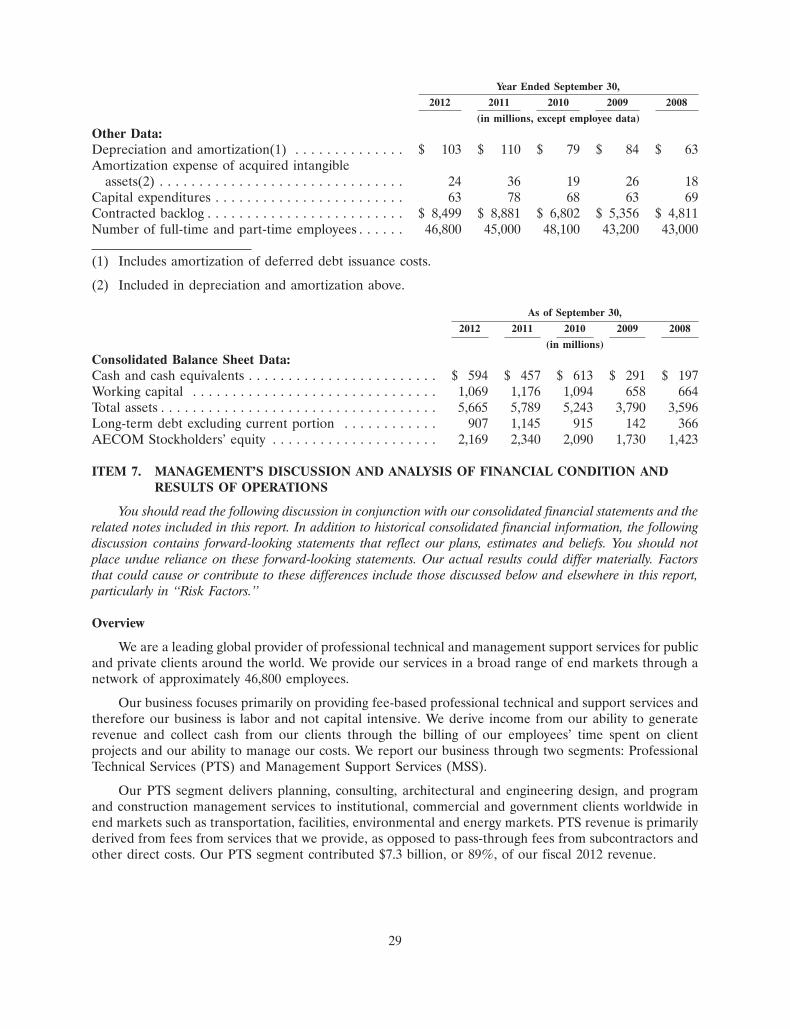
Year Ended September 30,2012 2011 2010 2009 2008
(in millions, except employee data)Other Data:Depreciation and amortization(1) . . . . . . . . . . . . . . $ 103 $ 110 $ 79 $ 84 $ 63Amortization expense of acquired intangible
assets(2) . . . . . . . . . . . . . . . . . . . . . . . . . . . . . . . 24 36 19 26 18Capital expenditures . . . . . . . . . . . . . . . . . . . . . . . . 63 78 68 63 69Contracted backlog . . . . . . . . . . . . . . . . . . . . . . . . . $ 8,499 $ 8,881 $ 6,802 $ 5,356 $ 4,811Number of full-time and part-time employees . . . . . . 46,800 45,000 48,100 43,200 43,000
(1) Includes amortization of deferred debt issuance costs.
(2) Included in depreciation and amortization above.
As of September 30,2012 2011 2010 2009 2008
(in millions)Consolidated Balance Sheet Data:Cash and cash equivalents . . . . . . . . . . . . . . . . . . . . . . . . $ 594 $ 457 $ 613 $ 291 $ 197Working capital . . . . . . . . . . . . . . . . . . . . . . . . . . . . . . . 1,069 1,176 1,094 658 664Total assets . . . . . . . . . . . . . . . . . . . . . . . . . . . . . . . . . . . 5,665 5,789 5,243 3,790 3,596Long-term debt excluding current portion . . . . . . . . . . . . 907 1,145 915 142 366AECOM Stockholders’ equity . . . . . . . . . . . . . . . . . . . . . 2,169 2,340 2,090 1,730 1,423
ITEM 7. MANAGEMENT’S DISCUSSION AND ANALYSIS OF FINANCIAL CONDITION ANDRESULTS OF OPERATIONS
You should read the following discussion in conjunction with our consolidated financial statements and therelated notes included in this report. In addition to historical consolidated financial information, the followingdiscussion contains forward-looking statements that reflect our plans, estimates and beliefs. You should notplace undue reliance on these forward-looking statements. Our actual results could differ materially. Factorsthat could cause or contribute to these differences include those discussed below and elsewhere in this report,particularly in ‘‘Risk Factors.’’
Overview
We are a leading global provider of professional technical and management support services for publicand private clients around the world. We provide our services in a broad range of end markets through anetwork of approximately 46,800 employees.
Our business focuses primarily on providing fee-based professional technical and support services andtherefore our business is labor and not capital intensive. We derive income from our ability to generaterevenue and collect cash from our clients through the billing of our employees’ time spent on clientprojects and our ability to manage our costs. We report our business through two segments: ProfessionalTechnical Services (PTS) and Management Support Services (MSS).
Our PTS segment delivers planning, consulting, architectural and engineering design, and programand construction management services to institutional, commercial and government clients worldwide inend markets such as transportation, facilities, environmental and energy markets. PTS revenue is primarilyderived from fees from services that we provide, as opposed to pass-through fees from subcontractors andother direct costs. Our PTS segment contributed $7.3 billion, or 89%, of our fiscal 2012 revenue.
29
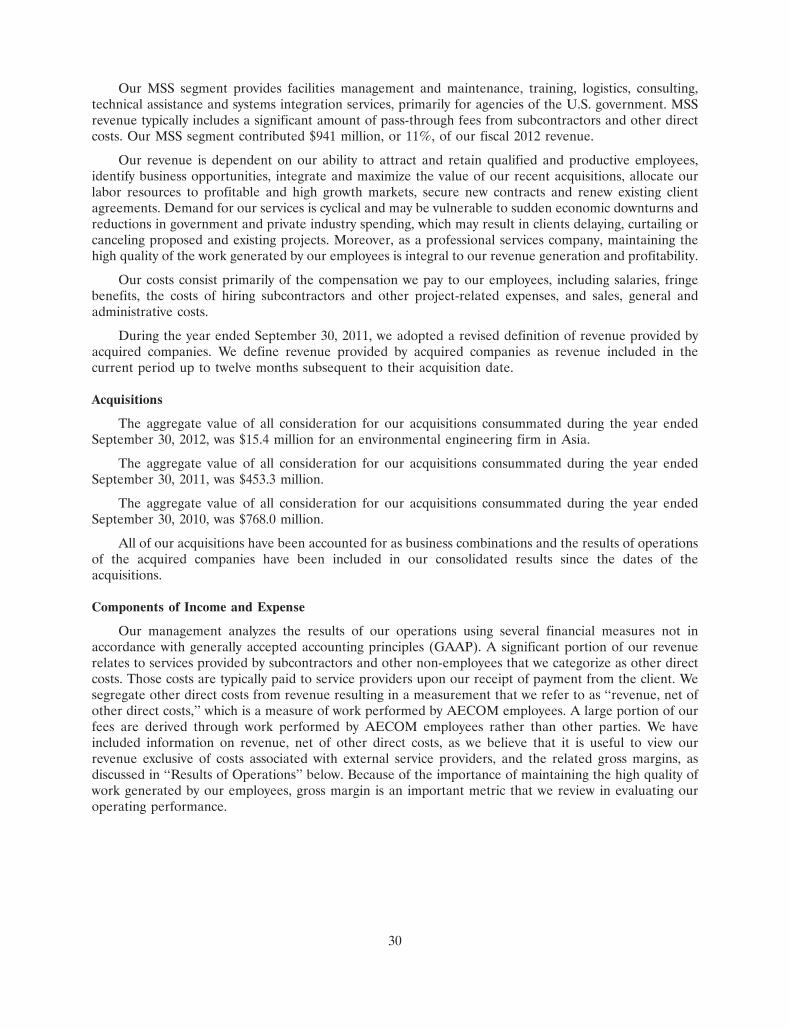
Our MSS segment provides facilities management and maintenance, training, logistics, consulting,technical assistance and systems integration services, primarily for agencies of the U.S. government. MSSrevenue typically includes a significant amount of pass-through fees from subcontractors and other directcosts. Our MSS segment contributed $941 million, or 11%, of our fiscal 2012 revenue.
Our revenue is dependent on our ability to attract and retain qualified and productive employees,identify business opportunities, integrate and maximize the value of our recent acquisitions, allocate ourlabor resources to profitable and high growth markets, secure new contracts and renew existing clientagreements. Demand for our services is cyclical and may be vulnerable to sudden economic downturns andreductions in government and private industry spending, which may result in clients delaying, curtailing orcanceling proposed and existing projects. Moreover, as a professional services company, maintaining thehigh quality of the work generated by our employees is integral to our revenue generation and profitability.
Our costs consist primarily of the compensation we pay to our employees, including salaries, fringebenefits, the costs of hiring subcontractors and other project-related expenses, and sales, general andadministrative costs.
During the year ended September 30, 2011, we adopted a revised definition of revenue provided byacquired companies. We define revenue provided by acquired companies as revenue included in thecurrent period up to twelve months subsequent to their acquisition date.
Acquisitions
The aggregate value of all consideration for our acquisitions consummated during the year endedSeptember 30, 2012, was $15.4 million for an environmental engineering firm in Asia.
The aggregate value of all consideration for our acquisitions consummated during the year endedSeptember 30, 2011, was $453.3 million.
The aggregate value of all consideration for our acquisitions consummated during the year endedSeptember 30, 2010, was $768.0 million.
All of our acquisitions have been accounted for as business combinations and the results of operationsof the acquired companies have been included in our consolidated results since the dates of theacquisitions.
Components of Income and Expense
Our management analyzes the results of our operations using several financial measures not inaccordance with generally accepted accounting principles (GAAP). A significant portion of our revenuerelates to services provided by subcontractors and other non-employees that we categorize as other directcosts. Those costs are typically paid to service providers upon our receipt of payment from the client. Wesegregate other direct costs from revenue resulting in a measurement that we refer to as ‘‘revenue, net ofother direct costs,’’ which is a measure of work performed by AECOM employees. A large portion of ourfees are derived through work performed by AECOM employees rather than other parties. We haveincluded information on revenue, net of other direct costs, as we believe that it is useful to view ourrevenue exclusive of costs associated with external service providers, and the related gross margins, asdiscussed in ‘‘Results of Operations’’ below. Because of the importance of maintaining the high quality ofwork generated by our employees, gross margin is an important metric that we review in evaluating ouroperating performance.
30
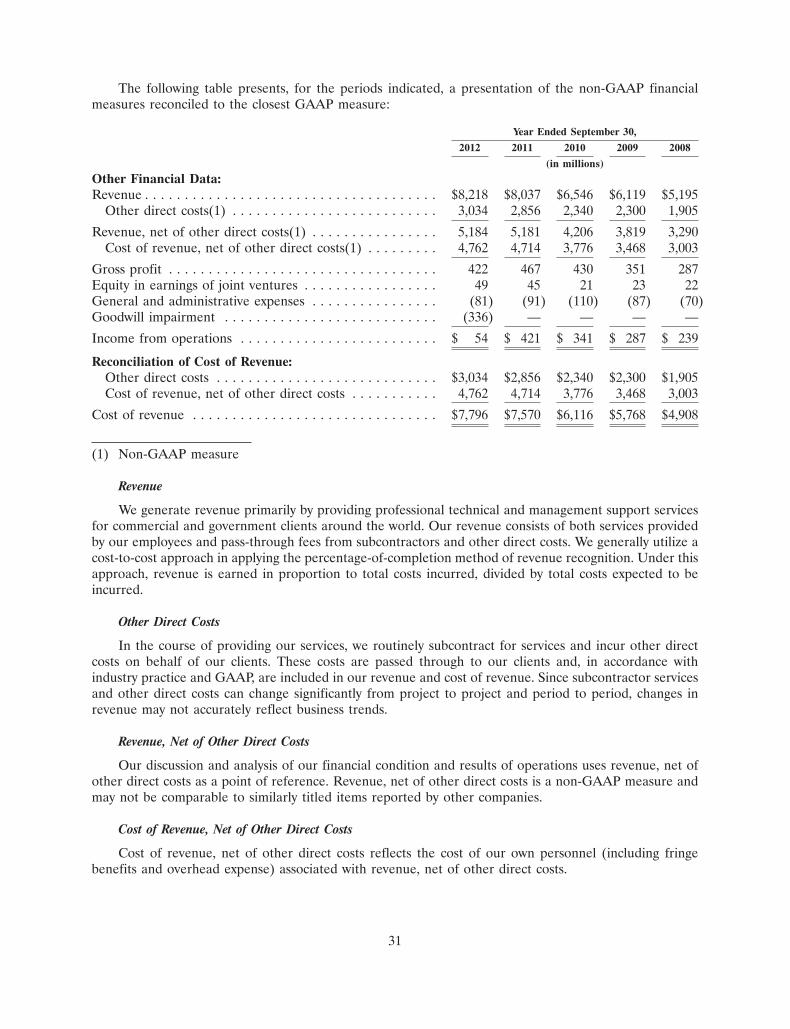
The following table presents, for the periods indicated, a presentation of the non-GAAP financialmeasures reconciled to the closest GAAP measure:
Year Ended September 30,2012 2011 2010 2009 2008
(in millions)Other Financial Data:Revenue . . . . . . . . . . . . . . . . . . . . . . . . . . . . . . . . . . . . . $8,218 $8,037 $6,546 $6,119 $5,195
Other direct costs(1) . . . . . . . . . . . . . . . . . . . . . . . . . . 3,034 2,856 2,340 2,300 1,905Revenue, net of other direct costs(1) . . . . . . . . . . . . . . . . 5,184 5,181 4,206 3,819 3,290
Cost of revenue, net of other direct costs(1) . . . . . . . . . 4,762 4,714 3,776 3,468 3,003Gross profit . . . . . . . . . . . . . . . . . . . . . . . . . . . . . . . . . . 422 467 430 351 287Equity in earnings of joint ventures . . . . . . . . . . . . . . . . . 49 45 21 23 22General and administrative expenses . . . . . . . . . . . . . . . . (81) (91) (110) (87) (70)Goodwill impairment . . . . . . . . . . . . . . . . . . . . . . . . . . . (336) — — — —Income from operations . . . . . . . . . . . . . . . . . . . . . . . . . $ 54 $ 421 $ 341 $ 287 $ 239
Reconciliation of Cost of Revenue:Other direct costs . . . . . . . . . . . . . . . . . . . . . . . . . . . . $3,034 $2,856 $2,340 $2,300 $1,905Cost of revenue, net of other direct costs . . . . . . . . . . . 4,762 4,714 3,776 3,468 3,003
Cost of revenue . . . . . . . . . . . . . . . . . . . . . . . . . . . . . . . $7,796 $7,570 $6,116 $5,768 $4,908
(1) Non-GAAP measure
Revenue
We generate revenue primarily by providing professional technical and management support servicesfor commercial and government clients around the world. Our revenue consists of both services providedby our employees and pass-through fees from subcontractors and other direct costs. We generally utilize acost-to-cost approach in applying the percentage-of-completion method of revenue recognition. Under thisapproach, revenue is earned in proportion to total costs incurred, divided by total costs expected to beincurred.
Other Direct Costs
In the course of providing our services, we routinely subcontract for services and incur other directcosts on behalf of our clients. These costs are passed through to our clients and, in accordance withindustry practice and GAAP, are included in our revenue and cost of revenue. Since subcontractor servicesand other direct costs can change significantly from project to project and period to period, changes inrevenue may not accurately reflect business trends.
Revenue, Net of Other Direct Costs
Our discussion and analysis of our financial condition and results of operations uses revenue, net ofother direct costs as a point of reference. Revenue, net of other direct costs is a non-GAAP measure andmay not be comparable to similarly titled items reported by other companies.
Cost of Revenue, Net of Other Direct Costs
Cost of revenue, net of other direct costs reflects the cost of our own personnel (including fringebenefits and overhead expense) associated with revenue, net of other direct costs.
31
Amortization Expense of Acquired Intangible Assets
Included in our cost of revenue, net of other direct costs is amortization of acquired intangible assets.We have ascribed value to identifiable intangible assets other than goodwill in our purchase priceallocations for companies we have acquired. These assets include, but are not limited, to backlog andcustomer relationships. To the extent we ascribe value to identifiable intangible assets that have finite lives,we amortize those values over the estimated useful lives of the assets. Such amortization expense, althoughnon-cash in the period expensed, directly impacts our results of operations.
It is difficult to predict with any precision the amount of expense we may record relating to acquiredintangible assets. As backlog is typically the shortest lived intangible asset in our business, we would expectto see higher amortization expense in the first 12 to 18 months (the typical backlog amortization period)after an acquisition has been consummated.
Equity in Earnings of Joint Ventures
Equity in earnings of joint ventures includes our portion of fees charged by our unconsolidated jointventures to clients for services performed by us and other joint venture partners along with earnings wereceive from investments in unconsolidated joint ventures.
General and Administrative Expenses
General and administrative expenses include corporate overhead expenses, including personnel,occupancy, and administrative expenses.
Goodwill Impairment
See Critical Accounting Policies and Consolidated Results below.
Income Tax Expense
Income tax expense varies as a function of income before income tax expense and permanent non-taxdeductible expenses. As a global enterprise, our tax rates are affected by many factors, including ourworldwide mix of earnings, the extent to which those earnings are indefinitely reinvested outside of theUnited States, our acquisition strategy and changes to existing tax legislation. Our tax returns are routinelyaudited and settlements of issues raised in these audits sometimes affect our tax provisions.
Critical Accounting Policies
Our financial statements are presented in accordance with GAAP. Highlighted below are theaccounting policies that management considers significant to understanding the operations of our business.
Revenue Recognition
We generally utilize a cost-to-cost approach in applying the percentage-of-completion method ofrevenue recognition, under which revenue is earned in proportion to total costs incurred, divided by totalcosts expected to be incurred. Recognition of revenue and profit under this method is dependent upon anumber of factors, including the accuracy of a variety of estimates, including engineering progress, materialquantities, the achievement of milestones, penalty provisions, labor productivity and cost estimates. Due touncertainties inherent in the estimation process, it is possible that actual completion costs may vary fromestimates. If estimated total costs on contracts indicate a loss, we recognize that estimated loss in theperiod the estimated loss first becomes known.
32
Claims Recognition
Claims are amounts in excess of the agreed contract price (or amounts not included in the originalcontract price) that we seek to collect from customers or others for delays, errors in specifications anddesigns, contract terminations, change orders in dispute or unapproved contracts as to both scope andprice or other causes of unanticipated additional costs. We record contract revenue related to claims only ifit is probable that the claim will result in additional contract revenue and if the amount can be reliablyestimated. In such cases, we record revenue only to the extent that contract costs relating to the claim havebeen incurred. The amounts recorded, if material, are disclosed in the notes to the financial statements.Costs attributable to claims are treated as costs of contract performance as incurred.
Government Contract Matters
Our federal government and certain state and local agency contracts are subject to, among otherregulations, regulations issued under the Federal Acquisition Regulations (FAR). These regulations canlimit the recovery of certain specified indirect costs on contracts and subject us to ongoing multiple auditsby government agencies such as the Defense Contract Audit Agency (DCAA). In addition, most of ourfederal and state and local contracts are subject to termination at the discretion of the client.
Audits by the DCAA and other agencies consist of reviews of our overhead rates, operating systemsand cost proposals to ensure that we account for such costs in accordance with the Cost AccountingStandards of the FAR (CAS). If the DCAA determines we have not accounted for such costs consistentwith CAS, the DCAA may disallow these costs. There can be no assurance that audits by the DCAA orother governmental agencies will not result in material cost disallowances in the future.
Allowance for Doubtful Accounts
We record accounts receivable net of an allowance for doubtful accounts. This allowance for doubtfulaccounts is estimated based on management’s evaluation of the contracts involved and the financialcondition of its clients. The factors we consider in our contract evaluations include, but are not limited to:
• Client type—federal or state and local government or commercial client;
• Historical contract performance;
• Historical collection and delinquency trends;
• Client credit worthiness; and
• General economic conditions.
Unbilled Accounts Receivable and Billings in Excess of Costs on Uncompleted Contracts
Unbilled accounts receivable represents the contract revenue recognized but not yet billed pursuant tocontract terms or accounts billed after the period end.
Billings in excess of costs on uncompleted contracts represent the billings to date, as allowed underthe terms of a contract, but not yet recognized as contract revenue using the percentage-of-completionaccounting method.
Investments in Unconsolidated Joint Ventures
We have noncontrolling interests in joint ventures accounted for under the equity method. Feesreceived for and the associated costs of services performed by us and billed to joint ventures with respect towork done by us for third-party customers are recorded as our revenues and costs in the period in whichsuch services are rendered. In certain joint ventures, a fee is added to the respective billings from bothourselves and the other joint venture partners on the amounts billed to the third-party customers. Thesefees result in earnings to the joint venture and are split with each of the joint venture partners and paid to
33
the joint venture partners upon collection from the third-party customer. We record our allocated share ofthese fees as equity in earnings of joint ventures.
Income Taxes
Valuation Allowance. Deferred income taxes are provided on the liability method whereby deferredtax assets and liabilities are established for the difference between the financial reporting and income taxbasis of assets and liabilities, as well as operating loss and tax credit carry forwards. Deferred tax assets andliabilities are adjusted for the effects of changes in tax laws and rates on the date of enactment of suchchanges to laws and rates.
Deferred tax assets are reduced by a valuation allowance when, in our opinion, it is more likely thannot that some portion or all of the deferred tax assets may not be realized. Whether a deferred tax assetmay be realized requires considerable judgment by us. In considering the need for a valuation allowance,we consider a number of factors including the future reversal of existing temporary differences, futuretaxable income exclusive of reversing temporary differences and carry forwards, taxable income incarry-back years if carry-back is permitted under tax law, and prudent and feasible tax planning strategiesthat would normally be taken by management, in the absence of the desire to realize the deferred tax asset.Whether a deferred tax asset will ultimately be realized is also dependent on varying factors, including, butnot limited to, changes in tax laws and audits by tax jurisdictions in which we operate.
We review the need for a valuation allowance at least quarterly. If we determine we will not realize allor part of our deferred tax asset in the future, we will record an additional valuation allowance. Conversely,if a valuation allowance exists and we determine that the ultimate realizability of all or part of the netdeferred tax asset is more likely than not to be realized, then the amount of the valuation allowance will bereduced. This adjustment will increase or decrease income tax expense in the period of such determination.
Undistributed Non-U.S. Earnings. The results of our operations outside of the United States areconsolidated for financial reporting; however, earnings from investments in non-U.S. operations areincluded in domestic U.S. taxable income only when actually or constructively received. No deferred taxeshave been provided on the undistributed pre-tax earnings of non-U.S. operations of approximately$797.4 million because we plan to permanently reinvest these earnings overseas. If we were to repatriatethese earnings, additional taxes would be due at that time.
Goodwill and Acquired Intangible Assets
Goodwill represents the excess amounts paid over the fair value of net assets acquired from anacquisition. In order to determine the amount of goodwill resulting from an acquisition, we perform anassessment to determine the value of the acquired company’s tangible and identifiable intangible assetsand liabilities. In our assessment, we determine whether identifiable intangible assets exist, which typicallyinclude backlog and customer relationships.
We test goodwill for impairment at least annually for each reporting unit. We have multiple reportingunits. A reporting unit is defined as an operating segment or one level below an operating segment. Ourimpairment tests are performed at the operating segment level as they represent our reporting units.
The impairment test is a two-step process. During the first step, we estimate the fair value of thereporting unit using income and market approaches, and compare that amount to the carrying value of thatreporting unit. In the event the fair value of the reporting unit is determined to be less than the carryingvalue, a second step is required. The second step requires us to perform a hypothetical purchase allocationfor that reporting unit and to compare the resulting current implied fair value of the goodwill to thecurrent carrying value of the goodwill for that reporting unit. In the event that the current implied fairvalue of the goodwill is less than the carrying value, an impairment charge is recognized.
During the fourth quarter of our year ended September 30, 2012, we conducted our annual goodwillimpairment test. The impairment evaluation process includes, among other things, making assumptions
34

about variables such as revenue growth rates, profitability, discount rates, and industry market multiples,which are subject to a high degree of judgment. As a result of the first step of the impairment analysis, dueto market conditions and business trends within the Europe, Middle East, and Africa (EMEA) and MSSreporting units, we determined that goodwill was impaired. The second step of the analysis is performed tomeasure the impairment as the excess of the goodwill carrying value over its implied fair value. Thisanalysis resulted in an impairment of $336.0 million, or $317.2 million, net of tax.
Material assumptions used in the impairment analysis included the weighted average cost of capital(WACC) percent and terminal growth rates. For example, a 1% increase in the WACC rate represents a$450 million increase to the fair value of our reporting units. A 1% decrease in the terminal growth raterepresents a $300 million decrease to the fair value of our reporting units.
Pension Plans
A number of assumptions are necessary to determine our pension liabilities and net periodic costs.These liabilities and net periodic costs are sensitive to changes in those assumptions. The assumptionsinclude discount rates, long-term rates of return on plan assets and inflation levels limited to the UnitedKingdom and are generally determined based on the current economic environment in each host countryat the end of each respective annual reporting period. We evaluate the funded status of each of ourretirement plans using these current assumptions and determine the appropriate funding level consideringapplicable regulatory requirements, tax deductibility, reporting considerations and other factors. Basedupon current assumptions, we expect to contribute $17.3 million to our international plans in fiscal 2013.We do not have a required minimum contribution for our U.S. plans; however, we may make additionaldiscretionary contributions. We currently expect to contribute $8.9 million to our U.S. plans in fiscal 2013.If the discount rate was reduced by 25 basis points, plan liabilities would increase by approximately$31.6 million. If the discount rate and return on plan assets were reduced by 25 basis points, plan expensewould increase by approximately $0.3 million and $1.4 million, respectively. If inflation increased by 25basis points, plan liabilities in the United Kingdom would increase by approximately $16.1 million and planexpense would increase by approximately $1.0 million.
At each measurement date, all assumptions are reviewed and adjusted as appropriate. With respect toestablishing the return on assets assumption, we consider the long term capital market expectations foreach asset class held as an investment by the various pension plans. In addition to expected returns foreach asset class, we take into account standard deviation of returns and correlation between asset classes.This is necessary in order to generate a distribution of possible returns which reflects diversification ofassets. Based on this information, a distribution of possible returns is generated based on the plan’s targetasset allocation.
Capital market expectations for determining the long term rate of return on assets are based onforward-looking assumptions which reflect a 20-year view of the capital markets. In establishing thosecapital market assumptions and expectations, we rely on the assistance of our actuary and our investmentconsultant. We and the plan trustees review whether changes to the various plans’ target asset allocationsare appropriate. A change in the plans’ target asset allocations would likely result in a change in theexpected return on asset assumptions. In assessing a plan’s asset allocation strategy, we and the plantrustees consider factors such as the structure of the plan’s liabilities, the plan’s funded status, and theimpact of the asset allocation to the volatility of the plan’s funded status, so that the overall risk levelresulting from our defined benefit plans is appropriate within our risk management strategy.
Between September 30, 2011 and September 30, 2012, the aggregate worldwide pension deficit grewfrom $166.5 million to an estimated $192.2 million. This increase in unfunded liabilities is primarily drivenby decreases in U.S. and international discount rates. Although funding rules are subject to local laws andregulations and vary by location, we expect to reduce this deficit over a period of 7 to 10 years. If thevarious plans do not experience future investment gains to reduce this shortfall, the deficit will be reducedby additional contributions.
35
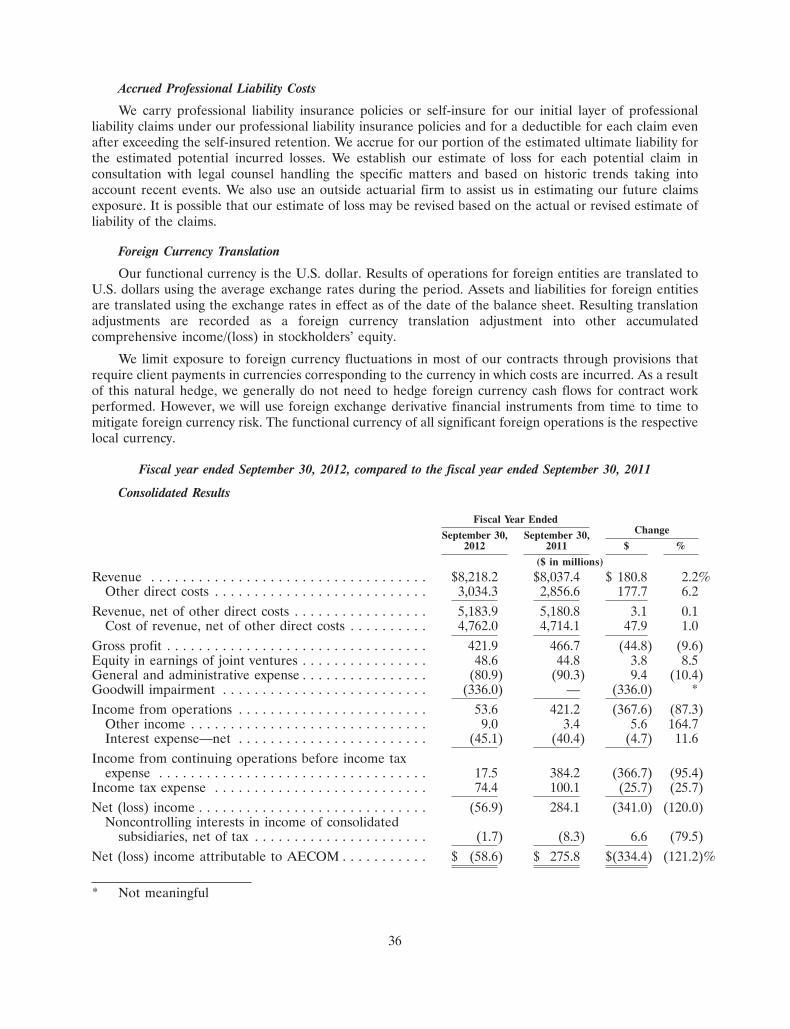
Accrued Professional Liability Costs
We carry professional liability insurance policies or self-insure for our initial layer of professionalliability claims under our professional liability insurance policies and for a deductible for each claim evenafter exceeding the self-insured retention. We accrue for our portion of the estimated ultimate liability forthe estimated potential incurred losses. We establish our estimate of loss for each potential claim inconsultation with legal counsel handling the specific matters and based on historic trends taking intoaccount recent events. We also use an outside actuarial firm to assist us in estimating our future claimsexposure. It is possible that our estimate of loss may be revised based on the actual or revised estimate ofliability of the claims.
Foreign Currency Translation
Our functional currency is the U.S. dollar. Results of operations for foreign entities are translated toU.S. dollars using the average exchange rates during the period. Assets and liabilities for foreign entitiesare translated using the exchange rates in effect as of the date of the balance sheet. Resulting translationadjustments are recorded as a foreign currency translation adjustment into other accumulatedcomprehensive income/(loss) in stockholders’ equity.
We limit exposure to foreign currency fluctuations in most of our contracts through provisions thatrequire client payments in currencies corresponding to the currency in which costs are incurred. As a resultof this natural hedge, we generally do not need to hedge foreign currency cash flows for contract workperformed. However, we will use foreign exchange derivative financial instruments from time to time tomitigate foreign currency risk. The functional currency of all significant foreign operations is the respectivelocal currency.
Fiscal year ended September 30, 2012, compared to the fiscal year ended September 30, 2011
Consolidated Results
Fiscal Year EndedChangeSeptember 30, September 30,
2012 2011 $ %($ in millions)
Revenue . . . . . . . . . . . . . . . . . . . . . . . . . . . . . . . . . . . $8,218.2 $8,037.4 $ 180.8 2.2%Other direct costs . . . . . . . . . . . . . . . . . . . . . . . . . . . 3,034.3 2,856.6 177.7 6.2
Revenue, net of other direct costs . . . . . . . . . . . . . . . . . 5,183.9 5,180.8 3.1 0.1Cost of revenue, net of other direct costs . . . . . . . . . . 4,762.0 4,714.1 47.9 1.0
Gross profit . . . . . . . . . . . . . . . . . . . . . . . . . . . . . . . . . 421.9 466.7 (44.8) (9.6)Equity in earnings of joint ventures . . . . . . . . . . . . . . . . 48.6 44.8 3.8 8.5General and administrative expense . . . . . . . . . . . . . . . . (80.9) (90.3) 9.4 (10.4)Goodwill impairment . . . . . . . . . . . . . . . . . . . . . . . . . . (336.0) — (336.0) *Income from operations . . . . . . . . . . . . . . . . . . . . . . . . 53.6 421.2 (367.6) (87.3)
Other income . . . . . . . . . . . . . . . . . . . . . . . . . . . . . . 9.0 3.4 5.6 164.7Interest expense—net . . . . . . . . . . . . . . . . . . . . . . . . (45.1) (40.4) (4.7) 11.6
Income from continuing operations before income taxexpense . . . . . . . . . . . . . . . . . . . . . . . . . . . . . . . . . . 17.5 384.2 (366.7) (95.4)
Income tax expense . . . . . . . . . . . . . . . . . . . . . . . . . . . 74.4 100.1 (25.7) (25.7)Net (loss) income . . . . . . . . . . . . . . . . . . . . . . . . . . . . . (56.9) 284.1 (341.0) (120.0)
Noncontrolling interests in income of consolidatedsubsidiaries, net of tax . . . . . . . . . . . . . . . . . . . . . . (1.7) (8.3) 6.6 (79.5)
Net (loss) income attributable to AECOM . . . . . . . . . . . $ (58.6) $ 275.8 $(334.4) (121.2)%
* Not meaningful
36
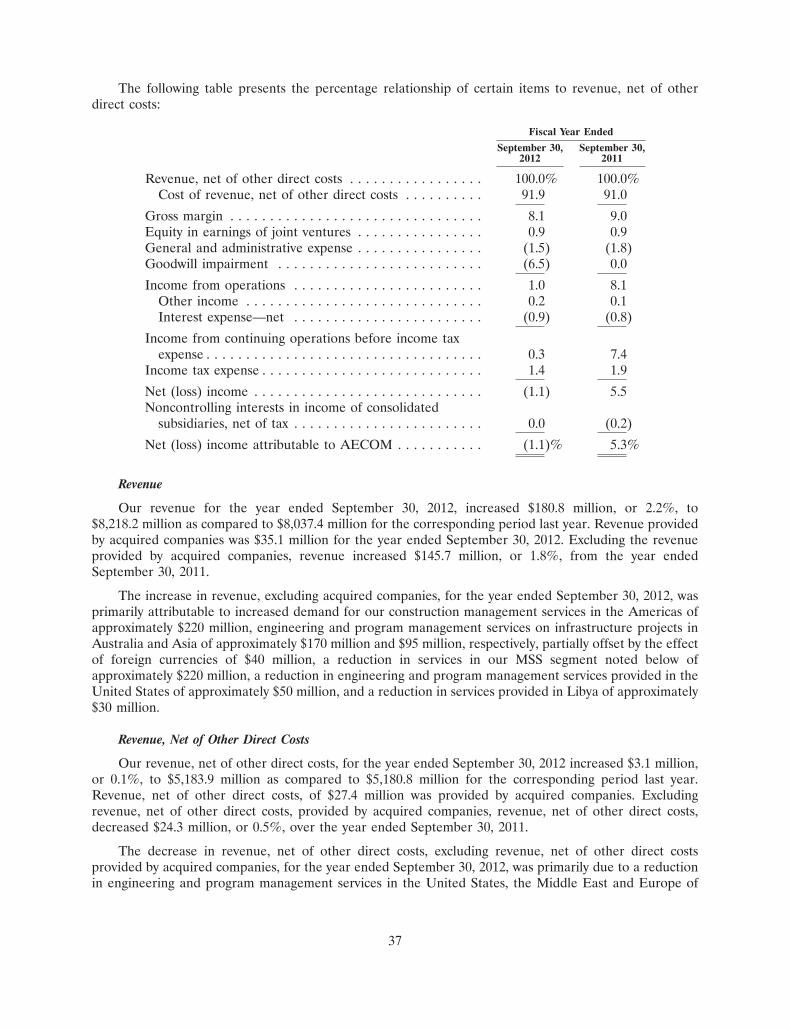
The following table presents the percentage relationship of certain items to revenue, net of otherdirect costs:
Fiscal Year EndedSeptember 30, September 30,
2012 2011
Revenue, net of other direct costs . . . . . . . . . . . . . . . . . 100.0% 100.0%Cost of revenue, net of other direct costs . . . . . . . . . . 91.9 91.0
Gross margin . . . . . . . . . . . . . . . . . . . . . . . . . . . . . . . . 8.1 9.0Equity in earnings of joint ventures . . . . . . . . . . . . . . . . 0.9 0.9General and administrative expense . . . . . . . . . . . . . . . . (1.5) (1.8)Goodwill impairment . . . . . . . . . . . . . . . . . . . . . . . . . . (6.5) 0.0Income from operations . . . . . . . . . . . . . . . . . . . . . . . . 1.0 8.1
Other income . . . . . . . . . . . . . . . . . . . . . . . . . . . . . . 0.2 0.1Interest expense—net . . . . . . . . . . . . . . . . . . . . . . . . (0.9) (0.8)
Income from continuing operations before income taxexpense . . . . . . . . . . . . . . . . . . . . . . . . . . . . . . . . . . . 0.3 7.4
Income tax expense . . . . . . . . . . . . . . . . . . . . . . . . . . . . 1.4 1.9Net (loss) income . . . . . . . . . . . . . . . . . . . . . . . . . . . . . (1.1) 5.5Noncontrolling interests in income of consolidated
subsidiaries, net of tax . . . . . . . . . . . . . . . . . . . . . . . . 0.0 (0.2)Net (loss) income attributable to AECOM . . . . . . . . . . . (1.1)% 5.3%
Revenue
Our revenue for the year ended September 30, 2012, increased $180.8 million, or 2.2%, to$8,218.2 million as compared to $8,037.4 million for the corresponding period last year. Revenue providedby acquired companies was $35.1 million for the year ended September 30, 2012. Excluding the revenueprovided by acquired companies, revenue increased $145.7 million, or 1.8%, from the year endedSeptember 30, 2011.
The increase in revenue, excluding acquired companies, for the year ended September 30, 2012, wasprimarily attributable to increased demand for our construction management services in the Americas ofapproximately $220 million, engineering and program management services on infrastructure projects inAustralia and Asia of approximately $170 million and $95 million, respectively, partially offset by the effectof foreign currencies of $40 million, a reduction in services in our MSS segment noted below ofapproximately $220 million, a reduction in engineering and program management services provided in theUnited States of approximately $50 million, and a reduction in services provided in Libya of approximately$30 million.
Revenue, Net of Other Direct Costs
Our revenue, net of other direct costs, for the year ended September 30, 2012 increased $3.1 million,or 0.1%, to $5,183.9 million as compared to $5,180.8 million for the corresponding period last year.Revenue, net of other direct costs, of $27.4 million was provided by acquired companies. Excludingrevenue, net of other direct costs, provided by acquired companies, revenue, net of other direct costs,decreased $24.3 million, or 0.5%, over the year ended September 30, 2011.
The decrease in revenue, net of other direct costs, excluding revenue, net of other direct costsprovided by acquired companies, for the year ended September 30, 2012, was primarily due to a reductionin engineering and program management services in the United States, the Middle East and Europe of
37
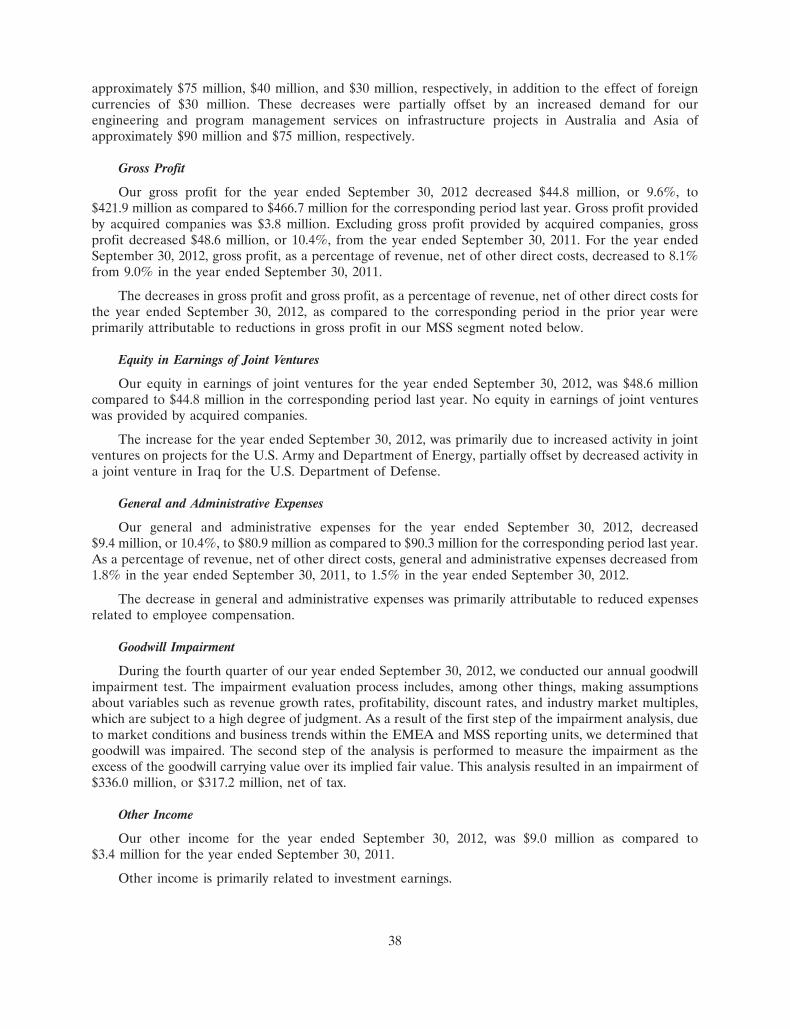
approximately $75 million, $40 million, and $30 million, respectively, in addition to the effect of foreigncurrencies of $30 million. These decreases were partially offset by an increased demand for ourengineering and program management services on infrastructure projects in Australia and Asia ofapproximately $90 million and $75 million, respectively.
Gross Profit
Our gross profit for the year ended September 30, 2012 decreased $44.8 million, or 9.6%, to$421.9 million as compared to $466.7 million for the corresponding period last year. Gross profit providedby acquired companies was $3.8 million. Excluding gross profit provided by acquired companies, grossprofit decreased $48.6 million, or 10.4%, from the year ended September 30, 2011. For the year endedSeptember 30, 2012, gross profit, as a percentage of revenue, net of other direct costs, decreased to 8.1%from 9.0% in the year ended September 30, 2011.
The decreases in gross profit and gross profit, as a percentage of revenue, net of other direct costs forthe year ended September 30, 2012, as compared to the corresponding period in the prior year wereprimarily attributable to reductions in gross profit in our MSS segment noted below.
Equity in Earnings of Joint Ventures
Our equity in earnings of joint ventures for the year ended September 30, 2012, was $48.6 millioncompared to $44.8 million in the corresponding period last year. No equity in earnings of joint ventureswas provided by acquired companies.
The increase for the year ended September 30, 2012, was primarily due to increased activity in jointventures on projects for the U.S. Army and Department of Energy, partially offset by decreased activity ina joint venture in Iraq for the U.S. Department of Defense.
General and Administrative Expenses
Our general and administrative expenses for the year ended September 30, 2012, decreased$9.4 million, or 10.4%, to $80.9 million as compared to $90.3 million for the corresponding period last year.As a percentage of revenue, net of other direct costs, general and administrative expenses decreased from1.8% in the year ended September 30, 2011, to 1.5% in the year ended September 30, 2012.
The decrease in general and administrative expenses was primarily attributable to reduced expensesrelated to employee compensation.
Goodwill Impairment
During the fourth quarter of our year ended September 30, 2012, we conducted our annual goodwillimpairment test. The impairment evaluation process includes, among other things, making assumptionsabout variables such as revenue growth rates, profitability, discount rates, and industry market multiples,which are subject to a high degree of judgment. As a result of the first step of the impairment analysis, dueto market conditions and business trends within the EMEA and MSS reporting units, we determined thatgoodwill was impaired. The second step of the analysis is performed to measure the impairment as theexcess of the goodwill carrying value over its implied fair value. This analysis resulted in an impairment of$336.0 million, or $317.2 million, net of tax.
Other Income
Our other income for the year ended September 30, 2012, was $9.0 million as compared to$3.4 million for the year ended September 30, 2011.
Other income is primarily related to investment earnings.
38
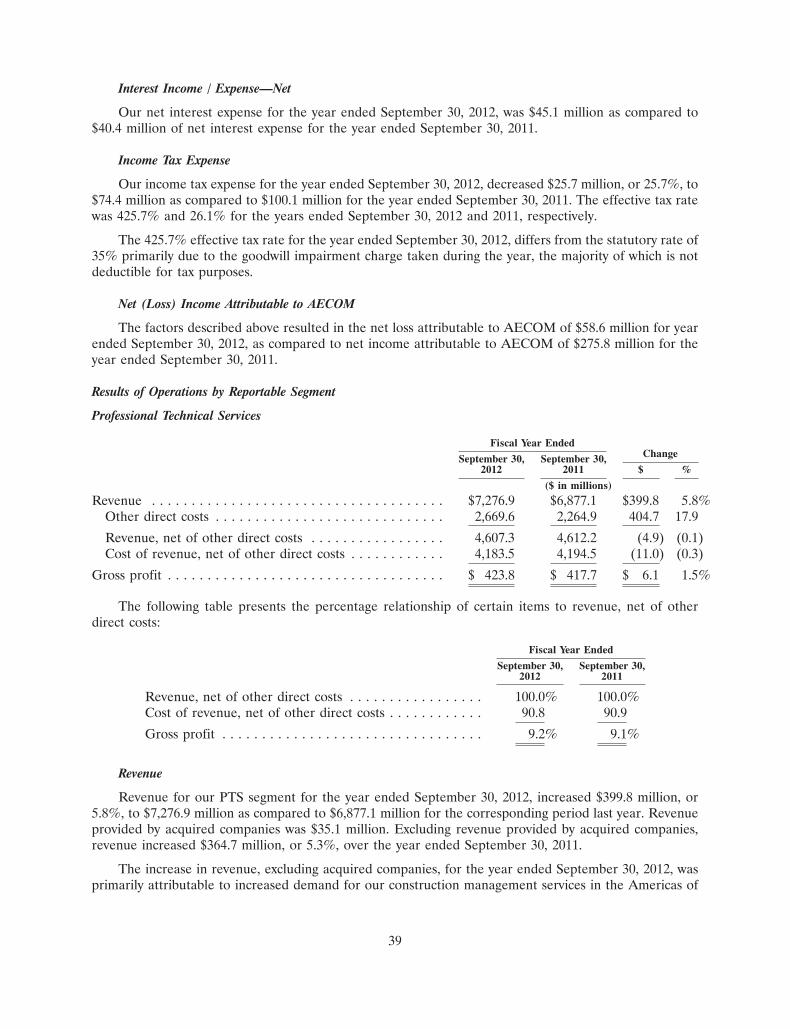
Interest Income / Expense—Net
Our net interest expense for the year ended September 30, 2012, was $45.1 million as compared to$40.4 million of net interest expense for the year ended September 30, 2011.
Income Tax Expense
Our income tax expense for the year ended September 30, 2012, decreased $25.7 million, or 25.7%, to$74.4 million as compared to $100.1 million for the year ended September 30, 2011. The effective tax ratewas 425.7% and 26.1% for the years ended September 30, 2012 and 2011, respectively.
The 425.7% effective tax rate for the year ended September 30, 2012, differs from the statutory rate of35% primarily due to the goodwill impairment charge taken during the year, the majority of which is notdeductible for tax purposes.
Net (Loss) Income Attributable to AECOM
The factors described above resulted in the net loss attributable to AECOM of $58.6 million for yearended September 30, 2012, as compared to net income attributable to AECOM of $275.8 million for theyear ended September 30, 2011.
Results of Operations by Reportable Segment
Professional Technical Services
Fiscal Year EndedChangeSeptember 30, September 30,
2012 2011 $ %($ in millions)
Revenue . . . . . . . . . . . . . . . . . . . . . . . . . . . . . . . . . . . . . $7,276.9 $6,877.1 $399.8 5.8%Other direct costs . . . . . . . . . . . . . . . . . . . . . . . . . . . . . 2,669.6 2,264.9 404.7 17.9Revenue, net of other direct costs . . . . . . . . . . . . . . . . . 4,607.3 4,612.2 (4.9) (0.1)Cost of revenue, net of other direct costs . . . . . . . . . . . . 4,183.5 4,194.5 (11.0) (0.3)
Gross profit . . . . . . . . . . . . . . . . . . . . . . . . . . . . . . . . . . . $ 423.8 $ 417.7 $ 6.1 1.5%
The following table presents the percentage relationship of certain items to revenue, net of otherdirect costs:
Fiscal Year EndedSeptember 30, September 30,
2012 2011
Revenue, net of other direct costs . . . . . . . . . . . . . . . . . 100.0% 100.0%Cost of revenue, net of other direct costs . . . . . . . . . . . . 90.8 90.9Gross profit . . . . . . . . . . . . . . . . . . . . . . . . . . . . . . . . . 9.2% 9.1%
Revenue
Revenue for our PTS segment for the year ended September 30, 2012, increased $399.8 million, or5.8%, to $7,276.9 million as compared to $6,877.1 million for the corresponding period last year. Revenueprovided by acquired companies was $35.1 million. Excluding revenue provided by acquired companies,revenue increased $364.7 million, or 5.3%, over the year ended September 30, 2011.
The increase in revenue, excluding acquired companies, for the year ended September 30, 2012, wasprimarily attributable to increased demand for our construction management services in the Americas of
39
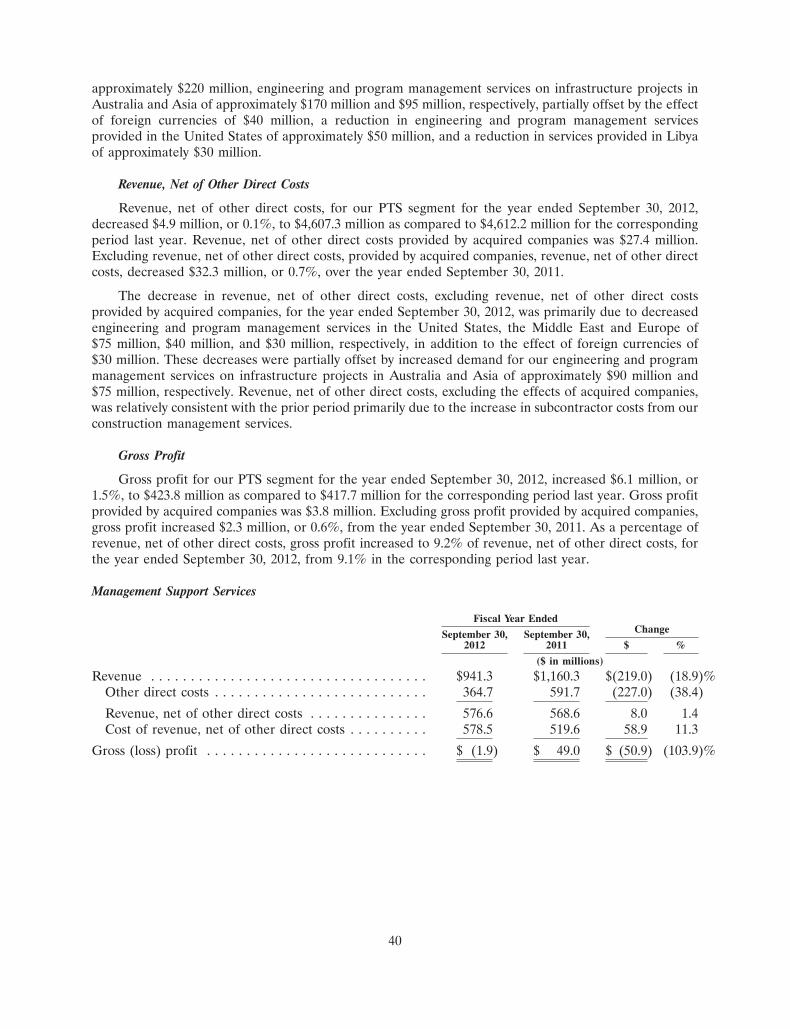
approximately $220 million, engineering and program management services on infrastructure projects inAustralia and Asia of approximately $170 million and $95 million, respectively, partially offset by the effectof foreign currencies of $40 million, a reduction in engineering and program management servicesprovided in the United States of approximately $50 million, and a reduction in services provided in Libyaof approximately $30 million.
Revenue, Net of Other Direct Costs
Revenue, net of other direct costs, for our PTS segment for the year ended September 30, 2012,decreased $4.9 million, or 0.1%, to $4,607.3 million as compared to $4,612.2 million for the correspondingperiod last year. Revenue, net of other direct costs provided by acquired companies was $27.4 million.Excluding revenue, net of other direct costs, provided by acquired companies, revenue, net of other directcosts, decreased $32.3 million, or 0.7%, over the year ended September 30, 2011.
The decrease in revenue, net of other direct costs, excluding revenue, net of other direct costsprovided by acquired companies, for the year ended September 30, 2012, was primarily due to decreasedengineering and program management services in the United States, the Middle East and Europe of$75 million, $40 million, and $30 million, respectively, in addition to the effect of foreign currencies of$30 million. These decreases were partially offset by increased demand for our engineering and programmanagement services on infrastructure projects in Australia and Asia of approximately $90 million and$75 million, respectively. Revenue, net of other direct costs, excluding the effects of acquired companies,was relatively consistent with the prior period primarily due to the increase in subcontractor costs from ourconstruction management services.
Gross Profit
Gross profit for our PTS segment for the year ended September 30, 2012, increased $6.1 million, or1.5%, to $423.8 million as compared to $417.7 million for the corresponding period last year. Gross profitprovided by acquired companies was $3.8 million. Excluding gross profit provided by acquired companies,gross profit increased $2.3 million, or 0.6%, from the year ended September 30, 2011. As a percentage ofrevenue, net of other direct costs, gross profit increased to 9.2% of revenue, net of other direct costs, forthe year ended September 30, 2012, from 9.1% in the corresponding period last year.
Management Support Services
Fiscal Year EndedChangeSeptember 30, September 30,
2012 2011 $ %($ in millions)
Revenue . . . . . . . . . . . . . . . . . . . . . . . . . . . . . . . . . . . $941.3 $1,160.3 $(219.0) (18.9)%Other direct costs . . . . . . . . . . . . . . . . . . . . . . . . . . . 364.7 591.7 (227.0) (38.4)Revenue, net of other direct costs . . . . . . . . . . . . . . . 576.6 568.6 8.0 1.4Cost of revenue, net of other direct costs . . . . . . . . . . 578.5 519.6 58.9 11.3
Gross (loss) profit . . . . . . . . . . . . . . . . . . . . . . . . . . . . $ (1.9) $ 49.0 $ (50.9) (103.9)%
40
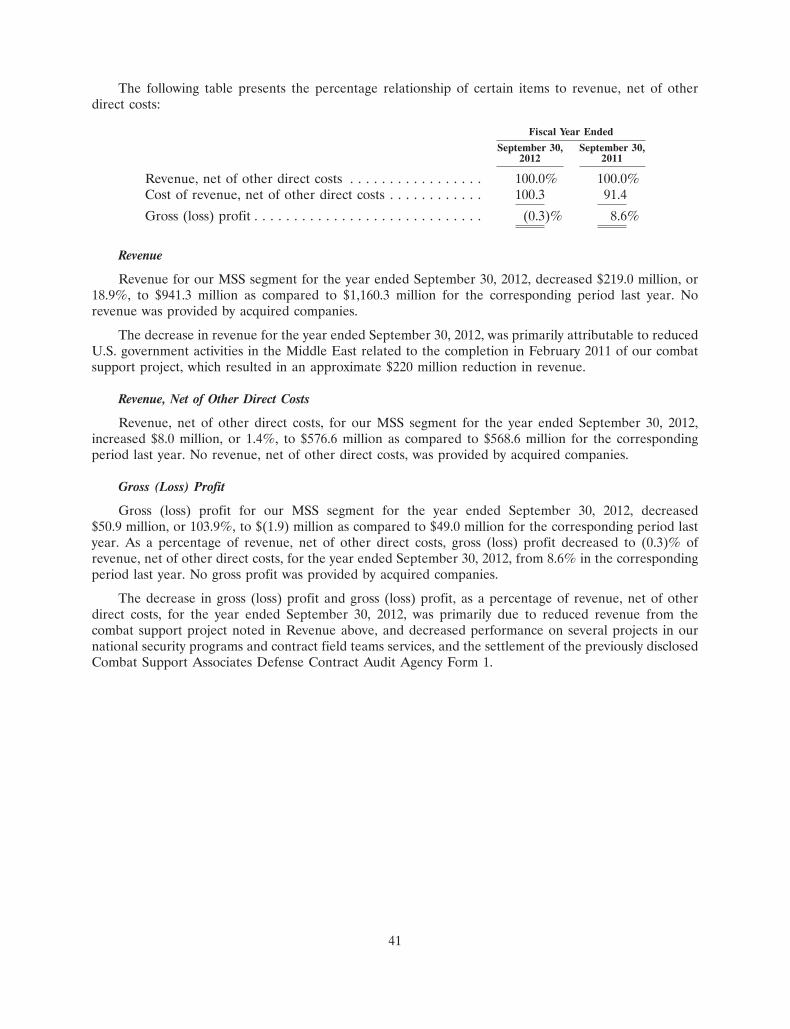
The following table presents the percentage relationship of certain items to revenue, net of otherdirect costs:
Fiscal Year EndedSeptember 30, September 30,
2012 2011
Revenue, net of other direct costs . . . . . . . . . . . . . . . . . 100.0% 100.0%Cost of revenue, net of other direct costs . . . . . . . . . . . . 100.3 91.4Gross (loss) profit . . . . . . . . . . . . . . . . . . . . . . . . . . . . . (0.3)% 8.6%
Revenue
Revenue for our MSS segment for the year ended September 30, 2012, decreased $219.0 million, or18.9%, to $941.3 million as compared to $1,160.3 million for the corresponding period last year. Norevenue was provided by acquired companies.
The decrease in revenue for the year ended September 30, 2012, was primarily attributable to reducedU.S. government activities in the Middle East related to the completion in February 2011 of our combatsupport project, which resulted in an approximate $220 million reduction in revenue.
Revenue, Net of Other Direct Costs
Revenue, net of other direct costs, for our MSS segment for the year ended September 30, 2012,increased $8.0 million, or 1.4%, to $576.6 million as compared to $568.6 million for the correspondingperiod last year. No revenue, net of other direct costs, was provided by acquired companies.
Gross (Loss) Profit
Gross (loss) profit for our MSS segment for the year ended September 30, 2012, decreased$50.9 million, or 103.9%, to $(1.9) million as compared to $49.0 million for the corresponding period lastyear. As a percentage of revenue, net of other direct costs, gross (loss) profit decreased to (0.3)% ofrevenue, net of other direct costs, for the year ended September 30, 2012, from 8.6% in the correspondingperiod last year. No gross profit was provided by acquired companies.
The decrease in gross (loss) profit and gross (loss) profit, as a percentage of revenue, net of otherdirect costs, for the year ended September 30, 2012, was primarily due to reduced revenue from thecombat support project noted in Revenue above, and decreased performance on several projects in ournational security programs and contract field teams services, and the settlement of the previously disclosedCombat Support Associates Defense Contract Audit Agency Form 1.
41
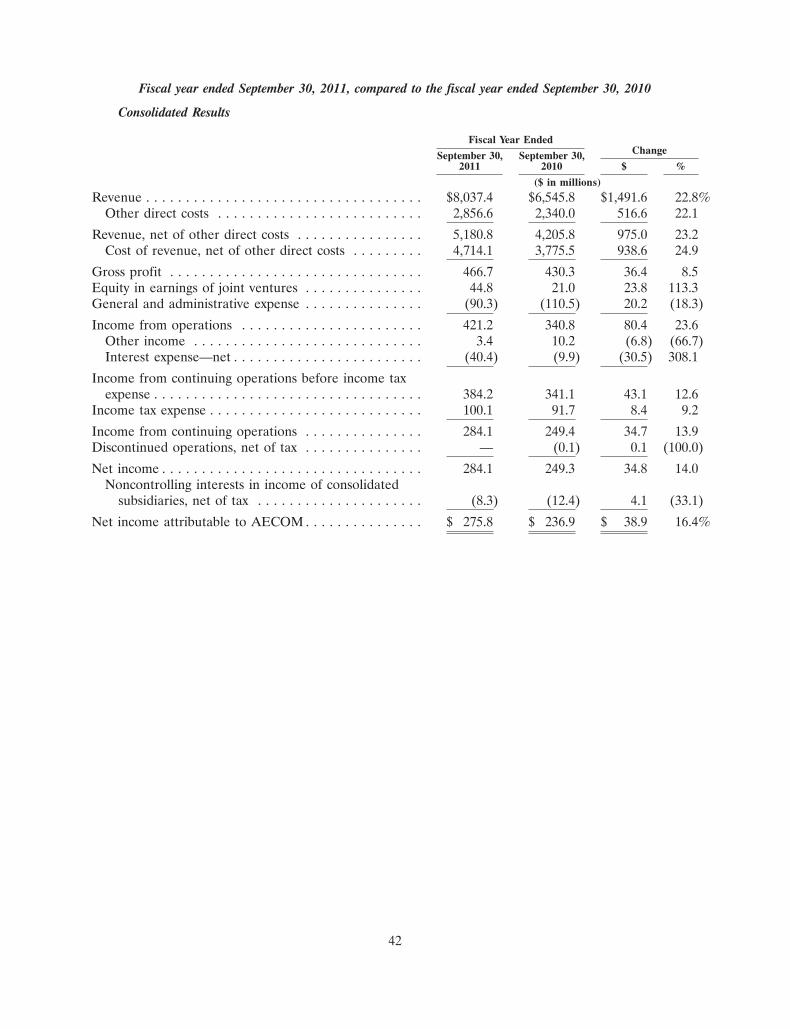
Fiscal year ended September 30, 2011, compared to the fiscal year ended September 30, 2010
Consolidated Results
Fiscal Year EndedChangeSeptember 30, September 30,
2011 2010 $ %($ in millions)
Revenue . . . . . . . . . . . . . . . . . . . . . . . . . . . . . . . . . . . $8,037.4 $6,545.8 $1,491.6 22.8%Other direct costs . . . . . . . . . . . . . . . . . . . . . . . . . . 2,856.6 2,340.0 516.6 22.1
Revenue, net of other direct costs . . . . . . . . . . . . . . . . 5,180.8 4,205.8 975.0 23.2Cost of revenue, net of other direct costs . . . . . . . . . 4,714.1 3,775.5 938.6 24.9
Gross profit . . . . . . . . . . . . . . . . . . . . . . . . . . . . . . . . 466.7 430.3 36.4 8.5Equity in earnings of joint ventures . . . . . . . . . . . . . . . 44.8 21.0 23.8 113.3General and administrative expense . . . . . . . . . . . . . . . (90.3) (110.5) 20.2 (18.3)Income from operations . . . . . . . . . . . . . . . . . . . . . . . 421.2 340.8 80.4 23.6
Other income . . . . . . . . . . . . . . . . . . . . . . . . . . . . . 3.4 10.2 (6.8) (66.7)Interest expense—net . . . . . . . . . . . . . . . . . . . . . . . . (40.4) (9.9) (30.5) 308.1
Income from continuing operations before income taxexpense . . . . . . . . . . . . . . . . . . . . . . . . . . . . . . . . . . 384.2 341.1 43.1 12.6
Income tax expense . . . . . . . . . . . . . . . . . . . . . . . . . . . 100.1 91.7 8.4 9.2Income from continuing operations . . . . . . . . . . . . . . . 284.1 249.4 34.7 13.9Discontinued operations, net of tax . . . . . . . . . . . . . . . — (0.1) 0.1 (100.0)Net income . . . . . . . . . . . . . . . . . . . . . . . . . . . . . . . . . 284.1 249.3 34.8 14.0
Noncontrolling interests in income of consolidatedsubsidiaries, net of tax . . . . . . . . . . . . . . . . . . . . . (8.3) (12.4) 4.1 (33.1)
Net income attributable to AECOM . . . . . . . . . . . . . . . $ 275.8 $ 236.9 $ 38.9 16.4%
42
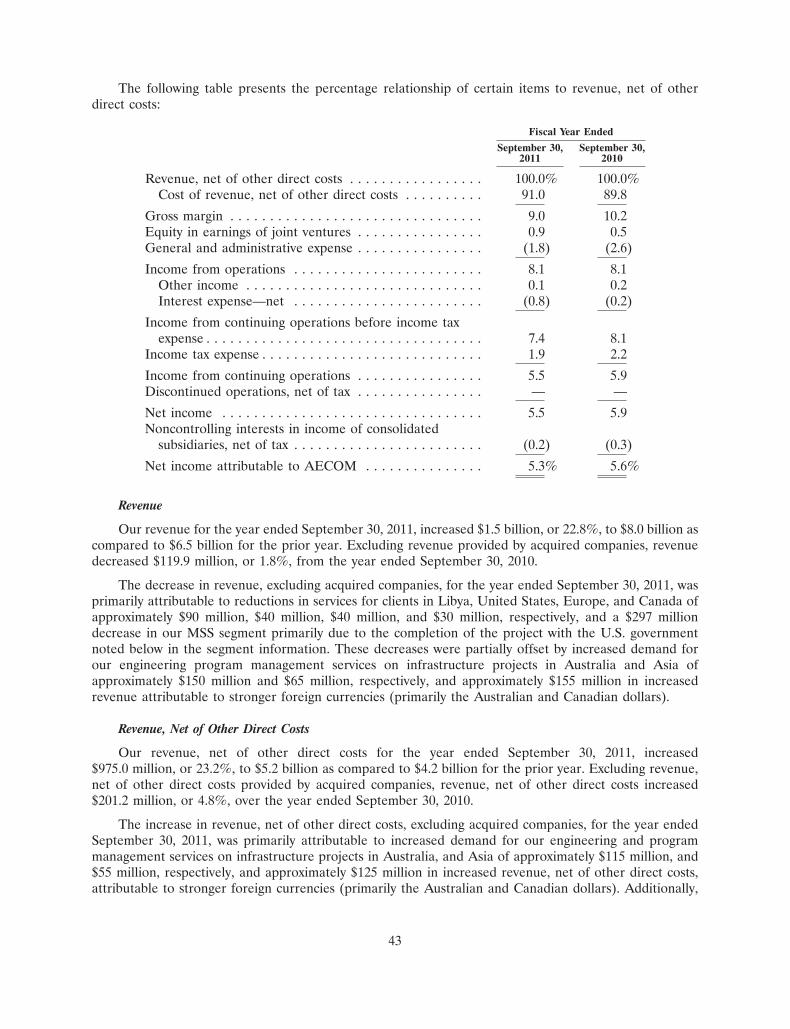
The following table presents the percentage relationship of certain items to revenue, net of otherdirect costs:
Fiscal Year EndedSeptember 30, September 30,
2011 2010
Revenue, net of other direct costs . . . . . . . . . . . . . . . . . 100.0% 100.0%Cost of revenue, net of other direct costs . . . . . . . . . . 91.0 89.8
Gross margin . . . . . . . . . . . . . . . . . . . . . . . . . . . . . . . . 9.0 10.2Equity in earnings of joint ventures . . . . . . . . . . . . . . . . 0.9 0.5General and administrative expense . . . . . . . . . . . . . . . . (1.8) (2.6)Income from operations . . . . . . . . . . . . . . . . . . . . . . . . 8.1 8.1
Other income . . . . . . . . . . . . . . . . . . . . . . . . . . . . . . 0.1 0.2Interest expense—net . . . . . . . . . . . . . . . . . . . . . . . . (0.8) (0.2)
Income from continuing operations before income taxexpense . . . . . . . . . . . . . . . . . . . . . . . . . . . . . . . . . . . 7.4 8.1
Income tax expense . . . . . . . . . . . . . . . . . . . . . . . . . . . . 1.9 2.2Income from continuing operations . . . . . . . . . . . . . . . . 5.5 5.9Discontinued operations, net of tax . . . . . . . . . . . . . . . . — —Net income . . . . . . . . . . . . . . . . . . . . . . . . . . . . . . . . . 5.5 5.9Noncontrolling interests in income of consolidated
subsidiaries, net of tax . . . . . . . . . . . . . . . . . . . . . . . . (0.2) (0.3)Net income attributable to AECOM . . . . . . . . . . . . . . . 5.3% 5.6%
Revenue
Our revenue for the year ended September 30, 2011, increased $1.5 billion, or 22.8%, to $8.0 billion ascompared to $6.5 billion for the prior year. Excluding revenue provided by acquired companies, revenuedecreased $119.9 million, or 1.8%, from the year ended September 30, 2010.
The decrease in revenue, excluding acquired companies, for the year ended September 30, 2011, wasprimarily attributable to reductions in services for clients in Libya, United States, Europe, and Canada ofapproximately $90 million, $40 million, $40 million, and $30 million, respectively, and a $297 milliondecrease in our MSS segment primarily due to the completion of the project with the U.S. governmentnoted below in the segment information. These decreases were partially offset by increased demand forour engineering program management services on infrastructure projects in Australia and Asia ofapproximately $150 million and $65 million, respectively, and approximately $155 million in increasedrevenue attributable to stronger foreign currencies (primarily the Australian and Canadian dollars).
Revenue, Net of Other Direct Costs
Our revenue, net of other direct costs for the year ended September 30, 2011, increased$975.0 million, or 23.2%, to $5.2 billion as compared to $4.2 billion for the prior year. Excluding revenue,net of other direct costs provided by acquired companies, revenue, net of other direct costs increased$201.2 million, or 4.8%, over the year ended September 30, 2010.
The increase in revenue, net of other direct costs, excluding acquired companies, for the year endedSeptember 30, 2011, was primarily attributable to increased demand for our engineering and programmanagement services on infrastructure projects in Australia, and Asia of approximately $115 million, and$55 million, respectively, and approximately $125 million in increased revenue, net of other direct costs,attributable to stronger foreign currencies (primarily the Australian and Canadian dollars). Additionally,
43
we experienced an increase of $51 million in our MSS segment. These increases were partially offset byreductions in services for clients in Libya, the United States, and Europe of $55 million, $50 million, and$35 million, respectively.
Gross Profit
Our gross profit for the year ended September 30, 2011, increased $36.4 million, or 8.5%, to$466.7 million, as compared to $430.3 million in the prior year. Excluding gross profit provided by acquiredcompanies, gross profit decreased $11.6 million, or 2.7%, from the year ended September 30, 2010. For theyear ended September 30, 2011, gross profit, as a percentage of revenue, net of other direct costs,decreased to 9.0% from 10.2% in the year ended September 30, 2010.
The increase in gross profit for the year ended September 30, 2011, was primarily due to increases inrevenue, net of other direct costs, pension curtailment gains in our PTS segment of $4.2 million, and grossprofit provided by our MSS segment, partially offset by the cessation of service provided under the LibyanHousing and Infrastructure Board project. Additionally, challenges in our Western European business,particularly in the United Kingdom, led us to restructure certain portions of this business in order toreduce our cost structure. The result of such actions resulted in facility exit and employee severanceexpenses of $12 million during the three months ended September 30, 2011.
Equity in Earnings of Joint Ventures
Our equity in earnings of joint ventures for the year ended September 30, 2011, increased$23.8 million, or 113%, to $44.8 million as compared to $21.0 million in the prior year. Excluding acquiredcompanies, equity in earnings of joint ventures increased $9.5 million.
The increase, excluding acquired companies, was primarily due to increased activity in a joint venturethat provides service to the U.S. Navy.
General and Administrative Expenses
Our general and administrative expenses for the year ended September 30, 2011, decreased$20.2 million, or 18.3%, to $90.3 million as compared to $110.5 million for the prior year. For the yearended September 30, 2011, general and administrative expenses, as a percentage of revenue, net of otherdirect costs was 1.8% as compared to 2.6% in the prior year.
The decrease in general and administrative expenses was primarily attributable to reduced expensesrelated to employee compensation and acquisitions.
Other Income / Expense
Our other income for the year ended September 30, 2011, was $3.4 million as compared to otherincome of $10.2 million for the year ended September 30, 2010.
Other income is primarily comprised of net gains and losses on investments we hold related to adeferred compensation plan, which was terminated in December 2010, as discussed in Note 17 in the notesto our consolidated financial statements. The decrease was primarily due to this termination.
Interest Income / Expense—Net
Our net interest expense for the year ended September 30, 2011, was $40.4 million as compared to$9.9 million for the year ended September 30, 2010.
The increase in interest expense primarily relates to increased borrowings associated with the fundingof acquisitions.
44
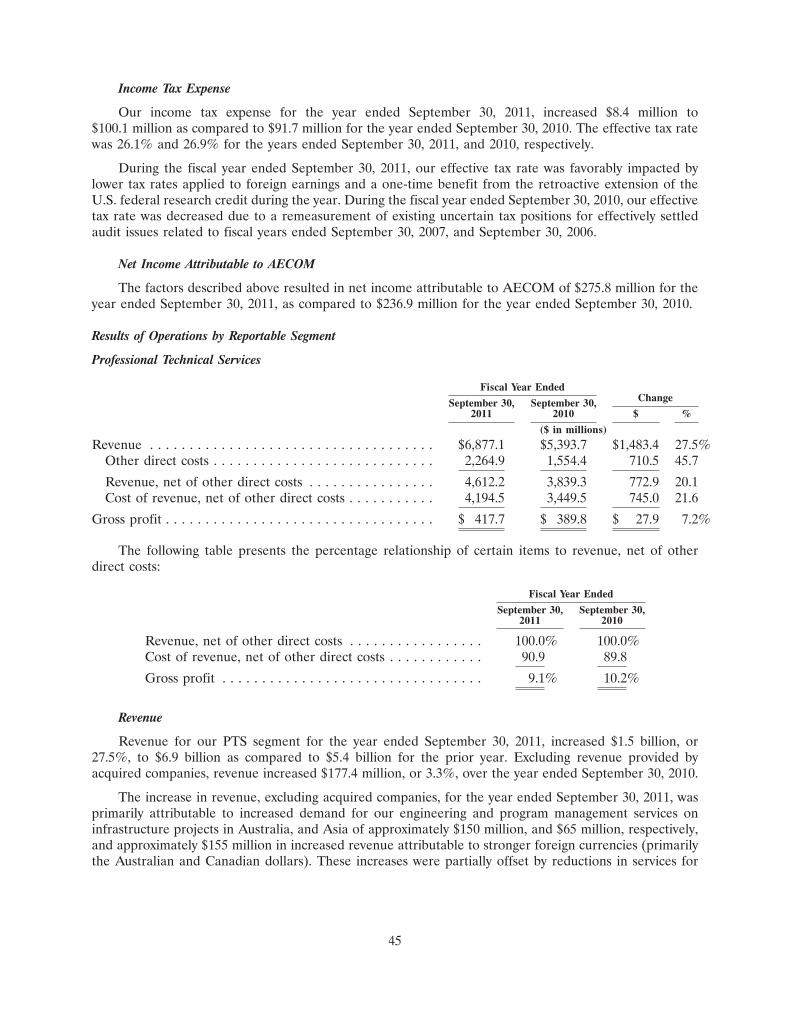
Income Tax Expense
Our income tax expense for the year ended September 30, 2011, increased $8.4 million to$100.1 million as compared to $91.7 million for the year ended September 30, 2010. The effective tax ratewas 26.1% and 26.9% for the years ended September 30, 2011, and 2010, respectively.
During the fiscal year ended September 30, 2011, our effective tax rate was favorably impacted bylower tax rates applied to foreign earnings and a one-time benefit from the retroactive extension of theU.S. federal research credit during the year. During the fiscal year ended September 30, 2010, our effectivetax rate was decreased due to a remeasurement of existing uncertain tax positions for effectively settledaudit issues related to fiscal years ended September 30, 2007, and September 30, 2006.
Net Income Attributable to AECOM
The factors described above resulted in net income attributable to AECOM of $275.8 million for theyear ended September 30, 2011, as compared to $236.9 million for the year ended September 30, 2010.
Results of Operations by Reportable Segment
Professional Technical Services
Fiscal Year EndedChangeSeptember 30, September 30,
2011 2010 $ %($ in millions)
Revenue . . . . . . . . . . . . . . . . . . . . . . . . . . . . . . . . . . . . $6,877.1 $5,393.7 $1,483.4 27.5%Other direct costs . . . . . . . . . . . . . . . . . . . . . . . . . . . . 2,264.9 1,554.4 710.5 45.7Revenue, net of other direct costs . . . . . . . . . . . . . . . . 4,612.2 3,839.3 772.9 20.1Cost of revenue, net of other direct costs . . . . . . . . . . . 4,194.5 3,449.5 745.0 21.6
Gross profit . . . . . . . . . . . . . . . . . . . . . . . . . . . . . . . . . . $ 417.7 $ 389.8 $ 27.9 7.2%
The following table presents the percentage relationship of certain items to revenue, net of otherdirect costs:
Fiscal Year EndedSeptember 30, September 30,
2011 2010
Revenue, net of other direct costs . . . . . . . . . . . . . . . . . 100.0% 100.0%Cost of revenue, net of other direct costs . . . . . . . . . . . . 90.9 89.8Gross profit . . . . . . . . . . . . . . . . . . . . . . . . . . . . . . . . . 9.1% 10.2%
Revenue
Revenue for our PTS segment for the year ended September 30, 2011, increased $1.5 billion, or27.5%, to $6.9 billion as compared to $5.4 billion for the prior year. Excluding revenue provided byacquired companies, revenue increased $177.4 million, or 3.3%, over the year ended September 30, 2010.
The increase in revenue, excluding acquired companies, for the year ended September 30, 2011, wasprimarily attributable to increased demand for our engineering and program management services oninfrastructure projects in Australia, and Asia of approximately $150 million, and $65 million, respectively,and approximately $155 million in increased revenue attributable to stronger foreign currencies (primarilythe Australian and Canadian dollars). These increases were partially offset by reductions in services for
45

clients in Libya, the United States, Europe and Canada of $90 million, $40 million, $40 million and$30 million, respectively.
Revenue, Net of Other Direct Costs
Revenue, net of other direct costs for our PTS segment for the year ended September 30, 2011,increased $772.9 million, or 20.1%, to $4.6 billion as compared to $3.8 billion for the prior year. Excludingrevenue, net of other direct costs provided by acquired companies, revenue, net of other direct costs,increased $150.7 million, or 3.9%, over the year ended September 30, 2010.
The increase in revenue, net of other direct costs, excluding acquired companies, for the year endedSeptember 30, 2011, was primarily attributable to increased demand for our engineering and programmanagement services on infrastructure projects in Australia and Asia of approximately $115 million and$55 million, respectively, and approximately $125 million in increased revenue, net of other direct costs,attributable to stronger foreign currencies (primarily the Australian and Canadian dollars). Theseincreases were partially offset by reductions in services in Libya, the United States and Europe of$55 million, $50 million and $35 million, respectively.
Gross Profit
Gross profit for our PTS segment for the year ended September 30, 2011, increased $27.9 million, or7.2%, to $417.7 million as compared to $389.8 million for the prior year. Excluding gross profit provided byacquired companies, gross profit decreased $5.3 million, or 1.4%. As a percentage of revenue, net of otherdirect costs, gross profit decreased to 9.1% of revenue, net of other direct costs, for the year endedSeptember 30, 2011, from 10.2% in the prior year.
The increase in gross profit for the year ended September 30, 2011, was primarily attributable to theincrease in revenue, net of other direct costs, pension curtailment gains of $4.2 million, and strongerforeign currencies (primarily the Australian and Canadian dollars) of $10 million, partially offset by a$24.5 million reduction resulting from the Libyan project. Additionally, challenges in our WesternEuropean business, particularly in the United Kingdom, led us to restructure certain portions of thisbusiness in order to reduce our cost structure, including facility exit and employee severance costs. Theresult of such actions resulted in expenses of $12 million during the fourth quarter ended September 30,2011.
Management Support Services
Fiscal Year EndedChangeSeptember 30, September 30,
2011 2010 $ %($ in millions)
Revenue . . . . . . . . . . . . . . . . . . . . . . . . . . . . . . . . . . . . $1,160.3 $1,152.1 $ 8.2 0.7%Other direct costs . . . . . . . . . . . . . . . . . . . . . . . . . . . . 591.7 785.6 (193.9) (24.7)Revenue, net of other direct costs . . . . . . . . . . . . . . . . 568.6 366.5 202.1 55.1Cost of revenue, net of other direct costs . . . . . . . . . . . 519.6 326.0 193.6 59.4
Gross profit . . . . . . . . . . . . . . . . . . . . . . . . . . . . . . . . . . $ 49.0 $ 40.5 $ 8.5 21.0%
46

The following table presents the percentage relationship of certain items to revenue, net of otherdirect costs:
Fiscal Year EndedSeptember 30, September 30,
2011 2010
Revenue, net of other direct costs . . . . . . . . . . . . . . . . . 100.0% 100.0%Cost of revenue, net of other direct costs . . . . . . . . . . . . 91.4 88.9Gross profit . . . . . . . . . . . . . . . . . . . . . . . . . . . . . . . . . 8.6% 11.1%
Revenue
Revenue for our MSS segment for the year ended September 30, 2011, increased $8.2 million, or0.7%, to $1.2 billion as compared to $1.2 billion for the prior year. Excluding revenue provided by acquiredcompanies, revenue decreased $297.3 million, or 25.8%, over the year ended September 30, 2010.
The decrease in revenue, excluding revenue provided by acquired companies, for the year endedSeptember 30, 2011, was primarily attributable to $355 million in decreased activity from our CombatSupport project with the U.S. government in the Middle East, which was completed in February 2011.
Revenue, Net of Other Direct Costs
Revenue, net of other direct costs for our MSS segment for the year ended September 30, 2011,increased $202.1 million, or 55.1%, to $568.6 million as compared to $366.5 million for the prior year.Excluding revenue, net of other direct costs provided by acquired companies, revenue, net of other directcosts, increased $50.5 million, or 13.8%, over the year ended September 30, 2010.
The increase in revenue, net of other direct costs, excluding acquired companies, for the year endedSeptember 30, 2011, was primarily attributable to increased activity of self-performed work for our globalmaintenance and support services for the United States Army and various projects with United Statessecurity and intelligence agencies.
Gross Profit
Gross profit for our MSS segment for the year ended September 30, 2011, increased $8.5 million, or21.0%, to $49.0 million as compared to $40.5 million for the prior year. Excluding gross profit provided byacquired companies, gross profit decreased $6.3 million, or 15.6%. As a percentage of revenue, net ofother direct costs, gross profit decreased to 8.6% in the year ended September 30, 2011, from 11.1% in theprior year.
The decrease in gross profit, excluding acquired companies, for the year ended September 30, 2011,was primarily attributable to decreased activity from our Combat Support project with the U.S.government in the Middle East, which was completed in February 2011.
The decrease in gross profit, as a percentage of revenue, net of other direct costs for the year endedSeptember 30, 2011, was primarily due to decreased activity from our Combat Support project and a depotmaintenance project for the United States Army.
Seasonality
We experience seasonal trends in our business. Our revenue is typically higher in the last half of thefiscal year. The fourth quarter of our fiscal year (July 1 to September 30) is typically our strongest quarter.We find that the U.S. Federal Government tends to authorize more work during the period preceding theend of our fiscal year, September 30. In addition, many U.S. state governments with fiscal years ending on
47
June 30 tend to accelerate spending during their first quarter, when new funding becomes available.Further, our construction management revenue typically increases during the high construction season ofthe summer months. Within the United States, as well as other parts of the world, our business generallybenefits from milder weather conditions in our fiscal fourth quarter, which allows for more productivityfrom our on-site civil services. Our construction and project management services also typically expandduring the high construction season of the summer months. The first quarter of our fiscal year (October 1to December 31) is typically our weakest quarter. The harsher weather conditions impact our ability tocomplete work in parts of North America and the holiday season schedule affects our productivity duringthis period. For these reasons, coupled with the number and significance of client contracts commencedand completed during a particular period, as well as the timing of expenses incurred for corporateinitiatives, it is not unusual for us to experience seasonal changes or fluctuations in our quarterly operatingresults.
Liquidity and Capital Resources
Cash Flows
Our principal sources of liquidity are cash flows from operations, borrowings under our creditfacilities, and access to financial markets. Our principal uses of cash are operating expenses, capitalexpenditures, working capital requirements, acquisitions, repurchases of stock under our stock repurchaseprogram and repayment of debt. We believe our anticipated sources of liquidity including operating cashflows, existing cash and cash equivalents, borrowing capacity under our revolving credit facility and ourability to issue debt or equity, if required, will be sufficient to meet our projected cash requirements for atleast the next 12 months. In the quarter ended September 30, 2011, we amended our term creditagreement to increase our bank term loans from $600 million to $750 million maturing July 2016, and alsoincreased our borrowing capacity to $1.05 billion under our revolving credit facility which expires in July2016.
At September 30, 2012, cash and cash equivalents were $593.8 million, an increase of $136.9 million,or 30.0%, from $456.9 million at September 30, 2011. The increase in cash and cash equivalents wasprimarily attributable to net cash provided by operating activities and a decrease in cash payments forbusiness acquisitions partially offset by our net repayment of borrowings.
Net cash provided by operating activities was $433.4 million for the year ended September 30, 2012,an increase of $301.4 million from $132.0 million for the year ended September 30, 2011. The increase wasprimarily attributable to the timing of receipts and payments of working capital, which include accountsreceivable, accounts payable, accrued expenses, and billings in excess of costs on uncompleted contracts.The increase provided by our accounts receivable was partially due to the sale of trade receivables to afinancial institution, of which $31.2 million was outstanding as of September 30, 2012, as discussed inNote 6, Accounts Receivable—Net, in the notes to our consolidated financial statements. We expect tocontinue to sell trade receivables in the future as long as the terms continue to remain favorable toAECOM. The change was also due to payments made in December 2010 for the $89.7 million settlementof our U.S. deferred compensation plan liability and a decrease of $60.0 million in excess tax benefit fromshare-based payments, which was primarily attributable to this plan’s equity distribution.
Net cash used in investing activities was $73.8 million for the year ended September 30, 2012,compared with $421.9 million for the year ended September 30, 2011. This decrease was primarilyattributable to a $353.0 million decrease in payments for business acquisitions, partially offset by a$63.3 million decrease in proceeds from the sale of investments in a rabbi trust due to the settlement of ourU.S. deferred compensation plan liability.
Net cash used in financing activities was $237.6 million for the year ended September 30, 2012,compared with net cash provided by financing activities of $137.5 million for the year ended September 30,2011. The change was primarily attributable to a $319.4 million decrease in net borrowings under credit
48
agreements, primarily due to reduced business combinations and a decrease of $60.0 million in excess taxbenefit from share-based payments, which was primarily attributable to our U.S. deferred compensationplan distribution in December 2010.
Working Capital
Working capital, or current assets less current liabilities, decreased $106.7 million, or 9.1%, to$1,068.9 million at September 30, 2012, from $1,175.6 million at September 30, 2011. Net accountsreceivable, which includes billed and unbilled costs and fees, net of billings in excess of costs onuncompleted contracts, increased $20.3 million, or 1.0%, to $2,075.6 million at September 30, 2012.
Accounts receivable increased 0.7%, or $15.7 million, to $2,395.9 million at September 30, 2012, from$2,380.2 million at September 30, 2011.
Days Sales Outstanding (DSO), including accounts receivable, net of billings in excess of costs onuncompleted contracts, excluding the effects of recent acquisitions, at September 30, 2012, was 91 dayscompared to the 88 days at September 30, 2011.
In Note 6, Accounts Receivable—Net, in the notes to our consolidated financial statements, acomparative analysis of the various components of accounts receivable is provided. Substantially allunbilled receivables are expected to be billed and collected within twelve months.
Unbilled receivables related to claims are recorded only if it is probable that the claim will result inadditional contract revenue and if the amount can be reliably estimated. In such cases, revenue is recordedonly to the extent that contract costs relating to the claim have been incurred. Other than as disclosed,there are no significant net receivables related to contract claims as of September 30, 2012 and 2011.Award fees in unbilled receivables are accrued only when there is sufficient information to assess contractperformance. On contracts that represent higher than normal risk or technical difficulty, award fees aregenerally deferred until an award fee letter is received.
Because our revenue depends to a great extent on billable labor hours, most of our charges areinvoiced following the end of the month in which the hours were worked, the majority usually within15 days. Other direct costs are normally billed along with labor hours. However, as opposed to salary costs,which are generally paid on either a bi-weekly or monthly basis, other direct costs are generally not paiduntil payment is received (in some cases in the form of advances) from the customers.
Debt
Debt consisted of the following:
September 30, September 30,2012 2011
(in millions)Unsecured term credit agreement . . . . . . . . . . . . . . . . . $ 750.0 $ 750.0Unsecured senior notes . . . . . . . . . . . . . . . . . . . . . . . . . 256.8 253.6Unsecured revolving credit facility . . . . . . . . . . . . . . . . . 24.0 101.4Notes secured by real properties . . . . . . . . . . . . . . . . . . 24.2 25.2Other debt . . . . . . . . . . . . . . . . . . . . . . . . . . . . . . . . . . 14.7 32.3
Total debt . . . . . . . . . . . . . . . . . . . . . . . . . . . . . . . . . 1,069.7 1,162.5Less: Current portion of debt and short-term borrowings (162.6) (17.8)
Long-term debt, less current portion . . . . . . . . . . . . . . $ 907.1 $1,144.7
49
The following table presents, in millions, scheduled maturities of our debt as of September 30, 2012:
Fiscal Year
2013 . . . . . . . . . . . . . . . . . . . . . . . . . . . . . . . . . . . . . . . . . . . . . . . . . . . $ 162.62014 . . . . . . . . . . . . . . . . . . . . . . . . . . . . . . . . . . . . . . . . . . . . . . . . . . . 152.12015 . . . . . . . . . . . . . . . . . . . . . . . . . . . . . . . . . . . . . . . . . . . . . . . . . . . 151.72016 . . . . . . . . . . . . . . . . . . . . . . . . . . . . . . . . . . . . . . . . . . . . . . . . . . . 325.82017 . . . . . . . . . . . . . . . . . . . . . . . . . . . . . . . . . . . . . . . . . . . . . . . . . . . 1.6Thereafter . . . . . . . . . . . . . . . . . . . . . . . . . . . . . . . . . . . . . . . . . . . . . . . 275.9
Total . . . . . . . . . . . . . . . . . . . . . . . . . . . . . . . . . . . . . . . . . . . . . . . . . $1,069.7
Unsecured Term Credit Agreement
In September 2011, we entered into an Amended and Restated Credit Agreement (the ‘‘Term CreditAgreement’’) with Bank of America, N.A., as administrative agent and a lender, and the other lendersparty thereto. Pursuant to the Term Credit Agreement, we borrowed $750 million in term loans on theclosing date and may borrow up to an additional $100 million in term loans upon our request subject tocertain conditions, including Company and lender approval. We used approximately $600 million of theproceeds from the loans to repay indebtedness under our prior term loan facility, approximately$147 million of the proceeds to pay down indebtedness under our revolving credit facility and a portion ofthe proceeds to pay fees and expenses related to the Term Credit Agreement. The loans under the TermCredit Agreement bear interest, at our option, at either the Base Rate (as defined in the Term CreditAgreement) plus an applicable margin or the Eurodollar Rate (as defined in the Term Credit Agreement)plus an applicable margin. The applicable margin for the Base Rate loans is a range of 0.375% to 1.50%and the applicable margin for Eurodollar Rate loans is a range of 1.375% to 2.50%, both based on ourdebt-to-earnings leverage ratio at the end of each fiscal quarter. The initial interest rate of the loansborrowed on September 30, 2011, was the 3 month Eurodollar rate plus 1.75%, or a total of 2.12%. For theyears ended September 30, 2012 and 2011, the average interest rate of our term loan facility was 2.19% and3.01%, respectively. Payments of the initial principal amount outstanding under the Term CreditAgreement are required on a quarterly basis beginning on December 31, 2012, while interest payments aremade on a quarterly basis beginning December 31, 2011. Any remaining principal of the loans under theTerm Credit Agreement is due no later than July 20, 2016. Accrued interest is payable in arrears on aquarterly basis for Base Rate loans, and at the end of the applicable interest period (but at least everythree months) for Eurodollar Rate loans. We may optionally prepay the loans at any time, without penalty.
Unsecured Senior Notes
In July 2010, we issued $300 million of notes to private institutional investors. The notes consisted of$175.0 million of 5.43% Senior Notes, Series A, due July 2020 and $125.0 million of 1.00% Senior DiscountNotes, Series B, due July 2022 for net proceeds of $249.8 million. The outstanding accreted balance ofSeries B Notes was $81.8 million and $78.6 million at September 30, 2012 and 2011, respectively, whichhave an effective interest rate of 5.62%. The fair value of our unsecured senior notes was approximately$277.8 million at September 30, 2012, and $259.2 million at September 30, 2011. We calculated the fairvalues based on model-derived valuations using market observable inputs, which are Level 2 inputs underthe accounting guidance. Our obligations under the notes are guaranteed by certain of our subsidiariespursuant to one or more subsidiary guarantees.
Unsecured Revolving Credit Facility
In July 2011, we entered into a Third Amended and Restated Credit Agreement (the ‘‘RevolvingCredit Agreement’’) with Bank of America, N.A., as an administrative agent and a lender and the other
50
lenders party thereto, which amended and restated our unsecured revolving credit facility and increasedour available borrowing capacity to $1.05 billion in order to support our working capital and acquisitionneeds. The Revolving Credit Agreement has an expiration date of July 20, 2016, and prior to thisexpiration date, principal amounts outstanding under the Revolving Credit Agreement may be repaid andreborrowed at our option without prepayment or penalty, subject to certain conditions. We may also, at ouroption, request an increase in the commitments under the facility up to a total of $1.15 billion, subject tocertain conditions, including Company and lender approval. The loans under the Revolving CreditAgreement may be borrowed in dollars or in certain foreign currencies and bear interest, at our option, ateither the Base Rate (as defined in the Revolving Credit Agreement) plus an applicable margin or theEurocurrency Rate (as defined in the Revolving Credit Agreement) plus an applicable margin. Theapplicable margin for the Base Rate loans is a range of 0.0% to 1.50% and the applicable margin forEurocurrency Rate loans is a range of 1.00% to 2.50%, both based on our debt-to-earnings leverage ratioat the end of each fiscal quarter. In addition to these borrowing rates, there is a commitment fee whichranges from 0.150% to 0.375% on any unused commitment. Accrued interest is payable in arrears on aquarterly basis for Base Rate loans, and at the end of the applicable interest period (but at least everythree months) for Eurocurrency Loans. At September 30, 2012 and 2011, $24.0 million and $101.4 million,respectively, were outstanding under our revolving credit facility. At September 30, 2012 and 2011,outstanding standby letters of credit totaled $35.1 million and $32.1 million, respectively, under ourrevolving credit facility. As of September 30, 2012, we had $990.9 million available under our RevolvingCredit Agreement.
Covenants and Restrictions
Under our debt agreements relating to our unsecured revolving credit facility and unsecured termcredit agreements, we are subject to a maximum consolidated leverage ratio at the end of any fiscalquarter. This ratio is calculated by dividing consolidated funded debt (including financial letters of credit)by consolidated earnings before interest, taxes, depreciation, and amortization (EBITDA). For our debtagreements, EBITDA is defined as consolidated net income attributable to AECOM plus interest,depreciation and amortization expense, amounts set aside for taxes and other non-cash items (including acalculated annualized EBITDA from our acquisitions). As of September 30, 2012, our consolidatedleverage ratio was 2.15, which did not exceed our most restrictive maximum consolidated leverage ratio of3.0.
Our Revolving Credit Agreement and Term Credit Agreement also contain certain covenants thatlimit our ability to, among other things, (i) merge with other entities, (ii) enter into a transaction resultingin a change of control, (iii) create new liens, (iv) sell assets outside of the ordinary course of business,(v) enter into transactions with affiliates, (vi) substantially change the general nature of the Company andits subsidiaries taken as a whole, and (vii) incur indebtedness and contingent obligations.
Additionally, our unsecured senior notes contain covenants that limit (i) certain types of indebtedness,which include indebtedness incurred by subsidiaries and indebtedness secured by a lien, (ii) merging withother entities, (iii) entering into a transaction resulting in a change of control, (iv) creating new liens,(v) selling assets outside of the ordinary course of business, (vi) entering into transactions with affiliates,and (vii) substantially changing the general nature of the Company and its subsidiaries taken as a whole.The unsecured senior notes also contain a financial covenant that requires us to maintain a net worthabove a calculated threshold. The threshold is calculated as $1.2 billion plus 40% of the consolidated netincome for each fiscal quarter commencing with the fiscal quarter ending June 30, 2010. In the calculationof this threshold, we cannot include a consolidated net loss that may occur in any fiscal quarter. Our networth for this financial covenant is defined as total AECOM stockholders’ equity, which is consolidatedstockholders’ equity, including any redeemable common stock and stock units and the liquidationpreference of any preferred stock. As of September 30, 2012, this amount was $2.2 billion, which exceedsthe calculated threshold of $1.5 billion.
51
Should we fail to comply with these covenants, all or a portion of our borrowings under the unsecuredsenior notes and unsecured term credit agreements could become immediately payable and our unsecuredrevolving credit facility could be terminated. At September 30, 2012, we were in compliance with all suchcovenants.
Our average effective interest rate on borrowings, including the effects of the swaps agreements, referto Note 11 in the notes to our consolidated financial statements for additional information regarding ourinterest rate swap agreements, during the years ended September 30, 2012 and 2011 was 3.1% and 3.3%,respectively.
Notes Secured by Real Properties
Notes secured by real properties, payable to a bank, were assumed in connection with a businessacquired during the year ended September 30, 2008. These notes payable bear interest at 6.04% perannum and mature in December 2028.
Other Debt
Other debt consists primarily of bank overdrafts and obligations under capital leases. In addition tothe revolving credit facility discussed above, at September 30, 2012, we had $470.1 million of unsecuredcredit facilities primarily used to cover periodic overdrafts and standby letters of credit, of which$209.8 million was utilized for outstanding standby letters of credit.
Commitments and Contingencies
Other than normal property and equipment additions and replacements, expenditures to further theimplementation of our Enterprise Resource Planning system, commitments under our incentivecompensation programs, amounts we may expend to repurchase stock under our stock repurchase programand acquisitions from time to time, we currently do not have any significant capital expenditures or outlaysplanned except as described below. However, as we acquire additional businesses in the future or if weembark on other capital-intensive initiatives, additional working capital may be required.
Under our unsecured revolving credit facility and other facilities discussed in Other Debt above, as ofSeptember 30, 2012, there was approximately $244.9 million outstanding under standby letters of creditissued primarily in connection with general and professional liability insurance programs and for contractperformance guarantees. For those projects for which we have issued a performance guarantee, if theproject subsequently fails to meet guaranteed performance standards, we may either incur significantadditional costs or be held responsible for the costs incurred by the client to achieve the requiredperformance standards.
We recognized on our balance sheet the funded status (measured as the difference between the fairvalue of plan assets and the projected benefit obligation) of our pension plans. The total amounts ofemployer contributions paid for the year ended September 30, 2012, were $13.2 million for U.S. plans and$17.2 million for non-U.S. plans. Funding requirements for each plan are determined based on the locallaws of the country where such plan resides. In certain countries, the funding requirements are mandatorywhile in other countries, they are discretionary. We do not have a required minimum contribution for ourdomestic plans; however, we may make additional discretionary contributions. In the future, such pensionfunding may increase or decrease depending on changes in the levels of interest rates, pension planperformance and other factors.
Combat Support Associates Joint Venture
As of September 30, 2012, we have settled the previously disclosed Combat Support AssociatesDefense Contract Audit Agency (DCAA) Form 1 matter.
52
Global Linguists Solutions Joint Venture
On October 5, 2011 and February 8, 2012, the DCAA issued DCAA Forms 1 questioning costsincurred by Global Linguists Solutions (GLS), an equity method joint venture, of which McNeilTechnologies Inc., which we acquired in August 2010, is an owner. The questioned costs were incurred byGLS during fiscal 2009, a period prior to the acquisition. Specifically, the DCAA questioned direct labor,associated burdens, and fees billed to the U.S. Government for linguists that allegedly did not meet specificcontract requirements. As a result of the issuance of the DCAA Forms 1, the U.S. Government haswithheld approximately $19 million from payments on current year billings pending final resolution.
GLS is performing a review of the issues raised in the Forms 1 in order to respond fully to thequestioned costs. Based on a review, GLS believes that the costs met the applicable contract requirements.
Additionally, on April 20, 2012, GLS received a subpoena from the Inspector General of the U.S.Department of Defense requesting documentation related to this contract with the United States Army.GLS plans to respond fully to the request. If the DCAA Forms 1 are not overruled and subsequent appealsare unsuccessful or there are unfavorable consequences from the Inspector General’s investigation, theseevents could have a material adverse effect on our results of operations.
AECOM Australia
In 2005 and 2006, our main Australian subsidiary, AECOM Australia Pty Ltd (AECOM Australia),performed a traffic forecast assignment for a client consortium as part of their project to design, build,finance and operate a tolled motorway tunnel in Australia. To fund the motorway’s design andconstruction, the client formed a special purpose vehicle (SPV) that raised approximately $700 millionAustralian dollars through an initial public offering (IPO) of equity units in 2006 and anotherapproximately $1.4 billion Australian dollars in long term bank loans. The SPV (and certain affiliatedSPVs) went into insolvency administrations in February 2011.
A class action lawsuit, which has been amended to include approximately 770 of the IPO investors,was filed against AECOM Australia in the Federal Court of Australia on May 31, 2012. Separately,KordaMentha, the receivers for the SPVs, filed a lawsuit in the Federal Court of Australia on May 14,2012, claiming damages that purportedly resulted from AECOM Australia’s role in connection with theabove described traffic forecast. WestLB, one of the lending banks to the SPVs, filed a lawsuit in theFederal Court of Australia on May 18, 2012. Centerbridge Credit Partners (and a number of relatedentities) and Midtown Acquisitions (and a number of related entities), both claiming to be assignees ofcertain other lending banks, previously filed their own proceedings in the Federal Court of Australia andthen subsequently withdrew the lawsuits. None of the lawsuits specify the amount of damages sought andthe damages sought by WestLB are duplicative of damages already included in the receivers’ claim.
AECOM Australia intends to vigorously defend the claims brought against it.
Hawaii Project
The U.S. Attorney’s Office (USAO) informed us that the USAO and the U.S. EnvironmentalProtection Agency are investigating potential criminal charges in connection with services our subsidiaryprovided to the operator of the Waimanalo Gulch Sanitary Landfill in Hawaii. We have cooperated fullywith the investigation and, as of this date, no actions have been filed. We believe that the investigation willshow that there has been no criminal wrongdoing on our part or any of our subsidiaries and, if any actionsare brought, we intend to vigorously defend against such actions.
The services performed by the subsidiary included the preparation of a pollution control plan, whichthe operator used to obtain permits necessary for the operation of the landfill. The USAO is investigatingwhether flooding at the landfill that resulted in the discharge of waste materials and storm water into the
53
Pacific Ocean in December 2010 and January 2011 was due in part to reliance on information contained inthe plan prepared by our subsidiary.
Contractual Obligations and Commitments
The following summarizes our contractual obligations and commercial commitments as ofSeptember 30, 2012:
Less than One to Three to More thanContractual Obligations and Commitments Total One Year Three Years Five Years Five Years
(in millions)Debt . . . . . . . . . . . . . . . . . . . . . . . . . . . . . . . . $1,069.7 $162.6 $303.8 $327.4 $275.9Interest on debt . . . . . . . . . . . . . . . . . . . . . . . 166.8 22.8 42.2 36.0 65.8Operating leases . . . . . . . . . . . . . . . . . . . . . . . 1,059.3 201.6 315.3 222.5 319.9Other . . . . . . . . . . . . . . . . . . . . . . . . . . . . . . . 39.6 39.6 — — —Pension obligations . . . . . . . . . . . . . . . . . . . . . 353.7 35.3 63.8 67.9 186.7Total contractual obligations and commitments . $2,689.1 $461.9 $725.1 $653.8 $848.3
New Accounting Pronouncements and Changes in Accounting
In January 2010, the Financial Accounting Standards Board (FASB) issued guidance to amend thedisclosure requirements related to fair value measurements. We adopted this guidance for the quarterended March 31, 2010, except for the portion of the guidance that requires the disclosure of activities onpurchases, sales, issuance, and settlements of the assets and liabilities measured using significantunobservable inputs (Level 3 fair value measurements). The Level 3 fair value measurement guidance wasadopted by us in our fiscal year beginning October 1, 2011. Since the Company carried no material Level 3assets or liabilities during the period, the adoption of the separate disclosures related to Level 3measurements did not have a material impact on our consolidated financial statements. Additionally, theFASB issued a new accounting standard on fair value measurements that changes certain fair valuemeasurement principles, clarifies the requirement for measuring fair value and expands disclosurerequirements, particularly for Level 3 fair value measurements. This guidance was effective for us in oursecond quarter ending March 31, 2012, and did not have a material impact on our consolidated financialstatements.
In June 2011, the FASB issued guidance on the presentation of comprehensive income. The newstandard will require companies to present items of net income, items of other comprehensive income andtotal comprehensive income in one continuous statement or two separate consecutive statements, andcompanies will no longer be allowed to present items of other comprehensive income in the statement ofstockholders’ equity. This guidance is effective for us in our fiscal year beginning October 1, 2012, and,although it will change the financial statement presentation, it is not expected to have a material impact onour financial condition or results of operations.
In September 2011, the FASB issued guidance intended to simplify goodwill impairment testing.Entities are allowed to perform a qualitative assessment to determine whether it is more likely than notthat the fair value of a reporting unit is less than its carrying amount as a basis for determining whether it isnecessary to perform the two-step goodwill impairment test. This guidance is effective for goodwillimpairment tests performed in interim and annual periods for fiscal years beginning after December 15,2011, with early adoption permitted. We do not expect this guidance will have a material impact on ourconsolidated financial statements.
54
Off-Balance Sheet Arrangements
We enter into various joint venture arrangements to provide architectural, engineering, programmanagement, construction management and operations and maintenance services. The ownershippercentage of these joint ventures is typically representative of the work to be performed or the amount ofrisk assumed by each joint venture partner. Some of these joint ventures are considered variable interestentities. We have consolidated all joint ventures for which we have control. For all others, our portion ofthe earnings are recorded in equity in earnings of joint ventures. See Note 8 in the notes to ourconsolidated financial statements. We do not believe that we have any off-balance sheet arrangements thathave or are reasonably likely to have a current or future effect on our financial condition, changes infinancial condition, revenues or expenses, results of operations, liquidity, capital expenditures or capitalresources that would be material to investors.
ITEM 7A. QUANTITATIVE AND QUALITATIVE DISCLOSURES ABOUT MARKET RISK
Financial Market Risks
We are exposed to market risk, primarily related to foreign currency exchange rates and interest rateexposure of our debt obligations that bear interest based on floating rates. We actively monitor theseexposures. Our objective is to reduce, where we deem appropriate to do so, fluctuations in earnings andcash flows associated with changes in foreign exchange rates and interest rates. In the past, we haveentered into derivative financial instruments, such as forward contracts and interest rate hedge contracts. Itis our policy and practice to use derivative financial instruments only to the extent necessary to manage ourexposures. We do not use derivative financial instruments for trading purposes.
Foreign Exchange Rates
We are exposed to foreign currency exchange rate risk resulting from our operations outside of theU.S. We do not comprehensively hedge our exposure to currency rate changes; however, our exposure toforeign currency fluctuations is limited in that most of our contracts require client payments to be incurrencies corresponding to the currency in which costs are incurred. As a result, we typically do not needto hedge most foreign currency cash flows for contract work performed. The functional currency of oursignificant foreign operations is the local currency.
Interest Rates
Our senior revolving credit facility and certain other debt obligations are subject to variable rateinterest which could be adversely affected by an increase in interest rates. As of September 30, 2012 and2011, we had $774.0 million and $851.4 million, respectively, outstanding borrowings under our creditfacility and our term credit agreements. Interest on amounts borrowed under the credit facility and ourterm credit agreements is subject to adjustment based on certain levels of financial performance. Theseborrowings are at offshore rates, for which the applicable margin added can range from 1% to 2.5%. Forthe year ended September 30, 2012, our weighted average floating rate borrowings were $413.5 million. Ifshort term floating interest rates had increased or decreased by 1%, our annual interest expense wouldhave increased or decreased by $4.1 million. We invest our cash in a variety of financial instruments,consisting principally of money market securities or other highly liquid, short-term securities that aresubject to minimal credit and market risk.
55
ITEM 8. FINANCIAL STATEMENTS AND SUPPLEMENTARY DATA
AECOM Technology CorporationIndex to Consolidated Financial Statements
September 30, 2012
Audited Annual Financial StatementsReports of Independent Registered Public Accounting Firm . . . . . . . . . . . . . . . . . . . . . . . . . . . . . 57Consolidated Balance Sheets at September 30, 2012 and 2011 . . . . . . . . . . . . . . . . . . . . . . . . . . . 59Consolidated Statements of Operations for the Years Ended September 30, 2012, 2011 and 2010 . . 60Consolidated Statements of Stockholders’ Equity for the Years Ended September 30, 2012, 2011
and 2010 . . . . . . . . . . . . . . . . . . . . . . . . . . . . . . . . . . . . . . . . . . . . . . . . . . . . . . . . . . . . . . . . 61Consolidated Statements of Cash Flows for the Years Ended September 30, 2012, 2011 and 2010 . 62Notes to Consolidated Financial Statements . . . . . . . . . . . . . . . . . . . . . . . . . . . . . . . . . . . . . . . . 63
56
Report of Independent Registered Public Accounting Firm
The Board of Directors and stockholders ofAECOM Technology Corporation
We have audited the accompanying consolidated balance sheets of AECOM Technology Corporation(the ‘‘Company’’) as of September 30, 2012 and 2011, and the related consolidated statements ofoperations, stockholders’ equity, and cash flows for each of the three years in the period endedSeptember 30, 2012. These financial statements are the responsibility of the Company’s management. Ourresponsibility is to express an opinion on these financial statements based on our audits.
We conducted our audits in accordance with the standards of the Public Company AccountingOversight Board (United States). Those standards require that we plan and perform the audits to obtainreasonable assurance about whether the financial statements are free of material misstatement. An auditincludes examining, on a test basis, evidence supporting the amounts and disclosures in the financialstatements. An audit also includes assessing the accounting principles used and significant estimates madeby management, as well as evaluating the overall financial statement presentation. We believe that ouraudits provide a reasonable basis for our opinion.
In our opinion, the financial statements referred to above present fairly, in all material respects, theconsolidated financial position of AECOM Technology Corporation at September 30, 2012 and 2011, andthe consolidated results of its operations and its cash flows for each of the three years in the period endedSeptember 30, 2012, in conformity with U.S. generally accepted accounting principles.
We also have audited, in accordance with the standards of the Public Company Accounting OversightBoard (United States), AECOM Technology Corporation’s internal control over financial reporting as ofSeptember 30, 2012, based on criteria established in Internal Control—Integrated Framework issued bythe Committee of Sponsoring Organizations of the Treadway and our report dated November 16, 2012expressed an unqualified opinion thereon.
Our audit was conducted for the purpose of forming an opinion on the financial statements as awhole. The information contained in Schedule II: Valuation and Qualifying Accounts included in Item 8 onpage 108 of the Form 10-K is presented for purposes of additional analysis and is not a required part of thefinancial statements. Such information is the responsibility of management and was derived from andrelates directly to the underlying accounting and other records used to prepare the financial statements.The information has been subjected to the auditing procedures applied in the audit of the financialstatements and certain additional procedures, including comparing and reconciling such informationdirectly to the underlying accounting and other records used to prepare the financial statements or to thefinancial statements themselves, and other additional procedures in accordance with auditing standardsgenerally accepted in the United States of America. In our opinion, the information is fairly stated in allmaterial respects in relation to the financial statements as a whole.
/s/ ERNST & YOUNG LLP
Los Angeles, CaliforniaNovember 16, 2012
57
Report of Independent Registered Public Accounting Firm
The Board of Directors and stockholders ofAECOM Technology Corporation
We have audited AECOM Technology Corporation’s (the ‘‘Company’’) internal control over financialreporting as of September 30, 2012, based on criteria established in Internal Control—IntegratedFramework issued by the Committee of Sponsoring Organizations of the Treadway Commission (the‘‘COSO criteria’’). AECOM Technology Corporation’s management is responsible for maintainingeffective internal control over financial reporting, and for its assessment of the effectiveness of internalcontrol over financial reporting included in the accompanying Management’s Report on Internal Controlover Financial Reporting. Our responsibility is to express an opinion on the company’s internal controlover financial reporting based on our audit.
We conducted our audit in accordance with the standards of the Public Company AccountingOversight Board (United States). Those standards require that we plan and perform the audit to obtainreasonable assurance about whether effective internal control over financial reporting was maintained inall material respects. Our audit included obtaining an understanding of internal control over financialreporting, assessing the risk that a material weakness exists, testing and evaluating the design andoperating effectiveness of internal control based on the assessed risk, and performing such otherprocedures as we considered necessary in the circumstances. We believe that our audit provides areasonable basis for our opinion.
A company’s internal control over financial reporting is a process designed to provide reasonableassurance regarding the reliability of financial reporting and the preparation of financial statements forexternal purposes in accordance with generally accepted accounting principles. A company’s internalcontrol over financial reporting includes those policies and procedures that (1) pertain to the maintenanceof records that, in reasonable detail, accurately and fairly reflect the transactions and dispositions of theassets of the company; (2) provide reasonable assurance that transactions are recorded as necessary topermit preparation of financial statements in accordance with generally accepted accounting principles,and that receipts and expenditures of the company are being made only in accordance with authorizationsof management and directors of the company; and (3) provide reasonable assurance regarding preventionor timely detection of unauthorized acquisition, use or disposition of the company’s assets that could havea material effect on the financial statements.
Because of its inherent limitations, internal control over financial reporting may not prevent or detectmisstatements. Also, projections of any evaluation of effectiveness to future periods are subject to the riskthat controls may become inadequate because of changes in conditions, or that the degree of compliancewith the policies or procedures may deteriorate.
In our opinion, AECOM Technology Corporation maintained, in all material respects, effectiveinternal control over financial reporting as of September 30, 2012, based on the COSO criteria.
We also have audited, in accordance with the standards of the Public Company Accounting OversightBoard (United States), the consolidated balance sheets of AECOM Technology Corporation as ofSeptember 30, 2012 and 2011, and the related consolidated statements of operations, stockholders’ equity,and cash flows for each of the three years in the period ended September 30, 2012 and our report datedNovember 16, 2012 expressed an unqualified opinion thereon.
/s/ ERNST & YOUNG LLP
Los Angeles, CaliforniaNovember 16, 2012
58
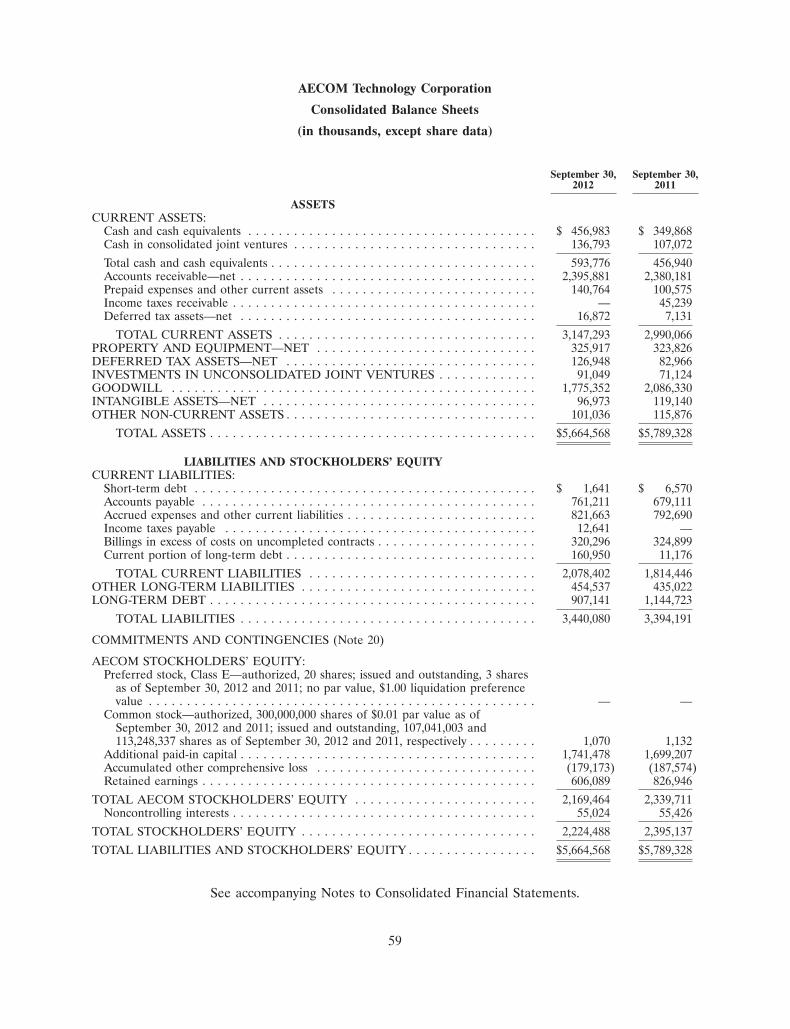
AECOM Technology Corporation
Consolidated Balance Sheets
(in thousands, except share data)
September 30, September 30,2012 2011
ASSETSCURRENT ASSETS:
Cash and cash equivalents . . . . . . . . . . . . . . . . . . . . . . . . . . . . . . . . . . . . . . $ 456,983 $ 349,868Cash in consolidated joint ventures . . . . . . . . . . . . . . . . . . . . . . . . . . . . . . . . 136,793 107,072Total cash and cash equivalents . . . . . . . . . . . . . . . . . . . . . . . . . . . . . . . . . . . 593,776 456,940Accounts receivable—net . . . . . . . . . . . . . . . . . . . . . . . . . . . . . . . . . . . . . . . 2,395,881 2,380,181Prepaid expenses and other current assets . . . . . . . . . . . . . . . . . . . . . . . . . . . 140,764 100,575Income taxes receivable . . . . . . . . . . . . . . . . . . . . . . . . . . . . . . . . . . . . . . . . — 45,239Deferred tax assets—net . . . . . . . . . . . . . . . . . . . . . . . . . . . . . . . . . . . . . . . 16,872 7,131
TOTAL CURRENT ASSETS . . . . . . . . . . . . . . . . . . . . . . . . . . . . . . . . . . 3,147,293 2,990,066PROPERTY AND EQUIPMENT—NET . . . . . . . . . . . . . . . . . . . . . . . . . . . . . 325,917 323,826DEFERRED TAX ASSETS—NET . . . . . . . . . . . . . . . . . . . . . . . . . . . . . . . . . 126,948 82,966INVESTMENTS IN UNCONSOLIDATED JOINT VENTURES . . . . . . . . . . . . . 91,049 71,124GOODWILL . . . . . . . . . . . . . . . . . . . . . . . . . . . . . . . . . . . . . . . . . . . . . . . . 1,775,352 2,086,330INTANGIBLE ASSETS—NET . . . . . . . . . . . . . . . . . . . . . . . . . . . . . . . . . . . . 96,973 119,140OTHER NON-CURRENT ASSETS . . . . . . . . . . . . . . . . . . . . . . . . . . . . . . . . . 101,036 115,876
TOTAL ASSETS . . . . . . . . . . . . . . . . . . . . . . . . . . . . . . . . . . . . . . . . . . . $5,664,568 $5,789,328
LIABILITIES AND STOCKHOLDERS’ EQUITYCURRENT LIABILITIES:
Short-term debt . . . . . . . . . . . . . . . . . . . . . . . . . . . . . . . . . . . . . . . . . . . . . $ 1,641 $ 6,570Accounts payable . . . . . . . . . . . . . . . . . . . . . . . . . . . . . . . . . . . . . . . . . . . . 761,211 679,111Accrued expenses and other current liabilities . . . . . . . . . . . . . . . . . . . . . . . . . 821,663 792,690Income taxes payable . . . . . . . . . . . . . . . . . . . . . . . . . . . . . . . . . . . . . . . . . 12,641 —Billings in excess of costs on uncompleted contracts . . . . . . . . . . . . . . . . . . . . . 320,296 324,899Current portion of long-term debt . . . . . . . . . . . . . . . . . . . . . . . . . . . . . . . . . 160,950 11,176
TOTAL CURRENT LIABILITIES . . . . . . . . . . . . . . . . . . . . . . . . . . . . . . 2,078,402 1,814,446OTHER LONG-TERM LIABILITIES . . . . . . . . . . . . . . . . . . . . . . . . . . . . . . . 454,537 435,022LONG-TERM DEBT . . . . . . . . . . . . . . . . . . . . . . . . . . . . . . . . . . . . . . . . . . . 907,141 1,144,723
TOTAL LIABILITIES . . . . . . . . . . . . . . . . . . . . . . . . . . . . . . . . . . . . . . . 3,440,080 3,394,191
COMMITMENTS AND CONTINGENCIES (Note 20)
AECOM STOCKHOLDERS’ EQUITY:Preferred stock, Class E—authorized, 20 shares; issued and outstanding, 3 shares
as of September 30, 2012 and 2011; no par value, $1.00 liquidation preferencevalue . . . . . . . . . . . . . . . . . . . . . . . . . . . . . . . . . . . . . . . . . . . . . . . . . . . — —
Common stock—authorized, 300,000,000 shares of $0.01 par value as ofSeptember 30, 2012 and 2011; issued and outstanding, 107,041,003 and113,248,337 shares as of September 30, 2012 and 2011, respectively . . . . . . . . . 1,070 1,132
Additional paid-in capital . . . . . . . . . . . . . . . . . . . . . . . . . . . . . . . . . . . . . . . 1,741,478 1,699,207Accumulated other comprehensive loss . . . . . . . . . . . . . . . . . . . . . . . . . . . . . (179,173) (187,574)Retained earnings . . . . . . . . . . . . . . . . . . . . . . . . . . . . . . . . . . . . . . . . . . . . 606,089 826,946
TOTAL AECOM STOCKHOLDERS’ EQUITY . . . . . . . . . . . . . . . . . . . . . . . . 2,169,464 2,339,711Noncontrolling interests . . . . . . . . . . . . . . . . . . . . . . . . . . . . . . . . . . . . . . . . 55,024 55,426
TOTAL STOCKHOLDERS’ EQUITY . . . . . . . . . . . . . . . . . . . . . . . . . . . . . . . 2,224,488 2,395,137TOTAL LIABILITIES AND STOCKHOLDERS’ EQUITY . . . . . . . . . . . . . . . . . $5,664,568 $5,789,328
See accompanying Notes to Consolidated Financial Statements.
59
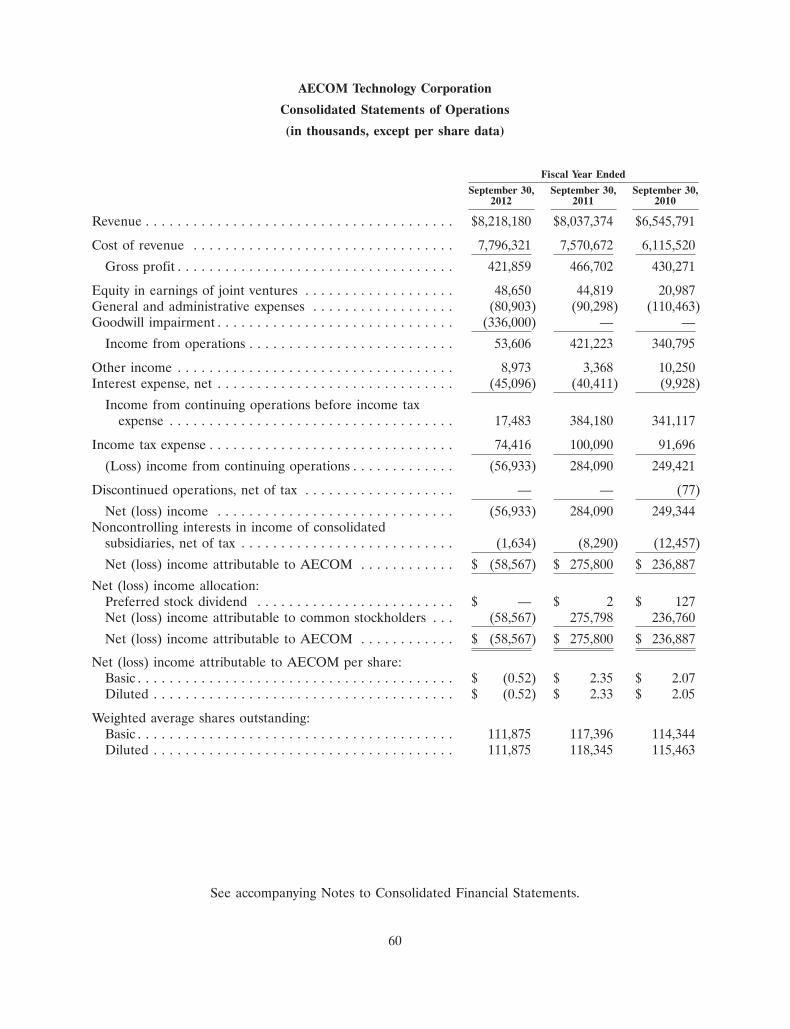
AECOM Technology Corporation
Consolidated Statements of Operations
(in thousands, except per share data)
Fiscal Year EndedSeptember 30, September 30, September 30,
2012 2011 2010
Revenue . . . . . . . . . . . . . . . . . . . . . . . . . . . . . . . . . . . . . . . $8,218,180 $8,037,374 $6,545,791
Cost of revenue . . . . . . . . . . . . . . . . . . . . . . . . . . . . . . . . . 7,796,321 7,570,672 6,115,520Gross profit . . . . . . . . . . . . . . . . . . . . . . . . . . . . . . . . . . . 421,859 466,702 430,271
Equity in earnings of joint ventures . . . . . . . . . . . . . . . . . . . 48,650 44,819 20,987General and administrative expenses . . . . . . . . . . . . . . . . . . (80,903) (90,298) (110,463)Goodwill impairment . . . . . . . . . . . . . . . . . . . . . . . . . . . . . . (336,000) — —
Income from operations . . . . . . . . . . . . . . . . . . . . . . . . . . 53,606 421,223 340,795
Other income . . . . . . . . . . . . . . . . . . . . . . . . . . . . . . . . . . . 8,973 3,368 10,250Interest expense, net . . . . . . . . . . . . . . . . . . . . . . . . . . . . . . (45,096) (40,411) (9,928)
Income from continuing operations before income taxexpense . . . . . . . . . . . . . . . . . . . . . . . . . . . . . . . . . . . . 17,483 384,180 341,117
Income tax expense . . . . . . . . . . . . . . . . . . . . . . . . . . . . . . . 74,416 100,090 91,696(Loss) income from continuing operations . . . . . . . . . . . . . (56,933) 284,090 249,421
Discontinued operations, net of tax . . . . . . . . . . . . . . . . . . . — — (77)Net (loss) income . . . . . . . . . . . . . . . . . . . . . . . . . . . . . . (56,933) 284,090 249,344
Noncontrolling interests in income of consolidatedsubsidiaries, net of tax . . . . . . . . . . . . . . . . . . . . . . . . . . . (1,634) (8,290) (12,457)Net (loss) income attributable to AECOM . . . . . . . . . . . . $ (58,567) $ 275,800 $ 236,887
Net (loss) income allocation:Preferred stock dividend . . . . . . . . . . . . . . . . . . . . . . . . . $ — $ 2 $ 127Net (loss) income attributable to common stockholders . . . (58,567) 275,798 236,760Net (loss) income attributable to AECOM . . . . . . . . . . . . $ (58,567) $ 275,800 $ 236,887
Net (loss) income attributable to AECOM per share:Basic . . . . . . . . . . . . . . . . . . . . . . . . . . . . . . . . . . . . . . . . $ (0.52) $ 2.35 $ 2.07Diluted . . . . . . . . . . . . . . . . . . . . . . . . . . . . . . . . . . . . . . $ (0.52) $ 2.33 $ 2.05
Weighted average shares outstanding:Basic . . . . . . . . . . . . . . . . . . . . . . . . . . . . . . . . . . . . . . . . 111,875 117,396 114,344Diluted . . . . . . . . . . . . . . . . . . . . . . . . . . . . . . . . . . . . . . 111,875 118,345 115,463
See accompanying Notes to Consolidated Financial Statements.
60
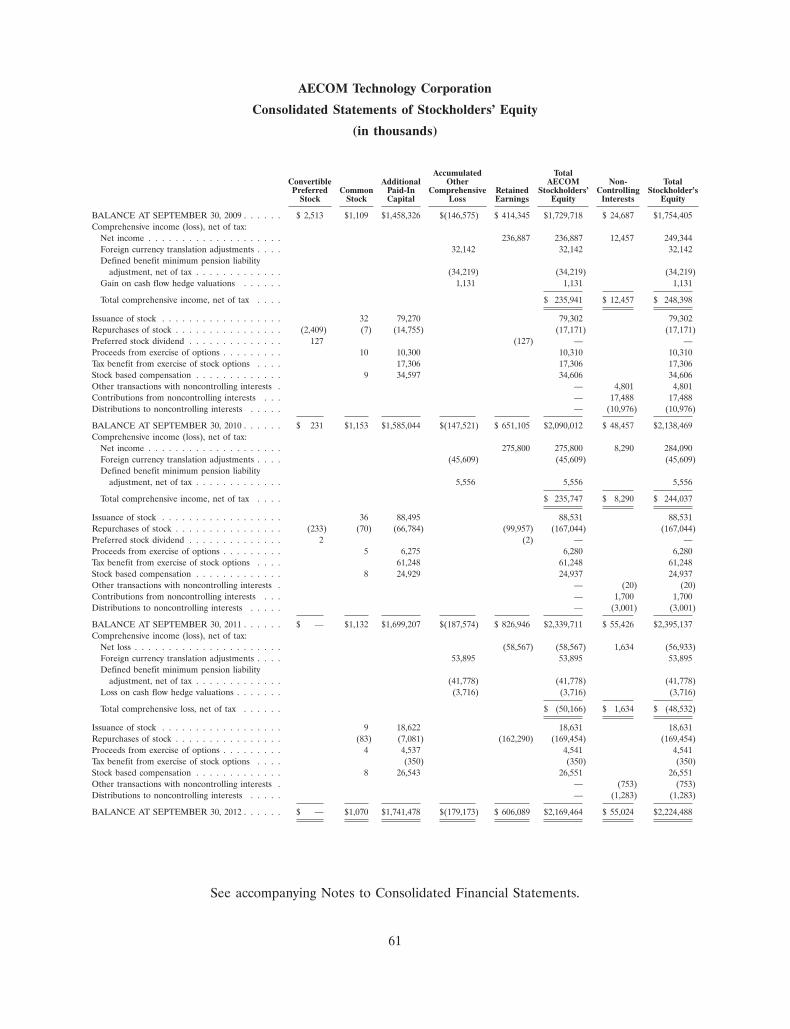
AECOM Technology Corporation
Consolidated Statements of Stockholders’ Equity
(in thousands)
Accumulated TotalConvertible Additional Other AECOM Non- TotalPreferred Common Paid-In Comprehensive Retained Stockholders’ Controlling Stockholder’s
Stock Stock Capital Loss Earnings Equity Interests Equity
BALANCE AT SEPTEMBER 30, 2009 . . . . . . $ 2,513 $1,109 $1,458,326 $(146,575) $ 414,345 $1,729,718 $ 24,687 $1,754,405Comprehensive income (loss), net of tax:
Net income . . . . . . . . . . . . . . . . . . . . 236,887 236,887 12,457 249,344Foreign currency translation adjustments . . . . 32,142 32,142 32,142Defined benefit minimum pension liability
adjustment, net of tax . . . . . . . . . . . . . (34,219) (34,219) (34,219)Gain on cash flow hedge valuations . . . . . . 1,131 1,131 1,131
Total comprehensive income, net of tax . . . . $ 235,941 $ 12,457 $ 248,398
Issuance of stock . . . . . . . . . . . . . . . . . . 32 79,270 79,302 79,302Repurchases of stock . . . . . . . . . . . . . . . . (2,409) (7) (14,755) (17,171) (17,171)Preferred stock dividend . . . . . . . . . . . . . . 127 (127) — —Proceeds from exercise of options . . . . . . . . . 10 10,300 10,310 10,310Tax benefit from exercise of stock options . . . . 17,306 17,306 17,306Stock based compensation . . . . . . . . . . . . . 9 34,597 34,606 34,606Other transactions with noncontrolling interests . — 4,801 4,801Contributions from noncontrolling interests . . . — 17,488 17,488Distributions to noncontrolling interests . . . . . — (10,976) (10,976)
BALANCE AT SEPTEMBER 30, 2010 . . . . . . $ 231 $1,153 $1,585,044 $(147,521) $ 651,105 $2,090,012 $ 48,457 $2,138,469Comprehensive income (loss), net of tax:
Net income . . . . . . . . . . . . . . . . . . . . 275,800 275,800 8,290 284,090Foreign currency translation adjustments . . . . (45,609) (45,609) (45,609)Defined benefit minimum pension liability
adjustment, net of tax . . . . . . . . . . . . . 5,556 5,556 5,556
Total comprehensive income, net of tax . . . . $ 235,747 $ 8,290 $ 244,037
Issuance of stock . . . . . . . . . . . . . . . . . . 36 88,495 88,531 88,531Repurchases of stock . . . . . . . . . . . . . . . . (233) (70) (66,784) (99,957) (167,044) (167,044)Preferred stock dividend . . . . . . . . . . . . . . 2 (2) — —Proceeds from exercise of options . . . . . . . . . 5 6,275 6,280 6,280Tax benefit from exercise of stock options . . . . 61,248 61,248 61,248Stock based compensation . . . . . . . . . . . . . 8 24,929 24,937 24,937Other transactions with noncontrolling interests . — (20) (20)Contributions from noncontrolling interests . . . — 1,700 1,700Distributions to noncontrolling interests . . . . . — (3,001) (3,001)
BALANCE AT SEPTEMBER 30, 2011 . . . . . . $ — $1,132 $1,699,207 $(187,574) $ 826,946 $2,339,711 $ 55,426 $2,395,137Comprehensive income (loss), net of tax:
Net loss . . . . . . . . . . . . . . . . . . . . . . (58,567) (58,567) 1,634 (56,933)Foreign currency translation adjustments . . . . 53,895 53,895 53,895Defined benefit minimum pension liability
adjustment, net of tax . . . . . . . . . . . . . (41,778) (41,778) (41,778)Loss on cash flow hedge valuations . . . . . . . (3,716) (3,716) (3,716)
Total comprehensive loss, net of tax . . . . . . $ (50,166) $ 1,634 $ (48,532)
Issuance of stock . . . . . . . . . . . . . . . . . . 9 18,622 18,631 18,631Repurchases of stock . . . . . . . . . . . . . . . . (83) (7,081) (162,290) (169,454) (169,454)Proceeds from exercise of options . . . . . . . . . 4 4,537 4,541 4,541Tax benefit from exercise of stock options . . . . (350) (350) (350)Stock based compensation . . . . . . . . . . . . . 8 26,543 26,551 26,551Other transactions with noncontrolling interests . — (753) (753)Distributions to noncontrolling interests . . . . . — (1,283) (1,283)
BALANCE AT SEPTEMBER 30, 2012 . . . . . . $ — $1,070 $1,741,478 $(179,173) $ 606,089 $2,169,464 $ 55,024 $2,224,488
See accompanying Notes to Consolidated Financial Statements.
61
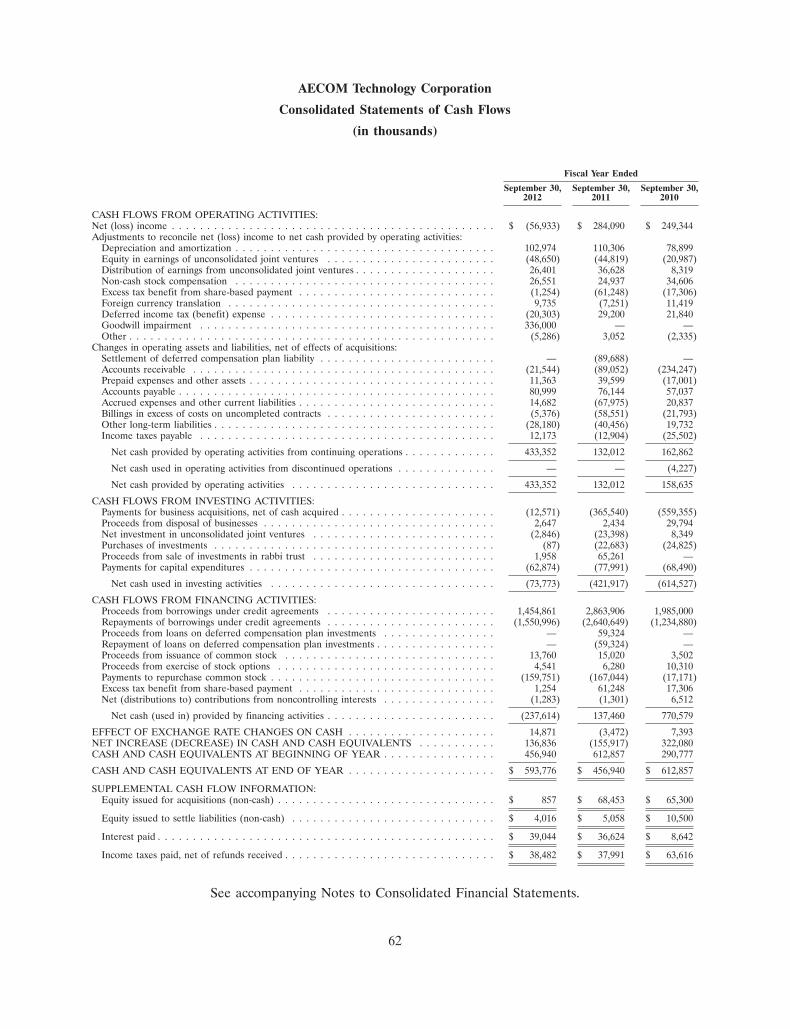
AECOM Technology Corporation
Consolidated Statements of Cash Flows
(in thousands)
Fiscal Year Ended
September 30, September 30, September 30,2012 2011 2010
CASH FLOWS FROM OPERATING ACTIVITIES:Net (loss) income . . . . . . . . . . . . . . . . . . . . . . . . . . . . . . . . . . . . . . . . . . . . . . $ (56,933) $ 284,090 $ 249,344Adjustments to reconcile net (loss) income to net cash provided by operating activities:
Depreciation and amortization . . . . . . . . . . . . . . . . . . . . . . . . . . . . . . . . . . . . . 102,974 110,306 78,899Equity in earnings of unconsolidated joint ventures . . . . . . . . . . . . . . . . . . . . . . . . (48,650) (44,819) (20,987)Distribution of earnings from unconsolidated joint ventures . . . . . . . . . . . . . . . . . . . . 26,401 36,628 8,319Non-cash stock compensation . . . . . . . . . . . . . . . . . . . . . . . . . . . . . . . . . . . . . 26,551 24,937 34,606Excess tax benefit from share-based payment . . . . . . . . . . . . . . . . . . . . . . . . . . . . (1,254) (61,248) (17,306)Foreign currency translation . . . . . . . . . . . . . . . . . . . . . . . . . . . . . . . . . . . . . . 9,735 (7,251) 11,419Deferred income tax (benefit) expense . . . . . . . . . . . . . . . . . . . . . . . . . . . . . . . . (20,303) 29,200 21,840Goodwill impairment . . . . . . . . . . . . . . . . . . . . . . . . . . . . . . . . . . . . . . . . . . 336,000 — —Other . . . . . . . . . . . . . . . . . . . . . . . . . . . . . . . . . . . . . . . . . . . . . . . . . . . . (5,286) 3,052 (2,335)
Changes in operating assets and liabilities, net of effects of acquisitions:Settlement of deferred compensation plan liability . . . . . . . . . . . . . . . . . . . . . . . . . — (89,688) —Accounts receivable . . . . . . . . . . . . . . . . . . . . . . . . . . . . . . . . . . . . . . . . . . . (21,544) (89,052) (234,247)Prepaid expenses and other assets . . . . . . . . . . . . . . . . . . . . . . . . . . . . . . . . . . . 11,363 39,599 (17,001)Accounts payable . . . . . . . . . . . . . . . . . . . . . . . . . . . . . . . . . . . . . . . . . . . . . 80,999 76,144 57,037Accrued expenses and other current liabilities . . . . . . . . . . . . . . . . . . . . . . . . . . . . 14,682 (67,975) 20,837Billings in excess of costs on uncompleted contracts . . . . . . . . . . . . . . . . . . . . . . . . (5,376) (58,551) (21,793)Other long-term liabilities . . . . . . . . . . . . . . . . . . . . . . . . . . . . . . . . . . . . . . . . (28,180) (40,456) 19,732Income taxes payable . . . . . . . . . . . . . . . . . . . . . . . . . . . . . . . . . . . . . . . . . . 12,173 (12,904) (25,502)
Net cash provided by operating activities from continuing operations . . . . . . . . . . . . . 433,352 132,012 162,862
Net cash used in operating activities from discontinued operations . . . . . . . . . . . . . . — — (4,227)
Net cash provided by operating activities . . . . . . . . . . . . . . . . . . . . . . . . . . . . . 433,352 132,012 158,635
CASH FLOWS FROM INVESTING ACTIVITIES:Payments for business acquisitions, net of cash acquired . . . . . . . . . . . . . . . . . . . . . . (12,571) (365,540) (559,355)Proceeds from disposal of businesses . . . . . . . . . . . . . . . . . . . . . . . . . . . . . . . . . 2,647 2,434 29,794Net investment in unconsolidated joint ventures . . . . . . . . . . . . . . . . . . . . . . . . . . (2,846) (23,398) 8,349Purchases of investments . . . . . . . . . . . . . . . . . . . . . . . . . . . . . . . . . . . . . . . . (87) (22,683) (24,825)Proceeds from sale of investments in rabbi trust . . . . . . . . . . . . . . . . . . . . . . . . . . 1,958 65,261 —Payments for capital expenditures . . . . . . . . . . . . . . . . . . . . . . . . . . . . . . . . . . . (62,874) (77,991) (68,490)
Net cash used in investing activities . . . . . . . . . . . . . . . . . . . . . . . . . . . . . . . . (73,773) (421,917) (614,527)
CASH FLOWS FROM FINANCING ACTIVITIES:Proceeds from borrowings under credit agreements . . . . . . . . . . . . . . . . . . . . . . . . 1,454,861 2,863,906 1,985,000Repayments of borrowings under credit agreements . . . . . . . . . . . . . . . . . . . . . . . . (1,550,996) (2,640,649) (1,234,880)Proceeds from loans on deferred compensation plan investments . . . . . . . . . . . . . . . . — 59,324 —Repayment of loans on deferred compensation plan investments . . . . . . . . . . . . . . . . . — (59,324) —Proceeds from issuance of common stock . . . . . . . . . . . . . . . . . . . . . . . . . . . . . . 13,760 15,020 3,502Proceeds from exercise of stock options . . . . . . . . . . . . . . . . . . . . . . . . . . . . . . . 4,541 6,280 10,310Payments to repurchase common stock . . . . . . . . . . . . . . . . . . . . . . . . . . . . . . . . (159,751) (167,044) (17,171)Excess tax benefit from share-based payment . . . . . . . . . . . . . . . . . . . . . . . . . . . . 1,254 61,248 17,306Net (distributions to) contributions from noncontrolling interests . . . . . . . . . . . . . . . . (1,283) (1,301) 6,512
Net cash (used in) provided by financing activities . . . . . . . . . . . . . . . . . . . . . . . . (237,614) 137,460 770,579
EFFECT OF EXCHANGE RATE CHANGES ON CASH . . . . . . . . . . . . . . . . . . . . . 14,871 (3,472) 7,393NET INCREASE (DECREASE) IN CASH AND CASH EQUIVALENTS . . . . . . . . . . . 136,836 (155,917) 322,080CASH AND CASH EQUIVALENTS AT BEGINNING OF YEAR . . . . . . . . . . . . . . . . 456,940 612,857 290,777
CASH AND CASH EQUIVALENTS AT END OF YEAR . . . . . . . . . . . . . . . . . . . . . $ 593,776 $ 456,940 $ 612,857
SUPPLEMENTAL CASH FLOW INFORMATION:Equity issued for acquisitions (non-cash) . . . . . . . . . . . . . . . . . . . . . . . . . . . . . . . $ 857 $ 68,453 $ 65,300
Equity issued to settle liabilities (non-cash) . . . . . . . . . . . . . . . . . . . . . . . . . . . . . $ 4,016 $ 5,058 $ 10,500
Interest paid . . . . . . . . . . . . . . . . . . . . . . . . . . . . . . . . . . . . . . . . . . . . . . . . $ 39,044 $ 36,624 $ 8,642
Income taxes paid, net of refunds received . . . . . . . . . . . . . . . . . . . . . . . . . . . . . . $ 38,482 $ 37,991 $ 63,616
See accompanying Notes to Consolidated Financial Statements.
62
AECOM TECHNOLOGY CORPORATION
NOTES TO CONSOLIDATED FINANCIAL STATEMENTS
1. Significant Accounting Policies
Organization—AECOM Technology Corporation and its consolidated subsidiaries (the Company)provide professional technical and management support services for commercial and government clientsaround the world. These services encompass a variety of technical disciplines, including consulting,planning, architectural and engineering design, and program and construction management for a broadrange of projects. These services are applied to a number of areas and industries, including transportationinfrastructure; research, testing and defense facilities; water, wastewater and other environmentalprograms; land development; security and communication systems; institutional, mining, industrial andcommercial and energy-related facilities. The Company also provides operations and maintenance servicesto governmental agencies throughout the U.S. and abroad.
Fiscal Year—The Company reports results of operations based on 52 or 53-week periods ending on theFriday nearest September 30. For clarity of presentation, all periods are presented as if the year ended onSeptember 30. Fiscal years 2012, 2011 and 2010 each contained 52 weeks and ended on September 28,September 30, and October 1, respectively.
Use of Estimates—The preparation of financial statements in conformity with accounting principlesgenerally accepted in the United States (GAAP) requires management to make estimates and assumptionsthat affect the reported amounts of assets and liabilities and disclosure of contingent assets and liabilitiesat the date of the financial statements and the reported amounts of revenues and expenses during thereporting period. The more significant estimates affecting amounts reported in the consolidated financialstatements relate to revenues under long-term contracts and self-insurance accruals. Actual results coulddiffer from those estimates.
Principles of Consolidation and Presentation—The consolidated financial statements include the accountsof all majority-owned subsidiaries and material joint ventures in which the Company is the primarybeneficiary. All inter-company accounts have been eliminated in consolidation. Also see Note 8 regardingjoint ventures.
Revenue Recognition—The Company generally utilizes a cost-to-cost approach in applying thepercentage-of-completion method of revenue recognition. Under this approach, revenue is earned inproportion to total costs incurred, divided by total costs expected to be incurred. Recognition of revenueand profit is dependent upon a number of factors including, the accuracy of a variety of estimates made atthe balance sheet date, engineering progress, materials quantities, the achievement of milestones, penaltyprovisions, labor productivity and cost estimates made at the balance sheet date. Due to uncertaintiesinherent in the estimation process, actual completion costs may vary from estimates. If estimated totalcosts on contracts indicate a loss, the Company recognizes that estimated loss in the period the estimatedloss first becomes known.
In the course of providing its services, the Company routinely subcontracts for services and incursother direct costs on behalf of its clients. These costs are passed through to clients and, in accordance withindustry practice and GAAP, are included in the Company’s revenue and cost of revenue. Becausesubcontractor services and other direct costs can change significantly from project to project and period toperiod, changes in revenue may not be indicative of business trends. These other direct costs for the yearsended September 30, 2012, 2011 and 2010 were $3.0 billion, $2.9 billion and $2.3 billion, respectively.
63

AECOM TECHNOLOGY CORPORATION
NOTES TO CONSOLIDATED FINANCIAL STATEMENTS (Continued)
1. Significant Accounting Policies (Continued)
Cost-Plus Contracts. The Company enters into two major types of cost-plus contracts:
Cost-Plus Fixed Fee. Under cost-plus fixed fee contracts, the Company charges clients for its costs,including both direct and indirect costs, plus a fixed negotiated fee. The total estimated cost plus the fixednegotiated fee represents the total contract value. The Company recognizes revenue based on the actuallabor and other direct costs incurred, plus the portion of the fixed fee it has earned to date.
Cost-Plus Fixed Rate. Under the Company’s cost-plus fixed rate contracts, the Company chargesclients for its direct and indirect costs based upon a negotiated rate. The Company recognizes revenuebased on the actual total costs it has expended and the applicable fixed rate.
Certain cost-plus contracts provide for award fees or a penalty based on performance criteria in lieu ofa fixed fee or fixed rate. Other contracts include a base fee component plus a performance-based awardfee. In addition, the Company may share award fees with subcontractors. The Company records accrualsfor fee-sharing as fees are earned. The Company generally recognizes revenue to the extent of costsactually incurred plus a proportionate amount of the fee expected to be earned. The Company takes theaward fee or penalty on contracts into consideration when estimating revenue and profit rates, and itrecords revenue related to the award fees when there is sufficient information to assess anticipatedcontract performance. On contracts that represent higher than normal risk or technical difficulty, theCompany may defer all award fees until an award fee letter is received. Once an award fee letter isreceived, the estimated or accrued fees are adjusted to the actual award amount.
Certain cost-plus contracts provide for incentive fees based on performance against contractualmilestones. The amount of the incentive fees varies, depending on whether the Company achieves above,at, or below target results. The Company originally recognizes revenue on these contracts based uponexpected results. These estimates are revised when necessary based upon additional information thatbecomes available as the contract progresses.
Time-and-Materials Contracts.
Time-and-Materials. Under time-and-materials contracts, the Company negotiates hourly billingrates and charges its clients based on the actual time that it expends on a project. In addition, clientsreimburse the Company for its actual out-of-pocket costs of materials and other direct incidentalexpenditures that it incurs in connection with its performance under the contract. Profit margins ontime-and-materials contracts fluctuate based on actual labor and overhead costs that it directly charges orallocates to contracts compared to negotiated billing rates. Many of the Company’s time-and-materialscontracts are subject to maximum contract values and, accordingly, revenue relating to these contracts isrecognized as if these contracts were a fixed-price contract.
Fixed-Price Contracts.
Firm Fixed-Price. Fixed-price contracting is the predominant contracting method outside of theUnited States. There are typically two types of fixed-price contracts. The first and more common type,lump-sum, involves performing all of the work under the contract for a specified lump-sum fee. Lump-sumcontracts are typically subject to price adjustments if the scope of the project changes or unforeseenconditions arise. The second type, fixed-unit price, involves performing an estimated number of units ofwork at an agreed price per unit, with the total payment under the contract determined by the actualnumber of units delivered. The Company recognizes revenue on firm fixed-price contracts using the
64
AECOM TECHNOLOGY CORPORATION
NOTES TO CONSOLIDATED FINANCIAL STATEMENTS (Continued)
1. Significant Accounting Policies (Continued)
percentage-of-completion method described above. Prior to completion, recognized profit margins on anyfirm fixed-price contract depend on the accuracy of the Company’s estimates and will increase to theextent that its actual costs are below the estimated amounts. Conversely, if the Company’s costs exceedthese estimates, its profit margins will decrease and the Company may realize a loss on a project. TheCompany recognizes anticipated losses on contracts in the period in which they become evident.
Service-Related Contracts.
Service-Related. Service-related contracts, including operations and maintenance services and avariety of technical assistance services, are accounted for over the period of performance, in proportion tothe costs of performance.
Contract Claims—Claims are amounts in excess of the agreed contract price (or amounts not included inthe original contract price) that the Company seeks to collect from customers or others for delays, errors inspecifications and designs, contract terminations, change orders in dispute or unapproved as to both scopeand price or other causes of unanticipated additional costs. The Company records contract revenue relatedto claims only if it is probable that the claim will result in additional contract revenue and if the amountcan be reliably estimated. In such cases, the Company records revenue only to the extent that contractcosts relating to the claim have been incurred. As of September 30, 2012 and 2011, the Company had nosignificant net receivables related to contract claims.
Government Contract Matters—The Company’s federal government and certain state and local agencycontracts are subject to, among other regulations, regulations issued under the Federal AcquisitionRegulations (FAR). These regulations can limit the recovery of certain specified indirect costs on contractsand subjects the Company to ongoing multiple audits by government agencies such as the DefenseContract Audit Agency (DCAA). In addition, most of the Company’s federal and state and local contractsare subject to termination at the discretion of the client.
Audits by the DCAA and other agencies consist of reviews of the Company’s overhead rates,operating systems and cost proposals to ensure that the Company accounted for such costs in accordancewith the Cost Accounting Standards of the FAR (CAS). If the DCAA determines the Company has notaccounted for such costs consistent with CAS, the DCAA may disallow these costs. There can be noassurance that audits by the DCAA or other governmental agencies will not result in material costdisallowances in the future. See also Note 20.
Cash and Cash Equivalents—The Company’s cash equivalents include highly liquid investments whichhave an initial maturity of three months or less.
Allowance for Doubtful Accounts—The Company records its accounts receivable net of an allowance fordoubtful accounts. This allowance for doubtful accounts is estimated based on management’s evaluation ofthe contracts involved and the financial condition of its clients. The factors the Company considers in itscontract evaluations include, but are not limited to:
• Client type—federal or state and local government or commercial client;
• Historical contract performance;
• Historical collection and delinquency trends;
65
AECOM TECHNOLOGY CORPORATION
NOTES TO CONSOLIDATED FINANCIAL STATEMENTS (Continued)
1. Significant Accounting Policies (Continued)
• Client credit worthiness; and
• General economic conditions.
Derivative Financial Instruments—The Company accounts for its derivative instruments as either assetsor liabilities and carries them at fair value.
For derivative instruments that hedge the exposure to variability in expected future cash flows that aredesignated as cash flow hedges, the effective portion of the gain or loss on the derivative instrument isreported as a component of accumulated other comprehensive income in stockholders’ equity andreclassified into income in the same period or periods during which the hedged transaction affectsearnings. The ineffective portion of the gain or loss on the derivative instrument, if any, is recognized incurrent income. To receive hedge accounting treatment, cash flow hedges must be highly effective inoffsetting changes to expected future cash flows on hedged transactions.
The net gain or loss on the effective portion of a derivative instrument that is designated as aneconomic hedge of the foreign currency translation exposure generated by the re-measurement of certainassets and liabilities denominated in a non-functional currency in a foreign operation is reported in thesame manner as a foreign currency translation adjustment. Accordingly, any gains or losses related to thesederivative instruments are recognized in current income.
Derivatives that do not qualify as hedges are adjusted to fair value through current income.
Fair Value of Financial Instruments—The Company determines the fair values of its financialinstruments, including short-term investments, debt instruments and derivative instruments, and pensionand post-retirement plan assets based on inputs or assumptions that market participants would use inpricing an asset or a liability. The Company categorizes its instruments using a valuation hierarchy fordisclosure of the inputs used to measure fair value. This hierarchy prioritizes the inputs into three broadlevels as follows: Level 1 inputs are quoted prices (unadjusted) in active markets for identical assets orliabilities; Level 2 inputs are quoted prices for similar assets and liabilities in active markets or inputs thatare observable for the asset or liability, either directly or indirectly through market corroboration, forsubstantially the full term of the financial instrument; Level 3 inputs are unobservable inputs based on theCompany’s assumptions used to measure assets and liabilities at fair value. The classification of a financialasset or liability within the hierarchy is determined based on the lowest level input that is significant to thefair value measurement.
The carrying amounts of cash and cash equivalents, accounts receivable and accounts payableapproximate fair value because of the short maturities of these instruments. The carrying amount of therevolving credit facility approximates fair value because the interest rates are based upon variablereference rates. See also Notes 10 and 12.
The Company’s fair value measurement methods may produce a fair value calculation that may not beindicative of net realizable value or reflective of future fair values. Although the Company believes itsvaluation methods are appropriate and consistent with those used by other market participants, the use ofdifferent methodologies or assumptions to determine fair value could result in a different fair valuemeasurement at the reporting date.
Property and Equipment—Property and equipment are recorded at cost and are depreciated over theirestimated useful lives using the straight-line method. Expenditures for maintenance and repairs are
66
AECOM TECHNOLOGY CORPORATION
NOTES TO CONSOLIDATED FINANCIAL STATEMENTS (Continued)
1. Significant Accounting Policies (Continued)
expensed as incurred. Typically, estimated useful lives range from three to ten years for equipment,furniture and fixtures. Leasehold improvements are amortized on a straight-line basis over the shorter oftheir estimated useful lives or the remaining terms of the underlying lease agreement.
Long-lived Assets—Long-lived assets to be held and used are reviewed for impairment whenever eventsor circumstances indicate that the assets may be impaired. For assets to be held and used, impairmentlosses are recognized based upon the excess of the asset’s carrying amount over the fair value of the asset.For long-lived assets to be disposed, impairment losses are recognized at the lower of the carrying amountor fair value less cost to sell.
Goodwill and Acquired Intangible Assets—Goodwill represents the excess amounts paid over the fairvalue of net assets acquired from an acquisition. In order to determine the amount of goodwill resultingfrom an acquisition, the Company performs an assessment to determine the value of the acquiredcompany’s tangible and identifiable intangible assets and liabilities. In its assessment, the Companydetermines whether identifiable intangible assets exist, which typically include backlog and customerrelationships.
The Company tests goodwill at least annually for each reporting unit. A reporting unit is defined as anoperating segment or one level below an operating segment. The Company’s impairment tests areperformed at the operating segment level as they represent the Company’s reporting units.
The impairment test is a two-step process. During the first step, the Company estimates the fair valueof the reporting unit using income and market approaches, and compares that amount to the carryingvalue of that reporting unit. In the event the fair value of the reporting unit is determined to be less thanthe carrying value, a second step is required. The second step requires the Company to perform ahypothetical purchase allocation for that reporting unit and to compare the resulting current implied fairvalue of the goodwill to the current carrying value of the goodwill for that reporting unit. In the event thatthe current implied fair value of the goodwill is less than the carrying value, an impairment charge isrecognized. See also Note 4.
Pension Plans—The Company has certain defined benefit pension plans. The Company calculates themarket-related value of assets, which is used to determine the return-on-assets component of annualpension expense and the cumulative net unrecognized gain or loss subject to amortization. This calculationreflects the Company’s anticipated long-term rate of return and amortization of the difference between theactual return (including capital, dividends, and interest) and the expected return over a five-year period.Cumulative net unrecognized gains or losses that exceed 10% of the greater of the projected benefitobligation or the market related value of plan assets are subject to amortization.
Insurance Reserves—The Company maintains insurance for certain insurable business risks. Insurancecoverage contains various retention and deductible amounts for which the Company accrues a liabilitybased upon reported claims and an actuarially determined estimated liability for certain claims incurredbut not reported. It is the Company’s policy not to accrue for any potential legal expense to be incurred indefending the Company’s position. The Company believes that its accruals for estimated liabilitiesassociated with professional and other liabilities are sufficient and any excess liability beyond the accrual isnot expected to have a material adverse effect on the Company’s results of operations or financial position.
Foreign Currency Translation—The Company’s functional currency is the U.S. dollar. Results ofoperations for foreign entities are translated to U.S. dollars using the average exchange rates during the
67
AECOM TECHNOLOGY CORPORATION
NOTES TO CONSOLIDATED FINANCIAL STATEMENTS (Continued)
1. Significant Accounting Policies (Continued)
period. Assets and liabilities for foreign entities are translated using the exchange rates in effect as of thedate of the balance sheet. Resulting translation adjustments are recorded as a foreign currency translationadjustment into other accumulated comprehensive income/(loss) in stockholders’ equity.
The Company uses foreign currency forward contracts from time to time to mitigate foreign currencyrisk. The Company limits exposure to foreign currency fluctuations in most of its contracts throughprovisions that require client payments in currencies corresponding to the currency in which costs areincurred. As a result of this natural hedge, the Company generally does not need to hedge foreign currencycash flows for contract work performed. The functional currency of all significant foreign operations is therespective local currency.
Income Taxes—The Company files a consolidated federal income tax return and combined /consolidated state tax returns and separate company state tax returns. The Company accounts for certainincome and expense items differently for financial reporting and income tax purposes. Deferred tax assetsand liabilities are determined based on the difference between the financial statement and tax basis ofassets and liabilities, applying enacted statutory tax rates in effect for the year in which the differences areexpected to reverse. In determining the need for a valuation allowance, management reviews both positiveand negative evidence, including current and historical results of operations, future income projections,and potential tax planning strategies. Based upon management’s assessment of all available evidence, theCompany has concluded that it is more likely than not that the deferred tax assets, net of valuationallowance, will be realized.
2. New Accounting Pronouncements and Changes in Accounting
In January 2010, the Financial Accounting Standards Board (FASB) issued guidance to amend thedisclosure requirements related to fair value measurements. The Company adopted this guidance for thequarter ended March 31, 2010, except for the portion of the guidance that requires the disclosure ofactivities on purchases, sales, issuance, and settlements of the assets and liabilities measured usingsignificant unobservable inputs (Level 3 fair value measurements). The Level 3 fair value measurementguidance was adopted by the Company in its fiscal year beginning October 1, 2011. Since the Companycarried no material Level 3 assets or liabilities during the period, the adoption of the separate disclosuresrelated to Level 3 measurements did not have a material impact on its consolidated financial statements.Additionally, the FASB issued a new accounting standard on fair value measurements that changes certainfair value measurement principles, clarifies the requirement for measuring fair value and expandsdisclosure requirements, particularly for Level 3 fair value measurements. This guidance was effective forthe Company in its second quarter ending March 31, 2012 and did not have a material impact on itsconsolidated financial statements.
In June 2011, the FASB issued guidance on the presentation of comprehensive income. The newstandard will require companies to present items of net income, items of other comprehensive income andtotal comprehensive income in one continuous statement or two separate consecutive statements, andcompanies will no longer be allowed to present items of other comprehensive income in the statement ofstockholders’ equity. This guidance is effective for the Company in its fiscal year beginning October 1, 2012and, although it will change the financial statement presentation, it is not expected to have a materialimpact on its financial condition or results of operations.
68
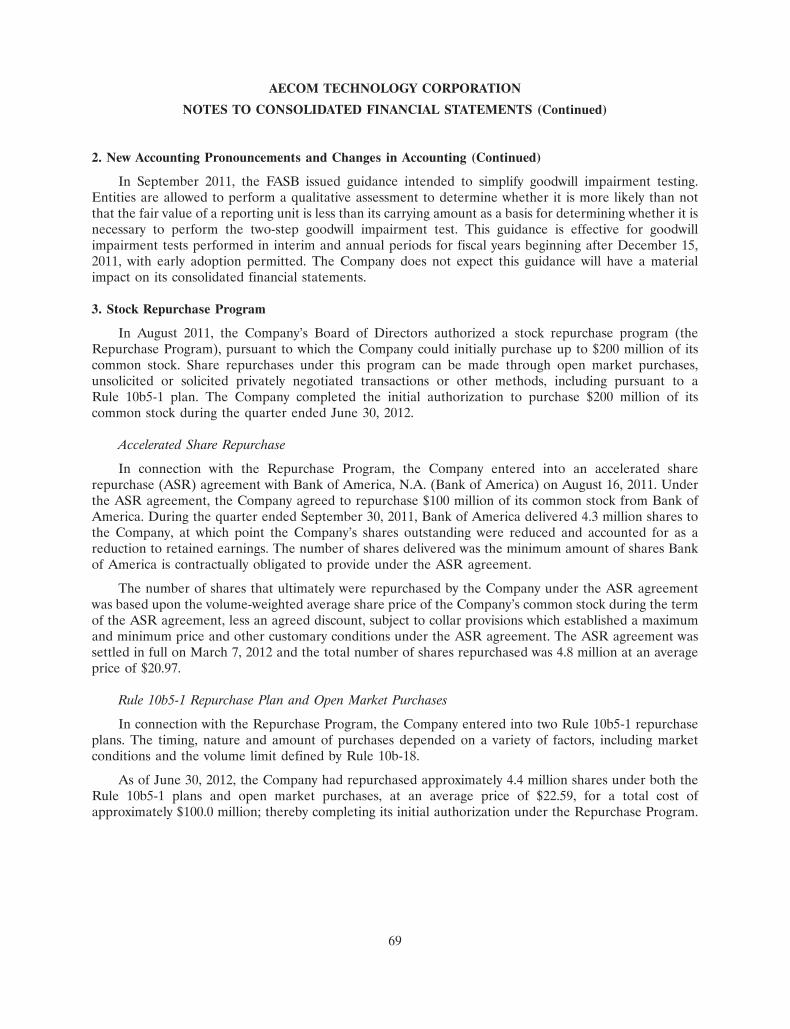
AECOM TECHNOLOGY CORPORATION
NOTES TO CONSOLIDATED FINANCIAL STATEMENTS (Continued)
2. New Accounting Pronouncements and Changes in Accounting (Continued)
In September 2011, the FASB issued guidance intended to simplify goodwill impairment testing.Entities are allowed to perform a qualitative assessment to determine whether it is more likely than notthat the fair value of a reporting unit is less than its carrying amount as a basis for determining whether it isnecessary to perform the two-step goodwill impairment test. This guidance is effective for goodwillimpairment tests performed in interim and annual periods for fiscal years beginning after December 15,2011, with early adoption permitted. The Company does not expect this guidance will have a materialimpact on its consolidated financial statements.
3. Stock Repurchase Program
In August 2011, the Company’s Board of Directors authorized a stock repurchase program (theRepurchase Program), pursuant to which the Company could initially purchase up to $200 million of itscommon stock. Share repurchases under this program can be made through open market purchases,unsolicited or solicited privately negotiated transactions or other methods, including pursuant to aRule 10b5-1 plan. The Company completed the initial authorization to purchase $200 million of itscommon stock during the quarter ended June 30, 2012.
Accelerated Share Repurchase
In connection with the Repurchase Program, the Company entered into an accelerated sharerepurchase (ASR) agreement with Bank of America, N.A. (Bank of America) on August 16, 2011. Underthe ASR agreement, the Company agreed to repurchase $100 million of its common stock from Bank ofAmerica. During the quarter ended September 30, 2011, Bank of America delivered 4.3 million shares tothe Company, at which point the Company’s shares outstanding were reduced and accounted for as areduction to retained earnings. The number of shares delivered was the minimum amount of shares Bankof America is contractually obligated to provide under the ASR agreement.
The number of shares that ultimately were repurchased by the Company under the ASR agreementwas based upon the volume-weighted average share price of the Company’s common stock during the termof the ASR agreement, less an agreed discount, subject to collar provisions which established a maximumand minimum price and other customary conditions under the ASR agreement. The ASR agreement wassettled in full on March 7, 2012 and the total number of shares repurchased was 4.8 million at an averageprice of $20.97.
Rule 10b5-1 Repurchase Plan and Open Market Purchases
In connection with the Repurchase Program, the Company entered into two Rule 10b5-1 repurchaseplans. The timing, nature and amount of purchases depended on a variety of factors, including marketconditions and the volume limit defined by Rule 10b-18.
As of June 30, 2012, the Company had repurchased approximately 4.4 million shares under both theRule 10b5-1 plans and open market purchases, at an average price of $22.59, for a total cost ofapproximately $100.0 million; thereby completing its initial authorization under the Repurchase Program.
69
AECOM TECHNOLOGY CORPORATION
NOTES TO CONSOLIDATED FINANCIAL STATEMENTS (Continued)
3. Stock Repurchase Program (Continued)
$300 million share repurchase authorization
In August 2012, the Company’s Board of Directors authorized an additional $300 million torepurchase its common stock under the Repurchase Program. As of September 30, 2012, the Companyrepurchased under open market purchases and purchases made under a Rule 10b5-1 plan, 3.0 millionshares at an average price of $20.71, for a total cost of $62.3 million, which included 0.5 million sharesrepurchased in transactions that were settled in fiscal 2013. As of September 30, 2012, $237.7 million ofshares remained available for repurchase pursuant to this repurchase program. Repurchased shares areretired, but remain authorized for registration and issuance in the future.
4. Business Acquisitions, Goodwill, and Intangible Assets
The Company completed one, six, and six business acquisitions during the years ended September 30,2012, 2011 and 2010, respectively. Business acquisitions completed during the years ended September 30,2012, 2011 and 2010 did not meet the quantitative thresholds to require proforma disclosures of operatingresults, either individually or in the aggregate, based on the Company’s consolidated assets, investmentsand net income.
Business acquisitions during the year ended September 30, 2012 included an environmentalengineering firm in Asia.
Business acquisitions during the year ended September 30, 2011 included four separate global costand project management consultancy firms that operated under the Davis Langdon name, includingbusinesses in Europe and Middle East, Australia and New Zealand, Africa, and North America. Each ofthe four acquisitions were separately negotiated, executed by separate purchase agreements, with no oneacquisition contingent upon the other, and the businesses, although operating as part of a Swiss Verein,under which they shared certain naming and marketing rights, were not under common control ormanagement. Business acquisitions for the year ended September 30, 2011 also included RSW, Inc., aninternational engineering firm based in Montreal, Quebec, Canada and Spectral Services ConsultantsPte. Ltd. (Spectral), a building services consultancy in India.
Business acquisitions during the year ended September 30, 2010 included Tishman ConstructionCorporation (Tishman), a New York based provider of construction management services in the UnitedStates and the United Arab Emirates, and MT Holdings Corporation, the parent of McNeilTechnologies, Inc. (McNeil), a government national security and intelligence services firm based inVirginia.
The aggregate value of all consideration for acquisitions consummated during the years endedSeptember 30, 2012, 2011 and 2010 were $15.4 million, $453.3 million and $768.0 million, respectively. The
70
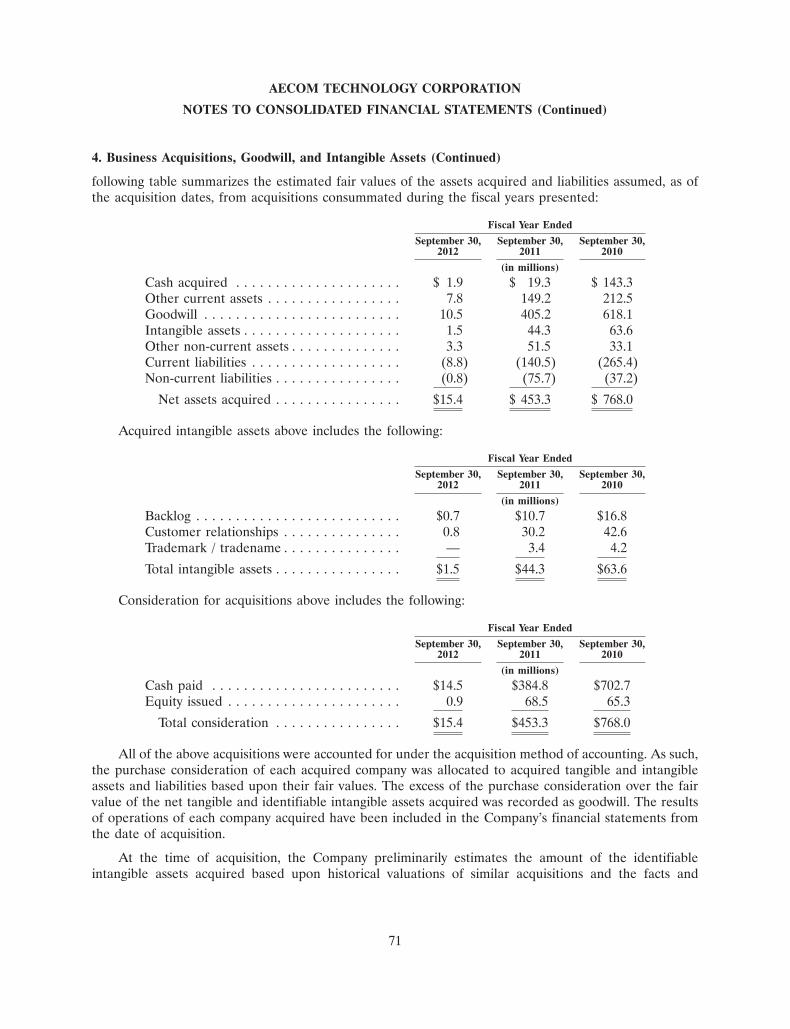
AECOM TECHNOLOGY CORPORATION
NOTES TO CONSOLIDATED FINANCIAL STATEMENTS (Continued)
4. Business Acquisitions, Goodwill, and Intangible Assets (Continued)
following table summarizes the estimated fair values of the assets acquired and liabilities assumed, as ofthe acquisition dates, from acquisitions consummated during the fiscal years presented:
Fiscal Year EndedSeptember 30, September 30, September 30,
2012 2011 2010(in millions)
Cash acquired . . . . . . . . . . . . . . . . . . . . . $ 1.9 $ 19.3 $ 143.3Other current assets . . . . . . . . . . . . . . . . . 7.8 149.2 212.5Goodwill . . . . . . . . . . . . . . . . . . . . . . . . . 10.5 405.2 618.1Intangible assets . . . . . . . . . . . . . . . . . . . . 1.5 44.3 63.6Other non-current assets . . . . . . . . . . . . . . 3.3 51.5 33.1Current liabilities . . . . . . . . . . . . . . . . . . . (8.8) (140.5) (265.4)Non-current liabilities . . . . . . . . . . . . . . . . (0.8) (75.7) (37.2)
Net assets acquired . . . . . . . . . . . . . . . . $15.4 $ 453.3 $ 768.0
Acquired intangible assets above includes the following:
Fiscal Year EndedSeptember 30, September 30, September 30,
2012 2011 2010(in millions)
Backlog . . . . . . . . . . . . . . . . . . . . . . . . . . $0.7 $10.7 $16.8Customer relationships . . . . . . . . . . . . . . . 0.8 30.2 42.6Trademark / tradename . . . . . . . . . . . . . . . — 3.4 4.2Total intangible assets . . . . . . . . . . . . . . . . $1.5 $44.3 $63.6
Consideration for acquisitions above includes the following:
Fiscal Year EndedSeptember 30, September 30, September 30,
2012 2011 2010(in millions)
Cash paid . . . . . . . . . . . . . . . . . . . . . . . . $14.5 $384.8 $702.7Equity issued . . . . . . . . . . . . . . . . . . . . . . 0.9 68.5 65.3
Total consideration . . . . . . . . . . . . . . . . $15.4 $453.3 $768.0
All of the above acquisitions were accounted for under the acquisition method of accounting. As such,the purchase consideration of each acquired company was allocated to acquired tangible and intangibleassets and liabilities based upon their fair values. The excess of the purchase consideration over the fairvalue of the net tangible and identifiable intangible assets acquired was recorded as goodwill. The resultsof operations of each company acquired have been included in the Company’s financial statements fromthe date of acquisition.
At the time of acquisition, the Company preliminarily estimates the amount of the identifiableintangible assets acquired based upon historical valuations of similar acquisitions and the facts and
71
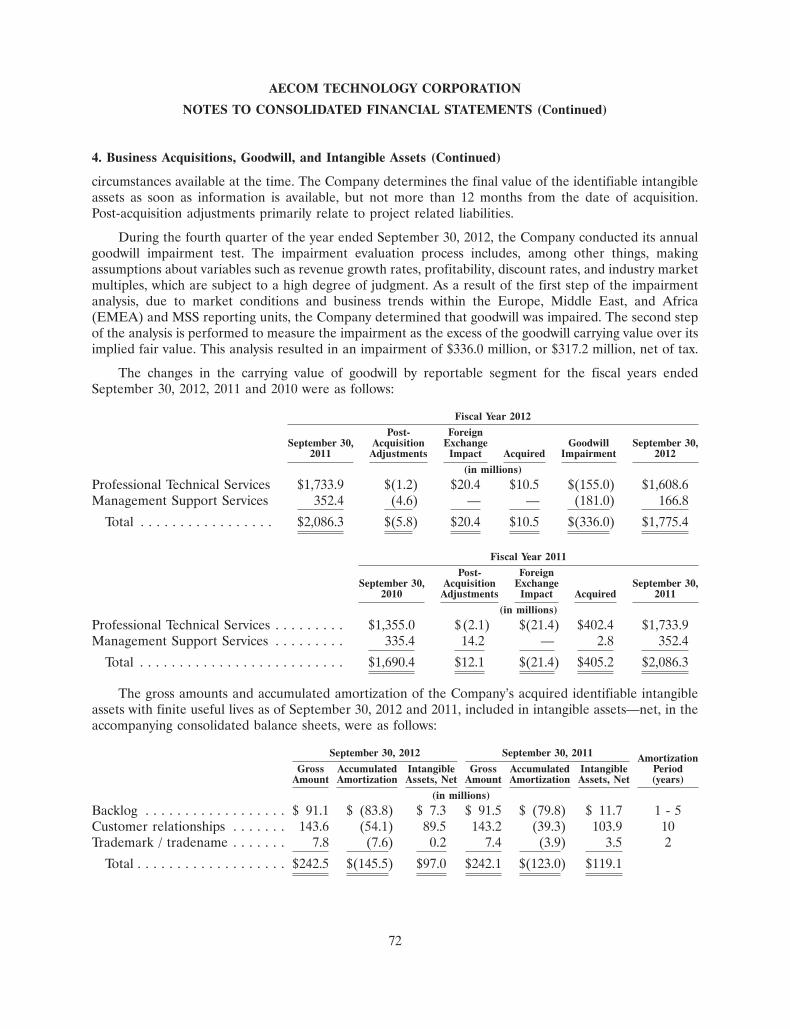
AECOM TECHNOLOGY CORPORATION
NOTES TO CONSOLIDATED FINANCIAL STATEMENTS (Continued)
4. Business Acquisitions, Goodwill, and Intangible Assets (Continued)
circumstances available at the time. The Company determines the final value of the identifiable intangibleassets as soon as information is available, but not more than 12 months from the date of acquisition.Post-acquisition adjustments primarily relate to project related liabilities.
During the fourth quarter of the year ended September 30, 2012, the Company conducted its annualgoodwill impairment test. The impairment evaluation process includes, among other things, makingassumptions about variables such as revenue growth rates, profitability, discount rates, and industry marketmultiples, which are subject to a high degree of judgment. As a result of the first step of the impairmentanalysis, due to market conditions and business trends within the Europe, Middle East, and Africa(EMEA) and MSS reporting units, the Company determined that goodwill was impaired. The second stepof the analysis is performed to measure the impairment as the excess of the goodwill carrying value over itsimplied fair value. This analysis resulted in an impairment of $336.0 million, or $317.2 million, net of tax.
The changes in the carrying value of goodwill by reportable segment for the fiscal years endedSeptember 30, 2012, 2011 and 2010 were as follows:
Fiscal Year 2012Post- Foreign
September 30, Acquisition Exchange Goodwill September 30,2011 Adjustments Impact Acquired Impairment 2012
(in millions)Professional Technical Services $1,733.9 $(1.2) $20.4 $10.5 $(155.0) $1,608.6Management Support Services 352.4 (4.6) — — (181.0) 166.8
Total . . . . . . . . . . . . . . . . . $2,086.3 $(5.8) $20.4 $10.5 $(336.0) $1,775.4
Fiscal Year 2011Post- Foreign
September 30, Acquisition Exchange September 30,2010 Adjustments Impact Acquired 2011
(in millions)Professional Technical Services . . . . . . . . . $1,355.0 $(2.1) $(21.4) $402.4 $1,733.9Management Support Services . . . . . . . . . 335.4 14.2 — 2.8 352.4
Total . . . . . . . . . . . . . . . . . . . . . . . . . . $1,690.4 $12.1 $(21.4) $405.2 $2,086.3
The gross amounts and accumulated amortization of the Company’s acquired identifiable intangibleassets with finite useful lives as of September 30, 2012 and 2011, included in intangible assets—net, in theaccompanying consolidated balance sheets, were as follows:
September 30, 2012 September 30, 2011 AmortizationGross Accumulated Intangible Gross Accumulated Intangible Period
Amount Amortization Assets, Net Amount Amortization Assets, Net (years)(in millions)
Backlog . . . . . . . . . . . . . . . . . . $ 91.1 $ (83.8) $ 7.3 $ 91.5 $ (79.8) $ 11.7 1 - 5Customer relationships . . . . . . . 143.6 (54.1) 89.5 143.2 (39.3) 103.9 10Trademark / tradename . . . . . . . 7.8 (7.6) 0.2 7.4 (3.9) 3.5 2
Total . . . . . . . . . . . . . . . . . . . $242.5 $(145.5) $97.0 $242.1 $(123.0) $119.1
72
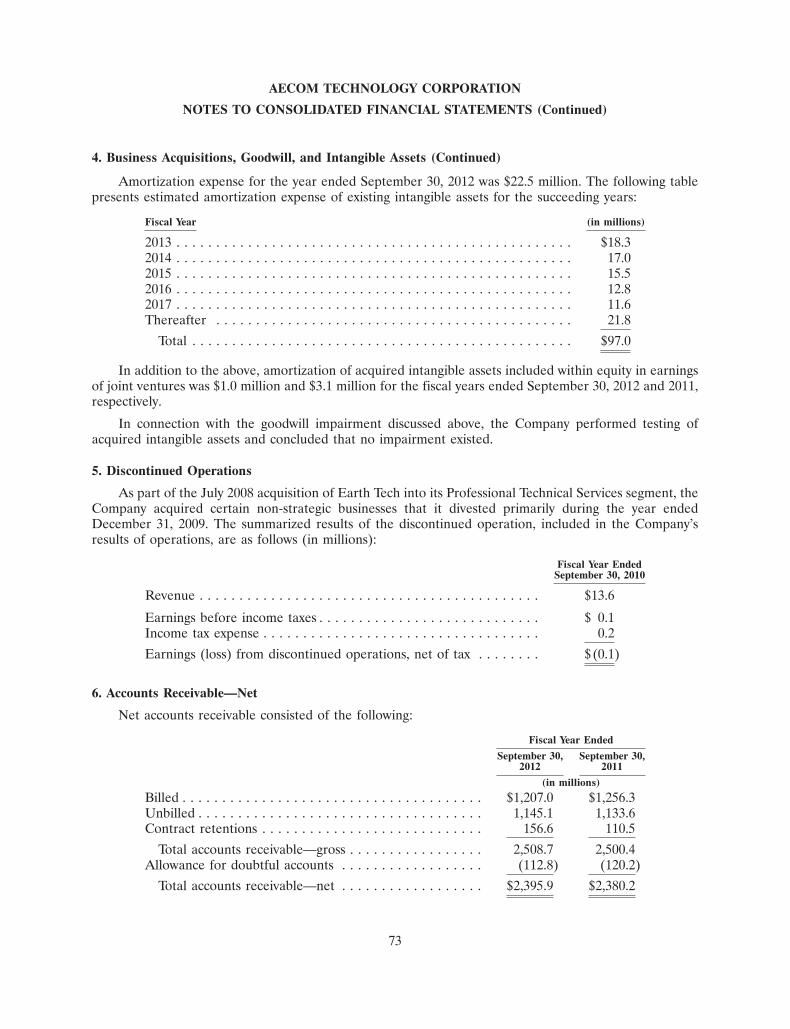
AECOM TECHNOLOGY CORPORATION
NOTES TO CONSOLIDATED FINANCIAL STATEMENTS (Continued)
4. Business Acquisitions, Goodwill, and Intangible Assets (Continued)
Amortization expense for the year ended September 30, 2012 was $22.5 million. The following tablepresents estimated amortization expense of existing intangible assets for the succeeding years:
Fiscal Year (in millions)
2013 . . . . . . . . . . . . . . . . . . . . . . . . . . . . . . . . . . . . . . . . . . . . . . . . . . $18.32014 . . . . . . . . . . . . . . . . . . . . . . . . . . . . . . . . . . . . . . . . . . . . . . . . . . 17.02015 . . . . . . . . . . . . . . . . . . . . . . . . . . . . . . . . . . . . . . . . . . . . . . . . . . 15.52016 . . . . . . . . . . . . . . . . . . . . . . . . . . . . . . . . . . . . . . . . . . . . . . . . . . 12.82017 . . . . . . . . . . . . . . . . . . . . . . . . . . . . . . . . . . . . . . . . . . . . . . . . . . 11.6Thereafter . . . . . . . . . . . . . . . . . . . . . . . . . . . . . . . . . . . . . . . . . . . . . 21.8
Total . . . . . . . . . . . . . . . . . . . . . . . . . . . . . . . . . . . . . . . . . . . . . . . . $97.0
In addition to the above, amortization of acquired intangible assets included within equity in earningsof joint ventures was $1.0 million and $3.1 million for the fiscal years ended September 30, 2012 and 2011,respectively.
In connection with the goodwill impairment discussed above, the Company performed testing ofacquired intangible assets and concluded that no impairment existed.
5. Discontinued Operations
As part of the July 2008 acquisition of Earth Tech into its Professional Technical Services segment, theCompany acquired certain non-strategic businesses that it divested primarily during the year endedDecember 31, 2009. The summarized results of the discontinued operation, included in the Company’sresults of operations, are as follows (in millions):
Fiscal Year EndedSeptember 30, 2010
Revenue . . . . . . . . . . . . . . . . . . . . . . . . . . . . . . . . . . . . . . . . . . . $13.6
Earnings before income taxes . . . . . . . . . . . . . . . . . . . . . . . . . . . . $ 0.1Income tax expense . . . . . . . . . . . . . . . . . . . . . . . . . . . . . . . . . . . 0.2Earnings (loss) from discontinued operations, net of tax . . . . . . . . $ (0.1)
6. Accounts Receivable—Net
Net accounts receivable consisted of the following:
Fiscal Year EndedSeptember 30, September 30,
2012 2011(in millions)
Billed . . . . . . . . . . . . . . . . . . . . . . . . . . . . . . . . . . . . . . $1,207.0 $1,256.3Unbilled . . . . . . . . . . . . . . . . . . . . . . . . . . . . . . . . . . . . 1,145.1 1,133.6Contract retentions . . . . . . . . . . . . . . . . . . . . . . . . . . . . 156.6 110.5
Total accounts receivable—gross . . . . . . . . . . . . . . . . . 2,508.7 2,500.4Allowance for doubtful accounts . . . . . . . . . . . . . . . . . . (112.8) (120.2)
Total accounts receivable—net . . . . . . . . . . . . . . . . . . $2,395.9 $2,380.2
73
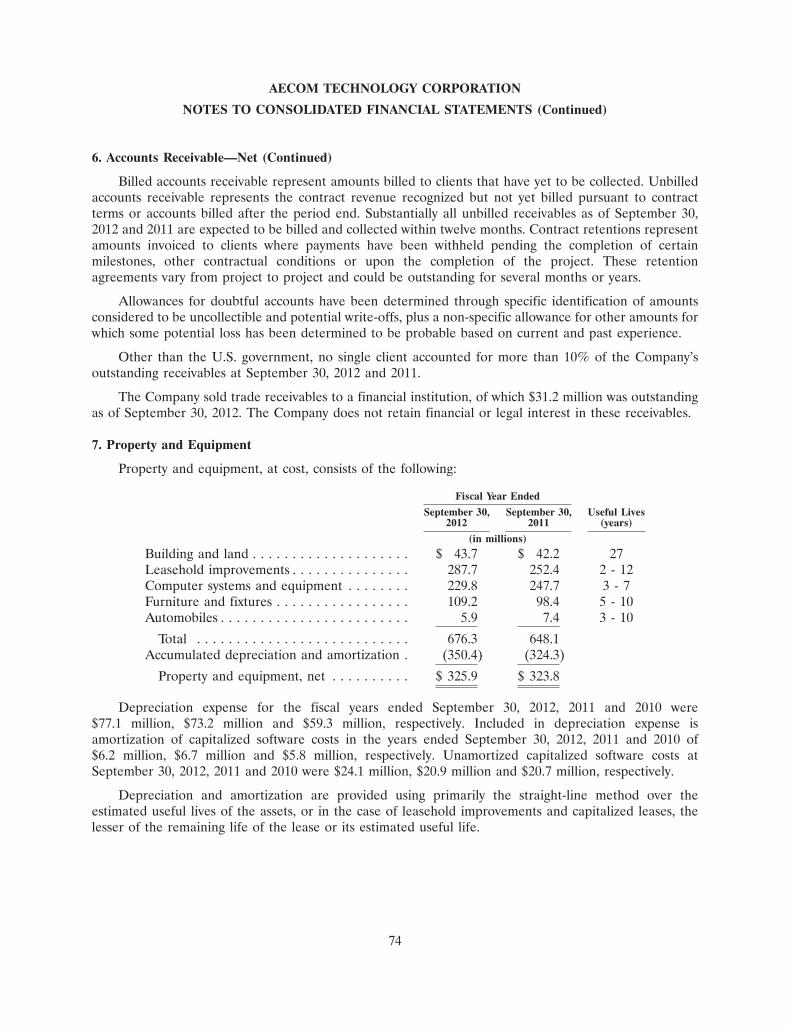
AECOM TECHNOLOGY CORPORATION
NOTES TO CONSOLIDATED FINANCIAL STATEMENTS (Continued)
6. Accounts Receivable—Net (Continued)
Billed accounts receivable represent amounts billed to clients that have yet to be collected. Unbilledaccounts receivable represents the contract revenue recognized but not yet billed pursuant to contractterms or accounts billed after the period end. Substantially all unbilled receivables as of September 30,2012 and 2011 are expected to be billed and collected within twelve months. Contract retentions representamounts invoiced to clients where payments have been withheld pending the completion of certainmilestones, other contractual conditions or upon the completion of the project. These retentionagreements vary from project to project and could be outstanding for several months or years.
Allowances for doubtful accounts have been determined through specific identification of amountsconsidered to be uncollectible and potential write-offs, plus a non-specific allowance for other amounts forwhich some potential loss has been determined to be probable based on current and past experience.
Other than the U.S. government, no single client accounted for more than 10% of the Company’soutstanding receivables at September 30, 2012 and 2011.
The Company sold trade receivables to a financial institution, of which $31.2 million was outstandingas of September 30, 2012. The Company does not retain financial or legal interest in these receivables.
7. Property and Equipment
Property and equipment, at cost, consists of the following:
Fiscal Year EndedSeptember 30, September 30, Useful Lives
2012 2011 (years)(in millions)
Building and land . . . . . . . . . . . . . . . . . . . . $ 43.7 $ 42.2 27Leasehold improvements . . . . . . . . . . . . . . . 287.7 252.4 2 - 12Computer systems and equipment . . . . . . . . 229.8 247.7 3 - 7Furniture and fixtures . . . . . . . . . . . . . . . . . 109.2 98.4 5 - 10Automobiles . . . . . . . . . . . . . . . . . . . . . . . . 5.9 7.4 3 - 10
Total . . . . . . . . . . . . . . . . . . . . . . . . . . . 676.3 648.1Accumulated depreciation and amortization . (350.4) (324.3)
Property and equipment, net . . . . . . . . . . $ 325.9 $ 323.8
Depreciation expense for the fiscal years ended September 30, 2012, 2011 and 2010 were$77.1 million, $73.2 million and $59.3 million, respectively. Included in depreciation expense isamortization of capitalized software costs in the years ended September 30, 2012, 2011 and 2010 of$6.2 million, $6.7 million and $5.8 million, respectively. Unamortized capitalized software costs atSeptember 30, 2012, 2011 and 2010 were $24.1 million, $20.9 million and $20.7 million, respectively.
Depreciation and amortization are provided using primarily the straight-line method over theestimated useful lives of the assets, or in the case of leasehold improvements and capitalized leases, thelesser of the remaining life of the lease or its estimated useful life.
74
AECOM TECHNOLOGY CORPORATION
NOTES TO CONSOLIDATED FINANCIAL STATEMENTS (Continued)
8. Joint Ventures and Variable Interest Entities
The Company’s joint ventures provide architecture, engineering, program management, constructionmanagement and operations and maintenance services. Joint ventures, the combination of two or morepartners, are generally formed for a specific project. Management of the joint venture is typicallycontrolled by a joint venture executive committee, comprised of a representative from the joint venturepartners. The joint venture executive committee normally provides management oversight and controlsdecisions which could have significant impact on the joint venture’s economics.
Some of the Company’s joint ventures have no employees and minimal operating expenses. For thesejoint ventures, the Company’s employees perform work for the joint venture, which is then billed to athird-party customer by the joint venture. These joint ventures function as pass through entities to bill thethird-party customer. For consolidated entities, the Company records the entire amount of the servicesperformed and the costs associated with these services, including the services provided by the other jointventure partners, in the Company’s result of operations. For certain of these joint ventures where a fee isadded by an unconsolidated joint venture to client billings, the Company’s portion of that fee is recorded inequity in earnings of joint ventures.
The Company also has joint ventures that have their own employees and operating expenses, and towhich the Company generally makes a capital contribution. The Company accounts for these joint ventureseither as consolidated entities or equity method investments based on the criteria further discussed below.
The Company follows guidance issued by the FASB on the consolidation of variable interest entities(VIEs) that requires companies to utilize a qualitative approach to determine whether it is the primarybeneficiary of a VIE. The process for identifying the primary beneficiary of a VIE requires considerationof the factors which provide a party the power to direct the activities that most significantly impact the jointventures’ economic performance, including powers granted to the joint venture’s program manager,powers contained in the joint venture governing board and, to a certain extent, a company’s economicinterest in the joint venture. The Company analyzes its joint ventures and classifies them as either:
• a VIE that must be consolidated because the Company is the primary beneficiary or the jointventure is not a VIE and the Company holds the majority voting interest with no significantparticipative rights available to the other partners; or
• a VIE that does not require consolidation because the Company is not the primary beneficiary orthe joint venture is not a VIE and the Company does not hold the majority voting interest.
If it is determined that the Company has the power to direct the activities that most significantlyimpact the joint venture’s economic performance, the Company considers whether or not it has theobligation to absorb losses or rights to receive benefits of the VIE that could potentially be significant tothe VIE.
The Company has not provided financial or other support during the periods presented to any of itsVIEs that it was not previously contractually required to provide. Contractually required support providedto the Company’s joint ventures is further discussed in Note 20.
75
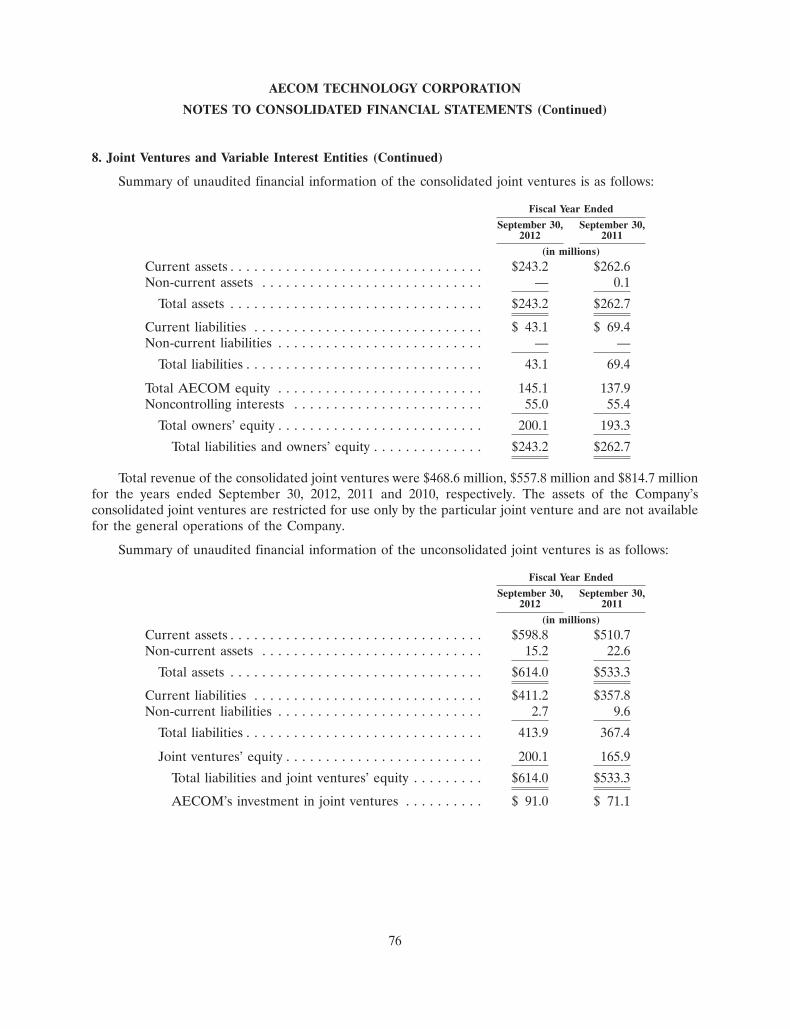
AECOM TECHNOLOGY CORPORATION
NOTES TO CONSOLIDATED FINANCIAL STATEMENTS (Continued)
8. Joint Ventures and Variable Interest Entities (Continued)
Summary of unaudited financial information of the consolidated joint ventures is as follows:
Fiscal Year EndedSeptember 30, September 30,
2012 2011(in millions)
Current assets . . . . . . . . . . . . . . . . . . . . . . . . . . . . . . . . $243.2 $262.6Non-current assets . . . . . . . . . . . . . . . . . . . . . . . . . . . . — 0.1
Total assets . . . . . . . . . . . . . . . . . . . . . . . . . . . . . . . . $243.2 $262.7
Current liabilities . . . . . . . . . . . . . . . . . . . . . . . . . . . . . $ 43.1 $ 69.4Non-current liabilities . . . . . . . . . . . . . . . . . . . . . . . . . . — —
Total liabilities . . . . . . . . . . . . . . . . . . . . . . . . . . . . . . 43.1 69.4
Total AECOM equity . . . . . . . . . . . . . . . . . . . . . . . . . . 145.1 137.9Noncontrolling interests . . . . . . . . . . . . . . . . . . . . . . . . 55.0 55.4
Total owners’ equity . . . . . . . . . . . . . . . . . . . . . . . . . . 200.1 193.3Total liabilities and owners’ equity . . . . . . . . . . . . . . $243.2 $262.7
Total revenue of the consolidated joint ventures were $468.6 million, $557.8 million and $814.7 millionfor the years ended September 30, 2012, 2011 and 2010, respectively. The assets of the Company’sconsolidated joint ventures are restricted for use only by the particular joint venture and are not availablefor the general operations of the Company.
Summary of unaudited financial information of the unconsolidated joint ventures is as follows:
Fiscal Year EndedSeptember 30, September 30,
2012 2011(in millions)
Current assets . . . . . . . . . . . . . . . . . . . . . . . . . . . . . . . . $598.8 $510.7Non-current assets . . . . . . . . . . . . . . . . . . . . . . . . . . . . 15.2 22.6
Total assets . . . . . . . . . . . . . . . . . . . . . . . . . . . . . . . . $614.0 $533.3
Current liabilities . . . . . . . . . . . . . . . . . . . . . . . . . . . . . $411.2 $357.8Non-current liabilities . . . . . . . . . . . . . . . . . . . . . . . . . . 2.7 9.6
Total liabilities . . . . . . . . . . . . . . . . . . . . . . . . . . . . . . 413.9 367.4
Joint ventures’ equity . . . . . . . . . . . . . . . . . . . . . . . . . 200.1 165.9Total liabilities and joint ventures’ equity . . . . . . . . . $614.0 $533.3
AECOM’s investment in joint ventures . . . . . . . . . . $ 91.0 $ 71.1
76
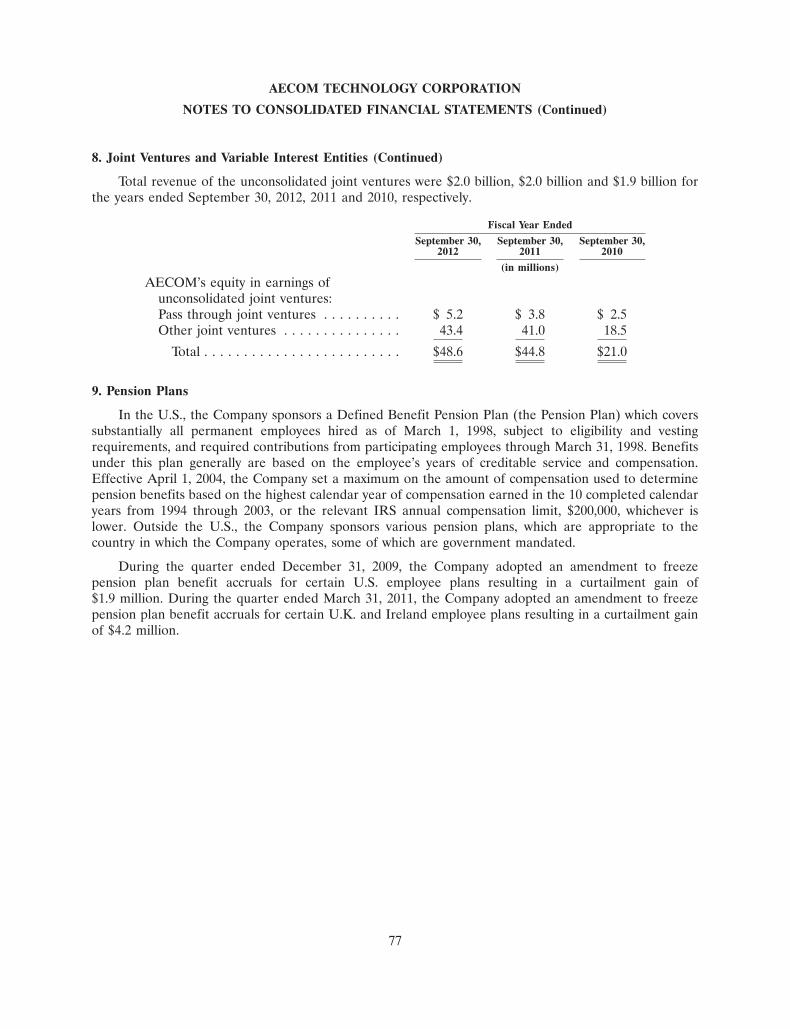
AECOM TECHNOLOGY CORPORATION
NOTES TO CONSOLIDATED FINANCIAL STATEMENTS (Continued)
8. Joint Ventures and Variable Interest Entities (Continued)
Total revenue of the unconsolidated joint ventures were $2.0 billion, $2.0 billion and $1.9 billion forthe years ended September 30, 2012, 2011 and 2010, respectively.
Fiscal Year EndedSeptember 30, September 30, September 30,
2012 2011 2010(in millions)
AECOM’s equity in earnings ofunconsolidated joint ventures:Pass through joint ventures . . . . . . . . . . $ 5.2 $ 3.8 $ 2.5Other joint ventures . . . . . . . . . . . . . . . 43.4 41.0 18.5
Total . . . . . . . . . . . . . . . . . . . . . . . . . $48.6 $44.8 $21.0
9. Pension Plans
In the U.S., the Company sponsors a Defined Benefit Pension Plan (the Pension Plan) which coverssubstantially all permanent employees hired as of March 1, 1998, subject to eligibility and vestingrequirements, and required contributions from participating employees through March 31, 1998. Benefitsunder this plan generally are based on the employee’s years of creditable service and compensation.Effective April 1, 2004, the Company set a maximum on the amount of compensation used to determinepension benefits based on the highest calendar year of compensation earned in the 10 completed calendaryears from 1994 through 2003, or the relevant IRS annual compensation limit, $200,000, whichever islower. Outside the U.S., the Company sponsors various pension plans, which are appropriate to thecountry in which the Company operates, some of which are government mandated.
During the quarter ended December 31, 2009, the Company adopted an amendment to freezepension plan benefit accruals for certain U.S. employee plans resulting in a curtailment gain of$1.9 million. During the quarter ended March 31, 2011, the Company adopted an amendment to freezepension plan benefit accruals for certain U.K. and Ireland employee plans resulting in a curtailment gainof $4.2 million.
77
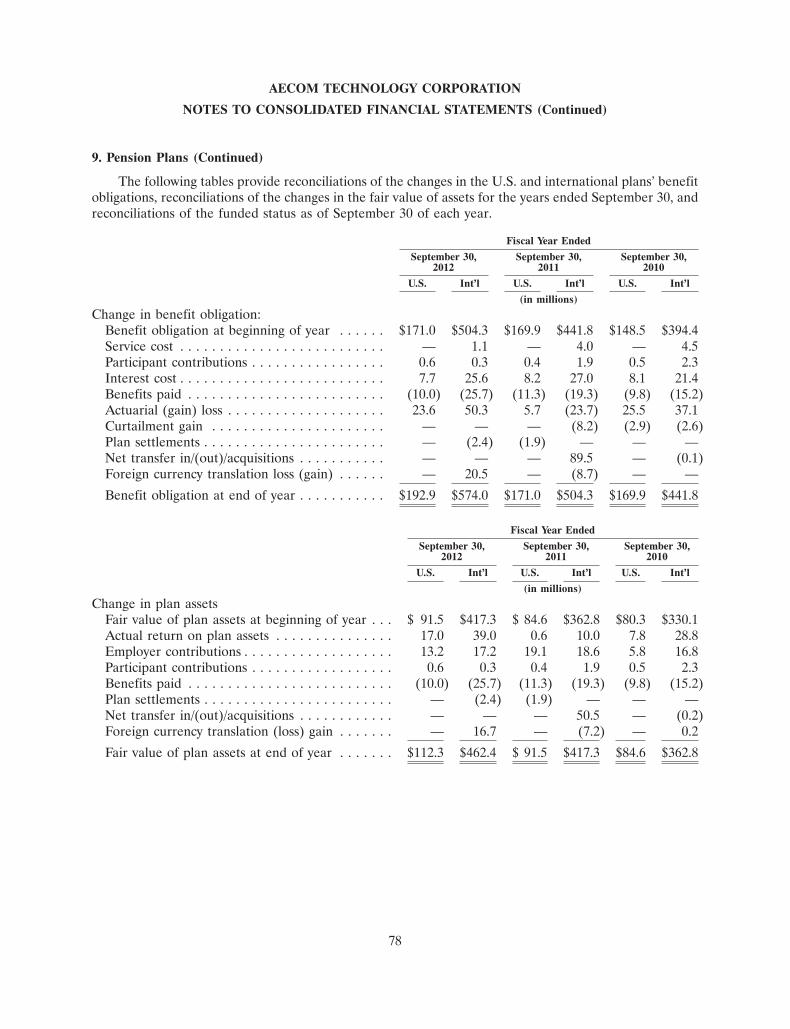
AECOM TECHNOLOGY CORPORATION
NOTES TO CONSOLIDATED FINANCIAL STATEMENTS (Continued)
9. Pension Plans (Continued)
The following tables provide reconciliations of the changes in the U.S. and international plans’ benefitobligations, reconciliations of the changes in the fair value of assets for the years ended September 30, andreconciliations of the funded status as of September 30 of each year.
Fiscal Year EndedSeptember 30, September 30, September 30,
2012 2011 2010U.S. Int’l U.S. Int’l U.S. Int’l
(in millions)Change in benefit obligation:
Benefit obligation at beginning of year . . . . . . $171.0 $504.3 $169.9 $441.8 $148.5 $394.4Service cost . . . . . . . . . . . . . . . . . . . . . . . . . . — 1.1 — 4.0 — 4.5Participant contributions . . . . . . . . . . . . . . . . . 0.6 0.3 0.4 1.9 0.5 2.3Interest cost . . . . . . . . . . . . . . . . . . . . . . . . . . 7.7 25.6 8.2 27.0 8.1 21.4Benefits paid . . . . . . . . . . . . . . . . . . . . . . . . . (10.0) (25.7) (11.3) (19.3) (9.8) (15.2)Actuarial (gain) loss . . . . . . . . . . . . . . . . . . . . 23.6 50.3 5.7 (23.7) 25.5 37.1Curtailment gain . . . . . . . . . . . . . . . . . . . . . . — — — (8.2) (2.9) (2.6)Plan settlements . . . . . . . . . . . . . . . . . . . . . . . — (2.4) (1.9) — — —Net transfer in/(out)/acquisitions . . . . . . . . . . . — — — 89.5 — (0.1)Foreign currency translation loss (gain) . . . . . . — 20.5 — (8.7) — —Benefit obligation at end of year . . . . . . . . . . . $192.9 $574.0 $171.0 $504.3 $169.9 $441.8
Fiscal Year EndedSeptember 30, September 30, September 30,
2012 2011 2010U.S. Int’l U.S. Int’l U.S. Int’l
(in millions)Change in plan assets
Fair value of plan assets at beginning of year . . . $ 91.5 $417.3 $ 84.6 $362.8 $80.3 $330.1Actual return on plan assets . . . . . . . . . . . . . . . 17.0 39.0 0.6 10.0 7.8 28.8Employer contributions . . . . . . . . . . . . . . . . . . . 13.2 17.2 19.1 18.6 5.8 16.8Participant contributions . . . . . . . . . . . . . . . . . . 0.6 0.3 0.4 1.9 0.5 2.3Benefits paid . . . . . . . . . . . . . . . . . . . . . . . . . . (10.0) (25.7) (11.3) (19.3) (9.8) (15.2)Plan settlements . . . . . . . . . . . . . . . . . . . . . . . . — (2.4) (1.9) — — —Net transfer in/(out)/acquisitions . . . . . . . . . . . . — — — 50.5 — (0.2)Foreign currency translation (loss) gain . . . . . . . — 16.7 — (7.2) — 0.2Fair value of plan assets at end of year . . . . . . . $112.3 $462.4 $ 91.5 $417.3 $84.6 $362.8
78
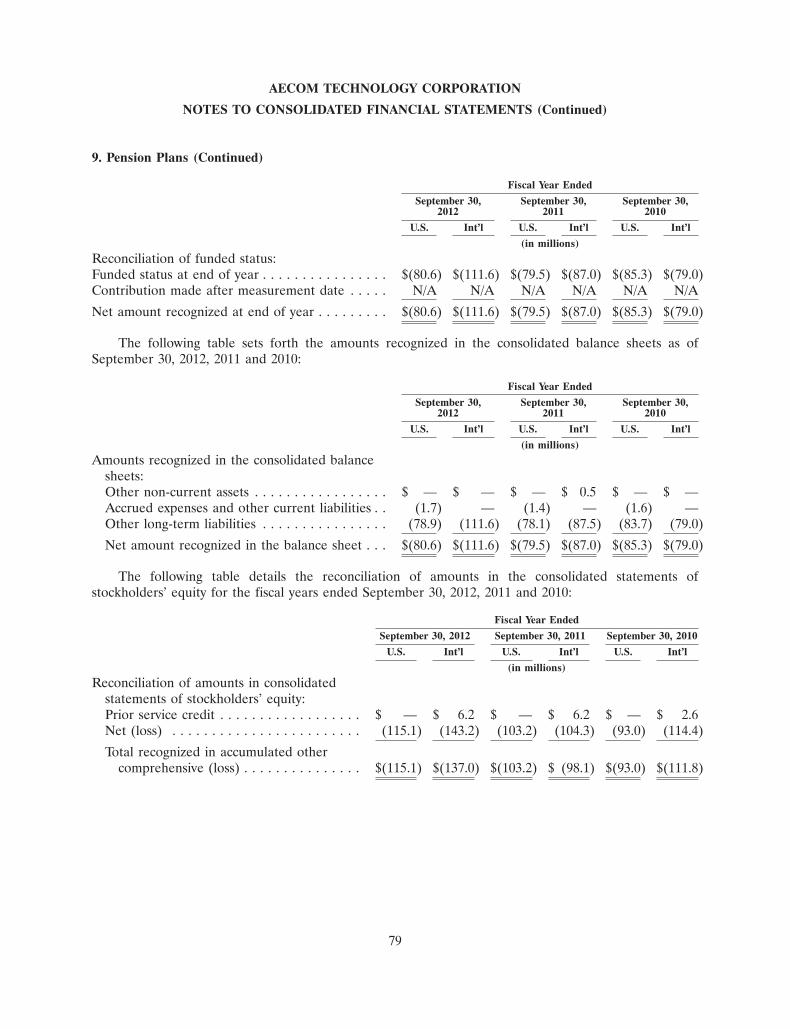
AECOM TECHNOLOGY CORPORATION
NOTES TO CONSOLIDATED FINANCIAL STATEMENTS (Continued)
9. Pension Plans (Continued)
Fiscal Year EndedSeptember 30, September 30, September 30,
2012 2011 2010U.S. Int’l U.S. Int’l U.S. Int’l
(in millions)Reconciliation of funded status:Funded status at end of year . . . . . . . . . . . . . . . . $(80.6) $(111.6) $(79.5) $(87.0) $(85.3) $(79.0)Contribution made after measurement date . . . . . N/A N/A N/A N/A N/A N/ANet amount recognized at end of year . . . . . . . . . $(80.6) $(111.6) $(79.5) $(87.0) $(85.3) $(79.0)
The following table sets forth the amounts recognized in the consolidated balance sheets as ofSeptember 30, 2012, 2011 and 2010:
Fiscal Year EndedSeptember 30, September 30, September 30,
2012 2011 2010U.S. Int’l U.S. Int’l U.S. Int’l
(in millions)Amounts recognized in the consolidated balance
sheets:Other non-current assets . . . . . . . . . . . . . . . . . $ — $ — $ — $ 0.5 $ — $ —Accrued expenses and other current liabilities . . (1.7) — (1.4) — (1.6) —Other long-term liabilities . . . . . . . . . . . . . . . . (78.9) (111.6) (78.1) (87.5) (83.7) (79.0)Net amount recognized in the balance sheet . . . $(80.6) $(111.6) $(79.5) $(87.0) $(85.3) $(79.0)
The following table details the reconciliation of amounts in the consolidated statements ofstockholders’ equity for the fiscal years ended September 30, 2012, 2011 and 2010:
Fiscal Year EndedSeptember 30, 2012 September 30, 2011 September 30, 2010
U.S. Int’l U.S. Int’l U.S. Int’l(in millions)
Reconciliation of amounts in consolidatedstatements of stockholders’ equity:Prior service credit . . . . . . . . . . . . . . . . . . $ — $ 6.2 $ — $ 6.2 $ — $ 2.6Net (loss) . . . . . . . . . . . . . . . . . . . . . . . . (115.1) (143.2) (103.2) (104.3) (93.0) (114.4)Total recognized in accumulated other
comprehensive (loss) . . . . . . . . . . . . . . . $(115.1) $(137.0) $(103.2) $ (98.1) $(93.0) $(111.8)
79
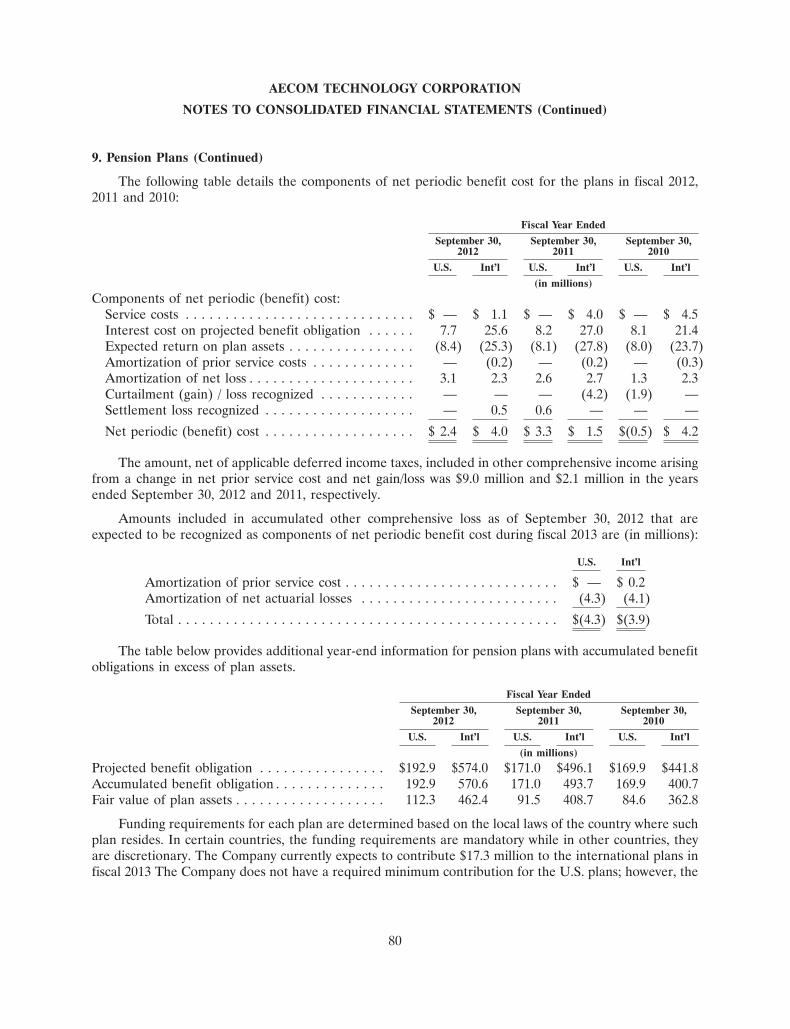
AECOM TECHNOLOGY CORPORATION
NOTES TO CONSOLIDATED FINANCIAL STATEMENTS (Continued)
9. Pension Plans (Continued)
The following table details the components of net periodic benefit cost for the plans in fiscal 2012,2011 and 2010:
Fiscal Year EndedSeptember 30, September 30, September 30,
2012 2011 2010U.S. Int’l U.S. Int’l U.S. Int’l
(in millions)Components of net periodic (benefit) cost:
Service costs . . . . . . . . . . . . . . . . . . . . . . . . . . . . . $ — $ 1.1 $ — $ 4.0 $ — $ 4.5Interest cost on projected benefit obligation . . . . . . 7.7 25.6 8.2 27.0 8.1 21.4Expected return on plan assets . . . . . . . . . . . . . . . . (8.4) (25.3) (8.1) (27.8) (8.0) (23.7)Amortization of prior service costs . . . . . . . . . . . . . — (0.2) — (0.2) — (0.3)Amortization of net loss . . . . . . . . . . . . . . . . . . . . . 3.1 2.3 2.6 2.7 1.3 2.3Curtailment (gain) / loss recognized . . . . . . . . . . . . — — — (4.2) (1.9) —Settlement loss recognized . . . . . . . . . . . . . . . . . . . — 0.5 0.6 — — —Net periodic (benefit) cost . . . . . . . . . . . . . . . . . . . $ 2.4 $ 4.0 $ 3.3 $ 1.5 $(0.5) $ 4.2
The amount, net of applicable deferred income taxes, included in other comprehensive income arisingfrom a change in net prior service cost and net gain/loss was $9.0 million and $2.1 million in the yearsended September 30, 2012 and 2011, respectively.
Amounts included in accumulated other comprehensive loss as of September 30, 2012 that areexpected to be recognized as components of net periodic benefit cost during fiscal 2013 are (in millions):
U.S. Int’l
Amortization of prior service cost . . . . . . . . . . . . . . . . . . . . . . . . . . . $ — $ 0.2Amortization of net actuarial losses . . . . . . . . . . . . . . . . . . . . . . . . . (4.3) (4.1)Total . . . . . . . . . . . . . . . . . . . . . . . . . . . . . . . . . . . . . . . . . . . . . . . . $(4.3) $(3.9)
The table below provides additional year-end information for pension plans with accumulated benefitobligations in excess of plan assets.
Fiscal Year EndedSeptember 30, September 30, September 30,
2012 2011 2010U.S. Int’l U.S. Int’l U.S. Int’l
(in millions)Projected benefit obligation . . . . . . . . . . . . . . . . $192.9 $574.0 $171.0 $496.1 $169.9 $441.8Accumulated benefit obligation . . . . . . . . . . . . . . 192.9 570.6 171.0 493.7 169.9 400.7Fair value of plan assets . . . . . . . . . . . . . . . . . . . 112.3 462.4 91.5 408.7 84.6 362.8
Funding requirements for each plan are determined based on the local laws of the country where suchplan resides. In certain countries, the funding requirements are mandatory while in other countries, theyare discretionary. The Company currently expects to contribute $17.3 million to the international plans infiscal 2013 The Company does not have a required minimum contribution for the U.S. plans; however, the
80
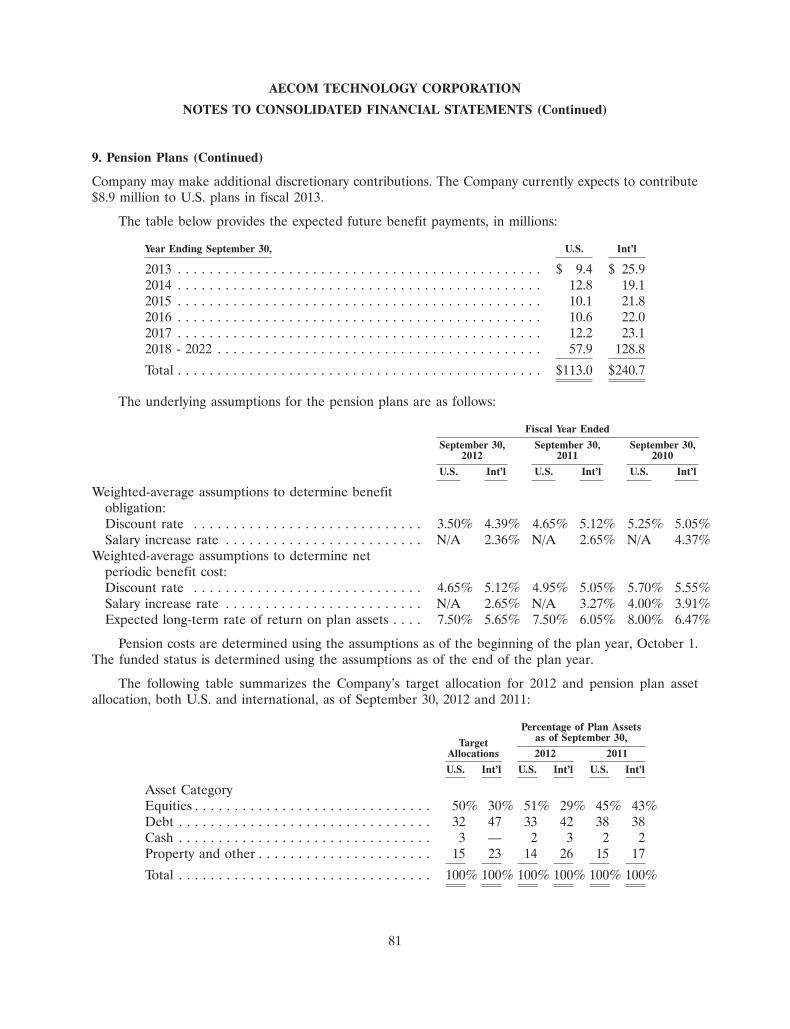
AECOM TECHNOLOGY CORPORATION
NOTES TO CONSOLIDATED FINANCIAL STATEMENTS (Continued)
9. Pension Plans (Continued)
Company may make additional discretionary contributions. The Company currently expects to contribute$8.9 million to U.S. plans in fiscal 2013.
The table below provides the expected future benefit payments, in millions:
Year Ending September 30, U.S. Int’l
2013 . . . . . . . . . . . . . . . . . . . . . . . . . . . . . . . . . . . . . . . . . . . . . . $ 9.4 $ 25.92014 . . . . . . . . . . . . . . . . . . . . . . . . . . . . . . . . . . . . . . . . . . . . . . 12.8 19.12015 . . . . . . . . . . . . . . . . . . . . . . . . . . . . . . . . . . . . . . . . . . . . . . 10.1 21.82016 . . . . . . . . . . . . . . . . . . . . . . . . . . . . . . . . . . . . . . . . . . . . . . 10.6 22.02017 . . . . . . . . . . . . . . . . . . . . . . . . . . . . . . . . . . . . . . . . . . . . . . 12.2 23.12018 - 2022 . . . . . . . . . . . . . . . . . . . . . . . . . . . . . . . . . . . . . . . . . 57.9 128.8Total . . . . . . . . . . . . . . . . . . . . . . . . . . . . . . . . . . . . . . . . . . . . . . $113.0 $240.7
The underlying assumptions for the pension plans are as follows:
Fiscal Year EndedSeptember 30, September 30, September 30,
2012 2011 2010U.S. Int’l U.S. Int’l U.S. Int’l
Weighted-average assumptions to determine benefitobligation:Discount rate . . . . . . . . . . . . . . . . . . . . . . . . . . . . . 3.50% 4.39% 4.65% 5.12% 5.25% 5.05%Salary increase rate . . . . . . . . . . . . . . . . . . . . . . . . . N/A 2.36% N/A 2.65% N/A 4.37%
Weighted-average assumptions to determine netperiodic benefit cost:Discount rate . . . . . . . . . . . . . . . . . . . . . . . . . . . . . 4.65% 5.12% 4.95% 5.05% 5.70% 5.55%Salary increase rate . . . . . . . . . . . . . . . . . . . . . . . . . N/A 2.65% N/A 3.27% 4.00% 3.91%Expected long-term rate of return on plan assets . . . . 7.50% 5.65% 7.50% 6.05% 8.00% 6.47%
Pension costs are determined using the assumptions as of the beginning of the plan year, October 1.The funded status is determined using the assumptions as of the end of the plan year.
The following table summarizes the Company’s target allocation for 2012 and pension plan assetallocation, both U.S. and international, as of September 30, 2012 and 2011:
Percentage of Plan Assetsas of September 30,Target
Allocations 2012 2011U.S. Int’l U.S. Int’l U.S. Int’l
Asset CategoryEquities . . . . . . . . . . . . . . . . . . . . . . . . . . . . . . 50% 30% 51% 29% 45% 43%Debt . . . . . . . . . . . . . . . . . . . . . . . . . . . . . . . . 32 47 33 42 38 38Cash . . . . . . . . . . . . . . . . . . . . . . . . . . . . . . . . 3 — 2 3 2 2Property and other . . . . . . . . . . . . . . . . . . . . . . 15 23 14 26 15 17Total . . . . . . . . . . . . . . . . . . . . . . . . . . . . . . . . 100% 100% 100% 100% 100% 100%
81
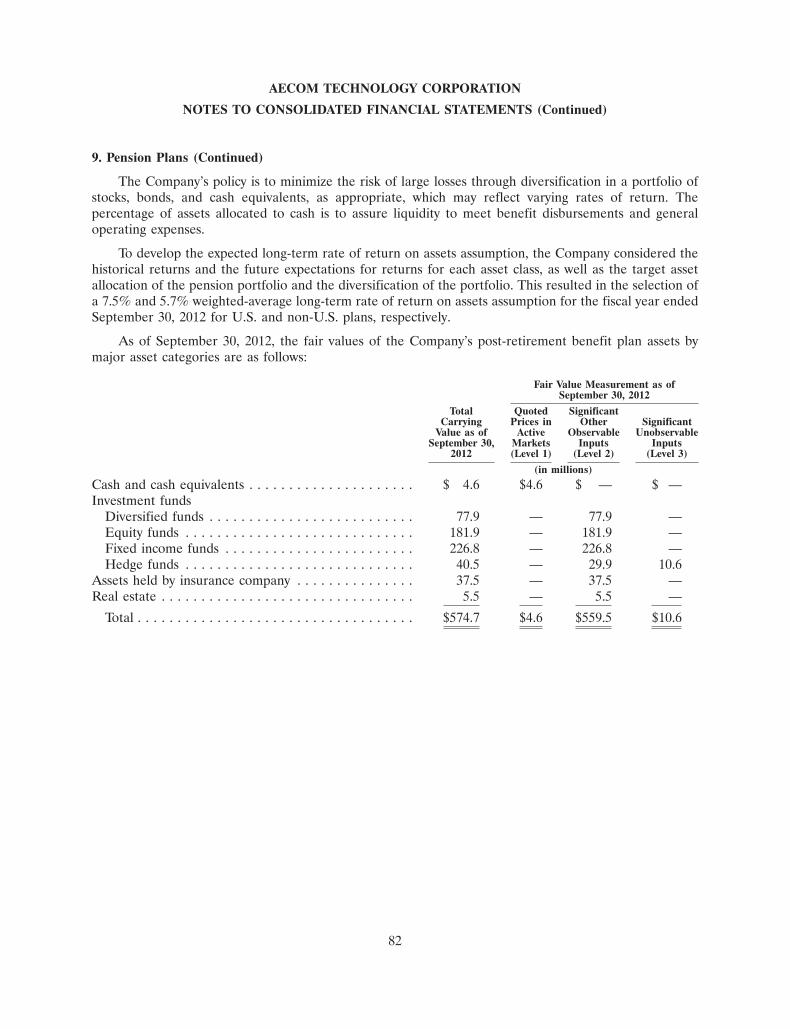
AECOM TECHNOLOGY CORPORATION
NOTES TO CONSOLIDATED FINANCIAL STATEMENTS (Continued)
9. Pension Plans (Continued)
The Company’s policy is to minimize the risk of large losses through diversification in a portfolio ofstocks, bonds, and cash equivalents, as appropriate, which may reflect varying rates of return. Thepercentage of assets allocated to cash is to assure liquidity to meet benefit disbursements and generaloperating expenses.
To develop the expected long-term rate of return on assets assumption, the Company considered thehistorical returns and the future expectations for returns for each asset class, as well as the target assetallocation of the pension portfolio and the diversification of the portfolio. This resulted in the selection ofa 7.5% and 5.7% weighted-average long-term rate of return on assets assumption for the fiscal year endedSeptember 30, 2012 for U.S. and non-U.S. plans, respectively.
As of September 30, 2012, the fair values of the Company’s post-retirement benefit plan assets bymajor asset categories are as follows:
Fair Value Measurement as ofSeptember 30, 2012
Total Quoted SignificantCarrying Prices in Other Significant
Value as of Active Observable UnobservableSeptember 30, Markets Inputs Inputs
2012 (Level 1) (Level 2) (Level 3)(in millions)
Cash and cash equivalents . . . . . . . . . . . . . . . . . . . . . $ 4.6 $4.6 $ — $ —Investment funds
Diversified funds . . . . . . . . . . . . . . . . . . . . . . . . . . 77.9 — 77.9 —Equity funds . . . . . . . . . . . . . . . . . . . . . . . . . . . . . 181.9 — 181.9 —Fixed income funds . . . . . . . . . . . . . . . . . . . . . . . . 226.8 — 226.8 —Hedge funds . . . . . . . . . . . . . . . . . . . . . . . . . . . . . 40.5 — 29.9 10.6
Assets held by insurance company . . . . . . . . . . . . . . . 37.5 — 37.5 —Real estate . . . . . . . . . . . . . . . . . . . . . . . . . . . . . . . . 5.5 — 5.5 —
Total . . . . . . . . . . . . . . . . . . . . . . . . . . . . . . . . . . . $574.7 $4.6 $559.5 $10.6
82
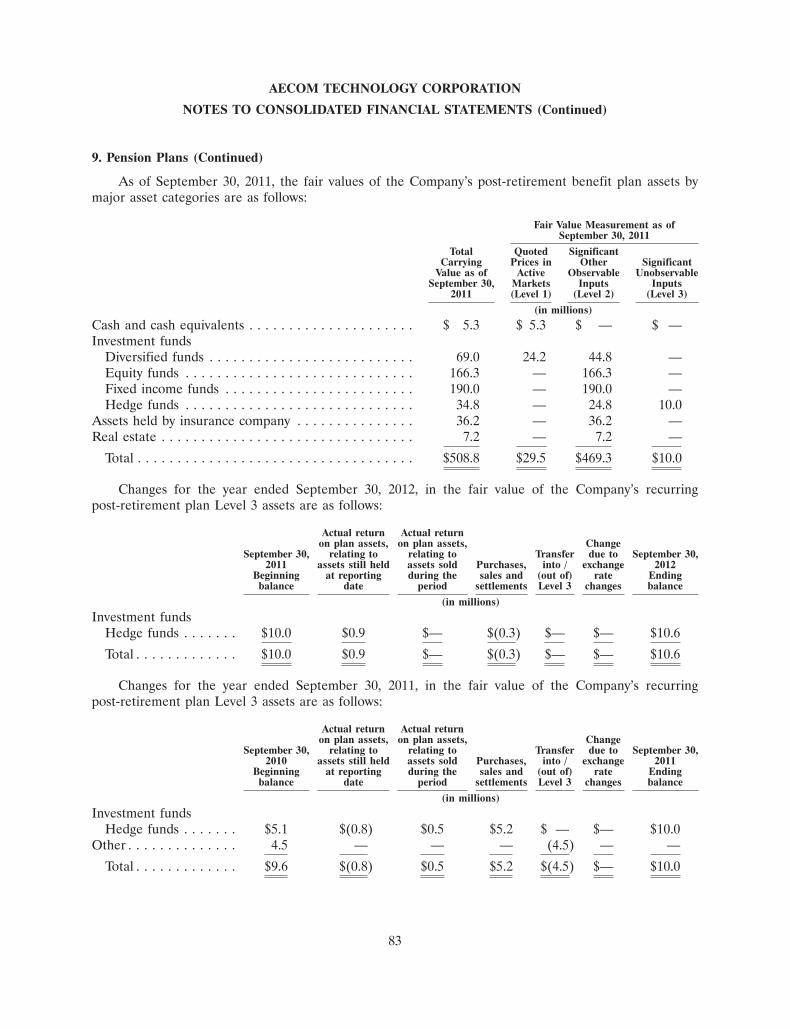
AECOM TECHNOLOGY CORPORATION
NOTES TO CONSOLIDATED FINANCIAL STATEMENTS (Continued)
9. Pension Plans (Continued)
As of September 30, 2011, the fair values of the Company’s post-retirement benefit plan assets bymajor asset categories are as follows:
Fair Value Measurement as ofSeptember 30, 2011
Total Quoted SignificantCarrying Prices in Other Significant
Value as of Active Observable UnobservableSeptember 30, Markets Inputs Inputs
2011 (Level 1) (Level 2) (Level 3)(in millions)
Cash and cash equivalents . . . . . . . . . . . . . . . . . . . . . $ 5.3 $ 5.3 $ — $ —Investment funds
Diversified funds . . . . . . . . . . . . . . . . . . . . . . . . . . 69.0 24.2 44.8 —Equity funds . . . . . . . . . . . . . . . . . . . . . . . . . . . . . 166.3 — 166.3 —Fixed income funds . . . . . . . . . . . . . . . . . . . . . . . . 190.0 — 190.0 —Hedge funds . . . . . . . . . . . . . . . . . . . . . . . . . . . . . 34.8 — 24.8 10.0
Assets held by insurance company . . . . . . . . . . . . . . . 36.2 — 36.2 —Real estate . . . . . . . . . . . . . . . . . . . . . . . . . . . . . . . . 7.2 — 7.2 —
Total . . . . . . . . . . . . . . . . . . . . . . . . . . . . . . . . . . . $508.8 $29.5 $469.3 $10.0
Changes for the year ended September 30, 2012, in the fair value of the Company’s recurringpost-retirement plan Level 3 assets are as follows:
Actual return Actual returnon plan assets, on plan assets, Change
September 30, relating to relating to Transfer due to September 30,2011 assets still held assets sold Purchases, into / exchange 2012
Beginning at reporting during the sales and (out of) rate Endingbalance date period settlements Level 3 changes balance
(in millions)Investment funds
Hedge funds . . . . . . . $10.0 $0.9 $— $(0.3) $— $— $10.6Total . . . . . . . . . . . . . $10.0 $0.9 $— $(0.3) $— $— $10.6
Changes for the year ended September 30, 2011, in the fair value of the Company’s recurringpost-retirement plan Level 3 assets are as follows:
Actual return Actual returnon plan assets, on plan assets, Change
September 30, relating to relating to Transfer due to September 30,2010 assets still held assets sold Purchases, into / exchange 2011
Beginning at reporting during the sales and (out of) rate Endingbalance date period settlements Level 3 changes balance
(in millions)Investment funds
Hedge funds . . . . . . . $5.1 $(0.8) $0.5 $5.2 $ — $— $10.0Other . . . . . . . . . . . . . . 4.5 — — — (4.5) — —
Total . . . . . . . . . . . . . $9.6 $(0.8) $0.5 $5.2 $(4.5) $— $10.0
83
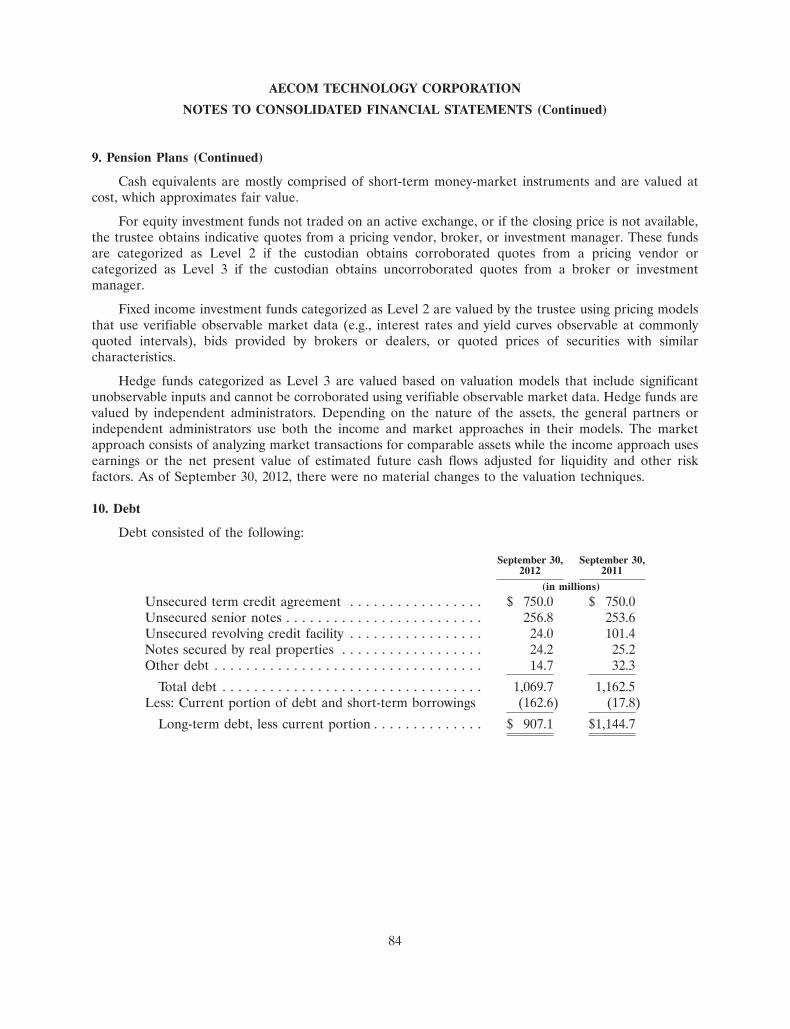
AECOM TECHNOLOGY CORPORATION
NOTES TO CONSOLIDATED FINANCIAL STATEMENTS (Continued)
9. Pension Plans (Continued)
Cash equivalents are mostly comprised of short-term money-market instruments and are valued atcost, which approximates fair value.
For equity investment funds not traded on an active exchange, or if the closing price is not available,the trustee obtains indicative quotes from a pricing vendor, broker, or investment manager. These fundsare categorized as Level 2 if the custodian obtains corroborated quotes from a pricing vendor orcategorized as Level 3 if the custodian obtains uncorroborated quotes from a broker or investmentmanager.
Fixed income investment funds categorized as Level 2 are valued by the trustee using pricing modelsthat use verifiable observable market data (e.g., interest rates and yield curves observable at commonlyquoted intervals), bids provided by brokers or dealers, or quoted prices of securities with similarcharacteristics.
Hedge funds categorized as Level 3 are valued based on valuation models that include significantunobservable inputs and cannot be corroborated using verifiable observable market data. Hedge funds arevalued by independent administrators. Depending on the nature of the assets, the general partners orindependent administrators use both the income and market approaches in their models. The marketapproach consists of analyzing market transactions for comparable assets while the income approach usesearnings or the net present value of estimated future cash flows adjusted for liquidity and other riskfactors. As of September 30, 2012, there were no material changes to the valuation techniques.
10. Debt
Debt consisted of the following:
September 30, September 30,2012 2011
(in millions)Unsecured term credit agreement . . . . . . . . . . . . . . . . . $ 750.0 $ 750.0Unsecured senior notes . . . . . . . . . . . . . . . . . . . . . . . . . 256.8 253.6Unsecured revolving credit facility . . . . . . . . . . . . . . . . . 24.0 101.4Notes secured by real properties . . . . . . . . . . . . . . . . . . 24.2 25.2Other debt . . . . . . . . . . . . . . . . . . . . . . . . . . . . . . . . . . 14.7 32.3
Total debt . . . . . . . . . . . . . . . . . . . . . . . . . . . . . . . . . 1,069.7 1,162.5Less: Current portion of debt and short-term borrowings (162.6) (17.8)
Long-term debt, less current portion . . . . . . . . . . . . . . $ 907.1 $1,144.7
84
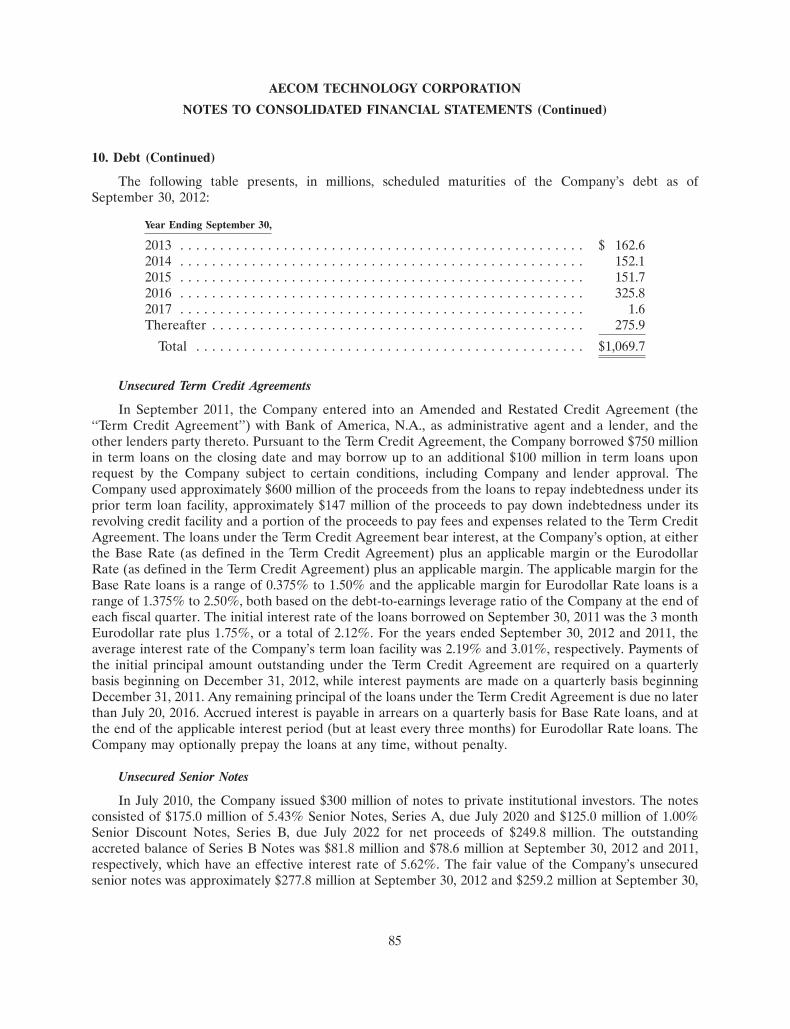
AECOM TECHNOLOGY CORPORATION
NOTES TO CONSOLIDATED FINANCIAL STATEMENTS (Continued)
10. Debt (Continued)
The following table presents, in millions, scheduled maturities of the Company’s debt as ofSeptember 30, 2012:
Year Ending September 30,
2013 . . . . . . . . . . . . . . . . . . . . . . . . . . . . . . . . . . . . . . . . . . . . . . . . . . . $ 162.62014 . . . . . . . . . . . . . . . . . . . . . . . . . . . . . . . . . . . . . . . . . . . . . . . . . . . 152.12015 . . . . . . . . . . . . . . . . . . . . . . . . . . . . . . . . . . . . . . . . . . . . . . . . . . . 151.72016 . . . . . . . . . . . . . . . . . . . . . . . . . . . . . . . . . . . . . . . . . . . . . . . . . . . 325.82017 . . . . . . . . . . . . . . . . . . . . . . . . . . . . . . . . . . . . . . . . . . . . . . . . . . . 1.6Thereafter . . . . . . . . . . . . . . . . . . . . . . . . . . . . . . . . . . . . . . . . . . . . . . . 275.9
Total . . . . . . . . . . . . . . . . . . . . . . . . . . . . . . . . . . . . . . . . . . . . . . . . . $1,069.7
Unsecured Term Credit Agreements
In September 2011, the Company entered into an Amended and Restated Credit Agreement (the‘‘Term Credit Agreement’’) with Bank of America, N.A., as administrative agent and a lender, and theother lenders party thereto. Pursuant to the Term Credit Agreement, the Company borrowed $750 millionin term loans on the closing date and may borrow up to an additional $100 million in term loans uponrequest by the Company subject to certain conditions, including Company and lender approval. TheCompany used approximately $600 million of the proceeds from the loans to repay indebtedness under itsprior term loan facility, approximately $147 million of the proceeds to pay down indebtedness under itsrevolving credit facility and a portion of the proceeds to pay fees and expenses related to the Term CreditAgreement. The loans under the Term Credit Agreement bear interest, at the Company’s option, at eitherthe Base Rate (as defined in the Term Credit Agreement) plus an applicable margin or the EurodollarRate (as defined in the Term Credit Agreement) plus an applicable margin. The applicable margin for theBase Rate loans is a range of 0.375% to 1.50% and the applicable margin for Eurodollar Rate loans is arange of 1.375% to 2.50%, both based on the debt-to-earnings leverage ratio of the Company at the end ofeach fiscal quarter. The initial interest rate of the loans borrowed on September 30, 2011 was the 3 monthEurodollar rate plus 1.75%, or a total of 2.12%. For the years ended September 30, 2012 and 2011, theaverage interest rate of the Company’s term loan facility was 2.19% and 3.01%, respectively. Payments ofthe initial principal amount outstanding under the Term Credit Agreement are required on a quarterlybasis beginning on December 31, 2012, while interest payments are made on a quarterly basis beginningDecember 31, 2011. Any remaining principal of the loans under the Term Credit Agreement is due no laterthan July 20, 2016. Accrued interest is payable in arrears on a quarterly basis for Base Rate loans, and atthe end of the applicable interest period (but at least every three months) for Eurodollar Rate loans. TheCompany may optionally prepay the loans at any time, without penalty.
Unsecured Senior Notes
In July 2010, the Company issued $300 million of notes to private institutional investors. The notesconsisted of $175.0 million of 5.43% Senior Notes, Series A, due July 2020 and $125.0 million of 1.00%Senior Discount Notes, Series B, due July 2022 for net proceeds of $249.8 million. The outstandingaccreted balance of Series B Notes was $81.8 million and $78.6 million at September 30, 2012 and 2011,respectively, which have an effective interest rate of 5.62%. The fair value of the Company’s unsecuredsenior notes was approximately $277.8 million at September 30, 2012 and $259.2 million at September 30,
85

AECOM TECHNOLOGY CORPORATION
NOTES TO CONSOLIDATED FINANCIAL STATEMENTS (Continued)
10. Debt (Continued)
2011. The Company calculated the fair values based on model-derived valuations using market observableinputs, which are Level 2 inputs under the accounting guidance. The Company’s obligations under thenotes are guaranteed by certain subsidiaries of the Company pursuant to one or more subsidiaryguarantees.
Unsecured Revolving Credit Facility
In July 2011, the Company entered into a Third Amended and Restated Credit Agreement (the‘‘Revolving Credit Agreement’’) with Bank of America, N.A., as an administrative agent and a lender andthe other lenders party thereto, which amended and restated its unsecured revolving credit facility andincreased its available borrowing capacity to $1.05 billion in order to support its working capital andacquisition needs. The Revolving Credit Agreement has an expiration date of July 20, 2016 and prior tothis expiration date, principal amounts outstanding under the Revolving Credit Agreement may be repaidand reborrowed at the option of the Company without prepayment or penalty, subject to certainconditions. The Company may also, at its option, request an increase in the commitments under the facilityup to a total of $1.15 billion, subject to certain conditions, including Company and lender approval. Theloans under the Revolving Credit Agreement may be borrowed in dollars or in certain foreign currenciesand bear interest, at the Company’s option, at either the Base Rate (as defined in the Revolving CreditAgreement) plus an applicable margin or the Eurocurrency Rate (as defined in the Revolving CreditAgreement) plus an applicable margin. The applicable margin for the Base Rate loans is a range of 0.0%to 1.50% and the applicable margin for the Eurocurrency Rate loans is a range of 1.00% to 2.50%, bothbased on the Company’s debt-to-earnings leverage ratio at the end of each fiscal quarter. In addition tothese borrowing rates, there is a commitment fee which ranges from 0.150% to 0.375% on any unusedcommitment. Accrued interest is payable in arrears on a quarterly basis for Base Rate loans, and at the endof the applicable interest period (but at least every three months) for Eurocurrency Loans. AtSeptember 30, 2012 and 2011, $24.0 million and $101.4 million, respectively, were outstanding under therevolving credit facility. At September 30, 2012 and 2011, outstanding standby letters of credit totaled$35.1 million and $32.1 million, respectively, under the revolving credit facility. As of September 30, 2012,the Company had $990.9 million available under its Revolving Credit Agreement.
Covenants and Restrictions
Under the Company’s debt agreements relating to its unsecured revolving credit facility andunsecured term credit agreements, the Company is subject to a maximum consolidated leverage ratio atthe end of any fiscal quarter. This ratio is calculated by dividing consolidated funded debt (includingfinancial letters of credit) by consolidated earnings before interest, taxes, depreciation, and amortization(EBITDA). For the Company’s debt agreements, EBITDA is defined as consolidated net incomeattributable to AECOM plus interest, depreciation and amortization expense, amounts set aside for taxesand other non-cash items (including a calculated annualized EBITDA from the Company’s acquisitions).As of September 30, 2012, the consolidated leverage ratio was 2.15, which did not exceed the Company’smost restrictive maximum consolidated leverage ratio of 3.0.
The Company’s Revolving Credit Agreement and Term Credit Agreement also contain certaincovenants that limit the Company’s ability to, among other things, (i) merge with other entities, (ii) enterinto a transaction resulting in a change of control, (iii) create new liens, (iv) sell assets outside of theordinary course of business, (v) enter into transactions with affiliates, (vi) substantially change the general
86
AECOM TECHNOLOGY CORPORATION
NOTES TO CONSOLIDATED FINANCIAL STATEMENTS (Continued)
10. Debt (Continued)
nature of the Company and its subsidiaries taken as a whole, and (vii) incur indebtedness and contingentobligations.
Additionally, the Company’s unsecured senior notes contain covenants that limit (i) certain types ofindebtedness, which include indebtedness incurred by subsidiaries and indebtedness secured by a lien,(ii) merging with other entities, (iii) entering into a transaction resulting in a change of control,(iv) creating new liens, (v) selling assets outside of the ordinary course of business, (vi) entering intotransactions with affiliates, and (vii) substantially changing the general nature of the Company and itssubsidiaries taken as a whole. The unsecured senior notes also contain a financial covenant that requiresthe Company to maintain a net worth above a calculated threshold. The threshold is calculated as$1.2 billion plus 40% of the consolidated net income for each fiscal quarter commencing with the fiscalquarter ended June 30, 2010. In the calculation of this threshold, the Company cannot include aconsolidated net loss that may occur in any fiscal quarter. The Company’s net worth for this financialcovenant is defined as total AECOM stockholders’ equity, which is consolidated stockholders’ equity,including any redeemable common stock and stock units and the liquidation preference of any preferredstock. As of September 30, 2012, this amount was $2.2 billion, which exceeds the calculated threshold of$1.5 billion.
Should the Company fail to comply with these covenants, all or a portion of its borrowings under theunsecured senior notes and unsecured term credit agreements could become immediately payable and itsunsecured revolving credit facility could be terminated. At September 30, 2012 and 2011, the Company wasin compliance with all such covenants.
The Company’s average effective interest rate on total borrowings, including the effects of the interestrate swap agreements, refer to Note 11 herein for additional information regarding the Company’s interestrate swap agreements, during the years ended September 30, 2012 and 2011 was 3.1% and 3.3%,respectively.
Notes Secured by Real Properties
Notes secured by real properties, payable to a bank, were assumed in connection with a businessacquired during the year ended September 30, 2008. These notes payable bear interest at 6.04% perannum and mature in December 2028.
Other Debt
Other debt consists primarily of bank overdrafts and obligations under capital leases. In addition tothe unsecured revolving credit facility discussed above, at September 30, 2012, the Company had$470.1 million of unsecured credit facilities primarily used to cover periodic overdrafts and standby lettersof credit, of which $209.8 million was utilized for outstanding standby letters of credit.
11. Derivative Financial Instruments
The Company uses certain interest rate derivative contracts to hedge interest rate exposures on theCompany’s variable rate debt. The Company enters into foreign currency derivative contracts withfinancial institutions to reduce the risk that its cash flows and earnings will be adversely affected by foreigncurrency exchange rate fluctuations. The Company’s hedging program is not designated for trading orspeculative purposes.
87
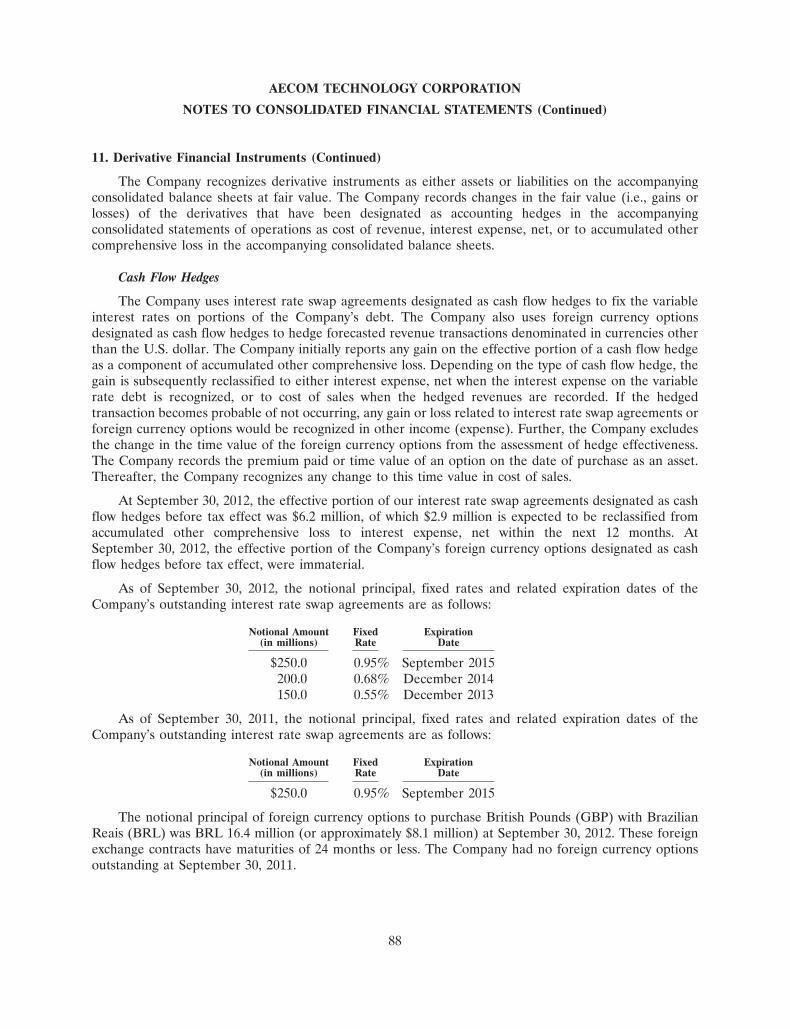
AECOM TECHNOLOGY CORPORATION
NOTES TO CONSOLIDATED FINANCIAL STATEMENTS (Continued)
11. Derivative Financial Instruments (Continued)
The Company recognizes derivative instruments as either assets or liabilities on the accompanyingconsolidated balance sheets at fair value. The Company records changes in the fair value (i.e., gains orlosses) of the derivatives that have been designated as accounting hedges in the accompanyingconsolidated statements of operations as cost of revenue, interest expense, net, or to accumulated othercomprehensive loss in the accompanying consolidated balance sheets.
Cash Flow Hedges
The Company uses interest rate swap agreements designated as cash flow hedges to fix the variableinterest rates on portions of the Company’s debt. The Company also uses foreign currency optionsdesignated as cash flow hedges to hedge forecasted revenue transactions denominated in currencies otherthan the U.S. dollar. The Company initially reports any gain on the effective portion of a cash flow hedgeas a component of accumulated other comprehensive loss. Depending on the type of cash flow hedge, thegain is subsequently reclassified to either interest expense, net when the interest expense on the variablerate debt is recognized, or to cost of sales when the hedged revenues are recorded. If the hedgedtransaction becomes probable of not occurring, any gain or loss related to interest rate swap agreements orforeign currency options would be recognized in other income (expense). Further, the Company excludesthe change in the time value of the foreign currency options from the assessment of hedge effectiveness.The Company records the premium paid or time value of an option on the date of purchase as an asset.Thereafter, the Company recognizes any change to this time value in cost of sales.
At September 30, 2012, the effective portion of our interest rate swap agreements designated as cashflow hedges before tax effect was $6.2 million, of which $2.9 million is expected to be reclassified fromaccumulated other comprehensive loss to interest expense, net within the next 12 months. AtSeptember 30, 2012, the effective portion of the Company’s foreign currency options designated as cashflow hedges before tax effect, were immaterial.
As of September 30, 2012, the notional principal, fixed rates and related expiration dates of theCompany’s outstanding interest rate swap agreements are as follows:
Notional Amount Fixed Expiration(in millions) Rate Date
$250.0 0.95% September 2015200.0 0.68% December 2014150.0 0.55% December 2013
As of September 30, 2011, the notional principal, fixed rates and related expiration dates of theCompany’s outstanding interest rate swap agreements are as follows:
Notional Amount Fixed Expiration(in millions) Rate Date
$250.0 0.95% September 2015
The notional principal of foreign currency options to purchase British Pounds (GBP) with BrazilianReais (BRL) was BRL 16.4 million (or approximately $8.1 million) at September 30, 2012. These foreignexchange contracts have maturities of 24 months or less. The Company had no foreign currency optionsoutstanding at September 30, 2011.
88
AECOM TECHNOLOGY CORPORATION
NOTES TO CONSOLIDATED FINANCIAL STATEMENTS (Continued)
11. Derivative Financial Instruments (Continued)
Foreign Currency Forward Contracts
The Company uses foreign currency forward contracts, which are not designated as accountinghedges, to hedge intercompany transactions and other monetary assets or liabilities denominated incurrencies other than the functional currency of a subsidiary. Gains and losses on these contracts arerecognized in cost of sales for those instruments related to the provision of our services or general andadministrative expenses, along with the offsetting losses and gains of the related hedged items. Thenotional principal of foreign currency forward contracts to purchase U.S. dollars with foreign currencieswas $60.1 million at September 30, 2012. The notional principal of foreign currency forward contracts tosell U.S. dollars for foreign currencies was $110.2 million at September 30, 2012. The notional principal offoreign currency forward contracts to purchase GBP with BRL was BRL 9.7 million (or approximately$4.9 million) at September 30, 2012. The notional principal of foreign currency forward contracts to sellU.S. dollars for foreign currencies was $57.1 million at September 30, 2011.
Other Derivatives
Other derivatives that are not designated as hedging instruments consist of option contracts that theCompany uses to hedge anticipated transactions in currencies other than the functional currency of asubsidiary. The Company recognizes gains and losses on these contracts as well as the offsetting losses andgains of the related hedged item costs in cost of sales. The Company records the premium paid or timevalue of an option on the date of purchase as an asset. Thereafter, the Company recognizes any change tothis time value in cost of sales. The notional principal of option contracts to sell U.S. dollars for foreigncurrencies was $17.3 million at September 30, 2012 and no such option contracts were outstanding atSeptember 30, 2011.
89
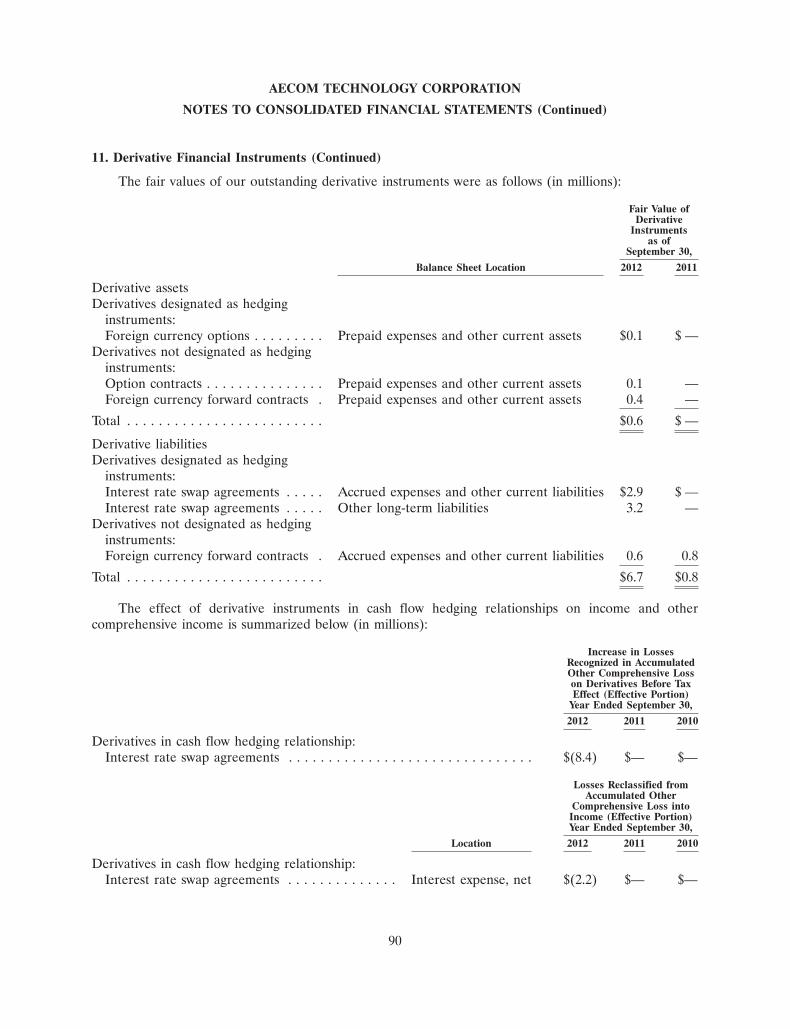
AECOM TECHNOLOGY CORPORATION
NOTES TO CONSOLIDATED FINANCIAL STATEMENTS (Continued)
11. Derivative Financial Instruments (Continued)
The fair values of our outstanding derivative instruments were as follows (in millions):
Fair Value ofDerivative
Instrumentsas of
September 30,Balance Sheet Location 2012 2011
Derivative assetsDerivatives designated as hedging
instruments:Foreign currency options . . . . . . . . . Prepaid expenses and other current assets $0.1 $ —
Derivatives not designated as hedginginstruments:Option contracts . . . . . . . . . . . . . . . Prepaid expenses and other current assets 0.1 —Foreign currency forward contracts . Prepaid expenses and other current assets 0.4 —
Total . . . . . . . . . . . . . . . . . . . . . . . . . $0.6 $ —
Derivative liabilitiesDerivatives designated as hedging
instruments:Interest rate swap agreements . . . . . Accrued expenses and other current liabilities $2.9 $ —Interest rate swap agreements . . . . . Other long-term liabilities 3.2 —
Derivatives not designated as hedginginstruments:Foreign currency forward contracts . Accrued expenses and other current liabilities 0.6 0.8
Total . . . . . . . . . . . . . . . . . . . . . . . . . $6.7 $0.8
The effect of derivative instruments in cash flow hedging relationships on income and othercomprehensive income is summarized below (in millions):
Increase in LossesRecognized in AccumulatedOther Comprehensive Losson Derivatives Before TaxEffect (Effective Portion)
Year Ended September 30,2012 2011 2010
Derivatives in cash flow hedging relationship:Interest rate swap agreements . . . . . . . . . . . . . . . . . . . . . . . . . . . . . . . $(8.4) $— $—
Losses Reclassified fromAccumulated Other
Comprehensive Loss intoIncome (Effective Portion)Year Ended September 30,
Location 2012 2011 2010
Derivatives in cash flow hedging relationship:Interest rate swap agreements . . . . . . . . . . . . . . Interest expense, net $(2.2) $— $—
90
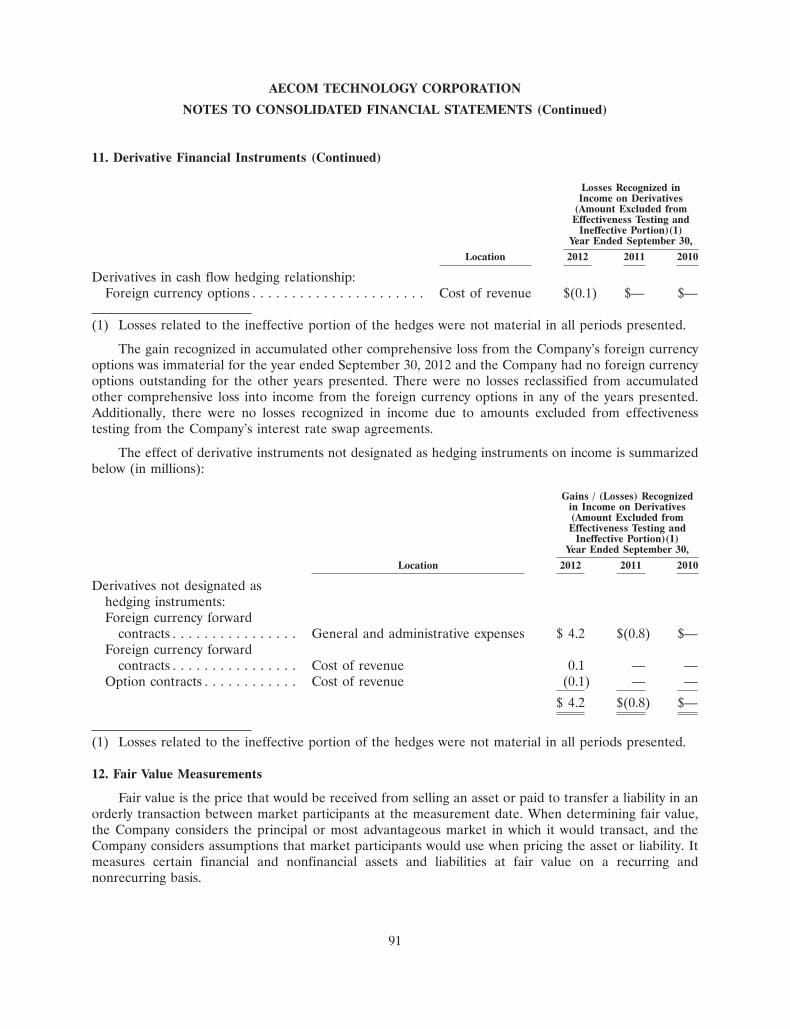
AECOM TECHNOLOGY CORPORATION
NOTES TO CONSOLIDATED FINANCIAL STATEMENTS (Continued)
11. Derivative Financial Instruments (Continued)
Losses Recognized inIncome on Derivatives
(Amount Excluded fromEffectiveness Testing and
Ineffective Portion)(1)Year Ended September 30,
Location 2012 2011 2010
Derivatives in cash flow hedging relationship:Foreign currency options . . . . . . . . . . . . . . . . . . . . . . Cost of revenue $(0.1) $— $—
(1) Losses related to the ineffective portion of the hedges were not material in all periods presented.
The gain recognized in accumulated other comprehensive loss from the Company’s foreign currencyoptions was immaterial for the year ended September 30, 2012 and the Company had no foreign currencyoptions outstanding for the other years presented. There were no losses reclassified from accumulatedother comprehensive loss into income from the foreign currency options in any of the years presented.Additionally, there were no losses recognized in income due to amounts excluded from effectivenesstesting from the Company’s interest rate swap agreements.
The effect of derivative instruments not designated as hedging instruments on income is summarizedbelow (in millions):
Gains / (Losses) Recognizedin Income on Derivatives(Amount Excluded fromEffectiveness Testing and
Ineffective Portion)(1)Year Ended September 30,
Location 2012 2011 2010
Derivatives not designated ashedging instruments:Foreign currency forward
contracts . . . . . . . . . . . . . . . . General and administrative expenses $ 4.2 $(0.8) $—Foreign currency forward
contracts . . . . . . . . . . . . . . . . Cost of revenue 0.1 — —Option contracts . . . . . . . . . . . . Cost of revenue (0.1) — —
$ 4.2 $(0.8) $—
(1) Losses related to the ineffective portion of the hedges were not material in all periods presented.
12. Fair Value Measurements
Fair value is the price that would be received from selling an asset or paid to transfer a liability in anorderly transaction between market participants at the measurement date. When determining fair value,the Company considers the principal or most advantageous market in which it would transact, and theCompany considers assumptions that market participants would use when pricing the asset or liability. Itmeasures certain financial and nonfinancial assets and liabilities at fair value on a recurring andnonrecurring basis.
91
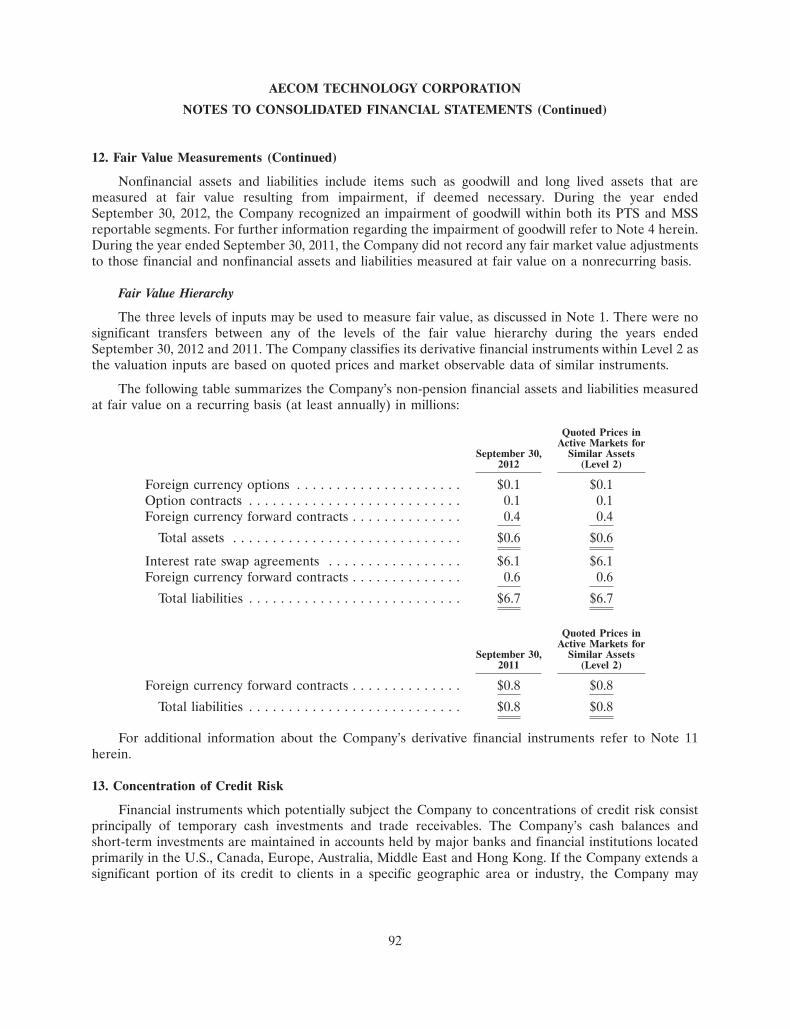
AECOM TECHNOLOGY CORPORATION
NOTES TO CONSOLIDATED FINANCIAL STATEMENTS (Continued)
12. Fair Value Measurements (Continued)
Nonfinancial assets and liabilities include items such as goodwill and long lived assets that aremeasured at fair value resulting from impairment, if deemed necessary. During the year endedSeptember 30, 2012, the Company recognized an impairment of goodwill within both its PTS and MSSreportable segments. For further information regarding the impairment of goodwill refer to Note 4 herein.During the year ended September 30, 2011, the Company did not record any fair market value adjustmentsto those financial and nonfinancial assets and liabilities measured at fair value on a nonrecurring basis.
Fair Value Hierarchy
The three levels of inputs may be used to measure fair value, as discussed in Note 1. There were nosignificant transfers between any of the levels of the fair value hierarchy during the years endedSeptember 30, 2012 and 2011. The Company classifies its derivative financial instruments within Level 2 asthe valuation inputs are based on quoted prices and market observable data of similar instruments.
The following table summarizes the Company’s non-pension financial assets and liabilities measuredat fair value on a recurring basis (at least annually) in millions:
Quoted Prices inActive Markets for
September 30, Similar Assets2012 (Level 2)
Foreign currency options . . . . . . . . . . . . . . . . . . . . . $0.1 $0.1Option contracts . . . . . . . . . . . . . . . . . . . . . . . . . . . 0.1 0.1Foreign currency forward contracts . . . . . . . . . . . . . . 0.4 0.4
Total assets . . . . . . . . . . . . . . . . . . . . . . . . . . . . . $0.6 $0.6
Interest rate swap agreements . . . . . . . . . . . . . . . . . $6.1 $6.1Foreign currency forward contracts . . . . . . . . . . . . . . 0.6 0.6
Total liabilities . . . . . . . . . . . . . . . . . . . . . . . . . . . $6.7 $6.7
Quoted Prices inActive Markets for
September 30, Similar Assets2011 (Level 2)
Foreign currency forward contracts . . . . . . . . . . . . . . $0.8 $0.8Total liabilities . . . . . . . . . . . . . . . . . . . . . . . . . . . $0.8 $0.8
For additional information about the Company’s derivative financial instruments refer to Note 11herein.
13. Concentration of Credit Risk
Financial instruments which potentially subject the Company to concentrations of credit risk consistprincipally of temporary cash investments and trade receivables. The Company’s cash balances andshort-term investments are maintained in accounts held by major banks and financial institutions locatedprimarily in the U.S., Canada, Europe, Australia, Middle East and Hong Kong. If the Company extends asignificant portion of its credit to clients in a specific geographic area or industry, the Company may
92
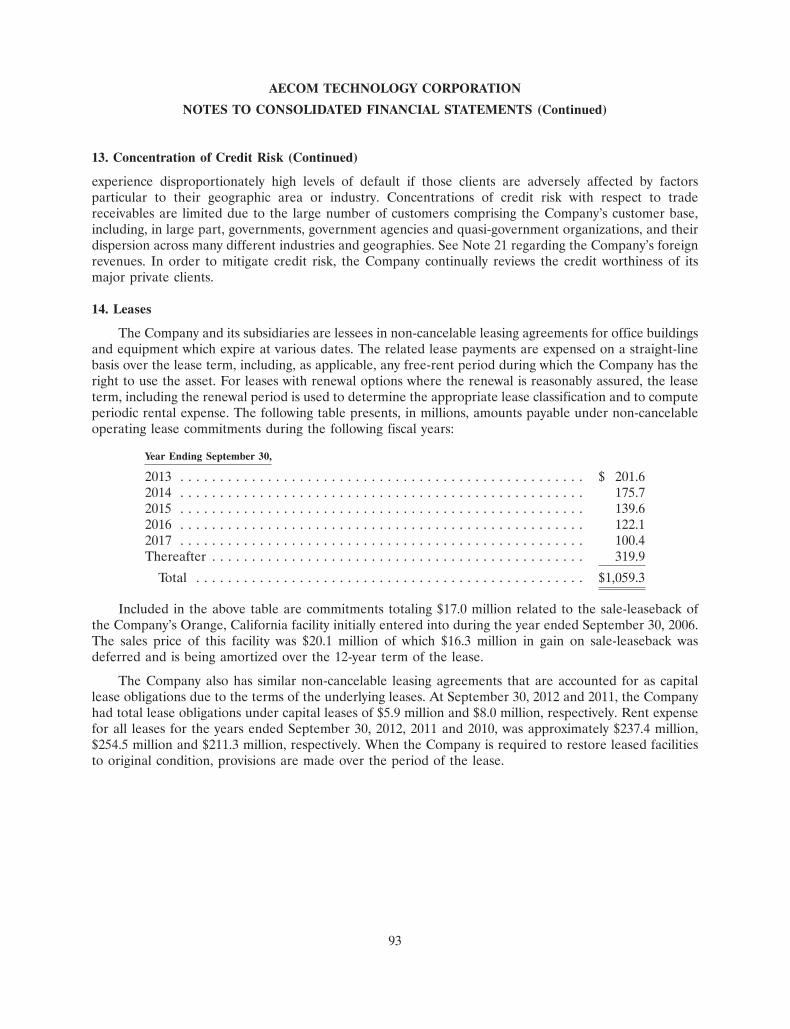
AECOM TECHNOLOGY CORPORATION
NOTES TO CONSOLIDATED FINANCIAL STATEMENTS (Continued)
13. Concentration of Credit Risk (Continued)
experience disproportionately high levels of default if those clients are adversely affected by factorsparticular to their geographic area or industry. Concentrations of credit risk with respect to tradereceivables are limited due to the large number of customers comprising the Company’s customer base,including, in large part, governments, government agencies and quasi-government organizations, and theirdispersion across many different industries and geographies. See Note 21 regarding the Company’s foreignrevenues. In order to mitigate credit risk, the Company continually reviews the credit worthiness of itsmajor private clients.
14. Leases
The Company and its subsidiaries are lessees in non-cancelable leasing agreements for office buildingsand equipment which expire at various dates. The related lease payments are expensed on a straight-linebasis over the lease term, including, as applicable, any free-rent period during which the Company has theright to use the asset. For leases with renewal options where the renewal is reasonably assured, the leaseterm, including the renewal period is used to determine the appropriate lease classification and to computeperiodic rental expense. The following table presents, in millions, amounts payable under non-cancelableoperating lease commitments during the following fiscal years:
Year Ending September 30,
2013 . . . . . . . . . . . . . . . . . . . . . . . . . . . . . . . . . . . . . . . . . . . . . . . . . . . $ 201.62014 . . . . . . . . . . . . . . . . . . . . . . . . . . . . . . . . . . . . . . . . . . . . . . . . . . . 175.72015 . . . . . . . . . . . . . . . . . . . . . . . . . . . . . . . . . . . . . . . . . . . . . . . . . . . 139.62016 . . . . . . . . . . . . . . . . . . . . . . . . . . . . . . . . . . . . . . . . . . . . . . . . . . . 122.12017 . . . . . . . . . . . . . . . . . . . . . . . . . . . . . . . . . . . . . . . . . . . . . . . . . . . 100.4Thereafter . . . . . . . . . . . . . . . . . . . . . . . . . . . . . . . . . . . . . . . . . . . . . . . 319.9
Total . . . . . . . . . . . . . . . . . . . . . . . . . . . . . . . . . . . . . . . . . . . . . . . . . $1,059.3
Included in the above table are commitments totaling $17.0 million related to the sale-leaseback ofthe Company’s Orange, California facility initially entered into during the year ended September 30, 2006.The sales price of this facility was $20.1 million of which $16.3 million in gain on sale-leaseback wasdeferred and is being amortized over the 12-year term of the lease.
The Company also has similar non-cancelable leasing agreements that are accounted for as capitallease obligations due to the terms of the underlying leases. At September 30, 2012 and 2011, the Companyhad total lease obligations under capital leases of $5.9 million and $8.0 million, respectively. Rent expensefor all leases for the years ended September 30, 2012, 2011 and 2010, was approximately $237.4 million,$254.5 million and $211.3 million, respectively. When the Company is required to restore leased facilitiesto original condition, provisions are made over the period of the lease.
93
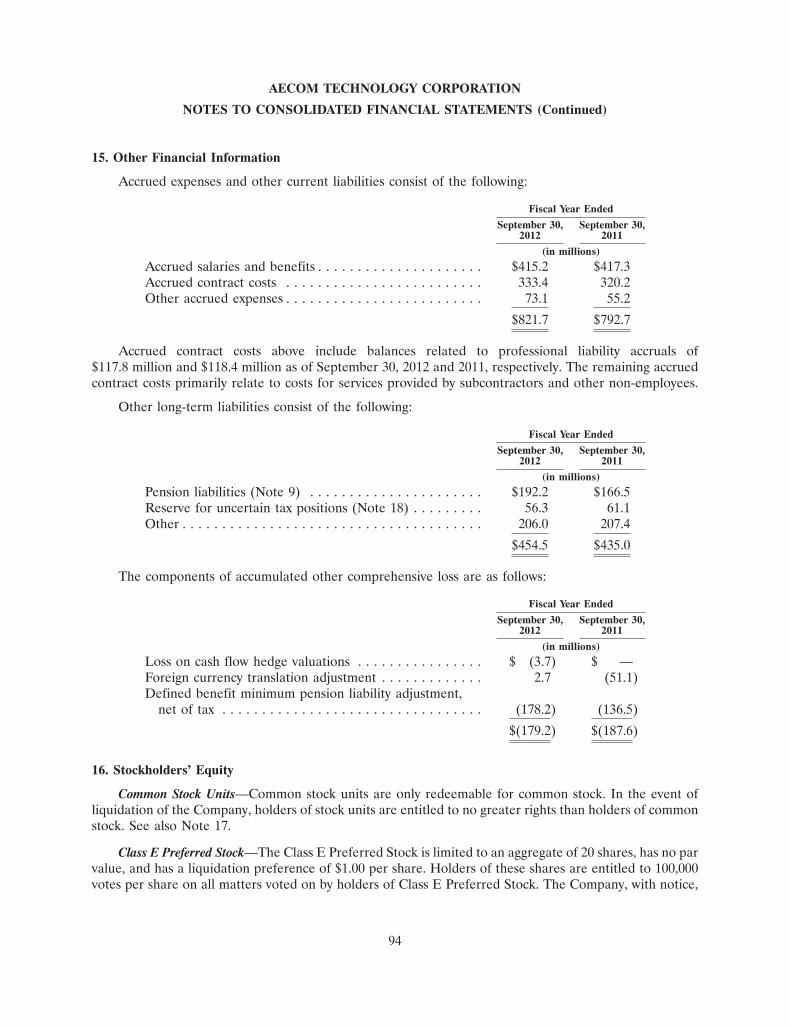
AECOM TECHNOLOGY CORPORATION
NOTES TO CONSOLIDATED FINANCIAL STATEMENTS (Continued)
15. Other Financial Information
Accrued expenses and other current liabilities consist of the following:
Fiscal Year EndedSeptember 30, September 30,
2012 2011(in millions)
Accrued salaries and benefits . . . . . . . . . . . . . . . . . . . . . $415.2 $417.3Accrued contract costs . . . . . . . . . . . . . . . . . . . . . . . . . 333.4 320.2Other accrued expenses . . . . . . . . . . . . . . . . . . . . . . . . . 73.1 55.2
$821.7 $792.7
Accrued contract costs above include balances related to professional liability accruals of$117.8 million and $118.4 million as of September 30, 2012 and 2011, respectively. The remaining accruedcontract costs primarily relate to costs for services provided by subcontractors and other non-employees.
Other long-term liabilities consist of the following:
Fiscal Year EndedSeptember 30, September 30,
2012 2011(in millions)
Pension liabilities (Note 9) . . . . . . . . . . . . . . . . . . . . . . $192.2 $166.5Reserve for uncertain tax positions (Note 18) . . . . . . . . . 56.3 61.1Other . . . . . . . . . . . . . . . . . . . . . . . . . . . . . . . . . . . . . . 206.0 207.4
$454.5 $435.0
The components of accumulated other comprehensive loss are as follows:
Fiscal Year EndedSeptember 30, September 30,
2012 2011(in millions)
Loss on cash flow hedge valuations . . . . . . . . . . . . . . . . $ (3.7) $ —Foreign currency translation adjustment . . . . . . . . . . . . . 2.7 (51.1)Defined benefit minimum pension liability adjustment,
net of tax . . . . . . . . . . . . . . . . . . . . . . . . . . . . . . . . . (178.2) (136.5)$(179.2) $(187.6)
16. Stockholders’ Equity
Common Stock Units—Common stock units are only redeemable for common stock. In the event ofliquidation of the Company, holders of stock units are entitled to no greater rights than holders of commonstock. See also Note 17.
Class E Preferred Stock—The Class E Preferred Stock is limited to an aggregate of 20 shares, has no parvalue, and has a liquidation preference of $1.00 per share. Holders of these shares are entitled to 100,000votes per share on all matters voted on by holders of Class E Preferred Stock. The Company, with notice,
94
AECOM TECHNOLOGY CORPORATION
NOTES TO CONSOLIDATED FINANCIAL STATEMENTS (Continued)
16. Stockholders’ Equity (Continued)
may redeem Class E Preferred Stock by paying the liquidation preference. The holders of Class EPreferred Stock have no conversion rights. All shares of Class E Preferred Stock redeemed or repurchasedby the Company will be restored to the status of authorized but un-issued shares of Preferred Stock,without designation as to series.
17. Stock Plans
Defined Contribution Plans—Substantially all permanent employees are eligible to participate in definedcontribution plans provided by the Company. Under these plans, participants may make contributions intoa variety of funds, including a fund that is fully invested in Company stock. Employees are not required toallocate any funds to Company stock, which allows employees to limit their exposure to market changes inthe Company’s stock price. Employees may generally reallocate their account balances on a daily basis.The only limit on the frequency of reallocations applies to changes involving Company stock investmentsby employees classified as insiders or restricted personnel under the Company’s insider trading policy.
Deferred Compensation Plan—In the past, the Company sponsored the Deferred Compensation Plan(DCP), a stock purchase plan that provided an opportunity for eligible employees and non-employeedirectors to continue to invest in the Company when the Company’s qualified plans were no longeravailable to them due to limitations contained in the U.S. Internal Revenue Code. Under the DCP,participants were permitted to defer compensation, on a pre-tax basis, for investment in common stockunits. The Company funded a rabbi trust for certain diversified DCP balances in connection with the initialpublic offering in May 2007. The Company elected to terminate this plan effective in December 2009. As aresult of the termination, 6.3 million outstanding restricted stock units and the Company’s deferredcompensation liability of $88.8 million as of September 30, 2010 were settled in December 2010.Investments in the rabbi trust totaled $67.2 million as of September 2010, which were substantially used tosettle the liability.
Compensation expense relating to employer contributions under defined contribution plans, includingthe DCP, for fiscal years ended September 30, 2012, 2011 and 2010 was $15.9 million, $17.2 million and$15.8 million, respectively. Issuances and repurchases of AECOM common stock related to employeeparticipants’ contributions to and withdrawals from these defined contribution plans are included asissuances and repurchases of stock in the accompanying Consolidated Statements of Stockholders’ Equityand of Cash Flows.
Stock Incentive Plans—Under the 2006 Stock Incentive Plan, the Company has 15.7 million securitiesremaining available for future issuance under stock options or restricted stock awards as of September 30,2012. Stock options may be granted to employees and non-employee directors with an exercise price notless than the fair market value of the stock on the date of grant. Unexercised options expire seven yearsafter date of grant. During the years ended September 30, 2012, 2011 and 2010, compensation expenserecognized relating to employee stock options as a result of the fair value method was $2.4 million,$4.6 million and $4.1 million, respectively. Unrecognized compensation expense relating to employee stockoptions outstanding as of September 30, 2012 was $1.3 million to be recognized on a straight-line basis overthe awards’ respective vesting periods which are generally three years.
95
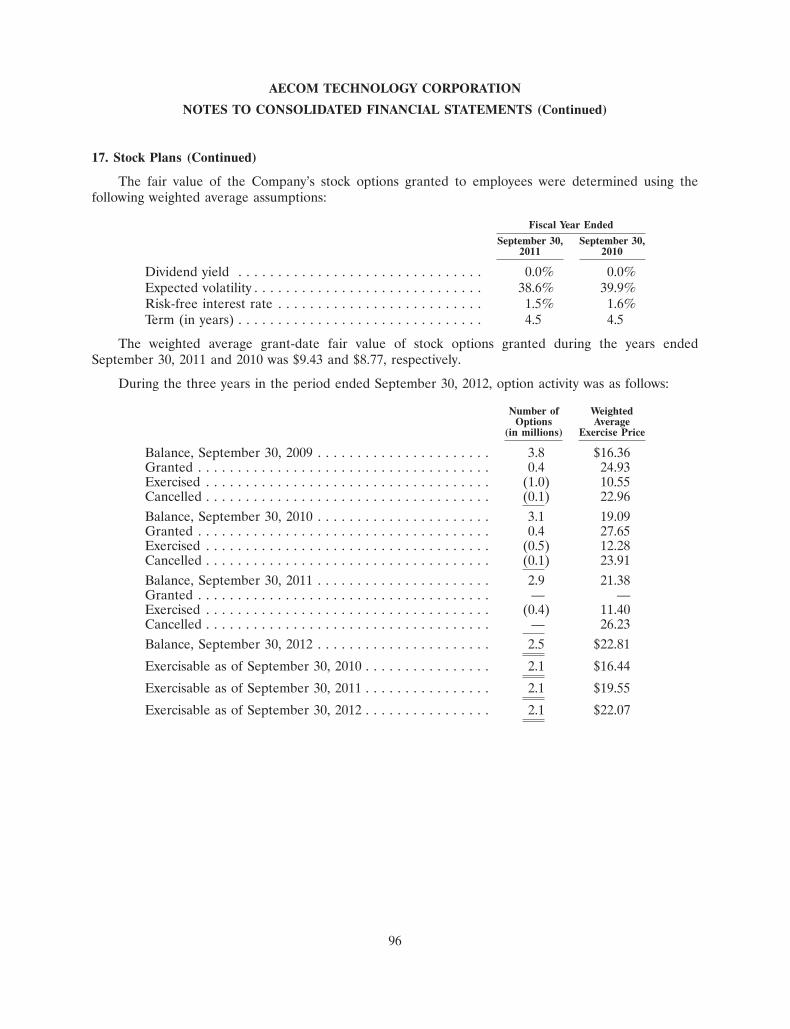
AECOM TECHNOLOGY CORPORATION
NOTES TO CONSOLIDATED FINANCIAL STATEMENTS (Continued)
17. Stock Plans (Continued)
The fair value of the Company’s stock options granted to employees were determined using thefollowing weighted average assumptions:
Fiscal Year EndedSeptember 30, September 30,
2011 2010
Dividend yield . . . . . . . . . . . . . . . . . . . . . . . . . . . . . . . 0.0% 0.0%Expected volatility . . . . . . . . . . . . . . . . . . . . . . . . . . . . . 38.6% 39.9%Risk-free interest rate . . . . . . . . . . . . . . . . . . . . . . . . . . 1.5% 1.6%Term (in years) . . . . . . . . . . . . . . . . . . . . . . . . . . . . . . . 4.5 4.5
The weighted average grant-date fair value of stock options granted during the years endedSeptember 30, 2011 and 2010 was $9.43 and $8.77, respectively.
During the three years in the period ended September 30, 2012, option activity was as follows:
Number of WeightedOptions Average
(in millions) Exercise Price
Balance, September 30, 2009 . . . . . . . . . . . . . . . . . . . . . . 3.8 $16.36Granted . . . . . . . . . . . . . . . . . . . . . . . . . . . . . . . . . . . . . 0.4 24.93Exercised . . . . . . . . . . . . . . . . . . . . . . . . . . . . . . . . . . . . (1.0) 10.55Cancelled . . . . . . . . . . . . . . . . . . . . . . . . . . . . . . . . . . . . (0.1) 22.96Balance, September 30, 2010 . . . . . . . . . . . . . . . . . . . . . . 3.1 19.09Granted . . . . . . . . . . . . . . . . . . . . . . . . . . . . . . . . . . . . . 0.4 27.65Exercised . . . . . . . . . . . . . . . . . . . . . . . . . . . . . . . . . . . . (0.5) 12.28Cancelled . . . . . . . . . . . . . . . . . . . . . . . . . . . . . . . . . . . . (0.1) 23.91Balance, September 30, 2011 . . . . . . . . . . . . . . . . . . . . . . 2.9 21.38Granted . . . . . . . . . . . . . . . . . . . . . . . . . . . . . . . . . . . . . — —Exercised . . . . . . . . . . . . . . . . . . . . . . . . . . . . . . . . . . . . (0.4) 11.40Cancelled . . . . . . . . . . . . . . . . . . . . . . . . . . . . . . . . . . . . — 26.23Balance, September 30, 2012 . . . . . . . . . . . . . . . . . . . . . . 2.5 $22.81
Exercisable as of September 30, 2010 . . . . . . . . . . . . . . . . 2.1 $16.44
Exercisable as of September 30, 2011 . . . . . . . . . . . . . . . . 2.1 $19.55
Exercisable as of September 30, 2012 . . . . . . . . . . . . . . . . 2.1 $22.07
96
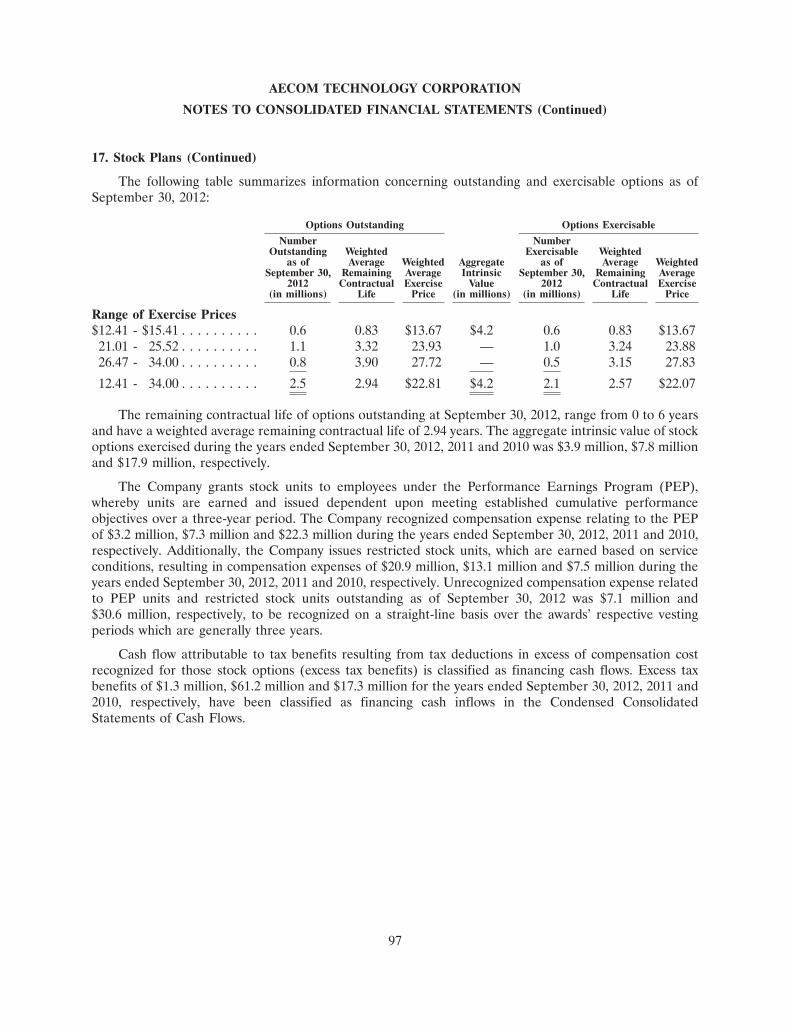
AECOM TECHNOLOGY CORPORATION
NOTES TO CONSOLIDATED FINANCIAL STATEMENTS (Continued)
17. Stock Plans (Continued)
The following table summarizes information concerning outstanding and exercisable options as ofSeptember 30, 2012:
Options Outstanding Options ExercisableNumber Number
Outstanding Weighted Exercisable Weightedas of Average Weighted Aggregate as of Average Weighted
September 30, Remaining Average Intrinsic September 30, Remaining Average2012 Contractual Exercise Value 2012 Contractual Exercise
(in millions) Life Price (in millions) (in millions) Life Price
Range of Exercise Prices$12.41 - $15.41 . . . . . . . . . . 0.6 0.83 $13.67 $4.2 0.6 0.83 $13.6721.01 - 25.52 . . . . . . . . . . 1.1 3.32 23.93 — 1.0 3.24 23.8826.47 - 34.00 . . . . . . . . . . 0.8 3.90 27.72 — 0.5 3.15 27.8312.41 - 34.00 . . . . . . . . . . 2.5 2.94 $22.81 $4.2 2.1 2.57 $22.07
The remaining contractual life of options outstanding at September 30, 2012, range from 0 to 6 yearsand have a weighted average remaining contractual life of 2.94 years. The aggregate intrinsic value of stockoptions exercised during the years ended September 30, 2012, 2011 and 2010 was $3.9 million, $7.8 millionand $17.9 million, respectively.
The Company grants stock units to employees under the Performance Earnings Program (PEP),whereby units are earned and issued dependent upon meeting established cumulative performanceobjectives over a three-year period. The Company recognized compensation expense relating to the PEPof $3.2 million, $7.3 million and $22.3 million during the years ended September 30, 2012, 2011 and 2010,respectively. Additionally, the Company issues restricted stock units, which are earned based on serviceconditions, resulting in compensation expenses of $20.9 million, $13.1 million and $7.5 million during theyears ended September 30, 2012, 2011 and 2010, respectively. Unrecognized compensation expense relatedto PEP units and restricted stock units outstanding as of September 30, 2012 was $7.1 million and$30.6 million, respectively, to be recognized on a straight-line basis over the awards’ respective vestingperiods which are generally three years.
Cash flow attributable to tax benefits resulting from tax deductions in excess of compensation costrecognized for those stock options (excess tax benefits) is classified as financing cash flows. Excess taxbenefits of $1.3 million, $61.2 million and $17.3 million for the years ended September 30, 2012, 2011 and2010, respectively, have been classified as financing cash inflows in the Condensed ConsolidatedStatements of Cash Flows.
97
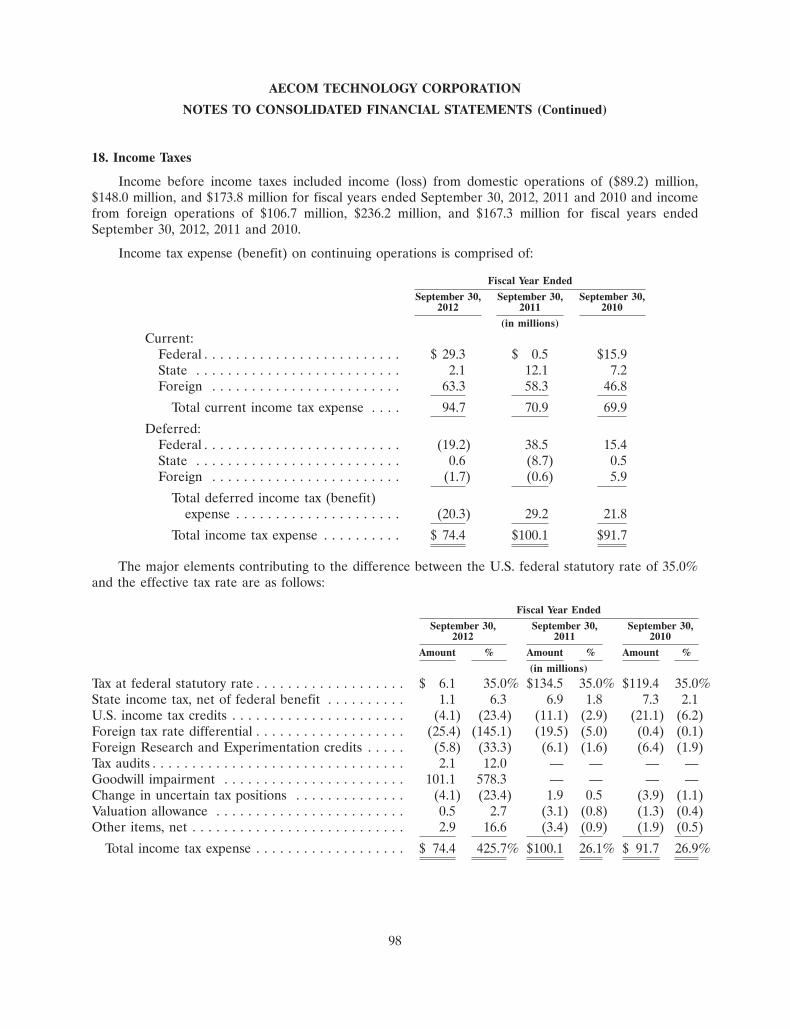
AECOM TECHNOLOGY CORPORATION
NOTES TO CONSOLIDATED FINANCIAL STATEMENTS (Continued)
18. Income Taxes
Income before income taxes included income (loss) from domestic operations of ($89.2) million,$148.0 million, and $173.8 million for fiscal years ended September 30, 2012, 2011 and 2010 and incomefrom foreign operations of $106.7 million, $236.2 million, and $167.3 million for fiscal years endedSeptember 30, 2012, 2011 and 2010.
Income tax expense (benefit) on continuing operations is comprised of:
Fiscal Year EndedSeptember 30, September 30, September 30,
2012 2011 2010(in millions)
Current:Federal . . . . . . . . . . . . . . . . . . . . . . . . . $ 29.3 $ 0.5 $15.9State . . . . . . . . . . . . . . . . . . . . . . . . . . 2.1 12.1 7.2Foreign . . . . . . . . . . . . . . . . . . . . . . . . 63.3 58.3 46.8
Total current income tax expense . . . . 94.7 70.9 69.9Deferred:
Federal . . . . . . . . . . . . . . . . . . . . . . . . . (19.2) 38.5 15.4State . . . . . . . . . . . . . . . . . . . . . . . . . . 0.6 (8.7) 0.5Foreign . . . . . . . . . . . . . . . . . . . . . . . . (1.7) (0.6) 5.9
Total deferred income tax (benefit)expense . . . . . . . . . . . . . . . . . . . . . (20.3) 29.2 21.8
Total income tax expense . . . . . . . . . . $ 74.4 $100.1 $91.7
The major elements contributing to the difference between the U.S. federal statutory rate of 35.0%and the effective tax rate are as follows:
Fiscal Year EndedSeptember 30, September 30, September 30,
2012 2011 2010Amount % Amount % Amount %
(in millions)Tax at federal statutory rate . . . . . . . . . . . . . . . . . . . $ 6.1 35.0% $134.5 35.0% $119.4 35.0%State income tax, net of federal benefit . . . . . . . . . . 1.1 6.3 6.9 1.8 7.3 2.1U.S. income tax credits . . . . . . . . . . . . . . . . . . . . . . (4.1) (23.4) (11.1) (2.9) (21.1) (6.2)Foreign tax rate differential . . . . . . . . . . . . . . . . . . . (25.4) (145.1) (19.5) (5.0) (0.4) (0.1)Foreign Research and Experimentation credits . . . . . (5.8) (33.3) (6.1) (1.6) (6.4) (1.9)Tax audits . . . . . . . . . . . . . . . . . . . . . . . . . . . . . . . . 2.1 12.0 — — — —Goodwill impairment . . . . . . . . . . . . . . . . . . . . . . . 101.1 578.3 — — — —Change in uncertain tax positions . . . . . . . . . . . . . . (4.1) (23.4) 1.9 0.5 (3.9) (1.1)Valuation allowance . . . . . . . . . . . . . . . . . . . . . . . . 0.5 2.7 (3.1) (0.8) (1.3) (0.4)Other items, net . . . . . . . . . . . . . . . . . . . . . . . . . . . 2.9 16.6 (3.4) (0.9) (1.9) (0.5)
Total income tax expense . . . . . . . . . . . . . . . . . . . $ 74.4 425.7% $100.1 26.1% $ 91.7 26.9%
98
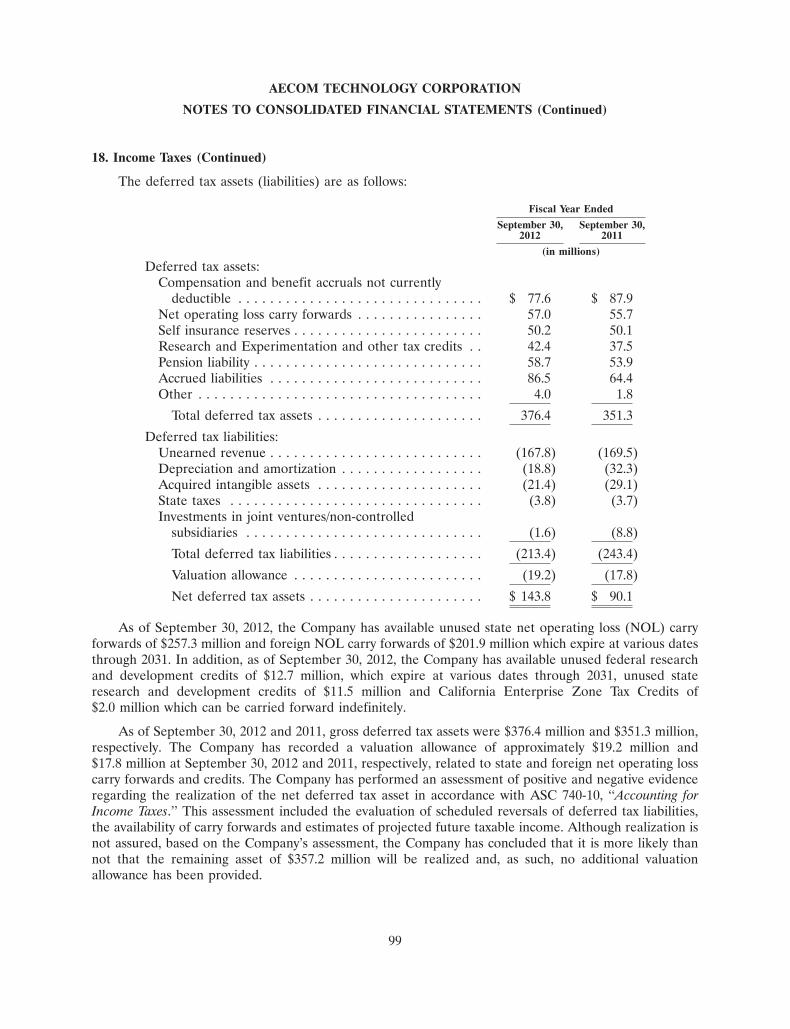
AECOM TECHNOLOGY CORPORATION
NOTES TO CONSOLIDATED FINANCIAL STATEMENTS (Continued)
18. Income Taxes (Continued)
The deferred tax assets (liabilities) are as follows:
Fiscal Year EndedSeptember 30, September 30,
2012 2011(in millions)
Deferred tax assets:Compensation and benefit accruals not currently
deductible . . . . . . . . . . . . . . . . . . . . . . . . . . . . . . . $ 77.6 $ 87.9Net operating loss carry forwards . . . . . . . . . . . . . . . . 57.0 55.7Self insurance reserves . . . . . . . . . . . . . . . . . . . . . . . . 50.2 50.1Research and Experimentation and other tax credits . . 42.4 37.5Pension liability . . . . . . . . . . . . . . . . . . . . . . . . . . . . . 58.7 53.9Accrued liabilities . . . . . . . . . . . . . . . . . . . . . . . . . . . 86.5 64.4Other . . . . . . . . . . . . . . . . . . . . . . . . . . . . . . . . . . . . 4.0 1.8
Total deferred tax assets . . . . . . . . . . . . . . . . . . . . . 376.4 351.3Deferred tax liabilities:
Unearned revenue . . . . . . . . . . . . . . . . . . . . . . . . . . . (167.8) (169.5)Depreciation and amortization . . . . . . . . . . . . . . . . . . (18.8) (32.3)Acquired intangible assets . . . . . . . . . . . . . . . . . . . . . (21.4) (29.1)State taxes . . . . . . . . . . . . . . . . . . . . . . . . . . . . . . . . (3.8) (3.7)Investments in joint ventures/non-controlled
subsidiaries . . . . . . . . . . . . . . . . . . . . . . . . . . . . . . (1.6) (8.8)Total deferred tax liabilities . . . . . . . . . . . . . . . . . . . (213.4) (243.4)Valuation allowance . . . . . . . . . . . . . . . . . . . . . . . . (19.2) (17.8)Net deferred tax assets . . . . . . . . . . . . . . . . . . . . . . $ 143.8 $ 90.1
As of September 30, 2012, the Company has available unused state net operating loss (NOL) carryforwards of $257.3 million and foreign NOL carry forwards of $201.9 million which expire at various datesthrough 2031. In addition, as of September 30, 2012, the Company has available unused federal researchand development credits of $12.7 million, which expire at various dates through 2031, unused stateresearch and development credits of $11.5 million and California Enterprise Zone Tax Credits of$2.0 million which can be carried forward indefinitely.
As of September 30, 2012 and 2011, gross deferred tax assets were $376.4 million and $351.3 million,respectively. The Company has recorded a valuation allowance of approximately $19.2 million and$17.8 million at September 30, 2012 and 2011, respectively, related to state and foreign net operating losscarry forwards and credits. The Company has performed an assessment of positive and negative evidenceregarding the realization of the net deferred tax asset in accordance with ASC 740-10, ‘‘Accounting forIncome Taxes.’’ This assessment included the evaluation of scheduled reversals of deferred tax liabilities,the availability of carry forwards and estimates of projected future taxable income. Although realization isnot assured, based on the Company’s assessment, the Company has concluded that it is more likely thannot that the remaining asset of $357.2 million will be realized and, as such, no additional valuationallowance has been provided.
99
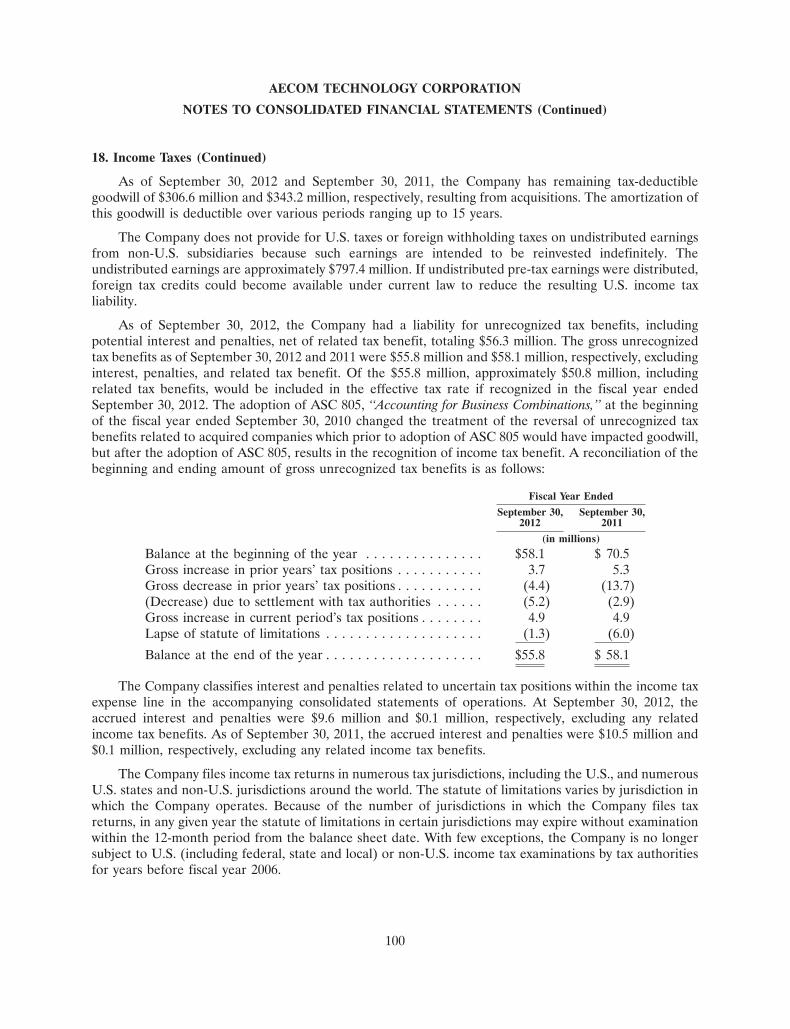
AECOM TECHNOLOGY CORPORATION
NOTES TO CONSOLIDATED FINANCIAL STATEMENTS (Continued)
18. Income Taxes (Continued)
As of September 30, 2012 and September 30, 2011, the Company has remaining tax-deductiblegoodwill of $306.6 million and $343.2 million, respectively, resulting from acquisitions. The amortization ofthis goodwill is deductible over various periods ranging up to 15 years.
The Company does not provide for U.S. taxes or foreign withholding taxes on undistributed earningsfrom non-U.S. subsidiaries because such earnings are intended to be reinvested indefinitely. Theundistributed earnings are approximately $797.4 million. If undistributed pre-tax earnings were distributed,foreign tax credits could become available under current law to reduce the resulting U.S. income taxliability.
As of September 30, 2012, the Company had a liability for unrecognized tax benefits, includingpotential interest and penalties, net of related tax benefit, totaling $56.3 million. The gross unrecognizedtax benefits as of September 30, 2012 and 2011 were $55.8 million and $58.1 million, respectively, excludinginterest, penalties, and related tax benefit. Of the $55.8 million, approximately $50.8 million, includingrelated tax benefits, would be included in the effective tax rate if recognized in the fiscal year endedSeptember 30, 2012. The adoption of ASC 805, ‘‘Accounting for Business Combinations,’’ at the beginningof the fiscal year ended September 30, 2010 changed the treatment of the reversal of unrecognized taxbenefits related to acquired companies which prior to adoption of ASC 805 would have impacted goodwill,but after the adoption of ASC 805, results in the recognition of income tax benefit. A reconciliation of thebeginning and ending amount of gross unrecognized tax benefits is as follows:
Fiscal Year EndedSeptember 30, September 30,
2012 2011(in millions)
Balance at the beginning of the year . . . . . . . . . . . . . . . $58.1 $ 70.5Gross increase in prior years’ tax positions . . . . . . . . . . . 3.7 5.3Gross decrease in prior years’ tax positions . . . . . . . . . . . (4.4) (13.7)(Decrease) due to settlement with tax authorities . . . . . . (5.2) (2.9)Gross increase in current period’s tax positions . . . . . . . . 4.9 4.9Lapse of statute of limitations . . . . . . . . . . . . . . . . . . . . (1.3) (6.0)Balance at the end of the year . . . . . . . . . . . . . . . . . . . . $55.8 $ 58.1
The Company classifies interest and penalties related to uncertain tax positions within the income taxexpense line in the accompanying consolidated statements of operations. At September 30, 2012, theaccrued interest and penalties were $9.6 million and $0.1 million, respectively, excluding any relatedincome tax benefits. As of September 30, 2011, the accrued interest and penalties were $10.5 million and$0.1 million, respectively, excluding any related income tax benefits.
The Company files income tax returns in numerous tax jurisdictions, including the U.S., and numerousU.S. states and non-U.S. jurisdictions around the world. The statute of limitations varies by jurisdiction inwhich the Company operates. Because of the number of jurisdictions in which the Company files taxreturns, in any given year the statute of limitations in certain jurisdictions may expire without examinationwithin the 12-month period from the balance sheet date. With few exceptions, the Company is no longersubject to U.S. (including federal, state and local) or non-U.S. income tax examinations by tax authoritiesfor years before fiscal year 2006.
100
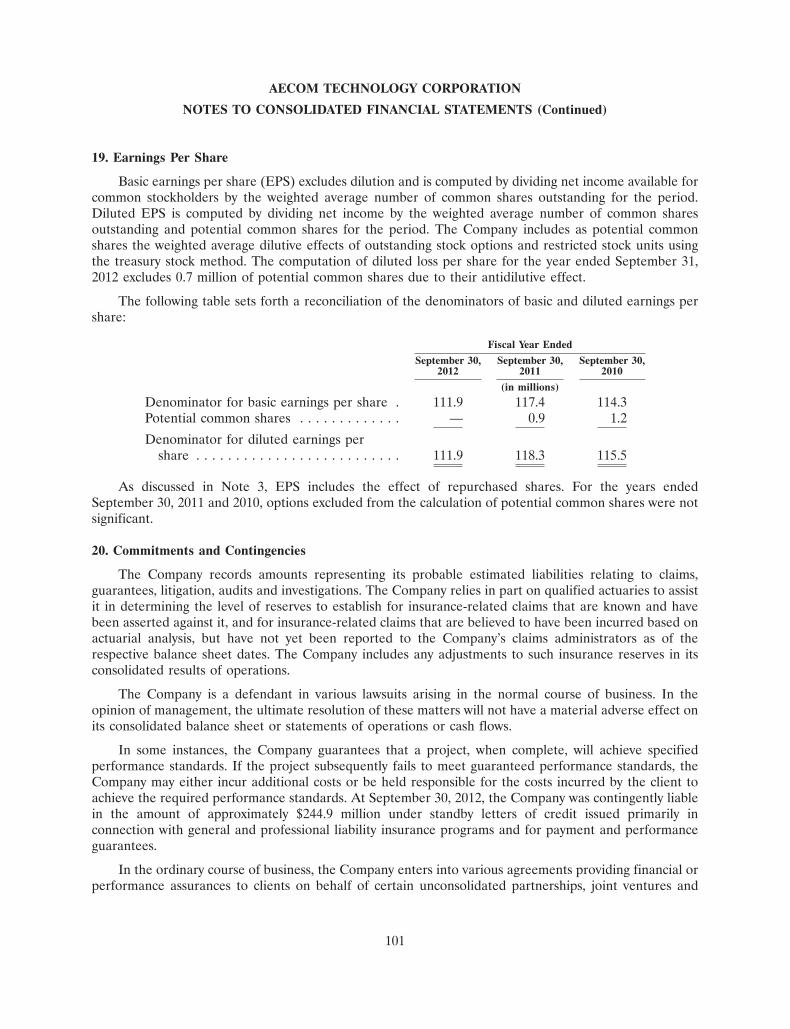
AECOM TECHNOLOGY CORPORATION
NOTES TO CONSOLIDATED FINANCIAL STATEMENTS (Continued)
19. Earnings Per Share
Basic earnings per share (EPS) excludes dilution and is computed by dividing net income available forcommon stockholders by the weighted average number of common shares outstanding for the period.Diluted EPS is computed by dividing net income by the weighted average number of common sharesoutstanding and potential common shares for the period. The Company includes as potential commonshares the weighted average dilutive effects of outstanding stock options and restricted stock units usingthe treasury stock method. The computation of diluted loss per share for the year ended September 31,2012 excludes 0.7 million of potential common shares due to their antidilutive effect.
The following table sets forth a reconciliation of the denominators of basic and diluted earnings pershare:
Fiscal Year EndedSeptember 30, September 30, September 30,
2012 2011 2010(in millions)
Denominator for basic earnings per share . 111.9 117.4 114.3Potential common shares . . . . . . . . . . . . . — 0.9 1.2Denominator for diluted earnings per
share . . . . . . . . . . . . . . . . . . . . . . . . . . 111.9 118.3 115.5
As discussed in Note 3, EPS includes the effect of repurchased shares. For the years endedSeptember 30, 2011 and 2010, options excluded from the calculation of potential common shares were notsignificant.
20. Commitments and Contingencies
The Company records amounts representing its probable estimated liabilities relating to claims,guarantees, litigation, audits and investigations. The Company relies in part on qualified actuaries to assistit in determining the level of reserves to establish for insurance-related claims that are known and havebeen asserted against it, and for insurance-related claims that are believed to have been incurred based onactuarial analysis, but have not yet been reported to the Company’s claims administrators as of therespective balance sheet dates. The Company includes any adjustments to such insurance reserves in itsconsolidated results of operations.
The Company is a defendant in various lawsuits arising in the normal course of business. In theopinion of management, the ultimate resolution of these matters will not have a material adverse effect onits consolidated balance sheet or statements of operations or cash flows.
In some instances, the Company guarantees that a project, when complete, will achieve specifiedperformance standards. If the project subsequently fails to meet guaranteed performance standards, theCompany may either incur additional costs or be held responsible for the costs incurred by the client toachieve the required performance standards. At September 30, 2012, the Company was contingently liablein the amount of approximately $244.9 million under standby letters of credit issued primarily inconnection with general and professional liability insurance programs and for payment and performanceguarantees.
In the ordinary course of business, the Company enters into various agreements providing financial orperformance assurances to clients on behalf of certain unconsolidated partnerships, joint ventures and
101
AECOM TECHNOLOGY CORPORATION
NOTES TO CONSOLIDATED FINANCIAL STATEMENTS (Continued)
20. Commitments and Contingencies (Continued)
other jointly executed contracts. These agreements are entered into primarily to support the projectexecution commitments of these entities. The guarantees have various expiration dates. The maximumpotential payment amount of an outstanding performance guarantee is the remaining cost of work to beperformed by or on behalf of third parties. Generally, under joint venture arrangements, if a partner isfinancially unable to complete its share of the contract, the other partner(s) will be required to completethose activities. The Company generally only enters into joint venture arrangements with partners who arereputable, financially sound and who carry appropriate levels of surety bonds for the project in order toadequately assure completion of their assignments. The Company does not expect that these guaranteeswill have a material adverse effect on its consolidated balance sheet or statements of operations or cashflows.
Combat Support Associates Joint Venture
As of September 30, 2012, the Company has settled the previously disclosed Combat SupportAssociates Defense Contract Audit Agency (DCAA) Form 1 matter.
Global Linguists Solutions Joint Venture
On October 5, 2011 and February 8, 2012, the DCAA issued DCAA Forms 1 questioning costsincurred by Global Linguists Solutions (GLS), an equity method joint venture, of which McNeilTechnologies, Inc., acquired by the Company in August 2010, is an owner. The questioned costs wereincurred by GLS during fiscal 2009, a period prior to the acquisition. Specifically, the DCAA questioneddirect labor, associated burdens, and fees billed to the U.S. Government for linguists that allegedly did notmeet specific contract requirements. As a result of the issuance of the DCAA Forms 1, the U.S.Government has withheld approximately $19 million from payments on current year billings pending finalresolution.
GLS is performing a review of the issues raised in the Forms 1 in order to respond fully to thequestioned costs. Based on a review, GLS believes that the costs met the applicable contract requirements.
Additionally, on April 20, 2012, GLS received a subpoena from the Inspector General of the U.S.Department of Defense requesting documentation related to this contract with the United States Army.GLS plans to respond fully to the request. If the DCAA Forms 1 are not overruled and subsequent appealsare unsuccessful or there are unfavorable consequences from the Inspector General’s investigation, theseevents could have a material adverse effect on the Company’s results of operations.
AECOM Australia
In 2005 and 2006, the Company’s main Australian subsidiary, AECOM Australia Pty Ltd (AECOMAustralia), performed a traffic forecast assignment for a client consortium as part of their project to design,build, finance and operate a tolled motorway tunnel in Australia. To fund the motorway’s design andconstruction, the client formed a special purpose vehicle (SPV) that raised approximately $700 millionAustralian dollars through an initial public offering (IPO) of equity units in 2006 and anotherapproximately $1.4 billion Australian dollars in long term bank loans. The SPV (and certain affiliatedSPVs) went into insolvency administrations in February 2011.
102
AECOM TECHNOLOGY CORPORATION
NOTES TO CONSOLIDATED FINANCIAL STATEMENTS (Continued)
20. Commitments and Contingencies (Continued)
A class action lawsuit, which has been amended to include approximately 770 of the IPO investors,was filed against AECOM Australia in the Federal Court of Australia on May 31, 2012. Separately,KordaMentha, the receivers for the SPVs, filed a lawsuit in the Federal Court of Australia on May 14, 2012claiming damages that purportedly resulted from AECOM Australia’s role in connection with the abovedescribed traffic forecast. WestLB, one of the lending banks to the SPVs, filed a lawsuit in the FederalCourt of Australia on May 18, 2012. Centerbridge Credit Partners (and a number of related entities) andMidtown Acquisitions (and a number of related entities), both claiming to be assignees of certain otherlending banks, previously filed their own proceedings in the Federal Court of Australia and thensubsequently withdrew the lawsuits. None of the lawsuits specify the amount of damages sought and thedamages sought by WestLB are duplicative of damages already included in the receivers’ claim.
AECOM Australia intends to vigorously defend the claims brought against it.
Hawaii Project
The U.S. Attorney’s Office (USAO) informed us that the USAO and the U.S. Environmental ProtectionAgency are investigating potential criminal charges in connection with services our subsidiary provided to theoperator of the Waimanalo Gulch Sanitary Landfill in Hawaii. The Company has cooperated fully with theinvestigation and, as of this date, no actions have been filed. The Company believes that the investigation willshow that there has been no criminal wrongdoing on our part or any of our subsidiaries and, if any actionsare brought, the Company intends to vigorously defend against such actions.
The services performed by the subsidiary included the preparation of a pollution control plan, whichthe operator used to obtain permits necessary for the operation of the landfill. The USAO is investigatingwhether flooding at the landfill that resulted in the discharge of waste materials and storm water into thePacific Ocean in December 2010 and January 2011 was due in part to reliance on information contained inthe plan prepared by a subsidiary of the Company.
21. Reportable Segments and Geographic Information
The Company’s operations are organized into two reportable segments: Professional TechnicalServices (PTS) and Management Support Services (MSS). The Company’s PTS reportable segmentdelivers planning, consulting, architectural and engineering design, and program and constructionmanagement services to commercial and government clients worldwide. The Company’s MSS reportablesegment provides program and facilities management and maintenance, training, logistics, consulting, andtechnical assistance and systems integration services, primarily for agencies of the U.S. government. Thesereportable segments are organized by the types of services provided, the differing specialized needs of therespective clients, and how the Company manages its business. The Company has aggregated operatingsegments into its PTS reportable segment based on their similar characteristics, including similar long termfinancial performance, the nature of services provided, internal processes for delivering those services, andtypes of customers.
Management internally analyzes the results of its operations using several non-GAAP measures. Asignificant portion of the Company’s revenues relates to services provided by subcontractors and othernon-employees that it categorizes as other direct costs. Other direct costs are segregated from cost ofrevenues resulting in revenue, net of other direct costs, which is a measure of work performed by Companyemployees. The Company has included information on revenue, net of other direct costs, as it believes thatit is useful to view its revenue exclusive of costs associated with external service providers.
103
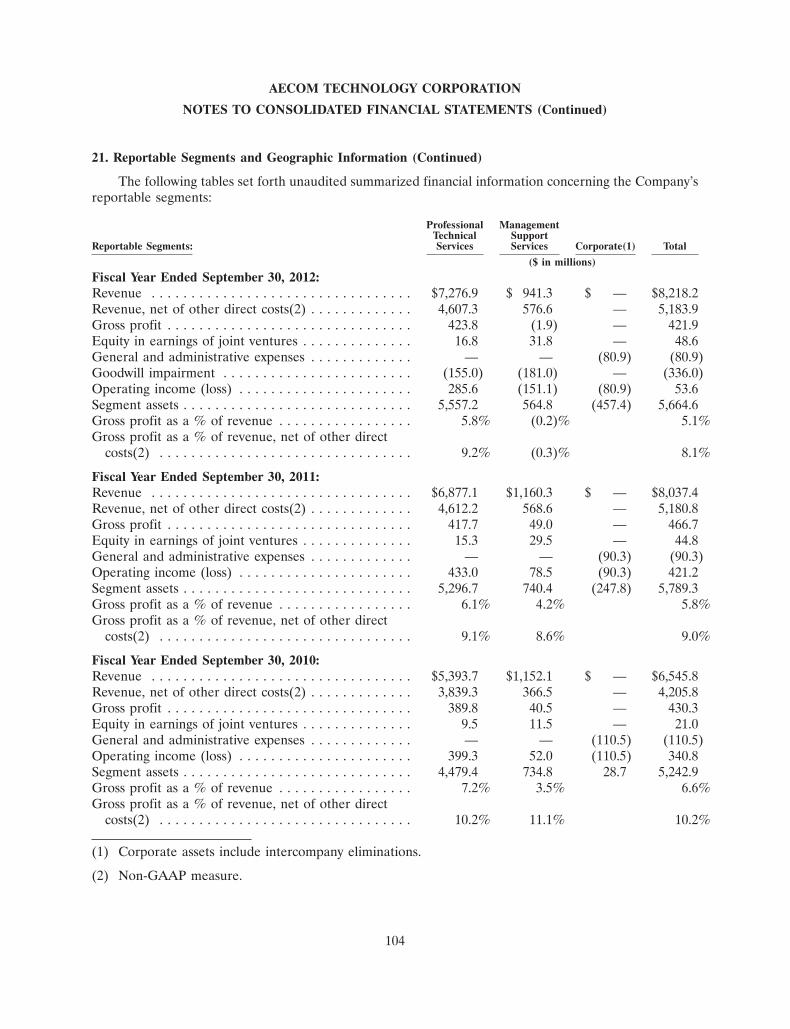
AECOM TECHNOLOGY CORPORATION
NOTES TO CONSOLIDATED FINANCIAL STATEMENTS (Continued)
21. Reportable Segments and Geographic Information (Continued)
The following tables set forth unaudited summarized financial information concerning the Company’sreportable segments:
Professional ManagementTechnical Support
Reportable Segments: Services Services Corporate(1) Total($ in millions)
Fiscal Year Ended September 30, 2012:Revenue . . . . . . . . . . . . . . . . . . . . . . . . . . . . . . . . . $7,276.9 $ 941.3 $ — $8,218.2Revenue, net of other direct costs(2) . . . . . . . . . . . . . 4,607.3 576.6 — 5,183.9Gross profit . . . . . . . . . . . . . . . . . . . . . . . . . . . . . . . 423.8 (1.9) — 421.9Equity in earnings of joint ventures . . . . . . . . . . . . . . 16.8 31.8 — 48.6General and administrative expenses . . . . . . . . . . . . . — — (80.9) (80.9)Goodwill impairment . . . . . . . . . . . . . . . . . . . . . . . . (155.0) (181.0) — (336.0)Operating income (loss) . . . . . . . . . . . . . . . . . . . . . . 285.6 (151.1) (80.9) 53.6Segment assets . . . . . . . . . . . . . . . . . . . . . . . . . . . . . 5,557.2 564.8 (457.4) 5,664.6Gross profit as a % of revenue . . . . . . . . . . . . . . . . . 5.8% (0.2)% 5.1%Gross profit as a % of revenue, net of other direct
costs(2) . . . . . . . . . . . . . . . . . . . . . . . . . . . . . . . . 9.2% (0.3)% 8.1%
Fiscal Year Ended September 30, 2011:Revenue . . . . . . . . . . . . . . . . . . . . . . . . . . . . . . . . . $6,877.1 $1,160.3 $ — $8,037.4Revenue, net of other direct costs(2) . . . . . . . . . . . . . 4,612.2 568.6 — 5,180.8Gross profit . . . . . . . . . . . . . . . . . . . . . . . . . . . . . . . 417.7 49.0 — 466.7Equity in earnings of joint ventures . . . . . . . . . . . . . . 15.3 29.5 — 44.8General and administrative expenses . . . . . . . . . . . . . — — (90.3) (90.3)Operating income (loss) . . . . . . . . . . . . . . . . . . . . . . 433.0 78.5 (90.3) 421.2Segment assets . . . . . . . . . . . . . . . . . . . . . . . . . . . . . 5,296.7 740.4 (247.8) 5,789.3Gross profit as a % of revenue . . . . . . . . . . . . . . . . . 6.1% 4.2% 5.8%Gross profit as a % of revenue, net of other direct
costs(2) . . . . . . . . . . . . . . . . . . . . . . . . . . . . . . . . 9.1% 8.6% 9.0%
Fiscal Year Ended September 30, 2010:Revenue . . . . . . . . . . . . . . . . . . . . . . . . . . . . . . . . . $5,393.7 $1,152.1 $ — $6,545.8Revenue, net of other direct costs(2) . . . . . . . . . . . . . 3,839.3 366.5 — 4,205.8Gross profit . . . . . . . . . . . . . . . . . . . . . . . . . . . . . . . 389.8 40.5 — 430.3Equity in earnings of joint ventures . . . . . . . . . . . . . . 9.5 11.5 — 21.0General and administrative expenses . . . . . . . . . . . . . — — (110.5) (110.5)Operating income (loss) . . . . . . . . . . . . . . . . . . . . . . 399.3 52.0 (110.5) 340.8Segment assets . . . . . . . . . . . . . . . . . . . . . . . . . . . . . 4,479.4 734.8 28.7 5,242.9Gross profit as a % of revenue . . . . . . . . . . . . . . . . . 7.2% 3.5% 6.6%Gross profit as a % of revenue, net of other direct
costs(2) . . . . . . . . . . . . . . . . . . . . . . . . . . . . . . . . 10.2% 11.1% 10.2%
(1) Corporate assets include intercompany eliminations.
(2) Non-GAAP measure.
104
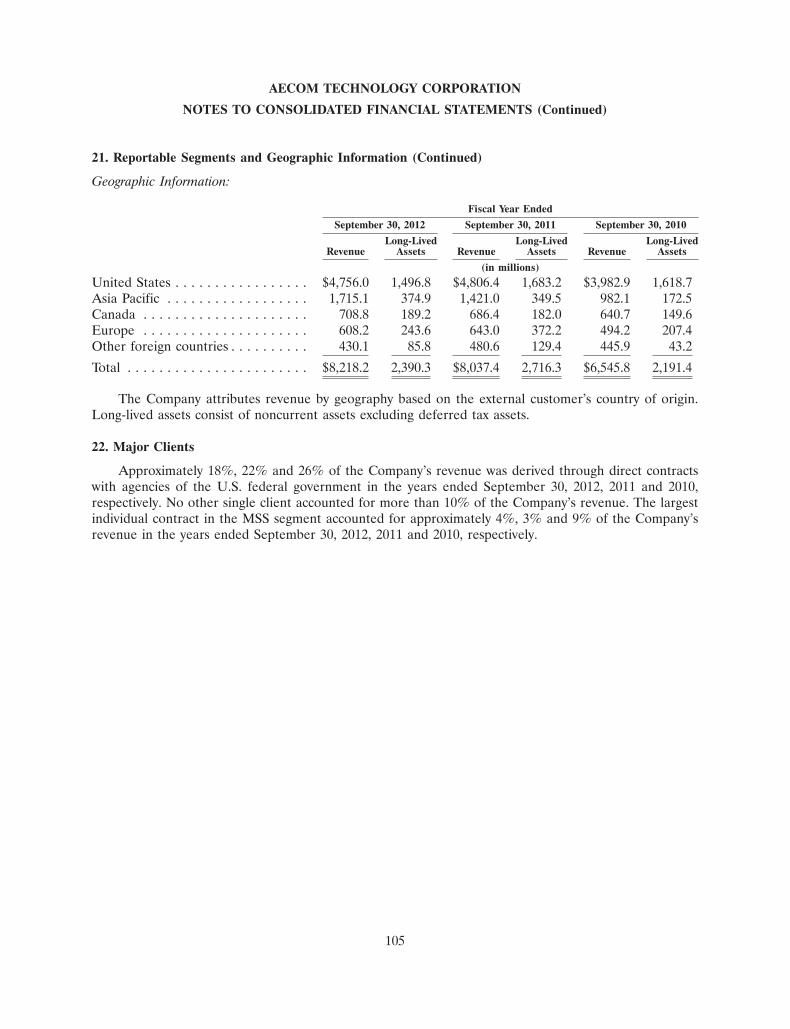
AECOM TECHNOLOGY CORPORATION
NOTES TO CONSOLIDATED FINANCIAL STATEMENTS (Continued)
21. Reportable Segments and Geographic Information (Continued)
Geographic Information:
Fiscal Year EndedSeptember 30, 2012 September 30, 2011 September 30, 2010
Long-Lived Long-Lived Long-LivedRevenue Assets Revenue Assets Revenue Assets
(in millions)United States . . . . . . . . . . . . . . . . . $4,756.0 1,496.8 $4,806.4 1,683.2 $3,982.9 1,618.7Asia Pacific . . . . . . . . . . . . . . . . . . 1,715.1 374.9 1,421.0 349.5 982.1 172.5Canada . . . . . . . . . . . . . . . . . . . . . 708.8 189.2 686.4 182.0 640.7 149.6Europe . . . . . . . . . . . . . . . . . . . . . 608.2 243.6 643.0 372.2 494.2 207.4Other foreign countries . . . . . . . . . . 430.1 85.8 480.6 129.4 445.9 43.2Total . . . . . . . . . . . . . . . . . . . . . . . $8,218.2 2,390.3 $8,037.4 2,716.3 $6,545.8 2,191.4
The Company attributes revenue by geography based on the external customer’s country of origin.Long-lived assets consist of noncurrent assets excluding deferred tax assets.
22. Major Clients
Approximately 18%, 22% and 26% of the Company’s revenue was derived through direct contractswith agencies of the U.S. federal government in the years ended September 30, 2012, 2011 and 2010,respectively. No other single client accounted for more than 10% of the Company’s revenue. The largestindividual contract in the MSS segment accounted for approximately 4%, 3% and 9% of the Company’srevenue in the years ended September 30, 2012, 2011 and 2010, respectively.
105
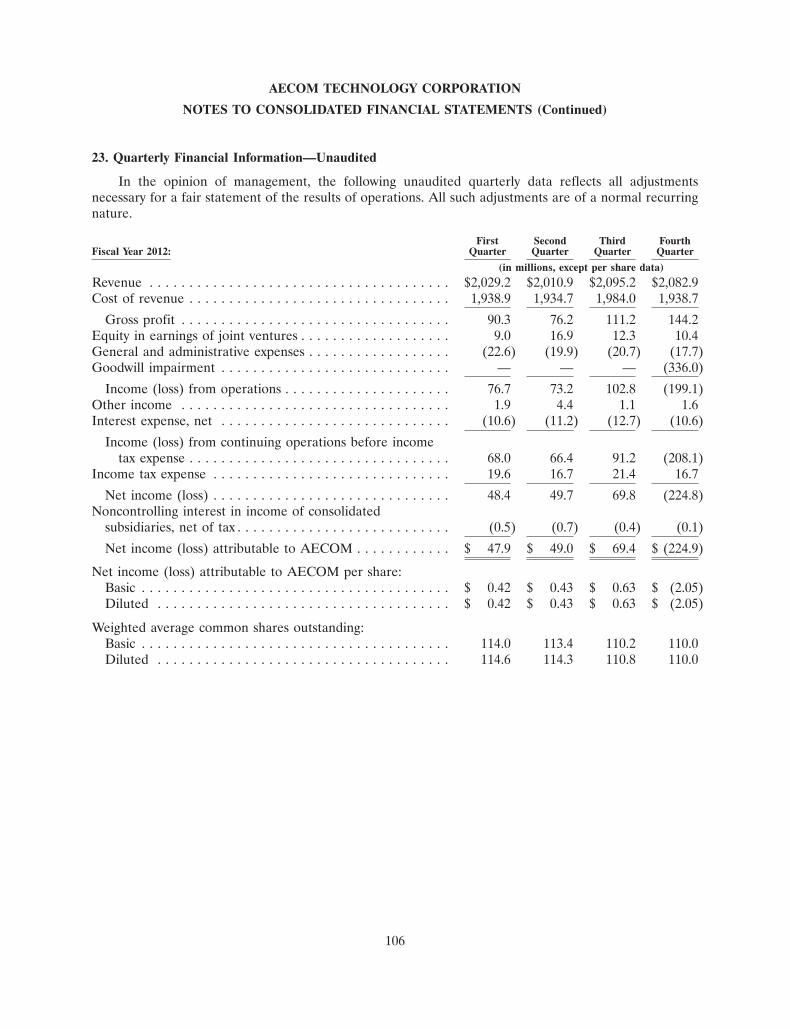
AECOM TECHNOLOGY CORPORATION
NOTES TO CONSOLIDATED FINANCIAL STATEMENTS (Continued)
23. Quarterly Financial Information—Unaudited
In the opinion of management, the following unaudited quarterly data reflects all adjustmentsnecessary for a fair statement of the results of operations. All such adjustments are of a normal recurringnature.
First Second Third FourthFiscal Year 2012: Quarter Quarter Quarter Quarter
(in millions, except per share data)Revenue . . . . . . . . . . . . . . . . . . . . . . . . . . . . . . . . . . . . . . $2,029.2 $2,010.9 $2,095.2 $2,082.9Cost of revenue . . . . . . . . . . . . . . . . . . . . . . . . . . . . . . . . . 1,938.9 1,934.7 1,984.0 1,938.7
Gross profit . . . . . . . . . . . . . . . . . . . . . . . . . . . . . . . . . . 90.3 76.2 111.2 144.2Equity in earnings of joint ventures . . . . . . . . . . . . . . . . . . . 9.0 16.9 12.3 10.4General and administrative expenses . . . . . . . . . . . . . . . . . . (22.6) (19.9) (20.7) (17.7)Goodwill impairment . . . . . . . . . . . . . . . . . . . . . . . . . . . . . — — — (336.0)
Income (loss) from operations . . . . . . . . . . . . . . . . . . . . . 76.7 73.2 102.8 (199.1)Other income . . . . . . . . . . . . . . . . . . . . . . . . . . . . . . . . . . 1.9 4.4 1.1 1.6Interest expense, net . . . . . . . . . . . . . . . . . . . . . . . . . . . . . (10.6) (11.2) (12.7) (10.6)
Income (loss) from continuing operations before incometax expense . . . . . . . . . . . . . . . . . . . . . . . . . . . . . . . . . 68.0 66.4 91.2 (208.1)
Income tax expense . . . . . . . . . . . . . . . . . . . . . . . . . . . . . . 19.6 16.7 21.4 16.7Net income (loss) . . . . . . . . . . . . . . . . . . . . . . . . . . . . . . 48.4 49.7 69.8 (224.8)
Noncontrolling interest in income of consolidatedsubsidiaries, net of tax . . . . . . . . . . . . . . . . . . . . . . . . . . . (0.5) (0.7) (0.4) (0.1)Net income (loss) attributable to AECOM . . . . . . . . . . . . $ 47.9 $ 49.0 $ 69.4 $ (224.9)
Net income (loss) attributable to AECOM per share:Basic . . . . . . . . . . . . . . . . . . . . . . . . . . . . . . . . . . . . . . . $ 0.42 $ 0.43 $ 0.63 $ (2.05)Diluted . . . . . . . . . . . . . . . . . . . . . . . . . . . . . . . . . . . . . $ 0.42 $ 0.43 $ 0.63 $ (2.05)
Weighted average common shares outstanding:Basic . . . . . . . . . . . . . . . . . . . . . . . . . . . . . . . . . . . . . . . 114.0 113.4 110.2 110.0Diluted . . . . . . . . . . . . . . . . . . . . . . . . . . . . . . . . . . . . . 114.6 114.3 110.8 110.0
106
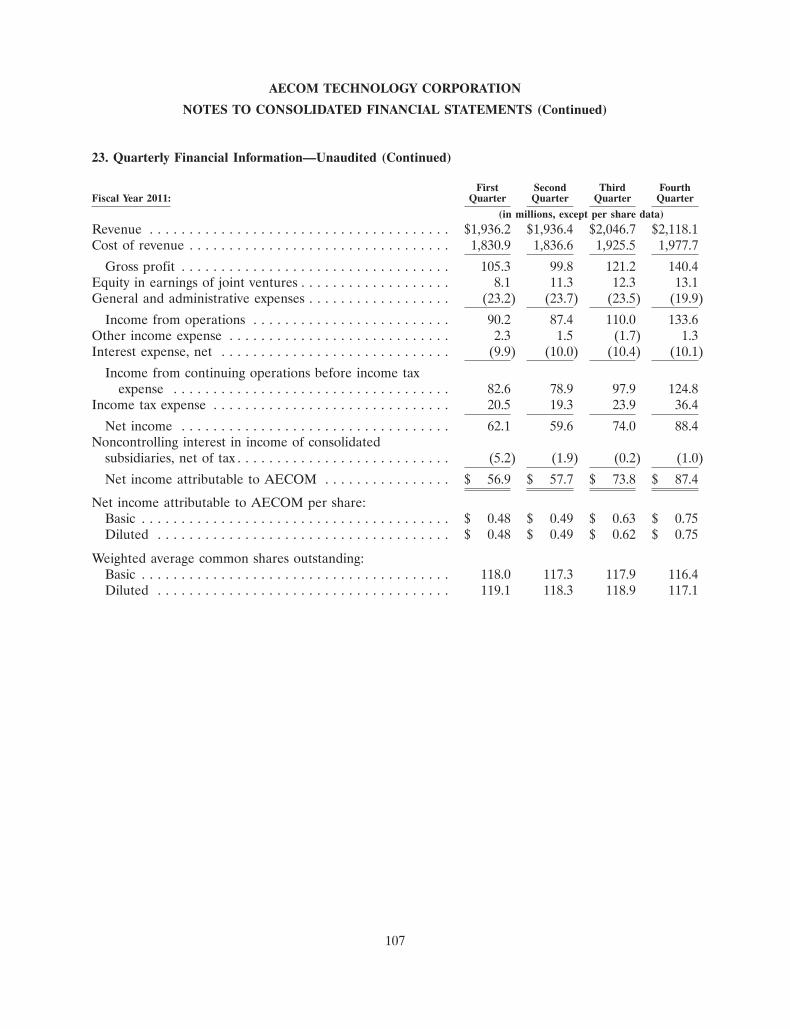
AECOM TECHNOLOGY CORPORATION
NOTES TO CONSOLIDATED FINANCIAL STATEMENTS (Continued)
23. Quarterly Financial Information—Unaudited (Continued)
First Second Third FourthFiscal Year 2011: Quarter Quarter Quarter Quarter
(in millions, except per share data)Revenue . . . . . . . . . . . . . . . . . . . . . . . . . . . . . . . . . . . . . . $1,936.2 $1,936.4 $2,046.7 $2,118.1Cost of revenue . . . . . . . . . . . . . . . . . . . . . . . . . . . . . . . . . 1,830.9 1,836.6 1,925.5 1,977.7
Gross profit . . . . . . . . . . . . . . . . . . . . . . . . . . . . . . . . . . 105.3 99.8 121.2 140.4Equity in earnings of joint ventures . . . . . . . . . . . . . . . . . . . 8.1 11.3 12.3 13.1General and administrative expenses . . . . . . . . . . . . . . . . . . (23.2) (23.7) (23.5) (19.9)
Income from operations . . . . . . . . . . . . . . . . . . . . . . . . . 90.2 87.4 110.0 133.6Other income expense . . . . . . . . . . . . . . . . . . . . . . . . . . . . 2.3 1.5 (1.7) 1.3Interest expense, net . . . . . . . . . . . . . . . . . . . . . . . . . . . . . (9.9) (10.0) (10.4) (10.1)
Income from continuing operations before income taxexpense . . . . . . . . . . . . . . . . . . . . . . . . . . . . . . . . . . . 82.6 78.9 97.9 124.8
Income tax expense . . . . . . . . . . . . . . . . . . . . . . . . . . . . . . 20.5 19.3 23.9 36.4Net income . . . . . . . . . . . . . . . . . . . . . . . . . . . . . . . . . . 62.1 59.6 74.0 88.4
Noncontrolling interest in income of consolidatedsubsidiaries, net of tax . . . . . . . . . . . . . . . . . . . . . . . . . . . (5.2) (1.9) (0.2) (1.0)Net income attributable to AECOM . . . . . . . . . . . . . . . . $ 56.9 $ 57.7 $ 73.8 $ 87.4
Net income attributable to AECOM per share:Basic . . . . . . . . . . . . . . . . . . . . . . . . . . . . . . . . . . . . . . . $ 0.48 $ 0.49 $ 0.63 $ 0.75Diluted . . . . . . . . . . . . . . . . . . . . . . . . . . . . . . . . . . . . . $ 0.48 $ 0.49 $ 0.62 $ 0.75
Weighted average common shares outstanding:Basic . . . . . . . . . . . . . . . . . . . . . . . . . . . . . . . . . . . . . . . 118.0 117.3 117.9 116.4Diluted . . . . . . . . . . . . . . . . . . . . . . . . . . . . . . . . . . . . . 119.1 118.3 118.9 117.1
107
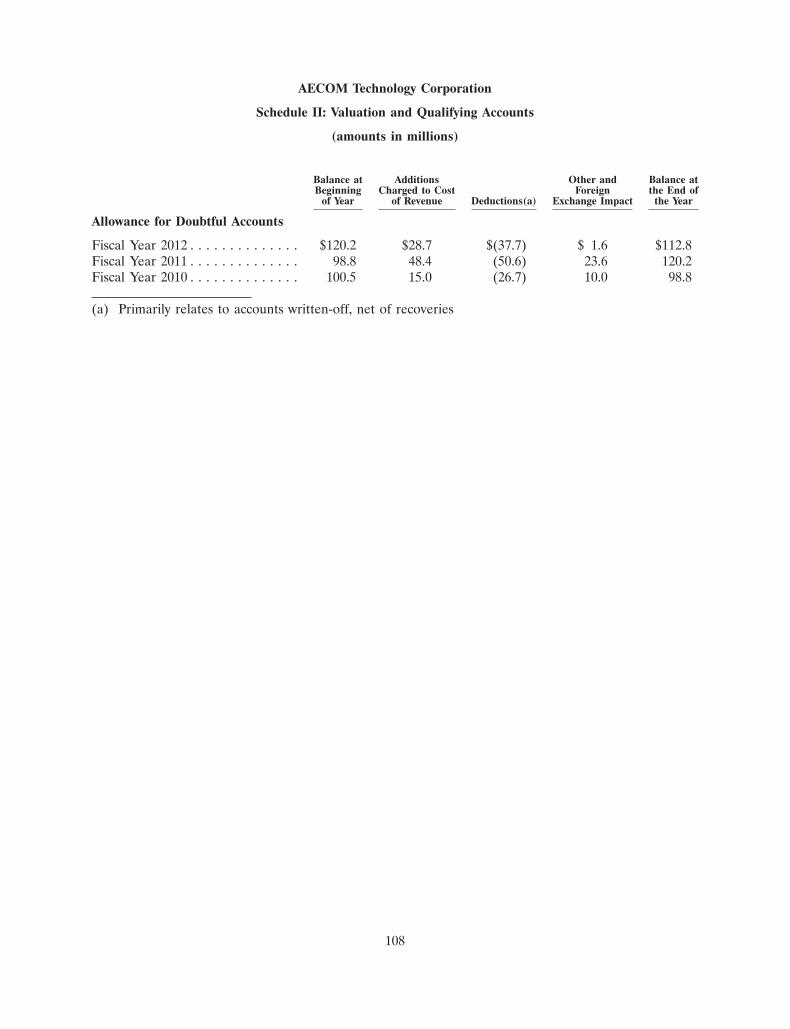
AECOM Technology Corporation
Schedule II: Valuation and Qualifying Accounts
(amounts in millions)
Balance at Additions Other and Balance atBeginning Charged to Cost Foreign the End of
of Year of Revenue Deductions(a) Exchange Impact the Year
Allowance for Doubtful Accounts
Fiscal Year 2012 . . . . . . . . . . . . . . $120.2 $28.7 $(37.7) $ 1.6 $112.8Fiscal Year 2011 . . . . . . . . . . . . . . 98.8 48.4 (50.6) 23.6 120.2Fiscal Year 2010 . . . . . . . . . . . . . . 100.5 15.0 (26.7) 10.0 98.8
(a) Primarily relates to accounts written-off, net of recoveries
108
ITEM 9. CHANGES IN AND DISAGREEMENTS WITH ACCOUNTANTS ON ACCOUNTING ANDFINANCIAL DISCLOSURE
None.
ITEM 9A. CONTROLS AND PROCEDURES
Evaluation of Disclosure Controls and Procedures
Our management, with the participation of our CEO and CFO, are responsible for establishing andmaintaining ‘‘disclosure controls and procedures’’ (as defined in Rule 13a-15(e) under the Exchange Act)for our company. Based on their evaluation as of the end of the period covered by this report, our CEOand CFO have concluded that our disclosure controls and procedures were effective to ensure that theinformation required to be disclosed by us in this Annual Report on Form 10-K was (i) recorded,processed, summarized and reported within the time periods specified in the SEC’s rules and(ii) accumulated and communicated to our management, including our principal executive and principalfinancial officers, to allow timely decisions regarding required disclosures.
Management’s Report on Internal Control over Financial Reporting
Our management is responsible for establishing and maintaining adequate internal control overfinancial reporting. Internal control over financial reporting is defined in Rule 13a-15(f) or 15d-15(f)promulgated under the Securities Exchange Act of 1934, as amended, as a process designed by, or underthe supervision of, the company’s principal executive and principal financial officers and effected by thecompany’s board of directors, management and other personnel, to provide reasonable assuranceregarding the reliability of financial reporting and the preparation of financial statements for externalpurposes in accordance with generally accepted accounting principles. Internal control over financialreporting includes those policies and procedures that (i) pertain to the maintenance of records that inreasonable detail accurately and fairly reflect the transactions and dispositions of the assets of thecompany; (ii) provide reasonable assurance that transactions are recorded as necessary to permitpreparation of financial statements in accordance with generally accepted accounting principles, and thatreceipts and expenditures of the company are being made only in accordance with authorizations ofmanagement and directors of the company; and (iii) provide reasonable assurance regarding prevention ortimely detection of unauthorized acquisition, use or disposition of the company’s assets that could have amaterial effect on the financial statements.
Because of its inherent limitations, internal control over financial reporting may not prevent or detectmisstatements. Projections of any evaluation of the effectiveness to future periods are subject to the riskthat controls may become inadequate because of changes in conditions, or that the degree of compliancewith the policies or procedures may deteriorate.
Our management, with the participation of our CEO and CFO, assessed the effectiveness of ourinternal control over financial reporting as of September 30, 2012, the end of our fiscal year. Ourmanagement based its assessment on criteria established in Internal Control—Integrated Framework issuedby the Committee of Sponsoring Organizations of the Treadway Commission. Our management’sassessment included evaluation and testing of the design and operating effectiveness of key financialreporting controls, process documentation, accounting policies, and our overall control environment.
Based on our management’s assessment, our management has concluded that our internal controlover financial reporting was effective as of September 30, 2012. Our management communicated theresults of its assessment to the Audit Committee of our Board of Directors.
Our independent registered public accounting firm, Ernst & Young LLP, audited our financialstatements for the fiscal year ended September 30, 2012 included in this Annual Report on Form 10-K, and
109

has issued an attestation report on our assessment of the Company’s internal control over financialreporting, a copy of which is included earlier in this Annual Report on Form 10-K.
Changes in Internal Control Over Financial Reporting
Our management, including our CEO and CFO, confirm that there were no changes in our company’sinternal control over financial reporting during the fiscal quarter ended September 30, 2012 that havematerially affected, or are reasonably likely to materially affect, our company’s internal control overfinancial reporting.
ITEM 9B. OTHER INFORMATION
None.
PART III
ITEM 10. DIRECTORS, EXECUTIVE OFFICERS AND CORPORATE GOVERNANCE
Incorporated by reference from our definitive proxy statement for the 2013 Annual Meeting ofStockholders, to be filed within 120 days of our fiscal 2012 year end.
ITEM 11. EXECUTIVE COMPENSATION
Incorporated by reference from our definitive proxy statement for the 2013 Annual Meeting ofStockholders, to be filed within 120 days of our fiscal 2012 year end.
ITEM 12. SECURITY OWNERSHIP OF CERTAIN BENEFICIAL OWNERS AND MANAGEMENTAND RELATED STOCKHOLDERS MATTERS
Other than with respect to the information relating to our equity compensation plans, which isincorporated herein by reference to Part II, Item 5, ‘‘Equity Compensation Plans’’ of this Form 10-K, theinformation required by this item is incorporated by reference from our definitive proxy statement for the2013 Annual Meeting of Stockholders, to be filed within 120 days of our fiscal 2012 year end.
ITEM 13. CERTAIN RELATIONSHIPS AND RELATED TRANSACTIONS, AND DIRECTORINDEPENDENCE
Incorporated by reference from our definitive proxy statement for the 2013 Annual Meeting ofStockholders, to be filed within 120 days of our fiscal 2012 year end.
ITEM 14. PRINCIPAL ACCOUNTING FEES AND SERVICES
Incorporated by reference from our definitive proxy statement for the 2013 Annual Meeting ofStockholders, to be filed within 120 days of our fiscal 2012 year end.
110
PART IV
ITEM 15. EXHIBITS, FINANCIAL STATEMENT SCHEDULES
(a) Documents filed as part of this report:
(1) The company’s Consolidated Financial Statements at September 30, 2012 and 2011 and foreach of the three years in the period ended September 30, 2012 and the notes thereto,together with the report of the independent auditors on those Consolidated FinancialStatements are hereby filed as part of this report.
(2) Financial Statement Schedule II—Valuation and Qualifying Accounts for the Years EndedSeptember 30, 2012, 2011 and 2010.
(3) See Exhibits and Index to Exhibits, below.
(b) Exhibits.
ExhibitNumbers Description
2.1 Purchase Agreement, dated as of February 11, 2008, by and among AECOM TechnologyCorporation, Tyco International Finance S.A. and certain other seller parties thereto(incorporated by reference to Exhibit 2.1 to the Company’s current report on Form 8-Kfiled with the SEC on February 12, 2008)
2.2 Amendment No. 1 to Purchase Agreement, dated as of July 25, 2008, by and amongAECOM Technology Corporation, Tyco International Finance S.A. and certain otherseller parties thereto (incorporated by reference to Exhibit 2.1 to the Company’s currentreport on Form 8-K filed with the SEC on July 31, 2008)
2.3 Amendment No. 2 to Purchase Agreement, dated as of July 25, 2008, by and amongAECOM Technology Corporation, Tyco International Finance S.A. and certain otherseller parties thereto (incorporated by reference to Exhibit 2.2 to the Company’s currentreport on Form 8-K filed with the SEC on July 31, 2008)
2.4 Stock Purchase Agreement, dated as of July 14, 2010, by and among AECOM TechnologyCorporation, AECOM Technical Services, Inc., Tishman Construction Corporation andthe stockholders of Tishman Construction Corporation (incorporated by reference toExhibit 2.1 to the Company’s current report on Form 8-K filed with the SEC on July 14,2010)
2.5 Stock Purchase Agreement, dated as of July 30, 2010, by and among MT Holding LLC,T&A Holding LLC, AECOM Government Services, Inc., AECOM TechnologyCorporation (solely for purposes of Article XI thereof) and The Veritas Capital Fund II,L.P. (solely for purposes of Article XI thereof) (incorporated by reference to Exhibit 2.1to the Company’s current report on Form 8-K filed with the SEC on August 4, 2010)
3.1 Amended and Restated Certificate of Incorporation of AECOM Technology Corporation(incorporated by reference to Exhibit 3.1 to the Company’s annual report on Form 10-Kfiled with the SEC on November 18, 2011)
3.2 Certificate of Designations for Class C Preferred Stock (incorporated by reference toExhibit 3.2 to the Company’s registration statement on Form 10 filed with the SEC onJanuary 29, 2007)
111
ExhibitNumbers Description
3.3 Certificate of Designations for Class E Preferred Stock (incorporated by reference toExhibit 3.3 to the Company’s registration statement on Form 10 filed with the SEC onJanuary 29, 2007)
3.4 Certificate of Designations for Class F Convertible Preferred Stock, Series 1 (incorporatedby reference to Exhibit 3.4 to the Company’s registration statement on Form 10 filed withthe SEC on January 29, 2007)
3.5 Certificate of Designations for Class G Convertible Preferred Stock, Series 1(incorporated by reference to Exhibit 3.5 to the Company’s registration statement onForm 10 filed with the SEC on January 29, 2007)
3.6 Amended and Restated Bylaws (incorporated by reference to Exhibit 3.1 to theCompany’s current report on Form 8-K filed with the SEC on September 2, 2009)
4.1 Form of Common Stock Certificate (incorporated by reference to Exhibit 4.1 to theCompany’s registration statement on Form 10 filed with the SEC on January 29, 2007)
10.1 Third Amended and Restated Credit Agreement, dated as of July 20, 2011, by and amongAECOM Technology Corporation, Bank of America, N.A., as administrative agent and alender, and the lenders party thereto (incorporated by reference to Exhibit 10.1 to theCompany’s current report on Form 8-K filed with the SEC on July 26, 2011)
10.2 Amended and Restated Credit Agreement, dated as of September 30, 2011, by and amongAECOM Technology Corporation, Bank of America, N.A., as administrative agent and alender, and the lenders party thereto (incorporated by reference to Exhibit 10.1 to theCompany’s current report on Form 8-K filed with the SEC on October 6, 2011)
10.3# AECOM Technology Corporation Stock Purchase Plan, restated as of October 1, 2006(incorporated by reference to Exhibit 10.10 to the Company’s registration statement onForm 10 filed with the SEC on January 29, 2007)
10.4# Amendment 2006-1, dated as of October 1, 2006, to AECOM Technology CorporationStock Purchase Plan (incorporated by reference to Exhibit 10.11 to the Company’sregistration statement on Form 10 filed with the SEC on January 29, 2007)
10.5# 1992 Supplemental Executive Retirement Plan, restated as of November 20, 1997(incorporated by reference to Exhibit 10.12 to the Company’s registration statement onForm 10 filed with the SEC on January 29, 2007)
10.6# First Amendment, effective July 1, 1998, to the 1992 Supplemental Executive RetirementPlan (incorporated by reference to Exhibit 10.13 to the Company’s registration statementon Form 10 filed with the SEC on January 29, 2007)
10.7# Second Amendment, effective March 1, 2003, to the 1992 Supplemental ExecutiveRetirement Plan (incorporated by reference to Exhibit 10.14 to the Company’s registrationstatement on Form 10 filed with the SEC on January 29, 2007)
10.8# Third Amendment, effective April 1, 2004, to the 1992 Supplemental ExecutiveRetirement Plan (incorporated by reference to Exhibit 10.15 to the Company’s registrationstatement on Form 10 filed with the SEC on January 29, 2007)
10.9# 1996 Supplemental Executive Retirement Plan, restated as of November 20, 1997(incorporated by reference to Exhibit 10.16 to the Company’s registration statement onForm 10 filed with the SEC on January 29, 2007)
112
ExhibitNumbers Description
10.10# First Amendment, effective July 1, 1998, to the 1996 Supplemental Executive RetirementPlan (incorporated by reference to Exhibit 10.17 to the Company’s registration statementon Form 10 filed with the SEC on January 29, 2007)
10.11# Second Amendment, effective April 1, 2004, to the 1996 Supplemental ExecutiveRetirement Plan (incorporated by reference to Exhibit 10.18 to the Company’s registrationstatement on Form 10 filed with the SEC on January 29, 2007)
10.12# 1998 Management Supplemental Executive Retirement Plan (incorporated by reference toExhibit 10.20 to the Company’s registration statement on Form 10 filed with the SEC onJanuary 29, 2007)
10.13# First Amendment, effective January 1, 2002, to the 1998 Management SupplementalExecutive Retirement Plan (incorporated by reference to Exhibit 10.21 to the Company’sregistration statement on Form 10 filed with the SEC on January 29, 2007)
10.14# Second Amendment, effective July 1, 1998, to the 1998 Management SupplementalExecutive Retirement Plan (incorporated by reference to Exhibit 10.22 to the Company’sregistration statement on Form 10 filed with the SEC on January 29, 2007)
10.15# Third Amendment, effective October 31, 2004, to the 1998 Management SupplementalExecutive Retirement Plan (incorporated by reference to Exhibit 10.23 to the Company’sregistration statement on Form 10 filed with the SEC on January 29, 2007)
10.16# 1996 Excess Benefit Plan (incorporated by reference to Exhibit 10.24 to the Company’sregistration statement on Form 1 filed with the SEC on January 29, 2007)
10.17# First Amendment, effective July 1, 1998, to the 1996 Excess Benefit Plan (incorporated byreference to Exhibit 10.25 to the Company’s registration statement on Form 10 filed withthe SEC on January 29, 2007)
10.18# Second Amendment, effective March 1, 2003, to the 1996 Excess Benefit Plan(incorporated by reference to Exhibit 10.26 to the Company’s registration statement onForm 10 filed with the SEC on January 29, 2007)
10.19# Third Amendment, effective April 1, 2004, to the 1996 Excess Benefit Plan (incorporatedby reference to Exhibit 10.27 to the Company’s registration statement on Form 10 filedwith the SEC on January 29, 2007)
10.20# 2005 ENSR Stock Purchase Plan (incorporated by reference to Exhibit 10.28 to theCompany’s registration statement on Form 10 filed with the SEC on January 29, 2007)
10.21# 2005 UMA Group Ltd. Employee Stock Purchase Plan (incorporated by reference toExhibit 10.29 to the Company’s registration statement on Form 10 filed with the SEC onJanuary 29, 2007)
10.22# 2006 Stock Incentive Plan (incorporated by reference to Exhibit 10.30 to the Company’sregistration statement on Form 10 filed with the SEC on January 29, 2007)
10.23 Cansult Maunsell Merger Investment Plan, dated September 11, 2006 (incorporated byreference to Exhibit 10.31 to the Company’s registration statement on Form 10 filed withthe SEC on January 29, 2007)
10.24 AECOM Technology Corporation Equity Investment Plan (incorporated by reference toExhibit 10.32 to the Company’s registration statement on Form 10 filed with the SEC onJanuary 29, 2007)
113
ExhibitNumbers Description
10.25# Global Stock Investment Plan—United Kingdom (incorporated by reference toExhibit 10.33 to the Company’s registration statement on Form 10 filed with the SEC onJanuary 29, 2007)
10.26# Hong Kong Stock Investment Plan—Grandfathered Directors (incorporated by referenceto Exhibit 10.34 to the Company’s registration statement on Form 10 filed with the SECon January 29, 2007)
10.27# AECOM Retirement & Savings Plan (incorporated by reference to Exhibit 10.35 to theCompany’s registration statement on Form 10 filed with the SEC on January 29, 2007)
10.28# Change in Control Severance Policy for Key Executives (incorporated by reference toExhibit 10.1 to the Company’s current report on Form 8-K filed with the SEC onMarch 11, 2009)
10.29# Standard Terms and Conditions for Non-Qualified Stock Options under AECOMTechnology Corporation 2006 Stock Incentive Plan (incorporated by reference toExhibit 10.1 to the Company’s current report on Form 8-K filed with the SEC onDecember 5, 2008)
10.30# Standard Terms and Conditions for Restricted Stock Units under AECOM TechnologyCorporation 2006 Stock Incentive Plan (incorporated by reference to Exhibit 10.2 to theCompany’s current report on Form 8-K filed with the SEC on December 5, 2008)
10.31# Standard Terms and Conditions for Performance Earnings Program under AECOMTechnology Corporation 2006 Stock Incentive Plan (incorporated by reference toExhibit 10.3 to the Company’s current report on Form 8-K filed with the SEC onDecember 5, 2008)
10.32# Employment Agreement, dated as of July 14, 2010, by and among AECOM TechnologyCorporation, Tishman Construction Corporation and Daniel R. Tishman (incorporated byreference to Exhibit 2.2 to the Company’s current report on Form 8-K filed with the SECon July 14, 2010)
10.33 Note Purchase Agreement, dated June 28, 2010, by and among AECOM TechnologyCorporation and the Purchasers identified therein (incorporated by reference toExhibit 10.1 to the Company’s current report on Form 8-K filed with the SEC on July 1,2010)
10.34# AECOM Technology Corporation Employee Stock Purchase Plan (incorporated byreference to Exhibit 4.3 to the Company’s registration statement on Form S-8 filed withthe SEC on May 24, 2010)
10.35# Consulting Agreement, dated as of February 8, 2011, between Francis S. Y. Bong andAECOM Technology Corporation.(incorporated by reference to Exhibit 10.1 to theCompany’s quarterly report on Form 10-Q filed with the SEC on February 14, 2011)
10.36# Consulting Agreement, dated as of April 21, 2011, between Richard G. Newman andAECOM Technology Corporation (incorporated by reference to Exhibit 10.1 to theCompany’s current report on Form 8-K filed with the SEC on April 25, 2011)
10.37# Consulting Agreement, dated as of May 4, 2012, between Richard G. Newman andAECOM Technology Corporation (incorporated by reference to Exhibit 10.3 to theCompany’s quarterly report on Form 10-Q filed with the SEC on May 5, 2012)
114
ExhibitNumbers Description
10.38# Amended and Restated 2006 Stock Incentive Plan (incorporated by reference to Annex Bto the Company’s definitive proxy statement on Schedule 14A filed with the SEC onJanuary 21, 2011)
10.39# Amended Stock Option Standard Terms and Conditions under 2006 Stock Incentive Plan(incorporated by reference to Exhibit 10.1 to the Company’s quarterly report onForm 10-Q filed with the SEC on May 4, 2012)
10.40# Amended Restricted Stock Unit Standard Terms and Conditions under 2006 StockIncentive Plan (incorporated by reference to Exhibit 10.2 to the Company’s quarterlyreport on Form 10-Q filed with the SEC on May 4, 2012)
21.1 Subsidiaries of AECOM
23.1 Consent of Independent Registered Public Accounting Firm
31.1 Certification of the Company’s Chief Executive Officer pursuant to Section 302 of theSarbanes-Oxley Act of 2002
31.2 Certification of the Company’s Chief Financial Officer pursuant to Section 302 of theSarbanes-Oxley Act of 2002
32 Certification of the Company’s Chief Executive Officer and Chief Financial al Officerpursuant to Section 906 of the Sarbanes-Oxley Act of 2002
101.INS XBRL Instance Document
101.SCH XBRL Taxonomy Extension Schema
101.CAL XBRL Taxonomy Extension Calculation Linkbase
101.LAB XBRL Taxonomy Extension Labels Linkbase
101.PRE XBRL Taxonomy Extension Presentation Linkbase
101.DEF XBRL Taxonomy Extension Definition Linkbase
# Management contract or compensatory plan or arrangement.
115
SIGNATURE
Pursuant to the requirements of Section 13 or 15(d) of the Securities Exchange Act of 1934, theRegistrant has duly caused this report to be signed on its behalf by the undersigned, thereunto dulyauthorized.
AECOM TECHNOLOGY CORPORATION
By: /s/ JOHN M. DIONISIO
John M. DionisioChairman and Chief Executive Officer
(Principal Executive Officer)
Date: November 16, 2012
Pursuant to the requirements of the Securities Exchange Act of 1934, this report has been signedbelow by the following persons on behalf of the Registrant in the capacities and on the date indicated.
Signature Title Date
/s/ JOHN M. DIONISIO Chairman and Chief Executive Officer November 16, 2012(Principal Executive Officer)John M. Dionisio
Executive Vice President and Chief/s/ STEPHEN M. KADENACYFinancial Officer (Principal Financial November 16, 2012
Stephen M. Kadenacy Officer)
Senior Vice President, Corporate/s/ RONALD E. OSBORNEController (Principal Accounting November 16, 2012
Ronald E. Osborne Officer)
/s/ RICHARD G. NEWMANDirector, Chairman Emeritus November 16, 2012
Richard G. Newman
/s/ FRANCIS S.Y. BONGDirector November 16, 2012
Francis S.Y. Bong
/s/ JAMES H. FORDYCEDirector November 16, 2012
James H. Fordyce
116
Signature Title Date
/s/ S. MALCOLM GILLISDirector November 16, 2012
S. Malcolm Gillis
/s/ LINDA GRIEGODirector November 16, 2012
Linda Griego
/s/ DAVID W. JOOSDirector November 16, 2012
David W. Joos
/s/ ROBERT J. LOWEDirector November 16, 2012
Robert J. Lowe
/s/ WILLIAM G. OUCHIDirector November 16, 2012
William G. Ouchi
/s/ ROBERT J. ROUTSDirector November 16, 2012
Robert J. Routs
/s/ WILLIAM P. RUTLEDGEDirector November 16, 2012
William P. Rutledge
/s/ DANIEL R. TISHMANDirector, AECOM Vice Chairman November 16, 2012
Daniel R. Tishman
117

EXHIBIT 21.1
AECOM Global, Inc., a Delaware CorporationAECOM, Inc., a Delaware CorporationAECOM Technical Services, Inc., a California CorporationAECOM USA, Inc., a New York CorporationNational Security Programs, Inc., a Virginia CorporationTishman Construction Corporation, a Delaware Corporation
EXHIBIT 23.1
Consent of Independent Registered Public Accounting Firm
We consent to the incorporation by reference in the following Registration Statements:
(1) Registration Statement (Form S-3 Nos. 333-157646 and 333-154826) of AECOM TechnologyCorporation, and
(2) Registration Statement (Form S-8 Nos. 333-167047 and 333-142070);
of our reports dated November 16, 2012, with respect to the consolidated financial statements of AECOMTechnology Corporation and the effectiveness of internal control over financial reporting of AECOMTechnology Corporation included in this Annual Report (Form 10-K) of AECOM for the year endedSeptember 30, 2012.
/s/ ERNST & YOUNG LLP
Los Angeles, CaliforniaNovember 16, 2012
EXHIBIT 31.1
Certification Pursuant toRule 13a-14(a)/15d-14(a)
I, John M. Dionisio, certify that:
1. I have reviewed this Annual Report on Form 10-K of AECOM Technology Corporation;
2. Based on my knowledge, this report does not contain any untrue statement of a material fact or omitto state a material fact necessary to make the statements made, in light of the circumstances underwhich such statements were made, not misleading with respect to the period covered by this report;
3. Based on my knowledge, the financial statements, and other financial information included in thisreport, fairly present in all material respects the financial condition, results of operations and cashflows of the registrant as of, and for, the periods presented in this report;
4. The registrant’s other certifying officer(s) and I are responsible for establishing and maintainingdisclosure controls and procedures (as defined in Exchange Act Rules 13a-15(e) and 15d-15(e)) andinternal control over financial reporting (as defined in Exchange Act Rules 13a-15(f) and 15d-15(f))for the registrant and have:
(a) Designed such disclosure controls and procedures, or caused such disclosure controls andprocedures to be designed under our supervision, to ensure that material information relating tothe registrant, including its consolidated subsidiaries, is made known to us by others within thoseentities, particularly during the period in which this report is being prepared;
(b) Designed such internal control over financial reporting, or caused such internal control overfinancial reporting to be designed under our supervision, to provide reasonable assuranceregarding the reliability of financial reporting and the preparation of financial statements forexternal purposes in accordance with generally accepted accounting principles;
(c) Evaluated the effectiveness of the registrant’s disclosure controls and procedures and presentedin this report our conclusions about the effectiveness of the disclosure controls and procedures,as of the end of the period covered by this report based on such evaluation; and
(d) Disclosed in this report any change in the registrant’s internal control over financial reportingthat occurred during the registrant’s most recent fiscal quarter (the registrant’s fourth fiscalquarter in the case of an annual report) that has materially affected, or is reasonably likely tomaterially affect, the registrant’s internal control over financial reporting; and
5. The registrant’s other certifying officer(s) and I have disclosed, based on our most recent evaluation ofinternal control over financial reporting, to the registrant’s auditors and the audit committee of theregistrant’s board of directors (or persons performing the equivalent functions):
(a) All significant deficiencies and material weaknesses in the design or operation of internal controlover financial reporting which are reasonably likely to adversely affect the registrant’s ability torecord, process, summarize and report financial information; and
(b) Any fraud, whether or not material, that involves management or other employees who have asignificant role in the registrant’s internal control over financial reporting.
Dated: November 16, 2012
/s/ JOHN M. DIONISIO
John M. DionisioChairman and Chief Executive Officer(Principal Executive Officer)

EXHIBIT 31.2
Certification Pursuant toRule 13a-14(a)/15d-14(a)
I, Stephen M. Kadenacy, certify that:
1. I have reviewed this Annual Report on Form 10-K of AECOM Technology Corporation;
2. Based on my knowledge, this report does not contain any untrue statement of a material fact or omitto state a material fact necessary to make the statements made, in light of the circumstances underwhich such statements were made, not misleading with respect to the period covered by this report;
3. Based on my knowledge, the financial statements, and other financial information included in thisreport, fairly present in all material respects the financial condition, results of operations and cashflows of the registrant as of, and for, the periods presented in this report;
4. The registrant’s other certifying officer(s) and I are responsible for establishing and maintainingdisclosure controls and procedures (as defined in Exchange Act Rules 13a-15(e) and 15d-15(e)) andinternal control over financial reporting (as defined in Exchange Act Rules 13a-15(f) and 15d-15(f))for the registrant and have:
(a) Designed such disclosure controls and procedures, or caused such disclosure controls andprocedures to be designed under our supervision, to ensure that material information relating tothe registrant, including its consolidated subsidiaries, is made known to us by others within thoseentities, particularly during the period in which this report is being prepared;
(b) Designed such internal control over financial reporting, or caused such internal control overfinancial reporting to be designed under our supervision, to provide reasonable assuranceregarding the reliability of financial reporting and the preparation of financial statements forexternal purposes in accordance with generally accepted accounting principles;
(c) Evaluated the effectiveness of the registrant’s disclosure controls and procedures and presentedin this report our conclusions about the effectiveness of the disclosure controls and procedures,as of the end of the period covered by this report based on such evaluation; and
(d) Disclosed in this report any change in the registrant’s internal control over financial reportingthat occurred during the registrant’s most recent fiscal quarter (the registrant’s fourth fiscalquarter in the case of an annual report) that has materially affected, or is reasonably likely tomaterially affect, the registrant’s internal control over financial reporting; and
5. The registrant’s other certifying officer(s) and I have disclosed, based on our most recent evaluation ofinternal control over financial reporting, to the registrant’s auditors and the audit committee of theregistrant’s board of directors (or persons performing the equivalent functions):
(a) All significant deficiencies and material weaknesses in the design or operation of internal controlover financial reporting which are reasonably likely to adversely affect the registrant’s ability torecord, process, summarize and report financial information; and
(b) Any fraud, whether or not material, that involves management or other employees who have asignificant role in the registrant’s internal control over financial reporting.
Dated: November 16, 2012
/s/ STEPHEN M. KADENACY
Stephen M. KadenacyExecutive Vice President and Chief Financial Officer(Principal Financial Officer)
Exhibit 32
Certification Pursuant to18 U.S.C. Section 1350
In connection with the Annual Report of AECOM Technology Corporation (the ‘‘Company’’) onForm 10-K for the fiscal year ended September 30, 2012 as filed with the Securities and ExchangeCommission on the date hereof (the ‘‘Report’’), we, John M. Dionisio, Chief Executive Officer of theCompany, and Stephen M. Kadenacy, Chief Financial Officer of the Company, hereby certify, pursuant to18 U.S.C. Section 1350, as adopted pursuant to Section 906 of the Sarbanes-Oxley Act of 2002, that, to ourknowledge:
1. The Report fully complies with the requirements of Section 13(a) or Section 15(d) of theSecurities Exchange Act of 1934, as amended; and
2. The information contained in the Report fairly presents, in all material respects, the financialcondition and results of operations of the Company.
/s/ JOHN M. DIONISIO
John M. DionisioChairman and Chief Executive OfficerNovember 16, 2012
/s/ STEPHEN M. KADENACY
Stephen M. KadenacyExecutive Vice President and Chief Financial OfficerNovember 16, 2012

About AECOM
AECOM is a global provider of professionaltechnical and management support services to abroad range of markets, including transportation,facilities, environmental, energy, water andgovernment. With approximately 45,000employees around the world, AECOM is a leader inall of the key markets that it serves. AECOMprovides a blend of global reach, local knowledge,innovation and technical excellence in deliveringsolutions that create, enhance and sustain theworld’s built, natural and social environments.A Fortune 500 company, AECOM serves clients inapproximately 140 countries and has annualrevenue in excess of $8.0 billion.
More information on AECOM and its services canbe found at www.aecom.com.


