77
Company Number: 07706036 Annual report and accounts For the year ended 31 March 2017

Company Number: 07706036
Annual reportand accountsFor the year ended 31 March 2017

About Nesta
Nesta is a global innovation foundation. We back new ideas to tackle the big challenges of our time.
We use our knowledge, networks, funding and skills - working in partnership with others, including governments, businesses and charities. We are a UK charity but work all over the world, supported by a financial endowment.
To find out more visit www.nesta.org.uk

Annual report and accountsFor the year ended 31 March 2017
Trustees 4
Chair and Chief Executive’s introductory statement 5
Strategic report 6
1. Achievements for 2016–2017 6
2. Performance and impact 22
3. Plans for the future 32
4. Financial review 33
5. Principal risks and uncertainties 38
Objectives 39
Governance and management 40
Independent auditor’s report 43
Financial statements 44
Reference and administrative details 75

Annual report and accounts: For the year ended 31 March 2017
4
Trustees
Sir John GieveNesta’s Chair.Independent Director of CLS, a Director of the Homerton Hospital Trust and Chair of Trustees for the Clore Social Leadership Programme.
Madeleine Atkins Chief Executive, Higher Education Funding Council for England.
Kersten EnglandChief Executive of the City of Bradford Metroplitan District Council.
David Pitt–Watson Executive Fellow at London Business School, and Chair of the UN Environment Programme’s Finance Initiative.
Dr Michelle Harrison CEO of WPP Government and Public Sector Practice, and CEO of TNS, BMRB.
Kim Shillinglaw Controller BBC 2 and BBC 4.
Dame Julie Mellor, DBE Chair of the Young Foundation, Trustee of the Clore Social Leadership Programme and Involve.
Ed WrayDirectorships at Funding Circle LMAX Limited, Property Partner and Prodigy Finance. He is a Trustee of The Mix.
Simon LinnettExecutive Vice Chairman at Rothschild.
Piers Linney Entrepreneur and investor.
Natalie TydemanPrivate equity investor with a focus on growth-stage tech-enabled businesses.

Annual report and accounts: For the year ended 31 March 2017
5
Chair and Chief Executive’s introductory statement
Last year felt like something of a rite of passage for Nesta. As an organisation we hit the age of 18, moving out of adolescence into adulthood. We moved into a new building, for the first time becoming an owner. And many of our big programmes moved up a gear.
Some of these built on our past work in public services, in particular the Centre for Social Action Innovation Fund (a partnership with the Cabinet Office) whose projects are now directly helping hundreds of thousands of people and mobilising tens of thousands of volunteers alongside professionals to deliver public services in new ways. Nesta’s Health Lab is now involved in projects all over the country, testing and scaling ways that people can use technology, data and mutual support to improve their health and wellbeing, and has seen many of its ideas adopted directly into NHS policy.
Our impact investments have proven their worth – through Nesta Impact Investments, and also the Arts Impact Fund (with Arts Council England and the Arts & Humanities Research Council). And our Skills team has continued to spread across the globe. Nesta has worked in over 20 countries this year, training up senior officials, innovators and non-profits in the methods and skills of effective innovation. We have also seen some new activities come of age – in particular the work of our data analytics team who are producing world-leading analysis of the economy, dramatised through brilliant data visualisations. In the middle of the year we held the third FutureFest, our biggest yet with over 4,000 people joining together to explore how we might work, love, play and thrive in the future. Audiences listened to speakers such as Brian Eno, Will Self and Cindy Gallop, and experienced immersive installations such as insect-infused ice creams and people being implanted with chips.
Not everything in 2016-2017 worked as we hoped. Our digital magazine, The Long and Short, for
example, produced fantastic content covering stories of innovation, but didn’t achieve the scale of readership we’d hoped for.
This year we concluded a three-year strategy that was about using our relatively new found independence to increase Nesta’s reach and impact. Over this period, Nesta shifted to multiple funding models (including support from many governments, companies, foundations, UN agencies and the European Commission). We built far more partnerships in more countries with literally hundreds of partner organisations, and deepened our expertise in key fields and innovation methods. We also shifted towards longer time horizons for programmes - having learned that we achieve most when we work in a field for five years or more combining research, advocacy and practical projects, as has happened in fields such as alternative finance, digital skills and people powered health.
In early 2017 we published our new strategy for the next three years, which defines more clearly the sectors and subjects where we will focus on growing new ideas that can change the world for the better.
We are more convinced than ever of the need to amplify innovation for common good. Too high a proportion of the world’s innovation resources are allocated to destructive or trivial tasks. Drones are a good example – developed first for military and surveillance use, then later tested out for commercial uses and only belatedly adapted for public purposes, like helping out in humanitarian disasters. Nesta’s work continues to show how much better it is to start from the challenges that really matter and to devote energy to devising and discovering new approaches and new technology to tackle them. We hope that over the next year you may be one of the thousands of people who work with us to make that happen.
Sir John Gieve, Chair Geoff Mulgan, CEO

Annual report and accounts: For the year ended 31 March 2017 Strategic report
6
We have a strategy to meet our charitable objects, which are set out on page 38 below.
In the financial year 2016-2017, our mission, in line with our 2014-2017 strategy, was to increase the creation and growth of new ideas in the following key areas:
• Health and Ageing
• Education and Opportunities for Young People
• Creative Economy, Arts & Heritage
• Government Innovation, and Citizen Engagement in Public Services
• Innovation Policy and New Models for Inclusive Economic Growth
• Impact Investment
• Future Thinking
We encouraged innovation in these areas by:
• Backing promising ideas to achieve the greatest possible impact.
• Designing policies that can improve the environment for innovation.
• Conducting original research to improve our understanding of how innovation works.
• Developing new tools and promoting skills to turn ideas into impact.
A revised strategy has been developed for 2017-2021 and can be found on page 32.
1. Achievements in 2016-2017
Nesta’s impact and influence continued to grow at pace over the last year, with achievements across all areas of the organisation.
Some of the highlights and themes of the year include:
• Championing the use of high quality evidence, data analytics and rigorous experimental methods in decision-making for social and economic innovation.
• Raising awareness and driving adoption of new ideas and tools for innovation.
• Convening organisations and individuals across sectors and countries.
• Understanding and spreading ‘people powered’ innovations.
Championing the use of high quality evidence, data analytics and rigorous experimental methods
When it comes to decision-making about innovation, Nesta champions the use of high quality evidence and rigorous experimental methods - from the development of policies to support entrepreneurship, to the creation of edtech products.
We’ve learned that it’s critical to work with policymakers to help them to adopt, experiment,
adapt and rigorously test new policies and programmes for innovation support. This is one of the reasons we set up the Innovation Growth Lab (IGL) in partnership with leading governments and foundations worldwide. We work with partners to carry out and fund randomised controlled trials (RCTs), build capacity through workshops and online resources, and share new research findings amongst a global community of like-minded individuals and organisations. In 2016-2017, IGL led by Nesta, brought together increasing numbers of governments, practitioners and researchers from across the world to champion experimentation and better use of evidence in innovation policymaking. IGL held the first global conference on experimental innovation and entrepreneurship policy, establishing it as a globally renowned centre for expertise in using RCTs for decision-making about innovation policy.
In addition, during 2016-2017, the IGL Grants programme provided funding for seven randomised controlled trials of policy ideas that support innovation, entrepreneurship and business growth. We published some of the results from trials funded in previous rounds, including one that shows how simple changes to messaging can substantially increase the number of ideas submitted to innovation contests, without decreasing their quality.
Strategic report

Annual report and accounts: For the year ended 31 March 2017Strategic report
7
Governments spend billions on policies to make their economies more innovative and entrepreneurial. Yet there is little experimentation with new programmes and limited evidence of the effectiveness of these policies.
Our intervention
Nesta set up the Innovation Growth Lab (IGL) with the aim of making innovation, entrepreneurship and growth policy more experimental and evidence-based.
IGL is led by Nesta in partnership with the Kauffman Foundation, the Argidius Foundation, ACCIÓ, the Australian Department of Industry, Innovation and Science, the Austrian Research Promotion Agency, Innovate UK, Innovation Norway, Scottish Enterprise, Tekes, and the UK Department for Business, Energy and Industrial Strategy.
We work with partners to carry out and fund randomised controlled trials (RCTs), build capacity through workshops and online resources, and share new research findings amongst a global community of like-minded individuals and organisations.
In 2016-2017 we tackled the barriers to the wider adoption of experimental approaches with a variety of initiatives - some open to the wider community of innovation policymakers, while others were directed specifically to our partners.
2016-2017 achievements
• We organised the first global conference on experimental innovation and entrepreneurship policy, bringing together over 230 participants from 27 countries.
• Awareness and interest in experimental policy is growing amongst innovation agencies, governments and the European Commission, with many of them starting to consider how to apply it within their own programmes.
• Nesta ran capacity-building workshops with a number of organisations, leading to several ideas for new policy trials that are now being taken forward.
• We published the first guide to running trials in innovation policy, which will be followed by a new online toolkit.
Case study: Innovation Growth Lab
IGL Conference 2016
RUNNING RANDOMISED CONTROLLED TRIALS IN INNOVATION, ENTREPRENEURSHIP AND GROWTH: AN INTRODUCTORY GUIDE
TRIIN EDOVALDTEO FIRPO

Annual report and accounts: For the year ended 31 March 2017 Strategic report
8
Nesta’s Alliance for Useful Evidence is a hub for sharing social research, good practice and resources - such as the Nesta Standards of Evidence (a framework to assess how confident we can be that a new intervention is having a positive impact). This year the Alliance co-curated and hosted a two-day international conference on the use of evidence in public sector policymaking. We followed the conference with a summary report distilling this exchange of ideas, specifically targeted at our new international following, and interested UK funders.
The Alliance further demonstrated the strength of its convening power by pulling together a multiple stakeholder group of key providers in UK social policy, building a strong coalition to bid for funding to review and develop an updated Standards of Evidence.
The Alliance’s advisory and advocacy role has been increasingly in demand and we have worked with a range of different organisations from Public Health England, the Government of Canada, and the Money Advice Service (MAS), as well as a range of academic institutions including UCL, to establish evidence centres or What Works models, building capacity, knowledge and skills across institutions. Some of these partnerships have led to income generating activity for this new financial year 2017-2018.
Nesta is interested in how the latest types of data analytics, drawing on new and varied sources of data, can help companies, cities, public services and countries do things better. In 2016-2017, we continued to build interactive data visualisations to support policymaking at a local level, such as mapping the economic importance of creativity in local areas in The Geography of Creativity. This report showed the important contribution of the creative industries to local economies across the UK. Its findings are informing the creative
industries ‘sector deal’ in the UK Government’s Industrial Strategy and the Arts and Humanities Research Council priorities for the Industrial Strategy Challenges Fund. The data set we published alongside the report has been used to measure the impact of BBC Media City in Salford. Nesta has also been running pilots in London and the North East to apply data analytics to datasets sourced from multiple local authorities to tackle rogue landlords and issues related to alcohol abuse.
The Behavioural Insights Team (BIT), in which Nesta has a 30 per cent stake, has continued to expand and grow its operations, with 2016-2017 annual turnover of over £10 million. BIT’s focus is on achieving social impact via the application of insights from the behavioural sciences to real world policy problems. BIT’s approach is highly empirical - testing and trialing policy ideas before they are scaled up.
Highlights this year include the launch of the Financial Capability Lab. Using their new Predictiv platform, BIT is running a suite of online lab experiments to develop evidence-based approaches to increase financial capability across a series of savings and credit policy challenges.
In the health policy area, BIT’s work has continued to expand, moving into mental health work whilst maintaining a strong public health portfolio. One trial within the NHS reduced the demand on overcrowded hospitals by simple changes to the choice-making structures within GP IT systems, and is currently being rolled out nationally.
2016-2017 was the first full year of operation for BIT North America. With the support of Bloomberg Philanthropies, they have run over 40 randomised controlled trials with government partners in 21 US states and are extending their work in Canada.

Annual report and accounts: For the year ended 31 March 2017Strategic report
9
BIT has increased its capacity to develop products and services through the creation of a subsidiary, Behavioural Insights Ventures Ltd. Their most advanced product, Applied, is an online recruitment tool that enables organisations to use behavioural science to remove implicit bias from their hiring decisions.
BIT continues to expand its operations outside of the UK, opening offices in Singapore and New Zealand and growing operations in Australia and North America.
Nesta has used investment to support innovation for nearly 20 years. We seek positive financial and social returns by investing in innovative approaches and technologies that tackle major challenges in the fields of health, education and employability, and community sustainability. Evidencing the social impact of our investments is critical and, this year our Impact Investment Team built on the lessons of our first fund to include external client investors in the process of refining its theory of change, making significant improvements to our impact evaluation and reporting frameworks. As an example, Nesta has previously demonstrated the effectiveness of tutoring on exam grades through randomised controlled trials. This year Nesta Impact Investments made follow-on investments into Third Space Learning, a programme that raises attainment by connecting around 6,000 primary school pupils every week with quality maths tutors abroad, via a secure web platform. Other notable milestones in the year were follow-on investments in rapidly growing portfolio companies CogBooks which has provided digital degree courses to over 2,000 undergraduates, Oomph! which provides exercise and activity programmes to around 90,000 older people and vunerable adults each month, and a new investment into Synopsis Healthcare, a leading provider of digital health data collection and risk analysis software.
Raising awareness and driving adoption of new ideas
A large part of Nesta’s impact comes from its communications, directly promoting research, new ideas, innovation methods and practical case studies. Over recent years we have shifted the focus of our communication from Whitehall and Westminster to a broader audience of thought leaders. We now spread knowledge and expertise about how to manage innovation to a substantial community of entrepreneurs and innovators in startups, civil society, businesses and the public sector.
Our communication activity ranges from intimate roundtable events with influential players, through to mainstream, mass media coverage. In the last year, some particularly high profile examples were New Radicals, FutureFest and the coverage of our European Digital City Index (EDCi) initiative. Other events included a conference in Edinburgh on the future of the economy in Scotland, involving the Scottish Cabinet.
Our biennial New Radicals campaign showcases the 50 people and organisations who are changing Britain for the better. It made a media splash once again through our rolling partnership with The Observer. The campaign attracted over 400 submissions, which were then shortlisted by a panel of judges. The winning submissions featured in a six-page spread in The Observer on 10 July and generated 100,000 page impressions to the Nesta site across all the New Radicals content.

Annual report and accounts: For the year ended 31 March 2017 Strategic report
10
In 2016 we ran our third New Radicals campaign to champion the UK’s unsung social entrepreneurs and innovators who are using their technical expertise, community influence, scientific prowess and artistic bravery for social good.
Our intervention
Once again we teamed up with The Observer for the campaign, working together to encourage nominations and entries from across the country and helping to shine a light on some of the pioneering social innovators in the UK today.
We filtered 400 nominations and applications down to a final list of 50, chosen by a panel of cross-industry judges including Mike Bracken, co-founder of the UK Government Digital Service (GDS); Fiona Duncan, Chief Executive at Lloyds TSB Foundation for Scotland; and performance artist and social activist Bryony Kimmings.
The work of the 2016 New Radicals spanned fields as diverse as hospitality, engineering, healthcare, music, international development, technology, retail and politics.
Themes from our third list included responses to the migration and refugee crisis, innovations in political engagement and the use of technology to improve disabled access to public spaces.
2016-2017 achievements
• The list of 50 New Radicals were showcased in a six-page exclusive spread in The Observer, including a front cover mention, and was supported by a regional and local radio campaign.
• Our online feature, for which we interviewed all 50 2016 radicals, attracted 24,000 visits to Nesta’s website.
• The campaign had a social media audience of over 20 million as a result of the #50radicals hashtag being shared by 2,100 Twitter users.
• 155 radicals (past and present) came together at the New Radicals event at Nesta.
Case study: New Radicals
New Radicals Non-profit Wayfindr is empowering vision impaired people through digital audio wayfinding

Annual report and accounts: For the year ended 31 March 2017Strategic report
11
We make it our job to understand the best conditions for innovation, in the UK and abroad. In 2016-2017, Nesta launched a new edition of the European Digital City Index (EDCi) - an index for startups, scale-ups and policymakers comparing how well different cities support
digital entrepreneurship. It secured front page coverage on CITY A.M., as well as informing the wider debate about skills and policy environment and providing tools for city governments and entrepreneurs.
The European Digital City Index is a project to measure the different conditions for supporting digital entrepreneurship across Europe. The index was produced as part of the European Digital Forum, a programme funded by the European Commission and managed by Nesta in collaboration with the Lisbon Council. The ultimate aim was to raise awareness among policymakers of the local conditions for entrepreneurship in different cities and prompt improvement.
Our intervention
Underpinned by a novel methodology, the index is a composite index built from 40 different characteristics, which compares 60 cities across the EU.
The choice of characteristics in the index was based on more than 70 interviews with entrepreneurs, venture capitalists, accelerator managers and digital experts from across Europe. Data for the index was provided by several data partners, including Teleport, Statista, Crowdsurfer and the European Business Angel Network.
2016-2017 achievements
• The index generated significant press attention, including the front page of CITY A.M. and headline slot on BBC London News. There were also appearances on France’s RFI (the equivalent of the BBC) and China’s CNC global news service.
• To provide assistance for local policymakers, the index was also accompanied by an ‘Idea Bank’ of exemplar initiatives supporting digital startups, collected from across the globe.
• Governments of several other cities, regions and even countries have since requested their own versions.
Case study: The European Digital City Index
FRIDAY 18 NOVEMBER 2016 ISSUE 2,758 CITYAM.COM FREE
BUSINESS WITH PERSONALITYEDITOR’S NOTESWHY FARAGEDESERVES APEERAGE P15
LUST FOR LIFE THE ESSENTIALGUIDE TO HITTING THE TOWN
THIS WEEKEND P34-35
FTSE 100▲ 6,794.71 +44.99 FTSE 250▲ 17,600.94 +126.97 DOW▲ 18,903.82 +35.68 NASDAQ▲ 5,333.97 +39.39 £/$▼ 1.242 -0.001 £/€▲ 1.168 +0.005 €/$▼ 1.062 -0.006
LONDON HOLDS EUSTARTUP TOP SPOT
As proud sponsors of the GB Women’s Hockey team, we’d like to congratulate them on being named Best Female Teat the Association of National Olympic Committees awards.
investec.com/hockey
Passion teamed with
commitment
BREXIT
S&P: The Cityto keep euroclearing titleHAYLEY KIRTON
@HayleyLEKEURO clearing is unlikely tobe shifted out of the UKfollowing Brexit, a reportfrom ratings agency S&Pfound yesterday.
Since the UK voted to leavethe EU in June, there havebeen some fears that Londoninstitutions could be blockedfrom carrying out lucrativeeuro clearing activities.
While the report noted thatthe European Central Bank(ECB) could try to move euroclearing out of the UK, theprobability of it doing so waslow and, even if it were to doso, the process could becomplex and take more thantwo years to complete.
S&P also noted that such amove would be “unparalleledamong major global markets”.
However, an attempt by theECB to snatch euro clearingaway from London would notbe without precedent, as ithas already tried to insistthese activities be moved intothe Eurozone in the past.However, the UK challengedthis, and, last year, the EUGeneral Court found in thecountry’s favour.
London is home to severalclearing giants. S&P warnedthat, while a policy changewould be unlikely to affectsuch organisations in theimmediate future, it couldeventually lead to “additionalcosts and lower efficiencies”.
REBECCA SMITH
@BexKSmithLONDON has been crowned the bestEU city for digital entrepreneurs forthe second year in a row.
Access to funding, a buzzingentrepreneurial culture and a skilledworkforce are some of the factors thatmake the capital the best city inEurope for startups and scale upsaccording to innovation foundationNesta and the European DigitalForum’s city index.
It stayed ahead of Stockholm insecond spot, Amsterdam in third andHelsinki in fourth, with Paris rounding
out the top five in the rankings.“This is yet more evidence that
London is open for business,” saidRajesh Agrawal, deputy mayor ofLondon for business. “It is fantasticnews, but no surprise when youconsider our vibrant entrepreneurialspirit, huge talent base and access tocapital.”
However, London may have to fightto retain its top digital talent if a so-called hard Brexit restricts access toEU markets or international talent.
“London remains the most attractiveEuropean city for digitalentrepreneurs in 2016, but Stockholmis snapping at its heels. Government
must continue to invest in digital skillsand digital infrastructure, as well asaddressing the cost of office space, if itis to continue to attract the nextDeliveroo or Funding Circle, withmany competitor cities in Europe,China and the US working hard toattract young firms,” said Chris Haley,head of startup and new technologyresearch at Nesta.
“Of course, it also remains to be seenhow a ‘hard Brexit’ will affect the UK’sbusiness allure for digital startups,given that access to markets is alsohugely important.”
Tech City UK’s chief executive GerardGrech said: “Access to talent is a
critical issue for the city’s techcommunity and Tech City UK isworking closely with government tomake sure it understands whycompanies and entrepreneurs need tobe able to access highly skilled stafffrom around the world because oftheir rapid rate of growth.”
Romilly Dennys, executive director ofthe Coalition for a Digital Economy(Coadec), added that the report’sfindings “highlight the globalimportance of London’s diverse techcommunity” but called on thegovernment to do more in support ofthe digital sector in cities and regionsbeyond London.
European Digital City Index - Illustration of factors.

Annual report and accounts: For the year ended 31 March 2017 Strategic report
12
Nesta’s third flagship FutureFest took place in September 2016 at Tobacco Dock in London and was designed to help people think about how we might work, love, play and thrive in the future.
Our intervention
The two-day festival featured 130 speakers, and plenty of installations, experiences and provocations including insect-infused ice creams, futuristic cocktails, the fertility shop of the future, dancing drones, footballers showing off their skills immersed in ‘collective reality’ and cybathlon equipment (featuring human-machine tech demonstrations).
Influential speakers included Will Self, Brian Eno, Cindy Gallop, Mustafa Suleyman and Rhianna Pratchett - and ranged from extended meditations, inspiring accounts of the future to a debate about future politics between Green Party leader Caroline Lucas and South Australian Premier Jay Weatherill.
The event was supported by Nissan, Oxford Martin School, University of Greenwich, Sedition and EUNIC amongst others, and was the most ambitious Nesta event to date.
Case study: FutureFest 2016
FutureFest 2016 was Nesta’s third execution of this two-day flagship festival. The aim was to excite and inspire a cross-section of our audience with ideas about what the future could hold, linking the experience more closely to Nesta’s work. We set ourselves ambitious ticket and production targets with a venue capacity twice as large as the previous festival. The smaller debate spaces, including Oxford Martin’s room and Nesta’s first dedicated room, The Nesta Lounge, were notable successful new additions.
The sessions covered a vast range of topics, all designed to provoke the audience to think about the future. But some interesting common themes emerged from across the weekend’s debate, such as a shared commitment to directing technology in a more human and responsive direction; a shared interest in using play to explore complexities which don’t easily succumb to linear logic; and a maker/hacker ethic of taking things apart and putting them back together in ways that better fit our needs.
FutureFest 2016 – DJ Spooky

Annual report and accounts: For the year ended 31 March 2017Strategic report
13
2016-2017 achievements
• FutureFest attracted an audience of 4,000 people - up 20 per cent from 2015.
• Over half of attendees reported that FutureFest was more innovative and thought provoking than similar events they had attended this year, and around 70 per cent would recommend the event or come to FutureFest again.
• The Nesta stage (dedicated Nesta content) was at 90 per cent capacity throughout the weekend.
• Over 155 pieces of international and national media coverage and broadcast were secured, up from 120 in 2015.
• #FutureFest trended in London over the weekend and there were over 15,000 visits to the FutureFest website.
4,000people attendedFutureFest.
70%of those wouldrecommend FutureFestto others or attend again.
There were over
15,000visits to the FutureFest website.
FutureFest 2016
FutureFest 2016

Annual report and accounts: For the year ended 31 March 2017 Strategic report
14
We all know that digital technology is completely changing the way we live and work. But which digital policies benefit entrepreneurs, business and society? And how might governments design better ones?
Responding to the impact of digital technology, many European governments have installed new digital economy units. These teams are mandated to design digital strategies, policies and initiatives that improve society and build economic growth.
Around Europe, some governments, agencies and businesses are already coming up with innovative solutions to support digital transformation. But, these efforts lack coordination and visibility. Despite many shared issues, policymakers struggle to find concrete case studies and learn what is working - and what is not.
Case study: Readie Policy Summit 2016
Convening organisations and individuals across sectors and countries
With Nesta’s unusual cross-sector view, we are ideally placed to act as a convener - bringing together organisations of all sizes, individual innovators and academics from different fields to focus on particular challenges or identify new opportunities for innovation.
For example, in 2016, Readie, a unit operated by Nesta to connect key digital policymakers across Europe, hosted its annual conference in Berlin to address opportunities of digitalisation and ways to drive more effective, efficient digital policymaking. In another area of Nesta’s work, we played an instrumental role in The Startup Europe Partnership - a group promoting open innovation through collaboration between startups and corporates (using findings from Nesta’s publication: Winning Together - A Guide
to Successful Corporate-Startup Collaboration). The work in 2016-2017 involved several matching events convening startups and corporates, as well as the first Corporate Startup Stars awards celebrating good practice from the top ‘startup friendly’ corporates in Europe.
We cannot make a future until we can imagine it, and fiction plays a huge role in defining and expanding the range of possible solutions to our problems and directions of development. Nesta brought together academics and science fiction writers in a workshop to explore The Roots of Collective Intelligence, with speakers including Robin Dunbar, known for his pioneering research on social connections between humans. We asked academics to collaborate with science fiction writers to develop short stories that explored the impact that developments in collective intelligence might have on our society.
“The best thing at this Summit was that there were people from 23 countries, so we had input from very, very different aspects and points of view – that was very interesting and fruitful.”Helge Braun, Minister of State to the Federal Chancellor, Germany
Annual report and accounts: For the year ended 31 March 2017Strategic report
15
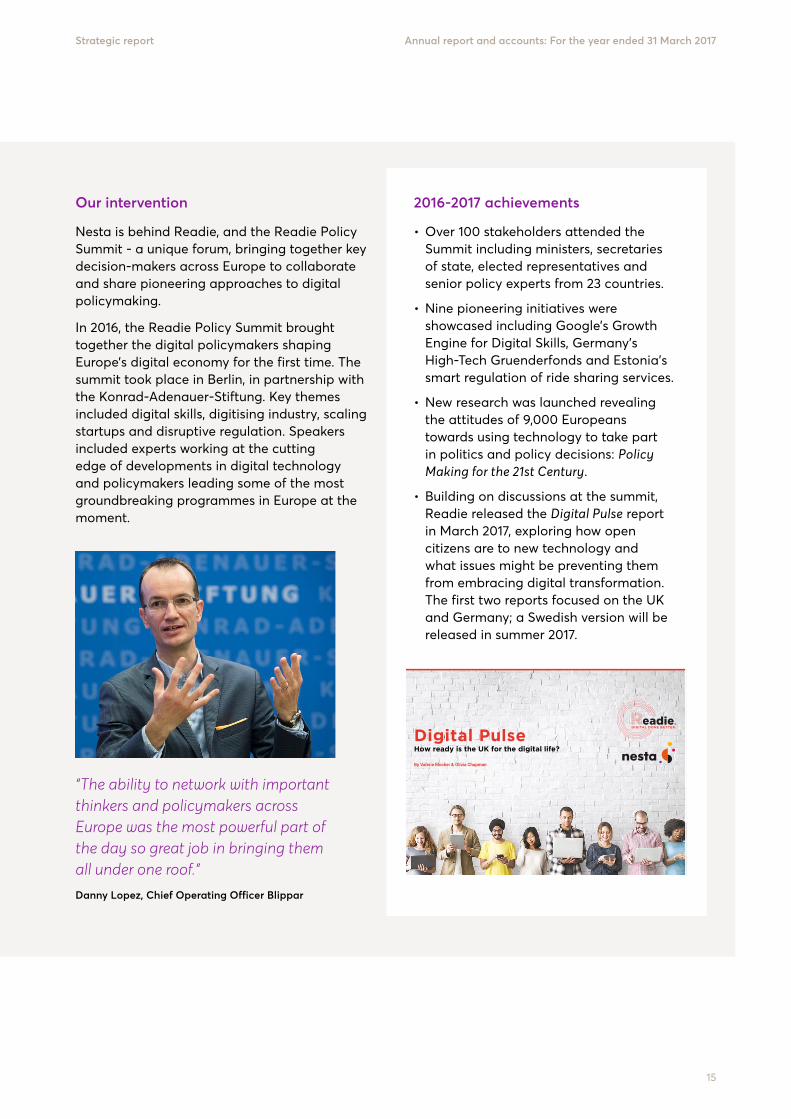
Our intervention
Nesta is behind Readie, and the Readie Policy Summit - a unique forum, bringing together key decision-makers across Europe to collaborate and share pioneering approaches to digital policymaking.
In 2016, the Readie Policy Summit brought together the digital policymakers shaping Europe’s digital economy for the first time. The summit took place in Berlin, in partnership with the Konrad-Adenauer-Stiftung. Key themes included digital skills, digitising industry, scaling startups and disruptive regulation. Speakers included experts working at the cutting edge of developments in digital technology and policymakers leading some of the most groundbreaking programmes in Europe at the moment.
2016-2017 achievements
• Over 100 stakeholders attended the Summit including ministers, secretaries of state, elected representatives and senior policy experts from 23 countries.
• Nine pioneering initiatives were showcased including Google’s Growth Engine for Digital Skills, Germany’s High-Tech Gruenderfonds and Estonia’s smart regulation of ride sharing services.
• New research was launched revealing the attitudes of 9,000 Europeans towards using technology to take part in politics and policy decisions: Policy Making for the 21st Century.
• Building on discussions at the summit, Readie released the Digital Pulse report in March 2017, exploring how open citizens are to new technology and what issues might be preventing them from embracing digital transformation. The first two reports focused on the UK and Germany; a Swedish version will be released in summer 2017.
“The ability to network with important thinkers and policymakers across Europe was the most powerful part of the day so great job in bringing them all under one roof.” Danny Lopez, Chief Operating Officer Blippar
1
Digital PulseHow ready is the UK for the digital life?
By Valerie Mocker & Olivia Chapman

Annual report and accounts: For the year ended 31 March 2017 Strategic report
16
In 2016-2017 Nesta demonstrated its convening power when it comes to innovation in funding, as the Arts Impact Fund made its first loans. Following our earlier report, The New Art of Finance, it was clear that there was an ever increasing appetite for an expanded range of financial instruments and methods that could
bring new money into the arts, and offer more opportunities for existing funding to work harder. The Arts Impact Fund brings together commercial, philanthropic and lottery finance in a ‘co-mingled’ fund and was the first of its kind to focus on the social, artistic and financial return created by arts-based organisations.
The Arts Impact Fund (AIF) is a £7 million pilot social impact fund, set up to prove the case for investing in arts and culture to achieve social and artistic outcomes. In 2016-2017 it made its first loans, and broke new ground by ‘co-mingling’ public funders, philanthropic organisations and other private investors to support arts organisations to grow and better evidence the social impact they have.
Our intervention
AIF is managed by Nesta, and funded by Arts Council England, Nesta, The Esmée Fairbairn Foundation and Bank of America Merrill Lynch, with additional support from Calouste Gulbenkian Foundation. The aims of the initiative were to:
• Provide risk capital to promote and enable greater resilience in arts and culture.
• Encourage and articulate the positive social impact of arts and culture.
• Demonstrate the value of mixing public, private and philanthropic capital alongside the catalytic potential of sector-specific investment funds.
2016-2017 achievements
• £5.05 million of investment was committed in the first 18 months of active investment to 16 organisations - representing a diverse portfolio of organisations operating across a range of art forms, social impact areas, geographies, and uses of finance.
• Examples include an image licensing trading subsidiary of a photography gallery celebrating cultural difference; a gourmet fish restaurant whose profits will support a creative writing programme for disadvantaged children; and an environmental retrofit generating income for a volunteer-run theatre company helping local schoolchildren engage with theatre, particularly Shakespeare.
• Nesta expanded the reach of the programme with bespoke London and regional publicity, awareness-raising events and multiple requests for national speaking engagements.
• We started work on pioneering methods of measuring artistic impact and cultural value to demonstrate return on investment.
Case study: The Arts Impact Fund
Bow Arts Trust
South East Dance

Annual report and accounts: For the year ended 31 March 2017Strategic report
17
Understanding and spreading ‘people powered’ innovations
Nesta has been at the forefront of the ‘people powered’ movement to better utilise the skills and time of citizens, working alongside professionals, to enhance and shape public services and give people greater control over their lives.
In 2016-2017, there was a rapid acceleration in our People Powered Health practical work, following the establishment of Nesta’s Health Lab (in 2015-2016). Health Lab was set up to test and scale new ways for people to remain healthy by drawing on new sources of support (to make it possible for people to be more involved in their health), new sources of data (to improve people’s knowledge about their health) and new sources of innovation (that can generate new solutions to problems). One practical example is People Powered Results, a structured innovation method developed by Nesta and the Rapid Results Institute that helps unlock the expertise and passion of leaders, frontline professionals and service users, to accelerate change and innovation in complex systems. In 2016-2017, the People Powered Results (PPR) team worked with NHS England to deliver the Elective Care Development Collaborative, a programme of ten teams across four different health economies (Stockport, Fylde Coast, Frimley and South Somerset) to test initiatives aimed at reducing demand for elective care. Early results indicate that:
• In Stockport, 41 orthopaedic patients attended virtual follow-up appointments none of which needed to be converted into face-to-face appointments. Patients also reported a reduction in stress and flare ups caused by long walks from hospital car parks to clinics.
• In Somerset, virtual diabetes clinics (consultant-led case reviews in primary care) have contributed to a 69 per cent decrease in referrals into secondary care from the practices involved.
• A telephone service piloted in Fylde Coast for GPs to discuss rheumatology patients with consultants led to 51 per cent of cases not being referred into the rheumatology service.
The PPR team have also been working with NHS England’s personalisation and choice group to support the Stockton health and care economy to be the first place in the UK to test the whole new Integrated Personalised Commissioning operating model within 100 days. The 100 Day Challenge focused on the Frail 65+ cohort (505 patients) and agreed a system-wide approach to personalised care and support planning which enabled:
• Forty-one per cent reduction in A&E attendance.
• Nineteen per cent reduction in admissions.
London School of Mosaics Our Ladies - Live Theatre

Annual report and accounts: For the year ended 31 March 2017 Strategic report
18
Realising the Value is another people powered success story coming out of Health Lab this year. Working in partnership with The Health Foundation, Voluntary Voices (National Voices, Regional Voices, NAVCA and Volunteering Matters), the Behavioural Insights Team, PPL, and the Institute of Health and Society at Newcastle University, Nesta researched and tested a people-
and community-centred approach to health by pulling together the experience of different locations around the country. The programme generated a set of popular digital tools and resources for healthcare professionals to put people and communities at the heart of decisions on health and wellbeing.
We want the health and care system to support people to have the knowledge, skills and confidence to play an active role in managing their own health.
Realising the Value was an 18-month programme, funded by NHS England and jointly led by Nesta and The Health Foundation. It was not about inventing new approaches, but rather about strengthening the case for change by identifying evidenced examples of initiatives that engage people in their own health and care.
Our intervention
The programme:
• Drew together and consolidated an evidence base for person- and community-centred approaches for health and wellbeing.
• Developed an economic tool for commissioners to evaluate the potential impact of investing in person- and community-centred approaches.
• Created tools to support behaviour and culture change in health systems.
Realising the Value also pulled together a catalogue of practical lessons from local areas already putting this approach into practice. It specifically drew on on-the-ground experience from five voluntary and community organisations across the UK (Positively UK, Penny Brohn UK, Big Life Group and Being Well Salford, Creative Minds, and Unlimited Potential with Inspiring Communities Together).
Case study: Realising the Value

Annual report and accounts: For the year ended 31 March 2017Strategic report
19
2016-2017 achievements
• Over 18 months, Realising the Value engaged more than 600 people directly through a series of programme events, including final launch events in London and Manchester.
• To date there have been more than 15,000 unique downloads of the reports and 26,000 views of the blogs. The content and hashtag, #RealisingTheValue, have had more than 4,000 social media mentions, reaching a potential audience of over three million.
• Realising the Value is also informing broader policymaking. For example, Jon Rouse, Chief Officer at the Greater Manchester Health & Social Care Partnership, has said that he has, “taken learning from the programme directly into the development of our Population Health Plan and our work on integration of health and care services”.
Creative Minds
Penny Brohn Cancer Care
Another example of how Nesta supports innovation that empowers people is DECODE (Decentralised Citizen Owned Data Ecosystem), an experimental European Commission-funded project launched in early 2017 to develop and test cutting edge blockchain-based tools that can give individuals control of their personal data on the internet and the ability to share it for the common good. DECODE is a response to the loss of control people have over their personal data on the internet. On the other hand, the huge quantities of data produced on the web every day offers the potential for insights that could benefit all of society. With the data controlled by a handful of monopolies, society cannot benefit from these insights. DECODE will develop and test new tools to give people control of their personal data, based on principles from the sharing economy, the Internet of Things, and participatory democracy. To support this work, Nesta will be undertaking research into the
future of the personal data economy and how the project can have a real impact for people. DECODE’s pilots (in Barcelona and Amsterdam) will engage with and build an active, diverse community of people who are interested in using tools that give them control of their data.
We’re also empowering public sector innovators through the development of the world’s first dedicated public innovation curriculum, designed and delivered by the world’s leading practitioners. The initiative launched this year and aims to help strengthen innovation capacity across governments by supporting the next generation of public sector leaders to learn the methods and skills of innovation. In December, we prototyped our first module on Experimentation with the UAE government, and we are entering partnerships with more than a dozen national governments to continue to develop the curriculum.

Annual report and accounts: For the year ended 31 March 2017 Strategic report
20
Our public services are under significant funding pressure and increasing demand. We need radical new models of public service delivery, including making the most of community expertise and skills. Over the last five years, Nesta has directed over £22 million towards new models of delivering public services in partnership with ‘people power’ - using the time and energy of local people. In 2016-2017 the Centre for Social Action Innovation Fund, a £14 million partnership between Nesta and the Cabinet Office, came to a close. The programme supported 52 promising
innovations that mobilised citizen time and skills alongside public services - from Code Club volunteers helping children learn computing, to GoodSAM - an app that alerts trained first aiders to emergencies nearby. The partnership helped innovations like this to grow both their reach and their evidence of impact. The collation of its results after four years, reveals impressive growth from the innovations it supported, and a bank of evidence for others to draw on.
We know that when people help other people it creates stronger communities and higher levels of social capital – economic, social and wellbeing. This kind of volunteer led ‘social action’ transforms lives, helping students who have fallen behind at school to catch up, job seekers to find work, isolated older people to feel connected, and more.
That’s why Nesta and the Cabinet Office together invested £14.5 million in the Centre for Social Action Innovation Fund over the last three years to back 52 social action innovations with grants and support to grow.
Case study: The Centre for Social Action Innovation Fund
North London Cares

Annual report and accounts: For the year ended 31 March 2017Strategic report
21
Our intervention
The aim was to help this portfolio of innovations to grow their impact (reaching many more people) and their evidence, and to enable a small number of proven innovations to achieve impact at significant scale with national reach.
During 2016-17, as the programme drew to a close, we’ve been publishing evidence of what works. We’ve compiled guides and toolkits from practitioners and commissioners to make this way of working the new normal in public services.
2016-2017 achievements
• More than 70,000 generous people across England gave their time and expertise to help nearly 175,000 people, including two lives saved by CPR from a volunteer.
• The innovations leveraged a further £18 million of investment as they have grown and some have reached significant scale, able to deliver their services to any public service in England that commissions them. For example, any primary school can now request a Code Club, any local authority a Shared Lives Plus caring scheme, any Ambulance Trust a GoodSAM first responder scheme and more.
• More than 1,000 people downloaded our social action reports and toolkits, sharing the lessons learnt from three years of the Fund, and more than 500 people attended our People Helping People series of events on making social action the new normal.
• We’ve published an evidence bank of social action evaluations so commissioners know what works. We’ve published 30 to date, all validated against Nesta’s standards of evidence, including validating two randomised controlled trials that show the impact of volunteer-led tutoring on students’ GCSE and A-Level scores.
City Year

Annual report and accounts: For the year ended 31 March 2017 Strategic report
22
2. Performance and impact
Nesta’s main activities are organised across functional teams, supported by the Communications and Corporate Services teams. The Nesta departments are as follows:
• Policy and Research: This team conducts research and analysis, using the findings to encourage debate and develop policy, with the aim of improving the conditions for innovation.
• Programmes comprising:
• Innovation Lab: Through its Innovation Lab, Nesta supports people and organisations who are developing ideas to solve big social challenges. The Lab delivers experiments, practical programmes and funds. It incubates and scales new ventures across a range of sectors, including education, government, civil society, arts and culture and the collaborative economy. We have a specific focus on the use of data and digital technology to drive innovation alongside mobilising the resources and skills of people and citizens in new ways to make a positive difference. Across our work, we also experiment with different ways in which finance can be deployed to best support innovation.
• Health Lab: A centre of expertise on people-powered and data-driven health. We use
funding, research and practical support to look for better ways for people to remain healthy, drawing on their own energy and ideas, as well as the insights of medical science and new digital tools.
• Investment Management: Nesta invests in mission-led businesses from a number of funds, primarily for a positive social impact, but also for a financial return. By leveraging Nesta’s research, knowledge, networks and capital, we have helped the UK’s impact investment sector to become a world leader.
• Communications: The Communications team works to raise the profile of the organisation, manage the brand and promote its work and achievements to key audiences in the UK and around the world. It does this by maximising positive coverage, and developing compelling events and digital content for our audiences to engage with.
• Innovation Skills: The Innovation Skills team helps people become better innovators for the common good by providing content, learning experiences and strategic support to improve innovation skills and embed them into everyday practice.
Data, mapping and evidence
In 2017-2018, we will launch Arloesiadur, the cutting-edge innovation data visualisation platform that Nesta has developed for the Welsh Government. We are also working on our first international innovation mapping project with the government of United Arab Emirates. These projects should help put new mapping methods at the heart of innovation policymaking.
We have begun a two-year research programme analysing online job ads to build a revised classification systems for occupations and skills for the Office of National Statistics, as part of the Economic Statistics Centre of Excellence that we are running with NIESR, King’s College London, Cambridge University, Warwick Business School
Data, mapping and evidence
The Geography of Creativity report showed the important contribution of the creative industries to local economies across the UK. Our findings are informing the creative industries ‘sector deal’ in the UK Government’s Industrial Strategy and the Arts and Humanities Research Council priorities for the Industrial Strategy Challenges Fund. The data set we published alongside the report has been used to measure the impact of BBC Media City in Salford.
Mapping the UK’s digital tech industries - our mapping method was used in Tech City’s UK Tech Nation 2017.
The Innovation Growth Lab (IGL) has continued its work to make innovation policy more experimental and evidence-based, by bringing new partners on board, providing capacity-building workshops and events, and funding seven trials.
The work of Policy and Research seeks to achieve impact primarily through generating new knowledge, influencing policy and systems change.
Department: Policy and Research
Current impact Future impact

Annual report and accounts: For the year ended 31 March 2017Strategic report
23
International innovation policy
In the next three years, the Global Innovation Policy Accelerator will develop the skills of innovation policymakers in ten more countries across Asia, Africa and South America.
Frugal innovation - we will find new opportunities to apply frugal innovation approaches to promote more inclusive outcomes in the UK.
The Social Innovation Community project will be working with policymakers to embed social innovation principles in policy design across Europe.
Action research projects with UNDP Moldova and others will help show how collective intelligence tools can be used in practice to improve governance, particularly in lower-resource settings.
Futures and explorations
Horizon-scanning across Nesta’s priority themes - in alignment with Nesta’s new three-year strategy, futures research will be integrated within a new Explorations function which will support teams across the organisation to identify emerging trends and technologies on core themes.
Healthcare and artificial intelligence - in collaboration with the Health Lab we will look ahead to the impact of these technologies on health systems and the medical profession.
and Strathclyde Business School. The aim is to improve official labour market statistics and therefore better understand labour market needs.
IGL’s ambition is to change how innovation policy is made, so that testing policy changes at small scale becomes part of the norm rather than the rare exception. Specifically, by 2021 we want to see more countries engaged in policy experimentation in this field, more trials being conducted, and more funding made available to test innovation support schemes across Europe and beyond.
Given the demand for The Alliance for Useful Evidence’s training arm and advisory services in 2016-2017, we expect to see an impressive number of organisations replicating our model (for example ANSA in France, are currently in the process of developing an Alliance for Useful Evidence equivalent in France), recycling our work in order to be useful in a range of different contexts (e.g. South African reproduction of Using Research Evidence - A Practice Guide, and Using Evidence - What Works with lower and middle income country case studies).
International innovation policy
The Global Innovation Policy Accelerator is a new Nesta-led executive development programme for innovation policymakers. In 2016-2017 it worked with 20 very senior policymakers and more than 100 other stakeholders across five countries to build their individual and system capabilities.
Our study of frugal innovation and its relevance for Europe, with Fraunhofer ISI, has prompted new interest in this topic within the European Commission.
Open innovation in health - Nesta research helped the State Government of São Paulo to set up a new accelerator scheme to support open innovation in health, which will now be repeated annually.
Collective intelligence - our work has prototyped a new approach to participatory poverty measurement with the UN Development Group.
Futures and explorations
Machine learning and artificial intelligence - we explored the impact of these technologies, influencing the House of Commons Science and Technology Committee’s Robotics and Artificial Intelligence report. Nesta research on these topics was featured in the media and has now been presented at several international conferences. This year, the Hot Topics events programme also examined the future of human-computer interactions attracting around 120 delegates.
Responsible research and innovation - a series of events and workshops attracting around 400 people were held with UCL looking at citizen participation, responsible social experimentation, investment and the role of universities.
We also published the first guide on how to conduct trials in innovation policy. As a result, interest in experimental policy from innovation agencies, governments and the European Commission has grown.
The Alliance for Useful Evidence co-curated and hosted the two-day international conference: Evidence Works 2016: A Global Forum for Government in September 2016, offering a space for high quality exchange around the challenges, solutions, and lessons learnt in promoting evidence-informed policymaking.
Current impact Future impact

Annual report and accounts: For the year ended 31 March 2017 Strategic report
24
Government and public innovation
Over the next years we will promote innovation in government through:
Researching, highlighting and advocating for best practice in how the smarter use of people, data and technology can reform public services, improve citizen engagement and deliver social impact at scale.
Testing our research ideas in real-world settings, for instance with pilots of tools for digital democracy and collective intelligence.
Using foresight and horizon scanning methods to spot emerging innovations in the way governments use people, technology and data to inform policy.
Startups and new tech
Over the coming years, we will continue to understand the conditions which help firms start and scale. This will involve:
Undertaking new mapping projects, in the UK and Europe, which help policymakers understand the local environment for entrepreneurs.
Working with BEIS and other partners to improve evidence about the effectiveness of different ways of supporting young businesses.
Extending our research on corporate-startup collaboration, understanding the benefits and inhibitors as well as establishing and promoting good practice.
Through Readie and other programmes, we will continue efforts to understand the ways in which new digital businesses are changing the digital economy, helping policymakers evolve public policy in ways which support these new digital businesses.
Creative and digital economy
Future skills needs - In 2017-2018 we are launching the results of an ambitious project with Pearson, to predict the future skills needs of UK and US employers in 2030. We developed a new methodology for the project, combining qualitative expert judgement with cutting-edge machine learning.
Data-driven foresight - we will develop data analysis tools which complement our futures research, in order to help Nesta identify the emergence of new technologies, trends and networks in real time.
Government and public innovation
Informing policy and practice - Nesta published the Wise Council and Digital Democracy reports - profiling digital and data-led innovations in public sector reform and citizen engagement. We articulated clear lessons for policymakers and practitioners about how to use these to best effect.
Mapping digital social innovation across Europe - through our digitalsocial.eu platform, almost 2,000 civil society organisations that use digital technologies to tackle social challenges were connected, mapped and championed to support digital social innovation across Europe.
Launched a £250,000 matchfund crowdfunding platform for Arts and Heritage projects - with the UK Department for Digital, Culture, Media and Sport.
DECODE - we launched an ambitious, experimental three-year European Commission project to research and trial how technology can give people control of their personal data and the ability to share it for the common good.
Startups and new tech
The European Digital Forum, a think tank run by Nesta and the Lisbon Council to promote better conditions for digital entrepreneurship across Europe, continued to influence European policymakers and received recognition from Commissioners Ansip, Oetinger and Moedas. Outputs included the European Digital City Index and Scale-Up Europe, a manifesto written and crowdsourced by leading startup associations and entrepreneurs across Europe.
The Startup Europe Partnership, a collaboration with three other European partners, continued its work to promote corporate-startup collaboration, with several successful matching events. We also ran a set of awards called the Corporate Startup Stars, a list of top ‘startup-friendly’ corporates in Europe, in order to promote good practice.
Readie, the research alliance for the digital economy, produced a report on European attitudes towards digitisation and held an event in Berlin which included a number of ministerial-level speakers on the digital economy.
Accelerators - Our workstream on Accelerators continued, with the Department for Business, Energy and Industrial Strategy (BEIS) commissioning Nesta to map the rapidly changing landscape of accelerators and incubators in the UK.
Creative and digital economy
Nesta’s creative economy research is widely held to have played a major role in the selection of the creative industries to be one of five sectors invited by government to submit a sector deal in the Industrial Strategy Green Paper. Our research on creative employment, creative clusters and creative R&D has been extensively cited in policy reports by bodies like the Creative Industries Federation, Creative Industries Council and the Greater London Authority.
Collective intelligence stories - bringing academics together with science fiction writers to explore the impact of collective intelligence on society. The collection received coverage in the Long and Short magazine and popular science publications such as WIRED magazine.
Current impact Future impact

Annual report and accounts: For the year ended 31 March 2017Strategic report
25
Education
By 2021 we will have:
• Influenced policy and practice on the skills needed for the future workplace, such as problem-solving, collaboration and creative skills. From industry to educators, we’ll work with partners to promote better skills development across the talent pipeline.
Skills profiling tool - launching in 2017-2018, it provides detailed information to employees about the current skills needs of employers. We would like to develop this tool into a career and lifelong learning skills resource, and evaluate its impact on career decisions.
Creative Nation - In 2017-2018 we will publish Creative Nation in partnership with the Creative Industries Council - the most detailed mapping yet of the networks underpinning the UK’s creative clusters. This report and open data set will inform the investment priorities of Local Enterprise Partnerships, universities and other bodies charged with promoting local economic development.
Data visualisations - we will use interactive data visualisations to highlight challenges facing the creative economy, arts and culture, including gender diversity in the British film industry, access to visual art in public collections and STEAM (Science, Technology, Engineering, Arts and Maths) subject combinations in English schools.
Valuing cultural institutions - we will be producing a transferable bank of economic value estimates of cultural institutions for the DCMS and the AHRC.
Education
Solved! Making the Case for Collaborative Problem-Solving - Over 2,500 people read our report, which argues that problem-solving with others is becoming increasingly important to help kids succeed in the classroom and to access future work.
Rocket Fund was launched: a pilot platform for teachers to crowdfund and test products that they think will aid learning in the classroom, raising £8,000 for good causes in the first pilot, reaching over 2,000 pupils.
Data visualisations - Our interactive data visualisations on the creative economy, such as creative skills and on museums in England, have been some of the most popular and widely shared content on Nesta’s website.
Valuing cultural institutions - Following the impact of our 2015 cultural value research in the Department for Digital, Culture, Media and Sport’s (DCMS) spending round discussions with HM Treasury, the DCMS commissioned Nesta and the consultancy Simetrica to undertake a major study to scope whether estimates of the economic value of culture can be transferred between different arts and culture sites.
Current impact Future impact
The Innovation Lab has had a strong year, working across a range of thematic areas, from very small-scale experiments and seed funding new ventures, through to national scaling of proven initiatives and running large, global challenge prizes. Through this work, we’ve intensively supported 71 organisations throughout the last year.
The Lab uses a range of financial instruments and incentives to stimulate novel ideas and grow the impact of initiatives that are proven to work; everything from match-crowdfunding and impact investing to awarding prizes, loans and grant funding. The Innovate to Save Fund is probably the most interesting example of our work to blend R&D support, grant and loan-making to drive innovation in public services in Wales.
We place a strong emphasis on opening up opportunities for more people to innovate, who may not ordinarily gain support from a philanthropic foundation, in the belief that in doing so, we build agency for social change and get a broader, better range of ideas to support.
The Lab has a long history of achieving impact through supporting innovations that engage citizens - in social action and public services, increasingly underpinned by digital technologies. The ShareLab Fund is an example of where we are supporting new ventures that combine both people power and digital platforms to tackle specific issues, such as integrating volunteer first-aid responders with the emergency services, bringing the benefits of ride-sharing apps to rural communities or giving disadvantaged pupils access to private tuition.
Department: Innovation Lab
Current impact Future impact

Annual report and accounts: For the year ended 31 March 2017 Strategic report
26
• Brought quality tutoring to those who need it most, helping 170,000 disadvantaged students do better in their GCSEs, or equivalent.
• Made it easier for teachers to access and experiment with affordable and evidence-driven education technology, helping 500,000 school children.
Government innovation
Offices of Data Analytics - our pilots in London and the North East have involved 18 local authorities and the GLA in using data to tackle rogue landlords and alcohol related harms.
Social action reports - more than 1,000 people downloaded our social action reports, sharing the lessons from three years of the Centre for Social Action Innovation Fund, which mobilised 170,000 volunteers. We published 30 evaluations of social action, including validating two randomised controlled trials (level 3) that show the impact of volunteer-led tutoring on students’ GCSE and A-Level scores.
ShareLab Fund launched in 2016-2017 offering grants to incubate eight new collaborative platforms that can support public services and address social need in areas such as homelessness, social care and community transport.
Click Connect Learn Fund - we gave grants of £370,000 to three organisations that are prototyping online volunteer-led tutoring in partnership with the Office for Civil Society.
Current impact Future impact
Government innovation
By 2021 we will have:
• Made social action easy to commission at a local level. We’ll have grown the supply of social action innovations that the public sector can use (integrating at least five into everyday public services nationwide), as well growing commissioner engagement in social action, through convening and publishing evidence and ‘what works’ guides. We’ll also have voiced the stories and impact of these radical models of caring and sharing on real lives in the community.
• Supported the development of at least eight tangible examples of how smarter use of people, technology and data can reform public services, improve citizen engagement and deliver social impact at scale. Through Nesta-led practical work (e.g. Offices for Data Analytics and Collective Intelligence pilots) regions will have the ability and confidence to use data to address local needs. Through financial support and mentoring (e.g. the ShareLab Fund), we’ll have supported the growth and market readiness of external projects that offer alternative service delivery models. And through our research, we’ll have inspired and facilitated new practices and collaborations.
• Made the case for the use of dedicated innovation funds, programmes and new financial instruments by governments. We’ll have proven the case for the Innovate to Save scheme and replicated the model with other governments.
• Established the pre-eminent global learning community for public sector innovation, with thousands of public innovation leaders delivering greater impact through their participation in an active curriculum across every continent.

Annual report and accounts: For the year ended 31 March 2017Strategic report
27
The creative economy, arts and culture
By 2021 we will have:
• Proven to policymakers that the creative economy is a crucial point of competitive advantage and placed the creative economy at the heart of industrial policy.
• Helped hundreds of arts and cultural organisations to innovate and grow by developing and testing new funding tools such as impact investment and matched crowdfunding.
• Helped hundreds of arts and cultural organisations to use emerging digital technologies to create new artforms, reach new audiences and engage existing audiences in new ways.
The creative economy, arts and culture
The Arts Impact Fund approved 11 unsecured loans totalling £3.95 million to arts and cultural organisations across England - generating social outcomes across our three target areas, though health and wellbeing was under-represented.
A matched crowdfunding campaign was launched on Crowdfunder (in partnership with Arts Council England, Heritage Lottery Fund and DCMS) to explore the potential to use grant funding to attract additional capital by matching contributions from the public. By 31 March there were 19 funded projects from the arts raising a total of £148,278 (including £43,500 from ACE), and four funded projects in heritage, which had raised a total of £59,291 (including £14,000 from HLF).
Digital R&D Accelerator - Nine of the most promising ideas backed by the Digital R&D Fund for the Arts came through the Digital R&D Accelerator (another partnership between Nesta and Arts Council England, delivered by The Accelerator Network). The cohort explored and tested commercial business models and pushed the boundaries of organisational practice. One has since secured equity investment in their venture and several are in discussions with other investors, including Arts Impact Fund.
Current impact Future impact
Challenge Prize Centre
Going forwards, we are focusing particularly on using Challenge Prizes to:
• Demonstrate the effectiveness of regulators addressing market failure and boosting innovation via prizes and outcome-based funding models. Firstly by the Open Up Challenge, then working with regulators in other ‘utility’ areas and in emerging technologies such as commercial drone development.
• Development of prizes for community and international development that result in impacts for poor and deprived groups including by developing prizes in aquaculture that can significantly improve the livelihoods of poor fish farmers and the nutrition of those living on less than $5 per day.
• Development of prizes which harness advanced technology for good, including a prize to radically impact on those living with paralysis.
By 2021 we hope to have found and enabled a winner for the Longitude Prize - that will have a significant impact on stemming the rise of drug resistant infection, potentially saving millions of lives.
Challenge Prize Centre
Open Up Challenge Prize launched in 2016-2017. This is a global-first in being a prize (of £5 million) that is backed by experimental regulation to encourage fin-tech companies to use new Open Banking APIs to deliver game-changing benefits for UK small businesses.
Prizes for Community and International Development - including a Data-Driven Farming Prize funded by USAID for translating data into actionable information for smallholder farms to improve agricultural productivity.
The Longitude Prize - The Challenge Prize Centre has continued to manage a wide variety of impactful prizes including the flagship Longitude Prize which this year included the awarding of discovery award funds for promising diagnostic tests that better target the use of antibiotics.

Annual report and accounts: For the year ended 31 March 2017 Strategic report
28
By 2021 we will have:
• Nurtured and grown effective sources of support to improve people’s health and wellbeing, such as peer support, and contributed to these approaches reaching millions of people through mainstream adoption.
• Created new pools of data collected by people, with many millions of datapoints, that improve day-to-day management of health, inform clinical decision-making and drive new research.
• Used the 100-day innovation method to transform at least 40 local health and care systems at pace.
Realising the Value - Nesta led a programme to bring together evidence and practice on how people can take an active role in their health and care. We worked with five local sites and produced ten reports and tools. Over 18 months, we engaged around 600 people directly through events, and more than 1,000 people through our newsletter. To date there have been more than 15,000 unique downloads of our resources.
Accelerating Ideas - we gave £5.44 million in grants to eight organisations to grow the reach and impact of their work with older people over five years with our partners The Big Lottery Fund.
Health as a Social Movement - we published groundbreaking research on the power of people in movements to improve health, read by more than 1,300 people. In addition, the social movements prediction series blog had 4,200 views.
Helping in Hospitals - a programme that supported ten hospital trusts to create new roles for volunteers with demonstrable impact on patient mood, hydration and nutrition. For example, the work with Kingston Hospital recently received a Health Services Journal Award for Value.
Digital health - in digital health we experimented with new ways to use apps to support health. We tested new ways for people with dementia to use digital apps to engage with music, reminisce and enhance relationships with the people around them. We supported 100 for Parkinson’s who built a research app that generated 2.2 million datapoints for Parkinson’s research. We also supported GoodSAM, an app that gets first responders to an accident quickly. GoodSAM has now been used over 10,000 times in London alone, and is being adopted nationally and internationally.
People Powered Results - Nesta has continued to develop the 100-day innovation method, co-created with the Rapid Results Institute, that transforms local systems by supporting frontline staff and leaders to achieve meaningful change. In 2016-2017, we worked with ten health and care systems from Stockton-on-Tees to Somerset, supporting frontline teams to increase the use of personalised care approaches and innovate new solutions to delivering elective care.
Changing local areas - our work in Greater Manchester, testing and growing a range of ways for people and communities to be supported to live well, has developed best practice and directly influenced the recent Greater Manchester Population Health Plan.
We want to see a people-powered and data-driven health system that makes the most of resources around the system: from patients’ motivation to data, as well as the knowledge and commitment of health professionals.
Over the past few years we have backed over 100 local health systems and individual organisations with more than £20 million of funding.
We track the impact of individual grants and activities, including beneficiaries reached and outcome goals achieved. We also track the impact of overall programmes, including audience reach, learning developed and wider impact goals attained, such as the Realising the Value programme’s influence on the Greater Manchester Population Health Plan. We also track the wider influence and take-up of our work, for example, Nesta’s influence on the focus on people power in NHS England’s Five Year Forward View.
Department: Health Lab
Current impact Future impact

Annual report and accounts: For the year ended 31 March 2017Strategic report
29
In the next year we intend to:
• Build on non-binding, in-principle commitments from Nesta and Big Society Capital (which are subject to satisfaction of certain terms and conditions) to fundraise from a diverse set of investors for our second impact investment fund.
• Make our last two or three final investments from Fund 1, and we will continue supporting our portfolio with follow-on investment, support on impact measurement, strategy governance and business development.
• Contribute to the Impact Management Project, a global collaboration to identify norms in the measurement and use of impact data.
• Publish our refreshed impact approach and our first annual report.
• Continue to break new ground for impact funds by undertaking an ‘impact audit’.
• Continue to manage Nesta’s technology venture investment portfolio with increasing focus upon profitable exits, enabling reinvestment into charitable activities.
We made follow-on investments into Oomph!, CogBooks and Third Space Learning and a new investment in Synopsis Healthcare, a business that helps reduce clinical risk and unnecessary cancellations in hospitals by improving the quality and consistency of pre-surgical assessments.
Theory of change - Building on our experience of the last four years, we revised our theory of change and made some significant changes to our impact assessment and measurement frameworks, enabling more objective and quantitative analysis of impacts, risks and returns.
Investee reach and impact via their products and services:
• Arbor data management systems are now used in 200 schools.
• Over 2,000 students completed undergraduate courses on the CogBooks adaptive learning platform.
• Ffrees launched it’s transformational U digital ‘unbanking’ platform with over 15,000 users in the first four months.
• FutureGov provided digital transformation consulting for over 85 local authorities and government agencies in the UK, Australia and the Middle East.
• GetMyFirstJob has supported over 300,000 young people as they seek apprenticeship placements.
• Third Space Learning provides one-to-one maths support for around 6,000 primary school students each term.
• Activity management provider Oomph! runs 6,000 exercise and activity classes for older people and vunerable adults each month and has launched its new Out and About service to help older people participate in community life.
• The Reconnections loneliness programme has supported nearly 700 isolated older people in the community.
We have seen strong performance from our portfolio of Programme Related Investments, including Abundance, Resonance, Bethnal Green Ventures and Behavioural Insights Team, all of which saw positive growth in revenues.
Continued management of our early-stage venture portfolio of investments, including £750,000 in cash proceeds during the year, and further investment commitments of £54,000.
Nesta’s Investments team achieves impact by:
• Investing in small, fast-growing businesses with the potential to improve lives at significant scale.
• Providing support to our portfolio with impact measurement, fundraising, business planning and networking.
• Sharing our approach, successes and failures to inform the wider market.
Department: Investments
Current impact Future impact

Annual report and accounts: For the year ended 31 March 2017 Strategic report
30
The communications priorities for 2017-2018 are to bring more consistency to Nesta’s narrative and promote the five newly defined priority areas of work. We will work with the relevant teams to develop campaigns and big events to support each area of work, and use backbone campaigns such as the annual Predictions series and FutureFest to promote Nesta at a masterbrand level.
The current website will reach the end of its technical life in mid 2017. We will design and build a new digital experience for Nesta’s audiences on an updated technical infrastructure, and use the new brand as an opportunity to express a more focused approach.
A new brand and marketing function will help strengthen our communications approach. The new unit will conduct an analysis of our audiences, developing tools and actionable insights that will help the wider organisation target existing and new audiences more successfully.
All teams will work more closely with Salesforce, helping to join up data from events, media and digital channels to create a more forensic view of our audiences and deliver better, more tailored, experiences for Nesta stakeholders.
FutureFest The team designed, produced and delivered Nesta’s third FutureFest. The aim was to excite and inspire a cross-section of our audiences with ideas about what the future could hold, linking the experience more closely to Nesta’s work. We set ourselves ambitious ticket and production targets with a venue capacity twice as large as the previous festival. Through careful planning and more targeted marketing campaigns we successfully filled the venue with over 4,000 people and delivered a vibrant festival with over 170 speakers, 15 debates and 12 curated experiences.
New Radicals The team worked with The Observer as media partner, on a third campaign to discover the 50 people and organisations who are changing Britain for the better. The campaign attracted over 600 submissions, which were then shortlisted by a panel of judges. The winning submissions featured in a six-page spread in The Observer on 10 July, and generated 100,000 page impressions to the Nesta site. Over 150 people came to the celebration event at Nesta, including 24 from previous cohorts.
Predictions Nesta’s annual thought leadership series was launched on 14 December. The series explores the trends and technological breakthroughs that will shape the world in the next 12 months. The campaign started with a radio tour, with 26 back-to-back interviews in a single morning. The most topical prediction - A Brexit Fairytale - was placed in CITY A.M. The campaign reached 25 per cent more people than the 2016 campaign, with over 30,000 reads in the first 20 days and more than 2,000 shares on Twitter. A total of 48 pieces of national and local radio coverage and online and print coverage were secured.
New brand The Communications team led on a new brand for the organisation, which was implemented in January 2017 to coincide with the move to Nesta’s new building. The new brand was carefully designed to communicate a clearer purpose for Nesta, and to help bring consistency to the way we talk about our work internally and externally.
The Communications team measures its impact in a number of significant ways, and uses key performance indicators to ensure annual targets are being met. Media coverage is tracked in national and international press, broadcast TV and radio, trade and specialist press. Website traffic and social media engagement levels are monitored on a weekly basis. Event registration and attendance records are evaluated on an event-by-event basis. The team also evaluates the impact of large campaigns, integrating all the different channels to provide an overarching view of communications impact.
Department: Communications
Current impact Future impact

Annual report and accounts: For the year ended 31 March 2017Strategic report
31
Over the next few years, our goals are:
• To grow a world-leading centre for government innovation education. We plan to maximise our reach by partnering with other innovation learning experts from across the globe and developing an affiliated network of learning providers. In this way we can increase our impact and broaden the scope of our offer. Our ambition is that the initiative will play an instrumental role in helping governments improve the way they operate, ultimately creating better outcomes for citizens.
• To continue to codify Nesta’s expertise on innovation approaches and methods in order to share our practical experience with a wider audience. We have already created five practice guides on topics ranging from using evidence to running a challenge prize, and we currently have two more in development - one on using data in government, and another on foresight and futures thinking.
• We will begin to run the revised Creative Enterprise Programme (in partnership with the British Council) in new locations across the world, including Egypt, Russia and West Africa, as well as continuing our work with the pilot countries. In order to increase the opportunities for impact, we will also be working with some countries to help them establish their own locally-run programmes, led by local creative entrepreneur experts and overseen by Nesta. The aim is that these locally-embedded programmes will be able to respond better to local demand and run with higher frequency.
A new public innovation curriculum - we launched a new initiative to develop the next generation of public innovation learning. The aim is to help strengthen innovation capacity across governments and improve their ability to solve complex problems. It does this by orchestrating the world’s best people, organisations and knowledge to create more effective learning on the approaches, culture and behaviours that enable innovation in government. In December we prototyped our first module on Experimentation with the UAE government, and we are entering partnerships with more than a dozen national governments to continue to develop the curriculum.
Creative Enterprise Programme - in partnership with the British Council, we redeveloped our Creative Enterprise Programme - a three-day practical workshop that supports creative entrepreneurs in setting up and growing their businesses. Having completed three pilots of the redesigned content in Macedonia, Colombia and Chile, we are now embarking on a global roll out, working closely with a select number of countries.
DIY Toolkit, which features 30 tried-and-tested social innovation tools, reached over one million website views, as well as 130,000 tool downloads over the past year. In parallel, our online innovation learning programme DIY Learn, which features bitesize modules on the Toolkit’s most popular tools, continued to attract new learners from across the globe.
Design for Europe - as part of the EC-supported Design for Europe programme, we worked with international design agency IDEO to create a new guide to design, targeted at the public sector. The practical guide brings together a collection of tools and methods for using design to improve public services.
Alongside this work, we continued to run a range of workshops to help people learn practical innovation skills. These included workshops with Nesta Lab programme participants, UNDP and USAID amongst others. In total, we ran almost 40 workshops in 17 countries, attracting over 1,100 attendees.
Our impact approach focuses on taking people on a learning journey that supports them to develop their innovation knowledge and skills. We do this through three different stages:Raising awareness: understanding the benefits of innovation.Making it happen: learning how to adopt new methods and approaches.Spreading skills: building innovation skills more widely across teams, organisations, sectors or regions.
Ultimately, we want to see innovation methods and approaches become part of everyday practice.
Department: Innovation Skills
Current impact Future impact

Annual report and accounts: For the year ended 31 March 2017 Strategic report
32
3. Plans for the future
Nesta’s new strategy for 2017-2021 sets out plans for being more systematic about where and how we back new ideas to tackle the big challenges of our time. This means working hard to see new opportunities and challenges; spark creative solutions from many sources; shape the most promising ideas so that they can work in practice and at scale; and then, in partnership with others, shift whole systems in a new direction.
Research and exploration A new Futures and Explorations team will explore new areas to find where we can achieve the greatest impact, using research, convening power and funding to map possible futures.
Innovation methods We’ll become more systematic in tracking, shaping and spreading the best methods for innovation. We’ve done this in the past around methods like accelerators and challenge prizes, and are now extending this work, for example to new uses of data and new ways of using money.
Priority fields of work We’ll prioritise the use of these innovation methods in a small number of fields where there are big challenges and our capacities are suited to the action that’s needed:
1. Health. How do we support a population living with more long-term health conditions when the health and care system is under serious financial pressure? We look for better ways for people to remain healthy, drawing on their own energy and ideas, as well as the insights of medical science and new digital tools.
2. Education. How do we educate young people for a future where work will be very different from today? We look for ways to prepare young people for good jobs in the future, testing and growing approaches to teaching skills that will complement new technologies and be relevant in a more automated world. We also focus on improving access and effectiveness in digital learning technologies.
3. The creative economy, arts and culture. How can we grow the creative economy and help arts and culture organisations thrive in a time of austerity? We show the value of the creative economy, influence policies to help it grow, and help arts and cultural organisations thrive by making the most of digital technologies and new funding sources.
4. Government innovation. How can governments respond to rising expectations,
shrinking budgets and fragile trust in political systems? We’ve worked with over 30 national governments, and dozens of local and city authorities, to help them get better at innovating. We support them to make smarter use of data, technology and people power to reform public services, address social need and engage citizens in the decisions that affect their lives.
5. Innovation policy. How can we create the conditions for innovation to fuel economic growth so that everyone benefits? We help design better ways for governments (at a national, regional and city level) to support innovation in the economy and society. We develop analytical tools and promote more effective innovation methods.
Growing units. We’ll continue to extend our impact by becoming a networked organisation, growing more autonomous units that can generate their own revenues and relationships. These include our various impact investment funds; the Challenge Prize Centre; the Alliance for Useful Evidence; Innovation Growth Lab; Innovation Skills and Readie.
Communications. Our brand signals Nesta’s spirit as a networked organisation and as an igniter and incubator of social change. We’ll use it to help tell Nesta’s story, focusing on media and digital to reach a wide audience and using our new building as a hub that can be used by many organisations sharing our mission.
Impact. We’ll continue to become more rigorous in assessing both the direct and indirect impact of what we do and support, learning from failures as well as successes.
Where will Nesta operate? Our primary focus is in the UK – working in England, Scotland, Wales and Northern Ireland. But we also have a European and an international outlook, working in dozens of countries, so we can both learn from others and achieve a greater impact through partnerships. We intend to grow this global presence, while also using our new building in London as a hub for sparking ideas and convening people.
What counts as success? We judge ourselves against many measures: from the direct impact of the programmes we fund to our influence on public policy; from the growth of firms and social ventures we invest in, to how much value people have gained from our events and publications.

Annual report and accounts: For the year ended 31 March 2017Strategic report
33
4. Financial review
The Group comprises of Nesta (the main operating charity through which all charitable activity is undertaken), the Nesta Trust (a charitable trust which holds all the investment assets invested to fund the charitable activities of Nesta in advancing the objects of the Trust), five companies and three limited liability partnerships.
A number of subsidiaries have been set up to manage investing and fund management activities undertaken by Nesta’s investment and programme teams and expanded to manage Nesta’s social impact investment activity. It enables Nesta to manage and invest funds on behalf of its investment partners in compliance with the Financial Conduct Authority’s (FCA) requirements. This structure is made up of Nesta GP Limited, Nesta GP2 Limited, Nesta PRI Limited, Nesta Partners Limited, Nesta Investment Management LLP, NII2 Special Partner LLP, and Nesta Arts Impact LLP. The Group also includes Nesta Enterprises Limited, incorporated as a trading subsidiary for non- primary purpose trading. The results of the Group consolidate all subsidiary undertakings as well as the Trust and the joint venture in Behavioural Insights Limited.
Nesta Trust purchased a long leasehold interest in a property located in London on 12 September 2016 for £50.8 million. The lease will run until 2162. The property will be held for both investment purposes and also to provide accommodation for the Group’s charitable activities. The total capital cost incurred by the Trust in regard to both acquisition of the leasehold interest and fitting out was £54.4 million.
Nesta Trust provides funding to Nesta to carry out the Trust’s charitable objectives and this year provided £19.4 million (2016: £16.1 million) of which £17.8 million (2016: £16.2 million) was applied to charitable operating activities and £1.6 million (2016: £2.5 million) was applied against Nesta’s commitment to the Impact Investment Fund and other programme-related investments held on Nesta’s Balance Sheet. The assets of the Trust are held as an expendable endowment,
and the Trust is therefore able to fund charitable activity beyond the income it received of £1.3 million (2016: £1.9 million) during the year.
Nesta’s Trustees have recently agreed an ‘in principle’ funding rule covering the three years to 31 March 2020, allowing Nesta to draw down £42-45 million for operating expenditure (adjusted in part for inflation) in support of its strategic plan. This is intended to move annual expenditure broadly into line with the assumed long-term real rate of return on the endowment of 3.25 per cent. During the last three years £48.6 million was drawn down which was the maximum funding available for that period.
Funding made available by Nesta Trust does not constitute a commitment until a drawdown is made. A further £12 million may be drawn for Nesta programme related investments for the three years to 31 March 2020, of which £5.5 million (2016: £4.6 million) has already been committed to the Nesta Impact Investment Fund.
In addition to funding from the Nesta Trust, the Nesta Board of Trustees set income targets for Nesta’s Executive team. Income of £20.7 million (2016: £10.6 million) was recognised in addition to £1.3 million (2016: £1.9 million) of investment income from Nesta Trust. This income is predominantly in the form of partnership funding where Nesta’s expertise in programme design and project management is combined with the funding capacity of other typically larger organisations. Nesta is the lead partner in a number of European funded grant programmes or service contracts which generated income of £1.4 million (2016: £0.6 million).
Total Group expenditure for the year was £33.4 million (2016: £25.7 million). Expenditure on charitable activities was £29.7 million (2016: £23.8 million) and £1.6 million (2016: £1.3 million) was spent on managing the endowment assets held by the Trust and impact investment funds held by Nesta. In addition £2 million (2016 £0.6 million) was spent on Nesta Enterprises trading activities. Grant commitment expenditure for the year was £11.1 million (2016: £2.1 million). Grant recipients of over £50,000 are detailed in Note 7b.

Annual report and accounts: For the year ended 31 March 2017 Strategic report
34
Programme expenditure was £21.6 million for the year (2016: £13.8 million), of which a proportion was funded by external income.
FutureFest expenditure was £0.8 million (2016: £0.6 million) and this event showcases some of the work of Nesta with the aim of engaging a larger and more diverse audience.
Support costs of £8.3 million (£9.7 million) relate to Communications and Corporate Service activities and are allocated to programme areas as shown in Note 7a.
At 31 March 2017, the Group had an unrestricted surplus of £5.3 million (2016: deficit of £0.3 million) as shown in the Statement of Financial Activities and unrestricted reserves of £8.3 million (2016: £2.9 million). At 31 March 2017 the reserves of the expendable endowment stood at £418.5 million (2015: £375.1 million).
An external review of the level of sustainable funding available from the endowment was commissioned during the year and which was taken into account when setting the strategic plan including a glide path reduction in drawdown during the next three years. The Trustees accordingly consider the level of expendable endowment reserves sufficient to sustain the future underlying value of the assets and funding plans for the Group.
As Nesta is able to draw down cash from Nesta Trust as required within the approved three year funding envelope, the Trustees have concluded that there is a reasonable expectation that the Group has adequate resources to continue activities for the foreseeable future and have therefore adopted the going concern basis in preparing the financial statements.
Investment income (0.5)
2016–2017 income (£ million) 2016–2017 expenditure (£ million)
Other trading activities (3.3)
Other income (3.7)
Charitable activities - Programmes (18)
Charitable activities - Policy and Research (2.1)Charitable activities - Skills (1.1)
Charitable activities - FutureFest (0.8)Charitable activities - Skills (0.4)
Raising funds (3.6)
Charitable activities - Programmes (21.6)
Charitable activities - Policy and Research (5.8)
Charitable activities - Investment management (early stage and social impact) (0.5)
18 3.7
3.3
0.4 0.5
2.1
21.6
0.5
5.8
3.6
0.8
1.1

Annual report and accounts: For the year ended 31 March 2017Strategic report
35
Investment review
The assets of the Trust provide income and capital to be applied by Nesta as sole Trustee to further the objects of the Nesta Trust. The investment strategy balances the desire to maintain the real value of the endowment and its ability to generate the income which Nesta will require, while at the same time maximising total return to fund activities to advance the charitable objectives of the Nesta Trust. The strategy aims to balance risk, return and capital preservation.
At 31 March 2017 the value of Trust investments and cash increased by £74 million to £417 million (2016: £343 million), after annual transfers to Nesta to carry out the objectives of the Trust in line with the Trust Deed. The increase included the sale of global equities of £58 million and purchase of a new head office building at £54 million. The value of the Trust investments has been assisted by realised and unrealised gains of £62 million.The asset values and relative allocation at 31 March 2017 compared with the previous year are as follows:
Strategic review. During the year, the Trustees of Nesta undertook a sustainable funding review of the investment portfolio including the asset allocation policy. Other asset investments were sold prior to purchasing a long leasehold property in London which now represents the only property class asset held. The gilt position. The Trust’s holding in gilts was reduced to £nil during the year (2016: £11.7 million).
Global equities performance. Global equities represent 54 per cent of endowment assets. At the start of the year the holding stood at £165 million, however due to market conditions this increased to £226 million as at 31 March 2017. Trustees continue to monitor investments in all asset classes in line with the tactical allocation policy agreed in January 2016.
During the year £58 million (2016: £28 million) of assets under active management were realised with proceeds invested and reallocated in line with the Trustees’ decision to reduce the fee burden by reducing investments in actively managed funds.
*Mixed motive investments – see Note 6 of the accounts for further breakdown
**Investment property value shown in the table above is the value held by the Trust before consolidation adjustments.
Market value of Proportion of Market value of Proportion of investment total endowment investment total endowment assets assets assets assets 31 March 2017 31 March 2017 31 March 2016 31 March 2016 Asset class £’000 % £’000 %
Current assets:
Cash 12,132 3 46,415 14
Fixed asset investments:
Gilts - - 11,686 3
Property trust funds - - 2,528 1
Private equity funds 14,485 3 15,800 5
Global equities 226,073 54 164,990 48
High yield bonds (fixed income) 85,563 21 75,183 22
Early-stage venture portfolio* 24,972 6 25,856 7
Deferred investment and loans in early–stage companies* 2 - 664 -
Investment property** 54,103 13 -
Total 417,330 100 343,122 100

Annual report and accounts: For the year ended 31 March 2017 Strategic report
36
Managing holdings of alternative asset classes. Drawdowns against the Trust’s commitment to two private equity secondary funds continued during the year, with additions of £0.9 million (2016: £2.7 million) and capital returns received of £5.4 million (2016: £1.4 million). It is expected that these two funds will continue to be drawn down over the next two years. £6 million financial commitment outstanding for this asset class is disclosed in Note 10 to these Financial Statements.
Maximising value from our self-managed venture portfolio. The early-stage venture portfolio includes equity and loan investments in nineteen (2016: nineteen) early-stage companies, and commitments to five (2016: five) early-stage investment funds. The Trust’s investment strategy is to maximise the returns from the current portfolio but not to invest in any new early-stage companies or funds in the near future. Follow-on funding invested in 2016-17 in accordance with this strategy totalled £0.7 million (2016: £1.0 million). A net realised gain of £0.6 million (2016: £1.7 million) was recognised in the year, due in part to earn-outs from realised investments in early-stage companies and in part due to disposals of holdings in various companies held by two early-stage fund of funds. A net unrealised loss of £1.5 million (2016: gain of £2.0 million) was also recognised, applying the valuation methodology which remains unchanged from previous years and is detailed in Note 1e to the Accounts.
Direct costs, reported by external fund managers, of the Trust’s investment assets totalled £1.4 million (2016: £1.2 million) across the Trust and include external fund manager fees and custodian fees. Where fund manager fees are offset against the relevant fund’s value, in accordance with normal practice, these fees are grossed up and shown as fund manager fee expenditure, in the Statement of Financial Activities, along with those fund manager fees that are invoiced and paid for in cash.
Investment policy
The Nesta Trust was established by a Trust Deed dated 22 September 2011. As the sole Trustee of the Nesta Trust (‘the Trust’), Nesta is responsible for the Trust’s investment policy. The investment strategy is delegated to the Trust Investment Committee of the Board which is responsible for strategic and tactical asset allocation, rebalancing, styles and weighting within asset classes, as well as monitoring manager, consultancy and custodial arrangements.
Nesta holds the investment assets of the Trust without distinction between capital and income, applying them in furtherance of the Trust’s objects. These investment assets are held as an expendable endowment.
Trust assets are invested in accordance with the wide investment powers set out in the Trust Deed, which places two specific conditions on Nesta’s power to invest:
a. UK Government Gilts may only be sold to fund the activities of Nesta in advancing the charitable objects of the Trust, to purchase other UK Government Gilts, or with the consent of the Secretary of State for the Department for Business, Energy and Industrial Strategy;
b. Nesta must set the investment and spending policy for the Trust with a view to preventing the value of the Trust assets and any returns generated by the Trust assets falling below £260 million.
Nesta’s investment objective for the Trust is to balance the current and future needs of the Group by:
• Producing a consistent and sustainable level of income to support the work of Nesta in advancing the charitable objects of the Trust;
• Ensuring sufficient liquidity to avoid the forced sale of Trust assets at distressed prices, while ensuring that the majority of the assets are invested in higher returning investment instruments;
• Being aware that higher levels of assets may be required to meet Nesta’s needs when investment income is expected to be low;
• Delivering these objectives within acceptable levels of risk.

Annual report and accounts: For the year ended 31 March 2017Strategic report
37
To meet these objectives Nesta invests globally and maintains diversification across a range of asset classes in order to produce an appropriate balance between risk and return, believing that diversification can limit the impact of any single risk.
Programme-related investments and grantmaking policy
Nesta achieves its charitable objects, and the objects of the Nesta Trust, in a number of ways which include providing investment, grant-making, providing non-financial support, and carrying out research. Support is provided in a range of different ways, depending on the nature and objectives of each programme.
In line with Charity Commission guidelines, programme related investments are made primarily to further the objects of the charity for public benefit but are also expected to make a financial return and are managed in line with programme objectives. Consequently they are, as permitted by Accounting and Reporting by Charities: Statement of Recommended Practice (FRS 102) applicable in the UK and Republic of Ireland (effective 1 January 2015) issued by the Charity Commission, included in the balance sheet at cost less any provision for impairment where there is no evidence for fair value.
There is no set allocation of the annual budget for overall grant expenditure, rather Nesta sets programme deliverables and the appropriate method of delivery will be determined within that programme’s budget. Where grants are appropriate as a funding mechanism, Nesta sets out specific entitlement criteria for each programme at its launch. These criteria vary from programme to programme and are made available on Nesta’s website where open calls are invited. Applications are then assessed against these criteria and awards made taking into account funds available, ability to deliver
the objectives of the programme, and the quality of applications. The period for which grants are awarded depends upon the programme but typically lasts between one and three years. Grants are monitored regularly and appropriate progress reports are required from recipients. (A list of grants over £50,000 can be found on pages 56 to 57, and a comprehensive list of all grants made during the year can be found on the Nesta website.)
Free reserves policy
In accordance with the Trust Deed of the Nesta Trust, Nesta’s reserves policy is to provide sustainable funding to advance the charitable aims of the Nesta Trust whilst holding reserves at sufficient levels with a view to maintaining the underlying assets above a market value of £260 million.
At 31 March 2017 the total funds of the Group stood at £439.4 million (2016: £384.9 million). Nesta Trust provided funding to fulfil its charitable objectives, through activities carried out by Nesta, totalling £19.4 million (2016: £16.1 million).
Nesta, as the parent charity, has no requirement to maintain its own free reserves provided that expenditure remains within the approved amount of drawdown from the Trust. The policy for drawdown was established in line with the Trust Deed and subject to the powers of the Protector of the Trust, and allows drawdowns at any time during the year as long as the approved drawdown total is not exceeded.
Restricted cash reserves are not used to fund Nesta’s general operating costs and are held on its balance sheet until required to fund specific programme expenditure.
This Reserves policy will only be reviewed on a change in the funding relationship between the Trust and Nesta; such a change is currently not foreseeable.

Annual report and accounts: For the year ended 31 March 2017 Strategic report
38
5. Principal risks and uncertainties
The Trustees are responsible for the management of risks within the Nesta Group and consider risk in two areas – organisational risk and activity risk.
i. Organisational risk:
The monitoring and implementation of the risk management framework and consideration of organisational risk is delegated to the Finance and Audit Committee. The top-level organisational risk register is presented regularly to the Finance and Audit Committee and reviewed by the Board annually. Broader strategic risks including reputational risks are considered by the Executive Team collectively when they meet each quarter to review the top-level register for the organisation as a whole.
The key controls in place include:
• An established organisational and governance structure and lines of reporting;
• Detailed terms of reference for the Board and all Board Committees;
• Comprehensive financial planning, budgeting, management reporting and monitoring;
• Formal written policies and hierarchical authorisation and approval levels;
• Internal audit services engagement with programmes selected for review which are informed by the risk register.
One of the Group’s main financial risks is the investment activity of Nesta Trust. Investment risk is managed with the support of our investment advisors, through regular review of the Nesta Trust investment policy, management of the strategic asset allocation, regular performance reporting, diversification across a broad range of asset classes, investment managers and investment strategies, and ongoing manager reviews.
The majority of Nesta’s Trust investments are externally managed by investment managers in pooled fund vehicles.
ii. Activity risk:
Nesta’s mission to help people and organisations bring great ideas to life requires it to have an element of risk-taking in its activities if it is to succeed, as the mission requires experimentation. Accordingly the risk appetite is for ‘managed
risk-taking’ rather than simple ‘risk aversion’. This includes the recognition that some activities or projects may fail to a greater or lesser extent, and that such failure can be an important source of learning.
The risk management of individual programmes is the responsibility of the relevant Executive Director. Risks identified in the normal course of business and performance dashboards for each programme with relevant risk ratings are discussed by the Executive Team in their monthly meetings.
Trustees are satisfied that the major risks identified through the risk management processes are being adequately managed where necessary while recognising that any framework can provide reasonable but not absolute assurance. There were no material control weaknesses identified by Trustees or management during the year.
Nesta has identified the following major organisational risks and uncertainties:
• Failure to achieve demonstrable impact in our projects (while recognising that some failure is inevitable in innovation) leading to an adverse impact on Nesta’s reputation as a catalyst for innovation;
• Inability to attract or retain staff with the skills we need to carry out the range of work we do, leading to lower quality management of projects and diminishing outputs;
• Failure to attract sufficient match-funding to enable us to grow our activities and leverage our own resources, in line with our three year strategy;
• Ensuring that property tenancy voids are minimised and landlord responsibilities are appropriately discharged;
• Risk that poor investment returns over an extended period put pressure on income available to fund our activities and achieve our objectives;
• Risk that passive management of cash flow leads to investment assets not being sold advantageously thereby not maximising investment returns;
• Lack of landlord experience leading to inability to secure tenants for the new property and therefore increased reliance on the endowment.

Annual report and accounts: For the year ended 31 March 2017Objectives
39
Nesta works to advance a number of charitable aims for the public benefit:
1. To advance education, and in particular the study of innovation, by the promotion of research and the publication of the useful results thereof, in:
• Science and technology
• The arts
• The efficiency of public services
• The voluntary sector and social enterprise
• Industry and commerce
2. To advance:
• Science and technology
• The arts
• The efficiency of public services
• The voluntary sector
• Industry and commerce and social enterprise which:
• Relieves poverty
• Relieves unemployment
• Advances health
• Advances environmental protection or improvement and sustainable development
• Advances citizenship or community development through or by encouraging and supporting innovation.
The voluntary sector means charities and voluntary organisations.
Charities are organisations, which are established for exclusively charitable purposes in accordance with the law of England and Wales.
Voluntary organisations are independent organisations, which are established for purposes that add value to the community as a whole, or a significant section of the community, and which are not permitted by their constitution to make a profit for private distribution. Voluntary organisations do not include local government or other statutory authorities.
Sustainable development means ‘development that meets the needs of the present without compromising the ability of future generations to meet their own needs.’
3. To advance any other purpose which is recognised as exclusively charitable under the laws of England and Wales and Scotland.
Public benefit statement
The Trustees confirm that, in exercising their powers and duties in relation to both Nesta and the Nesta Trust, they have had due regard to the Charity Commission’s statutory guidance on public benefit.
A copy of the Charity Commission’s guidance on public benefit is provided to each Trustee. Every proposal brought to the Board for approval outlines how it will advance Nesta’s charitable objects for public benefit.
This report sets out some of the activities and achievements of Nesta in carrying out its charitable purposes, and the purposes of the Nesta Trust, for the public benefit over the year. These range from major grant programmes to challenge prizes to other projects looking for ways to improve public services, education, healthcare and the arts. Nesta undertakes and disseminates research to improve public understanding of innovation through its reports,
events and digital media, and provides training and tools to teach innovation skills to a variety of audiences.
Support is provided to private and for-profit companies only where this will further Nesta’s charitable purposes for public benefit and where personal benefit is incidental to the furtherance of those purposes. The potential for personal benefit is assessed on a case-by-case basis, through due diligence on potential investments, for example, and appropriate conditions are imposed to ensure this is incidental to the furtherance of Nesta’s charitable purposes. Grants and investments are closely monitored to ensure they continue to further Nesta’s charitable purposes throughout the project.
The details of Nesta’s purposes and objectives and its strategies and achievements in pursuing these purposes and objectives, are set out on pages 6 to 31.
Objectives
Annual report and accounts: For the year ended 31 March 2017 Governace and management
40
Nesta was established and registered as a charity in 2011 to act as successor body to the National Endowment for Science, Technology and the Arts (‘NESTA’). NESTA was a non–departmental public body with a statutory remit to promote talent, creativity and innovation in science, technology and the arts and with an endowment from the National Lottery. All NESTA activities, staff, assets and liabilities were transferred on 1 April 2012 to Nesta and to the Nesta Trust, registered charity no. 1144091. The Trust holds the expendable endowment and Nesta, its sole trustee, uses returns from the Trust to pursue the charitable objects of the Trust. Nesta is governed by its Articles of Association adopted by special resolution in January 2014 and last amended in November 2015.
Nesta is a company limited by guarantee and a charity registered with the Charity Commission and the Office of the Scottish Charity Regulator (OSCR). Its Trustees are both directors and members of the company. For more information on the group structure and subsidiaries please see page 66.
Under company and charity law, the Board of Trustees retains overall responsibility for Nesta and its role as Trustee of the Nesta Trust. Trustees at the date of this Annual Report are listed on page 75. Sir John Gieve is Chair of the Board, which met six times in the year with members of the Executive Team also present. The Nesta Trust also has a Protector appointed by the Secretary of State for Business, Energy and Industrial Strategy with a fiduciary duty to ensure the integrity of administration of the Trust. The current Protector is James Sinclair Taylor.
New Trustees are selected through an open recruitment process, which generally includes advertising in the national press and online, and a targeted recruitment search. Trustees receive no remuneration for acting as Trustees and are appointed for an initial term of three years, renewable for another three years with Board approval. All new Trustees receive a tailored induction and information about structure and governance and their responsibilities as charity Trustees including previously Good Governance - A Code for the Voluntary and Community Sector and from July 2017 the Charity Governance Code. The Board observes all seven principle of the Charity Governance Code and provides appropriate control, challenge and support to the Executive team.
The Board has adopted a conflicts of interest policy and processes for both staff and Trustees to ensure that conflicts of interests are declared and managed appropriately, and maintains a Register of Interests. Trustees are reminded to declare relevant interests at the start of every Board and Committee meeting.
The Board has appointed a Chief Executive to lead and manage Nesta by implementing the policy and strategy adopted by the Trustees within the plan and budget approved by the Board. Approval for decisions up to certain financial thresholds have been delegated to the Chief Executive and other Executive Directors under a Scheme of Delegation. All decisions above this threshold must be approved by the Board or its Committees. The Board has also reserved to itself certain important decisions, such as changes to the Articles, appointment of the Chief Executive and approval of the long-term objectives and strategy.
Nesta’s Executive Team comprises the Chief Executive, Deputy Chief Executive, Chief Investment Officer, Chief Finance Officer, General Counsel and the Executive Director of each of its main areas of activity, each of whom report to the Chief Executive. A full list is given on page 76.
The Board has established a number of Committees to oversee aspects of Nesta’s activities. These include main Board Committees with delegated authority in respect of certain functions and activities, and Advisory Committees which advise and support the Board but do not make decisions for Nesta. Each Board Committee has written Terms of Reference approved by the Board and reports to the Board at each Board meeting. A list of Trustees and members of main Board Committees is provided on page 75.
The main Board Committees are as follows:
Finance and Audit Committee which reviews management reporting and financial performance against budget and recommends to the Board the annual budget; as well as reviewing audit and financial reporting, internal financial controls, risk management and compliance. Grant Thornton are engaged to provide internal audit services to assist the Committee with monitoring the effectiveness of internal control arrangements. The Committee met four times during the year.
Governance and management

Annual report and accounts: For the year ended 31 March 2017Governace and management
41
Trust Investment Committee whose key responsibilities are to draw up the policies and objectives governing the investment of the assets of the Nesta Trust, to approve the making of investments within ranges set by the Board, to oversee their implementation and to monitor financial performance of the Nesta Trust. The Committee met four times during the year.
Venture Investment Committee which manages the Trust’s portfolio of interests in early-stage companies and funds transferred from NESTA and certain programme-related and mixed-motive investments. The Committee met seven times during the year.
Innovation Lab Committee which has delegated authority to approve up to a certain threshold, and oversee, programmes in Nesta’s Innovation Lab. The Committee met four times during the year.
Remuneration Committee whose key responsibilities are staff terms and conditions, ensuring fair and appropriate remuneration and benefit policies. The Committee met twice during the year, determined an annual pay review and agreed annual remuneration of the CEO and other Executives.
Nominations Committee which manages the recruitment of new Trustees and oversees appointments to other Committees. The Committee generally meets twice during the year.
Advisory Committees The Board has also established the following Advisory Committees to provide advice and scrutiny in particular areas:
• Policy and Research Advisory Committee
• Creative Economy Advisory Committee
Nesta and its people
Nesta’s Executive team are responsible for strategic and day-to-day operational management of the charity and meets formally as the Executive team at least once a month.
Nesta has continued to expand in 2016-2017 and has 186.19 FTE as at 31 March 2017 (March 2016: 177.44 FTE).*
We continue to focus on four key areas: Pay and Reward, Organisational Development, Internal Communication and ensuring that HR provide a service that is ‘valued and value for money’. During 2017-2018 our aim will be to bring innovation to the way in which we recruit, retain, reward and develop our people; making Nesta a truly great place to work.
Pay at Nesta
At Nesta we understand the importance of transparency in all aspects of our work. In line with recommendations from the National Council for Voluntary Organisations inquiry into executive pay, we are once again detailing our approach to pay; explaining how our pay levels are defined, publishing the ratio of pay dispersion; and listing the roles and salaries of our executive team.
Our Remuneration Committee is responsible for agreeing salary levels of all Executive posts and annual pay awards for all staff. The Committee meets at least twice a year.
Nesta is proud to be an Accredited Living Wage employer. The ratio between our highest and mean based salaries in 2016 is 3.16:1 (2015: 3.25:1). The Executive salaries are disclosed in Note 8c of the
•This figure is different from the figure shown in Note 8b as the note is an average for the whole financial year.
Remuneration policy

Annual report and accounts: For the year ended 31 March 2017 Governace and management
42
accounts. These salaries are appropriate to ensure we attract and retain an Executive team that can successfully run a complex organisation recognised as a leader in innovation in the UK and beyond.
Nesta’s annual salary review takes place each year with any changes taking effect from 1 April. A general award to salaries may be made to reflect changes in the wider labour market and levels of inflation. A general award of 2 per cent was made in April 2016 (April 2015: 2 per cent)
Individual pay awards are available and decided with reference to individual achievement against objectives, demonstrating Nesta values or where
there have been substantial changes to a role. Individual pay awards are in the form of a salary increase within the range and are approved by Executive Directors who meet to review and agree any proposed increases. All increases fall within the budget set aside for salaries which is signed off by the Remuneration Committee.
Nesta provides a mixed portfolio of financial and non-financial rewards for our employees, to ensure we remain attractive and competitive and are able to attract and retain the most talented people to deliver our strategy.
Statement of Trustees’ responsibilities
The Trustees are responsible for preparing the Strategic Report, the Annual Report and the financial statements in accordance with applicable law and regulations.
Company law requires the Trustees to prepare financial statements for each financial year in accordance with United Kingdom Generally Accepted Accounting Practice (United Kingdom Accounting Standards and applicable law). Under company law the Trustees must not approve the financial statements unless they are satisfied that they give a true and fair view of the state of affairs of the Group and charity and of the net income of the Group for that period. In preparing these financial statements, the Trustees are required to:
• Select suitable accounting policies and then apply them consistently.
• Observe the methods and principles in the Charities SORP.
• Make judgements and estimates that are reasonable and prudent.
• State whether applicable accounting standards have been followed, subject to any material departures disclosed and explained in the financial statements.
• Prepare the financial statements on the going concern basis unless it is inappropriate to presume that the Group will continue in business.
The Trustees are responsible for keeping proper accounting records that are sufficient to show and explain the Group’s and charity’s transactions, and disclose with reasonable accuracy at any time the financial position of the Group and charity, and enable them to ensure that the financial statements comply with the Companies Act 2006. They are also responsible for safeguarding the assets of the Group and hence taking reasonable steps for the prevention and detection of fraud and other irregularities.
The Trustees are responsible for the maintenance and integrity of the corporate and financial information included on Nesta’s website. Legislation in the United Kingdom governing the preparation and dissemination of financial statements may differ from legislation in other jurisdictions.
Disclosure to our auditors
Insofar as the Trustees are aware, as at the date of this report, they have taken all the steps they ought to have taken to make themselves aware of any relevant audit information of which the company’s auditor is unaware.
The Trustees’ Report and the Strategic Report are approved by the Board of Trustees and authorised for issue on 12 September 2017, and signed on its behalf by:
Sir John Gieve, Chair of the Board of Trustees of Nesta

Annual report and accounts: For the year ended 31 March 2017
43
We have audited the financial statements of Nesta for the year ended 31 March 2017 which comprise the Group Statement of Financial Activities, the Group and Parent Balance Sheets, the consolidated Cash Flow and the related notes. The financial reporting framework that has been applied in their preparation is applicable law and United Kingdom Accounting Standards (United Kingdom Generally Accepted Accounting Practice).
This report is made solely to the charity’s Trustees and members, as a body, in accordance with Chapter 3 of Part 16 of the Companies Act 2006 and the Charities and Trustee Investment (Scotland) Act 2005. Our audit work has been undertaken so that we might state to the charity’s Trustees and members those matters we are required to state to them in an auditor’s report and for no other purpose. To the fullest extent permitted by law, we do not accept or assume responsibility to anyone other than the charity and the charity’s Trustees and members as a body, for our audit work, for this report, or for the opinions we have formed.
Respective responsibilities of Trustees and auditors As explained more fully in the statement of Trustees’ responsibilities, the Trustees (who are also the directors of the charitable company for the purposes of company law) are responsible for the preparation of the financial statements and for being satisfied that they give a true and fair view. Our responsibility is to audit and express an opinion on the financial statements in accordance with applicable law and International Standards on Auditing (UK and Ireland). Those standards require us to comply with the Financial Reporting Council’s (FRC’s) Ethical Standards for Auditors.
We have been appointed as auditor under section 44(1)(c) of the Charities and Trustee Investment (Scotland) Act 2005 and under the Companies Act 2006 and report in accordance with regulations made under those Acts.
Scope of the audit of the financial statements A description of the scope of an audit of financial statements is provided on the FRC’s website at www.frc.org.uk/auditscopeukprivate.
Opinion on financial statements In our opinion the financial statements:
• Give a true and fair view of the state of the group’s and parent charity’s affairs as at 31 March 2017 and of the group’s and parent charity’s incoming resources and application of resources, including the income and expenditure, for the year then ended;
• Have been properly prepared in accordance with United Kingdom Generally Accepted Accounting Practice; and
• Have been prepared in accordance with the requirements of the Companies Act 2006, the Charities and Trustee Investment (Scotland) Act 2005 and regulations 6 and 8 of the Charities Accounts (Scotland) Regulations 2006 (as amended).
Opinion on other matter prescribed by the Companies Act 2006 In our opinion the information given in the Trustees’ report, which includes the strategic report for the financial year for which the financial statements are prepared is consistent with the financial statements and the strategic report and the Trustees’ report have been prepared in accordance with applicable legal requirements.
Based on our knowledge and understanding of the charity and its environment obtained during the course of the audit we have identified no material misstatements in the strategic report and Trustees’ report.
Matters on which we are required to report by exception We have nothing to report in respect of the following matters where the Companies Act 2006 and the Charities Accounts (Scotland) Regulations 2006 (as amended) requires us to report to you if, in our opinion:
• Adequate accounting records have not been kept by the parent charity, or returns adequate for our audit have not been received from branches not visited by us; or
• The parent charity financial statements are not in agreement with the accounting records and returns; or
• Certain disclosures of Trustees’ remuneration specified by law are not made; or
• We have not received all the information and explanations we require for our audit.
Fiona Condron, Senior Statutory Auditor for and on behalf of BDO LLP, Statutory Auditor Gatwick, United Kingdom Date:
BDO LLP is a limited liability partnership registered in England and Wales (with registered number OC305127).
Independent auditor’s report to the Trustees and members of Nesta

Annual report and accounts: For the year ended 31 March 2017 Financial statements
44
Consolidated Statement of financial Activities for the year ended 31 March 2017
Financial statements
2017 2017 2017 2017 2016 £’000 £’000 £’000 £’000 £’000
Income and endowments from: Investment income 2 33 - 507 540 2,011Charitable activities 3 1,675 18,826 - 20,501 1 0,913Other trading activities 4 3,282 - - 3,282 1 ,452Other income 5 3,742 - - 3,742 2,425Total income 8,732 18,826 507 28,065 16,801Less share of joint ventures’ turnover (3,157) (3,157) (2,309)
Total group income 5,575 18,826 507 24,908 14,492
Expenditure on: Raising funds Trading operations 2,026 - - 2,026 565Investment management costs 6 956 - 638 1,594 1,276Total expenditure on raising funds 2,982 - 638 3,620 1,841
Charitable activities Policy and Research 7 4,759 1,052 - 5,811 5,701Programmes 7 7,840 13,755 28 21,623 13,826Investment (early-stage and social impact) management 7 394 - 69 463 2,530Skills 7 903 183 4 1,090 1,182FutureFest 7 752 - 6 758 593
Total expenditure on charitable activities 14,648 14,990 107 29,745 23,832
Total expenditure 17,630 14,990 745 33,365 25,673
Net gains on investments 10 - - 62,378 62,378 1,799
Net income/(expenditure) (12,055) 3,836 62,140 53,921 (9,382)
Net interest in joint venture 145 - - 145 335Transfers between funds 17,253 2,110 (19,363) - -
Net income/(expenditure) before other recognised gains and losses 5,343 5,946 42,777 54,066 (9,047)
Other recognised gains/(losses) Foreign exchange gains - - 632 632 143
Net movement in funds for the year 5,343 5,946 43,409 54,698 (8,904)
Reconciliation of funds
Total funds brought forward 2,926 6,892 375,067 384,885 393,789
Total funds carried forward 8,269 12,838 418,476 439,583 384,885
Unr
estr
icte
d
fund
s
Not
es to
the
acco
unts
Expe
ndab
le
endo
wm
ent
Tota
l fun
ds
Tota
l fun
ds
Res
tric
ted
fu
nds
A summary income and expenditure account is presented in Note 17 in compliance with the Companies Act 2016.
Total income for the year of Nesta, the parent charity, was £41,868k (2016: £27,811k); total expenditure was £30,223k (2016: £23,534); total net surplus was £11,645k (2016: £4,277).
The Group has no recognised gains or losses other than those included in the Consolidated Statement of Financial Activities. All activities are continuing.
The notes on pages 47 to 74 form parts of these accounts.
No separate Statement of Financial Activities has been presented for Nesta as permitted by section 408 of the Companies Act 2006.

Annual report and accounts: For the year ended 31 March 2017Financial statements
45
Parent Parent Notes Group Charity Group Charity to the 2017 2017 2016 2016 accounts £’000 £’000 £’000 £’000
Fixed assets
Tangible assets 9 26,651 546 607 257
Investments:Investments – quoted and unquoted 10 378,851 - 285,021 -
Programme– related investments 11a 4,960 5,460 3,450 3,450
Programme– related investment in joint venture – share of gross assets/costs 11b 919 30 808 30
Arts Impact Investments 11c 831 - 133 -
Total Fixed assets 412,212 6,036 290,019 3,737
Current assetsInvestments – quoted and unquoted 10 - - 11,686 -
Debtors 12 7,305 6,960 39,378 8,278
Bank and cash 35,376 21,099 51,277 3,082
Total current assets 42,681 28,059 102,341 11,360
Current liabilitiesCreditors: amounts due within one year 13 (9,919) (9,449) (6,434) (5,946)
Net current assets/(liabilities) 32,762 18,610 95,907 5,414
Total assets less current liabilities 444,974 24,646 385,926 9,151
Creditors: amounts due after one year 13 (5,391) (3,971) (1,041) (121)
Net Assets 439,583 20,675 384,885 9,030
Charitable fundsExpendable endowment funds 15a 418,476 - 375,067 -
General funds 15a 4,224 7,837 2,138 2,138
Total charitable unrestricted funds 422,700 33,942 377,205 2,138
Restricted funds 15b 12,838 12,838 6,892 6,892
Total charitable funds 435,538 20,675 384,097 9,030
Funds retained within non-charitable subsidiaries 15a 4,045 - 788 -
Total funds 439,583 20,675 384,885 9,030
The Parent Charity’s net surplus for the year was £11.6 million (2016: surplus of £4.3 million).
The notes on pages 47 to 74 form a part of these accounts.
Approved by the Board of Trustees and authorised for issue on 12 September 2017, and signed on its behalf by Sir John Gieve, Chair of the Board of Trustees.
Sir John Gieve
Consolidated balance sheet as at 31 March 2017Company Number: 07706036

Annual report and accounts: For the year ended 31 March 2017 Financial statements
46
Consolidated cash flow for the year ended 31 March 2017
Group Group 2017 2016 Note £’000 £’000
Cash flows from operating activities Net cash generated/used in operating activities (a) 33,685 (52,002)
Cash flows from investing activitiesNet cash outflows by investing activities (b) (26,952) (439)
Cash flows from financing activitiesNet cash outflows/inflows by financing activities (c) (23,266) 1,830
Change in cash and cash equivalents in the reporting period (16,533) (50,611)
Cash and cash equivalents at the beginning of the reporting period 51,277 101,745
Change in cash and cash equivalents due to exchange rate movements 632 143
Cash and cash equivalents at the end of the reporting period 35,376 51,277
Cash flow statement notes
a) Reconciliation of net income/(expenditure) to net cash flow from operating activities
Net income (expenditure) for the reporting period (as per consolidated statement of financial activities) 53,921 (9,382)
Depreciation charges 582 383
Loss on disposal of fixed assets 426 8
Amortisation of premium - (635)
Net gains/(losses) from investments (62,378) (1,799)
Impairments 1,060 1,146
Grossed up investment costs (non-cash) - 1,732
Dividends, interest and rents from investments (1,439) (2,011)
Interest paid and bank charges 11 9
Investment fees 1,594 1,276
Foreign exchange gains/(losses) - 2
(Increase)/decrease in debtors 32,073 (36,904)
Increase/(decrease) in creditors 7,835 (5,827)
33,685 (52,002)
b) Cash flows from investing activities Dividends, interest and rents from investments 174 35
Interest paid and bank charges (11) (9)
Investment fees (63) (19)
Purchase of property, plant and equipment (27,052) (446)
(26,952) (439)
c) Cash flows from financing activitiesPurchase of quoted investments (70,178) (40,802)
Purchase of unquoted investments (29,969) (4,667)
Purchase of programme-related Investments (1,664) (920)
Purchase of Arts Impact Fund investments (730) (150)
Investment fees (1,531) (1,257)
Proceeds from sale or maturity of quoted investments 72,103 42,000
Proceeds from sale or maturity of unquoted investments 7,271 5,384
Proceeds from sale of programme-related investments 102 263
Proceeds from sale of Arts Impact Fund investment 32 3
Dividends and interest from investments 1,298 1,976
(23,266) 1,830
The notes on pages 47 to 74 form part of these accounts.

Annual report and accounts: For the year ended 31 March 2017Financial statements
47
1. Accounting policies
a. Basis of preparation
The financial statements are prepared under the historical cost convention, modified by the revaluation of financial assets. They have been prepared on a going concern basis and in accordance and compliance with: (i) FRS 102, the Financial Reporting Standard applicable in the United Kingdom; (ii) Accounting and Reporting by Charities: Statement of Recommended Practice applicable to charities preparing their accounts in accordance with the Financial Reporting Standard applicable in the UK and Republic of Ireland (FRS 102) ‘Charities SORP (FRS 102)’ issued by the Charity Commission, (iii) Companies Act 2006.
b. Basis of consolidation
The consolidated financial statements incorporate the results of Nesta and all its subsidiary undertakings including Nesta Trust, ‘the Trust’, from the date that control commences to the date that it ceases.
Subsidiary undertakings are consolidated on a line-by-line basis using the acquisition method of accounting in accordance with Section 9 ‘Consolidated and Separate Financial Statements’ of FRS 102.
Details of Nesta’s subsidiary undertakings can be found in Note 14.
Joint ventures that are not held as part of an investment portfolio are consolidated using the Gross Equity method of accounting in accordance with Section 15 ‘Investments in Joint Ventures’ of FRS 102. Details of Nesta’s joint ventures can be found in Note 11b.
The group applies the exemption contained in Section 15 ‘Investments in Joint Ventures’ of FRS 102 so that where joint ventures and associates are held as part of an investment portfolio, they are included within investment assets.
No separate Statement of Financial Activities has been presented for Nesta as permitted by section 408 of the Companies Act 2006.
c. Fund accounting
The General fund consists of unrestricted funds that are available for the furtherance of the objects of the charity at the discretion of the Trustees.
Restricted funds are subject to specific restrictions as applied by programme funders.
Where Nesta provides match-funding or programme support on projects, total expenditure is shown in the restricted fund and a transfer from the general fund to the restricted fund is made to account for Nesta’s share of expenditure.
The expendable endowment fund relates to the funds of the Trust. These funds are held without distinction as to capital and income and can be applied in furtherance of the objects of the Trust. The Trust makes transfers throughout the year to Nesta to deliver its charitable aims as detailed in the reserves policy.
d. Income
Income is recognised in the Statement of Financial Activities in the period in which Nesta is entitled to receipt and where the amount can be measured with reasonable accuracy, and where receipt is probable.
Grant income is recognised in the Consolidated Statement of Financial Activities when the charity has entitlement to the funds, it is probable the income will be received, the amount can be measured reliably and any performance conditions attached to the grants have been met fully. Where performance-related conditions have only been partially met, income is recognised to that extent with the balance deferred until conditions have been satisfied.
Investment income includes interest and dividends from investment assets and deposits, with any associated tax credits or recoverable taxation included in the Consolidated Statement of Financial Activities on an accruals basis.

Annual report and accounts: For the year ended 31 March 2017 Financial statements
48
Income from trading activities represents the value of services provided under contracts to the extent that there is a right to consideration and is recorded at the value of the consideration due. Where a contract has only been partially completed at the balance sheet date, income represents the value of the service provided to date based on proportion of the total contract value. Where payments are received from customers in advance of services provided, the amounts are recorded as deferred income and included as part of creditors due within the year.
e. Expenditure
Expenditure is accounted for on an accruals basis.
Expenditure on raising funds is incurred on non-primary purpose trading activities of the trading subsidiary Nesta Enterprises Limited as well as investment management costs which include investment fund manager fees paid in cash as well as those that have been grossed up where they are offset against the fund’s value rather than payable in cash, dilution levies, investment consultancy and custodian fees.
Expenditure on charitable activities is incurred in pursuit of the group’s charitable objects and is reported as a functional analysis of the work undertaken. The categories defined by the Trustees for the purposes of organisational management are Programmes; Investment (early-stage and social impact) management; Policy and Research; Skills; and FutureFest. Expenditure includes direct expenditure and allocated support costs.
Grants payable are recognised as expenditure in the Statement of Financial Activities on the date when a grant agreement is signed or equivalent obligation created less any awards cancelled or refunded. Grants awarded but not yet paid are recorded as a liability in the Balance Sheet. Where grants paid are selected to be converted to an equity holding in the grantee organisation by virtue of grant conditions being met, on the date where there is a binding contract with investment terms agreed by both parties, grant expenditure is reversed and an investment asset is recognised and the asset valued in accordance with Nesta’s investment valuation policies.
Commitments or approvals to fund specific projects not yet signed by Nesta are disclosed by way of note (see Note 19).
Non-grant direct costs include staffing, programme delivery partner costs, workshop event costs, commissioned research and evaluation, and any other direct costs attributable to a specific activity.
Support costs include costs shared by all activities. They include the costs of the office of the CEO, communications, front of house, facilities, finance, legal, information technology, and human resources. Support costs also include the costs related to governance which are costs attributable to maintaining the public accountability of the charitable group and ensuring compliance with regulation and good practice. Costs incurred by Trustees, internal and external audit costs and legal fees are included within governance costs.
Irrecoverable VAT incurred is allocated to the expenditure category to which it relates.
f. Support costs – allocation
Support costs are allocated to each area of programme activity bases appropriate to the activity concerned. These include drivers such as percentage of total cost, headcount or floor space.
g. Tangible fixed assets and depreciation
Property, plant and equipment are capitalised at their historic cost and stated at cost less depreciation. Assets costing less than £500 are expensed in the year of purchase.
Depreciation is calculated on a straight-line basis over the expected useful life of the assets as follows:
• Leasehold over the improvements remaining life of the lease
• Office equipment, three to five years fixtures and fittings
• Computer hardware three years
• Computer software three to five years or the life of the licence

Annual report and accounts: For the year ended 31 March 2017Financial statements
49
h. Investment assets – quoted and unquoted
Investments assets include quoted and unquoted investments. Nesta holds its investment assets on trust without distinction between capital and income, applying them in furtherance of its objects. Assets held by Nesta Trust are classed as an expendable endowment.
Assets under construction relates to expenditure for the purchase of a new head office building which was completed in September 2016.
Cash and short-term deposits and investments to be held less than 12 months are presented in the balance sheet as current assets. All other financial assets are presented as fixed assets. Deferred investments and loans represent the portion of commitments which remain undrawn but draw down has been requested at the balance sheet date. The corresponding commitment is recognised under current liabilities.
Loans are recognised as financial assets when repayment of the loan or the option to convert to equity has not expired by the balance sheet date. The loans are included in fixed assets except where repayment is expected within 12 months of the balance sheet date, when they are included as current assets.
The carrying value of all investments is at market value and unrealised changes between accounting periods are charged or credited to the Statement of Financial Activities. For financial assets for which there is no quoted market, market value is established by using valuation guidelines as detailed below. Investment Property assets are revalued by an independent external property valuer.
I. Valuation – quoted investments:
The market values of quoted investments are based on externally reported bid prices at the balance sheet date.
Equity investments, high yield bonds, and property trusts are held in pooled funds and are stated at market value, being the market value of the underlying investments held. These valuations are provided by the relevant fund manager.
II. Valuation – unquoted investments:
Private equity investments are held through funds managed by private equity managers. As there is no identifiable market price for private equity funds, these funds are included at the most recent valuations provided by the private equity managers.
Where a valuation is not available at the balance sheet date, the most recent valuation from the private equity manager is used, adjusted for cash flows between the most recent valuation and the balance sheet date. Where a private equity manager does not provide a market value that complies with the above, the group is unable to obtain a reliable market value and therefore these investments are held at cost.
An estimated value of unquoted investments in early-stage companies is established by using valuation guidelines produced by the British Venture Capital Association (BVCA).
• BVCA guidelines provide for investments to be carried at cost unless there is information indicating an impairment or sufficiently clear evidence to support an increase in valuation.
• Where the price of a recent funding round (within previous 12 months) is not available, investments are valued using standard valuation methodologies, as appropriate and in the following order:
i. Earnings multiple
ii. Net asset value
iii. Discounted cash flow
iv. Applying BVCA valuation benchmarks
• At the balance sheet date, management assesses whether there is objective evidence that a financial asset or a group of financial assets should be revalued. The approach, which is within the principles of the BVCA guidelines, is to review and give a ‘health’ status:
• Healthy: value held at cost unless sufficiently clear evidence to support an increase in valuation; company is performing to plan, unlikely to run out of cash within 12 months.

Annual report and accounts: For the year ended 31 March 2017 Financial statements
50
• Sick: value down according to the seriousness of a number of events considered by management; company is performing off-plan, may or may not be recoverable.
• Terminal: value down, company is performing off-plan, likely to run out of cash within six months, recovery not foreseen, no intervention planned.
Valuation of companies at this early stage of development is an inherently volatile and uncertain process. The valuation guidelines used are considered to be the best estimate of market value at the balance sheet date.
Loans to early-stage companies have the same valuation methodology applied as for investments in early-stage companies.
An estimated value of investments in early-stage funds is calculated as the group’s share of partnership net asset value as stated in the last audited financial statements of each investment fund. Contributions made by the group in any period between the date of a fund’s balance date and the group’s own for which there is no audited valuation, are valued at cost unless there is information to determine otherwise.
Transaction costs incurred by the group and management support costs are not included in valuations and are charged to expenditure in the period in which they are incurred.
III. Treatment – unquoted investments
Investments, loans or contributions to funds to date are recognised in full in the Balance Sheet. Un-drawn commitments are disclosed by way of note.
Unrealised changes in value between accounting periods are reflected in the Statement of Financial Activities.
Financial assets are derecognised when the rights to receive cash flows from the investments have expired or have been transferred with all risks and rewards of ownership.
i. Investment assets – programme-related investments
Unquoted equity and similar programme-related investments are held at cost, less any provision for diminution in value, as Nesta is unable to obtain a reliable estimate of fair value. Programme-related investments that are loans are accounted for at the outstanding amount of the loan less any provision for unrecoverable amounts. Any diminution or impairment in value is charged to the Consolidated Statement of Financial Activities under charitable activities.
Investment Assets – Arts Impact investments
Arts Impact related investments are held at costs, less any provision for diminution in value, as Nesta is unable to obtain a reliable estimate of fair value. Arts Impact related investments that are loans are accounted for at the outstanding amount of the loan less any provision for unrecoverable amounts. Any diminution or impairment in value is charged to the Consolidated Statement of Financial Activities under charitable activities.
j. Significant estimates
The preparation of financial statements requires management to make estimates and judgements that affect the reported amounts of assets and liabilities as well as the disclosure of contingent liabilities at the balance sheet date. Actual outcomes could differ from those estimates. This is especially the case of the valuation of the group’s investment in early-stage companies which is an inherently volatile and uncertain process. However, the valuation guidelines applied are considered to be the best estimate of market value.
k. Debtors receivable, creditors, provisions and contingent liabilities
Debtors receivable are recognised at fair value less any provision for bad debt. A provision for bad debt is established when there is objective evidence that the debtor will not be collected according to the original terms.
a.
b.

Annual report and accounts: For the year ended 31 March 2017Financial statements
51
Creditors are recognised when Nesta has a present legal or constructive obligation as a result of past events, it is probable that an outflow of resources will be required to settle the obligation, and the amount can be reliably estimated.
Provisions are recognised when the group has a present legal or constructive obligation as a result of past events, it is probable that an outflow of resources will be required to settle the obligation, and the amount can be reliably estimated.
Where there are significant obligations which do not meet the requirements for recognition as a provision set out in Section 21 ‘Provisions and Contingencies’ of FRS 102 these are disclosed as a note to the accounts (see Note 19).
l. Pension costs
For defined contribution schemes the amount charged to the Consolidated Statement of Financial Activities in respect of pension costs and other post-retirement benefits is the contributions payable in the year.
Differences between contributions payable in the year and contributions actually paid are shown as either accruals or prepayments in the Balance Sheet.
m. Taxation
Nesta and the Nesta Trust are charities within the meaning of Para 1 Schedule 6 Finance Act 2010. Accordingly they are potentially exempt from taxation in respect of income or capital gains within categories covered by Chapter 3 of Part 11 of the Corporation Tax Act 2010 or Section 256 of the Taxation of Chargeable Gains Act 1992, to the extent that such income or gains are applied exclusively to charitable purposes.
No tax charge arose in the period.
The subsidiary companies make qualifying donations of all taxable profit to Nesta. No corporation tax liability on the subsidiaries arises in the accounts.
n. Exchange gains and losses
The Statutory financial statements are presented in pounds sterling, the functional and presentational currency. Foreign currency transactions are translated using the exchange rates prevailing at the date of settlement. Realised and unrealised exchange gains and losses are recognised in the Statement of Financial Activities.
o. Operating leases
Leases where the lessor retains a significant portion of the risks and rewards of ownership are classified as operating leases. Payments made under operating leases (net of any incentives received from the lessor) are charged to the Consolidated Statement of Financial Activities on a straight-line basis over the period of the lease.
p. Related party transactions
Material transactions with related parties are disclosed in the notes to these financial statements. The group’s policy is for all Trustees, non-Trustee Committee members, Executive Directors and senior direct reports to Executive Directors, to declare interests and related party transactions on appointment and at least annually. Declared interests are recorded in the Register of Interests and these are reviewed by the Finance and Audit Committee.
Transactions between all group undertakings (parent charity, subsidiaries, associates and joint ventures) are also disclosed in compliance with 23.4 of Charities SORP (FRS 102).
q. Going concern
The Trustees are not aware of any specific or general event which would change the charity’s status as a going concern.

Annual report and accounts: For the year ended 31 March 2017 Financial statements
52
3. Income from charitable activities
Other charitable activity income includes income from consultancy services, monitoring and product sales.
The breakdown between funds for 2016 is as follows: Unrestricted funds £1,943,000: Restricted funds £8,970,000 of which £1,514,000 was from government bodies shown in Note 3a.
2. Investment income
Group Group 2017 2016 £’000 £’000
Quoted investments:Interest and dividends receivable 207 1,513
Total income from quoted investments 207 1,513
Unquoted investments: Interest and dividends receivable 159 130
Total income from unquoted investments 159 130
Bank interest 174 368
Total investment income 540 2,011
2017 2017 2017 2017 2016 2016 2016 2016 £’000 £’000 £’000 £’000 £’000 £’000 £’000 £’000
Policy and Research 216 1,076 781 2,073 166 570 282 1,018Programmes 9,885 7,796 291 17,972 1,348 1,943 5,904 9,195
Investment (early-stage and social impact) management - - - - - - 392 392
Skills - 248 169 417 - 170 115 285
FutureFest - - - - - - - -
Other - - 39 39 - 11 12 23
Total income from charitable activities 10,101 9,120 1,280 20,501 1,514 2,694 6,705 10,913
Fund
ing
from
G
over
nmen
t bo
dies
Fund
ing
from
G
over
nmen
t bo
dies
Oth
er c
harit
able
ac
tivity
inco
me
Oth
er c
harit
able
ac
tivity
inco
me
Gro
up to
tal
Gro
up to
tal
Fund
ing
from
N
on-G
over
nmen
t bo
dies
Fund
ing
from
N
on-G
over
nmen
t bo
dies

Annual report and accounts: For the year ended 31 March 2017Financial statements
53
4. Income from other trading activities
3a. Funding from Government bodies
Group Group 2017 2016 £’000 £’000
Rental income 419 562Income from trading 2,863 890
Total other income 3,282 1,452
Restricted Restricted Funding from Funding from Government Government bodies bodies 2017 2016 £’000 £’000
Agency for Business Competitiveness - Accio - 75Arts Council England 77 1
Australian Department of Industry - 5
Cabinet Office 4,495 200
Centre for Economic and Social Inclusion - 25
Department for Communities and Local Government - 50
Department for International Development India - 6
Department for Business, Energy and Industrial Strategy - 525
Department of Health 35 400
Foreign and Commonwealth Office 125 -
Innovate UK 50 -
NHS England 400 162
Swedish Agency for Growth Policy Analysis - 10
Technology Strategy Board - 7
The Finnish Agency for Innovation - 13
The Welsh Government 4,919 35
Total restricted funding from Government bodies 10,101 1,514
All income from trading activities are unrestricted funds.

Annual report and accounts: For the year ended 31 March 2017 Financial statements
54
5. Other income
Group Group 2017 2016 £’000 £’000
Impact fund management fees 440 -
Events and workshops fees 145 107
Returns on legacy investments - 3
Share of income from joint ventures 3,157 2,309
Other sundry income - 6
Total other income 3,742 2,425
Group Group 2017 2016 £’000 £’000
Investment manager fees 1,531 1,170
Custodian fees 19 56
Dilution fees 44 50
Total investment management costs 1,594 1,276
Returns on legacy investments relate to investments granted which were expensed to programme expenditure in NESTA and were not transferred as a financial asset on 1 April 2012.
6. Investment management costs
The investment management costs are the direct fees paid to intermediaries, the full costs of management, including transaction costs for example, are substantially more than this.

Annual report and accounts: For the year ended 31 March 2017Financial statements
55
7. Charitable activities
7a. Support costsSupport costs have been allocated to charitable activity areas as follows
The 2016 breakdown between funds is shown in the following table.
2017 2017 2017 2017 2016 2016 2016 2016 £’000 £’000 £’000 £’000 £’000 £’000 £’000 £’000
Policy and Research 60 3,575 2,176 5,811 167 2,855 2,679 5,701
Programmes 11,077 5,335 5,211 21,623 1,753 6,629 5,444 13,826
Investment (early-stage and social impact) management - 159 304 463 45 1,642 843 2,530
Skills - 672 418 1,090 167 532 483 1,182
FutureFest - 547 211 758 - 352 241 593
Total charitable activities 11,137 10,288 8,320 29,745 2,132 12,010 9,690 23,832
2017 2017 2017 2017 2016 2016 2016 2016 £’000 £’000 £’000 £’000 £’000 £’000 £’000 £’000
Policy and Research 829 1,299 48 2,176 958 1,602 119 2,679Programmes 2,348 2,797 66 5,211 2,002 3,225 217 5,444
Investment (early-stage and social impact) management 134 163 7 304 391 414 38 843
Skills 200 208 10 418 238 219 26 483
FutureFest 92 116 3 211 92 139 10 241
Total support costs 3,603 4,583 134 8,320 3,681 5,599 410 9,690
Gra
nt-
mak
ing
Supp
ort
staf
f cos
ts
Supp
ort
staf
f cos
tsG
rant
- m
akin
g
Allo
cate
d
supp
ort c
osts
Gov
erna
nce
Gov
erna
nce
Allo
cate
d
supp
ort c
osts
Gro
up to
tal
Gro
up to
tal
Gro
up to
tal
Gro
up to
tal
Non
-gra
nt
dire
ct c
ost
Prem
ises
, te
chno
logy
an
d ot
her c
osts
Prem
ises
, te
chno
logy
an
d ot
her c
osts
Non
-gra
nt
dire
ct c
ost
The basis for allocation of support costs and governance is as follows:
Office of the Chief Executive, Front of House Allocated equally to each area
Finance, Legal, Publications, Events and Communications, Allocated on the ratio of direct costs of each area or project in FutureFest case of FutureFest
Facilities Allocated on the basis of floorspace occupied
Information Technology, Human Resources Allocated on the basis of headcount
Unrestricted Restricted Expendable funds funds endowment Total £’000 £’000 £’000 £’000
Policy and Research 4,438 1,199 64 5,701
Programmes 8,651 5,041 134 13,826
Investment 2,504 - 26 2,530
Skills 808 358 16 1,182
Futurefest 587 - 6 593
16,988 6,598 246 23,832

Annual report and accounts: For the year ended 31 March 2017 Financial statements
56
Grants to institutions Charitable 2017 activity Recipient £’000 area Programme
British Lung Foundation 958 Programme Accelerating Ideas
The Stroke Association 832 Programme Accelerating Ideas
British Red Cross 825 Programme Accelerating Ideas
GoodGym 819 Programme Accelerating Ideas
NL Cares (T/A North London Cares) 733 Programme Accelerating Ideas
Shared Lives Plus Limited 509 Programme Accelerating Ideas
GoodSAM 430 Programme Accelerating Ideas
Carers UK 420 Programme Accelerating Ideas
Home-Start Greater Manchester 285 Programme Second Half Fund
The Reader Organisation 270 Programme Second Half Fund
Crowdfunder Ltd 250 Programme Arts and Heritage
St John Ambulance 250 Programme Second Half Fund
Family Action 250 Programme Second Half Fund
Spice Innovations 247 Programme Second Half Fund
Aesop Arts and Society Limited 247 Programme Second Half Fund
St Joseph’s Hospice 244 Programme Second Half Fund
Volunteering Matters 225 Programme Second Half Fund
Volunteer It Yourself 201 Programme Second Half Fund
Fareshare 178 Programme Second Half Fund
Tutorfair Foundation 150 Programme Click Connect Learn
TLG 142 Programme Growth and Sustaining Fund
Eden Project 137 Programme Second Half Fund
Action Tutoring Ltd 130 Programme Growth and Sustaining Fund
BuddyHub Ltd 115 Programme Second Half Fund
Whole Education 113 Programme Click Connect Learn
The Access Project 113 Programme Click Connect Learn
Forum for the Future 102 Programme Aquaculture Prize Design
Genesis Housing Association 100 Programme Give More Get More
Behavioural Insights 100 Programme Behavioural Insights
Beanstalk 100 Programme Give More Get More
King’s College NHS Foundation Trust 100 Programme Give More Get More
Volunteering Matters 99 Programme Give More Get More
North Tyneside VODA 98 Programme Give More Get More
Behavioural Insights 90 Programme Behavioural Insights
The Access Project 84 Programme Second Half Fund
Bombastic Dance 73 Programme Digital Innovation Fund for the Arts in Wales
G39 63 Programme Digital Innovation Fund for the Arts in Wales
Behavioural Insights 55 Programme Behavioural Insights
Artis Community 54 Programme Digital Innovation Fund for the Arts in Wales
The Marine Conservation Society 50 Programme Join In Stay In
Barnardo’s 50 Programme Join In Stay In
CSW Group Limited 50 Programme Join In Stay In
Leicester City Council 50 Programme Join In Stay In
Grants below £50,000 (number of grants to institutions 45) 812
Grants cancelled in the year (66)
Total grants to institutions 11,137
7b. GrantsIncluded in the cost of charitable activities are grants committed. Grants of £50,000 and above are detailed below. A full list of grants committed is available via Nesta’s website.
There were no grants made to individuals in the year ended 31 March 2017.

Annual report and accounts: For the year ended 31 March 2017Financial statements
57
Grants committed in 2016
There were a total of 11 grants made to individuals in the year ended 31 March 2016, totaling £6k.
Open University 167 Programme Rockerfeller/DIY Toolkit
Behavioural Insights 136 Programme Behavioural Insights
Newcastle University 130 Programme Realising the Value
Behavioural Insights 100 Programme Behavioural Insights
Stockport Metropolitan Borough Council 100 Programme Centre for Social Action Innovation Fund
Behavioural Insights 90 Programme Behavioural Insights
National Voices 71 Programme Realising the Value
Development Bank of Latin America - CAF 60 Programme Innovation Growth Lab
The Better with Data Society 50 Programme Open Data Challenge Series
PIC - Performance in Context Limited 50 Programme Open Data Challenge Series
University Hospital Southampton NHS Trust 50 Programme Young People Helping in Hospitals
Western Sussex Hospitals NHS Foundation Trust 50 Programme Young People Helping in Hospitals
WikiHouse Foundation 50 Programme Collaborative Economy
360Giving 50 Programme Open Philanthropy / 360Giving
European School of Management and Technology 50 Programme Innovation Growth Lab
Grants below £50,000 (number of grants to institutions 62) 1,323
Grants cancelled in the year (401)
Total grants to institutions 2,126
Grants to institutions Charitable 2016 activity Recipient £’000 area Programme
7c. Auditor’s fees
External audit fees incurred for Nesta, the parent charity, were £21,000 (2016 £20,500) excluding VAT.
Group Group 2017 2016 £’000 £’000
External audit 46 48
Internal audit 23 29
Tax advisory services 17 3
Other financial services - 9
Total auditor fees 86 89

Annual report and accounts: For the year ended 31 March 2017 Financial statements
58
During the year, there were also redundancy payments totaling £90,938 (2016: £109,708) as a result of restructuring.
Group Group 2017 2016 £’000 £’000
Salaries and emoluments of directly employed staff 8,706 8,037
Social security costs 1,000 899
Pension costs 1,081 949
Agency/temporary staff costs 318 341
Other staff costs 91 110
Total 11,196 10,336
8. Employees for Parent and Group
8a. Staff costs
8b. Staff numbersThe following shows average full time equivalent staff numbers during the year.
Group 2017 Group 2016 F.T.E. Headcount F.T.E. Headcount
Policy and Research 45 54 39 51
Programmes 62 79 58 82
Investment (early-stage and social impact) management 7 10 8 18
Skills 9 10 7 9
Publications, Events and Communications 18 23 21 27
Governance and Corporate Services 32 45 34 50
Total 173 221 167 237
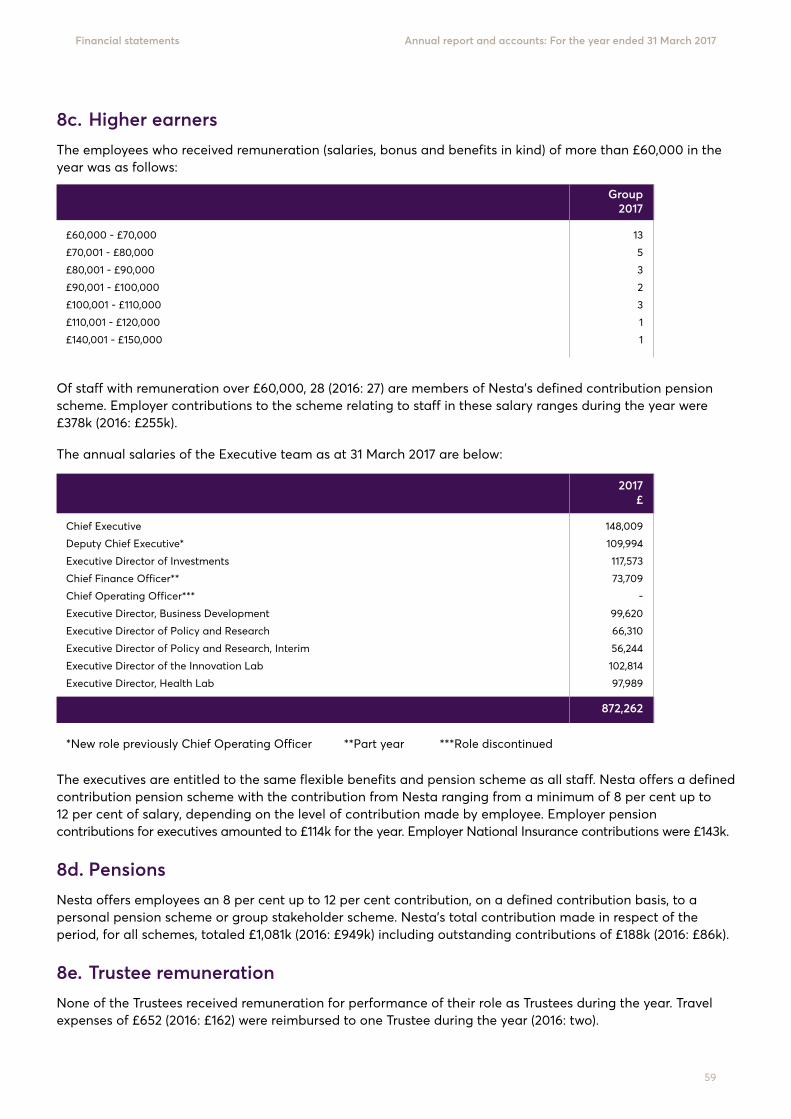
Annual report and accounts: For the year ended 31 March 2017Financial statements
59
The annual salaries of the Executive team as at 31 March 2017 are below:
2017 2016 £ £
Chief Executive 148,009 152,128
Deputy Chief Executive* 109,994 -
Executive Director of Investments 117,573 127,500
Chief Finance Officer** 73,709 102,000
Chief Operating Officer*** - 100,000
Executive Director, Business Development 99,620 110,000
Executive Director of Policy and Research 66,310 109,750
Executive Director of Policy and Research, Interim 56,244 -
Executive Director of the Innovation Lab 102,814 98,594
Executive Director, Health Lab 97,989 95,000
872,262 894,972
*New role previously Chief Operating Officer **Part year ***Role discontinued
The executives are entitled to the same flexible benefits and pension scheme as all staff. Nesta offers a defined contribution pension scheme with the contribution from Nesta ranging from a minimum of 8 per cent up to 12 per cent of salary, depending on the level of contribution made by employee. Employer pension contributions for executives amounted to £114k for the year. Employer National Insurance contributions were £143k.
8d. PensionsNesta offers employees an 8 per cent up to 12 per cent contribution, on a defined contribution basis, to a personal pension scheme or group stakeholder scheme. Nesta’s total contribution made in respect of the period, for all schemes, totaled £1,081k (2016: £949k) including outstanding contributions of £188k (2016: £86k).
8e. Trustee remunerationNone of the Trustees received remuneration for performance of their role as Trustees during the year. Travel expenses of £652 (2016: £162) were reimbursed to one Trustee during the year (2016: two).
8c. Higher earnersThe employees who received remuneration (salaries, bonus and benefits in kind) of more than £60,000 in the year was as follows:
Group Group 2017 2016
£60,000 - £70,000 13 8
£70,001 - £80,000 5 7
£80,001 - £90,000 3 5
£90,001 - £100,000 2 4
£100,001 - £110,000 3 1
£110,001 - £120,000 1 1
£140,001 - £150,000 1 1
Of staff with remuneration over £60,000, 28 (2016: 27) are members of Nesta’s defined contribution pension scheme. Employer contributions to the scheme relating to staff in these salary ranges during the year were £378k (2016: £255k).

Annual report and accounts: For the year ended 31 March 2017 Financial statements
60
£’000 £’000 £’000 £’000 £’000 £’000 £’000 £’000 £’000
Cost Opening balance 2,415 - - 638 16 10 498 350 3,927
Additions - 23,243 3,250 212 - - 347 - 27,052
Transfers - - - - - - - (350) (350)
Disposals (2,415) - - (194) (16) (10) (497) - (3,132)
- 23,243 3,250 656 - - 348 - 27,497
Depreciation Opening balance 2,364 - - 514 16 10 416 - 3,320
Transfers - - - - - - - - -
Charge for the year 51 157 231 104 - - 39 - 582
Disposals in the year (2,415) - - (180) (16) (10) (435) - (3,056)
- 157 231 438 - - 20 - 846
Net book value 2017 - 23,086 3,019 218 - - 328 - 26,651
Net book value 2016 51 - - 124 - - 82 350 607
£’000 £’000 £’000 £’000 £’000 £’000
Cost Opening balance 2,415 638 16 10 498 3,577
Additions - 212 - - 347 559
Transfers - - - - - -
Disposals (2,415) (194) (16) (10) (497) (3,132)
- 656 - - 348 1,004
Depreciation Opening balance 2,364 514 16 10 416 3,320
Transfers - - - - - -
Charge for the year 51 104 - 39 194
Disposals in the year (2,415) (180) (16) (10) (435) (3,056)
- 438 - - 20 458
Net book value 2017 - 218 - - 328 546
Net book value 2016 51 124 - - 82 257
Leas
ehol
d
impr
ovem
ents
Leas
ehol
d
impr
ovem
ents
Leas
ehol
d
asse
t
Plan
t and
m
achi
nery
Com
pute
r H
ardw
are
Com
pute
r H
ardw
are
Com
pute
r So
ftw
are
Com
pute
r So
ftw
are
Off
ice
Eq
uipm
ent
Off
ice
Eq
uipm
ent
Gro
up
Tota
lPa
rent
cha
rity
To
tal
Fixt
ures
and
fit
tings
Fixt
ures
and
fit
tings
Ass
et u
nder
co
nstr
uctio
n
9. Tangible fixed assets Group fixed assets
Parent charity fixed assets
The Assets under construction have been transfered to the investment property listed in Note 10.

Annual report and accounts: For the year ended 31 March 2017Financial statements
61
Quoted investments are held at market value, unquoted investments and the investment property are at fair value.
As at 31 March 2017, total cash and investments assets held by Nesta Trust totaled £417,330k (£343,112k). Refer also to the Investment Review on pages 35 and 36 of this report gives more detail of the investments. The above table has been adusted for consolidation in relation to the Investment Property.
Charges reflect investment management fees grossed up where offset against the value of a fund.
Deferred investments represent the portion of commitments which remain undrawn but for which draw down has been requested at the balance sheet date. The corresponding liability recognised under current liabilities.
The fair value of the investment property was determined by independent professional property valuers, Allsops LLP.
Category £’000 £’000 £’000 £’000 £’000 £’000 £’000
Fixed asset investments
Quoted investments Global Equities 164,990 68,178 (58,199) (790) 25,801 26,093 226,073
Gilts - UK Government (current assets) 11,686 - (11,477) (31) (178) - (0)
Property trust funds 2,528 - (2,427) (4) (306) 209 (0)
Fixed income 33,124 2,000 - (183) 183 4,234 39,358
Bonds 42,060 - - - - 4,145 46,205
Total quoted investments 254,388 70,178 (72,103) (1,008) 25,500 34,681 311,636
Investment property - 27,910 - - - (154) 27,756
Unquoted investmentsManaged Funds
Private equity funds 15,800 921 (5,436) - 1,067 2,133 14,485
Mixed Motive Investments
Investment in early-stage companies 16,467 831 (452) 300 438 (1,120) 16,464
Loans to early-stage funds 765 175 (340) (300) - (300) -
Investment in early-stage funds 8,624 128 (377) - 185 (52) 8,508
Deferred investment early-stage companies 489 4 (491) - - - 2
Deferred loans to early-stage companies 175 - (175) - - - -
Total unquoted investments 42,320 2,059 (7,271) - 1,690 661 39,459
Total investments 296,708 100,147 (79,374) (1,008) 27,190 35,188 378,851
Add
ition
s at
co
st
Cha
rges
Rea
lised
ga
in/(
loss
)
Unr
ealis
ed
gain
/(lo
ss)
Gro
up T
otal
m
arke
t/fa
ir
val
ue a
t 31
M
arch
20
17
Mat
uriti
es,
proc
eeds
and
di
spos
als
at
mar
ket v
alue
Mar
ket
/fai
r va
lue
at
1 A
pri
l 20
16
10. Investments

Annual report and accounts: For the year ended 31 March 2017 Financial statements
62
Realised Unrealised Realised Unrealised gain/(loss) gain/(loss) Group Total gain/(loss) gain/(loss) Group Total 31 March 31 March gain/(loss) 31 March 31 March gain/(loss) 2017 2017 2017 2016 2016 2016 £’000 £’000 £’000 £’000 £’000 £’000
Quoted investments 25,500 34,681 60,181 5,489 (9,402) (3,913)
Unquoted investments 1,690 361 2,051 2,679 3,033 5,712
27,190 35,042 62,232 8,168 -6,369 1,799
Total gains and losses on investment assets above impacting the Consolidated Statement of Financial Activities are summarised as follows:
Market/fair Market/fair Percentage Percentage value at 31 value at 31 of 2017 of 2016 March 2017 March 2016 Portfolio Portfolio £’000 £’000 % %
UK quoted investments 46,205 56,275 12 19
Overseas quoted investments 265,431 198,113 70 67
UK unquoted investments 23,162 24,710 6 8
Overseas unquoted investments 16,297 17,609 4 6
Investment property 27,756 - 8 -
378,851 296,707 100 100
Note 10 - Investments (continued)
Investment assets consist of the following
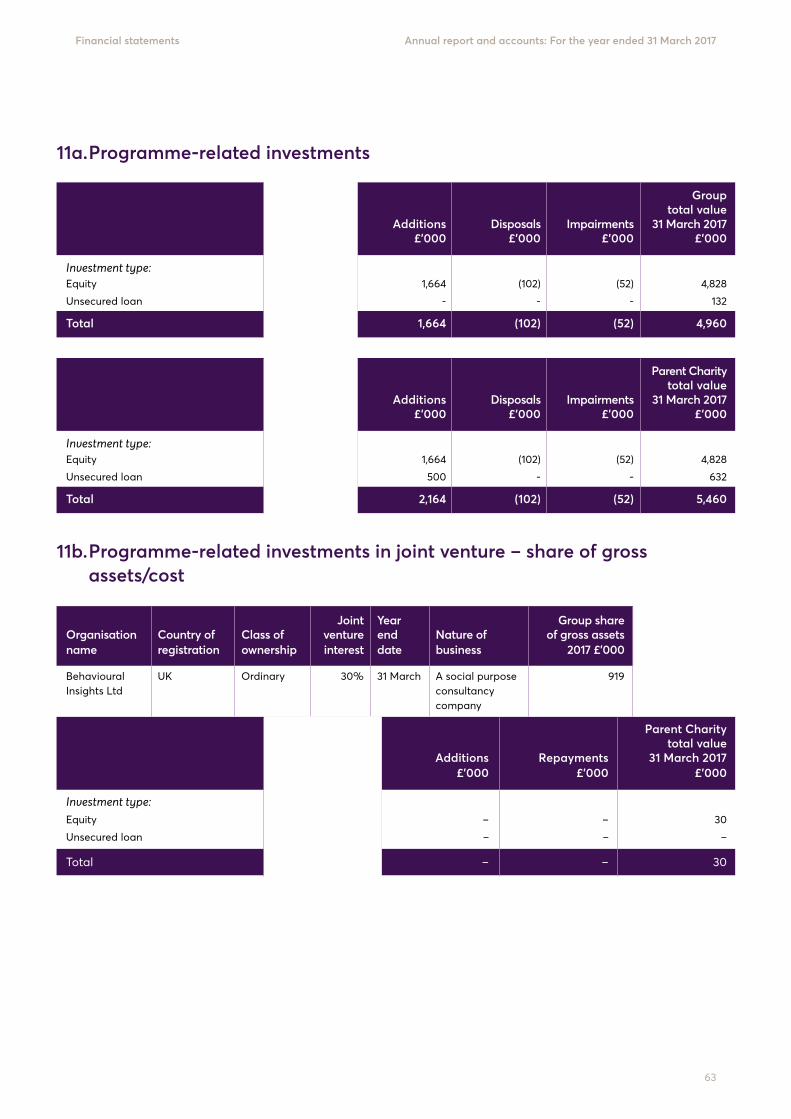
Annual report and accounts: For the year ended 31 March 2017Financial statements
63
11a. Programme-related investments
Group Group total value total value 1 April 2016 Additions Disposals Impairments 31 March 2017 £’000 £’000 £’000 £’000 £’000
Investment type: Equity 3,318 1,664 (102) (52) 4,828
Unsecured loan 132 - - - 132
Total 3,450 1,664 (102) (52) 4,960
Parent Charity Parent Charity total value total value 1 April 2016 Additions Disposals Impairments 31 March 2017 £’000 £’000 £’000 £’000 £’000
Investment type: Equity 3,318 1,664 (102) (52) 4,828
Unsecured loan 132 500 - - 632
Total 3,450 2,164 (102) (52) 5,460
11b. Programme-related investments in joint venture – share of gross assets/cost
Parent Charity Parent Charity total value total value 1 April 2016 Additions Repayments 31 March 2017 £’000 £’000 £’000 £’000
Investment type:Equity 30 – – 30
Unsecured loan – – – –
Total 30 – – 30
Joint Year Group share Group share Organisation Country of Class of venture end Nature of of gross assets of gross assets name registration ownership interest date business 2017 £’000 2016 £’000
Behavioural UK Ordinary 30% 31 March A social purpose 919 808 Insights Ltd consultancy company

Annual report and accounts: For the year ended 31 March 2017 Financial statements
64
11c. Arts Impact investments
Group Group total value total value 1 April 2016 Additions Disposals Impairments 31 March 2017 £’000 £’000 £’000 £’000 £’000
Investment type:Unsecured loans 133 730 (32) - 831
Total 133 730 (32) - 831
12. Debtors
Group Parent Group Parent 2017 2017 2016 2016 £’000 £’000 £’000 £’000
Amounts falling due within one year:
Trade receivables 761 348 401 343
Amounts due from subsidiaries - 1,295 - 2,630
Amounts due from joint ventures 20 20 - 55
Accrued income 3,640 2,596 30,295 2,220
Prepayments 359 283 5,307 208
Tax receivable - - 90 -
Other debtors 216 109 619 156
Total debtors falling due within one year 4,996 4,651 36,712 5,612
Included in accrued income at 31 March 2016 is £28 million relating to sale proceeds from sale of an investment asset. Within prepayments at 31 March 2016 is £5.1 million relating to a deposit for the purchase of 58 Victoria Embankment which was completed in September 2016.
Amounts falling due after more than one year:
Accrued income 2,309 2,309 2,666 2,666
Total debtors falling due after more than one year 2,309 2,309 2,666 2,666
Total debtors 7,305 6,960 39,378 8,278
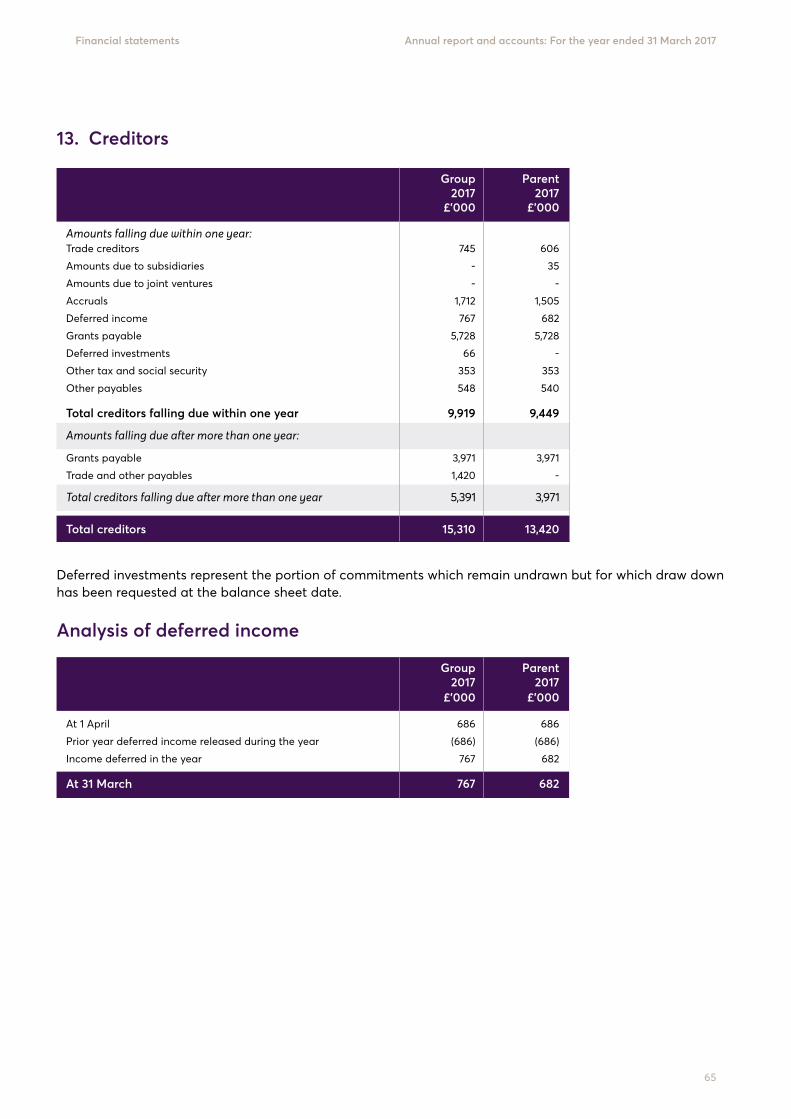
Annual report and accounts: For the year ended 31 March 2017Financial statements
65
Group Parent Group Parent 2017 2017 2016 2016 £’000 £’000 £’000 £’000
At 1 April 686 686 411 411
Prior year deferred income released during the year (686) (686) (411) (411)
Income deferred in the year 767 682 686 686
At 31 March 767 682 686 686
13. Creditors
Deferred investments represent the portion of commitments which remain undrawn but for which draw down has been requested at the balance sheet date.
Analysis of deferred income
Group Parent Group Parent 2017 2017 2016 2016 £’000 £’000 £’000 £’000
Amounts falling due within one year:Trade creditors 745 606 596 537
Amounts due to subsidiaries - 35 - 491
Amounts due to joint ventures - - - 21
Accruals 1,712 1,505 2,047 1,795
Deferred income 767 682 686 686
Grants payable 5,728 5,728 1,744 1,744
Deferred investments 66 - 664 -
Other tax and social security 353 353 427 427
Other payables 548 540 270 245
Total creditors falling due within one year 9,919 9,449 6,434 5,946
Amounts falling due after more than one year:
Grants payable 3,971 3,971 121 121
Trade and other payables 1,420 - 920 -
Total creditors falling due after more than one year 5,391 3,971 1,041 121
Total creditors 15,310 13,420 7,475 6,067

Annual report and accounts: For the year ended 31 March 2017 Financial statements
66
14. Subsidiaries
Country of Share Year Organisation registration and Class of Parent capital end name registered charity/ ownership interest held date Nature of business company number
United Kingdom charity number Sole corporate A charitable Trust that holds The Nesta Trust 1144683 Trustee 31 March investment assets
Nesta United Kingdom Enterprises company number Limited 08580327 Ordinary 100% £1 31 March A charitable trading company
United Kingdom General Partner in the Nesta Impact Nesta GP company number Investments 1 Limited Partnership Limited 08231985 Ordinary 100% £1 31 March Fund
United Kingdom Limited Partner in the Nesta Impact Nesta PRI company number Investments 1 Limited Partnership Limited 08232090 Ordinary 100% £1 31 March Fund
United Kingdom (Dormant) Partner in Nesta Nesta Partners company number Investment Management LLP and Limited 06618114 Ordinary 100% £1 31 March Nesta Arts Impact LLP
Nesta United Kingdom Investment company number Limited Liability Management LLP OC338038 Partnership 31 March Investment manager of funds
Nesta Arts United Kingdom Impact LLP company number Limited Liability Financial support for arts OC396102 Partnership 31 March organisations
(Dormant)To engage in charitable and educational activities within the Non- meaning of Section 501(c)(3) of the Nesta US Inc United States Sole member 100% stock 31 March Internal Revenue Code 1986
The results of the consolidated entities are as follows:
2017 2016 2017 2016 2017 2016 2017 2016 2017 2016 2017 2016 £’000 £’000 £’000 £’000 £’000 £’000 £’000 £’000 £’000 £’000 £’000 £’000
Income 1,298 1,976 440 440 - - 441 441 7 362 2,878 565
Expenditure (20,902) (17,623) (440) (440) (190) (969) (389) (466) (170) (145) (2,878) (565)
Other gains/ (losses) 62,865 1,942 - - - - - - - - -
Partner share/ Profit/(loss) for the period 43,261 (13,705) - - (190) (969) 52 (25) (163) 217 - -Assets 418,510 377,159 84 - 3,466 1,855 465 432 2,022 1,269 985 803
Liabilities (182) (2,092) (84) - (5,348) (3,928) (165) (32) (1,968) (1,052) (985) (803)
Net assets 418,328 375,067 0 - (1,882) (2,073) 300 400 54 217 0 -
Opening net assets 375,067 388,772 - - (2,073) (1,104) 400 402 217 - - -
Nes
ta P
RI
Lim
ited
Nes
ta P
RI
Lim
ited
Nes
ta G
P
Lim
ited
Nes
ta G
P
Lim
ited
Nes
ta T
rust
Nes
ta T
rust
Nes
ta In
vest
men
t M
anag
eman
ent
LLP
Nes
ta E
nter
pris
es
Lim
ited
Nes
ta A
rts
Impa
ct
LLP
Nes
ta A
rts
Impa
ct
LLP
Nes
ta E
nter
pris
es
Lim
ited
Nes
ta In
vest
men
t M
anag
eman
ent
LLP

Annual report and accounts: For the year ended 31 March 2017Financial statements
67
15. Funds
15a.Unrestricted funds
General Endowment Funds retained Total funds funds within £’000 £’000 £’000 non-charitable subsidiaries or joint ventures £’000
Balance at 1 April 2016 2,138 375,067 788 377,993Net income/(expenditure) (15,167) 394 3,112 (11,661)Transfers to restricted funds (2,110) - - (2,110)Transfers from endowment to unrestricted funds 19,363 (19,363) - -Gains - 62,378 - 62,378Share of operating profit in joint venture - - 145 145
Balance at 31 March 2017 4,224 418,476 4,045 426,745
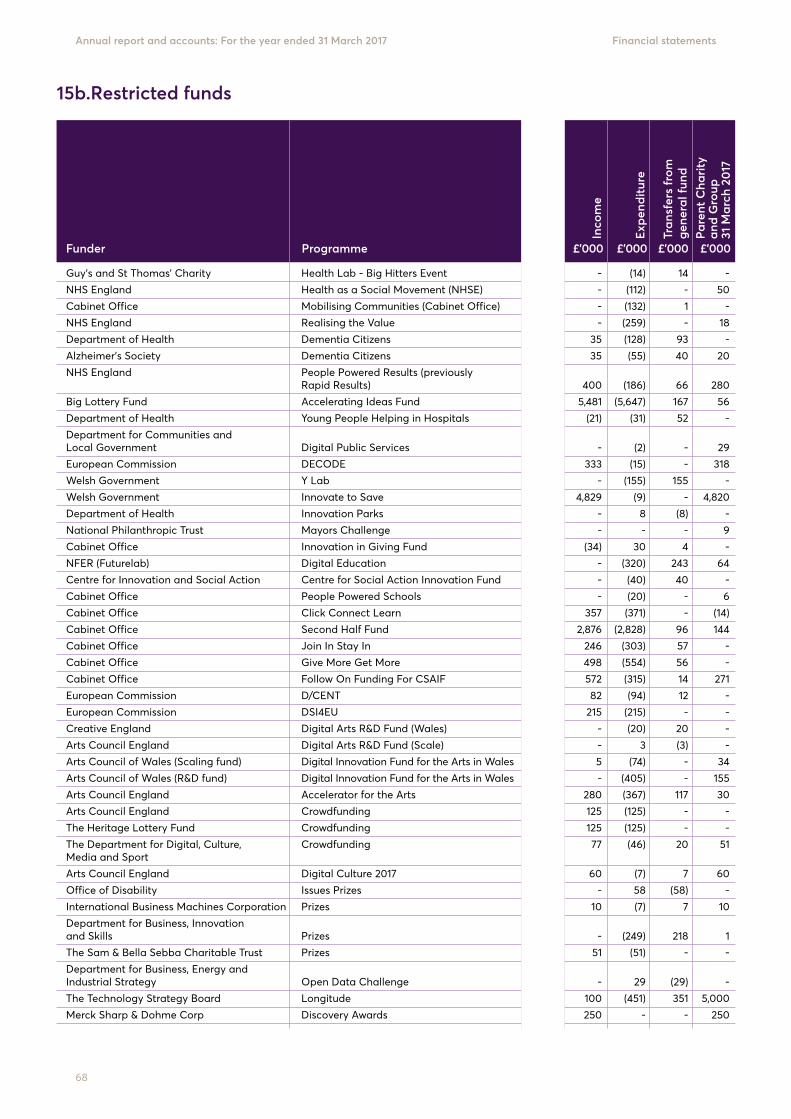
Annual report and accounts: For the year ended 31 March 2017 Financial statements
68
Guy’s and St Thomas’ Charity Health Lab - Big Hitters Event - - (14) 14 -
NHS England Health as a Social Movement (NHSE) 162 - (112) - 50
Cabinet Office Mobilising Communities (Cabinet Office) 131 - (132) 1 -
NHS England Realising the Value 277 - (259) - 18
Department of Health Dementia Citizens - 35 (128) 93 -
Alzheimer’s Society Dementia Citizens - 35 (55) 40 20
NHS England People Powered Results (previously Rapid Results) - 400 (186) 66 280
Big Lottery Fund Accelerating Ideas Fund 55 5,481 (5,647) 167 56
Department of Health Young People Helping in Hospitals - (21) (31) 52 -
Department for Communities and Local Government Digital Public Services 31 - (2) - 29
European Commission DECODE - 333 (15) - 318
Welsh Government Y Lab - - (155) 155 -
Welsh Government Innovate to Save - 4,829 (9) - 4,820
Department of Health Innovation Parks - - 8 (8) -
National Philanthropic Trust Mayors Challenge 9 - - - 9
Cabinet Office Innovation in Giving Fund - (34) 30 4 -
NFER (Futurelab) Digital Education 141 - (320) 243 64
Centre for Innovation and Social Action Centre for Social Action Innovation Fund - - (40) 40 -
Cabinet Office People Powered Schools 26 - (20) - 6
Cabinet Office Click Connect Learn - 357 (371) - (14)
Cabinet Office Second Half Fund - 2,876 (2,828) 96 144
Cabinet Office Join In Stay In - 246 (303) 57 -
Cabinet Office Give More Get More - 498 (554) 56 -
Cabinet Office Follow On Funding For CSAIF - 572 (315) 14 271
European Commission D/CENT - 82 (94) 12 -
European Commission DSI4EU - 215 (215) - -
Creative England Digital Arts R&D Fund (Wales) - - (20) 20 -
Arts Council England Digital Arts R&D Fund (Scale) - - 3 (3) -
Arts Council of Wales (Scaling fund) Digital Innovation Fund for the Arts in Wales 103 5 (74) - 34
Arts Council of Wales (R&D fund) Digital Innovation Fund for the Arts in Wales 560 - (405) - 155
Arts Council England Accelerator for the Arts - 280 (367) 117 30
Arts Council England Crowdfunding - 125 (125) - -
The Heritage Lottery Fund Crowdfunding - 125 (125) - -
The Department for Digital, Culture, Crowdfunding - 77 (46) 20 51 Media and Sport
Arts Council England Digital Culture 2017 - 60 (7) 7 60
Office of Disability Issues Prizes - - 58 (58) -
International Business Machines Corporation Prizes - 10 (7) 7 10
Department for Business, Innovation and Skills Prizes 32 - (249) 218 1
The Sam & Bella Sebba Charitable Trust Prizes - 51 (51) - -
Department for Business, Energy and Industrial Strategy Open Data Challenge - - 29 (29) -
The Technology Strategy Board Longitude 5,000 100 (451) 351 5,000
Merck Sharp & Dohme Corp Discovery Awards - 250 - - 250
Funder Programme £’000 £’000 £’000 £’000 £’000
Inco
me
Exp
end
itur
e
Tran
sfer
s fr
om
gene
ral f
und
Par
ent
Cha
rity
an
d G
roup
31
Mar
ch 2
017
Par
ent
Cha
rity
and
G
roup
1 A
pri
l 20
16
15b.Restricted funds

Annual report and accounts: For the year ended 31 March 2017Financial statements
69
European Commission EUICT 59 - (3) - 56
Global Innovation Fund Aquaculture Prize Design - 239 (144) 24 119
Lloyd’s Registration Foundation Safety Challenges - 90 (4) - 86
European Commission and European Business & Innovation Centre Network Accelerators FP7 Transition - 20 - - 20
Australian Department of Industry Innovation Growth Lab 19 50 (32) 29 66
Danish Business Authority Innovation Growth Lab (3) - - 3 -
Dutch Ministry of Economic Affairs Innovation Growth Lab 10 - (5) 4 9
Innovate UK (formerly Technology Strategy Board) Innovation Growth Lab 23 50 (33) 31 71
The Department for Business, Energy and Industrial Strategy Innovation Growth Lab 24 - (11) 10 23
Swedish Agency for Growth Policy Analysis Innovation Growth Lab 25 - (11) 11 25
Agency for Business competitiveness - AccInio Innovation Growth Lab 27 25 (24) 22 50
Tekes Innovation Growth Lab 14 25 (18) 16 37
Argidius Foundation Innovation Growth Lab - 40 (18) 17 39
Innovation Norway Innovation Growth Lab - 50 (23) 21 48
Scottish Enterprise Innovation Growth Lab - 50 (23) 21 48
Austrian Research Promotion Agency (FFG) Innovation Growth Lab - 50 (23) 21 48
UCL Start ups Workstream - - (37) 37 -
DFiD DfID India innovation capacity building - - (2) 2 -
European Commission European Digital Forum - 112 (89) (22) 1
European Commission Startup Europe Partnership - 50 (45) (5) -
Foreign and Commonwealth Office Accelerated Tech China - 9 (3) (5) 1
British Council Makerspaces China - - (1) 1 -
Foreign and Commonwealth Office São Paulo Open Innovation - 125 (91) - 34
Arts and Humanities Research Council Measuring Cultural Value 7 - - - 7
Creative England The Anatomy of Creative Clusters - - (10) 10 -
UKIE Video Games Living Map - 24 (7) - 17
The Welsh Government Arloesiadur 24 90 (156) 42 -
ESRC - Alliance for Useful Evidence UK Alliance for Useful Evidence 28 181 (121) 25 113
Big Lottery - Alliance for Useful Evidence UK Alliance for Useful Evidence 46 160 (120) 25 111
Welcome Trust A4UE Evidence Exchange 46 - (45) - 1
What Works Centre for Wellbeing A4UE Evidence Exchange 16 - (15) - 1
European Commission Social Innovation Community - 112 (42) - 70
Improvement & Development Agency Local Government Local Datavores - 25 (30) 5 -
SAP Local Datavores - 15 (17) 3 -
Rockefeller Foundation Bloomberg Philanthropies - - (26) 26 -
UNDP BRH UNDP - 33 - - 33
EU Commission EU Design Innovation Platform - 114 (98) (16) -
Bloomberg Philanthropies ISCHOOL - 100 (59) - 41
6,892 18,826 (14,990) 2,110 12,838
Funder Programme £’000 £’000 £’000 £’000 £’000
Inco
me
Exp
end
itur
e
Tran
sfer
s fr
om
gene
ral f
und
Par
ent
Cha
rity
an
d G
roup
31
Mar
ch 2
017
Par
ent
Cha
rity
and
G
roup
31
Mar
ch
2015
/1 A
pri
l 20
16
In many cases restricted income is received for programmes for which there is part or match-funding by Nesta (either in cash or in kind). The expenditure shown as restricted is total expenditure of the programme funded by both Nesta and the external donor. A transfer from the general fund represents the portion of the programme funded by Nesta.

Annual report and accounts: For the year ended 31 March 2017 Financial statements
70
16.Analysis of net assets between funds
Expendable Unrestricted Restricted endowment Group funds funds funds Total funds 2017 2017 2017 2017 £’000 £’000 £’000 £’000
Fund balances are represented by:Tangible fixed assets 546 - 26,105 26,651
Investment assets 6,710 - 378,851 385,561
Current and long-term assets 16,141 12,838 13,702 42,681
Current and long-term liabilities and provisions (15,128) - (182) (15,310)
Total net assets 8,269 12,838 418,476 439,583
Expendable Unrestricted Restricted endowment Group funds funds funds Total funds 2016 2016 2016 2016 £’000 £’000 £’000 £’000
Fund balances are represented by:
Tangible fixed assets 257 - 350 607
Investment assets 4,391 - 296,707 301,098
Current assets 1,535 9,018 80,102 90,655
Current and long-term liabilities and provisions (3,257) (2,126) (2,092) (7,475)
Total net assets 2,926 6,892 375,067 384,885

Annual report and accounts: For the year ended 31 March 2017Financial statements
71
Charity Charity 2017 2016 £’000 £’000
Gross income: Income 41,868 27,810
Income of non-charitable subsidiaries 5,056 3,135
46,924 30,945
Less: share of joint venture turnover (3,157) (2,309)
43,767 28,636
Gross expenditure: Expenditure 32,041 23,787
Interest payable - -
Depreciation and charges for impairment of fixed assets 582 383
32,623 24,170
Share of profit in joint ventures 145 335
Net income for the year 11,289 4,801
Reconciliation to Consolidated Statement of Financial Activities:Net income for the year 11,289 4,801
Movement on endowment funds 43,409 (13,705)
Net income/(expenditure) 54,698 (8,904)
17. Summary consolidated income and expenditure account for the year ended 31 MarchThe summary income and expenditure account is presented in order to ensure compliance with the Companies Act 2006.
The major difference in the figures presented from those in the Consolidated Statement of Financial Activities is that unrealised gains and losses on investment assets are not recognised.
18. Contingent liabilitiesThere were no contingent liabilities at the Balance Sheet date.

Annual report and accounts: For the year ended 31 March 2017 Financial statements
72
19. CommitmentsInvestments, loans or contributions to funds that have been contracted but not yet drawn down, and grant agreements not yet signed by Nesta by balance date, are shown as commitments below.
Parent Parent Charity and Charity and Group total Group total at 1 April De- Drawn 31 March 2016 Additions committed down Contracted 2017 £’000 £’000 £’000 £’000 £’000 £’000
Investments, loans, contributions to funds:Private equity secondaries 6,136 - - - - 6,136
Investments in early-stage funds 168 - - - - 168
Investments or loans in early-stage companies 3 - - - - 3
Programme-related investments 4,575 - - (1,513) - 3,062
Arts Impact Fund investments 1,000 - - (500) - 500
Grants: Grant agreements not yet signed by Nesta 190 11,353 - - (11,203) 340
Other: Property – 58 Victoria Embankment 45,855 8,548 - (54,403) - -
Total 57,927 19,901 - (56,416) (11,203) 10,209
20. Operating lease commitmentsAt 31 March 2017 the Charity was committed to annual payments during the next year in respect of operating leases which expire within the following periods.
At 31 March 2017 the Nesta Parent Charity had entered into an agreement with an organisation to lease part of 58 Victoria Embankment. The rental payments due to the Parent Charity are:
Expire Expire Expire within within two in more than one year to five years five years £’000 £’000 £’000
Buildings - 58 Victoria Embankment - - 37,583
Photocopiers 1 43 -
Total 1 43 37,583
Expire Expire Expire within within two in more than one year to five years five years £’000 £’000 £’000
Rental of part of 58 Victoria Embankment 146 1,757 2,196
Total 146 1,757 2,196

Annual report and accounts: For the year ended 31 March 2017Financial statements
73
Name Position at Nesta Related party Transaction £ £ £ £
David Pitt-Watson Trustee, Nesta Trustee and Facilitating the Asia Treasurer, Oxfam Impact@scale UK Accelerator - (7,920) (7,920) -
David Pitt-Watson Trustee, Nesta Public Interest Quality of Evidence, Committee Member, uncertainty and risk KPMG UK LLP project - (7,200) (7,200) -
Simon Linnett Trustee, Nesta Trustee, Science Venue hire Museum Group - 1,394 1,394 -
Sir John Gieve Trustee, Nesta Visiting Professor, Catering expenses University College and workshop London - (21,992) (392) (21,600)
Sir John Gieve Trustee, Nesta Visiting Professor, Research commissioned University College London - 86,992 86,992 -
Sir John Gieve Trustee, Nesta Trustee, Clore Social Leadership Training - 495 495 -
Geoff Mulgan Chief Executive Visiting Professor, Catering expenses Officer University College and workshop London - (21,992) (392) (21,600)
Geoff Mulgan Chief Executive Member of OECD’S Study skills for Public Officer Expert Advisory Sector and trAWel Group expenses - (43,322) (43,322) -
Geoff Mulgan Chief Executive Founder, Chair and Payments for Unusual Officer Board Member, Suspects Festival and Social Innovation organisational Exchange membership - 20,000 20,000 -
Geoff Mulgan Chief Executive Founder, Chair and Catering Officer Board Member, Social Innovation Exchange - (4,728) (4,728) -
Celia Hannon Director of Mother is a Board Catering expenses Explorations - Policy member and & Research consultant at Innovation Unit - (194) (194) -
Out
stan
ding
ba
lanc
e 1
Apr
il 20
16
Exp
ense
Pay
men
ts/
(Rec
eipt
s)
Out
stan
ding
ba
lanc
e 31
Mar
ch 2
017
21. Related party transactionsThe Trust holds investment assets previously held by NESTA which was abolished on 1 April 2012. The Trust is a registered charitable trust which is classified by the Office of National Statistics as within the public sector boundary. The Trust has transferred sums to its Trustee Nesta in furtherance of its charitable objects during the year. Nesta has had transactions with Government Departments and bodies during the year as part of its ordinary course of business. As the Trust is not involved in the operational decisions of Nesta, any transactions between Government Departments/bodies and Nesta are not considered to be related party transactions.
Nesta’s Trustees are drawn from among its key stakeholders, and staff may at times have links to stakeholder organisations and therefore it is in the nature of Nesta’s business to have some transactions which are classified as related. All transactions are entered into the ordinary course of business and on an arm’s length basis, consistent with Nesta’s policy on potential conflicts of interest. During the year Nesta entered into the following material transactions with related parties.
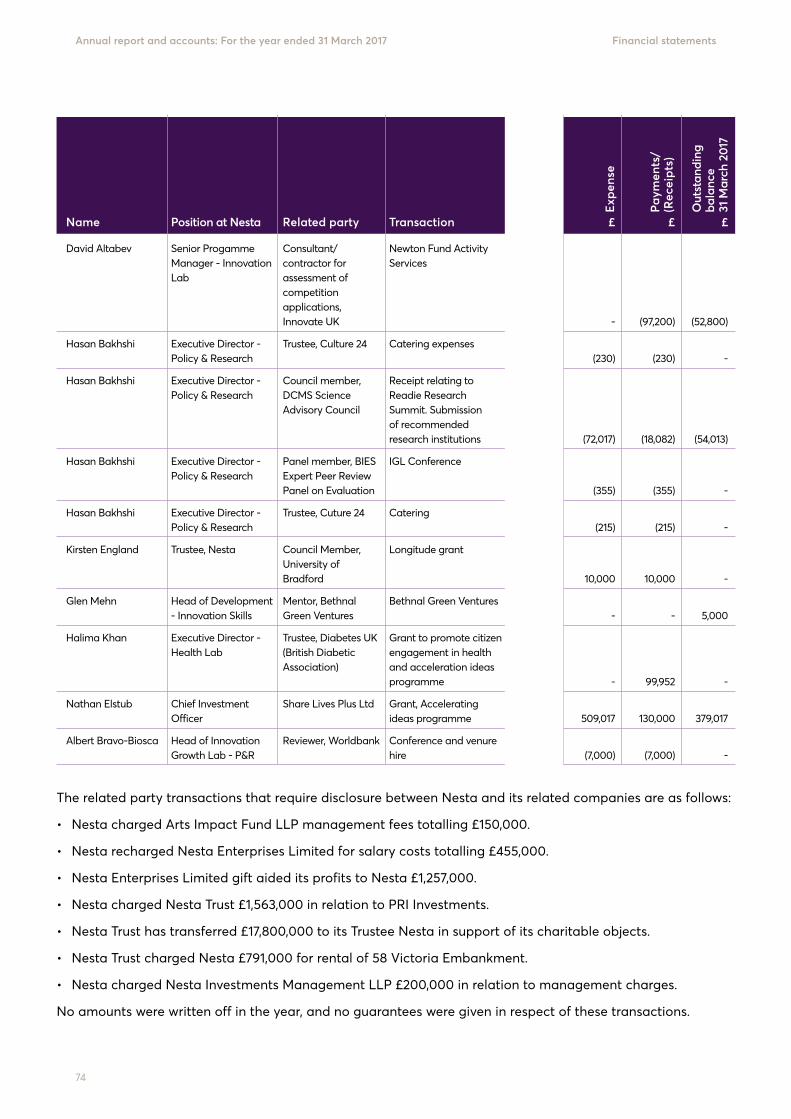
Annual report and accounts: For the year ended 31 March 2017 Financial statements
74
David Altabev Senior Progamme Consultant/ Newton Fund Activity Manager - Innovation contractor for Services Lab assessment of competition applications, Innovate UK (150,000) - (97,200) (52,800)
Hasan Bakhshi Executive Director - Trustee, Culture 24 Catering expenses Policy & Research - (230) (230) -
Hasan Bakhshi Executive Director - Council member, Receipt relating to Policy & Research DCMS Science Readie Research Advisory Council Summit. Submission of recommended research institutions (78) (72,017) (18,082) (54,013)
Hasan Bakhshi Executive Director - Panel member, BIES IGL Conference Policy & Research Expert Peer Review Panel on Evaluation - (355) (355) -
Hasan Bakhshi Executive Director - Trustee, Cuture 24 Catering Policy & Research - (215) (215) -
Kirsten England Trustee, Nesta Council Member, Longitude grant University of Bradford - 10,000 10,000 -
Glen Mehn Head of Development Mentor, Bethnal Bethnal Green Ventures - Innovation Skills Green Ventures 5,000 - - 5,000
Halima Khan Executive Director - Trustee, Diabetes UK Grant to promote citizen Health Lab (British Diabetic engagement in health Association) and acceleration ideas programme 99,952 - 99,952 -
Nathan Elstub Chief Investment Share Lives Plus Ltd Grant, Accelerating Officer ideas programme - 509,017 130,000 379,017
Albert Bravo-Biosca Head of Innovation Reviewer, Worldbank Conference and venure Growth Lab - P&R hire - (7,000) (7,000) -
Name Position at Nesta Related party Transaction £ £ £ £
Out
stan
ding
ba
lanc
e 1
Apr
il 20
16
Exp
ense
Pay
men
ts/
(Rec
eipt
s)
Out
stan
ding
ba
lanc
e 31
Mar
ch 2
017
The related party transactions that require disclosure between Nesta and its related companies are as follows:
• Nesta charged Arts Impact Fund LLP management fees totalling £150,000.
• Nesta recharged Nesta Enterprises Limited for salary costs totalling £455,000.
• Nesta Enterprises Limited gift aided its profits to Nesta £1,257,000.
• Nesta charged Nesta Trust £1,563,000 in relation to PRI Investments.
• Nesta Trust has transferred £17,800,000 to its Trustee Nesta in support of its charitable objects.
• Nesta Trust charged Nesta £791,000 for rental of 58 Victoria Embankment.
• Nesta charged Nesta Investments Management LLP £200,000 in relation to management charges.
No amounts were written off in the year, and no guarantees were given in respect of these transactions.

Annual report and accounts: For the year ended 31 March 2017Reference and administrative details
75
Trustees and Main Board Committee Members
Trustees
Sir John Gieve (Chair)
Madeleine Atkins Resigned 14 July 2017
Dame Julie Mellor Resigned 14 July 2017
Kim Shillinglaw
Kersten England
David Pitt-Watson
Michelle Harrison Resigned 16 March 2017
Ed Wray
Piers Linney
Simon Linnett
Natalie Tydeman
Finance and Audit Committee
Simon Linnett (Chair)
Madeleine Atkins Resigned 14 July 2017
Ed Wray
Tony Thomas (Non-Trustee member)
Remuneration Committee
Dame Julie Mellor (Chair) Resigned 14 July 2017
David Pitt-Watson
Simon Linnett
Trust Investment Committee
David Pitt-Watson (Chair)
Sir John Gieve
Simon Linnett
Sally Bridgeland (Non-Trustee member) Reappointed 31 April 2017
Venture Investment Committee
Natalie Tydeman (Chair)
Sir John Gieve
Ernie Richardson (Non-Trustee member) Resigned 15 April 2016
Nominations Committee
Ed Wray (Chair)
Sir John Gieve
Kim Shillinglaw
Innovation Lab Committee
Kersten England (Chair)
Madeleine Atkins Resigned 14 July 2017
Dame Julie Mellor Resigned 14 July 2017
Geoff Mulgan (Non-Trustee member)
Jon Drori (Non-Trustee member)
Alex Craven (Non-Trustee member)
Protector of the Nesta Trust
James Sinclair Taylor
Reference and administrative details

Annual report and accounts: For the year ended 31 March 2017 Reference and administrative details
76
Executive Team
Administrative details of the Charity
Geoff Mulgan Chief Executive Officer
Simon Morrison Deputy Chief Executive Appointed 1 April 2017 Chief Operating Officer 1 July 2015 until 1 April 2017
Trevor Richards Chief Financial Officer
Helen Goulden Executive Director of the Innovation Lab
Nathan Elstub Chief Investment Officer
Halima Khan Executive Director, Health Lab
Stian Westlake Executive Director of Policy and Research Resigned 20 January 2017
Kirsten Bound Executive Director of Policy and Research Appointed 16 May 2017
Brenton Caffin Executive Director of Global Innovation Appointed April 2017
Tom Blathwayt Executive Director for Enterprise Development Resigned 16 June 2017
Corinna Theuma General Counsel and Company Secretary
Registered name Nesta (changed from ‘Nesta Operating Company’ on 22 July 2013)
Companies House registered number 07706036 (registered 15 July 2011)
Charity Commission registered number 1144091 (registered 30 September 2011)
Office of the Scottish Charity Regulator registered number SC042833 (registered 30 December 2011)
Registered Office 58 Victoria Embankment London, EC4Y 0DS
Independent Auditor BDO LLP 2 City Place, Beehive Ring Road Gatwick, West Sussex, RH6 0PA
Internal Auditor Grant Thorton UK LLP 30 Finsbury Square London, EC2P 2YU
Principal Bankers Lloyds Bank plc 25 Gresham Street London, EC2V 7HN

58 Victoria Embankment London EC4Y 0DS
+44 (0)20 7438 2500 [email protected] @nesta_uk www.facebook.com/nesta.ukwww.nesta.org.uk
Nesta is a registered charity in England and Wales with company number 7706036 and charity number 1144091. Registered as a charity in Scotland number SCO42833. Registered office: 58 Victoria Embankment, London, EC4Y 0DS.


