452
ANNUAL REPORT AND ACCOUNTS FOR THE YEAR ENDED 31 DECEMBER 2016 BNY MELLON GLOBAL FUNDS, PLC

ANNUAL REPORT AND ACCOUNTS FOR THE YEAR ENDED 31 DECEMBER 2016
BNY MELLON GLOBAL FUNDS, PLC


BNY Mellon Global Funds, plc (the ‘Company’)
Addendum to the Report for the 12 month period ended 31 December 2016 for investors based in Hong Kong
1. Please note the following funds are not authorised in Hong Kong and are not available to Hong Kong
residents. BNY Mellon Absolute Insight Fund BNY Mellon Absolute Return Bond Fund BNY Mellon Absolute Return Equity Fund BNY Mellon Asian Bond Fund BNY Mellon Asian Income Fund BNY Mellon Brazil Equity Fund BNY Mellon Dynamic Total Return Fund BNY Mellon Emerging Markets Corporate Debt Fund BNY Mellon Emerging Markets Debt Fund BNY Mellon Emerging Markets Debt Opportunistic Fund BNY Mellon Euroland Bond Fund BNY Mellon European Credit Fund BNY Mellon Global Credit Fund BNY Mellon Global Dynamic Bond Fund BNY Mellon Global Emerging Markets Fund BNY Mellon Global Equity Income Fund BNY Mellon Global High Yield Bond Fund BNY Mellon Global Leaders Fund BNY Mellon Global Opportunistic Bond Fund BNY Mellon Global Property Securities Fund BNY Mellon Global Real Return Fund (EUR) BNY Mellon Global Real Return Fund (GBP) BNY Mellon Global Real Return Fund (USD) BNY Mellon Global Short-Dated High Yield Bond Fund BNY Mellon Japan All Cap Equity Fund BNY Mellon Japan REIT Alpha Fund BNY Mellon Japan Small Cap Equity Focus Fund BNY Mellon Long-Term Global Equity Fund BNY Mellon Targeted Return Bond Fund BNY Mellon US Opportunities Fund
2. Performance comparison of the tracker portfolios with the actual indices for 2016 year to date
31 December 2016 BNY Mellon S&P 500 Index Tracker: 9.96% S&P 500 Index: 11.23% Source: Lipper as at 31December 2016.The performance of the tracker portfolios is stated on a total return basis, including ongoing charge, but excluding initial charge, net of performance fees income reinvested gross of tax, expressed in share class currency. The impact of the initial charge which may be up to 5% can be material on the performance of your investment.
VBS_ID=000001;VBS_PAPIER=JAUNE

3.
Hig
hest
and
Low
est N
et A
sset
Val
ue p
er s
hare
BNY
Mel
lon
Asia
n Eq
uity
U
SD A
BNY
Mel
lon
Asia
n Eq
uity
U
SD B
BNY
Mel
lon
Asia
n Eq
uity
U
SD C
BNY
Mel
lon
Emer
ging
M
arke
ts
Debt
Lo
cal
Curr
ency
EU
R A
BNY
Mel
lon
Emer
ging
M
arke
ts
Debt
Loc
al
Curr
ency
U
SD A
BNY
Mel
lon
Emer
ging
M
arke
ts
Debt
Loc
al
Curr
ency
EU
R C
BNY
Mel
lon
Emer
ging
M
arke
ts
Debt
Loc
al
Curr
ency
U
SD C
BNY
Mel
lon
Emer
ging
M
arke
ts
Debt
Loca
l Cu
rren
cy
USD
C In
c*
BNY
Mel
lon
Emer
ging
M
arke
ts
Debt
Loc
al
Curr
ency
U
SD X
High
est p
rice
2007
3.70
15
3.76
444.
0199
0.88
911.
0197
0.89
02
1.27
52-
1.29
61Lo
wes
t pric
e 20
072.
3721
2.
4044
2.55
910.
8137
1.00
000.
8052
1.
0467
-1.
0536
High
est p
rice
2008
3.43
67
3.50
463.
7527
0.87
451.
0678
0.87
87
1.33
941.
0426
1.36
96Lo
wes
t pric
e 20
081.
3805
1.
4113
1.51
510.
7368
0.75
760.
7429
0.
9514
0.74
050.
9748
High
est p
rice
2009
2.90
38
2.98
413.
2199
0.94
131.
1111
0.95
52
1.40
371.
0392
1.45
44Lo
wes
t pric
e 20
091.
4879
1.
5232
1.63
750.
7666
0.77
790.
7744
0.
9787
0.72
451.
0066
High
est p
rice
2010
3.58
05
3.69
674.
0074
1.18
131.
2842
1.20
34
1.62
891.
1378
1.70
25Lo
wes
t pric
e 20
102.
4677
2.
5420
2.74
930.
9394
1.07
570.
9534
1.
3602
0.95
011.
4119
High
est p
rice
2011
3.75
75
3.88
814.
2243
1.18
431.
3339
1.20
85
1.69
861.
0962
1.78
99Lo
wes
t pric
e 20
112.
6423
2.
7404
2.98
421.
0927
1.17
021.
1189
1.
4927
0.95
161.
5769
High
est p
rice
2012
3.26
59
3.40
423.
7286
1.30
581.
3568
1.34
31
1.74
001.
0606
1.86
07Lo
wes
t pric
e 20
122.
7604
2.
8725
3.13
851.
1460
1.17
871.
1753
1.
5074
0.93
861.
6028
High
est p
rice
2013
3.52
11
3.68
114.
0407
1.34
031.
4061
1.38
37
1.80
661.
0765
1.93
97Lo
wes
t pric
e 20
132.
9667
3.
1062
3.41
481.
1012
1.18
861.
1406
1.
5296
0.90
321.
6479
High
est p
rice
2014
3.48
18
3.66
594.
0506
1.21
821.
2923
1.26
60
1.67
040.
9380
1.81
60Lo
wes
t pric
e 20
142.
9455
3.
0909
3.40
551.
0595
1.09
191.
0979
1.
4143
0.78
031.
5440
High
est p
rice
2015
3.25
50
3.43
753.
8098
1.27
681.
1375
1.33
09
1.47
430.
8036
1.61
17Lo
wes
t pric
e 20
152.
5599
2.
7084
3.00
731.
0201
0.91
691.
0659
1.
1935
0.62
591.
3162
High
est p
rice
2016
3.10
10
3.29
803.
6808
1.21
541.
0732
1.27
67
1.40
170.
7049
1.55
66Lo
wes
t Pric
e 20
162.
4059
2.
5515
2.83
961.
0129
0.88
621.
0600
1.
1541
0.59
641.
2741
VBS_ID=000001;VBS_PAPIER=JAUNE

BNY
Mel
lon
Glob
al
Bond
U
SD A
BNY
Mel
lon
Glob
al
Bond
U
SD B
BNY
Mel
lon
Glob
al
Bond
U
SD C
BNY
Mel
lon
Glob
al
Bond
U
SD X
BNY
Mel
lon
Glob
al
Equi
ty
USD
A
BNY
Mel
lon
Glob
al
Equi
ty
USD
B
BNY
Mel
lon
Glob
al
Equi
ty
USD
C
BNY
Mel
lon
Glob
al
Opp
ortu
nitie
s U
SD A
BNY
Mel
lon
Glob
al
Opp
ortu
nitie
s U
SD B
High
est p
rice
2007
1.86
80
1.87
801.
9065
1.88
292.
0693
2.09
76
2.14
392.
2902
2.32
59Lo
wes
t pric
e 20
071.
6299
1.
6364
1.65
621.
6344
1.58
691.
6034
1.
6334
1.71
191.
7328
High
est p
rice
2008
1.99
94
2.01
112.
0438
2.02
162.
0208
2.05
16
2.10
262.
2252
2.26
62Lo
wes
t pric
e 20
081.
6929
1.
7044
1.73
621.
7229
0.92
440.
9421
0.
968
0.97
020.
9905
High
est p
rice
2009
2.06
97
2.08
712.
1343
2.12
871.
3750
1.40
84
1.45
461.
5190
1.55
89Lo
wes
t pric
e 20
091.
7304
1.
7429
1.77
731.
7664
0.89
320.
9115
0.
9380
0.94
340.
9646
High
est p
rice
2010
2.22
05
2.24
202.
2985
2.30
451.
4773
1.52
15
1.57
991.
7029
1.75
71Lo
wes
t pric
e 20
101.
9347
1.
9525
1.99
932.
0008
1.21
601.
2486
1.
2926
1.35
011.
3888
High
est p
rice
2011
2.30
84
2.33
382.
3997
2.41
741.
5844
1.63
44
1.69
991.
8444
1.90
62Lo
wes
t pric
e 20
112.
0681
2.
0890
2.14
332.
1517
1.19
301.
2333
1.
2855
1.40
721.
4575
High
est p
rice
2012
2.34
72
2.37
692.
4535
2.48
721.
5067
1.56
71
1.64
331.
7989
1.87
44Lo
wes
t pric
e 20
122.
1934
2.
2193
2.28
662.
3107
1.28
171.
3266
1.
3844
1.52
881.
5853
High
est p
rice
2013
2.31
02
2.34
032.
4180
2.45
141.
8314
1.91
47
2.01
822.
1523
2.25
42Lo
wes
t pric
e 20
132.
1230
2.
1523
2.22
782.
2674
1.48
121.
5408
1.
6160
1.76
481.
8392
High
est p
rice
2014
2.25
96
2.29
462.
3843
2.44
121.
9415
2.03
49
2.15
042.
289
2.40
35Lo
wes
t pric
e 20
142.
1453
2.
1796
2.26
722.
3192
1.72
771.
8071
1.
9058
2.04
142.
1391
High
est p
rice
2015
2.18
90
2.22
452.
3152
2.37
632.
0406
2.15
00
2.28
392.
4344
2.56
95Lo
wes
t pric
e 20
152.
0385
2.
0739
2.16
422.
2302
1.79
121.
8890
2.
0086
2.15
052.
2639
High
est p
rice
2016
2.30
50
2.34
782.
4567
2.54
232.
0030
2.12
17
2.26
602.
4383
2.58
76Lo
wes
t Pric
e 20
162.
0637
2.
1001
2.19
272.
2614
1.70
571.
8022
1.
9199
2.11
622.
2400
VBS_ID=000001;VBS_PAPIER=JAUNE

BNY
Mel
lon
Glob
al
Opp
ortu
nitie
s U
SD C
BNY
Mel
lon
Pan
Euro
pean
Eq
uity
USD
A
BNY
Mel
lon
Pan
Euro
pean
Eq
uity
EU
R B
BNY
Mel
lon
Pan
Euro
pean
Eq
uity
USD
C^
BNY
Mel
lon
S&P
500
Inde
x Tr
acke
r U
SD A
BNY
Mel
lon
S&P
500
Inde
x Tr
acke
r U
SD C
BNY
Mel
lon
Smal
l Cap
Eu
rola
nd
USD
A*
BNY
Mel
lon
Smal
l Cap
Eu
rola
nd
USD
C*
BNY
Mel
lon
US
Dyna
mic
Va
lue
U
SD A
BNY
Mel
lon
US
Dyna
mic
Va
lue
USD
C
High
est p
rice
2007
2.33
94
2.26
251.
4404
2.84
381.
374
1.43
38-
-1.
9122
1.93
63
Low
est p
rice
2007
1.73
71
1.74
641.
2076
2.18
061.
2056
1.
2529
--
1.67
841.
6934
Hi
ghes
t pric
e 20
082.
2856
2.
2472
1.35
52.
8403
1.29
01
1.34
84-
-1.
7986
1.82
96
Low
est p
rice
2008
1.00
15
1.08
790.
7902
1.38
190.
6641
0.
6984
--
0.92
20.
9463
Hi
ghes
t pric
e 20
091.
5843
1.
6918
1.06
242.
1759
0.99
78
1.05
75-
-1.
3714
1.42
03
Low
est p
rice
2009
0.97
67
0.99
480.
7232
1.26
740.
5994
0.
6317
--
0.81
850.
8426
Hi
ghes
t pric
e 20
101.
7955
1.
7109
1.14
002.
2029
1.11
71
1.19
22-
-1.
5033
1.57
55
Low
est p
rice
2010
1.41
48
1.26
420.
9558
1.63
380.
9061
0.
9638
--
1.20
311.
2549
Hi
ghes
t pric
e 20
111.
9510
1.
8084
1.18
682.
362
1.21
06
1.29
51-
-1.
6196
1.70
35
Low
est p
rice
2011
1.49
50
1.24
840.
8624
1.63
70.
9766
1.
0479
--
1.16
721.
2328
Hi
ghes
t pric
e 20
121.
9343
1.
6458
1.15
982.
1849
1.30
69
1.41
17-
-1.
6221
1.73
41
Low
est p
rice
2012
1.62
80
1.33
030.
9764
1.75
671.
1188
1.
2026
--
1.35
101.
4364
Hi
ghes
t pric
e 20
132.
3383
1.
9992
1.36
542.
6816
1.65
6 1.
8051
--
2.17
352.
3478
Lo
wes
t pric
e 20
131.
8983
1.
6158
1.14
772.
1481
1.27
32
1.37
82-
-1.
6037
1.71
5 Hi
ghes
t pric
e 20
142.
4995
2.
0871
1.45
482.
8133
1.87
82
2.06
171.
0017
-2.
3995
2.61
8 Lo
wes
t pric
e 20
142.
2201
1.
7096
1.26
662.
3119
1.56
00
1.70
160.
8008
-2.
0369
2.20
22
High
est p
rice
2015
2.68
62
1.99
141.
7121
2.70
911.
9168
2.
1098
1.04
501.
0901
2.46
512.
7025
Lo
wes
t pric
e 20
152.
3604
1.
7315
1.38
402.
3469
1.67
80
1.85
040.
8599
0.96
942.
1210
2.33
15
High
est P
rice
2016
2.71
97
1.78
371.
5282
2.45
312.
0510
2.
2824
1.05
131.
1118
2.67
042.
9717
Lo
wes
t Pric
e 20
162.
3483
1.
5099
1.30
941.
9048
1.64
65
1.82
150.
8294
0.87
161.
9737
2.17
77
*Ple
ase
note
for s
hare
cla
sses
that
wer
e no
t lau
nche
d pr
ior t
o 1
Janu
ary
2007
, the
dat
a us
ed is
the
high
est a
nd lo
wes
t fig
ure
from
the
date
the
shar
e cl
ass
laun
ched
. ^B
NY
Mel
lon
Pan
Eur
opea
n Eq
uity
US
D C
Sha
re C
lass
Clo
sed
25/1
1/20
16
VBS_ID=000001;VBS_PAPIER=JAUNE

Sour
ce: B
NY
Mel
lon
Inve
stm
ent M
anag
emen
t EM
EA L
imite
d Th
e D
irect
ors
of th
e Fu
nd a
ccep
t res
pons
ibili
ty fo
r the
acc
urac
y of
the
info
rmat
ion
in th
is A
dden
dum
as
at 3
1 D
ecem
ber 2
016.
If
you
requ
ire fu
rther
info
rmat
ion,
ple
ase
cont
act o
ur re
pres
enta
tive
offic
e in
Hon
g K
ong;
H
SB
C In
stitu
tiona
l Tru
st S
ervi
ces
(Asi
a) L
imite
d
Inst
itutio
nal F
und
Ser
vice
s - I
nves
tor S
ervi
ces
2/F
Tow
er 2
& 3
HSB
C C
entre
1 Sh
am M
ong
Roa
d
Kow
loon
Hon
g Ko
ng
(Tel
epho
ne: 3
663
5500
; Fax
: 340
9 26
97)
VBS_ID=000001;VBS_PAPIER=JAUNE

CONTENTS
BACKGROUND TO THE COMPANY 4
DIRECTORS’ REPORT 9
DEPOSITARY’S REPORT 14
INDEPENDENT AUDITORS’ REPORT 15
INVESTMENT MANAGERS’ REPORTS 17
PORTFOLIO OF INVESTMENTS 41
STATEMENT OF COMPREHENSIVE INCOME 184
STATEMENT OF FINANCIAL POSITION 200
STATEMENT OF CHANGES IN NET ASSETS ATTRIBUTABLE
TO REDEEMABLE PARTICIPATING SHAREHOLDERS 216
NOTES TO THE FINANCIAL STATEMENTS 224
SIGNIFICANT PORTFOLIO MOVEMENTS 399
APPENDIX 1: UCITS V REMUNERATION POLICY (UNAUDITED) 427
APPENDIX 2: SECURITIES FINANCING TRANSACTIONS
REGULATION DISCLOSURES (UNAUDITED) 428
MANAGER AND OTHER INFORMATION 444
IMPORTANT INFORMATION 445

4
BNY MELLON GLOBAL FUNDS, PLC
17 July 2002 – Mellon Global Emerging Markets Fund was
launched.
18 September 2002 – Mellon US Large Companies Value
Fund was launched and subsequently changed its name to
Mellon U.S. Dynamic Value Fund on 24 May 2005.
28 April 2003 – Mellon Euroland Bond Fund, Mellon Small
Cap Euroland Fund and Mellon Small Cap Global ex-Euroland
Fund were launched.
31 May 2003 – Mellon Global Tactical Asset Allocation Fund
was closed (revoked by the Central Bank on 25 June 2004).
11 June 2003 – Mellon Global High Yield Bond Fund (USD)
was launched.
20 January 2004 – Mellon US Large Companies Growth Fund
was closed (revoked by the Central Bank on 25 May 2005).
11 February 2004 – Mellon Global High Yield Bond Fund
(EUR) was launched.
15 October 2004 – Mellon Global High Yield Bond Fund (USD)
was closed (revoked by the Central Bank on 25 May 2005).
10 May 2005 – Mellon Emerging Markets Debt Fund was
launched.
3 October 2005 – Mellon North American Equity Fund
changed its name to Mellon U.S. Equity Fund.
21 April 2006 – Mellon Small Cap Global ex-Euroland Fund
was closed (revoked by the Central Bank on 11 June 2007).
28 April 2006 – Mellon Emerging Markets Debt Local
Currency Fund was launched.
22 September 2006 – Mellon Evolution Global Alpha Fund
was launched.
30 November 2006 – Mellon Japan Equity Value Fund was
launched.
18 December 2006 – Mellon EURO STOXX 50SM Index Tracker
and Mellon Global Innovation Fund were closed (revoked by
the Central Bank on 11 June 2007).
10 January 2007 – Mellon Evolution Currency Option Fund
was launched.
2 July 2007 – Mellon Evolution Currency Alpha Fund was
launched.
6 July 2007 – Mellon Evolution Core Alpha Fund was
launched.
The following information is derived from and should be read
in conjunction with the full text and defi nitions section in the
prospectus.
STRUCTUREBNY Mellon Global Funds, plc (the “Company”) was
incorporated in the Republic of Ireland as a public limited
company on 27 November 2000 with registration number
335837 under the Companies Act 2014. The Company
changed its name from Mellon Global Funds, plc to
BNY Mellon Global Funds, plc effective 3 June 2008.
The Company is an open-ended umbrella type investment
company with variable capital organised under the laws
of Ireland, with segregated liability between sub-funds,
individually referred to as the “Fund” and collectively
the “Funds”. The Company qualifi es and is authorised
in Ireland by the Central Bank of Ireland (the “Central
Bank”) as an undertaking for collective investment
in transferable securities pursuant to the European
Communities (Undertakings for Collective Investment in
Transferable Securities) Regulations, 2011 (as amended)
(the “UCITS Regulations”). The Company currently
comprises of 39 active Funds at 31 December 2016
(31 December 2015: 37).
The history of the Funds is as follows:
23 March 2001 – Mellon EURO STOXX 50SM Index Tracker,
Mellon Euro Government Bond Index Tracker, Mellon S&P
500® Index Tracker and Mellon NIKKEI 225® Index Tracker
were launched.
29 March 2001 – Global Tactical Asset Allocation Fund
transferred to Mellon Global Funds, plc from Universal
Liquidity Funds, plc*.
10 December 2001 – saw the launch of
Mellon Asian Equity Fund
Mellon Continental European Equity Fund
Mellon Global Bond Fund
Mellon Global Equity Fund
Mellon Global Innovation Fund
Mellon Global Intrepid Fund
Mellon Japan Equity Fund
Mellon North American Equity Fund
Mellon Pan European Equity Fund
Mellon Sterling Bond Fund
Mellon Sterling Cash Fund
Mellon UK Equity Fund
Mellon US Dollar Cash Fund
11 January 2002 – Mellon European Ethical Index Tracker
was launched.
31 May 2002 – Mellon US Large Companies Growth Fund was
launched.
BACKGROUND TO THE COMPANY

55
BNY MELLON GLOBAL FUNDS, PLC
BACKGROUND TO THE COMPANY cont’d.
11 December 2009 – BNY Mellon European Ethical
Index Tracker was closed (revoked by Central Bank on
7 October 2010).
15 February 2010 – BNY Mellon Global Emerging Markets
Fund changed its name to BNY Mellon Global Emerging
Markets Equity Value Fund.
8 March 2010 – BNY Mellon Global Real Return Fund (EUR)
was launched.
14 May 2010 – BNY Mellon Global Strategic Bond Fund
changed its name to BNY Mellon Evolution Global Strategic
Bond Fund.
29 July 2010 – BNY Mellon Global Equity Higher Income Fund
was launched.
5 August 2010 – BNY Mellon Global Dynamic Bond Fund was
launched.
31 August 2010 – BNY Mellon Latin America Infrastructure
Fund was launched.
29 October 2010 – BNY Mellon Evolution Global Strategic
Bond Fund was launched.
26 November 2010 – The valuation point of BNY Mellon
Long-Term Global Equity was changed from 12.00 (Dublin
time) to 22.00 (Dublin time).
16 December 2010 – BNY Mellon Evolution Long/Short
Emerging Currency Fund was closed (revoked by the Central
Bank on 23 September 2011).
22 December 2010 – BNY Mellon Global Intrepid Fund
changed its name to BNY Mellon Global Opportunities Fund.
31 January 2011 – BNY Mellon Absolute Return Equity was
launched.
11 March 2011 – BNY Mellon Evolution U.S. Equity Market
Neutral Fund was launched.
20 June 2011 – BNY Mellon Emerging Markets Local Currency
Investment Grade Debt Fund was launched.
24 June 2011 – BNY Mellon Japan Equity Fund was closed
(revoked by the Central Bank on 3 September 2012).
18 August 2011 – The valuation point of BNY Mellon
U.S. Dynamic Value Fund was changed from 12.00 (Dublin
time) to 22.00 (Dublin time).
31 August 2007 – Mellon Brazil Equity Fund was launched.
17 December 2007 – Mellon Dynamic Europe Equity Fund
was launched.
17 December 2007 – Mellon NIKKEI 225® Index Tracker was
closed (revoked by the Central Bank on 13 October 2008).
31 January 2008 – Mellon Global Extended Alpha Fund was
launched.
4 April 2008 – Mellon Long-Term Global Equity Fund was
launched.
23 April 2008 – Mellon Global Property Securities Fund was
launched.
3 June 2008 – Mellon Global Funds, plc changed its name to
BNY Mellon Global Funds, plc and all registered Funds were
prefi xed with BNY.
6 June 2008 – BNY Mellon Sterling Cash Fund merged into
Universal Sterling Fund* (a sub-fund of Universal Liquidity
Funds, plc*) and BNY Mellon US Dollar Cash Fund merged
into Universal Liquidity Plus Fund* (a sub-fund of Universal
Liquidity Funds, plc*) (both Funds were revoked by the
Central Bank on 29 January 2010).
16 June 2008 – BNY Mellon Vietnam, India and China (VIC)
Fund was launched.
9 December 2008 – BNY Mellon Dynamic Europe Equity Fund
was closed (revoked by the Central Bank on 29 January 2010).
18 March 2009 – BNY Mellon Emerging Markets Equity Fund
was launched.
25 March 2009 – BNY Mellon Evolution Long/Short Emerging
Currency Fund was launched.
8 April 2009 – BNY Mellon Evolution Core Alpha Fund,
BNY Mellon Evolution Currency Alpha Fund and BNY Mellon
Global Extended Alpha Fund were closed (revoked by Central
Bank on 7 October 2010).
22 June 2009 – BNY Mellon Euro High Yield Bond Fund was
approved by the Central Bank.
30 June 2009 – BNY Mellon Global Real Return Fund (USD)
was launched.
22 July 2009 – BNY Mellon Euro Corporate Bond Fund was
launched.

66
BNY MELLON GLOBAL FUNDS, PLC
BACKGROUND TO THE COMPANY cont’d.
1 October 2013 – BNY Mellon Evolution Global Strategic Bond
Fund changed its name to BNY Mellon Global Opportunistic
Bond Fund.
25 November 2013 – BNY Mellon Crossover Credit Fund was
launched.
6 December 2013 – BNY Mellon Euro Government Bond Index
Tracker and BNY Mellon Vietnam, India and China (VIC) Fund
were closed (revoked by the Central Bank on 28 August 2014).
10 December 2013 – BNY Mellon Japan All Cap Equity Fund
was launched.
12 December 2013 – BNY Mellon Japan Small Cap Equity
Focus Fund was launched.
14 March 2014 – BNY Mellon Evolution Global Alpha Fund
and BNY Mellon Latin America Infrastructure Fund were
closed (revoked by the Central Bank on 10 November 2015
and 2 November 2015, respectively).
9 May 2014 – BNY Mellon Asian Income Fund was launched.
16 May 2014 – BNY Mellon U.S. Equity Fund was closed
(revoked by the Central Bank on 10 November 2015)
16 June 2014 – BNY Mellon US Opportunities Fund was
launched.
30 June 2014 – BNY Mellon Absolute Insight Fund was
launched.
25 July 2014 – BNY Mellon Asian Bond Fund was launched.
20 November 2014 – BNY Mellon Japan Equity Value Fund was
closed (revoked by the Central Bank on 2 November 2015).
31 December 2014 – The registered offi ce of the Company
changed from 33 Sir John Rogerson’s Quay, Dublin 2, Ireland
to Guild House, Guild Street, IFSC, Dublin 1, Ireland.
15 May 2015 – BNY Mellon Dynamic Total Return Fund was
launched.
16 June 2015 – BNY Mellon Emerging Markets Local
Currency Investment Grade Debt Fund was closed (pending
application to the Central Bank to revoke the Fund’s
registration and hence removal from the prospectus).
4 August 2015 – BNY Mellon Emerging Equity Income Fund
changed its name to BNY Mellon Global Emerging Markets
Fund and its distribution frequency from quarterly to annual.
30 November 2011 – BNY Mellon Evolution U.S. Market
Neutral Fund was closed (revoked by the Central Bank on
16 April 2014).
31 January 2012 – BNY Mellon Emerging Markets Corporate
Debt Fund was launched.
9 March 2012 – BNY Mellon Absolute Return Bond Fund was
launched.
14 June 2012 – BNY Mellon Global Real Return Fund (GBP)
was launched.
4 September 2012 – BNY Mellon Emerging Markets Equity
Core Fund was launched.
13 November 2012 – BNY Mellon Emerging Equity Income
Fund was launched.
19 December 2012 – The valuation point of BNY Mellon
Emerging Markets Debt Fund was changed from 12.00
(Dublin time) to 22.00 (Dublin time).
12 February 2013 – BNY Mellon European Credit Fund was
launched.
18 February 2013 – The valuation point of BNY Mellon
Emerging Markets Debt Local Currency Fund was changed
from 12.00 (Dublin time) to 22.00 (Dublin time).
21 February 2013 – BNY Mellon Evolution Currency
Option Fund was closed (revoked by the Central Bank on
28 August 2014).
25 April 2013 – BNY Mellon Continental European Equity
Fund, BNY Mellon Sterling Bond Fund and BNY Mellon
UK Equity Fund were closed (revoked by the Central Bank on
28 August 2014).
8 May 2013 – The valuation point of BNY Mellon U.S. Equity
Fund was changed from 12.00 (Dublin time) to 22.00
(Dublin time).
11 July 2013 – BNY Mellon Euro Corporate Bond Fund was
closed (revoked by the Central Bank on 28 August 2014).
29 July 2013 – The base currency of BNY Mellon Global High
Yield Bond Fund (EUR) changed from EUR to USD and the
Fund changed its name to BNY Mellon Global High Yield
Bond Fund.
27 September 2013 – BNY Mellon Emerging Markets Debt
Opportunistic Fund was launched.

77
BNY MELLON GLOBAL FUNDS, PLC
BACKGROUND TO THE COMPANY cont’d.
17 January 2017 – BNY Mellon U.S. Equity Income Fund was
launched.
28 February 2017 - BNY Mellon U.S. Municipal Infrastructure
Debt Fund was approved by the Central Bank.
9 March 2017 – BNY Mellon Pan European Equity Fund
closed (pending application to the Central Bank to revoke the
Fund’s registration and hence removal from the Prospectus).
A separate pool of assets (a “Portfolio”) is maintained for
each Fund, each being invested in accordance with the
investment objective applicable to the Fund to which the
Portfolio relates.
The Funds of the Company are listed on the Irish Stock
Exchange.
* Effective 1 March 2010, Universal Liquidity Funds, plc changed its
name to BNY Mellon Liquidity Funds, plc and the “Universal” prefi x was
removed from the name of all registered sub-funds and replaced with
“BNY Mellon”.
INVESTMENT OBJECTIVEThe assets of each Fund are invested separately in
accordance with the investment objectives and policies
of the relevant Fund, which are set out in the relevant
supplements to the prospectus.
OTHER RELEVANT INFORMATIONAudited annual reports and fi nancial statements
and unaudited semi-annual reports are available to
the public at the registered offi ce of the Company or
on www.bnymellonim.com. They can also be sent to
shareholders at their registered address.
As at the date of signing of this report, the Funds within the
Company are:
BNY Mellon Absolute Insight Fund
BNY Mellon Absolute Return Bond Fund
BNY Mellon Absolute Return Equity Fund
BNY Mellon Alpha Equity Select Fund**
BNY Mellon Asia Rising Stars Fund
BNY Mellon Asian Bond Fund
BNY Mellon Asian Equity Fund
BNY Mellon Asian Income Fund
BNY Mellon Brazil Equity Fund
BNY Mellon Crossover Credit Fund*
BNY Mellon Dynamic Total Return Fund
BNY Mellon Emerging Markets Corporate Debt Fund
BNY Mellon Emerging Markets Debt Fund
BNY Mellon Emerging Markets Debt Local Currency Fund
12 August 2015 – BNY Mellon Euro High Yield Bond Fund was
revoked by the Central Bank (never launched after approval).
15 September 2015 – BNY Mellon Alpha Equity Select Fund
was approved by the Central Bank.
2 October 2015 – BNY Mellon Emerging Markets Equity Core
Fund was closed (pending application to the Central Bank to
revoke the Fund’s registration and hence removal from the
prospectus).
16 November 2015 – BNY Mellon Targeted Return Bond Fund
was launched.
30 November 2015 – The valuation point of BNY Mellon Brazil
Equity Fund was changed from 12.00 (Dublin time) to 22.00
(Dublin time). BNY Mellon Global Equity Higher Income Fund
changed its name to BNY Mellon Global Equity Income Fund.
9 December 2015 – BNY Mellon Emerging Markets Equity
Fund was closed (pending application to the Central Bank to
revoke the Fund’s registration and hence removal from the
prospectus).
1 January 2016 – BNY Mellon Global Property Securities
Fund changed its distribution frequency from annual to
quarterly.
26 February 2016 – BNY Mellon Global Emerging Markets
Equity Value Fund was closed (pending application to the
Central Bank to revoke the Fund’s registration and hence
removal from the prospectus).
29 February 2016 – BNY Mellon Global Credit Fund was
launched.
20 September 2016 – BNY Mellon Crossover Credit Fund
merged into Oddo Compass Crossover Credit, a sub-fund
of Oddo Compass SICAV (pending application to the Central
Bank to revoke the Fund’s registration and hence removal
from the prospectus).
30 November 2016 – BNY Mellon Global Short-Dated High
Yield Bond Fund was launched
7 December 2016 – BNY Mellon Global Leaders Fund was
launched.
13 December 2016 – BNY Mellon Japan REIT Alpha Fund was
launched.
10 January 2017 – BNY Mellon Asia Rising Stars Fund was
launched.

88
BNY MELLON GLOBAL FUNDS, PLC
BACKGROUND TO THE COMPANY cont’d.
BNY Mellon Emerging Markets Debt Opportunistic Fund
BNY Mellon Emerging Markets Equity Fund*
BNY Mellon Emerging Markets Equity Core Fund*
BNY Mellon Emerging Markets Local Currency Investment
Grade Debt Fund*
BNY Mellon Euroland Bond Fund
BNY Mellon European Credit Fund
BNY Mellon Global Bond Fund
BNY Mellon Global Credit Fund
BNY Mellon Global Dynamic Bond Fund
BNY Mellon Global Emerging Markets Equity Value Fund*
BNY Mellon Global Emerging Markets Fund
BNY Mellon Global Equity Fund
BNY Mellon Global Equity Income Fund
BNY Mellon Global High Yield Bond Fund
BNY Mellon Global Leaders Fund
BNY Mellon Global Opportunistic Bond Fund
BNY Mellon Global Opportunities Fund
BNY Mellon Global Property Securities Fund
BNY Mellon Global Real Return Fund (EUR)
BNY Mellon Global Real Return Fund (GBP)
BNY Mellon Global Real Return Fund (USD)
BNY Mellon Global Short-Dated High Yield Bond Fund
BNY Mellon Japan All Cap Equity Fund
BNY Mellon Japan REIT Alpha Fund
BNY Mellon Japan Small Cap Equity Focus Fund
BNY Mellon Long-Term Global Equity Fund
BNY Mellon Pan European Equity Fund*
BNY Mellon S&P 500® Index Tracker
BNY Mellon Small Cap Euroland Fund
BNY Mellon Targeted Return Bond Fund
BNY Mellon U.S. Dynamic Value Fund
BNY Mellon U.S. Equity Income Fund
BNY Mellon U.S. Municipal Infrastructure Debt Fund**
BNY Mellon US Opportunities Fund
* Funds pending application to the Central Bank to revoke the Funds’
registration and hence removal from the prospectus.
** Funds approved by the Central Bank but not yet launched.

9
BNY MELLON GLOBAL FUNDS, PLC
The Directors submit their annual report together with
the audited fi nancial statements for the year ended
31 December 2016.
PRINCIPAL ACTIVITIESThe investment objective of each of the Funds is outlined in
the prospectus and discussed in the Investment Managers’
Reports.
DIRECTORS’ RESPONSIBILITIESThe Directors are responsible for preparing the Directors’
Report and fi nancial statements in accordance with the
Companies Act 2014.
Irish company law requires the Directors to prepare fi nancial
statements for each fi nancial year. Under that law, the
Directors have elected to prepare the fi nancial statements
in accordance with Financial Reporting Standard (“FRS”)
102: “The Financial Reporting Standard applicable in the
United Kingdom and the Republic of Ireland” (“FRS 102”).
Under company law, the Directors must not approve the
fi nancial statements unless they are satisfi ed that they give
a true and fair view of the assets, liabilities and fi nancial
position of BNY Mellon Global Funds, plc (the “Company”)
at the fi nancial year end date and of the profi t or loss of
the Company for the fi nancial year and otherwise comply
with the Companies Act 2014. In preparing the fi nancial
statements, the Directors are required to:
• select suitable accounting policies and then apply them
consistently;
• make judgements and estimates that are reasonable and
prudent;
• state whether the fi nancial statements have been prepared
in accordance with applicable accounting standards,
identify those standards and note the effect and the
reasons for any material departure from those standards;
and
• prepare the fi nancial statements on the going concern
basis unless it is inappropriate to presume that the
Company will continue in operation.
The Directors confi rm that they have complied with the
above requirement when preparing the fi nancial statements.
DIRECTORS’ COMPLIANCE STATEMENTThe Directors, in accordance with Section 225(2) of
the Companies Act 2014 (the “Act”), acknowledge that they
are responsible for securing the Company’s compliance
with its “Relevant Obligations” as defi ned in that section
and which constitute: (i) certain provisions under the Act,
a breach of which is a category 1 or 2 offence; (ii) serious
market abuse offences as referred to in Section 1368 of the
Act; and (iii) the Irish tax laws referred to in Section 225 of
the Act.
It is the policy of the Company to secure compliance with
its Relevant Obligations and to foster an environment in the
Company which raises awareness of, and promotes a culture
of compliance with, those obligations (the “Compliance
Policy”).
In order to give effect to the Compliance Policy, the Board,
with the assistance of the relevant advisers, have identifi ed
the Relevant Obligations that they consider apply to
the Company.
The Directors confi rm that:
• appropriate arrangements and structures (the “Compliance
Arrangements”) that, in their opinion, are designed to
secure material compliance with the Company’s Relevant
Obligations, have been put in place; and
• a review has been conducted, during the fi nancial year, of
the Compliance Arrangements that have been put in place
to secure the Company’s compliance with its Relevant
Obligations.
This Compliance Policy Statement will be subject to periodic
review and may be supplemented from time to time.
The Compliance Arrangements will be subject to annual
review with the aim of establishing that they continue to
provide a reasonable assurance of compliance, in all material
respects, with the Company’s Relevant Obligations.
ACCOUNTING RECORDSThe Directors are responsible for keeping adequate
accounting records which disclose with reasonable
accuracy at any time the fi nancial position of the Company
and to enable them to ensure that the fi nancial statements
are prepared in accordance with FRS 102 and comply
with the Companies Act 2014, the European Communities
(Undertakings for Collective Investment in Transferable
Securities) Regulations, 2011 (as amended) (the “UCITS
Regulations”) and the Central Bank (Supervision and
Enforcement) Act 2013 (Section 48(1)) (Undertakings
for Collective Investment in Transferable Securities)
Regulations 2015, as amended (the “Central Bank UCITS
Regulations”).
The measures taken by the Directors to secure compliance
with the Company’s obligation to keep adequate accounting
records are the use of appropriate systems and procedures
and employment of competent persons. To this end, BNY
Mellon Fund Services (Ireland) Designated Activity Company*
(the “Administrator”) has been appointed for the purpose of
DIRECTORS’ REPORT

1010
BNY MELLON GLOBAL FUNDS, PLC
DIRECTORS’ REPORT cont’d.
RESULTSThe results for the year are set out in the Statement
of Comprehensive Income.
EVENTS SINCE THE YEAR ENDThere have been no signifi cant events affecting the Company
since the year end other than as disclosed in Note 20 to the
fi nancial statements.
RELATED PARTY TRANSACTIONS AND BALANCESOther than as disclosed in Note 11 to the fi nancial statements,
the Directors are not aware of any contracts or arrangements
of any signifi cance in relation to the business of the Company
in which the Directors had any benefi cial interest as defi ned
in the Companies Act 2014, at any time during the year ended
31 December 2016 and 31 December 2015.
CONNECTED PERSON TRANSACTIONSIn accordance with the requirements of Section 41(1) of the
Central Bank UCITS Regulations, any transaction carried out
with the Company by its management company or depositary,
and the delegates or sub-delegates of such a management
company or depositary (excluding any non-group company
sub-custodian appointed by a depositary), and any
associated or group company of such a management
company, depositary, delegate or sub-delegate (“connected
persons”) must be carried out as if negotiated at arm’s
length. Such transactions must be in the best interests of
the shareholders. In addition to those transactions, there
are also transactions carried out by connected persons
on behalf of the Company to which the Directors have no
direct access and in respect of which the Directors must
rely upon assurances from its delegates that the connected
persons carrying out those transactions do carry them out
on a similar basis.
Shareholders should have regard to the governance structure
of the Company as more particularly described in the
Corporate Governance Statement section of this Directors’
Report and the roles and responsibilities of the Company’s
respective delegates subject to the overall supervision of the
Board. Further, shareholders should refer to the prospectus
which identifi es many of the connected person transactions
and the general nature of the contractual arrangements with
the principal connected persons but it is not exhaustive of
all connected person transactions. Shareholders should
also refer to the provisions of the prospectus dealing with
confl icts of interest.
Therefore, having regard to confi rmations from the Manager
and its relevant delegates, the Board of Directors of the
Company is satisfi ed that:
(i) there are arrangements (as evidenced by written
procedures documented by the Investment Managers) in
place to ensure that the obligations described above are
applied to all transactions with connected persons; and
maintaining adequate accounting records. Accordingly, the
accounting records are kept at Guild House, Guild Street,
IFSC, Dublin 1, Ireland. The Directors are also responsible
for safeguarding the assets of the Company and hence for
taking reasonable steps for the prevention and detection
of fraud and other irregularities. Under the Central Bank
UCITS Regulations, the Directors are required to entrust the
assets of the Company to the depositary for safe-keeping. In
carrying out this duty, the Company has delegated custody
of its assets to BNY Mellon Trust Company (Ireland) Limited
(the “Depositary”).
* Please refer to Note 19 of the fi nancial statements
The fi nancial statements of the Company are published
on the website of BNY Mellon Investment Management
EMEA Limited (www.bnymellonim.com). The Directors
are responsible for the maintenance and integrity of the
corporate and fi nancial information of the Company included
on this website. Legislation in the Republic of Ireland
governing the preparation and dissemination of fi nancial
statements may differ from legislation in other jurisdictions.
DISTRIBUTIONSDistributions paid to redeemable participating shareholders
are recognised in the Statement of Comprehensive Income
as fi nance costs when they are declared to the Irish Stock
Exchange (“ISE”), as detailed in the prospectus. Distributions
are declared to the extent necessary to enable the Company
to pursue a full distribution policy in accordance with the
current UK tax legislation.
Details of the distributions paid to redeemable
participating shareholders are disclosed in the Statement
of Comprehensive Income and distributions declared
subsequent to the year end to redeemable participating
shareholders are disclosed in Note 20 to the fi nancial
statements.
REVIEW OF BUSINESS AND FUTURE DEVELOPMENTThe Company is an open-ended investment company with
variable capital which has been authorised by the Central
Bank under the UCITS Regulations. There was no change in
the nature of the Company’s business during the year.
There is a detailed review in the Investment Managers’
Reports of factors contributing to the Funds’ performance.
The Directors do not anticipate any change in the structure
or investment objectives of the Company.
RISK MANAGEMENT OBJECTIVES AND POLICIESThe Company’s investment activities expose it to the various
types of risk, which are associated with the fi nancial
instruments and markets in which it invests.
Details of the risks inherent in investing in the Company are
disclosed in Note 16 to the fi nancial statements.

1111
BNY MELLON GLOBAL FUNDS, PLC
DIRECTORS’ REPORT cont’d.
These delegations of functions and the appointment of
regulated third party entities are detailed in the Company’s
prospectus. In summary, they are:
1. The Company has appointed BNY Mellon Global
Management Limited (the “Manager”) as its Manager
pursuant to the Management Agreement. Under the
terms of the Management Agreement, the Manager has
responsibility for the management and administration of
the Company’s affairs and the distribution of the shares
of the Funds. The Manager is regulated by and under the
supervision of the Central Bank;
2. The Manager has delegated the performance of the
investment management functions in respect of the
Company and of its Funds to the respective Investment
Managers as detailed in the prospectus and listed in the
directory to these fi nancial statements.
The respective Investment Managers have direct
responsibility for the decisions relating to the day-to-day
running of the Funds which they manage and they
are accountable to the Directors for the investment
performance of the Funds which they manage. The
respective Investment Managers have internal controls
and risk management processes in place to ensure that
all applicable risks pertaining to their management of
the Funds are identifi ed, monitored and managed at all
times and appropriate reporting is made to the Directors
on a regular basis. The Investment Managers are
regulated by and under the supervision of the regulator
of their operating jurisdiction;
3. The Manager has delegated its responsibility as
Administrator, Registrar and Transfer Agent to the
Administrator, which entity has responsibility for the
day-to-day administration of the Company and the Funds
including the calculation of the net asset values. The
Administrator is regulated by and under the supervision
of the Central Bank; and
4. BNY Mellon Investment Management EMEA Limited acts
as a distributor for the Funds of the Company.
The Company also has appointed the Depositary as
depositary of its assets which entity has responsibility
for the safekeeping of such assets in accordance with
the Central Bank UCITS Regulations and for exercising
independent oversight over how the Company is managed.
The Depositary is regulated by and under the supervision of
the Central Bank.
The Directors receive reports on a regular (and at least
quarterly) basis from each of its delegate service providers
and the Depositary which enable it to assess the performance
of the delegate service providers and the Depositary (as the
case may be).
(ii) transactions with connected persons entered into during
the year complied with these obligations, as attested by
the Investment Managers through regular updates to the
Directors.
Note 11 details related party transactions during the year
as required by Section 33 “Related Party Disclosures” of
FRS 102. However, shareholders should understand that
not all “connected persons” are related parties as defi ned
by Section 33 of FRS 102. Details of fees paid to related
parties and certain connected persons are set out in
Notes 3, 5 – 7 and 11.
CORPORATE GOVERANCE STATEMENTThe Company is subject to corporate governance practices
imposed by:
(i) The Memorandum and Articles of Association of the
Company;
(ii) The Irish Companies Act 2014 (the “Companies Acts”);
(iii) The Central Bank UCITS Regulations; and
(iv) The ISE Code of Listing Requirements and Procedures.
Copies of all of the above documents are available for
inspection at the Company’s registered offi ce at Guild House,
Guild Street, IFSC, Dublin 1, Ireland.
On 14 December 2011, the Irish Funds Industry Association
(“IF”) published a corporate governance code (“IF Code”)
that may be adopted on a voluntary basis by Irish
authorised collective investment schemes. The IF Code
became effective from 1 January 2012 with a twelve month
transitional period until 1 January 2013. It should be noted
that the IF Code refl ects the existing corporate governance
policies imposed on Irish authorised collective investment
schemes.
The Directors have reviewed the IF Code and adopted
this code on 20 December 2012 following assessment of
the measures included in the IF Code as being consistent
with its existing corporate governance principles and
procedures for the fi nancial year. The IF Code can be viewed
on the IF website (www.irishfunds.ie). Consistent with
the regulatory framework applicable to investment fund
companies such as the Company (and in contrast to normal
operating companies with a full time executive management
and employees), the Company, consequently, operates
under the delegated model whereby it has delegated
management (including investment management),
administration and distribution functions to third parties
without abrogating the Directors’ overall responsibility.
The Directors have in place mechanisms for monitoring
the exercise of such delegated functions, which are always
subject to the supervision and direction of the Directors.

1212
BNY MELLON GLOBAL FUNDS, PLC
DIRECTORS’ REPORT cont’d.
In accordance with the Companies Act 2014, shareholders
representing not less than one-tenth of the paid up share
capital of the Company may also request the Directors to
convene a shareholders’ meeting. Not less than twenty one
clear days’ notice of every annual general meeting and any
meeting convened for the passing of a special resolution
must be given to shareholders.
Two shareholders present either in person or by proxy
constitutes a quorum at a general meeting. Votes may
be cast in person or by proxy. On a show of hands, every
shareholder who is present in person or by proxy shall have
one vote and every management shareholder shall have one
vote in respect of all non-participating shares. On a poll,
every shareholder is entitled to one vote in respect of each
participating share held by him and every management
shareholder is entitled to one vote in respect of all non-
participating shares held by him. The chairman of a general
meeting of the Company or at least fi ve shareholders present
or a shareholder or shareholders representing at least one
tenth of the shares in issue having the right to vote at such
meeting may demand a poll.
Shareholders may resolve to sanction an ordinary
resolution or special resolution at a shareholders’ meeting.
An ordinary resolution of the Company or of the shareholders
of a particular fund or class requires an absolute majority of
the votes cast by the shareholders voting in person or by
proxy at the meeting at which the resolution is proposed.
A special resolution of the Company or of the shareholders
of a particular fund or share class requires a majority of not
less than 75% of the shareholders present in person or by
proxy and voting in general meeting in order to pass a special
resolution including a resolution to amend the Memorandum
and Articles of Association.
COMPOSTION AND OPERATION OF BOARD OF DIRECTORS AND COMMITTEESUnless otherwise determined by an ordinary resolution of
the Company in general meeting, the number of Directors
may not be less than two nor more than twelve. Currently
the Board of Directors of the Company is composed of
fi ve Directors, being those listed in the directory in these
fi nancial statements.
The business of the Company is managed by the Directors,
who exercise all such powers of the Company as are not by
the Companies Act 2014 or by the Articles of Association of
the Company required to be exercised by the Company in
general meeting. A Director may, and the company secretary
of the Company on the requisition of a Director will, at any
time summon a meeting of the Directors. Questions arising
FINANCIAL REPORTING PROCESS – DESCRIPTION OF MAIN FEATURESThe Directors are responsible for establishing and maintaining
adequate internal control and risk management systems of
the Company in relation to the fi nancial reporting process.
Such systems are designed to manage rather than eliminate
the risk of error or fraud in achieving the Company’s fi nancial
reporting objectives and can only provide reasonable and
not absolute assurance against material misstatement or
loss. The Directors have entrusted the administration of the
accounting records to the Administrator.
The Directors, through delegation to the Administrator, have
procedures in place to ensure all relevant accounting records
are properly maintained and are readily available, including
production of annual and semi-annual fi nancial statements.
The annual and semi-annual fi nancial statements of the
Company are required to be approved by the Directors of
the Company and fi led with the Central Bank. The annual
fi nancial statements are also required to be fi led with the
ISE and be audited by independent auditors who report
annually to the Board on their fi ndings.
The Directors have hired an independent external audit fi rm
to audit the fi nancial statements in accordance with the
Companies Act 2014. The Directors evaluate and discuss
signifi cant accounting and reporting issues as the need
arises.
An Audit Committee, currently consisting of Jonathan Lubran
(Chairman), David Dillon and Michael Meagher, has also been
formed on 20 October 2016 and is charged with oversight of
the Company’s audit and fi nancial control functions.
The Administrator has operating responsibility in respect
of its internal controls in relation to the fi nancial reporting
process and the Administrator’s report to the Directors.
The Administrator is authorised and regulated by
the Central Bank and complies with the rules imposed by the
Central Bank.
SHAREHOLDER MEETINGSThe convening and conduct of shareholders’ meetings are
governed by the Memorandum and Articles of Association
of the Company and the Companies Act 2014. Although the
Directors may convene an extraordinary general meeting
of the Company at any time, the Directors are required to
convene an annual general meeting of the Company within
eighteen months of incorporation and fi fteen months of
the date of the previous annual general meeting thereafter
provided that an annual general meeting is held within nine
months of the end of each accounting period for the Company.

1313
BNY MELLON GLOBAL FUNDS, PLC
DIRECTORS’ REPORT cont’d.
connection with preparing their report, which they have not
disclosed to the auditors. Each Director has taken all the
steps that they are obliged to take as a Director in order to
make themselves aware of any relevant audit information
and to ensure that it is disclosed to the auditors.
INDEPENDENT AUDITORSErnst & Young have indicated their willingness to remain in
offi ce in accordance with Section 383 (2) of the Companies
Act 2014.
On behalf of the board
Director – David Dillon
Director – Jonathan Lubran
Date: 19 April 2017
at any meeting of the Directors are determined by a majority
of votes. In the case of an equality of votes, the chairman
has a second or casting vote. The quorum necessary for the
transaction of business at a meeting of the Directors may
be fi xed by the Directors and unless so fi xed is two. The key
management functions of the Manager are delegated to the
designated Directors in accordance with its business plan.
DIRECTORSThe names of the persons who were Directors at any time
during the year ended 31 December 2016 are set out below.
David Dillon (Irish)1*^
David Turnbull (New Zealand)
Greg Brisk (British)
Jonathan Lubran (British)1**
Michael Meagher (Irish)1^
All of the Directors listed are non-executive Directors.
1 Audit Committee Member
* Chairman of the Board of Directors
** Chairman of the Audit Committee
^ Independent Director
DIRECTORS AND SECRETARY’S INTERESTSThe Directors and their families and the Secretary, Tudor
Trust Limited, had no interests in the shares of the Company
at any time during the year ended 31 December 2016 and
31 December 2015.
David Dillon, David Turnbull, Greg Brisk, Jonathan Lubran
and Michael Meagher are also Directors of the Manager.
Management fees of USD 144,077,063 (31 December 2015:
USD 134,600,432) were incurred during the year.
David Dillon acts as a consultant to Dillon Eustace, which
provide legal services to the Company.
David Turnbull and Greg Brisk have waived their right to
receive a fee for their services as Directors during the year
ended 31 December 2016 and 31 December 2015.
POLITICAL DONATIONSThere were no political donations made by the
Company during the year ended 31 December 2016 and
31 December 2015.
DISCLOSURE OF INFORMATION TO THE AUDITORSSo far as each person who was a Director at the date of
approving this report is aware, there is no relevant audit
information, being information needed by the auditors in

14
BNY MELLON GLOBAL FUNDS, PLC
For the period from 1 January 2016 to 31 December 2016
(the “Period”)
BNY Mellon Trust Company (Ireland) Limited (the “Depositary”,
“us” “we”, or “our”), has enquired into the conduct of
BNY Mellon Global Funds plc (the “Company”) for the period,
in its capacity as Depositary to the Company.
This report including the opinion has been prepared for and
solely for the shareholders in the Company, in accordance
with our role as depositary to the Company and for no other
purpose. We do not, in giving this opinion, accept or assume
responsibility for any other purpose or to any other person to
whom this report is shown.
RESPONSIBILITIES OF THE DEPOSITARYOur duties and responsibilities are outlined in Regulation 34
of the European Communities (Undertakings for Collective
Investment in Transferable Securities) Regulations 2011
(S.I. No 352 of 2011), as amended (the “Regulations”).
Our report shall state whether, in our opinion, the Company
has been managed in that period in accordance with the
provisions of the Company’s constitutional documentation
and the Regulations. It is the overall responsibility of the
Company to comply with these provisions. If the Company
has not been so managed, we as depositary must state in
what respects it has not been so managed and the steps
which we have taken in respect thereof.
BASIS OF DEPOSITARY OPINIONThe Depositary conducts such reviews as it, in its reasonable
opinion, considers necessary in order to comply with
its duties and to ensure that, in all material respects,
the Company has been managed (i) in accordance with the
limitations imposed on its investment and borrowing powers
by the provisions of its constitutional documentation and
the appropriate regulations and (ii) otherwise in accordance
with the Company’s constitutional documentation and
the appropriate regulations.
OPINIONIn our opinion, the Company has been managed during
the period, in all material respects:
(i) in accordance with the limitations imposed on
the investment and borrowing powers of the Company by
the constitutional documentation and the Regulations;
and
(ii) otherwise in accordance with the provisions of the
constitutional documentation and the Regulations.
BRIAN MCFADDEN
Brian McFadden
BNY Mellon Trust Company (Ireland) Limited
Guild House
Guild Street
IFSC
Dublin 1
Ireland
Date: 19 April 2017
DEPOSITARY’S REPORT

15
We have audited the fi nancial statements of BNY Mellon
Global Funds plc for the year ended 31 December 2016
which comprise the Statement of Comprehensive Income,
the Statement of Financial Position, Statement of Changes
in Net Assets Attributable to Redeemable Participating
Shareholders and the related notes 1 to 21. The fi nancial
reporting framework that has been applied in their
preparation is Irish law, the Central Bank (Supervision and
Enforcement) Act 2013 (Section 48(1)) (Undertaking for
Collective Investment in Transferable Securities) Regulations
2015 (as amended) and accounting standards issued by the
Financial Reporting Council and promulgated by the Institute
of Chartered Accountants in Ireland including FRS 102
The Financial Reporting Standard Applicable in the UK and
the Republic of Ireland.
This report is made solely to the company’s members, as
a body, in accordance with section 391 of the Companies
Act 2014. Our audit work has been undertaken so that we
might state to the company’s members those matters we
are required to state to them in an auditor’s report and for
no other purpose. To the fullest extent permitted by law,
we do not accept or assume responsibility to anyone other
than the company and the company’s members as a body,
for our audit work, for this report, or for the opinions we
have formed.
RESPECTIVE RESPONSIBILITIES OF DIRECTORS AND AUDITORSAs explained more fully in the Directors’ Responsibilities
Statement set out on page 9 the directors are responsible
for the preparation of the fi nancial statements and for being
satisfi ed that they give a true and fair view and otherwise
comply with the Companies Act 2014. Our responsibility is
to audit and express an opinion on the fi nancial statements
in accordance with Irish law and International Standards
on Auditing (UK and Ireland). Those standards require
us to comply with the Auditing Practices Board’s Ethical
Standards for Auditors.
SCOPE OF THE AUDIT OF THE FINANCIAL STATEMENTSAn audit involves obtaining evidence about the amounts and
disclosures in the fi nancial statements suffi cient to give
reasonable assurance that the fi nancial statements are free
from material misstatement, whether caused by fraud or
error. This includes an assessment of: whether the accounting
policies are appropriate to the company’s circumstances and
have been consistently applied and adequately disclosed;
the reasonableness of signifi cant accounting estimates
made by the directors; and the overall presentation of the
fi nancial statements. In addition, we read all the fi nancial
and non-fi nancial information in the Investment Managers’
Reports, Directors’ Report, Depositary’s Report and the
Directory to identify material inconsistencies with the
audited fi nancial statements and to identify any information
that is apparently materially incorrect based on, or
materially inconsistent with, the knowledge acquired by us
in the course of performing the audit. If we become aware of
any apparent material misstatements or inconsistencies we
consider the implications for our report.
OPINION ON FINANCIAL STATEMENTSIn our opinion the fi nancial statements:
• give a true and fair view of the assets, liabilities and
fi nancial position of the company as at 31 December 2016
and of its profi t for the year then ended;
• have been properly prepared in accordance with Generally
Accepted Accounting Practice in Ireland including FRS 102
The Financial Reporting Standard applicable in the UK and
Republic of Ireland; and
• have been properly prepared in accordance with the
requirements of the Companies Acts 2014, the European
Communities (Undertakings for Collective Investment in
Transferable Securities) Regulations, 2011 (as amended)
and the Central Bank (Supervision and Enforcement)
Act 2013 (Section 48(1)) (Undertakings for Collective
Investment in Transferable Securities) (Amendment)
Regulations 2015 (as amended).
INDEPENDENT AUDITORS’ REPORT TO THE MEMBERS OF BNY MELLON GLOBAL FUNDS PLC
BNY MELLON GLOBAL FUNDS, PLC

1616
BNY MELLON GLOBAL FUNDS, PLC
INDEPENDENT AUDITORS’ REPORT TO THE MEMBERS OF BNY MELLON GLOBAL FUNDS PLC cont’d.
MATTERS ON WHICH WE ARE REQUIRED TO REPORT BY EXCEPTIONWe have nothing to report in respect of sections 305 to 312 of
the Companies Act 2014 which require us to report to you if,
in our opinion, the disclosures of directors’ remuneration and
transactions specifi ed by law are not made.
LISA KEALY
Lisa Kealy
for and on behalf of Ernst & Young
Chartered Accountants and Statutory Audit Firm
Dublin
20 April 2017
MATTERS ON WHICH WE ARE REQUIRED TO REPORT BY THE COMPANIES ACT 2014• We have obtained all the information and explanations
which we consider necessary for the purposes of our audit.
• In our opinion the accounting records of the company were
suffi cient to permit the fi nancial statements to be readily
and properly audited.
• The fi nancial statements are in agreement with
the accounting records.
• In our opinion the information given in the Directors’ report
is consistent with the fi nancial statements.

17
INVESTMENT MANAGERS’ REPORTS
ECONOMIC & MARKET OVERVIEW
INTRODUCTIONThe year was characterised by a number of unexpected
outcomes, namely the election of Donald Trump as US
president in November against the odds and the UK’s
referendum vote on 23 June to leave the EU. Rounding off
2016, the US Federal Reserve (Fed) raised interest rates by
0.25% in mid-December.
The speculation around Trump’s agenda including the
prospect of tax cuts and his plans for expansionary policies
caused markets to rally. This rally continued right to the end
of the year on the back of optimism about renewed growth
in the US and, to some degree, around the view that infl ation
and interest-rate hikes would be modest in terms of degree.
Earlier in the year, market participants shrugged off the
news of the UK’s referendum result after the initial shock.
As well as signalling higher infl ation and increases in interest
rates, it was also a period that heralded a potential turning
point in the long-term rally in bond markets. In November,
yields in US Treasuries rose across the yield curve, while
the bond market sold off and the US dollar rose to a 14-year
high against major currencies. (The yield curve is the graphic
depiction of the relationship between the yield on bonds of
the same credit quality but with different maturities. It can
be used as an indicator of future interest rates.).
Commodity prices began to stabilise and the oil price
climbed higher in the fi nal months of 2016 as it became clear
that initially OPEC, and ultimately non-OPEC, members were
serious about cutting back on supply.
In contrast, there had been a diffi cult start to the year when
equity markets fell, as worries around the Chinese economy,
coupled with the US interest-rate hike late in 2015, had
combined to unsettle investor sentiment.
Over the year, global equity markets made progress in
aggregate, with the FTSE All-World Index rising by 9.92%.
NORTH AMERICAThe US economy continued to grow and in the three months
to the end of September, the economy went up by 3.5%,
representing a higher rate than in the previous quarters of
the year.
The Fed had raised interest rates at the end of 2015 and
markets participants speculated that further rate hikes
would follow in relatively quick succession. However, this
did not transpire as the Fed judged it prudent to hang
back from raising rates in spite of an increasingly tight
employment market.
Indeed, unemployment fell to 4.7% in December. US
non-farm payroll data and benefi t claims were also
supportive of this narrative of a robust US economy.
(Non-farm payroll is the total number of people employed
in non-agricultural businesses and is a closely watched
indicator of unemployment.)
Infl ation showed renewed growth with the November
producer price index rising 0.4%, ahead of expectations.
Markets participants began to price in likely higher infl ation
levels based on Trump’s expansionary and tax-cutting
agenda.
The Fed did fi nally raise interest rates again in December
by 0.25% and raised its expectation of the number of rate
hikes in 2017 from two to three. This was in recognition of a
changed infl ationary environment.
In this environment, the FTSE All-World North America Index
(which includes Canada) returned 12.25%.
EUROPEThe UK’s referendum on EU membership and the aftermath
of the vote to leave dominated the investment backdrop.
With the unexpected vote for Brexit, markets fell initially but
subsequently recovered to forge ahead in many instances.
Sterling fell away against major currencies, providing UK
exporters with a welcome boost.
In August, the Bank of England (BoE) opted for caution with
regards to the potential effects of the UK vote to leave the EU
and cut interest rates to 0.25%. Despite fears of a downturn,
the UK economy grew by 0.7% in the fi nal three months
of 2016, according to data from the Offi ce for National
Statistics.
In December, Italian Prime Minister Matteo Renzi resigned
following the overwhelming rejection in a referendum of his
proposals for constitutional reform. Europe witnessed the
rise of more populist and far-right parties, many of which
are anti-establishment and want to exit either the euro or
the EU, or both. Despite this trend, Austria narrowly voted
down the far-right candidate in its presidential election in
the same month.
Infl ation remained at low levels and well below the target of
2% stipulated by the European Central Bank (ECB), in spite
of rising oil and other commodity prices towards the end of
the year. Consumer prices in the eurozone recovered from
the negative levels of the fi rst half of the year to grow 1.1%
year on year in November.

1818
BNY MELLON GLOBAL FUNDS, PLC
INVESTMENT MANAGERS’ REPORTS cont’d.
ECONOMIC & MARKET OVERVIEW cont’d.
Another leg of support was taken away from bond markets
when the ECB announced it would be reducing the level of
monthly bond purchases from €80bn to €60bn. Mario Draghi,
president of the ECB, denied it was ‘tapering’. However, to
most market commentators, it appeared to be tapering in
deed if not in word.
Over the 12 months as a whole, the JP Morgan Global
Government Bond (Unhedged) Index increased by 1.57% in
local currency terms.
CURRENCY AND COMMODITIESThe US dollar strengthened noticeably following the election
of Trump to the US presidency in anticipation of the pursuit
of expansionary policies by the new administration.
Other currencies to experience major moves were sterling
and the yen. Sterling came under pressure following the UK’s
vote to leave the EU, although in the months after the vote
it recovered somewhat on the back of resilient economic
performance. The yen plunged against the US dollar, given
the strength of the US economy, and the Fed’s increase in
the number of projected interest-rate hikes for 2017.
Commodity prices recovered as they were given added
impetus in the fi nal few months of 2016, partly as a result of
Trump’s election and the implication of more expansionary
policy. OPEC’s agreement to cut oil production (a decision that
was followed by non-OPEC members) was another factor.
Most major commodities such as iron ore and copper
recovered through the period, a trend that seemed to have
started in early 2016. Reduced supply, cuts in investment
in existing and new projects, as well as stability in demand,
brought about the gradual recovery.
Meanwhile gold sold off on the rise in infl ationary
expectations following Trump’s election.
All performance data is from 1 January 2016 to 31 December 2016, total return in local currency terms unless otherwise indicated, sourced from Lipper and Bloomberg.
Against this backdrop, the FTSE All-World Europe ex UK Index
returned 4.59%. The UK stock market outperformed most
of its continental peers, with the FTSE All-World UK Index
returning 18.91%. The UK market was helped by its heavy
exposure to oil and mining, as commodity prices recovered.
ASIAAt the beginning of the year, investors were preoccupied
about the health of Chinese economy as growth slowed and
concerns returned about the magnitude of the bad debts
that had been accumulated and their impact upon the
fi nancial system. Despite this, the Chinese economy grew by
6.7% in 2016. Although it was the slowest growth since 1990,
the fi gure was within the offi cial target range of 6.5%-7.0%.
The Bank of Japan tried more unorthodox means in an effort
to reignite economic growth and infl ation, by introducing
‘yield curve control’. (The yield curve is the graphic depiction
of the relationship between the yield on bonds of the same
credit quality but different maturities. It can be used as an
indicator of future interest rates.) Essentially, the policy will
keep its 10-year government bond yield at zero. One likely
side effect of ‘yield curve control’ is that greater banking
activity will result that, in turn, spurs greater economic
activity and higher infl ation.
Trump’s election had a signifi cant impact on the Asian
economic and market backdrop. The soaring value of the
US dollar gave rise to concerns about the high amount of
dollar-denominated debt within the region and there was
also disquiet at the prospect of Trump’s re-examining US
trade relations around the world as well as rising commodity
prices, especially the cost of oil.
Against this backdrop, the FTSE All-World Asia Pacifi c ex
Japan Index returned 8.64% over the period. The FTSE
All-World Japan Index returned -0.28%.
FIXED INCOMEFor most of the year, bond markets were underpinned by the
loose monetary policies pursued by most central banks with
the aim of expanding the money supply in order to encourage
economic growth. In particular, government bonds in the
eurozone and Japan were supported by central-bank
purchases. Negative yields in key government bond markets
– where investors pay for the privilege of lending money to
governments – also became a feature.
Following Trump’s election, investors sold their bond
holdings more aggressively given the discussion around his
plans to cut taxes and boost fi scal spending radically. Rising
infl ation levels on the back of climbing commodity prices
gave further impetus to this.
The Fed increased interest rates in December by 0.25% in
a move that had been widely anticipated.

1919
BNY MELLON GLOBAL FUNDS, PLC
INVESTMENT MANAGERS’ REPORTS cont’d.
quality. A spread measures how much more a business pays
to borrow money than the government does.)
In the fi nal three months of the year, credit spreads
widened, as corporate bond prices fell more sharply than
those of government bonds. (Credit refers to fi xed-income
instruments.) The election of Donald Trump as US president
in November raised fears that interest rates would rise more
quickly and more steeply than had previously been expected.
In addition, the result soured sentiment towards emerging
market credit due to fears over a more protectionist attitude
towards international trade from the new US administration.
Market allocation was positive, having detracted from
performance towards the start of 2016. The two other main
contributors to performance were duration (sensitivity to
interest rates), which was managed actively throughout
the year ending in a marginally short position, and asset-
backed securities (ABS) which were fuelled primarily by
increasing demand for income in an environment of low
interest-rates. Negative contributions came from currency
exposure management and the high-yield bonds (those
with a rating below BBB) and loans segment.
The main events during 2016 were the UK vote on EU
membership and the US presidential election. The Fund
navigated both with a small gain.
Insight Investment Management (Global) Limited
February 2017
BNY MELLON ABSOLUTE RETURN EQUITY FUNDOver the review period, the Fund’s R share class returned
-0.67%, compared with 0.41% for LIBOR GBP 1 Month, both
in sterling terms.
Contributions came from a range of positions. In the fi rst
half of the year, macroeconomic data and central-bank
policy dominated markets and the difference between stock
returns within sectors was very low. This suppressed the
opportunities for active stock picking. In the second half of
2016, leadership within the equity markets decisively shifted
to banks and cyclicals, away from bond proxies and growth
stocks, for instance. (Cyclical refers to companies whose
share price is subject to the ups and downs of the overall
economy. Bond proxies are shares that behave somewhat
like bonds. They are typically more mature companies
that have relatively stable cash fl ows and pay dividends to
shareholders. Growth stocks are expected to rise in price over
time, outperforming the overall market.) Encouragingly, the
difference in returns between stocks within sectors started
to increase. This provided a better environment for the Fund,
allowing the manager to recoup most of the earlier losses.
Insight Investment Management (Global) Limited
February 2017
ABSOLUTE RETURN & TOTAL RETURN
BNY MELLON ABSOLUTE INSIGHT FUNDOver the review period, the Fund’s S share class returned
-1.55%, compared with -0.26% for EURIBOR 3 Months, both
in euro terms.
Performance was affected by losses from the strategies
in credit (fi xed-income instruments) and currency, which
more than offset gains elsewhere. The credit strategy
generated a negative performance contribution, led by
asset-backed securities holdings. In this strategy, there
was a bias towards securities with a higher volatility
and UK positions. The currency strategy also generated
a negative performance contribution, largely the result of
long US dollar positions against a number of currencies,
including the euro, Australian dollar, New Zealand dollar
and emerging market currencies. (A long position is the
buying of a currency with the expectation that it will rise in
value. A short position is the reverse.) The emerging market
debt strategy generated a positive contribution, mainly
from non-local currency positions in debt borrowed from
foreign lenders including commercial banks, governments
or international fi nancial institutions. The dynamic
opportunities strategy’s contribution was positive, aided by
positions focused on generating stable returns and relative
value strategies. The equity strategy generated a small
positive contribution, as a result of a range of positions.
Insight Investment Management (Global) Limited
February 2017
BNY MELLON ABSOLUTE RETURN BOND FUNDOver the review period, the Fund’s S share class returned
1.29%, compared with -0.26% for EURIBOR 3 Months, both
in euro terms.
UK, US and European government bonds prices rose over
the 12-month period. Yields trended lower before reversing
slightly in the fi nal three months of the year. Longer dated
bonds saw the strongest demand and this resulted in
a fl attening of the yield curve. (The yield curve is the graphic
depiction of the relationship between the yield on bonds
of the same credit quality but with different maturities.
It can be used as an indicator of future interest rates.
A yield curve is said to be fl at when there is little difference
between short-term and long-term interest rates.) The fall
in yields was driven by the continuing hunt for income in an
environment of low deposit rates alongside sizeable demand
from the asset-purchase programmes of central banks.
(Asset-purchasing programmes are intended to create new
money to use in the economy.) Both the European Central
Bank in March and the Bank of England in August broadened
their asset-purchase schemes to include corporate bonds.
On both occasions, this resulted in the spread of corporate
bonds relative to government bonds tightening. (The spread
on bonds is usually expressed as the yield difference
between bonds of the same maturity but different credit

2020
BNY MELLON GLOBAL FUNDS, PLC
INVESTMENT MANAGERS’ REPORTS cont’d.
ABSOLUTE RETURN & TOTAL RETURN cont’d. BNY MELLON DYNAMIC TOTAL RETURN FUNDOver the review period, Fund’s A share class returned 2.64%
in euro terms.
Currency allocations, mainly short positions in sterling
and the euro, drove the gain from diversifying assets. (With
a short position, an investor enters into an agreement to sell
a currency for a predetermined price on a specifi ed future
date. The trading strategy is aimed at taking advantage of
an expected fall in the value of the currency. A long position
is the reverse.) The US dollar rose against both currencies
on continued divergence in monetary policy and later in
the year as the interest-rate differential widened. Sterling
was particularly weak against the dollar as it tumbled
immediately following the UK’s vote in the referendum to
leave the EU and remained under pressure late in the year as
the Bank of England eased monetary policy.
A timely allocation to high-yield bonds and long exposure to
US equities drove the gain from growth assets. (High yield is
debt rated below BBB by the credit rating agency Standard
& Poor’s.) The managers increased the position in high-yield
bonds during March, after which the sector rallied as the
low yields of government bonds drove investors to seek
higher yields. Real-asset exposure was modestly positive
due to the allocation to US Treasury Infl ation-Protected
Securities. (Real assets are physical or tangible and include
precious metals, commodities, real estate, agricultural
land and oil.)
Defensive assets detracted due to a short position in German
bonds and a long in Australian bonds. The managers held
a short position in German bonds throughout the year due to
their low yields and narrow-term premium relative to other
markets. However, demand for German bonds remained
fi rm due to ‘safe-haven’ fl ows and the European Central
Bank’s asset-purchase programme. (‘Safe-haven’ assets
are favoured by investors in times of crisis because they are
judged to be stable and easy to liquidate.) Australian bonds
were an attractive long position due to their relatively high
yield. However, during the sovereign-bond sell-off late in the
year, Australian yields fell sharply along with US Treasuries,
representing a cost to the long position.
Mellon Capital Management Corporation
February 2017
BNY MELLON GLOBAL DYNAMIC BOND FUNDOver the review period, the Fund’s A share class returned
3.22%, compared with a return of 2.50% for LIBOR 1 Month
+ 200bps, both in US dollar terms.
UK Gilts, US Treasuries, emerging-market sovereign bonds
and investment-grade credit drove returns through the
bulk of the period. (Investment grade debt is rated BBB and
above by the credit rating agency Standard & Poor’s. Credit
refers to fi xed-income instruments.) However, they did give
back some performance later, in November and December,
as yields began to rise following Donald Trump’s election as
US president. UK Gilts were particularly buoyant following
the UK’s decision to leave the EU and the cut in interest
rates from the Bank of England in August. Investment-
grade credit rallied as yields fell and as spreads tightened.
(The spread on bonds is usually expressed as the yield
difference between bonds of the same maturity but
different credit quality. A spread measures how much more
a business pays to borrow money than the government.)
The Fund’s holding in the 10-year Treasury Corporation of
Victoria also rallied strongly, as expectations for Australian
interest rates declined amid weak global growth.
The currency weighting was a positive factor as long
positioning in US dollar assets aided the Fund’s
performance. (A long position is the buying of a currency
with the expectation that it will rise in value. A short position
is the reverse.) The US dollar rallied in the run-up to and
on the back of the increase in interest rates in December
and on the prospect of higher infl ation and further US rate
hikes in 2017. Exposure to the Mexican peso was a negative
infl uence on performance, however.
In terms of activity, US duration (sensitivity to interest rates)
was added in January with the purchase of 2025 and 2043
US Treasuries. The manager added duration in emerging-
market government bonds in early March with the purchase
of a local-currency exchange-traded fund (ETF) position,
alongside 2031 Colombia and 2021 Mexico holdings. This
left headline duration at approximately 4.1 years at the end
of June.
The manager reduced the Fund’s headline duration over
much of the remainder of the year. In the US, the manager
reduced duration with the sale of longer dated US Treasuries
and bought put options on US 10-year futures to hedge the
remaining US government bond holdings. (Put options give
the right to sell an asset at a set price by a certain date.)
The manager also reduced the Fund’s emerging-market
duration. In addition, the manager adjusted emerging-
market currency positioning, with the sale of Mexican peso
exposure in exchange for the US dollar, on confi rmation of
the new US administration. Into year end, the manager took
profi ts on short Turkish lira positions (among the world’s
weakest currencies).
As the prospects for high-yield credit improved with the
US growth outlook over the period, the manager increased
exposure by year end, aided by the purchase of Antero
Resources 2023, Range Resources 2023, Frontier 2025,
Tullow 2020 and Yum! Brands 2024 positions. (High yield is
debt rated below BBB by the credit rating agency Standard
& Poor’s.)
Newton Investment Management Limited
February 2017

2121
BNY MELLON GLOBAL FUNDS, PLC
INVESTMENT MANAGERS’ REPORTS cont’d.
ABSOLUTE RETURN & TOTAL RETURN cont’d.
BNY MELLON GLOBAL REAL RETURN FUND (EUR)Over the review period, the Fund’s A share class returned
0.50%, compared with a return of 3.66% for EURIBOR
1 Month + 400bps, both in euro terms.
The Fund generated a positive return but behind that of the
performance reference.
During the fi rst half of 2016, investors were largely gripped
by fear and in the second half optimism returned.
All the while, the backdrop as observed though the lens of
Newton’s view of the world has changed little. The portfolio
has therefore remained consistently positioned throughout
the period.
Gains made in the fi rst half of the year, predominantly from
equity, government bonds and gold were largely reversed in
the second half of the year.
For the 12-month period as a whole, the exposure of the
Fund to gold and precious-metal mining equities was
benefi cial to performance, with Barrick Gold one of the top
performing stocks over the period. On an individual stock
basis, there were strong returns generated from technology
stocks, such as Accenture and Microsoft. The media sector,
which has been a long-running area of focus within the
Fund, made an impressive contribution, with Wolters
Kluwer providing strong performance.
The Fund’s derivative protection generated a negative
contribution, as global equities made gains over the
period. (Derivatives are fi nancial instruments whose value
is derived from the value of an underlying asset, such as
gold or a bond.) Additionally, pharmaceutical stocks such
as Teva Pharmaceutical Industries, Roche Holdings and
Novartis all detracted from performance.
In terms of activity, the manager initiated new positions,
among others, in Japanese food-and-beverage business
Suntory, semiconductor manufacturer Maxim Integrated
and Adecco, an international employment business. The
manager also bought consumer goods company Unilever,
retailer Associated British Foods and beverages company
Diageo. Additions were made to information services
companies RELX and Wolters Kluwer and Dong Energy.
Following the US presidential election, the manager
implemented protection on a signifi cant portion of the
portfolio’s bond exposure in order to dampen the impact of
further volatility.
In the manager’s view the euphoria produced by the US
election result is misplaced and the positive market
reaction overdone. Financial assets, notably equity and
corporate debt markets, are reaching historic highs, which,
combined with the manager’s assessment of the backdrop,
BNY MELLON GLOBAL OPPORTUNISTIC BOND FUNDOver the review period, the Fund’s A share class returned
1.10%, compared with a return of 0.75% for LIBOR USD
3-Month, both in US dollar terms.
The earlier weakness experienced during the fi rst three
months of 2016 reversed through the remainder of the year,
despite the surprise outcomes of both the UK’s referendum
on EU membership in June and the US presidential election
in November. The year ended with the US Federal Reserve
(Fed) resuming its increase in interest rates with a 0.25%
hike in the Fed’s funds rate in December, the fi rst such
move since December 2015. Ahead of this move, global
bond yields had already begun to rise from the record lows
recorded mid-year.
Yields across developed and emerging economies rose sharply
in the latter half of the year with the 10-year US Treasury yield
nearly doubling from its summer low. This was as the impact of
higher infl ation expectations and the further raising of interest
rates by the Fed, in the face of a strengthening US economy,
took hold. Against this backdrop, the Fund benefi ted from its
exposure to high-yield and investment-grade corporate debt
securities where spreads tightened through the end of the
year. (High yield is debt rated below BBB by the credit rating
agency Standard & Poor’s, whereas Investment-grade debt is
rated BBB and above by the same agency. The spread on bonds
is usually expressed as the yield difference between bonds
of the same maturity but different credit quality. A spread
measures how much more a business pays to borrow money
than the government does.) While the duration position on the
Fund remains relatively low, the sharp moves higher in interest
rates across markets detracted from overall performance.
(Duration is a measure of the sensitivity of the price of a fi xed-
income investment to a change in interest rates.)
In addition to corporate bond exposure, the Fund had
taken exposure to emerging market debt, which enjoyed
strong performance for the year despite some volatility
in the immediate wake of the November US presidential
election. Exposure to global Treasury Infl ation-Protected
Securities was also positive for Fund performance as
market participants began to price in higher infl ation
expectations. Positioning across developed and emerging-
market currencies detracted from overall performance.
The positive contribution from the Fund’s holdings in
asset-backed securities and commercial mortgage backed
securities for the nine months from 31 March 2016 failed to
offset entirely the marked underperformance experienced
during the period of market turbulence in the fi rst three
months of 2016. (Securitised assets are the pooling of
assets, such as mortgages, into securities that are divided
up and sold to investors.)
Standish Mellon Asset Management Company, LLC
February 2017

2222
BNY MELLON GLOBAL FUNDS, PLC
INVESTMENT MANAGERS’ REPORTS cont’d.
ABSOLUTE RETURN & TOTAL RETURN cont’d.
In the manager’s view the euphoria produced by the US
election result is misplaced and the positive market
reaction overdone. Financial assets, notably equity and
corporate debt markets, are reaching historic highs, which,
combined with the manager’s assessment of the backdrop,
point towards a potentially unfavourable outcome that
even President Donald Trump cannot overcome.
Newton Investment Management Limited
February 2017
BNY MELLON GLOBAL REAL RETURN FUND (USD)Over the review period, the Fund’s A share class returned
1.69%, compared with a return of 4.50% for LIBOR USD
1 Month + 400bps, both in US dollar terms.
The Fund generated a positive return but behind that of the
performance reference.
During the fi rst half of 2016, investors were largely gripped
by fear and in the second half optimism returned.
All the while, the backdrop as observed though the lens of
Newton’s view of the world has changed little. The portfolio
has therefore remained consistently positioned throughout
the period.
Gains made in the fi rst half of the year, predominantly from
equity, government bonds and gold were largely reversed in
the second half of the year.
For the 12-month period as a whole, the exposure of the
Fund to gold and precious-metal mining equities was
benefi cial to performance, with Barrick Gold one of the top
performing stocks over the period. On an individual stock
basis, there were strong returns generated from technology
stocks, such as Accenture and Microsoft. The media sector,
which has been a long-running area of focus within the
Fund, made an impressive contribution, with Wolters
Kluwer providing strong performance.
The Fund’s derivative protection generated a negative
contribution, as global equities made gains over the
period. (Derivatives are fi nancial instruments whose value
is derived from the value of an underlying asset, such as
gold or a bond.) Additionally, pharmaceutical stocks such
as Teva Pharmaceutical Industries, Roche Holdings and
Novartis all detracted from performance.
In terms of activity, the manager initiated new positions,
among others, in Japanese food-and-beverage business
Suntory, semiconductor manufacturer Maxim Integrated
and Adecco, an international employment business. The
manager also bought consumer goods company Unilever,
retailer Associated British Foods and beverages company
Diageo. Additions were made to information services
point towards a potentially unfavourable outcome that
even President Donald Trump cannot overcome.
Newton Investment Management Limited
February 2017
BNY MELLON GLOBAL REAL RETURN FUND (GBP)Over the 12-month period, the Fund’s C share class
returned 3.53%, compared with a return of 4.41% for LIBOR
GBP 1 Month + 400bps, both in sterling terms.
The Fund generated a positive return but behind that of the
performance reference.
During the fi rst half of 2016, investors were largely gripped
by fear and in the second half optimism returned.
All the while, the backdrop as observed though the lens of
Newton’s view of the world has changed little. The portfolio
has therefore remained consistently positioned throughout
the period.
Gains made in the fi rst half of the year, predominantly from
equity, government bonds and gold were largely reversed in
the second half of the year.
For the 12-month period as a whole, the exposure of the
Fund to gold and precious-metal mining equities was
benefi cial to performance, with Barrick Gold one of the top
performing stocks over the period. On an individual stock
basis, there were strong returns generated from technology
stocks, such as Accenture and Microsoft. The media sector,
which has been a long-running area of focus within the
Fund, made an impressive contribution, with Wolters
Kluwer providing strong performance.
The Fund’s derivative protection generated a negative
contribution, as global equities made gains over the
period. (Derivatives are fi nancial instruments whose value
is derived from the value of an underlying asset, such as
gold or a bond.) Additionally, pharmaceutical stocks such
as Teva Pharmaceutical Industries, Roche Holdings and
Novartis all detracted from performance.
In terms of activity, the manager initiated new positions,
among others, in Japanese food-and-beverage business
Suntory, semiconductor manufacturer Maxim Integrated and
Adecco, an international employment business. The manager
also bought consumer goods company Unilever, retailer
Associated British Foods and beverages company Diageo.
Additions were made to information services companies
RELX and Wolters Kluwer and Dong Energy. Following
the US presidential election, the manager implemented
protection on a signifi cant portion of the portfolio’s bond
exposure in order to dampen the impact of further volatility.
BNY MELLON GLOBAL REAL RETURN FUND (EUR) cont’d.

2323
BNY MELLON GLOBAL FUNDS, PLC
INVESTMENT MANAGERS’ REPORTS cont’d.
ABSOLUTE RETURN & TOTAL RETURN cont’d.
companies RELX and Wolters Kluwer and Dong Energy.
Following the US presidential election, the manager
implemented protection on a signifi cant portion of the
portfolio’s bond exposure in order to dampen the impact of
further volatility.
In the manager’s view the euphoria produced by the US
election result is misplaced and the positive market
reaction overdone. Financial assets, notably equity and
corporate debt markets, are reaching historic highs, which,
combined with the manager’s assessment of the backdrop,
point towards a potentially unfavourable outcome that
even President Donald Trump cannot overcome.
Newton Investment Management Limited
February 2017
BNY MELLON TARGETED RETURN BOND FUNDOver the review period, the Fund’s A share class returned
0.66%, compared with a return of 3.96% for the Lipper
Global Bond Global sector, both in US dollar terms.
The earlier weakness in risk markets experienced during
fi rst three months of 2016 reversed through the remainder
of the year, despite the surprise outcomes of both the
UK’s referendum on EU membership in June and the
US presidential election in November. The year ended
with the US Federal Reserve (Fed) resuming its increase
in interest rates with a 0.25% hike in the Fed’s funds rate
in December, the fi rst such move since December 2015.
Ahead of this move, global bond yields had already begun to
rise from the record lows recorded mid-year. Yields across
developed and emerging economies rose sharply in the
latter half of the year, with the 10-year US Treasury yield
nearly doubling from its summer low. This was as the impact
of higher infl ation expectations and the further raising of
interest rates by the Fed in response to a strengthening US
economy took hold.
Against this backdrop, the largest contributors to
performance came from the Fund’s exposure to high-yield
and investment-grade credit, and US dollar emerging-
market debt where spreads tightened through year end.
(High yield is debt rated below BBB by the credit rating
agency Standard & Poor’s, whereas Investment-grade debt
is rated BBB and above by the same agency. The spread on
bonds is usually expressed as the yield difference between
bonds of the same maturity but different credit quality.
A spread measures how much more a business pays to
borrow money than the government does.) An additional
source of return came from the Fund’s holdings in
government bond infl ation-linked instruments, which
provide protection against rises in observed consumer and
producer price indices. With commodity prices stabilising
by mid-year, market participants began pricing in higher
infl ation expectations and the Fund’s holdings in bonds
with these protection features increased in value. Currency
positioning in both developed and emerging-economy
currencies nevertheless detracted from Fund performance.
The increase in bond yields experienced in the latter half
of the year similarly resulted in a negative contribution to
overall fund performance, as while duration is maintained
at relatively low levels, the rise in rates affected the total
return, notwithstanding accrued income. (Duration is
a measure of the sensitivity of the price of a fi xed-income
investment to a change in interest rates.)
Standish Mellon Asset Management Company, LLC
February 2017
BNY MELLON GLOBAL REAL RETURN FUND (USD) cont’d.

2424
BNY MELLON GLOBAL FUNDS, PLC
INVESTMENT MANAGERS’ REPORTS cont’d.
GLOBAL EQUITY
BNY MELLON GLOBAL EQUITY FUNDOver the review period, the Fund’s A share class returned
-0.64% against a return of 7.86% for the MSCI All-Country
World Index NR and 3.61% for the Lipper Global Equity
Global sector, all in US dollar terms.
Both asset allocation and stock selection detracted from
performance.
As investors moved more into cyclical stocks, the Fund’s
exposure to less cyclical areas, such as healthcare, was
a negative infl uence as these sectors were laggards within
the comparative index. (Cyclical refers to companies whose
share price is subject to the ups and downs of the overall
economy.) Consequently, the Fund’s underweight exposure
to energy, materials and fi nancials was detrimental, as
these sectors recovered. The energy sector benefi ted from
the increase in commodity prices, particularly, the price of
the oil following the production cuts agreed by OPEC and
non-OPEC members alike. Financials recovered on the
prospects for higher interest rates which will assist banks
in resetting their loan pricing more favourably.
The largest individual detractor was the holding in Teva
Pharmaceutical Industries. This was attributable to various
factors including politicking in the US presidential election
around drug pricing and a lack of confi dence from some
investors in Teva’s ability to defend its Copaxone franchise
(a treatment for multiple sclerosis) as well as pressure
on the pricing of generics. The potential pricing scrutiny
also exerted pressure on the shares of pharmacy benefi t
manager Express Scripts. Another prominent negative was
TripAdvisor, which suffered as the company confi rmed that
the transition to its Instant Booking platform was taking
longer than expected and that it would not contribute
signifi cantly to its revenues until 2017 – rather than in the
second half of 2016, as had been expected. As investors
favoured fi nancials and resources stocks, telecoms stocks
were also relatively weak over the period. In this regard, the
Fund’s holdings in Vodafone Group detracted from returns.
US IT company Trimble, which makes a range of high-
tech equipment including GPS and navigation systems,
was a signifi cant contributor. Shares in technology giant
Microsoft were buoyant as its substantial investment
in the ‘cloud’ began to pay off, which was refl ected in its
robust earnings. Principal Financial Group performed
well following the release of a strong set of third-quarter
results. Operating earnings beat consensus forecasts, net
infl ows were good, and there was broad-based strength
across all strategies. Rising interest rates could also act to
alleviate a drag on earnings that had persisted since 2012.
The holding in Citigroup benefi ted from the expectation that
the Federal Reserve would raise interest rates in December
(which it did) and from the pick-up in bond yields, which
accelerated after the US election result.
The manager initiated a position in Cisco Systems, the world
leader in switching and routing equipment and software for
IT networks. The company is highly profi table and boasts
dominant market share and cash on the balance sheet. The
manager used share-price weakness to initiate a position
in US oil & gas exploration company ConocoPhillips. The
management is focusing on returns to shareholders; it will
stop the search for oil and gas in deep-water fi elds by 2017
and is dramatically cutting capital expenditure. While the
manager remains cautious on the outlook for the oil price,
the decision to cut production by OPEC and non-OPEC
members goes some way to underpinning a ‘fl oor’ level.
The manager sold the holding Sawai Pharmaceutical,
as, although the company’s valuation is not excessive,
the free cash fl ow is not high and it seems that capital
expenditure will rise over the next two years at least.
(Free cash fl ow is the cash a company has left over after
all outgoings, including dividends, debt payments, tax,
operating cost and capital expenditure.) Entry into the
US market is the key priority but, as a non-US company,
there remains signifi cant risk associated with building
a presence in the US. The manager also sold another
pharmaceutical company, GlaxoSmithKline. The manager
also sold the Fund’s long-standing holding in Swiss staple
company Nestle and used the proceeds to buy Anglo-Dutch
consumer-goods company Unilever. Unilever was preferred
for its greater exposure to the emerging markets.
The backdrop of fragile economic growth and a challenging
pricing environment emphasise the importance of cash-
fl ow generation, strength of balance sheets and the ability
to sustain pricing or adapt to lower prices.
Newton Investment Management Limited
February 2017
BNY MELLON GLOBAL EQUITY INCOME FUNDOver the review period, the Fund’s A share class returned
5.87%, compared with a return of 8.65% for the FTSE World
Index TR and 5.08% for the Lipper Global Equity Global
Income sector, all in US dollar terms.
Asset allocation was the main negative infl uence on overall
returns. The Fund had overweight positions in sectors with
steadier growth, such as healthcare, consumer goods and
utilities, while being underweight more cyclical areas, for
example, oil & gas, fi nancials and basic materials. (Cyclical
refers to companies whose share price is subject to the
ups and downs of the overall economy.) This positioning
had an adverse effect on returns over the period as it was
the more cyclical sectors that rallied, particularly in the
second half of the period. This was prompted by evidence
of improving economic data across major economies, rising
commodity prices and speculation around the refl ationary
agenda of President Donald Trump. (Refl ation is the act

2525
BNY MELLON GLOBAL FUNDS, PLC
INVESTMENT MANAGERS’ REPORTS cont’d.
GLOBAL EQUITY cont’d.
of stimulating the economy by increasing the money supply
or reducing taxes.)
Financial stocks benefi ted from a steepening yield curve.
(The yield curve is the graphic depiction of the relationship
between the yield on bonds of the same credit quality but
different maturities. It can be used as an indicator of future
interest rates.)
Specifi c stock detractors included consumer staples names,
such as Japan Tobacco, beverages company Diageo and
telecommunications company Vodafone Group. (Consumer
staples are regarded as essential products, such as food,
beverage and household items, that are in demand no matter
how well the economy is doing.) Novartis and Roche Holdings
suffered as a result of the uncertainty surrounding the
US presidential election as well as fears around price cuts to
key drugs. The share price of aerospace and defence group
Cobham declined as the commercial side of its business
suffered from weakening markets in telecommunications
and transportation. This resulted in a rights issue when new
shares are made available to existing shareholders.
Two of the best performing stocks in the Fund were US tobacco
companies Philip Morris and Reynolds American. Both offer
robust defensive and stable returns. Reynolds American
benefi ted from the announcement by British American Tobacco
to acquire the 58% of Reynolds that it did not own. Money
transfer company Western Union, which receives around 8% of
its revenues from Mexico, was a surprising benefi ciary of the
post-US election rally in view of Trump’s plans to build a border
wall. US technology company Microsoft was also one of the top
performers on the back of strong quarterly results, showing
good revenue growth and margin expansion.
The manager took a new position in Adecco, the Swiss staffi ng
company which provides personnel and recruitment services,
in the manager’s view, a depressed and out-of-favour part of
the market. A new position was also started in Informa, the
UK exhibitions-led business. After two large US acquisitions,
the company should benefi t from good compounding growth
over the medium term. The manager sold the holding in US
tobacco company Altria and used some of the proceeds to
add to the position in Japan Tobacco. With only 40% of profi ts
derived domestically, Japan Tobacco has a lot more room for
profi t growth and further opportunity for price increases.
In an environment in which dividend growth may be under
pressure, the sustainability of shareholder payments will
be ever more important. The manager regards capital-light
business models and those with discernible intellectual
property as positive in the provision of good dividends, even
as market valuations remain high.
Newton Investment Management Limited
February 2017
BNY MELLON GLOBAL LEADERS FUNDThe Fund was launched on 7 December 2016.
The Fund aims to achieve long-term capital growth through
investing in high-quality, global companies with enduring
growth potential. It seeks to invest in those companies with
successful business models that are capable of generating
superior wealth through a strong or leading market position
or through a sustainable, competitive advantage.
The Fund is highly concentrated and invests in 25-30
equally weighted, large-capitalisation stocks.
The approach to investment is very much bottom-up,
focused and research driven. (A bottom-up approach
looks at the performance of individual companies before
considering general or economic trends.)
Turnover is typically very low as the managers only invest
in companies where they have conviction around the
prospects, taking a buy-and-hold approach. The managers
believe this approach will provide investors with superior
risk-adjusted returns over the long term.
Walter Scott & Partners Limited
February 2017
BNY MELLON GLOBAL OPPORTUNITIES FUNDOver the review period, the Fund’s A share class returned
0.94%, compared with a return of 7.86% for the MSCI
All-Country World Index NR and 3.61% for the Lipper Global
Equity Global sector, all in US dollar terms.
The Fund generated a positive return but was behind the
comparative index.
Performance was affected by the rotation in sectors that
took place in the latter half of the period and entailed a move
towards cyclicals, such as materials and fi nancials, which
the Fund had underweighted, away from healthcare and
consumer staples. (Cyclical refers to companies whose share
price is subject to the ups and downs of the overall economy.
Consumer staples are regarded as essential products, such
as food, beverage and household items, that are in demand
no matter how well the economy is doing.) The more cyclical
sectors rallied. This was because of improving economic
data across major economies, rising commodity prices and
speculation around the refl ationary agenda of President
Donald Trump. (Refl ation is the act of stimulating the
economy by increasing the money supply or reducing taxes.)
The holding in TripAdvisor hurt performance as the company
confi rmed that the transition to its Instant Booking platform
was taking longer than expected and that it would not
contribute signifi cantly to its revenues until 2017 – rather
than in the second half of 2016, as had been expected.
BNY MELLON GLOBAL EQUITY INCOME FUND cont’d.

2626
BNY MELLON GLOBAL FUNDS, PLC
INVESTMENT MANAGERS’ REPORTS cont’d.
GLOBAL EQUITY cont’d.
The position in Teva Pharmaceutical Industries detracted
from performance. This was attributable to various factors
including politicking in the US presidential election around
drug pricing and a lack of confi dence from some investors in
Teva’s ability to defend its Copaxone franchise (a treatment
for multiple sclerosis) as well as pressure on the pricing of
generics. The potential pricing scrutiny also exerted pressure
on the shares of pharmacy benefi t manager Express Scripts.
The decline in hepatitis C product sales at Gilead Sciences
continued to weigh on the share price.
On the positive side, US IT company Trimble, which makes
a range of high-tech equipment including GPS and navigation
systems, provided a boost to Fund returns. The manager
believes that the company is positioning itself well for the
future, operating through a business model that is relevant
to the weak macroeconomic environment. Norwegian bank
DNB was also boosted by an increase in its Tier 1 Common
Capital ratio (CET1), a key measure of a bank’s fi nancial
strength. The holdings in Yum! Brands – the owner of KFC and
Pizza Hut – and toymaker Mattel performed well. Although
a low relative allocation to energy was not helpful for Fund
returns, the holding in Suncor Energy offered some benefi t.
The company reported an impressive set of third-quarter
results: increased production, lower unit costs, strong cash
fl ow and further reductions to full-year capital expenditure
were all features. The resolution of a four-year tax dispute
with the Canada Revenue Agency removed a potential tax
liability of around US$1.2bn.
The manager sold the long-standing holding in Swiss company
Nestle and used part of the proceeds to buy Anglo-Dutch
consumer-goods company Unilever. While the former’s market
share has deteriorated, Unilever’s emerging-market exposure
offers more scope for future growth and margin expansion.
The manager initiated a position in Walmart de Mexico. It is a
fi nancially attractive Mexican retailer that has a signifi cant
scale advantage over its rivals and has plenty of room to grow.
Disposals included the holdings of Yum! Brands and the
Japanese tyre manufacturer Bridgestone.
Newton Investment Management Limited
February 2017
BNY MELLON LONG-TERM GLOBAL EQUITY FUNDOver the review period, the Fund’s A share class returned
7.20%, compared with a return of 10.73% for the MSCI
World Index NR and 6.71% for the Lipper Global Equity
Global sector, all in euro terms.
For much of the year, the US presidential election was the
dominant market theme. Global equity markets enjoyed
a strong start to the year. However, the underlying current
of concerns in the wake of the UK’s Brexit vote (the vote
to leave the EU) had become more pronounced by early
summer as nervousness ahead of the US election took
hold. Politically sensitive sectors were affected, healthcare
stocks in particular.
Following the US presidential election vote, US equity markets
rose strongly. Despite little certainty or clarity on the timing
or terms of President Donald Trump’s policy programme,
any previous concerns were placed to one side as hopes of
infrastructure spending and accommodative tax policies
came to the fore. Healthcare stocks recovered notably and
industrial, material and technology stocks moved upwards.
Medical device company Stryker, Shin-Etsu Chemical, Taiwan
Semiconductor and manufacturer of connectors Amphenol
were among the best performing stocks over the year.
US energy names also performed well in this rally, to the
benefi t of the portfolio. EOG Resources was the largest
individual contributor. 2015 certainly tested the energy sector
but those testing times added to the team’s confi dence in
both the resilience and opportunities for the names held. With
the benefi t of a long-term investment focus, weights in the
sector had been nudged upwards, which proved opportune.
However, banks also rose strongly in the latter part of the
year, to the detriment of performance as the portfolio is
absent from the sector. Although this strength looks set to
endure, the team remains of the view that the balance of risk
and return is ill-suited for long-term, fundamental investors.
Politically motivated equity-market rallies as seen in 2016
tend to be short-lived. Walter Scott remains committed
to its approach and to the companies held in the Fund.
Some will almost certainly prosper under ‘Trumponomics’
(Trump’s economic policies) but all have the strength to
grow profi tability beyond Trump’s tenure and to pursue
opportunities independent of policy shifts, good or bad.
Walter Scott & Partners Limited
February 2017
BNY MELLON GLOBAL OPPORTUNITIES FUND cont’d.

2727
BNY MELLON GLOBAL FUNDS, PLC
INVESTMENT MANAGERS’ REPORTS cont’d.
REGIONAL & SPECIALIST EQUITY
BNY MELLON ASIAN EQUITY FUNDOver the review period, the Fund’s A share class returned
2.18% compared with a return of 7.06% for the MSCI
All-Country Asia Pacifi c ex Japan Index TR and 3.17% for
the Lipper Global Equity Asia Pacifi c Ex Japan sector, all in
US dollar terms.
The Fund generated a positive return but was behind the
comparative index and sector.
Asset allocation was the main negative contributor to returns,
with the stock selection effect largely neutral. In terms of
sector contribution, the overweight exposure to healthcare
proved most detrimental, while the overweight position in
consumer discretionary (non-essential goods and services)
and the underweighting of basic materials also subtracted
from returns. (The basic materials sector comprises companies
involved in the discovery, development and processing of raw
materials.) Underweight positions in fi nancials, real estate
and industrials all contributed positively however.
Some of the key drivers behind positive relative performance
in the fi rst half of 2016 were reversed in November,
following Donald Trump’s election to the US presidency,
when there was a market shift away from high-quality
growth companies into commodities and fi nancials. The
manager has conviction in the underweight positioning in
both of these sectors, which is underpinned by Newton’s
long-term strategic view of the world. The sharp reversal in
performance did not dissuade the manager from this view
and did not prompt wholesale changes to the positioning to
chase this momentum. The manager has every confi dence
that the companies owned will create value over a three to
fi ve-year time horizon and the manager sees such gyrations
in markets as opportunities.
In terms of country contribution, the key negative infl uences
were the overweight position in the Philippines and the
overweighting of India. Investors responded favourably to the
country’s strong economic growth but took profi ts following
the inauguration of Rodrigo Duterte as president and in view
of his eccentricities and the severity of the clampdown on
drugs. The overweight position in India also detracted from
returns as the government called in and cancelled high-
denomination notes with the aim of harming the black
economy. While a positive factor for India’s economy and
growth in the long run, this measure had a detrimental effect
on consumer spending in the short term.
In terms of stock selection, Apollo Hospitals and IHH
Healthcare, leading private hospital companies across Asia,
led the underperformance, although there was no negative
news or change to the companies’ strategies. Both companies
are in investment mode as they grow their hospital footprint
and hence are trading on depressed earnings and margins. The
manager remains confi dent in the outlook for these stocks.
Two of the largest holdings in the Philippines, Universal
Robina and GT Capital, were key detractors to returns over
the period. Universal Robina faced a one-off challenge to
its Vietnam business, for which the stock is being overly
punished in the view of the manager. Incitec Pivot in
Australia was another detractor as its share price dropped
on the back of weak fertiliser prices.
On the positive side, Sands China was a notable contributor,
with the shares rising as gross gaming revenues in Macau
stabilised. Sands China also opened its new casino,
The Parisian, in mid-September, which should help it gain
more market share in the more lucrative mass-market
gaming segment. Elsewhere, the Indian auto manufacturer
Maruti Suzuki performed very well on the back of
encouraging sales fi gures.
In terms of activity, the Fund initiated a position in SEEK,
an online recruitment platform in Australia, New Zealand
and a number of Asian and emerging countries, which
is seeing strong growth rates. The manager used price
weakness to start a position in LG Household & Health
Care. The South Korean company is engaged in the
manufacture of household goods, cosmetics and beverages
and has demonstrated an ability to compound returns on
a sustainable basis.
The Fund participated in the initial public offering of
Samsung Biologics. This company is a global leader in
the contract manufacture of biosimilar drugs, a market
which is forecast to be valued at US$144bn by 2025. The
manager’s concerns over asset quality led to the sale of the
holding in Axis Bank and the reinvestment of the proceeds
into the housing fi nance companies LIC Housing Finance
and Indiabulls Housing Finance, which have long-term
structural support. Finally, the holding in TAL Education
was sold. The stock had performed well since it was bought
and the manager saw better opportunities elsewhere.
Newton Investment Management Limited
February 2017
BNY MELLON ASIAN INCOME FUNDOver the review period, the Fund’s W share class returned
30.78% compared with a return of 28.66% from the FTSE
All-World Asia Pacifi c ex Japan Index TR and 23.06% for the
Lipper Global Equity Asia Pacifi c ex Japan sector average,
all in sterling terms.
The Master Fund’s outperformance of its comparative index
was helped by positive country allocation, with underweight
positions in China and India proving benefi cial. The overweights
in Thailand and New Zealand were also benefi cial.
Stock selection was strongly positive in consumer services,
fi nancials and industrials.

2828
BNY MELLON GLOBAL FUNDS, PLC
INVESTMENT MANAGERS’ REPORTS cont’d.
REGIONAL & SPECIALIST EQUITY cont’d.
The manager also bought holdings in Indiabulls Housing
Finance, one of India’s largest home-loan companies, and
China Mobile, which has considerable potential to benefi t
from the rapid growth in mobile-data usage in China.
Complete sales included Thailand’s Intouch Holdings,
given fi ercer competition in the Thai telecoms industry,
and a number of Australian holdings, including Spotless
Group, Incitec Pivot and APA. Elsewhere, the manager sold
the holdings in the Hong Kong and China infrastructure and
services company NWS and in Singapore’s Cache Logistics
and Keppel Infrastructure Trust.
Newton Investment Management Limited
February 2017
BNY MELLON BRAZIL EQUITY FUNDOver the review period, the Fund’s A share class returned
57.85%, compared to a return of 65.23% for the MSCI Brazil
10/40 Index NR and 54.76% for the Lipper Global Equity
Brazil sector, all in US dollar terms.
At the industry level, the negative performance came
from the exposure to pulp and paper and underexposure
to mining and defensive fi nancial services, while steel,
utilities and banks were the main positive contributors. The
holdings in Suzano and Fibria were hit by lower prices for
hardwood pulp as new capacity entered the market and the
Brazilian currency appreciated. Shares in Embraer were
a negative contributor in the year as the company reported
lower margins in its business-jet unit. Moreover, the
company recognised a loss due to a defi nitive agreement
with the US and Brazilian regulators for the settlement
of the allegations of violations of the US Foreign Corrupt
Practices Act.
At the stock level, the Fund benefi ted from its exposure
to steel companies Gerdau and Metalurgica Gerdau.
The stocks soared due to several positive aspects,
including better prospects for the Brazilian economy, the
rebound in international steel prices, signifi cant cost-
cutting initiatives and asset sales. Petrobras shares were
also a positive contributor, with the new management
implementing a set of measures to reduce the company´s
debt, including asset divestures, lower investments, staff
cuts and the implementation of a fuel-pricing policy where
the company will follow international parity prices.
ARX Investimentos Ltda
February 2017
BNY MELLON ASIAN INCOME FUND cont’d.
The largest individual contribution to returns came
from the Hong Kong-listed Sands China, which operates
casinos in Macau. The Macau casino operator exceeded
expectations with its third-quarter results, helped by the
strong performance of its newly opened hotel, The Parisian.
Another Macau casino operator, Wynn Macau, was also
among the top contributors. The manager sold the holding
midway through the period to concentrate the Fund’s
exposure to Macau casinos in Sands China, which has
greater exposure to mass-market gambling.
Hong Kong’s Man Wah Holdings performed well too. The Hong
Kong sofa manufacturer, which sells to the US, might have
been expected to underperform on Donald Trump’s threat
to impose tariffs on Chinese goods. But investors looked
through the rhetoric to the company’s extremely strong
interim results – with year-on-year growth in core profi ts.
Elsewhere, there were strong performances from Taiwan
Semiconductor Manufacturing Co. (TSMC) and Australian
packaging company Orora. TSMC announced very strong
third-quarter results. The company is a key supplier of
chips for Apple’s iPhone 7, the prospects of which were
boosted by the recall of Samsung Electronics’ Galaxy Note
7. Besides announcing an increase in net profi ts in the third
quarter, TSMC raised its guidance for the full year. Orora
also forecast strong full-year profi t growth.
Among the main negative contributors were several
stocks that the Fund does not hold. Despite South Korea’s
political turmoil and the company’s recent withdrawal
of its spontaneously combusting Galaxy Note 7 handset,
investors grew optimistic that Samsung Electronics
would improve its corporate governance and shareholder
returns. The manager is sympathetic to this view but the
stock does not yet meet the Fund’s strict yield criteria.
Not owning Chinese internet stock Tencent Holdings also
detracted from returns; again, it does not meet the Fund’s
income criteria.
The zero weighting in Australian miner BHP Billiton also had
a negative effect. Its shares recovered well from weakness
at the start of the year, and they also benefi ted in the wake
of the US election, as investors favoured stocks that might
benefi t from an economic boom, given Trump’s proposals
of lower taxes and increased infrastructure spending.
Telecommunications stocks fell out of favour during this
period, with the Fund’s holdings in Philippine Long Distance
Telecom, Telstra and Singtel (Singapore Telecommunications)
all detracting from relative performance.
New holdings over the period included Singapore Airport
Terminal Services, which operates the largest food-
solutions and gateway-services network in Asia, Indian
tobacco fi rm ITC and Hong Kong power provider CLP.

2929
BNY MELLON GLOBAL FUNDS, PLC
INVESTMENT MANAGERS’ REPORTS cont’d.
REGIONAL & SPECIALIST EQUITY cont’d.
cash for everyday purchases, suddenly found themselves
cash-strapped. As the manager sees companies owned in
the Fund start to report profi ts, the impact has, in reality,
been far less than many commentators anticipated. The
manager had used the market weakness to top up existing
Indian positions, for which the manager remains positive.
As economic growth picked up and expectations of
infl ation rose, the shift in the second half of 2016 into
more cyclical areas of the market and away from steady-
growth sectors, such as healthcare and consumer staples,
hurt performance. (Cyclical refers to companies whose
share price is subject to the ups and downs of the overall
economy. Consumer staples are regarded as essential
products, such as food, beverage and household items, that
are in demand no matter how well the economy is doing.)
This was partially triggered by Donald Trump’s successful
election to the US presidency and speculation around
his refl ationary policies as well as the rise in commodity
prices. (Refl ation is the act of stimulating the economy by
increasing the money supply or reducing taxes.) In certain
cases, such as healthcare, reading across from US sector
weakness affected stocks on the other side of the world,
such as China, quite irrationally, providing the manager
with a buying opportunity.
The Fund’s performance was also negatively affected by
its exposure to Chinese internet stocks. In this regard,
the holdings in Vipshop (online discount retail) and Baidu
(internet search) had a negative impact on performance.
Additionally, the holding in 3SBio hurt relative performance,
as the stock was affected by the withdrawal of a product
from application to China’s Food & Drug Administration,
as well as general healthcare sector weakness. The zero
weighting in Samsung Electronics was the largest relative
stock detractor. Grupo Aeroportuario Centro Norte was also
a detractor as the stock sold off on the threat of Trump’s
policies and greater protectionism.
The top stock contributor to the Fund’s performance was
China’s TAL Education Group, which was helped by very
strong results, growing underlying earnings per share by
48% year on year. Hong Kong-listed Sands China, which
operates casinos in Macau, made a positive contribution to
returns. The Macau casino operator exceeded expectations
with its third-quarter results, helped by the strong
performance of its newly opened hotel, The Parisian.
Another Macau casino operator, Wynn Macau, was also
among the top contributors.
In terms of activity, the manager purchased a holding in
Fomento Economico Mexicano (FEMSA). The company’s
Coca-Cola FEMSA division is the largest public bottler of
Coca-Cola products in the world but the main attraction
of the company is its Oxxo business. Oxxo is the biggest
convenience store chain in Mexico and is growing fast and
BNY MELLON GLOBAL EMERGING MARKETS EQUITY VALUE FUNDThe Fund was closed on 26 February 2016.
Over the review period, the Fund’s A share class returned
-6.30% until its closure, compared with a return of -6.67%
for the MSCI EM (Emerging Markets) Index TR until
26 February 2016, both in US dollar terms.
The Fund outperformed its comparative index in the period
up to the Fund’s closure, and the exposure to the iShares
MSCI Emerging Markets ETF was the primary driver of this
relative performance.
Emerging-market equities continued to benefi t from the
recent turnaround in the broader asset class. The manager
also believes that the recent vote by the UK to leave the
EU, the US Federal Reserve’s decision to pause its plan
to tighten monetary policy (by raising interest rates) and
negative interest rates in Japan and Europe will prove
benefi cial for emerging markets as investors seek higher
yielding assets. Although many emerging economies have
faced economic slowdowns, their battered currencies have
responded well to vote for Brexit. Valuations appear to be
supportive of emerging markets but evidence is needed of
improving earnings trends.
The Boston Company Asset Management, LLC
February 2017
BNY MELLON GLOBAL EMERGING MARKETS FUNDOver the review period, the Fund’s A share class returned
0.38% against a return of 11.19% for the MSCI Emerging
Markets Index NR and 7.95% for the Lipper Global Equity
Emerging Markets Global sector, all in US dollar terms.
The index rally was led by commodity-related industry
sectors and markets, for which the Fund was not positioned,
given a cautious stance on commodities, linked to the
manager’s views on the outlook for the Chinese economy.
The zero weighting in Brazil and the large overweight
position in India were the key negative performance
contributors in terms of asset allocation, as the Brazilian
market was one of the best performing markets within
emerging markets, while the Indian market fell in US dollar
terms. The Brazilian market enjoyed a considerable rally
in the run-up to the impeachment of President Dilma
Rousseff and then prospered further as commodity prices
rallied further later in the period. The Indian market was hit
by the surprise ‘demonetisation’ programme to combat the
black market when the two highest-denomination notes
were declared invalid and replaced with new versions.
While likely to be a positive infl uence in the long term,
this knocked economic activity back in the very near term
as households, which, in general, still rely primarily on

3030
BNY MELLON GLOBAL FUNDS, PLC
INVESTMENT MANAGERS’ REPORTS cont’d.
profi tably. Another key new holding was Indiabulls Housing
Finance. The manager has a favourable view of the Indian
mortgage fi nance segment, given low penetration and
better controlled infl ation. In this context, the manager
expects Indiabulls to return continued compound growth
and high return on equity, while maintaining an attractive
and growing dividend yield, all at a very attractive valuation.
Finally, the manager has started to fi nd value in some
South Korean stocks, having previously had no exposure
to the country. The manager took the opportunity of price
weakness on China-related fears to add LG Household &
Health Care to the portfolio. The South Korean company
is engaged in the manufacture of household goods,
cosmetics and beverages and has demonstrated an ability
to compound returns on a sustainable basis.
Newton Investment Management Limited
February 2017
BNY MELLON GLOBAL PROPERTY SECURITIES FUNDOver the review period, the Fund’s A share class returned
4.16% against a return of 8.13% for the FTSE EPRA/ NAREIT
Developed Index TR and 3.11% for the Lipper Global Equity
Sector Real Estate Global, all in euro terms.
The global real-estate securities market performed in line
with the broad global equity markets, posting positive
total returns in spite of signifi cant market uncertainty.
Market participants had to contend, for instance, with the
unexpected vote of the UK to leave the EU in the fi rst half
of the year and the results of the US presidential election
in November. Real-estate stocks in the UK underperformed
signifi cantly, while other developed markets like Canada,
Australia and the US posted strongly positive returns.
In the latter half of the year, the change in expectations for
US growth and interest rates was a major driver of global
economies, interest rates and currencies.
Performance continues to be driven by stock selection,
especially in the US, Australia and the UK. Top-down regional
attribution was positive and broad based, while currency
was a slight detractor from performance. (Top-down is an
investment approach that looks fi rst at general economic or
market trends and then at individual companies that could
benefi t from those trends.) Signifi cant contributors included
stock selection in the US, particularly within the shopping-
centre, industrial and apartment sectors, and broadly in
Australia. The Fund also added value in the UK, where the
managers’ neutral positioning to the macroeconomic risk
associated with Brexit (the vote to leave the EU) enabled
the fund to outperform market participants. Signifi cant
detractors from performance included stock selection in
Japan and an overall underweight exposure to Canada.
The valuations of real-estate investment trusts positioned
the sector as a compelling investment option for investors
at the start of 2017. In Europe, the managers remain
cautious of meaningful political uncertainty that is likely
to infl uence markets for the short term. In Asia, sensitivity
to interest rates prevails in Hong Kong, while Japan saw
a boost from a Japanese yen in retreat and this should help
the Japanese authorities to achieve their infl ation goals.
In the US, the managers believe that the real-estate cycle
(historically encompassing a state of expansion followed by
a contraction) is entering its second half, with more room for
value growth given changing macroeconomic expectations.
CenterSquare Investment Management, Inc.
February 2017
BNY MELLON JAPAN ALL CAP EQUITY FUND Over the review period, the Fund’s C share class returned
-1.04%, compared with a return of 0.31% for the Tokyo
Stock Price Index (TOPIX) TR and -0.27% for the Lipper
Global Equity Japan average, all in Japanese yen terms.
At the stock level, the main detractors included IDOM, which
operates specialised stores to purchase used cars, Santen
Pharmaceutical, a producer of ophthalmic medicines,
and Daicel, a chemical company manufacturing cellulosic
derivatives. The major contributors to performance
included Nichias, which manufactures insulation materials,
Hikari Tsushin, a distributor of telecommunications line
services and offi ce automation equipment, and Osaki
Electric, which provides smart meters for electric power
companies. Nichias announced an impressive fi rst-half
result in November, with strong operating profi t growth of
32% year on year boosted by growth in sales of high-end
products for semiconductors production equipment and
recovery in construction-related products.
The main detractors at the sector level included wholesale
trade, where the Fund had an underweight position and
the Fund’s overweight in chemicals and services. Positive
contributors to performance were electric appliances,
glass and ceramics products, where the Fund was
moderately overweight, and the Fund underweight in land
transportation.
New purchases during the review period included Sekisui
Chemical, which constructs prefabricated residential houses
as well as manufacturing electronic materials, such as
conductive fi ne particles, liquid crystal sealants and foaming
materials used as car parts. Other purchases were Daikin
Industries, which manufactures air conditioning equipment,
and Trusco Nakayama, a wholesaler of machine tools.
All positions of the following stocks were sold: Mitsubishi
Estate, a leading real estate developer; UNIZO Holdings,
a real-estate company; and Leopalace21, engaged in
BNY MELLON GLOBAL EMERGING MARKETS FUND
cont’d.
REGIONAL & SPECIALIST EQUITY cont’d.

3131
BNY MELLON GLOBAL FUNDS, PLC
INVESTMENT MANAGERS’ REPORTS cont’d.
leasing and construction of residential apartments. Stock
decisions were based on the company’s growth prospects,
its potential for a long-term earnings surprise and valuation.
In the managers’ view, the mid- to longer term prospects
for the Japanese equity market remain attractive, as the
economy appears to be at a rare transitional phase, moving
from a period of contraction to one of expansion. The
market sell-off during the fi rst half of the year was largely
due to external factors. Japan will be affected by any global
slowdown but the country has a large domestic base and
can weather such turbulence much better than most
economies. Contrary to Japan’s image as export dependent,
reliance on exports in terms of GDP is only about 15%, much
smaller than in most countries in Asia or Europe.
The managers believe that Prime Minister Shinzo Abe
and the Bank of Japan are committed to ensuring that
economic recovery continues and to achieving their goals
of ending defl ation and guiding Japan back to a growth
path. Although real GDP quarter on quarter has looked
mixed at times, nominal GDP year on year has been positive
for 14 consecutive quarters.
Stage two of Abenomics targets a 20% increase in nominal
GDP, to be achieved in the early part of the next decade.
(‘Abenomics’ is the name given to the suite of measures
introduced by Prime Minister Abe to revive the sluggish
economy.) It will also aim to tackle the population problem
and to raise the nation’s fertility rate from 1.4 to 1.8.
Japan now enjoys a rare state of political stability, giving
the country a reasonable chance of delivering this target,
even if not fully. The stock market recovery still lags the
recovery in corporate profi ts since the fi nancial crises and
international investors continue to be underweight. Given
this backdrop, the manager expects to fi nd attractive
investment candidates in companies that benefi t from the
longer-term recovery of the domestic part of the economy,
not just exporters.
BNY Mellon Asset Management Japan Limited
February 2017
BNY MELLON JAPAN REIT ALPHA FUND The Fund was launched on 13 December 2016.
The Fund invests predominantly in closed-ended Japanese
Real Estate Investment Trusts (REITs) that are listed or
traded on one or more of the offi cial stock exchanges in
Japan. It seeks to achieve a total return from income and
long-term capital growth.
BNY Mellon Asset Management Japan Limited
February 2017
BNY MELLON JAPAN SMALL CAP EQUITY FOCUS FUND Over the review period, the Fund’s C share class returned
5.28%, compared with a return of 4.78% for the Russell/
Nomura Small Cap Index TR and 3.49% for the Lipper Global
Equity Japan Small & Mid Cap average, all in Japanese yen
terms.
At the stock level, the main contributors to performance
included Vector, which provides public relations and
advertising services, Osaki Denki, a supplier of smart
meters to utility companies, and Nichias, a manufacturer of
insulation materials. Vector announced an impressive fi rst-
half result, with strong operating profi t growth of 54% year
on year, boosted by growth in sales of its promotion service
division. The main negative contributors to performance
were Resorttrust, which operates timeshare resort hotels,
Anicom, a pet insurance specialist, and H.I.S., a leading
travel agency.
The main positive contributors to performance at the sector
level were electric appliances, glass and ceramics products,
where the Fund had an overweight position, and retail trade,
where the Fund was underweight. The main detractors were
insurance and real estate, where the Fund was overweight,
and foods, where the Fund was underweight.
New purchases during the review period included Sanken
Electric, which produces discrete semiconductors and
analog integrated circuits, Sakata Inx, a manufacturer of
printing inks, and Nifco, which manufactures synthetic
resinous fasteners and plastic components for automobiles.
All positions of the following stocks were sold: UNIZO
Holdings, a real estate company; Nikkiso, a manufacturer
of medical equipment and industrial pumps; and TADANO,
a producer of cranes for construction.
In the managers’ view, the mid to longer term prospects
for the Japanese equity market remain attractive, as the
economy appears to be at a rare transitional phase, moving
from a period of contraction to one of expansion. The
market sell-off during the fi rst half of the year was largely
due to external factors. Japan will be affected by any global
slowdown but the country has a large domestic base and
can weather such turbulence much better than most
economies. Contrary to Japan’s image as export dependent,
reliance on exports in terms of GDP is only about 15%, much
smaller than in most countries in Asia or Europe.
The managers believe that Prime Minister Shinzo Abe
and the Bank of Japan are committed to ensuring that
economic recovery continues and to achieving their goals
of ending defl ation and guiding Japan back to a growth
path. Although real GDP quarter on quarter has looked
mixed at times, nominal GDP year on year has been positive
for 14 consecutive quarters.
REGIONAL & SPECIALIST EQUITY cont’d.
BNY MELLON JAPAN ALL CAP EQUITY FUND cont’d.

3232
BNY MELLON GLOBAL FUNDS, PLC
INVESTMENT MANAGERS’ REPORTS cont’d.
UK-listed Irish construction fi rm CRH. The company, which
owns Tarmac, released good results that underscored the
benefi ts of its recent acquisitions. Towards the end of
the period, its shares made further gains on the potential
benefi ts from President Donald Trump’s proposed
infrastructure spending in the US. Not holding Danish
biotech company Novo Nordisk also boosted the Fund’s
relative performance, as the company’s share price fell
steadily over the year. Novo Nordisk produces diabetes
medicine but has faced increased competitive pressures,
especially in the US, where it has been losing market share
to cheaper producers.
In terms of activity, a new position was established in the
French integrated oil and gas company Total following the
decision by OPEC to curb production in 2017. While the
manager’s view is cautious on the outlook for the oil price,
the move by OPEC goes some way to underpin a ‘fl oor’ price.
Integrated oil companies continue to benefi t from defl ation
in the cost of services, providing the manager with greater
confi dence in the company’s ability to generate enough
free cash fl ow to cover the dividend payments. (Free cash
fl ow is the cash a company has left over after all outgoings,
including debt payments, tax, operating cost and capital
expenditure).
Newton Investment Management Limited
February 2017
BNY MELLON SMALL CAP EUROLAND FUND Over the review period, the Fund’s A share class returned
4.47%, compared with a return of 5.74% for the S&P
EuroZone SmallCap Index TR and 2.09% for the Lipper Global
Equity EuroZone Small & Mid Cap sector, all in euro terms.
Global equities were broadly positive in 2016 despite
increased volatility on the heels of several political
surprises and policy shifts. European markets were shaken
by the Brexit vote and broadly declined over the period,
while the US and emerging markets rallied.
In the Fund, real estate, energy and information technology
were the largest contributors to performance on a sector basis,
while industrials and healthcare detracted. On a country
basis, positioning in Belgium and Germany supported results
most, while Finland and Italy were the largest detractors.
The sudden move higher in various European yield curves,
in addition to those of Japan, took pressure off the banks
after negative interest-rate policies impaired the fi nancials
sector in 2016. (The yield curve is the graphic depiction of
the relationship between the yield on bonds of the same
credit quality but with different maturities. It can be used
as an indicator of future interest rates.) The unexpected
victory of Donald Trump in the US presidential election
triggered a surge in the US dollar and material weakness
Stage two of Abenomics targets a 20% increase in nominal
GDP, to be achieved in the early part of the next decade.
(‘Abenomics’ is the name given to the suite of measures
introduced by Prime Minister Abe to revive the sluggish
economy.) It will also aim to tackle the population problem
and to raise the nation’s fertility rate. Japan now enjoys a rare
state of political stability giving the country a reasonable
chance of delivering this target, even if not fully. The stock
market recovery still lags the recovery in corporate profi ts
since the fi nancial crises and international investors
continue to be underweight. Given this backdrop, the
manager expects to fi nd attractive investment candidates
in companies that benefi t from the longer term recovery
of the domestic part of the economy, not just exporters.
BNY Mellon Asset Management Japan Limited
February 2017
BNY MELLON PAN EUROPEAN EQUITY FUNDOver the review period, the Fund’s A share class returned
-8.40%, compared with a return of 3.10% for the
FTSEurofi rst 300 TR and -0.24% for the Lipper Global Equity
Europe sector, all in euro terms.
Sector allocation hurt performance, with the underweight
positions in oil & gas and basic materials having a negative
effect as these sectors rallied after falling heavily at
the start of 2016. (The basic materials sector comprises
companies involved in the discovery, development and
processing of raw materials.) The overweight positions in
consumer services and telecommunications also detracted
from returns, although the underweight position in health
care had a positive effect.
The largest individual detractor was the underweight position
in Royal Dutch Shell. The stock performed very strongly as its
sector rallied with the oil price from the lows it experienced
at the start of 2016. The manager increased the position later
in the period, as the OPEC production agreement improved
the outlook for the company. Retailers were an area of
weakness for the Fund, with the UK’s Dixons Carphone and
Next both out of favour with investors during the period.
Telecommunications companies also underperformed.
In this regard, the Fund’s holdings in Vodafone Group and
Telefonica Deutschland both had a negative effect on
returns. Another signifi cant detractor was Intesa Sanpaolo,
an Italian bank. Its shares performed very poorly in the fi rst
half of the year, on concerns about non-performing loans in
its sector. The manager sold the position during the period.
The largest positive contribution came from the German
semiconductor manufacturer Infi neon Technologies, which
delivered good fi nancial results and reaffi rmed its longer
term growth target. Another strong performer was the
BNY MELLON JAPAN SMALL CAP EQUITY FOCUS FUND
cont’d.
REGIONAL & SPECIALIST EQUITY cont’d.

3333
BNY MELLON GLOBAL FUNDS, PLC
INVESTMENT MANAGERS’ REPORTS cont’d.
REGIONAL & SPECIALIST EQUITY cont’d.
BNY MELLON US OPPORTUNITIES FUND Over the review period, the Fund’s C share class returned
5.12%, compared with a return of 11.96% for the Standard
& Poor’s 500 Index TR and 7.87% for the Lipper Global
Equity US average, all in US dollar terms.
US equities were broadly positive in 2016 despite increased
volatility. In the fi rst half of the year, Gross Domestic
Product (GDP) growth and infl ation targets remained
elusive amid mixed economic data and market fl uctuations
triggered by the unexpected vote for Brexit in the UK’s
referendum on EU membership. Trends began to reverse in
the three months to the end of September, with the highest
GDP growth in two years. In December, the Federal Reserve
raised its benchmark interest rate by 0.25% for the fi rst
time since 2015, citing increased infl ation expectations
and near full employment. Meanwhile, US equities rallied
on Donald Trump’s victory in the US presidential election as
investors expect steeper infl ation in coming years due to
Trump’s policies.
Against this backdrop, the Fund underperformed its
comparative index. In terms of relative returns, the Fund’s
holdings in information technology, healthcare and energy
were the primary laggards, while positions in fi nancials and
materials were the best performing.
The US remains in a sustained but moderate growth
environment. US corporate profi ts are the primary driver of
US equity prices over time and are positioned to increase
5-10% in 2017, prior to any changes to existing corporate
profi t tax rates or new border tax adjustments. The growth
in profi ts should act as a steady tailwind for equities
in 2017. (Tailwinds are conditions or situations that help
move growth higher.) A lessening of existing regulations
could also assist operating effi ciencies, create new profi ts
sources and lift industry valuations.
Selectivity remains critical. Banks, consumer fi nance
and investment fi rms orientated to capital markets are
well positioned to benefi t from rising demand for loans
and fi nancial services, higher spread income, reduced
regulation and corporate tax reform. Market leaders in
software, semiconductor and internet services offer
exposure to some of the most exciting growth markets
in technology. In consumer discretionary (non-essential
goods and services), opportunities exist in the speciality
retail and media industries. However, the managers
avoid companies exposed to wage infl ation pressures.
Out-of-favour chemical and steel companies present good
value not considering a potential recovery in demand and
pricing in 2018.
Despite the recent decline in their stock prices, most
consumer staples, real estate investment trusts and
utility companies are trading above intrinsic value and
in the yen and euro. The yield on the US 10-year Treasury
rose signifi cantly (bond yields rise as prices fall) and this
contributed to a steepening of yield curves in Europe and
Japan as well. In 2017, it is probable that there will be
diverging monetary policy between the US and non-US
developed markets.
Recent Purchasing Managers’ Index readings in Europe and
Japan have been better than expected, with some modest
semblance of infl ation coming back into the system,
particularly in Europe. Firming oil and commodity prices
are part of the story but credit conditions also remain
attractive and credit demand has slowly and steadily
improved from low levels.
The outlook appears brighter now than it did immediately
following the vote for Brexit in June, although the political
calendar will be challenging, with elections in France,
Germany and, perhaps, Italy, in addition to Brexit negotiations
The Boston Company Asset Management, LLC
February 2017
BNY MELLON U.S. DYNAMIC VALUE FUND Over the review period, the Fund’s A share class returned
16.40%, compared with a return of 17.34% for the Russell
1000 Value Index TR and a return of 7.87% for the Lipper
Global Equity US sector, all in US dollar terms.
Global equities were broadly positive in 2016 despite
increased volatility on the heels of several political
surprises and policy shifts. European markets were shaken
by the Brexit vote and broadly declined over the period,
while the US and emerging markets rallied.
In the Fund, positioning in fi nancials, particularly among
banks and capital-markets companies, contributed but
was offset by stock selection among aerospace and
defence companies in the industrials sector as well as the
lack of exposure to utilities.
Expansionary and pro-business policies should sustain
economic and earnings growth in the US over the next few
years. There is potential for a modest acceleration above the
trend of the past few years. Financials have the strongest
balance sheets in decades and infl ation is still modest.
While equity prices and valuations have risen to new highs,
they appear reasonable relative to historical levels and
are still quite attractive relative to alternatives such as
bonds. The manager believes that mid-to-high single-digit-
earnings growth, combined with a 2.1% dividend yield, will
lead to modest gains for equities over the course of 2017.
The Boston Company Asset Management, LLC
February 2017
BNY MELLON SMALL CAP EUROLAND FUND cont’d.

3434
BNY MELLON GLOBAL FUNDS, PLC
INVESTMENT MANAGERS’ REPORTS cont’d.
PASSIVE EQUITY
BNY MELLON S&P 500® INDEX TRACKEROver the review period, the Fund’s A share class returned
9.96%, compared with a return of 11.23% for the S&P 500
Index NR and 7.87% for the Lipper Global Equity US sector,
all in US dollar terms.
As at 31 December 2016, the one-year annualised tracking
error for the Fund was 0.11%. The tracking error is related to
withholding tax and the cost associated with managing the
daily activity. The anticipated tracking error of the Fund is
0.10%. Meanwhile, the difference in performance between
the Fund and S&P 500® Index related to the market impact
of fees and the cost associated with managing daily activity
on the former.
The annualised tracking error provided was calculated
using gross monthly returns for the period in question. The
tracking error being the standard deviation of the relative
returns which have been annualised (multiplied by the
square root of 12).
For further commentary, please refer to the market review
at the beginning of this document.
Mellon Capital Management Corporation
February 2017
are, therefore, underweighted in the strategy. (Consumer
staples are regarded as essential products, such as food,
beverage and household items, that are in demand no
matter how well the economy is doing.) In addition, it is
likely that a cyclical low in interest rates was reached during
2016. As interest rates increase over time, each of these
areas will likely face growing headwinds to performance.
(Headwinds are situations or conditions that make growth
harder.)
At the start of 2017, rising infl ation expectations will
change how management teams allocate capital and set
pricing, how and when consumers buy, and, of course, how
investors ultimately value equities. The managers have
already incorporated benefi ciaries and casualties into the
Fund’s macroeconomic view and positioning.
The Boston Company Asset Management, LLC
February 2017
BNY MELLON US OPPORTUNITIES FUND cont’d.
REGIONAL & SPECIALIST EQUITY cont’d.

3535
BNY MELLON GLOBAL FUNDS, PLC
INVESTMENT MANAGERS’ REPORTS cont’d.
GLOBAL FIXED INCOME
BNY MELLON GLOBAL BOND FUNDOver the review period, the Fund’s A share class returned
1.46%, compared with a return of 1.57% for the JP Morgan
Global Government Bond Index (Unhedged) TR and 3.29%
for the Lipper Global Bond Global (Filtered USD) sector, all
in US dollar terms.
Bond markets experienced an extreme reversal of fortunes
during the year. The fi rst half of 2016 was marked by
a continuation of the long-standing loose monetary policy that
kept interest rates low and that had formed the backdrop to
markets. This gave way in the second half to rising expectations
that the prices of goods and services would rise (infl ation),
leading to the largest sell-off seen in fi xed income (debt
issued by governments and companies) for many years. The
catalyst for this change was improving economic data across
the global economy and rising commodity prices. This was
especially evident in the oil price, which benefi ted from the
production cuts announced towards the end of the year, and
also the unexpected election of Donald Trump as US president.
Trump’s presidential election victory led to speculation that his
administration would introduce predominantly expansionary
policies. US Treasuries, in particular, proved a signifi cant drag
on performance as yields rose in response to expectations of
greater fi scal stimulus and tightening of monetary policy (by
raising interest rates) under a new US administration.
However, underweight US dollar duration (a measure of
the sensitivity of the price of a fi xed-income investment to
a change in interest rates) was a positive infl uence on returns,
with a bias towards infl ation-linked securities (Treasury
infl ation-protected securities, or TIPS), thus helping to
limit losses. Meanwhile, short 10-year US Treasury future
positioning generated fi rmly positive returns which helped
to mitigate some of the negative performance attributable to
the sell-off. In addition, underweight positioning to Japanese
government bonds further boosted relative performance.
However, this was undermined by long Australian and
emerging-market local-currency exposure (Mexico), which
produced signifi cant losses in the wake of the US election.
In terms of activity and in the wake of the vote for Brexit (the
vote to leave the EU), a reduction in the Fund’s duration was
made, primarily with the sale of longer dated US Treasuries
(2025 and 2043). The manager also took profi ts on some of the
Fund’s UK Gilt (2044) and Australian (2037) government bond
holdings.
With US infl ation expectations climbing sharply in the fi nal
months of the year, the opportunity was taken to exit 2041
and reduce 2025 TIPS exposure, helping to cut headline
duration to six years. European exposure was trimmed
ahead of the Italian referendum on constitutional reform
with the sale of Ireland 2025 and Spain 2044 holdings.
The manager took profi ts on short sterling exposure in
favour of a greater euro underweight position following a rise
in expectations of a ‘hard’ Brexit. (With a short position,
an investor enters into an agreement to sell a currency for
a predetermined price on a specifi ed future date. The trading
strategy is aimed at taking advantage of an expected fall
in the value of the currency. A long position is the reverse.)
(‘Hard’ Brexit could entail leaving the EU and the single
market entirely and then having a relationship based – at
least initially – on World Trade Organization rules.) Finally,
the Fund’s long Mexican peso exposure was sold in the
immediate wake of Trump’s victory.
Newton Investment Management Limited
February 2017
BNY MELLON GLOBAL CREDIT FUNDThe Fund was launched on 29 February 2016.
Over the review period since its inception, the Fund’s
C share class returned 4.66% compared with 4.33% for the
Bloomberg Barclays Global Aggregate Credit USDH TR and
3.50% for the Lipper Global Bond Global Corporates sector,
all in US dollar terms.
During 2016, the manager generally held overweight
exposure to global corporate bond markets, with
a preference for US dollar corporate bonds. The manager
had an underweight position in sterling credit (fi xed-
income instruments) for much of the period, although UK
exposure was added following the UK referendum on EU
membership in June. The credit strategy was negative early
in the period when concerns surrounding Chinese equities
and global growth caused markets to sell off.
However, the global corporate bond market performed
strongly for the rest of 2016, largely on the back of supportive
policies from central banks. Spreads on US dollar credit
outperformed other markets, particularly following the US
election later in November as investors reacted positively
to the prospect of fi scal spending, corporate tax cuts and
a more lax regulatory environment in the US under President
Donald Trump. (The spread on bonds is usually expressed
as the yield difference between bonds of the same maturity
but different credit quality. A spread measures how much
more a business pays to borrow money than the government
does.) One of the manager’s other key positions during the
year was the holdings in asset-backed securities market,
which performed strongly in the second half of the year.
Given the political event risks in 2016, the manager
implemented protective strategies against fi nancial risk
before the UK referendum, the US presidential election and
the Italian referendum on constitutional reform. However,
markets did not experience any lasting weakness following
these events.
Insight Investment Management (Global) Limited
February 2017
3636
BNY MELLON GLOBAL FUNDS, PLC
INVESTMENT MANAGERS’ REPORTS cont’d.
GLOBAL FIXED INCOME cont’d.
BNY MELLON GLOBAL HIGH YIELD BOND FUND Over the review period, the Fund’s C share class returned
13.11%, compared with a return of 16.21% for the Bank
of America Merrill Lynch Global High Yield Constrained
Index TR and 9.28% for the Lipper Global Bond Global High
Yield sector, all in US dollar terms.
Overall, the Fund’s relative performance was adversely
affected by its underweight position in commodity sectors
and emerging markets. After initial bouts of weakness, the
high-yield commodity sector and emerging-market issuer
spreads tightened sharply in 2016 and this was based
initially on improved market technicals. (High yield is debt
rated below BBB and above by the credit rating agency
Standard & Poor’s. The spread on bonds is usually expressed
as the yield difference between bonds of the same maturity
but different credit quality. A spread measures how much
more a business pays to borrow money than the government
does.) The Fund’s underweight position in commodity sectors
was based on fundamentals (underlying market trends), in
particular the manager’s expectation of increasing default
rates. As fundamentals stabilised in the latter half of the
year, the manager reduced the underweight position. The
Fund maintains its underweight position in emerging-market
issuers, based on the manager’s view of transparency and
governance in these areas, as well as the expected impact of
a stronger US dollar on certain emerging-market economies.
For 2017 an improvement in high-yield corporate
fundamentals is anticipated, particularly in the US, as
earnings and default rates should benefi t from the growth
initiatives of the new administration. The US Federal
Reserve will likely increase interest rates on several
occasions in 2017 but the impact on high-yield returns
should be mitigated by spread tightening, as in the fi nal
three months of 2016 when US 10-year Treasury yields
increased 85 basis points (US high-yield spreads tightened
75bps). In Europe, as growth indicators and infl ation
expectations continue to improve, corporate fundamentals
will likely benefi t, although the likelihood of the European
Central Bank tapering its quantitative easing programme
will also increase. (Quantitative easing is intended to create
new money for use in the economy.) In addition, some
political risk is expected to remain in 2017, particularly in
Europe as the implications of the UK’s EU exit vote play out
and markets focus on a number of key European elections.
2017 has started on a positive tone and the technical
environment will likely remain fi rm. There is potential for
volatility later in the year as some of the above risks come
into focus; however, these will have varying impacts for
different jurisdictions and sectors. The manager expects
to continue to exploit these opportunities using the Fund’s
large and experienced global investment team.
Alcentra NY, LLC
February 2017
BNY MELLON GLOBAL SHORT-DATED HIGH YIELD BOND FUNDThis Fund was launched on 30 November 2016.
The investment manager invests the majority (over 50%) of
assets in a portfolio of high-yielding bonds that are short
dated (mature or expected to mature within approximately
three years) with no geographical, industry or sector focus.
The manager invests in debt and debt-related securities
that may be investment-grade or sub investment-grade
quality. (Investment grade is debt rated BBB and above by
the credit rating agency Standard & Poor’s. High yield is
debt rated below BBB by the same credit rating agency.)
Insight Investment Management (Global) Limited
February 2017

3737
BNY MELLON GLOBAL FUNDS, PLC
INVESTMENT MANAGERS’ REPORTS cont’d.
REGIONAL & SPECIALIST FIXED INCOME
BB Constrained Index and 4.86% for the Lipper Global
Bond EUR Corporates sector until 20 September 2016, all
in euro terms.
In line with a sharp correction in commodity and equity
markets, credit spreads widened in the fi rst two months
of the year in light of the general ‘risk-off’ sentiment, with
higher beta bonds underperforming the overall market in
particular. (The spread on bonds is usually expressed as the
yield difference between bonds of the same maturity but
different credit quality. The ‘risk-off’ mood refers to periods
of perceived fi nancial risk that cause investors to take less
risk. Higher beta instruments will be more volatile than
the market.)
Markets recovered on the back of the corporate-bond
purchase programme of the European Central Bank (ECB).
Higher-than-expected purchase volumes, as well as an
overall broader buying scope, resulted in a tightening of
corporate bond spreads with subordinated and higher beta
bonds outperforming the general market. (Subordinated
debt is ranked below other debt in terms of the claims
on assets.)
At the end of the fi rst half of 2016, the surprising vote in
favour of a Brexit (the decision by UK voters to leave the
EU) led to a sell-off in capital markets and resulted in an
increase in market fl uctuations. Corporate spreads initially
widened before tightening back close to previous levels in
the following days. ECB corporate-bond purchases as well
as supportive remarks from the Bank of England helped to
stabilise market sentiment. Companies used the prevailing
low-yield environment for refi nancing and extending
debt maturities resulting in a high new issuance activity
in September.
The Fund’s positive total return was driven by both lower
spreads and declining interest rates. Relative to the
comparative index, strong security selection compensated
for trading and hedging costs. Security selection was
strongly positive in telecommunications as the Fund had no
holdings in the issuer OI Brazil, which fi led for bankruptcy in
June. Asset allocation had a positive effect due to the Fund’s
overweight position in basic resources. Active duration
management and yield-curve positioning had a slightly
negative impact on relative performance over the course
of the period. (Duration is a measure of the sensitivity of
the price of a fi xed-income investment to a change in
interest rates. The yield curve is the graphic depiction of
the relationship between the yield on bonds of the same
credit quality but different maturities. It can be used as an
indicator of future interest rates.).
Oddo Meriten Asset Management Gmbh
February 2017
BNY MELLON ASIAN BOND FUNDOver the review period, the Fund’s A share class returned
3.56%, compared with a return of 5.81% for the JP Morgan
Asia Credit Index and 4.72% for the Lipper Global Bond Asia
Pacifi c HC, all in US dollar terms.
Positive performance was driven by an overweight position
in commodity-sensitive bonds but was offset by yield-curve
allocation and security selection. (Yield curve is the graphic
depiction of the relationship between the yield on bonds of
the same credit quality but with different maturities. It can
be used as an indicator of future interest rates.)
Asian credit markets consolidated ahead of the US election,
while US Treasury yields moved higher, keeping returns in
the negative zone. There was a temporary rise in spreads
post the US election. (The spread on bonds is usually
expressed as the yield difference between bonds of the
same maturity but different credit quality.) However, the
bias towards tightening resumed once market participants
started considering the expected upside to global growth
deriving from the policies of Donald Trump. The US Federal
Reserve raised interest rates in December (as expected)
and the event did not have a major bearing on the markets.
The macroeconomic outlook for the region is likely to remain
stable, with potential for a cyclical improvement in China
from government spending and restraints on any capacity
expansion. Credit spreads have performed well in the
contrasting backdrops of, fi rst, lower yields in developed
markets and, later, with the rapid rise in developed-market
yields, post the US election. The potential for higher
US growth and a production cut of oil supply by OPEC have
bolstered investor sentiment.
Overall market valuations are almost fully pricing in most
of the positives and are thus susceptible to any reversal in
recent drivers of risk rally – namely optimism on US growth,
stable-to-improving outlook for commodities and stable
China activity levels. Nevertheless, certain emerging-
market currencies continue to show weakness, with the
Chinese renminbi on a steady decline. While the manager
views risks as balanced, the Fund is focused on improving
macroeconomic trends in the region and opportunities as
they arise.
Standish Mellon Asset Management Company, LLC
February 2017
BNY MELLON CROSSOVER CREDIT FUNDThe Fund was closed on 20 September 2016.
Over the review period, the Fund’s A share class returned
6.42% until its closure, compared with a return of 7.31% for
the 70% iBoxx Euro Corporate Non-Financial BBB Index/30%
Bank of America Merrill Lynch Euro High Yield Non-Financial

3838
BNY MELLON GLOBAL FUNDS, PLC
INVESTMENT MANAGERS’ REPORTS cont’d.
programme. Another overweight allocation that made
a major contribution to performance was in Argentina.
On the underweight side, the positions in the Philippines
and Lebanon helped performance as these countries
underperformed during the year.
The Fund’s security selection was a positive to performance.
The selections within Mexico, Russia and Venezuela
were the main contributors. In Venezuela, the Fund’s
overweight allocation to PDVSA ‘18s was very positive. The
security selection in Mexico was driven by PEMEX and in
Russia by VEB BANK. Negative returns from the Fund’s
position in longer dated Argentina bonds slightly offset
security selection.
The uncertainty of the new American political reality,
combined with the fundamental drivers of the emerging
markets (Chinese growth, commodity prices, US interest-
rates and low yields in Europe and Japan), are expected
to create an ever wider divergence in performance among
emerging market economies and emerging market bonds.
The manager will continue to focus on factors including
macroeconomic themes, instances of credit improvement
and high-yielding credits. The manager considers that, at
the moment, the Fund is not being compensated in some
of the countries most exposed in terms of exports to the
US, specifi cally Mexico (81% of total exports) in Latin
America, and Vietnam and China in emerging-market
Asia (collectively 39.1% of total exports). The focus will
continue to be on credits (fi xed-income investments) with
less correlation to the US geopolitical situation, such as
Sub-Saharan Africa, the Middle East and Asian high-yield
sovereigns. (High yield is debt rated below BBB by the
credit rating agency Standard & Poor’s.)
If higher US growth also implies a more solid fl oor to global
commodity prices or even an increase in the prices of
commodities, commodity exporters are likely to benefi t.
This particularly applies to oil exporters, such as Russia,
Kazakhstan, Saudi Arabia, Colombia and Mexico, as the oil
price received a lift from an OPEC supply cut. Other large
commodity exporters that could benefi t are Peru, Chile
and Morocco.
Standish Mellon Asset Management Company, LLC
February 2017
BNY MELLON EMERGING MARKETS DEBT LOCAL CURRENCY FUNDOver the review period, the Fund’s A share class returned
7.47%, compared with a return of 9.94% for the JP Morgan
GBI-EM Global Diversifi ed Index TR and 8.38% for the
Morningstar Europe OE Global Emerging Markets Bond –
Local Currency, all in US dollar terms.
BNY MELLON EMERGING MARKETS CORPORATE DEBT FUNDOver the review period, the Fund’s A share class returned
11.99% net of fees, compared with a return of 9.65% for
the JP Morgan CEMBI-BD (USD) and 9.19% for the Lipper
Global Bond Emerging Markets Global Corporates sector,
all in US dollar terms.
In the fi rst half of 2016, emerging market debt (EMD) rallied
following a diffi cult start. The second half of the year
saw continuing positive gains for EMD in July and August
but conditions became more challenging following the
victory of Donald Trump in the US presidential election in
November. EMD gave back some of its earlier gains in the
fi nal three months of 2016 but nonetheless ended the year
in strongly positive territory.
The best-performing sectors during the period were oil and
gas, metals and mining and telecoms, while the diversifi ed
sector produced a small negative contribution. By country,
Russia, Brazil, Indonesia and India were the strongest
performers. At a regional level, Latin America was the
largest contributor to performance, Asia was also positive,
while the Middle East and Africa detracted. Towards
the end of the year, the Latin American weighting was
reduced and the exposure to Central and Eastern Europe
was increased. The manager remains positive with regard
to the emerging markets and believes that valuations are
attractive, seeing scope for positive surprises should the
new US administration’s plan to accelerate US economic
growth is successful.
Insight Investment Management (Global) Limited
February 2017
BNY MELLON EMERGING MARKETS DEBT FUNDOver the review period, the Fund’s A share class returned
9.88%, compared with a return of 10.19% for the JP Morgan
EMBI Global and 8.31% for the Lipper Global Bond Emerging
Markets Global HC sector, all in US dollar terms.
2016 was a very volatile year in emerging-markets debt.
Declines at the start of the year were quickly recovered
by the middle of the fi rst quarter and the rally continued
until the US elections in November. However, there was
a large sell off in November due to the unexpected election
outcome and uncertainty around new policies in 2017.
In terms of country allocation, there was negative
attribution from an underweight position in Venezuela.
By way of contrast, the high-conviction overweight position
in Iraq contributed to performance. This high conviction
was based on positive news fl ows from Iraq, specifi cally
higher oil prices, possible de-escalation of the war
against ISIS and the International Monetary Fund funding
REGIONAL & SPECIALIST FIXED INCOME cont’d.

3939
BNY MELLON GLOBAL FUNDS, PLC
INVESTMENT MANAGERS’ REPORTS cont’d.
REGIONAL & SPECIALIST FIXED INCOME cont’d.
BNY MELLON EMERGING MARKETS DEBT OPPORTUNISTIC FUNDOver the review period, the Fund’s A share class returned
8.92%, compared with a return of 10.25% for BNYM
Emerging Market Opportunistic Comparative Index
(50/25/25) and 8.31% for the Lipper Global Bond Emerging
Markets Global HC average, all in US dollar terms.
2016 was a very volatile year in emerging-markets debt. The
year started roughly but quickly recovered by the middle of
the fi rst quarter and the rally continued all the way through
to the US elections in November. However, there was
a large sell-off in November due to the unexpected election
outcome and uncertainty around new policies in 2017.
In the dollar portion of the Fund, with regard to country
allocation, slightly offsetting positive performance was
a negative contribution from an underweight position in
Zambia. A signifi cant performance contribution resulted
from a high-conviction overweight allocation to Iraq. This
high conviction was based on positive news fl ow from Iraq,
specifi cally higher oil prices, possible de-escalation of
the war against ISIS and the International Monetary Fund
funding programme. On the underweight side, the Fund’s
position in El Salvador and zero weight to Korea helped
performance, as these countries underperformed during
the year. The Fund’s security selection performed positively
for the period. In Venezuela, an overweight allocation to
PDVSA ‘18s was most benefi cial.
With respect to local currency, underperformance in
currencies was driven mostly by short positions in local
emerging-market currencies. (With a short position,
an investor enters into an agreement to sell a currency
for a predetermined price on a specifi ed future date.
The trading strategy is aimed at taking advantage of an
expected fall in the value of the currency. A long position
is the reverse.) Specifi cally, the Fund had a short position
in the South African rand for the majority of the year as
the manager expected the uncertainty within the country
to weaken the currency. However, the rand appreciated
signifi cantly during the year. Other short currency positions
that negatively affected performance throughout the
year were the Thai baht, Taiwan new dollar and the Peru
nuevo sol.
On the positive side, several long positions in commodity-
sensitive currencies benefi ted performance for the year.
Namely, long positions in the Russian rouble, Colombian
peso and the Brazilian real helped to offset some of the
negative attribution from currency.
In terms of duration positioning (a measure of a bond’s
sensitivity to changes in interest rates), positions in
local rates added to excess returns, largely due to three
positions: overweights in Brazil, Russia and Colombia. The
2016 was a very volatile year in emerging-markets local
currency debt. The year started roughly but had quickly
recovered by the middle of the fi rst quarter and the rally
continued all the way through to the US elections in
November. However, there was a large sell-off in November
due to the unexpected election outcome and uncertainty
around new policies in 2017.
The Fund’s underperformance in currencies was driven
mostly by short positions in local emerging-market
currencies. (With a short position, an investor enters into
an agreement to sell a currency for a predetermined price
on a specifi ed future date. The trading strategy is aimed
at taking advantage of an expected fall in the value of the
currency. A long position is the reverse.) Specifi cally, the Fund
had a short position in the South African rand for the majority
of the year as the manager expected uncertainty within the
country to affect the currency. However, the rand appreciated
signifi cantly during the year. Other short currency positions
that negatively affected performance throughout the year
were the Thai baht, Taiwan new dollar and the Peru nuevo
sol. On the positive side, several of the Fund’s long positions
in commodity-sensitive currencies benefi ted performance.
Specifi cally, long positions in the Russian rouble, Colombian
peso and the Brazilian real helped to offset some of the
negative attribution from currency.
In terms of duration positioning (a measure of a bond’s
sensitivity to changes in interest rates), positions in
local rates added to excess returns, largely due to three
positions: overweights in Brazil, Russia and Colombia. The
Fund’s Brazil exposure was the most signifi cant driver of
performance as the bonds rallied signifi cantly in 2016
after large losses in 2015. Also helping performance were
overweights to Russia and Colombia as commodities,
specifi cally oil, stabilised and led to positive performance.
Russia also benefi ted from increased confi dence after the
surprise outcome of the US elections, as Donald Trump
was seen as the more Russia-friendly candidate. Slightly
offsetting positive performance from these positions was
a short position in South Africa rates.
The main external drivers (oil and commodities, US monetary
policy and China) of the Fund’s asset class seem to be more
supportive going forward. The manager continues to believe
the outlook for the asset class is very positive and that
commodity prices will refl ect more balanced supply-and-
demand dynamics. Once the Trump-related uncertainty
regarding immigration and trade policies dissipates (and
the manager leans towards positive surprises on this front),
it is likely that the asset class will continue to rebound from
the sharp drop experienced in November.
Standish Mellon Asset Management Company, LLC
February 2017
BNY MELLON EMERGING MARKETS DEBT LOCAL CURRENCY FUND cont’d.

4040
BNY MELLON GLOBAL FUNDS, PLC
INVESTMENT MANAGERS’ REPORTS cont’d.
REGIONAL & SPECIALIST FIXED INCOME cont’d.
activity was infl uenced by the effects of the European
Central Bank’s corporate-bond buying programme, which
pushed up the prices of some corporate bonds, making them
look expensive. This prompted the manager to sell certain
positions. The fi nal three months of 2016 saw European
credit assets give back some of the gains made earlier in the
year, with both government and corporate bonds producing
negative returns. Looking ahead, the manager expects growth
in the eurozone to be robust and infl ation to normalise but
credit spreads may come under pressure from rising global
yields. (The spread on bonds is usually expressed as the yield
difference between bonds of the same maturity but different
credit quality. A spread measures how much more a business
pays to borrow money than the government does.)
Insight Investment Management (Global) Limited
February 2017
All data sourced from Lipper as at 31 December 2016 Total Return, no
initial charge, but includes annual charges, income reinvested gross of
tax. The impact of the initial charge can be material on the performance
of your investment. Performance fi gures including the initial charge
are available on request. Past performance is not a guide to future
performance. Performance history is given in share class currency.
Fund’s Brazil exposure was the most signifi cant driver of
performance as the bonds rallied signifi cantly in 2016
after large losses in 2015. Also helping performance were
overweights to Russia and Colombia as commodities,
specifi cally oil, stabilised and led to outperformance.
Russia also benefi ted from increased confi dence after the
surprise outcome of the US elections, as Donald Trump
was seen as the more Russia-friendly candidate. Slightly
offsetting positive performance from these positions was
a short position in South Africa rates.
Standish Mellon Asset Management Company, LLC
February 2017
BNY MELLON EUROLAND BOND FUNDOver the review period, the Fund’s A share class returned
2.51%, compared with a return of 3.32% for the Barclays Euro
Aggregate Bond Index TR and 2.41% for the Lipper Global
Bond EUR sector, all in euro terms.
Security selection and asset allocation were the largest
contributors to the Fund’s performance (in particular, allocations
to government bonds and corporate bonds). Currency allocation
was the largest detractor from performance.
The Fund’s overall level of risk was reduced and European
infl ation-linked bonds and currency were the largest contributors
to tracking error. The manager continues to view ‘semi-core’
European growth as weak, versus the stronger growth of
‘peripheral’ Europe, the US and select emerging market countries.
The Fund had an underweight position in Austria, Finland,
Belgium, Sweden and France. Exposure was maintained in select
emerging market countries primarily denominated in external or
hard currencies (i.e. US dollar and the euro). The position in high-
yield corporates stands at approximately 3%. (High-yield is debt
rated below BBB by the credit rating agency Standard & Poor’s.)
The Fund was overweight in investment-grade credit, primarily
from an overweight to fi nancials. (Investment-grade is debt rated
BBB and above by the credit rating agency Standard & Poor’s.)
Standish Mellon Asset Management Company, LLC
February 2017
BNY MELLON EUROPEAN CREDIT FUND Over the review period, the Fund’s A share class returned
3.90%, compared with a return of 4.72% for the Markit iBoxx
Euro Corporates TR and 4.11% for the Lipper Global Bond EUR
Corporates sector, all in euro terms.
During a volatile fi rst three months of 2016 for credit (fi xed-
income instruments), the manager reduced risk early on and
later increased it as markets rebounded. The three months to
the end of June also saw sharp market fl uctuations around
the UK referendum on EU membership. Thereafter, portfolio
BNY MELLON EMERGING MARKETS DEBT OPPORTUNISTIC FUND cont’d.

41
Portfolio of investments – as at 31 December 2016
Holdings Description
Fair
value
Total
net assets
% Holdings Description
Fair
value
Total
net assets
%
BNY MELLON ABSOLUTE INSIGHT FUND
386,159 Compartment VCL 24 0.000% 21-Aug-2022 FRN 386,717 0.48
200,000 Glencore Finance Europe SA 2.081%
06-May-2018 FRN 190,291 0.24
138,162 Silver Arrow SA Compartment 5
0.000% 15-Oct-2022 FRN 138,202 0.17
Netherlands - 1,250,817 (31 December 2015: 2,415,747) 1,250,817 1.56
316,857 Bavarian Sky SA 0.000% 20-Apr-2024 FRN 317,288 0.40
10,803 Bavarian Sky SA 0.028% 20-Oct-2023 FRN 10,824 0.01
400,000 Ozlme BV 6.450% 18-Jan-2030 FRN 383,706 0.48
388,550 Storm 2016-I BV 0.000% 22-Apr-2054 FRN 389,201 0.48
150,000 Volkswagen International Finance NV
0.000% 16-Jul-2018 FRN 149,798 0.19
New Zealand - 400,600 (31 December 2015: 4,006,860) 400,600 0.50
400,000 ASB Finance Ltd 0.099% 03-Jul-2017 FRN 400,600 0.50
Spain - 56,247 (31 December 2015: 2,329,585) 56,247 0.07
200,000 BBVA Leasing 1 FTA 0.486% 26-May-2031 FRN 56,247 0.07
United Kingdom - 1,403,580 (31 December 2015: 8,705,005) 1,403,580 1.75
253,104 Auburn Securities 9 Plc 1.398% 18-Aug-2047 FRN 297,606 0.37
52,849 E-Carat 3 Plc 0.732% 18-Mar-2022 FRN 61,903 0.08
190,000 HSBC Bank Plc 1.625% Perpetual FRN 129,987 0.16
300,000 Newday Funding 2015-2 Plc 4.561%
15-Nov-2024 FRN 349,387 0.44
500,000 Towd Point Mortgage Funding 2016-Vantage1 Plc
2.838% 20-Feb-2054 FRN 564,697 0.70
United States of America - 676,365 (31 December 2015: 722,434) 676,365 0.84
500,000 Home Partners of America 2016-2 Trust 144A
4.516% 17-Oct-2033 FRN 476,129 0.59
200,000 Morgan Stanley 0.186% 03-Dec-2019 FRN 200,236 0.25
Total investments in fl oating rate notes 7,857,599 9.81
Certifi cate of deposit
France - 1,500,049 (31 December 2015: 4,001,231) 1,500,049 1.87
1,500,000 BNP Paribas SA 0.000% 03-Jan-2017 CD 1,500,049 1.87
Japan - 500,433 (31 December 2015: 12,002,023) 500,433 0.63
500,000 Sumitomo Trust and Banking Co Ltd
0.000% 20-Mar-2017 CD 500,433 0.63
Total investments in certifi cate of deposit 2,000,482 2.50
Commercial paper
France - 1,000,119 (31 December 2015: 13,003,956) 1,000,119 1.25
1,000,000 Dexia Credit Local De France
0.000% 11-Jan-2017 CP 1,000,119 1.25
Collective investment schemes
Cayman Islands - 43,210 (31 December 2015: 173,770) 43,210 0.05
25,855 Marwyn Value Investors Ltd 43,210 0.05
Guernsey - 677,974 (31 December 2015: 1,338,006) 677,974 0.85
187,531 HICL Infrastructure Co Ltd 361,166 0.45
47,724 International Public Partnerships Ltd 85,989 0.11
152,301 John Laing Infrastructure Fund Ltd 230,819 0.29
Luxembourg - 99,043 (31 December 2015: 205,093) 99,043 0.12
61,302 BBGI SICAV SA 99,043 0.12
Supranational - 5,217,215 (31 December 2015: 17,446,636) 5,217,215 6.51
5,233,491 Insight Liquidity Funds Plc - EUR Cash Fund 5,217,215 6.51
United Kingdom - 991,967 (31 December 2015: 1,609,285) 991,967 1.24
121,788 3i Infrastructure Plc 265,849 0.33
8,526 Electra Private Equity Plc 476,735 0.60
111,088 GCP Infrastructure Investments Ltd 159,646 0.20
64,195 Greencoat UK Wind Plc 89,737 0.11
Total investments in collective investment schemes 7,029,409 8.77
Floating rate notes
Argentina - 193,531 (31 December 2015: –) 193,531 0.24
3,200,000 Banco Hipotecario SA 24.729% 12-Jan-2020 FRN 193,531 0.24
Canada - 1,403,233 (31 December 2015: 4,007,635) 1,403,233 1.75
1,000,000 Canadian Imperial Bank of Commerce
0.000% 08-Sep-2017 FRN 1,001,225 1.25
400,000 Royal Bank of Canada 0.117% 22-Oct-2018 FRN 402,008 0.50
Cayman Islands - 331,805 (31 December 2015: 1,774,969) 331,805 0.42
401,443 Craft CLO Ltd 9.530% 15-Jan-2023 FRN 331,805 0.42
France - 368,959 (31 December 2015: 10,679,342) 368,959 0.46
368,452 SapphireOne Mortgages FCT 2016-1
0.236% 25-Feb-2061 FRN 368,959 0.46
Germany - 288,950 (31 December 2015: –) 288,950 0.36
288,852 SC Germany Auto 2014-1 UG haftungsbeschraenkt
0.048% 11-Dec-2023 FRN 288,950 0.36
Ireland - 188,880 (31 December 2015: 3,453,838) 188,880 0.24
200,000 European Residential Loan Securitisation 2016-1
DAC 3.631% 24-Jan-2059 FRN 188,880 0.24
Luxembourg - 1,294,632 (31 December 2015: 99,500) 1,294,632 1.62
300,000 Bumper 7 SA 0.261% 23-Mar-2026 FRN 299,609 0.38
279,938 Compartment VCL 23 0.179% 21-Jan-2022 FRN 279,813 0.35
Floating rate notes cont’d.
Luxembourg cont’d.
EUR EUR

42
Portfolio of investments – as at 31 December 2016
Holdings Description
Fair
value
Total
net assets
% Holdings Description
Fair
value
Total
net assets
%
BNY MELLON ABSOLUTE INSIGHT FUND
Germany - 500,316 (31 December 2015: 6,501,051) 500,316 0.62
500,000 Landesbank Hessen Thuringen International
0.000% 06-Mar-2017 CP 500,316 0.62
Total investments in commercial paper 1,500,435 1.87
Equities
Guernsey - 587,157 (31 December 2015: 1,392,762) 587,157 0.73
68,273 Amedeo Air Four Plus Ltd 83,928 0.10
66,704 Doric Nimrod Air Two Ltd Pfd 170,246 0.21
13,859 Market Tech Holdings Ltd 22,594 0.03
69,550 Renewables Infrastructure Group Ltd/The 89,202 0.11
136,903 Sherborne Investors Guernsey B Ltd 221,187 0.28
Isle of Man - 135,305 (31 December 2015: 158,008) 135,305 0.17
14,000 Playtech Plc 135,305 0.17
Spain - 635,379 (31 December 2015: 1,161,090) 635,379 0.79
41,607 Grifols SA ADR 635,379 0.79
Sweden - 80,568 (31 December 2015: –) 80,568 0.10
3,039 Hennes & Mauritz AB 80,568 0.10
Switzerland - 156,189 (31 December 2015: 388,795) 156,189 0.19
2,511 Adecco Group AG 156,189 0.19
United Kingdom - 409,166 (31 December 2015: 2,084,764) 409,166 0.51
60,642 Ibstock Plc 144A 131,806 0.16
2,447 Savills Plc 20,061 0.03
5,458 Softcat Plc 18,841 0.02
5,503 Spire Healthcare Group Plc 144A 21,796 0.03
54,808 Time out Group Plc 89,513 0.11
40,276 Worldpay Group Plc 144A 127,149 0.16
Total investments in equities 2,003,764 2.49
Bonds
Angola - 184,482 (31 December 2015: –) 184,482 0.23
200,000 Angolan Government International Bond
9.500% 12-Nov-2025 184,482 0.23
Argentina - 253,356 (31 December 2015: 1,103,576) 253,356 0.32
2,236,000 Argentine Bonos del Tesoro 18.200% 03-Oct-2021 137,280 0.17
125,000 Petrobras Argentina SA 7.375% 21-Jul-2023 116,076 0.15
Australia - 138,350 (31 December 2015: 592,782) 138,350 0.17
125,000 FMG Resources August 2006 Pty Ltd 144A
9.750% 01-Mar-2022 138,350 0.17
Austria - 401,051 (31 December 2015: 547,964) 401,051 0.50
100,000 Raiffeisen Bank International AG
4.500% 21-Feb-2025 VAR 99,656 0.12
300,000 Republic of Austria Government Bond 144A
3.200% 20-Feb-2017 301,395 0.38
Bahrain - 243,242 (31 December 2015: –) 243,242 0.30
250,000 Bahrain Government International Bond
7.000% 12-Oct-2028 243,242 0.30
Bermuda - 336,218 (31 December 2015: 189,156) 336,218 0.42
200,000 Digicel Group Ltd 8.250% 30-Sep-2020 163,961 0.20
200,000 Digicel Ltd 144A 6.750% 01-Mar-2023 172,257 0.22
Brazil - 858,318 (31 December 2015: –) 858,318 1.07
1,000,000 Brazil Notas do Tesouro Nacional Serie F
10.000% 01-Jan-2018 289,034 0.36
1,000,000 Brazil Notas do Tesouro Nacional Serie F
10.000% 01-Jan-2019 287,465 0.36
1,000,000 Brazil Notas do Tesouro Nacional Serie F
10.000% 01-Jan-2021 281,819 0.35
Canada - 23,739 (31 December 2015: –) 23,739 0.03
23,000 Viterra Inc 5.950% 01-Aug-2020 23,739 0.03
Colombia - 306,429 (31 December 2015: 1,172,393) 306,429 0.38
500,000,000 Colombian TES 10.000% 24-Jul-2024 187,173 0.23
330,000,000 Colombian TES 11.000% 24-Jul-2020 119,256 0.15
Cote d’Ivoire - 262,208 (31 December 2015: 420,961) 262,208 0.33
297,000 Cote d’Ivoire Government International Bond
5.750% 31-Dec-2032 262,208 0.33
Denmark - 272,254 (31 December 2015: 2,431,054) 272,254 0.34
150,000 Nykredit Realkredit A/S 4.000% 03-Jun-2036 VAR 154,954 0.19
120,000 TDC A/S 1.750% 27-Feb-2027 117,300 0.15
Dominican Republic - 198,446 (31 December 2015: –) 198,446 0.25
200,000 Dominican Republic International Bond
6.875% 29-Jan-2026 198,446 0.25
Ecuador - 194,746 (31 December 2015: –) 194,746 0.24
200,000 Ecuador Government International Bond
9.650% 13-Dec-2026 194,746 0.24
Egypt - 166,445 (31 December 2015: 160,193) 166,445 0.21
200,000 Egypt Government International Bond
6.875% 30-Apr-2040 166,445 0.21
Bonds cont’d. Commercial paper cont’d.
EUR EUR

43
Portfolio of investments – as at 31 December 2016
Holdings Description
Fair
value
Total
net assets
% Holdings Description
Fair
value
Total
net assets
%
BNY MELLON ABSOLUTE INSIGHT FUND
290,000 Mylan NV 144A 3.950% 15-Jun-2026 258,321 0.32
1,770,000 Netherlands Government Bond 144A
0.500% 15-Apr-2017 1,776,461 2.22
3,700,000 Netherlands Government Bond 144A
2.500% 15-Jan-2017 3,703,700 4.62
200,000 Petrobras Global Finance BV 8.375% 23-May-2021 205,196 0.26
100,000 Petrobras Global Finance BV 8.750% 23-May-2026 102,717 0.13
300,000 Teva Pharmaceutical Finance Netherlands II BV
0.375% 25-Jul-2020 297,959 0.37
New Zealand - 313,175 (31 December 2015: –) 313,175 0.39
270,000 ASB Finance Ltd 1.000% 07-Sep-2020 313,175 0.39
Panama - 231,670 (31 December 2015: –) 231,670 0.29
225,000 Carnival Corp 1.125% 06-Nov-2019 231,670 0.29
Peru - 283,669 (31 December 2015: 183,725) 283,669 0.35
150,000 Peruvian Government International Bond
6.900% 12-Aug-2037 42,377 0.05
800,000 Peruvian Government International Bond
6.950% 12-Aug-2031 231,377 0.29
31,000 Peruvian Government International Bond
8.200% 12-Aug-2026 9,915 0.01
Romania - 45,816 (31 December 2015: 1,421,376) 45,816 0.06
180,000 Romania Government Bond 5.850% 26-Apr-2023 45,816 0.06
Russia - 413,328 (31 December 2015: 858,130) 413,328 0.52
17,900,000 Russian Federal Bond - OFZ 7.000% 25-Jan-2023 262,645 0.33
10,600,000 Russian Federal Bond - OFZ 7.050% 19-Jan-2028 150,683 0.19
South Africa - 534,094 (31 December 2015: 499,096) 534,094 0.67
1,460,000 Republic of South Africa Government Bond
6.250% 31-Mar-2036 72,150 0.09
2,200,000 Republic of South Africa Government Bond
7.250% 15-Jan-2020 148,700 0.19
2,200,000 Republic of South Africa Government Bond
8.250% 15-Sep-2017 152,938 0.19
2,100,000 Republic of South Africa Government Bond
10.500% 21-Dec-2026 160,306 0.20
Spain - 99,518 (31 December 2015: 298,571) 99,518 0.12
100,000 Telefonica Emisiones SAU 0.318% 17-Oct-2020 99,518 0.12
Sweden - 191,423 (31 December 2015: 3,071,061) 191,423 0.24
200,000 Swedbank AB 6.000% Perpetual VAR 191,423 0.24
Ukraine - 266,814 (31 December 2015: –) 266,814 0.33
150,000 Ukraine Government International Bond
7.750% 01-Sep-2026 133,691 0.17
150,000 Ukraine Government International Bond
7.750% 01-Sep-2027 133,123 0.16
Finland - 4,383,103 (31 December 2015: –) 4,383,103 5.47
4,350,000 Finland Government Bond 144A
1.875% 15-Apr-2017 4,383,103 5.47
France - 11,192,535 (31 December 2015: 7,056,238) 11,192,535 13.97
112,000 BNP Paribas SA 1.125% 16-Aug-2022 128,262 0.16
4,500,000 French Republic Government Bond OAT
3.750% 25-Apr-2017 4,563,225 5.70
6,300,000 French Treasury Note BTAN 1.750% 25-Feb-2017 6,321,735 7.89
183,000 Total SA 2.708% Perpetual VAR 179,313 0.22
Germany - 5,267,172 (31 December 2015: 2,009,069) 5,267,172 6.57
5,000,000 Bundesrepublik Deutschland 3.750% 04-Jan-2017 4,999,800 6.24
113,000 Continental AG 0.000% 05-Feb-2020 112,648 0.14
148,000 Lanxess AG 4.500% 06-Dec-2076 VAR 154,724 0.19
Indonesia - 185,701 (31 December 2015: 1,918,815) 185,701 0.23
950,000,000 Indonesia Treasury Bond 8.375% 15-Sep-2026 69,031 0.09
1,586,000,000 Indonesia Treasury Bond 8.750% 15-May-2031 116,670 0.14
Ireland - 920,053 (31 December 2015: 5,674,200) 920,053 1.15
3,800,000 Magnolia Finance 0.000% 29-Oct-2017 460,872 0.57
2,800,000 Magnolia Finance Mortgage 0.000% 29-Oct-2017 341,648 0.43
100,000 Virgin Media Receivables Financing Notes I DAC
5.500% 15-Sep-2024 117,533 0.15
Italy - 233,565 (31 December 2015: 1,625,780) 233,565 0.29
75,000 Leonardo SpA 4.875% 24-Mar-2025 86,735 0.11
146,537 Sunrise Srl 0.620% 27-Nov-2031 146,830 0.18
Jersey - 214,619 (31 December 2015: 173,592) 214,619 0.27
100,000 CPUK Finance Ltd 7.000% 28-Aug-2020 124,619 0.16
100,000 RZB Finance Jersey IV Ltd 1.638% Perpetual VAR 90,000 0.11
Luxembourg - 194,366 (31 December 2015: 1,417,501) 194,366 0.24
200,000 INEOS Group Holdings SA 144A
5.875% 15-Feb-2019 194,366 0.24
Malaysia - 115,779 (31 December 2015: –) 115,779 0.14
560,000 Malaysia Government Investment Issue
4.070% 30-Sep-2026 115,779 0.14
Mexico - 628,898 (31 December 2015: 2,424,631) 628,898 0.78
135,000 America Movil SAB de CV 4.125% 25-Oct-2019 149,577 0.19
6,000,000 Mexican Bonos 8.000% 11-Jun-2020 283,102 0.35
200,000 Petroleos Mexicanos 6.500% 13-Mar-2027 196,219 0.24
Netherlands - 7,159,009 (31 December 2015: 11,030,011) 7,159,009 8.93
200,000 EDP Finance BV 5.750% 21-Sep-2017 208,155 0.26
300,000 GTH Finance BV 7.250% 26-Apr-2023 307,438 0.38
200,000 Marfrig Holdings Europe BV 8.000% 08-Jun-2023 197,140 0.24
100,000 Mylan NV 1.250% 23-Nov-2020 101,922 0.13
Bonds cont’d. Bonds cont’d.
Netherlands cont’d.
EUR EUR

44
Portfolio of investments – as at 31 December 2016
Holdings Description
Fair
value
Total
net assets
% Holdings Description
Fair
value
Total
net assets
%
BNY MELLON ABSOLUTE INSIGHT FUND
United Kingdom - 811,778 (31 December 2015: 3,364,102) 811,778 1.01
100,000 Annington Finance No 5 Plc 13.000% 15-Jan-2023 138,881 0.17
200,000 HSBC Holdings Plc 6.375% 18-Oct-2022 VAR 242,890 0.30
100,000 London Stock Exchange Group Plc
9.125% 18-Oct-2019 142,509 0.18
144,720 Punch Taverns Finance B Ltd
7.369% 30-Sep-2021 182,352 0.23
100,000 Thomas Cook Group Plc 6.250% 15-Jun-2022 105,146 0.13
United States of America - 7,170,997 (31 December 2015: 12,739,416) 7,170,997 8.95
231,000 AbbVie Inc 0.375% 18-Nov-2019 232,730 0.29
293,000 Concho Resources Inc 4.375% 15-Jan-2025 279,183 0.35
82,000 Concho Resources Inc 5.500% 01-Apr-2023 81,116 0.10
106,000 DR Horton Inc 4.750% 15-Feb-2023 103,467 0.13
44,000 DR Horton Inc 5.750% 15-Aug-2023 44,987 0.06
300,000 Flagship Credit Auto Trust 2016-1 144A
6.220% 15-Jun-2022 300,972 0.37
285,619 JP Morgan Chase Commercial Mortgage Securities
Trust 2007-CIBC19 5.713% 12-Feb-2049 VAR 272,983 0.34
150,000 Morgan Stanley Bank of America Merrill Lynch
Trust 2016-C32 4.297% 15-Dec-2049 VAR 137,866 0.17
150,000 Tesoro Corp 144A 4.750% 15-Dec-2023 143,744 0.18
800,000 United States Treasury Bill 0.000% 02-Mar-2017 759,405 0.95
810,000 United States Treasury Bill 0.000% 09-Mar-2017 768,831 0.96
800,000 United States Treasury Bill 0.000% 16-Mar-2017 759,234 0.95
500,000 United States Treasury Bill 0.000% 23-Mar-2017 474,477 0.59
750,000 United States Treasury Bill 0.000% 30-Mar-2017 711,646 0.89
700,000 United States Treasury Bill 0.000% 04-May-2017 663,692 0.83
1,562,989 United States Treasury Infl ation Indexed Bonds
0.125% 15-Jul-2026 1,436,664 1.79
Total investments in bonds 44,696,366 55.76
Leveraged loans
France - 284,995 (31 December 2015: 272,429) 284,995 0.35
300,000 Linxens France SA 0.000% 31-Jul-2023 284,995 0.35
United Kingdom - 647,686 (31 December 2015: 710,795) 647,686 0.81
198,345 Mint Mezzanine 2014 Ltd - EUR Class
6.000% 26-Feb-2018 197,393 0.25
388,462 Mint Mezzanine 2014 Ltd - GBP Class
6.591% 26-Feb-2018 450,293 0.56
Total investments in leveraged loans 932,681 1.16
Equity index swaps
United States of America - 1,100 (31 December 2015: 1,021) 1,100 0.00
(7) S&P 500 Biotech Index 06-Nov-2017 1,100 0.00
Total investments in equity index swaps 1,100 0.00
Equity swaps
Austria - 7,165 (31 December 2015: 61,852) 7,165 0.01
5,996 Zumtobel AG 17-Oct-2017 7,165 0.01
Belgium - 323 (31 December 2015: –) 323 0.00
449 Anheuser-Busch InBev NV 26-Jun-2017 323 0.00
France - 85,037 (31 December 2015: 119,572) 85,037 0.11
2,674 Compagnie de Saint-Gobain SA 26-Jun-2017 1,598 0.00
6 Dassault Aviation SA 11-Jan-2017 542 0.00
1,198 Euler Hermes Group 17-Oct-2017 6,811 0.01
1,436 Legrand Promesse 26-Jun-2017 345 0.00
29 Pernod Ricard SA 26-Jun-2017 6 0.00
1,415 Safran SA 11-Jan-2017 5,134 0.01
9,435 Spie SA 06-Nov-2017 31,914 0.04
9,858 Television Francaise 1 17-Oct-2017 8,067 0.01
302 Unibail-Rodamco SE 11-Jan-2017 1,661 0.00
2,955 Wendel 17-Oct-2017 28,959 0.04
Germany - 40,324 (31 December 2015: 72,833) 40,324 0.05
1,829 Continental AG 17-Oct-2017 16,095 0.02
1,323 Deutsche Boerse AG 11-Jan-2017 4,182 0.01
1,856 HeidelbergCement AG 11-Jan-2017 16,120 0.02
1,668 Henkel AG & Co KGaA 26-Jun-2017 1,293 0.00
2,802 Takkt AG 11-Jan-2017 2,634 0.00
Italy - 24,269 (31 December 2015: 25,841) 24,269 0.03
2,511 Atlantia SpA 11-Jan-2017 1,794 0.00
35,408 Cerved Information Solutions SpA 06-Nov-2017 20,802 0.03
312,485 Telecom Italia SpA 26-Jun-2017 1,673 0.00
Netherlands - 81,223 (31 December 2015: 12,644) 81,223 0.10
5,170 ASML Holding NV 17-Oct-2017 72,845 0.09
(990) Heineken NV 17-Oct-2017 6,683 0.01
721 Koninklijke DSM NV 26-Jun-2017 79 0.00
(1,449) Randstad Holding NV 26-Jun-2017 1,616 0.00
South Africa - 3,476 (31 December 2015: –) 3,476 0.00
(4,554) Mediclinic International Plc 17-Oct-2017 3,476 0.00
Spain - 29,702 (31 December 2015: 67,156) 29,702 0.03
(10,215) Abertis Infraestructuras SA 11-Jan-2017 2,644 0.00
18,832 Antena 3 Television EA 17-Oct-2017 17,514 0.02
(4,296) Enagas SA 17-Oct-2017 6,412 0.01
100 Ferrovial SA 11-Jan-2017 37 0.00
1,082 Merlin Properties 17-Oct-2017 736 0.00
5,357 Merlin Properties Socimi SA 17-Oct-2017 2,359 0.00
Sweden - 570 (31 December 2015: 13,436) 570 0.00
1,379 Saab AB 26-Jun-2017 570 0.00
Switzerland - 8,189 (31 December 2015: 81,287) 8,189 0.01
(474) Kuehne + Nagel International AG 26-Jun-2017 25 0.00
(340) LafargeHolcim Ltd 11-Jan-2017 91 0.00
(5) Panalpina Welttransport 26-Jun-2017 6 0.00
(151) SGS SA 17-Oct-2017 5,564 0.01
2,025 Sunrise Communications Group AG 26-Jun-2017 2,503 0.00
Equity swaps cont’d. Bonds cont’d.
EUR EUR

45
Portfolio of investments – as at 31 December 2016
Holdings Description
Fair
value
Total
net assets
% Holdings Description
Fair
value
Total
net assets
%
BNY MELLON ABSOLUTE INSIGHT FUND
United Kingdom - 353,461 (31 December 2015: 514,430) 353,461 0.44
10,308 Anglo American Plc 17-Oct-2017 15,438 0.03
397 ASOS Plc 17-Oct-2017 1,100 0.00
(2,065) AstraZeneca Plc 11-Jan-2017 12,609 0.02
17,522 Auto Trader Group Plc 11-Jan-2017 2,817 0.00
24,986 Aviva Plc 11-Jan-2017 14,242 0.02
3,301 Babcock International Group Plc 11-Jan-2017 206 0.00
(11,700) Barratt Developments Plc 17-Oct-2017 1,799 0.00
52,411 Biffa Group Ltd 06-Nov-2017 2,420 0.00
8,448 BP Plc 06-Nov-2017 1,308 0.00
3,227 British Land Co Plc 11-Jan-2017 770 0.00
(15,382) ConvaTec Group Plc 11-Jan-2017 1,299 0.00
42,884 Countryside Properties Plc 17-Oct-2017 7,757 0.01
4,500 Crest Nicholson Holdings Plc 11-Jan-2017 1,923 0.00
2,224 CRH Plc 11-Jan-2017 8,749 0.01
4,809 Diageo Plc 06-Nov-2017 2,829 0.00
26,171 DS Smith Plc 06-Nov-2017 7,079 0.01
1,250 Galiform Plc 11-Jan-2017 187 0.00
(4,923) GlaxoSmithKline Plc 11-Jan-2017 4,455 0.01
10,435 Great Portland Estates Plc 11-Jan-2017 1,619 0.00
(11,524) Halma Plc 06-Nov-2017 15,494 0.02
25,960 HSBC Holdings Plc 17-Oct-2017 5,575 0.01
(14,826) IMI Plc 11-Jan-2017 11,913 0.02
5,114 Informa Plc 17-Oct-2017 1,591 0.00
(1,515) Kingfi sher Plc 11-Jan-2017 2 0.00
3,163 Land Securities Group Plc 17-Oct-2017 2,907 0.01
136,058 Lloyds Banking Group Plc 11-Jan-2017 7,032 0.01
(30,199) McCarthy & Stone Plc 11-Jan-2017 7,124 0.01
68,667 Melrose Holdings Ltd 11-Jan-2017 27,629 0.03
6,700 Mondi Plc 11-Jan-2017 9,104 0.01
14,145 PageGroup Plc 11-Jan-2017 4,371 0.01
3,462 Provident Financial Plc 06-Nov-2017 893 0.00
2,649 Rathbone Brothers Plc 06-Nov-2017 6,001 0.01
981 Rio Tinto Plc 17-Oct-2017 6,521 0.01
(26,028) Rolls-Royce Holdings Plc 06-Nov-2017 13,431 0.02
25,419 Royal Dutch Shell Plc 06-Nov-2017 61,217 0.09
8,923 RPC Group Plc 11-Jan-2017 9,314 0.01
3,503 RSA Insurance Group Plc 06-Nov-2017 1,174 0.00
2,428 Savills Plc 06-Nov-2017 1,229 0.00
11,511 Schroders Plc 11-Jan-2017 23,037 0.03
8,396 Serco Group Plc 17-Oct-2017 919 0.00
63 Severn Trent Plc 17-Oct-2017 8 0.00
37,778 Shanks Group Plc 06-Nov-2017 15,088 0.02
7,859 Smiths Group Plc 11-Jan-2017 5,015 0.01
(10,982) SSE Plc 11-Jan-2017 2,480 0.00
18,118 SSP Group Plc 06-Nov-2017 11,711 0.01
(1,340) Travis Perkins Plc 11-Jan-2017 10 0.00
2,327 Ultra Electronics Holdings Plc 17-Oct-2017 1,608 0.00
2,215 Unite Group Plc 17-Oct-2017 370 0.00
1,150 Whitbread Plc 17-Oct-2017 1,365 0.00
2,304 Workspace Group Plc 11-Jan-2017 2,758 0.00
9,500 Worldpay Group Plc 17-Oct-2017 222 0.00
9,843 WPP 2012 Plc 11-Jan-2017 6,308 0.00
16,267 Zoopla Property Group 17-Oct-2017 1,434 0.00
Total investments in equity swaps 633,739 0.79
Credit default swaps - 253,034 (31 December 2015: 761,384)
(250,000) CDS British Sky Broadcasting
1.000% 20-Dec-2021 3,602 0.01
150,000 CDS Casino Guichard Perrachon SA
1.000% 20-Dec-2021 9,863 0.01
800,000 CDS Emerging Market Series 26 Version 1
1.000% 20-Dec-2021 47,709 0.06
800,000 CDS Emerging Market Series 26 Version 1
1.000% 20-Dec-2021 47,709 0.06
800,000 CDS Emerging Market Series 26 Version 1
1.000% 20-Dec-2021 47,709 0.06
34,000 CDS Freeport-McMoRan Inc 1.000% 20-Dec-2021 3,860 0.01
34,000 CDS Freeport-McMoRan Inc 1.000% 20-Dec-2021 3,860 0.01
(300,000) CDS International Lease Finance Corp
5.000% 20-Jun-2022 48,924 0.06
38,000 CDS Macy’s Inc 1.000% 20-Dec-2021 1,335 0.00
80,000 CDS Macy’s Inc 1.000% 20-Dec-2021 2,810 0.00
40,000 CDS Macy’s Inc 1.000% 20-Dec-2021 1,405 0.00
12,000 CDS Macy’s Inc 1.000% 20-Dec-2021 421 0.00
(100,000) CDS Rolls-Royce Plc 1.000% 20-Dec-2020 174 0.00
(100,000) CDS Rolls-Royce Plc 1.000% 20-Dec-2020 174 0.00
450,000 CDS Turkey Government International
1.000% 20-Dec-2021 33,479 0.04
Total credit default swaps 253,034 0.32
Currency options - 188,030 (31 December 2015: 220,306)
900,000 Euro/Japanese yen Call 02-Mar-2017 124.000 13,411 0.02
1,200,000 Euro/US dollar Put 20-Mar-2017 1.045 17,339 0.02
1,600,000 US dollar/Euro Call 03-Jan-2017 1.035 311 0.00
1,600,000 US dollar/Japanese yen Call 03-Jan-2017 118.750 617 0.00
1,600,000 US dollar/Japanese yen Call 04-Jan-2017 114.750 27,644 0.03
1,600,000 US dollar/Japanese yen Call 05-Jan-2017 118.250 3,029 0.00
1,800,000 US dollar/Japanese yen Call 23-Feb-2017 112.500 71,598 0.09
1,300,000 US dollar/Korean won Call 17-Mar-2017 1,200.000 30,531 0.04
450,000 US dollar/Korean won Call 31-Jan-2017 1,180.000 11,810 0.02
630,000 US dollar/Mexican peso Put 17-May-2017 20.000 8,278 0.01
300,000 US dollar/Turkish lira Call 20-Jan-2017 3.570 3,462 0.00
Total currency options 188,030 0.23
Equity options - 342 (31 December 2015: 18,987)
60 National Oilwell Varco Inc Put 20-Jan-2017 25.000 342 0.00
Total equity options 342 0.00
Future options - 1,378 (31 December 2015: 216,750)
145 iShares MSCI Emerging Markets Future Call
17-Mar-2017 39.000 1,378 0.00
Total future options 1,378 0.00
Index options - 232,624 (31 December 2015: 276,616)
17 Euro STOXX 50 Index Call 15-Dec-2017 3,100.000 50,898 0.06
76 Euro STOXX 50 Index Call 20-Jan-2017 3,200.000 81,244 0.10
76 Euro STOXX 50 Index Put 20-Jan-2017 2,850.000 608 0.00
13 FTSE 100 Index Put 17-Mar-2017 6,500.000 7,382 0.01
Equity swaps cont’d.
EUR EUR

46
Portfolio of investments – as at 31 December 2016
Holdings Description
Fair
value
Total
net assets
% Holdings Description
Fair
value
Total
net assets
%
BNY MELLON ABSOLUTE INSIGHT FUND
(410) STOXX 600- Auto & Parts Index 11-Jan-2017 (21,298) (0.03)
(201) STOXX 600- Food & Beverage Index 06-Nov-2017 (2,975) (0.00)
(691) STOXX 600- Industrial Goods & Service 11-Jan-2017 (13,581) (0.02)
(1,790) STOXX 600- Media 06-Nov-2017 (45,654) (0.06)
United Kingdom - (44,041) (31 December 2015: (159,356)) (44,041) (0.05)
(58) FTSE 250 Index 11-Jan-2017 (16,986) (0.01)
(4) FTSE 250 Index 06-Nov-2017 (3,775) (0.00)
(6) FTSE 350 Banks Index 06-Nov-2017 (3,188) (0.00)
(32) FTSE 350 General Retail Index 17-Oct-2017 (4,047) (0.01)
(9) FTSE 350 Travel & Leisure Index 17-Oct-2017 (3,844) (0.01)
(173) FTSE UK Mid Cap Tradable Plus 11-Jan-2017 (12,201) (0.02)
United States of America - (7,742) (31 December 2015: –) (7,742) (0.01)
(51) S&P 500 Biotech Index 06-Nov-2017 (7,742) (0.01)
Total investments in equity index swaps (175,842) (0.21)
Equity swaps
Austria - (11,576) (31 December 2015: –) (11,576) (0.01)
3,240 Erste Group Bank AG 26-Jun-2017 (3,182) (0.00)
(4,412) Wienerberger AG 11-Jan-2017 (8,394) (0.01)
Denmark - (510) (31 December 2015: –) (510) (0.00)
23 A.P. Moller - Maersk A/S 26-Jun-2017 (510) (0.00)
Finland - (18,205) (31 December 2015: (5,565)) (18,205) (0.02)
(12,908) Stora Enso OYJ 11-Jan-2017 (18,205) (0.02)
France - (14,644) (31 December 2015: (123,583)) (14,644) (0.02)
(189) Air Liquide SA 26-Jun-2017 (99) (0.00)
(16,640) Bureau Veritas SA 17-Oct-2017 (2,031) (0.00)
(488) L’Oreal SA 17-Oct-2017 (3,361) (0.01)
(456) LVMH Moet Hennessy Louis Vuitton SA 26-Jun-2017 (1,029) (0.00)
2,052 Nexity SA 17-Oct-2017 (3,468) (0.01)
1,205 Pernod Ricard SA 26-Jun-2017 (211) (0.00)
(771) Sanofi 26-Jun-2017 (921) (0.00)
(63) Thales SA 11-Jan-2017 (862) (0.00)
88 Unibail-Rodamco SE 11-Jan-2017 (1,094) (0.00)
25,095 Vivendi SA 17-Oct-2017 (1,568) (0.00)
Germany - (15,397) (31 December 2015: (167,561)) (15,397) (0.02)
457 Beiersdorf AG 17-Oct-2017 (41) (0.00)
(724) Hannover Rueck SE 17-Oct-2017 (5,564) (0.01)
(1,418) Henkel AG & Co KGaA 26-Jun-2017 (638) (0.00)
(364) MTU Aero Engines AG 11-Jan-2017 (7,664) (0.01)
3,419 Rheinmetall AG 11-Jan-2017 (325) (0.00)
(2,829) TUI AG 17-Oct-2017 (1,165) (0.00)
Ireland - (2,803) (31 December 2015: (37,018)) (2,803) (0.00)
7,706 Shire Plc 11-Jan-2017 (2,803) (0.00)
6 Russell 2000 Index Future Put
17-Mar-2017 1,250.000 10,260 0.01
5 S&P 500 Index Put 17-Mar-2017 2,125.000 12,516 0.02
3 S&P 500 Index Put 20-Jan-2017 2,150.000 1,453 0.00
2 S&P 500 Index Put 28-Apr-2017 2,250.000 14,402 0.02
3 S&P 500 Index Put 28-Feb-2017 2,100.000 4,218 0.01
2 S&P 500 Index Put 31-May-2017 2,225.000 12,711 0.02
12 Swiss Market Index Call 17-Mar-2017 8,000.000 36,932 0.05
Total index options 232,624 0.30
Holdings Description
Underlying
exposure
EUR
Fair
value
EUR
Total
net assets
%
Open futures contracts - 119,077 (31 December 2015: 222,269)
3 CBOE Volatility Index® (VX)
Long Futures Contracts
Exp May-2017 53,650 1,349 0.00
(4) CBOE Volatility Index® (VX)
Short Futures Contracts
Exp Jan-2017 (57,474) 6,543 0.01
55 Euro STOXX 50 Index Dividend
Long Futures Contracts
Exp Dec-2017 639,100 17,888 0.02
34 Euro STOXX 50 Index Dividend
Long Futures Contracts
Exp Dec-2018 395,760 41,265 0.05
24 Euro STOXX 50 Index Dividend
Long Futures Contracts
Exp Dec-2019 270,000 32,760 0.04
7 Euro-BTP
Long Futures Contracts
Exp Mar-2017 947,170 16,660 0.02
(11) U.S.10 Year Ultra Treasury Note
Short Futures Contracts
Exp Mar-2017 (1,400,928) 2,612 0.01
Total open futures contracts 119,077 0.15
Swaptions - 23,678 (31 December 2015: –)
1,010,000 CDX Option Call 15-Mar-2017 312.500 12,960 0.02
3,100,000 CDX Option Call 15-Mar-2017 72.500 8,931 0.01
800,000 CDX Option Put 15-Mar-2017 387.500 1,787 0.00
Total swaptions 23,678 0.03
Unrealised gain on forward foreign currency contracts - 475,785 (see below)
(31 December 2015: 1,894,510) 475,785 0.59
Total fi nancial assets at fair value through profi t or loss 67,949,523 84.77
Equity index swaps
Europe - (124,059) (31 December 2015: (42,349)) (124,059) (0.15)
(855) Euro STOXX Personal & Household Goods 06-Nov-2017 (36,927) (0.04)
(130) Euro STOXX Telecommunications 06-Nov-2017 (3,624) (0.00)
Index options cont’d. Equity index swaps cont’d.
Europe cont’d.
EUR EUR

47
Portfolio of investments – as at 31 December 2016
Holdings Description
Fair
value
Total
net assets
% Holdings Description
Fair
value
Total
net assets
%
BNY MELLON ABSOLUTE INSIGHT FUND
Italy - (12,880) (31 December 2015: (6,572)) (12,880) (0.02)
(7,637) Enel SpA 26-Jun-2017 (495) (0.00)
(321) Ferrari NV 11-Jan-2017 (3,834) (0.01)
5,553 Finmeccanica SpA 26-Jun-2017 (777) (0.00)
2,044 Moncler SpA 26-Jun-2017 (103) (0.00)
11,535 Snam Rete Gas 06-Nov-2017 (7,671) (0.01)
Luxembourg - (27,561) (31 December 2015: (5,415)) (27,561) (0.04)
1,122 Eurofi ns Scientifi c SE 17-Oct-2017 (15,371) (0.02)
(4,613) Fiat Chrysler Automobiles NV 11-Jan-2017 (12,190) (0.02)
Portugal - (146) (31 December 2015: (9,984)) (146) (0.00)
(4,858) Galp Energia 26-Jun-2017 (146) (0.00)
Spain - (80,075) (31 December 2015: (64,305)) (80,075) (0.10)
(500) Abertis Infraestructuras SA 11-Jan-2017 (459) (0.00)
3,670 Ferrovial SA 11-Jan-2017 (6,241) (0.01)
(17,489) Gestevision Telecinco SA 06-Nov-2017 (27,152) (0.03)
(31,639) Grifols SA 06-Nov-2017 (45,956) (0.06)
2,739 Red Electrica Corp SA 06-Nov-2017 (267) (0.00)
Switzerland - (16,697) (31 December 2015: (8,425)) (16,697) (0.02)
(2,566) LafargeHolcim Ltd 11-Jan-2017 (7,122) (0.01)
(412) Panalpina Welttransport 26-Jun-2017 0 (0.00)
464 Roche Holding AG 11-Jan-2017 (3,117) (0.00)
(812) Swiss Re AG 17-Oct-2017 (6,458) (0.01)
United Kingdom - (248,468) (31 December 2015: (320,807)) (248,468) (0.30)
(15,827) 3i Group Plc 06-Nov-2017 (12,871) (0.02)
2,400 Anglo American Plc 17-Oct-2017 (738) (0.00)
18,369 Applied Graphene Materials Plc 06-Nov-2017 (11,183) (0.02)
971 ASOS Plc 17-Oct-2017 (3,050) (0.01)
(400) AstraZeneca Plc 11-Jan-2017 (394) (0.00)
13,350 Babcock International Group Plc 11-Jan-2017 (19,480) (0.02)
(1,132) British American Tobacco Plc 06-Nov-2017 (3,150) (0.00)
74,380 Cobham Plc 11-Jan-2017 (4,603) (0.01)
(6,435) Compass Group Plc 11-Jan-2017 (8,670) (0.01)
(5,003) ConvaTec Group Plc 11-Jan-2017 (193) (0.00)
10,977 Crest Nicholson Holdings Plc 11-Jan-2017 (2,512) (0.00)
7,980 Galiform Plc 11-Jan-2017 (2,165) (0.00)
(5,515) Galliford Try Plc 11-Jan-2017 (7,910) (0.01)
(23) GlaxoSmithKline Plc 11-Jan-2017 (1) (0.00)
(35,411) Glencore Xstrata Plc 17-Oct-2017 (14,857) (0.02)
(6,174) Halfords Group Plc 11-Jan-2017 (784) (0.00)
(57,738) Hammerson Plc 17-Oct-2017 (12,266) (0.02)
3,250 HSBC Holdings Plc 17-Oct-2017 (37) (0.00)
(8,898) J D Wetherspoon Plc 11-Jan-2017 (6,516) (0.01)
(8,496) Kingfi sher Plc 11-Jan-2017 (68) (0.00)
45,224 Ladbrokes Coral Plc 17-Oct-2017 (10,783) (0.01)
7,019 Ladbrokes Plc 17-Oct-2017 (1,336) (0.00)
12,338 Lloyds Banking Group Plc 11-Jan-2017 (129) (0.00)
1,709 Micro Focus International 11-Jan-2017 (590) (0.00)
19 Mondi Plc 11-Jan-2017 (1) (0.00)
(5,941) Moneysupermarket.com 17-Oct-2017 (1,556) (0.00)
(743) Reckitt Benckiser Plc 06-Nov-2017 (2,463) (0.00)
(446) Rightmove Plc 17-Oct-2017 (1,031) (0.00)
(26,117) Royal Dutch Shell Plc 06-Nov-2017 (67,762) (0.08)
48,501 Saga Plc 17-Oct-2017 (2,896) (0.00)
13,603 Sage Group Plc 06-Nov-2017 (4,084) (0.01)
(9,533) Schroders Plc 11-Jan-2017 (27,354) (0.03)
7,585 Severn Trent Plc 17-Oct-2017 (6,457) (0.01)
46,414 Shanks Group Plc 06-Nov-2017 (725) (0.00)
2,750 Smiths Group Plc 11-Jan-2017 (3,518) (0.01)
692 Spire Healthcare Group Plc 11-Jan-2017 (216) (0.00)
(3,473) SSE Plc 11-Jan-2017 (1,260) (0.00)
21,218 Taylor Wimpey Plc 26-Jun-2017 (160) (0.00)
(3,611) Travis Perkins Plc 11-Jan-2017 (1,733) (0.00)
13,026 Worldpay Group Plc 17-Oct-2017 (2,951) (0.00)
1,686 WPP 2012 Plc 11-Jan-2017 (15) (0.00)
Total investments in equity swaps (448,962) (0.55)
Credit default swaps - (92,724) (31 December 2015: (621,314))
50,000 CDS CNH Industrial N.V. 5.000% 20-Dec-2021 (7,006) (0.01)
100,000 CDS CNH Industrial N.V. 5.000% 20-Dec-2021 (14,012) (0.02)
50,000 CDS CNH Industrial N.V. 5.000% 20-Dec-2021 (7,006) (0.01)
520,000 CDS iTraxx Europe Series 26 Version 1
1.000% 20-Dec-2021 (7,103) (0.01)
1,250,000 CDS iTraxx Europe Series 26 Version 1
1.000% 20-Dec-2021 (17,075) (0.02)
(520,000) CDS iTraxx Europe Series 26 Version 1
1.000% 20-Dec-2026 (4,956) (0.01)
(1,250,000) CDS iTraxx Europe Series 26 Version 1
1.000% 20-Dec-2026 (11,913) (0.01)
(300,000) CDS Republic of Indonesia 1.000% 20-Dec-2021 (7,364) (0.01)
(100,000) CDS Telecom Italia SpA 1.000% 20-Jun-2022 (7,678) (0.01)
50,000 CDS Valeo SA 1.000% 20-Dec-2020 (1,159) (0.00)
180,000 CDS Valeo SA 1.000% 20-Dec-2020 (4,171) (0.01)
100,000 CDS Vivendi SA 1.000% 20-Jun-2022 (1,648) (0.00)
250,000 CDS Vodafone Group Plc 1.000% 20-Dec-2021 (1,633) (0.00)
Total credit default swaps (92,724) (0.12)
Currency options - (91,520) (31 December 2015: (240,095))
(900,000) Euro/Japanese yen Call 02-Mar-2017 127.000 (6,024) (0.01)
(900,000) Euro/Japanese yen Put 02-Mar-2017 116.000 (3,358) (0.01)
(1,200,000) Euro/US dollar Call 20-Mar-2017 1.120 (3,656) (0.01)
(1,200,000) Euro/US dollar Put 20-Mar-2017 1.025 (10,275) (0.01)
(1,600,000) US dollar/Japanese yen Call 04-Jan-2017 118.000 (2,931) (0.00)
(1,800,000) US dollar/Japanese yen Call 23-Feb-2017 115.500 (41,732) (0.05)
(1,300,000) US dollar/Korean won Call 17-Mar-2017 1,230.000 (17,975) (0.02)
(450,000) US dollar/Korean won Call 31-Jan-2017 1,225.000 (3,358) (0.01)
(1,300,000) US dollar/Korean won Put 17-Mar-2017 1,125.000 (2,211) (0.00)
Total currency options (91,520) (0.12)
Future options - (5,372) (31 December 2015: (151,775))
(145) iShares MSCI Emerging Markets Future Call
17-Mar-2017 41.000 (413) (0.00)
(145) iShares MSCI Emerging Markets Future Put
17-Mar-2017 31.000 (4,959) (0.01)
Total future options (5,372) (0.01)
Equity swaps cont’d. Equity swaps cont’d.
United Kingdom cont’d.
EUR EUR

48
Portfolio of investments – as at 31 December 2016
Holdings Description
Fair
value
Total
net assets
% Holdings Description
Fair
value
Total
net assets
%
BNY MELLON ABSOLUTE INSIGHT FUND
(5) U.S. 10 Year Treasury Note
Short Futures Contracts
Exp Mar-2017 (590,325) (757) (0.00)
(14) U.S. 10 Year Treasury Note
Short Futures Contracts
Exp Mar-2017 (1,652,911) (17,857) (0.02)
(9) U.S. 5 Year Treasury Note
Short Futures Contracts
Exp Mar-2017 (1,006,010) (3,852) (0.01)
(1) U.S. Treasury Bond
Short Futures Contracts
Exp Mar-2017 (143,121) (668) (0.00)
(1) UK Long Gilt
Short Futures Contracts
Exp Mar-2017 (147,317) (2,529) (0.00)
Total open futures contracts (95,431) (0.12)
Swaptions - (33,877) (31 December 2015: (42,284))
(4,650,000) CDX Option Call 15-Mar-2017 70.000 (10,198) (0.01)
(3,600,000) CDX Option Call 15-Mar-2017 77.500 (12,756) (0.02)
(1,010,000) CDX Option Put 15-Mar-2017 400.000 (1,854) (0.00)
(3,600,000) CDX Option Put 15-Mar-2017 77.500 (9,041) (0.01)
(800,000) CDX Option Put 18-Jan-2017 437.500 (28) (0.00)
Total swaptions (33,877) (0.04)
Unrealised loss on forward foreign currency contracts - (1,268,639) (see below)
(31 December 2015: (1,282,769)) (1,268,639) (1.58)
Total fi nancial liabilities at fair value through profi t or loss (2,442,376) (3.04)
Net current assets 14,633,894 18.27
Total net assets 80,141,041 100.00
The counterparties for equity index swaps are Barclays Bank plc, JPMorgan Chase and Bank of America Merrill Lynch.
The counterparties for equity swaps are Barclays Bank plc, JPMorgan Chase, Bank of America Merrill Lynch and
Morgan Stanley.
The counterparties for credit default swaps are Barclays Bank plc, BNP Paribas, Citigroup, Credit Suisse,
Goldman Sachs, JPMorgan Chase and Bank of America Merrill Lynch.
The counterparties for currency options are Barclays Bank plc, Citigroup, Goldman Sachs, HSBC Bank plc,
JPMorgan Chase, Bank of America Merrill Lynch and UBS.
The counterparty for equity options is Goldman Sachs.
The counterparty for future options is Goldman Sachs.
The counterparty for index options is Goldman Sachs.
The counterparty for futures contracts is Goldman Sachs.
The counterparties for swaptions are Citigroup and JPMorgan Chase.
Analysis of portfolio % of Total assets
Transferable securities and money market instruments admitted
to offi cial stock exchange listing or traded on a regulated market 71.51
Transferable securities and money market instruments other than those
admitted to offi cial stock exchange listing or traded on a regulated market 5.15
Financial derivative instruments dealt in on a regulated market 0.41
OTC fi nancial derivative instruments 1.83
Other current assets 21.10
Total assets 100.00
Index options - (230,009) (31 December 2015: (378,248))
(17) Euro STOXX 50 Index Call 15-Dec-2017 3,400.000 (25,092) (0.03)
(76) Euro STOXX 50 Index Call 20-Jan-2017 3,150.000 (112,632) (0.14)
(17) Euro STOXX 50 Index Put 15-Dec-2017 2,300.000 (8,687) (0.01)
(76) Euro STOXX 50 Index Put 20-Jan-2017 2,900.000 (912) (0.00)
(26) FTSE 100 Index Put 17-Mar-2017 6,000.000 (5,175) (0.01)
(12) Russell 2000 Index Future Put 17-Mar-2017 1,170.000 (10,020) (0.01)
(10) S&P 500 Index Put 17-Mar-2017 1,950.000 (8,806) (0.01)
(6) S&P 500 Index Put 20-Jan-2017 2,000.000 (599) (0.00)
(4) S&P 500 Index Put 28-Apr-2017 2,125.000 (14,333) (0.02)
(6) S&P 500 Index Put 28-Feb-2017 1,950.000 (2,508) (0.00)
(4) S&P 500 Index Put 31-May-2017 2,075.000 (14,702) (0.02)
(12) Swiss Market Index Call 17-Mar-2017 8,200.000 (22,961) (0.03)
(6) Swiss Market Index Put 17-Mar-2017 7,550.000 (3,582) (0.01)
Total index options (230,009) (0.29)
Holdings Description
Underlying
exposure
EUR
Fair
value
EUR
Total
net assets
%
Open futures contracts - (95,431) (31 December 2015: (198,023))
(6) CAC 40 10 Euro Index
Short Futures Contracts
Exp Jan-2017 (291,780) (5,505) (0.01)
3 CBOE Volatility Index® (VX)
Long Futures Contracts
Exp Apr-2017 52,510 (1,319) (0.00)
(4) CBOE Volatility Index® (VX)
Short Futures Contracts
Exp Feb-2017 (62,984) (3,315) (0.00)
(1) DAX Index Short Futures Contracts
Exp Mar-2017 (286,625) (5,438) (0.01)
4 E-mini S&P 500 Index
Long Futures Contracts
Exp Mar-2017 424,870 (4,099) (0.01)
(12) Euro STOXX 50 Index
Short Futures Contracts
Exp Mar-2017 (393,240) (7,850) (0.01)
(6) Euro-Bobl
Short Futures Contracts
Exp Mar-2017 (801,780) (4,140) (0.01)
(2) Euro-Bund
Short Futures Contracts
Exp Mar-2017 (328,300) (4,959) (0.01)
(6) Euro-OAT
Short Futures Contracts
Exp Mar-2017 (910,920) (9,885) (0.01)
(10) Euro-Schatz
Short Futures Contracts
Exp Mar-2017 (1,122,900) (1,550) (0.00)
48 FTSE 100 Dividend Index
Long Futures Contracts
Exp Dec-2018 148,527 (112) (0.00)
(6) FTSE 100 Index
Short Futures Contracts
Exp Mar-2017 (495,231) (9,951) (0.01)
(11) MSCI Emerging Markets Index
Short Futures Contracts
Exp Mar-2017 (448,767) (11,645) (0.01)
Open futures contracts cont’d.
Underlying
exposure
EUREUR EUR

49
Portfolio of investments – as at 31 December 2016
BNY MELLON ABSOLUTE INSIGHT FUND
Forward foreign currency contracts
Unrealised
Gain/(Loss)Buy Sell Amount (B) Amount (S)
Settle
Date Counterparty
BNY Mellon Absolute Insight FundEuro Danish krone 3,119 23,189 03-Jan-17 Toronto Dominion
Bank -
Euro Swedish krona 6,132 58,685 03-Jan-17 Royal Bank of Canada 13
US dollar Euro 4,000 3,788 03-Jan-17 Goldman Sachs 11
Brazilian real US dollar 440,000 126,633 13-Jan-17 Toronto Dominion Bank 7,726
Brazilian real US dollar 550,000 160,842 13-Jan-17 Goldman Sachs 7,236
Brazilian real US dollar 500,000 145,964 13-Jan-17 HSBC Bank Plc 6,821
Brazilian real US dollar 1,000,000 294,676 13-Jan-17 Goldman Sachs 11,034
Chilean peso US dollar 187,100,000 277,679 13-Jan-17 HSBC Bank Plc 1,373
Czech koruna US dollar 19,350,000 747,003 13-Jan-17 RBC Capital Markets 6,825
Indonesian rupiah US dollar 3,169,200,000 232,284 13-Jan-17 UBS 2,358
Mexican peso US dollar 3,213,518 154,132 13-Jan-17 HSBC Bank Plc 610
Mexican peso US dollar 2,400,000 115,069 13-Jan-17 UBS 498
Peruvian nuevo sol US dollar 390,000 113,587 13-Jan-17 JPMorgan Chase 2,343
Peruvian nuevo sol US dollar 100,000 29,121 13-Jan-17 JPMorgan Chase 605
Philippine peso US dollar 20,660,000 414,610 13-Jan-17 UBS 620
Polish zloty Euro 942,045 208,620 13-Jan-17 HSBC Bank Plc 5,078
Russian rouble US dollar 20,000,000 310,930 13-Jan-17 Citigroup 13,385
South African rand US dollar 268,101 18,842 13-Jan-17 HSBC Bank Plc 607
South African rand US dollar 2,200,000 157,262 13-Jan-17 HSBC Bank Plc 2,468
South African rand US dollar 2,400,000 173,033 13-Jan-17 UBS 1,292
South African rand US dollar 3,400,000 239,523 13-Jan-17 Goldman Sachs 7,154
Swedish krona Euro 1,200,000 122,880 13-Jan-17 Goldman Sachs 2,264
Turkish lira US dollar 485,000 135,899 13-Jan-17 HSBC Bank Plc 1,253
US dollar Czech koruna 772,239 19,350,000 13-Jan-17 Goldman Sachs 17,136
US dollar Korean won 160,271 186,700,000 13-Jan-17 UBS 5,389
US dollar Korean won 379,037 444,000,000 13-Jan-17 Goldman Sachs 10,811
US dollar Korean won 801,750 942,850,000 13-Jan-17 UBS 19,967
US dollar Malaysian ringgit 413,176 1,800,000 13-Jan-17 Barclays Bank plc 11,579
US dollar Malaysian ringgit 136,132 600,000 13-Jan-17 Goldman Sachs 2,347
US dollar Malaysian ringgit 286,585 1,270,000 13-Jan-17 UBS 3,485
US dollar Mexican peso 155,250 3,200,000 13-Jan-17 UBS 1,070
US dollar Mexican peso 101,559 2,087,741 13-Jan-17 UBS 955
US dollar South African rand 153,592 2,104,094 13-Jan-17 JPMorgan Chase 664
US dollar Turkish lira 157,672 530,000 13-Jan-17 Citigroup 7,331
US dollar Turkish lira 291,163 995,689 13-Jan-17 Citigroup 8,979
US dollar Turkish lira 142,086 500,000 13-Jan-17 HSBC Bank Plc 592
Brazilian real US dollar 1,450,000 431,573 18-Jan-17 JPMorgan Chase 11,265
Euro US dollar 18,000 18,867 18-Jan-17 Goldman Sachs 91
Euro US dollar 764,197 800,000 18-Jan-17 Citigroup 4,839
Euro US dollar 48,000 49,817 18-Jan-17 Goldman Sachs 714
Japanese yen US dollar 6,838,618 58,000 18-Jan-17 RBC Capital Markets 536
US dollar Australian dollar 845,417 1,133,928 18-Jan-17 Goldman Sachs 26,056
US dollar Chinese yuan 3,313,680 22,956,509 18-Jan-17 HSBC Bank Plc 38,004
US dollar Japanese yen 800,000 91,766,400 18-Jan-17 Goldman Sachs 13,411
US dollar Japanese yen 2,570,815 295,309,899 18-Jan-17 HSBC Bank Plc 39,708
US dollar Korean won 853,632 990,000,000 18-Jan-17 HSBC Bank Plc 32,106
US dollar Sterling 1,696,050 1,346,295 18-Jan-17 Goldman Sachs 34,314
Euro Sterling 129,224 110,000 20-Jan-17 Goldman Sachs 497
Euro Sterling 574,047 482,000 20-Jan-17 Citigroup 9,991
Euro Sterling 343,858 289,000 20-Jan-17 HSBC Bank Plc 5,658
Sterling Euro 241,000 280,050 20-Jan-17 HSBC Bank Plc 1,977
Euro US dollar 276,541 290,000 08-Feb-17 HSBC Bank Plc 1,572
Euro US dollar 53,513 56,000 08-Feb-17 HSBC Bank Plc 416
Euro US dollar 63,404 66,000 08-Feb-17 HSBC Bank Plc 825
US dollar Euro 218,000 205,665 08-Feb-17 HSBC Bank Plc 1,035
Brazilian real US dollar 420,000 124,555 13-Feb-17 HSBC Bank Plc 2,782
Russian rouble US dollar 46,200,000 741,365 13-Feb-17 Barclays Bank plc 3,106
US dollar Chinese yuan 8,551 59,896 13-Feb-17 HSBC Bank Plc 74
US dollar Chinese yuan 356,376 2,500,000 13-Feb-17 HSBC Bank Plc 2,557
Euro Sterling 41,597 35,000 22-Feb-17 RBC Capital Markets 671
Euro Australian dollar 90,903 130,000 02-Mar-17 HSBC Bank Plc 2,162
Forward foreign currency contracts cont’d.
Unrealised
Gain/(Loss)Buy Sell Amount (B) Amount (S)
Settle
Date Counterparty
BNY Mellon Absolute Insight Fund cont’d.
Euro Sterling 2,523,535 2,150,000 02-Mar-17 HSBC Bank Plc 9,963
US dollar Chinese yuan 893,828 6,330,000 23-Mar-17 Barclays Bank plc 4,103
US dollar Sterling 455,000 366,300 23-Mar-17 JPMorgan Chase 2,521
EUR 422,833
Euro Swiss franc 22,478 24,146 03-Jan-17 JPMorgan Chase (48)
Euro US dollar 22,194 23,434 04-Jan-17 Citigroup (66)
Euro Hong Kong dollar 775,739 6,625,000 13-Jan-17 Citigroup (35,472)
Euro Polish zloty 210,078 932,000 13-Jan-17 HSBC Bank Plc (1,342)
Euro Polish zloty 2,289 10,192 13-Jan-17 HSBC Bank Plc (23)
Euro Swedish krona 122,479 1,200,000 13-Jan-17 Goldman Sachs (2,665)
Euro US dollar 250,000 265,938 13-Jan-17 HSBC Bank Plc (2,497)
Euro US dollar 3,990,318 4,250,000 13-Jan-17 HSBC Bank Plc (44,881)
Euro US dollar 4,075,433 4,340,532 13-Jan-17 Bank of America Merrill Lynch (45,723)
Euro US dollar 4,225,182 4,500,000 13-Jan-17 UBS (47,383)
Korean won US dollar 536,900,000 455,301 13-Jan-17 HSBC Bank Plc (10,183)
Korean won US dollar 387,010,000 329,065 13-Jan-17 JPMorgan Chase (8,169)
Mexican peso US dollar 955,000 46,555 13-Jan-17 RBC Capital Markets (530)
Mexican peso US dollar 1,100,000 53,929 13-Jan-17 RBC Capital Markets (901)
Mexican peso US dollar 4,800,000 234,245 13-Jan-17 UBS (2,905)
Romanian leu Euro 1,149,498 254,195 13-Jan-17 JPMorgan Chase (989)
Russian rouble US dollar 16,200,000 264,596 13-Jan-17 Barclays Bank plc (1,256)
South African rand US dollar 3,200,000 234,417 13-Jan-17 JPMorgan Chase (1,797)
Turkish lira US dollar 503,000 145,796 13-Jan-17 Barclays Bank plc (3,309)
Turkish lira US dollar 520,631 152,539 13-Jan-17 Goldman Sachs (4,974)
US dollar Brazilian real 94,248 332,224 13-Jan-17 RBC Capital Markets (7,132)
US dollar Brazilian real 257,415 900,000 13-Jan-17 HSBC Bank Plc (17,330)
US dollar Brazilian real 811,675 2,834,125 13-Jan-17 UBS (53,558)
US dollar Brazilian real 286,583 980,000 13-Jan-17 HSBC Bank Plc (12,901)
US dollar Chilean peso 278,838 187,100,000 13-Jan-17 RBC Capital Markets (273)
US dollar Colombian peso 338,425 1,065,700,000 13-Jan-17 Bank of America Merrill Lynch (15,027)
US dollar Euro 209,104 200,000 13-Jan-17 Bank of America Merrill Lynch (1,464)
US dollar Euro 420,132 400,000 13-Jan-17 Citigroup (1,102)
US dollar Indonesian rupiah 421,742 5,763,100,000 13-Jan-17 Toronto Dominion Bank (4,915)
US dollar Mexican peso 323,568 6,800,000 13-Jan-17 HSBC Bank Plc (3,746)
US dollar Mexican peso 196,217 4,100,000 13-Jan-17 HSBC Bank Plc (1,190)
US dollar Peruvian nuevo sol 220,866 760,000 13-Jan-17 JPMorgan Chase (5,024)
US dollar Philippine peso 412,952 20,660,000 13-Jan-17 Barclays Bank plc (2,194)
US dollar Russian rouble 145,114 9,000,000 13-Jan-17 HSBC Bank Plc (1,090)
US dollar Russian rouble 1,078,778 71,140,000 13-Jan-17 Bank of America Merrill Lynch (73,437)
US dollar South African rand 669,820 9,700,000 13-Jan-17 Goldman Sachs (33,252)
US dollar South African rand 152,125 2,100,000 13-Jan-17 HSBC Bank Plc (446)
US dollar South African rand 664,038 9,763,880 13-Jan-17 HSBC Bank Plc (43,149)
US dollar Thai baht 291,224 10,500,000 13-Jan-17 HSBC Bank Plc (1,863)
Australian dollar US dollar 65,000 48,031 18-Jan-17 RBC Capital Markets (1,084)
Australian dollar US dollar 1,067,385 800,000 18-Jan-17 Citigroup (28,509)
Chinese yuan US dollar 900,000 129,000 18-Jan-17 HSBC Bank Plc (625)
Euro US dollar 230,578 244,654 18-Jan-17 HSBC Bank Plc (1,646)
Euro US dollar 65,000 69,261 18-Jan-17 RBC Capital Markets (742)
Euro US dollar 753,528 800,000 18-Jan-17 Barclays Bank plc (5,830)
Euro US dollar 754,924 800,000 18-Jan-17 JPMorgan Chase (4,434)
Japanese yen US dollar 11,989,110 105,000 18-Jan-17 Goldman Sachs (2,209)
Korean won US dollar 990,000,000 848,569 18-Jan-17 Citigroup (27,300)
Sterling US dollar 18,000 22,517 18-Jan-17 Goldman Sachs (308)
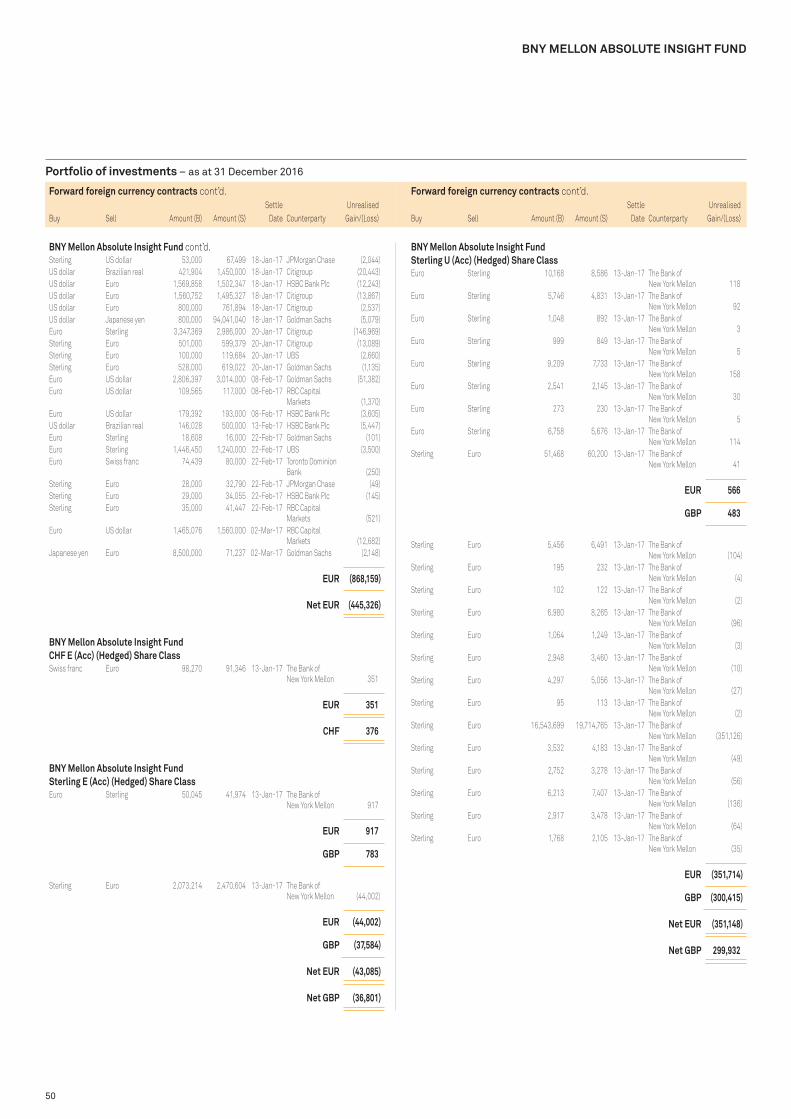
50
Portfolio of investments – as at 31 December 2016
BNY MELLON ABSOLUTE INSIGHT FUND
Forward foreign currency contracts cont’d.
Unrealised
Gain/(Loss)Buy Sell Amount (B) Amount (S)
Settle
Date Counterparty
BNY Mellon Absolute Insight Fund cont’d.
Sterling US dollar 53,000 67,499 18-Jan-17 JPMorgan Chase (2,044)
US dollar Brazilian real 421,904 1,450,000 18-Jan-17 Citigroup (20,443)
US dollar Euro 1,569,858 1,502,347 18-Jan-17 HSBC Bank Plc (12,243)
US dollar Euro 1,560,752 1,495,327 18-Jan-17 Citigroup (13,867)
US dollar Euro 800,000 761,894 18-Jan-17 Citigroup (2,537)
US dollar Japanese yen 800,000 94,041,040 18-Jan-17 Goldman Sachs (5,079)
Euro Sterling 3,347,369 2,986,000 20-Jan-17 Citigroup (146,969)
Sterling Euro 501,000 599,379 20-Jan-17 Citigroup (13,089)
Sterling Euro 100,000 119,684 20-Jan-17 UBS (2,660)
Sterling Euro 528,000 619,022 20-Jan-17 Goldman Sachs (1,135)
Euro US dollar 2,806,397 3,014,000 08-Feb-17 Goldman Sachs (51,382)
Euro US dollar 109,565 117,000 08-Feb-17 RBC Capital Markets (1,370)
Euro US dollar 179,392 193,000 08-Feb-17 HSBC Bank Plc (3,605)
US dollar Brazilian real 146,028 500,000 13-Feb-17 HSBC Bank Plc (5,447)
Euro Sterling 18,608 16,000 22-Feb-17 Goldman Sachs (101)
Euro Sterling 1,446,450 1,240,000 22-Feb-17 UBS (3,500)
Euro Swiss franc 74,439 80,000 22-Feb-17 Toronto Dominion Bank (250)
Sterling Euro 28,000 32,790 22-Feb-17 JPMorgan Chase (49)
Sterling Euro 29,000 34,055 22-Feb-17 HSBC Bank Plc (145)
Sterling Euro 35,000 41,447 22-Feb-17 RBC Capital Markets (521)
Euro US dollar 1,465,076 1,560,000 02-Mar-17 RBC Capital Markets (12,682)
Japanese yen Euro 8,500,000 71,237 02-Mar-17 Goldman Sachs (2,148)
EUR (868,159)
Net EUR (445,326)
BNY Mellon Absolute Insight Fund CHF E (Acc) (Hedged) Share ClassSwiss franc Euro 98,270 91,346 13-Jan-17 The Bank of
New York Mellon 351
EUR 351
CHF 376
BNY Mellon Absolute Insight Fund Sterling E (Acc) (Hedged) Share ClassEuro Sterling 50,045 41,974 13-Jan-17 The Bank of
New York Mellon 917
EUR 917
GBP 783
Sterling Euro 2,073,214 2,470,604 13-Jan-17 The Bank of New York Mellon (44,002)
EUR (44,002)
GBP (37,584)
Net EUR (43,085)
Net GBP (36,801)
Forward foreign currency contracts cont’d.
Unrealised
Gain/(Loss)Buy Sell Amount (B) Amount (S)
Settle
Date Counterparty
BNY Mellon Absolute Insight Fund Sterling U (Acc) (Hedged) Share ClassEuro Sterling 10,168 8,586 13-Jan-17 The Bank of
New York Mellon 118
Euro Sterling 5,746 4,831 13-Jan-17 The Bank of New York Mellon 92
Euro Sterling 1,048 892 13-Jan-17 The Bank of New York Mellon 3
Euro Sterling 999 849 13-Jan-17 The Bank of New York Mellon 5
Euro Sterling 9,209 7,733 13-Jan-17 The Bank of New York Mellon 158
Euro Sterling 2,541 2,145 13-Jan-17 The Bank of New York Mellon 30
Euro Sterling 273 230 13-Jan-17 The Bank of New York Mellon 5
Euro Sterling 6,758 5,676 13-Jan-17 The Bank of New York Mellon 114
Sterling Euro 51,468 60,200 13-Jan-17 The Bank of New York Mellon 41
EUR 566
GBP 483
Sterling Euro 5,456 6,491 13-Jan-17 The Bank of New York Mellon (104)
Sterling Euro 195 232 13-Jan-17 The Bank of New York Mellon (4)
Sterling Euro 102 122 13-Jan-17 The Bank of New York Mellon (2)
Sterling Euro 6,980 8,265 13-Jan-17 The Bank of New York Mellon (96)
Sterling Euro 1,064 1,249 13-Jan-17 The Bank of New York Mellon (3)
Sterling Euro 2,948 3,460 13-Jan-17 The Bank of New York Mellon (10)
Sterling Euro 4,297 5,056 13-Jan-17 The Bank of New York Mellon (27)
Sterling Euro 95 113 13-Jan-17 The Bank of New York Mellon (2)
Sterling Euro 16,543,699 19,714,765 13-Jan-17 The Bank of New York Mellon (351,126)
Sterling Euro 3,532 4,183 13-Jan-17 The Bank of New York Mellon (49)
Sterling Euro 2,752 3,278 13-Jan-17 The Bank of New York Mellon (56)
Sterling Euro 6,213 7,407 13-Jan-17 The Bank of New York Mellon (136)
Sterling Euro 2,917 3,478 13-Jan-17 The Bank of New York Mellon (64)
Sterling Euro 1,768 2,105 13-Jan-17 The Bank of New York Mellon (35)
EUR (351,714)
GBP (300,415)
Net EUR (351,148)
Net GBP 299,932

51
Portfolio of investments – as at 31 December 2016
BNY MELLON ABSOLUTE INSIGHT FUND
Forward foreign currency contracts cont’d.
Unrealised
Gain/(Loss)Buy Sell Amount (B) Amount (S)
Settle
Date Counterparty
BNY Mellon Absolute Insight Fund USD R (Acc) (Hedged) Share ClassUS dollar Euro 746,061 705,452 13-Jan-17 The Bank of
New York Mellon 2,901
EUR 2,901
USD 3,054
Euro US dollar 21,670 23,056 13-Jan-17 The Bank of New York Mellon (221)
EUR (221)
USD (233)
Net EUR 2,680
Net USD 2,821
BNY Mellon Absolute Insight Fund USD T (Acc) (Hedged) Share ClassUS dollar Euro 50,000 47,423 13-Jan-17 The Bank of
New York Mellon 50
US dollar Euro 9,202,340 8,701,453 13-Jan-17 The Bank of New York Mellon 35,789
EUR 35,839
USD 37,726
US dollar Euro 50,000 48,013 13-Jan-17 The Bank of New York Mellon (540)
US dollar Euro 42,500 40,811 13-Jan-17 The Bank of New York Mellon (459)
US dollar Euro 300,000 287,077 13-Jan-17 The Bank of New York Mellon (2,239)
EUR (3,238)
USD (3,408)
Net EUR 32,601
Net USD 34,318
Forward foreign currency contracts cont’d.
Unrealised
Gain/(Loss)Buy Sell Amount (B) Amount (S)
Settle
Date Counterparty
BNY Mellon Absolute Insight Fund USD U (Acc) (Hedged) Share ClassEuro US dollar 1,671 1,739 13-Jan-17 The Bank of
New York Mellon 20
US dollar Euro 2,918 2,742 13-Jan-17 The Bank of New York Mellon 28
US dollar Euro 3,139,326 2,968,451 13-Jan-17 The Bank of New York Mellon 12,209
US dollar Euro 13,269 12,477 13-Jan-17 The Bank of New York Mellon 121
EUR 12,378
USD 13,030
US dollar Euro 12,570 12,009 13-Jan-17 The Bank of New York Mellon (75)
US dollar Euro 27,688 26,588 13-Jan-17 The Bank of New York Mellon (299)
US dollar Euro 102,361 97,571 13-Jan-17 The Bank of New York Mellon (384)
US dollar Euro 44,434 42,595 13-Jan-17 The Bank of New York Mellon (406)
US dollar Euro 8,958 8,576 13-Jan-17 The Bank of New York Mellon (71)
US dollar Euro 9,406 9,001 13-Jan-17 The Bank of New York Mellon (70)
EUR (1,305)
USD (1,374)
Net EUR 11,073
Net USD 11,656

52
Portfolio of investments – as at 31 December 2016
Holdings Description
Fair
value
Total
net assets
% Holdings Description
Fair
value
Total
net assets
%
Collective investment schemes
Supranational - 178,516,529 (31 December 2015: 198,421,606) 178,516,529 8.26
10,905,306 Insight Global Funds II plc - Insight Emerging
Markets Debt Fund 173,142,727 8.01
5,390,512 Insight Liquidity Funds Plc - EUR Cash Fund 5,373,802 0.25
Total investments in collective investment schemes 178,516,529 8.26
Bonds
Australia - 52,112,972 (31 December 2015: 62,515,178) 52,112,972 2.41
20,015,000 Commonwealth Bank of Australia 144A
1.521% 07-Nov-2019 FRN 18,969,980 0.88
771,710 Interstar Millennium Series 2006-1 Trust
2.060% 27-Mar-2038 FRN 519,243 0.02
780,910 Interstar Millennium Series 2006-4H Trust
2.115% 07-Nov-2039 FRN 509,518 0.02
19,713,000 National Australia Bank Ltd
0.000% 16-Jan-2018 FRN 19,749,962 0.92
6,000,000 National Australia Bank Ltd
0.183% 25-Mar-2019 FRN 6,043,290 0.28
6,671,000 Westpac Banking Corp 4.322% 23-Nov-2031 VAR 6,320,979 0.29
Austria - 3,870,833 (31 December 2015: 4,009,179) 3,870,833 0.18
4,000,000 Erste Group Bank AG 5.500% 26-May-2025 VAR 3,870,833 0.18
Belgium - 20,669,511 (31 December 2015: 6,271,936) 20,669,511 0.95
8,178,000 Anheuser-Busch InBev Finance Inc
4.900% 01-Feb-2046 8,322,623 0.38
12,200,000 KBC Group NV 5.625% Perpetual VAR 12,346,888 0.57
Canada - 15,970,461 (31 December 2015: 9,249,375) 15,970,461 0.74
15,885,000 Royal Bank of Canada 0.117% 22-Oct-2018 FRN 15,970,461 0.74
Cayman Islands - 5,597,032 (31 December 2015: 9,253,186) 5,597,032 0.26
834,000 Cerberus Loan Funding XVI LP 144A
3.886% 17-Nov-2027 FRN 789,773 0.04
3,250,001 Craft CLO Ltd 9.530% 15-Jan-2023 FRN 2,677,702 0.12
750,000 OCP CLO 2014-6 Ltd 144A
3.980% 17-Jul-2026 FRN 713,748 0.03
1,500,000 OCP CLO 2015-9 Ltd 144A
3.780% 15-Jul-2027 FRN 1,415,809 0.07
Denmark - 15,042,217 (31 December 2015: –) 15,042,217 0.70
11,200,000 Danske Bank A/S 0.036% 02-Jun-2017 FRN 11,211,760 0.52
3,708,000 Nykredit Realkredit A/S 4.000% 03-Jun-2036 VAR 3,830,457 0.18
France - 228,733,249 (31 December 2015: 233,093,265) 228,733,249 10.59
19,400,000 Banque Federative du Credit Mutuel SA
0.000% 23-Mar-2017 FRN 19,412,610 0.90
4,800,000 Banque Federative du Credit Mutuel SA
0.000% 29-May-2017 FRN 4,804,608 0.22
9,100,000 Banque Federative du Credit Mutuel SA
0.000% 19-Jan-2018 FRN 9,116,698 0.42
4,000,000 Banque Federative du Credit Mutuel SA
0.237% 22-May-2017 FRN 4,007,100 0.19
3,500,000 Banque Federative du Credit Mutuel SA
0.406% 20-Mar-2019 FRN 3,540,793 0.16
11,200,000 BNP Paribas Cardif SA 4.032% Perpetual VAR 11,183,480 0.52
10,000,000 BPCE SA 0.346% 28-May-2018 FRN 10,074,300 0.47
300,000 Electricite de France SA 4.125% Perpetual VAR 296,516 0.01
5,600,000 Electricite de France SA 5.375% Perpetual VAR 5,632,894 0.26
105,014,000 French Republic Government Bond OAT
0.500% 25-May-2026 104,024,416 4.82
600,000 SapphireOne Mortgages FCT 2016-2
1.981% 25-Jun-2061 FRN 599,882 0.03
7,500,000 Societe Generale SA 0.038% 19-Feb-2018 FRN 7,517,213 0.35
39,900,000 Societe Generale SA 0.117% 22-Jul-2018 FRN 40,075,760 1.85
2,257,000 TOTAL SA 2.708% Perpetual VAR 2,215,245 0.10
6,443,000 TOTAL SA 3.369% Perpetual VAR 6,231,734 0.29
Germany - 878,835 (31 December 2015: 13,853,659) 878,835 0.04
1,000,000 Craft CLO Ltd 2014-2 9.530% 15-Jul-2021 FRN 878,835 0.04
Ireland - 55,777,121 (31 December 2015: 60,829,013) 55,777,121 2.59
16,120,000 Allied Irish Banks Plc 4.125% 26-Nov-2025 VAR 16,408,387 0.76
1,000,000 Aurium Clo I Ltd 3.650% 26-Apr-2029 FRN 1,000,945 0.05
2,500,000 Avoca CLO XII Ltd 3.339% 15-Oct-2027 FRN 2,503,137 0.12
2,500,000 Avoca CLO XV Ltd 3.650% 15-Jan-2029 FRN 2,508,756 0.12
500,000 Avoca CLO XVII Designated Activity Company
3.700% 15-Jan-2030 500,000 0.02
4,037,100 Bluestep Mortgage Securities No. 2 Ltd
1.428% 10-Nov-2055 FRN 422,520 0.02
8,214,874 Bluestep Mortgage Securities No. 3 DAC
0.928% 10-May-2063 FRN 841,356 0.04
9,000,000 Bluestep Mortgage Securities No. 3 DAC
1.678% 10-May-2063 FRN 915,908 0.04
800,000 Carlyle Global Market Strategies Euro CLO
2015-1 Ltd 3.900% 16-Apr-2029 FRN 802,149 0.04
1,500,000 Castle Park CLO Designated Activity Co
3.339% 15-Jan-2028 FRN 1,501,866 0.07
750,000 CVC Cordatus Loan Fund III Ltd
3.400% 08-Jul-2027 FRN 747,769 0.03
1,445,125 Deco 2014-BONN DAC 2.350% 07-Nov-2024 FRN 1,446,255 0.07
770,734 Deco 2014-BONN DAC 3.450% 07-Nov-2024 FRN 772,774 0.04
1,163,162 Deco 2015-HARP Ltd 2.400% 27-Apr-2027 FRN 1,166,216 0.05
5,000,000 European Residential Loan Securitisation
2016-1 DAC 1.131% 24-Jan-2059 FRN 4,935,650 0.23
1,445,335 Lusitano Mortgages No 3 Plc
0.149% 16-Oct-2047 FRN 1,148,828 0.05
3,180,000 Magellan Mortgages No 2 Plc
0.789% 18-Jul-2036 FRN 2,852,056 0.13
12,000,000 Magnolia Finance 0.000% 27-Oct-2017 1,450,761 0.07
30,000,000 Magnolia Finance Mortgage
0.000% 27-Oct-2017 3,648,883 0.17
1,100,000 Taurus 2015-2 DEU Ltd
2.100% 01-Feb-2026 FRN 1,096,462 0.05
1,961,200 Taurus 2015-3 EU Designated Activity Co
3.000% 22-Apr-2028 FRN 1,968,372 0.09
997,500 Taurus 2016-1 DEU DAC
3.200% 17-Nov-2026 FRN 1,001,251 0.05
BNY MELLON ABSOLUTERETURN BOND FUND
Bonds cont’d.
France cont’d.
EUR EUR

53
Portfolio of investments – as at 31 December 2016
Holdings Description
Fair
value
Total
net assets
% Holdings Description
Fair
value
Total
net assets
%
BNY MELLON ABSOLUTE RETURN BOND FUND
5,000,000 Dryden 32 Euro CLO 2014 BV
3.411% 23-Aug-2026 FRN 4,993,849 0.23
1,000,000 Dryden 35 Euro CLO 2014 BV
2.739% 17-May-2027 FRN 1,000,885 0.05
1,500,000 Eurosail-NL 2007-2 BV
1.889% 17-Oct-2040 FRN 1,129,609 0.05
8,000,000 ING Bank NV 0.342% 05-Jun-2017 FRN 8,019,800 0.37
11,515,000 ING Groep NV 6.875% Perpetual VAR 10,950,119 0.51
1,812,000 OZLME BV 3.600% 18-Jan-2030 FRN 1,798,954 0.08
750,000 St Pauls CLO 3.088% 25-Apr-2028 FRN 741,964 0.03
1,287,000 Volksbank NV 3.750% 05-Nov-2025 VAR 1,350,719 0.06
Norway - 388,258 (31 December 2015: 1,124,810) 388,258 0.02
400,000 Navigator Holdings Ltd 144A
9.000% 18-Dec-2017 388,258 0.02
Spain - 12,444,713 (31 December 2015: 43,580,358) 12,444,713 0.58
393,256 Bancaja 6 Fondo de Titulizacion de Activos
0.988% 20-Feb-2036 FRN 330,802 0.02
1 Bankinter 9 Fondo de Titulizacion de Activos
0.189% 16-Jul-2042 FRN 1 0.00
61,237 Fondo de Titulizacion de Activos Santander Empresas 2
0.008% 23-Jun-2050 FRN 61,204 0.00
1,300,000 TDA 14-Mixto Fondo de Titulizacion de Activos
0.339% 27-Dec-2030 FRN 1,234,767 0.06
1,000,000 TDA 15-Mixto Fondo de Titulizacion de Activos
0.337% 27-Jun-2042 FRN 881,691 0.04
4,400,000 TDA 15-Mixto Fondo de Titulizacion de Activos
0.337% 27-Jun-2042 FRN 4,091,745 0.19
600,000 TDA 17-Mixto Fondo de Titulizacion de Activos
0.337% 22-Sep-2035 FRN 540,702 0.02
700,000 TDA 18-Mixto Fondo de Titulizacion de Activos
0.437% 22-Jun-2045 FRN 615,953 0.03
4,800,000 Telefonica Europe BV 3.750% Perpetual VAR 4,687,848 0.22
Supranational - 1,077,215 (31 December 2015: 1,049,747) 1,077,215 0.05
1,100,000 Harvest CLO VIII DAC
2.938% 30-Apr-2026 FRN 1,077,215 0.05
Sweden - 8,781,928 (31 December 2015: 8,969,791) 8,781,928 0.40
38,000,000 Scandinavian Consumer Loans No.4 Ltd
4.010% 15-Jan-2037 FRN 4,206,793 0.19
4,800,000 Swedbank AB 6.000% Perpetual VAR 4,575,135 0.21
Switzerland - 87,946,950 (31 December 2015: 158,592,784) 87,946,950 4.07
15,300,000 Credit Suisse AG 6.500% 08-Aug-2023 15,454,113 0.72
950,000 Credit Suisse AG 144A 6.500% 08-Aug-2023 959,569 0.04
39,200,000 Credit Suisse AG/London
0.011% 30-Mar-2017 FRN 39,228,224 1.82
3,750,000 Credit Suisse AG/London
0.134% 18-Jun-2018 FRN 3,763,556 0.17
5,503,000 Credit Suisse USA Inc 7.125% 15-Jul-2032 6,875,648 0.32
2,800,000 UBS AG 4.750% 12-Feb-2026 VAR 3,015,936 0.14
10,012,000 UBS AG 5.125% 15-May-2024 9,596,718 0.44
9,045,000 UBS AG/London 0.000% 15-May-2017 FRN 9,053,186 0.42
1,025,155 Taurus 2016-2 DEU DAC
3.750% 03-Jan-2027 FRN 1,037,090 0.05
3,050,000 Taurus CMBS Plc 3.500% 20-Apr-2022 FRN 3,057,899 0.14
641,401 Taurus CMBS UK 2014-1 Ltd 2.902%
01-May-2022 FRN 741,831 0.03
1,300,000 Topaz Asset Finance 2016-2 DAC
4.000% 04-Nov-2026 1,300,000 0.06
Israel - 6,167,971 (31 December 2015: –) 6,167,971 0.29
2,815,000 Teva Pharmaceutical Finance Netherlands II BV
1.125% 15-Oct-2024 2,717,812 0.13
2,742,000 Teva Pharmaceutical Finance Netherlands III BV
3.150% 01-Oct-2026 2,390,260 0.11
1,317,000 Teva Pharmaceutical Finance Netherlands III BV
4.100% 01-Oct-2046 1,059,899 0.05
Italy - 34,486,303 (31 December 2015: 95,276,397) 34,486,303 1.60
7,148,000 Assicurazioni Generali SpA
5.500% 27-Oct-2047 VAR 7,468,230 0.35
1,000,000 Deco 2014-GONDOLA Srl 2.637%
22-Feb-2026 FRN 994,930 0.05
706,254 F-E Gold Srl 0.000% 30-Jul-2025 FRN 694,221 0.03
12,047,000 Intesa Sanpaolo SpA 144A
5.710% 15-Jan-2026 10,872,843 0.50
1,500,000 REITALY Finance Srl 3.150% 22-May-2027 FRN 1,469,580 0.07
1,827,862 Taurus 2015-1 IT Srl 2.189% 18-Feb-2027 FRN 1,809,933 0.08
11,097,000 UniCredit SpA 4.375% 03-Jan-2027 VAR 11,176,566 0.52
Japan - 14,204,057 (31 December 2015: 8,811,013) 14,204,057 0.66
2,600,000 SoftBank Group Corp 6.000% 30-Jul-2025 2,589,905 0.12
11,600,000 Sumitomo Mitsui Banking Corp
0.000% 08-Sep-2017 FRN 11,614,152 0.54
Luxembourg - 11,085,946 (31 December 2015: 1,506,621) 11,085,946 0.51
2,379,950 Deco 2015-Charlemagne SA 4.250%
27-Apr-2025 FRN 2,409,278 0.11
8,470,000 SES SA 5.625% Perpetual VAR 8,676,668 0.40
Netherlands - 132,419,159 (31 December 2015: 174,017,392) 132,419,159 6.12
47,300,000 ABN AMRO Bank NV
0.399% 03-Jul-2017 FRN 47,455,854 2.20
1,800,000 ABN AMRO Bank NV
0.487% 06-Mar-2019 FRN 1,824,777 0.08
3,000,000 ARES EUROPEAN CLO VII BV 2.989%
16-Jul-2028 FRN 2,958,878 0.14
2,000,000 Babson Euro CLO 2014-2 BV
2.987% 25-Nov-2027 FRN 1,987,074 0.09
9,100,000 Cooperatieve Rabobank UA
0.000% 12-Oct-2017 FRN 9,114,879 0.42
20,850,000 Cooperatieve Rabobank UA
0.000% 15-Jan-2018 FRN 20,892,221 0.97
4,100,000 Cooperatieve Rabobank UA
0.186% 20-Mar-2019 FRN 4,132,657 0.19
14,000,000 Cooperatieve Rabobank UA
0.383% 27-Sep-2017 FRN 14,066,920 0.65
Bonds cont’d.
Ireland cont’d.
Bonds cont’d.
Netherlands cont’d.
EUR EUR

54
Portfolio of investments – as at 31 December 2016
Holdings Description
Fair
value
Total
net assets
% Holdings Description
Fair
value
Total
net assets
%
BNY MELLON ABSOLUTE RETURN BOND FUND
1,875,480 Newgate Funding 2006-3
0.000% 01-Dec-2050 FRN 1,649,833 0.08
3,000,000 Paragon Mortgages No 15 Plc
0.784% 15-Dec-2039 FRN 2,180,520 0.10
2,500,000 Paragon Mortgages No 24 Plc
3.601% 15-Jul-2043 FRN 2,990,371 0.14
1,481,279 Paragon Personal & Auto Finance No 3 Plc
2.301% 15-Apr-2036 FRN 1,728,043 0.08
596,487 Precise Mortgage Funding 2014-1 Plc
1.176% 12-Sep-2047 FRN 694,440 0.03
1,750,000 Precise Mortgage Funding 2014-1 Plc
1.776% 12-Sep-2047 FRN 1,978,541 0.09
625,000 Precise Mortgage Funding 2014-1 Plc
2.276% 12-Sep-2047 FRN 697,401 0.03
500,000 Precise Mortgage Funding 2014-2 Plc
2.276% 12-Dec-2047 FRN 573,623 0.03
700,000 Precise Mortgage Funding 2014-2 Plc
2.776% 12-Dec-2047 FRN 797,458 0.04
1,500,000 Precise Mortgage Funding 2015-2B Plc
3.126% 12-Jun-2048 FRN 1,665,379 0.08
250,000 Precise Mortgage Funding No 1 Plc
3.626% 12-Mar-2047 FRN 288,779 0.01
578,881 Punch Taverns Finance B Ltd
7.369% 30-Sep-2021 725,795 0.03
536,805 Punch Taverns Finance Plc 7.274% 15-Oct-2026 752,358 0.03
633,793 Punch Taverns Finance Plc 7.320% 15-Oct-2025 888,266 0.04
814,200 Residential Mortgage Securities 20 Plc
0.862% 10-Aug-2038 FRN 859,442 0.04
1,628,400 Residential Mortgage Securities 20 Plc
1.862% 10-Aug-2038 FRN 1,776,044 0.08
1,200,000 Residential Mortgage Securities 25 Plc Class B1
0.000% 16-Dec-2050 FRN 1,307,670 0.06
1,500,000 Residential Mortgage Securities 25 Plc Class M1
0.000% 16-Dec-2050 FRN 1,741,883 0.08
1,000,000 Residential Mortgage Securities 25 Plc Class M2
0.000% 16-Dec-2050 FRN 1,100,135 0.05
500,000 Residential Mortgage Securities 26 Plc Class B1
0.000% 14-Feb-2041 526,876 0.02
1,000,000 Residential Mortgage Securities 26 Plc Class M2
0.000% 14-Feb-2041 1,067,278 0.05
1,000,000 Residential Mortgage Securities 28 Plc Class D
2.873% 15-Jun-2046 FRN 1,112,058 0.05
700,000 RESIMAC UK RMBS No.1 Plc
2.301% 24-Oct-2045 FRN 797,281 0.04
2,548,633 Rmac 2005-Nsp2 Plc 0.000% 12-Sep-2037 FRN 2,391,448 0.11
1,108,862 RMAC Securities No 1 Plc 0.000% 12-Jun-2044 FRN 966,915 0.04
1,543,194 RMAC Securities No 1 Plc 0.000% 12-Jun-2044 FRN 1,349,117 0.06
1,056,672 RMAC Securities No 1 Plc 0.000% 12-Jun-2044 FRN 991,154 0.05
1,085,165 RMAC Securities No 1 Plc 0.512% 12-Jun-2044 FRN 828,968 0.04
859,155 RMAC Securities No 1 Plc 0.526% 12-Jun-2044 FRN 948,246 0.04
1,768,519 Rochester Financing No 2 Plc
1.671% 20-Jun-2045 FRN 2,065,578 0.10
9,300,000 Santander UK Plc 0.238% 12-Feb-2018 FRN 9,330,318 0.43
700,000 Slate No.1 Plc 2.701% 24-Jan-2051 FRN 778,160 0.04
1,200,000 Slate No.2 Plc 2.301% 24-Oct-2044 FRN 1,348,100 0.06
474,686 Taurus 2013 GMF1 Plc 3.188% 21-May-2024 FRN 478,065 0.02
2,951,436 THRONES 2015-1 Plc 1.571% 18-Mar-2050 FRN 3,366,843 0.16
2,500,000 THRONES 2015-1 Plc 1.771% 18-Mar-2050 FRN 2,773,400 0.13
1,000,000 THRONES 2015-1 Plc 2.621% 18-Mar-2050 FRN 1,059,997 0.05
United Kingdom - 293,148,628 (31 December 2015: 205,477,313) 293,148,628 13.57
615,567 Annington Finance No 4 Plc
1.567% 10-Jan-2023 VAR 718,783 0.03
11,986,000 Barclays Bank Plc 7.625% 21-Nov-2022 12,478,320 0.58
15,850,000 Channel Link Enterprises Finance Plc
3.034% 30-Jun-2050 FRN 15,996,010 0.74
500,000 Dukinfi eld Plc 1.598% 15-Aug-2045 FRN 549,289 0.03
3,415,000 Dukinfi eld Plc 2.198% 15-Aug-2045 FRN 3,747,301 0.17
975,069 Duncan Funding 2016-1 Plc
1.171% 17-Apr-2063 FRN 1,143,889 0.05
950,000 Eurohome UK Mortgages 2007 -1 Plc
0.673% 15-Jun-2044 FRN 871,836 0.04
1,500,000 Eurohome UK Mortgages 2007-2 Plc
0.723% 15-Sep-2044 FRN 1,316,596 0.06
2,000,000 Eurosail 2006-2bl Plc 144A
1.203% 15-Dec-2044 FRN 1,642,064 0.08
2,926,693 Eurosail-UK 2007-5np Plc
1.145% 13-Sep-2045 FRN 3,178,788 0.15
1,474,801 First Flexible No 5 Plc 1.855% 01-Jun-2034 FRN 1,650,289 0.08
1,250,000 Gemgarto 2.648% 14-May-2045 FRN 1,457,428 0.07
1,000,000 Gemgarto 2.648% 14-May-2045 FRN 1,164,763 0.05
1,750,000 Gemgarto 2015-1 Plc 2.498% 16-Feb-2047 FRN 1,968,199 0.09
2,000,000 Gemgarto 2015-2 Plc 3.898% 16-Feb-2054 FRN 2,314,871 0.11
2,500,000 Great Hall Mortgages Plc 0.671% 18-Jun-2039 FRN 2,363,837 0.11
4,000,000 Greene King Finance Plc 2.453% 15-Mar-2036 FRN 3,301,527 0.15
1,500,000 Hawksmoor Mortgages 2016-1 Plc
1.991% 25-May-2053 FRN 1,751,435 0.08
3,726,000 Hawksmoor Mortgages 2016-1 Plc
2.891% 25-May-2053 FRN 4,333,901 0.20
4,000,000 Hawksmoor Mortgages 2016-1 Plc
3.141% 25-May-2053 FRN 4,652,637 0.22
2,462,000 Hawksmoor Mortgages 2016-2 Plc
2.611% 25-May-2053 FRN 2,821,599 0.13
5,828,000 HSBC Holdings Plc 3.900% 25-May-2026 5,544,469 0.26
2,200,000 Landmark Mortgage Securities No 3 Plc
1.201% 17-Apr-2044 FRN 2,240,528 0.10
1,952,862 Landmark Mortgage Securities Plc
0.284% 17-Jun-2038 FRN 1,664,398 0.08
11,700,000 Lloyds Bank Plc 0.196% 09-Oct-2018 FRN 11,763,765 0.54
51,500,000 Lloyds Bank Plc 0.228% 21-Aug-2017 FRN 51,640,595 2.39
3,000,000 Ludgate Funding Plc 0.399% 01-Jan-2061 FRN 2,534,398 0.12
750,000 Marketplace Originated Consumer Assets
2016-1 Plc 3.511% 20-Oct-2024 FRN 874,245 0.04
59,577,000 Nationwide Building Society
0.187% 02-Nov-2018 FRN 59,814,414 2.77
2,500,000 NewDay Funding 2.761% 15-Jul-2023 FRN 2,864,672 0.13
2,179,000 NewDay Funding 3.761% 15-Jul-2023 FRN 2,499,544 0.12
2,340,000 Newday Funding 2015-2 Plc
3.561% 15-Nov-2024 FRN 2,702,672 0.12
2,119,000 NewDay Funding 2016-1 Plc
4.611% 15-Jun-2024 FRN 2,520,092 0.12
750,000 Newday Partnership Funding 2014-1 Plc
2.511% 15-Dec-2022 FRN 871,096 0.04
750,000 Newday Partnership Funding 2015-1 Plc
1.761% 15-Apr-2025 FRN 855,553 0.04
2,000,000 Newday Partnership Funding 2015-1 Plc
2.111% 15-Apr-2025 FRN 2,278,119 0.11
1,500,000 Newday Partnership Funding 2015-1 Plc
2.661% 15-Apr-2025 FRN 1,684,894 0.08
Bonds cont’d.
United Kingdom cont’d.
Bonds cont’d.
EUR EUR

55
Portfolio of investments – as at 31 December 2016
Holdings Description
Fair
value
Total
net assets
% Holdings Description
Fair
value
Total
net assets
%
BNY MELLON ABSOLUTE RETURN BOND FUND
371,116,795 United States Treasury Infl ation Indexed Bonds
0.750% 15-Feb-2045 328,074,208 15.19
8,875,059 United States Treasury Infl ation Indexed Bonds
1.000% 15-Feb-2046 8,368,788 0.39
95,126,410 United States Treasury Infl ation Indexed Bonds
1.375% 15-Feb-2044 97,579,543 4.52
10,721,000 Verizon Communications Inc
4.672% 15-Mar-2055 9,500,012 0.44
5,310,000 Verizon Communications Inc
4.862% 21-Aug-2046 5,091,608 0.24
10,250,000 Wells Fargo & Co 0.137% 24-Apr-2019 FRN 10,298,380 0.48
Total investments in bonds 1,714,717,677 79.38
Leveraged loans
Ireland - 6,864,160 (31 December 2015: 2,136,852) 6,864,160 0.32
595,034 Mint Mezzanine 2014 Ltd 6.000% 26-Feb-2018 592,178 0.03
1,165,386 Mint Mezzanine 2014 Ltd 6.591% 26-Feb-2018 1,344,190 0.06
4,500,000 Swancastle Ltd 2016-1 Mezzanine Loan
0.000% 20-Dec-2035 4,927,792 0.23
Luxembourg - 4,369,467 (31 December 2015: 4,925,000) 4,369,467 0.20
4,328,884 Eircom Finco Sarl 4.500% 30-Sep-2019 4,369,467 0.20
Netherlands - 22,148,349 (31 December 2015: 16,074,185) 22,148,349 1.02
4,178,949 EREIP III Holdco 2 S.A.R.L. Project Nelson Credit
Senior Term Loan 0.000% 20-Apr-2019 4,189,396 0.19
3,447,500 LGP Holdings B.V. 2.500% 10-Feb-2020 3,447,500 0.16
3,109,920 Manhattan Cre Senior T Loan
3.000% 20-Oct-2019 3,109,920 0.14
5,550,007 Mbay Netherlands B.V. (Project Windmill)
2.750% 19-Oct-2018 5,550,007 0.26
3,366,467 Project Guilder Cre Senior T Loan
0.000% 25-Apr-2019 3,366,467 0.16
2,495,040 Triangle Secured Finance Loan
2.901% 05-Aug-2019 2,485,059 0.11
Spain - 2,895,000 (31 December 2015: 5,702,250) 2,895,000 0.13
2,895,000 Heref Habaneras Socimi S.A.U.
0.000% 14-Mar-2020 2,895,000 0.13
United Kingdom - 28,889,515 (31 December 2015: 13,468,375) 28,889,515 1.34
4,000,000 Aura Finance Ltd 3.999% 29-Apr-2018 4,659,850 0.22
4,700,000 Eurogarages 0.000% 31-Jan-2023 5,346,654 0.25
3,030,944 Ivory Cre Loan 3.322% 22-Aug-2019 3,530,937 0.16
839,971 Project Panther 4.091% 29-Aug-2018 980,981 0.04
155,447 Promontoria (Chestnut) Ltd 3.341% 28-Nov-2017 180,637 0.01
933,910 Q Park Securities Ltd Senior Term Loan
3.538% 15-Oct-2018 1,082,530 0.05
2,500,000 Queensgate Bow Uk Holdco Ltd
3.091% 01-Dec-2018 2,905,125 0.13
6,042,943 Swancastle Ltd 2016-1 San Term Bank Loan
0.000% 24-Dec-2035 7,057,402 0.33
2,700,000 Wellington Cre Loan 3.591% 21-Aug-2017 3,145,399 0.15
1,893,000 Towd Point Mortgage Funding 2016-Auburn 10 Plc
1.906% 20-Apr-2045 FRN 2,123,245 0.10
1,763,000 Towd Point Mortgage Funding 2016-Auburn 10 Plc
2.206% 20-Apr-2045 FRN 1,933,070 0.09
1,000,000 Towd Point Mortgage Funding 2016-Granite1 Plc
2.102% 20-Jul-2046 FRN 1,154,321 0.05
1,200,000 Towd Point Mortgage Funding 2016-Granite2 Plc
2.698% 20-Aug-2051 FRN 1,389,567 0.06
994,000 Towd Point Mortgage Funding 2016-Vantage1 Plc
2.338% 20-Feb-2054 FRN 1,123,631 0.05
400,000 Towd Point Mortgage Funding 2016-Vantage1 Plc
2.838% 20-Feb-2054 FRN 449,504 0.02
2,500,000 Trinity Square 2015-1 Plc 2.101% 15-Jul-2051 FRN 2,742,194 0.13
2,500,000 Trinity Square 2015-1 Plc 2.551% 15-Jul-2051 FRN 2,765,714 0.13
1,000,000 Warwick Finance Residential Mortgages No One Plc
1.862% 21-Sep-2049 FRN 1,114,783 0.05
United States of America - 713,914,318 (31 December 2015: 493,156,462) 713,914,318 33.05
9,910,000 AT&T Inc 4.750% 15-May-2046 8,886,115 0.41
4,898,000 Citigroup Inc 0.750% 26-Oct-2023 4,818,261 0.22
6,369,000 Citigroup Inc 1.500% 26-Oct-2028 6,202,419 0.29
762,500 Colony Starwood Homes 2016-2 Trust 144A
3.086% 17-Dec-2033 FRN 725,197 0.03
1,465,480 COMM 2007-C9 Mortgage Trust 144A
1.354% 10-Dec-2049 FRN 1,354,885 0.06
5,145,000 ERAC USA Finance LLC 144A
3.800% 01-Nov-2025 4,899,851 0.23
4,410,000 ERAC USA Finance LLC 144A
4.500% 15-Feb-2045 3,979,446 0.18
10,000,000 Goldman Sachs Group Inc/The
0.038% 30-Jan-2017 FRN 10,001,750 0.46
12,400,000 Goldman Sachs Group Inc/The
0.332% 11-Sep-2018 FRN 12,477,376 0.58
37,400,000 Goldman Sachs Group Inc/The
0.384% 18-Dec-2017 FRN 37,572,227 1.74
9,042,000 Goldman Sachs Group Inc/The
3.500% 16-Nov-2026 8,386,552 0.39
3,150,000 Home Partners of America 2016-2 Trust 144A
3.736% 17-Oct-2033 FRN 3,007,876 0.14
13,000,000 JPMorgan Chase & Co
0.088% 21-Feb-2017 FRN 13,008,970 0.60
53,455,000 JPMorgan Chase Bank NA
0.000% 14-Jun-2018 FRN 53,575,274 2.48
4,170,000 Kraft Heinz Foods Co 144A 4.875% 15-Feb-2025 4,257,895 0.20
4,500,000 Kraft Heinz Foods Co 5.000% 15-Jul-2035 4,468,152 0.21
4,430,000 Kraft Heinz Foods Co 5.200% 15-Jul-2045 4,388,457 0.20
9,300,000 Morgan Stanley 0.109% 17-Jan-2017 FRN 9,301,069 0.43
43,620,000 Morgan Stanley 0.186% 03-Dec-2019 FRN 43,684,121 2.02
923,000 Progress Residential 2016-SFR1 Trust 144A
3.236% 17-Sep-2033 FRN 885,935 0.04
4,487,000 Progress Residential 2016-SFR2 Trust 144A
3.040% 17-Jan-2034 FRN 4,266,589 0.20
5,561,476 RAIT 2015-FL5 Trust 144A
2.804% 15-Jan-2031 FRN 5,276,422 0.24
3,750,000 RAIT 2015-FL5 Trust 144A
4.604% 15-Jan-2031 FRN 3,554,704 0.16
6,996,535 United States Treasury Infl ation Indexed Bonds
0.625% 15-Feb-2043 6,022,236 0.28
Bonds cont’d.
United Kingdom cont’d.
Bonds cont’d.
United States of America cont’d.
EUR EUR

56
Portfolio of investments – as at 31 December 2016
Holdings Description
Fair
value
Total
net assets
% Holdings Description
Fair
value
Total
net assets
%
BNY MELLON ABSOLUTE RETURN BOND FUND
Currency options - 1,021,171 (31 December 2015: –)
16,800,000 US dollar/Euro Call 03-Jan-2017 1.035 1,593 0.00
16,800,000 US dollar/Japanese yen Call 03-Jan-2017 118.750 7,077 0.00
16,800,000 US dollar/Japanese yen Call 04-Jan-2017 114.750 308,550 0.02
16,800,000 US dollar/Japanese yen Call 05-Jan-2017 118.250 30,109 0.00
16,600,000 US dollar/Japanese yen Call 23-Feb-2017 112.500 673,842 0.03
Total currency options 1,021,171 0.05
Holdings Description
Underlying
exposure
EUR
Fair
value
EUR
Total
net assets
%
Open futures contracts - 8,760,528 (31 December 2015: 3,888,724)
3,748 U.S. 10 Year Treasury Note
Long Futures Contracts
Exp Mar-2017 439,884,142 3,043,529 0.14
(44) U.S. 10 Year Ultra Treasury Note
Short Futures Contracts
Exp Mar-2017 (5,561,848) 43,221 0.00
(97) U.S. 5 Year Treasury Note
Short Futures Contracts
Exp Mar-2017 (10,793,085) 27,408 0.00
(94) U.S. Treasury Bond
Short Futures Contracts
Exp Mar-2017 (13,343,925) 152,887 0.01
(4,297) U.S. Treasury Ultra Bond
Short Futures Contracts
Exp Mar-2017 (648,135,785) 5,493,483 0.25
Total open futures contracts 8,760,528 0.40
Warrants - – 13,475 Iona Energy Inc Warrants 27-Sep-2018* - 0.00
Total investments in warrants - 0.00
Unrealised gain on forward foreign currency contracts - 3,381,848 (see below)
(31 December 2015: 7,963,854) 3,381,848 0.16
Total fi nancial assets at fair value through profi t or loss 1,985,052,587 91.88
Credit default swaps - (10,625,097) (31 December 2015: (6,855,343))
4,850,000 CDS Engie 1.000% 20-Dec-2021 (105,499) (0.01)
2,400,000 CDS Engie 1.000% 20-Dec-2021 (52,206) (0.00)
(2,400,000) CDS Assicurazioni Generali
1.000% 20-Dec-2021 (219,830) (0.01)
4,200,000 CDS Bayerische Landesbank 1.000% 20-Dec-2021 (65,301) (0.00)
1,700,000 CDS Bayerische Landesbank 1.000% 20-Dec-2021 (26,431) (0.00)
1,500,000 CDS Bayerische Landesbank 1.000% 20-Dec-2021 (23,322) (0.00)
7,450,000 CDS Bayerische Landesbank 1.000% 20-Jun-2021 (123,855) (0.01)
1,800,000 CDS CNH Industrial N.V. 5.000% 20-Dec-2021 (253,577) (0.01)
4,150,000 CDS CNH Industrial N.V. 5.000% 20-Dec-2021 (584,635) (0.03)
2,050,000 CDS CNH Industrial N.V. 5.000% 20-Dec-2021 (288,796) (0.02)
(3,000,000) CDS Commerzbank Aktiengesellschaft
1.000% 20-Dec-2020 (191,852) (0.01)
United States of America - 7,696,432 (31 December 2015: 16,151,573) 7,696,432 0.36
2,368,853 Dupont (Axalta Coating) 3.750% 01-Feb-2020 2,269,870 0.11
2,000,000 Virgin Media Term Loan 0.000% 31-Jan-2025 1,905,303 0.09
3,703,267 Virgin Media Term Loan 3.649% 08-Jun-2020 3,521,259 0.16
Total investments in leveraged loans 72,862,923 3.37
Credit default swaps - 5,791,911 (31 December 2015: 905,190)
(1,800,000) CDS Airbus Group SE 1.000% 20-Jun-2018 17,916 0.00
(1,800,000) CDS Airbus Group SE 1.000% 20-Jun-2018 17,916 0.00
(6,300,000) CDS Anheuser-Busch InBev
1.000% 20-Jun-2021 94,124 0.01
(3,800,000) CDS AT&T Inc 1.000% 20-Dec-2021 12,438 0.00
(2,600,000) CDS AT&T Inc 1.000% 20-Dec-2021 8,510 0.00
(2,600,000) CDS AT&T Inc 1.000% 20-Dec-2021 8,510 0.00
(5,100,000) CDS AT&T Inc 1.000% 20-Dec-2021 16,693 0.00
2,400,000 CDS AXA SA 1.000% 20-Dec-2021 68,010 0.00
(5,510,000) CDS BHP Billiton Ltd 1.000% 20-Jun-2021 1,190 0.00
2,250,000 CDS Commerzbank Aktiengesellschaft
1.000% 20-Dec-2020 1,465 0.00
6,800,000 CDS Commerzbank Aktiengesellschaft
1.000% 20-Dec-2020 4,426 0.00
2,580,000 CDS Deutsche Bank AG 1.000% 20-Dec-2021 290,181 0.02
2,460,000 CDS Deutsche Bank AG 1.000% 20-Dec-2021 276,684 0.01
2,460,000 CDS Deutsche Bank AG 1.000% 20-Dec-2021 276,684 0.01
2,150,000 CDS Deutsche Bank AG 1.000% 20-Jun-2017 15,577 0.00
2,148,000 CDS Freeport-McMoRan Inc 1.000% 20-Dec-2021 241,399 0.01
2,148,000 CDS Freeport-McMoRan Inc 1.000% 20-Dec-2021 241,399 0.01
(3,750,000) CDS Imperial Tobacco Group Plc
1.000% 20-Dec-2020 50,813 0.00
(2,800,000) CDS Imperial Tobacco Group Plc
1.000% 20-Dec-2020 37,941 0.00
(950,000) CDS Imperial Tobacco Group Plc
1.000% 20-Dec-2020 12,873 0.00
(1,750,000) CDS Imperial Tobacco Group Plc
1.000% 20-Dec-2020 23,713 0.00
(5,200,000) CDS ING Bank NV 1.000% 20-Dec-2021 91,175 0.01
(112,700,000) CDS iTraxx Europe Series 26 Version 1
1.000% 20-Dec-2021 1,520,034 0.07
(112,350,000) CDS iTraxx Europe Series 26 Version 1
1.000% 20-Dec-2021 1,515,314 0.07
4,094,000 CDS Macy’s Inc 1.000% 20-Dec-2021 143,511 0.01
2,047,000 CDS Macy’s Inc 1.000% 20-Dec-2021 71,756 0.01
614,000 CDS Macy’s Inc 1.000% 20-Dec-2021 21,523 0.00
1,945,000 CDS Macy’s Inc 1.000% 20-Dec-2021 68,180 0.00
(1,900,000) CDS Rolls-Royce Plc 1.000% 20-Dec-2020 2,950 0.00
(950,000) CDS Rolls-Royce Plc 1.000% 20-Dec-2020 1,475 0.00
(500,000) CDS Rolls-Royce Plc 1.000% 20-Dec-2020 776 0.00
(4,850,000) CDS RWE AG 1.000% 20-Dec-2021 47,584 0.00
(2,400,000) CDS RWE AG 1.000% 20-Dec-2021 23,547 0.00
2,700,000 CDS Standard Chartered Plc
1.000% 20-Dec-2021 163,295 0.01
7,950,000 CDS UniCredit SpA 1.000% 20-Dec-2021 283,555 0.01
(6,700,000) CDS Volkswagen AG 1.000% 20-Jun-2018 58,947 0.00
(6,800,000) CDS Volkswagen AG 1.000% 20-Jun-2018 59,827 0.00
Total credit default swaps 5,791,911 0.26
Leveraged loans cont’d.
EUR EUR

57
Portfolio of investments – as at 31 December 2016
Holdings Description
Fair
value
Total
net assets
% Holdings Description
Fair
value
Total
net assets
%
BNY MELLON ABSOLUTE RETURN BOND FUND
(14) UK Long Gilt
Short Futures Contracts
Exp Mar-2017 (2,052,466) (47,213) (0.00)
Total open futures contracts (7,820,046) (0.36)
Unrealised loss on forward foreign currency contracts - (47,943,411) (see below)
(31 December 2015: (5,496,743)) (47,943,411) (2.22)
Total fi nancial liabilities at fair value through profi t or loss (66,814,757) (3.09)
Net current assets 242,005,690 11.21
Total net assets 2,160,243,520 100.00
The counterparties for credit default swaps are Barclays Bank plc, BNP Paribas, Citigroup, Credit Suisse,
Goldman Sachs, JPMorgan Chase and Bank of America Merrill Lynch.
The counterparties for currency options are Barclays Bank plc, Citigroup, Goldman Sachs and UBS.
The counterparty for futures contracts is Goldman Sachs.
* Subject to fair value by the Investment Manager, given the Company is subject to trading suspension on the
Toronto Stock Exchange.
Analysis of portfolio % of Total assets
Transferable securities and money market instruments admitted
to offi cial stock exchange listing or traded on a regulated market 84.16
Transferable securities and money market instruments other than those
admitted to offi cial stock exchange listing or traded on a regulated market 3.24
Financial derivative instruments dealt in on a regulated market 0.39
OTC fi nancial derivative instruments 0.45
Other current assets 11.76
Total assets 100.00
(1,000,000) CDS Commerzbank Aktiengesellschaft
1.000% 20-Dec-2020 (63,951) (0.00)
(4,920,000) CDS Deutsche Bank AG 1.000% 20-Dec-2021 (156,068) (0.01)
(5,160,000) CDS Deutsche Bank AG 1.000% 20-Dec-2021 (163,681) (0.01)
(4,920,000) CDS Deutsche Bank AG 1.000% 20-Dec-2021 (156,068) (0.01)
12,750,000 CDS HSBC Bank Plc 1.000% 20-Dec-2020 (216,837) (0.01)
12,800,000 CDS HSBC Bank Plc 1.000% 20-Dec-2020 (217,687) (0.01)
3,800,000 CDS ICE CDX North American IG Index Series 27
Version 1 1.000% 20-Dec-2021 (53,686) (0.00)
2,600,000 CDS ICE CDX North American IG Index Series 27
Version 1 1.000% 20-Dec-2021 (36,733) (0.00)
2,600,000 CDS ICE CDX North American IG Index Series 27
Version 1 1.000% 20-Dec-2021 (36,733) (0.00)
5,100,000 CDS ICE CDX North American IG Index Series 27
Version 1 1.000% 20-Dec-2021 (72,053) (0.00)
5,200,000 CDS ING Bank NV 1.000% 20-Dec-2021 (91,175) (0.01)
32,100,000 CDS iTraxx Europe Crossover Series 26
5.000% 20-Dec-2021 (3,049,556) (0.14)
32,200,000 CDS iTraxx Europe Crossover Series 26
5.000% 20-Dec-2021 (3,059,056) (0.14)
2,650,000 CDS iTraxx Europe Crossover Series 26
5.000% 20-Dec-2021 (251,755) (0.01)
2,550,000 CDS iTraxx Europe Crossover Series 26
5.000% 20-Dec-2021 (242,254) (0.01)
(7,550,000) CDS Pearson Plc 1.000% 20-Dec-2021 (35,968) (0.00)
(3,500,000) CDS Rolls-Royce Group Plc
1.000% 20-Dec-2021 (30,931) (0.00)
(3,500,000) CDS Rolls-Royce Group Plc
1.000% 20-Dec-2021 (30,931) (0.00)
6,300,000 CDS Tate & Lyle Plc 1.000% 20-Jun-2021 (145,694) (0.01)
(3,950,000) CDS Telecom Italia SpA 1.000% 20-Dec-2021 (248,123) (0.01)
(3,850,000) CDS Telecom Italia SpA 1.000% 20-Dec-2021 (241,842) (0.01)
2,100,000 CDS Veolia Environnement SA
1.000% 20-Dec-2020 (45,591) (0.00)
2,000,000 CDS Veolia Environnement SA
1.000% 20-Dec-2020 (43,420) (0.00)
Total credit default swaps (10,625,097) (0.49)
Currency options - (426,203) (31 December 2015: –)
(16,800,000) US dollar/Japanese yen Call 04-Jan-2017 118.000 (31,353) (0.00)
(16,600,000) US dollar/Japanese yen Call 23-Feb-2017 115.500 (394,850) (0.02)
Total currency options (426,203) (0.02)
Holdings Description
Underlying
exposure
EUR
Fair
value
EUR
Total
net assets
%
Open futures contracts - (7,820,046) (31 December 2015: –)
(331) Euro-Bobl
Short Futures Contracts
Exp Mar-2017 (44,233,185) (360,026) (0.02)
(3,154) Euro-Bund
Short Futures Contracts
Exp Mar-2017 (518,281,050) (7,412,807) (0.34)
Credit default swaps cont’d. Open futures contracts cont’d.
Underlying
exposure
EUREUR EUR

58
Portfolio of investments – as at 31 December 2016
BNY MELLON ABSOLUTE RETURN BOND FUND
Forward foreign currency contracts cont’d.
Unrealised
Gain/(Loss)Buy Sell Amount (B) Amount (S)
Settle
Date Counterparty
BNY Mellon Absolute Return Bond Fund cont’d.
Euro US dollar 84,270,841 89,415,154 18-Jan-17 HSBC Bank Plc (328,391)
Euro US dollar 7,926,697 8,400,000 18-Jan-17 JPMorgan Chase (20,877)
Euro US dollar 7,912,041 8,400,000 18-Jan-17 Barclays Bank plc (35,533)
Korean won US dollar 9,800,000,000 8,399,976 18-Jan-17 Citigroup (252,120)
US dollar Brazilian real 4,003,724 13,760,000 18-Jan-17 Citigroup (193,371)
US dollar Euro 16,387,896 15,700,935 18-Jan-17 Citigroup (195,695)
US dollar Euro 8,888,787 8,500,000 18-Jan-17 Goldman Sachs (89,965)
US dollar Euro 7,810,520 7,450,000 18-Jan-17 Toronto Dominion Bank (60,156)
US dollar Euro 8,400,000 7,999,886 18-Jan-17 Citigroup (52,312)
US dollar Euro 16,483,513 15,774,648 18-Jan-17 HSBC Bank Plc (178,941)
US dollar Japanese yen 8,400,000 987,430,920 18-Jan-17 Goldman Sachs (48,812)
Euro US dollar 835,202 891,000 25-Jan-17 Goldman Sachs (7,464)
EUR (39,918,297)
Net EUR (36,757,542)
BNY Mellon Absolute Return Bond Fund CHF T (Acc) (Hedged) Share ClassEuro Swiss franc 20,539 22,040 03-Jan-17 The Bank of
New York Mellon 36
Euro Swiss franc 2,546 2,728 13-Jan-17 The Bank of New York Mellon 8
Euro Swiss franc 2,356 2,528 13-Jan-17 The Bank of New York Mellon 4
Euro Swiss franc 3,300 3,534 13-Jan-17 The Bank of New York Mellon 13
Euro Swiss franc 6,313 6,759 13-Jan-17 The Bank of New York Mellon 24
Euro Swiss franc 941 1,007 13-Jan-17 The Bank of New York Mellon 4
Euro Swiss franc 8,482 9,110 13-Jan-17 The Bank of New York Mellon 6
Euro Swiss franc 1,510 1,613 13-Jan-17 The Bank of New York Mellon 10
Euro Swiss franc 3,297 3,523 13-Jan-17 The Bank of New York Mellon 19
EUR 124
CHF 133
Swiss franc Euro 2,528 2,355 03-Jan-17 The Bank of New York Mellon (4)
Swiss franc Euro 3,534 3,301 04-Jan-17 The Bank of New York Mellon (13)
Swiss franc Euro 10,254,208 9,558,509 13-Jan-17 The Bank of New York Mellon (17,510)
Swiss franc Euro 22,040 20,543 13-Jan-17 The Bank of New York Mellon (36)
Swiss franc Euro 64,000 59,933 13-Jan-17 The Bank of New York Mellon (385)
EUR (17,948)
CHF (19,293)
Net EUR (17,824)
Net CHF (19,160)
Forward foreign currency contracts
Unrealised
Gain/(Loss)Buy Sell Amount (B) Amount (S)
Settle
Date Counterparty
BNY Mellon Absolute Return Bond FundEuro Norwegian krone 3,992,079 35,894,000 13-Jan-17 Citigroup 43,308
Euro Sterling 2,060,093 1,724,000 13-Jan-17 HSBC Bank Plc 52,267
Euro Sterling 5,423,326 4,583,000 13-Jan-17 HSBC Bank Plc 85,814
Euro Sterling 1,138,750 956,000 13-Jan-17 HSBC Bank Plc 25,361
Euro US dollar 4,191,391 4,390,000 13-Jan-17 Toronto Dominion Bank 36,623
Euro US dollar 15,028,459 15,673,000 13-Jan-17 RBC Capital Markets 195,276
Sterling Euro 1,269,000 1,475,584 13-Jan-17 Citigroup 2,335
Sterling Euro 1,854,000 2,081,867 13-Jan-17 RBC Capital Markets 77,362
US dollar Euro 9,185,000 8,618,417 13-Jan-17 Toronto Dominion Bank 74,417
US dollar Euro 6,013,000 5,667,181 13-Jan-17 Citigroup 23,620
US dollar Euro 6,245,000 5,720,321 13-Jan-17 UBS 190,049
US dollar Euro 6,417,000 5,823,202 13-Jan-17 UBS 249,951
US dollar Euro 7,093,000 6,664,543 13-Jan-17 Citigroup 48,388
Brazilian real US dollar 13,760,000 4,095,482 18-Jan-17 JPMorgan Chase 106,556
Euro US dollar 9,560,000 10,020,666 18-Jan-17 Goldman Sachs 79,050
Euro US dollar 9,200,000 9,548,252 18-Jan-17 Goldman Sachs 166,019
Euro US dollar 8,024,065 8,400,000 18-Jan-17 Citigroup 76,491
US dollar Australian dollar 10,569,839 14,176,951 18-Jan-17 Goldman Sachs 313,329
US dollar Japanese yen 29,076,155 3,339,982,001 18-Jan-17 HSBC Bank Plc 462,356
US dollar Japanese yen 8,400,000 963,547,200 18-Jan-17 Goldman Sachs 144,603
US dollar Korean won 8,450,097 9,800,000,000 18-Jan-17 HSBC Bank Plc 299,541
US dollar Sterling 18,712,623 14,853,752 18-Jan-17 Goldman Sachs 408,039
EUR 3,160,755
Australian dollar Euro 874,000 607,593 13-Jan-17 RBC Capital Markets (10,127)
Euro Hong Kong dollar 4,555,882 38,910,000 13-Jan-17 RBC Capital Markets (193,253)
Euro Sterling 875,196 782,000 13-Jan-17 Goldman Sachs (35,547)
Euro Sterling 284,337,901 254,599,000 13-Jan-17 Goldman Sachs (12,176,420)
Euro Sterling 917,913 817,000 13-Jan-17 HSBC Bank Plc (33,592)
Euro Sterling 4,464,172 3,847,000 13-Jan-17 JPMorgan Chase (16,170)
Euro Sterling 8,501,086 7,328,000 13-Jan-17 JPMorgan Chase (33,342)
Euro Sterling 2,391,049 2,164,000 13-Jan-17 UBS (129,216)
Euro Sterling 3,981,122 3,550,000 13-Jan-17 Citigroup (153,324)
Euro Swedish krona 1,702,710 16,504,000 13-Jan-17 Goldman Sachs (22,559)
Euro Swedish krona 778,740 7,544,000 13-Jan-17 HSBC Bank Plc (9,883)
Euro US dollar 8,365,372 8,994,000 13-Jan-17 Goldman Sachs (146,696)
Euro US dollar 9,681,501 10,398,000 13-Jan-17 RBC Capital Markets (159,336)
Euro US dollar 9,935,602 10,677,000 13-Jan-17 JPMorgan Chase (169,285)
Euro US dollar 1,066,443 1,134,000 13-Jan-17 HSBC Bank Plc (6,793)
Euro US dollar 3,701,423 3,949,000 13-Jan-17 HSBC Bank Plc (35,975)
Euro US dollar 6,245,831 6,657,000 13-Jan-17 Goldman Sachs (54,463)
Euro US dollar 540,431 600,000 13-Jan-17 UBS (27,418)
Euro US dollar 261,416,575 288,000,000 13-Jan-17 Goldman Sachs (11,151,329)
Euro US dollar 596,070 659,000 13-Jan-17 Goldman Sachs (27,619)
Euro US dollar 17,361,787 19,276,000 13-Jan-17 Goldman Sachs (881,335)
Euro US dollar 12,509,024 13,501,000 13-Jan-17 Goldman Sachs (268,543)
Euro US dollar 20,871,748 23,114,000 13-Jan-17 RBC Capital Markets (1,003,719)
Euro US dollar 262,208,658 288,923,000 13-Jan-17 HSBC Bank Plc (11,232,789)
Sterling Euro 4,544,000 5,319,165 13-Jan-17 HSBC Bank Plc (27,073)
US dollar Euro 9,617,000 9,200,150 13-Jan-17 HSBC Bank Plc (98,465)
US dollar Euro 674,000 649,491 13-Jan-17 HSBC Bank Plc (11,606)
US dollar Euro 3,121,000 2,986,000 13-Jan-17 HSBC Bank Plc (32,235)
US dollar Euro 1,350,000 1,294,835 13-Jan-17 HSBC Bank Plc (17,173)
Australian dollar US dollar 11,207,546 8,400,000 18-Jan-17 Citigroup (289,375)

59
Portfolio of investments – as at 31 December 2016
BNY MELLON ABSOLUTE RETURN BOND FUND
Forward foreign currency contracts cont’d.
Unrealised
Gain/(Loss)Buy Sell Amount (B) Amount (S)
Settle
Date Counterparty
BNY Mellon Absolute Return Bond Fund Sterling I (Acc) (Hedged) Share ClassEuro Sterling 1,783,107 1,500,000 13-Jan-17 The Bank of
New York Mellon 36,158
Euro Sterling 4,640,228 3,900,000 13-Jan-17 The Bank of New York Mellon 98,160
EUR 134,318
GBP 115,298
Sterling Euro 31,692 37,404 13-Jan-17 The Bank of New York Mellon (494)
Sterling Euro 116,445,184 138,932,836 13-Jan-17 The Bank of New York Mellon (3,316,967)
EUR (3,317,461)
GBP (2,847,698)
Net EUR (3,183,143)
Net GBP (2,732,400)
BNY Mellon Absolute Return Bond Fund Sterling T (Acc) (Hedged) Share ClassEuro Sterling 7,841 6,596 13-Jan-17 The Bank of
New York Mellon 159
Euro Sterling 2,141,784 1,800,118 13-Jan-17 The Bank of New York Mellon 45,308
Euro Sterling 458 386 13-Jan-17 The Bank of New York Mellon 9
Euro Sterling 268 229 13-Jan-17 The Bank of New York Mellon 2
Euro Sterling 8,624 7,307 13-Jan-17 The Bank of New York Mellon 114
Euro Sterling 17,853 15,000 13-Jan-17 The Bank of New York Mellon 383
Euro Sterling 5,365 4,506 13-Jan-17 The Bank of New York Mellon 117
Euro Sterling 3,184 2,660 13-Jan-17 The Bank of New York Mellon 86
Euro Sterling 3,717 3,102 13-Jan-17 The Bank of New York Mellon 104
Euro Sterling 946 797 13-Jan-17 The Bank of New York Mellon 18
EUR 46,300
GBP 39,744
Sterling Euro 6,120 7,282 13-Jan-17 The Bank of New York Mellon (154)
Sterling Euro 1,869 2,239 13-Jan-17 The Bank of New York Mellon (63)
Sterling Euro 1,386 1,625 13-Jan-17 The Bank of New York Mellon (10)
Sterling Euro 1,682 1,985 13-Jan-17 The Bank of New York Mellon (26)
Sterling Euro 15,894,865 18,964,448 13-Jan-17 The Bank of New York Mellon (452,769)
Sterling Euro 6,426 7,651 13-Jan-17 The Bank of New York Mellon (166)
Forward foreign currency contracts cont’d.
Unrealised
Gain/(Loss)Buy Sell Amount (B) Amount (S)
Settle
Date Counterparty
BNY Mellon Absolute Return Bond Fund Sterling T (Acc) (Hedged) Share Class cont’d.
Sterling Euro 2,205 2,617 13-Jan-17 The Bank of New York Mellon (49)
Sterling Euro 3,061 3,643 13-Jan-17 The Bank of New York Mellon (78)
EUR (453,315)
GBP (389,124)
Net EUR (407,015)
Net GBP (349,380)
BNY Mellon Absolute Return Bond Fund Sterling W (Acc) (Hedged) Share ClassEuro Sterling 13,934 11,872 03-Jan-17 The Bank of
New York Mellon 103
Euro Sterling 5,097 4,282 13-Jan-17 The Bank of New York Mellon 111
Euro Sterling 5,944 5,000 13-Jan-17 The Bank of New York Mellon 121
Euro Sterling 459,098 386,765 13-Jan-17 The Bank of New York Mellon 8,658
EUR 8,993
GBP 7,720
Sterling Euro 59 70 03-Jan-17 The Bank of New York Mellon (1)
Sterling Euro 4,165 4,947 13-Jan-17 The Bank of New York Mellon (96)
Sterling Euro 10,000 11,887 13-Jan-17 The Bank of New York Mellon (241)
Sterling Euro 11,872 13,929 13-Jan-17 The Bank of New York Mellon (103)
Sterling Euro 218 257 13-Jan-17 The Bank of New York Mellon (3)
Sterling Euro 52,883,821 63,096,634 13-Jan-17 The Bank of New York Mellon (1,506,407)
Sterling Euro 2,785 3,315 13-Jan-17 The Bank of New York Mellon (72)
Sterling Euro 3,030 3,630 13-Jan-17 The Bank of New York Mellon (101)
Sterling Euro 434,460 516,921 13-Jan-17 The Bank of New York Mellon (10,935)
Sterling Euro 1,000 1,189 13-Jan-17 The Bank of New York Mellon (24)
EUR (1,517,983)
GBP (1,303,032)
Net EUR (1,508,990)
Net GBP (1,295,312)

60
Portfolio of investments – as at 31 December 2016
BNY MELLON ABSOLUTE RETURN BOND FUND
Forward foreign currency contracts cont’d.
Unrealised
Gain/(Loss)Buy Sell Amount (B) Amount (S)
Settle
Date Counterparty
BNY Mellon Absolute Return Bond Fund Sterling W (Inc) (Hedged) Share ClassSterling Euro 28,770 34,200 13-Jan-17 The Bank of
New York Mellon (694)
Sterling Euro 2,636,593 3,145,766 13-Jan-17 The Bank of New York Mellon (75,104)
EUR (75,798)
GBP (65,065)
BNY Mellon Absolute Return Bond Fund Sterling X (Acc) (Hedged) Share ClassSterling Euro 5,000,000 5,943,689 13-Jan-17 The Bank of
New York Mellon (120,525)
Sterling Euro 82,351,164 98,254,650 13-Jan-17 The Bank of New York Mellon (2,345,791)
EUR (2,466,316)
GBP (2,117,078)
BNY Mellon Absolute Return Bond Fund USD I (Hedged) Share ClassUS dollar Euro 45,874 43,848 13-Jan-17 The Bank of
New York Mellon (432)
US dollar Euro 112,797,707 106,840,934 13-Jan-17 The Bank of New York Mellon (87,342)
EUR (87,774)
USD (92,689)
BNY Mellon Absolute Return Bond Fund USD R (Hedged) Share ClassEuro US dollar 139,512 145,500 03-Jan-17 The Bank of
New York Mellon 1,728
Euro US dollar 155,645 162,435 13-Jan-17 The Bank of New York Mellon 1,913
Euro US dollar 97,198 101,714 13-Jan-17 The Bank of New York Mellon 935
Euro US dollar 19,117 20,000 13-Jan-17 The Bank of New York Mellon 189
Euro US dollar 12,723 13,314 13-Jan-17 The Bank of New York Mellon 122
Euro US dollar 245 256 13-Jan-17 The Bank of New York Mellon 2
Euro US dollar 121,386 126,202 13-Jan-17 The Bank of New York Mellon 1,946
Euro US dollar 6,195 6,483 13-Jan-17 The Bank of New York Mellon 59
Euro US dollar 95,937 100,000 13-Jan-17 The Bank of New York Mellon 1,296
Euro US dollar 82,978 86,492 13-Jan-17 The Bank of New York Mellon 1,121
US dollar Euro 30,000 28,125 13-Jan-17 The Bank of New York Mellon 268
EUR 9,579
USD 10,115
Forward foreign currency contracts cont’d.
Unrealised
Gain/(Loss)Buy Sell Amount (B) Amount (S)
Settle
Date Counterparty
BNY Mellon Absolute Return Bond Fund USD R (Hedged) Share Class cont’d.
US dollar Euro 162,435 155,751 03-Jan-17 The Bank of New York Mellon (1,930)
US dollar Euro 20,000 19,129 04-Jan-17 The Bank of New York Mellon (190)
Euro US dollar 19,994 21,245 13-Jan-17 The Bank of New York Mellon (113)
Euro US dollar 5,101 5,420 13-Jan-17 The Bank of New York Mellon (29)
US dollar Euro 145,500 139,417 13-Jan-17 The Bank of New York Mellon (1,714)
US dollar Euro 20,315,271 19,242,435 13-Jan-17 The Bank of New York Mellon (15,731)
US dollar Euro 121,650 116,708 13-Jan-17 The Bank of New York Mellon (1,576)
EUR (21,283)
USD (22,475)
Net EUR (11,704)
Net USD (12,360)
BNY Mellon Absolute Return Bond Fund USD T (Hedged) Share ClassEuro US dollar 932,041 975,342 13-Jan-17 The Bank of
New York Mellon 8,961
Euro US dollar 8,418 8,785 13-Jan-17 The Bank of New York Mellon 103
Euro US dollar 82,167 85,961 13-Jan-17 The Bank of New York Mellon 812
Euro US dollar 20,723 21,601 13-Jan-17 The Bank of New York Mellon 280
Euro US dollar 1,558 1,625 13-Jan-17 The Bank of New York Mellon 20
Euro US dollar 219,960 230,214 13-Jan-17 The Bank of New York Mellon 2,082
Euro US dollar 593,623 617,178 13-Jan-17 The Bank of New York Mellon 9,516
US dollar Euro 725 682 13-Jan-17 The Bank of New York Mellon 4
US dollar Euro 510 482 13-Jan-17 The Bank of New York Mellon 1
EUR 21,779
USD 22,999
US dollar Euro 8,785 8,424 03-Jan-17 The Bank of New York Mellon (104)
US dollar Euro 85,961 82,216 04-Jan-17 The Bank of New York Mellon (818)
Euro US dollar 2,121 2,262 13-Jan-17 The Bank of New York Mellon (20)
Euro US dollar 4,250,095 4,503,278 13-Jan-17 The Bank of New York Mellon (11,880)
US dollar Euro 397 379 13-Jan-17 The Bank of New York Mellon (4)
US dollar Euro 62,692,302 59,381,563 13-Jan-17 The Bank of New York Mellon (48,544)
US dollar Euro 15,995 15,289 13-Jan-17 The Bank of New York Mellon (151)

61
Portfolio of investments – as at 31 December 2016
BNY MELLON ABSOLUTE RETURN BOND FUND
Forward foreign currency contracts cont’d.
Unrealised
Gain/(Loss)Buy Sell Amount (B) Amount (S)
Settle
Date Counterparty
BNY Mellon Absolute Return Bond Fund USD T (Hedged) Share Class cont’d.
US dollar Euro 609 583 13-Jan-17 The Bank of New York Mellon (7)
US dollar Euro 50,000 48,092 13-Jan-17 The Bank of New York Mellon (771)
EUR (62,299)
USD (65,788)
Net EUR (40,520)
Net USD (42,789)
BNY Mellon Absolute Return Bond Fund USD W (Acc) (Hedged) Share ClassUS dollar Euro 2,651,708 2,511,673 13-Jan-17 The Bank of
New York Mellon (2,053)
EUR (2,053)
USD (2,168)
BNY Mellon Absolute Return Bond Fund USD W (Inc) (Hedged) Share ClassUS dollar Euro 3,724,773 3,528,070 13-Jan-17 The Bank of
New York Mellon (2,884)
EUR (2,884)
USD (3,046)

62
Portfolio of investments – as at 31 December 2016
Holdings Description
Fair
value
Total
net assets
% Holdings Description
Fair
value
Total
net assets
%
BNY MELLON ABSOLUTE RETURN EQUITY FUND
Collective investment schemes
Cayman Islands - 4,567,273 (31 December 2015: 6,426,350) 4,567,273 0.20
3,199,491 Marwyn Value Investors Ltd 4,567,273 0.20
United Kingdom - 222,412,023 (31 December 2015: 203,262,433) 222,412,023 9.80
1,211,379 Electra Private Equity Plc 57,740,380 2.55
164,672,914 Insight Liquidity Funds Plc - GBP Liquidity Fund 164,671,643 7.25
Total investments in collective investment schemes 226,979,296 10.00
Floating rate notes
Australia - 77,682,325 (31 December 2015: 41,559,185) 77,682,325 3.42
10,800,000 Commonwealth Bank of Australia
0.665% 26-Jul-2017 FRN 10,809,936 0.48
10,800,000 Commonwealth Bank of Australia
0.668% 13-Jan-2017 FRN 10,800,756 0.47
15,200,000 Commonwealth Bank of Australia
1.101% 26-Oct-2018 FRN 15,271,288 0.67
20,000,000 National Australia Bank Ltd
0.618% 15-Mar-2017 FRN 20,000,700 0.88
15,800,000 National Australia Bank Ltd
0.658% 14-Feb-2017 FRN 15,798,420 0.70
5,000,000 Westpac Banking Corp 0.621% 17-Mar-2017 FRN 5,001,225 0.22
Canada - 110,479,935 (31 December 2015: 52,598,822) 110,479,935 4.87
16,700,000 Bank of Montreal 0.642% 23-Mar-2017 FRN 16,702,923 0.73
21,700,000 Bank of Montreal 0.686% 19-Jan-2017 FRN 21,702,604 0.96
15,800,000 Bank of Nova Scotia/The
0.681% 08-Feb-2017 FRN 15,800,395 0.70
31,700,000 Canadian Imperial Bank of Commerce
0.682% 01-Feb-2017 FRN 31,700,792 1.40
10,800,000 Royal Bank of Canada 0.678% 13-Jan-2017 FRN 10,800,270 0.47
10,800,000 Royal Bank of Canada 1.096% 09-Oct-2018 FRN 10,854,864 0.48
2,920,000 Toronto-Dominion Bank/The
0.786% 19-Jan-2018 FRN 2,918,087 0.13
Denmark - 15,017,175 (31 December 2015: –) 15,017,175 0.66
15,000,000 Danske Bank A/S 0.883% 04-Oct-2018 FRN 15,017,175 0.66
France - 1,100,968 (31 December 2015: 25,055,250) 1,100,968 0.05
1,100,000 BPCE SA 1.182% 06-Mar-2017 FRN 1,100,968 0.05
Germany - 5,000,825 (31 December 2015: 20,752,469) 5,000,825 0.22
5,000,000 DZ Bank AG 0.706% 19-Oct-2017 FRN 5,000,825 0.22
Ireland - 19,958,279 (31 December 2015: 17,446,336) 19,958,279 0.88
19,950,000 GE Capital UK Funding 0.831% 16-Jan-2018 FRN 19,958,279 0.88
Netherlands - 53,418,432 (31 December 2015: 61,835,757) 53,418,432 2.35
18,000,000 ABN AMRO Bank NV 0.885% 30-Nov-2018 FRN 18,008,820 0.79
8,800,000 Bank Nederlandse Gemeenten NV
0.559% 03-Apr-2018 FRN 8,806,635 0.39
10,800,000 Cooperatieve Rabobank UA
0.645% 28-Apr-2017 FRN 10,800,054 0.47
15,800,000 Nederlandse Waterschapsbank NV
0.566% 09-Apr-2018 FRN 15,802,923 0.70
New Zealand - 54,977,067 (31 December 2015: 47,000,175) 54,977,067 2.42
21,100,000 ASB Finance Ltd/London
0.902% 01-May-2018 FRN 21,142,306 0.93
10,800,000 ASB Finance Ltd/London
0.957% 13-Mar-2017 FRN 10,809,666 0.47
9,000,000 Westpac Securities NZ Ltd/London
0.762% 23-Jun-2017 FRN 9,005,985 0.40
14,000,000 Westpac Securities NZ Ltd/London
0.843% 02-Oct-2017 FRN 14,019,110 0.62
Supranational - 38,874,758 (31 December 2015: 17,024,435) 38,874,758 1.71
13,300,000 European Investment Bank
0.598% 22-Feb-2017 FRN 13,304,323 0.59
5,500,000 European Investment Bank
0.598% 21-May-2021 FRN 5,495,435 0.24
20,000,000 European Investment Bank
0.648% 17-Feb-2020 FRN 20,075,000 0.88
Sweden - 62,029,453 (31 December 2015: 15,003,206) 62,029,453 2.73
10,300,000 Svenska Handelsbanken AB
0.677% 10-Jul-2017 FRN 10,316,068 0.45
31,700,000 Swedbank AB 0.693% 04-Jul-2017 FRN 31,701,585 1.40
20,000,000 Swedbank AB 0.904% 02-Dec-2019 FRN 20,011,800 0.88
Switzerland - 10,001,800 (31 December 2015: 20,496,238) 10,001,800 0.44
10,000,000 Credit Suisse AG/London
0.815% 30-Aug-2017 FRN 10,001,800 0.44
Total investments in fl oating rate notes 448,541,017 19.75
Certifi cate of deposit
Australia - 6,300,362 (31 December 2015: 44,949,063) 6,300,362 0.28
2,300,000 Commonwealth Bank of Australia
0.000% 30-Jan-2017 CD 2,299,513 0.10
4,000,000 Commonwealth Bank of Australia
0.450% 08-Mar-2017 CD 4,000,849 0.18
Denmark - 71,721,315 (31 December 2015: 40,013,696) 71,721,315 3.16
50,000,000 Danske Bank A/S 0.520% 09-May-2017 CD 50,013,957 2.20
21,700,000 Danske Bank A/S 0.650% 01-Feb-2017 CD 21,707,358 0.96
France - 234,527,164 (31 December 2015: 174,862,140) 234,527,164 10.33
50,000,000 Banque Federative du Credit Mutuel SA
0.410% 01-Feb-2017 CD 50,006,462 2.21
27,000,000 BPCE 0.570% 03-Apr-2017 CD 27,013,433 1.19
20,000,000 BPCE 0.650% 05-Jan-2017 CD 20,001,140 0.88
30,000,000 Credit Agricole Corporate and Investment Bank
0.640% 19-Jan-2017 CD 30,006,142 1.32
Floating rate notes cont’d.
Netherlands cont’d.
GBP GBP

63
Portfolio of investments – as at 31 December 2016
Holdings Description
Fair
value
Total
net assets
% Holdings Description
Fair
value
Total
net assets
%
BNY MELLON ABSOLUTE RETURN EQUITY FUND
15,000,000 Dexia Credit Local SA 0.000% 04-Jan-2017 CD 14,999,617 0.66
30,000,000 La Banque Postale S.A. 0.000% 23-Jan-2017 CD 29,995,277 1.32
47,500,000 Societe Generale 0.380% 31-Jan-2017 CD 47,504,827 2.09
15,000,000 Societe Generale 0.620% 31-Aug-2017 CD 15,000,266 0.66
Germany - 86,727,041 (31 December 2015: 45,004,963) 86,727,041 3.82
40,000,000 DZ Bank AG 0.280% 09-Jan-2017 CD 40,000,432 1.76
20,000,000 DZ Bank AG 0.550% 31-Mar-2017 CD 20,008,918 0.88
26,700,000 Landesbank Hessen Thuringen International
1.000% 02-Feb-2017 CD 26,717,691 1.18
Japan - 287,138,762 (31 December 2015: 159,986,107) 287,138,762 12.64
53,000,000 Mitsubishi UFJ Trust and Banking Corp
0.400% 01-Feb-2017 CD 53,006,386 2.33
31,700,000 Mitsubishi UFJ Trust and Banking Corp
0.440% 10-Feb-2017 CD 31,705,600 1.40
50,000,000 Norinchukin Bank 0.000% 28-Feb-2017 CD 49,973,999 2.20
51,000,000 Sumitomo Mitsui Banking Corp
0.000% 07-Mar-2017 CD 50,969,372 2.24
25,000,000 Sumitomo Mitsui Banking Corp
0.000% 29-Mar-2017 CD 24,978,011 1.10
30,000,000 Sumitomo Mitsui Trust Bank Ltd
0.400% 17-Feb-2017 CD 30,004,031 1.32
25,000,000 Sumitomo Mitsui Trust Bank Ltd
0.410% 28-Apr-2017 CD 24,999,173 1.10
20,000,000 Sumitomo Mitsui Trust Bank Ltd
0.650% 09-Jan-2017 CD 20,002,037 0.88
1,500,000 Sumitomo Trust and Banking Co Ltd
0.650% 09-Jan-2017 CD 1,500,153 0.07
Netherlands - 100,018,589 (31 December 2015: –) 100,018,589 4.40
50,000,000 ABN AMRO Bank NV 0.500% 08-May-2017 CD 50,010,702 2.20
50,000,000 ING Bank NV 0.420% 08-Mar-2017 CD 50,007,887 2.20
Sweden - 53,994,914 (31 December 2015: 99,939,369) 53,994,914 2.38
20,000,000 Nordea Bank AB 0.305% 05-Apr-2017 CD 19,996,217 0.88
10,000,000 Nordea Bank AB 0.310% 10-Apr-2017 CD 9,997,892 0.44
24,000,000 Nordea Bank AB 0.370% 22-Mar-2017 CD 24,000,805 1.06
Switzerland - 26,741,584 (31 December 2015: –) 26,741,584 1.18
26,700,000 Credit Suisse 1.060% 22-Mar-2017 CD 26,741,584 1.18
United Kingdom - 156,193,459 (31 December 2015: 180,003,084) 156,193,459 6.88
54,100,000 BNP Paribas London Branch
0.300% 03-Jan-2017 CD 54,100,296 2.38
54,100,000 BNP Paribas London Branch
0.330% 03-Apr-2017 CD 54,100,000 2.38
6,000,000 Mizuho Bank Ltd London Branch
0.000% 10-Feb-2017 CD 5,998,099 0.27
20,000,000 Mizuho Bank Ltd London Branch
0.000% 14-Feb-2017 CD 19,992,827 0.88
22,000,000 Mizuho Bank Ltd London Branch
0.390% 09-Mar-2017 CD 22,002,237 0.97
Total investments in certifi cate of deposit 1,023,363,190 45.07
Commercial paper
Finland - 9,998,123 (31 December 2015: –) 9,998,123 0.44
10,000,000 OP Corporate Bank Plc
0.000% 27-Jan-2017 CP 9,998,123 0.44
France - 85,663,962 (31 December 2015: 68,958,595) 85,663,962 3.77
11,000,000 Banque Federative du Credit Mutuel SA
0.000% 11-Jan-2017 CP 10,999,211 0.48
13,000,000 Banque Federative du Credit Mutuel SA
0.000% 02-Mar-2017 CP 12,992,946 0.57
1,700,000 BPCE 0.650% 05-Jan-2017 CP 1,700,097 0.08
20,000,000 Dexia Credit Local De France
0.000% 18-Apr-2017 CP 19,976,253 0.88
40,000,000 Regie Autonome Des Transports Parisiens
0.000% 17-Jan-2017 CP 39,995,455 1.76
Germany - 85,913,672 (31 December 2015: 44,961,628) 85,913,672 3.79
35,000,000 Erste Abwicklungsanstalt
0.000% 27-Apr-2017 CP 34,953,123 1.54
51,000,000 FMS Wertmanagement AoeR
0.000% 21-Mar-2017 CP 50,960,549 2.25
Japan - 19,999,233 (31 December 2015: –) 19,999,233 0.88
20,000,000 Sumitomo Mitsui Banking Corp
0.000% 06-Jan-2017 CP 19,999,233 0.88
Netherlands - 9,999,617 (31 December 2015: 24,988,880) 9,999,617 0.44
10,000,000 PACCAR Inc 0.000% 06-Jan-2017 CP 9,999,617 0.44
Sweden - 7,999,534 (31 December 2015: –) 7,999,534 0.35
8,000,000 Nordea Bank AB
0.000% 09-Jan-2017 CP 7,999,534 0.35
United States of America - 32,490,031 (31 December 2015: –) 32,490,031 1.43
32,500,000 Collateralized Commercial Paper Co LLC
0.000% 09-Feb-2017 CP 32,490,031 1.43
Total investments in commercial paper 252,064,172 11.10
Equities
Guernsey - 28,776,578 (31 December 2015: 21,600,799) 28,776,578 1.27
1,959,517 Market Tech Holdings Ltd 2,735,975 0.12
18,870,002 Sherborne Investors Guernsey B Ltd 26,040,603 1.15
Isle of Man - 5,018,932 (31 December 2015: 4,799,198) 5,018,932 0.22
610,390 Playtech Plc 5,018,932 0.22
Spain - 75,914,009 (31 December 2015: 47,072,336) 75,914,009 3.34
5,882,801 Grifols SA ADR 75,914,009 3.34
Certifi cate of deposit cont’d.
France cont’d.
GBPGBP

64
Portfolio of investments – as at 31 December 2016
Holdings Description
Fair
value
Total
net assets
% Holdings Description
Fair
value
Total
net assets
%
BNY MELLON ABSOLUTE RETURN EQUITY FUND
Sweden - 9,766,298 (31 December 2015: –) 9,766,298 0.43
429,620 Hennes & Mauritz AB 9,766,298 0.43
Switzerland - 31,108,368 (31 December 2015: 15,795,574) 31,108,368 1.37
355,052 Adecco Group AG 18,946,479 0.83
65,520 Roche Holding AG 12,161,889 0.54
United Kingdom - 80,536,131 (31 December 2015: 94,987,371) 80,536,131 3.55
2,283,405 Applied Graphene Materials Plc 2,911,342 0.13
6,410,300 Biffa Plc 144A 11,458,411 0.50
5,287,195 Countryside Properties Plc 144A 12,795,012 0.56
936,175 Crest Nicholson Holdings Plc 4,256,788 0.19
7,615,198 Ibstock Plc 144A 14,118,577 0.62
14,113 Rathbone Brothers Plc 279,296 0.01
170,825 Savills Plc 1,191,077 0.05
12,274,598 Shanks Group Plc 11,292,630 0.50
771,768 Softcat Plc 2,275,558 0.10
657,345 Spire Healthcare Group Plc 144A 2,227,414 0.10
7,738,525 Time out Group Plc 10,795,242 0.48
2,596,325 Worldpay Group Plc 144A 6,934,784 0.31
Total investments in equities 231,120,316 10.18
Equity index swaps
United Kingdom - 14,516 (31 December 2015: 725,132) 14,516 0.00
(735) FTSE UK Mid Cap Tradable Plus 11-Jan-2017 14,516 0.00
United States of America - 179,013 (31 December 2015: –) 179,013 0.01
(1,620) S&P 500 Biotech Index 06-Nov-2017 179,013 0.01
Total investments in equity index swaps 193,529 0.01
Equity swaps
Austria - 955,095 (31 December 2015: 2,329,251) 955,095 0.04
847,733 Zumtobel AG 17-Oct-2017 955,095 0.04
Belgium - 18,780 (31 December 2015: –) 18,780 0.00
63,415 Anheuser-Busch InBev SA/NV 26-Jun-2017 18,780 0.00
France - 10,117,310 (31 December 2015: 4,252,036) 10,117,310 0.44
(26,660) Air Liquide SA 26-Jun-2017 14,303 0.00
(2,194,689) Bureau Veritas SA 17-Oct-2017 51,808 0.00
378,079 Compagnie de Saint-Gobain SA 26-Jun-2017 51,927 0.00
788 Dassault Aviation SA 11-Jan-2017 46,934 0.00
169,366 Euler Hermes Group 17-Oct-2017 790,158 0.04
203,000 Legrand Promesse 26-Jun-2017 25,267 0.00
17,760 Nexity SA 17-Oct-2017 11,494 0.00
200,000 Safran SA 11-Jan-2017 529,153 0.02
1,330,280 Spie SA 06-Nov-2017 3,799,699 0.17
1,393,786 Television Francaise 1 17-Oct-2017 1,038,657 0.05
34,163 Unibail-Rodamco SE 11-Jan-2017 99,713 0.00
417,810 Wendel 17-Oct-2017 3,658,197 0.16
Germany - 4,667,488 (31 December 2015: 2,917,949) 4,667,488 0.21
64,667 Beiersdorf AG 17-Oct-2017 7,771 0.00
258,631 Continental AG 17-Oct-2017 1,870,417 0.08
187,075 Deutsche Boerse AG 11-Jan-2017 498,162 0.02
262,484 HeidelbergCement AG 11-Jan-2017 1,839,809 0.09
235,825 Henkel AG & Co KGaA 26-Jun-2017 73,887 0.00
20,787 Rheinmetall AG 11-Jan-2017 15,873 0.00
396,129 Takkt AG 11-Jan-2017 361,569 0.02
Isle of Man - 42,240 (31 December 2015: –) 42,240 0.00
250,000 Playtech Ltd 06-Nov-2017 42,240 0.00
Italy - 2,989,515 (31 December 2015: 993,281) 2,989,515 0.14
355,000 Atlantia SpA 11-Jan-2017 255,171 0.01
5,006,328 Cerved Information Solutions SpA 06-Nov-2017 2,363,579 0.11
44,181,911 Telecom Italia SpA 26-Jun-2017 370,765 0.02
Luxembourg - 63,741 (31 December 2015: 854,380) 63,741 0.00
13,368 Eurofi ns Scientifi c SE 17-Oct-2017 63,741 0.00
Netherlands - 9,144,242 (31 December 2015: 488,542) 9,144,242 0.41
730,954 ASML Holding NV 17-Oct-2017 8,136,980 0.36
(139,910) Heineken NV 17-Oct-2017 830,480 0.04
(204,920) Randstad Holding NV 26-Jun-2017 176,782 0.01
Portugal - 35,378 (31 December 2015: –) 35,378 0.00
(686,901) Galp Energia 26-Jun-2017 35,378 0.00
South Africa - 835,471 (31 December 2015: –) 835,471 0.04
(643,908) Mediclinic International Plc 17-Oct-2017 835,471 0.04
Spain - 3,266,733 (31 December 2015: 2,348,354) 3,266,733 0.13
(1,375,000) Abertis Infraestructuras SA 11-Jan-2017 256,546 0.01
2,662,698 Antena 3 Television EA 17-Oct-2017 1,885,662 0.08
(607,425) Enagas SA 17-Oct-2017 710,423 0.03
50,000 Ferrovial SA 11-Jan-2017 17,647 0.00
175,250 Merlin Properties 17-Oct-2017 97,095 0.00
735,112 Merlin Properties Socimi SA 17-Oct-2017 299,360 0.01
Sweden - 48,991 (31 December 2015: 547,175) 48,991 0.00
195,000 Saab AB 26-Jun-2017 48,991 0.00
Switzerland - 1,105,986 (31 December 2015: 3,054,171) 1,105,986 0.05
(42,000) LafargeHolcim Ltd 11-Jan-2017 11,308 0.00
(21,326) SGS SA 17-Oct-2017 808,911 0.04
286,289 Sunrise Communications Group AG 26-Jun-2017 285,767 0.01
United Kingdom - 37,400,895 (31 December 2015: 18,863,513) 37,400,895 1.65
1,331,800 Anglo American Plc 17-Oct-2017 1,358,253 0.06
70,000 ASOS Plc 17-Oct-2017 155,581 0.01
Equities cont’d. Equity swaps cont’d.
GBPGBP

65
Portfolio of investments – as at 31 December 2016
Holdings Description
Fair
value
Total
net assets
% Holdings Description
Fair
value
Total
net assets
%
BNY MELLON ABSOLUTE RETURN EQUITY FUND
(271,549) AstraZeneca Plc 11-Jan-2017 1,419,091 0.06
2,477,391 Auto Trader Group Plc 11-Jan-2017 313,021 0.01
3,532,691 Aviva Plc 11-Jan-2017 1,661,926 0.07
109,156 Babcock International Group Plc 11-Jan-2017 5,645 0.00
(950,000) Barratt Developments Plc 17-Oct-2017 178,073 0.01
1,000,000 Biffa Group Ltd 06-Nov-2017 46,511 0.00
1,194,444 BP Plc 06-Nov-2017 116,651 0.01
456,220 British Land Co Plc 11-Jan-2017 106,593 0.00
(2,050,977) ConvaTec Group Plc 11-Jan-2017 137,724 0.01
776,142 Countryside Properties Plc 17-Oct-2017 79,166 0.00
452,238 Crest Nicholson Holdings Plc 11-Jan-2017 172,475 0.01
314,486 CRH Plc 11-Jan-2017 909,382 0.04
680,000 Diageo Plc 06-Nov-2017 265,985 0.01
3,700,220 DS Smith Plc 06-Nov-2017 831,727 0.04
200,000 Galiform Plc 11-Jan-2017 26,220 0.00
(32,179) Galliford Try Plc 11-Jan-2017 17,635 0.00
(699,264) GlaxoSmithKline Plc 11-Jan-2017 587,332 0.03
1,475,411 Great Portland Estates Plc 11-Jan-2017 187,252 0.01
(1,629,320) Halma Plc 06-Nov-2017 1,957,037 0.09
2,980,000 HSBC Holdings Plc 17-Oct-2017 475,714 0.02
822,297 Ibstock Plc 11-Jan-2017 145,009 0.01
(2,096,193) IMI Plc 11-Jan-2017 1,207,644 0.05
723,000 Informa Plc 17-Oct-2017 173,314 0.01
(1,415,473) Kingfi sher Plc 11-Jan-2017 18,716 0.00
447,274 Land Securities Group Plc 17-Oct-2017 335,456 0.02
18,981,522 Lloyds Banking Group Plc 11-Jan-2017 764,962 0.03
(4,269,843) McCarthy & Stone Plc 11-Jan-2017 819,551 0.04
9,708,718 Melrose Holdings Ltd 11-Jan-2017 3,194,393 0.14
950,000 Mondi Plc 11-Jan-2017 1,004,999 0.04
2,000,000 PageGroup Plc 11-Jan-2017 544,706 0.02
360,362 Rathbone Brothers Plc 06-Nov-2017 699,102 0.03
138,650 Rio Tinto Plc 17-Oct-2017 750,790 0.03
(3,680,000) Rolls-Royce Holdings Plc 06-Nov-2017 1,610,000 0.07
3,593,996 Royal Dutch Shell Plc 06-Nov-2017 6,935,273 0.30
1,261,635 RPC Group Plc 11-Jan-2017 1,224,107 0.05
495,230 RSA Insurance Group Plc 06-Nov-2017 123,731 0.00
519,605 Savills Plc 06-Nov-2017 209,141 0.01
1,627,590 Schroders Plc 11-Jan-2017 2,644,354 0.13
1,187,056 Serco Group Plc 17-Oct-2017 116,331 0.01
9,695 Severn Trent Plc 17-Oct-2017 1,287 0.00
1,138,513 Smiths Group Plc 11-Jan-2017 483,868 0.02
(1,607,784) SSE Plc 11-Jan-2017 369,819 0.01
2,561,661 SSP Group Plc 06-Nov-2017 1,383,910 0.06
3,000,000 Taylor Wimpey Plc 26-Jun-2017 4,500 0.00
328,980 Ultra Electronics Holdings Plc 17-Oct-2017 158,854 0.01
313,226 Unite Group Plc 17-Oct-2017 37,587 0.00
162,558 Whitbread Plc 17-Oct-2017 154,774 0.01
325,741 Workspace Group Plc 11-Jan-2017 280,442 0.01
982,154 WPP 2012 Plc 11-Jan-2017 800,077 0.04
2,300,000 Zoopla Property Group 17-Oct-2017 195,204 0.01
Total investments in equity swaps 70,691,865 3.11
Unrealised gain on forward foreign currency contracts - 43,852,740 (see below)
(31 December 2015: 18,822,216) 43,852,740 1.93
Total fi nancial assets at fair value through profi t or loss 2,296,806,125 101.15
Equity index swaps
Europe - (13,878,966) (31 December 2015: (1,853,265)) (13,878,966) (0.61)
(120,843) Euro STOXX Personal & Household Goods
06-Nov-2017 (4,089,283) (0.18)
(18,389) Euro STOXX Telecommunications 06-Nov-2017 (415,747) (0.02)
(57,935) STOXX 600- Auto & Parts Index 11-Jan-2017 (2,489,618) (0.11)
(28,364) STOXX 600- Food & Beverage Index 06-Nov-2017 (291,197) (0.01)
(97,672) STOXX 600- Industrial Goods & Service
11-Jan-2017 (1,473,089) (0.06)
(253,024) STOXX 600- Media 06-Nov-2017 (5,120,032) (0.23)
United Kingdom - (6,746,176) (31 December 2015: (6,102,476)) (6,746,176) (0.30)
(5,353) FTSE 250 Index 11-Jan-2017 (1,578,065) (0.07)
(3,369) FTSE 250 Index 06-Nov-2017 (2,506,703) (0.11)
(848) FTSE 350 Banks Index 06-Nov-2017 (358,221) (0.02)
(4,562) FTSE 350 General Retail Index 17-Oct-2017 (437,645) (0.02)
(1,304) FTSE 350 Travel & Leisure Index 17-Oct-2017 (415,444) (0.02)
(23,676) FTSE UK Mid Cap Tradable Plus 11-Jan-2017 (1,450,098) (0.06)
United States of America - (1,015,041) (31 December 2015: (58,330)) (1,015,041) (0.04)
(6,597) S&P 500 Biotech Index 06-Nov-2017 (1,015,041) (0.04)
Total investments in equity index swaps (21,640,183) (0.95)
Equity swaps
Austria - (1,459,663) (31 December 2015: –) (1,459,663) (0.06)
458,146 Erste Group Bank AG 26-Jun-2017 (339,277) (0.01)
(623,792) Wienerberger AG 11-Jan-2017 (1,120,386) (0.05)
Denmark - (47,628) (31 December 2015: –) (47,628) (0.00)
3,300 A.P. Moller - Maersk A/S 26-Jun-2017 (47,628) (0.00)
Finland - (2,121,772) (31 December 2015: (175,805)) (2,121,772) (0.10)
(1,825,000) Stora Enso OYJ 11-Jan-2017 (2,121,772) (0.10)
France - (1,868,710) (31 December 2015: (4,468,014)) (1,868,710) (0.08)
(157,984) Bureau Veritas SA 17-Oct-2017 (187,908) (0.01)
(69,041) L’Oreal SA 17-Oct-2017 (331,882) (0.02)
(64,500) LVMH Moet Hennessy Louis Vuitton SA
26-Jun-2017 (9,689) (0.00)
272,359 Nexity SA 17-Oct-2017 (394,524) (0.02)
174,406 Pernod Ricard SA 26-Jun-2017 (41,170) (0.00)
(109,000) Sanofi 26-Jun-2017 (44,443) (0.00)
(8,201) Thales SA 11-Jan-2017 (73,720) (0.00)
20,967 Unibail-Rodamco SE 11-Jan-2017 (237,135) (0.01)
3,548,211 Vivendi SA 17-Oct-2017 (548,239) (0.02)
Germany - (1,730,632) (31 December 2015: (6,103,280)) (1,730,632) (0.08)
(102,381) Hannover Rueck SE 17-Oct-2017 (649,020) (0.03)
(200,518) Henkel AG & Co KGaA 26-Jun-2017 (47,334) (0.00)
(51,466) MTU Aero Engines AG 11-Jan-2017 (869,951) (0.04)
462,648 Rheinmetall AG 11-Jan-2017 (115,169) (0.01)
(400,000) TUI AG 17-Oct-2017 (49,158) (0.00)
Equity swaps cont’d.
United Kingdom cont’d.
GBPGBP

66
Portfolio of investments – as at 31 December 2016
Holdings Description
Fair
value
Total
net assets
% Holdings Description
Fair
value
Total
net assets
%
BNY MELLON ABSOLUTE RETURN EQUITY FUND
Equity swaps cont’d.
United Kingdom cont’d. Ireland - (1,002,443) (31 December 2015: (1,490,084)) (1,002,443) (0.05)
1,089,573 Shire Plc 11-Jan-2017 (1,002,443) (0.05)
Isle of Man - (523,559) (31 December 2015: (179,284)) (523,559) (0.02)
1,157,036 Playtech Ltd 06-Nov-2017 (523,559) (0.02)
Italy - (1,584,698) (31 December 2015: (229,309)) (1,584,698) (0.07)
(1,079,797) Enel SpA 26-Jun-2017 (34,295) (0.00)
(45,398) Ferrari NV 11-Jan-2017 (463,894) (0.02)
785,166 Finmeccanica SpA 26-Jun-2017 (144,907) (0.01)
289,000 Moncler SpA 26-Jun-2017 (26,048) (0.00)
1,630,866 Snam Rete Gas 06-Nov-2017 (915,554) (0.04)
Luxembourg - (3,575,717) (31 December 2015: (174,943)) (3,575,717) (0.15)
145,303 Eurofi ns Scientifi c SE 17-Oct-2017 (2,076,715) (0.09)
(652,277) Fiat Chrysler Automobiles NV 11-Jan-2017 (1,499,002) (0.06)
Netherlands - (27,111) (31 December 2015: (841,810)) (27,111) (0.00)
101,880 Koninklijke DSM NV 26-Jun-2017 (27,111) (0.00)
Spain - (9,354,566) (31 December 2015: (2,164,366)) (9,354,566) (0.42)
(140,000) Abertis Infraestructuras SA 11-Jan-2017 (115,786) (0.01)
483,000 Ferrovial SA 11-Jan-2017 (687,550) (0.03)
(2,472,759) Gestevision Telecinco SA 06-Nov-2017 (3,173,299) (0.14)
(4,473,444) Grifols SA 06-Nov-2017 (5,347,186) (0.24)
387,203 Red Electrica Corp SA 06-Nov-2017 (30,745) (0.00)
Switzerland - (1,623,065) (31 December 2015: (291,650)) (1,623,065) (0.07)
(67,000) Kuehne + Nagel International AG 26-Jun-2017 (26,751) (0.00)
(368,859) LafargeHolcim Ltd 11-Jan-2017 (833,931) (0.04)
(59,000) Panalpina Welttransport 26-Jun-2017 (2,356) (0.00)
125 Roche Holding AG 11-Jan-2017 (1,139) (0.00)
(114,845) Swiss Re AG 17-Oct-2017 (758,888) (0.03)
United Kingdom - (28,289,407) (31 December 2015: (12,054,165)) (28,289,407) (1.24)
(2,237,804) 3i Group Plc 06-Nov-2017 (1,471,094) (0.07)
465,000 Anglo American Plc 17-Oct-2017 (229,103) (0.01)
123,469 ASOS Plc 17-Oct-2017 (339,479) (0.01)
(77,000) AstraZeneca Plc 11-Jan-2017 (43,835) (0.00)
2,245,084 Babcock International Group Plc 11-Jan-2017 (2,376,742) (0.11)
(750,000) Barratt Developments Plc 17-Oct-2017 (1,875) (0.00)
(160,000) British American Tobacco Plc 06-Nov-2017 (357,756) (0.02)
10,516,508 Cobham Plc 11-Jan-2017 (554,516) (0.02)
(906,098) Compass Group Plc 11-Jan-2017 (983,535) (0.04)
(831,185) ConvaTec Group Plc 11-Jan-2017 (31,583) (0.00)
799,858 Crest Nicholson Holdings Plc 11-Jan-2017 (134,380) (0.00)
1,105,069 Galiform Plc 11-Jan-2017 (410,899) (0.02)
(747,532) Galliford Try Plc 11-Jan-2017 (938,153) (0.04)
(5,006,650) Glencore Xstrata Plc 17-Oct-2017 (1,712,690) (0.08)
(872,931) Halfords Group Plc 11-Jan-2017 (102,374) (0.00)
(8,163,478) Hammerson Plc 17-Oct-2017 (1,317,119) (0.06)
1,150,000 HSBC Holdings Plc 17-Oct-2017 (45,524) (0.00)
(1,258,036) J D Wetherspoon Plc 11-Jan-2017 (846,029) (0.04)
6,700,262 Ladbrokes Coral Plc 17-Oct-2017 (1,353,884) (0.06)
686,303 Ladbrokes Plc 17-Oct-2017 (117,617) (0.00)
2,000,000 Lloyds Banking Group Plc 11-Jan-2017 (24,736) (0.00)
241,631 Micro Focus International 11-Jan-2017 (118,421) (0.01)
(840,000) Moneysupermarket.com 17-Oct-2017 (197,585) (0.01)
489,501 Provident Financial Plc 06-Nov-2017 (9,790) (0.00)
(105,000) Reckitt Benckiser Plc 06-Nov-2017 (247,331) (0.01)
(63,000) Rightmove Plc 17-Oct-2017 (121,724) (0.01)
(3,692,622) Royal Dutch Shell Plc 06-Nov-2017 (7,764,638) (0.34)
6,857,480 Saga Plc 17-Oct-2017 (353,160) (0.01)
1,923,367 Sage Group Plc 06-Nov-2017 (525,026) (0.03)
(1,347,855) Schroders Plc 11-Jan-2017 (2,988,373) (0.14)
1,071,686 Severn Trent Plc 17-Oct-2017 (740,115) (0.03)
361,487 Smiths Group Plc 11-Jan-2017 (429,052) (0.02)
218,649 Spire Healthcare Group Plc 11-Jan-2017 (57,177) (0.00)
(436,057) SSE Plc 11-Jan-2017 (101,162) (0.00)
(700,000) Travis Perkins Plc 11-Jan-2017 (232,175) (0.01)
6,283,210 Worldpay Group Plc 17-Oct-2017 (970,510) (0.04)
647,929 WPP 2012 Plc 11-Jan-2017 (40,245) (0.00)
Total investments in equity swaps (53,208,971) (2.34)
Holdings Description
Underlying
exposure
GBP
Fair
value
GBP
Total
net assets
%
Open futures contracts - (2,789,288) (31 December 2015: (4,545,226))
(868) CAC 40 10 Euro Index
Short Futures Contracts
Exp Jan-2017 (35,993,355) (444,147) (0.02)
(134) DAX Index
Short Futures Contracts
Exp Mar-2017 (32,871,315) (527,793) (0.02)
(1,659) Euro STOXX 50 Index
Short Futures Contracts
Exp Mar-2017 (46,375,170) (676,985) (0.03)
(805) FTSE 100 Index
Short Futures Contracts
Exp Mar-2017 (56,649,862) (1,047,560) (0.05)
(43) FTSE MIB Index
Short Futures Contracts
Exp Mar-2017 (3,540,232) (92,803) (0.00)
Total open futures contracts (2,789,288) (0.12)
Equity swaps cont’d.
GBPGBP

67
Portfolio of investments – as at 31 December 2016
Holdings Description
Fair
value
Total
net assets
% Holdings Description
Fair
value
Total
net assets
%
BNY MELLON ABSOLUTE RETURN EQUITY FUND
Unrealised loss on forward foreign currency contracts - (1,085,753) (see below)
(31 December 2015: (1,208,367)) (1,085,753) (0.05)
Total fi nancial liabilities at fair value through profi t or loss (78,724,195) (3.46)
Net current assets 52,470,885 2.31
Total net assets 2,270,552,815 100.00
The counterparties for equity index swaps are Barclays Bank plc, JPMorgan Chase and Bank of America Merrill Lynch.
The counterparties for equity swaps are Barclays Bank plc, JPMorgan Chase, Bank of America Merrill Lynch and
Morgan Stanley.
The counterparty for futures contracts is Goldman Sachs.
Analysis of portfolio % of Total assets
Transferable securities and money market instruments admitted
to offi cial stock exchange listing or traded on a regulated market 37.31
Transferable securities and money market instruments other than those
admitted to offi cial stock exchange listing or traded on a regulated market 52.49
OTC fi nancial derivative instruments 4.72
Other current assets 5.48
Total assets 100.00
Forward foreign currency contracts
Unrealised
Gain/(Loss)Buy Sell Amount (B) Amount (S)
Settle
Date Counterparty
BNY Mellon Absolute Return Equity FundEuro Sterling 3,800,000 3,205,243 22-Feb-17 Goldman Sachs 61,026
Euro Sterling 10,000,000 8,435,461 22-Feb-17 Goldman Sachs 159,984
GBP 221,010
Sterling Euro 8,419,078 10,000,000 22-Feb-17 Goldman Sachs (176,367)
Sterling Euro 69,444,078 81,000,000 22-Feb-17 Citigroup Funding Inc (179,026)
Sterling Swiss franc 20,371,093 25,500,000 22-Feb-17 Goldman Sachs (32,384)
GBP (387,777)
Net GBP (166,767)
BNY Mellon Absolute Return Equity Fund CHF R (Hedged) Share ClassSwiss franc Sterling 3,474,175 2,715,010 13-Jan-17 The Bank of
New York Mellon 60,575
GBP 60,575
CHF 75,857
BNY Mellon Absolute Return Equity Fund EUR R (Hedged) Share ClassEuro Sterling 1,404,048 1,196,230 03-Jan-17 The Bank of
New York Mellon 8,999
Euro Sterling 298,548 254,697 04-Jan-17 The Bank of New York Mellon 1,583
Euro Sterling 1,352,912 1,146,315 13-Jan-17 The Bank of New York Mellon 15,350
Euro Sterling 941,736 792,853 13-Jan-17 The Bank of New York Mellon 15,760
Euro Sterling 698,252 587,457 13-Jan-17 The Bank of New York Mellon 12,090
Euro Sterling 1,871,912 1,595,631 13-Jan-17 The Bank of New York Mellon 11,667
Euro Sterling 811,778 692,788 13-Jan-17 The Bank of New York Mellon 4,237
Euro Sterling 1,789,459 1,526,711 13-Jan-17 The Bank of New York Mellon 9,790
Euro Sterling 880,421 739,737 13-Jan-17 The Bank of New York Mellon 16,228
Euro Sterling 324,816 271,358 13-Jan-17 The Bank of New York Mellon 7,542
Euro Sterling 763,310 641,265 13-Jan-17 The Bank of New York Mellon 14,144
Euro Sterling 927,112,479 777,145,268 13-Jan-17 The Bank of New York Mellon 18,910,415
Euro Sterling 693,060 582,998 13-Jan-17 The Bank of New York Mellon 12,090
Euro Sterling 1,246,561 1,047,631 13-Jan-17 The Bank of New York Mellon 22,716
Euro Sterling 2,808,632 2,366,121 13-Jan-17 The Bank of New York Mellon 45,482
Euro Sterling 1,004,253 838,277 13-Jan-17 The Bank of New York Mellon 24,015
GBP 19,132,108
EUR 22,288,189
Description GBP

68
Portfolio of investments – as at 31 December 2016
BNY MELLON ABSOLUTE RETURN EQUITY FUND
Forward foreign currency contracts cont’d.
Unrealised
Gain/(Loss)Buy Sell Amount (B) Amount (S)
Settle
Date Counterparty
BNY Mellon Absolute Return Equity Fund EUR R (Inc) (Hedged) Share Class cont’d.
Sterling Euro 4,255 4,994 03-Jan-17 The Bank of New York Mellon (32)
Sterling Euro 51,377 61,024 13-Jan-17 The Bank of New York Mellon (1,021)
Sterling Euro 6,944 8,196 13-Jan-17 The Bank of New York Mellon (93)
Sterling Euro 8,548 10,016 13-Jan-17 The Bank of New York Mellon (52)
Sterling Euro 8,379 9,946 13-Jan-17 The Bank of New York Mellon (161)
Sterling Euro 15,509 18,459 13-Jan-17 The Bank of New York Mellon (340)
Sterling Euro 3,164 3,761 13-Jan-17 The Bank of New York Mellon (65)
Sterling Euro 70,193 84,090 13-Jan-17 The Bank of New York Mellon (2,011)
GBP (3,775)
EUR (4,398)
Net GBP 304,596
Net EUR 354,843
BNY Mellon Absolute Return Equity Fund EUR T (Hedged) Share ClassEuro Sterling 1,812,471 1,544,202 03-Jan-17 The Bank of
New York Mellon 11,617
Euro Sterling 265,664 226,643 04-Jan-17 The Bank of New York Mellon 1,408
Euro Sterling 862,048 730,408 13-Jan-17 The Bank of New York Mellon 9,781
Euro Sterling 1,118,371 941,562 13-Jan-17 The Bank of New York Mellon 18,716
Euro Sterling 1,868,115 1,571,693 13-Jan-17 The Bank of New York Mellon 32,345
Euro Sterling 3,160,316 2,693,875 13-Jan-17 The Bank of New York Mellon 19,698
Euro Sterling 352,727 301,024 13-Jan-17 The Bank of New York Mellon 1,841
Euro Sterling 186,948 159,498 13-Jan-17 The Bank of New York Mellon 1,023
Euro Sterling 162,616 136,631 13-Jan-17 The Bank of New York Mellon 2,997
Euro Sterling 1,991,551 1,663,783 13-Jan-17 The Bank of New York Mellon 46,242
Euro Sterling 325,090 273,111 13-Jan-17 The Bank of New York Mellon 6,024
Euro Sterling 777,233,235 651,510,086 13-Jan-17 The Bank of New York Mellon 15,853,312
Euro Sterling 1,074,623 903,968 13-Jan-17 The Bank of New York Mellon 18,747
Euro Sterling 399,368 335,636 13-Jan-17 The Bank of New York Mellon 7,277
Euro Sterling 2,000,330 1,685,171 13-Jan-17 The Bank of New York Mellon 32,392
Euro Sterling 768,901 641,822 13-Jan-17 The Bank of New York Mellon 18,387
GBP 16,081,807
EUR 18,734,703
Forward foreign currency contracts cont’d.
Unrealised
Gain/(Loss)Buy Sell Amount (B) Amount (S)
Settle
Date Counterparty
BNY Mellon Absolute Return Equity Fund EUR R (Hedged) Share Class cont’d.
Sterling Euro 1,594,845 1,871,912 03-Jan-17 The Bank of New York Mellon (11,998)
Sterling Euro 692,543 811,778 04-Jan-17 The Bank of New York Mellon (4,304)
Sterling Euro 1,493,047 1,750,001 13-Jan-17 The Bank of New York Mellon (9,574)
Sterling Euro 633,568 747,755 13-Jan-17 The Bank of New York Mellon (8,484)
Sterling Euro 2,924,223 3,473,340 13-Jan-17 The Bank of New York Mellon (58,125)
Sterling Euro 254,787 298,548 13-Jan-17 The Bank of New York Mellon (1,558)
Sterling Euro 80,375 95,672 13-Jan-17 The Bank of New York Mellon (1,773)
Sterling Euro 1,196,820 1,404,048 13-Jan-17 The Bank of New York Mellon (8,751)
Sterling Euro 831,033 986,452 13-Jan-17 The Bank of New York Mellon (15,974)
Sterling Euro 336,085 402,294 13-Jan-17 The Bank of New York Mellon (9,341)
Sterling Euro 176,291 209,819 13-Jan-17 The Bank of New York Mellon (3,868)
Sterling Euro 2,044,940 2,449,832 13-Jan-17 The Bank of New York Mellon (58,583)
Sterling Euro 959,566 1,140,542 13-Jan-17 The Bank of New York Mellon (19,748)
Sterling Euro 1,353,756 1,610,814 13-Jan-17 The Bank of New York Mellon (29,353)
Sterling Euro 600,502 713,868 13-Jan-17 The Bank of New York Mellon (12,454)
GBP (253,888)
EUR (295,770)
Net GBP 18,878,220
Net EUR 21,992,419
BNY Mellon Absolute Return Equity Fund EUR R (Inc) (Hedged) Share ClassEuro Sterling 10,016 8,545 04-Jan-17 The Bank of
New York Mellon 53
Euro Sterling 4,994 4,257 13-Jan-17 The Bank of New York Mellon 31
Euro Sterling 15,473 13,201 13-Jan-17 The Bank of New York Mellon 85
Euro Sterling 101,066 85,981 13-Jan-17 The Bank of New York Mellon 798
Euro Sterling 14,729,318 12,346,743 13-Jan-17 The Bank of New York Mellon 300,436
Euro Sterling 6,892 5,909 13-Jan-17 The Bank of New York Mellon 9
Euro Sterling 54,970 46,576 13-Jan-17 The Bank of New York Mellon 624
Euro Sterling 19,770 16,655 13-Jan-17 The Bank of New York Mellon 320
Euro Sterling 135,159 112,914 13-Jan-17 The Bank of New York Mellon 3,138
Euro Sterling 124,345 104,598 13-Jan-17 The Bank of New York Mellon 2,169
Euro Sterling 9,935 8,364 13-Jan-17 The Bank of New York Mellon 166
Euro Sterling 29,745 24,998 13-Jan-17 The Bank of New York Mellon 542
GBP 308,371
EUR 359,241

69
Portfolio of investments – as at 31 December 2016
BNY MELLON ABSOLUTE RETURN EQUITY FUND
Forward foreign currency contracts cont’d.
Unrealised
Gain/(Loss)Buy Sell Amount (B) Amount (S)
Settle
Date Counterparty
BNY Mellon Absolute Return Equity Fund EUR T (Hedged) Share Class cont’d.
Sterling Euro 2,692,548 3,160,316 03-Jan-17 The Bank of New York Mellon (20,256)
Sterling Euro 300,918 352,727 04-Jan-17 The Bank of New York Mellon (1,870)
Sterling Euro 85,976 101,066 13-Jan-17 The Bank of New York Mellon (803)
Sterling Euro 569,969 668,061 13-Jan-17 The Bank of New York Mellon (3,655)
Sterling Euro 3,005,001 3,546,586 13-Jan-17 The Bank of New York Mellon (40,238)
Sterling Euro 1,544,963 1,812,471 13-Jan-17 The Bank of New York Mellon (11,297)
Sterling Euro 226,723 265,664 13-Jan-17 The Bank of New York Mellon (1,387)
Sterling Euro 5,909 6,892 13-Jan-17 The Bank of New York Mellon (9)
Sterling Euro 199,721 237,732 13-Jan-17 The Bank of New York Mellon (4,405)
Sterling Euro 1,229,045 1,458,900 13-Jan-17 The Bank of New York Mellon (23,625)
Sterling Euro 722,399 865,432 13-Jan-17 The Bank of New York Mellon (20,695)
Sterling Euro 400,528 476,701 13-Jan-17 The Bank of New York Mellon (8,787)
Sterling Euro 769,038 920,539 13-Jan-17 The Bank of New York Mellon (21,374)
Sterling Euro 582,448 692,298 13-Jan-17 The Bank of New York Mellon (11,987)
Sterling Euro 3,219,079 3,823,565 13-Jan-17 The Bank of New York Mellon (63,986)
Sterling Euro 1,134,748 1,348,971 13-Jan-17 The Bank of New York Mellon (23,533)
Sterling Euro 2,521,851 3,000,713 13-Jan-17 The Bank of New York Mellon (54,681)
GBP (312,588)
EUR (364,153)
Net GBP 15,769,219
Net EUR 18,370,550
BNY Mellon Absolute Return Equity Fund EUR U (Hedged) Share ClassEuro Sterling 1,824,198 1,554,193 03-Jan-17 The Bank of
New York Mellon 11,692
Euro Sterling 12,650 10,792 04-Jan-17 The Bank of New York Mellon 67
Euro Sterling 145,651 123,409 13-Jan-17 The Bank of New York Mellon 1,653
Euro Sterling 2,987,829 2,515,469 13-Jan-17 The Bank of New York Mellon 50,000
Euro Sterling 25,111 21,127 13-Jan-17 The Bank of New York Mellon 435
Euro Sterling 33,788 28,835 13-Jan-17 The Bank of New York Mellon 176
Euro Sterling 54,799 46,711 13-Jan-17 The Bank of New York Mellon 342
Euro Sterling 1,410,279 1,203,207 13-Jan-17 The Bank of New York Mellon 7,715
Euro Sterling 21,664 18,202 13-Jan-17 The Bank of New York Mellon 399
Euro Sterling 23,434 19,577 13-Jan-17 The Bank of New York Mellon 544
Forward foreign currency contracts cont’d.
Unrealised
Gain/(Loss)Buy Sell Amount (B) Amount (S)
Settle
Date Counterparty
BNY Mellon Absolute Return Equity Fund EUR U (Hedged) Share Class cont’d.
Euro Sterling 39,455 33,146 13-Jan-17 The Bank of New York Mellon 731
Euro Sterling 255,996,182 214,586,931 13-Jan-17 The Bank of New York Mellon 5,221,582
Euro Sterling 3,668,139 3,085,619 13-Jan-17 The Bank of New York Mellon 63,991
Euro Sterling 533,818 448,630 13-Jan-17 The Bank of New York Mellon 9,728
Euro Sterling 1,388,031 1,169,341 13-Jan-17 The Bank of New York Mellon 22,477
Euro Sterling 2,119,487 1,769,193 13-Jan-17 The Bank of New York Mellon 50,684
GBP 5,442,216
EUR 6,339,978
Sterling Euro 46,688 54,799 03-Jan-17 The Bank of New York Mellon (351)
Sterling Euro 28,825 33,788 04-Jan-17 The Bank of New York Mellon (179)
Sterling Euro 12,817 15,127 13-Jan-17 The Bank of New York Mellon (172)
Sterling Euro 257,994 302,395 13-Jan-17 The Bank of New York Mellon (1,654)
Sterling Euro 1,372 1,629 13-Jan-17 The Bank of New York Mellon (27)
Sterling Euro 550,040 654,724 13-Jan-17 The Bank of New York Mellon (12,132)
Sterling Euro 10,796 12,650 13-Jan-17 The Bank of New York Mellon (66)
Sterling Euro 1,554,959 1,824,198 13-Jan-17 The Bank of New York Mellon (11,370)
Sterling Euro 104,843 124,451 13-Jan-17 The Bank of New York Mellon (2,015)
Sterling Euro 462,486 553,596 13-Jan-17 The Bank of New York Mellon (12,854)
Sterling Euro 19,293 22,962 13-Jan-17 The Bank of New York Mellon (423)
Sterling Euro 4,188 5,017 13-Jan-17 The Bank of New York Mellon (120)
Sterling Euro 25,591 30,417 13-Jan-17 The Bank of New York Mellon (527)
Sterling Euro 20,379 24,249 13-Jan-17 The Bank of New York Mellon (442)
Sterling Euro 36,553 43,453 13-Jan-17 The Bank of New York Mellon (758)
GBP (43,090)
EUR (50,198)
Net GBP 5,399,126
Net EUR 6,289,780

70
Portfolio of investments – as at 31 December 2016
BNY MELLON ABSOLUTE RETURN EQUITY FUND
Forward foreign currency contracts cont’d.
Unrealised
Gain/(Loss)Buy Sell Amount (B) Amount (S)
Settle
Date Counterparty
BNY Mellon Absolute Return Equity Fund USD T (Hedged) Share ClassSterling US dollar 2,447 2,996 03-Jan-17 The Bank of
New York Mellon 12
US dollar Sterling 7,889 6,347 13-Jan-17 The Bank of New York Mellon 64
US dollar Sterling 27,191,090 21,588,479 13-Jan-17 The Bank of New York Mellon 507,825
GBP 507,901
USD 624,820
Sterling US dollar 2,451,127 3,091,672 13-Jan-17 The Bank of New York Mellon (61,260)
US dollar Sterling 2,996 2,447 13-Jan-17 The Bank of New York Mellon (12)
GBP (61,272)
USD (75,377)
Net GBP 446,629
Net USD 549,443
BNY Mellon Absolute Return Equity Fund USD U (Hedged) Share ClassUS dollar Sterling 955,000 767,547 13-Jan-17 The Bank of
New York Mellon 8,515
US dollar Sterling 56,213,061 44,630,594 13-Jan-17 The Bank of New York Mellon 1,049,845
GBP 1,058,360
USD 1,301,995
Sterling US dollar 488,523 603,221 13-Jan-17 The Bank of New York Mellon (1,672)
Sterling US dollar 1,206,843 1,500,000 13-Jan-17 The Bank of New York Mellon (12,102)
GBP (13,774)
USD (16,945)
Net GBP 1,044,586
Net USD 1,285,050
Forward foreign currency contracts cont’d.
Unrealised
Gain/(Loss)Buy Sell Amount (B) Amount (S)
Settle
Date Counterparty
BNY Mellon Absolute Return Equity Fund USD R (Hedged) Share ClassSterling US dollar 7,256 8,882 03-Jan-17 The Bank of
New York Mellon 36
Sterling US dollar 268 328 04-Jan-17 The Bank of New York Mellon 1
Sterling US dollar 27,670 33,879 13-Jan-17 The Bank of New York Mellon 139
US dollar Sterling 57,728 46,397 13-Jan-17 The Bank of New York Mellon 515
US dollar Sterling 4,003 3,221 13-Jan-17 The Bank of New York Mellon 32
US dollar Sterling 5,207 4,217 13-Jan-17 The Bank of New York Mellon 14
US dollar Sterling 9,000 7,202 13-Jan-17 The Bank of New York Mellon 112
US dollar Sterling 55,635,468 44,172,012 13-Jan-17 The Bank of New York Mellon 1,039,057
US dollar Sterling 7,474 5,877 13-Jan-17 The Bank of New York Mellon 197
US dollar Sterling 12,643 9,985 13-Jan-17 The Bank of New York Mellon 289
GBP 1,040,392
USD 1,279,891
US dollar Sterling 33,879 27,677 03-Jan-17 The Bank of New York Mellon (138)
Sterling US dollar 9,038 11,233 13-Jan-17 The Bank of New York Mellon (91)
Sterling US dollar 59,942 74,211 13-Jan-17 The Bank of New York Mellon (364)
Sterling US dollar 66,090 81,675 13-Jan-17 The Bank of New York Mellon (282)
Sterling US dollar 97,881 123,940 13-Jan-17 The Bank of New York Mellon (2,837)
Sterling US dollar 145,738 182,125 13-Jan-17 The Bank of New York Mellon (2,263)
Sterling US dollar 322,476 401,232 13-Jan-17 The Bank of New York Mellon (3,577)
US dollar Sterling 8,882 7,254 13-Jan-17 The Bank of New York Mellon (36)
US dollar Sterling 328 268 13-Jan-17 The Bank of New York Mellon (1)
GBP (9,589)
USD (11,796)
Net GBP 1,030,803
Net USD 1,268,095

71
Portfolio of investments – as at 31 December 2016
Holdings Description
Fair
value
Total
net assets
% Holdings Description
Fair
value
Total
net assets
%
Hong Kong - 1,908,112 (31 December 2015: 4,897,523) 1,908,112 7.44
200,000 AIA Group Ltd 3.200% 11-Mar-2025 192,947 0.75
200,000 CLP Power Hong Kong Financing Ltd
3.375% 26-Oct-2027 193,896 0.76
150,000 Hutchison Whampoa International 03/33 Ltd
7.450% 24-Nov-2033 202,986 0.79
300,000 Hutchison Whampoa International 11 Ltd
4.625% 13-Jan-2022 321,873 1.26
200,000 Li & Fung Ltd 5.250% Perpetual 175,021 0.68
200,000 Swire Properties MTN Financing Ltd
4.375% 18-Jun-2022 213,017 0.83
300,000 TVB Finance Ltd 3.625% 11-Oct-2021 300,322 1.17
300,000 Wharf Finance Ltd 3.500% 23-Jan-2019 308,050 1.20
India - 2,460,279 (31 December 2015: 2,472,404) 2,460,279 9.60
200,000 Export-Import Bank of India 2.750% 12-Aug-2020 197,974 0.77
200,000 Export-Import Bank of India 3.125% 20-Jul-2021 199,213 0.78
300,000 HDFC Bank Ltd/Bahrain 3.000% 06-Mar-2018 302,132 1.18
340,000 ICICI Bank Ltd/Dubai 4.000% 18-Mar-2026 330,671 1.29
400,000 Reliance Industries Ltd 4.125% 28-Jan-2025 399,770 1.56
380,000 UPL Corp Ltd 3.250% 13-Oct-2021 370,053 1.44
200,000 Vedanta Resources Plc 8.250% 07-Jun-2021 209,100 0.82
425,000 Vedanta Resources Plc 9.500% 18-Jul-2018 451,366 1.76
Indonesia - 1,973,273 (31 December 2015: 3,994,448) 1,973,273 7.70
200,000 Indo Energy Finance II BV 6.375% 24-Jan-2023 146,625 0.57
200,000 Indonesia Government International Bond
4.350% 08-Jan-2027 200,924 0.79
500,000 Indonesia Government International Bond
4.750% 08-Jan-2026 517,392 2.02
6,840,000,000 Indonesia Treasury Bond
8.375% 15-Sep-2026 522,577 2.04
200,000 Pertamina Persero PT 6.450% 30-May-2044 203,255 0.79
200,000 Perusahaan Listrik Negara PT
5.250% 24-Oct-2042 177,500 0.69
200,000 Star Energy Geothermal Wayang Windu Ltd
6.125% 27-Mar-2020 205,000 0.80
Macau - 299,589 (31 December 2015: 182,760) 299,589 1.17
300,000 MCE Finance Ltd 5.000% 15-Feb-2021 299,589 1.17
Malaysia - 508,549 (31 December 2015: 1,854,099) 508,549 1.99
200,000 Petronas Capital Ltd 4.500% 18-Mar-2045 201,916 0.79
250,000 Petronas Capital Ltd 7.875% 22-May-2022 306,633 1.20
Mongolia - 171,505 (31 December 2015: –) 171,505 0.67
200,000 Mongolia Government International Bond
5.125% 05-Dec-2022 171,505 0.67
BNY MELLON ASIAN BOND FUND
Bonds
Bahrain - 411,000 (31 December 2015: –) 411,000 1.60
400,000 CBB International Sukuk Co SPC
5.624% 12-Feb-2024 411,000 1.60
China - 10,916,532 (31 December 2015: 13,761,317) 10,916,532 42.60
200,000 Agile Property Holdings Ltd 9.875% 20-Mar-2017 202,609 0.79
300,000 Alibaba Group Holding Ltd 3.600% 28-Nov-2024 297,542 1.16
500,000 Azure Orbit II International Finance Ltd
3.375% 25-Apr-2019 512,233 2.00
200,000 Bank of China Ltd 5.000% 13-Nov-2024 207,766 0.81
500,000 Beijing State-Owned Assets Management Hong Kong
3.000% 26-May-2020 496,663 1.94
300,000 CCBL Cayman Corp Ltd 3.250% 28-Jul-2020 301,271 1.18
500,000 China Cinda Finance 2014 Ltd
4.000% 14-May-2019 514,969 2.01
200,000 China Cinda Finance 2015 I Ltd
4.250% 23-Apr-2025 197,338 0.77
200,000 China Overseas Finance Cayman V Ltd
3.950% 15-Nov-2022 201,931 0.79
300,000 China Resources Gas Group Ltd
4.500% 05-Apr-2022 314,311 1.23
200,000 China Resources Land Ltd 6.000% 27-Feb-2024 224,067 0.87
200,000 CIFI Holdings Group Co Ltd 8.875% 27-Jan-2019 210,780 0.82
710,000 CNOOC Nexen Finance 2014 ULC
4.250% 30-Apr-2024 727,606 2.84
750,000 CNPC General Capital Ltd 2.700% 25-Nov-2019 759,457 2.96
350,000 Country Garden Holdings Co Ltd
7.500% 09-Mar-2020 373,340 1.46
200,000 CRCC Yupeng Ltd 3.950% Perpetual VAR 204,715 0.80
300,000 CRCC Yuxiang Ltd 3.500% 16-May-2023 296,669 1.16
200,000 Dianjian Haixing Ltd 4.050% Perpetual VAR 204,029 0.80
200,000 Export-Import Bank of China 2.875% 26-Apr-2026 187,933 0.73
250,000 Geely Automobile Holdings Ltd
5.250% 06-Oct-2019 259,375 1.01
500,000 Huarong Finance II Co Ltd 3.750% 19-Nov-2020 502,215 1.96
300,000 JD.com Inc 3.875% 29-Apr-2026 286,070 1.12
500,000 King Power Capital Ltd 3.875% 03-Nov-2019 513,800 2.00
450,000 KWG Property Holding Ltd 8.975% 14-Jan-2019 472,503 1.84
300,000 Longfor Properties Co Ltd 6.750% 29-Jan-2023 318,678 1.24
200,000 Shimao Property Holdings Ltd
6.625% 14-Jan-2020 207,111 0.81
200,000 Sino-Ocean Land Treasure Finance II Ltd
4.450% 04-Feb-2020 202,041 0.79
430,000 Sinopec Group Overseas Development 2015 Ltd
3.250% 28-Apr-2025 410,636 1.60
400,000 Sinopec Group Overseas Development 2016 Ltd
2.000% 29-Sep-2021 381,970 1.49
300,000 State Grid Overseas Investment 2014 Ltd
4.850% 07-May-2044 333,303 1.30
200,000 State Grid Overseas Investment 2016 Ltd
2.875% 18-May-2026 188,927 0.74
400,000 Tencent Holdings Ltd 3.800% 11-Feb-2025 404,674 1.58
Bonds cont’d.
USDUSD

72
Portfolio of investments – as at 31 December 2016
Holdings Description
Fair
value
Total
net assets
% Holdings Description
Fair
value
Total
net assets
%
BNY MELLON ASIAN BOND FUND
Philippines - 1,203,168 (31 December 2015: 2,801,341) 1,203,168 4.70
350,000 Philippine Government International Bond
3.700% 01-Mar-2041 336,026 1.31
510,000 Philippine Government International Bond
4.200% 21-Jan-2024 549,206 2.15
250,000 Power Sector Assets & Liabilities Management Corp
7.390% 02-Dec-2024 317,936 1.24
Republic of Korea - 2,570,071 (31 December 2015: 4,094,755) 2,570,071 10.03
400,000 Export-Import Bank of Korea 4.000% 14-Jan-2024 419,068 1.63
300,000 GS Caltex Corp 3.000% 18-Jun-2019 305,336 1.19
300,000 KEB Hana Bank 4.250% 14-Oct-2024 301,884 1.18
400,000 Korea Development Bank/The 2.500% 13-Jan-2021 396,575 1.55
250,000 Korea Water Resources Corp 2.000% 16-Apr-2018 250,314 0.98
300,000 NongHyup Bank 2.750% 29-Sep-2019 305,026 1.19
300,000 Shinhan Bank 2.250% 15-Apr-2020 296,362 1.16
300,000 Woori Bank 2.625% 20-Jul-2021 295,506 1.15
Saudi Arabia - 230,465 (31 December 2015: –) 230,465 0.90
240,000 Saudi Government International Bond
4.500% 26-Oct-2046 230,465 0.90
Singapore - 808,009 (31 December 2015: 1,715,567) 808,009 3.15
200,000 CMT MTN Pte Ltd 3.731% 21-Mar-2018 204,654 0.80
200,000 SingTel Group Treasury Pte Ltd
3.250% 30-Jun-2025 199,901 0.78
200,000 SP PowerAssets Ltd 3.250% 24-Nov-2025 199,466 0.78
200,000 United Overseas Bank Ltd 3.750% 19-Sep-2024 VAR 203,988 0.79
Sri Lanka - 841,564 (31 December 2015: 533,466) 841,564 3.28
55,000,000 Sri Lanka Government Bonds
11.200% 01-Sep-2023 348,540 1.36
300,000 Sri Lanka Government International Bond
5.875% 25-Jul-2022 295,806 1.15
200,000 Sri Lanka Government International Bond
6.825% 18-Jul-2026 197,218 0.77
Supranational - 322,836 (31 December 2015: –) 322,836 1.26
4,500,000,000 European Investment Bank
7.200% 09-Jul-2019 322,836 1.26
Thailand - 466,227 (31 December 2015: 1,072,398) 466,227 1.82
255,000 Krung Thai Bank PCL/Cayman Islands
5.200% 26-Dec-2024 VAR 264,595 1.03
200,000 PTT PCL 3.375% 25-Oct-2022 201,632 0.79
United States of America - 64,884 (31 December 2015: 894,464) 64,884 0.25
65,000 United States Treasury Bill 0.000% 27-Apr-2017* 64,884 0.25
Total investments in bonds 25,156,063 98.16
Underlying
exposure
USD
Open futures contracts - 7,844 (31 December 2015: 10,154)
6 U.S. 10 Year Treasury Note
Long Futures Contracts
Exp Mar-2017 743,625 3,656 0.01
(12) U.S. 2 Year Treasury Note
Short Futures Contracts
Exp Mar-2017 (2,599,500) 2,813 0.01
(7) U.S. Treasury Bond
Short Futures Contracts
Exp Mar-2017 (1,049,344) 1,375 0.01
Total open futures contracts 7,844 0.03
Unrealised gain on forward foreign currency contracts - 35,124 (see below)
(31 December 2015: –) 35,124 0.14
Total fi nancial assets at fair value through profi t or loss 25,199,031 98.33
Holdings Description
Underlying
exposure
USD
Fair
value
USD
Total
net assets
%
Open futures contracts - (14,576) (31 December 2015: –)
(5) U.S. 5 Year Treasury Note
Short Futures Contracts
Exp Mar-2017 (587,500) (2,383) (0.01)
5 U.S. Ultra Bond
Long Futures Contracts
Exp Mar-2017 796,406 (12,193) (0.05)
Total open futures contracts (14,576) (0.06)
Unrealised loss on forward foreign currency contracts - (2,855) (see below)
(31 December 2015: (8,390)) (2,855) (0.01)
Total fi nancial liabilities at fair value through profi t or loss (17,431) (0.07)
Net current assets 446,460 1.74
Total net assets 25,628,060 100.00
* Holding is held as collateral by JPMorgan Chase in respect of futures contracts held by the Fund.
The counterparty for futures contracts is JPMorgan Chase.
Analysis of portfolio % of Total assets
Transferable securities and money market instruments admitted
to offi cial stock exchange listing or traded on a regulated market 97.93
Financial derivative instruments dealt in on a regulated market 0.03
OTC fi nancial derivative instruments 0.14
Other current assets 1.90
Total assets 100.00
Bonds cont’d.
USDUSD

73
Portfolio of investments – as at 31 December 2016
BNY MELLON ASIAN BOND FUND
Forward foreign currency contracts
Unrealised
Gain/(Loss)Buy Sell Amount (B) Amount (S)
Settle
Date Counterparty
BNY Mellon Asian Bond FundIndonesian rupiah US dollar 2,827,470,000 209,489 13-Jan-17 JPMorgan Chase 264
Indonesian rupiah US dollar 4,893,000,000 358,199 13-Jan-17 Standard Chartered 4,783
Indonesian rupiah US dollar 685,000,000 50,760 13-Jan-17 Bank of America Securities Ltd 57
US dollar Indian rupee 190,018 12,800,000 13-Jan-17 JPMorgan Chase 1,598
US dollar Indonesian rupiah 370,907 4,893,000,000 13-Jan-17 JPMorgan Chase 7,924
US dollar Indonesian rupiah 1,073,016 14,193,860,000 13-Jan-17 Bank of America Securities Ltd 20,059
USD 34,685
Indian rupee US dollar 12,800,000 189,014 13-Jan-17 JPMorgan Chase (593)
Indonesian rupiah US dollar 1,369,470,000 101,812 13-Jan-17 JPMorgan Chase (219)
Indonesian rupiah US dollar 3,775,330,000 281,154 13-Jan-17 JPMorgan Chase (1,085)
US dollar Indonesian rupiah 184,502 2,500,000,000 13-Jan-17 JPMorgan Chase (958)
USD (2,855)
Net USD 31,830
BNY Mellon Asian Bond Fund EUR H (Acc) (Hedged) Share ClassEuro US dollar 391,810 413,777 13-Jan-17 The Bank of
New York Mellon 216
USD 216
EUR 205
BNY Mellon Asian Bond Fund EUR H (Inc) (Hedged) Share ClassEuro US dollar 87,435 92,337 13-Jan-17 The Bank of
New York Mellon 48
USD 48
EUR 45
BNY Mellon Asian Bond Fund EUR I (Acc) (Hedged) Share ClassEuro US dollar 79,042 83,474 13-Jan-17 The Bank of
New York Mellon 44
USD 44
EUR 42
BNY Mellon Asian Bond Fund EUR I (Inc) (Hedged) Share ClassEuro US dollar 78,642 83,052 13-Jan-17 The Bank of
New York Mellon 43
USD 43
EUR 41
Forward foreign currency contracts cont’d.
Unrealised
Gain/(Loss)Buy Sell Amount (B) Amount (S)
Settle
Date Counterparty
BNY Mellon Asian Bond Fund EUR W (Acc) (Hedged) Share ClassEuro US dollar 79,701 84,170 13-Jan-17 The Bank of
New York Mellon 44
USD 44
EUR 42
BNY Mellon Asian Bond Fund EUR W (Inc) (Hedged) Share ClassEuro US dollar 79,242 83,685 13-Jan-17 The Bank of
New York Mellon 44
USD 44
EUR 42

74
Portfolio of investments – as at 31 December 2016
Holdings Description
Fair
value
Total
net assets
% Holdings Description
Fair
value
Total
net assets
%
South Korea - 5,134,452 (31 December 2015: 3,591,395) 5,134,452 7.06
1,084 LG Household & Health Care Ltd 769,606 1.06
1,100 Samsung Biologics Co Ltd 137,750 0.19
2,149 Samsung Electronics Co Ltd 3,204,462 4.41
4,783 Samsung SDI Co Ltd 429,670 0.59
16,013 SK Hynix Inc 592,964 0.81
Taiwan - 4,200,992 (31 December 2015: 5,495,296) 4,200,992 5.77
747,000 Taiwan Semiconductor Manufacturing Co Ltd 4,200,992 5.77
Thailand - 1,848,866 (31 December 2015: 3,705,155) 1,848,866 2.54
2,872,400 Bangkok Dusit Medical Services PCL 1,848,866 2.54
United States of America - 420,397 (31 December 2015: 1,513,002) 420,397 0.58
16,166 Yum China Holdings Inc 420,397 0.58
Total investments in equities 72,330,091 99.44
Total fi nancial assets at fair value through profi t or loss 72,330,091 99.44
Unrealised loss on forward foreign currency contracts - (11) (see below)
(31 December 2015: (28)) (11) (0.00)
Total fi nancial liabilities at fair value through profi t or loss (11) (0.00)
Net current assets 404,296 0.56
Total net assets 72,734,376 100.00
* The Company is subject to trading suspension on the Hong Kong Stock Exchange.
Analysis of portfolio % of Total assets
Transferable securities and money market instruments admitted
to offi cial stock exchange listing or traded on a regulated market 99.13
Other current assets 0.87
Total assets 100.00
Forward foreign currency contractsUnrealised
Gain/(Loss)Buy Sell Amount (B) Amount (S)
Settle
Date Counterparty
BNY Mellon Asian Equity FundUS dollar Australian dollar 6,555 9,087 03-Jan-17 Barclays Bank plc (10)
Hong Kong dollar US dollar 238,725 30,787 04-Jan-17 The Bank of New York Mellon (1)
USD (11)
BNY MELLON ASIANEQUITY FUND
Equities
Australia - 10,593,554 (31 December 2015: 14,630,841) 10,593,554 14.57
22,157 CSL Ltd 1,607,647 2.21
48,428 Domino’s Pizza Enterprises Ltd 2,274,125 3.13
187,864 Insurance Australia Group Ltd 814,390 1.12
349,731 Mesoblast Ltd 364,492 0.50
443,666 MYOB Group Ltd 1,171,605 1.61
351,270 Oil Search Ltd 1,815,886 2.50
758,134 Orora Ltd 1,640,517 2.26
84,198 SEEK Ltd 904,892 1.24
China - 14,415,214 (31 December 2015: 15,002,998) 14,415,214 19.83
999,500 3SBio Inc 144A 972,491 1.34
37,669 Alibaba Group Holding Ltd ADR 3,289,445 4.52
14,744 Baidu Inc ADR 2,454,950 3.38
10,000,000 Boshiwa International Holding Ltd* 0 0.00
16,437 China Biologic Products Inc 1,773,552 2.44
133,500 China Mobile Ltd 1,414,700 1.95
22,823 Ctrip.com International Ltd ADR 912,349 1.25
147,029 Tencent Holdings Ltd 3,597,727 4.95
Hong Kong - 7,426,799 (31 December 2015: 12,314,945) 7,426,799 10.20
593,000 AIA Group Ltd 3,347,528 4.60
2,641,200 Man Wah Holdings Ltd 1,786,447 2.45
527,200 Sands China Ltd 2,292,824 3.15
India - 14,326,588 (31 December 2015: 13,967,628) 14,326,588 19.70
195,718 Apollo Hospitals Enterprise Ltd 3,405,672 4.68
64,978 Cipla Ltd 542,744 0.75
681,682 Fortis Healthcare Ltd 1,811,926 2.49
81,848 Hindustan Unilever Ltd 995,273 1.37
118,580 Indiabulls Housing Finance Ltd 1,133,516 1.56
825,249 ITC Ltd 2,928,862 4.03
159,375 LIC Housing Finance Ltd 1,307,617 1.80
28,095 Maruti Suzuki India Ltd 2,200,978 3.02
Indonesia - 1,629,793 (31 December 2015: 2,505,670) 1,629,793 2.24
2,556,900 Indofood CBP Sukses Makmur Tbk PT 1,629,793 2.24
Malaysia - 2,644,787 (31 December 2015: 3,356,236) 2,644,787 3.64
1,869,900 IHH Healthcare Bhd 2,644,787 3.64
New Zealand - 840,925 (31 December 2015: 1,295,604) 840,925 1.15
352,872 Spark New Zealand Ltd 840,925 1.15
Philippines - 8,847,724 (31 December 2015: 13,223,824) 8,847,724 12.16
11,480,200 Energy Development Corp 1,188,144 1.63
2,889,500 First Gen Corp 1,271,467 1.75
111,620 GT Capital Holdings Inc 2,861,648 3.93
245,880 Security Bank Corp 942,221 1.30
787,430 Universal Robina Corp 2,584,244 3.55
Equities cont’d.
USDUSD

75
Portfolio of investments – as at 31 December 2016
Holdings Description
Fair
value
Total
net assets
%
BNY MELLON ASIAN INCOME FUND
Collective investment schemes
United Kingdom - 17,847,250 (31 December 2015: 20,866,698) 17,847,250 99.91
8,214,697 BNY Mellon Investments Funds -
Newton Asian Income Fund 17,847,250 99.91
Total investments in collective investment schemes 17,847,250 99.91
Unrealised gain on forward foreign currency contracts - 1,627 (see below)
(31 December 2015: –) 1,627 0.01
Total fi nancial assets at fair value through profi t or loss 17,848,877 99.92
Unrealised loss on forward foreign currency contracts - (10) (see below)
(31 December 2015: –) (10) (0.00)
Total fi nancial liabilities at fair value through profi t or loss (10) (0.00)
Net current assets 14,544 0.08
Total net assets 17,863,411 100.00
Analysis of portfolio % of Total assets
Transferable securities and money market instruments admitted
to offi cial stock exchange listing or traded on a regulated market 99.74
OTC fi nancial derivative instruments 0.01
Other current assets 0.25
Total assets 100.00
Forward foreign currency contractsUnrealised
Gain/(Loss)Buy Sell Amount (B) Amount (S)
Settle
Date Counterparty
BNY Mellon Asian Income Fund EUR H (Inc) (Hedged) Share ClassEuro Sterling 961 812 13-Jan-17 The Bank of
New York Mellon 10
GBP 10
EUR 12
Sterling Euro 812 961 13-Jan-17 The Bank of New York Mellon (10)
GBP (10)
EUR (12)
Net GBP –
Net EUR –
BNY Mellon Asian Income Fund EUR J (Inc) (Hedged) Share ClassEuro Sterling 110,409 92,713 13-Jan-17 The Bank of
New York Mellon 1,617
GBP 1,617
EUR 1,893
GBP

76
Portfolio of investments – as at 31 December 2016
Holdings Description
Fair
value
Total
net assets
% Holdings Description
Fair
value
Total
net assets
%
589,351 EDP - Energias do Brasil SA 2,423,714 3.01
399,831 Eletropaulo Metropolitana Eletricidade
de Sao Paulo SA Pfd 1,386,332 1.72
143,657 Engie Brasil Energia SA 1,546,607 1.92
Total investments in equities 79,177,799 98.38
Unrealised gain on forward foreign currency contracts - 2,239 (see below)
(31 December 2015: 33) 2,239 0.00
Total fi nancial assets at fair value through profi t or loss 79,180,038 98.38
Unrealised loss on forward foreign currency contracts - (6,295) (see below)
(31 December 2015: (324)) (6,295) (0.01)
Total fi nancial liabilities at fair value through profi t or loss (6,295) (0.01)
Net current assets 1,309,022 1.63
Total net assets 80,482,765 100.00
Analysis of portfolio % of Total assets
Transferable securities and money market instruments admitted
to offi cial stock exchange listing or traded on a regulated market 92.19
OTC fi nancial derivative instruments 0.00
Other current assets 7.81
Total assets 100.00
BNY MELLON BRAZILEQUITY FUND
Equities
Basic Materials - 17,791,908 (31 December 2015: 11,164,741) 17,791,908 22.11
908,331 Gerdau SA Pfd 3,011,304 3.74
299,140 Klabin SA 1,625,431 2.02
4,193,899 Metalurgica Gerdau SA Pfd 6,178,679 7.68
1,502,163 Usinas Siderurgicas de Minas Gerais SA Pfd 1,889,992 2.35
708,540 Vale SA Pfd 5,086,502 6.32
Communications - 2,911,652 (31 December 2015: 2,138,066) 2,911,652 3.62
187,240 Telefonica Brasil SA ADR 2,504,335 3.11
30,085 Telefonica Brasil SA Pfd 407,317 0.51
Consumer, Cyclical - 3,466,556 (31 December 2015: 2,235,686) 3,466,556 4.31
355,504 B2W Cia Digital 1,116,309 1.39
354,658 Lojas Americanas SA 1,351,202 1.68
191,439 Lojas Americanas SA Pfd 999,045 1.24
Consumer, Non-cyclical - 7,679,123 (31 December 2015: 3,638,825) 7,679,123 9.54
592,200 Ambev SA ADR 2,910,663 3.62
151,216 Cia Brasileira de Distribuicao Pfd 2,542,800 3.16
1,094,238 Marfrig Global Foods SA 2,225,660 2.76
Energy - 9,887,164 (31 December 2015: 3,613,163) 9,887,164 12.28
105,164 Cosan SA Industria e Comercio 1,232,358 1.53
126,470 Petroleo Brasileiro SA ADR 1,114,833 1.39
1,224,083 Petroleo Brasileiro SA Pfd 5,588,802 6.94
94,055 Ultrapar Participacoes SA ADR 1,951,171 2.42
Financials - 21,070,221 (31 December 2015: 15,461,186) 21,070,222 26.18
96,846 Banco Bradesco SA ADR 844,013 1.05
531,850 Banco Bradesco SA Pfd 4,733,166 5.88
322,378 Banco do Brasil SA 2,779,343 3.45
439,299 BM&FBovespa SA - Bolsa de Valores
Mercadorias e Futuros 2,227,741 2.77
101,408 CETIP SA - Mercados Organizados 1,387,283 1.72
133,000 Itau Unibanco Holding SA ADR 1,367,905 1.70
328,403 Itau Unibanco Holding SA Pfd 3,416,009 4.25
1,697,070 Itausa - Investimentos Itau SA Pfd 4,314,762 5.36
Industrials - 4,560,785 (31 December 2015: 3,823,258) 4,560,785 5.67
65,000 Embraer SA ADR 1,251,575 1.56
74,078 Embraer SA 363,824 0.45
181,676 Iochpe Maxion SA 650,577 0.81
793,953 Marcopolo SA Pfd 669,617 0.83
1,637,175 Santos Brasil Participacoes SA 1,192,154 1.48
117,353 Tupy SA 433,038 0.54
Utilities - 11,810,389 (31 December 2015: 10,520,058) 11,810,389 14.67
122,629 AES Tiete Energia SA 527,862 0.66
401,386 Cia Energetica de Sao Paulo Pfd 1,661,188 2.06
396,926 Cia Paranaense de Energia ADR 3,367,917 4.19
115,799 CPFL Energia SA 896,769 1.11
Equities cont’d.
Utilities cont’d.
USDUSD

77
Portfolio of investments – as at 31 December 2016
BNY MELLON BRAZIL EQUITY FUND
Forward foreign currency contracts
Unrealised
Gain/(Loss)Buy Sell Amount (B) Amount (S)
Settle
Date Counterparty
BNY Mellon Brazil Equity Fund EUR H (Hedged) Share ClassEuro US dollar 13,787 14,427 13-Jan-17 The Bank of
New York Mellon 94
Euro US dollar 200,000 209,348 13-Jan-17 The Bank of New York Mellon 1,298
Euro US dollar 3,000 3,147 13-Jan-17 The Bank of New York Mellon 12
Euro US dollar 9,480 9,867 13-Jan-17 The Bank of New York Mellon 118
Euro US dollar 3,500 3,645 13-Jan-17 The Bank of New York Mellon 41
Euro US dollar 2,500 2,613 13-Jan-17 The Bank of New York Mellon 21
US dollar Euro 167,454 158,823 13-Jan-17 The Bank of New York Mellon 177
US dollar Euro 16,039 15,051 13-Jan-17 The Bank of New York Mellon 187
US dollar Euro 21,346 20,063 13-Jan-17 The Bank of New York Mellon 215
US dollar Euro 3,140 2,969 13-Jan-17 The Bank of New York Mellon 13
US dollar Euro 5,507 5,169 13-Jan-17 The Bank of New York Mellon 63
USD 2,239
EUR 2,127
US dollar Euro 3,643 3,500 03-Jan-17 The Bank of New York Mellon (41)
US dollar Euro 3,145 3,000 04-Jan-17 The Bank of New York Mellon (13)
Euro US dollar 764,564 808,639 13-Jan-17 The Bank of New York Mellon (3,375)
Euro US dollar 7,800 8,224 13-Jan-17 The Bank of New York Mellon (9)
US dollar Euro 146,513 140,643 13-Jan-17 The Bank of New York Mellon (1,617)
US dollar Euro 2,832 2,708 13-Jan-17 The Bank of New York Mellon (20)
US dollar Euro 101,298 97,105 13-Jan-17 The Bank of New York Mellon (976)
US dollar Euro 27,669 26,503 13-Jan-17 The Bank of New York Mellon (244)
USD (6,295)
EUR (5,980)
Net USD (4,056)
Net EUR (3,853)

78
Portfolio of investments – as at 31 December 2016
Holdings Description
Fair
value
Total
net assets
%
7 CAC 40 10 Euro Index
Long Futures Contracts
Exp Jan-2017 358,333 6,222 0.04
3 DAX Index
Long Futures Contracts
Exp Mar-2017 905,148 16,909 0.10
7 Euro STOXX 50 Index
Long Futures Contracts
Exp Mar-2017 241,468 21,871 0.13
17 FTSE 100 Index
Long Futures Contracts
Exp Mar-2017 1,477,032 43,295 0.26
3 FTSE MIB Index
Long Futures Contracts
Exp Mar-2017 303,242 7,591 0.04
2 IBEX 35 Index
Long Futures Contracts
Exp Jan-2017 196,075 1,033 0.01
3 Nikkei 225 Dividend Index
Long Futures Contracts
Exp Mar-2017 244,749 9,232 0.05
60 SFE 10 Year Australian Treasury Bond
Long Futures Contracts
Exp Mar-2017 5,531,125 31,833 0.19
8 SPI 200 Index
Long Futures Contracts
Exp Mar-2017 812,722 16,331 0.10
3 Swiss Market Index
Long Futures Contracts
Exp Mar-2017 240,784 4,793 0.03
12 TOPIX Index
Long Futures Contracts
Exp Mar-2017 1,558,588 23,214 0.14
48 U.S. 10 Year Treasury Note
Long Futures Contracts
Exp Mar-2017 5,965,500 22,802 0.14
Total open futures contracts 207,249 1.24
Unrealised gain on forward foreign currency contracts - 143,580 (see below)
(31 December 2015: 78,267) 143,580 0.85
Total fi nancial assets at fair value through profi t or loss 15,350,088 91.11
Holdings Description
Underlying
exposure
USD
Fair
value
USD
Total
net assets
%
Open futures contracts - (148,319) (31 December 2015: (98,006))
17 Canadian 10 Year Treasury Bond
Long Futures Contracts
Exp Mar-2017 1,741,340 (5,132) (0.03)
37 E-mini S&P 500 Index
Long Futures Contracts
Exp Mar-2017 4,136,970 (22,279) (0.13)
BNY MELLON DYNAMIC TOTAL RETURN FUND
Collective investment schemes
Ireland - 784,110 (31 December 2015: 541,086) 784,110 4.66
3,946 iShares $ TIPS UCITS ETF 784,110 4.66
United States of America - 785,534 (31 December 2015: 495,014) 785,534 4.66
28,374 SPDR Barclays Short Term High Yield Bond ETF 785,534 4.66
Total investments in collective investment schemes 1,569,644 9.32
Bonds
United States of America - 11,893,885 (31 December 2015: 9,906,592) 11,893,885 70.60
1,869,000 United States Treasury Bill
0.000% 26-Jan-2017 1,868,509 11.09
1,124,000 United States Treasury Bill
0.000% 09-Feb-2017 1,123,489 6.67
1,124,000 United States Treasury Bill
0.000% 16-Feb-2017 1,123,402 6.67
1,141,000 United States Treasury Bill
0.000% 23-Feb-2017 1,140,247 6.77
1,370,000 United States Treasury Bill
0.000% 02-Mar-2017 1,368,952 8.13
1,370,000 United States Treasury Bill
0.000% 09-Mar-2017 1,368,834 8.12
755,000 United States Treasury Bill 0.000% 16-Mar-2017* 754,253 4.48
1,308,000 United States Treasury Bill
0.000% 06-Apr-2017 1,306,237 7.75
854,000 United States Treasury Bill 0.000% 20-Apr-2017 852,645 5.06
989,000 United States Treasury Bill 0.000% 27-Apr-2017 987,317 5.86
Total investments in bonds 11,893,885 70.60
Future options - 1,499,853 (31 December 2015: –)
13 Euro-Bund Future Put 24-Feb-2017 177.000 175,845 1.04
18 Nikkei Index Future Put 10-Mar-2017 16,500.000 9,164 0.05
99 U.S. 10 Year Treasury Note Future Call
24-Feb-2017 111.000 1,314,844 7.80
Total future options 1,499,853 8.89
Index options - 35,877 (31 December 2015: 70,445)
27 E-mini S&P 500 Index Put 17-Mar-2017 2,050.000 21,600 0.13
99 Euro STOXX 50 Index Put 17-Mar-2017 2,750.000 14,277 0.08
Total index options 35,877 0.21
Holdings Description
Underlying
exposure
USD
Fair
value
USD
Total
net assets
%
Open futures contracts - 207,249 (31 December 2015: 80,738)
1 AEX Index
Long Futures Contracts
Exp Jan-2017 101,707 2,123 0.01
Holdings Description
Underlying
exposure
USD
Fair
value
USD
Total
net assets
%
Open futures contracts cont’d.
USD

79
Portfolio of investments – as at 31 December 2016
Holdings Description
Fair
value
Total
net assets
%
BNY MELLON DYNAMIC TOTAL RETURN FUND
(20) Euro-Bund
Short Futures Contracts
Exp Mar-2017 (3,455,851) (47,716) (0.28)
1 S&P TSX 60 Index
Long Futures Contracts
Exp Mar-2017 133,601 (44) (0.00)
(26) UK Long Gilt
Short Futures Contracts
Exp Mar-2017 (4,031,897) (73,148) (0.44)
Total open futures contracts (148,319) (0.88)
Unrealised loss on forward foreign currency contracts - (92,633) (see below)
(31 December 2015: (23,379)) (92,633) (0.55)
Total fi nancial liabilities at fair value through profi t or loss (240,952) (1.43)
Net current assets 1,737,803 10.32
Total net assets 16,846,939 100.00
* Held as collateral by JPMorgan Chase in respect of futures contracts, future options and index options held
by the Fund.
The counterparty for future options is JPMorgan Chase.
The counterparty for index options is JPMorgan Chase.
The counterparty for futures contracts is JPMorgan Chase.
Analysis of portfolio % of Total assets
Transferable securities and money market instruments admitted
to offi cial stock exchange listing or traded on a regulated market 77.30
Financial derivative instruments dealt in on a regulated market 10.01
OTC fi nancial derivative instruments 0.82
Other current assets 11.87
Total assets 100.00
Forward foreign currency contracts
Unrealised
Gain/(Loss)Buy Sell Amount (B) Amount (S)
Settle
Date Counterparty
BNY Mellon Dynamic Total Return FundAustralian dollar US dollar 454,000 325,092 15-Mar-17 Morgan Stanley 1,969
Euro US dollar 32,256 33,837 15-Mar-17 Nomura 239
Euro US dollar 84,840 89,000 15-Mar-17 Nomura 628
Euro US dollar 50,904 53,337 15-Mar-17 Credit Suisse 439
Japanese yen US dollar 13,317,860 113,816 15-Mar-17 Nomura 538
Japanese yen US dollar 5,063,424 43,273 15-Mar-17 Nomura 205
Japanese yen US dollar 7,990,716 68,158 15-Mar-17 Credit Suisse 455
Norwegian krone US dollar 1,145,000 131,937 15-Mar-17 The Bank of New York Mellon 720
Swedish krona US dollar 731,245 80,131 15-Mar-17 Goldman Sachs 471
Swedish krona US dollar 1,479,000 162,032 15-Mar-17 Nomura 992
Swedish krona US dollar 9,070 993 15-Mar-17 BNP Paribas 6
Swedish krona US dollar 513,000 56,220 15-Mar-17 Credit Suisse 326
Swiss franc US dollar 157,000 152,954 15-Mar-17 Morgan Stanley 1,913
Swiss franc US dollar 102,000 99,894 15-Mar-17 The Bank of New York Mellon 720
Swiss franc US dollar 94,000 91,809 15-Mar-17 The Bank of New York Mellon 913
US dollar Australian dollar 6,000 8,000 15-Mar-17 Nomura 237
US dollar Australian dollar 96,446 128,589 15-Mar-17 The Bank of New York Mellon 3,811
US dollar Canadian dollar 238,394 313,000 15-Mar-17 Nomura 5,077
US dollar Canadian dollar 204,918 268,965 15-Mar-17 Morgan Stanley 4,425
US dollar Canadian dollar 1,276 1,675 15-Mar-17 BNP Paribas 27
US dollar Euro 1,037,335 972,289 15-Mar-17 Nomura 10,183
US dollar Euro 990,279 925,192 15-Mar-17 The Bank of New York Mellon 12,881
US dollar Euro 511,117 479,000 15-Mar-17 The Bank of New York Mellon 5,088
US dollar Euro 282,647 263,895 15-Mar-17 Citigroup 3,862
US dollar Japanese yen 288,779 33,079,900 15-Mar-17 Goldman Sachs 4,737
US dollar Japanese yen 413,028 47,333,000 15-Mar-17 Nomura 6,601
US dollar New Zealand dollar 138,923 193,000 15-Mar-17 The Bank of New York Mellon 5,131
US dollar Norwegian krone 247,518 2,084,000 15-Mar-17 The Bank of New York Mellon 6,071
US dollar Sterling 43,116 34,752 15-Mar-17 Nomura 211
US dollar Sterling 523,975 411,513 15-Mar-17 Nomura 15,921
US dollar Sterling 231,099 181,478 15-Mar-17 The Bank of New York Mellon 7,046
US dollar Sterling 1,674 1,315 15-Mar-17 BNP Paribas 51
US dollar Sterling 113,404 91,405 15-Mar-17 Nomura 555
US dollar Sterling 1,051,200 828,440 15-Mar-17 Morgan Stanley 28,408
US dollar Sterling 250,019 196,400 15-Mar-17 Goldman Sachs 7,544
US dollar Sterling 203,326 163,000 15-Mar-17 The Bank of New York Mellon 2,086
US dollar Sterling 67,952 54,843 15-Mar-17 Credit Suisse 242
US dollar Sterling 232,486 186,000 15-Mar-17 The Bank of New York Mellon 2,851
USD 143,580
Underlying
exposure
USD
Open futures contracts cont’d.
USD

80
Portfolio of investments – as at 31 December 2016
BNY MELLON DYNAMIC TOTAL RETURN FUND
Forward foreign currency contracts cont’d.
Unrealised
Gain/(Loss)Buy Sell Amount (B) Amount (S)
Settle
Date Counterparty
BNY Mellon Dynamic Total Return Fund cont’d.
Euro US dollar 800 844 03-Jan-17 Standard Chartered (2)
Australian dollar US dollar 264,115 191,291 15-Mar-17 Nomura (1,023)
Australian dollar US dollar 158,469 114,693 15-Mar-17 Credit Suisse (532)
Australian dollar US dollar 100,416 72,728 15-Mar-17 Nomura (389)
Canadian dollar US dollar 113,000 86,283 15-Mar-17 The Bank of New York Mellon (2,050)
Japanese yen US dollar 19,159,000 167,399 15-Mar-17 The Bank of New York Mellon (2,889)
New Zealand dollar US dollar 376,151 270,122 15-Mar-17 Goldman Sachs (9,365)
New Zealand dollar US dollar 140,000 98,323 15-Mar-17 The Bank of New York Mellon (1,272)
New Zealand dollar US dollar 165,000 114,425 15-Mar-17 The Bank of New York Mellon (43)
New Zealand dollar US dollar 58,000 41,654 15-Mar-17 Credit Suisse (1,447)
New Zealand dollar US dollar 797,489 572,725 15-Mar-17 Standard Chartered (19,888)
New Zealand dollar US dollar 237,000 170,119 15-Mar-17 RBC Capital Markets (5,825)
New Zealand dollar US dollar 23,000 16,517 15-Mar-17 Citigroup (573)
Norwegian krone US dollar 2,936,083 348,246 15-Mar-17 Morgan Stanley (8,078)
Norwegian krone US dollar 1,326,494 157,357 15-Mar-17 Goldman Sachs (3,673)
Norwegian krone US dollar 339,000 40,217 15-Mar-17 Credit Suisse (942)
Norwegian krone US dollar 2,550,950 302,582 15-Mar-17 Standard Chartered (7,036)
Swiss franc US dollar 190,233 189,485 15-Mar-17 The Bank of New York Mellon (1,837)
Swiss franc US dollar 232,000 231,043 15-Mar-17 Nomura (2,197)
Swiss franc US dollar 207,097 206,310 15-Mar-17 The Bank of New York Mellon (2,028)
Swiss franc US dollar 341,374 340,075 15-Mar-17 Morgan Stanley (3,340)
US dollar Canadian dollar 418,028 567,000 15-Mar-17 Morgan Stanley (4,627)
US dollar Euro 332,148 317,000 15-Mar-17 The Bank of New York Mellon (2,740)
US dollar Euro 270,074 258,000 15-Mar-17 The Bank of New York Mellon (2,484)
US dollar Japanese yen 134,091 15,715,000 15-Mar-17 Morgan Stanley (847)
US dollar Japanese yen 116,632 13,708,000 15-Mar-17 The Bank of New York Mellon (1,072)
US dollar Norwegian krone 53,233 460,560 15-Mar-17 Nomura (126)
US dollar Norwegian krone 31,870 276,336 15-Mar-17 Credit Suisse (146)
US dollar Norwegian krone 20,239 175,104 15-Mar-17 Nomura (48)
US dollar Swiss franc 100,049 102,010 15-Mar-17 Nomura (575)
US dollar Swiss franc 38,038 38,784 15-Mar-17 Nomura (219)
US dollar Swiss franc 59,976 61,206 15-Mar-17 Credit Suisse (398)
USD (87,711)
Net USD 55,869
BNY Mellon Dynamic Total Return Fund EUR H (Acc) (Hedged) Share ClassEuro US dollar 99,503 105,239 13-Jan-17 The Bank of
New York Mellon (439)
USD (439)
EUR (417)
Forward foreign currency contracts cont’d.
Unrealised
Gain/(Loss)Buy Sell Amount (B) Amount (S)
Settle
Date Counterparty
BNY Mellon Dynamic Total Return Fund EUR I (Acc) (Hedged) Share ClassEuro US dollar 85,841 90,789 13-Jan-17 The Bank of
New York Mellon (379)
USD (379)
EUR (360)
BNY Mellon Dynamic Total Return Fund EUR W (Acc) (Hedged) Share ClassEuro US dollar 86,173 91,140 13-Jan-17 The Bank of
New York Mellon (380)
USD (380)
EUR (361)
BNY Mellon Dynamic Total Return Fund EUR W (Inc) (Hedged) Share ClassEuro US dollar 86,173 91,140 13-Jan-17 The Bank of
New York Mellon (380)
USD (380)
EUR (361)
BNY Mellon Dynamic Total Return Fund Sterling W (Acc) (Hedged) Share ClassSterling US dollar 61,616 77,629 13-Jan-17 The Bank of
New York Mellon (1,672)
USD (1,672)
GBP (1,357)
BNY Mellon Dynamic Total Return Fund Sterling W (Inc) (Hedged) Share ClassSterling US dollar 61,616 77,629 13-Jan-17 The Bank of
New York Mellon (1,672)
USD (1,672)
GBP (1,357)

81
Portfolio of investments – as at 31 December 2016
Holdings Description
Fair
value
Total
net assets
% Holdings Description
Fair
value
Total
net assets
%
Collective investment schemes
Supranational - 13,406,035 (31 December 2015: 9,065,938) 13,406,035 7.64
13,406,035 Insight Liquidity Funds Plc - USD Liquidity Fund 13,406,035 7.64
Total investments in collective investment schemes 13,406,035 7.64
Bonds
Argentina - 7,450,924 (31 December 2015: 933,750) 7,450,924 4.25
47,500,000 Banco Hipotecario SA 24.729% 12-Jan-2020 FRN 3,015,049 1.72
2,900,000 Banco Macro SA 6.750% 04-Nov-2026 VAR 2,755,000 1.57
1,700,000 Petrobras Argentina SA 7.375% 21-Jul-2023 1,680,875 0.96
Azerbaijan - 540,675 (31 December 2015: 3,291,873) 540,675 0.31
500,000 Southern Gas Corridor CJSC
6.875% 24-Mar-2026 540,675 0.31
Brazil - 18,464,448 (31 December 2015: 5,038,848) 18,464,448 10.52
2,100,000 Banco do Brasil SA/Cayman
9.000% Perpetual VAR 1,990,800 1.13
2,700,000 GTL Trade Finance Inc 5.893% 29-Apr-2024 2,712,150 1.54
3,400,000 JBS Investments GmbH 7.250% 03-Apr-2024 3,590,400 2.05
3,100,000 Marfrig Holdings Europe BV
8.000% 08-Jun-2023 3,215,723 1.83
2,250,000 Petrobras Global Finance BV
8.375% 23-May-2021 2,430,000 1.39
1,100,000 Petrobras Global Finance BV
8.750% 23-May-2026 1,189,375 0.68
3,200,000 Vale Overseas Ltd 6.250% 10-Aug-2026 3,336,000 1.90
Chile - 6,137,895 (31 December 2015: 2,927,333) 6,137,895 3.50
2,850,000 Cencosud SA 5.500% 20-Jan-2021 3,068,140 1.75
3,250,000 Transelec SA 3.875% 12-Jan-2029 3,069,755 1.75
China - 10,249,771 (31 December 2015: 9,186,303) 10,249,771 5.85
1,700,000 361 Degrees International Ltd
7.250% 03-Jun-2021 1,814,391 1.04
4,000,000 Baidu Inc 3.500% 28-Nov-2022 4,017,892 2.29
1,860,000 CITIC Ltd 6.800% 17-Jan-2023 2,160,544 1.23
2,000,000 Franshion Development Ltd 6.750% 15-Apr-2021 2,256,944 1.29
Colombia - 4,962,730 (31 December 2015: 3,122,250) 4,962,730 2.83
900,000 Ecopetrol SA 5.375% 26-Jun-2026 897,750 0.51
3,000,000 Ecopetrol SA 5.875% 18-Sep-2023 3,187,500 1.82
1,000,000 Ecopetrol SA 5.875% 28-May-2045 877,480 0.50
Costa Rica - 4,552,500 (31 December 2015: –) 4,552,500 2.59
3,000,000 Banco Nacional de Costa Rica
5.875% 25-Apr-2021 3,041,250 1.73
1,500,000 Banco Nacional de Costa Rica
6.250% 01-Nov-2023 1,511,250 0.86
Cote d’Ivoire - 1,702,837 (31 December 2015: –) 1,702,837 0.97
1,831,500 Cote d’Ivoire Government International Bond
5.750% 31-Dec-2032 1,702,837 0.97
Guatemala - 4,050,000 (31 December 2015: –) 4,050,000 2.31
4,000,000 Comcel Trust via Comunicaciones Celulares SA
6.875% 02-Oct-2020 4,050,000 2.31
Hong Kong - 1,899,956 (31 December 2015: –) 1,899,956 1.08
1,700,000 Shimao Property Holdings Ltd
8.375% 10-Feb-2022 1,899,956 1.08
India - 11,602,778 (31 December 2015: 4,424,269) 11,602,778 6.61
2,300,000 Bharti Airtel International Netherlands BV
5.125% 11-Mar-2023 2,404,176 1.37
4,500,000 ONGC Videsh Vankorneft Pte Ltd
3.750% 27-Jul-2026 4,284,752 2.44
4,700,000 Vedanta Resources Plc 8.250% 07-Jun-2021 4,913,850 2.80
Indonesia - 3,897,388 (31 December 2015: 5,240,143) 3,897,388 2.22
2,900,000 Pertamina Persero PT 4.300% 20-May-2023 2,895,180 1.65
1,000,000 TBG Global Pte Ltd 5.250% 10-Feb-2022 1,002,208 0.57
Israel - 6,859,707 (31 December 2015: 3,750,222) 6,859,707 3.91
3,700,000 Teva Pharmaceutical Finance Netherlands III BV
2.200% 21-Jul-2021 3,537,485 2.02
3,609,000 Teva Pharmaceutical Finance Netherlands III BV
3.150% 01-Oct-2026 3,322,222 1.89
Jamaica - 3,266,751 (31 December 2015: 2,514,375) 3,266,751 1.86
2,200,000 Digicel Group Ltd 8.250% 30-Sep-2020 1,906,806 1.09
1,500,000 Digicel Ltd 144A 6.750% 01-Mar-2023 1,359,945 0.77
Mexico - 15,695,006 (31 December 2015: 9,863,637) 15,695,006 8.95
4,050,000 Alpek SAB de CV 4.500% 20-Nov-2022 4,041,900 2.31
4,200,000 Cemex SAB de CV 6.125% 05-May-2025 4,305,000 2.45
1,400,000 Cemex SAB de CV 7.250% 15-Jan-2021 1,494,500 0.85
800,000 Comision Federal de Electricidad
4.750% 23-Feb-2027 769,016 0.44
1,700,000 El Puerto de Liverpool SAB de CV
3.950% 02-Oct-2024 1,619,250 0.92
500,000 Petroleos Mexicanos 4.250% 15-Jan-2025 456,000 0.26
1,700,000 Petroleos Mexicanos 6.500% 13-Mar-2027 1,749,725 1.00
1,190,000 Petroleos Mexicanos 6.875% 04-Aug-2026 1,259,615 0.72
Morocco - 2,438,439 (31 December 2015: 3,927,925) 2,438,439 1.39
1,600,000 OCP SA 4.500% 22-Oct-2025 1,530,080 0.87
900,000 OCP SA 6.875% 25-Apr-2044 908,359 0.52
BNY MELLON EMERGING MARKETS CORPORATE DEBT FUND
Bonds cont’d.
USDUSD

82
Portfolio of investments – as at 31 December 2016
Holdings Description
Fair
value
Total
net assets
% Holdings Description
Fair
value
Total
net assets
%
BNY MELLON EMERGING MARKETS CORPORATE DEBT FUND
Underlying
exposure
USD
Open futures contracts - 6,530 (31 December 2015: –)
(28) U.S. 10 Year Treasury Note
Short Futures Contracts
Exp Mar-2017 (3,470,250) 6,530 0.00
Total open futures contracts 6,530 0.00
Unrealised gain on forward foreign currency contracts - 70,565 (see below)
(31 December 2015: 18,760) 70,565 0.04
Total fi nancial assets at fair value through profi t or loss 170,592,726 97.23
Unrealised loss on forward foreign currency contracts - (41,868) (see below)
(31 December 2015: (163,458)) (41,868) (0.02)
Total fi nancial liabilities at fair value through profi t or loss (41,868) (0.02)
Net current assets 4,885,815 2.79
Total net assets 175,436,673 100.00
The counterparty for futures contracts is Goldman Sachs.
Analysis of portfolio % of Total assets
Transferable securities and money market instruments admitted
to offi cial stock exchange listing or traded on a regulated market 97.07
Financial derivative instruments dealt in on a regulated market 0.00
OTC fi nancial derivative instruments 0.04
Other current assets 2.89
Total assets 100.00
Netherlands - 6,075,441 (31 December 2015: –) 6,075,441 3.46
4,200,000 GTH Finance BV 7.250% 26-Apr-2023 4,517,016 2.57
1,500,000 VimpelCom Holdings BV 5.950% 13-Feb-2023 1,558,425 0.89
Peru - 6,755,426 (31 December 2015: 5,333,642) 6,755,426 3.85
1,700,000 Cementos Pacasmayo SAA 4.500% 08-Feb-2023 1,708,500 0.97
2,600,000 Kallpa Generacion SA 4.875% 24-May-2026 2,632,500 1.50
2,429,000 Volcan Cia Minera SAA 5.375% 02-Feb-2022 2,414,426 1.38
Poland - 2,233,944 (31 December 2015: –) 2,233,944 1.27
2,106,000 mFinance France SA 1.398% 26-Sep-2020 2,233,944 1.27
Russia - 10,990,021 (31 December 2015: 9,859,127) 10,990,021 6.27
1,000,000 Alfa Bank AO Via Alfa Bond Issuance Plc
7.500% 26-Sep-2019 1,083,225 0.62
1,550,000 Alfa Bank AO Via Alfa Bond Issuance Plc
8.000% Perpetual VAR 1,598,670 0.91
1,000,000 Evraz Group SA 8.250% 28-Jan-2021 1,101,300 0.63
1,200,000 Gazprom OAO Via Gaz Capital SA
4.950% 19-Jul-2022 1,237,440 0.71
600,000 Lukoil International Finance BV
3.416% 24-Apr-2018 607,382 0.35
1,550,000 Sberbank of Russia Via SB Capital SA
5.500% 26-Feb-2024 VAR 1,572,901 0.90
1,700,000 Sberbank of Russia Via SB Capital SA
6.125% 07-Feb-2022 1,850,323 1.05
1,800,000 Severstal OAO Via Steel Capital SA
5.900% 17-Oct-2022 1,938,780 1.10
South Africa - 5,148,000 (31 December 2015: 1,714,625) 5,148,000 2.93
5,200,000 MTN Mauritius Investment Ltd
6.500% 13-Oct-2026 5,148,000 2.93
Thailand - 6,546,721 (31 December 2015: 3,178,963) 6,546,721 3.73
6,300,000 PTT Global Chemical PCL 4.250% 19-Sep-2022 6,546,721 3.73
Turkey - 7,537,981 (31 December 2015: 2,899,631) 7,537,981 4.30
4,000,000 Akbank TAS 6.500% 09-Mar-2018 4,119,676 2.35
3,300,000 Finansbank AS 6.250% 30-Apr-2019 3,418,305 1.95
Ukraine - 1,732,500 (31 December 2015: –) 1,732,500 0.99
1,800,000 Ukraine Government International Bond
7.750% 01-Sep-2023 1,732,500 0.99
United Arab Emirates - 6,317,757 (31 December 2015: 1,492,599) 6,317,757 3.60
4,250,000 DP World Crescent Ltd 3.908% 31-May-2023 4,247,471 2.42
2,000,000 MAF Global Securities Ltd 4.750% 07-May-2024 2,070,286 1.18
Total investments in bonds 157,109,596 89.55
Bonds cont’d.
USDUSD

83
Portfolio of investments – as at 31 December 2016
BNY MELLON EMERGING MARKETS CORPORATE DEBT FUND
Forward foreign currency contracts cont’d.
Unrealised
Gain/(Loss)Buy Sell Amount (B) Amount (S)
Settle
Date Counterparty
BNY Mellon Emerging Markets Corporate Debt Fund EUR H (Hedged) Share Class cont’d.
Euro US dollar 16,500 17,532 13-Jan-17 The Bank of New York Mellon (98)
US dollar Euro 20,357 19,278 13-Jan-17 The Bank of New York Mellon (12)
US dollar Euro 7,617 7,279 13-Jan-17 The Bank of New York Mellon (74)
USD (4,323)
EUR (4,094)
Net USD 14,420
Net EUR 13,655
BNY Mellon Emerging Markets Corporate Debt Fund EUR I (Hedged) Share ClassEuro US dollar 2,088,591 2,205,691 13-Jan-17 The Bank of
New York Mellon 1,152
USD 1,152
EUR 1,091
BNY Mellon Emerging Markets Corporate Debt Fund Sterling W (Acc) (Hedged) Share ClassSterling US dollar 1,000 1,226 13-Jan-17 The Bank of
New York Mellon 5
USD 5
GBP 4
US dollar Sterling 1,226 1,000 04-Jan-17 The Bank of New York Mellon (5)
Sterling US dollar 479,202 603,796 13-Jan-17 The Bank of New York Mellon (14,103)
Sterling US dollar 5,656 6,990 13-Jan-17 The Bank of New York Mellon (30)
USD (14,138)
GBP (11,492)
Net USD (14,133)
Net GBP (11,488)
Forward foreign currency contracts
Unrealised
Gain/(Loss)Buy Sell Amount (B) Amount (S)
Settle
Date Counterparty
BNY Mellon Emerging Markets Corporate Debt FundEuro US dollar 1,000,000 1,048,034 13-Jan-17 RBC Capital
Markets 8,584
US dollar Euro 3,083,063 2,894,642 13-Jan-17 HSBC Bank Plc 24,532
US dollar Euro 1,908,895 1,790,000 13-Jan-17 Citigroup Funding Inc 17,549
USD 50,665
Euro US dollar 1,500,000 1,601,861 13-Jan-17 HSBC Bank Plc (16,933)
US dollar Euro 417,356 400,000 13-Jan-17 HSBC Bank Plc (5,291)
USD (22,224)
Net USD 28,441
BNY Mellon Emerging Markets Corporate Debt Fund CHF W (Acc) (Hedged) Share ClassSwiss franc US dollar 1,636,447 1,610,019 13-Jan-17 The Bank of
New York Mellon (1,183)
USD (1,183)
CHF (1,204)
BNY Mellon Emerging Markets Corporate Debt Fund EUR H (Hedged) Share ClassEuro US dollar 82,129 85,712 13-Jan-17 The Bank of
New York Mellon 1,067
Euro US dollar 5,047 5,280 13-Jan-17 The Bank of New York Mellon 52
Euro US dollar 230,650 241,300 13-Jan-17 The Bank of New York Mellon 2,409
Euro US dollar 75,814 79,336 13-Jan-17 The Bank of New York Mellon 770
Euro US dollar 30,021 31,291 13-Jan-17 The Bank of New York Mellon 430
Euro US dollar 225,228 235,728 13-Jan-17 The Bank of New York Mellon 2,252
Euro US dollar 9,368,670 9,893,937 13-Jan-17 The Bank of New York Mellon 5,170
Euro US dollar 35,450 36,856 13-Jan-17 The Bank of New York Mellon 600
Euro US dollar 24,005 25,075 13-Jan-17 The Bank of New York Mellon 290
US dollar Euro 26,142 24,508 13-Jan-17 The Bank of New York Mellon 247
US dollar Euro 977,648 920,097 13-Jan-17 The Bank of New York Mellon 5,456
USD 18,743
EUR 17,749
US dollar Euro 85,654 82,129 03-Jan-17 The Bank of New York Mellon (1,075)
US dollar Euro 241,157 230,650 04-Jan-17 The Bank of New York Mellon (2,423)
Euro US dollar 10,333 11,022 13-Jan-17 The Bank of New York Mellon (104)
Euro US dollar 17,975 19,046 13-Jan-17 The Bank of New York Mellon (53)
Euro US dollar 81,630 86,736 13-Jan-17 The Bank of New York Mellon (484)

84
Portfolio of investments – as at 31 December 2016
Holdings Description
Fair
value
Total
net assets
% Holdings Description
Fair
value
Total
net assets
%
BNY MELLON EMERGING MARKETS DEBT FUND
Bonds
Argentina - 1,838,099 (31 December 2015: 2,733,644) 1,838,099 2.98
1,040,000 Argentine Republic Government International Bond
7.500% 22-Apr-2026 1,094,600 1.77
182,265 Argentine Republic Government International Bond
8.280% 31-Dec-2033 194,568 0.32
390,000 Provincia de Buenos Aires 9.125% 16-Mar-2024 425,295 0.69
115,000 YPF SA 8.500% 23-Mar-2021 123,636 0.20
Bahrain - 1,869,354 (31 December 2015: –) 1,869,354 3.03
1,100,000 Bahrain Government International Bond
6.000% 19-Sep-2044 902,550 1.46
925,000 Bahrain Government International Bond
7.000% 26-Jan-2026 966,804 1.57
Brazil - 2,715,867 (31 December 2015: 4,561,937) 2,715,867 4.40
590,000 Banco Nacional de Desenvolvimento Economico
e Social 5.750% 26-Sep-2023 594,561 0.96
420,000 Cosan Luxembourg SA 7.000% 20-Jan-2027 421,050 0.68
450,000 Odebrecht Finance Ltd 5.250% 27-Jun-2029 263,250 0.43
255,000 Petrobras Global Finance BV 4.375% 20-May-2023 223,431 0.36
435,000 Petrobras Global Finance BV 6.750% 27-Jan-2041 367,575 0.60
325,000 Petrobras Global Finance BV 8.375% 23-May-2021 351,000 0.57
500,000 Vale Overseas Ltd 6.875% 21-Nov-2036 495,000 0.80
Chile - 1,532,085 (31 December 2015: 1,393,154) 1,532,085 2.49
670,000 Corp Nacional del Cobre de Chile
3.000% 17-Jul-2022 650,077 1.05
440,000 Transelec SA 3.875% 12-Jan-2029 416,258 0.68
450,000 VTR Finance BV 6.875% 15-Jan-2024 465,750 0.76
China - 950,394 (31 December 2015: 2,638,843) 950,394 1.54
180,000 Sinochem Overseas Capital Co Ltd
4.500% 12-Nov-2020 188,453 0.31
400,000 Sinopec Group Overseas Development 2015 Ltd
3.250% 28-Apr-2025 384,197 0.62
340,000 State Grid Overseas Investment 2014 Ltd
4.850% 07-May-2044 377,744 0.61
Colombia - 1,605,167 (31 December 2015: 1,766,512) 1,605,167 2.60
290,000 Colombia Government International Bond
5.000% 15-Jun-2045 276,587 0.45
770,000 Ecopetrol SA 5.375% 26-Jun-2026 768,075 1.24
645,000 Ecopetrol SA 5.875% 28-May-2045 560,505 0.91
Cote d’Ivoire - 1,368,416 (31 December 2015: 1,441,388) 1,368,416 2.22
530,000 Cote d’Ivoire Government International Bond
5.375% 23-Jul-2024 512,775 0.83
920,700 Cote d’Ivoire Government International Bond
5.750% 31-Dec-2032 855,641 1.39
Dominican Republic - 294,413 (31 December 2015: 2,394,250) 294,413 0.48
310,000 Dominican Republic International Bond
6.850% 27-Jan-2045 294,413 0.48
Ecuador - 445,875 (31 December 2015: –) 445,875 0.72
410,000 Ecuador Government International Bond
10.750% 28-Mar-2022 445,875 0.72
El Salvador - 174,813 (31 December 2015: 1,054,725) 174,813 0.28
190,000 El Salvador Government International Bond
5.875% 30-Jan-2025 174,813 0.28
Georgia - 577,762 (31 December 2015: 793,447) 577,762 0.94
540,000 Georgian Railway JSC 7.750% 11-Jul-2022 577,762 0.94
Hungary - 1,022,212 (31 December 2015: 2,645,219) 1,022,212 1.66
374,000 Hungary Government International Bond
5.375% 25-Mar-2024 408,836 0.66
555,000 MFB Magyar Fejlesztesi Bank Zrt
6.250% 21-Oct-2020 613,376 1.00
India - 509,934 (31 December 2015: 689,368) 509,934 0.83
500,000 Export-Import Bank of India 4.000% 14-Jan-2023 509,934 0.83
Indonesia - 4,740,351 (31 December 2015: 4,565,435) 4,740,351 7.69
470,000 Indonesia Government International Bond
3.700% 08-Jan-2022 473,819 0.77
585,000 Indonesia Government International Bond
4.125% 15-Jan-2025 581,103 0.94
785,000 Pertamina Persero PT 4.300% 20-May-2023 783,695 1.27
200,000 Pertamina Persero PT 5.625% 20-May-2043 185,016 0.30
450,000 Pertamina Persero PT 6.450% 30-May-2044 457,324 0.74
575,000 Pertamina Persero PT 6.500% 27-May-2041 592,079 0.96
530,000 Perusahaan Gas Negara Persero Tbk PT
5.125% 16-May-2024 545,753 0.89
755,000 Perusahaan Listrik Negara PT
5.250% 24-Oct-2042 670,062 1.09
420,000 Perusahaan Listrik Negara PT
5.500% 22-Nov-2021 451,500 0.73
Iraq - 1,600,138 (31 December 2015: 487,807) 1,600,138 2.59
1,920,000 Iraq International Bond 5.800% 15-Jan-2028 1,600,138 2.59
Jamaica - 397,423 (31 December 2015: 1,124,350) 397,423 0.64
230,000 Jamaica Government International Bond
6.750% 28-Apr-2028 252,425 0.41
130,000 Jamaica Government International Bond
8.000% 15-Mar-2039 144,998 0.23
Kazakhstan - 2,629,363 (31 December 2015: 2,073,084) 2,629,363 4.26
590,000 KazMunayGas National Co JSC
4.400% 30-Apr-2023 581,463 0.94
740,000 KazMunayGas National Co JSC
5.750% 30-Apr-2043 709,727 1.15
1,420,000 Tengizchevroil Finance Co International Ltd
4.000% 15-Aug-2026 1,338,173 2.17
Bonds cont’d.
USDUSD

85
Portfolio of investments – as at 31 December 2016
Holdings Description
Fair
value
Total
net assets
% Holdings Description
Fair
value
Total
net assets
%
BNY MELLON EMERGING MARKETS DEBT FUND
Panama - 603,200 (31 December 2015: 1,359,262) 603,200 0.98
580,000 AES Panama SRL 6.000% 25-Jun-2022 603,200 0.98
Paraguay - 1,157,700 (31 December 2015: –) 1,157,700 1.88
285,000 Paraguay Government International Bond
5.000% 15-Apr-2026 290,700 0.47
850,000 Paraguay Government International Bond
6.100% 11-Aug-2044 867,000 1.41
Peru - 1,358,619 (31 December 2015: 1,357,675) 1,358,619 2.21
400,000 Southern Copper Corp 3.500% 08-Nov-2022 398,931 0.65
925,000 Union Andina de Cementos SAA
5.875% 30-Oct-2021 959,688 1.56
Romania - 553,357 (31 December 2015: 591,745) 553,357 0.90
80,000 Romanian Government International Bond
4.875% 22-Jan-2024 84,907 0.14
400,000 Romanian Government International Bond
6.125% 22-Jan-2044 468,450 0.76
Russia - 5,220,274 (31 December 2015: 6,583,137) 5,220,274 8.46
400,000 Alrosa Finance SA 7.750% 03-Nov-2020 452,684 0.74
400,000 Borets Finance DAC 7.625% 26-Sep-2018 399,500 0.65
770,000 Gazprom Neft OAO Via GPN Capital SA
6.000% 27-Nov-2023 820,050 1.33
480,000 Lukoil International Finance BV
4.750% 02-Nov-2026 482,518 0.78
550,000 MMC Norilsk Nickel OJSC via MMC Finance Ltd
6.625% 14-Oct-2022 614,350 1.00
200,000 Russian Foreign Bond - Eurobond
4.750% 27-May-2026 205,220 0.33
200,000 Russian Railways via RZD Capital Plc
3.450% 06-Oct-2020 198,843 0.32
510,000 Sberbank of Russia Via SB Capital SA
6.125% 07-Feb-2022 555,620 0.90
602,000 Vnesheconombank Via VEB Finance Plc
6.025% 05-Jul-2022 631,787 1.02
804,000 Vnesheconombank Via VEB Finance Plc
6.800% 22-Nov-2025 859,702 1.39
Senegal - 1,476,718 (31 December 2015: –) 1,476,718 2.39
1,475,000 Senegal Government International Bond
6.250% 30-Jul-2024 1,476,718 2.39
Serbia - 1,533,303 (31 December 2015: 1,826,065) 1,533,303 2.49
1,285,000 Republic of Serbia 4.875% 25-Feb-2020 1,309,748 2.13
200,000 Republic of Serbia 7.250% 28-Sep-2021 223,555 0.36
South Africa - 1,458,041 (31 December 2015: 838,631) 1,458,041 2.36
385,000 AngloGold Ashanti Holdings Plc
5.125% 01-Aug-2022 384,172 0.62
Kenya - 218,257 (31 December 2015: 379,000) 218,257 0.35
230,000 Kenya Government International Bond
6.875% 24-Jun-2024 218,257 0.35
Kuwait - 427,589 (31 December 2015: –) 427,589 0.69
445,000 Equate Petrochemical BV 4.250% 03-Nov-2026 427,589 0.69
Lebanon - 1,633,558 (31 December 2015: –) 1,633,558 2.65
510,000 Lebanon Government International Bond
5.450% 28-Nov-2019 499,290 0.81
555,000 Lebanon Government International Bond
6.000% 27-Jan-2023 535,658 0.87
365,000 Lebanon Government International Bond
6.600% 27-Nov-2026 352,605 0.57
250,000 Lebanon Government International Bond
6.650% 22-Apr-2024 246,005 0.40
Mexico - 6,567,707 (31 December 2015: 7,436,355) 6,567,707 10.65
200,000 Banco Nacional de Comercio Exterior SNC
4.375% 14-Oct-2025 196,500 0.32
665,000 Comision Federal de Electricidad
4.750% 23-Feb-2027 640,063 1.04
340,000 Comision Federal de Electricidad
5.750% 14-Feb-2042 317,050 0.51
690,000 Elementia SAB de CV 5.500% 15-Jan-2025 674,475 1.09
715,000 Metalsa SA de CV 4.900% 24-Apr-2023 683,719 1.11
400,000 Mexico City Airport Trust 4.250% 31-Oct-2026 393,000 0.64
350,000 Mexico Government International Bond
4.750% 08-Mar-2044 319,130 0.52
175,000 Petroleos Mexicanos 4.250% 15-Jan-2025 161,332 0.26
85,000 Petroleos Mexicanos 4.500% 23-Jan-2026 77,647 0.13
145,000 Petroleos Mexicanos 4.625% 21-Sep-2023 141,419 0.23
320,000 Petroleos Mexicanos 5.500% 21-Jan-2021 329,600 0.53
400,000 Petroleos Mexicanos 5.500% 27-Jun-2044 334,880 0.54
860,000 Petroleos Mexicanos 6.375% 04-Feb-2021 918,050 1.49
240,000 Petroleos Mexicanos 6.375% 23-Jan-2045 219,600 0.36
555,000 Petroleos Mexicanos 6.625% 15-Jun-2035 549,450 0.89
350,000 Petroleos Mexicanos 6.750% 21-Sep-2047 331,555 0.54
265,000 Petroleos Mexicanos 6.875% 04-Aug-2026 280,237 0.45
Morocco - 970,204 (31 December 2015: 807,971) 970,204 1.57
960,000 OCP SA 6.875% 25-Apr-2044 970,204 1.57
Netherlands - 474,650 (31 December 2015: –) 474,650 0.77
440,000 GTH Finance BV 7.250% 26-Apr-2023 474,650 0.77
Pakistan - 1,197,641 (31 December 2015: 1,280,091) 1,197,641 1.94
300,000 Pakistan Government International Bond
7.875% 31-Mar-2036 290,442 0.47
835,000 Pakistan Government International Bond
8.250% 15-Apr-2024 907,199 1.47
Bonds cont’d. Bonds cont’d.
USDUSD

86
Portfolio of investments – as at 31 December 2016
Holdings Description
Fair
value
Total
net assets
% Holdings Description
Fair
value
Total
net assets
%
BNY MELLON EMERGING MARKETS DEBT FUND
1,810,000 Venezuela Government International Bond
9.000% 07-May-2023 864,275 1.40
600,000 Venezuela Government International Bond
12.750% 23-Aug-2022 375,000 0.61
Total investments in bonds 59,856,214 97.05
Unrealised gain on forward foreign currency contracts - 612 (see below)
(31 December 2015: 420) 612 0.00
Total fi nancial assets at fair value through profi t or loss 59,856,826 97.05
Unrealised loss on forward foreign currency contracts - (1,019) (see below)
(31 December 2015: (33,983)) (1,019) (0.00)
Total fi nancial liabilities at fair value through profi t or loss (1,019) (0.00)
Net current assets 1,819,653 2.95
Total net assets 61,675,460 100.00
Analysis of portfolio % of Total assets
Transferable securities and money market instruments admitted
to offi cial stock exchange listing or traded on a regulated market 96.85
OTC fi nancial derivative instruments 0.00
Other current assets 3.15
Total assets 100.00
500,000 Myriad International Holdings BV
5.500% 21-Jul-2025 505,290 0.82
200,000 Republic of South Africa Government
International Bond 5.000% 12-Oct-2046 185,554 0.30
400,000 Transnet SOC Ltd 4.000% 26-Jul-2022 383,025 0.62
Sri Lanka - 1,755,711 (31 December 2015: 531,168) 1,755,711 2.85
1,280,000 Sri Lanka Government International Bond
6.825% 18-Jul-2026 1,262,195 2.05
500,000 Sri Lanka Government International Bond
6.850% 03-Nov-2025 493,516 0.80
Turkey - 4,326,528 (31 December 2015: 3,961,583) 4,326,528 7.02
745,000 Export Credit Bank of Turkey
5.375% 24-Oct-2023 693,316 1.12
975,000 TC Ziraat Bankasi AS 4.250% 03-Jul-2019 963,310 1.56
700,000 Turkey Government International Bond
3.250% 23-Mar-2023 621,978 1.01
200,000 Turkey Government International Bond
4.250% 14-Apr-2026 178,235 0.29
930,000 Turkey Government International Bond
4.875% 16-Apr-2043 752,672 1.22
615,000 Turkey Government International Bond
5.625% 30-Mar-2021 632,066 1.03
470,000 Turkey Government International Bond
6.875% 17-Mar-2036 484,951 0.79
Ukraine - 1,250,197 (31 December 2015: 347,155) 1,250,197 2.03
35,000 Ukraine Government International Bond
0.000% 31-May-2040 VAR 10,701 0.02
620,000 Ukraine Government International Bond
7.750% 01-Sep-2019 625,295 1.01
107,000 Ukraine Government International Bond
7.750% 01-Sep-2020 106,120 0.17
335,000 Ukraine Government International Bond
7.750% 01-Sep-2022 325,206 0.53
190,000 Ukraine Government International Bond
7.750% 01-Sep-2023 182,875 0.30
United Arab Emirates - 803,232 (31 December 2015: 513,500) 803,232 1.30
750,000 DP World Ltd 6.850% 02-Jul-2037 803,232 1.30
Uruguay - 248,187 (31 December 2015: 1,118,000) 248,187 0.40
275,000 Uruguay Government International Bond
5.100% 18-Jun-2050 248,187 0.40
Venezuela - 2,349,875 (31 December 2015: 2,620,550) 2,349,875 3.81
1,120,000 Petroleos de Venezuela SA
6.000% 16-May-2024 434,000 0.70
880,000 Petroleos de Venezuela SA
12.750% 17-Feb-2022 547,800 0.89
230,000 Venezuela Government International Bond
7.750% 13-Oct-2019 128,800 0.21
Bonds cont’d.
South Africa cont’d.
Bonds cont’d.
Venezuela cont’d.
USDUSD

87
Portfolio of investments – as at 31 December 2016
BNY MELLON EMERGING MARKETS DEBT FUND
Forward foreign currency contractsUnrealised
Gain/(Loss)Buy Sell Amount (B) Amount (S)
Settle
Date Counterparty
BNY Mellon Emerging Markets Debt Fund EUR H (Hedged) Share ClassEuro US dollar 80,260 84,012 13-Jan-17 The Bank of
New York Mellon 521
USD 521
EUR 495
Euro US dollar 204,455 216,241 13-Jan-17 The Bank of New York Mellon (902)
USD (902)
EUR (857)
Net USD (381)
Net EUR (362)
BNY Mellon Emerging Markets Debt Fund EUR I (Hedged) Share ClassUS dollar Euro 21,968 20,771 13-Jan-17 The Bank of
New York Mellon 91
USD 91
EUR 86
Euro US dollar 23,033 24,361 13-Jan-17 The Bank of New York Mellon (102)
US dollar Euro 2,368 2,263 13-Jan-17 The Bank of New York Mellon (15)
USD (117)
EUR (111)
Net USD (26)
Net EUR (25)

88
Portfolio of investments – as at 31 December 2016
Holdings Description
Fair
value
Total
net assets
% Holdings Description
Fair
value
Total
net assets
%
BNY MELLON EMERGING MARKETS DEBT LOCAL CURRENCY FUND
Bonds
Argentina - 32,965,691 (31 December 2015: 3,410,503) 32,965,691 3.97
31,400,000 Argentina Bonar Bonds 21.901% 28-Mar-2017 FRN 1,983,176 0.24
126,316,000 Argentina Treasury Infl ation Linked Boncer Bond
2.500% 22-Jul-2021 8,963,105 1.08
83,200,000 Argentine Bonos del Tesoro
15.500% 17-Oct-2026 5,094,447 0.61
124,000,000 Argentine Bonos del Tesoro
16.000% 17-Oct-2023 7,489,709 0.90
73,185,000 Argentine Bonos del Tesoro
18.200% 03-Oct-2021 4,729,773 0.57
10,620,000 Argentine Republic Government International Bond
5.830% 31-Dec-2033 VAR 4,705,481 0.57
Brazil - 163,574,472 (31 December 2015: 256,362,107) 163,574,472 19.69
301,150,000 Brazil Notas do Tesouro Nacional Serie F
10.000% 01-Jan-2017 92,527,729 11.14
147,705,000 Brazil Notas do Tesouro Nacional Serie F
10.000% 01-Jan-2023 42,810,851 5.15
98,840,000 Brazil Notas do Tesouro Nacional Serie F
10.000% 01-Jan-2025 28,235,892 3.40
Colombia - 80,165,975 (31 December 2015: 117,635,574) 80,165,975 9.65
59,350,500,000 Colombian TES 7.000% 04-May-2022 20,153,192 2.43
18,809,000,000 Colombian TES 7.750% 18-Sep-2030 6,527,218 0.79
52,263,600,000 Colombian TES 10.000% 24-Jul-2024 20,594,766 2.48
23,329,000,000 Empresas Publicas de Medellin ESP
7.625% 10-Sep-2024 7,229,394 0.87
47,954,000,000 Empresas Publicas de Medellin ESP
8.375% 01-Feb-2021 15,734,822 1.89
31,996,000,000 Financiera de Desarrollo Territorial SA Findeter
7.875% 12-Aug-2024 9,926,583 1.19
Hungary - 35,841,917 (31 December 2015: 35,672,736) 35,841,917 4.31
3,349,630,000 Hungary Government Bond
3.000% 26-Jun-2024 11,654,098 1.40
1,020,940,000 Hungary Government Bond
3.250% 22-Oct-2031 3,320,181 0.40
5,113,600,000 Hungary Government Bond
5.500% 24-Jun-2025 20,867,638 2.51
Indonesia - 86,082,151 (31 December 2015: 113,193,632) 86,082,151 10.36
13,402,000,000 Indonesia Treasury Bond
5.250% 15-May-2018 971,390 0.12
335,314,000,000 Indonesia Treasury Bond
7.000% 15-May-2027 23,638,673 2.85
205,206,000,000 Indonesia Treasury Bond
8.250% 15-Jun-2032 15,211,640 1.83
275,620,000,000 Indonesia Treasury Bond
8.375% 15-Sep-2026 21,081,938 2.54
101,578,000,000 Indonesia Treasury Bond
8.375% 15-Mar-2034 7,599,972 0.91
91,212,000,000 Indonesia Treasury Bond
10.000% 15-Sep-2024 7,589,238 0.91
113,463,000,000 Indonesia Treasury Bond
11.000% 15-Sep-2025 9,989,300 1.20
Malaysia - 18,096,234 (31 December 2015: 43,399,997) 18,096,234 2.18
41,870,000 Malaysia Government Bond
3.844% 15-Apr-2033 8,296,495 1.00
45,300,000 Malaysia Government Bond
3.955% 15-Sep-2025 9,799,518 1.18
1,000 Malaysia Government Bond
4.181% 15-Jul-2024 221 0.00
Mexico - 68,577,681 (31 December 2015: 111,030,904) 68,577,681 8.26
184,276,600 Comision Federal de Electricidad
7.350% 25-Nov-2025 7,871,668 0.95
84,386,600 Mexican Bonos 10.000% 20-Nov-2036 4,958,417 0.60
35,648,837 Mexican Udibonos 4.000% 15-Nov-2040 1,779,157 0.21
359,825,233 Mexican Udibonos 4.500% 04-Dec-2025 19,511,024 2.35
837,820,000 Petroleos Mexicanos 7.190% 12-Sep-2024 34,457,415 4.15
Peru - 12,576,868 (31 December 2015: –) 12,576,868 1.51
14,400,000 Peru Government Bond
8.200% 12-Aug-2026 4,847,968 0.58
26,290,000 Peruvian Government International Bond
6.350% 12-Aug-2028 7,728,900 0.93
Philippines - 7,217,199 (31 December 2015: 12,770,481) 7,217,199 0.87
357,000,000 Philippine Government International Bond
4.950% 15-Jan-2021 7,217,199 0.87
Poland - 56,881,970 (31 December 2015: 141,579,726) 56,881,970 6.85
57,380,000 Republic of Poland Government Bond
2.500% 25-Jul-2026 12,481,365 1.50
25,575,000 Republic of Poland Government Bond
3.250% 25-Jul-2025 6,002,163 0.72
83,000,000 Republic of Poland Government Bond
4.000% 25-Oct-2023 20,652,563 2.49
65,393,000 Republic of Poland Government Bond
5.750% 23-Sep-2022 17,745,879 2.14
Russia - 63,010,119 (31 December 2015: 89,189,556) 63,010,119 7.59
2,060,330,000 Russian Federal Bond - OFZ
7.000% 16-Aug-2023 31,689,854 3.82
1,940,590,000 Russian Federal Bond - OFZ
7.050% 19-Jan-2028 29,038,654 3.50
140,000,000 Russian Federal Bond - OFZ
8.150% 03-Feb-2027 2,281,611 0.27
South Africa - 80,273,339 (31 December 2015: 96,290,679) 80,273,339 9.66
119,060,000 Republic of South Africa Government Bond
7.000% 28-Feb-2031 7,106,678 0.85
213,629,022 Republic of South Africa Government Bond
7.250% 15-Jan-2020 15,199,607 1.83
575,656,735 Republic of South Africa Government Bond
10.500% 21-Dec-2026 46,257,086 5.57
170,760,000 Transnet SOC Ltd 9.500% 13-May-2021 11,709,968 1.41
Bonds cont’d.
USDUSD

89
Portfolio of investments – as at 31 December 2016
Holdings Description
Fair
value
Total
net assets
% Holdings Description
Fair
value
Total
net assets
%
BNY MELLON EMERGING MARKETS DEBT LOCAL CURRENCY FUND
Unrealised loss on forward foreign currency contracts - (18,731,022) (see below)
(31 December 2015: (5,879,624)) (18,731,022) (2.25)
Total fi nancial liabilities at fair value through profi t or loss (20,418,828) (2.45)
Net current assets 27,027,424 3.25
Total net assets 830,681,213 100.00
* Part of the holding is held as collateral by Bank of America Merrill Lynch, Citigroup, Goldman Sachs, JPMorgan
Chase and Morgan Stanley in respect of forward foreign currency contracts and currency options held
by the Fund.
The counterparties for currency options are Barclays Bank plc, Citigroup, Goldman Sachs and JPMorgan Chase.
Analysis of portfolio % of Total assets
Transferable securities and money market instruments admitted
to offi cial stock exchange listing or traded on a regulated market 95.23
OTC fi nancial derivative instruments 0.62
Other current assets 4.15
Total assets 100.00
Thailand - 27,197,910 (31 December 2015: 61,994,749) 27,197,910 3.27
685,484,280 Thailand Government Bond
1.200% 14-Jul-2021 18,741,650 2.25
326,549,064 Thailand Government Bond
1.250% 12-Mar-2028 8,456,260 1.02
Turkey - 69,511,798 (31 December 2015: 150,096,954) 69,511,798 8.37
6,017,000 Turkey Government Bond 6.300% 14-Feb-2018 1,646,320 0.20
77,170,000 Turkey Government Bond 8.800% 27-Sep-2023 19,561,082 2.36
11,130,000 Turkey Government Bond 9.000% 24-Jul-2024 2,825,971 0.34
57,795,000 Turkey Government Bond 10.400% 20-Mar-2024 15,854,337 1.91
53,225,302 Turkey Government Bond 10.500% 15-Jan-2020 15,151,607 1.82
52,405,000 Turkey Government Bond 10.600% 11-Feb-2026 14,472,481 1.74
United States of America - 16,766,415 (31 December 2015: 18,828,248) 16,766,415 2.02
16,795,000 United States Treasury Bill
0.000% 27-Apr-2017* 16,766,415 2.02
Total investments in bonds 818,739,739 98.56
Currency options - 2,241 (31 December 2015: –)
18,900,000 Euro/US dollar Put 04-Jan-2017 1.085 2,241 0.00
Total currency options 2,241 0.00
Unrealised gain on forward foreign currency contracts - 5,330,637 (see below)
(31 December 2015: 18,555,163) 5,330,637 0.64
Total fi nancial assets at fair value through profi t or loss 824,072,617 99.20
Currency options - (1,687,806) (31 December 2015: (2,386,918))
(9,600,000) US dollar/Brazilian real Put 16-Feb-2017 3.800 (8,851) (0.00)
(9,600,000) US dollar/Colombian peso Call
21-Feb-2017 3,450.000 (16,886) (0.00)
(18,900,000) US dollar/Euro Put 04-Jan-2017 1.040 (13,481) (0.00)
(9,600,000) US dollar/Indonesian rupiah Call
17-Feb-2017 14,500.000 (17,272) (0.00)
(10,400,000) US dollar/Korean won Call 10-Feb-2017 1,200.000 (169,229) (0.02)
(11,100,000) US dollar/Korean won Call 23-Jan-2017 1,175.000 (288,482) (0.04)
(9,500,000) US dollar/Mexican peso Put 03-Mar-2017 21.500 (107,108) (0.01)
(9,500,000) US dollar/Mexican peso Call 09-Mar-2017 22.000 (74,019) (0.01)
(9,500,000) US dollar/South African rand Call
09-Mar-2017 15.000 (90,375) (0.01)
(9,600,000) US dollar/South African rand Call
15-Feb-2017 16.000 (13,613) (0.00)
(11,100,000) US dollar/Turkish lira Call 19-Jan-2017 3.250 (888,490) (0.11)
Total currency options (1,687,806) (0.20)
Bonds cont’d.
Description USDUSD

90
Portfolio of investments – as at 31 December 2016
BNY MELLON EMERGING MARKETS DEBT LOCAL CURRENCY FUND
Forward foreign currency contracts
Unrealised
Gain/(Loss)Buy Sell Amount (B) Amount (S)
Settle
Date Counterparty
BNY Mellon Emerging Markets Debt Local Currency FundSwiss franc US dollar 7,000,000 6,831,401 03-Jan-17 HSBC Bank Plc 42,801
US dollar South African rand 1,751,539 23,979,308 04-Jan-17 Citigroup 5,883
Peruvian nuevo sol US dollar 6,500,000 1,896,149 09-Jan-17 JPMorgan Chase 39,128
Peruvian nuevo sol US dollar 6,500,000 1,886,792 09-Jan-17 JPMorgan Chase 48,485
Peruvian nuevo sol US dollar 42,480,000 12,325,548 09-Jan-17 Citigroup 322,236
Peruvian nuevo sol US dollar 17,380,000 5,108,009 09-Jan-17 JPMorgan Chase 66,626
Chilean peso US dollar 3,440,000,000 5,080,490 13-Jan-17 Barclays Bank plc 51,481
Indonesian rupiah US dollar 71,094,390,000 5,138,734 13-Jan-17 Bank of America Securities Ltd 127,796
Indonesian rupiah US dollar 110,000,000,000 8,079,324 13-Jan-17 Barclays Bank plc 69,256
Indonesian rupiah US dollar 70,208,860,000 5,130,351 13-Jan-17 JPMorgan Chase 70,580
Indonesian rupiah US dollar 31,487,110,000 2,305,059 13-Jan-17 Standard Chartered 27,443
Mexican peso US dollar 87,460,000 4,196,900 13-Jan-17 HSBC Bank Plc 15,493
Philippine peso US dollar 93,680,000 1,865,578 13-Jan-17 Barclays Bank plc 17,376
Russian rouble US dollar 212,550,000 3,283,640 13-Jan-17 JPMorgan Chase 170,595
Russian rouble US dollar 270,950,000 4,366,640 13-Jan-17 JPMorgan Chase 36,676
Russian rouble US dollar 180,730,000 2,790,335 13-Jan-17 JPMorgan Chase 146,780
South African rand US dollar 35,800,000 2,544,023 13-Jan-17 Bank of America Merrill Lynch 57,356
US dollar Chilean peso 4,146,732 2,765,165,000 13-Jan-17 JPMorgan Chase 21,515
US dollar Hungarian forint 10,238,211 2,902,840,000 13-Jan-17 JPMorgan Chase 354,143
US dollar Hungarian forint 2,204,633 613,900,000 13-Jan-17 JPMorgan Chase 114,325
US dollar Indian rupee 1,034,913 69,660,000 13-Jan-17 Citigroup 9,995
US dollar Indonesian rupiah 17,355,932 230,400,000,000 13-Jan-17 JPMorgan Chase 288,361
US dollar Korean won 10,565,470 11,982,300,000 13-Jan-17 Barclays Bank plc 643,611
US dollar Korean won 11,299,794 12,861,765,000 13-Jan-17 Citigroup 649,700
US dollar Malaysian ringgit 3,391,266 15,220,000 13-Jan-17 JPMorgan Chase 752
US dollar Mexican peso 2,890,069 59,290,000 13-Jan-17 JPMorgan Chase 34,446
US dollar Mexican peso 3,215,444 61,770,000 13-Jan-17 HSBC Bank Plc 240,375
US dollar Philippine peso 28,013,806 1,359,510,000 13-Jan-17 Barclays Bank plc 687,853
US dollar Taiwanese dollar 33,570,911 1,065,440,000 13-Jan-17 JPMorgan Chase 497,421
Brazilian real US dollar 23,050,000 6,962,694 02-Feb-17 Citigroup 53,621
Brazilian real US dollar 7,320,000 2,214,826 02-Feb-17 Citigroup 13,349
US dollar Argentinian peso 5,910,602 103,140,000 13-Jul-17 Citigroup 118,461
US dollar Argentinian peso 7,911,265 137,300,000 13-Jul-17 JPMorgan Chase 200,765
USD 5,244,684
US dollar Peruvian nuevo sol 3,916,104 13,350,000 09-Jan-17 Citigroup (58,658)
Colombian peso US dollar 8,823,185,000 2,967,772 13-Jan-17 Goldman Sachs (34,830)
Hungarian forint US dollar 691,760,000 2,404,867 13-Jan-17 JPMorgan Chase (49,448)
Hungarian forint US dollar 1,392,800,000 4,809,331 13-Jan-17 JPMorgan Chase (66,896)
Indian rupee US dollar 738,020,000 10,898,110 13-Jan-17 JPMorgan Chase (39,508)
Indonesian rupiah US dollar 86,684,290,000 6,553,091 13-Jan-17 Bank of America Merrill Lynch (131,692)
Indonesian rupiah US dollar 40,000,000,000 3,036,053 13-Jan-17 JPMorgan Chase (72,933)
Korean won US dollar 1,189,560,000 1,038,736 13-Jan-17 Citigroup (53,729)
Korean won US dollar 3,118,840,000 2,624,182 13-Jan-17 Citigroup (41,648)
Malaysian ringgit US dollar 20,160,000 4,816,054 13-Jan-17 JPMorgan Chase (325,072)
Malaysian ringgit US dollar 251,970,000 59,964,303 13-Jan-17 JPMorgan Chase (3,833,711)
Mexican peso US dollar 292,110,000 15,595,836 13-Jan-17 Goldman Sachs (1,526,751)
Mexican peso US dollar 16,150,000 787,569 13-Jan-17 JPMorgan Chase (9,726)
Philippine peso US dollar 132,920,000 2,740,054 13-Jan-17 Bank of America Merrill Lynch (68,381)
Philippine peso US dollar 50,500,000 1,036,748 13-Jan-17 Citigroup (21,705)
Polish zloty US dollar 6,450,000 1,653,736 13-Jan-17 JPMorgan Chase (112,694)
Polish zloty US dollar 4,190,000 1,055,308 13-Jan-17 JPMorgan Chase (54,229)
Polish zloty US dollar 162,500,000 40,895,421 13-Jan-17 JPMorgan Chase (2,070,735)
Romanian leu US dollar 135,060,000 32,819,790 13-Jan-17 JPMorgan Chase (1,485,756)
Taiwanese dollar US dollar 90,000,000 2,812,500 13-Jan-17 Citigroup (18,711)
Taiwanese dollar US dollar 314,800,000 10,060,722 13-Jan-17 Bank of America Merrill Lynch (288,671)
Taiwanese dollar US dollar 98,580,000 3,134,499 13-Jan-17 Citigroup (74,369)
Thai baht US dollar 331,120,000 9,471,396 13-Jan-17 JPMorgan Chase (225,677)
Thai baht US dollar 367,900,000 10,515,935 13-Jan-17 JPMorgan Chase (243,225)
Forward foreign currency contracts cont’d.
Unrealised
Gain/(Loss)Buy Sell Amount (B) Amount (S)
Settle
Date Counterparty
BNY Mellon Emerging Markets Debt Local Currency Fund cont’d.
Thai baht US dollar 48,750,000 1,391,783 13-Jan-17 JPMorgan Chase (30,559)
Turkish lira US dollar 36,215,000 11,569,548 13-Jan-17 JPMorgan Chase (1,323,395)
US dollar Hungarian forint 2,442,250 720,850,000 13-Jan-17 JPMorgan Chase (12,219)
US dollar Indian rupee 9,856,330 675,750,000 13-Jan-17 Barclays Bank plc (86,084)
US dollar Indian rupee 4,713,758 325,155,000 13-Jan-17 JPMorgan Chase (70,298)
US dollar Indian rupee 4,690,225 324,845,000 13-Jan-17 Bank of America Securities Ltd (89,269)
US dollar Romanian leu 3,695,577 16,000,000 13-Jan-17 JPMorgan Chase (16,437)
US dollar Russian rouble 947,463 60,000,000 13-Jan-17 Goldman Sachs (27,621)
US dollar South African rand 16,194,017 228,700,000 13-Jan-17 Bank of America Merrill Lynch (424,287)
US dollar South African rand 3,886,808 55,040,000 13-Jan-17 Barclays Bank plc (112,630)
US dollar Hong Kong dollar 8,649,487 68,305,000 19-Jan-17 JPMorgan Chase (159,795)
US dollar Hong Kong dollar 7,463,574 58,395,000 19-Jan-17 JPMorgan Chase (67,618)
US dollar Euro 18,284,271 17,535,000 31-Jan-17 Citigroup (202,528)
US dollar Singapore dollar 8,356,623 12,110,000 31-Jan-17 JPMorgan Chase (3,858)
US dollar Brazilian real 4,428,389 15,630,000 02-Feb-17 Morgan Stanley (329,312)
US dollar Brazilian real 75,088,701 260,310,000 02-Feb-17 Citigroup (4,148,484)
US dollar Argentinian peso 4,843,155 81,365,000 02-Mar-17 Citigroup (61,998)
US dollar Argentinian peso 5,324,069 90,030,000 14-Mar-17 Bank of America Securities Ltd (62,655)
USD (18,137,802)
Net USD (12,893,118)
BNY Mellon Emerging Markets Debt Local Currency Fund EUR H (Hedged) Share ClassEuro US dollar 200 208 13-Jan-17 The Bank of
New York Mellon 2
Euro US dollar 974 1,018 13-Jan-17 The Bank of New York Mellon 8
US dollar Euro 225,483 211,633 13-Jan-17 The Bank of New York Mellon 2,583
US dollar Euro 52,481 49,776 13-Jan-17 The Bank of New York Mellon 55
US dollar Euro 2,055 1,931 13-Jan-17 The Bank of New York Mellon 21
USD 2,669
EUR 2,536
US dollar Euro 208 200 03-Jan-17 The Bank of New York Mellon (2)
Euro US dollar 3,858,546 4,080,977 13-Jan-17 The Bank of New York Mellon (17,032)
US dollar Euro 149,837 143,382 13-Jan-17 The Bank of New York Mellon (1,178)
US dollar Euro 25,686 24,686 13-Jan-17 The Bank of New York Mellon (314)
US dollar Euro 16,222 15,551 13-Jan-17 The Bank of New York Mellon (156)
US dollar Euro 84,443 81,060 13-Jan-17 The Bank of New York Mellon (932)
USD (19,614)
EUR (18,633)
Net USD (16,945)
Net EUR (16,097)

91
Portfolio of investments – as at 31 December 2016
BNY MELLON EMERGING MARKETS DEBT LOCAL CURRENCY FUND
Forward foreign currency contracts cont’d.
Unrealised
Gain/(Loss)Buy Sell Amount (B) Amount (S)
Settle
Date Counterparty
BNY Mellon Emerging Markets Debt Local Currency Fund EUR I (Hedged) Share ClassEuro US dollar 1,034,282 1,093,905 13-Jan-17 The Bank of
New York Mellon (4,565)
USD (4,565)
EUR (4,337)
BNY Mellon Emerging Markets Debt Local Currency Fund EUR I (Inc) (Hedged) Share ClassUS dollar Euro 8,680,860 8,163,038 13-Jan-17 The Bank of
New York Mellon 83,284
USD 83,284
EUR 79,118
Euro US dollar 11,092,728 11,802,095 13-Jan-17 The Bank of New York Mellon (118,875)
Euro US dollar 11,070,910 11,795,388 13-Jan-17 The Bank of New York Mellon (135,147)
Euro US dollar 38,619,993 40,846,296 13-Jan-17 The Bank of New York Mellon (170,469)
USD (424,491)
EUR (403,259)
Net USD (341,207)
Net EUR (324,141)
BNY Mellon Emerging Markets Debt Local Currency Fund EUR W (Hedged) Share ClassEuro US dollar 31,501,006 33,316,925 13-Jan-17 The Bank of
New York Mellon (139,046)
USD (139,046)
EUR (132,091)
BNY Mellon Emerging Markets Debt Local Currency Fund Sterling J (Inc) (Hedged) Share ClassSterling US dollar 6,453 8,130 13-Jan-17 The Bank of
New York Mellon (175)
USD (175)
GBP (142)
BNY Mellon Emerging Markets Debt Local Currency Fund Sterling W (Inc) (Hedged) Share ClassSterling US dollar 196,407 247,451 13-Jan-17 The Bank of
New York Mellon (5,329)
USD (5,329)
GBP (4,324)

92
Portfolio of investments – as at 31 December 2016
Holdings Description
Fair
value
Total
net assets
% Holdings Description
Fair
value
Total
net assets
%
Bonds
Argentina - 3,501,555 (31 December 2015: 1,509,243) 3,501,555 5.24
2,550,000 Argentina Bonar Bonds 21.901% 28-Mar-2017 FRN 161,054 0.24
11,405,000 Argentina Treasury Infl ation Linked Boncer Bond
2.500% 22-Jul-2021 809,274 1.21
6,300,000 Argentine Bonos del Tesoro 15.500% 17-Oct-2026 385,758 0.58
9,500,000 Argentine Bonos del Tesoro 16.000% 17-Oct-2023 573,808 0.86
6,595,000 Argentine Bonos del Tesoro 18.200% 03-Oct-2021 426,219 0.64
910,000 Argentine Republic Government International Bond
5.830% 31-Dec-2033 VAR 403,200 0.60
135,000 Provincia de Buenos Aires 9.125% 16-Mar-2024 147,218 0.22
440,000 YPF SA 8.500% 23-Mar-2021 473,044 0.71
120,000 YPF SA 8.500% 28-Jul-2025 121,980 0.18
Bahrain - 1,165,391 (31 December 2015: –) 1,165,391 1.74
1,115,000 Bahrain Government International Bond
7.000% 26-Jan-2026 1,165,391 1.74
Brazil - 6,672,031(31 December 2015: 12,456,228) 6,672,031 9.98
400,000 Banco Nacional de Desenvolvimento
Economico e Social 5.750% 26-Sep-2023 403,092 0.60
5,500,000 Brazil Notas do Tesouro Nacional Serie F
10.000% 01-Jan-2017 1,689,864 2.53
3,725,000 Brazil Notas do Tesouro Nacional Serie F
10.000% 01-Jan-2023 1,079,655 1.62
4,750,000 Brazil Notas do Tesouro Nacional Serie F
10.000% 01-Jan-2025 1,356,945 2.03
650,000 Cosan Luxembourg SA 7.000% 20-Jan-2027 651,625 0.97
420,000 Globo Comunicacao e Participacoes SA
4.843% 08-Jun-2025 404,250 0.60
700,000 Odebrecht Finance Ltd 7.125% 26-Jun-2042 414,750 0.62
240,000 Petrobras Global Finance BV 6.750% 27-Jan-2041 202,800 0.30
200,000 Suzano Austria GmbH 5.750% 14-Jul-2026 193,250 0.29
280,000 Vale Overseas Ltd 4.375% 11-Jan-2022 275,800 0.42
Chile - 509,381 (31 December 2015: 1,774,037) 509,381 0.77
200,000 AES Gener SA 144A 5.000% 14-Jul-2025 198,881 0.30
300,000 VTR Finance BV 6.875% 15-Jan-2024 310,500 0.47
Colombia - 4,344,400 (31 December 2015: 5,673,833) 4,344,400 6.50
370,000 Colombia Government International Bond
7.375% 18-Sep-2037 451,400 0.67
1,592,100,000 Colombian TES 7.750% 18-Sep-2030 552,501 0.83
2,337,200,000 Colombian TES 10.000% 24-Jul-2024 920,987 1.38
500,000 Ecopetrol SA 5.375% 26-Jun-2026 498,750 0.75
220,000 Ecopetrol SA 5.875% 28-May-2045 191,180 0.29
125,000,000 Emgesa SA ESP 8.750% 25-Jan-2021 41,592 0.06
1,616,000,000 Empresas Publicas de Medellin ESP
7.625% 10-Sep-2024 500,780 0.75
2,372,000,000 Empresas Publicas de Medellin ESP
8.375% 01-Feb-2021 778,308 1.16
1,318,000,000 Financiera de Desarrollo Territorial SA Findeter
7.875% 12-Aug-2024 408,902 0.61
Cote d’Ivoire - 1,506,147 (31 December 2015: 290,062) 1,506,147 2.25
815,000 Cote d’Ivoire Government International Bond
5.375% 23-Jul-2024 788,513 1.18
772,200 Cote d’Ivoire Government International Bond
5.750% 31-Dec-2032 717,634 1.07
Dominican Republic - 104,469 (31 December 2015: 1,113,975) 104,469 0.16
110,000 Dominican Republic International Bond
6.850% 27-Jan-2045 104,469 0.16
Ecuador - 217,500 (31 December 2015: –) 217,500 0.32
200,000 Ecuador Government International Bond
10.750% 28-Mar-2022 217,500 0.32
Georgia - 1,586,764 (31 December 2015: –) 1,586,764 2.37
440,000 BGEO Group JSC 6.000% 26-Jul-2023 441,940 0.66
1,070,000 Georgian Railway JSC 7.750% 11-Jul-2022 1,144,824 1.71
Hong Kong - 918,784 (31 December 2015: 356,927) 918,784 1.37
450,000 MCE Finance Ltd 5.000% 15-Feb-2021 449,383 0.67
420,000 Shimao Property Holdings Ltd
8.375% 10-Feb-2022 469,401 0.70
Hungary - 2,011,118 (31 December 2015: 3,110,135) 2,011,118 3.01
60,340,000 Hungary Government Bond 3.250% 22-Oct-2031 196,231 0.29
363,260,000 Hungary Government Bond 5.500% 24-Jun-2025 1,482,395 2.22
116,000 Hungary Government International Bond
5.375% 25-Mar-2024 126,805 0.19
200,000 Magyar Export-Import Bank RT
4.000% 30-Jan-2020 205,687 0.31
India - 648,210 (31 December 2015: 1,735,524) 648,210 0.97
620,000 Vedanta Resources Plc 8.250% 07-Jun-2021 648,210 0.97
Indonesia - 5,845,447 (31 December 2015: 5,693,809) 5,845,447 8.74
1,020,000,000 Indonesia Treasury Bond 5.250% 15-May-2018 73,931 0.11
774,000,000 Indonesia Treasury Bond 5.625% 15-May-2023 51,262 0.08
8,384,000,000 Indonesia Treasury Bond 7.000% 15-May-2027 591,048 0.88
3,857,000,000 Indonesia Treasury Bond 8.250% 15-Jun-2032 285,914 0.43
8,620,000,000 Indonesia Treasury Bond 8.375% 15-Sep-2026 659,336 0.99
5,799,000,000 Indonesia Treasury Bond 8.375% 15-Mar-2034 433,876 0.65
6,850,000,000 Indonesia Treasury Bond 9.500% 15-Jul-2023 552,535 0.83
12,821,000,000 Indonesia Treasury Bond 10.000% 15-Sep-2024 1,066,763 1.59
5,517,000,000 Indonesia Treasury Bond 11.000% 15-Sep-2025 485,718 0.73
430,000 Pertamina Persero PT 6.500% 27-May-2041 442,772 0.66
750,000 Perusahaan Gas Negara Persero Tbk
5.125% 16-May-2024 772,292 1.15
400,000 Perusahaan Listrik Negara PT
5.500% 22-Nov-2021 430,000 0.64
BNY MELLON EMERGING MARKETS DEBT OPPORTUNISTIC FUND
Bonds cont’d.
USDUSD

93
Portfolio of investments – as at 31 December 2016
Holdings Description
Fair
value
Total
net assets
% Holdings Description
Fair
value
Total
net assets
%
BNY MELLON EMERGING MARKETS DEBT OPPORTUNISTIC FUND
Pakistan - 458,689 (31 December 2015: –) 458,689 0.69
200,000 Pakistan Government International Bond
8.250% 15-Apr-2024 217,293 0.33
220,000 Pakistan Government International Bond
8.250% 30-Sep-2025 241,396 0.36
Panama - 478,400 (31 December 2015: 895,550) 478,400 0.72
460,000 AES Panama SRL 6.000% 25-Jun-2022 478,400 0.72
Peru - 1,129,722 (31 December 2015: 476,400) 1,129,722 1.69
1,100,000 Peru Government Bond 8.200% 12-Aug-2026 370,331 0.55
995,000 Peruvian Government International Bond 144A
6.350% 12-Aug-2028 292,516 0.44
450,000 Union Andina de Cementos SAA 5.875% 30-Oct-2021 466,875 0.70
Poland - 2,241,322 (31 December 2015: 4,754,502) 2,241,322 3.35
4,350,000 Poland Government Bond 2.500% 25-Jul-2026 946,217 1.42
800,000 Poland Government Bond 3.250% 25-Jul-2025 187,751 0.28
595,000 Poland Government Bond 4.000% 25-Oct-2023 148,051 0.22
3,535,000 Poland Government Bond 5.750% 23-Sep-2022 959,303 1.43
Romania - 191,041 (31 December 2015: –) 191,041 0.29
180,000 Romanian Government International Bond
4.875% 22-Jan-2024 191,041 0.29
Russia - 5,397,803 (31 December 2015: 7,130,203) 5,397,803 8.08
400,000 Alrosa Finance SA 7.750% 03-Nov-2020 452,684 0.68
265,000 Gazprom Neft OAO Via GPN Capital SA
6.000% 27-Nov-2023 282,225 0.42
500,000 Novolipetsk Steel via Steel Funding DAC
4.500% 15-Jun-2023 498,594 0.75
133,135,000 Russian Federal Bond - OFZ 7.000% 16-Aug-2023 2,047,744 3.06
67,200,000 Russian Federal Bond - OFZ 7.050% 19-Jan-2028 1,005,569 1.51
445,000 SCF Capital Ltd 5.375% 16-Jun-2023 453,900 0.68
270,000 Vnesheconombank Via VEB Finance Plc
6.025% 05-Jul-2022 283,360 0.42
345,000 Vnesheconombank Via VEB Finance Plc
6.902% 09-Jul-2020 373,727 0.56
Senegal - 1,276,485 (31 December 2015: –) 1,276,485 1.91
1,275,000 Senegal Government International Bond
6.250% 30-Jul-2024 1,276,485 1.91
Serbia - 335,333 (31 December 2015: 340,261) 335,333 0.50
300,000 Serbia International Bond 7.250% 28-Sep-2021 335,333 0.50
South Africa - 2,286,324 (31 December 2015: 2,639,309) 2,286,324 3.42
120,000 AngloGold Ashanti Holdings Plc
5.125% 01-Aug-2022 119,742 0.18
200,000 Myriad International Holdings BV
5.500% 21-Jul-2025 202,116 0.30
1,905,000 South Africa Government Bond
7.250% 15-Jan-2020 135,540 0.20
Iraq - 1,450,125 (31 December 2015: –) 1,450,125 2.17
1,740,000 Iraq International Bond 5.800% 15-Jan-2028 1,450,125 2.17
Jamaica - 732,336 (31 December 2015: 151,000) 732,336 1.10
200,000 Digicel Group Ltd 7.125% 01-Apr-2022 156,148 0.24
525,000 Jamaica Government International Bond
6.750% 28-Apr-2028 576,188 0.86
Kazakhstan - 1,650,727 (31 December 2015: 1,926,847) 1,650,727 2.47
200,000 KazMunayGas National Co JSC
5.750% 30-Apr-2043 191,818 0.29
700,000 KazMunayGas National Co JSC
6.375% 09-Apr-2021 761,551 1.14
740,000 Tengizchevroil Finance Co International Ltd
4.000% 15-Aug-2026 697,358 1.04
Kuwait - 451,611 (31 December 2015: –) 451,611 0.68
470,000 Equate Petrochemical BV 4.250% 03-Nov-2026 451,611 0.68
Lebanon - 489,500 (31 December 2015: –) 489,500 0.73
500,000 Lebanon Government International Bond
5.450% 28-Nov-2019 489,500 0.73
Malaysia - 433,705 (31 December 2015: 2,879,096) 433,705 0.65
1,950,000 Malaysia Government Bond
3.620% 30-Nov-2021 433,705 0.65
Mexico - 7,010,966 (31 December 2015: 10,035,154) 7,010,966 10.49
3,940,000 America Movil SAB de CV 6.000% 09-Jun-2019 181,467 0.27
2,400,000 America Movil SAB de CV 8.460% 18-Dec-2036 101,898 0.15
340,000 Cemex SAB de CV 5.700% 11-Jan-2025 343,400 0.51
11,710,000 Comision Federal de Electricidad
7.350% 25-Nov-2025 500,211 0.75
380,000 Elementia SAB de CV 5.500% 15-Jan-2025 371,450 0.56
1,150,000 Metalsa SA de CV 4.900% 24-Apr-2023 1,099,688 1.65
675,000 Mexican Bonos 7.750% 14-Dec-2017 32,967 0.05
3,781,780 Mexican Udibonos 4.000% 15-Nov-2040 188,741 0.28
21,606,198 Mexican Udibonos 4.500% 04-Dec-2025 1,171,566 1.75
40,000 Petroleos Mexicanos 4.625% 21-Sep-2023 39,012 0.06
360,000 Petroleos Mexicanos 5.500% 21-Jan-2021 370,800 0.56
320,000 Petroleos Mexicanos 5.500% 27-Jun-2044 267,904 0.40
55,000 Petroleos Mexicanos 6.375% 04-Feb-2021 58,712 0.09
130,000 Petroleos Mexicanos 6.625% 15-Jun-2035 128,700 0.19
41,930,000 Petroleos Mexicanos 7.190% 12-Sep-2024 1,724,475 2.58
455,000 Sixsigma Networks Mexico SA de CV
8.250% 07-Nov-2021 429,975 0.64
Morocco - 363,826 (31 December 2015: 808,124) 363,826 0.54
360,000 OCP SA 6.875% 25-Apr-2044 363,826 0.54
Netherlands - 501,619 (31 December 2015: –) 501,619 0.75
465,000 GTH Finance BV 7.250% 26-Apr-2023 501,619 0.75
Bonds cont’d. Bonds cont’d.
USDUSD

94
Portfolio of investments – as at 31 December 2016
Holdings Description
Fair
value
Total
net assets
% Holdings Description
Fair
value
Total
net assets
%
BNY MELLON EMERGING MARKETS DEBT OPPORTUNISTIC FUND
Currency options - (123,495) (31 December 2015: (107,789))
(800,000) US dollar/Brazilian real Put
16-Feb-2017 3.800 (738) (0.00)
(800,000) US dollar/Colombian peso Call
21-Feb-2017 3,450.000 (1,407) (0.00)
(1,300,000) US dollar/Euro Put 04-Jan-2017 1.040 (927) (0.00)
(800,000) US dollar/Indonesian rupiah Call
17-Feb-2017 14,500.000 (1,439) (0.00)
(800,000) US dollar/Korean won Call
10-Feb-2017 1,200.000 (13,018) (0.02)
(800,000) US dollar/Korean won Call
23-Jan-2017 1,175.000 (20,792) (0.03)
(700,000) US dollar/Mexican peso Call
09-Mar-2017 22.000 (5,454) (0.01)
(700,000) US dollar/Mexican peso Put
03-Mar-2017 21.500 (7,892) (0.01)
(700,000) US dollar/South African rand Call
09-Mar-2017 15.000 (6,659) (0.01)
(800,000) US dollar/South African rand Call
15-Feb-2017 16.000 (1,134) (0.00)
(800,000) US dollar/Turkish lira Call
19-Jan-2017 3.250 (64,035) (0.10)
Total currency options (123,495) (0.18)
Unrealised loss on forward foreign currency contracts - (598,370) (see below)
(31 December 2015: (275,264)) (598,370) (0.89)
Total fi nancial liabilities at fair value through profi t or loss (721,865) (1.07)
Net current assets 1,946,607 2.90
Total net assets 66,839,955 100.00
The counterparties for currency options are Barclays Bank plc, Citigroup, Goldman Sachs and JPMorgan Chase.
Analysis of portfolio % of Total Assets
Transferable securities and money market instruments admitted
to offi cial stock exchange listing or traded on a regulated market 96.43
OTC fi nancial derivative instruments 0.63
Other current assets 2.94
Total assets 100.00
15,370,000 South Africa Government Bond
10.500% 21-Dec-2026 1,235,061 1.85
8,660,000 Transnet SOC Ltd 9.500% 13-May-2021 593,865 0.89
Sri Lanka - 848,848 (31 December 2015: 605,430) 848,848 1.27
860,000 Sri Lanka Government International Bond
6.850% 03-Nov-2025 848,848 1.27
Thailand - 1,933,375 (31 December 2015: 2,515,988) 1,933,375 2.89
57,212,640 Thailand Government Bond 1.200% 14-Jul-2021 1,564,236 2.34
14,254,776 Thailand Government Bond 1.250% 12-Mar-2028 369,139 0.55
Turkey - 4,276,183 (31 December 2015: 6,895,875) 4,276,183 6.40
470,000 Arcelik AS 5.000% 03-Apr-2023 448,207 0.67
410,000 Export Credit Bank of Turkey 5.375% 24-Oct-2023 381,556 0.57
835,000 Turk Telekomunikasyon AS 4.875% 19-Jun-2024 782,838 1.17
3,290,000 Turkey Government Bond 7.100% 08-Mar-2023 770,052 1.15
1,505,000 Turkey Government Bond 8.800% 27-Sep-2023 381,488 0.57
600,000 Turkey Government Bond 9.000% 24-Jul-2024 152,343 0.23
4,245,000 Turkey Government Bond 10.600% 11-Feb-2026 1,172,325 1.76
200,000 Turkiye Vakifl ar Bankasi TAO 5.500% 27-Oct-2021 187,374 0.28
Ukraine - 439,154 (31 December 2015: –) 439,154 0.66
340,000 Ukraine Government International Bond
7.750% 01-Sep-2019 342,904 0.51
100,000 Ukraine Government International Bond
7.750% 01-Sep-2023 96,250 0.15
United Arab Emirates - 856,781 (31 December 2015: 777,205) 856,781 1.28
800,000 DP World Ltd 6.850% 02-Jul-2037 856,781 1.28
United States of America - 254,566 (31 December 2015: 249,899) 254,566 0.38
255,000 United States Treasury Bill 0.000% 27-Apr-2017 254,566 0.38
Venezuela - 667,375 (31 December 2015: –) 667,375 1.00
340,000 Petroleos de Venezuela SA 6.000% 16-May-2024 131,750 0.20
210,000 Petroleos de Venezuela SA 12.750% 17-Feb-2022 130,725 0.19
560,000 Venezuela Government International Bond
9.000% 07-May-2023 267,400 0.40
220,000 Venezuela Government International Bond
12.750% 23-Aug-2022 137,500 0.21
Total investments in bonds 65,187,013 97.53
Currency options - 154 (31 December 2015: –)
1,300,000 Euro/US dollar Call 04-Jan-2017 1.085 154 0.00
Total currency options 154 0.00
Unrealised gain on forward foreign currency contracts - 428,046 (see below)
(31 December 2015: 743,920) 428,046 0.64
Total fi nancial assets at fair value through profi t or loss 65,615,213 98.17
Bonds cont’d.
South Africa cont’d.
USDUSD

95
Portfolio of investments – as at 31 December 2016
BNY MELLON EMERGING MARKETS DEBT OPPORTUNISTIC FUND
Forward foreign currency contracts
Unrealised
Gain/(Loss)Buy Sell Amount (B) Amount (S)
Settle
Date Counterparty
BNY Mellon Emerging Markets Debt Opportunistic Fund
Peruvian nuevo sol US dollar 335,000 97,242 09-Jan-17 JPMorgan Chase 2,499
Peruvian nuevo sol US dollar 1,710,000 496,156 09-Jan-17 Citigroup 12,971
Peruvian nuevo sol US dollar 335,000 97,725 09-Jan-17 JPMorgan Chase 2,017
Peruvian nuevo sol US dollar 1,340,000 393,828 09-Jan-17 JPMorgan Chase 5,137
Chilean peso US dollar 292,000,000 431,251 13-Jan-17 Barclays Bank plc 4,370
Indonesian rupiah US dollar 4,720,000 345 13-Jan-17 JPMorgan Chase 5
Indonesian rupiah US dollar 11,556,300,000 851,920 13-Jan-17 JPMorgan Chase 4,147
Indonesian rupiah US dollar 4,780,000 346 13-Jan-17 Bank of America Securities Ltd 9
Indonesian rupiah US dollar 9,801,500,000 719,905 13-Jan-17 Barclays Bank plc 6,171
Philippine peso US dollar 12,600,000 252,982 13-Jan-17 JPMorgan Chase 277
Polish zloty US dollar 580,000 136,983 13-Jan-17 JPMorgan Chase 1,591
Polish zloty US dollar 470,000 111,259 13-Jan-17 JPMorgan Chase 1,034
Russian rouble US dollar 13,630,000 215,232 13-Jan-17 Goldman Sachs 6,274
Russian rouble US dollar 5,900,000 91,176 13-Jan-17 HSBC Bank Plc 4,707
South African rand US dollar 810,000 57,560 13-Jan-17 Bank of America Securities Ltd 1,298
Turkish lira US dollar 520,000 145,162 13-Jan-17 JPMorgan Chase 1,959
US dollar Chilean peso 399,157 266,170,000 13-Jan-17 JPMorgan Chase 2,071
US dollar Hungarian forint 98,291 27,370,000 13-Jan-17 JPMorgan Chase 5,097
US dollar Hungarian forint 1,238,352 351,110,000 13-Jan-17 JPMorgan Chase 42,835
US dollar Indonesian rupiah 1,247,006 16,554,000,000 13-Jan-17 JPMorgan Chase 20,718
US dollar Korean won 720,042 816,600,000 13-Jan-17 Barclays Bank plc 43,862
US dollar Korean won 906,082 1,031,330,000 13-Jan-17 Citigroup 52,097
US dollar Mexican peso 231,447 4,335,000 13-Jan-17 Goldman Sachs 22,657
US dollar Mexican peso 195,727 3,760,000 13-Jan-17 HSBC Bank Plc 14,632
US dollar Mexican peso 69,808 1,310,000 13-Jan-17 JPMorgan Chase 6,713
US dollar Philippine peso 1,501,030 72,845,000 13-Jan-17 Barclays Bank plc 36,856
US dollar Romanian leu 89,743 380,000 13-Jan-17 JPMorgan Chase 1,583
US dollar Taiwanese dollar 2,707,880 85,940,000 13-Jan-17 JPMorgan Chase 40,123
US dollar Thai baht 2,053,273 71,920,000 13-Jan-17 JPMorgan Chase 45,083
Brazilian real US dollar 510,000 151,470 02-Feb-17 JPMorgan Chase 3,772
Brazilian real US dollar 1,150,000 340,771 02-Feb-17 JPMorgan Chase 9,284
US dollar Argentinian peso 677,038 11,750,000 13-Jul-17 JPMorgan Chase 17,181
US dollar Argentinian peso 449,857 7,850,000 13-Jul-17 Citigroup 9,016
USD 428,046
Forward foreign currency contracts cont’d.
Unrealised
Gain/(Loss)Buy Sell Amount (B) Amount (S)
Settle
Date Counterparty
BNY Mellon Emerging Markets Debt Opportunistic Fund cont’d.
Colombian peso US dollar 2,350,655,000 790,668 13-Jan-17 Goldman Sachs (9,279)
Hungarian forint US dollar 109,510,000 378,137 13-Jan-17 JPMorgan Chase (5,260)
Indian rupee US dollar 55,640,000 821,618 13-Jan-17 JPMorgan Chase (2,979)
Korean won US dollar 283,000,000 241,505 13-Jan-17 JPMorgan Chase (7,169)
Malaysian ringgit US dollar 10,190,000 2,425,036 13-Jan-17 JPMorgan Chase (155,040)
Malaysian ringgit US dollar 480,000 114,668 13-Jan-17 JPMorgan Chase (7,740)
Malaysian ringgit US dollar 330,000 74,408 13-Jan-17 JPMorgan Chase (895)
Polish zloty US dollar 8,900,000 2,239,811 13-Jan-17 JPMorgan Chase (113,413)
Romanian leu US dollar 5,080,000 1,234,448 13-Jan-17 JPMorgan Chase (55,884)
Taiwanese dollar US dollar 7,600,000 238,267 13-Jan-17 JPMorgan Chase (2,347)
Taiwanese dollar US dollar 26,490,000 846,596 13-Jan-17 Bank of America Securities Ltd (24,291)
Taiwanese dollar US dollar 9,220,000 292,457 13-Jan-17 JPMorgan Chase (6,249)
Thai baht US dollar 25,850,000 739,416 13-Jan-17 JPMorgan Chase (17,618)
Thai baht US dollar 26,900,000 768,901 13-Jan-17 JPMorgan Chase (17,784)
Turkish lira US dollar 2,120,000 677,273 13-Jan-17 JPMorgan Chase (77,471)
US dollar Indian rupee 341,467 23,650,000 13-Jan-17 Bank of America Securities Ltd (6,499)
US dollar Indian rupee 343,143 23,670,000 13-Jan-17 JPMorgan Chase (5,117)
US dollar Indian rupee 820,595 56,260,000 13-Jan-17 Barclays Bank plc (7,167)
US dollar South African rand 115,419 1,630,000 13-Jan-17 Bank of America Securities Ltd (3,024)
US dollar Hong Kong dollar 569,837 4,500,000 19-Jan-17 JPMorgan Chase (10,527)
US dollar Hong Kong dollar 570,041 4,460,000 19-Jan-17 JPMorgan Chase (5,164)
US dollar Euro 1,246,062 1,195,000 31-Jan-17 Citigroup (13,802)
US dollar Singapore dollar 662,457 960,000 31-Jan-17 JPMorgan Chase (306)
US dollar Brazilian real 610,090 2,115,000 02-Feb-17 Citigroup (33,706)
US dollar Argentinian peso 382,738 6,430,000 02-Mar-17 Citigroup (4,900)
US dollar Argentinian peso 402,720 6,810,000 14-Mar-17 Bank of America Securities Ltd (4,739)
USD (598,370)
Net USD (170,324)

96
Portfolio of investments – as at 31 December 2016
Holdings Description
Fair
value
Total
net assets
% Holdings Description
Fair
value
Total
net assets
%
BNY MELLON EUROLAND BOND FUND
Collective investment schemes
Ireland - 33,406,331 (31 December 2015: 35,323,377) 33,406,331 2.50
5,355,368 BNY Mellon Global Funds Plc - Asian Bond Fund^ 5,607,451 0.42
25,256,777 BNY Mellon Global Funds Plc -
Global Opportunistic Bond Fund^ 27,798,880 2.08
Total investments in collective investment schemes 33,406,331 2.50
Bonds
Argentina - 16,190,814 (31 December 2015: –) 16,190,814 1.21
113,600,000 Argentine Bonos del Tesoro
21.200% 19-Sep-2018 6,950,156 0.52
5,225,000 Provincia de Buenos Aires/Argentina 144A
5.750% 15-Jun-2019 5,200,428 0.39
3,900,000 Provincia de Buenos Aires/Argentina
9.125% 16-Mar-2024 4,040,230 0.30
Bahrain - 7,735,102 (31 December 2015: –) 7,735,102 0.58
7,950,000 Bahrain Government International Bond 144A
7.000% 12-Oct-2028 7,735,102 0.58
Belgium - 46,599,874 (31 December 2015: 47,206,869) 46,599,874 3.49
8,430,000 Anheuser-Busch InBev SA/NV
2.000% 17-Mar-2028 8,944,086 0.67
300,000 Anheuser-Busch InBev SA/NV
2.750% 17-Mar-2036 330,830 0.03
18,225,000 Kingdom of Belgium Government Bond 144A
2.600% 22-Jun-2024 21,551,214 1.61
9,810,000 Kingdom of Belgium Government Bond 144A
4.250% 28-Mar-2041 15,773,744 1.18
Brazil - 13,913,695 (31 December 2015: 10,411,596) 13,913,695 1.04
24,750,000 Brazil Notas do Tesouro Nacional Serie F
10.000% 01-Jan-2021 6,975,019 0.52
8,300,000 Brazilian Government International Bond
5.625% 21-Feb-2047 6,938,676 0.52
Canada - 2,552,143 (31 December 2015: 9,140,375) 2,552,143 0.19
850,000 Glencore Finance Canada Ltd 4.250% 25-Oct-2022 826,712 0.06
1,875,000 Teck Resources Ltd 6.250% 15-Jul-2041 1,725,431 0.13
Colombia - 6,983,090 (31 December 2015: –) 6,983,090 0.52
18,654,100,000 Colombian TES 10.000% 24-Jul-2024 6,983,090 0.52
Denmark - 7,236,035 (31 December 2015: 7,454,217) 7,236,035 0.54
6,900,000 Danske Bank A/S 3.500% 16-Apr-2018 7,236,035 0.54
France - 67,916,240 (31 December 2015: 338,766,154) 67,916,240 5.08
1,550,000 AXA SA 5.250% 16-Apr-2040 VAR 1,724,370 0.13
400,000 BNP Paribas SA 2.750% 27-Jan-2026 413,862 0.03
400,000 Engie SA 3.000% Perpetual VAR 416,666 0.03
31,600,000 French Republic Government Bond OAT
0.500% 25-May-2026 31,310,650 2.34
4,000,000 Pernod Ricard SA 2.000% 22-Jun-2020 4,253,679 0.32
400,000 Sanofi 1.875% 04-Sep-2020 425,247 0.03
1,800,000 SFR Group SA 144A 7.375% 01-May-2026 1,759,131 0.13
3,200,000 Societe Generale SA 1.000% 01-Apr-2022 3,217,584 0.24
13,000,000 Societe Generale SA 2.375% 28-Feb-2018 13,387,959 1.00
10,100,000 Societe Generale SFH SA 2.875% 14-Mar-2019 10,798,032 0.81
200,000 Veolia Environnement SA 4.450% Perpetual VAR 209,060 0.02
Germany - 59,113,135 (31 December 2015: 44,143,336) 59,113,135 4.42
5,500,000 Allianz SE 4.750% Perpetual VAR 6,094,303 0.46
12,900,000 Allianz SE 5.625% 17-Oct-2042 VAR 15,299,371 1.14
1,650,000 Bundesrepublik Deutschland
0.000% 15-Aug-2026 1,619,747 0.12
4,875,000 Bundesrepublik Deutschland
2.250% 04-Sep-2020 5,412,786 0.41
10,005,000 Bundesrepublik Deutschland
2.500% 15-Aug-2046 14,097,379 1.06
450,000 Daimler AG 0.875% 12-Jan-2021 463,716 0.03
6,074,798 Driver Thirteen UG haftungsbeschraenkt
0.000% 22-Feb-2021 FRN 6,084,018 0.46
600,000 Kreditanstalt fuer Wiederaufbau
1.625% 05-Jun-2020 728,832 0.05
12,500,000 Kreditanstalt fuer Wiederaufbau
4.000% 16-Jan-2019 8,851,814 0.66
600,000 Kreditanstalt fuer Wiederaufbau
5.500% 09-Feb-2022 461,169 0.03
Hungary - 4,094,622 (31 December 2015: 3,968,540) 4,094,622 0.31
3,900,000 MFB Magyar Fejlesztesi Bank RT
6.250% 21-Oct-2020 4,094,622 0.31
Iceland - 12,171,177 (31 December 2015: 32,864,632) 12,171,177 0.91
11,220,000 Iceland Government International Bond
5.875% 11-May-2022 12,171,177 0.91
Indonesia - 8,922,623 (31 December 2015: –) 8,922,623 0.67
1,300,000 Indonesia Government International Bond 144A
3.750% 14-Jun-2028 1,324,070 0.10
7,445,000 Indonesia Government International Bond
3.750% 14-Jun-2028 7,598,553 0.57
Ireland - 45,863,652 (31 December 2015: 34,428,533) 45,863,652 3.43
21,330,000 Ireland Government Bond 1.000% 15-May-2026 21,826,962 1.63
4,785,000 Ireland Government Bond 2.000% 18-Feb-2045 5,137,487 0.39
16,380,000 Ireland Government Bond 2.400% 15-May-2030 18,899,203 1.41
Italy - 285,782,514 (31 December 2015: 742,573,482) 285,782,514 21.39
7,070,000 Enel SpA 4.875% 20-Feb-2018 7,454,325 0.56
300,000 Enel SpA 144A 8.750% 24-Sep-2073 VAR 324,894 0.02
5,485,000 Intesa Sanpaolo SpA 3.000% 28-Jan-2019 5,768,989 0.43
17,600,000 Intesa Sanpaolo SpA 3.875% 16-Jan-2018 16,946,219 1.27
15,200,000 Intesa Sanpaolo SpA 5.000% 28-Feb-2017 15,314,456 1.15
230,000 Intesa Sanpaolo SpA 144A 5.710% 15-Jan-2026 208,867 0.02
Bonds cont’d.
France cont’d.
EUR EUR

97
Portfolio of investments – as at 31 December 2016
Holdings Description
Fair
value
Total
net assets
% Holdings Description
Fair
value
Total
net assets
%
BNY MELLON EUROLAND BOND FUND
8,281,486 Globaldrive Auto Receivables 2016-B BV
0.128% 20-Aug-2024 FRN 8,324,980 0.62
1,000,000 Iberdrola International BV 3.000% 31-Jan-2022 1,127,715 0.09
4,700,000 Iberdrola International BV 5.750% Perpetual VAR 4,977,447 0.37
7,530,000 ING Bank NV 3.625% 31-Aug-2021 8,823,668 0.66
3,000,000 ING Bank NV 5.250% 05-Jun-2018 3,237,266 0.24
600,000 ING Groep NV 6.500% Perpetual VAR 550,753 0.04
7,500,000 Lukoil International Finance BV 144A
4.750% 02-Nov-2026 7,166,261 0.54
20,325,000 Netherlands Government Bond 144A
2.000% 15-Jul-2024 23,360,945 1.75
300,000 Roche Finance Europe BV 0.500% 27-Feb-2023 305,078 0.02
1,800,000 Schaeffl er Finance BV 144A
4.750% 15-May-2023 1,744,169 0.13
300,000 Telefonica Europe BV 5.000% Perpetual VAR 311,975 0.02
1,150,000 Teva Pharmaceutical Finance Netherlands II BV
1.125% 15-Oct-2024 1,112,783 0.08
1,025,000 Teva Pharmaceutical Finance Netherlands II BV
1.625% 15-Oct-2028 963,672 0.07
2,125,000 Teva Pharmaceutical Finance Netherlands III BV
2.800% 21-Jul-2023 1,913,721 0.14
3,725,000 Teva Pharmaceutical Finance Netherlands III BV
3.150% 01-Oct-2026 3,269,138 0.25
9,500,000 Volkswagen International Finance NV
3.750% Perpetual VAR 9,672,841 0.73
14,000,000 Vonovia Finance BV 1.625% 15-Dec-2020 14,636,058 1.10
2,625,000 Vonovia Finance BV 3.625% 08-Oct-2021 3,001,082 0.23
Norway - 307,013 (31 December 2015: –) 307,013 0.02
300,000 Statoil ASA 0.875% 17-Feb-2023 307,013 0.02
Poland - 10,535,672 (31 December 2015: 26,901,852) 10,535,672 0.79
4,225,000 Republic of Poland Government International Bond
0.500% 20-Dec-2021 4,237,590 0.32
6,795,000 Republic of Poland Government International Bond
2.000% 25-Oct-2046 6,298,082 0.47
Portugal - 13,368,316 (31 December 2015: –) 13,368,316 1.00
14,350,000 Portugal Obrigacoes do Tesouro OT 144A
2.875% 21-Jul-2026 13,368,316 1.00
Romania - 13,526,240 (31 December 2015: –) 13,526,240 1.01
2,650,000 Romanian Government International Bond
2.750% 29-Oct-2025 2,763,177 0.21
10,475,000 Romanian Government International Bond
2.875% 26-May-2028 10,763,063 0.80
Russia - 12,366,998 (31 December 2015: –) 12,366,998 0.92
499,475,000 Russian Federal Bond - OFZ 7.000% 16-Aug-2023 7,298,155 0.54
5,200,000 Russian Foreign Bond - Eurobond
4.750% 27-May-2026 5,068,843 0.38
Serbia - 3,344,891 (31 December 2015: 7,383,917) 3,344,891 0.25
3,150,000 Serbia International Bond 7.250% 28-Sep-2021 3,344,891 0.25
51,970,000 Italy Buoni Poliennali Del Tesoro
1.050% 01-Dec-2019 53,490,676 4.00
16,105,000 Italy Buoni Poliennali Del Tesoro
1.350% 15-Apr-2022 16,569,100 1.24
44,711,222 Italy Buoni Poliennali Del Tesoro 144A
2.350% 15-Sep-2024 51,143,155 3.83
23,128,977 Italy Buoni Poliennali Del Tesoro
2.600% 15-Sep-2023 26,927,615 2.01
13,800,000 Italy Buoni Poliennali Del Tesoro 144A
2.800% 01-Mar-2067 12,344,187 0.92
39,945,000 Italy Buoni Poliennali Del Tesoro
4.750% 01-Sep-2021 47,652,522 3.57
23,305,000 Italy Buoni Poliennali Del Tesoro 144A
4.750% 01-Sep-2044 31,637,509 2.37
Japan - 902,041 (31 December 2015: –) 902,041 0.07
110,000,000 Japan Government Five Year Bond
0.100% 20-Dec-2020 902,041 0.07
Luxembourg - 22,489,711 (31 December 2015: 50,369,324) 22,489,710 1.68
1,800,000 Altice Financing SA 144A 7.500% 15-May-2026 1,782,643 0.13
1,354,819 Bavarian Sky SA 0.000% 20-Aug-2022 FRN 1,356,267 0.10
3,992,401 Bavarian Sky SA 0.000% 20-Apr-2024 FRN 3,997,822 0.30
4,437,306 Compartment VCL 21 0.000% 21-Feb-2021 FRN 4,433,019 0.33
3,452,636 Compartment VCL 22 0.249% 21-Aug-2021 FRN 3,471,117 0.26
1,453,716 E-CARAT SA 7 0.330% 18-Mar-2022 FRN 1,456,023 0.11
159,037 E-Carat SA-Compartment 6
0.400% 18-Sep-2021 FRN 159,180 0.01
5,407,053 E-Carat SA-Compartment 9
0.080% 18-Oct-2024 FRN 5,414,308 0.41
400,000 Nestle Finance International Ltd
1.250% 04-May-2020 419,331 0.03
Mexico - 6,136,831 (31 December 2015: 14,076,716) 6,136,831 0.46
6,575,000 Banco Nacional de Comercio Exterior SNC
4.375% 14-Oct-2025 6,136,831 0.46
Morocco - 10,514,025 (31 December 2015: 66,918,295) 10,514,025 0.79
9,960,000 Morocco Government International Bond
3.500% 19-Jun-2024 10,514,025 0.79
Netherlands - 119,859,213 (31 December 2015: 194,833,056) 119,859,213 8.97
5,450,000 ABN AMRO Bank NV 4.750% 28-Jul-2025 5,257,963 0.39
425,000 Airbus Group Finance BV 0.875% 13-May-2026 424,792 0.03
275,000 BMW Finance NV 1.000% 15-Feb-2022 285,230 0.02
9,705,000 Cooperatieve Rabobank UA
2.500% 26-May-2026 VAR 10,084,079 0.76
175,000 Deutsche Telekom International Finance BV
1.500% 03-Apr-2028 178,070 0.01
4,000,000 Equate Petrochemical BV 144A
3.000% 03-Mar-2022 3,630,347 0.27
100,000 General Motors Financial International BV
1.875% 15-Oct-2019 104,087 0.01
5,383,857 Globaldrive Auto Receivables 2016-A BV
0.000% 20-Jan-2024 FRN 5,395,093 0.40
Bonds cont’d.
Italy cont’d.
Bonds cont’d.
Netherlands cont’d.
EUR EUR

98
Portfolio of investments – as at 31 December 2016
Holdings Description
Fair
value
Total
net assets
% Holdings Description
Fair
value
Total
net assets
%
BNY MELLON EUROLAND BOND FUND
United States of America - 182,360,566 (31 December 2015: 371,300,266) 182,360,566 13.65
1,500,000 Abbott Laboratories 3.750% 30-Nov-2026 1,418,038 0.11
5,600,000 Abbott Laboratories 4.900% 30-Nov-2046 5,481,529 0.41
4,225,000 AbbVie Inc 1.375% 17-May-2024 4,287,826 0.32
1,800,000 Ally Financial Inc 8.000% 01-Nov-2031 1,991,978 0.15
5,008,170 Alternative Loan Trust 2004-18CB
5.500% 25-Sep-2034 4,875,684 0.37
250,000 American International Group Inc
1.500% 08-Jun-2023 253,992 0.02
300,000 Amgen Inc 2.000% 25-Feb-2026 321,305 0.02
1,450,000 Antero Resources Corp 5.000% 01-Mar-2025 1,354,072 0.10
480,000 Antero Resources Corp 5.625% 01-Jun-2023 469,102 0.04
225,000 Berkshire Hathaway Inc 0.500% 13-Mar-2020 228,095 0.02
1,800,000 CCO Holdings LLC / CCO Holdings Capital Corp 144A
5.875% 01-Apr-2024 1,829,667 0.14
375,000 Charter Communications Operating LLC /
Charter Communications Operating Capital
4.908% 23-Jul-2025 376,097 0.03
500,000 Citigroup Inc 5.950% Perpetual VAR 482,983 0.04
6,584,903 Colony Starwood Homes 2016-2 Trust 144A
1.986% 17-Dec-2033 FRN 6,268,547 0.47
330,000 Continental Resources Inc 5.000% 15-Sep-2022 317,614 0.02
4,425,000 Daimler Finance North America LLC 144A
1.500% 05-Jul-2019 4,137,402 0.31
1,875,000 DaVita Inc 5.000% 01-May-2025 1,756,726 0.13
200,000 Diamondback Energy Inc 144A
4.750% 01-Nov-2024 187,147 0.01
400,000 Digital Euro Finco LLC 2.625% 15-Apr-2024 412,959 0.03
1,800,000 DISH DBS Corp 5.875% 15-Nov-2024 1,765,971 0.13
240,000 Dollar Tree Inc 5.750% 01-Mar-2023 242,547 0.02
350,000 Dominion Resources Inc 1.250% 15-Mar-2017 332,534 0.03
4,000,000 Drive Auto Receivables Trust 2016-C 144A
3.020% 15-Nov-2021 3,804,503 0.29
4,100,000 Drive Auto Receivables Trust 2016-C 144A
4.180% 15-Mar-2024 3,869,734 0.29
1,025,000 Dynegy Inc 7.375% 01-Nov-2022 934,783 0.07
925,000 Dynegy Inc 7.625% 01-Nov-2024 815,026 0.06
250,000 FedEx Corp 1.625% 11-Jan-2027 254,970 0.02
1,800,000 First Data Corp 144A 5.750% 15-Jan-2024 1,770,896 0.13
5,150,000 Freeport-McMoRan Inc 2.150% 01-Mar-2017 4,867,950 0.37
2,250,000 Freeport-McMoRan Inc 5.450% 15-Mar-2043 1,779,480 0.13
280,000 Freeport-McMoRan Inc 6.750% 01-Feb-2022 274,640 0.02
6,210,000 GAHR Commercial Mortgage Trust 2015-NRF
3.382% 15-Dec-2034 VAR 5,592,794 0.42
8,285,000 GAHR Commercial Mortgage Trust 2015-NRF
3.382% 15-Dec-2034 VAR 7,662,987 0.57
1,481,000 General Electric Co 5.000% Perpetual VAR 1,464,960 0.11
720,000 Genesis Energy LP / Genesis Energy Finance Corp
6.750% 01-Aug-2022 714,083 0.05
5,480,000 Goldman Sachs Group Inc/The
3.500% 16-Nov-2026 5,096,606 0.38
350,000 Honeywell International Inc 0.650% 21-Feb-2020 355,947 0.03
1,670,000 Icahn Enterprises LP / Icahn Enterprises Finance Corp
5.875% 01-Feb-2022 1,582,505 0.12
400,000 International Business Machines Corp
1.125% 06-Sep-2024 414,193 0.03
967,273 JP Morgan Chase Commercial Mortgage
Securities Trust 2006-CIBC17
5.464% 12-Dec-2043 918,624 0.07
Spain - 261,270,945 (31 December 2015: 383,451,805) 261,270,945 19.55
3,800,000 Banco Bilbao Vizcaya Argentaria SA
3.875% 30-Jan-2023 4,593,899 0.34
9,700,000 BBVA Subordinated Capital SAU
3.500% 11-Apr-2024 VAR 10,130,227 0.76
7,155,404 Driver Espana Three FT 0.679% 21-Dec-2026 FRN 7,216,554 0.54
3,600,000 Santander International Debt SAU
4.000% 27-Mar-2017 3,632,454 0.27
6,800,000 Santander Issuances SAU
2.500% 18-Mar-2025 6,699,040 0.50
71,785,000 Spain Government Bond 0.500% 31-Oct-2017 72,297,520 5.41
17,885,000 Spain Government Bond 1.400% 31-Jan-2020 18,671,851 1.40
74,980,000 Spain Government Bond 2.750% 30-Apr-2019 80,080,402 5.99
22,080,000 Spain Government Bond 144A
4.400% 31-Oct-2023 27,339,383 2.05
8,950,000 Spain Government Bond 144A
5.150% 31-Oct-2044 13,633,095 1.02
4,050,000 Spain Government Bond 5.750% 30-Jul-2032 6,192,090 0.46
6,800,000 Telefonica Emisiones SAU 2.932% 17-Oct-2029 7,356,587 0.55
3,000,000 Telefonica Emisiones SAU 3.961% 26-Mar-2021 3,427,843 0.26
Sri Lanka - 7,348,249 (31 December 2015: –) 7,348,249 0.55
7,825,000 Sri Lanka Government International Bond 144A
5.750% 18-Jan-2022 7,348,249 0.55
Supranational - 1,157,784 (31 December 2015: 8,016,771) 1,157,784 0.09
1,100,000 European Investment Bank
1.375% 15-Nov-2019 1,157,784 0.09
Switzerland - 51,427 (31 December 2015: 36,386,994) 51,427 0.00
50,000 Credit Suisse AG/Guernsey 0.750% 17-Sep-2021 51,427 0.00
Turkey - 7,210,475 (31 December 2015: –) 7,210,475 0.54
28,028,016 Turkey Government Bond 2.000% 18-Sep-2024 7,210,475 0.54
United Kingdom - 36,438,904 (31 December 2015: 111,520,511) 36,438,904 2.73
175,000 AstraZeneca Plc 0.250% 12-May-2021 175,857 0.01
5,125,000 Barclays Plc 5.200% 12-May-2026 4,969,444 0.37
4,100,000 Barclays Plc 7.875% Perpetual VAR 3,982,118 0.30
450,000 British Telecommunications Plc
1.125% 10-Mar-2023 458,573 0.04
3,450,000 Diageo Finance Plc 2.375% 20-May-2026 3,875,387 0.29
340,000 FCE Bank Plc 1.615% 11-May-2023 349,540 0.03
300,000 HSBC Holdings Plc 3.375% 10-Jan-2024 VAR 314,452 0.02
2,950,000 HSBC Holdings Plc 4.375% 23-Nov-2026 2,828,892 0.21
1,750,000 International Game Technology Plc 144A
6.250% 15-Feb-2022 1,791,312 0.13
500,000 Lloyds Banking Group Plc 7.500% Perpetual VAR 490,429 0.04
16,550,000 Royal Bank of Scotland Group Plc
3.875% 12-Sep-2023 15,119,303 1.13
500,000 Royal Bank of Scotland Plc
9.500% 16-Mar-2022 VAR 482,879 0.04
500,000 Sky Plc 2.250% 17-Nov-2025 533,965 0.04
540,000 United Kingdom Gilt 3.500% 22-Jan-2045 856,139 0.06
200,000 Vodafone Group Plc 1.750% 25-Aug-2023 210,614 0.02
Bonds cont’d. Bonds cont’d.
EUR EUR

99
Portfolio of investments – as at 31 December 2016
Holdings Description
Fair
value
Total
net assets
% Holdings Description
Fair
value
Total
net assets
%
BNY MELLON EUROLAND BOND FUND
Underlying
exposure
EUR
Open futures contracts - 5,872,058 (31 December 2015: 5,269,584)
1,001 Euro-Bobl
Long Futures Contracts
Exp Mar-2017 133,763,630 1,076,910 0.08
254 Euro-Buxl 30 Year Bond
Long Futures Contracts
Exp Mar-2017 44,074,080 754,320 0.06
1,015 Euro-OAT
Long Futures Contracts
Exp Mar-2017 154,097,300 2,195,490 0.16
520 Euro-Schatz
Long Futures Contracts
Exp Mar-2017 58,390,800 83,200 0.01
(1,319) U.S. 10 Year Treasury Note
Short Futures Contracts
Exp Mar-2017 (155,727,833) 861,457 0.07
(960) U.S. 2 Year Treasury Note
Short Futures Contracts
Exp Mar-2017 (197,615,464) 157,787 0.01
(179) U.S. Treasury Bond
Short Futures Contracts
Exp Mar-2017 (25,618,637) 313,524 0.02
(161) U.S. Treasury Ultra Bond
Short Futures Contracts
Exp Mar-2017 (24,509,799) 429,370 0.03
Total open futures contracts 5,872,058 0.44
Unrealised gain on forward foreign currency contracts - 8,853,761 (see below)
(31 December 2015: 1,323,501) 8,853,761 0.66
Total fi nancial assets at fair value through profi t or loss 1,343,804,830 100.56
Credit default swaps - (1,471,456) (31 December 2015: (2,882,562))
93,000,000 CDS ICE CDX North American IG Index Series 26
1.000% 20-Jun-2021 (1,471,456) (0.11)
Total credit default swaps (1,471,456) (0.11)
Currency options - (354,623) (31 December 2015: –)
(15,200,000) US dollar/Mexican peso Call
01-Feb-2017 20.380 (354,623) (0.03)
Total currency options (354,623) (0.03)
Interest rate swaps - (660,344) (31 December 2015: 2,730,771)
113,500,000 IRS Receives Fixed 11.990% Brazilian real
04-Jan-2017 (660,344) (0.05)
Total interest rate swaps (660,344) (0.05)
7,900,000 JP Morgan Chase Commercial Mortgage Securities
Trust 2007-LDP10 5.464% 15-Jan-2049 VAR 7,442,943 0.56
50,000 Lamb Weston Holdings Inc 144A
4.625% 01-Nov-2024 47,737 0.00
105,000 Lamb Weston Holdings Inc 144A
4.875% 01-Nov-2026 98,938 0.01
400,000 Mastercard Inc 1.100% 01-Dec-2022 412,698 0.03
400,000 Merck & Co Inc 1.875% 15-Oct-2026 435,103 0.03
400,000 Microsoft Corp 2.125% 06-Dec-2021 438,774 0.03
2,414,158 ML-CFC Commercial Mortgage Trust 2006-4
5.239% 12-Dec-2049 2,298,887 0.17
10,650,000 Morgan Stanley Capital I Trust 2007-IQ14
5.690% 15-Apr-2049 VAR 9,921,440 0.74
2,317,768 Morgan Stanley Mortgage Loan Trust 2005-1
1.056% 25-Mar-2035 FRN 2,017,272 0.15
4,250,000 Oracle Corp 4.000% 15-Jul-2046 3,871,631 0.29
1,725,000 Prime Security Services Borrower LLC /
Prime Finance Inc 144A 9.250% 15-May-2023 1,788,254 0.13
500,000 Procter & Gamble Co/The 1.125% 02-Nov-2023 522,872 0.04
1,745,000 Reynolds Group Issuer Inc /
Reynolds Group Issuer LLC /
Reynolds Group Issuer Lu 144A
7.000% 15-Jul-2024 1,765,472 0.13
400,000 Simon Property Group LP 2.375% 02-Oct-2020 431,097 0.03
250,000 Southern Power Co 1.850% 20-Jun-2026 254,234 0.02
6,525,000 Springleaf Funding Trust 2016-A 144A
2.900% 15-Nov-2029 6,188,803 0.46
2,290,000 Sprint Communications Inc 7.000% 15-Aug-2020 2,311,667 0.17
5,400,000 Sprint Spectrum Co LLC /
Sprint Spectrum Co II LLC /
Sprint Spectrum Co III LLC
3.360% 20-Sep-2021 5,152,326 0.39
1,800,000 Targa Resources Partners LP /
Targa Resources Partners Finance Corp 144A
5.125% 01-Feb-2025 1,703,557 0.13
3,730,000 T-Mobile USA Inc 6.000% 01-Mar-2023 3,751,613 0.28
26,595,000 United States Treasury Bill
0.000% 27-Apr-2017* 25,221,797 1.89
16,479,450 United States Treasury Infl ation Indexed Bonds
0.625% 15-Jan-2026 15,801,526 1.18
150,000 United Technologies Corp 1.125% 15-Dec-2021 155,674 0.01
9,755,000 ZFS Finance USA Trust V 144A
6.500% 09-May-2037 VAR 9,359,755 0.70
Total investments in bonds 1,294,264,016 96.85
Credit default swaps - 1,408,407 (31 December 2015: 2,060,111)
(92,000,000) CDS iTraxx Europe Series 25 Version 1
1.000% 20-Jun-2021 1,408,407 0.11
Total credit default swaps 1,408,407 0.11
Currency options - 257 (31 December 2015: –)
15,200,000 US dollar/Mexican peso Put 01-Feb-2017 18.170 257 0.00
Total currency options 257 0.00
Bonds cont’d.
United States of America cont’d.
EUR EUR

100
Portfolio of investments – as at 31 December 2016
Holdings Description
Fair
value
Total
net assets
%
BNY MELLON EUROLAND BOND FUND
Underlying
exposure
EUR
Open futures contracts - (1,576,752) (31 December 2015: (733,381))
(178) Australian 10 Year Treasury Bond
Short Futures Contracts
Exp Mar-2017 (15,588,276) (75,759) (0.01)
2,783 Australian 3 Year Bond
Long Futures Contracts
Exp Mar-2017 212,668,263 (324,839) (0.02)
349 Canadian 10 Year Treasury Bond
Long Futures Contracts
Exp Mar-2017 33,960,642 (330,890) (0.03)
(309) Euro-BTP
Short Futures Contracts
Exp Mar-2017 (41,810,790) (828,120) (0.06)
35 U.S. 5 Year Treasury Note
Long Futures Contracts
Exp Mar-2017 3,912,260 (17,144) (0.00)
Total open futures contracts (1,576,752) (0.12)
Unrealised loss on forward foreign currency contracts - (7,509,478) (see below)
(31 December 2015: (14,532,591)) (7,509,478) (0.56)
Total fi nancial liabilities at fair value through profi t or loss (11,572,653) (0.87)
Net current assets 4,079,782 0.31
Total net assets 1,336,311,959 100.00
* Part of the holding is held as collateral by Bank of America Merrill Lynch, Goldman Sachs, JPMorgan Chase
and UBS in respect of futures contracts, credit default swaps, interest rate swaps, forward foreign currency
contracts and currency options held by the Fund.
^ Investment in other Funds of the Company.
The counteparty for credit default swaps is JPMorgan Chase.
The counterparty for currency options is Goldman Sachs.
The counterparty for futures contracts is JPMorgan Chase.
The counterparty for interest rate swaps is Goldman Sachs.
Analysis of portfolio % of Total assets
Transferable securities and money market instruments admitted
to offi cial stock exchange listing or traded on a regulated market 96.54
Financial derivative instruments dealt in on a regulated market 0.43
OTC fi nancial derivative instruments 0.75
Other current assets 2.28
Total assets 100.00
Forward foreign currency contracts Unrealised
Gain/(Loss)Buy Sell Amount (B) Amount (S)
Settle
Date Counterparty
BNY Mellon Euroland Bond FundHungarian forint Euro 2,328,930,000 7,515,565 13-Jan-17 JPMorgan Chase 13,567
Russian rouble US dollar 585,310,000 9,242,661 13-Jan-17 Goldman Sachs 255,820
US dollar Korean won 4,904,461 5,570,095,000 13-Jan-17 HSBC Bank Plc 277,419
US dollar Korean won 15,714,063 17,827,605,000 13-Jan-17 JPMorgan Chase 903,931
US dollar Korean won 25,368,493 28,875,180,000 13-Jan-17 Citigroup 1,384,897
US dollar Taiwanese dollar 8,949,964 284,045,000 13-Jan-17 JPMorgan Chase 125,915
US dollar Turkish lira 7,014,471 24,430,000 13-Jan-17 JPMorgan Chase 97,415
US dollar Turkish lira 684,208 2,300,000 13-Jan-17 JPMorgan Chase 31,787
US dollar Turkish lira 4,746,668 16,170,000 13-Jan-17 JPMorgan Chase 163,082
US dollar Turkish lira 1,470,090 5,030,000 13-Jan-17 JPMorgan Chase 44,600
US dollar Turkish lira 809,061 2,750,000 13-Jan-17 JPMorgan Chase 29,449
Euro Australian dollar 10,206,709 14,705,000 31-Jan-17 Citigroup 148,833
Euro Canadian dollar 13,398,043 18,905,000 31-Jan-17 Commonwealth Bank of Australia 37,828
Euro Canadian dollar 1,038,785 1,465,000 31-Jan-17 Commonwealth Bank of Australia 3,466
Euro Japanese yen 20,799,447 2,554,560,000 31-Jan-17 Goldman Sachs 32,834
Euro New Zealand dollar 847,809 1,280,000 31-Jan-17 Barclays Bank plc 5,245
Euro Singapore dollar 8,865,319 13,415,000 31-Jan-17 JPMorgan Chase 80,721
Euro Sterling 2,905,377 2,455,000 31-Jan-17 UBS 33,261
Euro Swiss franc 1,589,532 1,700,000 31-Jan-17 Credit Suisse 2,668
Euro US dollar 795,766 830,000 31-Jan-17 Goldman Sachs 8,499
Euro US dollar 4,778,680 5,000,000 31-Jan-17 Morgan Stanley 36,106
Euro US dollar 114,782,350 119,687,000 31-Jan-17 Citigroup 1,257,451
Euro US dollar 114,411,347 119,299,000 31-Jan-17 JPMorgan Chase 1,254,472
Euro US dollar 114,377,261 119,298,000 31-Jan-17 Goldman Sachs 1,221,335
Swedish krona Euro 265,925,000 27,235,861 31-Jan-17 Citigroup 503,517
Brazilian real US dollar 12,510,000 3,667,224 02-Feb-17 JPMorgan Chase 133,502
EUR 8,087,620
Colombian peso US dollar 26,292,335,000 8,843,705 13-Jan-17 Goldman Sachs (98,550)
Euro Hungarian forint 8,338,915 2,579,780,000 13-Jan-17 JPMorgan Chase (1,183)
Indian rupee US dollar 1,858,440,000 27,443,001 13-Jan-17 JPMorgan Chase (94,474)
Indonesian rupiah US dollar 249,749,575,000 18,880,373 13-Jan-17 Bank of America Merrill Lynch (360,258)
Korean won US dollar 14,457,410,000 12,257,236 13-Jan-17 Nomura (271,437)
Korean won US dollar 16,764,695,000 14,044,512 13-Jan-17 JPMorgan Chase (154,412)
Mexican peso Euro 162,665,000 7,950,497 13-Jan-17 Goldman Sachs (511,929)
South African rand US dollar 242,080,000 18,034,381 13-Jan-17 JPMorgan Chase (421,408)
Turkish lira US dollar 102,755,000 32,826,976 13-Jan-17 JPMorgan Chase (3,565,185)
US dollar Colombian peso 8,268,290 26,292,335,000 13-Jan-17 Citigroup (447,783)
US dollar Indian rupee 11,855,043 815,755,000 13-Jan-17 JPMorgan Chase (139,835)
US dollar Indian rupee 15,191,407 1,042,685,000 13-Jan-17 JPMorgan Chase (142,199)
US dollar Russian rouble 3,109,022 203,585,000 13-Jan-17 JPMorgan Chase (189,433)
US dollar Russian rouble 5,850,550 381,725,000 13-Jan-17 JPMorgan Chase (335,169)
US dollar South African rand 17,141,441 242,080,000 13-Jan-17 Bank of America Merrill Lynch (426,401)
US dollar Taiwanese dollar 14,015,005 452,630,000 13-Jan-17 JPMorgan Chase (33,772)
US dollar Turkish lira 6,979,563 24,760,000 13-Jan-17 JPMorgan Chase (24,375)
US dollar Euro 14,110,000 13,472,058 31-Jan-17 Goldman Sachs (88,513)
US dollar Euro 3,300,000 3,145,490 31-Jan-17 Citigroup (15,391)
EUR (7,321,707)
Net EUR 765,913
EUR

101
Portfolio of investments – as at 31 December 2016
BNY MELLON EUROLAND BOND FUND
Forward foreign currency contracts cont’d.
Unrealised
Gain/(Loss)Buy Sell Amount (B) Amount (S)
Settle
Date Counterparty
BNY Mellon Euroland Bond Fund CHF H (Hedged) Share Class cont’d.
Swiss franc Euro 179,438 167,573 13-Jan-17 The Bank of New York Mellon (139)
Swiss franc Euro 18,929 17,685 13-Jan-17 The Bank of New York Mellon (22)
EUR (29,185)
CHF (31,284)
Net EUR 601,780
Net CHF 645,056
BNY Mellon Euroland Bond Fund CHF I (Hedged) Share ClassEuro Swiss franc 11,481 12,285 13-Jan-17 The Bank of
New York Mellon 18
Euro Swiss franc 98,151 104,869 13-Jan-17 The Bank of New York Mellon 298
Euro Swiss franc 44,918 48,099 13-Jan-17 The Bank of New York Mellon 37
Euro Swiss franc 33,457 35,811 13-Jan-17 The Bank of New York Mellon 41
Euro Swiss franc 47,377 50,592 13-Jan-17 The Bank of New York Mellon 170
Swiss franc Euro 36,441 33,933 13-Jan-17 The Bank of New York Mellon 71
Swiss franc Euro 22,452,018 20,869,926 13-Jan-17 The Bank of New York Mellon 80,129
Swiss franc Euro 26,426 24,641 13-Jan-17 The Bank of New York Mellon 18
Swiss franc Euro 422,791 393,609 13-Jan-17 The Bank of New York Mellon 899
EUR 81,681
CHF 87,555
Swiss franc Euro 48,099 44,921 03-Jan-17 The Bank of New York Mellon (49)
Euro Swiss franc 63,192 68,107 13-Jan-17 The Bank of New York Mellon (359)
Euro Swiss franc 57,718 62,062 13-Jan-17 The Bank of New York Mellon (192)
Euro Swiss franc 151,500 162,728 13-Jan-17 The Bank of New York Mellon (342)
Euro Swiss franc 1,260 1,358 13-Jan-17 The Bank of New York Mellon (8)
Euro Swiss franc 82,126 88,198 13-Jan-17 The Bank of New York Mellon (172)
Swiss franc Euro 50,592 47,377 13-Jan-17 The Bank of New York Mellon (170)
EUR (1,292)
CHF (1,385)
Net EUR 80,389
Net CHF 86,170
Forward foreign currency contracts cont’d.
Unrealised
Gain/(Loss)Buy Sell Amount (B) Amount (S)
Settle
Date Counterparty
BNY Mellon Euroland Bond Fund CHF H (Hedged) Share ClassEuro Swiss franc 167,582 179,438 03-Jan-17 The Bank of
New York Mellon 182
Swiss franc Euro 65,019 60,562 04-Jan-17 The Bank of New York Mellon 96
Euro Swiss franc 50,867 54,319 13-Jan-17 The Bank of New York Mellon 182
Euro Swiss franc 133,789 142,945 13-Jan-17 The Bank of New York Mellon 406
Euro Swiss franc 40,374 43,201 13-Jan-17 The Bank of New York Mellon 64
Euro Swiss franc 191,697 205,270 13-Jan-17 The Bank of New York Mellon 159
Euro Swiss franc 104,205 111,537 13-Jan-17 The Bank of New York Mellon 129
Swiss franc Euro 31,897 29,707 13-Jan-17 The Bank of New York Mellon 56
Swiss franc Euro 36,707 34,180 13-Jan-17 The Bank of New York Mellon 71
Swiss franc Euro 37,372 34,675 13-Jan-17 The Bank of New York Mellon 197
Swiss franc Euro 9,998 9,272 13-Jan-17 The Bank of New York Mellon 57
Swiss franc Euro 176,265,933 163,845,270 13-Jan-17 The Bank of New York Mellon 629,077
Swiss franc Euro 3,085 2,876 13-Jan-17 The Bank of New York Mellon 2
Swiss franc Euro 240,861 224,687 13-Jan-17 The Bank of New York Mellon 61
Swiss franc Euro 34,790 32,355 13-Jan-17 The Bank of New York Mellon 108
Swiss franc Euro 76,367 71,140 13-Jan-17 The Bank of New York Mellon 118
EUR 630,965
CHF 676,340
Swiss franc Euro 205,270 191,707 03-Jan-17 The Bank of New York Mellon (208)
Euro Swiss franc 29,710 31,897 04-Jan-17 The Bank of New York Mellon (47)
Euro Swiss franc 93,126 100,134 13-Jan-17 The Bank of New York Mellon (310)
Euro Swiss franc 52,120 55,949 13-Jan-17 The Bank of New York Mellon (86)
Euro Swiss franc 484,270 519,361 13-Jan-17 The Bank of New York Mellon (347)
Euro Swiss franc 60,555 65,019 13-Jan-17 The Bank of New York Mellon (114)
Euro Swiss franc 80,778 86,765 13-Jan-17 The Bank of New York Mellon (183)
Euro Swiss franc 146,587 157,139 13-Jan-17 The Bank of New York Mellon (40)
Euro Swiss franc 879,570 947,982 13-Jan-17 The Bank of New York Mellon (4,996)
Euro Swiss franc 10,054,357 10,797,685 13-Jan-17 The Bank of New York Mellon (21,001)
Euro Swiss franc 162,475 175,189 13-Jan-17 The Bank of New York Mellon (995)
Swiss franc Euro 95,793 89,657 13-Jan-17 The Bank of New York Mellon (272)
Swiss franc Euro 103,968 97,361 13-Jan-17 The Bank of New York Mellon (348)
Swiss franc Euro 52,552 49,114 13-Jan-17 The Bank of New York Mellon (77)

102
Portfolio of investments – as at 31 December 2016
BNY MELLON EUROLAND BOND FUND
Forward foreign currency contracts cont’d.
Unrealised
Gain/(Loss)Buy Sell Amount (B) Amount (S)
Settle
Date Counterparty
BNY Mellon Euroland Bond Fund CHF Z (Acc) (Hedged) Share ClassSwiss franc Euro 95,676 88,934 13-Jan-17 The Bank of
New York Mellon 341
EUR 341
CHF 366
BNY Mellon Euroland Bond Fund USD H (Acc) (Hedged) Share ClassEuro US dollar 42,424 44,375 13-Jan-17 The Bank of
New York Mellon 292
US dollar Euro 1,004,121 949,466 13-Jan-17 The Bank of New York Mellon 3,905
EUR 4,197
USD 4,418
BNY Mellon Euroland Bond Fund USD I (Acc) (Hedged) Share ClassEuro US dollar 62,575 65,392 13-Jan-17 The Bank of
New York Mellon 488
US dollar Euro 4,582,410 4,332,987 13-Jan-17 The Bank of New York Mellon 17,821
EUR 18,309
USD 19,273
US dollar Euro 20,296,439 19,427,925 13-Jan-17 The Bank of New York Mellon (157,294)
EUR (157,294)
USD (165,576)
Net EUR (138,985)
Net USD (146,303)
BNY Mellon Euroland Bond Fund USD W (Acc) (Hedged) Share ClassUS dollar Euro 7,782,362 7,358,765 13-Jan-17 The Bank of
New York Mellon 30,266
EUR 30,266
USD 31,860
BNY Mellon Euroland Bond Fund USD Z (Acc) (Hedged) Share ClassUS dollar Euro 98,271 92,922 13-Jan-17 The Bank of
New York Mellon 382
EUR 382
USD 402

103
Portfolio of investments – as at 31 December 2016
Holdings Description
Fair
value
Total
net assets
% Holdings Description
Fair
value
Total
net assets
%
BNY MELLON EUROPEAN CREDIT FUND
Collective investment schemes
Ireland - 4,303,868 (31 December 2015: 3,014,628) 4,303,868 4.92
2,972,180 BNY Mellon Global Funds Plc -
Short-Dated High Yield Bond Fund^ 2,852,842 3.26
91,392 Insight Global Funds II plc -
Insight Emerging Markets Debt Fund 1,451,026 1.66
Total investments in collective investment schemes 4,303,868 4.92
Bonds
Australia - 2,397,033 (31 December 2015: 2,068,966) 2,397,033 2.74
660,000 AusNet Services Holdings Pty Ltd
2.375% 24-Jul-2020 710,368 0.81
150,000 Australia Pacifi c Airports Melbourne Pty Ltd
3.125% 26-Sep-2023 174,075 0.20
290,000 BHP Billiton Finance Ltd 2.250% 25-Sep-2020 313,008 0.36
140,000 Commonwealth Bank of Australia
2.000% 22-Apr-2027 VAR 141,238 0.16
247,000 QBE Insurance Group Ltd
6.115% 24-May-2042 VAR 306,812 0.35
270,000 SGSP Australia Assets Pty Ltd
2.000% 30-Jun-2022 286,525 0.33
274,000 Sydney Airport Finance Co Pty Ltd
2.750% 23-Apr-2024 302,638 0.35
160,000 Telstra Corp Ltd 1.125% 14-Apr-2026 162,369 0.18
Austria - 512,756 (31 December 2015: 1,020,581) 512,756 0.59
500,000 UniCredit Bank Austria AG 2.625% 30-Jan-2018 512,756 0.59
Belgium - 2,329,017 (31 December 2015: 1,178,220) 2,329,017 2.67
526,000 Anheuser-Busch InBev NV 2.000% 17-Mar-2028 559,664 0.64
307,000 Anheuser-Busch InBev NV 2.750% 17-Mar-2036 339,887 0.39
500,000 Belfi us Bank SA/NV 2.250% 26-Sep-2018 519,659 0.59
600,000 Belfi us Bank SA/NV 3.125% 11-May-2026 607,830 0.70
300,000 Euroclear Investments SA 1.125% 07-Dec-2026 301,977 0.35
Bermuda - 111,454 (31 December 2015: 212,326) 111,454 0.13
100,000 Bacardi Ltd 2.750% 03-Jul-2023 111,454 0.13
Czech Republic - 761,687 (31 December 2015: 417,348) 761,687 0.87
250,000 EP Energy AS 4.375% 01-May-2018 263,066 0.30
440,000 EP Energy AS 5.875% 01-Nov-2019 498,621 0.57
Denmark - 515,474 (31 December 2015: 157,571) 515,474 0.59
300,000 Nykredit Realkredit A/S 0.875% 13-Jun-2019 305,329 0.35
215,000 TDC A/S 1.750% 27-Feb-2027 210,145 0.24
France - 12,813,099 (31 December 2015: 6,868,334) 12,813,099 14.65
100,000 Aeroports de Paris 1.500% 24-Jul-2023 106,108 0.12
400,000 APRR SA 1.125% 09-Jan-2026 402,488 0.46
100,000 APRR SA 1.250% 06-Jan-2027 100,555 0.11
300,000 APRR SA 3.990% 03-Jan-2020 FRN 303,419 0.35
400,000 APRR SA 4.875% 21-Jan-2019 440,084 0.50
200,000 Autoroutes du Sud de la France SA
2.875% 18-Jan-2023 228,279 0.26
426,000 AXA SA 3.375% 06-Jul-2047 VAR 433,116 0.50
800,000 Banque Federative du Credit Mutuel SA
0.250% 14-Jun-2019 805,105 0.92
100,000 BNP Paribas SA 1.500% 25-May-2028 102,671 0.12
720,000 BNP Paribas SA 2.250% 13-Jan-2021 779,273 0.89
333,000 BNP Paribas SA 2.875% 20-Mar-2026 VAR 347,272 0.40
500,000 BPCE SA 0.625% 20-Apr-2020 507,427 0.58
300,000 BPCE SA 2.875% 22-Apr-2026 309,336 0.35
200,000 Credit Agricole Assurances SA
4.250% Perpetual VAR 197,663 0.23
100,000 Credit Agricole Assurances SA
4.750% 27-Sep-2048 VAR 101,354 0.12
400,000 Credit Agricole SA/London 1.250% 14-Apr-2026 404,650 0.46
400,000 Credit Agricole SA/London 1.875% 20-Dec-2026 403,304 0.46
400,000 Danone SA 1.208% 03-Nov-2028 391,400 0.45
600,000 Electricite de France SA 1.875% 13-Oct-2036 548,196 0.63
700,000 Electricite de France SA 4.125% Perpetual VAR 691,870 0.79
350,000 Electricite de France SA 4.625% 26-Apr-2030 452,935 0.52
100,000 Electricite de France SA 5.375% Perpetual VAR 100,587 0.12
300,000 Eutelsat SA 1.125% 23-Jun-2021 306,657 0.35
300,000 ICADE 1.125% 17-Nov-2025 291,348 0.33
200,000 LVMH Moet Hennessy Louis Vuitton SE
0.000% 14-Feb-2019 FRN 200,260 0.23
400,000 Natixis SA 4.125% 20-Jan-2017 400,724 0.46
400,000 RCI Banque SA 0.684% 18-Mar-2019 FRN 405,850 0.46
200,000 Sanofi 0.500% 13-Jan-2027 187,201 0.21
200,000 Sanofi 1.125% 05-Apr-2028 197,220 0.23
200,000 SapphireOne Mortgages FCT 2016-2
1.231% 25-Jun-2061 FRN 200,439 0.23
200,000 Societe Fonciere Lyonnaise SA
1.875% 26-Nov-2021 210,624 0.24
600,000 Societe Generale SA 0.750% 25-Nov-2020 614,186 0.70
300,000 Societe Generale SA 0.750% 26-May-2023 302,267 0.35
200,000 TDF Infrastructure SAS 2.500% 07-Apr-2026 204,876 0.23
100,000 TDF Infrastructure SAS 2.875% 19-Oct-2022 108,143 0.12
262,000 TOTAL SA 2.708% Perpetual VAR 257,153 0.29
363,000 TOTAL SA 3.369% Perpetual VAR 351,097 0.40
200,000 Transport et Infrastructures Gaz France SA
2.200% 05-Aug-2025 214,587 0.25
200,000 Vivendi SA 0.750% 26-May-2021 203,375 0.23
Germany - 6,102,689 (31 December 2015: 3,957,532) 6,102,689 6.98
200,000 ATF Netherlands BV 1.500% 03-May-2022 195,026 0.22
600,000 ATF Netherlands BV 1.500% 15-Jul-2024 564,039 0.64
100,000 ATF Netherlands BV 2.125% 13-Mar-2023 99,621 0.11
140,000 Bayer AG 2.375% 02-Apr-2075 VAR 133,846 0.15
243,000 Continental AG 0.000% 05-Feb-2020 242,311 0.28
300,000 Daimler AG 0.164% 09-Mar-2018 FRN 300,841 0.34
700,000 Deutsche Bank AG 1.250% 08-Sep-2021 704,821 0.81
69,000 EnBW Energie Baden-Wuerttemberg AG
3.625% 02-Apr-2076 VAR 69,896 0.08
490,000 EnBW Energie Baden-Wuerttemberg AG
7.375% 02-Apr-2072 VAR 498,492 0.57
80,000 EnBW International Finance BV
6.125% 07-Jul-2039 129,199 0.15
200,000 Eurogrid GmbH 1.500% 18-Apr-2028 203,247 0.23
Bonds cont’d.
France cont’d.
EUR EUR
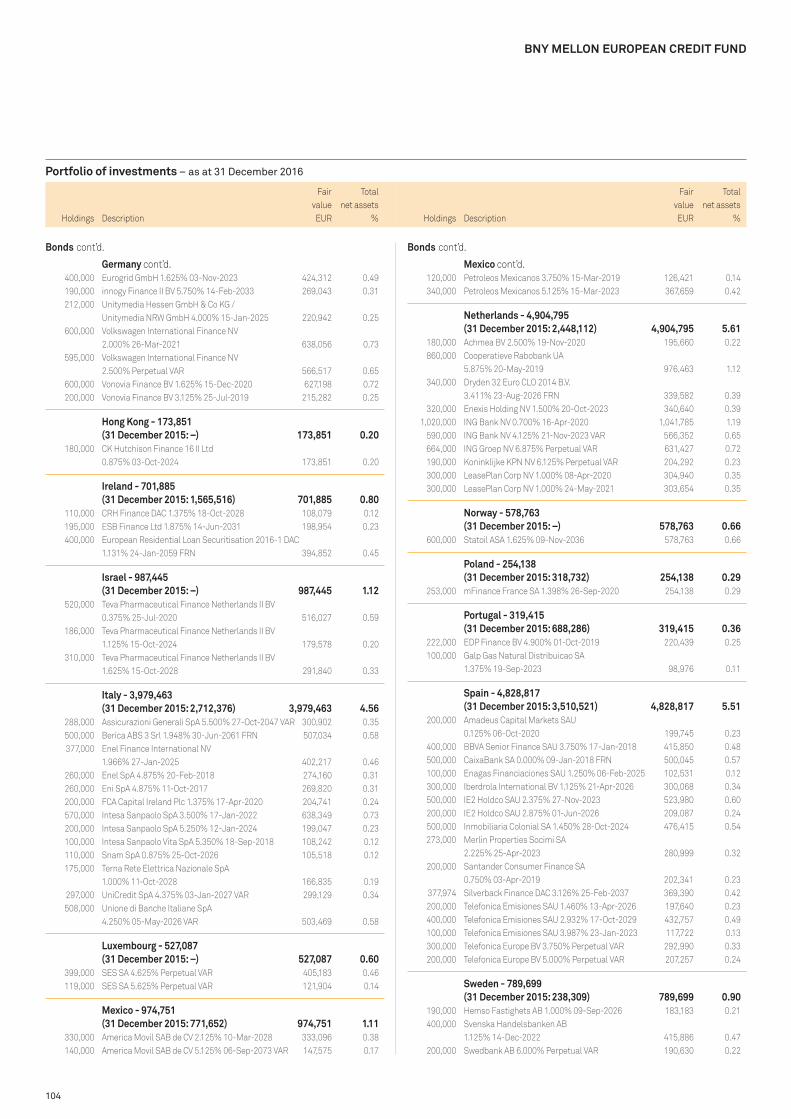
104
Portfolio of investments – as at 31 December 2016
Holdings Description
Fair
value
Total
net assets
% Holdings Description
Fair
value
Total
net assets
%
BNY MELLON EUROPEAN CREDIT FUND
120,000 Petroleos Mexicanos 3.750% 15-Mar-2019 126,421 0.14
340,000 Petroleos Mexicanos 5.125% 15-Mar-2023 367,659 0.42
Netherlands - 4,904,795 (31 December 2015: 2,448,112) 4,904,795 5.61
180,000 Achmea BV 2.500% 19-Nov-2020 195,660 0.22
860,000 Cooperatieve Rabobank UA
5.875% 20-May-2019 976,463 1.12
340,000 Dryden 32 Euro CLO 2014 B.V.
3.411% 23-Aug-2026 FRN 339,582 0.39
320,000 Enexis Holding NV 1.500% 20-Oct-2023 340,640 0.39
1,020,000 ING Bank NV 0.700% 16-Apr-2020 1,041,785 1.19
590,000 ING Bank NV 4.125% 21-Nov-2023 VAR 566,352 0.65
664,000 ING Groep NV 6.875% Perpetual VAR 631,427 0.72
190,000 Koninklijke KPN NV 6.125% Perpetual VAR 204,292 0.23
300,000 LeasePlan Corp NV 1.000% 08-Apr-2020 304,940 0.35
300,000 LeasePlan Corp NV 1.000% 24-May-2021 303,654 0.35
Norway - 578,763 (31 December 2015: –) 578,763 0.66
600,000 Statoil ASA 1.625% 09-Nov-2036 578,763 0.66
Poland - 254,138 (31 December 2015: 318,732) 254,138 0.29
253,000 mFinance France SA 1.398% 26-Sep-2020 254,138 0.29
Portugal - 319,415 (31 December 2015: 688,286) 319,415 0.36
222,000 EDP Finance BV 4.900% 01-Oct-2019 220,439 0.25
100,000 Galp Gas Natural Distribuicao SA
1.375% 19-Sep-2023 98,976 0.11
Spain - 4,828,817 (31 December 2015: 3,510,521) 4,828,817 5.51
200,000 Amadeus Capital Markets SAU
0.125% 06-Oct-2020 199,745 0.23
400,000 BBVA Senior Finance SAU 3.750% 17-Jan-2018 415,850 0.48
500,000 CaixaBank SA 0.000% 09-Jan-2018 FRN 500,045 0.57
100,000 Enagas Financiaciones SAU 1.250% 06-Feb-2025 102,531 0.12
300,000 Iberdrola International BV 1.125% 21-Apr-2026 300,068 0.34
500,000 IE2 Holdco SAU 2.375% 27-Nov-2023 523,980 0.60
200,000 IE2 Holdco SAU 2.875% 01-Jun-2026 209,087 0.24
500,000 Inmobiliaria Colonial SA 1.450% 28-Oct-2024 476,415 0.54
273,000 Merlin Properties Socimi SA
2.225% 25-Apr-2023 280,999 0.32
200,000 Santander Consumer Finance SA
0.750% 03-Apr-2019 202,341 0.23
377,974 Silverback Finance DAC 3.126% 25-Feb-2037 369,390 0.42
200,000 Telefonica Emisiones SAU 1.460% 13-Apr-2026 197,640 0.23
400,000 Telefonica Emisiones SAU 2.932% 17-Oct-2029 432,757 0.49
100,000 Telefonica Emisiones SAU 3.987% 23-Jan-2023 117,722 0.13
300,000 Telefonica Europe BV 3.750% Perpetual VAR 292,990 0.33
200,000 Telefonica Europe BV 5.000% Perpetual VAR 207,257 0.24
Sweden - 789,699 (31 December 2015: 238,309) 789,699 0.90
190,000 Hemso Fastighets AB 1.000% 09-Sep-2026 183,183 0.21
400,000 Svenska Handelsbanken AB
1.125% 14-Dec-2022 415,886 0.47
200,000 Swedbank AB 6.000% Perpetual VAR 190,630 0.22
400,000 Eurogrid GmbH 1.625% 03-Nov-2023 424,312 0.49
190,000 innogy Finance II BV 5.750% 14-Feb-2033 269,043 0.31
212,000 Unitymedia Hessen GmbH & Co KG /
Unitymedia NRW GmbH 4.000% 15-Jan-2025 220,942 0.25
600,000 Volkswagen International Finance NV
2.000% 26-Mar-2021 638,056 0.73
595,000 Volkswagen International Finance NV
2.500% Perpetual VAR 566,517 0.65
600,000 Vonovia Finance BV 1.625% 15-Dec-2020 627,198 0.72
200,000 Vonovia Finance BV 3.125% 25-Jul-2019 215,282 0.25
Hong Kong - 173,851 (31 December 2015: –) 173,851 0.20
180,000 CK Hutchison Finance 16 II Ltd
0.875% 03-Oct-2024 173,851 0.20
Ireland - 701,885 (31 December 2015: 1,565,516) 701,885 0.80
110,000 CRH Finance DAC 1.375% 18-Oct-2028 108,079 0.12
195,000 ESB Finance Ltd 1.875% 14-Jun-2031 198,954 0.23
400,000 European Residential Loan Securitisation 2016-1 DAC
1.131% 24-Jan-2059 FRN 394,852 0.45
Israel - 987,445 (31 December 2015: –) 987,445 1.12
520,000 Teva Pharmaceutical Finance Netherlands II BV
0.375% 25-Jul-2020 516,027 0.59
186,000 Teva Pharmaceutical Finance Netherlands II BV
1.125% 15-Oct-2024 179,578 0.20
310,000 Teva Pharmaceutical Finance Netherlands II BV
1.625% 15-Oct-2028 291,840 0.33
Italy - 3,979,463 (31 December 2015: 2,712,376) 3,979,463 4.56
288,000 Assicurazioni Generali SpA 5.500% 27-Oct-2047 VAR 300,902 0.35
500,000 Berica ABS 3 Srl 1.948% 30-Jun-2061 FRN 507,034 0.58
377,000 Enel Finance International NV
1.966% 27-Jan-2025 402,217 0.46
260,000 Enel SpA 4.875% 20-Feb-2018 274,160 0.31
260,000 Eni SpA 4.875% 11-Oct-2017 269,820 0.31
200,000 FCA Capital Ireland Plc 1.375% 17-Apr-2020 204,741 0.24
570,000 Intesa Sanpaolo SpA 3.500% 17-Jan-2022 638,349 0.73
200,000 Intesa Sanpaolo SpA 5.250% 12-Jan-2024 199,047 0.23
100,000 Intesa Sanpaolo Vita SpA 5.350% 18-Sep-2018 108,242 0.12
110,000 Snam SpA 0.875% 25-Oct-2026 105,518 0.12
175,000 Terna Rete Elettrica Nazionale SpA
1.000% 11-Oct-2028 166,835 0.19
297,000 UniCredit SpA 4.375% 03-Jan-2027 VAR 299,129 0.34
508,000 Unione di Banche Italiane SpA
4.250% 05-May-2026 VAR 503,469 0.58
Luxembourg - 527,087 (31 December 2015: –) 527,087 0.60
399,000 SES SA 4.625% Perpetual VAR 405,183 0.46
119,000 SES SA 5.625% Perpetual VAR 121,904 0.14
Mexico - 974,751 (31 December 2015: 771,652) 974,751 1.11
330,000 America Movil SAB de CV 2.125% 10-Mar-2028 333,096 0.38
140,000 America Movil SAB de CV 5.125% 06-Sep-2073 VAR 147,575 0.17
Bonds cont’d.
Mexico cont’d.
Bonds cont’d.
Germany cont’d.
EUR EUR

105
Portfolio of investments – as at 31 December 2016
Holdings Description
Fair
value
Total
net assets
% Holdings Description
Fair
value
Total
net assets
%
BNY MELLON EUROPEAN CREDIT FUND
United States of America - 18,975,308 (31 December 2015: 7,359,173) 18,975,308 21.70
868,000 AbbVie Inc 0.375% 18-Nov-2019 874,193 1.00
160,000 Amgen Inc 1.250% 25-Feb-2022 165,593 0.19
230,000 AT&T Inc 2.450% 15-Mar-2035 225,491 0.26
130,000 AT&T Inc 2.750% 19-May-2023 143,345 0.16
510,000 AT&T Inc 3.550% 17-Dec-2032 578,775 0.66
684,000 Bank of America Corp 0.189% 26-Jul-2019 FRN 687,454 0.79
800,000 Bank of America Corp 1.375% 26-Mar-2025 812,426 0.93
751,000 Carnival Corp 1.125% 06-Nov-2019 773,072 0.88
318,000 Carnival Corp 1.875% 07-Nov-2022 336,892 0.39
220,000 Citigroup Inc 0.750% 26-Oct-2023 216,418 0.25
320,000 Citigroup Inc 2.125% 10-Sep-2026 339,357 0.39
300,000 Citigroup Inc 7.375% 04-Sep-2019 359,098 0.41
137,000 Coca-Cola Co/The 1.875% 22-Sep-2026 149,877 0.17
460,000 Delphi Automotive Plc 1.500% 10-Mar-2025 461,845 0.53
180,000 DH Europe Finance SA 1.700% 04-Jan-2022 191,967 0.22
215,000 Eaton Capital Unlimited Co 0.750% 20-Sep-2024 211,847 0.24
330,000 Ecolab Inc 1.000% 15-Jan-2024 331,465 0.38
364,000 Goldman Sachs Group Inc/The 1.625% 27-Jul-2026 362,349 0.41
214,000 Goldman Sachs Group Inc/The 2.000% 27-Jul-2023 226,562 0.26
1,010,000 Goldman Sachs Group Inc/The
3.250% 01-Feb-2023 1,143,335 1.31
100,000 Goldman Sachs Group Inc/The 5.125% 23-Oct-2019 114,096 0.13
300,000 Honeywell International Inc 1.300% 22-Feb-2023 312,664 0.36
763,000 John Deere Bank SA 0.037% 21-Apr-2020 FRN 763,958 0.87
485,000 JPMorgan Chase & Co 1.375% 16-Sep-2021 509,590 0.58
820,000 JPMorgan Chase & Co 2.625% 23-Apr-2021 902,828 1.03
267,000 Kraft Heinz Foods Co 2.250% 25-May-2028 273,485 0.31
341,000 Liberty Mutual Group Inc 2.750% 04-May-2026 353,779 0.40
100,000 McDonald’s Corp 0.500% 15-Jan-2021 100,936 0.11
200,000 McDonald’s Corp 1.000% 15-Nov-2023 202,709 0.23
100,000 McDonald’s Corp 1.750% 03-May-2028 103,966 0.12
400,000 Molson Coors Brewing Co 1.250% 15-Jul-2024 399,990 0.46
100,000 Mondelez International Inc 2.375% 06-Mar-2035 96,910 0.11
452,000 Morgan Stanley 1.000% 02-Dec-2022 457,720 0.52
350,000 Morgan Stanley 1.750% 30-Jan-2025 362,337 0.41
100,000 Morgan Stanley 5.000% 02-May-2019 111,630 0.13
125,000 Mylan NV 1.250% 23-Nov-2020 127,256 0.15
148,000 Mylan NV 2.250% 22-Nov-2024 150,816 0.17
431,000 Mylan NV 3.125% 22-Nov-2028 440,542 0.50
100,000 National Grid North America Inc
0.750% 11-Feb-2022 101,574 0.12
843,000 PPG Industries Inc 0.000% 03-Nov-2019 844,484 0.97
400,000 PPG Industries Inc 0.875% 13-Mar-2022 409,326 0.47
150,000 Prologis LP 1.375% 13-May-2021 155,787 0.18
458,000 Simon International Finance SCA
1.375% 18-Nov-2022 476,418 0.55
382,000 Tesoro Corp 144A 5.125% 15-Dec-2026 366,038 0.42
137,000 Thermo Fisher Scientifi c Inc 1.375% 12-Sep-2028 130,810 0.15
300,000 Thermo Fisher Scientifi c Inc 1.500% 01-Dec-2020 312,813 0.36
373,000 Trinity Acquisition Plc 2.125% 26-May-2022 382,875 0.44
389,000 United Technologies Corp 1.125% 15-Dec-2021 403,718 0.46
100,000 Verizon Communications Inc 3.250% 17-Feb-2026 117,446 0.13
473,000 Wells Fargo & Co 1.375% 26-Oct-2026 473,516 0.54
187,000 Zimmer Biomet Holdings Inc 1.414% 13-Dec-2022 188,754 0.22
231,000 Zimmer Biomet Holdings Inc 2.425% 13-Dec-2026 235,176 0.27
Total investments in bonds 78,844,020 90.13
Switzerland - 3,848,163 (31 December 2015: 1,594,074) 3,848,163 4.39
650,000 Cloverie Plc for Zurich Insurance Co Ltd
7.500% 24-Jul-2039 VAR 754,676 0.86
840,000 Credit Suisse AG/London 0.375% 11-Apr-2019 846,238 0.97
205,000 Credit Suisse Group Funding Guernsey Ltd
1.250% 14-Apr-2022 205,416 0.23
540,000 Glencore Finance Europe SA 1.625% 18-Jan-2022 543,564 0.62
120,000 Glencore Finance Europe SA 1.750% 17-Mar-2025 114,741 0.13
100,000 Inovyn Finance Plc 6.250% 15-May-2021 106,279 0.12
298,000 UBS Group AG 6.875% Perpetual VAR 287,888 0.33
200,000 UBS Group Funding Jersey Ltd
1.250% 01-Sep-2026 193,044 0.22
520,000 UBS Group Funding Jersey Ltd
1.750% 16-Nov-2022 545,685 0.62
280,000 Willow No 2 Ireland Plc for Zurich Insurance Co Ltd
4.250% 01-Oct-2045 VAR 250,632 0.29
United Kingdom - 11,457,231 (31 December 2015: 8,397,279) 11,457,231 13.10
432,000 Barclays Plc 3.250% 12-Feb-2027 491,538 0.56
360,000 BAT International Finance Plc
4.000% 07-Jul-2020 408,562 0.47
300,000 BG Energy Capital Plc 3.625% 16-Jul-2019 327,800 0.37
292,000 BP Capital Markets Plc 1.117% 25-Jan-2024 297,352 0.34
500,000 BP Capital Markets Plc 2.994% 18-Feb-2019 532,591 0.61
320,000 British Telecommunications Plc
1.125% 10-Mar-2023 326,034 0.37
400,000 DECO 2014-GONDOLA Srl
2.637% 22-Feb-2026 FRN 397,972 0.45
550,000 EE Finance Plc 3.250% 03-Aug-2018 578,934 0.66
230,000 FCE Bank Plc 0.158% 10-Feb-2018 FRN 230,348 0.26
193,000 FCE Bank Plc 1.615% 11-May-2023 198,415 0.23
300,000 FCE Bank Plc 1.875% 18-Apr-2019 312,522 0.36
410,000 FCE Bank Plc 1.875% 24-Jun-2021 430,115 0.49
190,000 Heathrow Funding Ltd 1.500% 11-Feb-2030 186,506 0.21
113,000 Heathrow Funding Ltd 7.125% 14-Feb-2024 171,294 0.20
600,000 HSBC Holdings Plc 6.375% 18-Oct-2022 VAR 725,105 0.83
530,000 Intu SGS Finance Plc 3.875% 17-Mar-2023 668,110 0.76
104,000 Lloyds Banking Group Plc 0.750% 09-Nov-2021 103,697 0.12
290,000 London Stock Exchange Group Plc
9.125% 18-Oct-2019 411,302 0.47
700,000 Nationwide Building Society 0.500% 29-Oct-2019 706,461 0.81
160,000 RELX Finance BV 1.375% 12-May-2026 163,304 0.19
200,000 Royal Bank of Scotland Plc/The
5.375% 30-Sep-2019 227,516 0.26
150,000 Royal Bank of Scotland Plc/The
10.500% 16-Mar-2022 VAR 153,368 0.18
205,000 Santander UK Plc 0.875% 25-Nov-2020 209,036 0.24
260,000 Sky Plc 0.449% 01-Apr-2020 FRN 262,608 0.30
480,000 Sky Plc 1.500% 15-Sep-2021 500,353 0.57
355,000 Towd Point Mortgage Funding 2016-Granite2 Plc
2.698% 20-Aug-2051 FRN 411,080 0.47
398,000 Towd Point Mortgage Funding 2016-Vantage1 Plc
2.338% 20-Feb-2054 FRN 449,905 0.51
445,000 Urenco Finance NV 2.250% 05-Aug-2022 478,466 0.55
500,000 Vodafone Group Plc 0.637% 25-Feb-2019 FRN 506,850 0.58
380,000 Yorkshire Building Society 1.250% 17-Mar-2022 381,828 0.44
200,000 Yorkshire Building Society 2.125% 18-Mar-2019 208,259 0.24
Bonds cont’d. Bonds cont’d.
EUR EUR

106
Portfolio of investments – as at 31 December 2016
Holdings Description
Fair
value
Total
net assets
% Holdings Description
Fair
value
Total
net assets
%
BNY MELLON EUROPEAN CREDIT FUND
Credit default swaps - 54,725 (31 December 2015: 49,177)
(1,050,000) CDS Imperial Tobacco Group Plc
1.000% 20-Dec-2021 8,248 0.01
245,000 CDS Macy’s Inc 1.000% 20-Dec-2021 8,588 0.01
259,000 CDS Macy’s Inc 1.000% 20-Dec-2021 9,079 0.01
518,000 CDS Macy’s Inc 1.000% 20-Dec-2021 18,158 0.02
78,000 CDS Macy’s Inc 1.000% 20-Dec-2021 2,734 0.00
(900,000) CDS Volkswagen AG 1.000% 20-Jun-2018 7,918 0.01
Total credit default swaps 54,725 0.06
Holdings Description
Underlying
exposure
EUR
Fair
value
EUR
Total
net assets
%
Open futures contracts - 71,968 (31 December 2015: 30,544)
75 Euro-Bobl
Long Futures Contracts
Exp Mar-2017 10,022,625 68,365 0.08
(9) U.S. 10 Year Treasury Note
Short Futures Contracts
Exp Mar-2017 (1,056,285) 3,337 0.00
(3) U.S. 2 Year Treasury Note
Short Futures Contracts
Exp Mar-2017 (615,412) 266 0.00
Total open futures contracts 71,968 0.08
Unrealised gain on forward foreign currency contracts - 25,260 (see below)
(31 December 2015: 376,421) 25,260 0.03
Total fi nancial assets at fair value through profi t or loss 83,299,841 95.22
Credit default swaps - (70,015) (31 December 2015: (153,092))
650,000 CDS Compass Group plc 1.000% 20-Sep-2018 (9,975) (0.01)
(300,000) CDS Telecom Italia SpA 1.000% 20-Jun-2022 (22,991) (0.03)
200,000 CDS Valeo SA 1.000% 20-Dec-2020 (4,632) (0.00)
50,000 CDS Valeo SA 1.000% 20-Dec-2020 (1,158) (0.00)
50,000 CDS Valeo SA 1.000% 20-Dec-2020 (1,158) (0.00)
50,000 CDS Valeo SA 1.000% 20-Dec-2020 (1,158) (0.00)
800,000 CDS Veolia Environnement SA
1.000% 20-Sep-2020 (17,127) (0.02)
300,000 CDS Vivendi SA 1.000% 20-Jun-2022 (4,933) (0.01)
1,050,000 CDS Vodafone Group Plc 1.000% 20-Dec-2021 (6,883) (0.01)
Total credit default swaps (70,015) (0.08)
Underlying
exposure
EUR
Open futures contracts - (48,633) (31 December 2015: (35,745))
(1) Euro-Bund
Short Futures Contracts
Exp Mar-2017 (164,325) (2,655) (0.00)
(5) Euro-Buxl 30 Year Bond
Short Futures Contracts
Exp Mar-2017 (872,300) (17,300) (0.02)
(6) U.S. 5 Year Treasury Note
Short Futures Contracts
Exp Mar-2017 (667,613) (1,709) (0.00)
(8) UK Long Gilt
Short Futures Contracts
Exp Mar-2017 (1,172,838) (26,969) (0.03)
Total open futures contracts (48,633) (0.05)
Unrealised loss on forward foreign currency contracts - (414,872) (see below)
(31 December 2015: (5,378)) (414,872) (0.48)
Total fi nancial liabilities at fair value through profi t or loss (533,520) (0.61)
Net current assets 4,708,595 5.39
Total net assets 87,474,916 100.00
^ Investment in other Fund of the Company.
The counterparties for credit default swaps are Barclays Bank plc, BNP Paribas, Citigroup, Credit Suisse,
Goldman Sachs, JPMorgan Chase and Morgan Stanley.
The counterparty for futures contracts is Goldman Sachs.
Analysis of portfolio % of Total assets
Transferable securities and money market instruments admitted
to offi cial stock exchange listing or traded on a regulated market 93.88
Financial derivative instruments dealt in on a regulated market 0.08
OTC fi nancial derivative instruments 0.09
Other current assets 5.95
Total assets 100.00
EUR EUR

107
Portfolio of investments – as at 31 December 2016
BNY MELLON EUROPEAN CREDIT FUND
Forward foreign currency contractsUnrealised
Gain/(Loss)Buy Sell Amount (B) Amount (S)
Settle
Date Counterparty
BNY Mellon European Credit Fund Euro Sterling 458,523 385,000 20-Jan-17 Citigroup Funding
Inc 10,228
Sterling Euro 246,000 286,285 20-Jan-17 Citigroup Funding Inc 158
Euro US dollar 421,740 439,000 08-Feb-17 Barclays Bank plc 6,856
US dollar Euro 376,000 347,327 08-Feb-17 RBC Capital Markets 8,018
EUR 25,260
Euro Sterling 408,033 352,000 20-Jan-17 Citigroup Funding Inc (1,837)
Euro Sterling 7,471,605 6,665,000 20-Jan-17 Citigroup Funding Inc (289,135)
Sterling Euro 2,375,000 2,801,071 20-Jan-17 RBC Capital Markets (35,616)
Sterling Euro 554,000 658,329 20-Jan-17 JPMorgan Chase (13,250)
Euro US dollar 4,940,100 5,305,000 08-Feb-17 Toronto Dominion Bank (73,476)
Euro US dollar 169,499 181,000 08-Feb-17 RBC Capital Markets (1,558)
EUR (414,872)
Net EUR (389,612)

108
Portfolio of investments – as at 31 December 2016
Holdings Description
Fair
value
Total
net assets
% Holdings Description
Fair
value
Total
net assets
%
BNY MELLON GLOBAL BOND FUND
Bonds
Australian Dollar - 17,928,345 (31 December 2015: 12,172,358) 17,928,345 3.65
7,240,000 Australia Government Bond 3.000% 21-Mar-2047 4,507,030 0.92
10,030,000 Queensland Treasury Corp 144A
3.500% 21-Sep-2017 7,330,414 1.49
6,940,000 Treasury Corp of Victoria 5.500% 17-Nov-2026 6,090,901 1.24
Canadian Dollar - 4,094,422 (31 December 2015: –) 4,094,422 0.83
5,480,000 Canadian Government Bond
1.250% 01-Feb-2018 4,094,422 0.83
Chinese Yuan Renminbi - 3,225,955 (31 December 2015: 3,405,847) 3,225,955 0.66
11,200,000 International Finance Corp
2.000% 18-Jan-2017 1,608,033 0.33
11,390,000 United Kingdom Government International Bond
2.700% 21-Oct-2017 1,617,922 0.33
Danish Krone - 5,811,756 (31 December 2015: 5,204,383) 5,811,756 1.18
36,310,000 Denmark Government Bond 1
.750% 15-Nov-2025 5,811,756 1.18
Euro - 81,770,559 (31 December 2015: 74,426,661) 81,770,559 16.64
4,700,000 Banca Monte dei Paschi di Siena SpA
3.500% 20-Mar-2017 4,994,047 1.02
1,856,000 Export-Import Bank of Korea
0.375% 15-Mar-2019 1,978,624 0.40
4,800,000 FMS Wertmanagement AoeR
0.375% 29-Apr-2030 4,785,278 0.97
3,440,000 French Republic Government Bond OAT
3.250% 25-May-2045 5,015,914 1.02
7,380,000 French Republic Government Bond OAT
3.500% 25-Apr-2026 9,875,101 2.01
5,620,000 Italy Buoni Poliennali Del Tesoro
4.500% 01-Mar-2024 7,235,055 1.47
9,420,000 Italy Buoni Poliennali Del Tesoro
6.500% 01-Nov-2027 14,411,704 2.93
3,950,000 Morocco Government International Bond
3.500% 19-Jun-2024 4,403,224 0.90
2,950,000 Province of British Columbia Canada
0.875% 08-Oct-2025 3,218,049 0.66
3,185,000 Republic of Austria Government Bond 144A
3.150% 20-Jun-2044 4,921,475 1.00
3,700,000 SNCF Reseau 1.125% 25-May-2030 3,889,618 0.79
11,450,000 Spain Government Bond 144A
5.900% 30-Jul-2026 17,042,470 3.47
Japanese Yen - 21,567,035 (31 December 2015: –) 21,567,035 4.39
783,700,000 Japan Government Thirty Year Bond
1.400% 20-Sep-2045 7,955,046 1.62
498,600,000 Japan Government Twenty Year Bond
1.000% 20-Dec-2035 4,634,258 0.94
983,536,569 Japanese Government CPI Linked Bond
0.100% 10-Mar-2026 8,977,731 1.83
Mexican Nuevo Peso - 8,788,169 (31 December 2015: 4,930,302) 8,788,169 1.79
186,840,000 Mexican Bonos 6.500% 10-Jun-2021 8,788,169 1.79
New Zealand Dollar - 19,886,366 (31 December 2015: 12,163,042) 19,886,366 4.05
6,520,000 International Bank for Reconstruction
& Development 3.375% 13-Aug-2017 4,565,640 0.93
7,350,000 Landwirtschaftliche Rentenbank
4.000% 30-Jan-2020 5,216,349 1.06
7,260,000 New Zealand Local Government Funding
Agency Bond 4.500% 15-Apr-2027 5,112,160 1.04
6,870,000 New Zealand Local Government Funding
Agency Bond 5.000% 15-Mar-2019 4,992,217 1.02
Norwegian Krone - 9,261,359 (31 December 2015: –) 9,261,359 1.88
38,660,000 Norway Government Bond 144A
1.500% 19-Feb-2026 4,437,607 0.90
37,240,000 Norway Government Bond 144A
3.750% 25-May-2021 4,823,752 0.98
Peruvian Nuevo Sol - 4,697,723 (31 December 2015: 1,561,569) 4,697,723 0.96
7,660,000 Peruvian Government International Bond
6.950% 12-Aug-2031 2,340,547 0.48
6,990,000 Peruvian Government International Bond
8.200% 12-Aug-2026 2,357,176 0.48
Sterling - 18,490,602 (31 December 2015: 21,490,406) 18,490,602 3.76
1,215,000 Affordable Housing Finance Plc
3.800% 20-May-2042 1,972,181 0.40
5,590,000 United Kingdom Gilt 1.750% 07-Sep-2022 7,292,354 1.48
1,610,000 United Kingdom Gilt 3.250% 22-Jan-2044 2,566,432 0.52
2,420,000 United Kingdom Gilt 4.250% 07-Dec-2027 3,863,126 0.79
1,480,000 United Kingdom Gilt 4.750% 07-Dec-2038 2,796,509 0.57
US Dollar - 277,623,640 (31 December 2015: 164,250,868) 277,623,640 56.52
4,700,000 Abu Dhabi Government International Bond
2.125% 03-May-2021 4,614,813 0.94
3,580,000 Asian Development Bank 0.886% 10-Jul-2019 FRN 3,572,054 0.73
4,800,000 Bank of England Euro Note 1.250% 14-Mar-2019 4,762,349 0.97
5,600,000 Caisse des Depots et Consignations
1.250% 17-May-2019 5,523,655 1.12
5,620,000 Dexia Credit Local SA 2.250% 30-Jan-2019 5,637,391 1.15
4,068,000 Export-Import Bank of Korea
1.341% 21-Oct-2019 FRN 4,055,332 0.83
3,830,000 FMS Wertmanagement AoeR 0.625% 30-Jan-2017 3,828,972 0.78
5,400,000 FMS Wertmanagement AoeR
1.037% 27-Nov-2019 FRN 5,398,518 1.10
4,970,000 FMS Wertmanagement AoeR 1.625% 20-Nov-2018 4,987,323 1.02
3,751,000 Iceland Government International Bond
5.875% 11-May-2022 4,276,855 0.87
5,560,000 Instituto de Credito Ofi cial 1.625% 14-Sep-2018 5,533,551 1.13
7,070,000 Inter-American Development Bank
0.983% 12-Sep-2018 FRN 7,068,894 1.44
3,984,000 International Bank for Reconstruction
& Development 1.182% 11-Feb-2021 FRN 4,001,603 0.81
5,900,000 Kommunalbanken AS 1.014% 02-May-2019 FRN 5,897,519 1.20
5,020,000 Kommunekredit 1.625% 01-Jun-2021 4,887,497 1.00
4,800,000 Kommuninvest I Sverige AB 1.125% 09-Oct-2018 4,771,229 0.97
2,000,000 Nederlandse Financierings Maatschappij voor
Ontwikkelingslanden NV 1.202% 18-Apr-2019 FRN 2,002,748 0.41
10,820,000 Netherlands Government Bond 1.000% 24-Feb-2017 10,820,703 2.20
Bonds cont’d.
USDUSD

109
Portfolio of investments – as at 31 December 2016
Holdings Description
Fair
value
Total
net assets
%
BNY MELLON GLOBAL BOND FUND
Forward foreign currency contracts
Unrealised
Gain/(Loss)Buy Sell Amount (B) Amount (S)
Settle
Date Counterparty
BNY Mellon Global Bond FundEuro US dollar 362,366 379,694 03-Jan-17 State Street Bank 2,964
Czech koruna US dollar 122,719,119 4,765,136 16-Mar-17 JPMorgan Chase 48,481
Danish krone US dollar 8,397,921 1,180,579 16-Mar-17 State Street Bank 17,059
Euro US dollar 344,708 361,553 16-Mar-17 State Street Bank 3,821
Hungarian forint US dollar 2,253,930,640 7,624,032 16-Mar-17 Barclays Bank plc 73,071
South African rand US dollar 70,941,000 4,956,542 16-Mar-17 State Street Bank 140,740
Swedish krona US dollar 89,597,442 9,870,025 16-Mar-17 Royal Bank of Scotland 60,388
US dollar Australian dollar 1,736,863 2,337,629 16-Mar-17 Royal Bank of Scotland 50,899
US dollar Canadian dollar 5,899,956 7,823,637 16-Mar-17 State Street Bank 87,944
US dollar Chinese yuan 3,237,712 22,528,000 16-Mar-17 UBS 66,568
US dollar Euro 3,434,825 3,182,862 16-Mar-17 State Street Bank 61,153
US dollar Euro 486,864 456,770 16-Mar-17 State Street Bank 2,711
US dollar Hungarian forint 7,616,637 2,214,697,173 16-Mar-17 Barclays Bank plc 53,515
US dollar Japanese yen 10,530,575 1,213,698,000 16-Mar-17 JPMorgan Chase 113,893
US dollar Japanese yen 6,370,955 721,793,000 16-Mar-17 Barclays Bank plc 176,096
US dollar Korean won 9,914,122 11,603,488,000 16-Mar-17 Royal Bank of Scotland 264,974
US dollar Mexican peso 9,569,948 197,433,772 16-Mar-17 State Street Bank 119,071
US dollar New Zealand dollar 20,766,013 29,211,904 16-Mar-17 Royal Bank of Scotland 471,748
US dollar Norwegian krone 9,823,841 82,288,730 16-Mar-17 The Bank of New York Mellon 254,808
US dollar South African rand 5,114,892 70,941,000 16-Mar-17 JPMorgan Chase 17,611
USD 2,087,515
Danish krone US dollar 3,027,862 439,310 16-Mar-17 Royal Bank of Scotland (7,503)
Euro US dollar 1,369,970 1,466,705 16-Mar-17 Royal Bank of Scotland (14,606)
Euro US dollar 1,181,972 1,263,012 16-Mar-17 State Street Bank (10,183)
Euro US dollar 427,817 455,624 16-Mar-17 State Street Bank (2,160)
Euro US dollar 19,767,566 21,322,680 16-Mar-17 State Street Bank (370,062)
Euro US dollar 1,154,056 1,231,542 16-Mar-17 State Street Bank (8,301)
Hungarian forint US dollar 1,472,010,888 5,055,851 16-Mar-17 Royal Bank of Scotland (28,979)
Hungarian forint US dollar 1,467,152,000 5,037,086 16-Mar-17 JPMorgan Chase (26,807)
Japanese yen US dollar 11,552,849,084 101,894,498 16-Mar-17 State Street Bank (2,741,038)
Mexican peso US dollar 6,139,770 296,660 16-Mar-17 State Street Bank (2,758)
Sterling US dollar 2,022,503 2,555,776 16-Mar-17 The Bank of New York Mellon (63,188)
Sterling US dollar 10,804,372 13,812,049 16-Mar-17 State Street Bank (496,446)
US dollar Euro 381,039 362,366 16-Mar-17 State Street Bank (3,050)
US dollar Euro 240,747 230,495 16-Mar-17 State Street Bank (3,565)
US dollar Euro 5,664,153 5,407,797 16-Mar-17 State Street Bank (67,838)
US dollar Swedish krona 696,850 6,372,000 16-Mar-17 Royal Bank of Scotland (9,382)
USD (3,855,866)
Net USD (1,768,351)
5,160,000 Nordic Investment Bank 1.250% 02-Aug-2021 4,966,784 1.01
5,340,000 Province of British Columbia Canada
2.250% 02-Jun-2026 5,066,547 1.03
2,594,000 Saudi Government International Bond
2.375% 26-Oct-2021 2,519,119 0.51
4,360,000 Svensk Exportkredit AB 2.875% 14-Nov-2023 VAR 4,347,748 0.89
21,799,008 United States Treasury Infl ation Indexed Bonds
0.125% 15-Apr-2020 22,001,444 4.48
11,822,806 United States Treasury Infl ation Indexed Bonds
2.375% 15-Jan-2025 13,532,845 2.75
17,290,000 United States Treasury Note/Bond
0.875% 28-Feb-2017 17,302,846 3.52
17,290,000 United States Treasury Note/Bond
1.250% 30-Nov-2018 17,306,547 3.52
35,630,000 United States Treasury Note/Bond
1.625% 15-Aug-2022 34,681,494 7.06
30,650,000 United States Treasury Note/Bond
2.000% 15-Feb-2025 29,729,902 6.05
16,170,000 United States Treasury Note/Bond
2.875% 15-May-2043 15,529,199 3.16
10,620,000 United States Treasury Note/Bond
3.000% 15-Nov-2045 10,416,314 2.12
8,080,000 United States Treasury Note/Bond
3.500% 15-May-2020 8,581,845 1.75
Total investments in bonds 473,145,931 96.31
Future options - 226,359 (31 December 2015: –)
439 U.S. 10 Year Treasury Note Future Put
24-Feb-2017 122.500 226,359 0.05
Total future options 226,359 0.05
Unrealised gain on forward foreign currency contracts - 2,103,316 (see below)
(31 December 2015: 2,398,280) 2,103,316 0.43
Total fi nancial assets at fair value through profi t or loss 475,475,606 96.79
Unrealised loss on forward foreign currency contracts - (3,856,815) (see below)
(31 December 2015: (1,472,340)) (3,856,815) (0.79)
Total fi nancial liabilities at fair value through profi t or loss (3,856,815) (0.79)
Net current assets 19,665,688 4.00
Total net assets 491,284,479 100.00
The counterparty for future options is UBS.
Analysis of portfolio % of Total assets
Transferable securities and money market instruments admitted
to offi cial stock exchange listing or traded on a regulated market 95.19
Financial derivative instruments dealt in on a regulated market 0.05
OTC fi nancial derivative instruments 0.42
Other current assets 4.34
Total assets 100.00
Bonds cont’d.
US Dollar cont’d.
USD
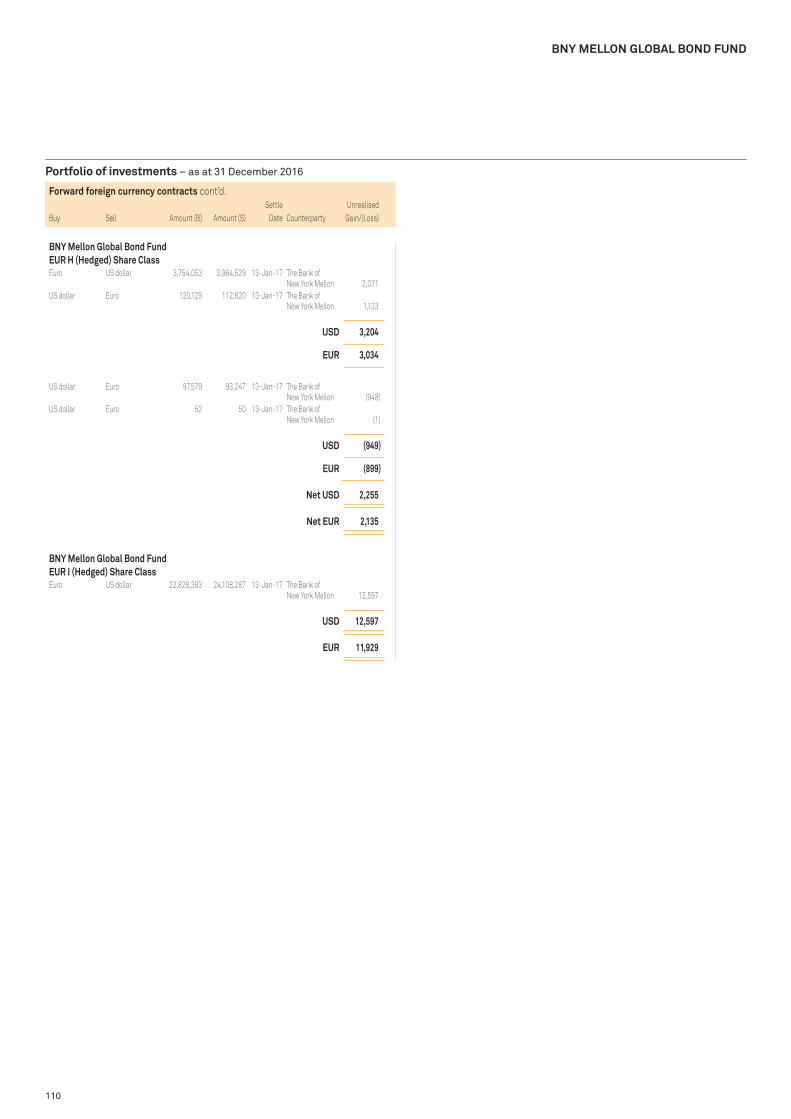
110
Portfolio of investments – as at 31 December 2016
BNY MELLON GLOBAL BOND FUND
Forward foreign currency contracts cont’d.
Unrealised
Gain/(Loss)Buy Sell Amount (B) Amount (S)
Settle
Date Counterparty
BNY Mellon Global Bond Fund EUR H (Hedged) Share ClassEuro US dollar 3,754,053 3,964,529 13-Jan-17 The Bank of
New York Mellon 2,071
US dollar Euro 120,129 112,620 13-Jan-17 The Bank of New York Mellon 1,133
USD 3,204
EUR 3,034
US dollar Euro 97,579 93,247 13-Jan-17 The Bank of New York Mellon (948)
US dollar Euro 52 50 13-Jan-17 The Bank of New York Mellon (1)
USD (949)
EUR (899)
Net USD 2,255
Net EUR 2,135
BNY Mellon Global Bond Fund EUR I (Hedged) Share ClassEuro US dollar 22,828,383 24,108,287 13-Jan-17 The Bank of
New York Mellon 12,597
USD 12,597
EUR 11,929

111
Portfolio of investments – as at 31 December 2016
Holdings Description
Fair
value
Total
net assets
% Holdings Description
Fair
value
Total
net assets
%
Collective investment schemes
Supranational - 29,113,649 29,113,649 7.27 8,154,006 Insight Global Funds II plc - Emerging Market
Bond Opportunities Fund 8,792,751 2.20
20,320,898 Insight Liquidity Funds Plc - USD Liquidity Fund 20,320,898 5.07
Total investments in collective investment schemes 29,113,649 7.27
Bonds
Australia - 2,421,505 2,421,505 0.61 2,409,000 Westpac Banking Corp 4.322% 23-Nov-2031 VAR 2,421,505 0.61
Austria - 3,668,323 3,668,323 0.92 1,000,000 Erste Group Bank AG 5.500% 26-May-2025 VAR 1,021,900 0.26
1,300,000 Raiffeisen Bank International AG
6.000% 16-Oct-2023 1,475,253 0.37
1,000,000 Raiffeisen Bank International AG
6.625% 18-May-2021 1,171,170 0.29
Belgium - 4,286,416 4,286,416 1.07 3,950,000 Anheuser-Busch InBev Finance Inc
4.900% 01-Feb-2046 4,286,416 1.07
Canada - 5,998,779 5,998,779 1.50 1,989,000 Enbridge Inc 4.250% 01-Dec-2026 2,040,544 0.51
960,000 Teck Resources Ltd 6.250% 15-Jul-2041 929,933 0.23
2,000,000 Toronto-Dominion Bank 2.250% 05-Nov-2019 2,012,727 0.50
1,000,000 Toronto-Dominion Bank 2.625% 10-Sep-2018 1,015,575 0.26
Chile - 1,513,664 1,513,664 0.38 1,600,000 Transelec SA 3.875% 12-Jan-2029 1,513,664 0.38
Denmark - 573,067 573,067 0.14 527,000 Nykredit Realkredit A/S
4.000% 03-Jun-2036 VAR 573,067 0.14
Finland - 5,136,189 5,136,189 1.28 4,877,000 OP Corporate Bank plc 0.037% 03-Mar-2017 FRN 5,136,189 1.28
France - 18,231,332 18,231,332 4.55 4,900,000 Banque Federative du Credit Mutuel SA
0.000% 23-Mar-2017 FRN 5,161,340 1.29
1,900,000 Credit Agricole Assurances SA
4.250% Perpetual VAR 1,976,853 0.49
2,300,000 Credit Agricole SA/London 1.875% 20-Dec-2026 2,434,981 0.61
6,180,000 Danone SA 144A 2.947% 02-Nov-2026 5,909,912 1.47
1,600,000 Electricite de France SA 5.375% Perpetual VAR 1,693,643 0.42
452,000 Total SA 2.708% Perpetual VAR 466,211 0.12
579,000 Total SA 3.369% Perpetual VAR 588,392 0.15
Germany - 25,502,271 25,502,271 6.37 3,500,000 ATF Netherlands BV 1.500% 03-May-2022 3,598,755 0.90
500,000 ATF Netherlands BV 1.500% 15-Jul-2024 495,290 0.12
1,700,000 ATF Netherlands BV 2.125% 13-Mar-2023 1,783,019 0.45
3,033,000 Kreditanstalt fuer Wiederaufbau
2.625% 25-Jan-2022 3,091,543 0.77
833,000 Kreditanstalt fuer Wiederaufbau
5.750% 07-Jun-2032 1,575,745 0.39
7,574,000 State of Hesse 0.375% 04-Jul-2022 8,169,326 2.04
6,227,000 State of North Rhine-Westphalia
0.625% 17-Nov-2023 6,788,593 1.70
Indonesia - 7,998,840 7,998,840 2.00 4,039,000 Indonesia Government International Bond
3.375% 15-Apr-2023 3,950,522 0.99
400,000 Indonesia Government International Bond 144A
5.875% 15-Jan-2024 442,321 0.11
3,612,000 Pertamina Persero PT 4.300% 20-May-2023 3,605,997 0.90
Ireland - 4,565,624 4,565,624 1.14 2,659,000 Allied Irish Banks Plc
4.125% 26-Nov-2025 VAR 2,844,981 0.71
500,000 Avoca CLO XI Ltd 3.189% 15-Jul-2027 FRN 525,675 0.13
1,150,000 European Residential Loan Securitisation
2016-1 DAC 1.131% 24-Jan-2059 FRN 1,194,968 0.30
Israel - 3,162,021 3,162,021 0.79 602,000 Teva Pharmaceutical Finance Netherlands II BV
1.125% 15-Oct-2024 613,188 0.15
466,000 Teva Pharmaceutical Finance Netherlands II BV
1.625% 15-Oct-2028 461,185 0.12
821,000 Teva Pharmaceutical Finance Netherlands III BV
3.150% 01-Oct-2026 758,463 0.19
1,545,000 Teva Pharmaceutical Finance Netherlands III BV
4.100% 01-Oct-2046 1,329,185 0.33
Italy - 7,654,897 7,654,897 1.91 300,000 Assicurazioni Generali SpA
7.750% 12-Dec-2042 VAR 376,828 0.09
700,000 Assicurazioni Generali SpA
10.125% 10-Jul-2042 VAR 960,982 0.24
2,750,000 Intesa Sanpaolo SpA 144A
5.710% 15-Jan-2026 2,628,809 0.66
500,000 REITALY Finance Srl 3.150% 22-May-2027 FRN 515,683 0.13
2,995,000 UniCredit SpA 4.375% 03-Jan-2027 VAR 3,172,595 0.79
Japan - 3,667,391 3,667,391 0.92 3,242,000 Mitsubishi UFJ Financial Group Inc
2.190% 13-Sep-2021 3,154,811 0.79
545,000 Mitsubishi UFJ Financial Group Inc
2.757% 13-Sep-2026 512,580 0.13
Luxembourg - 2,953,449 2,953,449 0.74 1,727,000 SES SA 4.625% Perpetual VAR 1,846,105 0.46
1,025,000 SES SA 5.625% Perpetual VAR 1,107,344 0.28
Mexico - 3,984,817 3,984,817 1.00 300,000 America Movil SAB de CV 5.750% 28-Jun-2030 469,067 0.12
3,500,000 Mexico Government International Bond
3.625% 15-Mar-2022 3,515,750 0.88
Morocco - 2,347,940 2,347,940 0.59 2,293,000 Morocco Government International Bond
4.250% 11-Dec-2022 2,347,940 0.59
Netherlands - 4,661,729 4,661,729 1.16 2,733,000 ING Groep NV 6.875% Perpetual VAR 2,769,035 0.69
1,714,000 Volksbank NV 3.750% 05-Nov-2025 VAR 1,892,694 0.47
Peru - 2,651,125 2,651,125 0.66 2,540,000 Peruvian Government International Bond
4.125% 25-Aug-2027 2,651,125 0.66
BNY MELLON GLOBAL CREDIT FUND
Bonds cont’d.
USDUSD

112
Portfolio of investments – as at 31 December 2016
Holdings Description
Fair
value
Total
net assets
% Holdings Description
Fair
value
Total
net assets
%
BNY MELLON GLOBAL CREDIT FUND
499,000 NewDay Funding 2016-1 Plc
4.611% 15-Jun-2024 FRN 627,829 0.16
250,000 Newday Partnership Funding 2015-1 Plc
1.761% 15-Apr-2025 FRN 301,693 0.07
500,000 Newday Partnership Funding 2015-1 Plc
2.661% 15-Apr-2025 FRN 606,110 0.15
1,088,991 Punch Taverns Finance Plc 7.320% 15-Oct-2025 1,628,941 0.41
1,678,000 RAC Bond Co Plc 4.870% 06-May-2026 2,287,803 0.57
1,282,960 Residential Mortgage Securities 21 Plc
0.348% 12-Nov-2038 FRN 1,260,729 0.31
500,000 Residential Mortgage Securities 25 Plc
0.000% 16-Dec-2050 FRN 576,460 0.14
500,000 Residential Mortgage Securities 25 Plc
0.000% 16-Dec-2050 FRN 587,920 0.15
500,000 Residential Mortgage Securities 26 Plc
0.000% 14-Feb-2041 564,932 0.14
500,000 Residential Mortgage Securities 26 Plc
0.000% 14-Feb-2041 564,582 0.14
771,597 RMAC Securities No 1 Plc
0.000% 12-Jun-2044 FRN 710,115 0.18
821,000 Scottish Widows Ltd 5.500% 16-Jun-2023 1,091,481 0.27
600,000 Scottish Widows Ltd 7.000% 16-Jun-2043 836,034 0.21
4,400,000 Sky Plc 144A 3.750% 16-Sep-2024 4,421,307 1.10
1,467,071 Southern Pacifi c Financing 06-A Plc
0.636% 10-Mar-2044 FRN 1,587,645 0.40
1,356,000 Southern Water Services Finance Ltd
4.500% 31-Mar-2038 VAR 1,841,441 0.46
398,843 THRONES 2015-1 Plc 1.571% 18-Mar-2050 FRN 479,281 0.12
500,000 THRONES 2015-1 Plc 1.771% 18-Mar-2050 FRN 586,790 0.15
994,000 Towd Point Mortgage Funding 2016-Vantage1 Plc
2.338% 20-Feb-2054 FRN 1,188,712 0.30
United States of America - 150,656,827 150,656,827 37.61 2,747,000 Anadarko Petroleum Corp 6.450% 15-Sep-2036 3,279,109 0.82
3,729,000 AT&T Inc 4.750% 15-May-2046 3,546,574 0.89
540,000 AT&T Inc 5.650% 15-Feb-2047 581,304 0.15
4,650,000 Bank of America Corp 4.183% 25-Nov-2027 4,662,327 1.16
1,069,000 Bank of America Corp 4.875% 01-Apr-2044 1,164,463 0.29
775,000 Bay Area Toll Authority 6.263% 01-Apr-2049 1,055,697 0.26
2,848,000 Burlington Northern Santa Fe LLC
4.700% 01-Sep-2045 3,124,739 0.78
327,000 Columbia Pipeline Group Inc 4.500% 01-Jun-2025 344,123 0.09
3,000,000 Comcast Corp 4.600% 15-Aug-2045 3,152,374 0.79
2,000,000 Concho Resources Inc 5.500% 01-Apr-2023 2,082,600 0.52
2,128,000 CSX Corp 3.350% 01-Nov-2025 2,134,155 0.53
1,400,000 CSX Corp 4.100% 15-Mar-2044 1,362,457 0.34
2,578,000 Dominion Resources Inc/VA 4.700% 01-Dec-2044 2,660,636 0.66
3,396,000 Entergy Corp 2.950% 01-Sep-2026 3,183,342 0.79
4,430,000 ERAC USA Finance LLC 144A 3.300% 01-Dec-2026 4,259,547 1.06
420,000 ERAC USA Finance LLC 144A 3.850% 15-Nov-2024 427,531 0.11
1,300,000 ERAC USA Finance LLC 144A 4.500% 16-Aug-2021 1,388,323 0.35
1,258,000 Exelon Corp 3.400% 15-Apr-2026 1,236,759 0.31
5,562,000 FirstEnergy Corp 4.250% 15-Mar-2023 5,757,501 1.44
3,580,000 General Motors Financial Co Inc
3.200% 06-Jul-2021 3,553,827 0.89
3,930,000 Goldman Sachs Group Inc/The
3.500% 16-Nov-2026 3,847,488 0.96
1,143,000 Goldman Sachs Group Inc/The 4.250% 29-Jan-2026 1,574,690 0.39
Qatar - 1,102,853 1,102,853 0.28 1,100,000 Qatar Government International Bond
4.625% 02-Jun-2046 1,102,853 0.28
Romania - 4,648,727 4,648,727 1.16 4,074,000 Romanian Government International Bond
6.750% 07-Feb-2022 4,648,727 1.16
Spain - 6,084,376 6,084,376 1.52 4,300,000 Inmobiliaria Colonial SA 1.450% 28-Oct-2024 4,329,318 1.08
1,700,000 Telefonica Europe BV 3.750% Perpetual VAR 1,755,058 0.44
Supranational - 25,847,580 25,847,580 6.45 1,757,000 European Investment Bank 1.750% 15-Sep-2045 2,047,574 0.51
900,000 European Investment Bank 2.250% 14-Oct-2022 1,078,636 0.27
1,529,000 European Investment Bank 2.750% 15-Sep-2025 1,952,798 0.49
3,910,000 European Investment Bank 2.875% 15-Sep-2020 4,042,506 1.01
600,000 European Investment Bank 4.000% 15-Oct-2037 988,280 0.24
4,900,000 European Union 2.750% 04-Apr-2022 5,973,971 1.49
2,117,000 Inter-American Development Bank
2.125% 15-Jan-2025 2,052,318 0.51
6,251,000 International Bank for Reconstruction
& Development 2.125% 01-Nov-2020 6,321,399 1.58
1,400,000 International Bank for Reconstruction
& Development 2.500% 29-Jul-2025 1,390,098 0.35
Sweden - 1,209,012 1,209,012 0.30 1,200,000 Swedbank AB 6.000% Perpetual VAR 1,209,012 0.30
Switzerland - 10,196,021 10,196,021 2.54 6,200,000 Credit Suisse AG/London
0.148% 10-Nov-2017 FRN 6,544,184 1.63
675,000 Glencore Funding LLC 144A
4.125% 30-May-2023 680,229 0.17
2,900,000 UBS Group Funding Jersey Ltd
4.125% 15-Apr-2026 2,971,608 0.74
United Kingdom - 62,562,108 62,562,108 15.62 1,911,400 Alba 2007-1 Plc 0.611% 17-Mar-2039 FRN 2,065,387 0.52
1,500,000 ALBA 2015-1 Plc 1.908% 24-Apr-2049 FRN 1,749,177 0.44
3,320,000 Annington Finance No 4 Plc
0.000% 07-Dec-2022 3,616,582 0.90
3,447,000 Barclays Bank Plc 7.625% 21-Nov-2022 3,789,546 0.95
3,710,000 Barclays Plc 1.875% 08-Dec-2023 3,958,582 0.99
1,200,000 Channel Link Enterprises Finance Plc
3.034% 30-Jun-2050 FRN 1,274,835 0.32
1,010,000 Dukinfi eld Plc 2.198% 15-Aug-2045 FRN 1,172,492 0.29
500,000 Gatwick Funding Ltd 6.500% 02-Mar-2041 975,199 0.24
800,000 Gemgarto 2.648% 14-May-2045 FRN 986,755 0.25
500,000 Hawksmoor Mortgages 2016-1 Plc
1.991% 25-May-2053 FRN 617,607 0.15
1,000,000 Hawksmoor Mortgages 2016-1 Plc
2.641% 25-May-2053 FRN 1,221,536 0.30
300,000 Hawksmoor Mortgages 2016-1 Plc
2.891% 25-May-2053 FRN 369,146 0.09
1,075,000 Heathrow Funding Ltd 5.225% 15-Feb-2023 1,577,396 0.40
5,246,000 HSBC Holdings Plc 3.900% 25-May-2026 5,288,020 1.32
4,838,000 Imperial Brands Finance Plc 144A
3.750% 21-Jul-2022 4,972,586 1.24
6,800,000 Lloyds Bank Plc 0.228% 21-Aug-2017 FRN 7,177,457 1.79
Bonds cont’d.
United Kingdom cont’d.
Bonds cont’d.
USDUSD

113
Portfolio of investments – as at 31 December 2016
Holdings Description
Fair
value
Total
net assets
% Holdings Description
Fair
value
Total
net assets
%
BNY MELLON GLOBAL CREDIT FUND
Credit default swaps - 381,209 500,000 CDS AXA SA 1.000% 20-Dec-2021 15,027 0.00
(1,970,000) CDS BHP Billiton Ltd 1.000% 20-Jun-2021 451 0.00
300,000 CDS Commerzbank Aktiengesellschaft
1.000% 20-Dec-2020 119 0.00
900,000 CDS Commerzbank Aktiengesellschaft
1.000% 20-Dec-2020 357 0.00
300,000 CDS Deutsche Bank AG 1.000% 20-Dec-2021 35,053 0.01
300,000 CDS Deutsche Bank AG 1.000% 20-Dec-2021 35,053 0.01
300,000 CDS Deutsche Bank AG 1.000% 20-Dec-2021 35,054 0.01
647,000 CDS Freeport-McMoRan Inc 1.000% 20-Dec-2021 77,314 0.02
646,000 CDS Freeport-McMoRan Inc 1.000% 20-Dec-2021 77,194 0.02
(100,000) CDS Imperial Tobacco Group Plc
1.000% 20-Dec-2020 1,430 0.00
(150,000) CDS Imperial Tobacco Group Plc
1.000% 20-Dec-2020 2,144 0.00
(350,000) CDS Imperial Tobacco Group Plc
1.000% 20-Dec-2020 5,004 0.00
(300,000) CDS Imperial Tobacco Group Plc
1.000% 20-Dec-2020 4,289 0.00
458,000 CDS Macy’s Inc 1.000% 20-Dec-2021 16,933 0.00
145,000 CDS Macy’s Inc 1.000% 20-Dec-2021 5,361 0.00
482,000 CDS Macy’s Inc 1.000% 20-Dec-2021 17,820 0.01
965,000 CDS Macy’s Inc 1.000% 20-Dec-2021 35,677 0.01
(100,000) CDS Rolls-Royce Plc 1.000% 20-Dec-2020 183 0.00
(100,000) CDS Rolls-Royce Plc 1.000% 20-Dec-2020 183 0.00
(500,000) CDS RWE AG 1.000% 20-Dec-2021 5,176 0.00
(1,100,000) CDS RWE AG 1.000% 20-Dec-2021 11,387 0.00
Total credit default swaps 381,209 0.09
Currency options - 87,727 1,400,000 US dollar/Euro Call 03-Jan-2017 1.035 287 0.00
1,400,000 US dollar/Japanese yen Call 03-Jan-2017 118.750 569 0.00
1,400,000 US dollar/Japanese yen Call 04-Jan-2017 114.750 25,462 0.01
1,400,000 US dollar/Japanese yen Call 05-Jan-2017 118.250 2,790 0.00
1,400,000 US dollar/Japanese yen Call 23-Feb-2017 112.500 58,619 0.02
Total currency options 87,727 0.03
Holdings Description
Underlying
exposure
USD
Fair
value
USD
Total
net assets
%
Open futures contracts - 423,470 20 Australian 10 Year Treasury Bond
Long Futures Contracts
Exp Mar-2017 1,843,708 15,144 0.00
32 Euro-Bobl
Long Futures Contracts
Exp Mar-2017 4,501,302 24,127 0.01
74 Euro-Oat
Long Futures Contracts
Exp Mar-2017 11,826,190 132,118 0.03
41 Euro-Schatz
Long Futures Contracts
Exp Mar-2017 4,846,287 6,474 0.00
2 Japanese 10 Year Bond
Long Futures Contracts
Exp Mar-2017 2,570,952 599 0.00
840,000 Goldman Sachs Group Inc/The 6.250% 01-Feb-2041 1,044,792 0.26
500,000 JM Smucker Co/The 4.250% 15-Mar-2035 506,388 0.13
4,878,000 JPMorgan Chase & Co 0.088% 21-Feb-2017 FRN 5,138,320 1.28
4,636,000 JPMorgan Chase Bank NA
0.000% 14-Jun-2018 FRN 4,890,335 1.22
1,927,000 Kinder Morgan Inc/DE 5.550% 01-Jun-2045 2,034,130 0.51
478,000 Kraft Heinz Foods Co 144A 4.875% 15-Feb-2025 516,029 0.13
1,595,000 Kraft Heinz Foods Co 5.000% 15-Jul-2035 1,678,338 0.42
1,031,000 Kraft Heinz Foods Co 5.200% 15-Jul-2045 1,083,327 0.27
2,330,000 Lockheed Martin Corp 4.700% 15-May-2046 2,544,776 0.64
1,600,000 Lowe’s Cos Inc 4.375% 15-Sep-2045 1,652,354 0.41
3,100,000 Metropolitan Life Global Funding I 144A
3.000% 10-Jan-2023 3,116,050 0.78
1,940,000 Microsoft Corp 2.400% 08-Aug-2026 1,835,042 0.46
2,970,000 Microsoft Corp 3.950% 08-Aug-2056 2,813,300 0.70
5,012,000 Mondelez International Holdings
Netherlands BV 144A 2.000% 28-Oct-2021 4,807,154 1.20
4,900,000 Morgan Stanley 0.109% 17-Jan-2017 FRN 5,158,580 1.29
3,886,000 Morgan Stanley 2.625% 17-Nov-2021 3,843,576 0.96
1,683,000 Morgan Stanley 3.125% 27-Jul-2026 1,611,183 0.40
800,000 Morgan Stanley 5.500% 28-Jul-2021 887,413 0.22
500,000 Morgan Stanley 7.250% 01-Apr-2032 679,179 0.17
2,970,000 MPLX LP 4.875% 01-Jun-2025 3,058,714 0.76
1,160,000 Mylan NV 2.250% 22-Nov-2024 1,246,352 0.31
2,281,000 Mylan NV 3.125% 22-Nov-2028 2,448,899 0.61
3,922,000 Nasdaq Inc 3.850% 30-Jun-2026 3,903,812 0.97
830,000 New York City Water & Sewer System
5.882% 15-Jun-2044 1,074,510 0.27
1,020,000 New York State Dormitory Authority
5.389% 15-Mar-2040 1,217,492 0.30
1,820,000 Newell Brands Inc 5.500% 01-Apr-2046 2,094,226 0.52
1,474,000 NiSource Finance Corp 5.650% 01-Feb-2045 1,725,066 0.43
1,464,000 Pacifi c Gas & Electric Co 4.250% 15-Mar-2046 1,493,971 0.37
1,820,000 Pioneer Natural Resources Co
4.450% 15-Jan-2026 1,935,451 0.48
750,000 RAIT 2016-FL6 Trust 144A
3.680% 13-Nov-2031 FRN 750,000 0.19
1,153,000 Reynolds American Inc 5.850% 15-Aug-2045 1,370,402 0.34
3,400,000 Royal Caribbean Cruises Ltd
5.250% 15-Nov-2022 3,650,750 0.91
550,000 Southern Co Gas Capital Corp
3.950% 01-Oct-2046 511,085 0.13
1,676,000 Southern Co Gas Capital Corp
4.400% 01-Jun-2043 1,663,699 0.42
2,217,000 Tesoro Corp 144A 5.125% 15-Dec-2026 2,246,431 0.56
2,461,000 UDR Inc 2.950% 01-Sep-2026 2,306,708 0.58
8,884,951 United States Treasury Infl ation Indexed Bonds
0.750% 15-Feb-2045 8,375,528 2.09
1,393,000 Verizon Communications Inc
4.522% 15-Sep-2048 1,341,286 0.33
1,979,000 Verizon Communications Inc
4.672% 15-Mar-2055 1,866,512 0.47
1,300,000 Waste Management Inc 3.900% 01-Mar-2035 1,296,645 0.32
1,400,000 Waste Management Inc 4.100% 01-Mar-2045 1,391,307 0.35
1,104,000 Western Gas Partners LP 4.650% 01-Jul-2026 1,145,227 0.29
488,000 Western Gas Partners LP 5.450% 01-Apr-2044 504,414 0.13
1,820,000 Zoetis Inc 3.250% 01-Feb-2023 1,818,508 0.45
Total investments in bonds 373,286,883 93.21
Bonds cont’d.
United States of America cont’d.
USDUSD

114
Portfolio of investments – as at 31 December 2016
Holdings Description
Fair
value
Total
net assets
% Holdings Description
Fair
value
Total
net assets
%
BNY MELLON GLOBAL CREDIT FUND
Currency options - (36,867) (1,400,000) US dollar/Japanese yen Call 04-Jan-2017 118.000 (2,700) (0.00)
(1,400,000) US dollar/Japanese yen Call 23-Feb-2017 115.500 (34,167) (0.01)
Total currency options (36,867) (0.01)
Holdings Description
Underlying
exposure
USD
Fair
value
USD
Total
net assets
%
Open futures contracts - (375,700) 49 Canadian 10 Year Treasury Bond
Long Futures Contracts
Exp Mar-2017 5,019,156 (62,771) (0.02)
(61) Euro-Bund
Short Futures Contracts
Exp Mar-2017 (10,540,347) (169,129) (0.04)
(72) U.S. 10 Year Ultra Treasury Note
Short Futures Contracts
Exp Mar-2017 (9,652,500) (43,453) (0.01)
187 U.S. 2 Year Treasury Note
Long Futures Contracts
Exp Mar-2017 40,520,563 (7,179) (0.00)
57 U.S. 5 Year Treasury Note
Long Futures Contracts
Exp Mar-2017 6,706,852 (9,360) (0.00)
108 U.S. Treasury Bond
Long Futures Contracts
Exp Mar-2017 16,270,875 (83,808) (0.02)
Total open futures contracts (375,700) (0.09)
Unrealised loss on forward foreign currency contracts - (7,591,825)
(see below) (7,591,825) (1.89)
Total fi nancial liabilities at fair value through profi t or loss (8,669,091) (2.16)
Net current liabilities (566,503) (0.14)
Total net assets 400,480,353 100.00
The counterparties for credit default swaps are Barclays Bank plc, BNP Paribas, Citigroup, Credit Suisse,
Goldman Sachs, JPMorgan Chase and Bank of America Merrill Lynch.
The counterparties for currency options are Barclays Bank plc, Citigroup, Goldman Sachs and UBS.
The counterparty for futures contracts is Goldman Sachs.
Analysis of portfolio % of Total assets
Transferable securities and money market instruments admitted
to offi cial stock exchange listing or traded on a regulated market 95.52
Financial derivative instruments dealt in on a regulated market 0.10
OTC fi nancial derivative instruments 1.64
Other current assets 2.74
Total assets 100.00
11 Swiss Federal Bond
Long Futures Contracts
Exp Mar-2017 1,748,787 17,824 0.01
(32) U.S. 10 Year Treasury Note
Short Futures Contracts
Exp Mar-2017 (3,977,000) 14,250 0.00
(192) U.S. Treasury Ultra Bond
Short Futures Contracts
Exp Mar-2017 (30,768,000) 125,126 0.03
24 UK Long Gilt
Long Futures Contracts
Exp Mar-2017 3,721,751 87,808 0.02
Total open futures contracts 423,470 0.10
Unrealised gain on forward foreign currency contracts - 6,423,009
(see below) 6,423,009 1.60
Total fi nancial assets at fair value through profi t or loss 409,715,947 102.30
Credit default swaps - (664,699) 1,100,000 CDS Engie 1.000% 20-Dec-2021 (25,081) (0.01)
500,000 CDS Engie 1.000% 20-Dec-2021 (11,400) (0.00)
(500,000) CDS Assicurazioni Generali
1.000% 20-Dec-2021 (44,880) (0.01)
2,600,000 CDS Bayerische Landesbank 1.000% 20-Dec-2021 (42,417) (0.01)
1,000,000 CDS Bayerische Landesbank 1.000% 20-Dec-2021 (16,314) (0.00)
1,050,000 CDS Bayerische Landesbank 1.000% 20-Dec-2021 (17,130) (0.01)
900,000 CDS Bayerische Landesbank 1.000% 20-Jun-2021 (15,732) (0.00)
450,000 CDS CNH Industrial N.V. 5.000% 20-Dec-2021 (66,375) (0.02)
1,000,000 CDS CNH Industrial N.V. 5.000% 20-Dec-2021 (147,501) (0.04)
500,000 CDS CNH Industrial N.V. 5.000% 20-Dec-2021 (73,750) (0.02)
(150,000) CDS Commerzbank Aktiengesellschaft
1.000% 20-Dec-2020 (9,991) (0.00)
(400,000) CDS Commerzbank Aktiengesellschaft
1.000% 20-Dec-2020 (26,643) (0.01)
(600,000) CDS Deutsche Bank AG 1.000% 20-Dec-2021 (19,547) (0.01)
(600,000) CDS Deutsche Bank AG 1.000% 20-Dec-2021 (19,547) (0.01)
(600,000) CDS Deutsche Bank AG 1.000% 20-Dec-2021 (19,547) (0.01)
757,000 CDS General Mills Inc 1.000% 20-Dec-2020 (20,593) (0.01)
341,000 CDS General Mills Inc 1.000% 20-Dec-2020 (9,276) (0.00)
800,000 CDS HSBC Bank Plc 1.000% 20-Dec-2020 (14,319) (0.00)
250,000 CDS LVMH Moet Hennessy Louis Vuitton SE
1.000% 20-Dec-2020 (7,466) (0.00)
150,000 CDS LVMH Moet Hennessy Louis Vuitton SE
1.000% 20-Dec-2020 (4,480) (0.00)
150,000 CDS LVMH Moet Hennessy Louis Vuitton SE
1.000% 20-Dec-2020 (4,480) (0.00)
150,000 CDS LVMH Moet Hennessy Louis Vuitton SE
1.000% 20-Dec-2020 (4,480) (0.00)
261,000 CDS Omnicom Group Inc 1.000% 20-Dec-2020 (7,914) (0.00)
186,000 CDS Omnicom Group Inc 1.000% 20-Dec-2020 (5,640) (0.00)
335,000 CDS Omnicom Group Inc 1.000% 20-Dec-2020 (10,158) (0.00)
(900,000) CDS Rolls-Royce Group Plc 1.000% 20-Dec-2021 (8,185) (0.00)
(800,000) CDS Rolls-Royce Group Plc 1.000% 20-Dec-2021 (7,276) (0.00)
200,000 CDS Veolia Environnement SA 1.000% 20-Dec-2020 (4,577) (0.00)
Total credit default swaps (664,699) (0.17)
Open futures contracts cont’d.
Underlying
exposure
USD USDUSD

115
Portfolio of investments – as at 31 December 2016
BNY MELLON GLOBAL CREDIT FUND
Forward foreign currency contracts cont’d.
Unrealised
Gain/(Loss)Buy Sell Amount (B) Amount (S)
Settle
Date Counterparty
BNY Mellon Global Credit Fund CAD X (Acc) (Hedged) Share ClassCanadian dollar US dollar 499,694,743 379,316,103 13-Jan-17 The Bank of
New York Mellon (7,097,985)
USD (7,097,985)
CAD (9,530,110)
BNY Mellon Global Credit Fund CHF W (Acc) (Hedged) Share ClassSwiss franc US dollar 97,185 95,576 13-Jan-17 The Bank of
New York Mellon (65)
USD (65)
CHF (66)
BNY Mellon Global Credit Fund EUR H (Acc) (Hedged) Share ClassEuro US dollar 1,175,129 1,227,458 13-Jan-17 The Bank of
New York Mellon 10,226
USD 10,226
EUR 9,715
Euro US dollar 7,936,792 8,394,320 13-Jan-17 The Bank of New York Mellon (35,033)
USD (35,033)
EUR (33,281)
Net USD (24,807)
Net EUR (23,566)
BNY Mellon Global Credit Fund EUR H (Inc) (Hedged) Share ClassEuro US dollar 99,267 104,989 13-Jan-17 The Bank of
New York Mellon (438)
USD (438)
EUR (416)
BNY Mellon Global Credit Fund EUR W (Acc) (Hedged) Share ClassSterling US dollar 104,684 131,890 13-Jan-17 The Bank of
New York Mellon (2,840)
USD (2,840)
EUR (2,698)
Forward foreign currency contracts
Unrealised
Gain/(Loss)Buy Sell Amount (B) Amount (S)
Settle
Date Counterparty
BNY Mellon Global Credit FundEuro US dollar 5,920,000 6,188,223 13-Jan-17 Toronto Dominion
Bank 46,912
Euro US dollar 1,900,000 1,980,912 13-Jan-17 RBC Capital Markets 20,230
Euro US dollar 1,175,000 1,225,502 13-Jan-17 HSBC Bank Plc 12,046
Sterling US dollar 418,000 514,191 13-Jan-17 Goldman Sachs 1,103
US dollar Euro 3,150,713 2,883,000 13-Jan-17 HSBC Bank Plc 114,244
US dollar Euro 2,625,424 2,469,000 13-Jan-17 Toronto Dominion Bank 24,993
US dollar Euro 1,080,995 1,018,000 13-Jan-17 Citigroup 8,805
US dollar Euro 3,969,211 3,690,000 13-Jan-17 HSBC Bank Plc 82,784
US dollar Euro 1,340,869 1,257,000 13-Jan-17 Goldman Sachs 16,956
US dollar Euro 257,891 243,000 13-Jan-17 Citigroup 1,955
US dollar Euro 856,661 807,000 13-Jan-17 Citigroup 6,702
US dollar Euro 1,182,020 1,071,000 13-Jan-17 RBC Capital Markets 54,008
US dollar Euro 3,524,486 3,309,000 13-Jan-17 Citigroup 39,340
US dollar Euro 2,936,385 2,679,000 13-Jan-17 HSBC Bank Plc 114,775
US dollar Euro 1,096,562 994,000 13-Jan-17 UBS 49,649
US dollar Euro 126,519,574 114,838,000 13-Jan-17 Goldman Sachs 5,568,474
US dollar Sterling 1,211,141 958,000 13-Jan-17 Citigroup 30,157
Brazilian real US dollar 1,280,000 380,975 18-Jan-17 JPMorgan Chase 10,477
Euro US dollar 668,672 700,000 18-Jan-17 Citigroup 4,462
US dollar Australian dollar 901,984 1,209,800 18-Jan-17 Goldman Sachs 29,287
US dollar Euro 3,862,078 3,654,219 18-Jan-17 HSBC Bank Plc 12,273
US dollar Japanese yen 2,607,775 299,555,525 18-Jan-17 HSBC Bank Plc 42,432
US dollar Japanese yen 700,000 80,295,600 18-Jan-17 Goldman Sachs 12,362
US dollar Korean won 758,784 880,000,000 18-Jan-17 HSBC Bank Plc 30,066
US dollar Sterling 3,673,212 2,915,732 18-Jan-17 Goldman Sachs 78,291
USD 6,412,783
Euro US dollar 1,459,000 1,568,889 13-Jan-17 HSBC Bank Plc (32,223)
Euro US dollar 3,480,000 3,711,634 13-Jan-17 Goldman Sachs (46,386)
Euro US dollar 3,587,000 3,817,349 13-Jan-17 Goldman Sachs (39,404)
Euro US dollar 1,804,000 1,924,007 13-Jan-17 Toronto Dominion Bank (23,976)
Euro US dollar 1,430,000 1,536,014 13-Jan-17 BNP Paribas (29,892)
Euro US dollar 1,575,000 1,728,889 13-Jan-17 Goldman Sachs (70,048)
Euro US dollar 1,134,000 1,222,105 13-Jan-17 HSBC Bank Plc (27,740)
Sterling US dollar 764,000 948,518 13-Jan-17 Goldman Sachs (6,689)
Sterling US dollar 451,000 559,818 13-Jan-17 HSBC Bank Plc (3,843)
US dollar Euro 2,394,359 2,286,000 13-Jan-17 HSBC Bank Plc (13,331)
US dollar Sterling 344,990 283,000 13-Jan-17 Goldman Sachs (3,881)
US dollar Sterling 31,674,466 25,728,000 13-Jan-17 Citigroup (41,985)
Australian dollar US dollar 933,962 700,000 18-Jan-17 Citigroup (26,280)
Euro US dollar 660,558 700,000 18-Jan-17 JPMorgan Chase (4,087)
Euro US dollar 659,337 700,000 18-Jan-17 Barclays Bank plc (5,373)
Korean won US dollar 880,000,000 754,284 18-Jan-17 Citigroup (25,565)
US dollar Brazilian real 372,439 1,280,000 18-Jan-17 Citigroup (19,012)
US dollar Euro 700,000 666,657 18-Jan-17 Citigroup (2,339)
US dollar Euro 1,365,658 1,308,411 18-Jan-17 Citigroup (12,784)
US dollar Euro 1,373,626 1,314,554 18-Jan-17 HSBC Bank Plc (11,287)
US dollar Euro 564,699 540,000 18-Jan-17 Goldman Sachs (4,203)
US dollar Japanese yen 700,000 82,285,910 18-Jan-17 Goldman Sachs (4,683)
USD (455,011)
Net USD 5,957,772

116
Portfolio of investments – as at 31 December 2016
BNY MELLON GLOBAL CREDIT FUND
Forward foreign currency contracts cont’d.
Unrealised
Gain/(Loss)Buy Sell Amount (B) Amount (S)
Settle
Date Counterparty
BNY Mellon Global Credit Fund Sterling W (Acc) (Hedged) Share ClassEuro US dollar 102,730 108,652 13-Jan-17 The Bank of
New York Mellon (453)
USD (453)
GBP (368)

117
Portfolio of investments – as at 31 December 2016
Holdings Description
Fair
value
Total
net assets
% Holdings Description
Fair
value
Total
net assets
%
BNY MELLON GLOBALDYNAMIC BOND FUND
1,010,000 SIG Combibloc Holdings SCA
7.750% 15-Feb-2023 1,151,650 0.32
1,937,115 Silverback Finance DAC 3.126% 25-Feb-2037 1,999,139 0.55
1,700,000 Societe Generale SA 6.750% Perpetual VAR 1,849,308 0.51
375,000 Spectrum Brands Inc 4.000% 01-Oct-2026 408,870 0.11
1,530,000 SPP Infrastructure Financing BV
2.625% 12-Feb-2025 1,736,121 0.48
700,000 Telefonica Europe BV 4.200% Perpetual VAR 757,192 0.21
859,000 Teva Pharmaceutical Finance Netherlands II BV
1.875% 31-Mar-2027 895,040 0.25
1,360,000 UBS AG 4.750% 12-Feb-2026 VAR 1,546,917 0.42
896,000 Unitymedia Hessen GmbH & Co KG /
Unitymedia NRW GmbH 4.000% 15-Jan-2025 986,086 0.27
829,000 Unitymedia Hessen GmbH & Co KG /
Unitymedia NRW GmbH 6.250% 15-Jan-2029 972,097 0.27
2,600,000 Vonovia Finance BV 1.500% 31-Mar-2025 2,780,340 0.76
1,493,000 Wind Acquisition Finance SA
7.000% 23-Apr-2021 1,651,970 0.45
Mexican Nuevo Peso - 6,284,453 (31 December 2015: 2,524,824) 6,284,453 1.72
133,610,000 Mexican Bonos 6.500% 10-Jun-2021 6,284,453 1.72
New Zealand Dollar - 14,830,562 (31 December 2015: 8,040,047) 14,830,562 4.06
5,470,000 International Bank for Reconstruction
& Development 4.625% 26-Feb-2019 3,939,687 1.08
1,540,000 KFW 3.750% 14-Jun-2018 1,086,247 0.30
3,520,000 Landwirtschaftliche Rentenbank
4.000% 30-Jan-2020 2,498,170 0.68
9,180,000 New Zealand Local Government Funding
Agency Bond 5.000% 15-Mar-2019 6,670,823 1.83
910,000 Nordic Investment Bank 4.125% 16-Mar-2017 635,635 0.17
Norwegian Krone - 3,668,332 (31 December 2015: 370,528) 3,668,332 1.01
28,320,000 Norway Government Bond 144A
3.750% 25-May-2021 3,668,332 1.01
Peruvian Nuevo Sol - 3,558,905 (31 December 2015: –) 3,558,905 0.98
4,860,000 Peruvian Government International Bond
6.950% 12-Aug-2031 1,484,995 0.41
6,150,000 Peruvian Government International Bond
8.200% 12-Aug-2026 2,073,910 0.57
Sterling - 49,113,360 (31 December 2015: 46,792,629) 49,113,360 13.45
326,000 AA Bond Co Ltd 2.875% 31-Jan-2022 405,421 0.11
1,025,000 AA Bond Co Ltd 4.249% 31-Jul-2020 1,349,606 0.37
900,000 AA Bond Co Ltd 5.500% 31-Jul-2022 1,137,883 0.31
253,000 AMC Entertainment Holdings Inc
6.375% 15-Nov-2024 331,033 0.09
880,000 Anheuser-Busch InBev SA/NV
6.500% 23-Jun-2017 1,111,471 0.30
1,055,000 Arqiva Broadcast Finance Plc
9.500% 31-Mar-2020 1,385,234 0.38
871,296 Arsenal Securities Plc 5.142% 01-Sep-2029 1,217,513 0.33
1,510,000 BG Energy Capital Plc 6.500% 30-Nov-2072 VAR 1,941,427 0.53
1,290,000 BP Capital Markets Plc 4.325% 10-Dec-2018 1,699,078 0.47
Collective investment schemes
US Dollar - 12,314,905 (31 December 2015: 53,263) 12,314,905 3.37
118,498 iShares USD High Yield Corp Bond UCITS ETF 12,314,905 3.37
Total investments in collective investment schemes 12,314,905 3.37
Bonds
Australian Dollar - 10,715,471 (31 December 2015: 8,324,401) 10,715,471 2.94
1,000,000 Cooperatieve Rabobank UA/Australia
7.250% 20-Apr-2018 764,094 0.21
4,700,000 New South Wales Treasury Corp
4.000% 20-Apr-2023 3,663,021 1.00
7,470,000 Queensland Treasury Corp 144A
3.500% 21-Sep-2017 5,459,441 1.50
1,150,000 Wells Fargo Bank NA 2.135% 25-May-2017 FRN 828,915 0.23
Chinese Yuan Renminbi - 2,753,228 (31 December 2015: 2,923,119) 2,753,228 0.75
9,530,000 International Finance Corp
2.000% 18-Jan-2017 1,368,264 0.37
9,750,000 United Kingdom Government International Bond
2.700% 21-Oct-2017 1,384,964 0.38
Euro - 51,601,031 (31 December 2015: 36,492,375) 51,601,031 14.14
584,000 Allied Irish Banks Plc 2.750% 16-Apr-2019 649,719 0.17
1,334,000 Anheuser-Busch InBev SA/NV
0.875% 17-Mar-2022 1,448,606 0.40
525,000 Atradius Finance BV 5.250% 23-Sep-2044 VAR 512,820 0.14
3,100,000 Banca Monte dei Paschi di Siena SpA
3.500% 20-Mar-2017 3,293,946 0.90
1,429,000 Barclays Bank Plc 6.000% 23-Jan-2018 1,601,877 0.44
627,000 Barry Callebaut Services NV
2.375% 24-May-2024 679,092 0.18
1,500,000 Bertelsmann SE & Co KGaA
3.500% 23-Apr-2075 VAR 1,518,494 0.42
719,000 BP Capital Markets Plc 1.117% 25-Jan-2024 773,181 0.21
179,000 Catalent Pharma Solutions Inc
4.750% 15-Dec-2024 197,908 0.05
1,870,000 Coca-Cola European Partners Plc
0.750% 24-Feb-2022 2,001,527 0.55
2,330,000 Coventry Building Society 2.500% 18-Nov-2020 2,650,700 0.73
1,900,000 Danske Bank A/S 3.875% 04-Oct-2023 VAR 2,127,985 0.58
1,700,000 Electricite de France SA 2.750% 10-Mar-2023 2,010,637 0.55
1,000,000 Fiat Chrysler Finance Europe
7.000% 23-Mar-2017 1,072,843 0.29
2,190,000 Fomento Economico Mexicano SAB de CV
1.750% 20-Mar-2023 2,355,378 0.65
563,000 Lloyds Bank Plc 13.000% Perpetual 861,323 0.24
2,930,000 Morocco Government International Bond
3.500% 19-Jun-2024 3,266,189 0.89
1,400,000 Motability Operations Group Plc
1.625% 09-Jun-2023 1,574,408 0.43
1,250,000 NET4GAS sro 2.500% 28-Jul-2021 1,416,855 0.39
2,801,000 Province of British Columbia Canada
0.875% 08-Oct-2025 3,055,510 0.84
1,153,000 Royal Bank of Scotland Plc/The
10.500% 16-Mar-2022 VAR 1,244,903 0.34
534,000 SELP FINANCE Sarl 1.250% 25-Oct-2023 552,400 0.15
Bonds cont’d.
Euro cont’d.
USDUSD

118
Portfolio of investments – as at 31 December 2016
Holdings Description
Fair
value
Total
net assets
% Holdings Description
Fair
value
Total
net assets
%
BNY MELLON GLOBAL DYNAMIC BOND FUND
3,050,000 Asian Development Bank
0.886% 10-Jul-2019 FRN 3,043,231 0.83
2,800,000 Bank Nederlandse Gemeenten
1.186% 15-May-2018 FRN 2,808,410 0.77
3,150,000 Bank of England Euro Note 1.250% 14-Mar-2019 3,125,291 0.86
1,670,000 Belarus International Bond
8.950% 26-Jan-2018 1,745,985 0.48
1,000,000 Cablevision Systems Corp 8.625% 15-Sep-2017 1,041,250 0.29
3,000,000 Caisse des Depots et Consignations
1.250% 17-May-2019 2,959,101 0.81
1,140,000 Cemex SAB de CV 7.250% 15-Jan-2021 1,216,950 0.33
1,000,000 CenturyLink Inc 6.000% 01-Apr-2017 1,010,000 0.28
1,000,000 CenturyLink Inc 7.500% 01-Apr-2024 1,050,000 0.29
1,484,000 Citigroup Inc 5.500% 13-Sep-2025 1,628,919 0.45
2,100,000 Commonwealth Bank of Australia
2.125% 22-Jul-2020 2,096,195 0.57
850,000 Constellation Brands Inc 7.250% 15-May-2017 868,581 0.24
1,690,000 Costa Rica Government International Bond
4.250% 26-Jan-2023 1,550,575 0.42
2,800,000 Council Of Europe Development Bank
1.125% 31-May-2018 2,786,941 0.76
1,750,000 Daimler Finance North America LLC
1.875% 11-Jan-2018 1,752,712 0.48
3,670,000 Dexia Credit Local SA/New York
2.250% 30-Jan-2019 3,681,357 1.01
1,160,000 Diamond 1 Finance Corp /
Diamond 2 Finance Corp 144A
6.020% 15-Jun-2026 1,255,035 0.34
1,170,000 DISH DBS Corp 4.625% 15-Jul-2017 1,189,012 0.33
2,070,000 Dominican Republic International Bond
7.500% 06-May-2021 2,250,814 0.62
343,000 DR Horton Inc 4.750% 15-May-2017 346,316 0.09
1,630,000 DS Services of America Inc 144A
10.000% 01-Sep-2021 1,797,075 0.49
3,155,000 Export-Import Bank of Korea
1.341% 21-Oct-2019 FRN 3,145,175 0.86
2,000,000 Fiji Government International Bond
6.625% 02-Oct-2020 1,978,470 0.54
3,400,000 FMS Wertmanagement AoeR
1.037% 27-Nov-2019 FRN 3,399,067 0.93
1,000,000 Frontier Communications Corp
11.000% 15-Sep-2025 1,040,080 0.28
2,100,000 General Electric Capital Corp
5.625% 15-Sep-2017 2,164,912 0.59
3,260,000 Glencore Finance Canada Ltd 144A
3.600% 15-Jan-2017 3,261,527 0.89
2,500,000 Iceland Government International Bond
5.875% 11-May-2022 2,850,476 0.78
1,147,000 Inmarsat Finance Plc 144A 6.500% 01-Oct-2024 1,167,072 0.32
3,160,000 Instituto de Credito Ofi cial
1.625% 14-Sep-2018 3,144,968 0.86
2,900,000 International Bank for Reconstruction
& Development 1.182% 11-Feb-2021 FRN 2,912,814 0.81
939,000 KFC Holding Co/Pizza Hut Holdings LLC/
Taco Bell of America LLC 5.000% 01-Jun-2024 961,301 0.26
2,800,000 Kommunalbanken AS 1.014% 02-May-2019 FRN 2,798,823 0.77
3,460,000 Kommunekredit 1.625% 01-Jun-2021 3,368,673 0.92
2,242,000 Kommuninvest I Sverige AB
0.967% 28-May-2019 FRN 2,234,119 0.61
1,100,000 BUPA Finance Plc 6.125% Perpetual VAR 1,454,600 0.40
1,543,000 Close Brothers Finance Plc 2.750% 19-Oct-2026 1,887,674 0.52
338,000 Close Brothers Finance Plc 3.875% 27-Jun-2021 455,311 0.12
850,000 Coventry Building Society 6.375% Perpetual VAR 1,013,318 0.28
1,236,000 CPUK Finance Ltd 2.666% 28-Feb-2020 1,578,534 0.43
560,000 CPUK Finance Ltd 7.000% 28-Aug-2020 731,639 0.20
1,150,000 Firstgroup Plc 6.125% 18-Jan-2019 1,548,853 0.42
419,311 General Electric Capital Corp
6.440% 15-Nov-2022 574,167 0.16
450,000 HSBC Holdings Plc 6.375% 18-Oct-2022 VAR 574,284 0.16
756,000 Iron Mountain Europe Plc 6.125% 15-Sep-2022 997,617 0.27
709,000 John Lewis Plc 8.375% 08-Apr-2019 1,007,885 0.28
1,320,000 Lloyds Banking Group Plc 7.000% Perpetual VAR 1,649,571 0.45
1,001,895 Mitchells & Butlers Finance Plc
6.013% 15-Dec-2028 1,445,182 0.40
1,791,000 National Grid Gas Finance Plc
1.125% 22-Sep-2021 2,193,386 0.60
990,000 Nationwide Building Society
0.601% 17-Jul-2017 FRN 1,218,380 0.33
1,865,000 Nationwide Building Society
6.875% Perpetual VAR 2,310,752 0.63
1,027,000 New Look Secured Issuer Plc
6.500% 01-Jul-2022 1,208,672 0.33
1,600,000 Prudential Plc 1.375% 19-Jan-2018 1,982,743 0.54
421,000 RAC Bond Co Plc 4.565% 06-May-2023 561,272 0.15
1,170,000 RSA Insurance Group Plc
9.375% 20-May-2039 VAR 1,669,428 0.46
1,350,000 Santander UK Plc 0.702% 20-Jan-2017 FRN 1,660,929 0.46
120,000 Santander UK Plc 9.625% 30-Oct-2023 VAR 167,395 0.05
1,100,000 Severn Trent Utilities Finance Plc
6.000% 22-Jan-2018 1,428,030 0.39
1,230,000 SLM Student Loan Trust 2003-10
0.927% 15-Dec-2039 FRN 1,306,484 0.36
1,860,000 Southern Gas Networks Plc 5.125% 02-Nov-2018 2,469,775 0.68
1,305,604 Tesco Property Finance 3 Plc
5.744% 13-Apr-2040 1,553,345 0.43
1,020,000 UNITE USAF II Plc 3.374% 30-Jun-2023 1,358,080 0.37
775,000 Virgin Media Secured Finance Plc
6.250% 28-Mar-2029 1,003,946 0.27
1,210,000 Yorkshire Building Society
4.125% 20-Nov-2024 VAR 1,523,442 0.42
Swiss Franc - 1,191,795 (31 December 2015: –) 1,191,795 0.33
1,200,000 Matterhorn Telecom SA 3.625% 01-May-2022 1,191,795 0.33
US Dollar - 191,669,574 (31 December 2015: 141,757,291) 191,669,574 52.52
1,277,000 1011778 BC ULC / New Red Finance Inc
6.000% 01-Apr-2022 1,337,657 0.37
2,408,000 Abu Dhabi Government International Bond
2.125% 03-May-2021 2,364,355 0.65
1,090,000 Agrokor dd 8.875% 01-Feb-2020 1,113,326 0.31
2,380,000 Anheuser-Busch InBev Finance Inc
1.900% 01-Feb-2019 2,384,775 0.65
1,140,000 Antero Resources Corp 5.625% 01-Jun-2023 1,168,500 0.32
2,300,000 Aquarius + Investments Plc
for Swiss Reinsurance Co Ltd
8.250% Perpetual VAR 2,448,746 0.67
Bonds cont’d.
Sterling cont’d.
Bonds cont’d.
US Dollar cont’d.
USDUSD

119
Portfolio of investments – as at 31 December 2016
Holdings Description
Fair
value
Total
net assets
% Holdings Description
Fair
value
Total
net assets
%
BNY MELLON GLOBAL DYNAMIC BOND FUND
2,400,000 Microsoft Corp 2.000% 08-Aug-2023 2,289,623 0.63
2,820,000 Nederlandse Financierings Maatschappij voor
Ontwikkelingslanden NV 1.021% 21-Oct-2019 FRN 2,808,241 0.77
2,380,000 New York Life Global Funding
1.700% 14-Sep-2021 2,291,664 0.63
1,655,000 PepsiCo Inc 1.130% 17-Jul-2017 FRN 1,656,810 0.45
1,170,000 Petrobras International Finance Co SA
6.750% 27-Jan-2041 984,794 0.27
1,000,000 Petrobras International Finance Co SA
7.875% 15-Mar-2019 1,074,340 0.29
1,200,000 Range Resources Corp 5.000% 15-Mar-2023 1,199,880 0.33
2,590,000 Roche Holdings Inc 1.087% 29-Sep-2017 FRN 2,589,750 0.71
2,700,000 Royal Bank of Canada 1.875% 05-Feb-2020 2,684,796 0.74
2,400,000 Royal Bank of Canada 2.000% 01-Oct-2018 2,416,044 0.66
1,750,000 Royal Bank of Scotland Plc/The
9.500% 16-Mar-2022 VAR 1,780,464 0.49
1,130,000 Sabine Pass Liquefaction LLC
5.625% 01-Mar-2025 1,217,575 0.33
1,572,000 Saudi Government International Bond
2.375% 26-Oct-2021 1,526,621 0.42
400,000 SFR Group SA 144A 7.375% 01-May-2026 411,000 0.11
2,258,000 Shell International Finance BV
1.352% 11-May-2020 FRN 2,260,566 0.62
840,000 Smithfi eld Foods Inc 7.750% 01-Jul-2017 865,200 0.24
1,561,000 Sprint Capital Corp 8.750% 15-Mar-2032 1,724,905 0.47
534,000 Sprint Communications Inc 8.375% 15-Aug-2017 554,692 0.15
1,045,000 Svensk Exportkredit AB
2.875% 14-Nov-2023 VAR 1,042,064 0.29
2,018,000 Tesco Plc 144A 2.700% 05-Jan-2017 2,018,761 0.55
1,000,000 Time Warner Cable LLC 5.850% 01-May-2017 1,014,368 0.28
828,000 Tullow Oil Plc 6.000% 01-Nov-2020 792,810 0.22
1,870,000 Turkey Government International Bond
6.750% 03-Apr-2018 1,955,624 0.54
6,481,902 United States Treasury Infl ation Indexed Bonds
0.125% 15-Apr-2020 6,542,096 1.79
15,079,848 United States Treasury Infl ation Indexed Bonds
2.375% 15-Jan-2025 17,260,982 4.73
5,600,000 United States Treasury Note/Bond
0.875% 28-Feb-2017 5,604,161 1.54
5,500,000 United States Treasury Note/Bond
1.250% 30-Nov-2018 5,505,263 1.51
7,220,000 United States Treasury Note/Bond
1.625% 15-Aug-2022 7,027,796 1.93
2,645,000 United States Treasury Note/Bond
3.000% 15-Nov-2045 2,594,270 0.71
11,800,000 United States Treasury Note/Bond
3.500% 15-May-2020 12,532,892 3.43
2,866,000 Vietnam Government International Bond
6.750% 29-Jan-2020 3,113,482 0.85
2,410,000 Vodafone Group Plc 1.500% 19-Feb-2018 2,401,777 0.66
2,140,000 Vodafone Group Plc 1.625% 20-Mar-2017 2,140,545 0.59
1,174,000 Western Digital Corp 144A 10.500% 01-Apr-2024 1,391,190 0.38
2,100,000 Westpac Banking Corp 1.375% 30-May-2018 2,091,938 0.57
1,869,000 Westpac Banking Corp 2.100% 25-Feb-2021 1,854,004 0.51
Total investments in bonds 335,386,711 91.90
Bonds cont’d.
US Dollar cont’d.
Future options - 201,148 (31 December 2015: –)
111 Euro-Bund Future Put 24-Feb-2017 159.000 30,476 0.01
331 U.S. 10 Year Treasury Note Future Put
24-Feb-2017 122.500 170,672 0.05
Total future options 201,148 0.06
Unrealised gain on forward foreign currency contracts - 4,405,739 (see below)
(31 December 2015: 1,694,982) 4,405,739 1.21
Total fi nancial assets at fair value through profi t or loss 352,308,503 96.54
Unrealised loss on forward foreign currency contracts - (503,022) (see below)
(31 December 2015: (2,299,462) ) (503,022) (0.14)
Total fi nancial liabilities at fair value through profi t or loss (503,022) (0.14)
Net current assets 13,159,992 3.60
Total net assets 364,965,473 100.00
The counterparty for future options is UBS.
Analysis of portfolio % of Total Assets
Transferable securities and money market instruments admitted
to offi cial stock exchange listing or traded on a regulated market 93.50
Financial derivative instruments dealt in on a regulated market 0.05
OTC fi nancial derivative instruments 1.18
Other current assets 5.27
Total assets 100.00
USDUSD

120
Portfolio of investments – as at 31 December 2016
BNY MELLON GLOBAL DYNAMIC BOND FUND
Forward foreign currency contracts cont’d.
Unrealised
Gain/(Loss)Buy Sell Amount (B) Amount (S)
Settle
Date Counterparty
BNY Mellon Global Dynamic Bond Fund cont’d.
US dollar Australian dollar 1,457,290 2,024,105 16-Mar-17 State Street Bank (2,551)
US dollar Euro 1,035,911 988,000 16-Mar-17 State Street Bank (11,319)
US dollar Euro 2,828,179 2,700,049 16-Mar-17 State Street Bank (33,736)
US dollar Euro 1,973,432 1,878,000 16-Mar-17 The Bank of New York Mellon (17,152)
US dollar Euro 700,630 670,070 16-Mar-17 State Street Bank (9,610)
US dollar Euro 389,090 371,144 16-Mar-17 State Street Bank (4,304)
US dollar Japanese yen 2,517,521 295,990,000 16-Mar-17 State Street Bank (22,842)
US dollar New Zealand dollar 2,560,887 3,714,085 16-Mar-17 Royal Bank of Scotland (19,383)
US dollar Norwegian krone 481,356 4,180,593 16-Mar-17 JPMorgan Chase (4,789)
US dollar Swiss franc 199,036 203,023 16-Mar-17 State Street Bank (1,319)
USD (418,373)
Net USD 3,897,433
BNY Mellon Global Dynamic Bond Fund CHF W (Acc) (Hedged) Share ClassSwiss franc US dollar 100,029 98,414 13-Jan-17 The Bank of
New York Mellon (72)
USD (72)
CHF (73)
BNY Mellon Global Dynamic Bond Fund EUR H (Hedged) Share ClassEuro US dollar 16,797 17,577 13-Jan-17 The Bank of
New York Mellon 171
Euro US dollar 7,165 7,477 13-Jan-17 The Bank of New York Mellon 93
Euro US dollar 14,193,510 14,989,288 13-Jan-17 The Bank of New York Mellon 7,832
Euro US dollar 43,300 45,164 13-Jan-17 The Bank of New York Mellon 588
US dollar Euro 15,840 14,908 13-Jan-17 The Bank of New York Mellon 88
USD 8,772
EUR 8,307
US dollar Euro 7,472 7,165 03-Jan-17 The Bank of New York Mellon (94)
US dollar Euro 20,936 20,072 13-Jan-17 The Bank of New York Mellon (273)
US dollar Euro 21,192 20,289 13-Jan-17 The Bank of New York Mellon (245)
USD (612)
EUR (580)
Net USD 8,160
Net EUR 7,727
Forward foreign currency contracts
Unrealised
Gain/(Loss)Buy Sell Amount (B) Amount (S)
Settle
Date Counterparty
BNY Mellon Global Dynamic Bond FundUS dollar Sterling 110,861 89,784 13-Jan-17 The Bank of
New York Mellon 375
Euro US dollar 1,105,069 1,158,825 16-Mar-17 State Street Bank 12,492
Hungarian forint US dollar 1,458,384,063 4,933,056 16-Mar-17 Barclays Bank plc 47,280
Hungarian forint US dollar 147,957,000 494,889 16-Mar-17 Barclays Bank plc 10,379
Hungarian forint US dollar 118,818,000 401,096 16-Mar-17 JPMorgan Chase 4,664
South African rand US dollar 47,031,000 3,285,986 16-Mar-17 State Street Bank 93,305
Swedish krona US dollar 6,120,000 658,420 16-Mar-17 Royal Bank of Scotland 19,883
Swedish krona US dollar 43,191,433 4,757,954 16-Mar-17 Royal Bank of Scotland 29,111
US dollar Australian dollar 3,789,804 5,100,664 16-Mar-17 Royal Bank of Scotland 111,061
US dollar Canadian dollar 364,257 487,000 16-Mar-17 Royal Bank of Scotland 2,475
US dollar Canadian dollar 4,740,713 6,287,000 16-Mar-17 State Street Bank 70,235
US dollar Chinese yuan 2,778,241 19,331,000 16-Mar-17 UBS 57,121
US dollar Euro 2,307,476 2,174,000 16-Mar-17 State Street Bank 3,147
US dollar Euro 188,126 174,000 16-Mar-17 State Street Bank 3,695
US dollar Euro 68,529,661 63,531,628 16-Mar-17 State Street Bank 1,189,355
US dollar Hungarian forint 361,062 105,090,577 16-Mar-17 Barclays Bank plc 2,181
US dollar Hungarian forint 1,259,402 366,674,890 16-Mar-17 Royal Bank of Scotland 7,219
US dollar Korean won 6,496,218 7,603,173,000 16-Mar-17 Royal Bank of Scotland 173,624
US dollar Korean won 558,948 667,216,000 16-Mar-17 Royal Bank of Scotland 4,109
US dollar Mexican peso 353,840 7,330,619 16-Mar-17 State Street Bank 2,934
US dollar Mexican peso 5,816,174 120,168,000 16-Mar-17 State Street Bank 63,901
US dollar Mexican peso 388,404 8,014,214 16-Mar-17 State Street Bank 4,775
US dollar New Zealand dollar 12,773,580 17,969,673 16-Mar-17 Royal Bank of Scotland 289,584
US dollar Norwegian krone 3,338,531 27,964,971 16-Mar-17 The Bank of New York Mellon 86,594
US dollar South African rand 3,387,504 47,031,000 16-Mar-17 JPMorgan Chase 8,214
US dollar Sterling 634,691 513,558 16-Mar-17 The Bank of New York Mellon 1,769
US dollar Sterling 593,081 478,014 16-Mar-17 State Street Bank 3,964
US dollar Sterling 55,914,624 43,745,569 16-Mar-17 State Street Bank 2,001,388
US dollar Swiss franc 1,101,431 1,104,983 16-Mar-17 State Street Bank 10,972
USD 4,315,806
US dollar Euro 2,470 2,358 03-Jan-17 The Bank of New York Mellon (20)
Australian dollar US dollar 548,000 396,640 16-Mar-17 State Street Bank (1,407)
Australian dollar US dollar 720,000 520,898 16-Mar-17 Royal Bank of Scotland (1,613)
Australian dollar US dollar 547,000 395,336 16-Mar-17 Royal Bank of Scotland (824)
Danish krone US dollar 21,956,503 3,185,651 16-Mar-17 Royal Bank of Scotland (54,409)
Euro US dollar 214,969 228,943 16-Mar-17 State Street Bank (1,088)
Euro US dollar 756,036 809,511 16-Mar-17 Royal Bank of Scotland (8,151)
Euro US dollar 358,441 383,021 16-Mar-17 State Street Bank (3,091)
Euro US dollar 569,543 607,812 16-Mar-17 State Street Bank (4,125)
Hungarian forint US dollar 954,163,000 3,275,871 16-Mar-17 JPMorgan Chase (17,434)
Japanese yen US dollar 294,136,232 2,594,775 16-Mar-17 State Street Bank (70,322)
Sterling US dollar 1,148,735 1,446,766 16-Mar-17 UBS (31,034)
Sterling US dollar 2,300,000 2,931,180 16-Mar-17 UBS (96,597)
Sterling US dollar 1,014,408 1,251,438 16-Mar-17 Royal Bank of Scotland (1,253)

121
Portfolio of investments – as at 31 December 2016
BNY MELLON GLOBAL DYNAMIC BOND FUND
Forward foreign currency contracts cont’d.
Unrealised
Gain/(Loss)Buy Sell Amount (B) Amount (S)
Settle
Date Counterparty
BNY Mellon Global Dynamic Bond Fund EUR I (Inc) (Hedged) Share ClassEuro US dollar 3,202 3,340 03-Jan-17 The Bank of
New York Mellon 42
Euro US dollar 68 71 04-Jan-17 The Bank of New York Mellon 1
Euro US dollar 8,735 9,081 13-Jan-17 The Bank of New York Mellon 148
Euro US dollar 12,112 12,672 13-Jan-17 The Bank of New York Mellon 127
Euro US dollar 8,169,417 8,627,447 13-Jan-17 The Bank of New York Mellon 4,508
Euro US dollar 31,271 32,636 13-Jan-17 The Bank of New York Mellon 406
Euro US dollar 5,627 5,889 13-Jan-17 The Bank of New York Mellon 56
US dollar Euro 14,312 13,507 13-Jan-17 The Bank of New York Mellon 40
US dollar Euro 11,724 11,034 13-Jan-17 The Bank of New York Mellon 65
US dollar Euro 34,467 32,312 13-Jan-17 The Bank of New York Mellon 325
USD 5,718
EUR 5,415
US dollar Euro 32,614 31,271 03-Jan-17 The Bank of New York Mellon (409)
US dollar Euro 12,664 12,112 04-Jan-17 The Bank of New York Mellon (127)
US dollar Euro 8,764 8,373 13-Jan-17 The Bank of New York Mellon (84)
US dollar Euro 71 68 13-Jan-17 The Bank of New York Mellon (1)
US dollar Euro 3,342 3,202 13-Jan-17 The Bank of New York Mellon (42)
US dollar Euro 5,665 5,424 13-Jan-17 The Bank of New York Mellon (66)
US dollar Euro 5,870 5,632 13-Jan-17 The Bank of New York Mellon (81)
US dollar Euro 14,903 14,241 13-Jan-17 The Bank of New York Mellon (145)
USD (955)
EUR (904)
Net USD 4,763
Net EUR 4,511
Forward foreign currency contracts cont’d.
Unrealised
Gain/(Loss)Buy Sell Amount (B) Amount (S)
Settle
Date Counterparty
BNY Mellon Global Dynamic Bond Fund EUR H (Inc) (Hedged) Share ClassEuro US dollar 639,548 675,405 13-Jan-17 The Bank of
New York Mellon 353
USD 353
EUR 334
US dollar Euro 91,348 87,640 13-Jan-17 The Bank of New York Mellon (1,254)
US dollar Euro 7,210 6,888 13-Jan-17 The Bank of New York Mellon (69)
USD (1,323)
EUR (1,253)
Net USD (970)
Net EUR (919)
BNY Mellon Global Dynamic Bond Fund EUR I (Hedged) Share ClassEuro US dollar 15,203 15,855 03-Jan-17 The Bank of
New York Mellon 199
Euro US dollar 109 114 04-Jan-17 The Bank of New York Mellon 1
Euro US dollar 53,732,945 56,745,555 13-Jan-17 The Bank of New York Mellon 29,650
Euro US dollar 1,388 1,447 13-Jan-17 The Bank of New York Mellon 20
Euro US dollar 44,210 45,964 13-Jan-17 The Bank of New York Mellon 749
Euro US dollar 9,960 10,388 13-Jan-17 The Bank of New York Mellon 135
US dollar Euro 10,215 9,576 13-Jan-17 The Bank of New York Mellon 96
USD 30,850
EUR 29,214
Euro US dollar 10,448 11,145 13-Jan-17 The Bank of New York Mellon (105)
Euro US dollar 10,202 10,840 13-Jan-17 The Bank of New York Mellon (60)
US dollar Euro 1,983 1,899 13-Jan-17 The Bank of New York Mellon (23)
US dollar Euro 114 109 13-Jan-17 The Bank of New York Mellon (1)
US dollar Euro 15,866 15,203 13-Jan-17 The Bank of New York Mellon (197)
USD (386)
EUR (366)
Net USD 30,464
Net EUR 28,848

122
Portfolio of investments – as at 31 December 2016
BNY MELLON GLOBAL DYNAMIC BOND FUND
Forward foreign currency contracts cont’d.
Unrealised
Gain/(Loss)Buy Sell Amount (B) Amount (S)
Settle
Date Counterparty
BNY Mellon Global Dynamic Bond Fund EUR W (Hedged) Share ClassEuro US dollar 2,447 2,559 04-Jan-17 The Bank of
New York Mellon 26
Euro US dollar 60,855,480 64,267,425 13-Jan-17 The Bank of New York Mellon 33,581
Euro US dollar 1,046,561 1,095,183 13-Jan-17 The Bank of New York Mellon 10,633
USD 44,240
EUR 41,894
Euro US dollar 13,299 14,131 13-Jan-17 The Bank of New York Mellon (79)
Euro US dollar 440,000 466,211 13-Jan-17 The Bank of New York Mellon (1,299)
US dollar Euro 2,560 2,447 13-Jan-17 The Bank of New York Mellon (26)
US dollar Euro 66,776 63,827 13-Jan-17 The Bank of New York Mellon (665)
USD (2,069)
EUR (1,959)
Net USD 42,171
Net EUR 39,935
BNY Mellon Global Dynamic Bond Fund Sterling W (Acc) (Hedged) Share ClassSterling US dollar 2,100 2,595 13-Jan-17 The Bank of
New York Mellon (11)
Sterling US dollar 2,691,911 3,391,811 13-Jan-17 The Bank of New York Mellon (79,221)
USD (79,232)
GBP (64,406)

123
Portfolio of investments – as at 31 December 2016
Holdings Description
Fair
value
Total
net assets
% Holdings Description
Fair
value
Total
net assets
%
Equities
Chile - 700,040 (31 December 2015: 89,103) 700,040 2.32
13,435 Banco Santander Chile ADR 294,428 0.98
14,237 Sociedad Quimica y Minera de Chile SA ADR 405,612 1.34
China - 6,079,315 (31 December 2015: 139,082) 6,079,315 20.15
472,000 3SBio Inc 144A 459,245 1.52
5,055 51job Inc ADR 170,429 0.57
12,343 Alibaba Group Holding Ltd ADR 1,077,853 3.57
5,624 Baidu Inc ADR 936,424 3.10
11,073 China Biologic Products Inc 1,194,777 3.96
12,742 Ctrip.com International Ltd ADR 509,362 1.69
346,000 Lenovo Group Ltd 209,932 0.70
4,065 TAL Education Group ADR 289,245 0.96
43,045 Tencent Holdings Ltd 1,053,290 3.49
6,874 Yum China Holdings Inc 178,758 0.59
Georgia - 278,549 (31 December 2015: 175,921) 278,549 0.92
4,976 BGEO Group Plc 182,267 0.60
5,346 TBC Bank Group Plc 96,282 0.32
Hong Kong - 1,985,910 (31 December 2015: 1,923,216) 1,985,910 6.58
235,000 AIA Group Ltd 1,326,592 4.40
151,600 Sands China Ltd 659,318 2.18
India - 9,026,556 (31 December 2015: 4,450,304) 9,026,556 29.92
47,142 Amara Raja Batteries Ltd 604,556 2.01
19,831 Apollo Hospitals Enterprise Ltd 345,078 1.14
49,785 Glenmark Pharmaceuticals Ltd 652,626 2.16
27,683 Godrej Consumer Products Ltd 616,117 2.04
38,552 Hindustan Unilever Ltd 468,793 1.56
89,862 Indiabulls Housing Finance Ltd 858,998 2.85
336,994 ITC Ltd 1,196,013 3.97
15,971 Jubilant Foodworks Ltd 200,267 0.66
88,849 LIC Housing Finance Ltd 728,975 2.42
15,942 Maruti Suzuki India Ltd 1,248,906 4.14
29,581 PVR Ltd 498,806 1.65
8,514 Tata Consultancy Services Ltd 296,463 0.98
166,884 Tata Motors Ltd 1,156,533 3.83
32,172 Titan Co Ltd 154,425 0.51
Indonesia - 269,039 (31 December 2015: 103,196) 269,039 0.89
1,292,200 Surya Citra Media Tbk PT 269,039 0.89
Malaysia - 370,997 (31 December 2015: 346,608) 370,997 1.23
262,300 IHH Healthcare Bhd 370,997 1.23
Mexico - 1,730,485 (31 December 2015: 1,252,996) 1,730,484 5.74
87,280 Fomento Economico Mexicano SAB de CV 671,998 2.23
175,400 Grupo Aeroportuario del Centro Norte SAB de CV 759,686 2.52
164,579 Wal-Mart de Mexico SAB de CV 298,800 0.99
Philippines - 2,092,336 (31 December 2015: 1,648,290) 2,092,336 6.94
20,090 GT Capital Holdings Inc 515,056 1.71
412,050 Metropolitan Bank & Trust Co 601,342 1.99
119,303 Security Bank Corp 457,173 1.52
158,070 Universal Robina Corp 518,765 1.72
Russia - 233,608 (31 December 2015: –) 233,608 0.78
5,325 Magnit PJSC GDR 233,608 0.78
South Africa - 3,522,379 (31 December 2015: 2,261,452) 3,522,379 11.68
24,902 British American Tobacco Plc 1,412,885 4.68
26,804 Discovery Ltd 223,461 0.74
64,463 Life Healthcare Group Holdings Ltd 153,176 0.51
9,817 Naspers Ltd 1,438,619 4.77
25,224 Net 1 UEPS Technologies Inc 294,238 0.98
South Korea - 1,110,184 (31 December 2015: –) 1,110,184 3.68
817 LG Household & Health Care Ltd 580,044 1.92
600 Samsung Biologics Co Ltd 75,137 0.25
5,065 Samsung SDI Co Ltd 455,003 1.51
Switzerland - 143,791 (31 December 2015: 294,212) 143,791 0.48
21,750 Cie Financiere Richemont SA 143,791 0.48
Taiwan - 1,895,630 (31 December 2015: 1,390,234) 1,895,630 6.28
41,000 Catcher Technology Co Ltd 285,279 0.94
37,000 Merida Industry Co Ltd 165,030 0.55
257,000 Taiwan Semiconductor Manufacturing Co Ltd 1,445,321 4.79
United Kingdom - 311,575 (31 December 2015: –) 311,575 1.03
7,717 Unilever Plc 311,575 1.03
Total investments in equities 29,750,393 98.62
Unrealised gain on forward foreign currency contracts - 186 (see below)
(31 December 2015: 544) 186 0.00
Total fi nancial assets at fair value through profi t or loss 29,750,579 98.62
Unrealised loss on forward foreign currency contracts - (166) (see below)
(31 December 2015: (3,737)) (166) (0.00)
Total fi nancial liabilities at fair value through profi t or loss (166) (0.00)
Net current assets 416,452 1.38
Total net assets 30,166,865 100.00
Analysis of portfolio % of Total assets
Transferable securities and money market instruments admitted
to offi cial stock exchange listing or traded on a regulated market 98.27
OTC fi nancial derivative instruments 0.00
Other current assets 1.73
Total assets 100.00
BNY MELLON GLOBAL EMERGING MARKETS FUND
Equities cont’d.
Philippines cont’d.
USDUSD

124
Portfolio of investments – as at 31 December 2016
BNY MELLON GLOBAL EMERGING MARKETS FUND
Forward foreign currency contracts
Unrealised
Gain/(Loss)Buy Sell Amount (B) Amount (S)
Settle
Date Counterparty
BNY Mellon Global Emerging Markets Fund EUR H (Hedged) Share ClassEuro US dollar 3,821 4,035 13-Jan-17 The Bank of
New York Mellon 2
USD 2
EUR 2
US dollar Euro 85 81 13-Jan-17 The Bank of New York Mellon (1)
US dollar Euro 78 75 13-Jan-17 The Bank of New York Mellon (1)
USD (2)
EUR (2)
Net USD –
Net EUR –
BNY Mellon Global Emerging Markets Fund EUR H (Inc) (Hedged) Share ClassEuro US dollar 260,829 275,453 13-Jan-17 The Bank of
New York Mellon 144
USD 144
EUR 136
US dollar Euro 5,798 5,541 13-Jan-17 The Bank of New York Mellon (56)
US dollar Euro 5,336 5,136 13-Jan-17 The Bank of New York Mellon (91)
USD (147)
EUR (139)
Net USD (3)
Net EUR (3)
Forward foreign currency contracts cont’d.
Unrealised
Gain/(Loss)Buy Sell Amount (B) Amount (S)
Settle
Date Counterparty
BNY Mellon Global Emerging Markets Fund EUR I (Hedged) Share ClassEuro US dollar 69,099 72,974 13-Jan-17 The Bank of
New York Mellon 38
USD 38
EUR 36
US dollar Euro 1,831 1,749 13-Jan-17 The Bank of New York Mellon (16)
USD (16)
EUR (15)
Net USD 22
Net EUR 21
BNY Mellon Global Emerging Markets Fund EUR I (Inc) (Hedged) Share ClassEuro US dollar 3,964 4,186 13-Jan-17 The Bank of
New York Mellon 2
USD 2
EUR 2
US dollar Euro 105 100 13-Jan-17 The Bank of New York Mellon (1)
USD (1)
EUR (1)
Net USD 1
Net EUR 1

125
Portfolio of investments – as at 31 December 2016
Holdings Description
Fair
value
Total
net assets
% Holdings Description
Fair
value
Total
net assets
%
BNY MELLON GLOBAL EQUITY FUND
United Kingdom - 31,370,434 (31 December 2015: 22,669,085) 31,370,434 12.16
101,576 Associated British Foods Plc 3,425,122 1.33
96,474 British American Tobacco Plc 5,460,576 2.12
1,228,291 Centrica Plc 3,537,355 1.37
160,251 Diageo Plc 4,135,523 1.60
722,513 Royal Bank of Scotland Group Plc 1,990,104 0.77
103,705 Unilever NV 4,258,941 1.65
1,660,318 Vodafone Group Plc 4,057,985 1.57
73,992 Wolseley Plc 4,504,828 1.75
United States of America - 139,696,523 (31 December 2015: 134,357,509) 139,696,523 54.14
46,640 Abbott Laboratories 1,787,478 0.69
42,639 Accenture Plc 4,988,976 1.93
28,480 Align Technology Inc 2,761,848 1.07
11,058 Alphabet Inc 8,877,196 3.44
88,216 Altria Group Inc 5,986,779 2.32
72,094 Apple Inc 8,414,812 3.26
107,581 CA Inc 3,458,191 1.34
32,062 Cerner Corp 1,536,251 0.60
152,383 Cisco Systems Inc 4,640,824 1.80
120,546 Citigroup Inc 7,157,419 2.77
65,428 ConocoPhillips 3,307,712 1.28
144,910 Discovery Communications Inc 4,011,109 1.56
49,254 Dollar General Corp 3,651,445 1.42
16,139 Dun & Bradstreet Corp/The 1,965,085 0.76
123,174 eBay Inc 3,692,141 1.43
61,927 Eversource Energy 3,440,974 1.33
67,046 Express Scripts Holding Co 4,651,987 1.80
72,674 Gilead Sciences Inc 5,241,249 2.03
26,991 Intuit Inc 3,101,941 1.20
52,156 Medtronic Plc 3,730,980 1.45
52,855 Merck & Co Inc 3,121,088 1.21
211,007 Microsoft Corp 13,271,285 5.14
90,810 Nielsen Holdings Plc 3,821,739 1.48
73,059 Principal Financial Group Inc 4,226,098 1.64
43,705 TJX Cos Inc/The 3,308,687 1.28
89,032 Trimble Inc 2,690,102 1.04
48,058 TripAdvisor Inc 2,256,323 0.88
52,243 United Technologies Corp 5,775,725 2.24
43,783 Walgreens Boots Alliance Inc 3,654,786 1.42
45,398 Walt Disney Co/The 4,747,042 1.84
197,567 Western Union Co/The 4,313,875 1.67
33,080 Yum! Brands Inc 2,105,376 0.82
Total investments in equities 246,410,689 95.50
Unrealised gain on forward foreign currency contracts - 288,439 (see below)
(31 December 2015: 82) 288,439 0.11
Total fi nancial assets at fair value through profi t or loss 246,699,128 95.61
Equities
Belgium - 3,595,207 (31 December 2015: 4,018,396) 3,595,207 1.39
34,020 Anheuser-Busch InBev NV 3,595,207 1.39
Brazil - 793,686 (31 December 2015: 200,001) 793,686 0.31
520,284 International Meal Co Alimentacao SA 793,686 0.31
Canada - 5,633,245 (31 December 2015: 5,143,134) 5,633,245 2.18
42,818 Intact Financial Corp 3,061,902 1.19
78,229 Suncor Energy Inc 2,571,343 0.99
France - 9,585,019 (31 December 2015: 8,506,665) 9,585,019 3.72
20,947 Air Liquide SA 2,310,991 0.90
14,148 L’Oreal SA 2,568,983 1.00
248,843 Vivendi SA 4,705,045 1.82
Germany - 8,497,220 (31 December 2015: 11,162,911) 8,497,220 3.29
11,191 Bayer AG 1,163,984 0.45
157,383 Infi neon Technologies AG 2,754,707 1.07
52,386 SAP AG 4,578,529 1.77
Hong Kong - 4,458,479 (31 December 2015: 4,471,820) 4,458,479 1.73
789,800 AIA Group Ltd 4,458,479 1.73
India - 935,351 (31 December 2015: 3,256,911) 935,351 0.36
53,753 Apollo Hospitals Enterprise Ltd 935,351 0.36
Israel - 5,119,511 (31 December 2015: 4,721,666) 5,119,511 1.98
141,913 Teva Pharmaceutical Industries Ltd ADR 5,119,511 1.98
Japan - 15,986,071 (31 December 2015: 20,674,334) 15,986,071 6.20
34,800 Bridgestone Corp 1,253,092 0.49
172,800 Japan Tobacco Inc 5,679,223 2.20
49,700 Sugi Holdings Co Ltd 2,367,172 0.92
93,400 Suntory Beverage & Food Ltd 3,877,524 1.50
47,800 Toyota Motor Corp 2,809,060 1.09
Netherlands - 7,846,311 (31 December 2015: 6,310,746) 7,846,311 3.04
298,375 RELX NV 5,008,261 1.94
78,115 Wolters Kluwer NV 2,838,050 1.10
Norway - 4,662,616 (31 December 2015: 2,623,662) 4,662,616 1.81
313,772 DNB ASA 4,662,616 1.81
Switzerland - 8,231,016 (31 December 2015: 15,543,844) 8,231,016 3.19
63,579 Novartis AG 4,629,691 1.79
15,771 Roche Holding AG 3,601,325 1.40
Equities cont’d.
USDUSD

126
Portfolio of investments – as at 31 December 2016
BNY MELLON GLOBAL EQUITY FUND
Unrealised loss on forward foreign currency contracts - (303,083) (see below)
(31 December 2015: (16,691)) (303,083) (0.12)
Total fi nancial liabilities at fair value through profi t or loss (303,083) (0.12)
Net current assets 11,621,159 4.51
Total net assets 258,017,204 100.00
Analysis of portfolio % of Total assets
Transferable securities and money market instruments admitted
to offi cial stock exchange listing or traded on a regulated market 95.12
OTC fi nancial derivative instruments 0.11
Other current assets 4.77
Total assets 100.00
Forward foreign currency contractsUnrealised
Gain/(Loss)Buy Sell Amount (B) Amount (S)
Settle
Date Counterparty
BNY Mellon Global Equity FundUS dollar Japanese yen 436,320 50,823,191 05-Jan-17 Royal Bank of
Scotland 1,674
US dollar Japanese yen 2,602,673 270,652,000 17-Jan-17 State Street Bank 286,262
USD 287,936
US dollar Canadian dollar 12,594 17,015 03-Jan-17 The Bank of New York Mellon (35)
US dollar Euro 155 148 03-Jan-17 The Bank of New York Mellon (1)
US dollar Japanese yen 436,933 51,376,073 04-Jan-17 The Bank of New York Mellon (2,413)
Japanese yen US dollar 82,231,000 791,965 17-Jan-17 Royal Bank of Scotland (88,180)
Japanese yen US dollar 54,509,000 522,324 17-Jan-17 Royal Bank of Scotland (55,802)
Japanese yen US dollar 133,912,000 1,302,702 17-Jan-17 State Street Bank (156,598)
USD (303,029)
Net USD (15,093)
BNY Mellon Global Equity Fund EUR I (Hedged) Share ClassEuro US dollar 1,015 1,059 03-Jan-17 The Bank of
New York Mellon 13
Euro US dollar 809,873 855,280 13-Jan-17 The Bank of New York Mellon 447
Euro US dollar 203 213 13-Jan-17 The Bank of New York Mellon 2
Euro US dollar 424 444 13-Jan-17 The Bank of New York Mellon 4
US dollar Euro 1,263 1,189 13-Jan-17 The Bank of New York Mellon 7
US dollar Euro 3,172 2,974 13-Jan-17 The Bank of New York Mellon 30
USD 503
EUR 476
Euro US dollar 225 239 13-Jan-17 The Bank of New York Mellon (1)
US dollar Euro 3,449 3,296 13-Jan-17 The Bank of New York Mellon (34)
US dollar Euro 1,059 1,015 13-Jan-17 The Bank of New York Mellon (13)
US dollar Euro 358 342 13-Jan-17 The Bank of New York Mellon (3)
US dollar Euro 240 230 13-Jan-17 The Bank of New York Mellon (3)
USD (54)
EUR (51)
Net USD 449
Net EUR 425
Description
Fair
value
USD
Total
net assets
%

127
Portfolio of investments – as at 31 December 2016
Holdings Description
Fair
value
Total
net assets
% Holdings Description
Fair
value
Total
net assets
%
BNY MELLON GLOBALEQUITY INCOME FUND
United States of America - 321,444,699 (31 December 2015: 264,408,048) 321,444,699 46.42
608,201 CA Inc 19,550,621 2.82
724,293 Cisco Systems Inc 22,058,343 3.19
296,358 CMS Energy Corp 12,380,355 1.79
260,327 Emerson Electric Co 14,629,076 2.11
226,679 Eversource Energy 12,595,419 1.82
87,285 Kraft Heinz Co/The 7,675,407 1.11
170,509 Las Vegas Sands Corp 9,218,569 1.33
436,168 Mattel Inc 12,046,960 1.74
387,766 Maxim Integrated Products Inc 15,132,568 2.18
134,148 McDonald’s Corp 16,472,704 2.38
321,200 Merck & Co Inc 18,966,860 2.74
692,800 Microsoft Corp 43,573,656 6.29
206,002 Paychex Inc 12,647,493 1.83
202,948 Philip Morris International Inc 18,617,435 2.69
148,346 Principal Financial Group Inc 8,581,074 1.24
260,120 Procter & Gamble Co/The 21,942,423 3.17
396,214 Reynolds American Inc 22,229,586 3.21
174,384 Verizon Communications Inc 9,372,268 1.35
1,087,881 Western Union Co/The 23,753,882 3.43
Total investments in equities 671,649,083 97.00
Unrealised gain on forward foreign currency contracts - 326,694 (see below)
(31 December 2015: 1,295,192) 326,694 0.05
Total fi nancial assets at fair value through profi t or loss 671,975,777 97.05
Unrealised loss on forward foreign currency contracts - (13,160) (see below)
(31 December 2015: (1,410,107)) (13,160) (0.00)
Total fi nancial liabilities at fair value through profi t or loss (13,160) (0.00)
Net current assets 20,481,273 2.95
Total net assets 692,443,890 100.00
Analysis of portfolio % of Total assets
Transferable securities and money market instruments admitted
to offi cial stock exchange listing or traded on a regulated market 96.77
OTC fi nancial derivative instruments 0.05
Other current assets 3.18
Total assets 100.00
Equities Australia - 8,244,326
(31 December 2015: 4,589,426) 8,244,326 1.19 1,185,541 Dexus Property Group 8,244,326 1.19
France - 23,758,633 (31 December 2015: 11,726,441) 23,758,633 3.43
194,286 Sanofi 15,622,370 2.26
814,245 Television Francaise 1 8,136,263 1.17
Hong Kong - 8,730,874 (31 December 2015: 5,672,079) 8,730,874 1.26
1,344,000 Link REIT 8,730,874 1.26
Italy - 6,092,758 (31 December 2015: 4,845,575) 6,092,758 0.88
257,459 Atlantia SpA 6,092,758 0.88
Japan - 16,899,634 (31 December 2015: –) 16,899,634 2.44
514,200 Japan Tobacco Inc 16,899,634 2.44
Netherlands - 35,796,273 (31 December 2015: 34,069,540) 35,796,273 5.17
316,754 Koninklijke Ahold Delhaize NV 6,630,473 0.96
1,090,442 RELX NV 18,303,204 2.64
395,941 Royal Dutch Shell Plc 10,862,596 1.57
New Zealand - 2,819,881 (31 December 2015: 1,879,591) 2,819,881 0.41
1,183,289 Spark New Zealand Ltd 2,819,881 0.41
Norway - 14,856,642 (31 December 2015: 9,183,501) 14,856,642 2.15
1,637,695 Orkla ASA 14,856,642 2.15
Republic of Korea - 6,086,204 (31 December 2015: 4,349,399) 6,086,204 0.88
901,400 Macquarie Korea Infrastructure Fund 6,086,204 0.88
Switzerland - 76,654,846 (31 December 2015: 42,420,760) 76,654,846 11.07
93,727 Adecco Group AG 6,152,863 0.89
76,275 Kuehne + Nagel International AG 10,130,537 1.46
100,249 Nestle SA 7,191,594 1.04
277,900 Novartis AG 20,236,099 2.92
71,323 Roche Holding AG 16,286,685 2.35
60,579 Zurich Insurance Group AG 16,657,068 2.41
United Kingdom - 150,264,313 (31 December 2015: 69,156,072) 150,264,313 21.70
887,698 BAE Systems Plc 6,429,425 0.93
231,099 British American Tobacco Plc 13,080,558 1.89
4,115,505 Centrica Plc 11,852,242 1.71
2,654,818 Cobham Plc 5,359,439 0.77
769,669 Diageo Plc 19,862,490 2.87
906,455 GlaxoSmithKline Plc 17,348,504 2.50
190,718 Imperial Brands Plc 8,295,627 1.20
1,598,031 Informa Plc 13,274,732 1.92
1,082,150 Royal Mail Plc 6,095,847 0.88
711,290 SSE Plc 13,576,082 1.96
1,316,313 UBM Plc 11,784,668 1.70
341,189 Unilever Plc 13,775,569 1.99
3,898,828 Vodafone Group Plc 9,529,130 1.38
Equities cont’d.
USDUSD

128
Portfolio of investments – as at 31 December 2016
BNY MELLON GLOBAL EQUITY INCOME FUND
Forward foreign currency contracts
Unrealised
Gain/(Loss)Buy Sell Amount (B) Amount (S)
Settle
Date Counterparty
BNY Mellon Global Equity Income FundUS dollar Euro 1,016,483 970,454 03-Jan-17 The Bank of
New York Mellon (8,317)
USD (8,317)
BNY Mellon Global Equity Income Fund EUR H (Hedged) Share ClassEuro US dollar 36,723 38,396 04-Jan-17 The Bank of
New York Mellon 386
Euro US dollar 4,234,900 4,472,336 13-Jan-17 The Bank of New York Mellon 2,337
Euro US dollar 24,838 25,944 13-Jan-17 The Bank of New York Mellon 300
Euro US dollar 9,275 9,706 13-Jan-17 The Bank of New York Mellon 94
US dollar Euro 23,786 22,386 13-Jan-17 The Bank of New York Mellon 132
US dollar Euro 7,289 6,834 13-Jan-17 The Bank of New York Mellon 69
USD 3,318
EUR 3,142
Euro US dollar 9,538 10,174 13-Jan-17 The Bank of New York Mellon (96)
Euro US dollar 55,395 58,860 13-Jan-17 The Bank of New York Mellon (328)
US dollar Euro 90,664 86,660 13-Jan-17 The Bank of New York Mellon (902)
US dollar Euro 38,419 36,723 13-Jan-17 The Bank of New York Mellon (384)
US dollar Euro 5,445 5,220 13-Jan-17 The Bank of New York Mellon (71)
US dollar Euro 9,192 8,782 13-Jan-17 The Bank of New York Mellon (88)
USD (1,869)
EUR (1,770)
Net USD 1,449
Net EUR 1,372
BNY Mellon Global Equity Income Fund EUR H (Inc) (Hedged) Share ClassEuro US dollar 40,008 41,725 03-Jan-17 The Bank of
New York Mellon 523
Euro US dollar 59,975 62,592 13-Jan-17 The Bank of New York Mellon 779
Euro US dollar 149,988 156,918 13-Jan-17 The Bank of New York Mellon 1,562
Euro US dollar 3,392,347 3,582,544 13-Jan-17 The Bank of New York Mellon 1,872
Euro US dollar 4,998 5,230 13-Jan-17 The Bank of New York Mellon 50
USD 4,786
EUR 4,532
Forward foreign currency contracts cont’d.
Unrealised
Gain/(Loss)Buy Sell Amount (B) Amount (S)
Settle
Date Counterparty
BNY Mellon Global Equity Income Fund EUR H (Inc) (Hedged) Share Class cont’d.
US dollar Euro 62,549 59,975 03-Jan-17 The Bank of New York Mellon (785)
Euro US dollar 11,628 12,355 13-Jan-17 The Bank of New York Mellon (69)
US dollar Euro 41,753 40,008 13-Jan-17 The Bank of New York Mellon (520)
US dollar Euro 4,179 3,993 13-Jan-17 The Bank of New York Mellon (40)
US dollar Euro 6,020 5,753 13-Jan-17 The Bank of New York Mellon (58)
USD (1,472)
EUR (1,394)
Net USD 3,314
Net EUR 3,138
BNY Mellon Global Equity Income Fund EUR I (Hedged) Share ClassEuro US dollar 10,282 10,723 03-Jan-17 The Bank of
New York Mellon 135
Euro US dollar 422 441 04-Jan-17 The Bank of New York Mellon 4
Euro US dollar 118,523,532 125,168,714 13-Jan-17 The Bank of New York Mellon 65,402
Euro US dollar 21,999 23,015 13-Jan-17 The Bank of New York Mellon 229
Euro US dollar 25,006,248 26,171,999 13-Jan-17 The Bank of New York Mellon 250,057
Euro US dollar 22,499 23,391 13-Jan-17 The Bank of New York Mellon 381
US dollar Euro 5,546 5,199 13-Jan-17 The Bank of New York Mellon 52
US dollar Euro 4,317 4,063 13-Jan-17 The Bank of New York Mellon 24
US dollar Euro 234,083 220,923 13-Jan-17 The Bank of New York Mellon 652
US dollar Euro 1,726 1,624 13-Jan-17 The Bank of New York Mellon 10
USD 316,946
EUR 300,138
Euro US dollar 14,475 15,338 13-Jan-17 The Bank of New York Mellon (43)
US dollar Euro 10,730 10,282 13-Jan-17 The Bank of New York Mellon (133)
US dollar Euro 441 422 13-Jan-17 The Bank of New York Mellon (4)
US dollar Euro 10,137 9,726 13-Jan-17 The Bank of New York Mellon (139)
US dollar Euro 10,514 10,066 13-Jan-17 The Bank of New York Mellon (122)
US dollar Euro 81,540 78,175 13-Jan-17 The Bank of New York Mellon (1,061)
USD (1,502)
EUR (1,422)
Net USD 315,444
Net EUR 298,716

129
Portfolio of investments – as at 31 December 2016
BNY MELLON GLOBAL EQUITY INCOME FUND
Forward foreign currency contracts cont’d.
Unrealised
Gain/(Loss)Buy Sell Amount (B) Amount (S)
Settle
Date Counterparty
BNY Mellon Global Equity Income Fund EUR I (Inc) (Hedged) Share ClassEuro US dollar 2,979,349 3,146,390 13-Jan-17 The Bank of
New York Mellon 1,644
USD 1,644
EUR 1,557

130
Portfolio of investments – as at 31 December 2016
Holdings Description
Fair
value
Total
net assets
% Holdings Description
Fair
value
Total
net assets
%
Bonds
Australia - 326,220 (31 December 2015: –) 326,220 0.21
280,000 FMG Resources August 2006 Pty Ltd 144A
9.750% 01-Mar-2022 326,220 0.21
Bermuda - 2,459,844 (31 December 2015: 1,805,000) 2,459,844 1.58
230,000 Aircastle Ltd 5.000% 01-Apr-2023 235,175 0.15
685,000 Aircastle Ltd 5.500% 15-Feb-2022 729,525 0.47
540,000 Digicel Group Ltd 144A 7.125% 01-Apr-2022 418,127 0.27
615,000 Digicel Group Ltd 144A 8.250% 30-Sep-2020 533,039 0.34
600,000 Digicel Ltd 144A 6.750% 01-Mar-2023 543,978 0.35
Canada - 5,349,932 (31 December 2015: 4,154,825) 5,349,932 3.44
390,000 ATS Automation Tooling Systems Inc 144A
6.500% 15-Jun-2023 404,625 0.26
285,000 Bombardier Inc 144A 7.500% 15-Mar-2025 281,794 0.18
165,000 Bombardier Inc 144A 7.750% 15-Mar-2020 174,487 0.11
375,000 GFL Environmental Inc 144A
9.875% 01-Feb-2021 414,375 0.27
105,000 HudBay Minerals Inc 144A 7.250% 15-Jan-2023 109,200 0.07
530,000 HudBay Minerals Inc 144A 7.625% 15-Jan-2025 553,850 0.36
730,000 Lions Gate Entertainment Corp 144A
5.875% 01-Nov-2024 744,600 0.48
550,000 Mattamy Group Corp 144A
6.875% 15-Dec-2023 559,625 0.36
320,000 Precision Drilling Corp 144A
7.750% 15-Dec-2023 338,800 0.22
414,000 Reliance Intermediate Holdings LP 144A
6.500% 01-Apr-2023 437,805 0.28
340,000 Teck Resources Ltd 4.500% 15-Jan-2021 346,800 0.22
570,000 Teck Resources Ltd 4.750% 15-Jan-2022 577,125 0.37
420,000 Teck Resources Ltd 6.250% 15-Jul-2041 406,846 0.26
Cayman Islands - 2,248,121 (31 December 2015: 1,532,706) 2,248,121 1.44
380,000 Noble Holding International Ltd
7.750% 15-Jan-2024 361,000 0.23
825,000 Sable International Finance Ltd 144A
6.875% 01-Aug-2022 870,622 0.56
510,000 Vale Overseas Ltd 6.250% 10-Aug-2026 531,675 0.34
430,000 Viridian Group FundCo II Ltd
7.500% 01-Mar-2020 484,824 0.31
France - 4,479,876 (31 December 2015: 2,540,099) 4,479,876 2.88
475,000 Europcar Groupe SA 5.750% 15-Jun-2022 531,022 0.34
160,000 HomeVi SAS 4.250% 15-Nov-2021 FRN 172,648 0.11
625,000 Horizon Holdings I SASU 7.250% 01-Aug-2023 706,629 0.46
295,000 Kerneos Corporate SAS 5.750% 01-Mar-2021 323,906 0.21
975,000 SFR Group SA 5.625% 15-May-2024 1,092,715 0.70
200,000 SFR Group SA 144A 6.000% 15-May-2022 205,550 0.13
895,000 SFR Group SA 144A 6.250% 15-May-2024 902,831 0.58
530,000 SFR Group SA 144A 7.375% 01-May-2026 544,575 0.35
Germany - 502,155 (31 December 2015: 1,119,909) 502,155 0.32
225,000 IHO Verwaltungs GmbH 3.750% 15-Sep-2026 237,555 0.15
270,000 IHO Verwaltungs GmbH 144A
4.500% 15-Sep-2023 264,600 0.17
Ireland - 1,562,657 (31 December 2015: 2,926,983) 1,562,657 1.00
705,000 Ardagh Packaging Finance Plc / Ardagh Holdings
USA Inc 144A 6.750% 31-Jan-2021 729,675 0.47
200,000 Ardagh Packaging Finance Plc / Ardagh Holdings
USA Inc 144A 7.250% 15-May-2024 210,250 0.13
560,000 eircom Finance DAC 4.500% 31-May-2022 622,732 0.40
Italy - 462,946 (31 December 2015: –) 462,946 0.30
425,000 Guala Closures SpA 4.750% 15-Nov-2021 FRN 462,946 0.30
Jersey - 2,042,121 (31 December 2015: 1,108,195) 2,042,121 1.31
595,000 AA Bond Co Ltd 5.500% 31-Jul-2022 752,267 0.48
455,000 CPUK Finance Ltd 7.000% 28-Aug-2020 594,457 0.38
530,000 TVL Finance Plc 8.500% 15-May-2023 695,397 0.45
Luxembourg - 10,129,067 (31 December 2015: 13,367,616) 10,129,067 6.50
310,000 Altice Financing SA 144A 6.625% 15-Feb-2023 320,478 0.21
615,000 Altice Financing SA 144A 7.500% 15-May-2026 642,613 0.41
305,000 Altice Finco SA 144A 7.625% 15-Feb-2025 310,414 0.20
350,000 Altice SA 6.250% 15-Feb-2025 388,579 0.25
550,000 Altice SA 7.250% 15-May-2022 620,771 0.40
255,000 Altice SA 144A 7.625% 15-Feb-2025 269,344 0.17
260,000 Altice SA 144A 7.750% 15-May-2022 278,746 0.18
635,000 ArcelorMittal 7.250% 25-Feb-2022 721,919 0.46
120,000 ArcelorMittal 8.000% 15-Oct-2039 132,281 0.08
1,055,000 ARD Finance SA 6.625% 15-Sep-2023 1,122,658 0.72
480,000 ARD Finance SA 144A 7.125% 15-Sep-2023 475,800 0.31
690,000 Cabot Financial Luxembourg SA 7.500% 01-Oct-2023 853,626 0.55
535,000 Consolidated Energy Finance SA 144A
6.750% 15-Oct-2019 537,675 0.34
430,000 Crystal Almond SARL 10.000% 01-Nov-2021 472,638 0.30
400,000 DEA Finance SA 7.500% 15-Oct-2022 454,080 0.29
355,000 Garfunkelux Holdco 2 SA 11.000% 01-Nov-2023 449,823 0.29
590,000 Garfunkelux Holdco 3 SA 8.500% 01-Nov-2022 757,573 0.49
475,000 INEOS Group Holdings SA 5.375% 01-Aug-2024 509,124 0.33
815,000 INEOS Group Holdings SA 144A
5.625% 01-Aug-2024 810,925 0.52
Mexico - 921,300 (31 December 2015: –) 921,300 0.59
830,000 Cemex SAB de CV 144A 7.750% 16-Apr-2026 921,300 0.59
Netherlands - 2,955,664 (31 December 2015: 3,236,618) 2,955,664 1.90
105,000 Alcoa Nederland Holding BV 144A
6.750% 30-Sep-2024 114,187 0.07
75,000 Alcoa Nederland Holding BV 144A
7.000% 30-Sep-2026 82,313 0.05
825,000 DPx Holdings BV 144A 7.500% 01-Feb-2022 875,531 0.56
500,000 Fiat Chrysler Automobiles NV 5.250% 15-Apr-2023 511,875 0.33
300,000 Telefonica Europe BV 5.875% Perpetual VAR 333,209 0.22
400,000 Telefonica Europe BV 7.625% Perpetual VAR 485,760 0.31
510,000 Ziggo Bond Finance BV 4.625% 15-Jan-2025 552,789 0.36
Spain - 376,248 (31 December 2015: –) 376,248 0.24
345,000 NH Hotel Group SA 3.750% 01-Oct-2023 376,248 0.24
BNY MELLON GLOBAL HIGH YIELD BOND FUND
Bonds cont’d.
USDUSD

131
Portfolio of investments – as at 31 December 2016
Holdings Description
Fair
value
Total
net assets
% Holdings Description
Fair
value
Total
net assets
%
BNY MELLON GLOBAL HIGH YIELD BOND FUND
190,000 CCO Holdings LLC / CCO Holdings Capital Corp 144A
5.750% 15-Feb-2026 197,125 0.13
250,000 CenturyLink Inc 7.500% 01-Apr-2024 262,500 0.17
215,000 Cheniere Corpus Christi Holdings LLC 144A
5.875% 31-Mar-2025 219,837 0.14
385,000 Cheniere Corpus Christi Holdings LLC 144A
7.000% 30-Jun-2024 420,851 0.27
65,000 CHS/Community Health Systems Inc
5.125% 01-Aug-2021 60,450 0.04
90,000 CHS/Community Health Systems Inc
6.875% 01-Feb-2022 63,000 0.04
160,000 CHS/Community Health Systems Inc
8.000% 15-Nov-2019 134,080 0.09
465,000 Cincinnati Bell Inc 144A 7.000% 15-Jul-2024 492,900 0.32
825,000 CIT Group Inc 5.000% 15-Aug-2022 862,125 0.55
880,000 Citigroup Inc 5.950% Perpetual VAR 891,000 0.57
570,000 ClubCorp Club Operations Inc 144A
8.250% 15-Dec-2023 607,050 0.39
695,000 CNO Financial Group Inc 5.250% 30-May-2025 697,606 0.45
290,000 CommScope Technologies Finance LLC 144A
6.000% 15-Jun-2025 307,942 0.20
825,000 Continental Resources Inc 4.500% 15-Apr-2023 812,625 0.52
1,195,000 Covanta Holding Corp 5.875% 01-Mar-2024 1,153,175 0.74
580,000 Crestwood Midstream Partners LP /
Crestwood Midstream Finance Corp
6.125% 01-Mar-2022 597,400 0.38
485,000 CSC Holdings LLC 144A 10.125% 15-Jan-2023 561,994 0.36
555,000 CVR Partners LP / CVR Nitrogen Finance Corp 144A
9.250% 15-Jun-2023 573,731 0.37
970,000 CVR Refi ning LLC / Coffeyville Finance Inc
6.500% 01-Nov-2022 967,575 0.62
780,000 DaVita Inc 5.000% 01-May-2025 775,086 0.50
280,000 Diamond 1 Finance Corp / Diamond 2 Finance
Corp 144A 5.875% 15-Jun-2021 297,884 0.19
725,000 Diamond 1 Finance Corp / Diamond 2 Finance
Corp 144A 6.020% 15-Jun-2026 784,397 0.50
5,000 DISH DBS Corp 5.000% 15-Mar-2023 5,000 0.00
560,000 DISH DBS Corp 5.875% 15-Jul-2022 590,800 0.38
455,000 DISH DBS Corp 7.750% 01-Jul-2026 515,287 0.33
465,000 DriveTime Automotive Group Inc /
Bridgecrest Acceptance Corp 144A
8.000% 01-Jun-2021 453,375 0.29
410,000 Dynegy Inc 6.750% 01-Nov-2019 419,225 0.27
325,000 Dynegy Inc 7.625% 01-Nov-2024 301,437 0.19
305,000 Dynegy Inc 144A 8.000% 15-Jan-2025 287,462 0.18
340,000 Eldorado Resorts Inc 7.000% 01-Aug-2023 362,100 0.23
435,000 Energy Transfer Equity LP 7.500% 15-Oct-2020 487,200 0.31
315,000 Engility Corp 144A 8.875% 01-Sep-2024 331,144 0.21
770,000 Ensemble S Merger Sub Inc 144A
9.000% 30-Sep-2023 820,050 0.53
450,000 Enviva Partners LP / Enviva Partners Finance
Corp 144A 8.500% 01-Nov-2021 470,250 0.30
935,000 Extraction Oil & Gas Holdings LLC /
Extraction Finance Corp 144A 7.875% 15-Jul-2021 1,005,125 0.65
665,000 FBM Finance Inc 144A 8.250% 15-Aug-2021 704,900 0.45
475,000 Ferrellgas LP / Ferrellgas Finance Corp
6.750% 15-Jan-2022 471,437 0.30
340,000 Ferrellgas LP / Ferrellgas Finance Corp
6.750% 15-Jun-2023 335,750 0.22
United Kingdom - 4,982,967 (31 December 2015: 12,664,553) 4,982,967 3.20
375,000 Bakkavor Finance 2 Plc 8.750% 15-Jun-2020 495,362 0.32
275,000 IDH Finance Plc 6.250% 15-Aug-2022 328,968 0.21
1,010,000 International Game Technology Plc 144A
6.250% 15-Feb-2022 1,088,275 0.70
245,000 International Game Technology Plc 144A
6.500% 15-Feb-2025 263,375 0.17
505,000 Ladbrokes Group Finance Plc 5.125% 08-Sep-2023 611,019 0.39
250,000 Synlab Bondco Plc 6.250% 01-Jul-2022 288,901 0.19
850,000 Synlab Unsecured Bondco Plc 8.250% 01-Jul-2023 982,109 0.63
710,000 Virgin Media Finance Plc 144A
6.375% 15-Oct-2024 924,958 0.59
United States of America - 104,494,485 (31 December 2015: 79,147,921) 104,494,485 67.07
785,000 Advanced Disposal Services Inc 144A
5.625% 15-Nov-2024 783,038 0.50
330,000 AdvancePierre Foods Holdings Inc 144A
5.500% 15-Dec-2024 334,950 0.22
120,000 AES Corp 5.500% 15-Mar-2024 122,700 0.08
140,000 AES Corp 5.500% 15-Apr-2025 141,050 0.09
350,000 AES Corp 6.000% 15-May-2026 355,250 0.23
465,000 Ahern Rentals Inc 144A 7.375% 15-May-2023 388,275 0.25
270,000 AK Steel Corp 7.625% 01-Oct-2021 290,925 0.19
415,000 Albertsons Cos LLC / Safeway Inc /
New Albertson’s Inc / Albertson’s LLC 144A
6.625% 15-Jun-2024 432,637 0.28
320,000 Ally Financial Inc 4.125% 13-Feb-2022 318,000 0.20
670,000 Ally Financial Inc 4.625% 19-May-2022 679,212 0.44
370,000 Ally Financial Inc 5.750% 20-Nov-2025 371,465 0.24
635,000 Ally Financial Inc 8.000% 01-Nov-2031 738,187 0.47
570,000 Alta Mesa Holdings LP / Alta Mesa Finance
Services Corp 144A 7.875% 15-Dec-2024 591,375 0.38
500,000 AMC Entertainment Holdings Inc
5.750% 15-Jun-2025 513,750 0.33
481,000 AMC Networks Inc 5.000% 01-Apr-2024 485,214 0.31
300,000 Antero Resources Corp 5.375% 01-Nov-2021 307,875 0.20
480,000 Antero Resources Corp 5.625% 01-Jun-2023 492,000 0.32
110,000 Archrock Partners LP / Archrock Partners
Finance Corp 6.000% 01-Apr-2021 107,250 0.07
295,000 Archrock Partners LP / Archrock Partners
Finance Corp 6.000% 01-Oct-2022 285,412 0.18
395,000 Ashton Woods USA LLC / Ashton Woods Finance
Co 144A 6.875% 15-Feb-2021 381,175 0.24
1,100,000 Bank of America Corp 5.125% Perpetual VAR 1,084,875 0.70
320,000 Bank of America Corp 6.100% Perpetual VAR 324,000 0.21
140,000 Belden Inc 5.500% 15-Apr-2023 158,689 0.10
450,000 BMC Software Finance Inc 144A
8.125% 15-Jul-2021 422,719 0.27
610,000 Boyd Gaming Corp 144A 6.375% 01-Apr-2026 657,275 0.42
1,450,000 BWAY Holding Co 144A 9.125% 15-Aug-2021 1,537,000 0.99
670,000 Cablevision Systems Corp 8.000% 15-Apr-2020 737,000 0.47
320,000 Callon Petroleum Co 144A 6.125% 01-Oct-2024 331,200 0.21
345,000 Calpine Corp 5.750% 15-Jan-2025 334,650 0.21
375,000 Calpine Corp 144A 6.000% 15-Jan-2022 393,281 0.25
525,000 Carrizo Oil & Gas Inc 6.250% 15-Apr-2023 540,750 0.35
395,000 Carrizo Oil & Gas Inc 7.500% 15-Sep-2020 411,787 0.26
360,000 CCO Holdings LLC / CCO Holdings Capital Corp
5.750% 01-Sep-2023 377,100 0.24
Bonds cont’d.
United States of America cont’d.
Bonds cont’d.
USDUSD

132
Portfolio of investments – as at 31 December 2016
Holdings Description
Fair
value
Total
net assets
% Holdings Description
Fair
value
Total
net assets
%
BNY MELLON GLOBAL HIGH YIELD BOND FUND
710,000 Jaguar Holding Co II / Pharmaceutical Product
Development LLC 144A 6.375% 01-Aug-2023 761,475 0.49
395,000 JBS USA LUX SA / JBS USA Finance Inc 144A
5.750% 15-Jun-2025 401,912 0.26
415,000 Kaiser Aluminum Corp 5.875% 15-May-2024 430,562 0.28
495,000 KCG Holdings Inc 144A 6.875% 15-Mar-2020 497,475 0.32
590,000 Kindred Healthcare Inc 8.750% 15-Jan-2023 553,125 0.36
130,000 Kraton Polymers LLC / Kraton Polymers Capital
Corp 144A 10.500% 15-Apr-2023 147,225 0.09
500,000 Kronos Acquisition Holdings Inc 144A
9.000% 15-Aug-2023 502,500 0.32
735,000 Laredo Petroleum Inc 5.625% 15-Jan-2022 738,675 0.47
530,000 Level 3 Financing Inc 144A 5.250% 15-Mar-2026 524,700 0.34
365,000 Level 3 Financing Inc 5.375% 15-Jan-2024 369,563 0.24
625,000 Louisiana-Pacifi c Corp 4.875% 15-Sep-2024 607,813 0.39
725,000 Matador Resources Co 6.875% 15-Apr-2023 764,875 0.49
1,195,000 Mercer International Inc 7.750% 01-Dec-2022 1,260,725 0.81
445,000 MGM Resorts International 6.000% 15-Mar-2023 481,713 0.31
470,000 Midcontinent Communications / Midcontinent
Finance Corp 144A 6.875% 15-Aug-2023 502,900 0.32
1,055,000 MPG Holdco I Inc 7.375% 15-Oct-2022 1,107,750 0.71
940,000 MPH Acquisition Holdings LLC 144A
7.125% 01-Jun-2024 994,050 0.64
320,000 Murray Energy Corp 144A 11.250% 15-Apr-2021 246,400 0.16
245,000 Netfl ix Inc 5.750% 01-Mar-2024 263,988 0.17
95,000 Netfl ix Inc 5.875% 15-Feb-2025 103,075 0.07
100,000 New Albertsons Inc 7.450% 01-Aug-2029 95,250 0.06
685,000 New Albertsons Inc 8.000% 01-May-2031 659,312 0.42
500,000 Nexstar Broadcasting Inc 144A
6.125% 15-Feb-2022 520,625 0.33
295,000 Novelis Corp 144A 5.875% 30-Sep-2026 298,688 0.19
390,000 Novelis Corp 144A 6.250% 15-Aug-2024 414,375 0.27
855,000 NRG Energy Inc 6.625% 15-Mar-2023 861,413 0.55
535,000 Oasis Petroleum Inc 6.500% 01-Nov-2021 547,706 0.35
605,000 Omega US Sub LLC 144A 8.750% 15-Jul-2023 638,275 0.41
200,000 Parsley Energy LLC / Parsley Finance Corp 144A
5.375% 15-Jan-2025 201,000 0.13
290,000 Parsley Energy LLC / Parsley Finance Corp 144A
6.250% 01-Jun-2024 306,617 0.20
540,000 PDC Energy Inc 144A 6.125% 15-Sep-2024 552,150 0.35
410,000 PetSmart Inc 144A 7.125% 15-Mar-2023 419,356 0.27
305,000 Platform Specialty Products Corp 144A
10.375% 01-May-2021 338,550 0.22
445,000 Post Holdings Inc 144A 5.000% 15-Aug-2026 428,313 0.28
1,070,000 Prime Security Services Borrower LLC /
Prime Finance Inc 144A 9.250% 15-May-2023 1,168,975 0.75
710,000 Project Homestake Merger Corp 144A
8.875% 01-Mar-2023 752,600 0.48
455,000 Provident Funding Associates LP /
PFG Finance Corp 144A 6.750% 15-Jun-2021 459,550 0.30
350,000 PSPC Escrow Corp 6.000% 01-Feb-2023 372,069 0.24
120,000 PulteGroup Inc 5.000% 15-Jan-2027 114,450 0.07
805,000 Quicken Loans Inc 144A 5.750% 01-May-2025 786,888 0.51
110,000 Regal Entertainment Group 5.750% 15-Mar-2022 115,500 0.07
950,000 Reynolds Group Issuer Inc /
Reynolds Group Issuer LLC /
Reynolds Group Issuer Lu 144A
7.000% 15-Jul-2024 1,011,750 0.65
195,000 Rice Energy Inc 6.250% 01-May-2022 201,338 0.13
605,000 First Data Corp 144A 5.375% 15-Aug-2023 629,200 0.40
410,000 First Data Corp 144A 7.000% 01-Dec-2023 439,212 0.28
405,000 Forum Energy Technologies Inc
6.250% 01-Oct-2021 407,025 0.26
325,000 Freeport-McMoRan Inc 3.550% 01-Mar-2022 303,875 0.20
465,000 Freeport-McMoRan Inc 3.875% 15-Mar-2023 430,125 0.28
795,000 Freeport-McMoRan Inc 5.450% 15-Mar-2043 661,837 0.42
270,000 Frontier Communications Corp
10.500% 15-Sep-2022 286,875 0.18
475,000 Gardner Denver Inc 144A 6.875% 15-Aug-2021 475,000 0.31
540,000 Gates Global LLC / Gates Global Co
5.750% 15-Jul-2022 545,093 0.35
1,025,000 Gates Global LLC / Gates Global Co 144A
6.000% 15-Jul-2022 1,007,062 0.65
375,000 Genesis Energy LP / Genesis Energy Finance Corp
5.625% 15-Jun-2024 370,312 0.24
905,000 Genesis Energy LP / Genesis Energy Finance Corp
5.750% 15-Feb-2021 918,575 0.59
440,000 Genesys Telecommunications Laboratories Inc/
Greeneden Lux 3 Sarl/Greeneden US Ho 144A
10.000% 30-Nov-2024 468,600 0.30
297,000 GEO Group Inc/The 6.000% 15-Apr-2026 293,287 0.19
510,000 Gibraltar Industries Inc 6.250% 01-Feb-2021 526,575 0.34
215,000 Gray Television Inc 144A 5.125% 15-Oct-2024 209,625 0.13
305,000 Gray Television Inc 144A 5.875% 15-Jul-2026 303,536 0.20
490,000 Griffon Corp 5.250% 01-Mar-2022 498,330 0.32
515,000 Grinding Media Inc / MC Grinding Media
Canada Inc 144A 7.375% 15-Dec-2023 542,037 0.35
770,000 Gulfport Energy Corp 144A 6.000% 15-Oct-2024 787,325 0.51
270,000 H&E Equipment Services Inc 7.000% 01-Sep-2022 285,525 0.18
255,000 HCA Holdings Inc 6.250% 15-Feb-2021 274,762 0.18
335,000 HCA Inc 5.250% 15-Jun-2026 346,725 0.22
650,000 HCA Inc 5.375% 01-Feb-2025 651,462 0.42
300,000 HCA Inc 5.875% 01-May-2023 318,750 0.20
335,000 HCA Inc 7.500% 15-Feb-2022 380,644 0.24
500,000 HealthSouth Corp 5.750% 01-Nov-2024 508,750 0.33
530,000 Hexion US Finance Corp 6.625% 15-Apr-2020 471,700 0.30
530,000 Hillman Group Inc/The 144A 6.375% 15-Jul-2022 500,850 0.32
400,000 Hilton Grand Vacations Borrower LLC/
Hilton Grand Vacations Borrower Inc 144A
6.125% 01-Dec-2024 417,500 0.27
1,205,000 Hub Holdings LLC / Hub Holdings Finance Inc 144A
8.125% 15-Jul-2019 1,208,012 0.78
235,000 HUB International Ltd 144A 7.875% 01-Oct-2021 248,512 0.16
395,000 Huntsman International LLC 4.250% 01-Apr-2025 422,213 0.27
440,000 IASIS Healthcare LLC / IASIS Capital Corp
8.375% 15-May-2019 385,000 0.25
570,000 Icahn Enterprises LP / Icahn Enterprises
Finance Corp 5.875% 01-Feb-2022 568,575 0.37
605,000 Icahn Enterprises LP / Icahn Enterprises
Finance Corp 6.000% 01-Aug-2020 621,637 0.40
835,000 Inception Merger Sub Inc /
Rackspace Hosting Inc 144A 8.625% 15-Nov-2024 885,893 0.57
675,000 Infor Software Parent LLC / Infor Software
Parent Inc 144A 7.125% 01-May-2021 698,625 0.45
405,000 Infor US Inc 5.750% 15-May-2022 440,540 0.28
350,000 Infor US Inc 6.500% 15-May-2022 367,063 0.24
550,000 Jack Ohio Finance LLC / Jack Ohio Finance 1
Corp 144A 6.750% 15-Nov-2021 557,562 0.36
Bonds cont’d.
United States of America cont’d.
Bonds cont’d.
United States of America cont’d.
USDUSD

133
Portfolio of investments – as at 31 December 2016
Holdings Description
Fair
value
Total
net assets
% Holdings Description
Fair
value
Total
net assets
%
BNY MELLON GLOBAL HIGH YIELD BOND FUND
640,000 West Corp 144A 5.375% 15-Jul-2022 621,600 0.40
170,000 Whiting Petroleum Corp 5.000% 15-Mar-2019 171,515 0.11
395,000 Whiting Petroleum Corp 5.750% 15-Mar-2021 395,332 0.25
240,000 Whiting Petroleum Corp 6.250% 01-Apr-2023 241,200 0.16
400,000 William Lyon Homes Inc 8.500% 15-Nov-2020 420,000 0.27
520,000 Williams Cos Inc/The 4.550% 24-Jun-2024 518,700 0.33
120,000 Williams Cos Inc/The 7.875% 01-Sep-2021 137,700 0.09
275,000 Wolverine World Wide Inc 144A
5.000% 01-Sep-2026 265,375 0.17
155,000 XPO Logistics Inc 144A 6.125% 01-Sep-2023 162,556 0.10
435,000 XPO Logistics Inc 144A 6.500% 15-Jun-2022 458,381 0.29
595,000 York Risk Services Holding Corp 144A
8.500% 01-Oct-2022 499,800 0.32
700,000 Zachry Holdings Inc 144A 7.500% 01-Feb-2020 721,875 0.46
Total investments in bonds 143,293,603 91.98
Leveraged loans
United States of America - 3,709,426 (31 December 2015: 644,675) 3,709,426 2.38
455,000 Asurion LLC 0.000% 03-Mar-2021 461,825 0.30
455,000 BMC Software Finance Inc 5.000% 10-Sep-2020 454,400 0.29
430,000 Dynacast International LLC 0.000% 28-Jan-2022 434,837 0.28
475,000 Federal-Mogul Holdings Corp 0.000% 15-Apr-2018 474,050 0.30
435,000 JDA Software Group Inc 0.000% 22-Sep-2023 438,217 0.28
425,000 Lonestar Intermediate Super Holdings LLC
0.000% 31-Aug-2021 437,750 0.28
595,000 Murray Energy Corp 0.000% 16-Apr-2020 570,084 0.37
435,000 Serta Simmons Bedding LLC 0.000% 21-Oct-2024 438,263 0.28
Total investments in leveraged loans 3,709,426 2.38
Unrealised gain on forward foreign currency contracts - 26,716 (see below)
(31 December 2015: 51,793) 26,716 0.02
Total fi nancial assets at fair value through profi t or loss 147,029,745 94.38
Unrealised loss on forward foreign currency contracts - (338,282) (see below)
(31 December 2015: (572,215)) (338,282) (0.22)
Total fi nancial liabilities at fair value through profi t or loss (338,282) (0.22)
Net current assets 9,100,732 5.84
Total net assets 155,792,195 100.00
Analysis of portfolio % of Total assets
Transferable securities and money market instruments admitted
to offi cial stock exchange listing or traded on a regulated market 91.40
Transferable securities and money market instruments other than those
admitted to offi cial stock exchange listing or traded on a regulated market 2.37
OTC fi nancial derivative instruments 0.02
Other current assets 6.21
Total assets 100.00
935,000 Rose Rock Midstream LP / Rose Rock Finance Corp
5.625% 15-Jul-2022 923,313 0.59
495,000 Rose Rock Midstream LP / Rose Rock Finance Corp
5.625% 15-Nov-2023 485,100 0.31
440,000 RP Crown Parent LLC 144A 7.375% 15-Oct-2024 456,500 0.29
680,000 RSI Home Products Inc 144A 6.500% 15-Mar-2023 714,000 0.46
310,000 RSP Permian Inc 144A 5.250% 15-Jan-2025 312,713 0.20
405,000 RSP Permian Inc 6.625% 01-Oct-2022 430,313 0.28
325,000 Sabine Pass Liquefaction LLC 144A
5.000% 15-Mar-2027 329,063 0.21
480,000 Sabine Pass Liquefaction LLC 144A
5.875% 30-Jun-2026 519,288 0.33
345,000 Sanchez Energy Corp 7.750% 15-Jun-2021 352,763 0.23
350,000 Scientifi c Games International Inc 144A
7.000% 01-Jan-2022 377,125 0.24
1,065,000 Scientifi c Games International Inc
10.000% 01-Dec-2022 1,065,000 0.68
895,000 Signode Industrial Group Lux SA/
Signode Industrial Group US Inc 144A
6.375% 01-May-2022 897,238 0.58
300,000 Sprint Communications Inc 11.500% 15-Nov-2021 369,750 0.24
395,000 Sprint Corp 7.250% 15-Sep-2021 421,169 0.27
445,000 Sprint Corp 7.625% 15-Feb-2025 469,475 0.30
870,000 Sprint Corp 7.875% 15-Sep-2023 930,900 0.60
130,000 Steel Dynamics Inc 144A 5.000% 15-Dec-2026 129,838 0.08
450,000 Steel Dynamics Inc 5.250% 15-Apr-2023 473,625 0.30
590,000 Summit Materials LLC / Summit Materials
Finance Corp 6.125% 15-Jul-2023 608,432 0.39
60,000 Summit Materials LLC / Summit Materials
Finance Corp 8.500% 15-Apr-2022 66,600 0.04
520,000 Surgical Care Affi liates Inc 144A 6.000% 01-Apr-2023 540,150 0.35
525,000 Talen Energy Supply LLC 6.500% 01-Jun-2025 412,125 0.26
520,000 Targa Resources Partners LP /
Targa Resources Partners Finance Corp 144A
5.125% 01-Feb-2025 518,050 0.33
365,000 Targa Resources Partners LP /
Targa Resources Partners Finance Corp
6.375% 01-Aug-2022 379,600 0.24
405,000 Taylor Morrison Communities Inc / Monarch
Communities Inc 144A 5.875% 15-Apr-2023 413,100 0.27
800,000 Tenet Healthcare Corp 6.750% 15-Jun-2023 708,000 0.45
160,000 Tenet Healthcare Corp 8.000% 01-Aug-2020 158,400 0.10
825,000 Tenet Healthcare Corp 8.125% 01-Apr-2022 782,719 0.50
440,000 T-Mobile USA Inc 6.000% 15-Apr-2024 464,750 0.30
405,000 T-Mobile USA Inc 6.500% 15-Jan-2024 436,388 0.28
405,000 T-Mobile USA Inc 6.731% 28-Apr-2022 424,744 0.27
750,000 Townsquare Media Inc 144A 6.500% 01-Apr-2023 721,875 0.46
575,000 TransDigm Inc 6.500% 15-Jul-2024 604,469 0.39
930,000 Tronox Finance LLC 6.375% 15-Aug-2020 869,550 0.56
1,175,000 Unit Corp 6.625% 15-May-2021 1,148,563 0.74
790,000 United Rentals North America Inc
5.500% 15-Jul-2025 813,700 0.52
130,000 United Rentals North America Inc
5.500% 15-May-2027 129,188 0.08
490,000 Univar USA Inc 144A 6.750% 15-Jul-2023 508,375 0.33
725,000 USI Inc 144A 7.750% 15-Jan-2021 741,313 0.48
240,245 Wave Holdco LLC / Wave Holdco Corp 144A
8.250% 15-Jul-2019 246,251 0.16
585,000 WESCO Distribution Inc 5.375% 15-Dec-2021 606,938 0.39
Bonds cont’d.
United States of America cont’d.
Bonds cont’d.
United States of America cont’d.
USDUSD

134
Portfolio of investments – as at 31 December 2016
BNY MELLON GLOBAL HIGH YIELD BOND FUND
Forward foreign currency contracts cont’d.
Unrealised
Gain/(Loss)Buy Sell Amount (B) Amount (S)
Settle
Date Counterparty
BNY Mellon Global High Yield Bond Fund EUR I (Hedged) Share Class cont’d.
Euro US dollar 1,378 1,464 13-Jan-17 The Bank of New York Mellon (8)
US dollar Euro 4,547 4,359 13-Jan-17 The Bank of New York Mellon (59)
US dollar Euro 3,293 3,153 13-Jan-17 The Bank of New York Mellon (38)
USD (105)
EUR (99)
Net USD 491
Net EUR 465
BNY Mellon Global High Yield Bond Fund EUR X (Inc) (Hedged) Share ClassEuro US dollar 35,826,160 37,834,802 13-Jan-17 The Bank of
New York Mellon 19,769
USD 19,769
EUR 18,721
US dollar Euro 846,078 810,000 13-Jan-17 The Bank of New York Mellon (9,783)
USD (9,783)
EUR (9,264)
Net USD 9,986
Net EUR 9,457
Forward foreign currency contracts
Unrealised
Gain/(Loss)Buy Sell Amount (B) Amount (S)
Settle
Date Counterparty
BNY Mellon Global High Yield Bond FundEuro US dollar 500,000 523,596 31-Jan-17 Citigroup 5,269
USD 5,269
US dollar Euro 2,047,705 1,965,000 31-Jan-17 Morgan Stanley (30,735)
US dollar Euro 4,255,256 4,085,000 31-Jan-17 Citigroup (65,573)
US dollar Euro 4,100,270 3,935,000 31-Jan-17 Commonwealth Bank of Australia (61,899)
US dollar Euro 3,955,983 3,795,000 31-Jan-17 Goldman Sachs (58,104)
US dollar Euro 3,939,239 3,780,000 31-Jan-17 Barclays Bank plc (58,982)
US dollar Sterling 3,293,654 2,695,000 31-Jan-17 Barclays Bank plc (24,539)
US dollar Sterling 989,861 810,000 31-Jan-17 Commonwealth Bank of Australia (7,444)
US dollar Sterling 2,492,735 2,040,000 31-Jan-17 Goldman Sachs (18,996)
US dollar Sterling 158,902 130,000 31-Jan-17 Morgan Stanley (1,159)
USD (327,431)
Net USD (322,162)
BNY Mellon Global High Yield Bond Fund EUR H (Hedged) Share ClassEuro US dollar 69,992 73,046 13-Jan-17 The Bank of
New York Mellon 909
Euro US dollar 313,103 330,658 13-Jan-17 The Bank of New York Mellon 173
USD 1,082
EUR 1,025
US dollar Euro 72,996 69,992 03-Jan-17 The Bank of New York Mellon (916)
Euro US dollar 7,993 8,493 13-Jan-17 The Bank of New York Mellon (47)
USD (963)
EUR (912)
Net USD 119
Net EUR 113
BNY Mellon Global High Yield Bond Fund EUR I (Hedged) Share ClassEuro US dollar 2,677 2,792 13-Jan-17 The Bank of
New York Mellon 36
Euro US dollar 1,014,138 1,070,997 13-Jan-17 The Bank of New York Mellon 560
USD 596
EUR 564

135
Portfolio of investments – as at 31 December 2016
Holdings Description
Fair
value
Total
net assets
% Holdings Description
Fair
value
Total
net assets
%
Equities
Australia - 913,144 913,144 3.22 12,600 CSL Ltd 913,144 3.22
Canada - 909,999 909,999 3.21 27,800 Suncor Energy Inc 909,999 3.21
Denmark - 913,681 913,681 3.22 25,400 Novo Nordisk A/S 913,681 3.22
France - 2,820,466 2,820,466 9.95 8,600 Air Liquide SA 956,201 3.37
5,200 L’Oreal SA 948,333 3.35
4,800 LVMH Moet Hennessy Louis Vuitton SE 915,932 3.23
Germany - 947,399 947,399 3.34 10,900 SAP SE 947,399 3.34
Hong Kong - 874,992 874,992 3.09 155,000 AIA Group Ltd 874,992 3.09
Japan - 1,875,961 1,875,961 6.62 5,400 FANUC Corp 915,516 3.23
1,400 Keyence Corp 960,445 3.39
Spain - 888,801 888,801 3.13 26,050 Industria de Diseno Textil SA 888,801 3.13
Switzerland - 2,853,172 2,853,172 10.07 13,400 Nestle SA 961,937 3.39
13,100 Novartis AG 953,908 3.37
4,100 Roche Holding AG 937,327 3.31
Taiwan - 874,152 874,152 3.08 30,400 Taiwan Semiconductor Manufacturing Co Ltd ADR 874,152 3.08
United Kingdom - 924,000 924,000 3.26 10,900 Reckitt Benckiser Group Plc 924,000 3.26
United States of America - 12,768,537 12,768,537 45.05 5,300 3M Co 947,057 3.34
1,190 Alphabet Inc 919,311 3.24
9,500 Automatic Data Processing Inc 976,505 3.45
7,700 Celgene Corp 891,814 3.15
16,200 Cognizant Technology Solutions Corp 907,848 3.20
13,900 Colgate-Palmolive Co 909,685 3.21
7,800 Ecolab Inc 914,355 3.23
8,700 EOG Resources Inc 879,657 3.10
8,200 Johnson & Johnson 945,132 3.34
8,900 Mastercard Inc 919,281 3.24
17,700 Nike Inc 899,779 3.17
10,800 Schlumberger Ltd 906,822 3.20
15,700 Starbucks Corp 871,743 3.08
11,700 TJX Cos Inc/The 879,548 3.10
Total investments in equities 27,564,304 97.24
Total fi nancial assets at fair value through profi t or loss 27,564,304 97.24
Unrealised loss on forward foreign currency contracts - (1,773) (see below) (1,773) (0.01)
Total fi nancial liabilities at fair value through profi t or loss (1,773) (0.01)
Net current assets 782,783 2.77
Total net assets 28,345,314 100.00
Analysis of portfolio % of Total Assets
Transferable securities and money market instruments admitted
to offi cial stock exchange listing or traded on a regulated market 97.17
Other current assets 2.83
Total assets 100.00
BNY MELLON GLOBAL LEADERS FUND
Description USDUSD

136
Portfolio of investments – as at 31 December 2016
BNY MELLON GLOBAL LEADERS FUND
Forward foreign currency contracts
Unrealised
Gain/(Loss)Buy Sell Amount (B) Amount (S)
Settle
Date Counterparty
BNY Mellon Global Leaders Fund EUR H (Acc) (Hedged) Share ClassEuro US dollar 100,390 106,177 13-Jan-17 The Bank of
New York Mellon (443)
USD (443)
EUR (421)
BNY Mellon Global Leaders Fund EUR H (Inc) (Hedged) Share ClassEuro US dollar 100,390 106,177 13-Jan-17 The Bank of
New York Mellon (443)
USD (443)
EUR (421)
BNY Mellon Global Leaders Fund EUR W (Acc) (Hedged) Share ClassEuro US dollar 100,393 106,180 13-Jan-17 The Bank of
New York Mellon (444)
USD (444)
EUR (422)
BNY Mellon Global Leaders Fund EUR W (Inc) (Hedged) Share ClassEuro US dollar 100,393 106,180 13-Jan-17 The Bank of
New York Mellon (443)
USD (443)
EUR (421)

137
Portfolio of investments – as at 31 December 2016
Holdings Description
Fair
value
Total
net assets
% Holdings Description
Fair
value
Total
net assets
%
BNY MELLON GLOBAL OPPORTUNISTIC BOND FUND
Indonesia - 852,193 (31 December 2015: –) 852,193 0.65
790,000 Indonesia Government International Bond
3.750% 14-Jun-2028 852,193 0.65
Ireland - 2,977,186 (31 December 2015: 4,136,222) 2,977,186 2.28
150,000 AerCap Ireland Capital Ltd /
AerCap Global Aviation Trust
4.500% 15-May-2021 155,062 0.12
900,000 AerCap Ireland Capital Ltd /
AerCap Global Aviation Trust
5.000% 01-Oct-2021 948,375 0.73
450,000 Ardagh Packaging Finance Plc /
Ardagh Holdings USA Inc
3.963% 15-Dec-2019 FRN 457,875 0.35
1,100,000 MMC Norilsk Nickel OJSC via MMC Finance Ltd
4.375% 30-Apr-2018 1,127,335 0.86
290,000 Trafi gura Securitisation Finance Plc. 2014-1
2.954% 15-Oct-2021 FRN 288,539 0.22
Italy - 944,529 (31 December 2015: 2,330,663) 944,529 0.72
425,000 Intesa Sanpaolo SpA 5.250% 12-Jan-2024 446,661 0.34
525,000 Italy Buoni Poliennali Del Tesoro 144A
2.800% 01-Mar-2067 497,868 0.38
Jamaica - 455,033 (31 December 2015: 4,365,000) 455,033 0.35
525,000 Digicel Group Ltd 8.250% 30-Sep-2020 455,033 0.35
Japan - 3,769,039 (31 December 2015: –) 3,769,039 2.89
414,353,200 Japanese Government CPI Linked Bond
0.100% 10-Mar-2025 3,769,039 2.89
Mexico - 3,343,343 (31 December 2015: 5,408,549) 3,343,343 2.56
30,031,781 Mexican Udibonos 4.500% 04-Dec-2025 1,623,987 1.25
1,200,000 Mexico City Airport Trust 4.250% 31-Oct-2026 1,179,000 0.90
525,000 Petroleos Mexicanos 144A 6.500% 13-Mar-2027 540,356 0.41
Netherlands - 5,322,301 (31 December 2015: 7,364,844) 5,322,301 4.08
400,000 Allianz Finance II BV 5.750% 08-Jul-2041 VAR 492,002 0.38
350,000 Equate Petrochemical BV 144A
3.000% 03-Mar-2022 333,588 0.26
638,857 Globaldrive Auto Receivables 2016-B BV
0.128% 20-Aug-2024 FRN 678,182 0.52
225,000 GTH Finance BV 6.250% 26-Apr-2020 236,812 0.18
650,000 Lukoil International Finance BV 144A
4.750% 02-Nov-2026 651,895 0.50
400,000 Lukoil International Finance BV
6.125% 09-Nov-2020 435,020 0.34
450,000 Mylan NV 2.500% 07-Jun-2019 447,855 0.34
300,000 Mylan NV 3.000% 15-Dec-2018 302,332 0.23
725,000 Petrobras Global Finance BV 5.375% 27-Jan-2021 709,050 0.54
700,000 Shell International Finance BV
3.750% 12-Sep-2046 642,477 0.49
400,000 Teva Pharmaceutical Finance Netherlands III BV
1.700% 19-Jul-2019 393,088 0.30
Bonds
Argentina - 4,533,955 (31 December 2015: 2,626,622) 4,533,955 3.47
10,900,000 Argentine Bonos del Tesoro
15.500% 17-Oct-2026 664,437 0.51
30,200,000 Argentine Bonos del Tesoro
21.200% 19-Sep-2018 1,935,406 1.48
736,070 Argentine Republic Government International Bond
8.280% 31-Dec-2033 782,074 0.60
500,000 Provincia de Buenos Aires 5.750% 15-Jun-2019 523,850 0.40
575,000 Provincia de Buenos Aires 9.125% 16-Mar-2024 628,188 0.48
Australia - 2,564,640 (31 December 2015: 12,156,855) 2,564,640 1.97
3,475,000 Australia Government Bond 2.750% 21-Oct-2019 2,564,640 1.97
Bahrain - 742,821 (31 December 2015: –) 742,821 0.57
725,000 Bahrain Government International Bond 144A
7.000% 12-Oct-2028 742,821 0.57
Brazil - 2,046,501 (31 December 2015: 1,988,791) 2,046,501 1.57
4,750,000 Brazil Notas do Tesouro Nacional Serie F
10.000% 01-Jan-2021 1,406,689 1.08
725,000 Brazilian Government International Bond
5.625% 21-Feb-2047 639,812 0.49
Canada - 3,280,758 (31 December 2015: 2,496,861) 3,280,758 2.51
1,675,000 Canadian Government Bond
2.250% 01-Jun-2025 1,302,517 1.00
1,050,000 Glencore Finance Canada Ltd
2.700% 25-Oct-2017 1,057,037 0.81
641,605 MBarc Credit Canada Inc 144A
1.261% 17-Sep-2018 476,544 0.36
475,000 MBarc Credit Canada Inc 144A
1.532% 17-Jun-2019 352,126 0.27
125,000 MBarc Credit Canada Inc 144A
1.716% 15-Jul-2021 92,534 0.07
Cayman Islands - 1,236,263 (31 December 2015: 2,497,126) 1,236,263 0.95
1,215,000 Transocean Inc 2.500% 15-Oct-2017 1,236,263 0.95
Colombia - 1,376,717 (31 December 2015: –) 1,376,717 1.05
3,500,000,000 Colombian TES 10.000% 24-Jul-2024 1,376,717 1.05
Germany - 761,933 (31 December 2015: 744,224) 761,933 0.58
700,000 Allianz SE 3.375% Perpetual VAR 761,933 0.58
Hungary - 1,474,498 (31 December 2015: –) 1,474,498 1.13
152,250,000 Hungary Government Bond 3.000% 26-Jun-2024 532,016 0.41
231,250,000 Hungary Government Bond 5.500% 24-Jun-2025 942,482 0.72
Iceland - 1,596,267 (31 December 2015: –) 1,596,267 1.22
1,400,000 Iceland Government International Bond
5.875% 11-May-2022 1,596,267 1.22
Bonds cont’d.
USDUSD

138
Portfolio of investments – as at 31 December 2016
Holdings Description
Fair
value
Total
net assets
% Holdings Description
Fair
value
Total
net assets
%
BNY MELLON GLOBAL OPPORTUNISTIC BOND FUND
Turkey - 1,423,861 (31 December 2015: –) 1,423,861 1.09
5,323,264 Turkey Government Bond 2.000% 18-Sep-2024 1,423,861 1.09
United Kingdom - 5,607,494 (31 December 2015: 9,701,627) 5,607,494 4.30
850,000 Barclays Plc 5.200% 12-May-2026 866,805 0.67
625,000 Barclays Plc 7.875% Perpetual VAR 635,691 0.49
550,000 British Telecommunications Plc
0.625% 10-Mar-2021 586,779 0.45
275,000 HSBC Holdings Plc 4.375% 23-Nov-2026 276,644 0.21
275,000 International Game Technology Plc
6.250% 15-Feb-2022 296,313 0.23
300,000 Interoute Finco Plc 7.375% 15-Oct-2020 341,105 0.26
275,000 Lloyds Banking Group Plc 3.100% 06-Jul-2021 278,602 0.21
1,075,000 Royal Bank of Scotland Group Plc
3.875% 12-Sep-2023 1,031,038 0.79
550,000 Royal Bank of Scotland Group Plc
8.625% Perpetual VAR 560,395 0.43
550,000 Virgin Media Finance Plc 7.000% 15-Apr-2023 734,122 0.56
United States of America - 59,580,864 (31 December 2015: 124,817,928) 59,580,864 45.64
125,000 Abbott Laboratories 3.750% 30-Nov-2026 124,158 0.10
500,000 Abbott Laboratories 4.900% 30-Nov-2046 508,116 0.39
400,000 AbbVie Inc 1.375% 17-May-2024 428,529 0.33
600,000 Aetna Inc 1.900% 07-Jun-2019 598,947 0.46
1,200,000 Ally Financial Inc 3.600% 21-May-2018 1,212,000 0.93
300,000 AmeriCredit Automobile Receivables Trust 2012-5
2.350% 10-Dec-2018 300,881 0.23
455,000 AmeriCredit Automobile Receivables Trust 2014-3
3.130% 08-Oct-2020 462,247 0.35
57,444 Avant Loans Funding Trust 2016-A 144A
4.110% 15-May-2019 57,585 0.04
170,315 Avant Loans Funding Trust 2016-B 144A
3.920% 15-Aug-2019 171,166 0.13
479,010 Avant Loans Funding Trust 2016-C 144A
2.960% 16-Sep-2019 479,521 0.37
715,000 Banc of America Commercial Mortgage Trust 2007-2
5.648% 10-Apr-2049 VAR 680,494 0.52
450,000 Bank of America Corp 4.250% 22-Oct-2026 454,795 0.35
903,743 Bear Stearns Commercial Mortgage Securities
Trust 2006-PWR14 5.273% 11-Dec-2038 905,958 0.69
325,000 Bear Stearns Commercial Mortgage Securities
Trust 2007-PWR17 5.887% 11-Jun-2050 VAR 327,458 0.25
35,000 Bear Stearns Commercial Mortgage Securities
Trust 2007-PWR18 6.222% 11-Jun-2050 VAR 34,201 0.03
350,000 BWAY Holding Co 9.125% 15-Aug-2021 371,000 0.28
275,000 Calpine Corp 5.500% 01-Feb-2024 266,750 0.20
225,000 Capital Auto Receivables Asset Trust 2014-3
3.140% 20-Feb-2020 228,388 0.17
375,000 CarMax Auto Owner Trust 2014-4
3.040% 17-May-2021 377,557 0.29
520,348 Carrington Mortgage Loan Trust Series 2006-NC4
0.816% 25-Oct-2036 FRN 511,013 0.39
1,130,400 Carrington Mortgage Loan Trust Series 2006-NC5
0.866% 25-Jan-2037 FRN 914,151 0.70
285,000 Cimarex Energy Co 5.875% 01-May-2022 296,269 0.23
275,000 CIT Equipment Collateral 2014-VT1
2.650% 20-Oct-2022 275,840 0.21
New Zealand - 2,840,356 (31 December 2015: 3,327,696) 2,840,356 2.18
3,875,000 New Zealand Government Bond
2.000% 20-Sep-2025 2,840,356 2.18
Peru - 457,489 (31 December 2015: –) 457,489 0.35
400,000 Peruvian Government International Bond
2.750% 30-Jan-2026 457,489 0.35
Poland - 2,734,487 (31 December 2015: 4,141,827) 2,734,487 2.10
9,075,000 Republic of Poland Government Bond
3.250% 25-Jul-2025 2,138,645 1.64
610,000 Republic of Poland Government International Bond
2.000% 25-Oct-2046 595,842 0.46
Portugal - 3,600,326 (31 December 2015: –) 3,600,326 2.76
1,600,000 Portugal Obrigacoes do Tesouro OT 144A
2.875% 21-Jul-2026 1,575,130 1.21
1,775,000 Portugal Obrigacoes do Tesouro OT 144A
3.850% 15-Apr-2021 2,025,196 1.55
Republic of Korea - 2,410,690 (31 December 2015: 5,197,759) 2,410,690 1.85
1,534,500,000 Korea Treasury Bond 2.250% 10-Jun-2025 1,289,190 0.99
1,333,000,000 Korea Treasury Bond 2.250% 10-Dec-2025 1,121,500 0.86
Romania - 1,281,872 (31 December 2015: –) 1,281,872 0.98
450,000 Romanian Government International Bond
2.750% 29-Oct-2025 495,218 0.38
725,000 Romanian Government International Bond
2.875% 26-May-2028 786,654 0.60
Russia - 1,833,013 (31 December 2015: 1,477,592) 1,833,013 1.40
81,300,000 Russian Federal Bond - OFZ
7.050% 19-Jan-2028 1,217,326 0.93
600,000 Russian Foreign Bond - Eurobond
4.750% 27-May-2026 615,687 0.47
Saudi Arabia - 379,740 (31 December 2015: –) 379,740 0.29
400,000 Saudi Government International Bond 144A
3.250% 26-Oct-2026 379,740 0.29
Sri Lanka - 1,388,673 (31 December 2015: –) 1,388,673 1.06
675,000 Sri Lanka Government International Bond
5.750% 18-Jan-2022 667,248 0.51
700,000 Sri Lanka Government International Bond
6.000% 14-Jan-2019 721,425 0.55
Supranational - 2,693,136 (31 December 2015: –) 2,693,136 2.06
450,000 European Investment Bank 1.125% 16-Sep-2021 325,637 0.25
3,405,000 International Bank for Reconstruction
& Development 3.500% 22-Jan-2021 2,367,499 1.81
Bonds cont’d. Bonds cont’d.
USDUSD

139
Portfolio of investments – as at 31 December 2016
Holdings Description
Fair
value
Total
net assets
% Holdings Description
Fair
value
Total
net assets
%
BNY MELLON GLOBAL OPPORTUNISTIC BOND FUND
704,239 Impac CMB Trust Series 2004-7
1.761% 25-Nov-2034 FRN 622,449 0.48
175,212 Impac Secured Assets Trust 2006-2
1.106% 25-Aug-2036 FRN 172,869 0.13
275,000 Infor US Inc 6.500% 15-May-2022 288,406 0.22
15,254 JP Morgan Chase Commercial Mortgage Securities
Trust 2006-CIBC17 5.464% 12-Dec-2043 15,251 0.01
840,000 JP Morgan Chase Commercial Mortgage Securities
Trust 2007-LDP12 6.039% 15-Feb-2051 VAR 771,480 0.59
1,085,000 JP Morgan Chase Commercial Mortgage Securities
Trust 2014-Inn 4.304% 15-Jun-2029 FRN 1,079,818 0.83
600,000 Kraft Heinz Foods Co 2.250% 25-May-2028 648,990 0.50
358,000 Kraft Heinz Foods Co 4.875% 15-Feb-2025 386,017 0.30
331,158 Marlette Funding Trust 2016-1 144A
3.060% 17-Jan-2023 331,295 0.25
180,394 ML-CFC Commercial Mortgage Trust 2006-4
5.239% 12-Dec-2049 180,832 0.14
260,000 ML-CFC Commercial Mortgage Trust 2007-9
6.177% 12-Sep-2049 VAR 211,193 0.16
475,000 Morgan Stanley 3.950% 23-Apr-2027 469,020 0.36
858,081 Morgan Stanley ABS Capital I Inc Trust 2006-NC4
0.906% 25-Jun-2036 FRN 745,863 0.57
815,000 Morgan Stanley Capital I Trust 2007-IQ14
5.690% 15-Apr-2049 VAR 799,098 0.61
275,000 NRG Energy Inc 6.250% 15-Jul-2022 276,375 0.21
325,000 Occidental Petroleum Corp
3.000% 15-Feb-2027 313,699 0.24
500,000 Omega Healthcare Investors Inc
4.375% 01-Aug-2023 494,525 0.38
825,000 OneMain Financial Issuance Trust 2016-1A
3.660% 20-Feb-2029 834,234 0.64
775,000 Oracle Corp 4.000% 15-Jul-2046 739,452 0.57
1,000,000 Oscar US Funding Trust 2.310% 15-Nov-2019 1,001,407 0.77
450,000 RAAC Series 2006-SP4 Trust
1.096% 25-Nov-2036 FRN 424,726 0.33
275,000 Santander Drive Auto Receivables Trust 2015-1
3.240% 15-Apr-2021 278,319 0.21
380,000 Scientifi c Games International Inc
10.000% 01-Dec-2022 380,000 0.29
356,006 SMB Private Education Loan Trust
1.354% 15-Nov-2023 FRN 356,643 0.27
538,816 SoFi Consumer Loan Program 2016-2 LLC 144A
3.090% 27-Oct-2025 538,909 0.41
538,123 Sofi Professional Loan Program 2016-B LLC
1.680% 25-Mar-2031 537,292 0.41
925,000 Springleaf Funding Trust 3.160% 15-Nov-2024 932,535 0.71
400,000 Springleaf Funding Trust 3.620% 15-Nov-2024 400,194 0.31
221,076 Springleaf Funding Trust 2014-A
2.410% 15-Dec-2022 221,168 0.17
625,000 Springleaf Funding Trust 2016-A 144A
3.800% 15-Nov-2029 624,013 0.48
250,000 Sprint Communications Inc 7.000% 15-Aug-2020 265,652 0.20
300,000 Sprint Corp 7.875% 15-Sep-2023 321,000 0.25
500,000 Sprint Spectrum Co LLC / Sprint Spectrum Co II LLC /
Sprint Spectrum Co III LLC 3.360% 20-Sep-2021 501,348 0.38
300,000 Tenet Healthcare Corp 6.750% 15-Jun-2023 265,500 0.20
480,000 T-Mobile USA Inc 6.625% 01-Apr-2023 510,000 0.39
275,000 United Rentals North America Inc
5.500% 15-Jul-2025 283,250 0.22
450,000 Citigroup Inc 4.300% 20-Nov-2026 453,559 0.35
1,375,000 Colony American Homes Single-Family Rental
Pass-Through Certifi cates
4.386% 17-Jul-2032 FRN 1,373,957 1.05
598,628 Colony Starwood Homes 2016-2 Trust
1.986% 17-Dec-2033 FRN 599,842 0.46
1,960,000 COMM 2006-C8 Mortgage Trust
5.377% 10-Dec-2046 1,955,695 1.50
666,017 Conn’s Receivables Funding 2016-B LLC 144A
3.730% 15-Oct-2018 667,877 0.51
200,000 Continental Resources Inc 3.800% 01-Jun-2024 185,500 0.14
155,000 Continental Resources Inc 5.000% 15-Sep-2022 157,037 0.12
175,000 Cox Communications Inc 3.350% 15-Sep-2026 166,866 0.13
625,000 Diamond 1 Finance Corp / Diamond 2 Finance Corp
3.480% 01-Jun-2019 638,431 0.49
175,000 Diamondback Energy Inc 4.750% 01-Nov-2024 172,375 0.13
875,000 Dominion Resources Inc 2.962% 01-Jul-2019 885,944 0.68
375,000 Drive Auto Receivables Trust
3.020% 15-Nov-2021 375,286 0.29
375,000 Drive Auto Receivables Trust
4.180% 15-Mar-2024 372,327 0.29
800,000 Drive Auto Receivables Trust
4.590% 17-Jan-2023 821,535 0.63
790,000 Drive Auto Receivables Trust 2015-C
3.010% 17-May-2021 796,914 0.61
600,000 Drive Auto Receivables Trust 2015-C
4.200% 15-Sep-2021 607,983 0.47
295,000 Dynegy Inc 7.375% 01-Nov-2022 283,200 0.22
310,000 First Data Corp 7.000% 01-Dec-2023 332,088 0.25
579,000 Freeport-McMoRan Inc 144A
6.875% 15-Feb-2023 612,292 0.47
800,000 General Motors Financial Co Inc
2.350% 04-Oct-2019 790,664 0.61
695,000 General Motors Financial Co Inc
2.440% 15-Jan-2020 FRN 702,641 0.54
1,450,000 Georgetown University 1.311% 01-Apr-2029 1,311,103 1.00
265,000 GLP Capital LP / GLP Financing II Inc
5.375% 15-Apr-2026 277,031 0.21
1,000,000 GM Financial Automobile Leasing Trust 2015-3
2.980% 20-Nov-2019 1,008,364 0.77
505,000 Goldman Sachs Group Inc/The
3.500% 16-Nov-2026 494,623 0.38
142,840 Government National Mortgage Association
0.379% 16-May-2051 VAR 4,122 0.00
4,986,536 Government National Mortgage Association
0.494% 16-Feb-2053 VAR 164,930 0.13
76,986 Government National Mortgage Association
0.616% 16-Apr-2042 VAR 3,045 0.00
2,095,268 Government National Mortgage Association
3.500% 20-Mar-2039 201,600 0.15
768,028 Government National Mortgage Association
4.000% 20-Mar-2042 114,535 0.09
921,829 Government National Mortgage Association
5.361% 20-Jul-2042 FRN 199,516 0.15
1,572,901 Government National Mortgage Association
5.461% 20-Nov-2045 FRN 360,821 0.28
299,707 HSI Asset Securitization Corp Trust 2005-I1
1.046% 25-Nov-2035 FRN 295,355 0.23
450,000 Hyundai Capital America 2.000% 01-Jul-2019 446,281 0.34
Bonds cont’d.
United States of America cont’d.
Bonds cont’d.
United States of America cont’d.
USDUSD

140
Portfolio of investments – as at 31 December 2016
Holdings Description
Fair
value
Total
net assets
% Holdings Description
Fair
value
Total
net assets
%
BNY MELLON GLOBAL OPPORTUNISTIC BOND FUND
Bonds cont’d.
United States of America cont’d. 19 Euro-OAT
Long Futures Contracts
Exp Mar-2017 3,048,224 43,269 0.03
1 Japanese 10 Year Bond
Long Futures Contracts
Exp Mar-2017 1,284,706 513 0.00
(174) U.S. 10 Year Treasury Note
Short Futures Contracts
Exp Mar-2017 (21,565,125) 142,141 0.11
(59) U.S. 2 Year Treasury Note
Short Futures Contracts
Exp Mar-2017 (12,780,875) 12,187 0.01
(22) U.S. Treasury Bond
Short Futures Contracts
Exp Mar-2017 (3,297,937) 42,906 0.03
(28) U.S. Treasury Ultra Bond
Short Futures Contracts
Exp Mar-2017 (4,459,875) 105,730 0.08
Total open futures contracts 469,500 0.36
Unrealised gain on forward foreign currency contracts - 1,155,073 (see below)
(31 December 2015: 736,689) 1,155,073 0.89
Total fi nancial assets at fair value through profi t or loss 129,460,857 99.18
Currency options - (117,205) (31 December 2015: (268,691))
(617) Euro/US dollar Call 13-Jan-2017 99.250 (3,856) (0.00)
(4,300,000) US dollar/Mexican peso Call 01-Feb-2017 20.380 (113,349) (0.09)
Total currency options (117,205) (0.09)
Holdings Description
Underlying
exposure
USD
Fair
value
USD
Total
net assets
%
Open futures contracts - (357,970) (31 December 2015: (26,223))
(24) Australian 10 Year Treasury Bond
Short Futures Contracts
Exp Mar-2017 (2,215,056) (10,765) (0.01)
470 Australian 3 Year Bond
Long Futures Contracts
Exp Mar-2017 37,851,462 (57,816) (0.04)
(72) Euro-Bund
Short Futures Contracts
Exp Mar-2017 (12,493,961) (220,092) (0.17)
(18) Euro-Buxl 30 Year Bond
Short Futures Contracts
Exp Mar-2017 (3,316,136) (67,669) (0.05)
(4) Euro-Schatz
Short Futures Contracts
Exp Mar-2017 (474,281) (644) (0.00)
6 U.S. 5 Year Treasury Note
Long Futures Contracts
Exp Mar-2017 705,000 (984) (0.00)
Total open futures contracts (357,970) (0.27)
2,270,000 United States Treasury Bill 0.000% 27-Apr-2017* 2,265,963 1.74
9,816,463 United States Treasury Infl ation Indexed Bonds
0.625% 15-Jan-2026 9,860,779 7.55
760,000 Wachovia Bank Commercial Mortgage Trust
Series 2007-C32 5.707% 15-Jun-2049 VAR 736,803 0.56
425,000 Walgreens Boots Alliance Inc
1.750% 30-May-2018 425,591 0.33
325,000 Wells Fargo & Co 3.000% 22-Apr-2026 309,425 0.24
115,000 Wells Fargo & Co 4.300% 22-Jul-2027 117,984 0.09
829,500 Wendys Funding LLC 2015-1 4.080% 15-Jun-2045 821,134 0.63
Total investments in bonds 123,509,978 94.61
Leveraged loans
Singapore - 424,028 (31 December 2015: 618,403) 424,028 0.33
421,700 Avago Technologies Cayman Finance Ltd
4.250% 01-Feb-2023 424,028 0.33
United States of America - 3,774,929 (31 December 2015: 5,418,363) 3,774,929 2.89
673,687 Capital Automotive LP 4.000% 10-Apr-2019 678,559 0.52
867,966 Carestream Health Inc 0.000% 07-Jun-2019 847,352 0.65
798,502 Catalent Pharma Solutions Inc
0.000% 19-May-2021 804,657 0.62
369,389 Hilton Worldwide Finance LLC
3.500% 25-Oct-2020 373,083 0.28
418,615 Ineos U.S. Finance LLC 0.000% 15-Dec-2020 421,343 0.32
643,500 Univar USA Inc 4.250% 01-Jul-2022 649,935 0.50
Total investments in leveraged loans 4,198,957 3.22
Currency options - 59 (31 December 2015: –)
4,300,000 US dollar/Mexican peso Put 01-Feb-2017 18.170 59 0.00
Total currency options 59 0.00
Interest rate swaps - 127,290 (31 December 2015: 54,404)
137,650,000 IRS Pays Fixed 0.586% Japanese yen 24-Mar-2046 76,877 0.06
114,000,000 IRS Pays Fixed 0.632% Japanese yen 04-Apr-2046 50,413 0.04
Total interest rate swaps 127,290 0.10
Holdings Description
Underlying
exposure
USD
Fair
value
USD
Total
net assets
%
Open futures contracts - 469,500 (31 December 2015: 503,275)
41 Canadian 10 Year Treasury Bond
Long Futures Contracts
Exp Mar-2017 4,182,164 31,003 0.02
53 Euro-Bobl
Long Futures Contracts
Exp Mar-2017 7,479,285 57,230 0.05
12 Euro-BTP
Long Futures Contracts
Exp Mar-2017 1,717,500 34,521 0.03
Open futures contracts cont’d.
Underlying
exposure
USD USDUSD

141
Portfolio of investments – as at 31 December 2016
Holdings Description
Fair
value
Total
net assets
% Holdings Description
Fair
value
Total
net assets
%
BNY MELLON GLOBAL OPPORTUNISTIC BOND FUND
Unrealised loss on forward foreign currency contracts - (1,918,251) (see below)
(31 December 2015: (1,363,201)) (1,918,251) (1.47)
Total fi nancial liabilities at fair value through profi t or loss (2,393,426) (1.83)
Net current assets 3,471,392 2.65
Total net assets 130,538,823 100.00
* Part of the holding is held as collateral by Goldman Sachs and JPMorgan Chase in respect of futures contracts,
currency options and forward foreign currency contracts held by the Fund.
The counterparties for currency options are Goldman Sachs and JPMorgan Chase.
The counterparty for futures contracts is JPMorgan Chase.
The counterparty for interest rate swaps is Citigroup.
Analysis of portfolio % of Total Assets
Transferable securities and money market instruments admitted
to offi cial stock exchange listing or traded on a regulated market 91.66
Transferable securities and money market instruments other than those
admitted to offi cial stock exchange listing or traded on a regulated market 3.12
Financial derivative instruments dealt in on a regulated market 0.35
OTC fi nancial derivative instruments 0.95
Other current assets 3.92
Total assets 100.00
Forward foreign currency contracts
Unrealised
Gain/(Loss)Buy Sell Amount (B) Amount (S)
Settle
Date Counterparty
BNY Mellon Global Opportunistic Bond FundCanadian dollar US dollar 1,759,413 1,301,218 04-Jan-17 HSBC Bank Plc 4,680
US dollar Hungarian forint 1,744,401 494,590,000 13-Jan-17 JPMorgan Chase 57,896
US dollar Indonesian rupiah 259,070 3,487,335,000 13-Jan-17 Citigroup 365
US dollar Korean won 7,643,016 8,699,510,000 13-Jan-17 Citigroup 428,651
US dollar Korean won 795,117 903,030,000 13-Jan-17 HSBC Bank Plc 46,248
US dollar Korean won 2,827,400 3,207,685,000 13-Jan-17 JPMorgan Chase 167,318
US dollar Mexican peso 293,237 6,010,000 13-Jan-17 JPMorgan Chase 3,196
US dollar Mexican peso 310,465 5,815,000 13-Jan-17 Goldman Sachs 29,834
US dollar Polish zloty 2,589,624 10,290,000 13-Jan-17 JPMorgan Chase 129,747
US dollar Taiwanese dollar 1,418,218 45,010,000 13-Jan-17 JPMorgan Chase 23,140
US dollar Turkish lira 280,574 960,000 13-Jan-17 JPMorgan Chase 9,147
US dollar Turkish lira 1,270,529 4,425,000 13-Jan-17 JPMorgan Chase 19,420
US dollar Turkish lira 152,986 520,000 13-Jan-17 JPMorgan Chase 5,963
US dollar Turkish lira 130,892 440,000 13-Jan-17 JPMorgan Chase 6,488
US dollar Turkish lira 898,256 3,060,000 13-Jan-17 JPMorgan Chase 33,082
Swedish krona US dollar 46,825,000 5,024,868 31-Jan-17 HSBC Bank Plc 153,304
US dollar Australian dollar 2,578,124 3,560,000 31-Jan-17 UBS 7,976
US dollar Canadian dollar 2,577,706 3,470,000 31-Jan-17 HSBC Bank Plc 1,257
US dollar Sterling 826,811 670,000 31-Jan-17 HSBC Bank Plc 1,880
Brazilian real US dollar 2,200,000 644,915 02-Feb-17 JPMorgan Chase 24,755
USD 1,154,347
Colombian peso US dollar 4,142,800,000 1,393,475 13-Jan-17 Goldman Sachs (16,279)
Hungarian forint US dollar 36,550,000 133,121 13-Jan-17 JPMorgan Chase (8,489)
Indian rupee US dollar 285,760,000 4,219,728 13-Jan-17 JPMorgan Chase (13,244)
Indonesian rupiah US dollar 38,481,645,000 2,909,105 13-Jan-17 Bank of America Securities Ltd (54,383)
Korean won US dollar 3,082,255,000 2,582,139 13-Jan-17 JPMorgan Chase (26,074)
Korean won US dollar 3,364,160,000 2,943,272 13-Jan-17 JPMorgan Chase (153,428)
Korean won US dollar 454,715,000 387,750 13-Jan-17 Citigroup (10,663)
Mexican peso US dollar 15,310,000 747,398 13-Jan-17 JPMorgan Chase (8,541)
Mexican peso US dollar 2,610,000 136,107 13-Jan-17 JPMorgan Chase (10,149)
Polish zloty US dollar 770,000 197,537 13-Jan-17 JPMorgan Chase (13,464)
Polish zloty US dollar 655,000 156,992 13-Jan-17 JPMorgan Chase (411)
South African rand US dollar 39,490,000 2,941,910 13-Jan-17 JPMorgan Chase (71,605)
Turkish lira US dollar 13,130,000 4,194,620 13-Jan-17 JPMorgan Chase (482,288)
Turkish lira US dollar 690,000 198,144 13-Jan-17 JPMorgan Chase (3,056)
US dollar Colombian peso 1,302,808 4,142,800,000 13-Jan-17 Citigroup (74,387)
US dollar Indian rupee 1,822,897 125,435,000 13-Jan-17 JPMorgan Chase (23,549)
US dollar Indian rupee 2,335,856 160,325,000 13-Jan-17 JPMorgan Chase (24,182)
US dollar Mexican peso 991,155 20,730,000 13-Jan-17 UBS (9,270)
US dollar Mexican peso 295,342 6,150,000 13-Jan-17 Goldman Sachs (1,455)
US dollar South African rand 2,796,247 39,490,000 13-Jan-17 Bank of America Securities Ltd (74,058)
US dollar Taiwanese dollar 2,568,112 82,940,000 13-Jan-17 JPMorgan Chase (2,601)
US dollar Turkish lira 1,244,538 4,415,000 13-Jan-17 JPMorgan Chase (3,744)
Hong Kong dollar US dollar 21,800,000 2,813,121 19-Jan-17 JPMorgan Chase (1,578)
US dollar Hong Kong dollar 1,386,759 10,850,000 19-Jan-17 JPMorgan Chase (12,564)
US dollar Hong Kong dollar 1,386,603 10,950,000 19-Jan-17 JPMorgan Chase (25,617)
US dollar Canadian dollar 1,399,838 1,900,000 31-Jan-17 HSBC Bank Plc (10,898)
US dollar Canadian dollar 1,302,108 1,760,000 31-Jan-17 HSBC Bank Plc (4,679)
US dollar Euro 3,336,706 3,201,000 31-Jan-17 HSBC Bank Plc (49,089)
US dollar Euro 3,720,459 3,567,000 31-Jan-17 Goldman Sachs (52,465)
US dollar Euro 3,020,556 2,898,000 31-Jan-17 UBS (44,746)
US dollar Euro 3,719,382 3,567,000 31-Jan-17 JPMorgan Chase (53,542)
Description USD

142
Portfolio of investments – as at 31 December 2016
BNY MELLON GLOBAL OPPORTUNISTIC BOND FUND
Forward foreign currency contracts cont’d.
Unrealised
Gain/(Loss)Buy Sell Amount (B) Amount (S)
Settle
Date Counterparty
BNY Mellon Global Opportunistic Bond Fund cont’d.
US dollar Euro 2,324,245 2,229,000 31-Jan-17 Citigroup (33,436)
US dollar Euro 2,246,049 2,155,000 31-Jan-17 Bank of America Securities Ltd (33,360)
US dollar Japanese yen 9,018,872 1,060,190,000 31-Jan-17 HSBC Bank Plc (62,972)
US dollar New Zealand dollar 5,279,137 7,615,000 31-Jan-17 HSBC Bank Plc (17,707)
US dollar Singapore dollar 1,424,973 2,065,000 31-Jan-17 JPMorgan Chase (3,975)
US dollar Brazilian real 166,138 550,000 02-Feb-17 Citigroup (1,279)
USD (1,493,227)
Net USD (338,880)
BNY Mellon Global Opportunistic Bond Fund EUR H (Hedged) Share ClassEuro US dollar 1,296,497 1,369,187 13-Jan-17 The Bank of
New York Mellon 715
USD 715
EUR 677
US dollar Euro 9,756 9,353 13-Jan-17 The Bank of New York Mellon (127)
USD (127)
EUR (120)
Net USD 588
Net EUR 557
BNY Mellon Global Opportunistic Bond Fund EUR I (Hedged) Share ClassEuro US dollar 19,549 20,645 13-Jan-17 The Bank of
New York Mellon 11
USD 11
EUR 10
BNY Mellon Global Opportunistic Bond Fund Sterling I (Acc) (Hedged) Share ClassSterling US dollar 14,437,818 18,191,672 13-Jan-17 The Bank of
New York Mellon (424,897)
USD (424,897)
GBP (345,388)

143
Portfolio of investments – as at 31 December 2016
Holdings Description
Fair
value
Total
net assets
% Holdings Description
Fair
value
Total
net assets
%
Bonds
United States of America - 8,201,332 (31 December 2015: 910,589) 8,201,332 7.69
5,056,000 United States Treasury Bill 0.000% 16-Mar-2017 5,051,093 4.74
3,147,900 United States Treasury Note/Bond
0.875% 28-Feb-2017 3,150,239 2.95
Total investments in bonds 8,201,332 7.69
Equities
Canada - 1,372,661 (31 December 2015: 1,652,606) 1,372,661 1.29
41,761 Suncor Energy Inc 1,372,661 1.29
France - 3,422,801 (31 December 2015: 4,059,196) 3,422,801 3.21
181,027 Vivendi SA 3,422,801 3.21
Germany - 3,028,667 (31 December 2015: 7,241,996) 3,028,667 2.84
34,653 SAP AG 3,028,667 2.84
Hong Kong - 1,343,527 (31 December 2015: 2,821,835) 1,343,527 1.26
238,000 AIA Group Ltd 1,343,527 1.26
Israel - 4,025,905 (31 December 2015: 3,552,137) 4,025,905 3.77
227,793 Bank Hapoalim BM 1,358,989 1.27
73,927 Teva Pharmaceutical Industries Ltd ADR 2,666,916 2.50
Japan - 5,536,200 (31 December 2015: 4,734,802) 5,536,200 5.19
84,700 Japan Tobacco Inc 2,783,740 2.61
66,300 Suntory Beverage & Food Ltd 2,752,460 2.58
Mexico - 2,217,871 (31 December 2015: –) 2,217,871 2.08
1,221,600 Wal-Mart de Mexico SAB de CV 2,217,871 2.08
Netherlands - 4,019,255 (31 December 2015: 5,517,144) 4,019,255 3.77
196,912 RELX NV 3,305,192 3.10
19,654 Wolters Kluwer NV 714,063 0.67
Norway - 1,936,867 (31 December 2015: 2,827,667) 1,936,867 1.82
130,342 DNB ASA 1,936,867 1.82
Switzerland - 1,818,773 (31 December 2015: 8,736,772) 1,818,773 1.70
24,977 Novartis AG 1,818,773 1.70
United Kingdom - 13,041,003 (31 December 2015: 14,235,889) 13,041,003 12.23
48,851 Associated British Foods Plc 1,647,246 1.54
13,759 British American Tobacco Plc 778,781 0.73
780,326 Centrica Plc 2,247,261 2.11
112,774 Diageo Plc 2,910,306 2.73
70,079 Unilever NV 2,877,994 2.70
42,367 Wolseley Plc 2,579,415 2.42
United States of America - 54,649,805 (31 December 2015: 72,501,570) 54,649,805 51.24
22,386 Accenture Plc 2,619,274 2.45
4,464 Alphabet Inc 3,583,632 3.36
28,624 Apple Inc 3,340,993 3.13
48,422 Blue Buffalo Pet Products Inc 1,171,570 1.10
61,911 CA Inc 1,990,129 1.87
30,650 CH Robinson Worldwide Inc 2,259,825 2.12
80,572 Cisco Systems Inc 2,453,820 2.30
40,719 Citigroup Inc 2,417,691 2.27
26,595 ConocoPhillips 1,344,510 1.26
13,368 Costco Wholesale Corp 2,153,785 2.02
117,268 Discovery Communications Inc 3,245,978 3.04
26,238 Dollar General Corp 1,945,154 1.82
32,881 Emerson Electric Co 1,847,748 1.73
22,490 Express Scripts Holding Co 1,560,469 1.46
46,339 Gilead Sciences Inc 3,341,969 3.13
9,921 Intuit Inc 1,140,171 1.07
31,589 Medtronic Plc 2,259,719 2.12
64,886 Microsoft Corp 4,081,005 3.83
38,321 Stratasys Ltd 638,428 0.60
62,802 Trimble Inc 1,897,563 1.78
45,575 TripAdvisor Inc 2,139,746 2.01
23,750 Walgreens Boots Alliance Inc 1,982,531 1.86
24,259 Walt Disney Co/The 2,536,643 2.38
123,538 Western Union Co/The 2,697,452 2.53
Total investments in equities 96,413,335 90.40
Unrealised gain on forward foreign currency contracts - 570,053 (see below)
(31 December 2015: 536) 570,053 0.53
Total fi nancial assets at fair value through profi t or loss 105,184,720 98.62
Unrealised loss on forward foreign currency contracts - (384,937) (see below)
(31 December 2015: (76,579)) (384,937) (0.36)
Total fi nancial liabilities at fair value through profi t or loss (384,937) (0.36)
Net current assets 1,850,608 1.74
Total net assets 106,650,391 100.00
Analysis of portfolio % of Total assets
Transferable securities and money market instruments admitted
to offi cial stock exchange listing or traded on a regulated market 97.49
OTC fi nancial derivative instruments 0.53
Other current assets 1.98
Total assets 100.00
BNY MELLON GLOBAL OPPORTUNITIES FUND
Equities cont’d.
USDUSD

144
Portfolio of investments – as at 31 December 2016
BNY MELLON GLOBAL OPPORTUNITIES FUND
Forward foreign currency contracts
Unrealised
Gain/(Loss)Buy Sell Amount (B) Amount (S)
Settle
Date Counterparty
BNY Mellon Global Opportunities FundJapanese yen US dollar 86,427,000 737,886 16-Feb-17 The Bank of
New York Mellon 2,934
US dollar Japanese yen 4,686,549 482,888,000 16-Feb-17 Royal Bank of Scotland 547,411
US dollar Norwegian krone 384,000 3,233,909 16-Feb-17 The Bank of New York Mellon 7,991
USD 558,336
US dollar Canadian dollar 6,850 9,254 03-Jan-17 The Bank of New York Mellon (19)
US dollar Euro 36,335 34,690 03-Jan-17 The Bank of New York Mellon (297)
US dollar Japanese yen 32,818 3,858,794 04-Jan-17 The Bank of New York Mellon (181)
Japanese yen US dollar 29,972,000 266,285 16-Feb-17 JPMorgan Chase (9,376)
Japanese yen US dollar 97,724,000 939,120 16-Feb-17 State Street Bank (101,466)
Japanese yen US dollar 73,208,000 681,251 16-Feb-17 JPMorgan Chase (53,739)
Japanese yen US dollar 62,209,000 564,100 16-Feb-17 JPMorgan Chase (30,867)
Japanese yen US dollar 43,925,000 407,216 16-Feb-17 JPMorgan Chase (30,707)
Japanese yen US dollar 35,899,000 337,831 16-Feb-17 State Street Bank (30,117)
Japanese yen US dollar 53,524,000 493,655 16-Feb-17 JPMorgan Chase (34,867)
Norwegian krone US dollar 13,797,650 1,686,000 16-Feb-17 State Street Bank (81,737)
USD (373,373)
Net USD 184,963
BNY Mellon Global Opportunities Fund EUR H (Hedged) Share ClassEuro US dollar 15,000 15,646 13-Jan-17 The Bank of
New York Mellon 203
Euro US dollar 4,810,844 5,080,570 13-Jan-17 The Bank of New York Mellon 2,655
USD 2,858
EUR 2,706
US dollar Euro 938,731 897,273 13-Jan-17 The Bank of New York Mellon (9,344)
US dollar Euro 1,256 1,200 13-Jan-17 The Bank of New York Mellon (12)
US dollar Euro 88,675 84,894 13-Jan-17 The Bank of New York Mellon (1,025)
US dollar Euro 19,143 18,366 13-Jan-17 The Bank of New York Mellon (263)
USD (10,644)
EUR (10,079)
Net USD (7,786)
Net EUR (7,373)
Forward foreign currency contracts cont’d.
Unrealised
Gain/(Loss)Buy Sell Amount (B) Amount (S)
Settle
Date Counterparty
BNY Mellon Global Opportunities Fund EUR I (Hedged) Share ClassEuro US dollar 58,787 61,274 13-Jan-17 The Bank of
New York Mellon 841
Euro US dollar 30,605 32,019 13-Jan-17 The Bank of New York Mellon 319
Euro US dollar 46,134 48,264 13-Jan-17 The Bank of New York Mellon 482
Euro US dollar 12,212,409 12,897,114 13-Jan-17 The Bank of New York Mellon 6,739
Euro US dollar 29,666 31,049 13-Jan-17 The Bank of New York Mellon 297
Euro US dollar 2,143 2,228 13-Jan-17 The Bank of New York Mellon 36
US dollar Euro 26,008 24,477 13-Jan-17 The Bank of New York Mellon 145
USD 8,859
EUR 8,389
US dollar Euro 48,235 46,134 04-Jan-17 The Bank of New York Mellon (485)
Euro US dollar 67,707 71,741 13-Jan-17 The Bank of New York Mellon (200)
Euro US dollar 15,511 16,545 13-Jan-17 The Bank of New York Mellon (156)
Euro US dollar 13,306 14,139 13-Jan-17 The Bank of New York Mellon (79)
USD (920)
EUR (871)
Net USD 7,939
Net EUR 7,518

145
Portfolio of investments – as at 31 December 2016
Holdings Description
Fair
value
Total
net assets
% Holdings Description
Fair
value
Total
net assets
%
BNY MELLON GLOBAL PROPERTY SECURITIES FUND
19,300 Mitsubishi Estate Co Ltd 363,553 1.70
25,400 Mitsui Fudosan Co Ltd 556,051 2.60
79 Mori Hills REIT Investment Corp 100,850 0.47
35 Nippon Building Fund Inc 183,228 0.86
51 Nippon Prologis REIT Inc 98,577 0.46
76 Orix JREIT Inc 113,421 0.53
7,000 Sumitomo Realty & Development Co Ltd 175,916 0.82
Netherlands - 87,381 (31 December 2015: 72,245) 87,381 0.41
2,050 Wereldhave NV 87,381 0.41
Norway - 105,936 (31 December 2015: 32,368) 105,936 0.49
11,340 Entra ASA 144A 105,936 0.49
Singapore - 354,710 (31 December 2015: 238,221) 354,710 1.66
76,300 Ascendas Real Estate Investment Trust 113,264 0.53
53,200 CapitaLand Ltd 105,123 0.49
69,700 Frasers Logistics & Industrial Trust 42,140 0.20
11,600 Global Logistic Properties Ltd 16,763 0.08
56,800 Keppel REIT Management Ltd 38,064 0.18
43,124 Mapletree Commercial Trust 39,356 0.18
Spain - 128,330 (31 December 2015: 59,531) 128,330 0.60
19,570 Inmobiliaria Colonial SA 128,330 0.60
Sweden - 229,932 (31 December 2015: 176,290) 229,932 1.08
7,800 Hufvudstaden AB 116,755 0.55
6,420 Wihlborgs Fastigheter AB 113,177 0.53
Switzerland - 179,793 (31 December 2015: 99,308) 179,793 0.84
2,200 PSP Swiss Property AG 179,793 0.84
United Kingdom - 1,042,509 (31 December 2015: 927,264) 1,042,509 4.88
120,730 Assura Plc 80,133 0.37
24,130 British Land Co Plc 177,588 0.83
27,460 Land Securities Group Plc 339,573 1.59
12,887 Safestore Holdings Plc 51,997 0.24
17,450 Segro Plc 93,410 0.44
11,950 Shaftesbury Plc 125,988 0.59
59,080 Tritax Big Box REIT Plc 95,565 0.45
11,140 UNITE Group Plc 78,255 0.37
United States of America - 11,844,529 (31 December 2015: 7,563,189) 11,844,529 55.44
6,950 American Homes 4 Rent 137,124 0.64
3,840 AvalonBay Communities Inc 638,491 2.99
4,430 Boston Properties Inc 518,742 2.43
2,140 Camden Property Trust 168,718 0.79
3,140 Care Capital Properties Inc 73,103 0.34
3,370 Colony Starwood Homes 91,127 0.43
5,660 Columbia Property Trust Inc 113,334 0.53
15,120 CubeSmart 378,358 1.77
9,960 CyrusOne Inc 422,545 1.98
16,860 DDR Corp 240,686 1.13
7,360 Douglas Emmett Inc 250,526 1.17
13,200 Duke Realty Corp 326,312 1.53
Equities Australia - 1,337,013
(31 December 2015: 815,567) 1,337,013 6.26 13,520 Dexus Property Group 89,033 0.42
32,470 Goodman Group 158,508 0.74
44,350 GPT Group 152,780 0.72
21,770 Investa Offi ce Fund 70,452 0.33
40,410 Mirvac Group 58,752 0.27
127,650 Scentre Group 405,677 1.90
66,620 Stockland 208,986 0.98
30,030 Westfi eld Corp 192,825 0.90
Canada - 502,805 (31 December 2015: 300,366) 502,805 2.35
2,910 Allied Properties Real Estate Investment Trust 72,661 0.34
11,320 Dream Offi ce Real Estate Investment Trust 153,917 0.72
2,190 RioCan Real Estate Investment Trust 40,875 0.19
10,420 Smart Real Estate Investment Trust 235,352 1.10
Finland - 44,624 (31 December 2015: 121,858) 44,624 0.21
19,160 Citycon OYJ 44,624 0.21
France - 733,098 (31 December 2015: 504,880) 733,098 3.43
1,290 Fonciere Des Regions 106,683 0.50
6,390 Klepierre 238,203 1.11
1,730 Unibail-Rodamco SE 388,212 1.82
Germany - 731,992 (31 December 2015: 499,871) 731,992 3.43
9,810 Alstria offi ce REIT-AG 116,126 0.54
10,190 Deutsche Wohnen AG 305,394 1.43
950 LEG Immobilien AG 69,744 0.33
7,800 Vonovia SE 240,728 1.13
Hong Kong - 1,441,815 (31 December 2015: 1,010,772) 1,441,815 6.75
53,700 Cheung Kong Property Holdings Ltd 311,984 1.46
38,000 Hang Lung Properties Ltd 76,104 0.36
12,100 Henderson Land Development Co Ltd 60,989 0.29
32,200 Hongkong Land Holdings Ltd 192,560 0.90
43,100 Link REIT 265,138 1.24
108,926 New World Development Co Ltd 109,208 0.51
23,400 Sun Hung Kai Properties Ltd 280,112 1.31
11,200 Swire Properties Ltd 29,372 0.14
18,500 Wharf Holdings Ltd 116,348 0.54
Ireland - 62,330 (31 December 2015: –) 62,330 0.29
45,663 Green REIT Plc 62,330 0.29
Japan - 2,337,779 (31 December 2015: 1,450,367) 2,337,779 10.94
23 Activia Properties Inc 102,527 0.48
24 Advance Residence Investment Corp 60,003 0.28
41 GLP J-Reit 44,604 0.21
31 Invincible Investment Corp 13,216 0.06
94 Japan Hotel REIT Investment Corp 59,790 0.28
124 Japan Rental Housing Investments Inc 78,721 0.37
72 Japan Retail Fund Investment Corp 137,827 0.65
11 Kenedix Offi ce Investment Corp 59,991 0.28
25 Kenedix Residential Investment Corp 63,920 0.30
35 Kenedix Retail REIT Corp 75,431 0.35
56 LaSalle Logiport REIT 50,153 0.24
Equities cont’d.
Japan cont’d.
EUR EUR

146
Portfolio of investments – as at 31 December 2016
Holdings Description
Fair
value
Total
net assets
%
BNY MELLON GLOBAL PROPERTY SECURITIES FUND
550 Equinix Inc 185,971 0.87
4,680 Equity Residential 282,196 1.32
1,120 Essex Property Trust Inc 243,361 1.14
6,290 Forest City Realty Trust Inc 121,124 0.57
8,230 General Growth Properties Inc 190,981 0.89
13,109 HCP Inc 364,656 1.71
6,480 Healthcare Trust of America Inc 176,512 0.83
4,250 Highwoods Properties Inc 202,620 0.95
4,670 Hilton Worldwide Holdings Inc 120,531 0.56
22,490 Host Hotels & Resorts Inc 399,219 1.87
4,360 Hudson Pacifi c Properties Inc 141,845 0.66
780 Hyatt Hotels Corp 41,463 0.19
13,780 Kimco Realty Corp 323,295 1.51
3,130 Liberty Property Trust 115,641 0.54
4,490 Macerich Co/The 294,295 1.38
4,100 National Retail Properties Inc 169,222 0.79
3,270 Omega Healthcare Investors Inc 95,793 0.45
5,240 Parkway Inc 107,604 0.50
7,410 Prologis Inc 366,746 1.72
1,210 PS Business Parks Inc 131,175 0.61
1,990 Public Storage 415,252 1.94
4,970 Regency Centers Corp 320,014 1.50
5,440 Simon Property Group Inc 906,254 4.24
810 SL Green Realty Corp 80,605 0.38
6,520 STAG Industrial Inc 145,064 0.68
13,030 STORE Capital Corp 300,393 1.41
16,420 Sunstone Hotel Investors Inc 236,426 1.11
10,710 UDR Inc 363,237 1.70
4,880 Ventas Inc 285,198 1.33
15,880 VEREIT Inc 125,341 0.59
4,840 Vornado Realty Trust 471,327 2.21
6,940 Weingarten Realty Investors 231,498 1.08
8,520 Welltower Inc 530,604 2.48
Total investments in equities 21,164,576 99.06
Unrealised gain on forward foreign currency contracts - 18 (see below)
(31 December 2015: 1) 18 0.00
Total fi nancial assets at fair value through profi t or loss 21,164,594 99.06
Unrealised loss on forward foreign currency contracts - (4,690) (see below)
(31 December 2015: (6,487)) (4,690) (0.02)
Total fi nancial liabilities at fair value through profi t or loss (4,690) (0.02)
Net current assets 204,482 0.96
Total net assets 21,364,386 100.00
Analysis of portfolio % of Total assets
Transferable securities and money market instruments admitted
to offi cial stock exchange listing or traded on a regulated market 98.82
OTC fi nancial derivative instruments 0.00
Other current assets 1.18
Total assets 100.00
Forward foreign currency contracts
Unrealised
Gain/(Loss)Buy Sell Amount (B) Amount (S)
Settle
Date Counterparty
BNY Mellon Global Property Securities FundEuro US dollar 2,500 2,623 03-Jan-17 The Bank of
New York Mellon 16
Euro Sterling 160 135 13-Jan-17 The Bank of New York Mellon 2
EUR 18
BNY Mellon Global Property Securities Fund Sterling I (Inc) (Hedged) Share ClassSterling Euro 72,272 86,229 13-Jan-17 The Bank of
New York Mellon (2,059)
EUR (2,059)
GBP (1,767)
BNY Mellon Global Property Securities Fund Sterling J (Acc) (Hedged) Share ClassSterling Euro 956 1,137 13-Jan-17 The Bank of
New York Mellon (24)
Sterling Euro 80,166 95,648 13-Jan-17 The Bank of New York Mellon (2,284)
EUR (2,308)
GBP (1,981)
BNY Mellon Global Property Securities Fund Sterling J (Inc) (Hedged) Share ClassSterling Euro 11,338 13,527 13-Jan-17 The Bank of
New York Mellon (323)
EUR (323)
GBP (277)
Equities cont’d.
United States of America cont’d.
EUR

147
Portfolio of investments – as at 31 December 2016
Holdings Description
Fair
value
Total
net assets
% Holdings Description
Fair
value
Total
net assets
%
BNY MELLON GLOBALREAL RETURN FUND (EUR)
New Zealand - 109,309,207 (31 December 2015: 54,677,148) 109,309,207 2.66
24,977,000 New Zealand Government Bond
2.000% 20-Sep-2025 17,337,134 0.42
37,817,000 New Zealand Government Bond
2.750% 15-Apr-2037 20,557,060 0.50
49,400,000 New Zealand Government Bond
4.500% 15-Apr-2027 35,835,155 0.87
47,485,000 New Zealand Government Bond
6.000% 15-May-2021 35,579,858 0.87
United Kingdom - 70,936,662 (31 December 2015: 97,273,079) 70,936,662 1.72
689,000 Anglian Water Services Financing Plc
3.666% 30-Jul-2024 1,613,040 0.04
853,000 Anglian Water Services Financing Plc
4.125% 28-Jul-2020 1,870,029 0.05
10,642,000 Arqiva Broadcast Finance Plc
9.500% 31-Mar-2020 13,232,133 0.32
1,602,000 British Telecommunications Plc
3.500% 25-Apr-2025 3,922,750 0.10
5,126,000 Centrica Plc 3.000% 10-Apr-2076 VAR 5,035,864 0.12
4,914,000 Centrica Plc 5.250% 10-Apr-2075 VAR 5,862,790 0.14
1,521,125 High Speed Rail Finance 1 Plc
1.566% 01-Nov-2038 2,512,878 0.06
2,665,000 National Grid Electricity Transmission Plc
2.983% 08-Jul-2018 5,030,672 0.12
3,272,125 Network Rail Infrastructure Finance Plc
1.750% 22-Nov-2027 5,339,637 0.13
2,840,000 Tesco Plc 3.322% 05-Nov-2025 5,898,283 0.14
3,493,000 Tesco Plc 6.125% 24-Feb-2022 4,617,785 0.11
14,201,996 Tesco Property Finance 3 Plc
5.744% 13-Apr-2040 16,000,801 0.39
United States of America - 991,372,995 (31 December 2015: 660,486,154) 991,372,995 24.09
9,137,000 Frontier Communications Corp
11.000% 15-Sep-2025 8,999,251 0.22
23,683,000 Sprint Capital Corp 8.750% 15-Mar-2032 24,781,922 0.60
10,653,000 Sprint Communications Inc
8.375% 15-Aug-2017 10,478,979 0.26
10,513,000 Sprint Corp 7.125% 15-Jun-2024 10,279,044 0.25
17,488,000 Sprint Corp 7.875% 15-Sep-2023 17,719,845 0.43
53,898,900 United States Treasury Note/Bond
0.875% 15-Apr-2019 50,557,132 1.23
64,706,700 United States Treasury Note/Bond
1.000% 31-Dec-2017 61,327,937 1.49
161,513,300 United States Treasury Note/Bond
1.500% 31-Aug-2018 153,874,194 3.74
209,275,700 United States Treasury Note/Bond
1.750% 31-Dec-2020 197,887,375 4.81
133,428,700 United States Treasury Note/Bond
2.000% 15-Feb-2025 122,559,858 2.98
198,202,000 United States Treasury Note/Bond
3.000% 15-May-2045 184,146,324 4.47
148,166,500 United States Treasury Note/Bond
3.000% 15-Nov-2045 137,618,097 3.34
9,930,000 Western Digital Corp 144A 10.500% 01-Apr-2024 11,143,037 0.27
Total investments in bonds 1,449,002,803 35.21
Collective investment schemes
Guernsey - 118,318,505 (31 December 2015: 64,552,894) 118,318,505 2.87
8,738,675 Bluefi eld Solar Income Fund Ltd 10,803,768 0.26
22,670,919 HICL Infrastructure Co Ltd/Fund 43,472,129 1.06
13,193,920 International Public Partnerships Ltd 23,678,136 0.57
4,391,488 John Laing Environmental Assets Group Ltd 5,422,874 0.13
14,065,284 John Laing Infrastructure Fund Ltd 21,211,067 0.52
10,938,508 NextEnergy Solar Fund Ltd 13,730,531 0.33
Ireland - 248,385,151 (31 December 2015: 52,220,782) 248,385,151 6.03
7,883,986 iShares Physical Gold ETC 170,605,016 4.14
724,270 Source Physical Markets Gold P-ETC 77,780,135 1.89
Jersey - 11,085,566 (31 December 2015: 62,564,865) 11,085,566 0.27
9,138,836 Foresight Solar Fund Ltd 11,085,566 0.27
Luxembourg - 7,216,786 (31 December 2015: 58,619,243) 7,216,786 0.18
4,493,103 BBGI SICAV SA/Fund 7,216,786 0.18
United Kingdom - 18,564,696 (31 December 2015: 7,735,635) 18,564,696 0.45
13,318,741 Greencoat UK Wind Plc 18,564,696 0.45
Total investments in collective investment schemes 403,570,704 9.80
Bonds
Australia - 220,645,815 (31 December 2015: 172,800,051) 220,645,815 5.36
71,340,000 Australia Government Bond
3.000% 21-Mar-2047 42,055,323 1.02
8,112,000 Australia Government Bond 3.250% 21-Jun-2039 5,255,263 0.13
152,250,000 Australia Government Bond
3.750% 21-Apr-2037 108,081,272 2.63
34,148,000 New South Wales Treasury Corp
2.750% 20-Nov-2025 33,504,755 0.81
38,201,000 Treasury Corp of Victoria 5.500% 17-Nov-2026 31,749,202 0.77
Cayman Islands - 6,346,379 (31 December 2015: 5,648,419) 6,346,379 0.15
3,159,650 Dwr Cymru Financing Ltd 1.859% 31-Mar-2048 6,346,379 0.15
France - 18,334,619 (31 December 2015: 3,019,279) 18,334,619 0.45
12,775,000 SFR Group SA 5.625% 15-May-2024 13,558,107 0.33
4,909,000 SFR Group SA 144A 7.375% 01-May-2026 4,776,512 0.12
Jersey - 2,109,449 (31 December 2015: 1,548,268) 2,109,449 0.05
1,705,000 CPUK Finance Ltd 7.000% 28-Aug-2020 2,109,449 0.05
Luxembourg - 10,499,781 (31 December 2015: 9,388,436) 10,499,781 0.26
9,724,000 SIG Combibloc Holdings SCA
7.750% 15-Feb-2023 10,499,781 0.26
Mexico - 19,447,896 (31 December 2015: –) 19,447,896 0.47
412,676,300 Mexican Bonos 8.500% 13-Dec-2018 19,447,896 0.47
Bonds cont’d.
EUR EUR

148
Portfolio of investments – as at 31 December 2016
Holdings Description
Fair
value
Total
net assets
% Holdings Description
Fair
value
Total
net assets
%
BNY MELLON GLOBAL REAL RETURN FUND (EUR)
Jersey - 48,063,421 (31 December 2015: 18,393,953) 48,063,421 1.17
99,946 Randgold Resources Ltd 7,408,072 0.18
705,161 Wolseley Plc 40,655,349 0.99
Netherlands - 176,167,962 (31 December 2015: 83,241,314) 176,167,962 4.28
3,410,359 RELX NV 54,207,656 1.32
846,827 Unilever NV 32,933,102 0.80
2,587,624 Wolters Kluwer NV 89,027,204 2.16
New Zealand - 21,970,590 (31 December 2015: 18,772,256) 21,970,590 0.53
9,735,670 Spark New Zealand Ltd 21,970,590 0.53
South Africa - 6,368,938 (31 December 2015: 3,199,075) 6,368,938 0.15
2,119,162 Gold Fields Ltd 6,368,938 0.15
South Korea - 32,422,814 (31 December 2015: –) 32,422,814 0.79
381,136 Samsung SDI Co Ltd 32,422,814 0.79
Switzerland - 162,436,537 (31 December 2015: 92,892,337) 162,436,537 3.95
1,431,842 Novartis AG 98,734,595 2.40
294,587 Roche Holding AG 63,701,942 1.55
United Kingdom - 385,091,392 (31 December 2015: 183,756,061) 385,091,392 9.36
323,640 Associated British Foods Plc 10,334,350 0.25
3,064,918 BAE Systems Plc 21,021,405 0.51
366,460 British American Tobacco Plc 19,642,229 0.48
28,103,299 Centrica Plc 76,642,679 1.86
15,276,839 Cobham Plc 29,204,787 0.71
1,721,224 Diageo Plc 42,063,275 1.02
4,947,480 Dixons Carphone Plc 20,322,555 0.50
514,905 Fresnillo Plc 7,216,136 0.18
3,459,835 GlaxoSmithKline Plc 62,705,719 1.52
5,206,043 United Utilities Group Plc 54,477,470 1.32
17,913,579 Vodafone Group Plc 41,460,787 1.01
United States of America - 529,319,592 (31 December 2015: 404,243,678) 529,319,592 12.86
1,206,226 Abbott Laboratories 43,777,085 1.06
259,950 AT&T Inc 10,505,079 0.25
1,565,315 CA Inc 47,648,712 1.16
1,638,814 CMS Energy Corp 64,830,910 1.58
272,599 Cognizant Technology Solutions Corp 14,499,889 0.35
280,674 Dollar General Corp 19,704,321 0.48
88,326 Dun & Bradstreet Corp/The 10,184,253 0.25
1,481,432 Eversource Energy 77,950,523 1.89
275,883 Maxim Integrated Products Inc 10,195,390 0.25
1,521,871 Microsoft Corp 90,642,099 2.20
401,399 Procter & Gamble Co/The 32,064,399 0.78
948,382 Reynolds American Inc 50,387,274 1.22
471,410 Sysco Corp 24,967,761 0.61
345,235 Trimble Inc 9,878,100 0.24
279,371 Walgreens Boots Alliance Inc 22,083,797 0.54
Total investments in equities 2,053,619,020 49.90
Equities
Australia - 52,137,082 (31 December 2015: 36,612,902) 52,137,082 1.27
4,739,830 Dexus Property Group 31,213,133 0.76
1,509,863 Newcrest Mining Ltd 20,923,949 0.51
Canada - 137,051,575 (31 December 2015: 59,154,860) 137,051,575 3.33
184,199 Agnico Eagle Mines Ltd 7,573,170 0.18
3,595,082 Alacer Gold Corp 5,622,254 0.14
1,177,790 Alamos Gold Inc 8,046,478 0.20
1,232,800 Barrick Gold Corp 19,139,916 0.46
1,509,904 Centerra Gold Inc 6,919,403 0.17
545,983 Detour Gold Corp 7,258,672 0.18
2,753,786 Eldorado Gold Corp 8,797,024 0.21
2,919,712 IAMGOLD Corp 11,071,415 0.27
3,210,724 Kinross Gold Corp 9,929,499 0.24
2,224,211 New Gold Inc 7,668,081 0.19
2,940,036 OceanaGold Corp 8,410,440 0.20
2,845,358 Primero Mining Corp 2,169,893 0.05
1,793,160 Silver Wheaton Corp 34,445,330 0.84
Denmark - 35,206,203 (31 December 2015: 9,407,449) 35,206,203 0.86
969,942 DONG Energy A/S 144A 35,206,203 0.86
France - 74,153,933 (31 December 2015: 56,180,350) 74,153,933 1.80
4,141,521 Vivendi SA 74,153,933 1.80
Germany - 130,616,823 (31 December 2015: 94,666,014) 130,616,823 3.17
439,511 Bayer AG 43,289,636 1.05
1,032,805 Infi neon Technologies AG 17,118,743 0.42
173,394 LEG Immobilien AG 12,729,720 0.31
244,886 SAP SE 20,267,990 0.49
9,138,196 Telefonica Deutschland Holding AG 37,210,734 0.90
Guernsey - 16,337,455 (31 December 2015: 13,016,218) 16,337,455 0.40
12,789,802 Renewables Infrastructure Group Ltd/The 16,337,455 0.40
India - 8,751,460 (31 December 2015: –) 8,751,460 0.21
1,126,378 LIC Housing Finance Ltd 8,751,460 0.21
Ireland - 86,668,867 (31 December 2015: –) 86,668,867 2.11
594,737 Accenture Plc 65,896,959 1.60
637,374 CRH Plc 20,771,908 0.51
Israel - 50,663,637 (31 December 2015: 24,588,537) 50,663,637 1.23
1,483,044 Teva Pharmaceutical Industries Ltd ADR 50,663,637 1.23
Japan - 100,190,739 (31 December 2015: 81,917,894) 100,190,739 2.43
2,535,700 Japan Tobacco Inc 78,918,549 1.92
844,600 Skylark Co Ltd 10,563,147 0.25
272,400 Suntory Beverage & Food Ltd 10,709,043 0.26
Equities cont’d.
EUR EUR

149
Portfolio of investments – as at 31 December 2016
Holdings Description
Fair
value
Total
net assets
%
BNY MELLON GLOBAL REAL RETURN FUND (EUR)
Forward foreign currency contracts
Unrealised
Gain/(Loss)Buy Sell Amount (B) Amount (S)
Settle
Date Counterparty
BNY Mellon Global Real Return Fund (EUR)
Euro US dollar 423,184 443,273 03-Jan-17 Royal Bank of Scotland 3,418
Euro Japanese yen 1,341,293 164,201,713 04-Jan-17 Barclays Bank plc 11,653
Euro Japanese yen 323,748 39,469,376 05-Jan-17 The Bank of New York Mellon 4,139
Swiss franc Euro 123,643 114,901 13-Jan-17 The Bank of New York Mellon 143
Euro Sterling 6,507,967 5,485,106 17-Jan-17 State Street Bank 120,557
Euro Sterling 14,713,133 12,441,396 17-Jan-17 UBS 225,117
Euro Sterling 2,615,644 2,229,156 17-Jan-17 The Bank of New York Mellon 19,789
Euro Sterling 5,533,117 4,648,117 17-Jan-17 State Street Bank 120,381
Euro Sterling 2,199,690 1,847,190 17-Jan-17 The Bank of New York Mellon 48,636
Sterling Euro 21,296,987 23,817,337 17-Jan-17 State Street Bank 983,022
Sterling Euro 5,529,553 6,192,970 17-Jan-17 State Street Bank 246,199
Sterling Euro 2,873,110 3,221,241 17-Jan-17 State Street Bank 124,498
Sterling Euro 6,612,796 7,397,544 17-Jan-17 State Street Bank 303,063
US dollar Australian dollar 47,167,000 61,981,104 17-Jan-17 State Street Bank 2,273,412
US dollar Australian dollar 11,386,891 14,829,581 17-Jan-17 State Street Bank 640,190
US dollar Canadian dollar 87,566,659 115,513,909 17-Jan-17 Royal Bank of Scotland 1,716,344
US dollar Sterling 104,759,538 82,271,587 17-Jan-17 UBS 3,317,623
Canadian dollar Euro 5,463,579 3,816,752 16-Feb-17 JPMorgan Chase 16,448
Canadian dollar Euro 5,872,111 4,104,913 16-Feb-17 JPMorgan Chase 14,910
Euro Korean won 1,065,935 1,356,509,381 16-Feb-17 Royal Bank of Scotland 86
Euro Korean won 5,413,295 6,885,981,265 16-Feb-17 Royal Bank of Scotland 2,778
Euro Korean won 5,582,112 7,005,271,857 16-Feb-17 Royal Bank of Scotland 77,866
Euro US dollar 13,799,247 14,447,812 16-Feb-17 The Bank of New York Mellon 149,812
Euro US dollar 3,472,032 3,616,694 16-Feb-17 The Bank of New York Mellon 55,194
Mexican peso Euro 59,096,000 2,663,517 16-Feb-17 JPMorgan Chase 18,479
Mexican peso Euro 152,000,000 6,850,834 16-Feb-17 JPMorgan Chase 47,490
US dollar Euro 4,354,270 4,079,226 16-Feb-17 JPMorgan Chase 34,430
US dollar Euro 11,208,652 10,505,250 16-Feb-17 JPMorgan Chase 84,019
US dollar Euro 19,135,482 17,975,429 16-Feb-17 Royal Bank of Scotland 102,639
US dollar Euro 13,661,438 12,813,685 16-Feb-17 The Bank of New York Mellon 92,831
US dollar Euro 4,686,006 4,388,837 16-Feb-17 The Bank of New York Mellon 38,223
US dollar Euro 6,614,265 6,214,545 16-Feb-17 The Bank of New York Mellon 34,220
US dollar Euro 12,189,000 11,473,155 16-Feb-17 State Street Bank 42,289
US dollar Euro 3,886,349 3,646,945 16-Feb-17 The Bank of New York Mellon 24,647
US dollar Euro 35,242,775 33,142,495 16-Feb-17 State Street Bank 152,787
US dollar Euro 5,774,065 5,405,365 16-Feb-17 The Bank of New York Mellon 49,629
US dollar Euro 6,386,636 5,930,073 16-Feb-17 JPMorgan Chase 103,642
US dollar Euro 5,711,966 5,140,293 16-Feb-17 State Street Bank 256,033
US dollar Euro 9,437,700 8,477,009 16-Feb-17 The Bank of New York Mellon 439,170
US dollar Euro 2,186,199 2,002,043 16-Feb-17 State Street Bank 63,348
US dollar Euro 3,602,200 3,331,108 16-Feb-17 The Bank of New York Mellon 72,037
US dollar Euro 18,330,156 17,023,769 16-Feb-17 State Street Bank 293,475
US dollar Euro 4,449,662 4,137,244 16-Feb-17 JPMorgan Chase 66,533
US dollar Euro 6,431,725 5,965,852 16-Feb-17 The Bank of New York Mellon 110,461
US dollar Euro 19,664,584 18,227,357 16-Feb-17 JPMorgan Chase 350,575
Future options - 3,284,016 (31 December 2015: –)
2,041 U.S. Treasury Bond Future Put
27-Jan-2017 146.000 936,183 0.02
1,889 U.S. Treasury Bond Future Put
27-Jan-2017 149.000 2,347,833 0.06
Total future options 3,284,016 0.08
Unrealised gain on forward foreign currency contracts - 23,324,103 (see below)
(31 December 2015: 10,982,392) 23,324,103 0.57
Total fi nancial assets at fair value through profi t or loss 3,932,800,646 95.56
Holdings Description
Underlying
exposure
EUR
Fair
value
EUR
Total
net assets
%
Open futures contracts - (19,356,582) (31 December 2015: 531,598)
(4,718) Euro STOXX 50 Index
Short Futures Contracts
Exp Mar-2017 (153,641,670) (8,375,818) (0.21)
(1,838) FTSE 100 Index
Short Futures Contracts
Exp Mar-2017 (150,681,676) (6,315,041) (0.15)
(1,593) S&P 500 Index
Short Futures Contracts
Exp Mar-2017 (846,695,918) (4,665,723) (0.11)
Total open futures contracts (19,356,582) (0.47)
Unrealised loss on forward foreign currency contracts - (137,485,437) (see below)
(31 December 2015: (10,943,707)) (137,485,437) (3.34)
Total fi nancial liabilities at fair value through profi t or loss (156,842,019) (3.81)
Net current assets 339,601,665 8.25
Total net assets 4,115,560,292 100.00
The counterparty for future options is UBS.
The counterparty for futures contracts is UBS.
Analysis of portfolio % of Total assets
Transferable securities and money market instruments admitted
to offi cial stock exchange listing or traded on a regulated market 91.05
Financial derivative instruments dealt in on a regulated market 0.08
OTC fi nancial derivative instruments 0.54
Other current assets 8.33
Total assets 100.00
EUR

150
Portfolio of investments – as at 31 December 2016
BNY MELLON GLOBAL REAL RETURN FUND (EUR)
Forward foreign currency contracts cont’d.
Unrealised
Gain/(Loss)Buy Sell Amount (B) Amount (S)
Settle
Date Counterparty
BNY Mellon Global Real Return Fund (EUR) cont’d.
US dollar Euro 2,197,310 2,030,467 16-Feb-17 The Bank of New York Mellon 45,422
US dollar New Zealand dollar 142,623,762 196,263,579 16-Feb-17 Royal Bank of Scotland 5,827,352
Euro Australian dollar 299,442,178 433,496,452 17-Mar-17 UBS 4,499,094
EUR 23,324,103
Swiss franc Euro 8,676,000 8,103,794 13-Jan-17 The Bank of New York Mellon (31,234)
Swiss franc Euro 399,903 372,771 13-Jan-17 The Bank of New York Mellon (683)
Australian dollar US dollar 79,367,126 58,553,891 17-Jan-17 JPMorgan Chase (1,166,617)
Canadian dollar US dollar 115,513,909 86,463,477 17-Jan-17 State Street Bank (672,519)
Euro South African rand 10,540,019 166,528,723 17-Jan-17 JPMorgan Chase (903,367)
Euro Sterling 2,057,384 1,835,394 17-Jan-17 Royal Bank of Scotland (79,934)
Euro Sterling 15,524,495 13,871,344 17-Jan-17 Royal Bank of Scotland (628,698)
Euro Sterling 4,465,534 3,842,506 17-Jan-17 State Street Bank (9,067)
Euro Sterling 13,947,433 12,433,052 17-Jan-17 Royal Bank of Scotland (530,866)
Euro Sterling 3,206,210 2,879,849 17-Jan-17 Royal Bank of Scotland (147,377)
Euro Sterling 5,700,335 5,106,746 17-Jan-17 Royal Bank of Scotland (246,475)
Euro Sterling 3,934,047 3,519,890 17-Jan-17 State Street Bank (164,868)
Euro Sterling 3,760,084 3,238,515 17-Jan-17 State Street Bank (11,170)
Euro Sterling 12,210,454 10,990,759 17-Jan-17 State Street Bank (588,295)
Euro Sterling 3,760,793 3,276,162 17-Jan-17 JPMorgan Chase (54,301)
Euro Sterling 3,927,790 3,519,520 17-Jan-17 State Street Bank (170,694)
Euro Sterling 1,566,289 1,415,300 17-Jan-17 JPMorgan Chase (81,829)
Euro Sterling 661,842,203 583,486,705 17-Jan-17 UBS (17,628,575)
Euro Sterling 1,919,680 1,736,723 17-Jan-17 Barclays Bank plc (102,736)
Sterling Euro 9,226,005 10,992,620 17-Jan-17 State Street Bank (248,929)
Sterling Euro 2,846,328 3,393,887 17-Jan-17 JPMorgan Chase (79,335)
Sterling Euro 7,847,269 9,188,829 17-Jan-17 UBS (50,677)
Sterling US dollar 8,377,142 10,444,496 17-Jan-17 Royal Bank of Scotland (127,340)
Sterling US dollar 13,543,866 16,690,706 17-Jan-17 State Street Bank (20,820)
Sterling US dollar 8,360,000 10,426,425 17-Jan-17 Royal Bank of Scotland (130,204)
Canadian dollar Euro 11,253,086 7,917,850 16-Feb-17 Royal Bank of Scotland (22,782)
Canadian dollar Euro 8,607,667 6,167,584 16-Feb-17 State Street Bank (128,519)
Euro Canadian dollar 132,438,957 197,285,005 16-Feb-17 JPMorgan Chase (5,974,506)
Euro Korean won 18,513,147 23,595,005,397 16-Feb-17 Royal Bank of Scotland (26,137)
Euro Mexican peso 9,518,691 211,096,000 16-Feb-17 JPMorgan Chase (61,630)
Euro New Zealand dollar 148,789,593 228,222,406 16-Feb-17 Royal Bank of Scotland (1,117,577)
Euro US dollar 6,088,522 6,504,794 16-Feb-17 The Bank of New York Mellon (56,822)
Euro US dollar 11,385,711 12,171,667 16-Feb-17 Royal Bank of Scotland (113,357)
Euro US dollar 2,917,677 3,139,770 16-Feb-17 The Bank of New York Mellon (48,592)
Euro US dollar 4,044,496 4,291,064 16-Feb-17 State Street Bank (9,447)
Euro US dollar 11,846,903 12,832,862 16-Feb-17 The Bank of New York Mellon (276,823)
Euro US dollar 3,804,689 4,098,335 16-Feb-17 The Bank of New York Mellon (67,175)
Euro US dollar 8,466,267 9,001,208 16-Feb-17 The Bank of New York Mellon (37,540)
Forward foreign currency contracts cont’d.
Unrealised
Gain/(Loss)Buy Sell Amount (B) Amount (S)
Settle
Date Counterparty
BNY Mellon Global Real Return Fund (EUR) cont’d.
Euro US dollar 2,304,567 2,463,628 16-Feb-17 The Bank of New York Mellon (22,923)
Euro US dollar 45,780,201 48,609,417 16-Feb-17 Royal Bank of Scotland (143,092)
Euro US dollar 25,653,641 28,471,437 16-Feb-17 The Bank of New York Mellon (1,244,483)
Euro US dollar 3,331,136 3,713,334 16-Feb-17 The Bank of New York Mellon (177,002)
Euro US dollar 1,888,931,051 2,105,695,334 16-Feb-17 Royal Bank of Scotland (100,404,964)
Euro US dollar 8,516,810 9,466,562 16-Feb-17 The Bank of New York Mellon (426,636)
Euro US dollar 10,192,255 10,950,834 16-Feb-17 The Bank of New York Mellon (153,443)
Euro US dollar 15,463,603 16,936,201 16-Feb-17 The Bank of New York Mellon (536,716)
Euro US dollar 4,519,561 4,824,857 16-Feb-17 The Bank of New York Mellon (38,678)
Euro US dollar 6,184,016 6,574,661 16-Feb-17 The Bank of New York Mellon (27,333)
Euro US dollar 9,976,896 10,642,554 16-Feb-17 The Bank of New York Mellon (77,558)
New Zealand dollar Euro 5,066,170 3,358,607 16-Feb-17 Royal Bank of Scotland (30,909)
New Zealand dollar Euro 3,711,466 2,456,935 16-Feb-17 UBS (19,070)
New Zealand dollar US dollar 5,151,262 3,599,937 16-Feb-17 JPMorgan Chase (17,417)
New Zealand dollar US dollar 34,459,583 24,275,398 16-Feb-17 State Street Bank (299,287)
US dollar Euro 86,688,014 82,805,789 16-Feb-17 State Street Bank (908,097)
US dollar Euro 2,731,471 2,612,778 16-Feb-17 The Bank of New York Mellon (32,246)
US dollar Euro 8,889,702 8,498,191 16-Feb-17 The Bank of New York Mellon (99,727)
US dollar Euro 6,269,712 5,992,256 16-Feb-17 State Street Bank (69,004)
US dollar Euro 2,233,337 2,128,502 16-Feb-17 The Bank of New York Mellon (18,578)
US dollar Euro 27,661,057 26,366,904 16-Feb-17 State Street Bank (234,378)
US dollar Euro 3,864,440 3,693,293 16-Feb-17 The Bank of New York Mellon (42,399)
US dollar Euro 6,040,430 5,747,317 16-Feb-17 The Bank of New York Mellon (40,677)
Australian dollar Euro 5,447,888 3,763,659 17-Mar-17 State Street Bank (57,015)
Australian dollar Euro 4,219,988 2,953,482 17-Mar-17 Royal Bank of Scotland (82,279)
Australian dollar Euro 5,423,501 3,794,616 17-Mar-17 Royal Bank of Scotland (104,565)
Australian dollar Euro 18,282,434 12,469,775 17-Mar-17 JPMorgan Chase (30,741)
Australian dollar Euro 5,400,049 3,737,332 17-Mar-17 State Street Bank (63,237)
Japanese yen US dollar 1,224,479,045 10,791,218 17-Mar-17 State Street Bank (265,466)
EUR (137,485,437)
Net EUR (114,161,334)

151
Portfolio of investments – as at 31 December 2016
Holdings Description
Fair
value
Total
net assets
% Holdings Description
Fair
value
Total
net assets
%
BNY MELLON GLOBALREAL RETURN FUND (GBP)
37,000 Anglian Water Services Financing Plc
4.125% 28-Jul-2020 69,629 0.11
222,000 Arqiva Broadcast Finance Plc
9.500% 31-Mar-2020 236,945 0.36
45,000 British Telecommunications Plc
3.500% 25-Apr-2025 94,586 0.14
206,000 Centrica Plc 5.250% 10-Apr-2075 VAR 210,972 0.32
103,000 National Grid Electricity Transmission Plc
2.983% 08-Jul-2018 166,899 0.25
79,997 Network Rail Infrastructure Finance Plc
1.750% 22-Nov-2027 112,058 0.17
50,000 Scotland Gas Networks Plc
2.127% 21-Oct-2022 82,818 0.12
18,000 Tesco Plc 3.322% 05-Nov-2025 32,090 0.05
101,000 Tesco Plc 6.125% 24-Feb-2022 114,616 0.17
291,876 Tesco Property Finance 3 Plc
5.744% 13-Apr-2040 282,279 0.42
United States of America - 14,853,100 (31 December 2015: 15,098,978) 14,853,100 22.27
167,000 Frontier Communications Corp
11.000% 15-Sep-2025 141,191 0.21
400,000 Sprint Capital Corp 8.750% 15-Mar-2032 359,291 0.54
199,000 Sprint Communications Inc
8.375% 15-Aug-2017 168,030 0.25
177,000 Sprint Corp 7.125% 15-Jun-2024 148,555 0.22
296,000 Sprint Corp 7.875% 15-Sep-2023 257,454 0.39
1,012,800 United States Treasury Note/Bond
0.875% 15-Apr-2019 815,482 1.22
3,016,100 United States Treasury Note/Bond
1.500% 31-Aug-2018 2,466,558 3.70
3,887,800 United States Treasury Note/Bond
1.750% 31-Dec-2020 3,155,668 4.73
2,508,600 United States Treasury Note/Bond
2.000% 15-Feb-2025 1,977,964 2.97
3,721,400 United States Treasury Note/Bond
3.000% 15-May-2045 2,967,901 4.45
2,774,400 United States Treasury Note/Bond
3.000% 15-Nov-2045 2,211,987 3.32
190,000 Western Digital Corp 144A 10.500% 01-Apr-2024 183,019 0.27
Total investments in bonds 22,305,160 33.45
Equities
Australia - 830,019 (31 December 2015: 830,813) 830,019 1.24
88,272 Dexus Property Group 498,983 0.75
27,828 Newcrest Mining Ltd 331,036 0.49
Canada - 2,168,440 (31 December 2015: 1,398,052) 2,168,440 3.25
3,394 Agnico Eagle Mines Ltd 119,782 0.18
66,270 Alacer Gold Corp 88,962 0.13
21,710 Alamos Gold Inc 127,317 0.19
22,721 Barrick Gold Corp 302,805 0.45
27,831 Centerra Gold Inc 109,480 0.17
10,064 Detour Gold Corp 114,852 0.17
50,760 Eldorado Gold Corp 139,192 0.21
Collective investment schemes
Guernsey - 1,740,677 (31 December 2015: 1,471,641) 1,740,677 2.61
192,498 Bluefi eld Solar Income Fund Ltd 204,288 0.31
397,981 HICL Infrastructure Co Ltd/Fund 655,077 0.98
246,608 International Public Partnerships Ltd 379,900 0.57
106,529 John Laing Environmental Assets Group Ltd 112,921 0.17
300,109 John Laing Infrastructure Fund Ltd 388,491 0.58
Ireland - 3,951,113 (31 December 2015: 2,565,249) 3,951,113 5.92
166,451 iShares Physical Gold ETC 3,091,864 4.63
9,321 Source Physical Markets Gold P-ETC 859,249 1.29
Jersey - 160,431 (31 December 2015: 126,004) 160,431 0.24
154,075 Foresight Solar Fund Ltd 160,431 0.24
Luxembourg - 175,658 (31 December 2015: 1,362,825) 175,658 0.26
127,404 BBGI SICAV SA/Fund 175,658 0.26
United Kingdom - 277,705 (31 December 2015: 183,170) 277,705 0.42
232,098 Greencoat UK Wind Plc 277,705 0.42
Total investments in collective investment schemes 6,305,584 9.45
Bonds
Australia - 3,544,446 (31 December 2015: 3,411,979) 3,544,446 5.32
1,340,000 Australia Government Bond 3.000% 21-Mar-2047 678,080 1.02
152,000 Australia Government Bond 3.250% 21-Jun-2039 84,528 0.13
2,859,000 Australia Government Bond 3.750% 21-Apr-2037 1,742,189 2.61
629,600 New South Wales Treasury Corp
2.750% 20-Nov-2025 530,266 0.80
714,000 Treasury Corp of Victoria 5.500% 17-Nov-2026 509,383 0.76
France - 201,335 (31 December 2015: 85,159) 201,335 0.30
221,000 SFR Group SA 5.625% 15-May-2024 201,335 0.30
Luxembourg - 158,496 (31 December 2015: 212,254) 158,496 0.24
171,000 SIG Combibloc Holdings SCA 7.750% 15-Feb-2023 158,496 0.24
Mexico - 314,170 (31 December 2015: –) 314,170 0.47
7,766,300 Mexican Bonos 8.500% 13-Dec-2018 314,170 0.47
New Zealand - 1,762,394 (31 December 2015: 1,303,057) 1,762,394 2.64
503,000 New Zealand Government Bond 2.000% 20-Sep-2025 299,704 0.45
700,000 New Zealand Government Bond 2.750% 15-Apr-2037 326,633 0.49
932,000 New Zealand Government Bond 4.500% 15-Apr-2027 580,345 0.87
864,000 New Zealand Government Bond 6.000% 15-May-2021 555,712 0.83
United Kingdom - 1,471,219 (31 December 2015: 1,751,337) 1,471,219 2.21
34,000 Anglian Water Services Financing Plc
3.666% 30-Jul-2024 68,327 0.10
Bonds cont’d.
United Kingdom cont’d.
GBPGBP

152
Portfolio of investments – as at 31 December 2016
Holdings Description
Fair
value
Total
net assets
% Holdings Description
Fair
value
Total
net assets
%
BNY MELLON GLOBAL REAL RETURN FUND (GBP)
Equities cont’d.
Canada cont’d.
53,819 IAMGOLD Corp 175,181 0.26
59,184 Kinross Gold Corp 157,115 0.24
40,999 New Gold Inc 121,331 0.18
54,192 OceanaGold Corp 133,073 0.20
52,447 Primero Mining Corp 34,333 0.05
33,053 Silver Wheaton Corp 545,017 0.82
Denmark - 465,679 (31 December 2015: 216,341) 465,679 0.70
14,946 DONG Energy A/S 144A 465,679 0.70
France - 1,185,441 (31 December 2015: 1,282,123) 1,185,441 1.78
77,129 Vivendi SA 1,185,441 1.78
Germany - 2,101,985 (31 December 2015: 2,167,511) 2,101,985 3.15
8,183 Bayer AG 691,854 1.04
19,233 Infi neon Technologies AG 273,646 0.41
3,456 LEG Immobilien AG 217,794 0.33
4,558 SAP SE 323,824 0.48
170,186 Telefonica Deutschland Holding AG 594,867 0.89
Guernsey - 322,814 (31 December 2015: 308,300) 322,814 0.48
294,404 Renewables Infrastructure Group Ltd/The 322,814 0.48
India - 141,464 (31 December 2015: –) 141,464 0.21
21,211 LIC Housing Finance Ltd 141,464 0.21
Ireland - 329,098 (31 December 2015: –) 329,098 0.49
11,764 CRH Plc 329,098 0.49
Israel - 818,476 (31 December 2015: 556,277) 818,476 1.23
27,911 Teva Pharmaceutical Industries Ltd ADR 818,476 1.23
Japan - 1,585,631 (31 December 2015: 1,864,454) 1,585,631 2.38
47,100 Japan Tobacco Inc 1,258,317 1.89
15,400 Skylark Co Ltd 165,330 0.25
4,800 Suntory Beverage & Food Ltd 161,984 0.24
Jersey - 766,987 (31 December 2015: 424,116) 766,987 1.15
1,841 Randgold Resources Ltd 117,134 0.18
13,131 Wolseley Plc 649,853 0.97
Netherlands - 2,857,911 (31 December 2015: 1,891,363) 2,857,911 4.29
62,888 RELX NV 858,058 1.29
16,505 Unilever NV 550,987 0.83
49,059 Wolters Kluwer NV 1,448,866 2.17
New Zealand - 351,231 (31 December 2015: 425,736) 351,231 0.53
181,313 Spark New Zealand Ltd 351,231 0.53
South Africa - 100,776 (31 December 2015: 81,524) 100,776 0.15
39,063 Gold Fields Ltd 100,776 0.15
South Korea - 527,444 (31 December 2015: –) 527,444 0.79
7,223 Samsung SDI Co Ltd 527,444 0.79
Switzerland - 2,670,185 (31 December 2015: 2,103,829) 2,670,185 4.00
27,907 Novartis AG 1,651,868 2.48
5,486 Roche Holding AG 1,018,317 1.52
United Kingdom - 6,313,604 (31 December 2015: 4,203,431) 6,313,604 9.47
6,205 Associated British Foods Plc 170,079 0.26
57,078 BAE Systems Plc 336,047 0.50
6,824 British American Tobacco Plc 313,972 0.47
547,797 Centrica Plc 1,282,393 1.92
284,511 Cobham Plc 466,883 0.70
33,548 Diageo Plc 703,753 1.06
92,139 Dixons Carphone Plc 324,882 0.49
9,490 Fresnillo Plc 114,165 0.17
67,438 GlaxoSmithKline Plc 1,049,167 1.57
95,579 United Utilities Group Plc 858,538 1.29
349,176 Vodafone Group Plc 693,725 1.04
United States of America - 9,586,426 (31 December 2015: 9,214,539) 9,586,426 14.38
22,462 Abbott Laboratories 699,769 1.05
11,173 Accenture Plc 1,062,670 1.59
5,058 AT&T Inc 175,459 0.26
29,150 CA Inc 761,686 1.14
30,337 CMS Energy Corp 1,030,180 1.55
5,076 Cognizant Technology Solutions Corp 231,766 0.35
5,226 Dollar General Corp 314,932 0.47
1,658 Dun & Bradstreet Corp/The 164,102 0.25
28,875 Eversource Energy 1,304,209 1.96
5,135 Maxim Integrated Products Inc 162,895 0.24
28,592 Microsoft Corp 1,461,789 2.19
7,356 Procter & Gamble Co/The 504,402 0.76
17,661 Reynolds American Inc 805,454 1.21
8,640 Sysco Corp 392,810 0.59
6,571 Trimble Inc 161,390 0.24
5,201 Walgreens Boots Alliance Inc 352,913 0.53
Total investments in equities 33,123,611 49.67
Future options - 52,304 (31 December 2015: –)
38 U.S. Treasury Bond Future Put 27-Jan-2017 146.000 14,962 0.02
35 U.S. Treasury Bond Future Put 27-Jan-2017 149.000 37,342 0.06
Total future options 52,304 0.08
Unrealised gain on forward foreign currency contracts - 453,502 (see below)
(31 December 2015: 110,956) 453,502 0.68
Total fi nancial assets at fair value through profi t or loss 62,240,161 93.33
Equities cont’d.
GBPGBP

153
Portfolio of investments – as at 31 December 2016
Holdings Description
Fair
value
Total
net assets
%
BNY MELLON GLOBAL REAL RETURN FUND (GBP)
Holdings Description
Underlying
exposure
GBP
Fair
value
GBP
Total
net assets
%
Open futures contracts - (314,166) (31 December 2015: (359))
(90) Euro STOXX 50 Index
Short Futures Contracts
Exp Mar-2017 (2,515,832) (135,933) (0.21)
(35) FTSE 100 Index
Short Futures Contracts
Exp Mar-2017 (2,463,037) (102,489) (0.15)
(30) S&P 500 Index
Short Futures Contracts
Exp Mar-2017 (13,687,401) (75,744) (0.11)
Total open futures contracts (314,166) (0.47)
Unrealised loss on forward foreign currency contracts - (90,570) (see below)
(31 December 2015: (1,182,589)) (90,570) (0.14)
Total fi nancial liabilities at fair value through profi t or loss (404,736) (0.61)
Net current assets 4,851,825 7.28
Total net assets 66,687,250 100.00
The counterparty for future options is UBS.
The counterparty for futures contracts is UBS.
Analysis of portfolio % of Total assets
Transferable securities and money market instruments admitted
to offi cial stock exchange listing or traded on a regulated market 91.71
Financial derivative instruments dealt in on a regulated market 0.08
OTC fi nancial derivative instruments 0.67
Other current assets 7.54
Total assets 100.00
Forward foreign currency contracts
Unrealised
Gain/(Loss)Buy Sell Amount (B) Amount (S)
Settle
Date Counterparty
BNY Mellon Global Real Return Fund (GBP)
Sterling US dollar 6,689 8,175 03-Jan-17 State Street Bank 43
Sterling Japanese yen 5,403 770,887 05-Jan-17 Royal Bank of Scotland 45
Euro Sterling 98,772 83,121 17-Jan-17 JPMorgan Chase 1,699
Sterling Euro 61,421 71,240 17-Jan-17 State Street Bank 245
Sterling Euro 450,466 498,897 17-Jan-17 Royal Bank of Scotland 22,045
Sterling Euro 64,373 74,730 17-Jan-17 The Bank of New York Mellon 199
Sterling Euro 176,610 205,117 17-Jan-17 JPMorgan Chase 469
Sterling Euro 5,341,666 6,057,045 17-Jan-17 UBS 140,257
Sterling Euro 91,108 101,434 17-Jan-17 JPMorgan Chase 4,003
Sterling Euro 84,495 94,254 17-Jan-17 UBS 3,555
Canadian dollar Sterling 324,818 191,779 16-Feb-17 Barclays Bank plc 4,073
Canadian dollar Sterling 65,123 39,229 16-Feb-17 The Bank of New York Mellon 37
Mexican peso Sterling 3,969,000 152,099 16-Feb-17 JPMorgan Chase 2,706
Sterling Canadian dollar 2,237,615 3,681,185 16-Feb-17 JPMorgan Chase 18,004
Sterling Korean won 85,099 125,786,670 16-Feb-17 Royal Bank of Scotland 158
Sterling Korean won 93,952 136,314,529 16-Feb-17 Royal Bank of Scotland 1,903
Sterling Korean won 16,530 24,348,759 16-Feb-17 Royal Bank of Scotland 88
Sterling Korean won 288,558 407,377,142 16-Feb-17 Royal Bank of Scotland 13,468
Sterling New Zealand dollar 2,484,218 4,227,082 16-Feb-17 Royal Bank of Scotland 98,002
Sterling US dollar 23,950,525 29,474,905 16-Feb-17 Royal Bank of Scotland 19,034
US dollar Sterling 653,073 526,121 16-Feb-17 State Street Bank 4,127
US dollar Sterling 121,498 95,478 16-Feb-17 Barclays Bank plc 3,169
US dollar Sterling 114,101 91,285 16-Feb-17 The Bank of New York Mellon 1,357
US dollar Sterling 247,376 199,002 16-Feb-17 State Street Bank 1,850
US dollar Sterling 190,255 149,351 16-Feb-17 The Bank of New York Mellon 5,122
US dollar Sterling 42,150 34,123 16-Feb-17 The Bank of New York Mellon 100
US dollar Sterling 84,202 67,913 16-Feb-17 The Bank of New York Mellon 452
US dollar Sterling 165,514 132,490 16-Feb-17 The Bank of New York Mellon 1,895
US dollar Sterling 39,077 31,497 16-Feb-17 The Bank of New York Mellon 231
US dollar Sterling 144,848 116,370 16-Feb-17 The Bank of New York Mellon 1,236
US dollar Sterling 327,871 262,567 16-Feb-17 State Street Bank 3,641
US dollar Sterling 62,186 49,557 16-Feb-17 The Bank of New York Mellon 933
US dollar Sterling 100,958 80,741 16-Feb-17 The Bank of New York Mellon 1,229
US dollar Sterling 661,680 520,069 16-Feb-17 Barclays Bank plc 17,167
US dollar Sterling 105,300 83,230 16-Feb-17 The Bank of New York Mellon 2,266
US dollar Sterling 70,852 56,129 16-Feb-17 The Bank of New York Mellon 1,398
US dollar Sterling 225,000 179,825 16-Feb-17 State Street Bank 2,859
US dollar Sterling 80,024 64,006 16-Feb-17 The Bank of New York Mellon 968

154
Portfolio of investments – as at 31 December 2016
BNY MELLON GLOBAL REAL RETURN FUND (GBP)
Forward foreign currency contracts cont’d.
Unrealised
Gain/(Loss)Buy Sell Amount (B) Amount (S)
Settle
Date Counterparty
BNY Mellon Global Real Return Fund (GBP) cont’d.
Sterling US dollar 641,241 800,000 16-Feb-17 Royal Bank of Scotland (8,301)
Sterling US dollar 36,752 46,787 16-Feb-17 The Bank of New York Mellon (1,235)
Sterling US dollar 653,156 815,132 16-Feb-17 Royal Bank of Scotland (8,672)
Sterling US dollar 63,547 79,328 16-Feb-17 UBS (861)
Sterling US dollar 69,550 86,420 16-Feb-17 The Bank of New York Mellon (617)
US dollar Sterling 167,075 135,819 16-Feb-17 The Bank of New York Mellon (166)
US dollar Sterling 113,805 92,562 16-Feb-17 The Bank of New York Mellon (161)
Australian dollar Sterling 182,953 107,757 17-Mar-17 JPMorgan Chase (696)
GBP (90,570)
Net GBP 362,932
Forward foreign currency contracts cont’d.
Unrealised
Gain/(Loss)Buy Sell Amount (B) Amount (S)
Settle
Date Counterparty
BNY Mellon Global Real Return Fund (GBP) cont’d.
New Zealand dollar US dollar 260,138 179,175 17-Mar-17 State Street Bank 1,253
Sterling Australian dollar 4,747,899 8,061,288 17-Mar-17 UBS 30,601
US dollar New Zealand dollar 2,106,535 2,958,443 17-Mar-17 Royal Bank of Scotland 41,615
GBP 453,502
Sterling Japanese yen 20,729 2,982,632 04-Jan-17 JPMorgan Chase (4)
Euro Sterling 48,705 44,070 17-Jan-17 UBS (2,246)
Euro Sterling 58,970 53,289 17-Jan-17 JPMorgan Chase (2,650)
Euro Sterling 161,849 145,755 17-Jan-17 UBS (6,769)
Sterling Euro 30,001 35,753 17-Jan-17 The Bank of New York Mellon (702)
Sterling Euro 34,350 40,905 17-Jan-17 The Bank of New York Mellon (777)
Sterling Euro 40,887 47,992 17-Jan-17 The Bank of New York Mellon (326)
Sterling Euro 197,311 234,576 17-Jan-17 The Bank of New York Mellon (4,128)
Sterling Euro 68,292 81,009 17-Jan-17 The Bank of New York Mellon (1,273)
Sterling Euro 67,771 79,116 17-Jan-17 The Bank of New York Mellon (168)
Sterling South African rand 179,478 3,220,955 17-Jan-17 JPMorgan Chase (10,590)
New Zealand dollar Sterling 95,062 54,008 16-Feb-17 JPMorgan Chase (345)
Sterling Mexican peso 152,205 3,969,000 16-Feb-17 JPMorgan Chase (2,600)
Sterling US dollar 189,844 241,147 16-Feb-17 The Bank of New York Mellon (5,950)
Sterling US dollar 34,176 43,018 16-Feb-17 State Street Bank (751)
Sterling US dollar 50,234 64,138 16-Feb-17 The Bank of New York Mellon (1,841)
Sterling US dollar 48,795 61,587 16-Feb-17 The Bank of New York Mellon (1,210)
Sterling US dollar 166,074 207,067 16-Feb-17 State Street Bank (2,049)
Sterling US dollar 56,373 69,763 16-Feb-17 The Bank of New York Mellon (269)
Sterling US dollar 404,986 504,023 16-Feb-17 The Bank of New York Mellon (4,244)
Sterling US dollar 55,450 70,362 16-Feb-17 State Street Bank (1,678)
Sterling US dollar 128,913 162,827 16-Feb-17 The Bank of New York Mellon (3,290)
Sterling US dollar 75,406 94,979 16-Feb-17 State Street Bank (1,710)
Sterling US dollar 71,070 89,999 16-Feb-17 The Bank of New York Mellon (2,003)
Sterling US dollar 52,720 65,736 16-Feb-17 The Bank of New York Mellon (653)
Sterling US dollar 143,301 178,434 16-Feb-17 The Bank of New York Mellon (1,575)
Sterling US dollar 1,456,959 1,798,322 16-Feb-17 Royal Bank of Scotland (3,148)
Sterling US dollar 108,749 135,388 16-Feb-17 UBS (1,176)
Sterling US dollar 91,368 114,141 16-Feb-17 The Bank of New York Mellon (1,306)
Sterling US dollar 53,759 66,287 16-Feb-17 UBS (61)
Sterling US dollar 152,016 189,174 16-Feb-17 The Bank of New York Mellon (1,580)
Sterling US dollar 240,952 299,296 16-Feb-17 The Bank of New York Mellon (2,055)
Sterling US dollar 85,062 105,670 16-Feb-17 The Bank of New York Mellon (734)

155
Portfolio of investments – as at 31 December 2016
Holdings Description
Fair
value
Total
net assets
% Holdings Description
Fair
value
Total
net assets
%
BNY MELLON GLOBALREAL RETURN FUND (USD)
New Zealand - 17,301,498 (31 December 2015: 11,412,345) 17,301,498 2.68
3,226,000 New Zealand Government Bond
2.000% 20-Sep-2025 2,364,642 0.36
5,844,000 New Zealand Government Bond
2.750% 15-Apr-2037 3,354,657 0.52
7,722,000 New Zealand Government Bond
4.500% 15-Apr-2027 5,915,292 0.92
7,162,000 New Zealand Government Bond
6.000% 15-May-2021 5,666,907 0.88
United Kingdom - 11,649,974 (31 December 2015: 11,547,191) 11,649,974 1.80
44,000 Anglian Water Services Financing Plc
3.666% 30-Jul-2024 108,778 0.02
60,000 Anglian Water Services Financing Plc
4.125% 28-Jul-2020 138,904 0.02
1,524,000 Arqiva Broadcast Finance Plc
9.500% 31-Mar-2020 2,001,039 0.31
127,000 British Telecommunications Plc
3.500% 25-Apr-2025 328,394 0.05
888,000 Centrica Plc 3.000% 10-Apr-2076 VAR 921,239 0.14
561,000 Centrica Plc 5.250% 10-Apr-2075 VAR 706,799 0.11
263,561 High Speed Rail Finance 1 Plc
1.566% 01-Nov-2038 459,782 0.07
328,000 National Grid Electricity Transmission Plc
2.983% 08-Jul-2018 653,833 0.10
670,940 Network Rail Infrastructure Finance Plc
1.750% 22-Nov-2027 1,156,192 0.18
450,000 Scotland Gas Networks Plc
2.127% 21-Oct-2022 916,948 0.14
550,000 Tesco Plc 3.322% 05-Nov-2025 1,206,241 0.19
444,000 Tesco Plc 6.125% 24-Feb-2022 619,844 0.09
2,044,108 Tesco Property Finance 3 Plc
5.744% 13-Apr-2040 2,431,981 0.38
United States of America - 150,018,727 (31 December 2015: 127,789,403) 150,018,727 23.25
1,316,000 Frontier Communications Corp
11.000% 15-Sep-2025 1,368,745 0.21
3,716,000 Sprint Capital Corp 8.750% 15-Mar-2032 4,106,180 0.64
1,579,000 Sprint Communications Inc 8.375% 15-Aug-2017 1,640,186 0.25
600,000 Sprint Communications Inc 9.250% 15-Apr-2022 675,000 0.10
1,617,000 Sprint Corp 7.125% 15-Jun-2024 1,669,553 0.26
2,690,000 Sprint Corp 7.875% 15-Sep-2023 2,878,300 0.45
7,780,400 United States Treasury Note/Bond
0.875% 15-Apr-2019 7,706,700 1.19
24,272,000 United States Treasury Note/Bond
1.500% 31-Aug-2018 24,418,955 3.78
32,285,400 United States Treasury Note/Bond
1.750% 31-Dec-2020 32,238,102 5.00
20,078,500 United States Treasury Note/Bond
2.000% 15-Feb-2025 19,475,753 3.02
30,898,900 United States Treasury Note/Bond
3.000% 15-May-2045 30,315,313 4.70
22,141,100 United States Treasury Note/Bond
3.000% 15-Nov-2045 21,716,445 3.37
1,527,000 Western Digital Corp 144A 10.500% 01-Apr-2024 1,809,495 0.28
Total investments in bonds 222,942,452 34.55
Collective investment schemes
Guernsey - 18,141,080 (31 December 2015: 11,917,886) 18,141,080 2.81
1,331,841 Bluefi eld Solar Income Fund Ltd 1,738,786 0.27
3,432,471 HICL Infrastructure Co Ltd/Fund 6,950,446 1.08
1,979,066 International Public Partnerships Ltd 3,750,576 0.58
651,701 John Laing Environmental Assets Group Ltd 849,826 0.13
1,970,552 John Laing Infrastructure Fund Ltd 3,138,094 0.49
1,292,568 NextEnergy Solar Fund Ltd 1,713,352 0.26
Ireland - 38,985,034 (31 December 2015: 16,720,593) 38,985,034 6.04
811,599 iShares Physical Gold ETC 18,546,051 2.87
180,230 Source Physical Markets Gold P-ETC 20,438,983 3.17
Jersey - 1,681,519 (31 December 2015: 5,849,623) 1,681,519 0.26
1,312,716 Foresight Solar Fund Ltd 1,681,519 0.26
Luxembourg - 1,312,376 (31 December 2015: 11,296,616) 1,312,376 0.21
773,743 BBGI SICAV SA/Fund 1,312,376 0.21
United Kingdom - 2,779,920 (31 December 2015: 1,505,876) 2,779,920 0.43
1,888,616 Greencoat UK Wind Plc 2,779,920 0.43
Total investments in collective investment schemes 62,899,929 9.75
Bonds
Australia - 35,013,289 (31 December 2015: 28,602,067) 35,013,289 5.43
11,114,000 Australia Government Bond
3.000% 21-Mar-2047 6,918,665 1.07
1,322,000 Australia Government Bond 3.250% 21-Jun-2039 904,403 0.14
23,757,000 Australia Government Bond
3.750% 21-Apr-2037 17,809,378 2.76
3,994,400 New South Wales Treasury Corp
2.750% 20-Nov-2025 4,138,631 0.64
5,973,000 Treasury Corp of Victoria 5.500% 17-Nov-2026 5,242,212 0.82
Cayman Islands - 1,031,043 (31 December 2015: 946,545) 1,031,043 0.16
486,100 Dwr Cymru Financing Ltd 1.859% 31-Mar-2048 1,031,043 0.16
France - 2,898,885 (31 December 2015: 563,438) 2,898,885 0.45
1,965,000 SFR Group SA 5.625% 15-May-2024 2,202,240 0.34
678,000 SFR Group SA 144A 7.375% 01-May-2026 696,645 0.11
Jersey - 258,686 (31 December 2015: 300,827) 258,686 0.04
198,000 CPUK Finance Ltd 7.000% 28-Aug-2020 258,686 0.04
Luxembourg - 1,667,042 (31 December 2015: 1,855,788) 1,667,042 0.26
1,462,000 SIG Combibloc Holdings SCA
7.750% 15-Feb-2023 1,667,042 0.26
Mexico - 3,103,308 (31 December 2015: –) 3,103,308 0.48
62,358,800 Mexican Bonos 8.500% 13-Dec-2018 3,103,308 0.48
Bonds cont’d.
USDUSD

156
Portfolio of investments – as at 31 December 2016
Holdings Description
Fair
value
Total
net assets
% Holdings Description
Fair
value
Total
net assets
%
BNY MELLON GLOBAL REAL RETURN FUND (USD)
Equities
Australia - 8,250,398 (31 December 2015: 7,040,108) 8,250,398 1.28
707,325 Dexus Property Group 4,918,782 0.76
227,659 Newcrest Mining Ltd 3,331,616 0.52
Canada - 21,822,147 (31 December 2015: 11,868,532) 21,822,147 3.38
27,774 Agnico Eagle Mines Ltd 1,205,849 0.19
542,076 Alacer Gold Corp 895,212 0.14
177,589 Alamos Gold Inc 1,281,203 0.20
185,884 Barrick Gold Corp 3,047,568 0.47
227,666 Centerra Gold Inc 1,101,746 0.17
82,323 Detour Gold Corp 1,155,748 0.18
415,221 Eldorado Gold Corp 1,400,712 0.22
440,241 IAMGOLD Corp 1,762,859 0.27
484,119 Kinross Gold Corp 1,581,032 0.24
335,370 New Gold Inc 1,220,953 0.19
443,305 OceanaGold Corp 1,339,161 0.21
429,029 Primero Mining Corp 345,503 0.05
270,377 Silver Wheaton Corp 5,484,601 0.85
Denmark - 3,107,480 (31 December 2015: 1,744,991) 3,107,480 0.48
81,072 DONG Energy A/S 144A 3,107,480 0.48
France - 11,685,686 (31 December 2015: 10,761,344) 11,685,686 1.81
618,039 Vivendi SA 11,685,686 1.81
Germany - 20,583,395 (31 December 2015: 18,531,429) 20,583,395 3.19
65,588 Bayer AG 6,821,857 1.06
154,125 Infi neon Technologies AG 2,697,681 0.42
25,875 LEG Immobilien AG 2,005,992 0.31
36,544 SAP SE 3,193,940 0.49
1,363,693 Telefonica Deutschland Holding AG 5,863,925 0.91
Guernsey - 3,146,347 (31 December 2015: 2,602,560) 3,146,347 0.49
2,332,502 Renewables Infrastructure Group Ltd 3,146,347 0.49
India - 1,372,819 (31 December 2015: –) 1,372,819 0.21
167,322 LIC Housing Finance Ltd 1,372,819 0.21
Ireland - 3,273,370 (31 December 2015: –) 3,273,370 0.51
95,115 CRH Plc 3,273,370 0.51
Israel - 7,983,903 (31 December 2015: 4,747,856) 7,983,903 1.24
221,314 Teva Pharmaceutical Industries Ltd ADR 7,983,903 1.24
Japan - 15,764,925 (31 December 2015: 15,968,631) 15,764,925 2.44
378,400 Japan Tobacco Inc 12,436,448 1.93
124,400 Skylark Co Ltd 1,642,958 0.25
40,600 Suntory Beverage & Food Ltd 1,685,519 0.26
Jersey - 7,586,214 (31 December 2015: 3,521,183) 7,586,214 1.17
15,069 Randgold Resources Ltd 1,179,474 0.18
105,231 Wolseley Plc 6,406,740 0.99
Netherlands - 27,781,469 (31 December 2015: 16,217,816) 27,781,469 4.31
510,102 RELX NV 8,562,125 1.33
126,372 Unilever NV 5,189,826 0.80
386,151 Wolters Kluwer NV 14,029,518 2.18
New Zealand - 3,462,277 (31 December 2015: 3,645,704) 3,462,277 0.54
1,452,854 Spark New Zealand Ltd 3,462,277 0.54
South Africa - 1,014,095 (31 December 2015: 668,181) 1,014,095 0.16
319,530 Gold Fields Ltd 1,014,095 0.16
South Korea - 5,109,328 (31 December 2015: –) 5,109,328 0.79
56,876 Samsung SDI Co Ltd 5,109,328 0.79
Switzerland - 25,597,766 (31 December 2015: 18,040,107) 25,597,766 3.97
213,673 Novartis AG 15,559,223 2.41
43,961 Roche Holding AG 10,038,543 1.56
United Kingdom - 60,771,567 (31 December 2015: 35,766,833) 60,771,567 9.42
48,455 Associated British Foods Plc 1,633,893 0.25
457,377 BAE Systems Plc 3,312,693 0.52
54,686 British American Tobacco Plc 3,095,312 0.48
4,193,856 Centrica Plc 12,077,885 1.87
2,279,763 Cobham Plc 4,602,293 0.71
256,858 Diageo Plc 6,628,615 1.03
738,312 Dixons Carphone Plc 3,202,567 0.50
77,638 Fresnillo Plc 1,148,989 0.18
516,311 GlaxoSmithKline Plc 9,881,597 1.53
783,152 United Utilities Group Plc 8,654,047 1.34
2,673,243 Vodafone Group Plc 6,533,676 1.01
United States of America - 93,790,987 (31 December 2015: 80,746,315) 93,790,987 14.54
180,005 Abbott Laboratories 6,898,692 1.07
88,752 Accenture Plc 10,384,428 1.61
38,792 AT&T Inc 1,655,449 0.26
233,592 CA Inc 7,508,815 1.16
244,560 CMS Energy Corp 10,216,494 1.58
40,680 Cognizant Technology Solutions Corp 2,284,996 0.36
41,885 Dollar General Corp 3,105,144 0.48
13,123 Dun & Bradstreet Corp/The 1,597,856 0.25
221,074 Eversource Energy 12,283,977 1.90
41,170 Maxim Integrated Products Inc 1,606,659 0.25
227,108 Microsoft Corp 14,283,958 2.22
59,900 Procter & Gamble Co/The 5,052,864 0.78
141,527 Reynolds American Inc 7,940,372 1.23
70,348 Sysco Corp 3,934,564 0.61
51,519 Trimble Inc 1,556,646 0.24
41,690 Walgreens Boots Alliance Inc 3,480,073 0.54
Total investments in equities 322,104,173 49.93
Equities cont’d.
USDUSD

157
Portfolio of investments – as at 31 December 2016
Holdings Description
Fair
value
Total
net assets
%
BNY MELLON GLOBAL REAL RETURN FUND (USD)
Future options - 516,828 (31 December 2015: –)
311 U.S. Treasury Bond Future Put 27-Jan-2017 146.000 150,641 0.02
279 U.S. Treasury Bond Future Put 27-Jan-2017 149.000 366,187 0.06
Total future options 516,828 0.08
Unrealised gain on forward foreign currency contracts - 15,464,311 (see below)
(31 December 2015: 6,274,101) 15,464,311 2.40
Total fi nancial assets at fair value through profi t or loss 623,927,693 96.71
Holdings Description
Underlying
exposure
USD
Fair
value
USD
Total
net assets
%
Open futures contracts - (2,957,660) (31 December 2015: 104,021)
(698) Euro STOXX 50 Index
Short Futures Contracts
Exp Mar-2017 (24,003,276) (1,307,877) (0.20)
(272) FTSE 100 Index
Short Futures Contracts
Exp Mar-2017 (23,547,665) (988,805) (0.16)
(236) S&P 500 Index
Short Futures Contracts
Exp Mar-2017 (132,460,900) (660,978) (0.10)
Total open futures contracts (2,957,660) (0.46)
Unrealised loss on forward foreign currency contracts - (566,229) (see below)
(31 December 2015: (1,565,570)) (566,229) (0.09)
Total fi nancial liabilities at fair value through profi t or loss (3,523,889) (0.55)
Net current assets 24,745,871 3.84
Total net assets 645,149,675 100.00
The counterparty for future options is UBS.
The counterparty for futures contracts is UBS.
Analysis of portfolio % of Total assets
Transferable securities and money market instruments admitted
to offi cial stock exchange listing or traded on a regulated market 93.34
Financial derivative instruments dealt in on a regulated market 0.08
OTC fi nancial derivative instruments 2.37
Other current assets 4.21
Total assets 100.00
Forward foreign currency contracts
Unrealised
Gain/(Loss)Buy Sell Amount (B) Amount (S)
Settle
Date Counterparty
BNY Mellon Global Real Return Fund (USD)
US dollar Japanese yen 50,341 5,858,735 05-Jan-17 The Bank of New York Mellon 236
Euro US dollar 892,711 930,906 17-Jan-17 State Street Bank 12,570
Sterling US dollar 537,462 659,464 17-Jan-17 State Street Bank 2,001
US dollar Euro 86,094,213 76,666,871 17-Jan-17 UBS 5,067,655
US dollar Euro 933,727 845,664 17-Jan-17 UBS 39,974
US dollar Euro 693,870 645,021 17-Jan-17 The Bank of New York Mellon 12,169
US dollar Euro 641,291 595,647 17-Jan-17 The Bank of New York Mellon 11,773
US dollar Euro 671,969 630,868 17-Jan-17 The Bank of New York Mellon 5,227
US dollar Euro 598,318 550,312 17-Jan-17 State Street Bank 16,713
US dollar Euro 1,703,960 1,584,708 17-Jan-17 State Street Bank 29,138
US dollar Euro 1,737,858 1,560,754 17-Jan-17 Royal Bank of Scotland 88,351
US dollar Euro 410,887 382,363 17-Jan-17 The Bank of New York Mellon 6,781
US dollar Euro 647,860 585,143 17-Jan-17 JPMorgan Chase 29,443
US dollar Euro 338,290 317,256 17-Jan-17 The Bank of New York Mellon 2,993
US dollar Euro 999,802 904,931 17-Jan-17 JPMorgan Chase 43,411
US dollar Euro 829,801 761,362 17-Jan-17 The Bank of New York Mellon 25,144
US dollar Euro 1,720,563 1,620,589 17-Jan-17 The Bank of New York Mellon 7,819
US dollar Sterling 359,006 287,667 17-Jan-17 State Street Bank 4,968
US dollar Sterling 828,070 656,502 17-Jan-17 State Street Bank 20,099
US dollar Sterling 584,260 470,477 17-Jan-17 JPMorgan Chase 5,233
US dollar Sterling 1,021,574 821,213 17-Jan-17 State Street Bank 10,890
US dollar Sterling 347,025 273,360 17-Jan-17 The Bank of New York Mellon 10,595
US dollar Sterling 432,745 340,905 17-Jan-17 The Bank of New York Mellon 13,186
US dollar Sterling 2,278,536 1,807,267 17-Jan-17 State Street Bank 54,295
US dollar Sterling 135,118,688 106,113,764 17-Jan-17 UBS 4,522,292
US dollar Sterling 580,145 465,078 17-Jan-17 JPMorgan Chase 7,764
US dollar Sterling 1,039,053 841,324 17-Jan-17 State Street Bank 3,618
Mexican peso US dollar 22,534,000 1,079,208 16-Feb-17 JPMorgan Chase 3,287
Mexican peso US dollar 8,760,000 419,203 16-Feb-17 JPMorgan Chase 1,612
New Zealand dollar US dollar 1,556,007 1,072,705 16-Feb-17 State Street Bank 9,136
US dollar Canadian dollar 35,146,864 47,008,330 16-Feb-17 JPMorgan Chase 237,121
US dollar Korean won 158,057 184,618,949 16-Feb-17 Royal Bank of Scotland 4,512
US dollar Korean won 989,776 1,151,445,611 16-Feb-17 Royal Bank of Scotland 32,132
US dollar Korean won 805,620 951,985,557 16-Feb-17 Royal Bank of Scotland 13,866
US dollar Korean won 2,751,892 3,149,980,583 16-Feb-17 UBS 132,091
US dollar Mexican peso 1,503,465 31,294,000 16-Feb-17 State Street Bank 154
US dollar New Zealand dollar 66,632,965 91,693,166 16-Feb-17 Royal Bank of Scotland 2,881,721
Australian dollar US dollar 555,121 399,653 17-Mar-17 State Street Bank 707
US dollar Australian dollar 68,733,184 92,399,457 17-Mar-17 UBS 2,093,634
USD 15,464,311
USD

158
Portfolio of investments – as at 31 December 2016
BNY MELLON GLOBAL REAL RETURN FUND (USD)
Forward foreign currency contracts cont’d.
Unrealised
Gain/(Loss)Buy Sell Amount (B) Amount (S)
Settle
Date Counterparty
BNY Mellon Global Real Return Fund (USD) cont’d.
US dollar Japanese yen 205,599 24,175,013 04-Jan-17 The Bank of New York Mellon (1,135)
Euro US dollar 333,720 355,666 17-Jan-17 State Street Bank (2,969)
Euro US dollar 11,897,227 12,637,235 17-Jan-17 UBS (63,468)
Euro US dollar 308,389 329,133 17-Jan-17 UBS (3,207)
Euro US dollar 386,424 411,437 17-Jan-17 State Street Bank (3,039)
Sterling US dollar 7,187,236 8,960,937 17-Jan-17 Royal Bank of Scotland (115,459)
Sterling US dollar 785,765 973,814 17-Jan-17 JPMorgan Chase (6,758)
Sterling US dollar 994,524 1,231,101 17-Jan-17 State Street Bank (7,120)
Sterling US dollar 408,273 506,861 17-Jan-17 JPMorgan Chase (4,391)
Sterling US dollar 941,848 1,169,499 17-Jan-17 State Street Bank (10,347)
Sterling US dollar 7,150,000 8,917,337 17-Jan-17 Royal Bank of Scotland (117,685)
US dollar South African rand 1,793,872 25,233,494 17-Jan-17 JPMorgan Chase (38,706)
US dollar Sterling 355,467 292,667 17-Jan-17 Royal Bank of Scotland (4,725)
US dollar Sterling 2,330,413 1,901,980 17-Jan-17 Royal Bank of Scotland (10,393)
US dollar Sterling 931,187 760,848 17-Jan-17 UBS (5,204)
US dollar Sterling 509,257 417,592 17-Jan-17 JPMorgan Chase (4,682)
US dollar Sterling 1,944,163 1,587,670 17-Jan-17 UBS (9,816)
US dollar Sterling 359,041 292,892 17-Jan-17 Royal Bank of Scotland (1,427)
US dollar Sterling 482,632 395,377 17-Jan-17 State Street Bank (3,967)
US dollar Sterling 352,390 288,316 17-Jan-17 JPMorgan Chase (2,445)
US dollar Sterling 705,969 574,234 17-Jan-17 Royal Bank of Scotland (753)
US dollar Sterling 318,798 260,153 17-Jan-17 Royal Bank of Scotland (1,378)
US dollar Sterling 546,450 445,682 17-Jan-17 Royal Bank of Scotland (2,059)
US dollar Sterling 2,645,610 2,152,315 17-Jan-17 State Street Bank (3,289)
New Zealand dollar US dollar 14,267,084 10,058,665 16-Feb-17 JPMorgan Chase (139,231)
US dollar Korean won 513,997 619,263,300 16-Feb-17 Royal Bank of Scotland (1,037)
Australian dollar US dollar 692,349 500,869 17-Mar-17 Royal Bank of Scotland (1,539)
USD (566,229)
Net USD 14,898,082

159
Portfolio of investments – as at 31 December 2016
Holdings Description
Fair
value
Total
net assets
% Holdings Description
Fair
value
Total
net assets
%
Collective investment schemes
Supranational - 1,945,000 1,945,000 0.43 1,945,000 Insight Liquidity Funds Plc - USD Liquidity Fund 1,945,000 0.43
Total investments in collective investment schemes 1,945,000 0.43
Bonds
Argentina - 5,219,750 5,219,750 1.16 5,000,000 Provincia de Buenos Aires
5.750% 15-Jun-2019 5,219,750 1.16
Australia - 13,980,840 13,980,840 3.11 12,000,000 FMG Resources August 2006 Pty Ltd 144A
9.750% 01-Mar-2022 13,980,840 3.11
Barbados - 5,339,450 5,339,450 1.19 5,000,000 Columbus Cable Barbados Ltd 144A
7.375% 30-Mar-2021 5,339,450 1.19
Brazil - 21,733,937 21,733,937 4.83 7,665,000 Marfrig Holdings Europe BV
6.875% 24-Jun-2019 7,875,787 1.75
5,000,000 Marfrig Overseas Ltd
9.500% 04-May-2020 5,175,000 1.15
2,600,000 Minerva Luxembourg SA
7.750% 31-Jan-2023 2,752,750 0.61
5,600,000 Vale Overseas Ltd 5.625% 15-Sep-2019 5,930,400 1.32
Canada - 11,355,000 11,355,000 2.53 3,000,000 Bombardier Inc 144A 4.750% 15-Apr-2019 3,030,000 0.67
2,500,000 Mattamy Group Corp 144A
6.500% 15-Nov-2020 2,550,000 0.57
5,000,000 Teck Resources Ltd 144A
8.500% 01-Jun-2024 5,775,000 1.29
Croatia - 3,063,600 3,063,600 0.68 3,000,000 Agrokor dd 8.875% 01-Feb-2020 3,063,600 0.68
France - 11,461,228 11,461,228 2.55 3,765,000 Loxam SAS 7.000% 23-Jul-2022 4,251,228 0.95
7,000,000 SFR Group SA 144A 6.000% 15-May-2022 7,210,000 1.60
Germany - 2,782,313 2,782,313 0.62 2,500,000 FTE Verwaltungs GmbH 9.000% 15-Jul-2020 2,782,313 0.62
India - 8,496,296 8,496,296 1.89 8,000,000 Vedanta Resources Plc 9.500% 18-Jul-2018 8,496,296 1.89
Italy - 20,968,339 20,968,339 4.67 5,172,000 Bormioli Rocco Holdings SA
10.000% 01-Aug-2018 5,623,194 1.25
3,000,000 Wind Acquisition Finance SA 144A
6.500% 30-Apr-2020 3,127,500 0.70
5,000,000 Wind Acquisition Finance SA
7.000% 23-Apr-2021 5,493,520 1.22
6,450,000 Wind Acquisition Finance SA 144A
7.375% 23-Apr-2021 6,724,125 1.50
Luxembourg - 31,245,500 31,245,500 6.96 5,000,000 Altice Luxembourg SA 7.250% 15-May-2022 5,647,908 1.26
10,000,000 INEOS Group Holdings SA 144A
5.875% 15-Feb-2019 10,230,000 2.28
3,940,000 Matterhorn Telecom Holding SA
4.875% 01-May-2023 4,211,106 0.94
10,011,000 Trionista TopCo GmbH 6.875% 30-Apr-2021 11,156,486 2.48
Mexico - 10,697,500 10,697,500 2.38 3,000,000 Cemex Finance LLC 144A 9.375% 12-Oct-2022 3,277,500 0.73
7,000,000 Cemex SAB de CV 144A 6.500% 10-Dec-2019 7,420,000 1.65
Netherlands - 10,687,500 10,687,500 2.38 10,000,000 Lincoln Finance Ltd 144A 7.375% 15-Apr-2021 10,687,500 2.38
Poland - 4,377,298 4,377,298 0.97 4,000,000 Play Finance 1 SA 6.500% 01-Aug-2019 4,377,298 0.97
Spain - 3,689,474 3,689,474 0.82 3,729,308 BBVA Leasing 1 FTA 0.096% 26-May-2031 FRN 3,689,474 0.82
Sweden - 4,717,242 4,717,242 1.05 4,100,000 Auris Luxembourg II SA 8.000% 15-Jan-2023 4,717,242 1.05
Switzerland - 8,856,050 8,856,050 1.97 5,000,000 Glencore Finance Europe SA
2.081% 06-May-2018 FRN 5,007,750 1.11
3,430,000 Inovyn Finance Plc 6.250% 15-May-2021 3,848,300 0.86
United Arab Emirates - 2,342,400 2,342,400 0.52 2,400,000 Topaz Marine SA 144A 8.625% 01-Nov-2018 2,342,400 0.52
United Kingdom - 89,176,239 89,176,239 19.85 6,000,000 Anglo American Capital Plc 144A
9.375% 08-Apr-2019 6,885,000 1.53
7,600,000 Annington Finance No 5 Plc
13.000% 15-Jan-2023 11,110,707 2.47
1,373,796 Bakkavor Finance 2 Plc 8.250% 15-Feb-2018 1,739,627 0.39
3,000,000 Bakkavor Finance 2 Plc 8.750% 15-Jun-2020 3,974,677 0.88
9,890,000 CPUK Finance Ltd 7.000% 28-Aug-2020 12,973,743 2.89
2,000,000 Enterprise Funding Ltd 3.500% 10-Sep-2020 2,310,751 0.51
6,000,000 Ithaca Energy Inc 144A 8.125% 01-Jul-2019 6,015,000 1.34
5,000,000 Marlin Intermediate Holdings Plc
10.500% 01-Aug-2020 6,778,203 1.51
1,600,000 Navigator Holdings Ltd 144A
9.000% 18-Dec-2017 1,632,045 0.37
3,241,732 Punch Taverns Finance B Ltd
7.369% 30-Sep-2021 4,299,740 0.96
1,494,900 Punch Taverns Finance Plc
7.274% 15-Oct-2026 2,224,596 0.50
1,306,789 Punch Taverns Finance Plc
7.320% 15-Oct-2025 1,954,729 0.43
3,310,000 Spirit Issuer Plc 2.167% 28-Dec-2036 FRN 3,987,463 0.89
3,500,000 Spirit Issuer Plc 4.313% 28-Dec-2036 VAR 4,367,580 0.97
5,731,000 Stonegate Pub Co Financing Plc
5.750% 15-Apr-2019 7,228,759 1.61
6,848,000 Virgin Media Finance Plc 7.000% 15-Apr-2023 9,158,523 2.04
2,568,851 Youngs PIK SCA 8.250% 01-Aug-2019 2,535,096 0.56
United States of America - 145,647,276 145,647,276 32.42 8,300,000 AECOM Global II LLC / URS Fox US LP
3.850% 01-Apr-2017 8,325,742 1.85
7,000,000 AK Steel Corp 7.625% 15-May-2020 7,175,000 1.60
7,680,000 Capsugel SA 144A 7.000% 15-May-2019 7,752,000 1.73
BNY MELLON GLOBAL SHORT-DATED HIGH YIELD BOND FUND
Bonds cont’d.
Luxembourg cont’d.
USDUSD

160
Portfolio of investments – as at 31 December 2016
Holdings Description
Fair
value
Total
net assets
% Holdings Description
Fair
value
Total
net assets
%
BNY MELLON GLOBAL SHORT-DATED HIGH YIELD BOND FUND
Unrealised loss on forward foreign currency contracts - (1,773,904)
(see below) (1,773,904) (0.39)
Total fi nancial liabilities at fair value through profi t or loss (1,773,904) (0.39)
Net current assets 7,253,562 1.61
Total net assets 449,324,739 100.00
Analysis of portfolio % of Total Assets
Transferable securities and money market instruments admitted
to offi cial stock exchange listing or traded on a regulated market 80.98
Transferable securities and money market instruments other than those
admitted to offi cial stock exchange listing or traded on a regulated market 4.10
OTC fi nancial derivative instruments 0.42
Other current assets 14.50
Total assets 100.00
5,000,000 CF Industries Inc 6.875% 01-May-2018 5,275,700 1.17
4,464,000 Cliffs Natural Resources Inc 144A
8.000% 30-Sep-2020 4,664,880 1.04
7,500,000 Concho Resources Inc 5.500% 01-Apr-2023 7,809,750 1.74
7,000,000 Diamond 1 Finance Corp / Diamond 2 Finance
Corp 144A 7.125% 15-Jun-2024 7,775,617 1.73
8,000,000 DS Services of America Inc 144A
10.000% 01-Sep-2021 8,810,000 1.96
6,400,000 Dynegy Inc 6.750% 01-Nov-2019 6,544,000 1.46
7,627,000 Hertz Corp/The 5.875% 15-Oct-2020 7,493,528 1.67
3,641,000 Hertz Corp/The 6.750% 15-Apr-2019 3,650,103 0.81
3,000,000 Navistar International Corp
4.500% 15-Oct-2018 2,971,875 0.66
5,876,000 NGL Energy Partners LP / NGL Energy Finance Corp
5.125% 15-Jul-2019 5,861,310 1.30
7,000,000 PBF Holding Co LLC / PBF Finance Corp
8.250% 15-Feb-2020 7,183,750 1.60
6,000,000 Rain CII Carbon LLC / CII Carbon Corp 144A
8.000% 01-Dec-2018 6,000,000 1.34
10,607,000 Rite Aid Corp 9.250% 15-Mar-2020 11,018,021 2.45
6,000,000 Sprint Communications Inc 144A
9.000% 15-Nov-2018 6,630,000 1.48
6,000,000 Targa Resources Partners LP / Targa Resources
Partners Finance Corp 4.125% 15-Nov-2019 6,105,000 1.36
5,300,000 Tesoro Logistics LP / Tesoro Logistics Finance Corp
5.875% 01-Oct-2020 5,472,250 1.22
3,000,000 Transocean Inc 7.375% 15-Apr-2018 3,060,000 0.68
5,000,000 WhiteWave Foods Co/The 5.375% 01-Oct-2022 5,493,750 1.22
10,000,000 WMG Acquisition Corp 144A
6.750% 15-Apr-2022 10,575,000 2.35
Total investments in bonds 415,837,232 92.55
Equities
Norway - 2,588,551 2,588,551 0.58 98,798 Norwegian Energy Co ASA 2,588,551 0.58
Total investments in equities 2,588,551 0.58
Leveraged loans
France - 5,500,000 5,500,000 1.22 5,500,000 Linxens France SA 0.000% 17-Jul-2023 5,500,000 1.22
United Kingdom - 6,694,017 6,694,017 1.49 997,500 Inovyn Finance Plc 0.000% 14-May-2021 1,065,916 0.24
5,360,000 Inovyn Finance Plc 0.000% 15-May-2021 5,628,101 1.25
United States of America - 9,102,258 9,102,258 2.03 9,032,258 Energy Future Intermediate Holdings
4.250% 30-Jun-2017 9,102,258 2.03
Total investments in leveraged loans 21,296,275 4.74
Unrealised gain on forward foreign currency contracts - 2,178,023
(see below) 2,178,023 0.48
Total fi nancial assets at fair value through profi t or loss 443,845,081 98.78
Bonds cont’d.
United States of America cont’d.
Description USDUSD

161
Portfolio of investments – as at 31 December 2016
BNY MELLON GLOBAL SHORT-DATED HIGH YIELD BOND FUND
Forward foreign currency contracts
Unrealised
Gain/(Loss)Buy Sell Amount (B) Amount (S)
Settle
Date Counterparty
BNY Mellon Global Short-Dated High Yield Bond FundNorwegian krone US dollar 5,382,000 623,048 13-Jan-17 RBC Capital
Markets 265
Sterling US dollar 5,061,000 6,196,511 13-Jan-17 RBC Capital Markets 42,487
US dollar Norwegian krone 1,410,512 12,007,000 13-Jan-17 Royal Bank of Canada 19,928
US dollar Sterling 2,788,162 2,246,000 13-Jan-17 RBC Capital Markets 19,383
US dollar Sterling 84,221,979 67,230,000 13-Jan-17 Royal Bank of Canada 1,343,520
US dollar Euro 2,297,131 2,164,000 19-Jan-17 The Bank of New York Mellon 17,181
Euro Sterling 5,938,000 5,064,472 26-Jan-17 Barclays Bank plc 12,941
Euro US dollar 407,000 426,132 26-Jan-17 RBC Capital Markets 2,842
US dollar Euro 2,294,314 2,166,000 26-Jan-17 RBC Capital Markets 11,374
US dollar Euro 74,491,922 70,083,000 26-Jan-17 Royal Bank of Canada 625,215
USD 2,095,136
Sterling US dollar 7,287,000 9,239,427 13-Jan-17 Barclays Bank plc (256,304)
Sterling US dollar 2,819,000 3,558,083 13-Jan-17 RBC Capital Markets (82,932)
Euro US dollar 5,220,000 5,572,533 26-Jan-17 RBC Capital Markets (70,711)
USD (409,947)
Net USD 1,685,189
BNY Mellon Global Short-Dated High Yield Bond Fund EUR H (Acc) (Hedged) Share ClassEuro US dollar 100,156 105,929 13-Jan-17 The Bank of
New York Mellon (442)
USD (442)
EUR (420)
BNY Mellon Global Short-Dated High Yield Bond Fund EUR I (Acc) (Hedged) Share ClassEuro US dollar 100,167 105,941 13-Jan-17 The Bank of
New York Mellon (442)
USD (442)
EUR (420)
Forward foreign currency contracts cont’d.
Unrealised
Gain/(Loss)Buy Sell Amount (B) Amount (S)
Settle
Date Counterparty
BNY Mellon Global Short-Dated High Yield Bond Fund Sterling W (Acc) (Hedged) Share ClassSterling US dollar 100,186 126,223 13-Jan-17 The Bank of
New York Mellon (2,718)
USD (2,718)
GBP (2,205)
BNY Mellon Global Short-Dated High Yield Bond Fund Sterling Y (Acc) (Hedged) Share ClassSterling US dollar 479,486 585,843 13-Jan-17 The Bank of
New York Mellon 5,248
US dollar Sterling 3,652,643 2,900,000 13-Jan-17 The Bank of New York Mellon 77,639
USD 82,887
GBP 67,257
Sterling US dollar 50,137,648 63,168,045 13-Jan-17 The Bank of New York Mellon (1,360,355)
USD (1,360,355)
GBP (1,103,825)
Net USD (1,277,468)
Net GBP (1,036,568)

162
Portfolio of investments – as at 31 December 2016
Holdings Description
Fair
value
Total
net assets
% Holdings Description
Fair
value
Total
net assets
%
BNY MELLON JAPAN ALL CAP EQUITY FUND
20,400 Mitsubishi Electric Corp 33,211,200 1.46
64,000 Mitsubishi Heavy Industries Ltd 34,067,200 1.49
5,400 Mitsubishi Pencil Co Ltd 33,183,000 1.46
41,000 Nichias Corp 46,227,500 2.03
6,000 Nidec Corp 60,450,000 2.65
13,000 Park24 Co Ltd 41,210,000 1.81
75,200 Penta-Ocean Construction Co Ltd 42,450,400 1.86
5,200 Recruit Holdings Co Ltd 24,362,000 1.07
41,000 Sankyu Inc 28,987,000 1.27
37,000 Shimizu Corp 39,534,500 1.73
5,200 Sohgo Security Services Co Ltd 23,361,000 1.02
11,600 Star Micronics Co Ltd 18,449,800 0.81
19,100 Temp Holdings Co Ltd 34,590,100 1.52
10,900 Totetsu Kogyo Co Ltd 33,027,000 1.45
10,200 Trusco Nakayama Corp 24,954,300 1.09
Information Technology - 277,142,200 (31 December 2015: 464,755,250) 277,142,200 12.15
2,200 Disco Corp 31,141,000 1.37
66,000 Hitachi Ltd 41,659,200 1.83
300 Keyence Corp 24,054,000 1.05
600 Nintendo Co Ltd 14,718,000 0.64
6,400 Omron Corp 28,688,000 1.26
23,000 Osaki Electric Co Ltd 27,991,000 1.23
4,400 Otsuka Corp 24,024,000 1.05
10,000 SCSK Corp 40,875,000 1.79
26,000 Yokogawa Electric Corp 43,992,000 1.93
Telecommunication Services - 100,076,400 (31 December 2015: 129,434,500) 100,076,400 4.39
5,200 Nippon Telegraph & Telephone Corp 25,537,200 1.12
9,600 SoftBank Corp 74,539,200 3.27
Total investments in equities 2,258,689,330 99.04
Unrealised gain on forward foreign currency contracts - 14,172,892 (see below)
(31 December 2015: 17,306,312) 14,172,892 0.62
Total fi nancial assets at fair value through profi t or loss 2,272,862,222 99.66
Unrealised loss on forward foreign currency contracts - (72,660) (see below)
(31 December 2015: (28,656,971)) (72,660) (0.00)
Total fi nancial liabilities at fair value through profi t or loss (72,660) (0.00)
Net current assets 7,756,625 0.34
Total net assets 2,280,546,187 100.00
Analysis of portfolio % of Total assets
Transferable securities and money market instruments admitted
to offi cial stock exchange listing or traded on a regulated market 98.84
OTC fi nancial derivative instruments 0.62
Other current assets 0.54
Total assets 100.00
Equities
Basic Materials - 114,346,300 (31 December 2015: 200,411,750) 114,346,300 5.01
24,500 Daicel Corp 31,592,750 1.38
2,500 Nippon Shokubai Co Ltd 18,250,000 0.80
4,300 Nitto Denko Corp 38,543,050 1.69
81,000 UACJ Corp 25,960,500 1.14
Consumer Discretionary - 559,638,650 (31 December 2015: 982,591,550) 559,638,650 24.54
11,100 Bandai Namco Holdings Inc 35,825,250 1.57
4,100 Denso Corp 20,739,850 0.91
11,200 Fuji Heavy Industries Ltd 53,390,400 2.34
3,300 Hikari Tsushin Inc 35,937,000 1.58
5,800 HIS Co Ltd 17,820,500 0.78
25,500 IDOM Inc 16,383,750 0.72
17,900 Isuzu Motors Ltd 26,496,475 1.16
3,600 Jin Co Ltd 19,368,000 0.85
21,100 Mazda Motor Corp 40,306,275 1.77
8,400 Nifco Inc 51,870,000 2.27
14,400 Nissan Motor Co Ltd 16,916,400 0.74
3,500 Rinnai Corp 33,005,000 1.45
1,500 Ryohin Keikaku Co Ltd 34,372,500 1.51
28,000 Sekisui Chemical Co Ltd 52,192,000 2.29
1,000 Shimano Inc 18,325,000 0.80
9,500 Tomy Co Ltd 11,780,000 0.52
10,900 Toyota Motor Corp 74,910,250 3.28
Consumer Staples - 121,406,750 (31 December 2015: 184,386,200) 121,406,750 5.32
2,200 Ezaki Glico Co Ltd 12,045,000 0.53
11,500 Japan Tobacco Inc 44,200,250 1.94
3,300 Pola Orbis Holdings Inc 31,861,500 1.39
3,000 Tsuruha Holdings Inc 33,300,000 1.46
Financials - 293,330,005 (31 December 2015: 661,477,520) 293,330,005 12.86
25,000 77 Bank Ltd/The 14,100,000 0.62
7,600 Anicom Holdings Inc 18,380,600 0.80
20,300 Dai-ichi Life Holdings Inc 39,493,650 1.73
114,100 Mitsubishi UFJ Financial Group Inc 82,112,065 3.60
142,400 Mizuho Financial Group Inc 29,847,040 1.31
10,200 Star Mica Co Ltd 19,992,000 0.88
12,300 Sumitomo Mitsui Financial Group Inc 54,790,350 2.40
18,300 Tokai Tokyo Financial Holdings Inc 11,364,300 0.50
6,200 Zenkoku Hosho Co Ltd 23,250,000 1.02
Health Care - 137,866,550 (31 December 2015: 267,326,000) 137,866,550 6.05
29,200 Astellas Pharma Inc 47,355,100 2.08
12,700 Nihon Kohden Corp 32,867,600 1.44
21,400 Nikkiso Co Ltd 23,764,700 1.04
23,700 Santen Pharmaceutical Co Ltd 33,879,150 1.49
Industrials - 654,882,475 (31 December 2015: 1,010,781,050) 654,882,475 28.72
19,300 Anest Iwata Corp 22,098,500 0.97
3,700 Daikin Industries Ltd 39,719,500 1.74
1,100 East Japan Railway Co 11,110,000 0.49
600 FANUC Corp 11,889,000 0.52
9,800 Kito Corp 12,377,400 0.54
8,500 Kubota Corp 14,175,875 0.62
9,200 METAWATER Co Ltd 25,447,200 1.12
Equities cont’d.
Industrials cont’d.
JPYJPY

163
Portfolio of investments – as at 31 December 2016
BNY MELLON JAPAN ALL CAP EQUITY FUND
Forward foreign currency contracts
Unrealised
Gain/(Loss)Buy Sell Amount (B) Amount (S)
Settle
Date Counterparty
BNY Mellon Japan All Cap Equity Fund EUR H (Hedged) Share ClassEuro Japanese yen 955 116,992 13-Jan-17 The Bank of
New York Mellon 941
Euro Japanese yen 40,711 4,944,327 13-Jan-17 The Bank of New York Mellon 83,015
JPY 83,956
EUR 680
BNY Mellon Japan All Cap Equity Fund EUR I (Hedged) Share ClassEuro Japanese yen 80,579 9,871,038 13-Jan-17 The Bank of
New York Mellon 79,437
Euro Japanese yen 3,438,039 417,545,167 13-Jan-17 The Bank of New York Mellon 7,010,531
JPY 7,089,968
EUR 57,411
BNY Mellon Japan All Cap Equity Fund USD H (Hedged) Share ClassUS dollar Japanese yen 1,383,659 159,125,452 13-Jan-17 The Bank of
New York Mellon 2,583,914
JPY 2,583,914
USD 22,095
US dollar Japanese yen 31,339 3,689,172 13-Jan-17 The Bank of New York Mellon (26,594)
JPY (26,594)
USD (227)
Net JPY 2,557,320
Net USD 21,868
Forward foreign currency contracts cont’d.
Unrealised
Gain/(Loss)Buy Sell Amount (B) Amount (S)
Settle
Date Counterparty
BNY Mellon Japan All Cap Equity Fund USD I (Hedged) Share ClassUS dollar Japanese yen 2,364,216 271,892,780 13-Jan-17 The Bank of
New York Mellon 4,415,054
JPY 4,415,054
USD 37,753
US dollar Japanese yen 54,284 6,390,318 13-Jan-17 The Bank of New York Mellon (46,066)
JPY (46,066)
USD (394)
Net JPY 4,368,988
Net USD 37,359

164
Portfolio of investments – as at 31 December 2016
Holdings Description
Fair
value
Total
net assets
% Holdings Description
Fair
value
Total
net assets
%
Real estate investment trust Real Estate - 2,133,619,950 2,133,619,950 98.70 186 Activia Properties Inc 102,393,000 4.74
227 Advance Residence Investment Corp 70,086,250 3.24
205 AEON REIT Investment Corp 26,168,250 1.21
100 Comforia Residential REIT Inc 26,220,000 1.21
203 Daiwa House REIT Investment Corp 59,854,550 2.77
115 Daiwa Offi ce Investment Corp 67,620,000 3.13
98 Frontier Real Estate Investment Corp 48,951,000 2.27
152 Fukuoka REIT Corp 28,066,800 1.30
43 Global One Real Estate Investment Corp 18,877,000 0.87
709 GLP J-Reit 95,254,150 4.41
8 Hankyu Reit Inc 1,167,600 0.05
67 Heiwa Real Estate REIT Inc 5,597,850 0.26
357 Hulic Reit Inc 69,900,600 3.23
19 Ichigo Hotel REIT Investment Corp 2,447,200 0.11
305 Ichigo Offi ce REIT Investment 23,134,250 1.07
62 Industrial & Infrastructure Fund Investment Corp 34,503,000 1.60
220 Invesco Offi ce J-Reit Inc 21,219,000 0.98
363 Invincible Investment Corp 19,111,950 0.88
221 Japan Excellent Inc 32,807,450 1.52
722 Japan Hotel REIT Investment Corp 56,713,100 2.62
115 Japan Logistics Fund Inc 28,364,750 1.31
34 Japan Prime Realty Investment Corp 15,674,000 0.73
271 Japan Real Estate Investment Corp 173,033,500 8.00
414 Japan Rental Housing Investments Inc 32,457,600 1.50
414 Japan Retail Fund Investment Corp 97,869,600 4.53
88 Kenedix Offi ce Investment Corp 59,268,000 2.74
69 Kenedix Residential Investment Corp 21,786,750 1.01
136 Kenedix Retail REIT Corp 36,196,400 1.68
401 LaSalle Logiport REIT 44,350,600 2.05
75 MCUBS MidCity Investment Corp 25,293,750 1.17
49 Mitsui Fudosan Logistics Park Inc 16,329,250 0.76
401 Mori Hills REIT Investment Corp 63,217,650 2.92
239 Mori Trust Sogo Reit Inc 43,976,000 2.03
90 Nippon Accommodations Fund Inc 45,855,000 2.12
270 Nippon Building Fund Inc 174,555,000 8.08
421 Nippon Prologis REIT Inc 100,492,700 4.65
4 NIPPON REIT Investment Corp 1,139,000 0.05
457 Nomura Real Estate Master Fund Inc 80,683,350 3.73
654 Orix JREIT Inc 120,532,200 5.58
228 Premier Investment Corp 31,555,200 1.46
195 Sekisui House Reit Inc 29,250,000 1.35
10 Sekisui House SI Residential Investment Corp 1,298,000 0.06
33 SIA Reit Inc 13,051,500 0.60
28 Starts Proceed Investment Corp 4,233,600 0.20
5 Tokyu REIT Inc 739,250 0.03
19 Tosei Reit Investment Corp 2,050,100 0.10
339 United Urban Investment Corp 60,274,200 2.79
Total investments in real estate investment trust 2,133,619,950 98.70
Total fi nancial assets at fair value through profi t or loss 2,133,619,950 98.70
Net current assets 28,118,393 1.30
Total net assets 2,161,738,343 100
Analysis of portfolio % of Total Assets
Transferable securities and money market instruments admitted
to offi cial stock exchange listing or traded on a regulated market 98.14
Other current assets 1.86
Total assets 100.00
BNY MELLON JAPAN REIT ALPHA FUND
JPYJPY

165
Portfolio of investments – as at 31 December 2016
Holdings Description
Fair
value
Total
net assets
% Description
Fair
value
Total
net assets
%
BNY MELLON JAPANSMALL CAP EQUITY FOCUS FUND
Unrealised loss on forward foreign currency contracts - (4,029) (see below)
(31 December 2015: (25,139,478)) (4,029) (0.00)
Total fi nancial liabilities at fair value through profi t or loss (4,029) (0.00)
Net current assets 52,057,291 1.91
Total net assets 2,724,538,443 100.00
Analysis of portfolio % of Total assets
Transferable securities and money market instruments admitted
to offi cial stock exchange listing or traded on a regulated market 97.48
OTC fi nancial derivative instruments 0.44
Other current assets 2.08
Total assets 100.00
Equities
Basic Materials - 310,127,550 (31 December 2015: 341,328,000) 310,127,550 11.38
125,000 Dowa Holdings Co Ltd 111,750,000 4.10
68,900 Sakata INX Corp 99,526,050 3.65
19,800 Sanyo Chemical Industries Ltd 98,851,500 3.63
Communications - 279,752,000 (31 December 2015: 516,329,750) 279,752,000 10.27
32,200 CyberAgent Inc 93,009,700 3.42
23,400 Open Door Inc 72,013,500 2.64
97,600 Vector Inc 114,728,800 4.21
Consumer, Cyclical - 536,868,750 (31 December 2015: 768,827,500) 536,868,750 19.71
32,900 HIS Co Ltd 101,085,250 3.71
14,700 Nifco Inc 90,772,500 3.33
31,500 Nippon Gas Co Ltd 105,840,000 3.89
29,300 PAL Group Holdings Co Ltd 81,278,200 2.98
45,800 Resorttrust Inc 98,744,800 3.63
47,700 Tomy Co Ltd 59,148,000 2.17
Consumer, Non-cyclical - 82,097,000 (31 December 2015: 132,705,500) 82,097,000 3.01
10,600 Ain Holdings Inc 82,097,000 3.01
Financials - 378,921,200 (31 December 2015: 911,150,250) 378,921,200 13.91
122,000 77 Bank Ltd/The 68,808,000 2.52
40,400 Anicom Holdings Inc 97,707,400 3.59
53,200 Financial Products Group Co Ltd 53,678,800 1.97
142,600 Leopalace21 Corp 91,977,000 3.38
17,800 Zenkoku Hosho Co Ltd 66,750,000 2.45
Industrials - 690,510,150 (31 December 2015: 1,502,090,500) 690,510,150 25.34
107,000 Nichias Corp 120,642,500 4.43
109,000 Osaki Electric Co Ltd 132,653,000 4.87
159,300 Penta-Ocean Construction Co Ltd 89,924,850 3.30
12,000 SHO-BOND Holdings Co Ltd 58,410,000 2.14
74,600 Star Micronics Co Ltd 118,651,300 4.36
51,500 Temp Holdings Co Ltd 93,266,500 3.42
25,400 Totetsu Kogyo Co Ltd 76,962,000 2.82
Information Technology - 382,146,750 (31 December 2015: 284,948,900) 382,146,750 14.03
29,000 Itokuro Inc 86,420,000 3.17
228,000 Sanken Electric Co Ltd 116,736,000 4.29
55,900 TechMatrix Corp 114,231,650 4.19
99,400 V-Cube Inc 64,759,100 2.38
Total investments in equities 2,660,423,400 97.65
Unrealised gain on forward foreign currency contracts - 12,061,781 (see below)
(31 December 2015: 168,652) 12,061,781 0.44
Total fi nancial assets at fair value through profi t or loss 2,672,485,181 98.09
JPYJPY

166
Portfolio of investments – as at 31 December 2016
BNY MELLON JAPAN SMALL CAP EQUITY FOCUS FUND
Forward foreign currency contracts
Unrealised
Gain/(Loss)Buy Sell Amount (B) Amount (S)
Settle
Date Counterparty
BNY Mellon Japan Small Cap Equity Focus Fund EUR H (Hedged) Share ClassEuro Japanese yen 244,717 29,720,558 13-Jan-17 The Bank of
New York Mellon 499,004
JPY 499,004
EUR 4,041
BNY Mellon Japan Small Cap Equity Focus Fund EUR I (Hedged) Share ClassEuro Japanese yen 3,919,768 476,050,488 13-Jan-17 The Bank of
New York Mellon 7,992,828
JPY 7,992,828
EUR 64,722
BNY Mellon Japan Small Cap Equity Focus Fund SGD H (Hedged) Share ClassJapanese yen Singapore dollar 29,190 360 13-Jan-17 The Bank of
New York Mellon 85
Singapore dollar Japanese yen 530,698 42,656,171 13-Jan-17 The Bank of New York Mellon 266,985
Singapore dollar Japanese yen 5,000 402,031 13-Jan-17 The Bank of New York Mellon 2,372
JPY 269,442
SGD 3,329
Singapore dollar Japanese yen 360 29,209 04-Jan-17 The Bank of New York Mellon (86)
Japanese yen Singapore dollar 402,176 5,000 06-Jan-17 The Bank of New York Mellon (2,422)
JPY (2,508)
SGD (31)
Net JPY 266,934
Net SGD 3,298
Forward foreign currency contracts cont’d.
Unrealised
Gain/(Loss)Buy Sell Amount (B) Amount (S)
Settle
Date Counterparty
BNY Mellon Japan Small Cap Equity Focus Fund USD H (Hedged) Share ClassJapanese yen US dollar 25,341 215 13-Jan-17 The Bank of
New York Mellon 187
Japanese yen US dollar 440,384 3,760 13-Jan-17 The Bank of New York Mellon 986
Japanese yen US dollar 8,608,396 72,879 13-Jan-17 The Bank of New York Mellon 90,971
US dollar Japanese yen 1,255,160 144,347,624 13-Jan-17 The Bank of New York Mellon 2,343,947
JPY 2,436,091
USD 20,831
Japanese yen US dollar 81,009 706 13-Jan-17 The Bank of New York Mellon (1,521)
JPY (1,521)
USD (13)
Net JPY 2,434,570
Net USD 20,818
BNY Mellon Japan Small Cap Equity Focus Fund USD I (Hedged) Share ClassUS dollar Japanese yen 462,886 53,233,432 13-Jan-17 The Bank of
New York Mellon 864,416
JPY 864,416
USD 7,392

167
Portfolio of investments – as at 31 December 2016
Holdings Description
Fair
value
Total
net assets
% Holdings Description
Fair
value
Total
net assets
%
BNY MELLON LONG-TERM GLOBAL EQUITY FUND
United States of America - 647,913,303 (31 December 2015: 673,300,422) 647,913,303 50.47
263,608 Adobe Systems Inc 25,782,312 2.01
34,854 Alphabet Inc 25,579,015 1.99
425,426 Amphenol Corp 27,160,730 2.12
308,789 Automatic Data Processing Inc 30,152,861 2.35
234,300 Cerner Corp 10,544,776 0.82
884,324 Cisco Systems Inc 25,408,606 1.98
427,618 Cognizant Technology Solutions Corp 22,765,120 1.77
376,910 Colgate-Palmolive Co 23,433,112 1.83
386,273 EOG Resources Inc 37,102,596 2.89
581,942 Fastenal Co 25,974,953 2.02
257,387 Gilead Sciences Inc 17,513,263 1.36
40,239 Intuitive Surgical Inc 24,268,964 1.89
244,560 Johnson & Johnson 26,778,107 2.09
283,041 MasterCard Inc 27,773,043 2.16
505,237 Microsoft Corp 29,829,922 2.32
495,673 Nike Inc 23,937,232 1.87
716,983 Oracle Corp 26,192,533 2.04
243,342 Praxair Inc 27,103,616 2.11
416,343 Schlumberger Ltd 33,209,734 2.59
519,003 Starbucks Corp 27,376,269 2.13
238,739 Stryker Corp 27,182,873 2.12
373,468 TJX Cos Inc 26,671,207 2.08
279,410 Tractor Supply Co 20,126,590 1.57
297,158 Walt Disney Co/The 29,439,139 2.29
120,595 WW Grainger Inc 26,606,730 2.07
Total investments in equities 1,262,788,522 98.37
Unrealised gain on forward foreign currency contracts - 2,102 (see below)
(31 December 2015: 10,018) 2,102 0.00
Total fi nancial assets at fair value through profi t or loss 1,262,790,624 98.37
Unrealised loss on forward foreign currency contracts - (500) (see below)
(31 December 2015: (1,490)) (500) (0.00)
Total fi nancial liabilities at fair value through profi t or loss (500) (0.00)
Net current assets 20,961,024 1.63
Total net assets 1,283,751,148 100.00
Analysis of portfolio % of Total assets
Transferable securities and money market instruments admitted
to offi cial stock exchange listing or traded on a regulated market 98.26
OTC fi nancial derivative instruments 0.00
Other current assets 1.74
Total assets 100.00
Equities
Australia - 27,814,147 (31 December 2015: 32,173,434) 27,814,147 2.17
404,000 CSL Ltd 27,814,147 2.17
Canada - 28,752,627 (31 December 2015: 17,217,991) 28,752,627 2.24
924,625 Suncor Energy Inc 28,752,627 2.24
China - 54,479,959 (31 December 2015: 57,505,921) 54,479,959 4.24
2,398,986 China Mobile Ltd 24,150,686 1.88
25,509,646 CNOOC Ltd 30,329,273 2.36
Denmark - 16,803,978 (31 December 2015: 32,733,975) 16,803,978 1.31
491,740 Novo Nordisk A/S 16,803,978 1.31
France - 82,528,873 (31 December 2015: 72,614,175) 82,528,872 6.43
236,900 Essilor International SA 25,395,680 1.98
170,000 L’Oreal SA 29,452,500 2.29
152,700 LVMH Moet Hennessy Louis Vuitton SA 27,680,692 2.16
Hong Kong - 48,064,519 (31 December 2015: 57,354,695) 48,064,519 3.74
4,404,600 AIA Group Ltd 23,620,803 1.84
14,500,626 Hong Kong & China Gas Co Ltd 24,443,716 1.90
Japan - 110,274,303 (31 December 2015: 168,704,622) 110,274,303 8.59
668,400 Denso Corp 27,482,258 2.14
152,600 FANUC Corp 24,577,790 1.91
40,700 Keyence Corp 26,524,957 2.07
106,800 Komatsu Ltd 2,295,885 0.18
398,900 Shin-Etsu Chemical Co Ltd 29,393,413 2.29
Spain - 24,393,648 (31 December 2015: 30,235,460) 24,393,648 1.90
752,600 Inditex SA 24,393,648 1.90
Sweden - 21,535,758 (31 December 2015: 28,693,797) 21,535,758 1.68
812,326 Hennes & Mauritz AB 21,535,758 1.68
Switzerland - 105,574,431 (31 December 2015: 137,600,519) 105,574,431 8.22
416,500 Nestle SA 28,403,540 2.21
386,200 Novartis AG 26,715,513 2.08
116,841 Roche Holding AG 25,375,718 1.98
7,023 SGS SA 13,572,120 1.06
30,650 Syngenta AG 11,507,540 0.89
Taiwan - 23,454,799 (31 December 2015: 29,845,264) 23,454,799 1.83
858,623 Taiwan Semiconductor Manufacturing Co Ltd ADR 23,454,799 1.83
United Kingdom - 71,198,178 (31 December 2015: 44,265,763) 71,198,178 5.55
1,752,400 Compass Group Plc 30,764,328 2.40
748,400 Experian Plc 13,778,189 1.07
331,000 Reckitt Benckiser Group Plc 26,655,661 2.08
Equities cont’d.
EUR EUR

168
Portfolio of investments – as at 31 December 2016
BNY MELLON LONG-TERM GLOBAL EQUITY FUND
Forward foreign currency contracts
Unrealised
Gain/(Loss)Buy Sell Amount (B) Amount (S)
Settle
Date Counterparty
BNY Mellon Long-Term Global Equity FundEuro US dollar 116,608 123,207 03-Jan-17 The Bank of
New York Mellon (436)
EUR (436)
BNY Mellon Long-Term Global Equity Fund CHF W (Hedged) Share ClassSwiss franc Euro 4,483 4,178 13-Jan-17 The Bank of
New York Mellon 4
Swiss franc Euro 200,513 186,384 13-Jan-17 The Bank of New York Mellon 716
EUR 720
CHF 772
BNY Mellon Long-Term Global Equity Fund USD W (Hedged) Share ClassUS dollar Euro 355,387 336,044 13-Jan-17 The Bank of
New York Mellon 1,382
EUR 1,382
USD 1,455
US dollar Euro 7,715 7,389 13-Jan-17 The Bank of New York Mellon (64)
EUR (64)
USD (67)
Net EUR 1,318
Net USD 1,388

169
Portfolio of investments – as at 31 December 2016
Holdings Description
Fair
value
Total
net assets
% Holdings Description
Fair
value
Total
net assets
%
BNY MELLON PAN EUROPEAN EQUITY FUND
1,013 Novartis AG 69,853 3.61
313 Roche Holding AG 67,684 3.50
United Kingdom - 766,540 (31 December 2015: 15,540,377) 766,540 39.64
1,442 Associated British Foods Plc 46,045 2.38
34,022 Barclays Plc 87,632 4.53
814 British American Tobacco Plc 43,630 2.26
9,933 Centrica Plc 27,089 1.40
1,495 Diageo Plc 36,535 1.89
2,133 GlaxoSmithKline Plc 38,658 2.00
22,871 Hays Plc 39,713 2.05
1,545 Just Eat Plc 10,498 0.54
359 Next Plc 20,773 1.07
1,049 Prudential Plc 19,703 1.02
3,472 RELX Plc 58,305 3.02
37,331 Royal Bank of Scotland Group Plc 97,372 5.04
2,249 Royal Dutch Shell Plc 61,354 3.17
1,667 Unilever Plc 63,736 3.30
27,358 Vodafone Group Plc 63,320 3.27
905 Wolseley Plc 52,177 2.70
Total investments in equities 1,925,854 99.59
Unrealised gain on forward foreign currency contracts - 23 (see below)
(31 December 2015: (3)) 23 0.00
Total fi nancial assets at fair value through profi t or loss 1,925,877 99.59
Net current assets 7,944 0.41
Total net assets 1,933,821 100.00
Analysis of portfolio % of Total assets
Transferable securities and money market instruments admitted
to offi cial stock exchange listing or traded on a regulated market 98.64
OTC fi nancial derivative instruments 0.00
Other current assets 1.36
Total assets 100.00
Forward foreign currency contractsUnrealised
Gain/(Loss)Buy Sell Amount (B) Amount (S)
Settle
Date Counterparty
BNY Mellon Pan European Equity FundEuro US dollar 2,875 3,012 03-Jan-17 Royal Bank of
Scotland 23
EUR 23
Equities
Denmark - 13,067 (31 December 2015: 1,088,355) 13,067 0.68
360 DONG Energy A/S 13,067 0.68
France - 198,490 (31 December 2015: 4,834,572) 198,490 10.26
282 Essilor International SA 30,054 1.55
219 L’Oreal SA 37,657 1.95
832 Total SA 40,235 2.08
425 Vinci SA 27,272 1.41
2,727 Vivendi SA 48,827 2.52
544 Worldline SA 14,445 0.75
Germany - 381,880 (31 December 2015: 8,942,359) 381,880 19.75
291 Bayer AG 28,662 1.48
948 Hella KGaA Hueck & Co 33,879 1.75
5,746 Infi neon Technologies AG 95,240 4.93
720 LEG Immobilien AG 52,859 2.73
270 MTU Aero Engines AG 29,477 1.53
653 SAP SE 54,046 2.80
8,085 Telefonica Deutschland Holding AG 32,922 1.70
413 Volkswagen AG Pfd 54,795 2.83
Ireland - 91,903 (31 December 2015: 830,567) 91,903 4.75
2,820 CRH Plc 91,903 4.75
Italy - 36,114 (31 December 2015: 2,314,807) 36,114 1.87
674 Atlantia SpA 15,104 0.78
779 Yoox Net-A-Porter Group SpA 21,010 1.09
Netherlands - 94,541 (31 December 2015: 2,712,779) 94,541 4.89
1,333 Intertrust NV 21,774 1.13
2,115 Wolters Kluwer NV 72,767 3.76
Norway - 56,555 (31 December 2015: 552,758) 56,555 2.92
4,019 DNB ASA 56,555 2.92
Portugal - 21,072 (31 December 2015: 705,077) 21,072 1.09
1,495 Galp Energia SGPS SA 21,072 1.09
Spain - 26,320 (31 December 2015: 587,612) 26,320 1.36
817 Inditex SA 26,320 1.36
Sweden - 29,361 (31 December 2015: 947,369) 29,361 1.52
1,097 Svenska Cellulosa AB SCA 29,361 1.52
Switzerland - 210,011 (31 December 2015: 7,130,417) 210,011 10.86
64 Actelion Ltd 13,187 0.68
4,412 Credit Suisse Group AG 59,287 3.07
Equities cont’d.
Switzerland cont’d.
EUR EUR

170
Portfolio of investments – as at 31 December 2016
Holdings Description
Fair
value
Total
net assets
% Holdings Description
Fair
value
Total
net assets
%
BNY MELLON S&P 500® INDEX TRACKER
1,036 Omnicom Group Inc 88,190 0.10
220 priceline.com Inc 322,696 0.37
441 Scripps Networks Interactive Inc 31,479 0.04
2,763 Symantec Corp 66,022 0.08
1,010 TEGNA Inc 21,599 0.02
3,441 Time Warner Inc 332,590 0.38
518 TripAdvisor Inc 24,017 0.03
4,681 Twenty-First Century Fox Inc - Class A 131,279 0.15
2,237 Twenty-First Century Fox Inc - Class B 60,969 0.07
404 VeriSign Inc 30,738 0.04
18,168 Verizon Communications Inc 970,080 1.12
1,609 Viacom Inc 56,500 0.07
6,555 Walt Disney Co/The 683,588 0.79
3,897 Yahoo! Inc 150,755 0.17
Consumer, Cyclical - 7,917,070 (31 December 2015: 7,933,048) 7,917,070 9.15
333 Advance Auto Parts Inc 56,334 0.06
544 Alaska Air Group Inc 48,266 0.06
2,312 American Airlines Group Inc 107,959 0.12
283 AutoNation Inc 13,774 0.02
128 AutoZone Inc 101,236 0.12
682 Bed Bath & Beyond Inc 27,720 0.03
1,237 Best Buy Co Inc 52,789 0.06
938 BorgWarner Inc 36,999 0.04
857 CarMax Inc 55,195 0.06
1,872 Carnival Corp 97,466 0.11
131 Chipotle Mexican Grill Inc 49,447 0.06
1,266 Coach Inc 44,342 0.05
1,938 Costco Wholesale Corp 310,293 0.36
4,720 CVS Health Corp 372,620 0.43
540 Darden Restaurants Inc 39,263 0.05
1,233 Delphi Automotive Plc 83,049 0.10
3,285 Delta Air Lines Inc 161,606 0.19
1,135 Dollar General Corp 84,075 0.10
1,033 Dollar Tree Inc 79,711 0.09
1,496 DR Horton Inc 40,893 0.05
1,258 Fastenal Co 59,107 0.07
613 Foot Locker Inc 43,459 0.05
17,422 Ford Motor Co 211,416 0.24
980 Gap Inc/The 21,996 0.03
6,187 General Motors 215,586 0.25
671 Genuine Parts Co 64,111 0.07
1,169 Goodyear Tire & Rubber Co/The 36,093 0.04
1,774 Hanesbrands Inc 38,274 0.04
807 Harley-Davidson Inc 47,084 0.05
304 Harman International Industries Inc 33,794 0.04
527 Hasbro Inc 40,993 0.05
5,433 Home Depot Inc/The 728,783 0.84
825 Kohl’s Corp 40,743 0.05
1,048 L Brands Inc 69,006 0.08
843 Lennar Corp 36,186 0.04
1,372 LKQ Corp 42,059 0.05
3,897 Lowe’s Cos Inc 277,174 0.32
1,426 Macy’s Inc 51,079 0.06
1,407 Marriott International Inc 116,331 0.13
1,540 Mattel Inc 42,435 0.05
3,705 McDonald’s Corp 451,102 0.52
739 Michael Kors Holdings Ltd 31,770 0.04
Bonds
Government - 39,960 (31 December 2015: 44,995) 39,960 0.05
40,000 United States Treasury Bill 0.000% 16-Mar-2017* 39,960 0.05
Total investments in bonds 39,960 0.05
Equities
Basic Materials - 1,982,594 (31 December 2015: 1,711,862) 1,982,594 2.29
526 Albemarle Corp 45,297 0.05
1,087 CF Industries Holdings Inc 34,224 0.04
5,046 Dow Chemical Co/The 288,757 0.33
650 Eastman Chemical Co 48,896 0.06
1,164 Ecolab Inc 136,450 0.16
3,867 EI du Pont de Nemours & Co 283,857 0.33
621 FMC Corp 35,133 0.04
5,489 Freeport-McMoRan Inc 72,373 0.08
342 International Flavors & Fragrances Inc 40,303 0.05
1,837 International Paper Co 97,480 0.11
1,505 LyondellBasell Industries NV 129,122 0.15
1,932 Monsanto Co 203,401 0.24
1,562 Mosaic Co/The 45,821 0.05
2,400 Newmont Mining Corp 81,780 0.09
1,435 Nucor Corp 85,447 0.10
1,170 PPG Industries Inc 110,875 0.13
1,268 Praxair Inc 148,667 0.17
352 Sherwin-Williams Co/The 94,711 0.11
Chemicals - 138,096 (31 December 2015: 144,843) 138,096 0.16
960 Air Products & Chemicals 138,096 0.16
Communications - 11,587,029 (31 December 2015: 10,096,100) 11,587,029 13.38
1,319 Alphabet Inc - Class A 1,045,782 1.21
1,322 Alphabet Inc - Class C 1,021,285 1.18
1,758 Amazon.com Inc 1,318,869 1.52
27,296 AT&T Inc 1,161,308 1.34
1,750 CBS Corp 111,379 0.13
2,500 CenturyLink Inc 59,462 0.07
965 Charter Communications Inc 277,872 0.32
22,300 Cisco Systems Inc 674,463 0.78
10,654 Comcast Corp 736,671 0.85
4,300 Corning Inc 104,382 0.12
685 Discovery Communications Inc - Class A 18,779 0.02
969 Discovery Communications Inc - Class C 25,969 0.03
4,719 eBay Inc 140,131 0.16
537 Expedia Inc 60,834 0.07
285 F5 Networks Inc 41,248 0.05
10,425 Facebook Inc 1,200,335 1.39
5,425 Frontier Communications Corp 18,255 0.02
559 Harris Corp 57,286 0.07
1,727 Interpublic Group of Cos Inc/The 40,438 0.05
1,648 Juniper Networks Inc 46,581 0.05
1,293 Level 3 Communications Inc 72,886 0.08
747 Motorola Solutions Inc 61,938 0.07
1,894 Netfl ix Inc 234,506 0.27
1,681 News Corp - Class A 19,273 0.02
441 News Corp - Class B 5,215 0.01
1,463 Nielsen Holdings Plc 61,380 0.07
Equities cont’d.
Communications cont’d.
USDUSD

171
Portfolio of investments – as at 31 December 2016
Holdings Description
Fair
value
Total
net assets
% Holdings Description
Fair
value
Total
net assets
%
BNY MELLON S&P 500® INDEX TRACKER
375 Cintas Corp 43,342 0.05
596 Clorox Co/The 71,541 0.08
17,225 Coca-Cola Co/The 714,235 0.83
3,994 Colgate-Palmolive Co 261,387 0.30
1,830 Conagra Brands Inc 72,386 0.08
778 Constellation Brands Inc 119,341 0.14
202 Cooper Cos Inc/The 35,337 0.04
2,184 Coty Inc 40,022 0.05
320 CR Bard Inc 71,896 0.08
705 DaVita Inc 45,272 0.05
1,050 Dentsply Sirona Inc 60,622 0.07
837 Dr Pepper Snapple Group Inc 75,895 0.09
931 Edwards Lifesciences Corp 87,244 0.10
4,296 Eli Lilly & Co 316,078 0.37
858 Endo International Plc 14,136 0.02
517 Envision Healthcare Corp 32,724 0.04
551 Equifax Inc 65,136 0.08
1,007 Estee Lauder Cos Inc/The 77,030 0.09
2,783 Express Scripts Holding Co 191,456 0.22
2,657 General Mills Inc 164,136 0.19
5,844 Gilead Sciences Inc 418,577 0.48
712 Global Payments Inc 49,423 0.06
1,064 H&R Block Inc 24,467 0.03
1,324 HCA Holdings Inc 98,022 0.11
362 Henry Schein Inc 54,921 0.06
611 Hershey Co/The 63,199 0.07
1,275 Hologic Inc 51,172 0.06
1,198 Hormel Foods Corp 41,708 0.05
656 Humana Inc 133,821 0.15
656 Illumina Inc 83,988 0.10
174 Intuitive Surgical Inc 110,468 0.13
507 JM Smucker Co/The 64,919 0.07
12,142 Johnson & Johnson 1,399,487 1.62
1,139 Kellogg Co 83,961 0.10
1,587 Kimberly-Clark Corp 181,116 0.21
2,651 Kraft Heinz Co/The 231,565 0.27
4,264 Kroger Co/The 147,215 0.17
455 Laboratory Corp of America Holdings 58,420 0.07
478 Mallinckrodt Plc 23,826 0.03
4,248 MasterCard Inc 438,776 0.51
507 McCormick & Co Inc 47,321 0.05
1,016 McKesson Corp 142,718 0.16
832 Mead Johnson Nutrition Co 58,868 0.07
6,121 Medtronic Plc 436,182 0.50
12,263 Merck & Co Inc 721,984 0.83
831 Molson Coors Brewing Co 80,881 0.09
6,879 Mondelez International Inc 304,980 0.35
1,833 Monster Beverage Corp 81,275 0.09
731 Moody’s Corp 68,930 0.08
2,008 Mylan NV 76,615 0.09
406 Patterson Cos Inc 16,660 0.02
4,953 PayPal Holdings Inc 195,520 0.23
6,380 PepsiCo Inc 667,827 0.77
635 Perrigo Co Plc 52,867 0.06
27,044 Pfi zer Inc 878,795 1.02
6,877 Philip Morris International Inc 629,349 0.73
11,923 Procter & Gamble Co/The 1,003,857 1.16
686 Quanta Services Inc 23,911 0.03
624 Quest Diagnostics Inc 57,355 0.07
332 Regeneron Pharmaceuticals Inc 121,929 0.14
273 Mohawk Industries Inc 54,525 0.06
2,129 Newell Brands Inc 95,070 0.11
5,966 Nike Inc 303,282 0.35
513 Nordstrom Inc 24,591 0.03
419 O’Reilly Automotive Inc 116,639 0.13
1,594 PACCAR Inc 101,872 0.12
1,463 PulteGroup Inc 26,897 0.03
341 PVH Corp 30,777 0.04
271 Ralph Lauren Corp 24,478 0.03
1,748 Ross Stores Inc 114,677 0.13
754 Royal Caribbean Cruises Ltd 61,866 0.07
334 Signet Jewelers Ltd 31,500 0.04
2,783 Southwest Airlines Co 138,719 0.16
2,759 Staples Inc 24,955 0.03
6,493 Starbucks Corp 360,524 0.42
2,506 Target Corp 181,096 0.21
478 Tiffany & Co 37,021 0.04
2,920 TJX Cos Inc 219,511 0.25
620 Tractor Supply Co 47,011 0.05
264 Ulta Salon Cosmetics & Fragrance Inc 67,313 0.08
877 Under Armour Inc - Class A 25,499 0.03
883 Under Armour Inc - Class C 22,234 0.03
1,283 United Continental Holdings Inc 93,518 0.11
399 Urban Outfi tters Inc 11,361 0.01
1,453 VF Corp 77,525 0.09
3,783 Walgreens Boots Alliance Inc 313,195 0.36
6,715 Wal-Mart Stores Inc 464,241 0.54
344 Whirlpool Corp 62,549 0.07
249 WW Grainger Inc 57,829 0.07
488 Wyndham Worldwide Corp 37,276 0.04
359 Wynn Resorts Ltd 31,062 0.04
1,529 Yum! Brands Inc 96,839 0.11
Consumer, Non-cyclical - 19,747,771 (31 December 2015: 19,345,852) 19,747,771 22.81
6,548 Abbott Laboratories 251,541 0.29
7,274 AbbVie Inc 455,534 0.53
1,548 Aetna Inc 192,006 0.22
1,006 Alexion Pharmaceuticals Inc 123,114 0.14
1,659 Allergan plc 348,730 0.40
263 Alliance Data Systems Corp 60,126 0.07
8,659 Altria Group Inc 585,651 0.68
727 AmerisourceBergen Corp 56,855 0.07
3,315 Amgen Inc 484,835 0.56
1,169 Anthem Inc 168,085 0.19
2,567 Archer-Daniels-Midland Co 117,209 0.14
2,025 Automatic Data Processing Inc 208,150 0.24
401 Avery Dennison Corp 28,160 0.03
2,193 Baxter International Inc 97,271 0.11
947 Becton Dickinson and Co 156,795 0.18
969 Biogen Inc 274,963 0.32
5,984 Boston Scientifi c Corp 129,464 0.15
7,399 Bristol-Myers Squibb Co 432,435 0.50
849 Brown-Forman Corp 38,167 0.04
847 Campbell Soup Co 51,222 0.06
1,444 Cardinal Health Inc 103,939 0.12
3,432 Celgene Corp 397,494 0.46
799 Centene Corp 45,155 0.05
1,158 Church & Dwight Co Inc 51,178 0.06
1,139 Cigna Corp 152,136 0.18
Equities cont’d.
Consumer, Cyclical cont’d.
Equities cont’d.
Consumer, Non-cyclical cont’d.
USDUSD

172
Portfolio of investments – as at 31 December 2016
Holdings Description
Fair
value
Total
net assets
% Holdings Description
Fair
value
Total
net assets
%
BNY MELLON S&P 500® INDEX TRACKER
2,019 Valero Energy Corp 137,989 0.16
2,994 Williams Cos Inc/The 93,278 0.11
Financials - 14,967,509 (31 December 2015: 12,354,125) 14,967,509 17.29
1,839 Afl ac Inc 128,013 0.15
1,632 Allstate Corp/The 120,972 0.14
3,453 American Express Co 255,816 0.30
4,355 American International Group Inc 284,490 0.33
1,878 American Tower Corp 198,495 0.23
706 Ameriprise Financial Inc 78,327 0.09
1,174 Aon Plc 130,954 0.15
729 Apartment Investment & Management Co 33,137 0.04
782 Arthur J Gallagher & Co 40,637 0.05
256 Assurant Inc 23,781 0.03
602 AvalonBay Communities Inc 106,689 0.12
45,062 Bank of America Corp 997,898 1.15
4,747 Bank of New York Mellon Corp/The 224,937 0.26
3,590 BB&T Corp 168,820 0.20
8,463 Berkshire Hathaway Inc 1,379,808 1.59
542 BlackRock Inc 206,375 0.24
695 Boston Properties Inc 87,448 0.10
2,153 Capital One Financial Corp 187,849 0.22
1,362 CBRE Group Inc 42,896 0.05
5,315 Charles Schwab Corp/The 209,810 0.24
2,071 Chubb Ltd 273,734 0.32
672 Cincinnati Financial Corp 50,917 0.06
12,711 Citigroup Inc 755,478 0.87
2,337 Citizens Financial Group Inc 83,279 0.10
1,525 CME Group Inc 175,916 0.20
754 Comerica Inc 51,404 0.06
1,591 Crown Castle International Corp 138,059 0.16
704 Digital Realty Trust Inc 69,179 0.08
1,760 Discover Financial Services 126,887 0.15
1,218 E*TRADE Financial Corp 42,210 0.05
323 Equinix Inc 115,513 0.13
1,656 Equity Residential 106,588 0.12
285 Essex Property Trust Inc 66,292 0.08
589 Extra Space Storage Inc 45,497 0.05
328 Federal Realty Investment Trust 46,615 0.05
3,355 Fifth Third Bancorp 90,501 0.10
1,529 Franklin Resources Inc 60,525 0.07
2,684 General Growth Properties Inc 67,060 0.08
1,649 Goldman Sachs Group Inc/The 395,158 0.46
1,719 Hartford Financial Services Group Inc/The 81,919 0.09
2,128 HCP Inc 63,319 0.07
3,229 Host Hotels & Resorts Inc 60,883 0.07
5,000 Huntington Bancshares Inc 66,075 0.08
2,645 Intercontinental Exchange Inc 149,244 0.17
1,843 Invesco Ltd 55,944 0.06
1,090 Iron Mountain Inc 35,409 0.04
15,957 JPMorgan Chase & Co 1,377,648 1.59
4,724 KeyCorp 86,331 0.10
1,886 Kimco Realty Corp 47,480 0.06
1,020 Lincoln National Corp 67,600 0.08
1,269 Loews Corp 59,446 0.07
708 M&T Bank Corp 110,777 0.13
567 Macerich Co/The 40,169 0.05
2,332 Marsh & McLennan Cos Inc 157,632 0.18
4,914 MetLife Inc 264,840 0.31
3,655 Reynolds American Inc 204,844 0.24
599 Robert Half International Inc 29,222 0.03
1,162 S&P Global Inc 124,944 0.14
1,276 St Jude Medical Inc 102,329 0.12
1,369 Stryker Corp 164,082 0.19
2,245 Sysco Corp 124,317 0.14
763 Total System Services Inc 37,414 0.04
1,330 Tyson Foods Inc 82,054 0.09
381 United Rentals Inc 40,232 0.05
4,223 UnitedHealth Group Inc 676,229 0.78
397 Universal Health Services Inc 42,245 0.05
409 Varian Medical Systems Inc 36,728 0.04
683 Verisk Analytics Inc 55,439 0.06
1,122 Vertex Pharmaceuticals Inc 82,736 0.10
8,328 Visa Inc 650,958 0.75
2,183 Western Union Co/The 47,426 0.05
1,397 Whole Foods Market Inc 42,965 0.05
876 Zimmer Biomet Holdings Inc 90,434 0.10
2,183 Zoetis Inc 116,867 0.14
Diversifi ed - 35,728 (31 December 2015: 24,610) 35,728 0.04
1,537 Leucadia National Corp 35,728 0.04
Energy - 6,470,115 (31 December 2015: 4,968,504) 6,470,115 7.47
2,456 Anadarko Petroleum Corp 171,269 0.20
1,719 Apache Corp 109,131 0.13
1,882 Baker Hughes Inc 122,358 0.14
2,012 Cabot Oil & Gas Corp 46,990 0.05
2,983 Chesapeake Energy Corp 20,956 0.02
8,412 Chevron Corp 990,808 1.14
427 Cimarex Energy Co 58,036 0.07
648 Concho Resources Inc 85,912 0.10
5,540 ConocoPhillips 277,803 0.32
2,302 Devon Energy Corp 105,144 0.12
2,556 EOG Resources Inc 258,437 0.30
776 EQT Corp 50,770 0.06
18,481 Exxon Mobil Corp 1,668,280 1.93
988 FMC Technologies Inc 35,109 0.04
3,801 Halliburton Co 205,615 0.24
503 Helmerich & Payne Inc 38,945 0.04
1,174 Hess Corp 73,134 0.08
8,469 Kinder Morgan Inc 175,520 0.20
3,661 Marathon Oil Corp 63,390 0.07
2,332 Marathon Petroleum Corp 117,451 0.14
749 Murphy Oil Corp 23,320 0.03
1,676 National Oilwell Varco Inc 62,758 0.07
869 Newfi eld Exploration Co 35,199 0.04
1,936 Noble Energy Inc 73,713 0.08
3,376 Occidental Petroleum Corp 240,489 0.28
913 ONEOK Inc 52,420 0.06
1,959 Phillips 66 169,297 0.20
766 Pioneer Natural Resources Co 137,968 0.16
806 Range Resources Corp 27,698 0.03
6,163 Schlumberger Ltd 517,476 0.60
2,061 Southwestern Energy Co 22,310 0.03
3,150 Spectra Energy Corp 129,449 0.15
532 Tesoro Corp 46,526 0.05
1,708 Transocean Ltd 25,167 0.03
Equities cont’d.
Consumer, Non-cyclical cont’d.
Equities cont’d.
Energy cont’d.
USDUSD

173
Portfolio of investments – as at 31 December 2016
Holdings Description
Fair
value
Total
net assets
% Holdings Description
Fair
value
Total
net assets
%
BNY MELLON S&P 500® INDEX TRACKER
647 Fluor Corp 33,984 0.04
1,311 Fortive Corp 70,342 0.08
678 Fortune Brands Home & Security Inc 36,249 0.04
543 Garmin Ltd 26,333 0.03
1,268 General Dynamics Corp 219,028 0.25
39,452 General Electric Co 1,248,064 1.44
3,369 Honeywell International Inc 390,383 0.45
1,409 Illinois Tool Works Inc 172,560 0.20
1,182 Ingersoll-Rand Plc 88,703 0.10
566 Jacobs Engineering Group Inc 32,270 0.04
399 JB Hunt Transport Services Inc 38,733 0.04
4,190 Johnson Controls International Plc 172,607 0.20
474 Kansas City Southern 40,224 0.05
346 L-3 Communications Holdings Inc 52,639 0.06
630 Leggett & Platt Inc 30,798 0.04
1,116 Lockheed Martin Corp 279,167 0.32
290 Martin Marietta Materials Inc 64,267 0.07
1,481 Masco Corp 46,837 0.05
115 Mettler-Toledo International Inc 48,150 0.06
1,296 Norfolk Southern Corp 140,065 0.16
792 Northrop Grumman Corp 184,279 0.21
596 Parker-Hannifi n Corp 83,452 0.10
775 Pentair Plc 43,458 0.05
507 PerkinElmer Inc 26,448 0.03
1,302 Raytheon Co 184,943 0.21
1,047 Republic Services Inc 59,737 0.07
585 Rockwell Automation Inc 78,647 0.09
564 Rockwell Collins Inc 52,336 0.06
456 Roper Technologies Inc 83,496 0.10
221 Ryder System Inc 16,455 0.02
863 Sealed Air Corp 39,133 0.05
250 Snap-on Inc 42,824 0.05
684 Stanley Black & Decker Inc 78,458 0.09
370 Stericycle Inc 28,503 0.03
1,600 TE Connectivity Ltd 110,856 0.13
1,187 Textron Inc 57,647 0.07
1,765 Thermo Fisher Scientifi c Inc 249,086 0.29
226 TransDigm Group Inc 56,286 0.06
3,688 Union Pacifi c Corp 382,575 0.44
3,060 United Parcel Service Inc 351,120 0.41
3,416 United Technologies Corp 375,060 0.43
600 Vulcan Materials Co 75,114 0.09
1,790 Waste Management Inc 126,992 0.15
371 Waters Corp 49,875 0.06
1,129 WestRock Co 57,336 0.07
833 Xylem Inc 41,254 0.05
Technology - 11,390,456 (31 December 2015: 10,054,193) 11,390,456 13.16
2,777 Accenture Plc 325,312 0.38
2,995 Activision Blizzard Inc 108,164 0.12
2,218 Adobe Systems Inc 228,354 0.26
799 Akamai Technologies Inc 53,281 0.06
1,390 Analog Devices Inc 100,942 0.12
23,780 Apple Inc 2,755,032 3.18
4,859 Applied Materials Inc 156,824 0.18
849 Autodesk Inc 62,839 0.07
1,770 Broadcom Ltd 312,989 0.36
1,447 CA Inc 45,986 0.05
502 Mid-America Apartment Communities Inc 49,161 0.06
6,432 Morgan Stanley 271,784 0.31
510 Nasdaq Inc 34,236 0.04
1,330 Navient Corp 21,859 0.03
971 Northern Trust Corp 86,472 0.10
1,475 People’s United Financial Inc 28,563 0.03
2,185 PNC Financial Services Group Inc/The 255,569 0.30
1,207 Principal Financial Group Inc 69,843 0.08
2,551 Progressive Corp/The 90,599 0.11
2,316 Prologis Inc 122,273 0.14
1,938 Prudential Financial Inc 201,717 0.23
656 Public Storage 146,521 0.17
1,151 Realty Income Corp 66,165 0.08
5,659 Regions Financial Corp 81,292 0.09
1,399 Simon Property Group Inc 249,029 0.29
429 SL Green Realty Corp 46,141 0.05
1,645 State Street Corp 127,866 0.15
2,203 SunTrust Banks Inc 120,846 0.14
3,547 Synchrony Financial 128,667 0.15
1,086 T Rowe Price Group Inc 81,738 0.09
523 Torchmark Corp 38,574 0.04
1,270 Travelers Cos Inc/The 155,505 0.18
1,195 UDR Inc 43,612 0.05
997 Unum Group 43,813 0.05
7,122 US Bancorp 365,964 0.42
1,572 Ventas Inc 98,289 0.11
749 Vornado Realty Trust 78,181 0.09
20,149 Wells Fargo & Co 1,110,714 1.28
1,570 Welltower Inc 105,088 0.12
3,286 Weyerhaeuser Co 98,892 0.11
566 Willis Towers Watson Plc 69,213 0.08
1,230 XL Group Ltd 45,836 0.05
948 Zions Bancorporation 40,807 0.05
Industrials - 8,971,231 (31 December 2015: 7,557,409) 8,971,231 10.36
2,678 3M Co 478,532 0.55
202 Acuity Brands Inc 46,654 0.05
254 Affi liated Managers Group Inc 36,913 0.04
1,467 Agilent Technologies Inc 66,844 0.08
445 Allegion Plc 28,482 0.03
1,042 AMETEK Inc 50,646 0.06
1,380 Amphenol Corp 92,743 0.11
1,997 Arconic Inc 37,034 0.04
757 Ball Corp 56,843 0.07
2,569 Boeing Co/The 400,186 0.46
2,582 Caterpillar Inc 239,480 0.28
648 CH Robinson Worldwide Inc 47,466 0.05
4,167 CSX Corp 149,741 0.17
681 Cummins Inc 93,116 0.11
2,683 Danaher Corp 208,992 0.24
1,272 Deere & Co 131,073 0.15
702 Dover Corp 52,604 0.06
2,009 Eaton Corp Plc 134,814 0.16
2,858 Emerson Electric Co 159,348 0.18
773 Expeditors International of Washington Inc 40,942 0.05
1,085 FedEx Corp 202,054 0.23
631 FLIR Systems Inc 22,848 0.03
564 Flowserve Corp 27,103 0.03
Equities cont’d.
Financials cont’d.
Equities cont’d.
Industrials cont’d.
USDUSD

174
Portfolio of investments – as at 31 December 2016
Holdings Description
Fair
value
Total
net assets
% Holdings Description
Fair
value
Total
net assets
%
BNY MELLON S&P 500® INDEX TRACKER
520 Pinnacle West Capital Corp 40,583 0.05
2,974 PPL Corp 101,279 0.12
2,304 Public Service Enterprise Group Inc 101,111 0.12
617 SCANA Corp 45,217 0.05
1,105 Sempra Energy 111,218 0.13
4,321 Southern Co/The 212,572 0.24
1,408 WEC Energy Group Inc 82,600 0.09
2,232 Xcel Energy Inc 90,876 0.10
Total investments in equities 85,929,892 99.25
Unrealised gain on forward foreign currency contracts - 225 (see below)
(31 December 2015: –) 225 0.00
Total fi nancial assets at fair value through profi t or loss 85,970,077 99.30
Holdings Description
Underlying
exposure
USD
Fair
value
USD
Total
net assets
%
Open futures contracts - (3,034) (31 December 2015: 1,147)
5 E-mini S&P 500 Index
Long Futures Contracts
Exp Mar-2017 559,050 (3,034) (0.00)
Total open futures contracts (3,034) (0.00)
Total fi nancial liabilities at fair value through profi t or loss (3,034) (0.00)
Net current assets 607,646 0.70
Total net assets 86,574,689 100.00
* Held as collateral by Goldman Sachs in respect of futures contracts held by the Fund.
The counterparty for futures contracts is Goldman Sachs.
Analysis of portfolio % of Total assets
Transferable securities and money market instruments admitted
to offi cial stock exchange listing or traded on a regulated market 99.08
OTC fi nancial derivative instruments 0.00
Other current assets 0.92
Total assets 100.00
Forward foreign currency contractsUnrealised
Gain/(Loss)Buy Sell Amount (B) Amount (S)
Settle
Date Counterparty
BNY Mellon S&P 500® Index TrackerEuro US dollar 9,400 9,826 03-Jan-17 The Bank of
New York Mellon 68
Euro US dollar 14,550 15,159 03-Jan-17 JPMorgan Chase 157
USD 225
1,341 Cerner Corp 63,530 0.07
676 Citrix Systems Inc 60,374 0.07
2,673 Cognizant Technology Solutions Corp 149,795 0.17
598 CSRA Inc 19,043 0.02
166 Dun & Bradstreet Corp/The 20,141 0.02
1,320 Electronic Arts Inc 103,970 0.12
1,445 Fidelity National Information Services Inc 109,307 0.13
394 First Solar Inc 12,638 0.01
967 Fiserv Inc 102,787 0.12
7,396 Hewlett Packard Enterprise Co 171,180 0.20
7,518 HP Inc 111,605 0.13
21,116 Intel Corp 766,405 0.88
3,856 International Business Machines Corp 640,115 0.74
1,100 Intuit Inc 126,076 0.15
692 KLA-Tencor Corp 54,440 0.06
700 Lam Research Corp 74,018 0.09
1,065 Linear Technology Corp 66,424 0.08
961 Microchip Technology Inc 61,653 0.07
4,731 Micron Technology Inc 103,727 0.12
34,663 Microsoft Corp 2,154,305 2.49
1,245 NetApp Inc 43,917 0.05
2,399 NVIDIA Corp 256,069 0.30
13,336 Oracle Corp 512,836 0.59
1,403 Paychex Inc 85,422 0.10
870 Pitney Bowes Inc 13,220 0.02
614 Qorvo Inc 32,379 0.04
6,579 QUALCOMM Inc 429,148 0.50
815 Red Hat Inc 56,810 0.07
2,877 salesforce.com Inc 197,003 0.23
1,330 Seagate Technology Plc 50,773 0.06
833 Skyworks Solutions Inc 62,196 0.07
591 Teradata Corp 16,063 0.02
4,438 Texas Instruments Inc 323,885 0.37
1,299 Western Digital Corp 88,274 0.10
3,963 Xerox Corp 34,617 0.04
1,103 Xilinx Inc 66,588 0.08
Utilities - 2,722,293 (31 December 2015: 2,281,754) 2,722,293 3.14
2,791 AES Corp 32,445 0.04
1,063 Alliant Energy Corp 40,282 0.04
1,109 Ameren Corp 58,184 0.07
2,182 American Electric Power Co Inc 137,390 0.16
800 American Water Works Co Inc 57,892 0.07
1,845 CenterPoint Energy Inc 45,470 0.05
1,245 CMS Energy Corp 51,823 0.06
1,379 Consolidated Edison Inc 101,612 0.12
2,763 Dominion Resources Inc 211,646 0.24
784 DTE Energy Co 77,244 0.09
3,043 Duke Energy Corp 236,213 0.27
1,476 Edison International 106,265 0.12
827 Entergy Corp 60,764 0.07
1,385 Eversource Energy 76,500 0.09
4,096 Exelon Corp 145,387 0.17
1,914 FirstEnergy Corp 59,286 0.07
2,091 NextEra Energy Inc 249,864 0.29
1,495 NiSource Inc 33,107 0.04
1,573 NRG Energy Inc 19,293 0.02
2,240 PG&E Corp 136,170 0.16
Equities cont’d.
Technology cont’d.
Equities cont’d.
Utilities cont’d.
USDUSD

175
Portfolio of investments – as at 31 December 2016
Holdings Description
Fair
value
Total
net assets
% Holdings Description
Fair
value
Total
net assets
%
BNY MELLON SMALL CAP EUROLAND FUND
Italy - 3,330,377 (31 December 2015: 5,827,961) 3,330,377 9.51
247,444 A2A SpA 303,614 0.87
88,990 Anima Holding SpA 144A 455,629 1.30
84,326 Autogrill SpA 724,360 2.07
6,743 Brembo SpA 390,251 1.11
332,562 Immobiliare Grande Distribuzione SIIQ SpA 239,777 0.68
20,111 Prysmian SpA 492,820 1.41
127,100 Saras SpA 219,629 0.63
62,665 Societa Iniziative Autostradali e Servizi SpA 504,297 1.44
Luxembourg - 1,004,665 (31 December 2015: –) 1,004,665 2.87
27,139 Orion Engineered Carbons SA 506,286 1.45
9,864 Stabilus SA 498,379 1.42
Malta - 404,516 (31 December 2015: –) 404,516 1.16
45,209 Kindred Group Plc 404,516 1.16
Netherlands - 2,312,513 (31 December 2015: 5,403,658) 2,312,513 6.60
24,444 Corbion NV 620,022 1.77
18,399 Euronext NV 144A 718,343 2.05
108,960 Koninklijke BAM Groep NV 475,883 1.36
33,435 SBM Offshore NV 498,265 1.42
Spain - 4,233,707 (31 December 2015: 7,118,778) 4,233,707 12.09
34,916 Almirall SA 513,789 1.47
19,068 Cia de Distribucion Integral Logista Holdings SA 419,258 1.20
72,732 Distribuidora Internacional de Alimentacion SA 337,913 0.96
27,534 Enagas SA 668,457 1.91
43,504 Euskaltel SA 144A 366,043 1.04
32,708 Gamesa Corp Tecnologica SA 625,213 1.79
12,024 Grupo Catalana Occidente SA 369,377 1.05
40,538 Hispania Activos Inmobiliarios SOCIMI SA 453,721 1.30
46,641 Merlin Properties Socimi SA 479,936 1.37
Switzerland - 479,937 (31 December 2015: –) 479,937 1.37
4,018 Baloise Holding AG 479,937 1.37
Total investments in equities 34,539,776 98.65
Equities
Belgium - 1,891,363 (31 December 2015: 3,411,899) 1,891,363 5.40
14,457 bpost SA 324,957 0.93
12,893 Galapagos NV 790,341 2.25
67,861 Nyrstar NV 528,298 1.51
8,837 Ontex Group NV 247,767 0.71
Finland - 1,537,686 (31 December 2015: 1,070,270) 1,537,686 4.39
15,215 Cramo OYJ 360,900 1.03
8,255 Huhtamaki OYJ 290,700 0.83
51,939 Oriola-KD OYJ 223,078 0.64
47,647 Valmet OYJ 663,008 1.89
France - 9,336,578 (31 December 2015: 17,230,733) 9,336,578 26.67
8,129 Alten SA 545,456 1.56
20,078 APERAM SA 872,088 2.49
9,976 Atos SE 1,002,089 2.86
23,670 Cie Plastic Omnium SA 713,059 2.04
19,938 Edenred 374,186 1.07
4,369 Eiffage SA 289,184 0.82
8,298 Fonciere Des Regions 686,245 1.96
11,083 Gaztransport Et Technigaz SA 453,987 1.30
10,616 Klepierre 395,738 1.13
18,747 Maisons du Monde SA 144A 468,628 1.34
4,607 Rubis SCA 361,788 1.03
27,161 SCOR SE 889,251 2.54
8,334 Sopra Steria Group 898,822 2.57
10,075 Technip SA 685,755 1.96
7,343 Teleperformance 700,302 2.00
Germany - 9,487,990 (31 December 2015: 16,176,310) 9,487,990 27.10
17,181 Aareal Bank AG 615,080 1.76
26,364 Alstria offi ce REIT-AG 312,084 0.89
3,429 Bechtle AG 338,597 0.97
13,845 Brenntag AG 728,455 2.08
13,555 Carl Zeiss Meditec AG 477,068 1.36
7,481 CEWE Stiftung & Co. KGaA 626,272 1.79
7,112 Covestro AG 144A 463,453 1.32
10,828 Drillisch AG 442,730 1.26
6,456 Gerresheimer AG 456,536 1.30
32,161 Jenoptik AG 527,119 1.51
17,908 Jungheinrich AG Pfd 487,545 1.39
16,466 K+S AG 374,231 1.07
6,842 Rheinmetall AG 435,972 1.25
18,400 Stroeer SE & Co KGaA 766,222 2.19
7,567 Symrise AG 438,318 1.25
68,074 TAG Immobilien AG 849,734 2.43
12,067 Wirecard AG 492,243 1.41
18,152 Zalando SE 144A 656,331 1.87
Ireland - 520,444 (31 December 2015: 2,748,764) 520,444 1.49
7,322 ICON Plc 520,444 1.49
Equities cont’d.
EUR EUR

176
Portfolio of investments – as at 31 December 2016
Holdings Description
Fair
value
Total
net assets
% Holdings Description
Fair
value
Total
net assets
%
BNY MELLON SMALL CAP EUROLAND FUND
Underlying
exposure
EUR
Open futures contracts - 1,006 (31 December 2015: 15,493)
8 Euro STOXX 50 Index
Long Futures Contracts
Exp Mar-2017 260,520 1,006 0.00
Total open futures contracts 1,006 0.00
Total fi nancial assets at fair value through profi t or loss 34,540,782 98.65
Net current assets 471,680 1.35
Total net assets 35,012,462 100.00
The counterparty for futures contracts is Goldman Sachs.
Analysis of portfolio % of Total assets
Transferable securities and money market instruments admitted
to offi cial stock exchange listing or traded on a regulated market 96.35
Financial derivative instruments dealt in on a regulated market 0.00
Other current assets 3.65
Total assets 100.00
EUR EUR

177
Portfolio of investments – as at 31 December 2016
Holdings Description
Fair
value
Total
net assets
% Holdings Description
Fair
value
Total
net assets
%
Bonds
Argentina - 2,502,256 (31 December 2015: 1,575,849) 2,502,256 3.17
6,500,000 Argentine Bonos del Tesoro
15.500% 17-Oct-2026 396,224 0.50
17,850,000 Argentine Bonos del Tesoro
21.200% 19-Sep-2018 1,143,940 1.45
350,510 Argentine Republic Government International Bond
8.280% 31-Dec-2033 372,417 0.47
250,000 Provincia de Buenos Aires 5.750% 15-Jun-2019 261,925 0.33
300,000 Provincia de Buenos Aires 144A
9.125% 16-Mar-2024 327,750 0.42
Australia - 5,621,747 (31 December 2015: 14,378,834) 5,621,747 7.12
1,100,000 Australia Government Bond 2.750% 21-Oct-2019 811,829 1.03
6,495,000 Australia Government Bond 3.250% 21-Oct-2018 4,809,918 6.09
Bahrain - 435,446 (31 December 2015: –) 435,446 0.55
425,000 Bahrain Government International Bond 144A
7.000% 12-Oct-2028 435,446 0.55
Bermuda - 212,349 (31 December 2015: 1,373,575) 212,349 0.27
245,000 Digicel Group Ltd 8.250% 30-Sep-2020 212,349 0.27
Brazil - 1,233,586 (31 December 2015: –) 1,233,586 1.56
2,750,000 Brazil Notas do Tesouro Nacional Serie F
10.000% 01-Jan-2021 814,399 1.03
475,000 Brazilian Government International Bond
5.625% 21-Feb-2047 419,187 0.53
Canada - 1,974,863 (31 December 2015: 1,290,481) 1,974,863 2.50
1,000,000 Canadian Government Bond 2.250% 01-Jun-2025 777,622 0.99
525,000 Glencore Finance Canada Ltd
2.700% 25-Oct-2017 528,519 0.67
501,254 MBarc Credit Canada Inc 144A
1.261% 17-Sep-2018 372,300 0.47
300,000 MBarc Credit Canada Inc 144A
1.532% 17-Jun-2019 222,395 0.28
100,000 MBarc Credit Canada Inc 144A
1.716% 15-Jul-2021 74,027 0.09
Cayman Islands - 737,687 (31 December 2015: 1,237,101) 737,687 0.94
725,000 Transocean Inc 2.500% 15-Oct-2017 737,687 0.94
Colombia - 826,030 (31 December 2015: –) 826,030 1.05
2,100,000,000 Colombian TES 10.000% 24-Jul-2024 826,030 1.05
France - 1,673,679 (31 December 2015: 857,763) 1,673,679 2.12
1,600,000 French Republic Government Bond OAT
0.500% 25-May-2026 1,673,679 2.12
Germany - 326,543 (31 December 2015: 318,953) 326,543 0.41
300,000 Allianz SE 3.375% Perpetual VAR 326,543 0.41
Hungary - 982,112 (31 December 2015: –) 982,112 1.24
68,200,000 Hungary Government Bond 3.000% 26-Jun-2024 238,315 0.30
182,500,000 Hungary Government Bond 5.500% 24-Jun-2025 743,797 0.94
Iceland - 741,124 (31 December 2015: –) 741,124 0.94
650,000 Iceland Government International Bond
5.875% 11-May-2022 741,124 0.94
Indonesia - 431,490 (31 December 2015: –) 431,490 0.55
400,000 Indonesia Government International Bond
3.750% 14-Jun-2028 431,490 0.55
Ireland - 1,445,019 (31 December 2015: 2,699,531) 1,445,019 1.83
200,000 AerCap Ireland Capital Ltd /
AerCap Global Aviation Trust 4.500% 15-May-2021 206,750 0.26
375,000 AerCap Ireland Capital Ltd /
AerCap Global Aviation Trust 5.000% 01-Oct-2021 395,156 0.50
325,000 Ardagh Packaging Finance Plc /
Ardagh Holdings USA Inc 3.963% 15-Dec-2019 FRN 330,688 0.42
500,000 MMC Norilsk Nickel OJSC via MMC Finance DAC
4.375% 30-Apr-2018 512,425 0.65
Italy - 518,397 (31 December 2015: 535,784) 518,397 0.66
200,000 Intesa Sanpaolo SpA 5.250% 12-Jan-2024 210,193 0.27
325,000 Italy Buoni Poliennali Del Tesoro 144A
2.800% 01-Mar-2067 308,204 0.39
Japan - 3,661,657 (31 December 2015: –) 3,661,657 4.64
56,000,000 Japan Government Ten Year Bond
0.500% 20-Dec-2024 498,421 0.63
347,753,600 Japanese Government CPI Linked Bond
0.100% 10-Mar-2025 3,163,236 4.01
Mexico - 1,999,656 (31 December 2015: 2,560,604) 1,999,656 2.53
18,074,683 Mexican Udibonos 4.500% 04-Dec-2025 977,400 1.24
700,000 Mexico City Airport Trust 4.250% 31-Oct-2026 687,750 0.87
325,000 Petroleos Mexicanos 144A
6.500% 13-Mar-2027 334,506 0.42
Netherlands - 3,317,544 (31 December 2015: 4,481,802) 3,317,544 4.20
300,000 Allianz Finance II BV 5.750% 08-Jul-2041 VAR 369,001 0.47
300,000 Equate Petrochemical BV 144A
3.000% 03-Mar-2022 285,933 0.36
378,582 Globaldrive Auto Receivables 2016-B BV
0.128% 20-Aug-2024 FRN 401,885 0.51
200,000 GTH Finance BV 144A 6.250% 26-Apr-2020 210,750 0.27
375,000 Lukoil International Finance BV 144A
4.750% 02-Nov-2026 376,093 0.48
200,000 Lukoil International Finance BV
6.125% 09-Nov-2020 217,510 0.27
225,000 Mylan NV 2.500% 07-Jun-2019 223,928 0.28
150,000 Mylan NV 144A 3.000% 15-Dec-2018 151,166 0.19
BNY MELLON TARGETED RETURN BOND FUND
Bonds cont’d.
USDUSD

178
Portfolio of investments – as at 31 December 2016
Holdings Description
Fair
value
Total
net assets
% Holdings Description
Fair
value
Total
net assets
%
BNY MELLON TARGETED RETURN BOND FUND
Supranational - 1,711,280 (31 December 2015: –) 1,711,280 2.17
275,000 European Investment Bank 1.125% 16-Sep-2021 199,001 0.25
2,175,000 International Bank for Reconstruction
& Development 3.500% 22-Jan-2021 1,512,279 1.92
Turkey - 849,597 (31 December 2015: –) 849,597 1.08
3,176,312 Turkey Government Bond 2.000% 18-Sep-2024 849,597 1.08
United Kingdom - 3,405,583 (31 December 2015: 5,440,657) 3,405,583 4.32
425,000 Barclays Plc 5.200% 12-May-2026 433,403 0.55
350,000 Barclays Plc 7.875% Perpetual VAR 355,987 0.45
300,000 British Telecommunications Plc
0.625% 10-Mar-2021 320,061 0.41
200,000 HSBC Holdings Plc 4.375% 23-Nov-2026 201,196 0.25
225,000 International Game Technology Plc
6.250% 15-Feb-2022 242,437 0.31
175,000 Interoute Finco Plc 7.375% 15-Oct-2020 198,978 0.25
200,000 Lloyds Banking Group Plc 3.100% 06-Jul-2021 202,620 0.26
750,000 Royal Bank of Scotland Group Plc
3.875% 12-Sep-2023 719,329 0.91
325,000 Royal Bank of Scotland Group Plc
8.625% Perpetual VAR 331,142 0.42
300,000 Virgin Media Finance Plc 7.000% 15-Apr-2023 400,430 0.51
United States of America - 34,953,234 (31 December 2015: 46,507,425) 34,953,234 44.30
95,739 A10 Term Asset Financing 2013-2 LLC
2.620% 15-Nov-2027 95,359 0.12
75,000 Abbott Laboratories 3.750% 30-Nov-2026 74,495 0.09
300,000 Abbott Laboratories 4.900% 30-Nov-2046 304,870 0.39
225,000 AbbVie Inc 1.375% 17-May-2024 241,048 0.31
214,139 ACE Securities Corp Home Equity Loan Trust
Series 2006-HE2 0.916% 25-May-2036 FRN 209,402 0.27
275,000 Aetna Inc 1.900% 07-Jun-2019 274,517 0.35
725,000 Ally Financial Inc 3.600% 21-May-2018 732,250 0.93
100,000 Ally Financial Inc 4.750% 10-Sep-2018 103,250 0.13
38,296 Avant Loans Funding Trust 2016-A 144A
4.110% 15-May-2019 38,390 0.05
106,447 Avant Loans Funding Trust 2016-B 144A
3.920% 15-Aug-2019 106,979 0.14
231,779 Avant Loans Funding Trust 2016-C 144A
2.960% 16-Sep-2019 232,026 0.29
870,000 Banc of America Commercial Mortgage Trust 2007-2
5.648% 10-Apr-2049 VAR 828,014 1.05
225,000 Bank of America Corp 4.250% 22-Oct-2026 227,397 0.29
369,713 Bear Stearns Commercial Mortgage Securities
Trust 2006-PWR14 5.273% 11-Dec-2038 370,619 0.47
675,000 Bear Stearns Commercial Mortgage Securities
Trust 2007-PWR16 5.711% 11-Jun-2040 VAR 677,943 0.86
500,000 Bear Stearns Commercial Mortgage Securities
Trust 2007-PWR18 6.222% 11-Jun-2050 VAR 488,583 0.62
225,000 BWAY Holding Co 9.125% 15-Aug-2021 238,500 0.30
150,000 Calpine Corp 5.500% 01-Feb-2024 145,500 0.18
285,000 Cimarex Energy Co 5.875% 01-May-2022 296,269 0.38
200,000 Citigroup Inc 4.300% 20-Nov-2026 201,582 0.26
325,000 Citizens Bank NA/Providence RI
2.500% 14-Mar-2019 327,494 0.41
425,000 Petrobras Global Finance BV
5.375% 27-Jan-2021 415,650 0.53
400,000 Shell International Finance BV
3.750% 12-Sep-2046 367,130 0.46
100,000 Teva Pharmaceutical Finance Netherlands II BV
1.125% 15-Oct-2024 101,954 0.13
200,000 Teva Pharmaceutical Finance Netherlands III BV
1.700% 19-Jul-2019 196,544 0.25
New Zealand - 1,832,488 (31 December 2015: 1,525,194) 1,832,488 2.32
2,500,000 New Zealand Government Bond
2.000% 20-Sep-2025 1,832,488 2.32
Peru - 257,337 (31 December 2015: –) 257,337 0.33
225,000 Peruvian Government International Bond
2.750% 30-Jan-2026 257,337 0.33
Poland - 1,979,382 (31 December 2015: 1,887,415) 1,979,382 2.51
6,000,000 Republic of Poland Government Bond
3.250% 25-Jul-2025 1,413,980 1.79
225,000 Republic of Poland Government International Bond
0.500% 20-Dec-2021 238,177 0.30
335,000 Republic of Poland Government International Bond
2.000% 25-Oct-2046 327,225 0.42
Portugal - 2,186,372 (31 December 2015: –) 2,186,372 2.77
975,000 Portugal Obrigacoes do Tesouro OT 144A
2.875% 21-Jul-2026 959,845 1.22
1,075,000 Portugal Obrigacoes do Tesouro OT 144A
3.850% 15-Apr-2021 1,226,527 1.55
Romania - 856,158 (31 December 2015: –) 856,158 1.09
285,000 Romanian Government International Bond
2.750% 29-Oct-2025 313,638 0.40
500,000 Romanian Government International Bond
2.875% 26-May-2028 542,520 0.69
Russia - 988,331 (31 December 2015: 662,369) 988,331 1.25
52,300,000 Russian Federal Bond - OFZ
7.050% 19-Jan-2028 783,102 0.99
200,000 Russian Foreign Bond - Eurobond
4.750% 27-May-2026 205,229 0.26
Saudi Arabia - 261,071 (31 December 2015: –) 261,071 0.33
275,000 Saudi Government International Bond 144A
3.250% 26-Oct-2026 261,071 0.33
Sri Lanka - 831,310 (31 December 2015: –) 831,310 1.05
450,000 Sri Lanka Government International Bond
5.750% 18-Jan-2022 444,832 0.56
375,000 Sri Lanka Government International Bond
6.000% 14-Jan-2019 386,478 0.49
Bonds cont’d.
Netherlands cont’d.
Bonds cont’d.
USDUSD

179
Portfolio of investments – as at 31 December 2016
Holdings Description
Fair
value
Total
net assets
% Holdings Description
Fair
value
Total
net assets
%
BNY MELLON TARGETED RETURN BOND FUND
170,000 Kraft Heinz Foods Co 4.875% 15-Feb-2025 183,304 0.23
165,578 Marlette Funding Trust 2016-1 144A
3.060% 17-Jan-2023 165,647 0.21
247,468 Merrill Lynch Mortgage Investors Trust
Series MLMI 2005-A1 3.126% 25-Dec-2034 VAR 230,771 0.29
102,224 ML-CFC Commercial Mortgage Trust 2006-4
5.239% 12-Dec-2049 102,472 0.13
260,000 ML-CFC Commercial Mortgage Trust 2007-9
6.177% 12-Sep-2049 VAR 211,193 0.27
225,000 Morgan Stanley 3.950% 23-Apr-2027 222,168 0.28
331,591 Morgan Stanley ABS Capital I Inc Trust 2006-NC4
0.906% 25-Jun-2036 FRN 288,227 0.37
275,000 Morgan Stanley Capital I Trust 2007-IQ14
5.690% 15-Apr-2049 VAR 269,634 0.34
150,000 Newell Brands Inc 2.600% 29-Mar-2019 151,740 0.19
165,000 NRG Energy Inc 6.250% 15-Jul-2022 165,825 0.21
175,000 Occidental Petroleum Corp 3.000% 15-Feb-2027 168,915 0.21
300,000 Omega Healthcare Investors Inc
4.375% 01-Aug-2023 296,715 0.38
375,000 OneMain Financial Issuance Trust 2016-1A
3.660% 20-Feb-2029 379,197 0.48
275,000 Oracle Corp 4.000% 15-Jul-2046 262,386 0.33
600,000 Oscar US Funding Trust 2.310% 15-Nov-2019 600,844 0.76
430,000 Prestige Auto Receivables Trust 2013-1
3.040% 15-Jul-2020 432,468 0.55
275,000 RAAC Series 2006-SP4 Trust
1.096% 25-Nov-2036 FRN 259,555 0.33
500,000 Santander Drive Auto Receivables Trust 2015-2
3.020% 15-Apr-2021 505,553 0.64
220,000 Scientifi c Games International Inc
10.000% 01-Dec-2022 220,000 0.28
178,003 SMB Private Education Loan Trust
1.354% 15-Nov-2023 FRN 178,322 0.23
434,722 Sofi Consumer Loan Program 2016-3 LLC 144A
3.050% 26-Dec-2025 433,697 0.55
241,227 Sofi Professional Loan Program 2016-B LLC
1.680% 25-Mar-2031 240,855 0.30
600,000 Southern Co/The 1.550% 01-Jul-2018 599,720 0.76
300,000 Springleaf Funding Trust 3.620% 15-Nov-2024 300,146 0.38
375,000 Springleaf Funding Trust 2016-A 144A
3.800% 15-Nov-2029 374,408 0.47
150,000 Sprint Communications Inc 7.000% 15-Aug-2020 159,391 0.20
175,000 Sprint Corp 7.875% 15-Sep-2023 187,250 0.24
275,000 Sprint Spectrum Co LLC / Sprint Spectrum Co II LLC /
Sprint Spectrum Co III LLC 3.360% 20-Sep-2021 275,741 0.35
175,000 Tenet Healthcare Corp 6.750% 15-Jun-2023 154,875 0.20
260,000 T-Mobile USA Inc 6.625% 01-Apr-2023 276,250 0.35
150,000 United Rentals North America Inc
5.500% 15-Jul-2025 154,500 0.20
670,000 United States Treasury Bill 0.000% 27-Apr-2017* 668,808 0.85
3,390,968 United States Treasury Infl ation Indexed Bonds
0.125% 15-Apr-2021 3,405,836 4.32
4,552,194 United States Treasury Infl ation Indexed Bonds
0.625% 15-Jan-2026 4,572,745 5.79
275,000 Verizon Owner Trust 2016-1 144A
1.420% 20-Jan-2021 273,311 0.35
200,000 Walgreens Boots Alliance Inc
1.750% 30-May-2018 200,278 0.25
155,000 Wells Fargo & Co 3.000% 22-Apr-2026 147,572 0.19
750,000 Colony American Homes Single-Family Rental
Pass-Through Certifi cates 4.386% 17-Jul-2032 FRN 749,431 0.95
324,257 Colony Starwood Homes 2016-2 Trust
1.986% 17-Dec-2033 FRN 324,915 0.41
175,000 COMM 2006-C8 Mortgage Trust 5.377% 10-Dec-2046 174,616 0.22
550,000 COMM 2015-CCRE23 Mortgage Trust
3.685% 10-May-2048 VAR 514,644 0.65
65,838 Conn’s Receivables Funding 2015-A LLC 144A
4.565% 15-Sep-2020 65,949 0.08
384,810 Conn’s Receivables Funding 2016-B LLC 144A
3.730% 15-Oct-2018 385,885 0.49
175,000 Continental Resources Inc 3.800% 01-Jun-2024 162,312 0.21
110,000 Continental Resources Inc 5.000% 15-Sep-2022 111,445 0.14
100,000 Cox Communications Inc 3.350% 15-Sep-2026 95,352 0.12
350,000 Diamond 1 Finance Corp / Diamond 2 Finance Corp
3.480% 01-Jun-2019 357,521 0.45
100,000 Diamondback Energy Inc 4.750% 01-Nov-2024 98,500 0.12
400,000 Dominion Resources Inc 2.962% 01-Jul-2019 405,003 0.51
225,000 Drive Auto Receivables Trust
3.020% 15-Nov-2021 225,172 0.29
500,000 Drive Auto Receivables Trust
3.840% 15-Jul-2021 503,618 0.64
225,000 Drive Auto Receivables Trust
4.180% 15-Mar-2024 223,396 0.28
160,000 Dynegy Inc 7.375% 01-Nov-2022 153,600 0.19
150,000 Ensemble S Merger Sub Inc 9.000% 30-Sep-2023 159,750 0.20
205,000 First Data Corp 7.000% 01-Dec-2023 219,606 0.28
350,000 Ford Motor Credit Co LLC 3.336% 18-Mar-2021 352,497 0.45
336,000 Freeport-McMoRan Inc 144A 6.875% 15-Feb-2023 355,320 0.45
525,000 General Motors Financial Co Inc
2.350% 04-Oct-2019 518,873 0.66
350,000 General Motors Financial Co Inc
2.440% 15-Jan-2020 FRN 353,848 0.45
900,000 Georgetown University 1.311% 01-Apr-2029 813,788 1.03
145,000 GLP Capital LP / GLP Financing II Inc
5.375% 15-Apr-2026 151,583 0.19
225,000 GM Financial Automobile Leasing Trust 2016-1
2.590% 20-Mar-2020 227,038 0.29
290,000 Goldman Sachs Group Inc/The 3.500% 16-Nov-2026 284,041 0.36
1,292,408 Government National Mortgage Association
3.500% 20-Mar-2039 124,352 0.16
472,633 Government National Mortgage Association
4.000% 20-Mar-2042 70,483 0.09
563,016 Government National Mortgage Association
5.361% 20-Jul-2042 FRN 121,856 0.15
971,498 Government National Mortgage Association
5.461% 20-Nov-2045 FRN 222,860 0.28
69,137 HSI Asset Securitization Corp Trust 2005-I1
1.046% 25-Nov-2035 FRN 68,133 0.09
300,000 Hyundai Capital America 2.000% 01-Jul-2019 297,521 0.38
82,219 Impac Secured Assets Trust 2006-2
1.106% 25-Aug-2036 FRN 81,120 0.10
175,000 Infor US Inc 6.500% 15-May-2022 183,531 0.23
47,556 JP Morgan Chase Commercial Mortgage Securities
Trust 2006-CIBC17 5.464% 12-Dec-2043 47,548 0.06
515,000 JP Morgan Chase Commercial Mortgage Securities
Trust 2014-INN 4.304% 15-Jun-2029 FRN 512,540 0.65
575,000 JPMorgan Chase & Co 1.850% 22-Mar-2019 573,074 0.73
300,000 Kraft Heinz Foods Co 2.250% 25-May-2028 324,495 0.41
Bonds cont’d.
United States of America cont’d.
Bonds cont’d.
United States of America cont’d.
USDUSD

180
Portfolio of investments – as at 31 December 2016
Holdings Description
Fair
value
Total
net assets
% Holdings Description
Fair
value
Total
net assets
%
BNY MELLON TARGETED RETURN BOND FUND
Underlying
exposure
USD
Open futures contracts - (229,232) (31 December 2015: (3,148))
(11) Australian 10 Year Treasury Bond
Short Futures Contracts
Exp Mar-2017 (1,015,234) (5,597) (0.01)
269 Australian 3 Year Bond
Long Futures Contracts
Exp Mar-2017 21,663,922 (24,995) (0.03)
(44) Euro-Bund
Short Futures Contracts
Exp Mar-2017 (7,635,198) (133,869) (0.17)
(11) Euro-Buxl 30 Year Bond
Short Futures Contracts
Exp Mar-2017 (2,026,528) (41,353) (0.05)
(25) U.S. 5 Year Treasury Note
Short Futures Contracts
Exp Mar-2017 (2,937,500) (23,418) (0.03)
Total open futures contracts (229,232) (0.29)
Unrealised loss on forward foreign currency contracts - (2,708,149) (see below)
(31 December 2015: (2,593,711)) (2,708,149) (3.43)
Total fi nancial liabilities at fair value through profi t or loss (2,960,544) (3.75)
Net current assets 2,320,390 2.94
Total net assets 78,908,389 100.00
* Held as collateral by JPMorgan Chase in respect of futures contracts held by the Fund.
The counterparties for currency options are Goldman Sachs and JPMorgan Chase.
The counterparty for interest rate swaps is Citigroup.
The counterparty for futures contracts is JPMorgan Chase.
Analysis of portfolio % of Total assets
Transferable securities and money market instruments admitted
to offi cial stock exchange listing or traded on a regulated market 94.99
Financial derivative instruments dealt in on a regulated market 0.27
OTC fi nancial derivative instruments 0.69
Other current assets 4.05
Total assets 100.00
50,000 Wells Fargo & Co 4.300% 22-Jul-2027 51,297 0.06
355,500 Wendys Funding LLC 2015-1 4.080% 15-Jun-2045 351,915 0.45
Total investments in bonds 78,753,328 99.80
Currency options - 11 (31 December 2015: –)
800,000 US dollar/Mexican peso Put 01-Feb-2017 18.170 11 0.00
Total currency options 11 0.00
Interest rate swaps - 83,090 (31 December 2015: –)
81,000,000 IRS Pays Fixed 0.603% Japanese yen 24-Mar-2046 41,834 0.06
99,000,000 IRS Pays Fixed 0.642% Japanese yen 04-Apr-2046 41,256 0.05
Total interest rate swaps 83,090 0.11
Holdings Description
Underlying
exposure
USD
Fair
value
USD
Total
net assets
%
Open futures contracts - 225,023 (31 December 2015: 215,501)
24 Canadian 10 Year Treasury Bond
Long Futures Contracts
Exp Mar-2017 2,448,096 20,367 0.03
33 Euro-Bobl
Long Futures Contracts
Exp Mar-2017 4,656,913 31,210 0.04
7 Euro-BTP
Long Futures Contracts
Exp Mar-2017 1,001,875 20,175 0.02
(51) U.S. 10 Year Treasury Note
Short Futures Contracts
Exp Mar-2017 (6,320,812) 45,906 0.06
(42) U.S. 2 Year Treasury Note
Short Futures Contracts
Exp Mar-2017 (9,098,250) 7,047 0.01
(18) U.S. Treasury Bond
Short Futures Contracts
Exp Mar-2017 (2,698,313) 36,125 0.04
(17) U.S. Treasury Ultra Bond
Short Futures Contracts
Exp Mar-2017 (2,707,781) 64,193 0.08
Total open futures contracts 225,023 0.28
Unrealised gain on forward foreign currency contracts - 487,091 (see below)
(31 December 2015: 328,529) 487,091 0.62
Total fi nancial assets at fair value through profi t or loss 79,548,543 100.81
Currency options - (23,163) (31 December 2015: (21,250))
(332) Euro/US dollar Call 13-Jan-2017 99.250 (2,075) (0.00)
(800,000) US dollar/Mexican peso Call 01-Feb-2017 20.380 (21,088) (0.03)
Total currency options (23,163) (0.03)
Bonds cont’d.
United States of America cont’d.
USDUSD

181
Portfolio of investments – as at 31 December 2016
BNY MELLON TARGETED RETURN BOND FUND
Forward foreign currency contracts cont’d.
Unrealised
Gain/(Loss)Buy Sell Amount (B) Amount (S)
Settle
Date Counterparty
BNY Mellon Targeted Return Bond Fund Sterling W (Acc) (Hedged) Share ClassSterling US dollar 63,900,565 80,514,806 13-Jan-17 The Bank of
New York Mellon (1,880,556)
USD (1,880,556)
GBP (1,528,658)
Forward foreign currency contracts
Unrealised
Gain/(Loss)Buy Sell Amount (B) Amount (S)
Settle
Date Counterparty
BNY Mellon Targeted Return Bond FundAustralian dollar US dollar 1,128,765 812,914 03-Jan-17 HSBC Bank Plc 2,619
US dollar Hungarian forint 1,062,180 301,160,000 13-Jan-17 JPMorgan Chase 35,253
US dollar Korean won 466,475 529,785,000 13-Jan-17 HSBC Bank Plc 27,133
US dollar Korean won 1,563,843 1,774,180,000 13-Jan-17 JPMorgan Chase 92,544
US dollar Korean won 1,165,006 1,326,045,000 13-Jan-17 Citigroup 65,338
US dollar Mexican peso 172,722 3,540,000 13-Jan-17 JPMorgan Chase 1,883
US dollar Mexican peso 114,789 2,150,000 13-Jan-17 Goldman Sachs 11,031
US dollar Polish zloty 1,569,126 6,235,000 13-Jan-17 JPMorgan Chase 78,618
US dollar Taiwanese dollar 833,412 26,450,000 13-Jan-17 JPMorgan Chase 13,598
US dollar Turkish lira 776,674 2,705,000 13-Jan-17 JPMorgan Chase 11,871
US dollar Turkish lira 543,063 1,850,000 13-Jan-17 JPMorgan Chase 20,001
US dollar Turkish lira 169,513 580,000 13-Jan-17 JPMorgan Chase 5,526
US dollar Turkish lira 88,261 300,000 13-Jan-17 JPMorgan Chase 3,440
US dollar Turkish lira 74,370 250,000 13-Jan-17 JPMorgan Chase 3,686
Swedish krona US dollar 29,090,000 3,121,696 31-Jan-17 HSBC Bank Plc 95,240
US dollar Australian dollar 803,853 1,110,000 31-Jan-17 UBS 2,487
US dollar Canadian dollar 1,593,424 2,145,000 31-Jan-17 HSBC Bank Plc 777
US dollar Sterling 376,384 305,000 31-Jan-17 HSBC Bank Plc 856
Brazilian real US dollar 1,350,000 395,744 02-Feb-17 JPMorgan Chase 15,190
USD 487,091
Colombian peso US dollar 2,402,275,000 808,031 13-Jan-17 Goldman Sachs (9,440)
Indian rupee US dollar 165,710,000 2,446,988 13-Jan-17 JPMorgan Chase (7,680)
Indonesian rupiah US dollar 22,433,975,000 1,695,946 13-Jan-17 Bank of America Securities Ltd (31,704)
Korean won US dollar 1,898,940,000 1,590,824 13-Jan-17 JPMorgan Chase (16,064)
Mexican peso US dollar 8,200,000 400,304 13-Jan-17 JPMorgan Chase (4,574)
South African rand US dollar 22,695,000 1,690,723 13-Jan-17 JPMorgan Chase (41,152)
Turkish lira US dollar 810,000 233,770 13-Jan-17 JPMorgan Chase (4,753)
Turkish lira US dollar 7,430,000 2,373,650 13-Jan-17 JPMorgan Chase (272,917)
US dollar Colombian peso 755,456 2,402,275,000 13-Jan-17 Citigroup (43,135)
US dollar Indian rupee 1,057,029 72,735,000 13-Jan-17 JPMorgan Chase (13,655)
US dollar Indian rupee 1,354,600 92,975,000 13-Jan-17 JPMorgan Chase (14,024)
US dollar Mexican peso 598,135 12,510,000 13-Jan-17 UBS (5,594)
US dollar Mexican peso 180,087 3,750,000 13-Jan-17 Goldman Sachs (887)
US dollar South African rand 1,607,010 22,695,000 13-Jan-17 Bank of America Securities Ltd (42,562)
US dollar Taiwanese dollar 1,587,034 51,255,000 13-Jan-17 JPMorgan Chase (1,607)
US dollar Turkish lira 790,698 2,805,000 13-Jan-17 JPMorgan Chase (2,379)
Hong Kong dollar US dollar 9,205,000 1,187,834 19-Jan-17 JPMorgan Chase (666)
US dollar Hong Kong dollar 585,378 4,580,000 19-Jan-17 JPMorgan Chase (5,304)
US dollar Hong Kong dollar 585,665 4,625,000 19-Jan-17 JPMorgan Chase (10,820)
US dollar Australian dollar 4,101,819 5,725,000 31-Jan-17 Bank of America Securities Ltd (31,352)
US dollar Australian dollar 813,234 1,130,000 31-Jan-17 HSBC Bank Plc (2,571)
US dollar Canadian dollar 1,738,746 2,360,000 31-Jan-17 HSBC Bank Plc (13,537)
US dollar Euro 2,137,737 2,051,000 31-Jan-17 UBS (31,668)
US dollar Euro 2,632,588 2,524,000 31-Jan-17 Goldman Sachs (37,124)
US dollar Euro 1,589,431 1,525,000 31-Jan-17 Bank of America Securities Ltd (23,608)
US dollar Euro 2,361,025 2,265,000 31-Jan-17 HSBC Bank Plc (34,735)
US dollar Euro 2,631,825 2,524,000 31-Jan-17 JPMorgan Chase (37,886)
US dollar Euro 1,645,428 1,578,000 31-Jan-17 Citigroup (23,671)
US dollar Japanese yen 6,932,185 814,895,000 31-Jan-17 HSBC Bank Plc (48,402)
US dollar New Zealand dollar 401,850 580,000 31-Jan-17 Barclays Bank plc (1,587)
US dollar New Zealand dollar 3,091,917 4,460,000 31-Jan-17 HSBC Bank Plc (10,370)
US dollar Singapore dollar 776,317 1,125,000 31-Jan-17 JPMorgan Chase (2,165)
USD (827,593)
Net USD (340,502)

182
Portfolio of investments – as at 31 December 2016
Holdings Description
Fair
value
Total
net assets
% Holdings Description
Fair
value
Total
net assets
%
BNY MELLON U.S. DYNAMIC VALUE FUND
70,282 Boston Scientifi c Corp 1,520,551 1.09
16,594 Bristol-Myers Squibb Co 969,836 0.69
16,048 Eli Lilly & Co 1,180,732 0.84
4,963 Humana Inc 1,012,427 0.72
6,690 Laboratory Corp of America Holdings 858,963 0.62
46,149 Merck & Co Inc 2,717,022 1.94
12,587 UnitedHealth Group Inc 2,015,556 1.44
6,526 Zimmer Biomet Holdings Inc 673,712 0.48
Industrials - 13,689,880 (31 December 2015: 3,825,598) 13,689,880 9.78
45,356 Delta Air Lines Inc 2,231,288 1.59
8,337 General Dynamics Corp 1,440,092 1.03
17,714 Honeywell International Inc 2,052,610 1.47
22,047 Quanta Services Inc 768,448 0.55
30,528 Raytheon Co 4,336,350 3.10
11,042 United Continental Holdings Inc 804,851 0.57
18,728 United Technologies Corp 2,056,241 1.47
Information Technology - 13,685,429 (31 December 2015: 5,505,219) 13,685,429 9.78
1,500 Alphabet Inc 1,189,290 0.85
12,348 Apple Inc 1,430,578 1.02
25,125 Applied Materials Inc 810,909 0.58
61,079 Cisco Systems Inc 1,847,334 1.32
42,227 Corning Inc 1,025,060 0.73
36,624 eBay Inc 1,087,550 0.78
9,498 Harris Corp 973,355 0.70
10,887 Microchip Technology Inc 698,456 0.50
35,128 Oracle Corp 1,350,847 0.96
36,095 Teradata Corp 981,062 0.70
31,392 Texas Instruments Inc 2,290,988 1.64
Materials - 8,044,286 (31 December 2015: 2,431,868) 8,044,286 5.75
49,232 CF Industries Holdings Inc 1,550,070 1.11
11,472 Dow Chemical Co/The 656,485 0.47
8,959 Martin Marietta Materials Inc 1,985,404 1.42
22,262 Packaging Corp of America 1,888,597 1.35
15,686 Vulcan Materials Co 1,963,730 1.40
Telecommunication Services - 3,261,287 (31 December 2015: 1,176,239) 3,261,287 2.33
76,655 AT&T Inc 3,261,287 2.33
Total investments in equities 138,190,537 98.75
Total fi nancial assets at fair value through profi t or loss 139,451,711 99.65
Net current assets 491,077 0.35
Total net assets 139,942,788 100.00
Analysis of portfolio % of Total assets
Transferable securities and money market instruments admitted
to offi cial stock exchange listing or traded on a regulated market 98.46
Other current assets 1.54
Total assets 100.00
Collective investment schemes United States of America - 1,261,174
(31 December 2015: –) 1,261,174 0.90 11,263 iShares Russell 1000 Value ETF 1,261,174 0.90
Total investments in collective investment schemes 1,261,174 0.90
Equities Consumer Discretionary - 8,645,897
(31 December 2015: 2,262,664) 8,645,897 6.18 20,233 Comcast Corp 1,399,011 1.00
28,513 Goodyear Tire & Rubber Co/The 880,339 0.63
28,059 Omnicom Group Inc 2,388,522 1.71
134,173 Staples Inc 1,213,595 0.87
28,601 Time Warner Inc 2,764,430 1.97
Consumer Staples - 12,873,876 (31 December 2015: 4,005,380) 12,873,876 9.20
28,927 Archer-Daniels-Midland Co 1,320,807 0.94
28,997 Coca-Cola Co/The 1,202,361 0.86
29,226 Coca-Cola European Partners Plc 917,404 0.66
35,355 Conagra Brands Inc 1,398,467 1.00
33,156 Kellogg Co 2,444,094 1.75
19,221 Lamb Weston Holdings Inc 727,611 0.52
25,247 Molson Coors Brewing Co 2,457,290 1.76
20,981 Mondelez International Inc 930,193 0.66
17,824 Walgreens Boots Alliance Inc 1,475,649 1.05
Energy - 19,939,371 (31 December 2015: 5,049,903) 19,939,371 14.25
38,552 Anadarko Petroleum Corp 2,688,424 1.92
32,618 EOG Resources Inc 3,298,006 2.36
58,862 Halliburton Co 3,184,140 2.27
56,485 Kinder Morgan Inc 1,170,652 0.84
27,756 Marathon Petroleum Corp 1,397,931 1.00
44,168 Occidental Petroleum Corp 3,146,307 2.25
29,007 Phillips 66 2,506,785 1.79
5,615 Pioneer Natural Resources Co 1,011,346 0.72
22,471 Valero Energy Corp 1,535,780 1.10
Financials - 44,926,094 (31 December 2015: 11,782,734) 44,926,094 32.10
23,116 Athene Holding Ltd 1,110,377 0.79
218,210 Bank of America Corp 4,832,260 3.45
21,887 BB&T Corp 1,029,236 0.74
38,691 Berkshire Hathaway Inc 6,308,181 4.51
35,425 Charles Schwab Corp/The 1,398,402 1.00
10,396 Chubb Ltd 1,374,091 0.98
55,759 Communications Sales & Leasing Inc REIT 1,416,836 1.01
53,101 E*TRADE Financial Corp 1,840,215 1.31
15,886 Goldman Sachs Group Inc/The 3,806,842 2.72
14,412 Hartford Financial Services Group Inc 686,804 0.49
77,181 JPMorgan Chase & Co 6,663,422 4.76
23,884 Morgan Stanley 1,009,218 0.72
17,292 PNC Financial Services Group Inc/The 2,022,559 1.44
26,970 Prudential Financial 2,807,173 2.01
22,938 Raymond James Financial Inc 1,589,030 1.14
19,053 SunTrust Banks Inc 1,045,152 0.75
86,065 Synchrony Financial 3,122,008 2.23
73,022 Voya Financial Inc 2,864,288 2.05
Health Care - 13,124,417 (31 December 2015: 5,074,137) 13,124,417 9.38
38,400 Abbott Laboratories 1,475,136 1.06
8,957 AmerisourceBergen Corp 700,482 0.50
Equities cont’d.
Health Care cont’d.
USDUSD

183
Portfolio of investments – as at 31 December 2016
Holdings Description
Fair
value
Total
net assets
% Holdings Description
Fair
value
Total
net assets
%
BNY MELLON US OPPORTUNITIES FUND
Information Technology - 7,767,920 (31 December 2015: –) 7,767,920 24.51
1,376 Alphabet Inc 1,063,001 3.35
8,408 Amphenol Corp 565,060 1.78
4,148 Broadcom Ltd 733,491 2.31
18,780 Fortinet Inc 565,748 1.79
10,082 HubSpot Inc 473,602 1.49
11,551 Microchip Technology Inc 741,054 2.34
25,310 Oracle Corp 973,296 3.07
11,810 Power Integrations Inc 801,013 2.53
9,662 salesforce.com Inc 661,606 2.09
8,860 Splunk Inc 453,233 1.43
12,205 Xilinx Inc 736,816 2.33
Materials - 2,034,199 (31 December 2015: –) 2,034,199 6.42
19,225 Dow Chemical Co/The 1,100,151 3.47
26,241 Steel Dynamics Inc 934,048 2.95
Utilities - 755,635 (31 December 2015: –) 755,635 2.39
10,442 American Water Works Co Inc 755,635 2.39
Total investments in equities 31,490,008 99.37
Total fi nancial assets at fair value through profi t or loss 31,521,683 99.47
Net current assets 167,489 0.53
Total net assets 31,689,172 100
Analysis of portfolio % of Total assets
Transferable securities and money market instruments admitted
to offi cial stock exchange listing or traded on a regulated market 98.63
Other current assets 1.37
Total assets 100.00
Collective investment schemes
United States of America - 31,675 (31 December 2015: 3,559,602) 31,675 0.10
71 SPDR S&P 500 ETF Trust 15,872 0.05
77 Vanguard S&P 500 ETF 15,803 0.05
Total investments in collective investment schemes 31,675 0.10
Equities
Consumer Discretionary - 2,836,392 (31 December 2015: –) 2,836,392 8.95
8,104 Lithia Motors Inc 784,791 2.48
3,144 Nexstar Broadcasting Group Inc 199,094 0.63
5,906 Sinclair Broadcast Group Inc 197,113 0.62
37,152 Staples Inc 336,040 1.06
16,416 Visteon Corp 1,319,354 4.16
Consumer Staples - 1,477,407 (31 December 2015: –) 1,477,407 4.66
14,102 Coca-Cola Co/The 584,739 1.84
10,336 ConAgra Brands Inc 408,841 1.29
4,971 Molson Coors Brewing Co 483,827 1.53
Energy - 2,028,690 (31 December 2015: –) 2,028,690 6.40
6,377 Pioneer Natural Resources Co 1,148,593 3.62
52,123 Superior Energy Services Inc 880,097 2.78
Financials - 9,684,713 (31 December 2015: 16,394,714) 9,684,713 30.56
68,097 Bank of America Corp 1,508,008 4.76
10,879 Capital One Financial Corp 949,193 2.99
22,279 Citigroup Inc 1,324,152 4.18
19,860 E*TRADE Financial Corp 688,248 2.17
53,450 KeyCorp 976,799 3.08
97,144 MGIC Investment Corp 989,412 3.12
66,807 SLM Corp 736,547 2.33
42,756 Synchrony Financial 1,550,974 4.90
17,440 Wells Fargo & Co 961,380 3.03
Health Care - 2,262,180 (31 December 2015: –) 2,262,180 7.14
25,941 Abbott Laboratories 996,523 3.14
4,110 Alexion Pharmaceuticals Inc 502,982 1.59
6,585 Celgene Corp 762,675 2.41
Industrials - 2,642,872 (31 December 2015: 5,975,755) 2,642,872 8.34
7,270 Honeywell International Inc 842,411 2.66
4,980 Snap-on Inc 853,049 2.69
9,133 Union Pacifi c Corp 947,412 2.99
Equities cont’d.
USDUSD

For the year ended 31 December 2016
184
STATEMENT OF COMPREHENSIVE INCOME
BNY Mellon BNY Mellon BNY Mellon BNY MellonAbsolute Absolute Absolute Asian
Insight Return Bond Return Equity BondFund Fund Fund Fund
Notes EUR EUR GBP USD
IncomeBank interest income 73,992 1,821 41,023 705
Dividend income 949,880 – 47,354,034 –
Securities lending income 14 – 223,759 38,044 –
Net gains/(losses) on financial assets/liabilities
at fair value through profit or loss
Net realised gains/(losses) on financial assets/
liabilities held at fair value through profit or loss (95,322,205) 67,717,743 250,756,541 2,021,790
Net change in unrealised gains/(losses)
on financial assets/liabilities held at fair value
through profit or loss 90,091,099 (51,955,120) 35,037,278 277,122
Total income (4,207,234) 15,988,203 333,226,920 2,299,617
ExpensesManagement fee 3 1,134,824 9,733,111 24,609,660 287,691
Performance fee 3 (3,069) 2,753,597 173,369 –
Depositary fee 5 222,131 401,095 323,852 23,122
Operating expenses 7 127,699 1,717,635 2,013,071 57,194
Dividend expense 947,933 – 36,897,274 –
Finance charges on swaps 73,768 – 4,988,593 –
Rebate due (from)/to the manager 6 – – – (72,512)
Total expenses 2,503,286 14,605,438 69,005,819 295,495
Net income/(expense) (6,710,520) 1,382,765 264,221,101 2,004,122
Finance costsBank interest – 871,233 4,797 –
Distributions 369,218 610,390 277,965 1,183,736
Profit/(loss) for the year (7,079,738) (98,858) 263,938,339 820,386
Withholding taxes on dividends
and other investment income (58,094) 59,778 (1,687,248) (2,078)
Increase/(decrease) in net assets attributableto redeemable participating shareholders from operations (7,137,832) (39,080) 262,251,091 818,308
Other than the Funds closed during the year, gains and losses arise solely from continuing operations.
There were no gains or losses other than those dealt with in the Statement of Comprehensive Income.
* Please refer to Note 19 of the fi nancial statements.
The accompanying notes form an integral part of these fi nancial statements.

For the year ended 31 December 2016 (cont’d.)
185
BNY MELLON GLOBAL FUNDS, PLC
STATEMENT OF COMPREHENSIVE INCOME
BNY Mellon BNY Mellon BNY Mellon BNY Mellon BNY Mellon BNY Mellon BNY MellonAsian Asian Brazil Crossover Dynamic Emerging Emerging
Equity Income Equity Credit Total Markets MarketsFund Fund Fund Fund* Return Corporate Debt
Fund Debt FundFund
USD GBP USD EUR USD USD USD
2,677 277 5,849 – – 5 1,729
1,521,975 1,211,389 2,528,315 – 32,786 41,075 –
446 – – 50,727 – 125,455 36,729
41,280 2,243,120 (10,884,409) 9,528,271 134,498 7,910,119 1,733,147
1,703,062 3,805,225 41,510,523 2,936,690 (4,718) 6,106,151 4,669,080
3,269,440 7,260,011 33,160,278 12,515,688 162,566 14,182,805 6,440,685
1,409,291 231,307 1,163,476 347,577 30,755 526,736 888,871
– – – – – – –
88,726 5,174 114,583 80,385 6,839 58,112 36,467
113,082 25,264 77,523 113,637 19,152 121,903 82,759
– – – – – – –
– – – – – – –
– (819) – (5,730) (4,861) – –
1,611,099 260,926 1,355,582 535,869 51,885 706,751 1,008,097
1,658,341 6,999,085 31,804,696 11,979,819 110,681 13,476,054 5,432,588
– 32 3,124 40,061 178 3,841 205
94,188 941,381 52,716 2,429,175 2,360 62,562 342,940
1,564,153 6,057,672 31,748,856 9,510,583 108,143 13,409,651 5,089,443
(146,612) (18,768) (2,117,801) 18,363 (9,891) (45,648) (14,898)
1,417,541 6,038,904 29,631,055 9,528,946 98,252 13,364,003 5,074,545

For the year ended 31 December 2016 (cont’d.)
186
BNY MELLON GLOBAL FUNDS, PLC
STATEMENT OF COMPREHENSIVE INCOME
BNY Mellon BNY Mellon BNY Mellon BNY Mellon Emerging Emerging Euroland European
Markets Markets Debt Bond CreditDebt Local Opportunistic Fund Fund
Currency FundFund
Notes USD USD EUR EUR
IncomeBank interest income 5,413 12,672 – 38
Dividend income – – – –
Securities lending income 14 51,165 26,098 165,497 6,119
Net gains/(losses) on financial assets/liabilities
at fair value through profit or loss
Net realised gains/(losses) on financial assets/
liabilities held at fair value through profit or loss (325,235,503) 4,749,186 68,368,672 5,088,798
Net change in unrealised gains/(losses)
on financial assets/liabilities held at fair value
through profit or loss 421,565,630 4,178,522 10,335,687 (438,030)
Total income 96,386,705 8,966,478 78,869,856 4,656,925
ExpensesManagement fee 3 5,542,554 2,668 13,431,695 101,574
Performance fee 3 – – – –
Depositary fee 5 1,028,235 83,489 519,609 36,801
Operating expenses 7 967,653 80,929 1,782,846 49,253
Dividend expense – – 128,437 –
Finance charges on swaps – – – –
Rebate due (from)/to the manager 6 (6) – – (4,092)
Total expenses 7,538,436 167,086 15,862,587 183,536
Net income/(expense) 88,848,269 8,799,392 63,007,269 4,473,389
Finance costsBank interest 14,223 24 207,462 16,896
Distributions 25,941,979 3,802,443 2,676,161 218,126
Profit/(loss) for the year 62,892,067 4,996,925 60,123,646 4,238,367
Withholding taxes on dividends
and other investment income (1,914,329) (97,496) 72,697 (10,495)
Increase/(decrease) in net assets attributableto redeemable participating shareholders from operations 60,977,738 4,899,429 60,196,343 4,227,872
* Please refer to Note 19 of the fi nancial statements.

For the year ended 31 December 2016 (cont’d.)
187
BNY MELLON GLOBAL FUNDS, PLC
STATEMENT OF COMPREHENSIVE INCOME
BNY Mellon BNY Mellon BNY Mellon BNY Mellon BNY Mellon BNY Mellon BNY Mellon Global Global Global Global Global Global Global Bond Credit Dynamic Emerging Emerging Equity Equity Fund Fund* Bond Markets Markets Fund Income
Fund Equity Value Fund FundFund*
USD USD USD USD USD USD USD
111,232 7,419 61,135 – 3,560 56,996 101,204
– 62,578 46,508 (4,727) 962,770 5,724,920 22,299,095
91,260 – 45,527 1,007 1,949 24,385 59,807
10,219,081 22,060,487 6,121,521 (441,890) 1,988,099 12,938,345 16,214,706
(12,847,004) (12,957,826) 446,178 192,558 498,030 (14,464,313) (4,293,405)
(2,425,431) 9,172,658 6,720,869 (253,052) 3,454,408 4,280,333 34,381,407
2,646,670 73,998 2,106,072 9,866 592,485 2,653,714 7,437,761
– – – – – – –
179,070 101,540 133,303 386 46,771 96,909 158,338
458,732 215,295 335,259 21,996 87,895 284,368 615,460
– – – – – – –
– – – – – – –
– (265,903) – (26,829) (19,500) – –
3,284,472 124,930 2,574,634 5,419 707,651 3,034,991 8,211,559
(5,709,903) 9,047,728 4,146,235 (258,471) 2,746,757 1,245,342 26,169,848
1,476 – 4,383 468 905 167 880
64,913 – 82,451 – 260 – 11,050,787
(5,776,292) 9,047,728 4,059,401 (258,939) 2,745,592 1,245,175 15,118,181
(106,831) (31,951) (37,666) (4,332) (250,100) (1,005,270) (3,816,288)
(5,883,123) 9,015,777 4,021,735 (263,271) 2,495,492 239,905 11,301,893

For the year ended 31 December 2016 (cont’d.)
188
BNY MELLON GLOBAL FUNDS, PLC
STATEMENT OF COMPREHENSIVE INCOME
BNY Mellon BNY Mellon BNY Mellon BNY Mellon Global Global Global Global
High Yield Leaders Opportunistic Opportunities Bond Fund* Bond FundFund Fund
Notes USD USD USD USD
IncomeBank interest income 33 – 805 26,495
Dividend income 53,296 2,886 – 3,215,069
Securities lending income 14 80,833 – 51,609 14,483
Net gains/(losses) on financial assets/liabilities
at fair value through profit or loss
Net realised gains/(losses) on financial assets/
liabilities held at fair value through profit or loss 2,255,204 21,511 (13,137,551) 5,507,956
Net change in unrealised gains/(losses)
on financial assets/liabilities held at fair value
through profit or loss 14,876,383 336,278 12,413,495 (6,587,507)
Total income 17,265,749 360,675 (671,642) 2,176,496
ExpensesManagement fee 3 645,382 17,823 484,871 1,240,406
Performance fee 3 – – – –
Depositary fee 5 64,717 838 104,723 146,852
Operating expenses 7 130,101 2,567 167,035 133,482
Dividend expense – – 3,484 –
Finance charges on swaps – – – –
Rebate due (from)/to the manager 6 – (691) (19,745) (2)
Total expenses 840,200 20,537 740,368 1,520,738
Net income/(expense) 16,425,549 340,138 (1,412,010) 655,758
Finance costsBank interest 4,693 – 1,069 269
Distributions 6,113,101 – 2,097,213 992,461
Profit/(loss) for the year 10,307,755 340,138 (3,510,292) (336,972)
Withholding taxes on dividends
and other investment income (39,111) (866) 1,675 (506,687)
Increase/(decrease) in net assets attributableto redeemable participating shareholders from operations 10,268,644 339,272 (3,508,617) (843,659)
* Please refer to Note 19 of the fi nancial statements.

For the year ended 31 December 2016 (cont’d.)
189
BNY MELLON GLOBAL FUNDS, PLC
STATEMENT OF COMPREHENSIVE INCOME
BNY Mellon BNY Mellon BNY Mellon BNY Mellon BNY Mellon BNY Mellon BNY MellonGlobal Global Global Global Global Japan Japan
Property Real Real Real Short-Dated All Cap REITSecurities Return Return Return High Yield Equity Alpha
Fund Fund (EUR) Fund (GBP) Fund (USD) Bond Fund Fund*Fund*
EUR EUR GBP USD USD JPY JPY
90 – – 147,379 3 – –
552,720 59,019,024 1,094,086 9,915,554 – 59,972,323 10,018,856
1,821 1,141,432 1,144 170,423 – 2,906,189 –
944,734 50,390,092 (6,098,337) 2,045,010 2,855,795 (438,404,228) (153,556)
(4,017) (106,188,980) 7,694,765 (1,869,553) 2,921,517 (28,803,071) 81,064,475
1,495,348 4,361,568 2,691,658 10,408,813 5,777,315 (404,328,787) 90,929,775
154,562 34,403,621 255,960 3,292,013 236 16,456,454 729,912
– – – – – – –
64,725 495,518 62,301 192,880 8,548 3,619,487 53,899
18,220 2,990,801 55,714 538,086 23,061 4,261,345 133,787
– – – – – – –
– – – – – – –
(29,209) – – – (9,472) (6,188,858) –
208,298 37,889,940 373,975 4,022,979 22,373 18,148,428 917,598
1,287,050 (33,528,372) 2,317,683 6,385,834 5,754,942 (422,477,215) 90,012,177
2,559 39,565 68 740 348 10,108 –
9,908 15,360,595 909,063 1,856,660 – 1,723,746 –
1,274,583 (48,928,532) 1,408,552 4,528,434 5,754,594 (424,211,069) 90,012,177
(129,268) (7,577,782) (141,171) (1,311,186) (40,370) (8,875,015) (2,860,179)
1,145,315 (56,506,314) 1,267,381 3,217,248 5,714,224 (433,086,084) 87,151,998

For the year ended 31 December 2016 (cont’d.)
190
BNY MELLON GLOBAL FUNDS, PLC
STATEMENT OF COMPREHENSIVE INCOME
BNY Mellon BNY Mellon BNY Mellon BNY MellonJapan Long-Term Pan S&P
Small Cap Global European 500®
Equity Equity Equity IndexFocus Fund Fund Tracker
Fund
Notes JPY EUR EUR USD
IncomeBank interest income – – – 129
Dividend income 47,499,557 25,927,707 1,188,056 1,914,545
Securities lending income 14 8,862,058 346,807 4,217 10,802
Net gains/(losses) on financial assets/liabilities
at fair value through profit or loss
Net realised gains/(losses) on financial assets/
liabilities held at fair value through profit or loss (420,141,970) 96,404,966 (4,494,245) 3,926,790
Net change in unrealised gains/(losses)
on financial assets/liabilities held at fair value
through profit or loss 96,764,634 (12,569,337) (1,302,517) 4,531,445
Total income (267,015,721) 110,110,143 (4,604,489) 10,383,711
ExpensesManagement fee 3 30,199,597 8,853,318 346,331 526,383
Performance fee 3 – – – –
Depositary fee 5 3,233,458 251,852 21,200 108,284
Operating expenses 7 4,715,130 954,451 30,530 90,721
Dividend expense – – – –
Finance charges on swaps – – – –
Rebate due (from)/to the manager 6 (5,931,935) – (1,584) –
Total expenses 32,216,250 10,059,621 396,477 725,388
Net income/(expense) (299,231,971) 100,050,522 (5,000,966) 9,658,323
Finance costsBank interest 13,203 130,781 884 –
Distributions 21,966 8,155,981 – –
Profit/(loss) for the year (299,267,140) 91,763,760 (5,001,850) 9,658,323
Withholding taxes on dividends
and other investment income (7,063,904) (5,242,322) (107,669) (557,733)
Increase/(decrease) in net assets attributableto redeemable participating shareholders from operations (306,331,044) 86,521,438 (5,109,519) 9,100,590
^ The Company Total as at 31 December 2016 has been adjusted to account for cross investments by BNY Mellon Euroland Bond Fund
and BNY Mellon European Credit Fund.

191
BNY MELLON GLOBAL FUNDS, PLC
STATEMENT OF COMPREHENSIVE INCOME
For the year ended 31 December 2016 (cont’d.)
BNY Mellon BNY Mellon BNY Mellon BNY Mellon Total31 December
2016^Small Cap Targeted U.S. US
Euroland Return Dynamic Opportunities Fund Bond Value Fund
Fund Fund
EUR USD USD USD USD
4,726 – – 1,233 691,683
1,174,480 – 1,362,011 641,666 216,708,158
47,728 14,946 4,032 7,330 3,178,978
(671,110) (16,018,823) 2,492,366 (334,231) 283,450,415
(1,009,172) 1,572,999 10,499,321 1,903,635 461,700,313
(453,348) (14,430,878) 14,357,730 2,219,633 965,729,547
582,222 552,902 642,194 543,725 144,077,063
– – – – 3,277,169
36,203 52,854 55,813 28,757 5,868,051
41,688 97,176 62,726 63,545 16,418,064
– – – – 51,012,175
– – – – 6,817,095
– – – (8,511) (585,522)
660,113 702,932 760,733 627,516 226,884,095
(1,113,461) (15,133,810) 13,596,997 1,592,117 738,845,452
5,637 – 150 4 1,498,931
239,715 3,209,153 – – 93,107,316
(1,358,813) (18,342,963) 13,596,847 1,592,113 644,239,205
(139,429) 4,115 (395,231) (189,143) (29,811,739)
(1,498,242) (18,338,848) 13,201,616 1,402,970 614,427,466

192
BNY MELLON GLOBAL FUNDS, PLC
STATEMENT OF COMPREHENSIVE INCOME
For the year ended 31 December 2015
192
BNY Mellon BNY Mellon BNY Mellon BNY MellonAbsolute Absolute Absolute Asian
Insight Return Bond Return Equity BondFund Fund Fund Fund
Notes EUR EUR GBP USD
IncomeBank interest income 11,181 – – –
Dividend income 1,322,591 159,874 33,532,169 –
Securities lending income 14 – 70,819 70,797 –
Net gains/(losses) on financial assets/liabilities
at fair value through profit or loss
Net realised gains/(losses) on financial assets/
liabilities held at fair value through profit or loss 95,025,810 51,112,217 23,324,156 1,067,436
Net change in unrealised gains/(losses)
on financial assets/liabilities held at fair value
through profit or loss (91,293,845) 6,318,675 12,054,841 (443,986)
Total income 5,065,737 57,661,585 68,981,963 623,450
ExpensesManagement fee 3 1,413,720 8,623,230 15,899,933 253,186
Performance fee 3 101,843 482,881 5,166,958 –
Depositary fee 5 220,138 350,777 204,748 30,649
Operating expenses 7 306,826 1,126,874 1,083,200 62,314
Dividend expense 1,377,769 – 29,847,169 –
Finance charges on swaps 131,934 – 4,923,806 –
Rebate due (from)/to the manager 6 1,425 – – (20,510)
Total expenses 3,553,655 10,583,762 57,125,814 325,639
Net income/(expense) 1,512,082 47,077,823 11,856,149 297,811
Finance costsBank interest 57,480 416,230 70,945 –
Distributions 64,614 441,622 125,455 1,296,136
Profit/(loss) for the year 1,389,988 46,219,971 11,659,749 (998,325)
Withholding taxes on dividends and other investment income (79,550) (206,793) (1,230,753) (5,990)
1,310,438 46,013,178 10,428,996 (1,004,315)
Change in adjustment for difference in valuation (111,881) (1,180,975) (504,740) (90,933)
Increase/(decrease) in net assets attributable to redeemable participating shareholders from operations 1,198,557 44,832,203 9,924,256 (1,095,248)
Other than the Funds closed during the year, gains and losses arise solely from continuing operations.
There were no gains or losses other than those dealt with in the Statement of Comprehensive Income.
* This Fund launched during the year.
The accompanying notes form an integral part of these financial statements.

193
BNY MELLON GLOBAL FUNDS, PLC
STATEMENT OF COMPREHENSIVE INCOME
For the year ended 31 December 2015 (cont’d.)
193
BNY Mellon BNY Mellon BNY Mellon BNY Mellon BNY Mellon BNY Mellon BNY MellonAsian Asian Brazil Crossover Dynamic Emerging Emerging
Equity Income Equity Credit Total Markets MarketsFund Fund Fund Fund Return Corporate Debt
Fund* Debt FundFund
USD GBP USD EUR USD USD USD
3,572 – 1,010 – – – 965
3,116,289 854,675 2,839,019 – 18,710 8,622 –
12,572 – – 26,742 – 35,355 59,773
11,306,453 447,391 (47,407,498) 4,611,335 (642,789) 2,954,753 (15,961,938)
(23,925,701) (2,334,464) 9,141,927 (8,303,977) (21,265) (2,642,090) 14,070,708
(9,486,815) (1,032,398) (35,425,542) (3,665,900) (645,344) 356,640 (1,830,492)
2,078,691 163,836 1,284,124 623,503 13,352 184,429 1,901,256
– – – – – – –
135,141 7,819 126,233 83,451 27,649 45,040 75,428
127,445 26,341 103,587 191,476 19,949 82,671 247,952
– – – – – – –
– – – – – – –
– – – 17,067 (36,177) – –
2,341,277 197,996 1,513,944 915,497 24,773 312,140 2,224,636
(11,828,092) (1,230,394) (36,939,486) (4,581,397) (670,117) 44,500 (4,055,128)
– 70 570 16,585 787 2,821 172
844 574,456 23,986 2,286,757 – 183,884 2,970,938
(11,828,936) (1,804,920) (36,964,042) (6,884,739) (670,904) (142,205) (7,026,238)
(283,843) (84,651) (211,041) (28) (5,668) (12,838) 105,095
(12,112,779) (1,889,571) (37,175,083) (6,884,767) (676,572) (155,043) (6,921,143)
(504,809) – (201,778) (474,423) – (335,001) (1,452,824)
(12,617,588) (1,889,571) (37,376,861) (7,359,190) (676,572) (490,044) (8,373,967)

194
BNY MELLON GLOBAL FUNDS, PLC
STATEMENT OF COMPREHENSIVE INCOME
For the year ended 31 December 2015 (cont’d.)
194
BNY Mellon BNY Mellon BNY Mellon BNY Mellon Emerging Emerging Emerging Emerging
Markets Debt Markets Debt Markets MarketsLocal Currency Opportunistic Equity Equity Core
Fund Fund Fund** Fund**
Notes USD USD USD USD
IncomeBank interest income – – 442 4,013
Dividend income – – 609,101 2,939,634
Securities lending income 14 102,649 1,650 3,415 45,868
Net gains/(losses) on financial assets/liabilities
at fair value through profit or loss
Net realised gains/(losses) on financial assets/
liabilities held at fair value through profit or loss (156,910,203) (139,148) (3,187,837) (24,625,442)
Net change in unrealised gains/(losses)
on financial assets/liabilities held at fair value
through profit or loss (140,039,640) (3,591,167) (822,376) 5,631,513
Total income (296,847,194) (3,728,665) (3,397,255) (16,004,414)
ExpensesManagement fee 3 10,975,178 862 95,290 199,588
Performance fee 3 – – – –
Depositary fee 5 1,551,070 32,147 37,824 156,562
Operating expenses 7 2,055,254 32,896 6,577 110,842
Dividend expense – – – –
Finance charges on swaps – – – –
Rebate due (from)/to the manager 6 – 1,992 (4,409) (27,841)
Total expenses 14,581,502 67,897 135,282 439,151
Net income/(expense) (311,428,696) (3,796,562) (3,532,537) (16,443,565)
Finance costsBank interest 20,013 2,419 1,078 4,147
Distributions 38,363,427 – 299,227 –
Profit/(loss) for the year (349,812,136) (3,798,981) (3,832,842) (16,447,712)
Withholding taxes on dividends and other investment income (3,285,443) (101,913) (71,081) (348,126)
(353,097,579) (3,900,894) (3,903,923) (16,795,838)
Change in adjustment for difference in valuation (4,638,763) (67,638) (23,884) (240,941)
Increase/(decrease) in net assets attributable to redeemable participating shareholders from operations (357,736,342) (3,968,532) (3,927,807) (17,036,779)
** This Fund closed during the year.

195
BNY MELLON GLOBAL FUNDS, PLC
STATEMENT OF COMPREHENSIVE INCOME
For the year ended 31 December 2015 (cont’d.)
195
BNY Mellon BNY Mellon BNY Mellon BNY Mellon BNY Mellon BNY Mellon BNY Mellon Emerging Markets Euroland European Global Global Global Global
Local Currency Bond Credit Bond Dynamic Emerging Emerging Investment Fund Fund Fund Bond Markets Markets Grade Debt Fund Equity Value Fund
Fund** Fund
USD EUR EUR USD USD USD USD
486 – – 6,070 – 89 319
– – – – 110,990 593,466 485,711
1,816 645,680 857 84,652 56,543 3,086 1,097
(42,129,093) 103,751,066 4,748,757 (16,196,195) (16,061,340) (8,960,101) (3,619,595)
38,195,814 (102,389,311) (3,672,993) (2,059,514) 346,468 2,327,499 2,369,461
(3,930,977) 2,007,435 1,076,621 (18,164,987) (15,547,339) (6,035,961) (763,007)
10,439 21,984,559 114,253 2,429,446 2,064,867 273,701 139,976
– – – – – – –
33,298 733,726 43,942 167,254 146,374 154,633 38,926
40,028 2,535,031 55,046 397,545 312,705 28,973 12,863
– – – – – – –
– – – – – – –
46,504 – (28,871) – – – (17,789)
130,269 25,253,316 184,370 2,994,245 2,523,946 457,307 173,976
(4,061,246) (23,245,881) 892,251 (21,159,232) (18,071,285) (6,493,268) (936,983)
239 291,980 5,599 141 5,941 12 –
– 2,823,665 121,551 206,152 327,072 109 244,666
(4,061,485) (26,361,526) 765,101 (21,365,525) (18,404,298) (6,493,389) (1,181,649)
111,905 (104,061) 13,458 27,001 (24,605) (72,985) (47,984)
(3,949,580) (26,465,587) 778,559 (21,338,524) (18,428,903) (6,566,374) (1,229,633)
(378,484) – (212,817) (451,225) (470,126) (18,466) (67,375)
(4,328,064) (26,465,587) 565,742 (21,789,749) (18,899,029) (6,584,840) (1,297,008)

196
BNY MELLON GLOBAL FUNDS, PLC
STATEMENT OF COMPREHENSIVE INCOME
For the year ended 31 December 2015 (cont’d.)
196
BNY Mellon BNY Mellon BNY Mellon BNY Mellon Global Global Global Global Equity Equity High Yield Opportunistic
Fund Income Bond Bond Fund Fund Fund
Notes USD USD USD USD
IncomeBank interest income 11,539 3,111 – –
Dividend income 5,093,366 14,047,504 81,217 –
Securities lending income 14 30,475 24,917 65,396 35,096
Net gains/(losses) on financial assets/liabilities
at fair value through profit or loss
Net realised gains/(losses) on financial assets/
liabilities held at fair value through profit or loss 10,014,595 9,097,320 (2,868,651) 2,221,550
Net change in unrealised gains/(losses)
on financial assets/liabilities held at fair value
through profit or loss (4,136,003) (4,233,848) (7,125,845) (11,315,545)
Total income 11,013,972 18,939,004 (9,847,883) (9,058,899)
ExpensesManagement fee 3 2,745,285 4,382,659 444,915 522,040
Performance fee 3 – – – –
Depositary fee 5 86,028 103,992 71,725 108,983
Operating expenses 7 265,914 337,406 149,865 172,537
Dividend expense – – – –
Finance charges on swaps – – – –
Rebate due (from)/to the manager 6 – – – 20,226
Total expenses 3,097,227 4,824,057 666,505 823,786
Net income/(expense) 7,916,745 14,114,947 (10,514,388) (9,882,685)
Finance costsBank interest – – 3,803 3,342
Distributions – 5,305,258 7,523,538 1,780,664
Profit/(loss) for the year 7,916,745 8,809,689 (18,041,729) (11,666,691)
Withholding taxes on dividends and other investment income (911,219) (2,714,277) (27,238) (32,501)
7,005,526 6,095,412 (18,068,967) (11,699,192)
Change in adjustment for difference in valuation (89,770) (133,894) (664,863) (261,209)
Increase/(decrease) in net assets attributable to redeemable participating shareholders from operations 6,915,756 5,961,518 (18,733,830) (11,960,401)

197
BNY MELLON GLOBAL FUNDS, PLC
STATEMENT OF COMPREHENSIVE INCOME
For the year ended 31 December 2015 (cont’d.)
197
BNY Mellon BNY Mellon BNY Mellon BNY Mellon BNY Mellon BNY Mellon BNY Mellon Global Global Global Global Global Japan Japan
Opportunities Property Real Real Real All Cap Small Cap Fund Securities Return Return Return Equity Equity
Fund Fund (EUR) Fund (GBP) Fund (USD) Fund Focus Fund
USD EUR EUR GBP USD JPY JPY
3,866 21 – 11,762 32,687 234 213
2,295,271 464,328 46,047,624 811,707 9,057,166 67,478,979 47,298,493
14,001 1,295 436,419 2,232 81,506 1,094,918 6,564,289
7,194,370 1,338,520 (321,957) 419,299 12,332,063 146,485,495 235,039,472
(2,743,443) (536,988) 8,036,726 (810,919) (16,490,660) 116,625,695 (43,954,033)
6,764,065 1,267,176 54,198,812 434,081 5,012,762 331,685,321 244,948,434
882,869 172,506 23,023,721 221,120 2,818,452 32,993,407 44,616,431
– – – – – – –
72,437 79,591 461,004 90,943 199,386 4,693,988 4,005,649
99,252 17,847 1,769,921 29,286 481,910 3,691,670 5,263,141
– – – – – – –
– – – – – – –
– (20,809) – – – (1,912,327) (2,303,818)
1,054,558 249,135 25,254,646 341,349 3,499,748 39,466,738 51,581,403
5,709,507 1,018,041 28,944,166 92,732 1,513,014 292,218,583 193,367,031
30 287 110,552 – – – 2,791
– 510 98,840 543,394 159,226 6,539 3,345
5,709,477 1,017,244 28,734,774 (450,662) 1,353,788 292,212,044 193,360,895
(416,591) (101,231) (6,224,614) (109,338) (1,240,170) (10,065,070) (7,025,295)
5,292,886 916,013 22,510,160 (560,000) 113,618 282,146,974 186,335,600
(26,249) (13,466) (683,797) (25,550) (173,876) (933,385) (3,067,500)
5,266,637 902,547 21,826,363 (585,550) (60,258) 281,213,589 183,268,100

198
BNY MELLON GLOBAL FUNDS, PLC
STATEMENT OF COMPREHENSIVE INCOME
For the year ended 31 December 2015 (cont’d.)
198
BNY Mellon BNY Mellon BNY Mellon BNY Mellon Long-Term Pan S&P Small Cap
Global European 500® Euroland Equity Equity Index Fund
Fund Fund Tracker
Notes EUR EUR USD EUR
IncomeBank interest income 2,493 1,046 698 1,579
Dividend income 31,321,820 1,435,987 1,736,014 944,843
Securities lending income 14 294,781 6,051 7,253 30,421
Net gains/(losses) on financial assets/liabilities
at fair value through profit or loss
Net realised gains/(losses) on financial assets/
liabilities held at fair value through profit or loss 102,415,327 1,101,601 7,414,393 (385,490)
Net change in unrealised gains/(losses)
on financial assets/liabilities held at fair value
through profit or loss 65,063,978 (575,233) (7,982,445) 3,487,410
Total income 199,098,399 1,969,452 1,175,913 4,078,763
ExpensesManagement fee 3 9,755,825 459,033 558,861 542,820
Performance fee 3 129,809 – – –
Depositary fee 5 305,425 49,832 118,220 23,980
Operating expenses 7 1,039,591 30,946 81,779 30,221
Dividend expense – – – –
Finance charges on swaps – – – –
Rebate due (from)/to the manager 6 – – – –
Total expenses 11,230,650 539,811 758,860 597,021
Net income/(expense) 187,867,749 1,429,641 417,053 3,481,742
Finance costsBank interest 10,345 – – –
Distributions 203,699 – – –
Profit/(loss) for the year 187,653,705 1,429,641 417,053 3,481,742
Withholding taxes on dividends and other investment income (6,122,647) (159,440) (609,620) (73,852)
181,531,058 1,270,201 (192,567) 3,407,890
Change in adjustment for difference in valuation (738,906) (9,101) (9,369) (7,920)
Increase/(decrease) in net assets attributable to redeemable participating shareholders from operations 180,792,152 1,261,100 (201,936) 3,399,970
* This Fund launched during the year.
^ The Company Total as at 31 December 2015 has been adjusted to account for cross investment by BNY Mellon Euroland Bond Fund.

199
BNY MELLON GLOBAL FUNDS, PLC
STATEMENT OF COMPREHENSIVE INCOME
199
For the year ended 31 December 2015 (cont’d.)
BNY Mellon BNY Mellon BNY Mellon Total 31 December
2015^ Targeted U.S. US
Return Dynamic Opportunities Bond Value Fund
Fund* Fund
USD USD USD USD
– 140 168 105,256
– 1,585,696 356,636 190,335,854
– 2,995 1,510 2,524,981
(263,547) 6,071,961 (147,170) 173,884,939
(4,390,786) (12,229,075) (476,659) (294,542,457)
(4,654,333) (4,568,283) (265,515) 72,308,573
77,052 375,321 356,714 134,600,432
– – – 8,687,851
6,991 68,868 20,190 6,759,688
14,663 74,219 38,895 15,052,624
– – – 47,135,360
– – – 7,670,014
– – (8,075) (115,506)
98,706 518,408 407,724 219,790,463
(4,753,039) (5,086,691) (673,239) (147,481,890)
– 42 1 1,162,542
– 756,645 – 68,043,416
(4,753,039) (5,843,378) (673,240) (216,687,848)
(24,562) (446,912) (106,071) (27,561,410)
(4,777,601) (6,290,290) (779,311) (244,249,258)
– (4,142) (2,576) (14,960,198)
(4,777,601) (6,294,432) (781,887) (259,209,456)

As at 31 December 2016
200
STATEMENT OF FINANCIAL POSITION
BNY Mellon BNY Mellon BNY Mellon BNY MellonAbsolute Absolute Absolute Asian
Insight Return Return BondFund Bond Equity Fund
Fund Fund
Notes EUR EUR GBP USD
Assets (due within one year)Financial assets at fair value through profit or loss 67,949,523 1,985,052,587 2,296,806,125 25,199,031
Cash at bank 9 14,480,000 200,975,758 71,821,457 159,959
Income receivable 825,524 6,816,057 3,502,088 307,514
Receivable for investments sold 56,196 452 – –
Rebate receivable from management company 6 – – – 12,115
Margins on derivatives contracts 9 2,341,498 46,983,146 35,546,822 6,732
Cash collateral received from broker 10,000 – 16,360,000 –
Subscriptions receivable 459,858 9,726,432 5,850,023 –
Other receivables 1,771 364 791 2,174
86,124,370 2,249,554,796 2,429,887,306 25,687,525
Liabilities (due within one year)Financial liabilities at fair value through profit or loss 2,442,376 66,814,757 78,724,195 17,431
Bank overdraft 9 8 – 525,497 –
Payable for investments purchased 1,874,584 2,171,818 54,100,000 –
Redemptions payable 237,451 5,742,595 5,176,206 –
Expenses payable 175,441 1,412,361 2,500,024 42,034
Performance fees payable 3 – 2,832,568 – –
Margins on derivatives contracts 9 1,228,942 10,183,146 242,451 –
Cash collateral payable to broker 10,000 – 16,360,000 –
Income payable on swaps 13,433 154,031 1,363,138 –
Finance charges payable on swaps 1,094 – 342,980 –
Tax payable – – – –
Other payables – – – –
5,983,329 89,311,276 159,334,491 59,465
Net assets attributable to redeemable participating shareholders at trading valuation 80,141,041 2,160,243,520 2,270,552,815 25,628,060
* Please refer to Note 19 of the fi nancial statements.
The accompanying notes form an integral part of these fi nancial statements.
Signed on behalf of the Board of Directors by
Director – David Dillon
Director – Jonathan Lubran
Date: 19 April 2017

As at 31 December 2016 (cont’d.)
201
BNY MELLON GLOBAL FUNDS, PLC
STATEMENT OF FINANCIAL POSITION
BNY Mellon BNY Mellon BNY Mellon BNY Mellon BNY Mellon BNY Mellon BNY MellonAsian Asian Brazil Crossover Dynamic Total Emerging Emerging
Equity Income Equity Credit Return Markets MarketsFund Fund Fund Fund* Fund Corporate Debt
Debt FundFund
USD GBP USD EUR USD USD USD
72,330,091 17,848,877 79,180,038 – 15,350,088 170,592,726 59,856,826
581,173 43,528 1,369,201 30,238 1,902,573 2,257,237 911,234
43,444 – 961,590 – 2,689 2,249,014 1,035,799
6,565 – 3,756,011 – – – –
– 819 – 5,730 612 – –
– – – – 122,083 197,068 –
– – – – – – –
3 – 615,902 – 40,000 363,079 –
1 – 357 – 249 453 64
72,961,277 17,893,224 85,883,099 35,968 17,418,294 175,659,577 61,803,923
11 10 6,295 – 240,952 41,868 1,019
10,587 – 824,516 – 200,767 – –
30,785 – 2,186,940 – – – –
16,301 – 307,930 – – 56,202 –
169,217 29,803 150,480 35,968 28,549 124,834 127,444
– – – – – – –
– – – – 101,087 – –
– – – – – – –
– – – – – – –
– – – – – – –
– – 1,924,173 – – – –
– – – – – – –
226,901 29,813 5,400,334 35,968 571,355 222,904 128,463
72,734,376 17,863,411 80,482,765 – 16,846,939 175,436,673 61,675,460

As at 31 December 2016 (cont’d.)
202
BNY MELLON GLOBAL FUNDS, PLC
STATEMENT OF FINANCIAL POSITION
BNY Mellon BNY Mellon BNY Mellon BNY Mellon Emerging Emerging Euroland European
Markets Debt Markets Debt Bond Credit Local Opportunistic Fund Fund
Currency FundFund
Notes USD USD EUR EUR
Assets (due within one year)Financial assets at fair value through profit or loss 824,072,617 65,615,213 1,343,804,830 83,299,841
Cash at bank 9 11,132,041 624,803 6,339,394 3,774,862
Income receivable 20,889,612 1,357,549 13,757,597 842,752
Receivable for investments sold 3,449,414 – – –
Rebate receivable from management company 6 – – – 1,185
Margins on derivatives contracts 9 – – 7,726,463 646,481
Cash collateral received from broker – – – –
Subscriptions receivable 229,673 – 3,665,966 222
Other receivables 10,356 3 553 1,024
859,783,713 67,597,568 1,375,294,803 88,566,367
Liabilities (due within one year)Financial liabilities at fair value through profit or loss 20,418,828 721,865 11,572,653 533,520
Bank overdraft 9 – – – –
Payable for investments purchased – – – –
Redemptions payable 7,569,060 – 12,506,663 –
Expenses payable 1,114,612 35,748 1,624,904 26,034
Performance fees payable 3 – – – –
Margins on derivatives contracts 9 – – 13,278,624 531,286
Cash collateral payable to broker – – – –
Income payable on swaps – – – 611
Finance charges payable on swaps – – – –
Tax payable – – – –
Other payables – – – –
29,102,500 757,613 38,982,844 1,091,451
Net assets attributable to redeemable participating shareholders at trading valuation 830,681,213 66,839,955 1,336,311,959 87,474,916
* Please refer to Note 19 of the fi nancial statements.

As at 31 December 2016 (cont’d.)
203
BNY MELLON GLOBAL FUNDS, PLC
STATEMENT OF FINANCIAL POSITION
BNY Mellon BNY Mellon BNY Mellon BNY Mellon BNY Mellon BNY Mellon BNY Mellon Global Global Global Global Global Global Global
Bond Credit Dynamic Emerging Emerging Equity Equity Fund Fund* Bond Markets Markets Fund Income
Fund Equity Value Fund FundFund*
USD USD USD USD USD USD USD
475,475,606 409,715,947 352,308,503 – 29,750,579 246,699,128 671,975,777
17,656,529 6,289,543 14,300,082 6,121 447,582 10,633,269 17,478,740
3,006,721 3,251,603 3,758,911 – 18,322 356,033 1,434,522
– 9,449 1,084,271 – – 1,270,806 –
– 22,496 – – 6,899 – –
– 1,993,434 100,700 – – – –
– – – – – – –
903,694 – 335,344 – 50,000 77,450 3,177,503
– 2,827 1 – 26 23,299 952
497,042,550 421,285,299 371,887,812 6,121 30,273,408 259,059,985 694,067,494
3,856,815 8,669,091 503,022 – 166 303,083 13,160
342,971 – 93,029 – 5,052 – –
– 11,672,052 – – 5,323 417,746 –
1,076,815 – 6,000,285 – – 2,320 727,921
481,470 116,276 326,003 6,121 96,002 319,632 882,523
– – – – – – –
– 339,210 – – – – –
– – – – – – –
– 8,317 – – – – –
– – – – – – –
– – – – – – –
– – – – – – –
5,758,071 20,804,946 6,922,339 6,121 106,543 1,042,781 1,623,604
491,284,479 400,480,353 364,965,473 – 30,166,865 258,017,204 692,443,890

As at 31 December 2016 (cont’d.)
204
BNY MELLON GLOBAL FUNDS, PLC
STATEMENT OF FINANCIAL POSITION
BNY Mellon BNY Mellon BNY Mellon BNY Mellon Global Global Global Global
High Yield Leaders Opportunistic Opportunities Bond Fund* Bond FundFund Fund
Notes USD USD USD USD
Assets (due within one year)Financial assets at fair value through profit or loss 147,029,745 27,564,304 129,460,857 105,184,720
Cash at bank 9 5,712,168 801,300 3,650,066 1,913,427
Income receivable 2,573,057 2,020 1,131,639 109,595
Receivable for investments sold 1,378,951 – – 32,997
Rebate receivable from management company 6 – 691 10,392 –
Margins on derivatives contracts 9 – – 486,287 –
Cash collateral received from broker – – – –
Subscriptions receivable 73,912 – – 65,756
Other receivables 226 – 10,442 899
156,768,059 28,368,315 134,749,683 107,307,394
Liabilities (due within one year)Financial liabilities at fair value through profit or loss 338,282 1,773 2,393,426 384,937
Bank overdraft 9 – – – –
Payable for investments purchased 496,830 – 1,305,881 –
Redemptions payable – – – 66,800
Expenses payable 140,752 21,228 94,267 205,266
Performance fees payable 3 – – – –
Margins on derivatives contracts 9 – – 414,012 –
Cash collateral payable to broker – – – –
Income payable on swaps – – 3,274 –
Finance charges payable on swaps – – – –
Tax payable – – – –
Other payables – – – –
975,864 23,001 4,210,860 657,003
Net assets attributable to redeemable participating shareholders at trading valuation 155,792,195 28,345,314 130,538,823 106,650,391
* Please refer to Note 19 of the fi nancial statements.

As at 31 December 2016 (cont’d.)
205
BNY MELLON GLOBAL FUNDS, PLC
STATEMENT OF FINANCIAL POSITION
BNY Mellon BNY Mellon BNY Mellon BNY Mellon BNY Mellon BNY Mellon BNY Mellon Global Global Global Global Global Japan Japan
Property Real Real Real Short-Dated All Cap REIT Securities Return Return Return High Yield Equity Alpha
Fund Fund (EUR) Fund (GBP) Fund (USD) Bond Fund Fund*Fund*
EUR EUR GBP USD USD JPY JPY
21,164,594 3,932,800,646 62,240,161 623,927,693 443,845,081 2,272,862,222 2,133,619,950
156,199 249,646,374 3,567,310 12,536,271 553,284 6,127,295 8,887,897
76,978 15,876,969 244,874 2,478,316 7,198,792 3,154,520 13,676,268
5,759 2,666,297 42,454 415,129 – – 17,776,117
10,615 – – – 9,472 3,023,076 –
– 75,076,888 1,218,055 11,663,545 – – –
– – – – – – –
– 14,128,557 – 336,000 67,500,000 – –
2,597 9,554 1,850 244 – – –
21,416,742 4,290,205,285 67,314,704 651,357,198 519,106,629 2,285,167,113 2,173,960,232
4,690 156,842,019 404,736 3,523,889 1,773,904 72,660 –
7,746 37,464 538 1,577 – – –
1,640 490,787 7,934 76,992 476,141 – 11,304,291
4,433 12,731,721 168,106 2,053,082 67,500,000 – –
33,569 4,543,002 46,140 551,983 31,845 4,548,266 917,598
– – – – – – –
– – – – – – –
– – – – – – –
– – – – – – –
– – – – – – –
– – – – – – –
278 – – – – – –
52,356 174,644,993 627,454 6,207,523 69,781,890 4,620,926 12,221,889
21,364,386 4,115,560,292 66,687,250 645,149,675 449,324,739 2,280,546,187 2,161,738,343

As at 31 December 2016 (cont’d.)
206
BNY MELLON GLOBAL FUNDS, PLC
STATEMENT OF FINANCIAL POSITION
BNY Mellon BNY Mellon BNY Mellon BNY Mellon Japan Long-Term Pan S&P
Small Cap Global European 500® Equity Equity Equity Index Focus Fund Fund Tracker
Fund
Notes JPY EUR EUR USD
Assets (due within one year)Financial assets at fair value through profit or loss 2,672,485,181 1,262,790,624 1,925,877 85,970,077
Cash at bank 9 49,478,057 21,195,471 20,487 659,886
Income receivable 3,664,265 703,767 4,555 77,980
Receivable for investments sold – – – –
Rebate receivable from management company 6 3,086,804 – 1,584 –
Margins on derivatives contracts 9 – – – 393
Cash collateral received from broker – – – –
Subscriptions receivable 404,682 386,350 – 57,093
Other receivables 7,796 40,541 – 48
2,729,126,785 1,285,116,753 1,952,503 86,765,477
Liabilities (due within one year)Financial liabilities at fair value through profit or loss 4,029 500 – 3,034
Bank overdraft 9 – – – –
Payable for investments purchased – – – –
Redemptions payable 29,125 236,871 3,805 65,129
Expenses payable 4,555,188 1,128,234 14,877 122,625
Performance fees payable 3 – – – –
Margins on derivatives contracts 9 – – – –
Cash collateral payable to broker – – – –
Income payable on swaps – – – –
Finance charges payable on swaps – – – –
Tax payable – – – –
Other payables – – – –
4,588,342 1,365,605 18,682 190,788
Net assets attributable to redeemable participating shareholders at trading valuation 2,724,538,443 1,283,751,148 1,933,821 86,574,689
^ The Company Total as at 31 December 2016 has been adjusted to account for cross investments by BNY Mellon Euroland Bond Fund and
BNY Mellon European Credit Fund.

207
BNY MELLON GLOBAL FUNDS, PLC
STATEMENT OF FINANCIAL POSITION
As at 31 December 2016 (cont’d.)
BNY Mellon BNY Mellon BNY Mellon BNY Mellon Total 31 December
2016^Small Cap Targeted U.S. US
Euroland Return Dynamic Opportunities Fund Bond Value Fund
Fund Fund
EUR USD USD USD USD
34,540,782 79,548,543 139,451,711 31,521,683 17,456,447,128
752,533 2,468,801 851,696 174,174 732,143,898
– 696,856 143,103 18,028 98,848,347
– – 688,825 238,608 15,407,813
– – – 6,591 142,675
105,000 192,545 – – 199,947,477
– – – – 20,172,600
442,742 – 504,299 – 111,869,734
5,398 – 3 1,817 122,818
35,846,455 82,906,745 141,639,637 31,960,901 18,635,102,490
– 2,960,544 – – 394,444,999
– – – – 2,174,384
770,478 815,533 1,532,035 227,920 91,612,391
7,609 – – – 125,156,544
52,357 74,446 164,814 43,809 18,255,407
– – – – 2,981,704
3,549 145,443 – – 27,852,231
– – – – 20,172,600
– 2,390 – – 1,870,837
– – – – 423,840
– – – – 1,924,173
– – – – 293
833,993 3,998,356 1,696,849 271,729 686,869,403
35,012,462 78,908,389 139,942,788 31,689,172 17,948,233,087

As at 31 December 2015
208
BNY MELLON GLOBAL FUNDS, PLC
STATEMENT OF FINANCIAL POSITION
BNY Mellon BNY Mellon BNY Mellon BNY Mellon Absolute Absolute Absolute Asian
Insight Return Return BondFund Bond Equity Fund
Fund Fund
Notes EUR EUR GBP USD
Assets (due within one year)Financial assets at fair value through profit or loss 203,605,536 1,878,182,652 1,869,384,940 38,698,210
Cash at bank 9 21,390,807 258,376,425 34,468,565 1,790,841
Income receivable 1,028,738 6,396,671 1,883,471 426,989
Receivable for investments sold – 2,252,122 – 100,463
Rebate receivable from management company 6 11,116 – – 24,178
Margins on derivatives contracts 9 3,019,513 34,656,816 17,630,270 –
Cash collateral received from broker 269,464 843,467 5,656,836 –
Subscriptions receivable 669,219 7,568,967 7,212,854 –
Other receivables 9,386 5,944 103,560 103
230,003,779 2,188,283,064 1,936,340,496 41,040,784
Liabilities (due within one year)Financial liabilities at fair value through profit or loss 3,899,487 12,409,378 42,598,008 8,390
Bank overdraft 9 9,905 – 7,110 –
Payable for investments purchased 205,429 – 883,067 –
Redemptions payable 7,036 2,436,415 1,152,459 –
Expenses payable 278,278 1,129,911 1,815,413 61,344
Performance fees payable 3 75,979 370,739 5,574,555 –
Margins on derivatives contracts 9 794,926 14,828,865 – 10,180
Cash collateral payable to broker 269,464 843,467 5,656,836 –
Income payable on swaps 40,279 104,965 471,104 –
Finance charges payable on swaps 5,555 – 214,850 –
Other payables – – – –
5,586,338 32,123,740 58,373,402 79,914
Net assets attributable to redeemable participating shareholders 224,417,441 2,156,159,324 1,877,967,094 40,960,870
* This Fund launched during the year.
The accompanying notes form an integral part of these financial statements.

As at 31 December 2015 (cont’d.)
209
BNY MELLON GLOBAL FUNDS, PLC
STATEMENT OF FINANCIAL POSITION
BNY Mellon BNY Mellon BNY Mellon BNY Mellon BNY Mellon BNY Mellon BNY Mellon Asian Asian Brazil Crossover Dynamic Emerging Emerging
Equity Income Equity Credit Total Markets Markets Fund Fund Fund Fund Return Corporate Debt
Fund* Debt Fund Fund
USD GBP USD EUR USD USD USD
90,602,594 20,866,698 52,595,016 226,341,225 11,172,142 105,177,154 66,158,871
2,090,148 174,887 4,531,294 3,185,105 1,048,184 1,581,246 3,240,685
43,038 – 427,980 4,074,405 1,715 1,449,207 1,196,184
– – – – – – 1,093,662
– – – 36,104 7,372 – –
– – – 43,168 63,075 – –
– – – – – – –
717 – 3,025 40,480 – 703,047 –
3,766 124 6,627 2,929 571 6 5,600
92,740,263 21,041,709 57,563,942 233,723,416 12,293,059 108,910,660 71,695,002
28 – 324 23,613 121,385 163,458 33,983
2 – 15,303 – – – –
– – 55,130 – 538,903 – 352,626
36,341 – 481,392 5,030 – – 465
194,242 39,450 123,650 127,731 31,185 39,252 140,248
– – – – – – –
– – – – 82,528 – –
– – – – – – –
– – – – – – –
– – – – – – –
– – – – – – –
230,613 39,450 675,799 156,374 774,001 202,710 527,322
92,509,650 21,002,259 56,888,143 233,567,042 11,519,058 108,707,950 71,167,680

As at 31 December 2015 (cont’d.)
210
BNY MELLON GLOBAL FUNDS, PLC
STATEMENT OF FINANCIAL POSITION
BNY Mellon BNY Mellon BNY Mellon BNY Mellon Emerging Emerging Emerging Emerging
Markets Debt Markets Debt Markets Markets Local Opportunistic Equity Equity
Currency Fund Fund** Core Fund Fund**
Notes USD USD USD USD
Assets (due within one year)Financial assets at fair value through profit or loss 1,273,745,947 83,210,917 – –
Cash at bank 9 33,192,014 3,682,284 1,418 119,875
Income receivable 27,252,556 1,480,828 1,536 14,034
Receivable for investments sold – – – –
Rebate receivable from management company 6 – 17,135 4,409 27,841
Margins on derivatives contracts 9 – – – –
Cash collateral received from broker 5,342,000 570,000 – –
Subscriptions receivable 200,000 – – –
Other receivables 497 2,787 – –
1,339,733,014 88,963,951 7,363 161,750
Liabilities (due within one year)Financial liabilities at fair value through profit or loss 8,266,542 383,053 – –
Bank overdraft 9 – – 5,551 136,195
Payable for investments purchased – – – –
Redemptions payable 336,381 – – –
Expenses payable 1,306,854 27,342 1,812 25,555
Performance fees payable 3 – – – –
Margins on derivatives contracts 9 – – – –
Cash collateral payable to broker 5,342,000 570,000 – –
Income payable on swaps – – – –
Finance charges payable on swaps – – – –
Other payables – – – –
15,251,777 980,395 7,363 161,750
Net assets attributable to redeemable participating shareholders 1,324,481,237 87,983,556 – –
** This Fund closed during the year.

As at 31 December 2015 (cont’d.)
211
BNY MELLON GLOBAL FUNDS, PLC
STATEMENT OF FINANCIAL POSITION
BNY Mellon BNY Mellon BNY Mellon BNY Mellon BNY Mellon BNY Mellon BNY Mellon Emerging Markets Euroland European Global Global Global Global
Local Currency Bond Credit Bond Dynamic Emerging Emerging Investment Fund Fund Fund Bond Markets MarketsGrade Debt Fund Equity Value Fund
Fund** Fund
USD EUR EUR USD USD USD USD
– 2,702,126,889 49,835,981 302,003,716 249,864,289 4,291,316 22,895,572
47,508 65,325,942 310,874 8,320,652 8,779,694 44,906,791 4,179,224
– 25,422,006 585,870 1,926,077 2,174,021 48,814 –
– – – 5,361,369 5,303,321 236,095 –
– – 32,098 – – – 29,483
– 291,103 723,337 – 75,690 – –
– – – – – – –
– 2,987,401 – 310,385 55,666 1,145 45,283,886
– 4,705 1,499 3,817 16 – 82,042
47,508 2,796,158,046 51,489,659 317,926,016 266,252,697 49,484,161 72,470,207
– 25,830,909 194,215 1,472,340 2,299,462 – 3,737
– – – 39,964 1,411 2 1
– – – 5,711,853 – – 3,375,850
– 5,435,158 – 1,137,592 7,029 45,296,251 –
1,004 2,168,238 49,944 289,441 232,086 61,760 153,681
– – – – – – –
– 6,399,563 489,691 – – – –
– – – – – – –
– 2,372,958 2,546 – – – –
– – – – – – –
46,504 – – – – – –
47,508 42,206,826 736,396 8,651,190 2,539,988 45,358,013 3,533,269
– 2,753,951,220 50,753,263 309,274,826 263,712,709 4,126,148 68,936,938

As at 31 December 2015 (cont’d.)
212
BNY MELLON GLOBAL FUNDS, PLC
STATEMENT OF FINANCIAL POSITION
BNY Mellon BNY Mellon BNY Mellon BNY Mellon Global Global Global Global Equity Equity High Yield Opportunistic
Fund Income Bond Bond Fund Fund Fund
Notes USD USD USD USD
Assets (due within one year)Financial assets at fair value through profit or loss 244,265,414 461,327,197 127,361,950 214,482,376
Cash at bank 9 11,235,990 9,684,815 6,376,027 7,338,345
Income receivable 341,089 1,118,649 2,397,428 2,193,536
Receivable for investments sold 54,989 – – –
Rebate receivable from management company 6 – – – 23,020
Margins on derivatives contracts 9 – – – 11,085
Cash collateral received from broker – – – –
Subscriptions receivable 55,051 310,174 11,020 40,566
Other receivables 16,227 4,388 – 1,345
255,968,760 472,445,223 136,146,425 224,090,273
Liabilities (due within one year)Financial liabilities at fair value through profit or loss 16,691 1,410,107 572,215 3,064,291
Bank overdraft 9 – 878 – –
Payable for investments purchased 208,319 – 1,066,683 2,771,950
Redemptions payable 13,949 1,312,928 7,552 38,722
Expenses payable 319,068 523,342 80,951 123,298
Performance fees payable 3 – – – –
Margins on derivatives contracts 9 – – – 623,535
Cash collateral payable to broker – – – –
Income payable on swaps – – – –
Finance charges payable on swaps – – – –
Other payables – – – –
558,027 3,247,255 1,727,401 6,621,796
Net assets attributable to redeemable participating shareholders 255,410,733 469,197,968 134,419,024 217,468,477

As at 31 December 2015 (cont’d.)
213
BNY MELLON GLOBAL FUNDS, PLC
STATEMENT OF FINANCIAL POSITION
BNY Mellon BNY Mellon BNY Mellon BNY Mellon BNY Mellon BNY Mellon BNY Mellon Global Global Global Global Global Japan Japan
Opportunities Property Real Real Real All Cap Small Cap Fund Securities Return Return Return Equity Equity
Fund Fund (EUR) Fund (GBP) Fund (USD) Fund Focus Fund
USD EUR EUR GBP USD JPY JPY
136,321,804 13,872,098 2,501,496,723 55,365,582 474,275,195 3,918,470,132 4,457,549,052
6,304,037 136,881 91,364,073 4,203,695 28,213,663 72,202,575 26,331,713
95,921 48,609 9,590,036 164,099 1,380,849 5,714,210 2,502,230
– 90,856 – – – – 30,365,005
– 9,533 – – – 3,169,970 2,316,408
– – 20,076,176 481,493 3,966,803 – –
– – – – – – –
246,434 1,415 3,983,966 34,381 480,000 – –
2,026 187 1,350 7,956 2,743 142 96
142,970,222 14,159,579 2,626,512,324 60,257,206 508,319,253 3,999,557,029 4,519,064,504
76,579 6,487 10,943,707 1,182,948 1,565,570 28,656,971 25,139,478
– – 2 1 10 – –
– 97,451 97,200 – 25,398 – 31,673,707
915,753 – 3,088,589 – 259,144 – –
137,690 35,674 2,394,940 24,378 330,890 7,646,853 7,622,194
– – – – – – –
– – – – – – –
– – – – – – –
– – – – – – –
– – – – – – –
– – – – – – –
1,130,022 139,612 16,524,438 1,207,327 2,181,012 36,303,824 64,435,379
141,840,200 14,019,967 2,609,987,886 59,049,879 506,138,241 3,963,253,205 4,454,629,125

As at 31 December 2015 (cont’d.)
214
BNY MELLON GLOBAL FUNDS, PLC
STATEMENT OF FINANCIAL POSITION
BNY Mellon BNY Mellon BNY Mellon BNY Mellon Long-Term Pan S&P Small Cap
Global European 500® EurolandEquity Equity Index Fund
Fund Fund Tracker
Notes EUR EUR USD EUR
Assets (due within one year)Financial assets at fair value through profit or loss 1,407,479,067 48,639,246 76,518,442 60,495,538
Cash at bank 9 42,250,466 540,996 411,410 1,107,887
Income receivable 727,988 61,457 74,452 17,663
Receivable for investments sold – – – –
Rebate receivable from management company 6 – – – –
Margins on derivatives contracts 9 – – – 172,000
Cash collateral received from broker – – – –
Subscriptions receivable 10,425,151 598 21,691 296,351
Other receivables 36,006 – 54 345
1,460,918,678 49,242,297 77,026,049 62,089,784
Liabilities (due within one year)Financial liabilities at fair value through profit or loss 1,490 4 – –
Bank overdraft 9 – 4,563 – –
Payable for investments purchased – – 10,249 –
Redemptions payable 10,184,783 602 48,584 281
Expenses payable 1,017,841 53,828 101,210 74,624
Performance fees payable 3 129,809 – – –
Margins on derivatives contracts 9 – – 4,994 23,700
Cash collateral payable to broker – – – –
Income payable on swaps – – – –
Finance charges payable on swaps – – – –
Other payables – – – –
11,333,923 58,997 165,037 98,605
Net assets attributable to redeemable participating shareholders 1,449,584,755 49,183,300 76,861,012 61,991,179
* This Fund launched during the year.
^ The Company Total as at 31 December 2015 has been adjusted to account for cross investment by BNY Mellon Euroland Bond Fund.

As at 31 December 2015 (cont’d.)
215
BNY MELLON GLOBAL FUNDS, PLC
STATEMENT OF FINANCIAL POSITION
BNY Mellon BNY Mellon BNY Mellon Total 31 December
2015^Targeted U.S. US
Return Dynamic OpportunitiesBond Value Fund
Fund* Fund
USD USD USD USD
93,433,467 41,113,742 51,008,282 17,000,738,853
3,182,088 438,118 225,099 774,973,729
1,042,118 54,463 23,027 100,363,528
– – 15,092 14,963,784
– – 18,715 294,355
20,989 – – 94,936,400
– – – 15,461,170
– – 298 86,633,496
– 1,733 3 366,699
97,678,662 41,608,056 51,290,516 18,088,732,014
2,654,484 6 – 145,037,630
– – – 225,525
938,412 – – 17,055,550
– – 811 74,584,647
74,273 58,351 65,102 15,367,939
– – – 8,844,945
285,793 – – 25,498,168
– – – 15,461,170
– – – 3,433,884
– – – 322,784
– – – 46,504
3,952,962 58,357 65,913 305,878,746
93,725,700 41,549,699 51,224,603 17,782,853,268

For the year ended 31 December 2016
216
BNY Mellon BNY Mellon BNY Mellon BNY Mellon BNY MellonAbsolute Absolute Absolute Asian Asian
Insight Return Return Bond EquityFund Bond Equity Fund Fund
Fund Fund
EUR EUR GBP USD USD
Net assets attributable to redeemable
participating shareholders at beginning of year 224,417,441 2,156,159,324 1,877,967,094 40,960,870 92,509,650
Notional exchange adjustment (Note 1) – – – – –
Increase/(decrease) in net assets attributable to redeemable
participating shareholders from operations (7,137,832) (39,080) 262,251,091 818,308 1,417,541
Proceeds from redeemable participating shares issued 42,478,068 1,083,138,889 1,193,571,100 15,420,095 2,651,323
Cost of redeemable participating shares redeemed (179,616,636) (1,079,015,613) (1,063,236,470) (31,571,213) (23,844,138)
Net increase/(decrease) in net assets from share transactions (137,138,568) 4,123,276 130,334,630 (16,151,118) (21,192,815)
Net assets attributable to redeemable participating shareholders at end of year 80,141,041 2,160,243,520 2,270,552,815 25,628,060 72,734,376
BNY Mellon BNY Mellon BNY Mellon BNY Mellon BNY Mellon European Global Global Global Global
Credit Bond Credit Dynamic Emerging Fund Fund Fund* Bond Markets
Fund Equity Value Fund*
EUR USD USD USD USD
Net assets attributable to redeemable
participating shareholders at beginning of year 50,753,263 309,274,826 – 263,712,709 4,126,148
Notional exchange adjustment (Note 1) – – – – –
Increase/(decrease) in net assets attributable to redeemable
participating shareholders from operations 4,227,872 (5,883,123) 9,015,777 4,021,735 (263,271)
Proceeds from redeemable participating shares issued 60,491,542 429,401,952 391,464,576 173,827,633 133,832
Cost of redeemable participating shares redeemed (27,997,761) (241,509,176) – (76,596,604) (3,996,709)
Net increase/(decrease) in net assets from share transactions 32,493,781 187,892,776 391,464,576 97,231,029 (3,862,877)
Net assets attributable to redeemable participating shareholders at end of year 87,474,916 491,284,479 400,480,353 364,965,473 –
* Please refer to Note 19 of the fi nancial statements.
The accompanying notes form an integral part of these financial statements.
STATEMENT OF CHANGES IN NET ASSETS ATTRIBUTABLE TO REDEEMABLEPARTICIPATING SHAREHOLDERS

For the year ended 31 December 2016 (cont’d.)
217
BNY MELLON GLOBAL FUNDS, PLC
STATEMENT OF CHANGES IN NET ASSETS ATTRIBUTABLE TO REDEEMABLE PARTICIPATING SHAREHOLDERS
BNY Mellon BNY Mellon BNY Mellon BNY Mellon BNY Mellon BNY Mellon BNY Mellon BNY Mellon BNY MellonAsian Brazil Crossover Dynamic Emerging Emerging Emerging Emerging Euroland
Income Equity Credit Total Markets Markets Markets Markets Debt Bond Fund Fund Fund* Return Corporate Debt Debt Local Opportunistic Fund
Fund Debt Fund Currency FundFund Fund
GBP USD EUR USD USD USD USD USD EUR
21,002,259 56,888,143 233,567,042 11,519,058 108,707,950 71,167,680 1,324,481,237 87,983,556 2,753,951,220
– – – – – – – – –
6,038,904 29,631,055 9,528,946 98,252 13,364,003 5,074,545 60,977,738 4,899,429 60,196,343
10,211,236 80,833,771 4,853,955 6,964,037 109,194,506 92,791,707 247,985,246 8,413,228 511,089,948
(19,388,988) (86,870,204) (247,949,943) (1,734,408) (55,829,786) (107,358,472) (802,763,008) (34,456,258) (1,988,925,552)
(9,177,752) (6,036,433) (243,095,988) 5,229,629 53,364,720 (14,566,765) (554,777,762) (26,043,030) (1,477,835,604)
17,863,411 80,482,765 – 16,846,939 175,436,673 61,675,460 830,681,213 66,839,955 1,336,311,959
BNY Mellon BNY Mellon BNY Mellon BNY Mellon BNY Mellon BNY Mellon BNY Mellon BNY Mellon BNY Mellon Global Global Global Global Global Global Global Global Global
Emerging Equity Equity High Yield Leaders Opportunistic Opportunities Property Real Markets Fund Income Bond Fund* Bond Fund Securities Return
Fund Fund Fund Fund Fund Fund (EUR)
USD USD USD USD USD USD USD EUR EUR
68,936,938 255,410,733 469,197,968 134,419,024 – 217,468,477 141,840,200 14,019,967 2,609,987,886
– – – – – – – – –
2,495,492 239,905 11,301,893 10,268,644 339,272 (3,508,617) (843,659) 1,145,315 (56,506,314)
4,879,268 262,373,219 573,364,507 137,277,336 28,006,042 12,098,743 62,533,499 9,518,372 2,569,249,067
(46,144,833) (260,006,653) (361,420,478) (126,172,809) – (95,519,780) (96,879,649) (3,319,268) (1,007,170,347)
(41,265,565) 2,366,566 211,944,029 11,104,527 28,006,042 (83,421,037) (34,346,150) 6,199,104 1,562,078,720
30,166,865 258,017,204 692,443,890 155,792,195 28,345,314 130,538,823 106,650,391 21,364,386 4,115,560,292

For the year ended 31 December 2016 (cont’d.)
218
BNY MELLON GLOBAL FUNDS, PLC
STATEMENT OF CHANGES IN NET ASSETS ATTRIBUTABLE TO REDEEMABLE PARTICIPATING SHAREHOLDERS
BNY Mellon BNY Mellon BNY Mellon BNY Mellon BNY Mellon Global Global Global Japan Japan
Real Return Real Return Short-Dated All Cap REIT Fund (GBP) Fund (USD) High Yield Equity Alpha
Bond Fund Fund* Fund*
GBP USD USD JPY JPY
Net assets attributable to redeemable
participating shareholders at beginning of year 59,049,879 506,138,241 – 3,963,253,205 –
Notional exchange adjustment (Note 1) – – – – –
Increase/(decrease) in net assets attributable to redeemable
participating shareholders from operations 1,267,381 3,217,248 5,714,224 (433,086,084) 87,151,998
Proceeds from redeemable participating shares issued 31,416,886 324,580,686 514,759,298 1,496,483,562 2,074,586,345
Cost of redeemable participating shares redeemed (25,046,896) (188,786,500) (71,148,783) (2,746,104,496) –
Net increase/(decrease) in net assets from share transactions 6,369,990 135,794,186 443,610,515 (1,249,620,934) 2,074,586,345
Net assets attributable to redeemable participating shareholders at end of year 66,687,250 645,149,675 449,324,739 2,280,546,187 2,161,738,343
* Please refer to Note 19 of the fi nancial statements.
^ The Company Total as at 31 December 2016 has been adjusted to account for cross investments by BNY Mellon Euroland Bond Fund and
BNY Mellon European Credit Fund.

For the year ended 31 December 2016 (cont’d.)
219
BNY MELLON GLOBAL FUNDS, PLC
STATEMENT OF CHANGES IN NET ASSETS ATTRIBUTABLE TO REDEEMABLE PARTICIPATING SHAREHOLDERS
BNY Mellon BNY Mellon BNY Mellon BNY Mellon BNY Mellon BNY Mellon BNY Mellon BNY Mellon Total 31 December
2016^Japan Long-Term Pan S&P Small Cap Targeted U.S. US
Small Cap Global European 500® Euroland Return Dynamic OpportunitiesEquity Equity Equity Index Fund Bond Value Fund Focus Fund Fund Tracker Fund Fund Fund
JPY EUR EUR USD EUR USD USD USD USD
4,454,629,125 1,449,584,755 49,183,300 76,861,012 61,991,179 93,725,700 41,549,699 51,224,603 17,782,853,268
– – – – – – – – (817,707,235)
(306,331,044) 86,521,438 (5,109,519) 9,100,590 (1,498,242) (18,338,848) 13,201,616 1,402,970 614,427,466
1,625,345,776 216,351,842 320,123 27,972,426 51,342,147 3,521,537 100,321,421 27,940,811 10,383,813,876
(3,049,105,414) (468,706,887) (42,460,083) (27,359,339) (76,822,622) – (15,129,948) (48,879,212) (10,015,154,288)
(1,423,759,638) (252,355,045) (42,139,960) 613,087 (25,480,475) 3,521,537 85,191,473 (20,938,401) 368,659,588
2,724,538,443 1,283,751,148 1,933,821 86,574,689 35,012,462 78,908,389 139,942,788 31,689,172 17,948,233,087

220
For the year ended 31 December 2015
BNY MELLON GLOBAL FUNDS, PLC
STATEMENT OF CHANGES IN NET ASSETS ATTRIBUTABLE TO REDEEMABLE PARTICIPATING SHAREHOLDERS
BNY Mellon BNY Mellon BNY Mellon BNY Mellon BNY MellonAbsolute Absolute Absolute Asian Asian
Insight Return Bond Return Equity Bond EquityFund Fund Fund Fund Fund
EUR EUR GBP USD USD
Net assets attributable to redeemable
participating shareholders at beginning of year 152,841,576 1,184,511,961 1,293,204,376 32,463,471 161,645,935
Notional exchange adjustment (Note 1) – – – – –
Increase/(decrease) in net assets attributable to redeemable
participating shareholders from operations 1,198,557 44,832,203 9,924,256 (1,095,248) (12,617,588)
Proceeds from redeemable participating shares issued 136,110,033 1,519,428,657 1,232,602,320 71,987,922 15,277,849
Cost of redeemable participating shares redeemed (65,732,725) (592,613,497) (657,763,858) (62,395,275) (71,796,546)
Net increase/(decrease) in net assets from share transactions 70,377,308 926,815,160 574,838,462 9,592,647 (56,518,697)
Net assets attributable to redeemable participating shareholders at end of year 224,417,441 2,156,159,324 1,877,967,094 40,960,870 92,509,650
BNY Mellon BNY Mellon BNY Mellon BNY Mellon BNY MellonEmerging Emerging Markets Euroland European Global
Markets Local Currency Bond Credit BondEquity Core Investment Fund Fund Fund
Fund** Grade DebtFund**
USD USD EUR EUR USD
Net assets attributable to redeemable
participating shareholders at beginning of year 161,186,349 179,211,791 3,136,435,340 105,847,788 559,453,129
Notional exchange adjustment (Note 1) – – – – –
Increase/(decrease) in net assets attributable to redeemable
participating shareholders from operations (17,036,779) (4,328,064) (26,465,587) 565,742 (21,789,749)
Proceeds from redeemable participating shares issued 158,369 – 1,537,582,012 24,855,328 202,449,873
Cost of redeemable participating shares redeemed (144,307,939) (174,883,727) (1,893,600,545) (80,515,595) (430,838,427)
Net increase/(decrease) in net assets from share transactions (144,149,570) (174,883,727) (356,018,533) (55,660,267) (228,388,554)
Net assets attributable to redeemable participating shareholders at end of year – – 2,753,951,220 50,753,263 309,274,826
* This Fund launched during the year.
** This Fund closed during the year.
The accompanying notes form an integral part of these financial statements.

221
For the year ended 31 December 2015 (cont’d.)
BNY MELLON GLOBAL FUNDS, PLC
STATEMENT OF CHANGES IN NET ASSETS ATTRIBUTABLE TO REDEEMABLE PARTICIPATING SHAREHOLDERS
BNY Mellon BNY Mellon BNY Mellon BNY Mellon BNY Mellon BNY Mellon BNY Mellon BNY Mellon BNY MellonAsian Brazil Crossover Dynamic Emerging Emerging Emerging Emerging Emerging
Income Equity Credit Total Markets Markets Markets Markets Debt MarketsFund Fund Fund Return Corporate Debt Debt Local Opportunistic Equity
Fund* Debt Fund Currency Fund Fund**Fund Fund
GBP USD EUR USD USD USD USD USD USD
19,898,582 113,896,415 172,572,315 – 89,815,077 309,091,452 2,137,882,176 16,668,797 14,312,715
– – – – – – – – –
(1,889,571) (37,376,861) (7,359,190) (676,572) (490,044) (8,373,967) (357,736,342) (3,968,532) (3,927,807)
26,112,510 74,033,600 115,969,328 12,798,150 61,188,075 111,555,690 511,350,904 91,635,899 15,334,719
(23,119,262) (93,665,011) (47,615,411) (602,520) (41,805,158) (341,105,495) (967,015,501) (16,352,608) (25,719,627)
2,993,248 (19,631,411) 68,353,917 12,195,630 19,382,917 (229,549,805) (455,664,597) 75,283,291 (10,384,908)
21,002,259 56,888,143 233,567,042 11,519,058 108,707,950 71,167,680 1,324,481,237 87,983,556 –
BNY Mellon BNY Mellon BNY Mellon BNY Mellon BNY Mellon BNY Mellon BNY Mellon BNY Mellon BNY Mellon Global Global Global Global Global Global Global Global Global
Dynamic Emerging Emerging Equity Equity High Yield Opportunistic Opportunities Property Bond Markets Markets Fund Income Bond Bond Fund SecuritiesFund Equity Value Fund* Fund* Fund Fund Fund
Fund
USD USD USD USD USD USD USD USD EUR
264,568,682 10,943,177 29,078,381 239,095,160 337,512,229 155,483,986 110,727,531 98,394,319 11,284,735
– – – – – – – –
(18,899,029) (6,584,840) (1,297,008) 6,915,756 5,961,518 (18,733,830) (11,960,401) 5,266,637 902,547
119,608,329 53,164,732 69,495,824 55,587,641 356,875,493 131,868,928 178,896,125 94,102,416 13,277,783
(101,565,273) (53,396,921) (28,340,259) (46,187,824) (231,151,272) (134,200,060) (60,194,778) (55,923,172) (11,445,098)
18,043,056 (232,189) 41,155,565 9,399,817 125,724,221 (2,331,132) 118,701,347 38,179,244 1,832,685
263,712,709 4,126,148 68,936,938 255,410,733 469,197,968 134,419,024 217,468,477 141,840,200 14,019,967

222
For the year ended 31 December 2015 (cont’d.)
BNY MELLON GLOBAL FUNDS, PLC
STATEMENT OF CHANGES IN NET ASSETS ATTRIBUTABLE TO REDEEMABLE PARTICIPATING SHAREHOLDERS
BNY Mellon BNY Mellon BNY Mellon BNY Mellon BNY Mellon Global Global Global Japan Japan
Real Real Real All Cap Small Cap Return Return Return Equity Equity
Fund (EUR) Fund (GBP) Fund (USD) Fund Focus Fund
EUR GBP USD JPY JPY
Net assets attributable to redeemable
participating shareholders at beginning of year 2,016,002,696 32,614,263 423,216,326 866,338,981 1,562,709,991
Notional exchange adjustment (Note 1) – – – – –
Increase/(decrease) in net assets attributable to redeemable
participating shareholders from operations 21,826,363 (585,550) (60,258) 281,213,589 183,268,100
Proceeds from redeemable participating shares issued 1,205,710,042 36,148,474 204,087,363 5,228,172,748 7,868,100,384
Cost of redeemable participating shares redeemed (633,551,215) (9,127,308) (121,105,190) (2,412,472,113) (5,159,449,350)
Net increase/(decrease) in net assets from share transactions 572,158,827 27,021,166 82,982,173 2,815,700,635 2,708,651,034
Net assets attributable to redeemable participating shareholders at end of year 2,609,987,886 59,049,879 506,138,241 3,963,253,205 4,454,629,125
* This Fund launched during the year.
^ The Company Total as at 31 December 2015 has been adjusted to account for cross investment by BNY Mellon Euroland Bond Fund.

223
BNY MELLON GLOBAL FUNDS, PLC
STATEMENT OF CHANGES IN NET ASSETS ATTRIBUTABLE TO REDEEMABLE PARTICIPATING SHAREHOLDERS
For the year ended 31 December 2015 (cont’d.)
BNY Mellon BNY Mellon BNY Mellon BNY Mellon BNY Mellon BNY Mellon BNY Mellon Total 31 December
2015^Long-Term Pan S&P Small Cap Targeted U.S. US
Global European 500® Euroland Return Dynamic OpportunitiesEquity Equity Index Fund Bond Value Fund
Fund Fund Tracker Fund* Fund
EUR EUR USD EUR USD USD USD USD
1,510,817,278 20,050,409 95,261,758 9,848,311 – 72,404,005 11,359,497 17,809,268,623
– – – – – – – (1,200,464,973)
180,792,152 1,261,100 (201,936) 3,399,970 (4,777,601) (6,294,432) (781,887) (259,209,456)
387,318,486 38,107,009 21,166,946 93,254,487 98,503,301 47,402,475 53,876,728 10,321,275,370
(629,343,161) (10,235,218) (39,365,756) (44,511,589) – (71,962,349) (13,229,735) (8,888,016,296)
(242,024,675) 27,871,791 (18,198,810) 48,742,898 98,503,301 (24,559,874) 40,646,993 1,433,259,074
1,449,584,755 49,183,300 76,861,012 61,991,179 93,725,700 41,549,699 51,224,603 17,782,853,268

224
1. SUMMARY OF SIGNIFICANT ACCOUNTING POLICIES
The significant accounting policies and estimation techniques applied in the preparation of these financial statements are set out below.
STATEMENT OF COMPLIANCEThe financial statements for the year ended 31 December 2016 have been prepared in accordance with Financial Reporting Standard (“FRS”) 102: “The Financial Reporting Standard applicable in the United Kingdom and the Republic of Ireland” (“FRS 102”) and Irish statute comprising the Companies Act 2014, the European Communities (Undertakings for Collective Investment in Transferable Securities) Regulations, 2011 (as amended) (the “UCITS Regulations”) and the Central Bank (Supervision and Enforcement) Act 2013 (Section 48(1)) (Undertakings for Collective Investment in Transferable Securities) Regulations 2015, as amended (the “Central Bank UCITS Regulations”).
BASIS OF PREPARATIONThe financial statements have been prepared on a going concern basis for the Company under the historical cost convention as modified by the revaluation of financial assets and liabilities held at fair value through the profit or loss.
The format and certain wordings of the financial statements has been adapted from those contained in the Companies Act 2014 so that, in the opinion of the Directors, they more appropriately reflect the nature of the Company’s business as an investment fund.
The Company has availed of the exemption available to open-ended investment funds under Section 7 “Statement of Cash Flows” of FRS 102 not to prepare a cash flow statement on the basis that substantially all of the Company’s investments are highly liquid and carried at fair value, and the Company provides a statement of changes in net assets attributable to redeemable participating shareholders.
CRITICAL ACCOUNTING ESTIMATES AND JUDGEMENTSThe preparation of financial statements requires the use of certain critical accounting estimates. It also requires the Directors to exercise its judgement in the process of applying the Company’s accounting policies. Management makes estimates and assumptions concerning the future. The estimates and assumptions that have a significant risk of causing a material adjustment to the carrying amounts of assets and liabilities are discussed below within “Financial assets and liabilities at fair value through profit or loss – Fair value estimation”. The Funds based its assumptions and estimates on parameters available when the financial statements were prepared. However, existing circumstances and assumptions about future developments may change due to market changes or circumstances arising beyond the control of the Funds. Such changes are reflected in the assumptions when they occur and are recognised prospectively.
FOREIGN CURRENCY TRANSLATION – FUNCTIONAL AND PRESENTATION CURRENCYItems included in the Company’s financial statements are measured using the currency of the primary economic environment in which each Fund operates (the “functional currency”). In accordance with Section 30 “Foreign Currency Translation” of FRS 102, the functional currency of each Fund has been evaluated by the Board of Directors based on the currency that most faithfully represents the economic effects of the underlying transactions, events, investors’ base and conditions. The financial statements are presented in US dollar, which is the Company’s presentational currency.
The functional and presentation currency of the Funds are US dollar, Euro, Sterling or Japanese yen as noted in the Statement of Financial Position.
Foreign currency assets and liabilities, including net assets attributable to redeemable participating shareholders are translated into the functional currency using the closing rate applicable at the year end date. Foreign currency income and expenses in the Statement of Comprehensive Income are translated into the functional currency at the exchange rates prevailing at the dates of the transactions. Proceeds from redeemable participating shares issued and the cost of redeemable participating shares redeemed are also translated into the functional currency at the exchange rates prevailing at the dates of the transactions. Foreign exchange gains and losses arising from transactions and translations are presented in the Statement of Comprehensive Income within “net gains/losses on financial assets/liabilities at fair value through profit or loss”.
NOTES TO THE FINANCIAL STATEMENTS
BNY MELLON GLOBAL FUNDS, PLC

225
BNY MELLON GLOBAL FUNDS, PLC
NOTES TO THE FINANCIAL STATEMENTS
1. SUMMARY OF SIGNIFICANT ACCOUNTING POLICIES cont’d.
FOREIGN CURRENCY TRANSLATION – FUNCTIONAL AND PRESENTATION CURRENCY cont’d.For Company aggregation purposes, all assets and liabilities together with income and expenses for all classes of shares are translated into US dollar using the closing rate for assets and liabilities and the average rate for income and expenses including subscriptions and redemptions, as this is the currency of the primary economic environment in which the Company operates. A currency adjustment arises from the re-translation of the opening net assets at the year end exchange rates, as disclosed in the Statement of Changes in Net Assets Attributable to Redeemable Participating Shareholders. This method of allocation has no effect on the value of net assets allocated to the individual Funds.
FINANCIAL ASSETS AND LIABILITIES AT FAIR VALUE THROUGH PROFIT OR LOSS – CLASSIFICATION This category has two sub-categories: financial assets and liabilities held for trading, and those designated at fair value through profit or loss at inception.
A financial asset or liability is classified as held for trading if it is acquired or incurred principally for the purpose of selling or repurchasing in the near term or if on initial recognition is part of a portfolio of identifiable financial investments that are managed together and for which there is evidence of a recent actual pattern of short-term profit taking. Derivatives are also categorised as held for trading. The Company does not classify any derivatives as hedges in a hedging relationship.
Financial assets and liabilities designated at fair value through profit or loss at inception are financial instruments that are not classified as held for trading but are managed, and their performance is evaluated on a fair value basis in accordance with the investment strategy of the Funds as documented in the prospectus.
FINANCIAL ASSETS AND LIABILITIES AT FAIR VALUE THROUGH PROFIT OR LOSS – RECOGNITION AND MEASUREMENTRegular purchases and sales of investments are recognised on the trade date – the date on which the Company commits to purchase or sell the investment. Financial assets and liabilities at fair value through profit or loss are initially recognised at fair value. Transaction costs are expensed as incurred in the Statement of Comprehensive Income.
Financial assets are derecognised when the rights to receive cash flows from the investments have expired or the Company has transferred substantially all risks and rewards of ownership.
Subsequent to initial recognition, all financial assets and liabilities at fair value through profit or loss are measured at fair value. Gains and losses arising from changes in the fair value of the “financial assets or financial liabilities at fair value through profit or loss” category are presented in the Statement of Comprehensive Income within “net gains/losses on financial assets/liabilities at fair value through profit or loss” in the year in which they arise using the average cost method.
For hedge share class level forward foreign currency contracts, the realised and unrealised gains or losses are allocated solely to the relevant share classes. The unrealised gains or losses on hedging activities are reflected in the “financial assets or financial liabilities at fair value through profit or loss” category in the Statement of Financial Position.
FINANCIAL ASSETS AND LIABILITIES AT FAIR VALUE THROUGH PROFIT OR LOSS – FAIR VALUE ESTIMATIONThe fair value of financial assets and liabilities traded in active markets (such as publicly traded derivatives and trading securities) are based on quoted market prices at the year end date. In accordance with FRS 102, the Company has applied the recognition and measurement provisions of International Accounting Standards No. 39 “Financial Instruments: Recognition and Measurement” as adopted for use in the European Union and the disclosure requirements of Sections 11 and 12 of FRS 102. Accordingly, the quoted market price used for financial assets held is the mid-market price. When the Company holds derivatives with offsetting market risks, it uses mid-market prices as a basis for establishing fair values for the offsetting risk positions and applies this mid-market price to the net open position, as appropriate.

226
BNY MELLON GLOBAL FUNDS, PLC
NOTES TO THE FINANCIAL STATEMENTS
1. SUMMARY OF SIGNIFICANT ACCOUNTING POLICIES cont’d.
FINANCIAL ASSETS AND LIABILITIES AT FAIR VALUE THROUGH PROFIT OR LOSS – FAIR VALUE ESTIMATION cont’d.If a significant movement in fair value occurs subsequent to the valuation point of the Funds on the year end date, valuation techniques will be applied to determine the fair value. A significant event is any event that occurs after the last market price for a security, close of market or close of the foreign exchange, but before the Funds’ valuation time that materially affects the integrity of the closing prices for any security, instrument, currency or securities affected by that event so that they cannot be considered readily available market quotations.
The fair value of financial assets and liabilities that are not traded in an active market (for example over-the-counter derivatives) is determined by using valuation techniques. The Company uses a variety of methods and makes assumptions that are based on market conditions existing at each reporting date. Valuation techniques used include the use of comparable recent arm’s length transactions, reference to other instruments that are substantially the same, discounted cash flow analysis, option pricing models and other valuation techniques commonly used by market participants making the maximum use of market inputs and relying as little as possible on entity-specific inputs.
For instruments for which there is no active market, the Company may use internally developed models, which are usually based on valuation methods and techniques generally recognised as standard within the industry. Valuation models are used primarily to value unlisted equity, debt securities and other debt instruments for which markets were or have been inactive during the financial year. Some of the inputs to these models may not be market observable and are therefore estimated based on assumptions. The output of a model is always an estimate or approximation of a value that cannot be determined with certainty, and valuation techniques employed may not fully reflect all factors relevant to the positions the Company holds. Valuations are therefore adjusted, where appropriate, to allow for additional factors including model risk, liquidity risk and counterparty risk. There were no instruments during the year or at year end that were valued using such model.
The carrying value less impairment provision of other receivables and payables are assumed to approximate their fair values.
The main valuation techniques of the Company are as follows:
(a) Financial assets and liabilities listed and regularly traded on a recognised exchange and for which market quotations are readily available or traded on over-the-counter markets shall be valued at the mid-market price accordingly on the principal exchange in the market for such investment.
(b) If the financial assets and liabilities are listed on several recognised exchanges, the quoted price on the recognised exchange, which, in the opinion of the Directors in consultation with the relevant investment manager, constitutes the principal market for such assets, will be used.
(c) If for specific financial assets or liabilities the quoted price referred to in (a) or (b) above is not available or does not, in the opinion of the Directors in consultation with the relevant investment manager, reflect a fair or appropriate value, the value shall be calculated by alternative methods with care and in good faith by the Directors, as appropriate, approved for such purpose by BNY Mellon Trust Company (Ireland) Limited (the “Depositary”), in consultation with the relevant investment manager with a view to establishing the probable realisation value for such assets.
(d) In the event that any financial assets or liabilities are not listed or dealt on any recognised exchange, such assets shall be valued by the Directors with care and in good faith and in consultation with the relevant investment manager at the probable realisation value. Such probable realisation value may be determined by using a quotation from a broker.
(e) Cash and other liquid assets are valued at their face value with interest accrued, where applicable.(f) Units or shares in collective investment schemes (other than those valued pursuant to (a) or (b) above), are valued at
the latest available net asset value of the relevant collective investment scheme.(g) Derivative instruments dealt on a market are fair valued at the settlement price for such instruments on such
market. Where such derivative instruments are not dealt on a market, their value shall be the weekly quotation from the counterparty provided that the valuation is approved or verified monthly by an independent party appointed by the relevant investment manager and approved for the purpose by the Depositary.

227
BNY MELLON GLOBAL FUNDS, PLC
NOTES TO THE FINANCIAL STATEMENTS
1. SUMMARY OF SIGNIFICANT ACCOUNTING POLICIES cont’d.
FINANCIAL ASSETS AND LIABILITIES AT FAIR VALUE THROUGH PROFIT OR LOSS – FAIR VALUE ESTIMATION cont’d.(h) Forward foreign exchange contracts are fair valued by an independent price source by reference to the price at which
a new forward contract of the same size and maturity could be undertaken. (i) Initial margin deposits are made upon entering into futures contracts and are generally made in cash or cash
equivalents. Futures contracts are fair valued based upon their quoted daily settlement prices. Changes in the value of open futures contracts are recognised as unrealised gains or losses on futures contracts until the contracts are terminated, at which time the realised gains and losses are recognised. Unrealised gains or losses on futures contracts are shown in the Portfolio of Investments. The variation margin receivable or payable at the reporting date is reported as an asset or liability, as applicable, in the Statement of Financial Position.
(j) The premium on purchased put options exercised is subtracted from the proceeds of the sale of the underlying security or foreign currency in determining the realised gain or loss. The premium on purchased call options exercised is added to the cost of the securities or foreign currencies purchased. Premiums paid from the purchase of options, which expire unexercised are treated as realised losses. The premium on written call options exercised is added to the proceeds from the sale of the underlying security or foreign currency in determining the realised gain or loss. The premium on written put options exercised is subtracted from the cost of the securities or foreign currencies purchased. Premiums received from written options, which expire unexercised are treated as realised gains.
(k) Interest rate, credit default and total return swap contracts are fair valued daily based upon quotations from independent pricing service or market makers and the change in the value if any is recorded as unrealised gains or losses. Payments received or made as a result of the contract termination are recognised net of any upfront payment as realised gains or losses. Income on over-the-counter derivatives accrues to the Funds and are not subject to any returns sharing arrangements with the Manager or any other parties.
(l) Commercial paper and time deposits are valued at amortised cost, as a best estimate of fair value. The Company may invest in financial instruments that are not traded in an active market, whereby fair value may be determined by applying valuation techniques, such as discounted cash flow analysis and other valuation techniques used by market participants.
(m) Exchange traded funds are fair valued based upon quotations of the net asset value per share from independent pricing sources.
(n) Certain Funds may enter into “TBA” (To Be Announced) purchase commitments to purchase securities for a fixed unit price at a future date beyond customary settlement time. Although the unit price has been established, the principal value has not been finalised. The Funds hold and maintain until settlement date, cash or high grade debt obligations in an amount sufficient to meet the purchase price, or the Funds may enter into offsetting contracts for the forward sale of other securities they own. Income on the securities will not be earned until settlement date. TBA purchase commitments may be considered securities in themselves and involve a risk of loss if the value of the security to be purchased declines prior to settlement date, which is in addition to the risk of decline in the value of the Funds’ other assets. Unsettled TBA purchase commitments are valued at the current market value of the underlying securities. Although the Funds may enter into TBA purchase commitments with the intention of acquiring securities for their portfolios or for delivery pursuant to option contracts that they have entered into, the Funds may dispose of a commitment prior to settlement if the investment manager deems it the appropriate action.
(o) Equity swaps are priced in accordance with the pricing basis for the underlying equity positions. Finance charges on equity swaps are accrued daily, reset on a monthly basis and subject to settlement on disposal of equity swaps. Income on equity swaps accrues to the Funds and are not subject to any returns sharing arrangements with the Manager or any other parties.
(p) Loans are fair valued based on valuations provided by the pricing vendor Markit. Fees earned or paid and the receipt of payments of principal are recorded as a component of “net gains/(losses) on financial assets/liabilities at fair value through profit or loss” in the Statement of Comprehensive Income. Where Markit is unable to provide a value for a loan, the loan is fair valued based on a quotation obtained from a loan house. Unsettled loans are fair valued based on the agreed purchase price until a valuation from pricing vendor becomes available.

228
BNY MELLON GLOBAL FUNDS, PLC
NOTES TO THE FINANCIAL STATEMENTS
1. SUMMARY OF SIGNIFICANT ACCOUNTING POLICIES cont’d.
LOANSCertain Funds of the Company may invest in direct debt instruments which are interests in amounts owed to lenders or lending syndicates by corporate, governmental, or other borrowers. A Fund’s investments in loans may be in the form of participations in loans or assignments of all or a portion of loans from third parties. A loan is often administered by a bank or other financial institution (the “lender”) that acts as agent for all holders. The agent administers the terms of the loan, as specified in the loan agreement. A Fund may invest in multiple series or tranches of a loan, which may have varying terms and carry different associated risks. A Fund generally has no right to enforce compliance with the terms of the loan agreement with the borrower. As a result, a Fund may be subject to the credit risk of both the borrower and the lender that is selling the loan agreement.
When a Fund purchases assignments from lenders, it acquires direct rights against the borrower of the loan. When investing in a loan, a Fund has the right to receive payments of principal, interest and any fees to which it is entitled only from the lender selling the loan agreement and only upon receipt of payments by the lender from the borrower. At 31 December 2016, loans are held on the portfolio of BNY Mellon Absolute Insight Fund, BNY Mellon Absolute Return Bond Fund, BNY Mellon Global High Yield Bond Fund, BNY Mellon Global Short-Dated High Yield Bond Fund and BNY Mellon Global Opportunistic Bond Fund (31 December 2015: loans are held on the portfolio of BNY Mellon Absolute Insight Fund, BNY Mellon Absolute Return Bond Fund, BNY Mellon Global High Yield Bond Fund and BNY Mellon Global Opportunistic Bond Fund).
RECEIVABLESReceivables include cash at bank, income receivable, receivable for investments sold, rebate receivable from management company, margins on derivatives contracts, cash collateral received from broker, subscriptions receivable and other receivables. These amounts are recognised initially at fair value and subsequently measured at amortised cost.
FINANCIAL LIABILITIES AT AMORTISED COSTFinancial liabilities at amortised cost include payable for investments purchased, redemptions payable, expenses payable, performance fees payable, margins on derivatives contracts, cash collateral payable to broker, income payable on swaps, finance charges payable on swaps, tax payable and other payables. These amounts are recognised initially at fair value and subsequently measured at amortised cost.
OFFSETTING FINANCIAL INSTRUMENTSFinancial assets and liabilities are offset and the net amount reported in the Statement of Financial Position when there is a legally enforceable right to offset the recognised amounts and there is an intention to settle on a net basis or realise the asset and settle the liability simultaneously.
CROSS INVESTMENTAs at the year end, BNY Mellon Euroland Bond Fund and BNY Mellon European Credit Fund invest in other Funds of the Company. These cross investments have been eliminated in the financial statements of the Company. Where a Fund invests in another Fund or Funds of the Company, these cross investments have been deducted from the total net asset value when calculating the management fees payable. The realised gains and losses, including movements in unrealised gains and losses, on the cross investments have been eliminated in the Total Company amounts disclosed in the Statement of Comprehensive Income.
CASH AND CASH EQUIVALENTS AND BANK OVERDRAFTSCash and cash equivalents are valued at face value, with interest accrued where applicable at relevant valuation point on the relevant business day. Cash equivalents include deposits held at call with banks and other short-term investments in an active market with original maturities of three months or less. Bank overdrafts are shown separately in the Statement of Financial Position.

229
BNY MELLON GLOBAL FUNDS, PLC
NOTES TO THE FINANCIAL STATEMENTS
1. SUMMARY OF SIGNIFICANT ACCOUNTING POLICIES cont’d.
COLLATERALCash collateral provided by the Funds is identified in the Statement of Financial Position as “margins on derivative contracts” and is not included as a component of cash and cash equivalents. Cash collateral received by the Funds is identified in the Statement of Financial Position as “cash collateral received from broker”. The obligation to return the cash collateral is identified in the Statement of Financial Position as “cash collateral payable to broker”. Cash collateral received is restricted and does not form part of the Funds’ cash and cash equivalents. For collateral other than cash, if the party to whom the collateral is provided has the right by contract or custom to sell or re-pledge the collateral, the Funds classify that asset in its Statement of Financial Position separately from other assets and identify the asset as pledged collateral. Where the party to whom the collateral is provided does not have the right to sell or re-pledge, a disclosure of the collateral provided is made in the Portfolio of Investments as indicated by a "*" tick mark.
TRANSACTION COSTSTransaction costs are costs incurred to acquire financial assets or liabilities at fair value through profit or loss. They include fees and commissions paid to agents, advisers, brokers and dealers. In respect of equities and financial derivative instruments, the transaction costs, when incurred, are immediately recognised in the Statement of Comprehensive Income as an expense and are included in the “net gains/(losses) on financial assets/liabilities at fair value through profit or loss”. In respect of all other securities, the bid ask spread is embedded in the purchase and sale price of the securities and cannot be separately verified or disclosed.
DIVIDEND INCOMEDividend income from financial assets at fair value through profit or loss is recognised in the Statement of Comprehensive Income within “dividend income” when the right of the Funds to receive payments is established. Dividend income is shown gross of any non-recoverable withholding taxes.
DIVIDEND EXPENSEInterest on short equity swaps is recognised in the Statement of Comprehensive Income as “dividend expense”, which may be subject to change, dependant on periodic resetting and/or final disposal of underlying swap instruments.
INTEREST INCOMEInterest income on interest bearing financial instruments is shown as a component of “net gains/losses on financial assets/liabilities at fair value through profit or loss”. Bank interest income is accounted for on a cash receipts basis.
TAXATIONUnder current law and practice, there is no income, gains or other taxes payable by the Funds. The Funds currently incur withholding taxes imposed by certain countries on investment income and capital gains. Withholding taxes are disclosed separately in the Statement of Comprehensive Income and net of any tax credits.
Effective 1 October 2016, BNY Mellon Brazil Equity Fund has elected to accrue for Brazilian capital gains tax on net realised and unrealised gains on investments. The capital gains tax is recorded in accordance with the understanding of the change in Brazilian tax regulations and rates on Irish investors, which came into effect on 1 October 2016. The capital gains tax expense and the amounts payable at the year end are reflected in the “withholding taxes on dividends and other investment income” and “tax payable” figures in the Statement of Comprehensive Income and the Statement of Financial Position, respectively.
EXPENSESExpenses are accounted for on an accruals basis. Any costs associated with the termination of a Fund are paid for by BNY Mellon Global Management Limited (the “Manager”).

230
BNY MELLON GLOBAL FUNDS, PLC
NOTES TO THE FINANCIAL STATEMENTS
1. SUMMARY OF SIGNIFICANT ACCOUNTING POLICIES cont’d.
SECURITIES LENDINGThe Company has entered into a securities lending agreement (as amended, assigned, novated and assumed) with The Bank of New York Mellon SA/NV (until 26 November 2015), The Bank of New York Mellon, London Branch (effective 27 November 2015) and the Depositary. The Company can lend securities with a value of up to 100% of any one line of stock, to borrowers approved by The Bank of New York Mellon. The Company receives securities, financial instruments or other assets as collateral against the loaned securities. The Company does not accept cash as collateral or engage in cash collateral reinvestment. Collateral held (and pending) will not be less than 102% of the value of the securities on loan. Securities lending income is accounted for on a cash receipts basis. Details of the securities lending position at the year end are contained in Note 14 to the financial statements.
DISTRIBUTIONS TO REDEEMABLE PARTICIPATING SHAREHOLDERSDistributions to redeemable participating shareholders are recognised as “finance costs” in the Statement of Comprehensive Income when they are declared to the Irish Stock Exchange, as detailed in the prospectus.
For non-distributing share classes, all income earned and realised net capital gains after the deduction of expenses will be accumulated and reflected in the net asset value per share.
REDEEMABLE PARTICIPATING SHARESThe Company issues multiple classes of redeemable participating shares within each Fund which are redeemable at the holder’s option and do not have identical rights. Such shares are classified as financial liabilities.
Redeemable participating shares can be put back to the Fund at any time for cash equal to a proportionate share of the Fund’s net asset value attributable to the share class. The redeemable participating shares are carried at the redemption amount that is payable at the year end date if the holder exercises the right to put the share back to the Fund.
Redeemable participating shares are issued and redeemed at the holder’s option at prices based on the Fund’s net asset value per share at the time of issue or redemption. The Fund’s net asset value per share is calculated by dividing the net assets attributable to the holders of each class of redeemable participating shares with the total number of outstanding redeemable participating shares for each respective class in accordance with the provisions of the prospectus in determining the net asset value per share for subscriptions and redemptions.
DILUTION ADJUSTMENTTo mitigate the effects of dilution, the Directors may, at their discretion, make a dilution adjustment to the net asset value per share. The Directors will retain the discretion in relation to the circumstances in which to make such a dilution adjustment.
The decision to make a dilution adjustment will depend on the volume of subscriptions or redemptions of shares in the Fund. The Directors may in their discretion make a dilution adjustment if, in their opinion, the existing shareholders, in the case of subscriptions, or remaining shareholders, in the case of redemptions, might otherwise be adversely affected. In particular, the dilution adjustment may be made in the following circumstances:
- where a Fund is in continual decline (i.e. is experiencing a net outflow of redemptions);- if the Fund is experiencing large levels of net subscriptions or net redemptions relevant to its size; and- in any other circumstances where the Directors believe it will be in the interests of shareholders to make a dilution
adjustment.
The dilution adjustment will involve adding to the net asset value per share when the Fund is in a net subscription position, and deducting from the net asset value per share when the Fund is in a net redemption position, such figure as the Directors consider represents an appropriate figure to meet transaction costs, including but not restricted to market spreads, brokerage fees and taxes, to preserve the value of the underlying assets of the relevant Fund and in any other circumstances where the Directors believe it will be in the interests of the shareholders. The resultant amount will be the price rounded to such number of decimal places, as the Directors deem appropriate.

231
BNY MELLON GLOBAL FUNDS, PLC
NOTES TO THE FINANCIAL STATEMENTS
1. SUMMARY OF SIGNIFICANT ACCOUNTING POLICIES cont’d.
DILUTION ADJUSTMENT cont’d.Where a dilution adjustment is made, it will increase the price at which shares shall be issued when there are net subscriptions and decrease the price at which shares shall be redeemed when there are net redemptions. The price at which each class of share shall be issued or redeemed (as appropriate) will be calculated separately but any dilution adjustment will in percentage terms affect the price of each class in an identical manner. Such dilution adjustment will not exceed 3% of the Funds’ net asset value. As dilution is directly related to the inflows and outflows from a Fund, it is not possible to accurately predict whether dilution will occur at any future point in time. Consequently, it is also not possible to accurately predict how frequently the dilution adjustment will be applied.
The dilution adjustment is included in “other receivables” in the Statement of Financial Position and “subscriptions” in the Statement of Changes in Net Assets Attributable to Redeemable Participating Shareholders. As at 31 December 2016, there is no dilution adjustment (31 December 2015: USD 82,041).
2. SHARE CAPITAL
AUTHORISED SHARESThe initial authorised share capital of the Company is EUR 38,092 divided into 38,092 subscriber shares of EUR 1.00 each and 25,000,000,000 at no par value initially designated as unclassified shares. The unclassified shares are available for issue as participating shares.
SUBSCRIBER SHARESThe 38,092 subscriber shares at EUR 1.00 each were all issued as fully paid, 38,085 of which are held by the Manager and the remainder are held on trust by nominees for the Manager. The subscriber shares do not entitle the holders to any dividend and on a winding up, entitle the holders to receive the amount paid up thereon but not otherwise to participate in the assets of the Company. The subscriber shares do not form part of the net asset value of the Company and are thus disclosed in the financial statements by way of this note only. In the opinion of the Directors, this disclosure reflects the nature of the Company’s investment business.
REDEEMABLE PARTICIPATING SHARESRedeemable participating shares carry the right to a proportionate share in the assets of the Funds and the holder of the share is entitled to one vote each on a poll. Shares are redeemed by shareholders at prices based on the value of net assets of the relevant class.
The activity on redeemable participating shares for the year ended 31 December 2016 is as follows:
Fund Share Class Currency
Shares in issue
at beginning of year
Shares issued during
the year
Shares redeemed
during the year
Shares in issue
at end of year
BNY Mellon Absolute Insight FundClass E (Acc) EUR 104,579,065 – (88,822,013) 15,757,052
Class E (Acc) (Hedged) CHF 1,873,142 – (1,773,142) 100,000Class E (Acc) (Hedged)^ USD 4,099,171 – (4,099,171) –
Class E (Inc)^ EUR 4,891,000 – (4,891,000) –Sterling E (Acc) (Hedged) GBP 5,684,897 – (3,680,601) 2,004,296
Class R (Acc) EUR 18,315,251 5,428,642 (12,781,374) 10,962,519Class R (Acc) (Hedged) USD 1,124,668 316,639 (710,222) 731,085
Class R (Inc) EUR 3,859,546 80,768 (693,950) 3,246,364Class S (Acc) EUR 13,030,343 13,473,751 (11,449,503) 15,054,591
Class T (Acc) (Hedged) USD 1,552,082 9,932,710 (1,834,789) 9,650,003Class U (Acc) EUR 30,869,805 423,750 (30,713,103) 580,452
Class U (Acc) (Hedged)^ CHF 458,535 12,000 (470,535) –Class U (Acc) (Hedged) USD 1,890,506 2,755,917 (1,225,690) 3,420,733

232
BNY MELLON GLOBAL FUNDS, PLC
NOTES TO THE FINANCIAL STATEMENTS
2. SHARE CAPITAL cont’d.
REDEEMABLE PARTICIPATING SHARES cont’d.
Fund Share Class Currency
Shares in issue
at beginning of year
Shares issued during
the year
Shares redeemed
during the year
Shares in issue
at end of year
BNY Mellon Absolute Insight Fund cont’d.Class U (Inc) EUR 3,684,911 265,311 (3,945,068) 5,154
Sterling U (Acc) (Hedged) GBP 18,852,697 8,721,218 (11,043,180) 16,530,735
BNY Mellon Absolute Return Bond FundClass C EUR 3,630,012 253,837 (2,733,068) 1,150,781
Class C (Inc) EUR 51 1,900 – 1,951Class I (Hedged) USD 1,692,670 263,155 (864,702) 1,091,123
Sterling I (Acc) (Hedged) GBP 991,601 517,533 (456,207) 1,052,927Class R EUR 1,119,207 634,227 (916,782) 836,652
Class R (Hedged) USD 280,963 33,437 (124,331) 190,069Class R (Inc) EUR 56,659 41,410 (27,022) 71,047
Class S EUR 8,407,270 5,591,382 (4,308,996) 9,689,656Class S (Inc) EUR 2,918 14,507 (14,499) 2,926
Class T (Hedged) USD 672,612 393,026 (567,475) 498,163Class T (Hedged)^ CHF – 213,452 (111,721) 101,731
Sterling T (Acc) (Hedged) GBP 53,681 101,851 (31,687) 123,845Class W (Acc)^ EUR – 51,087 – 51,087
Class W (Acc) (Hedged)^ USD – 26,466 – 26,466Class W (Inc) (Hedged)^ USD – 36,956 – 36,956
Sterling W (Acc) (Hedged) GBP 489,778 100,212 (76,029) 513,961Sterling W (Inc) (Hedged) GBP 25,057 3,637 (2,771) 25,923
Class X EUR 2,446,872 777,049 (31,767) 3,192,154Sterling X (Acc) (Hedged) GBP 7,100 733,191 (300) 739,991
Class Z (Acc)^ EUR – 50 – 50
BNY Mellon Absolute Return Equity FundClass R (Hedged) CHF 6,692,740 1,410,790 (4,549,308) 3,554,222Class R (Hedged) EUR 729,854,401 351,676,627 (269,653,861) 811,877,167Class R (Hedged) USD 42,329,465 21,088,003 (11,325,662) 52,091,806
Class R (Inc) (Hedged) EUR 12,467,816 3,630,513 (1,475,786) 14,622,543Sterling R (Acc) GBP 3,959,903 1,568,803 (2,058,298) 3,470,408Sterling S (Acc) GBP 57,858,432 13,687,178 (31,351,449) 40,194,161
Class T (Hedged) EUR 768,349,162 424,551,664 (534,615,365) 658,285,461Class T (Hedged) USD 31,477,986 4,355,135 (13,319,495) 22,513,626Class U (Hedged) EUR 221,816,479 188,972,885 (156,027,483) 254,761,881Class U (Hedged) USD 31,116,048 70,887,649 (49,778,908) 52,224,789
Sterling U (Acc) GBP 145,282,421 80,190,170 (32,775,092) 192,697,499Sterling X (Acc) GBP 62,689,846 93,432,225 (18,068,484) 138,053,587
BNY Mellon Asian Bond FundClass A (Acc) USD 5,000 – – 5,000Class A (Inc) USD 5,119 190 (82) 5,227
Class C (Acc) USD 23,812,946 – (9,266,680) 14,546,266Class C (Inc) USD 5,149 236 (101) 5,284
Class E (Acc)^ USD – 13,797,989 (13,792,989) 5,000Class E (Inc) USD 4,144,531 – (877,487) 3,267,044
Class H (Acc) (Hedged) EUR 374,689 – – 374,689Class H (Inc) (Hedged) EUR 76,250 12,500 (1,225) 87,525Class I (Acc) (Hedged) EUR 74,689 – – 74,689

233
BNY MELLON GLOBAL FUNDS, PLC
NOTES TO THE FINANCIAL STATEMENTS
2. SHARE CAPITAL cont’d.
REDEEMABLE PARTICIPATING SHARES cont’d.
Fund Share Class Currency
Shares in issue
at beginning of year
Shares issued during
the year
Shares redeemed
during the year
Shares in issue
at end of year
BNY Mellon Asian Bond Fund cont’d.Class I (Inc) (Hedged) EUR 76,637 3,541 (1,520) 78,658
Class W (Acc) USD 1,618,650 453,729 (2,067,734) 4,645Class W (Acc) (Hedged) EUR 74,689 – – 74,689
Class W (Inc) USD 5,171 270 (116) 5,325Class W (Inc) (Hedged) EUR 76,910 4,032 (1,731) 79,211
Class X (Acc) USD 9,363,676 – (4,008,308) 5,355,368
BNY Mellon Asian Equity FundClass A USD 13,409,081 142,902 (3,442,516) 10,109,467Class A EUR 10,579,995 664,404 (2,552,500) 8,691,899Class B USD 3,446,301 – (157,805) 3,288,496Class B EUR 49,870 – – 49,870Class C USD 121,550 78,087 (92,534) 107,103Class C EUR 5,438,676 20,525 (570,322) 4,888,879
Sterling C (Inc) GBP 8,164 93 – 8,257Class W USD 8,130,289 245,302 (7,203,285) 1,172,306
Sterling W (Inc) GBP 5,141 75 – 5,216
BNY Mellon Asian Income FundClass A (Acc) EUR 5,000 30,538 (17,229) 18,309Class A (Acc) USD 225,497 – – 225,497Class A (Inc) EUR 5,185 9,736 (119) 14,802Class A (Inc) USD 5,179 255 (121) 5,313
Sterling A (Acc) GBP 5,000 – – 5,000Sterling A (Inc) GBP 5,182 253 (121) 5,314
Class B (Acc) USD 953,747 57,267 (682,615) 328,399Class C (Acc) USD 29,853,614 – (13,534,774) 16,318,840
Sterling C (Acc) GBP 5,000 1,607 (1,607) 5,000Class H (Inc) Hedged^ EUR – 102,230 (102,230) –
Class J (Inc) (Hedged)^ EUR – 112,616 – 112,616Class W (Inc) EUR 400,342 573,454 (75,000) 898,796Class W (Inc) USD 1,937,460 8,004,939 (7,965,302) 1,977,097
Sterling W (Inc) GBP 2,010,889 3,444,263 (2,975,292) 2,479,860
BNY Mellon Brazil Equity FundClass A USD 32,926,543 17,485,540 (26,946,212) 23,465,871Class A EUR 22,614,795 21,493,480 (23,265,130) 20,843,145Class B USD 3,739,451 145,000 (2,464,698) 1,419,753Class B EUR 4,698 – – 4,698
Sterling B (Acc) GBP 335,396 170,608 (109,979) 396,025Class C USD 27,900,701 32,974,908 (29,661,131) 31,214,478Class C EUR 3,743,149 4,275,041 (6,299,852) 1,718,338
Sterling C (Inc) GBP 223,299 10,000 (107,864) 125,435Class H (Hedged) EUR 34,667 3,268,856 (2,637,637) 665,886Class I (Hedged)^ EUR 7,000 3,194,558 (3,201,558) –
Class W (Acc) USD 2,116,382 2,196,430 (2,230,344) 2,082,468Class W (Acc) EUR 704,522 85,592 (699,522) 90,592
Sterling W (Acc) GBP 141,942 4,790,970 (3,463,523) 1,469,389

234
BNY MELLON GLOBAL FUNDS, PLC
NOTES TO THE FINANCIAL STATEMENTS
2. SHARE CAPITAL cont’d.
REDEEMABLE PARTICIPATING SHARES cont’d.
Fund Share Class Currency
Shares in issue
at beginning of year
Shares issued during
the year
Shares redeemed
during the year
Shares in issue
at end of year
BNY Mellon Crossover Credit Fund*Class A^ EUR 3,415,636 400,150 (3,815,786) –
Class A (Inc)^ EUR 264,085 878,294 (1,142,379) –Class C^ EUR 2,913,857 24,893 (2,938,750) –Class C^ USD 5,183 – (5,183) –
Class C (Inc)^ EUR 104,534,351 1,042,150 (105,576,501) –Class I (Acc) (Hedged)^ USD 25,368,247 – (25,368,247) –
Class X^ EUR 92,428,140 1,820,000 (94,248,140) –
BNY Mellon Dynamic Total Return FundClass A (Acc) USD 5,000 – – 5,000Class A (Acc) EUR 5,000 – – 5,000Class A (Inc) EUR 5,000 – – 5,000
Class C (Acc) USD 360,975 7,384,781 – 7,745,756Class C (Inc) USD 5,000 – – 5,000
Class H (Acc) (Hedged) EUR 91,212 16,075 – 107,287Class I (Acc) (Hedged) EUR 91,212 – – 91,212
Class W (Acc) USD 1,855,926 – (1,850,926) 5,000Class W (Acc) (Hedged) EUR 91,212 – – 91,212
Class W (Inc) USD 5,000 – – 5,000Class W (Inc) (Hedged) EUR 91,212 – – 91,212
Sterling W (Acc) GBP 5,000 – – 5,000Sterling W (Acc) (Hedged) GBP 64,888 – – 64,888
Sterling W (Inc) GBP 5,000 – – 5,000Sterling W (Inc) (Hedged) GBP 64,888 – – 64,888
Class X (Acc) USD 9,348,448 – – 9,348,448
BNY Mellon Emerging Markets Corporate Debt FundClass A USD 11,217 31,959 (2,184) 40,992Class A EUR 5,926 39,395 (7,508) 37,813Class B USD 180 2,525 (1,950) 755Class C USD 31,590 339,864 (85,990) 285,464Class C EUR 104,014 30,262 (81,136) 53,140
Class H (Hedged) EUR 50 130,442 (52,110) 78,382Class I (Hedged) EUR 1,550 119,306 (103,509) 17,347
Class W USD 6,762 120,499 (20,445) 106,816Class W EUR 50 – – 50
Class W (Acc) (Hedged)^ CHF – 16,876 – 16,876Sterling W (Acc) (Hedged) GBP 25,998 1,006 (23,179) 3,825
Class X USD 662,650 468 (25,905) 637,213
BNY Mellon Emerging Markets Debt FundClass A USD 4,751,012 3,287,005 (4,461,446) 3,576,571Class A EUR 5,041,762 4,501,327 (4,805,321) 4,737,768Class C USD 3,864,968 18,288,044 (18,822,177) 3,330,835Class C EUR 22,126,674 4,114,651 (8,503,534) 17,737,791
Class C (Inc) USD 6,022 583 (246) 6,359Class H (Acc) (Hedged) EUR 1,436,025 15,765,698 (16,937,407) 264,316Class I (Acc) (Hedged)^ EUR 1,621,470 7,939,576 (9,561,046) –
Class W USD 5,000 – – 5,000

235
BNY MELLON GLOBAL FUNDS, PLC
NOTES TO THE FINANCIAL STATEMENTS
2. SHARE CAPITAL cont’d.
REDEEMABLE PARTICIPATING SHARES cont’d.
Fund Share Class Currency
Shares in issue
at beginning of year
Shares issued during
the year
Shares redeemed
during the year
Shares in issue
at end of year
BNY Mellon Emerging Markets Debt Local Currency FundClass A USD 88,558,629 26,093,135 (64,327,715) 50,324,049Class A EUR 44,626,300 21,581,047 (26,280,374) 39,926,973
Class A (Inc) USD 291,127 391,432 (75,435) 607,124Class A (Inc) EUR 1,478,994 117,800 (98,918) 1,497,876
Sterling A (Acc) GBP 586,045 891 (201,523) 385,413Sterling A (Inc) GBP 64,609 – (19,860) 44,749
Class B USD 5,000 – – 5,000Class B EUR 5,000 – – 5,000
Sterling B (Acc) GBP 6,210 29,570 (12,064) 23,716Sterling B (Inc) GBP 11,548 8,142 (11,852) 7,838
Class C USD 195,008,030 97,864,044 (279,828,896) 13,043,178Class C EUR 35,106,345 81,392 (7,082,132) 28,105,605
Class C (Inc) USD 3,463,630 – (2,182,932) 1,280,698Class C (Inc) EUR 122,616,138 6,838 (28,727,500) 93,895,476
Sterling C (Acc) GBP 9,717,522 1,665 (292,085) 9,427,102Sterling C (Inc) GBP 9,341,067 2,878 (8,713,465) 630,480
Class H (Hedged) EUR 2,071,331 4,097,078 (2,544,048) 3,624,361Class I (Hedged) EUR 3,657,282 79,375 (2,615,143) 1,121,514
Class I (Inc) (Hedged) EUR 102,964,913 37,503,769 (53,763,895) 86,704,787Sterling J (Inc) (Hedged) GBP 173,529 10,367 (172,896) 11,000
Class W USD 57,996,483 496,303 (1,783,174) 56,709,612Class W EUR 1,239,403 927,345 (767,991) 1,398,757
Class W (Hedged) EUR 66,209,439 17,173,385 (44,016,948) 39,365,876Class W (Inc) USD 30,273 9,460 (30,660) 9,073Class W (Inc) EUR 5,815 622 (263) 6,174
Sterling W (Inc) GBP 30,586,849 2,344,913 (8,873,559) 24,058,203Sterling W (Inc) (Hedged) GBP 969,149 20,888 (690,660) 299,377
Class X USD 322,075,097 7,973,952 (126,393,514) 203,655,535Class X (Inc) CHF 214,526,742 – (48,924,175) 165,602,567
BNY Mellon Emerging Markets Debt Opportunistic FundClass A USD 5,000 – – 5,000Class A EUR 5,000 113,152 (5,000) 113,152Class C USD 203,500 – – 203,500Class C EUR 5,000 – – 5,000
Class W EUR 5,000 – – 5,000Class X USD 18,750,016 3,457,050 (8,753,060) 13,454,006
Class X (Inc) USD 73,078,235 4,899,147 (25,762,035) 52,215,347
BNY Mellon Euroland Bond FundClass A EUR 468,545,608 100,933,652 (324,055,822) 245,423,438
Class A (Inc) EUR 29,085,807 4,508,479 (9,213,509) 24,380,777Class B EUR 372,209 – (144,215) 227,994
Class B (Inc) EUR 40,103 162,099 (40) 202,162Class C EUR 569,713,471 72,110,648 (447,677,986) 194,146,133
Class C (Inc) EUR 113,559,836 18,687,051 (23,059,520) 109,187,367Class C (Acc)^ USD – 21,677,282 (21,677,282) –
Class H (Acc) (Hedged) USD 1,601,554 654,325 (1,302,609) 953,270Class H (Hedged) CHF 141,184,041 20,866,494 (25,863,350) 136,187,185
Class I (Acc) (Hedged) USD 7,992,020 24,309,466 (8,193,703) 24,107,783

236
BNY MELLON GLOBAL FUNDS, PLC
NOTES TO THE FINANCIAL STATEMENTS
2. SHARE CAPITAL cont’d.
REDEEMABLE PARTICIPATING SHARES cont’d.
Fund Share Class Currency
Shares in issue
at beginning of year
Shares issued during
the year
Shares redeemed
during the year
Shares in issue
at end of year
BNY Mellon Euroland Bond Fund cont’d.Class I (Hedged) CHF 23,166,810 4,994,357 (10,241,062) 17,920,105
Class S EUR 375,035,740 27,781,977 (329,764,717) 73,053,000Class W (Acc)^ EUR – 1,431,408 – 1,431,408
Class W (Acc) (Hedged)^ USD – 8,116,076 (86,000) 8,030,076Class Z (Acc) EUR 11,162,550 36,869,650 (24,374,610) 23,657,590
Class Z (Acc) (Hedged) CHF 100,000 – – 100,000Class Z (Acc) (Hedged) USD 100,000 – – 100,000
BNY Mellon European Credit FundClass A EUR 962 732 (997) 697Class C EUR 55,050 45,130 (59,766) 40,414
Class C (Inc) EUR 53 – – 53Class I (Hedged)^ USD 198,308 – (198,308) –
Class X EUR 229,311 466,877 (14,384) 681,804Class X (Inc) EUR 53 2 (1) 54
BNY Mellon Global Bond FundClass A USD 32,965,754 13,446,941 (11,423,510) 34,989,185Class A EUR 11,629,187 4,827,611 (5,815,632) 10,641,166Class B USD 1,192,532 52,274 (86,720) 1,158,086Class C USD 35,290,716 78,301,300 (44,966,724) 68,625,292Class C EUR 42,785,010 89,368,290 (39,393,552) 92,759,748
Class C (Inc) USD 641,012 430,170 (430,078) 641,104Sterling C (Inc) GBP 3,560,183 3,385,908 (3,254,497) 3,691,594
Class H (Hedged) EUR 3,017,184 1,811,216 (1,891,129) 2,937,271Class I (Hedged) EUR 17,501,100 4,667,779 (3,967,406) 18,201,473
Class X USD 9,620,694 – (57,883) 9,562,811
BNY Mellon Global Credit Fund*Class B (Acc)^ USD – 15,609,922 – 15,609,922Class C (Acc)^ USD – 5,000 – 5,000
Class H (Acc) (Hedged)^ EUR – 8,909,446 – 8,909,446Class H (Inc) (Hedged)^ EUR – 100,000 – 100,000
Class W (Acc)^ USD – 26,000 – 26,000Class W (Acc) (Hedged)^ EUR – 100,000 – 100,000Class W (Acc) (Hedged)^ CHF – 100,000 – 100,000
Sterling W (Acc) (Hedged)^ GBP – 100,933 – 100,933Class X (Acc)^ USD – 5,000 – 5,000
Class X (Acc) (Hedged)^ CAD – 479,804,141 – 479,804,141
BNY Mellon Global Dynamic Bond FundClass A USD 1,263,195 1,114,107 (361,760) 2,015,542Class A EUR 463,050 927,311 (106,443) 1,283,918
Class A (Inc) USD 5,177 682,425 (1,534) 686,068Class C USD 88,656,802 60,999,448 (30,524,853) 119,131,397
Class H (Hedged) EUR 11,495,653 6,507,746 (9,533,788) 8,469,611Class H (Inc) (Hedged) EUR 673,207 291,394 (402,439) 562,162
Class I (Hedged) EUR 63,247,884 5,292,906 (17,060,739) 51,480,051Class I (Inc) (Hedged) EUR 2,593,427 6,716,467 (948,782) 8,361,112
Class W USD 33,682,328 41,497,158 (6,607,211) 68,572,275

237
BNY MELLON GLOBAL FUNDS, PLC
NOTES TO THE FINANCIAL STATEMENTS
2. SHARE CAPITAL cont’d.
REDEEMABLE PARTICIPATING SHARES cont’d.
Fund Share Class Currency
Shares in issue
at beginning of year
Shares issued during
the year
Shares redeemed
during the year
Shares in issue
at end of year
BNY Mellon Global Dynamic Bond Fund cont’d.Class W (Hedged) EUR 33,362,186 28,449,816 (668,181) 61,143,821
Class W (Acc) (Hedged)^ CHF – 100,000 – 100,000Sterling W (Acc) (Hedged) GBP 1,182,376 1,434,811 (105,930) 2,511,257
BNY Mellon Global Emerging Markets Equity Value Fund*Class A^ USD 167,124 489 (167,613) –Class A^ EUR 1,115,976 59,262 (1,175,238) –Class B^ USD 11,113 – (11,113) –Class B^ EUR 5,000 – (5,000) –
Sterling B (Acc)^ GBP 5,130 149 (5,279) –Class C^ USD 342,637 – (342,637) –Class C^ EUR 7,088 13 (7,101) –
BNY Mellon Global Emerging Markets FundClass A USD 5,000 6,965 – 11,965Class A EUR 5,000 23,394 (4,855) 23,539
Class A (Inc) USD 5,571 – – 5,571Class A (Inc) EUR 122,186 7,657 (10,447) 119,396Class B (Inc) USD 603,117 – (495,999) 107,118Class B (Inc) EUR 31,404 – – 31,404
Sterling B (Inc) GBP 5,605 – – 5,605Class C USD 4,698 5,261 (4,698) 5,261
Class C (Acc) USD 73,296,891 4,873,747 (46,813,663) 31,356,975Class C (Inc) USD 98,754 6,168 (247) 104,675
Sterling C (Inc) GBP 5,603 11 – 5,614Class H (Hedged) EUR 5,000 – – 5,000
Class H (Inc) (Hedged) EUR 380,540 – – 380,540Class I (Hedged) EUR 87,023 – – 87,023
Class I (Inc) (Hedged) EUR 5,540 11 – 5,551Class W (Acc) USD 5,000 – – 5,000Class W (Inc) USD 6,533 13 – 6,546Class W (Inc) EUR 32,557 48 – 32,605
Sterling W (Inc) GBP 5,603 25 – 5,628
BNY Mellon Global Equity FundClass A USD 11,745,484 7,311,509 (7,712,156) 11,344,837Class A EUR 563,702 4,766,212 (4,664,160) 665,754Class B USD 4,659,130 – (582,835) 4,076,295Class B EUR 5,000 – – 5,000Class C USD 16,985,288 5,588,846 (11,293,315) 11,280,819Class C EUR 95,245,258 10,125,195 (105,364,630) 5,823
Class I (Hedged) EUR 786,485 47,501 (104,672) 729,314Class W (Acc)^ USD – 17,943,091 (741,168) 17,201,923Class W (Acc)^ EUR – 170,799,706 (2,642,310) 168,157,396
BNY Mellon Global Equity Income FundClass A USD 13,508,531 7,198,976 (8,233,067) 12,474,440Class A EUR 30,254,758 50,268,343 (14,349,494) 66,173,607
Class A (Inc) USD 2,783,219 831,495 (763,075) 2,851,639Class A (Inc)^ EUR – 178,424 (65) 178,359

238
BNY MELLON GLOBAL FUNDS, PLC
NOTES TO THE FINANCIAL STATEMENTS
2. SHARE CAPITAL cont’d.
REDEEMABLE PARTICIPATING SHARES cont’d.
Fund Share Class Currency
Shares in issue
at beginning of year
Shares issued during
the year
Shares redeemed
during the year
Shares in issue
at end of year
BNY Mellon Global Equity Income Fund cont’d.Sterling A (Acc) GBP 30,158 154,660 (69,759) 115,059Sterling A (Inc) GBP 16,946 277 (12,035) 5,188
Class B USD 16,659,780 11,453,237 (6,050,861) 22,062,156Class B EUR 2,898,201 1,164,095 (1,321,248) 2,741,048
Class B (Inc) USD 16,701,061 960,631 (5,798,796) 11,862,896Class B (Inc) EUR 581,098 36,761 (348,978) 268,881
Sterling B (Inc) GBP 4,192,076 602,475 (838,489) 3,956,062Class C USD 6,189,055 4,107,429 (7,788,367) 2,508,117Class C EUR 7,394,946 20,854,215 (9,820,414) 18,428,747
Class C (Inc) USD 12,735,777 3,552,823 (3,452,061) 12,836,539Class C (Inc) EUR 22,922,044 26,613,681 (24,480,056) 25,055,669
Sterling C (Inc) GBP 16,150,837 1,484,627 (7,415,266) 10,220,198Class H (Hedged) EUR 420,968 24,243,165 (21,097,427) 3,566,706
Class H (Inc) (Hedged) EUR 345,377 3,715,928 (634,585) 3,426,720Class I (Hedged) EUR 105,920,632 63,667,123 (51,913,789) 117,673,966
Class I (Inc) (Hedged) EUR 34,453 2,739,781 (133) 2,774,101Class W USD 3,575,246 16,947,807 (14,635,758) 5,887,295Class W EUR 3,502,127 6,523,472 (2,055,184) 7,970,415
Class W (Inc) USD 4,846,254 7,725,970 (1,394,524) 11,177,700Class W (Inc) EUR 16,806,587 30,262,693 (3,711,055) 43,358,225
Sterling W (Acc) GBP 2,327,533 5,317,089 (3,922,628) 3,721,994Sterling W (Inc) GBP 18,001,503 14,411,252 (3,371,081) 29,041,674
Class Z (Acc) USD 5,000 41,214,873 (36,276,477) 4,943,396Class Z (Acc) EUR 5,000 9,479,377 (6,756,504) 2,727,873Class Z (Inc) USD 5,154 9,762,919 (9,160,521) 607,552Class Z (Inc) EUR 5,000 1,768,098 (119,957) 1,653,141
Sterling Z (Acc) GBP 285,147 – (280,147) 5,000Sterling Z (Inc) GBP 5,153 780,840 (22,553) 763,440
BNY Mellon Global High Yield Bond FundClass A EUR 6,853,523 1,886,058 (2,125,350) 6,614,231
Class A (Inc)^ EUR – 5,240 (120) 5,120Class C USD 14,748,800 89,652,012 (59,684,644) 44,716,168Class C EUR 1,055,302 7,529,447 (5,302,460) 3,282,289
Class H (Hedged) EUR 3,030,783 876,301 (3,563,022) 344,062Class I (Hedged) EUR 617,068 4,977,569 (4,717,860) 876,777
Class X USD 5,000 – – 5,000Class X (Inc) USD 56,338,055 2,462,659 (18,438,632) 40,362,082
Class X (Inc) (Hedged) EUR 45,013,667 3,568,138 (12,805,374) 35,776,431
BNY Mellon Global Leaders Fund*Class A (Acc)^ USD – 5,000 – 5,000Class C (Acc)^ USD – 27,541,559 – 27,541,559
Sterling E (Acc)^ GBP – 5,000 – 5,000Class H (Acc) (Hedged)^ EUR – 100,000 – 100,000Class H (Inc) (Hedged)^ EUR – 100,000 – 100,000
Class W (Acc)^ USD – 5,000 – 5,000Class W (Acc) (Hedged)^ EUR – 100,000 – 100,000Class W (Inc) (Hedged)^ EUR – 100,000 – 100,000
Sterling W (Acc)^ GBP – 5,000 – 5,000

239
BNY MELLON GLOBAL FUNDS, PLC
NOTES TO THE FINANCIAL STATEMENTS
2. SHARE CAPITAL cont’d.
REDEEMABLE PARTICIPATING SHARES cont’d.
Fund Share Class Currency
Shares in issue
at beginning of year
Shares issued during
the year
Shares redeemed
during the year
Shares in issue
at end of year
BNY Mellon Global Opportunistic Bond FundClass A USD 1,385,243 55,070 (117,914) 1,322,399Class C USD 62,634,762 8,964,588 (42,589,427) 29,009,923
Class C (Inc) USD 5,000 811,163 (810,962) 5,201Class H (Hedged) EUR 1,417,704 302,942 (492,376) 1,228,270
Class I (Hedged) EUR 4,782,714 5,959 (4,770,501) 18,172Sterling I (Acc) (Hedged) GBP 14,840,799 – – 14,840,799
Class X USD 70,436,961 317,715 (3,602,722) 67,151,954Class X (Inc)^ USD 43,089,158 – (43,089,158) –
BNY Mellon Global Opportunities FundClass A USD 7,772,279 6,682,965 (6,470,474) 7,984,770Class A EUR 10,983,439 10,786,641 (6,122,926) 15,647,154Class B USD 1,068,325 54,083 (117,035) 1,005,373Class B EUR 5,000 – – 5,000Class C USD 520,999 1,727,379 (1,644,800) 603,578Class C EUR 9,557,445 2,670,080 (8,080,088) 4,147,437
Class H (Hedged) EUR 3,560,410 900,758 (1,415,236) 3,045,932Class I (Hedged) EUR 2,004,042 8,119,173 (527,393) 9,595,822
Class X EUR 25,806,256 – (17,050,118) 8,756,138
BNY Mellon Global Property Securities FundClass A EUR 668,020 247,005 (639,433) 275,592Class A USD 1,164,302 – (660,040) 504,262Class C EUR 460,281 3,600 (459,015) 4,866Class C USD 9,926,084 8,565,310 (442,489) 18,048,905
Sterling I (Inc) (Hedged) GBP 52,752 10,766 (34,617) 28,901Sterling J (Acc) (Hedged) GBP 111,517 15,834 (80,951) 46,400Sterling J (Inc) (Hedged) GBP 26,565 410 (20,293) 6,682
BNY Mellon Global Real Return Fund (EUR)Class A EUR 471,869,006 885,658,613 (384,371,306) 973,156,313
Class A (Inc) EUR 11,583,736 44,654,852 (12,273,607) 43,964,981Class C EUR 802,226,027 469,474,649 (217,211,283) 1,054,489,393
Class C (Inc) EUR 6,125,633 3,988,881 (2,831,404) 7,283,110Class W EUR 580,716,208 550,162,425 (114,690,761) 1,016,187,872
Class W (Acc) (Hedged)^ CHF – 9,661,043 – 9,661,043Class X EUR 244,735,285 24,586,031 (52,263,408) 217,057,908
Class Z (Acc) EUR 12,871,218 31,068,662 (19,425,483) 24,514,397
BNY Mellon Global Real Return Fund (GBP)Sterling B (Acc) GBP 243,157 2,185,553 (175,740) 2,252,970Sterling B (Inc) GBP 300,207 441,188 – 741,395Sterling C (Inc) GBP 5,117,782 707,501 (1,348,960) 4,476,323
Sterling W (Acc) GBP 4,799,095 2,145,018 (713,981) 6,230,132Sterling W (Inc) GBP 14,919,690 11,468,908 (2,934,670) 23,453,928Sterling X (Acc) GBP 30,167,656 10,362,071 (17,046,302) 23,483,425
BNY Mellon Global Real Return Fund (USD)Class A USD 85,248,275 58,786,873 (27,402,047) 116,633,101
Class A (Inc)^ USD – 12,000 – 12,000

240
BNY MELLON GLOBAL FUNDS, PLC
NOTES TO THE FINANCIAL STATEMENTS
2. SHARE CAPITAL cont’d.
REDEEMABLE PARTICIPATING SHARES cont’d.
Fund Share Class Currency
Shares in issue
at beginning of year
Shares issued during
the year
Shares redeemed
during the year
Shares in issue
at end of year
BNY Mellon Global Real Return Fund (USD) cont’d.Class C USD 51,570,493 55,135,852 (63,608,200) 43,098,145
Class C (Inc) USD 4,356,366 596,541 (705,423) 4,247,484Class W (Acc) USD 28,481,024 101,254,527 (13,526,853) 116,208,698Class W (Inc) USD 5,567,010 7,126,124 (1,847,979) 10,845,155
Class X USD 201,148,872 26,508,728 (30,867,754) 196,789,846
BNY Mellon Global Short-Dated High Yield Bond Fund*Class A (Acc)^ USD – 5,000 – 5,000Class C (Acc)^ USD – 5,000 – 5,000
Class H (Acc) (Hedged)^ EUR – 100,000 – 100,000Class I (Acc) (Hedged)^ EUR – 100,000 – 100,000
Class W (Acc)^ USD – 5,000 – 5,000Sterling W (Acc) (Hedged)^ GBP – 100,000 – 100,000
Class X (Acc)^ USD – 17,763,485 – 17,763,485Class Y (Acc)^ USD – 433,124,663 (66,594,318) 366,530,345
Sterling Y (Acc) (Hedged)^ GBP – 50,042,647 (2,894,501) 47,148,146
BNY Mellon Japan All Cap Equity FundClass C JPY 5,000 – – 5,000Class C USD 5,000 6,858,213 (6,858,213) 5,000
Class H (Hedged) EUR 5,000 40,441 (11,199) 34,242Class H (Hedged) USD 194,230 2,051,852 (1,075,239) 1,170,843
Class I (Hedged) EUR 2,573,945 450,000 (210,000) 2,813,945Class I (Hedged) USD 12,694,687 1,748,301 (12,489,789) 1,953,199
Class W JPY 5,000 – – 5,000Sterling W (Acc) GBP 6,179 1,640 (2,122) 5,697
Class X (Inc) JPY 15,070,189 2,434,237 (4,249,501) 13,254,925
BNY Mellon Japan REIT Alpha Fund* Class C (Acc)^ JPY – 5,701 – 5,701 Class W (Inc)^ JPY – 20,740,163 – 20,740,163
BNY Mellon Japan Small Cap Equity Focus FundClass C JPY 2,393,000 – (2,388,000) 5,000Class C USD 5,000 10,401,246 (2,094,409) 8,311,837
Class H (Hedged) EUR 86,900 414,053 (332,903) 168,050Class H (Hedged) USD 2,324,839 902,623 (2,431,102) 796,360
Class H (Acc) (Hedged)^ SGD – 651,268 (182,274) 468,994Class I (Hedged) EUR 2,614,728 – (40,783) 2,573,945Class I (Hedged) USD 14,318,378 – (14,012,275) 306,103
Class W JPY 4,667,700 – – 4,667,700Sterling W (Acc) GBP 27,926 443,971 (36,162) 435,735
BNY Mellon Long-Term Global Equity FundClass A EUR 76,679,456 15,041,535 (31,747,770) 59,973,221Class A USD 87,700,119 3,896,150 (53,654,088) 37,942,181
Class A (Inc) EUR 4,179,979 3,948,480 (3,561) 8,124,898Sterling A (Acc) GBP 1,582,469 207,716 (613,973) 1,176,212
Class B EUR 1,026,488 1,215 (6,368) 1,021,335

241
BNY MELLON GLOBAL FUNDS, PLC
NOTES TO THE FINANCIAL STATEMENTS
2. SHARE CAPITAL cont’d.
REDEEMABLE PARTICIPATING SHARES cont’d.
Fund Share Class Currency
Shares in issue
at beginning of year
Shares issued during
the year
Shares redeemed
during the year
Shares in issue
at end of year
BNY Mellon Long-Term Global Equity Fund cont’d.Class B USD 3,290,374 481,481 (1,672,721) 2,099,134
Sterling B (Inc) GBP 64,616 27,721 – 92,337Class C EUR 107,003,513 27,319,977 (43,779,672) 90,543,818Class C USD 86,463,272 40,250,960 (11,661,608) 115,052,624
Class C (Inc) EUR 68,500 28,003 (28,003) 68,500Class S EUR 49,507,286 2,337,395 (6,618,090) 45,226,591
Class W EUR 2,038,731 19,579,232 (4,713,707) 16,904,256Class W USD 45,638,160 23,211,008 (13,556,281) 55,292,887
Class W (Hedged) CHF 202,200 33,300 (100,800) 134,700Class W (Hedged) USD 317,115 – (81,674) 235,441
Class W (Inc) USD 20,296,199 152,695 (170,650) 20,278,244Sterling W (Acc) GBP 12,601,211 16,416 (1,173,811) 11,443,816Sterling W (Inc) GBP 971,444 1,165,608 (172,827) 1,964,225
Class X^ EUR 100,904,915 – (100,904,915) –Sterling X GBP 301,522,894 – (13,791,984) 287,730,910
BNY Mellon Pan European Equity FundClass A EUR 1,085,124 88,698 (488,386) 685,436Class A USD 507,978 131,427 (99,943) 539,462Class B EUR 117,385 – – 117,385Class C EUR 4,517 – – 4,517
Class C^ USD 20,548,468 – (20,548,468) –
BNY Mellon S&P 500® Index TrackerClass A USD 21,318,684 994,680 (5,951,776) 16,361,588Class A EUR 1,792,632 740,352 (752,502) 1,780,482Class C USD 12,970,187 12,450,691 (6,912,002) 18,508,876Class C EUR 4,145,751 – (291,400) 3,854,351
BNY Mellon Small Cap Euroland FundClass A EUR 3,729,894 955,828 (1,518,443) 3,167,279Class A USD 5,000 – – 5,000Class B EUR 48,529 – (12,000) 36,529Class C EUR 2,779,497 3,501,718 (4,082,423) 2,198,792Class C USD 5,000 34,493,517 (24,998,478) 9,500,039
Class I (Acc) (Hedged)^ USD 35,408,090 – (35,408,090) –Sterling W (Acc)^ GBP – 5,000 – 5,000
BNY Mellon Targeted Return Bond FundClass A (Acc) USD 5,000 – – 5,000
Sterling W (Acc) (Hedged) GBP 64,822,766 239,980 – 65,062,746
BNY Mellon U.S. Dynamic Value FundClass A USD 1,252,399 1,241,675 (896,761) 1,597,313Class A EUR 661,688 3,083,316 (1,930,570) 1,814,434Class B USD 152,761 – – 152,761Class B EUR 5,000 555 – 5,555Class C USD 14,746,051 32,833,635 (3,142,293) 44,437,393Class C EUR 45,543 – – 45,543

242
BNY MELLON GLOBAL FUNDS, PLC
NOTES TO THE FINANCIAL STATEMENTS
2. SHARE CAPITAL cont’d.
REDEEMABLE PARTICIPATING SHARES cont’d.
Fund Share Class Currency
Shares in issue
at beginning of year
Shares issued during
the year
Shares redeemed
during the year
Shares in issue
at end of year
BNY Mellon US Opportunities FundClass A USD 5,000 – – 5,000Class A EUR 791,565 71,820 (497,788) 365,597
Class A (Inc) EUR 8,578 – – 8,578Class C USD 47,621,548 25,984,527 (46,285,630) 27,320,445Class C EUR 5,000 614,261 – 619,261
Class W EUR 5,000 – – 5,000
* Please refer to Note 19 of the financial statements.^ This share class was launched or closed during the year.
The activity on redeemable participating shares for the year ended 31 December 2015 was as follows:
Fund Share Class Currency
Shares in issue
at beginning of year
Shares issued during
the year
Shares redeemed
during the year
Shares in issue
at end of year
BNY Mellon Absolute Insight FundClass E (Acc) EUR 114,904,254 1,446,341 (11,771,530) 104,579,065
Class E (Acc) (Hedged) CHF 1,953,115 – (79,973) 1,873,142Class E (Acc) (Hedged) USD 7,722,191 – (3,623,020) 4,099,171
Class E (Inc) EUR 4,891,000 – – 4,891,000Sterling E (Acc) (Hedged) GBP 12,452,988 466,003 (7,234,094) 5,684,897
Class R (Acc) EUR 2,927,225 42,610,577 (27,222,551) 18,315,251Class R (Acc) (Hedged) USD 896,037 1,285,121 (1,056,490) 1,124,668
Class R (Inc) EUR 1,628,107 3,013,867 (782,428) 3,859,546Class S (Acc) EUR 2,002,663 11,421,114 (393,434) 13,030,343
Class T (Acc) (Hedged) USD 402,740 1,354,750 (205,408) 1,552,082Class U (Acc) EUR 6,474 38,276,782 (7,413,451) 30,869,805
Class U (Acc) (Hedged)^ CHF – 712,357 (253,822) 458,535Class U (Acc) (Hedged)^ USD – 2,066,022 (175,516) 1,890,506
Class U (Inc)^ EUR – 4,021,486 (336,575) 3,684,911Sterling U (Acc) (Hedged) GBP 324,802 20,059,578 (1,531,683) 18,852,697
BNY Mellon Absolute Return Bond FundClass C EUR 3,232,826 1,490,656 (1,093,470) 3,630,012
Class C (Inc) EUR 51 – – 51Class I (Hedged) USD 1,857,127 487,548 (652,005) 1,692,670
Sterling I (Acc) (Hedged) GBP 1,004,659 128,818 (141,876) 991,601Class R EUR 531,648 1,034,730 (447,171) 1,119,207
Class R (Hedged) USD 200,803 384,181 (304,021) 280,963Class R (Inc) EUR 26,639 52,598 (22,578) 56,659
Class S EUR 2,488,180 7,926,852 (2,007,762) 8,407,270Class S (Inc) EUR 51 2,871 (4) 2,918
Class T (Hedged) USD 171,371 650,408 (149,167) 672,612Sterling T (Acc) (Hedged) GBP 28,280 36,222 (10,821) 53,681
Sterling W (Acc) (Hedged)^ GBP – 545,760 (55,982) 489,778Sterling W (Inc) (Hedged)^ GBP – 34,029 (8,972) 25,057
Class X EUR 1,771,206 1,246,903 (571,237) 2,446,872Class X (Hedged)^ USD 151,170 – (151,170) –
Sterling X (Acc) (Hedged) GBP 7,100 – – 7,100
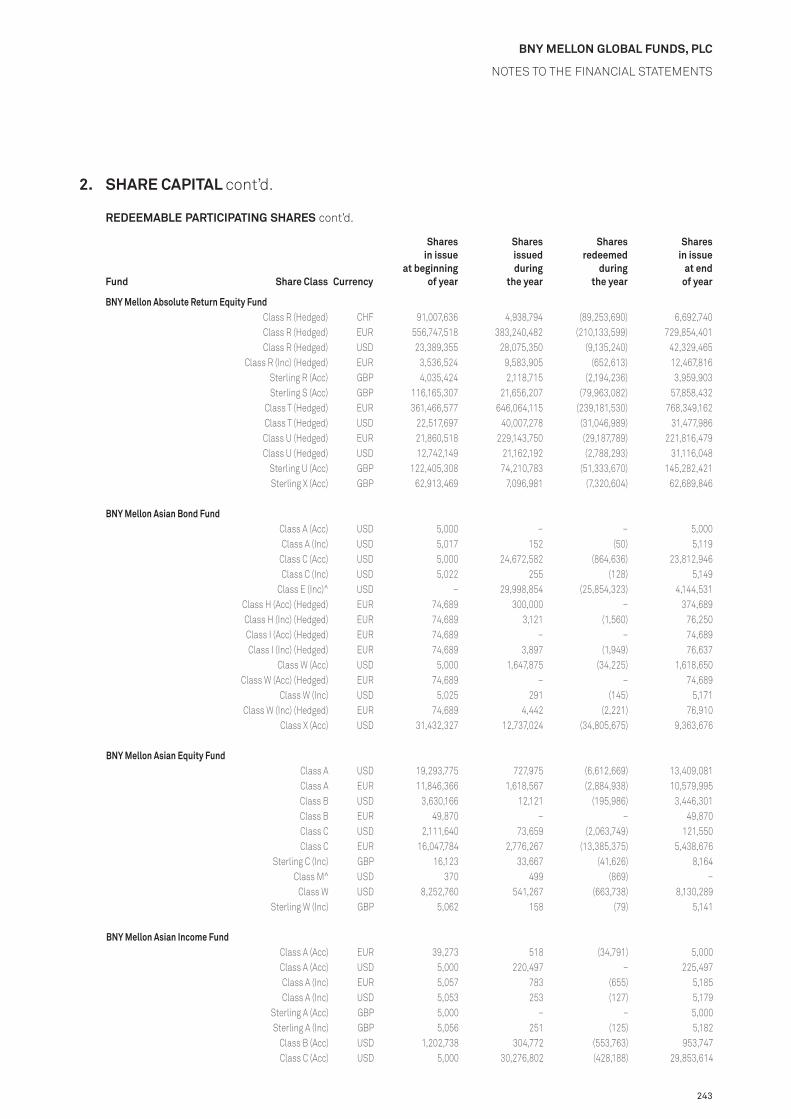
243
BNY MELLON GLOBAL FUNDS, PLC
NOTES TO THE FINANCIAL STATEMENTS
2. SHARE CAPITAL cont’d.
REDEEMABLE PARTICIPATING SHARES cont’d.
Fund Share Class Currency
Shares in issue
at beginning of year
Shares issued during
the year
Shares redeemed
during the year
Shares in issue
at end of year
BNY Mellon Absolute Return Equity FundClass R (Hedged) CHF 91,007,636 4,938,794 (89,253,690) 6,692,740Class R (Hedged) EUR 556,747,518 383,240,482 (210,133,599) 729,854,401Class R (Hedged) USD 23,389,355 28,075,350 (9,135,240) 42,329,465
Class R (Inc) (Hedged) EUR 3,536,524 9,583,905 (652,613) 12,467,816Sterling R (Acc) GBP 4,035,424 2,118,715 (2,194,236) 3,959,903Sterling S (Acc) GBP 116,165,307 21,656,207 (79,963,082) 57,858,432
Class T (Hedged) EUR 361,466,577 646,064,115 (239,181,530) 768,349,162Class T (Hedged) USD 22,517,697 40,007,278 (31,046,989) 31,477,986Class U (Hedged) EUR 21,860,518 229,143,750 (29,187,789) 221,816,479Class U (Hedged) USD 12,742,149 21,162,192 (2,788,293) 31,116,048
Sterling U (Acc) GBP 122,405,308 74,210,783 (51,333,670) 145,282,421Sterling X (Acc) GBP 62,913,469 7,096,981 (7,320,604) 62,689,846
BNY Mellon Asian Bond FundClass A (Acc) USD 5,000 – – 5,000Class A (Inc) USD 5,017 152 (50) 5,119
Class C (Acc) USD 5,000 24,672,582 (864,636) 23,812,946Class C (Inc) USD 5,022 255 (128) 5,149
Class E (Inc)^ USD – 29,998,854 (25,854,323) 4,144,531Class H (Acc) (Hedged) EUR 74,689 300,000 – 374,689Class H (Inc) (Hedged) EUR 74,689 3,121 (1,560) 76,250Class I (Acc) (Hedged) EUR 74,689 – – 74,689Class I (Inc) (Hedged) EUR 74,689 3,897 (1,949) 76,637
Class W (Acc) USD 5,000 1,647,875 (34,225) 1,618,650Class W (Acc) (Hedged) EUR 74,689 – – 74,689
Class W (Inc) USD 5,025 291 (145) 5,171Class W (Inc) (Hedged) EUR 74,689 4,442 (2,221) 76,910
Class X (Acc) USD 31,432,327 12,737,024 (34,805,675) 9,363,676
BNY Mellon Asian Equity FundClass A USD 19,293,775 727,975 (6,612,669) 13,409,081Class A EUR 11,846,366 1,618,567 (2,884,938) 10,579,995Class B USD 3,630,166 12,121 (195,986) 3,446,301Class B EUR 49,870 – – 49,870Class C USD 2,111,640 73,659 (2,063,749) 121,550Class C EUR 16,047,784 2,776,267 (13,385,375) 5,438,676
Sterling C (Inc) GBP 16,123 33,667 (41,626) 8,164Class M^ USD 370 499 (869) –
Class W USD 8,252,760 541,267 (663,738) 8,130,289Sterling W (Inc) GBP 5,062 158 (79) 5,141
BNY Mellon Asian Income FundClass A (Acc) EUR 39,273 518 (34,791) 5,000Class A (Acc) USD 5,000 220,497 – 225,497Class A (Inc) EUR 5,057 783 (655) 5,185Class A (Inc) USD 5,053 253 (127) 5,179
Sterling A (Acc) GBP 5,000 – – 5,000Sterling A (Inc) GBP 5,056 251 (125) 5,182
Class B (Acc) USD 1,202,738 304,772 (553,763) 953,747Class C (Acc) USD 5,000 30,276,802 (428,188) 29,853,614

244
BNY MELLON GLOBAL FUNDS, PLC
NOTES TO THE FINANCIAL STATEMENTS
2. SHARE CAPITAL cont’d.
REDEEMABLE PARTICIPATING SHARES cont’d.
Fund Share Class Currency
Shares in issue
at beginning of year
Shares issued during
the year
Shares redeemed
during the year
Shares in issue
at end of year
BNY Mellon Asian Income Fund cont’d.Sterling C (Acc) GBP 50,771 – (45,771) 5,000
Class W (Inc) EUR 1,134,931 581,645 (1,316,234) 400,342Class W (Inc) USD 6,731,301 2,679,949 (7,473,790) 1,937,460
Sterling W (Inc) GBP 13,385,648 4,190,967 (15,565,726) 2,010,889
BNY Mellon Brazil Equity FundClass A USD 42,970,203 42,332,223 (52,375,883) 32,926,543Class A EUR 22,630,000 25,125,465 (25,140,670) 22,614,795Class B USD 5,193,689 29,163 (1,483,401) 3,739,451Class B EUR 69,798 445,092 (510,192) 4,698
Sterling B (Acc) GBP 295,184 158,044 (117,832) 335,396Class C USD 25,850,771 20,458,646 (18,408,716) 27,900,701Class C EUR 14,198,658 5,044,515 (15,500,024) 3,743,149
Sterling C (Inc) GBP 235,911 8,740 (21,352) 223,299Class H (Hedged) EUR 5,000 74,875 (45,208) 34,667
Class I (Hedged) EUR 5,000 2,000 – 7,000Class M^ USD 16,691 – (16,691) –
Class W (Acc) USD 2,540,691 193,608 (617,917) 2,116,382Class W (Acc) EUR 419,522 285,000 – 704,522
Sterling W (Acc) GBP 174,875 125,307 (158,240) 141,942
BNY Mellon Crossover Credit FundClass A EUR 59,369 6,490,852 (3,134,585) 3,415,636
Class A^ USD 5,000 – (5,000) –Class A (Inc) EUR 6,779 444,952 (187,646) 264,085
Class A (Inc)^ USD 5,019 86 (5,105) –Class C EUR 1,387,429 14,063,610 (12,537,182) 2,913,857
Class C^ USD – 26,125,323 (26,120,140) 5,183Class C (Inc) EUR 67,492,122 43,691,389 (6,649,160) 104,534,351
Sterling C (Inc)^ GBP 5,071 117 (5,188) –Class I (Acc) (Hedged)^ USD – 25,368,247 – 25,368,247
Class X EUR 92,300,000 203,864 (75,724) 92,428,140
BNY Mellon Dynamic Total Return Fund*Class A (Acc)^ USD – 5,000 – 5,000Class A (Acc)^ EUR – 5,000 – 5,000Class A (Inc)^ EUR – 5,000 – 5,000
Class C (Acc)^ USD – 360,975 – 360,975Class C (Inc)^ USD – 5,000 – 5,000
Class H (Acc) (Hedged)^ EUR – 91,212 – 91,212Class I (Acc) (Hedged)^ EUR – 91,212 – 91,212
Class W (Acc)^ USD – 1,855,926 – 1,855,926Class W (Acc) (Hedged)^ EUR – 91,212 – 91,212
Class W (Inc)^ USD – 5,000 – 5,000Class W (Inc) (Hedged)^ EUR – 91,212 – 91,212
Sterling W (Acc)^ GBP – 5,000 – 5,000Sterling W (Acc) (Hedged)^ GBP – 64,888 – 64,888
Sterling W (Inc)^ GBP – 5,000 – 5,000Sterling W (Inc) (Hedged)^ GBP – 64,888 – 64,888
Class X (Acc)^ USD – 9,948,448 (600,000) 9,348,448

245
BNY MELLON GLOBAL FUNDS, PLC
NOTES TO THE FINANCIAL STATEMENTS
2. SHARE CAPITAL cont’d.
REDEEMABLE PARTICIPATING SHARES cont’d.
Fund Share Class Currency
Shares in issue
at beginning of year
Shares issued during
the year
Shares redeemed
during the year
Shares in issue
at end of year
BNY Mellon Emerging Markets Corporate Debt FundClass A USD 50 11,167 – 11,217Class A EUR 5,303 7,793 (7,170) 5,926Class B USD 45 135 – 180Class C USD 27,304 120,224 (115,938) 31,590Class C EUR 89,915 169,147 (155,048) 104,014
Class H (Hedged) EUR 50 – – 50Class I (Hedged) EUR 50 6,938 (5,438) 1,550
Class W USD 5,340 2,018 (596) 6,762Class W EUR 50 – – 50
Sterling W (Acc) (Hedged) GBP 30,199 1,817 (6,018) 25,998Class X USD 543,813 135,346 (16,509) 662,650
BNY Mellon Emerging Markets Debt FundClass A USD 15,833,124 3,452,025 (14,534,137) 4,751,012Class A EUR 10,403,817 4,201,269 (9,563,324) 5,041,762Class C USD 57,803,961 10,323,320 (64,262,313) 3,864,968Class C EUR 40,030,376 31,369,849 (49,273,551) 22,126,674
Class C (Inc) USD 5,404 1,236 (618) 6,022Class H (Acc) (Hedged) EUR 431,763 2,145,757 (1,141,495) 1,436,025
Class I (Acc) (Hedged) EUR 16,435,902 633,993 (15,448,425) 1,621,470Class W USD 5,000 – – 5,000
Class X (Inc)^ USD 34,429,686 7,555,866 (41,985,552) –
BNY Mellon Emerging Markets Debt Local Currency FundClass A USD 88,256,739 66,389,130 (66,087,240) 88,558,629Class A EUR 58,618,853 56,053,035 (70,045,588) 44,626,300
Class A (Inc) USD 686,485 626 (395,984) 291,127Class A (Inc) EUR 2,376,856 38,514 (936,376) 1,478,994
Sterling A (Acc) GBP 985,892 160,001 (559,848) 586,045Sterling A (Inc) GBP 114,362 – (49,753) 64,609
Class B USD 5,000 – – 5,000Class B EUR 5,000 – – 5,000
Sterling B (Acc) GBP 18,280 – (12,070) 6,210Sterling B (Inc) GBP 11,548 – – 11,548
Class C USD 181,937,464 66,417,234 (53,346,668) 195,008,030Class C EUR 111,007,822 6,327,488 (82,228,965) 35,106,345
Class C (Inc) USD 8,102,232 39,185 (4,677,787) 3,463,630Class C (Inc) EUR 274,578,843 8,401,838 (160,364,543) 122,616,138
Sterling C (Acc) GBP 13,697,720 152,399 (4,132,597) 9,717,522Sterling C (Inc) GBP 60,481,829 3,687,478 (54,828,240) 9,341,067
Class H (Hedged) EUR 10,302,206 500,116 (8,730,991) 2,071,331Class I (Hedged) EUR 6,345,993 92,394 (2,781,105) 3,657,282
Class I (Inc) (Hedged) EUR 91,416,850 50,600,104 (39,052,041) 102,964,913Sterling J (Inc) (Hedged) GBP 191,855 373,774 (392,100) 173,529
Class M^ USD 75,344 1,600 (76,944) –Class M (Hedged)^ EUR 2,928 – (2,928) –
Sterling M (Acc) (Hedged)^ GBP 180 – (180) –Class W USD 132,724,962 9,878,398 (84,606,877) 57,996,483Class W EUR 21,358,823 16,148,745 (36,268,165) 1,239,403
Class W (Hedged) EUR 2,462,410 68,860,562 (5,113,533) 66,209,439

246
BNY MELLON GLOBAL FUNDS, PLC
NOTES TO THE FINANCIAL STATEMENTS
2. SHARE CAPITAL cont’d.
REDEEMABLE PARTICIPATING SHARES cont’d.
Fund Share Class Currency
Shares in issue
at beginning of year
Shares issued during
the year
Shares redeemed
during the year
Shares in issue
at end of year
BNY Mellon Emerging Markets Debt Local Currency Fund cont’d.Class W (Inc) USD 607,031 53,000 (629,758) 30,273Class W (Inc) EUR 5,511 609 (305) 5,815
Sterling W (Inc) GBP 2,251,350 31,541,062 (3,205,563) 30,586,849Sterling W (Inc) (Hedged) GBP 1,634,986 13,600 (679,437) 969,149
Class X USD 353,393,392 47,705,108 (79,023,403) 322,075,097Class X (Inc)^ USD 43,688,854 11,383,813 (55,072,667) –
Class X (Inc) CHF 282,418,584 10,290 (67,902,132) 214,526,742
BNY Mellon Emerging Markets Debt Opportunistic FundClass A USD 5,000 – – 5,000Class A EUR 5,000 – – 5,000Class C USD 239,478 198,500 (234,478) 203,500Class C EUR 5,000 – – 5,000
Class W EUR 5,000 – – 5,000Class X USD 16,988,893 10,502,574 (8,741,451) 18,750,016
Class X (Inc)^ USD – 81,258,797 (8,180,562) 73,078,235
BNY Mellon Emerging Markets Equity Fund**Class A^ USD 3,207 – (3,207) –Class A^ EUR 83,971 74,274 (158,245) –Class C^ USD 2,644 8,579,686 (8,582,330) –Class C^ EUR 2,575 – (2,575) –
Class X (Inc)^ USD 8,439,647 – (8,439,647) –
BNY Mellon Emerging Markets Equity Core Fund**Class A^ EUR 8,851 583 (9,434) –Class C^ USD 5,000 – (5,000) –Class C^ EUR 5,000 – (5,000) –Class S^ USD 150,640,129 162,979 (150,803,108) –
Class W^ EUR 5,000 – (5,000) –
BNY Mellon Emerging Markets Local Currency Investment Grade Debt Fund**Class C^ USD 5,040 – (5,040) –Class C^ EUR 1,954,868 – (1,954,868) –Class X^ USD 204,765,250 – (204,765,250) –
BNY Mellon Euroland Bond FundClass A EUR 471,171,057 315,800,122 (318,425,571) 468,545,608
Class A (Inc) EUR 32,353,124 12,647,449 (15,914,766) 29,085,807Class B EUR 1,184,166 447,774 (1,259,731) 372,209
Class B (Inc) EUR 40,033 140 (70) 40,103Class C EUR 644,810,299 277,616,046 (352,712,874) 569,713,471
Class C (Inc) EUR 88,652,053 50,820,890 (25,913,107) 113,559,836Class H (Acc) (Hedged)^ USD – 4,855,368 (3,253,814) 1,601,554
Class H (Hedged) CHF 160,192,020 36,127,643 (55,135,622) 141,184,041Class I (Acc) (Hedged) USD 12,100,000 13,027,337 (17,135,317) 7,992,020
Class I (Hedged) CHF 20,609,026 6,648,805 (4,091,021) 23,166,810Class S EUR 594,599,400 200,924,695 (420,488,355) 375,035,740
Class Z (Acc)^ EUR – 11,162,550 – 11,162,550
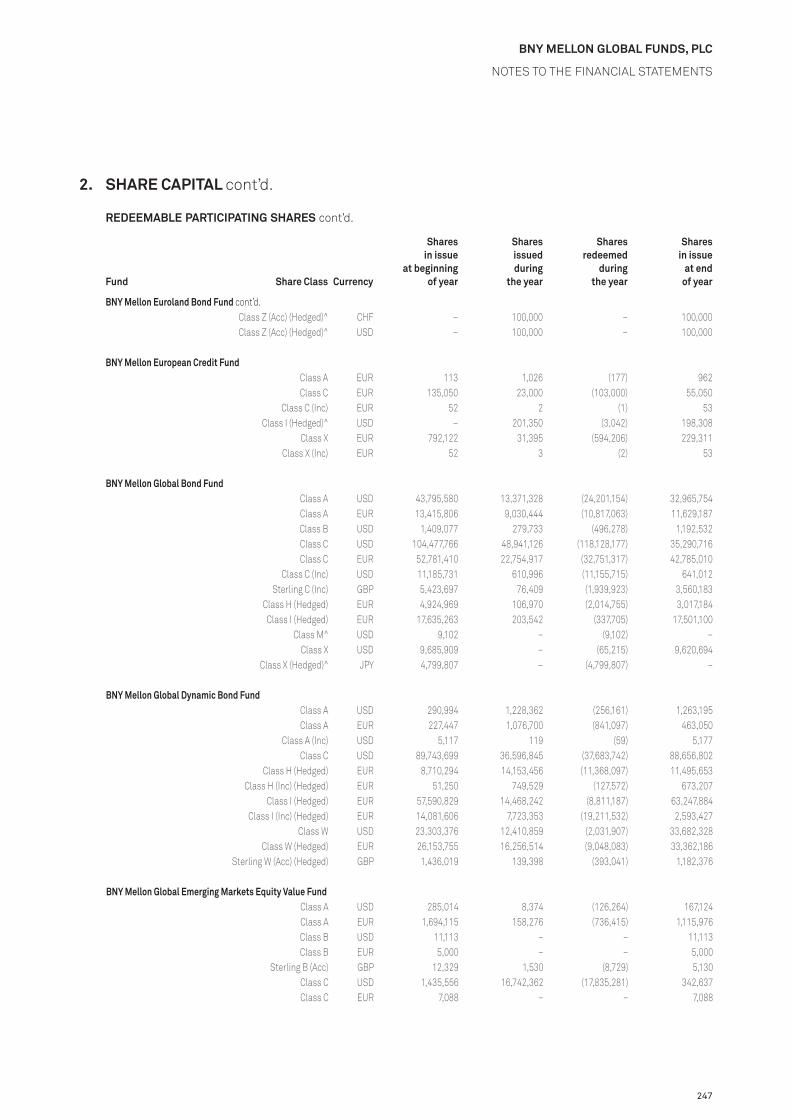
247
BNY MELLON GLOBAL FUNDS, PLC
NOTES TO THE FINANCIAL STATEMENTS
2. SHARE CAPITAL cont’d.
REDEEMABLE PARTICIPATING SHARES cont’d.
Fund Share Class Currency
Shares in issue
at beginning of year
Shares issued during
the year
Shares redeemed
during the year
Shares in issue
at end of year
BNY Mellon Euroland Bond Fund cont’d.Class Z (Acc) (Hedged)^ CHF – 100,000 – 100,000Class Z (Acc) (Hedged)^ USD – 100,000 – 100,000
BNY Mellon European Credit FundClass A EUR 113 1,026 (177) 962Class C EUR 135,050 23,000 (103,000) 55,050
Class C (Inc) EUR 52 2 (1) 53Class I (Hedged)^ USD – 201,350 (3,042) 198,308
Class X EUR 792,122 31,395 (594,206) 229,311Class X (Inc) EUR 52 3 (2) 53
BNY Mellon Global Bond FundClass A USD 43,795,580 13,371,328 (24,201,154) 32,965,754Class A EUR 13,415,806 9,030,444 (10,817,063) 11,629,187Class B USD 1,409,077 279,733 (496,278) 1,192,532Class C USD 104,477,766 48,941,126 (118,128,177) 35,290,716Class C EUR 52,781,410 22,754,917 (32,751,317) 42,785,010
Class C (Inc) USD 11,185,731 610,996 (11,155,715) 641,012Sterling C (Inc) GBP 5,423,697 76,409 (1,939,923) 3,560,183
Class H (Hedged) EUR 4,924,969 106,970 (2,014,755) 3,017,184Class I (Hedged) EUR 17,635,263 203,542 (337,705) 17,501,100
Class M^ USD 9,102 – (9,102) –Class X USD 9,685,909 – (65,215) 9,620,694
Class X (Hedged)^ JPY 4,799,807 – (4,799,807) –
BNY Mellon Global Dynamic Bond FundClass A USD 290,994 1,228,362 (256,161) 1,263,195Class A EUR 227,447 1,076,700 (841,097) 463,050
Class A (Inc) USD 5,117 119 (59) 5,177Class C USD 89,743,699 36,596,845 (37,683,742) 88,656,802
Class H (Hedged) EUR 8,710,294 14,153,456 (11,368,097) 11,495,653Class H (Inc) (Hedged) EUR 51,250 749,529 (127,572) 673,207
Class I (Hedged) EUR 57,590,829 14,468,242 (8,811,187) 63,247,884Class I (Inc) (Hedged) EUR 14,081,606 7,723,353 (19,211,532) 2,593,427
Class W USD 23,303,376 12,410,859 (2,031,907) 33,682,328Class W (Hedged) EUR 26,153,755 16,256,514 (9,048,083) 33,362,186
Sterling W (Acc) (Hedged) GBP 1,436,019 139,398 (393,041) 1,182,376
BNY Mellon Global Emerging Markets Equity Value FundClass A USD 285,014 8,374 (126,264) 167,124Class A EUR 1,694,115 158,276 (736,415) 1,115,976Class B USD 11,113 – – 11,113Class B EUR 5,000 – – 5,000
Sterling B (Acc) GBP 12,329 1,530 (8,729) 5,130Class C USD 1,435,556 16,742,362 (17,835,281) 342,637Class C EUR 7,088 – – 7,088

248
BNY MELLON GLOBAL FUNDS, PLC
NOTES TO THE FINANCIAL STATEMENTS
2. SHARE CAPITAL cont’d.
REDEEMABLE PARTICIPATING SHARES cont’d.
Fund Share Class Currency
Shares in issue
at beginning of year
Shares issued during
the year
Shares redeemed
during the year
Shares in issue
at end of year
BNY Mellon Global Emerging Markets FundClass A USD 5,000 – – 5,000Class A EUR 6,485 40,000 (41,485) 5,000
Class A (Inc) USD 5,406 330 (165) 5,571Class A (Inc) EUR 117,535 53,924 (49,273) 122,186Class B (Inc) USD 736,025 – (132,908) 603,117Class B (Inc) EUR 20,279 11,291 (166) 31,404
Sterling B (Inc) GBP 5,438 335 (168) 5,605Class C USD 17,338,997 – (17,334,299) 4,698
Class C (Acc)^ USD – 73,296,891 – 73,296,891Class C (Inc) USD 5,393,038 336,199 (5,630,483) 98,754
Sterling C (Inc) GBP 49,437 333 (44,167) 5,603Class H (Hedged) EUR 5,000 700 (700) 5,000
Class H (Inc) (Hedged) EUR 5,375 376,111 (946) 380,540Class I (Hedged) EUR 5,000 82,023 – 87,023
Class I (Inc) (Hedged) EUR 5,374 331 (165) 5,540Class W (Acc)^ USD – 5,000 – 5,000
Class W (Inc) USD 2,052,496 306,998 (2,352,961) 6,533Class W (Inc) EUR 194,329 380 (162,152) 32,557
Sterling W (Inc) GBP 3,496,811 308,940 (3,800,148) 5,603
BNY Mellon Global Equity FundClass A USD 11,896,984 1,015,341 (1,166,841) 11,745,484Class A EUR 646,730 396,961 (479,989) 563,702Class B USD 5,449,336 10,351 (800,557) 4,659,130Class B EUR 5,000 – – 5,000Class C USD 19,405,986 8,751,329 (11,172,027) 16,985,288Class C EUR 86,546,544 17,403,460 (8,704,746) 95,245,258
Class I (Hedged) EUR 903,590 344,132 (461,237) 786,485Class M^ USD 89 735 (824) –
BNY Mellon Global Equity Income FundClass A USD 6,416,343 10,612,534 (3,520,346) 13,508,531Class A EUR 13,963,557 31,083,529 (14,792,328) 30,254,758
Class A (Inc) USD 1,176,234 5,294,917 (3,687,932) 2,783,219Sterling A (Acc)^ GBP – 30,159 (1) 30,158Sterling A (Inc)^ GBP – 16,978 (32) 16,946
Class B USD 25,886,371 1,574,443 (10,801,034) 16,659,780Class B EUR 1,088,475 2,138,045 (328,319) 2,898,201
Class B (Inc) USD 21,737,738 794,506 (5,831,183) 16,701,061Class B (Inc) EUR 807,866 21,367 (248,135) 581,098
Sterling B (Inc) GBP 7,552,308 2,199,070 (5,559,302) 4,192,076Class C USD 4,648,658 2,553,201 (1,012,804) 6,189,055Class C EUR 24,830,983 12,630,902 (30,066,939) 7,394,946
Class C (Inc) USD 13,233,771 3,760,154 (4,258,148) 12,735,777Class C (Inc) EUR 5,666,914 19,321,279 (2,066,149) 22,922,044
Sterling C (Inc) GBP 21,626,622 4,042,645 (9,518,430) 16,150,837Class H (Hedged) EUR 268,142 355,617 (202,791) 420,968
Class H (Inc) (Hedged) EUR 210,982 168,132 (33,737) 345,377Class I (Hedged) EUR 683,401 107,246,507 (2,009,276) 105,920,632

249
BNY MELLON GLOBAL FUNDS, PLC
NOTES TO THE FINANCIAL STATEMENTS
2. SHARE CAPITAL cont’d.
REDEEMABLE PARTICIPATING SHARES cont’d.
Fund Share Class Currency
Shares in issue
at beginning of year
Shares issued during
the year
Shares redeemed
during the year
Shares in issue
at end of year
BNY Mellon Global Equity Income Fund cont’d.Class I (Inc) (Hedged) EUR 5,285 29,336 (168) 34,453
Class M^ USD 83,209 – (83,209) –Class M^ EUR 28,556 – (28,556) –
Class M (Inc)^ USD 60,832 1,738 (62,570) –Sterling M (Acc)^ GBP 251 – (251) –Sterling M (Inc)^ GBP 100 – (100) –
Class W USD 4,815,143 1,528,394 (2,768,291) 3,575,246Class W EUR 6,172,433 994,862 (3,665,168) 3,502,127
Class W (Inc) USD 13,475,637 2,832,379 (11,461,762) 4,846,254Class W (Inc) EUR 9,438,503 18,120,906 (10,752,822) 16,806,587
Sterling W (Acc) GBP 1,858,669 861,739 (392,875) 2,327,533Sterling W (Inc) GBP 8,564,313 11,602,681 (2,165,491) 18,001,503
Class Z (Acc) USD 5,000 52 (52) 5,000Class Z (Acc) EUR 5,000 – – 5,000Class Z (Inc) USD 5,000 369 (215) 5,154
Class Z (Inc)^ EUR – 5,000 – 5,000Sterling Z (Acc)^ GBP – 285,147 – 285,147
Sterling Z (Inc) GBP 5,000 306 (153) 5,153
BNY Mellon Global High Yield Bond FundClass A EUR 9,146,984 4,515,580 (6,809,041) 6,853,523Class C USD 5,000 23,368,409 (8,624,609) 14,748,800Class C EUR 2,423,366 30,233,059 (31,601,123) 1,055,302
Class H (Hedged) EUR 613,222 4,762,069 (2,344,508) 3,030,783Class I (Hedged) EUR 1,189,122 516,337 (1,088,391) 617,068
Class X^ USD – 5,000 – 5,000Class X (Inc) USD 51,337,898 14,221,550 (9,221,393) 56,338,055
Class X (Inc) (Hedged) EUR 60,690,277 2,787,179 (18,463,789) 45,013,667
BNY Mellon Global Opportunistic Bond FundClass A USD 695,305 802,333 (112,395) 1,385,243Class C USD 5,931,152 63,602,655 (6,899,045) 62,634,762
Class C (Inc)^ USD – 5,000 – 5,000Class H (Hedged) EUR 9,936 1,473,057 (65,289) 1,417,704
Class I (Hedged) EUR 43,665 5,145,498 (406,449) 4,782,714Sterling I (Acc) (Hedged) GBP 100,000 14,740,799 – 14,840,799
Class X USD 88,228,325 25,372,875 (43,164,239) 70,436,961Class X (Inc)^ USD – 43,183,075 (93,917) 43,089,158
BNY Mellon Global Opportunities FundClass A USD 8,590,626 2,194,229 (3,012,576) 7,772,279Class A EUR 6,139,417 8,668,996 (3,824,974) 10,983,439Class B USD 1,212,580 84,884 (229,139) 1,068,325Class B EUR 9,148 – (4,148) 5,000Class C USD 1,037,183 13,637,113 (14,153,297) 520,999Class C EUR 819,531 9,301,534 (563,620) 9,557,445
Class H (Hedged) EUR 5,000 3,605,574 (50,164) 3,560,410Class I (Hedged) EUR 621,654 1,656,800 (274,412) 2,004,042
Class X EUR 24,399,533 2,243,432 (836,709) 25,806,256

250
BNY MELLON GLOBAL FUNDS, PLC
NOTES TO THE FINANCIAL STATEMENTS
2. SHARE CAPITAL cont’d.
REDEEMABLE PARTICIPATING SHARES cont’d.
Fund Share Class Currency
Shares in issue
at beginning of year
Shares issued during
the year
Shares redeemed
during the year
Shares in issue
at end of year
BNY Mellon Global Property Securities FundClass A EUR 1,736,968 245,633 (1,314,581) 668,020Class A USD 2,677,242 107,300 (1,620,240) 1,164,302Class C EUR 2,767,998 1,116,689 (3,424,406) 460,281Class C USD 1,936,570 9,311,690 (1,322,176) 9,926,084
Sterling I (Inc) (Hedged) GBP 40,549 41,750 (29,547) 52,752Sterling J (Acc) (Hedged) GBP 3,055 109,037 (575) 111,517Sterling J (Inc) (Hedged) GBP 26,539 31 (5) 26,565
BNY Mellon Global Real Return Fund (EUR)Class A EUR 341,702,879 421,498,024 (291,331,897) 471,869,006
Class A (Inc) EUR 2,379,648 13,214,637 (4,010,549) 11,583,736Class C EUR 654,351,813 243,540,149 (95,665,935) 802,226,027
Class C (Inc) EUR 4,781,251 2,089,728 (745,346) 6,125,633Class W EUR 422,040,589 274,454,843 (115,779,224) 580,716,208Class X EUR 242,865,245 2,647,133 (777,093) 244,735,285
Class Z (Acc)^ EUR – 14,355,885 (1,484,667) 12,871,218
BNY Mellon Global Real Return Fund (GBP)Sterling B (Acc) GBP 483,776 189,139 (429,758) 243,157Sterling B (Inc) GBP 699,824 158,892 (558,509) 300,207Sterling C (Inc) GBP 9,237,394 320,165 (4,439,777) 5,117,782
Sterling W (Acc) GBP 3,703,091 2,482,013 (1,386,009) 4,799,095Sterling W (Inc) GBP 10,788,154 5,450,890 (1,319,354) 14,919,690Sterling X (Acc) GBP 5,723,797 24,708,409 (264,550) 30,167,656
BNY Mellon Global Real Return Fund (USD)Class A USD 98,675,866 19,967,824 (33,395,415) 85,248,275Class C USD 64,917,435 23,467,520 (36,814,462) 51,570,493
Class C (Inc) USD 6,048,297 1,833,674 (3,525,605) 4,356,366Class W (Acc) USD 9,607,751 21,179,983 (2,306,710) 28,481,024Class W (Inc) USD 4,342,238 3,802,127 (2,577,355) 5,567,010
Class X USD 132,621,368 81,162,884 (12,635,380) 201,148,872
BNY Mellon Japan All Cap Equity FundClass C JPY 5,000 – – 5,000
Class C^ USD – 5,000 – 5,000Class H (Hedged) EUR 5,000 – – 5,000Class H (Hedged) USD 47,388 146,842 – 194,230
Class I (Hedged) EUR 2,573,945 – – 2,573,945Class I (Hedged) USD 3,489,240 24,657,542 (15,452,095) 12,694,687
Class W JPY 5,000 – – 5,000Sterling W (Acc) GBP 5,000 13,487 (12,308) 6,179
Class X (Inc)^ JPY – 16,000,000 (929,811) 15,070,189
BNY Mellon Japan Small Cap Equity Focus FundClass C JPY 5,000 3,600,000 (1,212,000) 2,393,000
Class C^ USD – 5,000 – 5,000Class H (Hedged) EUR 78,669 4,995,490 (4,987,259) 86,900Class H (Hedged) USD 343,638 11,251,621 (9,270,420) 2,324,839

251
BNY MELLON GLOBAL FUNDS, PLC
NOTES TO THE FINANCIAL STATEMENTS
2. SHARE CAPITAL cont’d.
REDEEMABLE PARTICIPATING SHARES cont’d.
Fund Share Class Currency
Shares in issue
at beginning of year
Shares issued during
the year
Shares redeemed
during the year
Shares in issue
at end of year
BNY Mellon Japan Small Cap Equity Focus Fund cont’d.Class I (Hedged) EUR 5,573,945 40,783 (3,000,000) 2,614,728Class I (Hedged) USD 3,489,240 22,918,397 (12,089,259) 14,318,378
Class W JPY 5,000 4,662,700 – 4,667,700Sterling W (Acc) GBP 6,064 148,282 (126,420) 27,926
BNY Mellon Long-Term Global Equity FundClass A EUR 42,950,012 46,371,321 (12,641,877) 76,679,456Class A USD 134,794,459 16,776,693 (63,871,033) 87,700,119
Class A (Inc) EUR 30,695 4,156,253 (6,969) 4,179,979Sterling A (Acc) GBP 2,824,906 64,875 (1,307,312) 1,582,469
Class B EUR 1,021,335 5,714 (561) 1,026,488Class B USD 13,715,626 – (10,425,252) 3,290,374
Sterling B (Inc) GBP 18,141 46,475 – 64,616Class C EUR 93,366,357 57,230,063 (43,592,907) 107,003,513Class C USD 102,115,087 18,332,993 (33,984,808) 86,463,272
Class C (Inc) EUR 734,190 – (665,690) 68,500Class M^ USD 22,641 670 (23,311) –
Class S EUR 51,278,479 11,574,157 (13,345,350) 49,507,286Class W EUR 6,003,608 2,002,240 (5,967,117) 2,038,731Class W USD 53,724,410 30,339,120 (38,425,370) 45,638,160
Class W (Hedged) CHF 4,735,848 148,695 (4,682,343) 202,200Class W (Hedged) USD 31,893,494 6,039,203 (37,615,582) 317,115
Class W (Inc) USD 21,215,706 169,205 (1,088,712) 20,296,199Sterling W (Acc) GBP 1,360,732 11,660,524 (420,045) 12,601,211Sterling W (Inc) GBP 982,547 78,887 (89,990) 971,444
Class X EUR 88,817,311 22,825,866 (10,738,262) 100,904,915Class X^ USD 168,371,000 – (168,371,000) –
Sterling X GBP 307,494,143 172,221 (6,143,470) 301,522,894
BNY Mellon Pan European Equity FundClass A EUR 1,376,387 549,904 (841,167) 1,085,124Class A USD 492,346 230,568 (214,936) 507,978Class B EUR 117,385 – – 117,385Class C EUR 4,517 2,385,060 (2,385,060) 4,517Class C USD 8,553,771 13,885,238 (1,890,541) 20,548,468
BNY Mellon S&P 500® Index TrackerClass A USD 24,589,860 3,367,645 (6,638,821) 21,318,684Class A EUR 2,054,672 896,746 (1,158,786) 1,792,632Class C USD 18,697,191 6,334,808 (12,061,812) 12,970,187Class C EUR 4,161,147 135,000 (150,396) 4,145,751
BNY Mellon Small Cap Euroland FundClass A EUR 2,532,893 2,954,409 (1,757,408) 3,729,894Class A USD 5,000 51,975 (51,975) 5,000Class B EUR 5,000 43,529 – 48,529Class C EUR 308,465 3,054,857 (583,825) 2,779,497
Class C^ USD – 34,507,150 (34,502,150) 5,000Class I (Acc) (Hedged)^ USD – 37,235,873 (1,827,783) 35,408,090

252
BNY MELLON GLOBAL FUNDS, PLC
NOTES TO THE FINANCIAL STATEMENTS
2. SHARE CAPITAL cont’d.
REDEEMABLE PARTICIPATING SHARES cont’d.
Fund Share Class Currency
Shares in issue
at beginning of year
Shares issued during
the year
Shares redeemed
during the year
Shares in issue
at end of year
BNY Mellon Targeted Return Bond Fund*Class A (Acc)^ USD – 5,000 – 5,000
Sterling W (Acc) (Hedged)^ GBP – 64,822,766 – 64,822,766
BNY Mellon U.S. Dynamic Value FundClass A USD 1,319,030 603,168 (669,799) 1,252,399Class A EUR 669,436 2,129,744 (2,137,492) 661,688Class B USD 36,806 115,955 – 152,761Class B EUR 5,000 – – 5,000Class C USD 188,069 14,870,497 (312,515) 14,746,051Class C EUR 45,543 – – 45,543
Class X (Inc)^ USD 39,604,483 1,021,634 (40,626,117) –
BNY Mellon US Opportunities FundClass A^ USD – 5,000 – 5,000
Class A EUR 648,797 262,871 (120,103) 791,565Class A (Inc) EUR 5,000 3,578 – 8,578
Class C USD 10,057,971 49,699,453 (12,135,876) 47,621,548Class C EUR 5,000 – – 5,000
Class W EUR 5,000 – – 5,000
* This Fund launched during the year.** This Fund closed during the year.^ This share class was launched or closed during the year.
3. MANAGEMENT AND PERFORMANCE FEES
MANAGEMENT FEESThe Manager is entitled to receive out of the assets of a Fund an annual management fee in respect of each class, accruing daily and payable monthly in arrears at an agreed annual rate as set out in the relevant supplement of the prospectus. The table below outlines the range of annual management fee rates for each share class:
Share Class Rate Share Class Rate
Class A 1.00% – 2.00% Class R 1.00% – 2.75%Class B 0.75% – 1.50% Class S 0.20% – 2.00%Class C 0.30% – 1.00% Class T 0.50% – 2.00%Class E 0.40% – 1.50% Class U* 0.85% – 1.75%Class H 1.00% – 2.50% Class W 0.40% – 0.75%Class I 0.50% – 1.00% Class X NoneClass J 0.75% – 1.50% Class Y NoneClass M 1.00% – 2.00% Class Z 0.40% – 0.65%
* Please refer to Note 19 of the financial statements.
Management fees accrued to the Manager and the amounts due at the year end are included in the “Management Fee” and “Expenses Payable” figures in the Statement of Comprehensive Income and the Statement of Financial Position, respectively.

253
BNY MELLON GLOBAL FUNDS, PLC
NOTES TO THE FINANCIAL STATEMENTS
3. MANAGEMENT AND PERFORMANCE FEES cont’d.
PERFORMANCE FEESIn addition to the annual management fee, the Manager is entitled to an annual performance fee (the “Performance Fee”) in respect of certain classes of the following Funds, as detailed in the relevant supplement of the prospectus. The table below outlines the performance fee rates and benchmarks of the respective share class:
Fund Benchmark Rate BNY Mellon Absolute Insight Fund^ 1 month EURIBOR / USD LIBOR / GBP LIBOR /
CHF LIBOR / SGD SIBORClass E, H, I, R, S, T, U, and W – 10.00%*
BNY Mellon Absolute Return Bond Fund^ 3 month EURIBOR / USD LIBOR / GBP LIBOR / CHF LIBOR Class R, S and T – 10.00%
BNY Mellon Absolute Return Equity Fund^ 1 month EURIBOR / USD LIBOR / GBP LIBOR / CHF LIBOR Class R, S, T and U – 15.00%
BNY Mellon Emerging Markets Equity Core Fund (closed 2 November 2015)
Morgan Stanley Capital International Emerging Markets (MSCI EM) Index
Class S – 20.00%
BNY Mellon Long-Term Global Equity Fund^ MSCI World Daily (with net dividends reinvested) in Euro/USD terms Class S and T – 15.00%
^ The KIIDs for BNY Mellon Absolute Insight Fund, BNY Mellon Absolute Return Bond Fund, BNY Mellon Absolute Return Equity Fund and BNY Mellon Long-Term Global Equity Fund were updated on 21 April 2016 to show the actual performance fee charged for the last financial year as a percentage figure.
* Please refer to Note 19 of the financial statements.
Performance fees accrued to the Manager and the amounts due at the year end are included in the “Performance Fee” and “Performance Fees Payable” figures in the Statement of Comprehensive Income and the Statement of Financial Position, respectively.
4. ADMINISTRATION FEES
The Manager pays to BNY Mellon Fund Services (Ireland) Designated Activity Company (the “Administrator”) out of the assets of each Fund an annual fee which shall accrue daily and be payable monthly in arrears as detailed in the prospectus. The annual fee accrued to the Administrator is attributable to all share classes and represents a deduction from the net asset value of the Fund and, accordingly, each class. Fees accrued to the Administrator and the amounts due at the year end are included in the “Operating Expenses” and “Expenses Payable” figures in the Statement of Comprehensive Income and the Statement of Financial Position, respectively.
5. DEPOSITARY FEES
The Company pays to the Depositary out of the assets of each Fund an annual fee which shall accrue daily and be payable monthly in arrears as detailed in the prospectus. The annual fee accrued to the Depositary is attributable to all share classes and represents a deduction from the net asset value of the Fund and, accordingly, each class. Fees accrued to the Depositary and the amounts due at the year end are included in the “Depositary Fee” and “Expenses Payable” figures in the Statement of Comprehensive Income and the Statement of Financial Position, respectively.

254
BNY MELLON GLOBAL FUNDS, PLC
NOTES TO THE FINANCIAL STATEMENTS
6. REBATE FROM MANAGER
In order to maintain the Total Expense Ratios (“TER”) of particular funds at a competitive level with regard to the comparable funds in the market place, BNY Mellon Investment Management EMEA Limited (the “Global Distributor and Promoter”) undertook to pay, via the Manager, a sum equivalent to the percentage amount, if any, the TER of the following Funds exceeds an agreed TER limit, effectively structured as an Annual Management Charge (“AMC”) plus a cap arrangement:
Fund Agreed TER Limit
BNY Mellon Absolute Insight Fund TER limit of AMC plus 35 basis points1
BNY Mellon Asian Bond Fund TER limit of AMC plus 16 basis points2
BNY Mellon Asian Income Fund (capped from 1 December 2016) TER limit of AMC plus 9 basis pointsBNY Mellon Crossover Credit Fund (closed on 20 September 2016)9 TER limit of AMC plus 17 basis points3
BNY Mellon Dynamic Total Return Fund (capped from launch date of 15 May 2015) TER limit of AMC plus 22 basis points4
BNY Mellon Emerging Markets Debt Opportunistic Fund10 TER limit of AMC plus 30 basis points5
BNY Mellon Emerging Markets Equity Fund (capped from 12 November 2015 until closure date of 9 December 2015) TER limit of AMC plus 43 basis pointsBNY Mellon European Credit Fund10 TER limit of AMC plus 15 basis points6
BNY Mellon Global Credit Fund (capped from launch date of 29 February 2016)7
BNY Mellon Global Emerging Markets Equity Value Fund (capped from 4 January 2016 until closure date of 26 February 2016) TER limit of AMC plus 15 basis pointsBNY Mellon Global Emerging Markets Fund (capped from 4 January 2016) TER limit of AMC plus 30 basis pointsBNY Mellon Global Opportunistic Bond Fund TER limit of AMC plus 20 basis points8
BNY Mellon Global Property Securities Fund TER limit of AMC plus 55 basis pointsBNY Mellon Japan All Cap Equity Fund TER limit of AMC plus 17 basis pointsBNY Mellon Japan Small Cap Equity Focus Fund TER limit of AMC plus 17 basis pointsBNY Mellon Pan European Equity Fund (capped from 14 November 2016) TER limit of AMC plus 20 basis pointsBNY Mellon US Opportunities Fund TER limit of AMC plus 16 basis points
1 Rebate arrangement ceased effective 1 June 2015 and was subsequently reapplied effective 2 February 2017. 2 With exception for USD X (Acc) share class subject to TER limit of 11 basis points. 3 With exception for EUR X share class subject to TER limit of 12 basis points. 4 With exception for USD X (Acc) share class subject to TER limit of 17 basis points. 5 With exception for USD X and USD X (Inc) share classes subject to TER limit of 25 basis points. 6 With exception for EUR X and EUR X (Inc) share classes subject to TER limit of 10 basis points. 7 CAD X (Acc) (Hedged) share class subject to TER limit of 10 basis points and USD X (Acc) share class subject to TER limit of 7 basis points. 8 With exception for USD X and USD X (Inc) share classes subject to TER limit of 15 basis points. 9 Rebate arrangement ceased effective 20 September 2016. 10 Rebate arrangement ceased 1 November 2016.
The amount rebated to the Company during the year ended 31 December 2016 in this regard was USD 585,522 (31 December 2015: USD 115,506).
7. OPERATING EXPENSES
The operating expenses in the Statement of Comprehensive Income comprise of the following:
31 December 2016 31 December 2015Expense USD USD
Administration fee 13,006,661 11,807,980Audit fee 347,261 348,192Directors’ fee 102,339 102,613Other expenses 2,961,803 2,793,839
Total operating expenses 16,418,064 15,052,624

255
BNY MELLON GLOBAL FUNDS, PLC
NOTES TO THE FINANCIAL STATEMENTS
7. OPERATING EXPENSES cont’d.
Fees and expenses paid/payable to the statutory auditors, Ernst & Young, in respect of the financial year are as follows:
31 December 2016 31 December 2015USD USD
Statutory audit of financial statements 347,261 348,192Taxation services – –
Total 347,261 348,192
8. TRANSACTION COSTS
Transaction costs are costs incurred to acquire financial assets or liabilities at fair value through profit or loss and include the bid-ask spread, fees and commissions paid to agents, advisers, brokers and dealers.
Transaction costs incurred for the purchases and sales of equities and financial derivative instruments are included in the “net gains/(losses) on financial assets/liabilities at fair value through profit or loss” in the Statement of Comprehensive Income and are detailed in the table below. In respect of all other securities, the bid ask spread is embedded in the purchase and sale price of the securities and cannot be separately verified or disclosed.
Fund Base Currency 31 December 2016 31 December 2015
BNY Mellon Absolute Insight Fund^ EUR 6,200 32,429BNY Mellon Absolute Return Bond Fund^ EUR 869,375 56,651BNY Mellon Absolute Return Equity Fund GBP 713,550 680,665BNY Mellon Asian Bond Fund^ USD 1,625 198BNY Mellon Asian Equity Fund USD 123,139 247,703BNY Mellon Brazil Equity Fund USD 216,926 179,882BNY Mellon Crossover Credit Fund*^ EUR – 1,181BNY Mellon Dynamic Total Return Fund USD 12,658 593BNY Mellon Emerging Markets Corporate Debt Fund^ USD 211 13BNY Mellon Emerging Markets Debt Fund^ USD – 206BNY Mellon Emerging Markets Equity Fund** USD N/A 149,045BNY Mellon Emerging Markets Equity Core Fund** USD N/A 802,300BNY Mellon Euroland Bond Fund^ EUR 592,393 523BNY Mellon European Credit Fund^ EUR 8,110 3,342BNY Mellon Global Bond Fund^ USD 3,784 244BNY Mellon Global Dynamic Bond Fund^ USD 16,497 10,713BNY Mellon Global Emerging Markets Equity Value Fund* USD 1,953 263,954BNY Mellon Global Emerging Markets Fund USD 204,154 60,678BNY Mellon Global Equity Fund USD 176,088 110,519BNY Mellon Global Equity Income Fund USD 951,199 419,931BNY Mellon Global High Yield Bond Fund^ USD 26,320 –BNY Mellon Global Leaders Fund* USD 23,042 N/ABNY Mellon Global Opportunistic Bond Fund^ USD 87,191 17,364BNY Mellon Global Opportunities Fund USD 151,870 140,765BNY Mellon Global Property Securities Fund EUR 33,222 26,922BNY Mellon Global Real Return Fund (EUR)^ EUR 3,043,514 1,207,727BNY Mellon Global Real Return Fund (GBP)^ GBP 41,659 35,156BNY Mellon Global Real Return Fund (USD)^ USD 486,052 234,028BNY Mellon Global Short-Dated High Yield Bond Fund*^ USD 488 N/ABNY Mellon Japan All Cap Equity Fund JPY 1,587,937 2,089,908BNY Mellon Japan REIT Alpha Fund* JPY 89,180 N/A

256
BNY MELLON GLOBAL FUNDS, PLC
NOTES TO THE FINANCIAL STATEMENTS
8. TRANSACTION COSTS cont’d.
Fund Base Currency 31 December 2016 31 December 2015
BNY Mellon Japan Small Cap Equity Focus Fund JPY 2,731,046 4,264,330BNY Mellon Long-Term Global Equity Fund EUR 440,039 599,938BNY Mellon Pan European Equity Fund EUR 83,020 151,257BNY Mellon S&P 500® Index Tracker USD 2,123 1,431BNY Mellon Small Cap Euroland Fund EUR 94,599 122,775BNY Mellon Targeted Return Bond Fund^ USD 11,081 –BNY Mellon U.S. Dynamic Value Fund USD 66,204 103,186BNY Mellon US Opportunities Fund USD 123,142 47,224
* Please refer to Note 19 of the financial statements.** This Fund closed during the prior year. ^ Transaction costs on purchase and sales of bonds are included in the purchase and sale price of the investment, which cannot be practically
or reliably gathered and cannot be separately verified or disclosed.
9. CASH AT BANK
Cash held by the Company is deposited with The Bank of New York Mellon SA/NV London Branch (the “Global Sub-Custodian”) and held by counterparties (Bank of America Merrill Lynch, Barclays Bank plc, BNP Paribas, Citigroup, Credit Suisse, Goldman Sachs, JPMorgan Chase and UBS) in respect of collateral and margin requirements. Cash balances include cash invested into short-term investment vehicles daily as detailed further in Note 16 of the financial statements.
The Central Bank published the Central Bank (Supervision and Enforcement) Act 2013 (Section 48(1)) Client Asset Regulations 2015 (“Client Asset Regulations”) in March 2015, which came into effect on 1 July 2016. In response to the Client Asset Regulations, the Manager undertook, together with the Administrator, a review of the way in which subscription, distribution and redemption monies are channelled to and from the Company. As a result of this review, subscription and redemption monies are channelled through an umbrella cash collection account in the name of the Company effective from 1 July 2016. Pending issue of the shares and/or payment of subscription proceeds to an account in the name of the Company, and pending payment of redemption proceeds or distributions, the relevant investor will be an unsecured creditor of the relevant Fund in respect of amounts paid by or due to it. As at 31 December 2016, monies held in this cash collection account are deposited with the Global Sub-Custodian and are deemed to be immaterial in respect of the relevant Fund to which they are due.
10. TAXATION
Under current law and practice, the Company qualifies as an investment undertaking as defined in Section 739B of the Tax Consolidation Acts, 1997, as amended. On that basis, it is not chargeable to Irish tax on its income and gains.
However, Irish tax may arise on the happening of a “chargeable event”. A chargeable event includes any distribution payments to shareholders or any encashment, redemption, cancellation or transfer of shares and the holding of shares at the end of each eight year period beginning with the acquisition of the shares.
No Irish tax will arise on the Company in respect of chargeable events in respect of:
(a) a shareholder who is neither Irish resident nor ordinarily resident in Ireland for tax purposes at the time of the chargeable event, provided appropriate valid declarations in accordance with the provisions of the Taxes Consolidation Act, 1997, as amended, are held by the Company; or the Company has been authorised by the Irish Revenue to make gross payments in the absence of appropriate declarations; and
(b) certain exempted Irish resident investors who have provided the Company with the necessary signed statutory declarations.

257
BNY MELLON GLOBAL FUNDS, PLC
NOTES TO THE FINANCIAL STATEMENTS
10. TAXATION cont’d.
Distributions, interest and capital gains (if any) received on investments made by the Company may be subject to withholding taxes imposed by the country from which the investment income/gains are received and such taxes may not be recoverable by the Company or its shareholders.
Effective 1 October 2016, BNY Mellon Brazil Equity Fund has elected to accrue for Brazilian capital gains tax on net realised and unrealised gains on investments. As at 31 December 2016, a capital gains tax payable of USD 1,924,173 has been recorded in the Statement of Financial Position for this Fund.
11. RELATED PARTIES
In the opinion of the Directors, the Manager and the Investment Managers, Mellon Capital Management Corporation, The Boston Company Asset Management, LLC, Newton Investment Management Limited, Standish Mellon Asset Management Company, LLC, Walter Scott & Partners Limited, ARX Investimentos Ltda, Blackfriars Asset Management Limited, CenterSquare Investment Management, Inc., Oddo Meriten Investment Management Gmbh, Insight Investment Management (Global) Limited, Alcentra NY, LLC, BNY Mellon Asset Management Japan Limited and EACM Advisors LLC and the Global Distributor and Promoter are related parties under Section 33 “Related Party Transactions” of FRS 102.
As the Global Distributor and Promoter for BNY Mellon’s investment management group, distributor fees of USD 83,320,625 (31 December 2015: USD 81,016,288) were paid by the Manager to the Distributor during the year. Fees paid in respect of all material related party transactions during the year are fully disclosed in the Statement of Comprehensive Income and in Notes 3 and 5 – 7 of the financial statements.
The Directors are related parties of the Company. All Directors are Directors of the Manager.
David Dillon acts as a consultant to Dillon Eustace, which provide legal services to the Company.
Greg Brisk and David Turnbull have waived their right to receive a fee for their services as Directors. With effect from 1 April 2015, Jonathan Lubran no longer waived his right to receive a fee for his services as a Director. Directors’ fees incurred during the year are disclosed in Note 7 of the financial statements.
Greg Brisk was appointed as a Director of the following Investment Managers for the Funds:
• Alcentra NY, LLC effective on 16 October 2015; • Newton Investment Management Limited effective on 8 May 2016;• Insight Investment Management (Global) Limited effective on 8 May 2016;• Standish Mellon Asset Management Company, LLC effective on 8 June 2016;• CenterSquare Investment Management, Inc. effective on 13 July 2016;• EACM Advisors LLC effective on 13 July 2016;• Mellon Capital Management Corporation effective on 13 July 2016; and• The Boston Company Asset Management, LLC effective on 13 July 2016.
Greg Brisk is also a Director of BNY Mellon Investment Management Seed Capital Limited, a related entity of the Company, and a trustee of Mellon Retirement Benefits Plan, a pension scheme for BNY Mellon staff. These entities held a material beneficial interest in the share classes of the Funds listed below as at 31 December 2016 and 31 December 2015:
Investor Name FundBase
Currency31 December
201631 December
2015
BNY Mellon Investment Management Seed Capital Limited BNY Mellon Asian Bond Fund USD 532,374 524,638BNY Mellon Asian Income Fund GBP 122,397 –BNY Mellon Dynamic Total Return Fund USD 9,529,480 9,443,248BNY Mellon Global Emerging Markets Fund USD 4,255,174 4,194,433

258
BNY MELLON GLOBAL FUNDS, PLC
NOTES TO THE FINANCIAL STATEMENTS
11. RELATED PARTIES cont’d.
Investor Name FundBase
Currency31 December
201631 December
2015
BNY Mellon Investment Management Seed Capital Limited cont’d.
BNY Mellon Global Leaders Fund* USD 25,318,426 N/ABNY Mellon Global Opportunistic Bond Fund USD 4,964 4,881BNY Mellon Global Property Securities Fund EUR 2,261 2,254,475BNY Mellon Japan All Cap Equity Fund JPY 424,719,618 458,554,112BNY Mellon Japan Small Cap Equity Focus Fund JPY 542,033,170 546,834,920BNY Mellon Pan European Equity Fund EUR 6,779 7,329BNY Mellon US Opportunities Fund USD 27,542 26,304
Mellon Retirement Benefits Plan BNY Mellon Emerging Markets Debt Local Currency Fund USD 18,144,197 16,798,586BNY Mellon Global Opportunistic Bond Fund USD 17,869,144 24,118,000
* Please refer to Note 19 of the financial statements.
During the year, companies related to the Depositary and the Investment Managers were selected by the Investment Managers to execute investment transactions and foreign exchange transactions and to accept deposits on behalf of the Investment Managers. The Bank of New York Mellon, New York and The Bank of New York Mellon, London were counterparties to forward foreign exchange currency contracts open at the year end as disclosed in appendices to the Portfolio of Investments. The counterparties were selected by the Investment Managers as part of an arm’s length commercial process and the terms of such transactions were negotiated by the Investment Managers with such companies.
The following Funds invest in collective investment schemes managed by their own Investment Managers and in other Funds of the Company.
Fund Collective Investment Scheme Currency31 December
201631 December
2015
BNY Mellon Absolute Insight Fund Insight Liquidity Funds Plc - EUR Cash Fund EUR 5,217,215 14,499,289Insight Liquidity Funds Plc - GBP Liquidity Plus Fund EUR – 2,947,347
BNY Mellon Absolute Return Bond Fund Insight Global Funds II plc - Insight Emerging Markets Debt Fund EUR 173,142,727 182,294,501Insight Liquidity Funds Plc - EUR Cash Fund EUR 5,373,802 16,127,105
BNY Mellon Absolute Return Equity Fund Insight Liquidity Funds Plc - GBP Liquidity Fund GBP 164,671,643 173,867,074BNY Mellon Asian Income Fund BNY Mellon Investments Funds - Newton Asian Income Fund GBP 17,847,250 20,866,698BNY Mellon Emerging Markets Corporate Debt Fund Insight Liquidity Funds Plc - USD Liquidity Fund USD 13,406,035 9,065,938BNY Mellon Euroland Bond Fund BNY Mellon Global Funds Plc - Global Opportunistic Bond Fund EUR 27,798,880 26,294,449
BNY Mellon Global Funds Plc - Asian Bond Fund EUR 5,607,451 9,028,928BNY Mellon European Credit Fund BNY Mellon Global Funds Plc - Short-Dated High Yield Bond Fund EUR 2,852,842 –
Insight Global Funds II plc - Insight Emerging Markets Debt Fund EUR 1,451,026 1,718,154Insight Global Funds II plc - Short High Yield Bond Fund EUR – 1,296,474
BNY Mellon Global Credit Fund* Insight Global Funds II plc - Emerging Market Bond Opportunities Fund USD 8,792,751 N/AInsight Liquidity Funds Plc - USD Liquidity Fund USD 20,320,898 N/A
BNY Mellon Global Short-Dated High Yield Bond Fund* Insight Liquidity Funds Plc - USD Liquidity Fund USD 1,945,000 N/A
* Please refer to Note 19 of the financial statements.
As detailed in the prospectus, BNY Mellon Asian Income Fund (the “Feeder Fund”) is established as a feeder fund which invests in Newton Asian Income Fund (the “Master Fund”) on a permanent basis as detailed in the table above. The Master Fund is a sub-fund of BNY Mellon Investment Funds and is managed by Newton Investment Management Limited. The Feeder Fund invests in the X share class of the Master Fund which does not charge an annual management fee. The annual and semi-annual financial statements of the Master Fund are published on the website of BNY Mellon Investment Management EMEA Limited (www.bnymellonim.com).
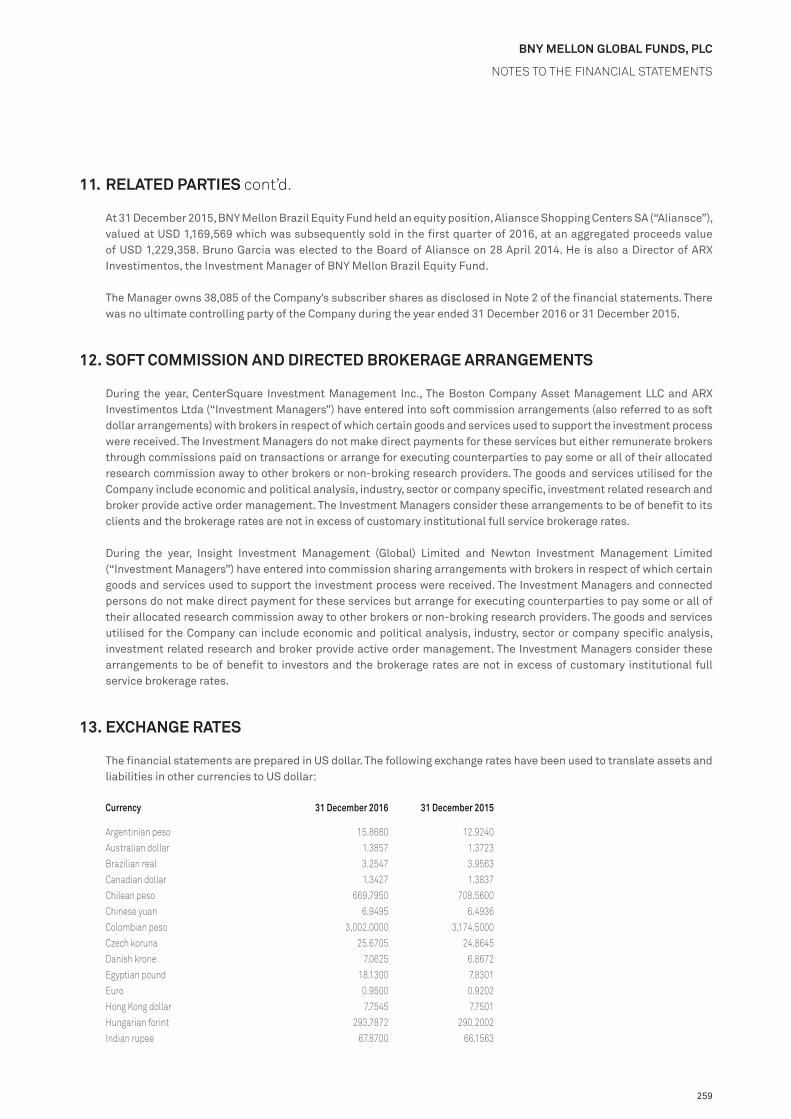
259
BNY MELLON GLOBAL FUNDS, PLC
NOTES TO THE FINANCIAL STATEMENTS
11. RELATED PARTIES cont’d.
At 31 December 2015, BNY Mellon Brazil Equity Fund held an equity position, Aliansce Shopping Centers SA (“Aliansce”), valued at USD 1,169,569 which was subsequently sold in the first quarter of 2016, at an aggregated proceeds value of USD 1,229,358. Bruno Garcia was elected to the Board of Aliansce on 28 April 2014. He is also a Director of ARX Investimentos, the Investment Manager of BNY Mellon Brazil Equity Fund.
The Manager owns 38,085 of the Company’s subscriber shares as disclosed in Note 2 of the financial statements. There was no ultimate controlling party of the Company during the year ended 31 December 2016 or 31 December 2015.
12. SOFT COMMISSION AND DIRECTED BROKERAGE ARRANGEMENTS
During the year, CenterSquare Investment Management Inc., The Boston Company Asset Management LLC and ARX Investimentos Ltda (“Investment Managers”) have entered into soft commission arrangements (also referred to as soft dollar arrangements) with brokers in respect of which certain goods and services used to support the investment process were received. The Investment Managers do not make direct payments for these services but either remunerate brokers through commissions paid on transactions or arrange for executing counterparties to pay some or all of their allocated research commission away to other brokers or non-broking research providers. The goods and services utilised for the Company include economic and political analysis, industry, sector or company specific, investment related research and broker provide active order management. The Investment Managers consider these arrangements to be of benefit to its clients and the brokerage rates are not in excess of customary institutional full service brokerage rates.
During the year, Insight Investment Management (Global) Limited and Newton Investment Management Limited (“Investment Managers”) have entered into commission sharing arrangements with brokers in respect of which certain goods and services used to support the investment process were received. The Investment Managers and connected persons do not make direct payment for these services but arrange for executing counterparties to pay some or all of their allocated research commission away to other brokers or non-broking research providers. The goods and services utilised for the Company can include economic and political analysis, industry, sector or company specific analysis, investment related research and broker provide active order management. The Investment Managers consider these arrangements to be of benefit to investors and the brokerage rates are not in excess of customary institutional full service brokerage rates.
13. EXCHANGE RATES
The financial statements are prepared in US dollar. The following exchange rates have been used to translate assets and liabilities in other currencies to US dollar:
Currency 31 December 2016 31 December 2015
Argentinian peso 15.8680 12.9240Australian dollar 1.3857 1.3723Brazilian real 3.2547 3.9563Canadian dollar 1.3427 1.3837Chilean peso 669.7950 708.5600Chinese yuan 6.9495 6.4936Colombian peso 3,002.0000 3,174.5000Czech koruna 25.6705 24.8645Danish krone 7.0625 6.8672Egyptian pound 18.1300 7.8301Euro 0.9500 0.9202Hong Kong dollar 7.7545 7.7501Hungarian forint 293.7872 290.2002Indian rupee 67.8700 66.1563
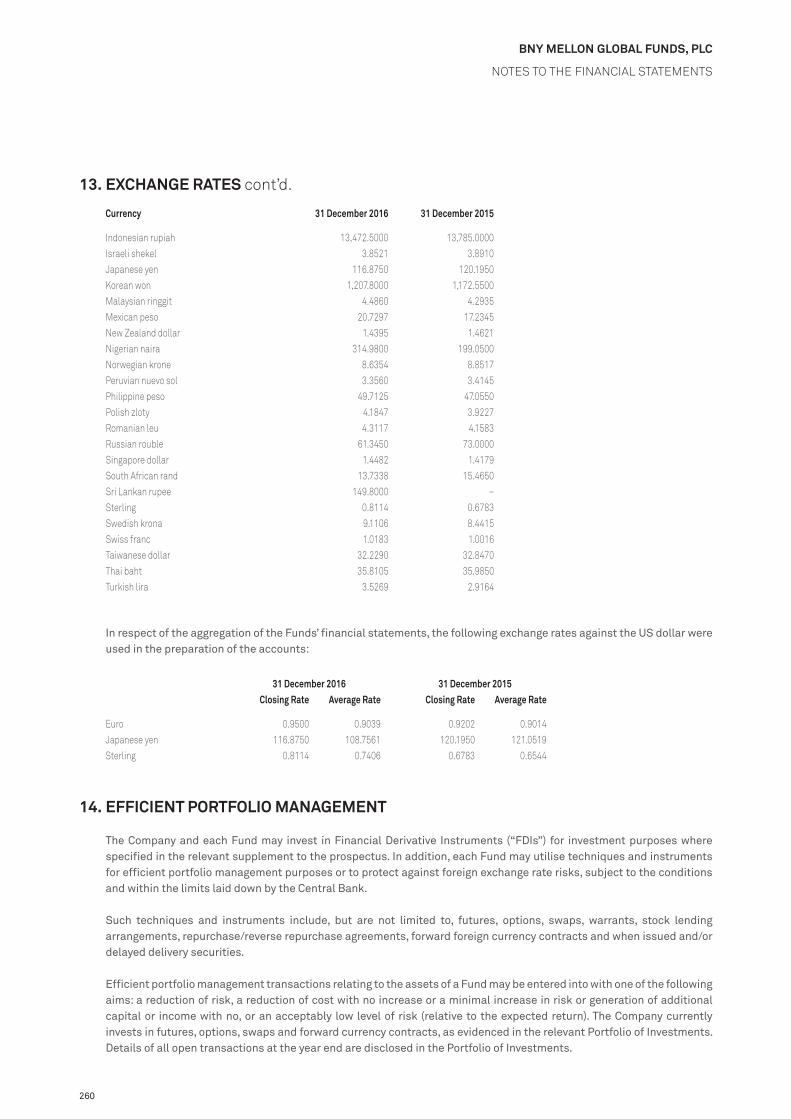
260
BNY MELLON GLOBAL FUNDS, PLC
NOTES TO THE FINANCIAL STATEMENTS
13. EXCHANGE RATES cont’d.
Currency 31 December 2016 31 December 2015
Indonesian rupiah 13,472.5000 13,785.0000Israeli shekel 3.8521 3.8910Japanese yen 116.8750 120.1950Korean won 1,207.8000 1,172.5500Malaysian ringgit 4.4860 4.2935Mexican peso 20.7297 17.2345New Zealand dollar 1.4395 1.4621Nigerian naira 314.9800 199.0500Norwegian krone 8.6354 8.8517Peruvian nuevo sol 3.3560 3.4145Philippine peso 49.7125 47.0550Polish zloty 4.1847 3.9227Romanian leu 4.3117 4.1583Russian rouble 61.3450 73.0000Singapore dollar 1.4482 1.4179South African rand 13.7338 15.4650Sri Lankan rupee 149.8000 –Sterling 0.8114 0.6783Swedish krona 9.1106 8.4415Swiss franc 1.0183 1.0016Taiwanese dollar 32.2290 32.8470Thai baht 35.8105 35.9850Turkish lira 3.5269 2.9164
In respect of the aggregation of the Funds’ financial statements, the following exchange rates against the US dollar were used in the preparation of the accounts:
31 December 2016 31 December 2015Closing Rate Average Rate Closing Rate Average Rate
Euro 0.9500 0.9039 0.9202 0.9014Japanese yen 116.8750 108.7561 120.1950 121.0519Sterling 0.8114 0.7406 0.6783 0.6544
14. EFFICIENT PORTFOLIO MANAGEMENT
The Company and each Fund may invest in Financial Derivative Instruments (“FDIs”) for investment purposes where specified in the relevant supplement to the prospectus. In addition, each Fund may utilise techniques and instruments for efficient portfolio management purposes or to protect against foreign exchange rate risks, subject to the conditions and within the limits laid down by the Central Bank.
Such techniques and instruments include, but are not limited to, futures, options, swaps, warrants, stock lending arrangements, repurchase/reverse repurchase agreements, forward foreign currency contracts and when issued and/or delayed delivery securities.
Efficient portfolio management transactions relating to the assets of a Fund may be entered into with one of the following aims: a reduction of risk, a reduction of cost with no increase or a minimal increase in risk or generation of additional capital or income with no, or an acceptably low level of risk (relative to the expected return). The Company currently invests in futures, options, swaps and forward currency contracts, as evidenced in the relevant Portfolio of Investments. Details of all open transactions at the year end are disclosed in the Portfolio of Investments.

261
BNY MELLON GLOBAL FUNDS, PLC
NOTES TO THE FINANCIAL STATEMENTS
14. EFFICIENT PORTFOLIO MANAGEMENT cont’d.
The Company has entered into a securities lending agreement (as amended, assigned, novated and assumed) with The Bank of New York Mellon SA/NV (until 26 November 2015), The Bank of New York Mellon, London Branch (effective 27 November 2015) and the Depositary. The securities lending income is currently split between the Company and The Bank of New York Mellon SA/NV or The Bank of New York Mellon, London Branch in the proportion 80%:20%.
Securities lending transactions and the related collateral are settled and cleared in accordance with the tri-party and bilateral agreements.
The Company earned revenue from securities lending during the year ended 31 December 2016, as detailed in the table below:
FundBase
CurrencyGross
Earnings
Direct Costs (Paid to The Bank
of New York Mellon SA/NA)
(20%)
Net Earnings to Company
(80%)^
BNY Mellon Absolute Return Bond Fund EUR 279,699 (55,940) 223,759BNY Mellon Absolute Return Equity Fund GBP 47,555 (9,511) 38,044BNY Mellon Asian Equity Fund USD 558 (112) 446BNY Mellon Crossover Credit Fund* EUR 63,409 (12,682) 50,727BNY Mellon Emerging Markets Corporate Debt Fund USD 156,819 (31,364) 125,455BNY Mellon Emerging Markets Debt Fund USD 45,911 (9,182) 36,729BNY Mellon Emerging Markets Debt Local Currency Fund USD 63,956 (12,791) 51,165BNY Mellon Emerging Markets Debt Opportunistic Fund USD 32,623 (6,525) 26,098BNY Mellon Euroland Bond Fund EUR 206,871 (41,374) 165,497BNY Mellon European Credit Fund EUR 7,649 (1,530) 6,119BNY Mellon Global Bond Fund USD 114,075 (22,815) 91,260BNY Mellon Global Dynamic Bond Fund USD 56,909 (11,382) 45,527BNY Mellon Global Emerging Markets Equity Value Fund* USD 1,259 (252) 1,007BNY Mellon Global Emerging Markets Fund USD 2,436 (487) 1,949BNY Mellon Global Equity Fund USD 30,481 (6,096) 24,385BNY Mellon Global Equity Income Fund USD 74,759 (14,952) 59,807BNY Mellon Global High Yield Bond Fund USD 101,041 (20,208) 80,833BNY Mellon Global Opportunistic Bond Fund USD 64,511 (12,902) 51,609BNY Mellon Global Opportunities Fund USD 18,104 (3,621) 14,483BNY Mellon Global Property Securities Fund EUR 2,276 (455) 1,821BNY Mellon Global Real Return Fund (EUR) EUR 1,426,790 (285,358) 1,141,432BNY Mellon Global Real Return Fund (GBP) GBP 1,430 (286) 1,144BNY Mellon Global Real Return Fund (USD) USD 213,029 (42,606) 170,423BNY Mellon Japan All Cap Equity Fund JPY 3,632,736 (726,547) 2,906,189BNY Mellon Japan Small Cap Equity Focus Fund JPY 11,077,573 (2,215,515) 8,862,058BNY Mellon Long-Term Global Equity Fund EUR 433,509 (86,702) 346,807BNY Mellon Pan European Equity Fund EUR 5,271 (1,054) 4,217BNY Mellon S&P 500® Index Tracker USD 13,503 (2,701) 10,802BNY Mellon Small Cap Euroland Fund EUR 59,660 (11,932) 47,728BNY Mellon Targeted Return Bond Fund USD 18,683 (3,737) 14,946BNY Mellon U.S. Dynamic Value Fund USD 5,040 (1,008) 4,032BNY Mellon US Opportunities Fund USD 9,163 (1,833) 7,330
^ Disclose as “Securities lending income” in the Statement of Comprehensive Income.* Please refer to Note 19 of the financial statements.

262
BNY MELLON GLOBAL FUNDS, PLC
NOTES TO THE FINANCIAL STATEMENTS
14. EFFICIENT PORTFOLIO MANAGEMENT cont’d.
The Company earned revenue from securities lending during the year ended 31 December 2015, as detailed in the table below:
FundBase
CurrencyGross
Earnings
Direct Costs (Paid to The Bank
of New York Mellon SA/NV)
(20%)
Net Earnings to Company
(80%)^
BNY Mellon Absolute Return Bond Fund EUR 88,524 (17,705) 70,819BNY Mellon Absolute Return Equity Fund GBP 88,496 (17,699) 70,797BNY Mellon Asian Equity Fund USD 15,715 (3,143) 12,572BNY Mellon Crossover Credit Fund EUR 33,428 (6,686) 26,742BNY Mellon Emerging Markets Corporate Debt Fund USD 44,194 (8,839) 35,355BNY Mellon Emerging Markets Debt Fund USD 74,716 (14,943) 59,773BNY Mellon Emerging Markets Debt Local Currency Fund USD 128,311 (25,662) 102,649BNY Mellon Emerging Markets Debt Opportunistic Fund USD 2,063 (413) 1,650BNY Mellon Emerging Markets Equity Fund* USD 4,269 (854) 3,415BNY Mellon Emerging Markets Equity Core Fund* USD 57,335 (11,467) 45,868BNY Mellon Emerging Markets Local Currency Investment Grade Debt Fund* USD 2,270 (454) 1,816BNY Mellon Euroland Bond Fund EUR 807,100 (161,420) 645,680BNY Mellon European Credit Fund EUR 1,071 (214) 857BNY Mellon Global Bond Fund USD 105,815 (21,163) 84,652BNY Mellon Global Dynamic Bond Fund USD 70,679 (14,136) 56,543BNY Mellon Global Emerging Markets Equity Value Fund USD 3,858 (772) 3,086BNY Mellon Global Emerging Markets Fund USD 1,371 (274) 1,097BNY Mellon Global Equity Fund USD 38,094 (7,619) 30,475BNY Mellon Global Equity Income Fund USD 31,146 (6,229) 24,917BNY Mellon Global High Yield Bond Fund USD 81,745 (16,349) 65,396BNY Mellon Global Opportunistic Bond Fund USD 43,870 (8,774) 35,096BNY Mellon Global Opportunities Fund USD 17,501 (3,500) 14,001BNY Mellon Global Property Securities Fund EUR 1,619 (324) 1,295BNY Mellon Global Real Return Fund (EUR) EUR 545,524 (109,105) 436,419BNY Mellon Global Real Return Fund (GBP) GBP 2,790 (558) 2,232BNY Mellon Global Real Return Fund (USD) USD 101,883 (20,377) 81,506BNY Mellon Japan All Cap Equity Fund JPY 1,368,648 (273,730) 1,094,918BNY Mellon Japan Small Cap Equity Focus Fund JPY 8,205,361 (1,641,072) 6,564,289BNY Mellon Long-Term Global Equity Fund EUR 368,476 (73,695) 294,781BNY Mellon Pan European Equity Fund EUR 7,564 (1,513) 6,051BNY Mellon S&P 500® Index Tracker USD 9,066 (1,813) 7,253BNY Mellon Small Cap Euroland Fund EUR 38,026 (7,605) 30,421BNY Mellon U.S. Dynamic Value Fund USD 3,744 (749) 2,995BNY Mellon US Opportunities Fund USD 1,888 (378) 1,510
^ Disclose as “Securities lending income” in the Statement of Comprehensive Income.* This Fund closed during the year.

263
BNY MELLON GLOBAL FUNDS, PLC
NOTES TO THE FINANCIAL STATEMENTS
14. EFFICIENT PORTFOLIO MANAGEMENT cont’d.
The value of securities on loan by counterparty and the value and type of collateral held by the Company in respect of those securities as at 31 December 2016 are detailed as follows:
Fund CounterpartyCountry of Incorporation Collateral Type
Aggregate value of
securities on loan at
31 December 2016
Aggregate value of
collateral held at
31 December 2016
Value of collateral as %
of securities on loan at
31 December 2016
BNY Mellon Absolute Insight Fund EUR EUR %Citigroup Global Markets Limited United Kingdom Equity Indices (TriParty) 34,495 38,151 110.60%
34,495 38,151 110.60%
BNY Mellon Absolute Return Bond Fund EUR EUR %Barclays Bank Plc United Kingdom Government Debt & Supranationals
(Euroclear TriParty) 65,261,212 66,594,247 102.04%G10 minus Belgium (Euroclear Triparty) 3,301,289 3,376,497 102.28%
HSBC Bank Plc United Kingdom Equity Indices 42,815,013 47,096,645 110.00%Credit Suisse Securities (Europe) Limited United Kingdom G10 minus Belgium (Euroclear Triparty) 5,982,302 6,120,613 102.31%Citigroup Global Markets Limited United Kingdom Government Debt & Supranationals
(Euroclear TriParty) 4,438,464 4,527,471 102.01%UBS AG Switzerland Government Debt & Supranationals (TriParty) 3,270,663 3,456,230 105.67%JP Morgan Securities PLC United Kingdom Government Debt & Supranationals
(Euroclear TriParty) 1,497,858 1,558,424 104.04%Goldman Sachs International United Kingdom Government Debt & Supranationals (TriParty) 66,161 69,694 105.34%
126,632,962 132,799,821 104.87%
BNY Mellon Absolute Return Equity Fund GBP GBP %Merrill Lynch International United Kingdom Government Debt & Supranationals (TriParty) 11,335,037 12,380,382 109.22%UBS AG Switzerland Equity Indices (TriParty) 7,593,352 8,353,047 110.00%Deutsche Bank, AG Germany Equity Indices (TriParty) 1,760,818 1,957,447 111.17%Merrill Lynch International United Kingdom G10 Debt (TriParty) 357,088 378,580 106.02%Citigroup Global Markets Limited United Kingdom Equity Indices (TriParty) 193,838 214,383 110.60%Barclays Capital Securities Ltd United Kingdom Equity Indices (TriParty) 124,565 141,778 113.82%
21,364,698 23,425,617 109.65%
BNY Mellon Asian Bond Fund USD USD %Credit Suisse Securities (Europe) Limited United Kingdom Government Debt & Supranationals
(Euroclear TriParty) 401,592 421,534 104.97%UBS AG Switzerland Government Debt & Supranationals
(Euroclear TriParty) 195,966 204,998 104.61%
597,558 626,532 104.85%
BNY Mellon Asian Equity Fund USD USD %Barclays Capital Inc United States
of America U.S. Government Debt (Bilateral) 884,779 903,123 102.07%
884,779 903,123 102.07%

264
BNY MELLON GLOBAL FUNDS, PLC
NOTES TO THE FINANCIAL STATEMENTS
14. EFFICIENT PORTFOLIO MANAGEMENT cont’d.
Fund CounterpartyCountry of Incorporation Collateral Type
Aggregate value of
securities on loan at
31 December 2016
Aggregate value of
collateral held at
31 December 2016
Value of collateral as %
of securities on loan at
31 December 2016
BNY Mellon Emerging Markets Corporate Debt Fund USD USD %Credit Suisse Securities (Europe) Limited United Kingdom Government Debt & Supranationals
(Euroclear TriParty) 7,641,582 8,021,038 104.97%UBS AG Switzerland Government Debt & Supranationals
(Euroclear TriParty) 5,114,894 5,350,628 104.61%Deutsche Bank, AG Germany Government Debt & Supranationals
(Euroclear TriParty) 2,980,056 3,118,318 104.64%JP Morgan Securities PLC United Kingdom Government Debt & Supranationals
(Euroclear TriParty) 2,223,408 2,443,734 109.91%G10 Debt (TriParty) 1,728,189 1,815,638 105.06%
Goldman Sachs International United Kingdom Government Debt & Supranationals (TriParty) 1,252,265 1,319,130 105.34%
20,940,394 22,068,486 105.39%
BNY Mellon Emerging Markets Debt Fund USD USD %Barclays Bank Plc United Kingdom G10 minus Belgium (Euroclear Triparty) 1,199,648 1,259,409 104.98%Credit Suisse Securities (Europe) Limited United Kingdom G10 Debt (TriParty) 1,088,000 1,142,728 105.03%JP Morgan Securities PLC United Kingdom Government Debt & Supranationals
(Euroclear TriParty) 985,603 1,083,270 109.91%Nomura International PLC United Kingdom G10 Debt (TriParty) 799,102 839,887 105.10%
Government Debt & Supranationals (Euroclear TriParty) 563,512 603,931 107.17%
Barclays Bank Plc United Kingdom G10 Debt (TriParty) 274,801 289,669 105.41%Government Debt & Supranationals (Euroclear TriParty) 239,712 251,316 104.84%
Deutsche Bank, AG Germany G10 Debt (TriParty) 302,479 324,144 107.16%Government Debt & Supranationals (Euroclear TriParty) 180,256 188,619 104.64%
Barclays Capital Inc United States of America U.S. Government Debt (Bilateral) 146,497 149,534 102.07%
5,779,610 6,132,507 106.11%
BNY Mellon Emerging Markets Debt Local Currency Fund USD USD %Citigroup Global Markets Limited United Kingdom G10 Debt (TriParty) 19,522,380 20,460,530 104.81%
Government Debt & Supranationals (Euroclear TriParty) 4,918,780 5,153,510 104.77%
BNP Paribas France G10 Debt (TriParty) 1,785,459 1,875,402 105.04%
26,226,619 27,489,442 104.82%
BNY Mellon Emerging Markets Debt Opportunistic Fund USD USD %Citigroup Global Markets Limited United Kingdom G10 Debt (TriParty) 1,482,033 1,553,252 104.81%
Government Debt & Supranationals (Euroclear TriParty) 1,407,667 1,474,843 104.77%
JP Morgan Securities PLC United Kingdom Government Debt & Supranationals (Euroclear TriParty) 1,154,686 1,269,108 109.91%
Deutsche Bank, AG Germany G10 Debt (TriParty) 1,005,251 1,077,252 107.16%Government Debt & Supranationals (Euroclear TriParty) 437,765 458,076 104.64%
Credit Suisse Securities (Europe) Limited United Kingdom Government Debt & Supranationals (Euroclear TriParty) 985,802 1,034,753 104.97%
6,473,204 6,867,284 106.09%

265
BNY MELLON GLOBAL FUNDS, PLC
NOTES TO THE FINANCIAL STATEMENTS
14. EFFICIENT PORTFOLIO MANAGEMENT cont’d.
Fund CounterpartyCountry of Incorporation Collateral Type
Aggregate value of
securities on loan at
31 December 2016
Aggregate value of
collateral held at
31 December 2016
Value of collateral as %
of securities on loan at
31 December 2016
BNY Mellon Euroland Bond Fund EUR EUR %Citigroup Global Markets Limited United Kingdom Government Debt & Supranationals
(Euroclear TriParty) 50,891,992 51,912,566 102.01%Barclays Bank Plc United Kingdom Government Debt & Supranationals
(Euroclear TriParty) 36,181,332 36,920,378 102.04%G10 minus Belgium (Euroclear Triparty) 3,681,018 3,764,878 102.28%
Morgan Stanley & Co. International PLC United Kingdom G10 minus Belgium (Euroclear Triparty) 21,246,863 21,679,953 102.04%BNP Paribas France G10 minus Belgium (Euroclear Triparty) 13,849,123 14,787,779 106.78%Merrill Lynch International United Kingdom Government Debt & Supranationals (TriParty) 13,355,664 14,587,355 109.22%Goldman Sachs International United Kingdom Government Debt & Supranationals
(Euroclear TriParty) 9,244,578 9,429,952 102.01%Deutsche Bank, AG Germany Government Debt & Supranationals
(Euroclear TriParty) 8,558,935 8,733,042 102.03%UBS AG Switzerland Government Debt & Supranationals (TriParty) 6,461,593 6,828,204 105.67%Barclays Capital Inc United States
of America U.S. Government Debt (Bilateral) 6,448,831 6,582,536 102.07%Deutsche Bank Securities Inc United States
of America U.S. Government Debt (Bilateral) 1,821,392 1,858,321 102.03%RBC Europe Limited United Kingdom G10 minus Belgium (Euroclear Triparty) 957,271 1,003,486 104.83%Societe Generale France Government Debt & Supranationals
(Euroclear TriParty) 519,538 530,048 102.02%Nomura International PLC United Kingdom Government Debt & Supranationals
(Euroclear TriParty) 481,095 515,602 107.17%JP Morgan Securities PLC United Kingdom Government Debt & Supranationals (TriParty) 199,769 214,147 107.20%
173,898,994 179,348,247 103.13%
BNY Mellon European Credit Fund EUR EUR %RBC Europe Limited United Kingdom G10 minus Belgium (Euroclear Triparty) 360,945 479,094 132.73%Citigroup Global Markets Limited United Kingdom Government Debt & Supranationals
(Euroclear TriParty) 325,565 332,094 102.01%Credit Suisse Securities (Europe) Limited United Kingdom Government Debt & Supranationals
(Euroclear TriParty) 307,198 313,524 102.06%Merrill Lynch International United Kingdom Government Debt & Supranationals (TriParty) 98,760 107,867 109.22%
1,092,468 1,232,579 112.83%
BNY Mellon Global Bond Fund USD USD %HSBC Bank Plc United Kingdom Equity Indices 25,272,315 27,799,623 110.00%ING Bank NV Netherlands Government Debt & Supranationals (TriParty) 15,606,477 16,386,807 105.00%Credit Suisse Securities (Europe) Limited United Kingdom Equity Indices 14,346,409 15,783,879 110.02%Nomura International PLC United Kingdom G10 Debt (TriParty) 3,937,106 4,138,052 105.10%BNP Paribas Arbitrage Netherlands Government Debt & Supranationals (TriParty) 2,968,868 3,119,670 105.08%Citigroup Global Markets Limited United Kingdom Equity Indices 2,491,980 2,741,268 110.00%RBC Europe Limited United Kingdom G10 minus Belgium (Euroclear Triparty) 2,045,659 2,144,419 104.83%
66,668,814 72,113,718 108.17%

266
BNY MELLON GLOBAL FUNDS, PLC
NOTES TO THE FINANCIAL STATEMENTS
14. EFFICIENT PORTFOLIO MANAGEMENT cont’d.
Fund CounterpartyCountry of Incorporation Collateral Type
Aggregate value of
securities on loan at
31 December 2016
Aggregate value of
collateral held at
31 December 2016
Value of collateral as %
of securities on loan at
31 December 2016
BNY Mellon Global Credit Fund* USD USD %JP Morgan Securities PLC United Kingdom Government Debt & Supranationals (TriParty) 3,266,879 3,502,049 107.20%Credit Suisse Securities (Europe) Limited United Kingdom G10 minus Belgium (Euroclear Triparty) 3,154,830 3,227,770 102.31%Deutsche Bank, AG Germany Government Debt & Supranationals
(Euroclear TriParty) 2,422,678 2,471,961 102.03%
8,844,387 9,201,780 104.04%
BNY Mellon Global Dynamic Bond Fund USD USD %HSBC Bank Plc United Kingdom Equity Indices 14,578,295 16,036,168 110.00%Deutsche Bank, AG Germany G10 Debt (TriParty) 1,903,591 2,039,936 107.16%Citigroup Global Markets Limited United Kingdom Government Debt & Supranationals
(Euroclear TriParty) 1,436,229 1,465,030 102.01%Barclays Bank Plc United Kingdom G10 minus Belgium (Euroclear Triparty) 744,544 781,634 104.98%UBS AG Switzerland Government Debt & Supranationals
(Euroclear TriParty) 305,713 319,803 104.61%
18,968,372 20,642,571 108.83%
BNY Mellon Global Emerging Markets Fund USD USD %Barclays Capital Inc United States
of America U.S. Government Debt (Bilateral) 509,553 520,117 102.07%Credit Suisse Securities (Europe) Limited United Kingdom Equity Indices (TriParty) 207,269 234,986 113.37%UBS AG Switzerland Equity Indices (TriParty) 59,241 65,760 111.00%Deutsche Bank, AG Germany Equity Indices (TriParty) 2,424 2,695 111.18%
778,487 823,558 105.79%
BNY Mellon Global Equity Fund USD USD %Citigroup Global Markets Limited United Kingdom Equity Indices (TriParty) 6,282,406 6,948,296 110.60%UBS AG Switzerland U.S. Government Debt (Bilateral) 4,903,571 5,008,996 102.15%Morgan Stanley & Co. LLC United States
of America U.S. Government Debt (Bilateral) 4,177,214 4,263,974 102.08%BNP Paribas Arbitrage Netherlands G10 Debt (TriParty) 2,404,057 2,565,240 106.70%JP Morgan Securities LLC United States
of America U.S. Government Debt (Bilateral) 2,185,335 2,230,736 102.08%HSBC Bank Plc United Kingdom G10 Debt (TriParty) 1,835,130 1,941,919 105.82%Barclays Capital Securities Ltd United Kingdom G10 Debt (TriParty) 1,436,339 1,546,604 107.68%
Equity Indices (TriParty) 104,947 119,452 113.82%Barclays Capital Inc United States
of America U.S. Government Debt (Bilateral) 816,015 832,934 102.07%
24,145,014 25,458,151 105.44%
BNY Mellon Global Equity Income Fund USD USD %HSBC Bank Plc United Kingdom G10 Debt (TriParty) 11,654,469 12,332,662 105.82%Merrill Lynch International United Kingdom Equity Indices (TriParty) 4,366,546 4,674,239 107.05%UBS Securities LLC United States
of America U.S. Government Debt (Bilateral) 2,616,216 2,671,662 102.12%UBS AG Switzerland Equity Indices (TriParty) 1,930,723 2,143,185 111.00%Morgan Stanley & Co. LLC United States
of America U.S. Government Debt (Bilateral) 1,457,109 1,487,373 102.08%

267
BNY MELLON GLOBAL FUNDS, PLC
NOTES TO THE FINANCIAL STATEMENTS
14. EFFICIENT PORTFOLIO MANAGEMENT cont’d.
Fund CounterpartyCountry of Incorporation Collateral Type
Aggregate value of
securities on loan at
31 December 2016
Aggregate value of
collateral held at
31 December 2016
Value of collateral as %
of securities on loan at
31 December 2016
BNY Mellon Global Equity Income Fund cont’d. USD USD %Credit Suisse Securities (USA) LLC United States
of America U.S. Government Debt (Bilateral) 310,772 317,225 102.08%
22,335,835 23,626,346 105.78%
BNY Mellon Global High Yield Bond Fund USD USD %Barclays Capital Inc United States
of America U.S. Government Debt (Bilateral) 13,281,657 13,557,029 102.07%Deutsche Bank Securities Inc United States
of America U.S. Government Debt (Bilateral) 1,920,502 1,959,440 102.03%Barclays Bank Plc United Kingdom Government Debt & Supranationals
(Euroclear TriParty) 1,290,793 1,353,276 104.84%Credit Suisse Securities (USA) LLC United States
of America U.S. Government Debt (Bilateral) 1,083,504 1,106,003 102.08%Credit Suisse Securities (Europe) Limited United Kingdom Government Debt & Supranationals
(Euroclear TriParty) 828,440 856,568 103.40%UBS AG Switzerland Government Debt & Supranationals
(Euroclear TriParty) 435,825 483,681 110.98%
18,840,721 19,315,997 102.52%
BNY Mellon Global Opportunistic Bond Fund USD USD %BNP Paribas France G10 minus Belgium (Euroclear Triparty) 2,118,143 2,224,143 105.00%Merrill Lynch International United Kingdom Government Debt & Supranationals (TriParty) 1,478,498 1,614,848 109.22%Credit Suisse Securities (Europe) Limited United Kingdom Equity Indices 747,601 822,508 110.02%
G10 minus Belgium (Euroclear Triparty) 617,815 649,205 105.08%Citigroup Global Markets Limited United Kingdom Government Debt & Supranationals
(Euroclear TriParty) 783,779 799,496 102.01%G10 Debt (TriParty) 507,772 532,173 104.81%
Barclays Capital Inc United States of America U.S. Government Debt (Bilateral) 696,247 710,683 102.07%
Barclays Bank Plc United Kingdom Government Debt & Supranationals (Euroclear TriParty) 588,751 600,777 102.04%
Nomura International PLC United Kingdom Government Debt & Supranationals (Euroclear TriParty) 496,388 531,992 107.17%
UBS AG Switzerland Government Debt & Supranationals (TriParty) 495,027 523,113 105.67%Credit Suisse Securities (USA) LLC United States
of America U.S. Government Debt (Bilateral) 289,151 295,155 102.08%Merrill Lynch, Pierce, Fenner & Smith Inc United States
of America U.S. Government Debt (Bilateral) 282,431 288,241 102.06%
9,101,603 9,592,334 105.39%
BNY Mellon Global Opportunities Fund USD USD %Citigroup Global Markets Limited United Kingdom Equity Indices (TriParty) 4,449,923 4,921,581 110.60%UBS AG Switzerland U.S. Government Debt (Bilateral) 2,667,286 2,724,632 102.15%Credit Suisse Securities (USA) LLC United States
of America U.S. Government Debt (Bilateral) 2,340,525 2,389,126 102.08%Goldman Sachs & Co United States
of America U.S. Government Debt (Bilateral) 1,681,265 1,715,402 102.03%UBS Securities LLC United States
of America U.S. Government Debt (Bilateral) 38,879 39,703 102.12%

268
BNY MELLON GLOBAL FUNDS, PLC
NOTES TO THE FINANCIAL STATEMENTS
14. EFFICIENT PORTFOLIO MANAGEMENT cont’d.
Fund CounterpartyCountry of Incorporation Collateral Type
Aggregate value of
securities on loan at
31 December 2016
Aggregate value of
collateral held at
31 December 2016
Value of collateral as %
of securities on loan at
31 December 2016
BNY Mellon Global Opportunities Fund cont’d. USD USD %Merrill Lynch International United Kingdom Equity Indices (TriParty) 31,304 33,510 107.05%
11,209,182 11,823,954 105.48%
BNY Mellon Global Property Securities Fund EUR EUR %Barclays Capital Inc United States
of America U.S. Government Debt (Bilateral) 306,043 312,388 102.07%JP Morgan Securities LLC United States
of America U.S. Government Debt (Bilateral) 237,261 242,190 102.08%JP Morgan Securities PLC United Kingdom Equity Indices (TriParty) 229,348 253,670 110.60%Credit Suisse Securities (Europe) Limited United Kingdom Equity Indices (TriParty) 219,305 248,630 113.37%Deutsche Bank, AG Germany Equity Indices (TriParty) 148,043 164,575 111.17%Barclays Capital Securities Ltd United Kingdom G10 Debt (TriParty) 121,147 130,447 107.68%UBS AG Switzerland U.S. Government Debt (Bilateral) 73,352 74,929 102.15%
Equity Indices (TriParty) 17,662 19,608 111.00%Citigroup Global Markets Limited United Kingdom Equity Indices (TriParty) 39,414 43,591 110.60%
1,391,575 1,490,028 107.07%
BNY Mellon Global Real Return Fund (EUR) EUR EUR %Barclays Capital Securities Ltd United Kingdom Equity Indices 281,448,212 309,614,056 110.01%
Equity Indices (TriParty) 2,866,361 3,262,506 113.82%G10 Debt (TriParty) 259,010 278,893 107.68%
HSBC Bank Plc United Kingdom Equity Indices 158,557,515 174,413,746 110.00%G10 Debt (TriParty) 248,938 263,426 105.82%
ING Bank NV Netherlands Government Debt & Supranationals (TriParty) 125,346,078 131,613,431 105.00%Citigroup Global Markets Limited United Kingdom Equity Indices (TriParty) 15,825,956 17,503,391 110.60%UBS AG Switzerland Government Debt & Supranationals
(Euroclear TriParty) 11,316,292 11,837,834 104.61%U.S. Government Debt (Bilateral) 4,080,078 4,167,798 102.15%
Deutsche Bank, AG Germany Equity Indices (TriParty) 5,155,288 5,730,974 111.17%Societe Generale France Equity Indices-Expanded 4,648,238 5,117,105 110.09%Credit Suisse Securities (Europe) Limited United Kingdom Equity Indices 3,481,500 3,830,336 110.02%UBS Securities LLC United States
of America U.S. Government Debt (Bilateral) 1,174,518 1,199,410 102.12%Merrill Lynch International United Kingdom G10 Debt (TriParty) 899,817 953,971 106.02%
615,307,801 669,786,877 108.85%
BNY Mellon Global Real Return Fund (GBP) GBP GBP %Citigroup Global Markets Limited United Kingdom Equity Indices (TriParty) 1,090,252 1,205,811 110.60%UBS AG Switzerland U.S. Government Debt (Bilateral) 817,103 834,671 102.15%Deutsche Bank, AG Germany Equity Indices (TriParty) 220,612 245,246 111.17%Barclays Capital Securities Ltd United Kingdom G10 Debt (TriParty) 114,330 123,106 107.68%Merrill Lynch International United Kingdom G10 Debt (TriParty) 98,452 104,378 106.02%
2,340,749 2,513,212 107.37%
BNY Mellon Global Real Return Fund (USD) USD USD %Barclays Capital Securities Ltd United Kingdom Equity Indices 38,721,651 42,596,706 110.01%
G10 Debt (TriParty) 15 16 106.67%

269
BNY MELLON GLOBAL FUNDS, PLC
NOTES TO THE FINANCIAL STATEMENTS
14. EFFICIENT PORTFOLIO MANAGEMENT cont’d.
Fund CounterpartyCountry of Incorporation Collateral Type
Aggregate value of
securities on loan at
31 December 2016
Aggregate value of
collateral held at
31 December 2016
Value of collateral as %
of securities on loan at
31 December 2016
BNY Mellon Global Real Return Fund (USD) cont’d. USD USD %HSBC Bank Plc United Kingdom Equity Indices 23,370,620 25,707,753 110.00%
G10 Debt (TriParty) 574,650 608,090 105.82%Citigroup Global Markets Limited United Kingdom Equity Indices (TriParty) 13,944,300 15,422,294 110.60%
Equity Indices 7,076,397 7,784,291 110.00%ING Bank NV Netherlands Government Debt & Supranationals (TriParty) 8,086,984 8,491,337 105.00%Credit Suisse Securities (Europe) Limited United Kingdom Equity Indices 2,493,183 2,742,993 110.02%Societe Generale France Equity Indices-Expanded 687,913 757,302 110.09%Deutsche Bank, AG Germany Equity Indices (TriParty) 570,062 633,721 111.17%Merrill Lynch International United Kingdom G10 Debt (TriParty) 362,459 384,274 106.02%UBS AG Switzerland U.S. Government Debt (Bilateral) 97,488 99,584 102.15%
95,985,722 105,228,361 109.63%
BNY Mellon Japan All Cap Equity Fund JPY JPY %UBS AG Switzerland Equity Indices (TriParty) 137,377,914 152,495,461 111.00%JP Morgan Securities PLC United Kingdom Equity Indices (TriParty) 76,673,506 84,804,500 110.60%Deutsche Bank, AG Germany Equity Indices (TriParty) 45,872,269 50,994,783 111.17%Credit Suisse Securities (Europe) Limited United Kingdom Equity Indices (TriParty) 21,093,016 23,913,560 113.37%
G10 Debt (TriParty) 10,988,470 11,825,997 107.62%BNP Paribas Arbitrage Netherlands G10 Debt (TriParty) 12,790,683 13,648,195 106.70%Merrill Lynch International United Kingdom G10 Debt (TriParty) 12,531,338 13,285,532 106.02%
317,327,196 350,968,028 110.60%
BNY Mellon Japan Small Cap Equity Focus Fund JPY JPY %UBS AG Switzerland Equity Indices (TriParty) 204,972,219 227,528,043 111.00%JP Morgan Securities PLC United Kingdom G10 Debt (TriParty) 53,045,589 55,729,740 105.06%
Equity Indices (TriParty) 33,899,711 37,494,669 110.60%Deutsche Bank, AG Germany Equity Indices (TriParty) 44,217,669 49,155,404 111.17%
G10 Debt (TriParty) 20,369,910 21,465,613 105.38%Credit Suisse Securities (Europe) Limited United Kingdom Equity Indices (TriParty) 48,531,292 55,020,776 113.37%
405,036,390 446,394,245 110.21%
BNY Mellon Long-Term Global Equity Fund EUR EUR %Citigroup Global Markets Limited United Kingdom Equity Indices (TriParty) 88,854,709 98,272,659 110.60%UBS AG Switzerland Equity Indices (TriParty) 31,647,392 34,844,778 110.10%Skandinaviska Enskilda Banken AB Sweden Equity Indices (TriParty) 17,951,799 19,917,723 110.95%Deutsche Bank, AG Germany Equity Indices (TriParty) 17,029,775 18,931,473 111.17%Credit Suisse Securities (USA) LLC United States
of America U.S. Government Debt (Bilateral) 16,573,922 16,918,078 102.08%JP Morgan Securities PLC United Kingdom Equity Indices (TriParty) 6,076,795 6,721,221 110.60%UBS Securities LLC United States
of America U.S. Government Debt (Bilateral) 4,882,366 4,985,839 102.12%Credit Suisse Securities (Europe) Limited United Kingdom Equity Indices (TriParty) 3,962,026 4,491,831 113.37%JP Morgan Securities LLC United States
of America U.S. Government Debt (Bilateral) 3,608,824 3,683,798 102.08%Nomura International PLC United Kingdom Equity Indices (TriParty) 1,251,534 1,577,963 126.08%Goldman Sachs International United Kingdom Equity Indices (TriParty) 324,133 356,577 110.01%
192,163,275 210,701,940 109.65%

270
BNY MELLON GLOBAL FUNDS, PLC
NOTES TO THE FINANCIAL STATEMENTS
14. EFFICIENT PORTFOLIO MANAGEMENT cont’d.
Fund CounterpartyCountry of Incorporation Collateral Type
Aggregate value of
securities on loan at
31 December 2016
Aggregate value of
collateral held at
31 December 2016
Value of collateral as %
of securities on loan at
31 December 2016
BNY Mellon Pan European Equity Fund EUR EUR %Societe Generale France Equity Indices (TriParty) 80,590 89,854 111.49%Barclays Capital Securities Ltd United Kingdom G10 Debt (TriParty) 25,762 27,739 107.67%Citigroup Global Markets Limited United Kingdom Equity Indices (TriParty) 9,836 10,879 110.60%Nomura International PLC United Kingdom Equity Indices (TriParty) 638 804 126.08%
116,826 129,276 110.66%
BNY Mellon S&P 500® Index Tracker USD USD %Citigroup Global Markets Limited United Kingdom Equity Indices (TriParty) 2,023,259 2,237,710 110.60%
G10 Debt (TriParty) 25,635 27,390 106.85%HSBC Bank Plc United Kingdom G10 Debt (TriParty) 1,392,802 1,473,852 105.82%
Equity Indices (TriParty) 370,441 408,548 110.29%Deutsche Bank, AG Germany Equity Indices (TriParty) 700,361 778,569 111.17%Societe Generale France Equity Indices (TriParty) 659,059 734,812 111.49%Barclays Capital Inc United States
of America U.S. Government Debt (Bilateral) 335,927 342,890 102.07%JP Morgan Securities LLC United States
of America U.S. Government Debt (Bilateral) 311,652 318,127 102.08%Goldman Sachs International United Kingdom Equity Indices (TriParty) 292,402 321,671 110.01%Credit Suisse Securities (USA) LLC United States
of America U.S. Government Debt (Bilateral) 258,861 264,236 102.08%Morgan Stanley & Co. LLC United States
of America U.S. Government Debt (Bilateral) 227,361 232,083 102.08%UBS Securities LLC United States
of America U.S. Government Debt (Bilateral) 211,231 215,708 102.12%UBS AG Switzerland U.S. Government Debt (Bilateral) 175,512 179,286 102.15%
Equity Indices (TriParty) 14,246 15,814 111.01%Merrill Lynch International United Kingdom G10 Debt (TriParty) 79,892 84,700 106.02%
Government Debt & Supranationals (TriParty) 51,463 56,209 109.22%Equity Indices (TriParty) 43,660 46,737 107.05%
Goldman Sachs & Co United States of America U.S. Government Debt (Bilateral) 136,290 139,057 102.03%
7,310,054 7,877,399 107.76%
BNY Mellon Small Cap Euroland Fund EUR EUR %Barclays Capital Securities Ltd United Kingdom G10 Debt (TriParty) 941,231 1,013,487 107.68%
Equity Indices (TriParty) 56,100 63,855 113.82%Credit Suisse Securities (Europe) Limited United Kingdom Equity Indices (TriParty) 823,217 933,298 113.37%UBS AG Switzerland Equity Indices (TriParty) 801,585 883,234 110.19%Citigroup Global Markets Limited United Kingdom Equity Indices (TriParty) 642,050 710,102 110.60%
G10 Debt (TriParty) 72,064 76,998 106.85%Nomura International PLC United Kingdom Equity Indices (TriParty) 489,868 617,638 126.08%Merrill Lynch International United Kingdom Government Debt & Supranationals (TriParty) 219,737 240,001 109.22%Goldman Sachs International United Kingdom G10 Debt (TriParty) 205,429 215,771 105.03%Societe Generale France Equity Indices (TriParty) 70,021 78,069 111.49%Deutsche Bank, AG Germany Equity Indices (TriParty) 35,086 39,004 111.17%
4,356,388 4,871,457 111.82%

271
BNY MELLON GLOBAL FUNDS, PLC
NOTES TO THE FINANCIAL STATEMENTS
14. EFFICIENT PORTFOLIO MANAGEMENT cont’d.
Fund CounterpartyCountry of Incorporation Collateral Type
Aggregate value of
securities on loan at
31 December 2016
Aggregate value of
collateral held at
31 December 2016
Value of collateral as %
of securities on loan at
31 December 2016
BNY Mellon Targeted Return Bond Fund USD USD %Merrill Lynch International United Kingdom Government Debt & Supranationals (TriParty) 699,664 764,189 109.22%Merrill Lynch, Pierce, Fenner & Smith Inc United States
of America U.S. Government Debt (Bilateral) 205,405 209,630 102.06%Credit Suisse Securities (USA) LLC United States
of America U.S. Government Debt (Bilateral) 157,718 160,993 102.08%
1,062,787 1,134,812 106.78%
BNY Mellon U.S. Dynamic Value Fund USD USD %Citigroup Global Markets Limited United Kingdom Equity Indices (TriParty) 7,218,997 7,984,158 110.60%HSBC Bank Plc United Kingdom G10 Debt (TriParty) 4,023,561 4,257,699 105.82%
Equity Indices (TriParty) 270,020 297,797 110.29%JP Morgan Securities LLC United States
of America U.S. Government Debt (Bilateral) 592,230 604,534 102.08%Deutsche Bank, AG Germany Equity Indices (TriParty) 57,831 64,289 111.17%
12,162,639 13,208,477 108.60%
BNY Mellon US Opportunities Fund USD USD %Deutsche Bank, AG Germany Equity Indices (TriParty) 629,272 699,543 111.17%UBS AG Switzerland Equity Indices (TriParty) 573,926 637,083 111.00%
U.S. Government Debt (Bilateral) 52,589 53,719 102.15%JP Morgan Securities LLC United States
of America U.S. Government Debt (Bilateral) 508,172 518,729 102.08%Citigroup Global Markets Limited United Kingdom Equity Indices (TriParty) 407,155 450,310 110.60%
2,171,114 2,359,384 108.67%
* Please refer to Note 19 of the financial statements.
The value of securities on loan by counterparty and the value and type of collateral held by the Company in respect of those securities as at 31 December 2015 are detailed as follows:
Fund CounterpartyCountry of Incorporation Collateral Type
Aggregate value of
securities on loan at
31 December 2015
Aggregate value of
collateral held at
31 December 2015
Value of collateral as %
of securities on loan at
31 December 2015
BNY Mellon Absolute Return Bond Fund EUR EUR %HSBC Bank Plc United Kingdom Equity Indices 38,149,366 41,966,011 110.00%JP Morgan Securities PLC United Kingdom Government Debt & Supranationals
(Euroclear TriParty) 8,455,386 8,715,850 103.08%Societe Generale France Government Debt & Supranationals
(Euroclear TriParty) 6,499,732 6,824,905 105.00%Goldman Sachs International United Kingdom Government Debt & Supranationals (TriParty) 5,333,128 5,600,737 105.02%BNP Paribas Arbitrage Netherlands Government Debt & Supranationals (TriParty) 5,076,373 5,612,881 110.57%Credit Suisse Securities (USA) LLC United States
of America U.S. Government Debt (Bilateral) 4,687,575 4,781,621 102.01%

272
BNY MELLON GLOBAL FUNDS, PLC
NOTES TO THE FINANCIAL STATEMENTS
14. EFFICIENT PORTFOLIO MANAGEMENT cont’d.
Fund CounterpartyCountry of Incorporation Collateral Type
Aggregate value of
securities on loan at
31 December 2015
Aggregate value of
collateral held at
31 December 2015
Value of collateral as %
of securities on loan at
31 December 2015
BNY Mellon Absolute Return Bond Fund cont’d. EUR EUR %Morgan Stanley & Co. International PLC United Kingdom Government Debt & Supranationals
(Euroclear TriParty) 3,439,377 3,540,437 102.94%UBS AG Switzerland Government Debt & Supranationals
(Euroclear TriParty) 2,178,475 2,380,277 109.26%Barclays Bank Plc United Kingdom Government Debt & Supranationals
(Euroclear TriParty) 2,135,784 2,244,176 105.08%Citigroup Global Markets Limited United Kingdom Government Debt & Supranationals
(Euroclear TriParty) 1,559,779 1,639,969 105.14%Credit Suisse Securities (Europe) Limited United Kingdom Government Debt & Supranationals (TriParty) 1,262,054 1,330,475 105.42%RBC Europe Limited United Kingdom Government Debt & Supranationals
(Euroclear TriParty) 530,989 559,851 105.44%
79,308,018 85,197,190 107.43%
BNY Mellon Absolute Return Equity Fund GBP GBP %Societe Generale France Equity Indices (TriParty) 3,638,559 4,056,037 111.47%Credit Suisse Securities (Europe) Limited United Kingdom Equity Indices (TriParty) 3,247,442 3,615,740 111.34%BNP Paribas Arbitrage Netherlands Equity Indices (TriParty) 3,245,453 3,925,149 120.94%UBS AG Switzerland G10 Debt (TriParty) 2,456,823 2,585,823 105.25%Citigroup Global Markets Limited United Kingdom Equity Indices 1,657,582 1,823,850 110.03%Merrill Lynch International United Kingdom G10 Debt (TriParty) 382,327 403,338 105.50%Barclays Capital Securities Ltd United Kingdom G10 Debt (TriParty) 299,299 320,004 106.92%UBS AG Switzerland Equity Indices (TriParty) 76,787 85,802 111.74%ING Bank NV Netherlands Equity Indices (TriParty) 7,447 10,023 134.59%
15,011,719 16,825,766 112.08%
BNY Mellon Crossover Credit Fund EUR EUR %JP Morgan Securities PLC United Kingdom Government Debt & Supranationals
(Euroclear TriParty) 11,666,766 12,188,955 104.48%Government Debt & Supranationals (TriParty) 4,582,652 4,812,413 105.01%
UBS AG Switzerland Government Debt & Supranationals (Euroclear TriParty) 4,698,769 5,065,664 107.81%
Citigroup Global Markets Limited United Kingdom Government Debt & Supranationals (Euroclear TriParty) 2,358,775 2,480,043 105.14%
Credit Suisse Securities (Europe) Limited United Kingdom Government Debt & Supranationals (Euroclear TriParty) 1,070,903 1,102,885 102.99%
RBC Europe Limited United Kingdom Government Debt & Supranationals (Euroclear TriParty) 686,916 716,633 104.33%
BNP Paribas Arbitrage Netherlands Government Debt & Supranationals (TriParty) 407,846 450,950 110.57%Credit Suisse Securities (Europe) Limited United Kingdom G10 Debt (TriParty) 305,478 320,973 105.07%
25,778,105 27,138,516 105.28%
BNY Mellon Emerging Markets Corporate Debt Fund USD USD %JP Morgan Securities PLC United Kingdom Government Debt & Supranationals
(Euroclear TriParty) 6,155,461 6,464,436 105.02%Credit Suisse Securities (Europe) Limited United Kingdom Government Debt & Supranationals (TriParty) 5,241,092 5,523,882 105.40%Goldman Sachs International United Kingdom Government Debt & Supranationals (TriParty) 1,405,634 1,476,167 105.02%
12,802,187 13,464,485 105.17%

273
BNY MELLON GLOBAL FUNDS, PLC
NOTES TO THE FINANCIAL STATEMENTS
14. EFFICIENT PORTFOLIO MANAGEMENT cont’d.
Fund CounterpartyCountry of Incorporation Collateral Type
Aggregate value of
securities on loan at
31 December 2015
Aggregate value of
collateral held at
31 December 2015
Value of collateral as %
of securities on loan at
31 December 2015
BNY Mellon Emerging Markets Debt Fund USD USD %JP Morgan Securities PLC United Kingdom Government Debt & Supranationals
(Euroclear TriParty) 2,968,160 3,117,147 105.02%Government Debt & Supranationals (TriParty) 252,353 265,006 105.01%
Credit Suisse Securities (Europe) Limited United Kingdom Government Debt & Supranationals (TriParty) 1,874,887 1,976,532 105.42%Government Debt & Supranationals (Euroclear TriParty) 576,520 605,679 105.06%
Deutsche Bank, AG Germany Government Debt & Supranationals (Euroclear TriParty) 1,309,588 1,375,615 105.04%
Barclays Bank Plc United Kingdom Government Debt & Supranationals (Euroclear TriParty) 716,630 752,999 105.08%
UBS AG Switzerland Government Debt & Supranationals (Euroclear TriParty) 63,943 69,866 109.26%
7,762,081 8,162,844 105.16%
BNY Mellon Emerging Markets Debt Local Currency Fund USD USD %JP Morgan Securities PLC United Kingdom Government Debt & Supranationals
(Euroclear TriParty) 87,471,771 91,862,439 105.02%G10 Debt (TriParty) 2,080,859 2,184,939 105.00%
BNP Paribas Arbitrage Netherlands G10 minus Belgium (Euroclear Triparty) 2,518,137 2,646,648 105.10%
92,070,767 96,694,026 105.02%
BNY Mellon Emerging Markets Debt Opportunistic Fund USD USD %JP Morgan Securities PLC United Kingdom Government Debt & Supranationals
(Euroclear TriParty) 5,142,415 5,400,540 105.02%G10 Debt (TriParty) 379,411 398,388 105.00%Government Debt & Supranationals (TriParty) 196,742 206,607 105.01%
Credit Suisse Securities (Europe) Limited United Kingdom Government Debt & Supranationals (Euroclear TriParty) 1,121,149 1,177,855 105.06%Government Debt & Supranationals (TriParty) 763,034 804,401 105.42%
7,602,751 7,987,791 105.06%
BNY Mellon Euroland Bond Fund EUR EUR %JP Morgan Securities PLC United Kingdom Government Debt & Supranationals
(Euroclear TriParty) 52,562,559 53,678,414 102.12%Government Debt & Supranationals (TriParty) 24,318,598 25,557,251 105.09%
Goldman Sachs International United Kingdom Government Debt & Supranationals (TriParty) 40,243,530 42,257,591 105.00%Deutsche Bank, AG Germany Government Debt & Supranationals
(Euroclear TriParty) 20,472,240 20,882,418 102.00%Citigroup Global Markets Limited United Kingdom Government Debt & Supranationals
(Euroclear TriParty) 6,357,262 6,640,101 104.45%Credit Suisse Securities (USA) LLC United States
of America U.S. Government Debt (Bilateral) 5,884,231 6,002,283 102.01%Barclays Bank Plc United Kingdom Government Debt & Supranationals
(Euroclear TriParty) 4,857,676 4,957,020 102.05%Barclays Capital Inc United States
of America U.S. Government Debt (Bilateral) 4,699,292 4,793,446 102.00%JP Morgan Clearing Corp United States
of America U.S. Government Debt (Bilateral) 4,250,331 4,335,341 102.00%

274
BNY MELLON GLOBAL FUNDS, PLC
NOTES TO THE FINANCIAL STATEMENTS
14. EFFICIENT PORTFOLIO MANAGEMENT cont’d.
Fund CounterpartyCountry of Incorporation Collateral Type
Aggregate value of
securities on loan at
31 December 2015
Aggregate value of
collateral held at
31 December 2015
Value of collateral as %
of securities on loan at
31 December 2015
BNY Mellon Euroland Bond Fund cont’d. EUR EUR %Nomura International PLC United Kingdom Government Debt & Supranationals
(Euroclear TriParty) 2,711,587 2,766,041 102.01%UBS AG Switzerland Government Debt & Supranationals
(Euroclear TriParty) 1,480,094 1,573,146 106.29%Government Debt & Supranationals (TriParty) 198,073 208,123 105.07%
Goldman Sachs & Co United States of America U.S. Government Debt (Bilateral) 1,044,593 1,065,527 102.00%
Societe Generale France Government Debt & Supranationals (Euroclear TriParty) 509,956 535,467 105.00%
Citigroup Global Markets Inc United States of America U.S. Government Debt (Bilateral) 322,004 334,520 103.89%
169,912,026 175,586,689 103.34%
BNY Mellon European Credit Fund EUR EUR %JP Morgan Securities PLC United Kingdom Government Debt & Supranationals
(Euroclear TriParty) 561,907 590,113 105.02%Government Debt & Supranationals (TriParty) 205,630 215,940 105.01%
Credit Suisse Securities (Europe) Limited United Kingdom Government Debt & Supranationals (Euroclear TriParty) 723,970 760,587 105.06%
UBS AG Switzerland Government Debt & Supranationals (Euroclear TriParty) 449,115 476,326 106.06%Government Debt & Supranationals (TriParty) 173,521 182,325 105.07%
Credit Suisse Securities (USA) LLC United States of America U.S. Government Debt (Bilateral) 187,496 191,258 102.01%
2,301,639 2,416,549 104.99%
BNY Mellon Global Bond Fund USD USD %HSBC Bank Plc United Kingdom Equity Indices 26,233,653 28,858,193 110.00%Citigroup Global Markets Limited United Kingdom Equity Indices 9,242,532 10,169,622 110.03%
Government Debt & Supranationals (Euroclear TriParty) 2,115,090 2,157,452 102.00%
37,591,275 41,185,267 109.56%
BNY Mellon Global Dynamic Bond Fund USD USD %HSBC Bank Plc United Kingdom Equity Indices 25,423,721 27,967,231 110.00%Citigroup Global Markets Limited United Kingdom Government Debt & Supranationals
(Euroclear TriParty) 1,489,062 1,518,885 102.00%Merrill Lynch International United Kingdom G10 Debt (TriParty) 2,106 2,222 105.51%
26,914,889 29,488,338 109.56%
BNY Mellon Global Emerging Markets Fund USD USD %Deutsche Bank, AG Germany Equity Indices (TriParty) 99,493 111,895 112.47%Deutsche Bank Securities Inc United States
of America U.S. Government Debt (Bilateral) 48,229 49,203 102.02%
147,722 161,098 109.05%

275
BNY MELLON GLOBAL FUNDS, PLC
NOTES TO THE FINANCIAL STATEMENTS
14. EFFICIENT PORTFOLIO MANAGEMENT cont’d.
Fund CounterpartyCountry of Incorporation Collateral Type
Aggregate value of
securities on loan at
31 December 2015
Aggregate value of
collateral held at
31 December 2015
Value of collateral as %
of securities on loan at
31 December 2015
BNY Mellon Global Equity Fund USD USD %Societe Generale France Equity Indices (TriParty) 4,377,651 4,879,930 111.47%Citigroup Global Markets Limited United Kingdom Equity Indices (TriParty) 115,020 134,000 116.50%
4,492,671 5,013,930 111.60%
BNY Mellon Global Equity Income Fund USD USD %Citigroup Global Markets Limited United Kingdom Equity Indices (TriParty) 6,991,400 8,145,060 116.50%Credit Suisse Securities (USA) LLC United States
of America U.S. Government Debt (Bilateral) 4,122,056 4,204,755 102.01%Merrill Lynch International United Kingdom Equity Indices (TriParty) 2,348,436 2,513,095 107.01%Goldman Sachs & Co United States
of America U.S. Government Debt (Bilateral) 235,953 240,681 102.00%Societe Generale France Equity Indices (TriParty) 132 147 111.36%
13,697,977 15,103,738 110.26%
BNY Mellon Global High Yield Bond Fund USD USD %Barclays Capital Inc United States
of America U.S. Government Debt (Bilateral) 5,092,798 5,194,836 102.00%Credit Suisse Securities (Europe) Limited United Kingdom Government Debt & Supranationals
(Euroclear TriParty) 3,023,695 3,112,341 102.93%Government Debt & Supranationals (TriParty) 1,094,593 1,152,170 105.26%
Credit Suisse Securities (USA) LLC United States of America U.S. Government Debt (Bilateral) 2,709,874 2,764,241 102.01%
Citigroup Global Markets Limited United Kingdom Government Debt & Supranationals (Euroclear TriParty) 1,861,129 1,929,555 103.68%
Goldman Sachs & Co United States of America U.S. Government Debt (Bilateral) 862,658 879,946 102.00%
Morgan Stanley & Co. International PLC United Kingdom Government Debt & Supranationals (Euroclear TriParty) 647,342 660,398 102.02%
RBC Europe Limited United Kingdom Government Debt & Supranationals (Euroclear TriParty) 592,916 625,144 105.44%
Barclays Bank Plc United Kingdom Government Debt & Supranationals (Euroclear TriParty) 462,542 472,001 102.05%
Goldman Sachs International United Kingdom Government Debt & Supranationals (TriParty) 348,320 365,798 105.02%UBS AG Switzerland Government Debt & Supranationals
(Euroclear TriParty) 283,113 309,339 109.26%
16,978,980 17,465,769 102.87%
BNY Mellon Global Opportunistic Bond Fund USD USD %Societe Generale France Equity Indices-Expanded 8,338,959 9,176,007 110.04%
Government Debt & Supranationals (Euroclear TriParty) 546,143 573,466 105.00%
JP Morgan Securities PLC United Kingdom Government Debt & Supranationals (Euroclear TriParty) 3,021,731 3,173,408 105.02%Government Debt & Supranationals (TriParty) 1,016,451 1,067,413 105.01%
Credit Suisse Securities (USA) LLC United States of America U.S. Government Debt (Bilateral) 2,061,522 2,102,882 102.01%
Barclays Capital Inc United States of America U.S. Government Debt (Bilateral) 1,465,046 1,494,399 102.00%
Goldman Sachs International United Kingdom Government Debt & Supranationals (TriParty) 1,086,907 1,141,447 105.02%

276
BNY MELLON GLOBAL FUNDS, PLC
NOTES TO THE FINANCIAL STATEMENTS
14. EFFICIENT PORTFOLIO MANAGEMENT cont’d.
Fund CounterpartyCountry of Incorporation Collateral Type
Aggregate value of
securities on loan at
31 December 2015
Aggregate value of
collateral held at
31 December 2015
Value of collateral as %
of securities on loan at
31 December 2015
BNY Mellon Global Opportunistic Bond Fund cont’d. EUR EUR %Credit Suisse Securities (Europe) Limited United Kingdom Government Debt & Supranationals (TriParty) 815,180 859,374 105.42%JP Morgan Clearing Corp United States
of America U.S. Government Debt (Bilateral) 777,464 793,013 102.00%Nomura International PLC United Kingdom Government Debt & Supranationals (TriParty) 271,727 290,564 106.93%UBS AG Switzerland Government Debt & Supranationals (TriParty) 126,417 132,830 105.07%
19,527,547 20,804,803 106.54%
BNY Mellon Global Opportunities Fund USD USD %UBS Securities LLC United States
of America U.S. Government Debt (Bilateral) 3,097,705 3,159,752 102.00%Societe Generale France Equity Indices (TriParty) 1,596,331 1,779,489 111.47%
4,694,036 4,939,241 105.22%
BNY Mellon Global Property Securities Fund EUR EUR %Deutsche Bank, AG Germany Equity Indices (TriParty) 237,811 267,455 112.47%UBS AG Switzerland Equity Indices (TriParty) 141,169 156,853 111.11%
G10 Debt (TriParty) 50,748 53,412 105.25%Barclays Capital Inc United States
of America U.S. Government Debt (Bilateral) 137,716 140,475 102.00%Credit Suisse Securities (USA) LLC United States
of America U.S. Government Debt (Bilateral) 118,541 120,919 102.01%JP Morgan Securities PLC United Kingdom Equity Indices (TriParty) 46,620 51,363 110.17%
G10 Debt (TriParty) 32,461 34,092 105.03%
765,066 824,569 107.78%
BNY Mellon Global Real Return Fund (EUR) EUR EUR %Barclays Capital Securities Ltd United Kingdom Equity Indices 130,539,053 143,595,852 110.00%HSBC Bank Plc United Kingdom Equity Indices 85,229,931 93,756,739 110.00%JP Morgan Securities PLC United Kingdom Equity Indices (TriParty) 9,327,926 10,261,507 110.01%Morgan Stanley & Co. International PLC United Kingdom Equity Indices (TriParty) 1,848,534 2,033,486 110.01%Citigroup Global Markets Limited United Kingdom Equity Indices (TriParty) 840,923 979,684 116.50%Societe Generale France Equity Indices (TriParty) 16,172 18,027 111.47%
227,802,539 250,645,295 110.03%
BNY Mellon Global Real Return Fund (GBP) GBP GBP %JP Morgan Securities PLC United Kingdom Equity Indices (TriParty) 222,864 245,170 110.01%Morgan Stanley & Co. International PLC United Kingdom Equity Indices (TriParty) 71,663 78,833 110.01%
294,527 324,003 110.01%
BNY Mellon Global Real Return Fund (USD) USD USD %Barclays Capital Securities Ltd United Kingdom Equity Indices 26,372,960 29,010,840 110.00%HSBC Bank Plc United Kingdom Equity Indices 14,936,140 16,430,422 110.00%JP Morgan Securities PLC United Kingdom Equity Indices (TriParty) 1,799,285 1,979,366 110.01%Morgan Stanley & Co. International PLC United Kingdom Equity Indices (TriParty) 602,071 662,311 110.01%UBS AG Switzerland G10 Debt (TriParty) 32,353 34,052 105.25%
43,742,809 48,116,991 110.00%
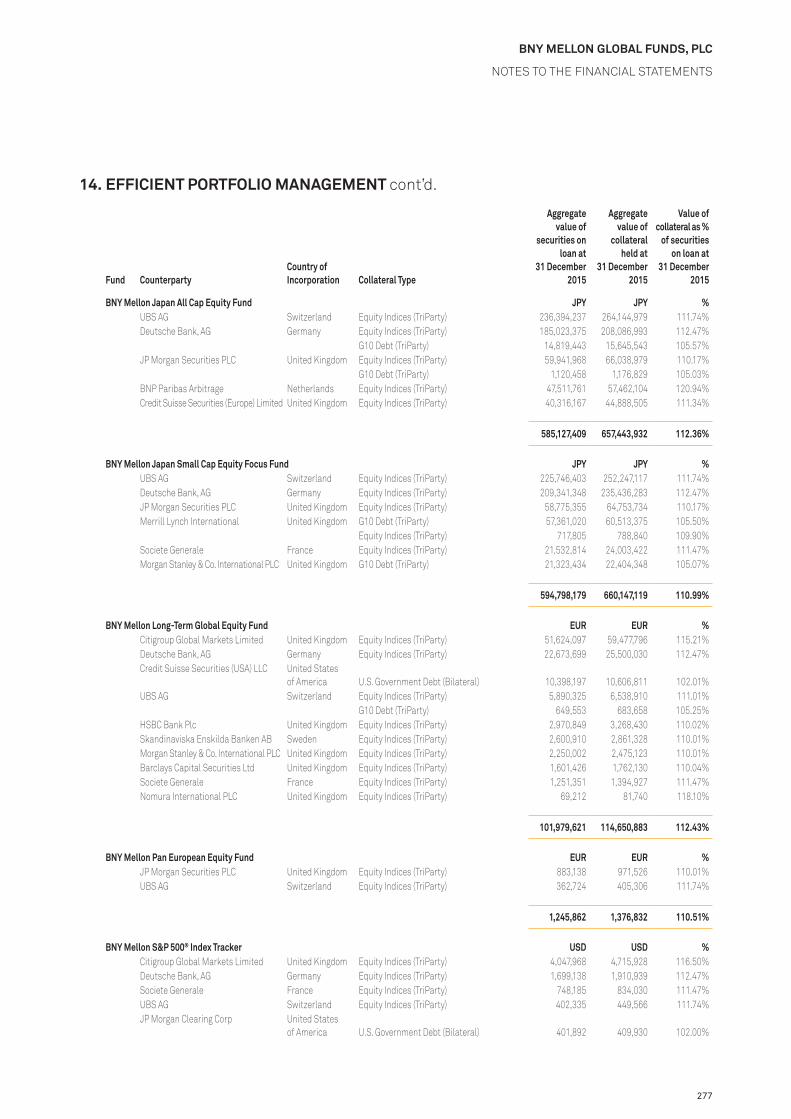
277
BNY MELLON GLOBAL FUNDS, PLC
NOTES TO THE FINANCIAL STATEMENTS
14. EFFICIENT PORTFOLIO MANAGEMENT cont’d.
Fund CounterpartyCountry of Incorporation Collateral Type
Aggregate value of
securities on loan at
31 December 2015
Aggregate value of
collateral held at
31 December 2015
Value of collateral as %
of securities on loan at
31 December 2015
BNY Mellon Japan All Cap Equity Fund JPY JPY %UBS AG Switzerland Equity Indices (TriParty) 236,394,237 264,144,979 111.74%Deutsche Bank, AG Germany Equity Indices (TriParty) 185,023,375 208,086,993 112.47%
G10 Debt (TriParty) 14,819,443 15,645,543 105.57%JP Morgan Securities PLC United Kingdom Equity Indices (TriParty) 59,941,968 66,038,979 110.17%
G10 Debt (TriParty) 1,120,458 1,176,829 105.03%BNP Paribas Arbitrage Netherlands Equity Indices (TriParty) 47,511,761 57,462,104 120.94%Credit Suisse Securities (Europe) Limited United Kingdom Equity Indices (TriParty) 40,316,167 44,888,505 111.34%
585,127,409 657,443,932 112.36%
BNY Mellon Japan Small Cap Equity Focus Fund JPY JPY %UBS AG Switzerland Equity Indices (TriParty) 225,746,403 252,247,117 111.74%Deutsche Bank, AG Germany Equity Indices (TriParty) 209,341,348 235,436,283 112.47%JP Morgan Securities PLC United Kingdom Equity Indices (TriParty) 58,775,355 64,753,734 110.17%Merrill Lynch International United Kingdom G10 Debt (TriParty) 57,361,020 60,513,375 105.50%
Equity Indices (TriParty) 717,805 788,840 109.90%Societe Generale France Equity Indices (TriParty) 21,532,814 24,003,422 111.47%Morgan Stanley & Co. International PLC United Kingdom G10 Debt (TriParty) 21,323,434 22,404,348 105.07%
594,798,179 660,147,119 110.99%
BNY Mellon Long-Term Global Equity Fund EUR EUR %Citigroup Global Markets Limited United Kingdom Equity Indices (TriParty) 51,624,097 59,477,796 115.21%Deutsche Bank, AG Germany Equity Indices (TriParty) 22,673,699 25,500,030 112.47%Credit Suisse Securities (USA) LLC United States
of America U.S. Government Debt (Bilateral) 10,398,197 10,606,811 102.01%UBS AG Switzerland Equity Indices (TriParty) 5,890,325 6,538,910 111.01%
G10 Debt (TriParty) 649,553 683,658 105.25%HSBC Bank Plc United Kingdom Equity Indices (TriParty) 2,970,849 3,268,430 110.02%Skandinaviska Enskilda Banken AB Sweden Equity Indices (TriParty) 2,600,910 2,861,328 110.01%Morgan Stanley & Co. International PLC United Kingdom Equity Indices (TriParty) 2,250,002 2,475,123 110.01%Barclays Capital Securities Ltd United Kingdom Equity Indices (TriParty) 1,601,426 1,762,130 110.04%Societe Generale France Equity Indices (TriParty) 1,251,351 1,394,927 111.47%Nomura International PLC United Kingdom Equity Indices (TriParty) 69,212 81,740 118.10%
101,979,621 114,650,883 112.43%
BNY Mellon Pan European Equity Fund EUR EUR %JP Morgan Securities PLC United Kingdom Equity Indices (TriParty) 883,138 971,526 110.01%UBS AG Switzerland Equity Indices (TriParty) 362,724 405,306 111.74%
1,245,862 1,376,832 110.51%
BNY Mellon S&P 500® Index Tracker USD USD %Citigroup Global Markets Limited United Kingdom Equity Indices (TriParty) 4,047,968 4,715,928 116.50%Deutsche Bank, AG Germany Equity Indices (TriParty) 1,699,138 1,910,939 112.47%Societe Generale France Equity Indices (TriParty) 748,185 834,030 111.47%UBS AG Switzerland Equity Indices (TriParty) 402,335 449,566 111.74%JP Morgan Clearing Corp United States
of America U.S. Government Debt (Bilateral) 401,892 409,930 102.00%

278
BNY MELLON GLOBAL FUNDS, PLC
NOTES TO THE FINANCIAL STATEMENTS
14. EFFICIENT PORTFOLIO MANAGEMENT cont’d.
Fund CounterpartyCountry of Incorporation Collateral Type
Aggregate value of
securities on loan at
31 December 2015
Aggregate value of
collateral held at
31 December 2015
Value of collateral as %
of securities on loan at
31 December 2015
BNY Mellon S&P 500® Index Tracker cont’d. USD USD %Credit Suisse Securities (USA) LLC United States
of America U.S. Government Debt (Bilateral) 401,176 409,225 102.01%Barclays Capital Inc United States
of America U.S. Government Debt (Bilateral) 161,176 164,406 102.00%JP Morgan Securities PLC United Kingdom Equity Indices (TriParty) 104,042 114,625 110.17%Goldman Sachs & Co United States
of America U.S. Government Debt (Bilateral) 96,733 98,671 102.00%Merrill Lynch International United Kingdom Equity Indices (TriParty) 36,480 39,038 107.01%
G10 Debt (TriParty) 26,278 27,722 105.50%UBS Securities LLC United States
of America U.S. Government Debt (Bilateral) 51,932 52,972 102.00%Credit Suisse Securities (Europe) Limited United Kingdom Equity Indices (TriParty) 36,843 41,021 111.34%Deutsche Bank Securities Inc United States
of America U.S. Government Debt (Bilateral) 13,443 13,714 102.02%Citigroup Global Markets Inc United States
of America U.S. Government Debt (Bilateral) 5,115 5,228 102.21%
8,232,736 9,287,015 112.81%
BNY Mellon Small Cap Euroland Fund EUR EUR %Deutsche Bank, AG Germany Equity Indices (TriParty) 2,932,963 3,298,563 112.47%
G10 Debt (TriParty) 27,470 29,001 105.57%Barclays Capital Securities Ltd United Kingdom G10 Debt (TriParty) 1,346,738 1,439,903 106.92%
Equity Indices (TriParty) 99,955 109,985 110.03%BNP Paribas Arbitrage Netherlands Equity Indices (TriParty) 822,163 994,349 120.94%HSBC Bank Plc United Kingdom Equity Indices (TriParty) 794,118 873,663 110.02%Merrill Lynch International United Kingdom G10 Debt (TriParty) 365,110 385,175 105.50%
Equity Indices (TriParty) 271,000 297,833 109.90%Societe Generale France Equity Indices (TriParty) 606,354 675,926 111.47%Goldman Sachs International United Kingdom G10 Debt (TriParty) 554,351 582,645 105.10%UBS AG Switzerland Equity Indices (TriParty) 163,261 180,252 110.41%Citigroup Global Markets Limited United Kingdom G10 Debt (TriParty) 43,205 45,404 105.09%Nomura International PLC United Kingdom Equity Indices (TriParty) 22 26 116.67%
8,026,710 8,912,725 111.04%
BNY Mellon U.S. Dynamic Value Fund USD USD %Citigroup Global Markets Limited United Kingdom Equity Indices (TriParty) 1,702,022 1,982,874 116.50%Deutsche Bank, AG Germany Equity Indices (TriParty) 729,703 820,663 112.47%JP Morgan Clearing Corp United States
of America U.S. Government Debt (Bilateral) 78,679 80,253 102.00%
2,510,404 2,883,790 114.87%
BNY Mellon US Opportunities Fund USD USD %Deutsche Bank, AG Germany Equity Indices (TriParty) 3,902,145 4,388,556 112.47%Societe Generale France Equity Indices (TriParty) 1,221,157 1,361,269 111.47%
5,123,302 5,749,825 112.23%

279
BNY MELLON GLOBAL FUNDS, PLC
NOTES TO THE FINANCIAL STATEMENTS
15. NET ASSET VALUE
The net asset value of each class of redeemable participating share is determined by dividing the value of the net assets of the share class by the total number of redeemable participating shares in issue at the year end.
The published net asset value of each class of redeemable participating share is as follows:
Fund Share Class Currency 31 December 2016 31 December 2015 31 December 2014
BNY Mellon Absolute Insight FundTotal net assets EUR 80,141,041 224,417,441 152,841,576 Net asset value per: Class E (Acc) EUR 1.0006 1.0114 1.0063
Class E (Acc) (Hedged) CHF 0.9850 1.0001 1.0038 Class E (Acc) (Hedged)^ USD – 1.0155 1.0072
Class E (Inc)^ EUR – 1.0095 1.0045 Sterling E (Acc) (Hedged) GBP 1.0168 1.0191 1.0077
Class R (Acc) EUR 0.9756 0.9959 1.0015 Class R (Acc) (Hedged) USD 0.9924 1.0004 1.0020
Class R (Inc) EUR 0.9758 0.9961 1.0012 Class S (Acc) EUR 0.9875 1.0030 1.0036
Class T (Acc) (Hedged) USD 1.0031 1.0062 1.0036 Class U (Acc) EUR 0.9913 1.0049 1.0046
Class U (Acc) (Hedged)^ CHF – 0.9769 – Class U (Acc) (Hedged) USD 0.9857 0.9868 –
Class U (Inc) EUR 0.9697 0.9833 – Sterling U (Acc) (Hedged) GBP 1.0074 1.0128 1.0065
BNY Mellon Absolute Return Bond FundTotal net assets EUR 2,160,243,520 2,156,159,324 1,184,511,961 Net asset value per: Class C EUR 105.1455 103.6759 102.6163
Class C (Inc) EUR 103.5435 102.3427 101.5342 Class I (Hedged) USD 103.1703 100.4807 99.0360
Sterling I (Acc) (Hedged) GBP 105.1026 102.8416 101.1454 Class R EUR 104.8450 103.8774 103.2877
Class R (Hedged) USD 104.8126 102.6019 101.6116 Class R (Inc) EUR 104.5947 103.6250 103.0539
Class S EUR 110.0282 108.6252 107.4987 Class S (Inc) EUR 104.0572 102.8894 102.1349
Class T (Hedged) USD 112.8007 109.9164 108.3046 Class T (Hedged)^ CHF 100.9574 – –
Sterling T (Acc) (Hedged) GBP 113.2574 110.8220 108.9644 Class W (Acc)^ EUR 100.8570 – –
Class W (Acc) (Hedged)^ USD 99.9449 – – Class W (Inc) (Hedged)^ USD 100.5379 – –
Sterling W (Acc) (Hedged) GBP 102.7010 100.5530 – Sterling W (Inc) (Hedged) GBP 102.4824 100.4839 –
Class X EUR 114.8703 112.4932 110.6028 Class X (Hedged) USD – – 103.2370
Sterling X (Acc) (Hedged) GBP 117.7481 114.4492 111.8119 Class Z (Acc)^ EUR 100.2904 – –
BNY Mellon Absolute Return Equity FundTotal net assets GBP 2,270,552,815 1,877,967,094 1,293,204,376 Net asset value per: Class R (Hedged) CHF 0.9727 0.9931 0.9804
Class R (Hedged) EUR 1.1367 1.1548 1.1310 Class R (Hedged) USD 1.0494 1.0526 1.0273

280
BNY MELLON GLOBAL FUNDS, PLC
NOTES TO THE FINANCIAL STATEMENTS
15. NET ASSET VALUE cont’d.
Fund Share Class Currency 31 December 2016 31 December 2015 31 December 2014
BNY Mellon Absolute Return Equity Fund cont’d.Net asset value per: Class R (Inc) (Hedged) EUR 1.0238 1.0399 1.0194
Sterling R (Acc) GBP 1.1711 1.1790 1.1467 Sterling S (Acc) GBP 1.2065 1.2086 1.1681
Class T (Hedged) EUR 1.1682 1.1810 1.1516 Class T (Hedged) USD 1.0680 1.0658 1.0359 Class U (Hedged) EUR 1.0354 1.0444 1.0191 Class U (Hedged) USD 1.0516 1.0484 1.0174
Sterling U (Acc) GBP 1.2113 1.2117 1.1716 Sterling X (Acc) GBP 1.3154 1.3042 1.2452
BNY Mellon Asian Bond FundTotal net assets USD 25,628,060 40,960,870 32,463,471 Net asset value per: Class A (Acc) USD 1.0617 1.0252 1.0077
Class A (Inc) USD 1.0149 1.0007 1.0040 Class C (Acc) USD 1.0744 1.0321 1.0097 Class C (Inc) USD 1.0162 1.0020 1.0053
Class E (Acc)^ USD 1.0323 – – Class E (Inc) USD 0.9883 0.9745 –
Class H (Acc) (Hedged) EUR 1.0412 1.0201 1.0066 Class H (Inc) (Hedged) EUR 0.9947 0.9955 1.0029 Class I (Acc) (Hedged) EUR 1.0541 1.0275 1.0087 Class I (Inc) (Hedged) EUR 0.9958 0.9967 1.0042
Class W (Acc) USD 1.0836 1.0373 1.0113 Class W (Acc) (Hedged) EUR 1.0631 1.0327 1.0102
Class W (Inc) USD 1.0170 1.0028 1.0062 Class W (Inc) (Hedged) EUR 0.9966 0.9975 1.0051
Class X (Acc) USD 1.1022 1.0479 1.0144
BNY Mellon Asian Equity FundTotal net assets USD 72,734,376 92,509,650 161,645,935 Net asset value per: Class A USD 2.7807 2.7215 3.0670
Class A EUR 2.3199 2.2013 2.2230 Class B USD 2.9619 2.8845 3.2344 Class B EUR 1.1961 1.1293 1.1347 Class C USD 3.3108 3.2082 3.5796 Class C EUR 2.3365 2.1950 2.1946
Sterling C (Inc) GBP 2.4130 1.9617 2.1066 Class M USD – – 178.62 Class W USD 0.9189 0.8883 0.9886
Sterling W (Inc) GBP 1.1553 0.9396 1.0089
BNY Mellon Asian Income FundTotal net assets GBP 17,863,411 21,002,259 19,898,582 Net asset value per: Class A (Acc) EUR 1.1212 1.0056 1.0496
Class A (Acc) USD 0.8726 0.8081 0.9394 Class A (Inc) EUR 1.0662 0.9811 1.0489 Class A (Inc) USD 0.8226 0.7812 0.9296
Sterling A (Acc) GBP 1.2103 0.9372 1.0305 Sterling A (Inc) GBP 1.1395 0.9050 1.0189
Class B (Acc) USD 0.8705 0.8022 0.9279 Class C (Acc) USD 0.9207 0.8442 0.9717

281
BNY MELLON GLOBAL FUNDS, PLC
NOTES TO THE FINANCIAL STATEMENTS
15. NET ASSET VALUE cont’d.
Fund Share Class Currency 31 December 2016 31 December 2015 31 December 2014
BNY Mellon Asian Income Fund cont’d.Net asset value per: Sterling C (Acc) GBP 1.1785 0.9035 0.9839
Class J (Inc) (Hedged)^ EUR 0.9852 – – Class W (Inc) EUR 1.1162 1.0270 1.0942 Class W (Inc) USD 0.8537 0.8112 0.9637
Sterling W (Inc) GBP 1.1718 0.9300 1.0422
BNY Mellon Brazil Equity FundTotal net assets USD 80,482,765 56,888,143 113,896,415 Net asset value per: Class A USD 0.8366 0.5300 0.8468
Class A EUR 1.1043 0.6777 0.9680 Class B USD 0.7047 0.4443 0.7062 Class B EUR 0.9474 0.5785 0.8223
Sterling B (Acc) GBP 0.8517 0.4489 0.6740 Class C USD 0.9185 0.5762 0.9113 Class C EUR 1.2128 0.7370 1.0422
Sterling C (Inc) GBP 1.0326 0.5555 0.8555 Class H (Hedged) EUR 0.8143 0.5232 0.8483 Class I (Hedged)^ EUR – 0.5376 0.8601
Class M USD – – 139.85 Class W (Acc) USD 0.7899 0.4942 0.7798 Class W (Acc) EUR 0.9812 0.5948 0.8391
Sterling W (Acc) GBP 1.0333 0.5406 0.8056
BNY Mellon Crossover Credit Fund*Total net assets EUR – 233,567,042 172,572,315 Net asset value per: Class A^ EUR – 1.0428 1.0683
Class A^ USD – – 0.9235 Class A (Inc)^ EUR – 0.9930 1.0371 Class A (Inc)^ USD – – 0.9091
Class C^ EUR – 1.0537 1.0743 Class C^ USD – 0.9308 –
Class C (Inc)^ EUR – 1.0123 1.0559 Sterling C (Inc)^ GBP – – 0.9843
Class I (Acc) (Hedged)^ USD – 0.9577 – Class X^ EUR – 1.0656 1.0805
BNY Mellon Dynamic Total Return FundTotal net assets USD 16,846,939 11,519,058 – Net asset value per: Class A (Acc) USD 0.9280 0.9334 –
Class A (Acc) EUR 1.0092 0.9832 – Class A (Inc) EUR 1.0092 0.9832 –
Class C (Acc) USD 0.9433 0.9393 – Class C (Inc) USD 0.9432 0.9393 –
Class H (Acc) (Hedged) EUR 0.9228 0.9397 – Class I (Acc) (Hedged) EUR 0.9370 0.9454 –
Class W (Acc) USD 0.9470 0.9407 – Class W (Acc) (Hedged) EUR 0.9408 0.9468 –
Class W (Inc) USD 0.9469 0.9408 – Class W (Inc) (Hedged) EUR 0.9408 0.9468 –
Sterling W (Acc) GBP 1.2093 1.0041 – Sterling W (Acc) (Hedged) GBP 0.9463 0.9449 –

282
BNY MELLON GLOBAL FUNDS, PLC
NOTES TO THE FINANCIAL STATEMENTS
15. NET ASSET VALUE cont’d.
Fund Share Class Currency 31 December 2016 31 December 2015 31 December 2014
BNY Mellon Dynamic Total Return Fund cont’d.Net asset value per: Sterling W (Inc) GBP 1.2093 1.0042 –
Sterling W (Inc) (Hedged) GBP 0.9463 0.9449 – Class X (Acc) USD 0.9595 0.9455 –
BNY Mellon Emerging Markets Corporate Debt FundTotal net assets USD 175,436,673 108,707,950 89,815,077 Net asset value per: Class A USD 118.7668 106.0477 106.3978
Class A EUR 142.8519 123.6597 111.1761 Class B USD 130.0582 115.8427 115.9313 Class C USD 131.4009 116.5712 116.1929 Class C EUR 157.3113 135.2970 120.8506
Class H (Hedged) EUR 118.2109 107.0378 107.7056 Class I (Hedged) EUR 120.8610 108.7738 108.7594
Class W USD 132.5739 117.3775 116.7629 Class W EUR 166.3248 142.7798 127.2598
Class W (Acc) (Hedged)^ CHF 97.3067 – – Sterling W (Acc) (Hedged) GBP 127.6105 113.0298 112.2026
Class X USD 141.3124 124.2625 122.7895
BNY Mellon Emerging Markets Debt FundTotal net assets USD 61,675,460 71,167,680 309,091,452 Net asset value per: Class A USD 2.0054 1.8250 1.8820
Class A EUR 1.9052 1.6794 1.5554 Class C USD 2.1257 1.9250 1.9752 Class C EUR 2.0142 1.7666 1.6280
Class C (Inc) USD 0.8072 0.7719 0.8825 Class H (Acc) (Hedged) EUR 1.0822 1.0068 1.0490 Class I (Acc) (Hedged)^ EUR – 1.0186 1.0537
Class W USD 1.0641 0.9613 0.9837 Class X (Inc) USD – – 1.3118
BNY Mellon Emerging Markets Debt Local Currency FundTotal net assets USD 830,681,213 1,324,481,237 2,137,882,176 Net asset value per: Class A USD 0.9965 0.9272 1.1125
Class A EUR 1.1785 1.0621 1.1444 Class A (Inc) USD 0.6025 0.5896 0.7404 Class A (Inc) EUR 0.9313 0.8828 0.9956
Sterling A (Acc) GBP 1.0560 0.8213 0.9321 Sterling A (Inc) GBP 0.7918 0.6478 0.7694
Class B USD 0.7733 0.7175 0.8585 Class B EUR 0.9798 0.8810 0.9469
Sterling B (Acc) GBP 1.0826 0.8398 0.9507 Sterling B (Inc) GBP 0.8273 0.6768 0.8039
Class C USD 1.3039 1.2072 1.4412 Class C EUR 1.2390 1.1111 1.1913
Class C (Inc) USD 0.6469 0.6331 0.7952 Class C (Inc) EUR 0.8762 0.8306 0.9369
Sterling C (Acc) GBP 1.5673 1.2130 1.3697 Sterling C (Inc) GBP 1.0405 0.8517 1.0119
Class H (Hedged) EUR 0.9226 0.8731 1.0583 Class I (Hedged) EUR 0.9261 0.8731 1.0537
Class I (Inc) (Hedged) EUR 0.6078 0.6050 0.7598

283
BNY MELLON GLOBAL FUNDS, PLC
NOTES TO THE FINANCIAL STATEMENTS
15. NET ASSET VALUE cont’d.
Fund Share Class Currency 31 December 2016 31 December 2015 31 December 2014
BNY Mellon Emerging Markets Debt Local Currency Fund cont’d.Net asset value per: Sterling J (Inc) (Hedged) GBP 0.5897 0.5814 0.7341
Class M USD – – 136.92 Class M (Hedged) EUR – – 93.80
Sterling M (Acc) (Hedged) GBP – – 94.030 Class W USD 0.7720 0.7122 0.8473 Class W EUR 0.9484 0.8475 0.9054
Class W (Hedged) EUR 0.8037 0.7542 0.9039 Class W (Inc) USD 0.6251 0.6118 0.7686 Class W (Inc) EUR 0.7678 0.7281 0.8213
Sterling W (Inc) GBP 0.8128 0.6650 0.7901 Sterling W (Inc) (Hedged) GBP 0.6597 0.6470 0.8139
Class X USD 1.4536 1.3319 1.5740 Class X (Inc) USD – – 0.9841 Class X (Inc) CHF 0.6733 0.6480 0.8083
BNY Mellon Emerging Markets Debt Opportunistic FundTotal net assets USD 66,839,955 87,983,556 16,668,797 Net asset value per: Class A USD 0.9096 0.8351 0.9254
Class A EUR 1.1931 1.0608 1.0557 Class C USD 0.9470 0.8650 0.9536 Class C EUR 1.2125 1.0728 1.0623
Class W EUR 1.2265 1.0813 1.0670 Class X USD 0.9796 0.8856 0.9663
Class X (Inc) USD 1.0209 0.9740 –
BNY Mellon Emerging Markets Equity Fund**Total net assets USD – – 14,312,715 Net asset value per: Class A USD – – 1.5431
Class A EUR – – 1.6818 Class C USD – – 1.7291 Class C EUR – – 1.9445
Class X (Inc) USD – – 1.6737
BNY Mellon Emerging Markets Equity Core Fund**Total net assets USD – – 161,186,349 Net asset value per: Class A EUR – – 0.9783
Class C USD – – 0.9309 Class C EUR – – 0.9960 Class S USD – – 1.0698
Class W EUR – – 1.1151
BNY Mellon Emerging Markets Local Currency Investment Grade Debt Fund**Total net assets USD – – 179,211,791 Net asset value per: Class C USD – – 0.8313
Class C EUR – – 1.0350 Class X USD – – 0.8632
BNY Mellon Euroland Bond FundTotal net assets EUR 1,336,311,959 2,753,951,220 3,136,435,340 Net asset value per: Class A EUR 1.8777 1.8318 1.8544
Class A (Inc) EUR 1.1863 1.1675 1.1951
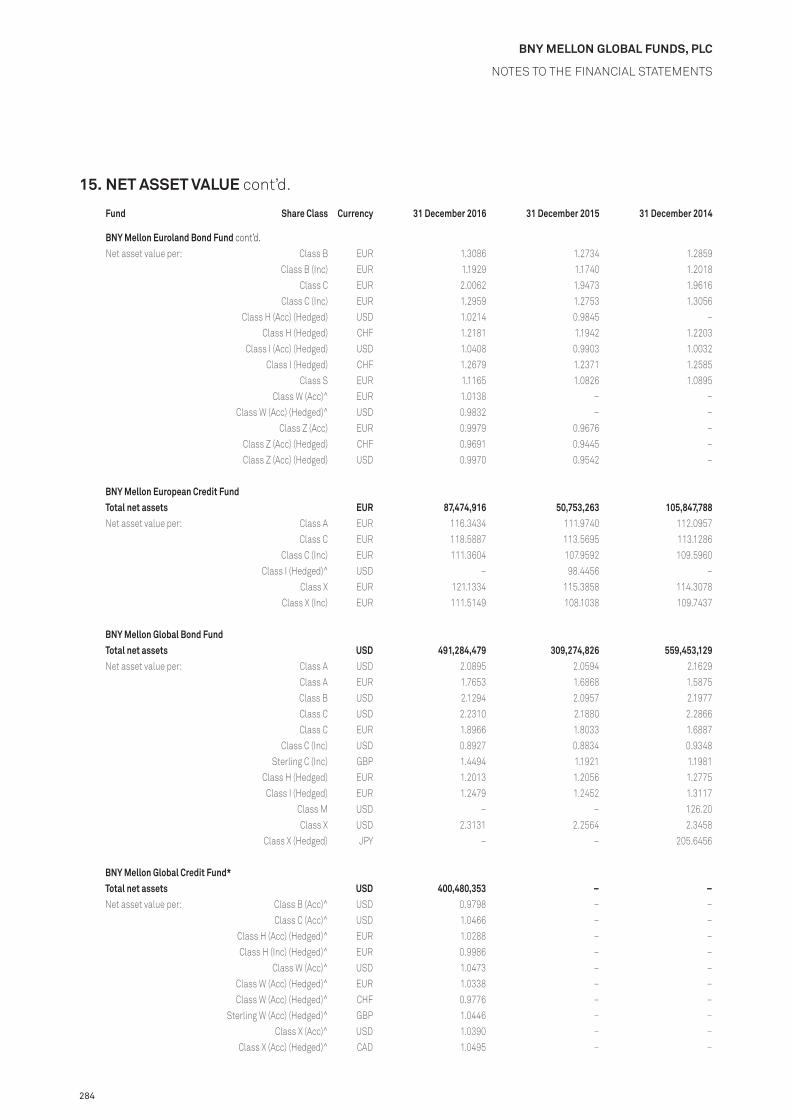
284
BNY MELLON GLOBAL FUNDS, PLC
NOTES TO THE FINANCIAL STATEMENTS
15. NET ASSET VALUE cont’d.
Fund Share Class Currency 31 December 2016 31 December 2015 31 December 2014
BNY Mellon Euroland Bond Fund cont’d.Net asset value per: Class B EUR 1.3086 1.2734 1.2859
Class B (Inc) EUR 1.1929 1.1740 1.2018 Class C EUR 2.0062 1.9473 1.9616
Class C (Inc) EUR 1.2959 1.2753 1.3056 Class H (Acc) (Hedged) USD 1.0214 0.9845 –
Class H (Hedged) CHF 1.2181 1.1942 1.2203 Class I (Acc) (Hedged) USD 1.0408 0.9903 1.0032
Class I (Hedged) CHF 1.2679 1.2371 1.2585 Class S EUR 1.1165 1.0826 1.0895
Class W (Acc)^ EUR 1.0138 – – Class W (Acc) (Hedged)^ USD 0.9832 – –
Class Z (Acc) EUR 0.9979 0.9676 – Class Z (Acc) (Hedged) CHF 0.9691 0.9445 – Class Z (Acc) (Hedged) USD 0.9970 0.9542 –
BNY Mellon European Credit FundTotal net assets EUR 87,474,916 50,753,263 105,847,788 Net asset value per: Class A EUR 116.3434 111.9740 112.0957
Class C EUR 118.5887 113.5695 113.1286 Class C (Inc) EUR 111.3604 107.9592 109.5960
Class I (Hedged)^ USD – 98.4456 – Class X EUR 121.1334 115.3858 114.3078
Class X (Inc) EUR 111.5149 108.1038 109.7437
BNY Mellon Global Bond FundTotal net assets USD 491,284,479 309,274,826 559,453,129 Net asset value per: Class A USD 2.0895 2.0594 2.1629
Class A EUR 1.7653 1.6868 1.5875 Class B USD 2.1294 2.0957 2.1977 Class C USD 2.2310 2.1880 2.2866 Class C EUR 1.8966 1.8033 1.6887
Class C (Inc) USD 0.8927 0.8834 0.9348 Sterling C (Inc) GBP 1.4494 1.1921 1.1981
Class H (Hedged) EUR 1.2013 1.2056 1.2775 Class I (Hedged) EUR 1.2479 1.2452 1.3117
Class M USD – – 126.20 Class X USD 2.3131 2.2564 2.3458
Class X (Hedged) JPY – – 205.6456
BNY Mellon Global Credit Fund*Total net assets USD 400,480,353 – – Net asset value per: Class B (Acc)^ USD 0.9798 – –
Class C (Acc)^ USD 1.0466 – – Class H (Acc) (Hedged)^ EUR 1.0288 – – Class H (Inc) (Hedged)^ EUR 0.9986 – –
Class W (Acc)^ USD 1.0473 – – Class W (Acc) (Hedged)^ EUR 1.0338 – – Class W (Acc) (Hedged)^ CHF 0.9776 – –
Sterling W (Acc) (Hedged)^ GBP 1.0446 – – Class X (Acc)^ USD 1.0390 – –
Class X (Acc) (Hedged)^ CAD 1.0495 – –

285
BNY MELLON GLOBAL FUNDS, PLC
NOTES TO THE FINANCIAL STATEMENTS
15. NET ASSET VALUE cont’d.
Fund Share Class Currency 31 December 2016 31 December 2015 31 December 2014
BNY Mellon Global Dynamic Bond FundTotal net assets USD 364,965,473 263,712,709 264,568,682 Net asset value per: Class A USD 1.1590 1.1228 1.1383
Class A EUR 1.2774 1.1997 1.0899 Class A (Inc) USD 1.0141 0.9901 1.0154
Class C USD 1.2153 1.1715 1.1817 Class H (Hedged) EUR 1.0238 1.0047 1.0229
Class H (Inc) (Hedged) EUR 0.9708 0.9604 0.9895 Class I (Hedged) EUR 1.0463 1.0218 1.0349
Class I (Inc) (Hedged) EUR 0.9738 0.9632 0.9934 Class W USD 1.0354 0.9957 1.0018
Class W (Hedged) EUR 1.0204 0.9939 1.0044 Class W (Acc) (Hedged)^ CHF 1.0015 – –
Sterling W (Acc) (Hedged) GBP 1.0394 1.0022 1.0052
BNY Mellon Global Emerging Markets Equity Value Fund*Total net assets USD – 4,126,148 10,943,177 Net asset value per: Class A^ USD – 2.4593 3.0417
Class A^ EUR – 2.2379 2.4804 Class B^ USD – 0.7460 0.9179 Class B^ EUR – 0.9693 1.0689
Sterling B (Acc)^ GBP – 0.7073 0.8265 Class C^ USD – 2.7952 3.4227 Class C^ EUR – 2.3896 2.6223
BNY Mellon Global Emerging Markets FundTotal net assets USD 30,166,865 68,936,938 29,078,381 Net asset value per: Class A USD 0.7436 0.7408 0.8533
Class A EUR 0.9674 0.9347 0.9647 Class A (Inc) USD 0.6675 0.6650 0.7894 Class A (Inc) EUR 0.8662 0.8367 0.8901 Class B (Inc) USD 0.7367 0.7305 0.8629 Class B (Inc) EUR 0.8874 0.8529 0.9028
Sterling B (Inc) GBP 0.9526 0.7842 0.8793 Class C USD 0.8504 0.8390 0.9565
Class C (Acc) USD 0.9382 0.9256 – Class C (Inc) USD 0.7524 0.7422 0.8723
Sterling C (Inc) GBP 0.9713 0.7968 0.8890 Class H (Hedged) EUR 0.7457 0.7550 0.8699
Class H (Inc) (Hedged) EUR 0.6689 0.6772 0.8089 Class I (Hedged) EUR 0.7756 0.7772 0.8853
Class I (Inc) (Hedged) EUR 0.6976 0.6989 0.8227 Class W (Acc) USD 1.0853 1.0680 – Class W (Inc) USD 0.7588 0.7481 0.8769 Class W (Inc) EUR 0.8972 0.8620 0.9092
Sterling W (Inc) GBP 0.9795 0.8034 0.8937
BNY Mellon Global Equity FundTotal net assets USD 258,017,204 255,410,733 239,095,160 Net asset value per: Class A USD 1.9203 1.9327 1.8938
Class A EUR 1.6404 1.6007 1.4056 Class B USD 2.0379 2.0409 1.9898

286
BNY MELLON GLOBAL FUNDS, PLC
NOTES TO THE FINANCIAL STATEMENTS
15. NET ASSET VALUE cont’d.
Fund Share Class Currency 31 December 2016 31 December 2015 31 December 2014
BNY Mellon Global Equity Fund cont’d.Net asset value per: Class B EUR 1.9122 1.8564 1.6219
Class C USD 2.1806 2.1729 2.1079 Class C EUR 1.8387 1.7769 1.5448
Class I (Hedged) EUR 1.1009 1.1114 1.0757 Class M USD – – 173.25
Class W (Acc)^ USD 0.9758 – – Class W (Acc)^ EUR 1.0391 – –
BNY Mellon Global Equity Income FundTotal net assets USD 692,443,890 469,197,968 337,512,229 Net asset value per: Class A USD 1.3832 1.3065 1.2721
Class A EUR 1.9451 1.7812 1.5541 Class A (Inc) USD 1.1375 1.1082 1.1151
Class A (Inc)^ EUR 1.1012 – – Sterling A (Acc) GBP 1.3446 1.0545 – Sterling A (Inc) GBP 1.2951 1.0475 –
Class B USD 1.6576 1.5580 1.5094 Class B EUR 1.8910 1.7232 1.4960
Class B (Inc) USD 1.3595 1.3178 1.3192 Class B (Inc) EUR 1.6712 1.5706 1.4091
Sterling B (Inc) GBP 1.7286 1.3911 1.3223 Class C USD 1.5364 1.4370 1.3852 Class C EUR 2.0146 1.8265 1.5778
Class C (Inc) USD 1.3961 1.3466 1.3413 Class C (Inc) EUR 1.6340 1.5280 1.3639
Sterling C (Inc) GBP 1.7726 1.4192 1.3422 Class H (Hedged) EUR 1.1791 1.1317 1.1063
Class H (Inc) (Hedged) EUR 1.0507 1.0376 1.0479 Class I (Hedged) EUR 1.2274 1.1636 1.1255
Class I (Inc) (Hedged) EUR 1.0844 1.0606 1.0617 Class M USD – – 134.28 Class M EUR – – 143.25
Class M (Inc) USD – – 114.61 Sterling M (Acc) GBP – – 135.32 Sterling M (Inc) GBP – – 119.21
Class W USD 1.3398 1.2500 1.2019 Class W EUR 1.6592 1.5007 1.2931
Class W (Inc) USD 1.1757 1.1312 1.1240 Class W (Inc) EUR 1.4607 1.3626 1.2132
Sterling W (Acc) GBP 1.7550 1.3593 1.2409 Sterling W (Inc) GBP 1.5402 1.2302 1.1606
Class Z (Acc) USD 1.1200 1.0437 1.0024 Class Z (Acc) EUR 1.3227 1.1952 1.0287 Class Z (Inc) USD 1.0521 1.0117 1.0024 Class Z (Inc) EUR 1.0909 1.0110 –
Sterling Z (Acc) GBP 1.2927 1.0002 – Sterling Z (Inc) GBP 1.3597 1.0850 1.0207
BNY Mellon Global High Yield Bond FundTotal net assets USD 155,792,195 134,419,024 155,483,986 Net asset value per: Class A EUR 2.3461 2.0159 1.8703
Class A (Inc)^ EUR 1.1515 – –

287
BNY MELLON GLOBAL FUNDS, PLC
NOTES TO THE FINANCIAL STATEMENTS
15. NET ASSET VALUE cont’d.
Fund Share Class Currency 31 December 2016 31 December 2015 31 December 2014
BNY Mellon Global High Yield Bond Fund cont’d.Net asset value per: Class C USD 1.1720 1.0362 1.0702
Class C EUR 2.4199 2.0739 1.9186 Class H (Hedged) EUR 1.1432 1.0241 1.0630
Class I (Hedged) EUR 1.1607 1.0326 1.0690 Class X USD 1.1005 0.9629 –
Class X (Inc) USD 0.9874 0.9218 1.0052 Class X (Inc) (Hedged) EUR 0.9861 0.9319 1.0179
BNY Mellon Global Leaders Fund*Total net assets USD 28,345,314 – – Net asset value per: Class A (Acc)^ USD 1.0122 – –
Class C (Acc)^ USD 1.0129 – – Sterling E (Acc)^ GBP 1.0380 – –
Class H (Acc) (Hedged)^ EUR 1.0110 – – Class H (Inc) (Hedged)^ EUR 1.0110 – –
Class W (Acc)^ USD 1.0130 – – Class W (Acc) (Hedged)^ EUR 1.0118 – – Class W (Inc) (Hedged)^ EUR 1.0118 – –
Sterling W (Acc)^ GBP 1.0379 – –
BNY Mellon Global Opportunistic Bond FundTotal net assets USD 130,538,823 217,468,477 110,727,531 Net asset value per: Class A USD 1.0646 1.0530 1.1010
Class C USD 1.1066 1.0879 1.1307 Class C (Inc) USD 0.9545 0.9761 –
Class H (Hedged) EUR 1.0515 1.0529 1.0993 Class I (Hedged) EUR 1.0798 1.0750 1.1264
Sterling I (Acc) (Hedged) GBP 0.9770 0.9652 1.0057 Class X USD 1.1586 1.1314 1.1677
Class X (Inc)^ USD – 0.9218 –
BNY Mellon Global Opportunities FundTotal net assets USD 106,650,391 141,840,200 98,394,319 Net asset value per: Class A USD 2.3795 2.3574 2.2464
Class A EUR 2.0165 1.9369 1.6540 Class B USD 2.5298 2.4939 2.3646 Class B EUR 2.0032 1.9144 1.6267 Class C USD 2.6639 2.6129 2.4652 Class C EUR 2.2534 2.1429 1.8116
Class H (Hedged) EUR 1.2493 1.2517 1.1915 Class I (Hedged) EUR 1.2920 1.2811 1.2088
Class X EUR 2.5079 2.3604 1.9754
BNY Mellon Global Property Securities FundTotal net assets EUR 21,364,386 14,019,967 11,284,735 Net asset value per: Class A EUR 1.6369 1.5715 1.4483
Class A USD 1.0834 1.0728 1.1032 Class C EUR 1.7855 1.6971 1.5484 Class C USD 1.1816 1.1584 1.1794
Sterling I (Inc) (Hedged) GBP 2.4930 2.4444 2.2454 Sterling J (Acc) (Hedged) GBP 1.7426 1.6571 1.5228 Sterling J (Inc) (Hedged) GBP 1.6708 1.6357 1.5044

288
BNY MELLON GLOBAL FUNDS, PLC
NOTES TO THE FINANCIAL STATEMENTS
15. NET ASSET VALUE cont’d.
Fund Share Class Currency 31 December 2016 31 December 2015 31 December 2014
BNY Mellon Global Real Return Fund (EUR)Total net assets EUR 4,115,560,292 2,609,987,886 2,016,002,696 Net asset value per: Class A EUR 1.2450 1.2388 1.2247
Class A (Inc) EUR 1.0458 1.0472 1.0452 Class C EUR 1.2878 1.2750 1.2543
Class C (Inc) EUR 1.1032 1.1048 1.1025 Class W EUR 1.1673 1.1528 1.1312
Class W (Acc) (Hedged)^ CHF 0.9614 – – Class X EUR 1.2584 1.2331 1.2007
Class Z (Acc) EUR 0.9795 0.9664 –
BNY Mellon Global Real Return Fund (GBP)Total net assets GBP 66,687,250 59,049,879 32,614,263 Net asset value per: Sterling B (Acc) GBP 1.1245 1.0916 1.0902
Sterling B (Inc) GBP 1.0740 1.0465 1.0545 Sterling C (Inc) GBP 1.0959 1.0681 1.0764
Sterling W (Acc) GBP 1.1304 1.0892 1.0797 Sterling W (Inc) GBP 1.0771 1.0500 1.0581 Sterling X (Acc) GBP 1.1134 1.0644 1.0471
BNY Mellon Global Real Return Fund (USD)Total net assets USD 645,149,675 506,138,241 423,216,326 Net asset value per: Class A USD 1.3103 1.2885 1.2963
Class A (Inc)^ USD 0.9524 – – Class C USD 1.3600 1.3307 1.3321
Class C (Inc) USD 1.1222 1.1100 1.1259 Class W (Acc) USD 1.1033 1.0767 1.0752 Class W (Inc) USD 1.0490 1.0375 1.0524
Class X USD 1.4703 1.4238 1.4109
BNY Mellon Global Short-Dated High Yield Bond Fund*Total net assets USD 449,324,739 – – Net asset value per: Class A (Acc)^ USD 1.0138 – –
Class C (Acc)^ USD 1.0143 – – Class H (Acc) (Hedged)^ EUR 1.0122 – –
Class I (Acc) (Hedged)^ EUR 1.0127 – – Class W (Acc)^ USD 1.0145 – –
Sterling W (Acc) (Hedged)^ GBP 1.0138 – – Class X (Acc)^ USD 1.0150 – – Class Y (Acc)^ USD 1.0149 – –
Sterling Y (Acc) (Hedged)^ GBP 1.0142 – –
BNY Mellon Japan All Cap Equity FundTotal net assets JPY 2,280,546,187 3,963,253,205 866,338,981 Net asset value per: Class C JPY 125.4772 126.7942 109.3984
Class C USD 1.0922 1.0713 – Class H (Hedged) EUR 1.2012 1.2339 1.0750 Class H (Hedged) USD 1.1942 1.2253 1.0737
Class I (Hedged) EUR 1.2347 1.2589 1.0859 Class I (Hedged) USD 1.2238 1.2486 1.0833
Class W JPY 126.4444 127.4470 109.6916 Sterling W (Acc) GBP 1.5098 1.2270 1.0157
Class X (Inc) JPY 105.6373 105.7885 –

289
BNY MELLON GLOBAL FUNDS, PLC
NOTES TO THE FINANCIAL STATEMENTS
15. NET ASSET VALUE cont’d.
Fund Share Class Currency 31 December 2016 31 December 2015 31 December 2014
BNY Mellon Japan REIT Alpha Fund*Total net assets JPY 2,161,738,343 – – Net asset value per: Class C (Acc)^ JPY 104.1878 – –
Class W (Inc)^ JPY 104.2009 – –
BNY Mellon Japan Small Cap Equity Focus FundTotal net assets JPY 2,724,538,443 4,454,629,125 1,562,709,991 Net asset value per: Class C JPY 154.2432 146.5065 122.9218
Class C USD 1.1650 1.0740 – Class H (Hedged) EUR 1.4611 1.4095 1.2080 Class H (Hedged) USD 1.4857 1.4164 1.2078
Class H Acc (Hedged)^ SGD 1.1466 – – Class I (Hedged) EUR 1.5288 1.4583 1.2208 Class I (Hedged) USD 1.5200 1.4459 1.2201
Class W JPY 155.4471 147.2666 123.2472 Sterling W (Acc) GBP 1.8054 1.3796 1.1104
BNY Mellon Long-Term Global Equity FundTotal net assets EUR 1,283,751,148 1,449,584,755 1,510,817,278 Net asset value per: Class A EUR 2.0079 1.8731 1.7081
Class A USD 1.3319 1.2828 1.3025 Class A (Inc) EUR 1.2878 1.2014 1.0956
Sterling A (Acc) GBP 2.0101 1.6184 1.5543 Class B EUR 1.8519 1.7190 1.5598 Class B USD 1.3764 1.3190 1.3326
Sterling B (Inc) GBP 1.6955 1.3588 1.2985 Class C EUR 2.1898 2.0226 1.8261 Class C USD 1.4536 1.3861 1.3934
Class C (Inc) EUR 1.7953 1.6672 1.5115 Class M USD – – 148.08 Class S EUR 2.2213 2.0419 1.8367
Class W EUR 1.5960 1.4704 1.3241 Class W USD 1.2951 1.2319 1.2353
Class W (Hedged) CHF 1.5013 1.3962 1.2742 Class W (Hedged) USD 1.5235 1.3941 1.2618
Class W (Inc) USD 1.2635 1.2115 1.2244 Sterling W (Acc) GBP 1.6871 1.3416 1.2724 Sterling W (Inc) GBP 1.6456 1.3190 1.2610
Class X^ EUR – 1.8326 1.6378 Class X USD – – 1.3030
Sterling X GBP 1.4643 1.1553 1.0874
BNY Mellon Pan European Equity FundTotal net assets EUR 1,933,821 49,183,300 20,050,409 Net asset value per: Class A EUR 1.3712 1.4970 1.3496
Class A USD 1.6000 1.8019 1.8127 Class B EUR 1.4465 1.5714 1.4095 Class C EUR 1.5007 1.6223 1.4479
Class C^ USD – 2.4663 2.4564

290
BNY MELLON GLOBAL FUNDS, PLC
NOTES TO THE FINANCIAL STATEMENTS
15. NET ASSET VALUE cont’d.
Fund Share Class Currency 31 December 2016 31 December 2015 31 December 2014
BNY Mellon S&P 500® Index TrackerTotal net assets USD 86,574,689 76,861,012 95,261,758 Net asset value per: Class A USD 2.0222 1.8391 1.8498
Class A EUR 1.9201 1.6915 1.5280 Class C USD 2.2510 2.0330 2.0305 Class C EUR 2.0275 1.7736 1.5910
BNY Mellon Small Cap Euroland FundTotal net assets EUR 35,012,462 61,991,179 9,848,311 Net asset value per: Class A EUR 4.4737 4.2824 3.4228
Class A USD 1.0124 1.0000 0.8918 Class B EUR 2.2291 2.1231 1.6885 Class C EUR 5.0434 4.7798 3.7824 Class C USD 1.0737 1.0497 –
Class I (Acc) (Hedged)^ USD – 1.0035 – Sterling W (Acc)^ GBP 1.3414 – –
BNY Mellon Targeted Return Bond FundTotal net assets USD 78,908,389 93,725,700 – Net asset value per: Class A (Acc) USD 0.9820 0.9756 –
Sterling W (Acc) (Hedged) GBP 0.9858 0.9757 –
BNY Mellon U.S. Dynamic Value FundTotal net assets USD 139,942,788 41,549,699 72,404,005 Net asset value per: Class A USD 2.6395 2.2676 2.3651
Class A EUR 2.4682 2.0538 1.9238 Class B USD 1.9063 1.6295 1.6910 Class B EUR 2.5656 2.1242 1.9799 Class C USD 2.9382 2.4991 2.5806 Class C EUR 2.9483 2.4290 2.2526
Class X (Inc) USD – – 1.6928
BNY Mellon US Opportunities FundTotal net assets USD 31,689,172 51,224,603 11,359,497 Net asset value per: Class A USD 1.0595 1.0183 –
Class A EUR 1.3894 1.2932 1.1568 Class A (Inc) EUR 1.3666 1.2720 1.1378
Class C USD 1.1054 1.0516 1.0370 Class C EUR 1.4253 1.3135 1.1631
Class W EUR 1.4344 1.3185 1.1647
* Please refer to Note 19 of the financial statements.** This Fund closed during 2015, hence only one year of NAV information. ̂ This share class was launched or closed during the year.
16. RISK MANAGEMENT OBJECTIVES AND POLICIES
STRATEGY IN USING FINANCIAL INSTRUMENTSThe Company’s investment activities expose it to the various types of risk, which are associated with the financial instruments and markets in which it invests: market risk (including market price risk, interest rate risk and currency risk), credit risk and liquidity risk. The Company has in place risk management programmes that seek to limit the potential adverse effects of these risks on the Funds’ financial performances.

291
BNY MELLON GLOBAL FUNDS, PLC
NOTES TO THE FINANCIAL STATEMENTS
16. RISK MANAGEMENT OBJECTIVES AND POLICIES cont’d.
STRATEGY IN USING FINANCIAL INSTRUMENTS cont’d.The assets of each Fund will be invested separately in accordance with the investment objectives and policies of the relevant Fund, which are set out in the relevant supplements to the prospectus. Where a Fund maintains in its name reference to a particular currency, country, region, economic sector or type of security, at least three quarters of the assets of that Fund will comprise investments corresponding to the relevant currency, country, region, economic sector or type of security (as appropriate).
The Funds may use FDI for efficient portfolio management purposes or to protect against foreign exchange risks. Some Funds have the facility to use FDI for investment purposes according to the Central Bank UCITS Regulations. In their Risk Management Process (“RMP”) it explains whether each Fund uses the commitment approach or Value at Risk (“VaR”) to calculate its global exposure. The commitment approach measures the leverage effect produced by the use of derivatives and is calculated by converting all derivative positions, whether used as part of the Fund’s general investment policy, for purposes of risk reduction or for the purpose of efficient portfolio management, based on the market values of the underlying assets or contracts. VaR for a pre-defined time horizon measures the threshold loss in value of a portfolio of financial instruments that may be exceeded for a given probability (either Absolute[1] or Relative[2]). The quality of the VaR model forecasts is demonstrated by back-testing. As a complement to VaR, stress testing is used to evaluate the potential impact on portfolio values of extreme, although plausible, events or movements in a set of financial variables.
For a more detailed description, the RMP for each of the Funds is available on request.
[1] This is defined as the VaR of the Fund capped as a percentage of NAV.[2] This is defined as the VaR of the Fund divided by the VaR of a benchmark or reference portfolio.
FINANCIAL RISK MANAGEMENT PROCESSIn order to achieve its investment objectives, the Company buys, sells and holds financial assets and liabilities. As a consequence, the Company is exposed to market price risk, interest rate risk, currency risk, credit risk and liquidity risk arising from the financial instruments it holds. The Company’s overall risk management programme focuses on the unpredictability of financial markets and seeks to minimise potential adverse effects on the Company’s financial performance. The Company uses FDI to moderate certain risk exposures.
The risk management policies employed by the Company to manage these risks are discussed below.
INVESTMENT RISKActivities of each Fund expose it to a variety of financial risks: market risk (including market price risk, interest rate risk and currency risk), credit risk and liquidity risk. Each type of risk is discussed in turn and quantitative analyses are provided when relevant.
MARKET RISKMarket risk is the risk that the fair value of a financial instrument will fluctuate because of changes in market prices. Market risk comprises three types of risk: market price risk, interest rate risk and currency risk.
MARKET PRICE RISKMarket price risk is the risk that the fair value of a financial instrument will fluctuate because of changes in market prices (other than those arising from interest rate risk and currency risk), whether those changes are caused by factors specific to individual financial instruments or its issuer, or other factors affecting similar financial instruments traded in the market.
Many of the Funds trade in financial instruments, taking positions in traded securities in the equity and equity derivative markets. The investment of the Fund is subject to market fluctuations and there can be no assurances that investments will appreciate in value, therefore presenting a risk of loss of capital.
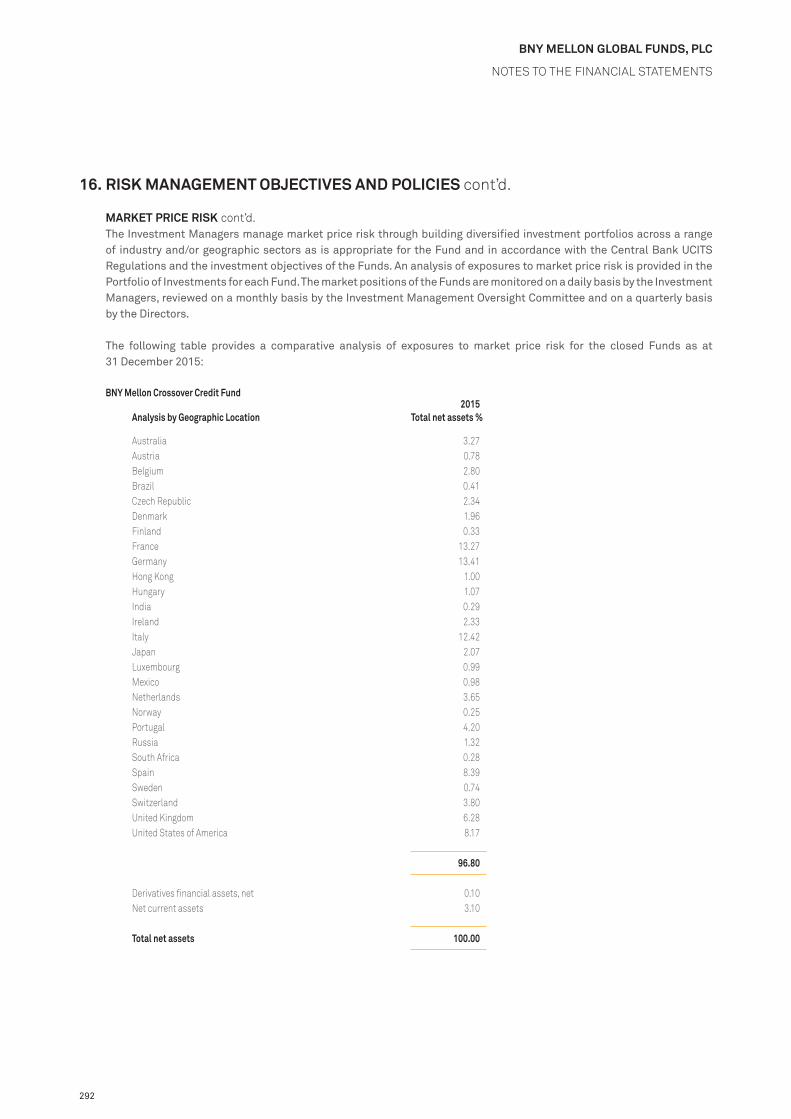
292
BNY MELLON GLOBAL FUNDS, PLC
NOTES TO THE FINANCIAL STATEMENTS
16. RISK MANAGEMENT OBJECTIVES AND POLICIES cont’d.
MARKET PRICE RISK cont’d.The Investment Managers manage market price risk through building diversified investment portfolios across a range of industry and/or geographic sectors as is appropriate for the Fund and in accordance with the Central Bank UCITS Regulations and the investment objectives of the Funds. An analysis of exposures to market price risk is provided in the Portfolio of Investments for each Fund. The market positions of the Funds are monitored on a daily basis by the Investment Managers, reviewed on a monthly basis by the Investment Management Oversight Committee and on a quarterly basis by the Directors.
The following table provides a comparative analysis of exposures to market price risk for the closed Funds as at 31 December 2015:
BNY Mellon Crossover Credit Fund
Analysis by Geographic Location2015
Total net assets %
Australia 3.27Austria 0.78Belgium 2.80Brazil 0.41Czech Republic 2.34Denmark 1.96Finland 0.33France 13.27Germany 13.41Hong Kong 1.00Hungary 1.07India 0.29Ireland 2.33Italy 12.42Japan 2.07Luxembourg 0.99Mexico 0.98Netherlands 3.65Norway 0.25Portugal 4.20Russia 1.32South Africa 0.28Spain 8.39Sweden 0.74Switzerland 3.80United Kingdom 6.28United States of America 8.17
96.80
Derivatives financial assets, net 0.10Net current assets 3.10
Total net assets 100.00

293
BNY MELLON GLOBAL FUNDS, PLC
NOTES TO THE FINANCIAL STATEMENTS
16. RISK MANAGEMENT OBJECTIVES AND POLICIES cont’d.
MARKET PRICE RISK cont’d.
BNY Mellon Global Emerging Markets Equity Value Fund
Analysis by Geographic Location2015
Total net assets %
China 5.93Hong Kong 0.14India 0.17Turkey 0.00United States of America 97.76
104.00
Net current liabilities (4.00)
Total net assets 100.00
The Company’s market risk strategy is driven by the Company’s investment risk and return objectives. The Board of Directors has instructed the Investment Managers to manage each of the risks in accordance with an established risk management system.
The following table demonstrates by way of example the likely increase in net asset value as a result of a 5% upwards movement in the Funds’ related market index (a 5% decrease would have similar negative results). Please note the table does not include the bond Funds as their main exposure is to interest rate risk, as detailed below. Detail of market sensitivity for these Funds is provided in the subsequent commentary. In the interests of providing consistent comparisons across the Funds, the table assumes a movement of 5%. It should be noted future market conditions could vary significantly and the table is meant for illustrative purposes only.
As at 31 December 2016 and 31 December 2015, for the Funds listed in the following table, should market value have increased or decreased by 5% with all other variables remaining constant, the increase or decrease in net assets attributable to redeemable participating shareholders for the year is shown.
Fund Benchmark Index Currency Volatility
Increase/(decrease) in financial assets & liabilities at fair value
through profit and loss2016 2015 2016 2015
BNY Mellon Asian Equity Fund MSCI All-Country Asia Pacific ex Japan USD 5.00% 5.00% 2,965,533 3,669,404
BNY Mellon Asian Income Fund FTSE All-World Asia Pacific ex Japan GBP 5.00% 5.00% 892,443^ 1,043,335^BNY Mellon Brazil Equity Fund MSCI Brazil 10/40 USD 5.00% 5.00% 3,444,058 2,130,085BNY Mellon Global Emerging Markets Equity Value Fund* MSCI Emerging Markets USD 5.00% 5.00% N/A 248,896BNY Mellon Global Emerging Markets Fund MSCI Emerging Markets USD 5.00% 5.00% 1,487,521 1,144,592 BNY Mellon Global Equity Fund MSCI All-Country World USD 5.00% 5.00% 11,580,614 11,357,566BNY Mellon Global Equity Income Fund FTSE World Index USD 5.00% 5.00% 25,198,598 18,856,601BNY Mellon Global Leaders Fund* MSCI World Large Cap USD 5.00% 5.00% 1,378,127^ N/ABNY Mellon Global Opportunities Fund MSCI All-Country World USD 5.00% 5.00% 4,768,390 5,926,667BNY Mellon Global Property Securities Fund FTSE EPRA/NAREIT Developed EUR 5.00% 5.00% 1,068,575 679,415BNY Mellon Global Real Return Fund (EUR) 1 Month EURIBOR EUR 5.00% 5.00% 188,797,931 124,527,651BNY Mellon Global Real Return Fund (GBP) 1 Month LIBOR GBP GBP 5.00% 5.00% 3,091,771 2,709,132BNY Mellon Global Real Return Fund (USD) 1 Month LIBOR USD USD 5.00% 5.00% 31,020,190 23,635,481BNY Mellon Japan All Cap Equity Fund Tokyo Stock Price Index (TOPIX) JPY 5.00% 5.00% 100,002,741 194,490,658^BNY Mellon Japan REIT Alpha Fund* Tokyo Stock Exchange REIT Index JPY 5.00% 5.00% 106,680,998^ N/ABNY Mellon Japan Small Cap Equity Focus Fund Russell Nomura Small Cap Index JPY 5.00% 5.00% 104,226,765 221,620,479^

294
BNY MELLON GLOBAL FUNDS, PLC
NOTES TO THE FINANCIAL STATEMENTS
16. RISK MANAGEMENT OBJECTIVES AND POLICIES cont’d.
MARKET PRICE RISK cont’d.
Fund Benchmark Index Currency Volatility
Increase/(decrease) in financial assets & liabilities at fair value
through profit and loss2016 2015 2016 2015
BNY Mellon Long-Term Global Equity Fund MSCI World Index EUR 5.00% 5.00% 57,456,951 66,855,185BNY Mellon Pan European Equity Fund FTSEurofirst 300 EUR 5.00% 5.00% 92,442 2,164,446BNY Mellon S&P 500® Index Tracker S&P 500 USD 5.00% 5.00% 4,298,352 3,864,181BNY Mellon Small Cap Euroland Fund S&P EuroZone Small Cap EUR 5.00% 5.00% 1,899,743 3,024,777BNY Mellon U.S. Dynamic Value Fund Russell 1000 Value USD 5.00% 5.00% 7,739,570 2,220,142BNY Mellon US Opportunities Fund S&P 500 USD 5.00% 5.00% 1,576,084^ 2,550,414^
* Please refer to Note 19 of the financial statements.^ As the Fund is in existence for less than three years, a statistically significant beta is not available. Hence, for market price risk sensitivity
disclosure, a notional beta of 1 is applied in the effective calculation for these Funds.
For the bond Funds, the likelihood of a decrease in net asset value as a consequence of a downward movement in market prices is defined as follows.
As at 31 December 2016 and 31 December 2015, for bond Funds utilising the Investment Managers VaR risk model (VaR is based on probability), one would not expect the Fund to lose more than the following percentage as listed in the table below (Regulatory limit) in any one week or day, i.e. 1 week in a hundred weeks or 1 day in a hundred days. The table below also shows the VaR of each Fund as at 31 December 2016 and 31 December 2015 calculated at the 99th percentile confidence level over the holding period listed below.
Fund Confidence
LevelHolding
Period VaR
TypeRegulatory
LimitVaR VaR
2016 2015
BNY Mellon Absolute Insight Fund 99% Five days Absolute 10.00% 0.62% 0.64%BNY Mellon Absolute Return Bond Fund 99% Five days Absolute 10.00% 1.47% 0.78%BNY Mellon Absolute Return Equity Fund 99% Five days Absolute 10.00% 0.90% 1.05%BNY Mellon Asian Bond Fund 99% Twenty days Relative 200.00% 109.81% 105.43%BNY Mellon Crossover Credit Fund*^ 99% Ten days Relative 200.00% 125.45% 131.66%BNY Mellon Dynamic Total Return Fund 99% Five days Absolute 10.00% 2.54% 3.61%BNY Mellon Emerging Markets Debt Fund 99% Twenty days Relative 200.00% 112.21% 120.35%BNY Mellon Emerging Markets Debt Local Currency Fund 99% Twenty days Relative 200.00% 109.70% 103.95%BNY Mellon Emerging Markets Debt Opportunistic Fund 99% Twenty days Relative 200.00% 118.19% 108.00%BNY Mellon Emerging Markets Local Currency Investment Grade Debt Fund+ 99% Twenty days Relative 200.00% N/A 3.01%BNY Mellon Euroland Bond Fund 99% Twenty days Relative 200.00% 110.59% 110.44%BNY Mellon European Credit Fund 99% Five days Relative 200.00% 104.00% 104.00%BNY Mellon Global Credit Fund* 99% Five days Relative 200.00% 109.00% N/ABNY Mellon Global High Yield Bond Fund 99% One day Relative 200.00% 104.00% 113.10%BNY Mellon Global Opportunistic Bond Fund 99% Twenty days Absolute 20.00% 1.71% 2.62%BNY Mellon Targeted Return Bond Fund 99% Twenty days Absolute 20.00% 1.56% 2.78%
* Please refer to Note 19 of the financial statements.^ The figure for 2016 relates to the period from 1 January 2016 to 20 September 2016 (date of closure).+ The figure for 2015 relates to the period from 1 January 2015 to 16 June 2015 (date of closure).
VaR is the risk measurement methodology used to assess the Fund’s leverage and market risk volatility. When the VaR is calculated as a percentage of the net asset value of the Fund (absolute or relative VaR), it may not be greater than the VaR limits, as detailed in the table above and the prospectus. VaR is calculated on a daily basis using a one-tailed 99% confidence level and pre-determined holding period on either an absolute (where the figure is compared to the net asset value of the fund) or relative basis (where VaR is compared to the benchmark or reference portfolio). The historical observation period will not be less than one year unless a shorter period is justified.

295
BNY MELLON GLOBAL FUNDS, PLC
NOTES TO THE FINANCIAL STATEMENTS
16. RISK MANAGEMENT OBJECTIVES AND POLICIES cont’d.
MARKET PRICE RISK cont’d.Some limitations of VaR analysis are:
– the models’ methodologies are based on historical data and cannot take account of the fact that future market price movements, correlations between markets and levels of market liquidity in conditions of market stress may bear no relation to historical patterns;
– the market price risk information is a relative estimate of risk rather than a precise and accurate number; and– the market price information represents a hypothetical outcome and is not intended to be predictive.
The minimum, average and maximum utilisation of the Regulatory limit calculated during the year ended 31 December 2016 are as follows:
Fund Minimum utilisation Average utilisation Maximum utilisation
BNY Mellon Absolute Insight Fund 4.60% 7.26% 30.30%BNY Mellon Absolute Return Bond Fund 7.40% 18.98% 27.70%BNY Mellon Absolute Return Equity Fund 0.10% 14.61% 20.60%BNY Mellon Asian Bond Fund 43.56% 52.63% 59.82%BNY Mellon Crossover Credit Fund*^ 51.59% 67.41% 94.07%BNY Mellon Dynamic Total Return Fund 13.28% 27.88% 44.20%BNY Mellon Emerging Markets Debt Fund 45.25% 54.12% 61.03%BNY Mellon Emerging Markets Debt Local Currency Fund 48.32% 51.40% 55.54%BNY Mellon Emerging Markets Debt Opportunistic Fund 42.02% 53.31% 60.59%BNY Mellon Euroland Bond Fund 47.55% 53.51% 59.12%BNY Mellon European Credit Fund 40.50% 48.70% 90.50%BNY Mellon Global Credit Fund* 51.00% 53.81% 62.50%BNY Mellon Global High Yield Bond Fund 26.20% 46.17% 58.75%BNY Mellon Global Opportunistic Bond Fund 7.68% 10.15% 14.76%BNY Mellon Targeted Return Bond Fund 7.31% 10.18% 16.77%
* Please refer to Note 19 of the financial statements.^ The figure for 2016 relates to the period from 1 January 2016 to 20 September 2016 (date of closure).
The minimum, average and maximum utilisation of the Regulatory limit calculated during the year ended 31 December 2015 were as follows:
Fund Minimum utilisation Average utilisation Maximum utilisation
BNY Mellon Absolute Insight Fund 4.70% 6.52% 19.30%BNY Mellon Absolute Return Bond Fund 4.10% 8.33% 12.20%BNY Mellon Absolute Return Equity Fund 4.60% 12.57% 17.40%BNY Mellon Asian Bond Fund 45.61% 51.78% 63.37%BNY Mellon Crossover Credit Fund 46.43% 63.57% 97.69%BNY Mellon Dynamic Total Return Fund 15.36% 24.57% 40.71%BNY Mellon Emerging Markets Debt Fund 38.58% 49.63% 61.72%BNY Mellon Emerging Markets Debt Local Currency Fund 43.94% 49.23% 52.74%BNY Mellon Emerging Markets Debt Opportunistic Fund 47.12% 51.76% 74.14%BNY Mellon Emerging Markets Local Currency Investment Grade Debt Fund* 1.51% 50.72% 55.40%BNY Mellon Euroland Bond Fund 50.34% 59.23% 70.43%BNY Mellon European Credit Fund 26.00% 51.22% 65.00%BNY Mellon Global High Yield Bond Fund 36.85% 47.26% 57.15%BNY Mellon Global Opportunistic Bond Fund 7.52% 10.53% 13.97%BNY Mellon Targeted Return Bond Fund 12.56% 13.53% 17.41%
* This Fund closed during the year.
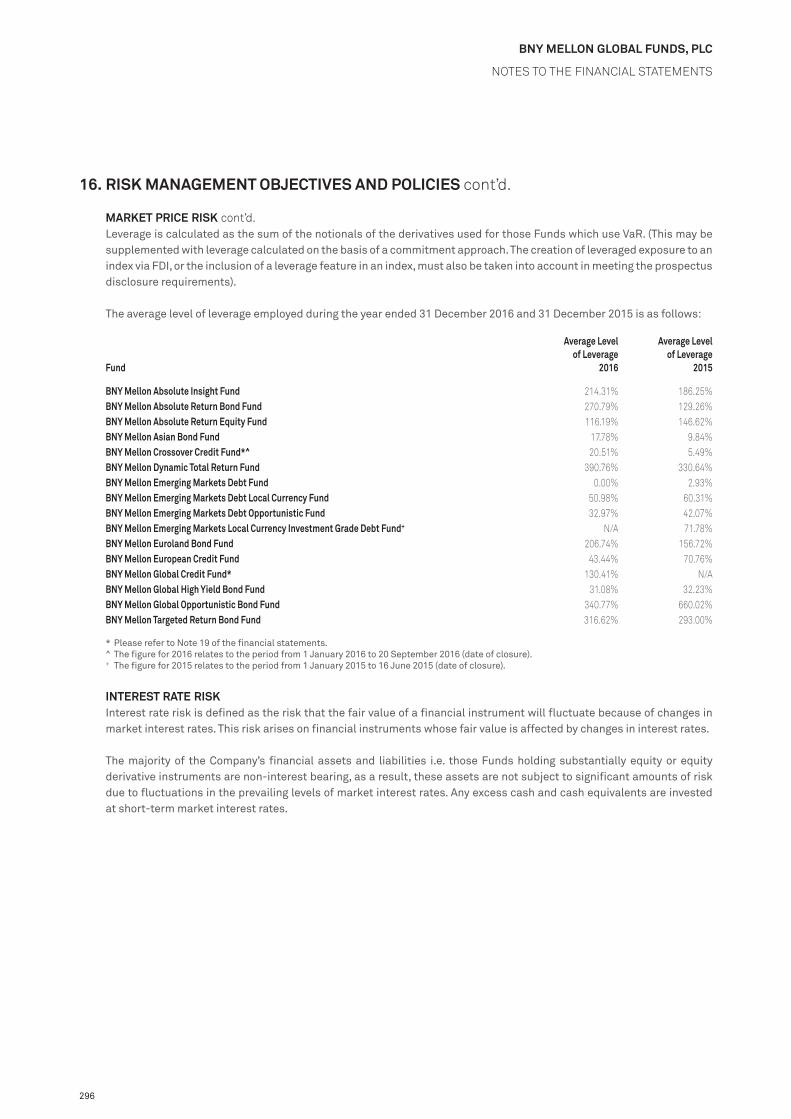
296
BNY MELLON GLOBAL FUNDS, PLC
NOTES TO THE FINANCIAL STATEMENTS
16. RISK MANAGEMENT OBJECTIVES AND POLICIES cont’d.
MARKET PRICE RISK cont’d.Leverage is calculated as the sum of the notionals of the derivatives used for those Funds which use VaR. (This may be supplemented with leverage calculated on the basis of a commitment approach. The creation of leveraged exposure to an index via FDI, or the inclusion of a leverage feature in an index, must also be taken into account in meeting the prospectus disclosure requirements).
The average level of leverage employed during the year ended 31 December 2016 and 31 December 2015 is as follows:
Fund
Average Level of Leverage
2016
Average Level of Leverage
2015
BNY Mellon Absolute Insight Fund 214.31% 186.25%BNY Mellon Absolute Return Bond Fund 270.79% 129.26%BNY Mellon Absolute Return Equity Fund 116.19% 146.62%BNY Mellon Asian Bond Fund 17.78% 9.84%BNY Mellon Crossover Credit Fund*^ 20.51% 5.49%BNY Mellon Dynamic Total Return Fund 390.76% 330.64%BNY Mellon Emerging Markets Debt Fund 0.00% 2.93%BNY Mellon Emerging Markets Debt Local Currency Fund 50.98% 60.31%BNY Mellon Emerging Markets Debt Opportunistic Fund 32.97% 42.07%BNY Mellon Emerging Markets Local Currency Investment Grade Debt Fund+ N/A 71.78%BNY Mellon Euroland Bond Fund 206.74% 156.72%BNY Mellon European Credit Fund 43.44% 70.76%BNY Mellon Global Credit Fund* 130.41% N/ABNY Mellon Global High Yield Bond Fund 31.08% 32.23%BNY Mellon Global Opportunistic Bond Fund 340.77% 660.02%BNY Mellon Targeted Return Bond Fund 316.62% 293.00%
* Please refer to Note 19 of the financial statements. ^ The figure for 2016 relates to the period from 1 January 2016 to 20 September 2016 (date of closure).+ The figure for 2015 relates to the period from 1 January 2015 to 16 June 2015 (date of closure).
INTEREST RATE RISKInterest rate risk is defined as the risk that the fair value of a financial instrument will fluctuate because of changes in market interest rates. This risk arises on financial instruments whose fair value is affected by changes in interest rates.
The majority of the Company’s financial assets and liabilities i.e. those Funds holding substantially equity or equity derivative instruments are non-interest bearing, as a result, these assets are not subject to significant amounts of risk due to fluctuations in the prevailing levels of market interest rates. Any excess cash and cash equivalents are invested at short-term market interest rates.

297
BNY MELLON GLOBAL FUNDS, PLC
NOTES TO THE FINANCIAL STATEMENTS
16. RISK MANAGEMENT OBJECTIVES AND POLICIES cont’d.
INTEREST RATE RISK cont’d.The table below summarises the Company’s exposure to interest rate risk as at 31 December 2016. It includes the Company’s assets and liabilities at fair value, categorised by the earlier of contractual repricing or maturity dates:
BNY Mellon Absolute Insight Fund Less than1 month 1-3 months
Over3 months
Non interestbearing
Total2016
EUR EUR EUR EUR EURAssetsFinancial assets at fair value through profit or loss 11,293,858 11,213,108 35,110,730 10,331,827 67,949,523 Cash and bank balances 14,480,000 – – – 14,480,000Margins on derivative contracts 2,341,498 – – – 2,341,498Debtors – – – 1,353,349 1,353,349
Total assets 28,115,356 11,213,108 35,110,730 11,685,176 86,124,370
LiabilitiesFinancial liabilities at fair value through profit or loss 120,433 176,159 160,821 1,984,963 2,442,376 Bank overdraft 8 – – – 8 Margins on derivative contracts 1,228,942 – – – 1,228,942 Creditors – amount falling due within one year – – – 2,312,003 2,312,003
Total liabilities 1,349,383 176,159 160,821 4,296,966 5,983,329
Total interest sensitivity gap 26,765,973 11,036,949 34,949,909
BNY Mellon Absolute Return Bond Fund Less than1 year 1-6 years
Over6 years
Non interestbearing
Total2016
EUR EUR EUR EUR EURAssetsFinancial assets at fair value through profit or loss 317,103,747 437,445,162 1,047,584,130 182,919,548 1,985,052,587 Cash and bank balances 200,975,758 – – – 200,975,758 Margins on derivative contracts 46,983,146 – – – 46,983,146 Debtors – – – 16,543,305 16,543,305
Total assets 565,062,651 437,445,162 1,047,584,130 199,462,853 2,249,554,796
LiabilitiesFinancial liabilities at fair value through profit or loss 7,820,046 10,625,097 – 48,369,614 66,814,757 Margins on derivative contracts 10,183,146 – – – 10,183,146 Creditors – amount falling due within one year – – – 12,313,373 12,313,373
Total liabilities 18,003,192 10,625,097 – 60,682,987 89,311,276
Total interest sensitivity gap 547,059,459 426,820,065 1,047,584,130

298
BNY MELLON GLOBAL FUNDS, PLC
NOTES TO THE FINANCIAL STATEMENTS
16. RISK MANAGEMENT OBJECTIVES AND POLICIES cont’d.
INTEREST RATE RISK cont’d.
BNY Mellon Absolute Return Equity Fund Less than1 month 1-3 months
Over3 months
Non interestbearing
Total2016
GBP GBP GBP GBP GBPAssetsFinancial assets at fair value through profit or loss 404,404,334 718,476,136 601,087,909 572,837,746 2,296,806,125 Cash and bank balances 71,821,457 – – – 71,821,457 Margins on derivative contracts 35,546,822 – – – 35,546,822 Debtors – – – 25,712,902 25,712,902
Total assets 511,772,613 718,476,136 601,087,909 598,550,648 2,429,887,306
LiabilitiesFinancial liabilities at fair value through profit or loss 444,147 2,345,141 – 75,934,907 78,724,195 Bank overdraft 525,497 – – – 525,497 Margins on derivative contracts 242,451 – – – 242,451 Creditors – amount falling due within one year – – – 79,842,348 79,842,348
Total liabilities 1,212,095 2,345,141 – 155,777,255 159,334,491
Total interest sensitivity gap 510,560,518 716,130,995 601,087,909
BNY Mellon Asian Bond Fund Less than1 year 1-6 years
Over6 years
Non interestbearing
Total2016
USD USD USD USD USDAssetsFinancial assets at fair value through profit or loss 275,337 12,953,844 11,934,726 35,124 25,199,031 Cash and bank balances 159,959 – – – 159,959 Margins on derivative contracts 6,732 – – – 6,732 Debtors – – – 321,803 321,803
Total assets 442,028 12,953,844 11,934,726 356,927 25,687,525
LiabilitiesFinancial liabilities at fair value through profit or loss 14,576 – – 2,855 17,431 Creditors – amount falling due within one year – – – 42,034 42,034
Total liabilities 14,576 – – 44,889 59,465
Total interest sensitivity gap 427,452 12,953,844 11,934,726

299
BNY MELLON GLOBAL FUNDS, PLC
NOTES TO THE FINANCIAL STATEMENTS
16. RISK MANAGEMENT OBJECTIVES AND POLICIES cont’d.
INTEREST RATE RISK cont’d.
BNY Mellon Dynamic Total Return Fund Less than1 year 1-6 years
Over6 years
Non interestbearing
Total2016
USD USD USD USD USDAssetsFinancial assets at fair value through profit or loss 13,636,864 – – 1,713,224 15,350,088 Cash and bank balances 1,902,573 – – – 1,902,573 Margins on derivative contracts 122,083 – – – 122,083 Debtors – – – 43,550 43,550
Total assets 15,661,520 – – 1,756,774 17,418,294
LiabilitiesFinancial liabilities at fair value through profit or loss 148,319 – – 92,633 240,952 Bank overdraft 200,767 – – – 200,767 Margins on derivative contracts 101,087 – – – 101,087 Creditors – amount falling due within one year – – – 28,549 28,549
Total liabilities 450,173 – – 121,182 571,355
Total interest sensitivity gap 15,211,347 – –
BNY Mellon Emerging Markets Corporate Debt Fund Less than1 year 1-6 years
Over6 years
Non interestbearing
Total2016
USD USD USD USD USDAssetsFinancial assets at fair value through profit or loss 6,530 69,041,893 88,067,703 13,476,600 170,592,726 Cash and bank balances 2,257,237 – – – 2,257,237 Margins on derivative contracts 197,068 – – – 197,068 Debtors – – – 2,612,546 2,612,546
Total assets 2,460,835 69,041,893 88,067,703 16,089,146 175,659,577
LiabilitiesFinancial liabilities at fair value through profit or loss – – – 41,868 41,868 Creditors – amount falling due within one year – – – 181,036 181,036
Total liabilities – – – 222,904 222,904
Total interest sensitivity gap 2,460,835 69,041,893 88,067,703

300
BNY MELLON GLOBAL FUNDS, PLC
NOTES TO THE FINANCIAL STATEMENTS
16. RISK MANAGEMENT OBJECTIVES AND POLICIES cont’d.
INTEREST RATE RISK cont’d.
BNY Mellon Emerging Markets Debt Fund Less than1 year 1-6 years
Over6 years
Non interestbearing
Total2016
USD USD USD USD USDAssetsFinancial assets at fair value through profit or loss – 16,441,138 43,415,076 612 59,856,826 Cash and bank balances 911,234 – – – 911,234 Debtors – – – 1,035,863 1,035,863
Total assets 911,234 16,441,138 43,415,076 1,036,475 61,803,923
LiabilitiesFinancial liabilities at fair value through profit or loss – – – 1,019 1,019 Creditors – amount falling due within one year – – – 127,444 127,444
Total liabilities – – – 128,463 128,463
Total interest sensitivity gap 911,234 16,441,138 43,415,076
BNY Mellon Emerging Markets Debt Local Currency Fund Less than1 year 1-6 years
Over6 years
Non interestbearing
Total2016
USD USD USD USD USDAssetsFinancial assets at fair value through profit or loss 111,277,320 137,964,512 569,497,907 5,332,878 824,072,617 Cash and bank balances 11,132,041 – – – 11,132,041 Debtors – – – 24,579,055 24,579,055
Total assets 122,409,361 137,964,512 569,497,907 29,911,933 859,783,713
LiabilitiesFinancial liabilities at fair value through profit or loss – – – 20,418,828 20,418,828 Creditors – amount falling due within one year – – – 8,683,672 8,683,672
Total liabilities – – – 29,102,500 29,102,500
Total interest sensitivity gap 122,409,361 137,964,512 569,497,907

301
BNY MELLON GLOBAL FUNDS, PLC
NOTES TO THE FINANCIAL STATEMENTS
16. RISK MANAGEMENT OBJECTIVES AND POLICIES cont’d.
INTEREST RATE RISK cont’d.
BNY Mellon Emerging Markets Debt Opportunistic Fund Less than1 year 1-6 years
Over6 years
Non interestbearing
Total2016
USD USD USD USD USDAssetsFinancial assets at fair value through profit or loss 2,138,451 15,886,599 47,161,963 428,200 65,615,213 Cash and bank balances 624,803 – – – 624,803 Debtors – – – 1,357,552 1,357,552
Total assets 2,763,254 15,886,599 47,161,963 1,785,752 67,597,568
LiabilitiesFinancial liabilities at fair value through profit or loss – – – 721,865 721,865 Creditors – amount falling due within one year – – – 35,748 35,748
Total liabilities – – – 757,613 757,613
Total interest sensitivity gap 2,763,254 15,886,599 47,161,963
BNY Mellon Euroland Bond Fund Less than1 year 1-6 years
Over6 years
Non interestbearing
Total2016
EUR EUR EUR EUR EURAssetsFinancial assets at fair value through profit or loss 127,538,769 435,893,547 738,112,165 42,260,349 1,343,804,830 Cash and bank balances 6,339,394 – – – 6,339,394 Margins on derivative contracts 7,726,463 – – – 7,726,463 Debtors – – – 17,424,116 17,424,116
Total assets 141,604,626 435,893,547 738,112,165 59,684,465 1,375,294,803
LiabilitiesFinancial liabilities at fair value through profit or loss 2,237,096 1,471,456 – 7,864,101 11,572,653 Margins on derivative contracts 13,278,624 – – – 13,278,624 Creditors – amount falling due within one year – – – 14,131,567 14,131,567
Total liabilities 15,515,720 1,471,456 – 21,995,668 38,982,844
Total interest sensitivity gap 126,088,906 434,422,091 738,112,165

302
BNY MELLON GLOBAL FUNDS, PLC
NOTES TO THE FINANCIAL STATEMENTS
16. RISK MANAGEMENT OBJECTIVES AND POLICIES cont’d.
INTEREST RATE RISK cont’d.
BNY Mellon European Credit Fund Less than1 year 1-6 years
Over6 years
Non interestbearing
Total2016
EUR EUR EUR EUR EURAssetsFinancial assets at fair value through profit or loss 742,512 37,865,816 40,362,385 4,329,128 83,299,841 Cash and bank balances 3,774,862 – – – 3,774,862 Margins on derivative contracts 646,481 – – – 646,481 Debtors – – – 845,183 845,183
Total assets 5,163,855 37,865,816 40,362,385 5,174,311 88,566,367
LiabilitiesFinancial liabilities at fair value through profit or loss 48,633 70,015 – 414,872 533,520 Margins on derivative contracts 531,286 – – – 531,286 Creditors – amount falling due within one year – – – 26,645 26,645
Total liabilities 579,919 70,015 – 441,517 1,091,451
Total interest sensitivity gap 4,583,936 37,795,801 40,362,385
BNY Mellon Global Bond Fund Less than1 year 1-6 years
Over6 years
Non interestbearing
Total2016
USD USD USD USD USDAssetsFinancial assets at fair value through profit or loss 52,294,936 204,234,451 216,842,903 2,103,316 475,475,606 Cash and bank balances 17,656,529 – – – 17,656,529 Debtors – – – 3,910,415 3,910,415
Total assets 69,951,465 204,234,451 216,842,903 6,013,731 497,042,550
LiabilitiesFinancial liabilities at fair value through profit or loss – – – 3,856,815 3,856,815 Bank overdraft 342,971 – – – 342,971 Creditors – amount falling due within one year – – – 1,558,285 1,558,285
Total liabilities 342,971 – – 5,415,100 5,758,071
Total interest sensitivity gap 69,608,494 204,234,451 216,842,903

303
BNY MELLON GLOBAL FUNDS, PLC
NOTES TO THE FINANCIAL STATEMENTS
16. RISK MANAGEMENT OBJECTIVES AND POLICIES cont’d.
INTEREST RATE RISK cont’d.
BNY Mellon Global Credit Fund* Less than1 year 1-6 years
Over6 years
Non interestbearing
Total2016
USD USD USD USD USDAssetsFinancial assets at fair value through profit or loss 34,739,540 85,924,137 253,427,885 35,624,385 409,715,947 Cash and bank balances 6,289,543 – – – 6,289,543Margins on derivative contracts 1,993,434 – – – 1,993,434Debtors – – – 3,286,375 3,286,375
Total assets 43,022,517 85,924,137 253,427,885 38,910,760 421,285,299
LiabilitiesFinancial liabilities at fair value through profit or loss 375,700 664,699 – 7,628,692 8,669,091 Margins on derivative contracts 339,210 – – – 339,210 Creditors – amount falling due within one year – – – 11,796,645 11,796,645
Total liabilities 714,910 664,699 – 19,425,337 20,804,946
Total interest sensitivity gap 42,307,607 85,259,438 253,427,885
BNY Mellon Global Dynamic Bond Fund Less than1 year 1-6 years
Over6 years
Non interestbearing
Total2016
USD USD USD USD USDAssetsFinancial assets at fair value through profit or loss 44,561,821 184,455,055 106,570,983 16,720,644 352,308,503 Cash and bank balances 14,300,082 – – – 14,300,082 Margins on derivative contracts 100,700 – – – 100,700 Debtors – – – 5,178,527 5,178,527
Total assets 58,962,603 184,455,055 106,570,983 21,899,171 371,887,812
LiabilitiesFinancial liabilities at fair value through profit or loss – – – 503,022 503,022 Bank overdraft 93,029 – – – 93,029 Creditors – amount falling due within one year – – – 6,326,288 6,326,288
Total liabilities 93,029 – – 6,829,310 6,922,339
Total interest sensitivity gap 58,869,574 184,455,055 106,570,983

304
BNY MELLON GLOBAL FUNDS, PLC
NOTES TO THE FINANCIAL STATEMENTS
16. RISK MANAGEMENT OBJECTIVES AND POLICIES cont’d.
INTEREST RATE RISK cont’d.
BNY Mellon Global High Yield Bond Fund Less than1 year 1-6 years
Over6 years
Non interestbearing
Total2016
USD USD USD USD USDAssetsFinancial assets at fair value through profit or loss – 64,179,457 82,823,572 26,716 147,029,745 Cash and bank balances 5,712,168 – – – 5,712,168 Debtors – – – 4,026,146 4,026,146
Total assets 5,712,168 64,179,457 82,823,572 4,052,862 156,768,059
LiabilitiesFinancial liabilities at fair value through profit or loss – – – 338,282 338,282 Creditors – amount falling due within one year – – – 637,582 637,582
Total liabilities – – – 975,864 975,864
Total interest sensitivity gap 5,712,168 64,179,457 82,823,572
BNY Mellon Global Opportunistic Bond Fund Less than1 year 1-6 years
Over6 years
Non interestbearing
Total2016
USD USD USD USD USDAssetsFinancial assets at fair value through profit or loss 5,028,763 42,453,042 80,823,920 1,155,132 129,460,857 Cash and bank balances 3,650,066 – – – 3,650,066 Margins on derivative contracts 486,287 – – – 486,287 Debtors – – – 1,152,473 1,152,473
Total assets 9,165,116 42,453,042 80,823,920 2,307,605 134,749,683
LiabilitiesFinancial liabilities at fair value through profit or loss 357,970 – – 2,035,456 2,393,426 Margins on derivative contracts 414,012 – – – 414,012 Creditors – amount falling due within one year – – – 1,403,422 1,403,422
Total liabilities 771,982 – – 3,438,878 4,210,860
Total interest sensitivity gap 8,393,134 42,453,042 80,823,920

305
BNY MELLON GLOBAL FUNDS, PLC
NOTES TO THE FINANCIAL STATEMENTS
16. RISK MANAGEMENT OBJECTIVES AND POLICIES cont’d.
INTEREST RATE RISK cont’d.
BNY Mellon Global Real Return Fund (EUR) Less than1 year 1-6 years
Over6 years
Non interestbearing
Total2016
EUR EUR EUR EUR EURAssetsFinancial assets at fair value through profit or loss 13,762,995 545,534,460 892,989,364 2,480,513,827 3,932,800,646 Cash and bank balances 249,646,374 – – – 249,646,374 Margins on derivative contracts 75,076,888 – – – 75,076,888 Debtors – – – 32,681,377 32,681,377
Total assets 338,486,257 545,534,460 892,989,364 2,513,195,204 4,290,205,285
LiabilitiesFinancial liabilities at fair value through profit or loss 19,356,582 – – 137,485,437 156,842,019 Bank overdraft 37,464 – – – 37,464 Creditors – amount falling due within one year – – – 17,765,510 17,765,510
Total liabilities 19,394,046 – – 155,250,947 174,644,993
Total interest sensitivity gap 319,092,211 545,534,460 892,989,364
BNY Mellon Global Real Return Fund (GBP) Less than1 year 1-6 years
Over6 years
Non interestbearing
Total2016
GBP GBP GBP GBP GBPAssetsFinancial assets at fair value through profit or loss 220,334 7,978,497 14,158,633 39,882,697 62,240,161 Cash and bank balances 3,567,310 – – – 3,567,310 Margins on derivative contracts 1,218,055 – – – 1,218,055 Debtors – – – 289,178 289,178
Total assets 5,005,699 7,978,497 14,158,633 40,171,875 67,314,704
LiabilitiesFinancial liabilities at fair value through profit or loss 314,166 – – 90,570 404,736 Bank overdraft 538 – – – 538 Creditors – amount falling due within one year – – – 222,180 222,180
Total liabilities 314,704 – – 312,750 627,454
Total interest sensitivity gap 4,690,995 7,978,497 14,158,633

306
BNY MELLON GLOBAL FUNDS, PLC
NOTES TO THE FINANCIAL STATEMENTS
16. RISK MANAGEMENT OBJECTIVES AND POLICIES cont’d.
INTEREST RATE RISK cont’d.
BNY Mellon Global Real Return Fund (USD) Less than1 year 1-6 years
Over6 years
Non interestbearing
Total2016
USD USD USD USD USDAssetsFinancial assets at fair value through profit or loss 2,157,014 78,398,226 142,904,040 400,468,413 623,927,693 Cash and bank balances 12,536,271 – – – 12,536,271 Margins on derivative contracts 11,663,545 – – – 11,663,545 Debtors – – – 3,229,689 3,229,689
Total assets 26,356,830 78,398,226 142,904,040 403,698,102 651,357,198
LiabilitiesFinancial liabilities at fair value through profit or loss 2,957,660 – – 566,229 3,523,889 Bank overdraft 1,577 – – – 1,577 Creditors – amount falling due within one year – – – 2,682,057 2,682,057
Total liabilities 2,959,237 – – 3,248,286 6,207,523
Total interest sensitivity gap 23,397,593 78,398,226 142,904,040
BNY Mellon Global Short-Dated High Yield Bond Fund* Less than1 year 1-6 years
Over6 years
Non interestbearing
Total2016
USD USD USD USD USDAssetsFinancial assets at fair value through profit or loss 19,060,045 343,038,925 75,034,537 6,711,574 443,845,081 Cash and bank balances 553,284 - - - 553,284 Debtors - - - 74,708,264 74,708,264
Total assets 19,613,329 343,038,925 75,034,537 81,419,838 519,106,629
LiabilitiesFinancial liabilities at fair value through profit or loss - - - 1,773,904 1,773,904 Creditors – amount falling due within one year - - - 68,007,986 68,007,986
Total liabilities - - - 69,781,890 69,781,890
Total interest sensitivity gap 19,613,329 343,038,925 75,034,537

307
BNY MELLON GLOBAL FUNDS, PLC
NOTES TO THE FINANCIAL STATEMENTS
16. RISK MANAGEMENT OBJECTIVES AND POLICIES cont’d.
INTEREST RATE RISK cont’d.
BNY Mellon Targeted Return Bond Fund Less than1 year 1-6 years
Over6 years
Non interestbearing
Total2016
USD USD USD USD USDAssetsFinancial assets at fair value through profit or loss 2,160,037 31,637,053 45,264,351 487,102 79,548,543 Cash and bank balances 2,468,801 - - - 2,468,801 Margins on derivative contracts 192,545 - - - 192,545 Debtors - - - 696,856 696,856
Total assets 4,821,383 31,637,053 45,264,351 1,183,958 82,906,745
LiabilitiesFinancial liabilities at fair value through profit or loss 229,232 - - 2,731,312 2,960,544 Margins on derivative contracts 145,443 - - - 145,443 Creditors – amount falling due within one year - - - 892,369 892,369
Total liabilities 374,675 - - 3,623,681 3,998,356
Total interest sensitivity gap 4,446,708 31,637,053 45,264,351
* Please refer to Note 19 of the financial statements.
The table below summarises the Company’s exposure to interest rate risk as at 31 December 2015:
BNY Mellon Absolute Insight Fund Less than 1 month 1-3 months
Over 3 months
Non interest bearing
Total 2015
EUR EUR EUR EUR EURAssetsFinancial assets at fair value through profit or loss 23,103,408 33,312,627 117,628,163 29,561,338 203,605,536Cash and bank balances 21,390,807 – – – 21,390,807Margins on derivative contracts 3,019,513 – – – 3,019,513Debtors – – – 1,987,923 1,987,923
Total assets 47,513,728 33,312,627 117,628,163 31,549,261 230,003,779
LiabilitiesFinancial liabilities at fair value through profit or loss 83,233 373,012 935,620 2,507,622 3,899,487Bank overdraft 9,905 – – – 9,905Margins on derivative contracts 794,926 – – – 794,926Creditors – amount falling due within one year – – – 882,020 882,020
Total liabilities 888,064 373,012 935,620 3,389,642 5,586,338
Total interest sensitivity gap 46,625,664 32,939,615 116,692,543
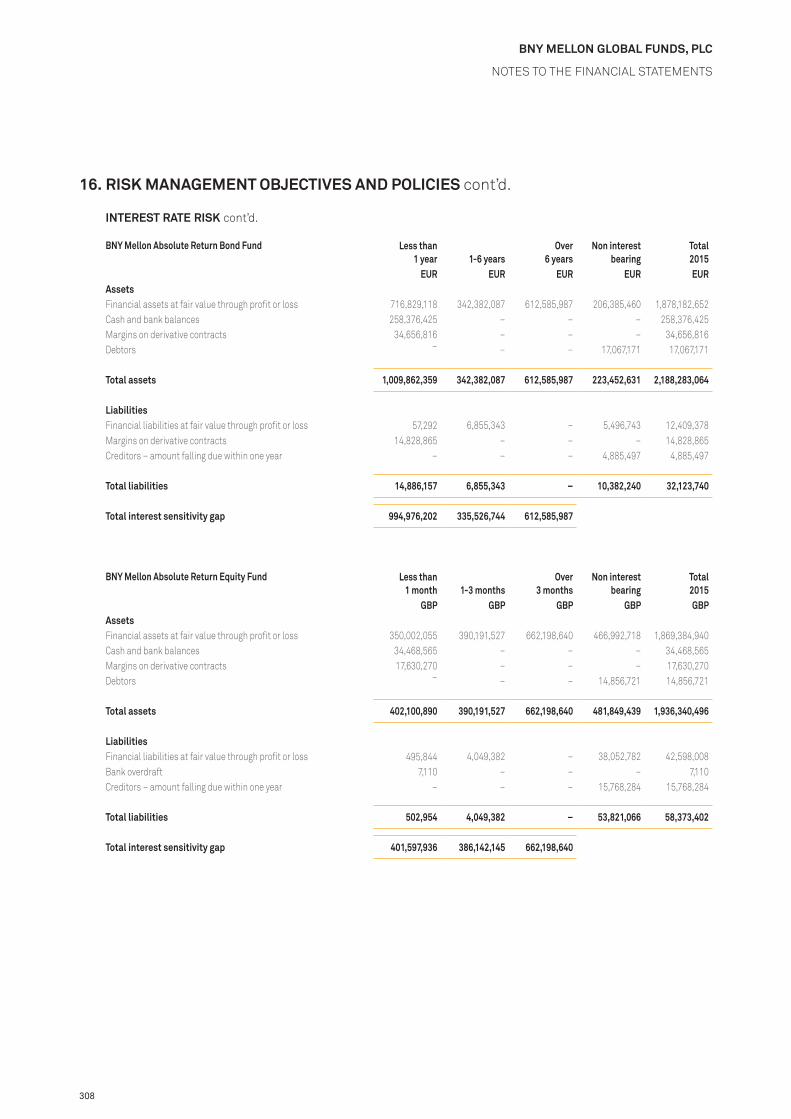
308
BNY MELLON GLOBAL FUNDS, PLC
NOTES TO THE FINANCIAL STATEMENTS
16. RISK MANAGEMENT OBJECTIVES AND POLICIES cont’d.
INTEREST RATE RISK cont’d.
BNY Mellon Absolute Return Bond Fund Less than 1 year 1-6 years
Over 6 years
Non interest bearing
Total 2015
EUR EUR EUR EUR EURAssetsFinancial assets at fair value through profit or loss 716,829,118 342,382,087 612,585,987 206,385,460 1,878,182,652Cash and bank balances 258,376,425 – – – 258,376,425Margins on derivative contracts 34,656,816 – – – 34,656,816Debtors – – – 17,067,171 17,067,171
Total assets 1,009,862,359 342,382,087 612,585,987 223,452,631 2,188,283,064
LiabilitiesFinancial liabilities at fair value through profit or loss 57,292 6,855,343 – 5,496,743 12,409,378Margins on derivative contracts 14,828,865 – – – 14,828,865Creditors – amount falling due within one year – – – 4,885,497 4,885,497
Total liabilities 14,886,157 6,855,343 – 10,382,240 32,123,740
Total interest sensitivity gap 994,976,202 335,526,744 612,585,987
BNY Mellon Absolute Return Equity Fund Less than 1 month 1-3 months
Over 3 months
Non interest bearing
Total 2015
GBP GBP GBP GBP GBPAssetsFinancial assets at fair value through profit or loss 350,002,055 390,191,527 662,198,640 466,992,718 1,869,384,940Cash and bank balances 34,468,565 – – – 34,468,565Margins on derivative contracts 17,630,270 – – – 17,630,270Debtors – – – 14,856,721 14,856,721
Total assets 402,100,890 390,191,527 662,198,640 481,849,439 1,936,340,496
LiabilitiesFinancial liabilities at fair value through profit or loss 495,844 4,049,382 – 38,052,782 42,598,008Bank overdraft 7,110 – – – 7,110Creditors – amount falling due within one year – – – 15,768,284 15,768,284
Total liabilities 502,954 4,049,382 – 53,821,066 58,373,402
Total interest sensitivity gap 401,597,936 386,142,145 662,198,640

309
BNY MELLON GLOBAL FUNDS, PLC
NOTES TO THE FINANCIAL STATEMENTS
16. RISK MANAGEMENT OBJECTIVES AND POLICIES cont’d.
INTEREST RATE RISK cont’d.
BNY Mellon Asian Bond Fund Less than 1 year 1-6 years
Over 6 years
Non interest bearing
Total 2015
USD USD USD USD USDAssetsFinancial assets at fair value through profit or loss 110,153 16,015,250 22,572,807 – 38,698,210Cash and bank balances 1,790,841 – – – 1,790,841Debtors – – – 551,733 551,733
Total assets 1,900,994 16,015,250 22,572,807 551,733 41,040,784
LiabilitiesFinancial liabilities at fair value through profit or loss – – – 8,390 8,390Margins on derivative contracts 10,180 – – – 10,180Creditors – amount falling due within one year – – – 61,344 61,344
Total liabilities 10,180 – – 69,734 79,914
Total interest sensitivity gap 1,890,814 16,015,250 22,572,807
BNY Mellon Crossover Credit Fund Less than 1 year 1-6 years
Over 6 years
Non interest bearing
Total 2015
EUR EUR EUR EUR EURAssetsFinancial assets at fair value through profit or loss – 102,515,207 123,573,988 252,030 226,341,225Cash and bank balances 3,185,105 – – – 3,185,105Margins on derivative contracts 43,168 – – – 43,168Debtors – – – 4,153,918 4,153,918
Total assets 3,228,273 102,515,207 123,573,988 4,405,948 233,723,416
LiabilitiesFinancial liabilities at fair value through profit or loss 23,613 – – – 23,613Creditors – amount falling due within one year – – – 132,761 132,761
Total liabilities 23,613 – – 132,761 156,374
Total interest sensitivity gap 3,204,660 102,515,207 123,573,988

310
BNY MELLON GLOBAL FUNDS, PLC
NOTES TO THE FINANCIAL STATEMENTS
16. RISK MANAGEMENT OBJECTIVES AND POLICIES cont’d.
INTEREST RATE RISK cont’d.
BNY Mellon Dynamic Total Return Fund Less than 1 year 1-6 years
Over 6 years
Non interest bearing
Total 2015
USD USD USD USD USDAssetsFinancial assets at fair value through profit or loss 10,057,775 – – 1,114,367 11,172,142Cash and bank balances 1,048,184 – – – 1,048,184Margins on derivative contracts 63,075 – – – 63,075Debtors – – – 9,658 9,658
Total assets 11,169,034 – – 1,124,025 12,293,059
LiabilitiesFinancial liabilities at fair value through profit or loss 98,006 – – 23,379 121,385Margins on derivative contracts 82,528 – – – 82,528Creditors – amount falling due within one year – – – 570,088 570,088
Total liabilities 180,534 – – 593,467 774,001
Total interest sensitivity gap 10,988,500 – –
BNY Mellon Emerging Markets Corporate Debt Fund Less than 1 year 1-6 years
Over 6 years
Non interest bearing
Total 2015
USD USD USD USD USDAssetsFinancial assets at fair value through profit or loss 992,500 41,382,040 53,717,916 9,084,698 105,177,154Cash and bank balances 1,581,246 – – – 1,581,246Debtors – – – 2,152,260 2,152,260
Total assets 2,573,746 41,382,040 53,717,916 11,236,958 108,910,660
LiabilitiesFinancial liabilities at fair value through profit or loss – – – 163,458 163,458Creditors – amount falling due within one year – – – 39,252 39,252
Total liabilities – – – 202,710 202,710
Total interest sensitivity gap 2,573,746 41,382,040 53,717,916

311
BNY MELLON GLOBAL FUNDS, PLC
NOTES TO THE FINANCIAL STATEMENTS
16. RISK MANAGEMENT OBJECTIVES AND POLICIES cont’d.
INTEREST RATE RISK cont’d.
BNY Mellon Emerging Markets Debt Fund Less than 1 year 1-6 years
Over 6 years
Non interest bearing
Total 2015
USD USD USD USD USDAssetsFinancial assets at fair value through profit or loss – 11,092,146 55,066,305 420 66,158,871Cash and bank balances 3,240,685 – – – 3,240,685Debtors – – – 2,295,446 2,295,446
Total assets 3,240,685 11,092,146 55,066,305 2,295,866 71,695,002
LiabilitiesFinancial liabilities at fair value through profit or loss – – – 33,983 33,983Creditors – amount falling due within one year – – – 493,339 493,339
Total liabilities – – – 527,322 527,322
Total interest sensitivity gap 3,240,685 11,092,146 55,066,305
BNY Mellon Emerging Markets Debt Local Currency Fund Less than 1 year 1-6 years
Over 6 years
Non interest bearing
Total 2015
USD USD USD USD USDAssetsFinancial assets at fair value through profit or loss 193,143,805 245,474,373 816,572,606 18,555,163 1,273,745,947Cash and bank balances 33,192,014 – – – 33,192,014Debtors – – – 32,795,053 32,795,053
Total assets 226,335,819 245,474,373 816,572,606 51,350,216 1,339,733,014
LiabilitiesFinancial liabilities at fair value through profit or loss – – – 8,266,542 8,266,542Creditors – amount falling due within one year – – – 6,985,235 6,985,235
Total liabilities – – – 15,251,777 15,251,777
Total interest sensitivity gap 226,335,819 245,474,373 816,572,606

312
BNY MELLON GLOBAL FUNDS, PLC
NOTES TO THE FINANCIAL STATEMENTS
16. RISK MANAGEMENT OBJECTIVES AND POLICIES cont’d.
INTEREST RATE RISK cont’d.
BNY Mellon Emerging Markets Debt Opportunistic Fund Less than 1 year 1-6 years
Over 6 years
Non interest bearing
Total 2015
USD USD USD USD USDAssetsFinancial assets at fair value through profit or loss 6,869,884 20,085,387 55,511,726 743,920 83,210,917Cash and bank balances 3,682,284 – – – 3,682,284Debtors – – – 1,750,750 1,750,750
Total assets 10,552,168 20,085,387 55,511,726 2,494,670 88,643,951
LiabilitiesFinancial liabilities at fair value through profit or loss – – – 383,053 383,053Creditors – amount falling due within one year – – – 277,342 277,342
Total liabilities – – – 660,395 660,395
Total interest sensitivity gap 10,552,168 20,085,387 55,511,726
BNY Mellon Euroland Bond Fund Less than 1 year 1-6 years
Over 6 years
Non interest bearing
Total 2015
EUR EUR EUR EUR EURAssetsFinancial assets at fair value through profit or loss 183,038,332 1,016,152,892 1,466,288,787 36,646,878 2,702,126,889Cash and bank balances 65,325,942 – – – 65,325,942Margins on derivative contracts 291,103 – – – 291,103Debtors – – – 28,414,112 28,414,112
Total assets 248,655,377 1,016,152,892 1,466,288,787 65,060,990 2,796,158,046
LiabilitiesFinancial liabilities at fair value through profit or loss 733,381 8,686,785 1,878,152 14,532,591 25,830,909Margins on derivative contracts 6,399,563 – – – 6,399,563Creditors – amount falling due within one year – – – 9,976,354 9,976,354
Total liabilities 7,132,944 8,686,785 1,878,152 24,508,945 42,206,826
Total interest sensitivity gap 241,522,433 1,007,466,107 1,464,410,635

313
BNY MELLON GLOBAL FUNDS, PLC
NOTES TO THE FINANCIAL STATEMENTS
16. RISK MANAGEMENT OBJECTIVES AND POLICIES cont’d.
INTEREST RATE RISK cont’d.
BNY Mellon European Credit Fund Less than 1 year 1-6 years
Over 6 years
Non interest bearing
Total 2015
EUR EUR EUR EUR EURAssetsFinancial assets at fair value through profit or loss 928,901 18,253,514 27,262,517 3,391,049 49,835,981Cash and bank balances 310,874 – – – 310,874Margins on derivative contracts 723,337 – – – 723,337Debtors – – – 619,467 619,467
Total assets 1,963,112 18,253,514 27,262,517 4,010,516 51,489,659
LiabilitiesFinancial liabilities at fair value through profit or loss 35,745 153,092 – 5,378 194,215Margins on derivative contracts 489,691 – – – 489,691Creditors – amount falling due within one year – – – 52,490 52,490
Total liabilities 525,436 153,092 – 57,868 736,396
Total interest sensitivity gap 1,437,676 18,100,422 27,262,517
BNY Mellon Global Bond Fund Less than 1 year 1-6 years
Over 6 years
Non interest bearing
Total 2015
USD USD USD USD USDAssetsFinancial assets at fair value through profit or loss 39,871,295 115,851,613 143,882,528 2,398,280 302,003,716Cash and bank balances 8,320,652 – – – 8,320,652Debtors – – – 7,601,648 7,601,648
Total assets 48,191,947 115,851,613 143,882,528 9,999,928 317,926,016
LiabilitiesFinancial liabilities at fair value through profit or loss – – – 1,472,340 1,472,340Bank overdraft 39,964 – – – 39,964Creditors – amount falling due within one year – – – 7,138,886 7,138,886
Total liabilities 39,964 – – 8,611,226 8,651,190
Total interest sensitivity gap 48,151,983 115,851,613 143,882,528

314
BNY MELLON GLOBAL FUNDS, PLC
NOTES TO THE FINANCIAL STATEMENTS
16. RISK MANAGEMENT OBJECTIVES AND POLICIES cont’d.
INTEREST RATE RISK cont’d.
BNY Mellon Global Dynamic Bond Fund Less than 1 year 1-6 years
Over 6 years
Non interest bearing
Total 2015
USD USD USD USD USDAssetsFinancial assets at fair value through profit or loss 64,721,641 124,768,734 58,625,669 1,748,245 249,864,289Cash and bank balances 8,779,694 – – – 8,779,694Margins on derivative contracts 75,690 – – – 75,690Debtors – – – 7,533,024 7,533,024
Total assets 73,577,025 124,768,734 58,625,669 9,281,269 266,252,697
LiabilitiesFinancial liabilities at fair value through profit or loss – – – 2,299,462 2,299,462Bank overdraft 1,411 – – – 1,411Creditors – amount falling due within one year – – – 239,115 239,115
Total liabilities 1,411 – – 2,538,577 2,539,988
Total interest sensitivity gap 73,575,614 124,768,734 58,625,669
BNY Mellon Global High Yield Bond Fund Less than 1 year 1-6 years
Over 6 years
Non interest bearing
Total 2015
USD USD USD USD USDAssetsFinancial assets at fair value through profit or loss – 52,036,859 74,258,504 1,066,587 127,361,950Cash and bank balances 6,376,027 – – – 6,376,027Debtors – – – 2,408,448 2,408,448
Total assets 6,376,027 52,036,859 74,258,504 3,475,035 136,146,425
LiabilitiesFinancial liabilities at fair value through profit or loss – – – 572,215 572,215Creditors – amount falling due within one year – – – 1,155,186 1,155,186
Total liabilities – – – 1,727,401 1,727,401
Total interest sensitivity gap 6,376,027 52,036,859 74,258,504

315
BNY MELLON GLOBAL FUNDS, PLC
NOTES TO THE FINANCIAL STATEMENTS
16. RISK MANAGEMENT OBJECTIVES AND POLICIES cont’d.
INTEREST RATE RISK cont’d.
BNY Mellon Global Opportunistic Bond Fund Less than 1 year 1-6 years
Over 6 years
Non interest bearing
Total 2015
USD USD USD USD USDAssetsFinancial assets at fair value through profit or loss 10,142,403 69,689,866 133,913,418 736,689 214,482,376Cash and bank balances 7,338,345 – – – 7,338,345Margins on derivative contracts 11,085 – – – 11,085Debtors – – – 2,258,467 2,258,467
Total assets 17,491,833 69,689,866 133,913,418 2,995,156 224,090,273
LiabilitiesFinancial liabilities at fair value through profit or loss 108,161 – 1,324,238 1,631,892 3,064,291Margins on derivative contracts 623,535 – – – 623,535Creditors – amount falling due within one year – – – 2,933,970 2,933,970
Total liabilities 731,696 – 1,324,238 4,565,862 6,621,796
Total interest sensitivity gap 16,760,137 69,689,866 132,589,180
BNY Mellon Global Real Return Fund (EUR) Less than 1 year 1-6 years
Over 6 years
Non interest bearing
Total 2015
EUR EUR EUR EUR EURAssetsFinancial assets at fair value through profit or loss 500,344,191 143,640,958 400,259,790 1,457,251,784 2,501,496,723Cash and bank balances 91,364,073 – – – 91,364,073Margins on derivative contracts 20,076,176 – – – 20,076,176Debtors – – – 13,575,352 13,575,352
Total assets 611,784,440 143,640,958 400,259,790 1,470,827,136 2,626,512,324
LiabilitiesFinancial liabilities at fair value through profit or loss – – – 10,943,707 10,943,707Bank overdraft 2 – – – 2Creditors – amount falling due within one year – – – 5,580,729 5,580,729
Total liabilities 2 – – 16,524,436 16,524,438
Total interest sensitivity gap 611,784,438 143,640,958 400,259,790

316
BNY MELLON GLOBAL FUNDS, PLC
NOTES TO THE FINANCIAL STATEMENTS
16. RISK MANAGEMENT OBJECTIVES AND POLICIES cont’d.
INTEREST RATE RISK cont’d.
BNY Mellon Global Real Return Fund (GBP) Less than 1 year 1-6 years
Over 6 years
Non interest bearing
Total 2015
GBP GBP GBP GBP GBPAssetsFinancial assets at fair value through profit or loss 9,730,628 3,227,247 9,144,974 33,262,733 55,365,582Cash and bank balances 4,203,695 – – – 4,203,695Margins on derivative contracts 481,493 – – – 481,493Debtors – – – 206,436 206,436
Total assets 14,415,816 3,227,247 9,144,974 33,469,169 60,257,206
LiabilitiesFinancial liabilities at fair value through profit or loss 359 – – 1,182,589 1,182,948Bank overdraft 1 – – – 1Creditors – amount falling due within one year – – – 24,378 24,378
Total liabilities 360 – – 1,206,967 1,207,327
Total interest sensitivity gap 14,415,456 3,227,247 9,144,974
BNY Mellon Global Real Return Fund (USD) Less than 1 year 1-6 years
Over 6 years
Non interest bearing
Total 2015
USD USD USD USD USDAssetsFinancial assets at fair value through profit or loss 77,705,413 28,099,246 79,023,586 289,446,950 474,275,195Cash and bank balances 28,213,663 – – – 28,213,663Margins on derivative contracts 3,966,803 – – – 3,966,803Debtors – – – 1,863,592 1,863,592
Total assets 109,885,879 28,099,246 79,023,586 291,310,542 508,319,253
LiabilitiesFinancial liabilities at fair value through profit or loss – – – 1,565,570 1,565,570Bank overdraft 10 – – – 10Creditors – amount falling due within one year – – – 615,432 615,432
Total liabilities 10 – – 2,181,002 2,181,012
Total interest sensitivity gap 109,885,869 28,099,246 79,023,586

317
BNY MELLON GLOBAL FUNDS, PLC
NOTES TO THE FINANCIAL STATEMENTS
16. RISK MANAGEMENT OBJECTIVES AND POLICIES cont’d.
INTEREST RATE RISK cont’d.
BNY Mellon Targeted Return Bond Fund Less than 1 year 1-6 years
Over 6 years
Non interest bearing
Total 2015
USD USD USD USD USDAssetsFinancial assets at fair value through profit or loss 5,870,129 28,762,847 58,471,962 328,529 93,433,467Cash and bank balances 3,182,088 – – – 3,182,088Margins on derivative contracts 20,989 – – – 20,989Debtors – – – 1,042,118 1,042,118
Total assets 9,073,206 28,762,847 58,471,962 1,370,647 97,678,662
LiabilitiesFinancial liabilities at fair value through profit or loss 39,523 – – 2,614,961 2,654,484Margins on derivative contracts 285,793 – – – 285,793Creditors – amount falling due within one year – – – 1,012,685 1,012,685
Total liabilities 325,316 – – 3,627,646 3,952,962
Total interest sensitivity gap 8,747,890 28,762,847 58,471,962
For those Funds holding primarily interest bearing securities and as such exposed to the risk of fluctuations in the prevailing levels of market interest rates, the Investment Managers monitor the Funds’ exposure to interest fluctuations on a daily basis. Whilst primarily an investment decision, the Investment Managers employ proprietary systems and processes to best position the Funds to benefit from or limit the risk of any fluctuations in the prevailing market levels of market interest rates.
The Investment Managers will endeavour to acquire interest bearing securities in liquid markets. However, not all securities invested by the Funds will be listed or rated and consequently liquidity may be low. Moreover the accumulation and disposal of holdings in some securities may be time consuming and need to be conducted at unfavourable prices. The Funds may also encounter difficulties in disposing of assets at their fair price due to adverse market conditions leading to limited liquidity. The financial markets of emerging market countries in general, are less liquid than those of the more developed nations. Purchases and sales of investments may take longer than would otherwise be expected on developed stock markets and transactions may need to be conducted at unfavourable prices.
The table below demonstrates the impacts of 25 basis points (“bps”) increase in the market interest rates in the key markets the listed Funds were invested.
At 31 December 2016 and 31 December 2015, should interest rates have increased by 25bps with all other variables remaining constant, the instantaneous shift in the Funds’ total return is listed (25bps decrease would have similar but opposite results in the Funds’ total return).
FundFunctional
currencyFunds Total Return (%) – Instantaneous Shift
Funds Total Return (%) – Instantaneous Shift
2016 2015
BNY Mellon Emerging Markets Corporate Debt Fund USD 1.125 1.075BNY Mellon Global Bond Fund USD 1.500 1.600BNY Mellon Global Dynamic Bond Fund USD 0.700 0.675BNY Mellon Global Real Return Fund (EUR) EUR 0.801 0.660BNY Mellon Global Real Return Fund (GBP) GBP 0.778 0.599BNY Mellon Global Real Return Fund (USD) USD 0.829 0.602BNY Mellon Global Short-Dated High Yield Bond Fund* USD 0.338 N/A
* Please refer to Note 19 of the financial statements.

318
BNY MELLON GLOBAL FUNDS, PLC
NOTES TO THE FINANCIAL STATEMENTS
16. RISK MANAGEMENT OBJECTIVES AND POLICIES cont’d.
INTEREST RATE RISK cont’d.It should be noted that the future market conditions could vary significantly and the table is meant for illustrative purposes only.
For those Funds which use VaR, the interest rate risk sensitivity analysis has been incorporated into the calculation of market price risk.
CURRENCY RISKCurrency risk is the risk that a fair value of a financial instrument will fluctuate because of changes in foreign exchange rates. The risk arises on financial instruments that are denominated in a currency other than the functional currency in which they are measured.
The Investment Managers monitor the Company’s currency position on a daily basis and may act to manage the Company’s currency exposure through the use of FDI such as forward foreign currency contracts or options. The Investment Managers of hedged non-base share classes may also use derivative instruments such as forward foreign currency contracts or options as a key component of their operating strategy. Currency risk does not arise from financial instruments denominated in the functional currency.
The following tables set out the Company’s material exposures to foreign currency risk as at 31 December 2016:
Fund CurrencyNet Exposure
31 December 2016Monetary
assetsMonetary liabilities
Non-monetary assets Hedging
BNY Mellon Absolute Insight FundEUR EUR EUR EUR EUR
Argentinian peso 330,811 330,811 – – – Australian dollar 199,606 289,404 – – (89,798)Brazilian real 91,869 858,317 – – (766,448)Chinese yuan (4,170,401) – – – (4,170,401)Colombian peso (26,595) 309,753 – – (336,348)Danish krone (510) 3,119 (510) – (3,119)Hong Kong dollar 4,666 815,877 – – (811,211)Indonesian rupiah 3,261 185,701 – – (182,440)Japanese yen (3,686,102) 2,647 – – (3,688,749)Korean won (510,742) – – – (510,742)Malaysian ringgit (660,456) 115,778 – – (776,234)Mexican peso 113,053 283,131 – – (170,078)Nigerian naira 18 18 – – – Norwegian krone 18,445 18,445 – – – Peruvian nuevo sol 209,323 285,607 – – (76,284)Polish zloty (33) – – – (33)Romanian leu 299,022 45,816 – – 253,206Russian rouble 555,683 527,783 – – 27,900South African rand (292,097) 549,592 – – (841,689)Sterling (1,687,201) 4,441,344 (314,243) 2,943,823 (8,758,125)Swedish krona 75,604 1,155 – 80,568 (6,119)Swiss franc 60,849 45,122 (43,247) 156,189 (97,215)Thai baht (278,369) – – – (278,369)Turkish lira (138,818) 77 – – (138,895)US dollar 13,587,476 15,100,794 (193,362) 635,380 (1,955,336)
4,098,362 24,210,291 (551,362) 3,815,960 (23,376,527)

319
BNY MELLON GLOBAL FUNDS, PLC
NOTES TO THE FINANCIAL STATEMENTS
16. RISK MANAGEMENT OBJECTIVES AND POLICIES cont’d.
CURRENCY RISK cont’d.
Fund CurrencyNet Exposure
31 December 2016Monetary
assetsMonetary liabilities
Non-monetary assets Hedging
BNY Mellon Absolute Return Bond FundEUR EUR EUR EUR EUR
Australian dollar (327,497) 1,104,053 – – (1,431,550)Hong Kong dollar 422,439 5,171,575 – – (4,749,136)Japanese yen (42,847,103) 4 – – (42,847,107)Norwegian krone 283,062 4,231,833 – – (3,948,771)Sterling (15,597,862) 146,178,879 (47,212) 173,142,727 (334,872,256)Swedish krona (223,269) 2,290,623 – – (2,513,892)Swiss franc 4,652 4,652 – – – US dollar 39,050,844 661,106,442 (625,408) – (621,430,190)
(19,234,734) 820,088,061 (672,620) 173,142,727 (1,011,792,902)
BNY Mellon Absolute Return Equity FundGBP GBP GBP GBP GBP
Danish krone (47,611) 17 (47,628) – – Euro (72,917,246) 31,258,281 (37,818,692) – (66,356,835)Swedish krona 9,815,866 49,567 – 9,766,299 – Swiss franc 10,186,604 1,105,986 (1,624,274) 31,108,368 (20,403,476)US dollar 75,125,381 226,414 (1,015,041) 75,914,008 –
22,162,994 32,640,265 (40,505,635) 116,788,675 (86,760,311)
BNY Mellon Asian Bond FundUSD USD USD USD USD
Euro 1,853 1,853 – – – Indonesian rupiah 249,226 845,412 – – (596,186)Sri Lankan rupee 348,540 348,540 – – –
599,619 1,195,805 – – (596,186)
BNY Mellon Asian Equity FundUSD USD USD USD USD
Australian dollar 10,586,988 – (2) 10,593,555 (6,565)Euro 22,027 22,027 – – – Hong Kong dollar 13,442,510 7 – 13,411,718 30,785Indian rupee 14,350,203 23,614 – 14,326,589 – Indonesian rupiah 1,629,793 – – 1,629,793 – Korean won 5,134,451 – – 5,134,451 – Malaysian ringgit 2,644,787 – – 2,644,787 – New Zealand dollar 840,925 – – 840,925 – Philippine peso 8,847,724 – – 8,847,724 – Taiwanese dollar 4,293,498 92,507 – 4,200,991 – Thai baht 1,848,866 – – 1,848,866 –
63,641,772 138,155 (2) 63,479,399 24,220
BNY Mellon Brazil Equity FundUSD USD USD USD USD
Brazilian real 64,722,216 856,829 – 63,865,387 – Euro (504,825) – (504,825) – – Sterling (286,202) – (286,202) – –
63,931,189 856,829 (791,027) 63,865,387 –

320
BNY MELLON GLOBAL FUNDS, PLC
NOTES TO THE FINANCIAL STATEMENTS
16. RISK MANAGEMENT OBJECTIVES AND POLICIES cont’d.
CURRENCY RISK cont’d.
Fund CurrencyNet Exposure
31 December 2016Monetary
assetsMonetary liabilities
Non-monetary assets Hedging
BNY Mellon Dynamic Total Return FundEUR EUR EUR EUR EUR
Australian dollar 653,596 48,165 – – 605,431Canadian dollar (778,656) – (5,176) – (773,480)Euro (3,221,101) 245,871 (248,484) – (3,218,488)Japanese yen (510,547) 41,610 – – (552,157)New Zealand dollar 1,111,678 – – – 1,111,678Norwegian krone 614,222 – – – 614,222Sterling (2,682,508) 43,976 (73,148) – (2,653,336)Swedish krona 301,173 – – – 301,173Swiss franc 1,111,252 4,793 – – 1,106,459
(3,400,891) 384,415 (326,808) – (3,458,498)
BNY Mellon Emerging Markets Corporate Debt FundUSD USD USD USD USD
Argentinian peso 3,015,049 3,015,049 – – – Euro 27,854 2,758,833 – – (2,730,979)Sterling 384 384 – – –
3,043,287 5,774,266 – – (2,730,979)
BNY Mellon Emerging Markets Debt FundUSD USD USD USD USD
Euro 47,083 47,083 – – – Hungarian forint 4 4 – – – Sterling 364 364 – – –
47,451 47,451 – – –
BNY Mellon Emerging Markets Debt Local Currency FundUSD USD USD USD USD
Argentinian peso 9,307,375 33,101,893 – – (23,794,518)Brazilian real 89,744,280 164,494,676 – – (74,750,396)Chilean peso 1,006,754 – – – 1,006,754Colombian peso 84,493,863 81,560,922 – – 2,932,941Euro (18,222,926) 263,872 – – (18,486,798)Hong Kong dollar (16,340,474) – – – (16,340,474)Hungarian forint 28,655,644 35,986,636 – – (7,330,992)Indian rupee (9,672,280) – – – (9,672,280)Indonesian rupiah 101,919,318 88,653,826 – – 13,265,492Korean won (17,004,414) – – – (17,004,414)Malaysian ringgit 75,526,820 18,295,760 – – 57,231,060Mexican peso 81,806,359 68,577,730 – – 13,228,629Peruvian nuevo sol 30,295,078 12,576,868 – – 17,718,210Philippine peso (14,479,143) 7,277,140 – – (21,756,283)Polish zloty 98,248,778 56,881,971 – – 41,366,807Romanian leu 27,622,021 – – – 27,622,021Russian rouble 72,895,055 63,075,473 – – 9,819,582Singapore dollar (8,360,481) – – – (8,360,481)South African rand 60,511,319 80,273,338 – – (19,762,019)Sterling 66,843 66,843 – – – Swiss franc 9,500,394 2,626,192 – – 6,874,202

321
BNY MELLON GLOBAL FUNDS, PLC
NOTES TO THE FINANCIAL STATEMENTS
16. RISK MANAGEMENT OBJECTIVES AND POLICIES cont’d.
CURRENCY RISK cont’d.
Fund CurrencyNet Exposure
31 December 2016Monetary
assetsMonetary liabilities
Non-monetary assets Hedging
BNY Mellon Emerging Markets Debt Local Currency Fund cont’d.USD USD USD USD USD
Taiwanese dollar (17,447,520) – – – (17,447,520)Thai baht 50,703,755 29,824,101 – – 20,879,654Turkish lira 79,793,975 69,547,822 – – 10,246,153
800,570,393 813,085,063 – – (12,514,670)
BNY Mellon Emerging Markets Debt Opportunistic FundUSD USD USD USD USD
Argentinian peso 874,716 2,770,511 – – (1,895,795)Brazilian real 4,156,532 4,295,032 – – (138,500)Chilean peso 38,535 – – – 38,535Colombian peso 3,989,141 3,207,753 – – 781,388Euro (1,249,335) 10,530 – – (1,259,865)Hong Kong dollar (1,155,569) – – – (1,155,569)Hungarian forint 769,472 1,685,305 – – (915,833)Indian rupee (705,349) – – – (705,349)Indonesian rupiah 4,556,943 4,200,383 – – 356,560Korean won (1,295,829) – – – (1,295,829)Malaysian ringgit 2,894,431 443,994 – – 2,450,437Mexican peso 3,453,386 3,906,365 – – (452,979)Peruvian nuevo sol 1,770,422 662,848 – – 1,107,574Philippine peso (1,210,916) – – – (1,210,916)Polish zloty 4,618,588 2,241,323 – – 2,377,265Romanian leu 1,090,404 – – – 1,090,404Russian rouble 3,370,704 3,053,314 – – 317,390Singapore dollar (662,763) – – – (662,763)South African rand 1,904,881 1,964,466 – – (59,585)Sterling 383 383 – – – Taiwanese dollar (1,323,325) – – – (1,323,325)Thai baht 1,398,118 1,933,394 – – (535,276)Turkish lira 3,224,198 2,477,274 – – 746,924
30,507,768 32,852,875 – – (2,345,107)
BNY Mellon Euroland Bond FundEUR EUR EUR EUR EUR
Argentinian peso 6,950,155 6,950,155 – – – Australian dollar (1,145,479) 9,312,995 (400,598) – (10,057,876)Brazilian real 9,926,208 6,975,019 (660,344) – 3,611,533Canadian dollar (14,705,965) 20,459 (330,890) – (14,395,534)Colombian peso 6,983,090 6,983,090 – – – Hungarian forint (808,411) 2,555 – – (810,966)Indonesian rupiah 17,565,876 – – – 17,565,876Japanese yen (19,863,371) 903,242 – – (20,766,613)Korean won (16,549,953) – – – (16,549,953)Mexican peso 7,438,568 – – – 7,438,568New Zealand dollar (842,563) – – – (842,563)Norwegian krone 1 1 – – – Russian rouble 7,298,154 7,298,154 – – – Singapore dollar (8,778,040) 6,557 – – (8,784,597)
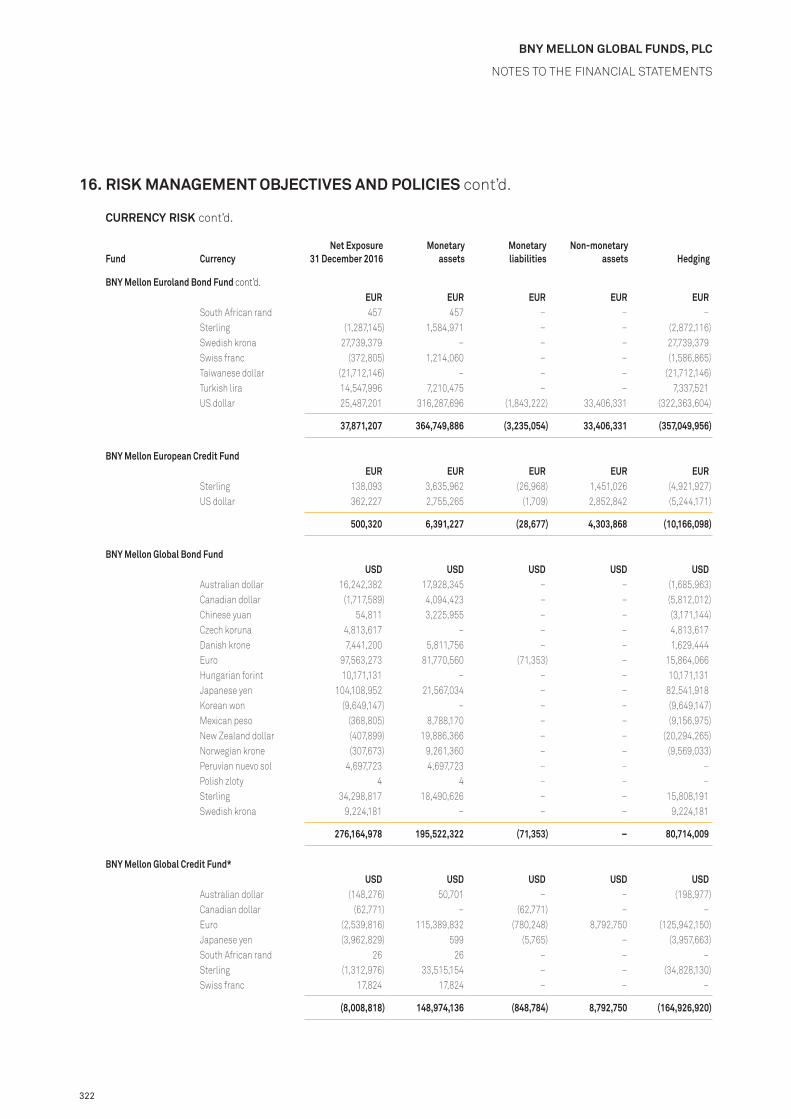
322
BNY MELLON GLOBAL FUNDS, PLC
NOTES TO THE FINANCIAL STATEMENTS
16. RISK MANAGEMENT OBJECTIVES AND POLICIES cont’d.
CURRENCY RISK cont’d.
Fund CurrencyNet Exposure
31 December 2016Monetary
assetsMonetary liabilities
Non-monetary assets Hedging
BNY Mellon Euroland Bond Fund cont’d.EUR EUR EUR EUR EUR
South African rand 457 457 – – – Sterling (1,287,145) 1,584,971 – – (2,872,116)Swedish krona 27,739,379 – – – 27,739,379Swiss franc (372,805) 1,214,060 – – (1,586,865)Taiwanese dollar (21,712,146) – – – (21,712,146)Turkish lira 14,547,996 7,210,475 – – 7,337,521US dollar 25,487,201 316,287,696 (1,843,222) 33,406,331 (322,363,604)
37,871,207 364,749,886 (3,235,054) 33,406,331 (357,049,956)
BNY Mellon European Credit FundEUR EUR EUR EUR EUR
Sterling 138,093 3,635,962 (26,968) 1,451,026 (4,921,927)US dollar 362,227 2,755,265 (1,709) 2,852,842 (5,244,171)
500,320 6,391,227 (28,677) 4,303,868 (10,166,098)
BNY Mellon Global Bond FundUSD USD USD USD USD
Australian dollar 16,242,382 17,928,345 – – (1,685,963)Canadian dollar (1,717,589) 4,094,423 – – (5,812,012)Chinese yuan 54,811 3,225,955 – – (3,171,144)Czech koruna 4,813,617 – – – 4,813,617Danish krone 7,441,200 5,811,756 – – 1,629,444Euro 97,563,273 81,770,560 (71,353) – 15,864,066Hungarian forint 10,171,131 – – – 10,171,131Japanese yen 104,108,952 21,567,034 – – 82,541,918Korean won (9,649,147) – – – (9,649,147)Mexican peso (368,805) 8,788,170 – – (9,156,975)New Zealand dollar (407,899) 19,886,366 – – (20,294,265)Norwegian krone (307,673) 9,261,360 – – (9,569,033)Peruvian nuevo sol 4,697,723 4,697,723 – – – Polish zloty 4 4 – – – Sterling 34,298,817 18,490,626 – – 15,808,191Swedish krona 9,224,181 – – – 9,224,181
276,164,978 195,522,322 (71,353) – 80,714,009
BNY Mellon Global Credit Fund*USD USD USD USD USD
Australian dollar (148,276) 50,701 – – (198,977)Canadian dollar (62,771) – (62,771) – – Euro (2,539,816) 115,389,832 (780,248) 8,792,750 (125,942,150)Japanese yen (3,962,829) 599 (5,765) – (3,957,663)South African rand 26 26 – – – Sterling (1,312,976) 33,515,154 – – (34,828,130)Swiss franc 17,824 17,824 – – –
(8,008,818) 148,974,136 (848,784) 8,792,750 (164,926,920)

323
BNY MELLON GLOBAL FUNDS, PLC
NOTES TO THE FINANCIAL STATEMENTS
16. RISK MANAGEMENT OBJECTIVES AND POLICIES cont’d.
CURRENCY RISK cont’d.
Fund CurrencyNet Exposure
31 December 2016Monetary
assetsMonetary liabilities
Non-monetary assets Hedging
BNY Mellon Global Dynamic Bond FundUSD USD USD USD USD
Australian dollar 6,885,916 10,715,471 – – (3,829,555)Canadian dollar (5,032,260) – – – (5,032,260)Chinese yuan 32,108 2,753,228 – – (2,721,120)Danish krone 3,131,242 – – – 3,131,242Euro (22,112,290) 51,631,510 (93,028) – (73,650,772)Hungarian forint 7,538,737 – – – 7,538,737Japanese yen (15,910) – – – (15,910)Korean won (6,877,432) – – – (6,877,432)Mexican peso (202,356) 6,284,453 – – (6,486,809)New Zealand dollar (233,705) 14,830,562 – – (15,064,267)Norwegian krone (69,749) 3,668,332 – – (3,738,081)Peruvian nuevo sol 3,558,904 3,558,904 – – – Sterling (631,906) 49,113,355 – – (49,745,261)Swedish krona 5,465,367 – – – 5,465,367Swiss franc (99,019) 1,191,795 – – (1,290,814)
(8,662,353) 143,747,610 (93,028) – (152,316,935)
BNY Mellon Global Emerging Markets FundUSD USD USD USD USD
Euro 11 11 – – – Hong Kong dollar 3,708,377 – – 3,708,377 – Indian rupee 9,031,605 5,050 – 9,026,555 – Indonesian rupiah 269,038 – – 269,038 – Korean won 1,110,183 – – 1,110,183 – Malaysian ringgit 371,377 380 – 370,997 – Mexican peso 1,730,485 – – 1,730,485 – Philippine peso 2,092,337 – – 2,092,337 – South African rand 3,371,932 – – 3,371,932 – Sterling 590,125 – – 590,125 – Taiwanese dollar 1,897,508 1,879 – 1,895,629 –
24,172,978 7,320 – 24,165,658 –
BNY Mellon Global Equity FundUSD USD USD USD USD
Brazilian real 793,686 – – 793,686 – Canadian dollar 5,647,070 26,453 – 5,633,246 (12,629)Euro 33,782,698 156 – 33,782,698 (156)Hong Kong dollar 4,458,479 – – 4,458,479 – Indian rupee 935,613 262 – 935,351 – Japanese yen 15,112,080 – – 15,986,072 (873,992)New Zealand dollar 1 1 – – – Norwegian krone 4,662,616 – – 4,662,616 – Sterling 27,111,494 1 – 27,111,493 – Swiss franc 8,231,015 – – 8,231,015 –
100,734,752 26,873 – 101,594,656 (886,777)

324
BNY MELLON GLOBAL FUNDS, PLC
NOTES TO THE FINANCIAL STATEMENTS
16. RISK MANAGEMENT OBJECTIVES AND POLICIES cont’d.
CURRENCY RISK cont’d.
Fund CurrencyNet Exposure
31 December 2016Monetary
assetsMonetary liabilities
Non-monetary assets Hedging
BNY Mellon Global Equity Income FundUSD USD USD USD USD
Australian dollar 8,244,327 – – 8,244,327 – Euro 64,629,296 6,431 – 65,647,665 (1,024,800)Hong Kong dollar 8,730,874 – – 8,730,874 – Japanese yen 16,899,634 – – 16,899,634 – Korean won 6,086,204 – – 6,086,204 – New Zealand dollar 2,819,881 – – 2,819,881 – Norwegian krone 14,856,642 – – 14,856,642 – South African rand 2 2 – – – Sterling 150,398,033 133,721 – 150,264,312 – Swiss franc 76,654,847 – – 76,654,847 – Taiwanese dollar 1,556 1,556 – – –
349,321,296 141,710 – 350,204,386 (1,024,800)
BNY Mellon Global High Yield Bond FundUSD USD USD USD USD
Euro (228,131) 17,816,750 – – (18,044,881)Sterling 50,001 7,037,291 – – (6,987,290)
(178,130) 24,854,041 – – (25,032,171)
BNY Mellon Global Leaders Fund*USD USD USD USD USD
Australian dollar 913,144 – – 913,144 – Canadian dollar 909,999 – – 909,999 – Danish krone 913,681 – – 913,681 – Euro 4,656,666 – – 4,656,666 – Hong Kong dollar 874,992 – – 874,992 – Japanese yen 1,875,961 – – 1,875,961 – Sterling 924,000 – – 924,000 – Swiss franc 2,853,172 – – 2,853,172 –
13,921,615 – – 13,921,615 –
BNY Mellon Global Opportunistic Bond FundUSD USD USD USD USD
Argentinian peso 2,624,535 2,624,535 – – – Australian dollar (39,810) 2,598,918 (68,581) – (2,570,147)Brazilian real 1,908,942 1,406,689 – – 502,253Canadian dollar (1,287,696) 2,700,379 – – (3,988,075)Colombian peso 1,376,827 1,376,827 – – – Euro (7,482,826) 11,439,616 (288,405) – (18,634,037)Hungarian forint (87,375) 1,474,498 – – (1,561,873)Indonesian rupiah 2,596,018 – – – 2,596,018Japanese yen (5,185,001) 3,896,842 – – (9,081,843)Korean won (2,466,946) 2,433,372 – – (4,900,318)Mexican peso 681,291 1,684,370 – – (1,003,079)New Zealand dollar (75,588) 5,221,255 – – (5,296,843)Polish zloty 19,422 2,138,645 – – (2,119,223)Russian rouble 1,217,326 1,217,326 – – – Singapore dollar (1,413,938) 15,010 – – (1,428,948)South African rand 9 9 – – – Sterling (67,127) 757,804 – – (824,931)

325
BNY MELLON GLOBAL FUNDS, PLC
NOTES TO THE FINANCIAL STATEMENTS
16. RISK MANAGEMENT OBJECTIVES AND POLICIES cont’d.
CURRENCY RISK cont’d.
Fund CurrencyNet Exposure
31 December 2016Monetary
assetsMonetary liabilities
Non-monetary assets Hedging
BNY Mellon Global Opportunistic Bond Fund cont’d.USD USD USD USD USD
Swedish krona 5,178,172 – – – 5,178,172Taiwanese dollar (3,965,791) – – – (3,965,791)Turkish lira 1,424,994 1,424,994 – – –
(5,044,562) 42,411,089 (356,986) – (47,098,665)
BNY Mellon Global Opportunities FundUSD USD USD USD USD
Canadian dollar 1,372,661 6,869 – 1,372,661 (6,869)Euro 13,438,559 126,474 – 13,348,717 (36,632)Hong Kong dollar 1,343,527 – – 1,343,527 – Israeli shekel 1,358,989 – – 1,358,989 – Japanese yen 5,503,202 – – 5,536,201 (32,999)Malaysian ringgit 1 1 – – – Mexican peso 2,217,870 – – 2,217,870 – Norwegian krone 3,165,121 – – 1,936,867 1,228,254Sterling 10,163,008 1 – 10,163,007 – Swiss franc 1,818,773 – – 1,818,773 – Taiwanese dollar 871 871 – – –
40,382,582 134,216 – 39,096,612 1,151,754
BNY Mellon Global Property Securities FundEUR EUR EUR EUR EUR
Australian dollar 1,337,793 779 – 1,337,014 – Canadian dollar 503,321 516 – 502,805 – Hong Kong dollar 1,250,259 1,005 – 1,249,254 – Japanese yen 2,337,632 – (148) 2,337,780 – Norwegian krone 105,936 – – 105,936 – Singapore dollar 354,859 148 – 354,711 – Sterling 1,043,509 1,158 – 1,042,509 (158)Swedish krona 229,931 – – 229,931 – Swiss franc 179,793 – – 179,793 – US dollar 12,179,257 144,651 – 12,037,090 (2,484)
19,522,290 148,257 (148) 19,376,823 (2,642)
BNY Mellon Global Real Return Fund (EUR)EUR EUR EUR EUR EUR
Australian dollar 5,957,697 220,645,816 (10,128) 52,137,081 (266,815,072)Canadian dollar 1,385,352 – – 117,911,659 (116,526,307)Danish krone 35,206,202 – – 35,206,202 – Indian rupee 8,751,460 – – 8,751,460 – Japanese yen 108,456,330 – – 100,190,740 8,265,590Korean won 1,902,919 – – 32,422,814 (30,519,895)Mexican peso 19,423,189 19,447,896 (24,707) – – New Zealand dollar (115,761,296) 109,309,207 (2,629) 21,970,590 (247,038,464)South African rand (5,074,449) – – 6,368,938 (11,443,387)Sterling (89,769,964) 75,458,841 (6,315,042) 625,449,730 (784,363,493)Swiss franc 170,996,229 – – 162,436,537 8,559,692US dollar 201,061,952 999,459,208 (4,665,724) 913,405,255 (1,707,136,787)
342,535,621 1,424,320,968 (11,018,230) 2,076,251,006 (3,147,018,123)

326
BNY MELLON GLOBAL FUNDS, PLC
NOTES TO THE FINANCIAL STATEMENTS
16. RISK MANAGEMENT OBJECTIVES AND POLICIES cont’d.
CURRENCY RISK cont’d.
Fund CurrencyNet Exposure
31 December 2016Monetary
assetsMonetary liabilities
Non-monetary assets Hedging
BNY Mellon Global Real Return Fund (GBP)GBP GBP GBP GBP GBP
Australian dollar (235,924) 3,544,446 (151) 830,019 (4,610,238)Canadian dollar (118,858) – – 1,865,634 (1,984,492)Danish krone 465,679 – – 465,679 – Euro 140,153 359,831 (135,932) 6,145,337 (6,229,083)Indian rupee 141,464 – – 141,464 – Japanese yen 1,559,541 – – 1,585,632 (26,091)Korean won 58,923 – – 527,444 (468,521)Mexican peso 313,784 314,171 (387) – – New Zealand dollar (1,739,888) 1,762,395 – 351,231 (3,853,514)South African rand (89,293) – – 100,776 (190,069)Swiss franc 2,670,186 – – 2,670,186 – US dollar 4,948,322 14,909,170 (75,743) 14,658,819 (24,543,924)
8,114,089 20,890,013 (212,213) 29,342,221 (41,905,932)
BNY Mellon Global Real Return Fund (USD)USD USD USD USD USD
Australian dollar (22,477,750) 35,013,289 (1,577) 8,250,399 (65,739,861)Canadian dollar (16,135,163) – – 18,774,580 (34,909,743)Danish krone 3,107,480 – – 3,107,480 – Euro (14,498,363) 4,790,522 (1,307,877) 60,050,549 (78,031,557)Indian rupee 1,445,846 73,027 – 1,372,819 – Japanese yen 15,508,087 – – 15,764,926 (256,839)Korean won 71,549 – – 5,109,328 (5,037,779)Mexican peso 3,103,308 3,103,308 – – – New Zealand dollar (31,986,193) 17,301,499 – 3,462,277 (52,749,969)South African rand (818,483) – – 1,014,095 (1,832,578)Sterling (17,410,932) 12,193,903 (988,806) 98,692,392 (127,308,421)Swiss franc 25,597,765 – – 25,597,765 –
(54,492,849) 72,475,548 (2,298,260) 241,196,610 (365,866,747)
BNY Mellon Global Short-Dated High Yield Bond Fund*USD USD USD USD USD
Euro (1,212,129) 65,028,086 – – (66,240,215)Norwegian krone 1,821,346 66 – 2,588,551 (767,271)Sterling (845,963) 72,349,648 – – (73,195,611)Swedish krona 72 72 – – – Swiss franc 436 436 – – –
(236,238) 137,378,308 – 2,588,551 (140,203,097)
BNY Mellon Japan All Cap Equity FundJPY JPY JPY JPY JPY
Sterling 910,087 910,087 – – – US dollar 4,882,115 4,882,115 – – –
5,792,202 5,792,202 – – –

327
BNY MELLON GLOBAL FUNDS, PLC
NOTES TO THE FINANCIAL STATEMENTS
16. RISK MANAGEMENT OBJECTIVES AND POLICIES cont’d.
CURRENCY RISK cont’d.
Fund CurrencyNet Exposure
31 December 2016Monetary
assetsMonetary liabilities
Non-monetary assets Hedging
BNY Mellon Japan Small Cap Equity Focus FundJPY JPY JPY JPY JPY
Sterling 15,928,395 15,928,395 – – – US dollar 17,318,785 17,318,785 – – –
33,247,180 33,247,180 – – –
BNY Mellon Long-Term Global Equity FundEUR EUR EUR EUR EUR
Australian dollar 27,814,148 1 – 27,814,147 – Canadian dollar 28,752,627 – – 28,752,627 – Danish krone 16,803,978 – – 16,803,978 – Hong Kong dollar 102,544,477 – – 102,544,477 – Japanese yen 110,274,303 – – 110,274,303 – Sterling 71,250,985 52,807 – 71,198,178 – Swedish krona 21,535,758 – – 21,535,758 – Swiss franc 105,574,525 95 – 105,574,430 – US dollar 684,373,737 13,122,678 – 671,368,103 (117,044)
1,168,924,538 13,175,581 – 1,155,866,001 (117,044)
BNY Mellon Pan European Equity FundEUR EUR EUR EUR EUR
Danish krone 13,067 – – 13,067 – Norwegian krone 56,555 – – 56,555 – Sterling 858,442 – – 858,442 – Swedish krona 29,361 – – 29,361 – Swiss franc 210,012 – – 210,012 – US dollar 75 2,927 – – (2,852)
1,167,512 2,927 – 1,167,437 (2,852)
BNY Mellon S&P 500® Index TrackerUSD USD USD USD USD
Euro 30,972 5,761 – – 25,211
30,972 5,761 – – 25,211
BNY Mellon Small Cap Euroland FundEUR EUR EUR EUR EUR
Sterling 18,571 18,571 – – – Swedish krona 417,549 13,033 – 404,516 – Swiss franc 483,704 3,767 – 479,937 – US dollar 1,030,051 3,320 – 1,026,731 –
1,949,875 38,691 – 1,911,184 –
BNY Mellon Targeted Return Bond FundUSD USD USD USD USD
Argentinian peso 1,559,682 1,559,682 – – – Australian dollar 736,635 5,702,037 (30,592) – (4,934,810)Brazilian real 1,225,333 814,399 – – 410,934Canadian dollar (1,631,883) 1,713,046 – – (3,344,929)Colombian peso 826,030 826,030 – – –

328
BNY MELLON GLOBAL FUNDS, PLC
NOTES TO THE FINANCIAL STATEMENTS
16. RISK MANAGEMENT OBJECTIVES AND POLICIES cont’d.
CURRENCY RISK cont’d.
Fund CurrencyNet Exposure
31 December 2016Monetary
assetsMonetary liabilities
Non-monetary assets Hedging
BNY Mellon Targeted Return Bond Fund cont’d.USD USD USD USD USD
Euro (4,706,548) 8,655,400 (175,222) – (13,186,726)Hungarian forint (527) 1,026,400 – – (1,026,927)Indonesian rupiah 1,664,242 – – – 1,664,242Japanese yen (3,161,661) 3,818,926 – – (6,980,587)Korean won (1,435,549) – – – (1,435,549)Mexican peso 388,229 1,051,801 – – (663,572)New Zealand dollar (97,417) 3,408,307 – – (3,505,724)Polish zloty (26,406) 1,464,102 – – (1,490,508)Russian rouble 783,102 783,102 – – – Singapore dollar (769,735) 8,747 – – (778,482)Sterling 33,469 408,997 – – (375,528)Swedish krona 3,216,936 – – – 3,216,936Taiwanese dollar (2,408,455) – – – (2,408,455)Turkish lira 778,913 849,597 – – (70,684)
(3,025,610) 32,090,573 (205,814) – (34,910,369)
BNY Mellon U.S. Dynamic Value FundUSD USD USD USD USD
Euro 102,507 102,507 – – – Sterling 1 1 – – –
102,508 102,508 – – –
BNY Mellon US Opportunities FundUSD USD USD USD USD
Euro 2,432 2,432 – – – Sterling 3,209 3,209 – – –
5,641 5,641 – – –
* Please refer to Note 19 of the financial statements.
The following tables set out the Company’s material exposures to foreign currency risk as at 31 December 2015:
Fund CurrencyNet Exposure
31 December 2015Monetary
assetsMonetary liabilities
Non-monetary assets Hedging
BNY Mellon Absolute Insight FundEUR EUR EUR EUR EUR
Australian dollar (701,737) 121,047 – – (822,784)Brazilian real (847,113) – – – (847,113)Canadian dollar (75,915) – – – (75,915)Chilean peso (798,832) – – – (798,832)Colombian peso (68,288) 1,173,611 – – (1,241,899)Hong Kong dollar (5,302) 909,120 (9,783) – (904,639)Hungarian forint (801,379) 781,533 – – (1,582,912)Indonesian rupiah 174,750 955,165 (201) – (780,214)Israeli shekel (1,407,150) 1,138,969 – – (2,546,119)Japanese yen 13,906 430,861 (78,089) – (338,866)Korean won (3,748,475) – – – (3,748,475)

329
BNY MELLON GLOBAL FUNDS, PLC
NOTES TO THE FINANCIAL STATEMENTS
16. RISK MANAGEMENT OBJECTIVES AND POLICIES cont’d.
CURRENCY RISK cont’d.
Fund CurrencyNet Exposure
31 December 2015Monetary
assetsMonetary liabilities
Non-monetary assets Hedging
BNY Mellon Absolute Insight Fund cont’d.EUR EUR EUR EUR EUR
Malaysian ringgit (2,139) – – – (2,139)Mexican peso 937,046 2,318,852 (221) – (1,381,585)New Zealand dollar (2,028) – – – (2,028)Peruvian nuevo sol 185,571 185,571 – – –Polish zloty 1,075,142 1,211,420 – – (136,278)Romanian leu 38,544 1,218,177 – – (1,179,633)Russian rouble 7,905 728,721 – – (720,816)South African rand (1,006,123) 641,761 – – (1,647,884)Sterling 33,942,964 11,377,253 (798,194) 6,961,688 16,402,217Swedish krona 8,484 13,534 (5,050) – –Swiss franc 2,533,647 81,287 (8,425) 388,795 2,071,990Thai baht (823,217) 1,246,229 – – (2,069,446)Turkish lira (39,133) 772,883 (9,704) – (802,312)US dollar 16,945,564 28,666,536 (366,593) 1,161,090 (12,515,469)
45,536,692 53,972,530 (1,276,260) 8,511,573 (15,671,151)
BNY Mellon Absolute Return Bond FundEUR EUR EUR EUR EUR
Australian dollar (2,246,753) 1,806,385 – – (4,053,138)Brazilian real (3,411,735) – – – (3,411,735)Canadian dollar 655,495 – – – 655,495Hong Kong dollar 141,323 4,974,809 – – (4,833,486)Japanese yen 5,985,869 467,971 – – 5,517,898Korean won (3,786,598) – – – (3,786,598)New Zealand dollar 5,229 – – – 5,229Norwegian krone 103,491 3,974,390 – – (3,870,899)South African rand (76,017) 228,062 – – (304,079)Sterling 1,248,772 96,408,100 – 182,294,501 (277,453,829)Swedish krona 51,227 1,849,380 – – (1,798,153)US dollar 16,776,619 306,303,000 (962,407) – (288,563,974)
15,446,922 416,012,097 (962,407) 182,294,501 (581,897,269)
BNY Mellon Absolute Return Equity FundGBP GBP GBP GBP GBP
Euro (45,606,989) 15,099,371 (19,984,348) 15,856,114 (56,578,126)Swedish krona 351,563 547,175 (195,612) – –Swiss franc 15,193,859 3,068,656 (291,650) 15,795,574 (3,378,721)US dollar 47,940,964 32,806 (58,330) 47,072,336 894,152
17,879,397 18,748,008 (20,529,940) 78,724,024 (59,062,695)
BNY Mellon Asian Bond FundUSD USD USD USD USD
Euro 838,353 534 – – 837,819
838,353 534 – – 837,819

330
BNY MELLON GLOBAL FUNDS, PLC
NOTES TO THE FINANCIAL STATEMENTS
16. RISK MANAGEMENT OBJECTIVES AND POLICIES cont’d.
CURRENCY RISK cont’d.
Fund CurrencyNet Exposure
31 December 2015Monetary
assetsMonetary liabilities
Non-monetary assets Hedging
BNY Mellon Asian Equity FundUSD USD USD USD USD
Australian dollar 14,630,839 – (2) 14,630,841 –Euro 9,557 70 – – 9,487Hong Kong dollar 18,847,442 7 – 18,847,435 –Indian rupee 13,991,854 24,226 – 13,967,628 –Indonesian rupiah 2,505,670 – – 2,505,670 –Korean won 3,591,395 – – 3,591,395 –Malaysian ringgit 3,356,236 – – 3,356,236 –New Zealand dollar 1,295,604 – – 1,295,604 –Philippine peso 13,223,824 – – 13,223,824 –Taiwanese dollar 5,742,637 247,341 – 5,495,296 –Thai baht 3,705,155 – – 3,705,155 –
80,900,213 271,644 (2) 80,619,084 9,487
BNY Mellon Asian Income FundGBP GBP GBP GBP GBP
Euro 32 32 – – –
32 32 – – –
BNY Mellon Brazil Equity FundUSD USD USD USD USD
Brazilian real 43,529,675 2,130,116 – 41,399,559 –Euro 114,273 114,273 – – –Sterling 12,939 12,939 – – –
43,656,887 2,257,328 – 41,399,559 –
BNY Mellon Crossover Credit FundEUR EUR EUR EUR EUR
Sterling 626 626 – – –US dollar 22,492,104 8,045 – – 22,484,059
22,492,730 8,671 – – 22,484,059
BNY Mellon Dynamic Total Return FundEUR EUR EUR EUR EUR
Australian dollar 992,076 22,178 – – 969,898 Canadian dollar 645,850 5,166 (21,005) – 661,689 Euro (1,151,223) 43,169 (7,915) – (1,186,477)Hong Kong dollar (3,391) – (3,391) – – Japanese yen 778,707 2,123 (23,141) – 799,725 New Zealand dollar 322,749 – – – 322,749 Norwegian krone (454,399) – – – (454,399)Sterling (1,556,315) 1,147 (23,601) – (1,533,861)Swedish krona 46,180 – – – 46,180 Swiss franc (150,827) 7,816 – – (158,643)
(530,593) 81,599 (79,053) – (533,139)

331
BNY MELLON GLOBAL FUNDS, PLC
NOTES TO THE FINANCIAL STATEMENTS
16. RISK MANAGEMENT OBJECTIVES AND POLICIES cont’d.
CURRENCY RISK cont’d.
Fund CurrencyNet Exposure
31 December 2015Monetary
assetsMonetary liabilities
Non-monetary assets Hedging
BNY Mellon Emerging Markets Corporate Debt FundUSD USD USD USD USD
Euro (929,549) 2,502,460 – – (3,432,009)Mexican peso (893) 511,259 – – (512,152)Sterling 587 587 – – –Turkish lira 1,929 154,482 – – (152,553)
(927,926) 3,168,788 – – (4,096,714)
BNY Mellon Emerging Markets Debt FundUSD USD USD USD USD
Euro 34,544 34,544 – – –Hungarian forint 4 4 – – –Sterling 5,493 5,493 – – –
40,041 40,041 – – –
BNY Mellon Emerging Markets Debt Local Currency FundUSD USD USD USD USD
Argentinian peso 3,429,494 3,429,494 – – –Brazilian real 126,784,352 256,362,107 – – (129,577,755)Chilean peso 27,661,925 – – – 27,661,925Colombian peso 76,596,515 117,635,574 – – (41,039,059)Euro 41,680 106,865 – – (65,185)Hungarian forint 54,629,880 35,746,931 – – 18,882,949Indian rupee 20,549,765 – – – 20,549,765Indonesian rupiah 123,746,977 113,193,632 – – 10,553,345Korean won (13,886,062) – – – (13,886,062)Malaysian ringgit 108,459,088 43,399,997 – – 65,059,091Mexican peso 182,394,646 111,030,911 – – 71,363,735Peruvian nuevo sol (15,230,668) – – – (15,230,668)Philippine peso 6,722,757 12,833,807 – – (6,111,050)Polish zloty 137,173,903 141,579,726 – – (4,405,823)Romanian leu 12,104,615 3,734,938 – – 8,369,677Russian rouble 66,527,523 89,189,556 – – (22,662,033)South African rand 68,517,739 99,337,009 – – (30,819,270)Sterling 73,226 86,713 – – (13,487)Swiss franc 6,495 6,495 – – –Taiwanese dollar (27,221,159) – – – (27,221,159)Thai baht 85,129,767 61,994,812 – – 23,134,955Turkish lira 104,011,520 150,096,954 – – (46,085,434)
1,148,223,978 1,239,765,521 – – (91,541,543)
BNY Mellon Emerging Markets Debt Opportunistic FundUSD USD USD USD USD
Argentinian peso 153,788 153,788 – – –Brazilian real 3,847,639 8,260,728 – – (4,413,089)Chilean peso 2,071,433 – – – 2,071,433Colombian peso 2,492,050 4,490,014 – – (1,997,964)Euro 1,121 1,121 – – –Hungarian forint 1,343,591 1,343,591 – – –

332
BNY MELLON GLOBAL FUNDS, PLC
NOTES TO THE FINANCIAL STATEMENTS
16. RISK MANAGEMENT OBJECTIVES AND POLICIES cont’d.
CURRENCY RISK cont’d.
Fund CurrencyNet Exposure
31 December 2015Monetary
assetsMonetary liabilities
Non-monetary assets Hedging
BNY Mellon Emerging Markets Debt Opportunistic Fund cont’d.USD USD USD USD USD
Indonesian rupiah 4,225,232 3,964,309 – – 260,923Korean won (1,004,914) – – – (1,004,914)Malaysian ringgit 3,082,097 1,843,760 – – 1,238,337Mexican peso 7,981,940 5,040,425 – – 2,941,515Peruvian nuevo sol (2,003,006) – – – (2,003,006)Philippine peso 268,327 – – – 268,327Polish zloty 4,624,567 4,754,502 – – (129,935)Romanian leu (562,789) – – – (562,789)Russian rouble 2,258,580 3,132,195 – – (873,615)South African rand 2,487,353 2,145,925 – – 341,428Sterling 1,474 1,474 – – –Taiwanese dollar (1,809,832) – – – (1,809,832)Thai baht 1,734,395 2,516,409 – – (782,014)Turkish lira 2,990,671 3,967,483 – – (976,812)
34,183,717 41,615,724 – – (7,432,007)
BNY Mellon Euroland Bond FundEUR EUR EUR EUR EUR
Australian dollar (27,980,818) 1,546,840 – – (29,527,658)Brazilian real (953,988) – (953,988) – –Canadian dollar 4,325,461 2,401,372 – – 1,924,089Indian rupee 56,282,869 – – – 56,282,869Japanese yen 2,889,436 – – – 2,889,436Korean won (291,975) 65,238,488 – – (65,530,463)Mexican peso 89,100,698 – – – 89,100,698New Zealand dollar (31,107,148) – – – (31,107,148)Norwegian krone 27,434,158 1 – – 27,434,157Polish zloty (2,720,093) – – – (2,720,093)Russian rouble 26,168,878 – – – 26,168,878Singapore dollar 6,487 6,487 – – –South African rand 389 389 – – –Sterling 1,038,797 22,439,600 – – (21,400,803)Swedish krona 28,345,595 – – – 28,345,595Swiss franc (810,051) 2,806,133 – – (3,616,184)Taiwanese dollar (55,870,440) – – – (55,870,440)US dollar (84,051,988) 538,836,110 (9,883,784) 35,323,376 (648,327,690)
31,806,267 633,275,420 (10,837,772) 35,323,376 (625,954,757)
BNY Mellon European Credit FundEUR EUR EUR EUR EUR
Sterling 68,061 2,934,119 – 3,014,628 (5,880,686)US dollar 18,256,485 6,258,954 (25,577) – 12,023,108
18,324,546 9,193,073 (25,577) 3,014,628 6,142,422
BNY Mellon Global Bond FundUSD USD USD USD USD
Australian dollar (4,523,040) 12,172,358 – – (16,695,398)Canadian dollar 3,692,269 1 – – 3,692,268

333
BNY MELLON GLOBAL FUNDS, PLC
NOTES TO THE FINANCIAL STATEMENTS
16. RISK MANAGEMENT OBJECTIVES AND POLICIES cont’d.
CURRENCY RISK cont’d.
Fund CurrencyNet Exposure
31 December 2015Monetary
assetsMonetary liabilities
Non-monetary assets Hedging
BNY Mellon Global Bond Fund cont’d.USD USD USD USD USD
Chinese yuan 83,603 3,405,847 – – (3,322,244)Danish krone 7,530,996 5,204,383 (3) – 2,326,616Euro 81,906,535 74,444,926 – – 7,461,609Indonesian rupiah (3,034,367) – – – (3,034,367)Japanese yen 65,746,380 – – – 65,746,380Korean won (3,062,380) – – – (3,062,380)Mexican peso (96,702) 4,930,302 – – (5,027,004)New Zealand dollar (3,458,195) 12,163,042 – – (15,621,237)Norwegian krone 3,053,344 – – – 3,053,344Peruvian nuevo sol (71,213) 1,561,569 – – (1,632,782)Polish zloty 90,241 4 – – 90,237Singapore dollar (3,083,796) – – – (3,083,796)Sterling 22,937,074 21,490,408 – – 1,446,666Swedish krona 1,140,490 – – – 1,140,490
168,851,239 135,372,840 (3) – 33,478,402
BNY Mellon Global Dynamic Bond FundUSD USD USD USD USD
Australian dollar (7,831,052) 8,324,401 – – (16,155,453)Canadian dollar 28,995 – – – 28,995Chinese yuan 41,713 2,923,119 – – (2,881,406)Danish krone 5,013,088 – – – 5,013,088Euro (618,698) 36,494,330 – – (37,113,028)Indonesian rupiah (2,478,833) – – – (2,478,833)Japanese yen (27,470) – – – (27,470)Korean won (2,533,144) – – – (2,533,144)Mexican peso 3,665,371 2,524,824 – – 1,140,547New Zealand dollar (2,871,995) 8,040,047 – – (10,912,042)Norwegian krone 2,456,986 370,528 – – 2,086,458Polish zloty 24,324 – – – 24,324Singapore dollar (2,519,257) – – – (2,519,257)South African rand (3,608,541) – – – (3,608,541)Sterling (942,590) 46,792,629 (1,411) – (47,733,808)Swedish krona (88,493) 864,033 – – (952,526)
(12,289,596) 106,333,911 (1,411) – (118,622,096)
BNY Mellon Global Emerging Markets Equity Value FundUSD USD USD USD USD
Brazilian real 25,864 25,864 – – –Euro 172 172 – – –Hong Kong dollar 250,455 – (2) 250,457 –Indian rupee 16,767 9,662 – 7,105 –Korean won 1,104 1,104 – – –Qatari riyal 1,484 1,484 – – –
295,846 38,286 (2) 257,562 –

334
BNY MELLON GLOBAL FUNDS, PLC
NOTES TO THE FINANCIAL STATEMENTS
16. RISK MANAGEMENT OBJECTIVES AND POLICIES cont’d.
CURRENCY RISK cont’d.
Fund CurrencyNet Exposure
31 December 2015Monetary
assetsMonetary liabilities
Non-monetary assets Hedging
BNY Mellon Global Emerging Markets FundUSD USD USD USD USD
Australian dollar 95,011 – – 82,169 12,842Euro 132,928 – (1) 114,893 18,036Hong Kong dollar 3,486,164 – – 3,012,291 473,873Indian rupee 1,012,328 – – 1,012,328 –Indonesian rupiah 106,775 – – 103,196 3,579Malaysian ringgit 356,760 – – 346,608 10,152Mexican peso 1,036,217 – – 895,196 141,021Philippine peso 1,648,290 – – 1,648,290 –South African rand 2,956,730 – – 2,555,664 401,066Sterling 203,935 – – 175,921 28,014Taiwanese dollar 1,616,219 225,985 – 1,390,234 –Turkish lira 113,601 – – 97,879 15,722
12,764,958 225,985 (1) 11,434,669 1,104,305
BNY Mellon Global Equity FundUSD USD USD USD USD
Brazilian real 432,632 232,631 – 200,001 –Canadian dollar 5,143,134 11,525 – 5,143,134 (11,525)Euro 29,994,409 7,617 – 29,998,718 (11,926)Hong Kong dollar 5,021,479 – – 5,076,468 (54,989)Indian rupee 2,754,066 269 – 3,256,911 (503,114)Japanese yen 20,674,334 – – 20,674,334 –Norwegian krone 2,623,662 – – 2,623,662 –Sterling 22,669,086 1 – 22,669,085 –Swiss franc 15,543,844 – – 15,543,844 –
104,856,646 252,043 – 105,186,157 (581,554)
BNY Mellon Global Equity Income FundUSD USD USD USD USD
Australian dollar 4,589,426 – – 4,589,426 –Danish krone 2,888,739 – – 2,888,739 –Euro 50,572,567 – (878) 50,641,556 (68,111)Hong Kong dollar 5,672,079 – – 5,672,079 –Japanese yen 33,040,734 – – – 33,040,734Korean won 4,349,399 – – 4,349,399 –New Zealand dollar 1,879,591 – – 1,879,591 –Norwegian krone 9,183,501 – – 9,183,501 –Sterling 37,689,769 101,044 – 69,156,072 (31,567,347)Swedish krona 4,842,834 – – 4,842,834 –Swiss franc 42,420,760 – – 42,420,760 –Taiwanese dollar 1,527 1,527 – – –
197,130,926 102,571 (878) 195,623,957 1,405,276
BNY Mellon Global High Yield Bond FundUSD USD USD USD USD
Euro (171,353) 15,561,939 – – (15,733,292)Sterling 37,681 8,833,082 – – (8,795,401)
(133,672) 24,395,021 – – (24,528,693)

335
BNY MELLON GLOBAL FUNDS, PLC
NOTES TO THE FINANCIAL STATEMENTS
16. RISK MANAGEMENT OBJECTIVES AND POLICIES cont’d.
CURRENCY RISK cont’d.
Fund CurrencyNet Exposure
31 December 2015Monetary
assetsMonetary liabilities
Non-monetary assets Hedging
BNY Mellon Global Opportunistic Bond FundUSD USD USD USD USD
Argentinian peso 591,468 591,468 – – –Australian dollar 721,409 12,516,998 (272) – (11,795,317)Brazilian real 1,988,791 1,988,791 – – –Canadian dollar (3,128,337) – – – (3,128,337)Chilean peso 2,887,333 – – – 2,887,333Colombian peso 104 104 – – –Euro (4,476,816) 7,520,710 (27,808) – (11,969,718)Hungarian forint (2,228,396) – – – (2,228,396)Indian rupee 8,740,816 – – – 8,740,816Japanese yen 620 620 – – –Korean won (1,784,896) 5,197,759 – – (6,982,655)Malaysian ringgit (1,657,234) – – – (1,657,234)Mexican peso 6,577,237 5,624,915 – – 952,322New Zealand dollar (6,904,410) 3,342,939 – – (10,247,349)Norwegian krone 3,885,725 – – – 3,885,725Peruvian nuevo sol (3,962,498) – – – (3,962,498)Polish zloty (175,193) 4,141,827 – – (4,317,020)Russian rouble 1,477,592 1,477,592 – – –South African rand (2,140,772) 8 – – (2,140,780)Sterling (23,370) 1,095,506 – – (1,118,876)Taiwanese dollar (11,849,604) – – – (11,849,604)Thai baht (2,221,631) – – – (2,221,631)Turkish lira (2,180,350) 1,369 – – (2,181,719)
(15,862,412) 43,500,606 (28,080) – (59,334,938)
BNY Mellon Global Opportunities FundUSD USD USD USD USD
Canadian dollar 1,652,606 – – 1,652,606 –Euro 22,838,892 5,893,772 – 16,818,336 126,784Hong Kong dollar 2,821,835 – – 2,821,835 –Israeli shekel 1,444,994 – – 1,444,994 –Japanese yen 4,734,802 – – 4,734,802 –Norwegian krone 2,827,667 – – 2,827,667 –Sterling 14,235,890 1 – 14,235,889 –Swiss franc 8,736,772 – – 8,736,772 –Taiwanese dollar 855 855 – – –
59,294,313 5,894,628 – 53,272,901 126,784
BNY Mellon Global Property Securities FundEUR EUR EUR EUR EUR
Australian dollar 822,080 6,513 – 815,567 –Canadian dollar 301,004 638 – 300,366 –Hong Kong dollar 915,792 7,680 – 903,374 4,738Japanese yen 1,452,437 2,070 – 1,450,367 –Norwegian krone 32,437 69 – 32,368 –Singapore dollar 239,307 1,086 – 238,221 –

336
BNY MELLON GLOBAL FUNDS, PLC
NOTES TO THE FINANCIAL STATEMENTS
16. RISK MANAGEMENT OBJECTIVES AND POLICIES cont’d.
CURRENCY RISK cont’d.
Fund CurrencyNet Exposure
31 December 2015Monetary
assetsMonetary liabilities
Non-monetary assets Hedging
BNY Mellon Global Property Securities Fund cont’d.EUR EUR EUR EUR EUR
Sterling 928,691 1,427 – 927,264 –Swedish krona 176,290 – – 176,290 –Swiss franc 99,467 159 – 99,308 –US dollar 7,768,456 102,607 – 7,670,587 (4,738)
12,735,961 122,249 – 12,613,712 –
BNY Mellon Global Real Return Fund (EUR)EUR EUR EUR EUR EUR
Australian dollar 1,703,779 148,229,647 – 36,612,902 (183,138,770)Canadian dollar (2,282,268) – – 50,872,899 (53,155,167)Danish krone 9,407,449 – – 9,407,449 –Hong Kong dollar 1,236 – – 7,277,622 (7,276,386)Israeli shekel (1,060,614) – – 6,150,026 (7,210,640)Japanese yen 81,917,894 – – 81,917,894 –New Zealand dollar (3,074,734) 54,677,150 – 18,772,256 (76,524,140)Norwegian krone 26,017,437 – – – 26,017,437South African rand 610,658 3 – 3,199,075 (2,588,420)Sterling 19,260,687 63,581,456 – 297,724,264 (342,045,033)Swedish krona (693,875) – – 13,255,453 (13,949,328)Swiss franc 92,892,337 – – 92,892,337 –US dollar (18,690,819) 669,853,059 (2) 542,393,176 (1,230,937,052)
206,009,167 936,341,315 (2) 1,160,475,353 (1,890,807,499)
BNY Mellon Global Real Return Fund (GBP)GBP GBP GBP GBP GBP
Australian dollar (170,635) 3,411,979 – 830,813 (4,413,427)Canadian dollar (66,029) – – 1,219,058 (1,285,087)Danish krone 216,341 – – 216,341 –Euro (857,671) 297,413 – 5,340,997 (6,496,081)Hong Kong dollar 1,588 – – 164,175 (162,587)Israeli shekel (10,412) – – 139,963 (150,375)Japanese yen 1,864,454 – – 1,864,454 –New Zealand dollar (61,505) 1,303,057 – 425,736 (1,790,298)Norwegian krone 359,533 – – – 359,533South African rand 22,715 – – 81,524 (58,809)Swedish krona (14,250) – – 310,304 (324,554)Swiss franc 2,103,829 – – 2,103,829 –US dollar 405,552 15,339,063 (360) 12,375,096 (27,308,247)
3,793,510 20,351,512 (360) 25,072,290 (41,629,932)
BNY Mellon Global Real Return Fund (USD)USD USD USD USD USD
Australian dollar (11,914,642) 28,602,068 – 7,040,108 (47,556,818)Canadian dollar (686,553) – – 10,173,823 (10,860,376)Danish krone 1,744,981 – (10) 1,744,991 –Euro (11,814,136) 2,419,226 – 45,510,589 (59,743,951)

337
BNY MELLON GLOBAL FUNDS, PLC
NOTES TO THE FINANCIAL STATEMENTS
16. RISK MANAGEMENT OBJECTIVES AND POLICIES cont’d.
CURRENCY RISK cont’d.
Fund CurrencyNet Exposure
31 December 2015Monetary
assetsMonetary liabilities
Non-monetary assets Hedging
BNY Mellon Global Real Return Fund (USD) cont’d.USD USD USD USD USD
Hong Kong dollar 184,594 – – 1,412,724 (1,228,130)Israeli shekel (473,107) – – 1,172,815 (1,645,922)Japanese yen 15,968,631 – – 15,968,631 –New Zealand dollar (7,980,904) 11,412,346 – 3,645,704 (23,038,954)South African rand 175,178 – – 668,181 (493,003)Sterling (8,314,679) 12,855,279 – 57,425,320 (78,595,278)Swedish krona (480,021) – – 2,597,941 (3,077,962)Swiss franc 18,040,107 – – 18,040,107 –
(5,550,551) 55,288,919 (10) 165,400,934 (226,240,394)
BNY Mellon Japan All Cap Equity FundJPY JPY JPY JPY JPY
Sterling 1,314,935 1,314,935 – – –US dollar 1,809,811 1,809,811 – – –
3,124,746 3,124,746 – – –
BNY Mellon Japan Small Cap Equity Focus FundJPY JPY JPY JPY JPY
Sterling 6,917,745 6,917,745 – – –US dollar 8,066,895 8,066,895 – – –
14,984,640 14,984,640 – – –
BNY Mellon Long-Term Global Equity FundEUR EUR EUR EUR EUR
Australian dollar 32,173,435 1 – 32,173,434 –Canadian dollar 17,217,991 – – 17,217,991 –Danish krone 32,733,975 – – 32,733,975 –Hong Kong dollar 114,860,616 – – 114,860,616 –Japanese yen 168,704,622 – – 168,704,622 –Singapore dollar 25,223,011 – – 25,223,011 –Sterling 44,316,392 50,629 – 44,265,763 –Swedish krona 28,693,813 16 – 28,693,797 –Swiss franc 137,644,553 44,034 – 137,600,519 –US dollar 705,812,041 902,194 – 703,145,686 1,764,161
1,307,380,449 996,874 – 1,304,619,414 1,764,161
BNY Mellon Pan European Equity FundEUR EUR EUR EUR EUR
Danish krone 1,088,355 – – 1,088,355 –Norwegian krone 552,758 – – 552,758 –Sterling 18,040,809 537,777 (724) 17,500,073 3,683Swedish krona 947,369 – – 947,369 –Swiss franc 7,130,417 – – 7,130,417 –US dollar 130 3,219 – – (3,089)
27,759,838 540,996 (724) 27,218,972 594

338
BNY MELLON GLOBAL FUNDS, PLC
NOTES TO THE FINANCIAL STATEMENTS
16. RISK MANAGEMENT OBJECTIVES AND POLICIES cont’d.
CURRENCY RISK cont’d.
Fund CurrencyNet Exposure
31 December 2015Monetary
assetsMonetary liabilities
Non-monetary assets Hedging
BNY Mellon S&P 500® Index TrackerUSD USD USD USD USD
Euro 56,437 56,437 – – –
56,437 56,437 – – –
BNY Mellon Small Cap Euroland FundEUR EUR EUR EUR EUR
Sterling 1,232,317 5,637 – 1,226,680 –US dollar 34,159,703 8,639 – 1,801,026 32,350,038
35,392,020 14,276 – 3,027,706 32,350,038
BNY Mellon Targeted Return Bond FundUSD USD USD USD USD
Argentinian peso 332,864 332,864 – – –Australian dollar 57,229 14,436,468 – – (14,379,239)Brazilian real 922,885 – – – 922,885Canadian dollar (1,418,372) – – – (1,418,372)Chilean peso 1,483,835 – – – 1,483,835Euro (1,951,294) 3,496,107 (3,148) – (5,444,253)Hungarian forint (992,059) – – – (992,059)Indian rupee 3,853,746 – – – 3,853,746Korean won (981,548) – – – (981,548)Malaysian ringgit (1,007,133) – – – (1,007,133)Mexican peso 3,326,073 2,663,038 – – 663,035New Zealand dollar (2,884,427) 1,532,180 – – (4,416,607)Norwegian krone 1,931,239 – – – 1,931,239Peruvian nuevo sol (1,848,886) – – – (1,848,886)Polish zloty (37,501) 1,887,415 – – (1,924,916)Russian rouble 662,369 662,369 – – –South African rand (926,597) – – – (926,597)Sterling 94,641,548 489,648 – – 94,151,900Taiwanese dollar (5,232,348) – – – (5,232,348)Thai baht (971,964) – – – (971,964)Turkish lira (968,520) – – – (968,520)
87,991,139 25,500,089 (3,148) – 62,494,198
BNY Mellon U.S. Dynamic Value FundUSD USD USD USD USD
Euro 4,412 391 – – 4,021Sterling 2,106 2,106 – – –
6,518 2,497 – – 4,021
BNY Mellon US Opportunities FundUSD USD USD USD USD
Euro 18,411 18,411 – – –
18,411 18,411 – – –

339
BNY MELLON GLOBAL FUNDS, PLC
NOTES TO THE FINANCIAL STATEMENTS
16. RISK MANAGEMENT OBJECTIVES AND POLICIES cont’d.
CURRENCY RISK cont’d.The following table demonstrates the impact on net assets attributable to redeemable participating shareholders of a movement in local currencies against the Funds’ functional currency by way of illustration. In the interests of providing consistent comparisons across the Funds, the table assumes a 5% upward movement in the value of the local currencies (a negative 5% would have similar negative results).
As at 31 December 2016 and 31 December 2015, had the exchange rate between the local currencies held by the Fund and its functional currency increased or decreased by 5% with all other variables held constant, the increase or decrease, respectively in net assets attributable to redeemable participating shareholders is listed in the table below.
FundFunctional
currencyIncrease/(decrease)
in net asset value Increase/(decrease)
in net asset value 2016 2015
BNY Mellon Asian Equity Fund USD 3,182,089 4,045,011BNY Mellon Asian Income Fund GBP N/A 2BNY Mellon Brazil Equity Fund USD 3,196,559 2,182,844BNY Mellon Emerging Markets Corporate Debt Fund USD 152,164 (46,396)BNY Mellon Global Bond Fund USD 13,808,249 8,442,562BNY Mellon Global Dynamic Bond Fund USD (433,118) (614,480)BNY Mellon Global Emerging Markets Equity Value Fund* USD N/A 14,792BNY Mellon Global Emerging Markets Fund USD 1,208,649 638,248BNY Mellon Global Equity Fund USD 5,036,738 5,242,832BNY Mellon Global Equity Income Fund USD 17,466,065 9,856,546BNY Mellon Global Leaders Fund* USD 696,081 N/ABNY Mellon Global Opportunities Fund USD 2,019,129 2,964,716BNY Mellon Global Property Securities Fund EUR 976,115 636,798BNY Mellon Global Real Return Fund (EUR) EUR 17,126,781 10,300,458BNY Mellon Global Real Return Fund (GBP) GBP 405,704 189,676BNY Mellon Global Real Return Fund (USD) USD (2,724,642) (277,528)BNY Mellon Global Short-Dated High Yield Bond Fund* USD (11,812) N/ABNY Mellon Japan All Cap Equity Fund JPY 289,610 156,237BNY Mellon Japan Small Cap Equity Focus Fund JPY 1,662,359 749,232BNY Mellon Long-Term Global Equity Fund EUR 58,446,227 65,369,022BNY Mellon Pan European Equity Fund EUR 58,376 1,387,992BNY Mellon S&P 500® Index Tracker USD 1,549 2,822BNY Mellon Small Cap Euroland Fund EUR 97,494 1,769,601BNY Mellon U.S. Dynamic Value Fund USD 5,125 326BNY Mellon US Opportunities Fund USD 282 921
* Please refer to Note 19 of the financial statements.
For those Funds which use VaR, the currency risk sensitivity analysis has been incorporated into the calculation of market price risk.
CREDIT RISKCredit risk is the risk that one party to a financial instrument will cause a financial loss for the other party by failing to discharge an obligation. This includes counterparty risk and issuer risk. Financial assets, which potentially expose the Company to credit risk, consist principally of interest bearing securities such as bonds, financial derivative instruments and investments in cash balances and deposits with and receivable from brokers.
The extent of the Company’s exposure to credit risk in respect of these financial assets approximates their carrying values as recorded in the Statement of Financial Position.
The Investment Managers manage issuer risk through building diversified portfolios with a limited concentration of exposure (10%) to any one issuer in accordance with the Central Bank UCITS Regulations and the investment objectives

340
BNY MELLON GLOBAL FUNDS, PLC
NOTES TO THE FINANCIAL STATEMENTS
16. RISK MANAGEMENT OBJECTIVES AND POLICIES cont’d.
CREDIT RISK cont’d.of the Funds. Additionally, if required the Investment Managers will limit ownership of debt instruments to those instruments carrying a credit rating equal to or in excess of that provided for in the individual investment objectives of the Funds.
Substantially all of the assets of the Company are held by the Depositary. Bankruptcy or insolvency of the Depositary may cause the Company’s rights with respect to securities and other positions held by the Depositary to be delayed or limited.
The Company only transacts with depositaries that are regulated entities subject to prudential supervision, or with high credit ratings assigned by international credit-rating agencies. The Directors monitor the credit quality of the Depositary on a quarterly basis in order to mitigate risk. The Depositary delegates the day-to-day responsibilities to its global sub-custodian, the London branch of The Bank of New York Mellon SA/NV, licensed as a bank in Belgium, whose long-term senior debt and long-term deposit rating by Standard & Poor’s is AA- (31 December 2015: AA-) as at the end of the year.
The Company’s securities and other positions are segregated from the assets of either the Depositary or its agents. Thus in the event of insolvency or bankruptcy of the Depositary, the Company’s securities and other positions are segregated from those of the Depositary or its agents. The Company will, however, be exposed to the credit risk of the Depositary, or any custodian used by the Depositary, in relation to the Company’s cash held by the Depositary and the subscription and redemption cash collection accounts held by the Global Sub-Custodian. In the event of insolvency or bankruptcy of the Depositary, the Company will be treated as a general creditor of the Depositary in relation to cash holdings of the Company.
Counterparty/issuer risk is monitored in the following manner:
– Each Investment Manager maintains an Approved Broker list which is subject to ongoing monitoring. The trading system only permits trading with approved brokers. New brokers are added, subject to a formal review process that includes a review of the broker’s creditworthiness and financial strength.
– Measurement and monitoring of counterparty or issuer trade exposure is conducted daily and consists of reviewing all outstanding positions held.
The permanent risk function of the Company oversees this process as well as performing independent checks.
The long-term senior debt and long-term deposit rating by Standard & Poor’s of the counterparties whom the Funds transacted with as at 31 December 2016 are listed in the table below (rating for 31 December 2015 is the same except where stated):
Counterparty Rating Counterparty Rating
Bank of America Merrill Lynch A+ (31 December 2015: A) Morgan Stanley & Co. LLC A+ (31 December 2015: A)Bank of Montreal A+ Nomura Holdings Inc A- (31 December 2015: BBB+)Bank of New York Mellon Corporation A RBC Capital Markets LLC AA-Barclays Bank Plc A- Royal Bank of Canada AA-BNP Paribas A (31 December 2015: A+) Royal Bank of Scotland Plc BBB+Credit Suisse AG A Skandinaviska Enskilda Banken AB A+ (31 December 2015: N/A)Citibank N.A. A+ (31 December 2015: A) Societe Generale ACommonwealth Bank of Australia AA- Standard Chartered Bank A (31 December 2015: A+)Deutsche Bank AG BBB+ State Street Corp A Goldman Sachs & Co. A+ (31 December 2015: A) Toronto Dominion Bank AA-HSBC Bank Plc AA- UBS AG A+ (31 December 2015: A)J.P. Morgan AG A+ Westpac Banking Corp AA-
For Funds using the cash sweep management, cash balances are automatically swept into the short-term investment vehicle daily before the designated dealing time for the Funds. The cash investment auto-sweep is part of the daily cash

341
BNY MELLON GLOBAL FUNDS, PLC
NOTES TO THE FINANCIAL STATEMENTS
16. RISK MANAGEMENT OBJECTIVES AND POLICIES cont’d.
CREDIT RISK cont’d.management procedure. All money market funds available through the cash sweep management are triple-A rated by Standard & Poor’s and Moody’s and maintains a stable net asset value. US dollar, Euro and Sterling prime and treasury funds are available for investments, in addition to a number of funds in additional currencies, depending on the domicile of the investor and the tax implications.
The table below details the cash sweep balances as at 31 December 2016 and 31 December 2015:
Fund Base Currency 31 December 2016 31 December 2015
BNY Mellon Asian Equity Fund USD 443,018 1,806,854BNY Mellon Brazil Equity Fund USD 512,372 2,273,966BNY Mellon Global Bond Fund USD 17,656,500 8,302,380BNY Mellon Global Dynamic Bond Fund USD 13,142,233 5,823,844BNY Mellon Global Emerging Markets Fund USD 440,262 –BNY Mellon Global Equity Fund USD 10,565,030 10,975,622BNY Mellon Global Equity Income Fund USD 15,515,515 8,413,422BNY Mellon Global Opportunities Fund USD 1,730,533 6,286,398BNY Mellon Global Property Securities Fund EUR 7,942 12,007BNY Mellon Global Real Return Fund (EUR) EUR 247,895,729 86,744,096BNY Mellon Global Real Return Fund (GBP) GBP 3,313,264 1,775,781BNY Mellon Global Real Return Fund (USD) USD 10,973,225 27,316,379BNY Mellon Pan European Equity Fund EUR 17,561 537,777BNY Mellon US Opportunities Fund USD 146,171 178,459
Details of Standard & Poor’s credit rating carried by all investments in interest bearing securities such as bonds and similar financial instruments as at 31 December 2016 and 31 December 2015 are listed in the table below and further analytics may be sourced from the Company’s Datafile, produced by BNY Mellon Investment Management EMEA Limited.
Fund Rating 31 December 2016 31 December 2015% %
BNY Mellon Absolute Insight Fund AAA to AA- 17.70 12.90A+ to BBB+ 5.80 8.50BBB to BBB- 15.50 13.40BB+ to BB- 6.60 7.90B+ to B- 4.20 4.20CCC+ to D 0.90 1.70
BNY Mellon Absolute Return Bond Fund AAA 26.10 5.63AA 10.17 14.19A 28.82 37.99BBB 13.29 15.11BB 10.64 9.74B 0.71 0.46Unrated 0.14 0.95
BNY Mellon Absolute Return Equity Fund A – 0.63A1+ 13.49 23.09A1 31.13 17.15A-1+ 23.01 32.75A-1 30.25 26.38Unrated 2.12 N/A

342
BNY MELLON GLOBAL FUNDS, PLC
NOTES TO THE FINANCIAL STATEMENTS
16. RISK MANAGEMENT OBJECTIVES AND POLICIES cont’d.
CREDIT RISK cont’d.
Fund Rating 31 December 2016 31 December 2015% %
BNY Mellon Asian Bond Fund AAA 2.20 6.80AA 10.70 10.90A 33.10 30.70BBB 32.60 38.20BB 7.40 6.90B 12.10 5.80C 0.60 –Unrated 1.30 0.70
BNY Mellon Crossover Credit Fund* A N/A 2.90BBB N/A 53.10BB N/A 40.00B N/A 2.60
BNY Mellon Dynamic Total Return Fund AA+ 70.60 86.00
BNY Mellon Emerging Markets Corporate Debt Fund AA – 6.30A 3.60 8.70BBB 52.10 42.60BB 22.00 23.50B 13.10 7.60CCC & below – 0.90
BNY Mellon Emerging Markets Debt Fund AAA 1.60 5.60AA 1.20 1.80A 2.20 4.40BBB 49.70 44.80BB 20.40 27.90B 20.90 7.60CCC 3.00 7.60CC 1.00 –D – 0.30
BNY Mellon Emerging Markets Debt Local Currency Fund AAA 15.00 4.50A 17.40 22.50A- 4.80 4.70BBB+ 8.80 15.50BBB 11.90 14.10BBB- 31.30 33.30BB+ – 4.40BB 8.50 –B- 4.10 –CCC+ – 0.20
BNY Mellon Emerging Markets Debt Opportunistic Fund AAA 4.20 4.70AA – 2.70A 13.90 21.20BBB 45.20 52.60BB 19.50 15.30B 16.60 1.30CCC 0.80 1.50

343
BNY MELLON GLOBAL FUNDS, PLC
NOTES TO THE FINANCIAL STATEMENTS
16. RISK MANAGEMENT OBJECTIVES AND POLICIES cont’d.
CREDIT RISK cont’d.
Fund Rating 31 December 2016 31 December 2015% %
BNY Mellon Emerging Markets Debt Opportunistic Fund cont’d. CC 0.20 –D – 0.30
BNY Mellon Euroland Bond Fund AAA 12.80 13.60AA 6.00 13.40A 12.90 9.60BBB 53.40 54.20BB 7.20 3.70B 5.10 5.40C 0.10 –Others 2.50 –
BNY Mellon European Credit Fund AAA – 0.20AA 5.60 6.00A 48.80 34.70BBB 32.70 39.90BB & below 2.60 8.40Insight EMD Fund 1.70 3.40Insight Short Dated HY Fund 3.30 2.60
BNY Mellon Global Bond Fund AAA 56.10 71.50AA 23.40 10.40A 8.60 4.60BBB 11.80 13.60
BNY Mellon Global Credit Fund* AAA 14.10 N/AAA 11.70 N/AA 26.70 N/ABBB 35.10 N/ABelow BBB 4.70 N/AInsight EM Bond Opportunities Fund 2.20 N/A
BNY Mellon Global Dynamic Bond Fund AAA 27.80 39.30AA 18.20 24.10A 14.10 7.40BBB 17.90 19.00BB 9.80 5.10B 7.00 3.90CCC 1.30 0.20Unrated 3.90 1.00
BNY Mellon Global High Yield Bond Fund BBB 2.80 1.00BB 32.90 32.10B 52.00 48.00CCC & below 8.60 14.90
BNY Mellon Global Opportunistic Bond Fund AAA 20.30 11.70AA 5.20 5.90A 14.80 12.60BBB 25.40 24.30BB 12.90 12.60B & below 21.30 32.90

344
BNY MELLON GLOBAL FUNDS, PLC
NOTES TO THE FINANCIAL STATEMENTS
16. RISK MANAGEMENT OBJECTIVES AND POLICIES cont’d.
CREDIT RISK cont’d.
Fund Rating 31 December 2016 31 December 2015% %
BNY Mellon Global Real Return Fund (EUR) AAA 77.73 81.80AA 7.91 8.62A 2.55 1.95BBB 1.03 1.05BB 3.27 2.63B 7.52 3.95
BNY Mellon Global Real Return Fund (GBP) AAA 76.69 81.76AA 8.77 8.12A 2.79 1.48BBB 1.38 1.28BB 3.43 3.46B 6.95 3.90
BNY Mellon Global Real Return Fund (USD) AAA 76.49 83.05AA 8.68 6.88A 2.47 1.45BBB 0.88 0.94BB 3.38 3.36B 8.09 4.32
BNY Mellon Global Short-Dated High Yield Bond Fund* BBB 6.59 N/ABB 30.23 N/AB 55.05 N/ACCC 7.01 N/AUnrated 1.11 N/A
BNY Mellon Targeted Return Bond Fund AAA 27.00 23.68AA 5.20 1.60A 14.70 8.47BBB 24.80 19.32BB 10.50 14.18B 9.80 17.44CCC – 14.15C 5.50 –D – 1.16Unrated 2.60 –
* Please refer to Note 19 of the financial statements.
All transactions in listed securities are settled or paid upon delivery using approved brokers. The risk of broker default is considered minimal as delivery of securities sold is only made once the broker has received payment. Payment is made on a purchase once the securities have been received by the broker.
Credit default swaps provide a measure of protection against defaults of debt issuers. The use of credit default swaps does not assure their use will be effective or will have the desired result. The credit events are specified in the contract and are intended to identify the occurrence of a significant deterioration in the creditworthiness of the reference asset. As a seller of protection on credit default swaps, the Funds will generally receive from the buyer of protection a fixed rate of income throughout the term of the swap provided that there is no credit event. As the seller, the Funds would effectively add leverage to their portfolios because, in addition to their total net assets, the Funds would be subject to investment exposure on the notional amounts of the swaps.

345
BNY MELLON GLOBAL FUNDS, PLC
NOTES TO THE FINANCIAL STATEMENTS
16. RISK MANAGEMENT OBJECTIVES AND POLICIES cont’d.
CREDIT RISK cont’d.The maximum potential amount of future payments (undiscounted) that a Fund as a seller of protection could be required to make under a credit default swap equals the notional amount of the agreement. These potential amounts would be partially offset by any recovery values of the respective referenced obligations, upfront payments received upon entering into the agreement, or net amounts received from the settlement of buy protection credit default swap entered into by the Funds for the same referenced entity or entities.
The maximum exposure for the Funds as a seller of protection is detailed below.
Fund Base Currency31 December 2016 31 December 2015
Maximum Exposure Maximum Exposure
BNY Mellon Absolute Insight Fund EUR 2,889,990 3,200,000BNY Mellon Absolute Return Bond Fund EUR 335,820,072 97,015,138BNY Mellon Crossover Credit Fund* EUR N/A 3,500,000BNY Mellon Euroland Bond Fund EUR 92,000,000 218,155,963BNY Mellon European Credit Fund EUR 2,250,000 1,400,000BNY Mellon Global Credit Fund* USD 9,601,716 N/ABNY Mellon Global Opportunistic Bond Fund USD – 23,700,000
* Please refer to Note 19 of the financial statements.
Where possible the Company restricts its exposure to credit losses on the trading derivative instruments it holds by entering into master netting arrangements which is a bilateral agreement between the Funds and the counterparties (approved brokers) with whom the Funds undertake a significant volume of over-the-counter derivative transactions (including total return swaps). Derivatives are held with counterparties on an unsegregated basis. Master netting arrangements do not result in an offset of balance sheet assets and liabilities, as transactions are usually settled on a gross basis. However, the credit risk associated with favourable contracts is reduced by a master netting arrangement to the extent that if an event of default occurs, all amounts with the counterparty are terminated and settled on a net basis. The Company’s overall exposure to credit risk on derivative instruments subject to a master netting arrangement can change substantially within a short period, as it is affected by each transaction subject to the arrangement.
The Company employs a risk management process which will enable it to measure, monitor and manage the risks attached to financial derivative positions and details of this process have been provided to the Central Bank.
For the purpose of providing margin or collateral in respect of transactions in financial derivative instruments, the Funds of the Company may transfer, mortgage, charge or encumber any assets or cash forming part of the Funds. The Funds may also be exposed to a credit risk in relation to the counterparties with whom they transact or place margin or collateral in respect of transactions in financial derivative instruments and may bear the risk of counterparty default.
The Funds may receive cash and eligible non-cash collateral in relation to derivative trading to reduce counterparty exposure. Cash collateral received by the Fund is shown as an asset in the Statement of Financial Position, which is offset by a corresponding liability.
At 31 December 2016, non-cash collateral provided by the counterparty is as follows:
Fund Counterparty Currency Fair Value
BNY Mellon Emerging Markets Debt Local Currency Fund HSBC plc USD 330,033BNY Mellon Euroland Bond Fund Citibank N.A. EUR 616,838BNY Mellon Euroland Bond Fund HSBC plc EUR 442,732BNY Mellon Global Opportunistic Bond Fund Citibank N.A. USD 872,136BNY Mellon Global Opportunistic Bond Fund HSBC plc USD 314,272

346
BNY MELLON GLOBAL FUNDS, PLC
NOTES TO THE FINANCIAL STATEMENTS
16. RISK MANAGEMENT OBJECTIVES AND POLICIES cont’d.
CREDIT RISK cont’d.At 31 December 2015, non-cash collateral provided by the counterparty is as follows:
Fund Counterparty Currency Fair Value
BNY Mellon Emerging Markets Debt Local Currency Fund Goldman Sachs & Co. USD 5,848,459BNY Mellon Euroland Bond Fund Citibank N.A. EUR 3,722,423BNY Mellon Euroland Bond Fund J.P. Morgan AG EUR 6,485,022
Those Funds entering into securities lending arrangements are also open to counterparty risk. To minimise such risk, collateral is held, exceeding in value the amount of securities on loan. Details of these are provided in Note 14 of the financial statements.
BNY Mellon Absolute Insight Fund, BNY Mellon Absolute Return Bond Fund, BNY Mellon Global High Yield Bond Fund, BNY Mellon Global Short-Dated High Yield Bond Fund and BNY Mellon Global Opportunistic Bond Fund have investments in leveraged loans which are held on an unsegregated basis with the agent banks. These loans are not held with the Depositary and accordingly the Funds are subject to the credit risk of the borrower. The Funds are also subject to the credit risk of the agent banks.
LIQUIDITY RISKLiquidity risk is the risk that the Company may not be able to generate sufficient cash resources to settle its obligations in full as they fall due or can only do so on terms that are materially disadvantageous.
The Company is exposed to the daily settlement of margin calls on derivatives and to daily cash redemptions of redeemable participating shares. Each Fund therefore invests the majority of its assets in investments that are traded in an active market and can be readily disposed of; it invests only a limited proportion of its assets in investments not actively traded on a listed exchange. Listed securities of each Fund are considered readily realisable, as they are listed on a regulated stock exchange.
The Investment Managers utilise derivative instruments and debt securities, if appropriate, such as exchange traded index future contracts to allow exposure to markets whilst maintaining sufficient liquidity.
Where any Fund acquires securities on the over-the-counter markets, there is no guarantee that the Fund will be able to realise the fair value of such securities due to their tendency to have limited liquidity and comparatively high price volatility.
The Company has the ability to borrow in the short term to ensure settlement. An overdraft facility is in place and has been utilised for settlement liquidity purposes. The Depositary shall be entitled to use available cash in the Fund’s account and to liquidate securities in the account as is necessary to meet the Fund’s obligations in connection with the provision of an overdraft facility to the Fund and/or unpaid amounts.
The Company’s financial assets and liabilities are held for trading and are acquired principally for the purpose of selling in the short term. As these securities are not expected to be held to maturity or termination, the current market value represents the estimated cash flow that may be required to dispose of the securities. Future cash flows of the Funds and realised liabilities may differ from current liabilities based on changes in market conditions.
All financial liabilities are realisable within three months except those noted in the table below.

347
BNY MELLON GLOBAL FUNDS, PLC
NOTES TO THE FINANCIAL STATEMENTS
16. RISK MANAGEMENT OBJECTIVES AND POLICIES cont’d.
LIQUIDITY RISK cont’d.The table below summarises financial liabilities for the Funds with derivative exposures, into relevant maturity groupings based on the remaining period as at 31 December 2016 to the contractual maturity date. The tables have been prepared based on the undiscounted gross cash outflows relating to its financial liabilities:
FundLess than
1 month 2-3 months3 months to 1 year
Greater than 1 year
Total 31 December 2016
BNY Mellon Absolute Insight Fund EUR EUR EUR EUR EUR
Futures 5,505 88,495 1,319 112 95,431 Options 117,102 180,862 62,814 – 360,778 Swaps 224,488 – 400,316 92,724 717,528 Forward contracts 59,471,367 6,496,222 – – 65,967,589
Financial liabilities at fair value through profit or loss 59,818,462 6,765,579 464,449 92,836 67,141,326
LiabilitiesBank overdraft 8 – – – 8 Accrued expenses 175,441 – – – 175,441 Other payables 2,136,562 – – – 2,136,562Margins on derivative contracts 1,228,942 – – – 1,228,942 Redeemable participating shares 80,141,041 – – – 80,141,041
Total financial liabilities 143,500,456 6,765,579 464,449 92,836 150,823,320
BNY Mellon Absolute Return Bond Fund EUR EUR EUR EUR EUR
Futures – 7,820,046 – – 7,820,046 Options 31,353 394,850 – – 426,203 Swaps – – – 10,625,097 10,625,097 Forward contracts 1,704,728,924 – – – 1,704,728,924
Financial liabilities at fair value through profit or loss 1,704,760,277 8,214,896 – 10,625,097 1,723,600,270
LiabilitiesAccrued expenses 1,412,361 – – – 1,412,361 Other payables 10,901,012 – – – 10,901,012 Margins on derivative contracts 10,183,146 – – – 10,183,146 Redeemable participating shares 2,160,243,520 – – – 2,160,243,520
Total financial liabilities 3,887,500,316 8,214,896 – 10,625,097 3,906,340,309
BNY Mellon Absolute Return Equity Fund GBP GBP GBP GBP GBP
Futures 444,147 2,345,141 – – 2,789,288 Swaps 26,546,135 – 48,303,019 – 74,849,154 Forward contracts 43,271,533 98,622,025 – – 141,893,558
Financial liabilities at fair value through profit or loss 70,261,815 100,967,166 48,303,019 – 219,532,000
LiabilitiesBank overdraft 525,497 – – – 525,497 Accrued expenses 2,500,024 – – – 2,500,024 Other payables 77,342,324 – – – 77,342,324 Margins on derivative contracts 242,451 – – – 242,451 Redeemable participating shares 2,270,552,815 – – – 2,270,552,815
Total financial liabilities 2,421,424,926 100,967,166 48,303,019 – 2,570,695,111

348
BNY MELLON GLOBAL FUNDS, PLC
NOTES TO THE FINANCIAL STATEMENTS
16. RISK MANAGEMENT OBJECTIVES AND POLICIES cont’d.
LIQUIDITY RISK cont’d.
FundLess than
1 month 2-3 months3 months to 1 year
Greater than 1 year
Total 31 December 2016
BNY Mellon Asian Bond Fund USD USD USD USD USD
Futures – 14,576 – – 14,576 Forward contracts 757,439 – – – 757,439
Financial liabilities at fair value through profit or loss 757,439 14,576 – – 772,015
LiabilitiesAccrued expenses 42,034 – – – 42,034 Redeemable participating shares 25,628,060 – – – 25,628,060
Total financial liabilities 26,427,533 14,576 – – 26,442,109
BNY Mellon Asian Equity Fund USD USD USD USD USD
Forward contracts 37,352 – – – 37,352
Financial liabilities at fair value through profit or loss 37,352 – – – 37,352
LiabilitiesBank overdraft 10,587 – – – 10,587 Accrued expenses 169,217 – – – 169,217 Other payables 47,086 – – – 47,086 Redeemable participating shares 72,734,376 – – – 72,734,376
Total financial liabilities 72,998,618 – – – 72,998,618
BNY Mellon Asian Income Fund GBP GBP GBP GBP GBP
Forward contracts 821 – – – 821
Financial liabilities at fair value through profit or loss 821 – – – 821
LiabilitiesAccrued expenses 29,803 – – – 29,803 Redeemable participating shares 17,863,411 – – – 17,863,411
Total financial liabilities 17,894,035 – – – 17,894,035
BNY Mellon Brazil Equity Fund USD USD USD USD USD
Forward contracts 1,104,874 – – – 1,104,874
Financial liabilities at fair value through profit or loss 1,104,874 – – – 1,104,874
LiabilitiesBank overdraft 824,516 – – – 824,516 Accrued expenses 150,480 – – – 150,480 Other payables 4,419,043 – – – 4,419,043 Redeemable participating shares 80,482,765 – – – 80,482,765
Total financial liabilities 86,981,678 – – – 86,981,678

349
BNY MELLON GLOBAL FUNDS, PLC
NOTES TO THE FINANCIAL STATEMENTS
16. RISK MANAGEMENT OBJECTIVES AND POLICIES cont’d.
LIQUIDITY RISK cont’d.
FundLess than
1 month 2-3 months3 months to 1 year
Greater than 1 year
Total 31 December 2016
BNY Mellon Dynamic Total Return Fund USD USD USD USD USD
Futures – 148,319 – – 148,319 Forward contracts 534,411 5,319,250 – – 5,853,661
Financial liabilities at fair value through profit or loss 534,411 5,467,569 – – 6,001,980
LiabilitiesBank overdraft 200,767 – – – 200,767 Accrued expenses 28,549 – – – 28,549 Margins on derivative contracts 101,087 – – – 101,087 Redeemable participating shares 16,846,939 – – – 16,846,939
Total financial liabilities 17,711,753 5,467,569 – – 23,179,322
BNY Mellon Emerging Markets Corporate Debt Fund USD USD USD USD USD
Forward contracts 4,739,264 – – – 4,739,264
Financial liabilities at fair value through profit or loss 4,739,264 – – – 4,739,264
LiabilitiesAccrued expenses 124,834 – – – 124,834 Other payables 56,202 – – – 56,202 Redeemable participating shares 175,436,673 – – – 175,436,673
Total financial liabilities 180,356,973 – – – 180,356,973
BNY Mellon Emerging Markets Debt Fund USD USD USD USD USD
Forward contracts 242,985 – – – 242,985
Financial liabilities at fair value through profit or loss 242,985 – – – 242,985
LiabilitiesAccrued expenses 127,444 – – – 127,444 Redeemable participating shares 61,675,460 – – – 61,675,460
Total financial liabilities 62,045,889 – – – 62,045,889
BNY Mellon Emerging Markets Debt Local Currency Fund USD USD USD USD USD
Options 1,190,453 497,353 – – 1,687,806 Forward contracts 442,551,276 94,286,763 – – 536,838,039
Financial liabilities at fair value through profit or loss 443,741,729 94,784,116 – – 538,525,845
LiabilitiesAccrued expenses 1,114,612 – – – 1,114,612 Other payables 7,569,060 – – – 7,569,060 Redeemable participating shares 830,681,213 – – – 830,681,213
Total financial liabilities 1,283,106,614 94,784,116 – – 1,377,890,730

350
BNY MELLON GLOBAL FUNDS, PLC
NOTES TO THE FINANCIAL STATEMENTS
16. RISK MANAGEMENT OBJECTIVES AND POLICIES cont’d.
LIQUIDITY RISK cont’d.
FundLess than
1 month 2-3 months3 months to 1 year
Greater than 1 year
Total 31 December 2016
BNY Mellon Emerging Markets Debt Opportunistic Fund USD USD USD USD USD
Options 85,754 37,741 – – 123,495 Forward contracts 16,603,838 1,438,894 – – 18,042,732
Financial liabilities at fair value through profit or loss 16,689,592 1,476,635 – – 18,166,227
LiabilitiesAccrued expenses 35,748 – – – 35,748 Redeemable participating shares 66,839,955 – – – 66,839,955
Total financial liabilities 83,565,295 1,476,635 – – 85,041,930
BNY Mellon Euroland Bond Fund EUR EUR EUR EUR EUR
Futures – 1,576,752 – – 1,576,752 Options – 354,623 – – 354,623 Swaps 660,344 – – 1,471,456 2,131,800 Forward contracts 271,096,196 – – – 271,096,196
Financial liabilities at fair value through profit or loss 271,756,540 1,931,375 – 1,471,456 275,159,371
LiabilitiesAccrued expenses 1,624,904 – – – 1,624,904 Other payables 12,506,663 – – – 12,506,663 Margins on derivative contracts 13,278,624 – – – 13,278,624 Redeemable participating shares 1,336,311,959 – – – 1,336,311,959
Total financial liabilities 1,635,478,690 1,931,375 – 1,471,456 1,638,881,521
BNY Mellon European Credit Fund EUR EUR EUR EUR EUR
Futures – 48,633 – – 48,633 Swaps – – – 70,015 70,015 Forward contracts 11,630,009 5,184,632 – – 16,814,641
Financial liabilities at fair value through profit or loss 11,630,009 5,233,265 – 70,015 16,933,289
LiabilitiesAccrued expenses 26,034 – – – 26,034 Other payables 611 – – – 611 Margins on derivative contracts 531,286 – – – 531,286 Redeemable participating shares 87,474,916 – – – 87,474,916
Total financial liabilities 99,662,856 5,233,265 – 70,015 104,966,136

351
BNY MELLON GLOBAL FUNDS, PLC
NOTES TO THE FINANCIAL STATEMENTS
16. RISK MANAGEMENT OBJECTIVES AND POLICIES cont’d.
LIQUIDITY RISK cont’d.
FundLess than
1 month 2-3 months3 months to 1 year
Greater than 1 year
Total 31 December 2016
BNY Mellon Global Bond Fund USD USD USD USD USD
Forward contracts 98,582 161,897,418 – – 161,996,000
Financial liabilities at fair value through profit or loss 98,582 161,897,418 – – 161,996,000
LiabilitiesBank overdraft 342,971 – – – 342,971 Accrued expenses 481,470 – – – 481,470 Other payables 1,076,815 – – – 1,076,815 Redeemable participating shares 491,284,479 – – – 491,284,479
Total financial liabilities 493,284,317 161,897,418 – – 655,181,735
BNY Mellon Global Credit Fund* USD USD USD USD USD
Futures – 375,700 – – 375,700 Options 2,700 34,167 – – 36,867 Swaps – – – 664,699 664,699 Forward contracts 447,626,780 – – – 447,626,780
Financial liabilities at fair value through profit or loss 447,629,480 409,867 – 664,699 448,704,046
LiabilitiesAccrued expenses 116,276 – – – 116,276 Other payables 11,680,369 – – – 11,680,369 Margins on derivative contracts 339,210 – – – 339,210 Redeemable participating shares 400,480,353 – – – 400,480,353
Total financial liabilities 860,245,688 409,867 – 664,699 861,320,254
BNY Mellon Global Dynamic Bond Fund USD USD USD USD USD
Forward contracts 4,320,788 32,298,181 – – 36,618,969
Financial liabilities at fair value through profit or loss 4,320,788 32,298,181 – – 36,618,969
LiabilitiesBank overdraft 93,029 – – – 93,029 Accrued expenses 326,003 – – – 326,003 Other payables 6,000,285 – – – 6,000,285 Redeemable participating shares 364,965,473 – – – 364,965,473
Total financial liabilities 375,705,578 32,298,181 – – 408,003,759

352
BNY MELLON GLOBAL FUNDS, PLC
NOTES TO THE FINANCIAL STATEMENTS
16. RISK MANAGEMENT OBJECTIVES AND POLICIES cont’d.
LIQUIDITY RISK cont’d.
FundLess than
1 month 2-3 months3 months to 1 year
Greater than 1 year
Total 31 December 2016
BNY Mellon Global Emerging Markets Fund USD USD USD USD USD
Forward contracts 13,399 – – – 13,399
Financial liabilities at fair value through profit or loss 13,399 – – – 13,399
LiabilitiesBank overdraft 5,052 – – – 5,052 Accrued expenses 96,002 – – – 96,002 Other payables 5,323 – – – 5,323 Redeemable participating shares 30,166,865 – – – 30,166,865
Total financial liabilities 30,286,641 – – – 30,286,641
BNY Mellon Global Equity Fund USD USD USD USD USD
Forward contracts 3,074,522 – – – 3,074,522
Financial liabilities at fair value through profit or loss 3,074,522 – – – 3,074,522
LiabilitiesAccrued expenses 319,632 – – – 319,632 Other payables 420,066 – – – 420,066 Redeemable participating shares 258,017,204 – – – 258,017,204
Total financial liabilities 261,831,424 – – – 261,831,424
BNY Mellon Global Equity Income Fund USD USD USD USD USD
Forward contracts 1,497,417 – – – 1,497,417
Financial liabilities at fair value through profit or loss 1,497,417 – – – 1,497,417
LiabilitiesAccrued expenses 882,523 – – – 882,523 Other payables 727,921 – – – 727,921 Redeemable participating shares 692,443,890 – – – 692,443,890
Total financial liabilities 695,551,751 – – – 695,551,751
BNY Mellon Global High Yield Bond Fund USD USD USD USD USD
Forward contracts 26,508,703 – – – 26,508,703
Financial liabilities at fair value through profit or loss 26,508,703 – – – 26,508,703
LiabilitiesAccrued expenses 140,752 – – – 140,752 Other payables 496,830 – – – 496,830 Redeemable participating shares 155,792,195 – – – 155,792,195
Total financial liabilities 182,938,480 – – – 182,938,480

353
BNY MELLON GLOBAL FUNDS, PLC
NOTES TO THE FINANCIAL STATEMENTS
16. RISK MANAGEMENT OBJECTIVES AND POLICIES cont’d.
LIQUIDITY RISK cont’d.
FundLess than
1 month 2-3 months3 months to 1 year
Greater than 1 year
Total 31 December 2016
BNY Mellon Global Leaders Fund* USD USD USD USD USD
Forward contracts 424,714 – – – 424,714
Financial liabilities at fair value through profit or loss 424,714 – – – 424,714
LiabilitiesAccrued expenses 21,228 – – – 21,228 Redeemable participating shares 28,345,314 – – – 28,345,314
Total financial liabilities 28,791,256 – – – 28,791,256
BNY Mellon Global Opportunistic Bond Fund USD USD USD USD USD
Futures – 357,970 – – 357,970 Options 3,856 113,349 – – 117,205 Forward contracts 97,696,913 167,418 – – 97,864,331
Financial liabilities at fair value through profit or loss 97,700,769 638,737 – – 98,339,506
LiabilitiesAccrued expenses 94,267 – – – 94,267 Other payables 1,309,155 – – – 1,309,155 Margins on derivative contracts 414,012 – – – 414,012 Redeemable participating shares 130,538,823 – – – 130,538,823
Total financial liabilities 230,057,026 638,737 – – 230,695,763
BNY Mellon Global Opportunities Fund USD USD USD USD USD
Forward contracts 1,286,094 5,375,457 – – 6,661,551
Financial liabilities at fair value through profit or loss 1,286,094 5,375,457 – – 6,661,551
LiabilitiesAccrued expenses 205,266 – – – 205,266 Other payables 66,800 – – – 66,800 Redeemable participating shares 106,650,391 – – – 106,650,391
Total financial liabilities 108,208,551 5,375,457 – – 113,584,008
BNY Mellon Global Property Securities Fund EUR EUR EUR EUR EUR
Forward contracts 196,541 – – – 196,541
Financial liabilities at fair value through profit or loss 196,541 – – – 196,541
LiabilitiesBank overdraft 7,746 – – – 7,746 Accrued expenses 33,569 – – – 33,569 Other payables 6,351 – – – 6,351 Redeemable participating shares 21,364,386 – – – 21,364,386
Total financial liabilities 21,608,593 – – – 21,608,593

354
BNY MELLON GLOBAL FUNDS, PLC
NOTES TO THE FINANCIAL STATEMENTS
16. RISK MANAGEMENT OBJECTIVES AND POLICIES cont’d.
LIQUIDITY RISK cont’d.
FundLess than
1 month 2-3 months3 months to 1 year
Greater than 1 year
Total 31 December 2016
BNY Mellon Global Real Return Fund (EUR) EUR EUR EUR EUR EUR
Futures – 19,356,582 – – 19,356,582 Forward contracts 974,518,248 2,710,690,961 – – 3,685,209,209
Financial liabilities at fair value through profit or loss 974,518,248 2,730,047,543 – – 3,704,565,791
LiabilitiesBank overdraft 37,464 – – – 37,464 Accrued expenses 4,543,002 – – – 4,543,002 Other payables 13,222,508 – – – 13,222,508 Redeemable participating shares 4,115,560,292 – – – 4,115,560,292
Total financial liabilities 5,107,881,514 2,730,047,543 – – 7,837,929,057
BNY Mellon Global Real Return Fund (GBP) GBP GBP GBP GBP GBP
Futures – 314,166 – – 314,166 Forward contracts 899,901 5,732,375 – – 6,632,276
Financial liabilities at fair value through profit or loss 899,901 6,046,541 – – 6,946,442
LiabilitiesBank overdraft 538 – – – 538 Accrued expenses 46,140 – – – 46,140 Other payables 176,040 – – – 176,040 Redeemable participating shares 66,687,250 – – – 66,687,250
Total financial liabilities 67,809,869 6,046,541 – – 73,856,410
BNY Mellon Global Real Return Fund (USD) USD USD USD USD USD
Futures – 2,957,660 – – 2,957,660 Forward contracts 49,063,848 11,074,568 – – 60,138,416
Financial liabilities at fair value through profit or loss 49,063,848 14,032,228 – – 63,096,076
LiabilitiesBank overdraft 1,577 – – – 1,577 Accrued expenses 551,983 – – – 551,983 Other payables 2,130,074 – – – 2,130,074 Redeemable participating shares 645,149,675 – – – 645,149,675
Total financial liabilities 696,897,157 14,032,228 – – 710,929,385

355
BNY MELLON GLOBAL FUNDS, PLC
NOTES TO THE FINANCIAL STATEMENTS
16. RISK MANAGEMENT OBJECTIVES AND POLICIES cont’d.
LIQUIDITY RISK cont’d.
FundLess than
1 month 2-3 months3 months to 1 year
Greater than 1 year
Total 31 December 2016
BNY Mellon Global Short-Dated High Yield Bond Fund* USD USD USD USD USD
Forward contracts 81,876,180 – – – 81,876,180
Financial liabilities at fair value through profit or loss 81,876,180 – – – 81,876,180
LiabilitiesAccrued expenses 31,845 – – – 31,845 Other payables 67,976,141 – – – 67,976,141 Redeemable participating shares 449,324,739 – – – 449,324,739
Total financial liabilities 599,208,905 – – – 599,208,905
BNY Mellon Japan All Cap Equity Fund JPY JPY JPY JPY JPY
Forward contracts 10,079,490 – – – 10,079,490
Financial liabilities at fair value through profit or loss 10,079,490 – – – 10,079,490
LiabilitiesAccrued expenses 4,548,266 – – – 4,548,266 Redeemable participating shares 2,280,546,187 – – – 2,280,546,187
Total financial liabilities 2,295,173,943 – – – 2,295,173,943
BNY Mellon Japan REIT Alpha Fund* JPY JPY JPY JPY JPY
LiabilitiesAccrued expenses 917,598 – – – 917,598 Other payables 11,304,291 – – – 11,304,291 Redeemable participating shares 2,161,738,343 – – – 2,161,738,343
Total financial liabilities 2,173,960,232 – – – 2,173,960,232
BNY Mellon Japan Small Cap Equity Focus Fund JPY JPY JPY JPY JPY
Forward contracts 516,337 – – – 516,337
Financial liabilities at fair value through profit or loss 516,337 – – – 516,337
LiabilitiesAccrued expenses 4,555,188 – – – 4,555,188 Other payables 29,125 – – – 29,125 Redeemable participating shares 2,724,538,443 – – – 2,724,538,443
Total financial liabilities 2,729,639,093 – – – 2,729,639,093

356
BNY MELLON GLOBAL FUNDS, PLC
NOTES TO THE FINANCIAL STATEMENTS
16. RISK MANAGEMENT OBJECTIVES AND POLICIES cont’d.
LIQUIDITY RISK cont’d.
FundLess than
1 month 2-3 months3 months to 1 year
Greater than 1 year
Total 31 December 2016
BNY Mellon Long-Term Global Equity Fund EUR EUR EUR EUR EUR
Forward contracts 124,433 – – – 124,433
Financial liabilities at fair value through profit or loss 124,433 – – – 124,433
LiabilitiesAccrued expenses 1,128,234 – – – 1,128,234 Other payables 236,871 – – – 236,871 Redeemable participating shares 1,283,751,148 – – – 1,283,751,148
Total financial liabilities 1,285,240,686 – – – 1,285,240,686
BNY Mellon Pan European Equity Fund EUR EUR EUR EUR EUR
LiabilitiesAccrued expenses 14,877 – – – 14,877 Other payables 3,805 – – – 3,805 Redeemable participating shares 1,933,821 – – – 1,933,821
Total financial liabilities 1,952,503 – – – 1,952,503
BNY Mellon S&P 500® Index Tracker USD USD USD USD USD
Futures – 3,034 – – 3,034
Financial liabilities at fair value through profit or loss – 3,034 – – 3,034
LiabilitiesAccrued expenses 122,625 – – – 122,625 Other payables 65,129 – – – 65,129 Redeemable participating shares 86,574,689 – – – 86,574,689
Total financial liabilities 86,762,443 3,034 – – 86,765,477
BNY Mellon Small Cap Euroland Fund EUR EUR EUR EUR EUR
LiabilitiesAccrued expenses 52,357 – – – 52,357 Other payables 778,087 – – – 778,087 Margins on derivative contracts 3,549 – – – 3,549 Redeemable participating shares 35,012,462 – – – 35,012,462
Total financial liabilities 35,846,455 – – – 35,846,455

357
BNY MELLON GLOBAL FUNDS, PLC
NOTES TO THE FINANCIAL STATEMENTS
16. RISK MANAGEMENT OBJECTIVES AND POLICIES cont’d.
LIQUIDITY RISK cont’d.
FundLess than
1 month 2-3 months3 months to 1 year
Greater than 1 year
Total 31 December 2016
BNY Mellon Targeted Return Bond Fund USD USD USD USD USD
Futures – 229,232 – – 229,232 Options 2,075 21,088 – – 23,163 Forward contracts 133,336,713 – – – 133,336,713
Financial liabilities at fair value through profit or loss 133,338,788 250,320 – – 133,589,108
LiabilitiesAccrued expenses 74,446 – – – 74,446 Other payables 817,923 – – – 817,923 Margins on derivative contracts 145,443 – – – 145,443 Redeemable participating shares 78,908,389 – – – 78,908,389
Total financial liabilities 213,284,989 250,320 – – 213,535,309
BNY Mellon U.S. Dynamic Value Fund USD USD USD USD USD
LiabilitiesAccrued expenses 164,814 – – – 164,814 Other payables 1,532,035 – – – 1,532,035 Redeemable participating shares 139,942,788 – – – 139,942,788
Total financial liabilities 141,639,637 – – – 141,639,637
BNY Mellon US Opportunities Fund USD USD USD USD USD
LiabilitiesAccrued expenses 43,809 – – – 43,809 Other payables 227,920 – – – 227,920 Redeemable participating shares 31,689,172 – – – 31,689,172
Total financial liabilities 31,960,901 – – – 31,960,901
* Please refer to Note 19 of the financial statements.

358
BNY MELLON GLOBAL FUNDS, PLC
NOTES TO THE FINANCIAL STATEMENTS
16. RISK MANAGEMENT OBJECTIVES AND POLICIES cont’d.
LIQUIDITY RISK cont’d.The table below summarises financial liabilities for Funds with material derivative exposures, into relevant maturity groupings based on the remaining period as at 31 December 2015 to the contractual maturity date:
FundLess than
1 month 2-3 months3 months to 1 year
Greater than 1 year
Total 31 December 2015
BNY Mellon Absolute Insight FundEUR EUR EUR EUR EUR
Futures 12,330 129,618 2,157 53,918 198,023Options 103,602 450,790 258,010 – 812,402Swaps – – 876,022 730,271 1,606,293Forward contracts 75,382,595 1,300,404 – – 76,682,999
Financial liabilities at fair value through profit or loss 75,498,527 1,880,812 1,136,189 784,189 79,299,717
LiabilitiesBank overdraft 9,905 – – – 9,905Accrued expenses 278,278 – – – 278,278Other payables 603,742 – – – 603,742Margins on derivative contracts 794,926 – – – 794,926Redeemable participating shares 224,417,441 – – – 224,417,441
Total financial liabilities 301,602,819 1,880,812 1,136,189 784,189 305,404,009
BNY Mellon Absolute Return Bond FundEUR EUR EUR EUR EUR
Options – 57,292 – – 57,292Swaps – – – 6,855,343 6,855,343Forward contracts 265,394,338 289,752,495 – – 555,146,833
Financial liabilities at fair value through profit or loss 265,394,338 289,809,787 – 6,855,343 562,059,468
LiabilitiesAccrued expenses 1,129,911 – – – 1,129,911Other payables 3,755,586 – – – 3,755,586Margins on derivative contracts 14,828,865 – – – 14,828,865Redeemable participating shares 2,156,159,324 – – – 2,156,159,324
Total financial liabilities 2,441,268,024 289,809,787 – 6,855,343 2,737,933,154
BNY Mellon Absolute Return Equity FundGBP GBP GBP GBP GBP
Futures 495,844 4,049,382 – – 4,545,226Swaps – – 29,705,750 7,138,665 36,844,415Forward contracts 36,670,642 63,690,850 – – 100,361,492
Financial liabilities at fair value through profit or loss 37,166,486 67,740,232 29,705,750 7,138,665 141,751,133
LiabilitiesBank overdraft 7,110 – – – 7,110Accrued expenses 1,815,413 – – – 1,815,413Other payables 13,952,871 – – – 13,952,871Redeemable participating shares 1,877,967,094 – – – 1,877,967,094
Total financial liabilities 1,930,908,974 67,740,232 29,705,750 7,138,665 2,035,493,621
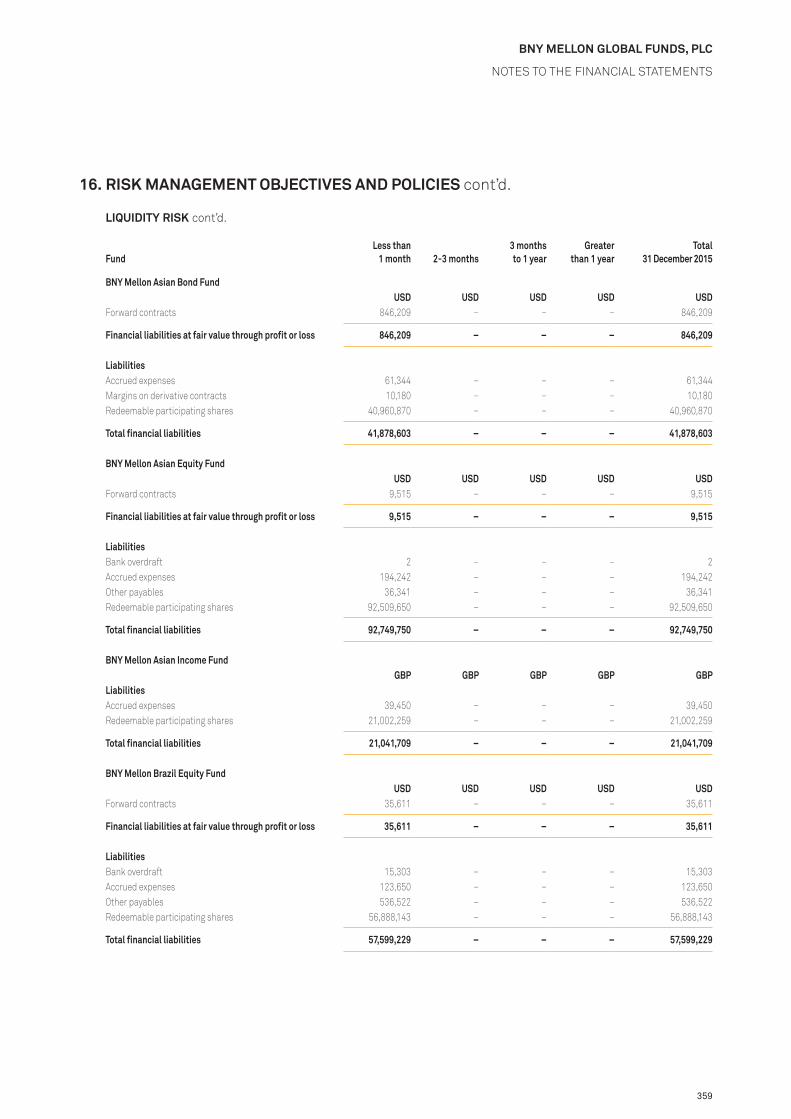
359
BNY MELLON GLOBAL FUNDS, PLC
NOTES TO THE FINANCIAL STATEMENTS
16. RISK MANAGEMENT OBJECTIVES AND POLICIES cont’d.
LIQUIDITY RISK cont’d.
FundLess than
1 month 2-3 months3 months to 1 year
Greater than 1 year
Total 31 December 2015
BNY Mellon Asian Bond FundUSD USD USD USD USD
Forward contracts 846,209 – – – 846,209
Financial liabilities at fair value through profit or loss 846,209 – – – 846,209
LiabilitiesAccrued expenses 61,344 – – – 61,344Margins on derivative contracts 10,180 – – – 10,180Redeemable participating shares 40,960,870 – – – 40,960,870
Total financial liabilities 41,878,603 – – – 41,878,603
BNY Mellon Asian Equity FundUSD USD USD USD USD
Forward contracts 9,515 – – – 9,515
Financial liabilities at fair value through profit or loss 9,515 – – – 9,515
LiabilitiesBank overdraft 2 – – – 2Accrued expenses 194,242 – – – 194,242Other payables 36,341 – – – 36,341Redeemable participating shares 92,509,650 – – – 92,509,650
Total financial liabilities 92,749,750 – – – 92,749,750
BNY Mellon Asian Income FundGBP GBP GBP GBP GBP
LiabilitiesAccrued expenses 39,450 – – – 39,450Redeemable participating shares 21,002,259 – – – 21,002,259
Total financial liabilities 21,041,709 – – – 21,041,709
BNY Mellon Brazil Equity FundUSD USD USD USD USD
Forward contracts 35,611 – – – 35,611
Financial liabilities at fair value through profit or loss 35,611 – – – 35,611
LiabilitiesBank overdraft 15,303 – – – 15,303Accrued expenses 123,650 – – – 123,650Other payables 536,522 – – – 536,522Redeemable participating shares 56,888,143 – – – 56,888,143
Total financial liabilities 57,599,229 – – – 57,599,229

360
BNY MELLON GLOBAL FUNDS, PLC
NOTES TO THE FINANCIAL STATEMENTS
16. RISK MANAGEMENT OBJECTIVES AND POLICIES cont’d.
LIQUIDITY RISK cont’d.
FundLess than
1 month 2-3 months3 months to 1 year
Greater than 1 year
Total 31 December 2015
BNY Mellon Crossover Credit FundEUR EUR EUR EUR EUR
Futures – 18,000 – – 18,000Swaps – – 5,613 – 5,613
Financial liabilities at fair value through profit or loss – 18,000 5,613 – 23,613
LiabilitiesAccrued expenses 127,731 – – – 127,731Other payables 5,030 – – – 5,030Redeemable participating shares 233,567,042 – – – 233,567,042
Total financial liabilities 233,699,803 18,000 5,613 – 233,723,416
BNY Mellon Dynamic Total Return FundUSD USD USD USD USD
Futures 8,955 89,051 – – 98,006Forward contracts 564,445 1,905,509 – – 2,469,954
Financial liabilities at fair value through profit or loss 573,400 1,994,560 – – 2,567,960
LiabilitiesAccrued expenses 31,185 – – – 31,185Other payables 538,903 – – – 538,903Margins on derivative contracts 82,528 – – – 82,528Redeemable participating shares 11,519,058 – – – 11,519,058
Total financial liabilities 12,745,074 1,994,560 – – 14,739,634
BNY Mellon Emerging Markets Corporate Debt FundUSD USD USD USD USD
Forward contracts 8,119,010 – – – 8,119,010
Financial liabilities at fair value through profit or loss 8,119,010 – – – 8,119,010
LiabilitiesAccrued expenses 39,252 – – – 39,252Redeemable participating shares 108,707,950 – – – 108,707,950
Total financial liabilities 116,866,212 – – – 116,866,212
BNY Mellon Emerging Markets Debt FundUSD USD USD USD USD
Forward contracts 3,486,902 – – – 3,486,902
Financial liabilities at fair value through profit or loss 3,486,902 – – – 3,486,902
LiabilitiesAccrued expenses 140,248 – – – 140,248Other payables 353,091 – – – 353,091Redeemable participating shares 71,167,680 – – – 71,167,680
Total financial liabilities 75,147,921 – – – 75,147,921

361
BNY MELLON GLOBAL FUNDS, PLC
NOTES TO THE FINANCIAL STATEMENTS
16. RISK MANAGEMENT OBJECTIVES AND POLICIES cont’d.
LIQUIDITY RISK cont’d.
FundLess than
1 month 2-3 months3 months to 1 year
Greater than 1 year
Total 31 December 2015
BNY Mellon Emerging Markets Debt Local Currency FundUSD USD USD USD USD
Options 1,615,125 771,793 – – 2,386,918Forward contracts 287,237,713 – – – 287,237,713
Financial liabilities at fair value through profit or loss 288,852,838 771,793 – – 289,624,631
LiabilitiesAccrued expenses 1,306,854 – – – 1,306,854Other payables 5,678,381 – – – 5,678,381Redeemable participating shares 1,324,481,237 – – – 1,324,481,237
Total financial liabilities 1,620,319,310 771,793 – – 1,621,091,103
BNY Mellon Emerging Markets Debt Opportunistic FundUSD USD USD USD USD
Options 78,267 29,522 – – 107,789Forward contracts 10,359,649 – – – 10,359,649
Financial liabilities at fair value through profit or loss 10,437,916 29,522 – – 10,467,438
LiabilitiesAccrued expenses 27,342 – – – 27,342Other payables 250,000 – – – 250,000Redeemable participating shares 87,983,556 – – – 87,983,556
Total financial liabilities 98,698,814 29,522 – – 98,728,336
BNY Mellon Euroland Bond FundEUR EUR EUR EUR EUR
Futures – 733,381 – – 733,381Swaps – – – 10,564,937 10,564,937Forward contracts 1,175,104,147 9,186,375 – – 1,184,290,522
Financial liabilities at fair value through profit or loss 1,175,104,147 9,919,756 – 10,564,937 1,195,588,840
LiabilitiesAccrued expenses 2,168,238 – – – 2,168,238Other payables 7,808,116 – – – 7,808,116Margins on derivative contracts 6,399,563 – – – 6,399,563Redeemable participating shares 2,753,951,220 – – – 2,753,951,220
Total financial liabilities 3,945,431,284 9,919,756 – 10,564,937 3,965,915,977

362
BNY MELLON GLOBAL FUNDS, PLC
NOTES TO THE FINANCIAL STATEMENTS
16. RISK MANAGEMENT OBJECTIVES AND POLICIES cont’d.
LIQUIDITY RISK cont’d.
FundLess than
1 month 2-3 months3 months to 1 year
Greater than 1 year
Total 31 December 2015
BNY Mellon European Credit FundEUR EUR EUR EUR EUR
Futures – 35,745 – – 35,745Swaps – – – 153,092 153,092Forward contracts 307,743 – – – 307,743
Financial liabilities at fair value through profit or loss 307,743 35,745 – 153,092 496,580
LiabilitiesAccrued expenses 49,944 – – – 49,944Other payables 2,546 – – – 2,546Margins on derivative contracts 489,691 – – – 489,691Redeemable participating shares 50,753,263 – – – 50,753,263
Total financial liabilities 51,603,187 35,745 – 153,092 51,792,024
BNY Mellon Global Bond FundUSD USD USD USD USD
Forward contracts 33,686,720 92,563,603 – – 126,250,323
Financial liabilities at fair value through profit or loss 33,686,720 92,563,603 – – 126,250,323
LiabilitiesBank overdraft 39,964 – – – 39,964Accrued expenses 289,441 – – – 289,441Other payables 6,849,445 – – – 6,849,445Redeemable participating shares 309,274,826 – – – 309,274,826
Total financial liabilities 350,140,396 92,563,603 – – 442,703,999
BNY Mellon Global Dynamic Bond FundUSD USD USD USD USD
Forward contracts 131,678,837 99,748,348 – – 231,427,185
Financial liabilities at fair value through profit or loss 131,678,837 99,748,348 – – 231,427,185
LiabilitiesBank overdraft 1,411 – – – 1,411Accrued expenses 232,086 – – – 232,086Other payables 7,029 – – – 7,029Redeemable participating shares 263,712,709 – – – 263,712,709
Total financial liabilities 395,632,072 99,748,348 – – 495,380,420
BNY Mellon Global Emerging Markets Equity Value FundUSD USD USD USD USD
LiabilitiesBank overdraft 2 – – – 2Accrued expenses 61,760 – – – 61,760Other payables 45,296,251 – – – 45,296,251Redeemable participating shares 4,126,148 – – – 4,126,148
Total financial liabilities 49,484,161 – – – 49,484,161

363
BNY MELLON GLOBAL FUNDS, PLC
NOTES TO THE FINANCIAL STATEMENTS
16. RISK MANAGEMENT OBJECTIVES AND POLICIES cont’d.
LIQUIDITY RISK cont’d.
FundLess than
1 month 2-3 months3 months to 1 year
Greater than 1 year
Total 31 December 2015
BNY Mellon Global Emerging Markets FundUSD USD USD USD USD
Forward contracts 923,158 – – – 923,158
Financial liabilities at fair value through profit or loss 923,158 – – – 923,158
LiabilitiesBank overdraft 1 – – – 1Accrued expenses 153,681 – – – 153,681Other payables 3,375,850 – – – 3,375,850Redeemable participating shares 68,936,938 – – – 68,936,938
Total financial liabilities 73,389,628 – – – 73,389,628
BNY Mellon Global Equity FundUSD USD USD USD USD
Forward contracts 993,002 503,114 – – 1,496,116
Financial liabilities at fair value through profit or loss 993,002 503,114 – – 1,496,116
LiabilitiesAccrued expenses 319,068 – – – 319,068Other payables 222,268 – – – 222,268Redeemable participating shares 255,410,733 – – – 255,410,733
Total financial liabilities 256,945,071 503,114 – – 257,448,185
BNY Mellon Global Equity Income FundUSD USD USD USD USD
Forward contracts 134,277,335 – – – 134,277,335
Financial liabilities at fair value through profit or loss 134,277,335 – – – 134,277,335
LiabilitiesBank overdraft 878 – – – 878Accrued expenses 523,342 – – – 523,342Other payables 1,312,928 – – – 1,312,928Redeemable participating shares 469,197,968 – – – 469,197,968
Total financial liabilities 605,312,451 – – – 605,312,451
BNY Mellon Global High Yield Bond FundUSD USD USD USD USD
Forward contracts 67,887,385 – – – 67,887,385
Financial liabilities at fair value through profit or loss 67,887,385 – – – 67,887,385
LiabilitiesAccrued expenses 80,951 – – – 80,951Other payables 1,074,235 – – – 1,074,235Redeemable participating shares 134,419,024 – – – 134,419,024
Total financial liabilities 203,461,595 – – – 203,461,595

364
BNY MELLON GLOBAL FUNDS, PLC
NOTES TO THE FINANCIAL STATEMENTS
16. RISK MANAGEMENT OBJECTIVES AND POLICIES cont’d.
LIQUIDITY RISK cont’d.
FundLess than
1 month 2-3 months3 months to 1 year
Greater than 1 year
Total 31 December 2015
BNY Mellon Global Opportunistic Bond FundUSD USD USD USD USD
Futures – 26,223 – – 26,223Options 178,067 172,562 – – 350,629Swaps – – – 1,324,238 1,324,238Forward contracts 87,069,731 – – – 87,069,731
Financial liabilities at fair value through profit or loss 87,247,798 198,785 – 1,324,238 88,770,821
LiabilitiesAccrued expenses 123,298 – – – 123,298Other payables 2,810,672 – – – 2,810,672Margins on derivative contracts 623,535 – – – 623,535Redeemable participating shares 217,468,477 – – – 217,468,477
Total financial liabilities 308,273,780 198,785 – 1,324,238 309,796,803
BNY Mellon Global Opportunities FundUSD USD USD USD USD
Forward contracts 7,837,439 – – – 7,837,439
Financial liabilities at fair value through profit or loss 7,837,439 – – – 7,837,439
LiabilitiesAccrued expenses 137,690 – – – 137,690Other payables 915,753 – – – 915,753Redeemable participating shares 141,840,200 – – – 141,840,200
Total financial liabilities 150,731,082 – – – 150,731,082
BNY Mellon Global Property Securities FundEUR EUR EUR EUR EUR
Forward contracts 487,175 – – – 487,175
Financial liabilities at fair value through profit or loss 487,175 – – – 487,175
LiabilitiesAccrued expenses 35,674 – – – 35,674Other payables 97,451 – – – 97,451Redeemable participating shares 14,019,967 – – – 14,019,967
Total financial liabilities 14,640,267 – – – 14,640,267
BNY Mellon Global Real Return Fund (EUR)EUR EUR EUR EUR EUR
Forward contracts 537,688,606 492,719,234 – – 1,030,407,840
Financial liabilities at fair value through profit or loss 537,688,606 492,719,234 – – 1,030,407,840
LiabilitiesBank overdraft 2 – – – 2Accrued expenses 2,394,940 – – – 2,394,940Other payables 3,185,789 – – – 3,185,789Redeemable participating shares 2,609,987,886 – – – 2,609,987,886
Total financial liabilities 3,153,257,223 492,719,234 – – 3,645,976,457

365
BNY MELLON GLOBAL FUNDS, PLC
NOTES TO THE FINANCIAL STATEMENTS
16. RISK MANAGEMENT OBJECTIVES AND POLICIES cont’d.
LIQUIDITY RISK cont’d.
FundLess than
1 month 2-3 months3 months to 1 year
Greater than 1 year
Total 31 December 2015
BNY Mellon Global Real Return Fund (GBP)GBP GBP GBP GBP GBP
Futures – 359 – – 359Forward contracts 1,942,827 36,695,756 – – 38,638,583
Financial liabilities at fair value through profit or loss 1,942,827 36,696,115 – – 38,638,942
LiabilitiesBank overdraft 1 – – – 1Accrued expenses 24,378 – – – 24,378Redeemable participating shares 59,049,879 – – – 59,049,879
Total financial liabilities 61,017,085 36,696,115 – – 97,713,200
BNY Mellon Global Real Return Fund (USD)USD USD USD USD USD
Forward contracts 26,665,610 32,299,378 – – 58,964,988
Financial liabilities at fair value through profit or loss 26,665,610 32,299,378 – – 58,964,988
LiabilitiesBank overdraft 10 – – – 10Accrued expenses 330,890 – – – 330,890Other payables 284,542 – – – 284,542Redeemable participating shares 506,138,241 – – – 506,138,241
Total financial liabilities 533,419,293 32,299,378 – – 565,718,671
BNY Mellon Japan All Cap Equity FundJPY JPY JPY JPY JPY
Forward contracts 4,052,463,113 – – – 4,052,463,113
Financial liabilities at fair value through profit or loss 4,052,463,113 – – – 4,052,463,113
LiabilitiesAccrued expenses 7,646,853 – – – 7,646,853Redeemable participating shares 3,963,253,205 – – – 3,963,253,205
Total financial liabilities 8,023,363,171 – – – 8,023,363,171
BNY Mellon Japan Small Cap Equity Focus FundJPY JPY JPY JPY JPY
Forward contracts 3,393,932,049 – – – 3,393,932,049
Financial liabilities at fair value through profit or loss 3,393,932,049 – – – 3,393,932,049
LiabilitiesAccrued expenses 7,622,194 – – – 7,622,194Other payables 31,673,707 – – – 31,673,707Redeemable participating shares 4,454,629,125 – – – 4,454,629,125
Total financial liabilities 7,887,857,075 – – – 7,887,857,075

366
BNY MELLON GLOBAL FUNDS, PLC
NOTES TO THE FINANCIAL STATEMENTS
16. RISK MANAGEMENT OBJECTIVES AND POLICIES cont’d.
LIQUIDITY RISK cont’d.
FundLess than
1 month 2-3 months3 months to 1 year
Greater than 1 year
Total 31 December 2015
BNY Mellon Long-Term Global Equity FundEUR EUR EUR EUR EUR
Forward contracts 338,008 – – – 338,008
Financial liabilities at fair value through profit or loss 338,008 – – – 338,008
LiabilitiesAccrued expenses 1,017,841 – – – 1,017,841Other payables 10,314,592 – – – 10,314,592Redeemable participating shares 1,449,584,755 – – – 1,449,584,755
Total financial liabilities 1,461,255,196 – – – 1,461,255,196
BNY Mellon Pan European Equity FundEUR EUR EUR EUR EUR
Forward contracts 3,089 – – – 3,089
Financial liabilities at fair value through profit or loss 3,089 – – – 3,089
LiabilitiesBank overdraft 4,563 – – – 4,563Accrued expenses 53,828 – – – 53,828Other payables 602 – – – 602Redeemable participating shares 49,183,300 – – – 49,183,300
Total financial liabilities 49,245,382 – – – 49,245,382
BNY Mellon S&P 500® Index TrackerUSD USD USD USD USD
LiabilitiesBank overdraft – – – – –Accrued expenses 101,210 – – – 101,210Other payables 58,833 – – – 58,833Margins on derivative contracts 4,994 – – – 4,994Redeemable participating shares 76,861,012 – – – 76,861,012
Total financial liabilities 77,026,049 – – – 77,026,049
BNY Mellon Small Cap Euroland FundEUR EUR EUR EUR EUR
LiabilitiesAccrued expenses 74,624 – – – 74,624Other payables 281 – – – 281Margins on derivative contracts 23,700 – – – 23,700Redeemable participating shares 61,991,179 – – – 61,991,179
Total financial liabilities 62,089,784 – – – 62,089,784

367
BNY MELLON GLOBAL FUNDS, PLC
NOTES TO THE FINANCIAL STATEMENTS
16. RISK MANAGEMENT OBJECTIVES AND POLICIES cont’d.
LIQUIDITY RISK cont’d.
FundLess than
1 month 2-3 months3 months to 1 year
Greater than 1 year
Total 31 December 2015
BNY Mellon Targeted Return Bond FundUSD USD USD USD USD
Futures – 3,148 – – 3,148Options – 57,625 – – 57,625Forward contracts 129,794,209 960,437 – – 130,754,646
Financial liabilities at fair value through profit or loss 129,794,209 1,021,210 – – 130,815,419
LiabilitiesAccrued expenses 74,273 – – – 74,273Other payables 938,412 – – – 938,412Margins on derivative contracts 285,793 – – – 285,793Redeemable participating shares 93,725,700 – – – 93,725,700
Total financial liabilities 224,818,387 1,021,210 – – 225,839,597
BNY Mellon U.S. Dynamic Value FundUSD USD USD USD USD
Forward contracts 4,027 – – – 4,027
Financial liabilities at fair value through profit or loss 4,027 – – – 4,027
LiabilitiesAccrued expenses 58,351 – – – 58,351Redeemable participating shares 41,549,699 – – – 41,549,699
Total financial liabilities 41,612,077 – – – 41,612,077
BNY Mellon US Opportunities FundUSD USD USD USD USD
LiabilitiesAccrued expenses 65,102 – – – 65,102Other payables 811 – – – 811Redeemable participating shares 51,224,603 – – – 51,224,603
Total financial liabilities 51,290,516 – – – 51,290,516
Redeemable shares are redeemed on demand at the holders’ option. However, the Directors do not envisage that the contractual maturity disclosed in the table above will be representative of the actual cash outflows, as holders of these instruments typically retain them for the medium to long term.
In order to manage the Company’s overall liquidity and to facilitate an orderly disposition of securities, the Directors are able to refuse to repurchase any shares in excess of one tenth of the shares in issue in a Fund on any one valuation day by way of the provisions in the prospectus.

368
BNY MELLON GLOBAL FUNDS, PLC
NOTES TO THE FINANCIAL STATEMENTS
16. RISK MANAGEMENT OBJECTIVES AND POLICIES cont’d.
LIQUIDITY RISK cont’d.The number of investors that held more than 10% of the net assets at trading valuation of the Fund at the end of the year are as follows:
Fund 31 December 2016 31 December 2015
BNY Mellon Absolute Insight Fund 2 2BNY Mellon Absolute Return Bond Fund 1 –BNY Mellon Absolute Return Equity Fund 1 –BNY Mellon Asian Bond Fund 3 2BNY Mellon Asian Equity Fund 2 3BNY Mellon Asian Income Fund 2 1BNY Mellon Brazil Equity Fund 2 2BNY Mellon Crossover Credit Fund* N/A 3BNY Mellon Dynamic Total Return Fund 2 2BNY Mellon Emerging Markets Corporate Debt Fund 2 3BNY Mellon Emerging Markets Debt Fund 2 2BNY Mellon Emerging Markets Debt Local Currency Fund 2 2BNY Mellon Emerging Markets Debt Opportunistic Fund 2 2BNY Mellon Euroland Bond Fund 1 1BNY Mellon European Credit Fund 2 4BNY Mellon Global Bond Fund 2 1BNY Mellon Global Credit Fund* 2 N/ABNY Mellon Global Dynamic Bond Fund 3 3BNY Mellon Global Emerging Markets Equity Value Fund* N/A 3BNY Mellon Global Emerging Markets Fund 3 2BNY Mellon Global Equity Fund 1 1BNY Mellon Global Equity Income Fund 2 2BNY Mellon Global High Yield Bond Fund 2 2BNY Mellon Global Leaders Fund* 2 N/ABNY Mellon Global Opportunistic Bond Fund 4 4BNY Mellon Global Opportunities Fund 1 2BNY Mellon Global Property Securities Fund 1 2BNY Mellon Global Real Return Fund (EUR) 1 1BNY Mellon Global Real Return Fund (GBP) 1 1BNY Mellon Global Real Return Fund (USD) 2 1BNY Mellon Global Short-Dated High Yield Bond Fund* 3 N/ABNY Mellon Japan All Cap Equity Fund 3 3BNY Mellon Japan REIT Alpha Fund* 1 N/ABNY Mellon Japan Small Cap Equity Focus Fund 3 3BNY Mellon Long-Term Global Equity Fund 1 1BNY Mellon Pan European Equity Fund 2 1BNY Mellon S&P 500® Index Tracker 3 2BNY Mellon Small Cap Euroland Fund 3 2BNY Mellon Targeted Return Bond Fund 1 1BNY Mellon U.S. Dynamic Value Fund 1 1BNY Mellon US Opportunities Fund 1 1
* Please refer to Note 19 of the financial statements.

369
BNY MELLON GLOBAL FUNDS, PLC
NOTES TO THE FINANCIAL STATEMENTS
16. RISK MANAGEMENT OBJECTIVES AND POLICIES cont’d.
NUMBER OF SHAREHOLDERSThe Company did not have less than 10 redeemable participating shareholders at the end of the year.
CAPITAL RISK MANAGEMENTThe capital of the Funds is represented by the net assets at the end of the year. The amount of net assets can change significantly on a daily basis as the Funds are subject to daily subscriptions and redemptions at the discretion of shareholders. The Funds’ objective when managing capital is to safeguard the Funds’ ability to continue as a going concern in order to provide returns for shareholders and benefits for other stakeholders and to maintain a strong capital base to support the development of the investment activities of the Funds.
In order to maintain or adjust the capital structure, it is part of the Company’s policy to perform the following:
– The level of daily subscriptions and redemptions relative to the assets it expects to be able to liquidate is monitored and the amount of distributions payable to redeemable participating shareholders is adjusted accordingly.
– Redeemable participating shares are issued and redeemed in accordance with the prospectus and supplements of the Funds, which include the ability to restrict redemptions and requirement for certain minimum holdings and subscriptions.
FAIR VALUE ESTIMATIONThe Company had early adopted the Amendments to FRS 102, “Fair Value Hierarchy Disclosures”, which are effective for accounting periods beginning on or after 1 January 2017. These amendments require the Company to categorise its fair value measurements into the following levels consistent with the fair value hierarchy set out in International Financial Reporting Standards as adopted for use in the European Union. These amendments did not have any impact on the Funds’ financial position or performance.
Level 1: Quoted prices (unadjusted) in active markets for identical assets or liabilities.
Level 2: Inputs other than quoted prices included within level 1 that are observable for the asset or liability, either directly (that is, as prices) or indirectly (that is, derived from prices).
Level 3: Inputs for the asset or liability that are not based on observable market data (that is, unobservable inputs).
Instruments whose values are based on quoted market prices in active markets, and therefore classified within level 1, include active listed equities, exchange traded derivatives, highly liquid government bonds (G7 countries), certificate of deposits and other quoted securities. The Company does not adjust the quoted price for these instruments.
Financial instruments that trade in markets that are not considered to be active but are valued based on quoted market prices, dealer quotations or alternative pricing sources supported by observable inputs are classified within level 2. These include investment-grade government (non-G7 countries) and corporate bonds, over-the-counter derivatives, collected investment schemes, money market instruments and certain listed equities. As level 2 investments include positions that are not traded in active markets and/or are subject to transfer restrictions, valuations may be adjusted to reflect illiquidity and/or non-transferability, which are generally based on available market information.
Investments classified within level 3 have significant unobservable inputs, as they trade infrequently. Level 3 instruments include leveraged loans and corporate debt securities. Unobservable inputs shall be used to measure fair value to the extent that relevant observable inputs are not available, thereby allowing for situations in which there is little, if any, market activity for the asset or liability at the measurement date. However, the fair value measurement objective remains the same, i.e. an exit price from the perspective of a market participant that holds the asset or owes the liability. Therefore, unobservable inputs shall reflect the assumptions that market participants would use when pricing the asset or liability, including assumptions about risk. The sensitivity of unobservable inputs used in the fair valuation of these level 3 securities is not readily determinable.

370
BNY MELLON GLOBAL FUNDS, PLC
NOTES TO THE FINANCIAL STATEMENTS
16. RISK MANAGEMENT OBJECTIVES AND POLICIES cont’d.
FAIR VALUE ESTIMATION cont’d.The following table provides an analysis of financial instruments, as at 31 December 2016 that are measured at fair value in accordance with FRS 102.
Fund Classification Level 1 Level 2 Level 3 Total
BNY Mellon Absolute Insight FundEUR EUR EUR EUR
Bonds 21,458,709 22,435,137 802,520 44,696,366Certificate of deposits 2,000,482 – – 2,000,482Collective investment schemes – 7,029,409 – 7,029,409Commercial paper – 1,500,435 – 1,500,435Credit default swaps – 253,034 – 253,034Equities 1,833,518 170,246 – 2,003,764Equity index swaps – 1,100 – 1,100Equity swaps – 633,739 – 633,739Floating rate notes – 7,336,914 520,685 7,857,599Forward contracts – 475,785 – 475,785Futures 119,077 – – 119,077Leveraged loans – 735,288 197,393 932,681Options 234,344 211,708 – 446,052
Financial assets 25,646,130 40,782,795 1,520,598 67,949,523
Credit default swaps – (92,724) – (92,724)Equity index swaps – (175,842) – (175,842)Equity swaps – (448,962) – (448,962)Forward contracts – (1,268,639) – (1,268,639)Futures (95,431) – – (95,431)Options (235,381) (125,397) – (360,778)
Financial liabilities (330,812) (2,111,564) – (2,442,376)
BNY Mellon Absolute Return Bond FundEUR EUR EUR EUR
Bonds 544,069,191 1,151,278,361 19,370,125 1,714,717,677Collective investment schemes – 178,516,529 – 178,516,529Credit default swaps – 5,791,911 – 5,791,911Forward contracts – 3,381,848 – 3,381,848Futures 8,760,528 – – 8,760,528Leveraged loans – 14,387,276 58,475,647 72,862,923Options – 1,021,171 – 1,021,171
Financial assets 552,829,719 1,354,377,096 77,845,772 1,985,052,587
Credit default swaps – (10,625,097) – (10,625,097)Forward contracts – (47,943,411) – (47,943,411)Futures (7,820,046) – – (7,820,046)Options – (426,203) – (426,203)
Financial liabilities (7,820,046) (58,994,711) – (66,814,757)
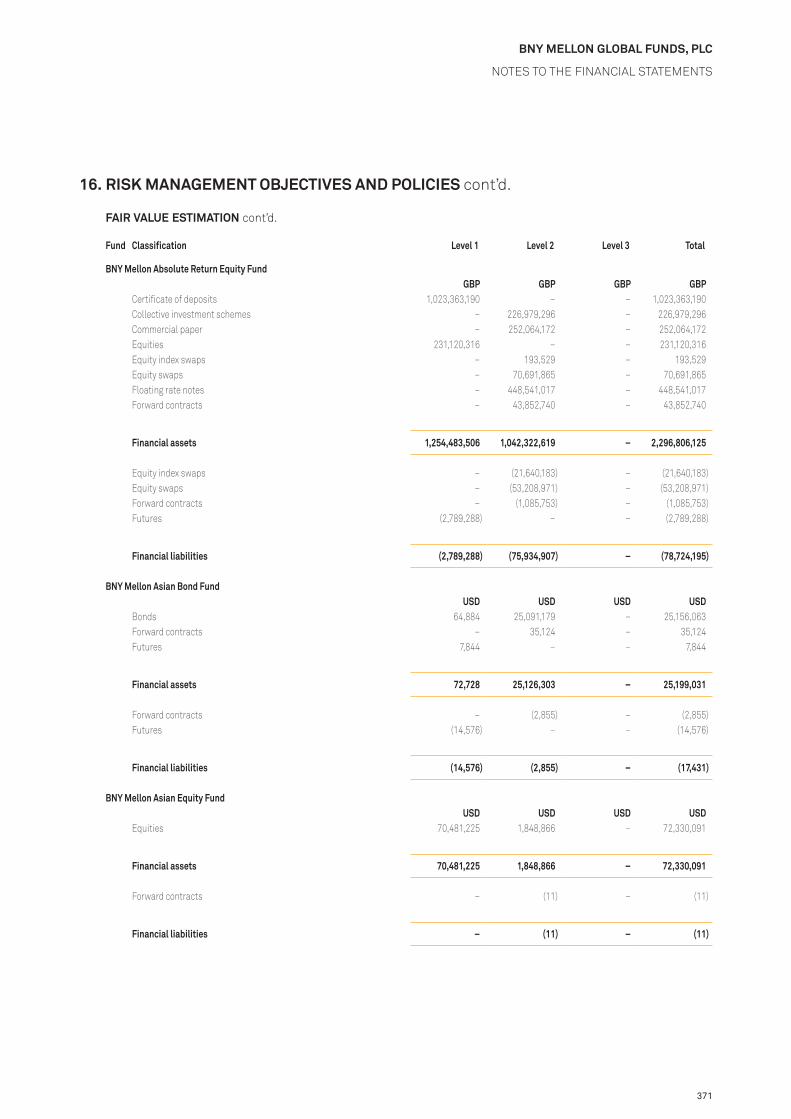
371
BNY MELLON GLOBAL FUNDS, PLC
NOTES TO THE FINANCIAL STATEMENTS
16. RISK MANAGEMENT OBJECTIVES AND POLICIES cont’d.
FAIR VALUE ESTIMATION cont’d.
Fund Classification Level 1 Level 2 Level 3 Total
BNY Mellon Absolute Return Equity FundGBP GBP GBP GBP
Certificate of deposits 1,023,363,190 – – 1,023,363,190Collective investment schemes – 226,979,296 – 226,979,296Commercial paper – 252,064,172 – 252,064,172Equities 231,120,316 – – 231,120,316Equity index swaps – 193,529 – 193,529Equity swaps – 70,691,865 – 70,691,865Floating rate notes – 448,541,017 – 448,541,017Forward contracts – 43,852,740 – 43,852,740
Financial assets 1,254,483,506 1,042,322,619 – 2,296,806,125
Equity index swaps – (21,640,183) – (21,640,183)Equity swaps – (53,208,971) – (53,208,971)Forward contracts – (1,085,753) – (1,085,753)Futures (2,789,288) – – (2,789,288)
Financial liabilities (2,789,288) (75,934,907) – (78,724,195)
BNY Mellon Asian Bond FundUSD USD USD USD
Bonds 64,884 25,091,179 – 25,156,063Forward contracts – 35,124 – 35,124Futures 7,844 – – 7,844
Financial assets 72,728 25,126,303 – 25,199,031
Forward contracts – (2,855) – (2,855)Futures (14,576) – – (14,576)
Financial liabilities (14,576) (2,855) – (17,431)
BNY Mellon Asian Equity FundUSD USD USD USD
Equities 70,481,225 1,848,866 – 72,330,091
Financial assets 70,481,225 1,848,866 – 72,330,091
Forward contracts – (11) – (11)
Financial liabilities – (11) – (11)

372
BNY MELLON GLOBAL FUNDS, PLC
NOTES TO THE FINANCIAL STATEMENTS
16. RISK MANAGEMENT OBJECTIVES AND POLICIES cont’d.
FAIR VALUE ESTIMATION cont’d.
Fund Classification Level 1 Level 2 Level 3 Total
BNY Mellon Asian Income FundGBP GBP GBP GBP
Collective investment schemes – 17,847,250 – 17,847,250Forward contracts – 1,627 – 1,627
Financial assets – 17,848,877 – 17,848,877
Forward contracts – (10) – (10)
Financial liabilities – (10) – (10)
BNY Mellon Brazil Equity FundUSD USD USD USD
Equities 37,292,285 41,885,514 – 79,177,799Forward contracts – 2,239 – 2,239
Financial assets 37,292,285 41,887,753 – 79,180,038
Forward contracts – (6,295) – (6,295)
Financial liabilities – (6,295) – (6,295)
BNY Mellon Dynamic Total Return FundUSD USD USD USD
Bonds 11,893,885 – – 11,893,885Collective investment schemes 1,569,644 – – 1,569,644Forward contracts – 143,580 – 143,580Futures 207,249 – – 207,249Options 1,535,730 – – 1,535,730
Financial assets 15,206,508 143,580 – 15,350,088
Forward contracts – (92,633) – (92,633)Futures (148,319) – – (148,319)
Financial liabilities (148,319) (92,633) – (240,952)

373
BNY MELLON GLOBAL FUNDS, PLC
NOTES TO THE FINANCIAL STATEMENTS
16. RISK MANAGEMENT OBJECTIVES AND POLICIES cont’d.
FAIR VALUE ESTIMATION cont’d.
Fund Classification Level 1 Level 2 Level 3 Total
BNY Mellon Emerging Markets Corporate Debt FundUSD USD USD USD
Bonds – 157,109,596 – 157,109,596Collective investment schemes – 13,406,035 – 13,406,035Forward contracts – 70,565 – 70,565Futures 6,530 – – 6,530
Financial assets 6,530 170,586,196 – 170,592,726
Forward contracts – (41,868) – (41,868)
Financial liabilities – (41,868) – (41,868)
BNY Mellon Emerging Markets Debt FundUSD USD USD USD
Bonds – 59,856,214 – 59,856,214Forward contracts – 612 – 612
Financial assets – 59,856,826 – 59,856,826
Forward contracts – (1,019) – (1,019)
Financial liabilities – (1,019) – (1,019)
BNY Mellon Emerging Markets Debt Local Currency FundUSD USD USD USD
Bonds 16,766,415 801,973,324 – 818,739,739Forward contracts – 5,330,637 – 5,330,637Options – 2,241 – 2,241
Financial assets 16,766,415 807,306,202 – 824,072,617
Forward contracts – (18,731,022) – (18,731,022)Options – (1,687,806) – (1,687,806)
Financial liabilities – (20,418,828) – (20,418,828)

374
BNY MELLON GLOBAL FUNDS, PLC
NOTES TO THE FINANCIAL STATEMENTS
16. RISK MANAGEMENT OBJECTIVES AND POLICIES cont’d.
FAIR VALUE ESTIMATION cont’d.
Fund Classification Level 1 Level 2 Level 3 Total
BNY Mellon Emerging Markets Debt Opportunistic FundUSD USD USD USD
Bonds 254,566 64,932,447 – 65,187,013Forward contracts – 428,046 – 428,046Options – 154 – 154
Financial assets 254,566 65,360,647 – 65,615,213
Forward contracts – (598,370) – (598,370)Options – (123,495) – (123,495)
Financial liabilities – (721,865) – (721,865)
BNY Mellon Euroland Bond FundEUR EUR EUR EUR
Bonds 334,986,829 959,277,187 – 1,294,264,016Collective investment schemes – 33,406,331 – 33,406,331Credit default swaps – 1,408,407 – 1,408,407Forward contracts – 8,853,761 – 8,853,761Futures 5,872,058 – – 5,872,058Options – 257 – 257
Financial assets 340,858,887 1,002,945,943 – 1,343,804,830
Credit default swaps – (1,471,456) – (1,471,456)Forward contracts – (7,509,478) – (7,509,478)Futures (1,576,752) – – (1,576,752)Interest rate swaps – (660,344) – (660,344)Options – (354,623) – (354,623)
Financial liabilities (1,576,752) (9,995,901) – (11,572,653)
BNY Mellon European Credit FundEUR EUR EUR EUR
Bonds – 78,038,088 805,932 78,844,020Collective investment schemes – 4,303,868 – 4,303,868Credit default swaps – 54,725 – 54,725Forward contracts – 25,260 – 25,260Futures 71,968 – – 71,968
Financial assets 71,968 82,421,941 805,932 83,299,841
Credit default swaps – (70,015) – (70,015)Forward contracts – (414,872) – (414,872)Futures (48,633) – – (48,633)
Financial liabilities (48,633) (484,887) – (533,520)

375
BNY MELLON GLOBAL FUNDS, PLC
NOTES TO THE FINANCIAL STATEMENTS
16. RISK MANAGEMENT OBJECTIVES AND POLICIES cont’d.
FAIR VALUE ESTIMATION cont’d.
Fund Classification Level 1 Level 2 Level 3 Total
BNY Mellon Global Bond FundUSD USD USD USD
Bonds 257,702,604 215,443,327 – 473,145,931Forward contracts – 2,103,316 – 2,103,316Options 226,359 – – 226,359
Financial assets 257,928,963 217,546,643 – 475,475,606
Forward contracts – (3,856,815) – (3,856,815)
Financial liabilities – (3,856,815) – (3,856,815)
BNY Mellon Global Credit Fund*USD USD USD USD
Bonds 23,333,447 348,008,468 1,944,968 373,286,883Collective investment schemes – 29,113,649 – 29,113,649Credit default swaps – 381,209 – 381,209Forward contracts – 6,423,009 – 6,423,009Futures 423,470 – – 423,470Options – 87,727 – 87,727
Financial assets 23,756,917 384,014,062 1,944,968 409,715,947
Credit default swaps – (664,699) – (664,699)Forward contracts – (7,591,825) – (7,591,825)Futures (375,700) – – (375,700)Options – (36,867) – (36,867)
Financial liabilities (375,700) (8,293,391) – (8,669,091)
BNY Mellon Global Dynamic Bond FundUSD USD USD USD
Bonds 61,507,934 273,878,777 – 335,386,711Collective investment schemes 12,314,905 – – 12,314,905Forward contracts – 4,405,739 – 4,405,739Options 201,148 – – 201,148
Financial assets 74,023,987 278,284,516 – 352,308,503
Forward contracts – (503,022) – (503,022)
Financial liabilities – (503,022) – (503,022)

376
BNY MELLON GLOBAL FUNDS, PLC
NOTES TO THE FINANCIAL STATEMENTS
16. RISK MANAGEMENT OBJECTIVES AND POLICIES cont’d.
FAIR VALUE ESTIMATION cont’d.
Fund Classification Level 1 Level 2 Level 3 Total
BNY Mellon Global Emerging Markets FundUSD USD USD USD
Equities 29,750,393 – – 29,750,393Forward contracts – 186 – 186
Financial assets 29,750,393 186 – 29,750,579
Forward contracts – (166) – (166)
Financial liabilities – (166) – (166)
BNY Mellon Global Equity FundUSD USD USD USD
Equities 246,410,689 – – 246,410,689Forward contracts – 288,439 – 288,439
Financial assets 246,410,689 288,439 – 246,699,128
Forward contracts – (303,083) – (303,083)
Financial liabilities – (303,083) – (303,083)
BNY Mellon Global Equity Income FundUSD USD USD USD
Equities 671,649,083 – – 671,649,083Forward contracts – 326,694 – 326,694
Financial assets 671,649,083 326,694 – 671,975,777
Forward contracts – (13,160) – (13,160)
Financial liabilities – (13,160) – (13,160)
BNY Mellon Global High Yield Bond FundUSD USD USD USD
Bonds – 143,293,603 – 143,293,603Forward contracts – 26,716 – 26,716Leveraged loans – 3,709,426 – 3,709,426
Financial assets – 147,029,745 – 147,029,745
Forward contracts – (338,282) – (338,282)
Financial liabilities – (338,282) – (338,282)

377
BNY MELLON GLOBAL FUNDS, PLC
NOTES TO THE FINANCIAL STATEMENTS
16. RISK MANAGEMENT OBJECTIVES AND POLICIES cont’d.
FAIR VALUE ESTIMATION cont’d.
Fund Classification Level 1 Level 2 Level 3 Total
BNY Mellon Global Leaders Fund*USD USD USD USD
Equities 27,564,304 – – 27,564,304
Financial assets 27,564,304 – – 27,564,304
Forward contracts – (1,773) – (1,773)
Financial liabilities – (1,773) – (1,773)
BNY Mellon Global Opportunistic Bond FundUSD USD USD USD
Bonds 17,696,166 105,813,812 – 123,509,978Forward contracts – 1,155,073 – 1,155,073Futures 469,500 – – 469,500Interest rate swaps – 127,290 – 127,290Leveraged loans – 4,198,957 – 4,198,957Options – 59 – 59
Financial assets 18,165,666 111,295,191 – 129,460,857
Forward contracts – (1,918,251) – (1,918,251)Futures (357,970) – – (357,970)Options – (117,205) – (117,205)
Financial liabilities (357,970) (2,035,456) – (2,393,426)
BNY Mellon Global Opportunities FundUSD USD USD USD
Bonds 8,201,332 – – 8,201,332Equities 96,413,335 – – 96,413,335Forward contracts – 570,053 – 570,053
Financial assets 104,614,667 570,053 – 105,184,720
Forward contracts – (384,937) – (384,937)
Financial liabilities – (384,937) – (384,937)

378
BNY MELLON GLOBAL FUNDS, PLC
NOTES TO THE FINANCIAL STATEMENTS
16. RISK MANAGEMENT OBJECTIVES AND POLICIES cont’d.
FAIR VALUE ESTIMATION cont’d.
Fund Classification Level 1 Level 2 Level 3 Total
BNY Mellon Global Property Securities FundEUR EUR EUR EUR
Equities 21,164,576 – – 21,164,576Forward contracts – 18 – 18
Financial assets 21,164,576 18 – 21,164,594
Forward contracts – (4,690) – (4,690)
Financial liabilities – (4,690) – (4,690)
BNY Mellon Global Real Return Fund (EUR)EUR EUR EUR EUR
Bonds 907,970,917 541,031,886 – 1,449,002,803Collective investment schemes 248,385,151 155,185,553 – 403,570,704Equities 2,053,619,020 – – 2,053,619,020Forward contracts – 23,324,103 – 23,324,103Options 3,284,016 – – 3,284,016
Financial assets 3,213,259,104 719,541,542 – 3,932,800,646
Forward contracts – (137,485,437) – (137,485,437)Futures (19,356,582) – – (19,356,582)
Financial liabilities (19,356,582) (137,485,437) – (156,842,019)
BNY Mellon Global Real Return Fund (GBP)GBP GBP GBP GBP
Bonds 13,595,560 8,709,600 – 22,305,160Collective investment schemes 3,951,113 2,354,471 – 6,305,584Equities 33,123,611 – – 33,123,611Forward contracts – 453,502 – 453,502Options 52,304 – – 52,304
Financial assets 50,722,588 11,517,573 – 62,240,161
Forward contracts – (90,570) – (90,570)Futures (314,166) – – (314,166)
Financial liabilities (314,166) (90,570) – (404,736)

379
BNY MELLON GLOBAL FUNDS, PLC
NOTES TO THE FINANCIAL STATEMENTS
16. RISK MANAGEMENT OBJECTIVES AND POLICIES cont’d.
FAIR VALUE ESTIMATION cont’d.
Fund Classification Level 1 Level 2 Level 3 Total
BNY Mellon Global Real Return Fund (USD)USD USD USD USD
Bonds 135,871,268 87,071,184 – 222,942,452Collective investment schemes 38,985,034 23,914,895 – 62,899,929Equities 322,104,173 – – 322,104,173Forward contracts – 15,464,311 – 15,464,311Options 516,828 – – 516,828
Financial assets 497,477,303 126,450,390 – 623,927,693
Forward contracts – (566,229) – (566,229)Futures (2,957,660) – – (2,957,660)
Financial liabilities (2,957,660) (566,229) – (3,523,889)
BNY Mellon Global Short-Dated High Yield Bond Fund*USD USD USD USD
Bonds – 415,837,232 – 415,837,232Collective investment schemes – 1,945,000 – 1,945,000Equities 2,588,551 – – 2,588,551Forward contracts – 2,178,023 – 2,178,023Leveraged loans – 21,296,275 – 21,296,275
Financial assets 2,588,551 441,256,530 – 443,845,081
Forward contracts – (1,773,904) – (1,773,904)
Financial liabilities – (1,773,904) – (1,773,904)
BNY Mellon Japan All Cap Equity FundJPY JPY JPY JPY
Equities 2,258,689,330 – – 2,258,689,330Forward contracts – 14,172,892 – 14,172,892
Financial assets 2,258,689,330 14,172,892 – 2,272,862,222
Forward contracts – (72,660) – (72,660)
Financial liabilities – (72,660) – (72,660)
BNY Mellon Japan REIT Alpha Fund*JPY JPY JPY JPY
Real estate investment trust 2,133,619,950 – – 2,133,619,950
Financial assets 2,133,619,950 – – 2,133,619,950

380
BNY MELLON GLOBAL FUNDS, PLC
NOTES TO THE FINANCIAL STATEMENTS
16. RISK MANAGEMENT OBJECTIVES AND POLICIES cont’d.
FAIR VALUE ESTIMATION cont’d.
Fund Classification Level 1 Level 2 Level 3 Total
BNY Mellon Japan Small Cap Equity Focus FundJPY JPY JPY JPY
Equities 2,660,423,400 – – 2,660,423,400Forward contracts – 12,061,781 – 12,061,781
Financial assets 2,660,423,400 12,061,781 – 2,672,485,181
Forward contracts – (4,029) – (4,029)
Financial liabilities – (4,029) – (4,029)
BNY Mellon Long-Term Global Equity FundEUR EUR EUR EUR
Equities 1,262,788,522 – – 1,262,788,522Forward contracts – 2,102 – 2,102
Financial assets 1,262,788,522 2,102 – 1,262,790,624
Forward contracts – (500) – (500)
Financial liabilities – (500) – (500)
BNY Mellon Pan European Equity FundEUR EUR EUR EUR
Equities 1,871,059 54,795 – 1,925,854Forward contracts – 23 – 23
Financial assets 1,871,059 54,818 – 1,925,877
BNY Mellon S&P 500® Index TrackerUSD USD USD USD
Bonds 39,960 – – 39,960Equities 85,929,892 – – 85,929,892Forward contracts – 225 – 225
Financial assets 85,969,852 225 – 85,970,077
Futures (3,034) – – (3,034)
Financial liabilities (3,034) – – (3,034)
BNY Mellon Small Cap Euroland FundEUR EUR EUR EUR
Equities 34,052,231 487,545 – 34,539,776Futures 1,006 – – 1,006
Financial assets 34,053,237 487,545 – 34,540,782

381
BNY MELLON GLOBAL FUNDS, PLC
NOTES TO THE FINANCIAL STATEMENTS
16. RISK MANAGEMENT OBJECTIVES AND POLICIES cont’d.
FAIR VALUE ESTIMATION cont’d.
Fund Classification Level 1 Level 2 Level 3 Total
BNY Mellon Targeted Return Bond FundUSD USD USD USD
Bonds 15,068,551 63,684,777 – 78,753,328Forward contracts – 487,091 – 487,091Futures 225,023 – – 225,023Interest rate swaps – 83,090 – 83,090Options – 11 – 11
Financial assets 15,293,574 64,254,969 – 79,548,543
Forward contracts – (2,708,149) – (2,708,149)Futures (229,232) – – (229,232)Options – (23,163) – (23,163)
Financial liabilities (229,232) (2,731,312) – (2,960,544)
BNY Mellon U.S. Dynamic Value FundUSD USD USD USD
Collective investment schemes 1,261,174 – – 1,261,174Equities 138,190,537 – – 138,190,537
Financial assets 139,451,711 – – 139,451,711
BNY Mellon US Opportunites FundUSD USD USD USD
Collective investment schemes 31,675 – – 31,675Equities 31,490,008 – – 31,490,008
Financial assets 31,521,683 – – 31,521,683
* Please refer to Note 19 of the financial statements.

382
BNY MELLON GLOBAL FUNDS, PLC
NOTES TO THE FINANCIAL STATEMENTS
16. RISK MANAGEMENT OBJECTIVES AND POLICIES cont’d.
FAIR VALUE ESTIMATION cont’d.The following table provides an analysis of financial instruments at 31 December 2015 that are measured at fair value in accordance with FRS 102.
Fund Classification Level 1 Level 2 Level 3 Total
BNY Mellon Absolute Insight FundEUR EUR EUR EUR
Bonds 11,904,006 58,957,447 1,193,358 72,054,811Certificate of deposits 19,004,220 – – 19,004,220Collective investment schemes – 20,772,790 – 20,772,790Commercial paper – 32,008,375 – 32,008,375Credit default swaps – 761,384 – 761,384Equities 5,636,025 – – 5,636,025Equity index swaps – 32,158 – 32,158Equity swaps – 1,005,549 – 1,005,549Floating rate notes – 46,422,565 1,677,039 48,099,604Forward contracts – 1,894,510 – 1,894,510Futures 222,269 – – 222,269Interest rate swaps – 35,403 – 35,403Leveraged loans – 634,984 710,795 1,345,779Options 512,353 220,306 – 732,659
Financial assets 37,278,873 162,745,471 3,581,192 203,605,536
Credit default swaps – (621,314) – (621,314)Equity index swaps – (201,705) – (201,705)Equity swaps – (783,053) – (783,053)Forward contracts – (1,282,769) – (1,282,769)Futures (198,023) – – (198,023)Interest rate swaps – (221) – (221)Options (530,023) (282,379) – (812,402)
Financial liabilities (728,046) (3,171,441) – (3,899,487)
BNY Mellon Absolute Return Bond FundEUR EUR EUR EUR
Bonds 183,100,553 1,402,374,593 21,192,574 1,606,667,720Collective investment schemes – 198,421,606 – 198,421,606Credit default swaps – 905,190 – 905,190Forward contracts – 7,963,854 – 7,963,854Futures 3,888,724 – – 3,888,724Leveraged loans – 22,646,382 37,381,661 60,028,043Options – 307,515 – 307,515
Financial assets 186,989,277 1,632,619,140 58,574,235 1,878,182,652
Credit default swaps – (6,855,343) – (6,855,343)Forward contracts – (5,496,743) – (5,496,743)Options – (57,292) – (57,292)
Financial liabilities – (12,409,378) – (12,409,378)

383
BNY MELLON GLOBAL FUNDS, PLC
NOTES TO THE FINANCIAL STATEMENTS
16. RISK MANAGEMENT OBJECTIVES AND POLICIES cont’d.
FAIR VALUE ESTIMATION cont’d.
Fund Classification Level 1 Level 2 Level 3 Total
BNY Mellon Absolute Return Equity FundGBP GBP GBP GBP
Bonds 79,991,725 – – 79,991,725Certificate of deposits 809,761,482 – – 809,761,482Collective investment schemes – 209,688,783 – 209,688,783Commercial paper – 168,858,392 – 168,858,392Equities 200,111,392 – – 200,111,392Equity index swaps – 894,465 – 894,465Equity swaps – 37,475,862 – 37,475,862Floating rate notes – 343,780,623 – 343,780,623Forward contracts – 18,822,216 – 18,822,216
Financial assets 1,089,864,599 779,520,341 – 1,869,384,940
Equity index swaps – (8,014,071) – (8,014,071)Equity swaps – (28,830,344) – (28,830,344)Forward contracts – (1,208,367) – (1,208,367)Futures (4,545,226) – – (4,545,226)
Financial liabilities (4,545,226) (38,052,782) – (42,598,008)
BNY Mellon Asian Bond FundUSD USD USD USD
Bonds 894,464 37,793,592 – 38,688,056Futures 10,154 – – 10,154
Financial assets 904,618 37,793,592 – 38,698,210
Forward contracts – (8,390) – (8,390)
Financial liabilities – (8,390) – (8,390)
BNY Mellon Asian Equity FundUSD USD USD USD
Equities 86,897,439 3,705,155 – 90,602,594
Financial assets 86,897,439 3,705,155 – 90,602,594
Forward contracts – (28) – (28)
Financial liabilities – (28) – (28)
BNY Mellon Asian Income FundGBP GBP GBP GBP
Collective investment schemes – 20,866,698 – 20,866,698
Financial assets – 20,866,698 – 20,866,698

384
BNY MELLON GLOBAL FUNDS, PLC
NOTES TO THE FINANCIAL STATEMENTS
16. RISK MANAGEMENT OBJECTIVES AND POLICIES cont’d.
FAIR VALUE ESTIMATION cont’d.
Fund Classification Level 1 Level 2 Level 3 Total
BNY Mellon Brazil Equity FundUSD USD USD USD
Equities 32,013,275 20,581,708 – 52,594,983Forward contracts – 33 – 33
Financial assets 32,013,275 20,581,741 – 52,595,016
Forward contracts – (324) – (324)
Financial liabilities – (324) – (324)
BNY Mellon Crossover Credit FundEUR EUR EUR EUR
Bonds – 226,089,195 – 226,089,195Forward contracts – 252,030 – 252,030
Financial assets – 226,341,225 – 226,341,225
Credit default swaps – (5,613) – (5,613)Futures (18,000) – – (18,000)
Financial liabilities (18,000) (5,613) – (23,613)
BNY Mellon Dynamic Total Return FundUSD USD USD USD
Bonds 9,906,592 – – 9,906,592Collective investment schemes 1,036,100 – – 1,036,100Forward contracts – 78,267 – 78,267Futures 80,738 – – 80,738Options 70,445 – – 70,445
Financial assets 11,093,875 78,267 – 11,172,142
Forward contracts – (23,379) – (23,379)Futures (98,006) – – (98,006)
Financial liabilities (98,006) (23,379) – (121,385)

385
BNY MELLON GLOBAL FUNDS, PLC
NOTES TO THE FINANCIAL STATEMENTS
16. RISK MANAGEMENT OBJECTIVES AND POLICIES cont’d.
FAIR VALUE ESTIMATION cont’d.
Fund Classification Level 1 Level 2 Level 3 Total
BNY Mellon Emerging Markets Corporate Debt FundUSD USD USD USD
Bonds – 96,092,456 – 96,092,456Collective investment schemes – 9,065,938 – 9,065,938Forward contracts – 18,760 – 18,760
Financial assets – 105,177,154 – 105,177,154
Forward contracts – (163,458) – (163,458)
Financial liabilities – (163,458) – (163,458)
BNY Mellon Emerging Markets Debt FundUSD USD USD USD
Bonds – 66,158,451 – 66,158,451Forward contracts – 420 – 420
Financial assets – 66,158,871 – 66,158,871
Forward contracts – (33,983) – (33,983)
Financial liabilities – (33,983) – (33,983)
BNY Mellon Emerging Markets Debt Local Currency FundUSD USD USD USD
Bonds 18,828,248 1,236,362,536 – 1,255,190,784Forward contracts – 18,555,163 – 18,555,163
Financial assets 18,828,248 1,254,917,699 – 1,273,745,947
Forward contracts – (5,879,624) – (5,879,624)Options – (2,386,918) – (2,386,918)
Financial liabilities – (8,266,542) – (8,266,542)
BNY Mellon Emerging Markets Debt Opportunistic FundUSD USD USD USD
Bonds 249,899 82,217,098 – 82,466,997Forward contracts – 743,920 – 743,920
Financial assets 249,899 82,961,018 – 83,210,917
Forward contracts – (275,264) – (275,264)Options – (107,789) – (107,789)
0
Financial liabilities – (383,053) – (383,053)

386
BNY MELLON GLOBAL FUNDS, PLC
NOTES TO THE FINANCIAL STATEMENTS
16. RISK MANAGEMENT OBJECTIVES AND POLICIES cont’d.
FAIR VALUE ESTIMATION cont’d.
Fund Classification Level 1 Level 2 Level 3 Total
BNY Mellon Euroland Bond FundEUR EUR EUR EUR
Bonds 974,629,097 1,673,108,073 – 2,647,737,170Collective investment schemes – 35,323,377 – 35,323,377Credit default swaps – 2,060,111 – 2,060,111Forward contracts – 1,323,501 – 1,323,501Futures 5,269,584 – – 5,269,584Interest rate swaps – 10,413,146 – 10,413,146
Financial assets 979,898,681 1,722,228,208 – 2,702,126,889
Credit default swaps – (2,882,562) – (2,882,562)Forward contracts – (14,532,591) – (14,532,591)Futures (733,381) – – (733,381)Interest rate swaps – (7,682,375) – (7,682,375)
Financial liabilities (733,381) (25,097,528) – (25,830,909)
BNY Mellon European Credit FundEUR EUR EUR EUR
Bonds – 46,365,211 – 46,365,211Collective investment schemes – 3,014,628 – 3,014,628Credit default swaps – 49,177 – 49,177Forward contracts – 376,421 – 376,421Futures 30,544 – – 30,544
Financial assets 30,544 49,805,437 – 49,835,981
Credit default swaps – (153,092) – (153,092)Forward contracts – (5,378) – (5,378)Futures (35,745) – – (35,745)
Financial liabilities (35,745) (158,470) – (194,215)
BNY Mellon Global Bond FundUSD USD USD USD
Bonds 150,437,987 149,167,449 – 299,605,436Forward contracts – 2,398,280 – 2,398,280
Financial assets 150,437,987 151,565,729 – 302,003,716
Forward contracts – (1,472,340) – (1,472,340)
Financial liabilities – (1,472,340) – (1,472,340)

387
BNY MELLON GLOBAL FUNDS, PLC
NOTES TO THE FINANCIAL STATEMENTS
16. RISK MANAGEMENT OBJECTIVES AND POLICIES cont’d.
FAIR VALUE ESTIMATION cont’d.
Fund Classification Level 1 Level 2 Level 3 Total
BNY Mellon Global Dynamic Bond FundUSD USD USD USD
Bonds 68,433,678 179,640,971 14,599 248,089,248Collective investment schemes 53,263 – – 53,263Forward contracts – 1,694,982 – 1,694,982Futures 26,796 – – 26,796
Financial assets 68,513,737 181,335,953 14,599 249,864,289
Forward contracts – (2,299,462) – (2,299,462)
Financial liabilities – (2,299,462) – (2,299,462)
BNY Mellon Global Emerging Markets Equity Value FundUSD USD USD USD
Collective investment schemes 4,033,753 – – 4,033,753Equities 257,563 – – 257,563
Financial assets 4,291,316 – – 4,291,316
BNY Mellon Global Emerging Markets FundUSD USD USD USD
Collective investment schemes 1,483,708 – – 1,483,708Equities 21,411,320 – – 21,411,320Forward contracts – 544 – 544
Financial assets 22,895,028 544 – 22,895,572
Forward contracts – (3,737) – (3,737)
Financial liabilities – (3,737) – (3,737)
BNY Mellon Global Equity FundUSD USD USD USD
Equities 244,265,332 – – 244,265,332Forward contracts – 82 – 82
Financial assets 244,265,332 82 – 244,265,414
Forward contracts – (16,691) – (16,691)
Financial liabilities – (16,691) – (16,691)

388
BNY MELLON GLOBAL FUNDS, PLC
NOTES TO THE FINANCIAL STATEMENTS
16. RISK MANAGEMENT OBJECTIVES AND POLICIES cont’d.
FAIR VALUE ESTIMATION cont’d.
Fund Classification Level 1 Level 2 Level 3 Total
BNY Mellon Global Equity Income FundUSD USD USD USD
Equities 460,032,005 – – 460,032,005Forward contracts – 1,295,192 – 1,295,192
Financial assets 460,032,005 1,295,192 – 461,327,197
Forward contracts – (1,410,107) – (1,410,107)
Financial liabilities – (1,410,107) – (1,410,107)
BNY Mellon Global High Yield Bond FundUSD USD USD USD
Bonds – 125,235,263 – 125,235,263Equities 1,014,794 – – 1,014,794Forward contracts – 51,793 – 51,793Leveraged loans – 1,060,100 – 1,060,100
Financial assets 1,014,794 126,347,156 – 127,361,950
Forward contracts – (572,215) – (572,215)
Financial liabilities – (572,215) – (572,215)
BNY Mellon Global Opportunistic Bond FundUSD USD USD USD
Bonds 6,837,537 197,753,683 2,107,375 206,698,595Forward contracts – 736,689 – 736,689Futures 503,275 – – 503,275Interest rate swaps – 54,404 – 54,404Leveraged loans – 6,358,313 – 6,358,313Options 131,100 – – 131,100
Financial assets 7,471,912 204,903,089 2,107,375 214,482,376
Credit default swaps – (1,324,238) – (1,324,238)Forward contracts – (1,363,201) – (1,363,201)Futures (26,223) – – (26,223)Options (81,938) (268,691) – (350,629)
Financial liabilities (108,161) (2,956,130) – (3,064,291)

389
BNY MELLON GLOBAL FUNDS, PLC
NOTES TO THE FINANCIAL STATEMENTS
16. RISK MANAGEMENT OBJECTIVES AND POLICIES cont’d.
FAIR VALUE ESTIMATION cont’d.
Fund Classification Level 1 Level 2 Level 3 Total
BNY Mellon Global Opportunities FundUSD USD USD USD
Bonds 6,803,817 – – 6,803,817Equities 129,517,451 – – 129,517,451Forward contracts – 536 – 536
Financial assets 136,321,268 536 – 136,321,804
Forward contracts – (76,579) – (76,579)
Financial liabilities – (76,579) – (76,579)
BNY Mellon Global Property Securities FundEUR EUR EUR EUR
Equities 13,872,097 – – 13,872,097Forward contracts – 1 – 1
Financial assets 13,872,097 1 – 13,872,098
Forward contracts – (6,487) – (6,487)
Financial liabilities – (6,487) – (6,487)
BNY Mellon Global Real Return Fund (EUR)EUR EUR EUR EUR
Bonds 641,089,436 402,376,561 – 1,043,465,997Collective investment schemes 109,660,081 136,033,338 – 245,693,419Equities 1,200,575,973 – – 1,200,575,973Forward contracts – 10,982,392 – 10,982,392Futures 531,598 – – 531,598Options 247,344 – – 247,344
Financial assets 1,952,104,432 549,392,291 – 2,501,496,723
Forward contracts – (10,943,707) – (10,943,707)
Financial liabilities – (10,943,707) – (10,943,707)

390
BNY MELLON GLOBAL FUNDS, PLC
NOTES TO THE FINANCIAL STATEMENTS
16. RISK MANAGEMENT OBJECTIVES AND POLICIES cont’d.
FAIR VALUE ESTIMATION cont’d.
Fund Classification Level 1 Level 2 Level 3 Total
BNY Mellon Global Real Return Fund (GBP)GBP GBP GBP GBP
Bonds 15,091,414 7,006,050 – 22,097,464Collective investment schemes 2,565,249 3,143,640 – 5,708,889Equities 27,442,888 – – 27,442,888Forward contracts – 110,956 – 110,956Options 5,385 – – 5,385
Financial assets 45,104,936 10,260,646 – 55,365,582
Forward contracts – (1,182,589) – (1,182,589)Futures (359) – – (359)
Financial liabilities (359) (1,182,589) – (1,182,948)
BNY Mellon Global Real Return Fund (USD)USD USD USD USD
Bonds 123,995,710 60,681,014 – 184,676,724Collective investment schemes 21,610,535 25,680,059 – 47,290,594Equities 235,882,255 – – 235,882,255Forward contracts – 6,274,101 – 6,274,101Futures 104,021 – – 104,021Options 47,500 – – 47,500
Financial assets 381,640,021 92,635,174 – 474,275,195
Forward contracts – (1,565,570) – (1,565,570)
Financial liabilities – (1,565,570) – (1,565,570)
BNY Mellon Japan All Cap Equity FundJPY JPY JPY JPY
Equities 3,901,163,820 – – 3,901,163,820Forward contracts – 17,306,312 – 17,306,312
Financial assets 3,901,163,820 17,306,312 – 3,918,470,132
Forward contracts – (28,656,971) – (28,656,971)
Financial liabilities – (28,656,971) – (28,656,971)

391
BNY MELLON GLOBAL FUNDS, PLC
NOTES TO THE FINANCIAL STATEMENTS
16. RISK MANAGEMENT OBJECTIVES AND POLICIES cont’d.
FAIR VALUE ESTIMATION cont’d.
Fund Classification Level 1 Level 2 Level 3 Total
BNY Mellon Japan Small Cap Equity Focus FundJPY JPY JPY JPY
Equities 4,457,380,400 – – 4,457,380,400Forward contracts – 168,652 – 168,652
Financial assets 4,457,380,400 168,652 – 4,457,549,052
Forward contracts – (25,139,478) – (25,139,478)
Financial liabilities – (25,139,478) – (25,139,478)
BNY Mellon Long-Term Global Equity FundEUR EUR EUR EUR
Equities 1,407,469,049 – – 1,407,469,049Forward contracts – 10,018 – 10,018
Financial assets 1,407,469,049 10,018 – 1,407,479,067
Forward contracts – (1,490) – (1,490)
Financial liabilities – (1,490) – (1,490)
BNY Mellon Pan European Equity FundEUR EUR EUR EUR
Equities 48,639,245 – – 48,639,245Forward contracts – 1 – 1
Financial assets 48,639,245 1 – 48,639,246
Forward contracts – (4) – (4)
Financial liabilities – (4) – (4)
BNY Mellon S&P 500® Index TrackerUSD USD USD USD
Bonds 44,995 – – 44,995Equities 76,472,300 – – 76,472,300Futures 1,147 – – 1,147
Financial assets 76,518,442 – – 76,518,442
BNY Mellon Small Cap Euroland FundEUR EUR EUR EUR
Equities 60,160,465 – – 60,160,465Forward contracts – 319,580 – 319,580Futures 15,493 – – 15,493
Financial assets 60,175,958 319,580 – 60,495,538

392
BNY MELLON GLOBAL FUNDS, PLC
NOTES TO THE FINANCIAL STATEMENTS
16. RISK MANAGEMENT OBJECTIVES AND POLICIES cont’d.
FAIR VALUE ESTIMATION cont’d.
Fund Classification Level 1 Level 2 Level 3 Total
BNY Mellon Targeted Return Bond FundUSD USD USD USD
Bonds 4,369,100 87,454,262 1,007,875 92,831,237Forward contracts – 328,529 – 328,529Futures 215,501 – – 215,501Options 58,200 – – 58,200
Financial assets 4,642,801 87,782,791 1,007,875 93,433,467
Forward contracts – (2,593,711) – (2,593,711)Futures (3,148) – – (3,148)Options (36,375) (21,250) – (57,625)
Financial liabilities (39,523) (2,614,961) – (2,654,484)
BNY Mellon U.S. Dynamic Value FundUSD USD USD USD
Equities 41,113,742 – – 41,113,742
Financial assets 41,113,742 – – 41,113,742
Forward contracts – (6) – (6)
Financial liabilities – (6) – (6)
BNY Mellon US Opportunities FundUSD USD USD USD
Collective investment schemes 3,559,602 – – 3,559,602Equities 47,448,680 – – 47,448,680
Financial assets 51,008,282 – – 51,008,282
17. COMMITMENTS AND CONTINGENCIES
There are no commitments or contingencies as at 31 December 2016 or 31 December 2015.
18. SEGREGATED LIABILITY
The Company avails of the segregated liability provisions of Section 1405 (1) of the Companies Act 2014. As such, under Irish Law the Company generally will not be liable as a whole to third parties and there generally will not be the potential for cross liability between the Funds.

393
BNY MELLON GLOBAL FUNDS, PLC
NOTES TO THE FINANCIAL STATEMENTS
19. SIGNIFICANT EVENTS
BNY Mellon Global Property Securities Fund changed its distribution frequency from annual to quarterly with effect from 1 January 2016.
The EU Securities Financing Transaction Regulation (“SFTR”) came into effect on 12 January 2016. The aim of the SFTR is to improve the transparency of securities financing transactions (“SFTs”). SFTs included repurchase transactions, securities or commodities lending or borrowing, buy-sell back transactions or sell-buy back transactions and margin lending transactions. Article 13, Transparency of Collective Investment Undertakings in Periodic Reports, applies to annual and semi-annual reports published after 13 January 2017. Please see Appendix 2 for SFTR disclosures not included in the notes to the financial statements.
On 27 January 2016, the Administrator, BNY Mellon Fund Services (Ireland) Limited converted to a designated activity company under the Companies Act 2014 and changed its name to BNY Mellon Fund Services (Ireland) Designated Activity Company.
BNY Mellon Global Emerging Markets Equity Value Fund closed on 26 February 2016.
BNY Mellon Global Credit Fund launched on 29 February 2016.
The UCITS V Directive came into effect for the Company on 18 March 2016. Please see Appendix 1 for disclosure on remuneration policy.
Greg Brisk was appointed as a Director of the following Investment Managers for the Funds:
• Newton Investment Management Limited effective on 8 May 2016;• Insight Investment Management (Global) Limited effective on 8 May 2016;• Standish Mellon Asset Management Company, LLC effective on 8 June 2016;• CenterSquare Investment Management, Inc. effective on 13 July 2016;• EACM Advisors LLC effective on 13 July 2016;• Mellon Capital Management Corporation effective on 13 July 2016; and• The Boston Company Asset Management, LLC effective on 13 July 2016.
With effect from 1 July 2016, for BNY Mellon Absolute Insight Fund, the performance fee rate changed to 10% for all in scope share classes and the annual management fee for Class U share classes decreased from 0.85% to 0.75%.
The Client Asset Regulations came into effect on 1 July 2016. Please refer to Note 9 of the financial statements for further details.
BNY Mellon Crossover Credit Fund merged into Oddo Compass Crossover Credit, a sub-fund of Oddo Compass SICAV, on 20 September 2016 and subsequently closed on the same date.
The Company established an Audit Committee on 20 October 2016.
BNY Mellon Global Short-Dated High Yield Bond Fund launched on 30 November 2016.
BNY Mellon Global Leaders Fund launched on 7 December 2016.
BNY Mellon Japan REIT Alpha Fund launched on 13 December 2016.

394
BNY MELLON GLOBAL FUNDS, PLC
NOTES TO THE FINANCIAL STATEMENTS
19. SIGNIFICANT EVENTS cont’d.
CLASS ACTIONS POLICYThe prospectus has been updated to include disclosure relating to the Manager’s policy on class action litigation relevant to the Funds. From time to time the Manager and/or the Directors are asked to consider participation in litigation relevant to the Company / the Funds. Typically that litigation takes the form of proposed or actual class, group or collective litigation (referred to generally as class actions) where eligible investors are either invited to “opt-in” to litigation or “opt-out” (i.e., to choose not to participate). In respect of opt-out class actions, eligible investors automatically comprise the class and are eligible to participate in any successful judgment or settlement unless they actively elect to opt-out. In respect of opt-in class actions, eligible investors are required to actively opt-in to the class action in order to comprise the class and participate in any successful judgment or settlement. The Manager and/or the Directors have delegated responsibility for considering participation in both opt-in and opt-out class action litigation to a Class Actions Committee (the “Committee”) pursuant to the terms of a Class Actions Policy (the “Policy”). The Policy provides that the default position in respect of opt-out class actions is that the Company and/or the Funds will not opt-out of such class actions, save in the event that there are considered to be compelling reasons, determined in the Committee’s sole discretion, for doing so. That is primarily because participation in opt-out class actions rarely gives rise to any risk or cost to the Company and/or the Funds. As regards opt-in class actions, however, participation in such litigation is rarely cost, risk and obligation free and, in fact, such costs, risks and obligations can be significant. On that basis, the Company and/or the Funds will not opt-in to such class actions save in the event that there are considered to be compelling reasons, determined in the Committee’s sole discretion, for doing so. In the event that the Committee determines that there are compelling reasons for opting-out of an opt-out class action, or opting-in to an opt-in class action, it would expect to consult with legal advisors, the Depositary, the relevant Investment Manager and any other relevant service providers before any action is taken by the Company and/or the Funds. The costs in doing so will ordinarily be for the account of the relevant Fund. In the event that the Company and/or the Funds participate in a class action which is ultimately successful, any financial award received from that action shall be to the benefit of the Company and/or the Funds as a whole, as opposed to any particular class of investor. It is possible, therefore, that those investors who were invested in the Company and/or the Funds at the time that the underlying cause of action in the claim arose, or when the Company and/or the Funds incurred costs relating to participation in the class action, do not ultimately benefit from the award in the class action; for example, if they have redeemed prior to the date of receipt of the award.
Other than disclosed above, there were no other significant events affecting the Company during the year.
20. SUBSEQUENT EVENTS
The Company declared the following distributions on 12 January 2017 and 4 April 2017:
Fund Share Class Currency 12 January 2017 4 April 2017
BNY Mellon Absolute Return Bond Fund Class C (Inc) EUR 0.1199 0.0913Sterling I (Acc) (Hedged) GBP 0.0979 0.0921
Class S (Inc) EUR - 0.0709Class T (Hedged) CHF - 0.0902
Sterling T (Acc) (Hedged) GBP 0.0608 0.0902Class W (Acc) USD 0.0255 0.0643Class W (Acc) EUR 0.0700 0.0638
Class W (Inc) (Hedged) USD 0.0287 0.0651Sterling W (Acc) (Hedged) GBP 0.0984 0.0738Sterling W (Inc) (Hedged) GBP 0.0855 0.0723Sterling X (Acc) (Hedged) GBP 0.3248 0.3032
Class Z (Acc) EUR 0.0526 0.0864BNY Mellon Absolute Return Equity Fund Sterling X (Acc) GBP 0.0092 -BNY Mellon Asian Bond Fund Class A (Acc) USD 0.0064 0.0069
Class A (Inc) USD 0.0063 0.0065Class C (Acc) USD 0.0080 0.0083Class C (Inc) USD 0.0076 0.0078
Class E (Acc) USD 0.0093 0.0096Class E (Inc) USD 0.0088 0.0091
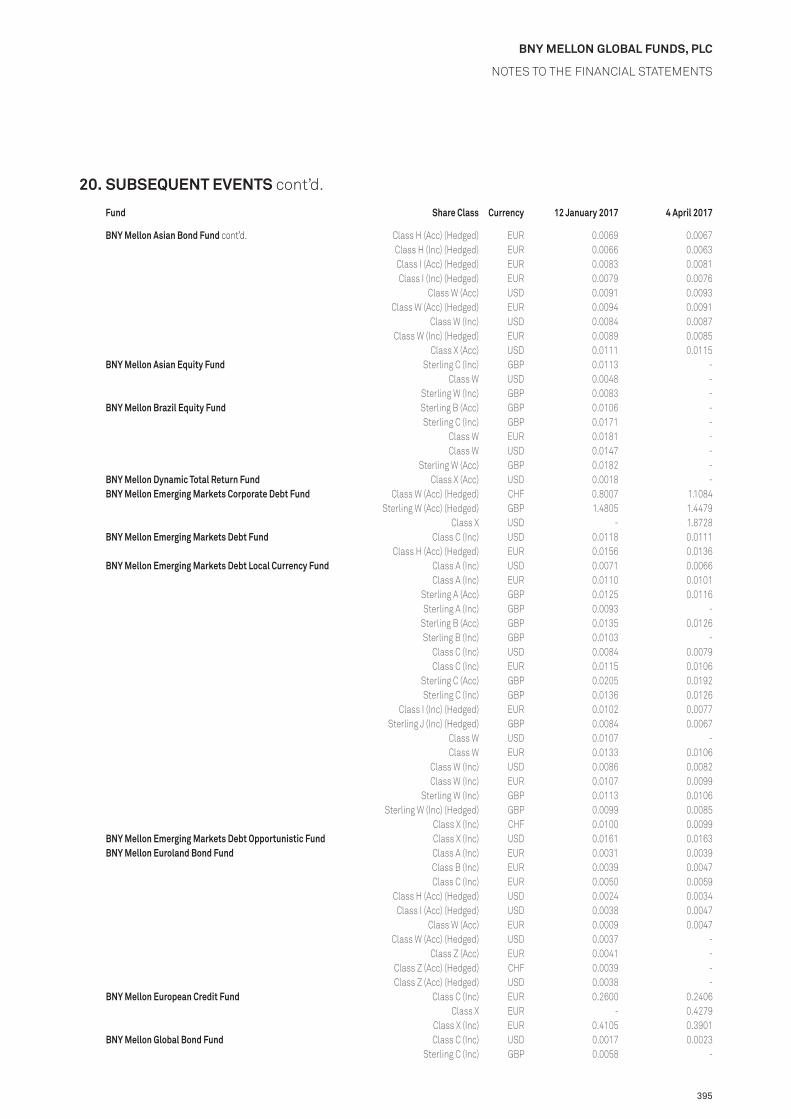
395
BNY MELLON GLOBAL FUNDS, PLC
NOTES TO THE FINANCIAL STATEMENTS
20. SUBSEQUENT EVENTS cont’d.
Fund Share Class Currency 12 January 2017 4 April 2017
BNY Mellon Asian Bond Fund cont’d. Class H (Acc) (Hedged) EUR 0.0069 0.0067Class H (Inc) (Hedged) EUR 0.0066 0.0063Class I (Acc) (Hedged) EUR 0.0083 0.0081Class I (Inc) (Hedged) EUR 0.0079 0.0076
Class W (Acc) USD 0.0091 0.0093Class W (Acc) (Hedged) EUR 0.0094 0.0091
Class W (Inc) USD 0.0084 0.0087Class W (Inc) (Hedged) EUR 0.0089 0.0085
Class X (Acc) USD 0.0111 0.0115BNY Mellon Asian Equity Fund Sterling C (Inc) GBP 0.0113 -
Class W USD 0.0048 -Sterling W (Inc) GBP 0.0083 -
BNY Mellon Brazil Equity Fund Sterling B (Acc) GBP 0.0106 -Sterling C (Inc) GBP 0.0171 -
Class W EUR 0.0181 -Class W USD 0.0147 -
Sterling W (Acc) GBP 0.0182 -BNY Mellon Dynamic Total Return Fund Class X (Acc) USD 0.0018 -BNY Mellon Emerging Markets Corporate Debt Fund Class W (Acc) (Hedged) CHF 0.8007 1.1084
Sterling W (Acc) (Hedged) GBP 1.4805 1.4479Class X USD - 1.8728
BNY Mellon Emerging Markets Debt Fund Class C (Inc) USD 0.0118 0.0111Class H (Acc) (Hedged) EUR 0.0156 0.0136
BNY Mellon Emerging Markets Debt Local Currency Fund Class A (Inc) USD 0.0071 0.0066Class A (Inc) EUR 0.0110 0.0101
Sterling A (Acc) GBP 0.0125 0.0116Sterling A (Inc) GBP 0.0093 -
Sterling B (Acc) GBP 0.0135 0.0126Sterling B (Inc) GBP 0.0103 -
Class C (Inc) USD 0.0084 0.0079Class C (Inc) EUR 0.0115 0.0106
Sterling C (Acc) GBP 0.0205 0.0192Sterling C (Inc) GBP 0.0136 0.0126
Class I (Inc) (Hedged) EUR 0.0102 0.0077Sterling J (Inc) (Hedged) GBP 0.0084 0.0067
Class W USD 0.0107 -Class W EUR 0.0133 0.0106
Class W (Inc) USD 0.0086 0.0082Class W (Inc) EUR 0.0107 0.0099
Sterling W (Inc) GBP 0.0113 0.0106Sterling W (Inc) (Hedged) GBP 0.0099 0.0085
Class X (Inc) CHF 0.0100 0.0099BNY Mellon Emerging Markets Debt Opportunistic Fund Class X (Inc) USD 0.0161 0.0163BNY Mellon Euroland Bond Fund Class A (Inc) EUR 0.0031 0.0039
Class B (Inc) EUR 0.0039 0.0047Class C (Inc) EUR 0.0050 0.0059
Class H (Acc) (Hedged) USD 0.0024 0.0034Class I (Acc) (Hedged) USD 0.0038 0.0047
Class W (Acc) EUR 0.0009 0.0047Class W (Acc) (Hedged) USD 0.0037 -
Class Z (Acc) EUR 0.0041 -Class Z (Acc) (Hedged) CHF 0.0039 -Class Z (Acc) (Hedged) USD 0.0038 -
BNY Mellon European Credit Fund Class C (Inc) EUR 0.2600 0.2406Class X EUR - 0.4279
Class X (Inc) EUR 0.4105 0.3901BNY Mellon Global Bond Fund Class C (Inc) USD 0.0017 0.0023
Sterling C (Inc) GBP 0.0058 -

396
BNY MELLON GLOBAL FUNDS, PLC
NOTES TO THE FINANCIAL STATEMENTS
20. SUBSEQUENT EVENTS cont’d.
Fund Share Class Currency 12 January 2017 4 April 2017
BNY Mellon Global Credit Fund* Class B (Acc) USD 0.0059 -Class C (Acc) USD 0.0153 -
Class H (Acc) (Hedged) EUR 0.0117 -Class H (Inc) (Hedged) EUR 0.0092 -
Class W (Acc) USD 0.0159 -Class W (Acc) (Hedged) CHF 0.0046 -Class W (Acc) (Hedged) EUR 0.0173 -
Sterling W (Acc) (Hedged) GBP 0.0178 -Class X (Acc) USD 0.0192 -
Class X (Acc) (Hedged) CAD 0.0210 -BNY Mellon Global Dynamic Bond Fund Class A (Inc) USD 0.0022 0.0030
Class H (Inc) (Hedged) EUR 0.0023 0.0028Class I (Hedged) EUR - 0.0043
Class I (Inc) (Hedged) EUR 0.0035 0.0040Class W (Acc) (Hedged) CHF 0.0022 0.0048
Sterling W (Acc) (Hedged) GBP 0.0043 0.0049BNY Mellon Global Emerging Markets Fund Class A (Inc) USD 0.0072 -
Class A (Inc) EUR 0.0094 -Class B (Inc) USD 0.0079 -Class B (Inc) EUR 0.0096 -
Sterling B (Inc) GBP 0.0102 -Class C (Acc) USD 0.0092 -Class C (Inc) USD 0.0080 -
Sterling C (Inc) GBP 0.0104 -Class H (Inc) (Hedged) EUR 0.0080 -
Class I (Inc) (Hedged) EUR 0.0084 -Class W (Acc) USD 0.0116 -Class W (Inc) USD 0.0081 -Class W (Inc) EUR 0.0097 -
Sterling W (Inc) GBP 0.0104 -BNY Mellon Global Equity Fund Class W (Acc) Shares USD 0.0019 -
Class W (Acc) Shares EUR 0.0021 -BNY Mellon Global Equity Income Fund Class A (Inc) USD 0.0066 0.0085
Class A (Inc) EUR 0.0065 0.0082Sterling A (Acc) GBP 0.0078 0.0100Sterling A (Inc) GBP 0.0075 0.0095
Class B EUR - 0.0141Class B (Inc) EUR 0.0099 0.0124Class B (Inc) USD 0.0079 0.0102
Sterling B (Inc) GBP 0.0100 0.0127Class C (Inc) USD 0.0081 0.0105Class C (Inc) EUR 0.0097 0.0121
Sterling C (Inc) GBP 0.0103 0.0131Class H (Inc) (Hedged) EUR 0.0064 0.0078
Class I (Inc) (Hedged) EUR 0.0066 0.0081Class W USD 0.0078 -Class W EUR 0.0098 -
Class W (Inc) USD 0.0068 0.0088Class W (Inc) EUR 0.0086 0.0108
Sterling W (Acc) GBP 0.0102 0.0130Sterling W (Inc) GBP 0.0089 0.0114
Class Z (Acc) USD 0.0066 0.0084Class Z (Acc) EUR 0.0078 0.0099Class Z (Inc) USD 0.0061 0.0079Class Z (Inc) EUR 0.0064 0.0081
Sterling Z (Acc) GBP 0.0075 0.0096Sterling Z (Inc) GBP 0.0079 0.0100

397
BNY MELLON GLOBAL FUNDS, PLC
NOTES TO THE FINANCIAL STATEMENTS
20. SUBSEQUENT EVENTS cont’d.
Fund Share Class Currency 12 January 2017 4 April 2017
BNY Mellon Global High Yield Bond Fund Class A (Inc) EUR 0.0166 0.0160Class X USD 0.0156 -
Class X (Inc) USD 0.0140 0.0139Class X (Inc) (Hedged) EUR 0.0149 0.0138
BNY Mellon Global Opportunistic Bond Fund Class C (Inc) USD 0.0073 0.0091Sterling I (Acc) (Hedged) GBP 0.0077 0.0092
BNY Mellon Global Property Securities Fund Sterling I (Inc) (Hedged) GBP 0.0164 0.0160Sterling J (Acc) (Hedged) GBP 0.0115 0.0112Sterling J (Inc) (Hedged) GBP 0.0110 0.0107
BNY Mellon Global Real Return Fund (EUR) Class A EUR 0.0103 -Class A (Inc) EUR 0.0086 -
Class C EUR 0.0172 -Class C (Inc) EUR 0.0147 -
Class W (Acc) (Hedged) CHF 0.0031 -Class Z (Acc) EUR 0.0165 -
BNY Mellon Global Real Return Fund (GBP) Sterling B (Acc) GBP 0.0085 -Sterling B (Inc) GBP 0.0081 -Sterling C (Inc) GBP 0.0138 -
Sterling W (Acc) GBP 0.0171 -Sterling W (Inc) GBP 0.0162 -Sterling X (Acc) GBP 0.0255 -
BNY Mellon Global Real Return Fund (USD) Class A USD 0.0105 -Class A (Inc) USD 0.0015 -
Class C USD 0.0178 -Class C (Inc) USD 0.0147 -
Class W USD 0.0172 -Class W (Inc) USD 0.0164 -
BNY Mellon Global Short-Dated High Yield Bond Fund* Class A (Acc) USD 0.0029 0.0100Class C (Acc) USD 0.0034 0.0113
Class H (Acc) (Hedged) EUR 0.0031 0.0099Class I (Acc) (Hedged) EUR 0.0035 0.0112
Class I (Inc) (Hedged)^ EUR - 0.0093Class W (Acc) USD 0.0036 0.0119
Sterling W (Acc) (Hedged) GBP 0.0044 0.0118Class W (Inc)^ USD - 0.0051
Class W (Inc) (Hedged)^ EUR - 0.0098Class X (Acc) USD 0.0034 0.0133Class Y (Acc) USD 0.0040 0.0134
Sterling Y (Acc) (Hedged) GBP 0.0049 0.0132BNY Mellon Japan All Cap Equity Fund Sterling W (Acc) GBP 0.0134 -
Class X (Inc) JPY 0.1707 -BNY Mellon Japan REIT Alpha Fund* Class C (Acc) JPY 0.3450 0.5045
Class W (Inc) JPY 0.3451 0.5680BNY Mellon Japan Small Cap Equity Focus Fund Sterling W (Acc) GBP 0.0129 -BNY Mellon Long-Term Global Equity Fund Sterling B (Inc) GBP 0.0005 -
Class C (Inc) EUR 0.0088 -Class W EUR 0.0115 -Class W USD 0.0092 -
Class W (Inc) USD 0.0090 -Sterling W (Acc) GBP 0.0121 -Sterling W (Inc) GBP 0.0118 -
Sterling X GBP 0.0210 -BNY Mellon Small Cap Euroland Fund Sterling W (Acc) GBP 0.0163 -BNY Mellon Targeted Return Bond Fund Class A (Acc) USD 0.0072 0.0047
Sterling W (Acc) (Hedged) GBP 0.0074 0.0068

398
BNY MELLON GLOBAL FUNDS, PLC
NOTES TO THE FINANCIAL STATEMENTS
20. SUBSEQUENT EVENTS cont’d.
Fund Share Class Currency 12 January 2017 4 April 2017
BNY Mellon U.S. Equity Income Fund** Class A (Acc)^ EUR - 0.0034Class A (Inc)^ EUR - 0.0034
Class C (Acc)^ USD - 0.0041Class C (Inc)^ USD - 0.0041Class C (Inc)^ EUR - 0.0034Class E (Inc)^ USD - 0.0007
Sterling E (Acc)^ GBP - 0.0041Sterling E (Inc)^ GBP - 0.0041
Class H (Acc) (Hedged)^ EUR - 0.0034Class H (Inc) (Hedged)^ EUR - 0.0034
Class I (Inc) (Hedged)^ EUR - 0.0034Class W (Acc)^ USD - 0.0041Class W (Inc)^ USD - 0.0041
Sterling W (Inc)^ GBP - 0.0041
* Please refer to Note 19 of the financial statements. ** Please refer to Note 20 of the financial statements. ^ This share class was launched in the first quarter of 2017.
The Company declared the following distributions on 12 January 2017 and 5 April 2017:
Fund Share Class Currency 12 January 2017 5 April 2017
BNY Mellon Asian Income Fund Class A (Acc) EUR 0.0056 0.0129 Class A (Acc) USD 0.0025 0.0101 Class A (Inc) EUR 0.0041 0.0122 Class A (Inc) USD 0.0026 0.0095
Sterling A (Acc) GBP 0.0034 0.0139 Sterling A (Inc) GBP 0.0032 0.0131
Class B (Acc) USD 0.0036 0.0101 Class C (Acc) USD 0.0044 0.0107
Sterling C (Acc) GBP 0.0063 0.0136 Class J (Inc) (Hedged) EUR 0.0052 0.0114
Class W (Inc) EUR 0.0068 0.0128 Class W (Inc) USD 0.0027 0.0099
Sterling W (Inc) GBP 0.0069 0.0135
BNY Mellon Asia Rising Stars Fund launched on 10 January 2017.
BNY Mellon U.S. Equity Income Fund launched on 17 January 2017.
BNY Mellon U.S. Municipal Infrastructure Debt Fund was approved by the Central Bank on 28 February 2017.
BNY Mellon Pan European Equity Fund closed on 9 March 2017.
Other than disclosed above, there were no other significant events affecting the Company since the year end.
21. APPROVAL OF FINANCIAL STATEMENTS
The financial statements were approved by the Directors on 19 April 2017.

399
SIGNIFICANT PORTFOLIO MOVEMENTS
Major Purchases NominalCost EUR Major Sales and Maturities Nominal
Proceeds EUR
Major Purchases NominalCost EUR Major Sales and Maturities Nominal
Proceeds EUR
United Kingdom Gilt 3.500% 22-Jan-2045 324,313,000 519,507,146United Kingdom Gilt 3.750% 22-Jul-2052 246,271,823 436,623,076Italy Buoni Poliennali del Tesoro 2.700% 01-Mar-2047 176,036,000 178,120,871Italy Buoni Poliennali del Tesoro 3.250% 01-Sep-2046 104,028,000 119,029,156United Kingdom Gilt 3.500% 22-Jul-2068 65,850,000 117,800,132United Kingdom Gilt 1.500% 22-Jul-2047 105,242,000 109,530,808United States Treasury Inflation Indexed Bonds 0.750% 15-Feb-2045 89,364,599 76,588,220Banque Federative du Credit Mutuel SA 0.000% 23-Mar-2017 FRN 72,300,000 72,299,286Cooperatieve Rabobank UA 0.000% 15-Jan-2018 FRN 69,791,000 69,866,645Bank of America Corp 0.013% 18-May-2016 FRN 56,600,000 56,600,000Morgan Stanley 0.257% 13-Apr-2016 FRN 54,650,000 54,654,120UBS AG/London 0.000% 05-Sep-2016 FRN 53,000,000 53,015,400BPCE SA 0.000% 10-Mar-2017 FRN 50,300,000 50,306,744Wells Fargo & Co 0.070% 23-Mar-2016 FRN 50,000,000 50,001,200Goldman Sachs Group Inc/The 0.152% 23-May-2016 FRN 42,000,000 42,000,000Spain Government Bond 3.450% 30-Jul-2066 32,234,000 38,988,148Canadian Imperial Bank of Commerce 0.137% 09-Aug-2017 FRN 38,346,000 38,342,501BPCE SA 0.431% 13-Jan-2016 FRN 38,000,000 38,000,000Cooperatieve Rabobank UA 0.201% 15-Jan-2016 FRN 37,200,000 37,200,000Societe Generale SA 0.127% 16-Jan-2017 FRN 36,500,000 36,528,154Bank of Nova Scotia/The 10-Sep-2018 FRN 35,700,000 35,775,527ABN AMRO Bank NV 0.420% 01-Aug-2016 FRN 34,800,000 34,864,640JPMorgan Chase & Co 0.188% 03-May-2016 FRN 34,000,000 34,000,000ING Bank NV 0.398% 14-Aug-2017 FRN 32,600,000 32,741,810
United Kingdom Gilt 3.500% 22-Jan-2045 324,313,000 514,049,973United Kingdom Gilt 3.750% 22-Jul-2052 246,271,823 438,279,280United States Treasury Inflation Indexed Bonds 0.750% 15-Feb-2045 391,007,169 323,103,697Italy Buoni Poliennali del Tesoro 2.700% 01-Mar-2047 176,036,000 181,572,415United Kingdom Gilt 1.500% 22-Jul-2047 105,242,000 119,810,446United Kingdom Gilt 3.500% 22-Jul-2068 65,850,000 117,405,829French Republic Government Bond OAT 0.500% 25-May-2026 105,014,000 103,753,787Cooperatieve Rabobank UA 0.000% 15-Jan-2018 FRN 90,641,000 90,717,218Societe Generale SA 0.117% 22-Jul-2018 FRN 60,700,000 60,967,489Nationwide Building Society 0.187% 02-Nov-2018 FRN 59,577,000 59,744,001United States Treasury Inflation Indexed Bonds 1.375% 15-Feb-2044 63,212,342 58,049,713JPMorgan Chase Bank NA 0.000% 14-Jun-2018 FRN 53,455,000 53,459,800ABN AMRO Bank NV 0.399% 03-Jul-2017 FRN 47,300,000 47,576,705Morgan Stanley 0.186% 03-Dec-2019 FRN 43,620,000 43,620,000Italy Buoni Poliennali del Tesoro 3.250% 01-Sep-2046 36,189,000 40,889,951Banque Federative du Credit Mutuel SA 0.000% 23-Mar-2017 FRN 40,300,000 40,336,270Spain Government Bond 3.450% 30-Jul-2066 32,234,000 40,164,894Goldman Sachs Group Inc/The 0.384% 18-Dec-2017 FRN 37,400,000 37,631,155Bank of Nova Scotia/The 10-Sep-2018 FRN 35,700,000 35,769,790ING Bank NV 0.452% 14-Aug-2017 FRN 32,600,000 32,771,488
Insight Liquidity Funds Plc - EUR Cash Fund 37,957,794 37,906,673France Treasury Bill BTF 0.000% 11-May-2016 14,400,000 14,400,000France Government Bond OAT 3.250% 25-Apr-2016 14,100,000 14,100,000France Treasury Bill BTF 0.000% 22-Jun-2016 11,200,000 11,200,050France Treasury Bill BTF 0.000% 25-May-2016 10,700,000 10,701,445French Treasury Note BTAN 2.500% 25-Jul-2016 10,050,000 10,059,520French Republic Government Bond 0.250% 25-Nov-2016 8,700,000 8,700,000France Treasury Bill BTF 0.000% 12-Oct-2016 7,900,000 7,900,000Bundesschatzanweisungen 0.000% 16-Dec-2016 6,200,000 6,206,548National Australia Bank Ltd 0.137% 16-Jan-2018 FRN 6,006,000 6,007,491French Republic Government Bond 5.000% 25-Oct-2016 6,000,000 6,000,000BNP Paribas SA 2.625% 16-Sep-2016 5,500,000 5,529,151ING Bank NV 4.000% 23-Dec-2016 5,025,000 5,102,473Norinchukin Bank 0.000% 12-Jan-2016 CD 5,000,000 5,000,000Danske Bank A/S 3.875% 18-May-2016 4,398,000 4,410,431Societe Generale SA 0.218% 29-Mar-2016 FRN 4,200,000 4,200,000ABN AMRO Bank NV 4.250% 11-Apr-2016 4,000,000 4,009,464Cooperatieve Rabobank UA 0.126% 15-Jan-2018 FRN 4,000,000 4,003,520Sumitomo Mitsui Banking Corp 0.000% 01-Dec-2016 CP 4,000,000 4,001,159Svenska Handelsbanken 0.000% 14-Nov-2016 CP 4,000,000 4,000,987
Insight Liquidity Funds Plc - EUR Cash Fund 28,687,065 28,650,002France Treasury Bill BTF 0.000% 11-May-2016 14,400,000 14,403,194France Government Bond OAT 3.250% 25-Apr-2016 14,100,000 14,145,899France Treasury Bill BTF 0.000% 22-Jun-2016 11,200,000 11,205,699France Treasury Bill BTF 0.000% 25-May-2016 10,700,000 10,702,031French Treasury Note BTAN 2.500% 25-Jul-2016 10,050,000 10,077,638French Republic Government Bond 0.250% 25-Nov-2016 8,700,000 8,706,242France Treasury Bill BTF 0.000% 12-Oct-2016 7,900,000 7,901,749French Treasury Note BTAN 1.750% 25-Feb-2017 6,300,000 6,339,564Bundesschatzanweisungen 0.000% 16-Dec-2016 6,200,000 6,214,991French Republic Government Bond 5.000% 25-Oct-2016 6,000,000 6,025,595Bundesrepublik Deutschland 3.750% 04-Jan-2017 5,000,000 5,051,458French Republic Government Bond 3.750% 25-Apr-2017 4,500,000 4,580,490Finland Government Bond 1.875% 15-Apr-2017 4,350,000 4,387,205Svenska Handelsbanken 0.000% 14-Nov-2016 CP 4,000,000 4,005,149Sumitomo Mitsui Banking Corp 0.000% 01-Dec-2016 CP 4,000,000 4,004,271Sumitomo Mitsui Banking Corp 0.000% 03-Aug-2016 CP 4,000,000 4,003,096Mitsubishi UFJ Trust and Banking Corp 0.000% 05-Jul-2016 CD 4,000,000 4,002,612Bundesrepublik Deutschland 4.000% 04-Jul-2016 4,000,000 4,002,040Cooperatieve Rabobank UA 0.000% 15-Jan-2018 FRN 4,000,000 4,000,000
BNY Mellon Absolute Return Bond Fund for the year ended 31 December 2016
BNY Mellon Absolute Insight Fund for the year ended 31 December 2016
BNY MELLON GLOBAL FUNDS, PLC

400
BNY MELLON GLOBAL FUNDS, PLC
SIGNIFICANT PORTFOLIO MOVEMENTS
Major Purchases NominalCost USD Major Sales Nominal
Proceeds USD
United States Treasury Note/Bond 2.250% 15-Nov-2025 3,500,000 3,603,047United States Treasury Note/Bond 2.500% 15-Feb-2046 2,200,000 2,218,791United States Treasury Note/Bond 1.125% 28-Feb-2021 2,220,000 2,196,938CNOOC Nexen Finance 2014 ULC 4.250% 30-Apr-2024 1,640,000 1,719,440Philippine Government International Bond 4.200% 21-Jan-2024 1,340,000 1,503,374United States Treasury Note/Bond 0.500% 31-Mar-2017 1,495,000 1,494,680Petronas Capital Ltd 7.875% 22-May-2022 1,050,000 1,343,365Indonesia Government International Bond 8.500% 12-Oct-2035 950,000 1,298,933United States Treasury Note/Bond 1.750% 31-Dec-2020 1,200,000 1,210,273Philippine Government International Bond 4.000% 15-Jan-2021 1,050,000 1,148,700Indonesia Government International Bond 4.750% 08-Jan-2026 1,100,000 1,138,770Oversea-Chinese Banking Corp Ltd 3.150% 11-Mar-2023 VAR 1,100,000 1,117,225Indonesia Government International Bond 4.125% 15-Jan-2025 1,100,000 1,110,710Philippine Government International Bond 7.750% 14-Jan-2031 700,000 1,078,720Baidu Inc 3.000% 30-Jun-2020 1,000,000 1,016,735Sri Lanka Government International Bond 6.825% 18-Jul-2026 950,000 965,806United States Treasury Note/Bond 1.625% 15-Feb-2026 900,000 889,398United States Treasury Note/Bond 1.625% 15-May-2026 860,000 856,849ONGC Videsh Ltd 4.625% 15-Jul-2024 800,000 853,804ICICI Bank Ltd/Dubai 3.500% 18-Mar-2020 800,000 824,293Pakistan Government International Bond 8.250% 15-Apr-2024 750,000 817,040Indonesia Government International Bond 5.950% 08-Jan-2046 700,000 811,385Industrial & Commercial Bank of China Ltd/Dubai 2.625% 26-May-2020 800,000 807,300Majapahit Holding BV 7.750% 20-Jan-2020 700,000 797,300Sri Lanka Government International Bond 6.250% 04-Oct-2020 750,000 789,600Minera y Metalurgica del Boleo SA de CV 2.875% 07-May-2019 750,000 763,950ICBCIL Finance Co Ltd 2.625% 19-Mar-2018 750,000 752,625China Construction Bank Corp 3.875% 13-May-2025 VAR 750,000 749,500Swire Properties MTN Financing Ltd 4.375% 18-Jun-2022 700,000 748,610Hutchison Whampoa International 14 Ltd 3.625% 31-Oct-2024 700,000 732,505Tencent Holdings Ltd 3.800% 11-Feb-2025 700,000 725,270Bangkok Bank PCL/Hong Kong 3.300% 03-Oct-2018 700,000 719,425Korea Development Bank/The 2.500% 13-Jan-2021 700,000 709,408
United States Treasury Note/Bond 2.250% 15-Nov-2025 3,400,000 3,483,672United States Treasury Note/Bond 1.125% 28-Feb-2021 2,220,000 2,204,245United States Treasury Note/Bond 2.500% 15-Feb-2046 2,200,000 2,157,613United States Treasury Note/Bond 0.500% 31-Mar-2017 1,495,000 1,494,664Indonesia Government International Bond 4.750% 08-Jan-2026 1,400,000 1,443,285Philippine Government International Bond 4.200% 21-Jan-2024 1,100,000 1,254,370Sri Lanka Government International Bond 6.825% 18-Jul-2026 1,150,000 1,221,375United States Treasury Note/Bond 1.750% 31-Dec-2020 1,200,000 1,205,000Indonesia Treasury Bond 8.375% 15-Sep-2026 14,340,000,000 1,143,138Korea Development Bank/The 2.500% 13-Jan-2021 1,100,000 1,111,746CNOOC Nexen Finance 2014 ULC 4.250% 30-Apr-2024 1,050,000 1,081,961United States Treasury Note/Bond 1.625% 15-Feb-2026 900,000 876,273United States Treasury Note/Bond 1.625% 15-May-2026 860,000 857,382Philippine Government International Bond 3.700% 01-Mar-2041 750,000 848,000Philippine Government International Bond 4.000% 15-Jan-2021 750,000 823,030ICICI Bank Ltd/Dubai 3.500% 18-Mar-2020 800,000 811,099ICICI Bank Ltd/Dubai 4.000% 18-Mar-2026 790,000 810,276ONGC Videsh Ltd 4.625% 15-Jul-2024 800,000 808,780Industrial & Commercial Bank of China Ltd/Dubai 2.625% 26-May-2020 800,000 804,220Pakistan Government International Bond 8.250% 15-Apr-2024 750,000 785,195Hutchison Whampoa International 11 Ltd 4.625% 13-Jan-2022 700,000 777,425Sri Lanka Government International Bond 6.250% 04-Oct-2020 750,000 768,788CNPC General Capital Ltd 2.700% 25-Nov-2019 700,000 706,150Petronas Capital Ltd 7.875% 22-May-2022 450,000 571,679
BNY Mellon Asian Bond Fund for the year ended 31 December 2016
Major Purchases NominalCost GBP Major Sales and Maturities Nominal
Proceeds GBP
KBC Bank NV 0.000% 30-Dec-2016 CD 60,000,000 60,000,000 BNP Paribas London Branch 0.600% 11-Jan-2016 CD 54,100,000 54,100,000ING Bank NV 0.560% 11-Jan-2016 CD 54,100,000 54,100,000Agence Centrale des Organismes de Securite Sociale 0.000% 07-Jan-2016 CP 51,000,000 51,000,000Abbey National Treasury Services Plc 0.740% 05-Jun-2016 CD 50,000,000 50,000,000Agence Centrale des Organismes de Securite Sociale 0.000% 14-Dec-2016 CP 50,000,000 50,000,000Agence Centrale des Organismes de Securite Sociale 0.000% 30-Sep-2016 CP 50,000,000 50,000,000Agence Centrale des Organismes de Securite Sociale 0.000% 09-Sep-2016 CP 50,000,000 50,000,000Agence Centrale des Organismes de Securite Sociale 0.000% 19-Aug-2016 CP 50,000,000 50,000,000Agence Centrale des Organismes de Securite Sociale 0.000% 27-May-2016 CP 50,000,000 50,000,000Mizuho Bank Ltd 0.000% 30-Jun-2016 CD 50,000,000 50,000,000Mizuho Bank Ltd London Branch 0.000% 30-Sep-2016 CD 50,000,000 50,000,000Sumitomo Mitsui Banking Corp 0.630% 05-May-2016 CD 50,000,000 50,000,000Sumitomo Mitsui Banking Corp 0.620% 08-May-2016 CD 50,000,000 50,000,000Sumitomo Mitsui Banking Corp 0.600% 02-May-2016 CD 50,000,000 50,000,000Sumitomo Mitsui Banking Corp 0.460% 11-Jul-2016 CD 50,000,000 50,000,000United Kingdom Treasury Bill 0.000% 25-Apr-2016 50,000,000 50,000,000La Banque Postale S.A. 0.000% 25-Jul-2016 CD 48,000,000 48,000,000Societe Generale 0.830% 31-Oct-2016 CD 45,000,000 45,000,000United Kingdom Treasury Bill 0.000% 02-Aug-2016 45,000,000 45,000,000Toronto-Dominion Bank 0.740% 20-Dec-2016 CD 44,000,000 44,000,000
KBC Bank NV 0.000% 30-Dec-2016 CD 60,000,000 59,947,689BNP Paribas London Branch 0.600% 11-Jan-2016 CD 54,100,000 54,100,987ING Bank NV 0.560% 11-Jan-2016 CD 54,100,000 54,100,871BNP Paribas London Branch 0.330% 03-Apr-2017 CD 54,100,000 54,100,000BNP Paribas London Branch 0.300% 01-Mar-2017 CD 54,100,000 54,100,000Mitsubishi UFJ Trust and Banking Corp 0.400% 02-Jan-2017 CD 53,000,000 53,000,000Agence Centrale des Organismes de Securite Sociale 0.000% 07-Jan-2016 CP 51,000,000 50,974,583FMS Wertmanagement AoeR 0.000% 21-Mar-2017 CP 51,000,000 50,946,569Sumitomo Mitsui Banking Corp 0.000% 03-Jul-2017 CD 51,000,000 50,924,659ABN AMRO Bank NV 0.500% 08-May-2017 CD 50,000,000 50,000,000Banque Federative du Credit Mutuel SA 0.410% 02-Jan-2017 CD 50,000,000 50,000,000Danske Bank A/S 0.520% 05-Sep-2017 CD 50,000,000 50,000,000Sumitomo Mitsui Banking Corp 0.630% 05-May-2016 CD 50,000,000 50,000,000Sumitomo Mitsui Banking Corp 0.620% 08-May-2016 CD 50,000,000 50,000,000Sumitomo Mitsui Banking Corp 0.460% 11-Jul-2016 CD 50,000,000 50,000,000ING Bank NV 0.420% 03-Aug-2017 CD 50,000,000 50,000,000United Kingdom Treasury Bill 0.000% 25-Apr-2016 50,000,000 49,995,446Agence Centrale des Organismes de Securite Sociale 0.000% 09-Sep-2016 CP 50,000,000 49,992,522Agence Centrale des Organismes de Securite Sociale 0.000% 30-Sep-2016 CP 50,000,000 49,991,947Agence Centrale des Organismes de Securite Sociale 0.000% 27-May-2016 CP 50,000,000 49,977,818Agence Centrale des Organismes de Securite Sociale 0.000% 19-Aug-2016 CP 50,000,000 49,977,079Agence Centrale des Organismes de Securite Sociale 0.000% 14-Dec-2016 CP 50,000,000 49,972,857Norinchukin Bank 0.000% 28-Feb-2017 CD 50,000,000 49,954,425Mizuho Bank Ltd London Branch 0.000% 30-Sep-2016 CD 50,000,000 49,928,267Mizuho Bank Ltd 0.000% 30-Jun-2016 CD 50,000,000 49,925,317La Banque Postale S.A. 0.000% 25-Jul-2016 CD 48,000,000 47,927,111Societe Generale 0.380% 31-Jan-2017 CD 47,500,000 47,500,000
BNY Mellon Absolute Return Equity Fund for the year ended 31 December 2016

401
BNY MELLON GLOBAL FUNDS, PLC
SIGNIFICANT PORTFOLIO MOVEMENTS
Major Purchases NominalCost USD Major Sales Nominal
Proceeds USD
Hengan International Group Co Ltd 275,000 2,397,974Incitec Pivot Ltd 942,000 2,090,076Intouch Holdings PCL 1,320,000 2,066,608Taiwan Semiconductor Manufacturing Co Ltd 415,000 2,021,575Sands China Ltd 458,800 1,711,296Yum! Brands Inc 20,500 1,468,437Axis Bank Ltd 196,000 1,377,972AIA Group Ltd 210,000 1,260,217Spotless Group Holdings Ltd 1,553,000 1,149,853Oil Search Ltd 222,730 1,121,270Apollo Hospitals Enterprise Ltd 53,282 1,088,141Tencent Holdings Ltd 49,225 1,052,268Baidu Inc ADR 6,256 1,041,532Robinsons Retail Holdings Inc 645,000 969,174Mesoblast Ltd 740,269 910,744TAL Education Group ADR 12,128 908,485Universal Robina Corp 212,570 884,668GT Capital Holdings Inc 29,940 859,267Alibaba Group Holding Ltd ADR 9,831 852,604Matahari Department Store Tbk PT 677,000 796,327Santos Ltd 287,300 723,099Samsung Electronics Co Ltd 576 721,800First Gen Corp 1,380,500 669,080Catcher Technology Co Ltd 94,000 665,363Orora Ltd 293,866 591,226Spark New Zealand Ltd 256,501 582,080Fortis Healthcare Ltd 218,318 580,326Wynn Macau Ltd 404,600 567,637Energy Development Corp 4,719,800 565,486ITC Ltd 127,127 559,349IHH Healthcare Bhd 330,100 511,565Indofood CBP Sukses Makmur Tbk PT 549,600 499,061Domino’s Pizza Enterprises Ltd 9,848 478,889SK Hynix Inc 16,787 445,617Bangkok Dusit Medical Services PCL 689,700 437,809China Mobile Ltd 36,500 410,230Maruti Suzuki India Ltd 5,464 387,716
CSL Ltd 24,063 1,804,910Indiabulls Housing Finance Ltd 120,362 1,434,332LIC Housing Finance Ltd 164,945 1,219,035China Biologic Products Inc 9,910 1,111,657Hindustan Unilever Ltd 86,413 1,054,161Seek Ltd 86,446 1,053,873Alibaba Group Holding Ltd ADR 12,500 850,078LG Household & Health Care Ltd 1,098 797,821TAL Education Group ADR 12,128 765,294Maruti Suzuki India Ltd 12,559 690,878Man Wah Holdings Ltd 604,000 542,086Ctrip.com International Ltd ADR 11,650 507,580Cipla Ltd 66,172 501,2983SBio Inc 144A 414,500 476,361Samsung SDI Co Ltd 4,868 452,515Bangkok Dusit Medical Services PCL 662,100 420,978Domino’s Pizza Enterprises Ltd 9,276 408,238MYOB Group Ltd 137,532 394,639Security Bank Corp 94,177 373,518Samsung Electronics Co Ltd 185 251,780Yum China Holdings Inc 7,965 237,755
BNY Mellon Asian Equity Fund for the year ended 31 December 2016

402
BNY MELLON GLOBAL FUNDS, PLC
SIGNIFICANT PORTFOLIO MOVEMENTS
Major Purchases NominalCost USD Major Sales Nominal
Proceeds USD
Petroleo Brasileiro SA Pfd 1,737,138 6,148,787Suzano Papel e Celulose SA Pfd 1,340,896 4,843,432Itausa - Investimentos Itau SA Pfd 1,836,400 4,339,102Cia Paranaense de Energia Pfd 500,458 4,185,316Ambev SA 536,710 2,812,467Banco Bradesco SA ADR 332,800 2,806,841Fibria Celulose SA 309,154 2,772,937Metalurgica Gerdau SA Pfd 3,086,641 2,684,296BM&FBovespa SA - Bolsa de Valores Mercadorias e Futuros 589,979 2,637,008EDP - Energias do Brasil SA 709,350 2,578,950CETIP SA - Mercados Organizados 195,647 2,277,637Banco Bradesco SA Pfd 295,700 2,032,122Banco do Estado do Rio Grande do Sul SA Pfd 912,048 1,999,296AES Tiete Energia SA 445,608 1,850,363Gerdau SA Pfd 657,892 1,839,217CPFL Energia SA 264,978 1,821,171AES Tiete SA 438,922 1,779,274Marfrig Global Foods SA 1,017,476 1,709,425Telefonica Brasil SA Pfd 118,900 1,407,810Banco do Brasil SA 319,598 1,316,715Ultrapar Participacoes SA 68,013 1,266,418Engie Brasil Energia SA 127,413 1,255,482Aliansce Shopping Centers SA 436,774 1,198,354Lojas Americanas SA Pfd 221,887 1,147,187Vale SA Pfd 207,300 1,120,220Itau Unibanco Holding SA Pfd 123,000 1,081,821Eletropaulo Metropolitana Eletricidade de Sao Paulo SA Pfd 310,916 1,017,600Petroleo Brasileiro SA ADR 89,200 801,202Itau Unibanco Holding SA ADR 77,000 789,217Iochpe Maxion SA 155,617 747,402Cia Energetica de Sao Paulo Pfd 188,400 745,955
Petroleo Brasileiro SA Pfd 2,692,236 6,049,999Vale SA Pfd 915,840 3,878,343Ambev SA ADR 653,800 3,306,783Ambev SA 536,710 3,127,195Metalurgica Gerdau SA Pfd 3,855,946 3,052,214Banco Bradesco SA Pfd 363,400 2,936,791Cia Energetica de Sao Paulo Pfd 589,786 2,686,540Cia Brasileira de Distribuicao Pfd 193,416 2,669,024B2W Cia Digital 586,204 2,634,928Itausa - Investimentos Itau SA Pfd 1,064,900 2,589,250AES Tiete Energia SA 568,237 2,324,051Klabin SA 423,440 2,318,865Itau Unibanco Holding SA ADR 210,000 2,186,940Banco do Brasil SA 403,578 2,185,155Cia Paranaense de Energia Pfd 227,285 1,963,535Usinas Siderurgicas de Minas Gerais SA Pfd 1,812,463 1,921,496Eletropaulo Metropolitana Eletricidade de Sao Paulo SA Pfd 710,747 1,771,938Gerdau SA Pfd 992,037 1,576,401Telefonica Brasil SA Pfd 115,800 1,476,048CETIP SA - Mercados Organizados 116,099 1,473,520Cia Paranaense de Energia ADR 163,726 1,379,899CPFL Energia SA 193,807 1,278,644Itau Unibanco Holding SA Pfd 125,900 1,220,784Iochpe Maxion SA 337,293 1,197,674Fibria Celulose SA 113,305 1,182,785EDP - Energias do Brasil SA 291,706 1,163,076BM&FBovespa SA - Bolsa de Valores Mercadorias e Futuros 245,100 1,141,790Marcopolo SA Pfd 1,495,573 1,082,596Marfrig Global Foods SA 574,500 1,010,234Ultrapar Participacoes SA 45,600 923,938Engie Brasil Energia SA 66,700 741,258Tupy SA 160,753 723,229
BNY Mellon Brazil Equity Fund for the year ended 31 December 2016
Major Purchases NominalCost GBP Major Sales Nominal
Proceeds GBP
BNY Mellon Investments Funds - Newton Asian Income Fund 8,412,421 18,110,607BNY Mellon Investments Funds - Newton Asian Income Fund 4,570,321 9,119,551
BNY Mellon Asian Income Fund for the year ended 31 December 2016
As detailed in the Prospectus, the Fund is established as a feeder fund which invests in Newton Asian Income Fund (the “Master Fund”), a sub-fund of BNY Mellon Investments Funds, on a permanent basis. Hence the above constitutes the full purchases and sales detail for the Fund during the reporting year.

403
BNY MELLON GLOBAL FUNDS, PLC
SIGNIFICANT PORTFOLIO MOVEMENTS
Major Purchases NominalCost EUR Major Sales Nominal
Proceeds EUR
Santos Finance Ltd 8.250% 22-Sep-2070 VAR 5,100,000 4,942,191AT&T Inc 2.650% 17-Dec-2021 3,300,000 3,634,612EDP Finance BV 2.625% 15-Apr-2019 2,950,000 3,091,717Telefonica Europe BV 6.500% Perpetual VAR 2,800,000 3,013,016SoftBank Group Corp 4.625% 15-Apr-2020 2,710,000 2,919,806Leonardo-Finmeccanica SpA 4.500% 19-Jan-2021 2,550,000 2,837,065AT&T Inc 2.600% 17-Dec-2029 2,500,000 2,718,912EDP Finance BV 4.125% 20-Jan-2021 2,300,000 2,494,842MOL Hungarian Oil & Gas Plc 5.875% 20-Apr-2017 2,360,000 2,472,701Electricite de France SA 4.125% Perpetual VAR 2,400,000 2,291,204EP Energy AS 4.375% 01-May-2018 2,200,000 2,286,620Glencore Finance Europe SA 4.625% 03-Apr-2018 2,300,000 2,282,100Enel Finance International NV 1.966% 27-Jan-2025 2,000,000 2,224,046Wind Acquisition Finance SA 4.000% 15-Jul-2020 2,150,000 2,171,888SoftBank Group Corp 4.000% 30-Jul-2022 2,050,000 2,168,750Koninklijke KPN NV 6.125% Perpetual VAR 2,020,000 2,156,808Glencore Finance Europe SA 5.250% 22-Mar-2017 2,100,000 2,121,392Unitymedia Hessen GmbH & Co KG / Unitymedia NRW GmbH 5.500% 15-Sep-2022 1,980,000 2,078,976HeidelbergCement Finance Luxembourg SA 3.250% 21-Oct-2020 1,900,000 2,071,770Volkswagen International Finance NV 3.875% Perpetual VAR 2,000,000 2,019,175
Telefonica Europe BV 6.500% Perpetual VAR 2,800,000 2,940,000TDC A/S 1.750% 27-Feb-2027 1,760,000 1,712,574DONG Energy A/S 2.625% 19-Sep-2022 1,500,000 1,620,000Teva Pharmaceutical Finance Netherlands II BV 0.375% 25-Jul-2020 1,560,000 1,554,446Santos Finance Ltd 8.250% 22-Sep-2070 VAR 1,500,000 1,429,375Faurecia 3.625% 15-Jun-2023 1,360,000 1,385,440Holcim Finance Luxembourg SA 1.375% 26-May-2023 1,320,000 1,318,772Deutsche Telekom International Finance BV 0.625% 03-Apr-2023 1,200,000 1,189,116Anheuser-Busch InBev SA/NV 0.875% 17-Mar-2022 1,155,000 1,147,608EDP - Energias de Portugal SA 5.375% 16-Sep-2075 VAR 1,200,000 1,120,440Bayer AG 3.000% 1-Jul-2075 VAR 1,100,000 1,111,500IHO Verwaltungs GmbH 3.250% 15-Sep-2023 1,090,000 1,090,000DONG Energy A/S 6.250% 26-Jun-2049 VAR 1,000,000 1,083,667Teva Pharmaceutical Finance Netherlands II BV 1.125% 15-Oct-2024 1,070,000 1,061,772Daimler AG 0.500% 09-Sep-2019 1,050,000 1,047,827Anheuser-Busch InBev SA/NV 1.950% 30-Sep-2021 1,000,000 1,046,035SES SA 4.625% Perpetual VAR 1,030,000 1,026,560Societe Des Autoroutes Paris-Rhin-Rhone 1.125% 15-Jan-2021 1,000,000 1,009,810Statkraft AS 1.500% 21-Sep-2023 1,000,000 1,005,810McDonald’s Corp 0.500% 15-Jan-2021 1,000,000 997,360Fiat Chrysler Finance Europe 7.375% 9-Jul-2018 900,000 994,320Anglo American Capital Plc 1.750% 03-Apr-2018 1,000,000 976,250SoftBank Group Corp 4.000% 30-Jul-2022 900,000 974,250Vonovia Finance BV 4.000% Perpetual VAR 1,000,000 951,250LKQ Italia Bondco SpA 3.875% 01-Apr-2024 930,000 948,375RCI Banque SA 1.000% 17-May-2023 950,000 947,511Volkswagen Leasing GmbH 2.125% 04-Apr-2022 900,000 911,322Kinder Morgan Inc/DE 1.500% 16-Mar-2022 950,000 911,000TOTAL SA 2.625% Perpetual VAR 1,000,000 904,333Anglo American Capital Plc 1.750% 20-Nov-2017 1,000,000 902,000Telefonica Europe BV 3.750% 29-Dec-2049 VAR 900,000 900,000Pernod Ricard SA 1.500% 18-May-2026 900,000 898,839Vodafone Group Plc 0.692% 25-Feb-2019 FRN 890,000 890,000EDP Finance BV 2.375% 23-Mar-2023 890,000 888,184
BNY Mellon Crossover Credit Fund* for the year ended 31 December 2016
* Please refer to Note 19 of the financial statements.

404
BNY MELLON GLOBAL FUNDS, PLC
SIGNIFICANT PORTFOLIO MOVEMENTS
Major Purchases NominalCost USD Major Sales and Maturities Nominal
Proceeds USD
United States Treasury Bill 0.000% 29-Sep-2016 4,091,000 4,090,331United States Treasury Bill 0.000% 21-Jul-2016 2,942,000 2,941,393United States Treasury Bill 0.000% 28-Apr-2016 2,550,000 2,549,733United States Treasury Bill 0.000% 25-Aug-2016 2,168,000 2,167,383United States Treasury Bill 0.000% 17-Mar-2016 2,040,000 2,039,852United States Treasury Bill 0.000% 16-Jun-2016 1,989,000 1,989,000United States Treasury Bill 0.000% 26-May-2016 1,968,000 1,968,000United States Treasury Bill 0.000% 10-Mar-2016 1,850,000 1,849,830United States Treasury Bill 0.000% 11-Feb-2016 1,625,000 1,625,000United States Treasury Bill 0.000% 18-Aug-2016 1,518,000 1,517,990United States Treasury Bill 0.000% 07-Apr-2016 1,276,000 1,276,000United States Treasury Bill 0.000% 04-Aug-2016 1,276,000 1,276,000United States Treasury Bill 0.000% 27-Oct-2016 1,141,000 1,141,000United States Treasury Bill 0.000% 3-Nov-2016 1,063,000 1,063,000United States Treasury Bill 0.000% 10-Nov-2016 1,063,000 1,063,000United States Treasury Bill 0.000% 04-Feb-2016 925,000 925,000United States Treasury Bill 0.000% 24-Mar-2016 925,000 925,000United States Treasury Bill 0.000% 22-Dec-2016 854,000 854,000United States Treasury Bill 0.000% 11-Aug-2016 848,000 848,000United States Treasury Bill 0.000% 8-Dec-2016 848,000 848,000United States Treasury Bill 0.000% 13-Oct-2016 778,000 778,000United States Treasury Bill 0.000% 20-Oct-2016 778,000 778,000United States Treasury Bill 0.000% 03-Mar-2016 688,000 688,000United States Treasury Bill 0.000% 15-Dec-2016 660,000 660,000United States Treasury Bill 0.000% 15-Sep-2016 625,000 625,000United States Treasury Bill 0.000% 25-Feb-2016 400,000 399,994
United States Treasury Bill 0.000% 29-Sep-2016 4,091,000 4,088,881United States Treasury Bill 0.000% 21-Jul-2016 2,942,000 2,939,890United States Treasury Bill 0.000% 28-Apr-2016 2,550,000 2,548,447United States Treasury Bill 0.000% 25-Aug-2016 2,168,000 2,166,205United States Treasury Bill 0.000% 26-May-2016 1,968,000 1,966,834United States Treasury Bill 0.000% 16-Jun-2016 1,899,000 1,897,424United States Treasury Bill 0.000% 26-Jan-2017 1,869,000 1,867,545United States Treasury Bill 0.000% 18-Aug-2016 1,518,000 1,517,321United States Treasury Bill 0.000% 02-Mar-2017 1,370,000 1,368,463United States Treasury Bill 0.000% 09-Mar-2017 1,370,000 1,368,198United States Treasury Bill 0.000% 06-Apr-2017 1,308,000 1,305,848United States Treasury Bill 0.000% 04-Aug-2016 1,276,000 1,274,890United States Treasury Bill 0.000% 27-Oct-2016 1,141,000 1,140,394 United States Treasury Bill 0.000% 23-Feb-2017 1,141,000 1,139,810 United States Treasury Bill 0.000% 16-Feb-2017 1,124,000 1,122,769 United States Treasury Bill 0.000% 09-Feb-2017 1,124,000 1,122,685 United States Treasury Bill 0.000% 03-Nov-2016 1,063,000 1,062,383 United States Treasury Bill 0.000% 10-Nov-2016 1,063,000 1,062,306 United States Treasury Bill 0.000% 27-Apr-2017 989,000 986,978 United States Treasury Bill 0.000% 22-Dec-2016 854,000 853,140 United States Treasury Bill 0.000% 20-Apr-2017 854,000 852,392 United States Treasury Bill 0.000% 11-Aug-2016 848,000 847,557 United States Treasury Bill 0.000% 8-Dec-2016 848,000 847,231 United States Treasury Bill 0.000% 13-Oct-2016 778,000 777,691 United States Treasury Bill 0.000% 20-Oct-2016 778,000 777,616 United States Treasury Bill 0.000% 16-Mar-2017 755,000 754,012 United States Treasury Bill 0.000% 15-Dec-2016 660,000 659,483 United States Treasury Bill 0.000% 15-Sep-2016 625,000 624,741
BNY Mellon Dynamic Total Return Fund for the year ended 31 December 2016
Insight Liquidity Funds Plc - USD Liquidity Fund 184,848,900 184,848,900Ecopetrol SA 5.875% 28-May-2045 25,200,000 21,242,170Southern Copper Corp 5.875% 23-Apr-2045 16,900,000 16,003,250OCP SA 6.875% 25-Apr-2044 9,600,000 10,388,875Banco Hipotecario SA 24.729% 12-Jan-2020 FRN 125,000,000 8,230,453Petrobras Global Finance BV 8.750% 23-May-2026 7,200,000 7,347,343Petrobras Global Finance BV 8.375% 23-May-2021 5,450,000 5,569,099Banco do Brasil SA/Cayman 9.000% Perpetual VAR 6,700,000 5,232,750MTN Mauritius Investment Ltd 6.500% 13-Oct-2026 5,200,000 5,188,500PTT Global Chemical PCL 4.250% 19-Sep-2022 4,700,000 5,089,546GTH Finance BV 7.250% 26-Apr-2023 4,700,000 4,947,600Petrobras Global Finance BV 6.750% 27-Jan-2041 6,000,000 4,760,750Petrobras Argentina SA 7.375% 21-Jul-2023 4,700,000 4,700,073Volcan Cia Minera SAA 5.375% 02-Feb-2022 4,929,000 4,629,328Petroleos Mexicanos 6.875% 04-Aug-2026 4,190,000 4,610,460Turkiye Vakiflar Bankasi TAO 5.500% 27-Oct-2021 4,600,000 4,570,939Vale SA 5.625% 09-Nov-2042 5,500,000 4,558,700ONGC Videsh Vankorneft Pte Ltd 3.750% 27-Jul-2026 4,500,000 4,491,450Vedanta Resources Plc 8.250% 07-Jun-2021 4,700,000 4,454,125DP World Crescent Ltd 3.908% 31-May-2023 4,250,000 4,388,125
Major Purchases NominalCost USD Major Sales Nominal
Proceeds USD
Insight Liquidity Funds Plc - USD Liquidity Fund 180,508,803 180,508,803Ecopetrol SA 5.875% 28-May-2045 24,200,000 20,407,086Southern Copper Corp 5.875% 23-Apr-2045 19,600,000 18,357,500OCP SA 6.875% 25-Apr-2044 10,500,000 10,971,550Petrobras Global Finance BV 8.750% 23-May-2026 6,100,000 6,458,631Korea Hydro & Nuclear Power Co Ltd 2.875% 02-Oct-2018 6,100,000 6,256,634Pertamina Persero PT 6.450% 30-May-2044 4,850,000 5,414,875Banco Hipotecario SA 24.729% 12-Jan-2020 FRN 77,500,000 5,091,104Marfrig Holdings Europe BV 6.875% 24-Jun-2019 4,900,000 4,839,375Petrobras Global Finance BV 6.750% 27-Jan-2041 6,000,000 4,748,310Vale SA 5.625 % 09-Nov-2042 5,500,000 4,585,938Turkiye Vakiflar Bankasi TAO 5.500% 27-Oct-2021 4,600,000 4,358,250Akbank TAS 4.000% 24-Jan-2020 4,250,000 4,217,565Petrobras Global Finance BV 7.250% 17-Mar-2044 5,210,000 3,996,625Southern Copper Corp 3.875% 23-Apr-2025 4,150,000 3,989,750Ecopetrol SA 4.125% 16-Jan-2025 4,400,000 3,870,750Banco do Brasil SA/Cayman 9.000% Perpetual VAR 4,600,000 3,727,250Export Credit Bank of Turkey 5.375% 24-Oct-2023 3,800,000 3,649,000QNB Finance Ltd 2.125% 07-Sep-2021 3,745,000 3,631,623Vale Overseas Ltd 5.875% 10-Jun-2021 3,600,000 3,611,450
BNY Mellon Emerging Markets Corporate Debt Fund for the year ended 31 December 2016

405
BNY MELLON GLOBAL FUNDS, PLC
SIGNIFICANT PORTFOLIO MOVEMENTS
Major Purchases NominalCost USD Major Sales Nominal
Proceeds USD
Romanian Government International Bond 4.875% 22-Jan-2024 2,800,000 3,053,057Mexico Government International Bond 4.125% 21-Jan-2026 2,795,000 2,954,372Petroleos Mexicanos 6.625% 15-Jun-2035 3,055,000 2,879,494Turkey Government International Bond 4.875% 16-Apr-2043 2,680,000 2,412,737Hungary Government International Bond 5.375% 25-Mar-2024 2,080,000 2,299,640Venezuela Government International Bond 7.750% 13-Oct-2019 4,570,000 2,292,759Ukraine Government International Bond 7.750% 01-Sep-2019 2,265,000 2,252,386Brazil Minas SPE via State of Minas Gerais 5.333% 15-Feb-2028 2,835,000 2,229,975Bahrain Government International Bond 7.000% 26-Jan-2026 1,965,000 2,069,451Petroleos Mexicanos 5.625% 23-Jan-2046 2,240,000 1,991,448Lebanon Government International Bond 6.200% 26-Feb-2025 2,010,000 1,946,685Colombia Government International Bond 4.500% 28-Jan-2026 1,820,000 1,843,940Development Bank of Kazakhstan JSC 4.125% 10-Dec-2022 1,910,000 1,841,103Cote d’Ivoire Government International Bond 5.375% 23-Jul-2024 1,970,000 1,839,167Dominican Republic International Bond 5.875% 18-Apr-2024 1,715,000 1,759,875Petroleos de Venezuela SA 8.500% 02-Nov-2017 2,560,000 1,705,647YPF SA 8.500% 28-Jul-2025 1,885,000 1,702,994Vnesheconombank Via VEB Finance Plc 6.800% 22-Nov-2025 1,696,000 1,698,801Gazprom Neft OAO Via GPN Capital SA 6.000% 27-Nov-2023 1,780,000 1,662,715State Grid Overseas Investment 2014 Ltd 4.125% 07-May-2024 1,500,000 1,653,208Poland Government International Bond 4.000% 22-Jan-2024 1,510,000 1,634,620Argentine Republic Government International Bond 7.500% 22-Apr-2026 1,535,000 1,611,998Republic of Serbia 7.250% 28-Sep-2021 1,410,000 1,599,323Nemak SAB de CV 5.500% 28-Feb-2023 1,530,000 1,558,107
Turkey Government International Bond 4.875% 16-Apr-2043 3,610,000 3,337,576Bahrain Government International Bond 7.000% 26-Jan-2026 2,890,000 3,075,658Mexico Government International Bond 4.125% 21-Jan-2026 2,795,000 2,785,944Argentine Republic Government International Bond 7.500% 22-Apr-2026 2,575,000 2,707,471Romanian Government International Bond 4.875% 22-Jan-2024 2,330,000 2,587,699Ukraine Government International Bond 7.750% 01-Sep-2019 2,640,000 2,572,475Iraq International Bond 5.800% 15-Jan-2028 3,050,000 2,391,963Petroleos Mexicanos 5.625% 23-Jan-2046 2,240,000 2,048,705Elementia SAB de CV 5.500% 15-Jan-2025 2,000,000 2,032,679Republic of Serbia 4.875% 25-Feb-2020 1,940,000 1,996,005Senegal Government International Bond 6.250% 30-Jul-2024 2,010,000 1,985,861Lebanon Government International Bond 6.200% 26-Feb-2025 2,010,000 1,960,135Petroleos Mexicanos 6.625% 15-Jun-2035 1,995,000 1,886,149Sri Lanka Government International Bond 6.825% 18-Jul-2026 1,750,000 1,839,898Hungary Government International Bond 5.375% 25-Mar-2024 1,530,000 1,751,787Perusahaan Listrik Negara PT 5.250% 24-Oct-2042 1,760,000 1,736,657Vnesheconombank Via VEB Finance Plc 6.800% 22-Nov-2025 1,580,000 1,730,740Colombia Government International Bond 5.000% 15-Jun-2045 1,630,000 1,636,155State Grid Overseas Investment 2014 Ltd 4.125% 07-May-2024 1,500,000 1,616,260Poland Government International Bond 4.000% 22-Jan-2024 1,510,000 1,599,688Export-Import Bank of India 4.000% 14-Jan-2023 1,500,000 1,567,182Petroleos de Venezuela SA 12.750% 17-Feb-2022 3,055,000 1,560,320
BNY Mellon Emerging Markets Debt Fund for the year ended 31 December 2016
Major Purchases NominalCost USD Major Sales and Maturities Nominal
Proceeds USD
Brazil Notas do Tesouro Nacional Serie F 10.000% 01-Jan-2017 391,650,000 119,954,676Russian Federal Bond - OFZ 7.000% 16-Aug-2023 3,557,765,000 43,895,517Poland Government Bond 5.250% 25-Oct-2017 150,015,000 41,366,247Mexican Bonos 7.750% 14-Dec-2017 541,360,000 32,529,483Indonesia Treasury Bond 8.375% 15-Sep-2026 327,220,000,000 27,402,978United States Treasury Bill 0.000% 15-Sep-2016 27,155,000 27,107,086Mexican Udibonos 4.500% 04-Dec-2025 417,394,372 25,663,971South Africa Government Bond 8.250% 15-Sep-2017 361,530,000 24,943,685Turkey Government Bond 10.600% 11-Feb-2026 55,805,000 20,184,461Mexican Bonos 10.000% 05-Dec-2024 252,760,000 18,111,134Hungary Government Bond 3.000% 26-Jun-2024 4,665,100,000 16,814,603United States Treasury Bill 0.000% 27-Apr-2017 16,795,000 16,753,143Malaysia Government Bond 3.955% 15-Sep-2025 64,000,000 16,226,700Republic of Poland Government Bond 2.500% 25-Jul-2026 62,380,000 15,817,035Hungary Government Bond 5.500% 24-Jun-2025 2,796,470,000 12,254,872Hungary Government Bond 6.750% 24-Nov-2017 3,035,000,000 11,997,991Republic of South Africa Government Bond 7.000% 28-Feb-2031 189,200,000 10,785,562United States Treasury Bill 0.000% 31-Mar-2016 9,450,000 9,448,675Argentina Treasury Inflation Linked Boncer Bond 2.500% 22-Jul-2021 133,316,000 9,245,419Turkey Government Bond 10.500% 15-Jan-2020 23,060,000 9,140,700Republic of South Africa Government Bond 10.500% 21-Dec-2026 89,400,000 8,388,629Argentine Bonos del Tesoro 16.000% 17-Oct-2023 124,000,000 8,234,012Republic of Poland Government Bond 5.750% 23-Sep-2022 27,000,000 8,222,336Peruvian Government International Bond 6.350% 12-Aug-2028 26,290,000 7,846,082
Brazil Letras do Tesouro Nacional 0.000% 01-Jul-2016 446,320,000 133,854,035Brazil Notas do Tesouro Nacional Serie F 10.000% 01-Jan-2023 221,450,000 50,355,564Poland Government Bond 5.250% 25-Oct-2017 179,832,000 47,690,140Brazil Letras do Tesouro Nacional 0.000% 01-Apr-2016 132,010,000 37,062,201Malaysia Government Bond 4.181% 15-Jul-2024 149,520,000 36,635,389Thailand Government Bond 1.200% 14-Jul-2021 1,262,329,355 33,965,534Poland Government Bond 5.750% 23-Sep-2022 113,510,000 33,488,179Poland Government Bond 3.250% 25-Jul-2025 126,060,000 33,278,785Turkey Government Bond 7.100% 8-Mar-2023 115,795,000 32,314,310Russian Agricultural Bank OJSC Via RSHB Capital SA 8.700% 17-Mar-2016 2,064,200,000 30,281,292Mexican Bonos 7.750% 14-Dec-2017 541,360,000 30,009,691Brazil Notas do Tesouro Nacional Serie F 10.000% 01-Jan-2017 90,500,000 27,232,705United States Treasury Bill 0.000% 15-Sep-2016 27,155,000 27,153,233South Africa Government Bond 10.500% 21-Dec-2026 370,740,000 26,799,020Indonesia Treasury Bond 10.000% 15-Sep-2024 317,670,000,000 26,757,505South Africa Government Bond 8.250% 15-Sep-2017 361,530,000 25,991,141United States Treasury Bill 0.000% 31-Mar-2016 25,070,000 25,070,000Brazil Notas do Tesouro Nacional Serie F 10.000% 01-Jan-2025 92,350,000 22,991,551Russian Federal Bond - OFZ 7.000% 16-Aug-2023 1,497,435,000 21,521,875Russian Agricultural Bank OJSC Via RSHB Capital SA 8.625% 17-Feb-2017 1,328,900,000 20,982,460Turkey Government Bond 10.500% 15-Jan-2020 58,300,000 19,668,041Turkey Government Bond 6.300% 14-Feb-2018 58,050,000 18,905,083Empresas Publicas de Medellin ESP 8.375% 01-Feb-2021 65,750,000,000 18,691,743Mexican Bonos 10.000% 05-Dec-2024 252,760,000 18,086,149Hungary Government Bond 5.500% 24-Jun-2025 4,405,700,000 18,052,452Mexican Bonos 10.000% 20-Nov-2036 240,200,000 16,559,549Indonesia Treasury Bond 9.500% 15-Jul-2023 202,317,000,000 15,814,785Poland Government Bond 4.000% 25-Oct-2023 53,500,000 14,371,226Turkey Government Bond 10.400% 20-Mar-2024 43,300,000 14,145,396Petroleos Mexicanos 7.190% 12-Sep-2024 308,100,000 13,766,679Colombian TES 7.000% 04-May-2022 40,450,000,000 13,494,192Mexican Bonos 7.750% 29-May-2031 207,335,000 12,493,109Republic of Poland Government Bond 5.500% 25-Oct-2019 42,801,000 12,281,361AHML Finance Ltd 7.750% 13-Feb-2018 877,100,000 11,833,777Hungary Government Bond 6.750% 24-Nov-2017 3,035,000,000 11,749,400
BNY Mellon Emerging Markets Debt Local Currency Fund for the year ended 31 December 2016

406
BNY MELLON GLOBAL FUNDS, PLC
SIGNIFICANT PORTFOLIO MOVEMENTS
Major Purchases NominalCost USD Major Sales and Maturities Nominal
Proceeds USD
Brazil Notas do Tesouro Nacional Serie F 10.000% 01-Jan-2017 15,200,000 4,541,194Brazil Notas do Tesouro Nacional Serie F 10.000% 01-Jan-2025 12,150,000 2,719,865Russian Federal Bond - OFZ 7.000% 16-Aug-2023 186,135,000 2,453,936Poland Government Bond 5.250% 25-Oct-2017 8,650,000 2,371,368Hungary Government Bond 5.500% 24-Jun-2025 366,210,000 1,576,256Bahrain Government International Bond 7.000% 26-Jan-2026 1,470,000 1,575,948Turkey Government Bond 10.600% 11-Feb-2026 4,245,000 1,510,891Provincia de Buenos Aires 9.125% 16-Mar-2024 1,330,000 1,363,931Mexican Udibonos 4.500% 04-Dec-2025 21,678,064 1,314,191Israel Electric Corp Ltd 144A 5.000% 12-Nov-2024 1,250,000 1,276,880Hutchison Whampoa International 14 Ltd 3.625% 31-Oct-2024 1,220,000 1,266,392Iraq International Bond 5.800% 15-Jan-2028 1,740,000 1,266,005Malaysia Government Bond 3.620% 30-Nov-2021 4,950,000 1,253,476Senegal Government International Bond 6.250% 30-Jul-2024 1,275,000 1,252,510Jamaica Government International Bond 6.750% 28-Apr-2028 1,165,000 1,199,723Georgian Railway JSC 7.750% 11-Jul-2022 1,070,000 1,130,150Poland Government Bond 2.500% 25-Jul-2026 4,350,000 1,092,090Pakistan Government International Bond 8.250% 30-Sep-2025 1,050,000 1,086,795Sri Lanka Government International Bond 6.850% 03-Nov-2025 1,110,000 1,067,938Ukraine Government International Bond 7.750% 01-Sep-2019 1,100,000 1,048,713Turkey Government International Bond 5.625% 30-Mar-2021 970,000 1,024,805Argentine Republic Government International Bond 7.500% 22-Apr-2026 980,000 996,800Poland Government Bond 3.250% 25-Jul-2025 3,565,000 970,821Cote d’Ivoire Government International Bond 5.750% 31-Dec-2032 1,030,000 937,850Turkey Government International Bond 4.875% 16-Apr-2043 975,000 927,400Petroleos de Venezuela SA 8.500% 02-Nov-2017 1,533,333 917,500Shimao Property Holdings Ltd 8.375% 10-Feb-2022 830,000 892,997
Brazil Letras do Tesouro Nacional 0.000% 01-Jul-2016 14,480,000 4,480,753Brazil Notas do Tesouro Nacional Serie F 10.000% 01-Jan-2017 10,900,000 3,292,730Brazil Notas do Tesouro Nacional Serie F 10.000% 01-Jan-2025 14,020,000 3,037,067Poland Government Bond 5.250% 25-Oct-2017 10,900,000 2,902,504Brazil Minas SPE via State of Minas Gerais 5.333% 15-Feb-2028 2,930,000 2,213,113Israel Electric Corp Ltd 144A 5.000% 12-Nov-2024 1,250,000 1,356,543Poland Government Bond 3.250% 25-Jul-2025 4,990,000 1,338,997Reliance Industries Ltd 4.125% 28-Jan-2025 1,250,000 1,305,678Provincia de Buenos Aires 9.125% 16-Mar-2024 1,195,000 1,302,095Turkey Government Bond 10.500% 15-Jan-2020 3,825,336 1,294,795MFB Magyar Fejlesztesi Bank Zrt 6.250% 21-Oct-2020 1,145,000 1,259,271Hutchison Whampoa International 14 Ltd 3.625% 31-Oct-2024 1,220,000 1,257,643Russian Agricultural Bank OJSC Via RSHB Capital SA 7.750% 29-May-2018 1,120,000 1,206,624Brazil Letras do Tesouro Nacional 0.000% 01-Apr-2016 4,140,000 1,162,317Colombian TES 7.000% 04-May-2022 3,440,600,000 1,104,659Argentine Republic Government International Bond 7.500% 22-Apr-2026 980,000 1,088,570Petrobras Global Finance BV 3.250% 17-Mar-2017 1,125,000 1,074,989Petronas Capital Ltd 3.500% 18-Mar-2025 1,075,000 1,069,594Brazil Notas do Tesouro Nacional Serie F 10.000% 01-Jan-2023 4,050,000 1,065,842Petroleos de Venezuela SA 8.500% 02-Nov-2017 1,533,333 1,063,320
BNY Mellon Emerging Markets Debt Opportunistic Fund for the year ended 31 December 2016
Bundesrepublik Deutschland 2.500% 15-Aug-2046 63,260,000 93,325,646French Republic Government Bond OAT 0.500% 25-May-2026 87,575,000 88,735,457France Government Bond OAT 1.000% 25-Nov-2025 80,955,000 82,397,640Mexican Bonos 4.750% 14-Jun-2018 1,290,000,000 65,564,922Bundesrepublik Deutschland 2.250% 04-Sep-2020 53,805,000 60,124,942United States Treasury Bill 0.000% 27-Apr-2017 56,195,000 51,149,325Deutsche Bundesrepublik Inflation Linked Bond 0.100% 15-Apr-2026 42,742,688 47,030,556French Republic Government Bond OAT 3.250% 25-Oct-2021 39,500,000 46,904,043Canadian Government Bond 0.750% 01-Sep-2020 58,350,000 40,263,859Ireland Government Bond 1.000% 15-May-2026 40,680,000 40,096,566Italy Buoni Poliennali Del Tesoro 144A 2.350% 15-Sep-2024 36,432,017 40,033,760Bundesrepublik Deutschland 0.500% 15-Feb-2025 36,560,000 37,867,782Italy Buoni Poliennali Del Tesoro 1.050% 01-Dec-2019 34,500,000 35,093,400United States Treasury Bill 0.000% 15-Sep-2016 38,540,000 34,158,862Bundesrepublik Deutschland 0.500% 15-Feb-2026 32,400,000 33,481,668French Republic Government Bond OAT 2.250% 25-May-2024 27,975,000 32,634,184International Bank for Reconstruction & Development 3.500% 22-Jan-2021 50,675,000 32,614,271Italy Buoni Poliennali Del Tesoro 4.750% 01-Sep-2021 23,700,000 28,716,105New Zealand Government Bond 2.000% 20-Sep-2025 45,587,000 27,947,727Hungary Government Bond 5.500% 24-Jun-2025 4,977,150,000 19,355,452Singapore Government Bond 2.125% 01-Jun-2026 25,600,000 17,806,854United States Treasury Inflation Indexed Bonds 0.625% 15-Jan-2026 18,132,246 17,255,982
French Republic Government Bond OAT 2.250% 25-May-2024 127,775,000 147,196,959French Republic Government Bond OAT 3.250% 25-Oct-2021 104,225,000 123,254,427Italy Buoni Poliennali Del Tesoro 2.100% 15-Sep-2016 104,292,951 104,961,220Italy Buoni Poliennali Del Tesoro 144A 2.350% 15-Sep-2024 87,014,208 97,854,968Italy Buoni Poliennali Del Tesoro 3.500% 01-Jun-2018 88,975,000 94,288,846Italy Buoni Poliennali Del Tesoro 1.350% 15-Apr-2022 86,095,000 88,689,406Italy Buoni Poliennali Del Tesoro 1.050% 01-Dec-2019 83,445,000 86,045,130France Government Bond OAT 1.000% 25-Nov-2025 80,955,000 83,058,377Bundesrepublik Deutschland 2.500% 15-Aug-2046 53,255,000 78,788,368Spain Government Bond 0.500% 31-Oct-2017 65,815,000 66,388,789Mexican Bonos 4.750% 14-Jun-2018 1,290,000,000 66,151,350Korea Treasury Bond 2.250% 10-Jun-2025 81,840,000,000 65,743,707French Republic Government Bond OAT 0.100% 01-Mar-2025 57,259,172 60,287,480French Republic Government Bond OAT 0.500% 25-May-2026 55,975,000 57,048,110Netherlands Government Bond 144A 1.250% 15-Jan-2019 53,400,000 55,672,085Bundesrepublik Deutschland 2.250% 04-Sep-2020 48,930,000 54,753,313Italy Buoni Poliennali Del Tesoro 144A 4.750% 01-Sep-2044 32,225,000 47,462,265Deutsche Bundesrepublik Inflation Linked Bond 0.100% 15-Apr-2026 42,742,688 46,578,266Spain Government Bond 2.750% 30-Apr-2019 40,325,000 43,452,956Canadian Government Bond 0.750% 01-Sep-2020 58,350,000 40,304,951Bundesrepublik Deutschland 0.500% 15-Feb-2025 36,560,000 37,905,817United States Treasury Bill 0.000% 15-Sep-2016 38,540,000 34,254,737International Bank for Reconstruction & Development 3.500% 22-Jan-2021 50,675,000 33,986,735Bundesrepublik Deutschland 0.500% 15-Feb-2026 32,400,000 33,388,677United States Treasury Bill 0.000% 31-Mar-2016 36,500,000 32,386,626New Zealand Government Bond 2.000% 20-Sep-2025 45,587,000 30,513,203
Major Purchases NominalCost EUR Major Sales and Maturities Nominal
Proceeds EUR
BNY Mellon Euroland Bond Fund for the year ended 31 December 2016

407
BNY MELLON GLOBAL FUNDS, PLC
SIGNIFICANT PORTFOLIO MOVEMENTS
BNY Mellon Global Funds Plc - Short-Dated High Yield Bond Fund 2,972,180 2,791,696Insight Global Funds II Plc - Short High Yield Bond Fund 110,000 1,697,269Credit Suisse AG/London 0.375% 11-Apr-2019 1,050,000 1,056,678ING Bank NV 0.700% 16-Apr-2020 1,020,000 1,039,615JPMorgan Chase & Co 2.625% 23-Apr-2021 950,000 1,039,148UBS Group Funding Jersey Ltd 2.650% 1-Feb-2022 1,160,000 1,035,138Anheuser-Busch InBev NV 2.000% 17-Mar-2028 1,006,000 1,031,052Autoroutes du Sud de la France SA 4.000% 24-Sep-2018 900,000 989,197Cooperatieve Rabobank UA 5.875% 20-May-2019 860,000 981,785Trinity Acquisition Plc 2.125% 26-May-2022 983,000 981,408John Deere Bank SA 0.037% 21-Apr-2020 FRN 943,000 943,000Achmea Bank NV 0.875% 17-Sep-2018 870,000 884,067AbbVie Inc 0.375% 18-Nov-2019 868,000 865,674PPG Industries Inc 0.000% 03-Nov-2019 843,000 839,898Snam SpA 0.875% 25-Oct-2026 840,000 835,850Gas Natural Capital Markets SA 4.125% 24-Apr-2017 800,000 835,440Commerzbank AG 4.000% 23-Mar-2026 832,000 834,948UniCredit Bank Austria AG 2.625% 30-Jan-2018 800,000 821,318Banque Federative du Credit Mutuel SA 0.250% 14-Jun-2019 800,000 801,036FCA Capital Ireland Plc 1.250% 23-Sep-2020 800,000 798,281
Insight Global Funds II Plc - Short High Yield Bond Fund 192,000 2,782,959Bankinter SA 0.625% 09-Oct-2020 1,400,000 1,429,054Achmea Bank NV 0.875% 17-Sep-2018 1,102,000 1,119,980UBS Group Funding Jersey Ltd 2.650% 1-Feb-2022 1,160,000 1,039,339UniCredit Bank Austria AG 2.625% 30-Jan-2018 1,000,000 1,028,971Autoroutes du Sud de la France SA 4.000% 24-Sep-2018 900,000 965,497Commerzbank AG 4.000% 23-Mar-2026 832,000 853,647QBE Capital Funding IV Ltd 7.500% 24-May-2041 VAR 590,000 839,179Gas Natural Capital Markets SA 4.125% 24-Apr-2017 800,000 829,912FCA Capital Ireland Plc 1.250% 23-Sep-2020 800,000 824,800EnBW Energie Baden-Wuerttemberg AG 3.625% 02-Apr-2076 VAR 821,000 815,435Carnival Corp 1.625% 22-Feb-2021 770,000 791,773Credit Suisse Group Funding Guernsey Ltd 1.250% 14-Apr-2022 785,000 775,607BMW Finance NV 3.625% 29-Jan-2018 720,000 756,007BP Capital Markets Plc 1.953% 03-Mar-2025 700,000 745,494Barclays Plc 2.625% 11-Nov-2025 VAR 764,000 741,934KBC IFIMA SA 2.125% 10-Sep-2018 700,000 727,650Snam SpA 0.875% 25-Oct-2026 730,000 721,217Coventry Building Society 2.500% 18-Nov-2020 670,000 720,369Banque Federative du Credit Mutuel SA 1.625% 11-Jan-2018 700,000 718,431
Major Purchases NominalCost EUR Major Sales Nominal
Proceeds EUR
BNY Mellon European Credit Fund for the year ended 31 December 2016
United States Treasury Note/Bond 2.000% 15-Feb-2025 75,840,000 77,564,348United States Treasury Inflation Indexed Bonds 2.375% 15-Jan-2025 33,851,480 39,912,392United States Treasury Note/Bond 3.500% 15-May-2020 31,980,000 34,904,045United States Treasury Note/Bond 3.000% 15-Nov-2045 27,970,000 30,346,844United States Treasury Inflation Indexed Bonds 0.125% 15-Apr-2020 28,807,650 28,935,512United States Treasury Note/Bond 0.875% 28-Feb-2017 25,270,000 25,308,155United States Treasury Note/Bond 1.625% 15-Aug-2022 24,610,000 24,392,287Mexican Bonos 6.500% 10-Jun-2021 418,950,000 24,208,827Italy Buoni Poliennali Del Tesoro 6.500% 01-Nov-2027 12,880,000 21,661,145United States Treasury Note/Bond 1.250% 30-Nov-2018 20,450,000 20,656,118Spain Government Bond 144A 5.900% 30-Jul-2026 12,600,000 19,489,260United States Treasury Inflation Indexed Bonds 2.125% 15-Feb-2041 14,548,837 18,442,892Japan Government Thirty Year Bond 1.400% 20-Sep-2045 1,679,250,000 17,643,219United States Treasury Note/Bond 1.000% 31-Oct-2016 16,550,000 16,595,712Mexico Government International Bond 4.125% 21-Jan-2026 15,500,000 16,299,282United States Treasury Note/Bond 2.875% 15-May-2043 15,200,000 16,299,016French Republic Government Bond OAT 3.250% 25-May-2045 9,560,000 14,814,041Japan Government Twenty Year Bond 1.000% 20-Dec-2035 1,114,800,000 11,740,016Australia Government Bond 3.750% 21-Apr-2037 12,340,000 10,773,609Japanese Government CPI Linked Bond 0.100% 10-Mar-2026 1,038,346,579 10,678,549French Republic Government Bond OAT 3.500% 25-Apr-2026 7,380,000 9,889,081Republic of Austria Government Bond 144A 3.150% 20-Jun-2044 5,220,000 9,178,608New Zealand Government Bond 2.000% 20-Sep-2025 11,620,000 8,887,922New Zealand Local Government Funding Agency Bond 5.000% 15-Mar-2019 11,560,000 8,644,080United Kingdom Gilt 1.750% 07-Sep-2022 6,140,000 8,638,943United Kingdom Gilt 4.250% 07-Jun-2032 4,515,000 8,443,515Canada Housing Trust No 1 144A 2.250% 15-Dec-2025 10,430,000 8,208,759United Kingdom Gilt 3.250% 22-Jan-2044 4,570,000 8,100,108
United States Treasury Note/Bond 2.000% 15-Feb-2025 57,070,000 58,354,980United States Treasury Note/Bond 3.500% 15-May-2020 30,760,000 33,452,182United States Treasury Inflation Indexed Bonds 2.375% 15-Jan-2025 23,669,014 27,745,052Italy Buoni Poliennali Del Tesoro 6.500% 01-Nov-2027 14,480,000 23,965,213United States Treasury Inflation Indexed Bonds 2.125% 15-Feb-2041 18,241,509 23,640,451United States Treasury Note/Bond 2.875% 15-May-2043 19,010,000 20,281,089United States Treasury Note/Bond 3.000% 15-Nov-2045 17,350,000 19,931,651United States Treasury Inflation Indexed Bonds 0.125% 15-Apr-2020 19,379,016 19,400,467Mexico Government International Bond 4.125% 21-Jan-2026 15,500,000 16,777,107United States Treasury Note/Bond 1.000% 31-Oct-2016 16,550,000 16,562,031United States Treasury Note/Bond 0.875% 28-Feb-2017 15,380,000 15,415,281United Kingdom Gilt 3.250% 22-Jan-2044 8,570,000 15,385,076Australia Government Bond 3.750% 21-Apr-2037 16,400,000 14,644,015Mexican Bonos 6.500% 10-Jun-2021 232,110,000 13,020,785French Republic Government Bond OAT 3.250% 25-May-2045 7,340,000 12,772,783United States Treasury Note/Bond 1.250% 30-Nov-2018 11,770,000 11,889,688New Zealand Government Bond 2.000% 20-Sep-2025 15,320,000 11,573,893Japan Government Thirty Year Bond 1.400% 20-Sep-2045 895,550,000 10,513,024United Kingdom Gilt 2.000% 22-Jan-2016 6,670,000 9,535,103United States Treasury Bill 0.000% 28-Apr-2016 9,300,000 9,296,387EUROFIMA 0.735% 10-Jun-2016 FRN 8,800,000 8,800,000United Kingdom Gilt 4.250% 07-Jun-2032 4,515,000 8,545,663Canada Housing Trust No 1 144A 2.250% 15-Dec-2025 10,430,000 7,951,198Hungary Government Bond 2.500% 27-Oct-2021 2,164,950,000 7,563,532Bundesrepublik Deutschland 6.500% 04-Jul-2027 3,925,000 7,338,102Denmark Government Bond 3.000% 15-Nov-2021 40,130,000 7,092,944United States Treasury Note/Bond 1.625% 15-Aug-2022 6,860,000 6,976,504Japan Government Twenty Year Bond 1.000% 20-Dec-2035 616,200,000 6,812,357Republic of Poland Government Bond 5.750% 23-Sep-2022 22,580,000 6,781,741Netherlands Government Bond 5.500% 15-Jan-2028 3,700,000 6,708,840Spain Government Bond 4.400% 31-Oct-2023 4,950,000 6,601,304Bundesrepublik Deutschland 4.000% 04-Jan-2037 3,390,000 6,446,527FADE - Fondo de Amortizacion del Deficit Electrico 0.850% 17-Sep-2019 5,500,000 6,342,490
Major Purchases NominalCost USD Major Sales and Maturities Nominal
Proceeds USD
BNY Mellon Global Bond Fund for the year ended 31 December 2016

408
BNY MELLON GLOBAL FUNDS, PLC
SIGNIFICANT PORTFOLIO MOVEMENTS
Major Purchases NominalCost USD Major Sales and Maturities Nominal
Proceeds USD
Insight Liquidity Funds Plc - USD Liquidity Fund 152,247,470 152,247,470Telefonica Emisiones SAU 3.987% 23-Jan-2023 5,200,000 7,045,190Credit Suisse Group Funding Guernsey Ltd 1.250% 14-Apr-2022 5,820,000 6,474,232Insight Global Funds II plc - Insight Emerging Markets Debt Fund 324,289 6,441,150Insight Global Funds II plc - Emerging Market Bond Opportunities Fund 5,772,217 6,231,082EP Energy AS 5.875% 01-Nov-2019 4,750,000 5,785,131ING Bank NV 0.234% 09-Sep-2016 FRN 4,900,000 5,588,728JPMorgan Chase & Co 0.055% 20-Nov-2016 FRN 4,884,000 5,563,582ABN AMRO Bank NV 0.420% 01-Aug-2016 FRN 4,877,000 5,557,701Cooperatieve Rabobank UA 0.047% 13-Jan-2017 FRN 4,883,000 5,544,849BPCE SA 0.000% 10-Mar-2017 FRN 4,900,000 5,451,797Koninklijke KPN NV 5.625% 30-Sep-2024 3,500,000 5,356,928Fortis Inc 3.055% 04-Oct-2026 5,170,000 5,098,809Molson Coors Brewing Co 3.000% 15-Jul-2026 4,800,000 4,789,296Nationwide Building Society 2.450% 27-Jul-2021 4,734,000 4,756,982Chubb INA Holdings Inc 3.350% 03-May-2026 4,011,000 4,298,910Bankia SA 4.000% 22-May-2024 VAR 3,500,000 3,880,445UBS AG 4.750% 12-Feb-2026 VAR 3,188,000 3,811,609Vonovia Finance BV 2.250% 15-Dec-2023 3,000,000 3,755,614General Electric Co 4.500% 11-Mar-2044 3,200,000 3,729,504
BNY Mellon Global Credit Fund* for the year ended 31 December 2016
* Please refer to Note 19 of the financial statements.
Insight Liquidity Funds Plc - USD Liquidity Fund 172,568,368 172,568,368Insight Global Funds II plc - Emerging Market Bond Opportunities Fund 13,926,223 16,437,274Danone SA 144A 2.947% 02-Nov-2026 9,480,000 9,480,000United States Treasury Inflation Indexed Bonds 0.750% 15-Feb-2045 8,895,895 8,758,863State of Hesse 0.375% 04-Jul-2022 7,574,000 8,589,032Lloyds Bank Plc 0.228% 21-Aug-2017 FRN 6,800,000 7,597,007Mexico Government International Bond 3.625% 15-Mar-2022 7,002,000 7,229,220State of North Rhine-Westphalia 0.625% 17-Nov-2023 6,227,000 7,116,167Credit Suisse AG/London 0.148% 10-Nov-2017 FRN 6,200,000 6,971,235Telefonica Emisiones SAU 3.987% 23-Jan-2023 5,200,000 6,961,724European Union 2.750% 04-Apr-2022 4,900,000 6,410,583International Bank for Reconstruction & Development 2.125% 01-Nov-2020 6,251,000 6,403,131Insight Global Funds II plc - Insight Emerging Markets Debt Fund 324,289 6,286,839Credit Suisse Group Funding Guernsey Ltd 1.250% 14-Apr-2022 5,820,000 6,188,718FirstEnergy Corp 4.250% 15-Mar-2023 5,562,000 5,860,094EP Energy AS 5.875% 01-Nov-2019 4,750,000 5,600,936ING Bank NV 0.336% 09-Sep-2016 FRN 4,900,000 5,505,131Morgan Stanley 0.109% 17-Jan-2017 FRN 4,900,000 5,469,506JPMorgan Chase & Co 0.088% 21-Feb-2017 FRN 4,878,000 5,458,456BPCE SA 0.000% 10-Mar-2017 FRN 4,900,000 5,454,105
Major Purchases NominalCost USD Major Sales and Maturities Nominal
Proceeds USD
United States Treasury Note/Bond 2.000% 15-Feb-2025 27,480,000 28,365,423United States Treasury Inflation Indexed Bonds 2.375% 15-Jan-2025 19,443,130 22,837,946United States Treasury Note/Bond 3.500% 15-May-2020 16,200,000 17,677,340United States Treasury Note/Bond 3.000% 15-Nov-2045 15,475,000 16,888,322United States Treasury Inflation Indexed Bonds 0.125% 15-Apr-2020 13,563,374 13,454,757Mexican Bonos 6.500% 10-Jun-2021 224,680,000 12,962,618United States Treasury Note/Bond 2.875% 15-May-2043 12,270,000 12,816,726iShares USD High Yield Corp Bond UCITS ETF 118,498 12,254,593SPDR Barclays Emerging Markets Local Bond UCITS ETF 165,895 12,186,454United States Treasury Note/Bond 1.250% 30-Nov-2018 11,200,000 11,270,297United States Treasury Inflation Indexed Bonds 2.125% 15-Feb-2041 6,799,206 8,506,137United States Treasury Note/Bond 1.000% 31-Oct-2016 8,390,000 8,416,213United States Treasury Note/Bond 0.875% 28-Feb-2017 7,600,000 7,608,313United States Treasury Note/Bond 1.625% 15-Aug-2022 7,220,000 7,000,805New Zealand Local Government Funding Agency Bond 5.000% 15-Mar-2019 9,180,000 6,856,737Queensland Treasury Corp 144A 3.500% 21-Sep-2017 7,470,000 5,783,757United Kingdom Gilt 4.250% 07-Jun-2032 2,790,000 5,224,243Hungary Government Bond 2.500% 27-Oct-2021 1,400,810,000 5,098,457United Kingdom Gilt 1.750% 07-Sep-2022 3,500,000 4,979,623Portugal Obrigacoes do Tesouro OT 144A 5.650% 15-Feb-2024 3,720,000 4,978,100
United States Treasury Note/Bond 2.000% 15-Feb-2025 27,480,000 28,184,879United States Treasury Note/Bond 0.875% 28-Feb-2017 24,430,000 24,487,832United States Treasury Note/Bond 1.000% 31-Oct-2016 19,910,000 19,965,408United States Treasury Note/Bond 2.875% 15-May-2043 18,080,000 19,088,821United States Treasury Inflation Indexed Bonds 0.125% 15-Apr-2020 16,100,267 16,119,310United States Treasury Bill 0.000% 28-Apr-2016 14,500,000 14,491,597United States Treasury Note/Bond 3.000% 15-Nov-2045 12,830,000 14,469,003United States Treasury Inflation Indexed Bonds 2.125% 15-Feb-2041 10,166,054 13,158,227SPDR Barclays Emerging Markets Local Bond UCITS ETF 166,273 12,303,345Treasury Corp of Victoria 5.500% 17-Nov-2026 6,620,000 6,556,953United States Treasury Note/Bond 1.250% 30-Nov-2018 5,700,000 5,760,613Brazilian Government International Bond 4.875% 22-Jan-2021 5,640,000 5,489,640United Kingdom Gilt 4.250% 07-Jun-2032 2,790,000 5,354,216Mexican Bonos 6.500% 10-Jun-2021 91,070,000 5,124,581United Kingdom Gilt 1.750% 07-Sep-2022 3,500,000 5,086,079United States Treasury Inflation Indexed Bonds 2.375% 15-Jan-2025 4,363,282 5,051,959Hungary Government Bond 2.500% 27-Oct-2021 1,400,810,000 4,893,911United States Treasury Note/Bond 3.500% 15-May-2020 4,400,000 4,809,977Portugal Obrigacoes do Tesouro OT 144A 5.650% 15-Feb-2024 3,720,000 4,752,030Colombia Government International Bond 144A 7.750% 18-Sep-2030 13,782,900,000 4,660,192FADE - Fondo de Amortizacion del Deficit Electrico 0.850% 17-Sep-2019 4,000,000 4,624,360United Kingdom Gilt 4.250% 07-Sep-2039 2,300,000 4,541,483Denmark Government Bond 1.750% 15-Nov-2025 25,080,000 4,332,430Singapore Government Bond 2.250% 01-Jun-2021 5,675,000 4,287,690Denmark Government Bond 3.000% 15-Nov-2021 23,900,000 4,264,414
BNY Mellon Global Dynamic Bond Fund for the year ended 31 December 2016

409
BNY MELLON GLOBAL FUNDS, PLC
SIGNIFICANT PORTFOLIO MOVEMENTS
Major Purchases NominalCost USD Major Sales Nominal
Proceeds USD
iShares MSCI Emerging Markets ETF 131,557 3,981,469Wumart Stores Inc 306,000 245,270NWS Holdings Ltd 3,826 5,715Parkson Retail Group Ltd 39 5
iShares MSCI Emerging Markets ETF 6,615 194,747
BNY Mellon Global Emerging Markets Equity Value Fund* for the year ended 31 December 2016
The above constitutes the full purchases and sales detail for the Fund during the reporting year.
* Please refer to Note 19 of the financial statements.
Major Purchases NominalCost USD Major Sales Nominal
Proceeds USD
China Biologic Products Inc 39,046 5,028,809Maruti Suzuki India Ltd 50,973 3,408,410Tata Motors Ltd 506,917 2,949,099Naspers Ltd 20,384 2,699,680ITC Ltd 548,158 2,600,988British American Tobacco Plc 44,957 2,541,966Alibaba Group Holding Ltd ADR 31,514 2,428,080AIA Group Ltd 411,000 2,406,280Taiwan Semiconductor Manufacturing Co Ltd 530,000 2,266,173Baidu Inc ADR 12,029 2,176,720Grupo Aeroportuario del Centro Norte SAB de CV 361,200 1,914,018Axis Bank Ltd 268,746 1,810,008Glenmark Pharmaceuticals Ltd 126,343 1,741,061LIC Housing Finance Ltd 230,098 1,641,152Indiabulls Housing Finance Ltd 141,744 1,615,081Tencent Holdings Ltd 79,661 1,604,858Godrej Consumer Products Ltd 78,035 1,562,046Tata Consultancy Services Ltd 43,632 1,548,422Vipshop Holdings Ltd ADR 105,631 1,517,280Amara Raja Batteries Ltd 114,704 1,515,000Fomento Economico Mexicano SAB de CV 161,609 1,482,883Universal Robina Corp 363,370 1,457,148TAL Education Group ADR 29,706 1,405,609Arca Continental SAB de CV 228,263 1,329,144Metropolitan Bank & Trust Co 671,770 1,145,411Yum! Brands Inc 15,033 1,081,088Hindustan Unilever Ltd 85,711 1,077,069GT Capital Holdings Inc 36,550 1,064,669Hero MotoCorp Ltd 26,628 1,056,6923SBio Inc 144A 856,000 1,050,739Apollo Hospitals Enterprise Ltd 47,297 1,035,881Ctrip.com International Ltd ADR 23,310 1,034,584Sands China Ltd 280,400 975,332Jubilant Foodworks Ltd 44,751 954,624Catcher Technology Co Ltd 110,000 823,770PVR Ltd 60,270 793,044
China Biologic Products Inc 34,006 4,191,775Maruti Suzuki India Ltd 37,281 2,785,764Taiwan Semiconductor Manufacturing Co Ltd 517,000 2,765,137Naspers Ltd 18,037 2,706,828Alibaba Group Holding Ltd ADR 29,322 2,680,651Tata Motors Ltd 363,859 2,477,401TAL Education Group ADR 39,613 2,428,464AIA Group Ltd 363,400 2,149,018British American Tobacco Plc 35,321 2,037,188Baidu Inc ADR 11,904 1,989,366Axis Bank Ltd 281,935 1,964,117Arca Continental SAB de CV 289,209 1,925,402Vipshop Holdings Ltd ADR 151,459 1,847,953ITC Ltd 431,028 1,747,750Yum! Brands Inc 22,461 1,687,240Tencent Holdings Ltd 58,693 1,418,435Tata Consultancy Services Ltd 37,508 1,364,817Universal Robina Corp 339,430 1,319,182Hero MotoCorp Ltd 28,102 1,286,276Godrej Consumer Products Ltd 54,488 1,203,905Grupo Financiero Santander Mexico SAB de CV ADR 130,554 1,162,180LIC Housing Finance Ltd 141,249 1,116,512Glenmark Pharmaceuticals Ltd 82,029 1,059,035Sands China Ltd 256,800 1,006,315Amara Raja Batteries Ltd 71,095 993,494Grupo Aeroportuario del Centro Norte SAB de CV 185,800 990,149Wynn Macau Ltd 663,200 981,677Kimberly-Clark de Mexico SAB de CV 455,617 913,279Tata Motors Ltd ADR 31,191 873,566Ctrip.com International Ltd ADR 20,520 853,481GT Capital Holdings Inc 27,960 783,673
BNY Mellon Global Emerging Markets Fund for the year ended 31 December 2016

410
BNY MELLON GLOBAL FUNDS, PLC
SIGNIFICANT PORTFOLIO MOVEMENTS
Major Purchases NominalCost USD Major Sales Nominal
Proceeds USD
Nestle SA 57,222 4,705,462Toyota Motor Corp 79,700 4,616,390Dollar General Corp 46,651 4,288,871PNC Financial Services Group Inc/The 50,441 4,164,418Equifax Inc 34,640 4,050,072Sawai Pharmaceutical Co Ltd 50,500 3,516,503Altria Group Inc 53,713 3,319,241Express Scripts Holding Co 35,263 2,786,719PayPal Holdings Inc 78,557 2,669,963EMC Corp 91,124 2,614,991Bayer AG 25,108 2,506,946Actelion Ltd 15,165 2,444,086TJX Cos Inc/The 31,456 2,348,805Medtronic Plc 26,691 2,291,061Brenntag AG 46,598 2,255,761Yum! Brands Inc 25,126 2,226,821Bridgestone Corp 58,000 2,122,770Baidu Inc ADR 11,709 2,053,744Trimble Inc 82,136 2,019,197ITC Ltd 430,175 1,967,527Apple Inc 17,851 1,925,455Merck & Co Inc 30,231 1,873,063GlaxoSmithKline Plc 80,189 1,697,063Don Quijote Holdings Co Ltd 44,400 1,499,950Dun & Bradstreet Corp/The 11,532 1,411,665SoftBank Group Corp 34,800 1,390,974Infineon Technologies AG 74,697 1,286,966CA Inc 39,175 1,261,553Air Liquide SA 12,439 1,250,306Prudential Plc 60,930 1,109,616Accenture Plc 8,148 908,558DNB ASA 57,402 887,243Principal Financial Group Inc 21,052 827,113
Gilead Sciences Inc 72,674 5,996,410Cisco Systems Inc 177,558 5,458,830Unilever NV 103,705 4,816,209Diageo Plc 160,251 4,342,751Apple Inc 39,423 4,171,964Suntory Beverage & Food Ltd 93,400 4,104,746Western Union Co/The 197,567 3,951,259Infineon Technologies AG 232,080 3,503,405Bridgestone Corp 92,800 3,461,468Teva Pharmaceutical Industries Ltd ADR 70,443 3,442,734Eversource Energy 61,927 3,188,563ConocoPhillips 65,428 2,736,964Vivendi SA 108,236 2,227,656DNB ASA 160,424 2,028,318Royal Bank of Scotland Group Plc 722,513 2,020,690CA Inc 56,930 1,750,021Baidu Inc ADR 11,709 1,714,918Toyota Motor Corp 31,700 1,648,608Microsoft Corp 28,911 1,613,717TJX Cos Inc/The 20,372 1,542,336RELX NV 78,009 1,384,415Japan Tobacco Inc 31,500 1,268,408Medtronic Plc 16,706 1,236,412Associated British Foods Plc 32,886 1,079,597Nielsen Holdings Plc 22,833 1,026,392Centrica Plc 358,523 1,003,173British American Tobacco Plc 17,490 990,161Walgreens Boots Alliance Inc 11,949 974,885Dollar General Corp 12,552 947,922Yum! Brands Inc 14,706 934,522Discovery Communications Inc 32,016 887,964
BNY Mellon Global Equity Fund for the year ended 31 December 2016
Japan Tobacco Inc 626,200 25,552,773Diageo Plc 906,732 24,482,361Microsoft Corp 416,577 22,714,095Maxim Integrated Products Inc 472,351 17,637,794British American Tobacco Plc 285,603 17,071,130Cisco Systems Inc 540,945 16,084,112Novartis AG 205,861 15,774,226Western Union Co/The 784,633 15,705,301Unilever Plc 378,229 14,954,702Informa Plc 1,721,778 14,415,942Procter & Gamble Co/The 167,368 14,189,680UBM Plc 1,593,424 13,764,265Kuehne + Nagel International AG 92,914 12,987,180CA Inc 405,873 12,760,088Merck & Co Inc 212,798 12,253,267Philip Morris International Inc 119,360 11,864,454Television Francaise 1 1,001,028 11,422,264Reynolds American Inc 224,844 11,357,021GlaxoSmithKline Plc 480,690 10,139,565Roche Holding AG 37,821 9,504,862RELX NV 541,206 9,234,324Adecco Group AG 169,564 9,197,285McDonald’s Corp 71,138 8,657,390Sanofi 103,027 8,383,455Eversource Energy 140,328 7,948,918Orkla ASA 868,461 7,814,127SSE Plc 377,191 7,770,587Zurich Insurance Group AG 32,122 7,710,064CMS Energy Corp 174,874 7,467,433Mattel Inc 231,296 7,400,514Emerson Electric Co 138,050 7,369,061Paychex Inc 128,952 7,366,224Johnson & Johnson 60,610 7,102,917Centrica Plc 2,182,424 6,689,981Sysco Corp 130,723 6,336,028Vodafone Group Plc 2,067,517 6,271,527Imperial Brands Plc 114,814 6,018,294Royal Dutch Shell Plc 200,544 5,108,962
Sysco Corp 532,855 26,357,310Philip Morris International Inc 200,993 19,609,138Johnson & Johnson 155,616 18,187,972Reynolds American Inc 346,409 18,050,356Wolters Kluwer NV 336,752 13,082,935Procter & Gamble Co/The 132,849 11,102,551Eversource Energy 197,380 11,045,396Microsoft Corp 161,759 9,615,875Altria Group Inc 111,352 7,744,900CMS Energy Corp 175,392 7,607,575Imperial Brands Plc 115,825 5,868,498Paychex Inc 96,460 5,564,033Mattel Inc 172,970 5,466,246Telia Co AB 1,184,533 5,272,254Verizon Communications Inc 104,753 5,219,886Cisco Systems Inc 166,486 5,103,308Western Union Co/The 237,300 4,942,489Adecco Group AG 75,837 4,880,118Novartis AG 65,378 4,794,942Merck & Co Inc 75,563 4,679,290Diageo Plc 178,907 4,644,191CA Inc 143,084 4,591,705Zurich Insurance Group AG 14,252 4,504,520Annaly Capital Management Inc 431,873 4,467,386Clorox Co/The 35,232 4,421,201GlaxoSmithKline Plc 213,249 4,191,859Roche Holding AG 16,780 3,946,809Japan Tobacco Inc 112,000 3,918,217Two Harbors Investment Corp 500,264 3,915,347McDonald’s Corp 31,560 3,734,851Sanofi 45,708 3,691,306Orkla ASA 385,281 3,465,796Maxim Integrated Products Inc 84,585 3,356,085Emerson Electric Co 61,245 3,353,883TDC A/S 639,507 3,256,438SSE Plc 167,333 3,179,199British American Tobacco Plc 54,504 3,070,229
Major Purchases NominalCost USD Major Sales Nominal
Proceeds USD
BNY Mellon Global Equity Income Fund for the year ended 31 December 2016

411
BNY MELLON GLOBAL FUNDS, PLC
SIGNIFICANT PORTFOLIO MOVEMENTS
Major Purchases NominalCost USD Major Sales Nominal
Proceeds USD
iShares USD High Yield Corporate Bond UCITS ETF 79,765 8,371,745Neiman Marcus Group Ltd LLC 4.250% 25-Oct-2020 1,997,436 1,842,654Prime Security Services Borrower LLC / Prime Finance Inc 144A 9.250% 15-May-2023 1,505,000 1,523,475Cabot Financial Luxembourg SA 7.500% 01-Oct-2023 990,000 1,264,350DaVita Inc 5.000% 01-May-2025 1,215,000 1,218,125First Data Corp 144A 5.375% 15-Aug-2023 1,180,000 1,217,606Post Holdings Inc 144A 5.000% 15-Aug-2026 1,190,000 1,190,000ARD Finance SA 6.625% 15-Sep-2023 1,055,000 1,170,759Covanta Holding Corp 5.875% 01-Mar-2024 1,195,000 1,106,188T-Mobile USA Inc 6.000% 15-Apr-2024 1,040,000 1,086,160SFR Group SA 5.625% 15-May-2024 975,000 1,079,849Talen Energy Supply LLC 6.500% 01-Jun-2025 1,060,000 1,056,857Bank of America Corp 5.125% Perpetual VAR 1,065,000 1,035,600Virgin Media Finance Plc 144A 6.375% 15-Oct-2024 710,000 1,012,362INEOS Group Holdings SA 5.375% 01-Aug-2024 910,000 1,008,626Varsity Brands Holding Co Inc 0.000% 12-Nov-2021 988,744 993,873MPH Acquisition Holdings LLC 144A 7.125% 01-Jun-2024 940,000 984,113Reynolds Group Issuer Inc / Reynolds Group Issuer LLC / Reynolds Group Issuer Lu 144A 7.000% 15-Jul-2024 950,000 981,900Extraction Oil & Gas Holdings LLC / Extraction Finance Corp 144A 7.875% 15-Jul-2021 935,000 961,581Huntsman International LLC 4.250% 01-Apr-2025 875,000 948,352
iShares USD High Yield Corporate Bond UCITS ETF 79,765 8,331,966Neiman Marcus Group Ltd LLC 4.250% 25-Oct-2020 1,997,436 1,808,347Royal Bank of Scotland Group Plc 8.000% Perpetual VAR 1,365,000 1,271,325Bank of Ireland 7.375% Perpetual VAR 1,135,000 1,164,924International Lease Finance Corp 8.250% 15-Dec-2020 895,000 1,082,950Talen Energy Supply LLC 6.500% 01-Jun-2025 1,060,000 1,056,857Lloyds Banking Group Plc 7.500% Perpetual VAR 1,074,000 1,041,788Valeant Pharmaceuticals International Inc 144A 6.750% 15-Aug-2018 1,075,000 1,012,321Cirsa Funding Luxembourg SA 5.875% 15-May-2023 920,000 1,008,905GMAC Capital Trust I Pfd 39,984 996,872Varsity Brands Holding Co Inc 0.000% 12-Nov-2021 988,744 994,923Sprint Corp 7.250% 15-Sep-2021 1,210,000 993,071ADS Waste Holdings Inc 8.250% 01-Oct-2020 940,000 982,300Energizer SpinCo Inc 144A 5.500% 15-Jun-2025 921,000 910,772Telecom Italia Capital SA 6.000% 30-Sep-2034 975,000 908,440Alcatel-Lucent USA Inc 6.450% 15-Mar-2029 805,000 869,650Post Holdings Inc 7.375% 15-Feb-2022 815,000 866,213Scientific Games International Inc 10.000% 01-Dec-2022 955,000 859,531Cequel Communications Holdings I LLC / Cequel Capital Corp 144A 6.375% 15-Sep-2020 830,000 851,273ConvaTec Finance International SA 144A 8.250% 15-Jan-2019 830,000 830,000
BNY Mellon Global High Yield Bond Fund for the year ended 31 December 2016
Major Purchases NominalCost USD Major Sales Nominal
Proceeds USD
FANUC Corp 5,400 953,969Air Liquide SA 8,600 934,460Mastercard Inc 8,900 933,6603M Co 5,300 928,963Automatic Data Processing Inc 9,500 924,215Ecolab Inc 7,800 922,401Starbucks Corp 15,700 920,638Cognizant Technology Solutions Corp 16,200 919,862Nike Inc- Class B 17,701 919,357Colgate-Palmolive Co 13,900 915,357Alphabet Inc 1,190 914,947SAP SE 10,900 913,159TJX Cos Inc/The 11,700 912,445Schlumberger Ltd 10,800 908,687Johnson & Johnson 8,200 907,814Taiwan Semiconductor Manufacturing Co Ltd ADR 30,400 906,988Nestle SA 13,400 905,273Suncor Energy Inc 27,800 903,881Reckitt Benckiser Group Plc 10,900 902,143L’Oreal SA 5,200 901,435EOG Resources Inc 8,700 899,877LVMH Moet Hennessy Louis Vuitton SE 4,800 899,657CSL Ltd 12,600 897,741Roche Holding AG 4,100 890,481Keyence Corp 1,400 888,452Industria de Diseno Textil SA 26,050 887,647AIA Group Ltd 155,000 887,587Novartis AG 13,100 882,313Novo Nordisk A/S 25,400 878,644Celgene Corp 7,700 864,200
BNY Mellon Global Leaders Fund* for the year ended 31 December 2016
* Please refer to Note 19 of the financial statements.
The Fund had no sales during the reporting year.

412
BNY MELLON GLOBAL FUNDS, PLC
SIGNIFICANT PORTFOLIO MOVEMENTS
Major Purchases NominalCost USD Major Sales and Maturities Nominal
Proceeds USD
Australia Government Bond 3.250% 21-Oct-2018 16,175,000 12,684,169Canadian Government Bond 2.500% 01-Jun-2024 12,400,000 10,617,038Canadian Government Bond 1.750% 01-Mar-2019 11,800,000 9,607,051United States Treasury Inflation Indexed Bonds 0.125% 15-Apr-2021 7,883,705 8,023,451France Government Bond OAT 0.500% 25-May-2026 6,925,000 7,609,960Australia Government Bond 3.250% 21-Apr-2025 8,400,000 6,784,704United States Treasury Bill 0.000% 31-Mar-2016 6,220,000 6,219,944Mexican Bonos 4.750% 14-Jun-2018 112,000,000 6,045,819United States Treasury Note/Bond 2.500% 15-Feb-2046 6,125,000 5,939,768Canadian Government Bond 2.250% 01-Jun-2025 6,550,000 5,564,373Korea Treasury Bond 2.250% 10-Jun-2025 5,935,500,000 5,467,563Mexican Bonos 10.000% 05-Dec-2024 74,350,000 5,123,871United States Treasury Bill 0.000% 15-Sep-2016 5,100,000 5,098,821United States Treasury Inflation Indexed Bonds 0.625% 15-Jan-2026 4,107,969 4,285,530United States Treasury Note/Bond 1.125% 31-Aug-2021 3,975,000 3,848,090Korea Treasury Bond 2.250% 10-Dec-2025 4,067,000,000 3,530,394Digicel Group Ltd 8.250% 30-Sep-2020 3,450,000 2,959,975United States Treasury Note/Bond 1.125% 30-Jun-2021 2,900,000 2,880,063Italy Buoni Poliennali Del Tesoro 144A 2.350% 15-Sep-2024 2,108,163 2,651,138General Electric Capital Corp 6.375% 15-Nov-2067 VAR 2,350,000 2,535,063
United States Treasury Inflation Indexed Bonds 0.625% 15-Jan-2026 13,924,432 14,234,071Canadian Government Bond 2.500% 01-Jun-2024 12,400,000 10,371,791Canadian Government Bond 1.750% 01-Mar-2019 11,800,000 9,542,203United States Treasury Inflation Indexed Bonds 0.125% 15-Apr-2021 7,883,705 7,959,945France Government Bond OAT 0.500% 25-May-2026 6,925,000 7,609,859Canadian Government Bond 2.250% 01-Jun-2025 8,225,000 6,737,261Mexican Bonos 4.750% 14-Jun-2018 112,000,000 6,325,929Australia Government Bond 3.250% 21-Oct-2018 8,500,000 6,147,880Japanese Government CPI Linked Bond 0.100% 10-Mar-2025 660,670,200 6,130,155United States Treasury Note/Bond 2.500% 15-Feb-2046 6,125,000 5,914,504United States Treasury Bill 0.000% 15-Sep-2016 5,100,000 5,093,973Korea Treasury Bond 2.250% 10-Dec-2025 5,400,000,000 4,783,922United States Treasury Note/Bond 1.125% 31-Aug-2021 3,975,000 3,850,626International Bank for Reconstruction & Development 3.500% 22-Jan-2021 5,125,000 3,715,129United States Treasury Bill 0.000% 31-Mar-2016 3,390,000 3,388,933United States Treasury Note/Bond 1.125% 30-Jun-2021 2,900,000 2,901,926Italy Buoni Poliennali Del Tesoro 144A 2.350% 15-Sep-2024 2,108,163 2,616,186Australia Government Bond 2.750% 21-Oct-2019 3,475,000 2,571,814United States Treasury Note/Bond 1.750% 31-Jan-2023 2,485,000 2,507,419United States Treasury Note/Bond 2.500% 15-May-2046 2,375,000 2,478,116United States Treasury Bill 0.000% 27-Apr-2017 2,420,000 2,413,142Singapore Government Bond 2.125% 01-Jun-2026 2,800,000 2,155,443
BNY Mellon Global Opportunistic Bond Fund for the year ended 31 December 2016

413
BNY MELLON GLOBAL FUNDS, PLC
SIGNIFICANT PORTFOLIO MOVEMENTS
Major Purchases NominalCost USD Major Sales and Maturities Nominal
Proceeds USD
United States Treasury Bill 0.000% 22-Sep-2016 7,338,400 7,338,007United States Treasury Bill 0.000% 28-Apr-2016 6,808,400 6,808,224United States Treasury Bill 0.000% 08-Dec-2016 6,790,400 6,790,159France Treasury Bill BTF 0.000% 02-Mar-2016 5,542,961 6,047,437France Treasury Bill BTF 0.000% 06-Jan-2016 5,410,298 5,815,533Merck & Co Inc 79,380 4,764,407Nestle SA 56,346 4,511,395United States Treasury Bill 0.000% 13-Oct-2016 4,438,000 4,437,838Trimble Inc 166,895 4,253,201Hershey Co/The 41,836 3,955,644Yum! Brands Inc 51,077 3,888,091Accenture Plc 29,837 3,388,230Alphabet Inc 4,338 3,304,219Apple Inc 31,090 3,286,653British American Tobacco Plc 55,383 3,139,416Roche Holding AG 12,053 3,069,068Bayer AG 30,336 3,035,449Wolseley Plc 53,044 2,960,802CH Robinson Worldwide Inc 40,910 2,924,918Bridgestone Corp 77,400 2,920,842Express Scripts Holding Co 38,494 2,901,213RELX NV 178,016 2,884,252TJX Cos Inc/The 39,500 2,839,921Equifax Inc 23,997 2,828,843Intuit Inc 27,090 2,762,385Microsoft Corp 48,421 2,734,108Johnson Matthey Plc 68,061 2,710,796SAP AG 32,698 2,698,471Mattel Inc 83,409 2,572,173Vivendi SA 127,140 2,559,426Dollar General Corp 32,808 2,509,453DNB ASA 177,415 2,391,793Discovery Communications Inc 87,284 2,330,067Emerson Electric Co 42,353 2,216,851Suntory Beverage & Food Ltd 51,000 2,211,911Centrica Plc 751,995 2,147,952Medtronic Plc 26,148 2,107,127Japan Tobacco Inc 57,500 2,082,751AIA Group Ltd 344,200 2,082,668Baidu Inc ADR 11,955 2,021,511John Wood Group Plc 225,155 1,992,011Citigroup Inc 38,598 1,918,475TripAdvisor Inc 32,748 1,918,273Teva Pharmaceutical Industries Ltd ADR 41,289 1,853,868United Technologies Corp 18,026 1,814,125Diageo Plc 65,570 1,701,394
United States Treasury Bill 0.000% 22-Sep-2016 7,338,400 7,329,875United States Treasury Bill 0.000% 28-Apr-2016 6,808,400 6,804,294United States Treasury Bill 0.000% 08-Dec-2016 6,790,400 6,787,165France Treasury Bill BTF 0.000% 02-Mar-2016 5,542,961 5,967,863Gilead Sciences Inc 67,626 5,543,085United States Treasury Bill 0.000% 16-Mar-2017 5,123,500 5,116,707Diageo Plc 178,344 4,807,886United States Treasury Bill 0.000% 13-Oct-2016 4,438,000 4,431,867Unilever NV 97,761 4,310,656United States Treasury Note/Bond 0.875% 28-Feb-2017 4,270,100 4,277,183Teva Pharmaceutical Industries Ltd ADR 83,321 4,211,026Western Union Co/The 190,981 3,805,933Suntory Beverage & Food Ltd 88,200 3,801,032Cisco Systems Inc 116,439 3,615,981Apple Inc 34,837 3,442,140Costco Wholesale Corp 22,172 3,431,116Wal-Mart de Mexico SAB de CV 1,604,200 3,283,358CA Inc 92,624 2,965,573Bridgestone Corp 77,400 2,615,124Alphabet Inc 3,378 2,508,250Vivendi SA 119,741 2,369,444CH Robinson Worldwide Inc 30,538 2,168,203TripAdvisor Inc 32,623 2,036,738Walt Disney Co/The 20,544 2,020,538Associated British Foods Plc 63,646 2,017,717RELX NV 116,409 1,897,933Japan Tobacco Inc 49,400 1,859,261Microsoft Corp 34,234 1,827,035Discovery Communications Inc 67,800 1,803,916Dollar General Corp 24,690 1,780,231Wolseley Plc 29,817 1,610,870SAP AG 19,424 1,549,590Accenture Plc 13,651 1,513,277Blue Buffalo Pet Products Inc 64,413 1,445,092ConocoPhillips 26,950 1,416,362Bayer AG 12,311 1,365,549
BNY Mellon Global Opportunities Fund for the year ended 31 December 2016

414
BNY MELLON GLOBAL FUNDS, PLC
SIGNIFICANT PORTFOLIO MOVEMENTS
Major Purchases NominalCost EUR Major Sales Nominal
Proceeds EUR
Simon Property Group Inc 4,060 675,664HCP Inc 16,060 463,773Vornado Realty Trust 5,220 443,844Regency Centers Corp 6,210 404,928AvalonBay Communities Inc 2,530 396,222Boston Properties Inc 3,510 395,676CubeSmart 15,520 379,898Welltower Inc 6,080 370,602UDR Inc 10,800 347,131Equity One Inc 13,590 334,138Unibail-Rodamco SE 1,710 328,150Macerich Co/The 4,870 327,775Mitsubishi Estate Co Ltd 17,700 322,273CyrusOne Inc 8,110 312,651Public Storage 1,540 309,454Equity Residential 4,950 290,816DDR Corp 18,360 282,328Mitsui Fudosan Co Ltd 13,200 264,771Douglas Emmett Inc 8,093 258,174STORE Capital Corp 11,160 258,118Duke Realty Corp 11,270 253,208Scentre Group 79,610 237,915Kimco Realty Corp 9,940 236,695Prologis Inc 5,380 235,677General Growth Properties Inc 9,200 219,780Sun Hung Kai Properties Ltd 16,300 213,760Healthcare Trust of America Inc 7,970 206,926Cheung Kong Property Holdings Ltd 31,200 204,444Link REIT 33,600 200,929National Retail Properties Inc 4,940 188,600
Simon Property Group Inc 2,880 547,042Equity One Inc 13,590 380,142Welltower Inc 5,110 324,061Digital Realty Trust Inc 3,570 308,124Boston Properties Inc 2,560 291,907Washington Real Estate Investment Trust 8,970 265,732Public Storage 1,060 225,944Empire State Realty Trust Inc 12,686 225,882Vornado Realty Trust 2,680 222,935Essex Property Trust Inc 1,110 218,987Unibail-Rodamco SE 1,140 212,518Duke Realty Corp 8,790 209,194Apartment Investment & Management Co 5,200 208,122Equity Residential 3,310 205,676Highwoods Properties Inc 4,420 201,544Sun Hung Kai Properties Ltd 16,900 195,589Deutsche Wohnen AG 8,445 190,054Regency Centers Corp 2,900 182,502RioCan Real Estate Investment Trust 9,810 180,788Camden Property Trust 2,220 168,962General Growth Properties Inc 6,640 162,955AvalonBay Communities Inc 1,030 162,380Hudson Pacific Properties Inc 5,910 159,471National Retail Properties Inc 3,850 158,855Host Hotels & Resorts Inc 10,220 148,849Prologis Inc 3,800 148,245Sumitomo Realty & Development Co Ltd 6,300 145,259Ventas Inc 2,680 145,103Hospitality Properties Trust 4,990 139,795Spirit Realty Capital Inc 13,220 137,824Liberty Property Trust 3,970 136,738Vonovia SE 4,110 135,951Education Realty Trust Inc 3,350 131,202First Industrial Realty Trust Inc 6,200 129,642Weingarten Realty Investors 3,620 128,405Urban Edge Properties 4,910 127,152GPT Group 36,600 125,834
BNY Mellon Global Property Securities Fund for the year ended 31 December 2016

415
BNY MELLON GLOBAL FUNDS, PLC
SIGNIFICANT PORTFOLIO MOVEMENTS
Major Purchases NominalCost GBP Major Sales and Maturities Nominal
Proceeds GBP
United States Treasury Note/Bond 1.750% 31-Dec-2020 6,941,100 5,155,091United States Treasury Note/Bond 1.000% 31-Dec-2017 6,391,700 4,493,219United Kingdom Treasury Bill 4.000% 07-Sep-2016 3,580,000 3,606,977United States Treasury Note/Bond 3.000% 15-Nov-2045 4,620,800 3,438,801United Kingdom Treasury Bill 1.750% 22-Jan-2017 2,154,000 2,167,592United States Treasury Note/Bond 2.000% 15-Feb-2025 3,053,500 2,156,522United States Treasury Note/Bond 3.000% 15-May-2045 1,738,400 1,487,859Source Physical Markets Gold P-ETC 15,406 1,407,594Novartis AG 17,271 1,001,313Teva Pharmaceutical Industries Ltd ADR 24,507 937,504Australia Government Bond 3.000% 21-Mar-2047 1,388,000 814,854United States Treasury Note/Bond 0.875% 15-Apr-2019 1,158,800 812,279Diageo Plc 34,313 719,304Australia Government Bond 3.750% 21-Apr-2037 1,112,000 679,120Centrica Plc 281,670 597,044Australia Government Bond 4.500% 21-Apr-2033 892,000 580,910Eversource Energy 13,559 572,581Unilever NV 16,882 548,955United States Treasury Note/Bond 1.500% 31-Aug-2018 719,000 542,745GlaxoSmithKline Plc 35,224 515,984Samsung SDI Co Ltd 7,662 515,439Wolters Kluwer NV 17,270 511,260
United States Treasury Note/Bond 1.000% 31-Oct-2016 13,580,000 9,567,710United States Treasury Note/Bond 1.000% 31-Dec-2017 6,391,700 4,465,557United Kingdom Treasury Bill 4.000% 07-Sep-2016 3,580,000 3,592,194Australia Government Bond 4.500% 21-Apr-2033 3,213,000 2,428,105United States Treasury Note/Bond 1.750% 31-Dec-2020 3,053,300 2,232,501United States Treasury Note/Bond 3.000% 15-May-2045 2,693,800 2,197,933United Kingdom Treasury Bill 1.750% 22-Jan-2017 2,154,000 2,159,630United States Treasury Note/Bond 3.000% 15-Nov-2045 1,846,400 1,443,848Merck & Co Inc 29,279 1,420,365United States Treasury Note/Bond 1.500% 31-Aug-2018 1,193,800 866,778Microsoft Corp 17,878 784,732Source Physical Markets Gold P-ETC 7,746 751,749RWC Funds - RWC Global Convertibles Fund 1,024 746,579Sysco Corp 22,144 700,080Reynolds American Inc 19,657 668,996Wolters Kluwer NV 21,655 651,461Bayer AG 7,366 580,128Accenture Plc 6,380 570,173Aviva Investors Sicav - Global Convertibles Fund 4,304 534,346Brenntag AG 12,719 493,275
BNY Mellon Global Real Return Fund (GBP) for the year ended 31 December 2016
United States Treasury Note/Bond 1.750% 31-Dec-2020 327,908,100 303,821,283United States Treasury Note/Bond 1.000% 31-Dec-2017 331,453,000 301,258,848United States Treasury Note/Bond 3.000% 15-Nov-2045 197,363,200 191,580,092iShares Physical Gold ETC 6,650,891 153,933,433United States Treasury Note/Bond 3.000% 15-May-2045 145,877,900 144,390,517United States Treasury Note/Bond 2.000% 15-Feb-2025 142,358,400 129,794,075Australia Government Bond 3.750% 21-Apr-2037 91,946,000 70,301,988United States Treasury Note/Bond 1.500% 31-Aug-2018 75,573,900 68,851,946Novartis AG 1,001,586 68,679,166Australia Government Bond 4.500% 21-Apr-2033 78,344,000 65,607,374Teva Pharmaceutical Industries Ltd ADR 1,315,507 62,737,775Australia Government Bond 3.000% 21-Mar-2047 78,025,000 50,935,376United States Treasury Note/Bond 0.875% 15-Apr-2019 56,626,800 50,070,627Eversource Energy 972,572 48,278,354Wolters Kluwer NV 1,376,202 48,032,983Centrica Plc 18,181,375 47,393,291Source Physical Markets Gold P-ETC 426,762 46,404,513Japan Tobacco Inc 1,289,100 46,279,182GlaxoSmithKline Plc 2,372,475 43,933,504Diageo Plc 1,823,419 43,752,256Vivendi SA 2,454,091 42,082,199Microsoft Corp 806,434 38,823,540United Utilities Group Plc 3,133,377 35,919,532Samsung SDI Co Ltd 414,105 33,882,262
United States Treasury Note/Bond 1.000% 31-Oct-2016 437,844,100 404,153,749United States Treasury Note/Bond 1.000% 31-Dec-2017 266,746,300 238,375,320Australia Government Bond 4.500% 21-Apr-2033 154,097,000 132,601,958United States Treasury Note/Bond 1.750% 31-Dec-2020 118,632,400 109,302,854United States Treasury Note/Bond 3.000% 15-May-2045 99,017,500 99,358,834ETFS Physical Gold 782,309 86,334,506Merck & Co Inc 1,297,990 74,215,484United States Treasury Note/Bond 3.000% 15-Nov-2045 49,196,700 47,541,380Aviva Investors Sicav - Global Convertibles Fund 253,445 32,434,299Banco Espanol de Credito SA 3.500% 18-Jan-2016 30,000,000 30,000,000Microsoft Corp 497,196 29,260,089RWC Funds - RWC Global Convertibles Fund 18,583 27,341,150United States Treasury Note/Bond 1.500% 31-Aug-2018 27,984,600 25,661,252Westpac Banking Corp 2.125% 16-Feb-2016 24,515,000 24,515,000Sysco Corp 548,758 24,058,124Brenntag AG 497,169 23,666,982Royal Bank of Scotland Plc/The 4.000% 15-Mar-2016 22,000,000 22,000,000Bayer AG 231,373 21,869,997Topcon Corp 1,404,900 20,068,859Accenture Plc 167,534 19,575,038
Major Purchases NominalCost EUR Major Sales and Maturities Nominal
Proceeds EUR
BNY Mellon Global Real Return Fund (EUR) for the year ended 31 December 2016

416
BNY MELLON GLOBAL FUNDS, PLC
SIGNIFICANT PORTFOLIO MOVEMENTS
Major Purchases NominalCost USD Major Sales and Maturities Nominal
Proceeds USD
United States Treasury Note/Bond 1.000% 31-Oct-2016 77,434,000 77,658,346United States Treasury Note/Bond 1.000% 31-Dec-2017 39,509,400 39,610,751Australia Government Bond 4.500% 21-Apr-2033 23,491,000 22,411,155United States Treasury Note/Bond 1.750% 31-Dec-2020 16,977,400 17,440,590United States Treasury Note/Bond 3.000% 15-May-2045 13,763,600 15,421,948Merck & Co Inc 207,483 12,858,845United States Treasury Note/Bond 3.000% 15-Nov-2045 9,118,800 10,013,926ETFS Physical Gold 73,485 9,263,782RWC Funds - RWC Global Convertibles Fund 4,437 6,408,874United States Treasury Note/Bond 1.500% 31-Aug-2018 6,259,900 6,347,561Microsoft Corp 93,574 5,606,861United States Treasury Bill 0.000% 22-Sep-2016 5,386,000 5,386,000Barrick Gold Corp 288,300 5,360,586Sysco Corp 95,297 4,628,083Bayer AG 41,007 4,353,798Brenntag AG 81,715 4,206,197Accenture Plc 34,819 4,088,695National Grid Plc 306,061 3,998,191Aviva Investors Sicav - Global Convertibles Fund 18,269 3,829,703Wolters Kluwer NV 91,955 3,690,973
United States Treasury Note/Bond 1.750% 31-Dec-2020 49,262,800 50,225,785United States Treasury Note/Bond 1.000% 31-Dec-2017 39,509,400 39,656,546United States Treasury Note/Bond 3.000% 15-Nov-2045 31,259,900 33,398,706United States Treasury Note/Bond 2.000% 15-Feb-2025 22,071,500 22,309,512United States Treasury Note/Bond 3.000% 15-May-2045 17,594,300 19,480,779iShares Physical Gold ETC 611,042 15,949,867Australia Government Bond 3.750% 21-Apr-2037 12,828,000 11,013,123Novartis AG 138,592 10,526,726United States Treasury Note/Bond 1.500% 31-Aug-2018 10,343,000 10,501,695Source Physical Markets Gold P-ETC 81,992 10,352,700Teva Pharmaceutical Industries Ltd ADR 188,696 10,027,279Australia Government Bond 4.500% 21-Apr-2033 10,067,000 9,476,702United States Treasury Note/Bond 0.875% 15-Apr-2019 8,440,700 8,443,930Australia Government Bond 3.000% 21-Mar-2047 11,295,000 8,127,779Centrica Plc 2,590,718 7,568,222Eversource Energy 125,764 6,962,622Diageo Plc 261,537 6,805,712Japan Tobacco Inc 170,300 6,801,977Wolters Kluwer NV 168,855 6,766,848GlaxoSmithKline Plc 318,607 6,607,763Vivendi SA 331,487 6,311,838Microsoft Corp 104,477 5,731,661United Utilities Group Plc 443,818 5,610,132Samsung SDI Co Ltd 59,481 5,427,611United States Treasury Bill 0.000% 22-Sep-2016 5,386,000 5,380,888Unilever NV 128,674 5,220,764Bayer AG 46,844 5,133,853
BNY Mellon Global Real Return Fund (USD) for the year ended 31 December 2016

417
BNY MELLON GLOBAL FUNDS, PLC
SIGNIFICANT PORTFOLIO MOVEMENTS
Major Purchases NominalCost USD Major Sales Nominal
Proceeds USD
Insight Liquidity Funds Plc - USD Liquidity Fund 27,525,000 27,525,000Play Topco SA 7.750% 28-Feb-2020 10,678,000 11,472,745Virgin Media Secured Finance Plc 6.000% 15-Apr-2021 4,590,000 6,064,229Petrofac Ltd 3.400% 10-Oct-2018 3,000,000 3,026,760Petroleum Geo-Services ASA 7.375% 15-Dec-2018 2,000,000 1,997,500Norwegian Energy Co ASA 59,864 729,170
Insight Liquidity Funds Plc - USD Liquidity Fund 29,470,000 29,470,000FMG Resources August 2006 Pty Ltd 144A 9.750% 01-Mar-2022 12,000,000 13,903,200CPUK Finance Ltd 7.000% 28-Aug-2020 9,890,000 13,130,198Play Topco SA 7.750% 28-Feb-2020 10,678,000 11,574,290Annington Finance No 5 Plc 13.000% 15-Jan-2023 7,600,000 11,244,538Trionista TopCo GmbH 6.875% 30-Apr-2021 10,011,000 11,205,446Rite Aid Corp 9.250% 15-Mar-2020 10,607,000 11,110,833Lincoln Finance Ltd 144A 7.375% 15-Apr-2021 10,000,000 10,737,500WMG Acquisition Corp 144A 6.750% 15-Apr-2022 10,000,000 10,525,000INEOS Group Holdings SA 144A 5.875% 15-Feb-2019 10,000,000 10,175,000Virgin Media Finance Plc 7.000% 15-Apr-2023 6,848,000 9,127,725Energy Future Intermediate Holdings 4.250% 30-Jun-2017 9,032,258 9,089,161DS Services of America Inc 144A 10.000% 01-Sep-2021 8,000,000 8,840,000Vedanta Resources Plc 9.500% 18-Jul-2018 8,000,000 8,490,592AECOM Global II LLC / URS Fox US LP 3.850% 01-Apr-2017 8,300,000 8,319,132Marfrig Holdings Europe BV 6.875% 24-Jun-2019 7,665,000 7,818,300Concho Resources Inc 5.500% 01-Apr-2023 7,500,000 7,748,625Capsugel SA 144A 7.000% 15-May-2019 7,680,000 7,686,989Diamond 1 Finance Corp / Diamond 2 Finance Corp 144A 7.125% 15-Jun-2024 7,000,000 7,653,258Hertz Corp/The 5.875% 15-Oct-2020 7,627,000 7,474,460Cemex SAB de CV 144A 6.500% 10-Dec-2019 7,000,000 7,367,500Stonegate Pub Co Financing Plc 5.750% 15-Apr-2019 5,731,000 7,318,416AK Steel Corp 7.625% 15-May-2020 7,000,000 7,202,500PBF Holding Co LLC / PBF Finance Corp 8.250% 15-Feb-2020 7,000,000 7,192,900SFR Group SA 144A 6.000% 15-May-2022 7,000,000 7,078,750Anglo American Capital Plc 144A 9.375% 08-Apr-2019 6,000,000 6,837,000Marlin Intermediate Holdings Plc 10.500% 01-Aug-2020 5,000,000 6,758,359Sprint Communications Inc 144A 9.000% 15-Nov-2018 6,000,000 6,607,500Wind Acquisition Finance SA 144A 7.375% 23-Apr-2021 6,450,000 6,604,688Dynegy Inc 6.750% 01-Nov-2019 6,400,000 6,496,000Targa Resources Partners LP / Targa Resources Partners Finance Corp 4.125% 15-Nov-2019 6,000,000 6,090,000Rain CII Carbon LLC / CII Carbon Corp 144A 8.000% 01-Dec-2018 6,000,000 5,985,000 Virgin Media Secured Finance Plc 6.000% 15-Apr-2021 4,590,000 5,974,108Ithaca Energy Inc 144A 8.125% 01-Jul-2019 6,000,000 5,910,000Vale Overseas Ltd 5.625% 15-Sep-2019 5,600,000 5,873,000Teck Resources Ltd 144A 8.500% 01-Jun-2024 5,000,000 5,850,000NGL Energy Partners LP / NGL Energy Finance Corp 5.125% 15-Jul-2019 5,876,000 5,846,620Inovyn Finance Plc 0.000% 15-May-2021 5,360,000 5,666,595Bormioli Rocco Holdings SA 10.000% 01-Aug-2018 5,172,000 5,661,509Altice Luxembourg SA 7.250% 15-May-2022 5,000,000 5,653,639WhiteWave Foods Co/The 5.375% 01-Oct-2022 5,000,000 5,531,250Wind Acquisition Finance SA 7.000% 23-Apr-2021 5,000,000 5,482,490Tesoro Logistics LP / Tesoro Logistics Finance Corp 5.875% 01-Oct-2020 5,300,000 5,478,345Linxens France SA 0.000% 17-Jul-2023 5,500,000 5,472,500Columbus Cable Barbados Ltd 144A 7.375% 30-Mar-2021 5,000,000 5,337,500CF Industries Inc 6.875% 01-May-2018 5,000,000 5,275,000Marfrig Overseas Ltd 9.500% 04-May-2020 5,000,000 5,180,000Provincia de Buenos Aires 5.750% 15-Jun-2019 5,000,000 5,006,250Glencore Finance Europe SA 2.081% 06-May-2018 FRN 5,000,000 4,937,470
BNY Mellon Global Short-Dated High Yield Fund* for the year ended 31 December 2016
* Please refer to Note 19 of the financial statements.
The above constitutes the full sales detail for the Fund during the reporting year.

418
BNY MELLON GLOBAL FUNDS, PLC
SIGNIFICANT PORTFOLIO MOVEMENTS
Major Purchases NominalCost JPY Major Sales Nominal
Proceeds JPY
Sekisui Chemical Co Ltd 47,100 71,537,536Daikin Industries Ltd 6,900 57,993,005Bic Camera Inc 38,500 41,398,455Recruit Holdings Co Ltd 10,200 37,473,543Yokogawa Electric Corp 27,700 37,336,569Trusco Nakayama Corp 7,100 35,568,127East Japan Railway Co 3,300 33,382,123SoftBank Corp 4,300 27,513,485Anicom Holdings Inc 9,500 23,437,966Mazda Motor Corp 11,700 21,173,089Otsuka Corp 3,300 20,090,367UACJ Corp 69,000 19,792,999Nintendo Co Ltd 900 19,712,119Nichias Corp 22,000 18,740,187Shimizu Corp 18,000 18,015,898Ezaki Glico Co Ltd 3,200 17,435,257Toyota Motor Corp 2,700 17,398,553Mitsubishi UFJ Financial Group Inc 27,200 17,368,427Omron Corp 4,300 17,235,095Osaki Electric Co Ltd 19,000 16,917,316Daicel Corp 13,700 16,830,463Park24 Co Ltd 5,100 16,174,158Anest Iwata Corp 15,400 16,074,778Nihon Kohden Corp 6,000 16,033,155Tomy Co Ltd 13,600 15,578,354Nitto Denko Corp 2,100 15,527,369Isuzu Motors Ltd 11,800 15,385,420HIS Co Ltd 4,400 13,745,803Zenkoku Hosho Co Ltd 3,600 13,736,047Nidec Corp 1,400 13,571,319Japan Tobacco Inc 3,300 13,154,501Star Micronics Co Ltd 9,500 13,141,128SCSK Corp 3,200 12,914,831IDOM Inc 13,400 12,783,583Nifco Inc 2,100 12,496,208Sumitomo Mitsui Financial Group Inc 2,900 11,772,661Kito Corp 9,800 11,666,049METAWATER Co Ltd 4,100 11,395,371Fuji Heavy Industries Ltd 2,600 11,315,103Astellas Pharma Inc 7,000 11,093,336
Toyota Motor Corp 13,900 79,453,832Mitsubishi UFJ Financial Group Inc 104,900 54,268,263Park24 Co Ltd 17,000 54,171,571SoftBank Corp 8,700 53,060,475Nifco Inc 9,200 52,176,034Nidec Corp 5,800 51,377,936Penta-Ocean Construction Co Ltd 84,900 48,433,201Santen Pharmaceutical Co Ltd 28,500 47,032,045SCSK Corp 11,800 47,015,810Mizuho Financial Group Inc 251,600 45,389,593Totetsu Kogyo Co Ltd 15,700 44,727,236Japan Tobacco Inc 10,600 43,547,563Disco Corp 3,900 42,857,052Hikari Tsushin Inc 4,700 41,386,206Astellas Pharma Inc 26,900 41,072,203Fuji Heavy Industries Ltd 10,700 41,000,233Rinnai Corp 4,300 40,805,672Leopalace21 Corp 62,300 40,763,586Mitsubishi Estate Co Ltd 20,000 38,727,207Sumitomo Mitsui Financial Group Inc 11,300 38,102,019Isuzu Motors Ltd 31,200 37,098,208Nippon Shokubai Co Ltd 5,600 37,068,201Hitachi Ltd 72,000 36,155,145Kubota Corp 22,600 35,831,135Sankyu Inc 61,000 35,740,360Bic Camera Inc 38,500 35,543,873Temp Holdings Co Ltd 20,500 35,252,456Aica Kogyo Co Ltd 16,100 35,010,850Otsuka Corp 6,600 33,302,978Mitsubishi Heavy Industries Ltd 79,000 33,298,458Bandai Namco Holdings Inc 11,700 33,134,233Denso Corp 8,000 33,024,055Nichias Corp 39,000 32,984,400Shimizu Corp 36,000 32,969,004Unizo Holdings Co Ltd 9,300 32,718,059Mazda Motor Corp 19,800 32,606,768Rakuten Inc 27,200 32,604,122Pola Orbis Holdings Inc 3,800 32,286,397Mitsubishi Pencil Co Ltd 6,100 31,968,907Yokogawa Electric Corp 23,900 31,317,849Nihon Kohden Corp 11,600 31,263,875Sohgo Security Services Co Ltd 6,100 30,947,288Tsuruha Holdings Inc 2,600 30,801,817Daikin Industries Ltd 3,200 29,963,193Daicel Corp 23,300 29,853,634Sekisui Chemical Co Ltd 19,100 29,175,150Keio Corp 31,000 28,236,104Nitto Denko Corp 4,000 27,808,996Omron Corp 7,200 26,085,298Dai-ichi Life Holdings Inc 18,800 25,900,381Ryohin Keikaku Co Ltd 1,100 25,780,133Mitsubishi Electric Corp 18,700 25,020,436
BNY Mellon Japan All Cap Equity Fund for the year ended 31 December 2016

419
BNY MELLON GLOBAL FUNDS, PLC
SIGNIFICANT PORTFOLIO MOVEMENTS
Major Purchases NominalCost JPY Major Sales Nominal
Proceeds JPY
Japan Excellent Inc 67 9,504,387Advance Residence Investment Corp 30 9,032,958Invincible Investment Corp 163 8,526,765Premier Investment Corp 58 7,665,826Frontier Real Estate Investment Corp 14 7,018,974NIPPON REIT Investment Corp 23 6,459,234
Nippon Building Fund Inc 270 170,640,00Japan Real Estate Investment Corp 271 170,052,500Orix JREIT Inc 654 115,561,800Nippon Prologis REIT Inc 421 96,114,300Activia Properties Inc 186 95,976,000Japan Retail Fund Investment Corp 414 94,731,958GLP J-Reit 709 90,007,550Nomura Real Estate Master Fund Inc 457 78,466,900Advance Residence Investment Corp 257 73,656,200Daiwa Office Investment Corp 115 65,320,000Hulic Reit Inc 357 65,313,150Mori Hills REIT Investment Corp 401 60,791,600United Urban Investment Corp 339 58,596,150Daiwa House REIT Investment Corp 203 57,489,600Japan Hotel REIT Investment Corp 722 56,640,900Frontier Real Estate Investment Corp 112 55,552,000Kenedix Office Investment Corp 88 54,032,000Nippon Accommodations Fund Inc 90 42,435,000LaSalle Logiport REIT 401 42,305,500Mori Trust Sogo Reit Inc 239 41,347,000Japan Excellent Inc 288 40,982,400Premier Investment Corp 286 38,695,800Kenedix Retail REIT Corp 136 34,401,200Japan Rental Housing Investments Inc 414 32,809,500Industrial & Infrastructure Fund Investment Corp 62 32,395,000Invincible Investment Corp 526 29,193,000Sekisui House Reit Inc 195 28,206,750Fukuoka REIT Corp 152 26,235,200MCUBS MidCity Investment Corp 75 26,231,250Japan Logistics Fund Inc 115 26,082,000AEON REIT Investment Corp 205 25,594,250Comforia Residential REIT Inc 100 23,975,000Ichigo Office REIT Investment 305 22,890,250
BNY Mellon Japan REIT Alpha Fund* for the year ended 31 December 2016
The above constitutes the full sales detail for the Fund during the reporting year.
* Please refer to Note 19 of the financial statements.

420
BNY MELLON GLOBAL FUNDS, PLC
SIGNIFICANT PORTFOLIO MOVEMENTS
Sanken Electric Co Ltd 439,000 171,068,503TechMatrix Corp 87,700 145,304,443Sakata INX Corp 103,300 130,005,771Itokuro Inc 39,400 105,441,221Nifco Inc 16,200 90,014,080Open Door Inc 25,700 72,252,862HIS Co Ltd 22,200 67,063,575Tomy Co Ltd 51,900 60,166,297Dowa Holdings Co Ltd 54,000 35,171,853Star Micronics Co Ltd 28,400 34,909,817Anicom Holdings Inc 13,800 32,960,307Financial Products Group Co Ltd 25,900 31,764,929Zenkoku Hosho Co Ltd 7,800 30,228,156Temp Holdings Co Ltd 18,800 29,729,651V-Cube Inc 32,400 26,065,641Resorttrust Inc 10,100 22,073,048Nippon Gas Co Ltd 3,200 9,833,380PAL Group Holdings Co Ltd 3,500 8,783,105Unizo Holdings Co Ltd 2,300 8,633,178Sanyo Chemical Industries Ltd 5,700 7,585,683
Vector Inc 95,600 220,595,789V-Cube Inc 166,400 179,672,403Unizo Holdings Co Ltd 42,300 164,652,526Totetsu Kogyo Co Ltd 52,500 155,445,064Penta-Ocean Construction Co Ltd 284,400 144,817,065Nichias Corp 153,000 122,428,563Nikkiso Co Ltd 159,000 122,417,610Osaki Electric Co Ltd 150,000 113,933,786Leopalace21 Corp 164,900 109,076,302Anicom Holdings Inc 38,000 102,736,932Tadano Ltd 75,000 99,943,565Kakaku.com Inc 41,800 97,673,530CyberAgent Inc 18,700 90,732,910TechMatrix Corp 45,300 89,958,486Resorttrust Inc 34,700 84,804,718PAL Group Holdings Co Ltd 34,100 84,718,311Nippon Gas Co Ltd 33,700 83,610,643Temp Holdings Co Ltd 47,900 80,669,936Ain Holdings Inc 13,100 80,140,187Sanken Electric Co Ltd 211,000 79,353,713Sanyo Chemical Industries Ltd 85,100 78,270,320Dowa Holdings Co Ltd 117,000 77,367,423HIS Co Ltd 23,800 72,699,146Itokuro Inc 20,700 69,650,860Star Micronics Co Ltd 56,300 68,864,51877 Bank Ltd/The 143,000 60,924,164SHO-BOND Holdings Co Ltd 11,400 49,918,473Sakata INX Corp 34,400 43,506,603Tsuruha Holdings Inc 4,200 42,548,409Financial Products Group Co Ltd 39,100 40,183,288Zenkoku Hosho Co Ltd 8,800 32,507,870
Major Purchases NominalCost JPY Major Sales Nominal
Proceeds JPY
BNY Mellon Japan Small Cap Equity Focus Fund for the year ended 31 December 2016

421
BNY MELLON GLOBAL FUNDS, PLC
SIGNIFICANT PORTFOLIO MOVEMENTS
Major Purchases NominalCost EUR Major Sales Nominal
Proceeds EUR
Compass Group Plc 1,303,264 20,115,687Tractor Supply Co 279,410 19,693,935Experian Plc 748,400 13,260,219Cerner Corp 234,300 13,141,529Essilor International SA 80,352 8,334,196CSL Ltd 93,000 6,341,839EOG Resources Inc 99,900 5,579,811Nestle SA 83,700 5,450,020Reckitt Benckiser Group Plc 67,000 5,421,358Suncor Energy Inc 262,800 5,137,611Novartis AG 78,112 5,114,638Schlumberger Ltd 66,100 4,231,514L’Oreal SA 24,874 3,995,086Roche Holding AG 17,500 3,778,475Keyence Corp 5,700 3,745,203Walt Disney Co/The 32,000 2,668,225TJX Cos Inc 36,100 2,370,629Inditex SA 63,800 2,080,045Starbucks Corp 43,600 2,065,254Oracle Corp 56,700 1,971,344AIA Group Ltd 317,000 1,771,407China Mobile Ltd 153,000 1,571,254
DBS Group Holdings Ltd 2,328,017 20,566,011Keyence Corp 36,200 20,039,170Komatsu Ltd 948,500 19,630,609Honda Motor Co Ltd 799,800 18,844,294Syngenta AG 45,350 16,925,975Intuitive Surgical Inc 24,561 13,465,303Taiwan Semiconductor Manufacturing Co Ltd ADR 567,377 12,831,168Adobe Systems Inc 150,492 12,504,746Stryker Corp 115,961 11,312,448Swatch Group AG 39,800 11,093,100Shin-Etsu Chemical Co Ltd 198,100 10,995,087CSL Ltd 144,000 10,688,460Reckitt Benckiser Group Plc 116,200 9,912,488Alphabet Inc 14,898 9,851,738TJX Cos Inc 142,432 9,543,974MSC Industrial Direct Co Inc 128,800 8,617,782Inditex SA 265,000 7,992,755Amphenol Corp 147,380 7,572,125Johnson & Johnson 65,340 6,424,050Cisco Systems Inc 255,876 6,290,940Automatic Data Processing Inc 81,011 6,221,028Schlumberger Ltd 94,429 6,105,761EOG Resources Inc 82,883 5,941,687Novo Nordisk A/S 118,760 5,748,557CNOOC Ltd 5,219,000 5,517,068MasterCard Inc 64,659 5,457,391Hong Kong & China Gas Co Ltd 3,428,001 5,424,464Microsoft Corp 115,763 5,259,610Colgate-Palmolive Co 82,246 5,124,415Nestle SA 72,200 5,091,160AIA Group Ltd 923,200 5,064,493Cognizant Technology Solutions Corp 90,082 4,845,479FANUC Corp 33,700 4,844,600L’Oreal SA 30,374 4,811,861China Mobile Ltd 456,000 4,757,061Compass Group Plc 295,381 4,626,672Fastenal Co 109,098 4,407,047Nike Inc 78,927 4,280,426Starbucks Corp 84,548 4,136,012Novartis AG 62,112 4,122,003LVMH Moet Hennessy Louis Vuitton SA 26,800 4,061,121
BNY Mellon Long-Term Global Equity Fund for the year ended 31 December 2016

422
BNY MELLON GLOBAL FUNDS, PLC
SIGNIFICANT PORTFOLIO MOVEMENTS
Major Purchases NominalCost EUR Major Sales Nominal
Proceeds EUR
Nestle SA 31,553 2,145,962Infineon Technologies AG 133,556 1,964,250LEG Immobilien AG 23,187 1,891,946Novartis AG 27,159 1,886,637Wolters Kluwer NV 48,486 1,693,528Unilever Plc 42,563 1,677,250Vodafone Group Plc 655,991 1,667,664British American Tobacco Plc 28,229 1,514,092Atlantia SpA 64,561 1,463,971Roche Holding AG 6,418 1,418,051Barclays Plc 670,659 1,363,816GlaxoSmithKline Plc 73,160 1,329,690DNB ASA 113,201 1,311,270Credit Suisse Group AG 109,619 1,308,496Diageo Plc 52,672 1,292,841BG Group Plc 95,693 1,280,949SAP SE 17,171 1,271,933Bayer AG 14,127 1,268,144Prudential Plc 88,873 1,252,112Vinci SA 19,897 1,248,185CRH Plc 41,376 1,246,125Royal Bank of Scotland Group Plc 543,890 1,187,881RELX Plc 74,006 1,183,995Vivendi SA 67,306 1,160,625Novo Nordisk A/S 20,296 1,029,471Wolseley Plc 19,461 953,764Centrica Plc 360,892 951,547L’Oreal SA 5,757 942,867Essilor International SA 8,443 926,693Svenska Cellulosa AB SCA 34,235 907,405Just Eat Plc 160,613 890,811Royal Dutch Shell Plc 44,363 887,513MTU Aero Engines AG 9,898 876,718Volkswagen AG 6,677 864,622Anheuser-Busch InBev NV 7,513 842,121Volkswagen AG Pfd 7,171 831,908Telefonica Deutschland Holding AG 228,840 816,214Veolia Environnement SA 41,617 791,027Associated British Foods Plc 26,007 785,618Hella KGaA Hueck & Co 22,320 749,531Sanofi 10,303 721,415Galp Energia SGPS SA 63,579 704,893Yoox Net-A-Porter Group SpA 27,800 694,838Dixons Carphone Plc 164,838 691,189Hays Plc 442,032 690,037Koninklijke Ahold Delhaize NV 32,441 658,012Inditex SA 21,464 657,974Zurich Insurance Group AG 3,164 632,822
Royal Bank of Scotland Group Plc 581,221 1,731,205Unilever Plc 44,230 1,715,831Credit Suisse Group AG 71,599 966,588L’Oreal SA 5,976 941,432Volkswagen AG 6,677 932,133Volkswagen AG Pfd 7,584 926,527DNB ASA 68,856 771,951Hays Plc 464,903 658,288Barclays Plc 265,705 615,033Infineon Technologies AG 45,417 562,006Whitbread Plc 10,455 548,673Atlantia SpA 20,961 505,045SAP SE 6,826 472,672Swisscom AG 1,014 427,226Vinci SA 6,193 403,535Telefonica Deutschland Holding AG 83,397 388,446CRH Plc 13,221 380,471Nestle SA 5,349 374,454Intesa Sanpaolo SpA 135,445 353,982BG Group Plc 26,749 347,788British American Tobacco Plc 6,477 345,361Diageo Plc 13,965 334,377Veolia Environnement SA 15,033 311,785Koninklijke Ahold NV 15,021 304,906Centrica Plc 106,077 288,723Vodafone Group Plc 103,733 278,187Associated British Foods Plc 7,628 267,428RELX Plc 14,838 250,793Actelion Ltd 1,515 238,612GlaxoSmithKline Plc 11,957 228,941Yoox Net-A-Porter Group SpA 9,916 219,483Wolseley Plc 4,260 218,756Essilor International SA 1,731 197,613Next Plc 2,075 190,577
BNY Mellon Pan European Fund for the year ended 31 December 2016

423
BNY MELLON GLOBAL FUNDS, PLC
SIGNIFICANT PORTFOLIO MOVEMENTS
Major Purchases NominalCost USD Major Sales Nominal
Proceeds USD
Apple Inc 5,123 504,621Microsoft Corp 7,459 393,137Exxon Mobil Corp 4,181 337,513Facebook Inc 2,629 290,429Charter Communications Inc 1,002 277,865Johnson & Johnson 2,640 277,208Berkshire Hathaway Inc 2,015 267,348General Electric Co 8,861 261,779Amazon.com Inc 435 258,607Procter & Gamble Co/The 3,012 245,953Alphabet Inc - Class A 324 242,053AT&T Inc 6,318 233,627Alphabet Inc - Class C 308 223,885Wells Fargo & Co 4,528 221,742Verizon Communications Inc 4,279 215,588JPMorgan Chase & Co 3,564 212,028Pfizer Inc 6,422 199,140Chevron Corp 2,015 179,841Coca-Cola Co/The 3,872 166,952Intel Corp 5,043 157,183
Apple Inc 5,159 533,545Microsoft Corp 6,915 375,326Time Warner Cable 1,468 307,145Exxon Mobil Corp 3,479 300,921General Electric Co 9,714 291,934Johnson & Johnson 2,314 262,486EMC Corp 8,654 249,078Facebook Inc 1,899 223,497Procter & Gamble Co/The 2,705 223,310Amazon.com Inc 318 223,298Berkshire Hathaway Inc 1,552 220,850JPMorgan Chase & Co 3,326 215,776AT&T Inc 5,290 205,176Wells Fargo & Co 4,228 204,107Pfizer Inc 5,734 193,088Alphabet Inc - Class A 249 188,732Alphabet Inc - Class C 255 188,411Verizon Communications Inc 3,483 176,961Chevron Corp 1,637 162,034Home Depot Inc/The 1,212 157,636
BNY Mellon S&P 500® Index Tracker for the year ended 31 December 2016

424
BNY MELLON GLOBAL FUNDS, PLC
SIGNIFICANT PORTFOLIO MOVEMENTS
Autogrill SpA 155,323 1,190,383 Hispania Activos Inmobiliarios SOCIMI SA 84,192 1,014,323 Wirecard AG 25,060 1,008,531 Merlin Properties Socimi SA 98,124 979,283 Baloise Holding AG 8,456 955,752 Kindred Group Plc 95,114 952,119 Valmet OYJ 87,794 922,875 Stabilus SA 20,484 913,442 Carl Zeiss Meditec AG 26,427 892,908 SCOR SE 28,586 865,470 Brenntag AG 17,693 855,069 Covestro AG 144A 22,138 842,453 Nyrstar NV 964,400 799,329 Cie Plastic Omnium SA 27,293 794,259 Drillisch AG 21,111 789,109 Fonciere Des Regions 9,880 744,428 Maisons du Monde SA 144A 38,936 707,426 Cia de Distribucion Integral Logista Holdings SA 35,049 705,210 Stroeer SE & Co KGaA 15,992 692,078 Galapagos NV 15,268 671,391 Orion Engineered Carbons SA 41,304 636,835 SBM Offshore NV 50,886 615,669 Technip SA 11,616 610,842 YIT OYJ 117,530 608,177 Jenoptik AG 37,084 594,906 Bechtle AG 7,215 574,217 Eiffage SA 9,193 554,269 Gamesa Corp Tecnologica SA 30,693 543,003 Amplifon SpA 58,151 535,440 Euronext NV 144A 12,981 489,004 Saras SpA 280,110 488,547 Cramo OYJ 23,156 481,720 Oriola-KD OYJ 109,269 479,378 Societa Iniziative Autostradali e Servizi SpA 56,349 478,155 Euskaltel SA 144A 51,155 477,761 Edenred 22,990 468,948 Koninklijke BAM Groep NV 104,611 448,792 TAG Immobilien AG 35,869 434,400 Korian SA 17,171 415,558 Enagas SA 15,815 412,467 bpost SA 16,670 393,642 Anima Holding SpA 144A 70,230 392,239 Gerresheimer AG 5,827 387,512 K+S AG 17,024 362,198
Atos SE 20,405 1,685,047 Valeo SA 34,651 1,614,066 Saft Groupe SA 42,266 1,507,805 STADA Arzneimittel AG 31,682 1,427,932 Dialog Semiconductor Plc 41,531 1,237,527 Mediaset Espana Comunicacion SA 112,602 1,183,812 Greencore Group Plc 252,502 1,156,730 Huhtamaki OYJ 29,052 1,129,555 AerCap Holdings NV 32,192 1,120,693 Stroeer SE & Co KGaA 25,627 1,113,612 Lagardere SCA 44,229 1,072,253 Gerresheimer AG 15,268 1,051,741 Alten SA 20,701 1,046,924 Gamesa Corp Tecnologica SA 54,464 1,032,742 Teleperformance 12,876 1,019,889 JCDecaux SA 28,239 989,440 Sopra Steria Group 10,030 985,575 Cofinimmo SA 8,751 933,614 Alstria office REIT-AG 70,347 883,767 Jungheinrich AG Pfd 22,826 878,355 SCOR SE 31,346 861,165 APERAM SA 24,171 844,287 USG People NV 47,262 807,866 TKH Group NV 24,193 798,199 Euronext NV 144A 21,813 785,117 Galapagos NV 14,924 783,799 YIT OYJ 117,530 780,029 Orpea 11,198 760,528 Aareal Bank AG 25,984 756,193 TAG Immobilien AG 61,892 749,896 Symrise AG 11,754 718,893 Brenntag AG 15,743 711,633 Enagas SA 26,192 682,983 Fonciere des Regions 8,633 677,019 Covestro AG 144A 15,026 673,785 Zalando SE 144A 21,854 664,234 Leonardo SpA 59,624 664,199 Corbion NV 29,432 652,930 Cewe Stiftung & Co KGAA 9,006 629,435 A2A SpA 521,874 627,090
Major Purchases NominalCost EUR Major Sales Nominal
Proceeds EUR
BNY Mellon Small Cap Euroland Fund for the year ended 31 December 2016

425
BNY MELLON GLOBAL FUNDS, PLC
SIGNIFICANT PORTFOLIO MOVEMENTS
Major Purchases NominalCost USD Major Sales and Maturities Nominal
Proceeds USD
Australia Government Bond 3.250% 21-Oct-2018 24,850,000 19,401,378Canadian Government Bond 2.500% 01-Jun-2024 11,800,000 9,957,554Australia Government Bond 2.750% 21-Oct-2019 10,575,000 7,858,657United States Treasury Note/Bond 1.625% 15-Feb-2026 5,485,000 5,373,722Canadian Government Bond 1.750% 01-Mar-2019 6,625,000 5,330,059United States Treasury Inflation Indexed Bonds 0.625% 15-Jan-2026 5,091,050 5,178,382United Kingdom Gilt 1.500% 22-Jul-2026 3,475,000 4,811,703United States Treasury Note/Bond 0.500% 30-Apr-2017 4,425,000 4,422,580United States Treasury Note/Bond 0.880% 30-Apr-2017 4,400,000 4,412,547United States Treasury Note/Bond 0.750% 15-Mar-2017 4,400,000 4,407,563Japanese Government CPI Linked Bond 0.100% 10-Mar-2025 426,504,200 4,033,817French Republic Government Bond OAT 0.500% 25-May-2026 3,625,000 3,963,679Singapore Government Bond 2.380% 01-Jun-2025 5,100,000 3,818,606United States Treasury Inflation Indexed Bonds 0.125% 15-Apr-2021 3,777,017 3,800,232United States Treasury Note/Bond 1.130% 31-Aug-2021 3,800,000 3,774,069Mexican Bonos 4.750% 14-Jun-2018 47,000,000 2,654,631United States Treasury Note/Bond 2.500% 15-Feb-2046 2,025,000 1,951,289International Bank for Reconstruction & Development 3.500% 22-Jan-2021 2,425,000 1,757,890United Kingdom Gilt 2.000% 07-Sep-2025 1,150,000 1,697,185United States Treasury Note/Bond 2.500% 15-May-2046 1,600,000 1,645,858United States Treasury Note/Bond 2.250% 15-Nov-2025 1,600,000 1,645,438
Australia Government Bond 3.250% 21-Oct-2018 33,455,000 26,098,543Canadian Government Bond 2.500% 01-Jun-2024 11,800,000 10,016,106Australia Government Bond 2.750% 21-Oct-2019 9,475,000 7,190,696United States Treasury Note/Bond 1.625% 15-Feb-2026 5,485,000 5,455,029Canadian Government Bond 1.750% 01-Mar-2019 6,625,000 5,228,650United States Treasury Note/Bond 0.500% 30-Apr-2017 4,425,000 4,422,338United Kingdom Gilt 1.500% 22-Jul-2026 3,475,000 4,414,387United States Treasury Note/Bond 0.875% 30-Apr-2017 4,400,000 4,410,656United States Treasury Note/Bond 0.750% 15-Mar-2017 4,400,000 4,405,500Singapore Government Bond 2.375% 01-Jun-2025 5,100,000 3,890,683United States Treasury Note/Bond 1.125% 31-Aug-2021 3,800,000 3,727,563Australia Government Bond 3.250% 21-Apr-2025 4,075,000 3,376,622Mexican Bonos 4.750% 14-Jun-2018 47,000,000 2,463,429Mexican Bonos 10.000% 05-May-2024 35,200,000 2,425,822France Government Bond OAT 0.500% 25-May-2026 2,025,000 2,309,197United States Treasury Bill 0.000% 11-Feb-2016 2,133,000 2,132,741United States Treasury Note/Bond 2.500% 15-Feb-2046 2,025,000 1,989,325Vereit Operating Partnership LP 2.000% 06-Feb-2017 1,790,000 1,785,073United States Treasury Note/Bond 2.500% 15-May-2046 1,600,000 1,704,071United Kingdom Gilt 2.000% 07-Sep-2025 1,150,000 1,678,411
BNY Mellon Targeted Return Bond Fund for the year ended 31 December 2016
Major Purchases NominalCost USD Major Sales Nominal
Proceeds USD
iShares Russell 1000 Value ETF 91,347 9,444,671Berkshire Hathaway Inc 38,992 5,994,844JPMorgan Chase & Co 62,543 4,526,734Bank of America Corp 234,224 4,081,740AT&T Inc 96,349 3,893,867Raytheon Co 26,693 3,738,236Goldman Sachs Group Inc/The 19,050 3,532,078Halliburton Co 62,695 2,976,913Occidental Petroleum Corp 40,285 2,856,401Merck & Co Inc 45,851 2,794,112EOG Resources Inc 27,857 2,577,075Time Warner Inc 30,512 2,552,574Anadarko Petroleum Corp 38,552 2,470,177Synchrony Financial 76,512 2,425,174Omnicom Group Inc 28,645 2,410,919Prudential Financial 24,702 2,253,219Cisco Systems Inc 72,102 2,164,674United Technologies Corp 20,650 2,140,815Kellogg Co 27,890 2,091,650Voya Financial Inc 60,182 2,032,091Delta Air Lines Inc 43,857 2,000,202Molson Coors Brewing Co 19,478 1,947,605PNC Financial Services Group Inc/The 19,081 1,930,902Texas Instruments Inc 27,022 1,891,621Martin Marietta Materials Inc 9,196 1,867,225Honeywell International Inc 16,638 1,842,624Phillips 66 21,553 1,782,593Apple Inc 15,875 1,760,593UnitedHealth Group Inc 11,281 1,656,618Packaging Corp of America 20,171 1,636,572Abbott Laboratories 40,940 1,635,984Vulcan Materials Co 13,778 1,623,998Valero Energy Corp 25,944 1,590,529Pioneer Natural Resources Co 9,588 1,519,951
iShares Russell 1000 Value ETF 80,084 8,288,627Citigroup Inc 43,412 2,178,984AT&T Inc 53,887 2,151,734Pfizer Inc 57,100 1,946,835Cisco Systems Inc 63,870 1,898,390Morgan Stanley 44,488 1,745,265Occidental Petroleum Corp 23,373 1,667,684Applied Materials Inc 55,806 1,597,513Northrop Grumman Corp 7,217 1,561,055Microchip Technology Inc 23,967 1,483,492Comerica Inc 19,306 1,280,679Carnival Corporation 24,252 1,195,783EOG Resources Inc 12,518 1,117,239JPMorgan Chase & Co 15,033 1,081,704Capital One Financial Corp 15,288 1,030,109Schlumberger Ltd 12,671 993,950Allstate Corp/The 14,656 985,714Prudential Financial 10,323 968,990United Technologies Corp 10,504 946,232Pioneer Natural Resources Co 5,131 927,099Hess Corp 18,123 917,493PepsiCo Inc 8,769 898,336Merck & Co Inc 13,980 843,080Hartford Financial Services Group Inc 17,243 814,495PNC Financial Services Group Inc/The 9,476 798,237Oracle Corp 20,607 794,041Vulcan Materials Co 6,297 775,930Apple Inc 7,483 743,818American International Group Inc 13,506 721,057UnitedHealth Group Inc 4,889 680,587US Bancorp 15,973 663,104Raytheon Co 4,729 659,547Viacom 18,168 656,994Goldman Sachs Group Inc/The 3,164 632,916
BNY Mellon U.S. Dynamic Value Fund for the year ended 31 December 2016

426
BNY MELLON GLOBAL FUNDS, PLC
SIGNIFICANT PORTFOLIO MOVEMENTS
Major Purchases NominalCost USD Major Sales Nominal
Proceeds USD
Vanguard S&P 500 ETF 44,973 8,677,063iShares Russell 1000 ETF 38,731 4,493,834SPDR S&P 500 ETF Trust 20,008 4,191,954Mosaic Co/The 116,463 3,202,874Bank of America Corp 177,881 2,841,805Citigroup Inc 58,199 2,838,126iShares Russell 3000 ETF 22,988 2,806,144Pioneer Natural Resources Co 16,655 2,629,148Union Pacific Corp 29,156 2,606,020Superior Energy Services Inc 136,159 2,590,750Equifax Inc 21,763 2,525,647SVB Financial Group 23,077 2,284,560Visteon Corp 30,402 2,208,407Snap-on Inc 13,005 2,131,582Intercontinental Exchange Inc 8,239 2,055,029Dow Chemical Co/The 36,965 2,042,046MGIC Investment Corp 228,756 2,006,795Lithia Motors Inc 21,170 1,937,933Abbott Laboratories 49,619 1,920,499Staples Inc 207,560 1,889,551Korn/Ferry International 64,571 1,876,979salesforce.com Inc 25,237 1,851,995Steel Dynamics Inc 60,916 1,769,464Visa Inc 23,629 1,744,258Brookdale Senior Living Inc 97,221 1,723,610Broadcom Ltd 10,834 1,696,096Coca-Cola Co/The 36,837 1,625,888Facebook Inc 13,624 1,600,176Power Integrations Inc 30,849 1,549,625E*TRADE Financial Corp 61,596 1,533,750Microchip Technology Inc 30,173 1,525,532Synchrony Financial 52,153 1,520,069HubSpot Inc 26,337 1,517,123Allergan plc 5,782 1,468,894American Water Works Co Inc 19,955 1,450,246Wells Fargo & Co 25,627 1,369,691Marsh & McLennan Cos Inc 20,593 1,368,022Honeywell International Inc 12,302 1,367,881BlackRock Inc 3,986 1,322,717Vanguard Total Stock Market ETF 12,957 1,305,705Molson Coors Brewing Co 12,983 1,272,463SLM Corp 174,513 1,184,867Splunk Inc 23,145 1,164,130Mylan NV 24,653 1,122,930
Vanguard S&P 500 ETF 50,424 9,670,154iShares Russell 1000 ETF 47,873 5,500,456SPDR S&P 500 ETF Trust 25,034 5,237,397Intercontinental Exchange Inc 35,131 3,548,074iShares Russell 3000 ETF 26,737 3,207,367Mosaic Co/The 116,463 3,143,210Equifax Inc 21,763 2,907,394Amazon.com Inc 3,666 2,829,380BlackRock Inc 7,182 2,564,788E*TRADE Financial Corp 92,572 2,560,981Synchrony Financial 76,967 2,375,090SVB Financial Group 23,077 2,364,294Honeywell International Inc 18,586 2,097,055Bank of America Corp 109,784 1,983,963Valspar Corp/The 18,394 1,917,775Visa Inc 23,629 1,894,773Wells Fargo & Co 37,397 1,883,203Union Pacific Corp 20,023 1,870,376Citigroup Inc 35,920 1,860,429Pioneer Natural Resources Co 10,278 1,843,155Alphabet Inc 2,217 1,716,411Korn/Ferry International 64,571 1,709,386Mylan NV 46,067 1,692,470FNF Group 49,390 1,667,983Facebook Inc 13,624 1,656,896First Republic Bank 22,829 1,633,450Oracle Corp 40,803 1,591,823Charles Schwab Corp/The 58,921 1,546,403CBS Corp 26,989 1,532,383Goldman Sachs Group Inc/The 9,737 1,495,663Staples Inc 170,408 1,461,391Apple Inc 15,641 1,458,745Bristol-Myers Squibb Co 24,182 1,453,926Universal Display Corp 24,794 1,422,032Signature Bank 9,989 1,371,949Eli Lilly & Co 17,810 1,340,556
BNY Mellon US Opportunities Fund for the year ended 31 December 2016

427
UCITS V REMUNERATION POLICY (unaudited)
APPENDIX 1
REMUNERATION DISCLOSURE
In accordance with the UCITS V Directive, the Irish implementing Regulations and the ESMA UCITS Remuneration Guidelines (the “UCITS Remuneration Code”), the Company is required to disclose details of the remuneration paid by the Manager to its staff for the financial year.
The remuneration policies are designed in line with the UCITS V Directive remuneration principles:
• are consistent with and promote sound and effective risk management of the UCITS which it manages;
• do not encourage risk-taking which is inconsistent with the risk profiles or fund rules governing the relevant UCITS which it manages; and
• do not impair compliance with the UCITS Manager’s duty to act in the best interest of the UCITS which it manages.
No numerical remuneration disclosures have been provided in these report and accounts, as the Manager has not yet completed its first annual performance period in which it has to comply with the UCITS remuneration code. The Manager believes that numerical remuneration disclosures for a partial financial year would not provide relevant and comparable information to shareholders.
The Manager’s Remuneration Policy is available at www.bnymellonim.com or a paper copy is available free of charge upon request from the registered office of the Manager.

428
SECURITIES FINANCING TRANSACTIONS REGULATION DISCLOSURES (“SFTR”) (unaudited)
APPENDIX 2
SECURITIES LENDING TRANSACTIONS
The Company has entered into a securities lending agreement (as amended, assigned, novated and assumed) with The Bank of New York Mellon, London Branch (the “Agent Lender”) effective 27 November 2015.
The following table details the aggregate value of securities on loan by Fund as a proportion of total lendable assets and each Fund’s net asset value as at 31 December 2016:
Fund CurrencyAggregate value
of securities on loan% of
Total lendable assets% of
Net asset value
BNY Mellon Absolute Insight Fund EUR 34,495 0.37 0.04 BNY Mellon Absolute Return Bond Fund EUR 126,632,962 7.80 5.86 BNY Mellon Absolute Return Equity Fund GBP 21,364,698 3.78 0.94 BNY Mellon Asian Bond Fund USD 597,558 2.49 2.33 BNY Mellon Asian Equity Fund USD 884,779 3.43 1.22 BNY Mellon Emerging Markets Corporate Debt Fund USD 20,940,394 13.63 11.94 BNY Mellon Emerging Markets Debt Fund USD 5,779,610 10.28 9.37 BNY Mellon Emerging Markets Debt Local Currency Fund USD 26,226,619 8.14 3.16 BNY Mellon Emerging Markets Debt Opportunistic Fund USD 6,473,204 14.66 9.68 BNY Mellon Euroland Bond Fund EUR 173,898,994 13.94 13.01 BNY Mellon European Credit Fund EUR 1,092,468 1.41 1.25 BNY Mellon Global Bond Fund USD 66,668,814 19.25 13.57 BNY Mellon Global Credit Fund USD 8,844,387 2.67 2.21 BNY Mellon Global Dynamic Bond Fund USD 18,968,372 9.14 5.20 BNY Mellon Global Emerging Markets Fund USD 778,487 6.96 2.58 BNY Mellon Global Equity Fund USD 24,145,014 14.22 9.36 BNY Mellon Global Equity Income Fund USD 22,335,835 5.52 3.23 BNY Mellon Global High Yield Bond Fund USD 18,840,721 12.99 12.09 BNY Mellon Global Opportunistic Bond Fund USD 9,101,603 9.28 6.97 BNY Mellon Global Opportunities Fund USD 11,209,182 15.62 10.51 BNY Mellon Global Property Securities Fund EUR 1,391,575 6.55 6.51 BNY Mellon Global Real Return Fund (EUR) EUR 615,307,801 30.87 14.95 BNY Mellon Global Real Return Fund (GBP) GBP 2,340,749 7.73 3.51 BNY Mellon Global Real Return Fund (USD) USD 95,985,722 30.69 14.88 BNY Mellon Japan All Cap Equity Fund JPY 317,327,196 13.87 13.91 BNY Mellon Japan Small Cap Equity Focus Fund JPY 405,036,390 15.64 14.87BNY Mellon Long-Term Global Equity Fund EUR 192,163,275 15.19 14.97BNY Mellon Pan European Equity Fund EUR 116,826 11.09 6.04BNY Mellon S&P 500® Index Tracker USD 7,310,054 8.47 8.44BNY Mellon Small Cap Euroland Fund EUR 4,356,388 13.27 12.44BNY Mellon Targeted Return Bond Fund USD 1,062,787 1.66 1.35BNY Mellon U.S. Dynamic Value Fund USD 12,162,639 8.79 8.69BNY Mellon US Opportunities Fund USD 2,171,114 6.92 6.85
The collaterals are held in the name of the Agent Lender to the order of its clients; the actual segregation to underlying client level is done with the Agent Lender’s books and records. The collaterals are held on account at the tri-party agent, who acts as a settlement and collection service for securities and collateral between the lender and the borrower. The tri-party agents used are Euroclear, Global Collateral Management - The Bank of New York Mellon Institutional Bank and JPMorgan Chase Bank, N.A. (where JPMorgan are the borrower). For bilateral transactions, the collaterals are held on account at the Agent Lender.

429
APPENDIX 2
SECURITIES FINANCING TRANSACTIONS REGULATION DISCLOSURES (“SFTR”) (unaudited) cont’d.
SECURITIES LENDING TRANSACTIONS cont’d.
The following table provides an analysis of the amounts held at each collateral agent as non-cash collateral received in respect of securities lending transactions as at 31 December 2016:
Fund Collateral agentAggregate value
of collateral held
BNY Mellon Absolute Insight Fund EURThe Bank of New York Mellon, London Branch 38,151
38,151
BNY Mellon Absolute Return Bond Fund EURThe Bank of New York Mellon, London Branch 50,622,569Euroclear Triparty 82,177,252
132,799,821
BNY Mellon Absolute Return Equity Fund GBPThe Bank of New York Mellon, London Branch 23,425,617
23,425,617
BNY Mellon Asian Bond Fund USDEuroclear Triparty 626,532
626,532
BNY Mellon Asian Equity Fund USDThe Bank of New York Mellon Institutional Bank 903,123
903,123
BNY Mellon Emerging Markets Corporate Debt Fund USDThe Bank of New York Mellon, London Branch 1,319,130Euroclear Triparty 18,933,718JPMorgan Chase Bank, N.A. 1,815,638
22,068,486
BNY Mellon Emerging Markets Debt Fund USDThe Bank of New York Mellon, London Branch 2,596,428The Bank of New York Mellon Institutional Bank 149,534Euroclear Triparty 3,386,545
6,132,507
BNY Mellon Emerging Markets Debt Local Currency Fund USDThe Bank of New York Mellon, London Branch 22,335,932Euroclear Triparty 5,153,510
27,489,442
BNY Mellon Emerging Markets Debt Opportunistic Fund USDThe Bank of New York Mellon, London Branch 2,630,504Euroclear Triparty 4,236,780
6,867,284
Fund Collateral agentAggregate value
of collateral held
BNY Mellon Euroland Bond Fund EURThe Bank of New York Mellon, London Branch 21,415,560The Bank of New York Mellon Institutional Bank 8,440,856Euroclear Triparty 149,277,683JPMorgan Chase Bank, N.A. 214,148
179,348,247
BNY Mellon European Credit Fund EURThe Bank of New York Mellon, London Branch 107,867Euroclear Triparty 1,124,712
1,232,579
BNY Mellon Global Bond Fund USDThe Bank of New York Mellon, London Branch 69,969,299Euroclear Triparty 2,144,419
72,113,718
BNY Mellon Global Credit Fund USDEuroclear Triparty 5,699,731JPMorgan Chase Bank, N.A. 3,502,049
9,201,780
BNY Mellon Global Dynamic Bond Fund USDThe Bank of New York Mellon, London Branch 18,076,104Euroclear Triparty 2,566,467
20,642,571
BNY Mellon Global Emerging Markets Fund USDThe Bank of New York Mellon, London Branch 303,441The Bank of New York Mellon Institutional Bank 520,117
823,558
BNY Mellon Global Equity Fund USDThe Bank of New York Mellon, London Branch 13,121,511The Bank of New York Mellon Institutional Bank 12,336,640
25,458,151
BNY Mellon Global Equity Income Fund USDThe Bank of New York Mellon, London Branch 19,150,086The Bank of New York Mellon Institutional Bank 4,476,260
23,626,346

430
APPENDIX 2
SECURITIES FINANCING TRANSACTIONS REGULATION DISCLOSURES (“SFTR”) (unaudited) cont’d.
SECURITIES LENDING TRANSACTIONS cont’d.
Fund Collateral agentAggregate value
of collateral held
BNY Mellon Global High Yield Bond Fund USDThe Bank of New York Mellon Institutional Bank 16,622,471Euroclear Triparty 2,693,526
19,315,997
BNY Mellon Global Opportunistic Bond Fund USDThe Bank of New York Mellon, London Branch 3,492,642The Bank of New York Mellon Institutional Bank 1,294,079Euroclear Triparty 4,805,613
9,592,334
BNY Mellon Global Opportunities Fund USDThe Bank of New York Mellon, London Branch 4,955,092The Bank of New York Mellon Institutional Bank 6,868,862
11,823,954
BNY Mellon Global Property Securities Fund EURThe Bank of New York Mellon, London Branch 606,850The Bank of New York Mellon Institutional Bank 629,508JPMorgan Chase Bank, N.A. 253,670
1,490,028
BNY Mellon Global Real Return Fund (EUR) EURThe Bank of New York Mellon, London Branch 652,581,835The Bank of New York Mellon Institutional Bank 5,367,208Euroclear Triparty 11,837,834
669,786,877
BNY Mellon Global Real Return Fund (GBP) GBPThe Bank of New York Mellon, London Branch 1,678,541The Bank of New York Mellon Institutional Bank 834,671
2,513,212
BNY Mellon Global Real Return Fund (USD) USDThe Bank of New York Mellon, London Branch 105,128,777The Bank of New York Mellon Institutional Bank 99,584
105,228,361
BNY Mellon Japan All Cap Equity Fund JPYThe Bank of New York Mellon, London Branch 266,163,528JPMorgan Chase Bank, N.A. 84,804,500
350,968,028
Fund Collateral agentAggregate value
of collateral held
BNY Mellon Japan Small Cap Equity Focus Fund JPYThe Bank of New York Mellon, London Branch 353,169,836JPMorgan Chase Bank, N.A. 93,224,409
446,394,245
BNY Mellon Long-Term Global Equity Fund EURThe Bank of New York Mellon, London Branch 178,393,004The Bank of New York Mellon Institutional Bank 25,587,715JPMorgan Chase Bank, N.A. 6,721,221
210,701,940
BNY Mellon Pan European Equity Fund EURThe Bank of New York Mellon, London Branch 129,276
129,276
BNY Mellon S&P 500® Index Tracker USDThe Bank of New York Mellon, London Branch 6,186,011The Bank of New York Mellon Institutional Bank 1,691,388
7,877,399
BNY Mellon Small Cap Euroland Fund EURThe Bank of New York Mellon, London Branch 4,871,457
4,871,457
BNY Mellon Targeted Return Bond Fund USDThe Bank of New York Mellon, London Branch 764,188The Bank of New York Mellon Institutional Bank 370,624
1,134,812
BNY Mellon U.S. Dynamic Value Fund USDThe Bank of New York Mellon, London Branch 12,603,943The Bank of New York Mellon Institutional Bank 604,534
13,208,477
BNY Mellon US Opportunities Fund USDThe Bank of New York Mellon, London Branch 1,786,936The Bank of New York Mellon Institutional Bank 572,448
2,359,384

431
APPENDIX 2
SECURITIES FINANCING TRANSACTIONS REGULATION DISCLOSURES (“SFTR”) (unaudited) cont’d.
SECURITIES LENDING TRANSACTIONS cont’d.
The type and quality of collateral obtained in respect of securities lending transactions are as follows:
(1) debt obligations and securities issued or guaranteed by the following governments, agencies and instrumentalities where rated either (i) AA or better by Standard & Poor’s or (ii) AA or better by Fitch or (iii) Aa2 or better by Moody’s Rating Agencies, respectively: Australia; Austria; Belgium; Canada; Denmark; Finland; France; Germany; Ireland; Italy; Japan; Luxembourg; Netherlands; New Zealand; Norway; Portugal; Spain; Sweden; Switzerland; United Kingdom; United States of America;
(2) debt obligations where rated either (i) AAA or better by Standard & Poor’s or (ii) AAA or better by Fitch or (iii) Aaa2 or better by Moody’s Rating Agencies, respectively for the following Supranational issuers: European Bank for Reconstruction and Development; European Investment Bank; European Union; Inter-American Development Bank; International Bank for Reconstruction and Development; International Finance Corporation;
(3) equity securities from the following indices: AEX 25 (Netherlands), CAC 40 (France), DAX 30 (Germany), Euro 50 (Eurozone), FTSE 100 (United Kingdom), Nikkei 225 (Japan), SMI 20 (Switzerland), S&P 500 (United States of America);
(4) FTSE100 DBV (Class F10) as defined in the Crest Reference Manual); and
(5) unstripped British Government Stock (Class UBG) as defined in the CREST Reference Manual.
The following table provides an analysis of the type and quality of non-cash collateral received in respect of securities lending transactions as at 31 December 2016:
Fund Type of collateral Quality of collateralAggregate value of collateral held
BNY Mellon Absolute Insight Fund EUREquities Recognised equity indices 38,151
38,151
BNY Mellon Absolute Return Bond Fund EURFixed income securities Investment grade 85,703,176Equities Recognised equity indices 47,096,645
132,799,821
BNY Mellon Absolute Return Equity Fund GBPFixed income securities Investment grade 12,758,961Equities Recognised equity indices 10,666,656
23,425,617
BNY Mellon Asian Bond Fund USDFixed income securities Investment grade 626,532
626,532
BNY Mellon Asian Equity Fund USDFixed income securities Investment grade 903,123
903,123
BNY Mellon Emerging Markets Corporate Debt Fund USDFixed income securities Investment grade 22,068,486
22,068,486
Fund Type of collateral Quality of collateralAggregate value of collateral held
BNY Mellon Emerging Markets Debt Fund USDFixed income securities Investment grade 6,132,507
6,132,507
BNY Mellon Emerging Markets Debt Local Currency Fund USDFixed income securities Investment grade 27,489,442
27,489,442
BNY Mellon Emerging Markets Debt Opportunistic Fund USDFixed income securities Investment grade 6,867,284
6,867,284
BNY Mellon Euroland Bond Fund EURFixed income securities Investment grade 179,348,247
179,348,247
BNY Mellon European Credit Fund EURFixed income securities Investment grade 1,232,579
1,232,579
BNY Mellon Global Bond Fund USDFixed income securities Investment grade 25,788,949Equities Recognised equity indices 46,324,769
72,113,718
BNY Mellon Global Credit Fund USDFixed income securities Investment grade 9,201,780
9,201,780

432
APPENDIX 2
SECURITIES FINANCING TRANSACTIONS REGULATION DISCLOSURES (“SFTR”) (unaudited) cont’d.
SECURITIES LENDING TRANSACTIONS cont’d.
Fund Type of collateral Quality of collateralAggregate value of collateral held
BNY Mellon Global Dynamic Bond Fund USDFixed income securities Investment grade 4,606,403Equities Recognised equity indices 16,036,168
20,642,571
BNY Mellon Global Emerging Markets Fund USDFixed income securities Investment grade 520,117Equities Recognised equity indices 303,441
823,558
BNY Mellon Global Equity Fund USDFixed income securities Investment grade 18,390,404Equities Recognised equity indices 7,067,747
25,458,151
BNY Mellon Global Equity Income Fund USDFixed income securities Investment grade 16,808,921Equities Recognised equity indices 6,817,425
23,626,346
BNY Mellon Global High Yield Bond Fund USDFixed income securities Investment grade 19,315,997
19,315,997
BNY Mellon Global Opportunistic Bond Fund USDFixed income securities Investment grade 8,769,826Equities Recognised equity indices 822,508
9,592,334
BNY Mellon Global Opportunities Fund USDFixed income securities Investment grade 6,868,863Equities Recognised equity indices 4,955,091
11,823,954
BNY Mellon Global Property Securities Fund EURFixed income securities Investment grade 759,956Equities Recognised equity indices 730,072
1,490,028
BNY Mellon Global Real Return Fund (EUR) EURFixed income securities Investment grade 150,314,762Equities Recognised equity indices 519,472,115
669,786,877
BNY Mellon Global Real Return Fund (GBP) GBPFixed income securities Investment grade 1,062,155Equities Recognised equity indices 1,451,057
2,513,212
Fund Type of collateral Quality of collateralAggregate value of collateral held
BNY Mellon Global Real Return Fund (USD) USDFixed income securities Investment grade 9,583,300Equities Recognised equity indices 95,645,061
105,228,361
BNY Mellon Japan All Cap Equity Fund JPYFixed income securities Investment grade 38,759,840Equities Recognised equity indices 312,208,188
350,968,028
BNY Mellon Japan Small Cap Equity Focus Fund JPYFixed income securities Investment grade 77,195,353Equities Recognised equity indices 369,198,892
446,394,245
BNY Mellon Long-Term Global Equity Fund EURFixed income securities Investment grade 25,587,715Equities Recognised equity indices 185,114,225
210,701,940
BNY Mellon Pan European Equity Fund EURFixed income securities Investment grade 27,739Equities Recognised equity indices 101,537
129,276
BNY Mellon S&P 500® Index Tracker USDFixed income securities Investment grade 3,333,538Equities Recognised equity indices 4,543,861
7,877,399
BNY Mellon Small Cap Euroland Fund EURFixed income securities Investment grade 1,546,257Equities Recognised equity indices 3,325,200
4,871,457
BNY Mellon Targeted Return Bond Fund USDFixed income securities Investment grade 1,134,812
1,134,812
BNY Mellon U.S. Dynamic Value Fund USDFixed income securities Investment grade 4,862,233Equities Recognised equity indices 8,346,244
13,208,477
BNY Mellon US Opportunities Fund USDFixed income securities Investment grade 572,448Equities Recognised equity indices 1,786,936
2,359,384

433
APPENDIX 2
SECURITIES FINANCING TRANSACTIONS REGULATION DISCLOSURES (“SFTR”) (unaudited) cont’d.
SECURITIES LENDING TRANSACTIONS cont’d.
The following table lists the ten largest collateral issuers based on the value of non-cash collateral received in respect of securities lending transactions as at 31 December 2016:
Collateral IssuerAggregate value
of collateral held
BNY Mellon Absolute Insight Fund EURHumana Inc 2,730Microsoft Corp 2,540Baxter International Inc 2,217Yahoo! Inc 2,213BlackRock Inc 1,934Biogen Inc 1,880Apple Inc 1,666UnitedHealth Group Inc 1,635Freeport-McMoRan Inc 1,523Linear Technology Corp 1,217
BNY Mellon Absolute Return Bond Fund EURFrench Republic 65,957,108German Federal Republic 7,152,071Royal Dutch Shell PLC 4,709,663AstraZeneca PLC 3,559,993KDDI Corp 3,529,840Kingdom of the Netherlands 3,129,807Diageo PLC 3,061,835Republic of Finland 2,846,309Republic of Austria 2,671,572National Grid PLC 2,636,517
BNY Mellon Absolute Return Equity Fund GBPRepublic of Austria 4,401,372French Republic 4,289,379German Federal Republic 2,145,469Government of Canada 714,142United States of America 619,451Republic of Finland 537,318Actelion Ltd 459,466Syngenta AG 405,133E*TRADE Financial Corp 382,914Baxter International Inc 317,719
BNY Mellon Asian Bond Fund* USDFrench Republic 198,667United Kingdom 178,136European Investment Bank 106,822German Federal Republic 103,006International Bank for Reconstruction & Development 38,847Kingdom of the Netherlands 1,054
BNY Mellon Asian Equity Fund* USDUnited States of America 903,123
Collateral IssuerAggregate value
of collateral held
BNY Mellon Emerging Markets Corporate Debt Fund USDFrench Republic 6,684,974United Kingdom 5,422,788European Investment Bank 4,530,461German Federal Republic 3,195,868International Bank for Reconstruction & Development 851,340Republic of Finland 552,942Republic of Austria 240,161International Finance Corp 167,681Inter-American Development Bank 128,919Norwegian Government 125,547
BNY Mellon Emerging Markets Debt Fund USDFrench Republic 2,035,795German Federal Republic 1,643,098European Investment Bank 761,406United Kingdom 635,416Kingdom of the Netherlands 608,430United States of America 250,329Republic of Finland 76,934Norwegian Government 55,653Republic of Austria 35,470Government of Canada 22,683
BNY Mellon Emerging Markets Debt Local Currency Fund USDUnited States of America 10,858,142Kingdom of the Netherlands 5,964,318Kingdom of Sweden 5,089,897French Republic 4,833,739German Federal Republic 502,320European Investment Bank 97,784Swiss Federation 79,024United Kingdom 26,884Republic of Austria 26,693International Bank for Reconstruction & Development 6,403
BNY Mellon Emerging Markets Debt Opportunistic Fund USDFrench Republic 2,383,308European Investment Bank 1,217,832United States of America 889,843German Federal Republic 744,381Kingdom of the Netherlands 560,415Kingdom of Sweden 375,124United Kingdom 356,459Republic of Finland 113,356International Bank for Reconstruction & Development 102,162Norwegian Government 65,201

434
APPENDIX 2
SECURITIES FINANCING TRANSACTIONS REGULATION DISCLOSURES (“SFTR”) (unaudited) cont’d.
SECURITIES LENDING TRANSACTIONS cont’d.
Collateral IssuerAggregate value
of collateral held
BNY Mellon Euroland Bond Fund EURFrench Republic 103,245,252German Federal Republic 26,055,328United States of America 13,755,507Kingdom of the Netherlands 10,594,691Republic of Austria 9,254,351European Investment Bank 7,768,079Republic of Finland 4,428,187United Kingdom 1,750,084Government of Canada 889,582Norwegian Government 603,996
BNY Mellon European Credit Fund EURFrench Republic 441,319German Federal Republic 271,918United Kingdom 209,386European Investment Bank 85,752United States of America 62,112Kingdom of the Netherlands 40,890Republic of Austria 40,068International Bank for Reconstruction & Development 29,306Government of Canada 28,287Bank of England (The Governor and Company of the) 17,889
BNY Mellon Global Bond Fund USDFrench Republic 8,582,856German Federal Republic 4,511,663Royal Dutch Shell PLC 4,358,349European Investment Bank 2,917,025Kingdom of the Netherlands 2,408,326KDDI Corp 2,202,966United Kingdom 2,110,737AstraZeneca PLC 2,101,348Republic of Finland 1,848,239Diageo PLC 1,807,302
BNY Mellon Global Credit Fund USDFrench Republic 4,582,449German Federal Republic 2,012,686United States of America 1,126,448European Investment Bank 563,785Republic of Finland 370,085Kingdom of the Netherlands 312,390Republic of Austria 182,084International Bank for Reconstruction & Development 26,817Inter-American Development Bank 14,277United Kingdom 10,041
Collateral IssuerAggregate value
of collateral held
BNY Mellon Global Dynamic Bond Fund USDFrench Republic 2,781,973Royal Dutch Shell PLC 1,603,616AstraZeneca PLC 1,212,160KDDI Corp 1,201,893Diageo PLC 1,042,539United Kingdom 1,014,050National Grid PLC 897,721Daikin Industries Ltd 793,925Citigroup Inc 772,483Deutsche Bank AG 735,658
BNY Mellon Global Emerging Markets Fund USDUnited States of America 520,117E*TRADE Financial Corp 25,652Monsanto Co 23,695St Jude Medical Inc 23,499Marathon Petroleum Corp 21,779CR Bard Inc 19,651Royal Dutch Shell PLC 17,489BNP Paribas SA 15,363Shire PLC 12,703Fresenius SE & Co KGaA 10,978
BNY Mellon Global Equity Fund USDUnited States of America 12,785,841United Kingdom 2,558,389German Federal Republic 2,206,856French Republic 822,900Humana Inc 497,201Microsoft Corp 462,688Baxter International Inc 415,733Yahoo! Inc 402,997BlackRock Inc 353,658Biogen Inc 342,427
BNY Mellon Global Equity Income Fund USDUnited Kingdom 12,318,877United States of America 4,476,260Actelion Ltd 584,151Fuji Heavy Industries Ltd 469,315ITOCHU Corp 468,068HSBC Holdings PLC 467,423SoftBank Group Corp 467,423Suzuki Motor Corp 428,389MS&AD Insurance Group Holdings Inc 415,863Osaka Gas Co Ltd 379,203

435
APPENDIX 2
SECURITIES FINANCING TRANSACTIONS REGULATION DISCLOSURES (“SFTR”) (unaudited) cont’d.
SECURITIES LENDING TRANSACTIONS cont’d.
Collateral IssuerAggregate value
of collateral held
BNY Mellon Global High Yield Bond Fund* USDUnited States of America 16,622,470French Republic 1,568,049United Kingdom 426,120German Federal Republic 283,760European Investment Bank 217,065International Bank for Reconstruction & Development 78,939Republic of Finland 56,721Republic of Austria 40,418Kingdom of the Netherlands 22,455
BNY Mellon Global Opportunistic Bond Fund USDFrench Republic 4,261,666United States of America 1,815,705German Federal Republic 1,011,430Republic of Austria 697,775Kingdom of the Netherlands 396,711United Kingdom 163,304Kingdom of Sweden 155,854Republic of Finland 95,303Government of Canada 93,131Royal Dutch Shell PLC 82,251
BNY Mellon Global Opportunities Fund USDUnited States of America 6,868,862Humana Inc 352,175Microsoft Corp 327,729Baxter International Inc 286,009Yahoo! Inc 285,449BlackRock Inc 249,496Biogen Inc 242,546Apple Inc 214,927UnitedHealth Group Inc 210,873Freeport-McMoRan Inc 196,498
BNY Mellon Global Property Securities Fund EURUnited States of America 667,395United Kingdom 52,179E*TRADE Financial Corp 28,936French Republic 26,134Monsanto Co 25,820Toyota Motor Corp 25,367St Jude Medical Inc 24,863Sony Corp 24,417Marathon Petroleum Corp 23,043Mitsubishi UFJ Financial Group Inc 21,720
Collateral IssuerAggregate value
of collateral held
BNY Mellon Global Real Return Fund (EUR) EURFrench Republic 59,408,265Transocean Ltd 28,085,811European Investment Bank 23,428,587Hewlett Packard Enterprise Co 22,882,999Boeing Co/The 22,069,897Universal Health Services Inc 20,334,427Intercontinental Exchange Inc 19,899,027Harman International Industries Inc 19,609,374Royal Dutch Shell PLC 17,825,733Level 3 Communications Inc 17,079,275
BNY Mellon Global Real Return Fund (GBP) GBPUnited States of America 916,561Humana Inc 91,342Microsoft Corp 80,295French Republic 71,048Baxter International Inc 70,074Yahoo! Inc 69,936Apple Inc 62,212BlackRock Inc 61,128Biogen Inc 59,425UnitedHealth Group Inc 52,562
BNY Mellon Global Real Return Fund (USD) USDFrench Republic 3,884,099Transocean Ltd 3,863,683Hewlett Packard Enterprise Co 3,148,243Boeing Co/The 3,036,377Harman International Industries Inc 2,949,224Royal Dutch Shell PLC 2,846,247Universal Health Services Inc 2,795,768Intercontinental Exchange Inc 2,719,162Masco Corp 2,472,928Level 3 Communications Inc 2,419,374
BNY Mellon Japan All Cap Equity Fund JPYGerman Federal Republic 18,847,984French Republic 10,980,807E*TRADE Financial Corp 9,684,209Toyota Motor Corp 8,480,442Actelion Ltd 8,422,326Sony Corp 8,121,235Syngenta AG 7,396,218Mitsubishi UFJ Financial Group Inc 7,261,536Mitsubishi Corp 6,796,677SoftBank Group Corp 6,730,903

436
APPENDIX 2
SECURITIES FINANCING TRANSACTIONS REGULATION DISCLOSURES (“SFTR”) (unaudited) cont’d.
SECURITIES LENDING TRANSACTIONS cont’d.
Collateral IssuerAggregate value
of collateral held
BNY Mellon Japan Small Cap Equity Focus Fund JPYFrench Republic 56,062,168E*TRADE Financial Corp 15,702,649Actelion Ltd 12,506,015Syngenta AG 11,035,390German Federal Republic 9,752,181Baxter International Inc 7,928,777United Kingdom 7,025,146Lockheed Martin Corp 6,808,534Public Service Enterprise Group Inc 6,187,998Monsanto Co 6,183,593
BNY Mellon Long-Term Global Equity Fund EURUnited States of America 25,587,716Baxter International Inc 7,424,794Humana Inc 7,422,736Microsoft Corp 6,543,996Apple Inc 6,313,626Yahoo! Inc 6,046,387BlackRock Inc 4,981,862Biogen Inc 4,843,087UnitedHealth Group Inc 4,322,711Freeport-McMoRan Inc 3,923,617
BNY Mellon Pan European Equity Fund EURUnited Kingdom 11,096Shionogi & Co Ltd 8,640Mitsui Fudosan Co Ltd 8,256United States of America 8,057Tokyo Electron Ltd 7,932East Japan Railway Co 7,330Eisai Co Ltd 7,225Secom Co Ltd 7,075Swiss Life Holding AG 6,610Actelion Ltd 6,513
BNY Mellon S&P 500® Index Tracker USDUnited States of America 1,745,025United Kingdom 1,472,240Humana Inc 176,179Microsoft Corp 149,009Baxter International Inc 130,592Yahoo! Inc 129,943Apple Inc 128,055BlackRock Inc 113,439Biogen Inc 110,279Secom Co Ltd 99,143
Collateral IssuerAggregate value
of collateral held
BNY Mellon Small Cap Euroland Fund EURUnited Kingdom 621,266United States of America 342,896French Republic 283,366German Federal Republic 142,879E*TRADE Financial Corp 127,631Monsanto Co 110,602St Jude Medical Inc 93,331Marathon Petroleum Corp 86,498Republic of Austria 85,323Baxter International Inc 79,981
BNY Mellon Targeted Return Bond Fund* USDUnited States of America 398,531Republic of Austria 271,678French Republic 254,381German Federal Republic 132,239Government of Canada 44,054Republic of Finland 33,166Kingdom of the Netherlands 763
BNY Mellon U.S. Dynamic Value Fund USDUnited Kingdom 4,252,940United States of America 604,534Humana Inc 572,650Microsoft Corp 531,666Baxter International Inc 463,985Yahoo! Inc 463,076BlackRock Inc 404,751Biogen Inc 393,476Apple Inc 351,176UnitedHealth Group Inc 342,330
BNY Mellon US Opportunities Fund USDUnited States of America 572,448Baxter International Inc 48,370Apple Inc 47,063Humana Inc 46,648Level 3 Communications Inc 43,058E*TRADE Financial Corp 42,166Williams Cos Inc/The 36,831Actelion Ltd 36,277Yahoo! Inc 32,455Syngenta AG 30,899
* Where there are less than 10 collateral issuers as at 31 December 2016, all issuers have been included.

437
APPENDIX 2
SECURITIES FINANCING TRANSACTIONS REGULATION DISCLOSURES (“SFTR”) (unaudited) cont’d.
SECURITIES LENDING TRANSACTIONS cont’d.
The following table provides a currency analysis of the non-cash collateral received by Fund in respect of securities lending transactions as at 31 December 2016:
Fund CurrencyAggregate value
of collateral held
BNY Mellon Absolute Insight Fund EUREuro 1,654Japanese yen 1,207Sterling 559US dollar 34,731
38,151
BNY Mellon Absolute Return Bond Fund EURAustralian dollar 3,264Danish krone 1,608Euro 85,004,965Japanese yen 24,191,627New Zealand dollar 7,634Norwegian krone 389,168Sterling 15,872,074Swedish krona 208,343Swiss franc 2,063,144US dollar 5,057,994
132,799,821
BNY Mellon Absolute Return Equity Fund GBPCanadian dollar 714,142Euro 11,550,387Japanese yen 2,878,498Sterling 45,868Swiss franc 1,088,641US dollar 7,148,081
23,425,617
BNY Mellon Asian Bond Fund USDEuro 389,982Sterling 197,702US dollar 38,848
626,532
BNY Mellon Asian Equity Fund USDUS dollar 903,123
903,123
BNY Mellon Emerging Markets Corporate Debt Fund USDAustralian dollar 30Danish krone 2,522Euro 12,638,181Norwegian krone 125,547Sterling 6,254,018Swedish krona 38,891Swiss franc 360US dollar 3,008,937
22,068,486
Fund CurrencyAggregate value
of collateral held
BNY Mellon Emerging Markets Debt Fund USDAustralian dollar 1,332Canadian dollar 22,683Danish krone 1,118Euro 4,493,648Norwegian krone 55,653Sterling 838,427Swedish krona 17,240Swiss franc 22US dollar 702,384
6,132,507
BNY Mellon Emerging Markets Debt Local Currency Fund USDAustralian dollar 3,716Euro 11,389,968New Zealand dollar 8,690Norwegian krone 3,848Sterling 52,593Swedish krona 4,886,614Swiss franc 79,024US dollar 11,064,989
27,489,442
BNY Mellon Emerging Markets Debt Opportunistic Fund USDAustralian dollar 1,068Danish krone 1,310Euro 4,188,450New Zealand dollar 2,487Norwegian krone 66,302Sterling 645,414Swedish krona 391,926Swiss franc 2,027US dollar 1,568,300
6,867,284
BNY Mellon Euroland Bond Fund EURAustralian dollar 38,648Canadian dollar 841,201Euro 159,448,773New Zealand dollar 87,540Norwegian krone 642,753Sterling 2,012,866Swedish krona 395,561Swiss franc 1,009US dollar 15,879,896
179,348,247

438
APPENDIX 2
SECURITIES FINANCING TRANSACTIONS REGULATION DISCLOSURES (“SFTR”) (unaudited) cont’d.
SECURITIES LENDING TRANSACTIONS cont’d.
Fund CurrencyAggregate value
of collateral held
BNY Mellon European Credit Fund EURAustralian dollar 239Canadian dollar 6,345Euro 889,755New Zealand dollar 560Norwegian krone 248Sterling 225,596Swedish krona 793US dollar 109,043
1,232,579
BNY Mellon Global Bond Fund USDCanadian dollar 633,698Euro 30,098,284Japanese yen 18,136,455Sterling 17,273,918Swedish krona 2,450Swiss franc 2,225,803US dollar 3,743,110
72,113,718
BNY Mellon Global Credit Fund USDAustralian dollar 24Euro 7,483,248Sterling 10,235Swiss franc 286US dollar 1,707,987
9,201,780
BNY Mellon Global Dynamic Bond Fund USDAustralian dollar 1,056Euro 4,501,793Japanese yen 8,237,126New Zealand dollar 2,470Norwegian krone 1,094Sterling 5,990,560Swedish krona 1,085Swiss franc 702,490US dollar 1,204,897
20,642,571
BNY Mellon Global Emerging Markets Fund USDEuro 41,802Japanese yen 34,575Sterling 46,603Swiss franc 8,542US dollar 692,036
823,558
Fund CurrencyAggregate value
of collateral held
BNY Mellon Global Equity Fund USDEuro 3,353,566Japanese yen 219,683Sterling 2,672,120US dollar 19,212,782
25,458,151
BNY Mellon Global Equity Income Fund USDEuro 117,516Japanese yen 4,092,162Sterling 13,032,903Swiss franc 745,582US dollar 5,638,183
23,626,346
BNY Mellon Global High Yield Bond Fund USDEuro 2,148,708Sterling 465,879US dollar 16,701,410
19,315,997
BNY Mellon Global Opportunistic Bond Fund USDAustralian dollar 1,748Canadian dollar 93,093Euro 6,750,793Japanese yen 140,270New Zealand dollar 1,348Norwegian krone 46,869Sterling 478,322Swedish krona 154,851Swiss franc 33,792US dollar 1,891,248
9,592,334
BNY Mellon Global Opportunities Fund USDEuro 213,925Japanese yen 180,154Sterling 77,163Swiss franc 3,351US dollar 11,349,361
11,823,954
BNY Mellon Global Property Securities Fund EUREuro 85,852Japanese yen 298,240Sterling 101,955Swiss franc 2,914US dollar 1,001,067
1,490,028

439
APPENDIX 2
SECURITIES FINANCING TRANSACTIONS REGULATION DISCLOSURES (“SFTR”) (unaudited) cont’d.
SECURITIES LENDING TRANSACTIONS cont’d.
Fund CurrencyAggregate value
of collateral held
BNY Mellon Global Real Return Fund (EUR) EURCanadian dollar 5,086,204Euro 142,254,286Japanese yen 96,699,079Sterling 66,723,791Swiss franc 7,807,536US dollar 351,215,981
669,786,877
BNY Mellon Global Real Return Fund (GBP) GBPCanadian dollar 119Euro 148,511Japanese yen 71,764Sterling 66,906Swiss franc 549US dollar 2,225,363
2,513,212
BNY Mellon Global Real Return Fund (USD) USDCanadian dollar 328,517Euro 12,480,377Japanese yen 18,313,307Sterling 11,649,152Swiss franc 2,295,823US dollar 60,161,185
105,228,361
BNY Mellon Japan All Cap Equity Fund JPYCanadian dollar 249,996Euro 38,270,602Japanese yen 140,719,721Sterling 5,523,980Swiss franc 19,908,721US dollar 146,295,008
350,968,028
BNY Mellon Japan Small Cap Equity Focus Fund JPYEuro 78,562,557Japanese yen 118,356,624Sterling 18,662,016Swiss franc 29,644,058US dollar 201,168,990
446,394,245
BNY Mellon Long-Term Global Equity Fund EUREuro 6,769,773Japanese yen 30,384,984Sterling 2,837,736Swiss franc 4,874,925US dollar 165,834,522
210,701,940
Fund CurrencyAggregate value
of collateral held
BNY Mellon Pan European Equity Fund EUREuro 9,402Japanese yen 76,428Sterling 11,340Swiss franc 13,856US dollar 18,250
129,276
BNY Mellon S&P 500® Index Tracker USDCanadian dollar 3,337Euro 316,676Japanese yen 1,081,084Sterling 1,836,670Swedish krona 6,536Swiss franc 121,411US dollar 4,511,685
7,877,399
BNY Mellon Small Cap Euroland Fund EURCanadian dollar 13,836Euro 1,021,795Japanese yen 451,727Sterling 890,376Swedish krona 18,373Swiss franc 164,996US dollar 2,310,354
4,871,457
BNY Mellon Targeted Return Bond Fund USDCanadian dollar 44,054Euro 692,227US dollar 398,531
1,134,812
BNY Mellon U.S. Dynamic Value Fund USDEuro 363,271Japanese yen 437,988Sterling 4,457,729Swiss franc 144US dollar 7,949,345
13,208,477
BNY Mellon US Opportunities Fund USDEuro 27,794Japanese yen 308,740Sterling 8,774Swiss franc 84,263US dollar 1,929,813
2,359,384

440
APPENDIX 2
SECURITIES FINANCING TRANSACTIONS REGULATION DISCLOSURES (“SFTR”) (unaudited) cont’d.
SECURITIES LENDING TRANSACTIONS cont’d.
The following table provides an analysis of the maturity tenor of securities lending transactions and the associated collateral received as at 31 December 2016:
The below maturity tenor analysis has been based on the contractual maturity date of the securities on loan and, in case of non-cash collateral, the contractual maturity date of the security received as collateral.
FundLess than
1 day1 day
to 1 week1 week
to 1 month1 month
to 3 months3 months to 1 year
Above 1 year
Open maturity Total
BNY Mellon Absolute Insight Fund EUR EUR EUR EUR EUR EUR EUR EURSecurities on loan – – – – – – 34,495 34,495Non-cash collateral received – – – – – – 38,151 38,151
BNY Mellon Absolute Return Bond Fund EUR EUR EUR EUR EUR EUR EUR EURSecurities on loan – – – 6,181,703 2,499,406 117,951,853 – 126,632,962Non-cash collateral received – 612,061 458,725 9,421,228 9,828,142 65,383,020 47,096,645 132,799,821
BNY Mellon Absolute Return Equity Fund GBP GBP GBP GBP GBP GBP GBP GBPSecurities on loan – – – – – – 21,364,698 21,364,698Non-cash collateral received – – – 974,047 1,055,042 10,729,872 10,666,656 23,425,617
BNY Mellon Asian Bond Fund USD USD USD USD USD USD USD USDSecurities on loan – – – – – 597,558 – 597,558Non-cash collateral received – 39,111 – – 577 586,844 – 626,532
BNY Mellon Asian Equity Fund USD USD USD USD USD USD USD USDSecurities on loan – – – – – – 884,779 884,779Non-cash collateral received – – 21,158 34,504 – 847,461 – 903,123
BNY Mellon Emerging Markets Corporate Debt Fund USD USD USD USD USD USD USD USDSecurities on loan – – – – – 20,940,394 – 20,940,394Non-cash collateral received – 744,219 – 227,292 1,154,477 19,942,498 – 22,068,486
BNY Mellon Emerging Markets Debt Fund USD USD USD USD USD USD USD USDSecurities on loan – – – – – 5,779,610 – 5,779,610Non-cash collateral received – 2,877 133,085 267,879 953,432 4,775,234 – 6,132,507
BNY Mellon Emerging Markets Debt Local Currency Fund USD USD USD USD USD USD USD USDSecurities on loan – – – – – 26,226,619 – 26,226,619Non-cash collateral received – 674 140,616 223,633 5,191,221 21,933,298 – 27,489,442
BNY Mellon Emerging Markets Debt Opportunistic Fund USD USD USD USD USD USD USD USDSecurities on loan – – – – – 6,473,204 – 6,473,204Non-cash collateral received – 96,008 5,752 115,255 1,078,156 5,572,113 – 6,867,284
BNY Mellon Euroland Bond Fund EUR EUR EUR EUR EUR EUR EUR EURSecurities on loan – – – 207,227 – 173,691,768 – 173,898,995Non-cash collateral received – 31,459 997,792 8,228,094 20,486,449 149,604,453 – 179,348,247
BNY Mellon European Credit Fund EUR EUR EUR EUR EUR EUR EUR EURSecurities on loan – – – – – 1,092,468 – 1,092,468Non-cash collateral received – 29,090 1,295 34,566 38,954 1,128,674 – 1,232,579
BNY Mellon Global Bond Fund USD USD USD USD USD USD USD USDSecurities on loan – – – – – 66,668,814 – 66,668,814Non-cash collateral received – – 3,833 1,650,461 1,295,213 22,839,442 46,324,769 72,113,718

441
APPENDIX 2
SECURITIES FINANCING TRANSACTIONS REGULATION DISCLOSURES (“SFTR”) (unaudited) cont’d.
SECURITIES LENDING TRANSACTIONS cont’d.
FundLess than
1 day1 day
to 1 week1 week
to 1 month1 month
to 3 months3 months to 1 year
Above 1 year
Open maturity Total
BNY Mellon Global Credit Fund USD USD USD USD USD USD USD USDSecurities on loan – – – – 3,154,829 5,689,558 – 8,844,387Non-cash collateral received – 322,777 – 35,091 913,563 7,930,349 – 9,201,780
BNY Mellon Global Dynamic Bond Fund USD USD USD USD USD USD USD USDSecurities on loan – – – – – 18,968,372 – 18,968,372Non-cash collateral received – – 67,656 82,528 538,735 3,917,484 16,036,168 20,642,571
BNY Mellon Global Emerging Markets Fund USD USD USD USD USD USD USD USDSecurities on loan – – – – – – 778,487 778,487Non-cash collateral received – – 12,185 19,871 – 488,061 303,441 823,558
BNY Mellon Global Equity Fund USD USD USD USD USD USD USD USDSecurities on loan – – – – – – 24,145,014 24,145,014Non-cash collateral received – – 608,526 283,174 1,843,021 15,655,683 7,067,747 25,458,151
BNY Mellon Global Equity Income Fund USD USD USD USD USD USD USD USDSecurities on loan – – – – – – 22,335,835 22,335,835Non-cash collateral received – – 158,622 1,751,139 675,754 14,223,406 6,817,425 23,626,346
BNY Mellon Global High Yield Bond Fund USD USD USD USD USD USD USD USDSecurities on loan – – – – – 18,840,721 – 18,840,721Non-cash collateral received – 79,475 317,608 693,853 965,752 17,259,309 – 19,315,997
BNY Mellon Global Opportunistic Bond Fund USD USD USD USD USD USD USD USDSecurities on loan – – – – – 9,101,603 – 9,101,603Non-cash collateral received – 67,455 46,026 375,934 733,734 7,546,677 822,508 9,592,334
BNY Mellon Global Opportunities Fund USD USD USD USD USD USD USD USDSecurities on loan – – – – – – 11,209,182 11,209,182Non-cash collateral received – – 322,749 151,773 1,176,128 5,218,213 4,955,091 11,823,954
BNY Mellon Global Property Securities Fund EUR EUR EUR EUR EUR EUR EUR EURSecurities on loan – – – – – – 1,391,575 1,391,575Non-cash collateral received – – 16,129 17,583 40,869 685,374 730,073 1,490,028
BNY Mellon Global Real Return Fund (EUR) EUR EUR EUR EUR EUR EUR EUR EURSecurities on loan – – – – 38,215,567 546,582,268 30,509,966 615,307,801Non-cash collateral received – – 561,307 13,021,379 7,342,111 129,389,965 519,472,115 669,786,877
BNY Mellon Global Real Return Fund (GBP) GBP GBP GBP GBP GBP GBP GBP GBPSecurities on loan – – – – – – 2,340,749 2,340,749Non-cash collateral received – – 98,150 38,523 193,640 731,841 1,451,058 2,513,212
BNY Mellon Global Real Return Fund (USD) USD USD USD USD USD USD USD USDSecurities on loan – – – – – 80,436,747 15,548,975 95,985,722Non-cash collateral received – – 11,710 781,569 419,454 8,370,567 95,645,061 105,228,361
BNY Mellon Japan All Cap Equity Fund JPY JPY JPY JPY JPY JPY JPY JPYSecurities on loan – – – – – – 317,327,196 317,327,196Non-cash collateral received – – – 76,152 – 38,683,643 312,208,233 350,968,028
BNY Mellon Japan Small Cap Equity Focus Fund JPY JPY JPY JPY JPY JPY JPY JPYSecurities on loan – – – – – – 405,036,390 405,036,390Non-cash collateral received – – – 108,754 3,773,197 73,313,396 369,198,898 446,394,245
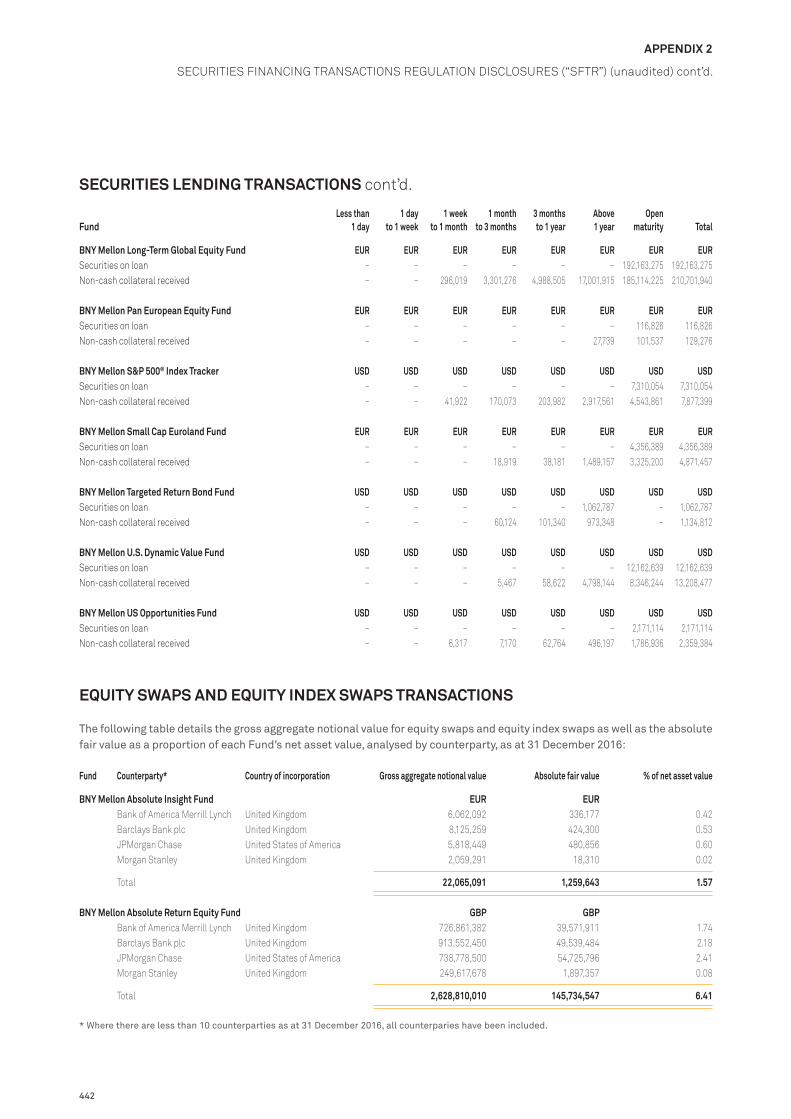
442
APPENDIX 2
SECURITIES FINANCING TRANSACTIONS REGULATION DISCLOSURES (“SFTR”) (unaudited) cont’d.
SECURITIES LENDING TRANSACTIONS cont’d.
FundLess than
1 day1 day
to 1 week1 week
to 1 month1 month
to 3 months3 months to 1 year
Above 1 year
Open maturity Total
BNY Mellon Long-Term Global Equity Fund EUR EUR EUR EUR EUR EUR EUR EURSecurities on loan – – – – – – 192,163,275 192,163,275Non-cash collateral received – – 296,019 3,301,276 4,988,505 17,001,915 185,114,225 210,701,940
BNY Mellon Pan European Equity Fund EUR EUR EUR EUR EUR EUR EUR EURSecurities on loan – – – – – – 116,826 116,826Non-cash collateral received – – – – – 27,739 101,537 129,276
BNY Mellon S&P 500® Index Tracker USD USD USD USD USD USD USD USDSecurities on loan – – – – – – 7,310,054 7,310,054Non-cash collateral received – – 41,922 170,073 203,982 2,917,561 4,543,861 7,877,399
BNY Mellon Small Cap Euroland Fund EUR EUR EUR EUR EUR EUR EUR EURSecurities on loan – – – – – – 4,356,389 4,356,389Non-cash collateral received – – – 18,919 38,181 1,489,157 3,325,200 4,871,457
BNY Mellon Targeted Return Bond Fund USD USD USD USD USD USD USD USDSecurities on loan – – – – – 1,062,787 – 1,062,787Non-cash collateral received – – – 60,124 101,340 973,348 – 1,134,812
BNY Mellon U.S. Dynamic Value Fund USD USD USD USD USD USD USD USDSecurities on loan – – – – – – 12,162,639 12,162,639Non-cash collateral received – – – 5,467 58,622 4,798,144 8,346,244 13,208,477
BNY Mellon US Opportunities Fund USD USD USD USD USD USD USD USDSecurities on loan – – – – – – 2,171,114 2,171,114Non-cash collateral received – – 6,317 7,170 62,764 496,197 1,786,936 2,359,384
EQUITY SWAPS AND EQUITY INDEX SWAPS TRANSACTIONS
The following table details the gross aggregate notional value for equity swaps and equity index swaps as well as the absolute fair value as a proportion of each Fund’s net asset value, analysed by counterparty, as at 31 December 2016:
Fund Counterparty* Country of incorporation Gross aggregate notional value Absolute fair value % of net asset value
BNY Mellon Absolute Insight Fund EUR EURBank of America Merrill Lynch United Kingdom 6,062,092 336,177 0.42Barclays Bank plc United Kingdom 8,125,259 424,300 0.53JPMorgan Chase United States of America 5,818,449 480,856 0.60Morgan Stanley United Kingdom 2,059,291 18,310 0.02
Total 22,065,091 1,259,643 1.57
BNY Mellon Absolute Return Equity Fund GBP GBPBank of America Merrill Lynch United Kingdom 726,861,382 39,571,911 1.74Barclays Bank plc United Kingdom 913,552,450 49,539,484 2.18JPMorgan Chase United States of America 738,778,500 54,725,796 2.41Morgan Stanley United Kingdom 249,617,678 1,897,357 0.08
Total 2,628,810,010 145,734,547 6.41
* Where there are less than 10 counterparties as at 31 December 2016, all counterparies have been included.

443
APPENDIX 2
SECURITIES FINANCING TRANSACTIONS REGULATION DISCLOSURES (“SFTR”) (unaudited) cont’d.
443
APPENDIX 2
SECURITIES FINANCING TRANSACTIONS REGULATION DISCLOSURES (“SFTR”) (unaudited) cont’d.
EQUITY SWAPS AND EQUITY INDEX SWAPS TRANSACTIONS cont’d.
The following table provides a currency analysis of the cash received/provided by Fund in respect of open derivative transactions as at 31 December 2016:
Fund Currency Cash collateral received Cash collateral provided
BNY Mellon Absolute Insight Fund EUR EUREuro 10,000 –
10,000 –
BNY Mellon Absolute Return Equity Fund GBP GBP Sterling 16,360,000 19,540,000
16,360,000 19,540,000
The following table provides an analysis of the maturity tenor of equity swaps and equity index swaps (net exposure) and the associated collateral received/provided as at 31 December 2016:
The below maturity tenor analysis has been based on the contractual maturity date of the open derivatives.
FundLess than
1 day1 day
to 1 week1 week
to 1 month1 month
to 3 months3 months to 1 year
Above 1 year
Open maturity Total
BNY Mellon Absolute Insight Fund EUR EUR EUR EUR EUR EUR EUR EUREquity index swaps – – (64,067) – (110,675) – – (174,742)Equity swaps – – 39,386 – 145,391 – – 184,777Cash collateral received/(provided) 10,000 – – – – – – 10,000
BNY Mellon Absolute Return Equity Fund GBP GBP GBP GBP GBP GBP GBP GBPEquity index swaps – – (6,976,357) – (14,470,297) – – (21,446,654)Equity swaps – – 3,423,564 – 14,059,330 – – 17,482,894Cash collateral received/(provided) (3,180,000) – – – – – – (3,180,000)

444
MANAGER AND OTHER INFORMATION
REGISTERED OFFICE
Guild House, Guild StreetIFSC, Dublin 1Ireland
THE DIRECTORS
The Directors of the Company are as follows:David Dillon (Irish)1*^David Turnbull (New Zealand)Greg Brisk (British)Jonathan Lubran (British)**Michael Meagher (Irish)1^
All of the Directors listed are non-executive Directors 1 Audit Committee Member * Chairman of the Board of Directors** Chairman of the Audit Committee ^ Independent Director
MANAGER
BNY Mellon Global Management Limited33 Sir John Rogerson’s QuayDublin 2, Ireland
INVESTMENT MANAGERS, SUB-INVESTMENT MANAGERS AND DELEGATED INVESTMENT MANAGERS
Mellon Capital Management Corporation50 Fremont StreetSuite 3900San Francisco CA 94105United States of America
The Boston Company Asset Management, LLCOne Boston Place14th Floor, Suite 024-0133Boston MA 02108-4408United States of America
Newton Investment Management LimitedBNY Mellon Centre160 Queen Victoria StreetLondon EC4V 4LAUnited Kingdom
Standish Mellon Asset Management Company, LLCBNY Mellon Centre201 Washington Street, Suite 2900Boston MA 02108-4408United States of America
Walter Scott & Partners LimitedOne Charlotte SquareEdinburgh EH2 4DZScotlandUnited Kingdom
ARX Investimentos Ltda Avenida Borges de Medeiros, 6334th floor, LeblonRio de Janeiro, R.J. 22430-041Brazil
BNY Mellon Asset Management Japan LimitedMaranouchi Trust Tower Main1-8-3 MaranouchiChiyoda – kuToyko 100-005Japan
Blackfriars Asset Management Limited9 Cloak LaneLondon EC4R 2RUUnited Kingdom
Center Square Investment Management, Inc.630 W. Germanstown PikeSuite 300Plymouth Meeting PA 19462United States of America
Oddo Meriten Investment Management GmbhHerzogstraße 1540217 DuesseldorfGermany
Insight Investment Management (Global) LimitedBNY Mellon Centre160 Queen Victoria StreetLondon EC4V 4LAUnited Kingdom
Alcentra NY, LLC200 Park AvenueNew YorkNY 10166United States of America
EACM Advisors LLC200 Connecticut Avenue,Suite 700Norwalk CT 06854-1958United States of America
Maybank Asset Management Singapore Pte. Ltd.9 Temasek Boulevard13-01 Suntec Tower TwoSingapore 038989Singapore
ADMINISTRATOR, REGISTRAR & TRANSFER AGENT
BNY Mellon Fund Services (Ireland) Designated Activity CompanyGuild House, Guild StreetIFSC, Dublin 1Ireland
SECRETARY
Tudor Trust Limited33 Sir John Rogerson’s QuayDublin 2, Ireland
LEGAL ADVISERS TO THE COMPANY
Dillon Eustace33 Sir John Rogerson’s QuayDublin 2, Ireland
INDEPENDENT AUDITORS
Ernst & YoungChartered Accountants & Registered AuditorsHarcourt CentreHarcourt StreetDublin 2, Ireland
DEPOSITARY
BNY Mellon Trust Company (Ireland) LimitedGuild House, Guild StreetIFSC, Dublin 1Ireland
GLOBAL DISTRIBUTOR AND PROMOTER
BNY Mellon Investment Management EMEA LimitedBNY Mellon Centre160 Queen Victoria StreetLondon EC4V 4LAUnited Kingdom

445
IMPORTANT INFORMATION
MELLON EURO STOXX 50SM INDEX TRACKERThe Dow Jones EURO STOXX 50SM is proprietary and copyrighted material. The Dow Jones EURO STOXX 50SM and the related trademarks have been licensed for certain purposes by BNY Mellon Global Funds, plc.
BNY MELLON NIKKEI 225® INDEX TRACKERCopyright and all other rights to the Index (“Nikkei 225”), and intellectual property rights and all other rights to the expressions “Nikkei” and “Nikkei 225” are vested in the Licensor. The Licensor shall reserve the right to change the contents of the “Nikkei 225”, and shall also reserve the right to cease publication of the “Nikkei 225”. Any and all copyrights, other intellectual property rights, and any other rights in connection with the content and designations to the “Nikkei 225” shall be vested in and owned by Nihon Keizai Shimbun Inc. (“NIKKEI”). The BNY Mellon Nikkei 225® Index Tracker is not sponsored, endorsed, sold or promoted by Nihon Keizai Shimbun, Inc. (“NIKKEI”) and NIKKEI does not make any representations or warranty, express or implied, to any purchaser or any prospective purchaser of the product. Nihon Keizai Shimbun, Inc (‘NIKKEI’) has the right to change the content of the “Nikkei 225” and to cease compilation and publication of the “Nikkei 225”.
BNY MELLON S&P 500® INDEX TRACKERS&P 500® is a trademark of The McGraw-Hill Companies, Inc and has been licensed for use by BNY Mellon Global Funds, plc. The BNY Mellon S&P 500® Index Tracker is not sponsored, endorsed, sold or promoted by Standard & Poor’s and Standard & Poor’s makes no representation regarding the advisability of investing in the BNY Mellon S&P 500® Index Tracker.
Please note: When a Fund of the Company invests in the shares of other collective investment schemes that are managed, directly or by delegation, by the Company’s management company, BNY Mellon Global Management (“BNY MGM”), or by any other company with which BNY MGM is linked by common management or control, or by a direct or indirect holding of more than 10% of the share capital or of the votes, BNY MGM or that other company shall not charge management, subscription, conversion or redemption fees on account of the Fund’s investment in the shares of such other collective investment scheme.


T5433
www.bnymellonim.com
T5433_Global_R&A_Covers_2016.indd 1 28/02/2017 14:33


