Annual Report and Financial Statements for the year ended 31 st March 2017 The Financial Conduct Authority: 29516R The Homes and Communities Agency: L4361 Cobalt Housing Limited is part of Onward Homes
Transcript
Annual Report and Financial Statements
for the year ended 31st March 2017
The Financial Conduct Authority: 29516R
The Homes and Communities Agency: L4361
Cobalt Housing Limited is part of Onward Homes
Association Statements
Foreword by the Chair of the Board 1
Board, Senior Management and Professional Advisors 2
Report of the Board and Financial Statements
Strategic Report 3 - 16
Report of the Board 17 - 21
Independent Auditor’s Report 22
Statement of Comprehensive Income 23
Statement of Financial Position 24
Statement of changes in Equity 25
Statement of Cash Flow 26
Notes to the Financial Statements 27 - 50
TABLE OF CONTENTS
FOREWORD BY THE CHAIR OF THE BOARD
1
The Board of Cobalt and I
are pleased to report, that
our financial results last
year far exceeded our
expectations and give us a
really sound financially
footing from which to move
forward.
This has never been more
important as we look to
leave Onward Homes and
start a new chapter as a
standalone organisation.
Our financial highlights include:
£11.5m operating surplus
£9.8m net surplus
£16.6m cash inflow from operating activities
£0.7m reduction in our borrowing
£8.2m increase in cash balances
These surpluses are generated for a purpose and will
be reinvested back into our homes and communities.
In 2016-17 our investment activities included:
The investment of £2.0m to complete 55 new
homes that handed over in the year
Securing a further £0.53 in HCA grant
The investment of £4.2m into continuing to
improve our existing homes
Our improved financial results are especially welcome
as our rents reduced by 1% at the start of the 2016-17
financial year. This was the first of four rent reductions
meaning that by 2019 our rental income will be around
12% lower in real terms that is was in 2015.
On the national stage housing still has a high political
profile. Although the Government is primarily focused
on housing for sale, there are signs that limited funding
may be available to support homes for rent as part of
mixed tenure developments.
Cobalt’s robust financial position means that we can
develop homes of all tenures including affordable rent
even if no grant subsidy is available.
As I reported in last year’s statement Onward Homes
(was Symphony Housing) is on a journey to simplify its
federated partnership of member organisations.
Throughout 2016 the board carefully examined the
options available to Cobalt, exploring the implications
of leaving the group to continue on as a standalone
organisation.
Tenants’ views were paramount in this process and a
ballot was undertaken in 2016. The strength of view
expressed was extremely encouraging with 98% of the
2,800 votes cast in favour of independence.
We reached a formal agreement on demerger with
Onward Homes and the target date is 29th September
2017. The board and all our employees are working
extremely hard in preparation so that none of our
services that you receive will be disrupted.
I would like to take this opportunity to thank Cobalt’s
voluntary board members, its directors and its staff for
their hard work, dedication and commitment over the
last year.
I would also like to acknowledge and thank the large
number of tenants and residents, including the
members of our award winning scrutiny panel who give
up their time to help make Cobalt the successful
organisation it is today. Our tenants are at the heart of
everything we are trying to achieve and their
contribution to helping set our agenda, scrutinising our
services and monitoring our performance is greatly
appreciated.
These are challenging but also exciting times as we are
about to enter a new chapter in the Cobalt story.
Peter Mitchell
Cobalt Chair
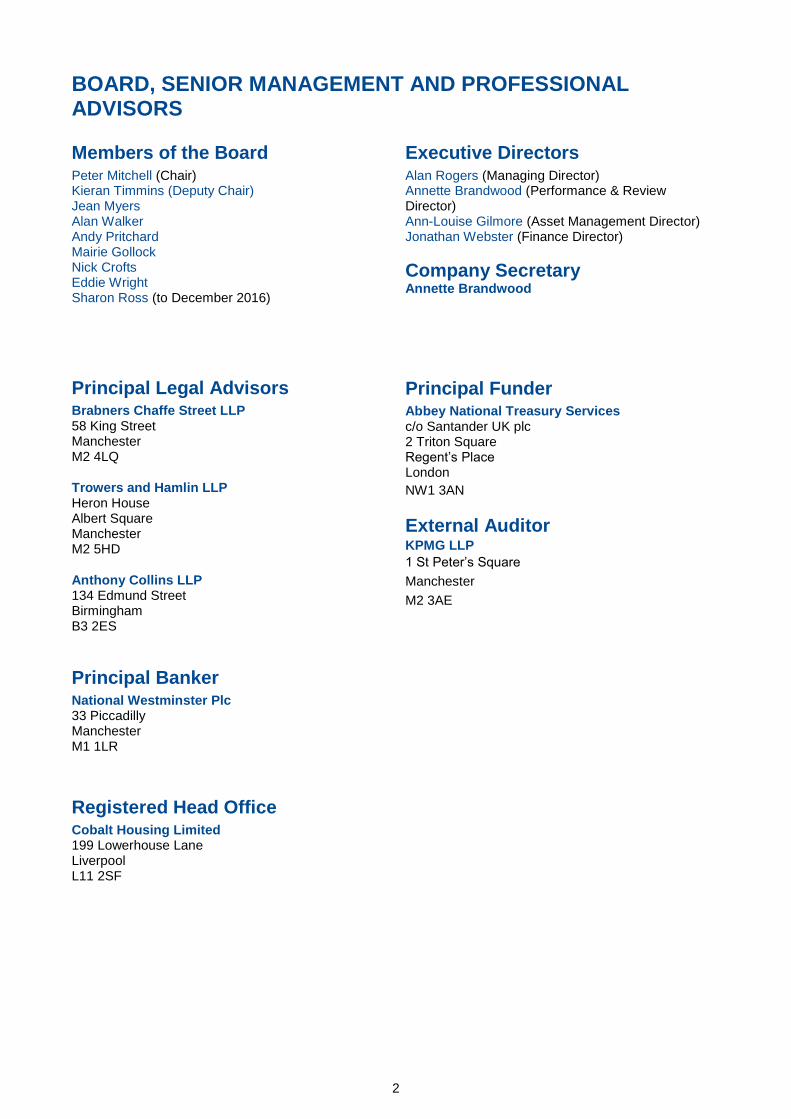
BOARD, SENIOR MANAGEMENT AND PROFESSIONAL ADVISORS
2
Members of the Board Peter Mitchell (Chair) Kieran Timmins (Deputy Chair) Jean Myers Alan Walker Andy Pritchard Mairie Gollock
Nick Crofts
Eddie Wright Sharon Ross (to December 2016)
Principal Legal Advisors Brabners Chaffe Street LLP 58 King Street Manchester M2 4LQ
Trowers and Hamlin LLP Heron House Albert Square Manchester M2 5HD
Anthony Collins LLP 134 Edmund Street Birmingham B3 2ES
Principal Banker National Westminster Plc 33 Piccadilly Manchester M1 1LR
Registered Head Office Cobalt Housing Limited 199 Lowerhouse Lane Liverpool L11 2SF
Principal Funder Abbey National Treasury Services c/o Santander UK plc 2 Triton Square Regent’s Place London
NW1 3AN
External Auditor KPMG LLP
1 St Peter’s Square Manchester
M2 3AE
STRATEGIC REPORT
3
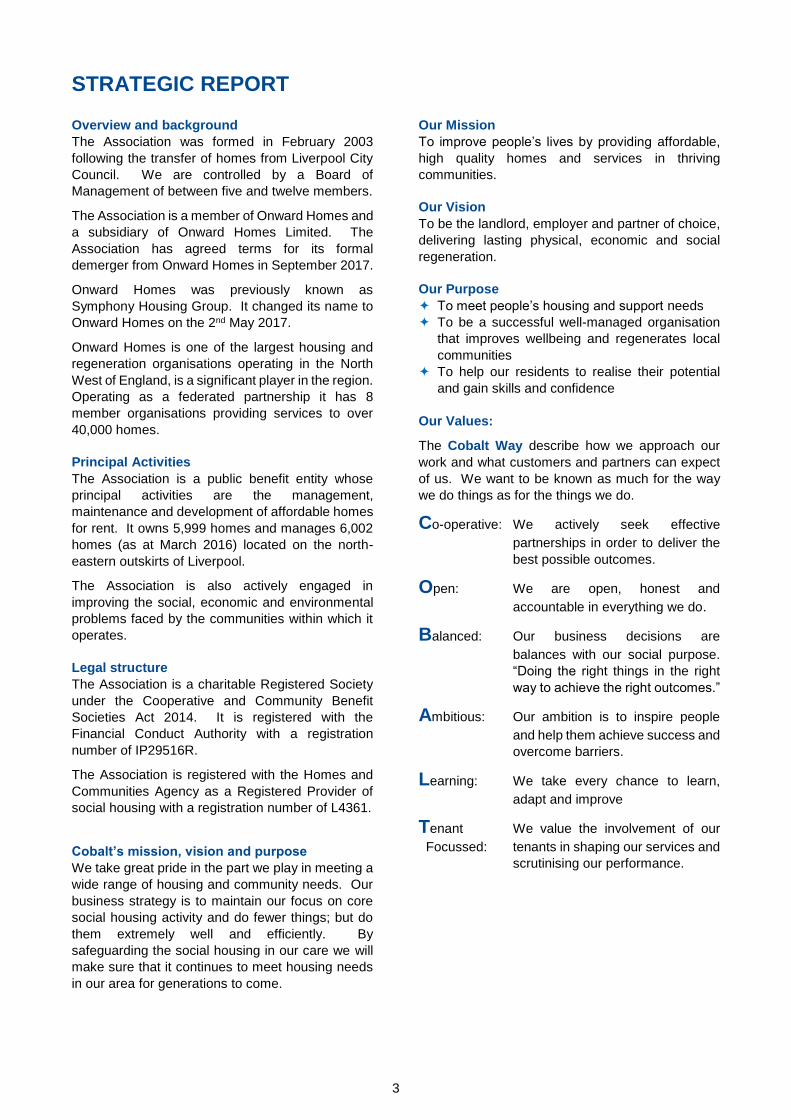
Overview and background
The Association was formed in February 2003
following the transfer of homes from Liverpool City
Council. We are controlled by a Board of
Management of between five and twelve members.
The Association is a member of Onward Homes and
a subsidiary of Onward Homes Limited. The
Association has agreed terms for its formal
demerger from Onward Homes in September 2017.
Onward Homes was previously known as
Symphony Housing Group. It changed its name to
Onward Homes on the 2nd May 2017.
Onward Homes is one of the largest housing and
regeneration organisations operating in the North
West of England, is a significant player in the region.
Operating as a federated partnership it has 8
member organisations providing services to over
40,000 homes.
Principal Activities
The Association is a public benefit entity whose
principal activities are the management,
maintenance and development of affordable homes
for rent. It owns 5,999 homes and manages 6,002
homes (as at March 2016) located on the north-
eastern outskirts of Liverpool.
The Association is also actively engaged in
improving the social, economic and environmental
problems faced by the communities within which it
operates.
Legal structure
The Association is a charitable Registered Society
under the Cooperative and Community Benefit
Societies Act 2014. It is registered with the
Financial Conduct Authority with a registration
number of IP29516R.
The Association is registered with the Homes and
Communities Agency as a Registered Provider of
social housing with a registration number of L4361.
Cobalt’s mission, vision and purpose
We take great pride in the part we play in meeting a
wide range of housing and community needs. Our
business strategy is to maintain our focus on core
social housing activity and do fewer things; but do
them extremely well and efficiently. By
safeguarding the social housing in our care we will
make sure that it continues to meet housing needs
in our area for generations to come.
Our Mission
To improve people’s lives by providing affordable,
high quality homes and services in thriving
communities.
Our Vision
To be the landlord, employer and partner of choice,
delivering lasting physical, economic and social
regeneration.
Our Purpose
To meet people’s housing and support needs
To be a successful well-managed organisation
that improves wellbeing and regenerates local
communities
To help our residents to realise their potential
and gain skills and confidence
Our Values:
The Cobalt Way describe how we approach our
work and what customers and partners can expect
of us. We want to be known as much for the way
we do things as for the things we do.
Co-operative: We actively seek effective
partnerships in order to deliver the
best possible outcomes.
Open: We are open, honest and
accountable in everything we do.
Balanced: Our business decisions are
balances with our social purpose.
“Doing the right things in the right
way to achieve the right outcomes.”
Ambitious: Our ambition is to inspire people
and help them achieve success and
overcome barriers.
Learning: We take every chance to learn,
adapt and improve
Tenant We value the involvement of our
Focussed: tenants in shaping our services and
scrutinising our performance.
STRATEGIC REPORT
4
Corporate Priorities
Cobalt is in a period of transition as it prepares to leave Onward Homes and become a standalone organisation
in September 2017. For 2018 the board has determined that it will prepare a revised suite of strategies and
corporate objectives that will reflect the new freedoms that independence will bring.
Our key corporate priories for 2016-21 are aligned around six strategic themes:
Best for Value for money
VfM Culture i. Set and achieve challenging efficiency targets and embed a culture of actively seeking
value for money in everything that we do.
Best for customers
Customer excellence i. Understand our different customer segments and deliver a high quality standard of
service tailored to meet their needs. ii. Tenants and staff are engaged in determining the priorities for our future service offer in
light of the rent reduction regime and independence. iii. Support tenants who need help with budgeting, banking or other financial inclusion to
sustain their tenancies and maintain our financial viability.
Best for customers and
people
Closing the digital divide i. Develop our digital service offer promoting and supporting digital access for our
customers. ii. Work with partners to identify practical solutions to help improve access for all tenants
and residents to services through the internet.
Best for neighbourhoods & communities
Active asset and neighbourhood management i. A holistic approach to management and investment in our homes and neighbourhoods
keeps them desirable and fit for the future. ii. Our stock of homes better matches the demand for smaller homes as a result of the
bedroom tax. iii. Sustainable development opportunities are pursued that deliver real and lasting benefits
to Cobalt, our residents and their communities. iv. To refine and utilise our active asset management model to inform our neighbourhood
and investment plans.
Best for customers
Our repairs service offer
i. Develop and expand on the success and savings being delivered through our in-house
Cobalt Plus service.
Partnerships, future and
VfM
Fit for independence i. Robust arrangements to replace current group services are put in place ii. All necessary funding, regulatory and stakeholder consents are secured iii. Standalone governance arrangements are put in place that fully comply with all
regulatory requirements iv. Appropriate funding facilities will be put in place to support independence and future
development plans
Best for customers and people
Behaviours and competency framework i. We enjoy a positive working environment where our staff are well trained, feel valued
and are motivated to go the extra mile for customers and colleagues. ii. To implement a systematic approach to performance management assessing the
achievements of our people through actions and behaviours.
STRATEGIC REPORT
5
Financial and Operating Review
The board is pleased to report that the association
achieved a surplus on ordinary activities for the year
of £9.8m (2016 £6.3m).
This represents a £3.5m (55%) increase on the
surplus achieved in the previous financial year and
puts the Association in a robust financial position as
it prepares for independence form Onward Homes.
Turnover:
Turnover reduced by £0.5m (1.7%) to £28.1m (2016
£28.6m). In April 2016 we implemented the first of
four 1% rent reductions in line with the current rent
setting regime.
Operating Costs:
Our operating costs reduced by £3.7m (18%) to
£17.0m (2016 £20.7m). The main factors behind
this reduction were:
The past service pension liabilities attributable to
Cobalt from other members of Onward were
reduced by £2.1m
Management costs reduced by £0.3m
Routine maintenance costs reduced by £0.3m
Planned and major repair costs reduced by
£0.4m
Impairment charges reduced by £0.3m (90%) to
£37k (2016 £0.4m)
Operating Surplus
Our operating surplus increased by £3.5m (44%) to
£11.5m (2016 £8.0m).
Interest Receivable and Payable
Net interest charges after amounts receivable and
other financing amounts reduced by £0.1m (6.6%)
to £1.7m (2016 £1.8m).
Cash Flows and Treasury Position
The net cash inflow from operating activities
increased by 17% to £16.7m (2016 £14.2m). This
operating cash inflow was sufficient to fund all of the
associations investing activities in the year. The
Association generated net cash from all activities of
£8.9m.
After repaying loans of £0.7m in the year the
Association increased its retained cash and
equivalent balances by £8.1m to £16.4m.
Financial Trends
These results are extremely positive and reflect the association’s commitment to maintaining its financial health.
Despite a fall in turnover as rent levels reduce, the association has improved its bottom-line and significantly
improved its operating margins.
The association creates this surplus for a purpose, re-investing it into improving its existing homes as well as
developing much needed new ones. The improved financials show the impact of the Association’s drive to
improve value for money and deliver more with the resources available.
Accounting Policies
The Association’s principle accounting policies are set out on pages 27 to 33 of the financial statements. The
policies that are most critical to the financial results relate to accounting for housing properties and include:
capitalisation of costs; deduction of capital grant from the cost of assets; housing property depreciation;
investment properties and the treatment of pensions.
STRATEGIC REPORT
6
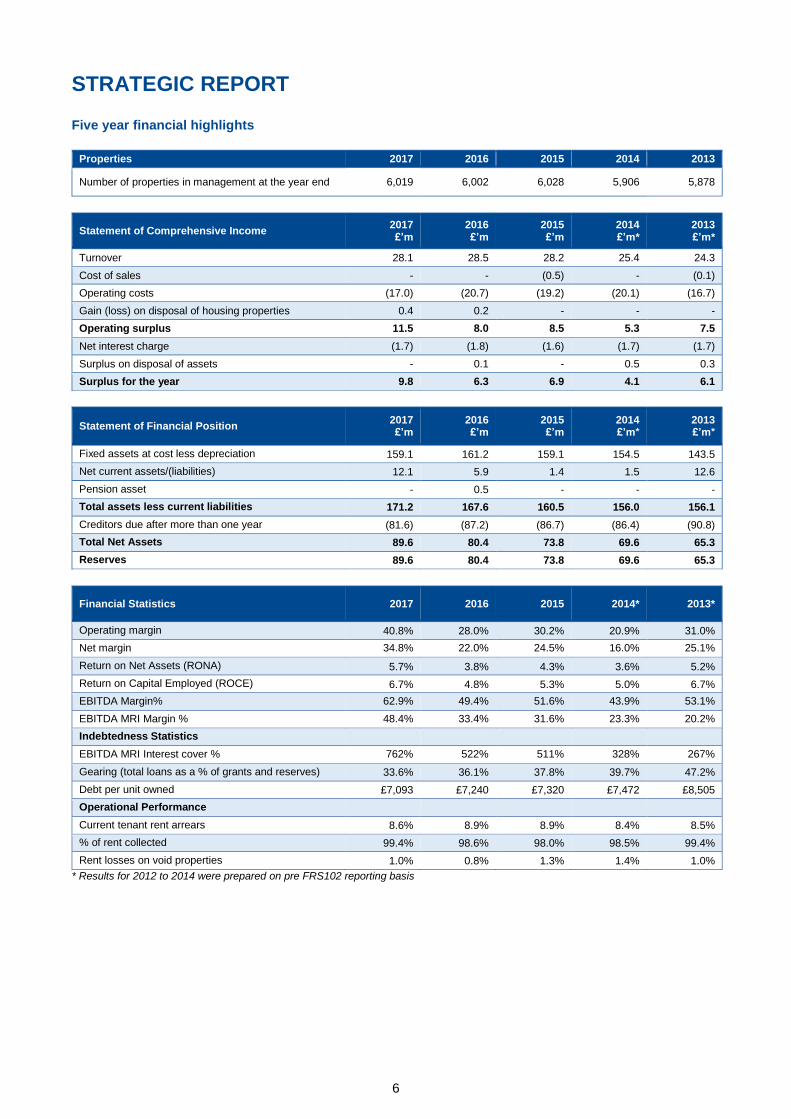
Five year financial highlights
Properties 2017 2016 2015 2014 2013
Number of properties in management at the year end 6,019 6,002 6,028 5,906 5,878
Gain (loss) on disposal of housing properties 0.4 0.2 - - -
Operating surplus 11.5 8.0 8.5 5.3 7.5
Net interest charge (1.7) (1.8) (1.6) (1.7) (1.7)
Surplus on disposal of assets - 0.1 - 0.5 0.3
Surplus for the year 9.8 6.3 6.9 4.1 6.1
Statement of Financial Position 2017 £’m
2016 £’m
2015 £’m
2014 £’m*
2013 £’m*
Fixed assets at cost less depreciation 159.1 161.2 159.1 154.5 143.5
Net current assets/(liabilities) 12.1 5.9 1.4 1.5 12.6
Pension asset - 0.5 - - -
Total assets less current liabilities 171.2 167.6 160.5 156.0 156.1
Creditors due after more than one year (81.6) (87.2) (86.7) (86.4) (90.8)
Total Net Assets 89.6 80.4 73.8 69.6 65.3
Reserves 89.6 80.4 73.8 69.6 65.3
Financial Statistics 2017 2016 2015 2014* 2013*
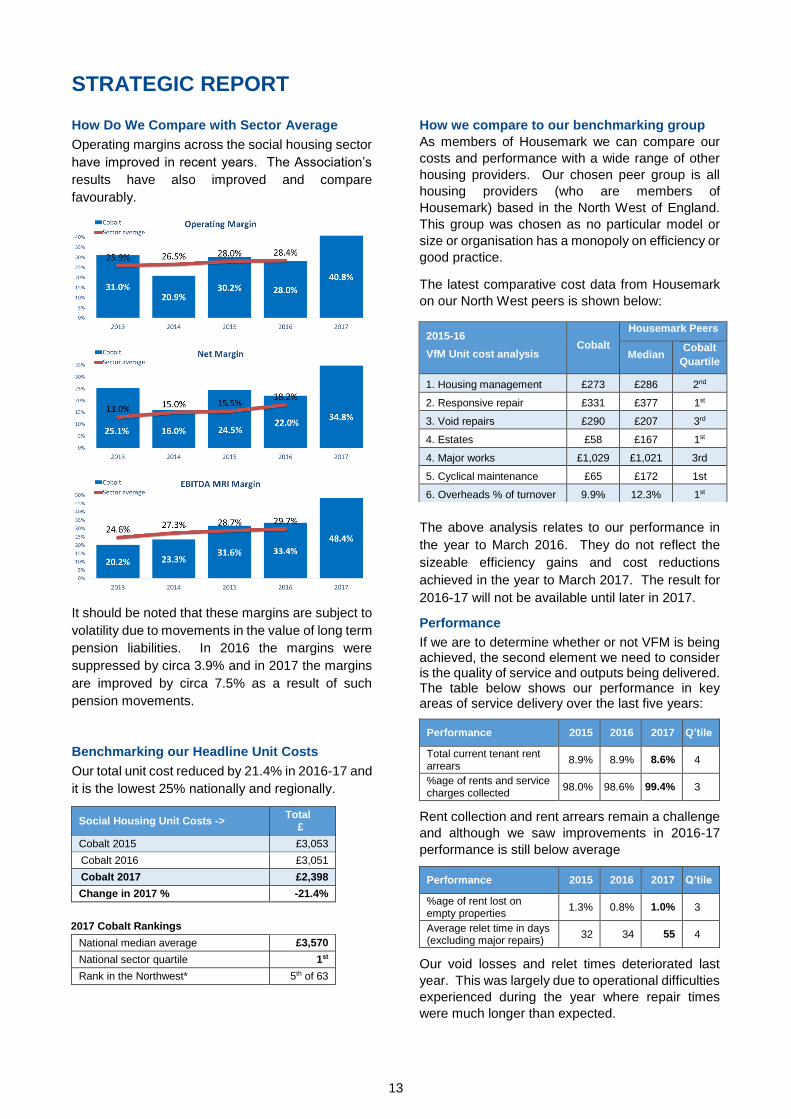
Operating margin 40.8% 28.0% 30.2% 20.9% 31.0%
Net margin 34.8% 22.0% 24.5% 16.0% 25.1%
Return on Net Assets (RONA) 5.7% 3.8% 4.3% 3.6% 5.2%
Return on Capital Employed (ROCE) 6.7% 4.8% 5.3% 5.0% 6.7%
EBITDA Margin% 62.9% 49.4% 51.6% 43.9% 53.1%
EBITDA MRI Margin % 48.4% 33.4% 31.6% 23.3% 20.2%
Indebtedness Statistics
EBITDA MRI Interest cover %
762% 522% 511% 328% 267%
Gearing (total loans as a % of grants and reserves) 33.6% 36.1% 37.8% 39.7% 47.2%
Debt per unit owned £7,093 £7,240 £7,320 £7,472 £8,505
Operational Performance
Current tenant rent arrears 8.6% 8.9% 8.9% 8.4% 8.5%
% of rent collected 99.4% 98.6% 98.0% 98.5% 99.4%
Rent losses on void properties 1.0% 0.8% 1.3% 1.4% 1.0%
* Results for 2012 to 2014 were prepared on pre FRS102 reporting basis
STRATEGIC REPORT
7
Operational Performance Review
The Board is pleased to provide details in relation to
our key housing management and maintenance
performance overleaf. These reflect the type of
indicators that the senior management team and
Board review to ensure the Association is achieving
its objectives and strategies.
Property Portfolio
The Association provides a range of tenancy and
property types located in the north-eastern outskirts
of Liverpool.
Development of new homes
The Association continues to pursue development
opportunities within its area, where these contribute
to its sustainable neighbourhoods. In 2016-17 we
developed 55 new homes.
Development of new homes 2017 2016 2015
Homes developed 55 3 149
Homes acquired - - 4
Home acquired from leaseholder - - 1
Total 55 3 154
Property Sales
The majority of our tenants are able to purchase their
home at a discount through either their protected right
to buy or through the right to acquire.
Property Sales 2017 2016 2015
Homes sold under the Right to Buy and Right to Acquire 38 29 31
Average market value of homes sold (before discount) £64.3k £64.1k £67.2k
Rent Levels
Social housing rents are determined by the
Government’s rent setting regime and the
requirements of the Homes and Communities
Agency’s Rent Standard.
Closing average weekly rent (excluding service charges)
2017 2016 2015
General Housing (social rent) £87.10 £87.97 £86.08
General Housing (affordable rent) £103.09 £103.55 £102.09
In April 2016 the social and affordable rents for all
existing tenancies were reduced by 1%. This was the
first of four annual rent reductions of 1% to take effect
between 2016 and 2019.
Occupancy Rates
Our average occupancy rate reduced slightly to
99.0% (2016 99.2%). With void losses of just 1.0%
of rental income we compare favourably with the
1.7% average for the sector in 2016.
Rent Collection Rates and Arrears
Our rent collection rate increased to 99.4% (2016
98.6%) and our rent arrears fell by 0.3% to 8.6%.
Performance was well ahead of our expectations of
the adverse impact of welfare reform.
Properties as at 31 March 2017 2016 2015
Properties Owned
General Housing (social rent) 5,703 5,736 5,753
General Housing (affordable rent) 300 245 242
Intermediate rents - - 3
Low cost home ownership 3 3 3
Rent to Home-buy - 5 14
Used by Tenant Associations 2 2 2
Non-Social Housing 8 8 8
Total Homes Owned 6,016 5,999 6,025
Leasehold 3 3 3
Total Homes in Management 6,019 6,002 6,028
STRATEGIC REPORT
8
Quality of Accommodation
All our homes meet the Government’s definition of
‘decent homes’ and through effective asset
management we have ensured this 100%
compliance has been maintained.
Accommodation Measure 2017 2016 2015
Homes meeting Decent Homes 100% 100% 100%
Homes with valid Gas Safe certificates
100% 100% 100%
Energy Efficiency SAP rating* 71 71 71
Customer satisfaction with the quality of their home**
91% 91% 91%
Complaints Analysis
We do not always get everything right, but when we
do get it wrong we are determined to learn why. This
learning is then used to help us improve and make
sure we get it right the next time.
Complaints Measure 2017 2016 2015
Number of complaints closed 106 91 104
Satisfaction with the outcome of complaint
73% 73% 76%
Satisfaction with the complaints process
82% 81% 93%
Future Prospects
Onward Homes Group has determined that it no
longer sees its future as a federated partnership and
is proposing that the operations of all its members are
consolidated into single entity. The Cobalt Board
believes that it is in the best interests of its tenants to
leave the group and operate as an independent
registered provider.
This terms for this demerger have been agreed and
were signed by both Cobalt and Onward in May 2017.
The agreed date for the demerger is 29th September
2017.
The Association has robust financial plans for
independence in place and has secured in principle
approval from its funders. The restatement and
renegotiation of the current funding facility will
increase the costs of current borrowing, but will also
allow the Association to better utilise its financial
capacity.
The Association’s ability to development new homes
has been constrained by the restrictions within its
current funding facility. The board has expressed its
aspiration to develop between 250 to 500 new homes
in its first five years after demerger.
Operating Environment Government policies designed to reform the welfare
state will continue to impact on the Association and
the communities it serves.
Almost 70% of the Association’s properties have
three or more bedrooms and the Under Occupancy
Penalty (better known as the bedroom tax) has
resulted in a significant mismatch between the size of
homes available and what those in housing need are
deemed to qualify for.
Housing benefit claims continue to be migrated into
Universal Credit under which the Association will no
longer receive housing benefit directly from the local
authority. Experience to date indicates that arrears
levels rise dramatically on transition.
The level of grant available to support social housing
is very much reduced with the Government preferring
to target help towards home ownership and first time
buyers. The Housing Association sector has more
recently been recognised by Government as a key
player in helping address the housing shortage,
however it is unlikely that significantly more funding
will be made available.
The new Government plans to extend the right to buy
to all social housing tenants. The intention is that this
will increase the number of homes sold to sitting
tenants and provide the resources to build new
homes. The challenge will be whether the funds are
sufficient to build one for one or like for like
replacements for the homes sold.
April 2016 saw the Association reduce all its social
and affordable housing rents are to be reduced by
1%. This was the first of four annual reductions of
1% after which rent levels will be around 10% lower
in real terms. The Association future financial
forecasts and business plan fully reflect this.
In July 2016 the UK electorate voted to leave the
European Union. Exactly how this will impact on UK
businesses is unclear. The increase in inflation
caused by the fall in sterling are already feeding
through and will increase the real terms impact of the
rent reduction regime.
The challenges ahead are daunting; however the
Association’s strong financial position and affordable
cost base mean that it is looking to the future with
confidence and ambition.
STRATEGIC REPORT
9
Risk and uncertainty
Effective risk management is vital to the success of the Association. The Association’s risk map details those
risks that could prevent the business from achieving its strategic objectives. The Group Audit, Risk and
Assurance Committee (GARAC) reviews and scrutinises the risk maps, on a quarterly basis, for all Group
members. The Cobalt Board considers the following risks the most likely to affect future performance and our
ability to achieve our five year plan.
Strategic Risk Area Comment and risk mitigation
Demerger risks
Failure to make a successful transition to independence in 2017 is a key short term risk. This is managed through robust project plans, regular programme meetings with our current and future service suppliers and active engagement with staff at all levels.
Threats to our income from welfare reform and government rent policy
The Association’s plan makes prudent assumptions about the future, stress tests the impact of adverse scenarios and keeps these under review. The Association’s in-house welfare benefits support team provides expert advice and support for staff and customers to maximise income.
Operating cost pressures outstrip growth in our income
The Association operates careful cost control, regular market testing and robust procurement. Limits on total cumulative commitments are in place to ensure the Association can react to adverse economic conditions.
Defined benefit pension liabilities
The Association has taken a number of steps to limit its exposure to pension deficits. It closed all its defined pension schemes to new entrants several years ago. In March 2016 the SHPS defined benefit schemes were closed to further service accrual for existing members.
Difficult funding conditions
Funding renegotiation should be concluded during the summer of 2017. This should secure the Association’s funding needs for the next five years. No commitments will be entered into until and unless adequate funding is agreed and put in place. The majority of the Association’s debt is on fixed interest rates.
Adverse economic conditions including uncertain impact of Brexit
Our projections are realistic and our financial plan projections have been independently assessed. Robust multi-variate stress testing demonstrates a high level of resilience to adverse eventualities.
Treasury risks
Effective monitoring arrangements and forward planning ensure that we meet all the conditions attached to our long term funding and there is early warning of potential future problems.
Ineffective governance and leadership
The Board regularly assesses its own performance and the performance of the Senior Management Team. A robust self-assessment against regulatory standards is carried out every year. The proposed new sub-committee structure is operating in shadow form in advance of demerger.
Service delivery risks
Realistic but challenging targets for project delivery, service standards and performance are set against which the Association regularly assesses its performance.
STRATEGIC REPORT
10
Treasury risk management
The Association defines its treasury management
activities as the management of the Association’s
cash flows, its banking, money market and capital
market transactions; the effective control of the risks
associated with those activities; and the pursuit of
optimum performance consistent with those risks.
The Association regards the successful
identification, monitoring and control of risk to be the
prime criteria by which the effectiveness of its
treasury management activities will be measured.
Accordingly, the analysis and reporting of treasury
management activities focuses on their risk
implications for the Association.
The Association also acknowledges that effective
treasury management will provide support towards
the achievement of its business and services
objectives. It is therefore committed to the principles
of achieving best value in treasury management,
and to employing suitable performance
measurement techniques, within the context of
effective risk management.
In addition to these core objectives, the Board of
Management sets annual targets/parameters within
which the treasury management function operates
including:
A limit on exposure to variable interest rates,
currently 40%
Use of derivative instruments
Approved sources of borrowing and
investment
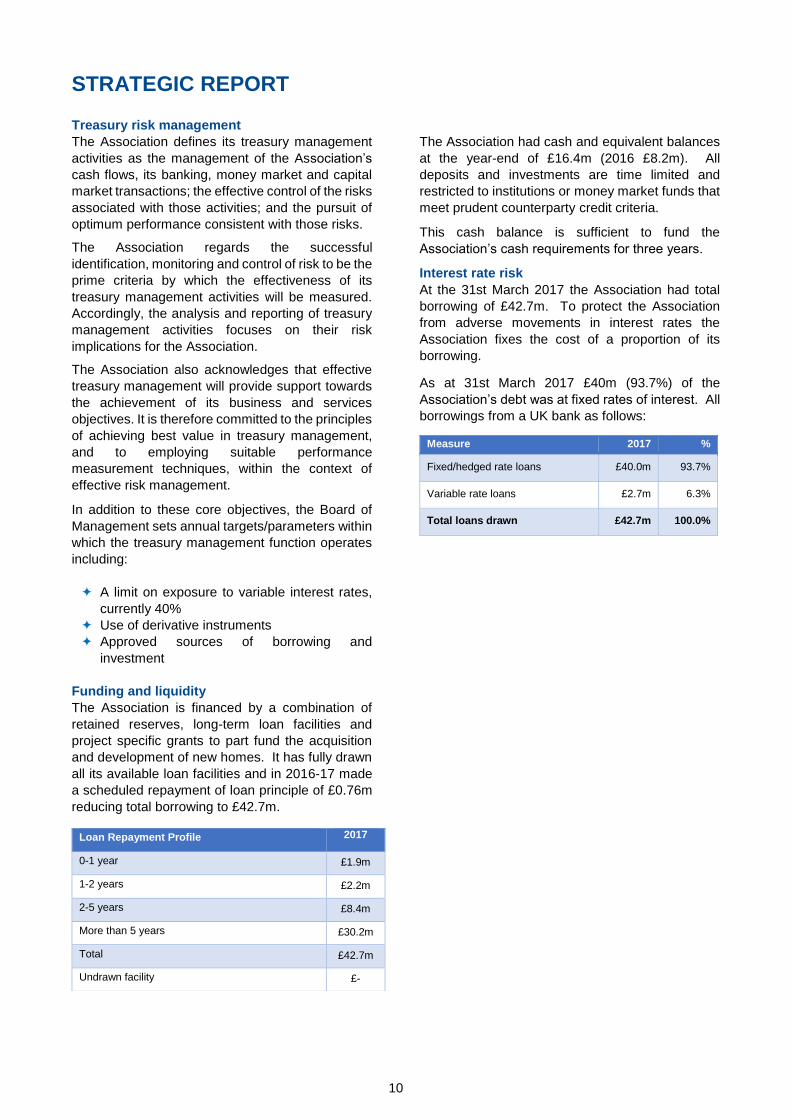
Funding and liquidity
The Association is financed by a combination of
retained reserves, long-term loan facilities and
project specific grants to part fund the acquisition
and development of new homes. It has fully drawn
all its available loan facilities and in 2016-17 made
a scheduled repayment of loan principle of £0.76m
reducing total borrowing to £42.7m.
The Association had cash and equivalent balances
at the year-end of £16.4m (2016 £8.2m). All
deposits and investments are time limited and
restricted to institutions or money market funds that
meet prudent counterparty credit criteria.
This cash balance is sufficient to fund the
Association’s cash requirements for three years.
Interest rate risk
At the 31st March 2017 the Association had total
borrowing of £42.7m. To protect the Association
from adverse movements in interest rates the
Association fixes the cost of a proportion of its
borrowing.
As at 31st March 2017 £40m (93.7%) of the
Association’s debt was at fixed rates of interest. All
borrowings from a UK bank as follows:
Measure 2017 %
Fixed/hedged rate loans £40.0m 93.7%
Variable rate loans £2.7m 6.3%
Total loans drawn £42.7m 100.0%
Loan Repayment Profile 2017
0-1 year £1.9m
1-2 years £2.2m
2-5 years £8.4m
More than 5 years £30.2m
Total £42.7m
Undrawn facility £-
STRATEGIC REPORT
11
Value for Money (VfM) and Benchmarking
VfM is a journey rather than a destination.
Squeezing every last drop of value from the assets
and resources the Association has available is the
key to maximising its investment into its homes,
neighbourhoods and services; as well as improving
performance and protecting its financial viability.
VfM Self-Assessment
The Board of Management and Executive
Management Team have conducted a rigorous self-
assessment of how Cobalt Housing is achieving
value for money in delivering its purpose and
objectives. This report aims to provide a robust and
evidenced based analysis of:
what we are aiming to achieve
how we allocate scarce resources between
competing priorities
how efficiently do we use the resources
available
how good are our service standards and
performance results
how successful are we in achieving the desired
outcome
The full self-assessment report is available on the
Association’s website:
http://www.cobalthousing.org.uk/about-us/value-
for-money-vfm
What VFM means to the Association
VfM is not just about costs, it is about getting the
most for our money. Good VfM is about competitive
costs, high productivity and successful outcomes.
The objective is to achieve the right balance
between cost, quantity and quality and then to keep
this under regular review.
Delivering VfM is not a separate or discrete function
within the organisation. It should, be integral to the
way we work and part of the day job for everyone
we employ or we work with. Onward Homes defines
VfM as:
“Making the most efficient use of our assets
and resources to deliver high quality and
innovative services that successfully meet
customer needs and expectations at lowest
possible cost”.
At its core it is about being a well-run effective social
business. It is having a clear understanding of what
we are here to achieve and then engineering our
business in such a way to maximise its delivery. Our
approach to VfM is framed around:
Our VfM Strategy
The Association’s VfM Strategy based around the
six aims listed below. This strategy is aimed at
maximising VfM for the benefit of our customers and
efficiency gains to be achieved last year of £193k.
This target reflected the fact that our cost base was
already in the lowest 25%. We are pleased to report
however we exceeded this target and secured gains
of £1.1m.
VfM Gains Achieved Target
£’000
Actual
£’000
Asset Management 38 492
Administration 80 274
Capital and Development: 75 340
Total Efficiencies 193 1,106
How these gains were achieved is set out in the full
self-assessment. . In more general terms value for
money in an integrated part of how we do business
that manifests itself in the following ways:
Challenging targets for annual improvement;
Effective scrutiny, measuring and monitoring;
A culture of looking for ways to save money,
improve efficiency and eliminate waste;
Refining the way we are organised and
restructuring to improve efficiency and reduce
costs
Best practice procurement and contract
management;
How do we use the gains we achieve?
We generate a “surplus for a purpose” and after
paying our interest costs, our surplus operating
cash is re-invested into our existing homes and into
supporting the development of new homes.
Our total cash receipts of £29.2m exceeded our
cash outflows by £8.9m and we reduced our net
debt. Our aim is to fund at least 50% of the spend
on developing new homes from operating cash
flows and in 2016-17 we were able to funded the
entire 100%. The 55 new homes that we completed
are therefore debt free and making an immediately
positive financial contribution.
These cash flows clearly demonstrate our capacity
to support additional development activity and
deliver more new homes. The reason why it has not
been possible to utilise this capacity is the
constraints of our existing funding facility.
Releasing this capacity is a priority for the board and
we will renegotiate the terms of our current funding
facility later in 2017. It will take time for us to gear
up and identify appropriate development
opportunities, but we are targeting increased
activity in 2018 onwards.
Targets for the future
The Board has set a target for efficiency gains of
£950k to be achieved over the next three years.
VfM Gains Target 2018
£’000
2019
£’000
2020
£’000
Asset Management 100 200 300
Administration 150 300 500
Capital and Development: 50 100 150
Total Gains vs 2017 300 600 950
We aim to deliver these targets by:
Establishing new back office support functions
for demerger in 2017 at a reduced cost
Introduce improved ICT capabilities to support
efficient ways of working
Review the delivery of all our neighbourhood
and asset services
Secure cost efficiencies through outsourcing
and partnership arrangements
Explore options to optimise the balance of in-
house and contractor repairs
Improving neighbourhood sustainability
Reducing instances of tenant damage and
misuse of our homes
STRATEGIC REPORT
13
How Do We Compare with Sector Average
Operating margins across the social housing sector
have improved in recent years. The Association’s
results have also improved and compare
favourably.
It should be noted that these margins are subject to
volatility due to movements in the value of long term
pension liabilities. In 2016 the margins were
suppressed by circa 3.9% and in 2017 the margins
are improved by circa 7.5% as a result of such
pension movements.
Benchmarking our Headline Unit Costs
Our total unit cost reduced by 21.4% in 2016-17 and
it is the lowest 25% nationally and regionally.
Social Housing Unit Costs -> Total
£
Cobalt 2015 £3,053
Cobalt 2016 £3,051
Cobalt 2017 £2,398
Change in 2017 % -21.4%
2017 Cobalt Rankings
National median average £3,570
National sector quartile 1st
Rank in the Northwest* 5th of 63
How we compare to our benchmarking group
As members of Housemark we can compare our
costs and performance with a wide range of other
housing providers. Our chosen peer group is all
housing providers (who are members of
Housemark) based in the North West of England.
This group was chosen as no particular model or
size or organisation has a monopoly on efficiency or
good practice.
The latest comparative cost data from Housemark
on our North West peers is shown below:
The above analysis relates to our performance in
the year to March 2016. They do not reflect the
sizeable efficiency gains and cost reductions
achieved in the year to March 2017. The result for
2016-17 will not be available until later in 2017.
Performance
If we are to determine whether or not VFM is being achieved, the second element we need to consider is the quality of service and outputs being delivered. The table below shows our performance in key areas of service delivery over the last five years:
Performance 2015 2016 2017 Q’tile
Total current tenant rent arrears
8.9% 8.9% 8.6% 4
%age of rents and service charges collected
98.0% 98.6% 99.4% 3
Rent collection and rent arrears remain a challenge
and although we saw improvements in 2016-17
performance is still below average
Performance 2015 2016 2017 Q’tile
%age of rent lost on empty properties
1.3% 0.8% 1.0% 3
Average relet time in days (excluding major repairs)
32 34 55 4
Our void losses and relet times deteriorated last
year. This was largely due to operational difficulties
experienced during the year where repair times
were much longer than expected.
2015-16
VfM Unit cost analysis Cobalt
Housemark Peers
Median Cobalt
Quartile
1. Housing management £273 £286 2nd
2. Responsive repair £331 £377 1st
3. Void repairs £290 £207 3rd
4. Estates £58 £167 1st
4. Major works £1,029 £1,021 3rd
5. Cyclical maintenance £65 £172 1st
6. Overheads % of turnover 9.9% 12.3% 1st
STRATEGIC REPORT
14
Performance 2015 2016 2017 Q’tile
% of repairs appointments kept
99.9% 98.1% 100% 1st
Average days taken to complete a repair
2.7 3.0 3.6 1st
%age of homes with a valid gas safety certificate
100% 100% 100% 1st
%age of properties meeting the decent homes standard
100% 100% 100% 1st
On repairs our performance remains positive.
Every property was covered by a valid gas safety
certificate and all homes were compliant with
decent homes. The length of time our tenants wait
for repairs is comparable with the best performance
in the sector.
Not all our performance results are where we would
want them to be. We recognise that we operate in
some deprived neighbourhoods, but this does not
stop us from aspiring to match the best performers
in the region.
Customer Satisfaction
The key to demonstrating VFM is to achieve
efficiencies and improve or maintain high customer
satisfaction at the same time. All our services
measure satisfaction on an ongoing basis, to
ensure we are delivering what our tenants want and
to the standard they expect.
Every two years we conduct a survey of all tenants,
to ask nationally defined questions. As shown in the
table below our key satisfaction results are all top
quartile and actually are amongst the best of any
provider in the country. A new survey is being
undertaken in 2017.
Tenant Survey Results 2010 2012 2014 Q’tile
Overall satisfaction with the services provided by Cobalt?
93% 93% 95% 1st
How satisfied are you that your views are taken into account
84% 85% 86% 1st
Satisfied with the way landlord deals with repairs and maintenance
92% 89% 91% 1st
Satisfaction with the quality of your home
N/A 90% 91% 1st
Satisfaction with the area / neighbourhood as a place to live
83% 84% 89% 1st
Do you think the rent you pay represents value for money?
86% 88% 89% 1st
How likely would you be to recommend Cobalt to family or friends
- 93% 94%
No data
Understanding the return on our assets
The properties that Cobalt owns are an extremely
valuable social asset. It is vital therefore that we
clearly demonstrate:
‘An understanding of the return on
assets and a proactive approach to
managing those assets’
The Group-wide Asset Management Strategy
Guide “Asset Management Our Approach”
establishes the requirements across the Group to
have a much more “dynamic approach” to using our
resources, to maintain and develop our homes and
services, delivering on business objectives and
meeting residents’ expectations.
Financial returns on our assets
Our headline financial results demonstrate a
significant improvement in the headline returns and
contributions from our assets in the last 12 months.
Properties 2015 2016 2017
Homes managed 6,028 6,002 6,019
Financial Statistics
Return on Net Assets (RONA)
4.3% 3.8% 4.5%
Return on Capital Employed (ROCE)
5.3% 4.9% 5.5%
The operating surplus generated on social housing
increased from £8.7m to £9.7m last year. The
operating surplus on lettings per property increased
from £1,455 to £1,949.
STRATEGIC REPORT
15
The average of £1,949 includes a range of results from our different neighbourhoods. This enables us to identify
trends and assets that are potentially performing less well. The chart below demonstrates that while some
areas are less “profitable”, all our neighbourhoods make a positive financial contribution.
Asset Performance Evaluation (APE)
The Group uses financial and non-financial indicators to inform strategic decision making on future investment, usage and retention or disposal of particular assets. This approach evaluates the predicted financial performance of all Onward Homes member’s stock based on their Net Present Value (NPV). This is being used to help us understand and improve over time the return on our assets including:
Measuring the long term performance of our properties
Modelling analysis of our assets value and contribution
Providing an objective baseline from which to make investment decisions
Identify properties requiring an option appraisal
Social Investment and Social Impact
We continue to drive to get better results for our
customers as some residents suffer
disproportionately from poor health, low educational
attainment and higher levels of unemployment. We
are committed to continuing to invest to improve the
neighbourhoods in which we work and to improve
the opportunities that are available for our residents.
In addition to meeting the long term accommodation
needs of over 6,000 social housing tenants and
their families, we create significant social impact
and social value through our work.
In 2016-17 we made a direct social investment of
£1.24m into key areas of activity that promote:
Sustainable tenancies
Community cohesion
Improved life chances & opportunities
Financial inclusion
Social Investment Activity 2016-17
£’000
Anti-social behaviour 299
Financial inclusion & welfare benefit advice 216
Community regeneration (net of grant) 122
Resident involvement and empowerment 112
Property adaptations 208
Free gardening & handyman service 87
Environmental improvements 196
Total Social Investment 1,240
Sustainable Tenancies
In the last year we successfully met the housing
need of 414 new tenants and their families. By
helping them to settle into their new homes our
investment in pre-tenancy support has seen starter
tenancy failure reduce significantly. Examples of
our tailored approach include:
Reusing furniture, giving new tenants a
positive start to their tenancy.
Providing tailored property incentives providing
items such as carpeting and laminate flooring.
Timely and effective response to any
dissatisfaction or issues raised.
Visits and courtesy calls after move in, making
sure tenants have settled in and any issues are
STRATEGIC REPORT
16
dealt with as soon as possible so the tenancy
is sustained.
Transfer inspection visits to check on property
condition and to provide appropriate advice
including promotion of mutual exchange as an
alternative to transfer.
Community Cohesion
We invest in a wide range of community cohesion
and development activities working in partnership
with other local agencies. These promote feelings
of belonging, understanding and community pride.
Managing £151k LCC Youth Grant Funding -
working with youth providers to share
resources and to deliver activities for young
people across our neighbourhoods.
Investing £69k through our Community Fund to
support local community and voluntary
organisations and projects that increase
community cohesion
Improved Life Chances and Opportunities
In the spirit of hand up rather than hand out we are
committed to helping our customers overcome any
obstacles or barriers that they may face. Our
support work is particularly focused on:
Employability, employment and training
opportunities
Health and wellbeing initiatives
Digital awareness
Financial Inclusion
Many of our customers face increased financial
hardship as a result of austerity and welfare reform.
In 2016-17 we delivered:
Completed 9,475 tenant advice contacts,
securing benefits with a total value of £3.5m
including £0.8m in housing-related benefits
Represented 38 tenants at benefit appeals
tribunals and were successful in 32
Successfully applied for 420 discretionary
housing payments on behalf of our tenants
worth a total of around £371,000.
Board VfM Self-Assessment 2017
The regulatory framework includes a specific
standard for VfM. Our regulator, the Homes and
Communities Agency, expects us to ‘have a
strategy for optimising VfM, and systems to
ensure that this strategy is delivered’. The
regulatory framework also includes the requirement
to publish a self-assessment report for
stakeholders, setting out how we comply with the
VfM standard, and our plans for future
improvement.
Sources of Assurance
The Board of Management has gained assurance that Cobalt complies with the regulators VfM standard through:
Annual review of VfM aims and objectives and VfM strategy to ensure it reflects regulatory updates and changes within the organisation
Reviewed half yearly VfM progress reports and on-going VfM updates
Active engagement in the self-assessment process and in reviewing this self-assessment document
Review of our self-assessment against the specific requirements of the standard
Independent review and feedback from Onward on their expectations of member organisations
VfM gains claimed are matched by improved financial results
It is the Board’s assessment that Cobalt Housing fully meets the requirements of the VfM standard. It has a robust and comprehensive approach which demonstrates value for money outcomes and tangible benefits for its tenants and other stakeholders.
The full VfM self-assessment can be found on the Association’s website:
Introduction The Board presents the Annual Report (the ‘Annual Report’) and the audited financial statements for Cobalt Housing Limited (the ‘Association’) for the year ended 31 March 2017.
Principle activities and future prospects
Details of Cobalt’s principle activities, its
performance during the year and factors likely to
affect its future development are contained within
the Strategic Report which precedes this Report.
Board members and executive directors
The current board members and executive directors
of the association (and others who served during
the period) are set out on page 2. The Board
members are drawn from a wide background
bringing together professional, commercial and
other experiences. Board members were not
remunerated for their services to the association but
were permitted to claim expenses incurred in the
performance of their duties.
Executive director’s remuneration
The remuneration of the executive directors is
reviewed by the Appointments and Remuneration
Committee, who make recommendations to be
considered and determined by the Board. Full
details of executive emoluments are set out in note
7 to the financial statements.
Service contracts
The executive directors are appointed on
permanent contracts of employment with a notice
period of three months. Details of the remuneration
of the executive directors is set out in note 7 to the
financial statements.
Pensions
The company closed future service accrual to the
Social Housing Pension Scheme defined benefit
schemes on 31st March 2016.
All company employees, including the executive
directors are able to participate in this defined
contribution schemes on the same terms as all
other eligible staff. The association contributes to
the schemes on behalf of its employees.
Non-executive directors are not eligible to
participate in any Group pension scheme.
Other benefits
The executive directors are not entitled to other
benefits.
Statement of compliance
The Board report and financial statements have
been prepared in accordance with applicable
reporting standards and legislation.
The Association confirms that these financial statements comply with United Kingdom Generally Accepted Accounting Practice (UK GAAP), including FRS 102 ‘The Financial Reporting Standard applicable in the UK and Republic of Ireland’.
Health and safety
Health and Safety is an integral part of the proper
management of all the undertakings over which the
Group has control. The Group has comprehensive
and robust Health and Safety policies and promotes
safe practices and continuous improvement
through a Health and Safety Forum on which all
parts of the Group are represented. Onward
Homes Group is committed to ensuring:
The health, safety and welfare of all our
tenants, leaseholders, staff, contractors and
third parties involved in the operations of the
Group
The safety of the general public who use or
have access to premises or sites under our
control
The way in which we operate contributes to the
wellbeing of the community at large
Donations
The Board has made no charitable or political
donations during the year.
Corporate governance
The Association is governed by a Board of non-executive members who delegate day-to-day operational control to the Managing Director and executive directors.
The Board complies with the 2015 National Housing
Federation Code of Governance and is committed
to upholding the Code of Practice for Board
members. The Board meets frequently to
determine policy and to monitor the performance of
the Association.
The Group operates an Audit Risk and Assurance
Committee which receives reports from Group
Business Assurance and validates and advises on
performance and the effectiveness of internal
controls. An annual report on activity goes to each
Board.
The Group also operates an Appointment and
Remuneration Committee which has responsibility
REPORT OF THE BOARD
18
for ensuring that each Board has effective
Governance arrangements and that these are fully
implemented.
Executive management team
The Board has delegated day to day management
to a group of Executive Directors, who meet as an
Executive Management Team (EMT) to control the
operations of the Association. The EMT meets on
a regular basis and recommends policy decisions to
the Board.
Lead by the Managing Director, the EMT ensures
the effective performance and successful delivery of
services to customers and investment in
neighbourhoods, in line with the agreed business
plan objectives.
Regulation of social housing
The Association is registered with and regulated by
the Homes and Communities Agency (HCA). The
HCA conducts this regulation through our parent
Onward Homes.
Under a co-regulation approach the onus is on each
registered provider to self-regulate, assess and
scrutinise service provision and demonstrate clearly
that services provided represent value for money.
Regulatory Compliance
The Governance and Financial Viability Standard
requires registered providers to assess their
compliance with the Standard at least annually and
Boards are now required to report their compliance
with the Standard within their annual accounts.
An annual self-assessment of the compliance with
the all the HCA standards, including the
Governance and Financial Viability Standard was
carried out in January 2017 and approved by the
Board in April 2017. It is the judgement of the Board
that the Association complies in full with the
Standard and is satisfied it has complied with all
laws and regulations that are relevant.
Group Regulatory Compliance
Onward is regulated as a group and its members
are not awarded their own regulatory judgements.
As a result of control failures at a group level
identified by Onward in 2016 Onward is currently
judged to be non-compliant with the requirements of
the Governance and Viability Standard and
downgraded to G3.
G3 is defined by the regulator as “The provider does not meet our governance requirements. There are issues of serious regulatory concern and in
agreement with us the provider is working to improve its position.”
Work to address the issues identified has been
undertaken and an independent assessment of
whether sufficient progress has been made to
request a regrading by the HCA is underway.
Onward Homes’ viability rating has remained
unchanged at V1 throughout.
Employee involvement
The Board recognises that its employees are its
greatest asset and that it cannot achieve its aims
and objectives without their involvement and
contribution towards running the organisation. The
Association communicates and consults with its
employees through a variety of structures including
regular team briefings, employee emails,
newsletters and trade union meetings (consultation
through staff forum).
The Association is committed to developing a
culture in which equality and diversity is integral to
all of its activities, including the recruitment and
development of staff. We aim to achieve an
inclusive culture that respects and values
differences and eliminates discrimination in all
areas.
Corporate social responsibility
The Board are committed to being a socially
responsible organisation. Managing in a socially
responsible way, ensuring adherence to legislation
and ethical operation. The Association is actively
working with local communities and partners to
improve the life chances of our tenants and
residents.
REPORT OF THE BOARD
19
Statement of internal control
The Group Board acknowledges its ultimate
responsibility for ensuring that the Group has in
place a system of internal control and risk
management that is appropriate to the various
business environments in which they operate and
for review of the effectiveness of that system during
the year.
The Group Audit and Risk Committee is responsible
to the Group Board for monitoring this system and
reporting on its effectiveness.
Internal controls are designed to identify and
manage rather than eliminate risks which may
prevent an organisation from achieving its
objectives.
The system of internal control is designed to
manage risk and give reasonable rather than
absolute assurance with respect to:
The achievement of key business objectives
and expected outcomes
The preparation and reliability of financial and
operational information used within
the organisation and for publication
The maintenance of proper accounting and
management records
The safeguarding of assets against
unauthorised use or disposition
Internal assurance activities
The process followed to identify, evaluate and
manage significant risks faced by the Group is
ongoing and has been in place during the past
financial year and up to the date of the annual report
and accounts.
Internal audit assurance
The Group’s in-house internal audit function is used
to provide assurance on the operation of the control
framework and the management of risk. Internal
audit are not responsible for the design and
construction of control systems but provide an
assessment as to their effectiveness.
The Group Audit and Risk Committee oversee the
work of internal auditors and review reports issued
by them. The Committee is responsible for
monitoring the actions identified as a result of
internal audit findings that are implemented in a
timely fashion.
External audit assurance
The work of the external auditors provides some
independent assurance over the adequacy of the
internal control environment. The Group receives a
management letter from the external auditors which
identifies any internal control weaknesses. The
Board itself and through the activities of the Group
Audit and Risk Committee has reviewed the
outcome of external audit work and the external
audit management letter.
Fraud
The Group Board has a current policy on fraud
which includes both fraud prevention and detection.
A register of frauds and losses is maintained and is
available and reported to the Group Audit and Risk
Committee
Review of risk management and governance
arrangements
During 2015-16 the Group identified that risks
relating to compliance with statutory health and
safety responsibilities were not being effectively
managed which led to a number of control failures.
The Group notified the regulator of its concerns and
in early July 2016 it received a regulatory judgement
that the Group is non-compliant with the
governance requirements set out in the
Governance and Viability Standard and as a result,
the Group’s governance rating has been
downgraded to G3. The Group’s Viability rating
remains unchanged at V1.
The Group established improvement plans, utilising
specialist external advice to improve management,
governance and assurance arrangements.
During 2016-17 the group has implemented the
improvement plans agreed with the regulator and
the regulator may review these arrangements
during 2017 to support a re-grading.
The Group Board acknowledges that their
responsibility applies to the full range of risks and
controls across all Group activities and is to ensure
that planned remedial and improvement action
agreed is implemented in a timely and
comprehensive manner.
The Group Board has considered the effectiveness
of the system of internal control in place in the year
ended 31st March 2017. The Group Board
acknowledges that historically internal control and
risk management arrangements were not working
adequately. We have made good progress in
implementing the improvement plans agreed with
the regulator and we are satisfied that, when
complete, this will address the issues identified
within our systems of internal control, governance
and risk management arrangements.
REPORT OF THE BOARD
20
Going concern
The Association has long-term debt facilities in place and cash and equivalent holdings of £16.4m which provide adequate resources to finance committed reinvestment and development programmes. The Association’s long-term financial plans shows that it is able to service these debt facilities and continue to comply with lenders’ covenants.
On this basis, the Board has a reasonable expectation that the Association has adequate resources to continue in operational existence for the foreseeable future, being a period of twelve months after the date on which the annual report and financial statements are signed. For this reason, it continues to adopt the going concern basis in the financial statements.
Effects of material estimates and judgements
upon performance
Preparation of the financial statements requires management to make significant judgements and estimates. The estimates and assumptions that can have the most significant effect on recognition and measurement of assets, liabilities, income and expenses is provided below.
Impairment
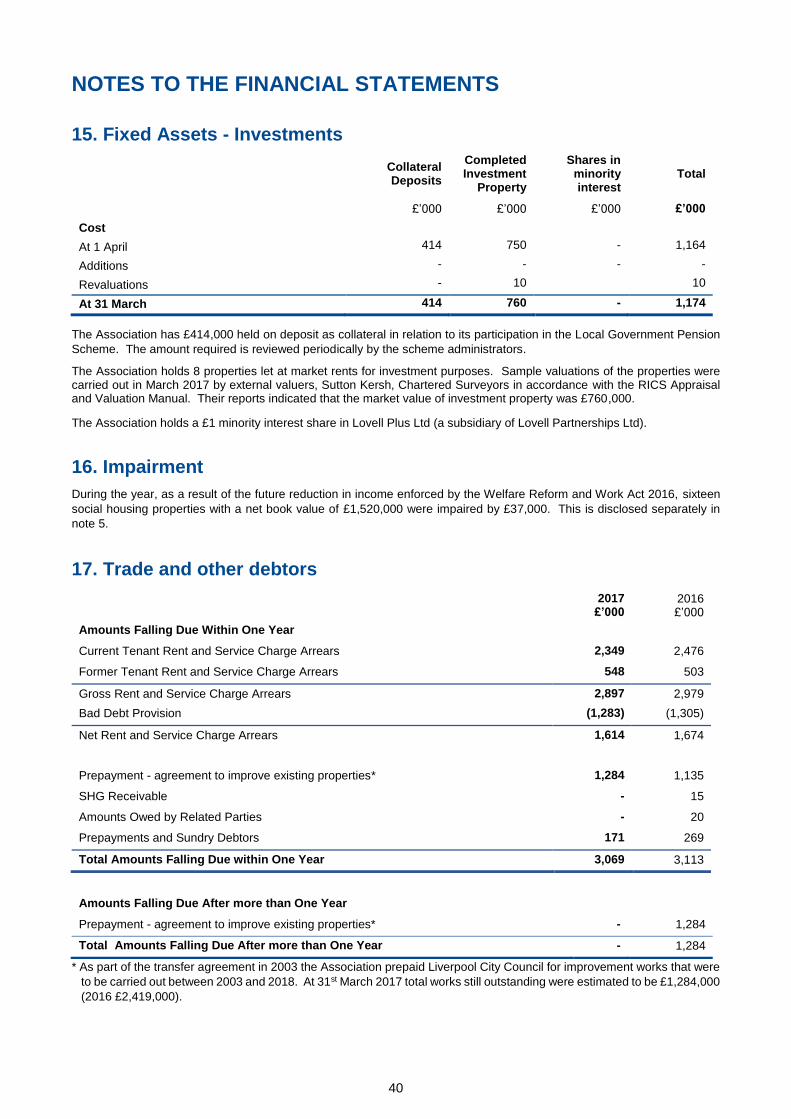
Management assesses the housing properties for indicators of impairment at each balance sheet date. Where indicators exist a detailed assessment is undertaken to compare the carrying amount of assets or cash generating units for which impairment is indicated to their recoverable amounts. Judgements in assessing the level of a cash generating units and the recoverable amounts could lead to increases or decreases in the impairment provision.
The impairment review at 31st March 2017 lead to 16 properties having their carrying value impaired by a total of £37,000. (2016 £367,000). Useful lives of depreciable assets
Management reviews its estimate of the useful lives
of its depreciable assets at each reporting date
based upon the expected utility of the assets.
Uncertainty in these estimates relate to changes in
decent homes standards, component failure or
obsolescence and customer abuse or misuse. Any
of these could lead to more frequent replacement of
key components.
Defined benefit pension obligations
Management’s estimate of the association’s
defined benefit pension obligations is based upon a
number of critical underlying assumptions such as
rates of inflation, mortality, discount rates,
investment returns and future salary increases.
Variation in these assumptions may significantly
impact upon the obligation amount and the annual
defined benefit expenses (as shown in note 36). At
31st March 2017 the association had a pension
deficit of £67,000 (2016 £504,000 surplus).
Provisions for doubtful debt
Management reviews the provision held against the risk of failure to recover current and former tenant rent and service charge arrears at each reporting date. The provision made has an impact upon the value of the current assets recognised at the reporting date and any change in value of the provision during the period is recognised as an operating cost in the statement of comprehensive income in the period.
Disclosure of information to auditors
So far as each of the directors of the Group is
aware, at the time this report is approved:
There is no relevant information which the
Group’s auditor is unaware; and
The directors have taken all the steps that they
ought to have taken as a director in order to
make themselves aware of any relevant audit
information and to establish that the Group’s
auditor is aware of that information.
Independent auditor
The Association will make arrangements to procure
and appoint auditors following its demerger from
Onward Homes in September 2017.
REPORT OF THE BOARD
21
Statement of Board’s responsibilities in respect of the Board’s report and the financial statements
The Board is responsible for preparing the Board’s
Report and the financial statements in accordance
with applicable law and regulations.
Co-operative and Community Benefit Society law
requires the Board to prepare financial statements
for each financial year. Under those regulations the
Board have elected to prepare the financial
statements in accordance with UK Accounting
Standards, including FRS 102 The Financial
Reporting Standard applicable in the UK and
Republic of Ireland.
The financial statements are required by law to
give a true and fair view of the state of affairs of
the association and of its income and expenditure
for that period.
In preparing these financial statements, the Board
is required to:
select suitable accounting policies and then
apply them consistently;
make judgements and estimates that are
reasonable and prudent;
state whether applicable UK Accounting
Standards and the Statement of
Recommended Practice have been
followed, subject to any material departures
disclosed and explained in the financial
statements; and
prepare the financial statements on the
going concern basis unless it is
inappropriate to presume that the
association will continue in business.
The Board is responsible for keeping proper books
of account that disclose with reasonable accuracy
at any time the financial position of the association
and enable them to ensure that its financial
statements comply with the Co-operative and
Community Benefit Societies Act 2014, the Housing
and Regeneration Act 2008 and the Accounting
Direction for Private Registered Providers of Social
Housing 2015.
The Board has general responsibility for taking such
steps as are reasonably open to it to safeguard the
assets of the association and to prevent and detect
fraud and other irregularities.
The Board is responsible for the maintenance and
integrity of the corporate and financial information
included on the association’s website. Legislation
in the UK governing the preparation and
dissemination of financial statements may differ
from legislation in other jurisdictions.
The Report of the Board, including the financial
statements, was approved by the Board on 3rd July
2017 and signed on its behalf by:
Annette Brandwood
Company Secretary
INDEPENDENT AUDITOR’S REPORT
22
Independent auditor’s report to Cobalt Housing
Limited
We have audited the financial statements of Cobalt
Housing Limited for the year ended 31 March 2017,
which comprise the Statement of Comprehensive
Income, Statement of Financial Position, Statement
of Changes in Equity, Statement of Cash Flows and
the related notes. The financial reporting
framework that has been applied in their
preparation is applicable law and UK Accounting
Standards (UK Generally Accepted Accounting
Practice), including FRS 102 The Financial
Reporting Standard applicable in the UK and
Republic of Ireland.
This report is made solely to the association in
accordance with section 87 of the Co-operative and
Community Benefit Societies Act 2014 and section
128 of the Housing and Regeneration Act 2008.
Our audit work has been undertaken so that we
might state to the association those matters we are
required to state to it in an auditor’s report and for
no other purpose. To the fullest extent permitted by
law, we do not accept or assume responsibility to
anyone other than the association as a body, for our
audit work, for this report, or for the opinions we
have formed.
Respective responsibilities of the Board and auditor As more fully explained in the Statement of Board’s Responsibilities set out on page 21 the association’s Board is responsible for the preparation of financial statements which give a true and fair view. Our responsibility is to audit, and express an opinion on, the financial statements in accordance with applicable law and International Standards on Auditing (UK and Ireland). Those standards require us to comply with the Auditing Practices Board’s Ethical Standards for Auditors.
Scope of the audit of the financial statements A description of the scope of an audit of financial statements is provided on the Financial Reporting Council’s website at:
www.frc.org.uk/auditscopeukprivate.
Opinion on financial statements In our opinion the financial statements:
give a true and fair view, in accordance with
UK Generally Accepted Accounting Practice,
of the state of affairs of the association as at
31 March 2017 and of its income and
expenditure for the year then ended;
comply with the requirements of the Co-
operative and Community Benefit Societies
Act 2014; and
have been properly prepared in accordance
with the Housing and Regeneration Act 2008
and the Accounting Direction for Private
Registered Providers of Social Housing
2015.
Matters on which we are required to report by exception We have nothing to report in respect of the following
matters where the Co-operative and Community
Benefit Societies Act 2014 requires us to report to
you if, in our opinion:
the association has not kept proper books of account; or
the association has not maintained a satisfactory system of control over transactions; or
the financial statements are not in agreement with the association’s books of account; or
we have not received all the information and explanations we need for our audit.
Hywel Jones for and on behalf of KPMG LLP, Statutory Auditor Chartered Accountants, 1 St Peter’s Square Manchester M2 3AE
(Loss) / Gain on disposal of fixed assets 6 (11) 123
Interest receivable and similar income 9 44 34
Interest payable and similar charges 10 (1,753) (1,802)
Other financing amounts 37 19 (42)
Surplus on ordinary activities before taxation 9,768 6,299
Taxation on surplus on ordinary activities 11 - -
Surplus for the year after taxation 9,768 6,299
Other Comprehensive Income
Actuarial (loss) / gain in respect of pension schemes 37 (574) 311
Other comprehensive Income for the year (574) 311
Total Comprehensive Income for the year 9,194 6,610
Statement of Financial Position
As at 31st March 2017
24
Note
s 2017
£’000
2016 restated
£’000
Fixed Assets
Housing Properties 12 155,088 155,995
Other Tangible Fixed Assets 13 2,671 2,753
Intangible Fixed Assets 14 138 2
Investments including properties 15 1,174 1,164
159,071 159,914
Debtors Due after more than one year 17 - 1,284
Current Assets
Trade and other debtors 17 3,069 3,113
Cash and cash equivalents 16,397 8,249
19,466 11,362
Creditors
Amounts Falling Due Within One Year 18 (7,306) (5,510)
Net Current Assets 12,160 5,852
Pension Asset 19 - 504
Total Assets less Current Liabilities 171,231 167,554
Creditors: Amounts Falling due After More Than One Year
Deferred grant income 20 (39,102) (39,394)
Loans 21 (40,559) (42,440)
Recycled Capital Grant Fund & Disposal Proceeds Fund 22 (845) (614)
Other Creditors 23 (980) (4,605)
(81,486) (87,053)
Provisions for Liabilities and Charges 25 (68) (85)
Pension Liability 19 (67) -
Total Net Assets 89,610 80,416
Capital and Reserves
Non-Equity Share Capital 26 - -
Revenue Reserves 27 89,610 80,416
Total Capital and Reserves 89,610 80,416
The financial statements were approved by the Board and signed on its behalf on 3rd July 2017 by:
………………………… ………………………… …………………………
Chair Board Member Company Secretary
Statement of Changes in Equity
For the year ended 31st March 2017
25
Notes
Non-equity share
capital £’000
Revenue Reserves
£’000
Total £’000
Balance at 1 April 2016 28 - 80,416 80,416
Total comprehensive income for the period
Surplus for the year ending 31 March 2017 - 9,768 9,768
Actuarial Gains / (Losses) in respect of pension schemes - (574) (574)
Balance at 31 March 2017 - 89,610 89,610
Comprehensive Statement of Cash Flows
For the year ended 31st March 2017
26
Notes 2017
£’000 2016
£’000
Cash flows from Operating Activities 32 16,683 14,225
Cash flow from investing activities
Purchase and Construction of Housing Properties (2,051) (3,707)
Housing component renewal (4,138) (4,354)
Social Housing Grant Received 320 1,985
Sale of Land & Offices 1 (2)
Purchase of Other Fixed Assets (153) (59)
Interest received 45 32
Cash flow from investing activities (5,976) (6,105)
Cash flow from financing activities
Interest Paid (1,799) (1,812)
Repayment of existing borrowing (760) (673)
Cash flow from financing activities (2,559) (2,485)
Net increase / (decrease) in cash and cash equivalents 8,148 5,635
Cash and cash equivalents at the beginning of the year 8,249 2,614
Cash and Cash Equivalents at the End of the Year 34 16,397 8,249
NOTES TO THE FINANCIAL STATEMENTS
27
1. Accounting Policies
Basis of accounting
The financial statements of the association are prepared in accordance with Financial Reporting Standard 102 – the applicable financial reporting standard in the UK and Republic of Ireland (“FRS102”) and the Statement of Recommended Practice: Accounting by Registered Social Providers Update 2014, and comply with the Accounting Direction for Private Registered Providers of Social Housing 2015.
The accounting policies set out below have, unless otherwise stated, been applied consistently to all periods presented in these financial statements. The presentation currency of these financial statements is sterling. All amounts in the financial statements have been rounded to the nearest £1,000.
The association’s ultimate parent undertaking,
Onward Homes Group, includes the association in
its consolidated financial statements.
Measurement convention
The financial statements are prepared on a historical
cost basis except for investment properties which
are stated at their fair value.
Provisions for doubtful debt
The provision is calculated for each individual
tenancy in line with the age of the debt and most
recent payment patterns. The provision rates used
at the reporting date were:
Age of Arrears Static or increasing
arrears
Reducing arrears
Up to 4 weeks 25% 10%
5-8 weeks 50% 25%
9 to 16 weeks 75% 50%
17 to 32 weeks 100% 75%
Above 32 weeks 100% 90%
Former tenant arrears 100% 100%
Other debtor amounts are dealt with on a case by case basis.
Basic financial instruments
Tenant arrears, trade and other debtors
Tenant arrears, trade and other debtors are
recognised initially at transaction price less
attributable transaction costs. Subsequent to initial
recognition they are measured at amortised cost
using the effective interest method, less any
impairment losses. If the arrangement constitutes a
financing transaction, for example if payment is
deferred beyond normal business terms, then it is
measured at the present value of future payments
discounted at a market rate of instrument for a
similar debt instrument.
Trade and other creditors
Trade and other creditors are recognised initially at
transaction price plus attributable transaction costs.
Subsequent to initial recognition they are measured
at amortised cost using the effective interest method.
If the arrangement constitutes a financing
transaction, for example if payment is deferred
beyond normal business terms, then it is measured
at the present value of future payments discounted
at a market rate of instrument for a similar debt
instrument.
Interest-bearing borrowings classified as basic
financial instruments
Interest-bearing borrowings are recognised initially
at fair value less attributable transaction costs.
Subsequent to initial recognition, interest-bearing
borrowings are stated at amortised cost using the
effective interest method, less any impairment
losses.
Cash and cash equivalents
Cash and cash equivalents comprise cash balances
and call deposits. Bank overdrafts that are repayable
on demand and form an integral part of the
association’s cash management are included as a
component of cash and cash equivalents for the
purpose only of the cash flow statement.
NOTES TO THE FINANCIAL STATEMENTS
28
1. Accounting Policies (continued)
Non-basic financial instruments
Non-basic financial instruments are recognised at
fair value and are revalued using a valuation
technique at each reporting date. Any movements
in the fair value are posted to the Statement of
Comprehensive Income unless hedge accounting is
applied.
Turnover Turnover comprises a range or significant income
streams including:
Rents and service charges
Rents and service charge income receivable is
shown net of void losses. Rental income on homes
newly acquired or developed is recognised from the
execution of the first tenancy agreement. Rental
income is taken up to 31 March.
Proceeds for property sales
Proceeds from first tranche sales of low-cost home
ownership, properties developed for sale and homes
sold under the Right to Buy or Right to Acquire are
shown within turnover. Proceeds on sales are
recognised upon practical completion of the sale.
Grants
Turnover includes grants recognised as income
under the performance method and the amortisation
of government grant under the accrual model. More
detail is provided in specific grant accounting
policies.
Grants relating to revenue are recognised as income
as the same period as the expenditure to which they
relate, one reasonable assurance has been gained
that any funding conditions have been met and the
grant will be received,
Other fees and income receivable
Other fees and income is recognised as receivable
on delivery of the services provided.
Expenses Cost of sales
Cost of sales comprises the carrying cost of the
asset sold including any capitalised interest and
direct overheads incurred in the development or
acquisition of the asset. It also includes any
marketing, conveyancing or other incidental costs
incurred in the sale.
Operating leases
Payments (excluding costs for services and
insurance) made under operating leases are
recognised in the statement of comprehensive
income on a straight-line basis over the term of the
lease unless the payments to the lessor are
structured to increase in line with expected general
inflation; in which case the payments related to the
structured increases are recognised as incurred.
Interest receivable and Interest payable
Interest payable and similar charges include interest
payable, finance charges on shares classified as
liabilities and finance leases recognised in the
statement of comprehensive income using the
effective interest method and unwinding of the
discount on provisions.
Interest, including issue costs, is allocated at a
constant rate on the carrying amount over the period
of the borrowing
Borrowing costs that are directly attributable to the
acquisition, construction or production of housing
properties that take a substantial time to be prepared
for use are capitalised as part of the cost of that
asset.
Other interest receivable and similar income
includes interest receivable on funds invested.
Value added tax
The Association charges VAT on some of its income
and is able to recover part of the VAT it incurs on
expenditure. The financial statements include VAT
on expenditure to the extent that it is suffered by the
Association and not recovered from HMRC.
Recoverable VAT arise from partially exempt
activities that is credited to the income and
expenditure account but also from certain qualifying
capital improvement works to the homes that
transferred from Liverpool City Council. Any VAT
recoverable or payable at the year-end is recognised
as an asset or liability in the Statement of Financial
Position.
NOTES TO THE FINANCIAL STATEMENTS
29
1. Accounting Policies (continued)
Tangible fixed assets
Housing properties for rent
Social housing properties for rent are stated at
historic cost less accumulated depreciation and
impairment. Costs include the cost of acquiring land
and buildings, development costs, interest charges
incurred during the development period, directly
attributable staff costs and expenditure incurred in
respect of improvement or component renewal.
Components and renewal
Where a housing property comprises two or more
major components with substantially different useful
economic lives, each component is accounted for
separately and depreciated over its individual useful
economic life.
Expenditure relating to the subsequent replacement
or renewal of major property components is
capitalised as incurred. The original component is
disposed of on renewal and any residual carrying
cost recognised as an operating cost.
Property improvement
Improvements are works which result in an increase
in the net rental income, such as a reduction in future
maintenance costs, or result in a significant
extension of the useful economic life of the property
in the business.
Shared ownership
Shared ownership properties are included in housing
properties at cost related to the percentage of equity
retained, less any provisions needed for impairment
or depreciation.
Unsold shared ownership properties, including those
under construction, are split between fixed assets
and current assets (stock). The proportion included
as stock is determined by the percentage of the
property agreed or expected to be sold under the first
tranche sale. The remainder is classified as tangible
fixed assets.
Donated land and other assets
Land and other assets donated by local authorities
and other government sources is added to cost at
their fair value at the time of the donation. Where
land is not related to a specific development and is
donated by a public body, an amount equivalent to
the difference between fair value and consideration
paid is treated as non-monetary government grant
and recognised as a deferred income liability on the
Statement of Financial Position.
Where the donation is from a non-public source, the
difference between fair value and consideration paid
is included as income on the Statement of
Comprehensive Income.
Capitalisation of Development Administration
Costs
Costs which are directly attributable to development
activity are capitalised.
Capitalisation of Interest
Borrowing costs that are directly attributable to the
acquisition, construction or production of housing
properties that take a substantial time to be prepared
for use are capitalised as part of the cost of that
asset.
NOTES TO THE FINANCIAL STATEMENTS
30
1. Accounting Policies (continued)
Depreciation of housing properties
Depreciation is charged to the statement of
comprehensive income on a straight-line basis over
the estimated useful lives of each component part of
housing properties. Depreciation is charged from
the year following the assets acquisition or
replacement. The estimated useful lives as set out
below:
Depreciation methods, useful lives and residual
values are reviewed if there is an indication of a
significant change since last annual reporting date in
the pattern by which the association expects to
consume an asset’s future economic benefits.
Fixed Asset Category Useful Economic
Life
New build housing structure 100 yrs
Other housing structure 50 yrs
Boundary walls and car hard-standings
50 yrs
Roofs 30 yrs
Windows 25 yrs
Electrical installation 25 yrs
Bathrooms 25 yrs
Structural cladding 25 yrs
Fascia and soffits – in PVCu 25 yrs
Fencing 25 yrs
External doors 20 yrs
Boilers and heating systems 17.5 yrs
Kitchens 15 yrs
Communal lift 25 yrs
Door entry system 12 yrs
Emergency lighting 10 yrs
Fire detection/prevention equip 10 yrs
TV aerial / satellite 10 yrs
White goods 5 yrs
Freehold land and properties in the course of
construction are not depreciated
Impairment
Financial assets not carried at fair value are impaired
if objective evidence indicates that a loss event has
occurred after the initial recognition of the asset, and
that the loss event has had a negative effect on the
estimated future cash flows of that asset that can be
estimated reliably.
An impairment loss in respect of a financial asset
measured at amortised cost is calculated as the
difference between its carrying amount and the
present value of the estimated future cash flows
discounted at the asset’s original effective interest
rate.
For financial instruments measured at cost less
impairment an impairment is calculated as the
difference between its carrying amount and the best
estimate of the amount that the Group would receive
for the asset if it were to be sold at the reporting date.
Interest on the impaired asset continues to be
recognised through the unwinding of the discount.
Impairment losses are recognised in the statement
of comprehensive income. When a subsequent
event causes the amount of impairment loss to
decrease, the decrease in impairment loss is
reversed through the statement of comprehensive
income.
An impairment loss is reversed if and only if the
reasons for the impairment have ceased to apply.
Impairment losses recognised in prior periods are
assessed at each reporting date for any indications
that the loss has decreased or no longer exists. An
impairment loss is reversed only to the extent that
the asset’s carrying amount does not exceed the
carrying amount that would have been determined,
net of depreciation or amortisation, if no impairment
loss had been recognised.
Housing properties are assessed annually for any
indicators of impairment. Where indicators are
identified as assessment of impairment is
undertaken comparing the carrying value of our
assets to their recoverable amount.
Where the carrying amount of our assets is deemed
to exceed its recoverable amount, the asset is
written down to its recoverable amount. The
resulting impairment loss is recognise as operating
expenditure. Where an asset is deemed not to be
providing its intended service potential, its
recoverable amount is deemed to be its fair value
less costs to sell.
For impairment purposes assets can be individual
properties, schemes or groups of similar properties.
NOTES TO THE FINANCIAL STATEMENTS
31
1. Accounting Policies (continued)
Housing property sales
Properties sold through tenants exercising their
preserved right to buy or right to acquire are included
within turnover. Properties sold that were developed
or acquired for outright sale are included within
turnover. The proceeds from the first tranche sales
of shared ownership properties are included within
turnover. Subsequent tranche sales are included
within the gain / (loss) on disposal of fixed assets.
Properties developed for sale Completed properties for outright sale and
properties under construction are recognised at the
lower of cost and net realisable value. Cost
comprises materials, direct labour, direct
development overheads and capitalised interest. Net
realisable value is based on estimated sales price
after allowing for all further costs of completion and
disposal.
Investment properties
Investment properties are not held for their social
benefit, but either to earn rental income or for capital
appreciation or for both. Investment properties are
recognised initially at cost. Investment properties
whose fair value can be measured reliably without
undue cost or effort are held at fair value. Any gains
or losses arising from changes in the fair value are
recognised in the statement of comprehensive
income in the period that they arise.
No depreciation is provided in respect of investment
properties applying the fair value model.
Other tangible fixed assets
Tangible fixed assets are stated at cost less
accumulated depreciation and any provision for
impairment. Depreciation is charged on a straight
line basis over the expected economic useful lives to
write them down to their estimated residual value as
shown below:
Fixed Asset Category Useful Economic
Life
Office premises 60 yrs
Furniture, fixtures and fittings 5 yrs
Office equipment 5 yrs
Vehicles 4 yrs
Computer equipment 5 yrs
Other fixed assets will be reviewed for impairment if
there is an indication that impairment may have
occurred and where there is evidence of impairment,
fixed assets will be written down to the recoverable
amount via operating expenditure.
Intangible fixed assets
Intangible fixed assets are stated at cost less
accumulated amortisation and any provision for
impairment. Amortisation is charged on a straight
line basis over the expected economic useful lives.
Fixed Asset Category Useful Economic
Life
ICT system licences 5 yrs
Government grants – including social housing
grant
Government grants includes grants receivable from
the Homes and Communities Agency (the HCA),
local authorities and other government
organisations. Government grants received for
housing properties are recognised as income over
the useful life of the housing property structure under
the accrual method.
An amount equivalent to the accumulated SHG
taken to revenue reserves is disclosed as a
contingent liability reflecting the potential future
obligation to repay SHG where properties are
disposed.
Government grants received for housing properties
are subordinated to the repayment of loans by
agreement with the HCA. On the sale, disposal or
change of approved use of a government grant
funded property, some or all of the grant is
transferred into the Recycled Capital Grant Fund or
Disposals Proceeds Fund. Amounts within these
funds are recognised as liabilities until they are either
recycled or repaid in accordance with the social
housing grant regime.
If there is no requirement to recycle or repay the
grant on disposal of an asset, any unamortised
residual grant is released from creditors and
recognised as income.
Grants due from government organisations or
received in advance are included as current assets
or liabilities.
NOTES TO THE FINANCIAL STATEMENTS
32
1. Accounting Policies (continued)
Other grants
Grants from non-government sources are
recognised using the performance method. A grant
which does not impose specific future performance
conditions is recognised as income when the grant
proceeds are received or receivable. A grant that
imposes specific future performance related
conditions on the association is recognised only
when these conditions are met.
Employee benefits
Defined contribution pension plans
The association has a number of employees who are
members of a defined contribution plan. The
association pays fixed contributions into a separate
entity and has no legal or constructive obligation to
pay further amounts. Any such contributions are
recognised as an expense in the statement of
comprehensive income in the period during which
services are rendered by employees.
Defined benefit pension plan – Merseyside
Pension Fund
A number of the association’s employees past and
present are members of the Local Government
Pension Scheme currently administered by the
Merseyside Pension Fund. Details of this
participation are disclosed in note 36.
The scheme’s assets are measured at fair values.
The scheme’s liabilities are measured on an
actuarial basis using the projected unit credit method
and are discounted at appropriate high quality
corporate bond rates. The resultant net surplus or
deficit on the scheme is presented separately from
other net assets on the statement of financial
position. Any net surplus in only recognised to the
extent that it is recoverable by the association
through reduced contributions or through refunds
from the plan.
The current service cost and costs from settlements
and curtailments are changed as operating costs.
Past service costs are recognised in the current
reporting period. Interest is calculated on the net
defined benefit liability. Remeasurements are
reported in other comprehensive income.
Defined benefit pension plan – Social Housing
Pension Scheme (SHPS)
SHPS is a multi-employee scheme where assets
and liabilities are pooled. As a result SHPS are
unable to provide sufficient information to use
defined benefit accounting. As a result the
association accounts for the scheme as if it were a
defined contribution scheme and the amount
charged to the statement of comprehensive income
represents the contributions payable to the scheme
in respect of the accounting period.
The association has a number of current and past
employees that participate in the SHPS defined
benefit plans. The association is not registered as
an employee in its own right with SHPS, its
employees participate as members of the Liverpool
Housing Trust Limited (LHT). Where LHT is notified
of an obligation to make contributions towards an
agreed deficit funding arrangement, the association
recognises its fair proportion as an intercompany
liability.
The same is true for the association’s agreed share
of its parent company obligations to make
contributions towards an agreed deficit funding
arrangement.
Any such deficit funding contributions are
recognised as a liability and results in a charge to the
statement of comprehensive income. Where these
payments are not expected to be settled within
twelve months the liability is measured at the present
value of the contributions payable.
Termination benefits
Termination benefits are recognised as an expense
when the association is demonstrably committed,
without realistic possibility of withdrawal, to a formal
detailed plan to either terminate employment before
the normal retirement date, or to provide termination
benefits as a result of an offer made to encourage
voluntary redundancy. Termination benefits for
voluntary redundancies are recognised as an
expense if the association has made an offer of
voluntary redundancy, it is probably that the offer will
be accepted, and the number of acceptances can be
estimated reliably. If benefits are payable more than
twelve months after the reporting date, then they are
discounted to their present value.
Loan finance issue costs
Material loan issue costs are written off evenly over
the life of the related loan. Loans are stated in the
Statement of Financial Position at the amount of the
net proceeds after issue and arrangement costs.
The cost of interest rate swap options not utilised is
written off to expenditure on the maturity of the
option where relevant.
NOTES TO THE FINANCIAL STATEMENTS
33
1. Accounting Policies (continued)
Property managed by agents
Where the Association carries the financial risk on
property managed by agents, all the income and
expenditure arising from the property is included in
the income and expenditure account. Where the
agency carries the financial risk, the income and
expenditure account includes only that income and
expenditure which relates solely to the Association.
Provisions
A provision is recognised in the statement of
financial position when the association has a present
legal or constructive obligation as a result of a past
event, which can be reliably measured and is likely
to be required to be settled. Provisions are
recognised at the best estimate of the amount
required to settle the obligation at the reporting date.
NOTES TO THE FINANCIAL STATEMENTS
34
2. Turnover, Operating Costs and Operating Surplus
Turnover
2017 Operating
costs Operating
Surplus Turnover
2016 Operating
costs Operating
Surplus
£’000 £’000 £’000 £’000 £’000 £’000
Social Housing Lettings
General Let Accommodation 27,822 (16,116) 11,706 28,167 (19,485) 8,682
Depreciation of Housing Properties (6,258) (2) (4) (6,264) (6,270)
Impairment of Housing Properties (37) - - (37) (367)
Rent Bad Debts (281) - - (281) (304)
Other costs (88) (1) - (89) (9)
Total Expenditure on Lettings (16,116) (6) (11) (16,133) (19,528)
Operating Surplus on Letting Activities 11,706 2 1 11,709 8,714
Void Losses 275 - - 275 210
4. Gain/(loss) on disposal of housing properties 2017
£’000 2016 £’000
Disposal proceeds from property sales 1,279 1,022
Right to Acquire grant 72 81
Carrying value of properties sold (578) (494)
Amounts transferred to the Disposal Proceeds Fund (367) (434)
Other costs of disposal (22) (18)
Gain / (loss) on disposal of housing properties 384 157
Number of properties sold
Preserved Right to Buy Sales 30 20
Right to Acquire Sales 8 9
38 29
NOTES TO THE FINANCIAL STATEMENTS
36
5. Operating Surplus
Operating surplus is after charging: 2017 £’000
2016 £’000
Depreciation of Housing Properties 6,264 6,270
Depreciation of Other Fixed Assets 97 94
Impairment of Housing Properties 37 367
Pension deficit adjustments - 1,104
Amortisation of Loan Costs 14 14
Auditors’ remuneration (excluding VAT):
In Their Capacity As Auditors 17 14
In Respect of Other Services 2 7
Operating Lease Payments 20 5
Surplus on preserved Right to Buy & Right to acquire sales 384 157
Amortisation of Government Grant (455) (454)
6. Gain/(Loss) on Disposal of Fixed Assets 2017
£’000 2016 £’000
Disposal Proceeds from Other Fixed Assets 1 125
Carrying value of fixed assets (11) -
Other Costs of Disposal (1) (2)
(Loss)/ Surplus on Disposal of Fixed Assets (11) 123
7. Directors’ and Senior Staff Emoluments
2017 £’000
2016 £’000
The emoluments paid to Directors including Executive Directors are as follows:
are listed on page 4 of the Boards report
Aggregate emoluments paid to or receivable by Directors and Senior staff 391 430
Emoluments paid to the highest paid director (the Managing Director) excluding
pension contributions
97 97
Pension contributions to the Managing Director 10 8
Remuneration paid to the Executive directors and senior staff of Cobalt Housing
including pension contributions was as follows:
2017 Number
2016 Number
Remuneration between £70,000 and £79,999 1 1
£80,000 and £89,999 2 3
£90,000 and £99,999 - -
1 £100,000 and £109,999 1 1
The only employees to receive more than £60,000 in remuneration during the year were the Executive Directors. The Non-
Executive Directors on the Board of Management receive no remuneration.
The Managing Director was an ordinary member of the Group’s SHPS final salary pension scheme. No enhanced or special
terms apply to his membership and he had no other pension arrangement to which the Association contributed.
NOTES TO THE FINANCIAL STATEMENTS
37
8. Employee Information 2017
£’000 2016 £’000
Average number of employees expressed as full time equivalents (based on an average of 35 hours per week)
122 122
Staff costs (For the above persons)
Wages and Salaries 3,379 3,458
Social Security Costs 287 273
Pension Costs 234 275
Defined benefit past service pension deficit adjustments (2,092) 1,134
Severance Payments 9 18
1,817 5,158
The Association’s employees are members of the Social Housing Pension Scheme (SHPS) or Merseyside Pension Fund
(MPF). Further information on the MPF scheme is shown in note 36.
9. Interest Receivable 2017
£’000 2016 £’000
Interest on deposits and investments 44
34
34
Other interest - -
44 34
10. Interest Payable and Similar Charges
2017 £’000
2016 £’000
Interest payable on bank and building society loans 1,792 1,805
Loan security costs 7 25
Defined benefit pension charge - 31
1,799 1,861
Capitalised Interest (46) (59)
1,753 1,802
Average interest rate used for capitalisation in the period 4.08% 4.06%
11. Taxation on Surplus on Ordinary Activities
Cobalt Housing Limited is considered to pass the tests set out in Paragraph 1 Schedule 6 Finance Act 2010 and therefore
it meets the definition of a charitable company for UK corporation tax purposes. Accordingly, the charity is exempt from
taxation in respect of income or capital gains received within the categories covered by Chapter 3 Part 11 Corporation Tax
Act 2010 or Section 256 of the Taxation of Chargeable Gains Act 1992, to the extent that such income or gains are applied
exclusively to charitable purposes.
Corporation Tax - -
NOTES TO THE FINANCIAL STATEMENTS
38
12. Fixed Assets – Housing Properties
Completed Schemes Assets Under
Construction
Rented
Shared
Ownership Rented
Shared
Ownership Total 2017
Total 2016
restated
£’000 £’000 £’000 £’000 £’000 £’000
Cost
At 1 April 193,473 226 4,066 - 197,765 191,084
Development additions - - 2,067 - 2,067 3,566
Component renewals 4,013 - - - 4,013 4,499
Completed properties 6,102 - (6,102) - - -
Disposals (1,414) - - - (1,414) (1,384)
At 31 March 202,174 226 31 - 202,431 197,765
Depreciation
At 1 April (41,390) (13) - - (41,403) (35,986)
Charge for the year (6,262) (2) - - (6,264) (6,270)
Disposals 728 - - - 728 853
At 31 March (46,924) (15) - - (46,939) (41,403)
Impairment
At 1 April (367) - - - (367) -
Charge for the year (37) - - - (37) (367)
Disposals - - -
At 31 March (404) - - - (404) (367)
Net Book Value
At 1 April 151,716 213 4,066 - 155,995 155,098
At 31 March 154,846 211 31 - 155,088 155,995
At 31 March 155,088 155,995
Additions to housing properties in the year included capitalised interest of £46,376 (2016: £58,856) at an average rate of
4.097%.
Expenditure on works to existing properties charged to the Statement of Comprehensive Income totalled £5,185k (2016:
£5,802K).
Freehold land & buildings 147,965 148,773
Long leasehold buildings 7,123 7,222
NOTES TO THE FINANCIAL STATEMENTS
39
13. Fixed Assets – Other Assets
Freehold
Land and
Buildings
Vehicles, Office
Furniture, Fixtures
and Equipment
Total
2017
Total
2016
£’000 £’000 £’000 £’000
Cost
At 1 April 3,141 376 3,517 3,459
Additions - 16 16 59
Disposals - (2) (2) (1)
At 31 March 3,141 390 3,531 3,517
Depreciation
At 1 April (510) (254) (764) (670)
Charge for the year (52) (45) (97)
(95)
Disposals - 1 1 1
At 31 March (562) (298) (860) (764)
Net Book Value
At 1 April 2,631 122 2,753 2,789
At 31 March 2,579 92 2,671 2,753
14. Fixed Assets – Intangible assets
Software
licences
Total
2017
Total
2016
£’000 £’000 £’000
Cost
At 1 April 23 23 23
Additions 137 137 -
Disposals - - -
At 31 March 160 160 23
Depreciation
At 1 April (21) (21) (20)
Charge for the year (1) (1)
(1)
Disposals - - -
At 31 March (22) (22) (21)
Net Book Value
At 1 April 2 2 3
At 31 March 138 138 2
NOTES TO THE FINANCIAL STATEMENTS
40
15. Fixed Assets - Investments
Collateral Deposits
Completed Investment
Property
Shares in minority interest
Total
£’000 £’000 £’000 £’000
Cost
At 1 April 414 750 - 1,164
Additions - - - -
Revaluations - 10 10
At 31 March 414 760 - 1,174
The Association has £414,000 held on deposit as collateral in relation to its participation in the Local Government Pension
Scheme. The amount required is reviewed periodically by the scheme administrators.
The Association holds 8 properties let at market rents for investment purposes. Sample valuations of the properties were carried out in March 2017 by external valuers, Sutton Kersh, Chartered Surveyors in accordance with the RICS Appraisal and Valuation Manual. Their reports indicated that the market value of investment property was £760,000.
The Association holds a £1 minority interest share in Lovell Plus Ltd (a subsidiary of Lovell Partnerships Ltd).
16. Impairment
During the year, as a result of the future reduction in income enforced by the Welfare Reform and Work Act 2016, sixteen
social housing properties with a net book value of £1,520,000 were impaired by £37,000. This is disclosed separately in
note 5.
17. Trade and other debtors
* As part of the transfer agreement in 2003 the Association prepaid Liverpool City Council for improvement works that were
to be carried out between 2003 and 2018. At 31st March 2017 total works still outstanding were estimated to be £1,284,000
(2016 £2,419,000).
2017 £’000
2016 £’000
Amounts Falling Due Within One Year
Current Tenant Rent and Service Charge Arrears 2,349 2,476
Former Tenant Rent and Service Charge Arrears 548 503
Gross Rent and Service Charge Arrears 2,897 2,979
Bad Debt Provision (1,283) (1,305)
Net Rent and Service Charge Arrears 1,614 1,674
Prepayment - agreement to improve existing properties* 1,284 1,135
SHG Receivable - 15
Amounts Owed by Related Parties - 20
Prepayments and Sundry Debtors 171 269
Total Amounts Falling Due within One Year 3,069 3,113
Amounts Falling Due After more than One Year
Prepayment - agreement to improve existing properties* - 1,284
Total Amounts Falling Due After more than One Year - 1,284
NOTES TO THE FINANCIAL STATEMENTS
41
18. Creditors: Amounts Falling Due Within One Year
* As part of the transfer agreement in 2003 the Association agreed to undertake improvement works for Liverpool City
Council between 2003 and 2018. At 31st March 2017 total works still outstanding were estimated to be £1,284,000 (2016
£2,419,000).
19. Pension (Liability) / Asset 2017
£’000
2016
£’000
At 1 April 504 (1,335)
Interest on pension liabilities (282) (264)
Expected return on plan assets 301 222
Remeasurement gains / (losses) on assets 1,432 (182)
Remeasurement gains/ (losses) on liabilities (2,006) 493
Contributions in period 87 1,696
Curtailments - -
Administration expenses (2) (2)
Current service costs in the period (101) (124)
At 31 March (67) 504
2017
£’000
2016 restated
£’000 Bank loans 1,896 760
Less issue costs (15) (15)
1,881 745
Trade Creditor - agreement to improve existing properties* 1,284 1,135
Trade Creditors 302 308
Capital Creditors and Retentions 546 552
Rent and Service Charges Received in Advance 696 545
Other Taxation and Social Security 90 100
Recycled Capital Grant Fund and Disposal Proceeds Fund 180 13
Unamortised Government Grant income 465 454
Accruals and Deferred Income 982 997
Grants received in advance 457 93
Amounts Owed to Related Parties 423 568
7,306 5,510
NOTES TO THE FINANCIAL STATEMENTS
42
20. Deferred grant income 2017
£’000 2016 £’000
Total Government Grant Income
As at 1 April 43,342 42,935
Grant received 305 465
Grant on property disposals (150) (58)
As at 31 March 43,497 43,342
Less Total Amount Amortised To Date
As at 1 April 3,494 3,050
Released to income Note 3 455 454
Amortised grant written back on disposals (19) (10)
As at 31 March 3,930 3,494
Unamortised Grant Income
Amounts to be released within one year Note 18 465 454
Amounts to be released in more than one year 39,102 39,394
39,567 39,848
21. Loans
Debt is repayable in instalments as follows: 2017
£’000
2016
£’000
Due within one year
Bank loans 1,896 760
Less Issue costs (15) (15)
1,881 745
Due after more than one year
Bank loans 40,774 42,670
Less Issue costs (215) (230)
40,559 42,440
2017
£’000
2016
£’000 Total borrowing is repayable in instalments as follows:
Within one year or on demand 1,896 760
One year or more but less than two years 2,162 1,896
Two years or more but less than five years 8,416 7,618
Five years or more 30,196 33,156
Total Loans 42,670 43,430
Loan Security
At 31st March 2017 the Association’s total loans of £42,670,500 were secured by a charge over 5,465 of the association’s 6,016 properties. These charged assets were valued at £148.2m providing asset cover of 3.5 times.
NOTES TO THE FINANCIAL STATEMENTS
43
21. Loans (continued) Terms of repayment and interest rates
Bank loans are repayable in either quarterly or half yearly instalments with the final repayment due in 2032.
The loan portfolio includes fixed and variable rate loans and at the reporting date interest rates chargeable
ranged from 0.61% to 5.58%. The closing weighted average all in cost of borrowing was 4.097%.
22. Recycled Capital Grant Fund and Disposal Proceeds Fund Recycled
Capital Grant Fund (RCGF)
£’000
Disposal Proceeds
Fund (DPF) £’000
Recycled Capital Grant Fund and Disposal Proceeds Fund
At 1 April 12 615
Net sales proceeds recycled 32 366
Withdrawals - -
Balance At 31 March 2017 44 981
Amounts Falling Due Within One Year - 180
Amounts Falling Due After More Than One Year 44 801
44 981
23. Other Creditors: Amounts Falling Due After More Than One Year
2017
£’000
2016
restated
£’000 Other Creditors
Amounts Owed to Related Parties 922 3,080
VAT Shelter improvement works - 1,284
Capital Creditors and Retentions - 180
Amounts Owed to Leaseholders 10 10
Accruals and Deferred Income 48 51
Total Other Creditors 980 4,605
The SHPS pension deficit liability is contractually with Liverpool Housing Trust. As at 31 March Cobalt’s agreed
contractual debt with LHT was £922K (2016: £2,721K)
24. Financial instruments
The carrying amounts of the financial assets and liabilities include:
2017 £’000
2016 restated
£’000
Trade and other debtors measured at amortised cost 3,069 4,397
Trade and other creditors measured at amortised cost (6,405) (8,267)
Loan commitments measured at cost (42,670) (43,430)
(46,006) (47,300)
NOTES TO THE FINANCIAL STATEMENTS
44
25. Provisions for liabilities and charges Public Liability
insurance Claims
£’000
Total 2017
£’000
Total 2016 £’000
At 1 April 85 85 183
Transfer in/(out) of provisions (17) (17) (98)
At 31 March 68 68 85
26. Non-equity Share Capital 2017
£ 2016
£
Shares of £1 each fully paid and issued
At start of the year 13 12
Shares issued in the year 5 1
Cancelled during the year - -
At 31 March 18 13
The Association’s shares are not transferable or redeemable. Payments of dividends or other benefits are forbidden by the
Association’s rules and by the Housing Association Acts.
27. Revenue Reserves
2017 £’000
2016 £’000
Original Reserves 80,416 73,806
Actuarial (loss)/gain on pension (574) 311
Surplus for the year 9,768 6,299
At 31 March 89,610 80,416
28. Registration
The Association is registered under the Housing Act 1996 with the Homes and Communities Agency, the regulator of Social
Housing in England, as a Registered Provider of social housing with a registration number of L4361. The Association is a
charitable Registered Society under the Cooperative and Community Benefit Societies Act 2014. It is registered with the
Financial Conduct Authority with a registration number of IP29516R.
29. Ultimate Parent Undertaking
The ultimate controlling party is Onward Homes Group Limited. Onward Homes Group is a Registered Social Landlord,
registration number 31216R. Its registered office is:
Onward Homes Group Limited
12 Hanover Street
Liverpool L1 4AA
NOTES TO THE FINANCIAL STATEMENTS
45
30. Transactions with related parties During the year the Association transacted with its parent organisation Onward Homes Group Limited, other members of
the Onward Homes Group and Board members who were tenants of Cobalt Housing.
The Association maintains a register of interests of Board Members. This register is available for inspection at the
Association’s head office. Peter Mitchell and Alan Walker are elected members of Liverpool City Council, a local authority
having nomination rights over tenancies for certain association properties. All transactions with the council are on normal
commercial terms and Peter Mitchell & Alan Walker are not able to use their positions to their advantage.
During the year Sharon Ross a tenant of the Association was a member of the board. Their tenancy was on standard terms
and they were not able to use their position to their advantage.
The Association received income from: 2017 £’000
2016 £’000
Regulated Group members of:
Onward Homes Group - Staff secondment income 55 113
Liverpool Housing Trust - Staff secondment income - 10
Beechwood & Ballantyne - Staff secondment income - 38
55 161
Cobalt Board members
General needs rent charges for the year 3 9
Preserved Right to Buy sale proceeds - 26
58 196
The Association made payments to:
2017 £’000
2016 £’000
Regulated Group members of:
Onward Homes Group Management services 1,674 1,560
Liverpool Housing Trust Pension deficit 142 207
Management services 13 30
155 237
Beechwood Ballantyne Management services - 15
Contour Homes Management services 6 5
1,835 1,817
The following amounts were owed to the Association as at 31 March: 2017 £’000
2016 £’000
Regulated Group members of:
Liverpool Housing Trust - 11
Contour Homes - 8
Hyndburn Homes - 1
- 20
Cobalt Board members
Rent arrears - -
- 20
NOTES TO THE FINANCIAL STATEMENTS
46
30. Transactions with related parties (continued)
The Association had the following creditors falling due within one year as at 31
March:
2017 £’000
2016 £’000
Regulated Group members of:
Onward Homes Group (General balance) 241 208
Contour Homes (General balance) 6 -
Onward Homes Group (Pension deficit) 22 41
Liverpool Housing Trust (Pension deficit) 154 319
423 568
The Association had the following creditors falling due after more than one year as at
31 March:
Onward Homes Group (Pension deficit) - 359
Liverpool Housing Trust (Pension deficit) 922 2,721
922 3,080
31. Housing Stock 2017
Number 2016
Number The number of properties in ownership at the year-end were:
General Needs (Social rent) 5,703 5,736
General Needs (Affordable rent) 300 245
6,003 5,981
Low Cost Home Ownership 3 3
Rent to Homebuy* - 5
Investment properties 8 8
Used by Tenant Associations 2 2
Total Homes Owned 6,016 5,999
Leasehold
3 3
Total Homes in Management 6,019 6,002
The number of properties under development at the year-end were:
Affordable Rents - 55
Total housing under development - 55
*Five rent to homebuy properties were converted to general needs social rent during the year.
NOTES TO THE FINANCIAL STATEMENTS
47
32. Reconciliation of Surplus to Net Cash Inflow from Operating
Activities 2017
£’000 2016 £’000
Surplus for the year (Statement of Comprehensive Income) 9,768 6,299
Depreciation of tangible fixed assets 6,362 6,366
Impairment of tangible fixed assets 37 367
Amortisation of deferred Government Grant (455) (454)
Preserved Right to Buy & Right to Acquire disposal adjustments 944 928
Unrealised gain on revaluation of investment properties (10) -