182
ANNUAL REPORT

ANNUAL REPORT

IndexGROUP 2016
The acquisition of Norvestia is an important strategic step 4CEO review 52016 Highlights 7
CapMan’s investment operations in figures in 2016 9Case: CapMan Real Estate converted an office building in
Helsinki into residential use 11
About CapMan 12
CORPORATE GOVERNANCECapMan Plc – Corporate Governance Statement 2016 13Board of Directors 19Management 21
FINANCIAL STATEMENTSKey Figures 2016 23Report of the Board of Directors 2016 33Group Statement of Comprehensive Income 52Group Balance Sheet (IFRS) 54Group Statement of Changes in Equity (IFRS) 56Group Cash Flow Statement (IFRS) 58Notes to the Consolidated Financial Statements 59
1. Accounting policies 592. Items affecting comparability and alternative
performance measures 733. Segment information 754. Acquisitions 795. Other operating income 836. Employee benefit expenses 847. Depreciation 858. Other operating expenses 869. Adjustments to cash flow statement 8710. Fair value gains/losses of investments 8811. Finance income and costs 89
12. Share of the income of investments
accounted for using the equity method 9013. Income taxes 9114. Earnings per share 9215. Tangible assets 9316. Goodwill 9417. Other intangible assets 9518. Investments accounted for using the equity method 9619. Investments at fair value through profit or loss 9720. Receivables - Non-current 10121. Deferred tax assets and liabilities 10222. Trade and other receivables 10323. Financial assets at fair value through profit or loss 10424. Cash and bank 10525. Share capital and shares 10626. Interest-bearing loans and borrowings – Non-current 11227. Trade and other payables – Current 11328. Interest-bearing loans and borrowings – Current 11429. Financial assets and liabilities 11530. Commitments and contingent liabilities 11731. Share-based payments 11832. Related party disclosures 12133. Financial risk management 125
Parent Company Income Statement (FAS) 141Parent Company Balance Sheet (FAS) 142Parent Company Cash Flow Statement (FAS) 144Notes to the Parent Company Financial Statements (FAS) 146Signatures to the report of the Board of Directors and Financial Statements 166Auditor’s report 167Shares and shareholders 175Information for shareholders 180Calculation of Key Ratios 182
GROUP 2016 CORPORATE GOVERNANCE FINANCIAL STATEMENTS ANNUAL REPORT 2016
Cover photo: Emma Suominen

In November 2016, CapMan announced a voluntary public exchange offer to acquire all of Norvestia Oyj’s shares and securities entitling to shares. The exchange offer was carried out in December. As of January 2017, CapMan holds 92.5 per cent of Norvestia’s shares. Altogether 4,639 Norvestia’s shareholders accepted the exchange offer during the offer period or subsequent offer period.
CapMan’s updated financial objectivesCapMan has updated its financial objectives as follows:
The acquisition of Norvestia: Strategic measures that build shareholder value
As part of the arrangement, all of CapMan’s series A shares have
been converted into series B shares. As a result, CapMan only has
one share series, which generates one vote per share and equal
rights to a dividend and other distributions to shareholders made by
the company.
CapMan has commenced the mandatory redemption pro-
ceedings of all Norvestia’s shares with the objective to obtain all
outstanding Norvestia’s shares held by minority shareholders.
Norvestia’s shares will be delisted from Nasdaq Helsinki after the
redemption.
CapMan continues to realise synergies as Norvestia became
CapMan’s subsidiary. For example, Growth Equity is now one of
CapMan’s core investment strategies and CapMan will continue
the operations while strengthening Norvestia’s Growth Equity team.
Read more about the exchange offer and the redemption
procedure at www.capman.com/exchange-offer.
Growth
>10%2016: -2.9%
Dividend
≥75%2016: 80.4 %*
Net gearing
≤40%2016: 14.5%
Return
>20%2016: 14.7%
The annual growth target for the manage-
ment company and services business is on
average over 10 per cent. CapMan has not
previously published a growth target.
Target ratio for net gearing (i.e. interest-bearing
net debt to equity) is on average a maximum of
40 per cent. CapMan has not previously pub-
lished a target for net gearing. CapMan’s previous
equity ratio target range was 45-60 per cent.
Target for the return on equity is more than
20 per cent per year on average and remains
unchanged from the previous target.
CapMan’s objective is to pay at least 75 per
cent of the earnings per share as dividend. Pre-
viously CapMan’s objective was to pay at least
60 per cent of earnings per share as dividend.
* Based on the proposition of the Board of
Directors for the AGM and the comparable
adjusted earnings per share.
CORPORATE GOVERNANCE FINANCIAL STATEMENTSGROUP 2016
4 / CapMan
ANNUAL REPORT 2016

CEO review
In 2016, we progressed as planned on many important strategic fronts and successfully grew shareholder value. Our operations now stand on several increasingly stable pillars.
Successes for the year included our services business, which grew
by 80 per cent, our Nordic real estate fund, which is among the
best-in-class in Europe, good exits in our investment operations as
well as our strengthened position as a leading value-adding private
equity fund manager. Our earnings per share have continued to
develop in the right direction for four years now. This progress has
been reflected in CapMan’s share price, which rose 26 per cent in
2016, supported by a larger trading volume. Following the positive
market cap development, CapMan was transferred to the mid cap
category among companies traded on Nasdaq Helsinki.
REAL ESTATE INVESTING IS A GROWING FIELDReal Estate investment activity has continued strongly and our Real
Estate team has completed several significant exits from the newest
Nordic fund, among others. International investors are interested in
the Nordic countries as well as value-adding strategies, and we are
already preparing to raise the next Nordic real estate fund.
Investments made under the €400 million investment mandate
from Germany’s largest pension insurance company BVK complement
our fund investments and improve the efficiency of our own resources.
The mandate demonstrates the trust that international investors place
in the local know-how and expertise of our Real Estate team.
NORVESTIA STRENGTHENS CAPMAN’S POSITION AS A NORDIC PRIVATE EQUITY INVESTMENT AND ASSET MANAGEMENT COMPANYThe single most important strategic step was the execution
of CapMan’s exchange offer for Norvestia’s shares. Following
the transaction, Norvestia became a subsidiary of CapMan and we
strengthened our position as a Nordic private equity investment
In 2016, we progressed as planned on many important strategic fronts and successfully grew shareholder value.
Heikki WesterlundCEO
CORPORATE GOVERNANCE FINANCIAL STATEMENTSGROUP 2016
5 / CapMan
ANNUAL REPORT 2016

and asset management company. We have broadened our scope
in Nordic private equity to also include smaller growth companies
and minority investments. CapMan Growth Equity is a clear market
leader by many indicators.
Following the acquisition of Norvestia, we are able to realise
private equity strategies using our own investment capacity of ap-
proximately €200 million. We invest mainly through our own funds,
but also directly in areas that our funds’ current strategies do not
cover. A strong balance sheet enables us to provide liquidity also to
our fund investors, if necessary. Our shareholders can benefit from
a cross-section of the Nordic private equity field through our own in-
vestments. However, our objective is not to purely be an investment
company, but rather to further grow our operations related to asset
management, fund management and services.
Central strategic themes alongside our profitable and high-quality
growth are customer-focused operations (Best Private Equity Expe-
rience), active and profitable balance sheet investment, as well as
the selective launch of new products, among others. For example, in
February 2017, CapMan established CapMan Infra, which invests in
Nordic infrastructure assets.
CapMan today is an international company that generates added value for customers
and shareholders through expertise and active measures.
UPDATED FINANCIAL OBJECTIVESCapMan renewed its financial objectives at the end of 2016. The
growth objective for the Management Company and Services
business is more than 10 per cent p.a. on average. The objective
for return on equity is more than 20 per cent p.a. on average. The
objective for net gearing, that is, ratio of net interest bearing debt to
equity, is a maximum of 40 per cent on average. CapMan’s objective
is to pay at least 75 per cent of earnings per share as dividend.
CapMan expects to achieve these financial objectives gradually
and key figures are expected to show seasonality. The dividend
proposition for 2016 is nine cents, which corresponds to more than
80 per cent of our adjusted earnings per share. Our net gearing was
15 per cent at the end of 2016. The development of our financing
structure and, for example, the repayment of our 2013 hybrid bond
also add to our earnings per share. Reaching our objective for return
on equity is feasible as the profitability of our Management Company
& Services business improves through growth and a deliberate
cost structure, our funds generate carried interest income and our
Investment business generates typical returns for the industry. We
have good and actionable plans to reach our growth objective.
STRENGTHENING OUR CULTURE OF WORKING TOGETHERCapMan’s Helsinki office moved to Ludviginkatu, a stone’s throw
away from the old headquarters. The move has provided us with
new and modern premises that enable us to work more effective-
ly together, while providing significant annual savings. CapMan
today is an international company that generates added value for
customers and shareholders through expertise and active measures.
We strive to constantly regenerate in order to meet the requirements
of an evolving market. This is accomplished by being present and
by understanding market changes, listening to customer feedback
and, above all, through the actions of CapMan’s knowledgeable and
motivated staff.
Our objective is to further grow our operations related to asset management,
fund management and services.
I would like to extend a warm thank you for 2016 also to our
customers as well as CapMan’s expanded shareholder base.
Heikki Westerlund
CEO
CORPORATE GOVERNANCE FINANCIAL STATEMENTSGROUP 2016
6 / CapMan
ANNUAL REPORT 2016

2016 Highlights
18 Jan 10 MarGrowthfrom services
Successful Growth EquityGrowth investing is generating more interest as the private equity
field is becoming more diverse. Norvestia, which is owned by
CapMan, developed its Growth Equity portfolio company Touhula
into one of the leading private day care players in Finland before
selling down its stake in the company after five years of owner-
ship. Growth Equity is one of CapMan’s core investment strategies
and CapMan continues as a minority investor in Touhula through
Norvestia.
12 Apr Exit from LämpöLux
Suomen Lämpöikkuna Oy, a provider of
turnkey window and door renovations (service
brand LämpöLux), was the first exit of the
2012 vintage CapMan Buyout X fund. The
company had continued its rapid growth
after CapMan Buyout’s investment in 2014.
The company’s profitability improved and
turnover increased by around 15 per cent per
year, while the number of employees nearly
doubled. The LämpöLux
exit is a very promising start to the latest
Buyout fund.
In January, CapMan´s fund advisory team was organised as a
separate business, Scala Fund Advisory. Scala offers private
equity advisory and fundraising services to best-in-class private
equity fund managers and investors in the asset class. The team
has over 15 years of extensive experience with fundraising and
investor relations, which form the basis for Scala’s service of-
fering. Scala is expanding in line with CapMan’s strategy. Scala
is an independent partnership within the CapMan Group. Read
more about Scala’s advisory services at www.scala-advisory.com. 31 Mar A new real estate productThe National Board of Antiquities established a Collections and
Conservation Centre in Mastola’s central warehouse in Vantaa. The
logistics facility was originally owned by CapMan Real Estate I
fund and has been renovated to meet the needs of this long-term
anchor tenant. The stable annual yield asset, Kokoelmakeskus Ky,
has generated ample investor interest and the Finnish investor
consortium that owns the asset also includes CapMan.
15 Jun Exit from Esperi
In June, CapMan Buyout IX fund exited Esperi Care Oy, a leading Finnish social care compa-ny to the investment company ICG, pension insurance company Etera and Esperis’ active management. Funds managed by CapMan invested in Esperi in 2010. During CapMan’s ownership, Esperi’s turnover and number of employees has increased fourfold. The trans-action generated €6.1 million in cash flow to CapMan Plc and its result impact for 2016 was €1.4 million.
16 May A new €100 millionprivate debt fund
In May CapMan established a €100 million Nordic private debt fund. Nest Capital, formerly CapMan Credit, became advisor to the fund. Investors in the fund include Nordic and European insurance companies, pension funds and other institutional investors. The fund’s private debt investments are expected to support leveraged buyouts, add-on acquisitions, expansion projects, refinancings and recapitalisations. Nest Capital is an independent investment partnership within the CapMan Group.
JANUARY FEBRUARY MARCH APRIL MAY JUNE
2016
26 Jun CapMan Real Estateis active in Denmark
In June CapMan strengthened its position in the Danish real estate market by opening an office in Copenhagen. CapMan Real Estate is a truly Nordic investor and it invests mainly in office, retail and residential properties in Finland, Swe-den, Norway and Denmark. CapMan Real Estate team has made several investments especially in the Copenhagen metropolitan area and opening a local office in Denmark was a natural continuum to this strategy.
CORPORATE GOVERNANCE FINANCIAL STATEMENTSGROUP 2016
7 / CapMan
ANNUAL REPORT 2016

2016 Highlights
19 Dec Successful acquisitionof Norvestia
CapMan announced 3 November a voluntary public exchange offer to acquire all Norvestia Oyj’s shares
and securities entitling to shares. Before the exchange offer, CapMan held 28.7 per cent of Norvestia’s
shares. The combined group is expected to create added value based on growth and strengthen the po-
sition of CapMan as a leading Nordic investment and specialised asset management company. CapMan
confirmed the exchange offer on 19 December and CapMan’s ownership exceeded 90 per cent of all
Norvestia’s shares. Read more about the exchange offer in this Annual Report under Strategic measures
that build shareholder value and at www.capman.com/exchange-offer.
7 Dec
28 Dec New location for CapMan
CapMan’s Helsinki office moved around
the corner to Ludviginkatu 6.
Investment in Forenom
Forenom is a leading Nordic temporary housing service operator
that manages more than 3,200 furnished apartments, several
aparthotels as well as hostels across the Nordics. The company has
approx. 260 employees and turnover for 2016 is expected around
€60 million. CapMan aims to grow the company’s core business
and further strengthen its market position. In December, CapMan
and Tesi acquired a majority equity stake in the company.
15 Jul Germany’s largest pensionscheme group as a client
In July CapMan Real Estate signed an agreement with Bayerische
Versorgungskammer (BVK), Germany’s largest pension scheme
group, to invest up to €400 million in residential real estate in
the Nordics on behalf of BVK. CapMan has already advised BVK
on two acquisitions under the investment mandate: a prime
residential portfolio in the Helsinki Metropolitan area and three
residential properties in Copenhagen. CapMan will receive an
annual advisory fee and a performance fee on the mandate.
22 Sep Value creation in real estatethrough transformations
CapMan Nordic Real Estate Fund has converted an office building located in Älvsjö,
Southern Stockholm, into a school and sold it to a Swedish real estate company.
The exit is just one of many successful real estate transactions during the year. The
2013 vintage fund has exited the If P&C insurance company headquarters and another
office building in Northern Stockholm and agreed to sell a landmark building in the
Helsinki city centre that it is in the process of converting from office use into a five-star
hotel. The fund has also completed several investments throughout the year, of which
the most significant were the Heron City retail centre in Stockholm and several resi-
dential properties in Copenhagen. CapMan’s older real estate and hotel funds have also
completed several exits.
CORPORATE GOVERNANCE FINANCIAL STATEMENTSGROUP 2016
8 / CapMan
ANNUAL REPORT 2016
JULY AUGUST SEPTEMBER OCTOBER NOVEMBER DECEMBER
2016 2017
JANUARY

CapMan’s investment operations in figures in 2016
Capital under management Investment activities
€2.7 billion under management
€1.3 billion in funds
making investments in portfolio companies
€1.4billion in funds making
investments in real estate
€400 million investment
mandate to invest in residential real estate in the Nordics
€181 million fair value of
investments made from CapMan’s own balance sheet
16 complete exits from portfolio companies and real estate
€380 million returned
to investors
€199 million capital
calls from investors
7new portfolio company
and real estate investments
€36 million in investments in
portfolio companies
€
129 million in investments
in real estate
CORPORATE GOVERNANCE FINANCIAL STATEMENTSGROUP 2016
9 / CapMan
ANNUAL REPORT 2016

Value creation in fund investments Footprint
CapMan’s investment operations in figures in 2016
2.6
xaverage portfolio company exit multiple
(compared to acquisition value)
6
average holding period of
portfolio companies (years)
1.7x average real estate exit multiple (compared to acquisition value)
2.7 average holding period of real estate
properties (years)
40 portfolio companies
€2.6billion combined turnover
of portfolio companies
25,000 combined headcount of portfolio companies
65 real estate investments
740,000 combined lettable area, m2
300commercial tenants
300residential tenants
95% average occupancy
More information about CapMan’s funds can be found in the Funds section of CapMan’s website at www.capman.com/investors/funds/managed-funds/.
CORPORATE GOVERNANCE FINANCIAL STATEMENTSGROUP 2016
10 / CapMan
ANNUAL REPORT 2016
*
**
**
*
*29 Buyout exits completed between 2004 – 2016 from investments made since 2000. **41 exits from CapMan Nordic Real Estate and CapMan Real Estate I & II funds and 4 exits by NEP Partners.

Case: CapMan Real Estate converted an office building in Helsinki into residential use
An old office building in central Helsinki was completely transformed and converted into residential use during 2016. Following the comprehensive overhaul, the building at Ruoholahdenkatu 4 now includes 68 apartments complete with French balconies, underground parking and a garden in the courtyard. The apartments of As Oy Helsingin Park are now for sale and awaiting new residents.
BEFORE AFTER
CORPORATE GOVERNANCE FINANCIAL STATEMENTSGROUP 2016
11 / CapMan
ANNUAL REPORT 2016

CapMan is a leading Nordic investment and specialised asset management company. As one of the Nordic private equity pioneers we have actively developed hundreds of companies and real estate and thereby created substantial value in these businesses and assets over the last 25 years. CapMan has today 100 private equity professionals and manages €2.8 billion in assets. We mainly manage the assets of our customers, the investors. We also make direct investments from our own balance sheet in areas without an active fund. Our objective is to provide attractive returns and innovative solutions to investors and value adding services to professional investment partnerships, growth-oriented companies and tenants. Our current investment strategies cover Buyout, Growth Equity, Real Estate, Russia, Credit, Infra and Tactical Opportunities. We also have a growing service business that currently includes fundraising advisory, procurement activities and fund management.
About CapMan
CORPORATE GOVERNANCE FINANCIAL STATEMENTSGROUP 2016
12 / CapMan
ANNUAL REPORT 2016

13 / CapMan
CapMan Plc – Corporate Governance Statement 2016
1. APPLICABLE RULES AND REGULATIONSCapMan Plc (“CapMan”) complies, in accordance with comply
or explain principle, with the Finnish Corporate Governance Code
2015 (the “CG Code”) for listed companies issued by the Securi-
ties Market Association and entered into force on 1 January 2016.
Furthermore, CapMan’s corporate governance is in compliance
with the laws of Finland, its articles of association and the rules and
directions of Nasdaq Helsinki Ltd. This Corporate Governance State-
ment (the “Statement”) has been prepared in compliance with the
CG Code’s Corporate Governance reporting guidelines A pertaining
to the Corporate Governance Statement. The CG Code as a whole is
publicly available on the website of the Securities Market Association
at www.cgfinland.fi.
The Statement is reviewed by the Audit Committee of CapMan’s
Board of Directors (the “Board”) and it is issued separate from the
report by the Board. CapMan’s auditor PricewaterhouseCoopers
Oy has checked that the Statement has been issued and that the
description of the main features of the internal control and risk man-
agement systems pertaining to the financial reporting process con-
tained in the Statement is consistent with the Financial Statements.
For further information regarding CapMan’s corporate governance,
please visit the company’s website at www.capman.com/investors/
corporate-governance/capman-plc-governance/.
2. BOARD OF DIRECTORS2.1 CompositionAll members of the Board are elected by the general meeting. There
is no specific order for the appointment of Board members in the
articles of association. According to the articles of association, the
Board comprises at least three and at most nine members, who
do not have deputies. Members are elected for a term of office of
one year, which starts at the close of the general meeting at which
they were elected and ends at the close of the AGM following their
election. The Board elects a Chairman and a Vice Chairman from
among its members.
The AGM held on 16 March 2016 elected five members to the
Board. Mr Claes de Neergaard, Mr Karri Kaitue, Ms Nora Kerp-
pola and Mr Ari Tolppanen were re-elected to the Board. Mr. Dirk
Beeusaert was elected to the Board of Directors as a new member.
The Board elected from among its members Karri Kaitue as the
Chairman of the Board and Nora Kerppola as the Vice Chairman of
the Board.
The composition of the Board of Directors is diverse pertaining
to the age and gender as well as the professional, educational
and international background of its members. The objective of the
company is to maintain the diversity of its Board of Directors in the
current extent, taking into account the competences of member
candidates that are relevant for CapMan’s business, such as know-
how of the financial sector. The principles concerning the diversity
of CapMan’s Board of Directors are defined in accordance with the
CG-Code’s recommendation 9.
The biographical details of the directors are presented in the
table on page 19.
2.2 Independence of the Board membersThe Board has in its organizing meeting on 16 March 2016
assessed its members’ independence of the company and of its
significant shareholders.Dirk Beeusaert, Karri Kaitue, Nora Kerppola
and Claes de Neergaard were independent of both the company
and its significant shareholders. Ari Tolppanen, CapMan Buyout’s
Senior Advisor, was non-independent of both the company and its
significant shareholders.
Shares and share-based rights of each director and corporations
over which he/she exercises control in the company and its group
companies are presented in the table on page 15.
2.3 Duties and responsibilities Under the Finnish Companies Act and CapMan’s articles of
association, the Board is responsible for the administration of the
company and the proper organisation of its operations. The Board
is also responsible for the appropriate arrangement of the control
of the company’s accounts and finances. The Board has confirmed
a written charter for its work, which describes the main tasks and
duties, working principles and meeting practices of the Board, and
an annual self-evaluation of the Board’s operations and working
methods.
In accordance with the charter, the main duties of the Board are:
• to appoint and dismiss the CEO
• to supervise management
• to approve strategic goals
• to decide on establishment of new CapMan funds and the level
of CapMan’s own commitments therein
• to decide on the major changes in the business portfolio
• to ensure that the company has a proper organisation
• to ensure the proper operation of the management system
• to approve annual financial statements and interim reports
• to ensure that the supervision of the accounting and financial
management is properly organised
• to ensure that the business complies with relevant rules and
regulations
• to approve the principles of corporate governance, internal con-
trol, risk management and other essential policies and practices
• to decide on the CEO’s remuneration and on the remuneration
policy to be followed for other executives and CapMan’s key
employees
• to confirm the central duties and operating principles of Board
committees
CORPORATE GOVERNANCE FINANCIAL STATEMENTSGROUP 2016 ANNUAL REPORT 2016

14 / CapMan
The Chairman of the Board ensures and monitors that the Board ful-
fils the tasks appointed to it under legislation and by the company’s
articles of association.
2.4 Work of the Board in 2016In 2016, the Board of Directors met sixteen (16) times. The Board
had Fifteen (15) meetings for the Board elected by the 2016 AGM
and one (1) meeting for the Board elected by the 2015 AGM. The
table on page 15 presents Board members’ attendance at the
meetings in 2016.
3. BOARD COMMITTEESThe committees are generally established and the committee mem-
bers elected in the Board’s organising meeting to be held after the
AGM from among its members for the same term as the Board. The
charters for each committee shall be confirmed by the Board and
the minutes of the meetings shall be delivered to the Board for infor-
mation. The committees do not have autonomous decision-making
power but the Board makes the decisions within its competence
collectively.
In its organising meeting held on 16 March 2016, CapMan’s
Board of Directors established Audit, Nomination and Remuneration
Committees.
3.1 Audit CommitteeThe Audit Committee has been established to improve the efficient
preparation of matters pertaining to financial reporting and supervi-
sion.
The duties of the Audit Committee include:
• monitoring the reporting process of financial statements
• supervising the financial reporting process
• monitoring the efficiency of the company’s internal control and
risk management systems
• reviewing the description of the main features of the internal
control and risk management systems pertaining to the financial
reporting process
• monitoring the statutory audit of the financial statements and
consolidated financial statements
• evaluating the independence of the statutory auditor or audit
company, particularly the provision of related services
• preparing the proposal for resolution on the election of the
auditor.
The Board has in its organising meeting on 16 March 2016 re-elect-
ed Nora Kerppola (Chairman) and Karri Kaitue as members of the
Audit Committee. Claes de Neergaard was elected to the Audit Com-
mittee as a new member. The number of the Committee members
increased from two to three members. In 2016, the Committee met
four (4) times in this new composition and once (1) in the compo-
sition elected by the Board of Directors in 2015. The table on page
15 presents the Committee members’ attendance at the meetings.
3.2 Nomination CommitteeThe Nomination Committee has been established to improve the
efficient preparation of matters pertaining to the nomination and
remuneration of Board members. The main duty of the Committee
is to give proposals to the AGM on the composition of the Board and
on the remuneration of the Board members.
The Board has in its organising meeting on 16 March 2016
re-elected Karri Kaitue (Chairman) and Ari Tolppanen as members
of the Nomination Committee. Dirk Beeusaert was elected to the
Nomination Committee as a new member instead of Koen Dejonck-
heere. In 2016, the Committee did not meet in this new composi-
tion but met once (1) in the composition elected by the Board of
Directors in 2015. The table on page 15 presents the Committee
members’ attendance at the meetings.
3.3 Remuneration CommitteeThe Remuneration Committee has been established to improve
the efficient preparation of matters pertaining to the remuneration
and appointment of the CEO and other executives of the company
as well as the remuneration policy covering the company’s other
personnel.
The main duty of the Remuneration Committee is to assist the Board
by preparing the Board decisions concerning:
• CEO remuneration
• company executive remuneration principles and individual
situations as required
• company’s overall principles for total compensation structure.
The Committee shall further contribute to:
• securing the objectivity and transparency of the decision-making
regarding remuneration issues in the company
• the systematic alignment of remuneration principles and practice
with company strategy and its long-term and short-term goals
• the appointment of the executives of the company.
The Board has in its organizing meeting on 16 March 2016 re-elect-
ed Karri Kaitue (Chairman) and Claes de Neergaard as members
of the Remuneration Committee. Dirk Beeusaert was elected to the
Remuneration Committee as a new member instead of Koen De-
jonckheere. In 2016, the Committee met three (3) times in this new
composition and two (2) in the composition elected by the Board
of Directors in 2015. The table on page 15 presents the Committee
members’ attendance at the meetings.
CORPORATE GOVERNANCE FINANCIAL STATEMENTSGROUP 2016 ANNUAL REPORT 2016

15 / CapMan
BOARD OF DIRECTORS IN 2016
Name Personal information Shares and share-based rights
as of 31 Dec 2016
Attendance at
the Board meetings
Attendance at
the Committee meetingsKarri Kaitue Chairman of the Board since 7 August 2013.
Vice Chairman of the Board during 20 March – 7 August 2013.
Member of the Board since 2012.
Born 1964, LL. Lic.
Main occupation: Board professional.
Chairman of the Nomination Committee and Remuneration Committee,
member of the Audit Committee.
Independent of the company and significant shareholders.
0 16/16 Audit Committee:5/5
Nomination Committee: 1/1
Remuneration Committee: 5/5
Nora Kerppola Vice Chairman of the Board since 7 August 2013.
Member of the Board since 2011.
Born 1964, MBA.
Main occupation: Managing Director of Nordic Investment Group Oy.
Chairman of the Audit Committee,
Independent of the company and significant shareholders.
10,000 13/16 Audit Committee: 5/5
Claes de Neergaard Member of the Board since 2011.
Born 1949, M.Sc. (Econ.).
Main occupation: Board professional and consultant.
Member of the Audit Committee and the Remuneration Committee.
Independent of the company and significant shareholders.
7,000 15/16 Audit Committee: 3/4
Remuneration Committee: 5/5
Ari Tolppanen Member of the Board since 2013.
Born 1953, M.Sc. (Eng.).
Main occupation: Senior Advisor of CapMan Buyout, with CapMan since 1989.
Member of the Nomination Committee.
Non-independent Board member.
7,024,794 16/16 Nomination Committee: 1/1
Dirk Beeusaert* Member of the Board since 2016.
Born 1964, Master of Laws (LL.M.) and Master’s degree in Tax Law and Accounting.
Main occupation: General counsel argenx NV.
Member of the Nomination Committee and the Remuneration Committee.
Independent of the company and significant shareholders.
0 15/15 Nomination Committee: 0/0
Remuneration Committee: 3/3
Koen Dejonckheere**
Member of the Board since 2010 until 2016.
Born 1969, MBA, M.Sc. (Eng.).
Main occupation: CEO of Gimv NV.
Member of the Nomination Committee and the Remuneration Committee until 16 March 2016.
Independent of the company and significant shareholders.
0 0/1 Nomination Committee: 0/1
Remuneration Committee: 1/2
*) was elected as a new member at the AGM held on 16 March 2016 **) a member of the Board of Directors until the AGM held on 16 March 2016
CORPORATE GOVERNANCE FINANCIAL STATEMENTSGROUP 2016 ANNUAL REPORT 2016

16 / CapMan
4. CHIEF EXECUTIVE OFFICER (CEO)The Board elects the company’s CEO. The CEO’s service terms and
conditions are specified in writing in the CEO’s service contract,
which is approved by the Board. The CEO manages and supervises
the company’s business operations according to the Finnish Com-
panies Act and in compliance with the instructions and authorisa-
tions issued by the Board. The CEO shall see to it that the accounts
of the company are in compliance with the law and that its financial
affairs have been arranged in a reliable manner. Generally, the CEO
is independently responsible for the operational activities of the
company and for day-to-day decisions on business activities and
the implementation of these decisions. The CEO appoints the heads
of business areas. The Board approves the recruitment of the CEO’s
immediate subordinates. The CEO cannot be elected as Chairman
of the Board.
In 2016, CapMan’s CEO was Heikki Westerlund (born 1966,
M.Sc. (Econ.)). His shares and share-based rights and those of the
corporations over which he exercises control are presented in the
table on page 16.
5. MANAGEMENT GROUPThe main tasks of the Management Group consist of (i) coordination
of team strategy, fundraising, resources as well as marketing and
brand issues, (ii) implementation of decisions by the Board and the
CEO/ Management Group, (iii) giving input by providing informa-
tion for the decision making and participate in discussion, and (iv)
spreading information within the teams as agreed in the Manage-
ment Group. The composition of the Management Group, respon-
sibilities and the shares and share-based rights of the members of
the Management Group and of the corporations over which he/she
exercises control are presented in the table on page 16.
MANAGEMENT GROUP IN 2016
Name Responsibilities Personal information Shares and share-based rights
of each member and corporations
over which he/she exercises
control as of 31 Dec 2016Heikki Westerlund CEO Born: 1966
Education: M.Sc. (Econ.)
Shares: 2,972,156
2013A-options: 400,000
2013B-options: 400,000
2013C-options: 400,000 Jerome Bouix Head of Scala Fund Advisory Born: 1971
Education: M.Sc. (Econ.)
Shares: 31,250
2013A-options: 200,000
2013B-options: 200,000
2013C-options: 200,000 Niko Haavisto CFO Born: 1972
Education: M. Sc. (Business)
2013A-options: 200,000
2013B-options: 200,000
2013C-options: 200,000 Mika Matikainen Head of CapMan Real Estate Born: 1975
Education: M. Sc. (Econ),
M.Soc.Sc
Shares: 45,000
Hans Christian Dall Nygård Head of CapMan Russia Born: 1968
Education: M. Sc. (Econ),
MBA, CEFA
Shares: 31,250
Markus Sjöholm Head of CapMan Buyout Born: 1971
Education: M. Sc. (Econ), LL.M.
Shares: 281,250
Joakim Frimodig Director,
Strategic Growth Initiatives
Born: 1978
Education: BA (Oxon)
Shares: 250,000
2013A-options: 100,000
2013B-options: 110,000
2013C-options: 120,000
CORPORATE GOVERNANCE FINANCIAL STATEMENTSGROUP 2016 ANNUAL REPORT 2016

17 / CapMan
6. INTERNAL CONTROL AND RISK MANAGEMENTPERTAINING TO THE FINANCIAL REPORTINGThe internal control and risk management pertaining to the finan-
cial reporting process is part of CapMan’s overall internal control
framework. The key roles and responsibilities for internal control
and risk management have been defined in the group’s internal
guidelines which are approved and updated by the management of
the company.
CapMan’s internal control and risk management concerning
financial reporting is designed to provide reasonable assurance
concerning the reliability, comprehensiveness and timeliness of the
financial reporting and the preparation of financial statements in
accordance with applicable laws and regulations, generally accepted
accounting principles and other requirements for listed companies.
The aim of CapMan’s internal control is to:
• focus on the most relevant risks from a strategic and operational
effectiveness point of view
• promote ethical values and good corporate governance and risk
management practices
• ensure compliance with laws, regulation, and CapMan’s internal
policies
• ensure the production of reliable financial reporting to support
internal decision-making and service the needs of shareholders
6.1 General description of the financial reporting process CapMan’s business model is based on having a local presence in
Finland, Sweden and Russia, and operating the organisation across
national borders. CapMan’s subsidiaries in six countries report their
results on a monthly basis to the parent company. The accounting
function is outsourced except for Finland.
Financial information is assembled, captured, analysed, and
distributed in accordance with existing processes and procedures.
The group has a common reporting and consolidation system that
facilitates compliance with a set of common control requirements.
The group accounting maintains a common chart of accounts that
is applied in all units. Subsidiaries submit their figures monthly to
the group accounting where the figures are inserted to the group
reporting system for consolidation. The reported figures are reviewed
in subsidiaries as well as in group accounting. The group account-
ing also monitors the balance sheet and income statement items
by analytically reviewing the figures. The consolidated accounts of
CapMan are prepared in compliance with International Financial
Reporting Standards (IFRS) as adopted by the EU.
6.2 Financial reporting process control and risk managementThe Board has the overall responsibility for the proper arrangement
of internal control and risk management over financial reporting.
The Board has appointed the Audit Committee to undertake the
more specific tasks in relation to financial reporting process control
such as monitoring the financial statements reporting process, the
supervision of the financial reporting process and monitoring the
efficiency of the company’s internal control. The Audit Committee
also reviews regularly the main features of the internal control and
risk management systems pertaining to the financial reporting
process.
The management of the group is responsible for the implemen-
tation of internal control and risk management processes and for
ascertaining their operational effectiveness. The management is also
responsible for ensuring that the company’s accounting practices
comply with laws and regulations and that the company’s financial
matters are managed in a reliable and consistent manner.
The CEO leads the risk management process by defining and
allocating responsibility areas. The CEO has nominated the group’s
CFO as risk manager to be in charge of coordinating the overall risk
management process. The risk manager reports to the Audit Com-
mittee on matters concerning internal control and risk management.
The management has allocated responsibility for establishing more
specific internal control policies and procedures to personnel in
charge of different functions. Management and accounting depart-
ment possess appropriate levels of authority and responsibility to
facilitate effective internal control over financial reporting.
6.3 Risk assessment and control activitiesCapMan has defined financial reporting objectives in order to identi-
fy risks related to the financial reporting process. The risk assess-
ment process is designed to identify financial reporting risks and to
determine how these risks should be managed.
The control activities are linked to risk assessment and specific
actions are taken to address risks and achieve financial reporting
objectives. Financial reporting risks are managed through control
activities performed at all levels of the organisation. These activities
include guidelines and instructions, approvals, authorisations, verifi-
cations, reconciliations, analytical reviews, and segregation of duties.
In the annual strategy process, the identified risks are reviewed,
the risk management control activities are audited and effects of
potential new identified risks on the strategy are evaluated.
6.4 Information and communication pertaining to the financial reportingCapMan has defined the roles and responsibilities pertaining to
financial reporting as an essential part of group’s information and
communication systems.
In terms of internal control and financial reporting informa-
tion, CapMan’s external and internal information is obtained
systematically, and the management is provided with relevant
information on the group’s activities. Timely, current and ac-
cessible information relevant for financial reporting purposes
is provided to the appropriate functions, such as the Board,
the management group and the monitoring team. All external
communications are handled in accordance with the group
disclosure policy, which is available on the company’s website
www.capman.com/investors/corporate-governance/disclosure/.
CORPORATE GOVERNANCE FINANCIAL STATEMENTSGROUP 2016 ANNUAL REPORT 2016

18 / CapMan
6.5 The organisation of internal controls and monitoringTo ensure the effectiveness of internal control pertaining to financial
reporting, monitoring activities are conducted at all levels of the
organisation. Monitoring is performed through ongoing follow-up
activities, separate evaluations or a combination of the two. Separate
internal audit assignments may be initiated by the Board or manage-
ment. The scope and frequency of separate evaluations depend pri-
marily on the assessment of risks and the effectiveness of ongoing
monitoring procedures. Internal control deficiencies are reported to
the management, and serious matters to the Audit Committee and
the Board.
The group accounting performs monthly consistency checks of
income statement and balance sheet for subsidiaries and business
areas. The group accounting team also conducts management fee
and cost analysis, quarterly fair value change checks, impairment
and cash flow checks as well as control of IFRS changes. The Audit
Committee and the Board regularly review group-level financial re-
ports, including comparison of actual figures with prior periods and
budgets, other forecasts, monthly cash flow estimates and covenant
levels. In addition, the Audit Committee monitors in more detail,
among others, the reporting process (including the management’s
discretionary evaluations), risk management, internal control and
audit.
The monitoring team is responsible for collecting the monthly re-
porting of the funds’ portfolio companies, monitoring and forecasting
fair value movements and preparing the models for and calculating
carried interest income.
7. OTHER INFORMATION7.1 Insider administrationCapMan complies with the insider rules of the Market Abuse
Regulation (596/2014) that came into force on 3 July 2016 and the
guidelines for insiders issued by Nasdaq Helsinki. CapMan has sup-
plemented the general insider guidelines with its own set of internal
insider guidelines, which are partly stricter than the general rules. The
Group’s Compliance Officer is responsible for insider management.
CapMan has not maintained a permanent company-specific
insider register after the Market Abuse Regulation (596/2014) that
came into force on 3 July 2016. The information contained in the
public insider register on 2 July 2016 is available on the company’s
webpage until 3 July 2017. CapMan maintains project-specific in-
sider lists for the projects which may have a significant effect on the
prices of the financial instruments issued by CapMan. These pro-
ject-specific insider lists will be drafted and maintained in accord-
ance with the Market Abuse Regulation and the internal policies.
As of 3 July 2016, CapMan has published a release regarding
the transactions by managers and their closely associated persons
with the financial instruments issued by CapMan in case the total
value of all transactions exceeds EUR 5,000 within a calendar year.
The total owning of CapMan’s shares and share-based rights of
each manager will be published as a part of the Annual Report as
required in the CG Code. CapMan maintains a non-public listing of
the managers and their closely associated persons. CapMan has
determined the members of the Board of Directors and the Manage-
ment Group (including the CEO) as managers defined in the Market
Abuse Regulation.
The members of the Board of Directors and the Management
Group and the employees of CapMan Group are not permitted to
trade CapMan’s shares and share-based rights without a pre-ap-
proval of the person responsible for insider management (compli-
ance officer). Trading by the aforementioned personnel is completely
forbidden in the 30-day period prior to publication of the company’s
financial results.
7.2 Decision-making procedure for Related Party TransactionsThe company only has insignificant related party transactions or
transaction which have been made on market terms and, therefore,
the company will not report on their decision-making procedure for
related party transactions in accordance with the recommendation
28 of the CG Code.
7.3 Audit feesIn 2016, the audit fees paid to the auditor amounted to 261,000
euros and the fees related to other non-audit related services
amounted to 299,000 euros.
7.4 Internal auditCapMan has not organised internal audit as a separate function.
CORPORATE GOVERNANCE FINANCIAL STATEMENTSGROUP 2016 ANNUAL REPORT 2016

Board of Directors
KARRI KAITUEChairman of the Board
Independent Member of the Board
Born 1964
Education LL. Lic.
Board of directors since: 2012
Board committees
Remuneration Committee (Chairman), Nomination Committee
(Chairman), Audit Committee (Member),
Main occupation
Board professional
Key Board memberships
CapMan Plc (Chairman), Feon Oy (Chairman),
Finnish University for Arts (Chairman)
Key employment history
Karri Kaitue worked as CEO of Ekokem Corporation during 2015–
2016. He was Deputy Chief Executive Officer of Outokumpu Group
during 2005–2011. He was a member of the Outokumpu Group
Executive Committee during 2002–2011, of which the last six years
he was Vice Chairman. His responsibilities at Outokumpu included
among others Tornio Works, Group strategy, business development
and M&A. He joined Outokumpu Group in 1990.
NORA KERPPOLAVice Chairman of the Board
Independent Member of the Board
Born 1964
Education MBA
Board of directors since: 2011
Board committees
Audit Committee (Chairman)
Main occupation
Managing Director of Nordic Investment Group Oy
Key Board memberships
CapMan Plc (Vice Chairman), Creditinfo Lánstraust hf, Creditinfo Group hf,
Krediidiinfo AS
Key employment history
Nora Kerppola has over 20 years of experience in private equity industry in
Europe and North America. She has been a partner at GMT Communica-
tions in London and a partner at Weiss, Peck & Greer Private Equity (now
Robeco) in New York. Previously, Kerppola worked at Investor International
(U.S), a subsidiary of Investor AB and affiliated with the Wallenberg family
of Sweden. Kerppola started her career in the corporate finance department
of Credit Suisse First Boston.
DIRK BEEUSAERTMember of the Board
Independent Member of the Board
Born 1964
Education Master of Laws (LL.M.) and Master’s degree
in Tax Law and Accounting
Board of directors since: 2016
Board committees
Remuneration Committee (Member), Nomination Committee (Member)
Main occupation
General counsel argenx NV
Key Board memberships
CapMan Plc (Member)
Key employment history
Dirk Beeusaert, a Belgian citizen, currently is the general counsel of argenx
NV, a biotech company listed on Euronext Brussels that designs and devel-
ops innovative antibody therapeutics. Before Dirk has worked for more than
20 years as General Counsel and Executive Vice President of the listed
private equity group Gimv NV. In this position he was jointly responsible
for the good operations and corporate governance of Gimv group. Before
joining Gimv he was an executive for Gamma, a DIY retail chain in Belgium
and the Netherlands, and he started his career as a lawyer at the law firm
Storme, Leroy & Van Parys.
CORPORATE GOVERNANCE FINANCIAL STATEMENTSGROUP 2016 ANNUAL REPORT 2016
19 / CapMan

20 / CapMan
CLAES DE NEERGAARDMember of the Board
Independent Member of the Board
Born 1949
Education M.Sc. (Econ.)
Board of directors since: 2011
Board committees
Audit Committee (Member), Remuneration Committee (Member)
Main occupation
Board professional and consultant
Key Board memberships
CapMan Plc (Member), Grön Bostad AB (Chairman), AB Stockholms
Spårvägar (Chairman)
Key employment history
Previously Claes de Neergaard has worked as CEO of Industrifonden. Prior
to that, Claes was Vice-President at the European Investment Bank, Exec-
utive Director at the European Bank for Reconstruction and Development
(EBRD) and CEO of Nordbanken Luxembourg SA. He has a long track re-
cord of Board assignments in the financial, industrial and property sectors.
He has been Chairman of the Nordic Investment Bank, the Third AP-fund
and CONNECT Sverige. In addition, he has been First Deputy Chairman of
the Swedish Export Credits Guarantee Board.
ARI TOLPPANENMember of the Board
Non-independent of the company
Born 1953
Education M.Sc. (Eng.)
Board of directors since: 2013
Board committees
Nomination Committee (Member)
Main occupation
Senior Advisor of CapMan Buyout, with CapMan since 1989.
Key Board memberships
CapMan Plc (Member), Kämp Collection Hotels Oy (Chairman),
Forenom Oy (Member)
Key employment history
Ari Tolppanen has 27 years of experience in private equity. Tolppanen is
one of the founders of CapMan and was the company’s CEO from 1989
to 2005. He was also the Chairman of Invest Europe (previously EVCA) in
2000–2001. During 2005–2010, Tolppanen was the Chairman of CapMan
Plc’s Board of Directors. Before CapMan, Tolppanen was the CEO of Huurre
Oy and Nordfilm Oy.
Board of Directors
CORPORATE GOVERNANCE FINANCIAL STATEMENTSGROUP 2016 ANNUAL REPORT 2016

21 / CapMan
Management
HEIKKI WESTERLUNDCEO
+358 207 207 504
M.Sc. (Econ.)
In Management Group since:
2013
Key positions of trust: Walki Group Oy, Orion Corporation,
Norvestia Oyj
Key employment history:
Heikki Westerlund has been the CEO of CapMan since 2013. He
was CapMan’s Chairman of the Board 1 June 2010–7 August 2013
and CapMan’s CEO 1 April 2005–31 May 2010. Westerlund joined
CapMan in 1994 and has headed CapMan’s Buyout and Technology
teams. Prior to CapMan he worked for the Finnish Innovation Fund
Sitra.
JEROME BOUIXManaging Partner, Scala Fund Advisory
+46 731 461 132
M.Sc. (Econ.)
In Management Group since:
2007
Career history:
Jerome is Managing Partner at Scala Fund Advisory, which was formed in
2016 and offers fundraising and advisory services. During his 16 years at
CapMan, he headed CapMan’s fundraising and business development and
raised multiple generations of buyout, venture capital, growth capital, real
estate, credit and activist funds. He has also headed a 30-strong team
responsible for various back office functions including reporting, legal,
compliance, IR and communications. Jerome has served four years in the
board of directors of Invest Europe (formerly EVCA). Before joining CapMan
Jerome worked at the Finnish Ministry of Trade and Industry, Merrill Lynch,
Danske Bank and Nordic Investment Bank.
HANS CHRISTIAN DALL NYGÅRDManaging Partner, CapMan Russia
+7 495 620 48 85
M.Sc. (Econ.), MBA, CEFA
In Management Group since: 2009
2009
Key positions of trust:
ROK-1
Career history:
Hans Christian is responsible for all the investment activity and manage-
ment of the CapMan Russia team. Prior to joining CapMan Hans Christian
worked at Norum for 12 years, most recently as Managing Director. CapMan
acquired Norum in 2008.
CORPORATE GOVERNANCE FINANCIAL STATEMENTSGROUP 2016 ANNUAL REPORT 2016

22 / CapMan
Management
JOAKIM FRIMODIGDirector, Strategic Growth Initiatives
+358 50 529 0665
BA, Oxon
In Management Group since:
2016
Key positions of trust:
Studentwork Sharper Oy
Key employment history:
Frimodig joined CapMan from Summa Capital, where
he worked for the past 12 years, most recently as
Deputy Managing Partner. Prior to that, he served as
an advisor for Alfred Berg and ABN Amro Corporate
Finance. He has advised numerous Finnish and inter-
national companies in M&A and financing transactions
over the course of his career.
NIKO HAAVISTOCFO
+358 207 207 583
M. Sc. (Business)
In Management Group since:
2010
Key positions of trust:
Norvestia Oyj
Career history:
Niko has served as CapMan’s CFO since 2010.
Prior to joining CapMan Niko worked for Oriola-KD
Corporation as Director of Financial Control and
Planning. Before that he worked as financial controller
at GE Healthcare Finland and as Authorised Public
Auditor at PwC.
MIKA MATIKAINENManaging Partner, CapMan Real Estate
+358 207 207 616
M.Sc. (Econ.), M.Soc.Sc.
In Management Group since:
2010
Career history:
Mika became the head of CapMan Real Estate and
a management group member of CapMan Plc in 2010.
Since taking over leadership of CapMan’s real estate
operations, Mika has been responsible for the expan-
sion of CapMan Real Estate from a local Finnish fund
manager into a Pan-Nordic operator. He also had an
active role in setting up the CapMan Hotels Real Estate
fund including the acquisition of its seed portfolio of
39 hotels in 2008. Mika joined CapMan in 2006, one
year after the inception of CapMan Real Estate. Prior
to CapMan, he worked for UBS Investment Bank in
London.
MARKUS SJÖHOLMManaging Partner, CapMan Buyout
+358 40 50 80 121
LL.M., M.Sc. (Econ.)
In Management Group since:
2014
Key positions of trust:
Infocare Holding AS, Kämp Group Oy,
Oral Hammaslääkärit Plc, Fortaco Group Oy
Career history:
Markus has been Head of CapMan Buyout since 2014
and member of the Buyout investment team since
1996. He has been instrumental in a number of
CapMan Buyout investments and a key contributor to
CapMan Buyout’s position as a leading Nordic mid-cap
buyout investor.
CORPORATE GOVERNANCE FINANCIAL STATEMENTSGROUP 2016 ANNUAL REPORT 2016
22 / CapMan

23 / CapMan
CORPORATE GOVERNANCE FINANCIAL STATEMENTSGROUP 2016 ANNUAL REPORT 2016
ANNUAL REPORT 2016 // KEY FIGURES
23 / CapMan / Annual Report 2016
KeyFigures2016KEYPERFORMANCEINDICATORSFORCAPMANGROUP
M€ 2012 2013 2014 2015 2016Turnover 27.3 29.8 39.5 31.8 26.6 Fees 25.5 26.9 28.7 27.4 26.6 Carried interest 1.8 2.9 10.8 4.4 0.0Other operating income 0.2 0.0 0.2 0.3 0.1Operating expenses ‐30.3 ‐27.9 ‐30.2 ‐28.0 ‐30.7Fair value gains/losses of investments 5.3 1.2 ‐3.2 5.2 22.6Operating profit 2.6 3.3 6.3 9.3 18.6Financial income and expenses 0.1 ‐0.7 ‐1.4 ‐2.9 ‐3.1Share of the income of investments accounted for using the equity method
0.6 ‐0.6 0.0 0.1 0.0
Profit before taxes 3.3 2.0 4.9 6.5 15.6Profit for the financial year 2.7 1.5 4.0 6.1 15.3Return on equity (ROE), % 3.2 2.0 6.1 9.3 14.7Return on investment (ROI), % 4.3 3.5 7.0 8.0 10.9Equity ratio, % 61.9 58.9 57.8 43.7 56.6Net gearing, % 32.2 22.3 5.0 72.9 14.5Dividend paid *) 0.0 3.4 5.2 6.0 13.0Personnel (at year‐end) 109 103 106 101 108
*)ProposaloftheBoardofDirectorstotheAnnualGeneralMeetingforyear2016.

24 / CapMan
CORPORATE GOVERNANCE FINANCIAL STATEMENTSGROUP 2016 ANNUAL REPORT 2016
ANNUAL REPORT 2016 // KEY FIGURES
24 / CapMan / Annual Report 2016
KEYRATIOSPERSHARE 2012 2013 2014 2015 2016Earnings/share, cents 0.3 ‐1.2 3.4 5.9 16.2Diluted, cents 0.3 ‐1.2 3.4 5.8 16.1Shareholders' equity/share, cents 93.9 77.0 76.1 75.5 98.6Dividend/share, cents *) 0.0 4.0 6.0 7.0 9.0Dividend/earnings, % *) 0.0 0.0 176.5 118.6 80.4Average share issue adjusted number of shares during the financial year ('000) 84,255 84,269 86,164 86,291 88,383Share issue adjusted number of shares at year‐end ('000) 84,282 85,267 86,317 86,317 143,313Number of shares outstanding ('000) 84,255 85,240 86,291 86,291 143,287Own shares ('000) 26 26 26 26 26
*)ProposaloftheBoardofDirectorstotheAnnualGeneralMeetingforyear2016.InlinewithIFRSstandards,theMEUR15(2011‐2012:MEUR29,2013‐2015;MEUR15)hybridbondhasbeenincludedinequity,alsowhencalculatingequitypershare.Theinterestonthehybridbond(netoftax)forthefinancialyearhasbeendeductedwhencalculatingearningspershare.

25 / CapMan
CORPORATE GOVERNANCE FINANCIAL STATEMENTSGROUP 2016 ANNUAL REPORT 2016
ANNUAL REPORT 2016 // KEY FIGURES
25 / CapMan / Annual Report 2016
KEYFIGURES–CAPMANGROUP
Adjustedgroupturnoverandoperatingprofit,M€*
*)Adjustmentsto2015and2016turnover,operatingprofitandearningspershareaswellasitemsaffectingcomparabilityaredescribedinNote2:Itemsaffectingcomparabilityandalternativeperformancemeasures.Turnover,operatingprofitandearningspersharefor2014havebeenadjustedforMEUR1.2reductioninreservesheldforthepotentialrepaymentriskofcarriedinteresttofunds.The dividend for 2016 is the Board of Directors´ proposition to the AGM.
Earnings/shareanddividend/share,€*
27.329.8
38.3
31.829.0
2.6 3.3 5.210.1
14.5
0,05,0
10,015,020,025,030,035,040,045,0
12 13 14 15 16
Adjusted turnover* Adjusted operating profit*
0.00
‐0.01
0.02
0.07
0.11
0.00
0.04
0.060.07
0.09
‐0,02
0,00
0,02
0,04
0,06
0,08
0,10
0,12
12 13 14 15 16
Adjusted earnings/share* Dividend/share

26 / CapMan
CORPORATE GOVERNANCE FINANCIAL STATEMENTSGROUP 2016 ANNUAL REPORT 2016
ANNUAL REPORT 2016 // KEY FIGURES
26 / CapMan / Annual Report 2016
ROIandROE,%
Netgearing,%
3.22.0
6.1
9.3
14.7
4.33.5
7.08.0
10.9
0
2
4
6
8
10
12
14
16
12 13 14 15 16
Return on equity (ROE) Return on investment (ROI)
32.2
22.3
5.0
72.9
14.5
0
10
20
30
40
50
60
70
80
12 13 14 15 16

27 / CapMan
CORPORATE GOVERNANCE FINANCIAL STATEMENTSGROUP 2016 ANNUAL REPORT 2016
ANNUAL REPORT 2016 // KEY FIGURES
27 / CapMan / Annual Report 2016
MANAGEMENTCOMPANYANDSERVICESBUSINESS
Fees,M€
Adjustedcarriedinterestincome,M€*
*)Adjustmentstocarriedinterestincomeaswellasitemsaffectingcomparabilityfor2015and2016aredescribedintheTableResultfortheManagementCompanyandServicesbusinessanditemsaffectingcomparabilityaswellasNote2:Itemsaffectingcomparabilityandalternativeperformancemeasures.Carriedinterestincomefor2014havebeenadjustedforMEUR1.2reductioninreservesheldforthepotentialrepaymentriskofcarriedinteresttofunds.
25.5
26.9
28.7
27.4
26.6
23
24
25
26
27
28
29
12 13 14 15 16
1.8
2.9
9.6
4.4
2.3
0
2
4
6
8
10
12
12 13 14 15 16

28 / CapMan
CORPORATE GOVERNANCE FINANCIAL STATEMENTSGROUP 2016 ANNUAL REPORT 2016
ANNUAL REPORT 2016 // KEY FIGURES
28 / CapMan / Annual Report 2016
ResultfortheManagementCompanyandServicesbusinessanditemsaffectingcomparability
M€ 2016 2015Turnover 26.7 31.8Fees 26.7 27.4Carriedinterestincome 0 4.4Reassessmentofpotentialrepaymentrisktothefunds 2.3 ‐
Adjustedturnover 29.0 31.8 Operatingprofit ‐1.5 4.1ItemsrelatedtotheacquisitionofNorvestia 0.2 0.8
Reassessmentofpotentialrepaymentrisktothefunds 2.3 ‐
Write‐downofavalue‐addedtaxreceivable 1.0 ‐Insurancecompensations ‐0.3 ‐Adjustedoperatingprofit 1.7 4.9 Profitfortheperiod ‐1.6 3.3ItemsrelatedtotheacquisitionofNorvestia 0.2 0.6Reassessmentofpotentialrepaymentrisktothefunds 1.8 ‐Write‐downofavalue‐addedtaxreceivable 1.3 ‐Insurancecompensations ‐0.2 ‐Adjustedprofitfortheperiod 1.4 3.9

29 / CapMan
CORPORATE GOVERNANCE FINANCIAL STATEMENTSGROUP 2016 ANNUAL REPORT 2016
ANNUAL REPORT 2016 // KEY FIGURES
29 / CapMan / Annual Report 2016
INVESTMENTBUSINESS
Investmentsandcommitments,M€
Adjustedresultimpactfromowninvestments,M€*
74.4 64.1 64.4103.6
181.122.5 30.3 30.3
25.2
36.5
0
50
100
150
200
250
12 13 14 15 16
Investments at fair value Remaining commitments
5.3
1.2
‐3.1
5.2
12.8
‐4
‐2
0
2
4
6
8
10
12
14
12 13 14 15 16

30 / CapMan
CORPORATE GOVERNANCE FINANCIAL STATEMENTSGROUP 2016 ANNUAL REPORT 2016
ANNUAL REPORT 2016 // KEY FIGURES
30 / CapMan / Annual Report 2016
Investmentsandcommitmentsbytype,M€
37.9
20.613.2
2.54.4 3.1 7.0
0.6 5.4 0.2
85.9
12.9
1.0
3.41.8
4.7
11.90.7
0,0
10,0
20,0
30,0
40,0
50,0
60,0
70,0
80,0
90,0
100,0
Growth Equity Buyout Real Estate Credit Russia Others Norvestia'sfunds
Fund of funds Joint ventures Otherinvestments
Tradingportfolio
Investments by type, €181 million Remaining commitments, €37 million

31 / CapMan
CORPORATE GOVERNANCE FINANCIAL STATEMENTSGROUP 2016 ANNUAL REPORT 2016
ANNUAL REPORT 2016 // KEY FIGURES
31 / CapMan / Annual Report 2016
Investmentbusinessresult
M€ 2016 2015Fairvaluechangeofinvestments 22.6 5.2Operatingprofit 20.2 5.2ItemsrelatedtotheacquisitionofNorvestia ‐7.3Adjustedoperatingprofit 12.8 5.2Profitforthefinancialyear 16.9 2.8ItemsrelatedtotheacquisitionofNorvestia ‐7.4 ‐Adjustedprofitforthefinancialyear 9.5 2.8

GROUP 2016 CORPORATE GOVERNANCE FINANCIAL STATEMENTS ANNUAL REPORT 2016
32 / CapMan
SHARE PRICE AND INDEX DEVELOPMENT IN 2016 (4 Jan 2016 = 100)
80
90
100
110
120
130
140
150
4.1.2016 4.4.2016 4.7.2016 4.10.2016
CapMan CapMan Total Return OMX Helsinki CAP PI OMX Helsinki CAP GI

33 / CapMan
CORPORATE GOVERNANCE FINANCIAL STATEMENTSGROUP 2016 ANNUAL REPORT 2016
ANNUAL REPORT 2016 // REPORT OF THE BOARD OF DIRECTORS
33 / CapMan / Annual Report 2016
ReportoftheBoardofDirectors2016BUSINESSOPERATIONSCapManGroupisapioneeringNordicprivateequityinvestmentandassetmanagementcompany.CapManhastwooperatingsegments:aManagementCompanyandServicesbusinessandanInvestmentbusiness.
InitsManagementCompanyandServicesbusiness,CapManmanagesprivateequityfundsthatareinvestedbyitspartnership‐basedinvestmentteams.InvestmentsareNordicandRussianmainlyunlistedcompaniesandNordicrealestate.CapManraisescapitalforthefundsfromNordicandinternationalinvestors.Inaddition,CapManoffersfundadvisoryservicesthroughScalaFundAdvisoryandprocurementservicestocompaniesinFinlandandSwedenthroughitsprocurementserviceCaPS.CapManalsooffersfundmanagementservicestoalternativefundmanagers.TheManagementCompanyandServicesbusinesshastwomainsourcesofincome:feesandcarriedinterest.ThefeesincludemanagementfeesrelatedtoCapMan’spositionasafundmanagementcompanyaswellasfeesfromCapMan’sservicebusiness.
ThroughitsInvestmentbusiness,CapManinvestsfromitsownbalancesheetintheprivateequityassetclassandlistedmarketsinadiversifiedmanner.CapManinvestsmainlyinitsownfundsanddirectlyinNordicgrowthcompanies.Incomeinthisbusinesssegmentisgeneratedbychangesinthefairvalueofinvestmentsandrealisedreturnsfollowingexitsandperiodicreturns,suchasinterestanddividends.
EXCHANGEOFFERFORNORVESTIA’SSHARESCapManmadeavoluntarypublicexchangeofferforallNorvestia’sshareson3November2016andconfirmedtheofferon19December2016inaccordancewithitstermsandconditions.Followingtheconfirmation,CapManheld90.7percentofallNorvestia’ssharesandtheirvotes.NorvestiaGrouphasbeenconsolidatedwithCapManGroupasofthedateoftheacquisitionon19December2016andisreportedaspartoftheInvestmentbusinesssegment.CapMan’sownershipinNorvestiaasofthepublicationofthisreportis92.5percent.
GROUPTURNOVERANDRESULTIN2016TheGroup’sturnovertotalledMEUR26.7(2015:MEUR31.8).ThedeclinewasmainlyduetoaMEUR2.3increaseintheclawbackprovision.ThecomparableturnoverwasMEUR29.0(MEUR31.8)andhasbeenadjustedwithitemsdescribedinTable1.
OperatingexpenseswereMEUR30.7(MEUR28.0)andincludedaprovisionforperformancefeesforthepersonnel.
TheGroup’soperatingprofitwasMEUR18.7(MEUR9.3).Theapprox.100percentincreaseyear‐over‐yearwasmainlyduetosuccessfulinvestmentactivitiesaswellastheacquisitionofNorvestia.Thecomparableoperating

34 / CapMan
CORPORATE GOVERNANCE FINANCIAL STATEMENTSGROUP 2016 ANNUAL REPORT 2016
ANNUAL REPORT 2016 // REPORT OF THE BOARD OF DIRECTORS
34 / CapMan / Annual Report 2016
profitwasMEUR14.5(MEUR10.1)andhasbeenadjustedwithitemsdescribedinTable1.FinancialincomeandexpensesamountedtoMEUR‐3.1(MEUR‐2.9).ProfitbeforetaxeswasMEUR15.5(MEUR6.4)andprofitaftertaxeswasMEUR15.3(MEUR6.1).ComparableadjustedresultaftertaxeswasMEUR10.9(MEUR6.7).Earningspersharewere16.2cents(5.9cents).Comparableadjustedearningspersharewere11.2cents(6.6cents).Dilutedearningspershare
were16.1cents(5.8cents).Comparableadjusteddilutedearningspersharewere11.2cents(6.5cents).Netoftaxinterestonthehybridbondfortheperiodhasbeendeductedwhencalculatingearningspershare.AdjustmentstoresultsandearningspersharearedescribedinTable1andintheNotestotheFinancialStatementsinNote2Itemsaffectingcomparabilityandalternativeperformancemeasures.

35 / CapMan
CORPORATE GOVERNANCE FINANCIAL STATEMENTSGROUP 2016 ANNUAL REPORT 2016
ANNUAL REPORT 2016 // REPORT OF THE BOARD OF DIRECTORS
35 / CapMan / Annual Report 2016
Table1:Itemsaffectingcomparabilityandalternativeperformancemeasures
€ ('000) 1‐12/16 1‐12/15
Turnover 26,677 31,767 Items affecting comparability Reassessment of potential repayment risk to the funds 2,278
Items affecting comparability, total 2,278 0 Adjusted turnover 28,955 31,767
Operating profit 18,672 9,271 Items affecting comparability Items related to the acquisition of Norvestia, of which: ‐7,109 779 gain from a bargain purchase ‐13,884 loss from the remeasurement of previous ownership at fair value 3,957 transaction costs 2,819
Reassessment of potential repayment risk to the funds 2,278 Write‐down of a value‐added tax receivable 975 Insurance compensations ‐294
Items affecting comparability, total ‐4,150 779 Adjusted operating profit 14,522 10,050

36 / CapMan
CORPORATE GOVERNANCE FINANCIAL STATEMENTSGROUP 2016 ANNUAL REPORT 2016
ANNUAL REPORT 2016 // REPORT OF THE BOARD OF DIRECTORS
36 / CapMan / Annual Report 2016
€ ('000) 1‐12/16 1‐12/15
Profit for the period 15,286 6,054 Items affecting comparability Items related to the acquisition of Norvestia ‐7,247 623 Reassessment of potential repayment risk to the funds 1,822 Write‐down of a value‐added tax receivable 1,255 Insurance compensations ‐236
Items affecting comparability, total ‐4,406 623 Adjusted profit for the period 10,879 6,677
Earnings per share, cents 16.2 5.9
Items affecting comparability, cents ‐5.0 0.7
Adjusted earnings per share, cents 11.2 6.6
Earnings per share, diluted, cents 16.1 5.8
Items affecting comparability, cents ‐4.9 0.7
Adjusted earnings per share, diluted, cents 11.2 6.5
Aquarterlybreakdownofturnoverandprofit,togetherwithturnover,operatingprofit/loss,andprofit/lossbysegmentforthefinancialyearcanbefoundintheNotestotheFinancialStatementsinNote3SegmentInformation.

37 / CapMan
CORPORATE GOVERNANCE FINANCIAL STATEMENTSGROUP 2016 ANNUAL REPORT 2016
ANNUAL REPORT 2016 // REPORT OF THE BOARD OF DIRECTORS
37 / CapMan / Annual Report 2016
MANAGEMENTCOMPANYANDSERVICESBUSINESSTurnovergeneratedbytheManagementCompanyandServicesbusinessforthefinancialyeartotalledMEUR26.7(MEUR31.8).FeestotalledMEUR26.6(MEUR27.4).Inadditiontomanagementfees,feesrecordedalsoincludedfeesgeneratedbyCapMan’sprocurementservices(CaPS),fundadvisoryservices(ScalaFundAdvisory)andotherservices.Thegrowthinnetfeesfromserviceswasapprox.80percentfromthepreviousyear.CapManreceivedMEUR2.3incarriedinterestin2016mainlyfromtheCapManEquityVIIandCapManPublicMarketfunds.CarriedinterestincomewaswrittendownbyMEUR2.3duetothechangeinclawbackprovision.ThecorrespondingperiodincludedMEUR4.4incarriedinterestincome.ThecomparableturnoveradjustedforthechangeinclawbackprovisionwasMEUR29.0(MEUR31.8).TheoperatinglossoftheManagementCompanyandServicesbusinesswasMEUR1.5(MEUR4.1).ComparableadjustedoperatingprofitwasMEUR1.7(MEUR4.9).ThelossforthefinancialyearwasMEUR1.6(profitofMEUR3.3).ComparableadjustedprofitwasMEUR1.4(MEUR3.9).ItemsaffectingcomparabilityarepresentedintheNotestotheFinancialStatementsinNote3SegmentInformation.
INVESTMENTBUSINESSTotalfairvaluechangesofinvestmentsfor2016wereMEUR22.6(2015:MEUR5.2).OperatingprofitfortheInvestmentbusinesswasMEUR20.2(MEUR5.2).ComparableadjustedoperatingprofitwasMEUR12.8(MEUR5.2).Profitfor
theInvestmentbusinesswasMEUR16.9(MEUR2.8).ComparableadjustedprofitwasMEUR9.5(MEUR2.8).ItemsaffectingcomparabilityarepresentedintheNotestotheFinancialStatementsinNote3SegmentInformation.
Table2:CapMan’sinvestmentsbookedatfairvalueasof31December2016
Fair value 31 December 2016 (MEUR)
Investments in funds 51.4
Growth equity investments 37.9
Investments in joint ventures (incl. Maneq)
5.4
Other financial assets 0.2
Current financial assets (incl.trading portfolio)
86.2
FairvaluechangesofCapMan’sfundinvestmentswereMEUR6.7(MEUR0.8)representinga12.5%increaseinvalue(+0.3%in2015).ThepositivechangeinthefairvalueoffundinvestmentsinthebeginningoftheyearwasmainlyduetoexitscompletedduringtheyearaswellaspositivedevelopmentofportfoliocompaniesthataresignificantforCapMan’sowninvestments.CapManinvestedatotalofMEUR7.5(MEUR4.4)initsfundsin2016.InvestmentsweremostlyallocatedtotheCapManNordicRealEstate,CapMan
38 / CapMan
CORPORATE GOVERNANCE FINANCIAL STATEMENTSGROUP 2016 ANNUAL REPORT 2016
ANNUAL REPORT 2016 // REPORT OF THE BOARD OF DIRECTORS
38 / CapMan / Annual Report 2016
BuyoutXandCapManRussiaIIfundsaswellasKokoelmakeskusKy,whichhasinvestedinKOyMastolanKeskusvarasto.CapManreceiveddistributionsfromfundstotallingMEUR14.4(MEUR10.7).ThemajorityofthedistributionscamefromtheCapManBuyoutIX,CapManLifeScienceIV,CapManPublicMarketandCapManNordicRealEstatefundsduetoexitscompletedin2016.AdditionstofundinvestmentsduetotheacquisitionofNorvestiawereMEUR6.4.Theaggregatefairvalueoffundinvestmentsasof31December2016wasMEUR51.4(31December2015:MEUR47.2).TheamountofremainingcommitmentsthathavenotyetbeencalledtotalledMEUR36.5asof31December2016,includingcommitmentstofundsfromNorvestia(31December2015:MEUR25.2).CapManestimatesthatonlyMEUR20‐25oftheremainingcommitmentswillbecalledinthenextfouryears.Thelowerestimatecomparedtotheremainingcommitmentsisdueinparticulartounusedinvestmentcapacityoftheolderandalreadywounddownfunds.CapManinvests1‐5%oftheoriginalcapitalinthenewfundsthatitmanages,dependingonfundsizeandinvestorcomposition.FairvalueofgrowthequityinvestmentswasMEUR37.9.GrowthinvestmentsincludedirectinvestmentsinNordicunlistedcompanies.ThefairvalueofcurrentfinancialassetswasMEUR86.2andincludedNorvestia’stradingportfolioinvestinginmarketinstruments.InvestmentsinportfoliocompaniesarevaluedatfairvalueinaccordancewiththeInternationalPrivateEquityandVentureCapitalValuationGuidelines(IPEVG),wherefairvalueisdefinedasthepricethatwouldbereceivedtosellanassetinanorderlytransactionbetweenmarketparticipantsatthe
measurementdate.Realestateassetsarevaluedinaccordancewiththevalueappraisalsofexternalexperts,asdetailedintheNotestotheFinancialStatemetsinNote33g).Fairvalueassessmentoffinancialassetsisbasedonquotedpricesofidenticalassetsorinformationderivedfromprices.Investmentsatfairvalue,theirsensitivityanalysisandremaininginvestmentcapacitybyinvestmentareaarepresentedintheNotestotheFinancialStatementsinNote30CommitmentsandcontingentliabilitiesandNote33g)Determiningfairvalues.
BALANCESHEETANDFINANCIALPOSITIONASOF31DECEMBER2016CapMan’sbalancesheettotalledMEUR252.7asof31December2016(31December2015:MEUR149.6).Non‐currentassetsamountedtoMEUR111.6(MEUR121.1),ofwhichgoodwilltotalledMEUR6.2(MEUR6.2).Asof31December2016,fundinvestmentsbookedatfairvaluetotalledMEUR51.4(MEUR47.2asof31December2015).GrowthequityinvestmentswerebookedfollowingtheacquisitionofNorvestiaatfairvalueofMEUR37.9(MEUR0).OtherfinancialassetsbookedatfairvaluewereMEUR0.2(MEUR48.8).OtherassetsinthecomparableperiodincludedthebookvalueofNorvestia’sNAVbasedonCapMan’spreviousownership.ThefairvalueofinvestmentsinjointventureswasMEUR5.4(MEUR7.7)andconsistedmainlyofCapMan’sinvestmentinManeqInvestmentsLuxembourg.Long‐termreceivablesamountedtoMEUR5.2(MEUR6.1).CurrentassetsamountedtoMEUR141.1(MEUR28.5).Financialassetsbookedatfairvalue,i.e.currentinvestments,wereMEUR86.2(MEUR0.3)and

39 / CapMan
CORPORATE GOVERNANCE FINANCIAL STATEMENTSGROUP 2016 ANNUAL REPORT 2016
ANNUAL REPORT 2016 // REPORT OF THE BOARD OF DIRECTORS
39 / CapMan / Annual Report 2016
includedthetradingportfolioacquiredwithNorvestia.CashinhandandatbanksamountedtoMEUR45.0(MEUR21.6).
CapMan’sinterest‐bearingnetdebtamountedtoMEUR20.8asof31December2016(MEUR47.5).CapMan’stotalinterestbearingdebtasof31December2016isoutlinedinTable3.
Table3:CapMan’sinterestbearingdebt
Debt amount 31 December 2016
Matures latest Annual interest Debt amount 31 December 2015
Bank financing MEUR 11.5 Q2 2019 MEUR 15Senior bond (issued in 2013) MEUR 15 Q4 2017 5.5% MEUR 15Multi‐issuer bond (issued in 2014) MEUR 10 Q2 2019 1.85% MEUR 10
Senior bond (issued in 2015) MEUR 30 Q4 2019 4.2% MEUR 30 Long‐term credit facility (available) (MEUR 10) (MEUR 15)
(Hybrid bond*) (MEUR 15) No maturity 8.0% (MEUR 15)
*) In line with IFRS standards, the hybrid bond is classified as equity. The interest on the hybrid bond is deducted from equity as interest is paid, which is annually. The hybrid bond has no maturity, but CapMan has the right to redeem it four years after the issue date and the option to redeem it earlier, under certain terms and conditions, two years after the issue date. The hybrid bond was issued on 11 December 2013.
CapManPlc’sbankloansincludefinancingcovenants,whichareconditionalonthecompany’sequityratioandtheratioofinterest‐bearingbankloanstofundinvestmentsonthebalancesheet.CapManhonouredallcovenantsasof31December2016.TradeandotherpayablestotalledMEUR33.3(MEUR13.1).
TheGroup’scashflowfromoperationstotalledMEUR‐3.1forthefinancialyear(MEUR0.6).Thechangewasmainlyduetoadjustmentsduetochangesinfairvalues.Incomefromfundmanagementfeesispaidsemi‐annually,inJanuaryandJuly,andisshownunderworkingcapitalinthecashflowstatement.CashflowfrominvestmentstotalledMEUR37.3(MEUR‐39.6)andincludes,interalia,investmentsandrepaidcapitalreceivedbytheGroup.Cash

40 / CapMan
CORPORATE GOVERNANCE FINANCIAL STATEMENTSGROUP 2016 ANNUAL REPORT 2016
ANNUAL REPORT 2016 // REPORT OF THE BOARD OF DIRECTORS
40 / CapMan / Annual Report 2016
flowbeforefinancingtotalledMEUR34.2(MEUR‐39.0)andreflectsthedevelopmentintheManagementCompanyandServicesbusinessandInvestmentbusiness.CashflowfromfinancingwasMEUR‐10.8(MEUR32.0)asCapManrepaidbankfinancingduringthefinancialyear.
KEYFIGURES31DECEMBER2016CapMan’sreturnonequitywas14.7percent(31December2015:9.3percent),itsreturnoninvestment10.9percent(8.0percent)anditsnetqearingwas14.5percent(72.9percent)asof31December2016.Thetargetlevelsforthecompany’sreturnonequityandnetgearingareonaverageover20percentandamaximumof40percent,respectively.
Table4:CapMan’skeyfigures
31.12.16 31.12.15
Earnings per share, cents * 16.2 5.9 Diluted, cents * 16.1 5.8 Shareholders' equity / share, cents ** 98.6 75.5 Share issue adjusted number of shares 88,382,868 86,290,467 Number of shares at the end of period 143,313,255 86,316,766 Number of shares outstanding 143,286,956 86,290,467 Company's possession of its own shares, end of period 26,299 26,299 Return on equity, % 14.7 9.3 Return on investment,% 10.9 8.0 Equity ratio,% 56.6 43.7 Net gearing,% 14.5 72.9
*) Hybrid bond of EUR 15 million (EUR 15 million as at December 31, 2015) is recognised to equity. Interest on the hybrid bond (net of tax) for the financial year has been deducted when calculating earnings per share. The share issue adjusted number of shares includes the shares issued as consideration transferred in the acquisition of Norvestia as of December 19, 2016, when calculating earnings per share under IAS 33. **) Includes hybrid bond of EUR 15 million (EUR 15 million as at December 31, 2015). Calculation of shareholders' equity per share includes all shares issued as consideration in the acquisition of Norvestia.

41 / CapMan
CORPORATE GOVERNANCE FINANCIAL STATEMENTSGROUP 2016 ANNUAL REPORT 2016
ANNUAL REPORT 2016 // REPORT OF THE BOARD OF DIRECTORS
41 / CapMan / Annual Report 2016
BOARD’SPROPOSALFORDISTRIBUTIONOFPROFITCapManPlc’spolicyistodistributeatleast75percentofearningspershareasdividends.CapManPlc’sBoardofDirectorswillproposetotheAnnualGeneralMeetingtobeheldon15March2017thatadividendofEUR0.09persharewillbepaidtoshareholders,equivalenttoatotalofapprox.MEUR13.0.AdividendofEUR0.07pershare,totallingMEUR6.0,waspaidfor2015.CapManPlc’sdistributableassetsamountedtoMEUR123.1on31December2016(MEUR39.3on31December2015).
CAPITALUNDERMANAGEMENTASOF31DECEMBER2016,FUNDRAISINGSTATUSANDSERVICEBUSINESSFORTHEFINANCIALYEARCapitalundermanagementreferstotheremaininginvestmentcapacity,mainlyequity,offundsandcapitalalreadyinvestedatacquisitioncostoratfairvalue,whenreferringtomandates.Ascapitalundermanagementiscalculatedbasedonthecapital,whichformsthebasisformanagementfees,investmentcapacityincludesinadditiontoequityalsodebtforsuchfundswheredebtisincludedinthefeebase.Capitalincreasesasfundraisingfornewfundsprogressesorasinvestmentsareexecutedunderinvestmentmandatesanddeclinesasexitsarecompleted.CapManestablishedanewMEUR100NordiccreditfundinMay.ThefundismanagedbyNestCapital,aninvestmentpartnershippartofCapManGroupandpreviouslyknownasCapManCredit.Fundraisingforthefundisongoing.CapManRealEstatewasawardedaninvestmentmandatefromBayerischeVersorgungskammer(BVK),Germany'slargestpensionschemegroup.Basedonthemandate,CapManRealEstatewillexecuteinvestmentsworthMEUR
400intotalinresidentialrealestateonbehalfofBVK.In2016,CapManhasadvisedBVKontheacquisitionoftwoprimeresidentialportfoliosintheHelsinkiMetropolitanAreaandinCopenhagentotallingMEUR165undertheinvestmentmandate.BVKhasapprox.BEUR62inassetsundermanagementanditinvestsalsothroughpartners.CapManwillreceiveanannualadvisoryfeeandperformancefee.CapitalundermanagementwasMEUR2,692asof31December2016(31December2015:MEUR2,805).TheestablishmentofaprivatedebtfundandinvestmentsmadebasedontheBVKinvestmentmandatehadapositiveimpactoncapitalundermanagement.Theincreasewasoffsetbyexitscompletedin2016.Ofthetotalcapitalundermanagement,MEUR1,408(MEUR1,464)washeldinrealestatefundsorinvestmentmandatesandMEUR1,285(MEUR1,341)washeldinfundsmakinginvestmentsinportfoliocompanies.Fundsundermanagement,togetherwiththeirinvestmentactivities,arepresentedinmoredetailinAppendices1and2oftheFinancialStatementsBulletin2016.CapMan’sservicebusinesshasgrownmorethan80percentin2016.CurrentlyCaPShasthemostsignificantimpactonfeesobtainedfromservices.CaPSdevelopsitsmembercompanies’purchasingactivitiesandfeesobtainedfromtheservicesaresignificant.FeesgeneratedbyCaPShavegrownthroughgeographicexpansionaswellasduetonewmembersandpurchasingcategories.ScalaFundAdvisoryoperatesaspartofCapManGroupandoffersprivateequityfundraisingandadvisoryservicesforprivateequityfundmanagersandinstitutionalinvestors.Scalahasseveralmandates,whichhavepartially

42 / CapMan
CORPORATE GOVERNANCE FINANCIAL STATEMENTSGROUP 2016 ANNUAL REPORT 2016
ANNUAL REPORT 2016 // REPORT OF THE BOARD OF DIRECTORS
42 / CapMan / Annual Report 2016
contributedtoadvisoryfeesalreadyin2016.Themajorityoffeesaresuccessfees,whicharepaidasaone‐offcompensationfollowingasuccessfulfundraise.CapManhasalsostartedmonetisingservicesrelatedtofundmanagement.ThestringentregulatoryenvironmentcreatespossibilitiesforestablishedcompanieslikeCapManwithsufficientknow‐howandresourcestoofferservicesrelatedtoamongothersfundestablishment,fundmanagementandvaluationtosmallerplayersintheindustry.Thebusinessisstillsmallscale.CapMan’svariousserviceofferingshavesignificantgrowthpotentialandareexpectedtoincreaseCapMan’sfeeincomeinthelongterm.
CAPMANPLC’SBOARDOFDIRECTORSANDMANAGEMENTGROUPThemembersofCapManPlc’sBoardofDirectorsasoftheendof2016wereKarriKaitue(Chairman),NoraKerppola(ViceChairman),DirkBeeusaert,ClaesdeNeergaardandAriTolppanen.ThemembersofCapManPlc’sManagementGroupasoftheendof2016wereHeikkiWesterlund(CEO),JeromeBouix(ManagingPartner,ScalaFundAdvisory),HansChristianDallNygård(ManagingPartner,CapManRussia),JoakimFrimodig(Director,StrategicGrowthInitiatives),NikoHaavisto(CFO),MikaMatikainen(ManagingPartner,CapManRealEstate)andMarkusSjöholm(ManagingPartner,CapManBuyout).
AUTHORISATIONSGIVENTOTHEBOARDBYTHEAGMTheAGMauthorisedtheBoardofDirectorstodecideontherepurchaseand/orontheacceptanceaspledgesofthecompany'sshares.Thenumberofsharesconcernedshallnotexceed8,000,000,andtheauthorisationshallremaininforceuntiltheendofthefollowingAGMand30June2017atthelatest.The
AGMalsoauthorisedtheBoardtodecideontheissuanceofsharesandotherspecialrightsentitlingtoshares.Thenumberofsharestobeissuedshallnotexceed15,000,000sharesandtheauthorizationshallremaininforceuntiltheendofthefollowingAGMand30June2017atthelatest.FurtherdetailsontheseauthorisationscanbefoundinthestockexchangereleaseonthedecisionstakenbytheAGMissuedon16March2016.
DECISIONSOFTHEEGMANDAUTHORISATIONSGIVENTOTHEBOARDCapMan’sExtraordinaryGeneralMeetingheldon8December2016authorisedtheBoardofDirectorstodecideontheissuanceofsharestocarryouttheexchangeofferconcerningNorvestiaanddecidedontheamendmentoftheArticlesofAssociationofCapMan,whichwasconditionaltotheconsummationoftheexchangeofferandallA‐sharesinCapManwereconvertedintoB‐shares.Thetotalnumberofsharestobeissuedundertheauthorisationmaynotexceed65,576,292shares.TheamendmentstotheArticlesofAssociationareregisteredbeforetheauthorisationmaybeused.TheauthorisationmaybeonlyusedtocarryouttheexchangeofferconcerningNorvestiaPlcinoneormoretranches.Theauthorisationisvaliduntil8December2021.Theauthorisationdoesnotcancelothereffectiveauthorisations.TheEGMapprovedalltheproposalsoftheBoardofDirectorstotheEGM.FurtherdetailsonthesedecisionsandauthorisationscanbefoundinthestockexchangereleaseonthedecisionstakenbytheEGMissuedon8December2016.

43 / CapMan
CORPORATE GOVERNANCE FINANCIAL STATEMENTSGROUP 2016 ANNUAL REPORT 2016
ANNUAL REPORT 2016 // REPORT OF THE BOARD OF DIRECTORS
43 / CapMan / Annual Report 2016
PERSONNELCapManemployedatotalof108peopleasof31December2016(31December2015:101),ofwhom71(67)workedinFinlandandtheremainderintheotherNordiccountries,Russia,LuxembourgandtheUnitedKingdom.AbreakdownofpersonnelbycountryispresentedintheNotestotheFinancialStatementsinSection6Employeebenefitexpenses.
SHARESANDSHARECAPITALTherewerenochangesinCapManPlc’ssharecapitalduringthefinancialyear.SharecapitaltotalledEUR771,586.98asof31December2016.AspartofarrangementsrelatedtoCapMan’sexchangeofferforNorvestia’sshares,CapMan’s5,750,000AshareswereconvertedintoBsharesat1:1on20December2016,afterwhichCapMan’sArticlesofAssociationwereamendedsothatCapManonlyhadoneshareseries.CapManissued56,967,318newsharesasshareconsiderationforNorvestia’sshareholders,whohadacceptedtheexchangeoffer,afterwhichCapManhad143,313,255sharesoutstandingasof31December2016.Allsharesgenerateequalvotingrightsandrightstoadividendandotherdistributiontoshareholders.CapManPlc’ssharesareincludedintheFinnishbook‐entrysystem.RedemptionobligationclausesassociatedwithsharesaredetailedintheNotestotheFinancialStatementsinSection25Sharecapitalandshares.
SHAREHOLDERSANDMANAGEMENTHOLDINGSThenumberofCapManPlcshareholdersincreasedby78%fromthecomparableperiodandtotalled11,861asof31December2016(31December2015:6,660).Thefollowingnotificationsregardingmajorshareholderchangesweregivenduringthefinancialyear:MandatumLife’sshareofownershipandvotesinCapManexceededone‐twentieth(1/20)followingtheacquisitionofshareson27December2016.OyInventiainvestAb’s(AriTolppanen)shareofownershipandvotesinCapManPlchasfallenbelowone‐twentieth(1/20)asaresultofashareissueon27December2016.GimvNV'sshareofownershipinCapManPlchasfallenbelowone‐twentieth(1/20)on20December2016asaresultofadisposalofshares.OyInventiainvestAb’s(AriTolppanen)shareofvotesinCapManPlchasfallenbelowone‐tenth(1/10)asaresultoftheconversionofAsharestoBshares(1:1)on20December2016.HeikkiWesterlund’sandHeiwesOy’scombinedshareofvotesinCapManPlcofhasfallenbelowone‐twentieth(1/20)asaresultoftheconversionofAsharestoBshares(1:1)on20December2016.

44 / CapMan
CORPORATE GOVERNANCE FINANCIAL STATEMENTSGROUP 2016 ANNUAL REPORT 2016
ANNUAL REPORT 2016 // REPORT OF THE BOARD OF DIRECTORS
44 / CapMan / Annual Report 2016
MOMInvestOy’sandGeldegalOy’s(OlliLiitola)combinedshareofvotesinCapManPlcofhasfallenbelowone‐twentieth(1/20)asaresultoftheconversionofAsharestoBshares(1:1)on20December2016.TuomoRaasio’sandWinsomeOy’scombinedshareofvotesinCapManPlcofhasfallenbelowone‐twentieth(1/20)asaresultoftheconversionofAsharestoBshares(1:1)on20December2016.GimvNV’sshareofvotingrightshasfallenbelowone‐twentieth(1/20)ofthevotingrightsinCapManPlcon4November2016asaresultofadisposalofshares.Nonotificationsregardingmajorshareholderchangesweregivenin2015.Asof31December2016,themembersoftheBoardofDirectorsandtheCEOheldatotalof10,013,950shareseitherdirectlyorthroughcompaniestheycontrol,representing7.0%ofCapManPlc’ssharesandvotingrights.TheChairmanoftheBoardofDirectorsandtheCEOalsoheldatotalof1,200,0002013A,2013Band2013Coptionsasoftheendoftheyear,entitlingthemtosubscribetoanequivalentnumberofshares,representing0.8%ofCapManPlc’ssharesandvotingrights.DetailsonCapManPlc’sownersbysectorandsize,togetherwiththecompany’smajorshareholders,nominee‐registeredshares,andredemptionobligationclausescoveringcompanysharesarepresentedintheNotestotheFinancialStatementsinSection25Sharecapitalandshares.
COMPANYSHARESAsof31December2016,CapManPlcheldatotalof26,299CapManshares,representing0.02%ofsharesandvotingrights.ThemarketvalueofownsharesheldbyCapManwasEUR32,874asof31December2016(31December2015:EUR26,299).NochangesoccurredinthenumberofownsharesheldbyCapManPlcduringtheyear.
TRADINGANDMARKETCAPITALISATIONCapManPlc’ssharesclosedatEUR1.25on31December2016(31December2015:EUR1.00).Thetrade‐weightedaveragepriceduring2016wasEUR1.10(EUR1.00).ThehighestpricepaidwasEUR1.30(EUR1.09)andthelowestEUR0.91(EUR0.83).ThenumberofCapManPlcsharestradedtotalled33.5million(13.7million),valuedatMEUR37.0(MEUR13.8).ThemarketcapitalisationofCapManPlcsharesasof31December2016wasMEUR179.1(31December2015:MEUR86.3,includingAsharesvaluedattheclosingpriceofBshares).
COMPENSATIONSCHEMESCapMan’scompensationschemeconsistsofshort‐termandlong‐termcompensationschemes.Theshort‐termschemecoversallCapManemployeesanditscentralobjectiveisearningspershare,forwhichtheBoardofDirectorshassetaminimumtarget.Short‐termbonusesforinvestmentteamsarebasedontheresultoftheManagementCompanybusinessfortheirrespectiveinvestmentpartnership,andtheminimumlevelofearningspershareprovidesthebasisforreceivingbonuses.

45 / CapMan
CORPORATE GOVERNANCE FINANCIAL STATEMENTSGROUP 2016 ANNUAL REPORT 2016
ANNUAL REPORT 2016 // REPORT OF THE BOARD OF DIRECTORS
45 / CapMan / Annual Report 2016
Thelong‐termschemeconsistsofcarriedinterestpayabletoinvestmentteamsandstockoptionprogrammesforCapMan’skeypersonnel.Thecarriedinterestpayabletoinvestmentteamsisbasedonthesuccessofinvestmentsmadeinthecorrespondingfunds.Thisarrangementisinlinewithinternationalindustrypractice.Attheendofthereportingperiod,CapManPlchadtwostockoptionprogrammes–OptionProgramme2013andStockOptionProgramme2016–inplaceaspartofitsincentiveandcommitmentarrangementsforkeypersonnel.TheBoardofDirectorsdecidesannuallyonthedistributionofstockoptionstothekeypersonnelemployedorrecruitedbytheGroup.ThemaximumnumberofstockoptionsissuedunderOptionProgramme2013willbe4,230,000,whichwillcarryanentitlementtosubscribetoamaximumof4,230,000newshares.TheprogrammeisdividedintoA,B,andCseries,eachofwhichcoversamaximumof1,410,000optionentitlements.Thesharesubscriptionpriceofthe2013AoptionsisEUR0.75(thetradevolume‐weightedaveragequotationoftheshareduring1April–31May2013withanadditionof10%),thatofthe2013BoptionsisEUR1.03(thetradevolume‐weightedaveragequotationoftheshareduring1April–31May2014withanadditionof10%),andthatofthe2013CoptionsisEUR1.05(thetradevolume‐weightedaveragequotationoftheshareduring1April–31May2015withanadditionof10%).Thesubscriptionperiodfor2013Aoptionsbeganon1May2016andthatfor2013Boptionsand2013Coptionswillbeginon1May2017and1May2018,respectively.Receivablesfromsharessubscribedtoundertheseoptionswillbeenteredinthecompany’sunrestrictedshareholders’equity.Atotalof1,325,000stockoptionentitlementsundertheOption
Programme2013A,atotalof1,218,334stockoptionentitlementsundertheOptionProgramme2013Bandatotalof1,227,291stockoptionentitlementsundertheOptionProgramme2013Chadbeenallocatedby31December2016.Atotalof29,171newshareshadbeensubscribedtowith2013Aoptionsasof31December2016.ThemaximumnumberofstockoptionsissuedunderOptionProgramme2016willbe4,230,000,whichwillcarryanentitlementtosubscribetoamaximumof4,230,000newshares.TheprogrammeisdividedintoA,B,andCseries,eachofwhichcoversamaximumof1,410,000optionentitlements.Thesharesubscriptionpriceofthe2016AoptionsisEUR1.04(thetradevolume‐weightedaveragequotationoftheshareduring1April–31May2016withanadditionof10%),thatofthe2016Boptionsisthetradevolume‐weightedaveragequotationoftheshareduring1April–31May2017withanadditionof10%,andthatofthe2016Coptionsisthetradevolume‐weightedaveragequotationoftheshareduring1April–31May2018withanadditionof10%.Thesubscriptionperiodfor2016Aoptionswillbeginon1May2019,thatfor2016Boptionson1May2020andthatfor2016Coptionson1May2021.Receivablesfromsharessubscribedtoundertheseoptionswillbeenteredinthecompany’sunrestrictedshareholders’equity.Nostockoptionentitlementshadbeenallocatedby31December2016undertheOptionProgramme2016.ThetermsoftheoptionprogrammescanbefoundonCapMan’swebsiteathttps://www.capman.com/investors/shares‐and‐shareholders/stock‐option‐programmes/.

46 / CapMan
CORPORATE GOVERNANCE FINANCIAL STATEMENTSGROUP 2016 ANNUAL REPORT 2016
ANNUAL REPORT 2016 // REPORT OF THE BOARD OF DIRECTORS
46 / CapMan / Annual Report 2016
TheimpactofthesestockoptionprogrammesandoptionissuesonthenumberofCapMansharesandvotingrightsisdescribedinmoredetailintheNotestoFinancialStatementsinNote31Share‐basedpayments.
DECISIONSTAKENBYTHEANNUALGENERALMEETINGFOR2016ANDORGANISINGMEETINGHELDBYTHEBOARDOFDIRECTORSThedecisionshavebeendescribedindetailintwostockexchangereleasespublishedon16March2016.
PUBLICATIONOFTHEFINANCIALSTATEMENTSANDTHEREPORTOFTHEBOARDOFDIRECTORS,ANDTHEANNUALGENERALMEETINGFOR2017CapManGroup’sFinancialStatementsandtheReportoftheBoardofDirectorsfor2016willbepublishedaspartofthecompany’sAnnualReportfor2016inFebruary2017duringweek8.CapManPlc’s2017AnnualGeneralMeetingwillbeheldonWednesday15March2017at10:00a.m.inHelsinki.TheNoticetotheAnnualGeneralMeetingandotherproposalsoftheBoardofDirectorstotheAnnualGeneralMeetingarepublishedby22February2017thelatest.Completefinancialstatements,asrequiredunderthetermsoftheFinnishCompaniesAct,willbeavailableonCapMan’swebsitewww.capman.comby22February2017atthelatest.
CORPORATEGOVERNANCESTATEMENTCapManPlc’sCorporateGovernanceStatementwillbepublishedseparatelyfromtheReportoftheBoardofDirectorsaspartofthecompany’sAnnualReportfor2016duringweek8andwillbeavailableonthecompany’swebsitewww.capman.comby22February2017atthelatest.
OTHERSIGNIFICANTEVENTSDURINGTHEFINANCIALYEARCapManLifeScienceIVfundmanagedbyCapManexiteditsinvestmentinSamsaABinJuly2016.TheexithadaMEUR1.5resultimpactandMEUR5.7cashflowimpacttoCapManPlc.
FundsmanagedbyCapManexitedEsperiCareOyinJune.CapManisasignificantinvestorinCapManBuyoutIXfundandtheresultimpactfromtheexitwasMEUR1.4.TheexitgeneratedMEUR6.1incashflowtoCapManPlc.TheCapManRealEstateIfundsolditsholdinginKOyMastolanKeskusvarastotoKokoelmakeskusKy.TheinvestorsofKokoelmakeskusareagroupofFinnishinvestors,includingCapMan.CapManRealEstateisresponsibleformanagingtheasset.
TheCapManPublicMarketfundexiteditsfinalportfoliocompaniesinthebeginningoftheyear.Asaresult,thefundtransferredtocarryandwillbeterminatedinthenearfuture.CapManreceivescarriedinterestincomeofMEUR1.2fromthefund,themajorityofwhichwerebookedinthefirstquarterof2016.
EVENTSAFTERTHEENDOFTHEFINANCIALYEARCapMancontinuedthesubsequentofferperiodfortheexchangeofferforNorvestia’ssharesuntil9January2017.Followingtheendofthesubsequentofferperiod,CapMan’sownershipinNorvestiahadrisento92.5percent.CapManhasissuedatotalof1,677,096sharestoNorvestia’sshareholders,whoacceptedtheexchangeofferduringthesubsequentofferperiod.CapManhascommencedmandatoryredemptionproceedingstoobtaintheremainingNorvestia’ssharesinaccordancewithChapter18oftheLimitedLiabilityCompaniesAct.

47 / CapMan
CORPORATE GOVERNANCE FINANCIAL STATEMENTSGROUP 2016 ANNUAL REPORT 2016
ANNUAL REPORT 2016 // REPORT OF THE BOARD OF DIRECTORS
47 / CapMan / Annual Report 2016
CapManhasadvancedtotheNasdaqHelsinki’sMid‐Capcategorybasedonmarketcap.Tradinginthenewcategorycommencedon11January2017.
SIGNIFICANTRISKSANDSHORT‐TERMUNCERTAINTIESPrivateequityinvestmentisgenerallysubjecttoariskofnon‐liquidinvestments,amongothers,whichmeansuncertaintyoftherealizationofanyincreaseinvalue,ariskconcerninggeneraleconomicdevelopmentandmarketsituationandariskconcerningtheeconomyandpoliticalsituationoftargetcountries.
InvestmentoperationscarriedoutbyCapManaresubjecttogeneralmarketrisk.Marketvaluescanchange,forexample,becauseoffluctuationsintheequity,fixedincome,currencyandrealestatemarkets.ChangesinmarketvaluesimpacttheresultofCapManthroughtheappreciationsofitsinvestmentassets.Changesintheequitymarketsalsoinfluencethevaluationofunlistedportfoliocompaniesbecausethevaluationmethodsusedbyfundsincludethesharevaluesofsuitablelistedcompanies.EconomicuncertaintymayhaveadirectimpactonthesuccessofthefundsadministeredbyCapMan,onthesuccessofCapMan’sinvestmentactivities,andalsoontheassetsavailableforinvestmentorsolvencyofthecurrentandpotentialinvestorsofthefunds.
ThebusinessoperationsoftheCapManGrouphaveamaterialriskoffailureregardingtheestablishmentofnewprivateequityfundsandtheirfundraising.Successfulfundingisimportanttomanagementfeesandcreatesopportunityforreceivingcarriedinterestincomeinthefuture.Forexample,poorperformanceofinvestmentsmadebyfundsmanagedbyCapMan,increasing
competitionorotherreasonsthatareindependentofCapManmaymakeitmoredifficulttoraisefundsfromneworcurrentinvestorsinthefuture.
Thetimingofexitsandthemagnitudeofthepotentialcarriedinterestprofitsaredifficulttoforetell.Thetimingoffeesfromfundadvisoryactivitiesaredifficulttopredictduetothenatureofthebusiness.
Groupcompaniesmanagingafundmayincertaincircumstances,pursuanttothetermsofthefundagreement,havetoreturncarriedinterestincometheyhavereceived(so‐calledclawback).Theobligationtoreturncarriedinterestincomeappliestypicallywhenthefundmanagementcompanyisdeemedtohavereceivedahighertotalcarriedinterestincomewhenthefundexpiresthanwhatitwasentitledtounderthefundagreement.CapManbooksreceivedcarriedinterestincomeonacashbasis.Assuch,onlyrealisedcarriedinterestincomeisbookedinCapMan’sresult.ReturnedcarriedinterestincomebasedonclawbackconditionswouldinturnhaveanegativeimpactonCapMan’sresultasapotentialclawbackprovisionmaynotbesufficient.CapManhasrecordedaEUR7.5millionclawbackprovisionfortheCapManRealEstateIKYfund.Thesufficiencyoftheprovisionisreviewedquarterlybythemanagementbutitsactualamountwillonlybeknownafteralltargetinvestmentsofthefundhavebeenliquidated.Therealisationoftheclawbackliabilitywouldhaveanegativecashflowimpactanditispossiblethattheprovisionmadeisnotsufficient.
Thecompany’sfinancingagreementsincludefinancingcovenantsandotherconditions.ViolationofcovenantsrelatedtofinancingagreementsandafailuretofulfilothercontractualtermsmaycausethecostoffinancingtoincreasesignificantlyandevenjeopardisecontinuedfinancingforCapMan.

48 / CapMan
CORPORATE GOVERNANCE FINANCIAL STATEMENTSGROUP 2016 ANNUAL REPORT 2016
ANNUAL REPORT 2016 // REPORT OF THE BOARD OF DIRECTORS
48 / CapMan / Annual Report 2016
Changesinthesecuritiesmarketsregulation,significantdomesticorinternationaltaxregulationorpracticeandregulationgenerallyapplicabletobusinessoperations,ormeasuresandactionsbyauthoritiesorrequirementssetbyauthorities,orinthemannerinwhichsuchlaws,regulationsandactionsareimplementedorinterpreted,aswellastheapplicationandimplementationofnewlawsandregulations,mayhaveasignificanteffectonCapMan’sbusinessoperations.
GENERALBUSINESSENVIRONMENTEconomicgrowthintheNordiccountriesisforecasttoremainmoderatein2017supportedbyapick‐upinglobalgrowth.Sweden’sgrowthisexpectedtoslowdownsomewhatfromthebriskpaceachievedinthepastfewyears.Denmark’s,Norway’sandFinland’seconomiesareexpectedtocontinueagradualrecovery.1TheNordicprivateequityindustryremainspositivewithinvestorsandfundmanagersexpectingtheregion’sstrongeconomiesandhighqualityinvestmentstogenerategoodreturnsalsoin2017,althoughtheincreasedcompetitionandhighpricingofdealsposeachallenge.2Russia’sGDPisexpectedtoreboundgraduallyduring2017.3Itisdifficulttoestimatetheoveralleconomicandbusinessimpactoflastyear’spoliticalchanges,whichincludedBrexit,anewUSadministrationandtheriseofpopulism,amongothers.
1DanskeBankNordicOutlookJanuary20172Unquote1.12.2016:Nordicoutlookremainsupbeatdespite2016slowdown3FocusEconomics10January20174BainGlobalPrivateEquityreport2016
PrivateEquity
Theexceptionallylong‐lastingbullmarkethascontinuedinthebeginningof2017despitemarketjittersandgeopoliticalinstability.Thelowinterestrateenvironmentanduncertaintyrelatedtothecyclicalityofthestockmarketdrivesinvestorstoseekoutinvestmentswithmoreattractivereturnprofiles.Long‐termreturnsoftheprivateequitymarkethavebeenhistoricallyhighercomparedtootherassetclasses.The10‐yearmediannetreturnofprivateequityinvestmentsmadebypublicpensionfundswas13percentp.a.,whichwas8percentagepointshighercomparedtoacomparablestockmarketindex.4AccordingtoPreqin,privateequityfundsinvestinginEuropeandestablishedbetween2010and2013havereturnedonaverage12percentp.a.5PrivateequityinvestmentsbyFinnishpensioninsurancecompanieshavereturnedonaverage11percentp.a.duringthepast10years.6Investorsconsidernewinvestmentcommitmentscarefullyandtheirreturnexpectationshaveincreased.NordicinvestmentsareexpectedtogeneratehigherreturnscomparedtotherestofEurope.7
Generousdistributionsfromprivateequityfundscomparedtocapitalcallsenablenewprivateequityinvestmentsforinstitutionalinvestorsandencourageadditionalgrowthoftheassetclassinthemediumterm.AccordingtoaninvestorsurveybyPreqin,89percentofrespondentsconsiderthatthedevelopmentoftheirprivateequityportfoliohaseithermetorexceededtheirexpectationsand93percentoftherespondentsexpecttoeitherincreaseor
5PreqinPrivateEquitySpotlightSeptember20166Tela7WillisTowerWatsonPrivateEquityRunwayQ22016

49 / CapMan
CORPORATE GOVERNANCE FINANCIAL STATEMENTSGROUP 2016 ANNUAL REPORT 2016
ANNUAL REPORT 2016 // REPORT OF THE BOARD OF DIRECTORS
49 / CapMan / Annual Report 2016
maintainallocationsintoprivateequityinthelongterm.Halfofrespondentsbelievesmallandmid‐sizedbuyoutfundsofferthebestopportunities.8
Thenumberofestablishedfundsaswellasfundsraisedhavedecreasedduring2016,butthenumberoffundsinthemarkethasgrownsteadilysince2010andtargetfundsizesareatrecordlevel.Halfoffundsestablishedin2016exceededtheirtargetsizewhenthecorrespondingfigurefor2012was32percent.Thedemandfortheassetclassremainshighandnewfundsenterthemarket,whichmeansthatcompetitionremainsintense.9Co‐investmentshavebecomegeneralpracticeintheNordicsastheyenablelargerinvestmentscomparedtofundsasastand‐aloneandbroadenindustryknow‐how.10Morethantwo‐thirdsofNordicfundmanagersrespondingtoasurveyexpectedco‐investmentstoincreaseintheupcoming12months.11
EBITDAmultiplesofbuyoutswereslightlylowerintheNordicstowardstheendof2016comparedtothebeginningoftheyear.InEurope,buyoutmultipleshavestabilisedsomewhatespeciallyinthehealthcareandfinancesectorsfollowingupwardmomentuminthebeginningoftheyear.Multiplesroseinthefood&beveragesindustry.12Lowinterestratesandhighmultipleshaveincreasedinteresttowardslonger‐termstrategies,suchasinfrastructure.Thelongerinvestmenthorizonhasalsoincreasedtheattractivenessofbuy‐andbuildstrategies.13TheactiveIPOmarketintheNordiccountrieshas
8PreqinInvestorOutlookAlternativeAssetsH220169Preqin2016FundraisingUpdate10White&Case:OutlookforNordicPE:Aninsiderperspectiveon201611WillisTowerWatsonPrivateEquityRunwayQ2201612ClearwaterInternationalUnquoteMultiplesHeatmapAnalysisDecember2016
boostedM&Aactivityintheregion.ThenumberoftransactionsintheNordiccountriesincreasedinthefirstthreemonthsof2016despiteasimultaneousslowdowninEurope.14
Theprivateequitysecondarymarketisbecominganincreasinglyimportantpartofinvestors’privateequitystrategyastheylookforoptionstoaddliquiditytotheiralternativeassetportfoliosanddiversifybetweendifferentvintages,forexample.Thepricingofsecondariesisedgingclosertofairvalue.15Withthegrowthofthesecondariesmarket,thereisincreaseddemandforadvisoryservicesthatfocusonthissegmentoftheprivateequitymarket.Competitionhastightenedforprivatedebtfundsasnewfundshaveenteredthemarketandmomentuminfundraisingappearstohavesloweddowninthesecondhalfof2016.Mezzaninestrategieshaveobtainedcompetitionfromdirectlending.Investorsaremostlyinterestedinlargerfundsandestablishedfundmanagers.16
RealEstate
Basedonthepreliminarymarketdata,transactionvolumeintheNordicrealestatemarketamountedtoEUR40.5billionin2016,whichrepresentsa10percentincreaseyearoveryear.Thestronginvestmentvolumeshowsthatthemarkethasremaineddynamicandliquidityisfurtherimproving.17
13WillisTowerWatsonPrivateEquityRunwayQ2201614UnquoteSLCapitalBarometerQ2&Q3201615SEI:PrivateEquityLiquidity:AWorkinProgress16Preqin2016FundraisingUpdate17CapManRealEstate,CBRENordicInvestmentMarketViewQ42016

50 / CapMan
CORPORATE GOVERNANCE FINANCIAL STATEMENTSGROUP 2016 ANNUAL REPORT 2016
ANNUAL REPORT 2016 // REPORT OF THE BOARD OF DIRECTORS
50 / CapMan / Annual Report 2016
ThesteadyincreaseintransactionvolumesacrosstheNordicregioncompressedtheyieldsfurther.InSwedenprimeofficesandretailpropertiestradedaslowas3.75percentinthefirsthalfof2016,whileinDenmarkprimeofficeandretailyieldsstoodaround4.0percentand3.2percent,respectively,attheyear‐end.AlsotheFinnishpropertyinvestmentmarketcontinuedonthestrongtrackin2016withprimeyieldsrangingbetween4.0percent(office)and3.75percent(retail)intheHelsinkicitycentreattheendoftheyear.Yieldsalsocompressedinthesecondarystockin2016althoughnotabledifferencesinpricingofriskstillexistbetweenthedifferentcountriesintheregion.Forexample,inStockholmB‐gradepropertiesinA‐locationsorA‐gradepropertiesinB‐locationstradedatonlywithaslightriskpremiumtoprimeassetsinthelatterpartof2016whereasinHelsinkitheyieldgapbetweenprimeandsecondaryassetsisstilltypicallyatleast200basispoints.18
ThemacroeconomiesofSwedenandDenmarkperformedrelativelywellin2016,whichalsobenefittedcountries’occupancymarketsresultingindecreasingvacanciesandrenthikes.AlsotheCopenhagenresidentialmarketcontinuedtodevelopfavourablyintermsofmarketrentsandaveragesalepricesthrough2016althoughthepaceofgrowthsloweddowntowardstheyearend.WhiletheSwedishandDanisheconomiesareperformingrelativelywell,theno‐growthenvironmentcontinuedtodepresstheFinnishoccupancymarket.Asaresult,bothoccupancyratesandrentlevelsdecreasedintheHelsinkiMetropolitanAreaduring2016.19
18CapManRealEstate,CBRENordicInvestmentMarketViewQ4201619CapManRealEstate,CBRE,Catella,boliga.dk,SadolinAlbaek20Preqin2016FundraisingUpdate
Fundraisingforrealestatefundshasremainedstrongin2016andfundsraisedareatthehighestlevelsincethefinancialcrisis.Therewasarecordnumberofrealestatefundsinthemarketinthebeginningof2017.Inadditiontovalueaddstrategies,investorsareincreasinglyinterestedinriskieropportunisticstrategies.20AccordingtoasurveybyPreqin,Europegeneratesthemostinvestorinterest.21InvestmentsinrealestatefundsinvestinginEuropeandestablishedbetween2009and2013havereturnedonaverage13percentp.a.22
FINANCIALOBJECTIVESANDOUTLOOKESTIMATEFOR2017CapManreneweditsfinancialobjectivesattheendof2016.ThegrowthobjectiveforManagementCompanyandServicesbusinessismorethan10percentp.a.onaverage.Theobjectiveforreturnonequityismorethan20percentp.a.onaverage.Theobjectivefornetgearing,thatisratioofinterestbearingdebttoequity,isamaximumof40percentonaverage.CapMan’sobjectiveistopayatleast75percentofearningspershareasdividend.
CapManexpectstoachievethesefinancialobjectivesgraduallyandkeyfiguresareexpectedtoshowseasonality.CapManexpectsfeesfromservicestohavealargerimpactonresultsfromtheManagementCompanyandServicesbusinessin2017.TheManagementCompanyandServicesbusinessisprofitablebeforecarriedinterestincomeandanypossibleitemsaffectingcomparability.TheintegrationofNorvestiaandothergrowthinitiativeswillgenerateexpensesin2017.
21PreqinInvestorOutlookAlternativeAssetsH2201622Preqindata

51 / CapMan
CORPORATE GOVERNANCE FINANCIAL STATEMENTSGROUP 2016 ANNUAL REPORT 2016
ANNUAL REPORT 2016 // REPORT OF THE BOARD OF DIRECTORS
51 / CapMan / Annual Report 2016
ThereturnonCapMan’sinvestmentshaveasubstantialimpactonCapMan’soverallresult.Thedevelopmentofindustriesandlocaleconomies,inflationdevelopment,valuationmultiplesofpeercompanies,exchangeratesandvariousotherfactorsoutsideofCapMan’scontrolinfluencefairvaluedevelopmentofCapMan’soverallinvestmentsinadditiontocompanyandrealestatespecificdevelopment.
CapMan’sobjectiveistoimproveresultslongerterm,takingintoaccounttheseasonalityaffectingservicesandtheInvestmentbusiness.Fortheseandotherabovementionedreasons,CapMandoesnotprovidenumericestimatesfor2017.
CapManPlcBoardofDirectors

52 / CapMan
CORPORATE GOVERNANCE FINANCIAL STATEMENTSGROUP 2016 ANNUAL REPORT 2016
ANNUAL REPORT 2016 // GROUP STATEMENT OF COMPREHENSIVE INCOME (IFRS)
52 / CapMan / Annual Report 2016
GroupStatementofComprehensiveIncome(IFRS)€ ('000) Note 1.1.‐31.12.2016 1.1.‐31.12.2015
Turnover 3 26,677 31,767
Other operating income 5 126 314Employee benefit expenses 6 ‐18,291 ‐17,066Depreciation 7 ‐257 ‐322Other operating expenses 8 ‐12,190 ‐10,574Fair value gains/losses of investments 10 22,607 5,152
Operating profit 18,672 9,271
Finance income 11 667 121Finance costs 11 ‐3,806 ‐2,996Share of the income of investments accounted for using the equity method 12 ‐8 53
Profit before taxes 15,525 6,449
Income taxes 13 ‐239 ‐395
Profit for the financial year 15,286 6,054
Other comprehensive income: Items that may be subsequently reclassified to profit or loss
Translation difference ‐195 ‐41Total comprehensive income 15,091 6,013

53 / CapMan
CORPORATE GOVERNANCE FINANCIAL STATEMENTSGROUP 2016 ANNUAL REPORT 2016
ANNUAL REPORT 2016 // GROUP STATEMENT OF COMPREHENSIVE INCOME (IFRS)
53 / CapMan / Annual Report 2016
€ ('000) Note 1.1.‐31.12.2016 1.1.‐31.12.2015
Profit attributable to:Equity holders of the Company 15,286 6,054
Total comprehensive income attributable to:Equity holders of the Company 15,091 6,013
Earnings per share for profit attributable to the equity holders of the Company:
Earnings per share (basic), cents 14 16.2 5.9Earnings per share (diluted), cents 14 16.1 5.8
TheNotesareanintegralpartoftheFinancialStatements.

54 / CapMan
CORPORATE GOVERNANCE FINANCIAL STATEMENTSGROUP 2016 ANNUAL REPORT 2016
ANNUAL REPORT 2016 // GROUP BALANCE SHEET (IFRS)
54 / CapMan / Annual Report 2016
GroupBalanceSheet(IFRS)€ ('000) Note 31.12.2016 31.12.2015ASSETS Non‐current assetsTangible assets 15 169 189Goodwill 16 6,204 6,204Other intangible assets 17 277 487Investments accounted for using the equity method 18 87 95Investments at fair value through profit and loss 19
Investments in funds 51,394 47,249 Growth equity investments 37,856 0 Other financial assets 179 48,784 Investments in joint ventures 5,376 7,651Receivables 20 5,202 6,062Deferred tax assets 21 4,887 4,400
111,631 121,121
Current assets Trade and other receivables 22 9,849 6,637Financial assets at fair value through profit and loss 23 86,213 306Cash and bank 24 45,001 21,576
141,063 28,519
Total assets 252,694 149,640

55 / CapMan
CORPORATE GOVERNANCE FINANCIAL STATEMENTSGROUP 2016 ANNUAL REPORT 2016
ANNUAL REPORT 2016 // GROUP BALANCE SHEET (IFRS)
55 / CapMan / Annual Report 2016
€ ('000) Note 31.12.2016 31.12.2015EQUITY AND LIABILITIES
Capital attributable to the Company's equity holders 25
Share capital 772 772Share premium account 38,968 38,968Other reserves 97,111 27,397Translation difference ‐101 96Retained earnings 6,229 ‐2,048
Total equity 142,979 65,185
Non‐current liabilitiesDeferred tax liabilities 21 9,868 1,958Interest‐bearing loans and borrowings 26 48,065 69,389Other non‐current liabilities 124 0
58,057 71,347Current liabilitiesTrade and other payables 27 33,341 13,108Interest‐bearing loans and borrowings 28 18,000 0Current income tax liabilities 317 0
51,658 13,108
Total liabilities 109,715 84,455
Total equity and liabilities 252,694 149,640
TheNotesareanintegralpartoftheFinancialStatements.

56 / CapMan
CORPORATE GOVERNANCE FINANCIAL STATEMENTSGROUP 2016 ANNUAL REPORT 2016
ANNUAL REPORT 2016 // GROUP STATEMENT OF CHANGES IN EQUITY (IFRS)
56 / CapMan / Annual Report 2016
GroupStatementofChangesinEquity(IFRS)€ ('000) Attributable to the equity holders of the Company
ShareShare premium Other Translation Retained
Note capital account reserves difference earnings TotalEquity on 1 January 2015 25 772 38,968 27,175 137 ‐1,485 65,567Profit for the year 6,054 6,054Other comprehensive income for the year Translation differences ‐41 ‐41Total comprehensive ‐41 6,054 6,013Options 222 25 247Dividends ‐5,177 ‐5,177Hybrid bond, interest (net of tax) ‐960 ‐960Total contributions by and distributions to owners of the parent, recognised directly in equity
222 ‐6,112 ‐5,890
Other changes ‐505 ‐505Equity on 31 December 2015 25 772 38,968 27,397 96 ‐2,048 65,185

57 / CapMan
CORPORATE GOVERNANCE FINANCIAL STATEMENTSGROUP 2016 ANNUAL REPORT 2016
ANNUAL REPORT 2016 // GROUP STATEMENT OF CHANGES IN EQUITY (IFRS)
57 / CapMan / Annual Report 2016
€ ('000) Attributable to the equity holders of the CompanyShare
Share premium Other Translation RetainedNote capital account reserves difference earnings Total
Profit for the year 15,286 15,286Other comprehensive income for the yearTranslation differences ‐197 ‐197Total comprehensive ‐197 15,286 15,089Share subscriptions with options 22 22Options 64 151 215Dividends 69,628 ‐6,040 63,588Share issue Hybrid bond, interest (net of tax) ‐1,120 ‐1,120Total contributions by and distributions to owners of the parent, recognised directly in equity
69,714 ‐7,009 62,705
Equity on 31 December 2016 25 772 38,968 97,111 ‐101 6,229 142,979
TheNotesareanintegralpartoftheFinancialStatements.

58 / CapMan
CORPORATE GOVERNANCE FINANCIAL STATEMENTSGROUP 2016 ANNUAL REPORT 2016
ANNUAL REPORT 2016 // GROUP CASH FLOW STATEMENT (IFRS)
58 / CapMan / Annual Report 2016
GroupCashFlowStatement(IFRS)€ ('000) Note 1.1.‐31.12.2016 1.1.‐31.12.2015Cash flow from operationsProfit for the financial year 15,286 6,054Adjustments on cash flow statement 9 ‐18,520 2,996Change in working capital:Change in current non‐interest‐bearing receivables 1,681 ‐1,383Change in current trade payables and other non‐interest‐bearing liabilities 2,949 ‐1,926
Interest paid ‐4,213 ‐4,317Taxes paid ‐310 ‐852Cash flow from operations ‐3,126 572Cash flow from investing activities Acquisition of subsidiaries 6,241 0Investments in tangible and intangible assets ‐23 ‐6Investments at fair value through profit and loss 10,838 ‐37,771Long‐term loan receivables granted ‐2,295 ‐2,095Receivables from long‐term receivables 3,055 12Dividends received 18,841 27Interest received 662 222Cash flow from investing activities 37,319 ‐39,611Cash flow from financing activities Proceeds from borrowings 26 0 63,900Repayment of long‐term loan ‐4,729 ‐26,758Dividends paid ‐6,040 ‐5,177Cash flow from financing activities ‐10,769 31,965Change in cash and cash equivalents 23,425 ‐7,074Cash and cash equivalents at start of year 21,576 28,650Cash and cash equivalents at end of year 24 45,001 21,576
TheNotesareanintegralpartoftheFinancialStatements.

59 / CapMan
CORPORATE GOVERNANCE FINANCIAL STATEMENTSGROUP 2016 ANNUAL REPORT 2016
ANNUAL REPORT 2016 // NOTES TO THE CONSOLIDATED FINANCIAL STATEMENTS
59 / CapMan / Annual Report 2016
NotestotheConsolidatedFinancialStatementsGROUPINFORMATIONCapMan’scorebusinessisprivateequityfundmanagementandadvisoryservices,aswellasdirectmarketandgrowthequityinvestments.ThefundsmanagedbyCapManmakeinvestmentsinNordicandRussiancompaniesandinrealestateintheNordiccountries.CapManmakesdirectmarketinvestmentsprimarilyinNordiclistedshares,hedgefundsandbonds.GrowthequityinvestmentsaremademainlyinNordicunlistedcompaniesandgrowth‐orientedlistedcompanies.
TheparentcompanyoftheGroupisCapManPlcandisdomiciledinHelsinki,witharegisteredofficeaddressatLudviginkatu6,00130Helsinki,Finland.
TheConsolidatedFinancialStatementsmaybeviewedonlineatwww.capman.com,orahardcopyisavailablefromtheofficeoftheparentcompany.
TheConsolidatedFinancialStatementsfor2016havebeenapprovedforpublicationbyCapManPlc’sBoardofDirectorsonFebruary1,2017.PursuanttotheFinnishCompaniesAct,shareholdersmayadoptorrejectthefinancialstatementsandmakedecisionsonamendmentstothemattheAnnualGeneralMeeting.
1. ACCOUNTINGPOLICIES
Basisofpreparation
TheGroup’sfinancialstatementshavebeenpreparedinaccordancewithInternationalFinancialReportingStandards(IFRS)inforceatDecember31,2016asadoptedbytheEuropeanUnion.InternationalFinancialReportingStandards,referredtointheFinnishAccountingActandinordinancesissuedbasedontheprovisionsofthisAct,arestandardsandtheirinterpretationsadoptedinaccordancewiththeprocedurelaiddowninregulation(EC)No1606/2002oftheEuropeanParliamentandoftheCouncil.ThenotestotheconsolidatedfinancialstatementshavebeenpreparedinaccordancewiththeFinnishaccountingstandardsasandwheretheysupplementIFRSrequirements.
ThepreparationoffinancialstatementsinconformitywithIFRSrequirestheGroup’smanagementtomakeestimatesandassumptionswhenapplyingCapMan’saccountingprinciples,andthesearepresentedinmoredetailunder‘Useofestimates’.
TheConsolidatedFinancialStatementshavebeenpreparedunderthehistoricalcostconvention,exceptforfinancialassetsandliabilitiesvaluedatfairvaluethroughprofitorloss.TheinformationintheConsolidatedFinancial

60 / CapMan
CORPORATE GOVERNANCE FINANCIAL STATEMENTSGROUP 2016 ANNUAL REPORT 2016
ANNUAL REPORT 2016 // NOTES TO THE CONSOLIDATED FINANCIAL STATEMENTS
60 / CapMan / Annual Report 2016
Statementsispresentedinthousandsofeuros.Figuresintheaccountshavebeenroundedandconsequentlythesumofindividualfigurescandeviatefromthepresentedsumfigure.
Newandamendedstandardsappliedinfinancialyearended
AsfromJanuary1,2016,theGrouphasappliedthefollowingneworamendedstandardsthathavecomeintoeffect:
AmendmentstoIFRS10,IFRS12andIAS28:Investmententities–ApplyingtheConsolidationException.Theseamendmentsclarifiedwhichsubsidiariesofaninvestmententityshouldbeconsolidatedinsteadofbeingmeasuredatfairvaluethroughprofitorloss.Theseamendmentshadnoimpactontheconsolidatedfinancialstatements.
AmendmentstoIAS1:PresentationofFinancialStatements–DisclosureInitiative.Theamendmentelaboratesontheeffectofmaterialityonthepresentationofnotes,subtotalsandtheorderofnotes.Theamendmentshadnomaterialimpactontheconsolidatedfinancialstatements.
AnnualImprovementstoIFRSs2012–2014cycle(effectiveforfinancialyearsbeginningonorafter1January2016).Theannualimprovementsprocessprovidesamechanismforminorandnon‐urgentamendmentstoIFRSstobegroupedtogetherandissuedinonepackageannually.Theirimpactsvarystandardbystandardbutwerenotsignificant.
Otherneworamendedstandardsorinterpretationshadnoimpactontheconsolidatedfinancialstatements.
Adoptionofnewandamendedstandardsandinterpretationsapplicableinfuturefinancialyears
TheGrouphasnotyetadoptedthefollowingnewandamendedstandardsandinterpretationsalreadyissuedbytheIASB.TheGroupwilladoptthemasoftheeffectivedateor,ifthedateisotherthanthefirstdayofthefinancialyear,fromthebeginningofthesubsequentfinancialyear.
TheseamendmentshavebeenendorsedforusebytheEuropeanUnion:
IFRS9Financialinstruments(effectiveforfinancialyearsbeginningonorafterJanuary1,2018)IFRS9willreplacethecurrentstandardIAS39FinancialInstruments:RecognitionandMeasurement.ThenewstandardreplacesthemultipleclassificationmodelsoffinancialassetsinIAS39withasinglemodel,underwhichtherearethreeclassificationcategories:amortisedcost,fairvaluethroughprofitandlossandfairvaluethroughothercomprehensiveincome.Classificationisbasedonentity’sbusinessmodelformanagingfinancialassetsandtheircontractualcashflowcharacteristics.Thenewstandardalsoincludesanewmodelforestimatingimpairmentoffinancialassets,whichisbasedonexpectedcreditlosses.Thenewhedgeaccountingrulesalignhedgeaccountingmorecloselywithcommonriskmanagementpractices.
TheGroupexpectsthestandardtocausechangesprimarilytoaccountingprinciplesrelatedtofinancialassetsmeasuredatamortisedcost,suchastradeandloanreceivables.However,theGroupdoesnotexpectsignificantchangestoreportedfigures,becausecreditlosseshavebeenhistoricallylowandarenotexpectedtoincreaseinthefuture.NeitherdoestheGroupexpectchangestotheclassificationoffinancialassets,asthemajorityofgroup’sfinancial

61 / CapMan
CORPORATE GOVERNANCE FINANCIAL STATEMENTSGROUP 2016 ANNUAL REPORT 2016
ANNUAL REPORT 2016 // NOTES TO THE CONSOLIDATED FINANCIAL STATEMENTS
61 / CapMan / Annual Report 2016
assetsarealreadyclassifiedundercategoryfairvaluethroughprofitandloss.Changestothehedgeaccountingrulesdonothaveanimpact,becausetheGroupdoesnotapplyhedgeaccounting.
IFRS15RevenuefromContractswithCustomers(effectiveforfinancialyearsbeginningonorafterJanuary1,2018)IFRS15willreplacethecurrentIAS18andIAS11standardsandestablishesa5‐stepmodelonhowtoaccountforrevenuefromcontractswithcustomers.Inthenewstandard,transferofcontrolisacentralcriterionforrevenuerecognition,whichcanhappenovertimeorinapointintime.Thenewstandardalsoincreasesthenumberofnotesdisclosed.TheGroupiscurrentlyintheprocessofestimatingtheimpactsofimplementingthestandardwithadateoftransitionbeingJanuary1,2018.Theimplementationprojectconsistsofthreephases:preliminaryimpactanalysis,conversionandembedding.Preliminaryimpactanalysishasbeencompletedandconversionisinprocess.
Inthepreliminaryimpactanalysis,thecontracttypesofthedifferentrevenuestreamsoftheGroupwereidentifiedandthe5‐stepmodelofIFRS15appliedtoanalysethepossibleimpacts.CapMan’smainrevenuestreamscomprisemanagementfeesandcarriedinterest.OtherfeesincurredaregeneratedbytheCapManProcurementServices(CaPS),ScalaFundAdvisoryandRealEstatebusinesslinesconsistingmainlyofcommissions,retainerandsuccessfeesandpropertymanagementservicefees.Themainissuesidentifiedbythemanagementresultingfromthepreliminaryimpactanalysiswere:
Determinationofthemethodtodefine“highlyprobable”forvariableconsideration,suchascarriedinterest,andensuringthatthecurrentaccountingpolicyforestimatingclawbackriskisinlinewithIFRS15constraints.UnderIFRS15performance‐basedfeeswillnotbe
recogniseduntilitishighlyprobablethatasignificantreversalintheamountofcumulativerevenuewillnotoccur.
IdentifyingtheseparateperformanceobligationsincertaincontractsofScalaFundAdvisoryandCapManPurchasingScheme.Therearecontractsinthesebusinesslinesthatincludeseveralperformanceobligationsandaccordingly,furtheranalysisisrequiredtodeterminewhethertheseperformanceobligationsareseparateandconsiderationshouldbeallocatedtoeachorwhethertheycanbetreatedasone.
Basedonthepreliminaryimpactanalysis,theGroupdoesnotexpectIFRS15tohaveasignificantimpactonthereportedfigures,butexpectsthenewstandardtoincreasetheamountofdisclosureonrevenuecontractsandrequiremoretransparencyonmanagementjudgementappliedrelatedtorevenuerecognition.
TheseamendmentshavenotbeenendorsedforusebytheEuropeanUnionyet:
IFRS16Leases(effectiveforfinancialyearsbeginningonorafterJanuary1,2019)IFRS16willreplacethecurrentstandardIAS17Leases.Thenewstandardrequireslesseestorecogniseassetsandliabilitiesformostoftheleasecontracts.TheGroupexpectsthestandardtoimpactmainlytheaccountingtreatmentofitsleasecontractsrelatedtoitsfacilitiesbyincreasingnon‐currentassetsandnetgearinganddecreasingtheequityratio.Intheincomestatement,otheroperatingexpensesareexpectedtodecreasebyannualrentalexpenses,whereasdepreciationandfinancecostsareexpectedtoincrease.However,netimpactontheprofitforthefinancialyearisestimatedtobelow.

62 / CapMan
CORPORATE GOVERNANCE FINANCIAL STATEMENTSGROUP 2016 ANNUAL REPORT 2016
ANNUAL REPORT 2016 // NOTES TO THE CONSOLIDATED FINANCIAL STATEMENTS
62 / CapMan / Annual Report 2016
OtherneworamendedstandardsorinterpretationsarenotexpectedtohaveanimpactontheGroup’sfinancialstatements.
Consolidationprinciples
AsCapManhasdetermineditmeetsthedefinitionofaninvestmententity,itssubsidiariesareclassifiedeitherasoperatingsubsidiaries,thatareconsideredtobeanextensionoftheParent’soperations,andassuch,theyareconsolidatedorinvestmententitysubsidiaries,thatarefairvaluedthroughprofitandloss.ThetypesofsubsidiariesandtheirtreatmentinCapMan’sconsolidatedaccountsareasfollows:
Subsidiariesthatprovidefundmanagementservices(fundmanagers)ormanagedirectinvestmentsareconsideredtobeanextensionoftheParent’sbusinessandassuch,theyareconsolidated;
Subsidiariesthatprovidefundmanagementservices(fundmanagers)andwhichalsoholddirectinvestmentsinthefundsareconsolidatedandtheinvestmentsinthefundsarefairvaluedthroughprofitandloss;
Subsidiariesthatprovidefundinvestmentadvisoryservices(advisors)areconsideredtobeanextensionoftheParent’sbusinessandassuch,theyareconsolidated;
Investmententitysubsidiaries(CapManFundInvestmentsSICAV‐SIF),throughwhichCapManmakesitsownfundinvestments,arefairvaluedthroughprofitandloss.
Significantjudgmentappliedbymanagementinthepreparationoftheconsolidatedfinancialstatements–investmententitybasis
ManagementhasdeterminedthatCapManqualifiesasaninvestmententityasdefinedbyIFRS10throughthefulfillmentoftheinvestmententitycriteria,irrespectiveofthedirectinvestmentsbroughtalongbytheacquisitionofNorvestia.ThecornerstoneofCapMan’sbusinesspurposeremainstoobtaincapitalfrominvestorstoitsclosed‐endprivateequityfundsandtoprovideinvestmentmanagementservicestothosefundstogainbothcapitalappreciationandinvestmentincome.EvenaftertheacquisitionofNorvestia,directinvestmentsrepresentarelativelysmallpartcomparedtototalassetsundermanagement.Further,CapManobtainsfundsfrommanyexternalinvestorsforinvestmentpurposes.Documentedexitstrategiesexistforeachfund’sportfolioinvestments.Eachfund’sportfolioinvestmentsandtherealestateinvestmentsarefairvaluedandsuchfairvalueinformationisprovidedbothtothefundinvestorsonreportingdateandalsoforCapMan’sinternalmanagementreportingpurposes.Inaddition,managementhasassessedthatthefollowingcharacteristicsfurthersupportinvestmententitycategorization:CapManholdsseveralinvestmentsitselfinthefunds,investmentsinthefundsareheldbyseveralinvestors,theinvestorsarenotrelatedpartiesandtheinvestmentsareheldmostlyinformofequity.
Significantjudgmentappliedbymanagementinthepreparationoftheconsolidatedfinancialstatements–controloverfundsOneofthemostsignificantjudgmentsmanagementmadeinpreparingtheCompany’sconsolidatedfinancialstatementsisthedeterminationthatCompanydoesnothavecontroloverthefundsunderitsmanagement.Controlispresumedtoexistwhenaparenthaspowerovertheinvestee,hasexposuretovariablereturnsfromthefundandisabletouseitspowertoaffectthelevelofreturns.

63 / CapMan
CORPORATE GOVERNANCE FINANCIAL STATEMENTSGROUP 2016 ANNUAL REPORT 2016
ANNUAL REPORT 2016 // NOTES TO THE CONSOLIDATED FINANCIAL STATEMENTS
63 / CapMan / Annual Report 2016
CapManmanagesthefundsagainstmanagementfeereceivedfromtheinvestorsonthebasisoftheinvestmentmanagementmandatenegotiatedwiththeinvestorsanditalsomakesdirectinvestmentsinthefundsunderitsmanagement.Accordingly,CapManwasrequiredtodetermine,whetheritisactingprimarilyasaprincipalorasanagentinexercisingitspoweroverthefunds.
Intheinvestmentmanagementmandatetheinvestorshavesetdetailedinstructionsinallcircumstancesrelatingtothemanagementofthefundlimitingtheactualinfluenceofthegeneralpartneratverylow.CapMan’sdirectinvestment(typicallybetweenof1%to5%)inthefundsandthustheshareofthevariabilityofthereturnscomparedwiththeotherinvestorsisrelativelysmall.AsaninvestorinthefundCapManhasnorepresentationnorvotingrightsasithasbeenspecificallyexcludedintheinvestmentmanagementmandate.
Therefore,managementhasconcludedthatdespiteitfromformalperspectiveexercisespoweroverthefundsbycontrollingthegeneralpartnerofthefund,itsactualoperationalabilityislimitedintheinvestmentmanagementmandateinamannerthatthegeneralpartnerisconsiderstoactasanagent.Furthermore,CapMan’sexposuretovariablereturnsfromthefundanditspowertoaffectthelevelofreturnsisverylowforthereasonsdescribedabove.Therefore,CapManhasdeterminedthatitdoesnothavecontroloverthefundsunderitsmanagement.
SubsidiariesSubsidiariesareconsolidatedusingtheacquisitionmethod.AllintercompanytransactionsareeliminatedintheConsolidatedFinancialStatements.Profitandloss,togetherwithallothercomprehensiveincome‐relateditems,are
bookedtotheownersoftheparentcompanyorownersnotholdingacontrollinginterestinthecompaniesconcerned.Non‐controllinginterestsarepresentedintheConsolidatedBalanceSheetunderequityseparatelyfromequityattributabletotheownersoftheparentcompany.
SubsidiariesandbusinessesacquiredduringtheyearareconsolidatedfromthedateonwhichtheGroupacquiresacontrollinginterest,andinthecaseofcompaniesandbusinessesdivestedbytheGroupduringthefinancialyearuptothedateonwhichCapMan’scontrollinginterestexpires.
AssociatesAnassociatedcompanyisanentityinwhichtheGrouphassignificantinfluencebutdoesnotholdacontrollinginterest.ThisisgenerallydefinedasexistingwhentheGroupholds,eitherdirectlyorindirectly,morethan20%ofacompany’svotingrights.
Asaninvestmententity,CapManmeasuresassociatedcompaniesbelongingtogrowthequityinvestmentsatfairvaluethroughprofitandloss.Thegroupconsidersthistogivemoremeaningfulinformationabouttherealvalueofinvestmentsandtobetterdescribethecompany’sbusiness,thecompany’swayofreviewingitsinvestmentsandmakingdecisionsrelatingtothem.
Otherassociatedcompanieshavebeenconsolidatedinaccordancewiththeequitymethod.Underthis,theinvestmentinanassociatedcompanyiscarriedinthebalancesheetatcostpluspost‐acquisitionchangesintheGroup’sshareofthecompany’snetassets,lessanyimpairmentvalue.IftheGroup’sshareofthelossincurredbyanassociatedcompanyexceedsthebookvalueofitsinvestment,theinvestmentisbookedatzerointhebalancesheet,andlossesexceedingbookvaluearenotcombinedunlesstheGroupiscommittedto

64 / CapMan
CORPORATE GOVERNANCE FINANCIAL STATEMENTSGROUP 2016 ANNUAL REPORT 2016
ANNUAL REPORT 2016 // NOTES TO THE CONSOLIDATED FINANCIAL STATEMENTS
64 / CapMan / Annual Report 2016
meetingtheobligationsofthecompanyconcerned.TheGroup’sshareoftheprofitrecordedbyanassociatedcompanyduringthefinancialyearinaccordancewithitsholdinginthecompanyispresentedasaseparateitemintheincomestatementafteroperatingprofit.
JointventuresCapManhasassessedthenatureofitsinvestmentinManeqLuxembourgS.a.r.l.andclassifieditasjointventuresincebasedoncontractualagreement,CapManhasrighttonetassetsofthearrangement.Theinvestmentismadethroughseveralseparateinstrumentsandtheirvaluesareco‐dependent.AsaninvestmententityCapManmeasuresitsinvestmentinthejointventureatfairvaluethroughprofitandloss.Inthebalancesheet,theinvestmentispresentedaspartofInvestmentsatfairvaluethroughprofitandlossasaseparatelineitem“Investmentsinjointventures”.Changesinthefairvalueoftheinvestmentarerecognisedinthegroupstatementofcomprehensiveincomeinlineitem“Fairvaluechangesofinvestments”.
Segmentreporting
Operatingsegmentsarereportedinaccordancewithinternalreportingpresentedtoseniormanagement.ThelatterisresponsibleforallocatingresourcestooperatingsegmentsandevaluatingtheirperformanceandisdefinedastheGroup’sManagementGroup,whichisresponsiblefortakingstrategicdecisionsaffectingCapMan.
Translationdifferences
TheresultandfinancialpositionofeachoftheGroup’sbusinessunitsaremeasuredinthecurrencyoftheprimaryeconomicenvironmentforthatunit(‘functionalcurrency’).TheConsolidatedFinancialStatementsare
presentedineuros,whichisthefunctionalandpresentationcurrencyoftheGroup’sparentcompany.
Transactionsinforeigncurrencieshavebeenrecordedintheparentcompany’sfunctionalcurrencyattheratesofexchangeprevailingonthedateofthetransactions;inpracticeareasonableapproximationoftheactualrateofexchangeonthedateofthetransactionisoftenused.Foreignexchangedifferencesforoperatingbusinessitemsarerecordedintheappropriateincomestatementaccountbeforeoperatingprofitand,forfinancialitems,arerecordedinfinancialincomeandexpenses.TheGroup’sforeigncurrencyitemshavenotbeenhedged.
Intheconsolidatedfinancialstatements,theincomestatementsofsubsidiariesthatuseafunctionalcurrencyotherthantheeuroaretranslatedintoeurosusingtheaverageratesfortheaccountingperiod.Theirbalancesheetsaretranslatedusingtheclosingrateonthebalancesheetdate.Allresultingexchangedifferencesarerecognisedinothercomprehensiveincome.Translationdifferencescausedbychangesinexchangeratesforthecumulativeshareholders’equityofforeignsubsidiarieshavebeenrecognisedinothercomprehensiveincome.
Tangiblenon‐currentassets
Tangiblenon‐currentassetshavebeenreportedinthebalancesheetattheiracquisitionvaluelessdepreciationaccordingtoplan.Assetsaredepreciatedonastraight‐linebasisovertheirestimatedusefullives.
Theestimatedusefullivesareasfollows:

65 / CapMan
CORPORATE GOVERNANCE FINANCIAL STATEMENTSGROUP 2016 ANNUAL REPORT 2016
ANNUAL REPORT 2016 // NOTES TO THE CONSOLIDATED FINANCIAL STATEMENTS
65 / CapMan / Annual Report 2016
Machineryandequipment 4‐5yearsOtherlong‐termexpenditure 4‐5years
Theresidualvaluesandusefullivesofassetsarereviewedoneverybalancesheetdateandadjustedtoreflectchangesintheexpectedeconomicbenefitswherenecessary.
Intangibleassets
GoodwillGoodwillacquiredinabusinessmergerisbookedasthesumpaidforaholding,theholdingheldbyownerswithanon‐controllinginterest,andtheholdingpreviouslyownedthat,whencombined,exceedsthefairvalueofthenetassetsoftheacquisition.Write‐offsarenotmadeagainstgoodwill,andpossibleimpairmentofgoodwillistestedannually.Goodwillismeasuredastheoriginalacquisitioncostlessaccumulatedimpairment.Thegoodwillacquiredduringamergerisbookedagainsttheunitsorgroupsofunitsresponsibleforgeneratingthecashflowusedfortestingimpairment.Everyunitorgroupofunitsforwhichgoodwillisbookedrepresentsthelowestleveloftheorganisationatwhichgoodwillismonitoredinternallyformanagementpurposes.Goodwillismonitoredatoperatingsegmentlevel.
OtherintangibleassetsIntangibleassetsacquiredseparatelyaremeasuredoninitialrecognitionatcost.IntangibleassetsarerecognisedinthebalancesheetonlyifthecostoftheassetcanbemeasuredreliablyandifitisprobablethatthefutureeconomicbenefitsattributabletotheassetwillflowtotheGroup.
Agreementsandtrademarksacquiredinbusinessmergersarebookedatfairvalueatthetimeofacquisition.Astheyhavealimitedlife,theyarebookedinthebalancesheetatacquisitioncostminusaccumulatedwrite‐offs.ITsystemsareexpensedonthebasisofthecostsassociatedwithacquiringandinstallingthesoftwareconcerned.Depreciationisspreadacrossthefinanciallifeoftherelevantsoftwarelicences.Impairmentistestedwheneverthereisanindicationthatthebookvalueofintangibleassetsmayexceedtherecoverableamountoftheseassets.
Theestimatedusefullivesare:
Agreementsandtrademarks 10yearsOtherintangibleassets 3‐5years
Impairmentofassets
TheGroupreviewsallassetsforindicationsthattheirvaluemaybeimpairedoneachbalancesheetdate.Ifsuchindicationisfoundtoexist,therecoverableamountoftheassetinquestionisestimated.Therecoverableamountforgoodwillismeasuredannuallyindependentofindicationsofimpairment.
Theneedforimpairmentisassessedonthelevelofcash‐generatingunits,inotherwordsatthesmallestidentifiablegroupofassetsthatislargelyindependentofotherunitsandcashinflowsfromotherassets.Therecoverableamountisthefairvalueofanasset,lesscoststosellorvalueinuse.Valueinusereferstotheexpectedfuturenetcashflowprojections,whicharediscountedtothepresentvalue,receivedfromtheassetinquestionorthecash‐generatingunit.Thediscountrateusedinmeasuringvalueinuseistheratethatreflectscurrentmarketassessmentsofthetimevalueofmoneyand

66 / CapMan
CORPORATE GOVERNANCE FINANCIAL STATEMENTSGROUP 2016 ANNUAL REPORT 2016
ANNUAL REPORT 2016 // NOTES TO THE CONSOLIDATED FINANCIAL STATEMENTS
66 / CapMan / Annual Report 2016
therisksspecifictotheasset.Impairmentisrecordedintheincomestatementasanexpense.Therecoverableamountforfinancialassetsiseitherthefairvalueorthepresentvalueofexpectedfuturecashflowsdiscountedbytheinitialeffectiveinterestrate.
Animpairmentlossisrecognisedwhenevertherecoverableamountofanassetisbelowthecarryingamount,anditisrecognisedintheincomestatementimmediately.Animpairmentlossofacash‐generatingunitisfirstallocatedtoreducethecarryingamountofanygoodwillallocatedtothecash‐generatingunitandthentoreducethecarryingamountsoftheotherassetsoftheunitprorata.Animpairmentlossisreversedifthereisanindicationthatanimpairmentlossmayhavedecreasedandthecarryingamountoftheassethaschangedfromtherecognitiondateoftheimpairmentloss.
Theincreasedcarryingamountduetoreversalcannotexceedwhatthedepreciatedhistoricalcostwouldhavebeeniftheimpairmenthadnotbeenrecognised.Reversalofanimpairmentlossforgoodwillisprohibited.Thecarryingamountofgoodwillisreviewedforimpairmentannuallyormorefrequentlyifthereisanindicationthatgoodwillmaybeimpaired,duetoeventsandcircumstancesthatmayincreasetheprobabilityofimpairment.
Financialinstruments
TheGroup’sfinancialinstrumentshavebeenclassifiedintothefollowingcategories:
1) financialassetsatfairvaluethroughprofitandloss2) loansandotherreceivables
Classificationoffinancialassetsismadeonthebasisofthepurposeoftheacquisitionoffinancialinstrumentsatthetimeofinitialrecognition.Transactioncostsarereportedintheinitialcostoffinancialassets,excludingitemsvaluedatfairvaluethroughprofitandloss.Allpurchasesandsalesoffinancialinstrumentsarerecognisedonthetradedate.AnassetiseligibleforderecognitionandremovedfromthebalancesheetwhentheGrouphastransferredthecontractualrightstoreceivethecashflowsorwhenithassubstantiallytransferredalloftherisksandrewardsofownershipoftheassetoutsidetheGroup.Financialassetsareclassifiedasshort‐termiftheyhavebeenacquiredfortradingpurposesorfallduewithin12months.
FinancialassetsatfairvaluethroughprofitandlossFairvaluethroughprofitandlossclasscomprisesoffinancialassetsthatareacquiredasheldfortradingordesignatedasatfairvaluethroughprofitandlossatinitialrecognitionbecauseCapManisaninvestmententity.Fundinvestments,growthequityinvestments,investmentsinjointventuresandotherinvestmentsinnon‐currentassetstheGroupasaninvestmententitydesignatesasatfairvaluethroughprofitandlossatinitialrecognition,becausethegroupmanagesandmonitorstheperformanceoftheseinvestmentsbasedonfairvaluesaccordingtogroup’sinvestmentstrategy.Investmentsinlistedshares,fundsandinterest‐bearingsecuritiesaswellasthosederivativeinstrumentsthatdonotmeetthehedgeaccountingcriteriaorforwhichhedgeaccountingisnotappliedincurrentassetsareheldfortradingandthereforeclassifiedasatfairvaluethroughprofitandloss.
Fairvalueinformationofthenon‐currentfundinvestmentsisprovidedquarterlytoCompany’smanagementandtootherinvestorsintheinvestmentfundsmanagementbyCapMan.ThevaluationofCapMan’sfunds’investment

67 / CapMan
CORPORATE GOVERNANCE FINANCIAL STATEMENTSGROUP 2016 ANNUAL REPORT 2016
ANNUAL REPORT 2016 // NOTES TO THE CONSOLIDATED FINANCIAL STATEMENTS
67 / CapMan / Annual Report 2016
isbasedonInternationalPrivateEquityandVentureCapitalValuationGuidelines(IPEVG)andIFRS13.
Theobjectiveofthegrowthequityinvestmentactivitiesistofindunlistedtargetcompanieswithapotentialtogrowrapidly,tomakesignificantminorityinvestmentsinthemand,asanactiveinvestor,todeveloptheirvalueinordertogainsignificantincreaseintheirvalue.Sinceaccordingtothisinvestmentstrategy,growthcompaniesaremanagedandtheirperformanceismonitoredbasedonfairvalue,bothequityinvestmentsinandloanreceivablesfromgrowthcompaniesaremeasuredatfairvaluethroughprofitandloss.IftheinvestmentshavenoactivemarketthenthefairvalueisdeterminedquarterlybyusingvaluationmethodsaccordingtoIPEVGandIFRS13.Thevaluationsarebasedonforecastedcashflowsorpeergroupmultiples.Inestimatingfairvalueofaninvestment,amethodthatisthemostappropriateinlightofthefacts,natureandcircumstancesoftheinvestmentisapplied.Externalvaluationsaremadeatleastonceayeartoverifythefairvaluesofgrowthequityinvestments.Loanreceivablesfromgrowthequityinvestmentsarevaluedatfairvaluethroughprofitandlossbasedonadiscountcashflowmodelandconsideringthepossibleoptionforconvertingthebondintoequity.
TheinvestmentsinjointventuresmainlyconsistsofinvestmentinManeqLuxembourgS.a.r.l.AsaninvestmententityCapManmeasuresitsinvestmentsinjointventuresatfairvaluethroughprofitandloss.Theinvestmentismadethroughseveralseparateinstrumentsandtheirvaluesareco‐dependent.Theinvestmentisthusvaluedasoneentitybasedondiscountedcashflows.
FinancialassetsheldfortradingListedsharesandderivativecontractsincurrentassetsaremeasuredatfairvaluebythelasttradepriceonactivemarketsonthebalancesheetdate.The
fairvalueofcurrentinvestmentsinfundsisdeterminedasthefunds’netassetvalueatthebalancesheetdate.Thefairvalueofcurrentinvestmentsininterest‐bearingsecuritiesisbasedonthelasttradepriceonthebalancesheetdateor,inanilliquidmarket,onvaluesdeterminedbythecounterparty.Thechangeinfairvalueofcurrentfinancialassetsmeasuredatfairvaluethroughprofitandlossispresentedonlineitem”Fairvaluechangesofinvestments”inthestatementofcomprehensiveincome.Dividendandinterestincomefromshort‐terminvestmentsinlistedsharesandinterest‐bearingsecuritiesisrecognisedasturnover.
TheGroupusesderivativefinancialinstrumentssuchasoptionsandfuturescontractstomanageitsportfoliomoreeffectively.TheGroupdoesnotusehedgeaccountinginderivativecontracts.Derivativefinancialinstrumentsareinitiallyrecognisedatfairvalueonthedateonwhichaderivativecontractisenteredintoandaresubsequentlyremeasuredatfairvalue.Fairvaluesofderivativecontractsarebasedonquotedmarketratesonthebalancesheetdateor,inanilliquidmarket,onvaluesdeterminedbythecounterparty.Derivativesarecarriedasassetswhenthefairvalueispositiveandasliabilitieswhenthefairvalueisnegative.AnygainsorlossesarisingfromchangesinthefairvalueofderivativesarerecordeddirectlyintheincomestatementinFairvaluegains/lossesofinvestments.
LoansandotherreceivablesLoansandreceivablesarenon‐derivativefinancialassetswithfixedordeterminablepaymentsthatarenotquotedinanactivemarket.Theyareincludedincurrentassets,exceptformaturitiesgreaterthan12monthsaftertheendofthereportingperiod.Theseareclassifiedasnon‐currentassets.This

68 / CapMan
CORPORATE GOVERNANCE FINANCIAL STATEMENTSGROUP 2016 ANNUAL REPORT 2016
ANNUAL REPORT 2016 // NOTES TO THE CONSOLIDATED FINANCIAL STATEMENTS
68 / CapMan / Annual Report 2016
categorymainlyincludesnon‐interestbearingcurrenttradereceivablesandinterest‐bearingcurrentandnon‐currentloanreceivables.
Cashandcashequivalents
Cashandshort‐termdepositsinthebalancesheetcomprisecashinbanksandinhand,togetherwithliquidshort‐termdeposits.Cashassetshaveamaximummaturityofthreemonths.
Financialliabilities
FinancialliabilitieslargelyconsistofloansfromfinancialinstitutionsandinterestoptionsusedforhedgingtheinterestratesoftheGroup’sinterest‐bearingdebts.Financialliabilitiesareinitiallyrecognisedatfairvalue.Transactioncostsarereportedintheinitialbookvalueofthefinancialliability.Financialliabilitiesaresubsequentlycarriedatamortizedcostusingtheeffectiveinterestmethod.Financialliabilitiesarereportedinnon‐currentandcurrentliabilities.
Equity
ThehybridbondhasbeentreatedasequityintheGroup’sfinancialstatements.Thehybridbondhasnomaturity,butCapManhastherighttocallitfouryearsfromtheissuedate.Thecompanyhasanoptiontocallthebondintwoyearstheearliestfromtheissuedateinaccordancewithcertaintermsandconditions.CapManisobligedtopayinterestonthehybridbond,whenithasdecidedtocallitorincertaincasessubjecttodecisionbytheAnnualGeneralMeeting,suchasdecisiontopaydividend.Theinterestonthehybridbondisdeductedfromequityasinterestispaid.
Dividendpayment
DividendpaymentcoversthedividenddecidedonbytheAnnualGeneralMeeting.ThedividendproposedtotheAnnualGeneralMeetingbytheBoardofDirectorsisnotsubtractedfromdistributablefundsuntilapprovedbytheAnnualGeneralMeeting.
Leases
AlltheGroup’sleasingarrangementsareclassifiedasoperatingleases,astherisksandbenefitsofownershipremainwiththelessor.Operatingleasepaymentsarerecognisedasanexpenseintheincomestatementonastraight‐linebasis.TheCapManGroupdoesnotactasalessor.
Provisions
ProvisionsarerecognisedinthebalancesheetwhentheGrouphasacurrentobligation(legalorconstructive)asaresultofapastevent,anditisprobablethatanoutflowwillberequiredtosettletheobligationandareliableestimateoftheoutflowcanbemade.TheGroup’sprovisionsareevaluatedontheclosingdateandareadjustedtomatchthebestestimateoftheirsizeonthedayinquestion.Changesarebookedinthesameentryintheincomestatementastheoriginalprovision.
Employeebenefits
PensionobligationsThedefinedcontributionpensionplanisapensionplaninaccordancewiththelocalregulationsandpracticesofitsbusinessdomiciles.Paymentsmadetotheseplansarechargedtotheincomestatementinthefinancialperiodto

69 / CapMan
CORPORATE GOVERNANCE FINANCIAL STATEMENTSGROUP 2016 ANNUAL REPORT 2016
ANNUAL REPORT 2016 // NOTES TO THE CONSOLIDATED FINANCIAL STATEMENTS
69 / CapMan / Annual Report 2016
whichtheyrelate.Pensioncoverhasbeenarrangedthroughinsurancepoliciesprovidedbyexternalpensioninstitutions.
Share‐basedpaymentsThefairvalueofstockoptionsisassessedonthedatetheyaregrantedandareexpensedinequalinstalmentsintheincomestatementoverthevestingperiodoftherightsconcerned.Anevaluationofhowmanyoptionswillgenerateanentitlementtosharesismadeattheendofeveryreportingperiod.FairvalueisdeterminedusingtheBlack‐Scholespricingmodel.ThetermsofthestockoptionprogramsarepresentedinSection29.Share‐basedpayments.
Revenuerecognition
RevenueisrecognisedtotheextentthatitisprobablethateconomicbenefitsfrombusinessactivitieswillflowtotheGroupandtheamountofrevenuecanbereliablymeasured.Thefollowingspecificrecognitioncriteriamustalsobemetbeforerevenueisrecognised:
1. Managementfeespaidbythefundsareaccountedforonastraight‐linebasisovertheagreementtermsonanongoingbasis.
2. Carriedinterestreceivedfromfundsthataregeneratingcarryisaccountedforwhenfundshaveexitedaportfoliocompany(closing).Anexithasbeenclosedwhenapprovalhasbeenreceivedfromtherelevantcompetitionauthorityandwhenallsignificantrisksandbenefitsrelatedtotheportfoliocompanyhavebeentransferredtothebuyer.
3. Potentialrepaymentrisktothefunds(clawback)willbeconsideredwhenassessingwhetherrevenuerecognitioncriteriahavebeenfulfilled.Clawbackriskrelatestoasituationwhen,inconjunctionwiththeliquidationofafund,itisrecognisedthattheGeneralPartnerhas
receivedmorecarriedinterestthanagreedinthefundagreement.Thesesituationscanoccur,forexample,iftherearerecallabledistributionsorifrepresentationsandwarrantieshavebeengivenbythevendorinthesaleandpurchaseagreementwhenthefundistowardstheendofitslifecycle.
FeesAsafundmanager,CapManreceivesmanagementfeesduringafund’sentireperiodofoperations.Thisfeeistypicallybasedonthefund'soriginalsizeduringitsinvestmentperiod,whichisusuallyfiveyears.Thereafterthefeeistypicallybasedontheacquisitioncostofthefund'sremainingportfolio.Annualmanagementfeesareusually0.5‐2.0%ofafund’stotalcommitments,dependingwhetherthefundisarealestatefund,amezzaninefund,oranequityfund.Inthecaseofrealestatefunds,managementfeesarealsopaidoncommitteddebtcapital.TheaveragemanagementfeepercentagepaidbyCapMan‐managedfundsisapprox.1%.
CapManservicesbusinessincludesfundadvisoryandfundmanagementservicestoexternalfundsandfeesfromCapManPurchasingservices(CaPS).Salesofservicesarerecognisedintheaccountingperiodservicesarerendered.
CarriedinterestincomeCarriedinterestreferstothedistributionoftheprofitsofasuccessfulprivateequityfundamongfundinvestorsandthefundmanagerresponsibleforthefund'sinvestmentactivities.Inpractice,carriedinterestmeansashareofafund’scashflowreceivedbythefundmanagerafterthefundhastransferredtocarry.

70 / CapMan
CORPORATE GOVERNANCE FINANCIAL STATEMENTSGROUP 2016 ANNUAL REPORT 2016
ANNUAL REPORT 2016 // NOTES TO THE CONSOLIDATED FINANCIAL STATEMENTS
70 / CapMan / Annual Report 2016
Therecipientsofcarriedinterestintheprivateequityindustryaretypicallytheinvestmentprofessionalsresponsibleforafund'sinvestmentactivities.InCapMan'scase,carriedinterestissplitbetweenCapManPlcandfunds’investmentteams.ThetableoffundspublishedinCapMan’sinterimreportsdetailsCapManPlc’sshareofafund’scashflowifitisincarry.
CapManappliesaprinciplewherefundstransfertocarryandcarriedinterestincomearebasedonrealisedcashflows,notonacalculatedandasyetunrealisedreturn.Asthelevelofcarriedinterestincomevaries,dependingonthetimingofexitsandthestageatwhichfundsareintheirlifecycle,predictingfuturelevelsofcarriedinterestisdifficult.
Totransfertocarry,afundmustreturnitspaid‐incapitaltoinvestorsandpayapreferentialannualreturnonthis.Thepreferentialannualreturnisknownasahurdlerate,whichisregularlysetat8%IRRp.a.Whenafundhastransferredtocarry,theremainderofitscashflowsisdistributedbetweeninvestorsandthefundmanager.Investorstypicallyreceive80%ofthecashflowsandthefundmanager20%.Whenafundisgeneratingcarriedinterest,thefundmanagerreceivescarriedinterestincomefromallofthefund'scashflows,evenifanexitismadeatbelowtheoriginalacquisitioncost.
Potentialrepaymentrisktothefunds(clawback)Potentialrepaymentrisktothefunds(clawback)isestimatedbymanagementatbalancesheetdateintheconsolidatedfinancialstatementsandquarterlyresults.Themanagementestimateincludessignificantestimatesrelatingtoinvestmentexittiming,exitprobabilityandrealizablefairvalue.Theclawbackriskismeasuredestimatingaweightedaverageofallpossibleoutcomes(the“expectedvalue”method).Theclawbackisanadjustmenttotherelated
revenuerecognisedandispresentedinshort‐termaccrualsintheconsolidatedbalancesheet.
Incometaxes
Taxexpensesintheconsolidatedincomestatementcomprisetaxesontaxableincomeandchangesindeferredtaxesforthefinancialperiod.Taxesarebookedintheincomestatementunlesstheyrelatetootherareasofcomprehensiveincomeordirectlytoitemsbookedasequity.Inthesecases,taxesarebookedtoeitherothercomprehensiveincomeordirectlytoequity.Taxesontaxableincomeforthefinancialperiodarecalculatedonthebasisofthetaxrateinforceforthecountryinquestion.Taxesareadjustedonthebasisofdeferredincometaxassetsandliabilitiesfrompreviousfinancialperiods,ifapplicable.TheGroup’staxeshavebeenrecognisedduringthefinancialyearusingtheaverageexpectedtaxrate.
Deferredtaxesarecalculatedontemporarydifferencesbetweenthecarryingamountandthetaxbase.Deferredtaxeshaveonlybeenrecognisedtotheextentthatitisprobablethattaxableprofitwillbeavailableagainstwhichthedeductibletemporarydifferencescanbeutilised.Thelargesttemporarydifferencesarisefromthevaluationofinvestmentsatfairvalue.Deferredtaxesarenotrecognisedfornon‐taxdeductibleamortisationofgoodwill.Deferredtaxeshavebeenmeasuredatthestatutorytaxratesenactedbythebalancesheetdateandthatareexpectedtoapplywhentherelateddeferredtaxisrealised.

71 / CapMan
CORPORATE GOVERNANCE FINANCIAL STATEMENTSGROUP 2016 ANNUAL REPORT 2016
ANNUAL REPORT 2016 // NOTES TO THE CONSOLIDATED FINANCIAL STATEMENTS
71 / CapMan / Annual Report 2016
Itemsaffectingcomparabilityandalternativeperformancemeasures
CapManusesalternativeperformancemeasures,suchasAdjustedoperatingprofit,todenotethefinancialperformanceofitsbusinessandtoimprovethecomparabilitybetweendifferentperiods.AlternativeperformancemeasuresdonotreplaceperformancemeasuresinaccordancewiththeIFRSandarereportedinadditiontosuchmeasures.Alternativeperformancemeasures,assucharepresented,arederivedfromperformancemeasuresasreportedinaccordancewiththeIFRSbyaddingordeductingtheitemsaffectingcomparabilityandtheywillbenominatedasadjusted.
Itemsaffectingcomparabilityare,amongothers,materialitemsrelatedtomergersandacquisitionsormajordevelopmentprojects,materialgainsorlossesrelatedtotheacquisitionordisposalsofbusinessunits,materialgainsorlossesrelatedtotheacquisitionordisposalofintangibleassets,materialexpensesrelatedtodecisionsbyauthoritiesandmaterialgainsorlossesrelatedtoreassessmentofpotentialrepaymentrisktothefunds.
Useofestimates
ThepreparationofthefinancialstatementsinconformitywithIFRSstandardsrequiresGroupmanagementtomakeestimatesandassumptionsinapplyingCapMan’saccountingprinciples.Theseestimatesandassumptionshaveanimpactonthereportedamountsofassetsandliabilitiesanddisclosureofcontingentliabilitiesinthebalancesheetofthefinancialstatementsandonthereportedamountsofincomeandexpensesduringthereportingperiod.EstimateshaveasubstantialimpactontheGroup’soperatingresult.Estimatesandassumptionshavebeenusedinassessingtheimpairmentofgoodwill,thefairvalueoffundinvestments,theimpairmenttestingofintangibleand
tangibleassets,indeterminingusefuleconomiclives,andinreportingdeferredtaxes,amongothers.
ValuationoffundinvestmentsThedeterminationofthefairvalueoffundinvestmentsusingtheInternationalPrivateEquityandVentureCapitalValuationGuidelines(IPEVG)takesintoaccountarangeoffactors,includingthepriceatwhichaninvestmentwasacquired,thenatureoftheinvestment,localmarketconditions,tradingvaluesonpublicexchangesforcomparablesecurities,currentandprojectedoperatingperformance,andfinancingtransactionssubsequenttotheacquisitionoftheinvestment.Thesevaluationmethodologiesinvolveasignificantdegreeofmanagementjudgment.Becausethereissignificantuncertaintyinthevaluationof,orinthestabilityof,thevalueofilliquidinvestments,thefairvaluesofsuchinvestmentsasreflectedinafund’snetassetvaluedonotnecessarilyreflectthepricesthatwouldactuallybeobtainedwhensuchinvestmentsarerealised.

72 / CapMan
CORPORATE GOVERNANCE FINANCIAL STATEMENTSGROUP 2016 ANNUAL REPORT 2016
ANNUAL REPORT 2016 // NOTES TO THE CONSOLIDATED FINANCIAL STATEMENTS
72 / CapMan / Annual Report 2016
ValuationofgrowthequityinvestmentsThefairvalueofgrowthequityinvestmentsisdeterminedquarterlybyusingvaluationmethodsaccordingtoIPEVGandIFRS13.Thevaluationsarebasedonforecastedcashflowsorpeergroupmultiples.Inestimatingfairvalueofaninvestment,amethodthatisthemostappropriateinlightofthefacts,natureandcircumstancesoftheinvestmentisapplied.Externalvaluationsaremadeatleastonceayeartoverifythefairvaluesofgrowthequityinvestments.
FairvaluemeasurementofotherinvestmentsBeforeacquiringthecontrolinNorvestiaOyj,otherinvestmentscomprisedmainlyofinvestmentsinCapMan’sassociatedcompany,NorvestiaOyj.Theinvestmentintheassociatecompanywasmeasuredatfairvaluethroughprofitandloss,sinceCapManhasbeenclassifiedasaninvestmententityasdefinedinIFRS10.ThefairvalueoftheNorvestiainvestmentinCapMan’sconsolidatedbalancesheetwasbasedonthenetassetvalue(NAV)asreportedbyNorvestiaOyj.ManagementhadusedjudgementinassessingthattheNAVreportedbyNorvestiaOyjrepresentsthebestavailableestimateofthefairvalueofNorvestiaOyj.
Fair value measurement of the investment in the joint venture TheinvestmentsinjointventuresmainlyconsistsofinvestmentinManeqLuxembourgS.a.r.l.Asaninvestmententity,CapManmeasuresitsinvestmentsatfairvaluethroughprofitandloss.Thevaluationisbasedondiscountedcashflows.Theinvestmentismadethroughseveralseparateinstrumentsandtheirvaluesareco‐dependent.Therefore,theinvestmenthasbeenvaluedasoneentity.Sincethefairvalueisnotbasedonthequotedmarketvalueoftheinvestment,managementhasuseditsjudgementalsoinassessingthefuturecashinflowsandothermainvariablesofthevaluation.
ValuationofgoodwillImpairmenttestingforgoodwillisperformedannually.Themostsignificantmanagementassumptionsrelatedtotherecoverableamountofanassetarelinkedtothetimingandsizeofnewfundstobeestablishedandtheaccrualofpotentialcarriedinterestincome.Themanagementfeesreceivedbyfundsarebasedonagreementsand,forafund’soperationalperiodofapproximatelytenyears,yieldscanbepredictedquitereliably.EstimatesandassumptionsincludenewfundsestablishedaspartofCapMan’songoingoperations.Anewfundisestablishedattheendofaninvestmentperiod,typicallyfouryears.Carriedinterestincomeistakenintoaccountinestimatesandassumptionswhentherealisationofcarryseemslikely.

73 / CapMan
CORPORATE GOVERNANCE FINANCIAL STATEMENTSGROUP 2016 ANNUAL REPORT 2016
ANNUAL REPORT 2016 // NOTES TO THE CONSOLIDATED FINANCIAL STATEMENTS
73 / CapMan / Annual Report 2016
2. ITEMSAFFECTINGCOMPARABILITYANDALTERNATIVEPERFORMANCEMEASURESCapManusesalternativeperformancemeasurestodenotethefinancialperformanceofitsbusinessandtoimprovethecomparabilitybetweendifferentperiods.AlternativeperformancemeasuresdonotreplaceperformancemeasuresinaccordancewiththeIFRSandarereportedinadditiontosuchmeasures.Alternativeperformancemeasures,assucharepresented,arederivedfromperformancemeasuresasreportedinaccordancewiththeIFRSbyaddingordeductingtheitemsaffectingcomparabilityandtheywillbenominatedasadjusted.
Itemsaffectingcomparabilityare,amongothers,materialitemsrelatedtomergersandacquisitionsormajordevelopmentprojects,materialgainsorlossesrelatedtotheacquisitionordisposalsofbusinessunits,materialgainsorlossesrelatedtotheacquisitionordisposalofintangibleassets,materialexpensesrelatedtodecisionsbyauthoritiesandmaterialgainsorlossesrelatedtoreassessmentofpotentialrepaymentrisktothefunds
€ ('000) 2016 2015Turnover 26,677 31,767Items affecting comparability Reassessment of potential repayment risk to the funds 2,278
Items affecting comparability, total 2,278 0Adjusted turnover 28,955 31,767
Operating profit 18,672 9,271Items affecting comparability Items related to the acquisition of Norvestia, of which: ‐7,108 779gain from a bargain purchase ‐13,885loss from the remeasurement of previous ownership at fair value 3,957transaction costs 2,819 779
Reassessment of potential repayment risk to the funds 2,278Write‐down of a value‐added tax receivable 975Insurance compensations ‐294
Items affecting comparability, total ‐4,150 779Adjusted operating profit 14,522 10,050

74 / CapMan
CORPORATE GOVERNANCE FINANCIAL STATEMENTSGROUP 2016 ANNUAL REPORT 2016
ANNUAL REPORT 2016 // NOTES TO THE CONSOLIDATED FINANCIAL STATEMENTS
74 / CapMan / Annual Report 2016
€ ('000) 2016 2015
Profit for the period 15,286 6,054Items affecting comparability Items related to the acquisition of Norvestia ‐7,247 623Reassessment of potential repayment risk to the funds 1,822Write‐down of a value‐added tax receivable 1,255Insurance compensations ‐236
Items affecting comparability, total ‐4,406 623Adjusted profit for the period 10,879 6,677
Earnings per share, cents 16,2 5,9
Items affecting comparability, cents ‐5,0 0,7
Adjusted earnings per share, cents 11,2 6,6
Earnings per share, diluted, cents 16,1 5,8
Items affecting comparability, cents ‐4,9 0,7
Adjusted earnings per share, diluted, cents 11,2 6,5

75 / CapMan
CORPORATE GOVERNANCE FINANCIAL STATEMENTSGROUP 2016 ANNUAL REPORT 2016
ANNUAL REPORT 2016 // NOTES TO THE CONSOLIDATED FINANCIAL STATEMENTS
75 / CapMan / Annual Report 2016
3.SEGMENTINFORMATIONCapManhastwooperatingsegments:theManagementcompanyandservicebusinessandInvestmentsbusiness.TheManagementcompanybusinessissubdividedintotwobusinessareas:CapManPrivateEquity,whichmanagesfundsthatinvestinportfoliocompanies,andCapManRealEstate,whichmanagesfundsthatinvestinrealestate.IncomefromtheManagementcompanyandservicebusinessisderivedfromfeesandcarriedinterestreceivedfromfunds.Thefeesincludemanagement
feesrelatedtoCapMan'spositionasafundmanagementcompanyandfeesfromCapMan'sservicebusinesscomprisingprocurementservices(CaPS),fundraidingadvisoryservicesandotherservicesrelatedtofundmanagement.TheInvestmentsbusinesscomprisesfundinvestmentsmadefromCapMan'sbalancesheet,growthequityinvestments,investmentsinManeqfundsandinvestmentsinassociatedcompaniesaswellasshort‐termmarketinvestmentsheldfortrading.IncomefromtheInvestmentbusinessisderivedfromrealisedreturnsonfundinvestmentsandunrealisedchangesinthefairvalueofinvestments.

76 / CapMan
CORPORATE GOVERNANCE FINANCIAL STATEMENTSGROUP 2016 ANNUAL REPORT 2016
ANNUAL REPORT 2016 // NOTES TO THE CONSOLIDATED FINANCIAL STATEMENTS
76 / CapMan / Annual Report 2016
2016 € ('000)
Management company and Services business Investment business
Total
CapMan Private Equity
CapMan Real Estate
Total
Turnover 20,430 6,247 26,677 0 26,677Items affecting comparability Reassessment of potential repayment risk to the funds 2,278 2,278 0 2,278
Items affecting comparability, total 0 2,278 2,278 0 2,278Adjusted turnover 20,430 8,525 28,955 0 28,955
Operating profit 412 ‐1,905 ‐1,493 20,165 18,672Items affecting comparability Items related to the acquisition of Norvestia, of which: 215 215 ‐7,324 ‐7,109gain from a bargain purchase ‐13,885 ‐13,885loss from the remeasurement of previous ownership at fair value 3,957 3,957transaction costs 215 215 2,604 2,819
Reassessment of potential repayment risk to the funds 2,278 2,278 2,278
Write‐down of a value‐added tax receivable 975 975 975Insurance compensations ‐294 ‐294 ‐294
Items affecting comparability, total 896 2,278 3,174 ‐7,324 ‐4,150Adjusted operating profit 1,308 373 1,681 12,841 14,522

77 / CapMan
CORPORATE GOVERNANCE FINANCIAL STATEMENTSGROUP 2016 ANNUAL REPORT 2016
ANNUAL REPORT 2016 // NOTES TO THE CONSOLIDATED FINANCIAL STATEMENTS
77 / CapMan / Annual Report 2016
2016 € ('000)
Management company and Services business Investment business
Total
CapMan Private Equity
CapMan Real Estate
Total
Profit for the period ‐103 ‐1,524 ‐1,627 16,913 15,286Items affecting comparability Items related to the acquisition of Norvestia 172 172 ‐7,419 ‐7,247Reassessment of potential repayment risk to the funds 1,822 1,822 1,822
Write‐down of a value‐added tax receivable 1,255 1,255 1,255Insurance compensations ‐236 ‐236 ‐236
Items affecting comparability, total 1,191 1,822 3,013 ‐7,419 ‐4,406Adjusted profit for the period 1,088 298 1,386 9,494 10,880
Earnings per share, cents 16,2Items affecting comparability, cents ‐5,0Adjusted earnings per share, cents 11,2
Non‐current assets 6,219 591 6,810 104,821 111,631Total assets include:Investments accounted for using the equity method 0 0 0 87 87
Investments in joint ventures 0 0 0 5,376 5,376

78 / CapMan
CORPORATE GOVERNANCE FINANCIAL STATEMENTSGROUP 2016 ANNUAL REPORT 2016
ANNUAL REPORT 2016 // NOTES TO THE CONSOLIDATED FINANCIAL STATEMENTS
78 / CapMan / Annual Report 2016
2015 Management company and Services business Investment business
Total
€ ('000) CapMan Private Equity
CapMan Real Estate
Total
Turnover 22,933 8,834 31,767 0 31,767
Operating profit 3,487 632 4,119 5,152 9,271Items affecting comparabilityTransaction costs related to the acquisition of Norvestia 779 779 779
Items affecting comparability, total 779 0 779 0 779Adjusted operating profit 4,266 632 4,898 5,152 10,050
Profit for the period 2,790 506 3,296 2,758 6,054Items affecting comparabilityTransaction costs related to the acquisition of Norvestia 623 623 623
Items affecting comparability, total 623 0 623 0 623Adjusted profit for the period 3,413 506 3,919 2,758 6,677
Earnings per share, cents 5.9Items affecting comparability, cents 0.7Adjusted earnings per share, cents 6.6
Non‐current assets 6,729 206 6,935 114,186 121,121Total assets include:Investments accounted for using the equity method 0 0 0 95 95Investments in joint ventures 0 0 0 7,651 7,651Earnings per share, cents 5.9Items affecting comparability, cents 0.7

79 / CapMan
CORPORATE GOVERNANCE FINANCIAL STATEMENTSGROUP 2016 ANNUAL REPORT 2016
ANNUAL REPORT 2016 // NOTES TO THE CONSOLIDATED FINANCIAL STATEMENTS
79 / CapMan / Annual Report 2016
4. ACQUISITIONS
AcquisitionofNorvestia
OnNovember3,2016,CapManofferedtoacquireallofNorvestiaOyj'ssharesandsubscriptionrightsentitlingtoshareswhicharenotheldbyNorvestiaGrouporCapManGroupinavoluntarypublicexchangeoffer.Beforetheexchangeoffer,CapManheld28.7percentofNorvestia'sshares.Intheexchangeoffer,CapManofferedsix(6)newsharesofCapManPlcforeachNorvestia'sshare.TheinitialofferperiodoftheExchangeOfferendedon16December2016,andthesharesofshareholderswhohadacceptedtheExchangeOfferduringtheinitialofferperiodtogetherwithNorvestia'ssharesownedbyCapManrepresentedapprox.90.6percentofallNorvestia'ssharesandvotes.AsaftertheinitialofferperiodalltheconditionstothecompletionoftheExchangeOfferhadbeenfulfilled,itbecameunconditional,andonDecember19,2016,beingtheacquisitiondate,CapManannouncedthatitwouldconsummatetheExchangeOfferinaccordancewithitstermsandconditions.CapManalsodecidedtocontinuethesubsequentofferperioduntilJanuary9,2017,toacquiretheremainingofNorvestiaOyj'ssharesandsubscriptionrightsentitlingtoitsshares.
NorvestiaGrouphasbeenconsolidatedintoCapMan'sconsolidatedfinancialstatementsinfullandreportedaspartofCapMan'ssegmentInvestmentbusinessasoftheacquisitiondateDecember19,2016.CombiningthebusinessesofCapManandNorvestiaisexpectedtocreateaddedvaluetobothCapMan'sandNorvestia'sshareholdersbasedongrowth,benefitsfromoperatingasalargerentityintheprivateequityfield,amoreeffectiveutilisationoftheexistingassetbase,aswellastangiblecostsynergies,among
others.TheobjectiveoftheCombinedGroupistoofferthebestprivateequityexperienceandhaveapositiveimpactontheeconomicdevelopmentofitsstakeholders.
Asoftheacquisitiondate,theconsolidatedcomprehensiveincomefor2016includesEUR0.0millionofturnoverandEUR0.5millionofprofitforthefinancialyearcontributedbyNorvestia.HadNorvestiabeenconsolidatedfromJanuary1,2016,consolidatedincomestatementwouldshowproformaturnoverofEUR32.2millionandprofitforthefinancialyearofEUR18.8million,excludingtheprovisionalbargainpurchasegainandremeasurementlossofpreviousholdinginNorvestia.ConsolidatingNorvestiafromJanuary1,2016andexcludingtransactionrelatedcostsimpactingthe2016results,proformaoperatingprofitexcl.itemsaffectingcomparabilityfor2016wouldhavebeenEUR29.8million.Thepresentedproformafiguresareunaudited.
ThesharesofshareholderswhoacceptedtheexchangeofferduringtheinitialandsubsequentofferperiodstogetherwithNorvestia'ssharesownedbyCapManrepresentapprox.92.5percentofallNorvestia'ssharesandvotes.BasedontheauthorisationoftheextraordinarygeneralmeetingheldonDecember8,2016,CapManPlc'sBoardofDirectorsresolvedtoissue58,644,414newCapMansharesasashareconsiderationforNorvestiaOyj'ssharesandsecurities.Thefairvalueoftheissuedshares,EUR70.4million,wasbasedontheclosingpriceofEUR1.20ofCapManPlc'sB‐shareonDecember19,2016,andwasrecordedintheinvestedunrestrictedequityfund.

80 / CapMan
CORPORATE GOVERNANCE FINANCIAL STATEMENTSGROUP 2016 ANNUAL REPORT 2016
ANNUAL REPORT 2016 // NOTES TO THE CONSOLIDATED FINANCIAL STATEMENTS
80 / CapMan / Annual Report 2016
AsCapMan'sownershipexceeds90percentofallsharesandvotesinNorvestia,CapManhassubmittedanapplicationtotheRedemptionCommitteeoftheFinnishCentralChamberofCommercetocommencearbitrationproceedingsofallNorvestiaOyj’ssharesheldbyminorityshareholders.CapManwillofferinsuchcompulsoryredemptionproceedingEUR7.14pershareincashtoNorvestia’sshareholders.TheoffercorrespondstothemarketvalueofCapMan’sshares(EUR1,19pershare)offeredasshareconsiderationforNorvestia’ssharesintheexchangeofferon16December2016,whichwasthelastdayoftheinitialofferperiod.ThetotalestimatedredemptionpriceofthesharestoberedeemedtotalsEUR8.2million,basedonthenumberofNorvestiasharesoutstanding,1,148,515shares.ThefinalredemptionpricewillbedeterminedbytheArbitralTribunalasdesignatedbytheRedemptionCommitteeoftheFinnishCentralChamberofCommerce.
Inthepurchasepriceallocation,thefairvalueofassetsacquiredandliabilitiesassumedisbasedonthesamevaluationprinciplesasNorvestiaappliedforreportingitsnetassetvaluepriortotheacquisitionandwhichCapManusedforvaluingitspreviousholdinginNorvestia.TheprovisionalbargainpurchasegainofEUR13.9millionismainlyattributabletoNorvestia’ssharepricebeinghistoricallyandstillconnectedtoasignificantdiscountonnetassetvalue.Duringthe30‐dayperiodprecedingtheannouncementoftheexchangeoffer,Norvestia’smarketvalue(averageofEUR142.3)wasapproximately16
percentlowerthanNorvestia’snetassetvalueasat30September2016(EUR169.8million).Ontheacquisitiondate,December19,2016,thenetassetvaluediscountwasapproximately11percenttakingintoaccountNorvestia'sextradividend.ThebargainpurchasegainrecognisedinFairvaluegains/lossesofinvestmentsoftheconsolidatedincomestatementisnotexpectedtobetaxedforincometaxpurposes.Usingthecostforacquiringthecontrol,thefairvaluemeasurementofpreviousholdingatthetimeofacquisitionresultedinalossofEUR4.0million,andisincludedinFairvaluegains/lossesofinvestmentsoftheconsolidatedincomestatementin2016.
Theexpensesarisingfromtheshareissue,EUR0.7million,havebeendeductedfromtheamountrecognizedintheinvestedunrestrictedequityfund,whereastheexpensesrelatedtotheacquisition,EUR2.2million,havebeenincludedinOtheroperatingexpensesoftheconsolidatedincomestatement.Inaddition,Fairvaluegains/lossesofinvestmentsincludeEUR0.4millionofchargesrelatedtoCapMan'sshareofincurredtransactioncoststoNorvestiabeforetheacquisitiondate.
Thepurchasepriceallocationisprovisional.Thefollowingtablesummarizestheprovisionalconsideration,thefairvalueofidentifiableassetsacquiredandliabilitiesassumedattheacquisitiondate,andtheprovisionalbargainpurchasegain:

81 / CapMan
CORPORATE GOVERNANCE FINANCIAL STATEMENTSGROUP 2016 ANNUAL REPORT 2016
ANNUAL REPORT 2016 // NOTES TO THE CONSOLIDATED FINANCIAL STATEMENTS
81 / CapMan / Annual Report 2016
€ ('000)
Fair value
70,373
31,637
8,200
110,210
155
37,939
6,39344,352
1,691115,39024,716141,797
Consideration
Share consideration (58,644,414 x EUR 1.20) Fair value of previous holding at the time of acquisition Redemption liability (1,148,515 x EUR 7,14) Total consideration
ASSETS
Non‐current assetsTangible assetsIntangible assetsInvestments at fair value through profit and loss Growth equity
investments Investments in funds
Current assets
Trade and other receivables Financial assets at fair value through profit and loss Cash and bank
Total assets 186,149

82 / CapMan
CORPORATE GOVERNANCE FINANCIAL STATEMENTSGROUP 2016 ANNUAL REPORT 2016
ANNUAL REPORT 2016 // NOTES TO THE CONSOLIDATED FINANCIAL STATEMENTS
82 / CapMan / Annual Report 2016
€ ('000)
7,8050
7,805
1,72351,3101,217
054,250
62,055
124,094110,210
Non‐current liabilities Deferred tax liabilities Interest‐bearing loans and borrowings
Current liabilitiesTrade and other payables Liability for dividend distribution Interest‐bearing loans and borrowings Current income tax liabilities
Total liabilities
Net assetsConsideration A gain from a bargain purchase 13,884

83 / CapMan
CORPORATE GOVERNANCE FINANCIAL STATEMENTSGROUP 2016 ANNUAL REPORT 2016
ANNUAL REPORT 2016 // NOTES TO THE CONSOLIDATED FINANCIAL STATEMENTS
83 / CapMan / Annual Report 2016
5. OTHEROPERATINGINCOME€ ('000) 2016 2015
Other items 126 314 Total 126 314

84 / CapMan
CORPORATE GOVERNANCE FINANCIAL STATEMENTSGROUP 2016 ANNUAL REPORT 2016
ANNUAL REPORT 2016 // NOTES TO THE CONSOLIDATED FINANCIAL STATEMENTS
84 / CapMan / Annual Report 2016
6.EMPLOYEEBENEFITEXPENSES€ ('000) 2016 2015
Salaries and wages 15,761 14,777 Pension expenses ‐ defined contribution plans 1,968 1,710 Share‐based compensation expenses 215 247 Other personnel expenses 347 332 Total 18,291 17,066
RemunerationofthemanagementispresentedinSection32.Relatedpartydisclosures.ThesharedbasedcompensationsrecognizedintheincomestatementarebasedonthefairvalueoftheinstrumentwhichismeasuredusingtheBlack&Scholesoptionpricingmodel.Thecounter‐entrytotheexpensesenteredintheincomestatementisretainedearnings,andthereforetheexpensehasnoeffectontotalequity.ThetermsofthestockoptionprogramsarepresentedinSection31.Share‐basedpayments.
Personnel
2016 2015 By country Finland 71 67 Sweden 22 20 Russia 11 10 Luxembourg 1 1 United Kingdom 3 3 In total 108 101 By team CapMan Private Equity 31 32 CapMan Real Estate 31 31 CapMan Platform 39 38 Norvestia 7 0 In total 108 101 Average number of people employed 103 103

85 / CapMan
CORPORATE GOVERNANCE FINANCIAL STATEMENTSGROUP 2016 ANNUAL REPORT 2016
ANNUAL REPORT 2016 // NOTES TO THE CONSOLIDATED FINANCIAL STATEMENTS
85 / CapMan / Annual Report 2016
7. DEPRECIATION€ ('000) 2016 2015
Depreciation by asset typeIntangible assetsOther intangible assets 215 269 Total 215 269
Tangible assetsMachinery and equipment 42 53 Total 42 53
Total depreciation 257 322

86 / CapMan
CORPORATE GOVERNANCE FINANCIAL STATEMENTSGROUP 2016 ANNUAL REPORT 2016
ANNUAL REPORT 2016 // NOTES TO THE CONSOLIDATED FINANCIAL STATEMENTS
86 / CapMan / Annual Report 2016
8.OTHEROPERATINGEXPENSES€ ('000) 2016 2015
Included in other operating expenses: Other personnel expenses 775 424 Office expenses 2,234 2,509 Travelling and entertainment 1,006 916 External services 6,577 4,952 Other operating expenses* 1,598 1,773 Total 12,190 10,574
*BasedonataxauditinFinlandduring2010‐11,CapManPlcreceivedataxreassessmentdecisionaccordingtowhichsomeoftheoperationsoftheGroup’sparentcompany,CapManPlc,includefinancialservicesexemptfromVAT,andthustheVATincludedinthepurchasesmadebytheparentcompanyisonlypartlydeductibleforVATpurposes.TheSupremeAdministrativeCourtdidnotgrantCapMananappealtoadecisionbytheTaxAuthoritiesandCapManhasthereforewroteoffthevalue‐addedtaxreceivableofEUR1.0million,beinganitemaffectingcomparability.ThedecisionbytheSupremeAdministratonCourtdoesnotincuranyadditionalpaymentsandhasnoeffectonthecashflowofCapManGroup.
Auditfees
€ ('000) 2016 2015 PricewaterhouseCoopers Oy, Authorised Public Accountants Audit fees 261 228 Tax advices 15 105 Other fees and services 279 74 Fees under Auditing Act chapter 1, section 1, paragraph 2 5 0 Total 560 407

87 / CapMan
CORPORATE GOVERNANCE FINANCIAL STATEMENTSGROUP 2016 ANNUAL REPORT 2016
ANNUAL REPORT 2016 // NOTES TO THE CONSOLIDATED FINANCIAL STATEMENTS
87 / CapMan / Annual Report 2016
9.ADJUSTMENTSTOCASHFLOWSTATEMENT€ ('000) 2016 2015
Personnel expenses 215 247 Depreciation 257 322 Unrealized fair value gains/losses of investments ‐22,607 ‐790 Finance income and costs 3,139 2,875 Share of the income of investments accounted for using the equity method
8 ‐53
Taxes 239 395 Write‐down of a value‐added tax receivable 975 0 Expenses arising from the share issue recognized in the invested unrestricted equity fund
‐745 0
Total ‐18,520 2,996

88 / CapMan
CORPORATE GOVERNANCE FINANCIAL STATEMENTSGROUP 2016 ANNUAL REPORT 2016
ANNUAL REPORT 2016 // NOTES TO THE CONSOLIDATED FINANCIAL STATEMENTS
88 / CapMan / Annual Report 2016
10. FAIRVALUEGAINS/LOSSESOFINVESTMENTS€ ('000) 2016 2015
Investments at fair value through profit and lossInvestments in funds (excl. Norvestia) 6,683 814 Norvestia* 15,715 4,394 Investments in joint ventures 209 ‐56 Total 22,607 5,152
* IncludesthefairvaluechangeofNorvestiauntilthedateofacquiringcontrol(December19,2016),andthereafterthefairvaluechangeofNorvestia'sfinancialassetsatfairvaluethroughprofitandloss(non‐currentinvestmentsandfinancialassetsheldfortrading).IncludesalsoEUR9.5millionofitemsaffectingcomparabilityrelatingtotheacquisitionofNorvestia:gainofEUR13.9millionfromabargainpurchaseandlossofEUR4.0millionfromtheremeasurementofpreviousownershipatfairvalueattheacquisitiondateandEUR0.4millionofchargesrelatedtoCapMan'sshareofincurredtransactioncoststoNorvestiabeforetheacquisitiondate.

89 / CapMan
CORPORATE GOVERNANCE FINANCIAL STATEMENTSGROUP 2016 ANNUAL REPORT 2016
ANNUAL REPORT 2016 // NOTES TO THE CONSOLIDATED FINANCIAL STATEMENTS
89 / CapMan / Annual Report 2016
11.FINANCEINCOMEANDCOSTS€ ('000) 2016 2015
Finance incomeInterest income, loan receivables 628 103 Other interest income 12 0 Exchange gains 27 18 Total 667 121
Finance costs Interest expenses/loans ‐2,762 ‐2,064 Other interest and finance expenses ‐992 ‐838 Exchange losses ‐52 ‐94 Total ‐3,806 ‐2,996

90 / CapMan
CORPORATE GOVERNANCE FINANCIAL STATEMENTSGROUP 2016 ANNUAL REPORT 2016
ANNUAL REPORT 2016 // NOTES TO THE CONSOLIDATED FINANCIAL STATEMENTS
90 / CapMan / Annual Report 2016
12.SHAREOFTHEINCOMEOFINVESTMENTSACCOUNTEDFORUSINGTHEEQUITYMETHOD€ ('000) 2016 2015
Associates ‐8 53 Total ‐8 53

91 / CapMan
CORPORATE GOVERNANCE FINANCIAL STATEMENTSGROUP 2016 ANNUAL REPORT 2016
ANNUAL REPORT 2016 // NOTES TO THE CONSOLIDATED FINANCIAL STATEMENTS
91 / CapMan / Annual Report 2016
13.INCOMETAXES€ ('000) 2016 2015
Current income tax 425 449 Taxes for previous years ‐44 27 Deferred taxes Temporary differences ‐142 ‐81 Total 239 395
Incometaxreconciliation
€ ('000) 2016 2015
Profit before taxes 15,525 6,449
Tax calculated at the domestic corporation tax rate of 20% 3,105 1,290 Effect of different tax rates outside Finland ‐128 ‐63 Tax exempt income ‐4,282 ‐1,062 Non‐deductible expenses 110 97 Deferred income tax asset of tax losses 1,390 82 Effect of consolidation 0 10 Taxes for previous years 44 41 Income taxes in the Group Income Statement 239 395

92 / CapMan
CORPORATE GOVERNANCE FINANCIAL STATEMENTSGROUP 2016 ANNUAL REPORT 2016
ANNUAL REPORT 2016 // NOTES TO THE CONSOLIDATED FINANCIAL STATEMENTS
92 / CapMan / Annual Report 2016
14. EARNINGSPERSHAREBasicearningspershareiscalculatedbydividingthedistributableretainedprofitforthefinancialyearbytheaverageshareissueadjustednumberofshares,excludingsharesthathavebeenpurchasedbytheCompanyandarepresentedastheCompany'sownshares.Dilutedearningspershareiscalculatedbyadjustingtheweightedaveragenumberofordinarysharesoutstandingtoassumeconversionofalldilutivepotentialordinaryshares.
2016 2015
Attributable to the equity holders of the Company, € ('000) 15,286 6,054 Interest expense on hybrid bond (net of tax) ‐960 ‐960 Profit/loss used determine diluted earnings per share 14,326 5,094
Weighted average number of shares ('000) 88,409 86,317 Own shares ('000) ‐26 ‐26 Weighted average number of shares ('000) 88,383 86,291
Effect of options ('000) 2,543 1,225 Weighted average number of shares adjusted for the effectof dilution ('000) 90,926 87,516
Earnings per share (basic), cents 16.2 5.9 Earnings per share (diluted), cents 16.1 5.8

93 / CapMan
CORPORATE GOVERNANCE FINANCIAL STATEMENTSGROUP 2016 ANNUAL REPORT 2016
ANNUAL REPORT 2016 // NOTES TO THE CONSOLIDATED FINANCIAL STATEMENTS
93 / CapMan / Annual Report 2016
15.TANGIBLEASSETS€ ('000) 2016 2015
Machinery and equipment Acquisition cost at 1 January 1,966 1,960 Additions 8 6 Acquisitions 15 0 Acquisition cost at 31 December 1,989 1,966
Accumulated depreciation at 1 January ‐1,897 ‐1,844 Accumulated depreciation in changes ‐1 ‐1 Depreciation for the financial year ‐42 ‐52 Accumulated depreciation at 31 December ‐1,940 ‐1,897
Book value on 31 December 49 69
Other tangible assets Acquisition cost at 1 January 120 120 Book value on 31 December 120 120
Tangible assets total 169 189

94 / CapMan
CORPORATE GOVERNANCE FINANCIAL STATEMENTSGROUP 2016 ANNUAL REPORT 2016
ANNUAL REPORT 2016 // NOTES TO THE CONSOLIDATED FINANCIAL STATEMENTS
94 / CapMan / Annual Report 2016
16.GOODWILL€ ('000) 2016 2015
Acquisition cost at 1 January 13,169 13,169 Acquisition cost at 31 December 13,169 13,169
Accumulated impairment at 1 January ‐6,965 ‐6,965 Accumulated impairment at 31 December ‐6,965 ‐6,965
Book value on 31 December 6,204 6,204
Impairmenttestingofgoodwill
ThemajorityofgoodwillconsistsofCapMan'sacquisitionon27August2008ofprivateequityhouseNorum,whosegoodwillwas€5.7millionasat31December2016.ThemanagementoftheRussianfundsformacashgeneratingunit.Cashflowprojectionshavebeenpreparedfortenyearswithnoresidualvalueconsideration.Thecashflowisbasedonalongtermcontract,wherebythecashflowsforthecurrentfundcanbereasonablyreliableestimated.Thediscountpercentageusedis15.4%(2015;16.7%).Thereisnosignificantcountryriskattachedtothesecashflows,astheyrelatetomanagementfeesreceivedfrominternationalinvestors.Thecarryingamountofgoodwillisgenerallysensitivetothesuccessoffundraising.Thegoodwillmaybeimpairedinfutureintheeventthatnewfundsarenotestablished,thefunds'sizeislessthanestimatedorincaseofdelaysinthefundraisingprocess.Carriedinterestincomeistakenintoconsiderationonlywhenthefundshasenteredintocarryoritcanbereliablybeestimatedtogeneratecarriedinterest.

95 / CapMan
CORPORATE GOVERNANCE FINANCIAL STATEMENTSGROUP 2016 ANNUAL REPORT 2016
ANNUAL REPORT 2016 // NOTES TO THE CONSOLIDATED FINANCIAL STATEMENTS
95 / CapMan / Annual Report 2016
17. OTHERINTANGIBLEASSETS€ ('000) 2016 2015
Acquisition cost at 1 January 5,218 5,218 Acquisitions 5 0 Acquisition cost at 31 December 5,223 5,218
Accumulated depreciation at 1 January ‐4,731 ‐4,462 Depreciation for the financial year ‐215 ‐269 Accumulated depreciation at 31 December ‐4,946 ‐4,731
Book value on 31 December 277 487
Otherintangibleassetsincludethemanagementfeeagreementof€0.3millionregardingthepurchaseofNorum.

96 / CapMan
CORPORATE GOVERNANCE FINANCIAL STATEMENTSGROUP 2016 ANNUAL REPORT 2016
ANNUAL REPORT 2016 // NOTES TO THE CONSOLIDATED FINANCIAL STATEMENTS
96 / CapMan / Annual Report 2016
18.INVESTMENTSACCOUNTEDFORUSINGTHEEQUITYMETHOD€ ('000) 2016 2015
Associates 95 42Additions / Disposals ‐8 53Total 87 95
Natureofinvestmentsinassociates
2016, € ('000) Assets Liabilities Turnover Profit/loss Ownership % BIF Management Ltd Jersey 26 12 0 ‐25 33.33%Baltic SME Management B.V. The Netherlands 0 41 0 ‐9 33.33%Total 26 53 0 ‐34
2015, € ('000) Assets Liabilities Turnover Profit/loss Ownership % BIF Management Ltd Jersey 48 8 188 161 33.33%Baltic SME Management B.V. The Netherlands 2 33 0 ‐9 33.33%Total 50 41 188 152

97 / CapMan
CORPORATE GOVERNANCE FINANCIAL STATEMENTSGROUP 2016 ANNUAL REPORT 2016
ANNUAL REPORT 2016 // NOTES TO THE CONSOLIDATED FINANCIAL STATEMENTS
97 / CapMan / Annual Report 2016
19.INVESTMENTSATFAIRVALUETHROUGHPROFITORLOSS
Investmentsinfunds
€ ('000) 2016 2015
Investments in funds at 1 January 47,249 55,258Acquisitions 6,393 0Additions 7,539 4,355Disposals ‐14,416 ‐10,745Fair value gains/losses of investments 4,629 ‐1,619Investments in funds at 31 December 51,394 47,249
Investments in funds by investment area at the end of period
Buyout 20,617 21,921Credit 2,491 3,061Russia 4,399 3,799Real Estate 13,163 9,751Other investment areas 3,121 7,509Funds of funds 614 1,208Norvestia 6,989 0Total 51,394 47,249
Investmentsinfundsincludethesubsidiary,CapManFundInvestmentsSICAV‐SIF,withafairvalueofMEUR27.7.

98 / CapMan
CORPORATE GOVERNANCE FINANCIAL STATEMENTSGROUP 2016 ANNUAL REPORT 2016
ANNUAL REPORT 2016 // NOTES TO THE CONSOLIDATED FINANCIAL STATEMENTS
98 / CapMan / Annual Report 2016
Growthequityinvestments
€ ('000) 2016 2015
Other investments at 1 January 0 0Acquisitions 37,940 0Fair value gains/losses of investments ‐84 0Other investments at 31 December 37,856 0
GrowthcompaniesconsistofAsteHelsinkiwhichoffersmediaproductionandconsulting,CoronariaHoitoketjuwhichoffershealthandelderlycareservices,Fluidowhichofferscloudservicesconsulting,IdeanEnterpriseswhichofferscustomerexperiencedesignservices,PolystarInstrumentswhichdevelopstelecommunicationsbusinessintelligencesoftwaresolutions,andTouhulaVarhaiskasvatuswhichoffersearlychildhoodandpreschooleducation.Investmentsinassociatesarediversifiedintovariousindustriesandthereforethecompanyassessestherelatedriskstoberelativelysmall.
Domicile Group ownership of
shares
Aste Holding Oy Helsinki 40,0 %Coronaria Hoitoketju Oy Oulu 19,8 %Fluido Oy Espoo 37,6 %Idean Enterprises Oy Helsinki 26,8 %Touhula Varhaiskasvatus Oy Oulu 2,4 %Polystar Instruments AB Stockholm 10,0 %

99 / CapMan
CORPORATE GOVERNANCE FINANCIAL STATEMENTSGROUP 2016 ANNUAL REPORT 2016
ANNUAL REPORT 2016 // NOTES TO THE CONSOLIDATED FINANCIAL STATEMENTS
99 / CapMan / Annual Report 2016
Otherfinancialassets
€ ('000) 2016 2015
Other investments at 1 January 48,784 121 Acquisitions ‐31,637 0 Additions 124 44,335 Disposals ‐18,191 ‐66 Fair value gains/losses of investments 1,099 4,394 Other investments at 31 December 179 48,784
UntilacquiringthecontrolinNorvestiaOyj,otherinvestmentsmainlyincludedsharesinCapMan'sassociatedcompany,NorvestiaOyj.Attheendofthecomparisonperiod,onDecember31,2015,thefairvalueofthesesharesamountedtoEUR48.7millionandCapMan'sshareinNorvestiawas28.7%ofNorvestia'stotalshares.ThefairvaluechangeoftheassociatedcompanywasrecognisedinCapMan'sincomestatementbasedonthechangeinNorvestia'sreportedNAV/share.TheassociatedcompanywasfairvaluedthroughprofitorlossbecauseCapManhasbeenqualifiedasaninvestmententityunderIFRS10.

100 / CapMan
CORPORATE GOVERNANCE FINANCIAL STATEMENTSGROUP 2016 ANNUAL REPORT 2016
ANNUAL REPORT 2016 // NOTES TO THE CONSOLIDATED FINANCIAL STATEMENTS
100 / CapMan / Annual Report 2016
Investmentsinjointventures
€ ('000) 2016 2015 Investments in joint ventures at 1 January 7,651 9,014 Disposals ‐2,484 ‐1,307 Fair value gains/losses of investments 209 ‐56 Investments in joint ventures at 31 December 5,376 7,651
Natureofinvestmentsinjointventures
2016 Assets Liabilities Turnover Profit/loss Ownership %Maneq Investments Luxembourg S.a.r.l. Luxembourg 5,725 2,360 0 270 18.18 %Maneq 2002 AB Sweden 20 1 0 ‐7 35.00 %Maneq 2004 AB Sweden 216 9 ‐12 13 41.90 %Yewtree Holding AB Sweden 220 4 12 0 35.00 %
2015 Assets Liabilities Turnover Profit/loss Ownership %Maneq Investments Luxembourg S.a.r.l. Luxembourg 9,040 4,094 0 735 18.18 %Maneq 2002 AB Sweden 91 1 18 23 35.00 %Maneq 2004 AB Sweden 222 4 12 26 41.90 %Yewtree Holding AB Sweden 655 4 267 433 35.00 %
TheGroup'sshareoftheManeqfundsisapprox.EUR5.4million.Asaninvestmententity,CapManmeasuresitsinvestmentsinjointventuresasatfairvaluethroughprofitorloss.TheownersofManeqInvestmentsLuxembourgS.a.r.lhaveagreementsrelatingtothedistributionoftheassetsandminorityrightsindecisionmaking.Theinvestmentismadethroughseveralseparateinstrumentsandtheirvaluesareco‐dependent.Theinvestmentisthusvaluedasoneentitybasedondiscountedcashflows.Basedonthecontractualagreement,CapManhasrighttonetassetsofthearrangement.TeammembersofCapManinvestmentteamsandotherpersonnelhavetheoptiontoinvestinportfoliocompaniesalongsideCapManviaManeqfunds.CapManhasnotestablishedthenewManeq‐fundsaftertheyear2011.ThevaluationprinciplesarepresentedinNote33.Financialriskmanagementg)Determiningfairvalues.

101 / CapMan
CORPORATE GOVERNANCE FINANCIAL STATEMENTSGROUP 2016 ANNUAL REPORT 2016
ANNUAL REPORT 2016 // NOTES TO THE CONSOLIDATED FINANCIAL STATEMENTS
101 / CapMan / Annual Report 2016
20.RECEIVABLES‐NON‐CURRENT€ ('000) 2016 2015
Other loan receivables 4,769 5,195 Accrued income 433 867 Total 5,202 6,062
OtherloanreceivablesincludereceivablesfromNorumRussiaCo‐InvestmentLtd€1.5million,receivablesfromNEPPriedvidzaS.a.r.l.€2.6million,receivablesfromNRECreamOy€0.5millionandreceivablesfromCapManRussiaTeamGuernseyLtd€0.1million.AccruedincomeincludesthePlacementAgentfeeof€0.4millionassociatedwithfundraisingforCapMan'sfunds.Thefeeisamortisedoverfiveyears.Non‐currentreceivableshaveafairvalueequaltotheirbookvalue.

102 / CapMan
CORPORATE GOVERNANCE FINANCIAL STATEMENTSGROUP 2016 ANNUAL REPORT 2016
ANNUAL REPORT 2016 // NOTES TO THE CONSOLIDATED FINANCIAL STATEMENTS
102 / CapMan / Annual Report 2016
21. DEFERREDTAXASSETSANDLIABILITIES
Changesindeferredtaxesduring2016:
€ ('000) 31.12.2015 Charged to Income
Statement
Charged in equity
Acquisitions 31.12.2016
Deferred tax assetsAccrued differences 1,320 247 0 0 1,567Interest expense on hybrid bond 3,080 0 240 0 3,320Total 4,400 247 240 0 4,887
Deferred tax liabilitiesAccrued differences 1,958 130 0 0 2,088Unrealised fair value changes 0 ‐25 0 7,805 7,780Total 1,958 130 0 7,805 9,868
Changesindeferredtaxesduring2015:€ ('000) 31.12.2014 Charged to
Income Statement
Charged in equity
31.12.2015
Deferred tax assetsAccrued differences 1,257 63 0 1,320Interest expense on hybrid bond 2,840 0 240 3,080Total 4,097 63 240 4,400
Deferred tax liabilitiesAccrued differences 1,976 ‐18 0 1,958Total 1,976 ‐18 0 1,958

103 / CapMan
CORPORATE GOVERNANCE FINANCIAL STATEMENTSGROUP 2016 ANNUAL REPORT 2016
ANNUAL REPORT 2016 // NOTES TO THE CONSOLIDATED FINANCIAL STATEMENTS
103 / CapMan / Annual Report 2016
22.TRADEANDOTHERRECEIVABLES€ ('000) 2016 2015
Trade receivables 1,201 1,620 Loan receivables 814 62 Accrued income 2,235 2,291 Other receivables 5,599 2,664 Total 9,849 6,637
TheGrouphashadnobaddebts.LoanreceivablesincludemainlycurrentloanfromtherelatedpartiespresentedinNote32.Relatedpartydisclosures.Accruedincomeincludesmainlyaccrualitems.Otherreceivablesmainlyincludereceivablesrelatedtosoldfinancialassetsheldfortrading.
Tradeandotherreceivablesbycurrencyatendofyear
(‘000) Amount in foreign
currency
Amount in euros proportion
EUR 0 8,678 88%SEK 10,884 1,139 12%GBP 27 32 0%

104 / CapMan
CORPORATE GOVERNANCE FINANCIAL STATEMENTSGROUP 2016 ANNUAL REPORT 2016
ANNUAL REPORT 2016 // NOTES TO THE CONSOLIDATED FINANCIAL STATEMENTS
104 / CapMan / Annual Report 2016
23. FINANCIALASSETSATFAIRVALUETHROUGHPROFITORLOSS€ ('000) 2016 2015
Financial assets held for trading 85,907 0Other financial assets at fair value through profit or loss 306 306Total 86,213 306
Financialassetsheldfortradingincludeinvestmentstolistedshares,derivativecontractsandinvestmentsinhedgeandinterestfunds.Listedsharesandderivativecontractsaremeasuredatfairvaluebythelasttradepriceonactivemarketsonthebalancesheetdate.TheirfairvalueamountedtoEUR63.6millionasatDecember31,2016.Thefairvalueofinvestmentsinfundsisdeterminedasthefunds'netassetvalueatthebalancesheetdate.ThefairvalueoffundinvestmentstotaledEUR11.8million,ofwhichhedgefundsandequityfundstotaledEUR5.2millionandEUR6.6million,respectively.Thefairvalueofinterest‐bearingsecuritiesonthebalancesheetdatewasEUR10.5million,ofwhichbondsandbondfundstotaledEUR6.7millionandEUR3.8million,respectively.Thefairvalueofbondsisbasedonthelasttradepriceonthebalancesheetdateor,inanilliquidmarket,onvaluesdeterminedbythecounterparty.Thefairvalueofinvestmentsinbondfundsisdeterminedasthefunds’netassetvalueatthebalancesheetdate.Otherfinancialassetsatfairvaluethroughprofitorlossincludessharesinexternalinvestmentfundcompanies.
Derivativecontracts
TheGroupusesstandardizedderivativecontractstomakeportfoliomanagementmoreeffective.Thefairvaluesofthederivativecontractsaswellastheunderlyingvaluesaregiveninthetablebelow.Thefairvaluesareadjustedforthecorrespondingshare’sdividendincome.Derivativecontractsarerecognizedatfairvalueonthedateonwhichthederivativecontractisenteredintoandaresubsequentlyremeasuredatfairvalue.Thefairvalueoffuturescorrespondstothefutures’gainorloss.Hedgeaccountingisnotused.
€ ('000) 2016 2015 Index derivatives, bought call options and sold futuresFair value ‐113 ‐ Underlying value ‐14,416 ‐

105 / CapMan
CORPORATE GOVERNANCE FINANCIAL STATEMENTSGROUP 2016 ANNUAL REPORT 2016
ANNUAL REPORT 2016 // NOTES TO THE CONSOLIDATED FINANCIAL STATEMENTS
105 / CapMan / Annual Report 2016
24. CASHANDBANK€ ('000) 2016 2015
Bank accounts 45,001 21,576 Total 45,001 21,576
Cashandbankincludesbankaccounts.

106 / CapMan
CORPORATE GOVERNANCE FINANCIAL STATEMENTSGROUP 2016 ANNUAL REPORT 2016
ANNUAL REPORT 2016 // NOTES TO THE CONSOLIDATED FINANCIAL STATEMENTS
106 / CapMan / Annual Report 2016
25. SHARECAPITALANDSHARESNumber of Number of Total A shares B shares
Movements in the number of shares: ('000) ('000) ('000)
At 31 December 2014 5,750 80,567 86,317 At 31 December 2015 5,750 80,567 86,317 A‐shares converted into B‐shares ‐5,750 5,750 0 Share subscriptions with options 0 29 29 Share issue 0 56,967 56,967 At 31 December 2016 0 143,313 143,313
Share
Share premium Othercapital account reserves Total
€ ('000) € ('000) € ('000) € ('000)
At 31 December 2014 772 38,968 27,175 66,915Options 0 0 222 222At 31 December 2015 772 38,968 27,397 67,137Share subscriptions with options 0 0 22 22Options 0 0 64 64Share issue 0 0 69,628 69,628At 31 December 2016 772 38,968 97,111 136,851

107 / CapMan
CORPORATE GOVERNANCE FINANCIAL STATEMENTSGROUP 2016 ANNUAL REPORT 2016
ANNUAL REPORT 2016 // NOTES TO THE CONSOLIDATED FINANCIAL STATEMENTS
107 / CapMan / Annual Report 2016
Otherreserves
Duringthefinancialyear2016,theshareconsiderationfortheNorvestiashareswasrecognisedintheinvestedunrestrictedequityfund,deductedbytheshareissuecosts(seeNote4Acquisitions).Investedunrestrictedequityfundalsoincludesgrantedstockoptionsubscriptionrightsandsubscribedshares.
ThestockoptionprogramsarepresentedinNote31.Share‐basedpayments.
ThehybridbondistreatedasequityintheGroup'sfinancialstatementsunderIFRS.Theinterestonthehybridbondisdeductedfromequity,wheninterestispaid.
Translationdifference
Theforeigncurrencytranslationreserveincludestranslationdifferencesarisingfromcurrencyconversionintheclosingofthebooksforforeignunits.
Dividendspaidandproposalforprofitdistribution
TheBoardofDirectorswillproposetotheAnnualGeneralMeetingtobeheldon15March2017thatadividendofEUR0.09persharewillbepaidtoshreholders,equivalenttoatotalofapprox.MEUR13.0.
AdividendofEUR0.07pershare,totalMEUR6.0,waspaidfortheyear2015.Thedividendwaspaidtotheshareholderson1April2016.
Redemptionobligationclause
AshareholderwhoseshareoftheentiresharecapitalorthevotingrightsoftheCompanyreachesorexceeds33.3%or50%has,attherequestofothershareholders,theobligationtoredeemhisorhersharesandrelatedsecuritiesinaccordancewiththeArticlesofAssociationofCapManPlc.
Ownershipandvotingrightsagreements
Asat31December2016CapManPlchadnoknowledgeofagreementsorarrangements,relatedtotheCompany'sownershipandvotingrights,thatwereapttohavesubstantialimpactonthesharevalueofCapManPlc.

108 / CapMan
CORPORATE GOVERNANCE FINANCIAL STATEMENTSGROUP 2016 ANNUAL REPORT 2016
ANNUAL REPORT 2016 // NOTES TO THE CONSOLIDATED FINANCIAL STATEMENTS
108 / CapMan / Annual Report 2016
Distributionofshareholdingsbynumberofsharesandsectorasat31December2016
ShareholdingNumber of holdings
% Number of shares
% Number of votes
%
1 – 100 1,248 10.52% 61,597 0.04% 61,597 0.04%
101 – 1 000 4,289 36.16% 2,349,488 1.64% 2,349,488 1.64% 1 001 – 10 000 5,203 43.87% 18,719,943 13.06% 18,719,943 13.06% 10 001 – 100 000 1,008 8.50% 24,816,015 17.32% 24,816,015 17.32% 100 001 ‐ 113 0.95% 97,347,503 67.93% 97,347,503 67.93% Total 11,861 100.00% 143,294,546 99.99% 143,294,546 99.99% of which Nominee registered 8 10,453,293 7.29% 10,453,293 7.29%
On the book‐entry register joint account 18,709 0.02% 18,709 0.01% Total shares outstanding 143,313,255 100.00% 143,313,255 100.00%
SectorNumber of holdings
% Number of shares
% Number of votes
%
Corporations 453 3.82% 35,932,993 25.07% 35,932,993 25.07% Financial and insurance corporations 20 0.17% 25,340,045 17.68% 25,340,045 17.68% Public sector institutions 6 0.05% 17,272,187 12.05% 17,272,187 12.05% Households 11,270 95.02% 60,678,143 42.34% 60,678,143 42.34% Non‐profit organisations 73 0.62% 2,754,338 1.92% 2,754,338 1.92% European Union 32 0.27% 1,269,117 0.89% 1,269,117 0.89% Other countries and international organisations 7 0.06% 47,723 0.03% 47,723 0.03% Total 11,861 100.00% 143,294,546 99.99% 143,294,546 99.99%
of which Nominee registered 8 10,453,293 7.29% 10,453,293 7.29%
On the book‐entry register joint account 18,709 0.01% 18,709 0.01% Total shares outstanding 143,313,255 100.00% 143,313,255 100.00%
Source:EuroClearFinlandLtd,asat31December2016.Figuresarebasedonthetotalnumberofshares143,294,546andtotalnumberofshareholders11,861.CapManPlchad26,299sharesasat31December2016.

109 / CapMan
CORPORATE GOVERNANCE FINANCIAL STATEMENTSGROUP 2016 ANNUAL REPORT 2016
ANNUAL REPORT 2016 // NOTES TO THE CONSOLIDATED FINANCIAL STATEMENTS
109 / CapMan / Annual Report 2016
CapMan'slargestshareholdersasat31December2016
Number of shares and votes Proportion of shares and votes, %
10,898,500 7.60 % 10,737,228 7.49 % 7,024,794 4.90 % 6,378,320 4.45 % 3,811,853 2.66 % 3,675,215 2.56 % 3,534,320 2.47 % 3,480,576 2.43 %
53,744 0.04 % 3,275,158 2.29 % 2,972,156 2.07 % 2,694,480 1.88 % 277,676 0.19 %
2,512,087 1.75 % 1,793,343 1.25 % 718,744 0.50 %
2,500,000 1.74 % 1,916,742 1.34 % 1,573,584 1.10 % 1,500,000 1.05 % 1,138,200 0.79 % 1,010,929 0.71 %
Ilmarinen Mutual Pension Insurance Company Mandatum Life OY Inventiainvest AB* (Ari Tolppanen**) Laakkonen Mikko Kalervo Joensuun Kauppa Ja Kone Oy Varma Mutual Pension Insurance Company Winsome Oy** + Tuomo Raasio*
Winsome Oy** Raasio Tuomo*
Vesasco Oy Heiwes Oy** + Heikki Westerlund*
Heiwes Oy** Westerlund Heikki*
Geldegal Oy** + Mom Invest Oy** Geldegal Oy** Mom Invest Oy**
State Pension Fund Laakkonen Hannu Sijoitusrahasto Taaleritehdas Arvo Markka Osake Sijoitusrahasto Taaleritehdas Mikro Markka Kaleva Mutual Insurance Company Guarneri Oy** + Petri Saavalainen*
Guarneri Oy** 696,041 0.49 % 314,888 0.22 % 974,544 0.68 % 903,124 0.63 % 830,000 0.58 %
Saavalainen Petri* Immonen Jukka Kalevi Icecapital Pankkiiriliike Oy Mr Max Oy OP Life Assurance Company Oy 768,853 0.54 %
67,935,607 47.40 % Total, 20 largest holders
Number of shares and votes Proportion of shares and votes, %

110 / CapMan
CORPORATE GOVERNANCE FINANCIAL STATEMENTSGROUP 2016 ANNUAL REPORT 2016
ANNUAL REPORT 2016 // NOTES TO THE CONSOLIDATED FINANCIAL STATEMENTS
110 / CapMan / Annual Report 2016
Nominee registered*** 10,453,293 7.29 % Shareholdings of management and employees*** 17,988,186 12.55 %
BelowisalistofflaggingnotificationsthatCapManPlchasreceivedinyear2016.Anup‐dateinformationofallflaggingnotificationscanbefoundatwww.capman.com.
27.12.2016TheshareofownershipandvotesinCapManPlcofMandatumHenkivakuutusyhtiöhasincreasedto7.93percentasaresultofsharetransactions.
27.12.2016TheshareofownershipandvotesinCapManPlcofOyInventiainvestAb(AriTolppanen)hasfallenbelow5percent.Thenotificationisrelatedtotheissueofnewshares.
21.12.2016GimvNV'sshareofownershipandvotesinCapManPlchasfallenbelow5percentasaresultofsharetransactions.
20.12.2016TheshareofvotesinCapManPlcofOyInventiainvestAb(AriTolppanen)hasfallento8.14percent.ThenotificationisrelatedtotheconversionofCapManPlc'sseriesAsharestoseriesBsharesat1:1.

111 / CapMan
CORPORATE GOVERNANCE FINANCIAL STATEMENTSGROUP 2016 ANNUAL REPORT 2016
ANNUAL REPORT 2016 // NOTES TO THE CONSOLIDATED FINANCIAL STATEMENTS
111 / CapMan / Annual Report 2016
20.12.2016 ThecombinedshareofvotesinCapManPlcofHeikkiWesterlundandHeiwesOyhasfallenbelow5percent.ThenotificationisrelatedtotheconversionofCapManPlc'sseriesAsharestoseriesBsharesat1:1.
20.12.2016ThecombinedshareofvotesinCapManPlcofMOMInvestOyandGeldegalOy(OlliLiitola)hasfallenbelow5percent.ThenotificationisrelatedtotheconversionofCapManPlc'sseriesAsharestoseriesBsharesat1:1.
20.12.2016ThecombinedshareofvotesinCapManPlcofTuomoRaasioandWinsomeOyhasfallenbelow5percent.ThenotificationisrelatedtotheconversionofCapManPlc'sseriesAsharestoseriesBsharesat1:1.
8.11.2016GimvNV'sshareofthetotalnumberofsharesinCapManPlchasfallenbelow5percentasaresultofdisposalofshares.
* EmployedbyCapMan.**CapManemployeewhoexercisescontrollingpowerintheaforementionedcompanybutwhodoesnotownCapMansharesdirectly.***Shareholdersamongthe200largestshareholdersoftheCompany.

112 / CapMan
CORPORATE GOVERNANCE FINANCIAL STATEMENTSGROUP 2016 ANNUAL REPORT 2016
ANNUAL REPORT 2016 // NOTES TO THE CONSOLIDATED FINANCIAL STATEMENTS
112 / CapMan / Annual Report 2016
26.INTEREST‐BEARINGLOANSANDBORROWINGS–NON‐CURRENT€ ('000) ‐ 2016 2015 Bank loans 8,489 15,000 Senior bond 29,587 44,400 Multi‐issuer bond 9,989 9,989 Total 48,065 69,389
Theinterestofthebankloanispaidquarterly.CapManissuedaMEUR30fixed‐rateunsecuredseniorbondtoinstitutionalinvestors.Thebondwillmatureinfouryearson15.10.2019.Thefixedcouponinterestrateofthebondis4.2%perannum.Theinterestispaidannually.Themulti‐issuerbond,MEUR10guaranteedbyGarantiaInsuranceCompanyLtd,hasanannualcouponrateof1.85%anditmaturesinJune2019.ThedifferencebetweenfairvalueandbookvalueoftheloansdonotmateriallydifferduetothefactthatCapMancreditriskhasremainedunchangedafterissuingtheloans.

113 / CapMan
CORPORATE GOVERNANCE FINANCIAL STATEMENTSGROUP 2016 ANNUAL REPORT 2016
ANNUAL REPORT 2016 // NOTES TO THE CONSOLIDATED FINANCIAL STATEMENTS
113 / CapMan / Annual Report 2016
27.TRADEANDOTHERPAYABLES–CURRENT€ ('000) 2016 2015
Trade payables 1,681 576 Advance payments received 0 447 Accrued expenses 22,733 11,494 Other liabilities 8,927 591 Total 33,341 13,108
Thematurityoftradepayablesisnormaltermsoftradeanddon'tincludeoverduepayments.AccruedexpensesincludeaclawbackliabilityofEUR7.5million(2015:MEUR5.2)relatingtopotentialrepaymentofcarriedinteresttoCapManRealEstateIFund.Liabilityisrelatedtotheexitin2007.AccruedexpensesincludealsoawithholdingtaxliabilityofEUR6.2millionduetotheextraordinarydividendpaidbyNorvestiaandanassettransfertaxliabilityofEUR1.2millionrelatedtotheacquisitionofsharesinNorvestia.Theothersignificantitemsinaccruedexpensesrelatetoaccruedsalariesandsocialbenefitexpenses.OtherliabilitiesincludetheredemptionliabilityofEUR8.2millionrelatedtotheacquisitionofNorvestia(seeNote4Acquisitions).
Tradeandotherliabilitiesbycurrencyatendofyear
('000) Amount in foreign
currency
Amount in euros Proportion
EUR 0 32,229 97%SEK 10,038 1,051 3%GBP 52 61 0%

114 / CapMan
CORPORATE GOVERNANCE FINANCIAL STATEMENTSGROUP 2016 ANNUAL REPORT 2016
ANNUAL REPORT 2016 // NOTES TO THE CONSOLIDATED FINANCIAL STATEMENTS
114 / CapMan / Annual Report 2016
28. INTEREST‐BEARINGLOANSANDBORROWINGS‐CURRENT€ ('000) 2016 2015
Bank loans 3,000 0Senior bond 15,000 0Total 18,000 0
Theseniorbond,MEUR15,hasanannualcouponrateof5.5%anditmatureson11.12.2017.

115 / CapMan
CORPORATE GOVERNANCE FINANCIAL STATEMENTSGROUP 2016 ANNUAL REPORT 2016
ANNUAL REPORT 2016 // NOTES TO THE CONSOLIDATED FINANCIAL STATEMENTS
115 / CapMan / Annual Report 2016
29.FINANCIALASSETSANDLIABILITIES
Financialassets
2016, € ('000) Note Balance sheet value
Fair value
Investments at fair value through profit or loss Investments in funds 19 51,394 51,394 Growth equity investments 19 37,856 37,856 Other financial assets 19 179 179 Investments in joint ventures 19 5,376 5,376Loan receivables 20 5,202 5,202Trade and other receivables 22 9,849 9,849Financial assets at fair value 23 86,213 86,213Cash and bank 24 45,001 45,001Total 241,070 241,070
2015, € ('000) Note Balance sheet
value Fair value
Investments at fair value through profit or loss Investments in funds 19 47,249 47,249 Other financial assets 19 48,784 48,784 Investments in joint ventures 19 7,651 7,651Loan receivables 20 6,062 6,062Trade and other receivables 22 6,637 6,637Other financial assets at fair value 23 306 306Cash and bank 24 21,576 21,576Total 138,265 138,265

116 / CapMan
CORPORATE GOVERNANCE FINANCIAL STATEMENTSGROUP 2016 ANNUAL REPORT 2016
ANNUAL REPORT 2016 // NOTES TO THE CONSOLIDATED FINANCIAL STATEMENTS
116 / CapMan / Annual Report 2016
Financialliabilities
2016, € ('000) Note Balance sheet value
Fair value
Non‐current liabilities 26 48,065 48,065Trade and other liabilities 27 33,341 33,341Current liabilities 28 18,000 18,000Total 99,406 99,406
2015, € ('000) Note Balance sheet value
Fair value
Liabilities 26 69,389 69,389Trade and other liabilities 27 12,661 12,661Total 82,050 82,050
Tradeandliabilitiesexcludingprepayments(2015:MEUR0.4)

117 / CapMan
CORPORATE GOVERNANCE FINANCIAL STATEMENTSGROUP 2016 ANNUAL REPORT 2016
ANNUAL REPORT 2016 // NOTES TO THE CONSOLIDATED FINANCIAL STATEMENTS
117 / CapMan / Annual Report 2016
30.COMMITMENTSANDCONTINGENTLIABILITIES
Leasingagreements‐CapManGroupaslessee
€ ('000) 2016 2015 Other hire purchase commitments Within one year 1,018 1,620 After one but not more than five years 1,876 398 After five years 923 0 Total 3,817 2,018
TheGrouphasleasedtheoffices.Therentalagreementsarefor1to7years.
Securitiesandothercontingentliabilities
€ ('000) 2016 2015 Contingencies for own commitment Mortgage bonds 0 60,000 Pledged deposit for own commitment 32,559 35,108 Pledged securities 9,580 0 Remaining commitments to funds by investment area Buyout 12,919 13,018 Credit 3,407 2,487 Russia 1,831 1,921 Real Estate 1,003 2,272 Other investment areas 4,747 4,751 Funds of funds 722 746 Norvestia 11,889 0 Total 36,518 25,195
CapManestimatesthatonlyMEUR20‐25oftheremainingcommitmentswillbecalledin4years,particularlyduetounusedinvestmentcapacityoftheolderfunds.

118 / CapMan
CORPORATE GOVERNANCE FINANCIAL STATEMENTSGROUP 2016 ANNUAL REPORT 2016
ANNUAL REPORT 2016 // NOTES TO THE CONSOLIDATED FINANCIAL STATEMENTS
118 / CapMan / Annual Report 2016
31. SHARE‐BASEDPAYMENTSCapManPlchadtwostockoptionprogramsattheendof2016,thestockoptionprogram2013andthestockoptionprogram2016.Stockoptionsareusedtocommitkeyindividuals/executivestothecompanyandreinforcethealignmentofinterestsofkeyindividuals/executivesandCapManshareholders.Thefairvalueofstockoptionshasbeenassessedatthegrantdateandexpensedstraight‐lineintheincomestatementoverthevestingperiod.FairvalueofoptionsatthegrantdateisdeterminedinaccordancewiththeBlack&Scholesmodel.Keyinformationonthestockoptionprogramsispresentedinthetablebelow.
Stock option program 2016
Stock option 2016A Stock option 2016B Stock option 2016C
Stock options, number 1,410,000 1,410,000 1,410,000 Entitlement to subscribe for B shares 1,410,000 1,410,000 1,410,000 Share subscription period begins 1.5.2019 1.5.2020 1.5.2021 Share subscription period ends 30.4.2021 30.4.2022 30.4.2023 Share subscription price Trade volume Trade volume Trade volume
weighted average weighted average weighted average price of the price of the price of the B share on the B share on the B share on the Nasdaq OMX Nasdaq OMX Nasdaq OMX Helsinki Helsinki Helsinki 1.4.‐31.5.2016 1.4.‐31.5.2017 1.4.‐31.5.2018 with an addition of with an addition of with an addition of ten (10) per cent ten (10) per cent ten (10) per cent less dividendsi.e. €1.04

119 / CapMan
CORPORATE GOVERNANCE FINANCIAL STATEMENTSGROUP 2016 ANNUAL REPORT 2016
ANNUAL REPORT 2016 // NOTES TO THE CONSOLIDATED FINANCIAL STATEMENTS
119 / CapMan / Annual Report 2016
Stock option program 2013
Stock option 2013A Stock option 2013B Stock option 2013C
Stock options, number 1,410,000 1,410,000 1,410,000 Entitlement to subscribe for B shares 1,410,000 1,410,000 1,410,000 Share subscription period begins 1.5.2016 1.5.2017 1.5.2018 Share subscription period ends 30.4.2018 30.4.2019 30.4.2020 Share subscription price Trade volume Trade volume Trade volume
weighted average weighted average weighted average price of the price of the price of the B share on the B share on the B share on the Nasdaq OMX Nasdaq OMX Nasdaq OMX Helsinki Helsinki Helsinki 1.4.‐31.5.2013 1.4.‐31.5.2014 1.4.‐31.5.2015 with an addition of with an addition of with an addition of ten (10) per cent ten (10) per cent ten (10) per cent
less dividends less dividends less dividends
i.e. €0.75 i.e. €1.03 i.e. €1.05
InformationappliedintheBlack&Scholesmodel
Stock option 2013A Stock option 2013B Stock option 2013C
18.7% 20.5% 20.5% Expected volatility Risk-free interest 0.0% 0.0% 0.0%

120 / CapMan
CORPORATE GOVERNANCE FINANCIAL STATEMENTSGROUP 2016 ANNUAL REPORT 2016
ANNUAL REPORT 2016 // NOTES TO THE CONSOLIDATED FINANCIAL STATEMENTS
120 / CapMan / Annual Report 2016
SharesandstockoptionsIssued Distributed Subscribed Sold Remaining Shares 31.12.2016 Stock options
31.12.2016 stock options stock options stock options stock options stock
options of shares and votes of shares and votes of shares and
votes % % %
31.12.2016 31.12.2016 31.12.2016 if all distributed if all stock options stock options of option
programs will be exercised will be exercised
Shares 143,313,255 100.0%
2016A options 1,410,000 0 0 0 1,410,000 0.0% 1.0%2016B options 1,410,000 0 0 0 1,410,000 0.0% 1.0%2016C options 1,410,000 0 0 0 1,410,000 0.0% 1.0%
2013A options 1,410,000 1,175,000 29,171 120,829 1,380,829 0.8% 1.0%2013B options 1,410,000 1,218,334 0 0 1,410,000 0.9% 1.0%2013C options 1,410,000 1,227,291 0 0 1,410,000 0.9% 1.0%

121 / CapMan
CORPORATE GOVERNANCE FINANCIAL STATEMENTSGROUP 2016 ANNUAL REPORT 2016
ANNUAL REPORT 2016 // NOTES TO THE CONSOLIDATED FINANCIAL STATEMENTS
121 / CapMan / Annual Report 2016
32. RELATEDPARTYDISCLOSURESGroup companies Group ownership
of shares, % Parent company Ownership of
shares, %
CapMan Plc, parent company FinlandCapMan Capital Management Oy Finland 100% 100%CapMan Sweden AB Sweden 100% 100%CapMan AB Sweden 100% 100%CapMan Norway AS Norway 100% 100%CapMan (Guernsey) Limited Guernsey 100% 100%CapMan Mezzanine (Guernsey) Limited Guernsey 100% 100%CapMan (Guernsey) Buyout VIII GP Limited Guernsey 100% 100%CapMan (Sweden) Buyout VIII GP AB Sweden 100% 100%CapMan Classic GP Oy Finland 100% 100%CapMan Real Estate Oy Finland 100% 100%Dividum Oy Finland 100% 100%CapMan RE I GP Oy Finland 100% 100%CapMan RE II GP Oy Finland 100% 100%CapMan (Guernsey) Life Science IV GP Limited Guernsey 100% 100%CapMan (Guernsey) Technology 2007 GP Limited Guernsey 100% 100%CapMan (Sweden) Technology Fund 2007 GP AB Sweden 100% 100%CapMan Hotels RE GP Oy Finland 100% 100%CapMan Public Market Manager S.A. Luxembourg 100% 100%CapMan Private Equity Advisors Limited Cyprus 100% 100%CapMan (Guernsey) Russia GP Limited Guernsey 100% 100%CapMan (Guernsey) Investment Limited Guernsey 100% 100%CapMan (Guernsey) Buyout IX GP Limited Guernsey 100% 100%CapMan Fund Investments SICAV‐SIF Luxembourg 100% 100%CapMan Mezzanine V Manager S.A. Luxembourg 100% 100%CapMan (Guernsey) Buyout X GP Limited Guernsey 100% 100%

122 / CapMan
CORPORATE GOVERNANCE FINANCIAL STATEMENTSGROUP 2016 ANNUAL REPORT 2016
ANNUAL REPORT 2016 // NOTES TO THE CONSOLIDATED FINANCIAL STATEMENTS
122 / CapMan / Annual Report 2016
Group companies Group ownershipof shares, %
Parent company Ownership of shares, %
Guernsey 100% 100%Sweden 100% 100%Luxembourg 100% 100%Finland 100% 100%Finland 100% 100%Finland 100% 100%United Kingdom 100%Finland 100% 100%Sweden 100%Finland 100% 100%Finland 100%Finland 100% 100%Finland 92.5% 92.5%Finland 100%
CapMan (Guernsey) Russia II GP Limited Maneq 2012 ABCapMan Nordic Real Estate Manager S.A. CapMan Buyout X GP OyCapMan Endowment GP Oy CapMan Collection OyCapMan Real Estate UK Limited Nest Capital 2015 GP OyDividum AB Valo Advisors OyValo Fund Management Oy Kokoelmakeskus GP OyNorvestia Oyj*Norventures OyNorvestia Industries Oy Finland 100%
* Includesallthesharesacquiredduringtheexchangeoffer(seeNote4Acquisitions)InvestmentsaccountedforusingtheequitymethodarepresentedinNote18.InvestmentsaccountedforusingtheequitymethodTheinvestmentsinjointventuresarepresentedinNote19.Investmentsatfairvaluethroughprofitandloss
Loanstorelatedparties
CapManhasgrantedaManagementGroupmemberashort‐termloanof133thousandeuros,theinterestrateofwhichbeing12‐monthEuribor+marginof1%.TheloanhasbeengrantedinJanuary2016anditwillmatureinJanuary2017.
Thegrouphasalsograntedakeypersonofagrowthequityinvestmentaloanof470thousandeuros,theinterestrateofwhichbeing3%.TheloanhasbeengrantedinDecember2016anditwillmatureinDecember2018bylatest.ThegrouphasreceivedsharesinIdeanEnterpriseasaguarantee.

123 / CapMan
CORPORATE GOVERNANCE FINANCIAL STATEMENTSGROUP 2016 ANNUAL REPORT 2016
ANNUAL REPORT 2016 // NOTES TO THE CONSOLIDATED FINANCIAL STATEMENTS
123 / CapMan / Annual Report 2016
Commitmentstorelatedparties
€ ('000) 2016 2015
Commitments to Maneq funds 4,075 4,075
Managementremuneration
€ ('000) 2016 2015
Salaries and other short‐term employee benefits 1,460 1,557 Other long‐term benefits 299 319 Share‐based payments 99 12 Total 1,858 1,888
Remuneration and fees
CEO Heikki Westerlund 486 405 Share‐based payments 60 36 Total 546 441
Members of the BoardClaes de Neergaard 38 35 Koen Dejonckheere * Until 15 March 2016 0 0 Dirk Beeusaert From 16 March 2016 29 0 Karri Kaitue 59 58 Nora Kerppola 44 45 Ari Tolppanen 77 120
* Mr.Dejonckheerehasinformedthecompanythatheprefersnottoacceptboardcompensation.

124 / CapMan
CORPORATE GOVERNANCE FINANCIAL STATEMENTSGROUP 2016 ANNUAL REPORT 2016
ANNUAL REPORT 2016 // NOTES TO THE CONSOLIDATED FINANCIAL STATEMENTS
124 / CapMan / Annual Report 2016
Pensioncosts
€ ('000) 2016 2015 2016 2015
Pension costs Additional pension costs
CEO Heikki Westerlund 90 75 38 38
Managementremunerationincludesmembersoftheboard,CEOandmanagementgroup.
TheCEOhasamutualnoticeperiodofsixmonthsandhewillbeentitledtoaseverancefeeof12months'salary,ifhisemploymentisterminatedbythecompany.
TheCEOandManagementGroupmembersarecoveredbyadditionalpayment‐basedpensioninsurance.TheretirementageoftheCEOisdeterminedtotheFinnishlegislation.
In2016theManagementGroupmembersweregranted330000stockoptions(2015;800000).Thestockoptionsgrantedtothemanagementaresubjecttothesametermsasforstockoptionsgrantedtoemployees.
125 / CapMan
CORPORATE GOVERNANCE FINANCIAL STATEMENTSGROUP 2016 ANNUAL REPORT 2016
ANNUAL REPORT 2016 // NOTES TO THE CONSOLIDATED FINANCIAL STATEMENTS
125 / CapMan / Annual Report 2016
33.FINANCIALRISKMANAGEMENTThepurposeoffinancialriskmanagementistoensurethattheGrouphasadequateandeffectivelyutilisedfinancingasregardsthenatureandscopeoftheGroup'sbusiness.TheobjectiveistominimisetheimpactofnegativemarketdevelopmentontheGroupwithconsiderationforcost‐efficiency.ThefinancialriskmanagementhasbeencentralisedandtheGroup'sCFOisresponsibleforfinancialriskmanagementandcontrol.ThepolicyofthemanagementistoconstantlymonitorcashflowforecastsandtheGroup'sliquiditypositiononbehalfofallGroupcompanies.Inaddition,theGroup'sprinciplesforliquiditymanagementincluderolling12‐monthloancovenantassessments.Theloancovenantsarerelatedtoequityratioandnetdebt/fundinvestmentsratio.Duringthefinancialyearallthecovenantshavebeenfullfilled.TheGrouphasaMonitoringteam,whichmonitorstheperformanceandthepriceriskoftheinvestmentportfolio(financialassetsenteredatfairvaluethroughprofitandloss)independentlyandobjectivelyoftheinvestmentteams.TheMonitoringteamisresponsibleforreviewingthemonthlyreportingandforecastsforportfoliocompanies.ValuationproposalsmadebythecaseinvestmentprofessionalsareexaminedbytheMonitoringteamandsubsequentlyapprovedbytheValuationCommittee,whichcomprisestheChairmanoftheInvesteeCommittee,theGroupCFOandHeadsofinvestmentteams.
a)Liquidityrisk
TheGroup’scashflowisamixofcashflowfrommanagementfeesreceivedandvolatilecarriedinterestincome.Thethirdmaincomponentinliquiditymanagementisthetimingofthecapitalcallstothefundsandtheproceedsreceivedfromfundinvestments.Managementfeesreceivedfromthefundsarebasedonlong‐termagreementsandaretargetedtocovertheoperationalexpensesoftheGroup.Managementfeesarerelativelypredictableforthecoming12months.Thetimingandreceiptofcarriedinterestgeneratedbythefundsisuncertainandwillcontributetothevolatilityoftheresults.ChangesininvestmentandexitactivitylevelsmayhaveasignificantimpactoncashflowsoftheGroup.Asingleinvestmentorexitmaychangethecashflowsituationcompletelyandtheexacttimingofthecashflowisdifficulttopredict.TheCapManRealEstateIfundtransferredintocarryin2007.FromtheEUR27.4millionofcarriedinterestpaidin2007approximatelyEUR6.4millionwasnotrecognisedintherevenuein2007butinsteadleftasaliabilityincasethatsomeofthecarriedinterestwouldhavetobereturnedtotheinvestorsinthefuture.CapMan'sshareoftheenteredcarriedinterestwasapprox.EUR13.5millionandtheshareofminorityownerswasapprox.EUR7.5million.In2014,theclawbackrisk

126 / CapMan
CORPORATE GOVERNANCE FINANCIAL STATEMENTSGROUP 2016 ANNUAL REPORT 2016
ANNUAL REPORT 2016 // NOTES TO THE CONSOLIDATED FINANCIAL STATEMENTS
126 / CapMan / Annual Report 2016
wasreassessedandtherelatedliabilitydecreasedbyEUR1.2milliontoEUR5.2million.However,inlightofthecurrentmarketsituation,itisconsideredunlikelythatanyfurthercarriedinterestwouldbepaidfromtheCapManRealEstateIfund.Theclawbackriskwasreassessedagainin2016,andasaresult,therelatedliabilitywasincreasedbyEUR2.3milliontoEUR7.5million.ThecurrentclawbackliabilityofEUR7.5million,includingtheminorityowners'share,isestimatedtobeadequatetocoverthepossiblereturnofcarriedinterest.
CapManhasmadecommitmentstothefundsitmanages.AsatDecember31,2016,theundrawncommitmentstothefundsamountedtoEUR36.5million(25.2)andthefinancingcapacityavailable(cashandthirdpartyfinancingfacilities)amountedtoEUR55.0million(36.6).
InOctober2015,CapManissuedaEUR30millionfixed‐rateunsecuredseniorbondtoinstitutionalinvestors.ThebondwillmatureinfouryearsonOctober15,2019andiscallablebeforematurity.Thefixedcouponinterestrateofthebondis4.2%perannum.Theinterestofthebondwillbepaidannually.
Furhermore,CapManPlc'sEUR30milliondebtsecuritiesconsistofaseniorbondofEUR15millionandahybridbondofEUR15million.
Asof31December2016,CapManPlchadaccesstoEUR11.5million(15.0)ofbankfinancing,andinadditionhadunusedlong‐termcreditfacilitiesofEUR10million(15) available.
Maturityanalysis
31 December 2016, € ('000) Due within 3 months
Due between 3 and 12 months
Due between 1 and 3 years
Due between 3 and 5 years
Due later
Bonds 30,000 39,989Bank loan 3,000 8,489Accounts payable 1,681Interests, bonds 3,465 2,880Interests, bank loan 72 197 262Commitments to funds 4,074 17,833 7,781 915 5,915 Commitments to Maneq ‐funds 4,075Clawback 7,489

127 / CapMan
CORPORATE GOVERNANCE FINANCIAL STATEMENTSGROUP 2016 ANNUAL REPORT 2016
ANNUAL REPORT 2016 // NOTES TO THE CONSOLIDATED FINANCIAL STATEMENTS
127 / CapMan / Annual Report 2016
Maturityanalysis
31 December 2015, € ('000) Due within 3 months
Due between 3 and 12 months
Due between 1 and 3 years
Due between 3 and 5 years
Bonds 30,000 39,389 Bank loan 15,000Accounts payable 576Interests, bonds 3,470 8,760Interests, bank loan 375 560Commitments to funds 1,500 4,500 12,000 7,195 Commitments to Maneq ‐funds 4,075Clawback 5,212

128 / CapMan
CORPORATE GOVERNANCE FINANCIAL STATEMENTSGROUP 2016 ANNUAL REPORT 2016
ANNUAL REPORT 2016 // NOTES TO THE CONSOLIDATED FINANCIAL STATEMENTS
128 / CapMan / Annual Report 2016
b) Interestraterisk
TheGroup'sexposuretointerestrateriskarisesprincipallyfromthenon‐currentbankloanofEUR11.5millionwithafloatinginterestrate.Theotherinterest‐bearingliabilitieshaveafixedinterestrate.
Theseniorbondissuedin2013hasanannualcouponrateof5.5%.Theannualcouponrateofthehybridloanis8.0%.Theannualcouponrateofthemulti‐issuerbondis1.85%.TheseniorbondissuedinOctober2015hasanannualcouponrateof4.2%.Theinterestofthebondswillbepaidannually.
Loans according to interest rate € ('000)
2016 2015
Floating rate 11,489 15,000
Fixed rate 54,576 54,389
Total 66,065 69,389
The effect on profit after tax
€ ('000) Change in interest rates
+1% ‐1% +2%
Floating rate 92 ‐92 184

129 / CapMan
CORPORATE GOVERNANCE FINANCIAL STATEMENTSGROUP 2016 ANNUAL REPORT 2016
ANNUAL REPORT 2016 // NOTES TO THE CONSOLIDATED FINANCIAL STATEMENTS
129 / CapMan / Annual Report 2016
c) Creditrisk
Creditrisksarisefromchangesintheresultcausedbycounterpartiesfailingtomeettheircommitments.Moneymarketinvestmentsandbondsthereforeincludecreditrisks,andtominimizethese,thecompanyhasdiversifieditsinvestments.Asmoneymarketinvestmentsareshort‐term,andbothmoneymarketinvestmentsandbondsaremadeinNordiclistedcompanies,theserisksareregardedassmall.
AsatDecember31,2016,thegrouphadEUR6.7million(10.4)investedinbonds.Thelongestmaturityoftheseinvestmentswas4.9yearsandtheaveragematuritywas3.7years.Noneoftheinvestmentswerepastdue.
Group’sothercreditrisksrelatetotradeandotherreceivablesrecognisedatamortisedcost.Themaximumcreditlossofthesereceivablesisthecarryingamountofthereceivableinquestion.Therearenocollateralsrelatingtothereceivables.
InJune2013,CapMantransferreditsownershipin2005‐2011Maneqfunds(includingequityandloanreceivables)toaLuxembourgcompanyfoundedbyCapManandsoldpartofthatcompanyforacashconsiderationofEUR14million.Afterthetransaction,theGroup’sshareoftheManeqfundsisapprox.EUR5.4millionatfairvalueasatDecember31,2016.TheGroup’sholdingsinManeqfundsarepresentedasinvestmentsinjointventures.Followingthetransaction,CapManhasaloanreceivablefromtheLuxembourgcompany,buttheriskprofileofthisreceivableislikethatofanequityinvestment.
d) Currencyrisk
Changesinexchangerates,particularlybetweentheSwedishkronaandtheeuro,impactthecompany’sperformance,sinceamajorityofthecompany’sinvestmentsinhedgefundsarekrona‐denominated.Anystrengthening/weakeningofthekronaagainsttheeurowouldimprove/weakenthereturnsfrominvestmentsinSwedishfunds.Inturn,however,changesinotherexchangeratesmayaffectthefunds’krona‐denominatedresults.
CapManhassubsidiariesoutsideoftheEurozone,andtheirequityisexposedtomovementsinforeigncurrencyexchangerates.However,theGroupdoesnothedgecurrencyastheimpactofexposuretocurrencymovementsonequityisrelativelysmall.Thegroupisnotexposedtosignificantcurrencyrisks,becauseGroupcompaniesoperateintheirprimarydomesticmarkets.
AsatDecember31,2016,89%oftheGroup'sassetswereineuros,6%inSwedishkrona,4%inUSdollarsand1%inothercurrencies.Thefollowingtablepresentsthefairvaluesoftheforeigncurrencydenominatedfinancialassets.

130 / CapMan
CORPORATE GOVERNANCE FINANCIAL STATEMENTSGROUP 2016 ANNUAL REPORT 2016
ANNUAL REPORT 2016 // NOTES TO THE CONSOLIDATED FINANCIAL STATEMENTS
130 / CapMan / Annual Report 2016
Fairvaluesofinvestmentsdenominatedinforeigncurrencies,ineuros
€ ('000) SEK USD Other currency Total
2016 15,502 9,344 858 25,704
2015 3,645 634 4,279
e) Capitalmanagement
Group’saimistohaveanefficientcapitalstructurethatallowsthecompanytomanageitsongoingobligationsandthatthebusinesshastheprerequisitesforoperatingnormally.TheReturnonequity(ROE)andtheEquityratioarethemeansformonitoringcapitalstructure.
Thelong‐termtargetsanddividendpolicyoftheGrouphavebeenconfirmedbytheBoardofDirectorsofCapManCorporation.Thetargetsarebasedonprofitability(ROE)andbalancesheet.ThetargetforReturnonequityisover20%p.a.andforEquityratioatleast45‐60%.Thetargetnetgearingis40%atmaximum.CapMan’stargetistopayoutdividendatleast75%ofearningspershareconsideringcompany’sfinancialpositionandcashflows.
InJune2014,CapManPlcparticipatedinamulti‐issuerbondofEUR70million,withashareofEUR10million.
Furhermore,CapManPlchasEUR30millionofdebtsecuritiesissuedin2013,consistingofaseniorbondofEUR15millionandahybridbondofEUR15million.
InOctober2015,CapManissuedafixed‐rateunsecuredseniorbondofEUR30milliontoinstitutionalinvestors.Theproceedsfromthebondissuehasbeenusedmainlyforrefinancingoftheseniorbankloan,whichwasobtainedfortheacquisitionofsharesinNorvestiainMay2015.
CapManPlc'sbankloansincludefinancingcovenants,whichareconditionalonthecompany'sequityratioandtheratioofinterst‐bearingbankloanstofundinvestmentsonthebalancesheet.

131 / CapMan
CORPORATE GOVERNANCE FINANCIAL STATEMENTSGROUP 2016 ANNUAL REPORT 2016
ANNUAL REPORT 2016 // NOTES TO THE CONSOLIDATED FINANCIAL STATEMENTS
131 / CapMan / Annual Report 2016
€ ('000) 2016 2015 Interest‐bearing loans 66,065 69,389 Cash and cash equivalents ‐45,307 ‐21,882 Net debt 20,758 47,507 Equity 142,979 65,185
Net gearing 14.5.% 72.9% Return on equity 14.7% 9.3% Equity ratio 56.6% 43.7%
f) Priceriskoftheinvestmentsinfunds
Investmentsinfundsandgrowthcompanies"TheinvestmentsinfundsarevaluedusingtheInternationalPrivateEquityandVentureCapitalValuationGuidelines.Accordingtotheseguidelines,thefairvaluesaregenerallyderivedbymultiplyingkeyperformancemetricsoftheinvesteecompany(e.g.,EBITDA)bytherelevantvaluationmultiple(e.g.,price/equityratio)observedforcomparablepubliclytradedcompaniesortransactions.Changesinvaluationmultiplescanleadtosignificantchangesinfairvaluesdependingontheleverageratiooftheinvesteecompany.
FinancialassetsheldfortradingInitsoperationstheGroupisexposedtomarketrisksarisingfrompricefluctuationsofitsfinancialassetsheldfortrading.PerformanceisgreatlyaffectedbyeconomicdevelopmentsandsharepricemovementsbothinFinlandandabroad.OneoftheguidingprinciplesofCapMan’sinvestmentactivitiesistodiversifyitsinvestmentsandtherebyreduceoverallrisks,aswellastopursuesteadyassetgrowth.Occasionallyasignificantpartofinvestmentsmaybefocusedoncertaintypesofinvestmentsandsecurities,thepossiblenegativedevelopmentofwhichmaysubstantiallydecreaseCapMan’sresult.CapManoccasionallyhedgesitsinvestmentswithoptionsandfutures,althoughtheremaybesituationswheresuchhedgesarenoteffective.

132 / CapMan
CORPORATE GOVERNANCE FINANCIAL STATEMENTSGROUP 2016 ANNUAL REPORT 2016
ANNUAL REPORT 2016 // NOTES TO THE CONSOLIDATED FINANCIAL STATEMENTS
132 / CapMan / Annual Report 2016
g) Determiningfairvalues
Fairvaluehierarchyoffinancialassetsmeasuredatfairvalueat31December2016
€ ('000) Fair value Level 1 Level 2 Level 3Investments in funds 51,394 41 51,353Growth equity investments 37,856 37,856Joint ventures 5,376 5,376Other non‐current investments 179 124 55Current financial assets at FVTPL* 86,213 75,818 10,395
*fairvaluethroughprofitorloss
Thedifferentlevelshavebeendefinedasfollows:Level1‐Quotedprices(unjusted)inactivemarketsforidenticalassetsLevel2‐OtherthanquotedpricesincludedwithinLevel1thatareobservablefortheasset,eitherdirectly(thatis,asprice)orindirectly(thatis,derivedfromprices)Level3‐Theassetthatisnotbasedonobservablemarketdata

133 / CapMan
CORPORATE GOVERNANCE FINANCIAL STATEMENTSGROUP 2016 ANNUAL REPORT 2016
ANNUAL REPORT 2016 // NOTES TO THE CONSOLIDATED FINANCIAL STATEMENTS
133 / CapMan / Annual Report 2016
€ ('000) Level 1 Level 2 Level 3 Total Non‐current investments at fair value through profit or loss
Investments in funds at Jan 1 548 46,701 47,249 Acquisitions 0 6,393 6,393 Additions 0 7,539 7,539 Distributions ‐480 ‐13,936 ‐14,416 Fair value gains/losses ‐27 4,656 4,629 at the end of period 41 51,353 51,394 Growth equity investments at Jan 1 0 0 Acquisitions 37,940 37,940 Fair value gains/losses ‐84 ‐84 at the end of period 37,856 37,856 Other investments at Jan 1 48,784 48,784 Additions 124 0 124 Disposals ‐18,191 ‐18,191 Acquisitions ‐31,637 ‐31,637 Fair value gains/losses 1,099 1,099 at the end of period 124 55 179 Investments in joint ventures at Jan 1 7,651 7,651 Disposals ‐2,484 ‐2,484 Fair value gains/losses 209 209 at the end of period 5,376 5,376

134 / CapMan
CORPORATE GOVERNANCE FINANCIAL STATEMENTSGROUP 2016 ANNUAL REPORT 2016
ANNUAL REPORT 2016 // NOTES TO THE CONSOLIDATED FINANCIAL STATEMENTS
134 / CapMan / Annual Report 2016
FundinvestmentsinLevel2areinvestmentsintheCapManPublicMarketfund.AllotherfundinvestmentsareincludedinLevel3.OtherinvestmentsreportedunderLevel3includedNorvestia'ssharesuntilacquiringcontrolinNorvestiaonDecember19,2016.InvestmentsinjointventuresreportedinLevel3includeinvestmentsinManeqInvestmentsLuxembourgS.a.r.l.Therewerenotransfersfromoneleveltoanotherduringthereviewperiod.
Fairvaluehierarchyoffinancialassetsmeasuredatfairvalueat31December2015
€ ('000) Fair value Level 1 Level 2 Level 3Investments in funds 47,249 548 46,701Joint ventures 7,651 7,651Other non‐current investments 48,784 48,784Current financial assets at FVTPL* 306 306
*fairvaluethroughprofitorloss

135 / CapMan
CORPORATE GOVERNANCE FINANCIAL STATEMENTSGROUP 2016 ANNUAL REPORT 2016
ANNUAL REPORT 2016 // NOTES TO THE CONSOLIDATED FINANCIAL STATEMENTS
135 / CapMan / Annual Report 2016
€ ('000) Level 1 Level 2 Level 3 Total Investments at fair value through profit or loss
Investments in funds at Jan 1 2,993 52,265 55,258 Additions 37 4,318 4,355 Distributions ‐2,433 ‐8,312 ‐10,745 Fair value gains/losses ‐49 ‐1,570 ‐1,619 at the end of period 548 46,701 47,249 Other investments at Jan 1 121 121 Additions 44,335 44,335 Distributions ‐66 ‐66 Fair value gains/losses 4,394 4,394 at the end of period 48,784 48,784 Investments in joint ventures at Jan 1 9,014 9,014 Disposals ‐1,307 ‐1,307 Fair value gains/losses ‐56 ‐56 at the end of period 7,651 7,651
FundinvestmentsinLevel2areinvestmentsintheCapManPublicMarketfund.AllotherfundinvestmentsareincludedinLevel3.InvestmentsinjointventuresreportedinLevel3includeinvestmentsinManeqInvestmentsLuxembourgS.a.r.lTherewerenotransfersfromoneleveltoanotherduringtheyear.

136 / CapMan
CORPORATE GOVERNANCE FINANCIAL STATEMENTSGROUP 2016 ANNUAL REPORT 2016
ANNUAL REPORT 2016 // NOTES TO THE CONSOLIDATED FINANCIAL STATEMENTS
136 / CapMan / Annual Report 2016
SensitivityanalysisofLevel3investmentsat31December2016
Investment area Fair value MEUR 31.12.2016
Valuation methodology Unobservable inputs Used input value (weighted average)
Fair value (MEUR) sensitivity to a +/‐ 10% change in input value
Norvestia growth investments 37.9
Discounted cash flows Discount rate 12 % ‐2.3 / +3.0
Peer group
Peer group earnings multiples EV/Sales 2017 1.3x EV/EBITDA 2017 11.8x +/‐ 1.4
Discount to peer group multiples 4 % ‐/+ 0.5
Buyout 20.6 Peer group
Peer group earnings multiples EV/EBITDA 2016 9.1x +/‐ 3.2
Discount to peer group multiples 23 % +/‐ 1.1
Real Estate 13.2 Valuation by an independent valuer NA NA NA
Norvestia investments in PE funds 7.0 Reports from PE fund
management company NA NA NA
Investments in joint ventures 5.4 Discounted cash flows Discount rate 15 %
‐ 0.2 / value increase based on a change in the discount rate is not
booked
Russia 4.4 Peer group
Peer group earnings multiples EV/EBITDA 2016 13.0x ‐ 0.4 / + 0.3 MEUR
Discount to peer group multiples 35 % ‐ 0.2 / + 0.1

137 / CapMan
CORPORATE GOVERNANCE FINANCIAL STATEMENTSGROUP 2016 ANNUAL REPORT 2016
ANNUAL REPORT 2016 // NOTES TO THE CONSOLIDATED FINANCIAL STATEMENTS
137 / CapMan / Annual Report 2016
Credit 2.5 Discounted cash flows Discount rate; market rate and risk premium 11 %
‐ 0.1 / value increase based on a change in the discount rate is not
booked
Funds of funds 1.7 Reports from PE fund management company NA NA NA
Other investment areas 2.0 Peer group
Peer group earnings multiples EV/EBITDA 2016 9.0x +/‐ 0.1
Discount to peer group multiples 20 % ‐/+ 0.0

138 / CapMan
CORPORATE GOVERNANCE FINANCIAL STATEMENTSGROUP 2016 ANNUAL REPORT 2016
ANNUAL REPORT 2016 // NOTES TO THE CONSOLIDATED FINANCIAL STATEMENTS
138 / CapMan / Annual Report 2016
SensitivityanalysisofLevel3investmentsat31December2015 Investment area Fair value MEUR
31.12.2015 Valuation methodology Unobservable inputs Used input value
(weighted average) Fair value sensitivity (MEUR) to a +/‐
10% change in input value
Norvestia 48.7 Net assets (amended NAV based on
Norvestia’s stock exchange releases)
NA NA NA
Buyout 21.9 Peer group
Peer group earnings multiples EV/EBITDA 2015 8.6x +/‐4.1
Discount to peer group multiples 21% ‐1.2 / +1.1
Real Estate 9.8 Valuation by an independent valuer
NA
NA NA
Investments in joint ventures 7.7 Discounted cash flows Discount rate 15%
‐0.3 / value increase based on a change in the discount rate is not
booked
Russia 3.8 Peer group
Peer group earnings multiples EV/EBITDA 2015 11.6x +/‐ 0.3
Discount to peer group multiples 36% ‐/+ 0.2
Credit 3.1 Discounted cash flows Discount rate; market rate and risk premium 11%
‐ 0.1 / value increase based on a change in the discount rate is not
booked
Other investment areas 5.5 Peer group
Peer group earnings multiples EV/EBITDA 2015 10.9x +/‐ 0.4
Discount to peer group multiples 32% ‐/+ 0.2

139 / CapMan
CORPORATE GOVERNANCE FINANCIAL STATEMENTSGROUP 2016 ANNUAL REPORT 2016
ANNUAL REPORT 2016 // NOTES TO THE CONSOLIDATED FINANCIAL STATEMENTS
139 / CapMan / Annual Report 2016
CapManhasmadesomeinvestmentsalsoinfundsthatarenotmanagedbyCapManGroupcompanies.ThefairvaluesoftheseinvestmentsinCapMan’sbalancesheetarebasedonthevaluationsbytherespectivefundmanagers.NoseparatesensitivityanalysisispreparedbyCapManfortheseinvestments.Thechangesinthepeergroupearningsmultiplesandthepeergroupdiscountsaretypicallyoppositetoeachother.Therefore,ifthepeergroupmultiplesincrease,ahigherdiscountistypicallyapplied.Becauseofthis,achangeinthepeergroupmultiplesmaynotinfullbereflectedinthefairvaluesofthefundinvestments.Theforeignexchangeratesatthetimeofvaluationhavebeenappliedindeterminingthefairvalues.ChangesintheratesofNorwegiankroneorSwedishkronawould,inCapMan’sestimate,havenosignificantdirectimpactonthefairvaluescalculatedbypeergroupmultiples.AchangeintheexchangeratefortheRussianroublehavehadanimpactandtheyhavebeentakenintoaccountinthevaluationoftheRussiafunds.ThevaluationofCapManfunds'investmentisbasedoninternationalvaluationguidelinesthatarewidelyusedandacceptedwithintheindustryandamonginvestors.CapManalwaysaimsatvaluingfunds’investmentsattheiractualvalue.Fairvalueisthebestestimateofthepricethatwouldbereceivedbysellinganassetinanorderlytransactionbetweenmarketparticipantsonthemeasurementdate.DeterminingthefairvalueoffundinvestmentsforfundsinvestinginportfoliocompaniesiscarriedoutusingInternationalPrivateEquityandVentureCapitalValuationGuidelines(IPEVG).Inestimatingfairvalueforaninvestment,CapManappliesatechniqueortechniquesthatis/areappropriateinlightofthenature,facts,andcircumstancesoftheinvestmentinthecontextofthetotalinvestmentportfolio.Indoingthis,currentmarketdataandseveralinputs,includingthepriceatwhichaninvestmentwasacquired,thenatureoftheinvestment,localmarketconditions,tradingvaluesonpublicexchangesforcomparablesecurities,currentandprojectedoperatingperformance,andfinancingtransactionssubsequenttotheacquisitionoftheinvestment,areevaluatedandcombinedwithmarketparticipantassumptions.Inselectingtheappropriatevaluationtechniqueforeachparticularinvestment,considerationofthosespecifictermsoftheinvestmentthatmayimpactitsfairvalueisrequired.Differentmethodologiesmaybeconsidered.ThemostappliedmethodologiesatCapManincludethepriceofrecentinvestments,whichistypicallyappliedinthecaseofnewinvestments,andtheearningsmultiplevaluationtechnique,wherebypublicpeergroupmultiplesareusedtoestimatethevalueofaparticularinvestment.CapManalwaysappliesadiscounttopeergroupmultiples,duetoe.g.limitedliquidityoftheinvestments.Duetoqualitativenatureofthevaluationmethodologies,theyaremainlybasedonCapMan’sjudgment.TheGrouphasaMonitoringteam,whichmonitorstheperformanceandthepriceriskoftheinvestmentportfolio(financialassetsenteredatfairvaluethroughprofitorloss)independentlyandobjectivelyoftheinvestmentteams.TheMonitoringteamisresponsibleforreviewingthemonthlyreportingandforecastsforportfoliocompanies.ValuationproposalsmadebythecaseinvestmentprofessionalsareexaminedbytheMonitoringteamandsubsequentlyapprovedbytheValuationCommittee,whichcomprisestheChairmanoftheInvesteeCommittee,theGroupCFOandHeadsofinvestmentteams.TheportfoliocompanyvaluationsarereviewedintheValuationCommitteequarterly.Thevaluationsarebacktestedagainstrealisedexitvaluations,andtheresultsofsuchbacktestingarereportedtotheAuditCommitteeannually.

140 / CapMan
CORPORATE GOVERNANCE FINANCIAL STATEMENTSGROUP 2016 ANNUAL REPORT 2016
ANNUAL REPORT 2016 // NOTES TO THE CONSOLIDATED FINANCIAL STATEMENTS
140 / CapMan / Annual Report 2016
Investmentsinrealestatearevaluedatfairvaluebasedonappraisalsmadebyindependentexternalexperts,whofollowInternationalValuationStandards(IVS).Themethodmostappropriatetotheuseofthepropertyisalwaysapplied,oracombinationofsuchmethods.Forthemostpart,thevaluationmethodologyappliedisthediscountedcashflowmethod,whichisbasedonsignificantunobservableinputs.Theseinputsincludethefollowing:
Futurerentalcashinflows Basedontheactuallocation,typeandqualityofthepropertiesandsupportedbythetermsofanyexistinglease,othercontractsorexternalevidencesuchascurrentmarketrentsforsimilarproperties;
Discountrates Reflectingcurrentmarketassessmentsoftheuncertaintyintheamountandtimingofcashflows;Estimatedvacancyrates Basedoncurrentandexpectedfuturemarketconditionsafterexpiryofanycurrentlease;Propertyoperatingexpenses Includingnecessaryinvestmentstomaintainfunctionalityofthepropertyforitsexpectedusefullife;Capitalisationrates Basedonactuallocationsizeandqualityofthepropertiesandtakingintoaccountmarketdataatthevaluationdate;Terminalvalue Takingintoaccountassumptionsregardingmaintenancecosts,vacancyratesandmarketrents.
InthevaluationofNorvestia'sgrowthinvestments,severalinputsincludingacquisitionprice,thenatureoftheinvestmentandsector,marketconditionsanddiscountrate,tradingvaluesonpublicexchangesforcomparablesecurities,currentandprojectedrevenueandoperatingperformanceaswellasfinancingtransactionssubsequenttotheacquisitionoftheinvestment,aretakenintoaccountinvaluations.Thedevelopmentstageofthecompanyalsohasasignificanteffectontheselectionofthevaluationmethod.Comparablepeergroupanalysisisnotusuallyasuitablevaluationmethodforfastgrowingunlistedcompaniesasthepeergrouptypicallyconsistsofsignificantlylarger,mature‐stagelistedcompanies.Duetothequalitativenatureofthevaluationmethodologies,theyaremainlybasedonCapMan’sjudgment.
Valuationmethodsusedinthevaluationofgrowthinvestmentsareasfollows:‐discountedcashflow‐earningsmultiplevaluation,wherebypublicpeergroupmultiplesareusedtoestimatethevalueofaparticularinvestment‐acquisitionprice,particularlywithnewinvestments.
ThevalueofinvestmentsinjointventuresconsistalmostentirelyofinvestmentsinManeqInvestmentsLuxembourg.Theinvestmentisvaluedbasedondiscountedcashflows.Theinvestmentismadethroughseveralseparateinstrumentsandtheirvaluesareco‐dependent.Thereforetheinvestmenthasbeenvaluesasoneentity.

141 / CapMan
CORPORATE GOVERNANCE FINANCIAL STATEMENTSGROUP 2016 ANNUAL REPORT 2016
ANNUAL REPORT 2016 // PARENT COMPANY INCOME STATEMENT (FAS)
141 / CapMan / Annual Report 2016
ParentCompanyIncomeStatement(FAS)€ Note 1.1.‐31.12.2016 1.1.‐31.12.2015
Turnover 1 5,693,533,99 4,421,176,61
Other operating income 2 338,733,00 221,598,65Employee benefit expenses 3 ‐5,952,993,48 ‐4,647,361,59Depreciation 4 ‐69,002,29 ‐126,817,55Other operating expenses 5 ‐8,643,283,72 ‐6,030,268,55
Operating loss ‐8,633,012,50 ‐6,161,672,43
Finance income and costs 6 25,263,183,96 13,680,735,34
Profit before appropriations and taxes 16,630,171,46 7,519,062,91
Appropriations 7 3,050,000,00 2,520,000,00
Income taxes 0,00 0,00
Profit for the financial year 19,680,171,46 10,039,062,91

142 / CapMan
CORPORATE GOVERNANCE FINANCIAL STATEMENTSGROUP 2016 ANNUAL REPORT 2016
ANNUAL REPORT 2016 // PARENT COMPANY BALANCE SHEET (FAS)
142 / CapMan / Annual Report 2016
ParentCompanyBalanceSheet(FAS)€ Note 31.12.2016 31.12.2015
ASSETS Non‐current assets Intangible assets 8 18,499,49 80,317,76Tangible assets 9 119,677,21 126,861,23Investments 10 Shares in subsidiaries 208,724,967,44 83,531,742,34 Investments in associated companies 1,171,603,83 46,091,703,86 Other investments 1,813,730,18 2,133,990,88Investments total 211,710,301,45 131,757,437,08
211,848,478,15 131,964,616,07
Current assets Long‐term receivables 11 9,253,516,36 15,976,505,31Short‐term receivables 12 11,425,037,62 11,123,814,99Cash and bank 32,451,006,80 14,793,637,48
53,129,560,78 41,893,957,78
Total assets 264,978,038,93 173,858,573,85

143 / CapMan
CORPORATE GOVERNANCE FINANCIAL STATEMENTSGROUP 2016 ANNUAL REPORT 2016
ANNUAL REPORT 2016 // PARENT COMPANY BALANCE SHEET (FAS)
143 / CapMan / Annual Report 2016
€ Note 31.12.2016 31.12.2015
SHAREHOLDERS' EQUITY AND LIABILITIES
Shareholders' equity 13
Share capital 771,586,98 771,586,98Share premium account 38,968,186,24 38,968,186,24Invested unrestricted shareholders' equity 79,206,065,72 8,810,890,67Retained earnings 24,164,245,37 20,165,515,15Profit for the financial year 19,680,171,46 10,039,062,91
162,790,255,77 78,755,241,95
Liabilities
Non‐current liabilities 14 48,189,573,97 84,389,100,00Current liabilities 15 53,998,209,19 10,714,231,90
102,187,783,16 95,103,331,90
Total shareholders' equity and liabilities 264,978,038,93 173,858,573,85

144 / CapMan
CORPORATE GOVERNANCE FINANCIAL STATEMENTSGROUP 2016 ANNUAL REPORT 2016
ANNUAL REPORT 2016 // PARENT COMPANY CASH FLOW STATEMENT (FAS)
144 / CapMan / Annual Report 2016
ParentCompanyCashFlowStatement(FAS)€ 1.1.‐31.12.2016 1.1.‐31.12.2015
Cash flow from operationsProfit before extraordinary items 16,630,171 7,519,063Finance income and costs ‐25,263,184 ‐13,680,735Adjustments to cash flow statement 3,117,132 2,126,818Change in net working capital Change in current non‐interest‐bearing receivables 1,383,880 ‐217,462 Change in current trade payables and other non‐interest‐bearing liabilities 2,897,241 297,592Interest paid ‐4,135,710 ‐4,316,827Interest received 1,093,576 267,255Dividends received 29,900,578 17,394,499
Cash flow from operations 25,623,684 9,390,203
Cash flow from investments Investments in other placements 444,734 ‐44,341,265Long‐term loan receivables granted ‐2,013,548 ‐2,095,193Repayment of long‐term loans 3,771,406 1,157,009
Cash flow from investments 2,202,592 ‐45,279,449

145 / CapMan
CORPORATE GOVERNANCE FINANCIAL STATEMENTSGROUP 2016 ANNUAL REPORT 2016
ANNUAL REPORT 2016 // PARENT COMPANY CASH FLOW STATEMENT (FAS)
145 / CapMan / Annual Report 2016
€ 1.1.‐31.12.2016 1.1.‐31.12.2015
Cash flow from financing activities Repayment of long‐term loan receivables 1,917,000 736,302Short‐term loan receivables granted ‐3,053,000 3,483,577Repayment of short‐term loans 1,089,080 ‐2,840,400Long‐term loan receivables granted 0 63,900,000Repayment of loans from financial institutions ‐3,511,500 ‐26,757,617Dividends paid ‐6,040,333 ‐5,177,428Change in group liabilities ‐570,153 ‐5,000,182
Cash flow from financing activities ‐10,168,906 28,344,252
Change in cash and cash equivalents 17,657,370 ‐7,544,994Cash and cash equivalents at beginning of year 14,793,637 22,338,631Cash and cash equivalents at end of year 32,451,007 14,793,637

146 / CapMan
CORPORATE GOVERNANCE FINANCIAL STATEMENTSGROUP 2016 ANNUAL REPORT 2016
ANNUAL REPORT 2016 // NOTES TO THE PARENT COMPANY FINANCIAL STATEMENTS (FAS)
146 / CapMan / Annual Report 2016
NotestotheParentCompanyFinancialStatements(FAS)BASISOFPREPARATIONFORPARENTCOMPANYFINANCIALSTATEMENTSCapManPlc’sfinancialstatementsfor2016havebeenpreparedinaccordancewiththeFinnishAccountingAct.
Foreigncurrencytranslation
Transactionsinforeigncurrencieshavebeenrecordedattheratesofexchangeprevailingatthedateofthetransaction.Foreigncurrencydenominatedreceivablesandpayablesarerecordedattheratesofexchangeprevailingattheclosingdateofthereviewperiod.
Investments
Investmentsarevaluedatacquisitioncost.Iftheprobablefutureincomefromtheinvestmentispermanentlylowerthanthevalueatacquisitioncostexcludingdepreciation,thedifferenceisrecognisedasanexpense.
Receivables
ReceivablescomprisereceivablesfromGroupcompaniesandassociatedcompanies,tradereceivables,accruedincomeandotherreceivables.Receivablesarerecordedatnominalvalue,howevernohigherthanatprobablevalue.Receivablesareclassifiedasnon‐currentassetsifthematurityexceeds12months.
Non‐currentliabilities
ThefinancialriskmanagementofCapManGroupiscentralisedwiththeparentcompany.ThefinancialriskmanagementprinciplesareprovidedintheNotestotheGroupfinancialstatementsunder33.Financialriskmanagement.

147 / CapMan
CORPORATE GOVERNANCE FINANCIAL STATEMENTSGROUP 2016 ANNUAL REPORT 2016
ANNUAL REPORT 2016 // NOTES TO THE PARENT COMPANY FINANCIAL STATEMENTS (FAS)
147 / CapMan / Annual Report 2016
Theseniorbondandthehybridbondarerecordedasthenon‐currentliabilityatnominalvalue.Theseniorbondwillhaveamaturityoffouryears.Thehybridbondhasnomaturity,butCapManhastherighttocallitfouryearsfromtheissuedate.Thecompanyhasanoptiontocallthebondintwoyearstheearliestfromtheissuedateinaccordancewithcertaintermsandconditions.
Leases
Leasepaymentsarerecognisedasotherexpenses.TheremainingcommitmentsundereachleaseareprovidedintheNotessectionunder“Commitments.”
Provisions
Provisionsarerecognisedasexpensesincasetheparentcompanyhasanobligationthatwillnotresultincomparableincomeorlossesthataredeemedapparent.
Pensions
Statutorypensionexpendituresarerecognisedasexpensesattheyearofaccrual.Pensionshavebeenarrangedthroughinsurancepoliciesofexternalpensioninstitutions.
Revenuerecognition
RevenueincludesthesaleofservicestoGroupcompanies.Thesaleisrecognisedatthecompletionoftheservice.
Incometaxes
IncometaxesarerecognisedbasedonFinnishtaxlaw.Deferredtaxesarecalculatedontemporarydifferencesbetweenthecarryingamountandthetaxbase.Deferredtaxeshavebeenmeasuredatthestatutorytaxratesthathavebeenenactedbythebalancesheetdateandareexpectedtoapplywhentherelateddeferredtaxisrealised.

148 / CapMan
CORPORATE GOVERNANCE FINANCIAL STATEMENTSGROUP 2016 ANNUAL REPORT 2016
ANNUAL REPORT 2016 // NOTES TO THE PARENT COMPANY FINANCIAL STATEMENTS (FAS)
148 / CapMan / Annual Report 2016
1.TURNOVERBYAREA€ 2016 2015
Finland 4,463,152 2,853,959Foreign 1,230,382 1,567,217Total 5,693,534 4,421,176

149 / CapMan
CORPORATE GOVERNANCE FINANCIAL STATEMENTSGROUP 2016 ANNUAL REPORT 2016
ANNUAL REPORT 2016 // NOTES TO THE PARENT COMPANY FINANCIAL STATEMENTS (FAS)
149 / CapMan / Annual Report 2016
2. OTHEROPERATINGINCOME€ 2016 2015
Other 338,733 221,599Total 338,733 221,599

150 / CapMan
CORPORATE GOVERNANCE FINANCIAL STATEMENTSGROUP 2016 ANNUAL REPORT 2016
ANNUAL REPORT 2016 // NOTES TO THE PARENT COMPANY FINANCIAL STATEMENTS (FAS)
150 / CapMan / Annual Report 2016
3.PERSONNEL€ 2016 2015
Salaries and wages 5,177,069 3,766,369Pension expenses 637,555 581,137Other personnel expenses 138,370 299,856Total 5,952,994 4,647,362 Salaries and other remuneration of the CEO Heikki Westerlund 486,013 404,816 Board members 208,600 173,100 Average number of employees 39 37
ManagementremunerationispresentedintheGroupFinancialStatementsNote32.Relatedpartydisclosures.
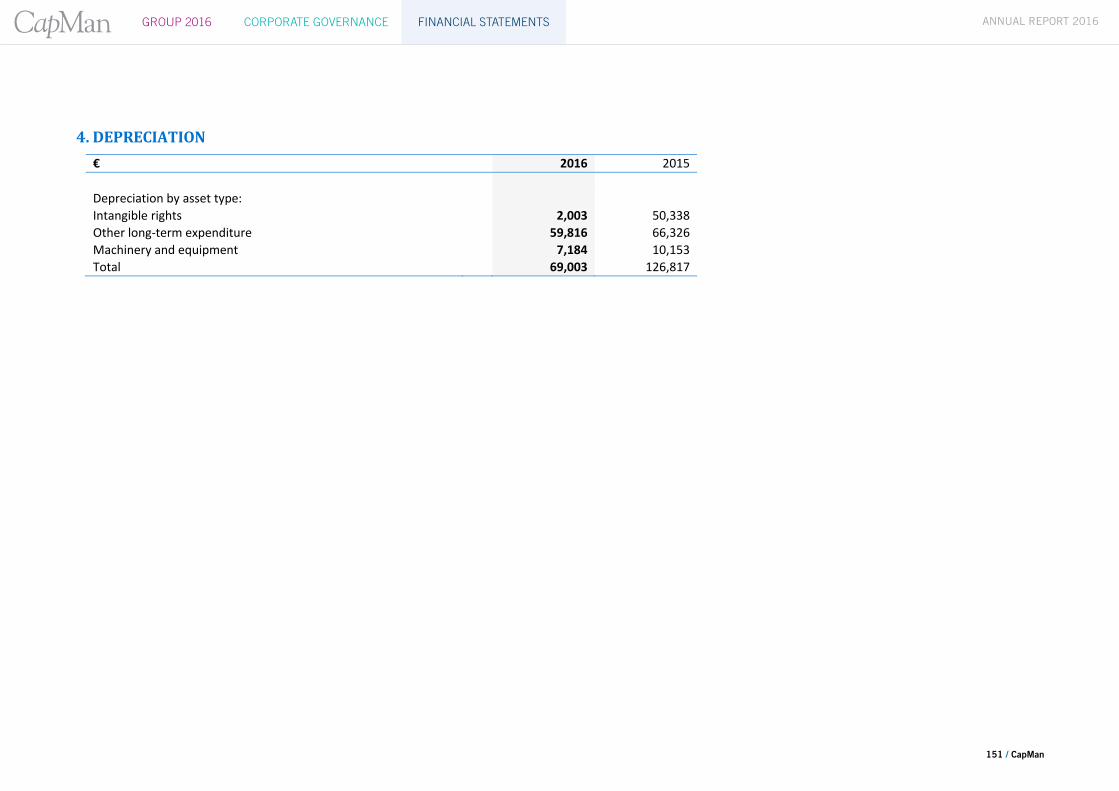
151 / CapMan
CORPORATE GOVERNANCE FINANCIAL STATEMENTSGROUP 2016 ANNUAL REPORT 2016
ANNUAL REPORT 2016 // NOTES TO THE PARENT COMPANY FINANCIAL STATEMENTS (FAS)
151 / CapMan / Annual Report 2016
4. DEPRECIATION€ 2016 2015
Depreciation by asset type:Intangible rights 2,003 50,338Other long‐term expenditure 59,816 66,326Machinery and equipment 7,184 10,153Total 69,003 126,817

152 / CapMan
CORPORATE GOVERNANCE FINANCIAL STATEMENTSGROUP 2016 ANNUAL REPORT 2016
ANNUAL REPORT 2016 // NOTES TO THE PARENT COMPANY FINANCIAL STATEMENTS (FAS)
152 / CapMan / Annual Report 2016
5.OTHEROPERATINGEXPENSES€ 2016 2015
Other personnel expenses 246,947 156,042Office expenses 1,237,217 1,035,746Travelling and entertainment 247,478 216,585External services 2,134,585 2,305,259Other operating expenses 1,728,927 316,636Impairment in shares of subsidiaries 0 2,000,000Impairment in loan receivables of associated companies 3,048,130 0Total 8,643,284 6,030,268
Auditfees
€ PricewaterhouseCoopers Oy, Authorised Public Accountants Audit fees 72,800 110,328Tax advices 12,230 62,100Other fees and services 205,774 53,046Fees under Auditing Act Chapter 1, Section 1, Paragraph 2 4,625 0Total 295,429 225,474

153 / CapMan
CORPORATE GOVERNANCE FINANCIAL STATEMENTSGROUP 2016 ANNUAL REPORT 2016
ANNUAL REPORT 2016 // NOTES TO THE PARENT COMPANY FINANCIAL STATEMENTS (FAS)
153 / CapMan / Annual Report 2016
6. FINANCEINCOMEANDCOSTS€ 2016 2015
Dividend incomeGroup companies 11,059,162 17,367,489Associated companies 18,841,416 27,010Total 29,900,578 17,394,499
Other interest and finance income Group companies 220,426 155,588Others 835,550 307,110Total 1,055,976 462,698
Interest and other finance costs Group companies ‐3,208 ‐29,110Others ‐5,690,162 ‐4,147,353Total ‐5,693,370 ‐4,176,463
Finance income and costs total 25,263,184 13,680,734
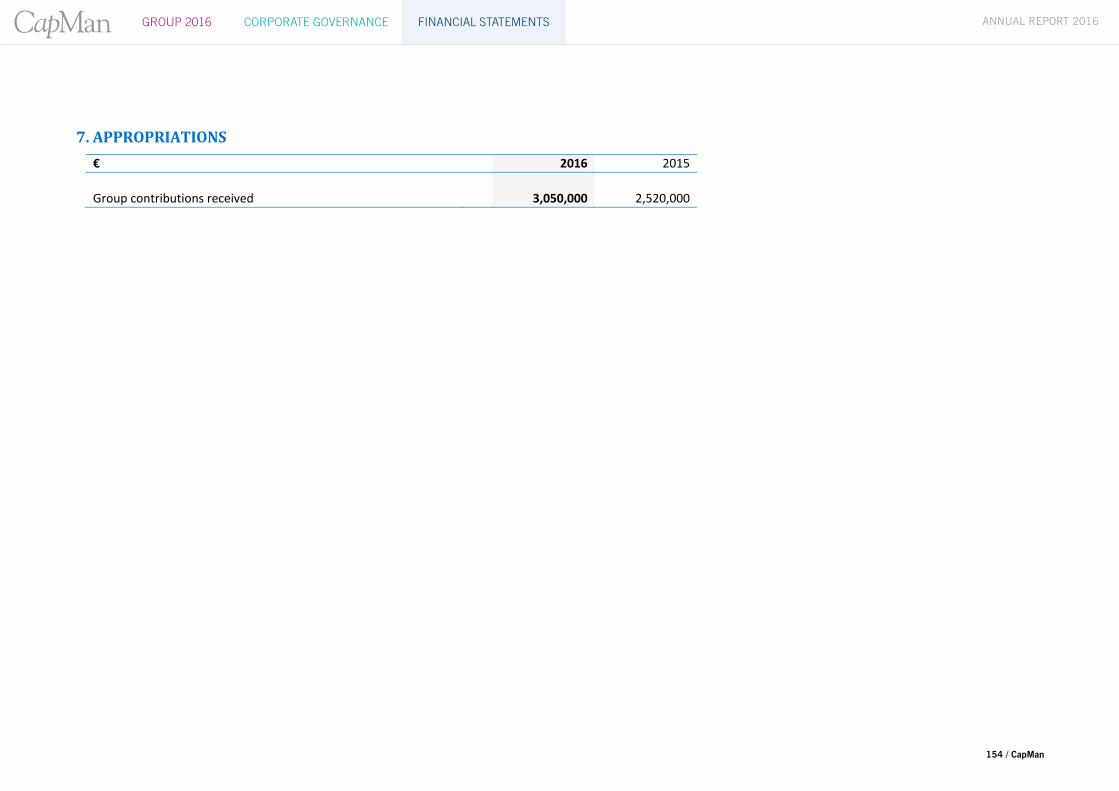
154 / CapMan
CORPORATE GOVERNANCE FINANCIAL STATEMENTSGROUP 2016 ANNUAL REPORT 2016
ANNUAL REPORT 2016 // NOTES TO THE PARENT COMPANY FINANCIAL STATEMENTS (FAS)
154 / CapMan / Annual Report 2016
7. APPROPRIATIONS€ 2016 2015
Group contributions received 3,050,000 2,520,000

155 / CapMan
CORPORATE GOVERNANCE FINANCIAL STATEMENTSGROUP 2016 ANNUAL REPORT 2016
ANNUAL REPORT 2016 // NOTES TO THE PARENT COMPANY FINANCIAL STATEMENTS (FAS)
155 / CapMan / Annual Report 2016
8. INTANGIBLEASSETS€ 2016 2015
Intangible rights
Acquisition cost at 1 January 828,188 828,188Acquisition cost at 31 December 828,188 828,188
Accumulated depreciation at 1 January ‐826,185 ‐775,847Depreciation for financial year ‐2,003 ‐50,338Accumulated depreciation at 31 December ‐828,188 ‐826,185Book value on 31 December 0 2,003
Other long‐term expenditure
Acquisition cost at 1 January 2,360,280 2,360,280Acquisition cost at 31 December 2,360,280 2,360,280
Accumulated depreciation at 1 January ‐2,281,965 ‐2,215,639Depreciation for financial year ‐59,815 ‐66,326Accumulated depreciation at 31 December ‐2,341,780 ‐2,281,965Book value on 31 December 18,500 78,315
Intangible rights total 18,500 80,318

156 / CapMan
CORPORATE GOVERNANCE FINANCIAL STATEMENTSGROUP 2016 ANNUAL REPORT 2016
ANNUAL REPORT 2016 // NOTES TO THE PARENT COMPANY FINANCIAL STATEMENTS (FAS)
156 / CapMan / Annual Report 2016
9. TANGIBLEASSETS€ 2016 2015
Machinery and equipment
Acquisition cost at 1 January 902,094 902,094Acquisition cost at 31 December 902,094 902,094
Accumulated depreciation at 1 January ‐894,910 ‐884,756Depreciation for financial year ‐7,184 ‐10,154Accumulated depreciation at 31 December ‐902,094 ‐894,910Book value on 31 December 0 7,184
Other tangible assets
Acquisition cost at 1 January 119,677 119,677Book value on 31 December 119,677 119,677
Tangible assets total 119,677 126,861

157 / CapMan
CORPORATE GOVERNANCE FINANCIAL STATEMENTSGROUP 2016 ANNUAL REPORT 2016
ANNUAL REPORT 2016 // NOTES TO THE PARENT COMPANY FINANCIAL STATEMENTS (FAS)
157 / CapMan / Annual Report 2016
10.INVESTMENTS
Sharesinsubsidiaries
€ 2016 2015
Acquisition cost at 1 January 83,531,742 82,777,442Additions * 125,205,759 754,300Disposals ‐12,534 0Acquisition cost at 31 December 208,724,967 83,531,742
*IncludesEUR124982759relatedtothesharesinNorvestiaOyj,whichwereacquiredinstagesin2015and2016.AcquisitionofNorvestiaispresentedinmoredetailintheNotestotheConsolidatedFinancialStatements,Note4.Acquisitions.
Sharesinassociatedcompanies
€ 2016 2015 Acquisition cost at 1 January 46,091,704 1,756,486Additions 1 44,335,218Disposals * ‐44,920,101 0Acquisition cost at 31 December 1,171,604 46,091,704
*IncludesEUR44335218relatedtothesharesintheassociatedcompanyNorvestiaOyj,whichwereacquiredin2015.AfteracquiringthecontrolinNorvestiaOyjin2016,theacquisitioncosthasbeentransferredaspartofthesharesinsubsidiaries.AcquisitionofNorvestiaispresentedinmoredetailintheNotestotheConsolidatedFinancialStatements,Note4.Acquisitions.

158 / CapMan
CORPORATE GOVERNANCE FINANCIAL STATEMENTSGROUP 2016 ANNUAL REPORT 2016
ANNUAL REPORT 2016 // NOTES TO THE PARENT COMPANY FINANCIAL STATEMENTS (FAS)
158 / CapMan / Annual Report 2016
Shares,other
€ 2016 2015
Acquisition cost at 1 January 2,133,991 2,939,549Additions 163,253 37,611Disposals ‐483,513 ‐843,169Acquisition cost at 31 December 1,813,731 2,133,991
Investments total 211,710,302 131,757,437
ThesubsidiariesandtheassociatedcompaniesarepresentedintheNotestotheConsolidatedFinancialStatements,Note32.Relatedpartydisclosures.

159 / CapMan
CORPORATE GOVERNANCE FINANCIAL STATEMENTSGROUP 2016 ANNUAL REPORT 2016
ANNUAL REPORT 2016 // NOTES TO THE PARENT COMPANY FINANCIAL STATEMENTS (FAS)
159 / CapMan / Annual Report 2016
11. LONG‐TERMRECEIVABLES€ 2016 2015
Receivables from Group companies Loan receivables 461,000 2,378,000
Receivables from associated companies Loan receivables 4,054,540 8,403,452
Other loan receivables 4,737,977 5,195,053Long‐term receivables total 9,253,517 15,976,505

160 / CapMan
CORPORATE GOVERNANCE FINANCIAL STATEMENTSGROUP 2016 ANNUAL REPORT 2016
ANNUAL REPORT 2016 // NOTES TO THE PARENT COMPANY FINANCIAL STATEMENTS (FAS)
160 / CapMan / Annual Report 2016
12. SHORT‐TERMRECEIVABLES€ 2016 2015
Accounts receivable 536,024 295,772
Receivables from Group companies Accounts receivable 80,994 15,239Loan receivables 6,590,000 4,635,839Other receivables 3,523,925 3,659,819Total 10,194,919 8,310,897
Receivables from associated companies
Accrued income 30,162 69,615 Total 30,162 69,615
Loan receivables 7,451 7,851 Other receivables 68,944 1,188,708 Accrued income 587,537 1,250,972
Short‐term receivables total 11,425,037 11,123,815

161 / CapMan
CORPORATE GOVERNANCE FINANCIAL STATEMENTSGROUP 2016 ANNUAL REPORT 2016
ANNUAL REPORT 2016 // NOTES TO THE PARENT COMPANY FINANCIAL STATEMENTS (FAS)
161 / CapMan / Annual Report 2016
13.SHAREHOLDERS'EQUITY€ 2016 2015
Share capital at 1 January 771,587 771,587Share capital at 31 December 771,587 771,587
Share premium account at 1 January 38,968,186 38,968,186Share premium account at 31 December 38,968,186 38,968,186
Invested unrestricted shareholders' equity at 1 January 8,810,891 8,810,891Share issue * 70,373,297 0Share subscriptions with options 21,878 0Invested unrestricted shareholders' equity at 31 December 79,206,066 8,810,891
Retained earnings at 1 January 30,204,578 25,342,943Dividend payment ‐6,040,333 ‐5,177,428Retained earnings at 31 December 24,164,245 20,165,515
Profit for the financial year 19,680,171 10,039,063
Shareholders' equity, total 162,790,255 78,755,242
Calculation of distributable assets Retained earnings 24,164,245 20,165,515Profit for the financial year 19,680,171 10,339,063Invested unrestricted shareholders' equity 79,206,066 8,810,891Total 123,050,482 39,315,469

162 / CapMan
CORPORATE GOVERNANCE FINANCIAL STATEMENTSGROUP 2016 ANNUAL REPORT 2016
ANNUAL REPORT 2016 // NOTES TO THE PARENT COMPANY FINANCIAL STATEMENTS (FAS)
162 / CapMan / Annual Report 2016
CapManPlc´ssharecapitalisdividedasfollows:
2016 2015Number of Number of
shares sharesSeries A share (10 votes/share) 0 5,750,000Series B share (1 vote/share) 143,313,255 80,566,766
A‐sharesconvertedintoB‐shares
* Includes58644414sharesinCapManPlc,EUR1.20pershare,issuedinthevoluntaryexchangeofferforacquiringthesharesinNorvestiaOyj.AcquisitionofNorvestiaispresentedinmoredetailintheNotestotheConsolidatedFinancialStatements,Note4.Acquisitions.

163 / CapMan
CORPORATE GOVERNANCE FINANCIAL STATEMENTSGROUP 2016 ANNUAL REPORT 2016
ANNUAL REPORT 2016 // NOTES TO THE PARENT COMPANY FINANCIAL STATEMENTS (FAS)
163 / CapMan / Annual Report 2016
14. NON‐CURRENTLIABILITIES€ 2016 2015
Hybrid bond 0 15,000,000Senior bond 29,587,500 44,400,000Multi‐issuer bond 9,989,100 9,989,100Bank loans 8,488,500 15,000,000Other liabilities 124,474 0Non‐current liabilities total 48,189,574 84,389,100

164 / CapMan
CORPORATE GOVERNANCE FINANCIAL STATEMENTSGROUP 2016 ANNUAL REPORT 2016
ANNUAL REPORT 2016 // NOTES TO THE PARENT COMPANY FINANCIAL STATEMENTS (FAS)
164 / CapMan / Annual Report 2016
15. CURRENTLIABILITIES€ 2016 2015
Accounts payable 186,927 280,320
Liabilities to Group companies Pohjola Bank plc; Group account 6,304,804 5,810,759Accounts payable 6,741 0Other liabilities 1,566,010 2,766,102Accrued expenses 1,750,199 73,732Total 9,627,754 8,650,593
Hybrid bond 15,000,000 0Senior bond 15,000,000 0Bank loans 3,000,000 0Other liabilities 8,347,911 117,536Accrued expenses 2,835,617 1,665,783
Current liabilities total 53,998,209 10,714,232

165 / CapMan
CORPORATE GOVERNANCE FINANCIAL STATEMENTSGROUP 2016 ANNUAL REPORT 2016
ANNUAL REPORT 2016 // NOTES TO THE PARENT COMPANY FINANCIAL STATEMENTS (FAS)
165 / CapMan / Annual Report 2016
16.CONTINGENTLIABILITIES€ 2016 2015
Leasing agreements Operating lease commitments Within one year 53,410 51,447After one but not more than five years 28,837 51,669Total 82,247 103,116
Other hire purchase commitments Within one year 461,322 1,146,627After one but not more than five years 1,845,288 95,552After five years 922,644 0Total 3,229,254 1,242,179
Securities and other contingent liabilities Contingencies for own commitment Mortgage bonds 0 60,000,000Loan commitments to Maneq funds 4,075,056 4,075,056Other contingent liabilities 32,559,362 35,107,868
Remaining commitments to funds Equity funds 578,459 628,102Fund of funds 284,522 309,035Total 862,981 937,137

166 / CapMan
CORPORATE GOVERNANCE FINANCIAL STATEMENTSGROUP 2016 ANNUAL REPORT 2016
ANNUAL REPORT 2016 // SIGNATURES
166 / CapMan / Annual Report 2016
SignaturestothereportoftheBoardofDirectorsandFinancialStatementsHelsinki2017
____________________________KarriKaitueChairman
____________________________DirkBeeusaert
____________________________NoraKerppola
____________________________ClaesdeNeergaard
____________________________AriTolppanen
____________________________HeikkiWesterlundCEO
TheAuditor'sNote
Ourreporthasbeenissuedtoday.
Helsinki2017
PricewaterhouseCoopersOyAuthorisedPublicAccountants
____________________________MikkoNieminenAuthorisedPublicAccountant

167 / CapMan
CORPORATE GOVERNANCE FINANCIAL STATEMENTSGROUP 2016 ANNUAL REPORT 2016
ANNUAL REPORT 2016 // AUDITOR’S REPORT
167 / CapMan / Annual Report 2016
Auditor’sreport(TranslationoftheFinnishOriginal)
TotheAnnualGeneralMeetingofCapManOyj
REPORTONTHEAUDITOFTHEFINANCIALSTATEMENTS
Opinion
Inouropinion theconsolidatedfinancialstatementsgiveatrueandfairviewofthe
group’sfinancialperformanceandfinancialpositioninaccordancewithInternationalFinancialReportingStandards(IFRS)asadoptedbytheEU
thefinancialstatementsgiveatrueandfairviewoftheparentcompany’sfinancialperformanceandfinancialpositioninaccordancewiththelawsandregulationsgoverningthepreparationofthefinancialstatementsinFinlandandcomplywithstatutoryrequirements.
WhatwehaveauditedWehaveauditedthefinancialstatementsofCapManOyj(businessidentitycode0922445‐7)fortheyearended31December2016.Thefinancialstatementscomprise:
theconsolidatedbalancesheet,statementofcomprehensiveincome,statementofchangesinequity,statementofcashflowsandnotes,includingasummaryofsignificantaccountingpolicies
theparentcompany’sbalancesheet,incomestatement,statementofcashflowsandnotes.
BasisforOpinion
WeconductedourauditinaccordancewithgoodauditingpracticeinFinland.OurresponsibilitiesundergoodauditingpracticearefurtherdescribedintheAuditor’sResponsibilitiesfortheAuditoftheFinancialStatementssectionofourreport.
Webelievethattheauditevidencewehaveobtainedissufficientandappropriatetoprovideabasisforouropinion.
IndependenceWeareindependentoftheparentcompanyandofthegroupcompaniesinaccordancewiththeethicalrequirementsthatareapplicableinFinlandandarerelevanttoouraudit,andwehavefulfilledourotherethicalresponsibilitiesinaccordancewiththeserequirements.

168 / CapMan
CORPORATE GOVERNANCE FINANCIAL STATEMENTSGROUP 2016 ANNUAL REPORT 2016
ANNUAL REPORT 2016 // AUDITOR’S REPORT
168 / CapMan / Annual Report 2016
OurAuditApproach
Overview
Materiality Wehaveappliedanoverallgroupmaterialityof€1.8million,which
represents0.7%oftotalassets.
Groupscoping ThegroupauditscopeincludedallsignificantlegalentitiesinFinland,
SwedenandGuernsey,coveringthevastmajorityofrevenues,assets
andliabilitiesoftheGroup.ThegroupauditscopecoveredalsothedirectfundinvestmentsmadethroughtheLuxembourggroupentity.
Keyauditmatters Revenuerecognition Valuationofbuyoutfundinvestmentsandgrowthinvestments Norvestiaacquisition
Aspartofdesigningouraudit,wedeterminedmaterialityandassessedtherisksofmaterialmisstatementinthefinancialstatements.Inparticular,weconsideredwheremanagementmadesubjectivejudgements;forexample,inrespectofsignificantaccountingestimatesthatinvolvedmakingassumptionsandconsideringfutureeventsthatareinherentlyuncertain.
MaterialityThescopeofourauditwasinfluencedbyourapplicationofmateriality.Anauditisdesignedtoobtainreasonableassurancewhetherthefinancialstatementsarefreefrommaterialmisstatement.Misstatementsmayariseduetofraudorerror.Theyareconsideredmaterialifindividuallyorinaggregate,theycouldreasonablybeexpectedtoinfluencetheeconomicdecisionsofuserstakenonthebasisofthefinancialstatements.
Basedonourprofessionaljudgement,wedeterminedcertainquantitativethresholdsformateriality,includingtheoverallgroupmaterialityfortheconsolidatedfinancialstatements.These,togetherwithqualitativeconsiderations,helpedustodeterminethescopeofourauditandthenature,timingandextentofourauditproceduresandtoevaluatetheeffectofmisstatementsonthefinancialstatementsasawhole.

169 / CapMan
CORPORATE GOVERNANCE FINANCIAL STATEMENTSGROUP 2016 ANNUAL REPORT 2016
ANNUAL REPORT 2016 // AUDITOR’S REPORT
169 / CapMan / Annual Report 2016
Wehaveappliedanoverallgroupmaterialityof€1.8million,calculatedfromtotalassets.Wechosetotalassetsasthebenchmarkbecause,inourview,incircumstancesofvolatileprofitsthroughfairvaluemovementandcarriedinterestincome,itrepresentsastableandrelevantmetricsforthefinancialstatementsanditisagenerallyacceptedbenchmark.Wechose0.7%whichiswithintherangeofacceptablequantitativematerialitythresholdsinauditingstandards.GroupauditscopeWetailoredthescopeofouraudit,takingintoaccountthestructureofthegroup,theaccountingprocessesandcontrols,andtheindustryinwhichthegroupoperates.UsingtheabovecriteriaweselectedthemostsignificantlegalentitiesinFinland,SwedenandGuernseyandthefundinvestmentsinLuxembourginto
ourauditscopeandatthesametimeensuredthatwegetsufficientcoveragetoouraudit,inordertoissueanauditopinionfortheGroup.KeyAuditMattersKeyauditmattersarethosemattersthat,inourprofessionaljudgment,wereofmostsignificanceinourauditofthefinancialstatementsofthecurrentperiod.Thesematterswereaddressedinthecontextofourauditofthefinancialstatementsasawhole,andinformingouropinionthereon,andwedonotprovideaseparateopiniononthesematters.Asinallofouraudits,wealsoaddressedtheriskofmanagementoverrideofinternalcontrols,includingamongothermattersconsiderationofwhethertherewasevidenceofbiasthatrepresentedariskofmaterialmisstatementduetofraud.
Key audit matter in the audit of the group How our audit addressed the key audit matter
Revenue recognition
Refer to Note 1 (Accounting policies, Revenue Recognition) and Note 3 (Segment reporting) in the consolidated financial statements.
CapMan’srevenuemainlyconsistsofmanagementfees,carriedinterestincomeandrevenuefromservicesrendered.Thetimingofrecognitionofrevenuecanbejudgmentalasrevenuemayberecognisedimmediatelyoroveraperiodoftimedependingonthenatureoftheserviceprovided.Determiningaccruedrevenuesorrepaymentriskstothefundscaninvolvetheuseofestimatesandmanualinputintotheprocess.
We audited a sample of management fees by agreeing them to fund agreements and payment received and we assessed the accounting treatment and timing of recognition of the fee. We also analysed the potential repayment risks to the funds. We audited a sample of carried interest received against cash receipts and underlying documentation for appropriate revenue recognition. We obtained a sample of service agreements and assessed that the service revenue had been calculated in accordance with the agreements and recognised appropriately.
Valuation of buyout fund investments and growth equity investments

170 / CapMan
CORPORATE GOVERNANCE FINANCIAL STATEMENTSGROUP 2016 ANNUAL REPORT 2016
ANNUAL REPORT 2016 // AUDITOR’S REPORT
170 / CapMan / Annual Report 2016
Refer to Note 1 (Accounting policies, Financial instruments) and Note 19 (Investments at fair value through profit and loss) in the consolidated financial statements.
CapManinvestmentsatfairvaluethroughprofitandlossincludemainlyinvestmentsinCapManmanagedfundsandthesubsidiaryNorvestia’sgrowthinvestments.
Thefairvaluationmodelforbuyoutfundinvestmentsandgrowthequityinvestments(unlistedcompanies)includescomplexkeyassumptionsandvariablesandmanagementjudgmentandisassuchdefinedasakeyauditmatter.
ThevaluationpolicyfollowedbythefundsthattheGroupmanagesandthegrowthinvestmentsisbasedontheInternationalPrivateEquityandVentureCapitalValuation(IPEV)guidelinesandIFRS.Thevaluationsareprimarilybasedonpeergroupmultiplesanddiscountedforecastedcashflows.
We assessed the appropriateness of management’s valuation policies.
We obtained an understanding of management’s oversight, processes and controls around the fair valuation of the investments by performing walkthrough procedures, assessing the design effectiveness of relevant controls and testing the operating effectiveness of those controls.
Our substantive audit procedures included reconciling the fund valuation and growth investment valuation reports to the balance sheet.
For a sample of portfolio companies in the buyout funds we conducted e.g. the following substantive audit procedures:
‐ We verified portfolio company figures used in the valuations to the underlying management accounts;
‐ We verified the appropriateness of the peer groups used; and
‐ We analysed the performance of the portfolio companies during the period.
For a sample of growth equity investments our substantive audit procedures were focused around the following:
‐ We evaluated the process by which the future cash flow forecasts were compiled. We tested the key underlying assumptions for the cash flow forecasts and we assessed the implied growth rates beyond the forecasted period;

171 / CapMan
CORPORATE GOVERNANCE FINANCIAL STATEMENTSGROUP 2016 ANNUAL REPORT 2016
ANNUAL REPORT 2016 // AUDITOR’S REPORT
171 / CapMan / Annual Report 2016
‐ We corroborated cash flow discount factor assumptions to underlying documentation and observable inputs, as appropriate;
‐ We verified the appropriateness of the peer groups used; and
‐ We agreed on a sample basis the peer group multiples used to available external market data.
Norvestia acquisition
Refer to Note 4 (Acquisitions) in the consolidated financial statements.
In a voluntary public exchange offer published on 3 November 2016, CapMan Oyj acquired Norvestia Oyj on 19 December 2016. The acquisition is accounted for as a business combination (IFRS 3) and includes a number of significant and complex judgments among others in the determination of the consolidation method (IFRS 10), accounting treatment of the minority shares at the acquisition date, the fair value of the total consideration, the fair value of the assets and liabilities acquired and determining the resulting gain from a bargain purchase and its rationale.
In accordance with IFRS, as of the acquisition date, Norvestia was consolidated 100% as CapMan has submitted an application to the Redemption Committee of the Finnish Central Chamber of Commerce to commence arbitration proceedings of all Norvestia Oyj’s shares held by minority shareholders. The total consideration for the acquisition includes the estimated fair value of the redemption price of the remaining minority shares.
In the preliminary purchase price allocation the acquisition resulted in a gain from a bargain purchase amounting to € 13.9 million. The main rationale for the bargain purchase gain is the discount on Norvestia’s net asset value.
We assessed management’s application of IFRS concerning the following key accounting areas:
‐ Norvestia acquisition date;
‐ Accounting treatment for the previously held interest in Norvestia;
‐ Consolidating the acquisition 100% including the minority shares in the compulsory redemption process;
‐ The methodology to determine the fair value of the total consideration;
‐ The methodology to determine the fair value of the acquired assets and liabilities; and
‐ The recognition of the bargain purchase gain.
Our substantive audit procedures were focused around the following areas in the preliminary purchase price allocation:
‐ We tested the key valuation assumptions concerning the fair value of the total consideration transferred; and
‐ We tested the acquired opening balance sheet at fair value to observable market data and other supporting documentation as at the acquisition date.

172 / CapMan
CORPORATE GOVERNANCE FINANCIAL STATEMENTSGROUP 2016 ANNUAL REPORT 2016
ANNUAL REPORT 2016 // AUDITOR’S REPORT
172 / CapMan / Annual Report 2016
We have no key audit matters to report with respect to our audit of the parent company financial statements.
ResponsibilitiesoftheBoardofDirectorsandtheManagingDirectorfortheFinancialStatements
TheBoardofDirectorsandtheManagingDirectorareresponsibleforthepreparationofconsolidatedfinancialstatementsthatgiveatrueandfairviewinaccordancewithInternationalFinancialReportingStandards(IFRS)asadoptedbytheEU,andoffinancialstatementsthatgiveatrueandfairviewinaccordancewiththelawsandregulationsgoverningthepreparationoffinancialstatementsinFinlandandcomplywithstatutoryrequirements.TheBoardofDirectorsandtheManagingDirectorarealsoresponsibleforsuchinternalcontrolastheydetermineisnecessarytoenablethepreparationoffinancialstatementsthatarefreefrommaterialmisstatement,whetherduetofraudorerror.
Inpreparingthefinancialstatements,theBoardofDirectorsandtheManagingDirectorareresponsibleforassessingtheparentcompany’sandthegroup’sabilitytocontinueasgoingconcern,disclosing,asapplicable,mattersrelatingtogoingconcernandusingthegoingconcernbasisofaccounting.Thefinancialstatementsarepreparedusingthegoingconcernbasisofaccountingunlessthereisanintentiontoliquidatetheparentcompanyorthegrouporceaseoperations,orthereisnorealisticalternativebuttodoso.
Auditor’sResponsibilitiesfortheAuditoftheFinancialStatements
Ourobjectivesaretoobtainreasonableassuranceonwhetherthefinancialstatementsasawholearefreefrommaterialmisstatement,whetherduetofraudorerror,andtoissueanauditor’sreportthatincludesouropinion.Reasonableassuranceisahighlevelofassurance,butisnotaguaranteethatanauditconductedinaccordancewithgoodauditingpracticewillalwaysdetectamaterialmisstatementwhenitexists.Misstatementscanarisefromfraudorerrorandareconsideredmaterialif,individuallyorintheaggregate,theycouldreasonablybeexpectedtoinfluencetheeconomicdecisionsofuserstakenonthebasisofthesefinancialstatements.
Aspartofanauditinaccordancegoodauditingpractice,weexerciseprofessionaljudgmentandmaintainprofessionalskepticismthroughouttheaudit.Wealso:
Identifyandassesstherisksofmaterialmisstatementofthefinancialstatements,whetherduetofraudorerror,designandperformauditproceduresresponsivetothoserisks,andobtainauditevidencethatissufficientandappropriatetoprovideabasisforouropinion.Theriskofnotdetectingamaterialmisstatementresultingfromfraudishigherthanforoneresultingfromerror,asfraudmayinvolvecollusion,forgery,intentionalomissions,misrepresentations,ortheoverrideofinternalcontrol.

173 / CapMan
CORPORATE GOVERNANCE FINANCIAL STATEMENTSGROUP 2016 ANNUAL REPORT 2016
ANNUAL REPORT 2016 // AUDITOR’S REPORT
173 / CapMan / Annual Report 2016
Obtainanunderstandingofinternalcontrolrelevanttotheauditinordertodesignauditproceduresthatareappropriateinthecircumstances,butnotforthepurposeofexpressinganopinionontheeffectivenessoftheparentcompany’sorthegroup’sinternalcontrol.
Evaluatetheappropriatenessofaccountingpoliciesusedandthereasonablenessofaccountingestimatesandrelateddisclosuresmadebymanagement.
ConcludeontheappropriatenessoftheBoardofDirectors’andtheManagingDirector’suseofthegoingconcernbasisofaccountingandbasedontheauditevidenceobtained,whetheramaterialuncertaintyexistsrelatedtoeventsorconditionsthatmaycastsignificantdoubtontheparentcompany’sorthegroup’sabilitytocontinueasagoingconcern.Ifweconcludethatamaterialuncertaintyexists,wearerequiredtodrawattentioninourauditor’sreporttotherelateddisclosuresinthefinancialstatementsor,ifsuchdisclosuresareinadequate,tomodifyouropinion.Ourconclusionsarebasedontheauditevidenceobtaineduptothedateofourauditor’sreport.However,futureeventsorconditionsmaycausetheparentcompanyorthegrouptoceasetocontinueasagoingconcern.
Evaluatetheoverallpresentation,structureandcontentofthefinancialstatements,includingthedisclosures,andwhetherthefinancialstatementsrepresenttheunderlyingtransactionsandeventssothatthefinancialstatementsgiveatrueandfairview.
Obtainsufficientappropriateauditevidenceregardingthefinancialinformationoftheentitiesorbusinessactivitieswithinthegrouptoexpressanopinionontheconsolidatedfinancialstatements.Weareresponsibleforthedirection,supervisionandperformanceofthegroupaudit.Weremainsolelyresponsibleforourauditopinion.
Wecommunicatewiththosechargedwithgovernanceregarding,amongothermatters,theplannedscopeandtimingoftheauditandsignificantauditfindings,includinganysignificantdeficienciesininternalcontrolthatweidentifyduringouraudit.
Wealsoprovidethosechargedwithgovernancewithastatementthatwehavecompliedwithrelevantethicalrequirementsregardingindependence,andtocommunicatewiththemallrelationshipsandothermattersthatmayreasonablybethoughttobearonourindependence,andwhereapplicable,relatedsafeguards.
Fromthematterscommunicatedwiththosechargedwithgovernance,wedeterminethosemattersthatwereofmostsignificanceintheauditofthefinancialstatementsofthecurrentperiodandarethereforethekeyauditmatters.Wedescribethesemattersinourauditor’sreportunlesslaworregulationprecludespublicdisclosureaboutthematterorwhen,inextremelyrarecircumstances,wedeterminethatamattershouldnotbecommunicatedinourreportbecausetheadverseconsequencesofdoingsowouldreasonablybeexpectedtooutweighthepublicinterestbenefitsofsuchcommunication.
OTHERREPORTINGREQUIREMENTS
OtherInformation
TheBoardofDirectorsandtheManagingDirectorareresponsiblefortheotherinformation.TheotherinformationcomprisesinformationincludedinthereportoftheBoardofDirectorsandintheAnnualReport,butdoesnotincludethefinancialstatementsandourauditor’sreportthereon.Weobtainedthe

174 / CapMan
CORPORATE GOVERNANCE FINANCIAL STATEMENTSGROUP 2016 ANNUAL REPORT 2016
ANNUAL REPORT 2016 // AUDITOR’S REPORT
174 / CapMan / Annual Report 2016
reportoftheBoardofDirectorspriortothedateofthisauditor’sreportandtheAnnualReportisexpectedtobemadeavailabletousafterthatdate.Ouropiniononthefinancialstatementsdoesnotcovertheotherinformation.Inconnectionwithourauditofthefinancialstatements,ourresponsibilityistoreadtheotherinformationidentifiedaboveand,indoingso,considerwhethertheotherinformationismateriallyinconsistentwiththefinancialstatementsorourknowledgeobtainedintheaudit,orotherwiseappearstobemateriallymisstated.WithrespecttothereportoftheBoardofDirectors,ourresponsibilityalsoincludesconsideringwhetherthereportoftheBoardofDirectorshasbeenpreparedinaccordancewiththeapplicablelawsandregulations.Inouropinion
theinformationinthereportoftheBoardofDirectorsisconsistentwiththeinformationinthefinancialstatements
thereportoftheBoardofDirectorshasbeenpreparedinaccordancewiththeapplicablelawsandregulations.
If,basedontheworkwehaveperformedontheinformationincludedinthereportoftheBoardofDirectors,weconcludethatthereisamaterialmisstatementofthisotherinformation,wearerequiredtoreportthatfact.Wehavenothingtoreportinthisregard.Helsinki,1February2017PricewaterhouseCoopersOyAuthorisedPublicAccountantsMikkoNieminenAuthorisedPublicAccountant

175 / CapMan
CORPORATE GOVERNANCE FINANCIAL STATEMENTSGROUP 2016 ANNUAL REPORT 2016
ANNUAL REPORT 2016 // SHARES AND SHAREHOLDERS
175 / CapMan / Annual Report 2016
SharesandshareholdersCapManisoneofthefewlistedprivateequityinvestmentandassetmanagementcompaniesinEurope.CapManPlc’ssharehasbeenlistedontheHelsinkiStockExchange(NasdaqHelsinki)since2001.CapManhad11,861shareholdersasoftheendof2016.
CAPMANSHARESCapMan’ssharesarequotedonthemainlistofNasdaqHelsinki.Allsharesgenerateequalvotingrightsandrightstoadividendandotherdistributiontoshareholders.CapManhad143,313,255sharesoutstandingasof31December2016.CapMan’ssharesareincludedinthebook‐entrysecuritiesregisterandhavenonominalvalue.CapMan’ssharecapitalasof31December2016was€771,568.98.
OPTIONPROGRAMMESCapManhadtwooptionprogrammetoengageandcommitpersonneltothecompanyinforceasoftheendof2016:Optionprogramme2013andOptionprogramme2016.MoredetailsontheprogrammescanbefoundintheReportoftheBoardofDirectorsandtheNotestotheFinancialStatements.
CAPMAN’SSHAREHOLDERSCapManhad11,861shareholdersasoftheendof2016.CapManissuedthefollowingnotificationsofchangesinmajorshareholdingsandvotingrightsduring2016:
MandatumLife’sshareofownershipandvotesinCapManexceededone‐twentieth(1/20)followingtheacquisitionofshareson27December2016.
OyInventiainvestAb’s(AriTolppanen)shareofownershipandvotesinCapManPlchasfallenbelowone‐twentieth(1/20)asaresultofashareissueon27December2016.
GimvNV'sshareofownershipinCapManPlchasfallenbelowone‐twentieth(1/20)on20December2016asaresultofadisposalofshares.
OyInventiainvestAb’s(AriTolppanen)shareofvotesinCapManPlchasfallenbelowone‐tenth(1/10)asaresultoftheconversionofAsharestoBshares(1:1)on20December2016.
HeikkiWesterlund’sandHeiwesOy’scombinedshareofvotesinCapManPlcofhasfallenbelowonetwentieth(1/20)asaresultoftheconversionofAsharestoBshares(1:1)on20December2016.

176 / CapMan
CORPORATE GOVERNANCE FINANCIAL STATEMENTSGROUP 2016 ANNUAL REPORT 2016
ANNUAL REPORT 2016 // SHARES AND SHAREHOLDERS
176 / CapMan / Annual Report 2016
MOMInvestOy’sandGeldegalOy’s(OlliLiitola)combinedshareofvotesinCapManPlcofhasfallenbelowone‐twentieth(1/20)asaresultoftheconversionofAsharestoBshares(1:1)on20December2016.
TuomoRaasio’sandWinsomeOy’scombinedshareofvotesinCapManPlcofhasfallenbelowonetwentieth(1/20)asaresultoftheconversionofAsharestoBshares(1:1)on20December2016.
GimvNV’sshareofvotingrightshasfallenbelowone‐twentieth(1/20)ofthevotingrightsinCapManPlcon4November2016asaresultofadisposalofshares.
NOMINEE‐REGISTEREDSHAREHOLDERSCapManPlc’sforeignshareholderscanregistertheirholdingsinnominee‐registeredbook‐entryaccounts,forwhichacustodianisregisteredinthecompany’slistofshareholdersratherthantheultimateowner.Foreignandnominee‐registeredshareholdersheldatotalof8%ofCapMan’ssharesasoftheendof2016.AbreakdownbysectorandsizeofholdingcanbefoundontheNotestotheFinancialStatements.
DIVIDENDPOLICYANDDIVIDENDPAYABLEFOR2016CapMan’sobjectiveistopayatleast75%ofitsearningspershareintheformofadividend.TheBoardofDirectorswillproposetotheAnnualGeneralMeetingthatadividendof€0.09pershareshouldbepaidtoshareholders.
IRCONTACTSCapMan’sIRcontactsarethejointresponsibilityoftheCEO,theCFOandtheCommunicationsandIRManager.Thecompanyobservesatwo‐weeksilentperiodpriortopublicationofitsinterimreportsandfinancialstatements,duringwhichitdoesnotcommentonthecompany’sfinancialperformanceorfutureprospects.
READMOREShare‐relatedkeyfiguresInformationforshareholders

177 / CapMan
CORPORATE GOVERNANCE FINANCIAL STATEMENTSGROUP 2016 ANNUAL REPORT 2016
ANNUAL REPORT 2016 // SHARES AND SHAREHOLDERS
177 / CapMan / Annual Report 2016
Holdingandvotingrightsbyshareholderclass MarketCapitalisation,M€
12.6%
8.1%
79.3%
Management and employees of CapMan
Nominee registered shareholders and other foreign ownership (non‐Finnish owners)Finnish institutions and households
7198
72 86
179
020406080
100120140160180200
2012 2013 2014 2015 2016
Market cap

178 / CapMan
CORPORATE GOVERNANCE FINANCIAL STATEMENTSGROUP 2016 ANNUAL REPORT 2016
ANNUAL REPORT 2016 // SHARES AND SHAREHOLDERS
178 / CapMan / Annual Report 2016
Sharepricedevelopmentandtradingvolume
2016 2015
Share price €
High 1.30 1.09
Low 0.91 0.83
Trade‐weighted average share price 1.10 1.00
Closing price 31 December 1.25 1.00
Volume
Shares (million) 33.5 13.7
Euros (million) 37.0 13.8
Sharepriceandindexdevelopment in 2016
(4Jan2016=100)
80
90
100
110
120
130
140
150
4.1.2016 4.4.2016 4.7.2016 4.10.2016
CapMan CapMan Total Return
OMX Helsinki CAP PI OMX Helsinki CAP GI

179 / CapMan
CORPORATE GOVERNANCE FINANCIAL STATEMENTSGROUP 2016 ANNUAL REPORT 2016
ANNUAL REPORT 2016 // SHARES AND SHAREHOLDERS
179 / CapMan / Annual Report 2016
Basicshareandoptioninformation
CapMan share Market Nasdaq Helsinki
Currency €
Listing date 2 April 2001ISIN FI0009009377Symbol CAPMANReuters‐symbol CAPMAN.HEBloomberg‐symbol CAPMANList Nordic Mid CapsIndustry FinanceNumber of shares 144,990,351Votes/share 1/share
CapMan 2013 A option
Stock options, number 1,410,000
Share subscription price €0.75
Exercise period 1 May 2016 – 30 April 2018
CapMan 2013 B option
Stock options, number 1,410,000Share subscription price €1.03
Exercise period 1 May 2017 – 30 April 2019
CapMan 2013 C option
Stock options, number 1,410,000 Share subscription price €1.05
Exercise period 1 May 2018 – 30 April 2020
CapMan 2016 A option
Stock options, number 1,410,000 Share subscription price €1.04
Exercise period 1 May 2019 – 30 April 2021
CapMan 2016 B option
Stock options, number 1,410,000
Share subscription price trade volume‐weighted average quotation of the share during 1 April–31 May 2017 with an addition of 10%
Exercise period 1 May 2020 – 30 April 2022
CapMan 2016 C option
Stock options, number 1,410,000
Share subscription price trade volume‐weighted average quotation of the share during 1 April–31
May 2018 with an addition of 10% Exercise period 1 May 2021 – 30 April 2023
Option programmes 2013 A, 2013 B, 2013 C, 2016 A, 2016 B, 2016 C each entitle holders to subscribe to 1,410,000 shares.

180 / CapMan
CORPORATE GOVERNANCE FINANCIAL STATEMENTSGROUP 2016 ANNUAL REPORT 2016
ANNUAL REPORT 2016 // INFORMATION FOR SHAREHOLDERS
180 / CapMan / Annual Report 2016
Informationforshareholders
ANNUALGENERALMEETING2017CapManPlc’sAnnualGeneralMeeting2017willbeheldonWednesday,15March2017at10.00amEETatGloHotelArtattheaddressLönnrotinkatu29,Helsinki.Allshareholdersregisteredwiththecompany’slistofshareholdersmaintainedbyEuroclearFinlandOyonFriday3March2017areentitledtoattend.
ShareholderswishingtoattendtheAGMshouldinformthecompanyby10.00amEETonFriday10March2017atthelatest.Registrationcanbemadebysendingawrittennotificationtothecompany'saddress(CapManPlc/AGM,Ludviginkatu6,00130Helsinki)onlineatwww.capman.com/investors/corporate‐governance/general‐meetings/, by email ([email protected]) orbyphone(KatriKautovaara,+358(0)207207562).Registrationsmustreachthecompanybythedateandtimespecifiedabove.AnyproxyforexercisingvotingrightsmustbedeliveredtoCapManattheaforementionedpostaladdressbeforeexpiryoftheregistrationperiod.
DIVIDENDTheBoardofDirectorswillproposetotheAGMthatadividendof€0.09persharewillbepaid.
CAPMANPLC’SFINANCIALREPORTINGIN2017CapManPlcwillpublishthreeinterimreportsduring2017:
January – 31 March 2017: Thursday, 4 May 2017
January – 30 June 2017: Thursday, 10 August 2017
1 January – 30 September 2017: Thursday, 2 November 2017.
FinancialreportsarepublishedinFinnishandEnglish.Thecompany’sAnnualReports,InterimReports,andstockexchangereleasesandpressreleasescanbeconsultedatwww.capman.com.Thecompany’swebsitealsoincludesotherIRmaterial.AnyoneinterestedinreceivingCapManreleasesbyemailcansubscribethemintheNewsandmaterialssectionofthewebsite.
CHANGESOFADDRESSEuroclearFinlandOymaintainsCapManPlc’sshare,shareholder,andoptionlists.ShareholdersandoptionholdersarerequestedtoinformEuroclearFinlandOyortheircustodianbankofanychangesintheirpersonalinformationoraddress.EuroclearFinland’sswitchboardnumber–+358(0)207706000–canprovidefurtherinformation.CapManisnotresponsibleforupdatingshareholders’addresses.
181 / CapMan
CORPORATE GOVERNANCE FINANCIAL STATEMENTSGROUP 2016 ANNUAL REPORT 2016
ANNUAL REPORT 2016 // INFORMATION FOR SHAREHOLDERS
181 / CapMan / Annual Report 2016
IRCONTACTSCapMan’sIRcontactsarethejointresponsibilityoftheCEO,theCFO,andtheCommunicationsandIRManager.Thecompanyobservesatwo‐weeksilentperiodpriortopublicationofitsinterimreportsandfinancialstatements,duringwhichitdoesnotcommentonthecompany’sfinancialperformanceorfutureprospects.
ANALYSTSFOLLOWINGCAPMANPLCInderes SauliVilén,tel.+358(0)440258908OPFinancialGroup NiclasCatani,tel.+358102528780

182 / CapMan
CORPORATE GOVERNANCE FINANCIAL STATEMENTSGROUP 2016 ANNUAL REPORT 2016
ANNUAL REPORT 2016 // CALCULATION OF KEY RATIOS
182 / CapMan / Annual Report 2016
CalculationofKeyRatiosReturn on equity (ROE), % = Profit / loss x 100
Shareholders' equity (average)
Profit / loss + income taxes + interest expenses
Return on investment (ROI), % = and other financial expenses x 100 Balance sheet total ‐ non‐interest bearing debts (average)
Equity ratio, % = Shareholders' equity + non‐controlling interests x 100
Balance sheet total ‐ advances received
Net gearing, % = Net interest‐bearing liabilities x 100
Shareholders' equity
Earnings per share (EPS) = Profit/loss for the financial year ‐ hybrid loan interest Share issue adjusted number of shares (average)
Shareholders' equity per share = Shareholders' equityShare issue adjusted number of sharesat the end of the financial year
Dividend per share = Dividend paid in the financial yearShare issue adjusted number of sharesat the end of the financial year
Dividend per earnings, % = Dividend/share x 100 Earnings/share


![Menu2 [Converted]](https://static.documents.pub/doc/80x56/58ede3dc1a28ab17058b45fb/menu2-converted.jpg)


![BOOK_BONECA [Converted]](https://static.documents.pub/doc/80x56/568bd9351a28ab2034a62cf9/bookboneca-converted.jpg)

![AllentonForestBalmoral [Converted]](https://static.documents.pub/doc/80x56/58cf72161a28abe6688b52fb/allentonforestbalmoral-converted.jpg)


