184
ANNUAL REPORT of the Inter-American Tropical Tuna Commission 1999ı INFORME ANUAL dela Comisi6n Interamericana del Atun Tropical La Jolla, California 2001
ANNUAL REPORT of the
Inter-American Tropical Tuna Commission
1999ı
INFORME ANUAL dela
Comisi6n Interamericana del Atun Tropical
La Jolla, California 2001

CONTENTS-INDICE�
ENGLISH VERSION-VERSION EN INGLES� Pageı
SPECIAL NOTICE 5ı
Intergovernmental meetings ll�
Comparison of estimates of catches of bigeye tunaı
INTRODUCTION , 7ı MEETINGS 8ı
IATTC meetings 8ı Meetings of IATTC working groups 9ı
Meetings of the AIDCP, the IRP, and AIDCP working groups 11ı ADMINISTRATION 13ı
Budget 13ı Financial statement 13ı
INTER-AGENCY COOPERATION 13ı DATA COLLECTION 16ı
Catch and effort data for tunas and billfishes 16ı Size compositions of the catches of tunas 21ı Observer program 23ı
RESEARCH , 24ı
made by observers and fishermen 24ı Discards and bycatches in the purse-seine fishery for tunas 25ı Growth of skipjack tuna 28ı Age and growth of bigeye tuna 28ı Ecological studies 29ı Early life history studies 32ı Oceanography and meteorology 37ı Stock assessment of tunas and billfishes 39ı Dolphins 39ı
GEAR PROGRAM 42ı Dolphin safety panel alignments '" .42ı Training and certification of fishing captains .42ı Other services 43ı
MEASURES FOR THE CONSERVATION OF TUNAS .43ı Yellowfin tuna 43ı Bigeye tuna 44ı Fish-aggregating devices 44ı Fleet size 44ı
THE INTERNATIONAL DOLPHIN CONSERVATION PROGRAM .44ı PUBLICATIONS 45ı
FIGURES-FIGURAS 46�
TABLES-TABLAS 95ı
APPENDIX l-ANEXO STAFF- PERSONAL 172ı
CIENTIFICOS Y ESTUDIANTES EN VISITA APPENDIX 2-ANEXO

VERSION EN ESPANOL-SPANISH VERSION� Paginaı
AVISO ESPECIAL 129ı
Comparaci6n de estimaciones de observadores y pescadoresı
Descartes y capturas incidentales en la perqueria atuneraı
PROGRAMA INTERNACIONAL PARA LA CONSERVACIONı
INTRODUCCION 131ı REUNIONES 132ı
Reuniones de la CIAT 132ı Reuniones de grupos de trabajo de la CIAT 133ı Reuniones intergubernamentales 135ı Runiones del APICD, el PIR, y grupos de trabajo del APICD 135ı
ADMINISTRACION 137ı Presupuesto 137ı Informe financiero 137ı
COLOBARACION CON ENTIDADES AFINES 138ı TOMA DE DATOS 140ı
Datos de captura y esfuerzo para los atunes y peces picudos 141ı Composici6n por tamafio de la captura de atunes 145ı Programa de observadores 147ı
INVESTIGACION 149ı
de la captura de attin patudo 149ı
con red de cerco 149ı Crecimiento del attin barrilete 153ı Edad y crecimiento del attin patudo 153ı Estudios ecologicos 154ı Estudios del ciclo vital temprano 157ı Oceanografia y meteorologia 163ı Evaluaci6n de los stocks de atunes y peces picudos 165ı Delfines 165ı
PROGRAMA DE ARTES DE PESCA. 168ı Alineaciones del pafio de protecci6n de delfines 168ı Entrenamiento y certificaci6n de capitanes de pesca 168ı Otros servicios 169ı
MEDIDAS PARA LA CONSERVACION DELATUN 169ı Attin aleta amarilla 169ı Attin patudo 170ı Dispositivos agregadores de peces 170ı Tamafio de la flota 170ı
DE LOS DELFINES 171ı PUBLICACIONES 171ı
APPENDIX l-ANEXO 1� STAFF- PERSONAL 172ı VISITING SCEINTISTS AND STUDENTS-
CONTRIBUTIONS BY IATTC STAFF MEMBERS PUBLISHED DURINGı 1999-CONTRIBUCIONES POR PERSONAL DE CIAT PUBLICADOSı
CIENTIFICOS Y ESTUDIANTES EN VISITA 175ı APPENDIX 2-ANEXO 2ı
FINANCIAL STATEMENT- DECLARACION FINANCIERA 176ı APPENDIX 3-ANEXO 3ı
DURANTE 1999 182ı

5 ANNUAL REPORT 1999
ANNUAL REPORT OF THE� INTER·AMERICAN TROPICAL TUNA COMMISSION, 1999�
SPECIAL NOTICE�
Dr. James Joseph, Director of the IATTC for 30 years, retired on June 30,1999, after more than 40 years of employment with the IATTC.
He was born in Los Angeles in 1930. Mter graduating from high school, he entered Humboldt State College (now Humboldt State University). His education was interrupted by ser-vice in the U.S. Army from 1952 to 1954. He then returned to Humboldt State, from which he obtained a B.S. degree in 1956 and an M.S. degree in 1958. He was then hired by the IATTC, and spent the next two years in Manta, Ecuador, studying baitfishes and tagging tunas. He was then transferred to Terminal Island, California, and then to La Jolla. Because of his obvious ability, Dr. J. L. Kask, Director of the IATTC at the time, named him Principal Scientist of the IATTC in 1964. He earned his Ph.D. degree from the University of Washington, where he studied popula-tion dynamics under the late Dr. Gerald J. Paulik, in 1967. In 1969, when Dr. Kask retired, Dr. Joseph was selected as the new Director of the IATTC.
Many changes took place in the tuna fisheries of the world, especially those of the eastern Pacific Ocean (EPa), during the three decades when Dr. Joseph was Director of the IATTC. Larger, more efficient boats were constructed, and many ofthem were registered in nations which had not previously been important participants in the fishery. The concept of200-mile Exclusive Economic Zones was not widely recognized at the beginning of this period, but now these are vig-orously enforced by most nations. The catches of tunas increased greatly during this period, and many stocks of tunas now appear to be fully exploited. At least two of them, Atlantic bluefin and southern bluefin, are considered to be overexploited. As a result, many fisheries for tunas are now regulated.
In addition, there has been much concern about the effect offishing on incidentally-caught species, particularly marine mammals. During most years of the 1960s, 1970s, and early 1980s the annual mortalities of dolphins in the EPa due to the purse-seine fishery for tunas exceeded 100,000 animals. In 1972 the U.S. Marine Mammal Protection Act (MMPA), which profoundly affected the fisheries for tunas in the EPa was passed, and its provisions were gradually strengthened during the ensuing period. Under Dr. Joseph's leadership, the IATTC initiated its Tuna-Dolphin Program, placing observers aboard fishing vessels to collect data on fishing activi-ties and dolphin mortality, sponsoring seminars to facilitate the transfer of dolphin-saving tech-niques from the more skilled to the less skilled fishermen, and conducting basic research on the population dynamics of dolphins. In 1986, the first year in which the IATTC placed observers aboard tuna vessels of all nations, the annual mortality exceeded 133,000 animals. In June 1992 the nations involved in the fishery adopted the Agreement for the Conservation of Dolphins ("the 1992 La Jolla Agreement"), a voluntary instrument designed to reduce or eliminate the mortality of dolphins, and by 1998 this had decreased to less than 2,000 animals, a biologically-insignifi-cant amount. On May 21, 1998, the Agreement on the International Dolphin Conservation Program, which formalizes, extends, and adds to the provisions of the 1992 La Jolla Agreement, was signed, and it subsequently came into effect on February 15, 1999, when four nations had ratified it. During the period when the dolphin mortalities were decreasing precipitously the catches of tunas in the EPa were increasing, demonstrating that it is not necessary to curtail fishing to protect dolphins. Dr. Joseph provided leadership through the many years of this com-plex and difficult process, and he deserves much of the credit for this remarkable achievement.

6 TUNA COMMISSION
Tunas and billfishes were certainly not neglected during this period. For example, the IATTC staff has pioneered in the development of methods for stock assessment of tunas, and the population dynamics of yellowfin tuna in the EPO are probably better understood those of any other stock of tunas. Also, great strides in understanding of the reproduction and early life his-tory of tunas have been made through work in the field and at the IATTC's Achotines Laboratory in Panama, established during Dr. Joseph's tenure as Director. The IATTC staff, in cooperation with several other organizations, is now developing a modeling approach to evaluate the relative ecological implications of alternative fishing strategies in the EPO.
Dr. Joseph is an affiliate professor at the University of Washington and at the Universidad Nacional Aut6noma de Mexico. He has served on numerous advisory committees, task forces, and consultative groups in the United States and elsewhere, including those of the U.S. National Academy ofSciences, Department of Commerce, and Department of the Interior. He has lectured on subjects relating to marine research and resource conservation all over the world. Additionally, he has served as a technical advisor to many international organizations, govern-ment ministries, and heads of state on matters pertaining to marine science, especially marine resource development, management, and conservation. He has published numerous papers and articles in scholarly and trade journals, and has co-authored three books.
His many awards and honors include the Distinguished Alumnus Award, Humboldt State University; Outstanding Achievement Award for Contributions to Marine Science, Portuguese Historical Society, San Diego; Outstanding Graduate in Fisheries, Humboldt State University; Nautilus Award, Marine Technological Society; Dave Wallace Award, Nautilus Press, Inc.; Docteur Honoris Causa, Universite de Bretagne, Brest, France; Roger Revelle Award, San Diego Oceans Foundation; Al Merito Pesquero Award, Ministry of Commerce of Ecuador. In addition, the IATTC was selected as the recipient of the Carl L. Sullivan Fishery Conservation Award of the American Fisheries Society in 1994.
Dr. Robin Allen succeeded Dr. James Joseph as Director of the IATTC on July 1,1999. Dr. Allen received a B.Sc. Hons. degree in mathematics at Victoria University of Wellington (New Zealand) in 1965 and a Ph.D. degree in zoology at the University of British Columbia (Canada) in 1972. From 1965 to 1976 he was employed by the Ministry ofAgriculture and Fisheries, New Zealand. From 1976 to 1981 he was employed by the IATTC, where he initially worked on the use of catch rate data to estimate the abundance of tunas, and later was in charge of the Tuna-Dolphin Program. From 1981 to 1995 he held various positions in the New Zealand Ministry of Agriculture and Fisheries, including Director of Fisheries Research and Group Director of Fisheries Policy. From 1995 to 1999 he was Assistant Director of the IATTC.

7 ANNUAL REPORT 1999
INTRODUCTION
The Inter-American Tropical Thna Commission (IATI'C) operates under the authority and direc-tion ofa convention originally entered into by Costa Rica and the United States. The convention, which came into force in 1950, is open to adherence by other governments whose nationals fish for tropical tunas and tuna-like species in the eastern Pacific Ocean (EPO). Under this provision Panama adhered in 1953, Ecuador in 1961, Mexico in 1964, Canada in 1968, Japan in 1970, France and Nicaragua in 1973, Vanuatu in 1990, Venezuela in 1992, and EI Salvador in 1997. Canada withdrew from the IATI'C in 1984.
The IATIC's responsibilities are met with two programs, the Thna-Billfish Program and the Thna-Dolphin Program.
The principal responsibilities of the Thna-Billfish Program specified in the IATI'C's convention were (l) to study the biology of the tunas and related species of the eastern Pacific Ocean to estimate the effects that fishing and natural factors have on their abundance and (2) to recommend appropriate conservation measures so that the stocks offish could be maintained at levels which would afford max-imum sustainable catches. It was subsequently given the responsibility of collecting information on compliance with Commission resolutions.
The IATI'C's responsibilities were broadened in 1976 to address the problems arising from the incidental mortality in purse seines of dolphins that associate with yellowfin tuna in the EPO. The Commission agreed that it "should strive to maintain a high level of tuna production and also to main-tain [dolphin] stocks at or above levels that assure their survival in perpetuity, with every reasonable effort being made to avoid needless or careless killing of [dolphins]" (IATIC, 33rd meeting, minutes: page 9). The principal responsibilities of the IATI'C's Thna-Dolphin Program are (1) to monitor the abundance of dolphins and their mortality incidental to purse-seine fishing in the EPO, (2) to study the causes ofmortality ofdolphins during fishing operations and promote the use of fishing techniques and equipment that minimize these mortalities, (3) to study the effects of different modes of fishing on the various fish and other animals of the pelagic ecosystem, and (4) to provide a secretariat for the International Dolphin Conservation Program, described below.
On June 17, 1992, the Agreement for the Conservation of Dolphins ("the 1992 La Jolla Agreement"), which created the International Dolphin Conservation Program (IDCP), was adopted. The main objective of the Agreement was to reduce the mortality of dolphins in the purse-seine fishery without harming the tuna resources of the region and the fisheries that depend on them. On May 21, 1998, the Agreement on the International Dolphin Conservation Program (AIDCP), which built on and formalized the provisions of the 1992 La Jolla Agreement, was signed, and it came into effect on February 15, 1999. The Parties to this agreement would be "committed to ensure the sustainability of tuna stocks in the eastern Pacific Ocean and to progressively reduce the incidental mortalities of dol-phins in the tuna fishery of the eastern Pacific Ocean to levels approaching zero; to avoid, reduce and minimize the incidental catch and the discard of juvenile tuna and the incidental catch of non-target species, taking into consideration the interrelationship among species in the ecosystem."
To carry out these missions, the IATIC conducts a wide variety of investigations at sea, in ports where tunas are landed, and in its laboratories. The research is carried out by a permanent, interna-tionally-recruited research and support staff (Appendix 1) selected by the Director, who is directly responsible to the Commission.
The scientific program is now in its 49th year. The results ofthe IATI'C staff's research are pub-lished in the IATIC's Bulletin series in English and Spanish, its two official languages, in its Special Report and Data Report series, and in books, outside scientific journals, and trade journals. Summaries of each year's activities are reported upon in the IATIC's Annual Reports, also in the two languages.

8 TUNA COMMISSION
MEETINGS
Copies of the minutes or reports of all of these meetings are available from the IATTC on request, and most of these are available on the IATTC's web site, www.iattc.org.
JATTe MEETINGS
63rd meeting of the IATTC
The 63rd meeting of the IATTC was held in Guayaquil, Ecuador, on June 8-10,1999. Ab. Gustavo Gutierrez Vera of Ecuador served as Chairman. Representatives of all the member gov-ernments attended, as did observers from Belize, Chile, Colombia, the European Union, Guatemala, Peru, the Seychelles, Spain, Taiwan, the Comisi6n Permanente del Pacifico Sur, the Forum Fisheries Agency, the International Commission for the Conservation of Atlantic Tunas, the Organizaci6n Latinoamericana de Desarrollo Pesquero, the Programa Regional de Apoyo al Desarrollo de la Pesca en el Istmo Centroamericano, the Center for Marine Conservation, the Fundaci6n para la Defensa de la Naturaleza, the Humane Society International, the Humane Society of the United States, the Whale and Dolphin Conservation Society, and the World Wildlife Fund.
The following actions were taken: (1) Apermanent working group on compliance with conservation and management mea-
sures adopted by the IATTC was established. (2) Acatch quota for yellowfin tuna of 225,000 metric tons (mt), with three increments of
15,000 mt each to be added at the discretion of the Director, was adopted. (3) Aresolution welcoming Japan's 20-percent reduction in the number of large tuna long-
line vessels, and calling upon other nations to do the same, was adopted. (4) Aresolution commending Dr. James Joseph, Director of the IATTC from July 1, 1969,
through June 30, 1999, for his dedicated service and for his many achievements was adopted. (5) A protocol to amend the IATTC convention to permit the adherence of the European
Union was adopted, and representatives of Ecuador, France, the United States, and Vanuatu signed it. The protocol must be ratified by all members of the IATTC before it becomes effective.
(6) Aresolution concerning fish-aggregating devices (FADs) and bigeye tuna was adopted. Two of the member nations were not represented at the meeting at that time, however, and sub-sequently those nations objected to the resolution. The matter was subsequently reconsidered at the 64th meeting of the IATTC, held in July 1999.
(7) Aworking group on finance was established.
64th meeting of the IATTC
The 64th meeting ofthe IATTC was held in La Jolla, California, USA, on July 21-22,1999. Mr. William Gibbons-Fly of the United States served as Chairman. Representatives of the member governments of Costa Rica, Ecuador, France, Japan, Mexico, Nicaragua, Panama, the United States, Vanuatu, and Venezuela attended, as did observers from Colombia, the European Union, Spain, the Center for Marine Conservation, the Humane Society of the United States, the Whale and Dolphin Conservation Society, and the World Wildlife Fund.

9 ANNUAL REPORT 1999
The following actions were taken: (l) Aresolution establishing a catch quota of 40,000 mt for bigeye tuna was adopted. This
would be implemented by prohibiting sets on all types of floating objects when the limit was reached.
(2) Aresolution on FADs was adopted. This would be implemented by (l) prohibiting the transshipment oftuna caught by purse seiners in the EPO unless the transfer ofthe fish occurred in port and (2) prohibiting the use of tender vessels operating in support of vessels fishing on FADs in the EPO.
65th meeting of the IATTC
The 65th meeting of the IATTC was held in La ,Jolla, California, USA, on October 4-10, 1999. Mr. Svein Fougner of the United States was appointed Chairman of the IATTC, and presided at the meeting. Representatives of all the member governments attended the meeting, as did observers from Colombia, the European Union, Guatemala, Peru, Spain, Taiwan, the Comisi6n Permanente del Pacifico Sur, the International Whaling Commission, Organizaci6n Latinoamericana de Desarrollo Pesquero, Organizaci6n del Sector Pesquero yAcuicola del Istmo Centroamerica, the Center for Marine Conservation, the Humane Society of the United States, the Whale and Dolphin Conservation Society, and the World Wildlife Fund.
The following actions were taken: (1) Aresolution for restricting fishing for yellowfin in 1999 after the catch of that species
in the Commission's Yellowfin Regulatory Area (CYRA) reached 240,000 mt was adopted. This resolution required that fishing for yellowfin by purse seiners and baitboats cease in two areas, one off Mexico and the other off northern South America. It also required that fishing for yel-lowfin by purse seiners and baitboats be curtailed in the CYRA on December 2, 1999, or when the catch of yellowfin in the CYRA reached 265,000 mt, whichever came first.
(2) Aresolution on the conservation of bigeye was adopted. This resolution established a limit of40,000 mt on the catch ofbigeye in the EPO in 2000, which would be implemented by pro-hibiting sets on floating objects if the limit were reached before the IATTC meeting of June 2000.
(3) Adraft resolution prepared by the Working Group on Finance was adopted. (4) Aresolution on bycatches was adopted.
MEETINGS OF IATTC WORKING GROUPS
Second meeting of the Permanent Working Group on Fleet Capacity
The second meeting of the Permanent Working Group on Fleet Capacity was held in La Jolla, California, USA, on October 8-9, 1999. Ambassador Jean-Fran~ois Pulvenis of Venezuela served as Chairman. A draft proposal for limitation of fleet capacity was circulated and dis-cussed, but not accepted. It was agreed that the working group would meet again in San Jose, Costa Rica, on January 26-28, 2000.
First meeting of the Working Group on Fish.Aggregating Devices (FADS)
This working group, which was established by a resolution adopted at the 62nd meeting of the IATTC on October 15-17, 1998, met in Ensenada, Mexico, on January 27, 1999. Lie. Mara

10 TUNA COMMISSION
Murillo Correa of Mexico presided at the meeting, which was attended by representatives of Colombia, Costa Rica, Ecuador, El Salvador, the European Union, France, Guatemala, Japan, Mexico, Nicaragua, Peru, Spain, Taiwan, the United States, Vanuatu, Venezuela, and the envi-ronmental community. Proposals submitted by Ecuador, the European Union and Spain, Mexico, and the United States were discussed, and it was agreed that the IATTC staff would analyze these proposals and prepare a report describing its results. This report would be considered at the next meeting of the working group, which would take place before the 63rd meeting of the IATTC (June 7-9, 1999), so that its recommendations could be presented at the IATTC meeting.
Second meeting of the Working Group on Fish-Aggregating Devices (FADS)
The second meeting of the Working Group on Fish-Aggregating Devices was held in Guayaquil, Ecuador, on June 7, 1999. Lic. Mara Murillo Correa of Mexico presided at the meeting, the purpose of which was to consider possible measures to regulate the use of FADs in the fishery for tunas in the eastern Pacific Ocean in accordance with a resolution approved by the IATTC at its 62nd meeting on October 17, 1998.
Informal consultations on a review of the IATTC convention
Informal consultations on a review of the IATTC convention were held in Ensenada, Mexico, on January 28, 1999. Views were exchanged concerning amending the convention by pro-tocol to allow for membership of regional economic integration organizations and separate-cus-toms territories.
Working Group on Bycatch
A meeting of the Working Group on Technology and Fishing Techniques, one of two sub-groups ofthe IATTC Working Group on Bycatch, was held in La Jolla, California, USA, on March 13-14,1999. The main objective was to provide the Purse-Seine Bycatch Working Group with a review of options, including those already available and those that could be developed, to reduce the bycatches in the fishery.
Ameeting of the Working Group on Ecological Studies and Modeling, the second subgroup of the IATTC Working Group on Bycatch, was held in La Jolla on April 26-28, 1999. The group discussed various approaches for developing an ecosystem model for the tropical eastern Pacific Ocean. The purpose of this type of modeling is to provide an ecological basis for limiting or reducing the bycatch. Based on the best information available, the predator-prey relationships of the principal members of the food web are hypothesized, and the effects of alternative fishing strategies on the bycatch and target species are explored.
The first report of the Working Group on Bycatch was distributed at the 63rd meeting of the IATTC. Parts ofthe contents of an appendix ofthis report dealing with ecological studies and modeling are summarized in the section of this report entitled ECOLOGICAL STUDIES.
First meeting of the Working Group on Finance
The first meeting of the Working Group on Finance was held in La Jolla, California, USA, on October 7-10,1999. Dr. William Hogarth of the United States served as Chairman. Several drafts of a resolution for financing the IATTC were considered, and one was presented to the ple-nary. Financing of the IATTC would be considered further at the next meeting of the Working Group, scheduled for February 9-10, 2000.
11 ANNUAL REPORT 1999
INTERGOVERNMENTAL MEETINGS
38th Intergovernmental Meeting
The 38th Intergovernmental meeting was held in Miami, Florida, USA, on March 15-16, 1999. Dr. William Hogarth of the United States presided at the meeting, which was attended by representatives of Costa Rica, Ecuador, EI Salvador, the European Union, Guatemala, Japan, Mexico, Nicaragua, Panama, Spain, Taiwan, the United States, Venezuela, and the environ-mental community. Aresolution inviting the eligible states and regional economic integration organizations that had not signed the Agreement on the International Dolphin Conservation Program to do so before May 14, 1999, was adopted.
39th Intergovernmental Meeting (lGM) and first meeting ofthe Parties to the Agreement on the International Dolphin Conservation Program
The 39th Intergovernmental Meeting and the 1st Meeting of the Parties to the Agreement on the International Dolphin Conservation Program were both opened in Guayaquil, Ecuador, on June 11, 1999. It was decided to combine the two meetings, and Mr. Brian S. Hallman of the United States was elected Chairman. Due to lack of time, the meetings did not progress beyond the discussion of the agendas for the meetings, and it was decided that they should be continued in La Jolla, California, on July 22, 1999. The meeting resumed, as planned, on that date. Representatives of Colombia, Costa Rica, Ecuador, the European Union, France, Japan, Mexico, Nicaragua, Panama, Spain, the United States, Vanuatu, and Venezuela were in attendance.
The following actions were taken: (1) The Tuna Tracking System, a system for monitoring the "dolphin-safe" status of tunas
caught in the EPO was approved. (2) Asystem for allocation of per-stock, per-year dolphin mortality limits for the year 2000
was approved.
MEETINGS OF THE AIDCP, THE IRP, AND AIDCP WORKING GROUPS
Second meeting of the Parties to the Agreement on the International Dolphin Conservation Program (AIDCP)
The second meeting of the Parties to the Agreement on the International Dolphin Conservation Program was held in La Jolla, California, USA, on October 11, 1999. Mr. William Gibbons-Fly of the United States served as Chairman. Representatives of Ecuador, EI Salvador, the European Union, Mexico, Panama, the United States, Vanuatu, and Venezuela (all members), Colombia, Costa Rica, Guatemala, Peru, and Taiwan (all non-members), the Center for Marine Conservation, the Humane Society of the United States, and the World Wildlife Fund were in attendance.
The following actions were taken: (1) Aresolution to support the on-board observer program and to establish a working group
to develop captain incentives was adopted. (2) A resolution committing the Parties to participate fully in dolphin necropsy studies
was adopted.

12 TUNA COMMISSION
Meetings of the International Review Panel
The International Review Panel ORP) has met three times each year since 1993. At the 20th, 21st, and 22nd meetings of the IRP the staff presented information from observer reports concerning possible infractions of the AIDCP, and these were reviewed by the IRP and, in some cases, referred to the government in question for appropriate action. Also, members of the IRP reported on actions taken by their governments in response possible infractions identified previ-ously by the Panel.
20th meeting of the International Review Panel
The 20th meeting of the IRP was held in Ensenada, Mexico, on January 25-26, 1999. Lie. Mara Murillo Correa of Mexico presided at the meeting, which was attended, as members, by rep-resentatives of Colombia, Costa Rica, Ecuador, El Salvador, France, Mexico, Nicaragua, Panama, Spain, the United States, Vanuatu, Venezuela, the tuna industry, and the environmental com-munity. Representatives of the European Union and the Programa Nacional de Aprovechamiento del Atun y Protecci6n de Delfines (PNAAPD) of Mexico attended as observers.
21st meeting of the International Review Panel
The 21st meeting of the IRP was held in Guayaquil, Ecuador, on June 4-5, 1999. Ab. Gustavo Gutierrez Vera of Ecuador presided at the meeting, which was attended by representa-tives of Colombia, Costa Rica, Ecuador, Mexico, Panama, Spain, the United States, Vanuatu, Venezuela, the tuna industry, and the environmental community. A representative of the European Union attended as an observer.
The IRP allocated 1999 second-semester Dolphin Mortality Limits (DMLs) of 20 dolphins to each o£1O vessels. These DMLs would become effective on July 1, 1999. As of June 4, requests had been received for 9 of the 37 vessels that had not utilized their DMLs to keep these for the remainder of the year, and 10 requests for second-semester DMLs were also received. The Panel approved all of these requests. Subsequently four additional requests for permission to maintain UDutilized DMLs were received, and these were eventually approved.
22nd meeting of the International Review Panel
The 22nd meeting of the IRP was held in Ensenada, Mexico, on October 1, 1999. Lie. Mara Murillo of Mexico presided at the meeting, which was attended by representatives of Colombia, Costa Rica, Ecuador, the European Union, Guatemala, Mexico, Panama, the United States, Vanuatu, Venezuela, the tuna industry, and the environmental community.
The Panel agreed that DMLs for 2000 would be assigned only to states that had ratified the AIDep and states or regional economic integration organizations that had formally com-mitted to apply it provisionally.
The Panel was informed that an Ecuadorian fishermen, Mr. Mario V. Rivera Mero, lost his life while deployed as a diver in a fishing vessel's net during dolphin-rescue procedures, and that the Director had sent a letter of condolence to Mr. Rivera's family.
Second meeting of the Working Group on Per-Stock, Per-Year Dolphin Mortality Limits
This working group, which was established by a resolution adopted at the 36th Intergovernmental Meeting on June 11, 1998, met in Ensenada, Mexico, on January 29, 1999.
13 ANNUAL REPORT 1999
Bio!. Harold Muller-Gelinek Ycaza of Ecuador presided at the meeting, which was attended by representatives of Colombia, Costa Rica, Ecuador, EI Salvador, the European Union, France, Guatemala, Japan, Mexico, Nicaragua, Panama, Spain, Peru, Taiwan, the United States, Vanuatu, Venezuela, and the environmental community. Proposals submitted by Colombia, Ecuador, Mexico, Spain, and the United States were discussed, and it was agreed that two pro-posals, one based on global limits and the other based on national limits, would be discussed at the 39th Intergovernmental Meeting, which would take place in Guayaquil, Ecuador, on June 8-10, 1999. The proposal based on global limits would be prepared by the United States, and that based on national limits would be prepared by Mexico.
Meeting of the Permanent Working Group on Tuna Tracking and Verification
This working group, which was formed in 1995, met in Ensenada, Mexico, on January 29, 1999, and in Miami, Florida, USA, on March 16, 1999. Several proposals for tuna tracking and verification were discussed at these meetings. It was agreed that a recommended system based on these discussions would be prepared prior to the 63rd meeting of the IATTC, which would take place in Guayaquil, Ecuador, on June 7-9, 1999.
ADMINISTRATION
BUDGET
At its 58th meeting, held in San Jose, Costa Rica, on June 3-4,1997, the Commission unan-imously approved the budget for the 1998-1999 fiscal year, submitted by the Director, in the amount of $4,553,226. However, the final amount received from the member states during the 1998-1999 fiscal year was $4,067,680, a shortfall of $485,546 relative to the amount that was rec-ommended and approved for the regular budget. As a consequence, some planned research had to be curtailed. In addition to its regular budget, during the 1998-1999 fiscal year the IATTC received $2,157,149 from vessel owners to pay part ofthe costs of placing observers on their ves-sels, as required by the Agreement on the International Dolphin Conservation Program, $8,100 from organizations which awarded contracts to the IATTC to perform various types of research, and $45,831 from interest and other sources.
FINANCIAL STATEMENT
The Commission's financial accounts for the 1998-1999 fiscal year were audited by KPMG LLP. Summary tables of its report are shown in Appendix 2 of this report.
INTER·AGENCY COOPERATION
During 1999 the scientific staff of the IATTC continued to maintain close contact with international, governmental, university, and private research organizations and institutions. This contact enabled the staff to keep abreast of the rapid advances and developments taking place in fisheries and oceanography research throughout the world. Some aspects of these rela-tionships are described below.
The IATTe's headquarters is located on the campus of Scripps Institution of Oceanography (SIG), University of California, La Jolla, California, USA, one of the major world centers for the study of marine science and the headquarters for federal and state agencies involved in fisheries,
14 TUNA COMMISSION
oceanography, and related sciences. This situation provides the staff with an excellent opportu-nity to maintain frequent contact with scientists of those organizations. Drs. James Joseph and Richard B. Deriso are members of the faculty of SIO, and Ms. Cleridy E. Lennert-Cody was reg-istered as a graduate student at SIO during 1999.
Drs. Joseph and Deriso also serve as members of the faculty of the University of Washington, Seattle, Washington, USA, and Dr. Joseph is also a member of the faculty of the Universidad Nacional Autonoma de Mexico, Mexico City. Drs. Martin A. Hall and Michael G. Hinton serve as members ofthe faculties of the University of British Columbia, Vancouver, B.C., Canada, and the University of San Diego, San Diego, California, USA, respectively. Drs. Joseph, Deriso, Hall, Hinton, and Robert J. Olson served on committees that supervised the research of graduate students at various universities during 1999.
The cordial and productive relationships that the IATTC has enjoyed with the Comision Permanente del Pacifico Sur (CPPS), the Convention for the Conservation of Southern Bluefin Tuna (CCSBT), the Food and Agriculture Organization (FAO) of the United Nations, the Indian Ocean Tuna Commission (IOTC), the International Commission for the Conservation ofAtlantic Tunas (ICCAT), the Organizacion Latinoamericana de Desarrollo Pesquero (OLDEPESCA), the Secretariat of the Pacific Community (SPC), and other international organizations have con-tinued for many years. Dr. Robin Allen was a member of the steering committee for a symposium, to be held in early 2000, on climate variability and its ecological impacts on the biota of the Pacific Ocean. The symposium is sponsored by the North Pacific Marine Science Organization (PICES), the IATTC, the International Pacific Halibut Commission, and the Interim Scientific Committee for Tuna and Tuna-Like Species in the North Pacific Ocean. The working title for the symposium is "Beyond EI Nino: Pacific Climate Variability and Ecological Impacts from the Tropics to the Arctic." Dr. Allen was also a member of the steering committee for the Expert Consultation on Implications of the Precautionary Approach: Tuna Biological and Technological Research, spon-sored by the CCSBT, FAO, the IATTC, ICCAT, the IOTC, and the SPC, which would meet in March 2000. Dr. Michael G. Hinton served as convener of the Working Group on Statistics and Data Collection for the consultation. Dr. George M. Watters participated in a meeting of the Working Group on Fish Stock Assessment of the Commission for the Conservation of Antarctic Marine Living Resources. Most of the working group's efforts were spent on assessing stocks of Patagonian toothfish. His expenses were paid by the U.S. National Marine Fisheries Service. Drs. Mark N. Maunder and George M. Watters were participants, with scientists from the National Research Institute of Far Seas Fisheries of Japan and the SPC, in a cooperative project to assess the condition ofthe stock(s) of bigeye tuna in the Pacific Ocean. This program receives its funding from the Pelagic Fisheries Research Program, University of Hawaii.
Also during 1999 the IATTC staff maintained close working relationships with fishery agencies of its member countries, and with similar institutions in many non-member countries in various parts of the world. Mr. Forrest R. Miller's studies of the effects of environmental condi-tions on the surface fishery for tunas, described in the subsection entitled OCEANOGRAPHY AND METEOROLOGY, were funded by Continental Weather Services, Inc.. Dr. Richard B. Deriso was a member of the Scientific and Statistical Committee of the Western Pacific Fishery Management Council of the United States. Dr. William H. Bayliff and Mr. Patrick K. Tomlinson were members of the editorial board of Investigaciones Marinas CICIMAR, published by the Centro Interdisciplinario de Ciencias Marinas, Instituto Politecnico Nacional, La Paz, Mexico, Dr. Ashley J. Mullen was Associate Editor of Natural Resource Modeling, a journal published by the Rocky Mountain Mathematics Consortium in association with the Resource Modeling Association, and Dr. Michael D. Scott was an Associate Editor of the journal Marine Mammal

15 ANNUAL REPORT 1999
Science. Dr. Scott was also Chairman of the Pacific Scientific Review Group, which has the responsibility of monitoring U.S. marine mammal management policies and research in the Pacific Ocean. In addition, Dr. Scott participated in joint research on Atlantic bottlenose dolphins with scientists from the U.s. National Marine Fisheries Service, the University of North Carolina at Wilmington, and the Woods Hole Oceanographic Institution. Dr. Felipe Galvan-Magana of CICIMAR and Dr. Robert J. Olson of the IATTC continued their joint study of the trophic inter-actions of yellowfin tuna, dolphins, and associated predators in the eastern Pacific Ocean described on pages 27-28 of the IATTC Annual Report for 1995. Dr. Olson was a co-convener, with Dr. James F. Kitchell of the University of Wisconsin, of the Working Group on Ecological Implications of Alternative Fishing Strategies for Apex Predators, sponsored by the National Center for Ecological Analysis and Synthesis (NCEAS), which is funded by the U.s. National Science Foundation and the state of California. The grant provided by the NCEAS will fund a series of workshops over two years to develop and evaluate a food web model for the tropical pelagic eastern Pacific Ocean. Dr. George M. Watters was also a member of the Working Group. Research on the swimbladder of yellowfin tuna was conducted jointly by Messrs. Kurt M. Schaefer of the IATTC and Charles W. Oliver of the Southwest Fisheries Science Center, U.S. National Marine Fisheries Service, La Jolla, California, USA. In addition, Messrs. Schaefer and Oliver collaborated with Drs. James J. Finneran and Sam H. Ridgway of the Biosciences Division, Space and Naval Warfare Systems Center, U.S. Navy, San Diego, California, USA, on a study of detection, by yellowfin tuna, oflow-frequency sounds produced by bottlenose dolphins.
Since 1977 the IATTC staff has been training observers for placement aboard tuna vessels to collect data on abundance, mortality, and other aspects of the biology of dolphins. In addition, these observers have collected stomach contents and samples of gonads and other tissues of tunas, recorded data on the incidental catches of species other than tunas and dolphins, recorded information on floating objects and the fauna and flora associated with them, etc. Government organizations, educational institutions, and industry representatives from the various countries involved have cooperated fully in the training and placement of these observers. Data collected by the observer program of Mexico were furnished to the IATTC staff for analysis.
Over the years, scientists and students from many countries have spent several weeks or months at the IATTC's headquarters in La Jolla and at its Achotines Laboratory learning new research methods and conducting research utilizing IATTC facilities and data. The visitors whose stays amounted to 2 weeks or more are listed in Appendix 1. Also, IATTC scientists have often rendered assistance with research on fisheries for tunas and other species to scientists of various countries while on duty travel to those countries, and occasionally have traveled to var-ious locations for the specific purpose of teaching or assisting with research programs.
The establishment by the IATTC of a research facility at Achotines Bay, Panama, described in the section entitled EARLY LIFE HISTORY STUDIES, gave the staff the opportunity to work more closely with Panamanian fisheries personnel. IATTC personnel have assisted local scientists in the implementation of research projects on species other than tunas, e.g. corvina-like fishes (Sciaenidae) and snappers (Lutjanidae), discussed in the subsection entitled Spawning and rearing ofpolla drum and spotted rose snappers.
Late in 1993, an agreement was reached by the OFCF of Japan, the government of the Republic of Panama, and the IATTC to undertake a joint five-year project, funded mostly by the OFCF, at the Achotines Laboratory. The project, which entered its initial stage in 1994, encom-passes research on the feasibility of culturing adult yellowfin tuna, corvina-like fishes, and snap-pers to supply larvae for research, and the production of food organisms for their larvae and juveniles. This project is described in the section entitled EARLY LIFE HISTORY STUDIES.

16 TUNA COMMISSION
In November 1999 it was recommended that the project be extended by an additional year, through March 2001.
Over the years, IATTC employees have collected tissue samples of tunas and billfishes for use in genetic studies conducted by scientists of other organizations. During 1999 samples of tis-sues of various species of tuna and tuna-like fishes were collected for the FISHTEC Genetics Laboratory, University of South Carolina, Columbia, South Carolina, USA.
IATTC staff members are also active in professional societies. During 1999 Dr. Martin A. Hall was a member of the Board of Directors of the National Fisheries Conservation Center, and Dr. Daniel Margulies served as the Western Regional Representative of the Early Life History Section of the American Fisheries Society.
DATA COLLECTION
The IATTC staff is concerned principally with the eastern Pacific Ocean (EPO; Figure 1), currently defined as the area bounded by the coastline of North, Central, and South America, 400 N, 1500 W, and 400 S.
During 1999 the IATTC had scientists and technicians in La Jolla and at its field offices in Manta, Ecuador; Ensenada and Mazatlan, Mexico; Panama, Republic of Panama; Mayaguez, Puerto Rico, USA; and Cumana, Venezuela. The personnel stationed at these offices collect land-ings data, abstract the logbooks of tuna vessels to obtain catch and effort data, measure fish and collect other biological data, and assist with the training, placement, and debriefing of observers aboard vessels participating in the International Dolphin Conservation Program. This work is carried out not only in the above-named ports, but also in other ports in California, Colombia, Costa Rica, Ecuador, Mexico, Panama, Peru, Puerto Rico, and Venezuela, which are visited regu-larly by IATTC employees. Personnel at these offices collected 1,359 length-frequency samples and abstracted the logbook information for 1,229 trips of fishing vessels during 1999. Also, the field staffs placed IATTC observers on 593 fishing trips by vessels participating in the International Dolphin Conservation Program. In addition, IATTC observers completed 609 trips during the year, and were debriefed by field staff members at their assigned stations.
CATCH AND EFFORT DATA FOR TUNAS AND BILLFISHES
The fleet
The IATTC staff maintains detailed records of gear, flag, and fish-carrying capacity for most of the vessels that fish at the surface for yellowfin (Thunnus albacares), skipjack (Katsuwonus pelamis), bigeye (Thunnus obesus), or bluefin (T. orientalis) tuna in the eastern Pacific Ocean (EPO; Figure 1). Detailed records are not maintained for most longline vessels, nor for sport-fishing vessels and small craft such as canoes and launches. However, catch data for most ofthe larger longline vessels, and for U.s.-flag sport-fishing vessels and some other vessels, are obtained from various sources and entered into the IATTC's data bases. The fleet described here includes purse seiners and baitboats that have fished all or part of the year in the EPO for yellowfin, skipjack, bigeye, or bluefin tuna.
The owners' or builders' estimates of vessel carrying capacities are used until landing records indicate that revision of these is appropriate. The vessels are grouped, by carrying capacity, into the following size classes for reporting purposes: class 1, less than 46 metric tons (mt); class 2, 46-91 mt; class 3, 92-181 mt; class 4, 182-272 mt; class 5, 273-363 mt; and class 6, more than 363 mt.
17 ANNUAL REPORT 1999
Until about 1960 fishing for tunas in the EPO was dominated by baitboats operating in the more coastal regions and in the vicinity of offshore islands. During the late 1950s and early 1960s most of the larger baitboats were converted to purse seiners, and by 1961 the EPO surface fleet was dominated by these vessels. During the 1961-1999 period the number of baitboats decreased from 93 to 14, and their total capacity from about 10 to 1 thousand mt. During the same period the number of purse seiners increased from 125 to 208, and their capacity from about 27 to 149 thousand mt. The peak in numbers and capacity of purse seiners occurred from the mid-1970s to the early 1980s, when the maximum number of vessels, 282, and the maximum capacity, about 168 thousand mt, were reached (Table 1).
The construction of new and larger purse seiners, which began during the mid-1960s, resulted in an increase in the total surface fleet capacity from about 42 thousand mt in 1966 to about 167 thousand mt in 1976. During the 1977-1981 period the fleet capacity remained fairly stable. During this period the construction of new vessels continued, but the new capacity was offset by losses due to sinkings and vessels leaving the fishery. A major El Nino event began in mid-1982 and persisted until late 1983. The catch rates in the EPO were low during the 1978-1981 period due to concentration of fishing effort on small fish, and the situation was exacerbated by the El Nino episode, which made the fish less vulnerable to capture. In 1982 the fleet capacity declined by about 16 thousand mt as vessels were deactivated or left the EPO to fish in other areas, primarily the western Pacific Ocean. This trend continued through 1983 as the catch rates in the EPO declined further, and the fleet capacity declined by about 48 thousand mt during 1983 and 1984. The fleet capacity in 1984, about 107 thousand mt, was the lowest it had been since 1971. In 1985, however, due primarily to the return of vessels from the western Pacific, the capacity increased to about 120 thousand mt, but in 1986 it decreased slightly to about 114 thou-sand mt. During 1987 and 1988 several new vessels were added to the fleet, and others returned to the EPO fishery from the western Pacific, causing the fleet capacity to increase to about 134 thousand mt. This was the greatest fleet capacity since 1982. In the spring of 1990 the U.S. tuna-canning industry adopted a policy of not purchasing tunas caught during trips during which sets on tunas associated with dolphins were made. This caused many of the U.s.-flag vessels fishing in the EPO to leave that fishery and enter the fisheries of the Atlantic or western Pacific, with a consequent reduction in the EPO fleet to about 101 thousand mt in 1992. With increases in par-ticipation of non-U.S.-flag vessels in the fishery, the capacity has increased steadily since 1992, and the 1999 capacity was about 151 thousand mt.
The 1998 and preliminary 1999 data for numbers and carrying capacities of purse seiners and baitboats that fished for tunas in the EPO are shown in Tables 2a and 2b. The EPO tuna fleet was dominated by vessels operating under the Mexican and Ecuadorian flags during 2000. The Mexican fleet has been the largest fleet since 1987, with about 26 percent ofthe total capacity during 1999, while vessels registered in Ecuador, Venezuela, Vanuatu, and Spain comprised 25, 15, 7, and 6 percent ofthe total capacity, respectively.
Class-6 purse seiners make up the majority ofthe total capacity ofthe fleet of vessels that fish at the surface for tunas in the EPO. This group of vessels comprised 89 percent of the total fishing capacity operating in the EPO during 1999.
The monthly average, minimum, and maximum capacities at sea (CAS), in thousands of metric tons, of vessels that fished at the surface for tunas in the EPO during 1989-1998, and the 1999 values, are shown in Figure 2. The monthly values are averages of the CAS estimates given in the Weekly Reports prepared by the IATTC staff. The fishery for yellowfin was regulated after November 25,1998, and after October 14,1999 (see the section entitled MEASURES FOR THE CONSERVATION OF TUNAS), so the CAS values for December of 1998 and October,
18 TUNA COMMISSION
November, and December of 1999 are not comparable to the CAS values for those months of1988-1997. Overall, the 1999 CAS values are greater than the 1989-1998 averages, although the per-centage of the fleet capacity at sea, 57 percent, was the same. During the 1989-1998 period the average CAS value was 65 thousand mt, but during 1999 it was 83 thousand mt.
The catches
Tunas
Estimates of the catches oftunas come from several sources, including logbooks kept by the fishermen, data recorded by observers, and unloading data provided by the canneries. The word "catch" in the text of this subsection, Figures 3-5, and Tables 4-6 and 8-9 refers to the retained catches, unless otherwise noted. The principal source of this information is unloading data. Some ofthe tunas caught are, for various reasons, discarded at sea. Data on fish discarded at sea by Class-6 vessels have been collected by observers since 1993. Annual estimates of the catches and discards of the various species of tunas landed by vessels of the EPO fleet that fish for tunas with surface gear are shown in Table 3. Recreational catches landed in California are included in the catch statistics. In the case of bluefin, these have become an increasingly important com-ponent of the catch in recent years.
The statistics for 1999 are compared to those for 1984-1998. There were no restrictions on fishing for tunas in the EPO during the 1980-1997 period. However, there were restrictions on fishing for yellowfin in the Commission's Yellowfin Regulatory Area (CYRA) (Figure 1) from November 26 through December 31,1998, and from October 14 through December 31,1999, and fishing for tunas associated with fish-aggregating devices (FADs) placed in the water by the fish-ermen was prohibited in the EPO from November 9 through December 31, 1999. Furthermore, regulations placed on purse-seine vessels directing their effort at tunas associated with dolphins have probably affected the way these vessels operate, especially during the late 1980s and the 1990s. As mentioned in the previous subsection, there was a major El Nino event during 1982-1983, which made the fish less vulnerable to capture and reduced the numbers of vessels in the EPO. The fishing effort remained relatively low during 1984-1986. During the 1997-1998 period another major El Nino event occurred in the EPO.
The average annual catch of yellowfin by surface gear in the CYRA during the 1984-1998 period was 217 thousand mt (range: 129 to 267 thousand mt), and the preliminary estimate for that area for 1999 is 265 thousand mt. The corresponding values for the area between the CYRA boundary and 1500W are 29 thousand mt (range: 17 to 47 thousand mt) for 1984-1998 and 32 thousand mt for 1999. The estimated 1999 yellowfin catch from the EPO, 297 thousand mt, is greater than that of any of the previous years and about 21 percent greater than the 1984-1998 average of 245 thousand mt (Table 3). The average annual amount of yellowfin discarded at sea during the 1993-1999 period was 5.5 thousand mt. '
During the 1984-1998 period the annual catch of skipjack in the EPO averaged 90 thou-sand mt (range: 49 to 162 thousand mt). The preliminary estimate of the 1999 skipjack catch in the EPO, 268 thousand mt, is greater than that of any previous year and nearly three times the average ofthe annual catches for the previous 15 years. The average annual amount of skipjack discarded at sea during the 1993-1999 period was 20.6 thousand mt.
Prior to 1994 the average catch of bigeye in the EPO by surface gear was about 5 thousand mt (range: less than 1 to 15 thousand mt). Since 1993 the catches have ranged from 29 thousand mt in 1994 to 52 thousand mt in 1997. The preliminary estimate ofthe 1999 bigeye catch in the

19 ANNUAL REPORT 1999
EPO is 41 thousand mt. These increasing catches of bigeye resulted from the discovery, made during the early 1990s, that tunas, principally skipjack, associated with floating objects, but well below the surface, can be detected with sonar and caught with purse seines. Many of these floating objects are FADs. The average annual amount of bigeye discarded at sea during the 1993-1999 period was 3.7 thousand mt.
While yellowfin, skipjack, and bigeye comprise the most significant portion of the catch made by vessels fishing for tunas at the surface in the EPO, bluefin, albacore (Thunnus alalunga), black skipjack, bonito (Barda orientalis), and other species contribute to the overall harvest in this area. The total catch of these other species in the EPO was about 5 thousand mt in 1999, well below the 1984-1998 average of 9 thousand mt (range: 2 to 17 thousand mt). Estimates of the discards of these species during the 1993-1999 period appear in Table 3.
The 1998 catches in the EPO, by flag, and the landings oftunas caught by surface gear in the EPO, by country, are given in Table 4a, and preliminary estimates of the 1999 catches and landings are given in Table 4b. The estimated catch of all species in the EPO during 1999 was about 611 thousand mt, which is much greater than the previous record total catch of 474 thou-sand mt, taken in 1997. Ecuadorian-, Mexican-, Venezuelan-, and Spanish-flag vessels harvested 34, 23, 11, and 9 percent, respectively, of the total EPO catch. The landings are fish unloaded during a calendar year, regardless of the year of catch. The country of landing is that in which the fish were unloaded from the fishing vessel or, in the case of transshipments, the country which received the transshipped fish. Preliminary landings data (Table 4b) indicate that, of the 632 thousand mt of tunas landed in 1999, 44 percent was landed in Ecuador, 19 percent in Mexico, 11 percent in Colombia, 6 percent each in Costa Rica and Venezuela, and 4 percent in the United States. It is important to note that when final information is available the landings cur-rently assigned to various countries may change due to exports from storage facilities to proces-sors in other nations.
Tunas are caught by surface gear in three types of schools, those in which the fish are asso-ciated with dolphins, those in which the fish are associated with floating objects, such as flotsam or FADs, and those in which the fish are associated only with other fish (unassociated schools). Estimates of the numbers of purse-seine sets of each type in the EPO during the 1987-1999 period, and the catches ofthese sets, are listed in Table 5. The estimates for Class-1 to -5 vessels were calculated from logbook data in the IATTC statistical data base, and those for Class-6 ves-sels were calculated from logbook data and from the observer data bases of the IATTC, the Programa Nacional de Aprovechamiento del Atun y de Protecci6n de Delfines (PNAAPD) of Mexico, the Programa Nacional de Observadores de Venezuela (PNOV), and the U.S. National Marine Fisheries Service. The greatest numbers of sets on schools associated with floating objects and on unassociated schools of tuna were made during the period from the mid-1970s to the early 1980s. Despite opposition to fishing for tunas associated with dolphins and the refusal of u.s. canners to accept tunas caught during trips during which sets were made on dolphin-asso-ciated fish, the numbers of sets made on fish associated with dolphins decreased only moderately during the mid-1990s, and in 1998 were the greatest since 1990.
There are two types of floating objects, flotsam and FADs. The occurrence of the former is fortuitous, whereas the latter are constructed by fishermen specifically for the purpose of attracting fish. FADs have been in use for only a few years, but their importance has increased during that period while that offlotsam has decreased, as shown by the data on numbers and per-centages of the sets made on floating objects by Class-6 vessels with IATTC observers aboard.

20 TUNA COMMISSION
1992 1993 1994 1995 1996 1997 1998 1999 No. % No, % No. % No. % No. % No. % No. % No. %
Flotsam 1,087 61.7 1,138 55.2 773 27.9 729 20.7 537 13.4 832 14.7 752 13.7 833 18.0 FADs 556 31.5 825 40.0 1,899 68.6 2,704 76.8 3,447 86.0 4,768 84.4 4,627 84.4 3,758 81.3 Unknown 120 6.8 100 4.8 98 3.5 88 2.5 23 0.6 52 0.9 102 1.9 29 0.6
The average annual distributions of the logged catches of yellowfin and skipjack by purse seiners in the EPO during the 1984-1998 period are shown in Figures 3a and 4a, and preliminary estimates for 1999 are shown in Figures 3b and 4b. During 1999 the catches of yellowfin were relatively greater north of about 5°N and west of about 85°W. Those of skipjack were relatively greater offshore along 5°N between about 800W and 135°W and relatively less in nearshore waters off Baja California and off Central America and northern South America.
Bigeye are not often caught by surface gear north of about 7°N. The catches of bigeye by purse seiners during the 1994-1998 period were made in two principal areas, (1) between about 6°N and 16°S from about 93°W to 1400 W, and (2) between about 3°N and the equator from about 82°W to 88DW(Figure 5a). Apreliminary estimate of the distribution of catches of bigeye by purse seiners in the EPO during 1999 is shown in Figure 5b. With the development of the fishery for tunas associated with floating objects, described above, the relative importance of the nearshore areas has decreased, while that of the offshore areas has increased.
The total catch per ton of carrying capacity (CPTCC) for the vessels that fish at the surface for tunas in the EPO provides an index of trends in annual relative gross income for vessels of various size groups. To provide more detail in this index than would be available if the rATTC's historical six classes of vessel capacity classification were used, the vessels are assigned to fol-lowing size groups: 1, <301 short tons (st) (273 metric tons (mt)); 2, 301-400 st (273-363 mt); 3, 401-600 st (364-544 mt); 4, 601-800 st (545-726 mt); 5, 801-1000 st (727-907 mt); 6,1001-1200 st (908-1089 mt); 7, 1201-1400 st (1090-1270 mt); and 8, >1400 st (1270 mt).
Estimates of the CPTCCs for the 1990-1999 period are presented in Table 6 for the EPO and for all ocean fishing areas from which vessels of the EPO tuna fleet harvested fish, by size group, area, and species. Yellowfin and skipjack contribute the most to the CPTCCs for the larger vessels, while other species, which include other tunas, and also miscellaneous other fishes, make up an important part of the CPTCCs of the smaller vessels in many years. Bigeye became more important for the larger vessels after 1993. During earlier years, and years during which the majority of the EPO tuna fleet exerts most of its fishing effort in the EPO, the CPTCCs for the EPO and all ocean fishing areas are nearly the same. During the 1990-1998 period the CPTCC in the EPO for all vessels and all species averaged 3.3 mt , with a range of 2.9 to 3.7 mt; for yel-lowfin it averaged 2.1 mt, with a range of 1.9 to 2.3 mt, and for skipjack it averaged 0.9 mt, with a range of 0.6 to 1.3 mt. The corresponding average for bigeye for the 1994-1998 period was 0.3 mt, with a range of 0.3 to 0.4 mt. The preliminary estimates for 1999 are 4.1, 2.0,1.8, and 0.3 mt for all species, yellowfin, skipjack, and bigeye, respectively.
Billfishes
Swordfish (Xiphias gladius) are fished in the EPO with longline gear and gillnets, and occasionally with recreational gear. Most of those caught with commercial gear are retained. Marlins (Makaira nigricans, M. indica, and Tetrapturus audax), shortbill spearfish (T. angustirostris), and sailfish (lstiophorus platypterus) are fished with longline and recreational gear, and they comprise a small part of the bycatches of purse-seine vessels. Most of the longline-caught marlins, spearfish, and sailfish are retained, and most of those caught with commercial

21 ANNUAL REPORT 1999
surface gear are discarded at sea. Information on the commercial catches and bycatches of bill-fishes in the EPO is given in Table 7.
Under the terms of the convention that established the IATTC, the primary objective of the IATTC staff's research is monitoring the condition of the stocks of tunas and other species taken in the EPO by tuna fisheries. Taking into consideration the extensive movements of the tunas and billfishes, the mobility of the vessels of the tuna fleets of various nations, and the interna-tional nature of the trade in these species, statistics on the catch and effort from the EPO must be viewed in the light of global statistics. Statistics of the catches of tunas, tuna-like fishes, and billfishes during 1970-1999, by oceans, appear in Tables 8 and 9.
SIZE COMPOSITIONS OF THE CATCHES OF TUNAS
Length-frequency samples are the basic source of data used for estimating the size and age compositions of the various species offish in the landings. This information is necessary to obtain age-structured estimates of the population for various purposes, including age-structured popu-lation modeling. The results of age-structured population modeling can be used to estimate recruitment, which can be compared to spawning biomass and oceanographic conditions. Also, the estimates of mortality obtained from age-structured population modeling can be used, in con-junction with growth estimates, for yield-per-recruit modeling. The results of such studies have been described in several IATTC Bulletins and in all of its Annual Reports since that for 1954.
Length-frequency samples of yellowfin, skipjack, bigeye, Pacific northern bluefin, and black skipjack from purse-seine, baitboat, and recreational catches made in the eastern Pacific Ocean (EPO) are collected by IATTC personnel at ports oflanding in Ecuador, Mexico, Panama, the USA (California and Puerto Rico), and Venezuela. The catches of yellowfin and skipjack were first sampled in 1954, and sampling has continued to the present.
The staff processed 684 yellowfin, 471 skipjack, 71 bigeye, 63 Pacific northern bluefin, and 4 black skipjack samples from the 1999 catch. (The total number of samples processed is slightly less than the number collected (page 16) because it was later found out that some of the samples collected contained fish from more than one area-time stratum.) Most ofthese were 50-fish sam-ples. For all of the above species except black skipjack the length-frequency samples are strati-fied by sampling areas (Figure 6), months, and years. The sampling procedures are explained in detail in IATTC Bulletin, Vol. 20, No.6.
Figure 7a consists of histograms showing the estimated catches of yellowfin in the sam-pling areas of the EPO (Figure 6) in 1999. Although the size range is approximately the same in all areas, with nearly all of the fish being between 40 and 160 cm in length, the distributions differ considerably from area to area. The average weights range from 2.1 kg in Area 13 to 20.3 kg in Area 2.
Histograms showing the estimated catches of yellowfin in the CYRA (all areas except 10 and 11 in Figure 6) during each year of the 1994-1999 period appear in Figure 7b. Alarge por-tion of the 1999 yellowfin catch consisted of smaller fish, resulting in an average weight (8.1 kg) less than that of any year of the past decade.
Figure 7c consists of histograms showing the estimated catches of yellowfin in the area between the CYRA boundary and 1500W(Areas 10 and 11 in Figure 6) during each year of the 1994-1999 period. During 1999 the catch of small yellowfin exceeded those ofprevious years. The

22 TUNA COMMISSION
average weight was less than that of any previous year since the fishery began during the late 1960s. The mean size has been declining almost continuously since 1994.
Histograms showing the estimated catches of skipjack in the sampling areas of the EPO (Figure 6) in 1999 appear in Figure 8a. The data for Areas 1 and 8, Areas 2, 4, and 5, and Areas 6 and 13 have been combined, since the catches were low in some of those areas (Figure 4b), The majority of the skipjack catch was taken in Area 7.
Figure 8b consists of histograms showing the estimated catches of skipjack in the EPO for each year of the 1994-1999 period. The average weight for 1999, 3.5 kg, was the greatest of the 6-year period.
Prior to 1994 the surface catch of bigeye in the EPO was incidental to that of yellowfin and skipjack, and the annual catches (Table 3) and numbers of length-frequency samples taken were considerably less than those of yellowfin and skipjack. During 1994-1999, however, more bigeye were caught and more samples were obtained. Histograms showing the estimated catches of bigeye in the sampling areas of the EPO (Figure 6) during 1999 appear in Figure 9a. The greatest catch occurred in Area 7. In addition, the average weight of bigeye caught in that area was greater than that of any of the other four areas.
Figure 9b consists of histograms showing the estimated catches of bigeye in the EPO during each year of the 1994-1999 period. The average weight for 1999, 9.2 kg, was greater than those of 1996-1998, and similar to those of 1994 and 1995. The upper limit of the size range has decreased from about 180 cm (1994-1996) to about 150-160 cm (1997-1999),
Pacific northern bluefin are caught by surface gear off California and Baja California from about 23°N to 35°N, with most of the catch being taken during May through October. During 1999 bluefin were caught between 27°N and 37°N, and most of the catch was taken during June, July, and August. Histograms showing the estimated catches of bluefin during each year of the 1994-1999 period appear in Figure 10.
The numbers of samples obtained from the commercial and recreational catches during recent years were as follows:
Year Commercial Recreational 1990 14 0 1991 4 0 1992 1 1 1993 4 35 1994 2 11 1995 6 16 1996 67 5 1997 17 9 1998 23 22 1999 51 12
The greatest number of samples was taken in 1996, a year of unusually high catches. The number of samples taken from the commercial fleet during 1999 was greater than during most of the previous few years.
Black skipjack are caught incidentally by fishermen who are directing their effort toward yellowfin, skipjack, and bigeye tuna. The demand for this species is low, so most of the catch is discarded at sea, but small amounts, mixed with the more desirable species, are sometimes retained. Annual percentage length-frequency distributions of black skipjack caught in the EPO
23 ANNUAL REPORT 1999
during 1994-1999 are shown in Figure 11. The average weights for 1994 and 1999 were the least and greatest, respectively, for the 6-year period, but this may not be significant, as few samples of black skipjack have been taken. No attempt has been made to estimate the weights of the catches by length intervals.
OBSERVER PROGRAM
The IATTC employs observers, who keep counts of dolphin mortalities during fishing oper-ations, and these data are used by the IATTC staff to make its annual estimates of dolphin mor-tality. The observers also record data on herds of dolphins sighted that may be used to make estimates of the relative abundance of dolphins. Information recorded on the conditions coinci-dent with mortality of dolphins is used to study the causes of dolphin mortality, and the knowl-edge gained from those studies is shared with the fishermen through the IATTC's educational activities, such as seminars for tuna boat captains and crew members and analyses of the per-formances of individual captains. In addition, since late 1992, the observers have recorded data on fish and other animals discarded at sea.
Coverage
The design for placement of observers during 1999 called for 100-percent coverage of fishing trips in the EPO by all Class-6 purse seiners (carrying capacity greater than 363 metric tons (400 short tons)). All trips by vessels of fleets other than that of Mexico were to be sampled by the IATTC Tuna-Dolphin Program. Half of the trips of vessels of the Mexican fleet were to be sampled by observers of its national program (Programa Nacional de Aprovechamiento del Attin y Protecci6n de Delfines (PNAAPD)) and the remainder by IATTC observers.
During 1999 observers from the IATTC and Mexican programs departed on 687 fishing trips. In addition, 54 vessels whose last trip of 1998 carried over into 1999 had observers aboard, bringing the total to 741 trips sampled in 1999 by the IATTC and Mexican programs. The IATTC sampled vessels operating under the jurisdictions of Belize, Colombia, Ecuador, EI Salvador, Guatemala, Honduras, Mexico, Panama, Spain, the United States, Vanuatu, and Venezuela.
One trip by a Class-6 vessel was not observed. The vessel had previously been classified as a Class-5 vessel (carrying capacity of 273-363 metric tons (301-400 short tons)), but it was re-classified as Class 6 in September when the flag government informed the IATTC that it had determined that the vessel's carrying capacity was greater than 363 metric tons, and that it should begin participating in the mcp. The vessel made one complete fishing trip without an observer after the re-classification.
The sampling coverage of vessels of the international fleet by the IATTC and Mexican pro-grams is summarized in Table 10. Over 86 percent of all trips of Class-6 vessels were sampled by the IATTC program, and 99.9 percent were sampled by the two programs combined.
Observer training
Two courses for training IATTC observers in the collection ofdata aboard tuna vessels were held during 1999, one in March in Panama, R.P., for 12 trainees, and the other in November-December in Guatemala City, Guatemala, for 16 trainees. The trainees were instructed in the identification oftunas and other large pelagic fishes, marine mammals, turtles, and seabirds, the requirements and procedures for data collection, methods for estimating the sizes of herds of marine mammals, fishing gear and operations, and shipboard protocol and safety.

24 TUNA COMMISSION
Venezuelan National Observer Program
In 1999 the Venezuelan government announced the creation of the Programa Nacional de Observadores (PNO), which is operated under the auspices of the Fundaci6n para la Pesca Sostenida y Responsable de Tunidos. The program conducted a training course for observers in November 1999, and planned to begin placing observers on approximately 25 percent of the trips of its vessels in early 2000. The IATTC and the PNAAPD of Mexico have provided logistical sup-port to the PNO.
At-sea reporting by observers
Article Y.2 of the Agreement on the International Dolphin Conservation Program (AIDCP) calls for the establishment of per-stock per-year dolphin mortality limits. In order to monitor that mortality on a current basis, and also to better monitor the cumulative catch of the principal tuna species in the EPO, the Parties to the AIDCP approved an at-sea reporting form that observers from the IATTC and national observer programs are to fax from their vessels to their respective offices on a weekly basis.
RESEARCH
COMPARISON OF ESTIMATES OF THE CATCHES OF BIGEYE TUNA MADE BY OBSERVERS AND FISHERMEN
Estimates of the catches of bigeye tuna are available from three principal sources, observer records, bridge logbooks, and unloading weight data from processors (mainly canners). The bridge logbooks frequently report estimates of the weights of the catches for a group of combined species taken during a set, e.g. yellowfin and bigeye or skipjack and bigeye. In addition, the pro-cessors sometimes do not distinguish between yellowfin and bigeye in the unloading data, reporting unloadings containing both species as all yellowfin or all bigeye. The data available as of September 27, 1999, included 351 trips made by Class-6 purse-seine vessels during 1998-1999 for which observer, bridge logbook, and unloading data were available. For 14 of these trips the bridge logbooks reported catches of bigeye mixed with yellowfin and/or skipjack, and in each of these catches of bigeye were reported in the observer and unloading records.
Catches of bigeye were reported for 170 of the 351 trips (153 of the observer records and 159 of the unloading records) (Table 11). In 142 cases catches of bigeye were reported in both the observer and the unloading records. For 97 of the 170 trips (57 percent), the observer's estimate of the bigeye catch was greater than the unloading estimate. The observer estimates for these 170 trips were, on average, 45 mt greater than the unloading estimates, with the difference (observer estimate minus unloading estimate) ranging from -372 to 622 mt.
Catches of bigeye were reported in the unloading data for 145 of the 337 trips for which the bridge logbooks reported catches by species (351 minus the 14 trips with bigeye catches reported in mixed-species categories) (Table 11). Bigeye were also reported in the bridge logbooks for 99 of these trips. There were no trips for which bigeye were reported in the bridge logbook, but not in the unloading data. In 88 of the 145 trips (61 percent) the logbook estimate of the bigeye catch was less than the unloading estimate. The logbook estimates for these 145 trips were, on average, 35 mt less than the unloading estimates, with the difference (logbook estimate minus unloading estimate) ranging from -636 to 497 mt.
It is clear from these comparisons that, on average, when bigeye have been identified in the catch by observers, fishermen, and processors, the catches estimated by the observers, on

25 ANNUAL REPORT 1999
average, are greater than the corresponding unloading estimates (Figure 12a), while those of the fishermen are less than the corresponding unloading estimates (Figure 12b).
DISCARDS AND BYCATCHES IN THE PURSE·SEINE FISHERY FOR TUNAS
IATTC observers began to collect information on discards and bycatches during purse-seine fishing operations in late 1992, and this program continued through 1999. In this report "catches" refers to fish that are retained aboard the fishing vessel, "discards" to commercially-important tunas (yellowfin, skipjack, bigeye, bluefin, and albacore) that are discarded dead at sea, "bycatches" to fish or other animals, other than commercially-important tunas, that are dis-carded dead at sea, and "total catches" to the sums of the first three categories. During 1999 the data collected during previous years were reviewed and revised when appropriate. Information on the coverage of sets on tunas associated with dolphins and with floating objects and on unas-sociated tunas is given in Table 12. Column 3 of this table lists the numbers of sets in the IATTC data base for which bycatch and discard data were recorded and Column 4 the numbers of sets in the IATTC Tuna-Dolphin data base, plus equivalent data collected by the U.s. National Marine Fisheries Service (U.s. NMFS) and the Programa ~acional de Aprovechamiento del Atlin y Protecci6n de Delfines (PNAAPD) of Mexico. (The numbers of sets for 1993, 1998, and 1999 in Column 4 of this table match those for Class-6 vessels in Table 5 because there were no observers on smaller vessels during those years. There were observers on some Class-5 vessels during 1994-1997, so the values for those years in Table 12 are greater than the corresponding values in the Class-6 columns of Table 5.) The coverage of vessels with observers is incomplete, but ade-quate for most statistical purposes.
The discards and bycatches on trips of vessels with observers aboard were estimated by
DISCARDS = (discard/set) x SETS and
BYCATCHES = (bycatchlset) x SETS
where DISCARDS and BYCATCHES = discards and bycatches for all trips with observers aboard, discard/set and bycatchlset = discards and bycatches per set for all sets for which IATTC observers collected discard and bycatch data, and SETS = all sets for trips with observers aboard (Table 12, Column 4). These estimates are less than they would be if data for smaller vessels, which fish almost entirely on unassociated schools and floating objects, were included.
Patterns of fishing effort by set type
The estimated numbers of sets made on tunas associated with dolphins, on tunas associ-ated with floating objects, and on unassociated schools of tunas are shown in Table 5. Two types of floating objects, fish-aggregating devices (FADs) and flotsam, are recognized. FADs are objects placed in the water by fishermen to attract fish. Flotsam includes various kinds of debris, and also boats and drifting and anchored weather buoys. In recent years a fishery for tunas associ-ated with FADs has developed, mostly south of lOON. Because the use of FADs is a new develop-ment in the fishery, it is important to monitor it to understand its main characteristics, the areas in which it occurs, and the species compositions of the catches, discards, and bycatehes. These characteristics are briefly described in this section. Data for years previous to 1996 are not shown in the figures because the range of the fishery on tunas associated with floating objects was much more limited prior to that year.
26 TUNA COMMISSION
The distributions of sets on flotsam and FADs by Class-6 vessels during 1996-1999 are shown in Figures 13a and 13b, respectively. The numbers of sets on FADs far exceeded those on flotsam. Sets on flotsam occur mostly in the Panama Bight and the southernmost section of the fishery offPeru. FADs are used mostly along two latitudinal strips: one between the Equator and about 7°N, and the other between the Equator and about 12°8. These will henceforth be called the "northern strip" and the "southern strip." There is a gap between the two strips, which is probably caused by the west-to-east flow of the Equatorial Countercurrent.
The proportions of the floating-object sets that were made on FADs during the 1993-1999 period are shown in Table 13; the increase in the proportion of sets on FADs coincided with a transfer of effort from coastal to more offshore areas.
Discards of tunas: spatial and temporal patterns
Tunas that are caught may be discarded for several reasons: they may be too small for pro-cessing, they may spoil in the net during a long set, the amount of catch may exceed the empty capacity of the vessel, etc. Most of the discards are fish too small for processing. It is important to quantifY and describe the patterns of the discards, because the total catches, rather than just the retained catches, should be used in assessments of the status of the stocks.
The distributions of the catches and discards of yellowfin from sets made in association with floating objects during 1996-1999 are shown in Figures 14a and 14b, respectively. The catches of yellowfin were greatest in the northern strip and off Peru, but relatively low. The dis-cards of yellowfin were greatest in the northern strip, and considerably less in the coastal areas.
The distributions of the catches and discards of skipjack from sets made in association with floating objects during 1996-1999 are shown in Figures 15a and 15b, respectively. As skipjack is the principal target of the floating-object fishery, the distribution of the catches is similar to that for the effort.
The distributions ofthe catches and discards of bigeye from sets made in association with floating objects during 1996-1999 are shown in Figures 16a and 16b, respectively. The catches of bigeye were greatest in the northern and southern strips. The California Current area, in the northern section, produced only negligible catches of bigeye. The distribution of the discards of bigeye was more limited, and concentrated in the northern strip, especially between 952 and 1WW. Annual estimates of tuna catches and discards
The average total catches per set, the average discards per set, the discard/total catch ratios, and the estimated total discards of yellowfin, skipjack, and bigeye in the EPO during the 1993-1999 period are shown in Tables 14a, 14b, and 14c, respectively. Nearly all of these values and estimates varied considerably from year to year. Year-to-year differences in the total catches could be due to differences in abundance of the fish and/or differences in the areas offishing, cou-pled with differences in the amounts of the various species in different areas. Year-to-year dif-ferences in the discards could be due to different policies for retention of fish, differences in recruitment, and/or differences in the areas of fishing, coupled with differences in the amounts of smaller fish in different areas.
The table below summarizes the information in Tables 14a, 14b, and 14c.

27 ANNUAL REPORT 1999
Species Set type Average total catch per Discards per set (mt) set (mt)
Range Average Range Average Yellowfin Dolphin 15-19 17
Floating-object 5-10 6 0.5-1.5 0.9 Unassociated 8-13 10 0.1-0.3 0.2
Skipjack Floating-object 20-43 26 4-6 5 Unassociated 3-11 5 0.1-0.7 0.3
Bigeye Floating-object 4-14 10 0.3-1.4 0.9 Unassociated 0.2-0.7 0.4
Bycatches ofother species
Ofthe species taken incidentally in the tuna purse-seine fishery, there are some, besides dol-phins, that have long life spans, delayed onsets of sexual maturity, small litter sizes, and/or pro-longed gestation periods. Because of these life-history characteristics, the ability of these species to withstand heavy exploitation is inferior to those of species with higher reproductive potentials. The former group includes sharks, rays, billfishes, and sea turtles (SRBST). In order to synthe-size information on the impacts of the fishery, the numbers of individuals of all species in this group have been added together. This combination ofheterogeneous units is undesirable from con-servation or management points of view, but as a first approach it provides a crude picture of the spatial and temporal distributions of the impact ofthe fishery. In the future, it may be possible to develop indices that attribute different "weights" to the different species, based on their status, etc. Because of the numerical predominance of sharks in the bycatches of SRBSTs, the overall results for this aggregate of species are similar to those for sharks alone, but in some area-time strata the results for the SRBSTs are distinctly different from those for the sharks alone.
The accumulated bycatches for the SRBSTs for the 1996-1999 period are shown in Figure 17. The areas with the higher values are similar to those with the greatest amounts of sets on floating objects (Figures 13a and 13b), but the data reveal some interesting points. First, the bycatches for the SRBSTs are less for the southern strip than for the northern one. Second, along both strips the offshore bycatches tend to be less than the inshore bycatches. Third, the bycatches in the northern Ecuador, northern Peru, and offshore California Current areas are important, but less so than those of the northern strip. Fourth, there are substantial bycatches in some coastal areas.
The ratios of SRBST bycatches to the catches of the main three tuna species during 1996-1999 are shown in Figure 18. This ratio indicates the "ecological cost" (measured in terms of SRSBTs only) offishing for tunas in various areas. The data show that the ratios are highest off-shore north of 7QN and in several much smaller coastal areas, including the Panama Bight (slightly north of Ecuador), off northern Peru, around the tip of Baja California, and off the Gulf of Tehuantepec.
Some of these species are discussed in greater detail below.
Blue marlin
Most of the bycatches of blue marlin occur off northern Peru, off northern Ecuador, and in the northern strip (Figure 19). The annual average bycatch of blue marlin for the 1996-1999 period was 813 individuals, with 80 percent coming from floating-object sets (IATTC Annual Report for 1998: Table 40).
28 TUNA COMMISSION
Sea turtles
The bycatches of sea turtles during the 1993-1999 period were as follows:
1993 1994 1995 1996 1997 1998 1999 151 117 146 152 135 170 162
About 60 percent of these bycatches came from floating-object sets. Ofthe 162 sea turtles caught in 1999, 108 were olive ridleys (Lepidochelys olivacea), 13 were other species, and 41 were uniden-tified. The locations of the bycatches of sea turtles during 1996-1999 are shown in Figure 20. Several of these are close to nesting beaches.
Manta rays
Two genera of manta rays, Manta and Mobula, are caught by purse-seine vessels fishing for tunas in the EPO. The locations of the bycatches of manta rays during 1996-1999 are shown in Figure 21. The distribution of manta rays is more restricted than that of any of the other species discussed in this report. The greatest concentration occurred in the vicinity of the Costa Rica Dome, and other concentrations occurred off the Gulf of Tehuantepec and in the Panama Bight.
GROWTH OF SKIPJACK TUNA
Data obtained from tagging experiments initiated during 1953-1958 and 1969-1981 for skipjack tuna from the coastal eastern Pacific Ocean (EPO) were reanalyzed, using the Schnute generalized growth model (Canad. Jour. Fish. Aquatic Sci., 38 (9): 1128-1140). The objective was to provide information that can be used to generate a growth transition matrix for use in a length-structured population dynamics model for skipjack tuna in the EPO. The analysis included sta-tistical approaches to incorporate individual variability in growth as a function of length at release and time at liberty, measurement error, and transcription error. The tagging data were divided into northern and southern regions, and the results suggest that the growth rates differ between the two regions. The Schnute model fits the data significantly better than the von Bertalanffy model, which is a sub-model of the Schnute growth model, in the northern region, but not in the southern region. Individual variation in growth is best described as a function of time at liberty and as a function of growth increment for the northern and southern regions, respec-tively. Measurement error is a significant part of the total variation, but the results suggest that there is no bias caused by this error. Additional tag return data, particularly for small and large fish, is needed to produce an adequate growth transition matrix that can be used in a length-structured population dynamics model for skipjack tuna in the EPO.
AGE AND GROWTH OF BIGEYE TUNA
A tag release-recapture experiment to investigate the usefulness of information on the deposition rate of microincrements on the sagittal otoliths of bigeye tuna for estimation of their age and growth was in progress during 1999. This experiment is described on pages 29-30 of the IATTC Annual Report for 1995. The fish are injected with oxytetracycline at the time of release, and the oxytetracycline is incorporated into the developing microincrement on the edge of the otolith, creating a mark that can be detected by its fluorescence under ultraviolet light. The number of microincrements between the oxytetracycline mark and the edge of the otolith can be compared to the number of days the fish was at liberty to determine whether the microincrements

29 ANNUAL REPORT 1999
are formed at daily intervals. The field work, conducted in the vicinity of Hawaii, was performed jointly by the Hawaii 'lUna Tagging Project of the University of Hawaii and the lATTC.
During 1995 and 1996 1,043 bigeye, 36 to 105 cm in length, captured west by southwest of the island of Hawaii, primarily by surface handlining and vertical jigging, were tagged and injected with tetracycline and released. There have been 130 recaptures to date (12.5 percent of the number released), with the majority of them made within 120 days of release. The maximum time at liberty was about 832 days. The sagittal otoliths were recovered from 102 of these (78 percent of the total recaptures). A subset of otoliths from 46 bigeye, 38 to 117 cm in length at recapture, at liberty from 9 to about 832 days, was selected for analysis (Figure 22). Twenty-one of those fish were at liberty for more than 30 days. Prominent oxytetracycline marks were vis-ible on 43 (94 percent) of the otoliths, and the mark was assignable to a single microincrement on 39 (90 percent) of those.
Surface counts of the microincrements between the fluorescent mark and the edge of the otolith were made in a depression slide, using immersion oil with a light microscope at 900x, along the primordium-postrostral axis from the tetracycline mark to the tip of the postrostrum. If the microincrements could not be resolved the otolith counting path was etched under low magnification with hydrochloric acid applied with a fine-tipped brush. The widths ofthe microin-crements, measured on the surface of the otoliths of the largest specimen recovered, 117 cm, ranged from 2 to 6 microns, with a mean of about 4 microns. The theoretical resolving power of the microscope utilized is 0.2 micron.
Initially five pairs of otoliths were selected to develop the criteria for what constitutes an increment. Following that, the counts of the microincrements on 10 pairs of otoliths were com-pared. A paired T test indicated no significant difference in counts between the right and left otoliths. Subsequently, therefore, either the right or left otolith was utilized in the analyses. The 46 pairs of otoliths utilized in the analyses were assigned codes, and the days at liberty were not known to the reader at the time the otoliths were read. The microincrements on each otolith were counted five times and averaged to obtain a final estimate.
Analysis of the regression coefficient, from a weighted linear regression, failed to reject the null hypothesis that the average deposition rate of the number of microincrements formed on these otoliths is one per day (Figure 23). The results of this experiment suggest that bigeye in the length range of 38 to 117 cm produce microincrements on their sagittal otoliths at daily intervals, and that the criteria adopted for identifying these microincrements on the surface of the otolith are valid. If it is assumed that the microincrements are deposited at the same rate on bigeye less than 40 cm, counts of the microincrements on the sagittal otoliths would provide accurate estimates of absolute age in days. Additional research on the deposition rate of microincrements on the sagittal otoliths of smaller and larger bigeye will be conducted as oppor-tunities arise.
Sampling of the commercial catch of bigeye tuna in the eastern Pacific Ocean for sagittal otoliths, and also caudal vertebrae, was planned for 2000 to obtain direct estimates of the age and growth of this species.
ECOLOGICAL STUDIES
The staff of the IATTC has been developing a modeling approach to investigate the rela-tive ecological implications of alternative fishing strategies in the pelagic waters of the tropical eastern Pacific Ocean (EPOl. The top levels of the food web in the open ocean include large tunas, dolphins, sharks, billfishes, and other species. The purse-seine fishery in the EPO is directed pri-

30 TUNA COMMISSION
marily at mature yellowfin, bigeye, and skipjack tunas, but substantial catches of other apex predators and ofjuvenile tunas also occur. Fisheries that are directed at apex predators have the potential of imparting a "top-down" effect on marine ecosystems, causing reciprocal changes at the next-lowest trophic levels.
The ecological costs of fishing are complex, due to the size dependence of predator-prey interactions and the dynamics of the fishery. The species composition and magnitude of the catches, bycatches, and discards are different for the three fishing modes employed by the purse-seine fishery (fishing for tunas associated with dolphins, tunas associated with floating objects, or tunas associated only with other fish). (In this report catches refers only to catches retained aboard the fishing vessel, bycatches to non-target species discarded at sea, and discards to target species (yellowfin, skipjack, bigeye, bluefin, and albacore) discarded at sea.) The components of an ecosystem are interdependent through predator-prey and competitive interactions. The effects on the food web of removing tunas and associated predators are not understood. Adequately assessing the status of an ecosystem would require assessments and monitoring of all major species. Adequate fisheries data are not available for most non-target species, scientific surveys are expensive and time-consuming, and monitoring the catches, size compositions of the fish caught, etc., may be impractical. The best option, at this time, is to develop models that repre-sent the life histories of the principal elements of the ecosystem and describe how biomass flows between them, based on the best available information.
At its 58th meeting, held in June 1997, the IATTC established the Purse-Seine Bycatch Working Group to examine the issue of bycatches and discards of all species taken in the purse-seine fishery for tunas in the EPO. One ofthe terms of reference for the Working Group was "to define the relationships among bycatch and target species with special reference to the sustain-ability of the catches of all such species." The Working Group held a technical meeting to con-sider ecological studies and modeling on April 26-28, 1999, in La Jolla, California. One of the primary purposes of the meeting was to evaluate an ecosystem model being developed by the IATTC staff, and to determine if employment of alternative methods was worthwhile.
IATTC staff members presented an overview of the variety of information required for ecosystem modeling in general, and estimates of these parameters for the pelagic waters of the tropical EPO. Steady-state models require the following information: (1) definitions ofthe impor-tant components of the food web, including trophic ontogeny where applicable, (2) predator-prey links (diet composition), (3) estimates of predator consumption rates or energy requirements, (4) estimates of prey biomass and productivity, and (5) other removals from the system (i.e. catches, bycatches, discards, and emigration). Additional needs for dynamic models include information (i.e. reproduction, recruitment, and growth parameters and weight-length relationships) neces-sary to evaluate the transition from small to large ontogenetic groups of the same taxa and time series of removals from the system. Other useful information that has not yet been incorporated for modeling the tropical EPO ecosystem includes the spatial heterogeneity of predators and prey, seasonal patterns of various parameters, recycling, and diet switching. There is only limited knowledge of most ofthese latter factors for the EPO.
The ecosystem model for the pelagic waters of the tropical EPO has 36 components (Table 15a). These include the principal exploited species (e.g. the various tunas), functional groups (e.g. sharks), sensitive species (e.g. sea turtles), and ontogenetic groups for large species (e.g. marlins). In general, the model has finer taxonomic resolution at the upper trophic levels, and most of the system's biomass is contained in the middle and lower trophic levels (Table 15a). Three of the components, baleen whales, swordfish, and bluefin tuna, predators that are not resident in the tropical EPO all year, but pass through the northern extremes of the model area seasonally, were

31 ANNUAL REPORT 1999
added to the model in accordance with recommendations of the Working Group. The ecosystem model was developed using Ecopath with Ecosim (EwE) (Christensen, v.,
C.J. Walters, and D. Pauly, Ecopath with Ecosim: a User's Guide, October 2000 Edition. Fisheries Centre, University of British Columbia, Vancouver, Canada, and ICLARM, Penang, Malaysia). EwE was chosen because the participants of the first meeting of the Working Group, held on July 8-9, 1998, agreed that the Ecopath steady-state model, interfaced with the Ecosim dynamic model, provides a useful starting point for modeling community dynamics, given the wide use of the approach and the fact that it requires that the analyses include all parts of the system. The information required to parameterize the model includes, for each model component, estimates of diet composition, biomass (B), production-to-biomass ratio (P IB), consumption-to-biomass ratio (Q IB), and ecotrophic efficiency (EE). Ecosim uses the steady-state solution from Ecopath, incor-porates density dependence, and simulates population trajectories forward in time. Ecosim pro-vides a tool to explore hypothesized changes in fishery exploitation by means of dynamic simulations.
The Working Group recommended several short-term priorities for revising and calibrating the EPO model. These included (l) adding model groups for the predators that pass through the northern extremes of the model area seasonally, (2) redefining the model area (considering, for example, ocean provinces or the main area ofthe surface fishery), (3) incorporating recently-avail-able bycatch and discard data for the longline fishery, (4) incorporating alternative methods for estimating the biomass of bycatch species, (5) comparing previous estimates of yellowfin tuna recruitment in the EPO with that produced by the model, (6) conducting a thorough sensitivity analysis, (7) evaluating the relative importance of environmental influences on the EPO ecosystem, and (8) comparing the EPO model with one based on a shorter food chain typical of upwelling systems. Several of these were completed during 1999, and further analyses were to be conducted during 2000.
Additional evaluation of the EPO ecosystem model was accomplished at two workshops funded by the National Center for Ecological Analysis and Synthesis (NCEAS) in Santa Barbara, California, on June 24-26 and November 30-December 2,1999. NCEAS, which is funded by the U.S. National Science Foundation and the state of California, provided a grant that will fund a series of workshops over two years to help in the development and evaluation of the EwE model for the EPO. A preliminary evaluation of the implications of climate forcing on ecosystem dynamics of the pelagic waters of the tropical EPO was made at the June workshop and further developed at a subsequent workshop held in La Jolla on August 30-September 1, 1999, sponsored by the IATTC. One of the ways that the physical environment affects ecosystem dynamics is by inducing variation in primary production at the base of the food web. The tropical EPO is strongly influenced by EI Nino and La Nina events, and those events that occurred during 1998 and 1999 are among the strongest on record. Over a large portion of the tropical EPO, the chloro-phyll concentrations are reduced during EI Nino events and increased during La Nina episodes. To simulate EI Nino- and La Nina-scale variations in producer biomass in the ecosystem model, the members of the workshop constructed an empirical model that relates sea-surface tempera-ture (SST) anomalies to surface chlorophyll concentrations, an index of phytoplankton biomass. This model was developed from NIN03 SST anomalies and three sets of shipboard and satellite phytoplankton pigment data collected during recent warm and cold events. (NIN03 SST is the monthly mean sea-surface temperature in the eastern equatorial Pacific, 5QN-5QS and 150Q-90~, obtained from NOAA, National Weather Service, Climate Prediction Center, U.S.A.) These anomalies and data suggest that, on average, log pigment concentration (mg m-3) changes by about -0.047 per degree Celsius, equivalent to a change of about 11 percent. The members of the
32 TUNA COMMISSION
workshop used time series of SST anomalies to specify trajectories of producer biomass, and sim-ulated the ecosystem effects of (1) single, positive (La Nina-like) and negative (EI Nino-like) pulses in producer biomass, (2) regular warm-cold cycles in producer biomass, and (3) a time series of producer biomass predicted from a greenhouse-warming scenario for the 21st century. Pulses in producer biomass in the model ecosystem affected components at middle trophic levels (forage fishes and cephalopods) more than the apex predators. The analysis of the role of bottom-up physical processes on ecosystem dynamics in the tropical EPO were to be developed further during 2000.
As mentioned above, the goal of this research is to better understand the relative ecolog-ical implications of alternative fishing strategies in pelagic waters of the tropical EPO. The anal-ysis of climate forcing of the ecosystem forms the foundation for evaluating the ecological effects of fishing because top-down effects of fishing on marine ecosystems occur over the background variability imposed on the system by bottom-up processes resulting from physical changes in the environment. The modeling work in 2000 would focus on exploring the ecosystem effects of fishing that might be detectable over and above this environmental variation.
EARLY LIFE HISTORY STUDIES
For many years fisheries scientists have believed that the abundance of a population offish is determined principally during its early life history (egg, larval, and/or early-juvenile) stages. Although decades of research have provided considerable information on the populations of adult tunas, relatively little is known about the early life history stages and the factors that affect their recruitment to the exploitable stocks. These considerations motivated the IATTC to establish a research facility at Achotines Bay in the Republic of Panama for the purpose of studying the early life histories of tunas.
Achotines Bay is located on the southern coast of the Azuero Peninsula in the Los Santos province of Panama (Figure 24). The continental shelf is quite narrow at this location; the 200-m depth contour occurs only 6 to 10 km (3 to 5 nm) from shore. This provides the scientists working at the Achotines Laboratory with ready access to oceanic waters where spawning of tunas occurs during every month of the year. The annual range of sea-surface temperature in these waters is approximately 21° to 29°C. Seawater pumped from Achotines Bay is suitable for maintaining live tunas in the laboratory. The proximity of the research station to the study area provides a low-cost alternative to a large research vessel, and improves sampling flexibility.
The IATTC's early life history research program involves laboratory and field studies aimed at gaining insight into the recruitment process and the factors that affect it. Previous research on recruitment of fishes suggests that abiotic factors, such as temperature and salinity, and biological factors, such as feeding and predation, can affect recruitment. As the survival of pre-recruit fishes is probably controlled by a combination of these factors, the research program addresses the interaction between the biological system and the physical environment (IATTC, Data Report 9).
Joint OFCF-Panama-IATTC project
In December 1993 an agreement was reached by the Overseas Fishery Cooperation Foundation (OFCF) ofJapan, the government of the Republic of Panama, and the IATTC to under-take a joint 5-year project, funded mostly by the OFCF, at the Achotines Laboratory. In 1998 the joint project was extended for an additional two years, and in 1999 it was agreed, in principle, that it would be funded through March 2001. The objectives ofthe project are: (1) to culture adult yel-

33 ANNUAL REPORT 1999
lowfin tuna to supply larvae and juveniles for research on its early life history; (2) to produce food organisms for the larval and juvenile tunas; and (3) to culture broodstock snappers (Lutjanidae), corvina-like fishes (Sciaenidae), and food organisms for their larvae and juveniles.
Expansion of and improvements to the infrastructure of the Laboratory were necessary to carry out the objectives ofthe project. An additional concrete tank was constructed during 1999. The dimensions and capacities ofthe tanks are as follows:
Tank Diameter (meters) Depth (meters) Capacity (liters) 1 17.0 6.0 1,361,900 2 8.5 3.0 170,200 3 8.5 1.5 85,100 4 8.5 1.5 85,100 5 8.5 1.5 85,100 6 8.5 3.0 170,200
Construction of a new concrete pier and boat ramp in Achotines Bay was completed during 1999. The new pier and boat ramp replaced the small ramp and seawall constructed many years ago. The new facilities have made it much easier to launch and retrieve boats and to transfer live fish, equipment, and personnel.
Yellowfin broodstock
Yellowfin in the size range of 2 to 7 kg were collected in nearshore waters adjacent to the Achotines Laboratory to establish a broodstock population in the laboratory. Procedures for transport, handling, tagging, weighing, and measuring newly-captured yellowfin were developed. Each fish was tagged with a microchip implant tag in the dorsal musculature and injected with oxytetracycline (OTC) to establish a temporal mark in the otoliths and vertebrae. The tag allows each fish to be identified throughout its life in captivity, and injection with OTC facilitates studies of the growth of the fish. All fish were immersed in dilute solutions of formalin and sodium nifurstyrenate, an antimicrobial agent, for several hours to treat any skin infections caused by capture and handling.
Yellowfin were stocked in the large broodstock tank (Tank 1) and in the reserve broodstock tank (Tank 2) during 1996 and maintained throughout 1997,1998, and 1999. The diet of the yel-lowfin broodstock in Tank 1 is being monitored to ensure that it provides enough energy to fuel high growth rates and spawning, but does not cause excess fat deposition. The feeding behavior of the fish, combined with growth rate estimates, are being used as guidelines for determining the daily ration schedules. The information on the proximate composition (protein, moisture, fat, and ash) of the food organisms and the broodstock fish (obtained from fish which occasionally died or were sacrificed) are used to adjust the feeding. The food organisms have included squid (Loligo spp.), anchovetas (Cetengraulis mysticetus), thread herring (Opisthonema spp.), and bigscale anchovy (Anchovia macrolepidota), and the diet is supplemented with vitamin and bile powders. Several specimens of each food taxon have been dried, homogenized, and analyzed for proximate composition by a laboratory in Aguadulce, Panama. On average, the anchovetas contain about 64 percent more calories and the thread herring about 116 percent more calories than the squid. By adjusting the quantities and proportions of squid and fish in the diet, the amount of food is kept high enough to avoid frenzied feeding activity, while not greatly exceeding the requirements for metabolism, growth, reproduction, and waste losses. The broodstock in Tank 1 were fed at approximately 2 to 4 percent oftheir body weight per day during 1999. During the year two yel-lowfin that had died in Tank 1were analyzed for proximate composition. The fish appeared to be in good health, and fat deposition was not excessive.
34 TUNA COMMISSION
In mid-August 14 younger yellowfin were transferred to Tank 1 to restock the spawning population, which had been reduced to five fish, all from the original group stocked in the tank in 1996. They were identified by their tag numbers, measured, weighed, and injected with oxyte-tracycline before being placed into the tank. Their lengths ranged from 74 to 89 cm and their weights from 8 to 15 kg. At the end of the year, there were 16 fish in the tank, 4 from the initial group and 12 from those transferred into it in August. Eight mortalities occurred during the year; including six fish from the older group and two from the younger one. The mortalities were due to starvation (1 fish) and wall strikes (7 fish). Growth models were fitted to the length and weight data of the yellowfin at the time of placement into the tank and at the time the fish were sacrificed or died. Daily estimates of lengths and weights were calculated from the growth models. The estimated lengths and weights of the two groups of fish at the end of the year in Tank 1 were as follows:
Length (cm) Weight (kg)
Large fish Small fish
Average 147
94
Range 146-149
88-101
Average 76 17
Range 74-78 14-22
At the end of the year the biomass in the tank was estimated to be 0.37 kg per cubic meter, which is somewhat less than the original target stocking density of 0.50 kg per cubic meter for the brood-stock population.
The yellowfin in Tank 2 were held in reserve to augment the broodstock population in Tank 1, should that become necessary. During 1999 the collection of small yellowfin tuna was continued in coastal waters near the Laboratory. The fish were to be used for broodstock replace-ment and for future experiments that compare different types of food for broodstock fish. Yellowfin in the size range of 52 to 69 cm and 3 to 6 kg were collected by hook and line at sea and transported to the Laboratory. Each fish was measured, weighed, injected with oxytetracycline, and tagged with a microchip implant tag. Following a holding period, each fish was moved to either the 170,200-L reserve broodstock tank (Tank 2) or the 85,100-L tank (Tank 5). They were fed a diet of squid and herring at approximately 5- to 8-percent body weight per day. Fourteen of these fish were transferred to Tank 1 in August. At the end of 1999 the population in Tank 2 was eight fish, ranging in length from about 50 to 70 cm and in weight from about 3 to 7 kg.
Yellowfin spawning
During 1999 the yellowfin in Tank 1 spawned on only six dates from January through April, and then spawned at nearly daily intervals from May through December. The water tem-peratures in the tank during spawning ranged from 25.8° to 28.TC. During the year spawning occurred between 4:20 p.m. and 9:30 p.m. The spawning events were usually preceded by courtship behavior (paired swimming, chasing) during the afternoon.
The numbers offertilized eggs collected after each spawning event in Tank 1 ranged from about 900 to 2,042,000. The eggs were collected by several methods, including siphoning and dip-netting at the surface and seining with a fine-mesh surface egg seine.
The following parameters were recorded for each spawning event: time of spawning, egg diameter, duration of egg stage, hatching rate, lengths ofhatched larvae, and duration ofyolk-sac stage. The weights of the eggs, yolk-sac larvae, and first-feeding larvae and the lengths and selected morphometrics of the first-feeding larvae were periodically measured. These data are entered into a data base for analysis of spawning parameters and the physical or biological fac-tors that may influence spawning (e.g. water temperature, salinity, lunar cycle, average size of the spawning fish, and average daily ration of the spawning fish).

35 ANNUAL REPORT 1999
Laboratory studies of the growth and feeding ofyellowfin larvae andjuveniles
Several experiments were conducted with yellowfin larvae during 1999. The experiments were designed to examine the effects of larval stocking density, prey type, and microturbulence on feeding incidence, survival, and growth of the larvae.
In mid-1999 an experiment was conducted to examine the effects of larval density on the growth and survival of yellowfin larvae. The experiment was similar to a 2-week density-depen-dence study conducted with yellowfin larvae in 1998. In the 1999 experiment, larvae were stocked at three different densities in replicated 1.2-m diameter tanks nested within 1.5-m tanks. The larvae in each tank were fed a sequential diet of rotifers enriched with a fatty-acid supple-ment (1,500-2,500 per liter) and brine shrimp nauplii enriched with a fatty-acid supplement (250 per liter). The water temperatures during the experiment ranged from 26.2Q to 27.9QC. The larvae were sampled at various stages of development up to 9 days after hatching (6 days after first feeding), and length measurements and dry weights were obtained from fresh specimens. In addition, larvae were preserved in formalin to determine the incidence of feeding. Apreliminary analysis ofthe growth data indicated that there was a trend for density-dependent growth in both length and weight. The larvae stocked at the lowest density grew more rapidly than the others. Mter 6 days of feeding, larvae stocked at the lowest density were, on average, 7 and 14 percent longer and 4and 48 percent heavier than those stocked at the medium and high densities, respec-tively. These results were similar to those of the 1998 density experiment, and confirmed the onset of density-dependent growth by yellowfin larvae during the first few weeks of feeding.
A6-day experiment to determine the effects of microtrubulence on the feeding, growth, and survival of yellowfin larvae was completed during mid-1999. The experiment was conducted jointly by Drs. Shingo Kimura and Hideaki Nakata of the Ocean Research Institute, University of Tokyo, and IATTC scientists. The experiment was similar to a 2-week turbulence study con-ducted with yellowfin larvae during 1998. In the 1998 study three levels of turbulence (low, medium, and high) were simulated in experimental tanks. In the 1999 study, however, five levels of turbulence (low, semi-low, medium, semi-high, and high) were simulated in replicated 1.2-m diameter tanks nested within 1.5-m tanks. The turbulence in each tank was controlled by the level of aeration, and initially measured by the mean horizontal velocity of a neutrally-buoyant object in multiple locations in the tank. In addition, daily measurements of the water velocities were made in each tank with a micro acoustic Doppler current meter. This instrument measures the water velocities in three dimensions simultaneously. The measurements made with this instrument were periodically compared to measurements taken with a geomagnetic current meter. The yellowfin larvae were initially fed enriched rotifers (500-1,000 per liter), and then enriched brine shrimp nauplii (250 per liter) were introduced on the sixth day of feeding. The water temperatures ranged from 26.6° to 28.2°C during the experiment. Larvae from each tank were sampled daily to obtain length measurements and dry weights from fresh specimens. In addition, larvae were sampled daily from each tank and preserved in formalin for use in exam-ining the feeding parameters. These larvae were to be measured, their stomachs were to be dis-sected, and the contents were to be enumerated and measured. The number of survivors in each tank after 6 days of feeding was calculated. Preliminary analysis of these data indicated that the highest survival occurred at the semi-low and semi-high turbulence levels. One replicate tank of medium turbulence also produced high survival, but the other produced low survival, which was most likely due to unknown suboptimal culture conditions in that tank). The lowest survivals occurred at the low and high turbulence levels. The survival oflarvae feeding at the semi-low or semi-high turbulence levels was 0.2-0.5 times higher than that of larvae feeding at high turbu-

36 TUNA COMMISSION
lence and 4-5 times higher than that oflarvae feeding at low turbulence. These results were con-sistent with the survival pattern observed in the 1998 turbulence experiment, and confirmed that larval feeding success and survival during the first week of feeding are markedly higher at medium turbulence levels.
Another turbulence experiment was conducted during 1999 for a period of 5 days. In this experiment the turbulence was created in a different manner by controlling the volume of water introduced through an inflow pipe at the bottom of each tank (no aeration). Low and high tur-bulence levels were simulated by this method. The water temperatures ranged from 26.8° to 28.3°C. The other experimental parameters and the sampling regime were the same as in the first experiment. The growth, survival, and feeding parameters from this experiment were to be compared to those of the previous turbulence experiments.
The turbulence data measured with the micro acoustic Doppler meter were to be analyzed, and an optimal range of turbulent energy for yellowfin larval survival was to be calculated. The optimal experimental levels ofturbulence were to be compared to historical data on levels of wind-induced mixing in the tropical eastern Pacific Ocean. If similar levels ofwind-induced mixing were identified, they would be compared to yellowfin recruitment levels for the same time periods to identify patterns of association between wind-induced mixing and yellowfin recruitment.
The fish that survived beyond the termination of the larval experiments were reared to larger sizes. Several groups of larvae were fed, through juvenile metamorphosis, a diet of recently-hatched larvae and chopped and whole fish fry. The juveniles were maintained in either 2.4-m diameter, 4,800-L tanks or 3.7-m diameter, 15,900-L tanks. Some juveniles had been reared to 7 weeks after hatching by the end of the year.
Genetic studies of captive yellowfin
In August 1999, during the transfer of new broodstock fish into Tank 1, a small piece of a dorsal finlet was removed from each fish for genetic analysis. Genetic samples have been taken from broodstock yellowfin and their eggs and larvae to determine the amount of genetic variation in both adults and their offspring. Any new broodstock fish that are introduced to the captive population will be sampled for genetic analysis. Ifthe different mitochondrial DNA genotypes are known for all females in the broodstock population, it will be possible to estimate the number of females contributing to any spawning event.
Respirometry experiments with yellowfin larvae and juveniles
During 1999 a series of experiments to measure the metabolic rates of yellowfin larvae and juveniles at the Achotines Laboratory was conducted, in collaboration with Dr. Shin Oikawa of the Department of Fisheries, Kyushu University, and Dr. Takeshi Kanda of the Fisheries Research Laboratory, Miyazaki University. The respiration rates were measured, by two methods, for 12 groups of larval and early-juvenile yellowfin hatched at the Laboratory. For the in vivo method, the oxygen consumption rates of live fish enclosed in small chambers at 27°C were measured. For the in vitro method, oxygen electrodes were used to measure the oxygen con-sumption rates of minced tissue at 27°C from freshly-killed fish. Other specimens were fixed in 2.5-percent glutaraldehyde fixative for subsequent measurements of the respiratory surface areas (gills and skin).
The mass-specific metabolic rates decreased with increasing body mass from 5 to 31 days after hatching. Different phases, identified by distinct regression intercepts, appeared to be related to transition from the larval to the juvenile stage and to the nutritional condition of the larvae. Further analysis of the development of the body structures, based on the preserved sam-

37 ANNUAL REPORT 1999
pies of larvae and juveniles, was begun. These studies will contribute to the understanding of the ontogeny of tuna bioenergetics, and will help evaluate the role of energy acquisition in survival and recruitment.
Spawning and rearing ofpolla drum and spotted rose snappers
The work on of polla drum and spotted rose snappers is carried out by the Direcci6n General de Recursos Marinos de Panama.
Polla drum (Umbrina xanti) and spotted rose snappers (Lutjanus guttatus) were collected during 1996 to establish broodstock populations in captivity.
During 1999 the polla drum broodstock spawned one to three times per week from May through November. Several experiments were conducted with fish in the early life stages. The fertilized eggs were used to study the effect of salinity on the hatching rates and development of the eggs. The larvae were reared through juvenile metamorphosis to examine the different stages of development. During 1999 it was decided to phase out the remaining broodstock of polla drum and replace it with broodstock of a larger, more commercially-valuable, species of corvina, and in early December the five surviving broodstock fish were released into Achotines Bay.
During 1999 the spotted rose snappers spawned two to three times per week from June through mid-December. Samples of eggs and larvae were periodically taken to monitor early development. In addition, a group ofjuveniles that had been hatched in October 1998 was being reared in a 12,000-L tank to attempt to complete the life cycle of this species in captivity and to study the growth patterns and feeding requirements of the juveniles. At the end of the year these fish were 30 to 31 cm long and weighed 450 to 500 grams.
New broodstock of corvina were collected during the year. Individuals of two species, white corvina (Cynoscion albus) and Stolzmann's weakfish (C. stolzmani), were captured and stocked in Tank 3, which has a capacity of 85,100 L. At the end of the year there were 10 fish in the tank. Potential broodstock ofboth species were to be collected during 2000. The species which appeared to do best in captivity would be used for spawning and rearing studies.
Project evaluation
Steering committee meetings for the joint IATTC-OFCF-Panama project were held at the Achotines Laboratory on May 10-11 and November 11-12,1999. The meetings were attended by representatives ofthe IATTC, the OFCF ofJapan and the Direccion General de Recursos Marinos y Costeros of Panama. Research progress was reviewed, and future commitments to the project were discussed. In principle, it was agreed that the project would receive funding for one addi-tional year, through March 2001.
OCEANOGRAPHY AND METEOROLOGY
During the 45 years from 1955 to 1999 there have been 10 significant anti-EI Nino events in the eastern tropical Pacific (ETP), each of which developed within 1 to 3 years after the termi-nation of a moderate to strong EI Nino episode. These events are characterized by stronger-than-normal easterly winds over the ETP, which cause marked increases in upwelling of cool, nutrient-rich subsurface water along the equator east of 160QW, in the coastal areas of Ecuador and Peru, and in offshore areas off Mexico and Central America. As a result, below-normal sea-surface temperatures (SSTs) and sea levels and shallower-than-normal thermoclines prevail over much of the ETP. In addition, the Southern Oscillation Indices (SOls) are positive during anti-EI Nino episodes. (The SOl is the difference between the anomalies of sea-level atmospheric pres-

38 TUNA COMMISSION
sure at Tahiti, French Polynesia, and Darwin, Australia, and it is a measure of the strength of easterly surface winds, especially in the tropical Pacific in the Southern Hemisphere.) Anti-El Niiio episodes have not received as much publicity as their opposite, El Niiio episodes, which have usually been associated with unfavorable oceanic and weather conditions for fishing for surface-dwelling fish. Anti-El Niiio episodes are important events, however, because they contribute to maintaining food supplies, through upwelling, for pelagic organisms, including those which are of direct commercial value. In addition, various species of fish, including yellowfin and skipjack tuna, are more vulnerable to capture when the thermocline is closer to the surface and strong (rapid decrease in temperature with depth) during anti-El Nino episodes.
During the first half of 1998 there was a rapid transition from strong El Nino conditions to strong anti-El Nino conditions. The latter continued during the second half of the year, especially during the fourth quarter. As a result, there was a marked improvement in fishing conditions in the ETP, which led to greater catch rates of tunas in the Commission's Yellowfin Regulatory Area (CYRA; Figure 1).
During January 1999 the SSTs were 2° to 3°C below normal over much of the equatorial region west of 1l00W, and the SOl was 2.0. In contrast, during February and March the area of the equatorial ocean with SSTs more than ZOC below normal was significantly reduced, and the SOls were 0.8 and 0.9, respectively, marking the first time since June 1998 that the SOls were less than 1.0. The SST anomaly pattern for February 1999, which is similar to that of January 1999, and also to that of November 1998, is shown in Figure 25a. This pattern is typical of anti-El Nino conditions in the ETP. The SSTs were also 1° to 2°C below normal along the coasts of Ecuador and Peru during the first quarter. During that quarter the thermocline was 40 to 80 m beneath the surface, which was, on average, 15 m closer to the surface than normal. In addition, the sea level remained an average of 5 cm below normal.
During the second quarter of 1999 the surface easterly winds were weaker, especially during May and June, indicating that the atmospheric surface pressure and wind circulation in the equatorial region were returning to normal. The weakening of the surface winds probably reduced the equatorial upwelling. The SSTs were 1° to 2°C below normal over much of the equa-torial region west of 1000W, but the areas of the equatorial ocean with SSTs more than 2°C below normal were markedly reduced relative to those of the first quarter. Nevertheless, there remained a large region of negative SST anomalies of 1° to 2°C along the coasts of Ecuador and Peru. The pattern of SST anomalies for April 1999, shown in Figure 25b, is typical of earlier periods during which anti-El Nino conditions have prevailed. The thermocline remained at depths of 40 to 80 m and the sea level an average of 5 to 10 cm below normal. The SOls were 0.1 in May and -0.1 in June, the lowest of the anti-El Nino episode. Nevertheless, the ocean condi-tions remained favorable for tuna fishing.
In the ETP the third quarter of most years is a transition period, during which the atmo-spheric and oceanic circulations and the SSTs approach their average annual patterns. The SST anomalies are usually small, and the southerly surface winds of the summer monsoon begin to change to northerly directions. In addition, the ocean currents in the ETP go through changes in strength and direction. During this transition period major tropical events, such as El Nino and anti-El Niiio episodes, also weaken. By the austral summer (November to February) the estab-lished El Niiio episodes will usually strengthen, but the anti-El Nino events will usually continue to weaken. This was not the case during the fourth quarter of 1999, however.
During the third quarter of 1999 SSTs more than 1C below normal occupied a smaller por-tion of the equatorial region between 5N and 5S from 120 to 155W and the areas along the coast of Peru than during the first half ofthe year. Over much of the CYRA the SSTs were, on average,

39 ANNUAL REPORT 1999
closer to normal than during the first half of the year. The SST anomalies for July 1999 (Figure 25c) were representative of those ofthe third quarter. The thermocline remained at depths of 40 to 80 m and the sea level at 5 to 10 cm below normal over most of the ETP. The SOl increased slightly to 0.5 in July, but it then decreased to 0.1 in August and to -0.1 in September. The increase in the SOl in July evidently reflected only a temporary increase in the intensity of the anti-El Nino episode.
Mter a short period of weakening during the third quarter, the anti-EI Nino conditions strengthened again during the fourth quarter. SSTs more than lC below normal covered more of the equatorial region between ION and lOS west of now than during the previous quarter. The SST anomaly pattern for December, which is representative of the fourth quarter of1999, is shown in Figure 25d. The thermocline in the equatorial region remained shallower than normal, at depths of 40 to 60 m. Above-normal easterly wind speeds were common in the ETP in association with increasing SOls (0.9 in October, 1.1 in November, and 1.5 in December). The strengthened surface winds caused increased upwelling of nutrient-rich water, especially in the equatorial region.
STOCK ASSESSMENT OF TUNAS AND BILLFISHES
Background Papers describing stock assessments of yellowfin, skipjack, bigeye, bluefin, albacore, and blue marlin conducted by the IATTC staff were presented at the 66th meeting of the IATTC in June 2000. These, plus a paper on production model analysis of yellowfin in the EPO, have been published as Stock Assessment Report 1 of the IATTC.
DOLPHINS
Yellowfin tuna in the size range of about 10 to 40 kg frequently associate with marine mammals, especially spotted dolphins (Stenella attenuata), spinner dolphins (S.longirostris), and common dolphins (Delphinus delphis and, to a lesser extent, D. capensis) in the eastern Pacific Ocean (EPO). The spatial distributions of the various stocks of these four species are shown in Figure 26. (D. capensis probably occurs only within the range of the northern stock of common dolphins.) Purse-seine fishermen have found that their catches of yellowfin in the EPO can be maximized by searching for herds of dolphins or flocks of seabirds which frequently occur with dolphins and tunas, setting their nets around the dolphins and tunas, retrieving most of the net, "backing down" to enable the dolphins to escape over the corkline of the net, and finally retrieving the rest of the net and bringing the fish aboard the vessel. Unfortunately, particularly during the 1960s and 1970s, many dolphins became entangled in the nets and suffocated.
Preliminary estimates of the mortality of dolphins due to fishing
In 1999 the incidental mortality of dolphins was 1,348 animals (Table 16), a 28-percent decrease relative to the mortality of 1,877 animals recorded in 1998. The mortalities for 1979-1999, by species and stock, are shown in Tablel7, and the standard errors of these estimates are shown in Table 18. The mortalities of the principal dolphin species affected by the fishery show declines in the last decade (Figure 27) similar to that for the mortalities of all dolphins combined (Figure 28). Estimates of the abundances of the various stocks of dolphins for 1986-1990 and the relative mortalities (mortality/abundance) are also shown in Table 16. The highest levels of rel-ative mortality occurred for northeastern spotted dolphins (0.05 percent) and eastern spinner dol-phins (0.06 percent). The upper bounds of the approximate 95-percent confidence intervals were less than 0.10 percent for all stocks, with the highest values occurring for northeastern spotted dolphins (0.061 percent) and eastern spinner dolphins (0.087 percent).

40 TUNA COMMISSION
The number of sets by Class-6 vessels on dolphin-associated schools of tuna decreased by 19 percent, from 10,645 in 1998 to 8,648 in 1999, and the proportion ofthe total sets made which were made on dolphins decreased from 51.3 percent in 1998 to 44.6 percent in 1999 (Table 5). The average mortality per set decreased from 0.18 dolphin in 1998 to 0.16 dolphin in 1999. The esti-mated spatial distribution of the average mortalities per set during 1999 is shown in Figure 29. The mortalities per set were greatest at the offshore margins of the fishery, in areas of high num-bers of dolphin sets, and off Baja California and north of the Panama Bight. The trends in the numbers of sets on dolphin-associated fish, mortality per set, and total mortality in recent years are shown in Figure 28.
The catches of dolphin-associated yellowfin by Class-6 vessels were nearly the same as those for 1998. However, the percentage of the catch of yellowfin taken in sets on dolphins decreased from 65.0 percent of the total catch by Class-6 vessels in 1998 to 57.2 percent of that catch in 1999, and the average catch of yellowfin per set on dolphins increased from 14.3 to 17.9 metric tons per set. The mortality of dolphins per metric ton of yellowfin caught decreased from 0.012 in 1998 to 0.009 in 1999.
The above figures include data from trips by tuna vessels covered by observers from the programs of the IATTC and the PNAAPD of Mexico. The comparisons in the next paragraph are based only on the IATTC data bases for 1986 through 1999.
The decrease in the mortality per set is the result of actions by the fishermen to better manage the factors that bring about incidental mortalities of dolphins. Indicative of this effort is the number of sets in which no mortalities occurred, which has risen from 38 percent in 1986 to 91 percent in 1999 (Table 19). The factors under the control ofthe fishermen which are thought likely to affect the mortality of dolphins per set include the occurrence of malfunctions, especially those which lead to net canopies and net collapses, and the time it takes to complete the back-down maneuver (Table 19). The percentage of sets with major mechanical malfunctions has decreased from an average of approximately 11 percent during the late 1980s to less than 7 per-cent during 1997-1999. The percentage of sets with net collapses has decreased from about 30 percent during the late 1980s to about 6 percent during 1997-1999. The equivalent percentages for net canopies were about 20 and 5. The average backdown time has changed little since 1986, but the average number of animals left in the net after backdown has decreased from 6.0 in 1986 to 0.1 in 1999. In addition to the factors listed above, the mortality of dolphins per set increases with the number of animals in the encircled herd. The fishermen can reduce the mortalities per set by encircling schools of fish associated with fewer dolphins. However, the average number of animals in encircled herds of spotted dolphins, the species most set upon by the fishery, was 29 percent more in 1999 than in 1998.
Trends in abundance ofdolphins
The IATTC Annual Report for 1996 includes estimates of the relative abundance of dol-phins obtained with a technique that uses the sightings from tuna vessels to examine long-term trends in dolphin abundance. Because this technique uses data collected during fishing activi-ties, the estimates are biased. Nevertheless, these estimates should be useful ifthere are no tem-poral trends in the factors causing bias. An analysis by the staff has suggested that there may be such trends in recent years, possibly due to the advent of "dolphin-safe" policies and the adop-tion of new fishing technologies (e.g., bird radar) by the international fleet. Indicative of poten-tial problems, the estimated index ofrelative abundance ofnortheastern spotted dolphins and the number of dolphin sets in the northeastern spotted dolphin area are highly correlated during 1990-1997, a period of "dolphin-safe" policies and individual vessel mortality limits (Figure 30).

41 ANNUAL REPORT 1999
One indication of a change in the searching behavior of the fleet in recent years is shown in the increase in the percentage of searching effort that occurs after a sighting that leads to a dolphin set (Figure 31). The encounter rate during this "post-detection" period is much lower than that prior to the set-sighting (Figure 31), and thus the increase in post-detection searching effort in recent years may impart a temporally varying bias to the estimates of the relative abundance. The IATTC staff, in coordination with the Research Unit for Wildlife Population Assessment at the University of St. Andrews, Scotland, was planning to re-examine these and other issues to determine if the existing methodologies for estimation ofthe relative abundance of dolphins could be suitably revised.
Estimates of the rates of growth of eastern spinner and northeastern spotted dolphin populations of the eastern Pacific Ocean
The growth rates of the populations of eastern spinner and northeastern spotted dolphins in the eastern Pacific Ocean were estimated by fitting a simple exponential population model to the U.S. National Marine Fisheries Service (NMFS) marine mammal survey data provided on the web site of the NMFS Southwest Fisheries Science Center.
The population model is given as
N(t+1) = exp(r(t» [N(t) - C(t)]
in which N(t) is the population abundance in year t, r(t) is the population growth rate in year t, and C(t) is the total mortality in the purse-seine fishery in year t, as estimated by the IATTC staff. The relationship between dolphin abundance, as measured by the NMFS survey, and true abun-dance is assumed to be
x(t) = In[N(t)] +e(t) +d(t)
in which x(t) is the logarithmic transformation of the survey estimate of abundance in year t, e(t) is the survey measurement error as characterized by the sample variance reported by the NMFS, and d(t) is an additional unreported survey error due to sources other than sample variance. The first error term, e(t), is assumed to be normally distributed, with a standard deviation equal to the survey sample coefficient of variation reported by the NMFS. The second error term, d(t), is assumed to be normally distributed, with an unknown variance V, which is an additional param-eter to be estimated. A Bayesian statistical estimation procedure, the MCMC algorithm, was applied to calculate posterior probability intervals for the net growth rate of the population and its annual abundance. Prior distributions were chosen as uniform distributions on r(t), In[N(l979)], and In(V) because of the nearly-linear structure ofthe problem under a logarithmic transformation. The bounds of the uniform priors were chosen well beyond appreciable density of the likelihood function.
The NMFS has proposed testing the hypothesis that after 1991 the population failed to grow at the rate expected from the dynamics in the 1975-1991 period. To examine this hypoth-esis, the population model was fitted on the assumption that r(t) =rl prior to 1992 and r(t) =r2 after 1991. The results (Figures 32-33) indicate that the abundance of the populations of both eastern spinner and northeastern spotted dolphins increased during the period covered by the NMFS surveys (1979-1998), but that the large amount of variance in the survey indices pre-cludes drawing definitive conclusions about population growth rates during the pre-1992 and post-1991 periods.
The analysis can be used to test the hypothesis that the depleted dolphin populations have not grown during the period covered by the NMFS surveys. The fishing effort on dolphin-associ-

42 TUNA COMMISSION
ated tunas has been substantial during that period, and the depleted populations are thought to have been at a low level of abundance. To address that question, the above population model was fitted on the assumption that r(t) = r, a constant rate, during 1979-1998. The results show that median population growth has more than tripled the abundance of the eastern spinner dolphin population and increased the abundance ofthe northeastern spotted dolphin by more than 50 per-cent (Figures 34a and 35a). The net cumulative growth rate during 1979-1998 is given by In[N(1998)IN(l979)). The results indicate that the probability that the population has grown during those years is greater than 95 percent for the eastern spinner dolphin and about 80 per-cent for the northeastern spotted dolphin (Figures 34b and 35b).
GEAR PROGRAM
The purpose of the IATTC's gear program is to find ways to minimize or eliminate the mor-tality of dolphins during fishing operations.
DOLPHIN SAFETY PANEL ALIGNMENTS
During 1999 the IATTC staff conducted alignments of dolphin-safety panels (DSPs) and inspections of dolphin rescue gear aboard 33 vessels, 22 registered in Mexico, 8 in Ecuador, 2 in Spain, and 1in Vanuatu. Atrial set, during which an IATTC employee observes the performance of the net from an inflatable raft during backdown, is made to check the alignment of the DSP. The IATTC employee transmits his observations, comments, and suggestions to the captain ofthe vessel, and attempts are made to resolve any problems that may arise. Afterward a report is prepared for the vessel owner or manager. This report contains a summary of the IATTC employee's observations and, ifnecessary, suggestions for improving the vessel's dolphin-safety gear and/or procedures.
TRAINING AND CERTIFICATION OF FISHING CAPTAINS
The IATTC has conducted dolphin mortality reduction seminars for tuna fishermen since 1980. Article V of the Agreement on the International Dolphin Conservation Program (AIDCP) calls for the establishment, within the framework ofthe IATTC, of a system of technical training and certification of fishing captains. Under the system, the IATTC staff is responsible for preparing and maintaining a list of all captains qualified to fish for tunas associated with dol-phins in the EPO. The names of the captains who meet the requirements are to be supplied to the IRP for approval and circulation to the Parties to the AIDCP.
The requirements for new captains include (1) attending a training seminar organized by the IATTC staff or by the pertinent national program in coordination with the IATTC staff, (2) participation in a trial set that includes direct observations of the backdown channel, and (3) a practical training component, consisting of a trip during which it is intended to fish for tuna asso-ciated with dolphins aboard a vessel with a DML, accompanied by either a qualified captain or an approved technical advisor.
Seven workshops on reducing dolphin mortality, which were attended by 206 representa-tives of the fishing industry, including 75 fishing captains, were held during 1999. These work-shops are intended not only for captains, who are directly in charge of fishing operations, but also for other crew members and for administrative personnel responsible for vessel equipment and maintenance. The fishermen and others who attend the workshops are presented with certifi-cates of attendance. The dates, locations, and attendance of the workshops are summarized in Table 20.

43 ANNUAL REPORT 1999
OTHER SERVICES�
The IATTC also offers other services to help governments and fleet managers and opera-tors of individual vessels to reduce dolphin mortality. Publications and video tapes on the subject are available at IATTC field offices. Trip Analyses, detailed reports of observed fishing trips, are prepared upon request and, after the required authorizations are obtained, provided to allow per-formance assessments of vessels and captains.
MEASURES FOR THE CONSERVATION OF TUNAS
The IATTC has the responsibility for conducting studies of the biology of the tunas and related species of fish inhabiting the eastern Pacific Ocean and the effects of fishing upon them, and recommending appropriate conservation measures when necessary so that the stocks of fish can be maintained at levels that will yield the maximum sustainable catches.
If such measures are adopted, it is the responsibility of the states in which the vessels are registered to enforce them.
YELLOWFIN TUNA
The Director first recommended that an annual quota be set on the catch of yellowfin in the CYRA in 1962. However, the member governments could not reach agreement on a yellowfin quota until 1966. Agreement was reached on a quota for every year from 1966 through 1986 and 1988 through 1999. The Director did not recommend a quota for 1987 because, due primarily to exceptionally high levels of recruitment in 1984 and 1985, the abundance of yellowfin appeared to be at its greatest level in recent years. The regulations were implemented during each year of the 1966-1979 period and during 1998 and 1999.
At the IATTC's 61st meeting (June 10-12, 1998) the Director recommended a yellowfin quota of 210,000 mt for that year, with the option to increase this limit by up to three increments of 15,000 mt each. This quota was also adopted. By October 1998 the Director had decided that one increment should be added, making the quota 225,000 mt, and a resolution to that effect was adopted at the 62nd meeting of the IATTC (October 15-17, 1998). Since all Class-6 vessels had observers aboard, these vessels were to cease fishing for yellowfin in the CYRA on a date to be designated by the Director. Mter that date, until January 1, 1999, each vessel would be limited to a 15-percent incidental catch of yellowfin. Purse seiners and baitboats without observers aboard which were at sea on the closure date could continue to fish without restriction until they returned to port to unload. For any subsequent trips commenced in 1998 each boat would be lim-ited to a 15-percent incidental catch of yellowfin. If a trip extended into 1999 the 15-percent rule would continue to apply until the vessel came to port to unload. The closure date that was sub-sequently announced was November 26, 1998.
At the IATTC's 63rd meeting (June 8-10, 1999) the Director recommended a yellowfin quota of 225,000 mt for that year, with the option to increase this limit by up to three increments of 15,000 mt each, and this quota was adopted. Aresolution implementing the catch limit was adopted at the 65th meeting of the IATTC (October 4-10,1999). At that meeting the Director announced that he had decided to add one increment of 15,000 mt to the base quota of 225,000 mt. On October 13, 1999, he announced that he estimated that the catch of yellowfin in the CYRA would reach 240,000 mt on October 14, 1999, and that the "restricted period" would begin on that date. From that date until the end of the year fishing for yellowfin with surface gear in two areas, one off northern Mexico and the other off northern South America, was restricted. On November

44 TUNA COMMISSION
12, 1999, the Director announced that he estimated that catch of yellowfin in the CYRA would reach 265,000 mt on November 23, 1999, at which time the "second phase of the restriction" would come into effect. From that date until the end of the year fishing for yellowfin with sur-face gear in the CYRA was restricted. The rules concerning incidental catches of yellowfin and vessels without observers were the same as in 1998.
BIGEYETUNA
The rapidly increasing catches of bigeye by surface gear during the mid-1990s is obviously a matter of concern. The possible effects of the purse-seine fishery on the longline fishery are dis-cussed on pages 25-26 of the IATTC Annual Report for 1997. At the time that that report was written there was insufficient information, particularly on natural mortality rates, to come to def-inite conclusions. Nevertheless, a resolution was passed at the 61st meeting ofthe IATTC (June 10-12,1998) calling for cessation of making purse-seine sets on schools of tunas associated with floating objects during 1998 after 45,000 mt ofbigeye had been caught in the EPO by surface gear. The catch of bigeye by the surface fishery during 1998 was less than 45,000 mt, so there were no restrictions on the catch of that species during that year.
Aresolution calling for restriction of the fishery for tunas associated with floating objects in 1999 was approved at the 64th meeting of the IATTC (July 21-22, 1999). The object of this res-olution was to limit the catch of bigeye in the EPO by surface gear to 40,000 mt, and fishing for tunas associated with floating objects was to be prohibited after the date that the catch of bigeye in the EPO by the surface fleet reached that amount until the end of the year. On October 13, 1999, the Director announced that his best estimate of that date was November 8,1999, and that the prohibition would commence on November 9,1999.
FISH·AGGREGATING DEVICES
Aresolution adopted at the 62nd meeting of the IATTC (October 15-17, 1998) (1) prohib-ited the use of tender vessels (non-fishing vessels which deploy, maintain, repair, and pick up fish· aggregating devices (FADs) in the EPO, (2) prohibited the "transshipment of tuna on the high seas by purse-seine vessels fishing for tunas in the EPO," and (3) stated that the number of FADs a fishing vessel could carry would be limited. The limits were to be "decided through consulta-tion among the Parties, based on recommendations of the Working Group." Aresolution adopted at the 64th meeting of the IATTC (July 21-22,1999) reaffirmed the first two points ofthe resolu-tion adopted at the 62nd meeting. Fishing for tunas associated with FADs was prohibited in the EPO from November 9 through December 31, 1999.
FLEET SIZE
Aresolution adopted at the 62nd meeting of the IATTC (October 15-17, 1998) established limits, for 1999, on the capacities of the purse-seine fleets of individual nations, ranging from 499 mt for Honduras to 49,500 mt for Mexico. It was agreed that the 1999 limits would not set a precedent for succeeding years.
THE INTERNATIONAL DOLPHIN CONSERVATION PROGRAM
On June 17, 1992, the Agreement for the Conservation of Dolphins ("the 1992 La Jolla Agreement"), which created the International Dolphin Conservation Program (IDCPJ, was adopted. The main objective of the Agreement was to reduce the mortality of dolphins in the purse-seine fishery without harming the tuna resources of the region and the fisheries that

45 ANNUAL REPORT 1999
depend on them. On May 21, 1998, the Agreement on the International Dolphin Conservation Program (AIDCP), which built on and formalized the provisions ofthe 1992 La Jolla Agreement, was signed, and it came into effect on February 15, 1999. In 1999 the governments or regional economic integration organizations that had ratified or were provisionally applying the AIDCP were Colombia, Costa Rica, Ecuador, El Salvador, the European Union, Mexico, Nicaragua, Panama, the United States, Vanuatu, and Venezuela. The Parties to this Agreement are "com-mitted to ensure the sustainability of tuna stocks in the eastern Pacific Ocean and to progres-sively reduce the incidental mortalities of dolphins in the tuna fishery of the eastern Pacific Ocean to levels approaching zero; to avoid, reduce and minimize the incidental catch and the dis-card of juvenile tuna and the incidental catch of non-target species, taking into consideration the interrelationship among species in the ecosystem."
One of the principal features of the IDCP is an annual limit on the number of dolphins that may be killed during fishing operations. The overall dolphin mortality limit (DML) established for the international fleet in 1999 was 5,000 animals. One hundred and twenty-five vessels were allocated individual DMLs of 40 animals each. Thirty-four of the vessels did not utilize their DMLs by June 1; 25 of those forfeited their DMLs, and the other 9 were allowed, due to extenu-ating circumstances, to keep them for the remainder of the year. None of those 9 vessels utilized its DML during the rest of the year, so 91 vessels utilized their DMLs. Ten vessels were allocated second-semester DMLs of 20 animals each, but none of these utilized its DML. The distribution of the mortality caused in 1999 by vessels with full-year DMLs is shown in Figure 36. The esti-mate of total mortality of dolphins caused by the fishery in 1999 is 1,348 animals.
PUBLICATIONS
The prompt and complete publication of research results is one of the most important ele-ments of the IATTC's program of scientific investigations. By this means the member govern-ments, the scientific community, and the public at large are currently informed of the research findings of the IATTC staff. The publication of basic data, methods of analysis, and conclusions afford the opportunity for critical review by other scientists, ensuring the soundness of the con-clusions reached by the IATTC staff and enlisting the interest of other scientists in the IATTC's research. By the end of 1999 IATTC staff members had published 144 Bulletins, 48 Annual Reports, 11 Special Reports, 10 Data Reports, 9 books, and 494 chapters, papers, and articles in books and outside journals. The contributions by staff members published during 1999 are listed in Appendix 3 of this report.
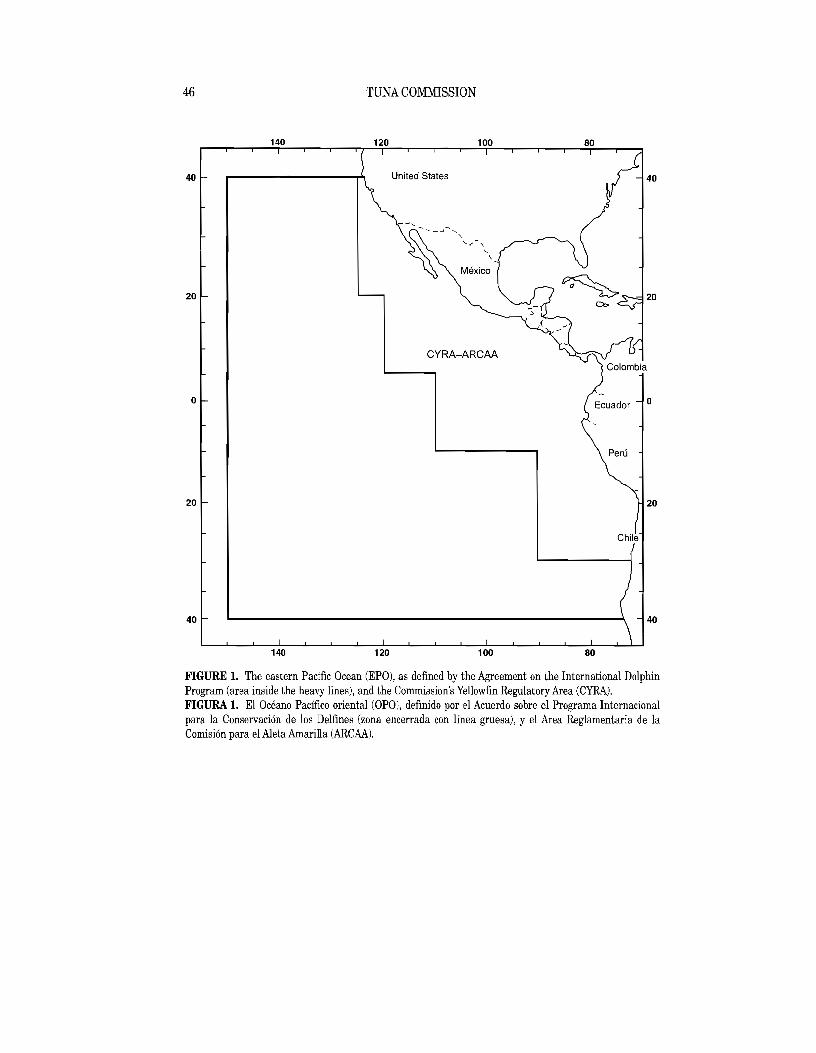
46 TUNA COMMISSION
140 120 100�
40 United States�
20 20�
CYRA-ARCAA
o o
Peru
20�
40 40�
140 120 100 80�
FIGURE 1. The eastern Pacific Ocean (EPO), as defined by the Agreement on the International Dolphin Program (area inside the heavy lines), and the Commission's Yellowfin Regulatory Area (CYRA). FIGURA 1. EI Oceano Pacifico oriental (OPO), definido por el Acuerdo sobre el Programa Internacional para la Conservaci6n de los Delfines (zona encerrada con linea gruesa), y el Area Reglamentaria de la Comisi6n para el Aleta Amarilla (ARCAA).

---
120
100 ,,-en
en (\j " e .~ o ~
+J~ 80 "" .g E " - en0) (\j
E-o .... (\j0- 600)en e ~
e_ /--.."",,- - - -(\j 0)
-0
en-o
0 - - - ~
......~ en - f..:J o 0) 40 " " ...... -- -- o""d-C_I- .
~ ~
...... <:D <:D
20 - - Maximum and-y Minimum <:D
- Average-Promedio
---- 1999 o I I I I I I I I ! I ! , !
J F M A M J J A s o N D
Month-Mes
FIGURE 2. Average, minimum, and maximum values for monthly capacity of purse seiners and baitboats at sea in the EPa during 1989-1998, and the 1999 monthly values. FIGURA 2. Valores mensuales medios, minimos, y maximos de la capacidad de barcos cerqueros y de carnada en el mar en el OPO durante 1989·1998, y los valores
>I>mensuales de 1999. ~

150 140 130 120 110 100 90 80 70 >I>00
o > 191 metric tons-toneladas metricas 30 30o 75 - 191
o 27 - 74 1 - 26
Effort, no catch-Esfuerzo sin captura
2020
10 I ~gggs0~~0l%0gggg~~~) 01 1000· "00,0",, C . ~00·0·· 00000 ...... . _./'-, >-3 C Z >
i 0
(":)uu' ....•• ···uu·u·u·· ··v· ,uou,oOUU0~OOOO~8§6'o 1-0 0·· •• • • o· • 00· ••••• 00 ••• 0 ••• 0 • o· . 00 • • 0000 0 ·0 o· •• "0·.000000000000000 .•.•• 0000···· "000 ~° ~ .-
UJ UJ.-0 - ..... - ......... v··· u •••ı
10 r n.. . .... ("\."..,r\ •• n •. _ A_ _:vX~:;~X~~~~X~ \ -I 10 Z '0
20 20
150 140 130 120 110 100 90 80 70
FIGURE 3a. Average annual catches of yellowfin and average annual fishing effort in the EPa during 1984-1998 for all purse-seine trips for which usable logbook data were obtained, The average catches and effort were calculated only for] -degree areas for which three or more years of data were available. FIGURA 3a. Capturas medias anuales de aleta amarilla y esfuerzo de pesca medio anual en el OPO durante L984-1998, para todos los viajes de barcos cerqueros de los que se obtuvieron datos de bitacora utilizables, Be calcularon promedios de captura y esfuerzo solamente para las areas de ] 0 para las cuales se disponfa de tres aiios 0
mas de datos.

150 140 130 120 110 100 90 80 70
o > 191 metric tons-toneladas metricas 30 30o 75 - 191
o 27 - 74 o 1 - 26
0-Effort, no catch-Esfuerzo sin captura
20 20
o
10 10
~ o ;
o ~ o ;00' -o o :::0 0- 08;:~~8
00 ""0 000 • o. oo . . . _0.
trl
o .0' • 0 o • ~ ..... .
-0 .... >-' 0- • o· • o <D
10 •••0' o o 10 <D o o -00 <D
o o
20 20
150 140 130 120 110 100 90 80 70
FIGURE 3b. Catches of yellowfin and fishing effort in the EPa in 1999 for all purse-seine trips for which usable logbook data were obtained_ FIGURA 3b. Capturas de aleta amarilla y esfuerzo de pesca en el OPO en 1999, para todos los viajes de barcos cerqueros de los que se obtuvieron datos de bitacora utilizables. <D *'"

150 140 130 120 110 100 90 80 70ı 01 o
o > 44 metric tons-toneladas metricas 30 o 18 - 44 30
o 5 - 17 1 - 4
Effort, no catch-Esfuerzo sin captura
20ı 20
10 t- o� 10
~ 0
r� o
0 0ı o o ..:)1.;)1.;}- 0 8'
"O~.·00000·,00 0 0 "0~~~~Oi'(OQ006' ~
ED0 '8~ UJ10 ~g8~I og~~<?gg8g o
V\;!O~10 0000000ı 10 Z~.Oo~ "'" O'O~OO~'O.o 0 0 8 00 000~00 00o' o '0 o 00 • 000ı . .. 0
. 00' o
'00·
20ı 20
150 140 130 120 110 100 90 80 70
FIGURE 4a. Average annual catches of skipjack and average annual fishing effort in the EPa during 1984-1998 for all purse-seine trips for which usable logbook data were obtained. The average catches and effort were calculated only for I-degree areas for which three or more years of data were available. FIGURA 4a. Capturas medias anuales de barrilete y esfuerzo medio anual de pesca en el OPO durante 1984-1998, para todos los viajes de barcos cerqueros de los que se obtuvieron datos de bitacora utilizables. Se calcularon promedios de captura y esfuerzo solamente para las areas de 10 para las cuales se disponia de tres afios 0 mas de datos.

150 140 130 120 110 100 90 80 70 i i u:::::
oı > 44 metric tons-toneladas metricas 30 ~ rı o 18 - 44
·0 o 5 - 17 0 1 - 4
Effort, no catch-Esfuerzo sin captura o
20 -0 20
- 0-
-0ˇ 00-
10 10 o~ - .0i'\C?Xn; - I
0ı gg0� o "d o0
~ 8ı ..... 0ı <.c
<.c <.c
10� 100~og8°
20� 20
150 140 130 120 110 100 90 80 70
FIGURE 4b. Catches of skipjack and fishing effort in the EPa in 1999 for all purse-seine trips for which usable logbook data were obtained.ˇ FIGURA 4b. Capturas de barrilete y esfuerzo de pesca en el OPO en 1999, para todos los viajes de barcos cerqueros de los que se obtuvieron datos de bitacoraˇ
01utilizables.ı .....

•••••
Cl1150 140 130 120 110 100 90 80 70� tv
o > 75 metric tons-toneladas matricas 30ı 30
o 35 - 75
oı 10 - 34 1 - 9
Effort, no catch-Esfuerzo sin captura
20ı 20
10ı 10 o o· •. . ·0· • • • o. •.. . . . . .. .
0o ·0.ı 0 ' 0000000-00 0 000 0 ··0.0 ••• • •••.0
00 ·00·0000000000.000000-0 0-0000.00"0 0
o 0.0'00.00000000018... ·000·00····ı ~
o 00§8. '0- 00000000-00' 0 .. .. . ·000·000··· ...• OQ·ˇ 0'0 ., •• 0 0°00 .•••.... '.. .. 'O'000~"o oˇ0 -000'0
000·· -0' 000000.0- .. 0 00.00- . 000.· o oo o ~ g~: g?08g8g~g .. :agoe) 80' ... .. o~ ~ ?go OOO:?' oı ~
0·00·· '000 . ·0·0·000·· .000.008. 00·· .00000,000'8t ~ o 0 00000000.00000000000 -00000°0 00- 00000000 •• ·• '0.0.
D 00'ı •••• 000.000000000.000.°1°00000000.00 •• 00.00 .. 0 00 •• ••· m o· 000·' 0000000000000000000000ı ·00· 0 .9Q08000'·' "00 UJ00· O. 0000000000°00000000000. ,0·· ~o 000'"
. .:0: . ~~?888gg?ggg~888~~8886ggg88~0 g 868g~: :.. . o o ogo:??:?;gg2~2~gg??2g~gg82?ggg8;2;~gg2;?: :;??;?;.; Z
10ı 1000 00.000.00°000000.000 0 000000.0000000000- 00 00 •••• • 0ı ·0····0· 00000000000-0·0 00000000000000000000 ..
oı 000-0 0 0 00 0000· 0 000.0'000000-00 - 0 0 - 0 00 0 00· .0 0 00 00000·000-0 •• · 0
oı o 0 0 0 - 0 - 000 • 00 0 0000
o o
20ı 20
150 140 130 120 110 100 90 80 70
FIGURE 5a. Average annual catches of bigeye and average annual fishing effort in the EPO during 1994-1998 for all purse-seine trips for which usable logbook dataˇ were obtained. The averages were calculated only for I-degree areas for which two Dr more years of data were available,ˇ FIGURA 5a. Capturas medias anuales de patudo y esfuerzo medio anual de pesca en el OPO durante 1994-1998, para todos los viajes de barcos cerqueros de los que seˇ obtuvieron datos de bitacora utilizables. Se calcularon los promedios solamente para las areas de 10 para las cuales se disponia de dos 0 mas afios de datos.ˇ

150 140 130 120 110 100 90 80 70
o > 75 metric tons-toneladas metricas 30 30 o 35 - 75
a 10 - 34 1 - 9
Effort, no catch-Esfuerzo sin captura
20 20
10 10 ·0 a "-,.Ja O· a o· 000 o . . .
0· o· a ·0 . o· .0080 .a•°~68:~:0•.'. • • .88880~2~0,00 0°6 8 •° : ... ~' '088<6'" 80 6 .• '00980,s' "'0 8 0"
O· . a ~0808;: 08~8'8000 00 0 ° ~ o· . a .'6:<;'6" 0: • §8§8a0<;818
0 o ·0 o. 80" .. 00.. .. ... Qooo .. o o. o ggg I a
0. . '000 :0000~60'8606 a . "1:1 ,00 '0' 088·00" 00 .. o0 o· 0 "'08' .0.... .'0 .. 8 0':0 go06 00 .0' .
'0 0 00: 0 00' 00," 00 0 ~
• • . : 0 . 00 ·00 0 00 a .......ı a 0000 00· g 0'00 .. 0 '-0o o 0000 0 ' 000 000 '-0
10 a 00 '0 OQ- ~o 0 0 o 10 '-0 a oO' 0·· 00 a
20 20
150 140 130 120 110 100 90 80 70
FIGURE 5b. Catches of bigeye and fishing effort in the EPO during 1999 for all purse-seine trips for which usable logbook data were obtained.ı FIGURA 5b. Capturas de patudo y esfuerzo de pesca en el OPO en 1999, para todos los viajes de barcos cerqueros de los que se obtuvieron datos de bitacora utilizables.ı
~
01

54 TUNA COMMISSION
140 120 100 80 40 .------r----T"'""""---,r-'I"""""""T'"---T"'""""---,----..------r"--r-----.40
1 20 10
2 4
3
0/-----------------1 9 7 6 o
20 11 20 12
40 L..-__.....L.. .L..-__.....L.. .L..-__--l.. ..L...-__......l.._---l..........J 40 140 120 100 80
FIGURE 6. Areas used for sampling lengths of surface-caught tunas in the eastern Pacific Ocean (EPa). FIGURA 6. Zonas usadas para el muestreo de tallas de atunes capturados can artes de superficie en el Oceano Pacifico oriental (OPO).

55 ANNUAL REPORT 1999
Area 1 - 5.3 kg 3000
1500
Area 8 - 6.8 kg 0
3000
1500
0 Area 2 - 20.3 kg
3000
1500
Area 4 - 16.4 kg 0
3000 <J) ctl () 1500
"i:: :a; E
0 Area 5 - 11.9 kg
<J) 3000 ctl "0 ctl 1500
Q) C 0
'I <J) 3000
Area 6 - 6.1 kg 0
c .8 1500 () 'i:: Q) ::2:
0 Area 7 - 5.3 kg
3000
1500
Area 13 - 2.1 kg 0
3000
1500
0 Area 10 - 11.5 kg
3000
1500
Area 11 - 5.2 kg 0
3000
1500
0
20 40 60 80 100 120 140 160 180 200
Length (em) Talla
FIGURE 7a. Estimated catches of yellowfin by surface gear in selected sampling areas of the EPO in 1999.ı The values at the tops of the panels are the average weights.ı FIGURA 7a. Captura estimada de aleta amarilla por artes de superficie en zonas de medici6n seleccionadası del OPO en 1999. El valor en cada recuadro representa el peso promedio.ı

56
12000
6000
TUNA COMMISSION
1994 - 11.8 kg
12000 1995 - 13.6 kg 0
6000
rn ttl c..l 'C :a; E rn ttl "0 ttl
'"iii c 0
~ rn c .8 c..l 'C (j) ~
0
12000
6000
0
1996 - 10.2 kg
1997 - 9.1 kg
1998 - 9.3 kg
12000
6000
0
12000
6000
12000 1999 - 8.1 kg 0
6000
0 20 40 60 80 100 120 140 160 180 200
Length (em) Talla
FIGURE 7b. Estimated catches of yellowfin by surface gear in the Commission's Yellowfin Regulatory Areaı (CYRA). The values at the tops of the panels are the average weights.ı FIGURA 7b. Captura estimada de aleta amarilla por artes de superficie en el Area Reglamentaria de laı Comision para el Aleta Amarilla (ARCAA). EI valor en cada recuadro representa el peso promedio.ı

57 ANNUAL REPORT 1999
1994-22.1 kg 2000
1000
2000 1995-15.6kg
0
1000
en CIl () 'C :a; E en CIl -0 CIl Qj c 0
'I en c .8 () 'C
Q5 ~
0
2000
1000
1996 - 16.4 kg
1997-13.8kg
2000
1000
0
0 1998-12.6kg
2000
1000
2000 1999 - 9.8 kg
0
1000
0
20 40 60 80 100 120 140 160 180 200
Length (em) Talla
FIGURE 7c. Estimated catches of yellowfin by surface gear in the area between the CYRA boundary andı 150QW. The values at the tops of the panels are the average weights.ı FIGURA 7c. Captura estimada de aleta amarilla por artes de superficie en la zona entre ellimite delı ARCAAy 150°0. El valor en cada recuadro representa el peso promedio.ı

58 TUNA COMMISSION
Areas 1 and 8 - 3.0 kg
6000
3000
Areas 2, 4 and 5 - 4.0 kg 0
6000
3000
<Jl III () .t:
:a; E <Jl III "0 III Q5 c 0
~ c .8 () 't: Q5 ~
0
6000
3000
0
Areas 6 and 13 - 2.9 kg
Area 7 - 3.5 kg
Area 10 - 4.4 kg
6000
3000
0
6000
3000
Area 11 - 2.7 kg 0
6000
3000
0
20 30 40 50 60 70 80 90
Length (em) Talla
FIGURE Sa. Estimated catches of skipjack in selected sampling areas of the EPa in 1999. The values atı the tops of the panels are the average weights.ı FIGURA Sa. Captura estimada de barrilete en zonas de medici6n seleccionadas del OPO en 1999. El valorı en cada recuadro representa el peso promedio.ı
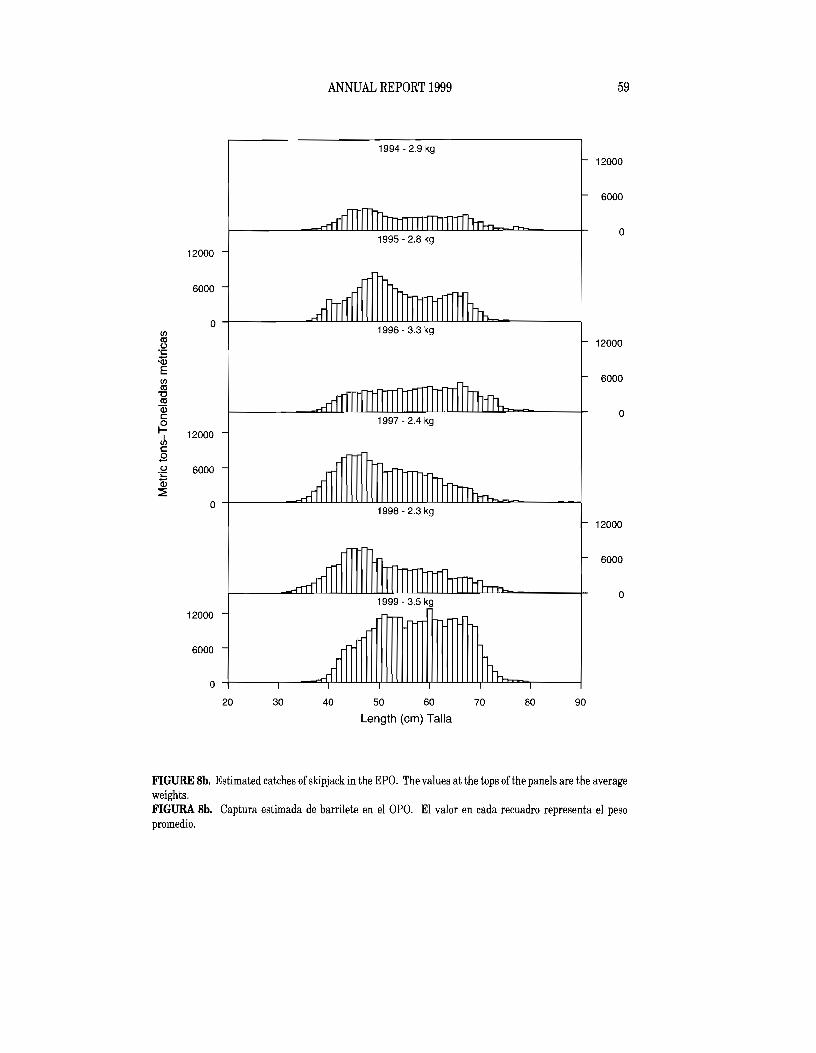
59
6000
ANNUAL REPORT 1999
1994 - 2.9 kg 12000
12000
1995 - 2.8 kg 0
6000
(/) III 0
";:: .Q5 E (/) III
"0 III Qi c: 0
'J (/) c: .8 0.;:: Q5 :iE
0
12000
6000
0
1996 - 3.3 kg
1997 - 2.4 kg
1998 - 2.3 kg
12000
6000
0
12000
6000
12000 1999 - 3.5 kg
0
6000
0
20 30 40 50 60 70 80 90
Length (em) Talla
FIGURE 8b. Estimated catches of skipjack in the EPO. The values at the tops ofthe panels are the averageı weights.ı FIGURA 8b. Captura estimada de barrilete en el OPO. El valor en cada recuadro representa el pesoı promedio.ı

60 TUNA COMMISSION
Area 5 - 9.8 kg
1000
500
0 Area 6 - 8.5 kg
1000
(/) 500 ell U 'C
'CD E Area 7 -13.4 kg
0
(/)
ell "0 ell
CD 1000 c 0
~ (/) 500 c .8 u "C
CD 0
Area 10 - 8.3 kg :2
1000
500
0Area 11 - 5.5 kg
1000
500
0
20 40 60 80 100 120 140 160
Length (em) Talla
FIGURE 9a. Estimated catches of bigeye by surface gear in selected sampling areas of the EPO in 1999.ı The values at the tops of the panels are the average weights.ı FIGURA 9a. Captura estimada de patudo por artes de superficie en zonas de medici6n seleccionadas delı OPO en 1999. El valor en cada recuadro representa el peso promedio.ı

61
3000
ANNUAL REPORT 1999
1994 - 9.3 kg
3000
1500
01995 - 9.5 kg
1500
CIl
0 1996 - 7.0 Kg
('IJ u.;::
3000
.(j) E CIl 1500 ('IJ "0 ('IJ
Qj c: 0 I
I 3000
1997 - 5.4 kg 0
CIl c: .8 u";:: 1500 (j) ::2:
a 1998 - 4.6 kg
3000
1500
1999 - 9.2 kg
3000
1500
0
20 40 60 80 100 120 140 160 180 200
Length (em) Talla
FIGURE 9b. Estimated catches of bigeye by surface gear in the EPO. The values at the tops of the panelsı are the average weights.ı FIGURA 9b. Captura estimada de patudo por artes de superficie en el OPO. El valor en cada recuadro rep-ıresenta el peso promedio.ı
0

62 TUNA COMMISSION
1994 - 38.2 kg
600
300
o1995 - 31.7 kg
600
300
0 1996 -16.7 kgl/l<Il 0 600
.'Q) 'C
E l/l 300 <Il
"'0 <Il Qi o c 1997-19.7kg0 I-j 600l/l C .9 0 300'C
'Q) ~
0 1998 - 22.7 kg
600
300
o1999 - 38.0 kg
600
40 60 80 100 120 140 160 180 200
Length (em) Talla
FIGURE 10. Estimated catches of Pacific bluefin by surface gear in the EPO. The values at the tops of theı panels are the average weights.ı FIGURA 10. Captura estimada de aleta azul del Pacifico por artes de superficie en el OPO. El valor enı cada recuadro representa el peso promedio.ı

63 ANNUAL REPORT 1999
1994 - 0.9 kg
20
10
01995 - 1.7 kg
20
10
0 1996 -1.7 kg
20 Q) "(if E 10 Q)
~ 0 a.. ..!. 1997 - 1.7 kg 0
c Q) u... 20 Q) a..
10
0 1998 - 1.7 kg
20
10
o1999 - 2.3 kg
20
10
0
20 30 40 50 60 70 Length (em) Talla
FIGURE 11. Length frequencies of black skipjack caught in the EPO. The values at the tops ofthe panelsı are the average weights.ı FIGURA 11. Frecuencias de talla de barriletes negros capturados en el OPO. EI valor en cada recuadroı representa el peso promedio.ı

• • •• •
64 TUNA COMMISSION
1200 •
rn ~ 0 1000 "0 coc: Ql rn
.Cl 800 0 Ql "0 rn .8 co 600 0
I ~
'" "0 400 Q;c: Ql rn
..0 0 200
200 300 500 600 700 800 900
Unloading data-Datos de descargas
FIGURE 12a. Comparison of estimates of catches of bigeye, in metric tons, by observers with the corre-sponding unloading weights. The diagonal line indicates equal values for the horizontal and vertical axes. FIGURA 12a. Comparaci6n de las estimaciones de los observadores de capturas de patudo, en toneladas metricas, con los pesos de descarga correspondientes. La linea diagonal indica valores iguales para los ejes horizontal y vertical.
900
•ı 750
~ 0 u •:ill •
600:0
•Ql "0 rn .8'"I •4500 •~
~ • •co "0
0 300""" • .10 •.Cl
0 --'0>
•• •150 • 150 300 450 600 750 900
Unloading data-Datos de descargas
FIGURE 12b. Comparison of estimates of catches of bigeye, in metric tons, by fishermen with the corre-sponding unloading weights. The diagonal line indicates equal values for the horizontal and vertical axes. FIGURA 12b. Comparaci6n de las estimaciones de los pescadores de capturas de patudo, en toneladas metricas, con los pesos de descarga correspondientes. La linea diagonal indica valores iguales para los ejes horizontal y vertical.

180 170 160 150 140 130 120 110 100 90 80 70
0 30 30
~f> 20
'" [ 10 "Iill 1M I ~/'<<>i10~
0= o 0 0 - -III q;-
0 0 g;o f.. 00 Z
0 0 III %0 0 0%
0 o 00 0 00 ~ EEBrnc:fID 0 ~
~
0 trl10 f.. db 00 Cb O 0 cFBBJ 10 ""do 0000 0 0 ~DO 0 0 00 '""'3 >-' <:D20 f.. 20 <:D
Sets-Lances <:D 001-2ı
03-5ı _ 6-10 30 f.. )-1 30 _ 11-18
_ >18
~ l ~~~
180 170 160 150 140 130 120 110 100 90 80 70
FIGURE 13a. Distribution of purse-seine sets made on tunas associated with flotsam during 1996-1999. ~FIGURA 13a. Distribuci6n de lances cerqueros sobre atunes asociados con despojos flotantes durante 1996-1999. en

0':> 0':>
180 170 160 150 140 130 120 110 100 90 80 70
~ r .. '~J'20 C>
n-~~ ~:;r
r Cmc",~~~~rrc~~c mm& _~ W 10
0
DO tTcfl~~Eb
o l- nn n q::j, nn rJillll q.., 10 d ~
0 10 1=""-= H1+I+I ,r I 1"bI'!"1 1 1 2 ,a 12UalBe'l"'- EI \ '"'--1l 10 0
~
~ .-Ui Ui
20 l- ------cIillI n U -t 20 .-0 Z
)1 Sets-Lances
30 I- )-j 3001-2 03-5 III 6-10 _ 11-18 _ >18
r i I -I 40 40
180 170 160 150 140 130 120 110 100 90 80 70
FIGURE 13b. Distribution of purse-seine sets made on tunas associated with FADs during 1996-1999.ı FIGURA 13b. Distribuci6n de lances cerqueros sobre atunes asociados con dispositivos agregadores de peces durante 1996-1999.ı

180 170 160 150 140 130 120 110 100 90 80 70
30 30
.. 20 20f>
10 4-1-+-kI-h-, I I I I'"LIIII!!!l!tF"1 bli IJ.I 11,1 Lli II I ~ II II U ."M.II I 1'>--'-. - (- fl\~ 10~
~
Z
10~ -r::n::1 I I ! I H$"I L"Ll] II LI"ldV"FFLiI TJ 1iiI!iI!IJ"l vi I. 11 LLI I I LTI&&"1 \ "-1l 10 ~
;:d tr:I "d 0
m ,..--20 I- El _ -t 20 ~
f-' <0 <0 <0
Tons-Toneladas 30 I- fLo00-20
0>20-70 III >70-160 _ >160-330 _ >330
40 [ ~U40
180 170 160 150 140 130 120 110 100 90 80 70
FIGURE 14a. Distribution of catches of yellowfin in purse-seine sets made on floating objects during 1996-1999.ı FIGURA 14a. Distribuci6n de las capturas de aleta amarilla en lances cerqueros sobre objetos flotantes durante 1996-1999.ı
m -:)

180 170 160 150 140 130 120 110 100 90 80 70 0':> 00
30 30
20 '(;> 20
10 10
10
20
o
10
20
d ~
('") o ~
'Xi 'Xi >-< o Z
30
40
Tons-Toneladas CJ 0-5 CJ >5-10 _ >10-40 _ >40-90 _ >90
30
40
180 170 160 150 140 130 120 110 100 90 80 70
FIGURE 14b. Distribution of discards of yellowfin in purse-seine sets made on floating objects during 1996-1999. FIGURA 14b. Distribuci6n de los descartes de aleta amarilla en lances cerqueros sobre objetos flotantes durante 1996-1999.

180 170 160 150 140 130 120 110 100 90 80 70
30ı 8 30
.. 20ı 20t>� rrP~
Clı ""
0 8 10 ~
10
0 ~
Z
~
t""10 J:"UillIII� ~ ."IIqfliil!lll!lLU 2 &...LUI!IIIIIIi/2jJ: I \ '-c..-1I 10 gg '"d :;:0
- o---cr-20 I-� >-3 ..... ~
~
~nr� 0
30 ~ Tons-Toneladas 30
00-20 0>20-70 .. >70-160 _ >160-330 I I -I 40 _ >33040 l
180 170 160 150 140 130 120 110 100 90 80 70
FIGURE 15a. Distribution of catches of skipjack in purse-seine sets made on floating objects during 1996-1999. FIGURA 15a. Distribuci6n de las capturas de barrilete en lances cerqueros sobre objetos flotantes durante 1996-1999. m
~

-:J 180 170 160 150 140 130 120 110 100 90 80 70 0
30 30
. 20 ~t> 20o::P~
0
1010
00 ilIIJ0 00 ~eP'Jt:
0 '-3 c:::: ~
C":l 0
10 I- L.LLJ H'-H4-1 ,111111"1&..11. .. ... ';;;/'I ..Jiiilli II \ '--1l 10
~W
20 I- wu '" -. 0 Z
Tons-Toneiadas 30 I- 30"r
-~
00-5 ~ >5-10ı .. >10-40ı .. >40-90ı
40 I- _>90 1iJ 40
180 170 160 150 140 130 120 110 100 90 80 70
FIGURE 15b. Distribution of discards of skipjack in purse-seine sets made on floating objects during 1996-1999. FIGURA 15b. Distribuci6n de los descartes de barrilete en lances cerqueros sobre objetos flotantes durante 1996-1999

180 170 160 150 140 130 120 110 100 i i i
:r . 'c>
.o~]~ o !?~
D B L.J 20
0 0rrn rPr"1 R-, n mI
10 ~ rn "rnR hI n mdlh ~~10n
0 rnDO
". W'd' ~"'m
~. .."=rJ:r t:::J 0 '. . ~ i{f6EJi1
101-%:·····~ I gg ""d 0 ~
----c:IJn~-20 l- ~ 20 >-3 >-' <:0 <:0
Tons-Toneladas30 ~ fJ 30
<:0
g 0-20� Q >20-70� l1li >70-160� _ >160-330 _ >33040 r ~{J 40
180 170 160 150 140 130 120 110 100 90 80 70
FIGURE 16a. Distribution of catches of bigeye in purse-seine sets made on floating objects during 1996-1999. FIGURA 16a. Distribuci6n de las capturas de patudo en lances cerqueros sobre objetos flotantes durante 1996-1999.
~ ,....

-'l 180 170 160 150 140 130 120 110 100 90 80 70 l:-:>
Dı (;> 0ı
:: [ ..� ~J: 0
D 8 u 0 ill10l IT] en R R ,R, n ~ ~_ ~10IillI
D DDIT] EfT ~~
Do cfl DO
>-3~. Hll:Jb 1P of� 0
D
10 ~% D
20 l
30 l
40 l
180
c::::~_ ~
10ˇ 0 0 ~
~
m-----cIJn---cr-- -I 20ˇ en ...... 0 Z
Tons-Toneladas 00-5ˇ
!Lo 0>5-10 l1li >10-40 _ >40-90 _ >90ˇ ; / ~ 40
170 160 150 140 130 120 110 100 90 80 70
FIGURE 16b. Distribution of discards of bigeye in purse-seine sets made on floating objects during 1996-1999. FIGURA 16b. Distribuci6n de los descartes de patudo en lances cerqueros sobre objetos flotantes durante 1996-1999.
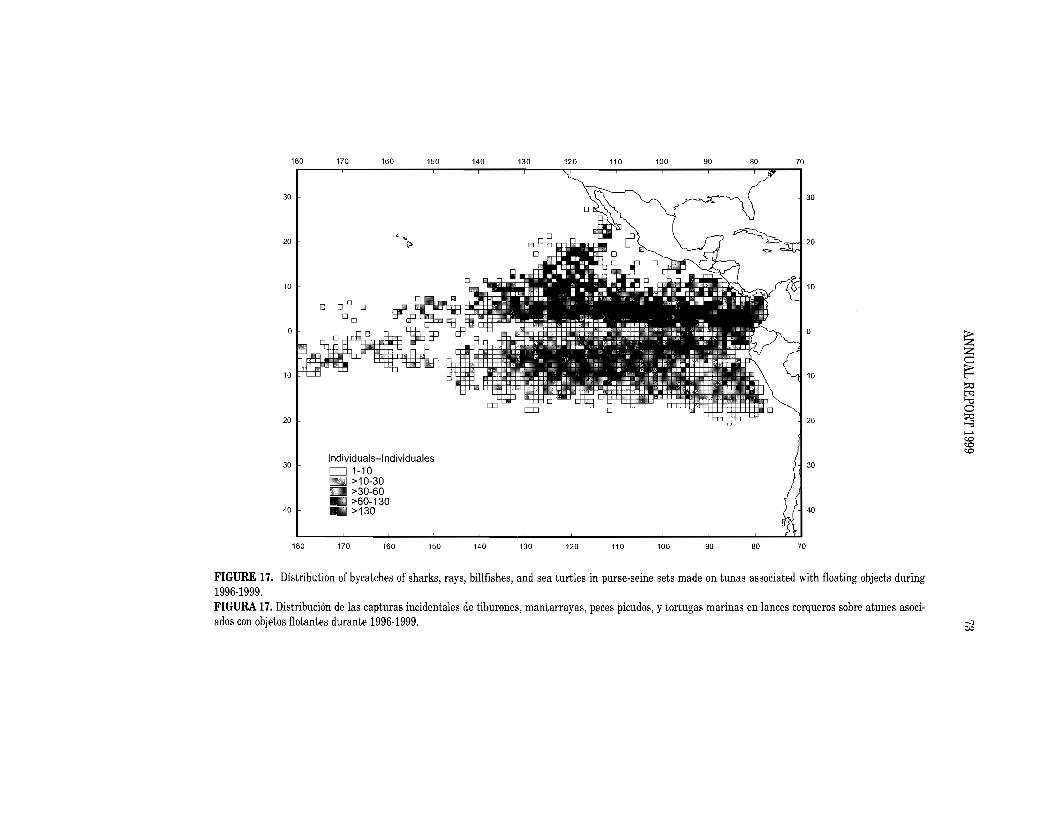
180 170 160 150 140 130 120 110 100 90
30
20
10
o
10
20
30
40
Individuals-Individuales II 1-10 II >10-30 .. >30-60 .. >60-130 _ >130
180 170 160 150 140 130 120 110 100 90
80 70
30
20
10
o
10
20
30
~
gg >-c:I o ~
>-' <.0 <.0 <.0
40
80 70
FIGURE 17. Distribution of bycatches of sharks, rays, billfishes, and sea turtles in purse-seine sets made on tunas associated with floating objects duringı 1996-1999.ı FIGURA 17. Distribucion de las capturas incidentales de tiburones, mantarrayas, peces picudos, y tortugas marinas en lances cerqueros sobre atunes asoci-ıados con objetos flotantes durante 1996-1999.ı -.::J
W

,p..180 170 160 150 140 130 120 110 100 90 80 70 ~
30 30
~ '(>20 20
10 10
• o
~
(")10 10
~ rn 20 20 rn...... o
Z
30 30 00-0.08 CO >0.08-0.14 _ >0.14-0.22ı _ >0.22-0.48ı
40 _ >0.48 40
180 170 160 150 140 130 120 110 100 90 80 70
FIGURE 18. Distribution of ratios of bycatches of sharks, rays, billfishes, and sea turtles to catches of tunas in purse-seine sets made on floating objects duringı 1996-1999.ı FIGURA 18. Distribuci6n de las proporciones de capturas incidentales de tiburones, mantarrayas, peces picudos, y tortugas marinas a las capturas de atunes enı lances cerqueros sobre objetos flotantes durante 1996-1999.ı

180 170 160 150 140 130 120 110 100 90 80 70
~C> ~~J: 10Ii rr<l n H Mn 0 ~ lliJ.U. ~ n n ua.n .P ~,,r <<>1
='iilPIIIlJ 0
o Do
~ 0 o 0dI(0O ~
0 ID� Z o IT] 0 0 oı 0
0 ~ 10 ~ 10 :;:0 t>j '"0 0 :;:0
20 ~ -120 >-3 .......ˇ <.D <.D
fLoı <.D
Individuals-Individuales� 30 ~ D 0-1�
D >1-2ˇ .. >2-4ˇ _ >4-8
) 1-1 40 40L:>8
180 170 160 150 140 130 120 110 100 90 80 70
FIGURE 19. Distribution of bycatches of blue marlin in purse-seine sets made on tunas associated with floating objects during 1996-1999.ˇ FIGURA 19. Distribucion de las capturas incidentales de marlines azules en lances cerqueros sobre atunes asociados con objetos flotantes durante 1996-1999.ˇ
-..l 01

-.:J 180 170 160 150 140 130 120 110 100 90 80 70 0':>
~ ~'"[ ~J'"20 C> eP (" I ( ""2.-.'> e-.-<I 20
0
10 l- n ~ _~10
eP° O o 0 B
III 0
c:flD
~ - 0 ~ ~ >-3 0 B 0 qp .' 0
Ell
01-
. CJ:FIl ~~'1P 0 DODO Ell B ~
0 r:P 0 0 DEP ("j10 I- 10 o 0 DO 0 0et 0 0 0
o qp ~
~ o 0 >-< W
20 I- 20 W >-< 0 Z
ILo30 I- Individuals-Individuales II 0-1ı mlillillillJ >1-2ı .. >2-3ı
40 l- • >3-4 .>4 ~U 40
! !
180 170 160 150 140 130 120 110 100 90 80 70
FIGURE 20. Distribution of bycatches of sea turtles in purse-seine sets made on tunas associated with floating objects during 1994-1997.ı FIGURA 20. Distribuci6n de las capturas incidentales de tortugas marinas en lances cerqueros sobre atunes asociados con objetos flotantes durante 1994-1997.ı

180 170 160 150 140 130 120 110 100 90 80 70
:1 ..� ~J:C>ı 0 0
0
10 ~ cP - 9:J 9:J (" /1\-1 10o ~~ 'it-'-
oı "~D~;D*~",.1 0~ o 0 0 , mE D� D D caD" ... ~B
D ~·0 D) 9:i1?9:J EhJca Cb D O~ Eb::J % Cl. D~ ~10 ~ qp ... DODD Dcft::i;jftJ 10
D D . ~0 B I:I!Jı tz:j '"1:j
eP~ 0 20 ~ 20 ~
>-' <.0 <.0
fLo <.0
Individuals-Individuales 30 ~
D 0-1� D >1-2� II1II >2-3� II1II >3-6�
40 ~ II1II>6� I J-I 40
180 170 160 150 140 130 120 110 100 90 80 70
FIGURE 21. Distribution of bycatches of manta rays in purse-seine sets made on tunas associated with floating objects during 1996-1999. FIGURA 21. Distribucion de las capturas incidentales de mantarrayas en lances cerqueros sobre atunes asociados con objetos flotantes durante 1996-1999.ı -:J
-:J

78 TUNA COMMISSION
Length (em) Talla
FIGURE 22. Lengths at recapture and days at liberty of the tagged bigeye tuna whose oxytetracycline-ımarked otoliths were recovered and processed.ı FIGURA 22. Talla de recaptura y dias en libertad de los atunes patudo marcados cuyos otolitos, marcadosı con oxitetraciclina, fueron recuperados y procesados.ı
1000
1= -0.109 + 0.999d� ,g (/)
n =46�
~ 800$ c: (/)ı Q)ı .2E Q)2: l:l (..J (/) .~ .s :E c: 600
Q)
E -~ 2: ()ı
0ı .~ c CD
l:l 400ı 0 0ı :::> (..J '6c: CD� ell� EQ)
::2 e c..ı 0ı 200ı $ı c: 0 U
200 400 600 800 1000
Days at liberty-Dfas en libertad
FIGURE 23. Relationship of the mean count of otolith increments (D from the oxytetracycline mark to theı postrostrum tip of the otolith to number of days at liberty (d) for 46 tagged bigeye tuna.ı FIGURA 23. Relaci6n entre el mimero promedio de incrementos en el otolito (D desde la marca de oxitetraci-ıclina a la punta postrostral del otolito y el nUmero de dias en libertad (d) para 46 atunes patudo marcados.ı

79 ANNUAL REPORT 1999
20' 80°
3000m--~
20'
FIGURE 24. Location of Achotines Bay, Panama. The Achotines Laboratory is located on the east side ofı the bay. The dots on the transects represent sampling stations.ı FIGURA 24. Situaci6n de la Bahia de Achotines, Panama. Ellaboratorio esta situado al borde este de laı bahia. Los puntos en los transectos representan estaciones de muestreo.ı
Caribbean Sea
Peninsula de Azuero
30' Pacific Ocean 30'

180 170 160 150 140 130 120 110 100 90 80 70 00 30 I I ,j I} ~i A Ii.. I I i ~ :::::::J \ .. s: I I /1 I i 30 o
20 ~ / -- I , 4:; 207" A««~<m<~'>--'-1 /-= 'N~ (
+
0-- --
10 I -j -1 10ı ~ ~~ ) ~~ +
0- I/\."","-..~""-"'\..",."lll "--.'.../ I p- I " >-3 cj
~
0 0
101 1 7~ I "1+ ) ["I G: + "'1 \,~ ~ 10 ~
7 \ _ ......... 7 ,,\ı ~
o~ en--+ en0 ~
20 1 _ 4 /- - -1=' ) -....... ......0:«:W:< " 01 20ı
+
+ +� I I ,1 I I I I I I I
+ "0 I -, A'0\'\\' ~ ) I 30ıI I
30180 170 160 150 140 130 120 110 100 90 80 70
FIGURE 25a. Sea-surface temperature (SST) anomalies (departures from long-term normals) for February 1999, based on data from fishing boats and other types of commercial vessels. The areas with SSTs from 1 to 2C below normal are hatched, and those areas more than 2°C below normal are cross hatched. The contours are dashed in areas of sparse data. FIGURA 25a. Anomalias (variaciones de los niveles normales a largo plazo) de la temperatura superficial del mar (TSM) en febrero de 1999, basadas en datos tornados por barcos pesqueros y otros buques comerciales. Las TSM en las zonas sombreadas fueron de 1° a 2°C inferiores a 10 normal, y aquellas en las zonas con sombreado doble mas de 2°C inferiores a 10 normal. Contornos de trazos significan que los datos para esa zona son escasos.

180 170 160 150 140 130 120 110 100 90 80 70 30 I I I _II ... i i <J '\... so , I A i I I 30
20 1+1== ~~+-----' 20ı
oı
10 f----- ( t I) ;«'0\:0\:<0000-:1 ---+ 'II f- -.10
~
Z c::
+1D~O~ I ~
\i::\::;»Y ~
trj--+- II =- : +1" I +10 l'0Peru 0 o ~
>--'3 >-'
-i47J~\+_~
""d
<.0 + <.0
20 c0l - I 20
<.0
+
30' ~-160 I (I \t+1ı
180 1ı
+ ,PIHO ' ,I 150 140
,!I I 120 + o 100---'-'1'0 _-190 80 1!30130 70
FIGURE 25b. Sea-surface temperature (SST) anomalies (departures from long-term normals) for April 1999, based on data from fishing boats and other typesı of commercial vessels. The areas with SSTs from 1 to 2C below normal are hatched, and those areas more than 2°C below normal are cross hatched. The con-ıtours are dashed in areas of sparse data.ı FIGURA 25b. Anomalias (variaciones de los niveles normales a largo plazo) de la temperatura superficial del mar (TSM) en abril de 1999, basadas en datosı tornados por barcos pesqueros y otros buques comerciales. Las TSM en las zonas sombreadas fueron de 1° a 2°C inferiores a 10 normal, y aquellas en las zonas (YO�
con sombreado doble mas de 2°C inferiores a 10 normal. Contornos de trazos significan que los datos para esa zona son escasos. >-'ı

180 170 160 150 140 130 120 110 100 90 80 70 00 30 t-:>
30 I~o) , + L/O' 1_ I I l' I i I ~~l ~ ~~ i , I 7 I , i , 1
0/. I l~
2020� r----~~---l---If8 I 1_
I�
+ i-I� ~ -,1010 -rk~ I~-+-+-- -� I
-
~ - ~--,-"
Colombia
I~ 1- -, 0"'~ ~~~_~-1~1~~~~I
~ + o+ 1-ı o Peru�
10 I------- -, 10 ~
+ -UJ+ UJ+,0,' + o~ , '
,: - ' 'r+ I -------- Z(5
I� , , ,,'� I~ \� :, I~~~--"
,"0 .,ı \ - -,-II, "-1
.".------J------;l;~- +� I·'I
IV 130 120 _---l2....-_, ,100~~--_-1'--90 80
FIGURE 25c. Sea-surface temperature (SST) anomalies (departures from long-term normals) for July 1999, based on data from fishing boats and other types of commercial vessels. The areas with SSTs from 1 to 2C below normal are hatched, and those areas more than 2°C below normal are cross hatched. The contours are dashed in areas of sparse data _ FIGURA 25c. Anomalias (variaciones de los niveles normales a largo plazo) de la temperatura superficial del mar (TSM) en julio de 1999, basadas en datos tornados por barcos pesqueros y otros buques comerciales. Las TSM en las zonas sombreadas fueron de 1° a 2°C inferiores a 10 normal, y aquellas en las zonas con sombreado doble mas de 2°C inferiores a 10 normal. Contomos de trazos significan que los datos para esa zona son escasos.

180 170 160 150 140 130 120 110 100 90 80 70ı 3D, i Ii I iX I i iU 0::;:.::;:\ i A i I I i .30�
++ + +1----:-
+
2020 ~/---------- 1/ ('S t =-- "-=1 ~'tA:9 ~
10 I <i<00"\)Y= I .1. I A'00"""00"N00::::::\\ I ( , 1/ '-'" 10
I + gg
10 I '--I~ 1\:/ ~y 7~ ...... ~ 10 ""d 0_1 + + ~
" .+ >-' <0 <0+
+ + 20 I / "d + 1/, "'---=-V r= r-"'·"f" '--"\ I c~.~I <0
++ ,+ ,+ ,,+' ,, 3°110 I 1~O+1!, 1lo ' 1~O 140 ~30 1~O/ + 110 100 q 80· I\+1 I I 90 I
FIGURE 25d. Sea-surface temperature (SST) anomalies (departures from long-term normals) for December 1999, based on data from fishing boats and other types of commercial vessels. The areas with SSTs from 1 to 2C below normal are hatched, and those areas more than 2°C below normal are cross hatched. The contours are dashed in areas of sparse data. FIGURA25d. Anomalfas (variaciones de los niveles normales a largo plazo) de la temperatura superficial del mar (TSM) en dicembre de 1999, basadas en datos tornados por barcos pesqueros y otros buques comerciales. Las TSM en las zonas sombreadas fueron de lOa 2°C inferiores a 10 normal, y aquellas en las zonas
00 con sombreado doble mas de 2°C inferiores a 10 normal. Contornos de trazos significan que los datos para esa zona son escasos. c:.:>

84 TUNA COMMISSION
3016;:-:0'-----'1.:r50=------'1,.4::..0__1'-;'3.::.0_-'T"'--='-r_--'ir---=,,;:,"""".nr-_--;7030
20 20
10
10 10 Spotted dolphin�
Delfin manchado� 20 20ı
160 150 140 130 120 110 100 90 80 70ı
160 150 140 130 90 80 70ı 30 30ı
20
.... ....10 10.... - .... " "-,
...... /.Whitebelly-Panza blanca
I I
10 10ISpinner dolphin� Delfin tornillo�
20 20ı 160 150 140 130 120 110 100 90 80 70ı
160 150 140 130 120 110 100 90 80 70ı 40 40ı
30 30
20 20
10 10
10 COmmon dolphin 10 Delfin cornun
20 L-_---'-__..L-_----'__--'-_----J__--'--__L-_---'--_----' 20 160 150 140 130 120 110 100 90 80 70
FIGURE 26. Average distributions of the stocks of spotted, spinner, and common dolphins in the eastern Pacific Ocean (EPO). FIGURA 26. Distribuciones medias de los stocks de delfines manchado, tornillo, y comtin en el Oceano Pacifico oriental (OPO).

85 ANNUAL REPORT 1999
70
(/J Q) c
<;::
Qi -0
~ 50 (/J
.!!1 Northeastern
~ Nororiental
ch c:c a.:g 30
'0 \ (/J -0 C
\ \
co \ (/J ::> ! \ o
r=. 10 I \ , /' --l'',t-:" Western and southern
Occidental y sureiio
\ "
......... __ .
o 1980 1985 1990 1995
25
1Il Q) C
<;:: 20Qi -0 Q) -0 (/J
.!!1 15 ~
I Eastern (/J C Oriental :c a. Jt"5 -0 10 0 -�(/J -0 C (/J co 5 I .::> 0 I
.J:: l- I Whitebelly
i' Panza blanca
0 1980 1985 1990 1995
Year-Ano
FIGURE 27. Estimated numbers of mortalities for the stocks of spotted (upper panel) and spinner (lowerı panel) dolphins in the EPa during 1979-1999. Each vertical line represents one positive and one negativeı standard error.ı FIGURA 27. Nlimero estimado de mortalidades para los stocks de delfines manchado (recuadro superior)ı y tornillo (recuadro inferior) en el OPO durante 1979-1999. Cada linea vertical representa un error estandarı positivo y un error estlindar negativo.ı

86 TUNA COMMISSION
14 Dolphin sets
Lances sobre delfines 12
10
8
6
4
2
12 Mortaiity per set Mortalidad por lance
10
en en 8.1: Q).c c:: 0.;';::::
8~ 6
4
2
o
140 Mortalities
Mortalidades120 en c::
:.c en Q.Q) 100 :g~ ..... Q)0-0 80� en Q)ı-0-0ı c:: en� 60ctl Q)(f):=g::2: .c 40 I
79 82 85 88 91 94 97 Year-Ana
FIGURE 28. Estimated numbers of sets on tunas associated with dolphins, average mortalities per set, andı total mortalities, for all species of dolphins combined, in the EPO during 1979-1999. Each vertical line rep-ıresents one positive and one negative standard error.ı FIGURA 28. Numero estimado de lances sobre atunes asociadas con delfines, mortalidad media par lance,ı y mortalidad total, para todas las especies de delfines combinadas, en el OPO durante 1979-1999. Cadaı linea vertical representa un error estandar positivo y un error estandar negativo.ı
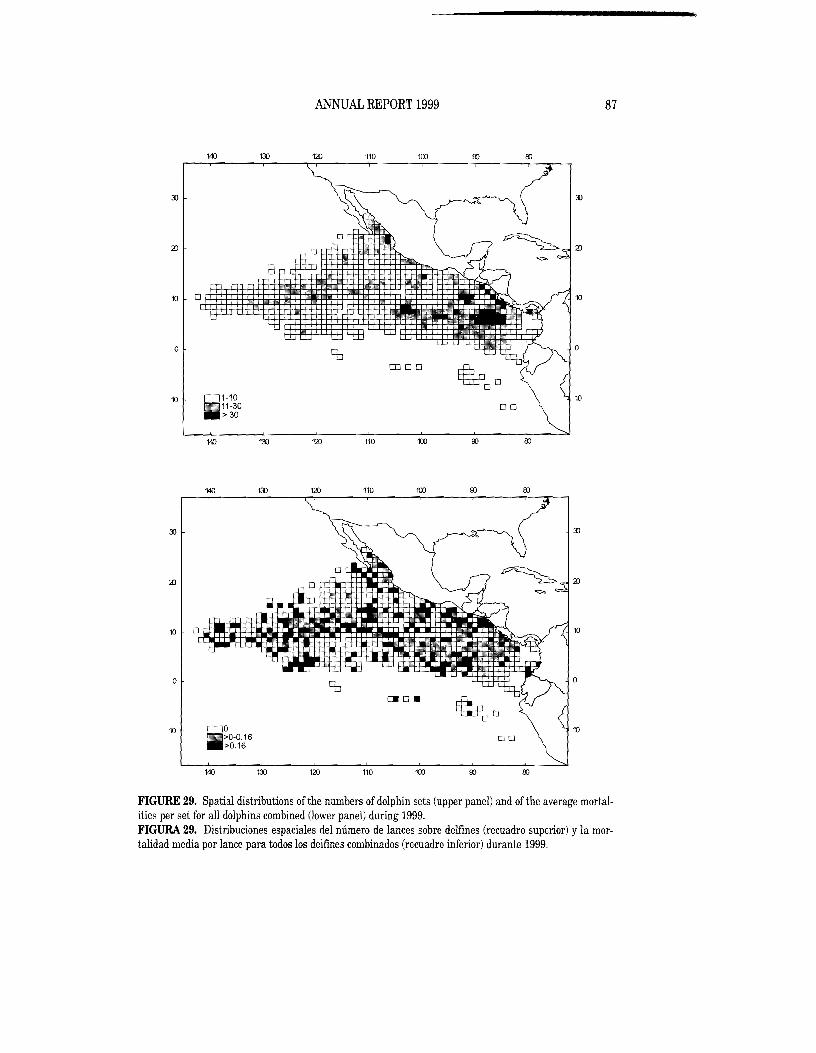
87 ANNUAL REPORT 1999
140 130 120 110 100
0
OJ 0 0
01-10 .11-30 DO
10
> 30
140 130 120 110 100 00 00
140 130 120 110 100
3J 3J
10
o
10 DO 10 ~>0-0.16 DO .>0.16
140 130 120 110 100
FIGURE 29. Spatial distributions of the numbers of dolphin sets (upper panel) and ofthe average mortal-ıities per set for all dolphins combined (lower panel) during 1999.ı FIGURA 29. Distribuciones espaciales del numero de lances sobre delfines (recuadro superior) y la mor-ıtalidad media por lance para todos los delfines combinadas (recuadro inferior) durante 1ı

88 TUNA COMMISSION
1600 f- -7.6
7.;1.5
(\] > ~ ~ (\]
'13 c Ctl "0 C
1400
80•
79• 86• 85•
92• ::l .a Ctl Q)
"0 Q) 0
1200 ~8
9~ 88• 89•
-
'6 c I Q) () c (\] 1000
82 • 84•
9J) 87• "0 c 8.1 :::l .a (\]
OJ 9~gJl > ~ • ~ .... 0 800 x OJ
"0 .E
600
83I•
4000 6000 8000 10000 Number of dolphin sels-Numero de lances sabre delfines
FIGURE 30. Estimates of the index of relative abundance of northeastern spotted dolphins (number ofı animals divided by 1000) versus the number of dolphin sets in the northeastern spotted dolphin area,ı 1975-1997.ı FIGURA 30. Estimaciones del indice de abundancia relativa del delfin manchado nororiental (numero deı animales/1000) versus el mimero de lances sobre delfines en la zona de ese stock, 1975-1997.ı

89 ANNUAL REPORT 1999
3
2
.....-. .-./'
o f----J.r-:/--+---t---t----+---\---+---t------jl---+------jttl
Before sightings :=Q)='EEı ... 0.06 Antes de los avistamientos ...ı 0 ~a. .!!l ~ oı ttl ~ C 0.04 ()� ttl
0"0
Q) ./ ."'."'. I·"./:::. E o .-\... "0
~ e 0.02 Eı Q) . :Jı E Z� -:::Jˇ
Z� 0.0
ttl Q)= • After sightings :=ı 'EEı ... Despues de los avistamientos 0.06 ...ı 0 ~a. en� en_ ttl� 0"0� oı ttl 0.04~ C ()� ttl
:::. E oı Q)
.\... "0 Q)ı 0 0.02.D� ...Eı Q) :Jı E Z� -::I .," Z .-./~-.....-~--./~-.-.-.-~--....--- ..............-.-.ˇ
'--'----_--'~ .•-===---"_'--_ __!.---""__~___L___'_.....:..._L--.....:...__L_:........Jˇ0.0 79 81 83 85 87 89 91 93 95 97
Year-Ana
FIGURE 31. Percentages of miles searched between sightings that led to dolphin sets and those dolphinˇ sets (upper panel) and the average encounter rates before (middle panel) and after (lower panel) the sight-ˇings that led to dolphin sets. The data are from the IATTC observer data base.ˇ FIGURA 31. Porcentajes de millas buscadas entre avistamientos que llevaron a lances sobre delfines y esosˇ lances (recuadro superior) y las tasas medias de encuentro antes (recaudro medio) y despwls (recaudro infe-ˇrior) de los avistamientos que llevaron a lances sobre delfines. Losˇ datos provienen de la base de datos de observadores de la CIAT.ˇ
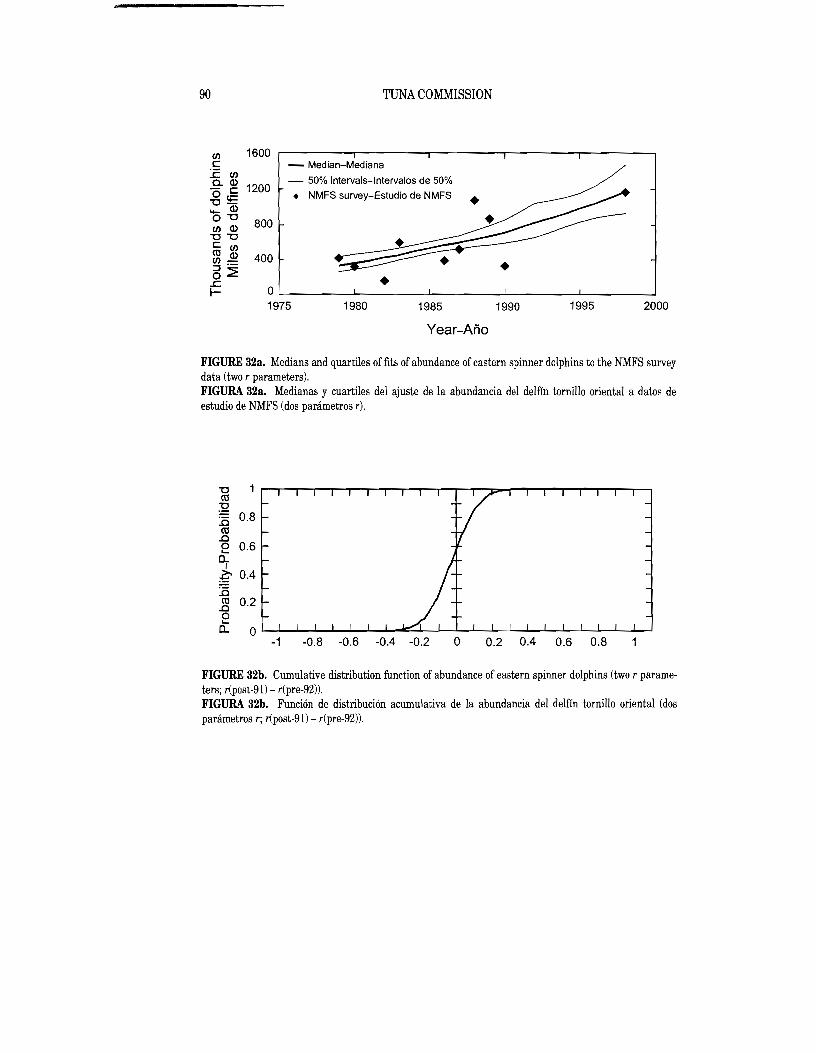
90 TUNA COMMISSION
en 1600 c: - Median-Mediana :Cen e.Q) - 50% intervals-Intervalos de 50% -c: 1200.g!E: • NMFS survey-Estudio de NMFS
- Q)0-0 en Q) 800 -0-0 c: en <a Q) en ::J'O~ .r: I-
Ol....-
400
---' • --' --J~
• ____'_ ____J
1975 1980 1985 1990 1995 2000
Year-Ana
FIGURE 32a. Medians and quartiles of fits of abundance of eastern spinner dolphins to the NMFS surveyı data (two r parameters).ı FIGURA 32a. Medianas y cuartiles del ajuste de la abundancia del delffn tornillo oriental a datos deı estudio de NMFS (dos panimetros r).�
"0 <a :2
0.8:0 co .D e 0.6 0j.., 0.4:': :0 co 0.2.D 0.... 0 0
-1 -0.8 -0.6 -0.4 -0.2 0 0.2 0.4 0.6 0.8
FIGURE 32b. Cumulative distribution function of abundance of eastern spinner dolphins (two r parame-ıters; r(post-91) - r(pre-92)).ı FIGURA 32b. Funci6n de distribuci6n acumulativa de la abundancia del delffn tornillo oriental (dosı parametros r; r(post-91) - r(pre-92)).ı

91 ANNUAL REPORT 1999
C/) c:c C/) Cl.Q) - c.g!:E
1600
1200
--
•
Median-Mediana 50% intervals-Intervalos de 50%
NMFS survey-Estudio de NMFS
••
- Q)0"0 C/) Q) "0"0 C C/) co Q)C/)-::J .-0:2: ..c
800
400 ••• ._~-~--=---=-----~----~--~-------
I- o 1975 1980 1985 1990 1995 2000
Year-Ana
FIGURE 33a. Medians and quartiles of fits of abundance of northeastern spotted dolphins to the NMFSı survey data (two r parameters).ı FIGURA 33a. Medianas y cuartiles del ajuste de la abundancia del delfin manchado nororiental a datos deı estudio de NMFS (dos panimetros r).�
"0 co ~ :0 0.8 co .0 e 0.6 0..., >-:::: 0.4
:.0 co .0
0.2 0....
0... 0 -1 -0.8 -0.6 -0.4 -0.2 o 0.2 0.4 0.6 0.8
FIGURE 33b. Cumulative distribution function of abundance of northeastern spotted dolphins ((two rı parameters; r(post-91) - r(pre-92)).ı FIGURA 33b. Funci6n de distribuci6n acumulativa de la abundancia del delfin manchado nororiental (dosı parametros r; r(post-91) - r(pre-92)).ı

92
800
TUNA COMMISSION
I/) 1600 c - Median-Mediana
.c: I/) - 50% intervals-Intervalos de 50% Q.CD-.g!E_ cCD
1200 • NMFS survey-Estudio de NMFS
0"0 I/) CD "0"0 C I/) l\'l CD 1/)- 400 ::l 'O~ •.c: •
Oc-- ----' ----L --'- ....L ----l ~
1975 1980 1985 1990 1995 2000
Year-Ano
FIGURE 34a. Medians and quartiles of fits of abundance of eastern spinner dolphins to the NMFS surveyı data (single r parameter).ı FIGURA 34a. Medianas y cuartiles del ajuste de la abundancia del delfin tornillo oriental a datos deı estudio de NMFS (parametro r sencillo).ı
"0 etlı
:Qı 0.8:0
etl .c 0.6e a.. ~ 0.4 :.c etl 0.2 .c e
OL..l---l..~I....I....L_...."...........L...l....Io...L_d:::::l:........L_....L_.L......l._l._....L.....JL_L....L.._.L..J.--l......l...._L..Jıa.. -3.5 -3 -2.5 -2 -1.5 -1 -0.5 0 0.5 1.5 2 2.5 3 3.5 4
FIGURE 34b. Cumulative distribution function of net growth rate of eastern spinner dolphins, 1979-1998ı (single r parameter).ı FIGURA 34b. Funci6n de distribuci6n acumulativa de la tasa neta de crecimiento del delfin tornillo ori-ıental, 1979-1998 (parametro r sencillo).ı
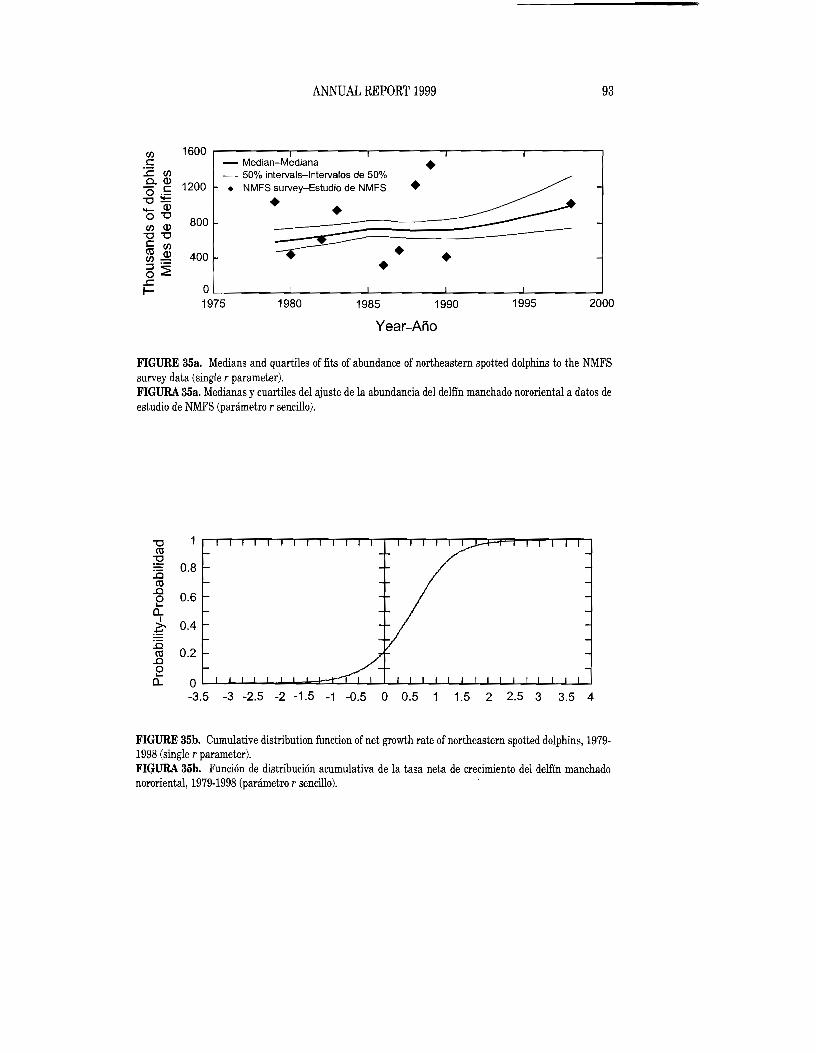
93
800
ANNUAL REPORT 1999
1600 ,....-----r-----.------r-----.---------,C/l •s:: - Median-Mediana .s:: C/l - 50% intervals-Intervalos de 50% 0..0> - s:: 1200 • NMFS survey-Estudio de NMFS •�.g~ - 0>0"0 ~~--~~ C/l Q) "0 "0 s:: C/lro Q)C/l~ .o~
.s:: O'--
400 ~.• ----J. --'
• -'
~ ...J...- ---'
t1975 1980 1985 1990 1995 2000
Year-Anc
FIGURE 35a. Medians and quartiles of fits of abundance of northeastern spotted dolphins to the NMFSı survey data (single r parameter).ı FIGURA 35a. Medianas y cuartiles del ajuste de la abundancia del delfin manchado nororiental a datos deı estudio de NMFS (parametro r sencillo).ı
"0 ro :2 0.8:.a ro .c 0.6e a..
0.4:b :.a ro 0.2 .c e a.. OL....l.-..J.....J...JL....L.......""-=b=I:::::r::::...L.JL.-l......L..L.JL.-l......L.L......I---L....1..-.L......I......L...l-L...J.......L.Jı
-3.5 -3 -2.5 -2 -1.5 -1 -0.5 o 0.5 1.5 2 2.5 3 3.5 4
FIGURE 35b. Cumulative distribution function of net growth rate of northeastern spotted dolphins, 1979-ı1998 (single r parameter).ı FIGURA 35b. Funci6n de distribuci6n acumulativa de la tasa neta de crecimiento del delfin manchadoı nororiental, 1979-1998 (parametro r sencillo).ı

CD
30 0f>-
(/) Average mortality per vessel = 14.3 Q)
25 Mortalidad promedio por buque = 14.3~ n0~
.0ı Q)ı "0
200 "-Q)
E '::J Z
I 15 (/) >-3 Q) (/) ~
(/) Q) l.l>-0 10 0
~ "- ...... Q) en .0 en ......E 0n nnnn
>
~
::J 5 Z '-
oI I I I I I , I I " I II L I I I ,I I , I I I
0-4 5-9 10-14 15-19 20-24 25-29 30-34 35-39
Mortality-Mortalidad
FIGURE 36. Distribution of mortalities caused in 1999 by vessels with full-year DMLs.ı FIGURA 36. Distribuci6n de la mortalidad causada en 1999 par buques can LMD de ana completo.ı

95 ANNUAL REPORT 1999
TABLE 1. Numbers and carrying capacities, in metric tons, of purse seiners and baitboats of the eastern Pacific Ocean (EPO) tuna fleet. Information for 1950-1960 is given in Table 4 of the IATTC Annual Report for 1988. The data for 1999 are preliminary. TABLA 1. Numero y capacidad de acarreo, en toneladas metricas, de los buques cerqueros y de carnada de la flota atunera del Oceano Pacifico oriental (OPO). En la Tabla 4 del Informe Anual de la CIAT de 1988 se presentan los datos de 1950-1960. Los datos de 1999 son preliminares.
Year Purse seiners Baitboats Total Number Capacity Number Capacity Number Capacity
Ano Cerqueros Buques de carnada Total Ntimero Capacidad Ntimero Capacidad Ntimero Capacidad
1961 125 27,250 93 9,544 218 36,794 1962 146 31,163 88 6,093 234 37,256 1963 159 36,550 108 5,425 267 41,975 1964 137 36,631 88 4,285 225 40,916 1965 163 38,728 109 5,249 272 43,977 1966 133 36,304 113 5,649 246 41,953 1967 130 36,650 108 5,326 238 41,976 1968 143 46,012 89 5,215 232 51,227 1969 153 51,807 69 4,501 222 56,308 1970 162 61,246 49 3,903 211 65,149 1971 191 80,668 102 5,054 293 85,722 1972 210 102,022 108 6,085 318 108,107 1973 219 119,734 106 6,219 325 125,953 1974 234 133,449 111 7,045 345 140,494 1975 253 148,667 102 6,717 355 155,384 1976 254 160,197 99 6,414 353 166,611 1977 253 162,294 79 4,926 332 167,220 1978 271 164,252 68 4,572 339 168,824 1979 282 167,016 45 3,608 327 170,624 1980 270 167,855 46 3,479 316 171,334 1981 251 167,862 39 2,776 290 170,638 1982 223 152,270 36 2,458 259 154,728 1983 215 127,640 52 3,145 267 130,785 1984 175 103,929 40 2,772 215 106,701 1985 178 117,738 25 2,199 203 119,937 1986 166 112,606 17 1,760 183 114,366 1987 177 130,158 29 2,030 206 132,188 1988 189 133,819 36 2,797 225 133,822 1989 178 121,277 30 2,678 208 123,955 1990 172 122,977 23 1,746 195 124,723 1991 155 106,365 19 1,392 174 107,757 1992 160 99,971 19 1,377 179 101,348 1993 152 101,434 15 1,318 167 102,752 1994 167 104,411 20 1,474 187 105,885 1995 175 106,019 20 1,524 195 107,543 1996 183 113,396 17 1,400 200 114,796 1997 194 125,187 23 1,798 217 126,985 1998 203 138,025 22 1,894 225 139,919 1999 208 149,268 14 1,404 222 150,672

96 TUNA COMMISSION
TABLE 2a. Estimates of the numbers and carrying capacities, in metric tons, of vessels (exclusive oflongliners and mis-cellaneous small vessels) of the EPO tuna fleet in 1998 by flag, gear, and size class. Each vessel is included in the totals for each flag under which it fished during the year, but is included only once in "Grand total." Therefore the grand totals may not equal the sums of the individual flag entries. PS =purse seiner; BB =baitboat. TABLA 2a. Estimaciones del mimero y capacidad de acarreo, en toneladas metricas, de buques de la flota atunera en el OPO en 1998 (excluidos los palangreros y barcos pequenos diversos), por bandera, arte de pesca, y clase de arqueo. Se incluye cada buque en los totales de cada bandera bajo la cual pesc6 durante el ano, pero solamente una vez en el "Total general"; por consiguiente, los totales generales no equivalen necesariamente a las sumas de las banderas individuales. PS =cerquero; BB =barco de camada.
Flag Gear Size class-Clase de arqueo Capacity Bandera Arte 2 3 4 5 6 Total Capacidad
Number-Numero Belize-Belice PS 1 1 1 4 7 4,043 Colombia PS 2 2 5 9 6,227 Cyprus-Chipre PS 1 1 1,262 Ecuador PS 6 13 10 5 33 67 34,383 Espana-Spain PS 6 6 9,877 Honduras PS 1 1 499 Mexico PS 3 40 53 40,323
BB 4 12 1,283 Panama PS 2 2 5 2,248 El Salvador PS 1 1 2 1,364 USA-EE.UU. PS 13 4 2 6 25 8,934
BB 4 5 2 11 772 Venezuela PS 21 21 22,127 Vanuatu PS 12 12 11,769 Undocumented -No documentado PS 2 3 1,723
Grand total- PS 19 30 14 13 127 203 Total general BB 5 9 8 22
PS+BB 5 28 38 14 13 127 225 Capacity-Capacidad
Grand total- PS 1,530 4,286 3,078 4,327 124,804 138,025 Total general BB 167 723 1,004 1,894
PS+BB 167 2,253 5,290 3,078 4,327 124,804 139,919

97 ANNUAL REPORT 1999
TABLE 2b. Preliminary estimates of the numbers and carrying capacities, in cubic meters, of the purse seiners and bait-boats of the EPO tuna fleet in 1999 by flag, gear, and size class. Each vessel is included in the totals for each flag under which it fished during the year, but is included only once in "Grand total." Therefore the grand totals may not equal the sums of the individual flag entries. PS =purse seiner; BB =haitboat. TABLA 2b. Estimaciones preliminares del mimero y capacidad de acarreo, en metros clibicos, de buques cerqueros y de camada de la flota atunera en el OPO en 1999, pOl' bandera, arte de pesca, y clase de arqueo. Se incluye cada buque en los totales de cada bandera bajo la cual pesce durante el ano, pero solamente una vez en el "Total general"; pOl' consigu-iente, los totales generales no equivalen necesariamente a las sumas de las handeras individuales. PS =cerquero; BB = barco de camada.
Flag Gear Size class- Clase de arqueo Capacity Bandera Arte 2 3 4 5 6 Total Capacidad
Number-Numero Belize-Belice PS 1 1 1 3 6 3,691 Colomhia PS 2 2 5 9 7,130 Ecuador PS 7 14 11 5 36 73 44,558 Espana - Spain PS 5 5 11,466 Guatemala PS 4 4 7,640 Honduras PS 2 2 1,926 Mexico PS 8 3 3 40 54 47,411
BB 4 7 12 1,501 Nicaragua PS 1 1 1,229 Panama PS 2 3 4 9 8,082 El Salvador PS 2 2 1,523 USA-EE.UU. PS 4 3 2 5 14 8,039
BB 1 2 141 Venezuela PS 23 23 27,733 Vanuatu PS 11 11 13,355
Grand total PS 11 29 18 13 137 208 Total general BB 2 5 7 14
PS+BB 2 16 36 18 13 137 222 Capacity-Capacidad
Grand total PS 1,184 4,939 5,117 6,280 162,299 179,819 Total general BB 95 482 1,065 1,642
PS+BB 95 1,666 6,004 5,117 6,280 162,299 181,461

TABLE 3. Estimated retained and discarded catches by surface gear, in metric tons, of the EPO tuna fleet. "Others" includes sharks, other tunas, and miscellaneous fishes; CYRA = Commission's Yellowfin Regulatory Area; Outside = area between the CYRA and 150'W. The 1999 data are preliminary. Additional information concerning this table is given in the text. <.0
et::>TABLA 3. Estimaciones de capturas retenidas y descartadas, en toneladas metricas, por artes de superficie de la !lota atunera del OPO. "Otros" incluye tiburones, otros atunes, y peces diversos; ARCAA =Area de Regulacion de la Comision para el Aleta Amarilla; Exterior = zona entre el ARCAA y 150'0. Los datos de 1999 son preliminares. En el texto se presenta infor-macion adicional sobre esta tabla.
Yellowfin Skipjack Bigeye Bluefin Year Retained Discarded Total Retained Discarded Total Retained Discarded Total Retained Discarded Total
CYRA Outside Total Aleta amarilla Barrilete Patudo Aleta azul
Aiio Retenido Descartado Total Retenido Descartado Total Retenido Descartado Total Retenido Descartado TotalARCAA Exterior Total
1970 127,793 27,833 155,626 155,626 56,020 56,020 1,332 1,332 3,966 3,966 1971 102,194 20,645 122,839 122,839 104,721 104,721 2,566 2,566 8,360 8,360 1972 136,515 40,612 177,127 177,127 33,409 33,409 2,238 2,238 13,347 13,347 1973 160,341 44,912 205,253 205,253 43,954 43,954 1,979 1,979 10,744 10,744 1974 173,180 37,184 210,364 210,364 78,803 78,803 890 890 5,617 5,617 >-3 1975 158,843 43,299 202,142 202,142 123,868 123,868 3,723 3,723 9,583 9,583 C 1976 190,216 46,111 236,327 236,327 126,161 126,161 10,186 10,186 10,645 10,645 Z
;J;>1977 182,676 16,140 198,816 198,816 86,337 86,337 7,055 7,055 5,473 5,473 Cl 1978 165,985 14,549 180,534 180,534 169,810 169,810 11,714 11,714 5,397 5,397 0 1979 175,906 13,768 189,674 189,674 132,024 132,024 7,532 7,532 6,117 6,117 ~
~1980 131,998 27,427 159,425 159,425 130,671 130,671 15,421 15,421 2,939 2,939 >-< en1981 157,733 24,080 181,813 181,813 119,606 119,606 10,091 10,091 1,089 1,089 en >-<1982 106,868 18,216 125,084 125,084 98,757 98,757 4,102 4,102 3,150 3,150 0
1983 82,026 12,230 94,256 94,256 58,142 58,142 3,260 3,260 853 853 Z 1984 128,559 16,502 145,061 145,061 60,55] 60,55] 5,936 5,936 88] 881 1985 192,543 24,449 216,992 216,992 49,460 49,460 4,532 4,532 4,055 4,055 1986 228,125 40,149 268,274 268,274 63,552 63,552 1,939 1,939 5,085 5,085 1987 248,153 24,094 272,247 272,247 62,345 62,345 776 776 1,005 1,005 1988 267,263 20,811 288,074 288,074 85,326 85,326 1,053 1,053 1,424 1,424 1989 242,342 47,033 289,375 289,375 92,374 92,374 1,470 1,470 1,170 1,170 1990 226,465 46,864 273,329 273,329 72,575 72,575 4,712 4,712 1,542 1,542 1991 219,525 19,596 239,121 239,121 63,260 63,260 3,740 3,740 461 461 1992 221,309 18,540 239,849 239,849 83,964 83,964 5,497 5,497 1,999 1,999 1993 2]3,258 18,813 232,071 5,040 237,111 87,357 10,589 97,946 8,069 585 8,654 879 0 879 1994 197,064 22,197 219,261 4,614 223,875 74,534 10,314 84,848 29,375 2,304 31,679 1,062 0 1,062 1995 196,220 27,556 223,776 5,344 229,120 138,239 16,614 154,853 37,328 3,260 40,588 874 0 874 1996 218,114 32,056 250,170 6,660 256,830 112,205 24,970 137,175 51,353 5,786 57,139 8,259 0 8,259 1997 214,277 43,554 257,831 5,631 263,462 161,809 31,867 193,676 51,619 5,627 57,246 2,807 3 2,810 1998 236,503 29,216 265,719 4,718 270,437 145,000 22,856 167,856 35,155 2,853 38,008 2,223 0 2,223 1999 264,739 32,176 296,915 6,628 303,543 268,021 26,813 294,834 41,163 5,166 46,329 3,091 55 3,146

TABLE 3. (continued) TABLA 3. (continuacion)
Year Albacore Bonito Black skipjack Others All species combined Retained Discarded Total Retained Discarded Total Retained Discarded Total Retained Discarded Total Retained Discarded Total
Aiio Albacora Bonito Barrilete negro Otros Todas las especies Retenido Descartado Total Retenido Descartado Total Retenido Descartado Total Retenido Descartado Total Retenido Descartado Total
1970 4,476 4,476 4,738 4,738 0 0 27 27 226,185 226,185 1971 2,490 2,490 9,600 9,600 6 6 61 61 250,643 250,643 1972 4,832 4,832 8,872 8,872 601 601 367 367 240,793 240,793 1973 2,316 2,316 7,864 7,864 1,674 1,674 355 355 274,139 274,139 1974 4,783 4,783 4,436 4,436 3,742 3,742 985 985 309,620 309,620 1975 3,332 3,332 16,838 16,838 511 511 277 277 360,274 360,274 1976 3,733 3,733 4,370 4,370 1,526 1,526 1,327 1,327 394,275 394,275 1977 1,963 1,963 11,275 11,275 1,458 1,458 1,950 1,950 314,327 314,327 1978 1979 1980
1,745 327 601
1,745 327 601
4,837 1,805 6,110
4,837 1,805 6,110
2,162 1,366 3,680
2,162 1,366 3,680
806 1,249
953
806 1,249
953
377,005 340,094 319,800
377,005 340,094 319,800
[Z Z
1981 739 739 5,918 5,918 1,911 1,911 1,010 1,010 322,177 322,177 ~
1982 553 553 2,121 2,121 1,338 1,338 783 783 235,888 235,888 ~
1983 1984
456 5,351
456 5,351
3,829 3,514
3,829 3,514
1,236 666
1,236 666
1,709 987
1,709 987
163,741 222,947
163,741 222,947
t:rl '"1::j 0
1985 919 919 3,604 3,604 296 296 536 536 280,394 280,394 ~
1986 133 133 490 490 595 595 1,140 1,140 341,208 341,208 ...... 1987 1988
417 288
417 288
3,326 9,550
3,326 9,550
557 1,267
557 1,267
1,612 1,297
1,612 1,297
342,285 388,279
342,285 388,279
<0 <0 <0
1989 1 1 12,095 12,095 783 783 1,072 1,072 398,340 398,340 1990 184 184 13,856 13,856 792 792 944 944 367,934 367,934 1991 834 834 1,288 1,288 446 446 649 649 309,799 309,799 1992 255 255 978 978 104 104 762 762 333,408 333,408 1993 1 0 1 599 12 611 104 3,950 4,054 314 1,981 2,295 329,394 22,157 351,551 1994 85 0 85 8,692 145 8,837 188 805 993 419 522 941 333,616 18,704 352,320 1995 465 2 467 8,009 55 8,064 187 1,415 1,602 172 668 840 409,050 27,358 436,408 1996 83 0 83 655 1 656 704 2,417 3,121 219 1,052 1,271 423,648 40,886 464,534 1997 60 0 60 1,104 4 1,108 101 2,582 2,683 148 3,407 3,555 475,479 49,121 524,600 1998 124 0 124 1,337 4 1,341 527 1,857 2,384 168 1,233 1,401 450,253 33,521 483,774 1999 276 0 276 1,597 0 1,597 178 3,412 3,590 240 3,096 3,336 611,481 45,170 656,651
<0 <0

TABLE 4a. Estimates of the catches and landings, in metric tons, of tunas caught by surface gear in the EPO in 1998, by species and vessel flag (upper panel) and location whereı .... o oprocessed (lower panel). YFT =yellowfin; SKJ =skipjack; BET =bigeye; BFT =bluefin; BEP =bonito; ALB =albacore; BKJ = black skipjack; Misc. =other species, including sharks,ˇ
other tunas, and miscellaneous fishes.ˇ TABLA4a. Estimaciones de las capturas y descargas de atun capturado con artes de superficie en el OPO en 1998 por especie y bandera del barco (panel superior) y localidad dondeˇ fue procesado (panel inferior), en toneladas metricas. YFT =aleta amarilla; SKJ =barrilete; BET =patudo; BFT =aleta azul; BEP =bonito; ALB =albacora; BKJ =barrilete negro;ˇ Misc. = otras especies, incluyendo tiburones, otros tunidos, y peces diversos. .ˇ
Flag YFT� Percent of total SKJ BET BFT BEP ALB BKJ Misc. TotalBandera CYRA-ARCAA Outside-Exterior %del total�
Catches-Capturas� Colombia 13,314 1,101 4,066 526 19,007 4.2 Ecuador 33,053 6,408 68,876 20,178 261 23 128,799 28.6 Mexico 97,223 11,339 18,226 135 1 412 8 85 61 127,490 28.4 Panama 5,114 1,990 54 9 7,167 1.6 U.S.A.-EE.UU. 5,550 477 9,039 3,740 2,222 924 116 76 11 22,155 4.9 Venezuela 60,887 2,467 5,646 237 72 9 69,318 15.4 Vanuatu 16,736 1,863 11,119 3,590 7 33,315 7.4 d Other-Otros1 6,579 4,149 25,004 6,588 18 42,338 9.4 ~
Total 238,456 27,804 143,966 35,048 2,223 1,336 124 528 104 449,589ı (":J 0Landings-Descargas ~
Colombia 47,898 2,589 14,118 2,900ı 20 67,525 15.3 ~ ......Costa Rica 26,064 1,161 2,891 143 30,559 6.9ı UJ UJEcuador 44,732 9,250 87,642 26,311 -282 22 168,239 38.1ı ...... 0Espana-Spain 5,037 820 4,905 1,956ı 12,718 2.9 ZMexico 87,438 9,854 16,948 79 34 412 8 85 61 114,919 26.0ˇ
U.8.A.-EE.UU. 3,630 199 5,525 1,786 2,188 783 115 75 10 14,311 3.2ˇ Venezuela 25,022 2,227 1,861 88 29,198 6.6ˇ Other- Otros2 2,964 69 1,148 321 141 9 4,652 1.0ˇ Total 242,785 26,169 135,038 33,884 2,222 1,336 123 442 122 442,121ˇ
1 Includes Belize, Cyprus, EI Salvador, Honduras, and undocumented. This category is used to avoid revealing the operations of individual vessels or companies.ˇ 1 Incluye Belice, Chiprc, EI Salvador, Honduras, y no documentado. Se usa esta categoria para no revelar informacion sobre las actividades de barcos 0 empresas individuales.ˇ 2 Includes Peru and unidentified locations. This category is used to avoid revealing the operations of individual vessels or companies.ˇ 2 Incluye Peru y lugares no identificados. Se usa esta categoria para no revelar informacion sobre las actividades de barcos 0 empresas individuales.ˇ

TABLE 4b. Preliminary estimates of the catches and landings, in metric tons, of tunas caught by surface gear in the EPO in 1999, by species and vessel flag (upper panel) and loca-ıtion where processed (lower panel). YFT = yellowfin; SKJ = skipjack; BET = bigeye; BFT = bluefin; BEP = bonito; ALB = albacore; BKJ = black skipjack; Misc. = other species, includingı sharks, other tunas, and miscellaneous fishes.ı TABLA 4b. Estimaciones preliminares de las capturas y descargas de atun capturado con artes de superficie en el OPO en 1999, por especie y bandera del buque (panel superior) yı localidad donde fue procesado (panel inferior), en toneladas metricas. YFT = aleta amarilla; SKJ = barrilete; BET = patudo; BFT = aleta azul; BEP = bonito; ALB = albacora; BKJ =� barrilete negro; Misc. = otras especies, incluyendo tiburones, otros tunidos, y peces diversos.ı
Flag YFT Percent of total SKJ BET BFT BEP ALB BKJ Misc. TotalBandera CYRA-ARCAA Outside-Exterior %del total
Catches-Capturas Colombia 13,314 1,101 4,066 526 19,007 4.2 Colombia 12,617 294 11,766 1,416 86 26,179 4.3 Costa Rica 30 96 20 146 0.0 Ecuador 55,686 4,197 126,870 19,047 6 75 205,881 33.7 Espana-Spain 4,862 4,273 35,201 10,632 20 54,988 9.0 Mexico 100,136 14,888 19,773 365 2,373 1,573 23 72 57 139,260 22.8 ~ Panama 6,178 5,023 961 12,162 2.0 Z U.S.A.-EE.UU. 3,958 371 13,804 1,757 718 24 253 64 2 20,951 3.4ı Venezuela 52,015 6,001 14,582 7 35 72,640 11.9 ~ Vanuatu 18,043 1,277 21,914 4,387 45,621 7.5 ~
Other-Otros1 11,214 875 18,992 2,571 1 33,653 5.5 t?:jı '"1:1
Total 264,739 32,176 268,021 41,163 3,091 1,597 276 178 240 611,481 0 ~ Landings-Descargas >-3 "'-'Colombia 34,456 2,724 30,121 4,275 3 6 71,585 11.3 <.D <.0Costa Rica 24,429 1,992 11,061 885 25 38,392 6.1 <.D
Ecuador 69,594 6,825 172,720 27,133 10 150 276,432 43.7 Espana-Spain 3,287 881 10,342 4,978 13 19,501 3.1 Mexico 86,230 12,639 18,014 168 1,303 1,572 23 72 56 120,077 19.0 U.S.A.-EE.UU. 3,573 187 15,094 2,502 534 24 252 63 1 22,230 3.5 Venezuela 24,804 3,108 7,572 4 78 35,566 5.6 Other-Otros2 20,271 5,408 16,876 4,269 1,252 48,076 7.2 Total 266,644 33,764 281,800 44,214 3,089 1,596 275 251 226 631,859
Includes Belize, El Salvador, Guatemala, Honduras, and Nicaragua. This category is used to avoid revealing the operations of individual vessels or companies.ı Incluye Belice, El Salvador, Guatemala, Honduras, y Nicaragua. Se usa esta categoria para no revelar informacion sobre las actividades de buques 0 empresas individuales.ı Includes Algeria, Italy, Japan, Libya, Thailand, and Turkey. This category is used to avoid revealing the operations of individual vessels or companies.ı Incluye Argelia, Italia, Japon, Libia, Tailandia, y Turquia. Se usa esta categoria para no revelar informacion sobre las actividades de buques 0 empresas individuales.ı
"'-' <=> "'-'

102 TUNA COMMISSION
TABLE 5. Estimated numbers of sets by set type and vessel size class, and estimated catches, in metric tons, forı yellowfin, skipjack, and bigeye tuna in the EPa, by purse-seine vessels. The data for 1999 are preliminary.ı TABLA 5. Numeros estimados de lances, par tipo de lance y clase de arqueo de los buques, y capturas estimadas, enı toneladas metricas, de atunes aleta amarilla, barrilete, y patudo en el OPO. Los datos de 1999 son preliminares.ı
Sets on fish associated with dolphins Year Number of sets Catch
Classes 1·5 Class 6 Total Yellowfin Skipjack Bigeye Lances sobre peces asociados con delfines
ADo Nlimero de lances Captura Clases 1·5 Clase 6 Total Aleta amarilla Barrilete Patudo
1987 33 13,286 13,319 190,434 138 24 1988 40 11,160 11,200 157,274 4,860 0 1989 29 12,827 12,856 195,043 1,502 0 1990 29 10,997 11,026 179,523 601 0 1991 0 9,661 9,661 159,265 717 0 1992 25 10,398 10,423 169,430 734 0 1993 34 6,953 6,987 110,405 697 98 1994 3 7,804 7,807 124,955 437 0 1995 0 7,185 7,185 131,499 938 0 1996 2 7,472 7,474 135,608 736 0 1997 35 8,977 9,012 153,654 6,222 35 1998 0 10,645 10,645 149,892 2,991 64 1999 0 8,648 8,648 142,056 1,116 0
Sets on fish associated with floating objects Year Number of sets Catch
Classes 1·5 Class 6 Total Yellowfin Skipjack Bigeye Lances sobre peces asociados con objetos flotantes
ADo Nlimero de lances Captura Clases 1·5 Clase 6 Total Aleta amarilla Barrilete Patudo
1987 1,311 1,813 3,124 27,232 32,049 474 1988 775 2,281 3,056 23,573 35,355 750 1989 953 2,339 3,292 28,220 41,269 1,231 1990 721 2,558 3,279 34,244 35,080 3,466 1991 795 2,165 2,960 23,642 37,821 1,971 1992 877 1.763 2,640 13,168 45,583 1,189 1993 491 2,063 2,554 16,389 47,812 4,498 1994 621 2,770 3,391 17,743 47,804 27,391 1995 671 3,521 4,192 21,540 80,705 32,634 1996 1194 4,007 5,201 34,343 73,702 48,221 1997 1685 5,652 7,337 31,115 122,299 50,233 1998 1204 5,481 6,685 35,192 114,532 31,328 1999 624 4,620 5,244 42,368 182,423 36,516
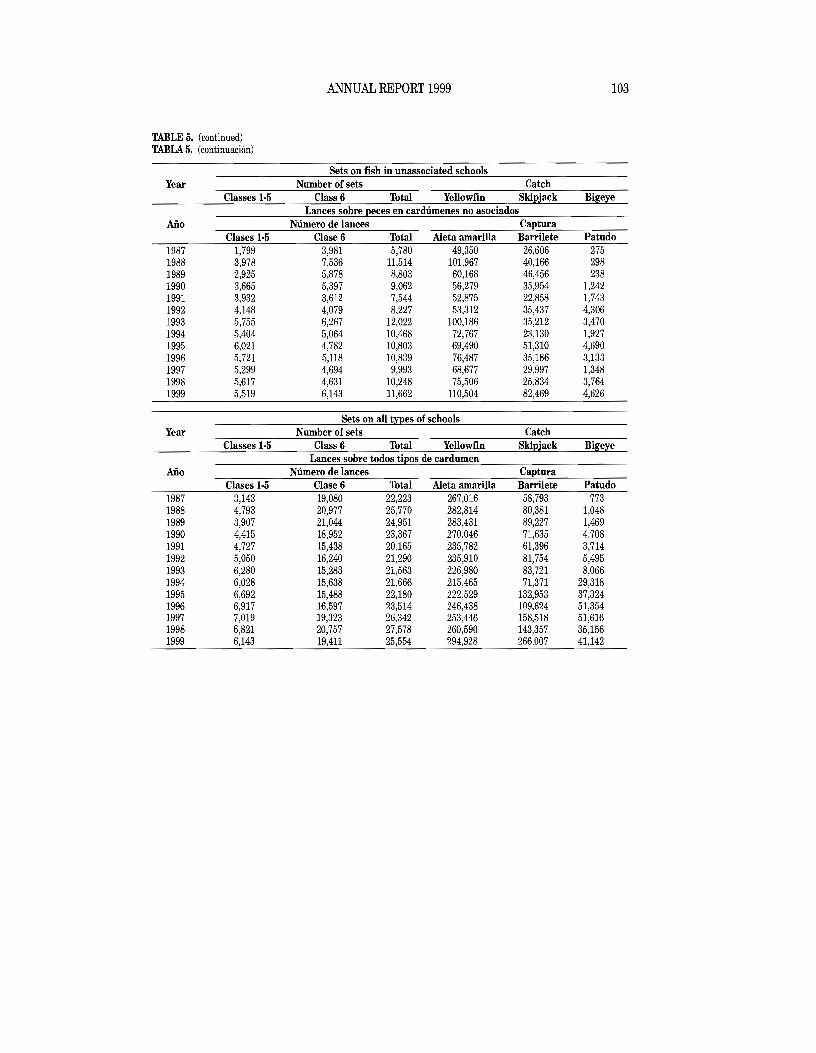
103 ANNUAL REPORT 1999
TABLE 5. (continued) TABLA 5. (continuaci6n)
Sets on fish in unassociated schools Year Number of sets Catch
Classes 1-5 Class 6 Total Yellowfin Skipjack Bigeye Lances sobre peces en cardumenes no asociados
AIio Numero de lances Captura Clases 1-5 Clase 6 Total Aleta amarilla Barrilete Patudo
1987 1,799 3,981 5,780 49,350 26,606 275 1988 3,978 7,536 11,514 101,967 40,166 298 1989 2,925 5,878 8,803 60,168 46,456 238 1990 3,665 5,397 9,062 56,279 35,954 1,242 1991 3,932 3,612 7,544 52,875 22,858 1,743 1992 4,148 4,079 8,227 53,312 35,437 4,306 1993 5,755 6,267 12,022 100,186 35,212 3,470 1994 5,404 5,064 10,468 72,767 23,130 1,927 1995 6,021 4,782 10,803 69,490 51,310 4,690 1996 5,721 5,118 10,839 76,487 35,186 3,133 1997 5,299 4,694 9,993 68,677 29,997 1,348 1998 5,617 4,631 10,248 75,506 25,834 3,764 1999 5,519 6,143 11,662 110,504 82,469 4,626
Sets on all types of schools Year Number of sets Catch
Classes 1-5 Class 6 Total Yellowfin Skipjack Bigeye Lances sobre todos tipos de cardumen
AIio Numero de lances Captura Clases 1-5 Clase 6 Total Aleta amarilla Barrilete Patudo
1987 3,143 19,080 22,223 267,016 58,793 773 1988 4,793 20,977 25,770 282,814 80,381 1,048 1989 3,907 21,044 24,951 283,431 89,227 1,469 1990 4,415 18,952 23,367 270,046 71,635 4,708 1991 4,727 15,438 20,165 235,782 61,396 3,714 1992 5,050 16,240 21,290 235,910 81,754 5,495 1993 6,280 15,283 21,563 226,980 83,721 8,066 1994 6,028 15,638 21,666 215,465 71,371 29,318 1995 6,692 15,488 22,180 222,529 132,953 37,324 1996 6,917 16,597 23,514 246,438 109,624 51,354 1997 7,019 19,323 26,342 253,446 158,518 51,616 1998 6,821 20,757 27,578 260,590 143,357 35,156 1999 6,143 19,411 25,554 294,928 266,007 41,142

104ı TUNA COMMISSION
TABLE 6. Catches per ton of carrying capacity by vessel size group for the EPa purse-seine fleet, by species, in the EPaˇ and in all ocean fishing areas. The size groups, by capacity, are as follows: 1, <273 metric tons (mt); 2, 273-363 mt; 3, 364-544 mt; 4, 545-726 mt; 5, 727-907 mt; 6, 908-1089 mt; 7,1090-1270 mt; 8, >1270 mt. YFT =yellowfin; SKJ =skipjack; BETˇ =bigeye; All =all species reported. The 1999 data are preliminary.ˇ TABLA 6. Capturas por tonelada de capacidad de acarreo y por clase de arqueo de la flota cerquera del OPO, por especie,ˇ en el OPO y en todas las zonas oceanicas de pesca. Las clases de arqueo, por capacidad, son: 1, <273 toneladas metricasˇ (tm); 2, 273-363 tm; 3, 364-544 tm; 4, 545-726 tm; 5, 727-907 tm; 6, 908-1089 tm; 7, 1090-1270 tm; 8, >1270 tm. YFT =ˇ aleta amarilla; SKJ =barrilete; BET =patudo; All =todas las especies reportadas. Los datos de 1999 son preliminares.ˇ
Size group and area of catch Year Species 1 2 3 4 5 6 7 8 Total
EPO All EPO All EPO All EPO All EPO All EPO All EPO All EPO All EPO All Clase de arqueo y zona de captura
Ano Especie 1 2 3 4 5 6 7 8 Total OPO Todas OPO Todas OPO Todas OPO Todas OPO Todas OPO Todas OPO Todas OPO Todas OPO Todas
1990 YFT 2.0 2.0 2.3 2.3 1.2 1.2 1.6 1.6 1.1 1.1 2.6 2.6 2.3 2.4 1.8 2.0 2.2 2.2 SKJ 2.4 2.4 2.2 2.2 1.2 1.2 0.6 0.6 0.4 0.4 0.5 0.6 0.2 0.5 0.4 0.4 0.6 0.7 BET 0.0 0.0 0.0 0.0 0.1 0.1 0.0 0.0 0.0 0.0 0.0 0.0 0.0 0.0 0.0 0.0 0.0 0.0 All 5.6 5.6 5.4 5.4 2.9 2.9 2.6 2.6 1.7 1.7 3.1 3.2 2.5 2.8 2.2 2.4 2.9 3.1
1991ı YFT 2.0 2.0 3.3 3.3 1.2 1.4 1.9 1.9 1.5 1.5 2.4 2.5 2.7 2.7 1.4 1.5 2.2 2.3 SJT 1.8 1.8 1.4 1.4 08 1.0 0.8 0.8 0.5 0.5 0.4 0.5 0.3 0.3 0.5 0.6 0.6 0.6 BET 0.1 0.1 0.1 0.1 0.1 0.1 0.0 0.0 0.0 0.0 0.0 0.0 0.0 0.0 0.0 0.0 0.0 0.0 All 4.1 4.1 5.0 5.0 2.2 2.5 2.8 2.8 2.0 2.0 2.9 3.0 3.0 3.0 1.8 2.1 2.8 2.9
1992ı YFT 1.5 1.5 2.1 2.1 0.9 0.9 1.8 1.8 1.5 1.5 2.6 2.7 3.4 3.4 1.1 1.1 2.3 2.4 SJT 2.1 2.1 2.1 2.1 1.2 1.2 1.1 1.1 0.7 0.7 0.6 0.6 0.5 0.5 0.9 0.9 0.8 0.8 BET 0.0 0.0 0.0 0.0 0.1 0.1 0.1 0.1 0.1 0.1 0.0 0.0 0.0 0.0 0.2 0.2 0.1 0.1 All 4.0 4.0 4.4 4.4 2.4 2.4 30 3.0 2.3 2.3 3.2 3.3 3.9 3.9 2.1 2.1 3.2 3.3
1993ı YFT 2.6 2.6 2.5 2.5 1.0 1.1 2.0 2.0 2.1 2.1 2.1 2.2 3.0 3.0 1.3 1.4 2.2 2.3 SKJ 2.0 2.0 1.7 1.7 1.5 1.6 1.1 1.1 0.8 0.8 0.5 0.6 0.7 0.7 0.9 1.0 0.8 0.9 BET 0.0 0.0 0.0 0.0 0.1 0.1 0.1 0.1 0.1 0.1 0.1 0.1 0.1 0.1 0.1 0.1 0.1 0.1 All 4.8 4.8 4.3 4.3 2.6 2.8 3.3 33 3.0 3.0 2.7 2.8 3.8 3.8 2.4 2.6 3.1 3.2
1994ı YFT 2.7 2.7 2.2 2.2 1.7 1.7 1.3 1.4 1.2 1.2 2.2 2.4 2.6 2.6 1.4 1.7 2.1 2.2 SKJ 1.1 1.1 1.4 1.4 0.6 0.6 0.8 0.9 1.0 1.0 0.5 0.6 0.7 0.7 0.6 0.8 0.7 0.7 BET 0.0 0.0 0.3 0.3 0.1 0.1 0.2 0.2 0.6 0.6 0.3 0.3 0.3 0.3 0.5 0.5 0.3 0.3 All 4.5 4.5 4.2 4.2 2.6 2.6 2.5 2.7 3.0 3.0 2.9 3.2 3.7 3.7 2.4 3.0 3.1 3.3
1995ı YFT 1.8 1.8 2.4 2.4 0.7 0.7 1.5 1.5 1.4 1.4 2.4 2.4 2.6 2.6 1.3 1.3 2.1 2.1 SKJ 2.3 2.3 2.8 2.8 1.4 1.4 1.6 1.6 1.6 1.6 0.9 0.9 1.0 1.0 0.8 0.8 1.2 1.2 BET 0.1 0.1 0.3 0.3 0.1 0.1 0.3 0.3 0.8 0.8 0.3 0.3 0.2 0.2 0.7 0.7 0.3 0.3 All 4.8 4.8 5.9 5.9 2.3 2.3 3.5 3.5 3.8 3.9 3.6 37 3.8 3.8 2.8 2.8 3.7 3.8
1996ı YFT 2.0 2.0 2.7 2.7 0.5 0.5 1.6 1.7 1.4 1.4 2.6 26 3.0 3.0 1.0 1.1 2.2 2.2 SKJ 2.0 2.0 2.5 2.5 1.5 1.5 1.1 1.2 1.2 1.3 0.7 0.7 0.6 0.6 0.6 0.7 1.0 1.0 BET 0.1 0.1 0.7 0.7 0.9 0.9 0.7 0.7 1.0 1.0 0.4 0.4 0.2 0.2 0.2 0.2 0.4 0.4 All 4.7 4.7 6.2 6.2 2.9 2.9 3.5 3.6 3.6 3.8 3.7 3.7 3.8 3.8 1.8 2.1 3.7 3.7
1997ı YFT 2.1 2.1 2.2 2.2 1.4 1.5 1.4 1.4 1.4 1.5 2.5 2.5 2.3 2.3 1.1 1.2 2.0 2.0 SKJ 2.6 2.6 3.4 3.4 2.0 2.1 1.5 1.5 2.0 2.1 0.9 0.9 0.9 0.9 0.9 1.0 1.3 1.3 BET 0.4 0.4 1.0 1.0 1.0 1.0 0.7 0.7 0.9 0.9 0.3 0.3 0.2 0.2 0.2 0.2 0.4 0.4 All 5.4 5.4 6.7 6.7 4.5 4.7 3.5 3.6 4.2 4.4 3.6 3.6 .3.3 3.4 2.2 2.4 3.7 3.8
1998ı YFT 2.0 2.0 2.2 2.2 1.0 1.0 1.3 1.3 1.5 1.5 2.3 2.3 2.5 2.5 0.8 0.9 1.9 1.9 SKJ 1.5 1.5 2.1 2.1 1.5 1.5 1.3 1.3 0.8 0.8 0.8 0.8 0.7 0.8 1.5 1.7 1.0 1.1 BET 0.2 0.2 0.4 0.4 0.4 0.4 0.4 0.4 0.1 0.1 0.2 0.2 0.1 0.1 0.4 0.4 0.3 0.3 All 4.0 4.0 4.9 4.9 3.1 3.1 3.0 30 2.4 2.4 3.3 3.4 3.3 3.4 2.8 3.0 3.2 3.3
1999ı YFT 3.7 3.7 3.5 3.5 1.6 1.6 1.6 1.6 1.9 2.0 2.1 2.1 2.2 2.2 1.0 1.0 2.0 2.0 SKJ 2.1 21 3.1 3.1 2.8 2.8 2.3 2.3 1.4 1.4 1.3 1.3 1.3 1.4 2.6 2.8 1.8 1.9 BET 0.2 0.2 0.3 0.3 0.4 0.4 0.3 0.3 0.2 0.2 0.2 0.2 0.2 0.2 0.7 0.7 0.3 0.3 All 6.2 6.2 7.1 7.1 4.8 4.8 4.2 4.2 3.5 3.6 3.5 3.6 3.7 3.8 4.2 4.6 4.1 4.2

TABLE 7. Preliminary estimates of commercial catches, in metric tons, of billfishes in the eastern Pacific Ocean. Most of the longline-caught fish were retained, and most of thoseı caught by surface gear were discarded.ı TABLA 7. Estimaciones preliminares de las capturas comerciales, en toneladas metricas, de peces picudos en el Oceano Pacifico oriental. La mayoria del pescado capturado canı palangre fue retenida, y la mayoria de la captura de superficie desechada.ı
Swordfish Blue marlin Black marlin Striped marlin Shortbill spearfish SailfishYear� Longline Surface Longline Surface Longline Surface Longline Surface Longline Surface Longline Surface�
Pez espada Marlin azul Marlin negro Marlin rayado Marlin trompa corta Pez velaAfio� Palangre Superficie Palangre Superficie Palangre Superficie Palangre Superficie Palangre Superficie Palangre Superficie�
1970 9,294 4,126 275 10,976 1971 4,844 2,832 308 10,118 1972 2,847 2,653 455 7,106 1973 5,105 3,825 307 5,277 1974 5,014 2,826 249 5,402 1975 3,065 2,281 182 5,429 554 1976 2,700 3,271 285 6,473 494 1977 4,258 3,106 188 3,086 753 ~
1978 6,555 3,630 283 2,496 878 1979 4,722 4,500 291 4,123 251 ~
1980 4,209 4,030 182 4,879 243 ~
trj1981 6,572 4,453 169 4,870 379 '"d 1982 5,918 4,717 143 4,682 1,083 0
~1983 5,008 4,432 209 4,455 889 >-3 1984 6,604 5,163 121 2,652 345 >-"
<.01985 6,557 3,574 194 1,592 392 <.0
1986 5,717 5,268 313 3,534 5 529 <.0
1987 7,357 7,232 199 7,282 15 604 1988 10,393 5,190 135 5,130 13 642 1989 12,159 5,064 151 3,311 0 171 1990 13,797 4,925 112 2,959 0 2 1991 15,683 17 5,780 81 145 58 2,594 1 710 40 1992 15,234 4 6,391 59 208 95 2,674 80 I 1 980 41 1993 12,695 4 6,831 85 178 85 3,354 67 3 0 1,963 47 1994 10,217 3 9,278 112 170 89 3,295 63 143 0 1,516 24 1995 8,483 7 7,160 124 95 111 3,082 35 156 1 1,297 38 1996 9,655 3 3,426 140 112 139 2,834 41 127 1 704 29 1997 13,318 13 5,531 220 183 154 3,932 40 164 1 1,186 32 1998 14,104 4,451 52 2,229 40 142 1,023 1999 15,839 2,829 1,536 174 1,1356 >-"
0 01

106 TUNA COMMISSION
TABLE 8a. Annual catches of yellowfin tuna, in thousands of metric tons. JPN: Japan; KOR: Republic of Korea; TWN:ı Taiwan; WCPO =western and central Pacific Ocean.ı TABLA 8a. Capturas anuales de atun aleta amarilla, en miles de toneladas metricas. JPN: Japon; KOR: Republica deı Corea; TWN: Taiwan; OPOC =Oceano Pacifico occidental y central.
Pacific Ocean Eastern Atlantic Indian
Year Total Lone:line2 WCP03 Total4 Oceans Ocean6
Surface! I I TotalI JPN KOR TWN Others Total Oceano Pacifico
Oriental Oceano OceanoAno Total Palane:re2 OPOC3 Total4 Atllintic05 Indico6
Superficie11 : TotalI JPN KOR TWN Otros Total 1970 155.6 13.8 0.1 0.0 13.9 169.5 94.9 264.5 74.3 37.2 376.0 1971 122.8 7.4 0.3 0.0 7.7 130.5 86.7 217.2 73.8 41.6 332.6 1972 177.1 16.0 0.5 0.0 16.5 193.6 114.7 308.4 94.1 43.6 446.1 1973 205.3 11.4 0.3 0.0 11.7 217.0 137.9 355.0 95.1 34.5 484.6 1974 210.4 69 0.3 0.0 7.2 217.6 143.7 361.3 107.1 37.8 506.2 1975 202.1 10.3 0.2 0.3 0.0 10.8 212.9 145.2 358.1 124.8 37.3 520.2 1976 236.3 15.0 0.4 0.2 0.0 15.6 251.9 153.0 404.9 125.0 37.5 567.4 1977 198.8 11.2 0.8 0.1 0.0 12.1 210.9 177.4 388.3 131.0 61.4 580.7 1978 180.5 9.2 0.8 0.1 0.0 10.1 190.6 193.9 384.5 134.0 46.1 564.6 1979 189.7 10.9 0.4 0.1 0.0 11.4 201.1 201.2 402.3 127.5 39.9 569.7 1980 159.4 11.5 1.9 0.1 0.0 13.5 172.9 217.4 390.3 131.0 35.1 556.5 1981 181.8 7.1 0.8 0.1 0.0 8.0 189.8 217.2 407.0 155.8 37.6 600.4 1982 125.1 9.8 1.1 0.1 0.0 11.0 136.1 244.5 380.5 165.0 51.9 597.4 1983 94.3 9.4 1.4 0.0 0.1 10.9 105.2 279.5 384.7 165.4 60.9 611.1 1984 145.1 9.1 1.2 0.0 0.0 10.3 155.4 255.5 410.9 1139 102.6 627.4 1985 217.0 10.6 2.5 0.0 0.0 13.1 230.1 243.6 473.7 156.5 116.9 747.2 1986 268.3 17.8 4.8 0.1 0.1 22.7 291.0 243.3 534.3 146.5 132.8 813.6 1987 272.2 13.5 4.1 0.1 0.3 18.0 290.2 308.3 598.5 144.4 145.1 888.0 1988 288.1 12.5 0.5 0.0 0.3 13.3 301.4 294.0 595.4 135.2 205.9 936.6 1989 289.4 15.3 0.3 0.2 0.0 15.8 305.2 344.5 649.7 161.3 202.5 1013.4 1990 273.3 29.3 0.9 0.3 0.0 30.5 303.8 401.2 705.0 192.5 258.3 1155.8 1991 239.1 23.7 1.6 0.3 0.2 25.8 264.9 404.2 669.1 166.1 245.4 1080.6 1992 239.8 15.3 0.8 0.0 0.1 16.2 256.0 470.9 727.0 162.2 317.4 1206.5 1993 232.1 20.3 3.6 0.1 0.2 24.2 256.3 432.4 688.8 158.6 397.7 1245.0 1994 219.3 26.0 2.3 0.2 0.8 29.4 248.7 464.2 712.8 169.5 310.8 1193.2 1995 223.8 17.0 2.0 0.0 0.7 19.8 243.6 410.4 653.9 149.7 319.2 1122.8 1996 250.2 12.6 1.8 0.0 0.6 15.0 265.2 356.8 622.0 150.0 311.4 1083.4 1997 257.8 13.6 2.8 0.1 1.0 17.5 275.3 509.8 785.1 133.5 290.3 1208.9 1998** 265.7 10.5 0.1 1.5 12.2 277.9 541.4 819.2 143.2 274.6 1237.0* 1999** 296.9 7.3 1.7 9.0 305.9 510.9 816.8 138.2 955.0
Source: Table 3- Fuente: Tabla 3 Sources: published and unpublished data from the National Research Institute of Far Seas Fisheries (NRIFSF), Shimizu, Japan, Institute of Oceanography, National Taiwan University, Taipei, Taiwan, and National Fisheries Research and Development Agency, Republic of Korea. The data were converted from numbers of fish to weight in metric tons with average weight data estimated by the IATTC staff.
2 Fuentes: datos publicados e ineditos del lnstituto Nacional de Investigacion de Pesquerias de Ultramar (NRIFSF) en Shimizu (Japon), el Instituto de Oceanografia de la Universidad Nacional de Taiwan en Taipei, y laAgencia Nacional de lnvestigacion y Desarrollo Pesquero de Corea. Se convirtieron los datos de numeros de peces a peso en toneladas metricas usando datos de peso promedio estimados por el personal de la CIAT. Source: Column 10 - Column 8-Fuente: Columna 10 - Columna 8 Source: FAO data set for Fishstat+-Fuente: datos de FAO para Fishstat+ Source: ICCAT data set for Fishstat+- Fuente: datos de CICM para Fishstat+ Source: IOTC data set for Fishstat+- Fuente: datos de CTOI para Fishstat+
* not available-no disponible ** preliminary- preliminares

107 ANNUAL REPORT 1999
TABLE 8b. Annual catches of skipjack tuna, in thousands of metric tons. WCPO =western and central Pacific Ocean.ı TABLA 8b. Capturas anuales de atun barrilete, en miles de toneladas metricas. OPOC =Oceano Pacifico occidental yı central.
Year Eastern Pacific! WCP02 Total Pacific3 Atlantic4 Indian5 Total Aiio Pacifico oriental! OPOC2 Pacifico total3 Atlantico4 Indico5 Total 1970 56.0 258.5 314.5 50.3 41.5 406.2 1971 104.7 246.6 351.3 78.4 41.1 470.8 1972 33.4 311.1 344.5 77.4 35.7 457.6 1973 44.0 402.2 446.2 78.4 34.1 558.6 1974 78.8 445.9 524.7 117.3 39.5 681.5 1975 123.9 344.5 468.4 56.0 35.2 559.6 1976 126.2 432.5 558.7 69.3 38.6 666.7 1977 86.3 420.1 506.4 110.6 30.3 647.3 1978 169.8 531.4 701.2 108.1 34.3 843.6 1979 132.0 469.6 601.6 89.7 41.2 732.5 1980 130.7 502.8 633.5 111.4 49.8 794.7 1981 119.6 455.7 575.3 131.1 50.6 757.0 1982 98.8 469.8 568.6 154.9 54.0 777.5 1983 58.1 651.1 709.2 135.0 64.3 908.5 1984 60.6 770.8 831.4 126.8 107.0 1,065.2 1985 49.5 611.3 660.8 118.7 133.5 912.9 1986 63.6 753.3 816.9 122.2 138.3 1,077.4 1987 62.3 687.1 749.4 114.6 154.3 1,018.2 1988 85.3 853.7 939.0 140.0 209.2 1,288.1 1989 92.4 773.7 866.1 116.1 256.1 1,238.3 1990 72.6 869.0 941.6 138.7 230.4 1,310.6 1991 63.3 1,195.6 1,258.9 213.8 242.6 1,715.2 1992 84.0 925.3 1,009.3 161.4 268.2 1,438.9 1993 87.4 922.3 1,009.7 193.6 284.3 1,487.6 1994 74.5 986.5 1,061.0 175.8 319.7 1,556.5 1995 138.2 1,047.6 1,185.8 163.0 314.2 1,663.1 1996 112.2 1,038.8 1,151.0 149.8 281.1 1,582.0 1997 161.8 1,008.2 1,170.0 144.8 290.3 1,605.2 1998 144.0 1,281.8 1,425.8 147.6 304.7 1,878.1
1999*' 268.0 1,161.0 1,429.0 166.2 1,595.2
Source: Table 3- Fuente: Tabla 3ı Column 4 - Column 2-Columna 4 - Columna 2ı Source: FAO data set for Fishstat+-Fuente: datos de FAO para Fishstat+ı Source: ICCAT data set for Fishstat+-Fuente: datos de ICCAT para Fishstat+ı Source: IOTC data set for Fishstat+-Fuente: datos de IOTC para Fishstat+ı
* not available-no disponible ** preliminary- preliminares

108 TUNA COMMISSION
TABLE Bc. Annual catches of bigeye tuna, in thousands of metric tons. JPN: Japan; KOR: Republic of Korea; TWN:ı Taiwan; WCPO = western and central Pacific Ocean.ı TABLA Bc. Capturas anuales de atun patudo, en miles de toneladas metricas. JPN: Japan; KOR: Republica de Corea;ı TWN: Taiwan; OPOC = Oceano Pacifico occidental y central.ı
Pacific Ocean Eastern Atlantic IndianYear Total Lonl!line2 WCP03 Total4 Ocean5 Ocean6
Surface l: JPN
I Total KOR TWN Others Total I
Oceano Pacifico Oriental Oceano OceanoAno Total Palani!re2 OPOC3 Total4 Atlantico; Indico6
Superficiell I TotalI JPN KOR TWN Otros Total I 1970 1.3 31.8 0.7 0.4 32.9 34.2 50.0 84.2 42.3 22.3 148.8 1971 2.6 28.9 1.7 0.3 30.9 33.5 32.4 66.0 55.8 21.0 142.8 1972 2.2 35.1 2.4 0.8 38.3 40.5 47.2 87.7 47.2 19.4 154.3 1973 2.0 49.7 1.2 1.3 52.2 54.2 36.2 90.4 57.0 15.5 162.9 1974 0.9 36.0 0.9 0.6 37.5 38.4 49.5 87.9 64.1 28.2 180.2 1975 3.7 40.7 0.5 0.6 0.4 42.2 45.9 57.2 103.1 61.3 39.4 203.8 1976 10.2 52.8 0.4 1.2 0.2 54.6 64.8 64.2 129.0 45.3 30.5 204.8 1977 7.1 70.0 0.4 3.5 0.2 74.1 81.2 63.8 145.0 54.9 37.5 237.3 1978 11.7 67.2 0.3 3.0 0.2 70.7 82.4 39.2 121.6 52.7 48.3 222.6 1979 7.5 54.4 0.8 0.8 0.1 56.2 63.7 65.3 129.0 46.0 32.9 207.9 1980 15.4 62.0 1.3 2.2 0.6 66.1 81.5 51.1 132.5 63.6 33.8 229.9 1981 10.1 50.0 0.6 3.0 0.4 54.0 64.1 40.1 104.2 67.8 34.5 206.5 1982 4.1 50.2 0.4 3.0 0.1 53.7 57.8 51.6 109.4 73.5 43.2 226.2 1983 3.3 57.2 0.2 2.6 0.1 60.1 63.4 48.0 111.4 59.4 48.0 218.8 1984 5.9 44.6 0.2 1.6 0.0 46.5 52.4 51.5 103.8 71.1 40.5 215.4 1985 4.5 61.6 0.2 4.5 0.0 66.3 70.8 53.9 124.7 78.2 47.8 250.7 1986 1.9 920 0.1 10.2 0.1 102.4 104.3 46.2 150.5 65.4 54.0 269.9 1987 0.8 87.9 0.6 9.8 0.4 98.6 99.4 49.5 149.0 56.0 59.2 264.2 1988 1.1 66.0 0.4 1.6 0.4 68.5 69.6 50.3 119.9 65.8 67.2 252.9 1989 1.5 67.5 0.1 1.1 0.5 69.2 70.7 54.9 125.6 78.1 59.7 263.3 1990 4.7 86.1 0.1 4.2 0.3 90.7 95.4 67.2 162.6 84.3 63.7 310.6 1991 3.7 85.0 0.0 4.5 0.2 89.8 93.5 50.1 143.6 95.9 68.1 307.6 1992 5.5 74.5 0.0 2.5 0.1 77.1 82.6 75.8 158.4 99.0 64.3 321.8 1993 8.1 63.2 0.1 10.7 0.2 74.2 82.3 47.5 129.9 112.9 92.5 335.3 1994 29.4 61.5 0.4 7.3 0.3 69.4 98.8 45.9 144.7 132.9 95.5 373.1 1995 37.3 49.0 0.4 6.6 0.0 56.0 93.3 46.6 140.0 127.1 115.6 382.6 1996 51.4 36.7 0.5 5.4 0.1 42.7 94.1 39.1 133.2 121.8 123.0 377.9 1997 51.6 32.9 0.3 6.8 0.1 40.1 91.7 70.1 161.8 107.6 131.6 401.0 1998** 35.2 36.8 0.2 * 0.2 37.2 72.4 80.2 152.6 110.8 143.0 406.4 1999** 41.2 22.8 * * 22.8 64.0 85.3 149.3 123.2 * 272.5
Source: Table 3-Fuente: Tabla 3 Sources: published and unpublished data from the National Research Institute of Far Seas Fisheries (NRIFSF), Shimizu, Japan, Institute of Oceanography, National Taiwan University, Taipei, Taiwan, and National Fisheries Research and Development Agency, Republic of Korea. The data were converted from numbers of fish to weight in metric tons with average weight data estimated by the IATTC staff.
2 Fuentes: datos publicados e ineditos dellnstituto Nacional de lnvestigacian de Pesquerias de Ultramar (NRIFSF) en Shimizu (Japan), ellnstituto de Oceanografia de la Universidad Nacional de Taiwan en Taipei, y laAgencia Nacional de Investigacian y Desarrollo Pesquero de Corea. Se convirtieron los datos de numeros de peces a peso en toneladas metricas usando datos de peso promedio estimados por el personal de la CIAT. Source: Column 10 - Column 8-Fuente: Columna 10 - Columna 8 Source: FAO data set for Fishstat+-Fuente: datos de FAO para Fishstat+ Source: ICCAT data set for Fishstat+-Fuente: datos de CICAA para Fishstat+ Source: IOTC data set for Fishstat+- Fuente: datos de CTOI para Fishstat+
* not available-no disponible ** preliminary- preliminares

109 ANNUAL REPORT 1999
TABLE 8d. Annual catches of Pacific bluefin, in metric tons.ı TABLA 8d. Capturas anuales de aleta azul del Pacifico, en toneladas metricas.ı
Western Pacific nations! Eastern Pacific nations
Year Surface Longline Subtotal
Surface
Commercial2 !Recreational3 Longline4 TotalSubtotal
Naciones de Pacifico occidental! Naciones de Pacificos oriental
Aiio Superficie Palangre Subtotal Suuerficie
Comercial2 I Deportiva3 Palangre4 TotalSubtotal
1970 7,505 1,123 8,629 3,951 15 3,966 12,595 1971 8,672 757 9,428 8,354 6 8,360 17,788 1972 7,951 724 8,674 13,335 12 13,347 22,021 1973 8,798 1,158 9,956 10,700 44 10,744 20,700 1974 14,762 3,533 18,295 5,570 47 5,617 23,912 1975 10,770 1,558 12,328 9,556 27 9,583 21,911 1976 9,185 520 9,705 10,628 17 10,645 20,350 1977 12,618 712 13,330 5,458 15 5,473 18,803 1978 21,285 1,049 22,334 5,393 4 5,397 27,731 1979 25,311 1,223 26,534 6,108 9 6,117 32,651 1980 18,372 1,170 19,542 2,933 6 2,939 22,481 1981 29,576 975 30,551 1,084 5 1,089 31,640 1982 24,095 1,056 25,151 3,145 5 3,150 28,301 1983 18,047 8,634 18,911 837 16 853 19,764 1984 10,564 831 11,395 858 23 881 12,276 1985 11,985 706 12,691 4,014 41 4,055 16,746 1986 14,496 319 14,815 5,079 6 5,085 19,900 1987 13,315 711 14,026 990 15 1,005 15,031 1988 7,331 349 7,680 1,421 3 1,424 9,104 1989 9,099 645 9,744 1,117 53 1,170 10,914 1990 6,294 585 6,879 1,511 31 1,542 8,421 1991 14,084 627 14,711 418 43 461 15,172 1992 10,221 1,037 11,258 1,929 70 1 2,000 13,258 1993 7,818 1,328 9,146 581 298 45 924 10,070 1994 11,052 1,521 12,573 974 88 24 1,086 13,659 1995 22,825 920 23,745 629 245 27 901 24,646 1996 10,148 1,873 12,021 8,222 37 53 8,312 20,333 1997 14,757 2,823 17,580 2,657 150 52 2,859 20,439 1998* 7,389 3,134 10,523 1,826 397 56 2,279 12,802 1999* 16,868 3,490 20,358 2,644 447 39 3,130 23,488
1� Sources: The data for Japan were obtained from the National Research Institute of Far Seas Fisheries of Japan. The data for Taiwan and the Republic of Korea were obtained from FAO yearbooks of fisheries statistics and data published by the Institute of Oceanography, National Taiwan University, Taipei, Taiwan, and the National Fisheries Research and Development Agency of Korea.
1ˇ Fuentes: Los datos de Japan provienen del Instituto Nacional de Investigacian de Pesquerias de ffitramar del Japan. Los datos de Taiwan y la Republica de Corea provienen de compendios anuales de estadisticas pesqueras de la FAO y datos publicados por el Instituto de Oceanografia de la Universidad Nacional de Taiwan en Taipei y laAgencia Nacional de Investigacian y Desarrollo Pesquero de Corea. Source: Table 3 minus recreational catch. Fuente: Tabla 3, menos la captura deportiva. Sources: 1970-1990, California's Living Marine Resources and their Utilization, published by the California Department of Fish and Game; 1991-1992, California Department of Fish and Game, unpub. data; 1993-1999, Calif. Coop. Ocean. Fish. Inves., Rep., 35-41.
3ˇ Fuentes: 1970-1990, California's Living Marine Resources and their Utilization, publicado par el California Department ofFish and Game; 1991-1992, California Department ofFish and Game, datos ineditos; 1993-1998, Calif. Coop. Ocean. Fish. Inves., Rep., 35-41
4 Sources: NOAA Tech. Rep. NMFS 142: page 149, and Pelagic Fisheries of the Western Pacific Region, 1998 Annual Report, Western Pacific Fishery Management Council, Honolulu, Hawaii: page 3-57.
4 Fuentes: NOAA Tech. Rep. NMFS 142: pagina 149, yPesquerias Pelagicas de la Regian del Pacifico Occidental, Informe Anual de 1998, Western Pacific Fishery Management Council, Honolulu, Hawaii: pagina 3-57.
*� preliminary- preliminares
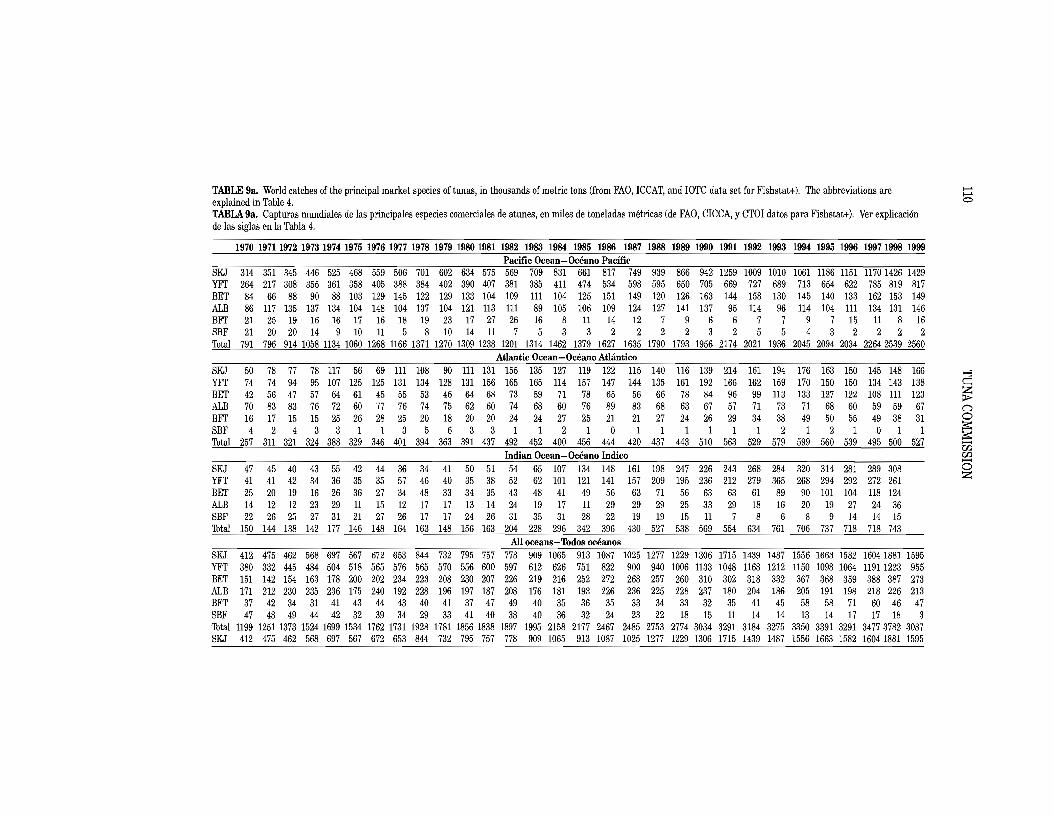
>-'TABLE 9a. World catches of the principal market species of tunas, in thousands of metric tons (from FAO, ICCAT, and lOTC data set for Fishstat+). The abbreviations are >-' explained in Table 4. 0
TABLA 9a. Capturas mundiales de las principales especies comerciales de atunes, en miles de toneladas metricas (de FAO, CICCA, y CTOI datos para Fishstat+). Ver explicaci6n de las siglas en la Tabla 4.
1970 19711972 1973 1974 1975 1976 1977 1978 1979 1980 1981 1982 1983 1984 1985 1986 1987 1988 1989 1990 1991 1992 1993 1994 1995 1996 1997 1998 1999 Pacific Ocean-Oceano Pacific
SKJ 314 351 345 446 525 468 559 506 701 602 634 575 569 709 831 66] 817 749 939 866 942 1259 1009 1010 1061 1186 1151 1170 1426 1429 YFT 264 217 308 355 361 358 405 388 384 402 390 407 381 385 411 474 534 598 595 650 705 669 727 689 713 654 622 785 819 817ı BET 84 66 88 90 88 103 129 145 122 129 133 104 109 111 104 125 151 149 120 126 163 144 158 130 145 140 133 162 153 149ı ALB 86 117 135 137 134 104 148 104 137 104 121 113 1ll 89 105 106 109 124 127 141 137 95 114 96 114 104 111 134 131 146ı BFT 2] 25 19 16 16 17 16 18 19 23 17 27 26 16 8 11 14 12 7 9 6 6 7 7 9 7 15 11 8 16ı SBF 21 20 20 14 9 10 11 5 8 10 14 11 7 5 3 3 2 2 2 2 3 2 5 5 4 3 2 2 2 2ı Total 791 796 914 1058 1134 1060 1268 1166 1371 1270 1309 1238 1201 1314 1462 1379 1627 1635 1790 1793 1956 2174 2021 1936 2045 2094 2034 22642539 2560ı
Atlantic Ocean-Oceano Atilinticoı SKJ 50 78 77 78 117 56 69 111 108 90 111 131 155 135 127 119 122 115 140 116 139 214 161 194 176 163 150 145 148 166ı >-3 YFT 74 74 94 95 107 125 125 131 134 128 131 156 165 165 114 157 147 144 135 161 192 166 162 159 170 150 150 134 143 138 d
ZBET 42 56 47 57 64 61 45 55 53 46 64 68 73 59 71 78 65 56 66 78 84 96 99 113 133 127 122 108 111 123 ;J> ALB 70 83 83 76 72 60 77 76 74 75 62 60 74 68 60 76 89 83 68 63 67 57 71 73 71 68 60 59 59 67 l:l BFT 16 17 15 15 25 26 28 25 20 18 20 20 24 24 27 25 2] 21 27 24 26 29 34 38 49 50 55 49 38 31 0
is:SBF 4 2 4 3 3 1 1 3 5 6 3 3 1 1 2 1 0 1 1 1 1 1 1 2 1 2 1 0 1 1 is:Total 257 311 321 324 388 329 346 401 394 363 391 437 492 452 400 456 444 420 437 443 510 563 529 579 599 560 539 495 500 527 ...... en. Indian Ocean-Oceano Indico en.......
SKJ 47 45 40 43 55 42 44 36 34 41 50 51 54 65 107 134 148 161 198 247 226 243 268 284 320 314 281 289 308 0 ZYFT 41 41 42 34 36 35 35 57 46 40 35 38 52 62 101 121 141 157 209 195 236 212 279 365 268 294 292 272 261
BET 25 20 19 16 26 36 27 34 48 33 34 35 43 48 41 49 56 63 71 56 63 63 61 89 90 101 104 118 124 ALB 14 12 12 23 29 11 15 12 17 17 13 14 24 19 17 11 29 29 29 25 33 29 18 16 20 19 27 24 36 SBF 22 26 25 27 31 21 27 26 17 17 24 26 31 35 31 28 22 19 19 15 11 7 8 6 8 9 14 14 15 Total 150 144 138 142 177 146 148 164 163 148 156 163 204 228 296 342 396 430 527 538 569 554 634 761 706 737 718 718 743
All oceans - Todos oceanos SKJ 412 475 462 568 697 567 672 653 844 732 795 757 778 909 1065 913 1087 1025 1277 1229 1306 1715 1439 1487 1556 1663 1582 1604 188] 1595 YFT 380 332 445 484 504 518 565 576 565 570 556 600 597 612 626 751 822 900 940 1006 1133 1048 1168 1212 1150 1098 1064 1191 1223 955 BET 151 142 154 163 178 200 202 234 223 208 230 207 226 219 216 252 272 268 257 260 310 302 318 332 367 368 359 388 387 273 ALB 171 212 230 235 236 175 240 192 228 196 197 187 208 176 18] 193 226 236 225 228 237 180 204 186 205 191 198 218 226 213 BFT 37 42 34 31 41 43 44 43 40 41 37 47 49 40 35 36 35 33 34 33 32 35 41 45 58 58 71 60 46 47 SBF 47 48 49 44 42 32 39 34 29 33 41 40 38 40 36 32 24 23 22 18 15 11 14 14 13 14 17 17 18 3 Total 1199 12511373 15241699 1534 1762 1731 1928 1781 18561838 1897 1995 2158 2177 2467 2485 2753 2774 3034 3291 3184 3275 3350 3391 3291 34773782 3087 SKJ 412 475 462 568 697 567 672 653 844 732 795 757 778 909 1065 913 1087 1025 1277 1229 1306 1715 1439 1487 1556 1663 1582 1604 1881 1595

TABLE 9b. World catches ofthe principal species of billfishes, in thousands of metric tons (from FAD, ICCAT, and roTC data set for Fishstat+). The following abbreviations are used for species: SWD, swordfish; BLZ, Pacific blue marlin; BUM, Atlantic blue marlin; BLM, black marlin; MLS, striped marlin; WHM. white marlin; SFA, Pacific sailfish; SAl, Atlantic sailfish; ElL, unidentified billfishes. TABLA 9b. Captures mundiales de las especies principales de picudos, en miles de toneladas metricas (de FAD, CICCA, y CTOI datos para Fishstat+l. Las siguientes abbreviations are used for species: SWD, pez espada; BLZ, marlin azul del Pacifico; BUM, marlin azul del Atlantico; BLM, marlin negro; MLS, marlin rayado; WHM. marlin blanco; SFA, pez vela del Pacifico; SAl, pez vela del Atlantico; ElL, picudos no identificados.
1970 1971 1972 1973 1974 1975 1976 1977 1978 1979 1980 1981 1982 1983 1984 1985 1986 1987 1988 1989 1990 1991 1992 1993 1994 1995 1996 1997 1998 1999ı Pacific Ocean- Oceano Pacificı
SWO 19 12 12 16 13 14 17 16 17 15 15 17 15 16 16 17 18 20 23 23 25 24 30 28 25 20 19 23 26 24 BUM 14 11 12 15 11 12 13 13 15 16 19 18 18 17 20 16 18 20 18 19 18 20 19 18 23 22 19 17 18 17 BLM 1 3 2 2 2 2 2 1 2 2 2 2 2 2 2 2 2 2 2 2 3 3 4 2 3 1 1 1 2 2 MLS 22 22 15 16 15 17 14 12 12 14 16 14 14 11 lJ 11 15 15 15 14 11 10 11 11 11 10 8 8 9 7 SFA 7 8 9 9 7 7 13 11 10 7 7 5 6 6 5 4 4 4 4 5 6 5 7 5 4 3 3 5 6 5 BIL 1 2 2 4 4 6 2 2 3 3 4 5 5 7 5 5 7 10 7 7 9 8 9 10 7 11 10 10 16 17 Total 65 57 52 61 51 58 61 55 60 57 63 59 59 59 57 55 64 70 69 69 72 70 79 74 72 67 62 64 78 71
Atlantic Ocean- Oceano Atlantico ~ SWO 18 12 13 14 14 16 14 15 21 21 25 22 26 27 36 39 41 45 53 52 45 41 44 46 51 51 45 46 39 40 Z
BUM 3 3 2 3 3 3 2 2 2 2 2 2 3 2 3 3 2 2 3 4 5 4 3 3 4 4 5 5 4 4 c:::: BLM 0 0 0 0 0 0 0 0 0 0 0 0 0 0 0 0 0 0 0 0 0 0 0 0 0 0 0 0 0 0 ~
WHM 2 2 2 2 2 2 2 1 1 1 1 1 1 2 1 2 2 2 1 2 2 2 1 1 2 2 2 1 1 1 ~
trlSAl 3 3 2 2 4 6 6 2 3 4 3 2 3 4 3 3 3 3 3 2 3 2 3 3 2 2 3 2 2 1 "dBIL 0 0 0 0 0 0 0 0 0 0 0 0.1 0 0.0 0.2 0.2 0.2 0.3 0.2 0.1 0.0 0.0 0.1 0.2 0.2 0.2 0.2 0.2 0.2 0.1 0 Total 26 21 20 21 23 27 25 20 26 27 31 28 33 35 43 47 48 52 60 60 54 49 51 54 59 59 54 54 46 46 ~
>-3 Indian Ocean-Oceano Indico ......
<.0SWO 3 2 2 1 2 2 1 1 1 2 2 2 3 3 3 4 5 6 8 6 6 7 12 22 18 25 29 29 37 <.0 <.0
BUM 5 4 3 2 3 2 1 1 2 2 3 3 3 4 4 4 8 8 8 6 7 8 7 6 9 3 4 6 8 BLM 1 1 1 1 1 0 0 0 1 0 1 1 1 1 1 1 2 2 2 2 2 J 2 3 1 1 1 1 1 MLS 4 2 2 J 2 2 2 4 6 4 5 6 3 3 3 6 6 5 4 3 2 2 2 5 3 4 4 3 4 SFA 1 1 1 0 0 0 0 0 0 0 0 0 0 0 0 2 2 2 4 3 4 5 4 5 8 9 10 12 J3 BIL 2 1 2 2 3 4 3 3 4 5 2 2 5 3 5 5 5 5 5 9 9 7 7 9 10 13 17 18 17 Total 15 10 10 7 11 10 9 10 14 13 14 14 14 16 17 23 28 28 30 27 29 30 34 50 50 55 66 68 79
All oceans-Thdos oceanos SWD 40 26 27 31 28 32 33 31 39 37 42 4J 44 46 54 61 64 70 83 80 76 71 86 97 94 95 93 98 103 65 BUM 22 18 18 20 17 17 16 17 19 19 23 22 24 23 27 23 28 30 28 29 30 32 29 27 36 29 28 27 30 21 BLM 2 3 3 2 3 3 2 1 2 3 3 3 3 4 3 3 4 4 4 4 5 5 6 5 3 2 2 2 3 2 MLS 26 24 16 J7 17 19 16 15 18 18 21 20 17 14 14 17 21 20 19 16 13 13 13 16 14 14 12 11 13 7 WHM 2 2 2 2 2 2 2 1 1 1 1 1 1 2 1 2 2 2 1 2 2 2 1 1 2 2 2 J 1 1 SFA 8 9 9 9 7 7 14 11 10 8 8 5 6 7 5 6 6 6 8 8 9 10 10 9 12 12 14 17 18 5 SAl 3 3 2 2 4 6 6 2 3 4 3 2 3 4 3 3 3 3 3 2 3 2 3 3 2 2 3 2 2 1 ...... ......ElL 3 3 4 5 7 10 5 5 8 8 6 7 10 10 10 10 13 15 12 16 18 14 16 19 18 24 27 27 33 17 ...... Total 106 88 83 88 85 95 95 85 100 98 108 101 107 110 117 125 140 149 159 156 J55 149 164 178 181 181 181 186 203 118
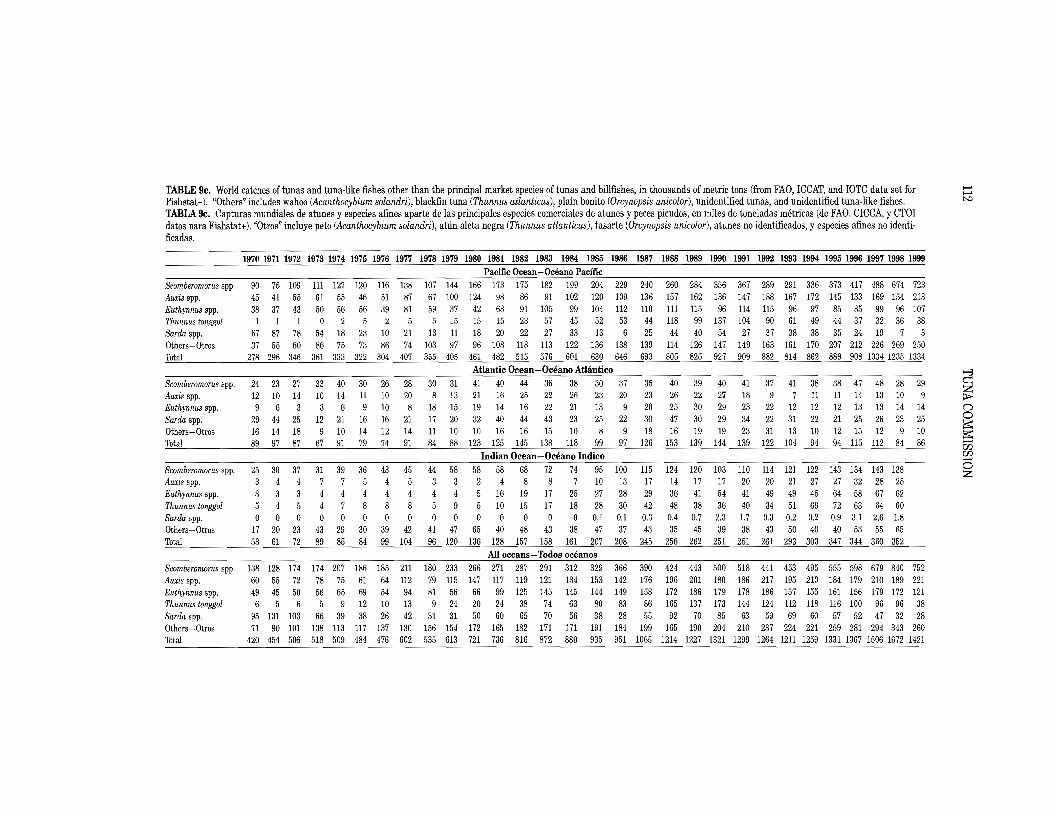
,....TABLE 9c. World catches of tunas and tuna-like fishes other than the principal market species of tunas and billfishes, in thousands of metric tons (from FAa, rCCAT, and rOTC data set forı ,.... t>.:>Fishstat+l. "Others" includes wahoo (Acanthocybillm solandril, blackfin tuna (Thunnus atlanticus), plain bonito lOrcynopsis unicolor), unidentified tunas, and unidentified tuna-like fishes.
TABLA 9c. Capturas mundiales de atunes y especies afines aparte de las principales especies comerciales de atunes y peces picudos, en miles de toneladas metricas (de FAa, CICCA, y CTOI datos para Fishstat+l. "Otros" incluye peto (Acanthocybium solandril, atun aleta negra (Thunnus atlanticusl, tasarte (Orcynopsis unicolorl, atunes no identificados, y especies afines no identi-ficadas.
1970 1971 1972 1973 1974 1975 1976 1977 1978 1979 1980 1981 1982 1983 1984 1985 1986 1987 1988 1989 1990 1991 1992 1993 1994 1995 1996 1997 1998 1999 Pacific Ocean- Oceano Pacific
Scomberomorus spp. 90 75 109 111 127 120 116 138 107 144 166 173 175 182 199 204 229 240 260 284 356 367 289 291 336 373 417 488 674 723 Auxis spp. 45 41 55 61 55 46 51 87 67 100 124 98 86 91 102 120 109 136 157 162 136 147 188 167 172 145 133 169 154 213 Euthynnus spp. 38 37 43 50 56 56 39 81 59 37 42 68 9] 105 99 ]04 112 110 J1] 115 96 114 115 96 97 85 85 99 96 107 Thunnus tonggul 1 1 1 0 2 5 2 5 5 15 [5 15 23 57 45 52 53 44 118 99 137 104 90 61 49 44 37 32 36 38 Sarda spp. 67 87 78 54 18 23 10 2] 13 11 18 20 22 27 33 13 6 25 44 40 54 27 37 38 38 35 24 19 7 3 Others-Otros 37 55 60 86 75 73 86 74 103 97 96 108 118 113 122 136 138 139 114 126 147 149 163 161 170 207 212 226 269 250 Total 278 296 346 361 333 322 304 407 355 105 461 482 515 576 601 630 646 693 805 825 927 909 882 814 862 889 908 1034 1235 1334
Atlantic Ocean-Oceano Atlantica >-3 Scomberomorus spp. 24 23 27 33 40 30 26 28 30 31 4] 40 44 36 38 30 37 35 40 39 40 41 37 41 38 38 47 48 28 29 Auxis spp. 12 10 14 10 14 11 10 20 8 13 21 16 25 22 26 23 20 23 26 22 27 18 9 7 11 11 14 13 10 9 ~
Ellthynnus spp. 9 6 3 3 6 9 10 8 18 15 19 14 16 22 21 13 9 20 25 30 29 23 22 12 12 12 13 13 14 14 l.l 0Sarda spp. 29 44 25 12 21 16 16 21 17 20 32 40 44 43 23 25 22 30 47 30 29 34 22 31 22 21 25 26 23 25 ~ Others-Otros 16 14 18 9 10 14 12 ]4 11 10 10 16 16 15 10 8 9 18 16 19 19 23 31 13 10 12 15 12 9 10 ~
Total 89 97 87 67 91 79 74 91 84 88 123 125 145 138 118 99 97 126 153 139 144 139 122 104 94 94 115 112 84 86ı >-< 00
Indian Ocean-Oceano Indica >-< 00
0Scomberomorus spp. 25 30 37 31 39 36 43 45 44 58 58 58 68 72 74 95 100 115 124 120 103 110 114 12] 122 143 134 143 138 ZAuxis spp. 3 4 4 7 7 5 4 5 3 3 2 4 8 8 7 10 13 17 14 17 17 20 20 2] 27 27 32 28 25 Euthynnus spp. 3 3 3 4 4 4 4 4 4 4 5 16 ]9 17 25 27 28 29 36 41 54 41 49 49 45 64 58 67 62 Thannus tonggol 5 4 5 4 7 8 8 8 5 9 5 10 15 17 18 28 30 42 48 38 36 40 34 51 69 72 63 64 60 Sarda spp. 0 0 0 0 0 0 0 0 0 0 0 0 0 0 0 0.1 0.1 0.3 0.4 0.7 2.3 1.7 0.3 0.2 0.2 0.9 3.1 2.6 1.8 Others-Otros 17 20 23 43 29 30 39 42 41 47 65 40 48 43 38 47 37 43 35 45 39 38 43 50 40 40 53 55 65 Total 53 61 72 89 85 84 99 104 96 120 136 128 157 158 161 207 208 245 256 262 251 251 261 293 303 347 344 360 352
All oceans- Todos oceanos Scomberomorus spp. 138 128 174 174 207 186 185 211 180 233 266 271 287 29] 312 329 366 390 424 443 500 518 44] 453 495 555 598 679 840 752 Auxis spp. 60 55 72 78 75 61 64 112 79 115 147 117 119 121 134 153 142 176 196 201 180 186 217 195 210 184 179 210 189 221 Euthynnus spp. 49 45 50 56 65 69 54 94 81 56 66 99 121i 145 145 144 149 158 172 186 179 178 186 157 155 161 156 179 172 121 Thunnus tonggol 6 5 6 5 9 12 10 13 9 24 20 24 38 74 63 80 83 86 165 137 173 144 124 112 118 116 100 96 96 38 Sarda spp. 95 131 103 66 39 38 26 42 31 31 50 60 65 70 56 38 28 55 92 70 85 63 59 69 60 57 52 47 32 28 Others-Otros 71 90 101 138 113 117 137 130 156 154 172 165 182 171 171 19] 184 199 165 190 204 210 237 224 221 259 281 294 343 260 Total 420 454 506 518 509 484 476 602 535 613 721 736 816 872 880 935 951 1065 1214 1227 1321 1299 1264 1211 1259 1331 1367 1506 1672 1421

113 ANNUAL REPORT 1999
TABLE 10. Sampling coverage by the IATTC and PNAAPD programs during 1999 of trips by Class-6 vessels (capacityı >400 short tons (>363 metric tons)).ı TABLA 10. Cobertura de muestreo por los programas de la CIAT y PNAAPD en 1999 de viajes de buques de la Clase 6ı (capacidad >400 toneladas cortas (>363 toneladas metricas)).ı
National fleet Number of trips Trips sampled by program Percent IATTC PNAAPD Total sampled
Flota nacional Nlimero de viajes Viajes muestreados por programa CIAT PNAAPD Total
Porcentaje muestreado
Belize- Belice 8 8 8 100.0 Colombia 22 22 22 100.0 Ecuador 255 255 255 100.0 Espana- Spain 40 40 40 100.0 Guatemala 14 14 14 100.0 Honduras 13 13 13 100.0 Mexico 200 101 99 200 100.0 Nicaragua 4 4 4 100.0 Panama 9 9 9 100.0 El Salvador 8 7 7 87.5 USA-EE.UU. 21 21 21 100.0 Venezuela 91 91 91 100.0 Vanuatu 57 57 57 100.0 Total 742 6421 992 7413 100.0
Includes 49 trips which departed in late 1998 and ended in 1999, and 593 trips which departed in 1999ı Incluye 49 viajes iniciados a fines de 1998 y terminados en 1999, y 593 viajes iniciados durante 1999ı Includes 5 trips which departed in late 1998 and ended in 1999, and 94 trips which departed in 1999ı Incluye 5 viajes iniciados a fines de 1998 y terminados en 1999, y 94 viajes iniciados durante 1999ı Includes 54 trips which departed in late 1998 and ended in 1999, and 687 trips which departed in 1999ı Incluye 54 viajes iniciados a fines de 1998 y terminados en 1999, y 687 viajes iniciados durante 1999ı
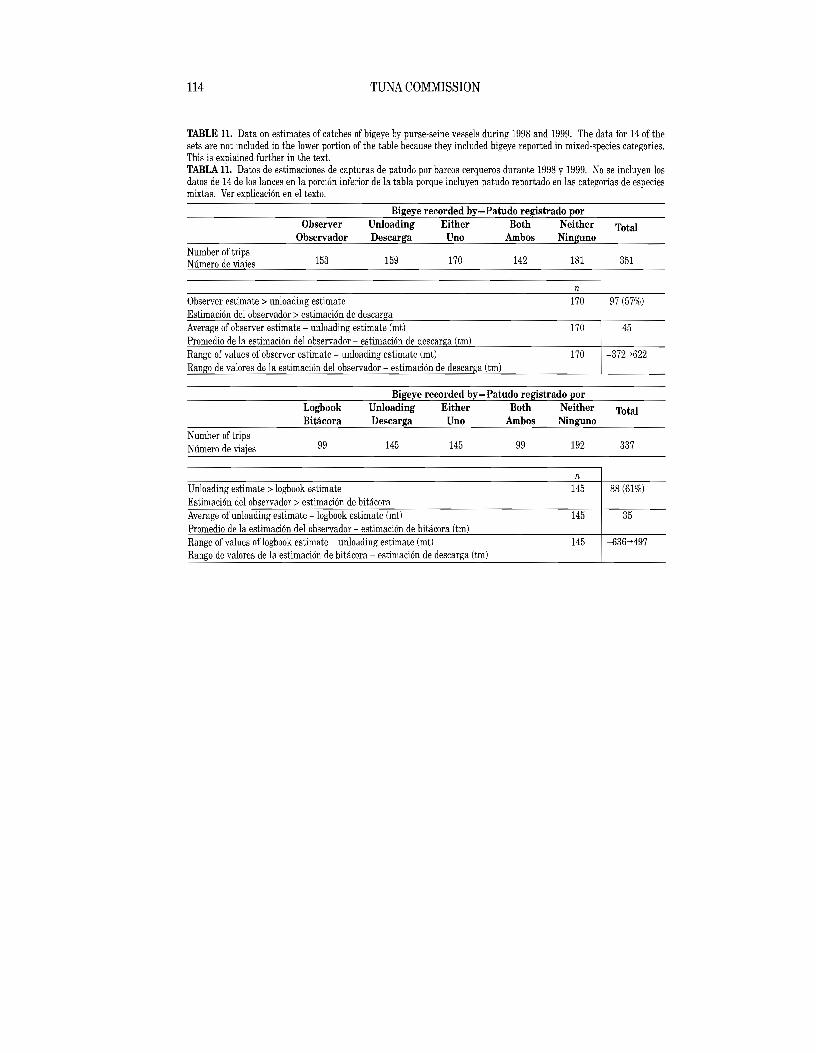
114 TUNA COMMISSION
TABLE 11. Data on estimates of catches of bigeye by purse-seine vessels during 1998 and 1999. The data for 14 of theı sets are not included in the lower portion of the table because they included bigeye reported in mixed-species categories.ı This is explained further in the text.ı TABLA 11. Datos de estimaciones de capturas de patudo pOl' barcos cerqueros durante 1998 y 1999. No se incluyen losı datos de 14 de los lances en la porci6n inferior de la tabla porque incluyen patudo reportado en las categorias de especiesı mixtas. Vel' explicaci6n en el texto.ı
Bigeye recorded by-Patudo registrado pOl'
Observer Unloading Either Both Neither Total Observador Descarga Uno Ambos Ninguno
Number of trips 153 159 170 142 181 351Numero de viajes
n Observer estimate> unloading estimate 170 97 (57%)ı Estimaci6n del observador > estimaci6n de descargaı Average of observer estimate - unloading estimate (mt) 170 45ı Promedio de la estimaci6n del observador - estimaci6n de descar a (tm)ı Range of values of observer estimate - unloading estimate (mtl 170 -372-->622ı Rango de valores de la estimaci6n del observador - estimaci6n de descar a (tm)ı
Bigeye recorded by-Patudo registrado pOl'
Logbook Unloading Either Both Neither Total Bitacora Descarga Uno Ambos Ninguno
Number of trips 99 145 145 99 192 337Numero de viajes
n Unloading estimate> logbook estimate 145 88 (61%)ı Estimaci6n del observador > estimaci6n de bitacoraı Average of unloading estimate - logbook estimate (mtl 145 35ı Promedio de la estimaci6n del observador - estimaci6n de bitacora (tm)ı Range of values oflogbook estimate - unloading estimate (mt) 145 -636-->497ı Rango de valores de la estimaci6n de bitacora - estimaci6n de descarga (tm)ı
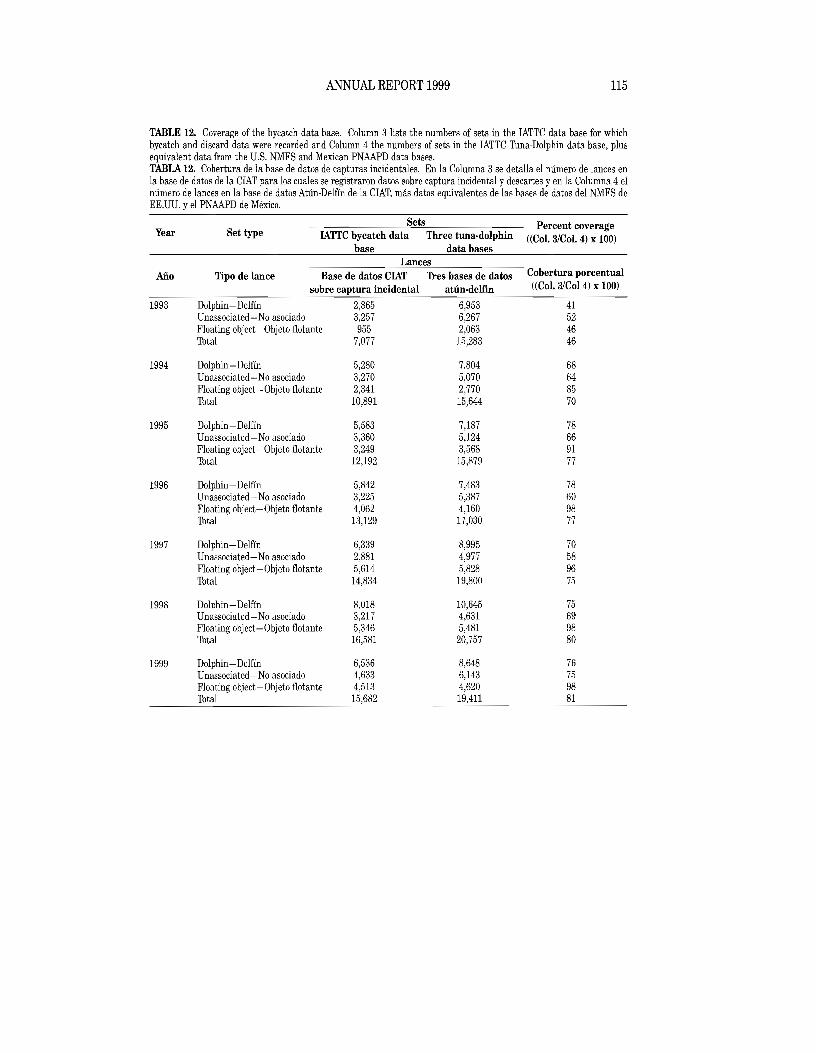
115 ANNUAL REPORT 1999
TABLE 12. Coverage of the bycatch data base, Column 3 lists the numbers of sets in the IATTC data base for which bycatch and discard data were recorded and Column 4 the numbers of sets in the IATTC Tuna-Dolphin data base, plus equivalent data from the U,S. NMFS and Mexican PNAAPD data bases. TABLA 12. Cobertura de la base de datos de capturas incidentales. En la Columna 3 se detalla el mimero de lances en la base de datos de la CIAT para los cuales se registraron datos sobre captura incidental y descartes y en la Columna 4 el mimero de lances en la base de datos Atlin-Delfin de la CIAT, mas datos equivalentes de las bases de datos del NMFS de EE.UU. y el PNAAPD de Mexico.
Year
Aiio
1993
1994
1995
1996
1997
1998
1999
Set type Sets
IATTC bycatch data Three tuna-dolphin base data bases
Percent coverage «Col. 3/Col. 4) x 100)
Lances Tipo de lance Base de datos CIAT Tres bases de datos Cobertura porcentual
sobre captura incidental Dolphin- Delfin Unassociated-No asociado Floating object-Objeto flotante Total
Dolphin- Delfin Unassociated-No asociado Floating object-Objeto flotante Total
Dolphin - Delfin Unassociated- No asociado Floating object-Objeto flotante Total
Dolphin- Delfin Unassociated- No asociado Floating object-Objeto flotante Total
Dolphin-Delfin Unassociated-No asociado Floating object-Objeto flotante Total
Dolphin- Delfin Unassociated-No asociado Floating object-Objeto flotante Total
Dolphin- Delfin Unassociated-No asociado Floating object-Objeto flotante Total
2,865 3,257 955
7,077
5,280 3,270 2,341 10,891
5,583 3,360 3,249 12,192
5,842 3,225 4,062 13,129
6,339 2,881 5,614 14,834
8,018 3,217 5,346 16,581
6,536 4,633 4,513 15,682
atun-delfin (Col. 3/CoI4) x 100)
6.953 41 6,267 52 2,063 46 15,283 46
7,804 68 5,070 64 2,770 85 15,644 70
7,187 78 5,124 66 3,568 91 15,879 77
7,483 78 5,387 60 4,160 98 17,030 77
8,995 70 4,977 58 5,828 96 19,800 75
10,645 75 4,631 69 5,481 98
20,757 80
8,648 76 6,143 75 4,620 98 19,411 81

116 TUNA COMMISSION
TABLE 13. Numbers and percentages of floating-object sets in the IATTC bycatch data base that were on fish associated with flotsam and fish associated with FADs. TABLA 13. Ntimero yporcentaje de lances sobre objetos flotantes en la base de datos de la CIAT sobre captura incidental realizados sobre peces asociados con despojos flotantes y peces asociados con dispositivos agregadores de peces.
Year Flotsam FADs Unknown Total No. Percent No. Percent No. Percent No.
Ano Despojos flotantes Dispositivos agregadores de peces Desconocidos Total No. Porcentaje No. Porcentaje No. Porcentaje No.
1993 1,122 54.4 827 40.1 114 5.5 2,063 1994 706 25.5 1,950 70.4 114 4.1 2,770 1995 771 21.6 2,672 74.9 125 3.5 3,568 1996 478 11.5 3,504 84.2 178 4.3 4,160 1997 838 14.4 4,764 81.7 226 3.9 5,828 1998 744 13.6 4,634 84.5 103 1.9 5,481 1999 839 18.2 3,715 80.4 66 1.4 4,620

117 ANNUAL REPORT 1999
TABLE 14a. Data on the total catches and discards, in metric tons, of yellowfin in sets of purse seiners with observersı aboard. The discard ratios are equal to (discards/total catches) x 100.ı TABLA 14a. Datos sobre las capturas y descartes totales, en toneladas metricas, de aleta amarilla en lances realizadası por buques cerqueros con observador a bordo. Proporci6n de descartes = (descarteslcapturas totales) x 100.ı
Year
ADo
1993
Set type
Tipo de lance
Dolphin- Delfin Unassociated-No asociado Floating object-Objeto flotante
Total catch per set
Captura total porlance
15.9 12.2 8.6
Discards per set
Descartes por lance 0.05 0.30 1.51
Discard ratio
Proporci6n de descartes
0.3 2.4
17.5
Estimated total discards
Descartes totales estimados
270 1,682 3,088
1994 Dolphin - Delfin Unassociated-No asociado Floating object-Objeto flotante
16.9 10.2
8.1
0.10 0.12 1.32
0.6 1.2
16.2
569 625
3,419
1995 Dolphin- Delfin Unassociated- No asociado Floating object-Objeto flotante
19.1 8.0 5.4
0.29 0.05 0.76
1.5 0.6
14.0
2,509 178
2,657
1996 Dolphin- Delfin Unassociated-No asociado Floating object-Objeto flotante
19.0 8.1 6.4
0.13 0.19 1.13
0.7 2.3
17.7
879 1,039 4,742
1997 Dolphin- Delfin Unassociated-No asociado Floating object-Objeto flotante
17.1 9.3 5.0
0.07 0.12 0.74
0.4 1.3
14.8
620 417
4,593
1998 Dolphin- Delfin Unassociated-No asociado Floating object-Objeto flotante
14.6 13.0 4.6
0.06 0.19 0.54
0.4 1.4
11.6
709 806
3,203
1999 Dolphin-Delfin Unassociated-No asociado Floating object-Objeto flotante
17.0 9.6 9.9
0.06 0.14 1.18
0.3 1.5
11.9
471 794
5,363
Average Promedio
Dolphin-Delfin Unassociated-No asociado Floating object-Objeto flotante
17.0 10.0 6.4
0.11 0.16 0.92
0.6 1.6
14.2
861 791
3,866

118 TUNA COMMISSION
TABLE 14b. Data on the total catches and discards, in metric tons, of skipjack in sets of purse seiners with observersı aboard. The discard ratios are equal to (discards/total catches) x 100.ı TABLA 14b. Datos sobre las capturas y descartes totales, en toneladas metricas, de barrilete en lances realizadas porı buques cerqueros con observador a bordo. Proporcion de descartes =(descartes/capturas totalesl x 100.ı
Year
Ano
Set type
Tipo de lance
Total catch per set
Captura total porlance
Discards per set
Descartes por lance
Discard ratio
Proporcion de descartes
Estimated total discards
Descartes totales estimados
1993 Dolphin - Delfin Unassociated-No asociado Floating object-Objeto flotante
0.1 2.5
20.0
0.01 0.13 4.01
12.3 5.1
20.1
84 734
9,770
1994 Dolphin - Delfin Unassociated-No asociado Floating object-Objeto flotante
0.2 2.9
20.4
>0.00 0.20 3.54
2.3 7.0
17.3
27 986
9,301
1995 Dolphin - Delfin Unassociated-No asociado Floating object-Objeto flotante
0.4 5.5
246
0.04 0.30 4.35
8.7 5.5
17.7
356 1,239
15,019
1996 Dolphin-Delfin Unassociated - No asociado Floating object-Objeto flotante
03 48
21.0
0.02 0.20 5.80
7.3 4.2
27.6
204 864
23,902
1997 Dolphin- Delfin Unassociated-No asociado Floating object-Objeto flotante
1.0 4.0
22.5
0.01 0.27 5.30
1.2 6.7
23.6
127 1,022
30,718
1998 Dolphin - Delfin Unassociated - No asociado Floating object-Objeto flotante
0.5 3.8
21.7
>0.00 0.42 3.80
0.8 10.9 17.5
34 1,731
21,091
1999 Dolphin- Delfin Unassociated- No asociado Floating object-Objeto flotante
0.2 11.4 43.0
0.01 0.69 5.04
6.5 6.1
11.7
125 3,367
23,321
Average Promedio
Dolphin- Delfin Unassociated-No asociado Floating object-Objeto flotante
0.4 5.4
25.6
0.01 0.34 4.70
34 6.3
18.3
137 1,420
19,018
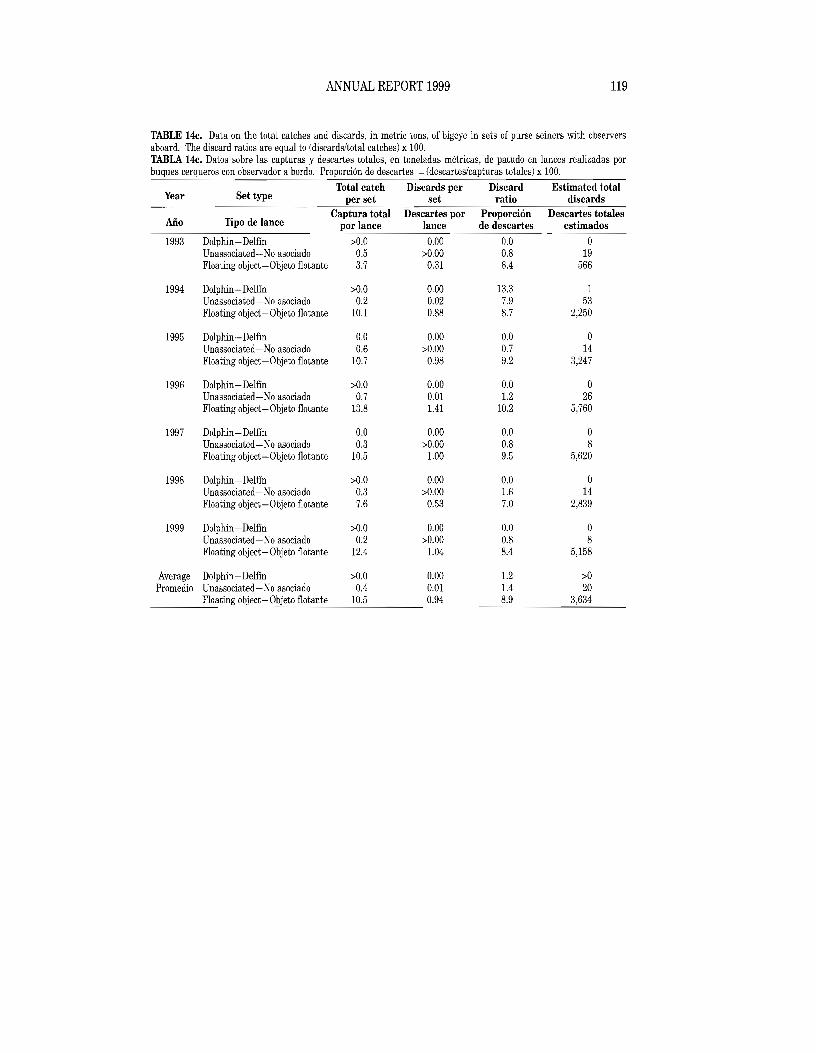
119 ANNUAL REPORT 1999
TABLE 14c. Data on the total catches and discards, in metric tons, of bigeye in sets of purse seiners with observersı aboard. '['he discard ratios are equal to (discards/total catches) x 100.ı TABLA 14c. Datos sobre las capturas y descartes totales, en toneladas metricas, de patudo en lances realizadas pOl'ı buques cerqueros con observador a bordo. Proporci6n de descartes =(descartes/capturas totales) x 100.ı
Year
Ano
Set type
Tipo de lance
Total catch per set
Captura total pOl' lance
Discards per set
Descartes pOl' lance
Discard ratio
Proporci6n de descartes
Estimated total discards
Descartes totales estimados
1993 Dolphin - Delfin Unassociated-No asociado Floating object-Objeto flotante
>0.0 0.5 3.7
0.00 >0.00
0.31
0.0 0.8 8.4
0 19
566
1994 Dolphin - Delfin Unassociated-No asociado Floating object- Objeto flotante
>0.0 0.2
10.1
0.00 0.02 0.88
13.3 7.9 8.7
1 53
2,250
1995 Dolphin - Delfin Unassociated - No asociado Floating object-Objeto flotante
0.0 0.6
10.7
0.00 >0.00
0.98
0.0 0.7 9.2
0 14
3,247
1996 Dolphin- Delfin Unassociated-No asociado Floating object- Objeto flotante
>0.0 0.7
13.8
0.00 0.01 1.41
0.0 1.2
10.2
0 26
5,760
1997 Dolphin- Delfin Unassociated - No asociado Floating object-Objeto flotante
0.0 0.3
10.5
0.00 >0.00
1.00
0.0 0.8 9.5
0 8
5,620
1998 Dolphin - Delfin Unassociated - No asociado Floating object-Objeto flotante
>0.0 0.3 7.6
0.00 >0.00
0.53
0.0 1.6 7.0
0 14
2,839
1999 Dolphin- Delfin Unassociated - N0 asociado Floating object-Objeto flotante
>0.0 0.2
12.4
0.00 >0.00 1.04
0.0 0.8 8.4
0 8
5,158
Average Promedio
Dolphin- Delfin Unassociated-No asociado Floating object- Objeto flotante
>0.0 0.4
10.5
0.00 0.01 0.94
1.2 1.4 8.9
>0 20
3,634

TABLE 15a. Components of the food web in the tropical eastern Pacific Ocean in order of their respective trophic levels. The common names listed do not necessarily include all the species in the corresponding model group.
Model Group Trophic Taxa level
Large marlins 5.5 Thothed whales 5.4
Small marlins 5.4ı Small sharks 5.4ı
Large bigeye 5.3 Spotted dolphin 5.2 Large sharks 5.1
Large sailfish 5.1 Large swordfish 5.1 Large wahoo 5.1 Pursuit birds 4.9 Mesopelagic dolphins 4.8
Large yellowfin 4.8 Large mahimahi 4.8 Small sailfish 4.8 Small mahimahi 4.8 Small yellowfin 4.7 Small bigeye 4.7 Small wahoo 4.7 Skipjack 4.7 Small swordfish 4.6 Cephalopods 4.6
Bluefin 4.5 Miscellaneous piscivores 4.5
Makaira indica, M. mazara, Tetrapturus audax Tursiops, Grampus, Globicephala, Peponocephala, Feresa, Pseudorca, Orcinus, Steno, Zyphius, Mesoplodon, Kogia, Physeter
Makaira indica, M. mazara, Tetrapturus audax Sphyrna spp., Alopias spp., Isurus oxyrinchus, Carcharhinus spp. (4 species), Prionace glauca, Nasolamia oelox Thunnus obesus Stenella attenuata Sphyrna spp., Alopias spp., Isurus oxyrinchus, Carcharhinus spp. (4 species), Prionace glauca, Nasolamia oelox Istiophorus platypterus Xiphias gladius Acanthocybium solandri Fregatidae, Sulidae, Laridae, Proeellariidae, Stereorariidae Stenella longirostris, Stenella eoeruleoalba, Delphinus delphis, Lagenodelphis hosei
Thunnus albacares Coryphaena hippurus, C. equiselis Istiophorus platypterus Coryphaena hippurus, C. equiselis Thunnus albacares Thunnus obesus Acanthocybium solandri Katsuwonus pelamis Xiphias gladius Primarily: Argonautidae, Octopoteuthidae, Thysanoteuthidae, Ommastrephidae, Enoploteuthidae Thunnus orientalis Euthynnus lineatus, various Carangidae, Gempylidae
.......ı I'-:> o
Common names (size range)
Black marlin, blue marlin, striped marlin (2150 em)ı Dolphins: bottlenose, Risso's, rough-toothed.ı Whales: pilot, pygmy killer, false killer, killer,ı goose-beaked, beaked, pygmy sperm, spermı Black marlin, blue marlin, striped marlin «150 em)ı Hammerhead, thresher, mako, blacktip, silky, oceanicı whitetip, bull, blue, whitenose (<150 em)ı Bigeye tuna (280 em)ı Spotted dolphin (3 stocks)ı Hammerhead, thresher, mako, blacktip, silky, oceanicı whitetip, bull, blue, whitenose (~150 em)ı Sailfish (~150 em) ~ Swordfish (~150 em) l.lı oWahoo (~90 em)ı Frigatebirds, boobies, terns, shearwaters, petrels, jaegers ~ .Spinner dolphin (2 stocks), Striped dolphin, m
mCommon dolphin (3 stocks), Fraser's dolphin .-o Yellowfin tuna (~90 em) zı Dolphin (mahimahi), Pompano dolphin (mahimahi) (~90 em)ı Sailfish «150 em)ı Dolphin (mahimahi), Pompano dolphin (mahimahi) «90 em)ı Yellowfin tuna «90 em)ı Bigeye tuna «80 em)ı Wahoo «90 em)ı Skipjack tunaı Swordfish «150 em)ı Pelagic octopods, argonauts, squidsı
Pacific bluefin tunaı Black skipjack, green jack, pilotfish, jack mackerel,ı rainbow runner, greater ambeIjack, snake mackerelı

TABLE 15a. (continued).
TrophicModel Group level
Baleen whales 4.1 Auxis 4.1 Grazing birds 3.9 Rays 3.9 Sea turtles 3.8 Flyingfishes 3.6
Miscellaneous 3.6 mesopelagic fishes
Crabs 3.6 Miscellaneous 3.3
epipelagic fishes Secondary consumers 3.0
Primary consumers 2.0
Producers 1.0
Taxa
Balaenoptera musculus, B. edeni Auxis thazard, A. rochei Oceanitidae, Phalaropodidae Manta birostris Lepidochelys olivacea, Chelonia mydas, Caretta caretta Primarily: Exocoetus spp., Hirundichthys spp., Prognichthys spp., Oxyporhamphus micropterus Primarily: Phosichthyidae, Myetophidae
Pleuroncodes planipes, Portunus xantusii, Euphylax robustus Primarily: Clupeidae, Nomeidae, Balistidae, Ostraciidae, Tetraodontidae, Diodontidae Copepods (carnivorous), miscellaneous micro/meso zooplankton, Chaetognaths, Pteropods, Euphausiids, larval fishes Copepods (herbivorous), flagellates, infusorians, ciliates, nauplii and copepodids, heterotrophic dinoflagellates, heterotrophic nanoflagellates, larval euphausiids Phytoplankton, bacteria
Common names (size rang!!)
Blue, Bryde's whale Frigate and bullet tuna Storm petrels, phalaropes Manta ray Olive ridley, green sea, loggerhead Flyingfishes
Bristlemouths, lightfishes
Red crabs, pelagic crabs Sardines, herrings, driftfishes, triggerfishes, filefishes, spiny boxfish, oceanic puffer, porcupine fish Carnivorous zooplankton I
ggHerbivorous zooplankton
C3 ~
>-' <.0 <.0 <.0
>-' t-:l >-'
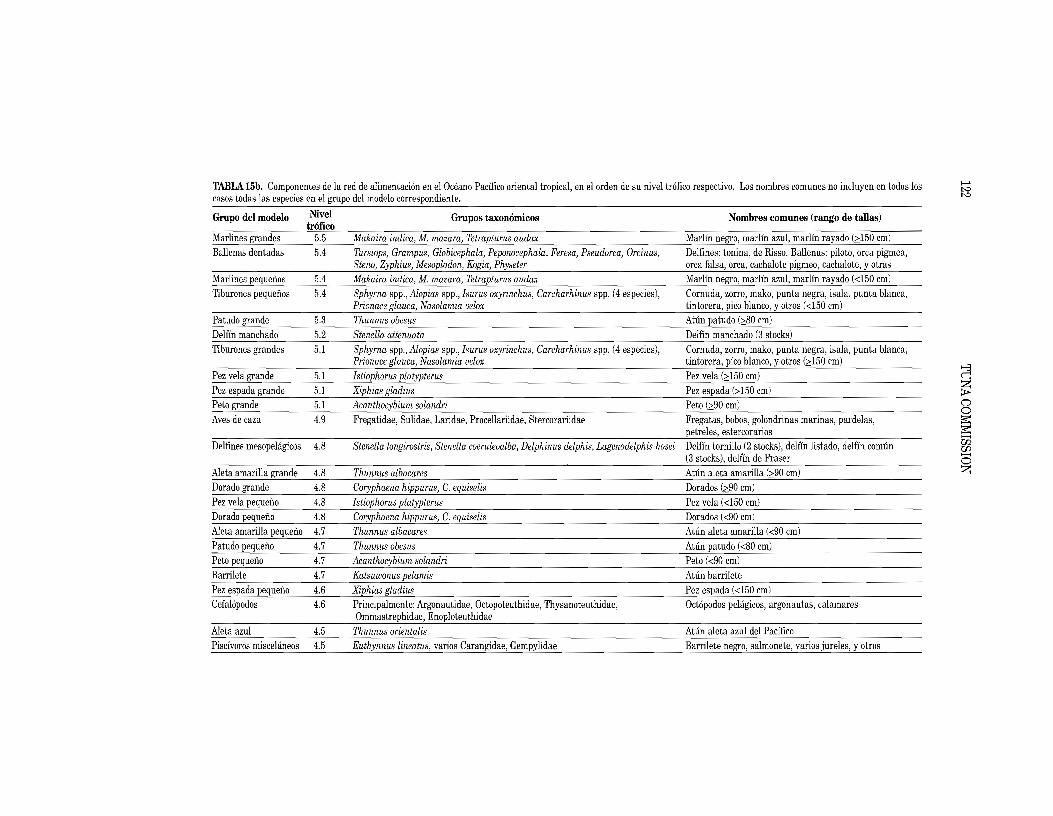
>-'TABLA 15h. Componentes de la red de a1imentacion en el Oceano Pacifico oriental tropical, en el orden de su nivel tr6fieo respectivo. Los nombres eamunes no incluyen en todos losı ~
~ casas tadas las espeeies en el grupo del madelo earrespondiente. NivelGrupo del modelo Grupos taxonomicos� Nomhres comunes (rango de tallas)
trofico Marlines grandes 5.5 Makaira indica, M. mazara, Tetrapturus audax Marlin negro, marlin azul, marlin rayado (;>:150 em) Ballenas dentadas 5.4 Tursiops, Grampus, Globicephala, Peponocephala, Feresa, Pseudorca, Orcinus, Delfines: tonina, de Risso. Ballenas: pilato, orca pigmea,
Steno, Zyphius, Mesoplodon, Kogia, Physetel' orca falsa, orca, eaehalote pigmeo, eaehalote, y otras Marlines pequenas 5.4 Makaira indica, M. mazara, Tetrapturus audax Marlin negro, marlin azul, marlin rayado «150 em) Tiburones pequenos 5.4 Sphyrna spp., Alopius spp., Isurus oxyrinchus, Careharhinus spp. (4 especies), Cornuda, zarro, maka, punta negra, isala, punta blanca,
Prionace glauca, Nasolamia uelax tintorera, pica blanco, y otras «150 em) Patudo grande 5.3 Thunnus ubesus At(m patudo (;>:80 em) Delfin manehado 5.2 Stenella attenuata Delfin manehado (3 stocks) Tiburones grandes 5.1 Sphyrna spp., Alopias spp., Isurus oXyl'inchus, Carcharhinus spp. (4 especies), Cornuda, zorro, mako, punta negra, isala, punta blanca,
Prionace glauca, Nasalamia velox tintorera, pica blanco, y otros (;:::150 em)
Pez vela grande 5.1 Istiophorus platypterus Pez vela (;:::150 em) Pez espada grande 5.1 Xiphias gladius Pez espada (;:::150 em) ~
Peto grande 5.1 Acanthocybium solandri Peto (;:::90 em) l.l o
Aves de eaza 4.9 Fregatidae, Sulidae, Laridae, Proeellariidae, Stercorariidae Fregatas, bobos, golondrinas marinas, pardelas, petreles, estereorarios ~
Delfines mesapelagieos 4.8 Stenella longirostris, Stenella coeruleoalba, Delphinus delphis, Lagenodelphis hosei Delfin tornillo (2 stocks), delfin listado, delffn eomun ww ......
(3 stocks), delfln de Fraser o Aleta amarilla grande 4.8 Thunnlls albacares Ahin aleta amarilla (;:::90 em) Z Dorado grande 4.8 Coryphaena hippurus, C. eqlliselis Dorados (;:::90 em)ˇ Pez vela pequeno 4.8 Istiophorus platypterus Pez vela «150 em)ˇ Dorado pequeno 4.8 Coryphaena hippurus, C. equiselis Dorados «90 em)ˇ Aleta amarilla pequeno 4.7 Thunnus albacores Attin aleta amarilla «90 em)ˇ Patuda pequeno 4.7 Thunnlls obesus Attin patudo «80 em)ˇ Peto pequeno 4.7 Acanthocybium solandri Peto «90 em)ˇ Barrilete 4.7 Katsuwonus pclamis Atun barrileteˇ Pez espada pequeno 4.6 Xiphias gladius Pez espada (<150 em)ˇ Cefal6padas 4.6 Prineipalmente: Argonautidae, Octopoteuthidae, Thysanoteuthidae, Oct6podos pelagieos, argonautas, ealamaresˇ
Ommastrephidae, Enoploteuthidae Aleta azul 4.5 Thunnus orientalis Attin aleta azul del Pacifico Piscivoros miseelaneos 4.5 Euthynnus lineatus, varios Carangidae, Gempylidae Barrilete negro, salmonete, varios jureles, y otros

TABLA 15b. (continuaci6n)
NivelGrupo del modelo trofico
Ballenas barbadas 4.1 Auxis 4.1 Aves forrajeras 3.9 Rayas 3.9 Tortugas marinas 3.8 Peces voladores 3.6
Peces mesopelagicos 3.6 miscelaneos
Cangrejos 3.6 Peces epipelagicos 3.3
miscelaneos Consumidores 3.0
secundarios Consumidores primarios 2.0
Productores 1.0
Grupos taxonomicos
Balaenoptera musculus, B. edeni Auxis thazard, A. rochei Oceanitidae, Phalaropodidae Manta birostris Lepidochelys olivacea, Chelonia mydas, Caretta caretta Principalmente: Exocoetus spp., Hirundichthys spp., Prognichthys spp., Oxyporhamphus micropterus Principalmente: Phosichthyidae, Myetophidae
Pleuroncodes planipes, Portunus xantusii, Euphylax robustus Principalmente: Clupeidae, Nomeidae, Balistidae, Ostraciidae, Tetraodontidae, Diodontidae Copepodos (carnivorosl, micro/meso zooplaneton misc., caetognatos, pter6podos, eufausidos, peces larvales Copepodos (herbivorosl, flagelados, infusorianos, ciliatos, nauplios y copep6didos, dinoflagelados heterotr6ficos, nanoflagelados heterotr6ficos, eufausidos larvales Fitoplancton, baeterias
Nombres comunes (rango de tallasl
Azul, de Brydeı Melvası Painos, falaroposı Mantarrayaı Golfina, verde, caguamaı Peces voladoresı
Variosı
Cangrejos rojos, cangrejos pelagicosı Sardinas, arenques, peces ballesta, y otros ~
Zooplancton carnivoro ~
~ Zooplaneton herbivoro "t:j o ~
>-' <D <D <D
>-' tv 00

124 TUNA COMMISSION
TABLE 16. Incidental mortalities of dolphins in 1999, estimates of population abundance pooled for 1986-1990 (from Report of the International Whaling Commission, 43: 477-493), and estimates of relative mOltality (with approximate 95-percent confidence intervals), by stock. All the data for 1999 are preliminary. TABLA 16. Mortalidades incidentales de delfines en 1999, estimaciones de abundancia de poblaciones agrupadas para 1986-1990 (del Informe de la Comisi6n Ballenera Internacional, 43: 477-493), y estimaciones de abundancia relativa (con intervalos de confianza de 95% aproximados), por stock. Todos los datos de 1999 son preliminares.
Incidental Population Relative mortality mortality abundance (percentage)
Stock Mortalidad Abundancia de Mortalidad relativa incidental Ia pobIaci6n (porcentaje)
Offshore spotted- Manchado de altamar Northeastern- Nororiental 358 730,900 0.05 (0.037, 0.061) Western-southern-Occidental-surefio 253 1,298,400 0.02 (0.015, 0.027)
Spinner dolphin- Tornillo Eastern-Oriental 363 631,800 0.06 10.036, 0.087) Whitebelly- Panza blanca 192 1,019,300 0.02 (0.012, 0.025)
Common dolphin-Comun Northern- Nortefio 85 476,300 0.02 (0.010, 0.038) Central 34 406,100 0.01 (0.004, 0.016) Southern- Surefio 1 2,210,900 <0.01 «0.001,<0.001)
Other dolphins-Otros delfines1 62 2,802,300 <0.01 (0.002, 0.003)
Total 1,348 9,576,000 0.01 (0.012, 0.016)
1 "Other dolphins" includes the following species and stocks, whose observed mortalities were as follows: striped dolphins (Stenella coeruleoalba), 5; bottlenose dolphins (Thrsiops truncatus), 9; Central American spinner dolphins (Stenella longirostris centroamericana), 13; Risso's dolphin (Grampus griseus), 3; and unidentified dolphins, 32.
1 "Otros delfines" incluye las siguientes especies y stocks, con las mortalidades observadas correspondientes: delfin lis-tado (Stenella coeruleoalba), 5; tonina (Tursiops truncatusl, 9; delfin tornillo centroamericano (Stenella longirostris centroamericana), 13; delfin de Risso (Grampus griseus), 3; y delfines no identificados, 32.

125 ANNUAL REPORT 1999
TABLE 17. Annual estimates of dolphin mortality, by species and stock. All the data for 1999 are preliminary. The esti-mates for 1979-1992 are based on a mortality-per-set ratio. The estimates for 1993-1994 are based on the sums of the IATTC species and stock tallies and the PNAAPD total dolphin mortalities, prorated to species and stock. The mortali-ties for 1995-1999 represent the sums of the observed species and stock tallies recorded by the IATTC and PNAAPD pro-grams. The standard errors for 1979-1994 are shown in Table 5. The sums of the estimated mortalities for the northeastern and western-southern stocks of offshore spotted dolphins do not necessarily equal those for the previous stocks of northern and southern offshore spotted dolphins because the estimates for the two stock groups are based on dif-ferent areal strata, and the mortalities per set and the total numbers of sets vary spatially. TABLA 17. Estimaciones anuales de la mortalidad de delfines, por especie y stock. Todos los datos para 1999 son pre-liminares. Las estimaciones para 1979-1992 se basan en una razon de mortalidad por lance. Las estimaciones para 1993-1994 se basan en las sumas de las mortalidades por especie y stock registradas por la CIAT y las mortalidades totales registradas por el PNAAPD, prorrateadas a especies y stocks. Las mortalidades para 1995-1999 son las sumas de las mor-talidades por especie y stock registradas por la CIAT y el PNAAPD. En la Tabla 35 se detallan los errores eslandar para 1979-1994. Las sumas de las mortalidades estimadas para los stocks nororiental y occidental-surefio del delfin manchado de altamar no equivalen necesariamente a las sumas de aquellas para los antiguos stocks de delfin manchado de altamar nortefio y sureiio porque las estimaciones para los dos grupos de stocks se basan en estratos espaciales diferentes, y las mortalidades por lance y el mimero total de lances varian espacialmente.
Offfshore spotted Spinner Common North· Western- Eastern White· Northern Central Southern Others Total eastern southern belly Manchado de altamar Tornillo Comun
Nor- Occiden· Oriental Panza Nortefio Central Surefio Otros Total oriental tal·surefio blanca
1979 4,828 6,254 1,460 1,312 4,161 2,342 94 880 21,331 1980 6,468 11,200 1,108 8,132 1,060 963 188 633 29,752 1981 8,096 12,512 2,261 6,412 2,629 372 348 367 32,997 1982 9,254 9,869 2,606 3,716 989 487 28 1,347 28,296 1983 2,430 4,587 745 4,337 845 191 0 353 13,488 1984 7,836 10,018 6,033 7,132 0 7,403 6 156 38,584 1985 25,975 8,089 8,853 6,979 0 6,839 304 1,777 58,816 1986 52,035 20,074 19,526 11,Q42 13,289 10,884 134 5,185 132,169 1987 35,366 19,298 10,358 6,026 8,216 9,659 6,759 3,200 98,882 1988 26,625 13,916 18,793 3,545 4,829 7,128 4,219 2,074 81,129 1989 28,898 28,530 15,245 8,302 1,066 12,711 576 3,123 98,451 1990 22,616 12,578 5,378 6,952 704 4,053 272 1,321 53,874 1991 9,005 4,821 5,879 2,974 161 3,182 115 990 27,127 1992 4,657 1,874 2,794 2,044 1,773 1,815 64 518 15,539 1993 1,139 757 821 412 81 230 0 161 3,601 1994 935 1,226 743 619 101 151 0 321 4,096 1995 952 859 654 445 9 192 0 163 3,274 1996 818 545 450 447 77 51 30 129 2,547 1997 721 1,044 391 498 9 114 58 170 3,005 1998 298 341 422 249 261 172 33 101 1,877 1999 358 253 363 192 85 34 1 62 1,348
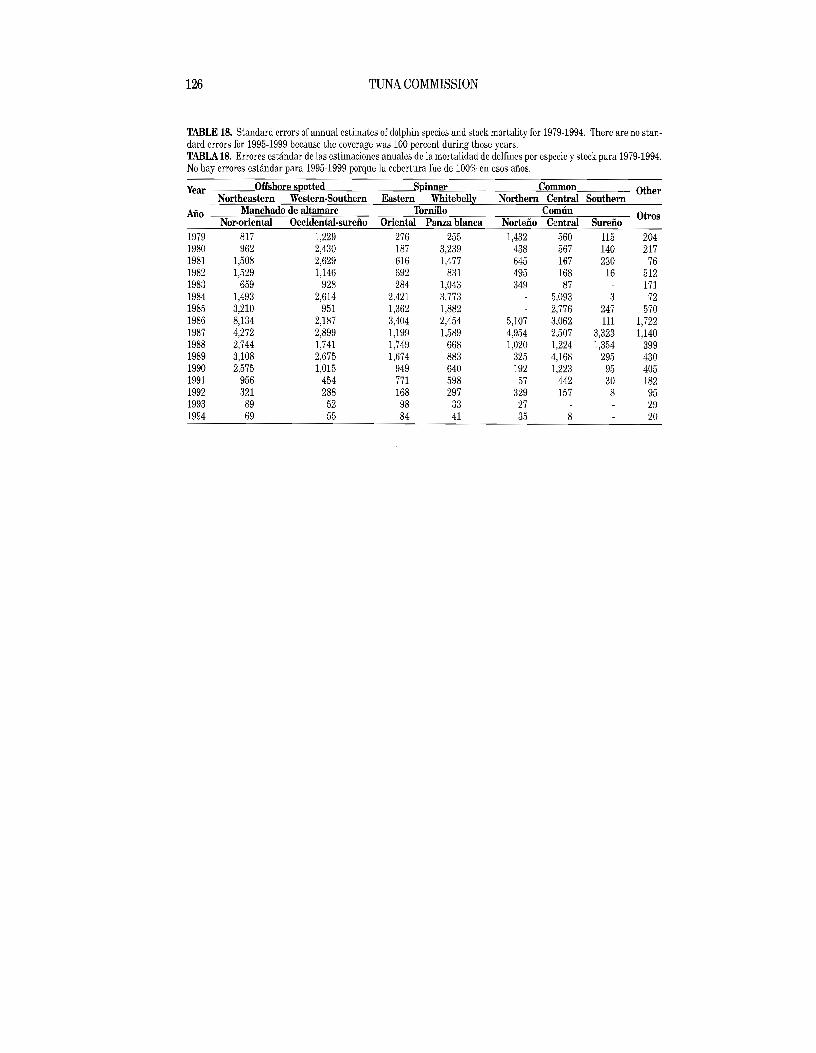
126 TUNA COMMISSION
TABLE 18. Standard errors of annual estimates of dolphin species and stock mortality for 1979-1994. There are no stan-dard errors for 1995-1999 because the coverage was 100 percent during those years.ı TABLA 18. Errores estandar de las estimaciones anuales de la mortalidad de delfines por especie y stock para 1979-1994.ı No hay errores estandar para 1995-1999 porque la cobertura fue de 100% en esos anos.
Offshore spotted Spinner CommonYear Other Northeastern Western-Southern Eastern Whitebelly Northern Central Southern
Manchado de altamare Tornillo ComunAno OtrosNor-oriental Occidental-sureiio Oriental Panza blanca Norteiio Central Sureiio 1979 817 1,229 276 255 1,432 560 115 204 1980 962 2,430 187 3,239 438 567 140 217 1981 1,508 2,629 616 1,477 645 167 230 76 1982 1,529 1,146 692 831 495 168 16 512 1983 659 928 284 1,043 349 87 171 1984 1,493 2,614 2,421 3,773 5,093 3 72 1985 3,210 951 1.362 1,882 2,776 247 570 1986 8,134 2,187 3,404 2,454 5,107 3,062 111 1,722 1987 4,272 2,899 1,199 1,589 4,954 2,507 3,323 1,140 1988 2,744 1,741 1,749 668 1,020 1,224 1,354 399 1989 3,108 2,675 1,674 883 325 4,168 295 430 1990 2,575 1,015 949 640 192 1,223 95 405 1991 956 454 771 598 57 442 30 182 1992 321 288 168 297 329 157 8 95 1993 89 52 98 33 27 29 1994 69 55 84 41 35 8 20

127 ANNUAL REPORT 1999
TABLE 19. Percentages of sets with no dDlphin mortalities, with major gear malfunctions, with net collapses, with net canopies, average times of backdown (in minutes), and average number oflive dolphins left in the net at the end of back-down. All data fDr 1999 are preliminary. TABLA 19. Porcentajes de lances sin mortalidad de delfines, con averias mayores, con colapso de la red, con abultamiento de la red, duraci6n media del retroceso (en minutos), y numero medio de delfines en la red despues del retroceso. Todos los datos para 1999 son preliminares.
Average Average numberSets with zero Sets with major Sets with net Sets with net duration of oflive dolphins Year mortality malfunctions collapse canopy backdown left in net after (percent) (percent) (percent) (percent) (minutes) breakdown Lances con Lances con NUmero medioLances sin Lances con Duraci6n media colapso de la abultamiento de delfines en Ano talidad averias mayores del retroceso red de la red la red despues
(%) (%) (minutos)(%j (%) del retroceso 1986 38.1 9.5 29.0 22.2 15.3 6.0 1987 46.1 10.9 32.9 18.9 14.6 4.4 1988 45.1 11.6 31.6 22.7 14.3 5.5 1989 44.9 10.3 29.7 18.3 15.1 5.0 1990 54.2 9.8 30.1 16.7 14.3 2.4 1991 61.9 10.6 25.2 13.2 14.2 1.6 1992 73.4 89 22.0 7.3 13.0 1.3 1993 84.3 9.4 12.9 5.7 13.2 0.7 1994 83.4 8.2 10.9 6.5 15.1 0.3 1995 85.0 7.7 10.3 6.0 14.0 0.4 1996 87.6 7.1 7.3 4.9 13.6 0.2 1997 87.7 6.6 6.1 4.6 14.3 0.2 1998 90.3 6.3 4.9 3.7 13.2 0.2 1999 91.0 6.6 59 4.6 14.0 0.1

128 TUNA COMMISSION
TABLE 20. Dolphin mortality reduction workshops sponsored by the IATTC during 1999.ı TABLA 20. Talleres sobre la reducci6n de la mortalidad de delfines auspiciados por la CIAT en 1999.ı
Date Fecha
Jan. 2 May 11 May 14 Nov. 15 Nov. 20 Dec. 13 Dec. 16 Total
Location� Sede�
Panama, Republica de Panama Pedernales, Espana Manta, Ecuador Manta, Ecuador Cumana, Venezuela Mazatlan, Mexico La Jolla, USA
Number of attendees� Numero de asistentes�
6 49 30 75 6
28 12
206

129 INFORME ANUAL 1999
INFORME ANUAL DE LA� COMISION INTERAMERICANA DEL ATUN TROPICAL, 1999�
AVISO ESPECIAL�
El Dr. James Joseph, Director de la CIAT desde 1969, se jubil6 el 30 de junio de 1999, al cabo de mas de 40 aiios con la CIAT.
Naci6 en Los Angeles en 1930. Comenz6 sus estudios universitarios en Humboldt State College (ahora Humboldt State University), donde obtuvo la licenciatura en 1956 y la maestria en 1958, interrumpido por su servicio militar entre 1952 y 1954. Fue contratado por la CIAT, y pas6 dos aiios en Manta (Ecuador), estudiando peces de carnada y marcando atunes. A contin-uaci6n fue trasladado a Terminal Island (California), y luego a La Jolla. Gracias a su evidente capacidad fue nombrado Cientifico Principal de la CIAT en 1964 por el Dr. J. L. Kask, entonces Director de la CIAT. En 1967 consigui6 su doctorado de la Universidad de Washington, donde estudi6 dinamica de poblaciones bajo el Dr. Gerald J. Paulik. En 1969, cuando el Dr. Kask se jubil6, el Dr. Joseph fue nombrado Director.
Durante las tres decadas en las que el Dr. Joseph dirigi6 la CIAT ocurrieron muchos cam-bios en las pesquerias de atun del mundo, y especialmente en el Oceano Pacifico oriental (OPO). Se construyeron buques mas grandes y eficaces, y muchos enarbolaban el pabe1l6n de paises que previamente no fueron participantes importantes en la pesqueria. AI principio del periodo no se reconocia generalmente el concepto de Zonas Econ6micas Exclusivas de 200 millas, pero ahora casi todas las naciones defienden activamente su jurisdicci6n. Las capturas de atun aumentaron mucho durante este periodo, y muchas poblaciones de atunes parecen ahora estar plenamente explotadas: incluso se considera que al menos dos, los aletas azules del Atlantico y del sur, estan sobreexplotadas. Como consecuencia, muchas pesquerias atuneras estan ahora reglamentadas.
Ademas, surgi6 una gran preocupaci6n en torno a los efectos de la pesca sobre especies cap-turadas incidentalmente, particularmente mamiferos marinos. En muchos afios del periodo entre principios de los afios 1960 y principios de los 1980 la mortalidad anual de delfines en el OPO oca-sionada por la pesca con red de cerco se cifr6 en mas de 100.000 animales. En 1972 se promulg6 la Ley de Protecci6n de Mamiferos Marinos de EE.UU., que afect6 profundamente las pesquerias de atunes en el OPO, y cuyas disposiciones fueron reforzadas en el transcurso de los afios. Bajo la direcci6n del Dr. Joseph la CIAT estableci6 su ProgramaAtun-Delfin, asignando observadores a buques atuneros de cerco para reunir datos sobre las actividades de pesca y la mortalidad de delfines, patrocinando seminarios para difundir y fomentar el uso de tecnicas de protecci6n de delfines, y realizando investigaciones basicas de la dinamica de poblaciones de los delfines. En 1986, el primer aiio en el que observadores de la CIAT acompafiaron buques de todas las naciones participantes en la pesqueria, la mortalidad anual fue mas de 133.000 delfines. Enjunio de 1992 las naciones participantes en la pesqueria negociaron el Acuerdo para la Conservaci6n de los Delfines (el Acuerdo de La Jolla), un instrumento internacional voluntario ideado para reducir esta mortalidad, y para 1998 habia disminuido a menos de 2.000 animales, cantidad biol6gica-mente insignificante. En febrero de 1999 entr6 en vigor el Acuerdo sobre el Programa Internacional para la Conservaci6n de los Delfines, firmado en 1998, que formaliza, extiende, y amplia el alcance del Acuerdo de La Jolla de 1992. Durante todo el periodo en el cualla mortal-idad de delfines disminuia precipitadamente las capturas de atun en el OPO aumentaron, demostrando que no es necesario limitar la pesca para proteger los delfines. Elliderazgo del Dr. Joseph a 10 largo de los muchos aiios de este proceso complejo y dificil es en gran parte respons-able de los notables resultados logrados.

130 COMISION DEL ATUN
Por supuesto que no se dej6 de prestar atenci6n a los atunes y peces picudos durante ese periodo. Por ejemplo, el personal de la CIAT ha estado en la vanguardia de muchos avances en los metodos para la evaluaci6n de los stocks de atunes, y se sabe probablemente mas sobre la dinamica de poblaciones del atun aleta amarilla del OPO que sobre la de ninglin otro stock de atunes. Ademas, se han logrado avances muy importantes en los conocimientos de la reproduc-ci6n y ciclo vital temprano gracias al trabajo realizado en el mar y en ellaboratorio de la CIAT en Achotines (Panama), establecido bajo la direcci6n del Dr. Joseph. EI personal de la CIAT, en coop-eraci6n con otras organizaciones, esta ahora desarrollando un metodo de modelado para evaluar las implicaciones eco16gicas relativas de distintas estrategias de pesca en el OPO.
EI Dr. Joseph es catedratico afiliado en la Universidad de Washington y en la Universidad Nacional Aut6noma de Mexico. Ha participado en numerosos comites consultivos, grupos de tra-bajo, yjuntas asesoras en Estados Unidos y otros paises, para, entre otros, la Academia Nacional de Ciencias, el Departamento de Comercio, y el Departamento del Interior de EE.UU. Ha pre-sentado ponencias sobre ternas relacionados con la investigaci6n marina y la conservaci6n de recursos en todo el mundo. Adicionalmente, ha servido de asesor tecnico para muchas organiza-ciones internacionales, ministerios de gobierno, y jefes de estado en asuntos relacionados con la ciencia marina, especialmente el desarrollo, administraci6n, y conservaci6n de recursos marinos. Ha publicado numerosos trabajos y articulos en revistas academicas y comerciales, y es coautor de tres libros.
Sus muchos premios y galardones incluyen el Premio de Alumno Distinguido de la Humboldt State University; Premio por Contribuciones Sobresalientes a la Ciencia Marina, Sociedad Hist6rica Portuguesa, San Diego; Graduado Sobresaliente en Pesquerias, Humboldt State University; Premio Nautilus, Sociedad Tecnol6gica Marina; Premio Dave Wallace, Editorial Nautilus, Inc.; Doctor honoris causa, Universidad de Bretaiia, Brest (Francia); Premio Roger Revelle, Fundaci6n para los Oceanos de San Diego; y el Premio AI Merito Pesquero, Ministerio de Comercio del Ecuador. Ademas, en 1994 la CIAT fue seleccionada por la American Fisheries Society para recibir el Premio CarlL. Sullivan de Conservaci6n Pesquera.
El Dr. Robin Allen sucedi6 al Dr. Joseph como Director de la CIAT ell0 de julio de 1999. EI Dr. Allen obtuvo su licenciatura en matematicas en la Universidad Victoria en Wellington (Nueva Zelanda) en 1965 y su doctorado en zoologia en la Universidad de Columbia Britanica (Canada) en 1972. Desde 1965 hasta 1976 trabaj6 para el Ministerio de Agricultura y Pesca de Nueva Zelanda; entre 1976 y 1981 en la CIAT, inicialmente en el uso de datos de tasas de captura para estimar la abundancia de atunes, y posteriormente como jefe del Programa Atun-Delfin; entre 1981 y 1995 en el Ministerio de Agricultura y Pesca de Nueva Zelanda, finalmente como Director de Investigaci6n Pesquera y Director Sectorial de Politica Pesquera; y de 1995 a 1999 como Subdirector de la CIAT.

131 INFORME ANUAL 1999
INTRODUCCION
La Comision Interamericana delAtUn Tropical (CIAT) funciona bajo la autoridad ydireccion de una convencion suscrita originalmente por Costa Rica ylos Estados Unidos deAmerica. La convencion, vigente desde 1950, esta abierta a la afiliacion de cualquier pais cuyos ciudadanos pesquen atunes tropicales y especies afines en el Oceano Pacifico oriental (OPO). Bajo esta estipulacion, la Republica de Panama se afilio en 1953, Ecuador en 1961, Mexico en 1964, Canada en 1968, Japan en 1970, Francia yNicaragua en 1973, Vanuatu en 1990, Venezuela en 1992, y El Salvador en 1997. Canada se retiro de la CIAT en 1984.
La CIAT cumple su mandato mediante dos programas, el Programa Atun-Picudo y el Programa Atun-Delfin.
Las responsabilidades principales del Programa Atun-Picudo detalladas en la Convencion de la CIAT son (1) estudiar la biologfa de los atunes y especies afines en el OPO para evaluar los efectos de la pesca y los factores naturales sobre su abundancia, y (2) recomendar las medidas de conservacion apropi-adas para que los stocks de peces puedan mantenerse a niveles que permitan las capturas maximas sostenibles. Posteriormente fue asignado la responsabilidad de reunir informacion sobre el cumplimiento de las resoluciones de la Comision.
En 1976 se ampliaron las responsabilidades de la CIAT para abarcar los problemas ocasionados por la mortalidad incidental en las redes de cerco de delfines asociados con atunes aleta amarilla en el OPO. La Comision acordo trabajar para mantener la produccion atunera a un alto nivel y al mismo tiempo man-tener a los stocks de delfines a, 0 por encima de, niveles que garantizaran su supervivencia a perpetuidad, haciendo todos los esfuerzos razonablemente posibles por e\~tar la muerte innecesaria 0 por descuido de delfines (Actas de la 33~ reunion de la CIAT; pagina 9). El resultado fue la creacion del Programa Atun-Delfin de la CIAT, cuyas responsabilidades principales son (1) dar seguimiento a la abundancia de los delfines ysu mortalidad incidental a la pesca con red de cerco en el OPO, (2) estudiar las causas de la mor-talidad de delfines en las faenas de pesca ypromover el uso de tecnicas yaparejos de pesca que minimicen dicha mortalidad, (3) estudiar los efectos de las distintas modalidades de pesca sobre las poblaciones de peces y otros animales del ecosistema pelagico, y (4) proporcionar la secretaria para el Programa Intemacional para la Conservacion de los Delfines, descrito a continuacion.
El17 de junio de 1992 se adoptO el Acuerdo para la Conservacion de Delfines ("el Acuerdo de La Jolla de 1992"), mediante el cual se creo el Programa Intemacional para la Conservacion de Delfines (PICD). El objetivo principal delAcuerdo fue reducir la mortalidad de delfines en la pesqueria cerquera sin peljudicar los recursos atuneros de la region ylas pesquerias que dependen de los mismos. E121 de mayo de 1998 se firmo elAcuerdo sobre el Programa Intemacional para la Conservacion de los Delfines (APICD), que amplia yformaliza las disposiciones del Acuerdo de La Jolla, yel15 de febrero de 1999 entro en vigor. Las Partes de este Acuerdo se comprometieron a "asegurar la sostenibilidad de las poblaciones de atun en el Oceano Pacifico Oriental ya reducir progresivamente la mortalidad incidental de delfines en la pesqueria de atun del Oceano Pacifico Oriental aniveles cercanos a cero; a evitar, reducir yminimizar la captura inci-dental y los descartes de atunes juveniles y la captura incidental de las especies no objetivo, considerando la interrelacian entre especies en el ecosistema."
Para llevar a cabo estas misiones, la CIAT realiza una amplia investigacion en el mar, en los puertos donde se desembarca el atUn, yen sus laboratorios. Estos estudios son llevados a cabo por un equipo inter-nacional permanente de investigadores ytecnicos (Anexo 1), seleccionados por el Director, quien responde directamente ante la Comision.
El programa cientffico se encuentra en su 4~ ano. Los resultados de las investigaciones del per-sonal de la CIAT son publicados en la serie de Boletines de la CIAT en ingles yespanol, los dos idiomas ofi-ciales, en su serie de Informes Especiales e Informes de Datos, y en libros, revistas cientfficas extemas, y revistas comerciales. En un Informe AnUal' asimismo bilingiie, se resumen las actividades realizadas en el ano en cuestion.

132 COMISION DEL ATUN
REUNIONES
Se pueden obtener las actas 0 informes de estas reuniones de la CIAT 0 de la pagina de internet de la Comisi6n (www.iattc.org).
REUNIONES DE LA CIAT
63!! reunion de la CIAT
La 63~ reuni6n de la CIAT tuvo lugar del 8 al10 de junio de 1999 en Guayaquil (Ecuador). Presidi6 el Ab. Gustavo Gutierrez Vera, de Ecuador, y asistieron representantes de todos los gob-iernos miembros de la CIAT, mas observadores de Belice, Chile, Colombia, Espana, Guatemala, Peru, Seychelles, Taiwan, la Uni6n Europea, la Comisi6n Permanente del Pacifico Sur, Forum Fisheries Agency, la Comisi6n Internacional para la Conservaci6n del Atun Atlantico, la Organizaci6n Latinoamericana de Desarrollo Pesquero, el Programa Regional de Apoyo al Desarrollo de la Pesca en el Istmo Centroamericano, Center for Marine Conservation, la Fundaci6n para la Defensa de la Naturaleza, Humane Society International, Humane Society de Estados Unidos, Whale and Dolphin Conservation Society, y World Wildlife Fund.
Se tomaron las acciones siguientes: (1) Se estableci6 un grupo de trabajo permanente sobre el cumplimiento de las medidas de
conservaci6n y ordenaci6n adoptadas por la CIAT. (2) Se adopt6 una cuota de captura para el atun aleta amarilla de 225.000 toneladas, con
tres incrementos de 15.000 toneladas cada uno, a aiiadir a discreci6n del Director. (3) Se adopt6 una resoluci6n reconociendo la reducci6n de 20% en el numero de buques palan-
greros atuneros a gran escala por parte de Jap6n e instando a otras naciones a hacer 10 mismo. (4) Se adopt6 una resoluci6n reconociendo el servicio dedicado y los muchos logros del Dr.
James Joseph, Director de la CIAT desde 1969 hasta 1999. (5) Se adopt6 un protocolo enmendando la Convenci6n de la CIAT para permitir la adhesi6n
de la Union Europea, y 10 firmaron representantes de Ecuador, Estados Unidos, Francia, y Vanuatu. El protocolo necesita ser ratificado por todos los miembros de la CIAT antes de poder entrar en vigor.
(6) La reuni6n adopt6 una resolucion sobre los dispositivos agregadores de peces y el atun patudo. Dos de los paises miembros no estuvieron presentes en la reuni6n en ese momento, y pos-teriormente se expresaron inconformes con la resoluci6n. Se retom6 el tema en la 64~ reunion de la CIAT, celebrada en julio de 1999.
(7) Se estableci6 un grupo de trabajo sobre el financiamiento.
64!! reunion de la CIAT
La 64~ reuni6n de la CIAT tuvo lugar en La Jolla, California (EE.UU.) e121 y 22 de julio de 1999, bajo la presidencia del Sr. William Gibbons-Fly, de Estados Unidos. Asistieron represen-tantes de los gobiernos miembros de Costa Rica, Ecuador, Estados Unidos, Francia, Japon, Mexico, Nicaragua, Panama, Vanuatu, y Venezuela, asi como observadores de Colombia, Espana, la Uni6n Europea, Center for Marine Conservation, Humane Society de Estados Unidos, Whale and Dolphin Conservation Society, y World Wildlife Fund.

133 INFORME ANUAL 1999
Se tomaron las acciones siguientes: (1) Se adopto una resolucion estableciendo una cuota de captura de 40.000 toneladas para
el atun patudo. Se instrumentaria mediante una prohibicion de la pesca sobre objetos flotantes de todo tipo una vez alcanzado ellimite.
(2) Se adopto una resolucion sobre los dispositivos agregadores de peces. Seria instru-mentada mediante la prohibicion de (1) el transbordo de atun por buques cerqueros pescando atun en el OPO, a menos que dicho transbordo tenga lugar en puerto, y (2) el uso de buques aux-iliares operando en apoyo de buques que pescan sobre dichos dispositivos en el OPO.
65!! reunion de la CIAT
La 65" reunion de la CIAT tuvo lugar en La Jolla, California (EE.UU.) del 4 all0 de octubre de 1999. El Sr. Svein Fougner, de Estados Unidos, fue nombrado Presidente de la Comision y pre-sidio la reunion. Asistieron representantes de todos los gobiernos miembros, mas observadores de Colombia, Espana, Guatemala, Peru, Taiwan, la Union Europea, la Comision Permanente de Pacifico Sur, la Comision Ballenera Internacional, la Organizacion Latinoamericana de Desarrollo Pesquero (OLDEPESCA), la Organizacion del Sector Pesquero y Acuicola del Istmo Centroamericano (OSPESCA), Center for Marine Conservation, Humane Society de Estados Unidos, Whale and Dolphin Conservation Society, y World Wildlife Fund.
Se tomaron las acciones siguientes: (l) Se adopto una resolucion para restringir la captura de aleta amarilla en 1999 una vez
la captura de dicha especie en el Area de Reglamentacion de la Comision para el Aleta Amarilla (ARCM) alcanzase 240.000 toneladas. Se prohibiria la pesca de atun con red de cerco y carnada en dos zonas, una frente a Mexico y la otra frente al norte de America del Sur. Se restringiria tambien la pesca de aleta amarilla con red de cereD y carnada en el ARCM a partir del 2 de diciembre 0 cuando la captura de dicha especie en el ARCM alcanzase 265.000 toneladas, seglin cual de los dos ocurriese primero.
(2) Se adopto una resolucion sobre la conservacion de patudo. Establecio un limite de 40.000 toneladas parar la captura de patudo en el OPO en 2000, instrumentado mediante una prohibicion de la pesca sobre objetos flotantes si se alcanzara ellimite antes de la reunion de la CIAT en junio de 2000.
(3) Se aprob6 un proyecto de resolucion redactado por el Grupo de Trabajo sobre Financiamiento.
(4) Se adopto una resolucion sobre la captura incidental.
REumONESDEGRUPOSDETRABAJODELAC~T
Segunda reunion del Grupo de Trabajo Permanente sobre la Capacidad de la Flota
La segunda reunion del Grupo de Trabajo Permanente sobre la Capacidad de la Flota tuvo lugar en La Jolla, California (EE.UU.) el 8 y 9 de octubre de 1999, bajo la presidencia del EmbajadorJean-Fran~ois Pulvenis, de Venezuela. Se circulo y debatio una propuesta para la lim-itacion de la capacidad de la flota, perc no fue aceptada. Se acordo que el grupo volveria a reunirse en San Jose de Costa Rica del 26 al 28 de enero de 2000.

134 COMISION DEL ATUN
Primera reunion del Grupo de Trabajo sobre Dispositivos Agregadores de Peces
Este grupo de trabajo, establecido mediante una resolucion adoptada en la 62a reunion de la CIAT en octubre de 1998, se reunio en Ensenada (Mexico) el 27 de enero de 1999, bajo la pres-idencia de Lic. Mara Murillo Correa, de Mexico. Asistieron representantes de Colombia, Costa Rica, Ecuador, El Salvador, Espana, Estados Unidos, Francia, Guatemala, Japon, Mexico, Nicaragua, Peru, Taiwan, la Union Europea, Vanuatu, Venezuela, Yla comunidad ambientalista. Se debatieron propuestas presentadas por Ecuador, Estados Unidos, Mexico, y la Union Europea YEspana, y se acordo que el personal de la CIAT analizaria las propuestas y prepararia un informe describiendo los resultados. Se consideraria el informe en la proxima reunion del grupo de trabajo, la que tendria lugar antes de la 63a reunion de la CIAT (7 al 9 de junio de 1999), para poder presentar sus recomendaciones a esa reunion.
Segunda reunion del Grupo de Trabajo sobre Dispositivos Agregadores de Peces
La segunda reunion del Grupo de Trabajo sobre Dispositivos Agregadores de Peces tuvo lugar en Guayaquil (Ecuador) el 7 de junio de 1999, bajo la presidencia de Lic. Mara Murillo Correa, de Mexico. El proposito de la reunion era considerar medidas posibles para regular el uso de dichos dispositivos en la pesca atunera en el OPO, de conformidad con la resolucion aprobada par la CIAT en su 62~ reunion en octubre de 1998.
Consultas informales sobre la revision de la convencion de la CIAT
E129 de enero de 1999 se sostuvieron en Ensenada (Mexico) consultas informales sobre la revision de la Convencion de la CIAT. Se intercambiaron opiniones sobre la enmienda de la Convencion mediante un protocolo para permitir la adhesion de organizaciones regionales de integracion economica y territorios aduaneros separados.
Grupo de Trabajo sobre Captura Incidental
E113 y 14 de marzo de 1999 se celebro en La Jolla, California (EE.UU.) una reunion del grupo de trabajo sobre tecnologia y tecnicas de pesca para reducir las capturas incidentales en la pesqueria atunera con red de cerco, uno de dos subgrupos del Grupo de Trabajo sobre Captura Incidental de la CIAT. El objetivo principal fue proporcionar a dicho grupo de trabajo una sintesis de opciones, ya existentes 0 por desarrollar, para reducir las capturas incidentales en la pesqueria.
Del 26 a128 de abril de 1999 tuvo lugar en La Jolla una reunion del subgrupo sobre estu-dios y modelado ecologicos, el segundo subgrupo del Grupo de Trabajo sobre Captura Incidental. El grupo analizo varios metodos para desarrollar un modelo del ecosistema para el Oceano Pacifico oriental tropical. El objetivo de este tipo de modelado es proporcionar una base ecologica para limitar 0 reducir la captura incidental. Utilizando la mejor informacion disponible, se for-mulan hipotesis sobre las relaciones depredador-presa de los miembros principales de la red tro-fica, y se exploran los efectos de distintas estrategias de pesca sobre la captura incidental y las especies objetivo.
El primer informe del Grupo de Trabajo sobre Captura Incidental fue distribuido a los asistentes a la 63~ reunion de la CIAT. En la seccion del presente informe titulada ESTUDIOS ECOLOGICOS se resume parte de un anexo de dicho informe que trata de estudios y modelado ecologicos.

135 INFORME ANUAL 1999
Primera reunion del Grupo de Trabajo sobre Financiamiento
La primera reuni6n del Grupo de Trabajo sobre Financiamiento tuvo lugar en La Jolla, California (EE.UU.) del 7 all0 de octubre de 1999, bajo la presidencia del Dr. William Hogarth, de Estados Unidos. Se consideraron varios borradores de una resoluci6n sobre el financiamiento de la CIAT, y se present6 uno a la plenaria. Se volveria a considerar el tema en la pr6xima reuni6n del grupo, prevista para el 9 y 10 de febrero de 2000.
REUNIONESINTERGUBERNAMENTALES
381! Reunion Intergubernamental
La 38§ Reuni6n Intergubernamental fue celebrada en Miami, Florida (EE.UD.) el15 y 16 de marzo de 1999. Presidi6 el Dr. William Hogarth, de Estados Unidos, y asistieron represen-tantes de Costa Rica, Ecuador, El Salvador, Espana, Estados Unidos, Guatemala, Jap6n, Mexico, Nicaragua, Panama, Taiwan, la Uni6n Europea, Venezuela, y la comunidad ambientalista. Se adopt6 una resoluci6n invitando a los estados y organizaciones regionales de integraci6n econ6mica elegibles que no firmaron el Acuerdo sobre el Programa Internacional para la Conservaci6n de los Delfines a hacerlo antes del 14 de mayo de 1999.
391! Reunion Intergubernamental y II! reunion de las Partes del Acuerdo sobre el Programa Internacional para la Conservacion de los Delfines
La 39§ Reuni6n Intergubernamental y la 1a Reuni6n de las Partes del Acuerdo sobre el Programa Internacional para la Conservaci6n de los Delfines (APICD) fueron inauguradas en Guayaquil (Ecuador) el11 de junio de 1999. Se decidi6 combinar las dos reuniones, y el Sr. Brian S. Hallman, de Estados Unidos, fue elegido Presidente. Debido a falta de tiempo, se avanz6 sola-mente hasta la discusi6n de las agendas de las reuniones, y se decidi6 continuarlas en La Jolla, California, el 22 de julio. Ala reuni6n reanudada asistieron representantes de Colombia, Costa Rica, Ecuador, Espana, Estados Unidos, Francia, Japan, Mexico, Nicaragua, Panama, la Uni6n Europea, Vanuatu, y Venezuela.
Se tomaron las acciones siguientes: (1) Se aprob6 el Sistema de Seguimiento y Verificaci6n de Atun, para dar seguimiento a la
condici6n dolphin safe de atun capturado en el OPO. (2) Se aprob6 un sistema para la distribuci6n de los limites de mortalidad de delfines por
stock para el ano 2000.
REUNIONES DEL APICD, EL PIR, YGRUPOS DE TRABAJO DEL APICD
Segunda reunion de las Partes del APICD
La segunda reuni6n de las Partes delAPICD fue celebrada en La Jolla, California (EE.UD.) el 11 de octubre de 1999, bajo la presidencia del Sr. William Gibbons-Fly, de Estados Unidos. Asistieron representantes de Ecuador, El Salvador, Estados Unidos, Mexico, Panama, la Uni6n Europea, Vanuatu, y Venezuela, mas observadores de Colombia, Costa Rica, Guatemala, Peru, y Taiwan, Center for Marine Conservation, Humane Society de Estados Unidos, World Wildlife Fund.
136 COMISION DEL ATUN
Se tomaron las acciones siguientes: (1) Se adopt6 una resoluci6n para respaldar el programa de observadores a bordo y
establecer un grupo de trabajo para desarrollar incentivos para los capitanes. (2) Se adopt6 una resoluci6n comprometiendo a las Partes a participar plenamente en el
estudio de necropsia de delfines.
Reuniones del Panel Internacional de Revision
El Panel Internacional de Revisi6n (PIR) se ha reunido tres veces al ano desde 1993. En las reuniones 20, 21, y 22 del Panel el personal de la CIAT present6 informaci6n de los registros de los observadores referente a posibles infracciones del APICD; fueron revisadas por el Panel y, en algunos casos, remitidas al gobierno pertinente para la acci6n correspondiente. Ademas, los miembros del Panel informaron sobre las acciones tomadas por los gobiernos en respuesta a las posibles infracciones identificadas previamente por el Panel.
20!! reunion del Panel Internacional de Revision
La 20§ reuni6n del Panel Internacional de Revisi6n tuvo lugar en Ensenada (Mexico) el25 y 26 de enero de 1999. Presidi6 la Lie. Mara Murillo Correa, de Mexico, y asistieron, en calidad de miembros, representantes de Colombia, Costa Rica, Ecuador, El Salvador, Espana, Estados Unidos, Francia, Mexico, Nicaragua, Panama, Vanuatu, Venezuela, la industria atunera, y la comunidad ambientalista y, en calidad de observadores, representantes de la Uni6n Europea y el Programa Nacional de Aprovechamiento del Attin y Protecci6n de Delfines (PNAAPD) de Mexico.
21!! reunion del Panel Internacional de Revision
Se celebr61a 21§ reuni6n del Panel Internacional de Revisi6n (PIR) en Guayaquil (Ecuador) el 4y 5 de junio de 1999. Presidi6 el Ab. Gustavo Gutierrez Vera, de Ecuador, y asistieron repre-sentantes de Colombia, Costa Rica, Ecuador, Espana, Estados Unidos, Mexico, Panama, Vanuatu, Venezuela, la industria atunera, y la comunidad ambientalista. Un representante de la Uni6n Europea asisti6 en calidad de observador.
El Panel asign6 Limites de Mortalidad de Delfines (LMD) de 20 animales a 10 buques para el segundo semestre de 1999. Estos LMD entraran en vigor el lOde julio. Para el 4 de junio se habian recibido solicitudes para 9 de los 37 buques que no utilizaron sus LMD para que los con-servasen durante el resto del ano, y 10 solicitudes de LMD de segundo semestre. Posteriormente llegaron cuatro solicitudes adicionales para conservar LMD no utilizados. Todas esta solicitudes fueron aprobadas.
22!! reunion del Panel Internacional de Revision
Se celebr6 la 22§ reuni6n del Panel Internacional de Revisi6n (PIR) en Ensenada, B.C. (Mexico) ell de octubre de 1999. Presidi6la Lie. Mara Murillo, de Mexico, y asistieron represen-tantes de Colombia, Costa Rica, Ecuador, Espana, Estados Unidos, Guatemala, Mexico, Panama, la Uni6n Europea, Vanuatu, Venezuela, la industria atunera, y la comunidad ambientalista.
EI Panel acord6 que los LMD para 2000 serian asignados tinicamente a estados que hubiesen ratificado el APICD y a estados u organizaciones regionales de integraci6n econ6mica que se hubiesen comprometido formalmente a aplicarlo provisionalmente.
Se inform6 al Panel que un pescador ecuatoriano, el Sr. Mario Rivera Mero, perdi6 la vida

137 INFORME ANUAL 1999
mientras trabajaba de buzo rescatando delfines en la red de un buque atunero. El Director envi6 un pesame a la familia del Sr. Rivera.
Segundo reunion del Grupo de Trabajo sobre Limites Anuales de Mortalidad de Delfines por Poblacion
Este grupo de trabajo, establecido por una resoluci6n adoptada en la 36~ Reuni6n Intergubernamental el 11 de junio de 1998, se reuni6 en Ensenada (Mexico) el 27 de enero de 1999, bajo la presidencia de BioI. Harold Muller-Gelinek Ycaza, de Ecuador. Asistieron represen-tantes de Colombia, Costa Rica, Ecuador, El Salvador, Espana, Estados Unidos, Francia, Guatemala, Jap6n, Mexico, Nicaragua, Panama, Peru, Taiwan, la Uni6n Europea, Vanuatu, Venezuela, y la comunidad ambientalista, mas miembros del personal de la CIAT. Se debatieron propuestas presentadas por Colombia, Ecuador, Espana, Estados Unidos, y Mexico, y se acord6 que en la 39~ Reuni6n Intergubernamental, prevista para junio de 1999 en Guayaquil (Ecuador), se considerarian dos propuestas, una basada en limites globales y la otra en limites nacionales. Estados Unidos prepararia la propuesta basada en limites globales, y Mexico aquella basada en limites nacionales.
Reunion del Grupo de Trabajo Permanente sobre del Seguimiento y Verificacion delAiUn
Este grupo de trabajo, formado en 1995, se reuni6 en Ensenada (Mexico) el29 de enero de 1999 y en Miami, Florida (EE.UU.) el16 de marzo de 1999. En estas reuniones se analizaron varias propuestas para el seguimiento y verificaci6n del atun. Se acord6 que antes de la 63~ reuni6n de la CIAT, prevista para junio de 1999 en Guayaquil (Ecuador), se prepararian recomen-daciones para un sistema basadas en estas discusiones.
ADMINISTRACION
PRESUPUESTO
En BU 58~ reuni6n, celebrada del 3 y 4 de junio de 1997 en San Jose de Costa Rica, la Comisi6n aprob6 unanimemente el presupuesto de US$4.553.226 presentado por el Director para el ano fiscal 1998-1999. Sin embargo, la cantidad aportada por los estados miembros en dicho ano fue US$4.067.680, 0 US$485.546 menos que la suma recomendada y aprobada para el pre-supuesto regular. Como consecuencia se tuvo que limitar algunos proyectos programados. Ademas de BU presupuesto regular, durante el ano fiscal 1998-1999la CIAT recibi6 US$2.157.149 de armadores de barcos para sufragar parte de los costos de proveer observadores para sus embarcaciones, conforme a las disposiciones del Acuerdo sobre el Programa Internacional para la Conservaci6n de los Delfines, US$8.100 de organizaciones que contrataron a la CIAT para llevar a cabo investigaciones de varios tipos, y US$45.831 por concepto de intereses y de otras fuentes.
INFORME FINANCIERO
EI estado de cuentas de la Comisi6n para el ano fiscal 1998-1999 fue verificado por KPMG LLP. En el Anexo 2 del presente informe se presentan las tablas compendiadas de su informe.

138 COMISION DEL ATUN
COLABORACION CON ENTIDADES AFlNES
Durante 1999 el equipo de investigadores de la CIAT continuo desarrollando vinculos estre-chos con organizaciones e instituciones de investigacion internacionales, gubernamentales, uni-versitarias, y privadas. Esta reciprocidad permite a los investigadores mantenerse al corriente de los avances mas actuales en la investigacion pesquera y oceanografica a nivel mundial. Acontin-uaci6n se describen algunos aspectos de estas relaciones.
Las oficinas principales de la CIAT se encuentran situadas en los terrenos del Scripps Institution of Oceanography (SIO) de la Universidad de California en La Jolla, California, uno de los principales centros mundiales de ciencias marinas y sede de varias agencias gubernamentales federales y estatales de pesca, oceanografia, y ciencias afines. Esta situaci6n fomenta un contacto frecuente entre los investigadores de la CIAT y los cientificos de estas entidades. Los Dres. James Joseph y Richard B. Deriso son catednlticos del SIO. La Sra. Cleridy E. Lennert-Cody curs6 estu-dios de postgraduado en el SIO en 1999.
Los Dres. Joseph y Deriso son tambien profesores de la Universidad de Washington en Seattle, Washington (EE.UU.), y el Dr. Joseph de la Universidad Nacional Aut6noma de Mexico en la Ciudad de Mexico. Los Dres. Martin A. Hall y Michael G. Hinton son miembros de las catedras de la Universidad de Columbia Britanica en Vancouver (Canada) y de la Universidad de San Diego, California (EE.UU.), respectivamente. Los Dres. Joseph, Deriso, Hall, Hinton y Robert J. Olson sirvieron en comites supervisores de las investigaciones de estudiantes de postgraduado en varias universidades durante 1999.
Durante muchos anos se han mantenido relaciones cordiales y productivas con la Comisi6n para la Conservacion del Atun Aleta Azul del Sur (CCSBT), la Comisi6n Internacional para la Conservacion del Atun Atlantico (CICAA), la Comisi6n Permanente del Pacifico Sur, la Organizacion de las Naciones Unidas para laAgricultura y laAlimentaci6n (FAO), la Comisi6n del Atun del Oceano Indico (lOTC), la Organizaci6n Latinoamericana de Desarrollo Pesquero (OLDE-PESCA), el Secretariado de la Comunidad de Paclfico (SPC), y otros organismos internacionales. EI Dr. Robin Allen fue miembro del comite directivo para un simposio sobre la variabilidad climatica y su impacto ecol6gico sobre la biota del Oceano Pacffico titulado "Beyond El Nino: Pacific Climate Variability and Ecological Impacts from the Tropics to the Arctic" [Mas alIa de EI Nino: variabilidad climatica en el Pacifico e impactos ecol6gicos de los tr6picos al ArticoJ. EI simposio, que se celebrara a principios de 2000, es patrocinado por el North Pacific Marine Science Organization (PICES), la CIAT, la International Pacific Halibut Commission, y el Comite Cientlfico Provisional para Atunes y Especies Afines en el Oceano Pacifico Norte. EI Dr. Allen fue tambien miembro del comite directivo para la Consulta Experta sobre las Implicaciones del Enfoque Precautorio: Investigaci6n Biol6gica y Tecnol6gica de los Atunes, patrocinada por la CCSBT, FAO, la CIAT, ICCAT, la IOTC, y el SPC, programada para marzo de 2000. EI Dr. Hinton presidi6 el Grupo de Trabajo sobre estadistica y colecci6n de datos para la consulta. EI Dr. George M. Watters particip6 en una reuni6n del Grupo de Trabajo sobre la Evaluaci6n de Stocks de Peces de la Comisi6n para la Conservaci6n de los Recursos Marinos Vivos de Antartida, dedicada princi-palmente ala evaluaci6n de los stocks de austromerluza negra. Junto con el Dr. Mark N. Maunder, el Dr. Watters particip6, con cientificos del Instituto Nacional de Investigaci6n de Pesquerfas de Ultramar del Jap6n y la SPC, en un proyecto cooperativo para evaluar la condici6n de los stocks de atun patudo en el Oceano Pacifico. Este programa es financiado por el Programa de Investigaci6n de Pesquerias Pelagicas de la Universidad de Hawaii.
Asimismo durante 1999, el personal de la CIAT continu6 su estrecha colaboraci6n con agencias pesqueras de naciones afiliadas a la CIAT y con organismos similares de diversos paises

139 INFORME ANUAL 1999
no afiliados. Los estudios del Sr. Forrest R. Miller de los efectos de las condiciones ambientales sobre la pesca atunera de superficie, descritos en la subsecci6n titulada OCEANOGRAFIA YMETEOROLOGIA, fueron pagados por Continental Weather Services, Inc. El Dr. Richard B. Deriso fue miembro del Comite Cientifico y Estadistico del Consejo de Administraci6n de Pesquerias del Pacifico Occidental de Estados Unidos. El Dr. William H. Bayliff y el Sr. Patrick K. Tomlinson formaron parte de la junta editorial de Investigaciones Marinas CICIMAR, publi-cado por el Centro Interdisciplinario de Ciencias Marinas del Instituto Politecnico Nacional en La Paz (Mexico), el Dr. Ashley J. Mullen fue Editor Asociado de Natural Resource Modeling, revista publicada por el Rocky Mountain Mathematics Consortium en asociaci6n con la Resource Modeling Association, y el Dr. Michael D. Scott fue Editor Asociado de la revista Marine Mammal Science. El Dr. Scott fue tambien Presidente del Pacific Scientific Review Group, responsable de revisar las normas de ordenaci6n y programas de investigaci6n de EE.UU. de mamiferos marinos en el Oceano Pacifico. Ademas, el Dr. Scott particip6 en una investigaci6n conjunta del delfin Tursiops del Atlantico con cientificos del Servicio Nacional de Pesquerias Marinas de EE.UU., la Universidad de Carolina del Norte en Wilmington, y el Instituto Oceanografico de Woods Hole. El Dr. Felipe Galvan Magana, de CICIMAR, y el Dr. Robert J. Olson, de la CIAT, continuaron su estudio conjunto de las interacciones tr6ficas de atunes aleta amarilla, delfines, y predadores aso-ciados en el Oceano Pacifico oriental, descrito en la pagina 238 del Informe Anual de 1995. El Dr. Olson y el Dr. James F. Kitchell, de la Universidad de Wisconsin, coordinaron el Grupo de Trabajo sobre las Implicaciones Eco16gicas de Estrategias Alternativas de Pesca de Depredadores Tope, patrocinado por el Centro Nacional para Analisis y Sintesis Eco16gicos (NCEAS), subvencionado por la Fundaci6n Nacional de Ciencia de EE.UU. y el Estado de California. La beca otorgada por el NCEAS pagara una serie de reuniones tecnicas durante dos anos para desarrollar y evaluar un modelo de la red tr6fica para el Oceano Pacifico oriental pelagico. El Dr. George M. Watters fue tambien miembro del grupo de trabajo. Los Sres. Kurt M. Schaefer, de la CIAT, y Charles W. Oliver, del Centro Sudoeste de Ciencia Pesquera del Servicio Nacional de Pesquerias Marinas de EE.UU. en La Jolla (California), realizaron una investigaci6n conjunta de la vejiga natatoria del atun aleta amarilla. Ademas, colaboraron con los Dres. James J. Finneran y Sam H. Ridgway de la Divisi6n de Biociencias del Centro de Sistemas de Guerra Espacial y Naval de la Marina de EE.UU. en San Diego (California) en un estudio de la detecci6n por atunes aleta amarilla de sonidos de baja frecuencia producidos por delfines Tursiops truncatus.
Desde 1977 los investigadores de la CIAT capacitan observadores para la toma, a bordo de barcos atuneros, de datos sobre la abundancia, mortalidad, y otros aspectos de la biologia de los delfines. Ademas, estos observadores colectan contenidos estomacales y muestras de g6nadas y otros tejidos de atun, reunen datos sobre las capturas incidentales de especies ademas de atunes y delfines, registran informaci6n sobre objetos flotantes y la flora y fauna con ellos asociadas, etcetera. Diversas organizaciones gubernamentales e instituciones educativas, asi como repre-sentantes del sector industrial, han colaborado activamente en el entrenamiento y embarque de estos observadores. Datos reunidos por el programa de observadores de Mexico son proporcionados al personal de la CIAT para analisis.
Atraves de los anos, cientificos y estudiantes de muchos paises han realizado visitas de dis-tintas duraciones a la oficina principal y el Laboratorio de Achotines de la CIAT, para informarse sobre metodos de investigaci6n 0 utilizar las instalaciones y datos de la CIAT para sus estudios. En el Anexo 1 se detallan aquellos cuyas visitas duraron mas de 2 semanas. Asimismo, cientificos de la CIAT que viajan a otros paises por razones profesionales con frecuencia ayudan a los cienti-ficos de aquellos paises con sus investigaciones relacionadas a la pesca del atun, y de vez en cuando viajan con el prop6sito especifico de ensenar 0 prestar ayuda en programas de investigaci6n.
140 COMISION DEL ATUN
Ellaboratorio de investigaci6n de la CIAT en Achotines (Republica de Panama), descrito en la secci6n titulada ESTUDIOS DEL CICLO VITAL TEMPRANO, permite una colaboraci6n mas estrecha entre los investigadores de la CIAT y el personal de las agencias pesqueras panamenas. Los investigadores de la CIAT han ayudado a cientificos locales con proyectos de investigaci6n fuera del campo de los tunidos, sobre corvinas y especies afines (Sciaenidae) y pargos (Lutjanidae), por ejemplo, analizados en la subsecci6n titulada Desove y cria de corvina colirrubia y pargo de la mancha.
Hacia fines de 1993, la Overseas Fishery Cooperation Foundation (OFCF) del Jap6n, el gobierno de la Republica de Panama, y la CIAT acordaron emprender un proyecto conjunto de cinco anos de duraci6n, subvencionado principalmente por la OFCF, en el Laboratorio de Achotines. El prayecto, cuya fase inicial comenz6 en 1994, abarca la investigaci6n de la viabil-idad de criar atunes aleta amarilla adultos, corvinas y especies afines, y pargos para suministrar larvas para la investigaci6n, y la producci6n de organismos de alimento para sus larvas y juve-niles. En la secci6n titulada ESTUDIOS DEL CICLO VITAL TEMPRANO se describe este proyecto. En noviembre de 1999 se recomend6 extender el proyecto un ana mas, hasta marzo de 2001.
Atraves de los anos, tecnicos de la CIAT han colectada muestras de tejido de atunes y peces picudos para usar en estudios de genetica llevados a cabo por cientificos de otras entidades. Durante 1999 fueron tomadas muestras de tejido de atunes y especies afines para el Laboratorio de Genetica FISHTEC en la Universidad de Carolina del Sur en Columbia, Carolina del Sur (EE.UU.).
Miembros del personal de la CIAT son tambien activos en sociedades profesionales. Durante 1999 el Dr. Martin A. Hall fue miembro de la Junta Directiva del Centro Nacional de Conservaci6n de Pesquerias, y el Dr. Daniel Margulies sirvi6 de Representante Regional del Oeste de la Secci6n del Ciclo Vital Temprano de la American Fisheries Society.
TOMA DE DATOS
La zona de interes principal para el personal de la CIAT es el Oceano Pacifico oriental (OPO; Figura 1), definido como la zona delimitada por ellitoral de las Americas, el paralelo de 40oN, el meridiana de 150'0, y el paralelo de 400 S.
Durante 1999 la CIAT cont6 con cientificos y tecnicos en La Jolla y en sus oficinas regionales en Manta (Ecuador); Mayagiiez, Puerto Rico, (EE.UU); Ensenada y Mazatlan (Mexico); Panama (Republica de Panama); y Cumana (Venezuela). El personal de dichas oficinas obtiene datos de las descargas, recopila las bitacoras de los barcos atuneros para obtener datos de cap-tura y esfuerzo, toma medidas y demas datos bio16gicos de los peces, y colabora en la capacitaci6n y embarque de los observadores que acompanan a los barcos que participan en el Programa Internacional para la Conservaci6n de los Delfines (PIeD). Este trabajo se lleva a cabo no s610 en los puertos arriba nombrados, sino que tambien en otros puertos de California, Colombia, Costa Rica, Ecuador, Mexico, Panama, Peru, Puerto Rico, yVenezuela visitados regularmente por el personal de la CIAT. Durante 1999 el personal de estas oficinas tom6 1.359 muestras de fre-cuencia de talla y recopil610s datos de cuadernos de bitacora de 1.229 viajes de barcos pesqueros. Ademas, el personal de las oficinas regionales tramit6 el embarque de observadores de la CIAT en 626 viajes de pesca por barcos participantes en el PICD. Ademas, observadores de la CIAT completaron 642 viajes durante el ano, y revisaron los datos que tomaron con tecnicos de la oficina regional correspondiente.

141 INFORME ANUAL 1999
DATOS DE CAPTURAYESFUERZO PARA LOS ATUNES YPECES PICUDOS
La /lola
El personal de la CIAT mantiene registros detallados del arte de pesca, bandera, y capacidad de acarreo de la mayoria de los buques que pescan atunes aleta amarilla (Thunnus albacares), barrilete (Katsuwonus pelamis), patudo (Thunnus obesus), 0 aleta azul (T. orientalis) con artes de superficie en el Oceano Pacifico oriental (OPO; Figura 1). No se mantienen registros detallados de la mayoria de los buques palangreros, ni de barcos de pesca deportiva ni embarca-ciones pequenas tales como canoas y lanchas, pero se obtienen de varias fuentes y se incluyen en la base de datos de la CIAT datos de captura para la mayoria de los buques palangreros grandes y para barcos de pesca deportiva de EE.UU. y ciertos otros buques. La £Iota aqui descrita incluye buques cerqueros y de camada que pescaron estas cuatro especies de atunes en el OPO durante el ano entero 0 parte del mismo.
Se usan las estimaciones de capacidad de acarreo del buque suministradas por el armador o astillero a menos que los registros de descarga indiquen que sea conveniente revisarlas. Para los registros se clasifican los buques de acuerdo a su capacidad en las siguientes clases: Clase 1, menos de 46 toneladas metricas (denominadas "toneladas" a secas de ahora en adelante) (51 toneladas cortas (tc); Clase 2, 46-91 toneladas (51-100 tc); Clase 3, 92-181 toneladas (101-200 tc); Clase 4,182-272 toneladas (201-300 tc); Clase 5, 273-363 toneladas (301-400 tc); y Clase 6, mas de 363 toneladas (400 tc).
Hasta aproximadamente 1960 predominaron en la pesca atunera en el OPO los barcos de camada, que faenaban en las zonas costeras y cerca de islas de alta mar. Hacia fines de los anos 1950 y a principios de los 1960, la mayoria de los barcos de camada grandes fueron convertidos a arte de cerco, y para 1961 este arte predominaba en la £Iota de superficie del OPO. Entre 1961 y 1999 el mimero de barcos de camada se redujo de unos 93 a 14, y su capacidad total disminuyo de unas 10 mil a unas mil toneladas. En el mismo periodo el mimero de cerqueros aumento de 125 a 208, ysu capacidad de unas 27 mil a 149 mil toneladas. Tanto el numero como la capaddad alcanzaron su nivel maximo entre fines de la decada de los 1970 y principios de la de los 1980, cuando lleg6 a haber 282 barcos, y la capacidad alcanz6 unas 168 mil toneladas (Tabla 1).
La construccion de nuevos cerqueros de mayor tamano, comenzada a mediados de los anos 1960, result6 en un aumento en la capacidad total de la flota de superficie de unas 42 mil toneladas en 1966 a unas 167 mil en 1976. Entre 1977 y 19811a capacidad permaneci6 bastante estable. Continu6 la construcci6n de buques nuevos durante este periodo, pero la capacidad adi-donal se vio compensada por perdidas ocasionadas por buques hundidos 0 que abandonaron la pesqueria. Un evento mayor de El Nino comenzo a mediados de 1982 y persistio hasta fines de 1983. Las tasas de captura en el OPO fueron bajas durante 1978-1981 debido ala concentracion del esfuerzo de pesca sobre peces pequenos, y la situaci6n se via agravada por el Nino, que hizo que los peces fueran menos vulnerables a la captura. En 1982 ocurri6 una reducci6n de 16 mil toneladas en la capacidad total, debido al retiro de buques 0a su traslado a otras zonas de pesca, principalmente el Pacifico occidental. Esta tendencia continuo en 1983 a medida que disminuian las tasas de captura en el OPO, ydurante 1983 y 19841a capacidad se redujo en 48 mil toneladas; en 1984 alcanzo el nivel mas bajo desde 1971, unas 107 mil toneladas. No obstante, en 1985 aumento a unas 120 mil toneladas, debido principalmente al regreso de buques del Pacifico occi-dental, pero en 1986 volvi6 a reducirse ligeramente a unas 114 mil toneladas. Durante 1987 y 1988 ingresaron a la £Iota varios buques nuevos, y otros regresaron del Pacifico occidental al OPO a pescar, 10 cual result6 en un aumento en la capacidad a unas 134 mil toneladas, la mayor desde 1982. En la primavera de 1990 la industria enlatadora de los Estados Unidos decidi6 no comprar

142 COMISION DEL ATUN
mas atun capturado en viajes en que se realizaran lances sobre atunes asociados con delfines. Esto !leva a que muchas de las embarcaciones de pabellon de Estados Unidos que pescaban en el OPO se fueran a pescar en el Atlantico 0 el Pacifico occidental, y una disminucion consecuente en la £lota del OPO a 101 mil toneladas en 1992. Con la mayor participacion de buques de otras naciones en la pesqueria, la capacidad ha aumentado progresivamente desde 1992, y en 1999 fue de unas 151 mil toneladas.
En las Tablas 2a y 2b se presentan los datos finales de 1998 y preliminares de 1999 del numero y capacidad de acarreo de los buques cerqueros y de carnada que pescaron atunes en el OPO. En 2000 predominaron buques de bandera mexicana y ecuatoriana. Desde 1987 la £lota mas grande ha sido la mexicana, con un 26% de la capacidad total en 1999, mientras que buques de Ecuador, Venezuela, Vanuatu y Espana formaron el 25, 15, 7, y 6% de la capacidad total, respectivamente.
Buques cerqueros de la Clase 6 forman la mayor parte de la capacidad total de la £lota de buques que pescan atunes en la superficie en el OPO; buques de esa clase de respondieron del 89% de la capacidad total faenando en el OPO durante 1999.
En la Figura 2 se presentan los valores mensuales medios, minimos, y maximos de capacidad en el mar (CEM), en toneladas metricas, de los buques que pescaron atunes en la superficie en el OPO durante 1989-1998, junto con los valores de 1999. Los valores mensuales son los promedios de las estimaciones de la CEM reportadas en los informes semanales preparados por el personal de la CIAT. La pesca de aleta amarilla fue reglamentada en 1998 y 1999, a partir del 25 de noviembre y el14 de octubre, respeetivamente (vease la seccion titulada MEDIDAS PARA LA CONSERVACION DEL ATUN), por 10 que los valores de la CEM para diciembre de 1998 y oetubre, noviembre y diciembre de 1999 no son comparables con los de esos meses durante 1988-1997. En general, los valores de la CEM en 1999 son mayores que los promedios de 1989-1998, aunque el porcentaje de la capacidad de la flota en el mar, 57%, fue el mismo. Durante 1989-1998 el valor medio de la CEM fue 65 mil toneladas, pero durante 1999 fue 83 mil toneladas.
Las capturas
Atunes
Las estimaciones de captura de atun provienen de varias fuentes, entre ellas los cuadernos de bitacora mantenidos por los pescadores, los datos registrados por los observadores, y los datos de descarga proporcionados por las enlatadoras. En esta subseccion, en las Figuras 3-5 y las Tablas 4-6 y 8-9 "captura" significa las capturas retenidas, a menos que se indique 10 contrario. Los datos de descarga constituyen la fuente principal de esta informacion. Algunos de los atunes capturados son, por varios motivos, descartados en el mar. Desde 1993 los observadores toman datos sobre pescado descartado en el mar por buques de la Clase 6. En la Tabla 3 se detallan las capturas anuales estimadas de las varias especies de atunes y especies afines descargadas por buques de la £lota atunera del OPO que pescan con artes de superficie. Se incluyen en las estadis-ticas de captura las capturas deportivas descargadas en California. En el caso del aleta azul, estas han formado un componente cada vez mas importante de las capturas en los liltimos anos.
Se comparan las estadisticas de 1999 con las de 1984-1998. No se impusieron restricciones sobre la pesca del atlin en el OPO entre 1980 y 1997, pero se restringiola pesca de aleta amarilla en el Area de Regulacion de la Comision para el Aleta Amarilla (ARCAA) (Figura 1) del 26 de noviembre al 31 de diciembre de 1998 y del 14 de octubre al 31 de diciembre de 1999, y se pro-hibio la pesca de atunes asociados con dispositivos agregadores de peces ("plantados") colocados en el agua por los pescadores en el OPO del 9 de noviembre al31 de diciembre de 1999. Ademas,
143 INFORME ANUAL 1999
la reglamentaci6n de aquellos eerqueros que dirigen su esfuerzo haeia atunes asociados con delfines afeet6 probablemente el modo de operacion de esos bareos, especialmente a fines de los anos 1980 y principios de los 1990. Tal como se comento en la subseccion anterior, durante 1982-1983 ocurrio un evento importante de El Nino que redujo la vulnerabilidad de los peces a la cap-tura y el mimero de barcos en el OPO. El esfuerzo de pesca permaneci6 relativamente bajo durante 1984-1986. Durante 1997-1998 ocurri6 otro evento importante de El Nino en el OPO.
En el ARCAA la captura anual media de aleta amarilla durante 1984-1998 fue 217 mil toneladas (rango: 129 a 267 mil), y la estimaci6n preliminar de la captura en dicha area en 1999 es de 265 mil toneladas. Las cifras correspondientes para la zona entre el lfmite del ARCAA y 150°0 son 29 mil toneladas (rango: 17 a 47 mil) y 32 mil toneladas. La captura estimada de la especie en el OPO en 1999, 297 mil toneladas, rebasa todas las capturas de anos anteriores, yes un 21%superior al promedio de 1984-1998 de 245 mil toneladas (Tabla 3). Durante 1993-19991a cantidad media de aleta amarilla deseartada en el mar fue 5,5 mil toneladas.
Durante 1984-19981a captura media anual de barrilete en el OPO fue de 90 mil toneladas (rango: 49 a 162 mil). La estimaci6n preliminar de la captura de la especie en el OPO en 1999, 268 mil toneladas, es mayor que en cualquier ano previa y casi tres veces el promedio de las cap-turas anuales en los liltimos 15 anos. Durante 1993-1999 la cantidad media de barrilete descar-tada en el mar fue 20,6 mil toneladas.
Antes de 1994 la captura promedio de patudo en el OPO pOl' artes de superficie fue alrededor de 5 mil toneladas (rango: <1 a 15 mil). Desde 1993 las capturas han variado de 29 mil toneladas en 1994 a 52 mil toneladas en 1997; la estimaci6n preliminar para 1999 es de 41 mil toneladas. Estos aumentos resultaron del descubrimiento, hecho a prineipios de la decada de los 1990, de que atunes (principalmente barrilete) asociados con objetos flotantes, pero a bastante profundidad, pueden ser detectados con equipo de sonar y capturados con red de cereo. Muchos de estos objetos flotantes son plantados eoloeados en el agua por los pescadores para agregar peees. Durante 1993-1999 la cantidad media de patudo descartada en el mar fue 3,7 mil toneladas.
El aleta amarilla, barrilete, y patudo forman la mayor parte de la captura total de los buques que pescan atunes en la superficie en el OPO, pero el aleta azul, albacora (Thunnus alalunga), barrilete negro, bonito (Barda orientalis), y otras especies contribuyen tambien. La captura total de estas otras especies en el OPO fue unas 5 mil toneladas en 1999, cantidad bien inferior al promedio de 1984-1998 de 9 mil toneladas (rango: 2 a 17 mil). En la Tabla 3 se pre-sentan estimaciones de los descartes de estas especies durante 1993-1999.
En la Tabla 4a se detallan las capturas, clasificadas pOl' bandera, y las descargas de atunes capturados con artes de superficie, clasificadas por pais, en el OPO en 1998, y en la Tabla 4b las estimaciones preliminares correspondientes para 1999. La captura estimada de todas las especies en el OPO en 1999 fue unas 611 mil toneladas, cantidad mucho mayor al record anterior de 474 mil toneladas, establecido en 1997. Buques de Ecuador, Mexico, Venezuela, y Espana respondieron del 34, 23, 11, y 9%, respectivamente, de este total. Las descargas representan pescado descargado en el ano correspondiente, sin tener en cuenta el ano de captura. El pais de descarga es aquel en el cual el pescado fue descargado del buque pesquero 0, en el caso de trans-bordos, el que recibi6 el pescado transbordado. Datos de descarga preliminares (Tabla 6b) senalan que de las 632 mil toneladas descargadas en 1999, el 44% fue descargado en Ecuador, 19% en Mexico, 11% en Colombia, 6% en Costa Rica y en Venezuela, y 4% en Estados Unidos. Es importante notar que cuando se disponga de informaci6n final los paises a los que se asignan actualmente algunas descargas podrian cambiar debido a la exportaci6n de pescado almacenado a procesadoras en otros paises.
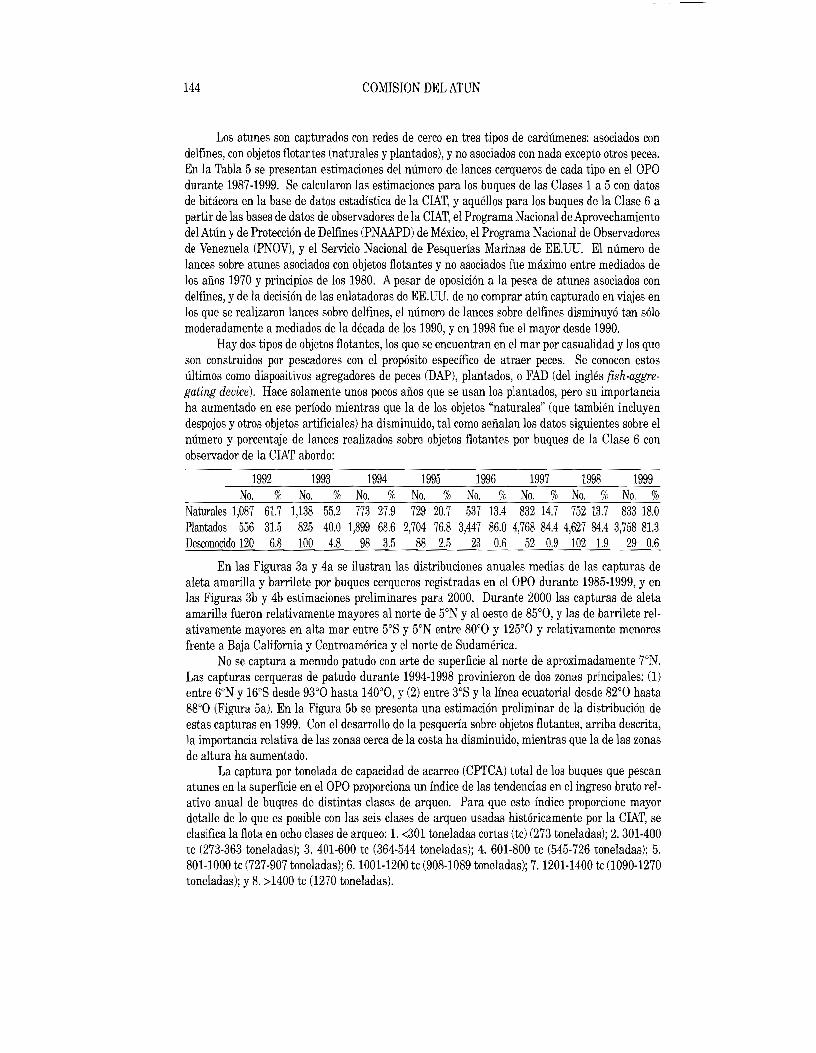
144 COMISION DEL ATUN
Los atunes son capturados con redes de cerco en tres tipos de cardumenes: asociados con delfines, con objetos flotantes (naturales y plantados), y no asociados con nada excepto otros peces. En la Tabla 5 se presentan estimaciones del mimero de lances cerqueros de cada tipo en el OPO durante 1987-1999. Se calcularon las estimaciones para los buques de las Clases 1a 5 con datos de bitacora en la base de datos estadfstica de la CIAT, y aquellos para los buques de la Clase 6 a partir de las bases de datos de observadores de la CIAT, el Programa Nacional de Aprovechamiento del Atun y de Proteccion de Delfines (PNAAPD) de Mexico, el Programa Nacional de Observadores de Venezuela (PNOV), y el Servicio Naciona1 de Pesquer(as Marinas de EE.UU. El mimero de lances sobre atunes asociados con objetos flotantes y no asociados fue maximo entre mediados de los alios 1970 y principios de los 1980. Apesar de oposici6n a la pesca de atunes asociados con delfines, y de la decisi6n de las enlatadoras de EE.UU. de no comprar atun capturado en viajes en los que se realizaron lances sobre delfines, e1 mimero de lances sobre delfines disminuy6 tan solo moderadamente a mediados de la decada de los 1990, y en 1998 fue el mayor desde 1990.
Hay dos tipos de objetos flotantes, los que se encuentran en el mar pOl' casualidad y los que son construidos pOl' pescadores con el proposito especifico de atraer peces. Se conocen estos ultimos como dispositivos agregadores de peces (DAPl, plantados, 0 FAD (del Ingles fish-aggregating device). Hace solamente unos pocas afios que se usan los plantados, pero su importancia ha aumentado en ese periodo mientras que 1a de los objetos "naturales" (que tambien incluyen despojos y otros objetos artificialesl ha disminuido, tal como sefialan los datos siguientes sobre e1 nlimero y porcentaje de lances realizados sobre objetos flotantes pOl' buques de la Clase 6 con observador de la CIAT abordo:
1992 1993 1994 1995 1996 1997 1998 1999 No. % No. % No. % No. % No. % No. % No. % No. %
Naturales 1,087 61.7 1,138 55.2 773 27.9 729 20.7 537 13.4 832 14.7 752 13.7 833 18.0 Plantados 556 31.5 825 40.0 1,899 68.6 2,704 76.8 3,447 86.0 4,768 84.4 4,627 84.4 3,758 81.3 DeEConocido 120 6.8 100 4.8 98 3.5 88 2.5 23 0.6 52 0.9 102 1.9 29 0.6
En las Figuras 3a y 4a se ilustran las distribuciones anualcs medias de las capturas de aleta amarilla y barrilete pOl' buques cerqueros registradas en el OPO durante 1985-1999, y en las Figuras 3b y 4b estimaciones preliminares para 2000. Durante 2000 las capturas de aleta amarilla fueron relativamente mayores al norte de 5°N y al oeste de 85°0, y las de barrilete rel-ativamente mayores en alta mar entre 50 S y 5°N entre 80°0 y 125°0 y relativamente menores frente a Baja California y Centroamerica y el norte de Sudamerica.
No se captura a menudo patudo con arte de superficie al norte de aproximadamente 7°N. Las capturas cerqueras de patudo durante 1994-1998 provinieron de dos zonas principales: (1) entre 6°N y 16°8 desde 93°0 hasta 140°0, y (2) entre 3°8 y la linea ecuatorial desde 82°0 hasta 88°0 (Figura 5a). En la Figura 5b se presenta una estimacion preliminar de la distribucion de estas capturas en 1999. Con el desarrollo de la pesqueria sabre objetos flotantes, arriba descrita, la importancia relativa de las zonas cerca de la costa ha disminuido, mientras que la de las zonas de altura ha aumentado.
La captura par tonelada de capacidad de acarreo (CPTCA) total de los buques que pescan atunes en la superficie en el OPO proporciona un indice de las tendencias en el ingreso bruto rel-ativo anual de buques de distintas clases de arqueo. Para que este indice proporcione mayor detalle de 10 que es posible con las seis clases de arqueo usadas hist6ricamente pOl' la CIAT, se clasifica la flota en ocho clases de arqueo: 1. <301 toneladas cortas (tc) (273 toneladas); 2. 301-400 tc (273-363 toneladasl; 3. 401-600 tc (364-544 toneladas); 4. 601-800 tc (545-726 toneladas); 5. 801-1000 td727-907toneladas); 6.1001-1200 tc (908-1089 toneladas); 7. 1201-1400 tc (1090-1270 toneladasl; y 8. >1400 tc (1270 toneladasl.

145 INFORME ANUAL 1999
En la Tabla 6 se presentan las estimaciones de la CPTCA durante 1990-1999 correspondi-entes al OPO y a todas las zonas oceanicas de pesca en las cuales buques de la flota atunera del OPO capturaron pescado, por clase de arqueo, zona, y especie. La CPTCA de los buques mayores consiste principalmente de aleta amarilla y barrilete, mientras que otras especies, entre ellas otros atunes y peces miscelaneos, forman una parte importante de la CPTCA de los buques mas pequelios en muchos alios. El patudo adquirio mayor importancia para los buques grandes a partir de 1993. En alios anteriores, y en aquellos alios cuando la mayoria de la flota del OPO ejerce la mayor parte de su esfuerzo de pesca en el OPO, las CPTCA del OPO y de todas las zonas oceanicas de pesca son casi iguales. Durante el periodo de 1990·1998, el promedio de las CPTCA de todos los barcos y todas las especies en el OPO fue 3,3 toneladas (rango: 2,9 a 3,7); para el aleta amarilla, el promedio fue 2,1 toneladas (rango: 1,9 a 2,3), y para el barrilete, 0,9 toneladas (rango: 0,6 a 1,3). El promedio correspondiente para el patudo durante 1994-1998 fue 0,3 toneladas (rango: 0,3 a 0,4). Las estimaciones preliminares para 1999 son 4,1, 2,0, 1,8, y 0,3 toneladas para todas las especies, aleta amarilla, barrilete, y patudo, respectivamente.
Peces picudos
El pez espada (Xiphias gladius) es pescado en el OPO con palangre y red agallera, y de vez en cuando can artes deportivas. La mayor parte de la captura comercial es retenida. Los mar-lines (Makaira nigricans, M. indica, y Tetrapturus audax), el marlin trompa corta (T. angustirostris), y el pez vela (lstiophorus platypterus) son pescados con palangre y artes deportivas, y forman una pequelia parte de las capturas incidentales de los buques cerqueros. La mayor parte de la captura palangrera de estas especies es retenida, y la mayor parte de la captura de super-ficie comercial es descartada en el mar. En la Tabla 7 se presenta informacion sobre las capturas comerciales e incidentales de peces picudos en el OPO.
Bajo las disposiciones de la Convencion que establecio la CIAT, el objetivo principal de las investigaciones del personal de la Comision es estudiar la condicion de los stocks de atunes y otras especies capturadas por la pesca atunera del OPO. Tomando en cuenta los desplazamientos extensos de los atunes y peces picudos, la movilidad de los barcos de las flotas atuneras de los dis-tintos paises, y el caracter internacional del comercio de estas especies, las estadisticas de cap-tura y esfuerzo del OPO deben ser vistas a la luz de las estadisticas mundiales. En las Tablas 8 y 9 se presentan estadisticas de captura de atunes, especies afines y peces picudos durante 1970-1999, por oceano.
COMPOSICION POR Ti\MANO DE LA CAPTURA DE ATUNES
Las muestras de frecuencia de talla son la fuente basica de los datos usados para estimar la composicion por talla y edad de las distintas especies de peces en las descargas. Esta infor-macion es necesaria para obtener estimaciones de la composicion de las poblaciones por edad, usadas para varios propositos, entre ellos el modelado de las poblaciones por edad. Los resultados de dicho modelado pueden ser usados para estimar el reclutamiento, que puede ser comparado con la biomasa reproductora y las condiciones oceanograficas. Ademas, las estimaciones de mor-talidad obtenidas con estos modelos pueden ser usadas, en conjunto con las estimaciones del cre-cimiento, para modelar el rendimiento por recluta. Los resultados de estudios de este tipo han sido descritos en diversos Boletines de la CIAT y en todos los Informes Anuales desde 1954.

146 COMISION DEL ATUN
Las muestras de frecuencia de talla de aleta amarilla, barrilete, patudo, aleta azul del norte del Pacifico, y barrilete negro capturados por barcos cerqueros, de carnada, y deportivos en el Oceano Pacifico oriental (OPO) son tomadas por el personal de la CIAT en puertos de descarga en Ecuador, Estados Unidos (California y Puerto Rico), Mexico, Panama, y Venezuela. El muestreo de las capturas de aleta amarilla y barrilete fue iniciado en 1954, y continua actualmente.
De la captura de 1999 se tomaron y procesaron 684 muestras de aleta amarilla, 471 de barrilete, 71 de patudo, 63 de aleta azul del Pacifico, y 4 de barrilete negro. (El numero total de muestras procesado es ligeramente inferior al numero tornado (pagina 140) porque se descubrio posteriormente que algunas muestras contenian pescado de mas de un estrato de zona-tiempo.) La mayoria de estas muestras fueron de 50 peces cada una. Se estratifican las muestras de fre-cuencia de talla de todas estas especies excepto el barrilete negro por zona de muestreo (Figura 6), mes, y arte de pesca. Se describen los procedimientos de muestreo en detalle en el Boletin de la CIAT, Vol. 20, W 6.
La Figura 7a consiste de histogramas de las capturas estimadas de aleta amarilla en 1999 en cada zona de muestreo del OPO. Aunque el rango de tamanos es aproximadamente igual en todas las zonas, con casi todo el pescado entre 40 y 160 cm, las distribuciones varian consider-ablemente entre zonas. Los pesos promedio varian de 2,1 kg en la Zona 13 a 20,3 kg en la Zona 2.
En la Figura 7b se presentan histogramas de las capturas estimadas de aleta amarilla en el ARCAA (todas las zonas excepto las 10 y 11 en la Figura 6) durante cada ano del periodo de 1994-1999. Una gran porcion de la captura de aleta amarilla en 1999 consistio de peces de menor tamano, con el resultado que el peso promedio anual (8,1 kg) fue el mas bajo de la ultima decada.
La Figura 7c consiste de histogramas de las capturas estimadas de aleta amarilla en la zona entre ellimite delARCAAy 150°0 (las Zonas 10 y 11 en la Figura 6) en cada ano del periodo de 1994-1999. Durante 19991a captura de aleta amarilla pequeno fue mayor que en anos ante-riores: el peso medio fue el mas bajo desde el comienzo de la pesqueria a fines de la decada de los 1960. El tamano medio viene disminuyendo casi continuamente desde 1994.
En la Figura 8a se presentan histogramas de las capturas estimadas de barrilete en cada zona de muestreo del OPO (Figura 6) durante 1999. Se combinaron los datos de las Zonas 1 y 8, las Zonas 2, 4 Y5, ylas Zonas 6 y 13 a raiz de las bajas capturas en algunas de esas zonas (Figura 4b). La mayor parte de la captura de barrilete provino de la Zona 7.
La Figura 8b consiste de histogramas de las capturas estimadas de barrilete en el OPO entero en cada ano del periodo de 1994-1999. El peso promedio de 1999, 3,5 kg, fue el mayor del periodo.
Antes de 1994 la captura de superficie de patudo en el OPO era incidental a la de aleta amarilla y barrilete, y las capturas anuales (Tabla 3) y la cantidad de muestras de frecuencia de talla era muy inferior a la de esas dos especies, pem durante 1994-1999 se capturo mas patudo y se obtuvieron mas muestras. En la Figura 9a se presentan histogramas de las capturas esti-madas de patudo en cada zona de muestreo del OPO (Figura 6) durante 1999. La mayor captura ocurrio en la Zona 7, donde el peso medio del patudo capturado fue tambien mayor que en cualquiera de las otras cuatro zonas.
La Figura 9b consiste de histogramas de las capturas estimadas de patudo en el OPO en cada ano del periodo de 1994-1999. El peso medio en 1999, 9,2 kg, fue mayor que los de 1996-1998 Ysimilar a los de 1994 y 1995. Ellimite superior del rango de tamanos ha disminuido de unos 180 cm (1994-1996) a unos 150-160 cm (1997-1999).
El aleta azul del norte del Pacifico es capturado con artes de superficie frente a California y Baja California entre 23°N y 35°N, aproximadamente, principalmente entre mayo y octubre. Durante 1999 fue capturado entre 27°N y 37°N, principalmente entre junio y agosto. En la

147 INFORME ANUAL 1999
Figura 10 se presentan histogramas de las capturas estimadas de aleta azul en cada ano del periodo de 1994-1999.
Las cantidades de muestras obtenidas de las capturas comerciales y deportivas en los liltimos anos son como sigue:
Ano Comercial Deportiva 1990 14 0 1990 14 0 1991 4 0 1992 1 1 1993 4 35 1994 2 11 1995 6 16 1996 67 5 1997 17 9 1998 23 22 1999 51 12
Se consiguio el mayor numero de muestras en 1996, ano de capturas extraordinariamente ele-vadas. EI numero de muestras conseguido de la flota comercial durante 1999 fue mayor que durante la mayoria de los anos recientes.
EI barrilete negro es capturado incidentalmente pOl' pescadores que dirigen su esfuerzo hacia los atunes aleta amarilla, barrilete, y patudo. La demanda de la especie es baja, y la may-oria de la captura es desechada en el mar, pero a veces se retienen pequenas cantidades, mez-cladas con las especies mas deseadas. En la Figura 11 se presentan las distribuciones anuales porcentuales de la frecuencia de talla de barriletes negros capturados en el OPO durante 1994-1999. EI peso medio en 1994 fue el minimo, y el de 1999 el maximo, del periodo, pero es posible que esto no sea significativo, ya que se toman pocas muestras de la especie. No se intento estimar los pesos de las capturas pOl' intervalos de talla.
PROGRAMA DE OBSERVADORES
Los observadores empleados porIa CIAT registran la mortalidad de delfines durante las faenas de pesca, y el personal de la CIAT usa estos datos para preparar sus estimaciones anuales de la mortalidad de delfines en la pesqueria. Los observadores recaban tambien datos sobre las manadas de delfines observadas, usados para calcular estimaciones de la abundancia relativa de los delfines. Se usa la informacion anotada sobre las condiciones coincidentes con la mortalidad de delfines para estudios de las causas de la mortalidad de delfines, y se comparten los conocimientos obtenidos de estos estudios con los pescadores a traves de las actividades educa-tivas de la CIAT, tales como seminarios para capitanes y tripulantes de barcos atuneros y analisis del desempeno de capitanes individuales. Ademas, desde fines de 1992 los observadores registran informacion sobre peces y otros animales descartados en el mar.
Cobertura
EI diseno de muestreo del programa de observadores para 1999 contemplo una cobertura del 100% de los viajes de pesca realizados en el OPO pOl' buques cerqueros de la Clase 6 (de mas de 363 toneladas de capacidad de acarreo). Todos los viajes de buques de flotas excepto la de

148 COMISION DEL ATUN
Mexico serian muestreados por el Programa Atun-Delfin de la ClAT. La mitad de los viajes de buques de Mexico seria muestreada por observadores del Programa Nacional para el Aprovechamiento del Atun y Protecci6n de Delfines (PNAAPD) de Mexico y la otra mitad por observadores de la CIAT.
Observadores de la CIAT y el PNAAPD zarparon en 687 viajes de pesca en el OPO en 1999, y con los 54 viajes iniciados en 1998 y terminados en 1999 que llevaron observador, en total 741 viajes fueron muestreados en 1999 por los dos programas, Buques faenando bajo la jurisdicci6n de Belice, Colombia, Ecuador, El Salvador, Espana, Estados Unidos, Guatemala, Honduras, Mexico, Nicaragua, Panama, Vanuatu, y Venezuela llevaron observadores de la ClAT,
Un viaje por un buque de la Clase 6 no fue observado. El buque en cuesti6n fue clasificado previamente en la Clase 5 (273-363 toneladas de capacidad de acarreo), pero fue cambiado ala Clase 6 cuando el gobierno de pabe1l6n inform6 a la CIAT que habia determinado que el buque era de mas de 363 toneladas de capacidad, y que por tanto deberia participar en el PICD. El buque realiz6 un viaje de pesca eompleto despues del cambio de clasificaci6n sin observador a bordo.
En la Tabla 10 se resume la cobertura de muestreo de los buques de la flota internacional por los programas de la CIAT y de Mexico. Mas del 86% de los viajes de los buques de la Clase 6 fue muestreado por la CIAT, y los dos programas combinados muestrearon el 99,9% de los mismos.
Capacitacion de observadores
Durante 1999 se llevaron a eabo dos cursos para entrenar nuevos observadores en los metodos de toma de datos a bordo de buques atuneros, uno en Panama en marzo, para 12 obser-vadores, y el otro en Guatemala en noviembre-diciembre, para 16 observadores. Los asistentes aprendieron c6mo identificar las especies de atunes, mamiferos marinos, tortugas y aves marinas, los requisitos y proeedimientos para la toma de datos, metodos para estimar los tamanos de man-adas de mamiferos marinos, caracteristicas de las operaeiones y artes de pesea, y el protoeolo y seguridad a bordo de los buques.
Programa Nacional de Observadores de Venezuela
En octubre de 1999 Venezuela anunei61a creaei6n del Programa Nacional de Observadores (PNOV), auspiciado por la Fundaci6n para la Pesea Sostenida y Responsable de Tunidos (FUN-DATUN). 5e llev6 a cabo un curso de entrenamiento de observadores en noviembre de 1999, con el objetivo de cubrir aproximadamente el 25% de los viajes de buques venezolanos a prineipios de 2000. La CIAT y el PNAAPD de Mexico brindaron apoyo logistico al PNOV.
Informes de observadores desde el mar
En el Articulo V (2) del Acuerdo sobre el Programa lnternaeional para la Conservaci6n de los Delfines (APICD) se dispone que se establezcan !imites anuales de mortalidad de delfines por poblaci6n. A fin de que el seguimiento de la mortalidad este al dia, y tambien para lograr un seguimiento mejor de la captura acumulativa de los principales especies de atun en el OPO, las Partes del APICD aprobaron el lnforme Desde el Mar, que los observadores enviarian por fax desde el buque a la ofieina del programa respectivo cada semana.

149 INFORME ANUAL 1999
INVESTIGACION�
COMPARACION DE ESTlMACIONES DE OBSERVADORES Y PESCADORES DE LA CAPTURA DE ATUN PATUDO
Las estimaciones de las capturas de atun patudo provienen de tres fuentes: los registros de los observadores, los cuadernos de bitacora de los buques, y los datos de pesos descargados por procesadores (principalmente enlatadoras). Las estimaciones del peso capturado en un lance reg-istradas en los cuadernos de bitacora a menudo incluyen mas que una especie, pero no estiman los pesos de las especies por separado. Ademas, los procesadores a veces no distinguen entre aleta amarilla y patudo en los datos de descarga, registrando descargas que contienen las dos especies como de una u otra especie solamente. Los datos disponibles el 27 de septiembre de 1999 com-prenden 351 viajes realizados por buques cerqueros de la Clase 6 en 1998 y 1999 para los cuales se disponia de datos del observador, de la bitacora, y de la descarga. En 14 de estos viajes se repor-taron en la bitacora capturas de patudo mezclado con aleta amarilla 0 barrilete, y se reportaron capturas de patudo en los registros del observador y en los datos de descarga.
5e reportaron capturas de patudo en 170 de los 351 viajes (153 de los registros de obser-vadores y 159 de los registros de descarga) (Tabla 11). En 142 casos se reportaron capturas de patudo en los registros del observador y en los datos de descarga tambien. Para 97 de los 170 viajes (57%), la estimacion del observador de la captura de patudo fue mayor que la estimacion de descarga. Las estimaciones de los observadores en estos 170 viajes fueron, en promedio, 45 toneladas mayores que las estimaciones de descarga, con diferencias (estimacion del observador menos estimacion de descarga) de entre -372 y 622 toneladas.
5e reportaron capturas de patudo en los datos de descarga para 145 de los 337 viajes para los que se reportaron capturas por especie en la bitacora (351 menos los 14 viajes para los que se reportaron las capturas de patudo en la categoria de especies mixtas) (Tabla 11). En 99 de estos viajes se reporto patudo en la bitacora tambien. No hubo ninglin viaje en el que se reporto patudo en la bitacora pero no en los datos de descarga. En 88 de los 145 viajes (61%) la estimacion en la bitacora de la captura de patudo fue inferior a la estimacion de descarga. Las estimaciones de bitacora de estos 145 viajes fueron, en promedio, 35 toneladas inferiores a las estimaciones de descarga, con diferencias (estimacion de bitacora menDs estimacion de descarga) de entre -636 y 497 toneladas.
Queda claro a partir de estas comparaciones que, en promedio, cuando los observadores, pescadores, y procesadores identifican patudo en la captura, las capturas estimadas por los obser-vadores son mayores (Figura 12a), y aquellas estimadas por los pescadores menores, que las esti-maciones de descarga (Figura 12b).
DESCARTES Y CAPTURAS INCIDENTALES EN LA PESQUERIAATUNERA CON RED DECERCO
A fines de 1992 los observadores de la CIAT comenzaron a reunir informacion sobre los descartes y las capturas incidentales en las operaciones de pesca con red de cerco, y el programa continuo en 1999. En el presente informe "capturas" significa pescado retenido a bordo del buque pesquero, "descartes" los atunes de importancia comercial (aleta amarilla, barrilete, patudo, aleta azul, y albacora) desechados muertos en el mar, "capturas incidentales" los peces u otros ani-males, aparte de los atunes de importancia comercial, desechados muertos en el mar, y"capturas totales" la suma de estas tres categorias. Durante 1999 se revisaron los datos reunidos en los aiios anteriores y se modificaron en casos apropiados. En la Tabla 12 se presenta informacion

150 COMISION DEL ATUN
sabre la cobertura de lances sobre atunes asociados con delfines yean objetos flotantes y sobre cardumenes de atunes no asociados. La Columna 3 de esta tabla detalla el numero de lances en la base de datos de la CIAT para los cuales se registraron datos de capturas incidentales y descartes, y la Columna 4 el mimero de lances en la base de datos Atun-Delfin de la CIAT, mas datos equivalentes recabados pOl' el Servicio Nacional de Pesquerias Marinas (NMFS) de Estados Unidos y el Programa Nacional de Aprovechamiento del Atun y Protecci6n de Delfines (PNAAPD) de Mexico. (El mimero de lances para 1993, 1998, Y1999 en la Columna 4 de esta tabla concuerda con los valores correspondientes a buques de la Clase 6 en la Tabla 5 porque los buques menores no llevaron observadores en esos arras. Algunos buques de la Clase 5 llevaron observadores en 1994-1997, pOl' 10 que algunos de los valores de esos arros en la Tabla 12 son mayores que los val-ores correspondientes en las columnas de Clase 6 en la Tabla 5.) La cobertura de buques con observadores es incompleta, pero suficiente para la mayoria de los fines estadisticos.
Se estimaron los descartes y capturas incidentales en viajes acompafiados pOl' observadores como sigue:
DESCARTES = (descartellance) x LANCES y
CAPTURAS INCIDENTALES = (captura incidentalilance) x LANCES,
donde DESCARTES y CAPTURAS INCIDENTALES =descartes y capturas incidentales en todos los viajes can observador a bordo, descartellance y captura incidentalilance =descartes y capturas incidentales pOl' lance en todos los lances en los que observadores de la CIAT tomaron datos sobre descartes y captura incidental, y LANCES =todos los lances en viajes con observador a bordo (Tabla 12, Columna 4). Estas estimaciones son mas bajas de 10 que serian si se incluyeran datos de buques mas pequerros, que pescan casi exclusivamente sobre atunes no asociados y objetos flotantes.
Patrones de esfuerzo de pesca por tipo de lance
En la Tabla 5 se detalla el numero estimado de lances realizados sobre atunes asociadas con delfines, sobre atunes asociados can objetos flotantes, y sobre cardumenes de atunes no asociados. Se distinguen dos tipos de objetos flotantes, dispositivos para agregar peces ("plantados") y objetos naturales ("despojos"). Los plantados son colocados en el agua pOl' los pescadores para atraer a los peces; los despojos incluyen toda clase de desperdicios, de origen natural 0 humano, y tambien barcos y boyas meteoro16gicas ancladas y a la deriva. En los ultimos afios se ha desarrollado una pesqueria de atunes asociados can plantados, principal-mente al sur de lOON. Ya que el uso de plantados es un fen6meno nuevo en la pesqueria, es importante darle seguimiento para saber sus caracteristicas principales, las zonas en que ocurre, y la composici6n pOl' especies de las capturas, descartes, y capturas incidentales. Se describen brevemente estas caraeteristicas en esta secci6n. No se incluyen datos de arros anteriores a 1996 en las figuras porque la zona ocupada porIa pesqueria sobre atunes asociados con objetos flotantes era entonces mucho mas restringida.
En las Figuras 13a y 13b se ilustra la distribuci6n de los lances sabre objetos naturales y despojos, respeetivamente, pOl' buques de la Clase 6 durante 1996-1999. Se realizaron muchos mas lances sobre plantados que sobre despojos. Los lances sabre despojos ocurren principalmente al este de 82°0 y en el extremo sur de la pesqueria frente a Peru. Los plantados son usados prin-

151 INFORME ANUAL 1999
cipalmente en dos bandas latitudinales, una entre la linea ecuatorial y 7°N (la "banda norte"), y la otra entre la linea ecuatorial y 12°8 (la "banda sur"), con una espacio entre las dos, debido prob-ablemente por el flujo hacia oriente de la Contracorriente Ecuatorial.
En la Tabla 13 se detallan las proporciones de los lances sobre objetos flotantes realizados sobre plantados durante 1993-1999; el aumento en la proporci6n de lances sobre plantados coin-cidi6 con un desplazamiento del esfuerzo de zonas costeras hacia alta mar.
Descartes de atunes: patrones espaciales y temporales
Hay varias razones para descartar atun capturado: puede ser demasiado pequeno para ser procesado, puede estropearse en la red durante un lance largo, la cantidad capturada puede no caber en las bodegas, etc. La mayoria de los descartes consiste de pescado demasiado pequeno para ser procesado. Es importante cuantificar y describir los patrones de los descartes, porque se deberia usar la captura total, y no s610 la captura retenida, en las evaluaciones de la condici6n de los stocks.
En las Figuras 14a y 14b se ilustran las distribuciones de las capturas y descartes, respec-tivamente, de aleta amarilla en lances realizados en asociaci6n con objetos flotantes durante 1996-1999. Las capturas de aleta amarilla fueron maximas en la banda norte frente a Peru, pero relativamente bajas. Los descartes de la especie fueron maximos en la banda norte, y consider-ablemente menores en las zonas costeras.
En las Figuras 15a y 15b se ilustran las distribuciones de las capturas y descartes, respec-tivamente, de barrilete en lances realizados en asociaci6n con objetos flotantes durante 1996-1999. Ya que el barrilete es el blanco principal de la pesqueria sobre objetos flotantes, la distribuci6n de las capturas es similar a la del esfuerzo.
En las Figuras 16a y 16b se ilustran las distribuciones de las capturas y descartes, respec-tivamente, de patudo en lances realizados en asociaci6n con objetos flotantes durante 1996-1999. Las capturas de patudo fueron maximas en las bandas norte y sur. La zona de la Corriente de California, en la secci6n norte, produjo solamente capturas insignificantes de patudo. La dis-tribuci6n de los descartes de patudo fue mas limitada, y concentrada en la banda norte, especial-mente entre 95° y 115°0.
Estimaciones anuales de las capturas y descartes de atunes
En las Tablas 14a, 14b, y 14c se detallan las capturas totales medias por lance, los descartes medios por lance, las proporciones de descartes/capturas totales, y los descartes totales estimados, respectivamente, de aleta amarilla, barrilete, y patudo en el OPO durante el periodo de 1993-1999. Casi todos estos valores y estimaciones variaron considerablemente entre anos. Las diferencias interanuales en las capturas totales podrian ser debidas a diferencias en la abun-dancia de los peces y/o diferencias en las zonas de pesca, junto con diferencias en la cantidad de las distintas especies en distintas zonas. Las diferencias interanuales en los descartes podrian ser debidas a diferencias en las practicas de retenci6n de pescado, diferencias en el reclutamiento, y/o diferencias en las zonas de pesca, junto con diferencias en la cantidad de peces de menor tamano en las distintas zonas.
En esta tabla se resume la informaci6n en las Tablas 14a, 14b, y 14c:

152 COMISION DEL ATUN
Captura total media por lance Descartes por lance (ton) (ton)
Tipo de lance Rango Promedio Rango Promedio Aleta amarilla Delphin 15-19 17
Objeto flotante 5-10 6 0,5-1,5 0,9 No asociado 8-13 10 0,1-0,3 0,2
Barrilete Objeto flotante 20-43 26 4-6 5 No asociado 3-11 5 0,1-0,7 0,3
Patudo Objeto flotante 4-14 10 0,3-1,4 0,9 No asociado 0,2-0,7 0,4
Capturas incidentales de atras especies
De las especies capturadas incidentalmente en la pesqueria atunera cerquera, hay algunas, ademas de los delfines, de vida larga, comienzo tardio de la madurez sexual, mimero pequeno de crias, y/o periodos de gestacion prolongados. Araiz de estas caracteristicas del ciclo vital, la capacidad de estas especies de soportar una explotacion intensiva es inferior a la de las especies con potencial reproductor mayor. EI grupo incluye los tiburones, rayas, peces picudos, y tortugas marinas (en 10 sucesivo TRPTM). Para permitir sintetizar la informacion sobre el impacto de la pesqueria, se sumo el mimero de individuos de todas las especies en este grupo. Esta combinacion de unidades heterogeneas no es deseable de una perspectiva de conservacion u ordenacion, pero como primer paso brinda una aproximacion de las distribuciones espacial y tem-poral del impacto de la pesqueria. En el futuro sea quiza posible desarrollar indices que atribuyan distintas ponderaciones a las distintas especies, con base en su condicion, etc. Debido a la predominancia numerica de los tiburones en las capturas incidentales de los TRPTM, los resultados generales de esta agregacion de especies son similares a los de los tiburones sola-mente, pero en ciertos estratos de zona-tiempo son notablemente diferentes.
En la Figura 17 se ilustran las capturas incidentales acumuladas de TRPTM durante 1996-1999. Las zonas con los valores mas elevados son similares a aquellas con los mayores mimeros de lances sobre objetos flotantes (Figuras 13a y 13b), pero los datos indican unos puntos intere-santes. En primer lugar, las capturas incidentales de TRPTM son menores en la banda sur que en la banda norte. En segundo lugar, a 10 largo de ambas bandas las capturas incidentales en alta mar suelen ser menores que en la zona costera. En tercer lugar, las capturas incidentales en las zonas del norte del Ecuador, del norte de Peru, y la Corriente de California de alta mar son importantes, pero no tanto como las de la banda norte. En cuarto lugar, hay capturas inciden-tales sustanciales en algunas zonas costeras.
En la Figura 18 se ilustran las proporciones de las capturas incidentales de los TRPTM a las capturas de las tres especies principales de atun durante 1994-1998. Esta proporcion indica el "costo ecologico" (medido en terminos de los TRPTM solamente) de la pesca de atunes en varias zonas. Estos datos indican que las proporciones son maximas en alta mar al norte de 7°N y en varias zonas costeras mucho mas pequenas, entre elIas la zona al este de 80°0 (al norte de Ecuador), frente al norte de Peru, alrededor de la punta de Baja California, y frente al Golfo de Tehuantepec.
Acontinuacion se comentan algunas de estas especies en mayor detalle.
Marlin azul
La mayoria de las capturas incidentales de marIfn azul ocurren frente al norte de Peru, frente al norte de Ecuador, y en la banda norte (Figura 19). La captura incidental media anual

153
162
INFORME ANUAL 1999
de la especie durante 1996-1999 se cifro en 813 individuos, e180% de los cuales provino de lances sobre objetos f10tantes Onforme Anual de la CIAT de 1998: Tabla 40).
Thrtugas marinas
Las capturas incidentales de tortugas marinas durante 1993-1999 fueron como sigue:
1993 1994 1995 1996 1997 1998 1999 151 117 146 152 135 170
tortugas marinas capturadas en 1999, 108 fueron golfinas (Lepidochelys olivacea), 13 fueron de otras especies, y 41 fueron de especie no identificada. En la Figura 20 se ilustra la ubicacion de las capturas incidentales de tortugas marinas durante 1996-1999. Varias ocurrieron cerca de playas de anidacion.
Mantarrayas
Los buques cerqueros atuneros capturan dos generos de mantarraya, Manta y Mobula, en el OPO. En la Figura 21 se ilustra la ubicacion de las capturas incidentales de mantarraya durante 1996-1999. La distribucion de mantarrayas es mas restringida que la de cualquier otra especie comentada en este informe. La mayor concentracion ocurrio cerca del Domo de Costa Rica, con otras concentraciones frente al Golfo de Tehuantepec y al este de 82°0.
CRECIMIENTO DEL ATUN BARRILETE
Fueron analizados de nuevo datos obtenidos de experimentos de marcado iniciados durante 1953-1958 y 1969-1981 para el atun barrilete en zonas costeras del Oceano Pacifico oriental (OPO), usando el modelo generalizado de crecimiento de Schnute (Canad. Jour. Fish. Aquatic Sci., 38 (9): 1128-1140). El objetivo fue proveer informacion util para generar una matriz de transicion de crecimiento para uso en un modelo de dinamica de poblacion por talla para el atun barrilete en el OPO. El anaIisis incluyo metodos estadisticos para incorporar variabilidad individual en el crecimiento como funcion de la talla de liberacion y tiempo en libertad, error de medicion, y error de transcripcion. Se dividieron los datos de marcado en regiones norte y sur, y los resultados sefialan diferencias entre las tasas de crecimiento de las dos regiones. El modelo de Schnute se ajusta a los datos de forma significativamente mejor que el modelo de von Bertalanffy, un sub-modelo del modelo de crecimiento de Schnute, en la region del norte, pero no en la del sur. La mejor descripcion de la variacion individual en el crecimiento es como funcion de tiempo en lib-ertad y como funcion de incremento de crecimiento para las regiones norte y sur, respectivamente. El error de medicion forma una parte significativa de la variacion total, pero los resultados sefialan que no causa ningtin sesgo. So necesarios datos adicionales de devoluciones de marcas, particularmente para peces grandes y pequefios, para poder producir una matriz de transicion de crecimiento adecuada para usar en un modelo de dinamica de poblacion por talla para el atun barrilete en el OPO.
EDAD YCRECIMIENTO DEL ATUN PATUDO
Durante 1999 se realizo un experimento de marcado y recaptura para investigar la utilidad de informacion sobre la tasa de deposicion de microincrementos en los otolitos sagitales de atunes patudo para la estimacion de la edad y el crecimiento. Se describe el experimento en las paginas 239-240 del Informe Anual de la CIAT de 1995. Se inyecta oxitetraciclina en los peces al mar-carlos, y la oxitetraciclina es incorporada en el microincremento en desarrollo al borde del otolito,

154 COMISION DEL ATUN
creando una marca que se puede detectar gracias a su fluorescencia bajo luz ultravioleta. Se puede comparar el mimero de microincrementos entre la marca de oxitetraciclina y el borde del otolito con el mimero de dias en que el pez permanecio en libertad para determinar si se forman los microincrementos a intervalos diarios. El marcado fue realizado cerca de Hawaii conjunta-mente por el Proyecto de Marcado de Atunes de la Universidad de Hawaii y la CIAT.
Durante 1995 y 1996 se marcaron, inyectaron con tetraciclina, y liberaron 1.043 patudos de entre 36 y 105 em de largo, capturados al sudsudoeste de la isla de Hawaii, principalmente con lineas de mana de superficie y currican vertical. Hasta la fecha se han recapturado 130 peces (12,5% del totalliberadol, la mayoria a menos de 120 dias de ser marcados. El periodo maximo en libertad fue unos 832 dias. Se recuperaron los otolitos sagitales de 102 peces (78% del total recapturado). Se selecciono para analisis un subconjunto de otolitos de 46 patudos, de entre 38 y 117 em de talla de recaptura, en libertad entre 9 y unos 832 dias (Figura 22). De estos, 21 estu-vieron en libertad mas de 30 dias. Eran visibles marcas de oxitetraciclina prominentes en 43 (94%) de los otolitos, y en 39 (90%) de estos se pudo asignar la marca a un solo microincremento.
Se contaron bajo microscopio de luz a 900x los microincrementos en la superficie entre la marca fluorescente y el borde del otolito, a 10 largo del eje primordio-postrostro desde la marca de tetraciclina hasta la punta del postrostro. Si no se podian distinguir los microincrementos se graM el otolito con acido clorhidrico, aplicado con un pincel fino. El ancho de los microincre-mentos, medido en la superficie de los otolitos del especimen de mayor tamaiio recuperado, 117 em, osci16 entre 2y 6fl, con un promedio de unos 4fl. La potencia de resolucion teorica del micro-scopio usado es 0,2 fl.
Inicialmente se seleccionaron cinco parejas de otolitos para elaborar los criterios de 10 que constituye un incremento. Luego se comparo el mimero de microincrementos contados en 10 parejas de otolitos. Una prueba de T emparejada no indica ninguna diferencia significativa entre el otolito derecho e izquierdo, por tanto se uso indistintamente subsecuentemente el otolito derecho 0 izquierdo en los analisis. Se asignaron codigos a las 46 parejas de otolitos utilizados en los analisis, y al contar los microincrementos la persona que 10 hacia no sabia el mimero de dias en libertad. Se conto cinco veces el mimero de microincrementos en cada otolito, y la estimacion final fue el promedio de los resultados.
Un analisis del coeficiente de regresion, de una regresion lineal ponderada, no rechazo la hipotesis nula de que la tasa media de deposicion del mimero de microincrementos formados en estos otolitos es uno por dia (Figura 23). Los resultados del experimento indican que los atunes patudo de entre 38 y 117 em de largo producen microincrementos en los otolitos sagitales a inter-valos diarios, y que los criterios adoptados para identificar estos microincrementos en la super-ficie del otolito son validos. Si se supone que la tasa de deposicion de microincrementos es la misma en patudos de menos de 40 em, el numero de microincrementos en los otolitos sagitales proporcionaria una estimacion precisa de la edad absoluta en dias. Se realizaran mas estudios de la tasa de deposicion de microincrementos en patudos mas grandes y mas pequeiios cuando se presenten oportunidades.
En 2000 se piensa realizar un muestreo de la captura comercial de atun patudo en el OPO para obtener otolitos sagitales yvertebras caudales, con miras a obtener estimaciones directas de la edad y crecimiento de esta especie.
ESTUDIOS ECOLOGICOS
El personal de la CIAT ha desarrollado un metodo de modelado para investigar las impli-caciones ecologicas relativas de distintas estrategias de pesca en las aguas pelagicas del Oceano
155 INFORME ANUAL 1999
Pacifico oriental (OPO) tropical. Los niveles mas altos de la red tr6fica en el oceano abierto incluyen atunes grandes, delfines, tiburones, peces picudos, y otras especies. La pesqueria cer-quera en el OPO esta dirigida principalmente hacia atunes aleta amarilla, patudo y barrilete maduros, pero captura tambien cantidades sustanciales de otros depredadores tope y de atunes juveniles. Las pesquerias dirigidas hacia los depredadores tope pueden potencialmente ejercer un efecto de "arriba-abajo" sobre los ecosistemas marinos, causando cambios reciprocos en el nivel tr6fico inferior adyacente.
Los costas eco16gicos de la pesca son complejos, debido a la dependencia de tamafio de las interacciones depredador-presa y la dinamica de la pesqueria. La composici6n por especies y mag-nitud de las capturas, capturas incidentales y descartes son diferentes para las tres modalidades de pesca usadas en la pesqueria con red de cerco (sobre delfines, objetos flotantes, yatunes no aso-ciados). (En este informe "captura" significa solamente las capturas retenidas a bordo del barco, "capturas incidentales" especies no objetivo descartadas en el mar, y "descartes" especies objetivo (aleta amarilla, patudo, barrilete, aleta azul, y albacora) descartadas en el mar.) Los compo-nentes de un ecosistema son interdependientes mediante interacciones depredador-presa y com-petitivas. No se entienden los efectos sobre la red tr6fica de extraer atunes y depredadores asociados. Una evaluaci6n adecuada de la condici6n de un ecosistema requeriria una evaluaci6n y seguimiento de todas las especies principales. Los datos de pesca disponibles para la mayoria de las especies no objetivo son insuficientes, los estudios cientificos en el mar son caros y ocupan mucho tiempo, y dar seguimiento a las capturas, composici6n por tamafio del pescado capturado, etc., es probablemente impractico. La mejor alternativa, en este momento, es desarrollar modelos que representen el ciclo vital de los elementos principales del ecosistema y describir c6mo fluye la biomasa entre los mismos, con base en la mejor informacion disponible.
En su 58" reuni6n, celebrada en junio de 1997, la CIAT establecio el Grupo de Trabajo sobre Capturas Incidentales en las Redes de Cerco para examinar la cuestion de capturas incidentales y descartes de todas especies tomadas en la pesca atunera cerquera del OPO. Uno de los terminos de referencia del grupo de trabajo es "definir las relaciones entre las especies objetivo de la pesca y aquellas capturadas incidentalmente, con referencia especial a la sustentabilidad de las cap-turas de todas estas especies." Del 26 al 28 de abril de 1999 el grupo de trabajo celebro en La Jolla, California, una reunion tecnica para considerar estudios y modelado eco16gicos. Uno de los objetivos principales de la reunion era evaluar un modelo de ecosistema que estaba desarrollando el personal de la CIAT, y determinar si valian otros metodos alternativos.
Miembros del personal de la CIAT presentaron una sintesis de la variedad de informacion requerida para el modelado de ecosistemas en general, y estimaciones de estos parametros para las aguas pelagicos del OPO tropical. Modelos de estado estacionario requieren la informacion siguiente: 1) definiciones de los componentes importantes de la red de alimentacion, inclusive ontogenia trofica en casos aplicables; 2) vinculos depredador-presa (composicion de la dieta); 3) estimaciones de las tasas de consumo 0 requerimientos energeticos de depredadores; 4) estima-ciones de biomasa y productividad de presas; y 5) otras extracciones del sistema (es decir, cap-turas, capturas incidentales, descartes, y emigracion). Requisitos adicionales para modelos dinamicos incluyen informacion (es decir, parametros de reproduccion, reclutamiento, y cre-cimiento y relaciones peso-talla) necesaria para evaluar la transicion de grupos ontogeneticos grandes a pequefios del mismo grupo taxonomico y series de tiempo de extracciones del sistema. Otra informacion util que todavia no se ha incorporado para el modelado del ecosistema del OPO tropical incluye la heterogeneidad espacial de depredadores y presas, los patrones estacionales de varios parametros, el reciclaje, y cambios de dieta. Los conocimientos de la mayoria de estos ultimos factores para el OPO son limitados.
156 COMISION DEL ATUN
EI modelo de ecosistema para las aguas pelagicas del OPO tropical tiene 36 componentes (Tabla 15b). Estos incluyen las principales especies explotadas (por ejemplo, los varios atunes), grupos funcionales (por ejemplo, tiburones), especies amenazadas (por ejemplo, tortugas marinas), y grupos ontogeneticos para especies grandes (por ejemplo, marlines). En general, la resolucion taxonomica del modelo es mas fina en los niveles troficos superiores, y los niveles medianos ybajos contienen la mayor parte de la biomasa del sistema (Tabla 15b). Tres de los componentes-ballenas barbadas, pez espada, yatlin aleta azul, depredadores que no residen en el OPO pero que pasan por los extremos septentrionales de la zona del modelo en ciertas epocas del ano-fueron anadidos al modelo de conformidad con las recomendaciones del Grupo de Trabajo.
Se desarrollo el modelo de ecosistema usando Ecopath with Ecosim (EwE) (Christensen, v., C.J. Walters, y D. Pauly. Ecopath with Ecosim: a User's Guide, edici6n de octubre de 2000. Centro de Pesquerias, Universidad de Columbia Britanica, Vancouver (Canada), e ICLARM, Penang (Malasia)). Fue seleccionado porque los participantes en la primera reunion del Grupo de Trabajo, celebrada el 8 y 9 de julio de 1998, reconocieron que el modelo de estado estacionario Ecopath, en combinaci6n con el modelo dinamico Ecosim, brinda un punto de partida liti! para modelar la dinamica de comunidades, dado el amplio uso del metodo y que requiere que los analisis incluyan todas las partes de un sistema. La informacion necesaria para parametrizar el modelo incluye, para cada componente del modelo, estimaciones de la composicion de la dieta, biomasa, razon pro-duccion/biomasa (P /B), razon consumo/biomasa (Q /B), y eficacia ecotr6fica (EE). Ecosim usa la solucion de estado estacionario de Ecopath, incorpora dependencia de densidad, y proyecta al futuro trayectorias simuladas de la poblacion. Ecosim proporciona una herramienta para explorar cambios hipoteticos en la explotacion de pesquerfas mediante simulaciones dinamicas.
El Grupo de Trabajo recomendo varias prioridades a corto plazo para revisar y calibrar el modelo para el OPO. Estas incluyen: 1) anadir grupos del modelo para los depredadores que pasan por los extremos septentrionales de la zona del modelo en ciertas epocas del ano; 2) definir de nuevo la zona del modelo (considerando, por ejemplo, provincias oceanicas 0 la zona principal de la pesqueria de superficie); 3) incorporar datos recientes sobre capturas incidentales y descartes para la pesqueria palangrera; 4) incorporar metodos alternativos para estimar la biomasa de especies capturadas incidentalmente; 5) comparar estimaciones previas de la van-abilidad del reclutamiento del atlin aleta amarilla en el OPO con aquella producida por el modelo; 6) realizar un analisis de sensibilidad comprensivo; 7) evaluar la importancia relativa de influ-encias ambientales sobre el ecosistema del OPO; y 8) comparar el modelo del OPO con uno basado en una cadena alimenticia mas corta tipica de sistemas de afloramiento. Varios de estos fueron llevados a cabo durante 1999, y se realizaran analisis adicionales durante 2000.
Se realizo una evaluacion adicional del modelo de ecosistema del OPO en dos reuniones patrocinadas por el Centro Nacional para Analisis y Sintesis Ecologicos (NCEAS) en Santa Barbara (California) del 24 al 26 de junio y del 30 de noviembre al 2 de diciembre de 1999. El NCEAS, organismo subvencionado por la Fundaci6n Nacional para la Ciencia de EE.UU. yel Estado de California, pagara una serie de reuniones en los dos proximos anos para ayudar en el desarrollo y evaluacion del modelo EwE para el OPO. En la reunion de junio se realiz6 una eval-uacion preliminar de las implicaciones del efecto del clima sobre la dinamica del ecosistema de las aguas pelagicas del OPO tropical, y se profundizo en una reunion subsecuente patrocinada por la CIAT y celebrada en La Jolla del 30 de agosto all de septiembre de 1999. Una de las formas en las que el ambiente fisico afecta la dinamica del ecosistema es al inducir variaci6n en la pro-duccion primaria en la base de la red tr6fica. El OPO tropical es fuertemente afectado por los eventos de El Nino y La Nina, y los eventos ocurridos durante 1998 y 1999 figuran entre los mas fuertes jamas registrados. Sobre una gran porcion del OPO tropical se reduce la concentracion

157 INFORME ANUAL 1999
de clorofila durante eventos de El Nino y se incrementa durante los episodios de La Nina. Afin de simular variaciones a escala de El Nino y La Nina en la biomasa de productores en el modelo de ecosistema, los participantes en la reunion construyeron un modelo empirico que relaciona las anomalias en la temperatura superficial del mar (TSM) con las concentraciones de clorofila en la superficie, un indice de biomasa de fitoplancton. Se desarrollo este modelo sobre la base de anomalias de las TSM NIN03 y tres conjuntos de datos de pigmento de fitoplancton tomados por buques y por satelite durante eventos calidos y frios recientes. (La TSM NIN03 es la temper-atura superficial media mensual en el Pacifico oriental ecuatorial, 5°N-5°S y 150°-90°0, obtenida de NOAA, Servicio Meteorologico Nacional, Centro de Prediccion de Clima, EE.UU.) Estas anomalias y datos sugieren que, en promedio, ellogaritmo de la concentracion de pigmento (mg m-3) cambia aproximadamente -0,047/°C, equivalente a un cambio de un 11%. Los participantes en la reunion usaron series de tiempo de las anomalias de las TSM para especificar trayectorias de la biomasa de productores, y simularon los efectos sobre el ecosistema de (1) pulsos sencillos positivos (tipo La Nina) y negativos (tipo El Nino) en la biomasa de productores, (2) ciclos regu-lares calentamiento-enfriamiento en la biomasa de productores, y (3) una serie de tiempo de la biomasa de productores predicha suponiendo un calentamiento por efecto invernadero en el siglo 21. Los pulsos en la biomasa de productores en el modelo de ecosistema afectaron los componentes en los niveles troficos medianos (peces de forraje y cefalopodos) mas que los depredadores tope. Durante 2000 se continuara desarrollando el analisis del papel de los procesos fisicos de "abajo-arriba" sobre la dinamica del ecosistema en el OPO tropical.
Tal como se comento anteriormente, el objetivo de esta investigacion es llegar a un mejor conocimiento de las implicaciones ecologicas relativas de distintas estrategias de pesca en aguas pelagicas del OPO tropical. El analisis de los efectos del clima sobre el ecosistema forma la base para la evaluacion de los efectos ecologicos de la pesca porque los efectos "arriba-abajo" de la pesca sobre los ecosistemas marinos ocurren sobre la variabilidad de fondo impuesta en el sistema por procesos de "abajo-arriba" que resultan de cambios fisicos en el medio ambiente. El modelado en 2000 se enfocara en la exploracion de los efectos de la pesca sobre el ecosistema que no son ocul-tados por esta variacion ambiental y podrian ser detectados.
ESTUDIOS DEL CICLO VITAL TEMPRANO
Desde hace ya muchos anos los biologos pesqueros creen que la fuerza de una clase anual se ve determinada principalmente durante las etapas tempranas del ciclo vital (huevo, larva, y/o juvenil temprano). Decadas de investigacion han descubierto una cantidad considerable de infor-macion sobre las poblaciones de atunes adultos, pero se sabe relativamente poco acerca de las etapas tempranas del ciclo vital y los factores que afectan el reclutamiento de los juveniles a los stocks explotables. Estas consideraciones motivaron a la CIAT a establecer en la Bahia de Achotines, en la Republica de Panama, un centro de investigacion dedicado al estudio del ciclo vital temprano de los atunes.
La Bahia de Achotines esta situada en la punta sur de la Peninsula de Azuero en la Provincia de Los Santos, Republica de Panama (Figura 22). La plataforma continental es bas-tante estrecha en este lugar: el contorno de 200 metros se encuentra a entre solamente 6 y 10 km dellitoral. Esto brinda a los cientificos dellaboratorio acceso facil a aguas oceanicas donde ocurre desove de atunes en cada mes del ano. La temperatura superficial del mar fluctua entre 21° Y 29°C. El agua de la Bahia de Achotines es adecuada para mantener atunes vivos en ellabora-torio. La proximidad dellaboratorio al area de estudio ofrece una alternativa menos costosa que un buque de investigacion, y permite una mayor flexibilidad en el muestreo.

158 COMISION DEL ATUN
EI programa de la CIAT de investigaci6n de las etapas tempranas del ciclo vital abarca estudios de laboratorio y de campo ideados para obtener un mayor conocimiento de los procesos de reclutamiento y de los factores que 10 afectan. Investigaciones anteriores del reclutamiento de los peces sugieren que tanto los factores abi6ticos (temperatura y salinidad, por ejemplo) como los bio16gicos (alimentaci6n, depredaci6n, etc.) pueden afectar el reclutamiento. Ya que la super-vivencia antes del reclutamiento es controlada probablemente por una combinaci6n de estos fac-tores, el programa de investigaci6n toma en cuenta la interacci6n entre el sistema bio16gico y el ambiente fisico (Informe de Datos 9 de la CIAT).
Proyecto conjunto OFCF-Panama-CIAT
En diciembre de 1993, la Overseas Fishery Cooperation Foundation (OFCF) del Jap6n, el gobierno de la Republica de Panama, y la CIAT acordaron emprender un proyecto conjunto de cinco mios de duraci6n, subvencionado principalmente por la OFCF, en el Laboratorio de Achotines. En 1998 se extendi6 el proyecto dos anos mas, y en 1999 se acord6, en principio, que sena financiado hasta marzo de 2001. Los objetivos del proyecto son: (1) criar atunes aleta amar-illa adultos para suministrar larvas y juveniles para la investigaci6n de su ciclo vital temprano; (2) producir organismos de alimento para los atunes larvales y juveniles; y (3) criar pargos (Lutjanidae) y corvinas y especies afines (Sciaenidae) reproductores y organismos de alimento para sus larvas y juveniles.
Fue necesario ampliar y mejorar la infraestructura del Laboratorio para poder llevar a cabo los objetivos del proyecto. En 1999 se construy6 un tanque de hormig6n adicional. Las dimensiones y capacidades de los tanques son:
Tanque Diametro (metros) Profundidad (metros) Capacidad (litros) 1 17,0 6,0 1.361.900 2 8~ 3,0 170.200 3 8~ 1,5 85.100 4 ~5 1,5 85.100 5 8~ 1,5 85.100 6 8,5 3,0 170.200
Durante 1999 se complet6 la construcci6n del nuevo muelle de hormig6n y la nueva rampa para barcos en la Bahia de Achotines; reemplazan el muelle y la rampa pequenos construidos hace muchos anos. Con esta nueva instalaci6n es mucho mas facil botar barcos a y sacarlos del agua, y trasladar peces vivos, equipo y gente.
Aletas amarillas reproductores
Se capturaron aletas amarillas de entre 2 y 7 kg en aguas costeras adyacentes al Laboratorio de Achotines para establecer la poblaci6n de reproductores en el mismo. Se desarrollaron protocolos para transportar, trasladar, marcar, pesar, y medir los especimenes recien capturados. Cada uno fue marcado con una marca con microprocesador implantada en la musculatura dorsal e inyectado con oxitetraciclina (OTC) para establecer una marca temporal en los otolitos y vertebras. Las marcas permiten identificar a los peces individuales durante todo el cautiverio, y la inyecci6n con OTC facilita los estudios del crecimiento de los peces. Be sumergi6 a todos los peces en soluciones diluidas de formol y nifurestirenato de sodio, un agente antimicrobiano, durante varias horas para tratar cualquier infecci6n de la piel causada por la captura y traslado.
Durante 1997-1999 se mantuvieron los aletas amarillas colocados en los tanques de

159 INFORME ANUAL 1999
reproductores grande (Tanque 1) y de reserva (Tanque 2) durante 1996. Be esta vigilando la dieta de los reproductores en el Tanque 1 para asegurar que proporcione suficiente energia para soportar tasas elevadas de crecimiento y desove, pero sin causar una deposici6n excesiva de grasa. Be esta usando el comportamiento de alimentaci6n de los peces, combinado con estimaciones de la tasa de crecimiento, como base para determinar las raciones diarias. Be usa informaci6n de analisis de la cantidad de proteina, humedad, grasa, y ceniza en los organismos alimenticios y en los peces reproductores (obtenidos de peces muertos 0 sacrificados) para ajustar el alimento. Los organismos alimenticios incluyeron calamares (Loligo spp.), anchovetas (Cetengraulis mysticetus), machuelos (Opisthonema spp.), y anchoas Anchouia macrolepidota, con suplementos de vitaminas y bilis en polvo. Varios especimenes de cada grupo taxon6mico usado de alimento fueron secados, homogeneizados, y analizados por un laboratorio en Aguadulce (Panama) para determinar las cantidades de estos componentes que contienen. En promedio, las anchovetas con-tienen un 64% mas de calorias, y los machuelos un 116% mas, que los calamares. Ajustando las cantidades y proporciones de calamar y pescado en la dieta, se mantiene la cantidad de alimento en un nivel suficientemente alto para evitar actividad frenetica al alimentarse los peces, pero sin rebasar demasiado los requisitos para el metabolismo, crecimiento, reproducci6n, y perdidas por desperdicios. Durante 1999 los reproductores en el Tanque 1 fueron alimentados a un nivel de alrededor del 2 al 4% de su peso por dia. Durante el ano se analiz6 la composici6n de dos aletas amarillas que murieron en Tanque 1; parecian estar en buenas condiciones, y la deposici6n de grasa no parecia excesiva.
A mediados de agosto fueron transferidos al Tanque 1 14 aletas amarillas j6venes para reabastecer la poblaci6n reproductora, reducida a cinco peces, todos del grupo inicial en el tanque desde 1996. Fueron identificados por su mimero de marca, medidos, pesados, e inyectados con oxitetraciclina antes de ser introducidos en el tanque. Bu talla vari6 de 74 a 89 em y su peso de 8 a 15 kg. Al fin del ano habia 16 aletas amarillas en el tanque, 4 del grupo inicial de 1996 y 12 de los 14 transferidos en agosto. Durante el ano murieron 6 peces del grupo inicial y 2 del grupo mas joven, uno a causa de inanici6n y 7 como resultado de golpes con la pared del tanque. Be ajus-taron modelos de crecimiento a los datos de talla y peso de los aletas amarillas en el momento de ser introducidos en el tanque y al morir 0 ser sacrificados, y se calcularon estimaciones diarias de la talla y peso a partir de los modelos. La talla y peso estimados de los dos grupos de peces en el Tanque 1 al fin del ano fueron:
Talla (em) Peso (kg) Promedio Rango Promedio Rango
Peces grandes 147 146-149 76 74-78 Pecesj6venes 94 88-101 17 14-22
Be estim6 la biomasa en el Tanque 1 al fin de ano en 0,37 kg/m3, algo inferior al nivel objetivo original de 0,50 kg/m3 para la poblaci6n reproductora.
Be mantuvieron los aletas amarillas en el Tanque 2 en reserva para incrementar la poblaci6n de reproductores en el Tanque 1 en caso necesario. Durante 1999 se sigui6 capturando atunes aletas amarillas pequenos en aguas costeras cerca del Laboratorio. La intenci6n era usar los peces para reemplazar a los reproductores muertos y para experimentos futuros que com-pararan distintos tipos de alimento para los peces reproductores. Aletas amarillas de entre 3 y 6 kg y 52 y 69 em fueron capturados en el mar con cana y anzuelo y transportados allaboratorio; cada uno fue medido, pesado, inyectado con oxitetraciclina, y marcado con marca de microproce-sador implantada. Al cabo de un periodo de adaptaci6n, se trasladaron los peces al Tanque 2 0 al

160 COMISION DEL ATUN
Tanque 5. Fueron alimentados con una dieta de calamar y arenque a entre el 5 y 8% del peso del cuerpo pOl' dia. En agosto 14 de estos peces fueron trasladados al Tanque 1. AI fin de 1999 la poblacion en el Tanque 2 consistia de 8 peces, de entre 50 y 70 cm y 3 y 7 kg.
Desove de atlin aleta amarilla
Durante 1999 los aletas amarillas en el Tanque 1 desovaron en solamente seis dias entre enero y abril, y a intervalos casi diarios entre mayo y diciembre. La temperatura del agua en el tanque durante la freza vari6 de 25,8 a 28,7°C. El desove tuvo lugar entre las 1620 y 2130 horas, y fue generalmente precedido pOl' comportamiento de cortejo (natacion en pareja, persecuci6n).
El mimero de huevos fertilizados recogido tras cada desove oscilo entre unos 900 y 2.042.000. Se usaron varios metodos para recoger los huevos, entre ellos sifones y salabardos en la superficie y una red de superficie de malla fina.
Para cada evento de desove se registraron los panimetros siguientes: hora de desove, diametro de los huevos, duraci6n de la etapa de huevo, tasa de eclosion, talla de las larvas, y duraci6n de la etapa de saco vitelino. Periodicamente se registro tambien el peso de los huevos y de larvas en etapa de saco vitelino y primera alimentacion y la talla y morfometria seleccionada de larvas en primera alimentacion. Se incorporo esta informacion en una base de datos para un analisis de los parametros de desove y los factores fisicos 0 biologicos que podrian afectar el desove (pOl' ejemplo, temperatura del agua, salinidad, ciclo lunar, tamafio medio de los peces que desovan, y la racion media diaria de los mismos).
Estudios de laboratorio del crecimiento y alimentaci6n de aletas amarillas lar· vales y juveniles
Se realizaron varios experimentos con larvas de aleta amarilla durante 1999. Estan dis-efiados para examinar los efectos de densidad de larvas, tipo de presas, y microturbulencia sobre la incidencia de alimentacion, supervivencia, y crecimiento de las larvas.
Amediados de 1999 se realizo un experimento para examinar los efectos de la densidad de larvas sobre el crecimiento y supervivencia de las larvas de aleta amarilla, similar al estudio de dependencia de densidad, de dos semanas de duraci6n, realizado con larvas de aleta amarilla en 1998. En el experimento de 1999 se mantuvieron larvas a tres densidades distintas en tanques replicados de 1,2 m de diametro dentro de tanques de 1,5 m. Se alimento a las larvas en cada tanque con una dieta secuencial de rotiferos enriquecidos con un suplemento de acido graso (1.500-2.0001L) y nauplios de camaron Artemia spp. igualmente enriquecidos (2501L). La tem-peratura del agua durante el experimento vario de 26,2° a 27,9°C. Se muestrearon las larvas en varias etapas de desarrollo hasta 9 dias despues de la cria (6 dias despues de la primera ali-mentacion); se midio la talla y el peso seco de especimenes frescos, y se conservaron larvas en formol para determinar la incidencia de alimentacion. Un analisis preliminar de los datos de cre-cimiento indico que el crecimiento en talla y peso tendia a depender de la densidad. Las larvas en el tanque con la densidad mas baja crecieron con mayor rapidez que las demas: al cabo de 6 dias de alimentacion eran en promedio entre 7 y 14% mas largas y pesaban de 4 a 48% mas que aquellas en los tanques de densidad mediana yalta, respectivamente. Estos resultados son sim-ilares a los del experimento de densidad de 1998, y confirman el comienzo de crecimiento depen-diente de la densidad en las larvas de aleta amarilla durante las primeras pocas semanas de alimentacion.
Amediados de 1999 se llevo a cabo un experimento de 6 dias de duracion para determinar los efectos de la microturbulencia sobre la alimentacion, crecimiento, y supervivencia de aletas amarillas larvales. EI experimento fue realizado conjuntamente pOl' los Dres. Hideaki Nakata y

161 INFORME ANUAL 1999
Shingo Kimura del Instituto de Investigacion Oceanica de la Universidad de Tokio y pOl' cienti-ficos de la CIAT. Fue similar a un estudio de turbulencia de dos semanas realizado con aletas amarillas larvales en 1998. En el estudio de 1998 se simularon tres niveles de turbulencia (bajo, mediano, y alto) en tanques experimentales. En el estudio de 1999 se simularon cinco niveles de turbulencia (bajo, semibajo, mediano, semialto, y alto) en tanques replicados de 1,2 m de diametro encerrados en tanques de 1,5 m. Se encerraron los tanques pequenos para permitir controlar la temperatura del agua en los mismos. Se controlo la turbulencia en cada tanque mediante el nivel de aeracion, y se midio inicialmente a partir de la velocidad horizontal media de un objeto de capacidad neutra de flotacion en multiples puntos en el tanque. Ademas, se midio a diario la velocidad del agua en cada tanque con un medidor de corrientes microactistico, que mide la velocidad del agua en tres dimensiones simultaneamente. Las mediciones de la velocidad del agua realizadas con este instrumento fueron comparadas periodicamente con otras realizadas con un medidor de corrientes geomagnetico. Se alimento a las larvas inicialmente con rotiferos enriquecidos (SOO-1.000Ilitro), y luego al sexto dia de alimentacion se introdujeron nauplios de camaron Artemia spp. enriquecidos (250Ilitro). La temperatura del agua vario entre 26,6° y 28,2°C durante el experimento. Se tomaron diariamente muestras de las larvas de cada tanque para obtener medidas de la talla y peso seco de especimenes frescos. Otras muestras tomadas diariamente de cada tanque fueron conservadas en formol para usaI' en analisis de los parametros de alimentacion: son medidas, se les extrae el estomago, y se enumera y mide el contenido. Se calculo el ntimero de supervivientes en cada tanque al cabo de 6 dias de alimentacion. Un analisis preliminar de los datos senalo que la supervivencia mas elevada ocurrio con los niveles de turbu-lencia semialto y semibajo. La supervivencia fue tambien elevada en un tanque replicado de tur-bulencia mediana, pero no en el otro, debido probablemente a condiciones de cultivo sub6ptimas desconocidas en ese tanque. La supervivencia fue minima a los niveles de turbulencia bajo y alto: la supervivencia de las larvas alimentandose a los niveles de turbulencia semibajo 0 semialto fue 0,2-0,5 veces mayor y 4-5 veces mayor que la de las larvas alimentandose con turbulencia alta y baja, respectivamente. Estos resultados son consistentes con el patron de supervivencia obser-vado en el experimento de turbulencia de 1998, y confirman que el exito de alimentacion y la supervivencia de las larvas durante la primera semana de alimentacion son marcadamente mas altos a niveles medianos de turbulencia.
Durante 1999 se realizo otro experimento de turbulencia durante un periodo de cinco dias. En este experimento se creo la turbulencia de otra manera, controlando el volumen de agua que entraba en el tanque pOl' el tubo de suministro de agua al fondo del tanque (sin aeracion). Se sim-ularon niveles de turbulencia bajo y alto con este metodo. La temperatura del agua vario entre 26,8° y 28,3°C. Los demas panimetros experimentales y el regimen de muestreo fueron los mismos que en el primer experimento. Se compararon los parametros de crecimiento, super-vivencia, y alimentacion de este experimento con aquellos de los experimentos de turbulencia anteriores.
Se analizaran los datos de turbulencia obtenidos en el experimento con el medidor de cor-rientes y se calculara un rango optimo de energia turbulenta para la supervivencia de las larvas de aleta amarilla. Se compararan los niveles experimentales optimos de turbulencia con datos historicos de mezcla inducida pOl' el viento en el Oceano Pacifico oriental tropical. Si se identif-ican niveles de mezcla pOl' el viento y de turbulencia experimental similares, se compararan con los niveles de reclutamiento de aleta amarilla en los mismos periodos para identificar patrones de asociacion entre la mezcla pOl' el viento y el reclutamiento del aleta amarilla.
Se permitio a los peces que sobrevivieron los experimentos seguir creciendo. Varios grupos de larvas fueron alimentados hasta despues de la metamorfosis juvenil con una dieta de larvas

162 COMISION DEL ATUN
recien criadas y pececillos picados y enteros. Se mantuvo a los juveniles en tanques de 4.800 L y 2,4 m de diametro 0 de 15.900 Ly 3.7 m de diametro. Para el fin del ano algunos habian sobre-vivido 7 semanas despues de la cria.
Estudios de genetica de aletas amarillas cautivos
En agosto de 1999, durante el traslado de nuevos peces reproductores al Tanque 1, se cort6 de cada pez un pequeno pedazo de la pinula dorsal para analisis genetico. Se han tornado mues-tras geneticas de aletas amarillas reproductores y sus huevos y larvas a fin de determinar el grado de variaci6n genetica en los adultos y su cria. Se tomara una muestra para analisis genetico de todo pez reproductor nuevo introducido en la poblaci6n cautiva. Si se conocen los dis-tintos genotipos de ADN mitocondrial de todas las hembras en la poblaci6n de reproductores, sera posible estimar el numero de hembras que contribuye a cualquier evento de desove.
Experimentos de respirometria con aletas amarillas larvales y juveniles
Durante 1999 se realiz6 en el Laboratorio de Achotines, en colaboraci6n con el Dr. Shin Oikawa, del Departamento de Pesca de la Universidad de Kyushu, y el Dr. Takeshi Kanda, del Laboratorio de Investigaci6n Pesquera de la Universidad de Miyazaki, una serie de experimentos para medir las tasas metab6licas de aletas amarillas larvales y juveniles. Se midieron las tasas de respiraci6n, usando dos metodos, de 12 grupos de aletas amarillas larvales y juveniles tem-pranos criados en el Laboratorio. Para el metoda en vivo, se midi6 el consumo de oxigeno de peces vivos encerrados en pequenas camaras a 27°C. Para el metoda in vitro, se usaron electrodos de oxigeno para medir el consumo de oxigeno de tejido picado a 27°C de peces recien muertos. Se fijaron otros especimenes en fijador glutaraldehido al 2,5% para mediciones posteriores de las areas superficiales respiratorias (branquias y piel).
Las tasas metab6licas por masa disminuyeron con aumentos en la masa del cuerpo de 5 a 31 dias despues de la eclosi6n. Distintas fases, identificadas por distintos interceptos de regre-si6n, parecian estar relacionadas con la transici6n de la etapa larval a la juvenil y con la condi-ci6n nutritiva de las larvas. Se comenz6 un analisis de] desarrollo de las estructuras del cuerpo, basado en las muestras conservadas de larvas yjuveniles. Estos estudios contribuiran a la com-prensi6n de la ontogenia de la bioenergetica de los atunes, y ayudaran a evaluar el papel de la adquisici6n de energia en la supervivencia y el reclutamiento.
Desove y cria de corvinas colirrubia y pargos de la mancha
Los estudios de pargos y corvinas son realizados por la Direcci6n General de Recursos Marinos de Panama.
Durante 1996 se capturaron corvinas colirrubia (Umbrina xanti) y pargos de la mancha (Lutjanus guttatus) para establecer poblaciones reproductoras en cautiverio.
Durante 1999 las corvinas reproductoras desovaron entre una y tres veces por semana desde mayo hasta noviembre. Be realizaron varios experimentos con peces en etapas tempranas del ciclo vital. Be usaron los huevos fertilizados para estudiar el efecto de la salinidad sobre las tasas de eclosi6n y el desarrollo de los huevos. Be mantuvo a las larvas durante la metam6rfosis juvenil a fin de examinar las distintas etapas de desarrollo. Durante 1999 se decidi6 reemplazar las corvinas reproductoras restantes con una especie de corvina de tamafio y valor comercial mayores, y a principios de diciembre fueron soltadas en la Bahia de Achotines.
Durante 1999 los pargos de la mancha desovaron entre dos y tres veces por semana desde junio hasta mediados de diciembre. Se tomaron peri6dicamente muestras de huevos y larvas para observar el desarrollo temprano. Ademas, se mantuvo en un tanque de 12.000 Lun grupo de juve-
163 INFORME ANUAL 1999
niles eclosionado en octubre de 1998 con el objetivo de completar el ciclo vital de la especie en cau-tiverio y estudiar los patrones de crecimiento y requisitos de alimentacion de los juveniles. Al fin del trimestre estos peces median entre 30 y 31 em de largo y pesaban entre 450 y 500 gramos.
Durante el ano se capturaron y mantuvieron en el Tanque 3, de 85.100 L, reproductores nuevos de dos especies, corvina blanca (Cynoscion albus) y corvinatas de Stolzmann (C. stolzmani). Al fin del ano habia 10 peces en el tanque. En 2000 se pretende capturar reproductores potenciales de ambas especies, y se usani la especie que sobreviva mejor en cautiverio para estu-dios de desove y cria.
Evaluaci6n del proyecto
El comite directivo del proyecto conjunto OFCF-Panama-CIAT celebro dos reuniones en el Laboratorio de Achotines en 1999, el 10 y 11 de mayo y el11 y 12 de noviembre. Asistieron rep-resentantes de la CIAT, el OFCF de Japon y la Direccion General de Recursos Marinos y Costeros de Panama. Se analizaron los avances de la investigacion, y se comentaron compromisos futuros al proyecto. En principio, se acordo que se seguiria financiando el programa un ano mas, hasta marzo de 2001.
OCEANOGRAFIA YMETEOROLOGIA
Durante los 45 anos desde 1955 hasta 1999 han ocurrido diez eventos significativos de La Nina en el Pacifico oriental tropical (POT), cada uno de los cuales se desarrollo de 1 a 3 anos despues de terminar un episodio de El Nino moderado a fuerte. Estos eventos son caracterizados por vientos de oriente fuertes sobre el POT, llevando a incrementos notorios en el afloramiento de agua subsuperficial fria y rica en nutrientes a 10 largo del ecuador al este de 160°0, en las zonas costeras de Ecuador y Perti, y en zonas de alta mar frente a Mexico y Centroamerica. Como con-secuencia, prevalecen temperaturas superficiales del mar (TSM) bajas, nivel del mar alto, y ter-moclinas menos profundas en gran parte del POT. Ademas, el Indice de Oscilacion del Sur (IDS) suele ser positivo. (El lOS es la diferencia entre las anomalias en la presion atmosferica a nivel del mar en Tahiti (Polinesia Francesa) y Darwin (Australia) y es una medida de la fuerza de los vientos superficiales de oriente, especialmente en el Pacifico tropical en el hemisferio sur.) Estos eventos no han atraido la misma atencion que los episodios de El Nino, generalmente asociados con condiciones oceanicas y meteorologicas adversas para la pesca de superficie. No obstante, los episodios de La Nina son eventos importantes, ya que contribuyen a mantener el suministro de alimento, a traves del afloramiento, para los organismos pelagicos, inclusive aquellos de valor comercial directo. Ademas, varias especies de peces, entre ellas los atunes aleta amarilla y barri-lete, son mas vulnerables a la captura cuando la termoclina esta mas cerca de la superficie y es marcada (con una disminucion rapida de temperatura con profundidad) durante episodios de La Nina.
Durante el primer semestre de 1998 ocurrio una transicion rapida de condiciones fuertes de El Nino a una Nina fuerte. La Nina persistio durante el segundo semestre del ano, especial-mente durante el cuarto trimestre. El resultado fue una mejora marcada en las condiciones para la pesca en el POT, con un aumento correspondiente en las tasas de captura de attin en el Area Regulatoria de la Comision para el Aleta Amarilla (ARCAA; Figura 1).
Durante enero de 1999 las TSM estuvieron entre 2° y 3°C por debajo de 10 normal sobre gran parte de la region ecuatorial al oeste de 110°0, y el lOS fue 2,0. Por contraste, durante febrero y marzo el tamano de la zona oceanica ecuatorial con TSM mas de 2°C por debajo de 10 normal disminuyo de forma significativa, y el lOS fue 0,8 y 0,9, respectivamente, la primera vez
164 COMISION DEL ATUN
desde junio de 1998 que habia estado por debajo de 1,0. En la Figura 25a se ilustra el patron de anomalias de las TSM en febrero de 1999, similar al de enero de 1999 y tambien al de noviembre de 1998. Este patron es tipico de condiciones de La Nina en el POT. Las TSM fueron tambien de 1° a 2°C inferiores 0 10 normal a 10 largo de las costas de Ecuador y Peru durante el primer trimestre. Durante ese trimestre la termoclina estuvo a una profundidad de entre 40 y 80 m, unos 15 m, en promedio, menos que de costumbre. Ademas, el nivel del mar permanecio en promedio 5 cm por debajo de 10 normal.
Durante el segundo trimestre de 1999 los vientos superficiales de oriente fueron menos fuertes, especialmente durante mayo yjunio, indicando que la presion atmosferica y circulacion del viento en la superficie en la region ecuatorial se estaban normalizando. La disminucion de los vientos de superficie redujo probablemente el afloramiento ecuatorial. Las TSM estuvieron de 1° a 2°C por debajo de 10 normal sobre gran parte de la region ecuatorial al oeste de 100°0, pero las zonas del oceano ecuatorial con anomalias negativas de la TSM de mas de 2°C fueron marcada-mente menores en comparacion con el primer trimestre. No obstante, persistio una zona grande con anomalias negativas de la TSM de entre 1° y 2°C a 10 largo de las costas de Ecuador y Peru. El patron de anomalias de las TSM en abril de 1999, ilustrado en la Figura 25b, es tipico de periodos previos en los que prevalecieron condiciones de La Nina. La termoclina permanecio a una profundidad de entre 40 y 80 m, y el nivel del mar entre 5y 10 cm por debajo de 10 normal. El lOS fue 0,1 en mayo y-0,1 en junio, el nivel mas bajo del episodio actual de La Nina. Las condiciones oceanicas siguieron favorables para la pesca del atun durante este trimestre.
En el POT el tercer trimestre en la mayoria de los anos es un periodo de transicion durante el cuallas circulaciones atmosferica y oceanica y las TSM se aproximan a sus patrones anuales medios. Las anomalias de las TSM son generalmente pequenas, y los vientos de superficie del sur del monzon de verano comienzan a cambiar a soplar del norte. Ademas, cambian la fuerza y direc-cion de las corrientes oceanicas en el POT. Durante este periodo de transicion tambien disminuyen eventos tropicales importantes tales como los episodios de El Nino y La Nina. Para el comienzo del verano austral (noviembre a febrero) los episodios de EI Nino establecidos generalmente se intensifican, pero los eventos de La Nina suelen seguir atenuandose. No obstante, esto no es 10 que ocurrio durante el cuarto trimestre de 1999.
Durante el tercer trimestre de 1999 las TSM mas de 1°C inferiores al nivel normal ocuparon una porcion menor de la region ecuatorial entre 5°N y 50 S desde 120° hasta 155°0 y las zonas a 10 largo de la costa de Peru que durante el primer semestre del ano. En gran parte del ARCAA las TSM fueron, en promedio, mas cercanas al nivel normal que durante el primer semestre del ano. Las anomalias de las TSM en julio de 1999 (Figura 25c) son representativas del tercer trimestre. La termoclina permanecio a una profundidad de 40 a 80 m y al nivel del mar entre 5 y 10 cm por debajo de 10 normal en la mayor parte del POT. El lOS aumento ligeramente a 0,5 en julio, pero luego disminuyo a -0,1 en septiembre. EI aumento en el lOS en julio reflejo evidentemente un incremento solamente temporario de la intensidad del episodio de La Nina.
Tras un corto periodo de atenuacion durante el tercer trimestre, las condiciones de La Nina volvieron a intensificarse durante el cuarto trimestre. TSM de mas de 1°C por debajo de 10 normal cubrieron una mayor parte de la region ecuatorial entre lOON y 100 S al oeste de 110°0 que durante el trimestre anterior. En la Figura 25d se ilustra el patron de anomalias de las TSM en diciembre, representativo del cuarto trimestre del ano. La termoclina en la region ecuatorial permanecio a una profundidad menor que la normal, entre 40 y 60 m. Fueron comunes en el POT vientos de ori-ente de velocidad superior a la normal en asociacion con el incremento en el lOS (0,9 en octubre, 1,1 en noviembre, y 1,5 en diciembre). El aumento en la fuerza de los vientos de superficie causo un aumento en el afloramiento de agua rica en nutrientes, especialmente en la region ecuatorial.

165 INFORME ANUAL 1999
EVALUACION DE LOS STOCKS DE ATUNES YPECES PICUDOS
En los documentos presentados en la 66~ reunion de la CIAT, celebrada en junio de 2000, se describen las evaluaciones de los stocks de aleta amarilla, barrilete, patudo, aleta azul, alba-cora, y marlin azul realizadas por el personal de la CIAT. Dichos documentos fueron publi-cados, junto con un analisis de modelo de produccion del aleta amarilla en el OPO, en el Informe de Evaluacion de Stocks 1 de la CIAT.
DELFINES
En el Oceano Pacifico oriental (OPO), los atunes aleta amarilla de entre unos 10 y 40 kg se asocian frecuentemente con mamiferos marinos, especialmente con delfines manchados (Stenella attenuata), tornillos (Stenella longirostris), y comunes (Delphinus delphis y, posible-mente, D. capensis). En la Figura 26 se ilustran las distribuciones espaciales de los distintos stocks de estas especies (D. capensis ocurre probablemente solamente dentro de la zona de dis-tribucion del stock nortefio del delfin comun.) Los pescadores descubrieron que la mejor forma de lograr capturas maximas de aleta amarilla con red de cerco en el OPO era buscar manadas de delfines 0 bandadas de aves marinas que se encuentran a menudo con delfines y atunes, calar la red alrededor de los delfines y los atunes, cobraI' la mayoria de la red, realizar una maniobra de retroceso para permitir a los delfines escapar sobre los corchos de la red, y final-mente cobraI' el resto de la red y cargar el pescado a bordo del buque. Desgraciadamente, par-ticularmente durante los afios 1960 y 1970, muchos delfines murieron sofocados tras enmallarse en las redes durante este proceso.
Estimaciones preliminares de la mortalidad de del/ines causada por la pesca
En 1999 la mortalidad incidental de delfines se cifro en 1.348 animales (Tabla 16), una reduccion de 28% con respecto a la mortalidad de 1.877 animales registrada en 1998. En la Tabla 17 se detallan las mortalidades en 1979-1999, por especie y stock, y en la Tabla 18 los errores estandar de estas estimaciones. Las mortalidades de las principales especies de delfines afectadas por la pesqueria muestran reducciones en la ultima decada (Figura 27) sim-ilares a las de las mortalidades de todos los delfines combinados (Figura 28). En la Tabla 16 se presentan estimaciones de las abundancias de los varios stocks de delfines en 1986-1990 y las mortalidades relativas (mortalidadlabundancia). Los stocks de delfines con los niveles mas altos de mortalidad relativa fueron el manchado nororiental (0,05%) y el tornillo oriental (0,06%). Ellimite superior de los intervalos de confianza de 95% aproximados fue menos de 0,10% para todos los stocks, con los valores mas altos en el caso de los delfines manchado noror-iental (0,061%) y tornillo oriental (0,087%).
Elmimero de lances sobre delfines por buques de la Clase 6 disminuyo un 19%, de 10.645 en 1998 a 8.648 en 1999, y lances de ese tipo respondieron del 51,3% del numero total de lances en 1998 al 44,6% en 1999 (Tabla 7). La mortalidad promedio por lance disminuyo de 0,18 delfines en 1998 a 0,16 delfines en 1999. En la Figura 29 se ilustra la distribucion de la mor-talidad promedio pol' lance durante 1999. La mortalidad por lance fue maxima en los margenes de altamar de la pesqueria, en zonas con cantidades elevadas de lances sobre delfines, y frente a Baja California y al norte del Golfo de Panama. En la Figura 28 se ilustran las tendencias en el numero de lances sobre delfines, mortalidad por lance, y mortalidad total en afios recientes.
Las capturas de aleta amarilla asociado con delfines pOl' buques de la Clase 6 fueron casi iguales que en 1998. Sin embargo, el porcentaje de la captura de aleta amarilla tomado en lances

166 COMISION DEL ATUN
sobre delfines disminuy6 del 65,0% de la captura total de buques de la Clase 6 en 1998 a157,2% de esa captura en 1999, y la captura promedio de aleta amarilla por lance sobre delfines aument6 de 14,3 a 17.9 toneladas por lance. La mortalidad de delfines por tonelada de aleta amarilla cap-turada disminuy6 de 0,012 en 1998 a 0,009 en 1998.
Las cifras arriba presentadas incluyen datos de viajes de buques atuneros cubiertos por observadores de los programas de la CIAT y el PNAAPD de Mexico. Las comparaciones en el par-rafo siguiente se basan exclusivamente en las bases de datos de la CIAT para 1986-1999.
La reducci6n en la mortalidad por lance es el resultado de acciones por parte de los pescadores para controlar mejor los factores que causan la mortalidad incidental de delfines. Una indicaci6n de este esfuerzo es el mimero de lances sin mortalidades, que en 1986 fue 38% y en 1999 91% (Tabla 19). Los factores bajo el control de los pescadores que probablemente afectan la mortalidad de delfines por lance incluyen la ocurrencia de averias, especialmente aquellas que llevan a abultamientos y colapsos de la red, y la duraci6n de la maniobra de retroceso (Tabla 19). El porcentaje de lances con averias mecanicas importantes ha disminuido de un promedio de un 11% a fines de los afios 1980 a menos de 7% durante 1997-1999. El porcentaje de lances con colapsos de la red ha disminuido de un 30% a fines de los afios 1980 a un 6% durante 1997·1999, y con abultamientos de la red de un 20% a un 5%. La duraci6n media del retroceso ha cambiado poco desde 1986, pero el mimero promedio de delfines que permanecen en la red despues del retroceso ha disminuido de 6.0 en 1986 a 0,1 en 1999. Ademas de estos factores, la mortalidad de delfines por lance aumenta con el mimero de animales en la manada capturada. Los pescadores pueden reducir las mortalidades por lance si cercan cardlimenes de atunes asociados con menos delfines, pero el nlimero promedio de animales en manadas cercadas de delfines manchados, la especie sobre la cual se realiza la mayoria de los lances, fue un 29% mayor en 1999 que en 1998.
Tendencias en La abundancia de deLfines
El Informe Anual de la CIAT de 1996 incluye estimaciones de abundancia relativa de delfines obtenidas con una tecnica que usa avistamientos desde buques atuneros para examinar tendencias a largo plazo en la abundancia de los delfines. Ya que esta tecnica usa datos tornados durante actividades de pesca, las estimaciones resultantes estan sesgadas. No obstante, son litiles si no hay tendencias temporales en los factores que causan los sesgos. Un analisis real-izado por el personal sugiere que pudieran haber ocurrido estas tendencias en arros recientes, debido tal vez a la introducci6n de la politica "dolphin-safe" y la adopci6n de nuevas tecnologias de pesca (radar de pajaros, por ejemplo) por la flota internacional. Es indicativo de problemas potenciales que el jndice estimado de abundancia relativa del delfin manchado nororiental y el nlimero de lances sobre delfines en la zona de ese stock esten altamente correlacionados durante 1990-1997, periodo de politica "dolphin-safe" y limites de mortalidad de delfines por buque (Figura 30). Una indicaci6n de un cambio en el comportamiento de blisqueda de la flota en los liltimos afios es el aumento del porcentaje de esfuerzo de blisqueda que ocurre despues de un avis-tamiento que conduce a un lance sobre delfines (Figura 31). La tasa de encuentro durante este periodo de "posdetecci6n" es mucho mas baja que antes del avistamiento (Figura 31), y por 10 tanto el aumento en el esfuerzo de blisqueda de posdetecci6n en los liltimos afios podria introducir un sesgo que varia con el tiempo en las estimaciones de la abundancia relativa. El personal de la CIAT, en coordinaci6n con la Unidad de Investigaci6n para la Evaluaci6n de Poblaciones Silvestres en la Universidad de St. Andrews (Escocia), tiene pensado examinar este y otros temas para determinar si la metodologia actual para estimar la abundancia relativa de delfines puede ser modificada adecuadamente.

167 INFORME ANUAL 1999
Estimaciones de las tasas de crecimiento de las poblaciones de delfines tornillo oriental y manchado nororiental del Oceano Pacifico oriental
Se estimaron las tasas de crecimiento de las poblaciones de delfines tornillo oriental y man-chadD nororiental en el Oceano Pacifico oriental ajustando un sencillo modelo exponencial de poblaci6n a los datos de los estudios de mamiferos marinos realizados por el Servicio Nacional de Pesquerias Marinas (NMFS) de EE.UU., obtenidos de la pagina de internet del Southwest Fisheries Science Center de NMFS.
Se expresa el modelo de poblaci6n como
N(t+ 1) =exp(rU)) [NU) - CU)]
donde N(t) es la abundancia de la poblaci6n en el ano t, r(t) es la tasa de crecimiento de la poblaci6n en el ano t, y e(t) es la mortalidad total en la pesqueria cerquera en el ano t estimada por el personal de la CIAT. Se supone que la relaci6n entre la estimaci6n de abundancia de delfines estimada a partir de los cruceros de investigaci6n y la abundancia real es:
x(t) =In[N(t)] +e(t) +d(t)
donde x(t) es la transformaci6n logaritmica de la estimaci6n de abundancia de los cruceros de investigaci6n en el ano t, e(t) es el error de medici6n del estudio caracterizado por la varianza de la muestra reportada por NMFS, y d(t) es un error adicional del estudio no reportado que no resulta de varianza de la muestra. Se supone que el primer termino de error e(t) esta distribuido normalmente con una desviaci6n estandar igual al coeficiente de variaci6n de la muestra del estudio reportado por NMFS. Se supone que el segundo termino de error d(t) esta distribuido nor-malmente con una varianza desconocida V, un parametro adicional por estimar. Se aplic6 un pro-cedimiento bayesiano de estimaci6n estadistica, el algoritmo MCMC, para calcular intervalos posteriores de probabilidad para la tasa neta de crecimiento de la poblaci6n y su abundancia anual. Se supuso que las distribuciones previas eran uniformes sobre r(t), In[N(l979)}, y In(V) debido a la estructura casi lineal del problema con transformaci6n logaritmica. Se seleccionaron los limites de las distribuciones uniformes muy afuera de la densidad apreciable de la funci6n de verosimilitud.
El NMFS ha propuesto comprobar una hip6tesis de que a partir de 1992 la tasa de cre-cimiento de la poblaci6n fue inferior a la que se esperaria a partir de la dinamica del periodo de 1975-1991. Afin de examinar esta hip6tesis se ajust6 el modelo de poblaci6n suponiendo que r(t) =rl antes de 1992 y r(t) =r2 despues de 1991. Los resultados (Figuras 32-33) indican que la abundancia de las poblaciones de delfines tornillo oriental y manchado nororiental se incremen-taron durante los anos de los estudios de NMFS (1979-1998), pero que el alto grado de varianza en los indices del estudio no permite formar una conclusi6n definitiva sobre las tasas de cre-cimiento durante los dos periodos (antes de 1992 y despues de 1991).
Se puede usar el analisis para probar la hip6tesis que las poblaciones reducidas de delfines no han demostrado crecimiento durante el periodo abarcado por los estudios de NMFS. El esfuerzo de pesca sobre atunes asociados con delfines ha sido sustancial durante ese periodo, y se cree que las poblaciones reducidas han estado en un bajo nivel de abundancia. Para poder con-testar la pregunta, se ajust6 el modelo de poblaci6n arriba detallado bajo el supuesto de que r(t) =r, una tasa constante, durante 1979-1998. Los resultados senalan que el crecimiento mediano de la poblaci6n ha triplicado con creces la abundancia del delfin tornillo oriental y ha aumentado la abundancia del delfin manchado nororiental en mas de un 50% (Figuras 34a y 35a). La tasa neta de crecimiento acumulativo durante 1979-1998 es calculada por In[N(l998)IN(l979)}. Los

168 COMISION DEL ATUN
resultados indican que la probabilidad de que haya crecido la poblaci6n durante esos anos es mas de 95% en el caso del delfin tornillo oriental y alrededor del 80% en el caso del delfin manchado nororiental (Figuras 34b y 35b).
PROGRAMA DE ARTES DE PESCA
El programa de artes de pesca de la CIAT busca formas de reducir al minimo 0 eliminar la mortalidad de delfines durante las faenas de pesca.
ALINEACIONES DEL PANO DE PROTECCION DE DELFINES
Durante 1999 el personal de la CIAT realiz6 alineaciones del panG de protecci6n de delfines y revisiones del equipo de protecci6n de delfines en 33 buques, 22 de Mexico, 8 de Ecuador, 2 de Espana y 1 de Vanuatu. Para verificar la alineaci6n del panG de protecci6n se realiza un lance de prueba, durante el cual un tecnico de la CIAT observa el funcionamiento de la red durante el retroceso desde una balsa inflable. El tecnico transmite sus observaciones, comentarios, y sug-erencias al capitan del buque por radio, y se procura resolver cualquier problema que surja. Posteriormente, se prepara un informe para el armador 0 administrador del buque, en el cual se resumen los comentarios del tecnico de la CIAT y, en caso necesario, las recomendaciones para mejorar el equipo de protecci6n de delfines del buque y/o la forma de usarlo.
ENTRENAMIENTO YCERTIFICACION DE CAPITANES DE PESCA
La CIAT realiza desde 1980 seminarios para los pescadores sobre la reducci6n de mortal-idad de delfines. En el Articulo V del Acuerdo sobre el Programa Internacional para la Conservaci6n de los Delfines (APICD) se contempla el establecimiento, en el marco de la CIAT, de un sistema de entrenamiento tecnico y certificaci6n para los capitanes de pesca. Bajo este sis-tema, el personal de la CIAT es responsable de preparar y mantener una lista de todos los capi-tanes calificados para pescar sobre delfines en el OPO. Los nombres de los capitanes que satisfacen los requerimientos serian proporcionados al Panel para aprobaci6n y circulaci6n a las Partes del APICD.
Los requerimientos para capitanes nuevos incluyen (1) asistencia a un seminario de entre-namiento organizado por el personal cientifico de la CIAT, 0 por el programa nacional competente en coordinaci6n con dicho personal, (2) participaci6n en un lance de prueba que incluya observa-ciones directas del canal de retroceso, y (3) un componente de entrenamiento practico, el cual con-siste en un viaje durante el cual se tiene la intenci6n de pescar atun asociado con delfines a bordo de un buque con LMD, acompanado por un capitan calificado 0 un asesor tecnico aprobado.
Durante 1999 se celebraron siete seminarios sobre la reducci6n de mortalidad de delfines, a los que asistieron 206 representantes de la industria atunera, entre ellos 75 capitanes de pesca. Estos cursos estan ideados no solamente para los capitanes de pesca, directamente encar-gados de las faenas de pesca, sino tambien para otros tripulantes y para el personal adminis-trativo responsable del equipo y mantenimiento de los buques. Se presentan certificados de asistencia a todos los que asisten a los cursos. En la Tabla 20 se detallan la fecha y lugar de, y los asistentes a, cada reuni6n.

169 INFORME ANUAL 1999
OTROS SERVICIOS�
La CIAT brinda ademas otros servicios para ayudar a los gobiernos, gerentes de flota, y operadores de buques individuales a reducir la mortalidad de delfines. En las oficinas regionales de la CIAT se pueden obtener publicaciones y cintas de video sobre el tema. A petici6n se preparanAnalisis de Crucero, informes detallados sobre viajes de pesca observados, que permiten evaluar el desempeno de buques y capitanes.
MEDIDAS PARA LA CONSERVACION DEL ATUN
La CIAT tiene la responsabilidad de realizar estudios de la biologia de los atunes y especies afines que viven en el OPO y del efecto de la pesca sobre los mismos, y de recomendar medidas de conservaci6n apropiadas cuando sea necesario para permitir mantener los stocks de peces a niveles que permitan las capturas maximas sostenibles.
Los estados de pabe1l6n de los buques son responsables de aplicar las medidas que se adopten.
ATUN ALETA AMARILLA Se recomend6 una cuota de captura para el aleta amarilla en el ARCAA por primera vez en
1962, pero los gobiernos miembros no se pusieron de acuerdo sobre una cuota hasta 1966. Se acord6 una cuota cada ano entre 1966 y 1999, con la excepci6n de 1987; no se recomend6 una cuota para ese ano porque la abundancia de aleta amarilla parecia estar al nivel mas alto de anos recientes, debido principalmente al reclutamiento excepcionalmente elevado de 1984 y 1985. Las cuotas fueron puestas en vigor durante cada ano del periodo de 1966-1979 y durante 1998 y 1999.
En la 61~ reuni6n de la CIAT (10-12 de junio de 1998), el Director recomend6 una cuota de 210 mil toneladas de aleta amarilla para 1998, con la opci6n de aumentar este tope por hasta tres incrementos de 15 mil toneladas cada uno. Esta cuota fue tambien aprobada. Para octubre de 1998 el Director decidi6 que se deberia anadir un incremento, para una cuota de 225 mil toneladas, y en la 62~ reuni6n de la CIAT (15-17 de octubre de 1998) se adopt6 una resoluci6n a tal efecto. Ya que todos los buques de la Clase 6 llevan observador a bordo, estos buques dejarian de pescar aleta amarilla en el ARCAA a partir de una fecha designada por el Director. Desde esa fecha hasta el 1 de enero de 1999 se limitaria a cada buque a una captura incidental de 15% de aleta amarilla. Buques cerqueros y de carnada sin observador a bordo que estaban en el mar en la fecha de veda podian seguir pescando sin restricci6n hasta que volviesen a puerto a descargar. En todo viaje subsiguiente iniciado en 1998 quedarian sujetos al mismo limite de 15% de captura incidental de aleta amarilla. Si un viaje continuase hasta 1999, ellimite seguiria en vigor hasta que el barco llegase a puerto para descargar. La fecha de veda anunciada posteriormente fue el 26 de noviembre de 1998.
En la 63~ reuni6n de la CIAT (8-10 de junio de 1999) el Director recomend6 una cuota para el aleta amarilla de 225 mil toneladas en 1999, con la opci6n de anadir un maximo de tres incre-mentos de 15 mil toneladas cada uno, y esta cuota fue adoptada. En la 65~ Reuni6n de la CIAT (4-11 de octubre de 1999) se adopt6 una resoluci6n ejecutando ellimite de captura. En esa reuni6n el Director inform6 que habia decidido anadir un incremento de 15 mil toneladas a la cuota basica de 225 mil toneladas. El13 de octubre anunci6 que estimaba que la captura de aleta amarilla en el ARCAA alcanzaria las 240 mil toneladas el dia siguiente, y que el periodo de
170 COMISION DEL ATUN
restriccion comenzaria en esa fecha. Hasta el fin de ano se restringio la pesca de aleta amarilla con artes de superficie en dos zonas, una frente al norte de Mexico y la otra frente al norte de America del Sur. El 12 de noviembre el Director anuncio que estimaba que la captura de aleta amarilla en el ARCAA alcanzaria las 265.000 toneladas el 23 de noviembre, fecha en la cualla segunda fase de la restriccion entraria en vigor. A partir de esa fecha hasta el fin de ano se restringio la pesca de aleta amarilla con artes de superficie en el ARCAA entero, bajo el mismo reglamento con respecto a las capturas incidentales de aleta amarilla y los buques sin observador que en 1998.
ATUNPATUDO
El aumento rapido en las capturas de patudo con artes de superficie a mediados de los anos 1990 es naturalmente motivo de inquietud. En el InformeAnual de la CIAT de 1997, paginas 220-221, se comentan los posibles efectos de la pesca cerquera sobre la palangrera. En el momenta de preparar dicho informe la informacion disponible, particularmente sobre las tasas de mortalidad natural, era insuficiente para permitir conclusiones definitivas. No obstante, en la 61~ reunion de la CIAT (10-12 de junio de 1998) se adopto una resolucion prohibiendo los lances sobre atunes asociados con objetos flotantes durante 1998 una vez capturadas 45 mil toneladas de patudo con artes de superficie en el OPO. La captura total de patudo por la pesqueria de superficie durante 1998 fue menos de 45 mil toneladas, y no se restringio la captura de la especie en ese ano.
La 64~ Reunion de la CIAT (21-22 de julio de 1999) aprob6 una resolucion para restringir la pesca de atunes asociados con objetos flotantes en 1999. La resolucion tenia como objetivo lim-itar la captura de atun patudo en el OPO con artes de superficie a 40 mil toneladas, y se pro-hibiria la pesca de atunes asociados con objetos flotantes a partir de la fecha en la cualla captura de patudo por la flota de superficie en el OPO alcanzase dicho nivel hasta el fin de ano. El Director anuncio que su mejor estimacion de esa fecha era el 8 de noviembre, y que la prohibicion comenzaria el dia siguiente.
DISPOSITIVOS AGREGADORES DE PECES
Una resolucion adoptada en la 62~ reunion de la CIAT (15-17 de octubre de 1998) (1) pro-hibio el uso de buques auxiliares (buques que no pescan pero que colocan, reparan, recogen y mantienen los dispositivos agregadores de peces (plantados) en el OPO), (2) prohibio el "trans-bordo de atun en alta mar por parte de buques cerqueros pescando atun en el OPO," y (3) establecio que se limitaria el numero de plantados que puede llevar una buque pesquero. Se decidirian los limites "mediante consultas entre las Partes, con base en las recomendaciones del Grupo de Trabajo." En su 64~ Reunion (21-22 de julio de 1999), la CIAT adopto una resolucion reafirmando los dos primeros puntos de la resolucion anterior. Se prohibiola pesca de atunes aso-ciados con plantados en el OPO del 9 de noviembre a131 de diciembre de 1999.
TAMANO DE LA FLOTA
Una resolucion adoptada en la 62~ reunion de la CIAT (15-17 de octubre de 1998) establecio limites para 1999 sobre la capacidad de las flotas cerqueras de naciones individuales, variando de 499 toneladas para Honduras a 49.500 toneladas para Mexico. Se acordo que los limites para 1999 no establecerian un precedente para anos posteriores.

171 INFORME ANUAL 1999
PROGRAMA INTERNACIONAL PARA LA CONSERVACION DE LOS DELFINES
El 17 de junio de 1992 se adopt6 el Acuerdo para la Conservaci6n de Delfines ("el Acuerdo de La Jolla de 1992"), mediante el cual se cre6 el Programa Internacional para la Conservaci6n de Delfines (PICD). El objetivo principal del Acuerdo fue reducir la mortalidad de delfines en la pesqueria cerquera sin perjudicar los recursos atuneros de la regi6n y las pesquerias que dependen de los mismos. El 21 de mayo de 1998 se firm6 el Acuerdo sobre el Programa Internacional para la Conservaci6n de los Delfines (APICD), que amplia y formaliza las disposi-ciones del Acuerdo de La Jolla, y el 15 de febrero de 1999 entr6 en vigor. Las Partes de este acuerdo se comprometieron a "asegurar la sostenibilidad de las poblaciones de atun en el Oceano Pacifico Oriental y a reducir progresivamente la mortalidad incidental de delfines en la pesqueria de atun del Oceano Pacifico Oriental a niveles cercanos a cero; a evitar, reducir y minimizar la captura incidental y los descartes de atunes juveniles y la captura incidental de las especies no objetivo, considerando la interrelaci6n entre especies en el ecosistema."
Una de las caracteristicas mas importantes del PICD es el limite de mortalidad de delfines (LMD) anual para la pesqueria; en 1999 el LMD general establecido para la flota internacional fue de 5.000 animales. Be les asign6 LMD individuales de 40 animales cada uno a 125 buques. De estos 125, 34 no utilizaron su LMD antes del 10 de junio; 25 10 perdieron, pero a los demas se les permiti6 conservarlos durante el resto del afio debido a circunstancias atenuantes. Diez buques fueron asignados LMD de segundo semestre de 20 animales cada uno, pero ninguno 10 uti-liz6. En la Figura 36 se ilustra la distribuci6n de la mortalidad causada en 1999 pOl' buques con LMD de afio completo. Be estima la mortalidad total de delfines ocasionada porIa pesca en 1999 en 1.348 animales.
PUBLICACIONES
La publicaci6n pronta y completa de los resultados de la investigaci6n es uno de los ele-mentos mas importantes del progI'ama cientifico de la CIAT. POI' este medio los gobiernos miem-bros, la comunidad cientifica, y el publico en general se mantienen informados de los resultados de las investigaciones realizadas pOl' los cientificos de la CIAT. La publicaci6n de datos basicos, metodos de analisis, y las conclusiones resultantes permiten que otros investigadores evaluen y critiquen los estudios, 10 que sirve para verificar la validez de los resultados obtenidos pOl' el per-sonal de la CIAT y despertar el interes de otros investigadores en su labor. AI fin de 1999 el per-sonal de la CIAT habia publicado 144 boletines, 48 Informes Anuales, 11 Informes Especiales, 10 Informes de Datos, 9 libros, y 494 capitulos, trabajos, y articulos en libros y revistas externas. En el Anexo 3 del presente informe se detallan las contribuciones del equipo de investigadores pub-licadas durante 1999.

172 TUNA COMMISSION
APPENDIX l-ANEXO 1
STAFF-PERSONAL
HEADQUARTERS-OFICINA PRINCIPAL DIRECTOR
James Joseph, Ph.D. (University of Washington) (to June 30-hasta 30 de junio) Robin Allen, Ph.D. (University of British Columbia) (from July I-desde 1 de Julio)
ASSISTANT DIRECTOR-SUBDIRECTOR Robin Allen, Ph.D. (University of British Columbia) (to June 30-hasta 30 de junio)
SCIENTIFIC AND TECHNICAL-CIENTIFICO YTECNICO Chief Scientists- Cientificos Dirigentes
Tuna-Billfish Program- Programa Atun-Picudo Richard B. Deriso, Ph.D. (University of Washington)
Tuna-Dolphin Program- Programa Atun·Delfin Martin A. Hall, Ph.D. (University of Washington)
Senior level-Nivel principal William H. Bayliff, Ph.D. (University of Washington) Fishery biology-
Biologia de pesca David A. Bratten, B.S. (San Diego State University) Fishery biology Brian S. Hallman, M.A. (Johns Hopkins University) Fishery
(from October 4-desde 4 de octubre)ı management-Administraci6n de pesqueria
Michael G. Hinton, Ph.D. (University of California at San Diego) Fishery biology Witold L. Klawe (emeritus), M.S. (University of Toronto) Fishery biology Daniel Margulies, Ph.D. (University of Maryland) Fishery biology Mark N. Maunder, Ph.D. (University of Washington) Fishery biology Ashley J. Mullen, Ph.D. (University of London) Fishery biology Robert J. Olson, Ph.D. (University of Wisconsin) Fishery biology Kurt M. Schaefer, M.S. (San Diego State University) Fishery biology Michael D. Scott, Ph.D. (University of California at Los Angeles) Fishery biology Patrick K. Tomlinson, B.S. (Humboldt State University) Fishery biology George M. Watters, Ph.D. (University of California at San Diego) Fishery biology
Associate level-Nivel asociada Ernesto Altamirano Nieto, B.S.ı Fishery biology
(Universidad Aut6noma de Baja California) Edward H. Everett, B.A. (San Jose State University) Fishery biology Michael J. P. Folkes, M.Sc. (University of British Columbia) Fishery biology
(to December 31-hasta 31 de diciembre) Marco A. Garcia, Lie. (Universidad de Oriente) Fishery biology
(to October 15-hasta el15 de octubre)

173 ANNUAL REPORT 1999
Cleridy E. Lennert-Cody, Ph.D. (University of California at San Diego)ı
Richard J. Lindsay, B.S. (Long Island University)ı Milton F. Lopez, B.S. (University of Rhode Island)ı
Robert E. Sarazen, B.S. (California State University, Long Beach)
Jenny M. Suter, B.S. (University of California at Davis) (from December 1-desde ell de diciembre)
Nickolas W. Vogel, B.A. (University of California at Santa Barbara) Jeanne B. Wexler, B.S. (Humboldt State University)
Assistant level- Nivel auxiliar Marcela Campa Acedo, LL.M. (American University)
(from October l-desde 1 de octubre) Lesly J. Rodriguez, Lie.
(Universidad NacionalAutonoma de Nicaragua) Marlon H. Roman Verdesota, BioI. (Universidad de Guayaquil)
(from March 8-desde 8 de marzo) Enrique Urena Portales, B.S.
(Universidad Autonoma de Baja California)
Technical support-Apoyo tecnico Sharon A. Booker
Joanne E. Boster Laura J. Bowling Nancy L. Haltof JoyDeLee C. Marrow, B.A. (University of California at San Diego) Mildred D. de los Reyes Jenny M. Suter, B.S. (University of California at Davis)
(to November 30-hasta el30 de noviembre)
ADMINISTRATIVE-ADMINISTRATIVO Marcela Campa Acedo, LL.M. (American University)
(to September 30-hasta 30 de septiembre)ı Berta N. Juarezı Daniel R. Lilly, B.S. (Marquette University)ı
Fishery biology
Fishery biology Computer systems management-Administraci6n de computadores Data base management-Administraci6n de base de datos Fishery biology
Fishery biology Fishery biology
Fishery management Fishery biology
Fishery biology
Fishery biology
Data processing-Procesamiento de datos Data processing Data processing Data processing Data processing Data processing Laboratory technology-Tecnologia de laboratorio
Secretarial-Secretaria Secretarial Accounting-Contabilidad

174 TUNA COMMISSION
Maria Teresa Musanoı Nora Roa-Wade, B.S. (San Diego State University)ı
(from July 26-desde 26 de Julio)ı
MANTA, ECUADOR Assistant level-Nivel auxiliar
Erick D. Largacha Delgado, in charge-encargado, Bi6I. (Universidad de Guayaquil)
Aldo X. Basantes Cuesta, Bi6I. (Universidad de Guayaquil) Carlos de la A. Florencia, Bi6I. (Universidad de Guayaquil)
(from January 4-desde 4 de enero) Kruger I. Loor Santana, Bi6I. (Universidad de Guayaquil)
(from August 4-desde 4 de agosto) Jorge B. Panaga Fernandez, BioI. (Universidad de Guayaquil) Marlon H. Roman Verdesota, Bi6I. (Universidad de Guayaquil)
(from January 1 to March 7-desde 1 de enero hasta 7 de marzo)
ENSENADA, MEXICO Assistant level-Nivel auxiliar
Eric E. Pedersen, in charge-encargado, B.S.ı (Humboldt State University)ı
Jose M. Lutt Manriquez, B.S.ı (Universidad Aut6noma de Baja California)ı
Alberto Morales Yanez, B.S.ı (Universidad Aut6noma de Baja California)ı
MAZATLAN, MEXICO Assistant level-Nivel auxiliar
Hector J. Perez Bojorquez, in charge-encargado, B.S. (Universidad Autonoma de Sinaloa)
Victor M. Fuentes, B.S. (Universidad Aut6noma de Sinaloa) Cesar Maldonado Gonzalez, B.S.
(Universidad Aut6noma de Sinaloa)
ACHOTINES, REPUBLIC OF PANAMA Associate level-Nivel asociado
Vernon P. Scholey, in charge-encargado, M.S.ı (University of Washington)ı
Assistant level-Nivel auxiliar NeilA. Bonilla Gaitan, B.S. (Universidad Nacional de Panama)ı Luis C. Tejada, B.S. (Universidad Aut6noma de Baja California)ı
Technical support-Apoye tecnico Jesus M. Budria Garcia
Secretarial Accounting
Fishery biology
Fishery biology Fishery biology
Fishery biology
Fishery biology Fishery biology
Fishery biology
Fishery biology
Fishery biology
Fishery biology
Fishery biology Fishery biology
Fishery biology
Fishery biology Fishery biology
Machinery maintenance-Mantenimiento de maquinaria
175 ANNUAL REPORT 1999
PANAMA, REPUBLIC OF PANAMA Assistant level-Nivel auxiliar
Andris Purmalis, in charge-encargado, B.S. Fishery biology (University of Michigan)
Julio C. Guevara Quintana, Lie. Fishery biology (Universidad Nacional de Panama)
MAYAGUEZ, PUERTO RICO, USA Technical support-Apoye tecnico
Juan A. Gracia, J.D. (Universidad Cat6lica de Puerto Rico)ı Data collection-Colecci6n de datos
CUMANA, VENEZUELA Assistant level-Nivel auxiliar
Alvin Delgado Martinez, in charge-encargado, Lie. Fishery biology (Universidad de Oriente) (to August 15-hasta 15 de agosto)
Armando E. Carrasco Arevalo, in charge-encargado, B.S. Fishery biology (University of West Florida) (from August 16-desde 16 de agosto)
Armando E. Carrasco Arevalo, B.S. (University of West Florida) Fishery biology (to August 15-hasta 15 de agosto)
Emilio R. Cedeno Perez, Lie. (Universidad de Oriente) Fishery biology (from September 1-desde 1 de septiembre)
VISITING SCIENTISTS AND STUDENTS-CIENTIFICOS YESTUDIANTES EN VISITA
ACHOTINES, REPUBLIC OF PANAMA
Dr. Takeshi Kanda, Fisheries Research Laboratory, Miyazaki University (September 13-0ctober 20)
Dr. Shingo Kimura, University of Tokyo, Tokyo, Japan (July 23-August 6) Dr. Hideaki Nakata, University of Tokyo, Tokyo, Japan (July 23-August 6) Mr. Akio Nakazawa, Overseas Fishery Cooperation Foundation, Tokyo, Japan
(January 1-December 31)ˇ Mr. Yukiyasu Niwa, Overseas Fishery Cooperation Foundation, Tokyo, Japanˇ
(February 12-December 31)ˇ Dr. Shin Oikawa, Department of Fisheries, Kyushu Universityˇ
(September 13-0ctober 20)ˇ

APPENDIX 2-ANEXO 2 .......ı -.;:, cr>
FINANCIAL STATEMENT-DECLARACION FINANCIERA
INTER-AMERICAN TROPICAL TUNA COMMISSION-COMISION INTERAMERICANA DEL ATUN TROPICAL Statement of Assets, Liabilities, and Fund Balances, September 30, 1999
Declaraci6n de Activo, Pasivo, y Balances de los Fondos, 30 de Septiembre de 1999
Assets - Activo
Current assets-Activo circulante Cash and cash equivalents-Efectivo y equivalentes Accounts receivable-Cuentas por cobrar Employee advances-Anticipos a los empleados Deposits and prepaid expenses-Depositos y gastos pagados por adelantado
Total current assets-Activo total circulante
Real property- Propiedad raiz
Liabilities and fund balances-Pasivo y balances de los fondos
Current liabilities (accrued expenses and other liabilitiesl-Pasivo circulante (costos acumulados y otros pasivosl
Fund balances- Balances de los fondos General fund-Fondo general Real property fund - Fondo propiedad raiz
Total fund balances- Balances totales de los fondos
$ 2,408,474 6,534
256,953 >-3 c::::
1,203 ~
Q
2,673,164 0 :s::: :s:::...... U1400,775 U1...... 0 z3,103,939
337,680
2,365,484 400,775
2,766,259
$ 3,103,939

INTER·AMERICAN TROPICAL TUNA COMMISSION-COMISION INTERAMERICANA DEL ATUN TROPICAL� Statements of Revenues and Expenses for the Fiscal Year Ended September 30, 1999�
Declaraci6n de Ingresos y Gastos Correspondiente al� Afio Fiscal Finalizado el 30 de Septiembre de 1999�
Revenue-Ingresos Government contributions for joint expenditures-Aportes de los gobiernos a los gastos combinados
United States ofAmerica- Estados Unidos de America Mexico- Mexico Japan-Japan Ecuador France-Francia El Salvador Nicaragua Panama- Panama Vanuatu
Total government contributions-Total de aportes por los gobiernos
Contract revenue- Ingresos por contrato Tonnage assessments-Cuotas por tonelaje Other miscellaneous contract revenue-Otros ingresos miscelaneos por contrato
Total contract revenue- Ingresos totales por contrato
Interest income-Ingresos por interesesı Other revenue-Otros ingresosı
Total revenues- Ingresos totales
$3,085,634 501,730 260,000 197,205
21,111 ~ 500 Z c::::500 E=:500 ~
trJ500 ""d 4,067,680 0
~
>-3 >-' <:0 <:0 <:0
2,157,149ı 8,100ı
2,165,249ı
33,239 12,592
6,2781760
>-' -CJ -CJ
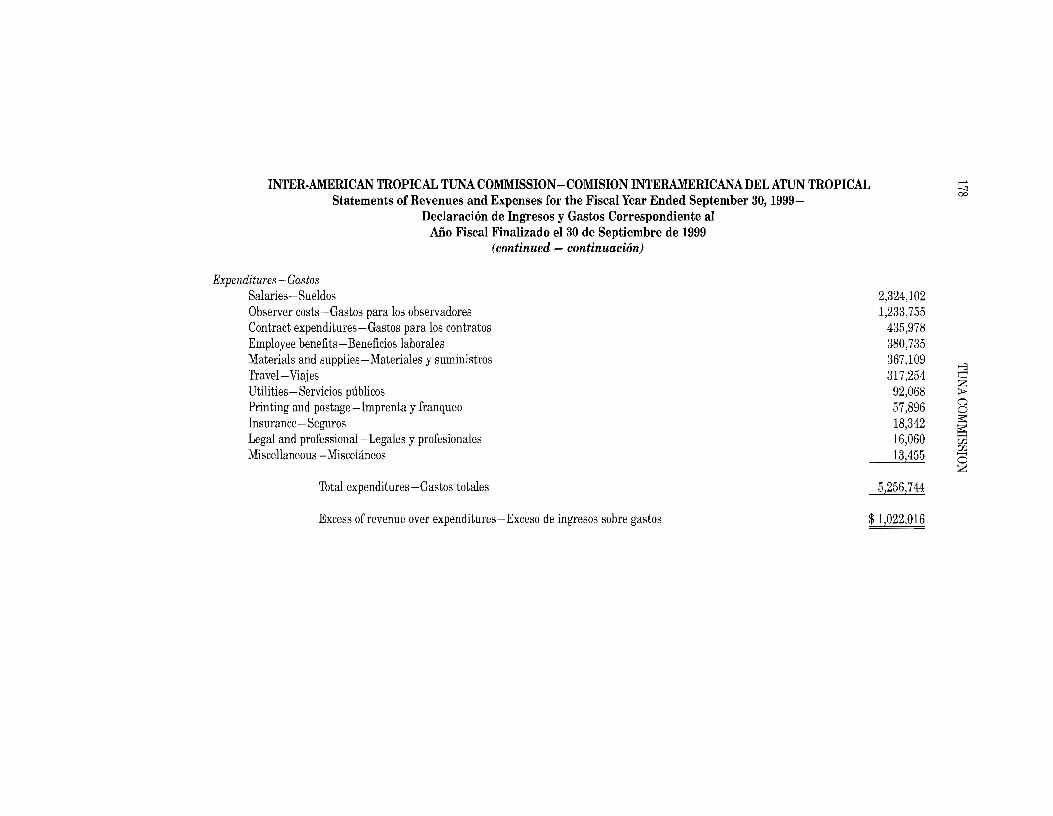
00
>-'INTER-AMERICAN TROPICAL TUNA COMMISSION-COMISION INTERAMERICANA DEL ATUN TROPICAL -:J
Statements of Revenues and Expenses for the Fiscal Year Ended September 30, 1999Declaracion de Ingresos y Gastos Correspondiente al
Afio Fiscal Finalizado el 30 de Septiembre de 1999 (continued - continuaci6n)
Expenditures - Gastos Salaries-Sueldos Observer costs-Gastos para los observadores Contract expenditures-Gastos para los contratos Employee benefits-Beneficios laborales Materials and supplies-Materiales y suministros Travel-Viajes Utilities-Servicios publicos Printing and postage-Imprenta y franqueo Insurance- Seguros Legal and professional- Legales y profesionales Miscellaneous - Miscelaneos
Total expenditures-Gastos totales
Excess of revenue over expenditures-Exceso de ingresos sobre gastos
2,324,102 1,233,755ı
435,978ı 380,735ı 367,109ı
~
317,254 ~
92,068ˇ S; (")57,896 0s:;:18,342 s:;:
16,060 W UJ......,13,455ˇ 0 z
52256,744
$1,022,016

INTER·AMERICAN TROPICAL TUNA COMMISSION-COMISION INTERAMERICANA DEL ATUN TROPICAL� Statements of Changes in Fund Balances for the Fiscal Year Ended September 30, 1999�
Declaracion de Cambios en el Balance de los Fondos Correspondiente al� Aiio Fiscal Finalizado el 30 de Septiembre de 1999�
General Real property fund- fund-Fondo Fondo general propiedad ralZ Total
iZBalance at September 30, 1997 Z c::::Balance al 30 de septiembre de 1997 $ 775,160 210,775 985,935 >r :;:cI trJExcess of revenue over expenditures 758.308 -- 758.308 "d
Exceso de ingresos sobre gastos :;:cI 0 >-3 >-' <0 <0Balance at September 30, 1998 <0
Balance al 30 de septiembre de 1998 1,533,468 210,775 1,744,243
Excess of revenue over expenditures 1,022,016 -- 1,022,016 Exceso de ingresos sobre gastos
Transfer of funds for purchase of real property (190.0001 190.000 Transferencia de fondos para la compra de bienes ralces
Balance at September 30, 1999 Balance al 30 de septiembre de 1999 $2,365,484 400,775 2,766,259
>-' --:) <0

INTER·AMERICAN TROPICAL TUNA COMMISSION-COMISION INTERAMERICANA DEL ATUN TROPICAL >-' en o
Statement of Cash Flows for the Fiscal Year Ended September 30, 1999Declaracion de Flujos de Fondos Correspondiente al�
Aiio Fiscal Finalizado el 30 de Septiembre de 1999�
Cash flows from operating activities- Flujos de fondos de actividades de operaci6n Excess of revenue over expenditures- Exceso de ingresos sobre gastos $ 1,022,016 Adjustments to reconcile excess of revenue over expenditures to net cash
provided by operating activities-Ajustes para reconciliar exceso de ingresos sobre gastos con efectivo neto provisto por actividades de operaci6n:
Decrease in accounts receivable-Reducci6n en cuentas por cobrar 12,342 Decrease in employee advances - Reducci6n en anticipos a los empleados 7,789 >-3 Decrease in deposits and prepaid expenses-Aumento en depositos y cuestos pagados en adelante 33,467 c:::zIncrease in accrued expenses and other liabilities-Aumento en cuestos acumulados y otro pasivo (43.386) >
Net cash provided by operating activities-Efectivo noto provisto por actividades de operaci6n 1,032,228 0(':}
~
-0
~
Cash flows from investing activities-purchase of real property- Flujos de fondos de actividades de inversi6n-compra de bienes raices (190,000) -w w
Increase in cash and cash equivalents-Aumento en efectivo y equivalentes 842,228 z
Cash and cash equivalents at beginning of year- Efectivo y equivalentes al principio de ano 1,566,246
Cash and cash equivalents at end of year-Efectivo y equivalentes al fin de ano $ 2,408,474

INTER-AMERICAN TROPICAL TUNA COMMISSION-COMISION INTERAMERICANA DEL ATUN TROPICAL� Schedule of Expenditures by Project, September 30, 1999
Programa de Gastos por Proyecto, 30 de Septiembre de 1999�
Description Administration Catch and Biology of Oceanography Tuna and Tuna-Dolphin Total effort tunas and and billfish Program
statistics billfishes meteorology tagging Descripci6n Adminstraci6n Estadisticas Biologia de Oceanografia Marcaci6n Programa Total
de captura atunes y y de atunes Atun-yesfuerzo picudos meteorologia y picudos Delfin
Salaries-Sueldos $250,162 437,832 737,401 23,044 92,175 783,488 2,324,102 Observer costs- ~ Gastos para los observadores - - - - - 1,233,755 1,233,755 Z Contract expenditures- ~
t""" Gastos por contratos 60,200 59,416 182,071 8,879 12,850 111,562 435,978 ~
t':I Employee benefits- 0
"ti
~Beneficios laborales 56,230 66,466 116,904 1,833 14,277 125,025 380,735 >-3
Materials and supplies- >-' <0 <0
Materiales y pertrechos 78,040 33,964 187,480 413 7,569 59,643 367,109 <0
Travel-Viajes 84,114 41,086 77,649 96 5,282 109,027 317,254 Utilities-Servicios publicos 24,051 13,471 18,945 93 3,736 31,722 92,068 Printing and postage-
Imprenta y franqueo 32,842 3,905 17,900 - 458 2,791 57,896 Insurance- Seguros 6,164 2,431 2,557 48 605 6,537 18,342 Legal and professional-
Legal y profesional 15,160 225 225 - - 450 16,060 Miscellaneous- Miscelanea 2,114 3,339 2,536 - 995 4,461 13,445
>-' 00
$609,354 662,135 1,344,668 34,406 137,947 2,468,511 5,256,744 >-'
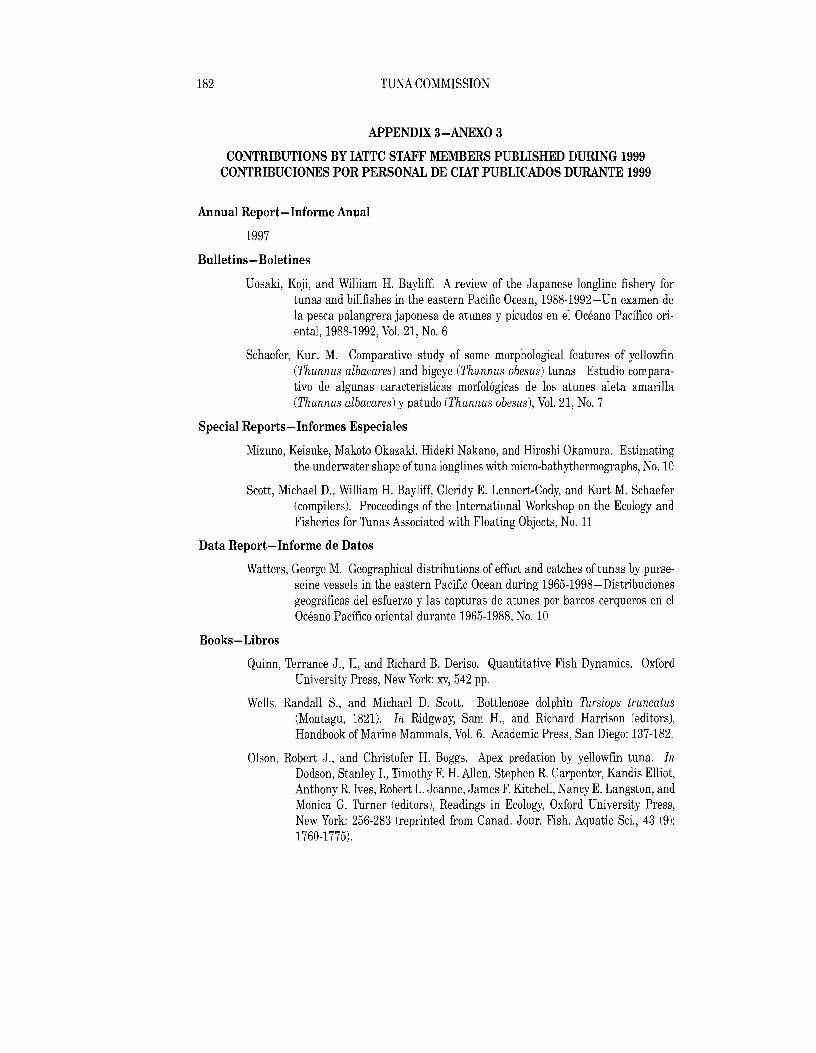
182 TU~A COMMISSION
APPENDIX 3-ANEXO 3ı
CONTRIBUTIONS BY IATTC STAFF MEMBERS PUBLISHED DURING 1999� CONTRIBUCIONES POR PERSONAL DE CIAT PUBLICADOS DURANTE 1999�
Annual Report- Informe Anual
1997
Bulletins - Boletines
Uosaki, Koji, and William H. Bayliff. A review of the Japanese longline fishery for tunas and billfishes in the eastern Pacific Ocean, 1988-1992-Un examen de la pesca palangrera japonesa de atunes y picudos en el Oceano Pacifico ori-ental, 1988-1992, Vol. 21, No.6
Schaefer, Kurt M. Comparative study of some morphological features of yellowfin (Thunnus albacares) and bigeye (Thunnus obesus) tunas-Estudio compara-tivo de algunas caracteristicas morfol6gicas de los atunes aleta amarilla (Thunnus albacares) y patudo (Thunnus obesus), Vol. 21, No.7
Special Reports-Informes Especiales
Mizuno, Keisuke, Makoto Okazaki, Hideki Nakano, and Hiroshi Okamura. Estimating the underwater shape of tuna longlines with micro-bathythermographs, No. 10
Scott, Michael D., William H. Bayliff, Cleridy E. Lennert-Cody, and Kurt M. Schaefer (compilers). Proceedings of the International Workshop on the Ecology and Fisheries for Tunas Associated with Floating Objects, No. 11
Data Report-Informe de Datos
Watters, George M. Geographical distributions of effort and catches of tunas by purse-seine vessels in the eastern Pacific Ocean during 1965-1998-Distribuciones geognificas del esfuerzo y las capturas de atunes par barcos cerqueros en el Oceano Pacifico oriental durante 1965-1988, No. 10
Books-Libros
Quinn, Terrance J., II, and Richard B. Deriso. Quantitative Fish Dynamics. Oxford Universi.ty Press, New York: xv, 542 pp.
Wells, Randall S., and Michael D. Scott. Bottlenose dolphin 'Ilirsiops truncatus (Montagu, 1821). In Ridgway, Sam H., and Richard Harrison (editors), Handbook of Marine Mammals, Vol. 6. Academic Press, San Diego: 137-182.
Olson, Robert J., and Christofer H. Boggs. Apex predation by yellowfin tuna. In Dodson, Stanley 1., Timothy F. H. Allen, Stephen R. Carpenter, Kandis Elliot, Anthony R. rves, Robert L. Jeanne, James F. Kitchell, Nancy E. Langston, and Monica G. Turner (editors), Readings in Ecology, Oxford University Press, New York: 256-283 (reprinted from Canad. Jour. Fish. Aquatic Sci., 43 (9): 1760-1775).

183 ANNUAL REPORT 1999
Joseph, James. Aualisis de la situacion actual y perspectivas futuras de la flota aiunera congeladora mundial: la produccion mundial de atun mas alIa del ana 2000. In 50 MOS: Foro Internacional de la Conservacion de Productos de la Pesca de Galicia. Asociacion Nacional de Fabrical1tes de Conservas de Pescados y Mariscos and Centro Tecnico Nacional de Conservacion de Produetos de la Pesca (Spain): 271-292.
Hall, Martin A. Estimating the ecological impacts of fisheries: what data are needed to estimate bycatches? In Nolan, C.P. (editor), Proceedings of the International Conference on Fisheries Monitoring, FAO, Rome: 175-184.
Outside journals-Revistas externas
Sayigh, Laela S., Peter L. Tyack, Randall S. Wells, Andrew 1. Solows, Michael D. Scott, and A. B. Irvine. Individual recognition in wild bottlenose dolphins: a field test using playback experiments. Animal Behav" 57(1): 41-50.
Joseph, James. Nomads of the sea. Big Game Fishing Journal, 12 (2): 10-17.
Childers, John, and Forrest R Miller. Summary of the 1998 U.S. North and South Pacific albacore troll fisheries. U.S. Nat. Mar. Fish. Serv., Admin. Rep., 13-99-09: iii, 44 pp.
Schaefer, Kurt M., and John Childers. Northernmost occurrence of the slender tuna, Allothunnus fallai, in the Pacific Ocean. Calif. Fish Game, 85 (3): 121-123.