326
Annual Report

2
Annual Report

3
This page intentionally left blank

2
Contents
1. Introduction ...................................................................................................... 24
Consolidated financial highlights .......................................................................................... 5 Key market data for Atlantia ............................................................................................... 6 Ownership structure .......................................................................................................... 7 Share price performance ................................................................................................... 8 Group structure .............................................................................................................. 9 The Group around the world ............................................................................................. 10 Corporate bodies ............................................................................................................. 11
Statement to Shareholders………………….………………………………………………….……………..12
2. Report on operations ......................................................................................... 1616
Group financial review .................................................................................................. 1818 Financial review for Atlantia SpA .................................................................................... 4245 Key performance indicators by operating segment ................................................................ 5555 Key performance indicators for the Group’s principal subsidiaries ........................................... 5758 Italian motorways ....................................................................................................... 6060 Overseas motorways..................................................................................................... 7070 Italian airports ............................................................................................................ 7474 Other activities ........................................................................................................... 7979 Innovation, research and development .............................................................................. 8181 Workforce ................................................................................................................. 8383 Corporate governance .................................................................................................. 8989 Sustainability .............................................................................................................. 9191 Related party transactions ...................................................................................……..100100 Significant regulatory aspects ........................................................................................ 101101 Other information ..................................................................................................... 110110 Events after 31 December 2015 ....................................................................................... 111111 Outlook and risks or uncertainties ................................................................................. 112112 Proposed resolutions for the Annual General Meeting of Atlantia SpA’s shareholders .................. 113113
3. Consolidated financial statements as at and for the year ended 31 December 2015 and notes . 116116
4. Separate financial statements as at and for the year ended 31 December 2014 and notes .... 235235
5. Reports .......................................................................................................... 300
6. Key indicators extracted from the financial statements of subsidiaries, associates and
joint ventures, as defined by paragraphs 3 and 4 of art. 2429 of the Italian Civil Code… … 314318

3
This page intentionally left blank

2
1. Introduzione
Introduction 1

5
Consolidated financial highlights
2015 ( a )
2014
5,304 5,083
3,836 3,678
Aviation revenue 565 520
903 885
Gross operating profit (EBITDA) 3,215 3,169
Adjusted gross operating profit (EBITDA) (b)
3,301 3,246
Operating profit (EBIT) 2,212 1,933
Profit/(Loss) from continuing operations 1,438 1,262
Prof i t for the year 975 773
Profit attributable to owners of the parent 853 740
Operating cash flow (c)
2,105 2,079
Adjusted operating cash flow (b)
2,138 2,181
Capital expenditure (d)
1,488 1,100
31 December 2015 ( a ) 31 December 2014
8,483 8,263
6,800 6,519
10,387 10,528
11,490 11,666
(a)
(b)
(c)
(d) The figure includes investment in assets held under concession, in property, plant and equipment and in intangible assets, as
presented in the statement of changes in consolidated net debt, included in the "Group financial review".
Adjusted amounts have been presented with the aim of enabling analysts and the rating agencies to assess the Group’s
results of operations and financial position using the basis of presentation normally adopted by them. Information on the
nature of the adjustments and on differences between the reported and adjusted amounts is provided in the section, "Adjusted
consolidated results of operations and financial position and reconciliation with reported consolidated amounts", in the "Group
financial review".
Operating cash flow is calculated as profit for the year + amortisation/depreciation +/- impairments/reversals of impairments
of assets +/- provisions/releases of provisions + other adjustments + financial expenses from discounting of provisions +/-
share of profit/(loss) of investees accounted for using equity method +/- (losses)/gains on sale of assets +/- other non-cash
items +/- net deferred tax assets/liabilities recognised in profit or loss.
Equity (including non-controlling interests)
Equity attributable to owners of the parent
Net debt
Adjusted net debt (b)
The figures for 2015 reflect the accounting effects of a number of non-recurring financial transactions carried out during the
year, as described in detail in the section, "Group financial review", and the notes to the consolidated financial statements.
€M
Revenue
Toll revenue
Other operating income and contract revenue
€M

1. Introduction
Annual Report 2015 6
Key market data for Atlantia
KEY MARKET DATA 2015 2014 KEY MARKET DATA 2015 2014
Issued capital (at 31 December) (€) 825,783,990 825,783,990 Dividend yield (a) 3.6% 4.1%
Number of shares 825,783,990 825,783,990 Year-end price (€) 24.50 19.33
Market capitalisation (€m) (a) 20,232 15,962 High (€) 25.58 21.31
Earnings per share (€) (b) 1.04 0.91 Low (€) 19.15 16.52
Operating cash flow per share (€) 2.56 2.55 Share price / Earnings per share (P/E) (a) 23.65 21.24
Dividend per share (€) 0.88 0.800 Share price / Cash flow per share (a) 9.6 7.6
Interim (€) 0.4 0.355 Market to book value (a) 2.4 1.9
Final (€) 0.48 0.445 Atlantia as % of FTSE Italia All Share index (a) 3.93% 2.73%
Dividend/Cash flow per share (%) 34% 31% Atlantia as % of FTSE/Mib index (a) 4.58% 3.11%
GROUP'S CREDIT RATING 2015 2014
Standard & Poor's BBB+ (stable outlook)
Moody's Baa1 (stable outlook)
Fitch Ratings A- (stable outlook)
(a) Figures based on the closing price at the end of the year.
(b) Calculated on the basis of the number of shares at the end of the year, after excluding treasury shares.
A- (stable outlook)
Baa1 (stable outlook)
BBB+ (stable outlook)

7
Ownership structure
Fondazione CRT
MAJOR INVESTORS (1)
Blackrock 5.04%
InvestCo Italian
Holdings (2)
(Governement of
Singapore Investment
Corporation)
8.14%
Athena Holding
(Goldman Sachs
Infrastructure Partners)
Mediobanca 2.71%
4.55%
Sintonia
(Edizione)30.25%
5.06%
FREE FLOAT (4)
GEOGRAPHIC BREAKDOWN OF FREE FLOAT
43.96%
UK
25.2%
USA
25.3%Italy(3)
20.3%
Rest of
Europe
8.6%
France
6.2%
Switzwerland
3.9%
Australia
4.7%
Rest of the
world
5.8%
(1) Source: CONSOB (as at 31 December 2015). (2) Includes 0.082% held directly by Governement of Singapore Investment Corporation (3) Includes retail investors. (4) Excludes treasury shares held by Atlantia SpA, equal to 0.29% of the issued capital. Source: Thomson Reuters (as of 31 December
2015).

1. Introduction
Annual Report 2015 8
Share price performance
Atlantia share price - 2015
Price
(€)
Volumes
(in millions)
0
5
10
15
20
16
17
18
19
20
21
22
23
24
25
26
Volumi scambiati titolo Atlantia
Prezzo titolo Atlantia
FTSE/MIB ribasato
January February March April May June July A ugust September October November December
Atlantia shares traded
Atlantia share price
FTSE/MIB rebased

9
Group structure (*)
(*)
Tangenziale di Napoli 100%
Autostrade Meridionali 58.98%
Società Italiana per il Traforo del Monte Bianco 51.00%
• Raccordo Autostradale Valle d’Aosta 47.97% (1)
Telepass 100%
Autostrade dell’Atlantico 100%
AD Moving 100%
EsseDiEsse 100%
Società Autostrada Tirrenica 99.93%
ADR Sviluppo 100%
ADR TEL 100%
ADR Assistance 100%
ADR Security 100%
ADR Mobility 100%Airport Cleaning 100%
Fiumicino Energia 87.14% (4)
• Leonardo Energia 90.00%
Pavimental 99.40% (5)
Spea Engineering 100% (6)
ETC 64.46% (7)
Autostrade Tech 100% (7)
Infoblu 75.00% (7)
Brazil
Autostrade Brasil 100% (2)
- AB Concessões 50.00%+ 1 share
• Triangulo do Sol Auto-Estradas 100%
• Rodovia das Colinas 100%• Concessionaria da Rodovia MG050 100%
• Concessionaria Rodovias do Tietê 50.00% (3)
• Soluciona Conservacao Rodoviaria 100%
Chile
Grupo Costanera 50.01%• Costanera Norte 100%
• AMB 100%
• Litoral Central 100%
• Autopista Nororiente 100%
• Vespucio Sur 100%Autostrade Holding do Sur 100%
• Los Lagos 100%
Poland
Stalexport Autostrady 61.20%
• Stalexport Autostrada Małopolska 100% India
Pune Solapur Expressways Private 50.00% (3)(4)
Other activities
100% 95.92%
Italian airportsOverseas motorwaysItalian motorways
(*) The above chart shows interests in the principal Atlantia Group companies as at 31 December 2015.
(1) The percentage shown refers to the interest in terms of the total number of shares in issue, whilst the interest in ordinary
voting shares is 58.00%.
(2) The company is 41.14% owned by Autostrade dell’Atlantico, 33.86% by Autostrade Holding do Sur and 25.00% by Autostrade
Portugal. (3) An unconsolidated company.
(4) This company is a direct subsidiary of Atlantia.
(5) This company is 59.4% owned by Atlantia, 20% by Autostrade per l’Italia and 20% by Aeroporti di Roma.
(6) This company is 60% owned by Atlantia, 20% by Autostrade per l’Italia and 20% by Aeroporti di Roma.
(7) A subsidiary of Autostrade per l’Italia.

1. Introduction
Annual Report 2015 10
The Group around the world
(1) The process of awarding the new concession is underway.
(2) A draft addendum to the concession arrangement, to expire in 2040, is currently being negotiated with the Grantor. (3) This company is consolidated using the equity method.
(4) The concession term is estimated on the basis of agreements with the Grantor.
MOTORWAY NETWORKS OPERATED UNDER CONCESSION KM CONCESSION
EXPIRY
Italy 3,005
Autostrade per l’Italia 2,855 2038
Società Italiana per il Traforo del Monte Bianco 6 2050
Raccordo Autostradale Valle d’Aosta 32 2032
Tangenziale di Napoli 20 2037
Autostrade Meridionali (1) 52 2012
Autostrada Tirrenica (2) 40 2046
Brazil 1,538
Atlantia Bertin Concessões
Colinas 307 2028
Rodovia MG050 372 2032
Triangulo do Sol 442 2021
Tieté (3) 417 2039
Chile 313
Grupo Costanera
Costanera Norte 43 2033
Acceso Vial Aeropuerto AMB (4) 10 2020
Litoral Central 81 2031
Nororiente (4) 22 2044
Vespucio Sur 24 2032
Los Lagos 135 2023
India 110
Pune-Solapur Expressway (3) 110 2030
Poland 61
Stalexport Autostrada Malopolska 61 2027
AIRPORTS NO. OF
AIRPORTS
CONCESSION
EXPIRY
Aeroporti di Roma 2 2044
OTHER ACTIVITIES KM OF NETWORK
USING THE
SERVICE
SECTOR OF ACTIVITY
Telepass (Italy) 5,907 Electronic tolling systems
Electronic Transaction Consultants (USA) 994 Electronic tolling systems
Pavimental (Italy)
Motorway and airport
infrastructure construction
and maintenance
Spea Engineering (Italy)
Motorway and airport
infrastructure engineering
services

11
Corporate bodies
Board of Directors Chairman Fabio Cerchiai
in office for 2013-2015 Chief Executive Officer Giovanni Castellucci
Directors Carla Angela (independent)
Gilberto Benetton
Carlo Bertazzo
Bernardo Bertoldi (independent)
Matteo Botto Poala (1)
Alberto Clô (independent)
Gianni Coda (independent)
Massimo Lapucci
Lucy P. Marcus (independent)
Giuliano Mari (independent)
Valentina Martinelli
Monica Mondardini (independent)
Clemente Rebecchini
Segretario Andrea Grillo
Internal Control, Risk and Chairman Giuliano Mari (independent)
Corporate Governance Committee Members Carla Angela (independent)
Lucy P. Marcus (independent)
Committee of Independent Chairman Giuliano Mari (independent)
Directors with responsibility Members Bernardo Bertoldi (independent)
for Related Party Transactions Monica Mondardini (independent)
Human Resources and Chairman Alberto Clô (independent)
Remuneration Committee Members Carlo Bertazzo
Gianni Coda (independent)
Massimo Lapucci
Monica Mondardini (independent)
Supervisory Board ( 2) Coordinator Attilio Befera
Members
Ethics Officer Coordinatore Giuseppe Langer
Members Antonio Sanna
Enzo Spoletini
Board of Statutory Auditors Chairman Corrado Gatti
for three-year period 2015-2017 Auditors Alberto De Nigro
Lelio Fornabaio
Silvia Olivotto
Livia Salvini
Alternate Auditors Laura Castaldi
Giuseppe Cerati
Independent Auditors
for the period 2012-2020Deloitte & Touche SpA
Giovanni Dionisi
Concetta Testa
(1) Mr. Matteo Botto Poala was co-opted on to the Board of Directors at the Board meeting of 12 June 2014 and elected a Director by the Annual General Meeting of 24 April 2015.
(2) New members of the Supervisory Board were appointed on 10 July 2015. Prior to this date, the Board's members were: Giovanni FERRARA
(Coordinator), Concetta TESTA (Member) and Pietro FRATTA (Member).

1. Introduction
Annual Report 2015 12
Statement to shareholders
Annual results
The Group’s results for 2015 are significant within the context of a moderate
economic recovery in Europe and in Italy, which continues to be held back by
ongoing global uncertainty.
The Group’s revenue is in excess of €5 billion, with €1.5 billion invested in
infrastructure during the year and EBITDA of over €3.2 billion. In terms of
financial strength, the ratio of net debt to EBITDA is down to 3.3x.
Opening of the Variante
di Valico
Investment in Italy:
motorways and airports
2015 was the year in which Italy witnessed the opening of the Variante di
Valico, a key component of Autostrade per l’Italia’s investment programme.
Covering around 59 km of motorway (including 32 km of new road alongside
the existing motorway), 41 new tunnels and 41 new viaducts, the Variante di
Valico is one of the most important infrastructure projects to have been carried
out in Europe in the last 20 years, comparable, in terms of the number of
tunnels bored and overall complexity, to construction of the Channel and San
Gotthard tunnels. The project has put Italy at the technological forefront,
resolving one of the main bottlenecks on the country’s motorway network and
bringing major benefits in terms of road safety and shorter journey times.
The close of the year also saw the opening to traffic of a further 16 kilometres
of new third lane on the A14, between Senigallia and Ancona North. Work on
the Ancona North-Ancona South section continues, in order to complete the
last 20 kilometres of the total 155 kilometres of widened motorway running
down Italy’s Adriatic coast. Thanks to the use of public consultations, a tool
promoted and adopted for the first time in Italy by Autostrade per l’Italia, it
was possible to complete the approval process for the Genoa Bypass in less than
100 days in 2015. Following the issue, in May, of the decree finalising the
agreement between central government and the regional authority, the final
design is currently being prepared.
Since 1997, major works with a value of more than €10 billion have so far been
completed, out of a total of over €22 billion envisaged in the Group’s
concession arrangements.

13
2015 also saw an acceleration in investment at Aeroporti di Roma, another of
the Group’s major assets, with capital expenditure of €335 million (almost
double the figure for 2014). The most important works carried out at
Fiumicino included completion of the upgrade of Runway 3, whilst work on
the piers, the new departure areas E/F and the avant-corps of Terminal 3
continued.
Motorway traffic Traffic on the Group’s motorway network rose 3.0%, whilst our overseas
operators recorded overall traffic growth of 1.9% in 2015, despite a slower rate
of increase in Brazil due to the weakness of the local economy. Moreover, the
contribution of our South American companies to the Group’s operating
results was hit by the overall negative impact of exchange rate movements.
Traffic at Aeroporti di
Roma
Aeroporti di Roma handled over 46 million passengers at Fiumicino and
Ciampino in 2015, registering growth of 6.1% and setting a new record for
traffic. The result is particularly significant if we take into account the fact that
it was achieved despite the limitations on operating capacity at Fiumicino
airport between 7 May and 18 July 2015, as a result of the fire at Terminal 3.
The airport is now also able to offer a greater number of connections: the
start-up of new intercontinental routes, above all those to the Far East, make
the Rome Fiumicino hub, together with Paris, the European gateway to China.
Atlantia has also played its part in the recapitalisation of the new Alitalia, which
took to the skies for the first time on 1 January 2015 following its partnership
agreement with Ethiad. The relaunch of Italy’s flag-carrier is capable of driving
further growth at Fiumicino, its hub airport.
Design and construction
Financing initiatives
With the reorganisation of the Group’s controlling interests in Pavimental and
Spea Engineering (created by the merger of ADR Engineering with and into
Spea – Ingegneria Europea), Atlantia has established a leading provider of
infrastructure design and construction services. In this way, the Group has
confirmed its unique status as a supplier of high-quality services at every stage
of the infrastructure building process, from conception through to
construction and maintenance.
We have ample cash reserves available to fund our investment programmes,
thanks to the financing raised on international markets at highly competitive
rates. We took further steps during the year in order to optimise our capital
structure, with the buyback of bonds worth €1.6 billion, resulting in a tangible
reduction in our cost of debt. Autostrade per l’Italia’s entry into the bond
markets to fund its investment programme, via the issue of its first retail bonds
in May 2015, is part of the same plan.
The combination of improved traffic growth and the operating policies put in
place by the Group have enabled Atlantia to boost its earnings in 2015,
allowing us to raise our dividend (10% higher than in the previous year), whilst

1. Introduction
Annual Report 2015 14
maintaining a prudent approach to financial stability.
Medium-term strategies
and objectives
Atlantia is today a global player in the management of motorway and airport
infrastructure. Whilst we remain firmly committed to completing the
contractually agreed investment programme designed to upgrade the
infrastructure operated under concession, we are also looking to exploit
opportunities for growth in other areas, not only in Italy but also in fast-
growing countries. Our goal is to consolidate our leading role in the Italian
economy and reinforce our ability to compete internationally with the biggest
and best in the industry.
Fabio Cerchiai Giovanni Castellucci
Chairman Chief Executive Officer

15
This page intentionally left blank

1. Introduction
Annual Report 2015 16
2. Relazione sulla gestione
Report on operations 2

17
This page intentionally left blank
2. Report on operations
Annual Report 2015 18
Group financial review
Introduction
The financial review contained in this section includes and analyses the reclassified consolidated
income statement, the statement of comprehensive income, the statement of changes in equity and the
statement of changes in net debt for the year ended 31 December 2015, in which amounts are
compared with those of the previous year. The review also includes and analyses the reclassified
statement of financial position as at 31 December 2015, compared with comparative amounts as at 31
December 2014, and the reconciliation of Atlantia’s equity and profit for 2015 with the Atlantia
Group’s corresponding consolidated amounts.
The accounting standards applied during preparation of the consolidated accounts for the year ended
31 December 2015 are consistent with those adopted for the consolidated financial statements for the
year ended 31 December 2014, in that the amendments to existing standards and interpretations that
have come into effect since 1 January 2015 have not had a material impact on the consolidated
accounts.
The scope of consolidation at 31 December 2015 differs from the scope used at 31 December 2014, due
to the acquisition of control of Autostrada Tirrenica (“SAT”) following the completion, in September
2015, of Autostrade per l’Italia’s purchase of a 74.95% interest in this company. When added to
Autostrade per l’Italia’s existing 24.98% interest in the company, the Group’s total interest amounts to
99.93%. In accordance with IFRS 3, the assets acquired and liabilities assumed have been recognised at
their fair value at the acquisition date, whilst SAT’s income and expenses for the fourth quarter of
2015 and its assets and liabilities at 31 December 2015 have been consolidated on a line-by-line basis.
The results of operations for 2014 also benefitted from the contribution of TowerCo and the gain
realised on this company’s sale, which Atlantia completed in the first half of 2014.
In May 2015, a fire broke out in Terminal 3 at Fiumicino airport, operated by Aeroporti di Roma.
This resulted in lost aviation and non-aviation revenues, safety and salvage costs relating to the affected
areas, and provisions to cover the cost of reconstruction of the fire-damaged portion of the building
and the potential cost to the company of meeting third-party claims. Whilst awaiting the outcome of
the final assessment, the company has recognised expected insurance proceeds based on existing
coverage. These proceeds are lower than the expenses and losses incurred as a result of the fire.
Given the significance of the event, the effects of the fire, where material, are described in the
following financial review. More details regarding the fire are provided in the notes to the consolidated
financial statements as at and for the year ended 31 December 2015, to which reference should be
made.
Other than the financial transactions referred to below, the Group did not enter into non-recurring
transactions during 2015, not did it enter into transactions of an atypical nature with third or related
parties.
The reclassified financial statements included and analysed below have not been audited and, in certain
cases, contain differences with respect to the corresponding statements presented in the consolidated
financial statements. These differences are described in notes to the reclassified statements.

19
Like-for-like changes
The term "like-for-like basis", used in the following consolidated financial review, indicates that
amounts for comparative periods have been determined by eliminating:
a) from the consolidated amounts for 2015:
1) the difference between foreign currency amounts for 2015 converted at average exchange rates
for the period and the matching amounts converted using average exchange rates for 2014;
2) SAT’s contribution for the fourth quarter of 2015;
3) the overall impact, including the related taxation, recognised by Autostrade per l’Italia as
income following the handover free of charge of buildings located at service areas, the higher
discounts applied to service area royalties (which have increased significantly from the second
half of 2014), less the matching concession fees, compared with the previous year, and the cost
of settlements with certain service area operators;
4) income recognised by Tangenziale di Napoli following settlement of a legal dispute arising in
previous years, including after-tax interest accrued since initiation of the dispute;
5) the net costs incurred by Aeroporti di Roma as a result of the fire at Fiumicino airport’s
Terminal 3, including: the cost of safety and salvage operations, provisions to cover the
estimated cost of reconstruction of the affected areas, partially offset by the recognition of
insurance proceeds payable under an existing policy, and provisions for risks made following a
prudent assessment, conducted on the basis of the best information currently available, of the
liabilities, other than those covered by existing insurance policies, the company is likely to be
required to pay once final responsibility for the incident has been determined;
6) the overall impact, including the related taxation, of the non-recurring financial transactions
carried out, relating to the partial buyback of certain bonds issued by Atlantia and Atlantia’s
purchase of notes issued by Romulus Finance, which also includes the charges incurred
following the conclusion, in July 2015, of an agreement between Aeroporti di Roma and
AMBAC resulting in termination of the guarantee provided for the notes;
7) the after-tax impact of the difference in the discount rates applied to the provisions accounted
for among the Group’s liabilities;
8) the increase in tax expense linked to reassessment of the deferred taxation of Italian companies
at 31 December 2015, following approval of the 2016 Stability Law, which has reduced the
IRES (corporation tax) rate from 27.5% to 24% from 1 January 2017;
b) from the consolidated amounts for 2014:
1) the overall impact, including the related taxation, recognised by Autostrade per l’Italia in
respect of one-off royalty payments received from service area operators whose contracts were
renewed and the cost of settlements with certain operators, in addition to income recognised as
a result of the handover free of charge of buildings located at service areas;
2) the income and related tax expense recognised by Aeroporti di Roma, essentially following the
collection of preferential claims from Alitalia in Extraordinary Administration, which had
been written off in previous years;
3) the after-tax impact of the difference in the discount rates applied to the provisions accounted
for among the Group’s liabilities;
4) the tax expense resulting from approval of a tax reform package by the Chilean Parliament in
September 2014 that, among other things, introduced a progressive increase in corporation
tax rates from 21% in 2014 to 25% from 2017 on;

2. Report on operations
Annual Report 2015 20
5) TowerCo’s contribution for 2014 and the gain realised on the sale of this company, both
classified in “Profit/(Loss) from discontinued operations” in application of IFRS 5.
The following table shows a reconciliation of like-for-like consolidated amounts for gross operating
profit (EBITDA), profit for the year, profit for the year attributable to owners of the parent and
operating cash flow for 2015 and 2014 and the corresponding amounts presented in the reclassified
financial statements included below.
€M
Gross
operati ng
pro fi t (EB ITDA)
Pro fi t fo r the
y ear
Pro fi t fo r the
y ear
attr i butabl e to
owners o f the
parent
Operati ng cash
fl ow
Repor ted amounts fo r 2015 (A) 3,215 975 853 2,105
Adj ustment fo r non l i k e - fo r - l i k e i tems i n 2015
Exchange rate movements -28 -10 -4 -6
Contribution of SAT for fourth quarter of 2015 2 - - 1
Handover free of charge of buildings at service areas, discounts on service area
royalties, cost of settlements-18 -12 -12 -19
Settlement of legal action involving Tangenziale di Napoli 4 9 9 9
Fire at Fiumicino airport's Terminal 3 -12 -20 -20 -11
Non recurring financial transactions and settlements between AdR and Ambac -3 -168 -166 -161
Change in discount rate applied to provisions - 68 67 -13
Change in IRES tax rate (2016 Stability Law) - -42 -40 -
Sub- to ta l (B ) -55 -175 -166 -200
Li k e - fo r - l i k e amounts (C)=(A)+(B ) 3,270 1,150 1,019 2,305
Repor ted amounts fo r 2014 (A) 3,169 773 740 2,079
Adj ustment fo r non l i k e - fo r - l i k e i tems i n 2014
Handover free of charge of buildings at service areas, one-off payments
received from sub-operators, cost of settlements35 24 24 -11
Settlement of prior claims Of AdR towards Alitalia in extraordinary
administration11 7 7 7
Change in discount rate applied to provisions - -132 -132 2
Tax reform (Chilean companies) - -107 -56 -
Contribution of TowerCo (profit/(loss) for first quarter of 2014 and gain on sale) - 73 73 2
Sub- to ta l (B ) 46 -135 -84 -
Li k e - fo r - l i k e amounts (C)=(A)+(B ) 3,123 908 824 2,079

21
Consolidated results of operations
“Revenue” for 2015 amounts to €5,304 million, up €221 million (4%) on 2014 (€5,083 million). On
a like-for-like basis, total revenue is up €293 million (6%).
“Toll revenue” of €3,836 million is up €158 million (4%) on 2014 (€3,678 million). On a like-for-
like basis, toll revenue is up €192 million (5%), reflecting a combination of the following main factors:
a) application of annual toll increases for 2015 by the Group’s Italian operators (a rise of 1.46% for
Autostrade per l’Italia from 1 January 2015), boosting toll revenue by an estimated €39 million;
b) a 3.0% improvement in traffic on the Italian network, accounting for an estimated €90 million
increase in toll revenue (including the impact of the different traffic mix);
c) an increase in toll revenue at overseas operators (up €41 million), primarily reflecting traffic
growth in Chile (up 6.7%) and Poland (up 8.6%), toll increases applied by the various operators
in 2014 and 2015 in accordance with their respective concession arrangements, partially offset by a
decline in traffic in Brazil (down 2.1%).

2. Report on operations
Annual Report 2015 22
Reclassified consolidated income statement
ABSOLUTE %
Toll revenue 3,836 3,678 158 4
Aviation revenue 565 520 45 9
Contract revenue 107 69 38 55
Other operating income 796 816 -20 -2
Totale revenue (1) 5,304 5,083 221 4
Cost of materials and external services (2) -832 -737 -95 13
Concession fees -477 -462 -15 3
Staff costs -866 -787 -79 10
Capitalised staff costs 86 72 14 19
Total net operating costs -2,089 -1,914 -175 9
Gross operating profit (EBITDA) (3) 3,215 3,169 46 1
Amortisation, depreciation, impairment losses and reversals of
impairment losses -918 -867 -51 6
Provisions and other adjustments -85 -369 284 -77
Operating profit (EBIT) (4) 2,212 1,933 279 14
Financial income accounted for as an increase in financial assets deriving
from concession rights and government grants 63 56 7 12
Financial expenses from discounting of provisions for construction
services required by contract and other provisions -56 -116 60 -52
Other financial income/(expenses) -792 -620 -172 28
Financial expenses capitalised on concessions right 29 18 11 61
Share of profit/(loss) of investees accounted for using the equity method -18 -9 -9 n.s.
Profit/(Loss) before tax from continuing operations 1,438 1,262 176 14
Income tax (expense)/benefit -470 -553 83 -15
Profit/(Loss) from continuing operations 968 709 259 37
Profit/(Loss) from discontinued operations 7 64 -57 -89
Profit for the period 975 773 202 26
(Profit)/Loss attributable to non-controlling interests 122 33 89 n.s.
(Profit)/Loss attributable to owners of the parent 853 740 113 15
2015 2014INCREASE/
(DECREASE)
Basic earnings per share attributable to the owners of the parent
(€) (5) 1.04 0.91 0.13
of which:
- from continuing operations 1.03 0.83 0.20
- from discontinued operations 0.01 0.08 -0.07
Diluted earnings per share attributable to the owners of the parent
(€) (5) 1.04 0.91 0.13
of which:
- from continuing operations 1.03 0.83 0.20
- from discontinued operations 0.01 0.08 -0.07
2015 2014INCREASE/
(DECREASE)
Operating cash flow
(€m) (6) 2,105 2,079 26
of which:
- from continuing operations 2,098 2,084 14
- from discontinued operations 7 -5 12
Operating cash flow per share
(€) (5) (6) 2.56 2.55 0.01
of which:
- from continuing operations 2.55 2.56 -0.01
- from discontinued operations 0.01 -0.01 0.02
€M 2015 2014
INCREASE/ (DECREASE)
(3) EBITDA is calculated by deducting all operating costs, with the exception of amortisation, depreciation, impairment losses and reversals of impairment losses, the operating
change in provisions and other adjustments, from operating revenue.
(4) EBIT is calculated by deducting amortisation, depreciation, impairment losses and reversals of impairment losses, the operating change in provisions and other adjustments
from EBITDA. In addition, it does not include the capitalised component of financial expenses relating to construction services, which is shown as a specific line item under
financial income and expenses in the reclassified statement, whilst it is included in revenue in the income statement in the consolidated financial statements.
(5) The weighted average number of shares outstanding in 2015 differs from the corresponding number for 2014 essentially due to the sale of 9,741,513 treasury shares
(equal to 1.18% of the issued capital), on 10 March 2015.
(6) A definition of "Operating cash flow" is provided in note (d) to the table headed "Consolidated financial highlights".
(1) Revenue in the reclassified consolidated income statement differs from revenue shown in the income statement in the consolidated financial statements, as revenue from
construction services, recognised on the basis of the cost of raw and consumable materials, services costs, staff costs, other operating costs and financial expenses relating to
construction services, and excluding revenue for services provided by sub-operators, are presented in the reclassified statement as a reduction in the respective operating costs
and financial expenses, including through the inclusion of specific items showing capitalised components.
(2) After deducting the margin recognised on construction services provided by the Group's own technical units.

23
“Aviation revenue” of €565 million is up €45 million (9%) on 2014 (€520 million), reflecting the
increases in airport fees applied from 1 March 2014 and 1 March 2015 and growth in traffic
(passengers up 6.1% and movements up 1.7%), achieved despite the impact of the fire at Fiumicino
airport’s Terminal 3.
“Contract revenue” and “Other operating income”, totalling €903 million, is up €18 million
compared with 2014 (€885 million). The figure was negatively impacted by non-recurring income
recognised by Aeroporti di Roma in 2014, following the collection of preferential claims from Alitalia
in Extraordinary Administration (written off in previous years), the impact on Autostrade per l’Italia’s
service area royalties of agreements with certain operators, further discounts applied with effect from
the second half of 2014, a reduction in “one-off” payments received and reduced income resulting
from the handover free of charge of buildings located at service areas following expiry of the related
sub-concessions. These items are partially offset by Aeroporti di Roma’s recognition, in 2015, of
insurance proceeds recognised on the basis of a best estimate (at the date of preparation of the Group’s
Annual Report) of the insurance payout due to cover the rebuilding, safety and salvage costs incurred
as a result of the fire at Terminal 3 and the contingent assets recognised by Tangenziale di Napoli in
2015, following settlement of a legal dispute regarding an expropriation. On a like-for-like basis,
contract revenue and other operating income is up €56 million, with this figure reflecting increased
revenue at Pavimental and Autostrade Tech, due to the greater volume of work carried out for external
customers, and growth at Telepass and Electronic Transaction Consultants (ETC).
“Net operating costs” of €2,089 million are up €175 million (9%) on 2014 (€1,914 million). On a
like-for-like basis, net operating costs are up €146 million (8%).
The “Cost of materials and external services” amounts to €832 million, up €95 million on 2014 (€737
million). The increase primarily reflects the cost of the safety and salvage procedures carried out in the
areas affected by the fire at Terminal 3 and the lower cost of settlements reached with certain service
area operators, which had a greater impact in 2014. On a like-for-like basis, the cost of materials and
external services is up €70 million, reflecting the following:
a) higher maintenance costs (up €23 million), primarily linked, in the case of the motorways
segment, to an increase in work on the Italian network (linked to the decision to bring forward
work initially scheduled for 2016) and the Chilean and Brazilian networks and, in the airports
segment, to the need to ensure a high degree of efficiency of airport infrastructure and, therefore,
guarantee service quality;
b) an increase in other costs of materials and external services (up €47 million), primarily reflecting
cost increases at Pavimental, Autostrade Tech, Telepass and ETC linked to growth in activity, an
increase in insurance deductibles, the corporate advertising costs incurred by Autostrade per
l’Italia in relation to the issue of bonds to retail investors in June 2015 and an increase in other
airport costs, mainly relating to commercial initiatives designed to boost traffic. These costs are
partially offset by increased margins earned on the construction services provided by the Group’s
own technical units and the impact of bringing airport cleaning services in-house.
“Concession fees”, totalling €477 million, are up €15 million (3%) compared with 2014 (€462
million). This broadly reflects the increase in toll revenue reported by the Italian operators and the
rise in aviation revenue. On a like-for-like basis, concession fees are up €17 million.

2. Report on operations
Annual Report 2015 24
“Staff costs”, after deducting capitalised expenses, amount to €780 million (€715 million in 2014) and
are up €65 million (9%).
“Gross staff costs” of €866 million are up €79 million (10%) compared with 2014 (€787 million).
On a like-for-like basis, staff costs, before deducting capitalised expenses, amount to €859 million,
marking an increase of €72 million (9.1%) compared with 2014. This reflects:
a) an increase of 855 in the average workforce excluding agency staff (up 6.1%), primarily linked to
the insourcing of cleaning services at Fiumicino and Ciampino airports, which began in 2014, and
of routine maintenance at Triangulo do Sol and Colinas, to the staff hired in connection with
implementation of the airport development plan and with improvements to passenger assistance
provided by Aeroporti di Roma, and the start-up of work on new contracts by Pavimental;
b) an increase in the average unit cost (up 3.0%), primarily due to the cost of contract renewals,
management incentive plans and early retirement incentives paid by the Italian companies,
partially offset by the recruitment of staff on different forms of contract at Airport Cleaning and
the Brazilian companies.
“Gross operating profit” (EBITDA) of €3,215 million is up €46 million (1%) compared with 2014
(€3,169 million).
On a like-for-like basis, after stripping out the impact of the events listed in the introduction, gross
operating profit is up €147 million (5%). The performance was held back by the loss of aviation and
non-aviation revenue resulting from reduced capacity at Fiumicino airport as a result of fire damage to
a part of Terminal 3. Given that the insurance assessors are still in the process of quantifying the loss
of revenue incurred by Aeroporti di Roma (known as indirect damage), the Group has not recognised
any insurance proceeds in relation to this type of damage in the consolidated financial statements for
the year ended 31 December 2015.
“Operating profit” (EBIT) of €2,212 million is up €279 million (14%) compared with 2014 (€1,933
million), primarily due to the different discount rates applied to provisions at the end of each financial
year (resulting in a total difference of €236 million between the two years). Provisions for the year
include both those to cover the estimated cost of reconstruction of the areas affected by the fire at
Terminal 3, based on expert assessments for design purposes, partially offset by the recognition of
insurance proceeds payable under an existing policy, and provisions for risks made following a prudent
assessment, conducted on the basis of the best information currently available, of the liabilities, other
than those covered by existing insurance policies, the company is likely to be required to pay once final
responsibility for the event has been determined.
On a like-for-like basis, operating profit is up €143 million (7%), reflecting, in addition to the above
improvement in EBITDA, a combination of the following:
a) the positive impact of a revised estimate of the maintenance work to be funded by provisions for
the repair and replacement of motorway infrastructure and provisions for the refurbishment of
airport infrastructure, totalling €40 million;
b) a reduction in provisions for risks, essentially relating to ongoing disputes, totalling €16 million;
c) an increase of €65 million in “Amortisation and depreciation, impairment losses and reversals of
impairment losses”, primarily due to a combination of the following:
1) a €51 million increase in amortisation, essentially of Autostrade per l’Italia’s intangible assets
deriving from concession rights;

25
2) the reversal of an impairment loss of €12 million, recognised in 2014, on the concession rights
attributable to the Polish operator, Stalexport Autostrada Malopolska.
“Financial income accounted for as an increase in financial assets deriving from concession rights and
government grants”, totalling €63 million, is down €7 million compared with 2014.
On a like-for-like basis, this income is up €5 million, primarily due to accrued interest on financial
assets deriving from concession rights and the financial assets of the Chilean operators.
“Financial expenses from discounting of provisions for construction services required by contract and
other provisions” amount to €56 million and are down €60 million on 2014 (€116 million).
The reduction in these expenses, computed on the basis of the value of the provisions and the discount
rates used at 31 December of the year prior to the reporting period, is primarily due to a reduction in
the rates used at 31 December 2014, compared with the rates used at the end of 2013. On a like-for-
like basis, financial expenses from discounting of provisions for construction services required by
contract and other provisions are up €3 million.
Net other financial expenses of €792 million are up €172 million on 2014 (€620 million).
The change essentially reflects net financial expenses on the non-recurring financial transactions
carried out in 2015, amounting to €234 million. These include:
a) the premium paid by Atlantia (€121 million) in order to partially buy back certain bonds issued by
the Company and maturing in 2016, 2017, 2019 and 2020;
b) the premium paid by Atlantia to Romulus Finance’s noteholders (€60 million) in order to buy
back notes issued by this company;
c) financial income (€25 million), accounted for as a reduction in financial expenses, deriving from
the reclassification, to profit or loss, of the residual fair value accounted for as an adjustment of the
carrying amount of the notes issued by Romulus Finance at the date of Atlantia’s acquisition of the
former Gemina group companies;
d) reclassification to profit or loss of fair value losses on the derivatives entered into in previous years
by Aeroporti di Roma in order to convert the underlyings (notes issued by Romulus Finance in
sterling) into euros (€66 million), in addition to the premium paid by Aeroporti di Roma to
AMBAC (€12 million) in order to terminate the guarantee for the notes issued by Romulus
Finance.
In this regard, it should be noted that, in return for the net financial expenses incurred in 2015 as a
result of the above non-recurring financial transactions, in present and future years the Group will
benefit from an equivalent reduction in its cost of debt.
On a like-for-like basis, net financial expenses for 2015 are down €55 million, essentially due to:
a) reductions in interest expense and in net financial expenses payable by the companies operating in
Italy (totalling €86 million), reflecting a reduction in average net debt compared with 2014 and
the decrease in borrowing costs linked to Atlantia’s redemption of bonds with a par value of
€2,094 million in June 2014 and the above-mentioned non-recurring financial transactions;
b) a €10 million increase in interest income and net financial income received by the companies
operating in Brazil and Chile, essentially due to an increase in average cash holdings and the
greater average yield on the medium/long-term loan from AB Concessões to Infra Bertin
Empreendimentos;

2. Report on operations
Annual Report 2015 26
c) a reduction in impairment losses on financial assets and investments (€8 million), which in both
periods regard impairment losses on the investment in and the financial assets attributable to
Compagnia Aerea Italiana (formerly Alitalia - Compagnia Aerea Italiana) and amounted to €36
million in 2015 and €44 million in 2014;
d) the recognition of financial income by Autostrade do Brasil (€50 million) in 2014, linked to the
agreements entered into with the Bertin Group in connection with the acquisition of the Brazilian
operators in 2012, which also provided for an earn-out adjustment based on the effective toll
revenue of Triangulo do Sol, Rodovias das Colinas and Tieté during the three-year period 2012-
2014.
“Capitalised financial expenses” of €29 million are up €11 million on 2014 (€18 million). This
primarily reflects the progressive increase in accumulated payments made in relation to investment in
construction services in progress for which additional economic benefits are received.
The “Share of (profit)/loss of investees accounted for using the equity method” amounts to a loss of
€18 million, compared with a loss of €9 million in 2014. This is essentially attributable to the losses
reported by the operators, Rodovias do Tietè and Pune-Solapur Expressway.
“Income tax expense” amounts to €470 million, down €83 million (15%) on the figure for 2014
(€553 million).
On a like-for-like basis, income tax expense is down €26 million, benefitting from the recognition of
deferred taxes following the corporate restructuring conducted by the Brazilian sub-holding, AB
Concessoes, and the reduction in current tax expense at the Italian companies due to the reform of
direct taxation introduced in Italy by the 2015 Stability Law, only partly offset by the increase in tax
expense recognised as a result of the rise in pre-tax profit.
“Profit from continuing operations” amounts to €968 million, marking an increase of €259 million
in 2015 compared with 2014. On a like-for-like basis, profit from continuing operations is up €226
million (25%).
The Group reports “Profit from discontinued operations” of €7 million, marking a reduction of €57
million compared with 2014, which benefitted from the after-tax gain on the sale of TowerCo,
amounting to €70 million. On a like-for-like basis, the increase of €16 million essentially reflects the
different contribution of Ecomouv in the two comparative periods.
“Profit for the year”, amounting to €975 million, is up €202 million (26%) on the figure for 2014
(€773 million). On a like-for-like basis, profit for the year is up €242 million (27%), after benefitting
from the growth in EBITDA, the above reduction in financial expenses and the previously noted tax
benefits.
“Profit for the year attributable to owners of the parent” (€853 million) is up €113 million (15%) on
2014 (€740 million), whilst “Profit attributable to non-controlling interests” amounts to €122
million, marking an increase of €89 million (€33 million in 2014), primarily due to the greater
contribution from the Chilean companies, which in 2014 were hit by the negative impact of the
country’s tax reforms.

27
On a like-for-like basis, profit attributable to owners of the parent is €1,019 million, up €195 million
(24%), whilst profit attributable to non-controlling interests is up €47 million (56%).
“Operating cash flow” for 2015, as defined in the section “Consolidated financial highlights”, to which
reference should be made, amounts to €2,105 million, up €26 million (1%) on the figure for 2014.
On a like-for-like basis, operating cash flow is up €226 million (11%), reflecting the improvement in
EBITDA and lower net financial expenses in 2015 (in part, as a result of the non-recurring financial
transactions carried out during the period).

2. Report on operations
Annual Report 2015 28
Consolidated statement of comprehensive income
For 2015, the “Other comprehensive loss for the year”, after the related taxation, amounts to €266
million (a loss of €112 million in 2014). This essentially reflects a combination of the following:
a) the loss on the translation of assets and liabilities denominated in functional currencies other than
the euro, totalling €314 million, linked primarily to the significant fall in the value of the Brazilian
real against the euro;
b) the reclassification of losses recognised in equity to profit or loss, amounting to €52 million,
including €47 million relating to fair value losses on cash flow hedges, after the related deferred
taxation, following Atlantia’s buyback of notes issued by Romulus Finance.
€M 2015 2014
Profit for the year (A) 975 773
Fair value gains/(losses) on cash flow hedges -1 -84
Gains/(losses) from translation of assets and liabilities of consolidated companies
denominated in functional currencies other than the euro-314 -29
Gains/(Losses) from translation of investments accounted for using the equity method
denominated in functional currencies other than the euro -6 2
Other comprehensive income/(loss) for the year reclassifiable to profit or loss,
after related taxation (B)-321 -111
Gains/(losses) from actuarial valuations of provisions for employee benefits 3 -13
Other comprehensive income/(loss) for the year not reclassifiable to profit or loss,
after related taxation (C)3 -13
Reclassifications of other components of comprehensive income to profit or loss
for the year (D)52 12
Total other comprehensive income/(loss) for the year, after related taxation
(E=B+C+D)-266 -112
Of which attributable to discontinued operations 6 12
Comprehensive income for the year (A+E) 709 661
Of which attributable to owners of the parent 741 638
Of which attributable to non-controlling interests -32 23

29
Consolidated financial position
As at 31 December 2015, “Non-current non-financial assets” of €26,761 million are down €597
million on the figure for 31 December 2014 (€27,358 million).
“Intangible assets” total €28,845 million (€25,182 million as at 31 December 2014). These assets
essentially relate to intangible assets deriving from the Group’s concession rights, amounting to
€20,043 million (€20,364 million as at 31 December 2014), and goodwill (€4,383 million)
recognised as at 31 December 2013 following the acquisition of the majority shareholding in the
former Autostrade – Concessioni e Costruzioni Autostrade SpA.
The net decrease of €337 million in intangible assets is essentially due to:
a) amortisation for the year (€866 million);
b) the negative effect of currency translation differences recognised at the end of 2015 on the
concession rights of overseas operators (totalling €423 million), essentially reflecting the
significant fall in the value of the Brazilian real against the euro;
c) investment in construction services for which additional economic benefits are received (€571
million);
d) recognition of the intangible assets attributable to SAT (€347 million), including the gain on the
company’s intangible assets deriving from concession rights following the acquisition of control in
2015.
“Property, plant and equipment” of €232 million (€192 million at the end of 2014) is up €40
million, primarily due to Pavimental’s purchase of industrial equipment.
“Investments”, totalling €97 million are down €57 million on the figure for 31 December 2014 (€154
million), essentially reflecting the impairment loss on the investment in Compagnia Aerea Italiana,
amounting to €36 million, and the line-by-line consolidation of SAT, which was accounted for at a
carrying amount of €28 million as at 31 December 2014.
“Deferred tax assets” of €1,575 million are down €243 million on the figure for the end of 2014. The
change is primarily due to the combined effect of a reduction in deferred tax assets (€160 million)
following a change in the IRES (corporation tax) rate from 2017 introduced in Italy by the 2016
Stability Law and the release of deferred tax assets (€111 million) on the deductible portion of the
goodwill recognised by Autostrade per l’Italia as a result of the contribution in 2003, partly offset by
the recognition of deferred tax assets, totalling €50 million, linked to the corporate restructuring
conducted by the Brazilian sub-holding, AB Concessoes, which resulted in the recognition, solely for
tax purposes, of deductible goodwill by the subsidiary’s Brazilian operators.
“Working capital” reports a negative balance of €1,221 million, compared with the negative balance of
€1,290 million as at 31 December 2014. After stripping out the changes in the scope of consolidation
resulting from the acquisition of SAT (€25 million), working capital is up €94 million.
The change primarily reflects a combination of the following:
a) a reduction in the current portion of provisions, totalling €165 million, primarily due to the
current portion of provisions for the repair of Autostrade per l’Italia’s infrastructure, linked to

2. Report on operations
Annual Report 2015 30
work planned for 2016, and the current portion of provisions for the refurbishment of airport
infrastructure;
b) a reduction of €58 million in the current portion of provisions for construction services
required by contract, reflecting the combined effect of uses during the year, totalling €502
million, less accrued grants for completed works, and reclassification of the current portion,
totalling €451 million, linked to expected investment in construction services for which no
additional benefits are received in 2016, primarily attributable to Autostrade per l’Italia;
c) a €62 million increase in trading assets, primarily due to an increase in Aeroporti di Roma’s
trade receivables following an increase in turnover and a lengthening of collection periods for
amounts due from the customers most affected by the fire of 7 May 2015;
d) an increase of €37 million in other current assets, primarily reflecting the contribution from
SAT and Aeroporti di Roma’s recognition of a receivable based on the best estimate, at the
date of preparation of this Annual Report, of an amount due from the insurance company
providing cover for damage caused by fire;
e) a reduction of €106 million in net non-financial assets related to discontinued operations,
essentially linked to Ecomouv’s collection of compensation due from the French government
in relation to the “EcoTaxe” project, less payments to suppliers by this company;
f) an increase in trading liabilities of €176 million, after stripping out the contribution from
SAT, totalling €23 million. This is primarily attributable to Autostrade per l’Italia as a result of
an increase in amounts payable to the operators of interconnecting motorways, reflecting the
performance of toll revenue on the Italian network and in line with standard payment periods,
and to Aeroporti di Roma, reflecting the greater volume of investment carried out during the
reporting period.
31
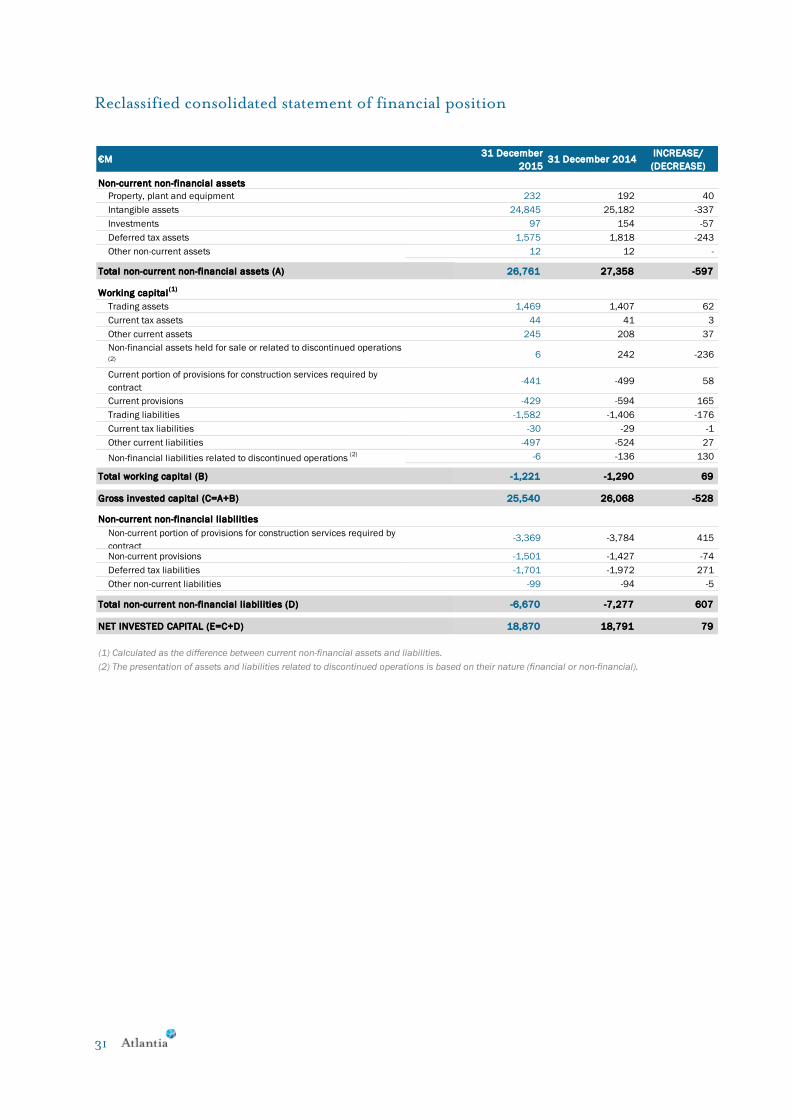
Reclassified consolidated statement of financial position
€M31 December
201531 December 2014
INCREASE/
(DECREASE)
Non-current non-financial assets
Property, plant and equipment 232 192 40
Intangible assets 24,845 25,182 -337
Investments 97 154 -57
Deferred tax assets 1,575 1,818 -243
Other non-current assets 12 12 -
26,761 27,358 -597
Working capital(1)
Trading assets 1,469 1,407 62
Current tax assets 44 41 3
Other current assets 245 208 37
Non-financial assets held for sale or related to discontinued operations (2)
6 242 -236
Current portion of provisions for construction services required by
contract-441 -499 58
Current provisions -429 -594 165
Trading liabilities -1,582 -1,406 -176
Current tax liabilities -30 -29 -1
Other current liabilities -497 -524 27
Non-financial liabilities related to discontinued operations (2) -6 -136 130
-1,221 -1,290 69
25,540 26,068 -528
Non-current non-financial liabilities
Non-current portion of provisions for construction services required by
contract-3,369 -3,784 415
Non-current provisions -1,501 -1,427 -74
Deferred tax liabilities -1,701 -1,972 271
Other non-current liabilities -99 -94 -5
-6,670 -7,277 607
NET INVESTED CAPITAL (E=C+D) 18,870 18,791 79
(1) Calculated as the difference between current non-financial assets and liabilities.
(2) The presentation of assets and liabilities related to discontinued operations is based on their nature (financial or non-financial).
Total non-current non-financial liabilities (D)
Total non-current non-financial assets (A)
Total working capital (B)
Gross invested capital (C=A+B)

2. Report on operations
Annual Report 2015 32
Situazione patrimoniale-finanziaria riclassificata consolidata
Situazione patrimoniale-finanziaria riclassificata consolidata
€M31 December
201531 December 2014
INCREASE/
(DECREASE)
Equity
Equity attributable to owners of the parent 6,800 6,519 281
Equity attributable to non-controlling interests 1,683 1,744 -61
Total equity (F) 8,483 8,263 220
Net debt
Non-current net debt
Non-current financial liabilities 14,044 13,994 50
Bond issues 10,301 10,331 -30
Medium/long-term borrowings 3,256 3,143 113
Non-current derivative liabilities 461 515 -54
Other non-current financial liabilities 26 5 21
Non-current financial assets -1,781 -1,756 -25
Non-current financial assets deriving from concession rights -766 -704 -62
Non-current financial assets deriving from government grants -256 -215 -41
Non-current term deposits -325 -291 -34
Other non-current financial assets -434 -546 112
Total non-current net debt (G) 12,263 12,238 25
Current net debt
Current financial liabilities 1,939 1,456 483
Bank overdrafts 37 1 36
Short-term borrowings 246 245 1
Current derivative liabilities 7 - 7
Current portion of medium/long-term borrowings 1,649 921 728
Other current financial liabilities - 2 -2
Financial liabilities related to discontinued operations (2) - 287 -287
Cash and cash equivalents -2,997 -1,954 -1,043
Cash in hand -2,251 -1,326 -925
Cash equivalents -707 -579 -128
Cash and cash equivalents related to discontinued operations (2) -39 -49 10
Current financial assets -818 -1,212 394
Current financial assets deriving from concession rights -435 -429 -6
Current financial assets deriving from government grants -75 -80 5
Current term deposits -222 -250 28
Current portion of other medium/long-term financial assets -69 -67 -2
Other current financial assets -17 -137 120
Financial assets held for sale or related to discontinued operations (2) - -249 249
Total current net debt (H) -1,876 -1,710 -166
Total net debt (I=G+H) (3) 10,387 10,528 -141
18,870 18,791 79
(3) Net debt includes non-current financial assets, unlike the Group's financial position shown in the notes to the consolidated financial statements
and prepared in compliance with the European Securities and Markets Authority (ESMA) Recommendation of 20 March 2013, which does not permit
the deduction of non-current financial assets from debt.
NET DEBT AND EQUITY (L=F+I)
(2) The presentation of assets and liabilities related to discontinued operations is based on their nature (financial or non-financial).

33
“Non-current non-financial liabilities”, totalling €6,670 million, are down €607 million compared
with 31 December 2014 (€7,277 million). The change essentially reflects the combined effect of the
following:
a) a reduction in the non-current portion of provisions for construction services required by
contract, due primarily to reclassification of the current portion of €451 million;
b) a reduction of €271 million in deferred tax liabilities, primarily as a result of the combined effect
of the reassessment of deferred tax liabilities, totalling €118 million, following the above reduction
in the IRES (corporation tax) rate from 2017 and translation differences recognised at the end of
2015 as a result of the fall in the value of the Brazilian real against the euro, amounting to €125
million;
c) an increase of €74 million in the non-current portion of other provisions, essentially following
the adjustment of provisions for the repair and replacement of motorway infrastructure based on a
revised estimate of the work to be carried out under maintenance programmes.
As a result, “Net invested capital”, totalling €18,870 million, is down €79 million on the figure for 31
December 2014 (€18,791 million).
“Equity attributable to owners of the parent and non-controlling interests” totals €8,483 million
(€8,263 million as at 31 December 2014).
“Equity attributable to owners of the parent”, totalling €6,800 million, is up €281 million on the
figure for 31 December 2014 (€6,519 million), primarily reflecting the following:
a) comprehensive income for the year of €741 million;
b) the sale in the market of treasury shares totalling €228 million, compared with a carrying amount
of the shares sold of €158 million;
c) payment of the final dividend for 2014 (€366 million) and of the interim dividend for 2015 (€329
million).
“Equity attributable to non-controlling interests” of €1,683 million is down €61 million on 31
December 2014 (€1,744 million). This is essentially due to the comprehensive loss for the year
attributable to non-controlling interests, amounting to €32 million, partly linked to the significant fall
in the value of the Brazilian real against the euro and dividends declared by a number of Group
companies that are not wholly owned subsidiaries, totalling €29 million.

2. Report on operations
Annual Report 2015 34
Statement of changes in consolidated equity
Iss
ue
d c
ap
ita
lC
as
h f
low
he
dg
e
res
erv
e
Ne
t in
ve
stm
en
t
he
dg
e r
es
erv
e
Re
se
rve
fo
r
tra
ns
lati
on
dif
fere
nc
es
on
tra
ns
lati
on
of
as
se
ts
an
d l
iab
ilit
ies
of
co
ns
oli
da
ted
co
mp
an
ies
de
no
min
ate
d i
n
fun
cti
on
al
cu
rre
nc
ies
oth
er
tha
n t
he
eu
ro
Re
se
rve
fo
r
tra
ns
lati
on
of
inve
stm
en
ts
ac
co
un
ted
fo
r u
sin
g
the
eq
uit
y m
eth
od
de
no
min
ate
d i
n
fun
cti
on
al
cu
rre
nc
ies
oth
er
tha
n t
he
eu
ro
Oth
er
res
erv
es
an
d
reta
ine
d e
arn
ing
sT
rea
su
ry s
ha
res
Pro
fit/
(Lo
ss
) fo
r ye
ar
TO
TA
L
82
6-1
-36
-19
8-5
5,7
57
-20
83
47
6,4
82
1,7
28
8,2
10
--7
4-
-16
1-1
3-
74
06
38
23
66
1
Atl
an
tia
Sp
A's
fin
al d
ivid
en
d
(€0
.39
1 p
er
sh
are
)-
--
--
--
-31
8-3
18
--3
18
Tra
nsfe
r o
f p
rofi
t/(l
oss)
for
pre
vio
us y
ea
r to
re
tain
ed
ea
rnin
gs
--
--
-3
0-
-30
--
-
Atl
an
tia
Sp
A's
in
teri
m d
ivid
en
d
(€0
.35
5 p
er
sh
are
)-
--
--
--
-28
8-2
88
--2
88
Div
ide
nd
s p
aid
by
oth
er
Gro
up
co
mp
an
ies t
o n
on
-
co
ntr
ollin
g s
ha
reh
old
ers
--
--
-
--
--
-8-8
Sh
are
-ba
se
d in
ce
nti
ve p
lan
s-
--
--
53
-8
-8
Ch
an
ge
s in
sco
pe
of
co
nso
lid
ati
on
an
d o
the
r m
ino
r
ch
an
ge
s a
nd
re
cla
ssif
ica
tio
ns
--
--
--3
--
-31
-2
82
6-7
5-3
6-2
14
-45
,77
6-2
05
45
16
,51
91
,74
48
,26
3
-4
7-
-16
0-3
4-
85
37
41
-32
70
9
Atl
an
tia
Sp
A's
fin
al d
ivid
en
d
(€0
.44
5 p
er
sh
are
)-
--
--
--
-36
6-3
66
--3
66
Tra
nsfe
r o
f p
rofi
t/(l
oss)
for
pre
vio
us y
ea
r to
re
tain
ed
ea
rnin
gs
--
--
-8
5-
-85
--
-
Atl
an
tia
Sp
A's
in
teri
m d
ivid
en
d
(€0
.40
0 p
er
sh
are
)-
--
--
--
-32
9-3
29
--3
29
Div
ide
nd
s p
aid
by
oth
er
Gro
up
co
mp
an
ies t
o n
on
-
co
ntr
ollin
g s
ha
reh
old
ers
--
--
--
--
--2
9-2
9
Sa
le o
f tr
ea
su
ry s
ha
res
--
--
-7
01
58
-2
28
-2
28
Sh
are
-ba
se
d in
ce
nti
ve p
lan
s-
--
--
-38
-5
-5
Ch
an
ge
s in
sco
pe
of
co
nso
lid
ati
on
an
d o
the
r m
ino
r
ch
an
ge
s a
nd
re
cla
ssif
ica
tio
ns
--
--
-2
--
2-
2
82
6-2
8-3
6-3
74
-75
,93
4-3
95
24
6,8
00
1,6
83
8,4
83
EQ
UIT
Y A
TT
RIB
UT
AB
LE
TO
OW
NE
RS
OF
TH
E P
AR
EN
T
EQ
UIT
Y
AT
TR
IBU
TA
BL
E T
O
NO
N-
CO
NT
RO
LL
ING
INT
ER
ES
TS
TO
TA
L E
QU
ITY
AT
TR
IBU
TA
BL
E T
O
OW
NE
RS
OF
TH
E
PA
RE
NT
AN
D T
O N
ON
-
CO
NT
RO
LL
ING
INT
ER
ES
TS
€m
Co
mp
reh
en
siv
e i
nc
om
e f
or
the
ye
ar
Ow
ne
r tr
an
sa
cti
on
s a
nd
oth
er
ch
an
ge
s
Ba
lan
ce
as
at
31
De
ce
mb
er
20
15
Ba
lan
ce
as
at
31
De
ce
mb
er
20
13
Co
mp
reh
en
siv
e i
nc
om
e f
or
the
ye
ar
Ow
ne
r tr
an
sa
cti
on
s a
nd
oth
er
ch
an
ge
s
Ba
lan
ce
as
at
31
De
ce
mb
er
20
14

35
The Group’s net debt as at 31 December 2015 amounts to €10,387 million, marking a reduction of
€141 million compared with the comparative amount (€10,528 million as at 31 December 2014). After
stripping out the impact of the consolidation of SAT, which resulted in an increase in debt of €274
million, the reduction totals €415 million.
Non-current net debt, amounting to €12,263 million, is up €25 million compared with 31 December
2014 (€12,238 million) and consists of:
a) non-current financial liabilities of €14,044 million, up €50 million essentially due to:
1) an increase in bond issues of €30 million, essentially due to the following:
a. the issue of bonds to institutional investors by Autostrade per l’Italia, accounted for in the
financial statements at a total of €1,885 million, as part of its €7 billion Euro Medium
Term Note (“EMTN”) Programme launched in October 2014; issues were completed in
October 2015 (a par value of €650 million, paying coupon interest of 1.125% and
maturing in November 2021 and a par value of €500 million, paying coupon interest of
1.875% and maturing in November 2025) and November 2015 (a par value of €750
million, paying coupon interest of 1.75% and maturing in June 2026);
b. the issue, by Autostrade per l’Italia, of bonds totalling €733 million to retail investors in
June 2015 (a par value of €750 million, paying coupon interest of 1.625% and maturing in
June 2023). In February 2015, the subsidiary entered into a number of Forward-Starting
Interest Rate Swaps with banks to hedge interest rate risk associated with the launch of the
bonds. The swaps have a weighted average rate of 0.54%. Fair value gains of €35 million
resulted from the unwinding of these derivatives following issue of the bonds.
Equity
as at 31 December
2015
Prof it for 2015
Amounts in financial statements of Atlantia SpA 9,708 733
9,582 1,470
-12,691 -
32 -
- -1,049
-4,299 -46
4,381 -
-20 -13
107 -242
6,800 853
1,683 122
8,483 975
(*)
Elimination of intercompany dividends
Reconciliation of Atlantia’s equity and profit with the corresponding consolidated
amounts
€M
Recognition in consolidated financial statements of equity and profit/(loss) for the year of
investments less non-controlling interests
Elimination of carrying amount of consolidated investments
Elimination of impairment losses on consolidated investments less reversals
Carrying amounts in consolidated financial statements
Other consolidation adjustments essentially include the different amounts, in the consolidated financial statements, for gains and/or losses on the sale of
investments with respect to the corresponding amounts included in the reporting packages of consolidated companies, and the effects of remeasurement at
fair value, solely for the purposes of consolidation, of previously held interests following the acquisition of control of the related companies.
Elimination of after-tax intercompany profits
Recognition of goodwill less non-controlling interests
Measurement of investments at fair value and using the equity method less dividends received
Other consolidation adjustments (*)
Consolidated carrying amounts (attributable to owners of the parent)
Consolidated carrying amounts (attributable to non-controll ing interests)

2. Report on operations
Annual Report 2015 36
Approximately €10 million has been recognised in the consolidated income statement,
representing the portion exceeding the nominal amount at issue, whilst the remaining
gains have been recognised in consolidated comprehensive income and will be reclassified
to profit or loss in line with the related interest flows. The cost of the issue, including the
above hedges, thus amounts to 1.28%;
c. Atlantia’s partial buyback of bonds maturing in 2017, 2019, 2020 and 2016 (with a total
par value of €1,351 million), the reclassification to short-term of the remaining bonds
maturing in May 2016 (€882 million) and Atlantia’s buyback of 99.87% of the asset-
backed securities named “£215,000,000 5.441% per cent Class A4 Notes due 2023” issued
by Romulus Finance Srl (totalling €286 million), with the resulting derecognition of the
special purpose entity’s corresponding financial liability, given that the entity is
consolidated by the Atlantia Group,
d. a reduction in the bonds issued by the Chilean and Brazilian companies (€184 million),
primarily due to the reclassification to short-term of bonds maturing in 2016 (€232
million), and movements in the value of the related currencies against the euro (€106
million), partially offset by Rodovia MG050’s issue of bonds worth €142 million (with a
par value of €143 million);
e. the impact of movements in exchange rates on Atlantia’s bonds denominated in sterling
and yen, reflecting a strengthening of these currencies against the euro (€54 million);
2) an increase in medium/long-term borrowings of €113 million, essentially due to:
a. the use of €200 million of the facility granted to Autostrade per l’Italia by Cassa Depositi e
Prestiti, subject to a floating rate and maturing in June 2021, and the use of €50 million of
the facility obtained from the EIB by the same company in 2010;
b. an increase (€54 million) in Autostrade per l'Italia’s exposure to the Grantor in relation to
laws 662/1996, 345/1997 and 135/1997;
c. the reclassification to short-term of portions of borrowings maturing in 2016 (€190
million);
d. a reduction in fair value losses on non-current derivatives, amounting to €54 million,
primarily due to foreign exchange gains for the year (€74 million), connected primarily to
matching losses on bonds denominated in currencies other than the euro;
e. an increase in fair value losses on cash flow hedges (€22 million), which include the new
Forward-Starting Interest Rate Swaps entered into with banks in June 2015 and having a
total notional value of €2,200 million, with varying durations of 6, 7 and 8 years. The
hedges are subject to a weighted average fixed rate of 1.16% and are associated with highly
likely future financial liabilities entered into through to 2017 in order to meet funding
requirements.
“Current net funds” of €1,876 million as at 31 December 2015 are up €166 million on the figure for
31 December 2014 (€1,710 million) and consist of:
a) “Current financial liabilities” of €1,939 million, up €483 million due primarily to the following:
1) an increase in the current portion of medium/long-term financial liabilities (€728 million),
essentially due to reclassifications to short-term (€1,304 million), after repayments during the
year (€505 million) and a reduction in the current portion of the overseas companies’
financial liabilities due to movements in exchange rates (€59 million), reflecting falls in the
related currencies against the euro;

37
2) the further use of short-term facilities (€36 million) to meet the working capital needs of
certain subsidiaries;
3) a reduction in financial liabilities held for sale (€287 million), following the French
government’s repayment, on 2 March 2015, of Ecomouv’s project debt;
b) “Cash and cash equivalents” of €2,997 million, up €1,043 million on the figure for 31 December
2014. In addition to operating cash flows during the period, the change reflects outflows relating
to the partial buyback of bonds issued by Atlantia and the buyback of notes issued by Romulus
Finance, partially offset by the liquidity acquired following the bonds issues carried out by
Autostrade per l’Italia and Rodovia MG050, and the cash resulting from the sale of a portion of
the treasury shares held by Atlantia (€228 million);
c) “Current financial assets” of €818 million, which are down €394 million, essentially due to:
1) a reduction in financial assets held for sale (€249 million), following the French government’s
payment of compensation for termination of the partnership agreement governing the
“EcoTaxe” project;
2) a reduction in other current financial assets (€119 million), essentially following the
consolidation of SAT and the resulting elimination, in the consolidated financial statements,
of the short-term loan to this company from Autostrade per l’Italia.
The residual weighted average term to maturity of the Group’s interest bearing debt is approximately
six years and six months as at 31 December 2015. 92% of the Group’s debt is fixed rate.
The average cost of the Group’s medium/long-term borrowings in 2015 was 4.85% (reflecting the
combined effect of costs of 4.2% for the companies operating in Italy, 7.5% for the Chilean companies
and 14.9% for the Brazilian companies).
As at 31 December 2015, project debt attributable to specific overseas companies amounts to €1,561
million. At the same date, the Group has cash reserves of €5,688 million, consisting of:
a) €2,997 million in cash and/or in investments maturing in the short term;
b) €547 million in term deposits allocated primarily to part finance the execution of specific
construction services and to service the debt of the Chilean companies;
c) €2,144 million in undrawn committed lines of credit.
As at 31 December 2015, the Group has lines of credit with a weighted average residual term to
maturity of approximately 8 years and six months and a weighted average residual drawdown period of
approximately two years and two months.
The Group’s net debt, as defined in the European Securities and Market Authority – ESMA (formerly
CESR) Recommendation of 20 March 2013 (which does not permit the deduction of non-current
financial assets from debt), amounts to €12,168 million as at 31 December 2015, compared with
€12,284 million as at 31 December 2014.

2. Report on operations
Annual Report 2015 38
Consolidated cash flow
“Net cash from operating activities” amounts to €2,211 million for 2015 (including €2,105 million
classifiable as operating cash flow). This is an increase of €388 million on the figure for 2014 (€1,823
million), primarily reflecting the differing performance of movements in operating capital and non-
financial assets and liabilities in the two comparative periods (amounting to an inflow of €106 million
in 2015 and an outflow of €256 million in 2014). Cash flows for 2015 benefitted from the collection
of compensation paid by the French government in March 2015, following early termination of the
“EcoTaxe” project, whilst the figure for 2014 reflected a cash outflow due to an increase in trade
receivables linked to the same project, following the signature, in June 2014, of a memorandum of
understanding with the French government.
“Cash used for investment in non-financial assets” amounts to €1,644 million, up €748 million on
the figure for 2014 (€897 million), primarily reflecting:
a) a €300 million increase in investment in assets held under concession, after the related
government grants and an increase in financial assets deriving from concession rights;
b) cash of €274 million used for the acquisition of a controlling interest in SAT, completed in
September 2015, including the outflow to fund the purchase of a controlling interest (€84
million) and the net debt contributed by this company (€190 million);
c) the proceeds, realised in 2014, from the deconsolidation of TowerCo, including net debt
transferred, totalling €83 million;
d) increased investment in property, plant and equipment, totalling €39 million, primarily
attributable to Pavimental.
“Net equity cash outflows” during 2015 amount to €493 million (€612 million in 2014), reflecting the
proceeds (€228 million) from Atlantia’s sale of treasury shares in the market, which partially offset the
dividends payable to owners of the parent and non-controlling shareholders (€724 million, up €110
million on the figure for 2014).
In addition, in 2015, net debt decreased by €67 million as a result of movements not linked to
operating or investing activities or to changes in equity, whilst, in 2014, there was an increase in net
debt of €73 million as a result of similar movements.
The contrasting impact in the two comparative periods essentially reflects a reduction in the fair value
of cash flow hedges recognised in the consolidated statement of comprehensive income in 2015,
amounting to €14 million (losses of €94 million in 2014),. This primarily reflects the positive impact of
the increase in interest rates (which declined in 2014), partially offset by the recognition of fair value
losses on the Forward-Starting Interest Rate Swaps entered into in February and June 2015.
The overall impact of the above cash flows has resulted in a reduction in net debt of €141 million in
2015, compared with a decrease of €241 million recorded in 2014.
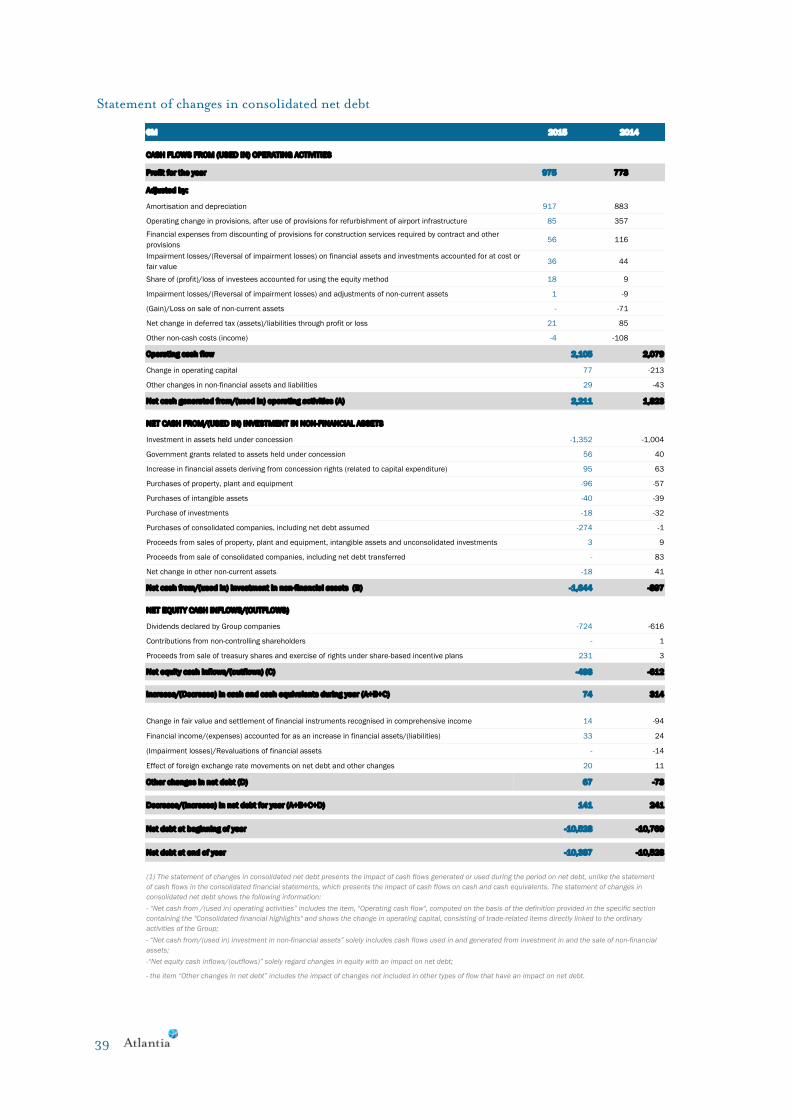
39
Statement of changes in consolidated net debt
€M
Profit for the year 975 773
Adjusted by:
917 883
85 357
56 116
36 44
18 9
1 -9
- -71
21 85
-4 -108
2,105 2,079
77 -213
29 -43
2,211 1,823
NET CASH FROM/(USED IN) INVESTMENT IN NON-FINANCIAL ASSETS
-1,352 -1,004
56 40
95 63
-96 -57
-40 -39
-18 -32
-274 -1
3 9
- 83
-18 41
-1,644 -897
NET EQUITY CASH INFLOWS/(OUTFLOWS)
-724 -616
- 1
231 3
-493 -612
74 314
14 -94
33 24
- -14
20 11
67 -73
141 241
-10,528 -10,769
-10,387 -10,528
2015 2014
CASH FLOWS FROM (USED IN) OPERATING ACTIVITIES
Other changes in non-financial assets and liabilities
Amortisation and depreciation
Operating change in provisions, after use of provisions for refurbishment of airport infrastructure
Financial expenses from discounting of provisions for construction services required by contract and other
provisions
Share of (profit)/loss of investees accounted for using the equity method
Impairment losses/(Reversal of impairment losses) and adjustments of non-current assets
(Gain)/Loss on sale of non-current assets
Net change in deferred tax (assets)/liabilities through profit or loss
Operating cash flow
Change in operating capital
Other non-cash costs (income)
Impairment losses/(Reversal of impairment losses) on financial assets and investments accounted for at cost or
fair value
Purchase of investments
Purchases of consolidated companies, including net debt assumed
Proceeds from sales of property, plant and equipment, intangible assets and unconsolidated investments
Proceeds from sale of consolidated companies, including net debt transferred
Net cash generated from/(used in) operating activities (A)
Investment in assets held under concession
Government grants related to assets held under concession
Increase in financial assets deriving from concession rights (related to capital expenditure)
Purchases of property, plant and equipment
Purchases of intangible assets
(Impairment losses)/Revaluations of financial assets
Net change in other non-current assets
Net cash from/(used in) investment in non-financial assets (B)
Dividends declared by Group companies
Contributions from non-controlling shareholders
Proceeds from sale of treasury shares and exercise of rights under share-based incentive plans
Net equity cash inflows/(outflows) (C)
Increase/(Decrease) in cash and cash equivalents during year (A+B+C)
Change in fair value and settlement of financial instruments recognised in comprehensive income
Financial income/(expenses) accounted for as an increase in financial assets/(liabilities)
- the item “Other changes in net debt” includes the impact of changes not included in other types of flow that have an impact on net debt.
(1) The statement of changes in consolidated net debt presents the impact of cash flows generated or used during the period on net debt, unlike the statement
of cash flows in the consolidated financial statements, which presents the impact of cash flows on cash and cash equivalents. The statement of changes in
consolidated net debt shows the following information:
- “Net cash from /(used in) operating activities” includes the item, "Operating cash flow", computed on the basis of the definition provided in the specific section
containing the "Consolidated financial highlights" and shows the change in operating capital, consisting of trade-related items directly linked to the ordinary
activities of the Group;
- “Net cash from/(used in) investment in non-financial assets” solely includes cash flows used in and generated from investment in and the sale of non-financial
assets;
-“Net equity cash inflows/(outflows)” solely regard changes in equity with an impact on net debt;
Effect of foreign exchange rate movements on net debt and other changes
Other changes in net debt (D)
Decrease/(Increase) in net debt for year (A+B+C+D)
Net debt at beginning of year
Net debt at end of year

2. Report on operations
Annual Report 2015 40
Adjusted consolidated results of operations and financial position and reconciliation with reported consolidated amounts
The following section presents estimates of adjusted amounts for consolidated gross operating profit
(EBITDA), operating cash flow and net debt. These amounts have been adjusted by stripping out,
from the reported amounts, the impact of application of the “financial model”, introduced by IFRIC
12, to the Group’s operators who, under their concession arrangements, have an unconditional right
to receive contractually guaranteed cash payments regardless of the extent to which the public uses the
service. This right is accounted for in “financial assets deriving from concession rights” in the
statement of financial position. It should be noted that the reported and adjusted for 2014 benefitted
from the contribution from Ecomouv (the “EcoTaxe” project), which ceased operations following the
French government’s decision to terminate the related partnership agreement on 30 October 2014.
The adjusted amounts, which are not IFRS compliant, are presented with the aim of enabling analysts
and the rating agencies to assess the Group’s results of operations and financial position using the basis
of presentation normally adopted by them.
In particular, the adjustments applied to the reported amounts regard:
a) an increase in revenue to take account of the reduction (following collection) in financial assets
accounted for in the statement of financial position, as a result of guaranteed minimum toll
revenue;
b) an increase in revenue, corresponding to the portion of government grants collected in relation to
motorway maintenance and accounted for, in the statement of financial position, as a reduction in
financial assets deriving from grants for investment in motorway infrastructure;
c) an increase in revenue, corresponding to the accrued portion of government grants collected (in
previous years) in relation to investment in motorway infrastructure and accounted for, in the
statement of financial position, as a reduction in financial assets deriving from grants for
investment in motorway infrastructure;
d) the reversal of financial income deriving from the discounting to present value of financial assets
deriving from concession rights (relating to guaranteed minimum revenue and the “Eco-Taxe”
project) and government grants for motorway maintenance, accounted for in financial income in
the income statement;
e) the elimination of financial assets recognised, in the statement of financial position, in application
of the “financial model” introduced by IFRIC 12 (takeover rights, guaranteed minimum revenue
and government grants for motorway maintenance).
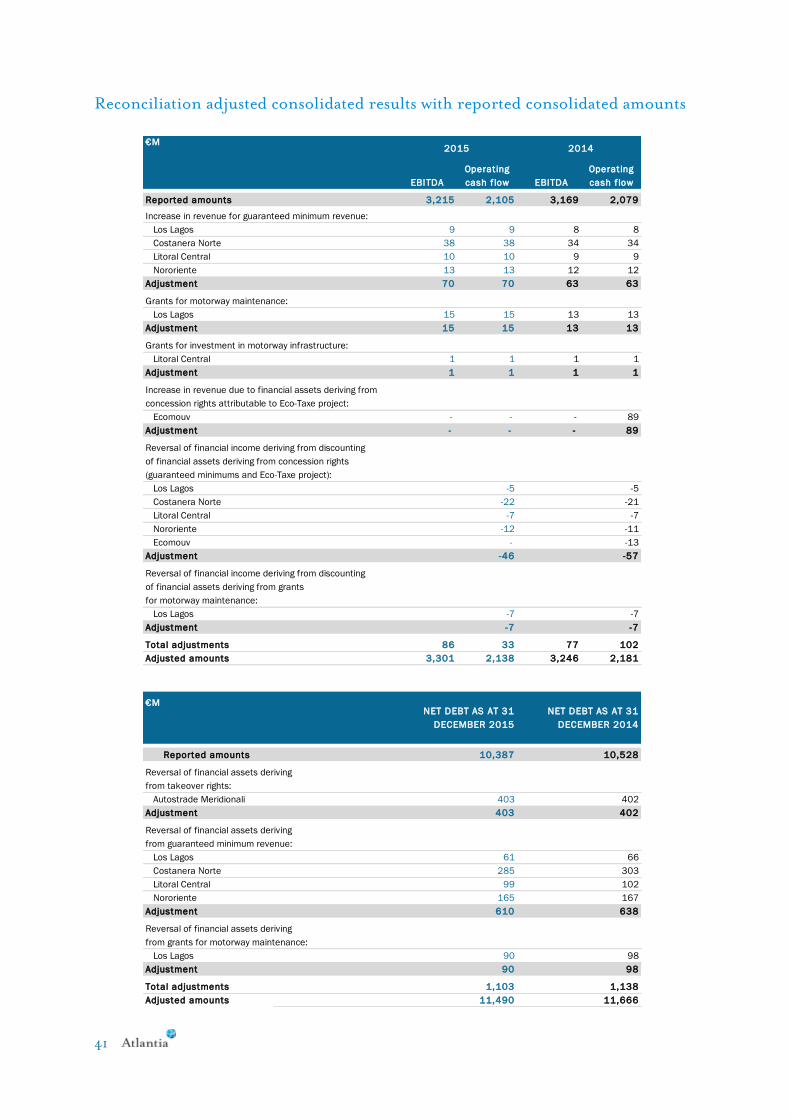
41
Reconciliation adjusted consolidated results with reported consolidated amounts
€M
EBITDA
Operating
cash f low EBITDA
Operating
cash f low
3,215 2,105 3,169 2,079
Increase in revenue for guaranteed minimum revenue:
Los Lagos 9 9 8 8
Costanera Norte 38 38 34 34
Litoral Central 10 10 9 9
Nororiente 13 13 12 12
Adjustment 70 70 63 63
Grants for motorway maintenance:
Los Lagos 15 15 13 13
Adjustment 15 15 13 13
Grants for investment in motorway infrastructure:
Litoral Central 1 1 1 1
Adjustment 1 1 1 1
Increase in revenue due to financial assets deriving from
concession rights attributable to Eco-Taxe project:
Ecomouv - - - 89
Adjustment - - - 89
Reversal of financial income deriving from discounting
of financial assets deriving from concession rights
(guaranteed minimums and Eco-Taxe project):
Los Lagos -5 -5
Costanera Norte -22 -21
Litoral Central -7 -7
Nororiente -12 -11
Ecomouv - -13
Adjustment -46 -57
Reversal of financial income deriving from discounting
of financial assets deriving from grants
for motorway maintenance:
Los Lagos -7 -7
Adjustment -7 -7
Total adjustments 86 33 77 102
Adjusted amounts 3,301 2,138 3,246 2,181
€M
Reported amounts
Reversal of financial assets deriving
from takeover rights:
Autostrade Meridionali
Adjustment
Reversal of financial assets deriving
from guaranteed minimum revenue:
Los Lagos
Costanera Norte
Litoral Central
Nororiente
Adjustment
Reversal of financial assets deriving
from grants for motorway maintenance:
Los Lagos
Adjustment
Total adjustments
Adjusted amounts 11,490 11,666
2015 2014
Reported amounts
NET DEBT AS AT 31
DECEMBER 2015
NET DEBT AS AT 31
DECEMBER 2014
10,387 10,528
403 402
403 402
61 66
285 303
99 102
90 98
1,103 1,138
165 167
610 638
90 98

2. Report on operations
Annual Report 2015 42
Simulation of the accounting effects of amortisation of goodwill recognised in
consolidated assets
The consolidated statement of financial position as at 31 December 2015 reports goodwill of €4,383
million goodwill recognised following the acquisition, in 2003, of the majority shareholding in the
former Autostrade – Concessioni e Costruzioni Autostrade SpA.
This amount, determined on the basis of Italian GAAP at that time applied by the Group, coincides
with the resulting net carrying amount as at 1 January 2004, having opted, on transition to IFRS, to
not retrospectively apply IFRS 3 – Business Combinations to acquisitions prior to 1 January 2004, in
accordance with the exemption provided for in IFRS 1 – First-time Adoption of IFRS.
This goodwill has been allocated in full to the Autostrade per l’Italia Cash Generating Unit (CGU).
From 2004, therefore, this goodwill is not systematically amortised, despite referring to activities with
a determinate life, but is tested for impairment at least annually, in accordance with the requirements
of IAS 36 – Impairment of Assets, in order to verify its recoverability. The impairment tests conducted
until 2014 have, by estimating the related value in use, always confirmed, the recoverability of
goodwill, the carrying amount of which has thus remained unchanged since 1 January 2004.
Taking into account the fact that Autostrade per l’Italia’s concession term expires on 31 December
2038, for the sole purpose of showing the theoretical impact on the consolidated result for the year,
and on consolidated equity as at 31 December 2015, of the simulation of straight-line amortisation of
goodwill from 1 January 2015 until the end of the concession term (a total of 24 years), the following
reclassified consolidated income statement and statement of financial position show amounts adjusted
for amortisation of goodwill. The goodwill accounted for in consolidated assets is not relevant for tax
purposes and the simulation conducted does not, therefore, result in deferred taxation.

43
Toll revenue 3,836 3,836
Aviation revenue 565 565
Contract revenue 107 107
Other operating income 796 796
Total revenue 5,304 5,304
Cost of materials and external services -832 -832
Concession fees -477 -477
Gross staff costs -866 -866
Capitalised staff costs 86 86
Total net operating costs -2,089 -2,089
Gross operating profit (EBITDA) 3,215 3,215
Amortisation, depreciation, impairment losses and
reversals of impairment losses -918 -183 -1,101
Provisions and other adjustments -85 -85
Operating profit (EBIT) 2,212 -183 2,029
Financial income accounted for as an increase in financial
assets deriving from concession rights and government
grants
63 63
Financial expenses from discounting of provisions for
construction services required by contract and other
provisions
-56 -56
Other financial income/(expenses) -792 -792
Capitalised financial expenses 29 29
Share of profit/(loss) of investees accounted for using the
equity method -18 -18
Profit/(Loss) before tax from continuing operations 1,438 -183 1,255
Income tax (expense)/benefit -470 -470
Profit/(Loss) from continuing operations 968 -183 785
Profit/(Loss) from discontinued operations 7 7
Profit for the year 975 -183 792
(Profit)/Loss attributable to non-controlling interests -122 -122
(Profit)/Loss attributable to owners of the parent 853 -183 670
Reclassified consolidated income statement adjusted for goodwill amortisation
€M2015
REPORTED AMOUNTS
GOODWILL
AMORTISATION
2015
ADJUSTED AMOUNTS
(POST-SIMULATION)

2. Report on operations
Annual Report 2015 44
€M31 DECEMBER 2015
REPORTED AMOUNTSGOODWILL AMORTISATION
2015
ADJUSTED AMOUNTS
(POST-SIMULATION)
Non-current non-financial assets
26,761 -183 26,578
-1,221 -1,221
25,540 -183 25,357
Non-current non-financial liabilities
-6,670 -6,670
NET INVESTED CAPITAL (E=C+D) 18,870 -183 18,687
Equity
Equity attributable to owners of the parent 6,800 -183 6,617
Equity attributable to non-controlling interests 1,683 1,683
Total equity (F) 8,483 -183 8,300
Net debt
Non-current net debt
Non-current financial liabilities 14,044 14,044
Non-current financial assets -1,781 -1,781
Total non-current net debt (G) 12,263 12,263
Current net debt
Current financial liabilities 1,939 1,939
Cash and cash equivalents -2,997 -2,997
Current financial assets -818 -818
Total current net debt (H) -1,876 -1,876
Total net debt (I=G+H) 10,387 10,387
18,870 -183 18,687 NET DEBT AND EQUITY (L=F+I)
Reclassified consolidated statement of financial position adjusted for goodwill amortisation
Total non-current non-financial assets (A)
Total working capital (B)
Gross invested capital (C=A+B)
Total non-current non-financial liabilities (D)

45
Financial review for Atlantia SpA
Introduction
This financial review includes and analyses the Parent Company’s reclassified income statement,
statement of comprehensive income, statement of changes in equity and statement of changes in net
debt for the year ended 31 December 2015, in which amounts are compared with those of the previous
year. The review also includes and analyses the reclassified statement of financial position as at 31
December 2015, compared with comparative amounts as at 31 December 2014.
The accounting standards applied during preparation of the accounts for the year ended 31 December
2015 are consistent with those adopted for the financial statements for the year ended 31 December
2014, in that the amendments to existing standards and interpretations that have come into effect since
1 January 2015 have not had a material impact on the accounts.
Other than the partial buyback of certain bonds issued by the Company, described in detail in note
5.10 “Material non-recurring transactions” in the financial statements, the Company did not enter
into non-recurring transactions with third or related parties during 2015. Moreover, there were no
transactions of an atypical or unusual nature during the year.
The reclassified financial statements presented and analysed below have not been audited and, in
certain cases, contain differences with respect to the corresponding statements presented in the
financial statements. These differences are described in notes to the reclassified statements.

2. Report on operations
Annual Report 2015 46
Results of operations
“Operating income” for 2015 amounts to €2 million, in line with the figure for 2014 and primarily
consisting of cost recoveries and rental income from subsidiaries.
The “Cost of materials and external services” totals €17 million for 2015, up €3 million on the figure
for 2014 (€14 million). This primarily reflects the cost of professional services, essentially relating to
investment of the Company’s available liquidity in the buyback of notes issued by Romulus Finance1,
partially offset by reductions in non-deductible VAT and the cost of corporate advertising compared
with 2014.
“Staff costs” of €15 million in 2015 are up €6 million on 2014 (€9 million), primarily due to the
transfer of staff from Autostrade per l’Italia to Atlantia during 2014 and the greater impact of share-
based incentive plans as a result of the benefits granted to certain of the Company’s directors and staff.
The “Gross operating loss” (negative EBITDA) amounts to €30 million (a loss of €21 million in
2014).
“Dividends received from investee companies”, totalling €794 million, are up €124 million on the
figure for 2014 (€670 million), essentially due to dividends for 2014 declared by Aeroporti di Roma
(€123 million).
“Impairment losses on financial assets and investments” amount to €36 million (€44 million in 2014)
and, in both comparative periods, refer to the impairment loss on the investment in Compagnia Aerea
Italiana.
Net other financial income, amounting to €9 million, is substantially in line with the figure for 2014
(€8 million).
(1) Asset-backed securities named “£215,000,000 5.441% Class A4 Notes due 2023” issued by Romulus Finance in
February 2003 as part of the securitisation of bank debt repayable by Aeroporti di Roma, a subsidiary of Atlantia.

47
€M
ABSOLUTE %
Operating income 2 2 - -
Total revenue 2 2 - -
Cost of materials and external services -17 -14 -3 21
Staff costs -15 -9 -6 67
Total net operating costs -32 -23 -9 39
Gross operating loss (EBITDA) (1) -30 -21 -9 43
Amortisation, depreciation, impairment losses and reversals
of impairment losses-1 -1 - -
Operating loss (EBIT) (2) -31 -22 -9 41
Dividends received from investees 794 670 124 19
(Impairment losses)/Reversals of impairment losses on
financial assets and investments-36 -44 8 -18
Other financial income/(expenses) 9 8 1 13
Profit before tax from continuing operations 736 612 124 20
Income tax (expense)/benefit -3 -5 2 -40
Profit from continuing operations 733 607 126 21
Profit/(Loss) from discontinued operations - 79 -79 n.s.
Profit for the year 733 686 47 7
2015 2014INCREASE/
(DECREASE)
Basic earnings per share (€) 0.89 0.85 0.04
of which:
- from continuing operations 0.89 0.75 0.14
- from discontinued operations - 0.10 -0.10
Diluted earnings per share (€) (3)
0.89 0.85 0.04
of which:
- from continuing operations 0.89 0.75 0.14
- from discontinued operations - 0.10 -0.10
(1) EBITDA is calculated by deducting all operating costs, with the exception of amortisation, depreciation, impairment
losses on assets and reversals of impairment losses.
(2) EBIT is calculated by deducting amortisation, depreciation, impairment losses on assets and reversals of impairment
(3) The weighted average number of shares outstanding in 2015 differs from the corresponding number for 2014
essentially due to the sale of 9,741,513 treasury shares (equal to 1.18% of the issued capital), on 10 March 2015.
Reclassified income statement
2015 2014
INCREASE/ (DECREASE)

2. Report on operations
Annual Report 2015 48
“Income tax expense” of €3 million is down €2 million on the previous year (€5 million), essentially
reflecting the positive impact resulting from the reassessment of net deferred tax income and expense,
amounting to €1,642 thousand, following the reduction in the IRES (corporation tax) rate from 2017,
introduced by the 2016 Stability Law (Law 208/2015), and the positive effects recognised in the
Company’s tax return in relation to taxation for previous years.
The “Profit/(Loss) from discontinued operations”, amounting to zero for 2015, reflected the after-tax
gain (€74 million) on the sale of TowerCo in 2014, and the dividends for 2013, after the related
taxation, declared by the investee (€5 million).
“Profit for the year” thus amounts to €733 million, up €47 million on 2014.
The “Total other comprehensive loss for the year, after the related taxation” amounts to €1 million,
reflecting fair value losses on derivatives.
In contrast, in 2014 the Company reported fair value gains of €21 million after the related taxation,
due to a reduction in interest rates as at 31 December 2014, compared with those as at 31 December
2013.
As a result, comprehensive income for 2015 amounts to €732 million (€707 million for 2014).
€M 2015 2014
Profit for the year (A) 733 686
Fair value gains/(losses) on cash flow hedges -1 21
Other comprehensive income/(loss) for the year reclassifiable to profit or loss,
after related taxation (B)-1 21
Other comprehensive income/(loss) for the year not reclassifiable to profit or loss,
after related taxation (C)- -
Reclassifications of other components of comprehensive income to profit or loss
for the year (D)- -
Total other comprehensive income/(loss) for the year, after related taxation
(E=B+C+D)-1 21
Comprehensive income for the year (A+E) 732 707
Statement of comprehensive income

49
Financial position
“Non-current non-financial assets” of €8,845 million are substantially in line with the figure for 31
December 2014 (€8,867 million).
These assets consist almost entirely of “Investments” amounting to €8,837 million, after a reduction of
€22 million compared with 31 December 2014 (€8,859 million). This primarily reflects the write-off
of the carrying amount of the investment in Compagnia Aerea Italiana (€36 million), after the
injection of fresh capital into the company that took place in 2015 (€9 million). The change also
reflects recognition of the accrued amount for share-based incentive plans, reflecting the benefits
granted to certain directors and personnel of subsidiaries (€5 million).
“Working capital” is a positive €18 million, compared with a negative €2 million as at 31 December
2014. This primarily reflects:
a) the recognition of amounts due from certain subsidiaries (€27 million) linked to the Group VAT
arrangement (governed by Ministerial Decree 11065 of 13 December 1979) adopted by the
Company from 2015. In addition to amounts payable to other subsidiaries (€4 million), other
current liabilities include the matching amount payable to the tax authorities, broadly offset by the
payment on account of VAT in December 2015 (€23 million). Amounts due to and from the
companies participating in the arrangement were settled in January 2016;
b) a reduction in net current tax assets (€6 million), essentially linked to provisions for taxation for
the year.
“Non-current non-financial liabilities” amount to €41 million, down €3 million on the figure for 31
December 2014 (€44 million). This primarily reflects a reduction in net deferred tax liabilities, linked
to the positive impact (€4 million) of the above reduction in the IRES (corporation tax) rate from
2017.
As a result, “Net invested capital” of €8,822 million is up €1 million on the figure for 31 December
2014 (€8,821 million).

2. Report on operations
Annual Report 2015 50
€M 31 December
201531 December 2014
INCREASE/
(DECREASE)
Non-current non-financial assets
Property, plant and equipment 8 8 -
Investments 8,837 8,859 -22
Total non-current non-financial assets (A) 8,845 8,867 -22
Working capital(1)
Trading assets 4 4 -
Current tax assets 29 31 -2
Other current assets 29 1 28
Current provisions -2 -2 -
Trading liabilities -4 -6 2
Current tax liabilities -18 -14 -4
Other current liabilities -20 -16 -4
Total working capital (B) 18 -2 20
Gross invested capital (C=A+B) 8,863 8,865 -2
Non-current non-financial liabilities
Non-current provisions -1 -1 -
Deferred tax liabilities -36 -42 6
Other non-current liabilities -4 -1 -3
Total non-current non-financial liabilities (D) -41 -44 3
NET INVESTED CAPITAL (E=C+D) 8,822 8,821 1
Equity
Issued capital 826 826 -
Reserves and retained earnings 8,517 8,420 97
Treasury shares -39 -205 166
Profit for the year after payment of interim dividend 404 397 7
Total equity (F) 9,708 9,438 270
Net debt
Non-current net debt
Non-current financial liabilities 6,627 8,869 -2,242
Bond issues 6,418 8,590 -2,172
Non-current derivative liabilities 209 279 -70
Non-current financial assets -7,078 -9,004 1,926
Non-current derivative assets -217 -245 28
Other non-current financial assets -6,861 -8,759 1,898
Total non-current net debt (G) -451 -135 -316
Current net debt
Current financial liabilities 1,092 251 841
Current portion of medium/long-term borrowings 1,092 250 842
Other current financial liabilities - 1 -1
Cash and cash equivalents -417 -465 48
Cash -4 -2 -2
Cash equivalents -400 -250 -150
Intercompany current account receivables due from related parties -13 -213 200
Current financial assets -1,110 -268 -842
Current portion of other medium/long-term financial assets -1,102 -259 -843
Other current financial assets -8 -9 1
Total current net debt (H) -435 -482 47
Total net debt (I=G+H) (2) -886 -617 -269
NET DEBT AND EQUITY (L=F+I) 8,822 8,821 1
Reclassified statement of financial position
(1) Calculated as the difference between current non-financial assets and liabilities.
(2) Net debt includes non-current financial assets, unlike the Company's financial position shown in the notes to the financial
statements and prepared in compliance with the European Securities and Markets Authority (ESMA) Recommendation of 20
March 2013, which does not permit the deduction of non-current financial assets from debt.

51
“Equity” totals €9,708 million and is up €270 million compared with 31 December 2014 (€9,438
million). This reflects a combination of the following:
a) comprehensive income for the year, amounting to €732 million;
b) proceeds of €228 million from the sale of 9,741,513 treasury shares in the market, compared with
the carrying amount of €158 million;
c) payment of the final dividend for 2014, totalling €366 million, and of the interim dividend for
2015, totalling €329 million.
Issued
capital
Reserves
and
retained
earnings
Treasury
shares
Profit for the
year after
payment of
interim dividend
TOTAL EQUITY
826 8,333 -208 378 9,329
- 21 - 686 707
Final dividend (€0.391 per share) - - - -318 -318
Transfer of profit/(loss) for previous year to retained earnings - 60 - -60 -
Interim dividend (€0.355 per share) - - - -289 -289
Share-based incentive plans - 6 3 - 9
826 8,420 -205 397 9,438
- -1 - 733 732
Final dividend (€0.445 per share) - - - -366 -366
Transfer of profit/(loss) for previous year to retained earnings - 31 - -31 -
Interim dividend (€0.400 per share) - - - -329 -329
Sale of treasury shares - 70 158 - 228
Share-based incentive plans - -3 8 - 5
826 8,517 -39 404 9,708
Statement of changes in equity
€M
Comprehensive income for the year
Owner transactions and other changes
Balance as at 31 December 2015
Balance as at 31 December 2013
Comprehensive income for the year
Owner transactions and other changes
Balance as at 31 December 2014

2. Report on operations
Annual Report 2015 52
As at 31 December 2015, net funds amount to €886 million, up €269 million on the figure for 31
December 2014 (€617 million). This primarily reflects the proceeds from the sale of treasury shares
(228 million), given that dividends received, other cash flows for and from operating activities and
dividends paid broadly offset each other.
Net funds consist of:
a) a non-current portion of €451 million, up €316 million compared with 31 December 2014 (€135
million), primarily due to the investment of available liquidity in the buyback of notes issued by
Romulus Finance, amounting to €347 million;
b) a current portion of €435 million, down €47 million compared with 31 December 2014 (€482
million) as a result of the cash outflow relating to the transaction described above, partially offset
by the proceeds from the sale of treasury shares (€228 million) and the net balance of dividends
received (€794 million) and those paid (€696 million).
The following should be noted in terms of the individual items:
a) a reduction of €2,172 million in bond issues, primarily as a result of the partial early redemption
of bonds issued by the Company (equal to €1,351 million and described in greater detail below)
and maturing in 2017, 2019 and 2020, in addition to the redemption of bonds maturing in May
2016 and reclassification of the remaining bonds from this issue (€882 million);
b) a reduction of €1,898 million in other non-current financial assets, following partial early
repayment of loans granted to Autostrade per l’Italia, corresponding with the Company’s early
redemption of the above bonds, and reclassification of the current portion of the loan granted to
the subsidiary and maturing in 2016, which also matches the maturing bonds indicated in point a)
above, partially offset by the previously mentioned investment in the notes issued by Romulus
Finance.
Further details regarding the partial early redemption of bonds issued by the Company and the
corresponding repayment of loans granted to Autostrade per l’Italia are provided in note 5.10 to the
financial statements.
The medium/long-term loans provided to the subsidiary, Autostrade per l’Italia, are granted on the
same terms as the Company’s borrowings in the market, plus a margin to take account of operating
costs, including those incurred for hedges using derivative financial instruments, entered into to
mitigate the exposure to cash flow risk of the underlying instruments as a result of movements in
interest and exchange rates.
The residual weighted average term to maturity of the Company’s interest bearing debt is
approximately six years as at 31 December 2015. 100% of the Company’s debt is fixed rate.
12% of the Company’s non-current debt is denominated in currencies other than the euro (sterling
and yen). Taking account of foreign exchange hedges, the percentage of foreign currency debt exposed
to currency risk on translation into euros is zero.
The average cost of medium/long-term borrowings in 2015 was approximately 4.4%.

53
Cash flow
“Cash generated from operating activities” amounts to €751 million, up €97 million on the figure for
2014 (€654 million). This essentially reflects dividends for 2014 declared by Aeroporti di Roma (€123
million), partially offset by the cash outflow following the payment on account of VAT, recovered in
January 2016. The payment of €23 million was made on behalf of the subsidiaries participating, from
2015, in the Group VAT arrangement, described above in the section “Financial position”.
“Cash used for investment in non-financial assets” in 2015 amounts to €9 million and relates entirely
to the injection of capital into Compagnia Aerea Italiana.
The outflow of €4 million in 2014 reflected the acquisition of investments, at a cost of €72 million, in
Pavimental, Spea Ingegneria Europea and ADR Engineering (the latter merged with and into Spea
Ingegneria Europea on 1 June 2015, with the merged company renamed Spea Engineering), and the
injection of capital into Compagnia Aerea Italiana (€27 million), partially offset by the proceeds from
the sale of the investment in TowerCo (€95 million).
“Net equity cash outflows” amount to €464 million, reflecting the payment to shareholders of the final
dividend for 2014 (€366 million) and of the interim dividend for 2015 (€329 million), partially offset
by the proceeds from the above sale of treasury shares.
The net outflow from changes in equity in 2014 amounted to €604 million, almost entirely reflecting
the payment to shareholders of the final dividend for 2013 (€318 million) and of the interim dividend
for 2014 (€289 million).
Net funds at the end of the period have also been reduced by other changes of €9 million, substantially
due to fair value losses (€6 million) on financial instruments recognised in comprehensive income,
after the related taxation.
Net funds increased in 2014, having benefitted from other changes of €16 million. These were
essentially the result of fair value gains (€32 million) on financial instruments recognised in
comprehensive income, after the related taxation, partially offset by impairment losses on convertible
bonds issued by Compagnia Aerea Italiana (€14 million).
As a result of the above, net funds rose €269 million in 2015, compared with an increase of €62
million in 2014.

2. Report on operations
Annual Report 2015 54
€M 2015 2014
CASH FLOWS FROM (USED IN) OPERATING ACTIVITIES
Profit for the year 733 686
Adjusted by:
1 1
36 44
- -75
-2 -
3 4
-1 -6
-19 -
751 654
NET CASH FROM/(USED IN) INVESTMENT IN NON-FINANCIAL ASSETS
-9 -99
- 95
-9 -4
NET EQUITY CASH INFLOWS/(OUTFLOWS)
-695 -607
231 3
-464 -604
278 46
-6 32
-3 -2
- -14
-9 16
269 62
617 555
886 617
Statement of changes in net debt (1)
Amortisation and depreciation
Impairment losses/(Reversal of impairment losses) on financial assets and
investments
Net cash generated from/(used in) operating activities (A)
(Gain)/Loss on sale of non-current assets
Net change in deferred tax (assets)/liabilities through profit or loss
Other non-cash costs (income)
Change in operating capital
Other changes in non-financial assets and liabilities
Net cash from/(used in) investment in non-financial assets (B)
Dividends declared
Proceeds from sale of treasury shares and exercise of rights under share-based
incentive plans
Purchase of investments
Proceeds from sales of property, plant and equipment, intangible assets and
investments
Net equity cash inflows/(outflows)(C)
Increase/(Decrease) in cash and cash equivalents during year (A+B+C)
Change in fair value and settlement of financial instruments recognised in
comprehensive income
Financial income/(expenses) accounted for as an increase in financial
assets/(liabilities)
(Impairment losses)/Revaluations of financial assets
- “Net equity cash inflows/(outflows)” solely regard changes in equity with an impact on net debt;
- the item “Other changes in net debt” includes the impact of changes not included in other types of flow that have an impact on net debt.
Other changes in net debt (D)
Increase in net debt for year (A+B+C+D)
Net debt at beginning of year
Net debt at end of year
(1) The statement of changes in net debt presents the impact of cash flows generated or used during the period on net debt, unlike the statement of
cash flows, which presents the impact of cash flows on cash and cash equivalents. The statement of changes in net debt shows the following
information
- Net cash from /(used in) operating activities” shows the change in operating capital, consisting of trade-related items directly linked to the ordinary
activities of the business;
- “Net cash from/(used in) investment in non-financial assets” solely includes cash flows used in and generated from investment in non-financial assets;

55
Key performance indicators by operating segment
The Atlantia Group’s operating segments are identified based on the information provided to and
analysed by Atlantia’s Board of Directors, which represents the Group’s chief operating decision
maker, taking decisions regarding the allocation of resources and assessing performance. In particular,
the Board of Directors assesses the performance of the business in terms of geographical area and
business segment.
Details of the composition of the Atlantia Group’s operating segments are as follows:
a) Italian motorways: this includes the Italian motorway operators (Autostrade per l’Italia,
Autostrade Meridionali, Tangenziale di Napoli, Società italiana per azioni per il Traforo del
Monte Bianco and Raccordo Autostradale Valle d’Aosta), whose core business consists of the
management, maintenance, construction and widening of the related motorways operated under
concession. This operating segment also include the motorway operator, Autostrada Tirrenica,
following the acquisition of control of this company and its consolidation from September 2015.
In addition, this segment also includes Telepass, the companies that provide support for the
motorway business in Italy, and the Italian holding company, Autostrade dell’Atlantico, which
holds investments in South America;
b) overseas motorways: this operating segment includes the activities of the holders of motorway
concessions in Brazil, Chile and Poland, and the companies that provide operational support for
these operators and the related foreign-registered holding companies;
c) Italian airports: this includes the airports business of Aeroporti di Roma, which holds the
concession to operate and expand the airports of Rome Fiumicino and Rome Ciampino, and the
companies responsible for supporting and developing the airports business;
d) Atlantia and other activities: this segment includes:
1) the Parent Company, Atlantia, which operates as a holding company for its subsidiaries and
associates whose business is the construction and operation of motorways, airports and
transport infrastructure, parking areas and intermodal systems, or who engage in activities
related to the management of motorway or airport traffic;
2) a number of subsidiaries that produce and operate free-flow tolling systems, traffic and
transport management systems, and public information and electronic payment systems. The
most important companies in this segment are Autostrade Tech and Electronic Transaction
Consultants. In addition, adjusted operating cash flow for 2014 benefitted from the
contribution of Ecomouv (the “EcoTaxe” project), which ceased operations following the
French government’s decision to terminate the related partnership agreement on 30 October
2014;
3) infrastructure design, construction and maintenance, essentially carried out by Pavimental and
Spea Engineering.
Key performance indicators for each of the Group’s operating segments in the two comparative periods
are shown below.

2. Report on operations
Annual Report 2015 56
20
15
20
14
20
15
20
14
20
15
20
14
20
15
20
14
20
15
20
14
20
15
20
14
RE
PO
RT
ED
AM
OU
NT
S
Ext
ern
al re
ven
ue
3,7
64
3,6
59
54
65
41
80
37
51
19
11
32
-
-
5,3
04
5,0
83
Inte
rse
gm
en
t re
ven
ue
13
19
-
-
1-
56
94
52
-58
3-4
71
-
-
To
tal
reve
nu
e3
,77
73
,67
85
46
54
18
04
75
17
60
58
4-5
83
-47
15
,30
45
,08
3
EB
ITD
A2
,31
42
,26
14
07
41
24
50
46
64
43
0-
-
3
,21
53
,16
9
Op
era
tin
g c
as
h f
low
1,4
71
1,4
17
33
03
20
32
03
37
-16
5-
-
2
,10
52
,07
9
Ca
pit
al
exp
en
dit
ure
(3)
96
77
74
17
21
56
31
81
51
41
18
-10
11
,48
81
,10
0
AD
JUS
TE
D A
MO
UN
TS
Ad
jus
ted
EB
ITD
A2
,31
42
,26
14
93
48
94
50
46
64
43
0-
-
3
,30
13
,24
6
Ad
jus
ted
op
era
tin
g c
as
h f
low
1,4
71
1,4
17
36
33
46
32
03
37
-16
81
-
-
2,1
38
2,1
81
TO
TA
L
AT
LA
NT
IA G
RO
UP
(2)
(1)
Th
e f
igu
re f
or
this
segm
en
t in
20
15
in
clu
de
s t
he c
on
trib
uti
on
fro
m A
DR
En
gin
eeri
ng, m
erg
ed
wit
h S
pea
In
gegn
eri
a E
uro
pea
(n
ow
Sp
ea
En
gin
eeri
ng)
du
rin
g 2
01
5 a
nd
, th
ere
fore
, cla
ssif
ied
in
th
e "
Atl
an
tia
an
d o
ther
acti
vit
ies"
segm
en
t. F
or
the c
om
pa
rati
ve
am
ou
nt
an
d u
nti
l 1
Ja
nu
ary
20
15
, th
e e
ffecti
ve d
ate
of
the m
erg
er,
AD
R E
ngin
eeri
ng is c
lassif
ied
in
th
e "
Ita
lia
n a
irp
ort
s"
segm
en
t.
(2)
A d
escri
pti
on
of
the p
rin
cip
al a
mo
un
ts in
th
e c
on
so
lid
ate
d i
nco
me s
tate
men
t a
nd
sta
tem
en
t o
f fi
na
ncia
l p
osit
ion
an
d t
he r
ela
ted
ch
an
ges is p
rovid
ed
in
th
e s
ecti
on
, "G
rou
p f
ina
ncia
l re
vie
w".
(3)
Th
is ite
m in
clu
de
s e
xpen
dit
ure
on
assets
held
un
de
r co
ncessio
n, o
n p
rop
ert
y, p
lan
t a
nd
eq
uip
men
t a
nd
on
oth
er
inta
ngib
le a
ssets
, a
s s
ho
wn
in
th
e s
tate
men
t o
f ch
an
ges in
net
de
bt.
€M
ITA
LIA
N M
OT
OR
WA
YS
OV
ER
SE
AS
MO
TO
RW
AY
SIT
AL
IAN
AIR
PO
RT
S
AT
LA
NT
IA
AN
D
OT
HE
R A
CT
IVIT
IES
(1)
CO
NS
OL
IDA
TIO
N A
DJU
ST
ME
NT
S

57
This page intentionally left blank

2. Report on operations
Annual Report 2015 58
Key performance indicators for the Group’s
principal subsidiaries (*)
(*) Figures calculated under IFRS and, in particular, in compliance with the standards and policies adopted by Atlantia,
and extracted from specific reporting packages prepared by each subsidiary for the purpose of preparing the Atlantia
Group's consolidated financial statements.
(a) Includes investment in assets held under concession, in property, plant and equipment and in other intangible assets.
(b) This company has been consolidated by the Group from 30 September 2015. (c) The figures for capital expenditure do not include the portion funded by ENAC for Pier C, amounting to €18 million in 2015
and €22 million in 2014. (d) Spea Engineering’s key performance indicators for 2015 include the contribution of ADR Engineering, following
the merger completed on 21 May 2015. In 2014, ADR Engineering’s contribution was, in contrast, included in the
figures for the Aeroporti di Roma group.
€M
2015 2014 2015 2014
Absolute % Absolute %
Italian motorways
Autostrade per l'Italia 3,405 3,332 73 2% 2,114 2,076 38 2%
Telepass 151 145 6 4% 89 88 1 1%
Società Italiana per il Traforo del Monte Bianco 58 55 3 5% 38 35 3 9%
Autostrade Meridionali 85 79 6 8% 28 28 - n/s
Tangenziale di Napoli 75 71 4 6% 31 26 5 19%
Raccordo Autostradale Valle d'Aosta 19 18 1 6% 7 5 2 40%
Società Autostrada Tirrenica (b)
7 - 7 n/s 2 - 2 n/s
Ad Moving 9 9 - n/s - - - n/s
Overseas motorways
Rodovia das Colinas 125 145 -20 -14% 91 116 -25 -22%
Triangulo do Sol 114 134 -20 -15% 88 103 -15 -15%
Vespucio Sur 85 70 15 21% 68 59 9 15%
Costanera Norte 95 76 19 25% 72 57 15 26%
Gruppo Stalexport Autostrady 64 54 10 19% 51 40 11 27%
Rodovia MG050 (Nascentes das Gerais) 27 32 -5 -16% 18 21 -3 -14%
Los Lagos 25 19 6 32% 16 12 4 33%
Autopista Nororiente 5 3 2 67% - - - n/s
Litoral Central 3 2 1 50% -1 - -1 n/s
AMB 1 1 - n/s - - - n/s
Italian airports
Aeroporti di Roma group(c)801 750 51 7% 445 460 -15 -3%
Fiumicino Energia 7 8 -1 -13% 5 6 -1 -17%
Leonardo Energia 23 25 -2 -8% - - - n/s
Other activities
Pavimental 507 401 106 26% 24 18 6 33%
SPEA Engineering (d)108 77 31 40% 29 18 11 61%
Autostrade Tech 65 52 13 25% 11 9 2 22%
ETC 71 48 23 48% 10 3 7 n/s
Increase/(Decrease) Increase/(Decrease)
REVENUE EBITDA

59
2015 2014 2015 201431 December
2015
31 December
2014
Absolute % Absolute % Absolute %
1,650 1,411 239 17% 904 739 165 22% 10,710 10,682 28 n/s
76 72 4 6% 16 9 7 78% 263 299 -36 -12%
22 11 11 n/s 2 1 1 n/s -125 -99 -26 26%
18 20 -2 -10% 7 11 -4 -36% -150 -148 -2 1%
21 13 8 62% 16 10 6 60% 22 37 -15 -41%
-2 -11 9 -82% 7 3 4 n/s -90 -88 -2 2%
2 - 2 n/s 15 - 15 n/s 230 - 230 n/s
- - - n/s - - - n/s 3 1 2 n/s
66 94 -28 -30% 18 20 -2 -10% -23 1 -24 n/s
68 83 -15 -18% 15 5 10 n/s -50 -42 -8 19%
66 54 12 22% - - - n/s -16 37 -53 n/s
68 54 14 26% 88 50 38 76% -217 -133 -84 63%
41 26 15 58% 5 10 -5 -50% -70 -34 -36 n/s
6 12 -6 -50% 42 65 -23 -35% 104 90 14 16%
11 7 4 57% - - - n/s -261 -241 -20 8%
- - - n/s - - - n/s -43 -32 -11 34%
- - - n/s - - - n/s -105 -99 -6 6%
- - - n/s - - - n/s -11 -8 -3 37%
268 271 -3 -1% 318 150 168 n/s 765 625 140 22%
3 4 -1 -25% - - - n/s 2 6 -4 -67%
- - - n/s - - - n/s - -1 1 n/s
14 8 6 75% 26 8 18 n/s 104 85 19 22%
25 15 10 67% 3 2 1 50% -10 3 -13 n/s
9 7 2 29% 1 1 - n/s -15 -10 -5 50%
5 -4 9 n/s 11 3 8 n/s 51 44 7 16%
Increase/(Decrease) Increase/(Decrease) Increase/(Decrease)
EBIT CAPITAL EXPENDITURE (a) NET DEBT

2. Report on operations
Annual Report 2015 60
Italian motorways
Italian motorway operations generated revenue of €3,777 million in 2015, an increase of €99 million
(3%) on the previous year. On a like-for-like basis2, total revenue is up €148 million (4%).
The Group’s Italian motorway operators report net toll revenue of €3,323 million for 2015, marking
an increase of €157 million compared with the previous year, including the contribution from
Autostrada Tirrenica. On a like-for-like basis, net toll revenue is up €151 million, primarily reflecting
an increase in motorway traffic (up 3%, accounting for an increase of €90 million, including the
impact of the different traffic mix) and the application of annual toll increases (up €39 million,
essentially reflecting the increase of 1.46% applied by Autostrade per l’Italia from 1 January 2015).
Other operating income is down €58 million on 2014. The figure was negatively influenced by a
reduction in royalties from service areas as a result of agreements with certain operators, further
discounts applied to royalties with effect from the second half of 2014, a reduction in “one-off”
payments received and reduced income resulting from the handover free of charge of buildings located
at service areas. These items are partially offset by the contingent assets recognised by Tangenziale di
Napoli in 2015, following settlement of a legal dispute regarding an expropriation. On a like-for-like
basis, other operating income has not changed significantly.
Net operating costs of €1,463 million in 2015 are up €46 million on the previous year, whilst
benefitting from the lower cost of settlements reached with certain service area operators (which had a
greater impact in 2014). On a like-for-like basis, net operating costs are up €48 million, primarily as a
result of the following:
higher maintenance costs, above all on Autostrade per l’Italia’s network, partly linked to the
decision to bring forward work initially scheduled for 2016;
an increase in operating costs, above all at Autostrade per l’Italia, linked primarily to an increase in
insurance deductibles and the corporate advertising costs incurred by Autostrade per l’Italia in
relation to the issue of bonds to retail investors in June 2015;
an increase in concession fees linked to the rise in toll revenue;
a 3.8% increase in staff costs which, before deducting capitalised expenses, substantially unchanged
across the two comparative periods. This reflects a combination of the following:
an increase in the average unit cost (up 4.5%), primarily due to the cost of contract renewals,
management incentive plans, early retirement incentives and a reduction in expenses recovered
for staff on secondment, partially offset by Giove Clear’s recruitment of personnel on different
forms of contract with respect to the one applicable to motorway and tunnel workers;
a reduction of 50 (0.7%) in the average workforce, primarily due to a slowdown in recruitment
(at Autostrade per l’Italia, Tangenziale di Napoli and Società Autostrade Meridionali) and the
transfer of personnel from Autostrade per l’Italia to Atlantia in 2014 following the merger with
2 The term “like-for-like basis”, used with reference to certain performance indicators, is defined in the introduction to the “Group
financial review” above.

61
Gemina, partly offset by recruitment for certain specific units at Autostrade per l’Italia and an
increase in Giove Clear’s workforce, reflected the company’s expanded operations compared
with 2014.
EBITDA for the Italian motorways segment in 2015 amounts to €2,314 million, up €53 million (2%)
on 2014. On a like-for-like basis, EBITDA is up €100 million (4%).
Traffic
Traffic on the Group’s Italian network in 2015 (measured in kilometres travelled) is up 3.0% on the
previous year.
The number of kilometres travelled by vehicles with 2 axles is up 2.9%, with the figure for those with 3
or more axles up 3.9%.
Traffic on the network operated under concession in Italy during 2015
VEHICLES
WITH 2
AXLES
VEHICLES
WITH 3+
AXLES
TOTAL
VEHICLES
%
INC./(DEC. )
ON 2014
ATVD *
2015
Autostrade per l'Italia 39,594 5,873 45,467 3.0 43,637
Autostrade Meridionali 1,550 34 1,584 4.5 84,082
Tangenziale di Napoli 841 76 917 0.7 124,431
Società Italiana per il Traforo del Monte Bianco 8 3 11 3.5 5,225
Raccordo Autostradale Valle d'Aosta 88 19 107 5.6 9,184
To ta l I ta l i an operators 42,081 6,005 48,086 3.0 44,445
Autostrada Tirrenica ** 245 23 268 3.0 18,346
* Average theoretical vehicles per day, equal to number of kilometres travelled/journey length/number of days.
** This company was consolidated from 30 September 2015.
OPERATOR
VEHICLES*KM (MILLIONS)

2. Report on operations
Annual Report 2015 62
Monthly traffic trends on the network operated under concession in Italy in 2015 (*)
(millions of vehicles*km)
(*) Excluding Autostrada Tirrenica.
Toll increases
Autostrade per l’Italia applied an annual toll increase of 1.46% from 1 January 2015. This was
determined, in accordance with the concession arrangement, on the basis of the following
components: 0.49%, equivalent to 70% of the consumer price inflation rate in the period from 1 July
2013 to 30 June 2014; 0.89% to provide a return capital expenditure via the X tariff component;
0.08% to provide a return on investment via the K tariff component.
In the case of Raccordo Autostradale Valle d'Aosta and Tangenziale di Napoli (which, unlike
Autostrade per l’Italia, apply a toll formula that takes into account the target inflation rate, a financial
compensation component and a return on investment, in addition to quality), a toll increase of 1.5%
has been provisionally authorised. Any difference with respect to the effective toll increase due as a
result of five-yearly revision of the respective financial plans, to be included in an addendum for
publication by 30 June 2015, will be recouped, as expressly agreed in a specific memorandum signed
by the Grantor and the operators on 30 December 2014. The process of drawing up the above
addendum is still under way.
As happened with the requested toll increase for 2014, the Grantor has not approved any toll increase
for Autostrade Meridionali, in view of the fact that its concession has expired.
Based on bilateral agreements between Italy and France, Traforo del Monte Bianco has applied an
increase of 2.59% from 1 January 2015, in compliance with the Intergovernmental Committee
resolution. This was determined on the basis of the inflation-linked component of 0.19% (the average
for Italy and France) and an increase of 2.40% resulting from the above surcharges introduced by the
joint declaration of the relevant Italian and French ministries dated 3 December 2012.
Capital expenditure
Autostrade per l’Italia is in the process of implementing a programme of investment in major
infrastructure projects under the original Agreement of 1997 and the IV Addendum of 2002, totalling
€14.2 billion.
The purpose of these investments is to increase the capacity of the existing motorway network on the
country’s principal arteries, in order to improve road safety and service quality.
2,851 2,557 3,104
3,448 3,608 3,736 4,365
4,718
3,780 3,475 3,085 3,354
442 460
526 501
506 522
572 395
545 545
517 473
-
1.000
2.000
3.000
4.000
5.000
January February March April May June July August September October November December
Vehicles with 3+ axles

63
In addition to the above programme, Autostrade per l’Italia’s new Single Concession Arrangement of
2007 also envisages further investment totalling €7 billion, via:
extensions to projects already included in the Agreement of 1997, involving new specific network
upgrades worth approximately €2 billion;
a commitment to develop preliminary designs for the upgrade of certain sections of motorway
operated under concession, totalling around 325 km, at a cost of approximately €5 billion.
The Group’s other motorway have, on the other hand, completed the programmes of investment in
major infrastructure projects (€1 billion) set out in their respective arrangements, whilst Autostrada
Tirrenica (SAT), a company acquired by the Group in September 2015, is currently working on an
extension of the section of motorway it operates between Civitavecchia and Tarquinia (€200 million
already completed). Completion of the entire section from Tarquinia to Livorno (at an estimated cost
of €1.2 billion) is, on the other hand, subject to fulfilment of the technical and financial conditions to
be verified jointly by the grantor and Autostrada Tirrenica, and execution of an addendum to the
Concession Arrangement, to include a viable financial plan.
Financial Plan 1997 233 197 6.8 5.5
IV Addendum 2002 270 213 7.4 3.4
Single Arrangement 2007 ** 325 - 5.0 0.0
Other projects - - 2.0 0.3
TOTAL 829 410 21.2 9.2
Km
Raccordo Autostradale Valle d'Aosta 12 12 0.4 0.4
Società Autostrade Meridionali (***) 20 20 0.6 0.5
Società Autostrada Tirrenica (****) 205 4 1.4 0.2
TOTAL 237 36 2.4 1.1
TOTAL GROUP 1,066 446 23.6 10.3
(*) Total cost of carrying out the works, as assessed as at 31 December 2015, including the base bid price (net of bid or
agreed reductions), available funds, recognised reserves and early completion bonuses.
The value of works under the 1997 Financial Plan are net of an amount included in "Other investment".
(**) The Single Arrangement signed by Autostrade per l'Italia on 12 October 2007 provides for further upgrades of the
network, totalling around 325 km, at a cost of approximately €5 billion, in addition to new specific projects worth
approximately €2 billion.
(***) The concession held by Autostrade Meridionali expired on 31 December 2012. At the Grantor's request, in 2015
the company continued to be responsible for day-to-day operation of the motorway whilst awaiting the transfer of the
concession to the new operator (subject to inclusion of the related costs in the value of its takeover right).
(****) This company was consolidated from 30 September 2015..
AUTOSTRADE per l'ITALIA Total kmKm opened
to traffic
(€bn) Total
*
(€Mln)
Completed
SUBSIDIARIESKm
completed
(€bn) Total
*
(€bn)
Completed

2. Report on operations
Annual Report 2015 64
Upgrade and modernisation of the network operating under concession in Italy
On a like-for-like basis, Autostrade per l’Italia and the Group’s other Italian operators invested a total
of €952 million in 2015, marking an increase of €178 million (23%) on 2014. Including Autostrada
Tirrenica, capital expenditure is up €193 million (25%).
Capital expenditure
The volume of investment relating to works envisaged in Autostrade per l’Italia’s Agreement of 1997 is
€93 million up compared with 2014. The difference primarily reflects the completion of work on the
Variante di Valico, opened to traffic on 23 December 2015, and the start of work on widening the A1
between Barberino and Florence North to three lanes and on completion of off carriageway works on
the Florence North-Florence South section of the A1.
The increase in investment in works envisaged in Autostrade per l’Italia’s IV Addendum of 2002,
amounting to approximately €52 million compared with 2014, is largely due to work on Lot 4 on the
A14 and on the A4-A13 interchange (where work, which had previously been halted due to the
financial difficulties faced by contractors, gradually recommenced in the second half of 2014). The
increase also reflects work on the fifth lane of the A8 between Milan and Lainate, which began in the
second half of 2014.
Contract reserves quantified by contractors
Autostrade per l'Italia -projects in Agreement of 1997 370 277 34%
Autostrade per l'Italia - projects in IV Addendum of 2002 268 216 24%
Investment in major works by other operators 14 14 0%
Other capital expenditure and capitalised costs (staff, maintenance and other) 250 224 12%
Total investment in infrastructure operated under concession 902 731 23%
Investment in other intangible assets 14 17 -18%
Investment in property, plant and equipment 36 26 38%
Total investment in motorways in Italy 952 774 23%
Investment by Autostrada Tirrenica (*) 15 -
Total investment in motorways in Italy ( including SAT) 967 774 25%
(*) This company was consolidated from 30 September 2015.
€M 2015 2014 % inc./(dec.)

65
As at 31 December 2015, Group companies have recognised contract reserves quantified by contractors
amounting to approximately €1,390 million (€1,880 million as at 31 December 2014).
Based on past experience, only a small percentage of the reserves will actually have to be paid to
contractors and, in this case, will be accounted for as an increase in intangible assets deriving from
concession rights.
Reserves have also been recognised in relation to works not connected to investment (work for external
parties and maintenance), amounting to approximately €44 million. The estimated future cost is
covered by provisions for disputes accounted for in the consolidated financial statements as at and for
the year ended 31 December 2015.
Stage of completion of works being carried out by Autostrade per l’Italia and the other Italian motorway operators
The following tables show major works to be carried out as part of the upgrade of the network operated
under concession, based on the commitments given in the respective concession arrangements.
The estimated value of each project includes the overall cost (before any government grants) of the
works, as assessed at the end of December 2015.
The final cost of the works is subject to change based on the effective future stage of completion of the
works. In spite of the Group’s determination to push ahead with design work and organisation of the
projects, the above complications and problems relating to approvals may well continue to delay
completion of works, with the following implications:
the impossibility of making a reasonable estimate of the date of completion and entry into service
of the various works, especially those where the related contracts have yet to be awarded;
potential cost overruns due to disputes and eventual changes to designs.
In 2009, Autostrade per l’Italia’s Board of Directors set up a body known as the “Committee
responsible for the Completion of Projects”, with the role of monitoring:
the performance of infrastructure investment plans in terms of state of progress of the works, the
related costs and compliance with the commitments given by the Company and its subsidiaries in
the relevant concession arrangements;
the process of selecting contractors to carry out the works;
the organisational and procedural aspects of carrying out the works;
the state of contract reserves;
the status of the most important legal disputes.
The Committee met on 10 occasions in 2015.

2. Report on operations
Annual Report 2015 66
Planned investment in the Italian network
Autostrade per l’Italia Motorway Network
Woks on Autostrade per l’Italia Motorway Network:
Woks on other operators:
ANAS and other operators
Autostrade Meridionali
Società Autostrada Tirrenica
Upgrades
Raccordo Autostradale Valle d’Aosta
A1 Modena-Bologna (4th lane)
A14 Bologna Ring Road
(Dynamic 3rd lane)
A1 Casalecchio –Sasso Marconi
(3rd lane)
A14 Rimini North – P.to
S.Elpidio (3rd lane)
A1 Orte-Rome North
(3rd lane)
Autostrade per l’Italia Motorway Network
Woks on Autostrade per l’Italia Motorway Network:
Woks on other operators:
A3 Naples-Pompei-Salerno
3rd lane)
A1 Fiano Romano –
Settebagni (3rd lane) and
Castelnuovo di Porto Juction
A12 Società Autostrade Tirrenica
A1 Variante di Valico
A1 Barberino-Incisa (3 rd lane)
Genoa bypass
A8 Milan-Gallarate
(3 rd and 4 th lane)
A8 Link new Milan
Exhibition Center
A8 Milan-Lainate (5th
lane)
A9 Lainate-Como
Grandate (3 rd lane)
Milan East –Bergamo
(3rd lane)
MONT BLANC TUNNEL
ROME
VENICE
GENOAFLORENCE
NAPLES
TURINMILAN
1997 Financial Plan
IV Addendum 2002

67
Planned upgrades and modernisation of the network operated under concession in Italy
STATUS AS AT 31
DECEMBER 2015
KM COVERED
BY PROJECT
(KM)
VALUE OF
PROJECT(a)
(€M)
KM OPENED TO
TRAFFIC AS AT 31
DECEMBER 2015
(KM)
STAGE OF
COMPLETION AS AT
31 DECEMBER
2015(b) (€M)
A8 3rd and 4th lanes Milan-Gallarate Completed 28.7 65 28.7 65
A1 4th lane Modena-Bologna Completed (1) 31.6 180 31.6 146
A14 3rd lane Bologna Ring Road Completed (2) 13.7 59 13.7 59
A1 3rd lane Casalecchio - Sasso Marconi Completed 4.1 83 4.1 83
A1 Variante di Valico Completed/in progress (3) 58.7 4,097 58.7 3,900
A1 3rd lane Barberino - Incisa (4) 58.5 2,059 21.9 1,011
A1 3rd lane Orte - Rome North Completed 37.8 192 37.8 192
Other projects Work in progress/completed (5) 27 n.a 24
Total projects under Arrangement of 1997 233.1 6,762 196.5 5,480
A1 3rd lane Fiano R. - Settebagni and Castelnuovo di Porto junction Completed 15.9 129 15.9 124
A4 4th lane Milan East - Bergamo Completed 33.6 514 33.6 511
A8 5th lane Milan - Lainate Work in progress 4.4 211 2.2 50
A9 3rd lane Lainate - Como Grandate Completed 23.2 345 23.2 302
A14 3rd lane Rimini North - Porto Sant'Elpidio Work in progress/completed (6) 154.7 2,541 134.6 2,077
A7/A10/A12 Genoa Bypass Final design in progress 34.8 3,256 - 65
A8 Link road for New Milan Exhibition Centre Completed 3.8 86 3.8 86
Other projects (7) 342 n.a 210
Total projects under IV Addendum of 2002 270.4 7,424 213.3 3,425
A5 RAV AO-Mont Blanc Tunnel, new Morgex- Entreves section Completed 12.4 430 12.4 422
A3 Autostrade Meridionali, 3rd lane Naples-Pompei East/Scafati (d) Work in progress/completed 20.0 545 20.0 541
A12 Società Autostrada Tirrenica (e) Work in progress -
Total projects of other operators 32.4 975 32.4 963
Total investment in major works 535.9 15,161 442 9,868
(2) Total investment of €247 million, of which €59 million in the Major Works Plan of 1997 and €188 million in "Other investment".
PROJECT
Autostrade per l 'Italia: Arrangement of 1997
Projects included in IV Addendum of 2002 (c)
Other Group motorway operators
(a) Total cost of carrying out the works, as assessed at 31 December 2015, including the base bid price (net of bid or agreed reductions), available funds, recognised reserves and early completion bonuses.
The value of works under the Arrangement of 1997 is net of an amount included in "Other investment".
(b) Excludes capitalised costs (financial expenses and staff costs).
(c) Final approval given in 2004.
(d) Planned widening on Autostrade Meridionali's network regards 24.5 km, including 4.5 km already open to traffic over duration of Arrangement of 1972-1992.
The concession held by Autostrade Meridionali expired on 31 December 2012. As requested by the Grantor, from 1 January 2013 the company has continued to be responsible for day-to-day operation of the
motorway, including completion of the investment plan, whilst awaiting the transfer of the concession to the new operator (subject to inclusion of the related costs in the value of its takeover right).
(e) Il piano di investimenti in Grandi Opere di SAT prevede il potenziamento della A12 tra Rosignano e Civitavecchia
(1) Includes construction of the Modena Ring Road, a work requested by local authorities and is awaiting approval from the Services Conference.
(3) The Variante di Valico is open to traffic as at 31 December 2015. Work is continuing on off carriageway works, landscaping and completion of the new Rioveggio and Firenzuola junctions.
(4) Work on Lots 0 and 1 on the Barberino-Florence North section is in progress. Approximately 21.9 km of third lane is open to traffic between Florence North and Florence South; the executive design for Lot 1
of the Florence South-Incisa section has been approved, Lot 2 is awaiting approval by the Services Conference.
(5) Work on widening the bridge over the Volturno, the Rio Tufano viaduct and the Marano viaduct has been completed. Construction of the Lodi junction and re-routing of the Lodi Vecchio section has been
(6) Approximately 134.6 km of third lane is open to traffic between Rimini North and Ancona North and between Ancona South and Porto Sant'Elpidio, in addition to the new junctions at Montemarciano, Porto
Sant'Elpidio and Senigallia. Work is in progress on Lot 5 (Ancona North - Ancona South, 17.2 km) and Lot 4 (Senigallia - Ancona North, 18.9 km, including 16 km open to traffic).
(7) The tender procedure is underway for the Maddaloni junction; work is in progress on the Tunnel Safety Plan and on the Padua Industrial Park junction; work has been completed on the Villamarzana,
Ferentino, Guidonia and Rubicone junctions.

2. Report on operations
Annual Report 2015 68
Investment in major works by Autostrade per l’Italia – 1997 Agreement
Of the works included in Autostrade per l’Italia’s Agreement of 1997, following the opening of the
section of motorway known as the Variante di Valico, as at 31 December 2015 approximately 81% of
these works have been completed.
The 1997 Agreement originally envisaged expenditure of €3,556 million for the above works.
The updated Financial Plan of 2002, which was included in the IV Addendum, entailed revisions to
construction schedules and to the estimated total cost of the works, which was increased to €4,500
million, reflecting accumulated delays in obtaining approvals. It was, moreover, ascertained that the
delays were not the fault of Autostrade per l’Italia, and that the financial benefits arising from the
delays in carrying out the works were, in any case, less than the increase in costs to be borne by the
Company.
The increase in costs above the levels originally set out in the Financial Plan annexed to the Agreement
of 1997, are primarily the result of the above delays in the authorisation process, which have led to
price increases, and of subsequently issued regulations. Cost increases have also been caused by works
requested by local authorities involved in the approval and authorisation process. It is not envisaged
that Autostrade per l'Italia will be able to claw back past and future cost overruns through increases in
tolls.
When, moreover, construction schedules were revised and agreed during the drafting of the IV
Addendum in mid-2002, the authorisation process for many sections had not yet been completed
(Casalecchio-Sasso Marconi, lots 5, 6, 7, 8, 13 and 14 of the Variante di Valico, Barberino-Florence
North, lots 4, 5 and 6 of the Florence North-Florence South section, Florence South-Incisa and the
Bologna Ring Road) and it was not possible to estimate when this might occur.
Today, in contrast, all the authorisation procedures have been completed for the upgrade of the A1
between Bologna and Florence, with the exception of Lot 2 (7.5 km) of the Florence South-Incisa
section, for which it has not been possible to finalise the agreement between central government and
the regional authority, and for which modifications to the earlier design were required. The new
design obtained an Environmental Impact Assessment decree in January 2015 and is currently awaiting
final approval by the Services Conference.
The final cost of the works (based on contracts in progress and final and executive designs awaiting
authorisation) amounts to €6.8 billion. Of this, works with a value of approximately €5.5 billion have
been completed, a figure that is higher than the cost of the works estimated in 2007. Compared with
the initial estimate of €3.6 billion in 1997, on the basis of which the Company was privatised, the
additional expense to be borne by the operator currently stands at €3.2 billion.
Investment in major works by Autostrade per l’Italia – IV Addendum 2002
Investment envisaged in the IV Addendum is designed to upgrade the network close to a number of
major conurbations and along the Adriatic coast. The authorisation process for works covered by the
IV Addendum, signed by Autostrade per l’Italia in December 2002, was completed and became
effective in June 2004. Work on the designs relating to the investment programme envisaged by the IV
Addendum could thus only start from this date, after a delay of 21 months with respect to the original
programme.
As at 31 December 2015, over 95% of the works have been authorised, approximately 50% have been
contracted out and over 46% have been completed.
The most important project included in the IV Addendum, from both a technical and financial
viewpoint, is the Genoa Interchange. The project aims to relieve congestion on the section of the A10
close to the city of Genoa, from the Genoa West toll station (the Port of Genoa) to the residential

69
district of Voltri. This will involve transferring through traffic on to a new road running alongside the
existing motorway, effectively doubling capacity.
To take account of accumulated delays in the approval process, the revised Financial Plan of 2013 has
amended the schedule for carrying out the works and the estimated total cost, increasing it to €3.3
billion.
In 2015, the project completed the final stage of the authorisation process, with the issue, in May, of the
Decree finalising the agreement between central government and the regional authority. The final
design is currently being prepared.
The investments included in the IV Addendum are associated with specific toll increases linked to
validation of the individual works and based on the stage of completion.
Planned investment in major works by the Group’s other Italian motorway operators
As at 31 December 2015, almost all of the investments in new works by the Group’s subsidiaries, Raccordo
Autostradale Valle d’Aosta and Autostrade Meridionali, have been completed.
The concession held by Autostrade Meridionali expired on 31 December 2012. As requested by the
Grantor, from January 2013 the company has continued to be responsible for day-to-day operation of
the motorway whilst awaiting the transfer of the concession to the incoming operator and subject to
inclusion of the related costs in the value of its takeover right. As at 31 December 2015, the works
included in the investment programme agreed with the grantor have been completed. SAT, which has
been recently acquired by the Group, is working on completion of the section of motorway linking
Civitavecchia with Tarquinia (approximately 90% of the work has been completed as at 31 December
2015).
Telepass As at 31 December 2015, 8.8 million Telepass devices are in circulation (up 327 thousand compared with
31 December 2014), whilst the number of subscribers of the Premium option stands at over 1.9 million
(up 95 thousand compared with 31 December 2014).
Telepass, the company responsible for operating tolling systems and the supplier, in Italy and overseas,
of other transport-related payment systems, generated revenue of €151 million in 2015, up €5 million
on the figure for 2014.
Revenue primarily consists of Telepass fees of €97 million, Viacard subscription fees of €21 million
and payments for Premium services of €17 million.
The company’s EBITDA for 2015 is €89 million, compared with €88 million for 2014.

2. Report on operations
Annual Report 2015 70
Overseas motorways
The Group’s overseas motorway operators generated total revenue of €546 million in 2015, up €5
million (1%) on 2014, after an overall negative impact of exchange rate movements. At constant
exchange rates, revenue is up 9%.
Revenue growth during the year was driven by toll increases applied by operators in accordance with
the terms of their concession arrangements, and by increases in traffic (measured in terms of
kilometres travelled) comparerd with 2014. Traffic growth was particularly evident in Chile (6.7%)
and Poland (8.6%), whilst traffic declined in Brazil3(a decline of 2.1%) as a result of the continuing
weakness of the country’s economy which, from the second half of 2014, has led to a reduction in heavy
vehicles.
EBITDA for the overseas companies, amounting to €407 million in 2015, is up 1% on 2014. At
constant exchange rates, EBITDA is up 6%.
Breakdown of reported EBITDA for overseas motorway operators
(by geographical area)
(3) If the 50% interest in Rodovias do Tieté is included, the decline in traffic in Brazil is 2.2%.
Chile 38%
Brazil 49%
Poland 13%

71
Chile The Chilean operators’ revenue for 2015 amounts to a total of €214 million, up 25% on 2014 (€171
million). At constant exchange rates4, revenue is up 20%. EBITDA of €155 million, marking an
increase of approximately €27 million (21%) on 2014. At constant exchange rates, EBITDA is up 16%.
Key performance indicators
Traffic on the motorways operated by the Group’s Chilean operators, measured in terms of kilometres
travelled, rose by a total of 6.7% in 2015.
In addition to the above traffic growth, toll revenue recorded by Costanera Norte in 2015 benefitted
from the reconfiguration of tollgates in the first quarter of 2014 and in January 2015, carried out as
part of the Santiago Centro Oriente upgrade programme. The effect of the new configuration, which
in a number of cases enables the company to bill certain types of traffic that previously did not pay, has
resulted in a 7.5% increase in traffic.
From January 2015, the operators controlled by Grupo Costanera applied the following annual toll
increases5, calculated under the terms of the related concession arrangements:
(4) The results of the Group’s Chilean companies for 2015 expressed in euros have benefitted from a strengthening of the Chilean
peso, with the exchange rate moving from 756.9 Chilean pesos per euro (the average rate for 2014) to an average of 726.4
Chilean pesos for 2015 (an increase in value of 4%).
(5) The toll increases applied to road users may also be influenced by the rounding off of tolls and, in the case of Nororiente, by
the distribution of the increase between the two barriers.
€m
2015 2014 % i nc./(dec. ) 2015 2014 % i nc./(dec. ) 2015 2014 % i nc./(dec. ) 2015 2014 % i nc./(dec. )
Grupo Costanera
Costanera Norte 95 76 25% 72 57 26% 133 109 22% 110 90 22%
Nororiente 5 3 67% 0 0 n/s 18 15 20% 13 12 8%
Vespucio Sur 85 70 21% 68 59 15% 85 70 21% 68 59 15%
Litoral Central 3 2 50% -1 0 n/s 14 12 17% 12 9 33%
AMB 1 1 n/s 0 0 n/s 1 1 n/s 0 0 n/s
Los Lagos 25 19 32% 16 12 33% 48 40 20% 39 33 18%
Total 214 171 25% 155 128 21% 299 247 21% 242 203 19%
(*) Information on the nature of the adjustments made and differences between reported and adjusted amounts is provided in the specific section of the "Group financial
review".
Revenue EBITDA Adj usted revenue (*)
Adj usted EB ITDA (*)
2015 2014 % i nc./(dec. ) 2015 2014 % i nc./(dec. )
Grupo Costanera
Costanera Norte (*)
1,076 1,038 3.6% 255,788 248,021 3.1%
Nororiente 79 73 8.3% 6,639 6,122 8.5%
Vespucio Sur 898 849 5.7% 292,678 277,706 5.4%
Litoral Central 111 99 12.3% 4,493 3,990 12.6%
AMB 23 22 2.6% 9,857 9,611 2.6%
Los Lagos 673 597 12.6% 17,385 16,033 8.4%
Total 2,859 2,679 6.7% 586,841 561,483 4.5%
(*) Excludes new tollgates installed in 2015.
Traffi c (mi l l i ons o f k m trave l l ed) Traffi c (thousands o f j ourney s)

2. Report on operations
Annual Report 2015 72
9.4% for Costanera Norte, Vespucio Sur and Nororiente, reflecting a combination of the increase
linked to inflation in 2014 (up 5.7%) and a further increase of 3.5%;
7.3% for AMB, reflecting a combination of the increase linked to inflation in 2014 (up 5.7%) and
a further increase of 1.5%;
5.7% for Litoral Central, linked to inflation in 2014.
From January 2015, the tolls applied by Los Lagos rose 9.0%, reflecting a combination of the increase
linked to inflation in 2014 (up 5.7%) and a further increase in the form of a bonus relating to safety
improvements in 2015 (up 4.0%), less the bonus for safety improvements awarded in 2014, equal to
0.85%.
Capital expenditure amounted to a total of €88 million in 2015, with around 52% of the works to be
carried out as part of the Santiago Centro Oriente upgrade programme, amounting to total investment
of approximately €250bn Chilean pesos (equal to around €338 million6) in the section operated by
Costanera Norte, having been completed
Brazil The Brazilian operators generated total revenue of €266 million in 2015, down 14% on 2014 (€311
million). At constant exchange rates7, revenue is up 1.3%. The Brazilian operators consolidated by the
Group recorded a 2.1% decline in traffic, measured in terms of kilometres travelled, in 2015.
Toll revenue reflects the annual toll increases applied by operators in the state of Sao Paulo from July
and those applied from June by the operator, Rodovia MG050, in the state of Minas Gerais.
Key performance indicators
Triangulo do Sol and Colinas increased their tolls by 4.11% from 1 July 2015, based on the rate of
general price inflation in the period between June 2014 and May 2015, whilst Rodovias do Tieté raised
its tolls by 8.47%, based on the rate of consumer price inflation in the same period. The increase were
applied in accordance with the respective concession arrangements.
(6) Amounts for previous years have been translated at the average peso/euro exchange rates for the relevant year (2013: 658.3;
2014: 756.9; 2015: 726.4), whilst amounts for 2016 and future years have been translated at the prevailing peso/euro
exchange rate as at 31 December 2015 (772.7).
(7)The results of the Group’s Brazilian companies for 2015 expressed in euros reflect a decline in the value of the Brazilian real,
with the exchange rate moving from 3.12 Brazilian reals per euro (the average rate for 2014) to an average of 3.70 Brazilian reals
per euro in 2015 (a reduction in value of 19%).
€m
2015 2014
%
i nc./(dec. ) 2015 2014
%
i nc./(dec. ) 2015 2014
%
i nc./(dec. )
Triangulo do Sol 1,465 1,511 -3.1% 114 134 -15% 88 103 -15%
Rodovias das Colinas 2,042 2,080 -1.8% 125 145 -14% 91 116 -22%
Rodovia MG050 795 804 -1.1% 27 32 -16% 18 21 -14%
Total 4,302 4,395 -2.1% 266 311 -14% 197 240 -18%
Rodovias do Tietè 1,292 1,326 -2.6%
Total including Tietè 5,595 5,722 -2.2%
Traffi c (mi l l i ons o f k m trave l l ed) Revenue EBITDA

73
From 24 June 2015, the tolls applied by the operator, Rodovia MG050, in the state of Minas Gerais
rose by 8.17%, based on the rate of consumer price inflation in the period between May 2014 and
April 2015, as provided for in the related concession arrangement.
Rodovia MG050’s toll revenue was negatively affected by the suspension of charges for the suspended
axles of heavy vehicles introduced by federal law 13103/2015, which came into effect on 17 April 2015.
The loss of revenue resulting from the entry into effect of above legislation will be subject to
compensation in accordance with the concession arrangement.
EBITDA of €197 million is down by approximately €43 million (18%) compared with 2014. At
constant exchange rates, EBITDA is down 2.9%.
A total of €67 million was invested in upgrading the network operated under concession in Brazil.
With the opening to traffic of the last 5.5 km of the Rodoanel (Sao Paulo’s orbital motorway), the
entire stretch of this road, covering 105 km, is now operational with a provisional layout8. This road is
operated under concession by SPMAR, on whose shares Atlantia Bertin Concessoes has a call option
exercisable in accordance with the terms of agreements with the Bertin group, currently SPMAR’s
controlling shareholder.
Poland
In Poland, the Stalexport Autostrady group recorded total revenue of €64million, marking an increase
of 19% compared with 2014. EBITDA of €51million is up 28% on 2014.
The operator, Stalexport Autostrada Malopolska, registered an 8.6% increase in traffic, in terms of
kilometres travelled, in 2015, compared with 2014. The number of light vehicles is up 8.5%, whilst
heavy vehicles are up 9.1%.
Tolls were increased by 10.7%9 from 1 March 2015, rising from 9.0 to 10.0 zlotys for light vehicles,
from 15.0 to 16.5 zlotys for vehicles with up to 3 axles and from 24.5 to 26.5 zlotys for those with more
than 3 axles.
(8)The regulator for the state of Sao Paulo (ARTESP) has also authorised collection of tolls from 2 July 2015, despite the fact that
a number of construction works still have to be carried out to complete the section of motorway. 9 The weighted average increase based on the distribution of traffic in the first quarter of 2015 (in terms of km travelled) over the
three classes of vehicle.
€m
2015 2014
%
i nc./(dec. ) 2015 2014
%
i nc./(dec. ) 2015 2014
%
i nc./(dec. )
Stalexport Autostrady group 822 757 8.6% 64 54 18.5% 51 40 27.5%
Total 822 757 8.6% 64 54 18.5% 51 40 27.5%
Revenue EBITDATraffi c (mi l l i ons of k m trave l l ed)

2. Report on operations
Annual Report 2015 74
Italian airports
The Italian airports business generated revenue of €804 million in 2015, up €53 million (7%) on the
previous year. On a like-for-like basis1, total revenue is up €47 million (6%).
Aviation revenue of €565 million is up €45 million (9%) overall on 2014, thanks to traffic growth
(passengers up 6.1%, movements up 1.7%) and to the increases in airport fees applied from 1 March
2014 and 1 March 2015. In the case of Fiumicino, the ratio between the maximum permitted revenue
for regulated services and fee-paying passengers, under the Planning Agreement, is €29.8, whilst the
figure for Ciampino airport is €18.8 per passenger.
Other operating income, which rose €8 million in 2015, also includes insurance proceeds recognised
on the basis of a best estimate of the amount payable to cover the rebuilding, safety and salvage costs
incurred as a result of the fire at Terminal 3 on 7 may 2015, which was based on a prudent estimate
given that the final cost is still being assessed. The figure for 2014 included income recognised
following the recovery of amounts receivable from Alitalia in Extraordinary Administration (which had
been written off in previous years). On a like-for-like basis, other operating income is up €2 million,
reflecting the performance of non-aviation revenue.
Net operating costs of €354 million in 2015 are up €69 million (24%), partly reflecting the above-
mentioned cost of the rebuilding, safety and salvage work carried out in the areas affected by the fire at
Terminal 3. On a like-for-like basis, net operating costs are up €37 million, reflecting:
the cost of materials and external services, totalling €145 million and up €18 million on the first
nine months of 2014. The increase primarily reflects rising maintenance costs (with the aim of
ensuring a high degree of efficiency of airport infrastructure and, therefore, service quality), the
cost of policing and security services and commercial initiatives (promotions), partly offset by a
reduction in the cost of external services following the decision to insource airport cleaning,
awarding the contract to the subsidiary, Airport Cleaning Srl, from the end of May 2014;
concession fees, amounting to €34 million and up €3 million, primarily due to traffic growth;
net staff costs, totalling €143 million and up €16 million, broadly due to an increase in the average
workforce employed by the ADR group and linked to the above insourcing of cleaning services,
now carried out by the subsidiary, Airport Cleaning Srl, initiatives designed to improve passenger
assistance and the recruitment of staff to work on implementation of the programmes envisaged in
the Planning Agreement.
(1) The term “like-for-like basis”, used with reference to certain performance indicators, is defined in the introduction to the “Group
financial review” above.

75
The combined impact of the above events has resulted in EBITDA of €450 million, down €16 million
(3%) on 2014. On a like-for-like basis, EBITDA is up €10 million (2%)12
Traffic performance
The Roman airport system handled 46 million passengers in 2015, marking an increase of 6.1% on the
previous year. This result is all the more significant in view of the limitations on operating capacity at
Fiumicino airport between 7 May and 18 July 2015 following the fire at Terminal 3.
In terms of the airport system as a whole, the EU segment continues to be the biggest driver of growth,
rising 9.7% on 2014 and accounting for 50% of total traffic. This was accompanied by growth in
domestic traffic (up 2.7%), reflecting a positive contribution from Alitalia, and an increase in non-UE
traffic (up 2.4%). In particular, passenger traffic at Fiumicino airport is up 4.8%, whilst Ciampino
registered growth of 16.1%, the latter performance in part due to the decision to switch flights that
could no longer operate from Fiumicino as a result of the fire. Capacity at the Roman airport system
also grew, with movements up 1.7%, the number of available seats rising 3.1% and aircraft tonnage up
2.9%.
1(2) After stripping out ADR Engineering’s contribution to EBITDA for 2014, in view of its merger with Spea Engineering, a
subsidiary of Atlantia SpA, in 2015, the like-for-like increase in EBITDA for 2015 is €14 million (3%).

2. Report on operations
Annual Report 2015 76
Breakdown of traffic using the Roman airport system in 2015
(millions of pax)
The breakdown of passengers by geographical area shows increases for the Middle East (up 16.5%),
Europe EU (up 9.7%), North America (up 5.6%), the Far East (up 4.8%), the Italian domestic market
(up 2.7%) and broad stability for Europe Non-EU; the remaining areas recorded falls (Africa down
16.6% and Central/South America down 1.6%).
28%
50%
22%
Domestic EU Non-EU
12.8
23.3
10.2
46.3
2.7%
9.7%
2.4%6.1%
0
5
10
15
20
25
30
35
40
45
50
Domestic EU Non-EU Total
Change 2015 vs 2014

77
Breakdown of passenger traffic using the Roman airport system by geographical area
(millions of pax)
Alitalia, the main carrier operating at Fiumicino, recorded a 3.6% increase in passenger traffic in
2015. Increases in traffic were registered by the Domestic segment (up 4.6%) and the International EU
segment (up 5.1%). Non-EU traffic was broadly stable.
Aviation activities
Aviation revenue31amounts to €565 million for 2015, up 9% on the previous year. The results were
affected by the above fire, which resulted in limitations on air traffic until 18 July 2015.
Airport fee revenue for the period under review totals €440 million, an increase of 11%. The
improvement primarily reflects traffic growth, in addition to the annual increase in unit fees which, in
accordance with the Planning Agreement, were applied from 1 March 2014 and 2015.
In detail:
passenger embarkation fees, amounting to €314 million, are up 11% on 2014, primarily due to the
increase in the number of passengers embarked (up 6.2%);
take-off, landing and parking fees, amounting to €124 million, are up 11%, primarily arising from
increases in movements (up 1.7%) and aircraft tonnage (up 2.9%).
Non-aviation activities
Non-aviation revenue42
of €207 million in 2015 is in line with the figure for 2014, despite the growth
in traffic compared with the comparative period.
In detail:
retail sub-concessions, which include sub-concessions for the retail sale of goods and services and
the advertising business, generated revenue of €115 million. Retail revenue is up 2% on 2014,
(3) This primarily includes revenue from airport fees, security services and centralised infrastructure. (4) This includes retail sub-concessions, property management, car parks and advertising, as well as other activities carried out for
external customers.
12.8
23.3
2.4 2.3 2.3 1.2 1.2 0.8
2.70%
9.70%
5.60%-0.70%
16.50% 4.80% -16.60% -1.60%
-20%
-15%
-10%
-5%
0%
5%
10%
15%
20%
0
2
4
6
8
10
12
14
16
18
20
22
24
26
Italia Europa UE Nord AmericaEuropa
Extra UeMedio Oriente
Estremo
OrienteAfrica
C/Sud
America
Totale 12.85 23.30 2.40 2.30 2.30 1.20 1.20 0.80
∆% vs 2014 2.70% 9.70% 5.60% -0.70% 16.50% 4.80% -16.60% -1.60%

2. Report on operations
Annual Report 2015 78
reflecting the above traffic growth and despite a less profitable passenger mix and the closure of a
number of shops following the fire. Over 100 outlets had to be closed, even if in some cases only
temporarily, and around twenty shops were damaged and have yet to reopen at the end of the year.
The advertising business generated revenue of €10 million, slightly down on the same period of the
previous year;
revenue from property management, which includes the sub-concession of space and provision of
the related utilities and services, amounts to €50 million, down 6% on the figure for 2014;
car park management generated revenue of €28 million, slightly down on the previous year (1%).
Capital expenditure
Design and construction work in implementation of the Master Plan, envisaged in the Planning
Agreement, continued in 2015, with expenditure of €336 million up €163 million on 2014. The
principal works relating terminals and piers regarded construction of the new departure areas E/F and
the avant-corps for Terminal 3. Work on the final design for the eastern area of Fiumicino airport is
nearing completion, with this project consisting primarily of the enlargement and reconfiguration of
Terminal 1, and construction of a new retail plaza and of a new departure area A. The planned
replacement of the façade of Terminal 3 is awaiting the relevant consents. The upgrade of the landside
area of the arrivals hall in Terminal 3 was completed, as was the restyling and functional improvement
of the zone connecting the landside areas of Terminal 1 and Terminal 2 and the arrivals corridor for
departure area D. With regard to work on runways and aprons, work on the upgrade of Runway 3 and
construction of the de-icing stand at the head of Runway 1 was completed. The upgrade and extension
of the aprons included in the Piazzali 200 (“200 Aprons”) project in the eastern part of the airport is
nearing completion. An upgrade of the underpass for road vehicles beneath Terminal 3 was carried
out, whilst similar work at Terminal 1 is nearing completion. In terms of new plant, all the boarding
bridges were replaced in departure areas G and D. As regards other investment, work continued on the
restyling of advertising spaces through the adoption of innovative solutions (for example, changes to
the assets located on the balcony in Terminal 1) and an upgrade of the digital network in the Terminals
(in particular, an increase in the number of "free-standing totems").
€M2015 2014
% IN C R EA SE/
(D EC R EA SE)
Work on terminals and piers 82 34 141%
Departure area E/F (Avant-corps and 3rd BHS) 80 51 57%
Work on runways and aprons 69 25 176%
Work on baggage handling sub-systems and airport
equipment
47 11 n.s
Work on technical systems and networks 12 17 -29%
Other 46 35 31%
TOTAL ( * )
336 173 94%
(*) Including capital expenditure funded by ENAC, totalling €18 million in 2015 and €22 million in 2014.

79
Other activities
Autostrade Tech
Autostrade Tech is a provider of Information Technology Systems, operating in Italy and overseas. It
supplies systems used for tolling, traffic management and information, urban access controls, car parks
and speed checks.
Revenue of €65 million in 2015 is up €13 million compared with 2014. The improvement is primarily
due to the positive impact of increases in the volume of Telepass devices supplied, the supply of tolling
equipment to Sat Lavori and the contract with Pedelombarda Lombarda for design and other work on a
free-flow tolling system for a section of the A8-A9 and on the first lot of the Como and Varese orbital
motorways.
EBITDA for 2015 amounts to €11 million, up €2 million on 2014.
Electronic Transaction Consultants
Electronic Transaction Consultants (ETC) is the leading US provider of systems integration, hardware
and software maintenance, customer services and consultancy in the field of free-flow electronic
tolling systems.
In 2015, ETC generated revenue of €71 million. EBITDA of €10 million is a €7 million improvement
on 2014.
Spea Engineering
ADR Engineering was merged with and into Spea Ingegneria Europea on 1 June 2015 and with
retroactive effect from 1 January 2015. The latter then changed its name to Spea Engineering.
The company supplies engineering services involved in the design, project management and controls
connected to the upgrade and maintenance of the Group’s motorway and airport infrastructure.
Revenue in 2015 amounted to €108 million, up €31 million (40%) on the previous year. This is
primarily due to the airport work acquired following the merger and the award of new contracts
overseas. 94% of the company’s total revenue during the period was earned on services provided to the
Group.
EBITDA for 2015, amounting to €29 million, is up €11 million on the previous year, primarily due to
the increase in activity resulting from the merger.
Pavimental
The company provides the Group with motorway and airport maintenance services and carries out
major infrastructure works for the Group and external customers.
Revenue in 2015 amounted to €507 million, up €106 million (26%) on 2014. The increase primarily
reflects the award of contracts by Aeroporti di Roma in 2015 and additional construction services
provided to Autostrade per l'Italia (primarily for the A8, the Variante di Valico and the Florence
Interchange).

2. Report on operations
Annual Report 2015 80
EBITDA of €24 million is up €6 million on the figure for the previous year, primarily due to the
above increase in airport and infrastructure construction services.

81
Innovation, research and development
The Group’s innovation, research and development activities aim to offer innovative, technologically
advanced solutions designed to improve service quality and infrastructure efficiency, and minimise the
impacts of activities right from the start of the design process.
Innovation, research and development activities, some of which are long-term in nature, are
undertaken by the relevant departments, in cooperation with other Group companies, in collaboration
with research centres and universities. Once again in 2015 activities focused on many projects, some of
which were co-financed at EU and national level.
The various projects in the motorway sector reaching the application stage in 2015 include:
the application of new information systems for use in monitoring traffic and accidents, with the
aim of improving traffic management and the planning of roadworks;
the free and geolocalised My Way application, providing real-time information on traffic, roads
and motorways, including those in urban areas, and enabling the computation of journey times
and average speeds in sections of motorway served by the Tutor system, cameras and motorway
services;
the Pyng application for the payment of parking;
the launch of interoperable DSRC (Dedicated Short Range Communication) technology in
Europe;
the start-up of a payment service for the ferries serving the Strait of Messina, using a Telepass
device;
the installation and testing of newly designed wireless devices in the Porto San Giorgio tunnel on
the A14 motorway for emergency communications and new aspiration systems to draw off
flammable and toxic liquids in accordance with Legislative Decree 264/2006;
the use of new card readers in compliance with international security standards.
The main activities underway in 2015 include:
participation in the EU-financed REETS project, regarding implementation of a Regional
European Electronic Toll Service, set up by European Directive 2004/527EC and Decision
2009/750/EC;
participation in the nationally funded EASYRIDER project regarding development of new
interaction services between fixed structures and vehicles, aimed at optimising traffic flows and
road safety, especially relating to urban and extra-urban infomobility;
participation in the European EASYWAY programme for the development and application of ITS
services (information for road users, traffic management, freight transport and logistics) required
to meet EU objectives regarding safety, and the environmental impact of transport and mobility;
continuation of the nationally funded Landslides Early Warning (LEW) project, regarding
development of a monitoring and early warning system to reduce hydrogeological risk in order to
protect people, including the circulation of information;

2. Report on operations
Annual Report 2015 82
application of new LED lighting systems for motorway tunnel entrances in order to improve safety
conditions and energy efficiency.
These activities also include those carried out in relation to the conduct of European or national
research, development and innovation programmes and the establishment of transport-related
regulations, such as safety, the implementation of intelligent transport and automated tolling systems,
by participating in bodies and associations at regional, national and European level.
Research and development activities in the airport sector include:
conclusion of the design phase and start-up of the implementation of the Smart Grid pilot project,
designed to save energy and more effectively manage internal distribution networks; the project
consists in the creation of an “energy pool” able to store electricity from several renewable sources,
making it available when required (in the event of any malfunctions in the electricity network or
airport plant);
conclusion, following its acceptance by the EU Commission, of the EU-financed CASCADE
project following a tender process. The project, coordinated by the Fraunhofer research centre in
Germany, aims to save energy at airports by using innovative fault detection and diagnosis (FDD)
technology, applied in particular to heating and air conditioning systems. ADR participated as part
of a consortium set up with other European companies, including SEA SpA, the company that
manages Milan’s airports. The initiative is producing interesting results in terms of the prevention
of malfunctions and improvements to plant efficiency and of energy savings. In view of the results
achieved, in addition to Terminal 1, where the system was tested, it has also been installed in the
other terminals. The system will also be installed in the avant-corps and in Pier C.
Group companies’ total expenditure on innovation, research and development in 2015 amounts to €8
million.
This sum represents the total amount spent by the Group on research and development, including
operating costs and investment in staff and the related expenses.

83
Workforce
As at 31 December 2015, the Group employs 14,406 staff on permanent contracts and 1,253
temporary staff, resulting in a total workforce of 15,659, including 12,538 in Italy and 3,121 at overseas
companies. This is up 831 (6%) on the 14,828 of 31 December 20141.
The increase in permanent staff at 31 December 2015 compared with the end of 2014 (up 718)
primarily reflects events at the following Group companies:
the Aeroporti di Roma group (up 4532), primarily due to the expansion of the operations of
Airport Cleaning (which, from March 2015, is also responsible for cleaning services in the western
area of Fiumicino airport), expansion of the technical departments linked to the infrastructure
development plan envisaged in the Planning Agreement, and the conversion of a number of
temporary contracts into permanent ones as a result of the contractual flexibility introduced by the
recent reform of employment law;
the Brazilian companies (up 159), due to the insourcing of routine maintenance at the operators,
Triangulo do Sol and Colinas;
Autostrada Tirrenica (up 73), following this company’s consolidation from 30 September 2015;
Electronic Transaction Consultants (up 56), reflecting an increase in contract work;
Giove Clear (up 61), reflecting the conversion of a number of temporary contracts into permanent
ones, due to the contractual flexibility introduced by the recent reform of employment law;
Italian motorway operators (down 40), primarily due to a slowdown in recruitment;
the Chilean companies (down 48), due to staff cuts following the centralisation of certain activities.
The change in temporary staff at 31 December 2015 compared with the end of 2014 (up 113) primarily
reflects events at the following Group companies:
Pavimental (up 80), primarily due to the start-up of work on new contracts;
the Aeroporti di Roma group (up 74), primarily due to increased security measures and
improvements to passenger assistance;
Italian motorway operators (up 28), primarily due to the different number of seasonal toll
collectors required by Autostrade per l’Italia in the comparative periods;
Giove Clear (down 66), reflecting the conversion of a number of temporary contracts into
permanent ones as a result of the contractual flexibility introduced by the recent reform of
employment law.
(1)Excluding Ecomouv, Ecomouv D and B, Tech Solutions Integrators and TowerCo, whose contributions to the results for 2014
have been accounted for in “Profit/(Loss) from discontinued operations”. (2)Workforce data for ADR Engineering in 2014 has been excluded from the figures for the ADR group and reclassified to Spea
Engineering following the merger that took place in 2015.

2. Report on operations
Annual Report 2015 84
The average workforce (including agency staff) is up from 13,661 in 2014 to 14,600 in 2015, marking
an increase of 939 on average (up 7%).
This increase primarily reflects:
the Aeroporti di Roma group (up 482 on average), primarily linked to the insourcing, started in
2014, of cleaning services at Fiumicino and Ciampino airports, the emergency measures and
operational procedures introduced following the incident of 7 May 2015, recruitment linked to
implementation of the infrastructure development plan envisaged in the Planning Agreement and
improvements to passenger assistance;
the Brazilian companies (up 290 on average), due to the insourcing of routine maintenance at the
operators, Triangulo do Sol and Colinas;
Pavimental (up 148 on average), primarily due to the start-up of work on new contracts;
Spea Engineering (up 22 on average), reflecting an increase in the volume of work;
Electronic Transaction Consultants (up 24 on average), reflecting an increase in contract work;
Autostrada Tirrenica (up on average 17), following this company’s consolidation from the last
quarter of 2015;
Atlantia (up 16 on average), mainly to boost the holding company’s organisational structure;
the Stalexport Autostrady SA group (up 12 on average), primarily due to the recruitment of
additional toll collectors in response to traffic trends;
Giove Clear (up 10 on average), reflecting an expansion of operations;
Italian motorway operators (down 61 on average), primarily due to a slowdown in recruitment (at
Autostrade per l’Italia, Tangenziale di Napoli and Autostrade Meridionali) and the transfer of staff
from Autostrade per l’Italia to Atlantia;
the Chilean companies (down 22), due to staff cuts following the centralisation of certain activities.
Information on the performance of staff costs is provided in the “Group financial review”.

85
(*) Includes agency staff.
31 December 201531 December 2014
ABSOLUTE %
Senior managers 238 234 4 2%
Middle managers 989 974 15 2%
Administrative staff 6,328 6,074 254 4%
Manual workers 3,618 3,121 497 16%
Toll collectors 3,233 3,285 (52) -2%
Total 14,406 13,688 718 5%
31 December 201531 December 2014
ABSOLUTE %
Senior managers 5 2 3 150%
Middle managers - - - n.a.
Administrative staff 604 487 117 24%
Manual workers 457 492 (35) -7%
Toll collectors 187 159 28 18%
Total 1,253 1 ,140 113 10%
ABSOLUTE %
Senior managers 242 240 2 1%
Middle managers 970 958 12 1%
Administrative staff 6,473 6,227 246 4%
Manual workers 3,689 2,955 734 25%
Toll collectors 3,226 3,281 (55) -2%
Total 14,600 13,661 939 7%
Permanent staff
CATEGORY INCREASE/(DECREASE)
Temporary staff
CATEGORY INCREASE/(DECREASE)
Average workforce (*)
CATEGORY 2015 2014 INCREASE/(DECREASE)

2. Report on operations
Annual Report 2015 86
Distribution of the Group’s workforce
The Group's human resources policies
During 2015, the Group extended its commitment to developing expertise, improving performance,
enhancing talent and supporting organisational change.
Regarding initiatives aimed at integrating the Group's people management processes, in 2015 the
Group's Human Resources department launched a process designed to capitalise on the Group’s skills
base, via intercompany mobility and cross-fertilisation initiatives. These initiatives aim to enhance the
Group's human resources, promote and encourage the diversification of experience in order to enrich
skills and expand cross-company experience.
Annual reviews were conducted in order to assess capabilities and skills. The results are used for the
purposes of succession planning, with a view to ensuring the Group’s ability to fill key management
positions.
The Group’s talent management and succession planning procedures were used to support
implementation of the Group’s new organisational model, which involved the introduction of new
departments with responsibility for business processes within the main subsidiaries, primarily with the
aim of concentrating various areas of business under one department.
1.7%
6.9%
43.9%
22.4%
25.1%
DISTRIBUTION OF PERMANENT STAFF BY CATEGORY
Senior managers
Middle managers
Admin. staff
Toll collectors
Manual workers
8.5%
31.4%
36.9%
16.4%
6.8%
DISTRIBUTION OF PERMANENT STAFF BY AGE RANGE
30 and under
31 to 45
46 to 55
56 to 60
over 60
18.9%
47.2%
33.9%
DISTRIBUTION OF PERMANENT STAFF BY EDUCATIONAL QUALIFICATION
University graduates
High school graduates
Other
14.9%
17.4%
17.9%13.3%
23.9%
12.6%
DISTRIBUTION OF PERMANENT STAFF BY LENGTH OF SERVICE
under 1 year
2 to 5 years
6 to 10 years
11 to 20 years
21 to 30 years
over 30 years

87
The partnership programme with Italy's major universities and polytechnics, called Atlantia per la
Conoscenza (Atlantia for Knowledge), continued. The initiative entails provision of scholarships for
the best students enrolled in the final year of Master’s Degree courses, focusing in particular on the
faculties of Engineering and Economics.
Details of remuneration policies are provided in Atlantia’s Remuneration Report for 2016 (as
approved by the Board of Directors on 4 March 2016) and in the information circulars for the various
equity plans, prepared pursuant to art. 84-bis, paragraph 1 of the Regulations for Issuers and available
for inspection on the Company’s website at
http://www.atlantia.it/it/corporategovernance/remunerazione.html
Training
Training plays a key role in career development, process innovation and in achieving the Group’s
business targets.
A total of 226 thousand hours of training was provided in 2015, involving over 11 thousand
participants at a total cost of €2.5 million (of which 44% financed by interprofessional funds for
continuous training).
As of the importance given to the quality of customer services, the Group renewed its commitment to
providing training for front-end airport staff and motorway personnel, focusing on improvements to
customer relations and customer care.
Organisation
The Group’s senior management positions were reorganised in 2015, with the holding company,
Atlantia, adding responsibility for corporate development to its existing role as a provider of strategic
guidance31.
Overall, the organisational activities of the various sub-holding companies focused on improving the
quality of services (via the constant monitoring of pre-defined quality indicators and the
implementation of specific projects) and compliance with control and certification systems.
Autostrade per l’Italia’s new organisational structure was also implemented in 2015. This involved
eliminating the role of General Manager and the creation of a Chief Operating Officer with
responsibility for infrastructure development and new investment, and a Chief Operations and
Maintenance Officer, with overall responsibility for existing motorway operations.
Aeroporti di Roma’s organisation was modified, with the creation of the position of General Manager
with overall responsibility for the company’s business processes. In addition, an External Relations and
Corporate Affairs unit was also set up within the Chief Executive Officer’s staff.
Industrial relations
The Group reached a number of agreements with the labour unions in 2015. In the Italian motorways
segment, the most important regard the staffing of existing and future toll stations, plans for further
automation of toll collection, the management of operational staff turnover, welfare, training and
productivity and performance bonuses.
1 (3) Atlantia SpA, the holding company, is responsible for direction and strategic coordination activities for the Group
(Infrastructure and Investment Projects, Finance, Administration and Investor Relations, Reporting and Cost Control, Human
Resources, Public Relations, Corporate Governance, Legal and Corporate department, Internal Audit).

2. Report on operations
Annual Report 2015 88
Other agreements reached during the year regarded improvements to customer service and training
funded by Fondimpresa, with particular attention to operational personnel, such as contact centre staff
and toll collectors.
In the airports segment, given the growing degree of attention to improving the quality of the services
provided to customers/passengers and to individual performance, the following union agreements
were reached with regard to non-managerial personnel:
Performance Bonus: new award criteria for the period 2015-2017, giving greater weight to the
service quality indicators with respect to those for profitability. The agreement also applies
measurement of the quality perceived by passengers across all the services offered by ADR and
other group companies that apply National Collective Labour contract for Air Transport personnel
covered by the agreement, and reconfirmed the targets set out in the Service Charter;
funded training: agreements relating to funding for technical, behavioural and compliance
training from the interprofessional fund for continuous training set up by Confindustria
(Fondimpresa).
Workplace health and safety
Atlantia implements a health and safety management system certified in accordance with the OHSAS
18001 international standard, the Workplace Health and Safety Organisation and Management Model.
The Model defines the responsibilities, processes, procedures, staff, means and tools for implementing
the Group’s Safety Policies within the various departments, with a view to preventing accidents, in
compliance with current legislation. The Model aims to ensure that the above policies are efficiently
implemented and smoothly integrated within the Group’s operations.
In 2015, the Group’s Italian and overseas companies implemented various initiatives aimed at raising
staff awareness of health and safety issues. Above all, this entailed adoption of a Workplace Health and
Safety Management System that meets OHSAS 18001:2007 requirements.

89
Corporate governance
Atlantia SpA’s Corporate Governance system is based on a collection of rules that are in line with
regulatory guidelines and best market practices.
This system is based on Atlantia SpA’s Corporate Governance Code, which has been drawn up in
accordance with the principles and criteria contained in the Corporate Governance Code for listed
companies published by the Corporate Governance Committee in July 2014.
In accordance with the current Articles of Association, management of the Company is assigned to the
Board of Directors, whilst supervisory functions are the responsibility of the Board of Statutory Auditors
and responsibility for auditing the Group’s accounts is assigned to the Independent Auditors elected by
General Meeting of shareholders.
Based on the provisions of art. 30 of the Articles of Association, the Chairman represents the Company.
Separation of the roles of Chairman and Chief Executive Officer means that it is not necessary to appoint
a Lead Independent Director.
Based on the provisions of the Company’s Corporate Governance Code, the Board of Directors has
established the following board committees: the Human Resources and Remuneration Committee and the
Internal Control, Risk and Corporate Governance Committee. The Board has also appointed the
Director, Guiliano Mari, as Director responsible for internal control and risk management.
In implementation of the provisions of Legislative Decree 231/2001, Atlantia has adopted the
Organisational, Management and Control Model and has set up a Supervisory Board.
Lastly, in compliance with the CONSOB requirements contained in the Regulations for Related Party
Transactions (Resolution 17221 of 12 March 2010, as amended), on 21 October 2010 Atlantia set up a
Committee of Independent Directors with responsibility for Related Party Transactions – consisting of
three independent Directors – and, on 11 November 2010, approved the new Procedure for Related Party
Transactions, which came into effect from 1 January 2011, and was subsequently updated by the Board of
Directors on 11 December 2015.
In addition to the above Procedure, Atlantia has, among others, adopted the Procedure for Market
Announcements, the Procedure for relations with the Independent Auditors, the Procedure for
Reporting to the Board of Statutory Auditors, the Code of Conduct for internal dealing, and the
Procedure for Notification of the Ethics Officer.
The Company’s Governance system is completed by the regulations contained in the Articles of
Association and in the General Meeting Regulations.

2. Report on operations
Annual Report 2015 90
Sintonia SpA (formerly Sintonia SA, which was transferred to Italy and registered with Rome Companies’
Register on 27 June 2012 under the name of Sintonia SpA) is the shareholder that directly holds a relative
majority of the issued capital of Atlantia SpA. Following termination, with effect from 16 June 2015, of
the shareholders’ agreement that, in certain provisions, regarded Atlantia, Sintonia SpA owns 30.25% of
the Company. Despite this new level of investment, given that there have been no changes in fact (e.g. the
composition of the Board of Directors), Sintonia SpA is deemed to hold sufficient voting rights to exercise
dominant influence at the ordinary general meetings of Atlantia SpA’s shareholders, pursuant to art. 2359
of the Italian Civil Code.
However, Sintonia does not manage or coordinate Atlantia SpA, , pursuant to art. 2497 of the Italian
Civil Code, as was confirmed in a specific declaration sent to Atlantia SpA on 12 March 2009 by the
former Sintonia SA and by Schemaventotto SpA.
Given that there have not been any further announcements or changes in circumstances, the basis for
considering Atlantia as not subject to management and coordination by Sintonia is deemed to be
unchanged.
Autostrade per l’Italia, which is a wholly owned subsidiary of Atlantia, is instead subject to management
and coordination by Atlantia. Moreover, following the Group’s reorganisation in 2007, Atlantia has
transferred responsibility for management and coordination of the motorway operators and industrial
companies controlled by its subsidiary to Autostrade per l’Italia itself.
Following the merger of Gemina with and into Atlantia, with effect from 1 December 2013, the board of
directors of Aeroporti di Roma - a company in which Atlantia has a 95.92% interest - declared on 21
February 2014 that it is managed and coordinated by Atlantia. Aeroporti di Roma itself manages and
coordinates its subsidiaries.
Finally, following completion, in 2015, of the Group’s restructuring of its holdings in Pavimental SpA
and Spea Engineering SpA (resulting from the merger between Spea – Ingegneria Europea SpA and ADR
Engineering SpA), Atlantia SpA is responsible for management and coordination of the two companies,
which have published the relevant announcements required by law.
The full text of the “Annual report on Corporate Governance and the Ownership Structure”, prepared in
accordance with indications contained in the format for corporate governance reports formulated by
Borsa Italiana, is available in the “Corporate Governance” section of the Company’s website at
www.atlantia.it.

91
Sustainability
Sustainability is the tool used by Atlantia to define, implement and communicate its social, environmental
and economic commitments, based around an ethical approach, measurable transparency and the
production of value for all the Group’s stakeholders over time. The key areas of intervention regard: the
safety of infrastructure, continual improvement of customer service quality standards, operational
excellence, workplace health and safety, respect for the environment and energy efficiency, dialogue with
communities and promotion of local development initiatives, as well as enhancement of people, who are at
the centre of all Group activities.
As confirmation of the effectiveness of the Group’s approach and proof of its commitment, Atlantia was
again rewarded in 2015 with reconfirmation of the Group’s membership of the prestigious Dow Jones
Sustainability World and Europe Indices, which select the best companies on the basis of economic,
environmental and social criteria. Atlantia was ranked among the best performers in the transport and
transport infrastructure sectors, scoring highly for its environmental strategy, stakeholder engagement and
staff development policies.
Economic responsibility
The economic responsibility underpinning the activities of the Group’s companies requires them to
maintain their ability to create long-term value for the various categories of stakeholder.
Distributable Integrated Added Value (DIAV) is the tool used to measure how the value generated is
distributed among the different stakeholders. DIAV is calculated by subtracting the costs of materials,
services and provisions and other expenses from the value of production, which includes toll revenue from
Italy and overseas, revenue from airport management and other operating income. Extraordinary and
ancillary items1, as well as amortisation and depreciation are then deducted from the gross Added Value
from ordinary activities to obtain the total net Added Value. The Added Value parameter serves to provide
social information and measure the value (economic and financial) produced by the Company during the
year, with reference to the stakeholders who participate in its distribution.
The DIAV of €3,080 million generated in 2015 is up 10% on the figure for 2014, with increases in toll
revenue (up 4%), aviation revenue (up 9%) and revenue from construction services (up 35%) all
contributing to the improvement. DIAV was distributed to the Group’s stakeholders as follows:
€610 million (20% of the total) was paid to capital providers as interest on borrowings, after
deducting financial income;
24% of DIAV was paid to shareholders in the form of dividends of approximately €725 million;
approximately €494 million (16% of the total) was transferred to the government in the form of direct
and indirect taxation and deferred tax liabilities. The government as stakeholder also received
approximately €477 million in concession fees;
8% of the total, amounting to €250 million, calculated as the difference between profit for the year
and dividends paid, was kept by the Group and used to finance its operations;

2. Report on operations
Annual Report 2015 92
staff accounted for 33% (€1,001 million) in salaries, wages, post-employment benefits, staff-related
provisions, Directors' fees, social security contributions and other expenses.
DIAV BREAKDOWN 2015 2014 2015/2014 (%)
A) Value of production 6,682,460 6,108,267 9%
Toll revenue 3,835,930 3,677,679 4%
Aviation revenue 565,312 519,979 9%
Revenue from construction services 716,412 530,502 35%
Contract revenue 106,467 69,319 54%
Other operating income 1,458,339 1,310,788 11%
B) Intermediate costs of production -2,486,086 -2,370,541 5%
Raw and ancillary materials and consumables, purchases of goods for resale -378,510 -341,955 11%
Service costs -1,457,839 -1,141,158 28%
Lease expense -16,466 -14,576 13%
Provisions -74,911 -349,868 -79%
Other operating costs -558,360 -522,984 7%
Gross added value from ordinary activities 4,196,374 3,737,726 12%
C) Ancillary and extraordinary items -199,869 47,360 n/s
Gross total added value 3,996,505 3,785,086 6%
- Amortisation and depreciation -916,892 -875,964 5%
Net total added value 3,079,613 2,909,122 10%
Note: The added value and its distribution were calculated using accounting data from the income statement, with application of
the methods established by the GBS Social Reporting Study Group.
DIAV breakdown 2014 – 2015 (€m)
1001
494 610
725
250
876
573 687
615
158
Dipendenti Stato Finanziatori Azionisti Impresa
2015 2014
Staff Government Capital providers Shareholders Company

93
Service quality
Improving service quality is a key objective in all the areas of business in which Atlantia operates. This
entails constant monitoring of the standard of service provided and the ongoing implementation of
improvements.
Motorways
In 2015, the number of accidents on the network operated by Autostrade per l’Italia and its Italian
subsidiaries (excluding SAT to provide a like-for-like basis for comparison with 2014), totalled 15,170 (up
2.1% compared with 2014), registering an accident rate of 31.55, broadly in line with the figure for 2014
(31.84). However, the fatal accident rate is up from 0.30 to 0.32.
There continues to be a high level of safety on the Italian motorway network, thanks to the initiatives taken
by the Group over the years, such as deployment of the “Tutor” system for measuring average speeds,
continual improvements in maintenance standards information campaigns designed to raise safety
awareness among road users.
Improvements in management of the network have enabled the Group to minimise traffic queues and
tailbacks, measured by the Total Delay indicator21. The overall Total Delay for the network managed by
Autostrade per l’Italia in 2015 is approximately 4.48 million hours, up 11% on the figure for 2014 due to
increased traffic. The indicator remains, however, less than half the level recorded in 2006 (9.8 million
hours).
In addition, Autostrade per l’Italia deploys a series of instruments, systems and devices to provide traffic
information and a widespread network of Information Centres, operating 24 hours a day, 7 days a week,
throughout Italy. All incidents with an impact on road conditions are registered by the information system
and reported in real time, either directly or using specific software, through the various communication
channels (Variable Message Panels, radio channels, the internet, satellite navigation systems, etc.) under
the supervision of the Multimedia Centre in Rome, which operates round the clock.
During snow events, Autostrade per l’Italia implements a series of operational procedures to manage road
traffic.
Customer satisfaction with the motorway service is measured through Customer Satisfaction surveys,
conducted periodically by specialised firms and/or via telephone interviews.
In 2015, Autostrade per l’Italia's Customer Satisfaction Index (CSI), based on a sample of 3,602
customers interviewed via phone on two occasions during the year, and measured on a scale from 0 to 10,
stood at 7.20, marking an increase with respect to 2014 (7.13). The components analysed are: safety,
traffic, service areas, toll stations and the payment systems offered.
(2) Total Delay (“TD”) measures the difference between the average transit time for a section of the network in the period under
review and the average time under normal traffic flow conditions at a specific average speed typical of the section in question.
This difference is then multiplied by the number of vehicles in transit, thereby obtaining the total delay for all customers using the
section in question.

2. Report on operations
Annual Report 2015 94
Customer satisfaction at Autostrade per l’Italia
Airports
In keeping with the progress made in 2014, surveys of both quality provided and quality perceived
continued to show improvements in the main operational processes. Following the fire that hit Terminal
3 on 7 May, it was necessary to halt customer satisfaction surveys, given the drastic impact on the way in
which the principal operational processes were managed.
The performance of cleaning services was well ahead of 2014: daily passenger interviews conducted by
ADR (around 2,000 interviews each month) revealed that 90% of passengers expressed satisfaction with
the cleanliness of toilets in the first 4 months of the year, compared with 84% in the previous year, whilst
91% expressed satisfaction with the cleanliness of terminals and gate areas, compared with 80% in 2014.
The level of customer satisfaction in the fourth quarter of 2015 stands at 4.49 (on a scale of 1-poor to 6-
excellent), marking an improvement of around 1% compared with the first quarter of 2015, when the
figure was 4.46.
During 2015, the level of service offered by Ciampino airport remained broadly in line with the previous
year, with the airport proving able to cope with the increase in traffic resulting from the redistribution of
flights during the period when capacity at Fiumicino airport was limited due to the fire. With regard to
interviews conducted in order to monitor customer satisfaction at Ciampino (around 800 each month),
the overall average score for passengers at Ciampino in 2015 is 4.23, compared with 4.25 in 2015 (on the
same scale used for Fiumicino above).
With regard to the Quality and Environmental Protection Plan, forming part of the Planning Agreement
entered into with ENAC, ADR again met all the related targets for both the airports it operates in 2015:
the overall score for Fiumicino airport, which measures the improvement in service quality, computed
in accordance with the method set out in the Planning Agreement, shows an improvement of 17.36%,
compared with the upper end of the target range of 7.93% in the above Agreement;
the overall score for Ciampino shows an improvement of 7.14%, compared with the upper end of the
target range of 7.10% set out in the Planning Agreement.
6.4
6.5
6.6
6.7
6.8
6.9
7.0
7.1
7.2
7.3
Total customers
Frequent travellers

95
In order to ensure compliance with the above indicators, ADR carries out daily surveys of both passenger
satisfaction and the quality of the main services provided: check-in, hand baggage screening, baggage
reclaim and the punctuality of departing flights.
At Fiumicino, the surveys reveal performances for check-in procedures, for both domestic and
international flights, and for security checks above the expected standards. Baggage reclaim and
punctuality, on the other hand, have failed to meet the required standards.
At Ciampino, the overall situation is stable and in keeping with the type of low-cost passenger served, with
the exception of security checks, where there has been a sharp improvement, despite the relevant standards
having been raised with respect to the previous year (from 10 minutes in 2014 (in 90% of cases) to 8
minutes in 2015 (in 90% of cases).
KEY INDICATORS OF AIRPORT QUALITY UM 2015 (3) 2014 (4) Standard
Fiumicino
Check-in waiting times for domestic flights, within 6 minutes % 95.9 96.5 90
Check-in waiting times for international flights, within 15 minutes % 95.4 90.3 90
Waiting times for carry-on baggage security screening, within 10 minutes for
flights at risk, within 5 minutes for other flights % 95.6 93.9 90
Delivery of first bag from block-on within set time % 75.8 84.1 90
Delivery of last bag from block-on within set time % 79.6 86.7 90
Punctuality of departing flights (flights departing with less than 15 minutes’
delay) % 66.7 74.8 75
Ciampino
Check-in waiting times, within 17 minutes % 86.1 88.6 90
Waiting times for carry-on baggage security screening, within 8 minutes % 97.1 93.2 90
Delivery of first bag from block-on within set time % 90.9 91.0 90
Delivery of last bag from block-on within set time % 90.4 90.4 90
Punctuality of departing flights (flights departing with less than 15 minutes’
delay) % 79.6 84.2 85
(3) Due to the fire on 7 May, the 2015 figures for FCO do not include the period from 7 May to 30 September, with the exception
of the punctuality indicator. (4) Compared with the data published in the 2014 Annual Report, the 2014 figures for security screening (FCO and CIA)
and delivery of the last bag (CIA) have been recalculated on the basis of the standards (Service Charter) in force from 26
June 2015.

2. Report on operations
Annual Report 2015 96
The environment
Environmental responsibility is incorporated at all organisational levels and promoted among all parties
the Group has dealings with, and thus permeates all phases of its activities.
During the phases of design, implementation and use of infrastructure, appropriate solutions are
identified aimed at achieving ever higher levels of environmental compatibility. The Group is committed
to using and sustainably managing environmental inputs and outputs, including raw materials, water, de-
icing salt and waste products.
Use of resources
In managing its activities the Group makes necessary use of materials whose impact on the environment
should be constantly monitored and limited. The materials normally used are: quarry materials, bitumen,
iron and steel and cement. Optimising use of the materials employed is a constant concern in managing
the Group’s activities. There is also consumption of products, albeit limited, for office activities.
Another essential material used to ensure that motorways are safe and kept open during the winter months
are the chlorides used to prevent ice forming on roads. In 2015, the Group’s motorway operators used a
total of 72,402 tonnes of de-icing salt during the winter in Italy (97%) and Poland and Chile (3%),
marking a slight increase of around 2% compared with the previous year. In terms of winter operations at
airports, 18,243 litres of de-icing fluid were used in 2015 in order to remove any ice and snow from
aircraft before take-off.
The Group's water consumption registered a slight reduction (0.5%) compared with 2014, with total
consumption of around 4.29 million cubic metres, with 32% represented by reclaimed water.
At Fiumicino airport, for example, the presence of a biological treatment plant enables waste water to be
reused in industrial applications. The industrial water is used primarily to clean the tanks and pumps used
in lifting gear, in fire-fighting equipment and the heating systems that serve the airport.
A factor to be taken into account is the higher consumption of the Chilean companies operating in the
Santiago area, which experiences a long dry season that requires more water for the irrigation of green
spaces and replenishment of the network of firefighting reservoirs.
Energy and climate change
Among environmental issues, special attention is undoubtedly focused on energy via various types of
projects and initiatives aimed at adoption of renewable energy sources, and the study and implementation
of eco-efficient solutions in terms of consumption.
Commitments on the energy front also enable important synergies with emission monitoring,
management and reduction and, more generally, with the approach to the issue of climate change.
The main energy sources used by the Group are fuel - directly used for heating and air conditioning
buildings, plant operation, maintenance equipment, service vehicles and generators - and electricity for
powering the various systems and equipment.
The Group consumed 2,903 TJoules of energy in 2015, including electricity, natural gas, LPG, diesel,
petrol and ethanol. This figure marks an increase of around 7% compared with the previous year,
reflecting a greater use of natural gas and diesel, only partly offset by a reduction in petrol for motor
vehicles.
Fiumicino airport, in particular, is served by a co-generation plant fuelled by natural gas, which
synergically generates electrical and thermal energy covering around 80% of the airport's energy
requirements. The remaining 20% is provided by natural gas and diesel plants.

97
Again with regard to tri-generation (the combined production of electricity, heat and cooling), in 2015
Autostrade per l’Italia completed the construction of its Rome plant and began functional testing. Work
on installation of the plant due to serve the Florence Data Processing Centre is nearing completion.
The aim of reducing and optimising energy consumption is also pursued via the use of renewable energy
and energy efficiency and saving initiatives.
During the year, the 160 photovoltaic plants installed and in operation along Autostrade per l’Italia’s
network produced around 11,400 MWh of electricity (including 40% for internal use on site), enabling
the emission of approximately 3,694 tonnes of CO2 to be avoided.
A “smart grid” has been installed on the terrace at Fiumicino airport’s Terminal 1. The grid is made up of
renewable energy plants, consisting of a concentrator photovoltaic plant capable of producing 15 kW of
electricity and 20 kW of heat, a thermodynamic solar power plant producing 7 kWt of thermal energy and
two micro wind turbines with capacity of 3 kWe, all connected to an intelligent system for storing and
managing the energy produced (the plant will come on stream in 2016).
As part of its energy saving programme, in 2015 Group companies continued to implement a series of
initiatives, above all with regard to lighting, with the replacement of traditional forms of lighting with LED
technology, and air conditioning, with the installation of solar thermal plants, the conversion of heating
systems to run on natural gas rather than diesel, the installation of more efficient boilers, the
implementation of initiatives in buildings with a view to reducing heat loss, the implementation of
automated systems for monitoring air conditioning and heat in order to manage internal temperatures,
and the installation of inverters in air conditioning units.
Both the airports operated by Aeroporti di Roma have an energy management system certified in
accordance with the ISO 50001 standard. Thanks to a continually updated energy action plant, this
enables the company to plan work to be carried out and investment, and to analyse and monitor energy
trends in order to improve performance.
With regard to greenhouse gas emissions, in 2015 the Group's CO2 equivalent emissions (CO2eq)
totalled 227,362 tonnes in 2015, up around 6% on the figure for 2014.
In 2015, Fiumicino airport confirmed its 3+ “Neutrality” accreditation under the Airport Carbon
Accreditation (ACA) scheme set up by ACI Europe (Airport Council International), offsetting direct and
indirect emissions (scope 1 and 2) with the acquisition of carbon credits from renewable energy
production projects and projects involving the implementation of energy-saving lighting systems.
In 2015, ADR also achieved level 3 ACA “Optimisation” accreditation for Ciampino airport, requiring
quantification of all direct and indirect emissions and other indirect emissions (scope 1, 2 and 3) and
proof of absolute or relative improvements in performance.
Waste
The total amount of waste produced by the Atlantia Group in 2015 amounted to around 557,000 tonnes,
compared with 284,000 tonnes in 2014, with the amount recovered or recycled rising from 67% to 83%.
The increase compared with the previous year is due to a rise in the amount of motorway and airport
works carried out, which consequently produced mixed waste from demolition and construction activities,
as well as soil, rocks and bituminous conglomerate, which account for around 89% of the total recorded.

2. Report on operations
Annual Report 2015 98
KEY ENVIRONMENTAL INDICATORS 2015(a) 2014 2015/2014 (%)
Water consumption (m3) 4,287,951 4,308,226(c) -0.5%
Water recycled (%) 32 32 0.0%
Energy consumption by type (TJoule) 2,903 2,709 7.2%
Diesel 703 638 10.2%
Natural gas 1068 967 10.4%
Petrol 67 72 -6.9%
Electricity 883 837 5.5%
Other 182 193 -5.7%
CO2 emissions (t) 227,362 214,204 6.1%
Direct emissions (c) 148,931 140,623 5.9%
Indirect emissions from electricity consumption (d) 78,431 73,581 6.6%
De-icing salts and fluids (t) 72,420 70,848 2.2%
Waste produced (t) 557,490 284,329 96.1%
% of waste recycled /recovered 83 67 23.9%
a) The 2015 figures only include Autostradale Tirrenica’s data for the quarter in which the company was consolidated.
b) This figure differs from the amount published in the 2014 Annual Report following improvements to the system for measuring
consumption.
c) This type of emissions includes fuel consumption for heating and air conditioning buildings, motor vehicles, running generators, road
maintenance works.
d) This figure has been calculated using updated emission factors. For this reason, the amount for 2014, reported in the previous Annual
Report, has been restated. Sources used for emission factors information: ISPRA – Emission factors for the production and consumption
of electricity in Italy; Department for Environment Food & Rural Affairs - Greenhouse Gas Conversion Factor Repository; IPPC Emission
Factor Database.
Government and the community
A leading international player in the motorway and airport concessions sector, the Group works closely
with communities and maintains constant dialogue with central and local government authorities
throughout all stages of its operations. At central government level, the Group’s vital counterparties are
the Ministries of Infrastructure, the Environment, Heritage and Culture and Tourism, parliamentary
committees – during the discussion phase of new regulatory proposals for the sector – supervisory and
monitoring bodies, and government-level technical organisations. Relations with local stakeholders,
regions and municipalities, as well as with government departments, in order to guarantee a shared
approach to local planning for development.
In 2015, the ADR Group proceeded with stakeholder engagement activities relating to implementation of
the Fiumicino airport development plan. The objectives are: to mitigate conflict at local level and achieve
greater consensus regarding expansion of the airport; to improve perceptions and raise interest in airport
activities at local and national level.
Suppliers
The Group’s main suppliers are businesses that provide goods and services, road and airport construction
and maintenance, engineering and architecture firms, telecommunications operators and logistics firms.
Group companies have a Register of Suppliers, for which financial, technical and organisational details of
potential suppliers are requested and assessed during the qualification process. This qualification process
for new suppliers also includes requests for specific information on sustainability backed up by
documentary evidence (e.g. sustainability reports, environmental reports, adoption of sustainability

99
strategies, certification of processes and/or products, implementation of initiatives aimed at developing a
socially responsible approach to planning and business management).
All the Group’s suppliers must commit to complying with the Group’s Code of Ethics and Conduct on
their own behalf and on behalf of any authorised sub-contractors, and to meeting all social and
environmental obligations, including health and safety at the workplace and the procedures used in
disposing of waste and scrap. In order to ensure that suppliers comply with their obligations regarding
sustainability, a number of specific audits and training and awareness raising initiatives have been carried
out.
In addition, the activities of the “Procurement Planning Committee” continued. This committee, which
was set up in 2014 to optimise and standardise procurement policies, met six times in 2015, dealing with
issues such as the definition of a more effective Group procurement strategy for the most common goods
and services, the adoption of new Group-wide standards for managing suppliers and the impact of the
supply chain in terms of sustainability.
Finally, Atlantia confirmed its strategic decision to use local goods and services companies in the countries
in which it operates, in order to contribute towards creating value at local level and to mitigate the impact
of its logistics.

2. Report on operations
Annual Report 2015 100
Related party transactions
Information on related party transactions is provided in note 10.5 to the consolidated financial statements
and note 7.2 to Atlantia SpA’s separate financial statements.

101
Significant regulatory aspects
Italian motorways
Toll increases with effect from 1 January 2016
The decrees issued by the Minister of Infrastructure and Transport and Minister of the Economy and
Finance on 31 December 2015 approved the following:
a)Autostrade per l’Italia’s right, in accordance with its request to the Grantor, to apply an increase of
1.09% with effect from 1 January 2016, corresponding to the sum of the following components:
0.00% for inflation;
0.97% to provide a return capital expenditure via the “X” tariff component;
0.12% to provide a return on investment via the “K” tariff component;
b) the provisional suspension of the toll increases to be applied by Tangenziale di Napoli, Raccordo
Autostradale Valle d’Aosta and Autostrada Tirrenica with effect from 1 January 2016 (the increases
thus amount to 0.00%), whilst awaiting approval of the operators’ revised financial plans. The toll
increases will be finalised by the interministerial decree approving the related addenda revising the
financial plans, subject to the right of the operators to recoup any toll increases on the basis of the
revised financial plans. Revenue lost as a result of suspension of the increases will be taken into
account in the toll increases for 2017. The above companies have challenged the legislation
suspending the toll increases for 2016;
c) the absence of any toll increase for Autostrade Meridionali, given that its concession expired on 31
December 2012. Autostrade Meridionali has brought a legal challenge contesting the above
decision, in line with 2014 (the related legal challenge was upheld by the Campania Regional
Administrative Court sentence of 22 January 2015) and 2015 (judgement is pending).
Based on bilateral agreements between Italy and France, Traforo del Monte Bianco has applied an
increase of 0.2% from 1 January 2016, in compliance with the relevant Intergovernmental Committee
resolution. This was determined on the basis of inflation (the average rate for Italy and France).
Legal actions brought by Autostrade Meridionali, challenging the Grantor
In addition to the above challenges regarding tolls, on 19 March 2015 Autostrade Meridionali brought
an action before Campania Regional Administrative Court, challenging the Grantor’s failure to
respond to a request to review its toll structure with effect from 1 January 2015 in order to maintain
the same level of revenue for the company, as provided for in the existing toll policies. In a sentence
entered on 11 June 2015, Campania Regional Administrative Court upheld Autostrade Meridionali’s
challenge, ordering the Grantor to respond to the above request within 30 days of the date of
notification of the sentence, which took place on 10 July 2015. As things stand, the Grantor has yet to
respond to the request.

2. Report on operations
Annual Report 2015 102
On 24 April 2015, the company also brought an action before Campania Regional Administrative
Court, challenging the Grantor’s adoption of a financial compensation plan for the period from 1
January 2013 (the date of expiry of the concession) and 31 December 2015 (the date on which it was
assumed that the new operator would take over, at the time of filing the action). The Campania
Regional Administrative Court sentence entered on 30 July 2015 upheld Autostrade Meridionali’s
challenge, ruling that the Grantor’s failure to respond to the request for adoption of a new financial
plan for the concession period 2013-2015 is unlawful. The Grantor appealed the above sentence
before the Council of State in October 2015. Judgement is pending.
Reduced tolls for frequent users
The reduced tolls for frequent users, introduced by the Memorandum of Understanding of 24
February 2014 signed by a number of motorway operators, including Autostrade per l’Italia and the
trade association, AISCAT, have been extended, at the request of the Minister of Infrastructure and
Transport on 31 December 2015, for a further 12 months, and therefore until the end of 2016.
Recovery of the revenue lost as a result of the initiative during the period 1 June 2014 – 31 December
2016 is assured on the basis of the criteria set out in the Memorandum. One of the options for
operators requesting such a solution (as notified to the above Ministry by Autostrade per l’Italia) is the
application of a specific toll increase to be introduced in the first year of the next regulatory period.
II Addendum to Autostrade per l’Italia’s Single Concession Arrangement
On 10 December 2015, the Ministry of Infrastructure and Transport and Autostrade per l’Italia
signed the II Addendum to the Single Concession Arrangement, which has added the Casalecchio -
Northbound interchange to Autostrade per l’Italia’s investment commitments. This project requires a
commitment to invest up to a total of approximately €157 million, with around €2 million already
invested as at 31 December 2015 to cover the cost of design, and the remainder to be paid to ANAS on
the basis of the state of progress of the works. ANAS is to build and then manage the road. The
Addendum will be effective once the Minister of Infrastructure and Transport and Minister of the
Economy and Finance have issued the relevant decree and it has been registered with the Court of
Auditors.
Addendum to Autostrada Tirrenica’s Single Concession Arrangement
In response to observations from the European Commission regarding, among other things, extension
of the concession to 2046, on 14 October 2014 the Grantor sent Autostrada Tirrenica a draft
addendum envisaging extension of the concession to 2043, completion of work on the Civitavecchia–
Tarquinia section (in progress), and eventual completion of the motorway (in sections, if necessary) to
be put out to tender.
Completion of the motorway is subject to fulfilment of the technical and financial conditions to be
verified jointly by the grantor and the operator and execution of an addendum to the Concession
Arrangement, with a viable financial plan attached. Subsequently, on 13 May 2015, a memorandum of
understanding was signed by the Grantor, Tuscany Regional Authority, Lazio Regional Authority,
Autostrade per l’Italia and Autostrada Tirrenica with an attached draft addendum which, whilst
maintaining the duration of the concession until 2043, a viable financial plan for the Civitavecchia–
Tarquinia section and the obligation to put all the works out to tender, provides for further
commitments regarding the design of the Tarquinia–Ansedonia and Ansedonia–Grosseto South

103
sections and of the improvements to the existing dual carriageway (the SS. 1 Variante Aurelia) between
Grosseto South and San Pietro in Palazzi, retaining the current layout of the road.
Performance of the above construction work is subject to positive outcomes of studies of the
technical/design, financial and administrative feasibility to be conducted jointly by the Grantor and
Autostrada Tirrenica and execution of an addendum with a viable financial plan.
Following a request from the Grantor on 5 June 2015, after further discussion with Italy’s
representative office at the EU, on 24 June 2015 Autostrada Tirrenica prepared and submitted further
versions of a financial plan, relating to (i) the sections in operation and the Civitavecchia–Tarquinia
section under construction, and (ii) the entire Civitavecchia–San Pietro in Palazzi section of road,
both expiring on 31 December 2040.
Finally, again at the Grantor’s request, on 6 August 2015 Autostrada Tirrenica submitted a draft
financial plan for the sections in operation between Livorno and Cecina and Rosignano and San Pietro
in Palazzi and for the section under construction between Civitavecchia and Tarquinia, with an expiry
date of 2028 if the financial design for the San Pietro in Palazzi–Tarquinia section and the financial
plan for the entire road not be approved by 2017.
Award of the concession for the A3 Naples – Pompei – Salerno motorway
With regard to award of the concession for maintenance and operation of the Naples – Pompei –
Salerno motorway (the previous concession expired at the end of 2012), Autostrade Meridionali,
which continues to operate the motorway under a contract extension, submitted its bid on 23 April
2015.
On 16 November 2015, the Tender Committee raised a number of doubts regarding the two bids
received, proposing to disqualify both. The two bidders responded with a request to be allowed to
resolve the issues raised and thus continue with the tender process. The Grantor thus submitted a
supplement to the procedure to the Tender Committee and, on 16 December 2015, informed the
bidders that the final outcome of the tender process will be announced at the next public session of the
Committee, which has, however, yet to be scheduled.
The bidder, Consorzio Stabile SIS, has brought a legal challenge before Campania Regional
Administrative Court, contesting the minutes of the meeting of 16 November 2015. This challenge,
which was not notified to Autostrade Meridionali, will be discussed at a hearing on 9 March 2016. The
company will be represented in court in order to object to the challenge on the grounds of
inadmissibility, given that the conclusions of the Tender Committee are not final in view of the
position adopted by the Grantor.
Enabling Act on tenders and concessions
Enabling Act 11 of 28 January 2016 regarding tenders and concessions, designed to apply the relevant
EU directives and reform the regulations governing public contracts, was published in the Official
Gazette of 29 January 2016.
In this regard, the legislation has introduced an obligation for public and private entities, which hold
an existing or future concession to provide public works or services, to award 80% of the related
contracts for works, services or goods, with a value of over €150 thousand, by public tender. The
legislation also establishes that the remaining part may be carried out in-house, in the case of public
entities, or by direct or indirect subsidiaries or associates in the case of private entities. The legislation
provides for a transitional period of adjustment of no more than twenty-four months in the case of
existing concessions. The only exclusions from compliance with the above obligation are existing or
future concessions awarded in the form of project financing, and existing or future concessions

2. Report on operations
Annual Report 2015 104
awarded by public tender in accordance with EU law, for which existing legislation governing tenders
in force at the date of entry into effect of the enabling act (13 February 2016) will continue to apply.
By 18 April 2016, the government is authorised to issue a legislative decree applying the above EU
directives, in accordance with the criteria contained in the enabling act.
Overseas motorways
Brazil
The pending legal action regarding the ban on toll charges for the suspended axles of heavy vehicles,
involving operators in the State of Sao Paulo, including Triangulo do Sol, is described in detail in the
Annual Report for the year ended 31 December 2014. On 24 March 2015, the Supreme Court
(Tribunale Superiore di Giustizia or “STJ”) for the State of Sao Paulo rejected the challenge brought
by the operators with the aim of obtaining a reinstatement of proceedings before the Court of the State
of Sao Paulo, ruling it inadmissible. On 14 April 2015, the operators filed an extraordinary challenge
against the court’s ruling before Brazil’s Federal Supreme Court (Supremo Tribunal Federal or
“STF”). On 3 June 2015, the STJ refuted the existence of the grounds of a political, social or
economic nature necessary for the case to be heard by the STF. On 28 June 2015, the operators filed a
further challenge, contesting this preliminary judgement. This challenge was also rejected by the
Supreme Court on 5 August 2015.
Thus, as a result of this decision, toll charges for the suspended axles of heavy vehicles are not
permitted under the terms of the concession. To date, the operator, Triangulo do Sol (in common
with Colinas, which was not a party to the legal action) has, in any event, applied this charge, not in
application of any court ruling, but as a means of compensating for the decision, taken by the Public
Transport Services Regulator for the State of Sao Paulo (ARTESP) in the same period, not to allow the
application of annual toll increases from July 2013.
On 17 April 2015, Federal Law 13103/2015 come into effect. This, among other things, authorises the
exemption of road hauliers from the payment of toll charges for the suspended axles of heavy vehicles.
The above legislation has been applied by the state of Minas Gerais, whilst the government of the state
of Sao Paulo has decided not to apply the exemption. Thus, from 17 April 2015, Rodovias MG050, in
Minas Gerais, has ceased charging for the suspended axles of heavy vehicles, whilst operators in the
state of Sao Paulo, including Rodovias das Colinas and Triangulo do Sol, continue to levy the charge.
Rodovias MG050’s lost revenue, following the entry into effect of the above legislation and the
resulting cessation of charges for the suspended axles of heavy vehicles, will be recouped in accordance
with the terms of the concession arrangement.
The investigation launched by ARTESP on 13 July 2013, with a view to revising the Addenda and
Amendments signed and approved by the Regulator and 12 motorway operators in 2006 - the changes
were designed to extend the concession terms to compensate, among other things, for the expenses
incurred as a result of taxes introduced after the concessions were granted – is described in detail in the
Annual Report for the year ended 31 December 2014. On 24 February 2015, the Public Prosecutor for
the State of Sao Paulo provided a non-binding opinion the judge appointed to take charge of the
investigation relating to the operator, Colinas. This recommended termination of the proceedings
underway, reiterating that legality of the Addenda and Amendments of 2006, which were subject to
close examination and endorsed by the relevant Ministry. On 10 March 2015, ARTESP responded to
the judge, contesting the Public Prosecutor’s opinion and requesting that the investigation continue.

105
On 15 February 2016, the Court of the State of Sao Paulo issued a ruling, granting Rodovias das
Colinas the option of submitting a financial assessment to demonstrate its case.
The operators concerned, including Colinas and Triangulo do Sol, and industry insiders, including
banks, believe that the risk of a negative outcome is remote. This view is backed up by a number of
unequivocal legal opinions provided by leading experts in administrative law and regulation.
Poland
Since 20 June 2012, the Polish Antitrust Authority has been conducting an Explanatory Proceeding to
investigate Stalexport Autostrada Maloposka.
The proceeding aims to investigate the company’s "abuse of its dominant position" with regard to the
tolls charged to road users when carrying out construction and extraordinary maintenance work, given
that Stalexport Autostrada Maloposka is held to operate as a "monopoly".
Should the Authority rule that there has been an "abuse of its dominant position", the proceeding
could result in a fine.
Whilst reserving the right to challenge any ruling the Authority’s investigation may result in, the
company is taking steps to define the timing and amount of eventual reductions in tolls whilst such
work takes place.
At the end of a similar investigation in 2008 the local Antitrust office fined the Polish company
approximately €300 thousand, given that it had not put in place a procedure for reducing tolls during
the work. The fine was confirmed at various instances, including by the Supreme Court.
Italian airports
Fee increases
In keeping with existing regulations and with the ENAC Guidelines for the “Procedure for
consultation between airport operators and users for ordinary planning agreements and those in
derogation”, on 31 August 2015, Aeroporti di Roma sent a letter inviting all the Users’ Associations to
attend a public hearing held on 30 September 2015, on the same date publishing, as part of the
consultation process, all the documentation relating to the proposed fees for 2016 on its website.
On 18 September 2015, a request for clarification of the published documents was received from
AssoHandlers. ADR responded to this request at the public hearing of 30 September 2015.
On 30 October 2015, the company published responses to further requests for clarification from
Ryanair, IBAR (together with AOC, Assaereo, IATA and the Users’ Committee for Fiumicino),
AssoHandlers and EasyJet on its website.
The proposed fee increases for 2016 envisage average increases of 10.4% and 6.4% for Fiumicino and
Ciampino, respectively.
On 15 December 2015, at the end of the consultation process, the fees for Fiumicino and Ciampino
were published on the websites of ENAC and ADR. The new fees will be in effect from 1 March 2016
until 28 February 2017.
The Regional Tax on Aircraft Noise (IRESA) and municipal surcharge

2. Report on operations
Annual Report 2015 106
The national law, converting Law Decree 145/2013 (the so-called “Destination Italy” law, published in
the Official Gazette on 21 February 2014) includes measures for airports that provide subsidies to
airlines; fixes the maximum value of the Regional Tax on Aircraft Noise (IRESA) calculation
parameters applicable throughout the country; establishes that the municipal surcharge introduced by
article 2, paragraph 11 of Law 350 of 24 December 2003, and subsequent increases, is not payable by
passengers in transit at Italian airports, if they have arrived from another Italian airport, and that the
Commissioner’s surcharge for Roma Capitale should continue to be applied to all passengers departing
from or in transit at the airports of Rome Fiumicino and Ciampino, with the exception of transit
passengers arriving from and departing for an Italian airport.
IRESA
On 15 April 2014, Lazio Regional Authority adopted a resolution (no. 196) authorising a legal
challenge to be brought before the Constitutional Court, contesting the constitutional legitimacy of the
“Destinazione Italia” Law Decree - and, in particular, article 13, paragraph 15 bis - as converted into
Law 9 of 21 February 2014. On 9 February 2015, the Constitutional Court ruled Lazio Regional
Authority’s challenge to be inadmissible.
In response to the Constitutional Court sentence, Lazio Regional Authority: i) authorised ADR, whilst
awaiting specific legislation to be enacted by Lazio Regional Authority, to assess, collect and pass on
IRESA, applying, in the form of a payment on account, the maximum rate of €0.50 per tonne based
on the maximum takeoff weight, subject to application of an eventual adjustment; ii) granted the
Regional Office for Economic Planning, Budgeting and Estate and Asset Management (Direzione
Regionale Programmazione Economica, Bilancio, Demanio e Patrimonio) authority to take all the
necessary steps in order to sign an addendum to the Agreement between Lazio Regional Authority and
ADR, whilst awaiting enactment of the relevant legislation.
Regional Law 11 was published in the Lazio Region’s Official Gazette on 30 July 2015. Article 2 of the
new legislation sets out “amendments to the provisions of art. 13, paragraph 15-bis of Law Decree 145
of 23 December 2013, converted with amendments into Law 9 of 21 February 2014, containing urgent
measures pertaining to air transport”. The new rates for IRESA introduced by the new legislation,
where applicable, are effective from 22 February 2014.
In October 2015, ADR and Lazio Regional Authority agreed an Addendum to the agreement governing
the application of IRESA signed by the parties on 30 January 2014.
Limitation on the handlers authorised to operate at Fiumicino airport
In December 2014, ADR was notified of five challenges lodged with Lazio Regional Administrative
Court, contesting ENAC’s decision of 13 October 2014 to limit the number of handlers authorised to
provide the services listed in points 3, 4 and 5 (with the exclusion of 5.7) in Annex A to Legislative
Decree 18/99 at Fiumicino airport. The challenges were lodged by Assaereo, Aviation Services SpA,
Consulta S.r.l, Consulta SpA and IBAR. In December 2014, ADR was also notified of two additional
grounds for a challenge lodged by “Fallimento Groundcare Milano Srl”. Finally, on 6 February 2015,
ALHA Airport filed an extraordinary challenge with the Italian President, requesting cancellation of
ENAC’s decision.
With two separate rulings dated 17 April 2015, Lazio Regional Administrative Court rejected the
requests for injunctive relief brought by IBAR and Assaereo. No dates have so far been set for hearings
on the merits of the other challenges filed. The hearing on the merits of Assaereo’s challenge is
scheduled for 16 June 2016.

107
Noise Reduction and Abatement Plan for Ciampino airport
Pursuant to the Ministerial Decree of 29 November 2000, ADR submitted its Noise Reduction and
Abatement Plan for Ciampino airport to Lazio Regional Authority and the municipalities of Rome,
Marino and Ciampino on 28 November 2013. In February 2014, the three municipalities expressed
their opposition to the proposed plan.
On 5 May 2014, Lazio Regional Authority formally set up a cross-agency panel to look into the above
Plan. In addition to Lazio Regional Authority, the panel’s members include representatives from the
Municipality of Rome, the municipalities of Ciampino and Marino, ENAC, ARPA Lazio (the region’s
environmental protection agency) and ADR.
On 12 June 2014, Regulation 598/2014 was published in the Office Journal of the European Union
L173. The regulation has introduced rules and procedures for the introduction of operational
restrictions aimed at containing the noise at airports in the EU, as part of a balanced approach, based
on an examination (using a process developed by the International Civil Aviation Organisation) of the
available measures, with a view to resolving the issue of noise pollution in keeping with the principle of
cost effectiveness at the level of each individual airport.
The Regulation, which has abolished Directive 2002/30/EC, will come into effect on 13 June 2016
and will apply to European airports “with traffic in excess of 50,000 movements of civil aircraft per
calendar year, based on the average of the last three calendar years prior to determining the level of
noise”. On 11 November 2015, ADR submitted a new Noise Reduction and Abatement Plan for
Ciampino airport to Lazio Regional Authority and the municipalities of Rome, Ciampino and Marino.
The new Plan was drawn up following the opposition expressed by the authorities to the Noise
Reduction and Abatement Plan submitted by ADR in 2013.
Following receipt of the Plan, Lazio Regional Authority called a Services Conference with all the
interested authorities (neighbouring municipalities) in order to jointly assess the Plan submitted by
ADR, which must then be approved by each individual municipality.
The Conference’s first sitting, to which ADR was invited, was held on 12 January 2016.
Determination of airport concession fees for the three-year period 2016-2018
The interdepartmental decree (“Decreto interdirigenziale”) of 14 December 2015 issued by the State
Property Office and the Ministry of Infrastructure and Transport, containing the “Determination of
the airport concession fees for the three-year period 2016-2018”, was published in Official Gazette
no. 296 on 21 December 2015. This Decree confirms application of the same criteria defined in the
previous decree (Executive Decree of 22 April 2013), determining airport concession fees for the
three-year period 2013-2015, for the three-year period 2016-2018. This is based on the method for
quantifying airport concession fees contained in art. 1 of the interdepartmental decree of 30 June
2003.
Airports Plan – Airports of national interest
With the issue of Presidential Decree 201 of 17 September 2015, containing “Regulations governing
the identification of airports of national interest, in accordance with article 698 of the Navigation
Code”, the procedure provided for in the Navigation Code and the related process of planning the
development and restructuring of Italy’s airport system has come to an end.
For each of the 10 catchment areas indicated, the Presidential Decree identifies 38 airports of national
interest (including Fiumicino and Ciampino) that are the sole responsibility of the State, assigning
responsibility for airports of regional importance to the relevant regional and local authorities, as

2. Report on operations
Annual Report 2015 108
required by the legislation governing the federal approach to the management of public property
(Legislative Decree 85/2010).
12 airports of “strategic importance” were then chosen from among those of national interest,
including Rome Fiumicino, which is the principal hub for the country’s airport system and, together
with the airports of Milan Malpensa and Venice Marco Polo, acts as an intercontinental gateway.
Procedure for approving airport infrastructure projects
Law Decree 185 of 25 November 2015 contains “Urgent measures for infrastructure projects” and was
published in Official Gazette 275 of 25 November 2015 and effective from the date of publication.
Article 9 (Withdrawal of unused funding and repeal of procedures for airports), c. 3 states that
“Paragraph 3-bis of article 71 of Law Decree 1 of 24 January 2012, converted, with amendments, into
Law 27 of 24 March 2012, is hereby repealed”.
Article 71, c. 3-bis had assimilated the procedures involved in carrying out infrastructure projects at
Fiumicino and Ciampino airports with those relating to strategic infrastructure projects of national
interest (so-called major works) and had extended application of the legislation governing consents for
such works to include the airports.
With the repeal of art. 71, c. 3-bis, infrastructure projects for Fiumicino and Ciampino airports no
longer on a par with the above major works and are, therefore, once again subject to the pre-existing
legislation governing consents.
Following the entry into effect of Law Decree 185/2015, ENAC has formally withdrawn its request for
an environmental impact assessment linked to approval of the Master Plan for Ciampino in accordance
with the procedure introduced by art. 71, c. 3-bis, announcing that it would shortly submit a new
request for the assessment according to the ordinary procedure.
On 4 December 2015, the Ministry of the Environment and Land and Sea Protection took receipt of
the above withdrawal (ceasing to process the application) and ENAC’s commitment to submit a new
request for an assessment in accordance with the ordinary procedure.
Notice of withdrawal of the application was also given in a release published on the Ministry’s website,
which also stated that a new request for an environmental impact assessment would be submitted in
accordance with the ordinary procedure, pursuant to art. 23 of Legislative Decree 152/2006, as
amended, following the Law Decree’s conversion into law.
Law 9 of 22 January 2016, converting Law Decree 185/2015 into law with amendments, published in
Official Gazette 18 of 23 January 2016, has confirmed the repeal of art. 71, c. 3-bis.
Increase in the municipal surcharge on air passenger duty
The Decree issued by the Ministry of Infrastructure and Transport on 29 October 2015, regarding
“Definition of the increase in the municipal surcharge on air passenger duty to be transferred to
INPS”, was published in Official Gazette 300 of 28 December 2015.
The decree has introduced a further increase in the municipal surcharge, which amounts to €2.50 for
2016, €2.42 for 2017 and €2.34 for 2018, in application of paragraph 23 of art. 13 of Law Decree
145/2013, the so-called “Destinazione Italia” legislation, converted with amendments into Law
9/2014.
As a result of this decree, the municipal surcharge on air passenger duty paid by passengers departing
from Fiumicino and Ciampino airports amounts to €10 in 2016.
The airline, EasyJet, has challenged the decree before Lazio Regional Administrative Court, requesting
its cancellation subject to prior injunctive relief.

109
Other activities
Electronic Transaction Consultants (ETC)
Following the withholding of payment by the Miami-Dade Expressway Authority ("MDX") for the on site
and office system management and maintenance services provided by ETC, and after a failed attempt at
mediation as required by the service contract, on 28 November 2012 ETC petitioned the Miami Dade
County Court in Florida to order MDX to settle unpaid claims amounting to over US$30 million and
damages for breach of contact.
In December 2012, MDX, in turn, notified ETC of its decision to terminate the service contract and sue
for compensation for alleged damages of US$26 million for breach of contract by ETC.
In August 2013, ETC and MDX agreed a settlement covering the services rendered by ETC during the
“disentanglement” phase, which ended on 22 November 2013. MDX has duly paid the sum due.
In December 2015, the court case, during which the parties presented their respective arguments and
the various experts and witnesses were heard, came to an end. Judgement is expected by the end of the
first half of 2016.

2. Report on operations
Annual Report 2015 110
Other information
As at 31 December 2015, Atlantia SpA holds 2,401,753 treasury shares, representing 0.29% of its
issued capital. In March 2015, the Company sold 9,741,513 treasury shares by way of an accelerated
book building process to institutional investors.
Atlantia SpA does not own, either directly or indirectly through trust companies or proxies, shares or
units issued by parent companies. No transactions were carried out during the period involving shares
or units issued by parent companies.
In 2015, a total of 484,535 of the Company’s ordinary shares were allotted as a result of the exercise of
share options and the conversion of share grants in relation to share-based incentive plans for the
Group’s managers.
Atlantia SpA does not own, either directly or indirectly through trust companies or proxies, shares or
units issued by parent companies. No transactions were carried out during the period involving shares
or units issued by parent companies.
Atlantia does not operate branch offices. Its administrative headquarters are at Via Bergamini 50,
00159 Rome.
With reference to CONSOB Ruling 2423 of 1993, regarding criminal proceedings or judicial
investigations, the Group is not involved in proceedings, other than those described in note 10.7
“Significant legal and regulatory aspects”, that may result in charges or potential liabilities with an
impact on the consolidated financial statements.
On 17 January 2013 a meeting of the Board of Directors elected to apply the exemption provided for by
article 70, paragraph 8 and article 71, paragraph 1-bis of the CONSOB Regulations for Issuers
(Resolution 11971/99, as amended). The Company will therefore exercise the exemption from
disclosure requirements provided for by Annex 3B of the above Regulations in respect of significant
mergers, spin-offs, capital increases involving contributions in kind, acquisitions and disposals.

111
Events after 31 December 2015
There were no material events after the end of the year under review.

2. Report on operations
Annual Report 2015 112
Outlook and risks or uncertainties
Despite the continuing instability of the global economy, the consolidated operating results are
expected to register improvements across all the Group’s areas of business in 2016.
Italian motorways
Traffic trends on the Group’s Italian motorway network in recent months show signs of a recovery. In
addition, Autostrada Tirrenica will contribute to the full-year results, following its consolidation by
the Group from 30 September 2015, and we expect to see a reduction in the margins generated by
service areas, partly as a result of the award of new sub-concessions.
Overseas motorways
Traffic on the Group’s overseas motorways continues to register overall traffic growth, with the
exception of Brazil, where the performance of the local economy continues to weigh. The related
contribution to the Group’s results is, however, subject to movements in the respective currencies.
Aeroporti di Roma
Aviation revenue is expected to rise in line with the growth in passenger traffic registered in early 2016
and with airlines’ forecasts, partly reflecting the launch of new direct flights from Fiumicino. This
category of revenue will also benefit from increases in airport fees. Growth in non-aviation revenue
may also contribute to an improvement in results, having been hit by the damage to retail outlets in
2015 as a result of the fire that broke out at Fiumicino on 7 May.
The Group’s performance for 2016 will also benefit from the tangible reduction in the cost of debt
resulting from the steps taken, in 2015, to improve the capital structure.

113
Proposed resolutions for the Annual General
Meeting of Atlantia SpA’s shareholders
Dear Shareholders,
In conclusion, we invite you:
a) to discuss and approve the Board of Directors' report on operations and the financial statements as
at and for the year ended 31 December 2015, which report profit of €733,408,922.33;
b) to appropriate the remaining €404,063,684.33 in profit for the year, after payment of the interim
dividend of €329,345,238.00 (equal to €0.400 per share) in 2015, to:
1) pay a final dividend of €0.480 per share, payable to holders of each of the shares with a par value
of €1.00. The total value of the final dividend, based on the number of shares outstanding as at
31 December 2015 (823,382,237), is estimated at €395,223,473.76;
2) take the remaining profit for the year to retained earnings. This amount, based on the number
of shares outstanding as at 31 December 2015, is estimated at €8,840,210.57;
c) to establish the dividend payment date as 25 May 2016, the ex-dividend date for coupon 28 as 23
May 2016 and the record date as 24 May 2016.
For the Board of Directors
The Chairman

2. Report on operations
Annual Report 2015 114
This page intentionally left blank

115
This page intentionally left blank

2. Report on operations
Annual Report 2015 116
3. Bilancio consolidato As at 31 December 2015:
prospetti contabili e note illustrative
Consolidated financial statements
as at and for the year ended
31 December 2015 and notes3

117
CONSOLIDATED FINANCIAL STATEMENTS
ASSETS
NON-CURRENT ASSETS
Property, plant and equipment 7.1 231,742 191,555
Property, plant and equipment 227,862 187,398
Property, plant and equipment held under finance leases 2,951 3,271
Investment property 929 886
Intangible assets 7.2 24,844,588 25,182,029
Intangible assets deriving from concession rights 20,043,215 20,364,088
Goodwill and other intangible assets with indefinite lives 4,382,789 4,382,790
Other intangible assets 418,584 435,151
Investments 7.3 96,865 153,845
Investments accounted for at cost or fair value 62,231 72,830
Investments accounted for using the equity method 34,634 81,015
Other non-current financial assets 7.4 1,781,276 1,756,081
Non-current financial assets deriving from concession rights 766,499 704,347
Non-current financial assets deriving from government grants 255,662 215,023
Non-current term deposits 324,894 291,189
Non-current derivative assets 562 -
Other non-current financial assets 433,659 15,631 545,522 9,660
Deferred tax assets 7.5 1,574,566 1,817,627
Other non-current assets 7.6 13,623 12,782
TOTAL NON-CURRENT ASSETS 28,542,660 29,113,919
CURRENT ASSETS
Trading assets 7.7 1,468,759 1,407,260
Inventories 57,392 59,623
Contract work in progress 16,471 20,088
Trade receivables 1,394,896 39,749 1,327,549 45,598
Cash and cash equivalents 7.8 2,957,246 1,904,996
Cash 2,250,532 1,325,521
Cash equivalents 706,714 579,475
Other current financial assets 7.4 818,981 962,918
Current financial assets deriving from concessions 435,511 428,933
Current financial assets deriving from government grants 74,627 79,847
Current term deposits 221,834 250,018
Current derivative assets 36 -
Current portion of medium/long-term financial assets 68,987 66,864
Other current financial assets 17,986 545 137,256 116,667
Current tax assets 7.9 43,626 7,588 41,222 18,710
Other current assets 7.10 244,735 207,794
Non-current assets held for sale and related to discontinued
operations7.11 44,985 539,354
TOTAL CURRENT ASSETS 5,578,332 5,063,544
TOTAL ASSETS 34,120,992 34,177,463
Consolidated statement of financial position
€000 NOTE 31 December 2015
OF WHICH
RELATED PARTY
TRANSACTIONS
31 December 2014
OF WHICH
RELATED PARTY
TRANSACTIONS
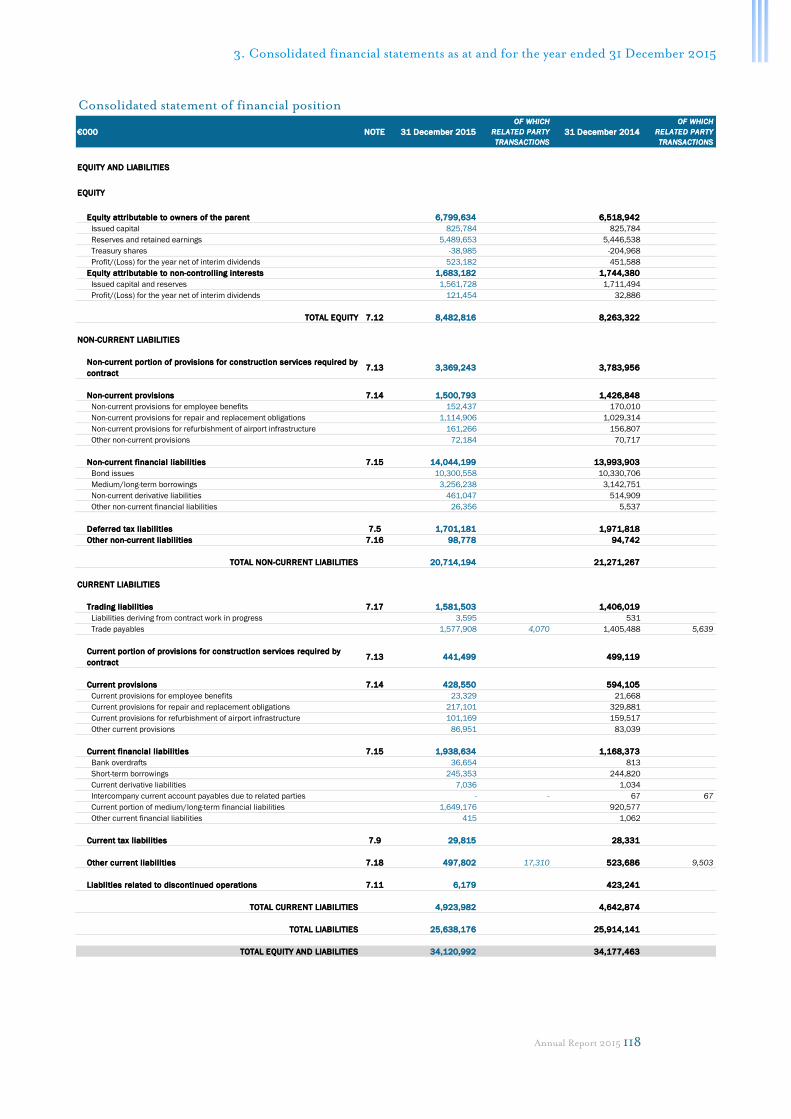
3. Consolidated financial statements as at and for the year ended 31 December 2015
Annual Report 2015 118
EQUITY AND LIABILITIES
EQUITY
Equity attributable to owners of the parent 6,799,634 6,518,942
Issued capital 825,784 825,784
Reserves and retained earnings 5,489,653 5,446,538
Treasury shares -38,985 -204,968
Profit/(Loss) for the year net of interim dividends 523,182 451,588
Equity attributable to non-controlling interests 1,683,182 1,744,380
Issued capital and reserves 1,561,728 1,711,494
Profit/(Loss) for the year net of interim dividends 121,454 32,886
TOTAL EQUITY 7.12 8,482,816 8,263,322
NON-CURRENT LIABILITIES
Non-current portion of provisions for construction services required by
contract7.13 3,369,243 3,783,956
Non-current provisions 7.14 1,500,793 1,426,848
Non-current provisions for employee benefits 152,437 170,010
Non-current provisions for repair and replacement obligations 1,114,906 1,029,314
Non-current provisions for refurbishment of airport infrastructure 161,266 156,807
Other non-current provisions 72,184 70,717
Non-current financial liabilities 7.15 14,044,199 13,993,903
Bond issues 10,300,558 10,330,706
Medium/long-term borrowings 3,256,238 3,142,751
Non-current derivative liabilities 461,047 514,909
Other non-current financial liabilities 26,356 5,537
Deferred tax liabilities 7.5 1,701,181 1,971,818
Other non-current liabilities 7.16 98,778 94,742
TOTAL NON-CURRENT LIABILITIES 20,714,194 21,271,267
CURRENT LIABILITIES
Trading liabilities 7.17 1,581,503 1,406,019
Liabilities deriving from contract work in progress 3,595 531
Trade payables 1,577,908 4,070 1,405,488 5,639
Current portion of provisions for construction services required by
contract7.13 441,499 499,119
Current provisions 7.14 428,550 594,105
Current provisions for employee benefits 23,329 21,668
Current provisions for repair and replacement obligations 217,101 329,881
Current provisions for refurbishment of airport infrastructure 101,169 159,517
Other current provisions 86,951 83,039
Current financial liabilities 7.15 1,938,634 1,168,373
Bank overdrafts 36,654 813
Short-term borrowings 245,353 244,820
Current derivative liabilities 7,036 1,034
Intercompany current account payables due to related parties - - 67 67
Current portion of medium/long-term financial liabilities 1,649,176 920,577
Other current financial liabilities 415 1,062
Current tax liabilities 7.9 29,815 28,331
Other current liabilities 7.18 497,802 17,310 523,686 9,503
Liablities related to discontinued operations 7.11 6,179 423,241
TOTAL CURRENT LIABILITIES 4,923,982 4,642,874
TOTAL LIABILITIES 25,638,176 25,914,141
TOTAL EQUITY AND LIABILITIES 34,120,992 34,177,463
OF WHICH
RELATED PARTY
TRANSACTIONS
Consolidated statement of financial position
€000 NOTE 31 December 2015
OF WHICH
RELATED PARTY
TRANSACTIONS
31 December 2014
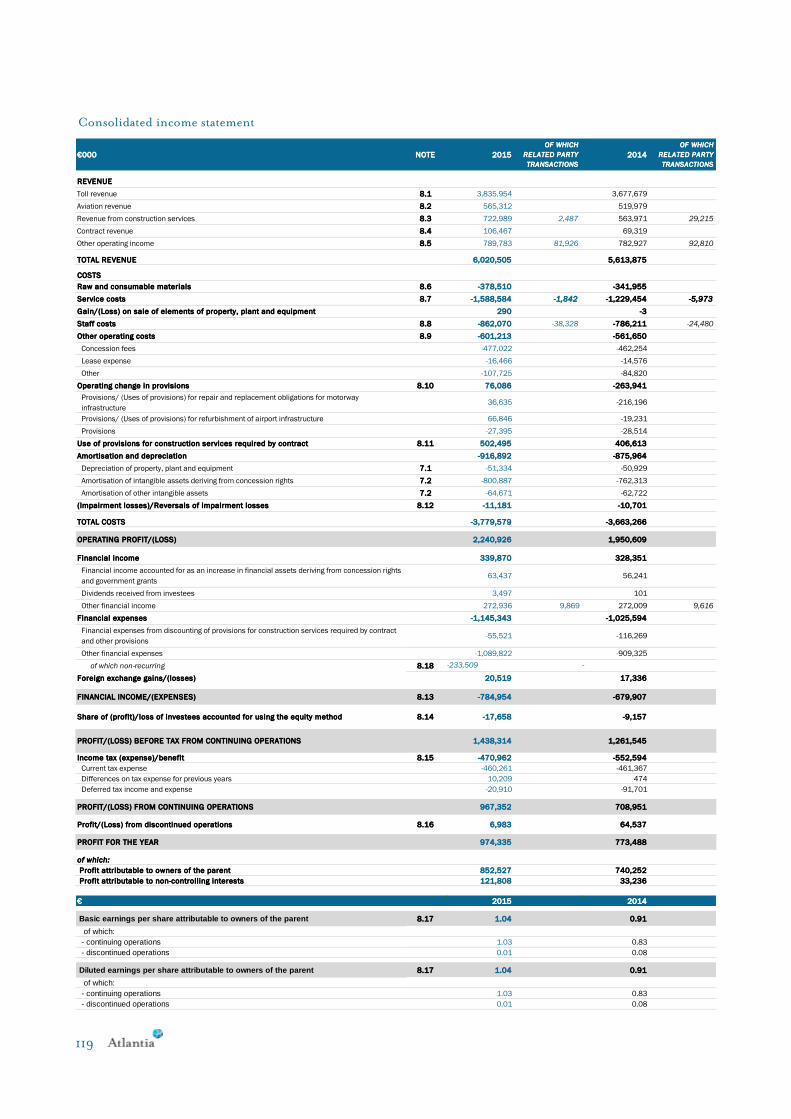
119
REVENUE
Toll revenue 8.1 3,835,954 3,677,679
Aviation revenue 8.2 565,312 519,979
Revenue from construction services 8.3 722,989 2,487 563,971 29,215
Contract revenue 8.4 106,467 69,319
Other operating income 8.5 789,783 81,926 782,927 92,810
TOTAL REVENUE 6,020,505 5,613,875
COSTS
Raw and consumable materials 8.6 -378,510 -341,955
Service costs 8.7 -1,588,584 -1,842 -1,229,454 -5,973
Gain/(Loss) on sale of elements of property, plant and equipment 290 -3
Staff costs 8.8 -862,070 -38,328 -786,211 -24,480
Other operating costs 8.9 -601,213 -561,650
Concession fees -477,022 -462,254
Lease expense -16,466 -14,576
Other -107,725 -84,820
Operating change in provisions 8.10 76,086 -263,941
Provisions/ (Uses of provisions) for repair and replacement obligations for motorway
infrastructure36,635 -216,196
Provisions/ (Uses of provisions) for refurbishment of airport infrastructure 66,846 -19,231
Provisions -27,395 -28,514
Use of provisions for construction services required by contract 8.11 502,495 406,613
Amortisation and depreciation -916,892 -875,964
Depreciation of property, plant and equipment 7.1 -51,334 -50,929
Amortisation of intangible assets deriving from concession rights 7.2 -800,887 -762,313
Amortisation of other intangible assets 7.2 -64,671 -62,722
(Impairment losses)/Reversals of impairment losses 8.12 -11,181 -10,701
TOTAL COSTS -3,779,579 -3,663,266
OPERATING PROFIT/(LOSS) 2,240,926 1,950,609
Financial income 339,870 328,351
Financial income accounted for as an increase in financial assets deriving from concession rights
and government grants63,437 56,241
Dividends received from investees 3,497 101
Other financial income 272,936 9,869 272,009 9,616
Financial expenses -1,145,343 -1,025,594
Financial expenses from discounting of provisions for construction services required by contract
and other provisions-55,521 -116,269
Other financial expenses -1,089,822 -909,325
of which non-recurring 8.18 -233,509 -
Foreign exchange gains/(losses) 20,519 17,336
FINANCIAL INCOME/(EXPENSES) 8.13 -784,954 -679,907
Share of (profit)/loss of investees accounted for using the equity method 8.14 -17,658 -9,157
PROFIT/(LOSS) BEFORE TAX FROM CONTINUING OPERATIONS 1,438,314 1,261,545
Income tax (expense)/benefit 8.15 -470,962 -552,594
Current tax expense -460,261 -461,367
Differences on tax expense for previous years 10,209 474
Deferred tax income and expense -20,910 -91,701
PROFIT/(LOSS) FROM CONTINUING OPERATIONS 967,352 708,951
Profit/(Loss) from discontinued operations 8.16 6,983 64,537
PROFIT FOR THE YEAR 974,335 773,488
of which:
Profit attributable to owners of the parent 852,527 740,252
Profit attributable to non-controlling interests 121,808 33,236
€ 2015 2014
Basic earnings per share attributable to owners of the parent 8.17 1.04 0.91
of which:
- continuing operations 1.03 0.83
- discontinued operations 0.01 0.08
Diluted earnings per share attributable to owners of the parent 8.17 1.04 0.91
of which:
- continuing operations 1.03 0.83
- discontinued operations 0.01 0.08
Consolidated income statement
€000 NOTE 2015
OF WHICH
RELATED PARTY
TRANSACTIONS
2014
OF WHICH
RELATED PARTY
TRANSACTIONS

3. Consolidated financial statements as at and for the year ended 31 December 2015
Annual Report 2015 120
€000 Note 2015 2014
Profit for the year (A) 974,335 773,488
Fair value gains/(losses) on cash flow hedges -1,029 -83,751
Gains/(losses) from translation of assets and liabilities of consolidated companies denominated in functional
currencies other than the euro-314,426 -29,231
Gains/(Losses) from translation of investments accounted for using the equity method denominated in functional
currencies other than the euro -6,077 1,806
Other comprehensive income/(loss) for the year reclassifiable to profit or loss, after related
taxation (B)-321,532 -111,176
Gains/(losses) from actuarial valuations of provisions for employee benefits 4,421 -13,283
Other comprehensive income for the year not reclassifiable to profit or loss, after related taxation
(C)4,421 -13,283
Reclassifications of other components of comprehensive income to profit or loss for the year (D) 51,858 12,344
Total other comprehensive income/(loss) for the year, after related taxation (E=B+C+D) -265,253 -112,115
Of which attributable to discontinued operations 5,618 12,344
Comprehensive income for the year (A+E) 7.12 709,082 661,373
Of which attributable to owners of the parent 740,651 638,155
Of which attributable to non-controlling interests -31,569 23,218
Consolidated statement of comprehensive income

121
Iss
ue
d c
ap
ita
lC
as
h f
low
he
dg
e
res
erv
e
Ne
t in
ve
stm
en
t
he
dg
e r
es
erv
e
Re
se
rve
fo
r tr
an
sla
tio
n
dif
fere
nc
es
on
tra
ns
lati
on
of
as
se
ts
an
d l
iab
ilit
ies
of
co
ns
oli
da
ted
co
mp
an
ies
de
no
min
ate
d i
n
fun
cti
on
al
cu
rre
nc
ies
oth
er
tha
n t
he
eu
ro
Re
se
rve
fo
r tr
an
sla
tio
n
of
inve
stm
en
ts
ac
co
un
ted
fo
r u
sin
g t
he
eq
uit
y m
eth
od
de
no
min
ate
d i
n
fun
cti
on
al
cu
rre
nc
ies
oth
er
tha
n t
he
eu
ro
Oth
er
res
erv
es
an
d r
eta
ine
d
ea
rnin
gs
Tre
as
ury
sh
are
sP
rofi
t/(L
os
s)
for
ye
ar
TO
TA
L
82
5,7
84
-1,2
44
-36
,40
0-1
97
,75
8-5
,09
35
,75
6,2
19
-20
8,3
68
34
8,2
27
6,4
81
,36
71
,72
8,3
00
8,2
09
,66
7
--7
4,4
39
--1
5,9
83
1,3
94
-13
,06
9-
74
0,2
52
63
8,1
55
23
,21
86
61
,37
3
Atl
an
tia
Sp
A's
fin
al d
ivid
en
d
(€0
.39
1 p
er
sh
are
)-
--
--
--
-31
7,8
62
-31
7,8
62
--3
17
,86
2
Tra
nsfe
r o
f p
rofi
t/(l
oss)
for
pre
vio
us y
ea
r to
re
tain
ed
ea
rnin
gs
--
--
-3
0,3
65
--3
0,3
65
--
-
Atl
an
tia
Sp
A's
in
teri
m d
ivid
en
d
(€0
.35
5 p
er
sh
are
)-
--
--
--
-28
8,6
64
-28
8,6
64
--2
88
,66
4
Div
ide
nd
s p
aid
by
oth
er
Gro
up
co
mp
an
ies t
o n
on
-co
ntr
olli
ng
sh
are
ho
lde
rs
--
--
--
--
--8
,21
1-8
,21
1
Sh
are
-ba
se
d in
ce
nti
ve p
lan
s-
--
--
4,5
62
3,4
00
-7
,96
28
68
,04
8
Ch
an
ge
s in
sco
pe
of
co
nso
lida
tio
n a
nd
oth
er
min
or
ch
an
ge
s a
nd
recla
ssif
ica
tio
ns
--
--
--2
,01
6-
--2
,01
69
87
-1,0
29
82
5,7
84
-75
,68
3-3
6,4
00
-21
3,7
41
-3,6
99
5,7
76
,06
1-2
04
,96
84
51
,58
86
,51
8,9
42
1,7
44
,38
08
,26
3,3
22
-4
6,8
99
--1
60
,49
7-2
,64
24
,36
4-
85
2,5
27
74
0,6
51
-31
,56
97
09
,08
2
Atl
an
tia
Sp
A's
fin
al d
ivid
en
d
(€0
.39
1 p
er
sh
are
)-
--
--
--
-36
6,3
09
-36
6,3
09
--3
66
,30
9
Tra
nsfe
r o
f p
rofi
t/(l
oss)
for
pre
vio
us y
ea
r to
re
tain
ed
ea
rnin
gs
--
--
-8
5,2
79
--8
5,2
79
--1
1-1
1
Atl
an
tia
Sp
A's
in
teri
m d
ivid
en
d
(€0
.35
5 p
er
sh
are
)-
--
--
--
-32
9,3
45
-32
9,3
45
--3
29
,34
5
Div
ide
nd
s p
aid
by
oth
er
Gro
up
co
mp
an
ies t
o n
on
-co
ntr
olli
ng
sh
are
ho
lde
rs
--
--
--
--
--2
9,0
44
-29
,04
4
Sa
le o
f tr
ea
sury
sha
res
--
--
-6
9,8
32
15
8,1
20
-2
27
,95
2-
22
7,9
52
Sh
are
-ba
se
d in
ce
nti
ve p
lan
s-
--
--
-2,7
97
7,8
63
-5
,06
64
95
,11
5
Ch
an
ge
s in
sco
pe
of
co
nso
lida
tio
n a
nd
oth
er
min
or
ch
an
ge
s a
nd
recla
ssif
ica
tio
ns
-5
-7
3-5
62
,65
5-
-2
,67
7-6
23
2,0
54
82
5,7
84
-28
,77
9-3
6,4
00
-37
4,1
65
-6,3
97
5,9
35
,39
4-3
8,9
85
52
3,1
82
6,7
99
,63
41
,68
3,1
82
8,4
82
,81
6
Sta
tem
ent
of
chan
ges
in c
on
soli
dat
ed e
qu
ity
€0
00
EQ
UIT
Y A
TT
RIB
UT
AB
LE
TO
OW
NE
RS
OF
TH
E P
AR
EN
T
EQ
UIT
Y
AT
TR
IBU
TA
BL
E T
O
NO
N-
CO
NT
RO
LL
ING
INT
ER
ES
TS
TO
TA
L E
QU
ITY
AT
TR
IBU
TA
BL
E T
O
OW
NE
RS
OF
TH
E
PA
RE
NT
AN
D T
O N
ON
-
CO
NT
RO
LL
ING
INT
ER
ES
TS
Ow
ne
r tr
an
sa
cti
on
s a
nd
oth
er
ch
an
ge
s
Ba
lan
ce
as a
t 3
1 D
ece
mb
er
20
15
Ba
lan
ce
as a
t 3
1 D
ece
mb
er
20
14
Co
mp
reh
en
siv
e i
nco
me
fo
r th
e y
ea
r
Ba
lan
ce
as a
t 3
1 D
ece
mb
er
20
13
Co
mp
reh
en
siv
e i
nco
me
fo
r th
e y
ea
r
Ow
ne
r tr
an
sa
cti
on
s a
nd
oth
er
ch
an
ge
s

3. Consolidated financial statements as at and for the year ended 31 December 2015
Annual Report 2015 122
€000 NOTE 2015OF WHICH RELATED
PARTY TRANSACTIONS2014
OF WHICH RELATED
PARTY TRANSACTIONS
CASH FLOWS FROM (USED IN) OPERATING ACTIVITIES
Profit for the year 974,335 773,488
Adjusted by:
916,892 883,176
84,830 357,159
55,521 116,269
36,249 44,108
8.14 17,658 9,157
Impairment losses/(Reversal of impairment losses) and
adjustments of non-current assets1,347 -9,153
(Gain)/Loss on sale of non-current assets 379 -70,846
Net change in deferred tax (assets)/liabilities through profit or loss 20,910 85,133
Other non-cash costs (income) -3,019 -2,487 -109,167 -29,215
105,718 13,572 -256,016 -2,028
9.1 2,210,820 1,823,308
Investment in assets held under concession 7.2 -1,352,095 -1,003,672
Government grants related to assets held under concession 56,021 39,875
Increase in financial assets deriving from concession rights
(related to capital expenditure)95,120 63,465
7.1 -95,525 -57,008
7.2 -39,655 -38,719
-17,746 -32,241
-72,193 -701
2,731 8,925
- 83,342
-18,266 40,754
101,083 -9,856 179,806 -1,417
9.1 -1,340,525 -716,174
CASH FLOWS FROM (USED IN) FINANCING ACTIVITIES
-724,671 -903,792
24 720
231,221 3,096
- 2,880
7.15 2,758,388 227,683
260,972 397,940
- 3,935
7.15 -147,902 -2,514,241
7.15 -1,637,932 -
-358,360 -821,218
- -6,034
-2,730 -6,688
-206,432 65,013
9.1 172,578 -3,550,706
-36,008 2,841
9.1 1,006,865 -2,440,731
1,952,748 4,393,479
2,959,613 1,952,748
Change in working capital and other changes
Consolidated statement of cash flows
Financial expenses from discounting of provisions for construction services
required by contract and other provisions
Impairment losses/(Reversal of impairment losses) on financial assets and
investments accounted for at cost or fair value
Share of (profit)/loss of investees accounted for using the equity method
Amortisation and depreciation
Operating change in provisions, after use of provisions for refurbishment of
airport infrastructure
Dividends paid
Net cash generated from/(used in) operating activities [a]
CASH FLOWS FROM (USED IN) INVESTING ACTIVITIES
Investment in consolidated companies, net of cash and cash equivalents
acquired
Net change in current and non-current financial assets
Net cash generated from/(used in) investing activities [b]
Purchases of property, plant and equipment
Purchases of intangible assets
Purchase of investments
Proceeds from sales of property, plant and equipment, intangible assets and
unconsolidated investments
Proceeds from sales of consolidated investments net of cash and cash
equivalents transferred
Net change in other non-current assets and other changes generated by
investing activities
Repayments of non-controlling shareholder loans
Contributions from non-controlling shareholders
Proceeds from sale of treasury shares and exercise of rights under share-based
incentive plans
New non-controlling shareholder loans
Issuance of bonds
Increase in medium/long term borrowings (excluding finance lease liabilities)
Increase in finance lease liabilities
Bond redemptions
Buyback of bonds issued by Atlantia and
purchase of notes issued by Romulus Finance
Repayments of medium/long term borrowings (excluding finance lease
liabilities)
NET CASH AND CASH EQUIVALENTS AT END OF YEAR
Payment of finance lease liabilities
Net change in other current and non-current financial liabilities
Net cash generated from/(used in) financing activities [c]
Net effect of foreign exchange rate movements on net cash and cash
equivalents [d]
Increase/(Decrease) in cash and cash equivalents [a+b+c+d]
NET CASH AND CASH EQUIVALENTS AT BEGINNING OF YEAR

123
€000 NOTE 2015 2014
Income taxes paid 445,702 441,620
Interest and other financial income collected 148,995 108,723
Interest and other financial expenses paid 867,272 801,597
Dividends received 8.13 3,497 101
Foreign exchange gains collected 168 171
Foreign exchange losses incurred 204 414
€000 NOTE 2015 2014
NET CASH AND CASH EQUIVALENTS AT BEGINNING OF YEAR 1,952,748 4,393,479
Cash and cash equivalents 7.8 1,904,996 4,414,215
Bank overdrafts repayable on demand 7.15 -813 -7,228
Intercompany current account payables due to related parties -67 -13,508
Cash and cash equivalents related to discontinued operations 7.11 48,632 -
NET CASH AND CASH EQUIVALENTS AT END OF YEAR 2,959,613 1,952,748
Cash and cash equivalents 7.8 2,957,246 1,904,996
Bank overdrafts repayable on demand 7.15 -36,654 -813
Intercompany current account payables due to related parties - -67
Cash and cash equivalents related to discontinued operations 7.11 39,021 48,632
Additional information on the consolidated statement of cash flows
Reconciliation of net cash and cash equivalents
3. Consolidated financial statements as at and for the year ended 31 December 2015
Annual Report 2015 124
NOTES 1. INTRODUCTION
The core business of the Atlantia Group (the “Group”) is the management of concessions granted by the
relevant authorities. Under the related concession arrangements, the Group’s operators are responsible for the
construction, management, improvement and serviceability of motorway and airport assets in Italy and abroad.
Further information on the Group’s concession arrangements is provided in note 4.
The Parent Company is Atlantia SpA (“Atlantia” or the “Company” or the “Parent Company”), a holding
company listed on the screen-based trading system (Mercato Telematico Azionario) operated by Borsa Italiana
SpA. The Company’s registered office is in Rome, at Via Nibby, 20. The Company does not have branch
offices. The duration of the Company is currently until 31 December 2050.
At the date of preparation of these consolidated financial statements, Sintonia SpA is the shareholder that
holds a relative majority of the issued capital of Atlantia SpA. Neither Sintonia SpA nor its direct parent,
Edizione Srl, exercise management and coordination of Atlantia SpA.
The consolidated financial statements as at and for the year ended 31 December 2015 were approved by the
Board of Directors of Atlantia at its meeting of 4 March 2016.
2. BASIS OF PREPARATION
The consolidated financial statements as at and for the year ended 31 December 2015 are based on the
assumption that the Parent and consolidated companies are going concerns. They have been prepared in
compliance with articles 2 and 3 of Legislative Decree 38/2005 and International Financial Reporting
Standards (IFRS) issued by the International Accounting Standards Board and endorsed by the European
Commission, as in force at that date. These standards reflect the interpretations issued by the International
Financial Reporting Interpretations Committee (IFRIC), in addition to previous International Accounting
Standards (IAS) and interpretations issued by the Standard Interpretations Committee (SIC) and still in force.
For the sake of simplicity, all the above standards and interpretations are hereinafter referred to as “IFRS”.
Moreover, the measures introduced by the CONSOB, in application of paragraph 3 of article 9 of Legislative
Decree 38/2005, relating to the preparation of financial statements, have also been taken into account.
The consolidated financial statements consist of the statement of financial position, the income statement, the
statement of comprehensive income, the statement of changes in equity, the statement of cash flows and these
notes, in application of IAS 1 “Presentation of financial statements” and, in general, the historic cost
convention, with the exception of those items that are required by IFRS to be recognised at fair value, as
explained in the accounting policies for the relevant items described in note 3. The statement of financial
position is based on the format that separately discloses current and non-current assets and liabilities. The
income statement is classified by nature of expense. The statement of cash flows has been prepared in
application of the indirect method.
IFRS have been applied in accordance with the indications provided in the “Conceptual Framework for
Financial Reporting”, and no events have occurred that would require exemptions pursuant to paragraph 19 of
IAS 1.
CONSOB Resolution 15519 of 27 July 2006 requires that, in addition to the specific requirements of IAS 1
and other IFRS, financial statements must, where material, include separate sub-items providing (i) disclosure
of amounts deriving from related party transactions; and, with regard to the income statement, (ii) separate
disclosure of income and expenses deriving from events and transactions that are non-recurring in nature, or
transactions or events that do not occur on a frequent basis in the normal course of business.
A number of non-recurring transactions and events occurred in 2015, as described in notes 8.18 and 8.19.
Otherwise, no atypical or unusual transactions, having a material impact on the Group’s income statement and
statement of financial position, were entered into during the period, either with third or related parties. The

125
consolidated financial statements therefore show the principal amounts relating to the related party and non-
recurring transactions that took place during the reporting period.
All amounts are shown in thousands of euros, unless otherwise stated. The euro is both the functional
currency of the Parent Company and its principal subsidiaries and the presentation currency for these
consolidated financial statements.
Each component of the consolidated financial statements is compared with the corresponding amount for the
comparative reporting period. To this end, it should be noted that, to improve presentation, certain amounts
in the consolidated statement of cash flows for 2014 have been reclassified with respect to the information
published in the consolidated financial statements as at and for the year ended 31 December 2014.
3. ACCOUNTING STANDARDS AND POLICIES APPLIED
A description follows of the more important accounting standards and policies used in the consolidated
financial statements as at and for the year ended 31 December 2015. These accounting standards and policies
are consistent with those applied in preparation of the consolidated financial statements for the previous year,
as no new standards, interpretations, or amendments to existing standards became effective in 2015 having a
material effect on the Atlantia Group's consolidated financial statements.
It should be noted that the following new standards and interpretations and/or amendments to existing
standards and interpretations were applicable from 1 January 2015:
a) IFRS 3 – Business Combinations. The amendment to the standard clarifies that a contingent consideration
classified as an asset or a liability must be measured at fair value at each reporting date, with the effects to be
recognised in profit or loss, regardless of whether the contingent consideration is a financial instrument or
a non-financial asset or liability. In addition, it clarifies that the standard does not apply to all joint
ventures;
b) IFRS 13 – Fair Value Measurement. The amendment clarifies and explicitly confirms the option of
accounting for short-term trade receivables and payables on an undiscounted basis, should the effect of
discounting not be material;
c) IFRIC 21 - Levies. The interpretation applies to all levies imposed by the government that do not fall within
the scope of other standards (for example, IAS 12 – Income Taxes). The interpretation clarifies that an
entity must only recognise a liability for a levy when the activity that triggers payment, as identified by the
relevant legislation, occurs. In addition, a liability for a levy may only be accrued progressively if the activity
that triggers payment occurs over a period of time. For a levy that is triggered upon reaching a minimum
threshold, the liability must be estimated and recognised before the threshold is reached, when the
threshold is expected to be exceeded in the assessment period.
Property, plant and equipment Property, plant and equipment is stated at cost. Cost includes expenditure that is directly attributable to the
acquisition of the items and financial expenses incurred during construction of the asset. Assets acquired
through business combinations prior to 1 January 2004 (the IFRS transition date) are stated at previous
amounts, as determined under Italian GAAP for those business combinations and representing deemed cost.
The cost of assets with finite useful lives is systematically depreciated on a straight-line basis applying rates that
represent the expected useful life of the asset. Each component of an asset with a cost that is significant in
relation to the total cost of the item, and that has a different useful life, is accounted for separately. Land, even
if undeveloped or annexed to residential and industrial buildings, is not depreciated as it has an indefinite
useful life.
Investment property, which is held to earn rentals or for capital appreciation, or both, is recognised at cost
measured in the same manner as property, plant and equipment. The relevant fair value of such assets has also
been disclosed.
The bands of annual rates of depreciation used in 2015 are shown in the table below by asset class:

3. Consolidated financial statements as at and for the year ended 31 December 2015
Annual Report 2015 126
Assets acquired under finance leases are initially accounted for as property, plant and equipment, and the
underlying liability recorded in the statement of financial position, at an amount equal to the relevant fair
value or, if lower, the present value of the minimum payments due under the contract. Lease payments are
apportioned between the interest element, which is charged to the income statement as incurred, and the
capital element, which is deducted from the financial liability.
Property, plant and equipment is tested for impairment, as described below in the relevant note, whenever
events or changes in circumstances indicate that the carrying amount may not be recoverable.
Property, plant and equipment is derecognised on disposal. Any gains or losses (determined as the difference
between disposal proceeds, less costs to sell, and the carrying amount of the asset) are recognised in the income
statement for the year in which the asset is sold.
Intangible assets
Intangible assets are identifiable assets without physical substance, controlled by the entity and from which
future economic benefits are expected to flow, and purchased goodwill. Identifiable intangible assets are those
purchased assets that, unlike goodwill, can be separately distinguished. This condition is normally met when:
(i) the intangible asset arises from a legal or contractual right, or (ii) the asset is separable, meaning that it may
be sold, transferred, licensed or exchanged, either individually or as an integral part of other assets. The asset
is controlled by the entity if the entity has the ability to obtain future economic benefits from the asset and can
limit access to it by others.
Internally developed assets are recognised as assets to the extent that: (i) the cost of the asset can be measured
reliably; (ii) the entity has the intention, the available financial resources and the technical expertise to
complete the asset and either use or sell it; (iii) the entity is able to demonstrate that the asset is capable of
generating future economic benefits.
Intangible assets are stated at cost which, apart from concession rights, is determined in the same manner as
the cost of property, plant and equipment. The cost of concession rights is recovered in the form of payments
received from road users and may include one or more of the following:
a) the fair value of construction services and/or improvements carried out on behalf of the Grantor
(measured as described in the note on "Construction contracts and services in progress") less finance-
related amounts, consisting of (i) the amount funded by government grants, (ii) the amount that will be
unconditionally paid by replacement operators on termination of the concession (so-called "takeover
rights"), and/or (iii) any minimum level of tolls or revenue guaranteed by the Grantor. In particular, the
following give rise to intangible assets deriving from concession rights:
1) rights received as consideration for specific obligations to provide construction services for road
widening and improvement for which the operator does not receive additional economic benefits.
These rights are initially recognised at the fair value of the construction services to be provided in the
future (equal to their present value, less the portion covered by grants, and excluding any financial
expenses that may be incurred during provision of the services), with a contra entry of an equal
amount in “Provisions for construction services required by contract”, accounted for in liabilities in
the statement of financial position. In addition to the impact of amortisation, the initial value of the
rights changes over time as a result of periodic reassessment of the fair value of the part of the
construction services still to be rendered at the end of the reporting period (equal to their present
value, less the portion covered by grants, and excluding any financial expenses that may be incurred
during provision of the services);
2) rights received as consideration for construction and/or upgrade services rendered for which the
operator receives additional economic benefits in the form of specific toll increases and/or
Property, plant and equipment Rate of depreciation
Buildings 2.5% - 33.33%
Plant and machinery 10% - 33%
Industrial and business equipment 4.5% - 40%
Other assets 8.6% - 33.33%

127
significant increases in the expected number of users as a result of expansion/upgrade of the
infrastructure;
3) rights to infrastructure constructed and financed by service area concession holders which will revert
free of charge to Group companies on expiry of the related concessions;
b) rights acquired from third parties, to the extent costs were incurred to acquire concessions from the
Grantor or from third parties (the latter relating to the acquisition of companies that hold a concession).
Concession rights, on the other hand, are amortised over the concession term in a pattern that reflects the
estimated manner in which the economic benefits embodied in the right are consumed. Amortisation rates
are, consequently, determined taking, among other things, any significant changes in traffic volumes during
the concession term into account. Amortisation is charged from the date on which economic benefits begin to
accrue.
In contrast, amortisation of other intangible assets with finite useful lives begins when the asset is ready for
use, in relation to their residual useful lives.
The bands of annual rates of amortisation used in 2015 are shown in the table below by asset class:
Intangible assets are tested for impairment, as described below in the note on “Impairment of assets and
reversals (impairment testing)”, whenever events or changes in circumstances indicate that the carrying
amount may not be fully recoverable. Gains and losses on the disposal of intangible assets are determined as the difference between the disposal
proceeds, less costs to sell, and the carrying amount of the asset and then recognised in profit or loss on
disposal.
Goodwill Acquisitions of companies or business units are accounting for using the acquisition method, as required by
IFRS 3. For this purpose, the identifiable assets acquired and liabilities assumed through business
combinations are measured at their respective fair values at the acquisition date. The cost of an acquisition is
measured as the fair value, at the date of exchange, of the assets acquired, liabilities assumed and any equity
instruments issued by the Group in exchange for control.
Goodwill is initially measured as the positive difference between 1) the acquisition cost, plus both the fair value
at the acquisition date of any previous non-controlling interests held in the acquiree and the value of non-
controlling interests held by third parties in the acquiree (at fair value or prorated to the current net asset value
of the acquiree), and 2) the fair value of net assets.
The goodwill, as measured on the date of acquisition, is allocated to each of the substantially independent cash
generating units or groups of cash generating units which are expected to benefit from the synergies of the
business combination.
A negative difference between the cost of the acquisition, as increased by the above components, and the
Group’s share in the fair value of net assets is recognised as income in profit or loss in the year of acquisition.
Goodwill on acquisitions of non-controlling interests is included in the carrying amount of the relevant
investments.
After initial recognition, goodwill is no longer amortised and is carried at cost less any accumulated
impairment losses, determined as described in the note on impairment testing.
IFRS 3 was not applied retrospectively to acquisitions prior to 1 January 2004, the Parent Company’s IFRS
transition date, as noted above. As a result, the carrying amount of goodwill on these acquisitions is that
Intangible assets Rate of amortisation
Concession rights
On the commencement of generation of economic
benefits for the entity, based on the residual term of the
concession and/or traffic projections.
Development costs 4.8% - 33.33%
Industrial patents and intellectual property rights 5% - 55%
Licences and similar rights 7.7% - 33.33%
Other assets 3.3% - 33.33%

3. Consolidated financial statements as at and for the year ended 31 December 2015
Annual Report 2015 128
determined under Italian GAAP, which is the net carrying amount at this date, subject to impairment testing
and the recognition of any impairment losses.
Investments
Investments in unconsolidated subsidiaries and other companies, which qualify as available-for-sale financial
instruments as defined by IAS 39, are initially accounted for at cost at the settlement date, in that this
represents fair value, plus any directly attributable transaction costs.
After initial recognition, these investments are measured at fair value, to the extent reliably determinable,
through the statement of comprehensive income and hence in a specific equity reserve. On realisation or
recognition of an impairment loss in the income statement, the accumulated gains and losses in that reserve
are reclassified to the income statement.
Impairment losses, identified as described below in the note on “Impairment of assets and reversals
(impairment testing)”, are reversed to other comprehensive income in the event the circumstances giving rise
to the impairment cease to exist.
When fair value cannot be reliably determined, investments, classified as available-for-sale, are measured at
cost less any impairment losses. In this case impairment losses may not be reversed.
Investments in associates and joint ventures are accounted for using the equity method. The Group’s share of
post-acquisition profits or losses is recognised in the income statement for the accounting period to which they
relate, with the exception of the effects deriving from other changes in the equity of the investee, excluding any
owner transactions, when the Group’s share is recognised directly in comprehensive income attributable to
owners of the parent.
Provisions are made to cover any losses of an associate or joint venture exceeding the carrying amount of the
investment, to the extent that the investor is required to comply with actual or constructive obligations to cover
such losses.
Construction contracts and services in progress
Construction contracts are accounted for on the basis of a contract's revenue and costs that can be reliably
estimated with reference to the stage of completion of the contract, in accordance with the percentage of
completion method, as determined by a survey of the works carried out or based on the ratio of costs incurred
to total estimated costs. Contract revenue is allocated to the individual reporting periods in proportion to the
stage of contract completion. Any positive or negative difference between contract revenue and any advance
payments received is recognised in assets or liabilities, taking account of any impairments, in order to reflect
the risks linked to the inability to recover the value of work performed on behalf of customers.
In addition to contract payments, contract revenue includes variations, price reviews and any additional
payments to the extent that they can be reliably determined.
Expected losses are recognised immediately in profit or loss, regardless of the stage of contract completion.
Revenue from construction and/or upgrade services provided to the Grantor and relating to the concessions
held by certain Group companies, are recognised on a percentage of completion basis. Construction and/or
upgrade service revenues, representing the consideration for services provided, are measured at fair value,
calculated on the basis of the total costs incurred (consisting primarily of the cost of materials and external
services, relevant employee benefits and financial expenses, the latter only in the case of construction and/or
upgrade services for which the operator receives additional economic benefits), plus any arm's length profits
realised on construction services provided by Group entities (in that they represent the fair value of the
services). The double entry of construction and /or upgrade service revenue is represented by financial assets
deriving from concession rights and/or grants, or by intangible assets deriving from concession rights, as
explained in the relevant note.
Inventories Inventories, primarily consisting of stocks and spare parts used in the maintenance and assembly of plant, are
measured at the lower of purchase or conversion costs and net realisable value obtained on their sale in the
ordinary course of business. The purchase cost is determined using the weighted average cost method.
Receivables and payables

129
Receivables are initially recognised at fair value and subsequently measured at amortised cost, using the
effective interest method, less any allowance for bad debts. The amount of the allowance is based on the
present value of expected future cash flows. These cash flows take account of expected collection times,
estimated realisable value, any guarantees received, and the expected costs of recovering amounts due.
Impairment losses are reversed in future periods if the circumstances that resulted in the loss no longer exist.
In this case, the reversal is accounted for in the income statement and may not in any event exceed the
amortised cost of the receivable had no previous impairment losses been recognised.
Payables are initially recognised at cost, which corresponds to the fair value of the liability, less any directly
attributable transaction costs. After initial recognition, payables are recognised at amortised cost, using the
original effective interest method.
Trade receivables and payables, which are subject to normal commercial terms and conditions, are not
discounted to present value.
Cash and cash equivalents
Cash and cash equivalents is recognised at face value. They include highly liquid demand deposits or very
short-term instruments subject to an insignificant risk of changes in value.
Derivative financial instruments All derivative financial instruments are recognised at fair value at the end of the year.
As required by IAS 39, derivatives are designated as hedging instruments when the relationship between the
derivative and the hedged item is formally documented and the periodically assessed effectiveness of the hedge
is high and ranges between 80% and 125%.
Changes in the fair value of cash flow hedges hedging assets and liabilities (including those that are pending
and highly likely to arise in the future) are recognised in the statement of comprehensive income. The gain or
loss relating to the ineffective portion is recognised in profit or loss.
Changes in the value of fair value hedged assets and liabilities are recognised in profit or loss for the period.
Analogously, the hedged assets and liabilities are restated at fair value through profit or loss.
Since derivative contracts deemed net investment hedges in accordance with IAS 39, because they were
concluded to hedge the risk of unfavourable movements in the exchange rates used to translate net investments
in foreign operations, are treated as cash flow hedges, the effective portion of fair value gains or losses on the
derivatives is recognised in other comprehensive income, thus offsetting changes in the foreign currency
translation reserve for net investments in foreign operations. Accumulated fair value gains and losses,
recognised in the net investment hedge reserve, are reclassified from equity to profit or loss on the disposal or
partial disposal of the foreign operation.
Changes in the fair value of derivative instruments that do not qualify for hedge accounting under IAS 39 are
recognised in profit or loss.
Other financial assets and liabilities
Other financial assets that Group companies intend and are able to hold to maturity and other financial
liabilities are recognised at the fair value of the purchase consideration at the settlement date, with assets being
increased and liabilities being reduced by transaction costs directly attributable to the purchase of the assets or
issuance of the liabilities. After initial recognition, financial assets and liabilities are measured at amortised
cost using the original effective interest method.
Financial assets and liabilities are derecognised when, following their sale or settlement, the Group is no
longer involved in their management and has transferred all risks and rewards of ownership.
Financial assets held for trading are recognised and measured at fair value through profit or loss. Other
categories of financial asset classified as available-for-sale financial instruments are recognised and measured at
fair value through comprehensive income and, consequently, in a specific equity reserve. The financial
instruments in these categories have, to date, never been reclassified.
Financial assets also include the following considerations for assets held under concession:
a) “takeover rights”, being the amount that will be unconditionally paid by an incoming operator on
termination of the concession;

3. Consolidated financial statements as at and for the year ended 31 December 2015
Annual Report 2015 130
b) the present value of minimum toll revenue guaranteed by the Grantor, representing an unconditional
right to receive cash payments for construction services performed, regardless of the extent to which the
public uses the service;
c) amounts due from public entities as grants or similar compensation relating to the construction of
infrastructure (construction and/or upgrade services).
Fair value measurement and the fair value hierarchy For all transactions or balances (financial or non-financial) for which an accounting standard requires or
permits fair value measurement and which falls within the application of IFRS 13, the Group applies the
following criteria:
a) identification of the unit of account, defined as the level at which an asset or a liability is aggregated or
disaggregated in an IFRS for recognition purposes;
b) identification of the principal market or, in the absence of such a market, the most advantageous market in
which the particular asset or liability to be measured could be traded; unless otherwise indicated, it is
assumed that the market currently used coincides with the principal market or, in the absence of such a
market, the most advantageous market;
c) definition for non-financial assets of the highest and best use of the asset; unless otherwise indicated,
highest and best use is the same as the asset's current use;
d) definition of valuation techniques that are appropriate for the measurement of fair value, maximising the
use of relevant observable inputs that market participants would use when determining the price of an asset
or liability;
e) determination of the fair value of assets, based on the price that would be received to sell an asset, and of
liabilities and equity instruments, based on the price paid to transfer a liability in an orderly transaction
between market participants at the measurement date;
f) inclusion of non-performance risk in the measurement of assets and liabilities and above all, in the case of
financial instruments, determination of a valuation adjustment when measuring fair value to include, in
addition to counterparty risk (CVA – credit valuation adjustment), the own credit risk (DVA - debit
valuation adjustment).
Based on the inputs used for fair value measurement, a fair value hierarchy for classifying the assets and
liabilities measured at fair value, or the fair value of which is disclosed in the financial statements, has been
identified:
a) level 1: includes quoted prices in active markets for identical assets or liabilities;
b) level 2: includes inputs other than quoted prices included within level 1 that are observable, such as the
following: i) quoted prices for similar assets or liabilities in active markets; ii) quoted prices for similar or
identical assets or liabilities in markets that are not active; iii) other observable inputs (interest rate and
yield curves, implied volatilities and credit spreads);
c) level 3: unobservable inputs used to the extent that observable data is not available. The unobservable inputs
used for fair value measurement should reflect the assumptions that market participants would use when
pricing the asset or liability being measured.
Definitions of the fair value hierarchy level in which individual financial instruments measured at fair value
have been classified, or for which the fair value is disclosed in the financial statements, are provided in the
notes to individual components of the financial statements.
There are no assets or liabilities classifiable in level 3 of the fair value hierarchy.
No transfers between the various levels of the fair value hierarchy took place during the year.
The fair value of derivative financial instruments is based on expected cash flows that are discounted at rates
derived from the market yield curve at the measurement date and the curve for listed credit default swaps
entered into by the counterparty and Group companies, to include the non-performance risk explicitly
provided for by IFRS 13.
In the case of medium/long-term financial instruments, other than derivatives, where market prices are not
available, the fair value is determined by discounting expected cash flows, using the market yield curve at the
measurement date and taking into account counterparty risk in the case of financial assets and own credit risk
in the case of financial liabilities.

131
Provisions for construction services required by contract and other provisions “Provisions for construction services required by contract” relate to specific contractual obligations having
regard to motorway expansion and upgrading for which the operator receives no additional economic benefit.
Since the performance of such obligations is treated as part of the consideration for the concession, an amount
equal to the fair value of future construction services (equal to the present value of the services, less the portion
covered by grants, and excluding any financial expenses that may be incurred during provision of the services)
is initially recognised. The double entry is concession rights for works without additional economic benefits.
The fair value of the residual liability for future construction services (equal to their present value, less the
portion covered by grants, and excluding any financial expenses that may be incurred during provision of the
services) is periodically reassessed and changes to the measurement of the liabilities (such as, for example,
changes to the estimated cash outflows necessary to discharge the obligation, a change in the discount rate or a
change in the construction period) are recognised as a matching increase or reduction in the corresponding
intangible asset. Any increase in provisions to reflect the time value of money is recognised as a financial
expense.
Other provisions are made when: (i) the Group has a present (actual or constructive) obligation as a result of a
past event; (ii) it is probable that an outflow of resources will be required to settle the obligation; and (iii) the
related amount can be reliably estimated.
Provisions are measured on the basis of management’s best estimate of the expenditure required to settle the
present obligation at the end of the reporting period. If the discount to present value is material, provisions
are determined by discounting future expected cash flows to their present value at a rate that reflects the market
view of the time value of money. Subsequent to the computation of present value, the increase in provisions
over time is recognised as a financial expense.
“Provisions for the repair and replacement of motorway infrastructure” cover the liability represented by the
contractual obligation to repair and replace motorway infrastructure, as required by the concession
arrangements entered into by the Group’s motorway operators and the respective grantors. These provisions
are calculated on the basis of the usage and wear and tear of motorways at the end of the reporting period,
taking into account, if material, the time value of money.
In accordance with existing contractual obligations, “Provisions for the refurbishment of airport
infrastructure” reflect, at the end of the reporting period, provisions covering the cost of cyclical maintenance
works and the refurbishment of parts of the airport infrastructure for which specific increases in charges are
not envisaged. The provisions are calculated on the basis of the estimated costs to be incurred in order to carry
out the maintenance or refurbishment works, taking account, if material, of the time value of money.
Employee benefits
Short-term employee benefits, provided during the period of employment, are accounted for as the accrued
liability at the end of the reporting period.
Liabilities deriving from medium/long-term employee benefits are recognised in the vesting period, less any
plan assets and advance payments made. They are determined on the basis of actuarial assumptions and, if
material, recognised on an accruals basis in line with the period of service necessary to obtain the benefit.
Post-employment benefits in the form of defined benefit plans are recognised at the amount accrued at the end
of the reporting period.
Post-employment benefits in the form of defined benefit plans are recognised in the vesting period, less any
plan assets and advance payments made. Such defined benefit plans primarily regard the obligation as
determined on the basis of actuarial assumptions and recognised on an accruals basis in line with the period of
service necessary to obtain the benefit. The obligation is calculated by independent actuaries. Any resulting
actuarial gain or loss is recognised in full in other comprehensive income in the period to which it relates.
Non-current assets held for sale, assets and liabilities included in disposal groups and/or related to discontinued operations Where the carrying amount of non-current assets held for sale, or of assets and liabilities included in disposal
groups and/or related to discontinued operations is to be recovered primarily through sale rather than through
continued use, these items are presented separately in the statement of financial position.

3. Consolidated financial statements as at and for the year ended 31 December 2015
Annual Report 2015 132
Immediately prior to being classified as held for sale, each asset and liability is recognised under the specific
IFRS applicable and subsequently accounted for at the lower of the carrying amount and fair value. Any
impairment losses are recognised immediately in the income statement.
Disposal groups or discontinuing operations are recognised in profit or loss as discontinued operations
provided the following conditions are met:
a) they represent a major line of business or geographical area of operation;
b) they are part of a single coordinated plan to dispose of a separate major line of business or geographical area
of operation;
c) they are subsidiaries acquired exclusively with a view to resale.
After tax gains and losses resulting from the management or sale of such operations are recognised as one
amount in profit or loss with comparatives.
Revenue
Revenue is recognised when the fair value can be reliably measured and it is probable that the economic
benefits associated with the transactions will flow to the Group. Depending on the type of transaction, revenue
is recognised on the basis of the following specific criteria:
a) toll revenue is accrued with reference to traffic volumes;
b) revenue from airport charges is recognised when the facilities are utilised by airport users;
c) to the extent, for sales of goods, that significant risks and rewards of ownership are transferred to the
buyer;
d) the provision of services is prorated to percentage of completion of work, based on the previously
described criteria used for “construction contracts and services in progress”, which also include the
construction and/or upgrade services provided to grantors, in application of IFRIC 12. When revenue
cannot be reliably determined, it is only recognised to the extent that expenses are considered to be
recoverable;
e) rental income or royalties, on an accruals basis, based on the agreed terms and conditions of the contract;
f) interest income (and interest expense) is calculated with reference to amount of the financial asset or
liability, in accordance with the effective interest method;
g) dividend income is recognised when the right to receive payment is established.
Government grants
Government grants are accounted for at fair value when: (i) the related amount can be reliably determined and
there is reasonable certainty that (ii) they will be received and that (iii) the conditions attaching to them will be
satisfied.
Grants related to income are accounted for in the income statement for the accounting period in which they
accrue, in line with the corresponding costs.
Grants received for investment in motorways and airports are accounted for as construction service revenue, as
explained in the note on "Construction contracts and services work in progress".
Grants related to assets received to fund development projects and activities are accounted for in liabilities, and
are subsequently recognised as operating income, in line with depreciation of the assets to which they refer.
Any grants received to fund investment in property, plant and equipment are accounted for as a reduction in
the cost of the asset to which they refer and result in a reduction in depreciation.
Income taxes
Income taxes are recognised on the basis of an estimate of tax expense to be paid, in compliance with the
regulations in force, as applicable to each Group company.
Income tax payables are reported under current tax liabilities in the statement of financial position less any
payments of taxes on account. Any overpayments are recognised as current tax assets.
Deferred tax assets and liabilities are determined on the basis of temporary differences between the carrying
amounts of assets and liabilities as in the Company's books (resulting from application of the accounting
policies described in note 3) and the corresponding tax bases (resulting from application of the tax regulations
in force in the country relevant to each subsidiary), as follows:
a) deferred tax assets are only recognised to the extent that it is probable that future taxable profits will be
available against which the asset can be utilised;

133
b) deferred tax liabilities are always recognised.
The Parent Company, Atlantia SpA, has again operated a tax consolidation arrangement for 2015, in which
certain Italian-registered subsidiaries participate.
Share-based payments
The cost of services provided by directors and/or employees remunerated through share-based incentive plans,
and settled through the award of financial instruments, is based on the fair value of the rights at the grant date.
Fair value is computed using actuarial assumptions and with reference to all characteristics, at the grant date
(vesting period, any consideration due and conditions of exercise, etc.), of the rights and the plan's underlying
securities. The obligation is determined by independent actuaries. The cost of these plans is recognised in
profit or loss, with a contra-entry in equity, over the vesting period, based on a best estimate of the number of
options that will vest.
The cost of any services provided by Directors and/or employees and remunerated through share-based
payments, but settled in cash, is instead measured at the fair value of the liability assumed and recognised in
profit or loss, with a contra entry in liabilities, over the vesting period, based on a best estimate of the number
of options that will vest. Fair value is remeasured at the end of each reporting period until such time as the
liability is settled, with any changes recognised in profit or loss.
Impairment of assets and reversals (impairment testing)
At the end of the reporting period, the Group tests property, plant and equipment, intangible assets, financial
assets and investments for impairment.
If there are indications that these assets have been impaired, the value of such assets is estimated in order to
verify the recoverability of the carrying amounts and eventually measure the amount of the impairment loss.
Irrespective of whether there is an indication of impairment, intangible assets with indefinite lives and those
which are not yet available for use are tested for impairment at least annually, or more frequently, if an event
has occurred or there has been a change in circumstances that could cause an impairment.
If it is not possible to estimate the recoverable amounts of individual assets, the recoverable amount of the
cash-generating unit to which a particular asset belongs is estimated.
This entails estimating the recoverable amount of the asset (represented by the higher of the asset's fair value
less costs to sell and its value in use) and comparing it with the carrying amount. If the recoverable amount of
an asset is estimated to be less than its carrying amount, the carrying amount is reduced to its recoverable
amount. In calculating value in use, expected future pre-tax cash flows are discounted, using a pre-tax rate that
reflects current market assessments of the cost of capital, embodying the time value of money and the risks
specific to the asset.
In estimating an operating CGU’s future cash flows, after-tax cash flows and discount rates are used because
the results are substantially the same as pre-tax computations.
Impairments are recognised in profit or loss in a variety of classifications depending on the nature of the
impaired asset. Losses are reversed if the circumstances that resulted in the loss no longer exist, provided that
the reversal does not exceed the cumulative impairment losses previously recognised, unless the impairment
loss relates to goodwill and investments measured at cost, where the related fair value cannot be reliably
determined.
Estimates and judgements
Preparation of financial statements in compliance with IFRS involves the use of estimates and judgements,
which are reflected in the measurement of the carrying amounts of assets and liabilities and in the disclosures
provided in the notes to the financial statements, including contingent assets and liabilities at the end of the
reporting period. These estimates are primarily used in determining amortisation and depreciation,
impairment testing of assets (including the measurement of receivables), provisions, employee benefits, the
fair value of financial assets and liabilities, and deferred tax assets and liabilities.
The amounts subsequently recognised may, therefore, differ from these estimates. Moreover, these estimates
and judgements are periodically reviewed and updated, and the resulting effects of each change immediately
recognised in the financial statements.
Translation of foreign currency items

3. Consolidated financial statements as at and for the year ended 31 December 2015
Annual Report 2015 134
The reporting package of each consolidated enterprise is prepared using the functional currency of the
economy in which the enterprise operates. Transactions in currencies other than the functional currency are
recognised by application of the exchange rate at the transaction date. Assets and liabilities denominated in
currencies other than the functional currency are, subsequently, remeasured by application of the exchange
rate at the end of the reporting period. Any exchange differences on remeasurement are recognised in profit
or loss. Non-monetary assets and liabilities denominated in foreign currencies and recognised at historical
cost are translated using the exchange rate at the date of initial recognition.
Translation of the liabilities, assets, goodwill and consolidation adjustments shown in the reporting packages
of consolidated companies with functional currencies other than the euro is made at the closing rate of
exchange, whereas the average rate of exchange is used for income statement items to the extent that they
approximate the transaction date rate or the rate during the period of consolidation, if lower. All resultant
exchange differences are recognised directly in comprehensive income and reclassified to profit or loss upon
the loss of control of the investment and the resulting deconsolidation.
Earnings per share
Basic earnings per share is computed by dividing profit attributable to owners of the parent by the weighted
average number of shares outstanding during the accounting period.
Diluted earnings per share is computed by dividing profit attributable to owners of the parent by the above
weighted average, also taking into account the effects deriving from the subscription, exercise or conversion of
all potential shares that may be issued as a result of the exercise of any outstanding rights.
New accounting standards and interpretations, or revisions and amendments of existing standards, that have either yet to come into effect As required by IAS 8 “Accounting Policies, Changes in Accounting Estimates and Errors”, this section
describes new accounting standards and interpretations, and amendments of existing standards and
interpretations that are already applicable, but that have either yet to come into effect at the reporting date,
and that may in the future be applied in the Group’s consolidated financial statements:
IFRS 9 – Financial Instruments In July 2014, the IASB published the final version of IFRS 9, the standard created to replace the existing IAS
39 for the classification and measurement of financial instruments.
The standard introduces new rules for the classification and measurement of financial instruments, a new
impairment model for financial assets and a new hedge accounting model.
Classification and measurement IFRS 9 envisages a single approach for the assessment and classification of all financial assets, including those
containing embedded derivatives. The classification and related measurement is driven by both the business
model in which the financial asset is held and the contractual cash flow characteristics of the asset.
The financial asset is measured at amortised cost subject to both of the following conditions:
a) the asset is held in conjunction with a business model whose objective is to hold assets in order to collect
contractual cash flows; and
Name of documentEffective date of IASB
document
Date of EU
endorsement
New accounting standards and interpretations
IFRS 9 – Financial Instruments 1 January 2018 Not endorsed
IFRS 15 – Revenue from Contracts with Customeri 1 January 2018 Not endorsed
Amendments to exist ing standards and interpretations
Amendments to IAS 1 – Disclosure Initiative 1 January 2016 December 2015
Amendments to IAS 16 and IAS 38 – Clarification of Acceptable Methods of Depreciation and
Amortisation 1 January 2016 December 2015
Amendments to IFRS 11 – Accounting for Acquisitions of Interests in Joint Operation 1 January 2016 November 2015
Annual Improvements to IFRSs: 2010–2012 1 February 2015 December 2014
Annual Improvements to IFRSs: 2012–2014 1 January 2016 December 2015

135
b) the contractual terms of the financial asset give rise on specified dates to cash flows that are solely
payments of principal and interest on the principal amount outstanding.
The financial asset is measured at fair value, with any changes recognised in comprehensive income, if the
objectives of the business model are to hold the financial asset to collect the contractual cash flows, or to sell it.
Finally, the standard envisages a residual category of financial asset measured at fair value through profit or
loss, which includes assets held for trading.
A financial asset meeting the conditions to be classified and measured at amortised cost may, on initial
recognition, be designated as a financial asset at fair value through profit or loss, to the extent that this
accounting treatment would eliminate or significantly reduce a measurement or recognition inconsistency
(sometimes referred to as an ‘accounting mismatch’) that would otherwise arise from measuring assets or
liabilities or recognising the gains and losses on them on different bases.
In addition, the new standard provides that an entity may, with respect to investments in equity instruments,
which consequently may not be carried and measured at amortised cost unless such instruments are shares that
are not held for trading but rather for strategic reasons, make an irrevocable election on initial recognition to
present changes in the fair value in comprehensive income.
The new IFRS 9, on the other hand, has confirmed the provisions of IAS 39 for financial liabilities including
the relative measurement at amortised cost or, in specific circumstances, at fair value through profit or loss.
The requirements of IAS 39 that have been changed are primarily:
a) the reporting of changes in fair value in connection with the credit risk of certain liabilities, which IFRS
9 requires to be recognised in comprehensive income rather than in profit or loss as movements in fair
value as a result of other risks;
b) the elimination of the option to measure, at amortised cost, financial liabilities consisting of derivative
financial instruments entailing the delivery of unlisted equity instruments. The consequence of the
change is that all derivative financial instruments must now be recognised at fair value.
Impairment IFRS 9 has defined a new impairment model for financial assets, with the objective of providing the users of
financial statements with more useful information about an entity’s expected losses. The model requires an
entity to recognise expected credit losses at all times and to update the amount of expected losses recognised at
each reporting date to reflect changes in the credit risk of the financial instruments. It is, therefore, no longer
necessary to wait for evidence of a trigger event before testing for impairment and recognition of a credit loss.
All financial instruments must be tested for impairment, with the exception of those measured at fair value
through profit or loss.
Hedge accounting The most important changes introduced by IFRS 9 regard:
a) the extended scope of the risks eligible for hedge accounting, to include those to which non-financial
assets and liabilities are exposed, also permitting the designation of groups and net positions as hedged
items, also including any derivatives;
b) the option of designating a financial instrument at fair value through profit or loss as a hedging
instrument;
c) the alternative method of accounting for forwards and options, when included in a hedge accounting
relationship;
d) changes to the method of conducting hedge effectiveness tests, following introduction of the principle of
the “economic relationship” between the hedged item and the hedging instrument; in addition,
retrospective hedge effectiveness testing is no longer required;
e) the possibility of “rebalancing” an existing hedge where the risk management objectives continue to be
valid.
IFRS 15 – Revenue from Contracts with Customers On 28 May the IASB published the new standard, IFRS 15. IFRS 15 replaces the previous IAS 18, in addition
to IAS 11, regarding contract work, and the related interpretations, IFRIC 13, IFRIC 15, IFRIC 18 and SIC 31.

3. Consolidated financial statements as at and for the year ended 31 December 2015
Annual Report 2015 136
IFRS 15 establishes the standards to follow in recognising revenue from contracts with customers, with the
exception of contracts falling within the scope of application of standards governing leases, insurance contracts
and financial instruments.
The new standard provides an overall framework for identifying the timing and amount of revenue to be
recognised in the financial statements. Based on the new standard, the amount recognised as revenue by an
entity must reflect the consideration to which the entity is entitled in exchange for goods transferred to the
customer and/or services rendered. This revenue is to be recognised when the entity has satisfied its
performance obligations under the contract.
In addition, in recognising revenue, the standard stresses the need to assess the likelihood of
obtaining/collecting the economic benefits linked to the proceeds. In the case of contract work in progress,
currently governed by IAS 11, the new standard introduces the requirement to recognise revenue taking into
account the effect of discounting to present value resulting from the deferral of collections over time.
If it is not possible to retrospectively apply the new standard, a modified approach can be used upon first-time
adoption. Under this approach, the effects of application of the new standard must be recognised in opening
equity at the beginning of the reporting period of first-time adoption.
Amendments to IAS 1 – Disclosure Initiative In December 2014, the IASB published a number of amendments to IFRS 1, in order to clarify the disclosures
to be included in the notes to financial statements.
A number of changes have been made to the disclosures to be provided regarding:
a) the concept of materiality, relating to the relevance of the information to be provided in financial
statements;
b) the items to be presented in the financial statements;
c) the structure of the notes;
d) the accounting policies;
e) the basis of presentation in the statement of comprehensive income of profits and losses attributable to
investments accounted for using the equity method.
Given that the amendments regard the classification of items in the financial statements and the
disclosures to be included in the notes, they will not have any impact on amounts in the Group’s
consolidated financial statements.
Amendments to IAS 16 and IAS 38 – Clarification of Acceptable Methods of Depreciation and Amortisation In May 2014, the IASB published a number of amendments to IAS 16 – Property, Plant and Equipment, and
IAS 38 – Intangible Assets.
The amendments provide clarification regarding acceptable methods of depreciation and amortisation under
the above standards. Above all, whilst reiterating that the method of depreciation or amortisation used must
reflect the expected pattern of consumption of the future economic benefits embodied in the asset, the
amendments introduce the presumption that a revenue-based method of depreciation or amortisation is not
appropriate. This is because the IASB believes that revenue generated by an asset reflects factors not directly
linked to consumption of the economic benefits embodied in the asset.
In the case of intangible assets, the IASB has also specified that in choosing which method of amortisation to
use, the entity must take into account the predominant, limiting factors inherent in the intangible asset, and
that the above presumption may only be overcome in limited circumstances, when, for example, (i) the
intangible asset is expressed as a measure of revenue that can be obtained from the asset, or (ii) when it can be
demonstrated that revenue and the consumption of economic benefits of the intangible asset are highly
correlated.
Amendments to IFRS 11 – Accounting for Acquisitions of Interests in Joint Operations On 6 May 2014, the IASB published a number of amendments to IFRS 11 – Joint Arrangements. The aim of
the amendments is to clarify the accounting, by investors, of the acquisition of an interest in a joint operation
that constitutes or contains a business.
Annual Improvements to IFRSs: 2010 – 2012 The IASB published "Annual Improvements to IFRSs: 2010-2012 Cycle” on 12 December 2013.
The principal amendments that could be relevant to the Group are:

137
a) IFRS 2 – Share-based Payment: amendments have been made to the definitions of “vesting condition” and
“market condition” and further definitions for “performance condition” and “service condition” have
been added, for the recognition of share-based benefit plans;
b) IFRS 8 – Operating Segments: the amendments require disclosure of the judgements made by
management in applying the aggregation criteria for operating segments, including a description of the
aggregate operating segments and the economic indicators assessed in determining if the operating
segments have “similar economic characteristics”. In addition, the reconciliation of the total of the
reportable segment’s assets to the entity’s total assets should only be disclosed if the total of the reportable
segment’s assets is regularly provided to the chief operating decision maker.
Annual Improvements to IFRSs: 2012 – 2014 The IASB published "Annual Improvements to IFRSs: 2012-2014 Cycle” on 25 September 2014.
The principal amendments that could be relevant to the Group are:
a) IFRS 7 – Financial Instruments: Disclosures: the amendments eliminate uncertainty regarding when
disclosures regarding the offsetting of financial assets and liabilities (that came into effect from accounting
periods beginning on or after 1 January 2013) must be included in interim financial statements; the
document clarifies that fact that offsetting disclosures are not explicitly required for all interim financial
statements. However, such disclosures may be necessary in order to meet the requirements of IAS 34, if
the disclosure is material;
b) IAS 19 – Employee Benefits: the document clarifies that the high-quality corporate bonds used in
estimating the discount rate for post-employment benefits should be denominated in the same currency as
the benefits to be paid. The changes also establish that the depth of the market for such bonds should be
assessed at currency level;
c) IAS 34 – Interim Financial Statements: changes have been introduced to clarify the requirements when the
required disclosures are presented in the interim financial report, but not in the interim financial
statements. Such disclosures may be included by including a reference in the interim financial statements
to elsewhere in the interim financial report, provided that the latter document is available to readers of the
interim financial statements in the same way and at the same time as the interim financial statements.
The effect of the future application of newly issued standards and interpretations, as well as all revisions and
amendments to existing standards, with the exception of those regarding IAS 1, is currently being evaluated by
the Atlantia Group. The impact cannot currently be reasonably estimated.

3. Consolidated financial statements as at and for the year ended 31 December 2015
Annual Report 2015 138
4. CONCESSIONS
The Group’s core business is the operation of motorways and airports under concessions held by Group
companies. The purpose of the concessions is the construction and operation of motorway infrastructure (in
Italy and abroad) and of the airport system serving Italy’s capital city.
Essential information regarding the concessions held by Group companies is set out below.
Further details of events of a regulatory nature, linked to the Group’s concession arrangements, during the
year are provided in note 10.7 “Significant legal and regulatory aspects”.
Italian motorways
Existing concession arrangements establish the right for motorway operators to demand tolls from motorway
users. Tolls are revised annually through a toll formula contained in the specific individual concession
arrangements. On the other hand, operators have an obligation to pay concession fees, to expand and
modernise the motorway infrastructure operated under the concessions, and to maintain and operate the
motorways. Concessions are not automatically renewed on expiry but are publicly re-tendered in accordance
with laws as may be in effect from time to time. This consequently entails the handover free of charge of all
assets in a good state of repair by the operator to the Grantor, unless the concession provides for a payment by
a replacement operator of the residual carrying amount of assets to be handed over.
The only developments affecting the motorway concessions held by the Group’s Italian companies in 2015 are
the following:
a) the signature by the Ministry of Infrastructure and Transport and Autostrade per l’Italia, on 10
December 2015, of the II Addendum to the Single Concession Arrangement, which has added the
Casalecchio - Northbound interchange to Autostrade per l’Italia’s investment commitments, at a cost
of up to €157,875 thousand;
b) the fact that the process of revising the financial plans of Raccordo Autostradale Valle d’Aosta, Tangenziale
di Napoli and Autostrada Tirrenica is still in progress.
Further details of both the above aspects are provided in note 10.7 “Significant legal and regulatory aspects”.
With the exception of the above, there were no further changes during 2015 to report regarding the concession
arrangements to which the Group’s Italian companies are party.
In addition, with regard to Autostrade per l’Italia’s concession, the company is in the process of implementing
a programme of investment in major infrastructure projects (including the works envisaged in the Concession
Arrangement of 1997, the IV Addendum of 2002 and other investment), worth approximately €16.0 billion,
including approximately €9.2 billion already completed as at 31 December 2015 (€8.5 billion as at 31
December 2014). The investment programme, which forms part of the company’s financial plan, updated to
December 2013, essentially regards the upgrade of existing motorways.
With regard to the concession held by Autostrade Meridionali, which expired on 31 December 2012, the
company is continuing to operate the relevant motorway (the A3 Naples-Salerno) under a contract extension,
in accordance with the terms of the previous arrangement, and whilst awaiting the conclusion of the tender
process that will select the new operator to take over operation of the motorway. Further information is
provided in note 10.7.

139
Overseas motorways
Brazil The concessions held by the Group’s Brazilian companies also envisage a series of obligations relating to the
construction, expansion, modernisation, maintenance and operation of the motorways covered by the
concession arrangements, in return for the right to charge motorway users a toll, revised annually on the basis
of inflation.
The following should be noted with regard to operators’ investment commitments:
a) Triangulo do Sol has residual investment commitments, under its concession arrangement, of
approximately 89 million Brazilian reals (equal to approximately €21 million at the closing exchange rate
at the end of 2015);
b) Rodovias das Colinas is currently engaged in widening the existing sections, with the remaining amount to
be invested totalling approximately 184 million Brazilian reals (equal to approximately €43 million at the
closing exchange rate at the end of 2015). Work is scheduled for completion in 2019;
c) Rodovia MG050 is currently carrying out work designed to upgrade the section of motorway. The
remaining value of the works to be carried out is approximately 564 million Brazilian reals (equal to
approximately €131 million at the closing exchange rate at the end of 2015).
On expiry, the concessions are publicly re-tendered and all the motorway assets built by the operator must be
handed over to the Grantor free of charge in a good state of repair.
Chile
The concessions held by Group companies establish the right for motorway operators to charge motorway users
a toll which may be subject to a minimum guaranteed by the Grantor. These tolls are revised annually on the
basis of inflation and, in certain cases, other parameters represented by unconditional increases (3.5% for the
concessions held by Costanera Norte, Vespucio Sur and Nororiente, 1.5% for AMB) and/or quality indicators.
The operators have specific obligations: the payment of concession fees, the expansion and/or upgrade of the
motorways covered by their concession arrangements and maintainance and operation of the motorways. On
expiry, the concessions are publicly re-tendered and all the motorway assets built by the operator handed over
to the Grantor free of charge in a good state of repair. The concessions held by Nororiente and AMB will
expire on reaching specific thresholds for revenue (in real terms) and, in any event, not beyond a certain date.
The investment programme to which the operator, Costanera Norte, is committed, named “Programma
Santiago Centro Oriente” (or “CC7”), covers seven projects designed to eliminate the principal bottlenecks on
the section operated under concession. The total value of the work to be carried out is around 250 billion
Chilean pesos (approximately €338 million181), with approximately 52% of the work completed at the end of
2015. The agreement with the Chilean government envisages that the operator will receive specific payment
from the grantor in return for the above construction services, including an amount to be paid on the expiry
of the concession term designed to guarantee a minimum return, and a share of the increase in revenue
deriving from the installation of new tollgates.
Finally, the operator, AMB, has plans in place for the construction of the remaining 8-km section of the total
of 10 km covered by the concession at an estimated cost of approximately 22 billion Chilean pesos (equal to
€28 million at the closing exchange rate at the end of 2015). Work should start in 2016 and be completed in
2018. This investment is included in the company’s financial plan.
Poland
Stalexport Autostrada Malopolska, holds a concession requiring implementation of an investment programme
and the obligation to operate and maintain the specific section of motorway covered by its concession
arrangement. In return for the services rendered, the operator has the right to charge motorway users a toll.
The concession arrangement has capped the tolls that may be charged, although the cap may rise in line with
18(1) The amounts for previous years are converted at the average exchange rate for the year in question, whilst the closing exchange rate at
the end of 2015 has been used to convert the amounts for 2016 and future years.

3. Consolidated financial statements as at and for the year ended 31 December 2015
Annual Report 2015 140
inflation and growth in Poland’s GDP. The tolls currently applied are well below the cap. The concession
arrangement envisages a profit sharing scheme, with the share of the profits to be passed on to the State rising
in line with increases in shareholder returns. Completion of the second and final phase of the investment and
maintenance programme is currently in progress. The operator has residual investment commitments, under
its concession arrangement, of approximately 344 million zloty (equal to approximately €81 million at the
closing exchange rate for 2015). On expiry, the concession is to be transferred to the Grantor and the
motorway infrastructure must have at least 50% of its remaining usful life.
Italian airports The operator, Aeroporti di Roma (“ADR”) holds an exclusive concession to manage the airport system serving
Italy’s capital city, consisting of “Leonardo da Vinci” Fiumicino airport and “G.B. Pastine” Ciampino airport,
in accordance with the concession awarded to the company by Law 755 of 10 November 1973, the Single
Concession Arrangement covering management of the capital city’s airport system and the Planning Agreement
(“the Single Deed”), signed on 25 October 2012, and which replaced the previous Arrangement 2820, dated
26 June 1974. The Single Deed regulates, in one single document, both relations pertaining to the airport
concession (Section I of the Agreement), and the criteria for determining and periodically reviewing the
applicable regulatory tariffs, being the fees receivable for the aviation services provided, within the airports, on
an exclusive basis by the operator, and their review throughout the airport concession term (Section II,
“Planning Agreement and Tariff Regulation”). The setting and revision of regulatory tariffs is based on
application of a RAB-based method, which takes into account, among other things, the amount of capital
expenditure carried out and traffic projections.
In accordance with the principle that management of the concession must be based on affordable and organic
criteria, as defined by Law 755 of 10 November 1973, as amended, by signing the Single Deed, ADR has
committed:
a) to progressive construction of the infrastructure listed therein for the purposes of increasing the capacity of
the capital’s airport system to cope with the projected volume of traffic through to the end of the remaining
concession term (June 2044);
b) to manage the above airport system by providing the airport services for which it is responsible (e.g. the
maintenance of runways and aprons), but also through the sub-concession of areas and premises to be used
for aviation and other activities, such as, for example, retail businesses.
Information of the investment commitments included in ADR’s concession arrangement is provided in the
section, “Italian airports”, in the Report on Operations accompanying these financial statements. The
commitments are focused within a period of ten years and constitutes, under the terms of the concession
arrangement, the so-called “Airport Master Plan”. In turn, the Master Plan contains a detailed list of the
investments to be carried out in each five-year period, corresponding to each regulatory “sub-period” for tariff
purposes.
The first ten-year period from 2012 to 2021 is currently in progress. The latest Master Plan, approved in
January 2014, envisages that during the initial regulatory period (2012-16), the company will carry out capital
expenditure amounting to approximately €930 million, of which €746 million is to be carried out in the three
years from 2014 to 2016. Capital expenditure totalling €491 million was completed in the two-year period,
2014-2015 (based on the regulatory accounts).
In return for the commitments contained in the Single Deed, ADR has the right to receive income from:
a) the use, by airlines and passengers, of airport infrastructure;
b) the use, for whatever purpose, of areas, buildings and premises within the grounds of the airports
managed under concession;
c) collection of a fair consideration from whoever conducts a non-aviation activity for profit within the
grounds of the airport managed under concession, unless otherwise remunerated.
ADR is also required to pay an annual concession fee to ENAC.

141
The works carried out by ADR on the grounds of the airport are the property of ADR until expiry of the
airport concession term, at the end of which the company will receive from ENAC a consideration equal to the
remaining value of the capital expenditure carried out, as assessed on the basis of the regulatory accounts. At
the end of 2015, ADR does not have operating assets with a remaining value, based on its regulatory accounts,
of more than zero.

3. Consolidated financial statements as at and for the year ended 31 December 2015
Annual Report 2015 142
Italy A1 Milan – Naples 803.5
A4 Milan – Brescia 93.5
A7 Genoa – Serravalle 50.0
A8/9 Milan – lakes 77.7
A8 / A26 link road 24.0
A10 Genoa – Savona 45.5
A11 Florence – Pisa North 81.7
A12 Genoa – Sestri Levante 48.7
A12 Rome – Civitavecchia 65.4
A13 Bologna – Padua 127.3
A14 Bologna – Taranto 781.4
A16 Naples – Canosa 172.3
A23 Udine – Tarvisio 101.2
A26 Genoa – Gravellona Toce 244.9
A27 Mestre – Belluno 82.2
A30 Caserta – Salerno 55.3
2,854.6 31 Dec 2038
Autostrade Meridionali A3 Naples – Salerno 51.6 31 Dec 2012 (1)
Raccordo Autostradale Valle d’Aosta A5 Aosta – Monte Bianco 32.3 31 Dec 2032
Tangenziale di Naples Naples ring road 20.2 31 Dec 2037
Società Autostrada Tirrenica A12 Livorno - Civitavecchia 40.1 31 Dec 1946
Società Italiana per azioni per il Traforo del Monte Bianco Mont Blanc Tunnel 5.8 31 Dec 2050
Brazil Triangulo do Sol Auto-Estradas SP 310 Rodovia Washington Luis
SP326 Rodovia Brigadeiro Faria Lima
SP333 Rodovia Carlos Tonani, Nemesio Cadetti e
Laurentino Mascari
442.0 18 July 2021
Rodovias das Colinas SP075 - Itu/Campinas
SP127- Rio Claro/Tatuí
SP280 - Itu/Tatuí
SP300 – Jundiaí/Tietê
SPI-102/300
Concessionaria da Rodovia MG050 MG-050
BR-265
BR-491
Chile Sociedad Concesionaria de Los Lagos Rio Bueno - Puerto Montt (Chile) 135.0 20 Sept 2023
Sociedad Concesionaria Litoral Central Nuevo Camino Costero: Cartagena Algarrobo 80.6 16 Nov 2031
Camino Algarrobo - Casablanca (Ruta F-90)
Camino Costero Interior (Ruta F-962-G)
Sociedad Concesionaria Vespucio Sur Ruta 78 - General Velàsquez 23.5 6 Dec 2032
General Velàsquez - Ruta 5 Sur
Ruta 5 Sur - Nuevo Acceso Sur a Santiago
Nuevo Acceso Sur a Santiago - Av. Vicuna Mackenna
Av. Vicuna Mackenna - Av. Grecia
Sociedad Concesionaria Costanera Norte Puente La Dehesa - Puente Centenario 43.0 30 June 2033
Puente Centenario - Vivaceta
Vivaceta - A. Vespucio
Estoril - Puente Lo Saldes
Sociedad Concesionaria Autopista Nororiente Sector Oriente: Enlace Centenario - Enlace Av. Del Valle 21.5 7 Jan 2044 (2)
Sector Poniente: Enlace Av. Del Valle - Enlace Ruta 5 Norte
Sociedad Concesionaria AMB Section A 10.0 2020 (3)
Section B
Poland Stalexport Autostrada Malopolska A4 Krakow – Katowice (Poland) 61.0 15 Mar 2027
Italy Aeroporti di Roma "Leonardo da Vinci" Fiumicino
"G.B. Pastine" Ciampino
EXPIRY DATE
Autostrade per l’Italia
OVERSEAS MOTORWAYS
307.0 1 July 2028
ITALIAN MOTORWAYS
COUNTRY OPERATOR SECTION OF MOTORWAYKILOMETRES IN
SERVICE
372.0 12 June 2032
(1) In compliance with the concession arrangement, in December 2012 the Grantor asked Autostrade Meridionali to continue operating the motorway after 1 January 2013, in accordance
with the terms and conditions of the existing arrangement.
(2) Estimated date: the concession will expire when the net present value of the revenues received, discounted to the start date of the concession at the real rate of 9.5%, reaches the
agreed threshold of €360 million and, in any event, no later than 2044.
(3) Estimated date: the concession will expire when the net present value of the revenues received, discounted to the start date of the concession at the real rate of 9.0%, reaches the
agreed threshold of €40 million and, in any event, no later than 2048.
COUNTRY OPERATOR AIRPORT EXPIRY DATE
ITALIAN AIRPORTS
30 June 2044

143
5. SCOPE OF CONSOLIDATION
In addition to the Parent Company, entities are consolidated when Atlantia exercises control as a result of its
direct or indirect ownership of a majority of the voting power of the relevant entities (including potential
voting rights resulting from currently exercisable options), or because, as a result of other events or
circumstances that (regardless of its percentage interest in the entity) mean it has power over the investee,
exposure, or rights, to variable returns from its involvement with the investee, and the ability to use its power
over the investee to affect the amount of the investor's returns. Subsidiaries are consolidated using the line-by-
line method and are listed in Annex 1.
Four companies listed in Annex 1 have not been consolidated due to their quantitative and qualitative
immateriality to a true and fair view of the Group's financial position, results of operations and cash flows, as a
result of their operational insignificance (dormant companies or companies whose liquidation is nearing
completion).
All entities over which control is exercised are consolidated from the date on which the Group acquires
control, as defined above, whilst they are deconsolidated from the date on which the Group ceases to exercise
control.
Companies are, in part, consolidated on the basis of the specific reporting packages prepared by each
consolidated company, as of the end of the reporting period and in compliance with the IFRS accounting
policies adopted by the Group. Companies are consolidated according to the following criteria and
procedures:
a) use of the line-by-line method, entailing the reporting of non-controlling interests in equity and profit
or loss and the recognition of all assets, liabilities, revenues and costs, regardless of percentage ownership;
b) elimination of intercompany assets, liabilities, revenues and costs, including the reversal of unrealised
profits and losses on transactions between consolidated companies and recognition of the consequent
deferred taxation;
c) reversal of intercompany dividends and reallocation to the relevant opening equity reserves;
d) netting of the carrying amount of investments in consolidated companies against the corresponding
amount of equity, with any resultant positive and/or negative differences being debited/credited to the
relevant balance sheet accounts (assets, liabilities and equity), as determined on the acquisition date of
each investment and adjusted for subsequent variations. Following the acquisition of control, any
acquisition of further interests from non-controlling shareholders, or the sale of interests to such
shareholders not resulting in the loss of control of the entity, are accounted for as owner transactions and
the related changes recognsied directly in equity; any resulting difference between the amount of the
change in equity attributable to non-controlling interests and cash and cash equivalents exchanged are
recognised directly in equity attributable to owners of the Parent;
e) translation of the reporting packages of consolidated companies in functional currencies other than the
euro applying the method prevsiously described in the policy regarding the “Translation of foreign
currency items”, included in note 3.
The exchange rates, shown below, used for the translation of reporting packages denominated in functional
currencies other than the euro, were obtained from the Bank of Italy:
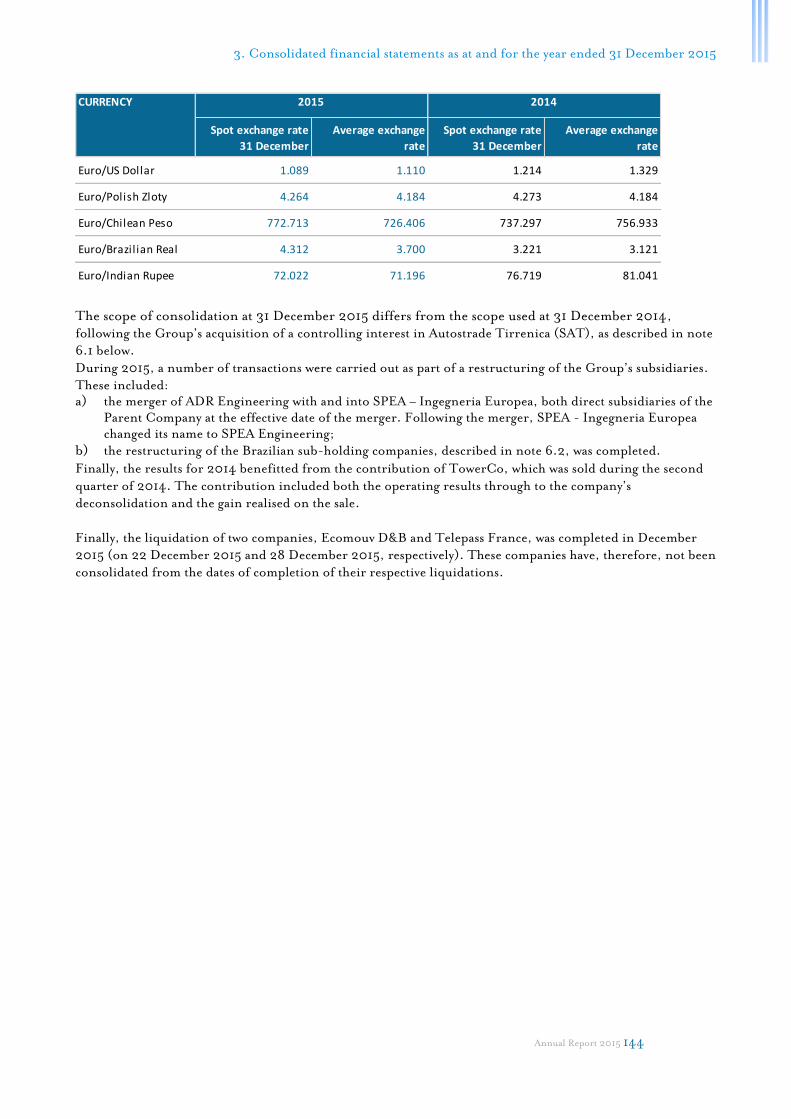
3. Consolidated financial statements as at and for the year ended 31 December 2015
Annual Report 2015 144
The scope of consolidation at 31 December 2015 differs from the scope used at 31 December 2014,
following the Group’s acquisition of a controlling interest in Autostrade Tirrenica (SAT), as described in note
6.1 below.
During 2015, a number of transactions were carried out as part of a restructuring of the Group’s subsidiaries.
These included:
a) the merger of ADR Engineering with and into SPEA – Ingegneria Europea, both direct subsidiaries of the
Parent Company at the effective date of the merger. Following the merger, SPEA - Ingegneria Europea
changed its name to SPEA Engineering;
b) the restructuring of the Brazilian sub-holding companies, described in note 6.2, was completed.
Finally, the results for 2014 benefitted from the contribution of TowerCo, which was sold during the second
quarter of 2014. The contribution included both the operating results through to the company’s
deconsolidation and the gain realised on the sale.
Finally, the liquidation of two companies, Ecomouv D&B and Telepass France, was completed in December
2015 (on 22 December 2015 and 28 December 2015, respectively). These companies have, therefore, not been
consolidated from the dates of completion of their respective liquidations.
Spot exchange rate
31 December
Average exchange
rate
Spot exchange rate
31 December
Average exchange
rate
Euro/US Dollar 1.089 1.110 1.214 1.329
Euro/Polish Zloty 4.264 4.184 4.273 4.184
Euro/Chilean Peso 772.713 726.406 737.297 756.933
Euro/Brazilian Real 4.312 3.700 3.221 3.121
Euro/Indian Rupee 72.022 71.196 76.719 81.041
CURRENCY 2015 2014

145
6. ACQUISITIONS AND CORPORATE ACTIONS DURING THE PERIOD
6.1 Acquisition of control of Autostrada Tirrenica
On 25 February 2015, Autostrade per l’Italia which already owned 24.98% of Autostrada Tirrenica SpA
(SAT), agreed to acquire a further 74.95% stake in the company from SAT’s other existing shareholders, thus
raising its total interest to 99.93%. The transaction was completed in September 2015, following the receipt of
clearance from the Grantor, with Autostrade per l’Italia’s payment of a total consideration of €84.3 million.
SAT, which was a subsidiary of Autostrade per l’Italia until 2011, holds the concession for the A12 Livorno–
Civitavecchia motorway. The related Single Concession Arrangement entered into with the Grantor in 2009
envisages an extension of the concession from 31 October 2028 to 31 December 2046, and execution of the
work needed to complete the motorway through to Civitavecchia. In response to observations from the
European Commission regarding, among other things, extension of the concession to 2046, on 14 October
2014 the Grantor sent SAT a draft addendum envisaging extension of the concession to 2043, completion of
work on the Civitavecchia–Tarquinia section (in progress), and eventual completion of the motorway (in
sections, if necessary) to be put out to tender. The draft addendum envisages that completion of the motorway
will, in any event, be subject to fulfilment of the technical and financial conditions to be verified jointly by the
grantor and the operator and execution of an addendum to the Concession Arrangement, with a viable
financial plan attached. Subsequently, on 13 May 2015, a memorandum of understanding was signed by the
Grantor, Tuscany Regional Authority, Lazio Regional Authority, Autostrade per l’Italia and SAT with an
attached draft addendum which, whilst maintaining (i) the duration of the concession until 2043, (ii) a viable
financial plan for the Civitavecchia–Tarquinia section and (iii) the obligation to put all the works out to
tender, provides for a commitment from SAT to carry out the design work involved in improving the final
designs for the Tarquinia–Ansedonia section, in preparing the final design and for the environmental impact
study for the Ansedonia–Grosseto South section, and for the final design for improvements to the existing dual
carriageway (the SS. 1 Variante Aurelia) between Grosseto South and San Pietro in Palazzi, retaining the
current layout of the road. Performance of the above construction work is subject to positive outcomes of
studies of the technical/design, financial and administrative feasibility to be conducted jointly by the Grantor
and SAT, with regard to the above completion work, and execution of an addendum with a viable financial
plan. Following a request from the Grantor on 5 June 2015, after further discussion with Italy’s representative
office at the EU, on 24 June 2015 SAT prepared and submitted further versions of a financial plan, relating to
(i) the sections in operation and the Civitavecchia–Tarquinia section under construction, and (ii) the entire
Civitavecchia–San Pietro in Palazzi section of road, both expiring on 31 December 2040.
For the purposes of preparation of these consolidated financial statements, the transaction has been accounted
for, in accordance with IFRS 3, using the acquisition method, which involved recognition of the fair value of
the assets acquired and liabilities assumed.

3. Consolidated financial statements as at and for the year ended 31 December 2015
Annual Report 2015 146
The table below shows the carrying amounts of the net assets acquired, in addition to the fair values identified.
Completion of the measurement process has resulted in a net fair value adjustment to the net assets acquired of
€52.7 million, reflecting recognition of the following:
a) an increase in the value of the concession held by SAT, estimated at €58.8 million;
b) a fair value adjustment of SAT’s non-interest bearing financial liability consisting of an amount payable to
the former Central Guarantee Fund (“Fondo Centrale di Garanzia”), with the recognition of an estimated
reduction in the value of the liability of €17.8 million;
c) net deferred tax liabilities of €23.9 million.
From the date of its first-time consolidation to 31 December 2015, SAT generated total revenue of €21.3
million and a net loss of €0.1 million.
Had the company been consolidated on a line-by-line basis from 1 January 2015, the Atlantia Group’s
consolidated revenue and consolidated profit for 2015 would have amounted to €6,116.2 million (including
€805.3 million in revenue from construction services) and €980.5 million.
At the end of 2015, SAT completed the acquisition of own shares representing 0.06% of its issued capital. As
at 31 December 2015, the Group holds a 99.99% interest in SAT.
€MCARRYING
AMOUNT
FAIR VALUE
ADJUSTMENTS FAIR VALUE
Net assets acqu ired:
Property, plant and equipment 0.3 0.3
Intangible assets 287.2 58.8 346.0
Non-current financial assets 4.4 4.4
Other non-current assets 0.1 0.1
Cash and cash equivalents 12.6 12.6
Trading and other current assets 22.3 22.3
Non-current financial liabilities -47.9 17.8 -30.1
Deferred tax assets/(liabilities) 9.2 -23.9 -14.7
Current financial liabilities -176.9 -176.9
Provisions -8.5 -8.5
Trading and other current liabilities -42.9 -42.9
Total net assets acqu ired 59.9 52.7 112.6
Carrying amount of 24.98% interest already held in acquired company 28.2
Non-controlling interests 0.1
Cons iderat ion 84.3
Cash and cash equivalents acquired -12.6
Net ef fec t ive cash ou t f low for the acqu is i t ion 71.7

147
6.2 Restructuring of the Group’s Brazilian operations
The Brazilian sub-holding companies underwent a comprehensive restructuring in the second half of 2015,
with the aim of simplifying the corporate structure and shortening the chain of control over the locally owned
motorway operators.
In particular, following receipt of clearance from the competent local authorities, the reverse merger of
Triângulo do Sol Participações with its former subsidiary, Atlantia Bertin Concessões, was carried out and a
complete carve-out of the latter conducted, resulting in the merger of the four carved-out business units with
and into the motorway operators, Rodovias das Colinas, Triângulo do Sol and Rodovia MG-050 and the
parent, Infra Bertin Participações. Finally, Infra Bertin Participações changed its name to AB Concessões,
which has thus assumed the new role of holding company with direct control over the local motorway
operators. The above restructuring resulted in the recognition of tax benefits (consisting of deferred tax assets)
totalling €50 million (at the average euro/real exchange rate of 3.7 for 2015) for the operators, Rodovias das
Colinas and Triângulo do Sol. A matching amount has been accounted for in the income statement for 2015.

3. Consolidated financial statements as at and for the year ended 31 December 2015
Annual Report 2015 148
7. NOTES TO THE CONSOLIDATED STATEMENT OF FINANCIAL POSITION
The following notes provide information on items in the consolidated statement of financial position as at 31
December 2015. Comparative amounts as at 31 December 2014 are shown in brackets. Details of items in the
consolidated statement of financial position deriving from related party transactions are provided in note 10.5.
7.1 Property, plant and equipment €231,742 thousand (€191,555 thousand)
As at 31 December 2015, property, plant and equipment amounts to €231,742 thousand, compared with a
carrying amount of €191,555 thousand as at 31 December 2014. The following table provides details of
property, plant and equipment at the beginning and end of the period, showing the original cost and
accumulated depreciation at the end of the period.
The increase in the carrying amount with respect to 31 December 2014, amounting to €40,187 thousand,
primarily reflects a combination of capital expenditure during the year, amounting to €95,525 thousand, and
depreciation of €51,334 thousand, as shown in the following table.
“Investment property” of €929 thousand as at 31 December 2015 refers to land and buildings not used in
operations and is stated at cost. The total fair value of these assets is estimated to be €2 million, based on
independent appraisals and information on property markets relevant to these types of investment property.
There were no significant changes in the expected useful lives of these assets during 2015. As at 31 December
2015, property, plant and equipment is free of mortgages, liens or other collateral guarantees restricting use.
7.2 Intangible assets €24,844,588 thousand (€25,182,029 thousand)
€000
Property, plant and equipment
Land 8,001 - - - - -19 - - 7,982
Buildings 44,941 1,053 -3,625 - -44 5 930 - 43,260
Plant and machinery 29,906 11,435 -8,845 - -130 -58 2,347 - 34,655
Industrial and business equipment 47,557 15,541 -19,233 -8 -684 -153 5,573 242 48,835
Other assets 43,856 26,964 -19,349 -1,254 -124 -1 701 39 50,832
Property, plant and equipment under construction
and advance payments13,137 40,532 - - -44 68 -11,406 11 42,298
Total 187,398 95,525 -51,052 -1,262 -1,026 -158 -1,855 292 227,862
Property, plant and equipment held under
finance leases
Equipment held under finance leases 15 - -3 - - 1 -10 - 3
Other assets held under finance leases 3,256 - -160 - -9 -139 - - 2,948
Total 3,271 - -163 - -9 -138 -10 - 2,951
Investment property
Land 39 - - - - - - - 39
Buildings 847 - -119 - -8 1 169 - 890
Total 886 - -119 - -8 1 169 - 929
Total property, plant and equipment 191,555 95,525 -51,334 -1,262 -1,043 -295 -1,696 292 231,742
Carrying amount
as at
31 December
2014
Additions Depreciation Impairments
Net change in
scope of
consolidation
Carrying amount
as at
31 December
2015
CHANGES DURING THE YEAR
Disposals
Net currency
translation
differences
Reclassifications
and other
adjustments
€000
CostAccumulated
depreciationCarrying amount Cost
Accumulated
depreciationCarrying amount
Property, plant and equipment 748,342 -520,480 227,862 686,780 -499,382 187,398
Property, plant and equipment held under finance leases 3,286 -335 2,951 3,493 -222 3,271
Investment property 7,053 -6,124 929 6,804 -5,918 886
Total property, plant and equipment 758,681 -526,939 231,742 697,077 -505,522 191,555
31 December 201431 December 2015

149
This item consists of:
a) intangible assets deriving from concession rights, totalling €20,043,215 thousand (€20,364,088 thousand
as at 31 December 2014), and regarding the following categories:
1) rights acquired from third parties (€6,087,169 thousand), essentially reflecting the fair value
recognised following the acquisitions of Aeroporti di Roma and the Chilean and Brazilian companies
in previous years;
2) rights deriving from the commitment to perform construction services for which no additional
economic benefits are received (€8,440,514 thousand);
3) rights deriving from construction services for which additional economic benefits are received
(€5,415,985 thousand);
4) rights deriving from construction services carried out by service area operators, represented by assets
that were handed over free of charge to the Group’s operators on expiry of the related sub-concessions
(€99,547 thousand);
b) goodwill and other intangible assets with indefinite lives, totalling €4,382,789 thousand;
c) other intangible assets of €418,514 thousand (€435,151 thousand as at 31 December 2014), essentially
consisting of contractual rights attributable to Aeroporti di Roma, accounted for following identification
of the fair value of the former Gemina group’s assets and liabilities.
Intangible assets recorded a net decrease of €337,441 thousand in 2015, primarily due to a combination of the
following:
a) amortisation for the year of €865,558 thousand;
b) the negative impact of currency translation differences, accounting for a reduction of €423,339 thousand,
substantially due to a significant fall in the value of the Brazilian real against the euro;
c) investment in construction services for which additional economic benefits are received, totalling
€570,751 thousand;
d) recognition of the intangible assets attributable to SAT from the date of the company’s first-time
consolidation, totalling €346,087 thousand, including the related gain accounted for in intangible assets
deriving from concession rights (€58,842 thousand), following the acquisition of control in 2015.
The following table shows intangible assets at the beginning and end of the period and changes during 2015 in
the different categories of intangible asset.
€000Cost
Accumulated
amortisation
Accumulated
impairmentsCarrying amount Cost
Accumulated
amortisation
Accumulated
impairmentsCarrying amount
Intangible assets deriving from concession rights 27,216,893 -6,978,931 -194,747 20,043,215 26,800,520 -6,241,685 -194,747 20,364,088
Goodwill and other intangible assets with
indefinite lives4,402,304 - -19,515 4,382,789 4,401,725 - -18,935 4,382,790
Other intangible assets 840,684 -418,260 -3,840 418,584 789,607 -351,008 -3,448 435,151
Intangible assets 32,459,881 -7,397,191 -218,102 24,844,588 31,991,852 -6,592,693 -217,130 25,182,029
31 December 201431 December 2015

3. Consolidated financial statements as at and for the year ended 31 December 2015
Annual Report 2015 150
There were no significant changes in the expected useful lives of intangible assets during the period.
The following analysis shows the various components of investment in motorway and airport infrastructure
effected through construction services, as reported in the consolidated statement of cash flows.
Research and development expenditure of approximately €1.1 million has been recognised in the consolidated
income statement for 2015. These activities are carried out in order to improve infrastructure, the services
offered, safety levels and environmental protection.
"Goodwill and other intangible assets with indefinite lives", totalling €4,382,789 thousand, consists of the
goodwill allocated to the CGU represented by Autostrade per l’Italia, amounting to €4,382,757 thousand,
following the acquisition of a majority interest in the former Autostrade – Concessioni e Costruzioni
Autostrade SpA in 2003. This goodwill coincides with the carrying amount as at 1 January 2004 (the IFRS
transition date) and was determined in accordance with prior accounting standards under the exemption
permitted by IFRS 1. The impairment test of the CGU represented by Autostrade per l’Italia, to which the
above goodwill is allocated, confirmed that the carrying amount is fully recoverable.
With regard to the recoverability of the intangible assets belonging to other Group companies, CGUs showing
evidence of a potential impairment have been tested for impairment.
In terms of the methodology used in impairment testing, the following should be noted:
a) as explained in note 3, in line with the approach adopted in previous years, each operator is a separate
CGU since the cash flows generated by the motorways operated under concession arrangements are largely
independent of cash flows generated by other assets. Subsidiaries that do not hold concessions are also
treated as a separate CGU;
b) in the case of the motorway operators tested for impairment, with the exception of Autostrade Meridionali
(which is dealt with below), value in use was estimated on the basis of the long-term plans drawn up by the
respective companies, containing traffic, investment, revenue and cost projections for the full term of the
€000
Carrying amount
as at
31 December
2014
Additions due to
completion of
construction
services
Additions:
purchases and
capitalisations
Additions free of
chargeAmortisation
Changes due to
revised present
value of
contractual
obligations
Disposals
Net currency
translation
differences
Reclassifications
and other
adjustments
e altre
rettifiche
Change in scope
of consolidation
Carrying amount
as at
31 December
2015
Intangible assets deriving from concession rights
Acquired concession rights 6,543,078 - - - -231,650 - - -283,101 - 58,842 6,087,169
Concession rights accruing from construction services for
which no additional economic benefits are received8,824,429 - - - -369,991 9,018 - -8,057 -14,885 - 8,440,514
Concession rights accruing from construction services for
which additional economic benefits are received4,899,578 570,751 - - -194,927 - - -126,895 -19,416 286,894 5,415,985
Concession rights accruing from construction services
provided by sub-operators97,003 - - 6,577 -4,319 - - - - 286 99,547
Total 20,364,088 570,751 - 6,577 -800,887 9,018 - -418,053 -34,301 346,022 20,043,215
Goodwill and other intangible assets with indefinite
lives
Goodwill 4,382,757 - - - - - - - - - 4,382,757
Trademarks 33 - - - - - - -1 - - 32
Total 4,382,790 - - - - - - -1 - - 4,382,789
Other intangible assets
Commercial contractual relations 368,149 - - - -36,390 - - - - - 331,759
Development costs 10,920 - 11,381 - -11,719 - - 26 7 54 10,669
Industrial patents and intellectual property rights 11,305 - 8,103 - -9,010 - -2 -457 192 3 10,134
Concessions and licenses 10,040 - 2,907 - -3,367 - -5 -155 1,179 - 10,599
Other 16,212 - 8,754 - -4,185 - -57 -6,581 13,340 - 27,483
Intangible assets under development and advance payments 18,525 - 8,510 - - - -394 1,882 -591 8 27,940
Total 435,151 - 39,655 - -64,671 - -458 -5,285 14,127 65 418,584
Intangible assets 25,182,029 570,751 39,655 6,577 -865,558 9,018 -458 -423,339 -20,174 346,087 24,844,588
VARIAZIONI DELL'ESERCIZIO
€000 NOTE 2015 2014INCREASE/
(DECREASE)
Use of provisions for construction services required by contract for which no additional economic
benefits are received7.13 / 8.11 502,495 406,613 95,882
Use of provisions for refurbishment of airport infrastructure 7.14 150,997 85,927 65,070
Increase in intangible concession rights accruing from completed construction services for which
additional economic benefits are received7.2 570,751 424,369 146,382
Increase in financial assets deriving from motorway construction services 8.3 87,895 52,181 35,714
Revenue from government grants for construction services for which no additional economic benefits
are received7.13 / 8.3 39,957 34,582 5,375
Investment in assets held under concession 1,352,095 1,003,672 348,423

151
related concessions, as previously described in note 4. The use of long-term plans covering the entirety of
the respective concession terms is deemed more appropriate than the approach provisionally suggested by
IAS 36 (namely, a limited explicit projection period and the estimated terminal value), given the intrinsic
nature of the motorway concession arrangements, above all with regard to the regulations governing the
sector and the predetermined duration of the arrangements;
c) in the case of the CGUs represented by Spea Engineering and Pavimental, which essentially provide
support services to the Group’s operators (with regard to their construction and maintenance activities), it
was also considered appropriate to estimate value in use on the basis of the same period covered by the
long-term plans of the operators to which they provide their services (2044), without estimating the
terminal value.
The following table shows the key assumptions forming the basis for the long-term plans of the CGUs
represented by the Group’s motorway operators, prepared on the basis of the regulatory mechanisms included
in the specific concession arrangements. The recoverable value of the CGUs is estimated on the basis of these
assumptions (rate of traffic growth, rate of toll increases and discount rate used, representing the companies’
after-tax WACC).
The quantification of the above assumptions was primarily based on publically available information from
external sources, integrated, where appropriate, by estimates based also on historical data.
In the case of the CGU represented by Raccordo Autostradale Valle d’Aosta, this company’s intangible assets
deriving from concession rights were written down in previous years by €193,843 thousand, before the related
deferred taxation. In 2015, the company submitted a proposal for a further addendum to its Single Concession
Arrangement of 2009 to the Grantor. An annex to this document contains a new long-term plan based on the
financial compensation mechanism provided for in the existing arrangement, maintaining the same returns
contained therein. The addendum will be examined by the Interministerial Economic Planning Committee
(“CIPE”) at an upcoming meeting. The related impairment test was conducted on the basis of the proposed
plan and would have resulted in the partial reversal of previous impairments . However, this was not done in
view of the uncertainty surrounding the regulatory framework in the process of being finalised.
Should the addendum not be approved, the company could activate the clause contained in art. 9 bis of the
existing Single Concession Arrangement, which provides for termination of the concession arrangement and
payment to the company of the value of any unamortised assets, in addition to compensation for lost earnings.
The recoverability of the CGU’s net assets was, therefore, also tested with reference to the above value
determined in accordance with art. 9 bis of the Concession Arrangement. The resulting amount is higher than
the carrying amount of the CGU’s net assets as at 31 December 2015.
The impairment tests confirmed that the assets accounted for in the financial statements and allocated to the
above CGUs, which in Autostrade per l’Italia’s case also includes the value of goodwill, are fully recoverable.
In addition to the above impairment test, sensitivity analyses were conducted on the recoverable values,
increasing the above discount rates by 1%, and reducing the average annual rate of traffic growth by 1%. The
Traff ic growth rate
(CAGR)
Average annual toll
increase(1 )
Discount rate
(after-tax WACC)
Autostrade per l’Italia 1.0% 2.12% 6.14%
Raccordo Autostradale
Valle d'Aosta1.7% 3.44% 6.78%
Rodovia Das Colinas (Brasil) 3.5% 4.95% 11.15%
Triangulo do Sol Auto-Estradas (Brasil) 3.5% 5.38% 11.15%
Concessionaria da Rodovia MG050 (Brasil) 4.5% 5.57% 11.15%
(1) in Autostrade per l'Italia's case, this includes an average annual toll increase of 1.15% based on implementation of the investment programme,
in addition to annual toll increases designed to take account of inflation in the country of operation.

3. Consolidated financial statements as at and for the year ended 31 December 2015
Annual Report 2015 152
results of these analyses have not, in any event, resulted in any material differences with respect to the
outcomes of the above tests.
In the case of Autostrade Meridionali, the operator’s motorway concession expired on 31 December 2012. The
operator is continuing to operate the relevant motorway whilst awaiting the conclusion of the tender process
that will select the new operator, which will be required (i) to pay Autostrade Meridionali compensation equal
to the unamortised carrying amount of the capital expenditure carried out in the final years of the concession
arrangement, and (ii) to assume the obligations relating to sale and purchase agreements entered into by
Autostrade Meridionali, excluding those of a financial nature, and to outstanding legal actions and disputes. In
this regard, the value of this CGU’s net assets is recoverable due to the above obligations to be honoured by the
incoming operator.
7.3 Investments €96,865 thousand (€153,845 thousand)
As at 31 December 2015, this item is down €56,980 thousand, primarily due to a combination of the
following:
a) the write-off of the carrying amount of the investment in Compagnia Aerea Italiana as at 31 December
2015, totalling €36,249 thousand;
b) elimination of the value of the investment in SAT, accounted for at a value of €28,268 thousand,
following this company’s line-by-line consolidation as a result of the transaction described in note 6.1;
c) recognition of the Group’s share of the results of associates and joint ventures measured using the equity
method, resulting in a loss of €23,735 thousand and primarily attributable to Rodovias do Tieté (€20,177
thousand);
d) capital injections of €17,746 thousand, primarily related to:
1) Compagnia Aerea Italiana (€9,026 thousand), as approved by the extraordinary general meeting of
shareholders held on 25 July 2014, in view of Etihad’s purchase of an interest in the new airline,
“Alitalia – Società Aerea Italiana”, controlled by Compagnia Aerea Italiana. The remaining
commitment as at 31 December 2015 amounts to €13,618 thousand;
2) the Brazilian operator, Rodovias do Tieté (€7,432 thousand);
e) the reclassification to investments accounted for at cost or fair value, of the minority interest in
Lusoponte, amounting to €15,339 thousand, following its failure to meet the requirements of IFRS 5 for
its classification in non-current assets held for sale or related to discontinued operations.
The following table shows an analysis of the Group’s principal investments as at 31 December 2015, including
the Group’s percentage interest and the relevant carrying amount, net of unpaid, called-up issued capital, and
showing the original cost and any accumulated revaluations and impairments at the end of the year. There are
no investments in associates and joint ventures that are individually material with respect to total consolidated
assets, operating activities and geographical area and, therefore, the additional disclosures required in such
cases by IFRS 12 are not presented.
31 December 2014 31 December 2015
72,830 10,314 -36,249 - - - 15,336 62,231
38,380 - - 848 - -28,268 -1,810 9,150
42,635 7,432 - -18,506 -6,077 - - 25,484
153,845 17,746 -36,249 -17,658 -6,077 -28,268 13,526 96,865
CHANGES DURING THE YEAR
RECLASSIFICATIONS
AND OTHER CHANGES
- joint ventures
Investments
- associates
€000
MEASURMENT USING EQUITY METHODOPENING BALANCE CAPITAL
INJECTIONS
REVERSALS OF
IMPAIRMENTS
(IMPAIRMENTS)
RECOGNISED IN
PROFIT OR LOSS
CLOSING BALANCE
PROFIT OR LOSS OTHER
COMPREHENSIVE
INCOME
Investments accounted for at cost or fair
value
Investments accounted for using the equity
method in:
CHANGES IN SCOPE OF
CONSOLIDATION

153
Annex 1 provides a list of the Group's investments as at 31 December 2015, as required by CONSOB
Communication DEM/6064293 of 28 July 2006.
€000
% INTEREST COST
REVERSALS OF
IMPAIRMENTS
(IMPAIRMENTS)
CARRYING
AMOUNT% INTEREST COST
REVERSALS OF
IMPAIRMENTS
(IMPAIRMENTS)
CARRYING
AMOUNT
Investments accounted for at cost or fair
value
Tangenziali Esterne di Milano 13.67% 36,034 -1,490 34,544 13.67% 36,034 -1,490 34,544
Lusoponte 17.21% 39,852 -24,513 15,339 - - - -
Compagnia Aerea Italiana 7.02% 162,249 -162,249 - 5.96% 153,223 -126,000 27,223
Tangenziale Esterna 1.25% 5,811 - 5,811 1.25% 4,527 - 4,527
Firenze Parcheggi 5.47% 2,582 - 2,582 5.36% 2,582 - 2,582
S.A.CAL. 16.57% 1,307 - 1,307 16.57% 1,307 - 1,307
Aeroporto di Genova 15.00% 894 - 894 15.00% 894 - 894
Emittente Titoli 7.24% 827 - 827 7.24% 827 - 827
Uirnet 1.51% 427 - 427 1.51% 427 - 427
Veneto Strade 5.00% 258 - 258 5.00% 258 - 258
Other smaller investments - 242 - 242 - 241 - 241
62,231 72,830
Investments accounted for using the equity
method in:
- associates
Autostrada Tirrenica (1) - - - - 24.98% 6,343 21,925 28,268
Società Infrastrutture Toscane (in liquidation) 46.60% 6,990 -182 6,808 46.60% 6,990 -1,368 5,622
Pedemontana Veneta (in liquidation) 29.77% 1,935 -96 1,839 29.77% 1,935 -61 1,874
Bologna & Fiera Parking 36.81% 5,557 -5,411 146 32.50% 5,557 -4,879 678
Arcea Lazio (2) - - - - 34.00% 1,430 228 1,658
Other smaller investments - 411 -54 357 - 419 -139 280
- joint ventures
Rodovia do Tieté 50.00% 53,903 -36,205 17,698 50.00% 46,471 -16,028 30,443
Pune Solapur Expressways Private Limited 50.00% 16,426 -9,640 6,786 50.00% 16,426 -5,234 11,192
Geie del Traforo del Monte Bianco 50.00% 1,000 - 1,000 50.00% 1,000 - 1,000
34,634 81,015
Investments 96,865 153,845
31 December 2015 31 December 2014
(1) Information on the acquisition of control of Autostrada Tirrenica in 2015 is contained in note 6.1.
(2) The company has been wound up and was struck off the companies' register on 9 December 2015.

3. Consolidated financial statements as at and for the year ended 31 December 2015
Annual Report 2015 154
7.4 Financial assets (non-current)€1,781,276 thousand (€1,756,081 thousand)
(current)€818,981 thousand (€962,918 thousand)
The following analysis shows the composition of other financial assets at the beginning and end of the period,
together with the current and non-current portions.
Financial assets deriving from concession rights include:
a) takeover rights attributable to Autostrade Meridionali (€403,293 thousand as at 31 December 2015),
being the amount payable by a replacement operator on termination of the concession for the company's
unamortised capital expenditure during the final years of the outgoing operator's concession;
b) the present value of the financial asset deriving from concession rights represented by the minimum tolls
guaranteed by the Grantor of the concessions held by certain of the Group's Chilean operators (€610,454
thousand);
c) other financial assets deriving from concession rights (€188,263 thousand as at 31 December 2015),
attributable to the Chilean operator, Costanera Norte. In particular, this item regards the financial assets
due to this company as a result of carrying out the motorway investment programme named Santiago
Centro Oriente (“CC7”), which are subject to revaluation at a real annual rate of 7%. Under the
agreements, the increase in toll revenue resulting from the installation of new tollgates along the existing
motorway, after deducting the company’s contractually agreed share, remains at the company’s disposal
and are recognised in financial liabilities until such time as it has covered the cost of the related capital
expenditure. If, at the end of the concession term, the specific amount at Costanera Norte’s disposal, also
revalued at a real annual rate of 7%, is lower than the financial assets recognised at that time, the Grantor
has the option of either extending the concession term or paying Costanera Norte the remaining net
amount due.
The increase of €68,730 thousand in financial assets deriving from concession rights primarily reflects
motorway construction services performed by Costanera Norte during the year as part of the CC7 project.
Financial assets deriving from government grants to finance infrastructure works include amounts receivable
from grantors or other public entities as grants accruing as a result of construction and maintenance of assets
31 December 2015 31 December 2014
CARRYING
AMOUNT
CURRENT
PORTION
NON-CURRENT
PORTION
CARRYING
AMOUNT
CURRENT
PORTION
NON-CURRENT
PORTION
Takeover rights 403,293 403,293 - 401,716 401,716 -
Guaranteed minimum tolls 610,454 32,218 578,236 637,068 27,217 609,851
Other financial assets deriving from concession rights 188,263 - 188,263 94,496 - 94,496
Financial assets deriving from concession rights ( 1) 1,202,010 435,511 766,499 1,133,280 428,933 704,347
Financial assets deriving from government grants
related to construction services ( 1)
330,289 74,627 255,662 294,870 79,847 215,023
Term deposits ( 2) 546,728 221,834 324,894 541,207 250,018 291,189
Derivative assets (3) 60,246 59,684 562 47,596 47,596 -
Other medium/long-term financial assets (1) 442,962 9,303 433,659 564,790 19,268 545,522
Other medium/long-term financial assets 503,208 68,987 434,221 612,386 66,864 545,522
Current derivative assets ( 3) 36 36 - - - -
Other current f inancial assets ( 1)
17,986 17,986 - 137,256 137,256 -
Total 2,600,257 818,981 1,781,276 2,718,999 962,918 1,756,081
€000
(1) These assets include financial instruments primarily classified as "loans and receivables" under IAS 39.
The carrying amount is equal to fair value.
(2) These assets have been classified as "available-for-sale" financial instruments and in level 2 of the fair value hierarchy.
The carrying amount is equal to fair value.
(3) These assets primarily include derivative financial instruments classified as hedges under level 2 of the fair value hierarchy.

155
held under concession. This item has increased €35,419 thousand compared with 31 December 2014,
essentially due to grants accruing to Autostrade per l’Italia during the period.
Other medium/long-term financial assets are down €109,178 thousand, primarily reflecting a combination of
the following:
a) a reduction in the loan repayable to AB Concessões by Infra Bertin Empreendimentos (€121,722
thousand), reflecting translation differences recognised at the end of the year due to the significant fall in
the value of the Brazilian real against the euro in 2015;
b) Vespucio Sur’s receipt of amounts due to it from Chile’s Ministry of Public Works, linked to the loss of
toll revenue incurred by the company as a result of the delayed opening to traffic of the motorway it
operates under concession (€59,890 thousand);
c) capitalised interest income (€58,799 thousand), relating to the receivable in point a);
d) new assets arising during the year, totalling €18,570 thousand.
Derivative assets primarily include hedging derivatives. The non-current portion, on the other hand, refers to
the fair value of Cross Currency Swaps entered into by Atlantia in January 2015 to hedge the interest rate and
currency risk resulting from Atlantia’s acquisition of 99.87% of the notes issued by Romulus Finance. This
buyback means that the hedges no longer qualify for classification as cash flow hedges in the consolidated
financial statements as at 31 December 2015. Further details are provided in note 9.2, “Financial risk
management”.
Other current financial assets, totalling €17,986 thousand, are down €119,270 thousand. This primarily
reflects the consolidation of SAT and the resulting elimination, in the consolidated financial statements, of the
short-term loan from Autostrade per l’Italia to this company.
There has been no indication of impairment of any financial assets.
7.5 Deferred tax assets and liabilities
Deferred tax assets €1,574,566 thousand (€1,817,627 thousand) Deferred tax liabilities €1,701,181 thousand (€1,971,818 thousand)
The amount of deferred tax assets and liabilities both eligible and ineligible for offset is shown below, with
respect to temporary timing differences between consolidated carrying amounts and the corresponding tax
bases at the end of the period.
Changes in the Group’s deferred tax assets and liabilities during the period, based on the nature of the
temporary differences giving rise to them, are summarised in the following table.
€000 31 December 2015 31 December 2014
Deferred tax assets 2,175,043 2,438,160
Deferred tax liabilities eligible for offset -600,477 -620,533
Deferred tax assets less deferred tax liabilities
eligible for offset 1 ,574,566 1 ,817,627
Deferred tax liabilities not eligible for offset -1 ,701,181 -1 ,971,818
Difference between deferred tax assets and liabilities
(eligible and ineligible for offset) -126,615 -154,191

3. Consolidated financial statements as at and for the year ended 31 December 2015
Annual Report 2015 156
Deferred tax assets primarily include the residual deferred tax assets (€509,726 thousand) recognised in
connection with the reversal of intercompany gains arising in 2003 on the contribution of the portfolio of
motorways to Autostrade per l’Italia, and those that will be released on a straight-line basis over the life of
Autostrade per l’Italia's concession, recognised as a result of the impact on taxation of adoption of IFRIC 12
(€445,524 thousand).
Deferred tax liabilities essentially regard fair value gains recognised on assets acquired as a result of past
business combinations (€1,733,960 thousand). They are primarily attributable to the Aeroporti di Roma
group and the Group’s Chilean and Brazilian motorway operators.
Deferred tax assets have decreased by €263,117 thousand, essentially due to a combination of the following:
a) the release of €174,816 thousand in deferred tax assets, following approval of the 2016 Stability Law,
which has reduced the IRES (corporation tax) rate from 27.5% to 24% with effect from 1 January 2017;
b) the release of €110,940 thousand in deferred tax assets, following the reversal of the above intercompany
gain on the transfer, in 2003, of the portfolio of motorways to Autostrade per l’Italia, equal to the
deductible amount of goodwill recognised by this company as a result of the above transaction;
c) the increase in other temporary differences, amounting to €101,823 thousand, which also includes
recognition of deferred tax assets of €49,288 thousand relating to the Brazilian companies’ tax deductible
goodwill, as a result of the transactions described in note 6.2.
Deferred tax liabilities have decreased by €290,693 thousand, reflecting:
a) the release of deferred tax liabilities, totalling €124,727 thousand relating to the reduction in the IRES
rate introduced by the 2016 Stability Law;
b) the release of €79,439 thousand in deferred tax liabilities accounted for on gains resulting from business
combinations, primarily regarding the Brazilian and Chilean companies and due to the impact of
exchange rate movements resulting from the significant fall in the value of the Brazilian real and the
Chilean peso against the euro;
c) the release of €71,436 thousand in deferred tax liabilities accounted for on gains resulting from business
combinations in previous years and allocated to concession rights, following recognition of amortisation
of the rights for the year.
7.6 Other non-current assets
€000 PROVISIONS RELEASES
DEFERRED TAX
ASSETS/LIABILITIES ON
GAINS AND LOSSES
RECOGNISED IN
COMPREHENSIVE
INCOME
EFFECT OF CHANGE
IN TAX RATES
RECOGNIZED IN
OTHER
GAINS/LOSSES IN
COMPREHENSIVE
INCOME
EFFECT OF CHANGE
IN TAX RATES
RECOGNIZED IN THE
INCOME STATEMENT
CURRENCY
TRANSLATION
DIFFERENCES AND
OTHER CHANGES
Deferred tax assets on:
Deductible intercompany goodwill 666,281 - -110,940 - - -45,615 - 509,726
Operating change in provisions 578,533 130,690 -111,605 - - -47,050 -182 550,386
Restatement of global balance on application of IFRIC 12 by Autostrade
per l'Italia519,688 1,059 -23,132 - - -52,091 - 445,524
Losses on hedging derivatives 172,387 - -95 -3,787 -13,622 -3,670 6 151,219
Perdite fiscalmente riportabili 138,783 13,761 -28,882 - - -2,537 -795 120,330
Impairments and depreciation of non-current assets 127,522 8,659 -9,841 - - -5,174 -18,047 103,119
Impairment of receivables and inventories 34,232 9,691 -6,645 - - -504 -1,356 35,418
Other temporary differences 200,734 101,823 -38,518 2,028 -1,278 -3,275 -2,193 259,321
Total 2,438,160 265,683 -329,658 -1,759 -14,900 -159,916 -22,567 2,175,043
Deferred tax liabilities on:
Differences between carrying amounts and fair values of assets and
liabilities acquired through business combinations-2,002,026 -286 71,436 - - 117,477 79,439 -1,733,960
Financial assets deriving from concession rights and governaments
grants-187,468 -2,106 2,503 -823 - - 8,021 -179,873
Gains on hedging derivatives -86,659 - - 1,376 7,058 - -2,113 -80,338
Accelerated depreciation -12,524 -75 6,616 - - - 17,070 11,087
Other temporary differences -303,674 -24,940 17,930 4 192 - -8,086 -318,574
Total -2,592,351 -27,407 98,485 557 7,250 117,477 94,331 -2,301,658
Difference between deferred tax assets and liabilities (eligible and
ineligible for offset) -154,191 238,276 -231,173 -1,202 -7,650 -42,439 71,764 -126,615
31 December
2014
CHANGES DURING THE YEAR
31 December
2015

157
€13,623 thousand (€12,782 thousand)
This item is in line with the previous year and essentially includes the amount due to the operator, Rodovias
MG 050, from the Grantor for the state of Minas Gerais.
7.7 Trading assets €1,468,759 thousand (€1,407,260 thousand) As at 31 December 2015, trading assets consist of:
a) inventories of €57,392 thousand as at 31 December 2015 (€59,623 thousand as at 31 December 2014),
consisting of stocks and spare parts used in the maintenance or assembly of plant;
b) contract work in progress, totalling €16,471 thousand (€20,088 thousand as at 31 December 2014);
c) trade receivables of €1,394,896 thousand (€1,327,549 thousand as at 31 December 2014), the detailed
composition of which is shown in the following table.
The most significant changes regard the following:
a) an increase in receivables due from motorway customers, totalling €31,986 thousand, essentially reflecting
an increase in trade receivables at the Chilean companies and including overdue interest on past due
receivables;
b) an increase in receivables due from airport customers, totalling €34,690 thousand, which, in addition to
the increase in air traffic, also reflects longer average collection times with respect to airlines;
c) an increase in amounts due from sundry customers, totalling €31,977 thousand, mainly regarding
amounts receivable as a result of construction services performed by Aeroporti di Roma and due from the
Civil Aviation Authority (“ENAC”), totalling €13,971 thousand, an increase in fees and payments for
transport services due to Telepass (€10,387 thousand) and an increase of €10,145 thousand in amounts
due to Autostrade Tech on contract work carried out during the year;
d) a reduction in other trading assets of €22,670 thousand, essentially reflecting reduced prepayments to
suppliers for services provided during the year.
The following table shows an ageing schedule for trade receivables.
Overdue receivables regard uncollected and unpaid tolls, royalties due from service area operators and sales of
other goods and services. The following table shows movements in the allowance for bad debts for trade
€000
Total receivables
as at 31
December 2015
Total not yet dueMore than 90
days overdue
Between 90 and
365 days overdue
More than one
year overdue
Trade receivables 1,546,894 1,066,536 128,918 64,581 286,859
€000 31 December 2015
Trade receivables due from:
Motorway users 860,091 828,105
Airport users 265,134 230,444
Sub-operators at motorway service areas 103,309 94,946
Sundry customers 318,360 286,383
Gross trade receivables 1,546,894 1,439,878
Allowance for bad debts 216,474 199,475
Other trading assets 64,476 87,146
Net trade receivables 1,394,896 1,327,549
31 December 2014

3. Consolidated financial statements as at and for the year ended 31 December 2015
Annual Report 2015 158
receivables in 2015. The allowance has been determined with reference to past experience and historical data
regarding losses on receivables, also taking into account guarantee deposits and other collateral given by
customers.
The carrying amount of trade receivables approximates to fair value.
7.8 Cash and cash equivalents €2,957,246 thousand (€1,904,996 thousand)
Cash and cash equivalents consists of cash on hand and short-term investments. The balance is €1,052,250
thousand on the figure for 31 December 2014, essentially due to cash generated from operating activities and
the new bond issues by Autostrade per l’Italia, partially offset by capital expenditure during the year, outflows
relating to the partial buyback of bonds issued by Atlantia and the Parent Company’s buyback of 99.87% of the
notes issued by Romulus Finance. Detailed explanations of the cash flows resulting in the increase in net cash
are contained in note 9.1.
7.9 Current tax assets and liabilities
Current tax assets €43,626 thousand (€41,222 thousand) Current tax liabilities €29,815 thousand (€28,331 thousand)
Current tax assets and liabilities at the beginning and end of the period are detailed below.
As at 31 December 2015, the Group reports net current tax assets of €13,811 thousand, compared with net
current tax assets of €12,891 thousand as at 31 December 2014. During the year, the Group collected €11,125
thousand in amounts due from Sintonia, following a request for a refund of IRES for deductible IRAP, in
accordance with art. 6 of Law 2 of 28 January 2009, having participated in the tax consolidation arrangement
headed by the former consolidating entity for the tax years 2004-2007. In Addition, a net increase in
refundable IRAP, amounting to €28,901 thousand, reflects the fact that payments on account were higher than
the effective tax charge for the year, due partly to the deductibility of staff costs for employees hired on
permanent contracts, recently introduced by the 2015 Stability Law.
7.10 Other current assets
€244,735 thousand (€207,794 thousand)
This item consists of receivables and other current assets that are not eligible for classification as trading or
financial. The composition of this item is shown below.
€00031 December
2014Additions Uses
Change in scope of
consolidation
Reclassifications
and other changes31 December 2015
Allowance for bad debts 199,475 39,073 -24,475 101 2,300 216,474
€000
31 December 201531 December 2014 31 December 2015 31 December 2014
IRES 11,838 34,444 4,298 127
IRAP 26,683 1,366 30 3,614
Taxes attributable to foreign operations 5,105 5,412 25,487 24,590
Total 43,626 41,222 29,815 28,331
Cur rent tax l i abi l i ti esCur rent tax assets

159
The balance as at 31 December 2015 is up €36,941 thousand on the figure for 31 December 2014. The
increase primarily reflects a €27,303 thousand increase in “Payments on account to suppliers and other
current assets”, which include insurance claims made by Aeroporti di Roma, within the minimum limit for
claims against its “Fire” policy, to cover the cost of safety and salvage operations, incurred in 2015, in the
areas affected by the fire at Fiumicino airport’s Terminal 3. The increase in tax credits other than for
income tax is primarily attributable to the contribution from Autostrada Tirrenica (€6,988 thousand),
following its consolidation.
The allowance for bad debts, totalling €29,748 thousand as at 31 December 2015 (€30,930 thousand as at 31
December 2014), primarily relates to Stalexport Autostrady’s accounts receivable (presented in other current
assets) from a number of investee companies, which are now insolvent. This follows Stalexport's repayment, in
previous years, of loans to the investee companies from local authorities, acting in its capacity of guarantor.
7.11 Non-current assets held for sale or related to discontinued operations €44,985 thousand (€539,354 thousand) Liabilities related to discontinued operations €6,179 thousand (€423,241 thousand)
Net non-current assets held for sale or related to discontinued operations, totalling €38,806 thousand as at 31
December 2015, primarily consist of:
a) the remaining net assets of the French companies involved in the EcoTaxe project, totalling €34,535
thousand;
b) the remaining 2% interest in Strada dei Parchi, amounting to €4,271 thousand, that is the subject of put
and call options agreed with Toto Costruzioni Generali in the contract governing the sale, in 2011, of a
controlling interest in the company.
The following table shows the composition of these assets and liabilities according to their nature (trading,
financial or other).
€00031 December
201531 December 2014
INCREASE/
(DECREASE)
Tax credits other than for income tax 60,143 48,435 11,708
Receivables due from end users and insurance
companies for damages24,436 32,933 -8,497
Receivable from public entities 22,867 18,409 4,458
Receivables from social security institutions 1,671 1,325 346
Amounts due from staff 2,479 2,806 -327
Accrued income of a non-trading nature 3,742 3,506 236
Payments on account to suppliers and other current
assets159,145 131,310 27,835
Gross other current assets 274,483 238,724 35,759
Allowance for bad debts -29,748 -30,930 1,182
Other current assets 244,735 207,794 36,941

3. Consolidated financial statements as at and for the year ended 31 December 2015
Annual Report 2015 160
The reduction in financial and trading assets, totalling €416,107 thousand, is essentially due to the French
government’s payment of the compensation due as a result of termination of the Partnership Agreement
relating to the “EcoTaxe” project, in accordance with the method of calculation set out in the
Memorandum of Understanding signed by Ecomouv and the French government. As a result of agreements
with the government, the French companies’ financial liabilities have also been reduced by €286,635
thousand. The reduction in trading liabilities reflects payment of both amounts due to the suppliers of the
Group’s French companies and of penalties for early termination of the related contracts following the above
early termination of the Partnership Agreement relating to the “EcoTaxe” project.
In addition, investments held for sale or related to discontinued operations have decreased as a result of the
reclassification of the minority interest in Lusoponte, as it no longer meets the requirements of IFRS 5, as
previously indicated in note 7.3.
7.12 Equity €8,482,816 thousand (€8,263,322 thousand) Atlantia SpA’s issued capital as at 31 December 2015 is fully subscribed and paid-in and consists of
825,783,990 ordinary shares with a par value of €1 each, amounting to €825,784 thousand. The issued capital
did not undergo any changes in 2015.
Equity attributable to owners of the parent, totalling €6,799,634 thousand, is up €280,692 thousand
compared with 31 December 2014. The most important changes during the period are shown in detail in the
statement of changes in consolidated equity. These regard:
a) profit for the year attributable to owners of the parent (€852,527 thousand);
b) the sale of 9,741,513 treasury shares for a total of €227,952 thousand, compared with a carrying amount of
the treasury shares sold of €158,120 thousand. The reduction in treasury shares also reflects the exercise
and conversion of a number of options and units awarded under the Group’s share-based incentive plans
(as described in note 10.6). As at 31 December 2015, Atlantia holds 2,401,753 treasury shares
(12,627,801 as at 31 December 2014);
c) payment of the final dividend for 2014, amounting to €366,309 thousand (€0.445 per share) and the
interim dividend for 2015, amounting to €329,345 thousand (€0.400 per share);
€000 31 December 2015 31 December 2014INCREASE/
(DECREASE)
Property, plant and equipment - 1,570 -1,570
Investments 4,271 16,510 -12,239
Financial assets 39,034 297,532 -258,498
- Cash and Cash equivalents 39,021 48,632 -9,611
- Other current financial assets 13 248,900 -248,887
Deferred tax assets - 2,829 -2,829
Trading assets 7 157,616 -157,609
Other assets 1,673 63,297 -61,624
Assets held for sale or
related to discontinued operations44,985 539,354 -494,369
-
Financial liabilities 411 287,046 -286,635
Trading liabilities 1,260 71,833 -70,573
Other liabilities 4,508 64,362 -59,854
Liabil ities related to discontinued
operations6,179 423,241 -417,062
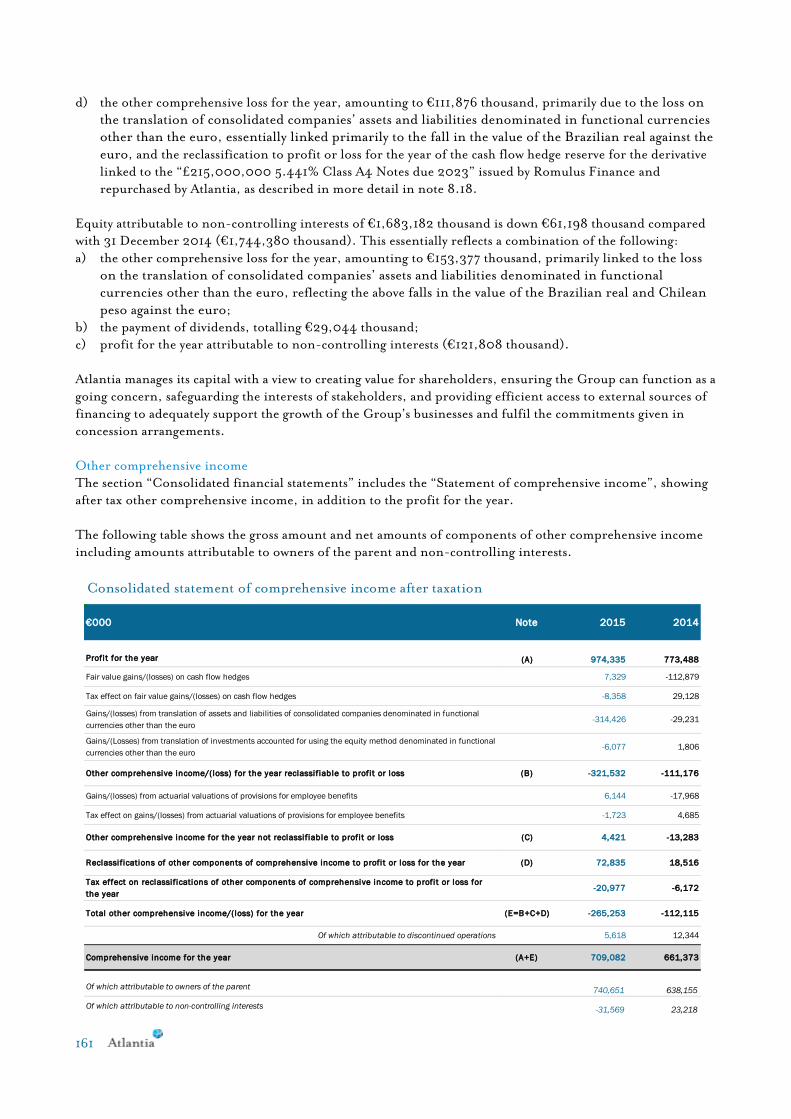
161
d) the other comprehensive loss for the year, amounting to €111,876 thousand, primarily due to the loss on
the translation of consolidated companies’ assets and liabilities denominated in functional currencies
other than the euro, essentially linked primarily to the fall in the value of the Brazilian real against the
euro, and the reclassification to profit or loss for the year of the cash flow hedge reserve for the derivative
linked to the “£215,000,000 5.441% Class A4 Notes due 2023” issued by Romulus Finance and
repurchased by Atlantia, as described in more detail in note 8.18.
Equity attributable to non-controlling interests of €1,683,182 thousand is down €61,198 thousand compared
with 31 December 2014 (€1,744,380 thousand). This essentially reflects a combination of the following:
a) the other comprehensive loss for the year, amounting to €153,377 thousand, primarily linked to the loss
on the translation of consolidated companies’ assets and liabilities denominated in functional
currencies other than the euro, reflecting the above falls in the value of the Brazilian real and Chilean
peso against the euro;
b) the payment of dividends, totalling €29,044 thousand;
c) profit for the year attributable to non-controlling interests (€121,808 thousand).
Atlantia manages its capital with a view to creating value for shareholders, ensuring the Group can function as a
going concern, safeguarding the interests of stakeholders, and providing efficient access to external sources of
financing to adequately support the growth of the Group’s businesses and fulfil the commitments given in
concession arrangements.
Other comprehensive income
The section “Consolidated financial statements” includes the “Statement of comprehensive income”, showing
after tax other comprehensive income, in addition to the profit for the year.
The following table shows the gross amount and net amounts of components of other comprehensive income
including amounts attributable to owners of the parent and non-controlling interests.
€000 Note 2015 2014
Profit for the year (A) 974,335 773,488
Fair value gains/(losses) on cash flow hedges 7,329 -112,879
Tax effect on fair value gains/(losses) on cash flow hedges -8,358 29,128
Gains/(losses) from translation of assets and liabilities of consolidated companies denominated in functional
currencies other than the euro-314,426 -29,231
Gains/(Losses) from translation of investments accounted for using the equity method denominated in functional
currencies other than the euro -6,077 1,806
Other comprehensive income/(loss) for the year reclassifiable to profit or loss (B) -321,532 -111,176
Gains/(losses) from actuarial valuations of provisions for employee benefits 6,144 -17,968
Tax effect on gains/(losses) from actuarial valuations of provisions for employee benefits -1,723 4,685
Other comprehensive income for the year not reclassifiable to profit or loss (C) 4,421 -13,283
Reclassifications of other components of comprehensive income to profit or loss for the year (D) 72,835 18,516
Tax effect on reclassifications of other components of comprehensive income to profit or loss for
the year-20,977 -6,172
Total other comprehensive income/(loss) for the year (E=B+C+D) -265,253 -112,115
Of which attributable to discontinued operations 5,618 12,344
Comprehensive income for the year (A+E) 709,082 661,373
Of which attributable to owners of the parent 740,651 638,155
Of which attributable to non-controlling interests -31,569 23,218
Consolidated statement of comprehensive income after taxation
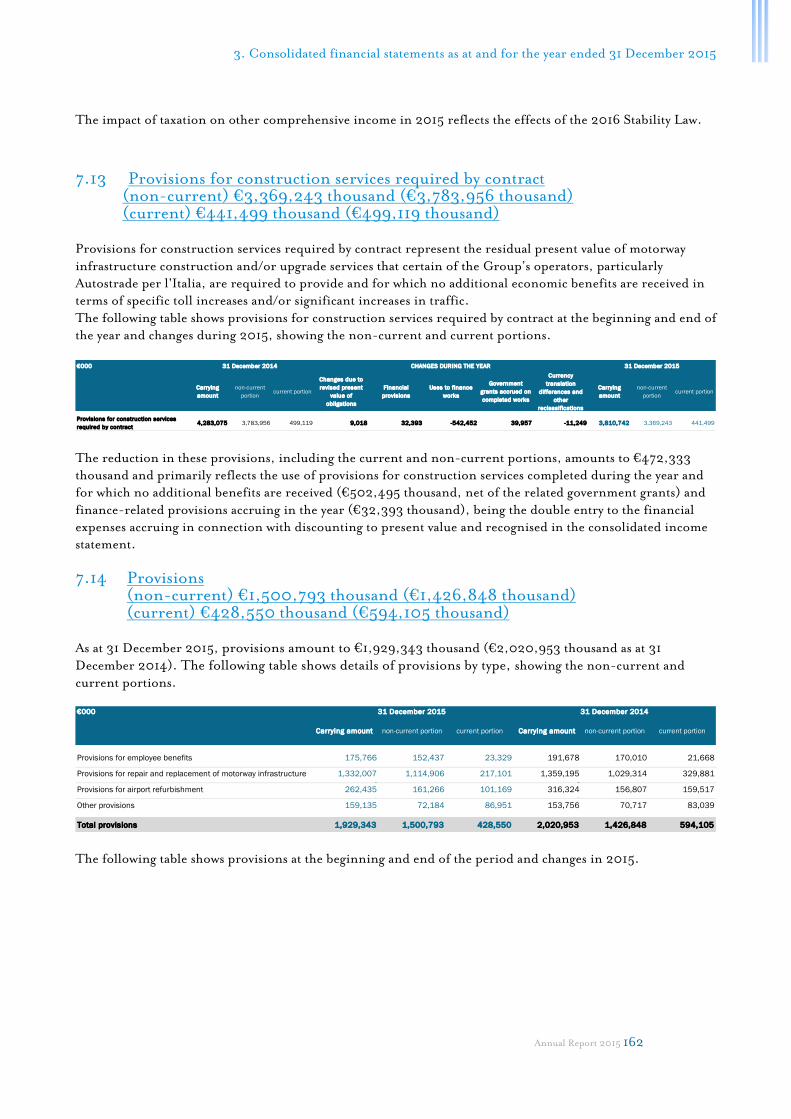
3. Consolidated financial statements as at and for the year ended 31 December 2015
Annual Report 2015 162
The impact of taxation on other comprehensive income in 2015 reflects the effects of the 2016 Stability Law.
7.13 Provisions for construction services required by contract (non-current) €3,369,243 thousand (€3,783,956 thousand)
(current) €441,499 thousand (€499,119 thousand)
Provisions for construction services required by contract represent the residual present value of motorway
infrastructure construction and/or upgrade services that certain of the Group’s operators, particularly
Autostrade per l'Italia, are required to provide and for which no additional economic benefits are received in
terms of specific toll increases and/or significant increases in traffic.
The following table shows provisions for construction services required by contract at the beginning and end of
the year and changes during 2015, showing the non-current and current portions.
The reduction in these provisions, including the current and non-current portions, amounts to €472,333
thousand and primarily reflects the use of provisions for construction services completed during the year and
for which no additional benefits are received (€502,495 thousand, net of the related government grants) and
finance-related provisions accruing in the year (€32,393 thousand), being the double entry to the financial
expenses accruing in connection with discounting to present value and recognised in the consolidated income
statement.
7.14 Provisions
(non-current) €1,500,793 thousand (€1,426,848 thousand) (current) €428,550 thousand (€594,105 thousand) As at 31 December 2015, provisions amount to €1,929,343 thousand (€2,020,953 thousand as at 31
December 2014). The following table shows details of provisions by type, showing the non-current and
current portions.
The following table shows provisions at the beginning and end of the period and changes in 2015.
€000
Carrying
amount
non-current
portioncurrent portion
Changes due to
revised present
value of
obligations
Financial
provisions
Uses to finance
works
Government
grants accrued on
completed works
Currency
translation
differences and
other
reclassifications
Carrying
amount
non-current
portioncurrent portion
Provisions for construction services
required by contract4,283,075 3,783,956 499,119 9,018 32,393 -542,452 39,957 -11,249 3,810,742 3,369,243 441,499
31 December 2014 31 December 2015CHANGES DURING THE YEAR
€000
Provisions for employee benefits 175,766 152,437 23,329 191,678 170,010 21,668
Provisions for repair and replacement of motorway infrastructure 1,332,007 1,114,906 217,101 1,359,195 1,029,314 329,881- -
Provisions for airport refurbishment 262,435 161,266 101,169 316,324 156,807 159,517- -
Other provisions 159,135 72,184 86,951 153,756 70,717 83,039
Total provisions 1,929,343 1,500,793 428,550 2,020,953 1,426,848 594,105
31 December 201431 December 2015
Carrying amount non-current portion current portionCarrying amount non-current portion current portion

163
PROVISIONS FOR EMPLOYEE BENEFITS
(non-current) €152,437 thousand (€170,010 thousand) (current) €23,329 thousand (€21,668 thousand)
As at 31 December 2015, this item consists almost entirely of provisions for post-employment benefits to be
paid to staff employed under Italian law.
The reduction of €15,912 thousand is primarily due to the payment of benefits and of advances during the
year.
The most important actuarial assumptions used to measure the provision for post-employment benefits at 31
December 2015 are summarised below.
(*)The annual discount rate used to determine the present value of the obligation was determined, in accordance with paragraph 83 of IAS 19, with
reference to the average yield curve taken from the Iboxx Corporate AA index on the valuation date for durations of 7-10 years, reflecting the overall
duration of the relevant provisions.
31 December
2014
31 December
2015
€000
Provisions for employee benefits
Post-employment benefits 189,701 1,725 1,690 -13,952 -6,144 -195 812 173,637
Other employee benefits 1,977 663 7 -199 - -319 - 2,129
Total 191,678 2,388 1,697 -14,151 -6,144 -514 812 175,766
Provisions for repair and replacement of motorway
infrastructure1,359,195 336,156 18,553 -372,791 - -16,707 7,601 1,332,007
Provisions for airport refurbishment 316,324 94,230 2,878 -150,997 - - - 262,435
Other provisions
Provisions for impairments exceeding carrying
amounts of investments3,554 38 - -387 - 349 - 3,554
Provisions for disputes, liabilities and sundry charges 150,202 27,395 -141 -19,498 - -2,377 - 155,581
Total 153,756 27,433 -141 -19,885 - -2,028 - 159,135
Provisions 2,020,953 460,207 22,987 -557,824 -6,144 -19,249 8,413 1,929,343
Carrying amount Carrying amount
CHANGES DURING THE YEAR
Operating
provisions
Financial
provisions
Operating uses
and other
reductions
Currency
translation
differences,
reclassifications
and other
changes
Changes in
scope of
consolidation
Deferred
actuarial
gains/(losses)
recognised in
comprehensive
income
Annual discount rate(*)
1.39%
Annual inflation rate 1.50% for 2016
1.80% for 2017
1.70% for 2018
1.60% for 2019
2.00% from 2020 on
Annual rate of increase in post-
employment benefits
2.625% for 2016
2.850% for 2017
2.775% for 2018
2.700% for 2019
3.000% from 2020 on
Annual rate of increase in real salaries 0.65%
Annual turnover rate from 0.75% to 6%
Duration (years) from 7.1 to 17.6
FINANCIAL ASSUMPTIONS
Mortality Government General Accounting Office
projections
Disability INPS tables by age and sex
Retirement age Mandatory state pension retirement age
DEMOGRAPHIC ASSUMPTIONS

3. Consolidated financial statements as at and for the year ended 31 December 2015
Annual Report 2015 164
The following table shows a sensitivity analysis of provisions for post-employment benefits at the end of the
year, based on assumed changes in the individual rates used in the actuarial assumptions.
PROVISIONS FOR REPAIR AND REPLACEMENT OF MOTORWAY
INFRASTRUCTURE
(non-current) €1,114,906 thousand (€1,029,314 thousand) (current) €217,101 thousand (€329,881 thousand)
This item regards the present value of provisions for the repair and replacement of motorway infrastructure,
in accordance with the contractual commitments of the Group’s operators. The balance of these provisions is
down €27,188 thousand, essentially due to uses (€372,791 thousand) to fund repairs and replacements during
the period, partially offset by operating and financial provisions (totalling €354,709 thousand), in part
reflecting the positive impact of an increase in the interest rates used to discount to present value.
PROVISIONS FOR REFURBISHMENT OF AIRPORT INFRASTRUCTURE (non-current) €161,266 thousand (€156,807 thousand) (current) €101,169 thousand (€159,517 thousand) Provisions for the refurbishment of airport infrastructure, including the current and non-current portions,
amount to €262,435 thousand (€316,324 thousand as at 31 December 2014). They represent the present value
of the estimated costs to be incurred for extraordinary maintenance, repairs and replacements under the
contractual obligation provided for in the airport concession arrangement entered into by Aeroporti di Roma.
The objective of such services is to ensure that the airport infrastructure is fit for purpose and safe. Compared
with 31 December 2014, the provisions have decreased by €53,889 thousand, essentially due to uses to cover
work carried out during the period (totalling €150,997 thousand), partially offset by operating and financial
provisions of €97,108 thousand. The value of the provisions as at 31 December 2015 includes the estimated
cost of reconstruction of the part of Terminal 3 at Fiumicino airport that was struck by the previously
mentioned fire. Full details of the fire at Fiumicino airport’s Terminal 3 are provided in notes 8.19 and 10.7
OTHER PROVISIONS
(non-current) €72,184 thousand (€70,717 thousand) (current) €86,951 thousand (€83,039 thousand)
These provisions essentially regard estimates of liabilities, at the end of the period, expected to be incurred in
connection with pending litigation and disputes, including the estimated expenses provisioned for contract
reserves relating to contractors who carry out maintenance work. The overall balance at the end of 2015 is
almost in line with the figure for 31 December 2014. These provisions also include a prudent assessment,
conducted on the basis of the best information currently available, of the liabilities, other than those
covered by existing insurance policies, Aeroporti di Roma is likely to be required to pay once final
responsibility for the incident has been determined. In this regard, at the date of approval of these
consolidated financial statements, a total of approximately 150 claims for compensation have been received
from third parties (airlines, handlers, sub-operators and passengers), only partially backed up by an exact
quantification of the alleged damages incurred and estimated to amount to a total of approximately €100
million. Full details of the fire at Fiumicino airport’s Terminal 3 are provided in notes 8.19 and 10.7.
€000
+ 1 % - 1 % + 0.25 % - 0.25 % + 0.25 % - 0.25 %
Atlantia Group's provision for post-employment benefits 172,925 174,363 175,583 171,733 170,570 176,811
CHANGE IN ASSUMPTION
TURNOVER RATE INFLATION RATE DISCOUNT RATE
SENSITIVITY ANALYSIS OF ASSUMPTIONS AS AT 31 DECEMBER 2015

165
7.15 Financial liabilities (non-current) €14,044,199 thousand (€13,993,903 thousand) (current) €1,938,634 thousand (€1,168,373 thousand)
MEDIUM/LONG-TERM BORROWINGS
(non-current) €14,044,199 thousand (€13,993,903 thousand)
(current) €1,649,176 thousand (€920,577 thousand)
The following tables provide an analysis of medium/long-term financial liabilities, showing:
a) an analysis of the balance by face value and maturity (current and non-current portions);
b) type of interest rate, maturity and fair value;
Face valueCarrying
amountCurrent portion
Non-current
portion
between 13 and
60 monthsafter 60 months Face value
Carrying
amountCurrent portion
Non-current
portion
Bond issues (1) (2) (3) 11,465,101 11,386,551 1,085,993 10,300,558 1,936,880 8,363,678 10,699,995 10,493,593 162,887 10,330,706
Bank borrowings 3,310,536 3,308,211 191,569 3,116,642 828,549 2,288,093 3,415,785 3,421,849 344,138 3,077,711
Other borrowings 225,801 202,149 62,553 139,596 137,789 1,807 139,242 130,421 65,381 65,040
Medium/long-term borrowings (2) (3) 3,536,337 3,510,360 254,122 3,256,238 966,338 2,289,900 3,555,027 3,552,270 409,519 3,142,751
Derivative liabilities (4) 461,047 - 461,047 15,742 445,305 517,581 2,672 514,909
Accrued expenses on medium/long-term financial liabilities (2) 303,718 303,718 - - - 340,824 340,824 -
Other financial liabilities 31,699 5,343 26,356 19,273 7,083 10,212 4,675 5,537
Other medium/long-term financial liabilities 335,417 309,061 26,356 19,273 7,083 351,036 345,499 5,537
Total 15,693,375 1,649,176 14,044,199 2,938,233 11,105,966 14,914,480 920,577 13,993,903
(2) Financial instruments classified as financial liabilities measured at amortised cost in accordance with IAS 39.
(3) Further details of hedged financial liabilities are contained in note 9.2.
(4) Financial instruments classified as hedging derivatives in accordance with IAS 39 and in level 2 of the fair value hierarchy.
€000
31 December 2015 31 December 2014
Term
(1) The par value of the bond issues hedged by Cross Currency Swaps and IPCA x CDI Swaps is shown at the hedged notional value.
Maturity
Bond issues
- listed fixed ratefrom 2016 to
2034 10,568,634 11,766,231 9,581,430 11,064,795
- listed floating ratefrom 2016 to
2023 339,574 353,853 481,548 522,269
- unlisted fixed ratefrom 2032 to
2038 355,875 486,702 335,980 467,144
- unlisted floating rate 2016 122,468 138,385 94,635 111,473
11,386,551 12,745,171 10,493,593 12,165,681
Bank borrowings
- fixed rate from 2016 to
2036 1,843,116 2,131,387 1,853,032 2,174,926
- floating ratefrom 2016 to
2034 1,358,871 1,417,437 1,408,307 1,414,296
- non-interest bearing (3) from 2016 to
2017 106,224 106,224 160,510 160,510
3 ,308,211 3 ,655,048 3 ,421,849 3 ,749,732
Other borrowings
- fixed rate 2017 4,672 4,672 6,981 6,981
- floating rate 2016 5,615 5,615 78,031 78,031
- non-interest bearing (4) from 2016 to
2020 191,862 191,886 45,409 45,404
202,149 202,173 130,421 130,416
Medium/long-term borrowings 3 ,510,360 3 ,857,221 3 ,552,270 3 ,880,148
Derivative liabilit ies 461,047 461,047 517,581 517,581
Accrued expenses on medium/long-term financial liabilities 303,718 340,824
Other financial liabilities 31,699 10,212
Other medium/long-term f inancial liabilit ies 335,417 351,036
Total 15,693,375 17,063,439 14,914,480 16,563,410
(1) The amounts shown in the table for medium/long-term financial liabilities include both the non-current and current portions.
(2) The fair value shown is classified in level 2 of the fair value hierarchy.
31 December 2015 31 December 2014
€000Carrying
amount ( 1)
Fair
value (2)
Carrying
amount ( 1)
Fair
value (2)
(3) Figure refers to Autostrade per l'Italia financial assets deriving from governament grants (Law n. 662/1996, n. 135/1997, n. 345/1997) for the infrastructure works carried out on
the stretches of motorway "Firenze Nord - Firenze Sud" and "Cà Nova - Aglio (Variante di Valico), which will be reimbursed by ANAS.
(4) Item mainly includes Autostrade per l'Italia's financial liabilities and Stalexport Autostrada Malopolska's financial liabilities recognized on the basis of the related concession
agreements as well as SAT's financial liability with "Fondo Centrale di Garanzia" recognized after the Company control acquisition performed during the year 2015.

3. Consolidated financial statements as at and for the year ended 31 December 2015
Annual Report 2015 166
c) a comparison of the face value of each liability (bond issues and medium/long-term borrowings) and the
related carrying amount, by issue currency, showing the corresponding average and effective interest rates;
d) movements during the period in the carrying amounts of outstanding bond issues and medium/long-term
borrowings.
The Group uses derivative financial instruments to hedge certain current and highly likely future financial
liabilities, including interest rate swaps (IRSs), cross currency swaps (CCSs), and Índice Nacional de Preços ao
Consumidor Amplo (IPCA) x Certificado de Depósito Interfinanceiro (CDI) Swaps, which are classified as
cash flow hedges or fair value hedges pursuant to IAS 39. The fair value of the hedging instruments as at 31
December 2015 is recognised in “Derivative liabilities”. More detailed information on financial risks and the
manner in which they are managed, in addition to details of outstanding financial instruments held by the
Group, is contained in note 9.2 “Financial risk management”.
Bond issues (non-current) €10,300,558 thousand (€10,330,706 thousand) (current) €1,085,993 thousand (€162,887 thousand)
This item principally refers to bonds issued by Atlantia as part of its €10 billion Medium Term Note (MTN)
programme, accounted for at a total amount of €6,297,919 thousand as at 31 December 2015, and the bonds
issued by Autostrade per l’Italia as part of its own Medium Term Note (MTN) Programme, authorised for an
amount of up to €7 billion.
The increase of €892,958 thousand primarily reflects:
a) new bond issues by Autostrade per l’Italia, totalling €2,617,531 thousand, as follows:
1) the issue of bonds to institutional investors, with a total carrying amount of €1,884,610 thousand, as
part of the above MTN Programme launched in October 2014; issues were completed in October
2015 (a par value of €650,000 thousand, paying coupon interest of 1.125% and maturing in
November 2021 and a par value of €500,000 thousand, paying coupon interest of 1.875% and
Face value Carrying amount
Average interest
rate applied
to 31 December
2015 (1)
Effex tive
interest rate
to 31 December
2015
Face value Carrying amount
Euro (EUR) 12,566,143 12,500,409 4.00% 4.41% 11,271,408 11,279,187
Chilean peso (CLP) / Unidad de fomento (UF) 980,482 1,012,924 7.48% 6.92% 1,072,166 1,110,066
Pound sterling (GBP) 750,000 674,140 5.99% 6.26% 1,068,972 841,888
Brazilian real (BRL) 452,699 462,040 14.90% 14.93% 581,686 576,183
Yen (JPY) 149,176 152,014 5.30% 5.48% 149,176 137,387
Polish zloty (PLN) 97,126 89,572 6.41% 6.16% 104,449 93,987
UD dollar (USD) 5,812 5,812 5.25% 5.25% 7,165 7,165
15,001,438 14,896,911 4.85% 14,255,022 14,045,863
31 December 2015 31 December 2014
€000
Total
(1) This figure includes the impact of interest and foreign currency hedges.
€000
Carrying amount
as at 31 December
2014
New borrowings Repayments
Buyback of bonds
issued by Atlantia
and purchase of
notes issued by
Romulus F inance
Currency
translation
differences and
other changes
Carrying amount
as at 31 December
2015
Bond issues 10,493,593 2,758,388 -147,902 -1,637,932 -79,596 11,386,551
Bank borrowings 3,421,849 259,464 -354,616 - -18,486 3,308,211
Other borrowings 130,421 1,508 -6,474 - 76,694 202,149
Total 14,045,863 3,019,360 -508,992 -1,637,932 -21,388 14,896,911

167
maturing in November 2025) and November 2015 (a par value of €750,000 thousand, paying
coupon interest of 1.75% and maturing in June 2026);
2) the issue of bonds with a carrying amount of €732,921 thousand to retail investors in June 2015 (a par
value of €750 million, paying coupon interest of 1.625% and maturing in June 2023);
b) Rodovia MG050’s issue of the new floating rate CDI bonds, with a carrying amount of €142,275 thousand
(a par value of €143,226 thousand, paying interest of 15.6% throughout 2015 and maturing in October
2016);
c) Atlantia’s partial buyback of bonds maturing in 2016, 2017, 2019 and 2020 (with a total par value of
€1,351,250 thousand);
d) Atlantia’s buyback of 99.87% of the asset-backed securities named “£215,000,000 5.441% per cent Class
A4 Notes due 2023” issued by Romulus Finance Srl (totalling €286,682 thousand), with the resulting
derecognition of the corresponding financial liability issued by the special purpose entity, consolidated by
the Atlantia Group;
e) redemptions during the period by overseas companies (€147,902 thousand);
f) the decrease in the value of bonds denominated in foreign currencies as a result of exchange rate
movements (€82,130 thousand), primarily reflecting a fall in the value of the Brazilian real against the
euro, partially offset by a strengthening of sterling.
With regard to the above bonds issued to retail investors by Autostrade per l’Italia, in February 2015,
Autostrade per l’Italia entered into a number of Forward-Starting Interest Rate Swaps with banks, having a
notional value of €1,250 million, to hedge interest rate risk associated with the issue of the retail bonds, at a
weighted average rate of 0.54%. At the date on which these derivatives were unwound, fair value gains on these
instruments totalled €34,849 thousand. €9,678 thousand has been recognised in the financial income,
representing the portion exceeding the nominal amount at issue, whilst the remaining €25,171 thousand,
corresponding to the hedged portion of the par value of the issue, has been recognised in other comprehensive
income and will be reclassified to profit or loss. This amount will be effectively reclassified in line with the
interest flows associated with the hedged instrument, in keeping with the nature of the derivatives as cash flow
hedges.
The cost of the bond issue, including the above hedges, thus amounts to 1.28%.
Finally, the remaining value of Atlantia’s bond issues, amounting to €882,489 thousand and maturing in May
2016, has been reclassified to the current portion of medium/long-term financial liabilities.
Medium/long-term borrowings
(non-current) €3,256,238 thousand (€3,142,751 thousand) (current) €254,122 thousand (€409,519 thousand)
The balance of this item, amounting to €3,510,360 thousand, including the current and non-current
portions, is down €41,910 thousand on 31 December 2014, essentially due to a combination of the following:
a) repayments of €361,090 thousand during the year;
b) the effect of exchange rate movements on the medium/long-term borrowings of the Chilean companies
(€19,106 thousand), reflecting a fall in the value of the Chilean peso against the euro;
c) new borrowings, totalling €260,972 thousand, which include:
1) use of the line of credit granted by Cassa Depositi e Prestiti to Autostrade per l’Italia (floating rate,
maturing in June 2021), totalling €200,000 thousand;
2) use of the line of credit granted by the EIB to Autostrade per l’Italia (at a fixed rate of 1.83%, maturing
in September 2036), totalling €50,000 thousand;
d) an increase (€54,287 thousand) in Autostrade per l'Italia’s exposure to ANAS in relation to laws
662/1996, 345/1997 and 135/1997;
e) Autostrada Tirrenica’s debt to the Central Guarantee Fund (“Fondo Centrale di Garanzia”), accounted
for at fair value at the date of the company’s first-time consolidation and amounting to €16,389 thousand
as at 31 December 2015.

3. Consolidated financial statements as at and for the year ended 31 December 2015
Annual Report 2015 168
A number of the medium/long-term loan agreements include negative pledge provisions, in line with
international practice. Under these provisions, it is not possible to create or maintain (unless required to do so
by law) collateral guarantees on all or a part of any proprietary assets, with the exception of project debt. The
above agreements also require compliance with certain financial covenants.
The method of selecting the variables to compute the ratios is specified in detail in the relevant loan
agreements. Breach of these covenants, at the relevant measurement dates, could constitute a default event and
result in the lenders calling in the loans, requiring the early repayment of principal, interest and of further
sums provided for in the agreements.
The most important covenants are described below:
a) as regards Autostrade per l'Italia, the loan agreements with Cassa Depositi e Prestiti (totalling €840,744
thousand as at 31 December 2015) require compliance with a minimum threshold for “Operating cash
flow available for Debt Service/Debt Service” (DSCR);
b) as regards Aeroporti di Roma, the company’s revolving line of credit require compliance with a maximum
leverage ratio (based on the long-term rating assigned to Aeroporti di Roma by the relevant rating
agencies) and a minimum Debt Service Coverage Ratio (DSCR).
With regard to the financial commitments of the foreign project companies, the related debt does not envisage
recourse to direct or indirect parents and is subject to covenants typical of international practice. The main
commitments provide for a pledge on all the project companies’ assets and receivables in favour of their
creditors.
Non-current derivative liabilities
(non-current) €461,047 thousand (€514,909 thousand) (current) - (€2,672 thousand)
This item represents fair value losses on outstanding derivatives as at 31 December 2015 and includes:
a) fair value losses (€308,625 thousand) on Cross Currency Interest Rate Swaps (CCIRSs), linked to both
derivative instruments classified as cash flow hedges in accordance with IAS 39, hedging the foreign
currency and interest rate risks on medium/long-term bonds issued by Atlantia, denominated in pounds
sterling (£500 million) and Japanese yen (¥20 billion) and having a total value in euros of €209,018
thousand, and to derivatives entered into by Aeroporti di Roma (with a total value of €99,607 thousand)
to hedge the notes with a par value of £215 million issued by Romulus Finance (the special purpose entity
controlled by Aeroporti di Roma), 99.87% of which have been repurchased by Atlantia. These latter
derivatives, following the above buyback by the Group, no longer qualify as cash flow hedges in the
consolidated financial statements as at and for the year ended 31 December 2015.
Fair value losses on these derivatives have declined by a total of €92,463 thousand, essentially reflecting
the weakening of the euro against the above currencies (€71,098 thousand), with a matching adjustment
of the hedged liabilities, the payment of differentials during the year and an increase in the interest rates
used at 31 December 2015 compared with 31 December 2014 (€21,365 thousand);
b) fair value losses (€139,961 thousand) on Interest Rate Swaps (IRSs), classified as cash flow hedges in
accordance with IAS 39, entered into by certain Group companies to hedge interest rate risk on their
existing non-current financial liabilities and those that are highly likely to be assumed in the future. The
increase of €35,940 thousand primarily reflects fair value losses on the new Forward-Starting Interest
Rate Swaps (€53,567 thousand) entered into by Autostrade per l’Italia with a number of banks and having
a total notional value of €2,200 million, variable durations of 6, 7 and 8 years and a weighted average
fixed rate of 1.16%, linked to highly likely future financial liabilities to be assumed through to 2017 in
order to meet the company’s expected financing requirements;
c) fair value losses on IPCA x CDI Swaps (€12,461 thousand), classified as fair value hedges, previously
entered into by Triangulo do Sol and Rodovias das Colinas with the aim of converting bonds issued at a
real IPCA rate to a floating nominal CDI rate.
Further details of derivative financial instruments entered into by the Group companies for hedging purposes
are contained in note 9.2.

169
Other medium/long-term financial liabilities
(non-current) €26,356 thousand (€5,537 thousand) (current) €309,061 thousand (€345,499 thousand)
The balance of this item, including the current and non-current portions, is down €15,619 thousand,
primarily due to a reduction in accrued expenses payable (€37,106 thousand), essentially Atlantia’s partial
buyback of its own bonds maturing in 2016, 2017, 2019 and 2020. This is offset by an increase in other
financial liabilities (€21,487 thousand), essentially linked to deferred financial income (€13,743 thousand).
SHORT-TERM FINANCIAL LIABILITIES
€289,458 thousand (€247,796 thousand)
The composition of short-term financial liabilities is shown below.
The increase of €41,662 thousand compared with 31 December 2014 primarily reflects the use of short-term
current account overdrafts by certain Group companies to meet their working capital requirements.
€000 31 December 2015 31 December 2014
Bank overdrafts 36,654 813
Short-term borrowings 245,353 244,820
Derivative liabilities (1) 7,036 1,034
Intercompany current account payables due to related
parties- 67
Other current financial liabilities 415 1,062
Short-term financial l iabilities 289,458 247,796
(1) These liabilities primarily include derivative instruments that do not qualify for hedge accounting and that are
classified in level 2 of the fair value hierarchy.

3. Consolidated financial statements as at and for the year ended 31 December 2015
Annual Report 2015 170
NET DEBT IN COMPLIANCE WITH ESMA
RECOMMENDATION OF 20 MARCH 2013
An analysis of the various components of consolidated net debt is shown below with amounts payable to and
receivable from related parties, as required by CONSOB Ruling DEM/6064293 of 28 July 2006, in
accordance with European Securities and Markets Authority ("ESMA") Recommendation of 20 March 2013
(which does not entail the deduction of non-current financial assets from debt).
NOTE 31 December 2015
OF WHICH RELATED
PARTY
TRANSACTIONS
31 December 2014
OF WHICH RELATED
PARTY
TRANSACTIONS
Cash -2,251 -1,326
Cash equivalents -707 -579
Cash and cash equivalents related to discontinued operations -39 -49
Cash and cash equi val ents (A) -2,997 -1,954
Cur rent fi nanci a l assets ( 1 )
(B ) 7.4 -818 -1 -1,212 -117
Bank overdrafts 37 1
Current portion of medium/long-term financial liabilities 1,649 921
Other financial liabilities 253 247
Financial liabilities related to discontinued operations - 287
Cur rent fi nanci a l assets (C) 7.15 1,939 1,456
Cur rent net debt (D=A+B+C) -1,876 -1,710
Bond issues 10,301 10,331
Medium/long-term borrowings 3,256 3,143
Other non-current financial liabilities 487 520
Non-cur rent fi nanci a l l i abi l i ti es (E) 7.15 14,044 13,994
12,168 12,284
Non-cur rent fi nanci a l assets (G) 7.4 -1,781 -16 -1,756 -10
Net debt (H=F+G) 10,387 10,528
(1) Includes financial assets held for sale or related to discontinued operations.
€M
(Net funds) / Net debt as defi ned by ESMA recommendati on (F=D+E)

171
7.16 Other non-current liabilities €98,778 thousand (€94,742 thousand)
The balance at the end of 2015 is substantially in line with 31 December 2014. The following table shows a
breakdown of this item.
7.17 Trading liabilities €1,581,503 thousand (€1,406,019 thousand)
An analysis of trading liabilities is shown below.
The increase during the year, amounting to €175,484 thousand, primarily reflects an increase of €94,277
thousand in amounts payable to the operators of interconnecting motorways, primarily attributable to
Autostrade per l’Italia. This reflects increases in the operators’ toll revenue and is in line with standard
payment periods. The increase in trading liabilities is also due to an increase in amounts payable to suppliers,
totalling €76,388 thousand. This primarily reflects the greater volume of capital expenditure carried out by
Aeroporti di Roma in 2015.
7.18 Other current liabilities €497,802 thousand (€523,686 thousand)
The following table shows a breakdown of this item.
€00031 December
2015
31 December
2014
Accrued expenses of a non-trading nature 38,791 40,662
Liabilities deriving from contractual obligations 26,933 23,012
Amounts payable to grantors 13,681 24,640
Payable to staff 13,526 4,201
Taxation other than income taxes 2,954 -
Other payables 2,893 2,227
Other non-current liabilities 98,778 94,742
€000 31 December 2015 31 December 2014
Liabilities deriving from contract work in progress 3,595 531
Amounts due from customers 845,900 769,512
Payable to operators of interconnecting motorways 619,621 525,344
Tolls in the process of settlement 94,110 93,331
Accrued expenses, deferred income and other trading liabilities 18,277 17,301
Trade payables 1,577,908 1,405,488
Trading liabilities 1,581,503 1,406,019

3. Consolidated financial statements as at and for the year ended 31 December 2015
Annual Report 2015 172
The overall reduction of €25,884 thousand primarily reflects a combination of the following:
a) a reduction in amounts payable for expropriations, totalling €27,094 thousand, recorded by Autostrade
per l’Italia, essentially connected to a reduction in new construction projects and a revision of amounts
payable as compensation for projects in progress;
b) a reduction of €26,337 thousand in amounts payable in the form of taxation other than income taxes,
essentially reflecting a decrease in the amount payable by Aeroporti di Roma to Lazio Regional Authority
in the form of a Regional Tax on Aircraft Noise (IRESA) following a change in the relevant legislation.
The above payable has decreased at the same time as the amount billed to airlines by Aeroporti di Roma
until 30 June 2015 and no longer due following the change in legislation;
c) an increase of €27,687 thousand in other payables, partly due to the accrued portion, for 2015, of the
extraordinary toll increase applied by Traforo Monte Bianco (€10,694 thousand), which is still awaiting a
decision on the use of the resulting funds.
€000 31 December 2015 31 December 2014
Concession fees payable 101,849 99,826
Taxation other than income taxes 94,860 121,197
Payable to staff 61,166 61,064
Guarantee deposits from users who pay by direct debit 47,464 48,255
Social security contributions payable 38,208 36,877
Amounts payable for expropriations 16,514 43,608
Amounts payable to public entities 14,629 17,268
Other payables 123,112 95,591
Other current liabilities 497,802 523,686

173
8. NOTES TO THE CONSOLIDATED INCOME STATEMENT
This section contains analyses of the most important consolidated income statement items. Negative
components of the income statement are indicated with a minus sign in the headings and tables in the notes,
whilst amounts for 2014 are shown in brackets.
It should be noted that, as required by IFRS 5, the contributions of Ecomouv, Ecomouv D&B and Tech
Solutions Integrators to the consolidated income statement for both comparative periods have been presented
in “Profit/(Loss) from discontinued operations”, rather than included in each component of the consolidated
income statement for continuing operations
Finally, in 2014, the item “Profit/(Loss) from discontinued operations” benefitted from the contribution to
the income statement of the sale of TowerCo, consisting of both the operating result through to the date of
deconsolidation and the gain recognised on the sale.
Details of amounts in the consolidated income statement deriving from related party transactions are provided
in note 10.5.
8.1 Toll revenue €3,835,954 thousand (€3,677,679 thousand)
“Toll revenue” of €3,835,954 thousand is up €158,275 thousand (4%) on 2014 (€3,677,679 thousand). This
primarily reflects:
a) application of annual toll increases for 2015 by the Group’s Italian operators (a rise of 1.46% for
Autostrade per l’Italia from 1 January 2015), boosting toll revenue by an estimated €39 million;
b) a 3.0% improvement in traffic on the Italian network, accounting for an estimated €90 million increase
in toll revenue (including the impact of the different traffic mix);
c) an increase in toll revenue at overseas operators (up €41 million), primarily reflecting traffic growth in
Chile (up 6.7%) and Poland (up 8.6%), toll increases applied by the various operators in 2014 and 2015
in accordance with their respective concession arrangements, partially offset by a decline in traffic in Brazil
(down 2.1%).
8.2 Aviation revenue €565,312 thousand (519,979 thousand)
This item refers to aviation revenue generated by Aeroporti di Roma and a number of its subsidiaries. It is up
€45,333 thousand compared with 2014 (an increase of 9%). This reflects increases in airport fees applied
from 1 March 2014 and 1 March 2015 and growth in traffic (passengers up 6.1% and movements up 1.7% in
2015), achieved despite the negative impact of the fire at Fiumicino airport’s Terminal 3. An analysis of this
item is shown below.
€000 2015 2014INCREASE/
(DECREASE)
Airport fees 440,174 398,248 41,926
Centralised infrastructure 13,198 13,171 27
Security services 84,313 78,134 6,179
Other 27,627 30,426 -2,799
Aviation revenue 565,312 519,979 45,333

3. Consolidated financial statements as at and for the year ended 31 December 2015
Annual Report 2015 174
8.3 Revenue from construction services €722,989 thousand (€563,971 thousand)
An analysis of revenue from construction services is shown below.
Revenue from construction services essentially consists of construction services for which additional benefits
are received and financial assets deriving from concession rights, represented by the fair value of the
consideration due in return for the construction and upgrade services rendered in relation to assets held
under concession during the year. The consideration is based on the operating costs and financial expenses
incurred (the latter solely in relation to investment in assets held under concession) and any margins earned
on the services provided by the Group’s own technical units.
Revenue from construction services performed during the year is up €159,018 thousand on 2014, reflecting a
combination of the following:
a) an increase in construction services for which additional benefits are received, amounting to €142,291
thousand, primarily due to the greater volume of work carried out by Aeroporti di Roma and Autostrade
per l’Italia;
b) an increase in construction services accounted for as an increase in financial assets deriving from
concession rights, amounting to €38,244 thousand, linked to construction carried out under the Santiago
Centro Oriente (“CC7”) project being implemented by the Chilean operator, Costanera Norte;
c) a reduction in income resulting from the handover free of charge of buildings located at service areas to
Autostrade per l’Italia, following expiry of the related sub-concessions.
In 2015, the Group carried out additional construction services for which no additional benefits are received,
amounting to €502,495 thousand, net of related government grants, for which the Group made use of a
portion of the specifically allocated “Provisions for construction services required by contract”. Uses of these
provisions are classified as a reduction in operating costs for the period, as explained in note 8.11.
Details of total investment in assets held under concession during the year are provided in note 7.2, above.
8.4 Contract revenue €106,467 thousand (€69,319 thousand)
Contract revenue of €106,467 thousand is up €37,148 thousand on 2014 (€69,319 thousand), essentially due
to an increase in work carried out by Pavimental and Electronic Transaction Consultants for external
customers.
8.5 Other operating income
€789,783 thousand (€782,927 thousand) An analysis of other operating income is provided below.
€000 2015 2014INCREASE/
(DECREASE)
Revenue from construction services for which additional economic benefits are received 588,560 446,269 142,291
Revenue from investments in financial concession rights 87,895 49,651 38,244
Revenue from construction services: government grants for services for which no additional
economic benefits are received39,957 34,582 5,375
Revenue from construction services provided by sub-operators 6,577 33,469 -26,892
Revenue from construction services 722,989 563,971 159,018

175
Other operating income of €789,783 thousand is up €6,856 thousand on 2014 (€782,927 thousand), due
essentially to a combination of the following:
a) an increase in damages and compensation, totalling €12,579 thousand, which reflects recognition, based
on the best currently available information regarding the incident, of a prudently assessed amount for
insurance proceeds covering additional expenses and the cost of rebuilding and salvage work carried
out in the areas affected by the fire that struck Terminal 3 at Fiumicino airport. Full details of the
incident are provided in notes 8.19 and 10.7;
b) an increase of €10,831 thousand in sales of equipment and technology services, essentially reflecting sales
generated by Autostrade Tech during the year;
c) an increase in Telepass and Viacard fees, totalling €6,714 thousand;
d) a €22,944 thousand reduction in revenue from sub-concessions, primarily reflecting the impact on
service area royalties of agreements with a number of sub-operators (above all oil service providers),
further discounts applied with effect from the second half of 2014 and a reduction in “one-off” payments
received in 2015.
8.6 Raw and consumable materials
-€378,510 thousand (-€341,955 thousand)
This item, which consists of purchases of materials and the change in inventories of raw and consumable
materials, is up €36,555 thousand on 2014. This primarily reflects the greater volume of maintenance and
construction work carried out by Pavimental for both the Group’s operators and external customers. A
breakdown of the balance is shown below.
€000 2015 2014INCREASE/
(DECREASE)
Construction materials -223,199 -188,604 -34,595
Electrical and electronic materials -34,017 -19,101 -14,916
Lubricants and fuel -39,272 -46,556 7,284
Other raw and consumable materials -74,633 -88,631 13,998
Cost of materials -371,121 -342,892 -28,229
Change in inventories of raw, ancil lary and consumable materials and
goods for resale-8,605 627 -9,232
Capitalised cost of raw materials 1,216 310 906
Raw and consumable materials -378,510 -341,955 -36,555
€000 2015 2014INCREASE/
(DECREASE)
Revenue from sub-concessions 356,565 379,509 -22,944
Revenue from Telepass and Viacard fees 134,180 127,466 6,714
Maintenance revenue 40,411 35,155 5,256
Other revenue from motorway operation 35,560 32,046 3,514
Revenue from the sale of technology devices and
services34,717 23,886 10,831
Damages and compensation 34,527 21,948 12,579
Revenue from products related to the airport business 27,733 28,030 -297
Refunds 26,530 23,027 3,503
Advertising revenue 5,091 14,871 -9,780
Other income 94,469 96,989 -2,520
Other operating income 789,783 782,927 6,856

3. Consolidated financial statements as at and for the year ended 31 December 2015
Annual Report 2015 176
8.7 Service costs -€1,588,584 thousand (-€1,229,454 thousand)
An analysis of service costs is provided below.
Service costs rose €359,130 thousand in 2015, compared with 2014. The cost of construction and similar
services is up €283,126 thousand, essentially due to increases in investment in assets held under concession
and in motorway maintenance work. The €46,104 thousand rise in the cost of professional services reflects an
increase in airport design work and investment by Spea Engineering.
€000 2015 2014INCREASE/
(DECREASE)
Construction and similar -1,114,412 -831,286 -283,126
Professional services -133,732 -87,628 -46,104
Transport and similar -60,595 -52,277 -8,318
Utilities -51,495 -50,858 -637
Insurance -33,966 -25,904 -8,062
Statutory Auditors' fees -1,547 -1,602 55
Other services -197,371 -180,833 -16,538
Gross service costs -1,593,118 -1,230,388 -362,730
Capitalised service costs for assets other than concession assets 4,534 934 3,600
Service costs -1,588,584 -1,229,454 -359,130

177
8.8 Staff costs -€862,070 thousand (-€786,211 thousand)
An analysis of staff costs is shown below.
Gross staff costs of €865,764 thousand are up €78,635 thousand (10%) on 2014 (€787,129 thousand),
primarily due to the following:
a) an increase in the average workforce, primarily linked to the insourcing of cleaning services at Fiumicino
and Ciampino airports, which began in 2014, and of routine maintenance at Triangulo do Sol and
Colinas, to the staff hired in connection with implementation of the airport development plan and with
improvements to passenger assistance provided by Aeroporti di Roma, and the start-up of work on new
contracts by Pavimental;
b) an increase in the average unit cost, partly due to the cost of contract renewals, management incentive
plans and early retirement incentives paid by the Italian companies, partially offset by the recruitment of
staff on different forms of contract at Airport Cleaning and the Brazilian companies.
The following table shows the average number of employees (by category and including agency staff), as
commented on in the section on the “Workforce” in the report on operations:
€000 2015 2014INCREASE/
(DECREASE)
Wages and salaries -605,472 -555,282 -50,190
Social security contributions -172,392 -160,092 -12,300
Payments to supplementary pension funds, INPS and post-employment benefits -33,760 -31,176 -2,584
Directors' remuneration -6,218 -5,646 -572
Other staff costs -47,922 -34,933 -12,989
Gross staff costs -865,764 -787,129 -78,635
Capitalised staff costs for assets other than concession assets 3,694 918 2,776
Staff costs -862,070 -786,211 -75,859
AVERAGE
WORKFORCE2015
(* )2014
(* )INCREASE/
(DECREASE)
Senior managers 242 240 2
Middle managers and
administrative staff
7,443 7,184 259
Toll collectors 3,226 3,281 -55
Manual workers 3,689 2,956 733
Total 14,600 13,661 939
(*) The figures for both comparative periods do not include staff employed by the
companies whose the related staff costs have been classified in "Profit/(Loss) from
discontinued operations", as explained in note 8.16.

3. Consolidated financial statements as at and for the year ended 31 December 2015
Annual Report 2015 178
8.9 Other operating costs
-€601,213 thousand (-€561,650 thousand)
An analysis of other operating costs is shown below.
Other operating costs are up €39,563 thousand, primarily reflecting the increase in the concession fees
payable by the Italian motorway operators as a result of the traffic growth registered in 2015, and the increase
of €16,348 thousand in other costs, including the contract reserves paid to contractors by Autostrade per
l’Italia following the opening to traffic of the Variante di Valico.
8.10 Operating change in provisions -€76,086 thousand (-€263,941 thousand)
This item consists of operating changes (new provisions and uses) in provisions, excluding those for employee
benefits (classified in staff costs), made by Group companies during the period in order to meet their legal and
contractual obligations requiring the use of financial resources in future years. The balance of this item for
2015, totalling €76,086 thousand, consists of:
a) €103,481 thousand, linked to the positive impact of changes in provisions for the repair and replacement
of motorway infrastructure and for the refurbishment of airport infrastructure, primarily relating to an
increase in the discount rate applied at 31 December 2015, compared with the rate applied at 31 December
2014;
b) provisions for the year of €27,395 thousand, including, among other things, those to cover the estimated
cost of reconstruction of the areas affected by the fire at Fiumicino airport’s Terminal 3, based on expert
assessments for design purposes, after deducting the best estimate of the insurance proceeds receivable in
order to cover this type of damage.
8.11 Use of provisions for construction services required by contract €502,495 thousand (€406,613 thousand)
This item regards the use of provisions for construction services required by contract, relating to services for
which no additional economic benefits are received rendered in 2015, less accrued government grants
(recognised in revenue from construction services, as explained in note 8.3). The item represents the indirect
adjustment to construction costs classified by nature and incurred by the Group’s operators, above all
Autostrade per l’Italia, whose concesssion arrangements provide for such obligations. The increase of €95,882
thousand is broadly linked to increased investment in the upgrade of the A1 on the section between Bologna
and Florence. This reflects completion of the motorway in view of the opening to traffic of the Variante di
Valico. Further information on construction services and capital expenditure in 2015 is provided in notes 7.2
e n. 8.3.
€000 2015 2014INCREASE/
(DECREASE)
Concession fees -477,022 -462,254 -14,768
Lease expense -16,466 -14,576 -1 ,890
Grants and donations -34,371 -30,943 -3,428
Direct and indirect taxes -23,161 -20,032 -3,129
Other -50,193 -33,845 -16,348
Other costs -107,725 -84,820 -22,905
Other operating costs -601,213 -561,650 -39,563

179
8.12 (Impairment losses) and reversals of impairment losses -€11,181 thousand (-€10,701 thousand)
The balance for 2015 essentially consists of the impairment (€5,801 thousand) of short-term financial assets
deriving from concession rights, in keeping with a revised estimate of the value of the takeover right due to
Autostrade Meridionali under the relevant concession arrangement. This company continues to operate the
section of motorway under an extension of its concession term, as described in note 10.7.
8.13 Financial income/(expenses)
-€784,954 thousand (-€679,907 thousand)
Financial income €339,870 thousand (€328,351 thousand)
Financial expenses -€1,145,343 thousand (-€1,025,594 thousand)
Foreign exchange gains/(losses) €20,519 thousand
(€17,336 thousand)
An analysis of financial income and expenses is shown below.
The increase in net financial expenses essentially reflects the non-recurring financial transactions carried out,
relating to the partial buyback of certain bonds issued by Atlantia and Atlantia’s buyback of notes issued by
Romulus Finance. Details of these transactions and of the composition of non-recurring financial expenses in
2015 (amounting to €233,509 thousand) are provided in note 8.18.
After stripping out the impact of the non-recurring financial transactions, net financial expenses are down as a
result of the following:
€000 2015 2014INCREASE/
(DECREASE)
Financial income accounted for as an increase in financial assets deriving from concession rights
and government grants63,437 56,241 7,196
Dividends received from investees 3,497 101 3,396
Income from derivative financial instruments 111,034 70,417 40,617
Financial income linked to agreements with the Bertin group - 50,067 -50,067
Financial income accounted for as an increase in financial assets 61,722 48,582 13,140
Interest and fees receivable on bank and post office deposits 31,131 49,932 -18,801
Other 69,049 53,011 16,038
Other financial income 272,936 272,009 927
Financial income (a) 339,870 328,351 11,519
Financial expenses from discounting of provisions for construction services required by contract
and other provisions-55,521 -116,269 60,748
Expenses on bonds -490,299 -571,997 81,698
Losses on derivative financial instruments -132,259 -116,916 -15,343
Interest on medium/long-term borrowings -115,190 -111,292 -3,898
Impairment losses on investments carried at cost or fair value and non-current financial assets -36,324 -44,138 7,814
Interest expense accounted for as an increase in financial liabilities -25,350 -21,548 -3,802
Interest and fees payable on bank and post office deposits -2,237 -1,124 -1,113
Other -288,398 -42,310 -246,088
of which non-recurring -233,509 - -233,509
Other financial expenses -1,090,057 -909,325 -180,732
Capitalised financial expenses on assets held under concession 235 - 235
Financial expenses (b) -1,145,343 -1,025,594 -119,749
Foreign exchange gains/(losses) (c) 20,519 17,336 3,183
Financial income/(expenses) (a+b+c) -784,954 -679,907 -105,047

3. Consolidated financial statements as at and for the year ended 31 December 2015
Annual Report 2015 180
a) reductions in interest expense and in net financial expenses payable by the companies operating in Italy
(totalling €103,139 thousand), reflecting a reduction in average net debt compared with 2014 and the
decrease in borrowing costs linked to Atlantia’s redemption of bonds with a par value of €2,094,200
thousand in June 2014 and the above-mentioned non-recurring financial transactions;
b) a reduction in financial expenses from discounting of provisions for construction services required by
contract and other provisions (€60,748 thousand), due to a reduction in the interest rates used at 31
December 2014, compared with the rates used at 31 December 2013;
c) a €9,668 thousand increase (at constant exchange rate) in interest income and net financial income
received by the companies operating in Brazil and Chile, essentially due to an increase in average cash
holdings and the greater average yield on the medium/long-term loan from AB Concessões to Infra Bertin
Empreendimentos;
d) the recognition of financial income by Autostrade do Brasil (€50,067 thousand) in 2014, linked to the
agreements entered into with the Bertin Group in connection with the acquisition of the Brazilian
operators in 2012, which also provided for an earn-out adjustment based on the effective toll revenue of
Triangulo do Sol, Rodovias das Colinas and Tieté during the three-year period 2012-2014.
8.14 Share of profit/(loss) of investees accounted for using the equity method -€17,658 thousand (-€9,157 thousand)
The “Share of (profit)/loss of investees accounted for using the equity method” amounts to a loss of €17,658
thousand, essentially attributable to the share of the losses reported by the operators, Rodovias do Tiete
(€13,307 thousand) and Pune Solapur (€5,199 thousand) for 2015, partially by the positive results of other
associates.
8.15 Income tax (expense)/benefit -€470,962 thousand (-€552,594 thousand)
A comparison of the tax charges for the two comparative periods is shown below.
Income tax expense amounts to €470,962 thousand, down €81,632 thousand on the figure for 2014
(€552,594 thousand). This essentially reflects a combination of the following:
€000 2015 2014INCREASE/
(DECREASE)
IRES -315,053 -287,840 -27,213
IRAP -78,187 -105,044 26,857
Income taxes attributable to foreign operations -71,488 -74,115 2,627
Current tax benefit of tax loss carry-forwards 4,467 5,632 -1,165
Current tax expense -460,261 -461,367 1,106
Recovery of previous years' income taxes 7,362 5,760 1,602
Previous years' income taxes 2,847 -5,286 8,133
Differences on income taxes for previous years 10,209 474 9,735
Provisions 265,683 263,715 1,968
Releases -311,489 -284,023 -27,466
Changes in prior year estimates -157,075 35,298 -192,373
Deferred tax income -202,881 14,990 -217,871
Provisions -27,407 -38,412 11,005
Releases 98,485 81,449 17,036
Changes in prior year estimates 110,893 -149,728 260,621
Deferred tax expense 181,971 -106,691 288,662
Income tax (expense)/benefit -470,962 -552,594 81,632

181
a) the recognition, in 2014, of deferred tax liabilities of €107,093 thousand, following the tax reforms
approved by the Chilean parliament, which increased corporation tax rates from 21% in 2014 to 25% from
2017;
b) recognition, in 2015, of deferred tax assets of €49,288 thousand, resulting from the corporate
restructuring carried out by the Brazilian sub-holding company, AB Concessoes, which has enabled the
Brazilian motorway operators to recognise tax-deductible goodwill, as descriobed in note 6.2;
c) the benefits of application of the 2015 Stability Law, estimated at €19,974 thousand;
d) recognition, in 2015, of net deferred tax expense of €42,439 thousand, following the reduction in the
IRES (corporation tax) rate from 27.5% to 24% with effect from 1 January 2017, introduced by the 2016
Stability Law, which resulted in a reassessment of the Group’s net deferred tax assets and liabilities.
The following table shows a reconciliation of the Statutory rate of IRES with the effective charge in the two
comparative periods.
8.16 Profit/(Loss) from discontinued operations
€6,983 thousand (€64,537 thousand)
An analysis of the net profit from discontinued operations for the two comparative periods is shown below.
TAX TAX RATE TAX TAX RATE
Pre-tax prof i t/( loss ) f rom cont inu ing operat ions 1,438,314 1,261,545
Tax expense computed using statutory rate applied by Parent Company 395,536 27.5% 346,925 27.5%
Temporary differences deductible in future years 717,714 192,842 13.4% 854,558 228,795 18.1%
Temporary differences taxable in future years -100,912 -25,649 -1.8% -141,805 -34,261 -2.7%
Reversal of prior year temporary differences -762,460 -196,790 -13.7% -687,411 -177,251 -14.1%
Permanent differences 78,306 18,610 1.3% -36,620 -7,341 -0.6%
Effect on taxation of application of different rates in various foreign countries -2,475 -0.2% -1,948 -543 -
IRAP 78,187 5.4% 105,044 8.3%
TOTAL 460,261 32.0% 461,367 36.6%
2014€000 BEFORE TAX
2015BEFORE TAX
€000 2015 2014Increase/
(Decrease)
Operating income - 214,636 -214,636
Operating costs -5,251 -178,159 172,908
Financial income 10,730 12,891 -2,161
Financial expenses -11,541 -50,953 39,412
Tax benefit/(expense) 13,045 -6,953 19,998
Net contribution to net profit of discontinued operations 6,983 -8,538 15,521
After-tax profit/(loss) on disposals - 69,718 -69,718
Other net profit/(loss) from discontinued operations - 3,357 -3,357
Profit/(Loss) from discontinued operations 6,983 64,537 -57,554

3. Consolidated financial statements as at and for the year ended 31 December 2015
Annual Report 2015 182
Both comparative periods reflect the resulyts of the French companies engaged in the “Ecotaxe” project,
classified in accordance with IFRS 5 following early termination of the project, as previously described in the
consolidated financial statements as at and for the year ended 31 December 2014. In addition, the amount for
2014 included the result of the sale of TowerCo, including both the operating results through to the
company’s deconsolidation and the gain recognised in the consolidated financial statements, totalling €69,795
thousand after the related taxation.

183
8.17 Earnings per share
The following table shows the calculation of basic and diluted earnings per share for the two comparative
periods.
The weighted number of treasury shares held by the Group is down compared with 2014, due to both the
exercise and conversion of a number of options and units awarded under the Group’s share-based incentive
plans, as described in greater detail in note 10.6, and the impact of the sale of 9,741,513 treasury shares to
institutional investors, as described in note 7.12.
8.18 Material non-recurring transactions
During 2015, the Group concluded the following non-recurring financial transactions:
a) Atlantia’s buyback of 99.87% of the asset-backed securities (ABS – CLASS A4) issued by Romulus Finance
(the special purpose entity controlled by Aeroporti di Roma and consolidated in the Atlantia Group),
resulting in non-recurring net financial expenses of €112,832 thousand, before the related taxation;
b) the partial buyback of bonds issued by Atlantia and maturing in 2016, 2017, 2019 and 2020, resulting in
non-recurring net financial expenses of €120,677 thousand, before the related taxation.
With regard to the first transaction, in January 2015 Atlantia launched voluntary cash tender offer, governed
by English law, for all the asset backed securities named “£215,000,000 5.441% per cent Class A4 Notes due
2023” issued by Romulus Finance. At the end of the offer period, acceptances had been received for 99.87%
of the total securities in issue at a total cost of €286,682 thousand. Completion of the transaction on 27
January 2015 resulted in the recognition of non-recurring financial expenses of €112,832 thousand, which
breaks down as follows:
a) €60,203 thousand relating to the premium paid by Atlantia to Romulus Finance’s noteholders to
purchase the securities in issue;
b) €66,069 thousand, relating to reclassification to profit or loss of fair value losses on the cash flow
hedges entered into to hedge the notes issued by Romulus, as they no longer qualify as cash flow hedges;
c) €25,011 thousand accounted for as a reduction in financial expenses, deriving from the reclassification, to
profit or loss, of the residual fair value accounted for as an adjustment of the carrying amount of the notes,
at the date of Atlantia’s acquisition of the former Gemina group companies;
d) the cost of terminating the guarantee for the notes issued by Romulus Finance, resulting in recognition of
financial expense of €11,571 thousand.
Weighted average of shares outstanding 825,783,990 825,783,990
Weighted average of treasury shares in portfolio -4,456,170 -12,765,737
Weighted average of shares outstanding for the calculation of basic earnings
per share821,327,820 813,018,253
Weighted average of diluted shares held under share-based incentive plans 1,381,762 1,145,986
Weighted average of all shares outstanding for the calculation of diluted
earnings per share822,709,582 814,164,239
Profit for the year attributable to owners of the parent (€000) 852,527 740,252
Basic earnings per share (€) 1.04 0.91
Diluted earnings per share (€) 1.04 0.91
Profit from continuing operations attributable to owners of the parent (€000) 847,482 673,113
Basic earnings per share from continuing operations (€) 1.03 0.83
Diluted earnings per share from continuing operations (€) 1.03 0.83
Profit from discontinued operations attributable to owners of the parent (€000) 5,045 67,139
Basic earnings/(losses) per share from discontinued operations (€) 0.01 0.08
Diluted earnings/(losses) per share from discontinued operations (€) 0.01 0.08
2015 2014

3. Consolidated financial statements as at and for the year ended 31 December 2015
Annual Report 2015 184
In 2015, Atlantia then launched tender offers with the aim of partially repurchasing the following bonds issued
by the Company.
The first tender offer, in February 2015, was aimed at holders of the following bonds:
a) 5.625%, having a total par value of €1,500,000 thousand, maturing 2016 (“Bonds due 2016”);
b) 3.375%, having a total par value of €1,000,000 thousand, maturing 2017 (“Bonds due 2017”);
c) 4.500%, having a total par value of €1,000,000 thousand, maturing 2019 (“Bonds due 2019”).
The tender offer closed on 25 February 2015, with the par value of the repurchased bonds totalling
€1,020,130 thousand, compared with a total purchase price of €1,102,245 thousand, inclusive of a premium
of €82,115 thousand paid to bondholders accepting the offer.
The second tender offer, in December 2015, was aimed at holders of the following bonds:
a) 3.375%, having a total par value of €1,000,000 thousand, maturing 2017 (“Bonds due 2017”);
b) 4.500%, having a total par value of €1,000,000 thousand, maturing 2019 (“Bonds due 2019”);
c) 4.375%, having a total par value of €750,000 thousand, maturing 2020 (“Bonds due 2020”).
The tender offer closed in December 2015, with the par value of the repurchased bonds totalling €331,120
thousand, compared with a total purchase price of €369,682 thousand, including a premium of €38,562
thousand paid to bondholders accepting the offer.
As a result of the above financial transactions, the Group has recognised financial expenses of €233,509
thousand, before the related taxation of €67,568 thousand. This results in a net impact on the result for the
year of €165,941 thousand. In this regard, it should be noted that, in return for the net financial expenses
incurred in 2015 as a result of the above non-recurring financial transactions, in present and future years the
Group will benefit from an equivalent reduction in its cost of debt.
8.19 Material non-recurring events
The fire that broke out in Terminal 3 at Fiumicino airport, operated by Aeroporti di Roma, in May 2015 has
resulted in a loss of aviation and non-aviation revenue, additional expenses for safety procedures and the need
to make specific provisions, all of which having an impact on the operating results.
In particular, Aeroporti di Roma has incurred the cost of the safety and salvage procedures carried out in the
areas affected by the fire, partially covered by recognition, in other operating income, of prudently assessed
insurance proceeds (including €5 million already received in advance).
With regard to the cost of rebuilding the damaged infrastructure, provisions for the year include the estimated
cost of reconstruction of the areas affected by the fire, based on expert assessments for design purposes,
partially covered by the recognition of insurance proceeds payable under an existing policy.
Provisions have been made to cover third-party claims for damages, calculated on the basis of the best
information currently available, of the liabilities, other than those covered by existing insurance policies, the
company is likely to be required to pay once final responsibility for the incident has been determined.
Finally, it should be noted that the operating performance was influenced by the loss of aviation and non-
aviation revenue caused by the fire and that Aeroporti di Roma immediately proceeded to claim on its
insurance policies and which also cover the loss of income resulting from business interruption. However,
given that the entity of the damage is still being assessed, no insurance proceeds covering such a loss have been
recognised in these consolidated financial statements.
Further information on the fire is provided in the section, “Significant legal and regulatory aspects”, in note
10.7.

185
9. OTHER FINANCIAL INFORMATION
9.1 Notes to the consolidated statement of cash flows
Consolidated cash flow in 2015, compared with 2014, is analysed below. The consolidated statement of cash
flows is included in the “Consolidated financial statements”.
Cash flows during 2015 resulted in an increase of €1,066,865 thousand in cash and cash equivalents, versus a
net cash outflow of €2,440,731 thousand in 2014.
Operating activities generated cash flows of €2,210,820 thousand in 2015, up €387,512 thousand on the figure
for 2014 (€1,823,308 thousand). The increase is primarily attributable to the inflow generated from working
capital and other non-financial assets and liabilities, totalling €105,718 thousand, compared with an outflow of
€256,016 thousand in 2014. This differing performance primarily reflects collection, in March 2015, of
compensation payable by the French government, following early termination of the “EcoTaxe” project in
2014, following the signature, in June 2014, of a memorandum of understanding with the French
government.
Cash used in investing activities, totalling €1,340,525 thousand (€716,174 thousand in 2014), essentially
regards the following:
a) investment in assets held under concession, after the related government grants and the increase in
financial assets deriving from concession rights, totalling €1,200,954 thousand;
b) investment in property, plant and equipment, totalling €95,525 thousand, primarily attributable to
Autostrade per l’Italia, Aeroporti di Roma and Pavimental;
c) the amount invested in order to acquire a controlling interest in SAT (amounting to €71,674 thousand),
including the outflow incurred in 2015 to fund the purchase of a 74.95% interest, after the cash and cash
equivalents contributed by the company.
Net cash generated by financing activities amounts to €172,578 thousand for 2015, whilst 2014 recorded an
outflow of €3,550,706 thousand as a result of the redemption of bonds and the repayment of borrowings.
The following table shows net cash flows generated from discontinued operations, including the contributions
of the French companies (Ecomouv, Ecomouv D&B and Tech Solutions Integrators) in the two comparative
periods and TowerCo’s contribution for 2014, through to this company’s deconsolidation. These cash flows
are included in the consolidated statement of cash flows under operating, investing and financing activities.
9.2 Financial risk management The Atlantia Group’s financial risk management objectives and policies In the normal course of business, the Atlantia Group is exposed to:
a) market risk, principally linked to the effect of movements in interest and foreign exchange rates on
financial assets acquired and financial liabilities assumed;
b) liquidity risk, with regard to ensuring the availability of sufficient financial resources to fund the Group’s
operating activities and repayment of the liabilities assumed;
€M 2015 2014
Net cash generated from/(used in) operating activities 96 -192
Net cash generated from/(used in) investing activities 247 404
Net cash generated from/(used in) financing activities -280 -193
Cash flows from discontinued operations

3. Consolidated financial statements as at and for the year ended 31 December 2015
Annual Report 2015 186
c) credit risk, linked to both ordinary trading relations and the likelihood of defaults by financial
counterparties.
The Atlantia Group’s financial risk management strategy is derived from and consistent with the business goals
set by the Atlantia Board of Directors, as contained in the various long-term plans prepared each year.
Market risk The adopted strategy for each type of risk aims, wherever possible, to eliminate interest rate and currency risks
and minimise borrowing costs, whilst taking account of stakeholders’ interests, as defined in the Financial
Policy as approved by Atlantia’s Board of Directors.
Management of these risks is based on prudence and best market practice.
The main objectives set out in this policy are as follows:
a) to protect the scenario forming the basis of the long-term plan from the effect of exposure to currency
and interest rate risks, identifying the best combination of fixed and floating rates;
b) to pursue a potential reduction of the Group’s borrowing costs within the risk limits determined by the
Board of Directors;
c) to manage derivative financial instruments taking account of their potential impact on the results of
operations and financial position in relation to their classification and presentation.
The Group's hedges outstanding as at 31 December 2015 are classified, in accordance with IAS 39, either as
cash flow or fair value hedges, depending on the type of risk hedged. Fair value measurement of derivative
financial instruments is dealt with in note 3. The residual average term to maturity of the Group’s debt as at 31
December 2015 is approximately 6 years and 6 months. The average cost of medium to long-term debt for
2015 was 4.5% (4.2% for the companies operating in Italy, 7.5% for the Chilean companies and 14.9% for the
Brazilian companies). Monitoring is, moreover, intended to assess, on a continuing basis, counterparty
creditworthiness and the degree of risk concentration.
Interest rate risk
This risk is linked to uncertainty regarding the performance of interest rates, and takes two forms:
a) cash flow risk: linked to financial assets and liabilities with cash flows indexed to a market interest rate. In
order to reduce the amount of floating rate debt, the Group has entered into interest rate swaps (IRSs),
classified as cash flow hedges. The hedging instruments and the underlying financial liabilities have
matching terms to maturity and notional amounts. Following tests of effectiveness, changes in fair value
are essentially recognised in other comprehensive income. The tests conducted revealed the presence of a
minimal ineffective portion (€966 thousand), accounted for in profit or loss and linked primarily to the
impact of IFRS 13 on the new Forward-Starting IRSs with a total notional value of €2,200 million,
variable durations of 6, 7 and 8 years and a weighted average fixed rate of 1.16%, entered into to hedge
highly likely future financial liabilities to be assumed through to 2017 in order to meet Autostrade per
l’Italia’s expected financing requirements. Interest income or expense deriving from the hedged
instruments is recognised simultaneously in profit or loss;
b) fair value risk: the risk of losses deriving from an unexpected change in the value fixed rate financial assets
and liabilities following an unfavourable shift in the market yield curve. As at 31 December 2015, the
Group reports transactions classifiable as fair value hedges in accordance with IAS 39, regarding the
previously mentioned new IPCA Linked Swaps entered into by the Brazilian companies, Triangulo do Sol
and Colinas, with the aim of converting the real IPCA rate bonds issued in 2013 to a floating CDI rate.
Changes in the fair value of these instruments are recognised in profit or loss and are offset by matching
changes in the fair value of the underlying liabilities.
As a result of cash flow hedges, 92% of interest bearing debt is fixed rate.
Currency risk Currency risk can result in the following types of exposure:

187
a) economic exposure incurred through purchases and sales denominated in currencies other than the
company's functional currency;
b) translation exposure through equity investments in subsidiaries and associates whose financial statements
are denominated in a currency other than the euro;
c) transaction exposure incurred by making deposits or obtaining loans in currencies other than the
currency in which financial statements are denominated.
The Group's prime objective of currency risk is to minimise transaction exposure through the assumption of
liabilities in currencies other than the presentation currency. Cross currency swaps (CCIRS) with notional
amounts and maturities matching those of the underlying financial liabilities have been entered into
specifically to eliminate the currency risk to which the sterling and yen-denominated bonds issued by Atlantia
are exposed. These swaps also qualify as cash flow hedges and tests have shown that they are fully effective.
Following Atlantia’s buyback of 99.87% of the sterling-denominated notes, amounting to £215 million,
issued by Romulus Finance (the special purpose entity controlled by Aeroporti di Roma), the Cross Currency
Swaps entered into by Atlantia and Aeroporti di Roma to hedge interest and currency risk associated with the
underlying in foreign currency, no longer qualify for hedge accounting in the consolidated financial
statements. The fair value, recognised in the other comprehensive income of the respective companies (as at 31
December 2015, amounting to €61 million) has, therefore, been accounted for in profit or loss in the
consolidated financial statements.
16% of the Group’s debt is denominated in currencies other than the euro. Taking account of foreign
exchange hedges and the proportion of debt denominated in the local currency of the country in which the
relevant Group company operates (around 10%), the Group is effectively not exposed to currency risk on
translation.
The following table summarises outstanding derivative financial instruments as at 31 December 2015
(compared with 31 December 2014) and shows the corresponding market and notional values of the hedged
financial asset or liability.
Sensitivity analysis Sensitivity analysis describes the impact that the interest rate and foreign exchange movements to which the
Group is exposed would have had on the consolidated income statement for 2015 and on equity as at 31
December 2015.
Type Purpose of hedgeFair value
asset/(liability)Notional amount
Fair value
asset/(liability)Notional amount
Cross Currency Swaps Currency and interest rate risk -209,018 899,176 -401,088 (2) 1,224,195
Interest Rate Swaps Interest rate risk -146,997 3,132,107 -115,119 942,591
Total cash flow hedges -356,015 4,031,283 -516,207 2,166,786
IPCA x CDI Swaps Interest rate risk -12,461 154,954 -9,800 225,670
Cross Currency Swaps (1) Currency and interest rate risk -99,045 611,701 - -
FX Forwards Currency risk 36 (3) 35,914 -1,034 (3) 31,230
Total derivatives not accounted for as
hedges-99,009
647,615-1,034
31,230
-467,485 4,833,852 -527,041 2,423,686
fair value (asset) 598 -
fair value (liability) -468,083 -527,041
TOTAL
(1) The fair value of cash flow hedges excludes accruals at the measurement date.
(2) As at 31 December 2014, this included the fair value of derivatives entered into by Aeroporti di Roma to hedge currency risk associated with the Class A4 notes issued by Romulus Finance in
pounds sterling, which no longer qualify for hedge accounting as at 31 December 2015 following Atlantia's repurchase of 99.87% of the notes.
(3) The fair value of these derivatives is classified in short-term assets and liabilities.
Derivatives not accounted for as hedges
€000 31 December 2015 31 December 2014
Cash flow hedges (1)
Fair value hedges (1)

3. Consolidated financial statements as at and for the year ended 31 December 2015
Annual Report 2015 188
The interest rate sensitivity analysis is based on the exposure of derivative and non-derivative financial
instruments at the end of the year, assuming, in terms of the impact on the income statement, a 0.10% (10
bps) shift in the market yield curve at the beginning of the year, whilst, with regard to the impact of changes in
fair value on other comprehensive income, the 10 bps shift in the curve was assumed to have occurred at the
measurement date. The results of the analyses were:
a) in terms of interest rate risk, an unexpected and unfavourable 0.10% shift in market interest rates would
have resulted in a negative impact on the consolidated income statement, totalling €989 thousand, and on
other comprehensive income, totalling €26,439 thousand, before the related taxation;
b) in terms of currency risk, an unexpected and unfavourable 10% shift in the exchange rate would have
resulted in a negative impact on the consolidated income statement, totalling €22,716 thousand, and on
other comprehensive income, totalling €233,769 thousand, due to the adverse effect on the overseas
companies’ after-tax results and changes in the foreign currency translation reserves.
Liquidity risk Liquidity risk relates to the risk that cash resources may be insufficient to fund the payment of liabilities as they
fall due. The Atlantia Group believes that its ability to generate cash, the ample diversification of its sources of
funding and the availability of committed and uncommitted lines of credit provides access to sufficient sources
of finance to meet its projected financial needs.
As at 31 December 2015, project debt allocated to specific overseas companies amounts to €1,828 million. At
the same date the Group has cash reserves of €5,688 million, consisting of:
a) €2,997 million in cash and/or investments maturing in the short term;
b) €547 million in term deposits allocated primarily to part finance the execution of specific construction
services and to service the debt of certain Chilean companies;
c) €2,144 million in undrawn committed lines of credit. The Group has lines of credit with a weighted
average residual term to maturity – computed with reference to expiry of the drawdown period - of
approximately 8 years and 5 months and a weighted average residual drawdown period of approximately 2
year and 3 months.
Details of drawn and undrawn committed lines of credit are shown below.
The following schedules show the distribution of loan maturities outstanding as at 31 December 2015 and 31
December 2014.
The amounts in the above tables include interest payments and exclude the impact of any offset agreements. The time distribution of terms to maturity is based on the residual contract term or on the earliest date on
which repayment of the liability may be required, unless a better estimate is available.
Borrower Line of creditDrawdown period
expiresFinal maturity Available Drawn Undrawn
Autostrade per l'Italia Medium/long-term committed EIB line 2013 "Environment and Motorw ay Safety" 31 Dec 2017 15 Sept 2037 200 - 200
Autostrade per l'Italia Medium/long-term committed EIB line 2010 "Upgrade A14 B" 31 Dec 2017 31 Dec 2036 300 100 200
Autostrade per l'Italia Medium/long-term committed EIB line 2013 "Florence Bologna IV B" 31 Dec 2017 15 Sept 2038 250 150 100
Autostrade per l'Italia Medium/long-term committed CDP/SACE line 23 Sept 2016 23 Dec 2024 1,000 200 800
Autostrade per l'Italia Medium/long-term committed CDP A1 2012 line 21 Nov 2020 20 Dec 2021 700 200 500
Autostrade Meridionali Short-term loan from Banco di Napoli 30 June 2016 31 Dec 2016 300 245 55
Pavimental Buyer's Credit Euler Hermes loan 31 Aug 2017 30 Sept 2025 50 11 39
Aeroporti di Roma Committed Revolving Facility 16 Nov 2018 16 Dec 2018 250 - 250
Lines of credit 3,050 906 2,144
31 December 2015€M

189
The distribution for transactions with amortisation schedules is based on the date on which each instalment
falls due. The following table shows the time distribution of expected cash flows from cash flow hedges, and the financial
years in which they will be recognised in profit or loss.
31 December 2015
Non-derivative f inancial l iabilities (1)
Bond issues (A) 11,386,551 -14,716,589 -1,542,245 -1,097,359 -3,687,641 -8,389,344
Medium/long-term borrowings ( 2)
Total bank borrowings 3,308,211 -4,230,486 -249,397 -299,687 -877,141 -2,804,261
Total other borrowings 202,149 -52,280 - - -52,280 -
Total medium/long-term borrowings (B) 3,510,360 -4,282,766 -249,397 -299,687 -929,421 -2,804,261
Total non-derivative f inancial l iabilities (C ) = (A)+(B) 14,896,911 -18,999,355 -1,791,642 -1,397,046 -4,617,062 -11,193,605
Derivatives ( 2) ( 3)
Interest rate swaps (4)
146,997 -379,025 -22,379 -35,340 -133,789 -187,517
IPCA x CDI Swaps (4)
12,461 52,020 -7,833 -3,779 15,760 47,872
Cross currency swaps 308,625 -244,355 -12,241 -11,971 -36,163 -183,980
Total derivatives 468,083 -571,360 -42,453 -51,090 -154,192 -323,625
(1) Future cash flows relating to interest on bond issues and floating rate loans have been projected on the basis of the latest established rate and applied and held constant to final maturity.
(2) As at 31 December 2015, expected contractual flows are linked to the hedging of outstanding and highly likely future financial liabilities to meet funding requirements through to 2017 .
(3) Expected future cash flows from differentials on derivatives have been projected on the basis of the exchange rate fixed at the measurement date.
(4) Future cash flows relating to differentials on interest rate swaps (IRS) and IPCA x CDI Swaps have been projected on the basis of the latest interest rate fixed and held constant to the maturity of the contract.
31 December 2014
Non-derivative f inancial l iabilities ( 1)
Bond issues (A) 10,493,593 -13,815,143 -675,641 -2,082,053 -4,401,347 -6,656,101
Medium/long-term borrowings ( 2)
Total bank borrowings 3,495,168 -4,418,940 -460,848 -229,456 -880,435 -2,848,201
Total other borrowings 161,710 -83,460 -31,293 - -46,909 -5,258
Total medium/long-term borrowings (B) 3,656,878 -4,502,400 -492,141 -229,456 -927,344 -2,853,459
Total non-derivative f inancial l iabilities (C ) = (A)+(B) 14,150,471 -18,317,543 -1,167,782 -2,311,509 -5,328,691 -9,509,560
Derivatives ( 3) ( 4)
Interest rate swaps (5)
115,119 -308,420 -45,813 -37,486 -112,251 -112,870
IPCA x CDI Swaps (5)
9,800 61,384 -6,753 -4,400 10,994 61,543
Cross currency swaps 401,088 -364,367 -15,776 -16,025 -47,411 -285,155
Total derivatives 526,007 -611,403 -68,342 -57,911 -148,668 -336,482
(1) Future cash flows relating to interest on bond issues and floating rate loans have been projected on the basis of the latest established rate and applied and held constant to final maturity.
(2) This item includes the French companies' liabilities classified in liabilities related to discontinued operations.
(3) Expected contractual flows are linked to the outstanding hedged financial liabilities as at 31 December 2014.
(4) Expected future cash flows from differentials on derivatives have been projected on the basis of the exchange rate fixed at the measurement date.
(5) Future cash flows relating to differentials on interest rate swaps (IRS) and IPCA x CDI Swaps have been projected on the basis of the latest interest rate fixed and held constant to the maturity of the contract.
€000
€000Carrying amount
Total contractual
f lows
Within 12
months
Between 1
and 2 years
Between 3
and 5 yearsAfter 5 years
Carrying amountTotal contractual
f lows
Within 12
months
Between 1
and 2 years
Between 3
and 5 yearsAfter 5 years

3. Consolidated financial statements as at and for the year ended 31 December 2015
Annual Report 2015 190
Credit risk The Group manages credit risk essentially through recourse to counterparties with high credit ratings, with no
significant credit risk concentrations as required by Financial Policy.
Credit risk deriving from outstanding derivative financial instruments can also be considered marginal in that
the counterparties involved are major financial institutions. There are no margin agreements providing for the
exchange of cash collateral if a certain fair value threshold is exceeded.
Provisions for impairment losses on individually material items, on the other hand, are established when there
is objective evidence that the Group will not be able to collect all or any of the amount due. The amount of the
provisions takes account of estimated future cash flows and the date of collection, any future recovery costs and
expenses, and the value of any security and guarantee deposits received from customers. General provisions,
based on the available historical and statistical data, are established for items for which specific provisions have
not been made. Details of the allowance for bad debts for trade receivables are provided in note 7.7.
Interest rate swaps
Derivative liabilities -146,997 -151,096 -32,109 -33,235 -75,637 -10,115 115,119- 119,120- 27,642- 15,664- 37,644- 38,170-
Cross currency swaps
Assets
Liabilities -209,018 -210,928 -7,013 -7,440 -26,526 -169,949 401,088- 404,598- 15,071- 15,698- 49,224- 324,605-
Total cash flow hedges -356,015 -362,024 -39,122 -40,675 -102,163 -180,064 516,207- 523,718- 42,713- 31,362- 86,868- 362,775-
Accrued expenses on cash flow hedges -30,154 30,253-
Accrued income on cash flow hedges 24,145 22,742
Total cash flow hedge derivative assets/liabilities -362,024 -362,024 -39,122 -40,675 -102,163 -180,064 523,718- 523,718- 42,713- 31,362- 86,868- 362,775-
Interest rate swaps
Income from cash flow hedges 10,871 - - - 10,871 - - - - -
Losses on cash flow hedges -157,868 -27,560 -34,017 -75,370 -20,921 -115,119 -27,451 -15,355 -36,343 -35,970
Cross currency swaps
Income from cash flow hedges 1,086,742 46,469 45,912 132,932 861,429 1,421,636 36,426 80,579 170,899 1,133,732
Losses on cash flow hedges -1,295,760 -53,849 -53,761 -160,506 -1,027,644 -1,822,724 -48,393 -99,729 -220,929 -1,453,673
Total income ( losses) from cash flow hedges -356,015 -34,940 -41,866 -102,944 -176,265 -516,207 -39,418 -34,505 -86,373 -355,911
Expected
cash flows ( 1)
Within 12
months
Between 1
and 2 years
Between 3
and 5 yearsAfter 5 years
(1) Expected cash flows from swap differentials are calculated on the basis of market curves at the measurement date.
31 December 2015 31 December 2014
€000 Expected
cash flows ( 1)
Within 12
months
Between 1
and 2 years
Between 3
and 5 yearsAfter 5 years
After 5 years
Derivati di copertura dei flussi di cassa - gestione dei rischi finanziari sezione rischio liquidità
31 December 2015 31 December 2014
€000 Carrying
amount
Expected
cash flows ( 1)
Within 12
months
Between 1
and 2 years
Between 3
and 5 yearsAfter 5 years
Carrying
amount
Expected
cash flows ( 1)
Within 12
months
Between 1
and 2 years
Between 3
and 5 years

191
10. OTHER INFORMATION
10.1 Operating and geographical segments
Operating segments
The Atlantia Group’s operating segments are identified based on the information provided to and analysed by
Atlantia’s Board of Directors, which represents the Group’s chief operating decision maker, taking decisions
regarding the allocation of resources and assessing performance. In particular, the Board of Directors assesses
the performance of the business in terms of geographical area and business segment.
The composition of the Atlantia Group’s operating segments is as follows:
a) Italian motorways: this includes the Italian motorway operators (Autostrade per l’Italia, Autostrade
Meridionali, Tangenziale di Napoli, Società italiana per azioni per il Traforo del Monte Bianco and
Raccordo Autostradale Valle d’Aosta), whose core business consists of the management, maintenance,
construction and widening of the related motorways operated under concession. This operating segment
also include the motorway operator, Autostrada Tirrenica, following the acquisition of control of this
company and its consolidation from 30 September 2015. In addition, this segment also includes Telepass,
the companies that provide support for the motorway business in Italy, and the Italian holding company,
Autostrade dell’Atlantico, which holds investments in South America;
b) overseas motorways: this includes the activities of the holders of motorway concessions in Brazil, Chile
and Poland, and the companies that provide operational support for these operators and the related
foreign-registered holding companies;
c) Italian airports: this includes the airports business of Aeroporti di Roma, which holds the concession to
operate and expand the airports of Rome Fiumicino and Rome Ciampino, and the companies responsible
for supporting and developing the airports business;
d) Atlantia and other activities: this segment includes:
1) the Parent Company, Atlantia, which operates as a holding company for its subsidiaries and associates
whose business is the construction and operation of motorways, airports and transport infrastructure,
parking areas and intermodal systems, or who engage in activities related to the management of
motorway or airport traffic;
2) a number of subsidiaries that produce and operate free-flow tolling systems, traffic and transport
management systems, and public information and electronic payment systems. The most important
companies in this segment are Autostrade Tech and Electronic Transaction Consultants. In addition,
adjusted operating cash flow for 2014 benefitted from the contribution of Ecomouv (the “EcoTaxe”
project), which ceased operations following the French government’s decision to terminate the related
partnership agreement on 30 October 2014;
3) infrastructure design, construction and maintenance, essentially carried out by Pavimental and Spea
Engineering.
Other than those identified and presented in the following tables, there are no other operating segments that
meet the quantitative thresholds provided for by IFRS 8.
The column “Consolidation adjustments” includes consolidation adjustments and intersegment eliminations.
The “Unallocated items” include income and cost components that have not been allocated to the individual
segments. These regard: revenue from construction services recognised in accordance with IFRIC 12 by the
Group’s operators, depreciation, amortisation, impairment losses and reversals of impairment losses,
provisions and other adjustments, financial income and expenses and income tax expense. In relation to the
information used to assess the performances of its operating segments, the Group reports EBITDA (calculated
as shown below), deemed to be an appropriate means of assessing the results of the Atlantia Group and its
operating segments.
A summary of the key performance indicators for each segment, identified in accordance with the
requirements of IFRS 8, is shown below.

3. Consolidated financial statements as at and for the year ended 31 December 2015
Annual Report 2015 192
The following should be noted with regard to the operating segment information presented in the above tables:
a) intersegment revenue regards intragroup transactions between companies in different operating
segments. They relate primarily to the design and construction of infrastructure carried out by Pavimental
and Spea Engineering;
b) total revenue does not include the balance of revenue from construction services, totalling €723 million
in 2015 and €564 million in 2014;
c) EBITDA is calculated by deducting all operating costs, with the exception of amortisation, depreciation,
impairment losses on assets and reversals of impairment losses, provisions and other adjustments, from
operating revenue;
d) EBIT is calculated by deducting amortisation, depreciation, impairment losses on assets and reversals of
impairment losses, provisions and other adjustments from EBITDA. EBIT differs from the item
“Operating profit” in the consolidated income statement due to the fact that the capitalised component of
External revenue 3,764 546 803 191 - - 5,304
Intersegment revenue (a) 13 - 1 569 -583 - -
Total revenue (b) 3,777 546 804 760 -583 - 5,304
EBITDA (c) 2,314 407 450 44 - - 3,215
Amortisation, depreciation, impairment losses
and reversals of impairment losses-918 -918
Provisions and other adjustments -85 -85
EBIT (d) 2,212
Financial income/(expenses) -774 -774
Profit/(Loss) before tax from continuing
operations1,438
Income tax (expense)/benefit -470 -470
Profit/(Loss) from continuing operations 968
Profit/(Loss) from discontinued operations 7 7
Profit for the period 975
Operating cash flow (e) 1,471 330 320 -16 - - 2,105
Capital expenditures (f) 967 172 318 41 -10 - 1,488
€M
2015
Italian motorwaysOverseas
motorwaysItalian airports
Atlantia
and
other activities
Consolidation
adjustmentsUnallocated items
Total consolidated
amounts
External revenue 3,659 541 751 132 - - 5,083
Intersegment revenue (a) 19 - - 452 -471 - -
Total revenue (b) 3,678 541 751 584 -471 - 5,083
EBITDA (c) 2,261 412 466 30 - - 3,169
Amortisation, depreciation, impairment losses
and reversals of impairment losses-867 -867
Provisions and other adjustments -369 -369
EBIT (d) 1,933
Financial income/(expenses) -671 -671
Profit/(Loss) before tax from continuing
operations1,262
Income tax (expense)/benefit -553 -553
Profit/(Loss) from continuing operations 709
Profit/(Loss) from discontinued operations 64 64
Profit for the period 773
Operating cash flow (e) 1,417 320 337 5 - - 2,079
Capital expenditures (f) 774 156 151 18 1 - 1,100
2014
€M Italian motorwaysOverseas
motorwaysItalian airports
Atlantia
and
other activities
Consolidation
adjustmentsUnallocated items
Total consolidated
amounts
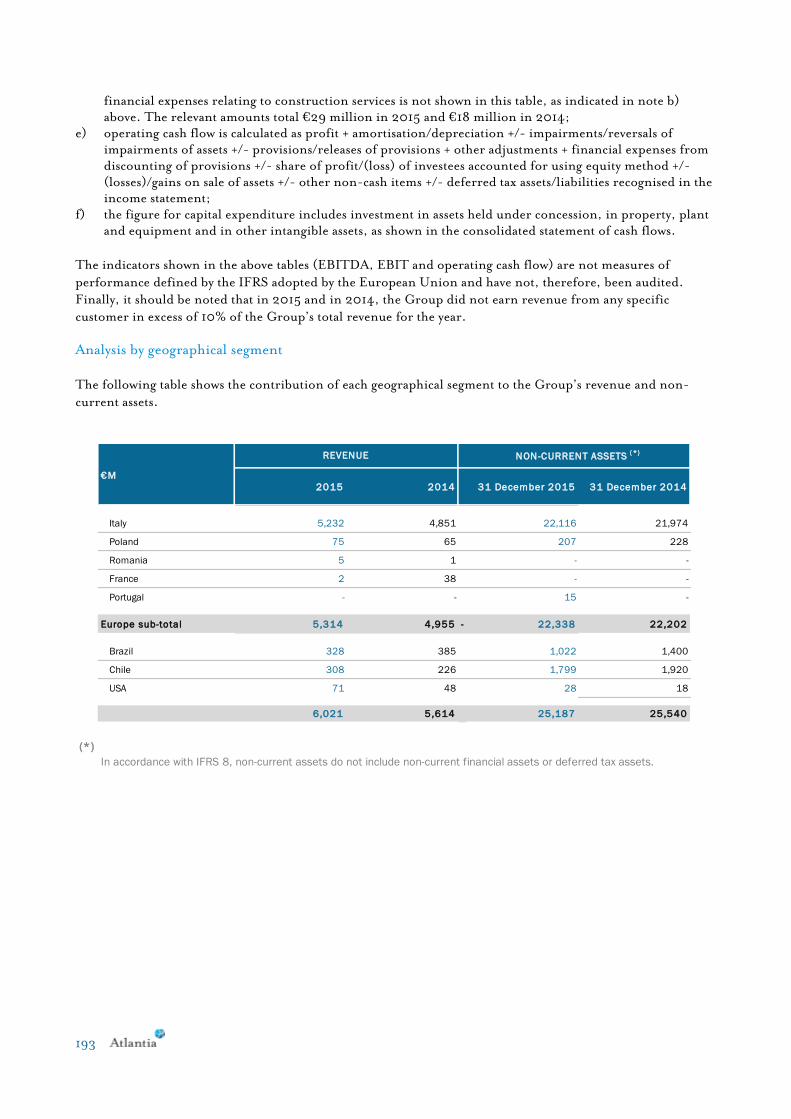
193
financial expenses relating to construction services is not shown in this table, as indicated in note b)
above. The relevant amounts total €29 million in 2015 and €18 million in 2014;
e) operating cash flow is calculated as profit + amortisation/depreciation +/- impairments/reversals of
impairments of assets +/- provisions/releases of provisions + other adjustments + financial expenses from
discounting of provisions +/- share of profit/(loss) of investees accounted for using equity method +/-
(losses)/gains on sale of assets +/- other non-cash items +/- deferred tax assets/liabilities recognised in the
income statement;
f) the figure for capital expenditure includes investment in assets held under concession, in property, plant
and equipment and in other intangible assets, as shown in the consolidated statement of cash flows.
The indicators shown in the above tables (EBITDA, EBIT and operating cash flow) are not measures of
performance defined by the IFRS adopted by the European Union and have not, therefore, been audited.
Finally, it should be noted that in 2015 and in 2014, the Group did not earn revenue from any specific
customer in excess of 10% of the Group’s total revenue for the year.
Analysis by geographical segment
The following table shows the contribution of each geographical segment to the Group’s revenue and non-
current assets.
€M
2015 2014 31 December 2015 31 December 2014
Italy 5,232 4,851 22,116 21,974
Poland 75 65 207 228
Romania 5 1 - -
France 2 38 - -
Portugal - - 15 -
Europe sub-total 5,314 4,955 - 22,338 22,202
Brazil 328 385 1,022 1,400
Chile 308 226 1,799 1,920
USA 71 48 28 18
6,021 5,614 25,187 25,540
REVENUE NON-CURRENT ASSETS ( *)
(*)
In accordance with IFRS 8, non-current assets do not include non-current financial assets or deferred tax assets.

3. Consolidated financial statements as at and for the year ended 31 December 2015
Annual Report 2015 194
10.2 Disclosures regarding non-controlling interests in
consolidated companies and structured entities
Disclosure regarding non-controlling interests The following list shows the principal consolidated companies with non-controlling interests as at 31
December 2015 (with the relevant comparatives as at 31 December 2014). A complete list of the Group’s
investments as at 31 December 2015 is provided in Annex 1, “The Atlantia Group’s scope of consolidation and
investments”.
The consolidated companies deemed relevant for the Atlantia Group, in terms of the percentage interests held
by non-controlling shareholders for the purposes of the disclosures required by IFRS 12, are the following:
a) the Brazilian sub-holding company, AB Concessões, and its subsidiaries;
b) the Chilean sub-holding company, Grupo Costanera, and its direct and indirect subsidiaries;
c) Aeroporti di Roma and its subsidiaries.
The non-controlling interests in these sub-groups of companies are deemed relevant in relation to their
contribution to the Atlantia Group’s consolidated accounts. In addition, the non-controlling interest in AB
GROUP
INTEREST
NON-
CONTROLLING
INTERESTS
GROUP
INTEREST
NON-
CONTROLLING
INTERESTS
Italyn motorways
Autostrade Meridional i SpA Italy 58.98% 41.02% 58.98% 41.02%
Società Ita lyna per Azioni per i l Traforo del Monte Bianco SpA Italy 51.00% 49.00% 51.00% 49.00%
Raccordo Autostradale Val le d'Aosta SpA Italy 24.46% 75.54% 24.46% 75.54%
Overseas motorways
ABertin Concessões SA Brazi l 50.00% 50.00% 50.00% 50.00%
Concess ionária da Rodovia MG 050 SA Brazi l 50.00% 50.00% 50.00% 50.00%
Rodovia das Col inas SA Brazi l 50.00% 50.00% 50.00% 50.00%
Triangulo do Sol Auto-Estradas SA Brazi l 50.00% 50.00% 50.00% 50.00%
Grupo Costanera SA Chi le 50.01% 49.99% 50.01% 49.99%
Sociedad conces ionaria AMB SA Chi le 50.01% 49.99% 50.01% 49.99%
Sociedad conces ionaria Costanera Norte SA Chi le 50.01% 49.99% 50.01% 49.99%
Sociedad conces ionaria Vespucio Sur SA Chi le 50.01% 49.99% 50.01% 49.99%
Sociedad conces ionaria Li tora l Centra l SA Chi le 50.01% 49.99% 50.01% 49.99%
Sociedad Gestion Via l SA Chi le 50.01% 49.99% 50.01% 49.99%
Sociedad Operation y Logis tica de Infraestructuras SA Chi le 50.01% 49.99% 50.01% 49.99%
Sociedad conces ionaria Autopis ta Nororiente SA Chi le 50.01% 49.99% 50.01% 49.99%
Sociedad conces ionaria Autopis ta Nueva Vespucio Sur SA Chi le 50.01% 49.99% 50.01% 49.99%
Sta lexport Autostrady SA Poland 61.20% 38.80% 61.20% 38.80%
Sta lexport Autostrada Małopolska SA Poland 61.20% 38.80% 61.20% 38.80%
Sta lexport Autoroute SAR.L. Poland 61.20% 38.80% 61.20% 38.80%
Via4 SA Poland 33.66% 66.34% 33.66% 66.34%
Italian airports
Aeroporti di Roma SpA Italy 95.92% 4.08% 95.92% 4.08%
Airport Cleaning Srl Italy 95.92% 4.08% 95.92% 4.08%
AdR Ass is tence Srl Italy 95.92% 4.08% 95.92% 4.08%
AdR Mobi l i ty Srl Italy 95.92% 4.08% 95.92% 4.08%
AdR Securi ty Srl Italy 95.92% 4.08% 95.92% 4.08%
AdR Svi luppo Srl Italy 95.92% 4.08% 95.92% 4.08%
AdR Tel SpA Italy 95.92% 4.08% 95.92% 4.08%
Fiumicino Energia Srl Italy 87.14% 12.86% 87.14% 12.86%
Leonardo Energia - Società consorti le arl Italy 88.02% 11.98% 88.02% 11.98%
Other activities
Ecomouv' SAS. France 70.00% 30.00% 70.00% 30.00%
Electronic Transactions Consultants Co. USA 64.46% 35.54% 64.46% 35.54%
Infoblu SpA Ita ly 75.00% 25.00% 75.00% 25.00%
CONSOLIDATED COMPANIES WITH RELEVANT NON-CONTROLLING INTERESTS COUNTRY
31 December 2015 31 December 2014

195
Concessões is held by a sole shareholder (a Bertin group company), whilst the non-controlling interest in
Grupo Costanera (49.99%) is held by the Canadian fund, Canada Pension Plan Investment Board.
Information on the corporate restructuring carried out by the Brazilian sub-holding companies is provided in
note 6.2.
The key financial indicators presented in the following table thus include amounts for the above companies
and their respective subsidiaries, extracted, unless otherwise indicated, from the reporting packages prepared
by these companies for the purposes of Atlantia’s consolidated financial statements, in addition to the
accounting effects of acquisitions (fair value adjustments of the net assets acquired).
2015 2014 2015 2014 2015 2014
Revenue (1) 327 384 280 206 952 820
Profit for the year 76 54 124 2 124 62
Prof i t/(Loss ) for the period
at t r ibu table to non -con trol l ing in teres ts(2 )
38 27 62 1 5 -2
Net cash generated from operating activities(2) 91 115 181 159 319 304
Net cash used in investing activities(2) -124 -181 -33 -103 -310 -136
Net cash generated from/(used in) financing activities(2) 7 22 -23 -9 -145 -607
Effect of exchange rate movements on
cash and cash equivalents (2)
-22 3 -12 0 - -
Inc rease/(Decrease)
in cash and cash equ ivalen ts(1 )
-48 -41 113 47 -136 -439
Dividends paid to non -con trol l ing shareholders 16 - - - 5 -
2015 2014 2015 2014 2015 2014
Non-current assets 1,911 2,365 2,922 3,271 5,085 5,123
Current assets 126 164 697 396 576 642
Non-current liabilities 1,013 1,371 1,686 1,987 2,177 2,361
Current liabilities 324 271 313 104 527 504
Net assets 700 887 1,620 1,576 2,957 2,900
Net assets at t r ibu table to non -con trol l ing
in teres ts (1 )
351 445 823 802 121 119
Notes
€MAB Concessoes
and di rec t subs idiaries
Grupo Costanera
and di rec t and indi rec t
subs idiaries
Aeroport i di Roma
and di rec t subs idiaries
(2) The amounts shown contribute to the Atlantia Group's consolidated amounts and, therefore, include the impact of any consolidation adjustments.
€MAB Concessoes
and di rec t subs idiaries
Grupo Costanera
and di rec t and indi rec t
subs idiaries
Aeroport i di Roma
and di rec t subs idiaries
(1) This item includes toll revenue, aviation revenue, revenue from construction services, contract revenue and other operating income.

3. Consolidated financial statements as at and for the year ended 31 December 2015
Annual Report 2015 196
Disclosures regarding structured entities included in the scope of consolidation
Among the entities consolidated by the Group as at 31 December 2015, Romulus Finance (“Romulus”)
qualifies, in accordance with IFRS 12, as a structured entity, in that the Group exercises control over the entity
as a result of existing contractual arrangements, rather than on the basis of voting rights. In addition, Romulus
is a special purpose entity and is therefore subject to restrictions on its activities. In particular, it is an entity
established in accordance with Law 130/1999 and listed on the Luxembourg Stock Exchange. As a result of a
securitisation transaction, in 2003 the entity acquired Aeroporti di Roma’s pre-existing bank debt from its
banks, financing the transaction through the issue of asset-backed securities in 5 tranches (one of which
denominated in pounds sterling), amounting to a total of €1,265 million. Servicing of the debt and
redemption of the notes issued was guaranteed by the contemporaneous signature of a matching intercompany
loan between the above entity and Aeroporti di Roma, exactly replicating the repayment terms and conditions
of the issue. In January 2015, Atlantia repurchased 99.87% of the total amount of notes issued by Romulus, as
previously described in note 7.15 above, which provides further details. Following this transaction, the
remaining portion of the notes issued by Romulus accounted for in the Atlantia Group’s consolidated financial
statements as at 31 December 2015 amounts to €0.4 million. The guarantee provided by Ambac Assurance UK
for the benefit of Romulus’s noteholders was terminated in July 2015, following the noteholders’ meeting and
agreement regarding the payment due to the guarantor. As a result, Ambac no longer qualifies as a Controlling
Party.
Finally, in January 2016, Aeroporti di Roma formally requested a waiver, with the aim of obtaining a full and
final release from the contract governing the Romulus loan of 2003. The proposed waiver provides for, among
other things, the conclusion of a novation agreement between Aeroporti di Roma and the securitisation
vehicle, Romulus Finance, by which, subject to the prior consent of all the latter’s creditors, Aeroporti di
Roma will assume all the assets and liabilities receivable and payable by the Romulus vehicle from and to its
debtors and creditors (primarily the A4 Noteholders and hedge counterparties). Once the novation is
effective, Romulus Finance will cease to serve the original purpose for which it was established and, for this
reason, will be placed in liquidation. Aeroporti di Roma will, on the other hand, be required to remove, from
the existing financial agreements, all remaining interference resulting from the previous coexistance with the
Romulus contract of 2003.
Disclosures regarding structured entities not included in the scope of consolidation
Unconsolidated subsidiaries include Gemina Fiduciary Services (“GFS”), in which Atlantia holds a 99.99%
interest. This company is registered in Luxembourg and its sole purpose is to represent the interests of the
holders of notes with a value of 40 million US dollars issued, in June 1997, by Banco Credito Provincial
(Argentina), which subsequently became insolvent.
Any amount that GFS eventually recovers will be returned to the noteholders after deducting any management
costs, which will be retained by GFS. Taking into account the specific activities and the company’s corporate
structure, GFS is identifiable as a structured entity. As indicated in Note 5, this company has not been
consolidated due to its quantitative and qualitative immateriality to a true and fair view of the Group's financial
position, results of operations and cash flows. The carrying amount of GFS in Atlantia’s consolidated financial
statements is zero.

197
10.3 Guarantees
The Group has certain personal guarantees in issue to third parties as at 31 December 2015. These include,
listed by importance:
a) the guarantee issued by Atlantia in favour of credit institutions on behalf of Strada dei Parchi as a safeguard
against the impact on cash flow hedges of movements in interest rates. The amount of the guarantee, based
on the fair value of the hedges, has been capped at €40,000 thousand, which corresponds to the value as
at 31 December 2015. This guarantee was renewed for a further 12 months in February 2016. The
guarantee can only be enforced if the concession held by Strada dei Parchi is terminated, whilst Atlantia
has received a counter-indemnity from Toto Holding (Strada dei Parchi’s majority shareholder), which
has undertaken to assume Atlantia’s guarantee obligations by 31 October 2016;
b) bank guarantees provided by Tangenziale di Napoli (€29,756 thousand) to the Ministry of Infrastructure
and Transport, as required by the covenants in the relevant concession arrangement;
c) Atlantia's corporate counter-indemnity issued on behalf of the subsidiary, Electronic Transaction
Consultants, to the insurance companies which have issued performance and maintenance bonds totalling
€107,779 thousand for free-flow tolling projects;
d) guarantees issued by the Brazilian, Chilean and Polish operators securing project financing in the form of
either bank loans or bonds.
e) bank guarantees provided by Telepass (€25,789 thousand) to certain French operators in connection with
the company’s operations in France.
As at 31 December 2015, the shares of certain of the Group’s overseas operators (Rodovia das Colinas,
Concessionaria da Rodovia MG050, Triangulo do Sol, Sociedad Concesionaria Costanera Norte, Sociedad
Concesionaria de Los Lagos, Sociedad Concesionaria Autopista Nororiente, Sociedad Concesionaria Litoral
Central, Sociedad Concesionaria Vespucio Sur and Stalexport Autostrada Malopolska) have also been pledged
to the respective providers of project financing to the same companies, as have shares in Pune Solapur
Expressways, Lusoponte and Bologna & Fiera Parking.
10.4 Reserves
As at 31 December 2015, Group companies have recognised contract reserves quantified by contractors amounting
to approximately €1,390 million (€1,880 million as at 31 December 2014).
Based on past experience, only a small percentage of the reserves will actually have to be paid to contractors
and, in this case, will be accounted for as an increase in the cost of intangible assets deriving from concession
rights. Reserves have also been recognised in relation to works not connected to investment (work for external
parties and maintenance), amounting to approximately €44 million. The estimated future cost is covered by
provisions for disputes accounted for in the consolidated financial statements as at and for the year ended 31
December 2015.
10.5 Related party transactions
In implementation of the provisions of art. 2391-bis of the Italian Civil Code, the Regulations adopted by the
Commissione Nazionale per le Società e la Borsa (the CONSOB) in Resolution 17221 of 12 March 2010, as
amended, and Resolution 17389 of 23 June 2010, on 11 November 2010 Atlantia’s Board of Directors - with
the prior approval of the Independent Directors on the Related Party Transactions Committee – approved the
new Procedure for Related Party Transactions entered into directly by the Company and/or through
subsidiaries.
The Procedure, which is available for inspection at the Company’s website www.atlantia.it, establishes the
criteria to be used in identifying related parties, in distinguishing between transactions of greater and lesser
significance and in applying the rules governing the above transactions of greater and lesser significance, and
in fulfilling the related reporting requirements.
The following tables show material amounts of a trading or financial nature in the income statement and
statement of financial position generated by the Atlantia Group’s related party transactions, including those
with Directors, Statutory Auditors and key management personnel at Atlantia SpA.

3. Consolidated financial statements as at and for the year ended 31 December 2015
Annual Report 2015 198
Trade
receivables
Current tax
assetsTotal Trade payable
Other current
liabilitiesTotal
Revenue
from
construction
services and
other
operating
Total
Raw and
consumable
materials
Service costs Staff costs
Other
operating
costs
Total
Sintonia - 7.6 7.6 - - - - - - - - - -
Edizione - - - - - - - - - - 0.1 0.1 0.2
Total parents - 7 .6 7.6 - - - - - - - 0 .1 0.1 0.2
Società Autostrada Tirrenica - - - - - - 1.6 1.6 - - - - -
Biuro Centrum - - - 0.1 - 0 .1 0.1 0.1 - 0.7 - - 0 .7
Bologna & Fiere Parking 1.0 - 1 .0 - - - - - - - - - -
Total associates 1.0 - 1 .0 0.1 - 0 .1 1.7 1.7 - 0 .7 - - 0 .7
Pune Solapur Expressways Private 0.3 - 0 .3 - - - - - - - - - -
Total joint ventures 0.3 - 0 .3 - - - - - - - - - -
Autogrill 38.4 - 38.4 4.0 - 4 .0 82.7 82.7 0.4 1.1 - 0.3 1.8
Total affiliates 38.4 - 38.4 4.0 - 4 .0 82.7 82.7 0.4 1.1 - 0 .3 1.8
ASTRI pension fund - - - - 4.1 4.1 - - - - 13.5 - 13.5
CAPIDI pension fund - - - - 1.1 1.1 - - - - 2.0 - 2 .0
Total pension funds - - - - 5 .2 5.2 - - - - 15.5 - 15.5
Key management personnel - - - - 12.1 12.1 - - - - 22.7 - 22.7
Total key management personnel ( 1) - - - - 12.1 12.1 - - - - 22.7 - 22.7
TOTAL 39.7 7.6 47.3 4.1 17.3 21.4 84.4 84.4 0.4 1.8 38.3 0.4 40.9
Sintonia - 18.7 18.7 - - - - - - - 0.1 - 0 .1
Edizione - - - - - - - - - - 0.1 0.1 0.2
Total parents - 18.7 18.7 - - - - - - - 0 .2 0.1 0.3
Società Autostrada Tirrenica 4.9 - 4 .9 5.1 - 5 .1 1.9 1.9 - - - - -
Biuro Centrum - - - - - - 0.1 0.1 - 0.7 - - 0 .7
Bologna and Fiere Parking 1.1 - 1 .1 - - - - - - - - - -
Altre imprese collegate 1.8 - 1 .8 - - - 0.1 0.1 - - - - -
Total associates 7.8 - 7 .8 5.1 - 5 .1 2.1 2.1 0.0 0.7 - - 0 .7
Pune Solapur Expressways Private 0.6 - 0 .6 - - - - - - - - - -
Total joint ventures 0.6 - 0 .6 - - - - - - - - - -
Autogrill 37.2 - 37.2 0.6 - 0 .6 120.2 120.2 1.7 1.2 - - 2 .9
United Colors Communication - - - - - - 0.2 0.2 - 4.0 - - 4 .0
Total affiliates 37.2 - 37.2 0.6 - 0 .6 120.4 120.4 1.7 5.2 - - 6 .9
ASTRI pension fund - - - - 4.6 4.6 - - - - 11.6 - 11.6
CAPIDI pension fund - - - - 1.4 1.4 - - - - 2.9 - 2 .9
Total pension funds - - - - 6 .0 6.0 - - - - 14.5 - 14.5
Key management personnel - - - - 3.5 3.5 - - - - 9.7 - 9 .7
Total key management personnel ( 1) - - - - 3 .5 3.5 - - - - 9 .7 - 9 .7
TOTAL 45.6 18.7 64.3 5.7 9.5 15.2 122.5 122.5 1.7 5.9 24.4 0.1 32.1
31 December 2015 2015
31 December 2014 2014
(1) Atlantia's "key management personnel" means the Company's Directors, Statutory Auditors and other key management personnel as a whole. Expenses for each year include emoluments, salaries, benefits in kind, bonuses and other incentives (including the
fair value of share-based incentive plans) for Atlantia staff and staff of the relevant subsidiaries and associates.
In addition to the information shown in the table, the consolidated financial statements also include contributions of €4.6 million paid on behalf of Directors, Statutory Auditors and other key management personnel and the related liabilities of €1.6 million as at 31
December 2015.
€M
PRINCIPAL TRADING TRANSACTIONS WITH RELATED PARTIES
Assets Liabilities Income Expenses
Trading and other assets Trading and other liabilitiesTrading and other
incomeTrading and other expenses
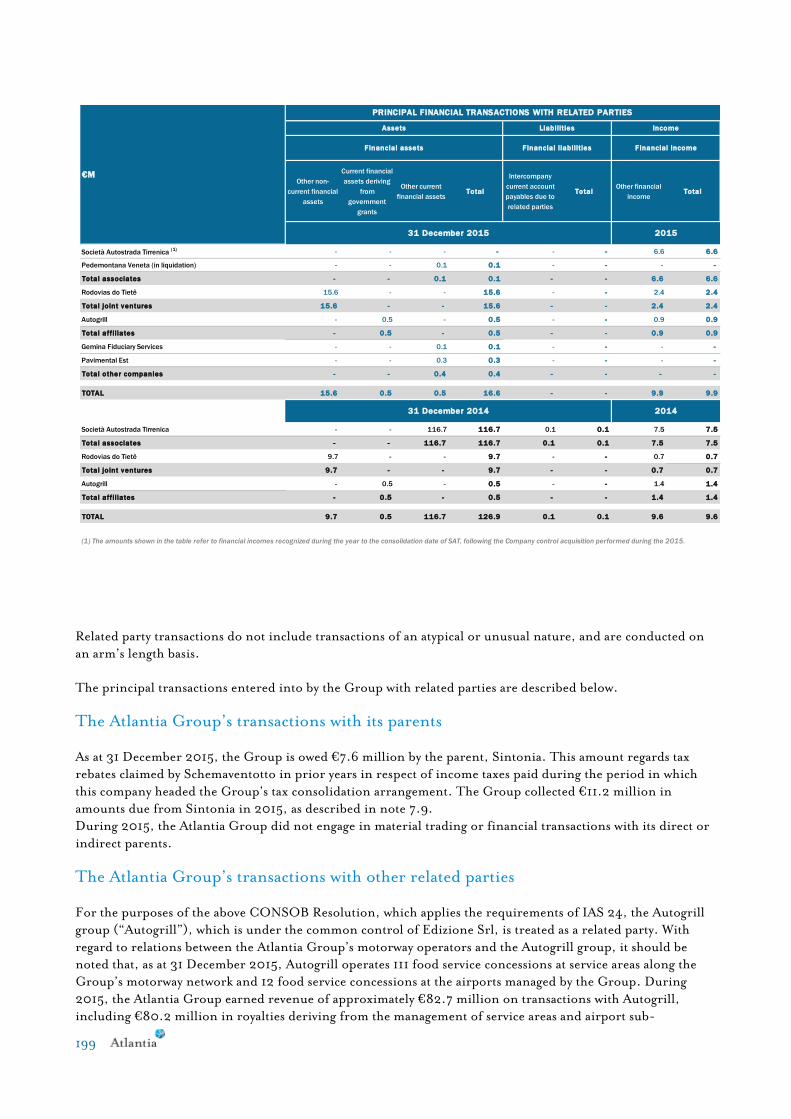
199
Related party transactions do not include transactions of an atypical or unusual nature, and are conducted on
an arm’s length basis.
The principal transactions entered into by the Group with related parties are described below.
The Atlantia Group’s transactions with its parents
As at 31 December 2015, the Group is owed €7.6 million by the parent, Sintonia. This amount regards tax
rebates claimed by Schemaventotto in prior years in respect of income taxes paid during the period in which
this company headed the Group’s tax consolidation arrangement. The Group collected €11.2 million in
amounts due from Sintonia in 2015, as described in note 7.9.
During 2015, the Atlantia Group did not engage in material trading or financial transactions with its direct or
indirect parents.
The Atlantia Group’s transactions with other related parties
For the purposes of the above CONSOB Resolution, which applies the requirements of IAS 24, the Autogrill
group (“Autogrill”), which is under the common control of Edizione Srl, is treated as a related party. With
regard to relations between the Atlantia Group’s motorway operators and the Autogrill group, it should be
noted that, as at 31 December 2015, Autogrill operates 111 food service concessions at service areas along the
Group’s motorway network and 12 food service concessions at the airports managed by the Group. During
2015, the Atlantia Group earned revenue of approximately €82.7 million on transactions with Autogrill,
including €80.2 million in royalties deriving from the management of service areas and airport sub-
Other non-
current financial
assets
Current financial
assets deriving
from
government
grants
Other current
financial assetsTotal
Intercompany
current account
payables due to
related parties
TotalOther financial
incomeTotal
Società Autostrada Tirrenica (1) - - - - - - 6.6 6.6
Pedemontana Veneta (in liquidation) - - 0.1 0.1 - - - -
Total associates - - 0 .1 0.1 - - 6 .6 6.6
Rodovias do Tietê 15.6 - - 15.6 - - 2.4 2.4
Total joint ventures 15.6 - - 15.6 - - 2 .4 2.4
Autogrill - 0.5 - 0 .5 - - 0.9 0.9
Total affiliates - 0 .5 - 0 .5 - - 0 .9 0.9
Gemina Fiduciary Services - - 0.1 0.1 - - - -
Pavimental Est - - 0.3 0.3 - - - -
Total other companies - - 0 .4 0.4 - - - -
TOTAL 15.6 0.5 0.5 16.6 - - 9 .9 9.9
Società Autostrada Tirrenica - - 116.7 116.7 0.1 0.1 7.5 7.5
Total associates - - 116.7 116.7 0.1 0.1 7.5 7.5
Rodovias do Tietê 9.7 - - 9 .7 - - 0.7 0.7
Total joint ventures 9.7 - - 9 .7 - - 0 .7 0.7
Autogrill - 0.5 - 0 .5 - - 1.4 1.4
Total affiliates - 0 .5 - 0 .5 - - 1 .4 1.4
TOTAL 9.7 0.5 116.7 126.9 0.1 0.1 9.6 9.6
(1) The amounts shown in the table refer to financial incomes recognized during the year to the consolidation date of SAT, following the Company control acquisition performed during the 2015.
31 December 2015 2015
31 December 2014 2014
€M
PRINCIPAL FINANCIAL TRANSACTIONS WITH RELATED PARTIES
Assets Liabilities Income
Financial assets Financial liabilities Financial income

3. Consolidated financial statements as at and for the year ended 31 December 2015
Annual Report 2015 200
concessions. Recurring income is generated by contracts entered into over various years, of which a large part
was awarded as a result of transparent and non-discriminatory competitive tenders. As at 31 December 2015,
trading assets due from Autogrill amount to €38.4 million.
10.6 Disclosures regarding share-based payments
In order to incentivise and foster the loyalty of directors and/or employees holding key positions and
responsibilities within Atlantia or in Group companies, and to promote and disseminate a value creation
culture in all strategic and operational decision-making processes, driving the Group’s growth and boosting
management efficiency, a number of share incentive plans based on Atlantia’s shares have been introduced in
previous years. The plans entail payment in the form of shares or cash and are linked to the achievement of
predetermined corporate objectives.
There were no changes, during 2015, in the share-based incentive plans already adopted by the Group as at 31
December 2014 and originally approved by the Annual General Meetings of shareholders held on 20 April
2011 (later amended by subsequent Annual General Meetings) and 16 April 2014.
The following table shows the main aspects of existing incentive plans as at 31 December 2015, including the
options and units awarded to directors and employees of the Group and changes during 2015 (in terms of new
awards and the exercise, conversion or lapse of rights). The table also shows the fair value (at the grant date) of
each option or unit awarded, as determined by a specially appointed expert, using the Monte Carlo model and
other assumptions. The amounts have been adjusted for the amendments to the plans originally approved,
which were required to ensure plan benefits remained substantially unchanged despite the dilution caused by
the bonus issues approved by the shareholders on 20 April 2011 and 24 April 2012.

201
NUMBER OF
OPTIONS/UNITS
AWARDED
VESTING DATEEXERCISE/GRANT
DATE
EXERCISE PRICE
(€)
FAIR VALUE OF
EACH OPTION OR
UNIT AT GRANT
DATE (€)
EXPECTED
EXPIRATION AT
GRANT DATE
(YEARS)
RISK FREE
INTEREST RATE
USED
EXPECTED
VOLATILITY
(BASED ON
HISTORIC MEAN)
EXPECTED
DIVIDENDS AT
GRANT DATE
2011 SHARE OPTION PLAN
Options outstanding as at 1 January 2015
- 13 May 2011 grant 279,860 13 May 2014 14 May 2017 14.8 3.48 3.0 - 6.0 2.60% 25.20% 4.09%
- 14 October 2011 grant 13,991 13 May 2014 14 May 2017 14.8 (*) (*) (*) (*) (*)
- 14 June 2012 grant 14,692 13 May 2014 14 May 2017 14.8 (*) (*) (*) (*) (*)
345,887 14 June 2015 14 June 2018 9.7 2.21 3.0 - 6.0 1.39% 28.00% 5.05%
- 8 November 2013 grant 1,592,367 8 Nov 2016 9 Nov 2019 16.0 2.65 3.0 - 6.0 0.86% 29.50% 5.62%
- 13 May 2014 grant 173,762 N/A (**) 14 May 2017 N/A (**) (**) (**) (**) (**)
- options exercised in 2014 -209,525
- options lapsed in 2014 -43,557
Total 2,167,477
Changes in options in 2015
- 14 June 2015 grant 52,359 N/A (**) 14 June 2018 N/A (**) (**) (**) (**) (**)
- options exercised -459,762
- options lapsed -142,172
Options outstanding as at 31 December 2015 1,617,902
2011 SHARE GRANT PLAN
Units outstanding as at 1 January 2015
- 13 May 2011 grant 192,376 13 May 2014 14 May 2016 N/A 12.90 4.0 - 5.0 2.45% 26.30% 4.09%
- 14 October 2011 grant 9,618 13 May 2014 14 May 2016 N/A (*) (*) (*) (*) (*)
- 14 June 2012 grant 10,106 13 May 2014 14 May 2016 N/A (*) (*) (*) (*) (*)
348,394 14 June 2015 15 June 2017 N/A 7.12 4.0 - 5.0 1.12% 29.90% 5.05%
- 8 November 2013 grant 209,420 8 Nov 2016 9 Nov 2018 N/A 11.87 4.0 - 5.0 0.69% 28.50% 5.62%
- units lapsed in 2014 -19,683
Total 750,231
Changes in units in 2015
- units converted into "shares" on 14 May 2015 -97,439
- units lapsed -28,699
Units outstanding as at 31 December 2015 624,093
MBO SHARE GRANT PLAN
Units outstanding as at 1 January 2015
- 14 May 2012 grant 96,282 14 May 2015 14 May 2015 N/A 13.81 3.0 0.53% 27.20% 4.55%
- 14 June 2012 grant 4,814 14 May 2015 14 May 2015 N/A (*) (*) (*) (*) (*)
- 2 May 2013 grant 41,077 2 May 2016 2 May 2016 N/A 17.49 3.0 0.18% 27.80% 5.38%
- 8 May 2013 grant 49,446 8 May 2016 8 May 2016 N/A 18.42 3.0 0.20% 27.80% 5.38%
- 12 May 2014 grant 61,627 12 May 2017 12 May 2017 N/A 25.07 3.0 0.34% 28.20% 5.47%
Total 253,246
Changes in units in 2015
- units converted into "shares" on 14 May 2015 -101,096
Units outstanding as at 31 December 2015 152,150
2014 PHANTOM SHARE OPTION PLAN
Options outstanding as at 1 January 2015
- 9 May 2014 grant 2,718,203 9 May 2017 9 May 2020 N/A (***) 2.88 3.0 - 6.0 1.10% 28.90% 5.47%
- options lapsed in 2014 -48,201
Total 2,670,002
Changes in options in 2015
- 8 May 2015 grant 2,971,817 8 May 2018 8 May 2021 N/A (***) 2.59 3.0 - 6.0 1.01% 25.80% 5.32%
- options lapsed -282,242
Options outstanding as at 31 December 2015 5,359,577
(*) Options and units awarded as a result of Atlantia's bonus issues which, therefore, do not represent the award of new benefits.
(**) These are phantom share options granted in place of certain conditional rights included in the grants of 2011 and 2012, and which, therefore, do not represent the award of new benefits.
(***) Given that this is a cash bonus plan, involving payment of a gross amount in cash, the 2014 Phantom Share Option Plan does not require an exercise price. However, the Terms and Conditions of this specific plan indicate an
"Exercise price" (equal to the arithmetic mean of Atlantia's share price in a determinate period) as the basis on which to calculate the gross amount to be paid to beneficiaries.

3. Consolidated financial statements as at and for the year ended 31 December 2015
Annual Report 2015 202
Details of each plan are contained in specific information circulars prepared pursuant to art. 84-bis of
CONSOB Regulation 11971/1999, as amended, and in the Remuneration Report prepared pursuant to art. 123
ter of the Consolidated Finance Act. These documents, to which reference should be made, are published in
the “Remuneration” section of the Company’s website at www.atlantia.it.
2011 Share Option Plan
Description
As approved by the Annual General Meeting of shareholders on 20 April 2011, and amended by the Annual
General Meeting of shareholders on 30 April 2013 and 16 April 2014, the 2011 Share Option Plan entails the
award of up to 2,500,000 options free of charge in three annual award cycles (2011, 2012 and 2013). Each
option will grant beneficiaries the right to purchase one ordinary Atlantia share held in treasury, with
settlement involving either physical delivery or, at the beneficiary’s option, a cash payment equivalent to the
proceeds from the sale of the shares on the stock exchange organised and managed by Borsa Italiana SpA, after
deduction of the full exercise price. The exercise price is equivalent to the average of the official prices of
Atlantia’s ordinary shares in the month prior to the date on which Atlantia’s Board of Directors announces the
beneficiary and the number of options to be awarded.
The options granted will vest in accordance with the Plan terms and conditions and, in particular, only if, on
expiration of the vesting period (three years from the date of award of the options to beneficiaries by the Board
of Directors), cumulative FFO for the three annual reporting periods preceding expiration of the vesting
period, adjusted for a number of specific items (total operating cash flow of the Group, Atlantia or of certain
of its subsidiaries – depending on the role held by the various beneficiaries of the Plan), is higher than a pre-
established target, unless otherwise decided by the Board of Directors, which has the authority to assign
beneficiaries further targets. Vested options may be exercised, in part, from the first day following expiration
of the vesting period and, in part, from the end of the first year following expiration of the vesting period and,
in any event, in the three years following expiration of the vesting period (subject to the clause in the Plan
terms and conditions requiring executive Directors and key management personnel to retain a minimum
holding). The maximum number of exercisable options will be calculated on the basis of a mathematical
algorithm that takes account, among other things, of the current value and the exercise price, plus any
dividends paid, so as to cap the realisable gain.
Changes in options in 2015 The vesting period for the second award cycle expired on 14 June 2015. In accordance with the Terms and
Conditions of this plan, following confirmation of effective achievement of the related performance hurdles,
the final value of the shares (the arithmetic mean of the share price in the fifteen days prior to the vesting date)
was determined as well as the additional options resulting from dividends paid during the vesting period. On 8
May 2015, Atlantia’s Board of Directors, exercising the authority provided for in the Plan Terms and
Conditions, awarded the plan beneficiaries, in place of these additional options, a matching amount of
phantom options in such a way that, on exercising the awarded options, the beneficiaries receive a gross
amount in cash, determined with a calculation method which allow the beneficiaries to receive a net amount
equal to what would have been received if they had exercised the additional options (resulting in the award of
shares in Atlantia and payment of the exercise price) and sold the underlying shares in the market. On expiry
of the vesting period, this resulted in the award of a total of 52,359 phantom options for the second cycle of
the plan. For the reasons given above, the options awarded do not constitute an additional benefit with respect
to the benefits established in the Plan Terms and Conditions.
During 2015, a number of beneficiaries exercised vested options and paid the established exercise price; this
entailed the allocation to them of Atlantia’s ordinary shares held by the Company as treasury shares. This
resulted in the transfer of:
a) 99,018 of Atlantia’s ordinary shares to beneficiaries in connection with the first cycle, the vesting period
for which expired on 13 May 2014, accompanied by the exercise of 173,762 phantom options awarded in
2014; following the exercise of these options, the first cycle of the Plan has for all purposes concluded;
b) 186,982 of Atlantia’s ordinary shares to beneficiaries in connection with the second cycle, the vesting
period for which expired on 14 June 2015, whilst no phantom options awarded in 2015 were exercised.
Thus, as at 31 December 2015, taking into account lapsed options at that date, the remaining options
outstanding total 1,617,902, including 52,359 phantom options awarded under the second cycle (the unit fair

203
values of which, as at 31 December 2015, was measured as €21.29, in place of the unit fair values at the grant
date).
2011 Share Grant Plan
Description
As approved by the Annual General Meeting of shareholders on 20 April 2011, and amended by the Annual
General Meeting of shareholders on 30 April 2013, the 2011 Share Grant Plan entails the grant of up to
920,000 units free of charge in three annual award cycles (2011, 2012 and 2013). Each unit will grant
beneficiaries the right to receive one Atlantia ordinary share held in treasury, with settlement involving either
physical delivery or, at the beneficiary’s option, a cash payment equivalent to the proceeds from the sale of the
shares on the stock exchange organised and managed by Borsa Italiana SpA.
The units granted will vest in accordance with the Plan terms and conditions and, in particular, only if, on
expiration of the vesting period (three years from the date the units are granted to beneficiaries by the Board of
Directors), cumulative FFO for the three annual reporting periods preceding expiration of the vesting period,
adjusted for a number of specific items (total operating cash flow of the Group, Atlantia or of certain of its
subsidiaries – depending on the role held by the various beneficiaries of the Plan) is higher than a pre-
established target, unless otherwise decided by the Board of Directors. Vested units may be converted into
shares, in part, after one year from the date of expiration of the vesting period and, in part, after two years
from the date of expiration of the vesting period (subject to the clause in the Plan terms and conditions
requiring executive Directors and key management personnel to maintain a minimum holding). The number
of convertible units will be calculated on the basis of a mathematical algorithm that takes account, among other
things, of the current value and initial value of the shares so as to cap the realisable gain.
Changes in units in 2015
The vesting period for the second award cycle expired on 14 June 2015. In accordance with the Terms and
Conditions of this plan, following confirmation of effective achievement of the related performance hurdles,
the units previously awarded vested: these units may be converted into Atlantia’s ordinary shares from 14 June
2016.
In addition, with regard to the first award cycle, the vesting period for which expired on 13 May 2014, on 15
May 2015 vested units were converted, in accordance with the Plan Terms and Conditions, into Atlantia’s
ordinary shares. As a result, Plan beneficiaries received 97,439 shares held by the Company as treasury shares.
The remaining units will be converted into Atlantia’s ordinary shares from 15 May 2016.
As at 31 December 2015, taking into account lapsed units at that date, the remaining units outstanding total
624,093.
MBO Share Grant Plan
Description
As approved by the Annual General Meetings of shareholders on 20 April 2011 and amended by the Annual
General Meetings of 30 April 2013 and 16 April 2014, the MBO Share Grant Plan, serving as part payment of
the annual bonus for the achievement of objectives assigned to each beneficiary under the Management by
Objectives (MBO) plan adopted by the Atlantia Group in 2011, 2012 and 2013, entails the grant of up to
340,000 units free of charge annually for three years (2012, 2013 and 2014). Each unit will grant
beneficiaries the right to receive one ordinary share in Atlantia SpA held in treasury.
The units granted (the number of which is based on the unit price of the company’s shares at the time of
payment of the bonus, and on the size of the bonus effectively awarded on the basis of achievement of the
assigned objectives) will vest in accordance with the Plan terms and conditions, on expiration of the vesting
period (three years from the date of payment of the annual bonus to beneficiaries, following confirmation that
the objectives assigned have been achieved). Vested units will be converted into a maximum number of shares
on expiration of the vesting period (subject to the clause in the Plan terms and conditions requiring executive
Directors and key management personnel to maintain a minimum holding), on the basis of a mathematical
algorithm that takes account, among other things, of the current value and initial value of the shares, plus any
dividends paid during the vesting period, so as to cap the realisable gain.

3. Consolidated financial statements as at and for the year ended 31 December 2015
Annual Report 2015 204
Changes in the units in 2015
The vesting period for the MBO Plan units awarded in relation to the objectives for 2011 expired on 14 May
2015. In accordance with the Terms and Conditions of this plan, all the units awarded thus vested, resulting in
their conversion into Atlantia’s ordinary shares and the allocation to beneficiaries of 101,096 shares held by
the Company as treasury shares.
In addition, on 8 May 2015, Atlantia’s Board of Directors, exercising the authority provided for in the Plan
Terms and Conditions, awarded the plan beneficiaries a gross amount in cash in place of the additional units
to be awarded as a result of the payment of dividends during the vesting period. This amount is computed in
such a way as to enable beneficiaries to receive a net amount equal to what they would have received in case they
had been awarded a number of Atlantia shares equal to the additional units and sold these shares in the market.
Following the conversion of these units, there are no remaining units outstanding in relation to the awards for
2012.
As at 31 December 2015, the remaining units outstanding total 152,150.
2014 Phantom Share Option Plan
Description On 16 April 2014, the Annual General Meeting of Atlantia’s shareholders approved the new incentive plan
named the “2014 Phantom Share Option Plan”, subsequently also approved, within the scope of their
responsibilities, by the boards of directors of the subsidiaries employing the beneficiaries. The plan entails the
award of phantom share options free of charge in three annual award cycles (2014, 2015 and 2016), being
options that give beneficiaries the right to payment of a gross amount in cash, computed on the basis of the
increase in the value of Atlantia’s ordinary shares in the relevant three-year period.
In accordance with the Terms and Conditions of the plan, the options granted will only vest if, at the end of
the vesting period (equal to three years from the date on which the options were awarded to the beneficiaries by
the Board of Directors), a minimum operating/financial performance target for (alternatively) the Group, the
Company or for one or more of Autostrade per l’Italia’s subsidiaries, as indicated for each Plan beneficiary
(the “hurdle”), has been met or exceeded. The vested options may be exercised from, in part, the first day
immediately following the vesting period, with the remaining part exercisable from the end of the first year
after the end of the vesting period and, in any event, in the three years after the end of the vesting period
(without prejudice to the Terms and Conditions of the plan as regards minimum holding requirements for
executive directors and key management personnel). The number of exercisable options is to be computed in
application of a mathematical algorithm, taking into account, among other things, the current value, the target
value and the exercise price, in order to cap the realisable gain.
Changes in options in 2015
On 8 May 2015, the Board of Directors selected the beneficiaries for the second cycle of the plan in question,
awarding a total of 2,971,817 phantom options with a vesting period from 8 May 2015 to 8 May 2018 and an
exercise period, on achievement of the relevant hurdles, from 9 May 2018 to 8 May 2021.
Thus, as at 31 December 2015, taking into account lapsed options at that date, the remaining options
outstanding total 5,359,577, including 2,670,002 phantom options awarded under the first cycle and
2,689,575 phantom options awarded under the second cycle (the unit fair values of which as at 31 December
2015 were measured as €4.10 and €2.33, respectively, in place of the unit fair values at the grant date).
The prices of Atlantia’s ordinary shares in the various periods covered by the above plans are shown below:
a) price as at 31 December 2015: €24.57;
b) price as at 8 May and 15 June 2015 (the grant date for new options or units, as described): €23.58 and
€21.73, respectively;
c) the weighted average price for 2015: €23.64;
d) the weighted average price for the period 8 May 2015 – 31 December 2015: €23.89;
e) the weighted average price for the period 15 June 2015 – 31 December 2015: €24.01.

205
In accordance with the requirements of IFRS 2, as a result of existing plans, in 2015 the Group has recognised
staff costs of €7,014 thousand, based on the accrued fair value of the options and units awarded at that date,
including €3,415 thousand accounted for as an increase in equity reserves. In contrast, the liabilities
represented by phantom share options outstanding as at 31 December 2015 have been recognised in other
current and non-current liabilities, based on the assumed exercise date.
Finally, following the exercise, by Atlantia’s Board of Directors, of its authority to award phantom options in
place of any additional options due, on closure of the second cycle of the “2011 Share Option Plan”, the
amount of €705 thousand was reclassified from equity reserves to other current liabilities, corresponding to
the initial estimate of the fair value of the additional options.
10.7 Significant legal and regulatory aspects This section describes the main disputes outstanding and key regulatory aspects of importance to the Group’s
operators.
Current disputes are unlikely to give rise to significant charges for Group companies in addition to the
provisions already accounted for in the consolidated financial statements as at and for the year ended 31
December 2015.
Italian motorways
Toll increases with effect from 1 January 2016
The decrees issued by the Minister of Infrastructure and Transport and Minister of the Economy and Finance
on 31 December 2015 approved the following:
a) Autostrade per l’Italia’s right, in accordance with its request to the Grantor, to apply an increase of 1.09%
with effect from 1 January 2016, corresponding to the sum of the following components:
0.00% for inflation;
0.97% to provide a return capital expenditure via the “X” tariff component;
0.12% to provide a return on investment via the “K” tariff component;
b) the provisional suspension of the toll increases to be applied by Tangenziale di Napoli, Raccordo
Autostradale Valle d’Aosta and Autostrada Tirrenica with effect from 1 January 2016 (the increases thus
amount to 0.00%), whilst awaiting approval of the operators’ revised financial plans. The toll increases
will be finalised by the interministerial decree approving the related addenda revising the financial plans,
subject to the right of the operators to recoup any toll increases on the basis of the revised financial plans.
Revenue lost as a result of suspension of the increases will be taken into account in the toll increases for
2017. The above companies have challenged the legislation suspending the toll increases for 2016;
c) the absence of any toll increase for Autostrade Meridionali, given that its concession expired on 31
December 2012. Autostrade Meridionali has brought a legal challenge contesting the above decision, in line
with 2014 (the related legal challenge was upheld by the Campania Regional Administrative Court sentence
of 22 January 2015) and 2015 (judgement is pending).
Based on bilateral agreements between Italy and France, Traforo del Monte Bianco has applied an increase of
0.02% from 1 January 2016, in compliance with the relevant Intergovernmental Committee resolution. This
was determined on the basis of inflation (the average rate for Italy and France).
Legal actions brought by Autostrade Meridionali, challenging the Grantor
In addition to the above challenges regarding tolls, on 19 March 2015 Autostrade Meridionali brought an
action before Campania Regional Administrative Court, challenging the Grantor’s failure to respond to a
request to review its toll structure with effect from 1 January 2015 in order to maintain the same level of
revenue for the company, as provided for in the existing toll policies. In a sentence entered on 11 June 2015,
Campania Regional Administrative Court upheld Autostrade Meridionali’s challenge, ordering the Grantor to
respond to the above request within 30 days of the date of notification of the sentence, which took place on 10
July 2015. As things stand, the Grantor has yet to respond to the request.

3. Consolidated financial statements as at and for the year ended 31 December 2015
Annual Report 2015 206
On 24 April 2015, the company also brought an action before Campania Regional Administrative Court,
challenging the Grantor’s adoption of a financial compensation plan for the period from 1 January 2013 (the
date of expiry of the concession) and 31 December 2015 (the date on which it was assumed that the new
operator would take over, at the time of filing the action). The Campania Regional Administrative Court
sentence entered on 30 July 2015 upheld Autostrade Meridionali’s challenge, ruling that the Grantor’s failure
to respond to the request for adoption of a new financial plan for the concession period 2013-2015 is
unlawful. The Grantor appealed the above sentence before the Council of State in October 2015. Judgement is
pending.
Reduced tolls for frequent users
The reduced tolls for frequent users, introduced by the Memorandum of Understanding of 24 February 2014
signed by a number of motorway operators, including Autostrade per l’Italia and the trade association,
AISCAT, have been extended, at the request of the Minister of Infrastructure and Transport on 31 December
2015, for a further 12 months, and therefore until the end of 2016. Recovery of the revenue lost as a result of
the initiative during the period 1 June 2014 – 31 December 2016 is assured on the basis of the criteria set out
in the Memorandum. One of the options for operators requesting such a solution (as notified to the above
Ministry by Autostrade per l’Italia) is the application of a specific toll increase to be introduced in the first year
of the next regulatory period.
II Addendum to Autostrade per l’Italia’s Single Concession Arrangement
On 10 December 2015, the Ministry of Infrastructure and Transport and Autostrade per l’Italia signed the II
Addendum to the Single Concession Arrangement, which has added the Casalecchio - Northbound
interchange to Autostrade per l’Italia’s investment commitments. This project requires a commitment to invest
up to a total of approximately €157 million, with around €2 million already invested as at 31 December 2015 to
cover the cost of design, and the remainder to be paid to ANAS on the basis of the state of progress of the
works. ANAS is to build and then manage the road. The Addendum will be effective once the Minister of
Infrastructure and Transport and Minister of the Economy and Finance have issued the relevant decree and it
has been registered with the Court of Auditors.
Addendum to Autostrada Tirrenica’s Single Concession Arrangement
In response to observations from the European Commission regarding, among other things, extension of the
concession to 2046, on 14 October 2014 the Grantor sent Autostrada Tirrenica a draft addendum envisaging
extension of the concession to 2043, completion of work on the Civitavecchia–Tarquinia section (in progress),
and eventual completion of the motorway (in sections, if necessary) to be put out to tender.
Completion of the motorway is subject to fulfilment of the technical and financial conditions to be verified
jointly by the grantor and the operator and execution of an addendum to the Concession Arrangement, with a
viable financial plan attached. Subsequently, on 13 May 2015, a memorandum of understanding was signed by
the Grantor, Tuscany Regional Authority, Lazio Regional Authority, Autostrade per l’Italia and Autostrada
Tirrenica with an attached draft addendum which, whilst maintaining the duration of the concession until
2043, a viable financial plan for the Civitavecchia–Tarquinia section and the obligation to put all the works out
to tender, provides for further commitments regarding the design of the Tarquinia–Ansedonia and
Ansedonia–Grosseto South sections and of the improvements to the existing dual carriageway (the SS. 1
Variante Aurelia) between Grosseto South and San Pietro in Palazzi, retaining the current layout of the road.
Performance of the above construction work is subject to positive outcomes of studies of the technical/design,
financial and administrative feasibility to be conducted jointly by the Grantor and Autostrada Tirrenica and
execution of an addendum with a viable financial plan.
Following a request from the Grantor on 5 June 2015, after further discussion with Italy’s representative office
at the EU, on 24 June 2015 Autostrada Tirrenica prepared and submitted further versions of a financial plan,
relating to (i) the sections in operation and the Civitavecchia–Tarquinia section under construction, and (ii)
the entire Civitavecchia–San Pietro in Palazzi section of road, both expiring on 31 December 2040.
Finally, again at the Grantor’s request, on 6 August 2015 Autostrada Tirrenica submitted a draft financial plan
for the sections in operation between Livorno and Cecina and Rosignano and San Pietro in Palazzi and for the
section under construction between Civitavecchia and Tarquinia, with an expiry date of 2028 if the financial

207
design for the San Pietro in Palazzi–Tarquinia section and the financial plan for the entire road not be
approved by 2017.
Award of the concession for the A3 Naples – Pompei – Salerno motorway
With regard to award of the concession for maintenance and operation of the Naples – Pompei – Salerno
motorway (the previous concession expired at the end of 2012), Autostrade Meridionali, which continues to
operate the motorway under a contract extension, submitted its bid on 23 April 2015.
On 16 November 2015, the Tender Committee raised a number of doubts regarding the two bids received,
proposing to disqualify both. The two bidders responded with a request to be allowed to resolve the issues
raised and thus continue with the tender process. The Grantor thus submitted a supplement to the procedure
to the Tender Committee and, on 16 December 2015, informed the bidders that the final outcome of the
tender process will be announced at the next public session of the Committee, which has, however, yet to be
scheduled.
The bidder, Consorzio Stabile SIS, has brought a legal challenge before Campania Regional Administrative
Court, contesting the minutes of the meeting of 16 November 2015. This challenge, which was not notified to
Autostrade Meridionali, will be discussed at a hearing on 9 March 2016. The company will be represented in
court in order to object to the challenge on the grounds of inadmissibility, given that the conclusions of the
Tender Committee are not final in view of the position adopted by the Grantor.
Enabling Act on tenders and concessions
Enabling Act 11 of 28 January 2016 regarding tenders and concessions, designed to apply the relevant EU
directives and reform the regulations governing public contracts, was published in the Official Gazette of 29
January 2016.
In this regard, the legislation has introduced an obligation for public and private entities, who hold an existing
or future concession to provide public works or services, to award 80% of the related contracts for works,
services or goods, with a value of over €150 thousand, by public tender. The legislation also establishes that the
remaining part may be carried out in-house, in the case of public entities, or by direct or indirect subsidiaries
or associates in the case of private entities. The legislation provides for a transitional period of adjustment of
no more than twenty-four months in the case of existing concessions. The only exclusions from compliance
with the above obligation are existing or future concessions awarded in the form of project financing, and
existing or future concessions awarded by public tender in accordance with EU law, for which existing
legislation governing tenders in force at the date of entry into effect of the enabling act (13 February 2016) will
continue to apply.
By 18 April 2016, the government is authorised to issue a legislative decree applying the above EU directives, in
accordance with the criteria contained in the enabling act.
Litigation regarding the Ministry of Infrastructure and Transport and the Ministry for Economic
Development decree of 7 August 2015 and competitive tenders for oil and food services at service areas
On 7 August 2015, the Ministry of Infrastructure and Transport and the Ministry for Economic
Development issued a decree approving the plan to restructure the motorway service area network.
The plan envisages steps to rationalise the network and revisit the manner in which services are provided to
motorway users and the tender process for the award of the related concessions, in keeping with the Guidelines
of 29 March 2013 and 29 January 2015.
The above Plan envisages, among other things, (i) the closure of 15 service areas on Autostrade per l’Italia’s
network and (ii) the option of revisiting the manner in which services are provided by operators. With regard
to the above decree and with reference to the competitive tenders for the award of concessions at service areas,
a number of challenges have been brought before Lazio Regional Administrative Court, in which Autostrade
per l’Italia is a party. These appeals can be summarised as follows:
a) a challenge, with a request for injunctive relief, brought by Unione Petrolifera, the trade body
representing oil service providers, and notified to AISCAT, with the aim of obtaining the cancellation
of the above decree of 7 August 2015 and all other related or connected acts;

3. Consolidated financial statements as at and for the year ended 31 December 2015
Annual Report 2015 208
b) a challenge, with a request for injunctive relief, brought by a number of certain oil service providers
(Q8, TotalErg, API) with the aim of obtaining the cancellation of the above decree of 7 August 2015 and
all other related or connected acts;
c) a challenge, with a request for injunctive relief, brought by Maglione Srl (Sarni group), with the aim of
contesting the tender process for the award of a unified concession called by the Advisor, Roland Berger,
appointed by Autostrade per l’Italia;
d) challenges, with in some cases a request for injunctive relief, brought by individual oil service providers,
with the aim of obtaining the cancellation of the above decree of 7 August 2015 and all other related or
connected acts, including those regarding the competitive tenders called and those relating to the closure
of service areas. Certain appeals also involve claims for compensation;
e) a challenge brought by trade bodies representing oil service providers, contesting initial calls for tenders
for oil service concessions, published by Autostrade per l’Italia in June 2015, and the related acts.
The requests for injunctive relief have been turned down. In some cases, the plaintiffs have appealed to the
Council of State against the refusal to grant injunctive relief; as of 4 March 2016, these appeals have also been
rejected.
In addition, the acts relating to a number of competitive tenders for oil service concessions, forming part of
the first tranche of awards, have been challenged before Lazio Regional Administrative Court by TotalErg and
ENI. In particular, the requests for injunctive relief filed by the plaintiff, TotalErg, regarding awards in the
first tranche have been rejected by both the Regional Administrative Court and the Council of State. The two
plaintiffs, TotalErg and ENI, have requested a hearing on the merits of the second tranche of awards.
Hearings on the merits of the above challenges at Lazio Regional Administrative Court are, if scheduled,
expected to take place from April 2016.
Accident on the Acqualonga viaduct on the A16 Naples-Canosa motorway on 28 July 2013
On 28 July 2013, there was an accident, involving a coach travelling along the Naples-bound carriageway (at
km 32+700) of the Acqualonga viaduct on the A16 Naples-Canosa motorway, operated by Autostrade per
l’Italia. At the beginning of 2015, all those under investigation, including the Chief Executive Officer,
received notice of completion of the preliminary investigation. Including executives, former managers and
former employees, twelve of Autostrade per l’Italia’s employees are under investigation. At the preliminary
hearing held on 22 October 2015, after two adjournments due to irregularities in the writs of summons, the
court admitted the entry of appearance of the civil parties and ordered, at the request of the civil parties, the
citation of Autostrade per l’Italia and Reale Mutua (the company that insured the coach) as liable in civil law.
At the hearing of 17 December 2015, Autostrade per l’Italia and Reale Mutua were represented in court and
the Public Prosecutors concluded their briefs requesting the indictment of all the defendants.
At the hearing of 14 January 2016, evidence was presented by the attorneys for the defendants and the civil
parties. Discussion of the defence of all the accused took place at the hearing of 22 February 2016 and will
continue at the hearing of 14 March 2016.
To date, approximately 60% of the civil parties have received compensation and have, therefore, withdrawn
their actions following payment of their claims by Autostrade per l’Italia’s insurance provider under the
existing general liability policy.
In addition to the criminal proceedings, a number of civil actions have been brought and were recently
combined by the Civil Court of Avellino. Following the combination of the various proceedings, judgement is
pending before the Civil Court of Avellino in relation to: (i) the original action brought by Reale Mutua
Assicurazioni, the company that insured the coach, in order to make the maximum claim payable available
to the damaged parties, including Autostrade per l’Italia (€6 million), (ii) subsequent claims, submitted as
counterclaims or on an individual basis, by a number of damaged parties, including claims against Autostrade
per l’Italia. Subject to the permission of the court, Autostrade per l’Italia intends to refer claimants to its
insurance provider (Swiss Re International), with a view to being indemnified against any claims should it lose
the case. In addition, as a result of the accident, the Autorità di Vigilanza sui Contratti Pubblici (the Authority
for the Control of Public Contracts, now known as the Autorità Nazionale Anticorruzione, Italy’s National
Anti-Corruption Authority) launched an investigation of Autostrade per l’Italia regarding maintenance,
carried out over the years, of the section of the A16 Naples-Canosa motorway including the above Acqualonga
viaduct. On completing its investigation, the National Anti-Corruption Authority published resolution 30 of
22 December 2014, registered on 22 January 2015, stating that it had found clear evidence of irregularities in

209
the work carried out in 2012 in order to upgrade the safety barriers on the Naples-Canosa section, which
should also have included, according to the Authority, the Acqualonga viaduct.
Based on the opinion of its own technical units, Autostrade per l’Italia responded to the Authority on 24
February 2015, contesting the conclusions contained in the above resolution.
Investigation by the Public Prosecutor’s Office in Prato of a fatal accident to a worker employed by Pavimental
On 27 August 2014, a worker employed by Pavimental SpA – the company contracted by Autostrade per
l’Italia to carry out work on the widening of the A1 to three lanes – was involved in a fatal accident whilst at
work. In response, the Public Prosecutor’s Office in Prato has placed a number of Pavimental personnel
under criminal investigation for reckless homicide, alleging violation of occupational health and safety
regulations. In December 2014, Autostrade per l’Italia was notified of a request for information from the
Company, together with a request to appoint a defence counsel and elect an address for service, given that the
Company is considered a juridical person under investigation in accordance with Legislative Decree 231/2001
(regarding the administrative responsibility of corporate entities). The crime of which Autostrade per l’Italia is
accused is that defined in art. 25 septies of Legislative Decree 231/2001, in relation to art. 589, paragraph 3 of
the penal code (“Reckless homicide committed in violation of occupational health and safety regulations”). The
suspects include Autostrade per l’Italia’s Project Manager. Pavimental has also been ordered to hand over
documentation. Preliminary investigations are underway and a preliminary hearing has been requested by the
defence counsel of one of the suspects employed by Pavimental, with the aim of appointing experts to
reconstruct the dynamics of the fatal accident. The hearing, held to examine the experts’ report, took place on
5 February 2016, during which the expert appointed by the court concluded that the company’s
Organisational, Management and Control Model, required by Legislative Decree 231/2001, and the related
procedures were broadly in compliance with the Decree. At the hearing of 24 February 2016, scheduled to
enable the defendants’ attorneys to respond, the preliminary hearing held to examine the experts’ report came
to an end. The decision of the Public Prosecutor’s office is now awaited.
Investigation by the Public Prosecutor’s Office in Florence of the state of New Jersey barriers installed on the
section of motorway between Barberino and Roncobilaccio
On 23 May 2014, the Public Prosecutor’s Office in Florence issued an order requiring Autostrade per l’Italia
to hand over certain documentation, following receipt, on 14 May 2015, of a report from Traffic Police
investigators in Florence noting the state of disrepair of the New Jersey barriers on the section of motorway
between Barberino and Roncobilaccio. The report alleges negligence on the part of unknown persons, as
defined by art. 355, paragraph 2.3 of the penal code (breach of public supply contracts concerning “goods or
works designed to protect against danger or accidents to the public”).
At the same time, the Prosecutor’s Office ordered the seizure of the New Jersey barriers located along the right
side of the carriageways between Barberino and Roncobilaccio, on ten viaducts, ordering Autostrade per l’Italia
to take steps to ensure safety on the relevant sections of motorway. This seizure was executed on 28 May 2014.
In June 2014, Autostrade per l’Italia’s IV Section Department handed over the requested documents to the
Police. The documentation concerns the maintenance work carried out over the years on the safety barriers
installed on the above section of motorway. In October 2014, addresses for service were formally nominated
for a former General Manager and an executive of Autostrade per l’Italia, both under investigation in relation
to the crime defined in art. 355 of the penal code. In addition, at the end of November 2014, experts
appointed by the Public Prosecutor’s Office, together with experts appointed by Autostrade per l’Italia, carried
out a series of sample tests on the barriers installed on the above motorway section to establish their state of
repair. Following the experts’ tests, the barriers were released from seizure.
Preliminary investigations are still in progress, given that the Public Prosecutor’s Office has yet to take a final
decision.
Proceedings before the Supreme Court - Autostrade per l’Italia versus Craft Srl (Judgement no. 22563/2015)
Craft Srl holds a patent for a type of speed check equipment. In 2006, Craft filed suit against Autostrade per
l’Italia, claiming that the IT system used by the latter for its speed checks (“Sicve Tutor”) infringed its patent
and requesting the court to, therefore, find in its favour and declare an infringement of its patent. The related

3. Consolidated financial statements as at and for the year ended 31 December 2015
Annual Report 2015 210
claim for damages from Autostrade per l’Italia amounted to approximately €1.8 million. Autostrade per l’Italia
filed a counterclaim, requesting that Craft’s patent be declared null and void on the grounds that the patent
did not meet the requirements of novelty and innovation. The court of first instance rejected both Craft’s
claim and Autostrade per l’Italia’s counterclaim.
Craft then appealed and the court found that Autostrade per l’Italia had not infringed the patent and that
Craft’s patent was valid. In 2012, Autostrade per l’Italia appealed the second judgement before the Supreme
Court (Corte di Cassazione), requesting that the case be referred to the Court of Appeal for a judgement
declaring the patent null and void. Craft, for its part, filed a cross-appeal, repeating its request for a
judgement upholding its claim that its patent had been infringed. On 4 November 2015, the First Civil
Section of the Supreme Court handed down judgement no. 22563, rejecting Autostrade per l’Italia’s appeal
and confirming the judgement handed down by the court of second instance in relation to validity of the
patent. The Court also upheld Craft’s cross-appeal, revoking the previous judgement on the basis of
inadequate grounds and referring the case to the Court of Appeal in Rome, before different judges. There
will, therefore, be a new hearing before the Court of Appeal in Rome, to be held by 5 December 2016. The
Court must decide whether or not Craft has incurred damages as a result of Autostrade per l’Italia’s
infringement of its patent.
Autostrade per l’Italia -Autostrade Tech against Alessandro Patanè and others
On 14 August 2013, Autostrade per l’Italia and Autostrade Tech served a writ on Mr. Alessandro Patanè and
the companied linked to him with the aim of protecting the Group’s position, following repeated claims filed
by Mr. Patanè regarding ownership of the software used in the SICVe (Safety Tutor) system. Patanè responded
by filing a counterclaim that included, among other things, a claim for damages of approximately €7.5 billion
and permission to summons numerous third parties.
At the hearing of 19 November 2015, the court, having noted Autostrade per I’Italia and Autostrade Tech’s
refusal to accept the settlement proposed by Mr. Patanè during the previous hearing of 10 June 2015 (a
“settlement based on the payment of €240 million for a 20-year licence to use the Tutor software from
2006, and the waiver of any other future claim”), reserved judgement on the objections put forward by
Autostrade per I’Italia and Autostrade Tech regarding the inadmissibility of the counterclaim and the request
to summons third parties given that they were filed late by Mr. Patanè and his companies.
On 10 December 2015, the court announced its decision, declaring that the plaintiffs had filed their claims
late and that the counterclaim and summons of third parties were, therefore, inadmissible. The hearing was
adjourned until 9 November 2016, when the case will be heard.
Appeals brought before the Civil Court of Rome and the Court of Latina in accordance with art. 700 of the
Code of Civil Procedure
On 24 November 2015 and 4 January 2016, Mr. Patanè and the companied linked to him (MPA Group Srl
and Alessandro Patanè Srl) filed two urgent appeals, the first in Rome, against Autostrade per l’Italia,
Autostrade Tech, Atlantia and Edizione, the second in Latina, also citing ANAS and Deloitte & Touche.
On an urgent preliminary basis, without hearing the defendants, and then with regard to the merits, the
appellants made various requests, largely the same as those contained in the counterclaim filed by Mr. Patanè
within the context of the action brought by Autostrade per l’Italia and Autostrade Tech against Alessandro
Patanè and associated companies.
In both the above actions, the courts turned down the appeals, ordering Mr. Patanè and the companied linked
to him to pay the legal expenses of all the parties involved.
Claim for damages from the Ministry of the Environment
The criminal case (initiated in 2007 and relating to events in 2005) pending before the Court of Florence
involves two of Autostrade per l'Italia’s managers and another 18 people from contractors, who are accused of
violating environmental laws relating to the reuse of soil and rocks resulting from excavation work during
construction of the Variante di Valico. A total of seven hearings were held between September and December
2014, in order to hear evidence from certain witnesses and experts called on by a number of the parties
involved.
Numerous hearings were then held in 2015, during which all the witnesses for the prosecution were heard.

211
In particular, at the hearing of 12 January 2015, in response to matching objections raised by the counsel for
the defence, the court issued a lengthy order establishing that the reports on the inspections conducted by the
Police, with particular reference to the sampling report collected by the Police under the above warrant, and
the ensuing laboratory analyses of the samples, were null and void due to procedural irregularities. Similarly,
the reports on the laboratory analyses of the samples collected by ARPAT staff in exercising their regulatory
powers were also declared null and void and thus returned to the investigating magistrate as they may no longer
be used as evidence.
In response, the investigating magistrate filed an objection to the judge which, in the order dated 9 February
2015, was declared inadmissible by the court appointed to rule on such objections at the Florence Court of
Appeal, in view of the absence of any grounds for the objection.
The witnesses and experts called by the defence are currently being heard. Once this process has been
completed, the preliminary hearing will conclude.
Investigation by the Public Prosecutor’s Office in Vasto of the fatal motorway accident of 21 September 2013
Following the motorway accident of 21 September 2013 at km 450 of the A14, operated by Autostrade per
l’Italia, in which several people were killed, the Public Prosecutor’s Office in Vasto has launched a criminal
investigation, initially against persons unknown. On 23 March 2015, the Chief Executive Officer and, later,
further two executives of the Company received notice of completion of the investigation, containing a formal
notification of charges. The charges relate to negligent cooperation resulting in reckless manslaughter. The
Public Prosecutor, following initiatives taken by the defence counsel, has requested that the case be brought to
court. Due to irregularities in the writs of summons sent to the defendants, the preliminary hearing was
adjourned until 1 March 2016. At this hearing, the case was adjourned until 17 May 2016.
Overseas motorways
Brazil
The pending legal action regarding the ban on toll charges for the suspended axles of heavy vehicles, involving
operators in the State of Sao Paulo, including Triangulo do Sol, is described in detail in the Annual Report for
the year ended 31 December 2014. On 24 March 2015, the Supreme Court (Tribunale Superiore di Giustizia
or “STJ”) for the State of Sao Paulo rejected the challenge brought by the operators with the aim of obtaining a
reinstatement of proceedings before the Court of the State of Sao Paulo, ruling it inadmissible. On 14 April
2015, the operators filed an extraordinary challenge against the court’s ruling before Brazil’s Federal Supreme
Court (Supremo Tribunal Federal or “STF”). On 3 June 2015, the STJ refuted the existence of the grounds of
a political, social or economic nature necessary for the case to be heard by the STF. On 28 June 2015, the
operators filed a further challenge, contesting this preliminary judgement. This challenge was also rejected by
the Supreme Court on 5 August 2015.
Thus, as a result of this decision, toll charges for the suspended axles of heavy vehicles are not permitted under
the terms of the concession. To date, the operator, Triangulo do Sol (in common with Colinas, which was not
a party to the legal action) has, in any event, applied this charge, not in application of any court ruling, but as a
means of compensating for the decision, taken by the Public Transport Services Regulator for the State of Sao
Paulo (ARTESP) in the same period, not to allow the application of annual toll increases from July 2013.
On 17 April 2015, Federal Law 13103/2015 come into effect. This, among other things, authorises the
exemption of road hauliers from the payment of toll charges for the suspended axles of heavy vehicles. The
above legislation has been applied by the state of Minas Gerais, whilst the government of the state of Sao Paulo
has decided not to apply the exemption. Thus, from 17 April 2015, Rodovia MG050, in Minas Gerais, has
ceased charging for the suspended axles of heavy vehicles, whilst operators in the state of Sao Paulo, including
Rodovias das Colinas and Triangulo do Sol, continue to levy the charge. Rodovia MG050’s lost revenue,
following the entry into effect of the above legislation and the resulting cessation of charges for the suspended
axles of heavy vehicles, will be recouped in accordance with the terms of the concession arrangement.
The investigation launched by ARTESP on 13 July 2013, with a view to revising the Addenda and Amendments
signed and approved by the Regulator and 12 motorway operators in 2006 - the changes were designed to
extend the concession terms to compensate, among other things, for the expenses incurred as a result of taxes

3. Consolidated financial statements as at and for the year ended 31 December 2015
Annual Report 2015 212
introduced after the concessions were granted – is described in detail in the Annual Report for the year ended
31 December 2014. On 24 February 2015, the Public Prosecutor for the State of Sao Paulo provided a non-
binding opinion the judge appointed to take charge of the investigation relating to the operator, Colinas. This
recommended termination of the proceedings underway, reiterating that legality of the Addenda and
Amendments of 2006, which were subject to close examination and endorsed by the relevant Ministry. On 10
March 2015, ARTESP responded to the judge, contesting the Public Prosecutor’s opinion and requesting that
the investigation continue. On 15 February 2016, the Court of the State of Sao Paulo issued a ruling, granting
Rodovias das Colinas the option of submitting a financial assessment to demonstrate its case.
The operators concerned, including Colinas and Triangulo do Sol, and industry insiders, including banks,
believe that the risk of a negative outcome is remote. This view is backed up by a number of unequivocal legal
opinions provided by leading experts in administrative law and regulation.
Poland
Since 20 June 2012, the Polish Antitrust Authority has been conducting an Explanatory Proceeding to
investigate Stalexport Autostrada Maloposka. The proceeding aims to investigate the company’s "abuse of its
dominant position" with regard to the tolls charged to road users when carrying out construction and
extraordinary maintenance work, given that Stalexport Autostrada Maloposka is held to operate as a
"monopoly". Should the Authority rule that there has been an "abuse of its dominant position", the
proceeding could result in a fine. Whilst reserving the right to challenge any ruling the Authority’s
investigation may result in, the company is taking steps to define the timing and amount of eventual reductions
in tolls whilst such work takes place. At the end of a similar investigation in 2008 the local Antitrust office
fined the Polish company approximately €300 thousand, given that it had not put in place a procedure for
reducing tolls during the work. The fine was confirmed at various instances, including by the Supreme Court.
Italian airports Fee increases
In keeping with existing regulations and with the ENAC Guidelines for the “Procedure for consultation
between airport operators and users for ordinary planning agreements and those in derogation”, on 31 August
2015, Aeroporti di Roma sent a letter inviting all the Users’ Associations to attend a public hearing held on 30
September 2015, on the same date publishing, as part of the consultation process, all the documentation
relating to the proposed fees for 2016 on its website.
On 18 September 2015, a request for clarification of the published documents was received from
AssoHandlers. ADR responded to this request at the public hearing of 30 September 2015.
On 30 October 2015, the company published responses to further requests for clarification from Ryanair,
IBAR (together with AOC, Assaereo, IATA and the Users’ Committee for Fiumicino), AssoHandlers and
EasyJet on its website.
The proposed fee increases for 2016 envisage average increases of 10.4% and 6.4% for Fiumicino and
Ciampino, respectively.
On 15 December 2015, at the end of the consultation process, the fees for Fiumicino and Ciampino were
published on the websites of ENAC and ADR. The new fees will be in effect from 1 March 2016 until 28
February 2017.
The Regional Tax on Aircraft Noise (IRESA) and municipal surcharge
The national law, converting Law Decree 145/2013 (the so-called “Destination Italy” law, published in the
Official Gazette on 21 February 2014) includes measures for airports that provide subsidies to airlines; fixes
the maximum value of the Regional Tax on Aircraft Noise (IRESA) calculation parameters applicable
throughout the country; establishes that the municipal surcharge introduced by article 2, paragraph 11 of Law
350 of 24 December 2003, and subsequent increases, is not payable by passengers in transit at Italian airports,
if they have arrived from another Italian airport, and that the Commissioner’s surcharge for Roma Capitale

213
should continue to be applied to all passengers departing from or in transit at the airports of Rome Fiumicino
and Ciampino, with the exception of transit passengers arriving from and departing for an Italian airport.
IRESA
On 15 April 2014, Lazio Regional Authority adopted a resolution (no. 196) authorising a legal challenge to be
brought before the Constitutional Court, contesting the constitutional legitimacy of the “Destinazione Italia”
Law Decree - and, in particular, article 13, paragraph 15 bis - as converted into Law 9 of 21 February 2014. On
9 February 2015, the Constitutional Court ruled Lazio Regional Authority’s challenge to be inadmissible.
In response to the Constitutional Court sentence, Lazio Regional Authority: i) authorised ADR, whilst
awaiting specific legislation to be enacted by Lazio Regional Authority, to assess, collect and pass on IRESA,
applying, in the form of a payment on account, the maximum rate of €0.50 per tonne based on the maximum
takeoff weight, subject to application of an eventual adjustment; ii) granted the Regional Office for Economic
Planning, Budgeting and Estate and Asset Management (Direzione Regionale Programmazione Economica,
Bilancio, Demanio e Patrimonio) authority to take all the necessary steps in order to sign an addendum to the
Agreement between Lazio Regional Authority and ADR, whilst awaiting enactment of the relevant legislation.
Regional Law 11 was published in the Lazio Region’s Official Gazette on 30 July 2015. Article 2 of the new
legislation sets out “amendments to the provisions of art. 13, paragraph 15-bis of Law Decree 145 of 23
December 2013, converted with amendments into Law 9 of 21 February 2014, containing urgent measures
pertaining to air transport”. The new rates for IRESA introduced by the new legislation, where applicable, are
effective from 22 February 2014.
In October 2015, ADR and Lazio Regional Authority agreed an Addendum to the agreement governing the
application of IRESA signed by the parties on 30 January 2014.
Limitation on the handlers authorised to operate at Fiumicino airport
In December 2014, ADR was notified of five challenges lodged with Lazio Regional Administrative Court,
contesting ENAC’s decision of 13 October 2014 to limit the number of handlers authorised to provide the
services listed in points 3, 4 and 5 (with the exclusion of 5.7) in Annex A to Legislative Decree 18/1999 at
Fiumicino airport. The challenges were lodged by Assaereo, Aviation Services SpA, Consulta S.r.l, Consulta
SpA and IBAR. In December 2014, ADR was also notified of two additional grounds for a challenge lodged by
“Fallimento Groundcare Milano Srl”. Finally, on 6 February 2015, ALHA Airport filed an extraordinary
challenge with the Italian President, requesting cancellation of ENAC’s decision.
With two separate rulings dated 17 April 2015, Lazio Regional Administrative Court rejected the requests for
injunctive relief brought by IBAR and Assaereo. No dates have so far been set for hearings on the merits of the
other challenges filed. The hearing on the merits of Assaereo’s challenge is scheduled for 16 June 2016.
Selection of 3 handlers authorised to provide the services defined in points 3, 4 and 5 (with the exclusion
of 5.7) in Annex A of Legislative Decree 18/1999 at Fiumicino airport
ENAC published a call for tenders in Volume S/81 of the Official Journal of the European Union on 25 April
2015, with the aim of selecting ground handlers to be authorised to operate at the airport, in accordance with
art. 11 of Legislative Decree 18/1999. This followed ENAC’s decision, dated 13 October 2014, to limit the
number of ground handlers to three.
Following publication of the above call for tenders, Consulta SpA, Assaereo, IBAR and Aviation Services filed
a legal challenge with Lazio Regional Administrative Court against the call for tenders, citing additional
grounds. ATA Italia has, instead, filed a new challenge with Lazio Regional Administrative Court. At the
hearing held on 26 June 2015, the Court rejected the request for injunctive relief brought by the plaintiff. The
hearing on the merits has been scheduled for 8 July 2016.
At the respective hearings of 9 and 17 July 2015, Consulta SpA and IBAR withdrew their requests for
injunctive relief. No date has so far been set for the hearing on the merits.
At the date for the submission of tenders, scheduled for 30 June 2015 in the call for tenders, ENAC had
received five bids.
On 30 June 2015, ENAC met in public session to open the envelopes containing participants’ “administrative
documents” and, on 1 July 2015, began opening the envelopes containing the “Tender”.
On 16 December 2015, ENAC’s Tender Committee, meeting in public session, read the scores assigned to the
bidders and the related rankings.

3. Consolidated financial statements as at and for the year ended 31 December 2015
Annual Report 2015 214
On 23 December 2015, ENAC’s General Manager issued a Directive announcing the selection of the following
bidders: Aviation Services SpA, Aviaprtner Handling SpA and Alitalia SAI SpA.
On 29 December 2015, Consulta, citing additional grounds, challenged the above selection before Lazio
Regional Administrative Court, requesting injunctive relief. At the hearing of 21 January 2016, held to
consider the request for injunctive relief, the Regional Administrative Court upheld Consulta’s request for a
postponement, adjourning the case until a later date.
In a challenge filed with Lazio Regional Administrative Court on 14 January 2016, WFS Srl has also challenged
ENAC’s selection of handlers. In response, ADR filed a cross-appeal opposing the challenge and, at the
hearing of 4 February 2016, the court rejected WFS’s request for injunctive relief and scheduled the hearing
on the merits for 14 April 2016.
Procedure for selecting a provider to operate cargo handling services in a portion of the Cargo Terminal at
Fiumicino airport under a sub-concession arrangement
ADR published a call for tenders in Volume S/67 of the Official Journal of the European Union on 4 April
2015, with the aim of selecting a provider to operate cargo handling services in a portion of the Cargo
Terminal at Fiumicino airport under a sub-concession arrangement.
At the date indicated in the call for tenders, ADR had received three applications to tender.
Following the above publication of the call for tenders, Fiumicino Logistica Europa and BAS Handler filed two
separate challenges with Lazio Regional Administrative Court, requesting annulment of the call for tenders
and injunctive relief.
At the hearing of 11 June 2015, the Regional Administrative Court rejected both requests for injunctive relief.
BAS thus filed a second challenge before Lazio Regional Administrative Court, contesting the new layout of the
cargo terminal, requesting an urgent injunction against a letter from ENAC and one from ADR. This was
turned down by the administrative court on 26 June 2015.
At the hearing held to discuss the injunctive relief, the plaintiff requested an adjournment to enable them to
submit additional evidence and the court scheduled another hearing for 29 October 2015, when the plaintiff
withdrew its request for injunctive relief.
In a letter dated 5 October 2015, ADR proceeded to exclude Alha Airport from the procedure and, on 29
December 2015, sent out letters of invitation. The tender process is currently in progress.
Noise Reduction and Abatement Plan for Ciampino airport
Pursuant to the Ministerial Decree of 29 November 2000, ADR submitted its Noise Reduction and Abatement
Plan for Ciampino airport to Lazio Regional Authority and the municipalities of Rome, Marino and Ciampino
on 28 November 2013. In February 2014, the three municipalities expressed their opposition to the proposed
plan.
On 5 May 2014, Lazio Regional Authority formally set up a cross-agency panel to look into the above Plan. In
addition to Lazio Regional Authority, the panel’s members include representatives from the Municipality of
Rome, the municipalities of Ciampino and Marino, ENAC, ARPA Lazio (the region’s environmental
protection agency) and ADR.
On 12 June 2014, Regulation 598/2014 was published in the Office Journal of the European Union L173. The
regulation has introduced rules and procedures for the introduction of operational restrictions aimed at
containing the noise at airports in the EU, as part of a balanced approach, based on an examination (using a
process developed by the International Civil Aviation Organisation) of the available measures, with a view to
resolving the issue of noise pollution in keeping with the principle of cost effectiveness at the level of each
individual airport.
The Regulation, which has abolished Directive 2002/30/EC, will come into effect on 13 June 2016 and will
apply to European airports “with traffic in excess of 50,000 movements of civil aircraft per calendar year,
based on the average of the last three calendar years prior to determining the level of noise”. On 11 November
2015, ADR submitted a new Noise Reduction and Abatement Plan for Ciampino airport to Lazio Regional
Authority and the municipalities of Rome, Ciampino and Marino. The new Plan was drawn up following the
opposition expressed by the authorities to the Noise Reduction and Abatement Plan submitted by ADR in
2013.

215
Following receipt of the Plan, Lazio Regional Authority called a Services Conference with all the interested
authorities (neighbouring municipalities) in order to jointly assess the Plan submitted by ADR, which must
then be approved by each individual municipality.
The Conference’s first sitting, to which ADR was invited, was held on 12 January 2016.
Determination of airport concession fees for the three-year period 2016-2018
The interdepartmental decree (“Decreto interdirigenziale”) of 14 December 2015 issued by the State Property
Office and the Ministry of Infrastructure and Transport, containing the “Determination of the airport
concession fees for the three-year period 2016-2018”, was published in Official Gazette no. 296 on 21
December 2015. This Decree confirms application of the same criteria defined in the previous decree
(Executive Decree of 22 April 2013), determining airport concession fees for the three-year period 2013-
2015, for the three-year period 2016-2018. This is based on the method for quantifying airport concession
fees contained in art. 1 of the interdepartmental decree of 30 June 2003.
Airports Plan – Airports of national interest
With the issue of Presidential Decree 201 of 17 September 2015, containing “Regulations governing the
identification of airports of national interest, in accordance with article 698 of the Navigation Code”, the
procedure provided for in the Navigation Code and the related process of planning the development and
restructuring of Italy’s airport system has come to an end.
For each of the 10 catchment areas indicated, the Presidential Decree identifies 38 airports of national interest
(including Fiumicino and Ciampino) that are the sole responsibility of the State, assigning responsibility for
airports of regional importance to the relevant regional and local authorities, as required by the legislation
governing the federal approach to the management of public property (Legislative Decree 85/2010).
12 airports of “strategic importance” were then chosen from among those of national interest, including Rome
Fiumicino, which is the principal hub for the country’s airport system and, together with the airports of Milan
Malpensa and Venice Marco Polo, acts as an intercontinental gateway.
Procedure for approving airport infrastructure projects
Law Decree 185 of 25 November 2015 contains “Urgent measures for infrastructure projects” and was
published in Official Gazette 275 of 25 November 2015 and effective from the date of publication. Article 9
(Withdrawal of unused funding and repeal of procedures for airports), c. 3 states that “Paragraph 3-bis of
article 71 of Law Decree 1 of 24 January 2012, converted, with amendments, into Law 27 of 24 March 2012,
is hereby repealed”.
Article 71, c. 3-bis had assimilated the procedures involved in carrying out infrastructure projects at Fiumicino
and Ciampino airports with those relating to strategic infrastructure projects of national interest (so-called
major works) and had extended application of the legislation governing consents for such works to include the
airports.
With the repeal of art. 71, c. 3-bis, infrastructure projects for Fiumicino and Ciampino airports no longer on
a par with the above major works and are, therefore, once again subject to the pre-existing legislation
governing consents.
Following the entry into effect of Law Decree 185/2015, ENAC has formally withdrawn its request for an
environmental impact assessment linked to approval of the Master Plan for Ciampino in accordance with the
procedure introduced by art. 71, c. 3-bis, announcing that it would shortly submit a new request for the
assessment according to the ordinary procedure.
On 4 December 2015, the Ministry of the Environment and Land and Sea Protection took receipt of the above
withdrawal (ceasing to process the application) and ENAC’s commitment to submit a new request for an
assessment in accordance with the ordinary procedure.
Notice of withdrawal of the application was also given in a release published on the Ministry’s website, which
also stated that a new request for an environmental impact assessment would be submitted in accordance with
the ordinary procedure, pursuant to art. 23 of Legislative Decree 152/2006, as amended, following the Law
Decree’s conversion into law.
Law 9 of 22 January 2016, converting Law Decree 185/2015 into law with amendments, published in Official
Gazette 18 of 23 January 2016, has confirmed the repeal of art. 71, c. 3-bis.

3. Consolidated financial statements as at and for the year ended 31 December 2015
Annual Report 2015 216
Increase in the municipal surcharge on air passenger duty
The Decree issued by the Ministry of Infrastructure and Transport on 29 October 2015, regarding “Definition
of the increase in the municipal surcharge on air passenger duty to be transferred to INPS”, was published in
Official Gazette 300 of 28 December 2015.
The decree has introduced a further increase in the municipal surcharge, which amounts to €2.50 for 2016,
€2.42 for 2017 and €2.34 for 2018, in application of paragraph 23 of art. 13 of Law Decree 145/2013, the so-
called “Destinazione Italia” legislation, converted with amendments into Law 9/2014.
As a result of this decree, the municipal surcharge on air passenger duty paid by passengers departing from
Fiumicino and Ciampino airports amounts to €10 in 2016.
The airline, EasyJet, has challenged the decree before Lazio Regional Administrative Court, requesting its
cancellation subject to prior injunctive relief.
Fire at Fiumicino airport’s Terminal 3
During the night of 6 May 2015 a fire broke out in the airside part of Terminal 3 (also “T3”) at Fiumicino
airport, affecting an area of approximately 5,450 square metres. Prosecutors are currently investigating the
causes of the fire.
The fire primarily damaged the areas used for security and passport controls at T3, the concourse linking gates
C and D, a part of the transit corridor and the various systems and equipment serving arrivals and departures
at T3. The worst hit area was immediately seized by the police on 7 May 2015. This area was then rendered
once again accessible to ADR on 15 June 2015 by order of the Public Prosecutor’s Office in Civitavecchia. ADR
immediately began work on a clean-up and on making the area safe.
From an operational viewpoint, Fiumicino airport was closed to all departing and arriving traffic from
8.00am to 1.00pm on 7 May 2015, with the sole exclusion of intercontinental flights. Following a meeting
that day between ENAC (the Civil Aviation Authority) and other authorities involved in managing the
emergency, with the aim of assessing the state of Terminal 3 and agreeing on how to proceed, the airport
gradually began operating again that afternoon, with 50% of the airport’s normal capacity restored.
ADR took the necessary steps to get the airport working again, whilst giving priority to the health and safety of
staff. A leading fire damage clean-up and restoration company, Belfor, was contracted to carry out the work.
The airport returned to full capacity, including short- and medium-haul flights, from 19 July 2015, following
the opening of Pier D.
A total of 114 retail outlets, operated under concession by third parties, were damaged by the fire. 20 were
seriously damaged and it is not known when they will reopen.
Following the event, ADR immediately hired HSI Consulting to monitor the air quality. The survey, which
focused on the type of pollutants present following a fire, was conducted in compliance with national and
international regulations governing situations of this nature and on the basis of the procedures following by
public bodies in Italy.
Based on the results of the monitoring of air quality, ADR announced that, under national legislation
(Legislative Decree 81/2008), pollutant levels were within permitted amounts, with the exception of one day
and one pollutant (toluene), which was present in an area closed to traffic for renovation. With specific regard
to dioxin, given that Italy has yet to introduce specific legislation, the readings were in any event well below the
level set by legislation in Germany, the only EU country to have a put a limit on the level of this pollutant. ADR
also issued regular announcements, communicating the results of its monitoring to passengers and airport
operators.
On 26 May 2015, the relevant Giudice delle Indagini Preliminari (Preliminary Investigating Magistrate), took
the precautionary measure of ordering the preventive confiscation of Pier D in Terminal 3 in accordance with
art. 321 of the Code of Criminal Procedure, authorising access only in order to decontaminate the premises so
as to make them fit for use again.
At ADR’s request, following compliance with the related requirements, the release of Pier D in Terminal 3 was
ordered on 19 June 2015, subject to a complete, uniform and immediate clean-up of the retail areas, assigning
the Supervisory Authority responsibility for monitoring the situation. ADR announced that it had complied
with all the related requirements.
Investigations by the relevant authorities are ongoing, with the aim of understanding exactly what happened to
cause the fire and identify any responsible parties. At the same time, ADR and the insurance assessors are
217
working to quantify the damage directly and indirectly incurred, on which the related insurance claims will be
based and potential contractual and legal safeguards activated.
The Public Prosecutor’s Office in Civitavecchia has launched two criminal proceedings as a result of the fire:
the first regards violation of articles 113 and 449 of the criminal code (negligent arson), in relation to which,
on 25 November 2015, the investigators issued the order required by art.415-bis of the criminal code giving
notice of completion of the preliminary investigation of: (i) five employees of the contractor that was carrying
out routine maintenance work on the air conditioning system and two employees of ADR, all also being
investigated for the offence referred to in art. 590 of the criminal code (personal injury through negligence),
(ii) ADR’s Chief Executive Officer in his role as “employer”, (iii) the airport fire chief and (iv) the Director of
the Lazio Airport System (ENAC).
The second investigation, punishable by a fine, regards violations of occupational safety regulations contained
in Legislative Decree 81/2008 allegedly committed by ADR’s former Chief Executive Officer, in his role as
“employer”, and two ADR Group managers with the same roles within two subsidiaries (ADR Security Srl and
Airport Cleaning Srl). All the parties were notified of fines imposed for the violations identified and, as a
result, the investigations were closed.
Dispute over airport fees for flights to Switzerland
In July 2011 ADR was served with a writ by Swiss International Airlines Ltd. (“Swiss”), claiming the repayment
of €1.8 million due to a material error made in the initial quantification, equal to the excess amount paid by
Swiss from 2002 to 2009 for take-off and landing fees. ADR had applied the fees applicable to destinations
outside the EU to flights to and from the Swiss Confederation, rather than those for EU flights.
In August 2011, ADR was served with another writ regarding a similar claim by Swiss, amounting to €3.5
million (including interest) in passenger boarding fees. At the hearing of 20 February 2015, at the joint
request of the parties, the judge ordered a further adjournment, to allow negotiations to take place, until 10
July 2015.The case was then further adjourned until 3 November 2017.
In December 2015, ADR and Swiss reached a settlement that will bring the legal action to an end.
On 7 April 2014, ADR was served with a writ by EasyJet Switzerland SA, claiming the repayment of €1 million,
plus interest, equal to the excess amount paid, according to the airline, between 2009 and 2013 (based on the
fees applicable to destinations outside the EU) for take-off and landing fees and passenger boarding fees. At
the initial hearing on 23 October 2014, the investigating judge set a deadline for the submission of further
evidence. The next hearing is scheduled for 20 December 2017 for the admission of the facts.
Contract tenders
With regard to the dispute with ATI Alpine Bau, relating to the upgrade of runway 3 at Fiumicino airport, the
judgement filed by the Court of Appeal in Rome on 14 July 2014 has, in substance, rejected the appeal brought
by ATI Alpine Bau, upholding ADR’s position, and declared the contract signed on 30 December 1997
terminated due to the negligence of the temporary consortium to which the contract was awarded. On 19 June
2015, ADR was notified of an appeal lodged at the Supreme Court by Alpine Bau, now insolvent, regarding the
Court of Appeal judgement. A date for the hearing is awaited.
Pier C: contract reserves
With regard to the integrated tender for construction of the new Pier C and the Avant-corps at Fiumicino
airport, covered by contract no. TDS 254 of 27 July 2006 and subsequent addenda, awarded to the temporary
consortium, Cimolai (the total value of which is approximately €300 million, it should be noted that with
signature of the State of Progress of the Work SAL no. 91 (work completed through to 30 November 2015),
the temporary consortium, Cimolai, has accounted for contract reserves 19, 20 and 21, with 21 yet to be
quantified. These have been rejected by the appointed Site Manager. To date, the quantified reserves entered
into the accounts amount to a provisional total of approximately €71 million.
In view of the sum reached (more than 10% of the value of the contract), the procedure provided for in art.
240 of the Code for Tenders and Contracts (amicable agreement) has been activated. As a result, the Site
Manager is preparing the confidential report required by paragraph 3 of the above article, to be submitted to
the person responsible for any further action.
Other activities

3. Consolidated financial statements as at and for the year ended 31 December 2015
Annual Report 2015 218
Electronic Transaction Consultants (ETC)
Following the withholding of payment by the Miami-Dade Expressway Authority ("MDX") for the on site and
office system management and maintenance services provided by ETC, and after a failed attempt at mediation
as required by the service contract, on 28 November 2012 ETC petitioned the Miami Dade County Court in
Florida to order MDX to settle unpaid claims amounting to over US$30 million and damages for breach of
contact. In December 2012, MDX, in turn, notified ETC of its decision to terminate the service contract and
sue for compensation for alleged damages of US$26 million for breach of contract by ETC.
In August 2013, ETC and MDX agreed a settlement covering the services rendered by ETC during the
“disentanglement” phase, which ended on 22 November 2013. MDX has duly paid the sum due. In December
2015, the court case, during which the parties presented their respective arguments and the various experts and
witnesses were heard, came to an end. Judgement is expected by the end of the first half of 2016.
10.8 Events after 31 December 2015 There were no material events after the end of the year under review.

219
ANNEXES TO THE CONSOLIDATED FINANCIAL STATEMENTS
ANNEX 1
THE ATLANTIA GROUP’S SCOPE OF CONSOLIDATION AND INVESTMENTS AS AT 31 DECEMBER 2015
ANNEX 2
DISCLOSURE PURSUANT TO ART.149-DUODECIES OF THE CONSOB REGULATIONS FOR ISSUERS
11971/1999
THE ABOVE ANNEXES HAVE NOT BEEN AUDITED
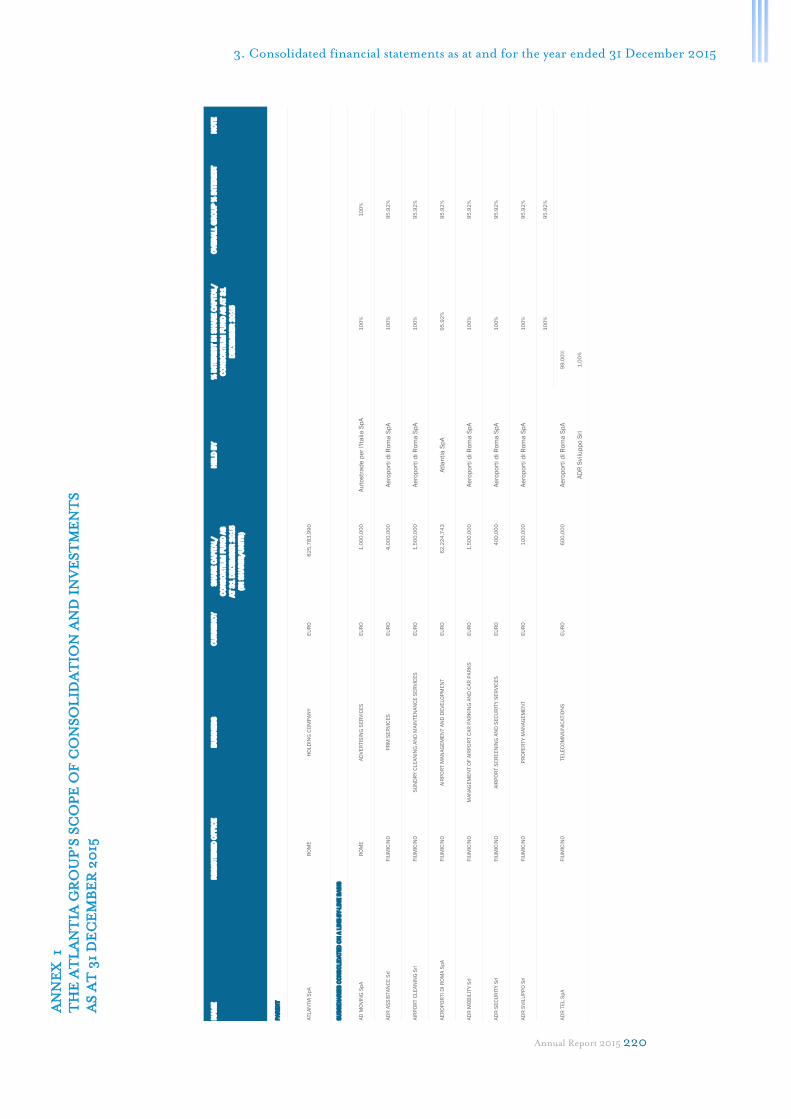
3. Consolidated financial statements as at and for the year ended 31 December 2015
Annual Report 2015 220
AN
NE
X 1
TH
E A
TL
AN
TIA
GR
OU
P’S
SC
OP
E O
F C
ON
SO
LID
AT
ION
AN
D I
NV
ES
TM
EN
TS
AS
AT
31
DE
CE
MB
ER
20
15
PA
RE
NT
ATLA
NTIA
Sp
A
RO
ME
HO
LD
ING
CO
MP
AN
YE
UR
O8
25
,78
3,9
90
SU
BS
IDIA
RIE
S C
ON
SO
LID
AT
ED
ON
A L
INE
-BY
-LIN
E B
AS
IS
AD
MO
VIN
G S
pA
RO
ME
AD
VE
RTIS
ING
SE
RV
ICE
SE
UR
O1
,00
0,0
00
Au
tostr
ad
e p
er
l'Ita
lia
Sp
A1
00
%1
00
%
AD
R A
SS
ISTA
NC
E S
rlF
IUM
ICIN
OP
RM
SE
RV
ICE
SE
UR
O4
,00
0,0
00
Ae
rop
ort
i d
i R
om
a S
pA
10
0%
95
.92
%
AIR
PO
RT C
LE
AN
ING
Srl
FIU
MIC
INO
SU
ND
RY
CLE
AN
ING
AN
D M
AIN
TE
NA
NC
E S
ER
VIC
ES
EU
RO
1,5
00
,00
0
Ae
rop
ort
i d
i R
om
a S
pA
10
0%
95
.92
%
AE
RO
PO
RTI D
I R
OM
A S
pA
FIU
MIC
INO
AIR
PO
RT M
AN
AG
EM
EN
T A
ND
DE
VE
LO
PM
EN
TE
UR
O6
2,2
24
,74
3
Atl
an
tia
Sp
A9
5.9
2%
95
.92
%
AD
R M
OB
ILIT
Y S
rlF
IUM
ICIN
OM
AN
AG
EM
EN
T O
F A
IRP
OR
T C
AR
PA
RK
ING
AN
D C
AR
PA
RK
SE
UR
O1
,50
0,0
00
Ae
rop
ort
i d
i R
om
a S
pA
10
0%
95
.92
%
AD
R S
EC
UR
ITY
Srl
FIU
MIC
INO
AIR
PO
RT S
CR
EE
NIN
G A
ND
SE
CU
RIT
Y S
ER
VIC
ES
EU
RO
40
0,0
00
Ae
rop
ort
i d
i R
om
a S
pA
10
0%
95
.92
%
AD
R S
VIL
UP
PO
Srl
FIU
MIC
INO
PR
OP
ER
TY
MA
NA
GE
ME
NT
EU
RO
10
0,0
00
Ae
rop
ort
i d
i R
om
a S
pA
10
0%
95
.92
%
10
0%
95
.92
%
Ae
rop
ort
i d
i R
om
a S
pA
99
.00
%
AD
R S
vilu
pp
o S
rl1
.00
%
OV
ER
ALL G
RO
UP
% I
NTE
RE
ST
NO
TE
SH
AR
E C
AP
ITA
L/
CO
NS
OR
TIU
M F
UN
D A
S
AT 3
1 D
EC
EM
BE
R 2
01
5
(IN
SH
AR
ES
/U
NIT
S)
AD
R T
EL S
pA
FIU
MIC
INO
TE
LE
CO
MM
UN
ICA
TIO
NS
EU
RO
60
0,0
00
NA
ME
% I
NTE
RE
ST I
N S
HA
RE
CA
PIT
AL/
CO
NS
OR
TIU
M F
UN
D A
S A
T 3
1
DE
CE
MB
ER
20
15
RE
GIS
TE
RE
D O
FF
ICE
BU
SIN
ES
SH
ELD
BY
CU
RR
EN
CY
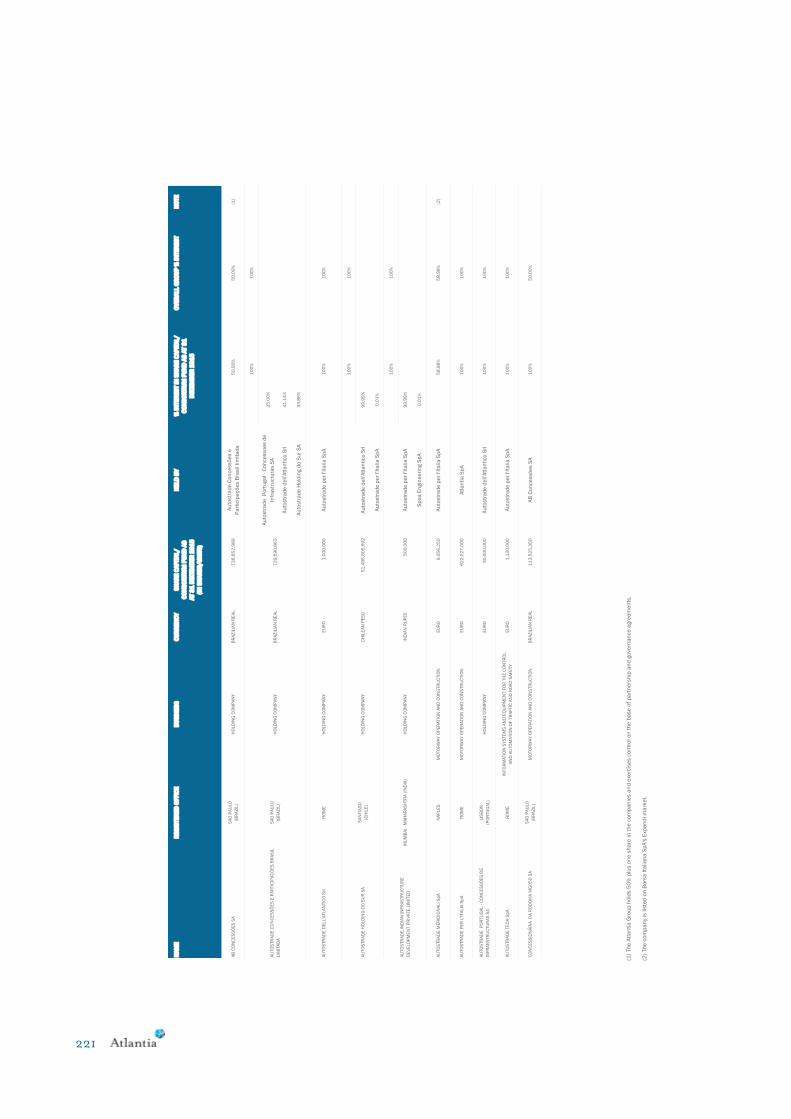
221
AB
CO
NC
ES
SÕ
ES
SA
SA
O P
AU
LO
(BR
AZ
IL)
HO
LD
ING
CO
MP
AN
Y
BR
AZ
ILIA
N R
EA
L7
38
,65
2,9
89
Au
tostr
ad
e C
on
ce
ssõ
es e
Pa
rtic
ipa
çõ
es B
rasil lim
ita
da
50
.00
%5
0.0
0%
(1)
10
0%
10
0%
Au
tostr
ad
e P
ort
uga
l - C
on
ce
sso
es d
e
Infr
astr
uctu
ras S
A2
5.0
0%
Au
tostr
ad
e d
ell'A
tla
nti
co
Srl
41
.14
%
Au
tostr
ad
e H
old
ing d
o S
ur
SA
33
.86
%
AU
TO
STR
AD
E D
ELL'A
TLA
NTIC
O S
rlR
OM
EH
OLD
ING
CO
MP
AN
Y
EU
RO
1,0
00
,00
0
Au
tostr
ad
e p
er
l'Ita
lia
Sp
A1
00
%1
00
%
10
0%
10
0%
Au
tostr
ad
e d
ell'A
tla
nti
co
Srl
99
.99
%
Au
tostr
ad
e p
er
l'Ita
lia
Sp
A0
.01
%
10
0%
10
0%
Au
tostr
ad
e p
er
l'Ita
lia
Sp
A9
9.9
9%
Sp
ea
En
gin
ee
rin
g S
pA
0.0
1%
AU
TO
STR
AD
E M
ER
IDIO
NA
LI S
pA
NA
PLE
SM
OTO
RW
AY
OP
ER
ATIO
N A
ND
CO
NS
TR
UC
TIO
NE
UR
O9
,05
6,2
50
Au
tostr
ad
e p
er
l'Ita
lia
Sp
A5
8.9
8%
58
.98
%(2
)
AU
TO
STR
AD
E P
ER
L'IT
ALIA
Sp
AR
OM
EM
OTO
RW
AY
OP
ER
ATIO
N A
ND
CO
NS
TR
UC
TIO
NE
UR
O6
22
,02
7,0
00
Atl
an
tia
Sp
A1
00
%1
00
%
AU
TO
STR
AD
E P
OR
TU
GA
L - C
ON
CE
SS
ÕE
S D
E
INF
RA
ES
TR
UC
TU
RA
S S
A
LIS
BO
N
(PO
RTU
GA
L)
HO
LD
ING
CO
MP
AN
YE
UR
O3
0,0
00
,00
0
Au
tostr
ad
e d
ell'A
tla
nti
co
Srl
10
0%
10
0%
AU
TO
STR
AD
E T
EC
H S
pA
RO
ME
INF
OR
MA
TIO
N S
YS
TE
MS
AN
D E
QU
IPM
EN
T F
OR
TH
E C
ON
TR
OL
AN
D A
UTO
MA
TIO
N O
F T
RA
FF
IC A
ND
RO
AD
SA
FE
TY
EU
RO
1,1
20
,00
0
Au
tostr
ad
e p
er
l'Ita
lia
Sp
A1
00
%1
00
%
CO
NC
ES
SIO
NÁ
RIA
D
A R
OD
OV
IA M
G0
50
SA
SA
O P
AU
LO
(BR
AZ
IL)
MO
TO
RW
AY
OP
ER
ATIO
N A
ND
CO
NS
TR
UC
TIO
NB
RA
ZIL
IAN
RE
AL
11
3,5
25
,35
0
AB
Co
nce
ssõ
es S
A1
00
%5
0.0
0%
AU
TO
STR
AD
E IN
DIA
N IN
FR
AS
TR
UC
TU
RE
DE
VE
LO
PM
EN
T P
RIV
ATE
LIM
ITE
DIN
DIA
N R
UP
EE
5
00
,00
0
OV
ER
ALL G
RO
UP
% I
NTE
RE
ST
NO
TE
72
9,5
90
,86
3
SH
AR
E C
AP
ITA
L/
CO
NS
OR
TIU
M F
UN
D A
S
AT 3
1 D
EC
EM
BE
R 2
01
5
(IN
SH
AR
ES
/U
NIT
S)
5
1,4
96
,80
5,6
92
C
HIL
EA
N P
ES
O
BR
AZ
ILIA
N R
EA
LA
UTO
STR
AD
E C
ON
CE
SS
ÕE
S E
PA
RTIC
IPA
CÕ
ES
BR
AS
IL
LIM
ITA
DA
SA
O P
AU
LO
(BR
AZ
IL)
NA
ME
% I
NTE
RE
ST I
N S
HA
RE
CA
PIT
AL/
CO
NS
OR
TIU
M F
UN
D A
S A
T 3
1
DE
CE
MB
ER
20
15
RE
GIS
TE
RE
D O
FF
ICE
BU
SIN
ES
SH
ELD
BY
CU
RR
EN
CY
AU
TO
STR
AD
E H
OLD
ING
DO
SU
R S
A
HO
LD
ING
CO
MP
AN
Y
MU
MB
AI - M
AH
AR
AS
HTR
A (
IND
IA)
HO
LD
ING
CO
MP
AN
Y
SA
NTIA
GO
(CH
ILE
)H
OLD
ING
CO
MP
AN
Y
(1)
Th
e A
tla
nti
a G
rou
p h
old
s 5
0%
plu
s o
ne
sh
are
in
th
e c
om
pa
nie
s a
nd
exe
rcis
es c
on
tro
l o
n t
he
ba
se
of
pa
rtn
ers
hip
an
d g
ove
rna
nce
agre
em
en
ts.
(2)
Th
e c
om
pa
ny
is lis
ted
on
Bo
rsa
Ita
lia
na
Sp
A's
Exp
an
di m
ark
et.

3. Consolidated financial statements as at and for the year ended 31 December 2015
Annual Report 2015 222
DA
NN
II H
OLD
ING
GM
BH
VIE
NN
A
(AU
STR
IA)
AC
QU
ISIT
ION
AN
D M
AN
AG
EM
EN
T O
F IN
VE
STM
EN
TS
EU
RO
10
,00
0
Au
tostr
ad
e T
ech
Sp
A1
00
%1
00
%
EC
OM
OU
V S
AS
.P
AR
IS
(FR
AN
CE
)
FIN
AN
CIN
G/D
ES
IGN
/C
ON
STR
UC
TIO
N/O
PE
RA
TIO
N O
F
EQ
UIP
ME
NT R
EQ
UR
IED
FO
R E
CO
-TA
XE
EU
RO
30
,00
0,0
00
Au
tostr
ad
e p
er
l'Ita
lia
Sp
A7
0.0
0%
70
.00
%
ELE
CTR
ON
IC T
RA
NS
AC
TIO
N C
ON
SU
LTA
NTS
Co
.R
ICH
AR
DS
ON
(TE
XA
S - U
SA
)M
AN
AG
EM
EN
T O
F A
UTO
MA
TE
D T
OLLIN
G S
ER
VIC
ES
U
S D
OLLA
R2
0,0
00
,00
0
Au
tostr
ad
e d
ell'A
tla
nti
co
Srl
64
.46
%6
4.4
6%
ES
SE
DIE
SS
E S
OC
IETÀ
DI S
ER
VIZ
I S
pA
RO
ME
GE
NE
RA
L A
ND
AD
MIN
ISTR
ATIV
E S
ER
VIC
ES
EU
RO
50
0,0
00
Au
tostr
ad
e p
er
l'Ita
lia
Sp
A1
00
%1
00
%
FIU
MIC
INO
EN
ER
GIA
Srl
FIU
MIC
INO
ELE
CTR
ICIT
Y P
RO
DU
CTIO
NE
UR
O7
41
,79
5
Atl
an
tia
Sp
A8
7.1
4%
87
.14
%
GIO
VE
CLE
AR
Srl
RO
ME
SU
ND
RY
CLE
AN
ING
AN
D M
AIN
TE
NA
NC
E S
ER
VIC
ES
E
UR
O1
0,0
00
Au
tostr
ad
e p
er
l'Ita
lia
Sp
A1
00
%1
00
%
GR
UP
O C
OS
TA
NE
RA
Sp
AS
AN
TIA
GO
(CH
ILE
)H
OLD
ING
CO
MP
AN
YC
HIL
EA
N P
ES
O4
65
,29
8,4
30
,41
8
Au
tostr
ad
e d
ell'A
tla
nti
co
Srl
50
.01
%5
0.0
1%
INF
OB
LU
Sp
AR
OM
ETR
AF
FIC
IN
FO
RM
ATIO
NE
UR
O5
,16
0,0
00
Au
tostr
ad
e p
er
l'Ita
lia
Sp
A7
5.0
0%
75
.00
%
10
0%
88
.02
%
Fiu
mic
ino
En
erg
ia S
rl9
0.0
0%
Ae
rop
ort
i d
i R
om
a S
pA
10
.00
%
MIZ
AR
D S
rlR
OM
EA
CQ
UIS
ITIO
N, S
ALE
AN
D M
AN
AG
EM
EN
T O
F IN
VE
STM
EN
TS
IN
IT S
ER
VIC
ES
CO
MP
AN
IES
EU
RO
10
,00
0
Atl
an
tia
Sp
A1
00
%1
00
%
FIU
MIC
INO
ELE
CTR
ICIT
Y P
RO
DU
CTIO
N
OV
ER
ALL G
RO
UP
% I
NTE
RE
ST
NO
TE
EU
RO
10
,00
0
SH
AR
E C
AP
ITA
L/
CO
NS
OR
TIU
M F
UN
D A
S
AT 3
1 D
EC
EM
BE
R 2
01
5
(IN
SH
AR
ES
/U
NIT
S)
NA
ME
% I
NTE
RE
ST I
N S
HA
RE
CA
PIT
AL/
CO
NS
OR
TIU
M F
UN
D A
S A
T 3
1
DE
CE
MB
ER
20
15
RE
GIS
TE
RE
D O
FF
ICE
BU
SIN
ES
SH
ELD
BY
CU
RR
EN
CY
LE
ON
AR
DO
EN
ER
GIA
– S
OC
IETA
' CO
NS
OR
TIL
E a
r.l.

223
PA
VIM
EN
TA
L P
OLS
KA
SP
.ZO
.O.
WA
RS
AW
(PO
LA
ND
)
MO
TO
RW
AY
AN
D A
IRP
OR
T C
ON
STR
UC
TIO
N A
ND
MA
INTE
NA
NC
EP
OLIS
H Z
LO
TY
3,0
00
,00
0
Pa
vim
en
tal S
pA
10
0%
98
.58
%
99
.40
%9
8.5
8%
Atl
an
tia
Sp
A5
9.4
0%
Au
tostr
ad
e p
er
l'Ita
lia
Sp
A2
0.0
0%
Ae
rop
ort
i d
i R
om
a S
pA
20
.00
%
RA
CC
OR
DO
AU
TO
STR
AD
ALE
VA
LLE
D'A
OS
TA
Sp
AA
OS
TA
MO
TO
RW
AY
OP
ER
ATIO
N A
ND
CO
NS
TR
UC
TIO
NE
UR
O3
43
,80
5,0
00
So
cie
tà I
talia
na
pe
r A
zio
ni
pe
r il T
rafo
ro d
el M
on
te B
ian
co
47
.97
%2
4.4
6%
(3)
RO
MU
LU
S F
INA
NC
E S
rlC
ON
EG
LIA
NO
SE
CU
RIT
ISA
TIO
N V
EH
ICLE
EU
RO
10
,00
0
N/A
(4)
RO
DO
VIA
D
AS
CO
LIN
AS
S
AS
AO
PA
ULO
(BR
AZ
IL)
MO
TO
RW
AY
OP
ER
ATIO
N A
ND
CO
NS
TR
UC
TIO
NB
RA
ZIL
IAN
RE
AL
22
6,1
45
,40
1
AB
Co
nce
ssõ
es S
A1
00
%5
0.0
0%
SA
NTIA
GO
(CH
ILE
)1
00
%5
0.0
1%
Gru
po
Co
sta
ne
ra S
A9
9.9
8%
So
cie
da
d G
esti
on
Via
l S
A0
.02
%
10
0%
50
.01
%
Gru
po
Co
sta
ne
ra S
A9
9.9
0%
So
cie
da
d G
esti
on
Via
l S
A0
.10
%
10
0%
50
.01
%
Gru
po
Co
sta
ne
ra S
A9
9.9
99
96
%
So
cie
da
d G
esti
on
Via
l S
A0
.00
00
4%
10
0%
50
.01
%
Gru
po
Co
sta
ne
ra S
A9
9.9
98
04
%
So
cie
da
d G
esti
on
Via
l S
A0
.00
19
6%
10
0%
10
0%
Au
tostr
ad
e H
old
ing D
o S
ur
SA
9
9.9
52
38
%
Au
tostr
ad
e d
ell'A
tla
nti
co
Srl
0.0
47
62
%
(3)
The issued c
apital is
made u
p o
f €284,3
50,0
00 in o
rdin
ary
share
s a
nd €
59,4
55,0
00 in p
refe
rence s
hare
s.
The p
erc
enta
ge inte
rest
is c
alc
ula
ted w
ith r
efe
rence t
o a
ll share
s in issue,
where
as t
he 5
8.0
0%
of
voting r
ights
is c
alc
ula
ted w
ith r
efe
rence t
o o
rdin
ary
voting s
hare
s.
(4)
A s
pecia
l purp
ose e
ntity
, esta
blis
hed p
urs
uant
to L
aw
130/9
9,
thro
ugh w
hic
h A
ero
port
i di R
om
a S
pA
's c
reditor
banks s
ecuritised a
port
ion o
f th
e a
mount
receiv
able
fro
m t
he c
om
pany a
s a
t 14 F
ebru
ary
2003;
in a
ccord
ance w
ith IF
RS
, th
e G
roup's
inte
rest
in t
he c
om
pany is c
onsid
ere
d o
n a
par
with f
ull
contr
ol.
SO
CIE
DA
D C
ON
CE
SIO
NA
RIA
DE
LO
S L
AG
OS
SA
SO
CIE
DA
D C
ON
CE
SIO
NA
RIA
AU
TO
PIS
TA
NO
RO
RIE
NTE
SA
SA
NTIA
GO
(CH
ILE
)2
2,7
38
,90
4,6
54
CH
ILE
AN
PE
SO
MO
TO
RW
AY
OP
ER
ATIO
N A
ND
CO
NS
TR
UC
TIO
N
SA
NTIA
GO
(CH
ILE
)H
OLD
ING
CO
MP
AN
Y
SO
CIE
DA
D C
ON
CE
SIO
NA
RIA
CO
STA
NE
RA
NO
RTE
SA
58
,85
9,7
65
,51
9
CH
ILE
AN
PE
SO
5,8
75
,17
8,7
00
SO
CIE
DA
D C
ON
CE
SIO
NA
RIA
AM
B S
A
MO
TO
RW
AY
OP
ER
ATIO
N A
ND
CO
NS
TR
UC
TIO
N
CH
ILE
AN
PE
SO
16
6,9
67
,67
2,2
29
MO
TO
RW
AY
OP
ER
ATIO
N A
ND
CO
NS
TR
UC
TIO
N
OV
ER
ALL G
RO
UP
% I
NTE
RE
ST
NO
TE
SH
AR
E C
AP
ITA
L/
CO
NS
OR
TIU
M F
UN
D A
S
AT 3
1 D
EC
EM
BE
R 2
01
5
(IN
SH
AR
ES
/U
NIT
S)
NA
ME
% I
NTE
RE
ST I
N S
HA
RE
CA
PIT
AL/
CO
NS
OR
TIU
M F
UN
D A
S A
T 3
1
DE
CE
MB
ER
20
15
RE
GIS
TE
RE
D O
FF
ICE
BU
SIN
ES
SH
ELD
BY
CU
RR
EN
CY
SA
NTIA
GO
(CH
ILE
)
SO
CIE
DA
D C
ON
CE
SIO
NA
RIA
AU
TO
PIS
TA
NU
EV
A
VE
SP
UC
IO S
UR
SA
PA
VIM
EN
TA
L S
pA
RO
ME
MO
TO
RW
AY
AN
D A
IRP
OR
T C
ON
STR
UC
TIO
N A
ND
MA
INTE
NA
NC
EE
UR
O1
0,1
16
,45
2
CH
ILE
AN
PE
SO
LLA
NQ
UIH
UE
(CH
ILE
)M
OTO
RW
AY
OP
ER
ATIO
N A
ND
CO
NS
TR
UC
TIO
NC
HIL
EA
N P
ES
O5
3,6
02
,28
4,0
61

3. Consolidated financial statements as at and for the year ended 31 December 2015
Annual Report 2015 224
10
0%
50
.01
%
Gru
po
Co
sta
ne
ra S
A9
9.9
9%
So
cie
da
d G
esti
on
Via
l S
A0
.01
%
10
0%
50
.01
%
So
cie
da
d C
on
ce
sio
na
ria
Au
top
ista
Nu
eva
Ve
sp
ucio
Su
r S
A9
9.9
97
5%
So
cie
da
d G
esti
on
Via
l S
A0
.00
25
%
10
0%
50
.01
%
Gru
po
Co
sta
ne
ra S
A9
9.9
9%
So
cie
da
d O
pe
racio
n y
Lo
gis
tica
de
Infr
ae
str
uctu
ras S
A0
.01
%
10
0%
50
.01
%
Gru
po
Co
sta
ne
ra S
A9
9.9
9%
So
cie
da
d G
esti
on
Via
l S
A0
.01
%
SO
CIE
TÀ
AU
TO
STR
AD
A T
IRR
EN
ICA
Sp
AR
OM
EM
OTO
RW
AY
OP
ER
ATIO
N A
ND
CO
NS
TR
UC
TIO
NE
UR
O2
4,4
60
,80
0
Au
tostr
ad
e p
er
l'Ita
lia
Sp
A9
9.9
3%
99
.99
%(5
)
SO
CIE
TÀ
ITA
LIA
NA
PE
R A
ZIO
NI P
ER
IL
TR
AF
OR
O D
EL M
ON
TE
BIA
NC
O
PR
E' S
AIN
T D
IDIE
R
MO
NT B
LA
NC
TU
NN
EL O
PE
RA
TIO
N A
ND
CO
NS
TR
UC
TIO
NE
UR
O1
98
,74
9,2
00
Au
tostr
ad
e p
er
l'Ita
lia
Sp
A5
1.0
0%
51
.00
%
SO
LU
CIO
NA
CO
NS
ER
VA
CA
O R
OD
OV
IAR
IA L
TD
AM
ATA
O
(BR
AZ
IL)
MO
TO
RW
AY
MA
INTE
NA
NC
E B
RA
ZIL
IAN
RE
AL
50
0,0
00
AB
Co
nce
ssõ
es S
A1
00
%5
0.0
0%
10
0%
99
.18
%
Sp
ea
En
gin
ee
rin
g S
pA
99
.99
%
Au
sto
str
ad
e C
on
ce
sso
es e
Pa
rte
cip
aco
es
Bra
sil L
imit
ad
a0
.01
%
10
0%
99
.18
%
Atl
an
tia
Sp
A6
0.0
0%
Au
sto
str
ad
e p
er
l'Ita
lia
Sp
A2
0.0
0%
Ae
rop
ort
i d
i R
om
a S
pA
20
.00
%
STA
LE
XP
OR
T A
UTO
RO
UTE
SA
R.L
.LU
XE
MB
OU
RG
(LU
XE
MB
OU
RG
)M
OTO
RW
AY
SE
RV
ICE
SE
UR
O5
6,1
49
,50
0
Sta
lexp
ort
Au
tostr
ad
y S
A1
00
%6
1.2
0%
6,9
66
,00
0
SP
EA
DO
BR
AS
IL P
RO
JETO
S E
IN
FR
A E
STR
UTU
RA
LIM
ITA
DA
SA
O P
AU
LO
(BR
AZ
IL)
INTE
GR
ATE
D T
EC
HN
ICA
L A
ND
EN
GIN
EE
RIN
G S
ER
VIC
ES
BR
AZ
ILIA
N R
EA
L
1,0
00
,00
0
SP
EA
EN
GIN
EE
RIN
G S
PA
RO
ME
EU
RO
SO
CIE
DA
D O
PE
RA
CIO
N Y
LO
GIS
TIC
A D
E
INF
RA
ES
TR
UC
TU
RA
S S
A
SA
NTIA
GO
(CH
ILE
)C
ON
CE
SS
ION
CO
NTR
UC
TIO
N A
ND
SE
RV
ICE
SC
HIL
EA
N P
ES
O1
1,7
36
,81
9
SO
CIE
DA
D C
ON
CE
SIO
NA
RIA
VE
SP
UC
IO S
UR
SA
SA
NTIA
GO
(CH
ILE
)M
OTO
RW
AY
OP
ER
ATIO
N A
ND
CO
NS
TR
UC
TIO
N
SO
CIE
DA
D G
ES
TIO
N V
IAL S
AS
AN
TIA
GO
(CH
ILE
)
CO
NS
TR
UC
TIO
N A
ND
MA
INTE
NA
NC
E O
F R
OA
DS
AN
D T
RA
FF
IC
SE
RV
ICE
S
INTE
GR
ATE
D T
EC
HN
ICA
L A
ND
EN
GIN
EE
RIN
G S
ER
VIC
ES
CH
ILE
AN
PE
SO
CH
ILE
AN
PE
SO
39
7,2
37
,78
8
SO
CIE
DA
D C
ON
CE
SIO
NA
RIA
LIT
OR
AL C
EN
TR
AL S
AS
AN
TIA
GO
(CH
ILE
)M
OTO
RW
AY
OP
ER
ATIO
N A
ND
CO
NS
TR
UC
TIO
N1
8,3
68
,22
4,6
75
5
2,9
67
,79
2,7
04
OV
ER
ALL G
RO
UP
% I
NTE
RE
ST
NO
TE
SH
AR
E C
AP
ITA
L/
CO
NS
OR
TIU
M F
UN
D A
S
AT 3
1 D
EC
EM
BE
R 2
01
5
(IN
SH
AR
ES
/U
NIT
S)
NA
ME
% I
NTE
RE
ST I
N S
HA
RE
CA
PIT
AL/
CO
NS
OR
TIU
M F
UN
D A
S A
T 3
1
DE
CE
MB
ER
20
15
RE
GIS
TE
RE
D O
FF
ICE
BU
SIN
ES
SH
ELD
BY
CU
RR
EN
CY
CH
ILE
AN
PE
SO
(5)
On
29
De
ce
mb
er
20
15
, A
uto
str
ad
a T
irre
nic
a,
follo
win
g a
uth
ori
sa
tio
n b
y th
e g
en
era
l m
ee
tin
g o
f sh
are
ho
lde
rs h
eld
on
th
e s
am
e d
ate
, p
urc
ha
se
d 1
09
,60
0 o
wn
sh
are
s f
rom
no
n-c
on
tro
llin
g s
ha
reh
old
ers
. A
uto
str
ad
e p
er
l'Ita
lia
's in
tere
st
is,
the
refo
re,
eq
ua
l to
99
.99
% a
s a
t 3
1 D
ece
mb
er
20
15
(th
e p
erc
en
tage
in
tere
st
ca
lcu
late
d o
n t
he
ba
sis
of
the
ra
tio
of
sh
are
s h
eld
by
Au
tostr
ad
e p
er
l'Ita
lia
an
d t
he
su
bsid
iary
's t
ota
l sh
are
s is 9
9.9
3%
).

225
STA
LE
XP
OR
T A
UTO
STR
AD
A M
AŁO
PO
LS
KA
SA
MY
SŁO
WIC
E
(PO
LA
ND
)M
OTO
RW
AY
OP
ER
ATIO
N A
ND
CO
NS
TR
UC
TIO
NP
OLIS
H Z
LO
TY
66
,75
3,0
00
Sta
lexp
ort
Au
toro
ute
SA
r.l.
10
0%
61
.20
%
STA
LE
XP
OR
T A
UTO
STR
AD
Y S
A
MY
SLO
WIC
E
(PO
LA
ND
)H
OLD
ING
CO
MP
AN
Y
PO
LIS
H Z
LO
TY
18
5,4
46
,51
7
Au
tostr
ad
e p
er
l'Ita
lia
Sp
A6
1.2
0%
61
.20
%(6
)
TA
NG
EN
ZIA
LE
DI N
AP
OLI S
pA
NA
PLE
SM
OTO
RW
AY
OP
ER
ATIO
N A
ND
CO
NS
TR
UC
TIO
NE
UR
O1
08
,07
7,4
90
Au
tostr
ad
e p
er
l'Ita
lia
Sp
A1
00
%1
00
%
TE
CH
SO
LU
TIO
NS
IN
TE
GR
ATO
RS
SA
S. (I
N
LIQ
UID
ATIO
N)
PA
RIS
(FR
AN
CE
)
CO
NS
TR
UC
TIO
N, IN
STA
LLA
TIO
N A
ND
MA
INTE
NA
NC
E O
F
ELE
CTR
ON
IC T
OLLIN
G S
YS
TE
MS
E
UR
O2
,00
0,0
00
Au
tostr
ad
e p
er
l'Ita
lia
Sp
A1
00
%1
00
%
10
0%
10
0%
Au
tostr
ad
e p
er
l'Ita
lia
Sp
A9
6.1
5%
Au
tostr
ad
e T
ech
Sp
A3
.85
%
TR
IAN
GU
LO
DO
SO
L A
UTO
-ES
TR
AD
AS
SA
MA
TA
O
(BR
AZ
IL)
MO
TO
RW
AY
OP
ER
ATIO
N A
ND
CO
NS
TR
UC
TIO
NB
RA
ZIL
IAN
RE
AL
71
,00
0,0
00
Atl
an
tia
Be
rtin
Co
nce
sso
es S
A1
00
%5
0.0
0%
VIA
4 S
AM
YS
ŁO
WIC
E
(PO
LA
ND
)M
OTO
RW
AY
SE
RV
ICE
SP
OLIS
H Z
LO
TY
50
0,0
00
Sta
lexp
ort
Au
toro
ute
SA
r.l.
55
.00
%3
3.6
6%
EU
RO
AU
TO
MA
TE
D T
OLLIN
G S
ER
VIC
ES
2
6,0
00
,00
0
TE
LE
PA
SS
Sp
AR
OM
E
OV
ER
ALL G
RO
UP
% I
NTE
RE
ST
NO
TE
SH
AR
E C
AP
ITA
L/
CO
NS
OR
TIU
M F
UN
D A
S
AT 3
1 D
EC
EM
BE
R 2
01
5
(IN
SH
AR
ES
/U
NIT
S)
NA
ME
% I
NTE
RE
ST I
N S
HA
RE
CA
PIT
AL/
CO
NS
OR
TIU
M F
UN
D A
S A
T 3
1
DE
CE
MB
ER
20
15
RE
GIS
TE
RE
D O
FF
ICE
BU
SIN
ES
SH
ELD
BY
CU
RR
EN
CY
(6)
The c
om
pany is lis
ted o
n t
he W
ars
aw
sto
ck e
xchange.
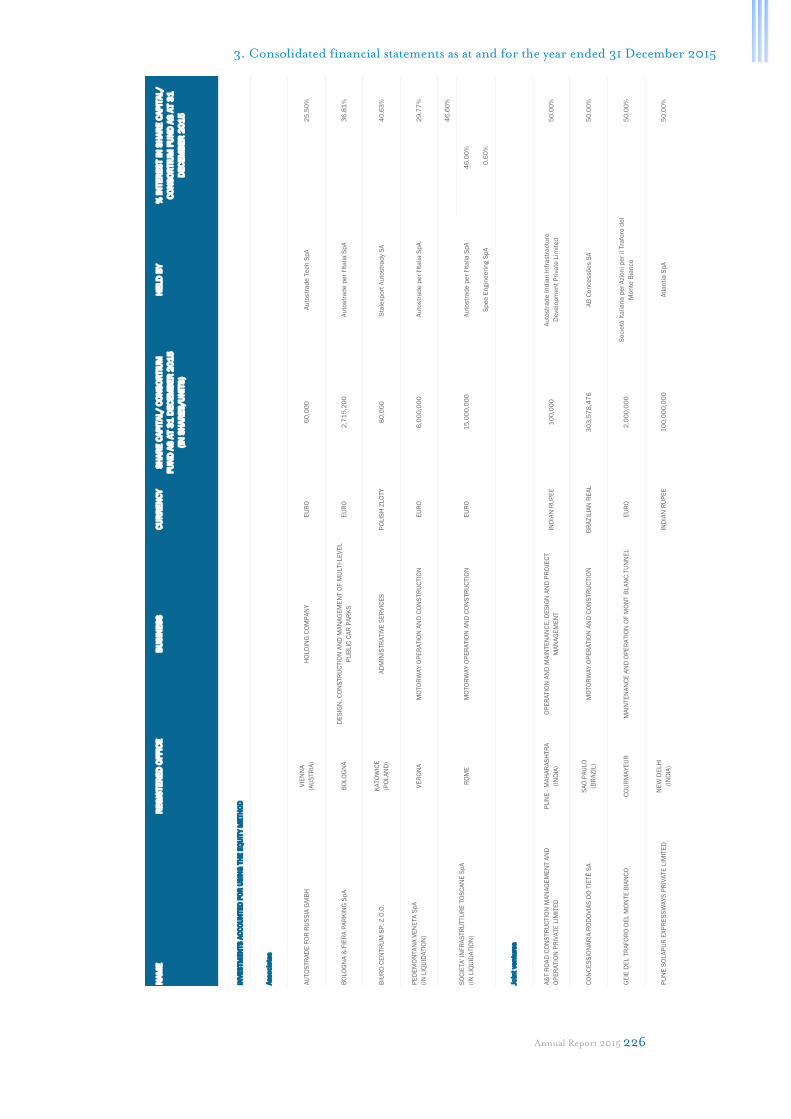
3. Consolidated financial statements as at and for the year ended 31 December 2015
Annual Report 2015 226
INV
ES
TM
EN
TS
AC
CO
UN
TE
D F
OR
US
ING
TH
E E
QU
ITY
ME
TH
OD
Asso
cia
tes
AU
TO
STR
AD
E F
OR
RU
SS
IA G
MB
H
VIE
NN
A
(AU
STR
IA)
HO
LD
ING
CO
MP
AN
YE
UR
O6
0,0
00
Au
tostr
ad
e T
ech
Sp
A2
5.5
0%
BO
LO
GN
A &
FIE
RA
PA
RK
ING
Sp
AB
OLO
GN
AD
ES
IGN
, C
ON
STR
UC
TIO
N A
ND
MA
NA
GE
ME
NT O
F M
ULTI-LE
VE
L
PU
BLIC
CA
R P
AR
KS
EU
RO
2,7
15
,20
0A
uto
str
ad
e p
er
l'Ita
lia
Sp
A3
6.8
1%
BIU
RO
CE
NTR
UM
SP
. Z
O.O
.K
ATO
WIC
E
(PO
LA
ND
)A
DM
INIS
TR
ATIV
E S
ER
VIC
ES
PO
LIS
H Z
LO
TY
80
,00
0S
tale
xpo
rt A
uto
str
ad
y S
A
40
.63
%
PE
DE
MO
NTA
NA
VE
NE
TA
Sp
A
(IN
LIQ
UID
ATIO
N)
VE
RO
NA
MO
TO
RW
AY
OP
ER
ATIO
N A
ND
CO
NS
TR
UC
TIO
N
EU
RO
6,0
00
,00
0A
uto
str
ad
e p
er
l'Ita
lia
Sp
A2
9.7
7%
46
.60
%
Au
tostr
ad
e p
er
l'Ita
lia
Sp
A4
6.0
0%
Sp
ea
En
gin
ee
rin
g S
pA
0.6
0%
Join
t ve
ntu
res
A&
T R
OA
D C
ON
STR
UC
TIO
N M
AN
AG
EM
EN
T A
ND
OP
ER
ATIO
N P
RIV
ATE
LIM
ITE
D
PU
NE
- M
AH
AR
AS
HTR
A
(IN
DIA
)
OP
ER
ATIO
N A
ND
MA
INTE
NA
NC
E, D
ES
IGN
AN
D P
RO
JEC
T
MA
NA
GE
ME
NT
IND
IAN
RU
PE
E1
00
,00
0A
uto
str
ad
e In
dia
n In
fra
str
actu
re
De
ve
lop
me
nt
Pri
va
te L
imit
ed
50
.00
%
CO
NC
ES
SIO
NÁ
RIA
RO
DO
VIA
S D
O T
IETÊ
SA
SA
O P
AU
LO
(BR
AZ
IL)
MO
TO
RW
AY
OP
ER
ATIO
N A
ND
CO
NS
TR
UC
TIO
NB
RA
ZIL
IAN
RE
AL
30
3,5
78
,47
6A
B C
on
ce
ssõ
es S
A5
0.0
0%
GE
IE D
EL T
RA
FO
RO
DE
L M
ON
TE
BIA
NC
OC
OU
RM
AY
EU
RM
AIN
TE
NA
NC
E A
ND
OP
ER
ATIO
N O
F M
ON
T B
LA
NC
TU
NN
EL
EU
RO
2,0
00
,00
0S
ocie
tà Ita
lia
na
pe
r A
zio
ni p
er
il T
rafo
ro d
el
Mo
nte
Bia
nco
50
.00
%
PU
NE
SO
LA
PU
R E
XP
RE
SS
WA
YS
PR
IVA
TE
LIM
ITE
DN
EW
DE
LH
I
(IN
DIA
)IN
DIA
N R
UP
EE
10
0,0
00
,00
0A
tla
nti
a S
pA
50
.00
%
15
,00
0,0
00
EU
RO
MO
TO
RW
AY
OP
ER
ATIO
N A
ND
CO
NS
TR
UC
TIO
N
RO
ME
SO
CIE
TA
' IN
FR
AS
TR
UTTU
RE
TO
SC
AN
E S
pA
(IN
LIQ
UID
ATIO
N)
SH
AR
E C
AP
ITA
L/ C
ON
SO
RTIU
M
FU
ND
AS
AT 3
1 D
EC
EM
BE
R 2
01
5
(IN
SH
AR
ES
/U
NIT
S)
HE
LD
BY
% I
NTE
RE
ST I
N S
HA
RE
CA
PIT
AL/
CO
NS
OR
TIU
M F
UN
D A
S A
T 3
1
DE
CE
MB
ER
20
15
NA
ME
RE
GIS
TE
RE
D O
FF
ICE
BU
SIN
ES
SC
UR
RE
NC
Y

227
Imp
rese
co
ntr
olla
te n
on
co
nso
lid
ate
DO
MIN
O S
rlF
IUM
ICIN
O
SE
RV
IZI IN
TE
RN
ET
EU
RO
10
,00
0A
tla
nti
a S
pA
10
0%
GE
MIN
A F
IDU
CIA
RY
SE
RV
ICE
S S
ALU
SS
EM
BU
RG
O
(LU
SS
EM
BU
RG
O)
FID
UC
IAR
IAE
UR
O1
50
,00
0A
tla
nti
a S
pA
99
.99
%
PA
VIM
EN
TA
L E
ST A
O (
IN L
IQU
IDA
TIO
N)
MO
SC
A
(RU
SS
IA)
CO
STR
UZ
ION
E E
MA
NU
TE
NZ
ION
E A
UTO
STR
AD
ALE
RU
BLO
RU
SS
O4
,20
0,0
00
Pa
vim
en
tal S
pA
10
0%
PE
TR
OS
TA
L S
A (
IN L
IQU
IDA
TIO
N)
VA
RS
AV
IA
(PO
LA
ND
)S
ER
VIZ
I IM
MO
BIL
IAR
IZ
LO
TY
PO
LA
CC
O2
,05
0,5
00
Sta
lexp
ort
Au
tostr
ad
y S
A1
00
%
INV
ES
TM
EN
TS
AC
CO
UN
TE
D F
OR
AT
CO
ST
OR
FA
IR V
AL
UE
% I
NTE
RE
ST I
N S
HA
RE
CA
PIT
AL/
CO
NS
OR
TIU
M F
UN
D A
S A
T 3
1
DE
CE
MB
ER
20
15
NA
ME
RE
GIS
TE
RE
D O
FF
ICE
BU
SIN
ES
SC
UR
RE
NC
YS
HA
RE
CA
PIT
AL/
CO
NS
OR
TIU
M F
UN
D A
S
AT 3
1 D
EC
EM
BE
R 2
01
5
(IN
SH
AR
ES
/U
NIT
S)
HE
LD
BY

3. Consolidated financial statements as at and for the year ended 31 December 2015
Annual Report 2015 228
Oth
er
inve
stm
en
ts
AE
RO
PO
RTO
DI G
EN
OV
A S
pA
G
EN
OV
A
GE
STIO
NE
AE
RO
PO
RTU
ALE
EU
RO
7,7
46
,90
0A
ero
po
rti d
i R
om
a S
pA
15
.00
%
CE
NTR
O IN
TE
RM
OD
ALE
TO
SC
AN
O A
ME
RIG
O
VE
SP
UC
CI S
pA
LIV
OR
NO
CE
NTR
O D
I S
MIS
TA
ME
NTO
ME
RC
IE
UR
O1
1,7
56
,69
5S
ocie
tà A
uto
str
ad
a T
irre
nic
a p
.A.
0.4
3%
CO
MP
AG
NIA
AE
RE
A ITA
LIA
NA
Sp
AF
IUM
ICIN
O
TR
AS
PO
RTO
AE
RE
OE
UR
O3
59
,02
6,5
36
Atl
an
tia
Sp
A7
.02
%
DIR
EC
TIO
NA
L C
AP
ITA
L H
OLD
ING
S
(IN
LIQ
UID
ATIO
N)
CH
AN
NE
L IS
LA
ND
S
(STA
TI U
NIT
I)F
INA
NZ
IAR
IAE
UR
O1
50
,00
0A
tla
nti
a S
pA
5.0
0%
EM
ITTE
NTI TIT
OLI S
pA
MIL
AN
PA
RTE
CIP
AZ
ION
E IN
BO
RS
A S
.p.A
.E
UR
O4
,26
4,0
00
Atl
an
tia
Sp
A7
.24
%
FIR
EN
ZE
PA
RC
HE
GG
I S
pA
FIR
EN
ZE
GE
STIO
NE
PA
RC
HE
GG
IE
UR
O2
5,5
95
,15
8A
tla
nti
a S
pA
5.4
7%
HU
TA
JE
DN
OŚ
Ć S
AS
IEM
IAN
OW
ICE
(PO
LA
ND
)C
OM
ME
RC
IALIZ
ZA
ZIO
NE
AC
CIA
IOZ
LO
TY
PO
LA
CC
O2
7,2
00
,00
0S
tale
xpo
rt A
uto
str
ad
y S
A2
.40
%
INW
ES
T S
TA
R S
A (
IN L
IQU
IDA
TIO
N)
STA
RA
CH
OW
ICE
(PO
LA
ND
)C
OM
ME
RC
IALIZ
ZA
ZIO
NE
AC
CIA
IOZ
LO
TY
PO
LA
CC
O1
1,7
00
,00
0S
tale
xpo
rt A
uto
str
ad
y S
A0
.26
%
ITA
LM
EX
Sp
A (
IN L
IQU
IDA
TIO
N)
MIL
AN
AG
EN
ZIA
DI C
OM
ME
RC
IOE
UR
O1
,46
4,0
00
Sta
lexp
ort
Au
tostr
ad
y S
A4
.24
%
LU
SO
PO
NTE
- C
ON
CE
SS
ION
AR
IA P
AR
A A
TR
AV
ES
SIA
DO
TE
JO
SA
MO
NTIJ
O
(PO
RTO
GA
LLO
) C
ON
CE
SS
ION
AR
IA A
UTO
STR
AD
ALE
EU
RO
25
,00
0,0
00
Au
tostr
ad
e P
ort
uga
l -
Co
nce
sso
es d
e In
fra
estr
uctu
ras S
A1
7.2
1%
% I
NTE
RE
ST I
N S
HA
RE
CA
PIT
AL/
CO
NS
OR
TIU
M F
UN
D A
S A
T 3
1
DE
CE
MB
ER
20
15
NA
ME
RE
GIS
TE
RE
D O
FF
ICE
BU
SIN
ES
SC
UR
RE
NC
YS
HA
RE
CA
PIT
AL/
CO
NS
OR
TIU
M F
UN
D A
S
AT 3
1 D
EC
EM
BE
R 2
01
5
(IN
SH
AR
ES
/U
NIT
S)
HE
LD
BY
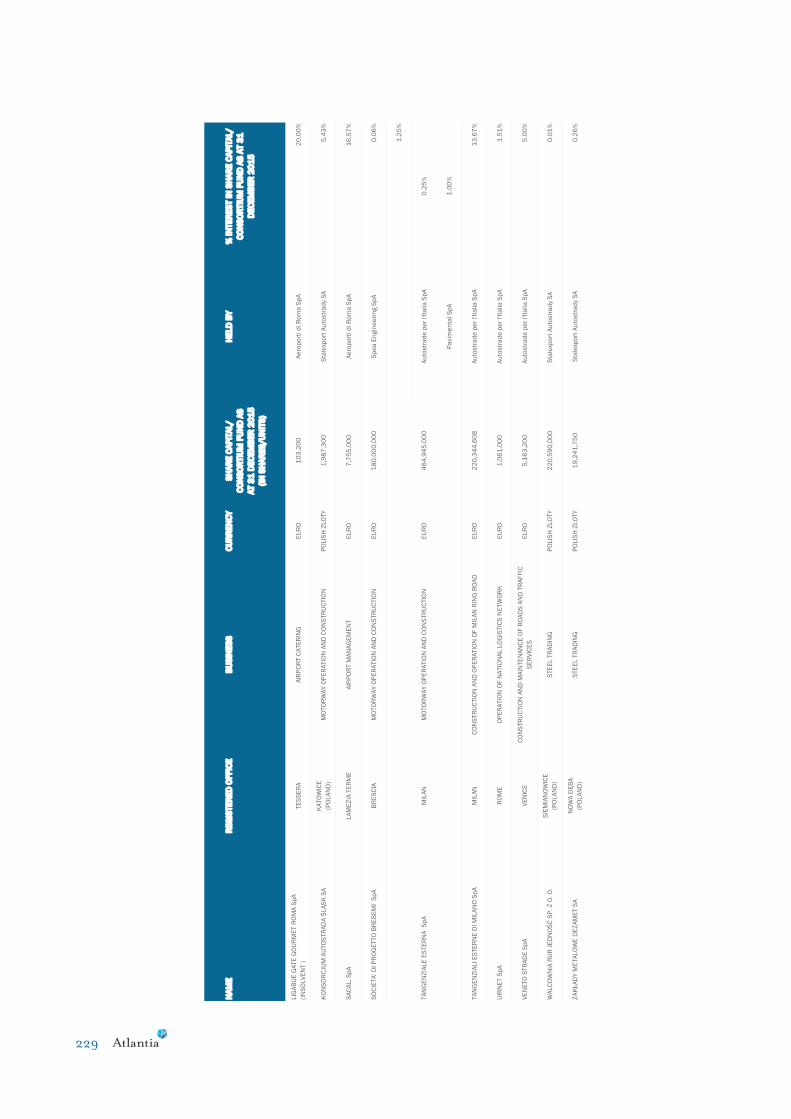
229
LIG
AB
UE
GA
TE
GO
UR
ME
T R
OM
A S
pA
(IN
SO
LV
EN
T )
TE
SS
ER
AA
IRP
OR
T C
ATE
RIN
GE
UR
O1
03
,20
0A
ero
po
rti d
i R
om
a S
pA
20
.00
%
KO
NS
OR
CJU
M A
UTO
STR
AD
A Ś
LĄ
SK
SA
K
ATO
WIC
E
(PO
LA
ND
)M
OTO
RW
AY
OP
ER
ATIO
N A
ND
CO
NS
TR
UC
TIO
NP
OLIS
H Z
LO
TY
1,9
87
,30
0S
tale
xpo
rt A
uto
str
ad
y S
A5
.43
%
SA
CA
L. S
pA
LA
ME
ZIA
TE
RM
EA
IRP
OR
T M
AN
AG
EM
EN
TE
UR
O7
,75
5,0
00
Ae
rop
ort
i d
i R
om
a S
pA
16
.57
%
SO
CIE
TA
' DI P
RO
GE
TTO
BR
EB
EM
I S
pA
BR
ES
CIA
MO
TO
RW
AY
OP
ER
ATIO
N A
ND
CO
NS
TR
UC
TIO
NE
UR
O1
80
,00
0,0
00
Sp
ea
En
gin
ee
rin
g S
pA
0.0
6%
1.2
5%
Au
tostr
ad
e p
er
l'Ita
lia
Sp
A0
.25
%
Pa
vim
en
tal S
pA
1.0
0%
TA
NG
EN
ZIA
LI E
STE
RN
E D
I M
ILA
NO
Sp
AM
ILA
NC
ON
STR
UC
TIO
N A
ND
OP
ER
ATIO
N O
F M
ILA
N R
ING
RO
AD
EU
RO
22
0,3
44
,60
8A
uto
str
ad
e p
er
l'Ita
lia
Sp
A1
3.6
7%
UIR
NE
T S
pA
RO
ME
OP
ER
ATIO
N O
F N
ATIO
NA
L L
OG
ISTIC
S N
ETW
OR
KE
UR
O1
,06
1,0
00
Au
tostr
ad
e p
er
l'Ita
lia
Sp
A1
.51
%
VE
NE
TO
STR
AD
E S
pA
VE
NIC
EC
ON
STR
UC
TIO
N A
ND
MA
INTE
NA
NC
E O
F R
OA
DS
AN
D T
RA
FF
IC
SE
RV
ICE
SE
UR
O5
,16
3,2
00
Au
tostr
ad
e p
er
l'Ita
lia
Sp
A5
.00
%
WA
LC
OW
NIA
RU
R J
ED
NO
ŚĆ
SP
. Z
O. O
.
SIE
MIA
NO
WIC
E
(PO
LA
ND
)S
TE
EL T
RA
DIN
GP
OLIS
H Z
LO
TY
22
0,5
90
,00
0S
tale
xpo
rt A
uto
str
ad
y S
A
0.0
1%
ZA
KŁA
DY
ME
TA
LO
WE
DE
ZA
ME
T S
AN
OW
A D
ĘB
A
(PO
LA
ND
)S
TE
EL T
RA
DIN
GP
OLIS
H Z
LO
TY
19
,24
1,7
50
Sta
lexp
ort
Au
tostr
ad
y S
A0
.26
%
46
4,9
45
,00
0E
UR
OM
OTO
RW
AY
OP
ER
ATIO
N A
ND
CO
NS
TR
UC
TIO
NM
ILA
NTA
NG
EN
ZIA
LE
ES
TE
RN
A S
pA
% I
NTE
RE
ST I
N S
HA
RE
CA
PIT
AL/
CO
NS
OR
TIU
M F
UN
D A
S A
T 3
1
DE
CE
MB
ER
20
15
NA
ME
RE
GIS
TE
RE
D O
FF
ICE
BU
SIN
ES
SC
UR
RE
NC
YS
HA
RE
CA
PIT
AL/
CO
NS
OR
TIU
M F
UN
D A
S
AT 3
1 D
EC
EM
BE
R 2
01
5
(IN
SH
AR
ES
/U
NIT
S)
HE
LD
BY

3. Consolidated financial statements as at and for the year ended 31 December 2015
Annual Report 2015 230
CO
NS
OR
TIA
CO
NS
OR
CIO
AN
HA
NG
UE
RA
NO
RTE
RIB
ER
AO
PR
ETO
(BR
AZ
IL)
CO
NS
OR
ZIO
DI C
OS
TR
UZ
ION
EB
RA
ZIL
IAN
RE
AL
-A
uto
str
ad
e C
on
ce
sso
es e
Pa
rtic
ipa
co
es B
rasil
13
.13
%
34
.50
%
Au
tostr
ad
e p
er
l'Ita
lia
Sp
A2
7.3
0%
Ta
nge
nzi
ale
di N
ap
oli S
pA
2.0
0%
So
cie
tà Ita
lia
na
pe
r A
zio
ni
pe
r il T
rafo
ro d
el M
on
te B
ian
co
1.9
0%
Ra
cco
rdo
Au
tostr
ad
ale
Va
lle
d'A
osta
Sp
A1
.10
%
So
cie
tà A
uto
str
ad
a T
irre
nic
a p
.A.
0.3
0%
Au
tostr
ad
e M
eri
dio
na
li S
pA
0.9
0%
Pa
vim
en
tal S
pA
1.0
0%
CO
NS
OR
ZIO
CO
STR
UTTO
RI TE
EM
TO
RTO
NA
ES
EC
UZ
ION
E O
PE
RE
E A
TTIV
ITA
' AU
TO
STR
AD
ALI
EU
RO
10
,00
0P
avim
en
tal S
pA
1.0
0%
CO
NS
OR
ZIO
E.T
.L. –
EU
RO
PE
AN
TR
AN
SP
OR
T L
AW
(IN
LIQ
UID
ATIO
N)
RO
MA
STU
DIO
RE
GO
LE
EU
RO
PE
E S
UL T
RA
SP
OR
TO
EU
RO
82
,63
3A
ero
po
rti d
i R
om
a S
pA
25
.00
%
CO
NS
OR
ZIO
GA
LIL
EO
SC
AR
L
(IN
LIQ
UID
ATIO
N)
TO
DI
RE
ALIZ
ZA
ZIO
NE
PIA
ZZ
ALI A
ER
OP
OR
TI
EU
RO
10
,00
0P
avim
en
tal S
pA
40
.00
%
CO
NS
OR
ZIO
ITA
LTE
CN
AS
UD
(IN
LIQ
UID
ATIO
N)
RO
MA
CO
NTR
OLLO
FO
ND
I TE
RR
EM
OTO
IR
PIN
IAE
UR
O5
1,6
46
Sp
ea
En
gin
ee
rin
g S
pA
20
.00
%
CO
NS
OR
ZIO
MID
RA
FIR
EN
ZE
RIC
ER
CA
SC
IEN
TIF
ICA
PE
R L
A
TE
CN
OLO
GIA
DI B
AS
E D
EI D
ISP
OS
ITIV
I E
UR
O7
3,9
89
Au
tostr
ad
e T
ech
Sp
A3
3.3
3%
CO
NS
OR
ZIO
MIT
EC
OP
ES
CH
IER
A B
OR
RO
ME
O
ES
EC
UZ
ION
E D
I A
TTIV
ITA
' E L
AV
OR
I A
FF
IDA
TI D
A T
AN
GE
NZ
IALE
ES
TE
RN
A S
.P.A
EU
RO
10
,00
0P
avim
en
tal S
pA
1.3
0%
CO
NS
OR
ZIO
NU
OV
A R
OM
EA
EN
GIN
EE
RIN
GM
ON
SE
LIC
E
PR
OG
ETTA
ZIO
NE
AU
TO
STR
AD
ALE
EU
RO
60
,00
0S
pe
a E
ngin
ee
rin
g S
pA
16
.67
%
CO
NS
OR
ZIO
PE
DE
MO
NTA
NA
EN
GIN
EE
RIN
GV
ER
ON
AD
ES
IGN
OF
PE
DE
MO
NTA
NA
VE
NE
TA
MO
TO
RW
AY
EU
RO
20
,00
0S
pe
a E
ngin
ee
rin
g S
pA
23
.54
%
CO
NS
OR
ZIO
RA
MO
NTI S
.C.A
.R.L
.
(IN
LIQ
UID
ATIO
N)
TO
RTO
NA
M
OTO
RW
AY
CO
NS
TR
UC
TIO
NE
UR
O1
0,0
00
Pa
vim
en
tal S
pA
49
.00
%
CO
NS
OR
ZIO
R.F
.C.C
. (I
N L
IQU
IDA
TIO
N)
TO
RTO
NA
C
ON
STR
UC
TIO
N O
F M
OR
OC
CA
N R
OA
D N
ETW
OR
KE
UR
O5
10
,00
0P
avim
en
tal S
pA
30
.00
%
CO
NS
OR
ZIO
SP
EA
-GA
RIB
ELLO
SA
O P
AU
LO
(BR
AZ
IL)
INTE
GR
ATE
D T
EC
HN
ICA
L E
NG
INE
ER
ING
SE
RV
ICE
S - H
IGH
WA
Y
MG
-05
0B
RA
ZIL
IAN
RE
AL
-S
PE
A d
o B
rasil P
roje
tos e
In
fra
Estr
utu
ra L
imit
ad
a5
0.0
0%
CO
NS
OR
ZIO
TA
NG
EN
ZIA
LE
EN
GIN
EE
RIN
G
MIL
AN
INTE
GR
ATE
D T
EC
HN
ICA
L E
NG
INE
ER
ING
SE
RV
ICE
S - M
ILA
N
EX
TE
RN
AL R
ING
RO
AD
EA
ST
EU
RO
20
,00
0S
pe
a E
ngin
ee
rin
g S
pA
30
.00
%
RE
GIS
TE
RE
D O
FF
ICE
EU
RO
NA
ME
CO
NS
OR
ZIO
AU
TO
STR
AD
E ITA
LIA
NE
EN
ER
GIA
RO
MA
AP
PR
OV
VIG
ION
AM
EN
TO
SU
L M
ER
CA
TO
ELE
TTR
ICO
HE
LD
BY
% I
NTE
RE
ST I
N S
HA
RE
CA
PIT
AL/
CO
NS
OR
TIU
M F
UN
D A
S A
T 3
1
DE
CE
MB
ER
20
15
11
3,9
49
BU
SIN
ES
SC
UR
RE
NC
YS
HA
RE
CA
PIT
AL/
CO
NS
OR
TIU
M F
UN
D A
S
AT 3
1 D
EC
EM
BE
R 2
01
5
(IN
SH
AR
ES
/U
NIT
S)

231
CO
NS
OR
ZIO
TR
INA
CR
IA S
.C.A
.R.L
.
(IN
LIQ
UID
ATIO
N)
LIM
EN
A
CO
NS
TR
UC
TIO
N O
F A
IRP
OR
T A
PR
ON
SE
UR
O1
0,0
00
Pa
vim
en
tal S
pA
47
.73
%
CO
NS
OR
ZIO
20
50
RO
ME
MO
TR
OW
AY
DE
SIG
NE
UR
O5
0,0
00
Sp
ea
En
gin
ee
rin
g S
pA
0.5
0%
10
0%
Pa
vim
en
tal S
pA
75
.00
%
Au
tostr
ad
e T
ech
Sp
A2
0.0
0%
Pa
vim
en
tal P
ols
ka
Sp
. z
o.o
.5
.00
%
ELM
AS
S.C
.A.R
.L. (I
N L
IQU
IDA
TIO
N)
RO
ME
CO
NS
TR
UC
TIO
N A
ND
MA
INTE
NA
NC
E O
F A
IRP
OR
T R
UN
WA
YS
AN
D A
PR
ON
SE
UR
O1
0,0
00
Pa
vim
en
tal S
pA
60
.00
%
IDR
OE
LE
TTR
ICA
S
.C.A
.R.L
.C
HA
TIL
LO
N
ELE
CTR
ICIT
Y G
EN
ER
ATIO
NE
UR
O5
0,0
00
Ra
cco
rdo
Au
tostr
ad
ale
Va
lle
d'A
osta
Sp
A0
.10
%
LA
MB
RO
S
.C.A
.R.L
.TO
RTO
NA
OP
ER
ATIO
N A
ND
CO
NS
TR
UC
TIO
N O
N B
EH
ALF
OF
TE
EM
CO
NS
TR
UC
TIO
N C
ON
SO
RTIU
ME
UR
O2
00
,00
0P
avim
en
tal S
pA
2.7
8%
SA
T L
AV
OR
I S
.C.A
.R.L
.R
OM
EC
ON
STR
UC
TIO
N C
ON
SO
RTIU
ME
UR
O1
00
,00
0S
ocie
tà A
uto
str
ad
a T
irre
nic
a p
.A.
1.0
0%
INV
ES
TM
EN
TS
AC
CO
UN
TE
D F
OR
IN
CU
RR
EN
T A
SS
ET
S
DO
M M
AK
LE
RS
KI B
DM
SA
BIE
LS
KO
-BIA
ŁA
(PO
LA
ND
)H
OLD
ING
CO
MP
AN
YP
OLIS
H Z
LO
TY
19
,79
6,9
24
Sta
lexp
ort
Au
tostr
ad
y S
A2
.71
%
IDE
ON
SA
KA
TO
WIC
E
(PO
LA
ND
)S
TE
EL T
RA
DIN
GP
OLIS
H Z
LO
TY
34
3,4
90
,78
1S
tale
xpo
rt A
uto
str
ad
y S
A2
.63
%
STR
AD
A D
EI P
AR
CH
I S
pA
RO
ME
MO
TO
RW
AY
OP
ER
ATIO
N A
ND
CO
NS
TR
UC
TIO
NE
UR
O4
8,1
14
,24
0A
uto
str
ad
e p
er
l'Ita
lia
Sp
A2
.00
%
RO
ME
RE
GIS
TE
RE
D O
FF
ICE
CO
STR
UZ
ION
I IM
PIA
NTI A
UTO
STR
AD
ALI S
.C.A
.R.L
.C
ON
STR
UC
TIO
N O
F P
UB
LIC
WO
RK
S A
ND
IN
FR
AS
TR
UC
TU
RE
NA
ME
EU
RO
10
,00
0
HE
LD
BY
% I
NTE
RE
ST I
N S
HA
RE
CA
PIT
AL/
CO
NS
OR
TIU
M F
UN
D A
S A
T 3
1
DE
CE
MB
ER
20
15
BU
SIN
ES
SC
UR
RE
NC
YS
HA
RE
CA
PIT
AL/
CO
NS
OR
TIU
M F
UN
D A
S
AT 3
1 D
EC
EM
BE
R 2
01
5
(IN
SH
AR
ES
/U
NIT
S)
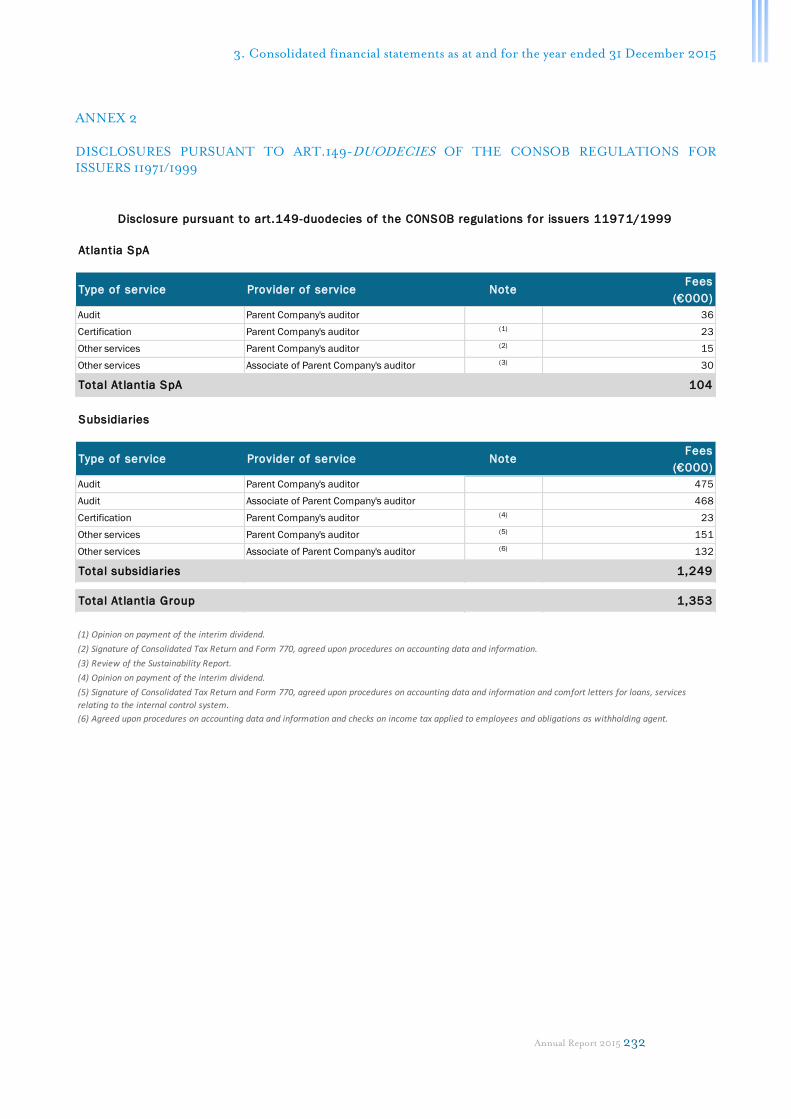
3. Consolidated financial statements as at and for the year ended 31 December 2015
Annual Report 2015 232
ANNEX 2
DISCLOSURES PURSUANT TO ART.149-DUODECIES OF THE CONSOB REGULATIONS FOR
ISSUERS 11971/1999
Atlantia SpA
Type of service Provider of service NoteFees
(€000)
Audit Parent Company's auditor 36
Certification Parent Company's auditor (1) 23
Other services Parent Company's auditor (2) 15
Other services Associate of Parent Company's auditor (3) 30
Total At lantia SpA 104
Subsidiaries
Type of service Provider of service NoteFees
(€000)
Audit Parent Company's auditor 475
Audit Associate of Parent Company's auditor 468
Certification Parent Company's auditor (4) 23
Other services Parent Company's auditor (5) 151
Other services Associate of Parent Company's auditor (6) 132
Total subsidiaries 1,249
Total At lantia Group 1,353
(1) Opinion on payment of the interim dividend.
(2) Signature of Consolidated Tax Return and Form 770, agreed upon procedures on accounting data and information.
(3) Review of the Sustainability Report.
(4) Opinion on payment of the interim dividend.
Disclosure pursuant to art .149-duodecies of the CONSOB regulations for issuers 11971/1999
(5) Signature of Consolidated Tax Return and Form 770, agreed upon procedures on accounting data and information and comfort letters for loans, services
relating to the internal control system.
(6) Agreed upon procedures on accounting data and information and checks on income tax applied to employees and obligations as withholding agent.

233
This page intentionally left blank

Annual Report 2015 234
This page intentionally left blank
235
4.Bilancio di esercizio As at 31 December 2015:
prospetti contabili e note illustrative
Separate financial statements
as at and for the year ended
31 December 2015 and notes 4

4. Separate financial statements as at and for the year ended 31 December 2015
Annual Report 2015 236
ATLANTIA SPA’S FINANCIAL STATEMENTS
€ 31 December 2015 31 December 2014
ASSETS
NON-CURRENT ASSETS
Property, plant and equipment 7,539,720 7,993,004
Property, plant and equipment 2,025,725 2,206,273
Investment property 5,513,995 5,786,731
Intangible assets 224,974 227,621
Investments 8,836,431,848 8,857,911,996
Non-current financial assets 7,078,406,899 9,003,591,242
Non-current derivative assets 216,685,760 245,232,387
Other non-current financial assets 6,861,721,139 8,758,358,855
Other non-current assets 274,937 335,978
TOTAL NON-CURRENT ASSETS 15,922,878,378 17,870,059,841
CURRENT ASSETS
Trading assets 4,280,445 4,446,988
Trade receivables 4,280,445 4,446,988
Cash and cash equivalents 417,479,529 465,320,239
Cash 4,150,640 2,374,658
Cash equivalents 400,000,000 250,000,000
Intercompany current account receivables due from related parties 13,328,889 212,945,581
Other current financial assets 1,109,271,459 267,637,278
Current portion of medium/long-term financial assets 1,102,323,741 259,469,629
Other current financial assets 6,947,718 8,167,649
Current tax assets 29,455,350 31,281,702
Other current assets 28,477,672 1,303,661
Non-current assets held for sale and related to discontinued
operations- -
TOTAL CURRENT ASSETS 1,588,964,455 769,989,868
TOTAL ASSETS 17,511,842,833 18,640,049,709
Statement of financial position (1)
(1) As required by CONSOB Resolution 15519 of 27 July 2006, the impact of related party transactions on Atlantia SpA's statement of
financial position are shown in the statement of financial position, expressed in thousands of euros, on the following pages. The impact
is also described in further detail in note 7.2.

237
This page intentionally left blank
Statement of financial position
EQUITY AND LIABILITIES
EQUITY
Issued capital 825,783,990 825,783,990
Reserves and retained earnings 8,517,467,265 8,419,605,878
Treasury shares -38,984,692 -204,967,766
Profit/(Loss) for the year net of interim dividends 404,063,684 397,552,656
TOTAL EQUITY 9,708,330,247 9,437,974,758
NON-CURRENT LIABILITIES
Non-current provisions 749,143 896,583
Non-current provisions for employee benefits 749,143 896,583
Non-current financial liabilities 6,627,153,731 8,869,037,007
Bond issues 6,418,135,566 8,589,586,045
Non-current derivative liabilities 209,018,165 279,450,962
Deferred tax liabilities 35,548,838 40,782,944
Other non-current liabilities 3,889,473 1,162,489
TOTAL NON-CURRENT LIABILITIES 6,667,341,185 8,911,879,023
CURRENT LIABILITIES
Trading liabilities 4,660,311 6,223,738
Trade payables 4,660,311 6,223,738
Current provisions 1,675,365 1,567,732
Current provisions for employee benefits 138,833 31,200
Other current provisions 1,536,532 1,536,532
Current financial liabilities 1,091,876,099 250,866,904
Bank overdrafts 73 126
Current portion of medium/long-term financial liabilities 1,091,549,927 249,584,263
Other current financial liabilities 326,099 1,282,515
Current tax liabilities 18,126,593 14,372,000
Other current liabilities 19,833,033 17,165,554
Liablities related to discontinued operations - -
TOTAL CURRENT LIABILITIES 1,136,171,401 290,195,928
TOTAL LIABILITIES 7,803,512,586 9,202,074,951
TOTAL EQUITY AND LIABILITIES 17,511,842,833 18,640,049,709
€ 31 December 2015 31 December 2014

4. Separate financial statements as at and for the year ended 31 December 2015
Annual Report 2015 238
€ 2015 2014
REVENUE
Operating income 2,100,243 1,592,158
TOTAL REVENUE 2,100,243 1,592,158
COSTS
Raw and consumable materials -65,697 -30,955
Service costs -11,765,462 -9,247,209
Staff costs -15,448,910 -8,523,127
Other operating costs -4,699,288 -4,879,635
Lease expense -1,045,295 -548,317
Other -3,653,993 -4,331,318
Amortisation and depreciation -469,427 -470,491
Depreciation of property, plant and equipment -187,326 -188,591
Depreciation of investment property -279,454 -279,253
Amortisation of intangible assets -2,647 -2,647
TOTAL COSTS -32,448,784 -23,151,417
OPERATING PROFIT/(LOSS) -30,348,541 -21,559,259
Financial income 1,397,657,130 1,210,661,258
Dividends received from investees 794,023,295 670,009,565
Other financial income 603,633,835 540,651,693
Financial expenses -631,870,597 -577,363,022
Financial expenses from discounting of provisions -8,250 -11,703
Impairment losses on financial assets and investments -36,248,533 -44,111,648
Other financial expenses -595,613,814 -533,239,671
Foreign exchange gains/(losses) 470,371 397,982
FINANCIAL INCOME/(EXPENSES) 766,256,904 633,696,218
PROFIT/(LOSS) BEFORE TAX FROM CONTINUING OPERATIONS 735,908,363 612,136,959
Income tax (expense)/benefit -2,499,441 -4,896,918
Current tax expense -5,191,436 -5,083,505
Differences on tax expense for previous years 1,138,430 -174,845
Deferred tax income and expense 1,553,565 361,432
PROFIT/(LOSS) FROM CONTINUING OPERATIONS 733,408,922 607,240,041
Profit/(Loss) from discontinued operations - 78,976,675
PROFIT FOR THE YEAR 733,408,922 686,216,716
Income statement (2)
(2) As required by CONSOB Resolution 15519 of 27 July 2006, the impact of related party transactions and components of income
deriving from non-recurring transactions on Atlantia SpA's income statement are shown in the income statement, expressed in
thousands of euros, on the following pages. The impact is also described in further detail in notes 7.2 and 5.10.

239
This page intentionally left blank

4. Separate financial statements as at and for the year ended 31 December 2015
Annual Report 2015 240
ASSETS
NON-CURRENT ASSETS
Property, plant and equipment 4.1 7,540 7,992
Property, plant and equipment 2,026 2,207
Investment property 5,514 5,785
Intangible assets 4.2 225 228
Investments 4.3 8,836,432 8,857,912
Non-current financial assets 4.4 7,078,407 9,003,591
Non-current derivative assets 216,686 216,123 245,232 245,232
Other non-current financial assets 6,861,721 6,860,865 8,758,359 8,757,890
Other non-current assets 4.5 275 337
TOTAL NON-CURRENT ASSETS 15,922,879 17,870,060
CURRENT ASSETS
Trading assets 4.6 4,280 4,447
Trade receivables 4,280 4,049 4,447 3,848
Cash and cash equivalents 4.7 417,480 465,322
Cash 4,151 2,376
Cash equivalents 400,000 400,000 250,000 250,000
Intercompany current account receivables due from related parties 13,329 13,329 212,946 212,946
Other current financial assets 4.4 1,109,271 267,637
Current portion of medium/long-term financial assets 1,102,324 1,077,109 259,470 236,649
Other current financial assets 6,947 6,820 8,167 8,038
Current tax assets 4.8 29,456 28,855 31,281 21,562
Other current assets 4.9 28,477 27,032 1,304 95
Non-current assets held for sale and related to discontinued
operations- -
TOTAL CURRENT ASSETS 1,588,964 769,991
TOTAL ASSETS 17,511,843 18,640,051
of which related
party
transactions
Statement of financial position
€000 NOTE 31 December 2015
of which related
party
transactions
31 December 2014

241
EQUITY AND LIABILITIES
EQUITY
Issued capital 825,784 825,784
Reserves and retained earnings 8,517,467 8,419,606
Treasury shares -38,985 -204,968
Profit/(Loss) for the year net of interim dividends 404,064 397,553
TOTAL EQUITY 4.10 9,708,330 9,437,975
NON-CURRENT LIABILITIES
Non-current provisions 4.11 749 896
Non-current provisions for employee benefits 749 896
Non-current financial liabilities 4.12 6,627,154 8,869,037
Bond issues 6,418,136 8,589,586
Non-current derivative liabilities 209,018 279,451
Deferred tax liabilities 4.13 35,549 40,784
Other non-current liabilities 4.14 3,889 3,289 1,163 202
TOTAL NON-CURRENT LIABILITIES 6,667,341 8,911,880
CURRENT LIABILITIES
Trading liabilities 4.15 4,660 6,224
Trade payables 4,660 3,010 6,224 1,852
Current provisions 4.11 1,675 1,568
Current provisions for employee benefits 138 31
Other current provisions 1,537 1,537
Current financial liabilities 4.12 1,091,876 250,866
Current portion of medium/long-term financial liabilities 1,091,550 249,584
Other current financial liabilities 326 1,282
Current tax liabilities 4.8 18,127 13,779 14,372 14,361
Other current liabilities 4.16 19,834 13,833 17,166 15,538
Liablities related to discontinued operations - -
TOTAL CURRENT LIABILITIES 1,136,172 290,196
TOTAL LIABILITIES 7,803,513 9,202,076
TOTAL EQUITY AND LIABILITIES 17,511,843 18,640,051
of which related
party
transactions
€000 NOTE 31 December 2015
of which related
party
transactions
31 December 2014
Statement of financial position

4. Separate financial statements as at and for the year ended 31 December 2015
Annual Report 2015 242
REVENUE
Operating income 5.1 2,100 2,002 1,592 912
TOTAL REVENUE 2,100 1,592
COSTS
Raw and consumable materials 5.2 -66 -31
Service costs 5.3 -11,765 -2,188 -9,247 -3,829
Staff costs 5.4 -15,449 -3,982 -8,523 -2,617
Other operating costs 5.5 -4,699 -4,879
Lease expense -1,045 -748 -548 -288
Other -3,654 -4,331
Amortisation and depreciation -470 -471
Depreciation of property, plant and equipment 4.1 -188 -191
Depreciation of investment property 4.1 -279 -278
Amortisation of intangible assets 4.2 -3 -2
TOTAL COSTS -32,449 -23,151
OPERATING PROFIT/(LOSS) -30,349 -21,559
Financial income 1,397,658 1,210,661
Dividends received from investees 794,023 670,009
Other financial income 603,635 530,646 540,652 486,285
of which non-recurring 5.10 125,486 125,486 - -
Financial expenses -631,871 -577,363
Financial expenses from discounting of provisions -8 -12
Impairment losses on financial assets and investments -36,249 -44,111
Other financial expenses -595,614 -31,594 -533,240 -26,953
of which non-recurring 5.10 -120,677 -
Foreign exchange gains/(losses) 470 398
FINANCIAL INCOME/(EXPENSES) 5.6 766,257 633,696
PROFIT/(LOSS) BEFORE TAX FROM CONTINUING OPERATIONS 735,908 612,137
Income tax (expense)/benefit 5.7 -2,499 -4,897
Current tax expense -5,191 -5,083
Differences on tax expense for previous years 1,139 -175
Deferred tax income and expense 1,553 361
PROFIT/(LOSS) FROM CONTINUING OPERATIONS 733,409 607,240
Profit/(Loss) from discontinued operations 5.8 - 78,977
PROFIT FOR THE YEAR 733,409 686,217
€ 2015 2014
Basic earnings per share 5.9 0.89 0.85
of which:
- from continuing operations 0.89 0.75
- from discontinued operations - 0.10
Diluted earnings per share 5.9 0.89 0.85
of which:
- from continuing operations 0.89 0.75
- from discontinued operations - 0.10
Income statement
€000 NOTE 2015
of which related
party
transactions
2014
of which related
party
transactions
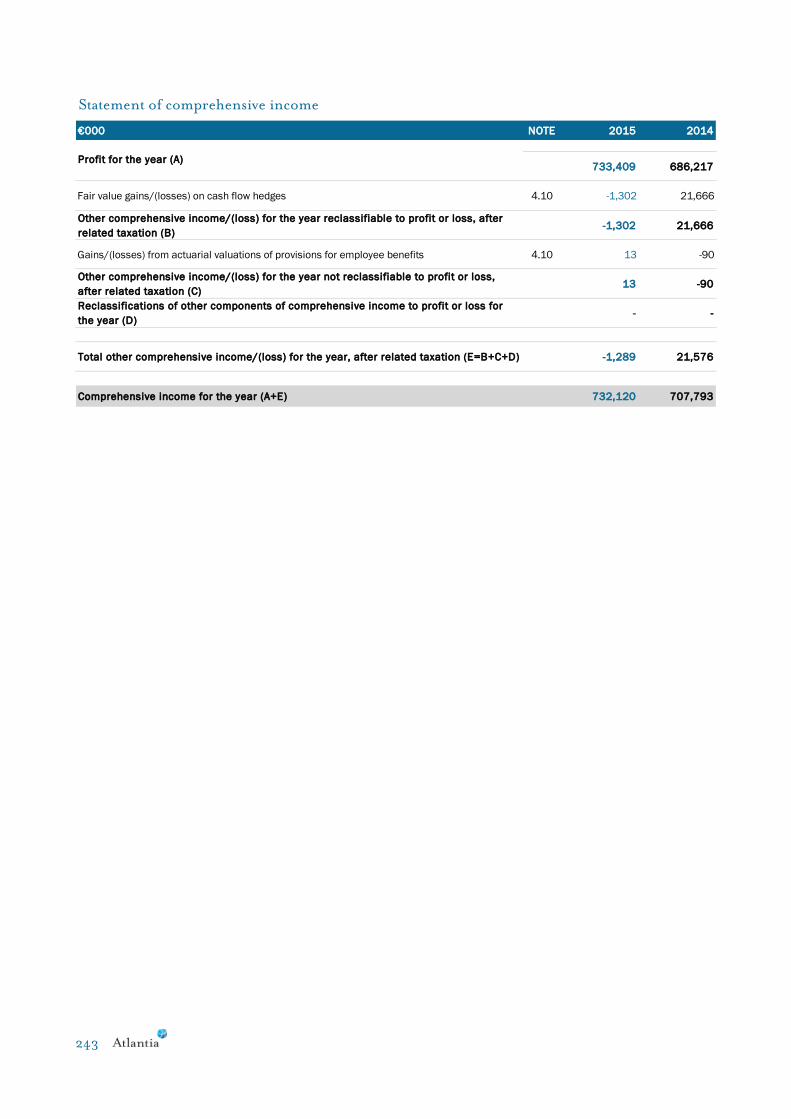
243
€000 NOTE 2015 2014
Profit for the year (A)733,409 686,217
Fair value gains/(losses) on cash flow hedges 4.10 -1,302 21,666
Other comprehensive income/(loss) for the year reclassifiable to profit or loss, after
related taxation (B)-1,302 21,666
Gains/(losses) from actuarial valuations of provisions for employee benefits 4.10 13 -90
Other comprehensive income/(loss) for the year not reclassifiable to profit or loss,
after related taxation (C)13 -90
Reclassifications of other components of comprehensive income to profit or loss for
the year (D)- -
Total other comprehensive income/(loss) for the year, after related taxation (E=B+C+D) -1,289 21,576
Comprehensive income for the year (A+E) 732,120 707,793
Statement of comprehensive income
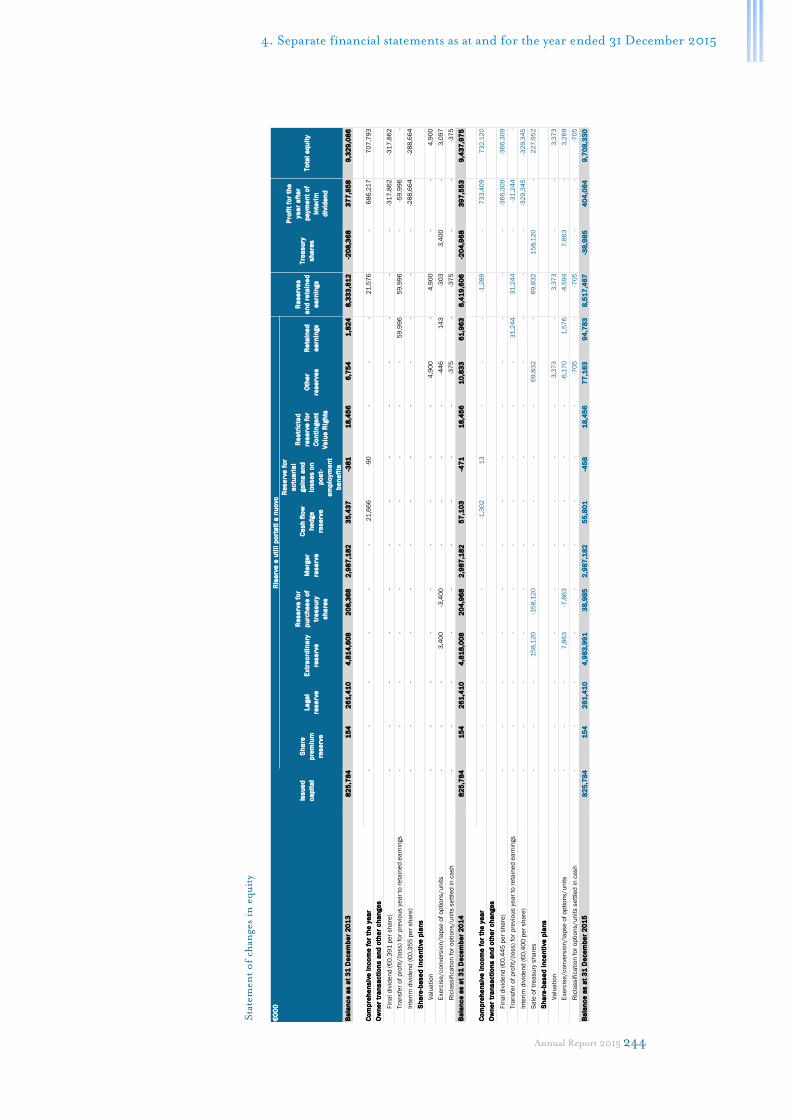
4. Separate financial statements as at and for the year ended 31 December 2015
Annual Report 2015 244
€0
00
Sh
are
pre
miu
m
res
erv
e
Le
ga
l
res
erv
e
Extr
ao
rdin
ary
res
erv
e
Re
se
rve
fo
r
pu
rch
as
e o
f
tre
as
ury
sh
are
s
Me
rge
r
res
erv
e
Ca
sh
flo
w
he
dg
e
res
erv
e
Re
se
rve
fo
r
ac
tua
ria
l
ga
ins
an
d
los
se
s o
n
po
st-
em
plo
ym
en
t
be
ne
fits
Re
str
icte
d
res
erv
e f
or
Co
nti
ng
en
t
Va
lue
Rig
hts
Oth
er
res
erv
es
Re
tain
ed
ea
rnin
gs
82
5,7
84
15
42
61
,41
04
,81
4,6
08
20
8,3
68
2,9
87
,18
23
5,4
37
-38
11
8,4
56
6,7
54
1,8
24
8,3
33
,81
2-2
08
,36
83
77
,85
89
,32
9,0
86
--
--
--
21
,66
6-9
0-
--
21
,57
6-
68
6,2
17
70
7,7
93
Fin
al d
ivid
en
d (
€0
.39
1 p
er
sh
are
)-
--
--
--
--
--
--
-31
7,8
62
-31
7,8
62
Tra
nsfe
r o
f p
rofi
t/(l
oss)
for
pre
vio
us y
ea
r to
re
tain
ed
ea
rnin
gs
--
--
--
--
--
59
,99
65
9,9
96
--5
9,9
96
-
Inte
rim
div
ide
nd
(€
0.3
55
pe
r sh
are
)-
--
--
--
--
--
--
-28
8,6
64
-28
8,6
64
Sh
are
-ba
se
d i
nc
en
tive
pla
ns
Va
lua
tio
n-
--
--
--
--
4,9
00
-4
,90
0-
-4
,90
0
Exe
rcis
e/co
nve
rsio
n/la
pse
of
op
tio
ns/u
nit
s-
--
3,4
00
-3,4
00
--
--
-44
61
43
-30
33
,40
0-
3,0
97
Ric
lassif
ica
tio
n f
or
op
tio
ns/u
nit
s s
ett
led
in
ca
sh
--
--
--
--
--3
75
--3
75
--
-37
5
82
5,7
84
15
42
61
,41
04
,81
8,0
08
20
4,9
68
2,9
87
,18
25
7,1
03
-47
11
8,4
56
10
,83
36
1,9
63
8,4
19
,60
6-2
04
,96
83
97
,55
39
,43
7,9
75
--
--
--
-1,3
02
13
--
--1
,28
9-
73
3,4
09
73
2,1
20
Fin
al d
ivid
en
d (
€0
.44
5 p
er
sh
are
)-
--
--
--
--
--
--
-36
6,3
09
-36
6,3
09
Tra
nsfe
r o
f p
rofi
t/(l
oss)
for
pre
vio
us y
ea
r to
re
tain
ed
ea
rnin
gs
--
--
--
--
--
31
,24
43
1,2
44
--3
1,2
44
-
Inte
rim
div
ide
nd
(€
0.4
00
pe
r sh
are
)-
--
--
--
--
--
--
-32
9,3
45
-32
9,3
45
Sa
le o
f tr
ea
su
ry s
ha
res
--
-1
58
,12
0-1
58
,12
0-
--
-6
9,8
32
-6
9,8
32
15
8,1
20
-2
27
,95
2
Sh
are
-ba
se
d i
nc
en
tive
pla
ns
Va
lua
tio
n-
--
--
--
--
3,3
73
-3
,37
3-
-3
,37
3
Exe
rcis
e/co
nve
rsio
n/la
pse
of
op
tio
ns/u
nit
s-
--
7,8
63
-7,8
63
--
--
-6,1
70
1,5
76
-4,5
94
7,8
63
-3
,26
9
Ric
lassif
ica
tio
n f
or
op
tio
ns/u
nit
s s
ett
led
in
ca
sh
--
--
--
--
--7
05
--7
05
--
-70
5
82
5,7
84
15
42
61
,41
04
,98
3,9
91
38
,98
52
,98
7,1
82
55
,80
1-4
58
18
,45
67
7,1
63
94
,78
38
,51
7,4
67
-38
,98
54
04
,06
49
,70
8,3
30
Ow
ne
r tr
an
sa
cti
on
s a
nd
oth
er
ch
an
ge
s
Ba
lan
ce
as
at
31
De
ce
mb
er
20
15
Ba
lan
ce
as
at
31
De
ce
mb
er
20
13
Co
mp
reh
en
siv
e i
nc
om
e f
or
the
ye
ar
Ow
ne
r tr
an
sa
cti
on
s a
nd
oth
er
ch
an
ge
s
Ba
lan
ce
as
at
31
De
ce
mb
er
20
14
Co
mp
reh
en
siv
e i
nc
om
e f
or
the
ye
ar
Sta
tem
ent
of
chan
ges
in e
qu
ity
Iss
ue
d
ca
pit
al
Ris
erv
e e
uti
li p
ort
ati
a n
uo
vo
Re
se
rve
s
an
d r
eta
ine
d
ea
rnin
gs
Tre
as
ury
sh
are
s
Pro
fit
for
the
ye
ar
aft
er
pa
ym
en
t o
f
inte
rim
div
ide
nd
To
tal
eq
uit
y

245
€000 NOTE 2015
of which related
party
transactions
2014
of which related
party
transactions
CASH FLOWS FROM (USED IN) OPERATING ACTIVITIES
Profit for the year 733,409 686,217
Adjusted by:
Amortisation and depreciation 470 471
Operating change in provisions 3 8
Financial expenses from discounting of provisions 5.6 8 12
Impairment losses/(Reversal of impairment losses) on financial assets and
investments 5.6 36,249 44,111
(Gain)/Loss on sale of non-current assets - -74,501
Net change in deferred tax (assets)/liabilities through profit or loss -1,553 -361
Other non-cash costs (income) 3,456 3,592
-21,040 -32,473 -5,638 -31,036
6.1 751,002 653,911
Purchases of property, plant and equipment 4.1 -15 -54
Purchase of investments 4.3 -9,225 -199 -99,082 -71,859
Proceeds from sales of property, plant and equipment, intangible assets and
investments- 94,659
Net change in other non-current assets 61 30
1,062,331 1,057,783 1,943,167 1,898,389
6.1 1,053,152 1,938,720
CASH FLOWS FROM (USED IN) FINANCING ACTIVITIES
-695,639 -895,100
231,221 3,097
- 195,870
4.12 -1,351,250 -2,094,200
-36,328 -337 -42,993 -4,370
6.1 -1,851,996 -2,833,326
-47,842 -240,695
465,322 706,017
417,480 465,322
€000 NOTE 2015 2014
Income taxes paid/(refunded) to/(by) the tax authorities 279,666 232,359
Income taxes refunded/(paid) by/(to) companies participating in tax consolidation 281,187 226,583
Interest and other financial income collected 628,189 568,481
Interest and other financial expenses paid 604,775 556,445
Dividends received 5.6 794,023 670,009
Foreign exchange gains collected - 31
Foreign exchange losses incurred - 35
€000 NOTE 2015 2014
465,322 706,017
Cash and cash equivalents 4.7 465,322 706,017
417,480 465,322
Cash and cash equivalents 4.7 417,480 465,322
Net cash and cash equivalents at beginning of year
Net cash and cash equivalents at end of year
Reconciliation of net cash and cash equivalents
Net change in other current and non-current financial liabilities
Net cash generated from/(used in) financing activities [c]
Decrease in cash and cash equivalents [a+b+c]
NET CASH AND CASH EQUIVALENTS AT BEGINNING OF YEAR
NET CASH AND CASH EQUIVALENTS AT END OF YEAR
Additional information on the statement of cash flows
Proceeds from sale of treasury shares and exercise of rights under share-based incentive plans
Issuance of bonds
Bond redemptions
Dividends paid
Statement of cash flows
Change in working capital and other changes
Net cash generated from/(used in) operating activities [a]
CASH FLOWS FROM (USED IN) INVESTING ACTIVITIES
Net change in current and non-current financial assets
Net cash generated from/(used in) investing activities [b]

4. Separate financial statements as at and for the year ended 31 December 2015
Annual Report 2015 246
NOTES 1. INTRODUCTION
Atlantia SpA (or the “Company”) was formed in 2003. The Company’s registered office is in Rome, at Via
Nibby, 20. The Company does not have branch offices.
The duration of the Company is currently until 31 December 2050.
The Company, listed on the screen-based trading system (Mercato Telematico Azionario) operated by Borsa
Italiana SpA, is a holding company with investments in companies whose business is the construction and
operation of motorways, airports and transport infrastructure, parking areas and intermodal systems, or who
engage in activities related to the management of motorway or airport traffic.
At the date of preparation of these consolidated financial statements Sintonia SpA is the shareholder that holds
a relative majority of the issued capital of Atlantia SpA. Neither Sintonia SpA nor its direct parent, Edizione
Srl, exercise management and coordination of Atlantia SpA.
These financial statements as at and for the year ended 31 December 2015 were approved by the Company’s
Board of Directors at its meeting of 4 March 2016.
Due to the fact that the Company has significant controlling interests in other companies, it also prepares
Group consolidated financial statements that are presented together with the Company’s separate financial
statements.
2. BASIS OF PREPARATION
The financial statements as at and for the year ended 31 December 2015 have been prepared on a going
concern basis. They have been prepared in compliance with articles 2 and 4 of Legislative Decree 38/2005 and
in accordance with the International Financial Reporting Standards (IFRS) issued by the International
Accounting Standards Board and endorsed by the European Commission. These standards reflect the
interpretations issued by the International Financial Reporting Interpretations Committee (IFRIC), in
addition to previous International Accounting Standards (IAS) and interpretations issued by the Standard
Interpretations Committee (SIC) and still in force. For the sake of simplicity, all the above standards and
interpretations are hereinafter referred to as “IFRS”.
Moreover, the measures introduced by the CONSOB, in application of paragraph 3 of article 9 of Legislative
Decree 38/2005, relating to the preparation of financial statements, have also been taken into account.
The financial statements consist of the statement of financial position, the income statement, the statement of
comprehensive income, the statement of changes in equity, the statement of cash flows and these notes, in
application of IAS 1 “Presentation of financial statements” and, in general, the historic cost convention, with
the exception of those items that are required by IFRS to be recognised at fair value, as explained in the
accounting policies for individual items described in note 3. The statement of financial position is based on
the format that separately discloses current and non-current assets and liabilities. The income statement is
classified by nature of expense, whilst the statement of cash flows has been prepared in application of the
indirect method.
IFRS have been applied in accordance with the indications provided in the “Conceptual Framework for
Financial Reporting”, and no events have occurred that would require exemptions pursuant to paragraph 19 of
IAS 1.
CONSOB Resolution 15519 of 27 July 2006 requires that, in addition to the specific requirements of IAS 1
and other IFRS, financial statements must, where material, include separate sub-items providing (i) disclosure
of amounts deriving from related party transactions; and, with regard to the income statement, (ii) separate
disclosure of income and expenses deriving from events and transactions that are non-recurring in nature, or
transactions or events that do not occur on a frequent basis during the normal course of business.
A number of non-recurring transactions occurred in 2015, as described in note 5.10. Otherwise, no atypical
or unusual transactions, having a material impact on the Company’s income statement and statement of
financial position, were entered into during the period, either with third or related parties. The financial

247
statements therefore show the principal amounts relating to the related party and non-recurring transactions
that took place during the reporting period.
Amounts in the income statement and statement of financial position are shown in euros, whilst amounts in
the statement of comprehensive income, the statement of cash flows, the statement of changes in equity and
these notes are shown in thousands of euros, unless otherwise indicated. With regard CONSOB Resolution
15519 of 27 July 2006 relating to the format for financial statements, a specific supplementary income
statement and statement of financial position, showing material related party transactions, has been included.
The euro is both the Company’s functional currency and its presentation currency.
Each item in the financial statements is compared with the corresponding amount for the previous year.
3. ACCOUNTING STANDARDS AND POLICIES APPLIED
A description follows of the more important accounting standards and policies employed by the Company for
its financial statements as at and for the year ended 31 December 2015. These accounting standards and
policies are consistent with those applied in preparation of the financial statements for the previous year, as no
new standards, interpretations, or amendments to existing standards became effective in 2015 having a
material effect on the Company’s financial statements.
It should be noted that the following new interpretations and/or amendments to existing standards and
interpretations were applicable from 1 January 2015:
a) Annual improvements to IFRSs: 2011-2013, relating specifically to:
1) IFRS 3 - Business Combinations. The amendment to the standard clarifies that a contingent
consideration classified as an asset or a liability must be measured at fair value at each reporting date,
with the effects to be recognised in profit or loss, regardless of whether the contingent consideration
is a financial instrument or a non-financial asset or liability. In addition, it clarifies that the standard
does not apply to all joint ventures;
2) IFRS 13 – Fair Value Measurement. The amendment clarifies and explicitly confirms the option of
accounting for short-term trade receivables and payables on an undiscounted basis, should the effect
of discounting not be material;
b) IFRIC 21 - Levies. The interpretation applies to all levies imposed by the government that do not fall
within the scope of other standards (for example, IAS 12 – Income Taxes). The interpretation clarifies
that an entity must only recognise a liability for a levy when the activity that triggers payment, as identified
by the relevant legislation, occurs. In addition, a liability for a levy may only be accrued progressively if the
activity that triggers payment occurs over a period of time. For a levy that is triggered upon reaching a
minimum threshold, the liability must be estimated and recognised before the threshold is reached, when
the threshold is expected to be exceeded in the assessment period.
Property, plant and equipment Property, plant and equipment, including items acquired under finance leases, are stated at purchase cost.
Cost includes expenditure that is directly attributable to the acquisition of the items and financial expenses
incurred during construction of the asset. As permitted by IFRS 1, assets acquired through business
combinations prior to 1 January 2004 are stated at previous amounts, as determined under Italian GAAP for
those business combinations and representing deemed cost.
The cost of assets with finite useful lives is systematically depreciated on a straight-line basis applying rates that
represent the expected useful life of the asset. Each component of an asset with a cost that is significant in
relation to the total cost of the item, and that has a different useful life, is accounted for separately. Land,
whether free of constructions or annexed to civil and industrial buildings, is not depreciated as it has an
indefinite useful life.
Investment property, which is held to earn rentals or for capital appreciation, or both, is recognised at cost
measured in the same manner as property, plant and equipment. The relevant fair value of such assets has also
been disclosed.

4. Separate financial statements as at and for the year ended 31 December 2015
Annual Report 2015 248
The annual rates of depreciation applied to “Property, plant and equipment” and “Investment property” in
2015 are shown in the table below by asset class.
Property, plant and equipment is tested for impairment, as described in the relevant note, whenever events or
changes in circumstances indicate that the carrying amount may not be recoverable.
Property, plant and equipment is derecognised on disposal. Any gains or losses (determined as the difference
between disposal proceeds, less costs to sell, and the carrying amount of the asset) are recognised in profit or
loss in the period in which the asset is sold.
Intangible assets Intangible assets are identifiable assets without physical substance, controlled by the entity and from which
future economic benefits are expected to flow, and purchased goodwill. Identifiable intangible assets are those
purchased assets that, unlike goodwill, can be separately distinguished. This requirement is generally satisfied
when the intangible asset: (i) arises from a legal or contractual right, or (ii) is separable, meaning that it may be
sold, transferred, licensed or exchanged, either individually or as an integral part of other assets. The asset is
controlled by the entity if the entity has the power to obtain future economic benefits from the asset and can
limit access to it by others.
Internally developed assets are recognised as assets to the extent that: (i) the cost of the asset can be measured
reliably; (ii) the entity has the intention, the available financial resources and the technical expertise to
complete the asset and either use or sell it; (iii) the entity is able to demonstrate that the asset is capable of
generating future economic benefits.
Intangible assets are recognised at cost, measured in the same manner as property, plant and equipment,
provided that the assets can be identified and their cost reliably determined, are under the entity’s control and
are able to generate future economic benefits.
Amortisation of intangible assets with finite useful lives begins when the asset is ready for use and is based on
remaining economic benefits to be obtained in relation to their residual useful lives. The annual rate of
amortisation used in 2015 is 1.01%.
Intangible assets are tested for impairment, as described below in the note on “Impairment of assets and
reversals (impairment testing)”, whenever events or changes in circumstances indicate that the carrying
amount may not be fully recoverable.
Gains and losses deriving from the disposal of an intangible asset are determined as the difference between the
disposal proceeds, less costs to sell, and the carrying amount of the asset and are recognised as income or
expense in the income statement at the time of the disposal.
Goodwill Acquisitions of companies or business units are accounting for using the acquisition method, as required by
IFRS 3. For this purpose, the identifiable assets acquired and liabilities assumed through business
combinations are measured at their respective fair values at the acquisition date. The cost of an acquisition is
measured as the fair value, at the date of exchange, of the assets acquired, liabilities assumed and any equity
instruments issued by the Company in exchange for control.
Goodwill is initially measured as the positive difference between the acquisition cost, plus the fair value at the
acquisition date of any previous non-controlling interests held in the acquiree, and the fair value of net assets
acquired.
The goodwill, as measured on the date of acquisition, is allocated to each of the substantially independent cash
generating units expected to benefit from the synergies of the business combination.
A negative difference between the cost of the acquisition and the fair value of the net assets acquired is
recognised as income in profit or loss in the year of acquisition.
Buildings 3%
Industrial and business equipment 20%
Other assets 12%
Property, plant and equipmentRate of
depreciation

249
Goodwill on acquisitions of non-controlling interests is included in the carrying amount of the relevant
investments.
After initial recognition, goodwill is no longer amortised and is carried at cost less any accumulated
impairment losses, determined as described in the note on impairment testing.
IFRS 3 was not applied retrospectively to acquisitions prior to 1 January 2004, the Company’s IFRS transition
date, as noted above. As a result, the carrying amount of goodwill on these acquisitions is that determined
under Italian GAAP, which is the net carrying amount at this date, subject to impairment testing and the
recognition of any impairment losses.
Investments Investments in subsidiaries, associates and joint ventures are accounted for at cost and include any directly
attributable transaction costs. Impairment losses are identified in accordance with IAS 36, as described below
in the note on “Impairment of assets and reversals (impairment testing)”. The impairment is reversed in the
event the circumstances giving rise to the impairment cease to exist; the reversal may not exceed the original
carrying amount of the investment. Provisions are made to cover any losses of an associate or joint venture
exceeding the carrying amount of the investment, to the extent that the shareholder is required to comply with
actual or constructive obligations to cover such losses.
Investments in other companies, which qualify as available-for-sale financial instruments, as defined by IAS
39, are initially accounted for at cost at the settlement date, in that this represents fair value, including any
directly attributable transaction costs. After initial recognition, these investments are measured at fair value, to
the extent reliably determinable, through other comprehensive income and hence in a specific equity reserve.
On realisation or recognition of an impairment loss in the income statement, the accumulated gains and losses
in that reserve are taken to the income statement.
Impairment losses, identified as described below in the note on “Impairment of assets and reversals
(impairment testing)”, are reversed to other comprehensive income in the event the circumstances giving rise
to the impairment cease to exist.
When fair value cannot be reliably determined, investments classified as available-for-sale financial
instruments are measured at cost less any impairment losses. In this case impairment losses may not be
reversed.
Investments held for sale, or those in the process of being sold, are accounted for in current assets at the lower
of their carrying amount and fair value, less any costs to sell. Acquisitions or disposals of companies and/or business units between companies belonging to the Atlantia
Group (entities or businesses under common control) are treated, in accordance with IAS 1 and IAS 8, on the
basis of their economic substance, with reference to both the (i) the method of determining the purchase
consideration, and (ii) confirmation of the generation of added value for all the parties involved, resulting in
significant measurable changes in the cash flows generated by the assets transferred before and after the
transaction. In this regard:
a) in the case of the disposal of an intra-group investment, if both requirements to be confirmed are met,
the difference between the carrying amount of the investment transferred and the related purchase
consideration is recognised in profit or loss. In the other cases, the difference is recognised directly in
equity;
b) in the case of acquisitions of intra-group investments, such investments are recognised at cost (as defined
above) when the consideration is determined on the basis of the fair value of the investment being
acquired; in the other cases, the investment is accounted for at the same amount at which it was accounted
for in the financial statements of the transferee.
Receivables and payables
Receivables are initially recognised at fair value and subsequently measured at amortised cost, using the
effective interest method, less any allowance for bad debts. The amount of the allowance is based on the
present value of expected future cash flows. These cash flows take account of expected collection times,
estimated realisable value, any guarantees received, and the expected costs of recovering amounts due.
Impairment losses are reversed in future periods if the circumstances that resulted in the loss no longer exist.
In this case, the reversal is accounted for in the income statement and may not in any event exceed the
amortised cost of the receivable had no previous impairment losses been recognised.

4. Separate financial statements as at and for the year ended 31 December 2015
Annual Report 2015 250
Payables are initially recognised at cost, which corresponds to the fair value of the liability, less any directly
attributable transaction costs. After initial recognition, payables are recognised at amortised cost, using the
original effective interest method.
Trade receivables and payables, which are subject to normal commercial terms and conditions, are not
discounted to present value.
Cash and cash equivalents Cash and cash equivalents are recognised at face value. They include highly liquid demand deposits or very
short-term instruments of excellent quality, which are subject to an insignificant risk of changes in value.
Derivative financial instruments All derivative financial instruments are recognised at fair value at the end of the year.
As required by IAS 39, derivatives are designated as hedging instruments when the relationship between the
derivative and the hedged item is formally documented and the periodically assessed effectiveness of the hedge
is high and ranges between 80% and 125%.
Changes in the fair value of cash flow hedges hedging assets and liabilities (including those that are pending
and highly likely to arise in the future) are recognised in the statement of comprehensive income. The gain or
loss relating to the ineffective portion is recognised in profit or loss.
Changes in the fair value of derivatives serving as fair value hedges are recognised in profit or loss.
Analogously, the hedged assets and liabilities are restated at fair value through profit or loss.
Changes in the fair value of derivative instruments that do not qualify for hedge accounting under IAS 39 are
recognised in profit or loss.
Other financial assets and liabilities Financial assets that the Company intends and is able to hold to maturity and other financial liabilities are
recognised at the fair value of the purchase consideration at the settlement date, with assets being increased and
liabilities being reduced by transaction costs directly attributable to the purchase of assets or issuance of
financial liabilities. After initial recognition, financial assets are measured at amortised cost using the original
effective interest method.
Financial assets and liabilities are derecognised when, following their sale or settlement, the Company is no
longer involved in their management and has transferred all risks and rewards of ownership.
Financial assets held for trading are recognised and measured at fair value through profit or loss. Other
categories of financial assets classified as available-for-sale financial instruments are recognised and measured
at fair value through comprehensive income and, consequently, in a specific equity reserve. The financial
instruments in these categories have, to date, never been reclassified.
Fair value measurement and fair value hierarchy For all transactions or balances (financial or non-financial) for which an accounting standard requires or
permits fair value measurement and which falls within the application of IFRS 13, the Company applies the
following criteria:
a) identification of the unit of account, defined as the level at which an asset or a liability is aggregated or
disaggregated in an IFRS for recognition purposes;
b) identification of the principal market or, in the absence of such a market, the most advantageous market in
which the particular asset or liability to be measured could be traded; unless otherwise indicated, it is
assumed that the market currently used coincides with the principal market or, in the absence of such a
market, the most advantageous market;
c) definition for non-financial assets of the highest and best use of the asset; unless otherwise indicated,
highest and best use is the same as the asset's current use;
d) definition of valuation techniques that are appropriate for the measurement of fair value, maximising the
use of relevant observable inputs that market participants would use when determining the price of an asset
or liability;
e) determination of the fair value of assets, based on the price that would be received to sell an asset, and of
liabilities and equity instruments, based on the price paid to transfer a liability in an orderly transaction
between market participants at the measurement date;
251
f) inclusion of non-performance risk in the measurement of assets and liabilities and above all, in the case of
financial instruments, determination of a valuation adjustment when measuring fair value to include, in
addition to counterparty risk (CVA – credit valuation adjustment), the own credit risk (DVA - debit
valuation adjustment).
Based on the inputs used for fair value measurement, as required by IFRS 13, a fair value hierarchy for
classifying the assets and liabilities measured at fair value, or the fair value of which is disclosed in the financial
statements, has been identified:
a) level 1: includes quoted prices in active markets for identical assets or liabilities;
b) level 2: includes inputs other than quoted prices included within level 1 that are observable, such as the
following: i) quoted prices for similar assets or liabilities in active markets; ii) quoted prices for similar or
identical assets or liabilities in markets that are not active; iii) other observable inputs (interest rate and
yield curves, implied volatilities and credit spreads);
c) level 3: unobservable inputs. These inputs are used to the extent that observable data is not available. The
unobservable data used for fair value measurement should reflect the assumptions that market participants
would use when pricing the asset or liability being measured.
Definitions of the fair value hierarchy level in which individual financial instruments measured at fair value
have been classified, or for which the fair value is disclosed in the financial statements, are provided in the
notes to individual components of the financial statements.
There are no assets or liabilities classifiable in level 3 of the fair value hierarchy.
No transfers between the various levels of the fair value hierarchy took place during the year.
The fair value of derivative financial instruments is based on expected cash flows that are discounted at rates
derived from the market yield curve at the measurement date and the curve for listed credit default swaps
entered into by the counterparty and the Company, to include the non-performance risk explicitly provided
for by IFRS 13.
In the case of medium/long-term financial instruments, other than derivatives, where market prices are not
available, the fair value is determined by discounting expected cash flows, using the market yield curve at the
measurement date and taking into account counterparty risk in the case of financial assets and own credit risk
in the case of financial liabilities.
Provisions Provisions are made when: (i) the Company has a present (actual or constructive) obligation as a result of a
past event; (ii) it is probable that an outflow of resources will be required to settle the obligation; and (iii) the
related amount has been reliably estimated.
Provisions are measured on the basis of management’s best estimate of the expenditure required to settle the
present obligation at the end of the reporting period. If the discount to present value is material, provisions
are determined by discounting future expected cash flows to their present value using a discount rate used that
reflects current market assessments of the time value of money. Subsequent to the computation of present
value, the increase in provisions over time is recognised as a financial expense.
Employee benefits Short-term employee benefits, provided during the period of employment, are accounted for at the accrued
liability at the end of the reporting period.
Liabilities deriving from other medium/long-term employee benefits are recognised in the vesting period, less
any plan assets and advance payments made. They are determined on the basis of actuarial assumptions, if
material, and recognised on an accruals basis in line with the period of service necessary to obtain the benefit.
Post-employment benefits in the form of defined contribution plans are recognised at the amount accrued at
the end of the reporting period.
Post-employment benefits in the form of defined benefit plans are recognised in the vesting period, less any
plan assets and advance payments made. Such defined benefit plans primarily regard the obligation as
determined on the basis of actuarial assumptions and recognised on an accruals basis in line with the period of
4. Separate financial statements as at and for the year ended 31 December 2015
Annual Report 2015 252
service necessary to obtain the benefit. The obligation is calculated by independent actuaries. Any resulting
actuarial gain or loss is recognised in full in other comprehensive income in the period to which it relates.
Non-current assets held for sale, assets and liabilities included in disposal groups and/or related to discontinued operations Where the carrying amount of non-current assets held for sale, or of assets and liabilities included in disposal
groups and/or related to discontinued operations is to be recovered primarily through sale rather than through
continued use, these items are presented separately in the statement of financial position.
Immediately prior to being classified as held for sale, the above assets and liabilities are recognised under the
specific IFRS applicable to each asset and liability, and subsequently accounted for at the lower of the carrying
amount and estimated fair value. Any impairment losses are recognised immediately in the income statement.
Disposal groups or discontinuing operations are recognised in profit or loss as discontinued operations
provided the following conditions are met:
a) they represent a major line of business or geographical area of operation;
b) they are part of a single coordinated plan to dispose of a separate major line of business or geographical
area of operation;
c) they are subsidiaries acquired exclusively with a view to resale.
After tax gains and losses resulting from the management or sale of such operations are recognised as one
amount in profit or loss with comparatives.
Revenue Revenue is recognised when the fair value can be reliably measured and it is probable that the economic
benefits associated with the transactions will flow to the Company. Depending on the type of transaction,
revenue is recognised on the basis of the following specific criteria:
a) to the extent, for sales of goods, that significant risks and rewards of ownership are transferred to the
buyer;
b) the provision of services is prorated to percentage of completion of work. When the amount of the revenue
cannot be reliably determined, revenue is recognised only to the extent that expenses are considered to be
recoverable;
c) rental income or royalties, on an accruals basis, based on the agreed terms and conditions of the contract;
d) interest income (and interest expense) is accrued with reference to amount of the financial asset or
liability, in accordance with the effective interest method;
e) dividend income is recognised when the right to receive payment is established.
Income taxes Income taxes are recognised on the basis of a realistic estimate of tax expense to be paid, in compliance with
the regulations in force.
Deferred tax assets and liabilities are determined on the basis of temporary differences between the carrying
amounts of assets and liabilities as in the Company's books (resulting from application of the accounting
policies described in note 3) and the corresponding tax bases (resulting from application of the tax regulations
in force in the country relevant to each subsidiary), as follows:
a) deferred tax assets are only recognised to the extent that it is probable that future taxable profit will be
available against which the asset can be utilised;
b) deferred tax liabilities are always recognised.
Atlantia operates a tax consolidation arrangement, on the basis of Legislative Decree 344/2003.
The current tax assets and liabilities for IRES of the companies included in the consolidation are reported as
current tax assets and liabilities, with recognition of a matching receivable or payable due from or to the
subsidiary, in connection with the transfer of funds to be carried out as a result of the tax consolidation.
Relations between the companies are regulated by a specific contract. This contract establishes that
participation in the tax consolidation arrangement may not, under any circumstances, result in economic or
financial disadvantages for the participating companies compared with the situation that would have arisen had
they not participated in the arrangement. Should such disadvantages arise, they are to be offset by a
corresponding indemnity to be paid to the participating companies concerned.

253
Share-based payment The cost of services provided by directors and/or employees remunerated through share-based incentive plans,
and settled through the award of financial instruments, is based on the fair value of the rights at the grant date.
Fair value is computed using actuarial assumptions and with reference to all characteristics, at the grant date
(vesting period, any consideration due and conditions of exercise, etc.), of the rights and the plan's underlying
securities. The obligation is determined by independent actuaries. The cost of these plans is recognised in
profit or loss, with a contra-entry in equity, over the vesting period, based on a best estimate of the number of
options that will vest.
The cost of any services provided by Directors and/or employees and remunerated through share-based
payments, but settled in cash, is instead measured at the fair value of the liability assumed and recognised in
profit or loss, with a contra entry in liabilities, over the vesting period, based on a best estimate of the number
of options that will vest. Fair value is remeasured at the end of each reporting period until such time as the
liability is settled, with any changes recognised in profit or loss.
Impairment of assets and reversals (impairment testing) At the end of the reporting period, the Company tests property, plant and equipment, intangible assets,
financial assets and investments for impairment.
If there are indications that these assets have been impaired, the recoverable amounts of such assets are
estimated in order to verify and eventually measure the amount of the impairment loss. Irrespective of whether
there is an indication of impairment, intangible assets with indefinite lives and those which are not yet
available for use are tested for impairment at least annually, or more frequently, if an event has occurred or
there has been a change in circumstances that could cause an impairment.
If it is not possible to estimate the recoverable amounts of individual assets, the recoverable amount of the
cash-generating unit to which a particular asset belongs is estimated.
This entails estimating the recoverable amount of the asset (represented by the higher of the asset's fair value
less costs to sell and its value in use) and comparing it with the carrying amount. If the recoverable amount of
an asset is estimated to be less than its carrying amount, the carrying amount is reduced to its recoverable
amount. In calculating value in use, expected future pre-tax cash flow is discounted using a pre-tax rate that
reflects current market assessments of the cost of capital which embodies the time value of money and the risks
specific to the business.
In contrast, in estimating the future cash flow of a CGU, the Company uses after-tax cash flows and discount
rates that produce results that are substantially equivalent to those resulting from a pre-tax computation.
Impairments are recognised in profit or loss in a variety of classifications depending on the nature of the
impaired asset. Losses are reversed if the circumstances that resulted in the loss no longer exist, provided that
the reversal does not exceed the cumulative impairment losses previously recognised, unless the impairment
loss relates to goodwill and investments measured at cost, where the related fair value cannot be reliably
determined.
Estimates and judgements Preparation of financial statements in compliance with IFRS involves the use of estimates and judgements,
which are reflected in the measurement of the carrying amounts of assets and liabilities and in the disclosures
provided in the notes to the financial statements, including contingent assets and liabilities at the end of the
reporting period. These estimates are primarily used in determining amortisation and depreciation,
impairment testing of assets (including the measurement of receivables), provisions, employee benefits, the
fair value of financial assets and liabilities, and current and deferred tax assets and liabilities.
The amounts subsequently recognised may, therefore, differ from these estimates. Moreover, these estimates
and judgements are periodically reviewed and updated, and the resulting effects of each change immediately
recognised in the financial statements.
Translation of foreign currency items Transactions in currencies other than the functional currency are recognised by application of the exchange
rate at the transaction date. Assets and liabilities denominated in currencies other than the functional currency
are, subsequently, remeasured by application of the exchange rate at the end of the reporting period. Any

4. Separate financial statements as at and for the year ended 31 December 2015
Annual Report 2015 254
exchange differences on remeasurement are recognised in the income statement. Non-monetary assets and
liabilities denominated in foreign currencies and recognised at historical cost are translated using the exchange
rate at the date of initial recognition.
Earnings per share Basic earnings per share is computed by dividing profit by the weighted average number of shares outstanding
during the accounting period.
Diluted earnings per share is computed by dividing profit attributable to owners of the parent by the above
weighted average, also taking into account the effects deriving from the subscription, exercise or conversion of
all potential shares that may be issued as a result of the exercise of any outstanding rights.
New accounting standards and interpretations, or revisions and amendments of existing standards, that have either yet to come into effect As required by IAS 8 “Accounting Policies, Changes in Accounting Estimates and Errors”, this section
describes new accounting standards and interpretations, and amendments of existing standards and
interpretations that are already applicable, but that have either yet to come into effect in 2015, and that may in
the future be applied in the Company’s financial statements:
IFRS 9 – Financial instruments In July 2014, the IASB published the final version of IFRS 9, the standard created to replace the existing IAS
39 for the classification and measurement of financial instruments.
The standard introduces new rules for the classification and measurement of financial instruments, a new
impairment model for financial assets and a new hedge accounting model.
Classification and measurement IFRS 9 envisages a single approach for the assessment and classification of all financial assets, including those
containing embedded derivatives. The classification and related measurement is driven by both the business
model in which the financial asset is held and the contractual cash flow characteristics of the asset.
The financial asset is measured at amortised cost subject to both of the following conditions:
a) the asset is held in conjunction with a business model whose objective is to hold assets in order to collect
contractual cash flows; and
b) the contractual terms of the financial asset give rise on specified dates to cash flows that are solely
payments of principal and interest on the principal amount outstanding.
The financial asset is measured at fair value, with any changes recognised in comprehensive income, if the
objectives of the business model are to hold the financial asset to collect the contractual cash flows, or to sell it.
Finally, the standard envisages a residual category of financial asset measured at fair value through profit or
loss, which includes assets held for trading.
A financial asset meeting the conditions to be classified and measured at amortised cost may, on initial
recognition, be designated as a financial asset at fair value through profit or loss, to the extent that this
accounting treatment would eliminate or significantly reduce a measurement or recognition inconsistency
Name of documentEffective date of IASB
document
Date of EU
endorsement
New accounting standards and interpretations
IFRS 9 – Financial Instruments 1 January 2018 Not endorsed
IFRS 15 – Revenue from Contracts with Customeri 1 January 2018 Not endorsed
Amendments to exist ing standards and interpretations
Amendments to IAS 1 – Disclosure Initiative 1 January 2016 December 2015
Amendments to IAS 16 and IAS 38 – Clarification of Acceptable Methods of Depreciation and
Amortisation 1 January 2016 December 2015
Amendments to IFRS 11 – Accounting for Acquisitions of Interests in Joint Operation 1 January 2016 November 2015
Annual Improvements to IFRSs: 2010–2012 1 February 2015 December 2014
Annual Improvements to IFRSs: 2012–2014 1 January 2016 December 2015

255
(sometimes referred to as an ‘accounting mismatch’) that would otherwise arise from measuring assets or
liabilities or recognising the gains and losses on them on different bases.
In addition, the new standard provides that an entity may, with respect to investments in equity instruments,
which consequently may not be carried and measured at amortised cost unless such instruments are shares that
are not held for trading but rather for strategic reasons, make an irrevocable election on initial recognition to
present changes in the fair value in comprehensive income.
The new IFRS 9, on the other hand, has confirmed the provisions of IAS 39 for financial liabilities including
the relative measurement at amortised cost or, in specific circumstances, at fair value through profit or loss.
The requirements of IAS 39 that have been changed are primarily:
a) the reporting of changes in fair value in connection with the credit risk of certain liabilities, which IFRS 9
requires to be recognised in comprehensive income rather than in profit or loss as movements in fair
value as a result of other risks;
b) the elimination of the option to measure, at amortised cost, financial liabilities consisting of derivative
financial instruments entailing the delivery of unlisted equity instruments. The consequence of the
change is that all derivative financial instruments must now be recognised at fair value.
Impairment IFRS 9 has defined a new impairment model for financial assets, with the objective of providing the users of
financial statements with more useful information about an entity’s expected losses. The model requires an
entity to recognise expected credit losses at all times and to update the amount of expected losses recognised at
each reporting date to reflect changes in the credit risk of the financial instruments. It is, therefore, no longer
necessary to wait for evidence of a trigger event before testing for impairment and recognition of a credit loss.
All financial instruments must be tested for impairment, with the exception of those measured at fair value
through profit or loss.
Hedge accounting
The most important changes introduced by IFRS 9 regard:
a) the extended scope of the risks eligible for hedge accounting, to include those to which non-financial
assets and liabilities are exposed, also permitting the designation of groups and net positions as hedged
items, also including any derivatives;
b) the option of designating a financial instrument at fair value through profit or loss as a hedging
instrument;
c) the alternative method of accounting for forwards and options, when included in a hedge accounting
relationship;
d) changes to the method of conducting hedge effectiveness tests, following introduction of the principle of
the “economic relationship” between the hedged item and the hedging instrument; in addition,
retrospective hedge effectiveness testing is no longer required;
e) the possibility of “rebalancing” an existing hedge where the risk management objectives continue to be
valid.
IFRS 15 – Revenue from Contracts with Customers
On 28 May the IASB published the new standard, IFRS 15. IFRS 15 replaces the previous IAS 18, in addition
to IAS 11, regarding contract work, and the related interpretations, IFRIC 13, IFRIC 15, IFRIC 18 and SIC 31. IFRS 15 establishes the standards to follow in recognising revenue from contracts with customers, with the
exception of contracts falling within the scope of application of standards governing leases, insurance contracts
and financial instruments.
The new standard provides an overall framework for identifying the timing and amount of revenue to be
recognised in the financial statements. Based on the new standard, the amount recognised as revenue by an
entity must reflect the consideration to which the entity is entitled in exchange for goods transferred to the
customer and/or services rendered. This revenue is to be recognised when the entity has satisfied its
performance obligations under the contract.
In addition, in recognising revenue, the standard stresses the need to assess the likelihood of
obtaining/collecting the economic benefits linked to the proceeds. In the case of contract work in progress,

4. Separate financial statements as at and for the year ended 31 December 2015
Annual Report 2015 256
currently governed by IAS 11, the new standard introduces the requirement to recognise revenue taking into
account the effect of discounting to present value resulting from the deferral of collections over time.
If it is not possible to retrospectively apply the new standard, a modified approach can be used upon first-time
adoption. Under this approach, the effects of application of the new standard must be recognised in opening
equity at the beginning of the reporting period of first-time adoption.
Amendments to IAS 1 – Disclosure initiative In December 2014, the IASB published a number of amendments to IFRS 1, in order to clarify the disclosures
to be included in the notes to financial statements.
A number of changes have been made to the disclosures to be provided regarding:
a) the concept of materiality, relating to the relevance of the information to be provided in financial
statements;
b) the items to be presented in the financial statements;
c) the structure of the notes;
d) the accounting policies;
e) the basis of presentation in the statement of comprehensive income of profits and losses attributable to
investments accounted for using the equity method.
Given that the amendments regard the classification of items in the financial statements and the
disclosures to be included in the notes, they will not have any impact on amounts in the Company’s
financial statements.
Amendments to IAS 16 and IAS 38 – Clarification of Acceptable Methods of Depreciation and
Amortisation In May 2014, the IASB published a number of amendments to IAS 16 – Property, Plant and Equipment, and
IAS 38 – Intangible Assets.
The amendments provide clarification regarding acceptable methods of depreciation and amortisation under
the above standards. Above all, whilst reiterating that the method of depreciation or amortisation used must
reflect the expected pattern of consumption of the future economic benefits embodied in the asset, the
amendments introduce the presumption that a revenue-based method of depreciation or amortisation is not
appropriate. This is because the IASB believes that revenue generated by an asset reflects factors not directly
linked to consumption of the economic benefits embodied in the asset.
In the case of intangible assets, the IASB has also specified that in choosing which method of amortisation to
use, the entity must take into account the predominant, limiting factors inherent in the intangible asset, and
that the above presumption may only be overcome in limited circumstances, when, for example, (i) the
intangible asset is expressed as a measure of revenue that can be obtained from the asset, or (ii) when it can be
demonstrated that revenue and the consumption of economic benefits of the intangible asset are highly
correlated.
Amendments to IAS 27 – Equity Method in Separate Financial Statements
On 12 August 2014, the IASB published amendments to IAS 27 – Separate Financial Statements, which
required an entity to disclose its investments in subsidiaries, associates and joint ventures at cost or, in
accordance with IFRS 9 (or IAS 39, for entities who have yet to adopt IFRS 9), at fair value. The amendments
introduce, alongside the methods of measurement already permitted in the separate financial statements, the
option of measuring such investments using the equity method.
Amendments to IFRS 11 – Accounting for Acquisitions of Interests in Joint Operations On 6 May 2014, the IASB published a number of amendments to IFRS 11 – Joint Arrangements. The aim of
the amendments is to clarify the accounting, by investors, of the acquisition of an interest in a joint operation
that constitutes or contains a business.
Annual Improvements to IFRSs: 2010 – 2012 The IASB published "Annual Improvements to IFRSs: 2010-2012 Cycle” on 12 December 2013.
The principal amendments that could be relevant to the Company are:

257
a) IFRS 2 – Share-based Payment: amendments have been made to the definitions of “vesting condition” and
“market condition” and further definitions for “performance condition” and “service condition” have
been added, for the recognition of share-based benefit plans;
b) IFRS 8 - Operating Segments: the amendments require disclosure of the judgements made by
management in applying the aggregation criteria for operating segments, including a description of the
aggregate operating segments and the economic indicators assessed in determining if the operating
segments have “similar economic characteristics”. In addition, the reconciliation of the total of the
reportable segment’s assets to the entity’s total assets should only be disclosed if the total of the reportable
segment’s assets is regularly provided to the chief operating decision maker.
Annual Improvements to IFRS: 2012 – 2014 The IASB published "Annual Improvements to IFRSs: 2012-2014 Cycle” on 25 September 2014.
The principal amendments that could be relevant to the Company are:
a) IFRS 7 - Financial Instruments: Disclosures: the amendments eliminate uncertainty regarding when
disclosures regarding the offsetting of financial assets and liabilities (that came into effect from accounting
periods beginning on or after 1 January 2013) must be included in interim financial statements; the
document clarifies that fact that offsetting disclosures are not explicitly required for all interim financial
statements. However, such disclosures may be necessary in order to meet the requirements of IAS 34, if
the disclosure is material;
b) IAS 19 – Employee Benefits: the document clarifies that the high-quality corporate bonds used in
estimating the discount rate for post-employment benefits should be denominated in the same currency as
the benefits to be paid. The changes also establish that the depth of the market for such bonds should be
assessed at currency level;
c) IAS 34 – Interim Financial Statements: changes have been introduced to clarify the requirements when the
required disclosures are presented in the interim financial report, but not in the interim financial
statements. Such disclosures may be included by including a reference in the interim financial statements
to elsewhere in the interim financial report, provided that the latter document is available to readers of the
interim financial statements in the same way and at the same time as the interim financial statements.
The effect of the future application of newly issued standards and interpretations, as well as all revisions and
amendments to existing standards, with the exception of those regarding IAS 1, is currently being evaluated by
the Company. The impact cannot currently be reasonably estimated.

4. Separate financial statements as at and for the year ended 31 December 2015
Annual Report 2015 258
4 NOTES TO THE STATEMENT OF FINANCIAL POSITION The following notes provide information on items in the statement of financial position as at 31 December
2015. Comparative amounts as at 31 December 2014 are shown in brackets. Details of items in the
consolidated statement of financial position deriving from related party transactions are provided in note 7.2.
4.1 Property, plant and equipment €7,540 thousand (€7,992 thousand)
The following table provides details of property, plant and equipment at the beginning and end of the period,
showing the original cost and accumulated depreciation at the end of the period.
The reduction of €452 thousand in the carrying amount of property, plant and equipment as at 31 December
in 2015 essentially reflects depreciation for the year (€467 thousand), as shown in the following table.
This item consists of :
a) property, plant and equipment, including owned buildings and land used in operations;
b) investment property, which includes buildings and land owned by the Company, together with the
surrounding land, and leased to other Group companies. The total fair value of these assets is estimated to
be €12,460 thousand, based on independent appraisals and information on property markets relevant to
these types of investment property. This amount is higher than the related carrying amount.
Investment property generated rental income of €724 thousand in 2015, whilst direct maintenance and
management costs totalled €135 thousand.
There were no changes in the expected useful lives of these assets during 2015.
Property, plant and equipment as at 31 December 2015 is free of mortgages, liens or other collateral guarantees
restricting use.
€000
CostAccumulated
depreciation
Carrying
amountCost
Accumulated
depreciation
Carrying
amount
Property, plant and equipment 5,763 -3,737 2,026 5,756 -3,549 2,207
Investment property 10,438 -4,924 5,514 10,430 -4,645 5,785
Total property, plant and
equipment16,201 -8,661 7,540 16,186 -8,194 7,992
31 December 2015 31 December 2014
€000
Property, plant and equipment
Land 39 - - - 39
Buildings 2,048 3 -164 -8 1,879
Industrial and business equipment 88 - -14 - 74
Other assets 32 12 -10 - 34
Total 2,207 15 -188 -8 2,026
Investment property
Land 1,124 - - - 1,124
Buildings 4,661 - -279 8 4,390
Total 5,785 - -279 8 5,514
Total property, plant and equipment 7,992 15 -467 - 7,540
Carrying amount
as at 31
December 2014
Additions Depreciation
Reclassif ications
and other
adjustments
Carrying amount
as at 31
December 2015

259
4.2 Intangible assets €225 thousand (€228 thousand)
The following table provides details of intangible assets at the beginning and end of the period, showing the
original cost and accumulated amortisation at the end of the period.
Intangible assets, whose carrying amount is in line with the figure for 31 December 2014, consist solely of
building rights for land owned by the Municipality of Florence, which are amortised over the term of the
rights.
4.3 Investments €8,836,432 thousand (€8,857,912 thousand)
This item is down €21,480 thousand compared with 31 December 2014, primarily due to the following:
a) the write-off of the investment in Compagnia Aerea Italiana, totalling €36,249 thousand, as described
below, including capital injections of €9,026 thousand and €27,223 thousand by the Company in 2015
and 2014. These injections of fresh capital were carried out in implementation of the equity commitments
approved by the extraordinary general meeting of shareholders held on 25 July 2014, in view of Etihad’s
purchase of an interest in the new airline, “Alitalia – Società Aerea Italiana”, controlled by Compagnia
Aerea Italiana. The remaining commitment as at 31 December 2015 amounts to €13,618 thousand;
b) recognition of the accrued amount for share-based incentive plans, totalling €5,566 thousand, reflecting
the benefits granted to certain directors and personnel of subsidiaries. Further details are provided in note
7.3.
The following tables show:
a) amounts at the beginning and end of the period (showing the original cost and any accumulated
revaluations and impairments) for the investment held by the Company, classified by category, and the
related changes during the year;
b) details of investments, showing, as well as other information, percentage interest and the relevant carrying
amount as at 31 December 2015 (net of any unpaid, called-up issued capital).
€000
Building rights 228 -3 225
Intangible assets 228 -3 225
Carrying amount
as at 31
December 2014
Amortisation
Carrying amount
as at 31
December 2015

4. Separate financial statements as at and for the year ended 31 December 2015
Annual Report 2015 260
Imp
air
me
nts
Co
st
Ac
cu
mu
late
d
(im
pa
irm
en
ts)
Ca
rryin
g
am
ou
nt
Ne
w
ac
qu
isit
ion
s
an
d
pu
rch
as
es
of
ad
dit
ion
al
sh
are
s
Ch
an
ge
s d
ue
to c
orp
ora
te
ac
tio
ns
Cu
rre
nc
y
tra
ns
lati
on
dif
fere
nc
es
Inc
rea
se
s d
ue
to s
ha
re-
ba
se
d
pa
ym
en
t
pla
ns
(In
cre
as
es
)/
De
cre
as
es
Co
st
Ac
cu
mu
late
d
(im
pa
irm
en
ts)
Ca
rryin
g
am
ou
nt
Au
tostr
ad
e p
er
l'Ita
lia
Sp
A5
,96
5,0
64
-5
,96
5,0
64
--
-4
,83
9-
5,9
69
,90
3-
5,9
69
,90
3
Ae
rop
ort
i d
i R
om
a S
pA
2,7
66
,23
5-
2,7
66
,23
51
97
--
60
1-
2,7
67
,03
3-
2,7
67
,03
3
Sp
ea
En
gin
ee
rin
g S
pA
(1
)2
4,4
20
-2
4,4
20
-1
8,4
45
-6
7-
42
,93
2-
42
,93
2
Pa
vim
en
tal S
pA
29
,04
7-
29
,04
7-
-5
9-
29
,10
6-
29
,10
6
Fiu
mic
ino
En
erg
ia S
rl7
,67
3-
7,6
73
--
--
-7
,67
3-
7,6
73
Miz
ard
Srl
21
-2
1-
--
--
21
-2
1
Do
min
o S
rl1
1-
11
2-
--
-1
3-
13
AD
R E
ngin
ee
rin
g S
pA
(1
)1
8,4
45
-1
8,4
45
--1
8,4
45
--
--
--
Ge
min
a F
idu
cia
ry S
erv
ice
Sp
A (
2)
--
--
--
--
--
-
Inv
es
tme
nts
in
su
bs
idia
rie
s (
A)
8,8
10
,91
6-
8,8
10
,91
61
99
--
5,5
66
-8
,81
6,6
81
-8
,81
6,6
81
Pu
ne
So
lap
ur
Exp
ressw
ays
Pri
va
te L
td1
6,3
64
-1
6,3
64
--
-22
--
16
,34
2-
16
,34
2
Inv
es
tme
nts
in
jo
int
ve
ntu
res
(B
)1
6,3
64
-1
6,3
64
--
-22
--
16
,34
2-
16
,34
2
Fir
en
ze
Pa
rch
eggi S
pA
2,5
82
-2
,58
2-
--
--
2,5
82
-2
,58
2
Em
itte
nte
Tit
oli S
pA
82
7-
82
7-
--
--
82
7-
82
7
Co
mp
agn
ia A
ere
a Ita
lia
na
Sp
A (
3)
15
3,2
23
-12
6,0
00
27
,22
39
,02
6-
--
-36
,24
91
62
,24
9-1
62
,24
9-
Inv
es
tme
nts
in
oth
er
co
mp
an
ies
(C
)1
56
,63
2-1
26
,00
03
0,6
32
9,0
26
--
--3
6,2
49
16
5,6
58
-16
2,2
49
3,4
09
To
tal
inv
es
tme
nts
(A
+B
+C
)8
,98
3,9
12
-12
6,0
00
8,8
57
,91
29
,22
5-
-22
5,5
66
-36
,24
98
,99
8,6
81
-16
2,2
49
8,8
36
,43
2
(1)
Wit
h e
ffe
ct
fro
m 1
Ju
ne
20
15
, A
DR
En
gin
ee
rin
g S
pA
wa
s m
erg
ed
wit
h a
nd
in
to S
pe
a In
ge
gn
eri
a E
uro
pe
a S
pA
, w
hic
h c
ha
ng
ed
its
na
me
to
Sp
ea
En
gin
ee
rin
g S
pA
.
(2)
Th
is in
ve
stm
en
t, a
cco
un
ted
fo
r a
s a
re
su
lt o
f th
e m
erg
er
of
Ge
min
a S
pA
wit
h a
nd
in
to A
tla
nti
a, h
as a
ca
rryin
g a
mo
un
t o
f 1
eu
ro c
en
t.
(3)
Co
mp
ag
nia
Ae
rea
Ita
lia
na
assu
me
d its
ne
w n
am
e f
rom
1 J
an
ua
ry 2
01
5.
31
De
ce
mb
er
20
15
CH
AN
GE
S D
UR
ING
TH
E Y
EA
R
€0
00
31
De
ce
mb
er
20
14
Co
st

261
Na
me
Re
gis
tere
d
off
ice
Nu
mb
er
of
sh
are
s/
un
its
Inte
res
t (%
)
Nu
mb
er
of
sh
are
s/
un
its
he
ld
Pro
fit/
(Lo
ss
)
for
20
15
(€0
00
) (1
)
Eq
uit
y a
s a
t
31
De
ce
mb
er
20
15
(€0
00
) (1
)
Ca
rryin
g
am
ou
nt
(€0
00
)
Au
tostr
ad
e p
er
l'Ita
lia
Sp
AR
om
e6
22
,02
7,0
00
eu
ro1
.00
eu
ro6
22
,02
7,0
00
10
0.0
0%
62
2,0
27
,00
09
54
,95
32
,56
5,6
08
5,9
69
,90
3
Ae
rop
ort
i d
i R
om
a S
pA
Fiu
mic
ino
62
,22
4,7
43
eu
ro1
.00
eu
ro6
2,2
24
,74
39
5.9
2%
59
,68
7,6
41
13
4,5
56
1,1
28
,70
42
,76
7,0
33
Sp
ea
En
gin
ee
rin
g S
pA
(4
)M
ila
n1
,35
0,0
00
eu
ro5
.16
eu
ro6
,96
6,0
00
60
.00
%8
10
,00
01
6,4
08
87
,37
04
2,9
32
Pa
vim
en
tal S
pA
Ro
me
77
,81
8,8
65
eu
ro0
.13
eu
ro1
0,1
16
,45
25
9.4
0%
46
,22
3,2
90
7,7
64
49
,29
52
9,1
06
Fiu
mic
ino
En
erg
ia S
rlF
ium
icin
o7
41
,79
5e
uro
1.0
0
eu
ro7
41
,79
58
7.1
4%
64
6,3
87
1,2
26
9,3
43
7,6
73
Miz
ard
Srl
Ro
me
1e
uro
10
,00
0.0
0
eu
ro1
0,0
00
10
0.0
0%
1-1
14
21
Do
min
o S
rlF
ium
icin
o1
eu
ro-
eu
ro1
0,0
00
10
0.0
0%
1-1
91
3
Ge
min
a F
idu
cia
ry S
erv
ice
s S
ALu
xe
mb
ou
rg1
7,6
47
eu
ro-
eu
ro1
50
,00
09
9.9
9%
17
,64
7-3
5-7
9-
Inv
es
tme
nts
in
su
bs
idia
rie
s (
A)
8,8
16
,68
1
Pu
ne
So
lap
ur
Exp
ressw
ays
Pri
va
te L
td.
Ne
w D
elh
i (I
nd
ia)
10
,00
0,0
00
rup
ia1
0.0
0
rup
ia1
00
,00
0,0
00
50
.00
%5
,00
0,0
00
-10
,39
7(3
)1
3,6
64
(3)
16
,34
2
Inv
es
tme
nts
in
jo
int
ve
ntu
res
(B
)1
6,3
42
Fir
en
ze
Pa
rch
eggi S
pA
Flo
ren
ce
49
5,5
50
eu
ro5
1.6
5
eu
ro2
5,5
95
,15
85
.47
%2
7,1
20
11
6(2
)3
3,4
96
(2)
2,5
82
Em
itte
nte
Tit
oli S
pA
Mila
n8
,20
0,0
00
eu
ro0
.52
eu
ro4
,26
4,0
00
7.2
4%
59
4,0
00
10
,10
4(2
)1
5,9
97
(2)
82
7
Co
mp
agn
ia A
ere
a Ita
lia
na
Sp
A (
5)
Fiu
mic
ino
58
,38
5,8
29
,31
9e
uro
-e
uro
35
9,0
26
,53
67
.02
%4
,09
7,3
27
,77
2-6
98
,83
4(2
)2
5,9
90
(2)
-
Inv
es
tme
nts
in
oth
er
co
mp
an
ies
(C
)3
,40
9
Inv
es
tme
nts
(A
+B
+C
)8
,83
6,4
32
(1)
Th
e f
igu
res h
ave
be
en
ta
ke
n f
rom
th
e la
test
fin
an
cia
l sta
tem
en
ts a
pp
rove
d b
y t
he
bo
ard
s o
f d
ire
cto
rs o
f e
ach
co
mp
an
y.
(2)
La
test
fin
an
cia
l sta
tem
en
ts a
pp
rove
d (
31
De
ce
mb
er
20
14
).
(3)
Th
e f
igu
res h
ave
be
en
ta
len
fro
m t
he
re
po
rtin
g p
acka
ge
pre
pa
red
by t
he
co
mp
an
y f
or
the
pu
rpo
se
s o
f p
rep
ara
tio
n o
f th
e A
tla
nti
a G
rou
p's
co
nso
lid
ate
d f
ina
ncia
l sta
tem
en
ts.
(4)
Wit
h e
ffe
ct
fro
m 1
Ju
ne
20
15
, A
DR
En
gin
ee
rin
g S
pA
wa
s m
erg
ed
wit
h a
nd
in
to S
pe
a In
ge
gn
eri
a E
uro
pe
a S
pA
, w
hic
h c
ha
ng
ed
its
na
me
to
Sp
ea
En
gin
ee
rin
g S
pA
.
(5)
Co
mp
ag
nia
Ae
rea
Ita
lia
na
assu
me
d its
ne
w n
am
e f
rom
1 J
an
ua
ry 2
01
5.
Pa
r v
alu
e
Ca
pit
al/
Co
ns
ort
ium
fu
nd

4. Separate financial statements as at and for the year ended 31 December 2015
Annual Report 2015 262
Impairment tests have been conducted on the carrying amounts of investments as at 31 December 2015:
a) that included goodwill (in this case, IAS 36 requires an impairment test to be conducted at least once a
year), or
b) for which there is evidence of a potential impairment.
As regards point a), the carrying amount of the investment in Autostrade per l’Italia has been tested for
impairment, given that the carrying amount includes goodwill resulting from the Group’s reorganisation in
2003. For this purpose, value in use was determined by using the company’s long-term business plan,
prepared on the basis of the regulatory mechanisms included in the Single Concession Arrangement,
containing projections for traffic, investment, costs and revenues through to the end of the related concession
term. Use of the long-term plan covering the entirety of the company’s concession term is deemed more
appropriate than the approach provisionally suggested by IAS 36 (namely, a limited explicit projection period
and the estimated terminal value), given the intrinsic nature of the motorway concession arrangement, above
all with regard to the regulations governing the sector and the predetermined duration of the arrangement. In
particular, Autostrade per l’Italia’s long-term plan used for the test has been prepared on the basis of the
following assumptions:
a) a CAGR for traffic of 1.00%;
b) an average annual toll increase, linked to inflation, of 0.97%, which is 70% lower than the target inflation
rate (2.00%) for the medium term indicated in the update to the Italian government’s Economic and
Finance Document for 2015;
c) an average annual increase in the return on investment to be carried out of 1.15%. In this regard, a
portion of this toll increase is not recognised if the planned investment is not carried out; in this case, the
other economic and financial effects of not carrying out such investment would, instead, be taken into
account.
As regards point b), the investments in Spea Engineering and Pavimental were tested for impairment.
In terms of the method used in carrying out the impairment tests for these two companies, which essentially
provide support services to the Atlantia Group’s operators (with regard to their construction and maintenance
activities), it was also considered appropriate to estimate value in use on the basis of the same period covered by
the long-term plans of the operators to which they provide their services or until 2044, without estimating the
terminal value.
The projected after-tax cash flows for the long-term plans of the subsidiaries indicated in points a) and b)
were discounted to present value using the rate of 6.14% (6.25% in 2014), representing the companies’
specific after-tax WACC.
The impairment tests confirmed that the carrying amounts of the investments accounted for as at 31 December
2015 are fully recoverable.
In addition to the above impairment test, sensitivity analyses were conducted on the recoverable values,
increasing the above discount rates by 1%, and, in Autostrade per l’Italia’s case, reducing the average annual
rate of traffic growth by 1%. The results of these analyses have not, in any event, resulted in any material
differences with respect to the outcomes of the above tests.
Finally, with regard to the investment in Compagnia Aerea Italiana, given the lack of sufficient information on
which to base a reliable fair value measurement and in view of the significant losses incurred by this investee,
reference was made to the Company’s share of the investee’s assets and liabilities measured in accordance with
IFRS. This resulted in the write-off of the carrying amount of the investment (€36,249 thousand).
4.4 Financial assets (non-current) €7,078,407 thousand (€9,003,591 thousand) (current) €1,109,271 thousand (€267,637 thousand)
The following analysis shows the composition of financial assets at the beginning and end of the period,
together with the current and non-current portions.

263
Medium/long-term financial assets, totalling €8,180,731 thousand, are down €1,082,330 thousand. This
primarily reflects a combination of the following:
a) partial early repayment, totalling €1,351,250 thousand, of loans granted to Autostrade per l’Italia,
maturing in 2016, 2017, 2019 and 2020, corresponding with the Company’s early redemption of bonds
in issue;
b) a reduction of €39,927 thousand in accrued income, primarily due to the above early repayment of loans
to Autostrade per l’Italia;
c) a reduction of €29,109 thousand in fair value gains on derivative assets entered into with Autostrade per
l’Italia to hedge interest rate risk associated with the medium/long-term, floating rate loan (disbursed in
2004 and maturing in 2022) of €750,000 thousand granted to the subsidiary, essentially reflecting the
payment of differentials for 2015 and an increase in the interest rates used for measurement purposes as at
31 December 2015, compared with those used as at 31 December 2014;
d) the recognition of the amount receivable as a result of the investment of available liquidity in the buyback
of notes issued by Romulus Finance. In January 2015, Atlantia launched a voluntary cash tender offer for
all the asset backed securities named “£215,000,000 5.441% per cent Class A4 Notes due 2023” issued by
Romulus Finance (a special purpose vehicle controlled by Aeroporti di Roma). At the end of the offer
period, acceptances had been received for 99.87% of the total securities in issue, resulting in an cash
outflow of £259,817 thousand, including payment of a premium to Romulus Finance’s noteholders,
totalling £45.092 thousand. The Company entered into Cross Currency Swaps to hedge the currency risk
associated with the investment. Fair value gains as at 31 December 2015 amount to €563 thousand. As at 31
December 2015, exchange rate movements have generated an increase in the receivable and a matching
reduction in the derivatives, totalling €5,879 thousand.
Further information on the early redemption of bonds described in point a) is provided in note 5.10, whilst
details of the hedging strategy and of the derivatives entered into to hedge certain financial assets (indicated in
the above table) are provided in note 6.2.
Other current financial assets, essentially relating to short-term receivables in the form of guaranteed given to
certain subsidiaries, are down €1,220 thousand compared with 31 December 2014, primarily due to a
combination of the repayment received from the subsidiary, Autostrade per l’Italia (€2,779 thousand) and an
increase in amounts due from the indirect subsidiary, Electronic Transaction Consultants (€1,438 thousand).
The loans granted to Autostrade per l’Italia are on the same terms as those applied to the Company’s
borrowings, increased by a spread that takes account of the cost of managing the loans.
The following two tables include details of financial assets, showing:
a) the composition of the carrying amount and the related face value and maturity (current and non-
current), indicating loans to subsidiaries:
€000
Total
f inancial
assets
Current
portion
Non-current
portion
Total
f inancial
assets
Current
portion
Non-current
portion
Loans to subsidiaries (1) (2) 7,397,335 882,732 6,514,603 8,757,890 - 8,757,890
Bonds held (1) (2) 346,262 - 346,262 - - -
Derivative assets (3) 216,686 - 216,686 245,232 - 245,232
Accrued income of medium/long-term financial assets (1) 219,464 219,464 - 259,391 259,391 -
Other loans and receivables (1) 984 128 856 548 79 469
Medium/long-term financial assets 8,180,731 1,102,324 7,078,407 9,263,061 259,470 9,003,591
Other financial assets (1) 6,947 6,947 - 8,167 8,167 -
Other current f inancial assets 6,947 6,947 - 8,167 8,167 -
F inancial assets Total 8,187,678 1,109,271 7,078,407 9,271,228 267,637 9,003,591
31 December 2015 31 December 2014
(1) These assets are classified as "loans and receivables" in accordance with IAS 39.
(2) As at 31 December 2015, these assets are hedged against interest rate and currency risk with notional amounts and maturities matching those of the underlyings.
These are classified as cash flow hedges in accordance with IAS 39 and included in "Derivative assets".
(3) These assets are classified as hedging derivatives and in level 2 of the fair value hierarchy.
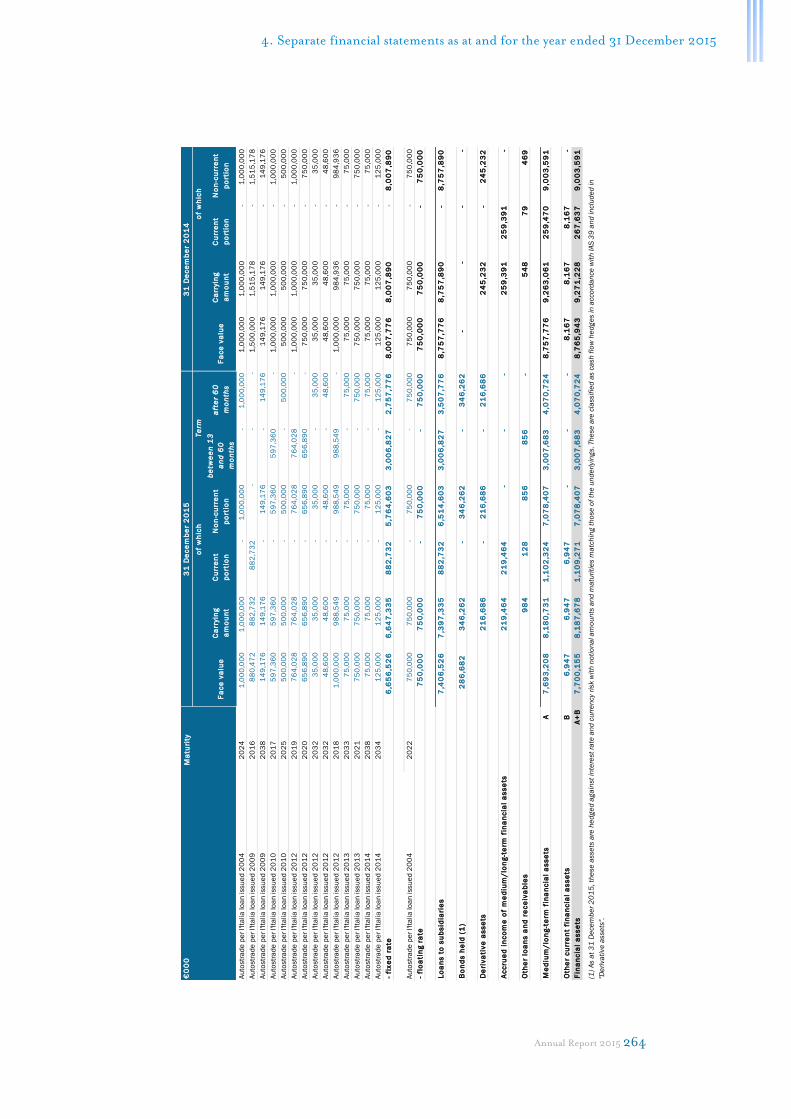
4. Separate financial statements as at and for the year ended 31 December 2015
Annual Report 2015 264
Ma
turi
ty
Fa
ce
va
lue
Ca
rryin
g
am
ou
nt
Cu
rre
nt
po
rtio
n
No
n-c
urr
en
t
po
rtio
n
be
twe
en
13
an
d 6
0
mo
nth
s
aft
er
60
mo
nth
sF
ac
e v
alu
eC
arr
yin
g
am
ou
nt
Cu
rre
nt
po
rtio
n
No
n-c
urr
en
t
po
rtio
n
Au
tostr
ad
e p
er
l'Ita
lia
lo
an
issu
ed
20
04
20
24
1,0
00
,00
0 1
,00
0,0
00
-
1
,00
0,0
00
-
1
,00
0,0
00
1
,00
0,0
00
1
,00
0,0
00
-
1
,00
0,0
00
Au
tostr
ad
e p
er
l'Ita
lia
lo
an
issu
ed
20
09
20
16
88
0,4
72
8
82
,73
2
8
82
,73
2
-
-
-
1,5
00
,00
0 1
,51
5,1
78
-
1
,51
5,1
78
Au
tostr
ad
e p
er
l'Ita
lia
lo
an
issu
ed
20
09
20
38
14
9,1
76
1
49
,17
6
- 1
49
,17
6
- 1
49
,17
6
14
9,1
76
1
49
,17
6
- 1
49
,17
6
Au
tostr
ad
e p
er
l'Ita
lia
lo
an
issu
ed
20
10
20
17
59
7,3
60
5
97
,36
0
- 5
97
,36
0
5
97
,36
0
-
1,0
00
,00
0 1
,00
0,0
00
-
1
,00
0,0
00
Au
tostr
ad
e p
er
l'Ita
lia
lo
an
issu
ed
20
10
20
25
50
0,0
00
5
00
,00
0
- 5
00
,00
0
- 5
00
,00
0
50
0,0
00
5
00
,00
0
- 5
00
,00
0
Au
tostr
ad
e p
er
l'Ita
lia
lo
an
issu
ed
20
12
20
19
76
4,0
28
7
64
,02
8
- 7
64
,02
8
7
64
,02
8
-
1,0
00
,00
0 1
,00
0,0
00
-
1
,00
0,0
00
Au
tostr
ad
e p
er
l'Ita
lia
lo
an
issu
ed
20
12
20
20
65
6,8
90
6
56
,89
0
- 6
56
,89
0
6
56
,89
0
-
75
0,0
00
7
50
,00
0
- 7
50
,00
0
Au
tostr
ad
e p
er
l'Ita
lia
lo
an
issu
ed
20
12
20
32
35
,00
0 3
5,0
00
-
3
5,0
00
-
3
5,0
00
3
5,0
00
3
5,0
00
-
3
5,0
00
Au
tostr
ad
e p
er
l'Ita
lia
lo
an
issu
ed
20
12
20
32
48
,60
0 4
8,6
00
-
4
8,6
00
-
4
8,6
00
4
8,6
00
4
8,6
00
-
4
8,6
00
Au
tostr
ad
e p
er
l'Ita
lia
lo
an
issu
ed
20
12
20
18
1,0
00
,00
0 9
88
,54
9
- 9
88
,54
9
9
88
,54
9
-
1,0
00
,00
0 9
84
,93
6
- 9
84
,93
6
Au
tostr
ad
e p
er
l'Ita
lia
lo
an
issu
ed
20
13
20
33
75
,00
0 7
5,0
00
-
7
5,0
00
-
7
5,0
00
7
5,0
00
7
5,0
00
-
7
5,0
00
Au
tostr
ad
e p
er
l'Ita
lia
lo
an
issu
ed
20
13
20
21
75
0,0
00
7
50
,00
0
- 7
50
,00
0
- 7
50
,00
0
75
0,0
00
7
50
,00
0
- 7
50
,00
0
Au
tostr
ad
e p
er
l'Ita
lia
lo
an
issu
ed
20
14
20
38
75
,00
0 7
5,0
00
-
7
5,0
00
-
7
5,0
00
7
5,0
00
7
5,0
00
-
7
5,0
00
Au
tostr
ad
e p
er
l'Ita
lia
lo
an
issu
ed
20
14
20
34
12
5,0
00
1
25
,00
0
- 1
25
,00
0
- 1
25
,00
0
12
5,0
00
1
25
,00
0
- 1
25
,00
0
- fi
xe
d r
ate
6
,65
6,5
26
6,6
47
,33
5
8
82
,73
2
5
,76
4,6
03
3,0
06
,82
7
2
,75
7,7
76
8
,00
7,7
76
8,0
07
,89
0 -
8,0
07
,89
0
Au
tostr
ad
e p
er
l'Ita
lia
lo
an
issu
ed
20
04
20
22
75
0,0
00
7
50
,00
0
- 7
50
,00
0
-
7
50
,00
0
75
0,0
00
7
50
,00
0
- 7
50
,00
0
- fl
oa
tin
g r
ate
7
50
,00
0
7
50
,00
0
-
75
0,0
00
-
7
50
,00
0
75
0,0
00
75
0,0
00
-
7
50
,00
0
Lo
an
s t
o s
ub
sid
iari
es
7,4
06
,52
67
,39
7,3
35
88
2,7
32
6,5
14
,60
33
,00
6,8
27
3,5
07
,77
68
,75
7,7
76
8,7
57
,89
0
-
8,7
57
,89
0
Bo
nd
s h
eld
(1
)2
86
,68
2
3
46
,26
2
-
34
6,2
62
-
3
46
,26
2
-
-
-
-
De
riv
ati
ve
as
se
ts
21
6,6
86
-
2
16
,68
6
-
21
6,6
86
24
5,2
32
-
2
45
,23
2
Ac
cru
ed
in
co
me
of
me
diu
m/
lon
g-t
erm
fin
an
cia
l a
ss
ets
21
9,4
64
21
9,4
64
-
-
-
2
59
,39
1
2
59
,39
1
-
Oth
er
loa
ns
an
d r
ec
eiv
ab
les
9
84
12
8
8
56
85
6
-
54
8
79
46
9
Me
diu
m/
lon
g-t
erm
fin
an
cia
l a
ss
ets
A
7,6
93
,20
8
8
,18
0,7
31
1,1
02
,32
4
7
,07
8,4
07
3,0
07
,68
3
4
,07
0,7
24
8,7
57
,77
6
9
,26
3,0
61
25
9,4
70
9,0
03
,59
1
Oth
er
cu
rre
nt
fin
an
cia
l a
ss
ets
B
6,9
47
6,9
47
6,9
47
-
-
-
8
,16
7
8
,16
7
8
,16
7
-
Fin
an
cia
l a
ss
ets
A+
B
7,7
00
,15
5
8
,18
7,6
78
1,1
09
,27
1
7
,07
8,4
07
3,0
07
,68
3
4
,07
0,7
24
8,7
65
,94
3
9
,27
1,2
28
26
7,6
37
9,0
03
,59
1
(1)
As a
t 3
1 D
ece
mb
er
20
15
, th
ese
asse
ts a
re h
ed
ge
d a
ga
inst
inte
rest
rate
an
d c
urr
en
cy r
isk w
ith
no
tio
na
l a
mo
un
ts a
nd
ma
turi
tie
s m
atc
hin
g t
ho
se
of
the
un
de
rlyin
gs. Th
ese
are
cla
ssif
ied
as c
ash
flo
w h
ed
ge
s in
acco
rda
nce
wit
h IA
S 3
9 a
nd
in
clu
de
d in
"De
riva
tive
asse
ts".
€0
00
31
De
ce
mb
er
20
15
31
De
ce
mb
er
20
14
of
wh
ich
Te
rmo
f w
hic
h

265
b) the type of interest rate applied, the maturity and the fair value:
Details of the criteria applied in determining the fair values shown in the table are provided in note 3;
c) a comparison of the face value and the related carrying amount of loans to subsidiaries and bonds held,
indicating the related currency, showing the average and effective yield:
€000
Maturity
Carrying
amount
(1)
Fair value
(2)
Carrying
amount
(1)
Fair value
(2)
Autostrade per l'Italia loan issued 2004 2024 1,000,000 1,379,059 1,000,000 1,406,123
Autostrade per l'Italia loan issued 2009 2016 882,732 931,511 1,515,178 1,668,426
Autostrade per l'Italia loan issued 2009 2038 149,176 221,050 149,176 225,613
Autostrade per l'Italia loan issued 2010 2017 597,360 637,456 1,000,000 1,092,782
Autostrade per l'Italia loan issued 2010 2025 500,000 620,507 500,000 627,856
Autostrade per l'Italia loan issued 2012 2019 764,028 900,273 1,000,000 1,209,373
Autostrade per l'Italia loan issued 2012 2020 656,890 786,815 750,000 915,794
Autostrade per l'Italia loan issued 2012 2032 35,000 46,941 35,000 47,895
Autostrade per l'Italia loan issued 2012 2032 48,600 67,602 48,600 69,023
Autostrade per l'Italia loan issued 2012 2018 988,549 1,103,087 984,936 1,125,646
Autostrade per l'Italia loan issued 2013 2033 75,000 92,068 75,000 93,714
Autostrade per l'Italia loan issued 2013 2021 750,000 852,879 750,000 827,648
Autostrade per l'Italia loan issued 2014 2038 75,000 91,002 75,000 92,531
Autostrade per l'Italia loan issued 2014 2034 125,000 140,524 125,000 142,700
- f ixed rate 6,647,335 7,870,774 8,007,890 9,545,122
Autostrade per l'Italia loan issued 2004 2022 750,000 765,644 750,000 759,377
- f loating rate (3) 750,000 765,644 750,000 759,377
Loans to subsidiaries 7,397,335 8,636,418 8,757,890 10,304,500
Derivative assets 216,686 216,686 245,232 245,232
Bonds held (3) 346,262 346,262 - -
Other loans and receivables 984 984 548 548
Accrued income of medium/long-term financial assets 219,464 - 259,391 -
Medium/long-term financial assets A 8,180,731 9,200,350 9,263,061 10,550,280
Other current f inancial assets B 6,947 6,947 8,167 8,167
Financial assets A+B 8,187,678 9,207,297 9,271,228 10,558,447
(3) As at 31 December 2015, these assets are hedged against interest rate and currency risk with notional amounts and maturities matching those
of the underlyings. These are classified as cash flow hedges in accordance with IAS 39 and included in "Derivative assets".
31 December 2015 31 December 2014
(2) The fair value shown is classified in level 2 of the fair value hierarchy.
(1) The value of medium/long-term financial assets shown in the table includes both the non-current and current portions.
€000
Face valueCarrying
amount
Average interest
rate applied to
31 December
2015
(1)
Effective
interest rate
as at 31
December
2015
Face valueCarrying
amount
Loans to subsidiaries (€) 7,406,526 7,397,335 4.68% 4.34% 8,757,776 8,757,890
Bonds held (sterling) 286,682 346,262 4.26% 1.52% - -
31 December 2015 31 December 2014
(1) This amount includes the impact of interest rate hedges outstanding as at 31 December 2015.

4. Separate financial statements as at and for the year ended 31 December 2015
Annual Report 2015 266
d) changes in the carrying amounts of loans to subsidiaries and bonds held during the period:
There is no evidence of impairment of any of the above financial assets.
4.5 Other non-current assets €275 thousand (€337 thousand)
This item regards prepayments for long-term insurance policies.
4.6 Trading assets €4,280 thousand (€4,447 thousand)
This item, which primarily regards trade receivables due from Group companies, is essentially in line with the
figure for 31 December 2014.
The carrying amount of trade receivables approximates to fair value.
4.7 Cash and cash equivalents €417,480 thousand (€465,322 thousand) This item includes:
a) cash equivalents of €400,000 thousand (€250,000 thousand as at 31 December 2014), including
liquidity invested in Autostrade per l’Italia (€200,000 thousand maturing on 29 January 2016 and
€200,000 thousand maturing on 29 February 2016);
b) the balance receivable on the intercompany current account with the subsidiary, Autostrade per l’Italia,
totalling €13,329 thousand (€212,946 thousand as at 31 December 2014), the reduction in which is
connected with the events described in point a);
c) bank deposits of €4,151 thousand (€2,376 thousand as at 31 December 2014).
The overall reduction in cash and cash equivalents is essentially linked to cash generated from operating
activities and the cash outflow relating to the buyback of the notes issued by Romulus Finance (described in
note 4.4 above), partially offset by the cash resulting from the sale in the market of a portion of the Company’s
treasury shares and the greater value of dividends received compared with those paid.
Detailed explanations of the cash flows resulting in the decrease in the Group’s cash at the end of 2015 are
contained in note 6.1.
4.8 Current tax assets and liabilities Current tax assets €29,456 thousand (€31,281 thousand) Current tax liabilities €18,127 thousand (€14,372 thousand)
Current tax assets and liabilities at the beginning and end of the period are detailed below.
€000Carrying
amount as at
31 December
2014 (1)
AdditionsRepayments
received
Currency
translation
differences
and other
changes
Carrying
amount as at
31 December
2015 (1)
Loans to subsidiaries 8,757,890 - 1,351,250 -9,305 7,397,335
Bonds held - 346,885 - -623 (2) 346,262
(1) The loans shown in the table include both the non-current and current portions.
(2) Accrued portion of the premium payable to Romulus Finance's noteholders, totalling €6,502 thousand, was partially offset by the
positive impact of exchange rate movements, totalling €5,879 thousand.

267
Atlantia SpA operates a tax consolidation arrangement, on the basis of Legislative Decree 344/2003, in which
the following participated in 2015:
a) the direct subsidiaries, Autostrade per l’Italia, Aeroporti di Roma, Pavimental and Spea Engineering;
b) the indirect subsidiaries (through Autostrade per l’Italia), Tangenziale di Napoli, EsseDiEsse Società di
Servizi, AD Moving, Autostrade Meridionali, Autostrade dell’Atlantico, Giove Clear, Telepass, Infoblu e
Autostrade Tech and the indirect subsidiaries (through Aeroporti di Roma), ADR Assistance, ADR Tel,
ADR Security and ADR Mobility.
As a result, Atlantia recognises the following items in its current tax assets and liabilities:
a) current tax assets and liabilities for IRES attributable to the companies included in the arrangement;
b) matching receivables or payables due from or to the subsidiaries, in connection with the transfer of funds
as a result of the tax consolidation.
The balance of IRES (a liability of €4,348 thousand) essentially regards:
a) IRES payable, deriving from the calculation of current tax expense, less payments on account or offsets, by
the companies included in the tax consolidation arrangement, totalling €32,563 thousand;
b) IRES payable by the Company for the period under review, totalling €4,971 thousand;
c) IRES refundable to the Company and the companies included in the tax consolidation arrangement,
amounting to €33,091 thousand and regarding:
1) €31,756 thousand in IRES following the failure to deduct IRAP paid on staff costs during the four-
year period 2008-2011, in accordance with the provisions of Law 44 of 26 April 2012 and the tax
authorities’ ruling of 17 December 2012;
2) €1,278 thousand in IRES due to IRAP deductible for the tax years 2004-2007, in accordance with
art. 6 of Law 2 of 28 January 2009.
The reduction in net tax assets of €5,580 thousand essentially reflects:
a) provision for IRES payable for 2015 (€4,971 thousand) after payments on account (€622 thousand, in
that the Company offset a portion of the credit for 2014, amounting to €5,366 thousand);
b) collection of the remaining IRES credit for 2014 (€2,728 thousand);
c) positive changes in estimates of the tax due for previous years (€1,253 thousand).
Moreover, in 2015, the Company recovered the tax credit, amounting to €3,625 thousand, included in the
total for 2014, as referred to in point a). This was accounted for in 2013 following the merger with Gemina
and relates to tax losses that may be carried forward by Gemina, as they were realised in the portion of the tax
year prior to the legally effective date of its merger with and into the Company (1 January to 30 November
2013). In July 2015, the tax authorities responded to the request for an opinion submitted in accordance with
art. 172, Presidential Decree 600 of 29 September 1973, for the purposes of disapplying art. 172 of
Presidential Decree 917 of 22 December 1986. The response confirmed the deductible nature of the above
losses.
4.9 Other current assets €28,477 thousand (€1,304 thousand) This item, consisting of receivables and other current assets that are not eligible for classification as trading or
financial, is up €27,173 thousand. This essentially reflects the recognition of amounts due from certain
subsidiaries, totalling €26,919 thousand, as a result of the Group VAT arrangement governed by Ministerial
€000
31 December 2015 31 December 2014 31 December 2015 31 December 2014
IRAP 601 362 - -
IRES - 9,357 4,348 -
IRES from tax consolidation (1) 28,855 21,562 13,779 14,372
Total 29,456 31,281 18,127 14,372
Current tax assets Current tax liabilities
(1) Tax assets and liabilities due from and to the companies participating in the tax consolidation arrangement, as described below.
4. Separate financial statements as at and for the year ended 31 December 2015
Annual Report 2015 268
Decree 11065 of 13 December 1979, which the Company has adopted since 2015. Similarly, other current
liabilities, described in note 4.16, include payables due to other subsidiaries linked to the above arrangement
and the matching amount payable to the tax authorities, which, as at 31 December 2015, is broadly offset
by the payment on account of VAT in December 2015 on behalf of all the companies participating in the
arrangement. Amounts due to and from the companies participating in the arrangement were settled in
January 2016.
In 2015, the Group VAT arrangement included the direct subsidiaries, Autostrade per l’Italia, Aeroporti di
Roma and Mizard, and the indirect subsidiary (controlled via Autostrade per l’Italia), Autostrade Meridionali.
4.10 Equity €9,708,330 thousand (€9,437,975 thousand)
Atlantia SpA’s issued capital as at 31 December 2015 is fully subscribed and paid-in and consists of
825,783,990 ordinary shares with a par value of €1 each, amounting to €825,784 thousand. The issued capital
did not undergo any changes in 2015.
As at 31 December 2015, the number of shares outstanding totals 823,382,237 (813,156,189 as at 31 December
2014) and the number of treasury shares totals 2,401,753 (12,627,801 as at 31 December 2014). The increase
in shares outstanding and the accompanying decrease in treasury shares reflects the sale of 9,741,513 shares in
the market and the transfer of 484,535 shares to the beneficiaries of share-based incentive plans, as described
in note 7.3.
Equity has increased by €270,355 thousand compared with 31 December 2014, primarily due to:
a) comprehensive income for the year, totalling €732,120 thousand, essentially due to the effect of profit for
the year (€733,409 thousand);
b) proceeds of €227,952 thousand from the above sale of treasury shares, compared with a carrying amount
of the treasury shares sold of €158,120 thousand;
c) payment of the final dividend for 2014, amounting to €366,309 thousand (€0.445 per share) and the
interim dividend for 2015, amounting to €329,345 thousand (€0.400 per share).
With regard to point b), the sale of treasury shares in the market, completed on 10 March 2015, took the form
of an accelerated book building process aimed at institutional investors. The sale was completed at a price of
€23.40 per share, representing a 1.38% discount to the average market price for the relevant trading day.
Settlement of the transaction took place on 13 March 2015.
Atlantia manages its capital with a view to creating value for shareholders, ensuring the Group can function as a
going concern, safeguarding the interests of stakeholders, and providing efficient access to external sources of
financing to adequately support the growth of the Group’s businesses.
The table below shows an analysis of issued capital and equity reserves, showing their permitted uses and
distributable amounts.

269
Other components of comprehensive income
The section “Financial statements” includes the “Statement of comprehensive income”, which, in addition to
profit for the year, includes other components of comprehensive income, after the related taxation.
The following table shows the gross amounts of these other components and the related taxation.
To cover losses
Issued capital 825,784 (1) B - - -
Share premium reserve 154 A, B, C 154 - -
Legal reserve 261,410 A (2), B 96,253 - -
Extraordinary reserve 4,983,991 A, B, C 4,983,991 - 49,972 (3)
Treasury shares in portfolio 38,985 - - -
Merger reserve 2,987,182 (4) A, B, C 2,987,182 - -
Cash flow hedge reserve 55,801 B - - -
Reserve for actuarial gains and losses on post-employment benefits-458 (5) -458
Restricted reserve for Contingent Value Rights 18,456 A, B - - -
Other reserves 77,163 (6) A, B, C 77,163 - -
Retained earnings 94,783 A, B, C 94,783 - -
Reserves and retained earnings 8,517,467 8,239,068 - 49,972
Treasury shares -38,985 (7) -
Total 9,304,266 8,239,068 - 49,972
of which:
Non-distributable -
Distributable 8,239,068
* Key:
A: capital increases
B: to cover losses
C: shareholder distributions
Notes
(2) €96,253 thousand of which being the excess over one fifth of the issued capital.
(7) Pursuant to art. 2357 of the Italian Civil Code, the General Meeting of shareholders held on 21 April 2015 authorised the purchase of treasury share with a value
of up to €1,900,000,000.
Description
Equity as at 31
December 2015
(€000)
Permitted
uses
(A, B, C )*
Available
portion
(€000)
Uses between 1 January 2012 and
31 December 2015
For other
reasons
(1) Of which €730,643 thousand related to capital increases: €163,956 thousand relating to the merger with Gemina SpA in 2013 and €566,687 thousand relating
to the merger of Autostrade with and into the former NewCo28 SpA in 2003. With reference for the Autostrade merger to art. 172, paragraph 5 of the Consolidated
Income Tax Act, this capital increase is restricted to the following reserves that are taxable on distribution:
- revaluation reserve pursuant to Law 72/1982, amounting to €556,960 thousand;
- revaluation reserve pursuant to Law 413/1991, amounting to €6,807 thousand;
- revaluation reserve pursuant to Law 342/2000, amounting to €2,920 thousand.
(3) This item regards the following uses:
- bonus issues in 2012, totalling €31,516 thousand;
- established of the restricted reserve for Contingent Value Rights issued in connection with the merger with Gemina in 2013, amounting to €18,456 thousand.
Si segnala, inoltre, l'aumento gratuito di capitale avvenuto nel 2011, pari a 30.015 migliaia di euro.
(4) With reference to art. 172, paragraph 5 of the Consolidated Income Tax Act, the merger surplus of €448,999 thousand generated by the merger in 2003
described in note (1) is restricted to and accounted for in the following reserves that are taxable on distribution:
- reserve for capital contributions, amounting to €8,113 thousand;
- revaluation reserve pursuant to Law 72/1982, amounting to €368,840 thousand;
- revaluation reserve pursuant to Law 413/1991, amounting to €50,416 thousand;
- revaluation reserve pursuant to Law 342/2000, amounting to €21,630 thousand.
(5) Reserves with a zero balance are included in the calculation of the available portion.
(6) This item essentially includes:
- €66,575 thousand recognised in equity following the sale of treasury shares in the market and the exercise and conversion of a number of options and units granted
under the share-based incentive plans;
- €10,595 thousand relating to the "Reserve for share-based incentive plans".

4. Separate financial statements as at and for the year ended 31 December 2015
Annual Report 2015 270
The “Total other comprehensive loss for the year, after the related taxation” amounts to €1,289 thousand and
reflects the fact that the following broadly offset each other:
a) fair value losses of €12,870 thousand on existing hedging derivatives, linked to an increase in interest
rates as at 31 December 2015, compared with those as at 31 December 2014;
b) fair value gains of €7,887 thousand on new cash flow hedges entered into by the Company in relation to
its buyback of sterling-denominated notes issued by Romulus Finance, as described in note 4.4;
c) the positive impact of the reassessment of net deferred taxation, amounting to €2,033 thousand,
reflecting the reduction in the IRES rate introduced by the 2016 Stability Law (Law 208/2015).
In contrast, in 2014, after-tax fair value gains on derivative financial instruments amounted to €21,666
thousand, reflecting the reduction in interest rates as at 31 December 2014, compared with those as at 31
December 2013.
4.11 Provisions (non-current) €749 thousand (€896 thousand) (current) €1,675 thousand (€1,568 thousand)
PROVISIONS FOR EMPLOYEE BENEFITS
(non-current) €749 thousand (€896 thousand)
(current) €138 thousand (€31 thousand)
As at 31 December 2015, this item refers solely to provisions for post-employment benefits. The balance is
broadly in line with 31 December 2014.
The most important actuarial assumptions used to measure the provision for post-employment benefits at 31
December 2015 are summarised below.
€000 Note 2015 2014
Profit for the year (A) 733,409 686,217
Fair value gains/(losses) on cash flow hedges -4,984 32,372
Tax effect on fair value gains/(losses) on cash flow hedges 3,682 -10,706
Other comprehensive income for the year reclassif iable to profit or loss after the related taxation (B) -1,302 21,666
Gains/(losses) from actuarial valuations of provisions for employee benefits 18 -123
Tax effect on gains/(losses) from actuarial valuations of provisions for employee benefits -5 33
Other comprehensive income for the year not reclassif iable to profit or loss after the related
taxation(C) 13 -90
Reclassif ications of other components of comprehensive income to profit or loss for the year (D) - -
Total other comprehensive income/(loss) for the year after the related taxation (E=A+B+C+D) -1,289 21,576
Comprehensive income for the year (A+E) 732,120 707,793

271
The following table shows a sensitivity analysis for each actuarial assumption at the end of 2015, showing the
impact on the defined benefit obligation of assumed changes in the individual rates used in the actuarial
assumptions.
OTHER PROVISIONS (non-current) - (-) (current) €1,537 thousand (€1,537 thousand)
Provisions for tax liabilities and contract disputes are unchanged with respect to 31 December 2014, given no
changes in the estimated potential liabilities to be met.
4.12 Financial liabilities (non-current) €6,627,154 thousand (€8,869,037 thousand) (current) €1,091,876 thousand (€250,866 thousand)
MEDIUM/LONG-TERM BORROWINGS (non-current) €6,627,154 thousand (€8,869,037 thousand) (current) €1,091,550 thousand (€249,584 thousand)
The following tables provide an analysis of outstanding medium to long-term financial liabilities with respect
to:
a) the composition of the carrying amount (current and non-current), the related face value and terms to
maturity:
Annual discount rate(*)
1.39%
Annual inflation rate
1.50% for 2016
1.80% for 2017
1.70% for 2018
1.60% for 2019
2.00% from 2020 on
Annual rate of increase in post-
employment benefits
2.625% for 2016
2.850% for 2017
2.775% for 2018
2.700% for 2019
3.000% from 2020 on
Annual rate of increase in real salaries 0.65%
Annual turnover rate 3.50%
Annual rate for advances paid 3.00%
Duration (years) 7.6
MortalityGovernment General Accounting Office
projections
Disability INPS tables by age and sex
Retirement ageMandatory state pension retirement
age
Financial assumptions
(1) The annual discount rate is used to determined the present value of the obligation
and was, in turn, determined with reference to the average yield curve taken from the
Iboxx Eurozone Corporate AA on the valuation date for durations of 7-10 years which
reflect the overall duration of the provisions.
Demographic assumptions
+1% -1% +0.25% -0.25% +0.25% -0.25%
Balance post-
employment benefits885 891 897 879 873 903
Sensitivity analysis€000
CHANGE IN ASSUMPTION
turnover rate inflation rate discount rate

4. Separate financial statements as at and for the year ended 31 December 2015
Annual Report 2015 272
Fa
ce
va
lue
Ca
rryin
g
am
ou
nt
Cu
rre
nt
po
rtio
n
No
n-c
urr
en
t
po
rtio
n
be
twe
en
13
an
d 6
0
mo
nth
s
aft
er
60
mo
nth
sF
ac
e v
alu
eC
arr
yin
g
am
ou
nt
Cu
rre
nt
po
rtio
n
No
n-c
urr
en
t
po
rtio
n
GB
P B
on
d issu
e 2
00
4 (
1)
(2)
20
22
75
0,0
00
68
0,8
76
-
68
0,8
76
-
68
0,8
76
75
0,0
00
64
1,5
16
-
64
1,5
16
Bo
nd
issu
e 2
00
42
02
41
,00
0,0
00
99
3,2
39
-
99
3,2
39
-
99
3,2
39
1,0
00
,00
09
92
,63
7 -
99
2,6
37
Bo
nd
issu
e 2
00
92
01
68
80
,47
28
82
,48
9 8
82
,48
9
--
-
1,5
00
,00
01
,51
3,5
68
-
1,5
13
,56
8
Bo
nd
issu
e 2
01
02
01
75
97
,36
05
95
,69
1 -
59
5,6
91
59
5,6
91
-
1,0
00
,00
09
95
,89
8 -
99
5,8
98
Bo
nd
issu
e 2
01
02
02
55
00
,00
04
95
,78
6 -
49
5,7
86
-
49
5,7
86
50
0,0
00
49
5,4
45
-
49
5,4
45
Bo
nd
issu
e 2
01
22
01
97
64
,02
87
58
,35
3 -
75
8,3
53
75
8,3
53
-
1,0
00
,00
09
90
,57
8 -
99
0,5
78
Bo
nd
issu
e 2
01
22
02
06
56
,89
06
53
,12
1 -
65
3,1
21
6
53
,12
1
-7
50
,00
07
44
,92
6 -
74
4,9
26
Bo
nd
issu
e 2
01
22
03
23
5,0
00
35
,00
0 -
35
,00
0 -
35
,00
03
5,0
00
35
,00
0 -
35
,00
0
Re
tail b
on
d issu
e 2
01
22
01
81
,00
0,0
00
98
3,5
17
-
98
3,5
17
98
3,5
17
-
1,0
00
,00
09
78
,74
8-
97
8,7
48
Bo
nd
issu
e 2
01
32
02
17
50
,00
07
42
,97
9 -
74
2,9
79
-
74
2,9
79
75
0,0
00
74
1,7
76
-7
41
,77
6
Bo
nd
issu
e 2
01
42
03
41
25
,00
01
23
,69
9 -
12
3,6
99
-
12
3,6
99
12
5,0
00
12
3,5
14
-1
23
,51
4
lis
ted
fix
ed
ra
te 7
,05
8,7
50
6
,94
4,7
50
8
82
,48
9
6,0
62
,26
12
,99
0,6
82
3,0
71
,57
98
,41
0,0
00
8,2
53
,60
6-
8,2
53
,60
6
JPY
Bo
nd
issu
e 2
00
9 (
1)
(2)
20
38
14
9,1
76
15
2,0
14
-
15
2,0
14
-
15
2,0
14
14
9,1
76
13
7,1
23
-1
37
,12
3
Ze
ro c
ou
po
n b
on
d issu
e 2
01
22
03
25
8,8
58
58
,85
8 -
58
,85
8 -
58
,85
85
4,0
23
54
,02
3-
54
,02
3
Bo
nd
issu
e 2
01
32
03
37
5,0
00
72
,48
9 -
72
,48
9 -
72
,48
97
5,0
00
72
,39
1-
72
,39
1
Bo
nd
issu
e 2
01
42
03
87
5,0
00
72
,51
4 -
72
,51
4 -
72
,51
4 7
5,0
00
7
2,4
43
-
7
2,4
43
un
lis
ted
fix
ed
ra
te
3
58
,03
4
35
5,8
75
-
35
5,8
75
-3
55
,87
53
53
,19
93
35
,98
0-
33
5,9
80
Bo
nd
is
su
es
(3
)A
7,4
16
,78
47
,30
0,6
25
88
2,4
89
6,4
18
,13
62
,99
0,6
82
3,4
27
,45
48
,76
3,1
99
8,5
89
,58
6 -
8,5
89
,58
6
De
riv
ati
ve
lia
bil
itie
s (
4)
B2
09
,01
8 -
20
9,0
18
-
20
9,0
18
27
9,4
51
-
27
9,4
51
Ac
cru
ed
ex
pe
ns
es
on
me
diu
m/
lon
g-t
erm
fin
an
cia
l li
ab
ilit
ies
(3)
C2
09
,06
12
09
,06
1 -
-
-
24
9,5
84
24
9,5
84
-
Me
diu
m/
lon
g-t
erm
fin
an
cia
l li
ab
ilit
ies
A+
B+
C7
,41
6,7
84
7,7
18
,70
41
,09
1,5
50
6,6
27
,15
42
,99
0,6
82
3,6
36
,47
28
,76
3,1
99
9,1
18
,62
12
49
,58
48
,86
9,0
37
(1)
As a
t 3
1 D
ece
mb
er
20
15
, th
ese
asse
ts a
re h
ed
ge
d a
ga
inst
inte
rest
rate
an
d c
urr
en
cy r
isk w
ith
no
tio
na
l a
mo
un
ts a
nd
ma
turi
tie
s m
atc
hin
g t
ho
se
of
the
un
de
rlyin
gs. Th
ese
are
cla
ssif
ied
as c
ash
flo
w h
ed
ge
s in
acco
rda
nce
wit
h IA
S 3
9 a
nd
in
clu
de
d in
"De
riva
tive
lia
bilit
ies".
(2)
Th
e e
uro
pa
r va
lue
is c
alc
ula
ted
on
th
e b
asis
of
the
exch
an
ge
ra
te f
ixe
d a
t th
e t
ime
of
exe
cu
tio
n o
f th
e h
ed
ge
s, w
hic
h a
re C
ross C
urr
en
cy S
wa
ps.
(3)
Th
ese
fin
an
cia
l in
str
um
en
ts a
re c
lassif
ied
as f
ina
ncia
l lia
bilit
ies m
ea
su
red
at
am
ort
ise
d c
ost,
in
acco
rda
nce
wit
h IA
S 3
9.
(4)
Th
ese
fin
an
cia
l in
str
um
en
ts a
re c
lassif
ied
as h
ed
gin
g d
eri
va
tive
s in
le
ve
l 2
of
the
fa
ir v
alu
e h
iera
rch
y.
€0
00
Ma
turi
ty
31
De
ce
mb
er
20
15
31
De
ce
mb
er
20
14
of
wh
ich
Te
rmo
f w
hic
h

273
b) type of interest rate, maturity and fair value:
The methods of fair value measurement used are dealt with in note 3;
c) a comparison of the par value and the carrying amount of bond issues, showing the currency of issue, and
the average and effective interest rates:
d) movements during the period in the carrying amounts of outstanding bond issues:
Changes in the individual components of medium/long-term liabilities with respect to 31 December 2014
relate to:
Carrying
amount (1)Fair value (2)
Carrying
amount (1)Fair value (2)
GBP Bond issue 2004 (3) 2022 680,876 814,885 641,516 788,341
Bond issue 2004 2024 993,239 1,348,200 992,637 1,410,290
Bond issue 2009 2016 882,489 896,541 1,513,568 1,603,440
Bond issue 2010 2017 595,691 629,576 995,898 1,077,710
Bond issue 2010 2025 495,786 618,545 495,445 640,410
Bond issue 2012 2019 758,353 859,050 990,578 1,151,420
Bond issue 2012 2020 653,121 757,933 744,926 884,318
Bond issue 2012 2032 35,000 45,316 35,000 47,921
Retail bond issue 2012 2018 983,517 1,093,300 978,748 1,109,490
Bond issue 2013 2021 742,979 821,378 741,776 835,523
Bond issue 2014 2034 123,699 141,069 123,514 149,735
listed fixed rate 6,944,750 8,025,793 8,253,606 9,698,598
JPY Bond issue 2009 (3) 2038 152,014 226,282 137,123 205,034
Zero coupon bond issue 2012 2032 58,858 85,959 54,023 84,847
Bond issue 2013 2033 72,489 87,735 72,391 89,176
Bond issue 2014 2038 72,514 86,726 72,443 88,087
unlisted fixed rate 355,875 486,702 335,980 467,144
Bond issues A 7,300,625 8,512,495 8,589,586 10,165,742
Derivative liabilities B 209,018 209,018 279,451 279,451
Accrued expenses on medium/long-term financial C 209,061 - 249,584 -
Medium/long-term financial l iabilities A+B+C 7,718,704 8,721,513 9,118,621 10,445,193
(3) As at 31 December 2015, these assets are hedged against interest rate and currency risk with notional amounts and maturities matching those of the underlyings.
These are classified as cash flow hedges in accordance with IAS 39 and included in "Derivative liabilities".
€000 Maturity 31 December 2015 31 December 2014
(1) The medium/long-term financial liabilities shown in the table include both current and non-current portions.
(2) The fair value shown is classified in level 2 of the fair value hierarchy.
€000
Currency Par valueCarrying
amount
Average
interest rate
applied to 31
December
2015
(1)
Effective
interest rate
as at 31
December
2015
Par valueCarrying
amount
Euro (EUR) 6,517,608 6,467,735 4.17% 4.49% 7,864,023 7,810,947
Sterling (GBP) 750,000 680,876 5.99% 6.26% 750,000 641,516
Jen (JPY) 149,176 152,014 5.30% 5.48% 149,176 137,123
Bond issues 7,416,784 7,300,625 4.40% 8,763,199 8,589,586
31 December 2015 31 December 2014
1) This amount includes the impact of interest rate and foreign currency hedges as at 31 December 2015.
€000Carrying
amount as at
31 December
2014 (1)
New issues Redemptions
Currency
translation
differences
and other
changes
Carrying
amount as at
31 December
2015 (1)
Bond issues 8,589,586 - 1,351,250 62,289 7,300,625
(1) The value of the bond issues shown in the table includes both the non-current and current portions.

4. Separate financial statements as at and for the year ended 31 December 2015
Annual Report 2015 274
a) a reduction of €1,288,961 thousand in bond issues, essentially due to the partial early redemption of
bonds issued by the Company and maturing in 2016, 2017, 2019 and 2020, amounting to a total par value
of €1,351,250 thousand;
b) fair value losses of €70,433 thousand on derivative financial instruments, primarily as a result of the
strengthening of sterling and the yen against the euro, partially offset by matching changes in the
underlying financial liabilities;
c) a reduction of €40,523 thousand in accrued expenses payable, consisting of interest payable, essentially
due to the above partial early redemption of bonds issued by the Company.
Further information on the early redemption of bonds described in point a) is provided in note 5.10, whilst
details of the hedging strategy and of the derivatives entered into to hedge certain financial assets (indicated in
the above table) are provided in note 6.2.
Atlantia’s Medium Term Note (MTN) and a number of Autostrade per l’Italia’s long-term loan agreements,
for which Atlantia is guarantor, include include negative pledge provisions, in line with international practice.
Under these provisions, it is not possible to create or maintain (unless required to do so by law) collateral
guarantees on all or a part of any proprietary assets, with the exception of project debt.
SHORT-TERM FINANCIAL LIABILITIES €326 thousand (€1,282 thousand) The reduction of €956 thousand primarily reflects settlement of accrued financial expenses relating to fees
payable on the guarantee given on behalf of the indirect subsidiary, Ecomouv, in favour of its creditor banks.
This guarantee was released on 3 March 2015.
NET DEBT IN COMPLIANCE WITH ESMA RECOMMENDATION OF 20 MARCH 2013
An analysis of total net debt is shown below with amounts payable to and receivable from related parties, as
required by CONSOB Ruling DEM/6064293 of 28 July 2006, in accordance with European Securities and
Markets Authority - ESMA Recommendation of 20 March 2013 (which does not entail the deduction of non-
current financial assets from debt).
€000 Note31 December
2015
of whi ch
re l ated par ty
transacti ons
31 December 2014
of whi ch
re l ated par ty
transacti ons
Cash -4,151 -2,376
Cash equivalents and intercompany current account receivables due from related parties -413,329 -413,329 -462,946 -462,946
Cash and cash equi val ents (A) 4.7 -417,480 -465,322
Cur rent fi nanci a l assets (B ) 4.4 -1,109,271 -1,083,929 -267,637 -244,687
Current portion of medium/long-term financial liabilities 1,091,550 249,584
Other financial liabilities 326 1,282
Cur rent fi nanci a l assets (C) 1,091,876 250,866
Cur rent net debt (D=A+B+C) -434,875 -482,093
Bond issues 6,418,136 8,589,586
Non-current derivative liabilities 209,018 279,451
Non-cur rent fi nanci a l l i abi l i ti es (E) 6,627,154 8,869,037
(Net funds) / Net debt as defi ned by ESMA recommendati on F= (D+E) 6,192,279 8,386,944
Non-cur rent fi nanci a l assets (G) 4.4 -7,078,407 -7,076,988 -9,003,591 -9,003,122
Net debt H= (F +G) -886,128 -616,647

275
4.13 Net deferred tax liabilities €35,549 thousand (€40,784 thousand)
The following tables show deferred tax liabilities, after offsetting against deferred tax assets.
The nature of the temporary differences giving rise to deferred tax assets and liabilities and changes during the
year are summarised in the following table.
The reduction in net deferred tax liabilities, totalling €5,235 thousand, is essentially due to:
a) the positive impact on comprehensive income, amounting to €3,675 thousand, of the reassessment
of net deferred taxation following the reduction in the IRES (corporation tax) rate from 27.5% to
24% from 2017, introduced by the 2016 Stability Law (Law 208/2015);
b) net fair value gains (€1,649 thousand), recognised in other comprehensive income, on hedging derivative
assets and liabilities.
4.14 Other non-current liabilities €3,889 thousand (€1,163 thousand)
Other non-current liabilities, have increased €2,726 thousand compared with 31 December 2014 due
primarily to the effect of the provision for the year for share-based incentive plans, including cash payments
due to the beneficiaries of the plans, as described in note 7.3.
4.15 Trading liabilities €4,660 thousand (€6,224 thousand)
Trade payables primarily regard those due to Group companies (€3,010 thousand, essentially due to
Autostrade per l’Italia) and amounts due to the providers of professional services (€1,650 thousand).
The reduction of €1,564 thousand compared with 31 December 2014 primarily refers to payment for
professional services accounted for as at 31 December 2014.
The carrying amount of trade payables approximates to fair value.
€000 31 December 2015 31 December 2014
Deferred tax liabilities (IRES) 66,512 80,342
Deferred tax liabilities (IRAP) 12,502 13,684
Deferred tax liabilities 79,014 94,026
Deferred tax assets eligible for offset (IRES) 35,459 44,335
Deferred tax assets eligible for offset (IRAP) 8,006 8,907
Deferred tax assets eligible for offset 43,465 53,242
Net deferred tax liabilities 35,549 40,784
Profit or
loss
Other
comprehensive
income
Gains on hedging derivatives 81,100 - - -7,020 - - -6,471 67,609
Difference between carrying amounts and fair values of
assets and liabilities acquired through business
combinations (the merger with Gemina with effect from 1
December 2013)
12,606 - - - - -1,605 - 11,001
Other temporary differences 320 136 - - - -52 - 404
Deferred tax liabilities 94,026 136 - -7,020 - -1,657 -6,471 79,014
Losses on hedging derivatives 52,884 - - -5,371 - -4,438 43,075
Other temporary differences 358 275 -232 - 4 -15 - 390
Deferred tax assets eligible for offset 53,242 275 -232 -5,371 4 -15 -4,438 43,465
Net deferred tax liabilities 40,784 -139 232 -1,649 -4 -1,642 -2,033 35,549
31 December
2015
CHANGES DURING THE YEAR
€00031 December
2014Provisions Releases
Deferred tax
assets/liabilities on
gains and losses
recognised in
comprehensive
income
Changes in
prior year
estimates
Effect of change in rate

4. Separate financial statements as at and for the year ended 31 December 2015
Annual Report 2015 276
4.16 Other current liabilities €19,834 thousand (€17,166 thousand)
The composition of this item is shown in the following table.
The balance of other current liabilities is substantially in line with the previous year. As at 31 December 2015,
this item primarily regards amounts payable to Aeroporti di Roma and its subsidiaries:
a) €7,470 thousand, relating to the tax consolidation agreement with Gemina prior to the merger in 2013,
consisting of a contra entry for current tax assets deriving from application for an IRES refund following
the failure to deduct IRAP paid on staff costs during the five-year period 2007-2011, as described in note
4.8;
b) €3,528 thousand in VAT payable under the Group VAT arrangement described in the note 4.9.
The reduction in amounts payable to subsidiaries is primarily linked to a combination of the following:
a) payment of amounts due to Aeroporti di Roma, totalling €4,225 thousand, under the indemnity
previously provided by Gemina to the subsidiary, following the judgement settling the subsidiary’s dispute
with the tax authorities;
b) the recognition of payables linked to the above Group VAT arrangement.
Finally, the increase in the amount payable to staff primarily regards the impact of the adjustment of the fair
value of additional phantom options on the 2011 share option plan, as described in note 7.3.
€000 31 December 2015 31 December 2014
Sundry amounts due to subsidiaries 11,153 12,780
Payable to staff 3,509 1,870
Taxation other than income taxes 1,758 985
Social security contributions payable 1,418 831
Other payables 1,996 700
Other current liabilities 19,834 17,166

277
5 NOTES TO THE INCOME STATEMENT
This section contains analyses income statement items. Negative components of the income statement are
indicated with a minus sign in the headings and tables in the notes, whilst amounts for 2014 are shown in
brackets. Details of amounts in the income statement deriving from related party transactions are provided in
note 7.2.
5.1 Operating income €2,100 thousand (€1,592 thousand)
Operating income, which is substantially in line with 2013, primarily regards cost recoveries and rental
income from subsidiaries.
5.2 Raw and consumable materials -€66 thousand (-€31 thousand)
These costs relate primarily to purchases of office materials.
5.3 Service costs -€11,765 thousand (-€9,247 thousand)
An analysis of service costs is provided below.
The overall increase of €2,518 thousand compared with the previous year is essentially due to the increased
costs incurred for professional services, primarily relating to investment of the Company’s available liquidity
in the buyback of notes issued by Romulus Finance, partially offset by a reduction in the cost of corporate
advertising (in 2014, these costs related to the “Atlantia – La Passione di muovere il Paese” (“Atlantia – A
passion for moving the country”) advertising campaign.
5.4 Staff costs -€15,449 thousand (-€8,523 thousand)
The composition of this item and details of changes between the two comparative periods are shown in the
following table.
The increase of €6,926 thousand compared with 2014 is due to an increase of 16 in the average workforce, as
shown in the following table, primarily reflecting the transfer of personnel from Autostrade per l’Italia to
Atlantia during 2014 and the greater impact of share-based incentive plans as a result of the benefits granted to
certain of the Company’s directors and staff, as described in detail in the note 7.3.
€000 2015 2014INCREASE/
(DECREASE)
Professional services -9,578 -4,811 -4,767
Advertising and promotions -807 -3,139 2,332
Remuneration of Statutory Auditors -326 -330 4
Insurance -190 -310 120
Other services -864 -657 -207
Service costs -11,765 -9 ,247 -2 ,518
€000 2015 2014INCREASE/
(DECREASE)
Wages and salaries -9,299 -5,915 -3,384
Recovery of cost of seconded staff 2,707 2,493 214
Social security contributions -2,449 -1,446 -1,003
Directors' remuneration -2,357 -1,613 -744
Cost of share-based incentive plans -2,305 -926 -1,379
Post-employment benefits (including payments to
supplementary pension funds or to INPS)-735 -303 -432
Other staff costs -1,011 -813 -198
Staff costs -15,449 -8 ,523 -6 ,926

4. Separate financial statements as at and for the year ended 31 December 2015
Annual Report 2015 278
The average workforce breaks down as follows by category:
5.5 Other operating costs -€4,699 thousand (-€4,879 thousand)
The composition of this item and details of changes between the two comparative periods are shown in the
following table.
The balance, essentially in line with the comparative period, primarily includes non-deductible VAT of
€2,559 thousand (€3,353 thousand in 2014) and rental expense of €1,045 thousand (€548 thousand in
2014), primarily payable to the subsidiary, Autostrade per l’Italia.
Workforce 2015 2014INCREASE/
(DECREASE)
Senior managers 20 13 7
Middle managers and
administrative staff 39 30 9
Average workforce 59 43 16
€000 2015 2014INCREASE/
(DECREASE)
Lease expense -1,045 -548 -497
Indirect taxes and duties -3,180 -3,892 712
Grants and donations -315 -139 -176
Other -159 -300 141
Other costs -3,654 -4 ,331 677
Other operating costs -4 ,699 -4 ,879 180

279
5.6 Financial income/(expenses) €766,257 thousand (€633,696 thousand) Financial income €1,397,658 thousand (€1,210,661 thousand) Finance expenses €631,871 thousand (€577,363 thousand) Foreign exchange gains/(losses) €470 thousand (€398 thousand)
An analysis of financial income and expenses and details of changes between the two comparative periods are
shown below.
“Net financial income” is up €132,561 thousand, essentially due to:
a) an increase in dividends received from the subsidiary, Aeroporti di Roma, amounting to €122,955
thousand;
b) a reduction of €7,853 thousand in impairment losses on the investment in Compagnia Aerea Italiana. The
balance reflects, in both comparative periods, impairment losses on the investment in the company
(further details are provided in note 4.3 above) and, solely as regards 2014, the write-off of convertible
bonds issued by the airline, amounting to €14,177 thousand, following the Company’s formal decision to
waive its rights under the convertible bonds in December 2014.
5.7 (Income tax (expense)/benefit -€2,499 thousand (-€4,897 thousand)
€000 2015 2014INCREASE/
(DECREASE)
Dividends received from investees 794,023 670,009 124,014
Interest income 358,865 438,060 -79,195
Income from derivative financial instruments 98,638 81,133 17,505
Income from measurement of financial instruments at amortised cost 15,330 13,333 1,997
Gain on sale of investments - 1 -1
Other 130,802 8,125 122,677
of which non-recurring (1) 125,486 - 125,486
Other f inancial income 603,635 540,652 62,983
Financial income (a) 1,397,658 1,210,661 186,997
Financial expenses from discounting of provisions -8 -12 4
Interest expense -358,660 -438,484 79,824
Losses on derivative financial instruments -73,662 -57,629 -16,033
Losses from measurement of financial instruments at amortised cost -26,985 -18,269 -8,716
Financial expenses accounted for as an increase in financial liabilities -2,932 -2,786 -146
Other -133,375 -16,072 -117,303
of which non-recurring (1) -120,677 - -120,677
Other f inancial expenses -595,614 -533,240 -62,374
Impairment losses on investments -36,249 -29,934 -6,315
Impairment losses on financial assets - -14,177 14,177
Impairments of f inancial assets and investments -36,249 -44,111 7,862
Financial expenses (b) -631,871 -577,363 -54,508
Foreign exchange gains/(losses)(c) 470 398 72
Financial income/(expenses) (a+b+c) 766,257 633,696 132,561
(1) Details of non-recurring financial transactions are provided in note 5.10.

4. Separate financial statements as at and for the year ended 31 December 2015
Annual Report 2015 280
A comparison of the income tax expense and benefit for 2015 and the comparative period is shown in the
following table.
Tax expense is down €2,398 thousand on 2014, essentially due to:
a) the positive effects recognised in the Company’s tax return in relation to taxation for previous years,
amounting to €1,846 thousand;
b) the positive impact of the reassessment of net deferred tax income and expense, amounting to €1,642
thousand, following the reduction in the IRES (corporation tax) rate from 2017, introduced by the 2016
Stability Law (Law 208/2015), as described in note 4.13 above. This refers almost entirely to the
deferred taxation accounted for, during allocation of the purchase price calculated as part of the merger
with Gemina, with effect from 1 December 2013, reflecting the irrelevance for tax purposes of the gain on
the investment in Aeroporti di Roma.
The following table shows a reconciliation of the statutory rates of taxation and the effective charge for IRES
for the year.
€000 2015 2014INCREASE/
(DECREASE)
IRES -4,966 -4,378 -588
IRAP -225 -705 480
Current tax expense -5,191 -5,083 -108
Recovery of previous years' income taxes 1,846 82 1,764
Previous years' income taxes -707 -257 -450
Differences on income tax for previous years 1,139 -175 1,314
Provisions 275 297 -22
Releases -232 -121 -111
Changes in prior year estimates -11 -5 -6
Deferred tax income 32 171 -139
Provisions -136 -121 -15
Releases - 311 -311
Changes in prior year estimates 1,657 - 1,657
Deferred tax expense 1,521 190 1,331
Income tax (expense)/benefit -2 ,499 -4,897 2,398
€000
Tax Tax rate Tax Tax rate
Profit/(Loss) before tax from continuing operations 735,908 612,137
IRES tax expense/(benefit) at statutory rate 202,375 27.50% 168,338 27.50%
Temporary differences deductible in future years 1,000 275 0.04% 1,076 296 0.05%
Temporary differences taxable in future years -493 -136 -0.02% -438 - 121 -0.02%
Reversal of temporary differences arising in previous years -842 -232 -0.03% 573 158 0.03%
Tax free dividends -754,322 -207,439 -28.19% -641,808 - 176,497 -28.83%
Impairment losses on investments and financial assets 36,249 9,968 1.35% 44,111 12,131 1.98%
Other permanent differences 561 155 0.02% 279 73 0.01%
Taxable income assessable to IRES 18,061 15,930
Current IRES charge for the year 4,966 0.67% 4,378 0.72%
Current IRAP charge for the year 225 0.03% 705 0.12%
Current income tax expense 5,191 0.71% 5,083 0.83%
2015 2014
Taxable
income
Tax expense
Taxable
income
Tax expense

281
5.8 Profit/(Loss) from discontinued operations - (€78,977) An analysis of the profit from discontinued operations is shown below. The balance, which in 2015 amounts to
zero, in 2014 reflected the impact of the operating results of TowerCo and this company’s sale.
5.9 Earnings per share
The following table shows the calculation of basic and diluted earnings per share with comparative amounts.
The weighted number of treasury shares held by the Group is down, reflecting both the sale of 9,741,513 shares
in the market, as described in note 4.10 above, and the exercise and conversion of a number of options and
units awarded under share-based incentive plans, as described in greater detail in note 7.3.
5.10 Material non-recurring transactions
During 2015, Atlantia proceeded with early redemption of a portion of bonds with a par value of €1,351,250
thousand, maturing in 2016, 2017, 2019 and 2020 (the total par value of the bonds in the issues amounts to
€4,250,000 thousand). At the same time, Autostrade per l’Italia repaid matching loans with the same face
value granted to this subsidiary.
This took place through two separate transactions:
a) in February 2015, the redemption of bonds with a par value of €1,020,130 thousand, maturing in 2016,
2017 and 2019, via a Tender Offer. As a result of this transaction, the Company recognised non-recurring
financial expenses of €82,115 thousand, corresponding to the premium paid to the bondholders, before
tax of €26,972 thousand. At the same time, the Company recognised non-recurring financial income of
€85,164 thousand, corresponding to the premium received from Autostrade per l’Italia, before tax of
€28,164 thousand. The overall impact on the results for the year totals €1,858 thousand;
b) in December 2015, the redemption of bonds with a par value of €331,120 thousand, maturing in 2017,
2019 and 2020, through their repurchase in the market via a Tender Offer conducted by Autostrade per
€000 2015 2014INCREASE/
(DECREASE)
Gain on sale of investment in TowerCo - 74,500 -74,500
Tax expense - -1,024 1,024
After-tax gains on sale of investment in TowerCo - 73,476 -73,476
Dividends declared by TowerCo - 5,578 -5,578
Tax expense - -77 77
After-tax dividends declared by TowerCo - 5 ,501 -5,501
Proft/(Loss) from discontinued operations - 78,977 -78,977
2015 2014
Weighted average of shares outstanding 825,783,990 825,783,990
Weighted average of treasury shares in portfolio -4,456,170 -12,765,737
Weighted average of shares outstanding for the calculation of basic earnings per share 821,327,820 813,018,253
Weighted average of diluted shares held under share-based incentive plans 1,381,762 1,145,986
Weighted average of all shares outstanding for the calculation of diluted earnings per share 822,709,582 814,164,239
Profit for the year (€000) 733,409 686,217
Basic earnings per share (€) 0.89 0.85
Diluted earnings per share (€) 0.89 0.85
Profit from continuing operations 733,409 607,240
Basic earnings per share from continuing operations (€) 0.89 0.75
Diluted earnings per share from continuing operations (€) 0.89 0.75
Profit from discontinued operations (€000) - 78,977
Basic earnings/(losses) per share from discontinued operations (€) - 0 .10
Diluted earnings/(losses) per share from discontinued operations (€) - 0 .10

4. Separate financial statements as at and for the year ended 31 December 2015
Annual Report 2015 282
l’Italia, which at the same time transferred the securities to the Company (which then cancelled them). As
a result of this transaction, the Company recognised non-recurring financial expenses of €38,562
thousand, corresponding to the premium paid, via Autostrade per l’Italia, to the bondholders, before tax
of €12,667 thousand. At the same time, the Company recognised non-recurring financial income of
€40,322 thousand, corresponding to the premium received from Autostrade per l’Italia, before tax of
€13,334 thousand. The overall impact on the results for the year totals €1,092 thousand.

283
6 OTHER FINANCIAL INFORMATION
6.1 Notes to the statement of cash flows
Cash flows during 2015 resulted in a decrease of €47,842 thousand in cash and cash equivalents, versus a net
cash outflow of €240,695 thousand in 2014.
Cash generated from operating activities amounts to €751,002 thousand, up €97,091 thousand on the figure
for 2014 (€653,911 thousand). This essentially reflects dividends for 2014 declared by Aeroporti di Roma
(€122,955 thousand), partially offset by the cash outflow following the payment on account of VAT, recovered
in January 2016. The payment was made on behalf of the subsidiaries participating, from 2015, in the Group
VAT arrangement, described above in note 4.8.
Cash generated from investing activities, totalling €1,053,152 thousand, primarily reflects the combined effect
of the following:
a) the receipt of cash, totalling €1,351,250 thousand, following the early repayment of loans to Autostrade
per l’Italia;
b) the investment of cash, totalling €346,885 thousand, in notes issued by Romulus Finance.
Cash generated from investing activities in 2014, totalling €1,938,720 thousand, primarily reflected:
a) repayment of the intercompany loan to the subsidiary, Autostrade per l’Italia, amounting to €2,094,200
thousand;
b) the sale of the entire investment in TowerCo (a wholly owned subsidiary), previously accounted for at a
carrying amount of €20,100 thousand, for a purchase consideration of €94,600 thousand;
c) two new loans to Autostrade per l’Italia, totalling €200,000 thousand;
d) the acquisition, for a total of €71,858 thousand, of controlling interests in Pavimental, Spea Ingegneria
Europea and ADR Engineering (on 1 June 2015, the latter merged with and into Spea Ingegneria Europea,
which changed its name to Spea Engineering) as part of a restructuring of the Atlantia Group’s
investments.
Cash used in financing activities, totalling €1,851,996 thousand, essentially reflects:
a) the partial early redemption of bonds, totalling €1,351,250 thousand;
b) payment to shareholders of the final dividend for 2014 (€366,300 thousand) and the interim dividend
for 2015 (€329,339 thousand);
c) proceeds from the sale of treasury shares, totalling €227,952 thousand.
Cash used in financing activities in 2014, amounting to €2,833,326 thousand, reflected:
a) the redemption of bonds with a par value of €2,094,200 thousand;
b) new bond issues, amounting to €200,000 thousand;
c) payment to shareholders of the interim dividend for 2013, totalling €288,596 thousand, and paid in
January 2014, of the final dividend for 2013, totalling €317,862 thousand, and of the interim dividend
for 2014, totalling €288,664 thousand.
The following table shows net cash flows generated in the two comparative periods from discontinued
operations. The balance, amounting to zero in 2015, in 2014 related to the investment in TowerCo and
consisted of dividends payable to the Company and the gain on the sale of the investment.
€000 2015 2014
Net cash generated from/(used in) operating activities - 5,578
Net cash generated from/(used in) investing activities - 94,600
Net cash generated from/(used in) financing activities - -

4. Separate financial statements as at and for the year ended 31 December 2015
Annual Report 2015 284
6.2 Financial risk management
Financial risk management objectives and policies
In the normal course of business, the Company is exposed to:
a) market risk, principally linked to the effect of movements in interest and foreign exchange rates on
financial assets acquired and financial liabilities assumed;
b) liquidity risk, with regard to ensuring the availability of sufficient financial resources to fund the Group’s
operating activities and repayment of the liabilities assumed;
c) credit risk, linked to both ordinary trading relations and the likelihood of defaults by financial
counterparties.
The Company’s financial risk management strategy is derived from and consistent with the business goals set by
the Board of Directors, as contained in the various long-term plans prepared each year.
Market risk
The adopted strategy for each type of risk aims to eliminate interest rate and currency risks and minimise
borrowing costs, whilst taking account of stakeholders’ interests, as defined in the Financial Policy as approved
by the Board of Directors.
Management of these risks is based on prudence and best market practice.
The main objectives set out in this policy are as follows:
a) to protect the scenario forming the basis of the long-term plan from the effect of exposure to currency and
interest rate risks, identifying the best combination of fixed and floating rates;
b) to pursue a potential reduction of the Group’s borrowing costs within the risk limits determined by the
Board of Directors;
c) to manage derivative financial instruments taking account of their potential impact on the results of
operations and financial position in relation to their classification and presentation.
The Company’s derivative hedging instruments as at 31 December 2015 are classified as cash flow hedges in
accordance with IAS 39. Details of the fair value measurement of derivative financial instruments are provided in note 3.
Amounts in foreign currencies other than the euro are translated at closing exchange rates communicated by
the European Central Bank.
The residual average term to maturity of debt as at 31 December 2015 is approximately 6 years and 6 months.
The average cost of medium to long-term debt for 2015 was 4.4%. Monitoring is, moreover, intended to assess, on a continuing basis, counterparty creditworthiness and the
degree of risk concentration.
Interest rate risk Interest rate risk is linked to uncertainty regarding the performance of interest rates, and takes two forms:
a) cash flow risk: this is linked to financial assets and liabilities with cash flows indexed to a market interest
rate. In order to reduce floating rate debt, the Company has entered into interest rate swaps (IRS),
classified as cash flow hedges. The hedging instruments and the underlying financial liabilities have
matching terms to maturity and notional amounts. Following tests of effectiveness, changes in fair value
were recognised in full in comprehensive income, with no recognition of any ineffective portion in the
income statement. Interest income or expense deriving from the hedged instruments is recognised
simultaneously in the income statement;
b) fair value risk: this represents the risk of losses deriving from an unexpected change in the value a financial
asset or liability following an unfavourable shift in the market interest rate curve. As at 31 December 2015,
the Company has not entered into derivatives classified as fair value hedges.
All debt is fixed rate.

285
Currency risk Currency risk is mainly incurred through the assumption of financial liabilities denominated in a currency
other than the Group's currency of account.
12% of the Company’s medium/long-term debt is nominally denominated in currencies other than the euro.
Taking account of foreign exchange hedges, the percentage of foreign currency debt exposed to currency risk
on translation into euros is zero. Cross currency swaps (CCIRS) with notional amounts and maturities
matching those of the underlying financial liabilities were entered into specifically to eliminate the interest and
currency risk to which the sterling and yen denominated bonds are exposed.
Following Atlantia’s repurchase of 99.87% of the sterling-denominated notes, issued by Romulus Finance (the
special purpose entity controlled by Aeroporti di Roma), the Company entered into Cross Currency Swaps
with notional amounts and maturities matching those of the underlying financial asset in order to hedge the
interest and currency risk to which the underlying foreign currency asset is exposed.
These swaps also qualify as cash flow hedges. Following tests of effectiveness, changes in fair value were
primarily recognised in other comprehensive income, whilst an ineffective portion with a negative value
(€1,445 thousand) was recognised in profit or loss. This is connected to the impact of the application of IFRS
13 to the new derivatives relating to the above investment of cash in the notes issued by Romulus Finance.
The following table summarises outstanding derivative financial instruments at 31 December 2015 (compared
with 31 December 2014) and shows the corresponding market value.
Sensitivity analysis Sensitivity analysis describes the impact that the interest rate and foreign exchange movements to which the
Company is exposed would have had on the income statement for 2015 and on equity as at 31 December 2015.
The interest rate sensitivity analysis is based on the exposure of derivative and non-derivative financial
instruments at the end of the reporting period, assuming, in terms of the impact on the income statement, a
0.10% (10 bps) shift in the interest rate curve at the beginning of the year, whilst, with regard to the impact of
changes in fair value on other comprehensive income, the 10 bps shift in the curve was assumed to have
occurred at the measurement date. The following outcomes resulted from the analysis carried out:
a) in terms of interest rate risk, an unexpected and unfavourable 10 bps shift in market interest rates would
have resulted in a negative impact on the income statement, totalling €225 thousand, and on other
comprehensive income, totalling €4,844 thousand, before the related taxation;
b) in terms of currency risk, an unexpected and unfavourable 10% shift in the exchange rate would have had
no impact on the income statement.
Liquidity risk
Liquidity risk relates to the risk that cash resources may be insufficient to fund the payment of liabilities as they
fall due. The Company believes that its ability to generate cash, the ample diversification of its sources of
funding and the availability of uncommitted lines of credit provides access to sufficient sources of finance to
meet its projected financial needs.
The following tables show the time distributions of financial liabilities by term to maturity as at 31 December
2015 and comparable figures as at 31 December 2014, excluding accrued expenses at these dates.
Type Purpose of hedgeFair value
asset/( liability)
Notional
amount
Fair value
asset/( liability)
Notional
amount
Cross Currency Swaps (2) Currency and interest rate risk -208,455 1,185,858 -279,451 899,176
Interest Rate Swaps Interest rate risk 216,123 750,000 245,232 750,000
Cash flow hedges (1) 7,668 1,935,858 -34,219 1,649,176
of which
fair value (asset) 216,686 245,232
fair value ( liability) -209,018 -279,451
(2) As at 31 December 2015, this amount is shown after fair value gains of €56.3 thousand linked to the derivatives entered into, in January 2015, to hedge
the interest rate and currency risk resulting from the repurchase of 99.87% of the notes issued by Romulus Finance in pounds sterling.
€000 31 December 2015 31 December 2014
Cash flow hedges (1)
(1) The fair value of cash flow hedges excludes accruals at the measurement date.

4. Separate financial statements as at and for the year ended 31 December 2015
Annual Report 2015 286
The amounts in the above tables include interest payments and exclude the impact of any offset agreements.
The time distribution of terms to maturity is based on the residual contract term or on the earliest date on
which repayment of the liability may be required, unless a better estimate is available.
The distribution for transactions with amortisation schedules is based on the date on which each instalment
falls due.
The following table shows the time distribution of expected cash flows from cash flow hedges, and the periods
in which they will be recognised in profit or loss.
€000
Non-derivative f inancial l iabilities
Bond 2004-2022 (GBP) -680,876 -979,290 -42,578 -42,578 -127,733 -766,401
Bond 2004-2024 -993,239 -1,528,750 -58,750 -58,750 -176,250 -1,235,000
Bond 2009-2016 -882,489 -929,999 -929,999 - - -
Bond 2009-2038 (JPY) -152,014 -248,402 -4,166 -4,166 -12,497 -227,573
Bond 2010-2017 -595,691 -635,546 -20,093 -615,453 - -
Bond 2010-2025 -495,786 -718,750 -21,875 -21,875 -65,625 -609,375
Bond 2012-2019 -758,353 -879,369 -33,535 -33,535 -812,299 -
Bond 2012-2020 -653,121 -774,139 -27,790 -27,790 -718,559 -
Bond 2012-2032 -35,000 -63,560 -1,680 -1,680 -5,040 -55,160
Zero Coupon Bond 2012-2032 -58,858 -135,000 - - - -135,000
Retail bond 2012-2018 -983,517 -1,108,750 -36,250 -36,250 -1,036,250 -
Bond 2013-2033 -72,489 -125,664 -2,820 -2,813 -8,445 -111,586
Bond 2013-2021 -742,979 -879,495 -21,622 -21,563 -64,747 -771,563
Bond 2014-2034 -123,699 -201,961 -4,050 -4,050 -12,150 -181,711
Bond 2014-2038 -72,514 -137,544 -2,719 -2,719 -8,157 -123,949
Total bond issues -7,300,625 -9,346,219 -1,207,927 -873,222 -3,047,752 -4,217,318
Derivative liabilities
Cross Currency Swaps (1) -209,018 -175,222 -7,032 -6,820 -20,651 -140,719
Total derivative liabilities -209,018 -175,222 -7,032 -6,820 -20,651 -140,719
€000
Non-derivative f inancial l iabilities
Bond 2004-2022 (GBP) -641,516 -962,897 -40,121 -40,121 -120,362 -762,293
Bond 2004-2024 -992,637 -1,587,500 -58,750 -58,750 -176,250 -1,293,750
Bond 2009-2016 -1,513,568 -1,668,750 -84,375 -1,584,375
Bond 2009-2038 (JPY) -137,123 -227,943 -3,760 -3,760 -11,279 -209,144
Bond 2010-2017 -995,898 -1,101,250 -33,750 -33,750 -1,033,750 -
Bond 2010-2025 -495,445 -740,625 -21,875 -21,875 -65,625 -631,250
Bond 2012-2019 -990,578 -1,225,000 -45,000 -45,000 -1,135,000 -
Bond 2012-2020 -744,926 -946,877 -32,813 -32,813 -98,438 -782,813
Bond 2012-2032 -35,000 -65,240 -1,680 -1,680 -5,040 -56,840
Zero Coupon Bond 2012-2032 -54,023 -135,000 - - - -135,000
Retail bond 2012-2018 -978,748 -1,145,000 -36,250 -36,250 -1,072,500 -
Bond 2013-2033 -72,391 -128,477 -2,813 -2,820 -8,438 -114,406
Bond 2013-2021 -741,776 -901,057 -21,563 -21,622 -64,688 -793,184
Bond 2014-2034 -123,514 -206,011 -4,050 -4,050 -12,150 -185,761
Bond 2014-2038 -72,443 -140,988 -3,449 -2,719 -8,156 -126,664
Total bond issues -8,589,586 -11,182,615 -390,249 -1,889,585 -3,811,676 -5,091,105
Derivative liabilities
Cross Currency Swaps (1) -279,451 -265,661 -9,705 -9,896 -29,197 -216,863
Total derivative liabilities -279,451 -265,661 -9,705 -9,896 -29,197 -216,863
(1) Future cash flows deriving from cross currency swap (CCS) differentials are calculated on the basis of the closing exchange rate at the measurement date.
31 December 2014
Carrying
amount
Total
contractual
f lows
Within 12
months
Between 1 and
2 years
Between 3 and
5 yearsAfter 5 years
31 December 2015
Carrying
amount
Total
contractual
f lows
Within 12
months
Between 1 and
2 years
Between 3 and
5 yearsAfter 5 years

287
Credit risk
The Company manages credit risk essentially through recourse to counterparties with high credit ratings and
does not report significant credit risk concentrations in accordance with the Financial Policy.
Credit risk deriving from outstanding derivative financial instruments can also be considered marginal in that
the counterparties involved are major financial institutions.
Provisions for impairment losses on individually material items are established when there is objective
evidence that the Group will not be able to collect all or any of the amount due. The amount of the provisions
takes account of estimated future cash flows and the date of collection, any future recovery costs and expenses,
and the value of any security and guarantee deposits received from customers. General provisions, based on the
available historical and statistical data, are established for items for which specific provisions have not been
made.
€000
Interest rate swaps
Assets 216,123 237,868 38,761 38,103 100,682 60,322 245,232 266,880 37,070 36,583 101,315 91,912
Cross currency swaps
Assets 563 16,563 - - - 16,563 - - - - -
Liabilities -209,018 -227,111 -10,662 -10,893 -35,607 -169,949 -279,451 -282,763 -9,575 -10,032 -31,195 -231,961
Total cash flow hedges 7,668 -34,219
Accrued expenses on cash flow hedges -26,577 -26,055
Accrued income on cash flow hedges 46,229 44,391
Total cash flow hedge derivative
assets/liabilities27,320 27,320 28,099 27,210 65,075 -93,064 -15,883 -15,883 27,495 26,551 70,120 -140,049
€000
Interest rate swaps
Income from cash flow hedges 216,123 21,669 37,575 100,561 56,318 245,232 19,964 36,516 100,957 87,795
Losses on cash flow hedges
Cross currency swaps
Income from cash flow hedges 1,447,912 58,664 58,060 168,819 1,162,369 1,063,184 21,482 65,765 127,769 848,168
Losses on cash flow hedges -1,656,367 -69,616 -69,356 -205,488 -1,311,907 -1,342,635 -27,982 -79,245 -159,751 -1,075,657
Total income ( losses) from cash flow
hedges 7,668 10,717 26,279 63,892 -93,220 -34,219 13,464 23,036 68,975 -139,694
31 December 2015
After 5
years
(1) Expected cash flows from swap differentials are calculated on the basis of market curves at the measurement date.
After 5
years
Expected
cash flows ( 1)
Within 12
months
Between 1
and 2 years
Between 3
and 5 years
Expected
cash flows ( 1)
Within 12
months
Between 1
and 2 years
Between 3
and 5 years
31 December 2014
31 December 2015 31 December 2014
Carrying
amount
Expected
cash flows ( 1)
Within 12
months
Between 1
and 2 years
Between 3
and 5 years
After 5
years
Carrying
amount
Expected
cash flows ( 1)
Within 12
months
Between 1
and 2 years
Between 3
and 5 years
After 5
years

4. Separate financial statements as at and for the year ended 31 December 2015
Annual Report 2015 288
OTHER INFORMATION
7.1 Guarantees
As at 31 December 2015, the Company reports the following outstanding personal and collateral guarantees in
issue, which include the following material items:
a) in favour of the European Investment Bank as security for loans granted to the subsidiary (€2,073,010
thousand, equal to 120% of the underlying liability);
b) counter-indemnities issued on behalf of the subsidiary, Electronic Transaction Consultants Corporation,
to the insurance companies which have issued performance bonds totalling €107,779 thousand (at the
euro/US dollar exchange rate as at 31 December 2015), for free-flow tolling projects being carried out by
the subsidiary;
c) the guarantee issued in favour of credit institutions on behalf of Strada dei Parchi as a safeguard against the
impact on cash flow hedges of movements in interest rates. The amount of the guarantee, based on the fair
value of the hedges, has been capped at €40,000 thousand, which corresponds to the value as at 31
December 2015. This guarantee was renewed for a further 12 months in February 2016. The guarantee
can only be enforced if the concession held by Strada dei Parchi is terminated, whilst Atlantia has received
a counter-indemnity from Toto Holding (Strada dei Parchi’s majority shareholder), which has undertaken
to assume Atlantia’s guarantee obligations by 31 October 2016;
d) a portion of the Company’s holding of shares in Pune Solapur Expressways Private Ltd. pledged to credit
institutions.
7.2 Related party transactions The principal related party transactions between the Company and its related parties are described below. The
transactions have been identified based on the criteria set out in the Procedure for Related Party Transactions
adopted by the Company in implementation of the provisions of art. 2391-bis of the Italian Civil Code, the
Regulations adopted by the Commissione Nazionale per le Società e la Borsa (the CONSOB) in Resolution
17221 of 12 March 2010, as amended. This procedure, published in the section, “Articles of Association, codes
and procedures” on the Company’s website at www.atlantia.it, establishes the criteria to be used in identifying
related parties, in distinguishing between transactions of greater and lesser significance and in applying the
rules governing the above transactions of greater and lesser significance, and in fulfilling the related reporting
requirements.
The following table shows amounts in the income statement and statement of financial position generated by
related party transactions, broken down by nature of the transaction (trading or financial) and including those
with Directors, Statutory Auditors and the Company’s key management personnel.

289
Tra
de
re
ce
iva
ble
s
Cu
rre
nt
tax
as
se
ts
Oth
er
cu
rre
nt
as
se
ts
To
tal
O
the
r n
on
-cu
rre
nt
lia
bil
itie
s
Tra
de
pa
ya
ble
s
Cu
rre
nt
tax
lia
bil
itie
s
Oth
er
cu
rre
nt
lia
bil
itie
s
To
tal
O
the
r o
pe
rati
ng
in
co
me
(2)
To
tal
R
aw
an
d c
on
su
ma
ble
ma
teri
als
S
erv
ice
co
sts
S
taff
co
sts
(2)
Le
as
e e
xp
en
se
T
ota
l
Ed
izio
ne
-
-
-
-
-
-
-
-
-
-
-
-
- 1
40
-
1
40
To
tal
pa
ren
ts
-
-
-
-
-
-
-
-
-
-
-
-
1
40
-
1
40
Au
tostr
ad
e d
ell'A
tla
nti
co
-
-
2
1
2
1
-
-
3
,09
5
-
3
,09
5
-
-
-
-
-
-
-
Au
tostr
ad
e M
eri
dio
na
li
34
2,4
60
1,1
38
3,6
32
-
-
-
-
-
-
-
1
7
-
-58
-
-41
Au
tostr
ad
e p
er
l'Ita
lia
2
,93
4 -
25
,78
12
8,7
15
-
2,4
70
10
,32
1 -
12
,79
11
,26
61
,26
6 -
1,4
42
-2,4
71
69
7-3
32
Au
tostr
ad
e T
ech
- 9
31
-
9
31
-
-
-
-
-
-
-
-
-
-2 -
-2
Ele
ctr
on
ic T
ran
sa
cti
on
Co
nsu
lta
nts
Co
-
-
4
4
-
-
-
-
-
-
-
-
-
-
-
-
Esse
DiE
sse
So
cie
tà d
i S
erv
izi
-
-
-
-
- 3
12
2
55
-
5
67
-
-
- 7
36
-4
-
7
32
Ae
rop
ort
i d
i R
om
a g
rou
p
1,0
48
17
,09
41
51
8,1
57
16
52
01
-
10
,99
81
1,3
64
16
21
62
-
-
-76
55
1-7
14
Pa
vim
en
tal
71
,98
2 -
1
,98
9
-
-
-
-
-
55
3
55
3
-
-
-7 -
-7
Sp
ea
E
ngin
ee
rin
g
- 7
64
-
7
64
-
2
7
- 1
55
18
2
-
-
-
1
0
1
8
-
28
Ta
nge
nzia
le d
i N
ap
oli
18
2,4
18
-
2
,43
6
-
-
-
-
-
-
-
-
-
-24
-
-24
Te
lep
ass
-
3
,04
8
-
3
,04
8
-
-
-
-
-
-
-
-
-
-3 -
-3
Oth
er
su
bsid
iari
es (
1)
81
58
73
23
9 -
-
10
8 -
10
8 -
-
-
-
-42
-
-42
To
tal
su
bs
idia
rie
s
4,0
49
28
,85
5
2
7,0
32
59
,93
6
1
65
3
,01
0
1
3,7
79
11
,15
3
2
8,1
07
1
,98
1
1,9
81
17
2
,18
8
-3,3
58
7
48
-4
05
Asso
cia
tes (
1)
-
-
-
-
-
-
-
-
-
2
1
2
1
-
-
-13
-
-13
To
tal
as
so
cia
tes
-
-
-
-
-
-
-
-
-
21
21
-
-
-1
3
-
-1
3
AS
TR
I p
en
sio
n f
un
d
-
-
-
-
-
-
-
3
0
3
0
-
-
-
- 1
01
-
1
01
CA
PID
I p
en
sio
n f
un
d
-
-
-
-
-
-
- 4
61
46
1
-
-
-
- 5
38
-
5
38
To
tal
pe
ns
ion
fu
nd
s
-
-
-
-
-
-
-
4
91
49
1
-
-
-
-
63
9
-
6
39
Ke
y m
an
age
me
nt
pe
rso
nn
el (3
) -
-
-
-
3,1
24
-
-
2
,18
9
5,3
13
-
-
-
-
6
,57
4
-
6
,57
4
To
tal
Ke
y m
an
ag
em
en
t
pe
rso
nn
el
-
-
-
-
3
,12
4
-
-
2
,18
9
5,3
13
-
-
-
6
,57
4
-
6
,57
4
To
tal
4,0
49
28
,85
5
2
7,0
32
59
,93
6
3,2
89
3
,01
0
1
3,7
79
13
,83
3
3
3,9
11
2
,00
2
2,0
02
17
2
,18
8
3,9
82
74
8
6
,93
5
Ed
izio
ne
-
-
-
-
-
-
-
-
-
-
-
-
- 1
44
-
1
44
Sin
ton
ia
-
-
-
-
-
-
-
-
-
-
-
-
-
5
-
5
To
tal
pa
ren
ts
-
-
-
-
-
-
-
-
-
-
-
-
-
1
49
-
1
49
Au
tostr
ad
e d
ell'A
tla
nti
co
-
-
2
6
2
6
-
-
3
,16
7
-
3
,16
7
-
-
-
-
-
-
-
Au
tostr
ad
e M
eri
dio
na
li
4
7
-
-
47
-
-
1
,72
9
-
1
,72
9
-
-
-
-
-54
-
-54
Au
tostr
ad
e p
er
l'Ita
lia
1
,90
8
2
1,0
69
-
22
,97
7
-
1
,76
2
-
-
1
,76
2
1
52
15
2
7
1
,36
4
-2,7
23
2
88
-1
,06
4
Eco
mo
uv
1
,30
0
-
-
1
,30
0
-
-
-
-
-
-
-
-
-
-
-
-
Ele
ctr
on
ic T
ran
sa
cti
on
Co
nsu
lta
nts
Co
-
-
2
2
-
-
-
-
-
-
-
-
-
-
-
-
Esse
DiE
sse
So
cie
tà d
i S
erv
izi
-
-
-
-
-
- 6
71
-
6
71
-
-
- 4
62
-6
-
4
56
Ae
rop
ort
i d
i R
om
a g
rou
p
5
65
-
1
5
5
80
2
02
9
0
1
,12
7
1
2,1
26
13
,54
5
2
06
20
6
-
1
-3
17
-
-31
6
Pa
vim
en
tal
3
-
-
3
-
-
1
,30
5
-
1
,30
5
5
54
55
4
-
-
-3 -
-3
Sp
ea
E
ngin
ee
rin
g
5
-
-
5
-
-
3
,66
3
-
3
,66
3
-
-
-
-
-5 -
-5
Ta
nge
nzia
le d
i N
ap
oli
1
2
-
-
12
-
-
1
,05
5
-
1
,05
5
-
-
-
-
-12
-
-12
Te
lep
ass
-
-
-
-
-
-
1
,27
0
-
1
,27
0
-
-
-
-
-3 -
-3
Oth
er
su
bsid
iari
es (
1)
84
93
52
55
3 -
-
27
61
59
43
5 -
-
-
-
-26
-
-26
To
tal
su
bs
idia
rie
s
3,8
48
21
,56
2
9
5
2
5,5
05
20
2
1,8
52
14
,26
3
1
2,2
85
28
,60
2
9
12
91
2
7
1,8
27
-3
,14
9
28
8
-1,0
27
Asso
cia
tes (
1)
-
-
-
-
-
-
98
-
98
5
5
-
-
-42
-
-42
To
tal
as
so
cia
tes
-
-
-
-
-
-
98
-
98
5
5
-
-
-42
-
-42
Un
ite
d C
olo
rs C
om
mu
nic
ati
on
-
-
-
-
-
-
-
-
-
-
-
-
2
,00
2
-
-
2
,00
2
To
tal
aff
ilia
tes
-
-
-
-
-
-
-
-
-
-
-
-
2
,00
2
-
-
2
,00
2
AS
TR
I p
en
sio
n f
un
d
-
-
-
-
-
-
-
3
7
3
7
-
-
-
-
81
-
81
CA
PID
I p
en
sio
n f
un
d
-
-
-
-
-
-
- 2
31
23
1
-
-
-
-
3
43
-
3
43
To
tal
pe
ns
ion
fu
nd
s
-
-
-
-
-
-
-
2
68
26
8
-
-
-
-
4
24
-
4
24
Ke
y m
an
age
me
nt
pe
rso
nn
el (3
) -
-
-
-
-
-
-
2
,98
5
2,9
85
-
-
-
-
5
,23
5
-
5
,23
5
To
tal
Ke
y m
an
ag
em
en
t
pe
rso
nn
el
-
-
-
-
-
-
-
2
,98
5
2,9
85
-
-
-
-
5
,23
5
-
5
,23
5
To
tal
3,8
48
21
,56
2
9
5
2
5,5
05
20
2
1,8
52
14
,36
1
1
5,5
38
31
,95
3
9
17
91
7
7
3,8
29
2
,61
7
2
88
6
,74
1
(3)
Atl
an
tia
's "
ke
y m
an
age
me
nt
pe
rso
nn
el"
me
an
s t
he
Co
mp
an
y's D
ire
cto
rs, S
tatu
tory
Au
dit
ors
an
d o
the
r k
ey
ma
na
ge
me
nt
pe
rso
nn
el a
s a
wh
ole
. E
xp
en
se
s f
or
ea
ch
pe
rio
d in
clu
de
em
olu
me
nts
, sa
lari
es, b
en
efi
ts in
kin
d, b
on
use
s a
nd
oth
er
ince
nti
ve
s (
inclu
din
g t
he
fa
ir v
alu
e o
f A
tla
nti
a s
ha
re-b
ase
d in
ce
nti
ve
pla
ns).
In a
dd
itio
n t
o t
he
in
form
ati
on
sh
ow
n in
th
e t
ab
le, th
e c
on
so
lid
ate
d f
ina
ncia
l sta
tem
en
ts a
lso
in
clu
de
co
ntr
ibu
tio
ns o
f €
1,4
38
th
ou
sa
nd
in
20
15
pa
id o
n b
eh
alf
of
Dir
ecto
rs, S
tatu
tory
Au
dit
ors
an
d o
the
r k
ey
ma
na
ge
me
nt
pe
rso
nn
el (€
61
9 t
ho
usa
nd
in
20
14
) a
nd
th
e r
ela
ted
lia
bilit
ies o
f €
34
8 t
ho
usa
nd
as a
t 3
1 D
ece
mb
er
20
15
(8
1 t
ho
usa
nd
as a
t 3
1 D
ece
mb
er
20
14
).
31
De
ce
mb
er
20
15
20
15
31
De
ce
mb
er
20
14
20
14
(1)
Th
is ite
m in
clu
de
s b
ala
nce
s f
or
co
mp
an
ies w
he
re t
he
re
leva
nt
am
ou
nt
is n
ot
ma
teri
al.
(2)
"Sta
ff c
osts
" in
clu
de
co
st
reco
ve
rie
s.
Pri
nc
ipa
l tr
ad
ing
tra
ns
ac
tio
ns
wit
h r
ela
ted
pa
rtie
s
€0
00
A
ss
ets
Lia
bil
itie
s I
nc
om
e
Ex
pe
ns
es
Tra
din
g a
nd
oth
er
as
se
tsT
rad
ing
an
d o
the
r li
ab
ilit
ies
Tra
din
g a
nd
oth
er
inc
om
e
Tra
din
g a
nd
oth
er
ex
pe
ns
es

4. Separate financial statements as at and for the year ended 31 December 2015
Annual Report 2015 290
Oth
er
no
n-
cu
rre
nt
fin
an
cia
l
as
se
ts
No
n-c
urr
en
t
de
riv
ati
ve
as
se
ts
Ca
sh
eq
uiv
ale
nts
Inte
rco
mp
an
y
cu
rre
nt
ac
co
un
t
rec
eiv
ab
les
du
e f
rom
rela
ted
pa
rtie
s
Cu
rre
nt
po
rtio
n
of
me
diu
m/
lon
g-
term
lo
an
s
Oth
er
cu
rre
nt
fin
an
cia
l
as
se
ts
To
tal
Oth
er
cu
rre
nt
fin
an
cia
l
lia
bil
itie
s
To
tal
Oth
er
fin
an
cia
l
inc
om
e
(1)
To
tal
Oth
er
fin
an
cia
l
ex
pe
ns
es
(1)
To
tal
Au
tostr
ad
e p
er
l'Ita
lia
6
,51
4,6
03
2
16
,12
3
4
00
,00
0
1
3,3
29
1
,07
6,5
87
7
94
8,2
21
,43
6
-
-
1
,18
4,2
82
1,1
84
,28
2
2
5,0
92
25
,09
2
Au
tostr
ad
e T
ech
-
-
-
-
-
-
-
-
-
7
7
-
-
Eco
mo
uv
-
-
-
-
-
3
3
-
-
7
88
7
88
-
-
Ele
ctr
on
ic T
ran
sa
cti
on
Co
nsu
lta
nts
Co
-
-
-
-
-
5
,92
3
5,9
23
-
-
1
,11
0
1,1
10
-
-
Ae
rop
ort
i d
i R
om
a g
rou
p
3
46
,26
2
-
-
-
5
22
-
34
6,7
84
-
-
1
37
,95
5
13
7,9
55
6
,50
2
6,5
02
Oth
er
su
bsid
iari
es (
2)
-
-
-
-
-
1
00
1
00
-
-
5
5
-
-
TO
TA
L S
UB
SID
IAR
IES
6,8
60
,86
5
21
6,1
23
4
00
,00
0
1
3,3
29
1,0
77
,10
9
6,8
20
8,5
74
,24
6
-
-
1
,32
4,1
47
1,3
24
,14
7
3
1,5
94
31
,59
4
Au
tostr
ad
e p
er
l'Ita
lia
8
,75
7,8
90
2
45
,23
2
2
50
,00
0
2
12
,94
6
2
36
,64
9
3
,53
1
9
,70
6,2
48
5
5
1
,15
1,7
98
1,1
51
,79
8
2
6,9
53
26
,95
3
Eco
mo
uv
-
-
-
-
-
3
3
-
-
2
,93
3
2,9
33
-
-
Ele
ctr
on
ic T
ran
sa
cti
on
Co
nsu
lta
nts
Co
-
-
-
-
-
4
,48
5
4,4
85
3
32
3
32
1
,42
7
1,4
27
-
-
Oth
er
su
bsid
iari
es (
2)
-
-
-
-
- 1
9
1
9
-
- 5
0
5
0
-
-
TO
TA
L S
UB
SID
IAR
IES
8,7
57
,89
0
24
5,2
32
2
50
,00
0
21
2,9
46
2
36
,64
9
8,0
38
9,7
10
,75
5
33
7
33
7
1
,15
6,2
08
1,1
56
,20
8
2
6,9
53
26
,95
3
31
De
ce
mb
er
20
14
20
14
(1
) Th
e t
ab
le d
oe
s n
ot
inclu
de
re
ve
rsa
ls o
f im
pa
irm
en
t lo
sse
s o
n f
ina
ncia
l a
sse
ts a
nd
in
ve
stm
en
ts o
r im
pa
irm
en
t lo
sse
s o
n f
ina
ncia
l a
sse
ts a
nd
in
ve
stm
en
ts.
(2
) Th
is ite
m in
clu
de
s b
ala
nce
s f
or
co
mp
an
ies w
he
re t
he
re
leva
nt
am
ou
nt
is n
ot
ma
teri
al.
Pri
nc
ipa
l fi
na
nc
ial
tra
ns
ac
tio
ns
wit
h r
ela
ted
pa
rtie
s
€0
00
As
se
tsIn
co
me
Ex
pe
ns
es
Fin
an
cia
l a
ss
ets
Fin
an
cia
l in
co
me
Fin
an
cia
l e
xp
en
se
s
31
De
ce
mb
er
20
15
20
15

291
A number of material non-recurring transactions were carried out in 2015, as described in detail in note 5.10,
whilst no atypical or unusual transactions, having a material impact on the income statement and statement of
financial position, were entered into, either with third or related parties.
The principal transactions entered into with related parties are described below.
Atlantia SpA’s relations with its subsidiaries
The Company primarily engages in transactions of a trading and financial nature with the subsidiary,
Autostrade per l’Italia, over which it exercises management and coordination.
With regard to transactions of a trading nature, Autostrade per l’Italia provides administrative, financial and
tax services to the Company.
With regard to transactions of a financial nature with Autostrade per l’Italia, as reported in note 4.4, as at 31
December 2015 the Company has granted medium/long-term loans with a total face value of €7,406,526
thousand to Autostrade per l’Italia on the same terms as those applied to Atlantia’s borrowings, increased by a
spread that takes account of the cost of managing the loans. The reduction of €1,351,250 thousand in these
loans, compared with 31 December 2014, relates to the partial buyback of bonds maturing in 2016, 2017, 2019
and 2020, as described in note 5.10.
The floating rate loan 2004-2022, with a face value of €750,000 thousand, is hedged against interest rate risk
through the use of specific derivative financial instruments entered into with Autostrade per l’Italia. Fair value
gains on these hedges total €216,123 thousand as at 31 December 2015, as reported in note 4.4.
The Company also has an intercompany current account with Autostrade per l’Italia, which provides
centralised treasury services for the Group. The account has a credit balance of €13,329 thousand as at 31
December 2015. In addition, the Company has invested liquidity of €400,000 with the subsidiary
(€200,000 thousand maturing 29 January 2016 and the remaining €200,000 thousand maturing on 29
February 2016), as described in note 4.7.
As regards transactions with other Group companies, the Company holds notes issued by Romulus Finance
(the special purpose entity controlled by Aeroporti di Roma), amounting to €346,262 thousand as at 31
December 2015, as described in note 4.4.
With regard, on the other hand, to other liabilities, the Company owes the sum of €10,998 thousand to
Aeroporti di Roma and its subsidiaries, essentially in relation to the tax consolidation arrangement in force
between these companies and Gemina prior to this company’s merger with the Company, as described in note
4.16.
As at 31 December 2015, the Company has issued a number of guarantees in favour of direct or indirect
subsidiaries, as described in note 7.1.
Finally, as a result of the tax consolidation arrangement headed by the Company, the statement of financial
position as at 31 December 2015 includes current tax assets due from Group companies of €28,855 thousand,
and current tax liabilities payable to Group companies of €13,779 thousand, which mirror matching amounts
due to and from the tax authorities. The arrangement is described in note 4.8.
7.3 Disclosures regarding share-based payments There were no changes, during 2015, in the share-based incentive plans already adopted by the Group as at 31
December 2014 and originally approved by the Annual General Meetings of shareholders held on 20 April
2011 (later amended by subsequent Annual General Meetings) and 16 April 2014.
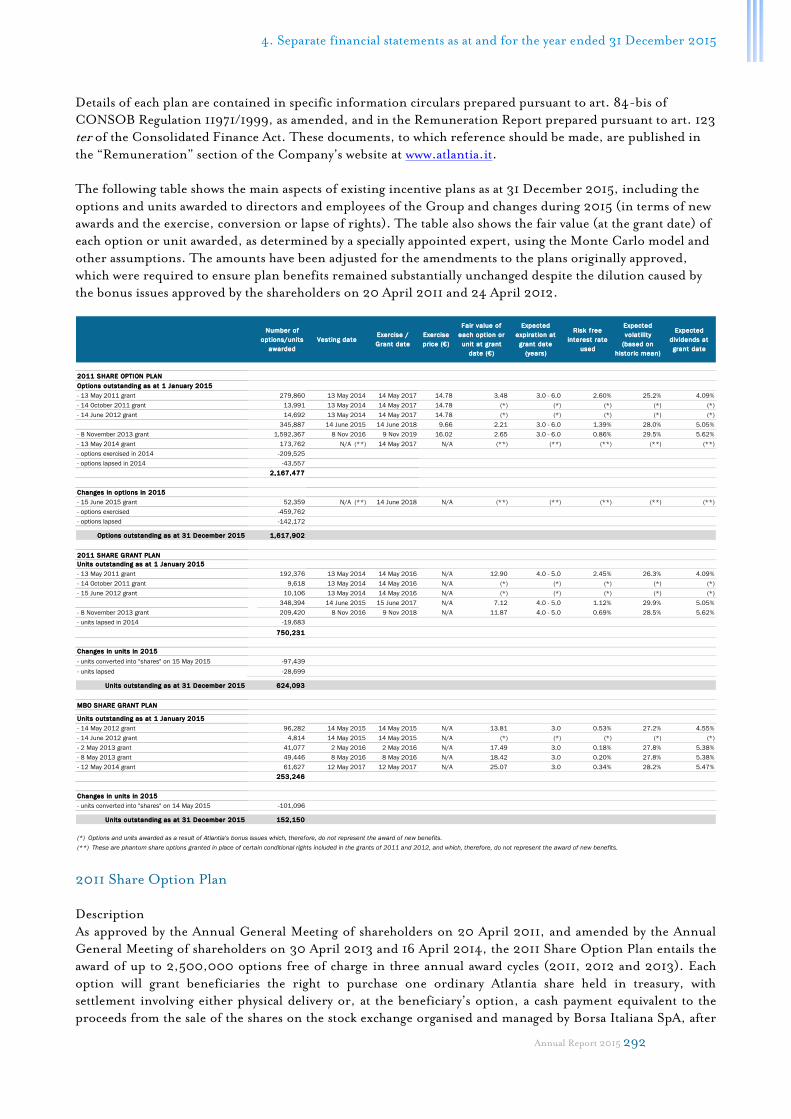
4. Separate financial statements as at and for the year ended 31 December 2015
Annual Report 2015 292
Details of each plan are contained in specific information circulars prepared pursuant to art. 84-bis of
CONSOB Regulation 11971/1999, as amended, and in the Remuneration Report prepared pursuant to art. 123
ter of the Consolidated Finance Act. These documents, to which reference should be made, are published in
the “Remuneration” section of the Company’s website at www.atlantia.it.
The following table shows the main aspects of existing incentive plans as at 31 December 2015, including the
options and units awarded to directors and employees of the Group and changes during 2015 (in terms of new
awards and the exercise, conversion or lapse of rights). The table also shows the fair value (at the grant date) of
each option or unit awarded, as determined by a specially appointed expert, using the Monte Carlo model and
other assumptions. The amounts have been adjusted for the amendments to the plans originally approved,
which were required to ensure plan benefits remained substantially unchanged despite the dilution caused by
the bonus issues approved by the shareholders on 20 April 2011 and 24 April 2012.
2011 Share Option Plan
Description
As approved by the Annual General Meeting of shareholders on 20 April 2011, and amended by the Annual
General Meeting of shareholders on 30 April 2013 and 16 April 2014, the 2011 Share Option Plan entails the
award of up to 2,500,000 options free of charge in three annual award cycles (2011, 2012 and 2013). Each
option will grant beneficiaries the right to purchase one ordinary Atlantia share held in treasury, with
settlement involving either physical delivery or, at the beneficiary’s option, a cash payment equivalent to the
proceeds from the sale of the shares on the stock exchange organised and managed by Borsa Italiana SpA, after
Number of
options/units
awarded
Vesting dateExercise /
Grant date
Exercise
price (€)
Fair value of
each option or
unit at grant
date (€)
Expected
expirat ion at
grant date
(years)
Risk f ree
interest rate
used
Expected
volat ility
(based on
historic mean)
Expected
dividends at
grant date
2011 SHARE OPTION PLAN
Options outstanding as at 1 January 2015
- 13 May 2011 grant 279,860 13 May 2014 14 May 2017 14.78 3.48 3.0 - 6.0 2.60% 25.2% 4.09%
- 14 October 2011 grant 13,991 13 May 2014 14 May 2017 14.78 (*) (*) (*) (*) (*)
- 14 June 2012 grant 14,692 13 May 2014 14 May 2017 14.78 (*) (*) (*) (*) (*)
345,887 14 June 2015 14 June 2018 9.66 2.21 3.0 - 6.0 1.39% 28.0% 5.05%
- 8 November 2013 grant 1,592,367 8 Nov 2016 9 Nov 2019 16.02 2.65 3.0 - 6.0 0.86% 29.5% 5.62%
- 13 May 2014 grant 173,762 N/A (**) 14 May 2017 N/A (**) (**) (**) (**) (**)
- options exercised in 2014 -209,525
- options lapsed in 2014 -43,557
2,167,477
Changes in options in 2015
- 15 June 2015 grant 52,359 N/A (**) 14 June 2018 N/A (**) (**) (**) (**) (**)
- options exercised -459,762
- options lapsed -142,172
Options outstanding as at 31 December 2015 1,617,902
2011 SHARE GRANT PLAN
Units outstanding as at 1 January 2015
- 13 May 2011 grant 192,376 13 May 2014 14 May 2016 N/A 12.90 4.0 - 5.0 2.45% 26.3% 4.09%
- 14 October 2011 grant 9,618 13 May 2014 14 May 2016 N/A (*) (*) (*) (*) (*)
- 15 June 2012 grant 10,106 13 May 2014 14 May 2016 N/A (*) (*) (*) (*) (*)
348,394 14 June 2015 15 June 2017 N/A 7.12 4.0 - 5.0 1.12% 29.9% 5.05%
- 8 November 2013 grant 209,420 8 Nov 2016 9 Nov 2018 N/A 11.87 4.0 - 5.0 0.69% 28.5% 5.62%
- units lapsed in 2014 -19,683
750,231
Changes in units in 2015
- units converted into "shares" on 15 May 2015 -97,439
- units lapsed -28,699
Units outstanding as at 31 December 2015 624,093
MBO SHARE GRANT PLAN
Units outstanding as at 1 January 2015
- 14 May 2012 grant 96,282 14 May 2015 14 May 2015 N/A 13.81 3.0 0.53% 27.2% 4.55%
- 14 June 2012 grant 4,814 14 May 2015 14 May 2015 N/A (*) (*) (*) (*) (*)
- 2 May 2013 grant 41,077 2 May 2016 2 May 2016 N/A 17.49 3.0 0.18% 27.8% 5.38%
- 8 May 2013 grant 49,446 8 May 2016 8 May 2016 N/A 18.42 3.0 0.20% 27.8% 5.38%
- 12 May 2014 grant 61,627 12 May 2017 12 May 2017 N/A 25.07 3.0 0.34% 28.2% 5.47%
253,246
Changes in units in 2015
- units converted into "shares" on 14 May 2015 -101,096
Units outstanding as at 31 December 2015 152,150
(*) Options and units awarded as a result of Atlantia's bonus issues which, therefore, do not represent the award of new benefits.
(**) These are phantom share options granted in place of certain conditional rights included in the grants of 2011 and 2012, and which, therefore, do not represent the award of new benefits.

293
deduction of the full exercise price. The exercise price is equivalent to the average of the official prices of
Atlantia’s ordinary shares in the month prior to the date on which Atlantia’s Board of Directors announces the
beneficiary and the number of options to be awarded.
The options granted will vest in accordance with the Plan terms and conditions and, in particular, only if, on
expiration of the vesting period (three years from the date of award of the options to beneficiaries by the Board
of Directors), cumulative FFO for the three annual reporting periods preceding expiration of the vesting
period, adjusted for a number of specific items (total operating cash flow of the Group, Atlania or of certain of
its subsidiaries – depending on the role held by the various beneficiaries of the Plan), is higher than a pre-
established target, unless otherwise decided by the Board of Directors, which has the authority to assign
beneficiaries further targets. Vested options may be exercised, in part, from the first day following expiration
of the vesting period and, in part, from the end of the first year following expiration of the vesting period and,
in any event, in the three years following expiration of the vesting period (subject to the clause in the Plan
terms and conditions requiring executive Directors and key management personnel to retain a minimum
holding). The maximum number of exercisable options will be calculated on the basis of a mathematical
algorithm (which could result in an assignment of some "additional" options) that takes account, among other
things, of the current value and the exercise price, plus any dividends paid, so as to cap the realisable gain.
Changes in options in 2015 The vesting period for the second award cycle expired on 14 June 2015. In accordance with the Terms and
Conditions of this plan, following confirmation of effective achievement of the related performance hurdles,
the final value of the shares (the arithmetic mean of the share price in the fifteen days prior to the vesting date)
was determined as well as the additional options resulting from dividends paid during the vesting period. On 8
May 2015, Atlantia’s Board of Directors, exercising the authority provided for in the Plan Terms and
Conditions, awarded the plan beneficiaries, in place of these additional options, a matching amount of
phantom options in such a way that, on exercising the awarded options, the beneficiaries receive a gross
amount in cash, determined with a calculation method which allow the beneficiaries to receive a net amount
equal to what would have been received if they had exercised the additional options (resulting in the award of
shares in Atlantia and payment of the exercise price) and sold the underlying shares in the market. On expiry
of the vesting period, this resulted in the award of a total of 52,359 phantom options for the second cycle of
the plan. For the reasons given above, the options awarded do not constitute an additional benefit with respect
to the benefits established in the Plan Terms and Conditions.
During 2015, a number of beneficiaries exercised vested options and paid the established exercise price. This
entailed the allocation to them of Atlantia’s ordinary shares held by the Company as treasury shares. This
resulted in the transfer of:
a) 99,018 of Atlantia’s ordinary shares to beneficiaries in connection with the first cycle, the vesting period
for which expired on 13 May 2014, accompanied by the exercise of 173,762 phantom options awarded in
2014; following the exercise of these options, the first cycle of the Plan has for all purposes concluded;
b) 186,982 of Atlantia’s ordinary shares to beneficiaries in connection with the second cycle, the vesting
period for which expired on 14 June 2015, whilst no phantom options awarded in 2015 were exercised.
Thus, as at 31 December 2015, taking into account lapsed options at that date, the remaining options
outstanding total 1,617,902, including 52,359 phantom options awarded under the second cycle (the unit fair
values of which, as at 31 December 2015, was measured as €21.29, in place of the unit fair values at the grant
date).
2011 Share Grant Plan
Description
As approved by the Annual General Meeting of shareholders on 20 April 2011, and amended by the Annual
General Meeting of shareholders on 30 April 2013, the 2011 Share Grant Plan entails the grant of up to
920,000 units free of charge in three annual award cycles (2011, 2012 and 2013). Each unit will grant
beneficiaries the right to receive one Atlantia ordinary share held in treasury, with settlement involving either
physical delivery or, at the beneficiary’s option, a cash payment equivalent to the proceeds from the sale of the
shares on the stock exchange organised and managed by Borsa Italiana SpA.

4. Separate financial statements as at and for the year ended 31 December 2015
Annual Report 2015 294
The units granted will vest in accordance with the Plan terms and conditions and, in particular, only if, on
expiration of the vesting period (three years from the date the units are granted to beneficiaries by the Board of
Directors), cumulative FFO for the three annual reporting periods preceding expiration of the vesting period,
adjusted for a number of specific items (total operating cash flow of the Group, Atlantia or of certain of its
subsidiaries – depending on the role held by the various beneficiaries of the Plan) is higher than a pre-
established target, unless otherwise decided by the Board of Directors. Vested units may be converted into
shares, in part, after one year from the date of expiration of the vesting period and, in part, after two years
from the date of expiration of the vesting period (subject to the clause in the Plan terms and conditions
requiring executive Directors and key management personnel to maintain a minimum holding). The number
of convertible units will be calculated on the basis of a mathematical algorithm that takes account, among other
things, of the current value and initial value of the shares so as to cap the realisable gain.
Changes in units in 2015
The vesting period for the second award cycle expired on 14 June 2015. In accordance with the Terms and
Conditions of this plan, following confirmation of effective achievement of the related performance hurdles,
the units previously awarded vested: these units may be converted into Atlantia’s ordinary shares from 15 June
2016.
In addition, with regard to the first award cycle, the vesting period for which expired on 13 May 2014, on 15
May 2015 vested units were converted, in accordance with the Plan Terms and Conditions, into Atlantia’s
ordinary shares. As a result, Plan beneficiaries received 97,439 shares held by the Company as treasury shares.
The remaining units will be converted into Atlantia’s ordinary shares from 15 May 2016.
As at 31 December 2015, taking into account lapsed units at that date, the remaining units outstanding total
624,093.
MBO Share Grant Plan
Description
As approved by the Annual General Meetings of shareholders on 20 April 2011 and amended by the Annual
General Meetings of 30 April 2013 and 16 April 2014, the MBO Share Grant Plan, serving as part payment of
the annual bonus for the achievement of objectives assigned to each beneficiary under the Management by
Objectives (MBO) plan adopted by the Atlantia Group in 2011, 2012 and 2013, entails the grant of up to
340,000 units free of charge annually for three years (2012, 2013 and 2014). Each unit will grant
beneficiaries the right to receive one ordinary share in Atlantia SpA held in treasury.
The units granted (the number of which is based on the unit price of the company’s shares at the time of
payment of the bonus, and on the size of the bonus effectively awarded on the basis of achievement of the
assigned objectives) will vest in accordance with the Plan terms and conditions, on expiration of the vesting
period (three years from the date of payment of the annual bonus to beneficiaries, following confirmation that
the objectives assigned have been achieved). Vested units will be converted into a maximum number of shares
on expiration of the vesting period (subject to the clause in the Plan terms and conditions requiring executive
Directors and key management personnel to maintain a minimum holding), on the basis of a mathematical
algorithm (which could result in an assignment of some "additional" options) that takes account, among other
things, of the current value and initial value of the shares, plus any dividends paid during the vesting period,
so as to cap the realisable gain.
Changes in the units in 2015
The vesting period for the MBO Plan units awarded in relation to the objectives for 2011 expired on 14 May
2015. In accordance with the Terms and Conditions of this plan, all the units awarded thus vested, resulting in
their conversion into Atlantia’s ordinary shares and the allocation to beneficiaries of 101,096 shares held by
the Company as treasury shares.
In addition, on 8 May 2015, Atlantia’s Board of Directors, exercising the authority provided for in the Plan
Terms and Conditions, awarded the plan beneficiaries a gross amount in cash in place of the additional units
to be awarded as a result of the payment of dividends during the vesting period. This amount is computed in
such a way as to enable beneficiaries to receive a net amount equal to what they would have received in case they

295
had been awarded a number of Atlantia shares equal to the additional units and sold these shares in the market.
Following the conversion of these units, there are no remaining units outstanding in relation to the awards for
2012.
As at 31 December 2015, the remaining units outstanding total 152,150.
The following table shows the main aspects of the “2014 Phantom Share Option Plan”, unlike the other plans
settled entirely in cash. The table shows the options awarded to directors and employees of the Company and
changes (in terms of new awards and the exercise, conversion or lapse of rights, and transfers or secondments
to other Atlantia Group companies) during 2015. The table also shows the fair value (at the grant date) of each
option awarded, as determined by a specially appointed expert, using the Monte Carlo model and other
assumptions.
2014 Phantom Share Option Plan
Description On 16 April 2014, the Annual General Meeting of Atlantia’s shareholders approved the new incentive plan
named the “2014 Phantom Share Option Plan”, subsequently approved, within the scope of their
responsibilities, by the boards of directors of the subsidiaries employing the beneficiaries. The plan entails the
award of phantom share options free of charge in three annual award cycles (2014, 2015 and 2016), being
options that give beneficiaries the right to payment of a gross amount in cash, computed on the basis of the
increase in the value of Atlantia’s ordinary shares in the relevant three-year period.
In accordance with the Terms and Conditions of the plan, the options granted will only vest if, at the end of
the vesting period (equal to three years from the date on which the options were awarded to the beneficiaries by
the Board of Directors), a minimum operating/financial performance target for (alternatively) the Group, the
Company or for one or more of Autostrade per l’Italia’s subsidiaries, as indicated for each Plan beneficiary
(the “hurdle”), has been met or exceeded. The vested options may be exercised from, in part, the first day
immediately following the vesting period, with the remaining part exercisable from the end of the first year
after the end of the vesting period and, in any event, in the three years after the end of the vesting period
(without prejudice to the Terms and Conditions of the plan as regards minimum holding requirements for
executive directors and key management personnel). The number of exercisable options is to be computed in
application of a mathematical algorithm, taking into account, among other things, the current value, the target
value and the exercise price, in order to cap the realisable gain.
Changes in options in 2015
On 8 May 2015, the Board of Directors selected the beneficiaries for the second cycle of the plan in question,
awarding a total of 2,971,817 phantom options with a vesting period from 8 May 2015 to 8 May 2018 and an
exercise period, on achievement of the relevant hurdles, from 9 May 2018 to 8 May 2021.
Thus, as at 31 December 2015, taking into account lapsed options at that date, the remaining options
outstanding total 5,311,376, including 2,396,902 phantom options awarded under the first cycle and
2,914,474 phantom options awarded under the second cycle (the unit fair values of which as at 31 December
2015 were measured as €4.10 and €2.33, respectively, in place of the unit fair values at the grant date).
Number of
options/units
awarded
Vesting dateExercise /
Grant date
Exercise
price (€)
Fair value of each
option or unit at
grant date (€)
Expected
expiration at
grant date
(years)
Risk free
interest rate
used
Expected
volatil ity
(based on
historic
mean)
Expected
dividends at
grant date
2014 PHANTOM SHARE OPTION PLAN
Options outstanding as at 1 January 2015
- 9 May 2014 grant 385,435 9 May 2017 9 May 2020 N/A (*) 2.88 3,0 - 6,0 1.10% 28.9% 5.47%
- transfers/secondments 30,973
416,408
Changes in options in 2015
- 8 May 2015 grant 642,541 8 May 2018 8 May 2021 N/A (*) 2.59 3,0 - 6,0 1.01% 25.8% 5.32%
- transfers/secondments -115,174
Options outstanding as at 31 December 2015 943,775
(*) Given that this is a cash bonus plan, involving payment of a gross amount in cash, the 2014 Phantom Share Option Plan does not require an exercise price. However, the Terms and Conditions if this specific plan indicate an
"Exercise price" (equal to the arithmetic mean of Atlantia's share price in a determinate period) as the basis on which to calculate the gross amount to be paid to beneficiaries.

4. Separate financial statements as at and for the year ended 31 December 2015
Annual Report 2015 296
The prices of Atlantia’s ordinary shares in the various periods covered by the above plans are shown below:
a) price as at 31 December 2015: €24.57;
b) price as at 8 May and 15 June 2015 (the grant date for new options or units, as described): €23.58 and
€21.73, respectively;
c) the weighted average price for 2015: €23.64;
d) the weighted average price for the period 8 May 2015 – 31 December 2015: €23.89;
e) the weighted average price for the period 15 June 2015 – 31 December 2015: €24.01.
In accordance with the requirements of IFRS 2, as a result of existing plans, in 2015 the Company has
recognised staff costs, as indicated in note 5.4, of €2,305 thousand, based on the accrued fair value of the
options and units awarded at that date, including €525 thousand accounted for as an increase in equity
reserves. In contrast, the liabilities represented by phantom share options outstanding as at 31 December 2015
have been recognised in other current and non-current liabilities, based on the assumed exercise date. In
addition, the Company has recognised the accrued portion of share-based incentive plans, with regard to the
benefits awarded to certain directors and employees at its subsidiaries, in “Investments”, as described in note
4.3.
Finally, following the exercise, by Atlantia’s Board of Directors, of its authority to award phantom options in
place of any additional options due, on closure of the second cycle of the “2011 Share Option Plan”, the
amount of €705 thousand was reclassified from equity reserves to other current liabilities, corresponding to
the initial estimate of the fair value of the additional options.

297
7.4 Events after 31 December 2015
There were no material events after the end of the year under review.

4. Separate financial statements as at and for the year ended 31 December 2015
Annual Report 2015 298
ANNEXES TO THE FINANCIAL STATEMENTS
ANNEX 1
DISCLOSURES PURSUANT TO ART.149-DUODECIES OF THE CONSOB REGULATIONS FOR ISSUERS
11971/1999
The above annex has not been audited.

299
Annex 1 Disclosures pursuant to art.149-duodecies of the CONSOB Regulations for Issuers 11971/1999
Atlantia S.p.A.
Type of service Provider of service NoteFees
(€000)
Audit Parent Company's auditor 36
Certification Parent Company's auditor (1) 23
Certification Associate of Parent Company's auditor (2) 30
Other services Parent Company's auditor (3) 15
Total Parent Company 104
(1) Opinion on payment of the interim dividend for 2015.
(2) Review of the Sustainability Report.
(3) Signature of Consolidated Tax Return and Form 770, agreed upon procedures on accounting data and information and
comfort letters for loans and bond issues, controls included in the requirements for tenders in which the Group
participated

300
Reports 5

301
Attestations of the consolidated and separate financial
statements
Attestation of the consolidated financial statements pursuant to art. 81-ter of
CONSOB Regulation 11971 of 14 May 1999, as amended
1. We, the undersigned, Giovanni Castellucci and Giancarlo Guenzi, as Chief Executive Officer and as the
manager responsible for Atlantia SpA’s financial reporting, having taken account of the provisions of art.
154-bis, paragraphs 3 and 4 of Legislative Decree 58 of 24 February 1998, attest to:
• the adequacy with regard to the nature of the Company and
• the effective application
of the administrative and accounting procedures adopted in preparation of the consolidated financial
statements during 2015.
2. The administrative and accounting procedures adopted in preparation of the consolidated financial
statements as at and for the year ended 31 December 2015 were drawn up, and their adequacy assessed, on
the basis of the regulations and methods drawn up by Atlantia SpA in accordance with the Internal
Control–Integrated Framework model issued by the Committee of Sponsoring Organizations of the
Treadway Commission. This Commission has established a body of general principles providing a
standard for internal control systems that is generally accepted at international level.
3. We also attest that
3.1 the consolidated financial statements:
a) have been prepared in compliance with international accounting standards approved for
application in the European Community by EC Regulation 1606/2002, passed by the European
Parliament and by the Council on 19 July 2002;
b) are consistent with the underlying accounting books and records;
c) present a true and fair view of the financial position and results of operations of the issuer and the
consolidated companies;
3.2 the report on operations contains a reliable analysis of operating trends and results, in addition to the
state of affairs of the issuer and the consolidated companies, together with a description of the
principal risks and uncertainties to which they are exposed.
4 March 2016
Giovanni Castellucci Giancarlo Guenzi Chief Executive Officer Manager responsible for financial reporting
Annual Report 2015 302
Attestation of the separate financial statements pursuant to art. 81-ter of CONSOB
Regulation 11971 of 14 May 1999, as amended
1. We, the undersigned, Giovanni Castellucci and Giancarlo Guenzi, as Chief Executive Officer and as the
manager responsible for Atlantia SpA’s financial reporting, having taken account of the provisions of art.
154-bis, paragraphs 3 and 4 of Legislative Decree 58 of 24 February 1998, attest to:
• the adequacy with regard to the nature of the Company and
• the effective application
of the administrative and accounting procedures adopted in preparation of the separate financial statements
during 2015.
2. The administrative and accounting procedures adopted in preparation of the separate financial statements
as at and for the year ended 31 December 2015 were drawn up, and their adequacy assessed, on the basis of
the regulations and methods drawn up by Atlantia SpA in accordance with the Internal Control–Integrated
Framework model issued by the Committee of Sponsoring Organizations of the Treadway Commission.
This Commission has established a body of general principles providing a standard for internal control
systems that is generally accepted at international level.
3. We also attest that
3.1 the separate financial statements:
a) have been prepared in compliance with international accounting standards approved for
application in the European Community by EC Regulation 1606/2002, passed by the European
Parliament and by the Council on 19 July 2002;
b) are consistent with the underlying accounting books and records;
c) present a true and fair view of the financial position and results of operations of the issuer;
3.2 the report on operations contains a reliable analysis of operating trends and results, in addition to the
state of affairs of the issuer, together with a description of the principal risks and uncertainties to
which it is exposed.
4 March 2016
Giovanni Castellucci Giancarlo Guenzi Chief Executive Officer Manager responsible for financial reporting

303
REPORT OF THE BOARD OF STATUTORY AUDITORS TO THE ANNUAL GENERAL MEETING
(pursuant to art 153 of Legislative Decree 58/1998 and art. 2429, para. 2 of the Italian Civil Code)
Dear Shareholders,
The Board of Statutory Auditors of Atlantia SpA (“Atlantia” or the “Company”), pursuant to art. 153 of Legislative Decree 58/1998 (the “Consolidated Finance Act” or “CFA”) and art. 2429, paragraph 2 of the Italian Civil Code, is required to report to the Annual General Meeting, called to approve the financial statements, on the audit activities conducted during the financial year within the scope of our responsibilities, on any omissions and irregularities observed and on the results for the Company’s financial year. The Board of Statutory Auditors is also required to make proposals regarding the financial statements and its approval.
During the annual reporting period ended 31 December 2015, we performed the audit procedures required by law, adopting the Standards recommended by the Italian accounting profession and in compliance with CONSOB requirements regarding corporate controls, and the provisions of art. 19 of Legislative Decree 39 of 27 January 2010.
* * *
Atlantia’s financial statements have been prepared on the basis of the IAS/IFRS issued by the International Accounting Standards Board (IASB) and endorsed by the European Union, and in accordance with the measures introduced in application of art. 9 of Legislative Decree 38/2005. The Directors’ report on operations summarises the principal risks and uncertainties and reports on the outlook for the Company. The Company’s financial statements have been prepared in accordance with the relevant legislation and are accompanied by the documents required by the Italian Civil Code and the CFA. The Board of Statutory Auditors obtained the information needed in order to conduct its assigned audit activities by participating in meetings of the Board of Directors and of the various board committees, during discussions with the management of the Company and the Group, during meetings with the independent auditors and with the boards of statutory auditors of Group companies, through examination of the information obtained by the relevant company departments and through further audit activities. Election of the Board of Statutory Auditors The Board of Statutory Auditors in office at the date of this report was elected by the Annual General Meeting of 24 April 2015 and its members are Corrado Gatti (Chairman), Alberto di Nigro (standing Auditor), Lelio Fornabaio (standing Auditor), Silvia Olivotto (standing Auditor) and Livia Salvini (standing Auditor). The alternate Auditors are Laura Castaldi and Giuseppe Cerati. Material transactions and events Material transactions and events with an impact on the Group in 2015 are described below: ■ Atlantia’s buyback of 99.87% of the asset-backed securities (ABS – CLASS A4) issued by Romulus
Finance (the special purpose entity controlled by Aeroporti di Roma and consolidated in the

Annual Report 2015 304
Atlantia Group), resulting in non-recurring net financial expenses of €112,832 thousand, before the related taxation;
■ the partial buyback of bonds issued by Atlantia and maturing in 2016, 2017, 2019 and 2020, resulting in non-recurring net financial expenses of €120,677 thousand, before the related taxation. As a result of the above financial transactions, the Group has recognised financial expenses of €233,509 thousand, before the related taxation of €67,568 thousand, resulting in a net impact on the result for the year of €165,941 thousand;
■ new bond issues by Autostrade per l’Italia (“ASPI”), totalling €2,617,531 thousand, including €1,884,610 thousand, as part of the above MTN Programme launched in October 2014 and €732,921 thousand in bonds issued to retail investors;
■ Atlantia’s early redemption of a portion of bonds with a par value of €1,351,250 thousand, maturing in 2016, 2017, 2018 and 2019, accompanied, at the same time, by Autostrade per l’Italia’s repayment of matching loans with the same face value granted to this subsidiary. The resulting impact on the separate and consolidated financial statements are described in the related notes;
■ in May 2015, a fire broke out in Terminal 3 at Fiumicino airport, operated by Aeroporti di Roma. This resulted in both lost aviation and non-aviation revenues and specific costs and provisions having an impact on the operating results of the airports segment;
■ on 11 June 2015, the Group’s Chief Human Resources Officer was appointed the “Employer” pursuant to the legislation governing occupational health and safety (Legislative Decree 81/2008). On the same date, this corporate officer was assigned sole authority and responsibility for ensuring compliance with environmental regulations (Legislative Decree 152/2006);
■ on 16 June 2015, Edizione Srl informed Atlantia that the partial demerger of Sintonia SpA (also “Sintonia”) was effective. in accordance with art. 120 of the CFA and articles 117 et seq. of the Regulations for Issuers, the Company received notification of the new investments, also published by the CONSOB on 24 June 2015;
■ on 10 July 2015, the Board of Directors appointed the following members of the Supervisory Board required by Legislative Decree 231/2001: Attilio Befera, as Coordinator, Giovanni Dionisi, external member, and Concetta Testa, internal member (and currently the Group’s Head of Internal Audit);
■ on 16 October 2015, Atlantia’s Board of Directors approved payment of an interim dividend for 2015 of €0.40 per share, amounting to total of €329 million (based on the number of shares outstanding as at 16 October 2015). On the same date, the independent auditors, Deloitte & Touche SpA (“Deloitte & Touche”), issued the opinion required by article 2433-bis of the Italian Civil Code;
■ as already reported in last year’s Board of Statutory Auditors’ report, on 30 October 2014, the project company, Ecomouv, was notified of the decision to terminate its partnership agreement (the “Agreement”) due to difficulties in implementing the ecotax. Subsequently, on 30 December 2014, the French government informed Ecomouv that it would assume liability for the compensation due as a result of termination of the Agreement. The compensation, totalling a net amount of €403 million, was paid on 2 March 2015, enabling Ecomouv: (i) to recover its investment, including repayment of the borrowings not transferred to the French government, (ii) earn a return on invested capital and (iii) cover the cost of putting Ecomouv into voluntary liquidation, including the cost of safeguarding jobs. The French government also undertook to repurchase the equipment produced by Ecomouv and distributed to operators, and to repay the related project financing. Finally, the obligation to repay the project financing obtained from the company’s banks was assumed directly by the French government;
■ on 10 December 2015, the Ministry of Infrastructure and Transport and ASPI signed the II Addendum to the Single Concession Arrangement, which has added the Casalecchio - Northbound interchange to ASPI’s investment commitments. This project requires a commitment to invest up to a total of approximately €157 million, with around €2 million already invested as at 31 December 2015 to cover the cost of design, and the remainder to be paid to ANAS on the basis of the state of progress of the works. ANAS is to build and then manage the road. The Addendum will be effective once the Minister of Infrastructure and Transport and Minister of the Economy and Finance have issued the relevant decree and it has been registered with the Court of Auditors;

305
■ Enabling Act 11/2016 regarding tenders and concessions, designed to apply the relevant EU directives and reform the regulations governing public contracts, was published in the Official Gazette of 29 January 2016. The legislation has introduced an obligation for public and private entities, which hold an existing or future concession to provide public works or services, to award 80% of the related contracts for works, services or goods, with a value of over €150 thousand, by public tender. The legislation also establishes that the remaining part may be carried out in-house, in the case of public entities, or by direct or indirect subsidiaries or associates in the case of private entities. The legislation provides for a transitional period of adjustment of no more than twenty-four months in the case of existing concessions. The only exclusions from compliance with the above obligation are existing or future concessions awarded in the form of project financing, and existing or future concessions awarded by public tender in accordance with EU law, for which existing legislation governing tenders in force at the date of entry into effect of the enabling act (13 February 2016) will continue to apply. By 18 April 2016, the government is authorised to issue a legislative decree applying the above EU directives, in accordance with the criteria contained in the enabling act;
■ on 21 January 2015, the Board of Directors, with the prior agreement of the Internal Control, Risk and Corporate Governance Committee and having consulted with the Board of Statutory Auditors and the Director Responsible for the Internal Control and Risk Management System, approved the 2015 Audit Plan;
■ on 11 December 2015, the Board of Directors, having noted the results of an assessment and review of of the nature and degree of risk compatible with the Group’s strategic goals, approved Atlantia’s new risk catalogue.
Atypical or unusual transactions The Board of Statutory Auditors has not found evidence of atypical and/or unusual transactions, including intra-group or intra-group and other related party transactions. The Board has also assessed the adequacy of the information provided in the management report on operations, regarding the absence of atypical and/or unusual transactions, including intra-group or intra-group and other related party transactions. Intercompany or related party transactions The Board of Statutory Auditors has verified ordinary or recurring related party and/or intercompany transactions, with regard to which we report the following: ■ intercompany transactions, whether of a trading or financial nature, between subsidiaries and
parents are conducted on an arm’s length basis. Such transactions are adequately described in the Annual Report. In particular, note 10.5 to the consolidated financial statements , “Related party transactions", provides details of the impact on the income statement and financial position of trading and financial transactions between the Group and related parties, including Atlantia’s Directors, Statutory Auditors and key management personnel. Related party transactions did not include atypical and/or unusual transactions and, during 2015, the Atlantia Group did not engage in material trading or financial relations with Atlantia’s direct or indirect parents;
■ with reference to the Atlantia Group’s transactions with other related parties, note 10.5 to the consolidated financial statements states that, for the purposes of the CONSOB Regulations adopted in Resolution 17221 of 12 March 2012, as amended, on 11 November 2010 Atlantia’s Board of Directors, with the prior agreement of the Committee of Independent Directors with responsibility for Related Party Transactions, approved the Procedure for Related Party Transactions entered into directly by the Company and/or indirectly through one of its subsidiaries. The Procedure was subsequently revised by the Board of Directors on 20 February 2014, with the prior agreement of the Committee of Independent Directors with responsibility for Related Party Transactions communicated on 19 February 2014. On 11 December 2015, following the resolution approved by the Board of Directors and with the agreement of the Committee of Independent Directors with responsibility for Related Party Transactions, an amended version of the Procedure was approved in order to reflect organisational changes within Atlantia and the Group and to ensure correct flows of information between the various parties involved in the process;

Annual Report 2015 306
■ with reference to Atlantia’s related party transactions, note 7.2 to the separate financial statements, “Related party transactions”, states that the Company primarily engages in transactions with its wholly-owned subsidiary, ASPI, over which it exercises management and coordination;
■ as a result of the tax consolidation arrangement headed by Atlantia, the statement of financial position as at 31 December 2015 includes current tax assets and liabilities due from and to Group companies of €28,855 thousand and €13,7789 thousand, respectively. The balances refer to IRES deriving the tax assets and liabilities resulting from the tax consolidation arrangement;
■ details of the impact of related party transactions on the results of operations and the financial position as at and for the year ended 31 December 2015 are provided in note 7.2 to the separate financial statements;
■ the “Remuneration Report 2015”, published on the Company’s website and prepared pursuant to art. 123-ter of the CFA, provides details of the remuneration paid to Directors, Statutory Auditors and key management personnel for 2015. Disclosures regarding the remuneration policy are included in the Remuneration Report, which was examined by the Board of Statutory Auditors and agreed on with the Human Resources and Remuneration Committee and the Internal Control, Risk and Corporate Governance Committee.
Impairment testing As required by the joint instructions issued by the Bank of Italy/CONSOB/ISVAP on 3 March 2010, Atlantia’s Board of Directors independently approved the impairment testing procedures and results prior to approval of the financial statements. At a Board meeting held on 12 February 2016, thus preceding the meeting held to approve the financial statements on 4 March 2016, Atlantia’s Board of Directors verified compliance of the impairment testing procedures used with the requirements of IAS 36. Oversight pursuant to the Consolidated Act on Statutory Audits The Consolidated Act on External Audits (Legislative Decree 39/2010) requires the Board of Statutory Auditors (identified in the Consolidated Act as the “Internal and Statutory Audit Committee”) to oversee: (i) the financial reporting process; (ii) the effectiveness of internal control, internal audit and risk management systems; (iii) the statutory audit of the annual and consolidated accounts; (iv) the independence of the independent auditors, checking any services other than auditing
provided. The Board of Statutory Auditors interacted with the Internal Control, Risk and Corporate Governance Committee, a Board committee, with the aim of coordinating expertise, exchanging information, engaging in ongoing consultation and avoiding any overlap between their activities.
* * *
With specific reference to the Consolidated Act on Statutory Audits, the following should be noted. Oversight of the financial reporting process The Board of Statutory Auditors has verified the existence of regulations and procedures governing the process of preparing and publishing financial information. In this regard, the Annual Report on Corporate Governance and the Ownership Structure defines guidelines for the establishment and management of administrative and accounting procedures. The Board of Statutory Auditors, with the assistance of the manager responsible for financial reporting, examined the procedures involved in preparing the Company’s financial statements and the consolidated financial statements, in addition to periodic financial reports. The Board of Statutory Auditors also received information on the process that enables the manager responsible for financial reporting and the Chief Executive Officer to issue the attestations required by art. 154-bis of the CFA. The Board of Statutory Auditors was informed that the administrative/accounting procedures applied in preparation of the financial statements and of all other financial reports are the responsibility of the manager responsible for financial reporting, who together with the Chief Executive Officer attests to

307
their adequacy and effective application in the preparation of the separate and consolidated financial statements and interim half-year report. With reference to the oversight required by art. 19 of Legislative Decree 39/2010, relating to financial reporting, the Board of Statutory Auditors has verified that the administrative and accounting aspects of the internal control system, as they relate to the attestations to be issued by the Chief Executive Officer and the manager responsible for financial reporting, were revised in 2015. The process entailed Group-level analyses of significant entities and the related significant processes, through the mapping of activities carried out to verify the existence of controls (at entity and process level) designed to oversee compliance risk in respect of the law and accounting regulations and standards relating to periodic financial reporting. Effective application of the administrative and accounting procedures was verified by the manager responsible for financial reporting, with the assistance of the relevant internal departments (including the Internal Audit department) and leading firm of consultants. With regard to art. 18-ter of the CONSOB Regulation on Markets (which has introduced requirements for subsidiaries incorporated under, or regulated by, the laws of non-EU states and of material significance for the purposes of the consolidated financial statements), the Group companies to which the regulations are applicable have adopted procedures enabling them to submit reporting packages, for use during preparation of the consolidated financial statements, on a regular basis to the Company’s management and the Parent Company’s independent auditors. On 4 March 2016, the Chief Executive Officer and the manager responsible for financial reporting issued the attestations of the consolidated and separate financial statements required by art. 81-ter of the CONSOB Regulations of 14 May 1999, as amended. Furthermore, in implementing the Audit Plan 2015, the Internal Audit department took the necessary steps to verify the correct application of the instructions contained in the “Financial management and financial risk management policy”, which sets out the principles, organisation and responsibilities relating to the management of financial risks. The Board of Statutory Auditors thus believes the financial reporting process to be adequate and deems that there is nothing to report to the General Meeting. Oversight of the effectiveness of the internal control, internal audit and risk management systems and the statutory audit of the annual and consolidated accounts The Board of Statutory Auditors has assessed and verified the adequacy of the internal control system and the effectiveness of internal control and risk management systems. You will recall that, in order to assess the correct functioning of the internal control system, in 2015 the Board of Directors made use of the Internal Control, Risk and Corporate Governance Committee, the Head of the Internal Audit department (operating with an adequate level of independence and suitably equipped to carry out the assigned role, and reporting on her activities to the Chairman, Chief Executive Officer, the Internal Control, Risk and Corporate Governance Committee and the Board of Statutory Auditors), the Group Controller, the Supervisory Board and the Ethics Officer. In particular, during our periodic meetings with the Head of Internal Audit and the Group Controller (whose department includes Risk Management), the Board of Statutory Auditors was kept fully informed regarding internal auditing activities (with a view to assessing the adequacy and functionality of the internal control system, and compliance with the law and with internal procedures and regulations), and the activities of the Risk Management unit, which is responsible for overseeing the management of risk via correct implementation and development of the COSO Enterprise Risk Management (ERM), a methodological framework that Atlantia has adopted to identify, measure, manage and monitor the risks inherent in the Company’s current Business Risk Model (compliance, regulatory and operational risks). It should be remembered that, on 11 December 2014, the Board of Directors, at the recommendation of the Director Responsible for the Internal Control and Risk Management System, with the prior agreement of the Internal Control, Risk and Corporate Governance Committee and having consulted with the Board of Statutory Auditors, established an Internal Audit department (later named “Group Internal Audit”), effective from 1 January 2015, and appointed, with effect from the same date, the Group’s Head of Internal Audit. In accordance with art. 11.3 of Atlantia’s Corporate Governance Code, “the Head of Internal Audit is responsible for verifying that the internal control and risk management

Annual Report 2015 308
system is properly functioning and fit for purpose”. The same person is required to prepare “periodic reports containing sufficient information on audit activities, the method of risk management and compliance with plans developed for risk mitigation. The periodic reports must contain an assessment of the internal control and risk management system”. On 15 February 2016, the Head of Group Internal Audit issued her report on the fitness of the internal control and risk management system, which supplements the reports prepared periodically and submitted to the Internal Control, Risk and Corporate Governance Committee and the Board of Statutory Auditors, and contains an assessment of whether or not the internal control and risk management system is fit for purpose (to the extent of her responsibilities). This assessment then forms the basis for the overall assessment of the internal control system that Atlantia’s Internal Control, Risk and Corporate Governance Committee submits annually to the Company’s Board of Directors. The report for 2015, issued on 15 February 2016, states that the internal control and risk management system is fit to ensure that the Company is managed in a way that is sound, proper and consistent with pre-established objectives. The Board of Statutory Auditors also expressed a favourable opinion – as explicitly required by art. 7, criterion 7.C.1. of the Corporate Governance Code, on the fixed and variable remuneration to be paid to the Head of Internal Audit for 2015, as fixed by the Board of Directors on the recommendation of the Director Responsible for the Internal Control and Risk Management System, with the agreement of the Internal Control, Risk and Corporate Governance Committee. Subsequently, at its meeting of 8 May 2015, the Board of Directors set out the Risk Appetite level for the Group as a whole, as well as the strategies and objectives to be pursued. At its meeting of 11 December 2015, the Board of Directors heard a presentation on the results of the risk review carried out from the boards of directors of the most important Group companies. Lastly, at its meeting of 4 March 2016 – on the recommendation of the Director Responsible for the Internal Control and Risk Management System, with the agreement of the Internal Control, Risk and Corporate Governance Committee, in consultation with the Board of Statutory Auditors – the Board of Directors set out the guidelines for the internal control and risk management system. Moreover, at the same meeting, after noting the conclusions of the analysis by the Control, Risk and Corporate Governance Committee of the detailed information provided by staff responsible for the internal control and risk management system, the Board of Directors concluded that the internal control and risk management system, as a whole, may be deemed adequate, efficacious and in good working order. In addition, the Board of Statutory Auditors also notes that, during 2015, Atlantia’s Supervisory Board continued its review of the organisational, management and control model (“OMCM”) adopted by Atlantia, pursuant to Legislative Decree 231/2001, in order to ensure that the model had kept pace with changes in legislation and in the Company’s organisational structure during the year. The Supervisory Board dealt with issues arising during its review of the OMCM (its review was in response to the new offences added in the first half of 2015) and drew up a plan of action for monitoring and assessing the adequacy and effective implementation of the OMCM. The Board of Statutory Auditors examined the Supervisory Board’s reports on their activities in the first and second halves of 2015 and do not have anything to mention in this regard in this report. Finally, we declare that: ■ the accounts have been submitted to the required controls by the independent auditors, Deloitte
& Touche, appointed by the Annual General Meeting of 24 April 2012 for the annual reporting periods 2012-2020. During their periodic meetings with the Board of Statutory Auditors, the independent auditors had nothing to report on this matter;
■ with regard to the provisions of art. 19 of Legislative Decree 39/2010, the Board of Statutory Auditors oversaw the audit of the annual and consolidated accounts, obtaining detailed information, during meetings with the independent auditors, on the audit plan, significant aspects of the financial statements and the potential impact of the significant risks highlighted in the financial statements;
■ as noted above, we held periodic meetings during the year with the manager responsible for financial reporting and the head of Internal Audit;
■ the Board of Statutory Auditors, on occasion in the person of its Chairman, participated in the meetings of the Internal Control, Risk and Corporate Governance Committee and of the Human Resources and Remuneration Committee.

309
Independence of the independent auditors, checking any services other than auditing provided ■ the Board of Statutory Auditors verified, also with reference to the provisions of art. 19 of
Legislative Decree 39/2010, the independence of the independent auditors, Deloitte & Touche, checking the nature and entity of any services other than auditing provided to Atlantia, its subsidiaries, Sintonia and entities under common control by the auditors and by their associates. The fees paid by the Atlantia Group to the independent auditors, Deloitte & Touche or associates of Deloitte & Touche, are as follows:
€000
Audit 979
Certification (audit-related) 46
Other services 328
Total 1,353
It should be noted that the category “Other services” (those other than audit or certification) includes €166 thousand for services relating to signature of the Company’s tax return and Form 770, agreed-upon procedures on accounting data and information, comfort letters relating to the issue of bonds and services relating to the internal control system, whilst €162 thousand regards a review of the sustainability report, agreed-upon procedures on accounting data and information and checks on the income tax applied to employees and obligations as a withholding agent. “Other Services” account for 32% of the total fees paid for “Audit” and “Certification (linked to audits)” services. In the light of the above, we therefore deem that the independent auditors, Deloitte & Touche, meet the requirements for independence. Finally, pursuant to art. 13, paragraph 1 of Legislative Decree 39/2010, on 21 January 2015, the Board of Statutory Auditors prepared a reasoned recommendation to Atlantia’s shareholders regarding a request, received from Deloitte & Touche on 29 May 2014, for an annual supplement of €10 thousand to be added to the fees payable for the years between 2014 and 2020, in recognition of an additional workload. Further activities of the Board of Statutory Auditors and disclosures required by the CONSOB In carrying out our duties, as required by art. 2403 of the Italian Civil Code and art. 149 of the CFA, the Board of Statutory Auditors: ■ verified compliance with the law and the articles of association; ■ within the scope of our responsibilities, obtained information on and checked the adequacy of the
Company’s organisational structure and on observance of the principles of good governance, by means of direct observation, the gathering of information from the heads of the various departments and through meetings with the independent auditors with a view to exchanging the relevant data and information; in this regard we have no particular observations to make;
■ assessed and verified the adequacy of the administrative/accounting system and its ability to correctly represent operating activities, by gathering information from the respective heads of department, examining corporate documents and analysing the results of the work carried out by the independent; in this regard we have no particular observations to make;
■ oversaw the methods for implementing the governance rules laid down in Atlantia’s Corporate Governance Code;
■ verified the adequacy of the guidelines communicated by the Company to its subsidiaries pursuant to article 114, paragraph 2 of the CFA;
■ with regard to the provisions of art. 149, paragraph 1.c-bis of the CFA relating to the Board of Statutory Auditors’ supervision “of the methods of actually implementing the corporate governance rules laid down in the corporate governance codes prepared by stock exchange companies and the related trade associations, with which the Company has publicly declared it will comply”, taking account of the fact that art. 15, paragraph 2 of the Corporate Governance Code requires that “Statutory Auditors shall be chosen from people who may be qualified as independent also on the

Annual Report 2015 310
basis of the criteria contained in this Code with reference to Directors” and that “the Board of Statutory Auditors shall check compliance with the above criteria after election and every year thereafter, including the outcome of their checks in the corporate governance report”, at the meeting of 8 May 2015 the Board of Statutory Auditors checked that all the Statutory Auditors meet the independence requirements. In accordance with art. 144 novies, paragraph 1-ter of CONSOB Regulation 11971, the Board of Statutory Auditors notified the outcome of its checks to the Board of Directors for publication:
■ oversaw compliance with the requirements relating to “Market abuse” and “Protections for savers”, as they relate to financial reporting, and those relating to “Internal dealing”, with particular regard to the processing of confidential information and the procedure for publishing news releases and announcements. The Board of Statutory Auditors monitored compliance with the provisions of art. 115-bis of the CFA and the Regulations governing updates of the register of persons with access to confidential information;
■ was informed about the Group’s initiatives with regard to health, safety, the environment and quality, and the related training programmes needed to keep pace with new regulations governing such matters. The Board noted the ongoing attention given to such matters by the Company’s Directors and management and that the relevant policy forms an integral part of its Code of Ethics. We were able to confirm the ongoing commitment to training and improvement and the existence of a formal system for delegating specific duties and responsibilities;
■ notes that the Atlantia Group has revised its security policies with a view to ensuring adequate levels of data protection, which are managed in application of the Data Protection Code (Legislative Decree 196/2003) and the directives issued by the Information Commissioner.
With specific regard to our examination of the financial statements as at and for the year ended 31 December 2015, the consolidated financial statements and the report on operations, the Board of Statutory Auditors states the following: ■ we have checked the overall basis of presentation of the separate and consolidated financial
statements and their general compliance with the laws relating to their preparation and structure; ■ we have checked the reasonableness of the valuation procedures applied and their compliance
with the requirements of IFRS; ■ we have verified that the financial statements are consistent with the information in our
possession, as a result of carrying out our duties, and have no particular observations to make in this regard;
■ to the best of the Board of Statutory Auditors’ knowledge, in preparing the financial statements, the Directors did not elect to apply any of the exemptions permitted by art. 2423, paragraph 4 of the Italian Civil Code;
■ we verified compliance with the laws governing preparation of the management report on operations and have no particular observations to make in this regard;
■ we note that, as described in the Introduction to the section “Financial review for Atlantia SpA” in the report on operations, the Company has presented the reclassified consolidated income statement, the consolidated statement of comprehensive income, the statement of changes in consolidated equity and the statement of changes in consolidated net debt for the year ended 31 December 2015, and the reclassified consolidated statement of financial position as at 31 December 2015, which include comparative amounts for the previous year. In the Introduction to the “Group financial review”, it is reported that the scope of consolidation at 31 December 2015 differs from that used in the consolidated financial statements for the year ended 31 December 2014, following the acquisition of control of Autostrada Tirrenica SpA following the completion, in September 2015, of Autostrade per l’Italia’s purchase of a 74.95% interest in this company. When added to Autostrade per l’Italia’s existing 24.98% interest in the company, the Group’s total interest amounts to 99.93%. The acquired company’s income and expenses for the fourth quarter of 2015 and its assets and liabilities at 31 December 2015 have been included in the consolidated financial statements. Finally, it is stated that the reclassified financial statements analysed in the “Group financial review” have not been independently audited.
Moreover, the Board of Statutory Auditors:

311
■ pursuant to art. 150, paragraphs 1 and 2 of the CFA: (i) obtained reports from the Directors, on at least a quarterly basis, providing adequate information on the Company’s activities and on transactions carried out by the Company and its subsidiaries with a major impact on the Company’s results of operations, financial position and cash flow, ensuring that the actions decided on and carried out were in compliance with the law and the articles of association, were not subject to any potential conflict of interest or contrary to the resolutions adopted by the General Meeting, and were not clearly imprudent or risky or such as to compromise the value of the Company; (ii) held meetings with representatives of the independent auditors and no significant information that should be included in this report has come to light;
■ pursuant to art. 151, paragraphs 1 and 2 of the CFA, exchanged information with the board of statutory auditors of Atlantia’s direct subsidiaries (ASPI, ADR, Pavimental SpA and Spea Engineering SpA) regarding activities carried out during the year;
■ received information from the Supervisory Board on its activities, which did not find any problems or significant irregularities;
■ notes that the Annual Report on Corporate Governance and the Ownership Structure, in compliance with the related legal and regulatory obligations, contains information on the ownership structure, application of the codes of conduct and fulfilment of the resulting commitments, highlighting the choices made by the Company in applying corporate governance standards;
■ with regard to the periodic assessment to be conducted in accordance with the Corporate Governance Code, the Directors issued the necessary representations confirming their compliance with the relevant independence requirements, as established by art. 148, paragraph 3 of Legislative Decree 58/1998 (referred to in art. 147-ter, paragraph 4 of Legislative Decree 58/1998) and art. 3.1 of Atlantia’s Corporate Governance Code.
The Board of Statutory Auditors states that: ■ we issued a favourable opinion, pursuant to art. 2389, paragraph 3 of the Italian Civil Code,
regarding the remuneration of executive Directors; ■ we did not issue further opinions during the year, other than those referred to above; ■ no complaints have been lodged under art. 2408 of the Italian Civil Code, and no petitions of any
kind have been presented. With regard to the independent auditors, the Board of Statutory Auditors reports that Deloitte & Touche: ■ on 15 March 2016, provided their annual confirmation of independence pursuant to art. 17,
paragraph 9.a) of Legislative Decree 39/2010; ■ on 30 March 2016, issued their report containing their opinion on the fact that the separate and
consolidated financial statements comply with the applicable laws and accounting standards, and their opinion on the consistency of the report on operations with the financial statements. The report does not contain any reservations or additional information.
The above audit procedures were carried out during 16 meetings of the Board of Statutory Auditors (including 6 attended by the outgoing Board and 10 by the current Board), by taking part in 12 meetings of the Board of Directors, and through the participation of the Chairman of the Board of Statutory Auditors, or another Auditor, in meetings of the Internal Control, Risk and Corporate Governance Committee, the Human Resources and Remuneration Committee and the Committee of Independent Directors with responsibility for Related Party Transactions, and participation in the Annual General Meeting of shareholders held on 24 April 2015. In addition, as a result of the audit procedures carried out and on the basis of the information obtained from the independent auditors, we are not aware of any negligence, fraud, irregularities or any other material events, that would require a report to be made to regulatory bodies. Proposal to the Annual General Meeting The Board of Statutory Auditors is in favour of approval of the financial statements for the year ended 31 December 2015 and has no objections regarding the Board of Directors’ proposal for the appropriation of profit for the year. Election of the new Board of Directors

Annual Report 2015 312
The term of office of the Board of Directors elected by the Annual General Meeting of 30 April 2013 expires with approval of the financial statements for the year ended 31 December 2015. You are thus invited, in accordance with the law and the Company’s articles of association, to elect a new Board of Directors.
***
Pursuant to art. 144 quinquiesdecies of the Regulations for Issuers, approved by the CONSOB with Resolution 11971/99, as amended, the list of positions held by members of the Board of Statutory Auditors at the companies in Book V, Section V, Chapters V, VI and VII of the Italian Civil Code is published by the CONSOB on its website (www.consob.it).
*** 30 March 2016 Corrado Gatti (Chairman) ____________________________ Alberto De Nigro (Auditor) ____________________________ Lelio Fornabaio (Auditor) ____________________________ Silvia Olivotto (Auditor) ____________________________ Livia Salvini (Auditor) ____________________________

313
Independent Auditors’ Report

Annual Report 2015 314

315

Annual Report 2015 316

317
This page intentionally left blank

Annual Report 2015 318
Key performance indicators for
subsidiaries, associates and joint
ventures pursuant to art. 2429,
paragraphs 3 and 4 of the Italian Civil Code 6

319
Key indicators extracted from the financial statements of subsidiaries, associates and joint ventures, as defined by paragraphs 3 and 4 of art. 2429 of the Italian Civil Code The figures provided below were extracted from the most recent financial statements of Atlantia’s subsidiaries
and joint ventures, as approved by their respective boards of directors. The companies’ reporting date is 31
December of each year, unless otherwise indicated.
Autostrade per l’Italia SpA and Aeroporti di Roma SpA prepare their financial statements in accordance with
international financial reporting standards, whereas the other companies’ financial statements are prepared in
accordance with accounting principles generally accepted in their countries.
Subsidiaries
Aeroporti di Roma SpA
€000 FINANCIAL POSITION 31 December 2015 31 December 2014
Non-current assets 2,231,667 2,163,470
Current assets 554,415 610,050
Total assets 2,786,082 2,773,520
Equity 1,128,704 1,126,311
of which issued capital 62,225 62,225
Liabilities 1,657,378 1,647,209
Total equity and liabilities 2,786,082 2,773,520
€000 RESULTS OF OPERATIONS 2015 2014
Operating income 941,220 804,767
Operating costs -692,693 -558,795
Operating profit/(loss) 248,527 245,972
Profit/(Loss) for the period 134,556 131,023
Autostrade per l'Italia SpA
€000 FINANCIAL POSITION 31 December 2014 31 December 2013
Non-current assets 19,779,305 19,685,369
Current assets 2,259,732 4,483,643
Total assets 22,039,037 24,169,012
Equity 2,268,554 2,304,278
of which issued capital 622,027 622,027
Liabilities 19,770,483 21,864,734
Total equity and liabilities 22,039,037 24,169,012
€000 RESULTS OF OPERATIONS 2014 2013
Operating income 3,646,013 3,565,855
Operating costs -2,217,086 -2,112,734
Operating profit/(loss) 1,428,927 1,453,121
Profit/(Loss) for the period 703,531 809,810

6. Key performance indicators for subsidiaries,
associates and joint ventures pursuant to art. 2429,
paragraphs 3 and 4 of the Italian Civil Code
Annual Report 2015 320
Fiumicino Energia Srl
€000 FINANCIAL POSITION 31 December 2015 31 December 2014
Non-current assets 4,200 4,332
of which non-current investments 266 266
Current assets 5,677 4,209
Other assets 96 109
Total assets 9,973 8,650
Equity 9,343 8,117
of which issued capital 742 742
Provisions and post-employment benefits 13 10
Payables 617 523
Other liabilities - -
Total equity and liabilities 9,973 8,650
€000 RESULTS OF OPERATIONS 2015 2014
Value of production 6,502 8,022
Costs of production -4,779 -4,546
Operating profit/(loss) 1,723 3,476
Profit/(Loss) for the period 1,226 2,139
Mizard Srl
€000 FINANCIAL POSITION 31 December 2015 31 December 2014
Non-current assets - -
of which non-current investments - -
Current assets 14 15
Other assets - -
Total assets 14 15
Equity 14 15
of which issued capital 10 10
Provisions and post-employment benefits - -
Payables - -
Other liabilities - -
Total equity and liabilities 14 15
€000 RESULTS OF OPERATIONS 2015 2014
Value of production - -
Costs of production -1 -1
Operating profit/(loss) -1 -1
Profit/(Loss) for the period -1 -1

321
Pavimental SpA
€000 FINANCIAL POSITION 31 December 2015 31 December 2014
Non-current assets 58,290 40,625
of which non-current investments 5,397 5,396
Current assets 313,007 327,397
Other assets 6,038 4,029
Total assets 377,335 372,051
Equity 49,295 41,537
of which issued capital 10,116 10,116
Provisions and post-employment benefits 11,356 9,661
Payables 316,641 320,848
Other liabilities 43 5
Total equity and liabilities 377,335 372,051
€000 RESULTS OF OPERATIONS 2015 2014
Value of production 510,984 402,122
Costs of production -495,441 -393,786
Operating profit/(loss) 15,543 8,336
Profit/(Loss) for the period 7,764 3,047
SPEA Engineering SpA (1)
€000 FINANCIAL POSITION 31 December 2015 31 December 2014
Non-current assets 6,913 6,944
of which non-current investments 634 634
Current assets 164,753 126,983
Other assets 840 613
Total assets 172,506 134,540
Equity 87,370 60,132
of which issued capital 6,966 5,160
Provisions and post-employment benefits 23,954 21,061
Payables 61,182 53,347
Other liabilities - -
Total equity and liabilities 172,506 134,540
€000 RESULTS OF OPERATIONS 2015 2014
Value of production 109,508 79,045
Costs of production -84,627 -63,143
Operating profit/(loss) 24,881 15,902
Profit/(Loss) for the period 16,408 9,772
(1) Amounts for 2014 refer to Spea Ingegneria Europea, which absorbed ADR Engineering SpA, with effect from 1 June 2015,
changing its name to Spea Engineering SpA.

6. Key performance indicators for subsidiaries,
associates and joint ventures pursuant to art. 2429,
paragraphs 3 and 4 of the Italian Civil Code
Annual Report 2015 322
Associates and joint ventures
PuneSolapur Expressways Private Ltd
THOUSANDS OF RUPEES FINANCIAL POSITION
31 March
2015
31 March
2014
Non-current assets 13,421,264 12,698,167
Current assets 270,162 322,554
Total assets 13,691,426 13,020,721
Equity 3,698,483 3,797,544
of which issued capital 47,734 47,734
Liabilities 9,992,943 9,223,177
Total equity and liabilities 13,691,426 13,020,721
THOUSANDS OF RUPEES RESULTS OF OPERATIONS
1 April 2014 -
31 March
2015
1 April 2013 -
31 March
2014
Operating income 1,231,619 1,010,366
Operating costs -422,228 -401,254
Operating profit/(loss) 809,391 609,112
Profit/(Loss) for the period -187,994 -136,386

323
This page intentionally left blank

Annual Report 2015 324
Legal information and contacts
Registered office
Via Antonio Nibby 20 - 00161 Rome
Tel. +39 06 44172652
Fax +39 06 44172696
www.atlantia.it
Legal information
Issued capital: €825,783,990.00, fully paid-up.
Tax code, VAT number and Rome Companies’
Register no. 03731380261
REA no. 1023691
Investor Relations
e-mail: [email protected]
Media Relations
e-mail: [email protected]

325
www.atlantia.it


