35
Annual Report December 31, 2020 Goldman Sachs Finance Corp International Ltd Company Number: 122341

Annual Report December 31, 2020 Goldman Sachs Finance Corp International Ltd Company Number: 122341

GOLDMAN SACHS FINANCE CORP INTERNATIONAL LTD ANNUAL REPORT FOR THE FINANCIAL YEAR ENDED DECEMBER 31, 2020
1
INDEX
Page No.
Part I
Management Report 2
Introduction 2
Executive Overview 2
Business Environment 3
Principal Risks and Uncertainties 3
Date of Authorisation of Issue 4
Page No. .
Part II
Directors’ Report and Audited Financial Statements 5
Directors’ Report 5
Independent Auditors’ Report 6
Income Statement 13
Statement of Comprehensive Income 13
Balance Sheet 14
Statement of Changes in Equity 15
Statement of Cash Flows 15
Notes to the Financial Statements 16
Note 1. General Information 16
Note 2. Basis of Preparation 16
Note 3. First Time Adoption of IFRS 16
Note 4. Summary of Significant Accounting Policies 18
Note 5. Critical Accounting Estimates and Judgements 22
Note 6. Net Revenues 22
Note 7. Operating Expenses 22
Note 8. Compensation and Benefits 22
Note 9. Income Tax Expense 23
Note 10. Customer and Other Receivables 23
Note 11. Derivative Assets and Liabilities 23
Note 12. Intercompany Loans 23
Note 13. Customer and Other Payables 23
Note 14. Unsecured Borrowings 23
Note 15. Share Capital 24
Note 16. Statement of Cash Flows Reconciliations 25
Note 17. Financial Commitments and Contingencies 25
Note 18. Maturity of Assets and Liabilities 25
Note 19. Related Party Disclosures 26
Note 20. Financial Instruments 27
Note 21. Fair Value Measurement 29
Note 22. Financial Risk Management and Capital Management 33
GOLDMAN SACHS FINANCE CORP INTERNATIONAL LTD
Management Report
2
Introduction
Goldman Sachs Finance Corp International Ltd (the company)
issues warrants, certificates and notes (debt securities) in a
number of European and Asian markets. The company is
exposed to interest rate, equity price, currency rate and credit-
related risks on its debt securities issued and manages these risks
by entering into over-the-counter (OTC) derivative transactions
with affiliates. The company issues debt securities primarily to
raise funding which is lent to affiliates.
The company’s ultimate parent undertaking and controlling
entity is The Goldman Sachs Group, Inc. (Group Inc.). Group
Inc. is a bank holding company and a financial holding company
regulated by the Board of Governors of the Federal Reserve
System. Group Inc., together with its consolidated subsidiaries
(GS Group affiliates), form “GS Group”. GS Group is a leading
global financial institution that delivers a broad range of
financial services across investment banking, securities,
investment management and consumer banking to a large and
diversified client base that includes corporations, financial
institutions, governments and individuals. The debt securities
issued by the company are fully and unconditionally guaranteed
by Group Inc. The company’s results prepared under United
States Generally Accepted Accounting Principles (U.S. GAAP)
are included in the consolidated financial statements of GS
Group.
References to “the financial statements” are to the directors’
report and audited financial statements as presented in Part II of
this annual report. All references to 2020 and 2019 refer to the
years ended, or the dates, as the context requires, December 31,
2020 and December 31, 2019, respectively.
During the year ended December 2020, the company adopted
International Financial Reporting Standards (IFRS) having
previously prepared financial statements in accordance with
United Kingdom Generally Accepted Accounting Practices
(U.K. GAAP). As such, the company has applied the provisions
of IFRS 1 ‘First-Time Adoption of International Financial
Reporting Standards’ (IFRS 1) in the preparation of this annual
report.
Executive Overview
Income Statement
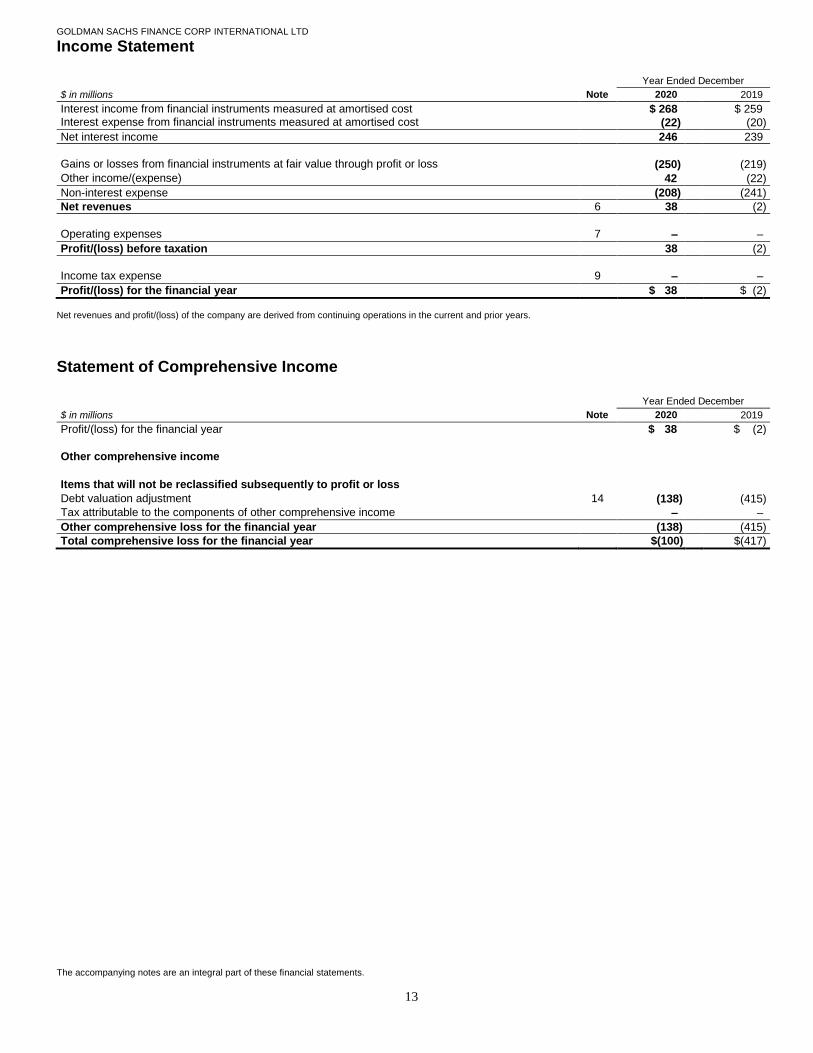
The income statement is set out on page 13 of this annual report.
The company made a gain of $38 million for 2020, compared to
a loss of $2 million for 2019. The company’s gain of $38 million
for 2020 was primarily driven by net gains from the company’s
issuance, hedging and lending activity.
Other Comprehensive Income
The statement of comprehensive income is set out on page 13 of
this annual report. The company’s other comprehensive income,
which relates to the company’s debt valuation adjustment
(DVA), was a loss of $138 million for 2020, compared to a loss
of $415 million for 2019.
Balance Sheet
The balance sheet is set out on page 14 of this annual report. As
of December 2020, total assets were $15.52 billion, an increase
of $2.93 billion from December 2019, mainly reflecting an
increase in intercompany loans. As of December 2020, total
liabilities were $15.47 billion, an increase of $2.90 billion from
December 2019, mainly reflecting an increase in debt securities
issued.
Future Outlook
The directors consider that the year-end financial position of the
company was satisfactory and no significant change in the
company’s principal business activities is currently expected.
As at the time of publication, there continues to be uncertainty
regarding the impact of coronavirus (COVID-19) on the near
term economic outlook, even as efforts to distribute vaccines are
underway. While the company continues to successfully ensure
continuity of business operations on behalf of its clients, the
extent of the impact of COVID-19 on the company’s operational
and financial performance, will depend on future developments,
including the duration and continued spread of the outbreak.

GOLDMAN SACHS FINANCE CORP INTERNATIONAL LTD
Management Report
3
Business Environment
In the beginning of 2020, the spread of COVID-19 across the
globe and the accompanying temporary closures of non-
essential businesses and stay-at-home requirements caused a
sharp contraction in global economic activity, widespread
unemployment, high levels of volatility across most financial
assets and global markets, an unprecedented decline in global
equity prices, and a significant widening of credit spreads.
Global central banks responded quickly with accommodative
monetary policy by reducing policy interest rates and increasing
large scale asset purchases, and the establishment of a number
of facilities to support the functioning of markets and to provide
liquidity to markets. In addition, governments globally
intervened with fiscal policy to mitigate the impact, which
provided economic relief to businesses and individuals. These
monetary and fiscal interventions, combined with the reopening
of businesses and relaxation of earlier lockdowns, contributed to
a sharp rebound in global economic activity during the second
half of 2020. As a result, investors became more optimistic
towards the prospect of a quicker economic recovery and a
return to pre-pandemic levels, effecting sharp increases in equity
prices and tighter credit spreads. Late in the year, medical
professionals developed effective COVID-19 vaccines and
governments began to distribute them globally, which is
expected to reduce virus spread and further aid economic
recovery.
Despite broad improvements in the overall economy since the
pandemic began, there continues to be uncertainty related to the
prospects for economic growth, virus resurgence, vaccine
distribution, further fiscal stimulus and geopolitical risks.
Principal Risks and Uncertainties
The company faces a variety of risks that are substantial and
inherent in its business.
The principal risks and uncertainties that the company faces are:
market risk, liquidity risk, credit risk, operational risk, legal and
regulatory risk and market development. These risks have been
summarised below. For further information about the risk
factors that impact GS Group, see GS Group’s Annual Report
on Form 10-K for the year ended December 31, 2020 in Part 1,
Item 1A.
Economic and Market Conditions
The company is primarily involved in the issuance of debt
securities in a number of markets and the proceeds from these
debt securities are lent to affiliates. The company also enters into
derivative transactions with affiliates for hedging purposes. The
activity of the company and its annual issuance volume is
affected both by positive and negative developments in the
markets where it carries out its business activity. A difficult
general economic situation may lead to a lower issuance
volume. The market of these debt securities depends particularly
on the development of capital markets, which are in turn
affected by the general situation of the world economy, as well
as the economic and political conditions in the respective
countries.
Commercial Activity
The company was established only for the purpose of issuing
debt securities, lending these proceeds to affiliates and entering
into derivative transactions with affiliates for hedging purposes,
and does not carry out any other operating business activities.
The company is an indirect, wholly-owned subsidiary of Group
Inc. and depends on Group Inc. for capital. All of the company’s
unsecured debt issuances are guaranteed by Group Inc. If the
company fails or goes bankrupt, an investment in a security may
mean a complete loss of the invested amount if the loss cannot
be satisfied by the guarantee from Group Inc. The debt securities
are not covered by a deposit protection fund or similar safety
system in relation to the claims of holders of debt securities in
the case of an insolvency of the company.
Liquidity
The credit ratings of Group Inc. are important to the company’s
liquidity. A reduction in Group Inc.’s credit ratings could
adversely affect the company’s liquidity and competitive
position, increase borrowing costs or limit access to the capital
markets. There is no rating of the company regarding its credit
risk by renowned rating agencies, such as Moody’s Investors
Service or Standard & Poor’s Ratings Services.
The company’s liquidity could be impaired by an inability to
access unsecured debt markets, an inability to access funds from
Group Inc., or unforeseen outflows of cash.

GOLDMAN SACHS FINANCE CORP INTERNATIONAL LTD
Management Report
4
Credit Markets
Widening credit spreads for Group Inc., as well as significant
declines in the availability of credit, could adversely affect the
company’s ability to borrow on an unsecured basis. The
company issues debt securities, the proceeds of which are
onward lent to Group Inc. and/or GS Group affiliates. Any
disruptions in the credit markets may make it harder and more
expensive to obtain funding for GS Group’s businesses.
Reliance on GS Group
The company is a wholly-owned subsidiary of Group Inc. As a
wholly-owned subsidiary, the company relies on various
business relationships of Group Inc. and other GS Group
affiliates generally, including the ability to receive various
services, as well as, in part, the capital and liquidity of the
company’s ultimate parent, Group Inc. The company remains an
operating subsidiary of a larger organisation and therefore its
interconnectedness within the organisation will continue.
Because the company’s business relies upon Group Inc. and
other GS Group affiliates to a significant extent, risks that could
affect these entities could also have a significant impact on the
company.
Furthermore, the company relies upon certain GS Group
affiliates for various support services, including, but not limited
to, trade execution, relationship management, settlement and
clearing, risk management and other technical, operational and
administrative services.
As a consequence of the foregoing, in the event the company’s
relationships with other GS Group affiliates are not maintained,
for any reason, including as a result of possible strategic
decisions that Group Inc. may make from time-to-time or as a
result of material adverse changes in Group Inc.’s performance,
the company’s net revenues may decline, the cost of operating
and funding its business may increase and the company’s
business, financial condition and profitability may be materially
and adversely affected.
Changes in Underliers
The company’s business and its funding may be adversely
affected by changes in the reference rates, currencies, indexes,
baskets, exchange-traded funds or other financial metric (the
underlier) to which the products issued by the company are
linked, in particular by changes in or the discontinuance of
Interbank Offered Rates (IBORs), in particular LIBOR.
The discontinuation of an IBOR, changes in an IBOR or changes
in market acceptance of any IBOR as a reference rate may also
adversely affect the amounts paid on debt securities the
company has issued, amounts received and paid on derivative
instruments the company has entered into, the value of such debt
securities or derivative instruments, the trading market for debt
securities, the company’s ability to effectively use derivative
instruments to manage risk, or the availability or cost of its
floating-rate funding and its exposure to fluctuations in interest
rates.
Date of Authorisation of Issue
The management report was authorised for issue by the Board
of Directors on April 26, 2021.
By order of the board
K. G. Kochar
Director
April 30, 2021

GOLDMAN SACHS FINANCE CORP INTERNATIONAL LTD
Directors’ Report
5
The directors present their report and the audited financial
statements for the year ended December 2020.
Dividends
The directors do not recommend the payment of an ordinary
dividend for the year ended December 2020.
Disclosure of Information to Auditors
In the case of each of the persons who are directors of the
company at the date when this report was approved:
So far as each of the directors is aware, there is no relevant
audit information of which the company’s auditors are
unaware; and
Each of the directors has taken all the steps that they ought to
have taken as a director to make themselves aware of any
relevant audit information and to establish that the company’s
auditors are aware of that information.
Independent Auditors
PricewaterhouseCoopers LLP have indicated their willingness
to continue in office as auditors of the company.
Statement of Directors’ Responsibilities
The directors are responsible for preparing the management
report, the directors’ report and the financial statements in
accordance with applicable law and regulations. Company law
requires the directors to prepare accounts for each financial year
which give a true and fair view of the state of affairs of the
company as at the end of the financial year and of the profit or
loss of the company for that year. The directors have prepared
the financial statements in accordance with applicable
accounting standards in conformity with the requirements of the
Companies (Jersey) Law 1991 and International Financial
Reporting Standards (IFRS) as adopted in the E.U. In preparing
those accounts, the directors are required to:
Select suitable accounting policies and then apply them
consistently;
Make judgements and estimates that are reasonable and
prudent;
State whether applicable accounting standards in conformity
with the requirements of the Company (Jersey) Law 1991 and
IFRS as adopted in the E.U. have been followed, subject to any
material departures disclosed and explained in the financial
statements; and
Prepare the accounts on the going concern basis unless it is
inappropriate to presume that the company will continue in
business.
The directors confirm that they have complied with the above
requirements in preparing the financial statements.
The directors are responsible for keeping adequate accounting
records which disclose with reasonable accuracy at any time the
financial position of the company and to enable them to ensure
that the accounts comply with the Companies (Jersey) Law
1991. They are also responsible for safeguarding the assets of
the company and, hence, for taking reasonable steps for the
prevention and detection of fraud and other irregularities.
The directors confirm to the best of their knowledge:
The financial statements, prepared in accordance with
applicable accounting standards in conformity with the
requirements of the Companies (Jersey) Law 1991 and IFRS
as adopted in the E.U., give a true and fair view of the assets,
liabilities, financial position and profit or loss of the company;
and
The management report includes a fair review of the
development and performance of the business and the position
of the company, together with a description of the principal
risks and uncertainties that the company faces.
Directors
There were no changes in the directorship of the company
between the date of issue of this financial report and the 2019
Annual Report.
No director had, at the year end, any interest requiring note
herein.
Date of Authorisation of Issue
The financial statements were authorised for issue by the Board
of Directors on April 26, 2021.
By order of the board
K. G. Kochar
Director
April 30, 2021
Independent auditors’ report to the member of Goldman Sachs Finance Corp International Ltd
6
Report on the audit of the financial
statements
Opinion
In our opinion, Goldman Sachs Finance Corp International Ltd’s
financial statements:
give a true and fair view of the state of the company’s affairs
as at December 31, 2020 and of its profit and cash flows for
the year then ended;
have been properly prepared in accordance with International
Financial Reporting Standards as adopted in the European
Union; and
have been prepared in accordance with the requirements of the
Companies (Jersey) Law 1991.
We have audited the financial statements, included within the
Annual Report, which comprise: the balance sheet as at
December 31, 2020; the income statement and the statement of
comprehensive income, the statement of cash flows and the
statement of changes in equity for the year then ended; and the
notes to the financial statements, which include a description of
the significant accounting policies.
Basis for opinion
We conducted our audit in accordance with International
Standards on Auditing (UK) (“ISAs (UK)”) and applicable law.
Our responsibilities under ISAs (UK) are further described in
the Auditors’ responsibilities for the audit of the financial
statements section of our report. We believe that the audit
evidence we have obtained is sufficient and appropriate to
provide a basis for our opinion.
Independence
We remained independent of the company in accordance with
the ethical requirements that are relevant to our audit of the
financial statements in the UK, which includes the Financial
Reporting Council (“FRC”)’s Ethical Standard, as applicable to
listed entities, and we have fulfilled our other ethical
responsibilities in accordance with these requirements.
Our audit approach
Overview Audit scope. We perform a full scope audit of the financial
statements of the company as a whole as a single component.
The scope of the audit and the nature, timing and extent of audit
procedures were determined by our risk assessment, the
financial significance of financial statement line items and
qualitative factors (including history of misstatement through
fraud or error).
Key audit matters.
Valuation of debt securities issued designated at fair value
through profit and loss and the associated derivatives recorded
at fair value.
Impact of COVID-19 on the financial statements.
Materiality.
Overall materiality: $155 million (2019: $126 million) based
on 1% of total assets.
Performance materiality: $116 million (2019: $94 million).
The scope of our audit
As part of designing our audit, we determined materiality and
assessed the risks of material misstatement in the financial
statements.
Capability of the audit in detecting irregularities,
including fraud
Irregularities, including fraud, are instances of non-compliance
with laws and regulations. We design procedures in line with
our responsibilities, outlined in the Auditors’ responsibilities for
the audit of the financial statements section, to detect material
misstatements in respect of irregularities, including fraud. The
extent to which our procedures are capable of detecting
irregularities, including fraud, is detailed below.

Independent auditors’ report to the member of Goldman Sachs Finance Corp International Ltd
7
Based on our understanding of the company and industry, we
identified that the principal risks of non-compliance with laws
and regulations, including those that have a direct impact on the
preparation of the financial statements such as the Companies
(Jersey) Law 1991, and the extent to which non-compliance
might have a material effect on the financial statements. We
evaluated management’s incentives and opportunities for
fraudulent manipulation of the financial statements (including
the risk of override of controls), and determined that the
principal risks were related to the posting of inappropriate
journal entries and management bias through the manipulation
of the valuation of financial instruments held at fair value. Audit
procedures performed by the engagement team included:
● Discussions with management and those charged with
governance in relation to known or suspected instances of non-
compliance with laws and regulations and fraud;
● Evaluating and testing of the operating effectiveness of
management’s controls designed to prevent and detect fraud
in financial reporting;
● Assessing matters reported on the company’s whistleblowing
helpline and the results of management’s investigation of such
matters;
● Identifying and testing journal entries, in particular any journal
entries posted by senior management;
● Challenging assumptions and judgments made by
management in their significant accounting estimates, in
particular in relation to the valuation of financial assets and
liabilities measured at fair value; and
● Incorporating unpredictability into the nature, timing and/or
extent of our testing.
There are inherent limitations in the audit procedures described
above. We are less likely to become aware of instances of non-
compliance with laws and regulations that are not closely related
to events and transactions reflected in the financial statements.
Also, the risk of not detecting a material misstatement due to
fraud is higher than the risk of not detecting one resulting from
error, as fraud may involve deliberate concealment by, for
example, forgery or intentional misrepresentations, or through
collusion.
Key audit matters
Key audit matters are those matters that, in the auditors’
professional judgement, were of most significance in the audit
of the financial statements of the current period and include the
most significant assessed risks of material misstatement
(whether or not due to fraud) identified by the auditors,
including those which had the greatest effect on: the overall
audit strategy; the allocation of resources in the audit; and
directing the efforts of the engagement team. These matters, and
any comments we make on the results of our procedures thereon,
were addressed in the context of our audit of the financial
statements as a whole, and in forming our opinion thereon, and
we do not provide a separate opinion on these matters. This is
not a complete list of all risks identified by our audit.
The key audit matters below are consistent with the prior period.
Independent auditors’ report to the member of Goldman Sachs Finance Corp International Ltd
8
Key audit matter How our audit addressed the key audit matter
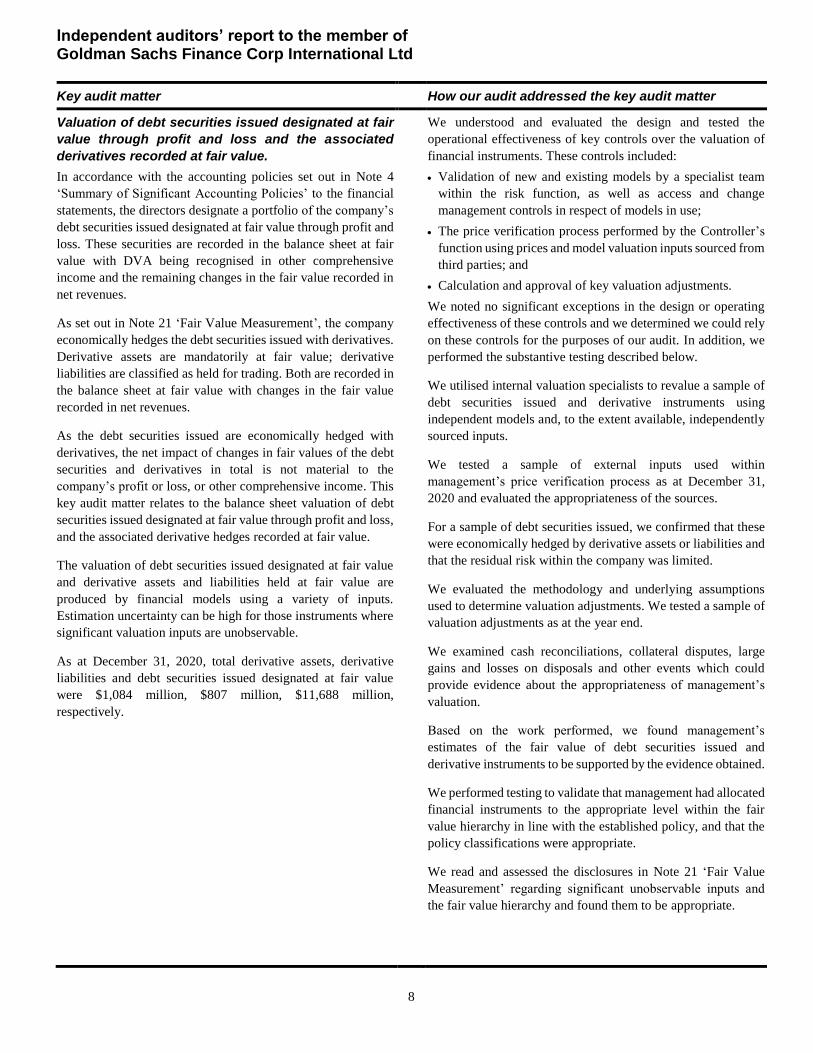
Valuation of debt securities issued designated at fair
value through profit and loss and the associated
derivatives recorded at fair value.
In accordance with the accounting policies set out in Note 4
‘Summary of Significant Accounting Policies’ to the financial
statements, the directors designate a portfolio of the company’s
debt securities issued designated at fair value through profit and
loss. These securities are recorded in the balance sheet at fair
value with DVA being recognised in other comprehensive
income and the remaining changes in the fair value recorded in
net revenues.
As set out in Note 21 ‘Fair Value Measurement’, the company
economically hedges the debt securities issued with derivatives.
Derivative assets are mandatorily at fair value; derivative
liabilities are classified as held for trading. Both are recorded in
the balance sheet at fair value with changes in the fair value
recorded in net revenues.
As the debt securities issued are economically hedged with
derivatives, the net impact of changes in fair values of the debt
securities and derivatives in total is not material to the
company’s profit or loss, or other comprehensive income. This
key audit matter relates to the balance sheet valuation of debt
securities issued designated at fair value through profit and loss,
and the associated derivative hedges recorded at fair value.
The valuation of debt securities issued designated at fair value
and derivative assets and liabilities held at fair value are
produced by financial models using a variety of inputs.
Estimation uncertainty can be high for those instruments where
significant valuation inputs are unobservable.
As at December 31, 2020, total derivative assets, derivative
liabilities and debt securities issued designated at fair value
were $1,084 million, $807 million, $11,688 million,
respectively.
We understood and evaluated the design and tested the
operational effectiveness of key controls over the valuation of
financial instruments. These controls included:
Validation of new and existing models by a specialist team
within the risk function, as well as access and change
management controls in respect of models in use;
The price verification process performed by the Controller’s
function using prices and model valuation inputs sourced from
third parties; and
Calculation and approval of key valuation adjustments.
We noted no significant exceptions in the design or operating
effectiveness of these controls and we determined we could rely
on these controls for the purposes of our audit. In addition, we
performed the substantive testing described below.
We utilised internal valuation specialists to revalue a sample of
debt securities issued and derivative instruments using
independent models and, to the extent available, independently
sourced inputs.
We tested a sample of external inputs used within
management’s price verification process as at December 31,
2020 and evaluated the appropriateness of the sources.
For a sample of debt securities issued, we confirmed that these
were economically hedged by derivative assets or liabilities and
that the residual risk within the company was limited.
We evaluated the methodology and underlying assumptions
used to determine valuation adjustments. We tested a sample of
valuation adjustments as at the year end.
We examined cash reconciliations, collateral disputes, large
gains and losses on disposals and other events which could
provide evidence about the appropriateness of management’s
valuation.
Based on the work performed, we found management’s
estimates of the fair value of debt securities issued and
derivative instruments to be supported by the evidence obtained.
We performed testing to validate that management had allocated
financial instruments to the appropriate level within the fair
value hierarchy in line with the established policy, and that the
policy classifications were appropriate.
We read and assessed the disclosures in Note 21 ‘Fair Value
Measurement’ regarding significant unobservable inputs and
the fair value hierarchy and found them to be appropriate.

Independent auditors’ report to the member of Goldman Sachs Finance Corp International Ltd
9
Key audit matter How our audit addressed the key audit matter
Impact of COVID-19 on the financial statements
The global pandemic generated significant volatility in global
financial markets and caused disruption to normal patterns of
business activity around the world. Given the pervasive effect
of the pandemic on macroeconomic events and financial
markets, as well as the possible disruption to the company’s
operations and the conduct of our audit, this represents a key
audit matter.
As described in the Management Report, the directors have
assessed that there has been no significant disruption to the
company’s operations.
The Directors have considered the impact of the pandemic on
the company’s ability to continue as a going concern. Based on
recent and forecast financial performance and the availability of
capital resources and liquidity, the Directors have concluded
that there is no material uncertainty and the company will
continue as a going concern for at least twelve months from the
date of this report.
We critically assessed the impact of COVID-19 on the planning
and execution of our audit. In particular:
We assessed the impact of the disruption caused by COVID-
19 on the risks of material misstatement. This included a
consideration of the impact of higher trade volumes and the
markets in which the company operates. We reviewed
operational risk reports, internal audit reports and discussed
the impact of the pandemic with senior management in all
three lines of defence. We concluded that no significant
changes to our risk assessment were required;
We evaluated the controls relevant to our audit by undertaking
walkthroughs of key processes and tested the operating
effectiveness of relevant controls that we planned to rely on.
We considered the impact of remote working on the
effectiveness of controls such as reconciliations;
We considered the impact on estimates included in the
financial statements, in particular in relation to the valuation
of financial instruments. We did not identify any material
impacts on the estimates as at December 31, 2020 (see also
above key audit matter); and
We adapted our own working practices to remote working and
ensured we gathered appropriate audit evidence.
We reviewed management’s going concern assessment and
evaluated the impact of COVID-19 on the company’s financial
performance, business operations and liquidity, as well as the
support available from the ultimate parent undertaking, GS
Group Inc.
As a result of these procedures, we concluded that the impact of
COVID-19 as it relates to the going concern assumption has
been appropriately evaluated for the purposes of the preparation
of the financial statements.
Based on the work performed, we are satisfied that our audit
addressed the impact of the disruption caused by COVID-19.
We have also concluded that the impact of COVID-19 has been
appropriately evaluated and reflected in the preparation of these
financial statements.

Independent auditors’ report to the member of Goldman Sachs Finance Corp International Ltd
10
How we tailored the audit scope We tailored the scope of our audit to ensure that we performed
enough work to be able to give an opinion on the financial
statements as a whole, taking into account the structure of the
company, the accounting processes and controls, and the
industry in which it operates.
The company issues warrants, certificates and notes to investors
in a number of European and Asian markets. We consider that
the company is a single audit component. There are a number of
centralised functions operated by the ultimate parent company,
The Goldman Sachs Group, Inc., in the U.S. or in group shared
service centres in other locations that are relevant to the audit of
the company. We determined the scope of the work required in
each of these locations and issued instructions to PwC network
firms. We interacted regularly with the firms responsible for the
work throughout the course of the audit. This included
reviewing key working papers and discussing and challenging
the results of work in higher risk areas of the audit. We
concluded that the procedures performed on our behalf were
sufficient for the purposes of issuing our opinion.
Materiality The scope of our audit was influenced by our application of
materiality. We set certain quantitative thresholds for
materiality. These, together with qualitative considerations,
helped us to determine the scope of our audit and the nature,
timing and extent of our audit procedures on the individual
financial statement line items and disclosures and in evaluating
the effect of misstatements, both individually and in aggregate
on the financial statements as a whole.
Based on our professional judgement, we determined
materiality for the financial statements as a whole as follows:
Overall materiality
$155 million (2019: $126 million)
How we determined it
1% of total assets (2019: 1% of total assets)
Rationale for benchmark applied
The company’s main activity is to issue
warrants, certificates and notes to investors in
a number of European and Asian markets and
lend the proceeds to affiliates. The company
is not run for profit. As such total assets is
considered an appropriate benchmark.
We use performance materiality to reduce to an appropriately
low level the probability that the aggregate of uncorrected and
undetected misstatements exceeds overall materiality.
Specifically, we use performance materiality in determining the
scope of our audit and the nature and extent of our testing of
account balances, classes of transactions and disclosures, for
example in determining sample sizes. Our performance
materiality was 75% of overall materiality, amounting to $116
million for the company financial statements.
In determining the performance materiality, we considered a
number of factors - the history of misstatements, risk assessment
and aggregation risk and the effectiveness of controls - and
concluded that an amount at the upper end of our normal range
was appropriate.
We agreed with the Board of Directors that we would report to
them misstatements identified during our audit above $7.8
million (2019: $6.3 million) as well as misstatements below that
amount that, in our view, warranted reporting for qualitative
reasons.
Conclusions relating to going concern
Our evaluation of the directors’ assessment of the company’s
ability to continue to adopt the going concern basis of
accounting included our review over management’s going
concern assessment and evaluate the impact of COVID-19 on
the company’s financial performance, business operations and
liquidity, as well as the support available from the ultimate
parent undertaking, GS Group Inc. For details, please refer to
the Key Audit Matters session above.
Based on the work we have performed, we have not identified
any material uncertainties relating to events or conditions that,
individually or collectively, may cast significant doubt on the
company’s ability to continue as a going concern for a period of
at least twelve months from when the financial statements are
authorised for issue.
In auditing the financial statements, we have concluded that the
directors’ use of the going concern basis of accounting in the
preparation of the financial statements is appropriate.
However, because not all future events or conditions can be
predicted, this conclusion is not a guarantee as to the company’s
ability to continue as a going concern.
Our responsibilities and the responsibilities of the directors with
respect to going concern are described in the relevant sections
of this report.
Reporting on other information
The other information comprises all of the information in the
Annual Report other than the financial statements and our
auditors’ report thereon. The directors are responsible for the
other information. Our opinion on the financial statements does
not cover the other information and, accordingly, we do not
express an audit opinion or any form of assurance thereon.

Independent auditors’ report to the member of Goldman Sachs Finance Corp International Ltd
11
In connection with our audit of the financial statements, our
responsibility is to read the other information and, in doing so,
consider whether the other information is materially inconsistent
with the financial statements or our knowledge obtained in the
audit, or otherwise appears to be materially misstated. If we
identify an apparent material inconsistency or material
misstatement, we are required to perform procedures to
conclude whether there is a material misstatement of the
financial statements or a material misstatement of the other
information. If, based on the work we have performed, we
conclude that there is a material misstatement of this other
information, we are required to report that fact. We have nothing
to report based on these responsibilities.
Management Report and Directors’ Report
In our opinion, based on the work undertaken in the course of
the audit, the information given in the Management Report and
Directors’ Report for the year ended December 31, 2020 is
consistent with the financial statements and has been prepared
in accordance with applicable legal requirements.
In light of the knowledge and understanding of the company and
its environment obtained in the course of the audit, we did not
identify any material misstatements in the Management Report
and Directors’ Report.
Responsibilities for the financial statements and the
audit
Responsibilities of the directors for the financial
statements
As explained more fully in the Statement of Directors’
Responsibilities, the directors are responsible for the preparation
of the financial statements in accordance with the applicable
framework and for being satisfied that they give a true and fair
view. The directors are also responsible for such internal control
as they determine is necessary to enable the preparation of
financial statements that are free from material misstatement,
whether due to fraud or error.
In preparing the financial statements, the directors are
responsible for assessing the company’s ability to continue as a
going concern, disclosing, as applicable, matters related to going
concern and using the going concern basis of accounting unless
the directors either intend to liquidate the company or to cease
operations, or have no realistic alternative but to do so.
Auditors’ responsibilities for the audit of the financial
statements
Our objectives are to obtain reasonable assurance about whether
the financial statements as a whole are free from material
misstatement, whether due to fraud or error, and to issue an
auditors’ report that includes our opinion. Reasonable assurance
is a high level of assurance, but is not a guarantee that an audit
conducted in accordance with ISAs (UK) will always detect a
material misstatement when it exists. Misstatements can arise
from fraud or error and are considered material if, individually
or in the aggregate, they could reasonably be expected to
influence the economic decisions of users taken on the basis of
these financial statements.
Our audit testing might include testing complete populations of
certain transactions and balances, possibly using data auditing
techniques. However, it typically involves selecting a limited
number of items for testing, rather than testing complete
populations. We will often seek to target particular items for
testing based on their size or risk characteristics. In other cases,
we will use audit sampling to enable us to draw a conclusion
about the population from which the sample is selected.
A further description of our responsibilities for the audit of the
financial statements is located on the FRC’s website at:
www.frc.org.uk/auditorsresponsibilities. This description forms
part of our auditors’ report. In our engagement letter, we also
agreed to describe our audit approach, including communicating
key audit matters.
Use of this report
This report, including the opinions, has been prepared for and
only for the company’s members as a body in accordance with
Article 113A of the Companies (Jersey) Law 1991 and for no
other purpose. We do not, in giving these opinions, accept or
assume responsibility for any other purpose or to any other
person to whom this report is shown or into whose hands it may
come save where expressly agreed by our prior consent in
writing.

Independent auditors’ report to the member of Goldman Sachs Finance Corp International Ltd
12
Other required reporting
Companies (Jersey) Law 1991 exception reporting
Under the Companies (Jersey) Law 1991 we are required to
report to you if, in our opinion:
we have not obtained all the information and explanations we
require for our audit; or
proper accounting records have not been kept, or proper
returns adequate for our audit have not been received from
branches not visited by us; or
the financial statements are not in agreement with the
accounting records and returns.
We have no exceptions to report arising from this responsibility.
Appointment
We were appointed by the directors on November 11, 2016 to
audit the financial statements for the year ended December 31,
2017 and subsequent financial periods. The period of total
uninterrupted engagement is 4 years, covering the years ended
December 31, 2017 to December 31, 2020.
Mike Wallace
for and on behalf of PricewaterhouseCoopers LLP
Chartered Accountants and Recognized Auditor
London
April 30, 2021
GOLDMAN SACHS FINANCE CORP INTERNATIONAL LTD
Income Statement
13
Year Ended December
$ in millions Note 2020 2019
Interest income from financial instruments measured at amortised cost $ 268 $ 259 Interest expense from financial instruments measured at amortised cost (22) (20)
Net interest income 246 239
Gains or losses from financial instruments at fair value through profit or loss
(250) (219)
Other income/(expense) 42 (22)
Non-interest expense (208) (241)
Net revenues 6 38 (2)
Operating expenses 7 – –
Profit/(loss) before taxation 38 (2)
Income tax expense 9 – –
Profit/(loss) for the financial year $ 38 $ (2)
Net revenues and profit/(loss) of the company are derived from continuing operations in the current and prior years.
Statement of Comprehensive Income Year Ended December
$ in millions Note 2020 2019
Profit/(loss) for the financial year $(038 $ (2)
Other comprehensive income
Items that will not be reclassified subsequently to profit or loss
Debt valuation adjustment 14 (138) (415)
Tax attributable to the components of other comprehensive income – –
Other comprehensive loss for the financial year (138) (415)
Total comprehensive loss for the financial year $(100) $(417)
The accompanying notes are an integral part of these financial statements.

GOLDMAN SACHS FINANCE CORP INTERNATIONAL LTD
Balance Sheet
14
As of
December December January 1
$ in millions Note 2020 2019 2019
Assets
Cash and cash equivalents 16 $00,011 $00,015 $00,013
Customer and other receivables 10 132 114 271
Derivative assets 11 1,084 668 323
Intercompany loans 12 14,291 11,793 9,526
Total assets $15,518 $12,590 $10,133
Liabilities
Customer and other payables 13 $00,007 $00,094 $00,073
Derivative liabilities 11 807 811 522
Unsecured borrowings 14 14,656 11,662 9,123
Total liabilities 15,470 12,567 9,718
Shareholder’s equity
Share capital 15 5 5 5
Share premium account 175 50 25
Retained earnings 105 72 55
Accumulated other comprehensive income (237) (104) 330
Total shareholder’s equity 48 23 415
Total liabilities and shareholder’s equity $15,518 $12,590 $10,133
The financial statements were approved by the Board of Directors on April 26, 2021 and signed on its behalf by:
K. G. Kochar
Director The accompanying notes are an integral part of these financial statements. Company number: 122341

GOLDMAN SACHS FINANCE CORP INTERNATIONAL LTD
Statement of Changes in Equity
15
Year Ended December
$ in millions Note 2020 2019
Share capital Beginning balance $ 5 $005
Shares issued 15 – –
Ending balance 5 5
Share premium account
Beginning balance 50 25
Shares issued 15 125 25
Ending balance 175 50
Retained earnings
Beginning balance 72 55
Profit/(loss) for the financial year 38 (2)
Transfer of realised debt valuation adjustment into retained earnings 14 (5) 19
Ending balance 105 72
Accumulated other comprehensive income
Beginning balance (104) 330
Other comprehensive loss (138) (415)
Transfer of realised debt valuation adjustment into retained earnings 14 5 (19)
Ending balance (237) (104)
Total shareholder’s equity $ 48 $ 23
No dividends were paid for 2020 and 2019.
Statement of Cash Flows Year Ended December
$ in millions Note 2020 2019
Cash flows from operating activities Cash used in operations 16 $(131) $(22)
Net cash used in operating activities (131) (22)
Cash flows from financing activities
Receipts from issuing ordinary share capital 125 25
Net cash from financing activities 125 25
Net increase/(decrease) in cash and cash equivalents (6) 3
Cash and cash equivalents, beginning balance 15 13
Foreign exchange gains/(losses) on cash and cash equivalents 2 (1)
Cash and cash equivalents, ending balance 16 $(011 $(15
The accompanying notes are an integral part of these financial statements.

GOLDMAN SACHS FINANCE CORP INTERNATIONAL LTD
Notes to the Financial Statements
16
Note 1.
General Information
The company is a registered public limited company
incorporated on October 19, 2016 and domiciled in Jersey. The
address of its registered office is 22 Grenville Street, St. Helier,
Jersey JE4 8PX.
The company’s immediate parent undertaking is GS Global
Markets, Inc., a company incorporated and domiciled in
Delaware, United States of America.
The ultimate controlling undertaking and the parent company of
the smallest and largest group for which consolidated financial
statements are prepared is The Goldman Sachs Group, Inc., a
company incorporated in the United States of America. Copies
of its consolidated financial statements, as well as certain
regulatory filings, for example Quarterly Reports on Form 10-Q
and the Annual Report on Form 10-K, that provide further
information about GS Group and its business activities, can be
obtained from Investor Relations, 200 West Street, New York,
NY 10282, United States of America, GS Group’s principal
place of business, or at www.goldmansachs.com/investor-
relations.
Note 2.
Basis of Preparation
Statement of Compliance
These financial statements have been prepared in accordance
with applicable accounting standards in conformity with the
requirements of the Companies (Jersey) Law 1991 and
International Financial Reporting Standards (IFRS) as adopted
in the E.U. In the prior year, the company prepared financial
statements under U.K. GAAP, in accordance with FRS 101
‘Reduced Disclosure Framework’ (FRS 101). As such, the
company has prepared IFRS transition disclosures required by
IFRS 1 ‘First-time adoption of International Financial Reporting
Standards’. The impact on the company’s financial statements
as a result of adopting IFRS is described in Note 3.
These financial statements have been prepared on the going
concern basis, under the historical cost basis (modified as
explained in “Financial Assets and Liabilities” below).
Note 3.
First Time Adoption of IFRS
Reconciliation of Equity
On adoption of IFRS, the company has changed the format of
its balance sheet to be based on order of liquidity as permitted
by IAS 1 ‘Presentation of Financial Statements’. In order to aid
comparability between the two formats, the company’s balance
sheets under U.K. GAAP as of December 2019 and January 1,
2019 have been presented below in order of liquidity and
financial statement lines spanning amounts due within one year
and amounts falling due after more than one year have been
combined.
The tables below provide a reconciliation of the company’s
balance sheets between U.K. GAAP and IFRS. See
“Reconciliation Notes” below for an explanation of each
adjustment.

GOLDMAN SACHS FINANCE CORP INTERNATIONAL LTD
Notes to the Financial Statements
17
$ in millions As of December 2019
Previous presentation Note U.K. GAAP Adjustments IFRS Current presentation
Assets Assets
Cash at bank and in hand $00,015 $ – $00,015 Cash and cash equivalents
Debtors A 11,907 (11,793) 114 Customer and other receivables
Derivative financial assets 668 – 668 Derivative assets
A – 11,793 11,793 Intercompany loans
Total assets $12,590 $ – $12,590 Total assets
Liabilities Liabilities
Other creditors B $11,756 $(11,662) $00,094 Customer and other payables
Derivative financial liabilities 811 – 811 Derivative liabilities
B – 11,662 11,662 Unsecured borrowings
Total liabilities 12,567 – 12,567 Total liabilities
Capital and reserves Shareholder’s equity
Called up share capital 5 – 5 Share capital
Share premium account 50 – 50 Share premium account
Profit and loss account 72 – 72 Retained earnings
Accumulated other comprehensive income (104) – (104) Accumulated other comprehensive income
Total shareholder’s funds 23 – 23 Total shareholder’s equity
Total liabilities and shareholder’s funds $12,590 $ – $12,590 Total liabilities and shareholder’s equity
$ in millions As of January 1, 2019
Previous presentation Note U.K. GAAP Adjustments IFRS Current presentation
Assets Assets
Cash at bank and in hand $00,013 $ – $00,013 Cash and cash equivalents
Debtors A 9,797 (9,526) 271 Customer and other receivables
Derivative financial assets 323 – 323 Derivative assets
A – 9,526 9,526 Intercompany loans
Total assets $10,133 $ – $10,133 Total assets
Liabilities Liabilities
Other creditors B $9,196 $(9,123) $00,073 Customer and other payables
Derivative financial liabilities 522 – 522 Derivative liabilities
B – 9,123 9,123 Unsecured borrowings
Total liabilities 9,718 – 9,718 Total liabilities
Capital and reserves Shareholder’s equity
Called up share capital 5 – 5 Share capital
Share premium account 25 – 25 Share premium account
Profit and loss account 55 – 55 Retained earnings
Accumulated other comprehensive income 330 – 330 Accumulated other comprehensive income
Total shareholder’s funds 415 – 415 Total shareholder’s equity
Total liabilities and shareholder’s funds $10,133 $ – $10,133 Total liabilities and shareholder’s equity
Reconciliation Notes
A. Intercompany loans. The company has reclassified
unsecured loans to affiliates from debtors to intercompany
loans. The remaining debtors have been renamed as
customer and other receivables. The impact of this change
is:
As of December 2019, the company has reclassified
$11.79 billion of unsecured loans from debtors to
intercompany loans.
As of January 1, 2019, the company has reclassified
$9.53 billion of unsecured loans from debtors to
intercompany loans.
B. Unsecured borrowings. The company has reclassified
unsecured borrowings and accrued interest on unsecured
borrowings from other creditors to unsecured borrowings.
The impact of this change is:
As of December 2019, the company has reclassified
$11.66 billion of unsecured borrowings from other
creditors to unsecured borrowings.
As of January 1, 2019, the company has reclassified
$9.12 billion of unsecured borrowings from other
creditors to unsecured borrowings.
The remaining other creditors, following the reclassification
of unsecured borrowings and accrued interest on unsecured
borrowings, have been renamed as customer and other
payables.
Reconciliation of Total Comprehensive Income
The format of the company’s total comprehensive income is
unchanged between U.K. GAAP and IFRS.

GOLDMAN SACHS FINANCE CORP INTERNATIONAL LTD
Notes to the Financial Statements
18
Note 4.
Summary of Significant Accounting Policies
Accounting Policies
Revenue Recognition. Net revenues include non-interest
income/(expense) and net interest income. Non-interest income
/(expense) includes the net profit/(loss) arising from the issuance
of debt securities, OTC derivative hedges with affiliates,
allocations of net revenues from/(to) affiliates for their
participation in the company’s activities and allowance for
impairment. Net interest income primarily relates to interest
income from loans to affiliates. Net revenues have been
disclosed instead of turnover as this reflects more meaningfully
the nature and results of the company’s activities.
Debt securities issued by the company are either designated at
fair value through profit or loss, or are measured at amortised
cost where the host instrument is classified as a hedged item (see
“Financial Assets and Liabilities — Fair Value Hedges” below).
Debt securities designated at fair value through profit or loss are
recognised at fair value with realised and unrealised gains and
losses, as well as associated interest and expenses included in
net revenues, with the exception of changes in fair value
attributable to own credit risk, which are recognised in other
comprehensive income, unless this would create or enlarge an
accounting mismatch in profit or loss. Financial liabilities are
marked to offer prices. Fair value measurements do not include
transaction costs. Debt securities measured at amortised cost are
initially recognised at fair value plus transaction costs and
subsequently measured at amortised cost using the effective
interest method. Finance costs, including discounts allowed on
issue, are recorded in net revenues.
The company enters into OTC derivative instruments for
hedging purposes which are measured mandatorily at fair value
through profit or loss. The net of the gains and losses of these
instruments are included in net revenues for the year. Financial
assets are marked to bid prices and financial liabilities are
marked to offer prices. Fair value measurements do not include
transaction costs.
Allowance for impairment on loans to affiliates are included in
net revenues (see “Financial Assets and Liabilities —
Impairment” below).
Interest income and interest expense from intercompany loans
and debt securities measured at amortised cost are included in
net revenues using the effective interest method.
Segment Reporting. The directors manage the company’s
business activities as a single operating segment and accordingly
no segmental reporting has been provided.
Dividends. Final equity dividends are recognised as a liability
and deducted from equity in the year in which the dividends are
approved by the company’s shareholder. Interim equity
dividends are recognised and deducted from equity when paid.
Cash and cash equivalents. This includes cash at bank and
highly liquid overnight deposits held in the ordinary course of
business.
Foreign Currencies. The company’s financial statements are
presented in U.S. dollars, which is also the company’s functional
currency.
Transactions denominated in foreign currencies are translated
into U.S. dollars at rates of exchange ruling on the date the
transaction occurred. Monetary assets and liabilities, and non-
monetary assets and liabilities measured at fair value,
denominated in foreign currencies are translated into U.S.
dollars at rates of exchange ruling at the balance sheet date.
Foreign exchange gains and losses are recognised in net
revenues.
Financial Assets and Liabilities.
Recognition and Derecognition
Financial assets and liabilities are recognised when the company
becomes party to the contractual provisions of the instrument.
Financial assets are derecognised when the contractual rights to
the cash flows from the financial asset expire or if the company
transfers the financial asset and the transfer qualifies for
derecognition. A transferred financial asset qualifies for
derecognition if the company transfers substantially all the risks
and rewards of ownership of the financial asset or if the
company neither transfers nor retains substantially all the risks
and rewards of ownership of the financial asset but does not
retain control. Financial liabilities are derecognised only when
they are extinguished, i.e., when the obligation specified in the
contract is discharged or cancelled or expires.
Classification and Measurement: Financial Assets
The company classifies financial assets as subsequently
measured at amortised cost or fair value through profit or loss
on the basis of both the company’s business model for managing
financial assets and the contractual cash flow characteristics of
the financial assets. The business model reflects how the
company manages particular groups of assets in order to
generate future cash flows. Where the company’s business
model is to hold the assets to collect contractual cash flows, the
company subsequently assesses whether the financial assets’
cash flows represent solely payments of principal and interest.
Financial assets with embedded derivatives (hybrid instruments)
are also subject to the same assessment.

GOLDMAN SACHS FINANCE CORP INTERNATIONAL LTD
Notes to the Financial Statements
19
Financial assets measured at amortised cost.
Financial assets that are held for the collection of contractual
cash flows and have cash flows that represent solely payments
of principal and interest are measured at amortised cost. The
company considers whether the cash flows represent basic
lending arrangements, and where contractual terms introduce
exposure to risk or volatility inconsistent with a basic lending
arrangement, the financial asset is mandatorily measured at
fair value through profit or loss (see below).
Financial assets measured at amortised cost are initially
measured at fair value plus transaction costs and subsequently
at amortised cost using the effective interest method. The
effective interest method is a method of calculating the
amortised cost of a financial instrument and allocating the
interest income over the relevant year. The effective interest
rate is the rate that exactly discounts estimated future cash
receipts through the expected life of the financial asset or,
when appropriate, a shorter period to the net carrying value of
the financial asset. When calculating the effective interest rate,
the company estimates cash flows considering all contractual
terms of the financial asset but does not consider future credit
losses. Finance revenue is recorded in net revenues. Financial
assets measured at amortised cost include:
Cash and cash equivalents
Substantially all customer and other receivables; and
Intercompany loans
Financial assets mandatorily measured at fair value
through profit or loss. Financial assets that are not held for
the collection of contractual cash flows and/or do not have
cash flows that represent solely payments of principal and
interest are mandatorily measured at fair value through profit
or loss. Financial assets mandatorily measured at fair value are
initially measured at fair value with transaction costs expensed
in the income statement. Such financial assets are
subsequently measured at fair value with gains or losses
recognised in net revenues. Financial assets mandatorily
measured at fair value include:
Derivative assets; and
Certain customer and other receivables, which consists of
hybrid financial instruments.
Classification and Measurement: Financial Liabilities
The company classifies its financial liabilities into the below
categories based on the purpose for which they were acquired or
originated.
Financial liabilities held for trading. Financial liabilities
held for trading are initially measured at fair value and
subsequently at fair value through profit or loss, with gains or
losses recognised in net revenues. Financial liabilities held for
trading include derivative liabilities.
Financial liabilities designated at fair value through
profit or loss. The company designates certain financial
liabilities at fair value through profit or loss. Financial
liabilities designated at fair value through profit or loss are
initially measured at fair value and subsequently at fair value
through profit or loss, with DVA being recognised in other
comprehensive income, if it does not create or enlarge an
accounting mismatch, and the remaining changes in the fair
value being recognised in net revenues. Amounts recognised
in other comprehensive income attributable to own credit
spreads are not subsequently transferred to the income
statement, even upon derecognition of the financial liability.
Gains or losses exclude contractual interest, which is included
in interest income and interest expense, for all instruments
other than hybrid financial instruments. The primary reasons
for designating such financial liabilities at fair value through
profit or loss are:
To eliminate or significantly reduce a measurement or
recognition inconsistency that would otherwise arise from
measuring assets or liabilities or recognising the gains and
losses on them on different bases; and
The group of financial liabilities, or financial assets and
liabilities, is managed and its performance evaluated on a
fair value basis.
Financial liabilities designated at fair value through profit or
loss include debt securities issued, which are hybrid financial
instruments.
Hybrid financial instruments are instruments that contain
bifurcatable embedded derivatives. If the company elects to
bifurcate the embedded derivative from the associated debt,
the derivative is accounted for at fair value and the host
contract is accounted for at amortised cost, adjusted for the
effective portion of any fair value hedges. If the company does
not elect to bifurcate, the entire hybrid financial instrument is
designated at fair value through profit or loss.

GOLDMAN SACHS FINANCE CORP INTERNATIONAL LTD
Notes to the Financial Statements
20
Financial liabilities measured at amortised cost.
Financial liabilities measured at amortised cost are initially
measured at fair value plus transaction costs and subsequently
measured at amortised cost using the effective interest method.
See “Financial assets measured at amortised cost” above for
further information on the effective interest method. Finance
costs, including discounts allowed on issue, are recorded in net
interest income and interest expense.
Financial liabilities measured at amortised cost include
customer and other payables and certain unsecured
borrowings that have not been designated at fair value through
profit or loss.
Impairment
The company assesses the expected credit losses (ECL)
associated with financial assets measured at amortised cost on a
forward-looking basis in accordance with the provisions of IFRS
9 ‘Financial Instruments’ (IFRS 9). The measurement of ECL
reflects an unbiased and probability weighted amount that is
determined by evaluating a range of possible outcomes, the time
value of money, and reasonable and supportable information
that is available without undue cost or effort at the reporting date
about past events, current conditions and forecasts of future
economic conditions. ECL are recorded in net revenues.
The company’s impairment model is based on changes in credit
quality since initial recognition of the financial assets measured
at amortised cost and incorporates the following three stages:
Stage 1. Financial assets measured at amortised cost that are
not credit-impaired on initial recognition and there has been
no significant increase in credit risk since initial recognition.
The ECL is measured at an amount equal to the expected credit
losses that result from default events possible within the next
twelve months.
Stage 2. Financial assets measured at amortised cost where
there has been a significant increase in credit risk since initial
recognition, however not yet deemed to be credit-impaired.
The ECL is measured based on expected credit losses on a
lifetime basis.
Stage 3. Financial assets measured at amortised cost that are
in default, or are defined as credit-impaired. The ECL is
measured based on expected credit losses on a lifetime basis.
Determination of the relevant staging for each financial asset is
dependent on the definition of ‘significant increase in credit
risk’ (stage 1 to stage 2) and the definition of ‘credit-impaired’
(stage 3). The company considers a financial asset to have
experienced a significant increase in credit risk when certain
quantitative or qualitative conditions are met. Quantitative
thresholds include absolute probability of default thresholds on
investment-grade financial assets and relative probability of
default thresholds on non-investment-grade financial assets.
Qualitative review is also performed as part of the company’s
credit risk management process, including a back-stop
consideration of 30 days past due. The company considers a
financial asset to be credit-impaired when it meets Credit Risk’s
definition of default, which is either when the company
considers that the obligor is unlikely to pay its credit obligations
to the company in full, without recourse by the company to
actions, such as realising security (if held), or the obligor has
defaulted on a payment and/or is past due more than 90 days.
The ECL is determined by projecting the probability of default
(PD), loss given default (LGD) and exposure at default (EAD)
for each individual exposure. To calculate ECL, these three
components are multiplied together and discounted back to the
reporting date. The discount rate used in the ECL calculation is
the original effective interest rate. The probability of default
represents the likelihood of a borrower defaulting on its
financial obligation. The loss given default is the company’s
expectation of the extent of loss on the default exposure, and
takes into consideration amongst other things, collateral on the
financial asset. The exposure at default is the amount the
company expects to be owed at the time the financial obligation
defaults. The company uses internal credit risk ratings that
reflect the assessment of the probability of default of individual
counterparties. The company uses multiple macroeconomic
scenarios within the ECL calculation, the weightings for which
are subject to ongoing internal review and approval.
The ECL model takes into account the weighted average of a
range of forecasts of future economic conditions. The forecasts
include baseline, favourable and adverse economic scenarios
over a three-year period. To the extent the company has
financial assets in Stage 2 or Stage 3 which have an expected
life beyond three years, the model reverts to historical loss
information based on a non-linear modelled approach. The
company applies judgement in weighing individual scenarios
each quarter based on a variety of factors, including internally
derived economic outlook, market consensus, recent
macroeconomic conditions and industry trends.
Forward-looking information, such as key economic variables
impacting credit risk and expected credit losses, is incorporated
into both the assessment of staging and the calculation of ECL.

GOLDMAN SACHS FINANCE CORP INTERNATIONAL LTD
Notes to the Financial Statements
21
The company writes off financial assets, in whole or in part,
when it has concluded that there is no reasonable expectation of
recovery. When a financial asset is deemed to be uncollectable,
the company concludes this to be an indicator that there is no
reasonable expectation of recovery. The company still seeks to
recover amounts it is legally owed in full, but which have been
wholly or partially written off due to no reasonable expectation
of full recovery.
Classification of Financial Liabilities and Equity
Financial liabilities and equity instruments are classified
according to the substance of the contractual arrangements. A
financial liability is any liability that is a contractual obligation
to deliver cash or another financial asset to another entity; or to
exchange financial assets or financial liabilities with another
entity under conditions that are potentially unfavourable to the
entity. An equity investment is any contract that evidences a
residual interest in the assets of the entity after deducting all
liabilities. Instruments are evaluated to determine if they contain
both liability and equity components. The initial carrying value
of a compound financial instrument is allocated first to the
liability component, measured at fair value, and the equity is
assigned the residual amount.
Offsetting Financial Assets and Liabilities
Financial assets and liabilities are offset and the net amount
presented in the balance sheet where there is:
Currently a legally enforceable right to set-off the recognised
amounts; and
Intent to settle on a net basis or to realise the asset and settle
the liability simultaneously.
Where these conditions are not met, financial assets and
liabilities are presented on a gross basis in the balance sheet.
Fair Value Measurement
See Note 21 for details about the fair value measurement of the
company’s financial assets and liabilities.
Fair Value Hedges
The company applies hedge accounting under IAS 39 ‘Financial
Instruments: Recognition and Measurement’ for certain interest
rate swaps used to manage the interest rate exposure of certain
fixed-rate unsecured long-term borrowings. To qualify for
hedge accounting, the derivative hedge must be highly effective
at reducing the risk from the exposure being hedged.
Additionally, the company must formally document the hedging
relationship at inception and test the hedging relationship to
ensure the derivative hedge continues to be highly effective over
the life of the hedging relationship.
The company applies a statistical method that utilises regression
analysis when assessing the effectiveness of its fair value
hedging relationships in achieving offsetting changes in the fair
values of the hedging instrument and the risk being hedged (i.e.,
interest rate risk). An interest rate swap is considered highly
effective in offsetting changes in fair value attributable to
changes in the hedged risk when the regression analysis results
in a coefficient of determination of 80% or greater and a slope
between 80% and 125%. Possible sources of ineffectiveness on
these hedges include:
Differences in timing of cash flows between the hedged item
and hedging instrument.
Differences in discounting between the hedged item and the
hedging instrument, as cash collateralised derivatives are
discounted using Overnight Indexed Swap discount curves,
which are not consistently applied to the hedged item.
Counterparty credit risk impacting fair value movements on
uncollateralised interest rate swaps but not the underlying
hedged item.
For qualifying fair value hedges, gains or losses on derivatives
and the change in fair value of the hedged item attributable to
the hedged risk are included in net revenues. When a derivative
is no longer designated as a hedge, any remaining difference
between the carrying value and par value of the hedged item is
amortised over the remaining life of the hedged item using the
effective interest method.
New Standards, Amendments and Interpretations Not
Yet Adopted During the Year
Amendments to IFRS 9, IAS 39, IFRS 7 ‘Financial
Instruments: Disclosures’, IFRS 4 ‘Insurance
Contracts’ and IFRS 16 ‘Leases’. On August 27, 2020, the
IASB issued “Interest Rate Benchmark Reform – Phase 2”
which provides optional relief for issues affecting financial
reporting when changes are made to contractual cash flows of
financial instruments or hedging relationships as a result of
reference rate reform. The company has not elected to early
apply the reliefs available, which are otherwise effective for
periods beginning on or after January 1, 2021. The company is
currently assessing the impact of the adoption of these
amendments on its financial statements.

GOLDMAN SACHS FINANCE CORP INTERNATIONAL LTD
Notes to the Financial Statements
22
Note 5.
Critical Accounting Estimates and
Judgements
The preparation of financial statements requires management to
make judgements, estimates and assumptions that affect the
amounts recognised in these financial statements. The nature of
estimation means that actual outcomes could differ from those
estimates. The following estimates have had the most significant
effect on amounts recognised in the financial statements:
Fair Value Measurement
Certain financial liabilities of the company which are
economically hedged include significant unobservable inputs
(i.e., level 3). See Note 21 for information about the carrying
value and valuation techniques of these instruments.
Note 6.
Net Revenues
Net revenues include net interest income and non-interest
expense. Net interest income primarily relates to interest income
from loans to affiliates. Non-interest expense includes:
Gains and losses on financial instruments mandatorily
measured at fair value through profit or loss, which primarily
relate to non-interest gains and losses on derivative assets and
liabilities.
Gains and losses on financial instruments designated at fair
value through profit or loss, which primarily relate to non-
interest gains and losses on unsecured borrowings.
Allocations of net revenues from/(to) affiliates, which relate to
allocations of net revenues from/(to) affiliates for their
participation in the company’s business activities.
The table below presents net revenues.
Year Ended
$ in millions 2020 2019
Interest income
Interest income from financial instruments
measured at amortised cost $ 268 $ 259
Total interest income 268 259
Interest expense
Interest expense from financial instruments
measured at amortised cost, net of hedges (22) (20)
Total interest expense (22) (20)
Net interest income 246 239
Non-interest expense
Financial instruments mandatorily measured at
fair value through profit or loss (256) 320
Financial instruments designated at
fair value through profit or loss 6 (539)
Allocations of net revenues from/(to) affiliates 46 (22)
Net changes in impairments on financial assets (4) –
Non-interest expense (208) (241)
Net revenues $(038 $00(2)
Note 7.
Operating Expenses
The company incurred operating expenses of $177,000 for 2020
and $246,000 for 2019, which primarily related to professional
fees.
Note 8.
Compensation and Benefits
The company has no employees. All persons involved in the
company’s operations are employed by GS Group affiliates and
no costs are borne by the company.

GOLDMAN SACHS FINANCE CORP INTERNATIONAL LTD
Notes to the Financial Statements
23
Note 9.
Income Tax Expense
The company is domiciled in Jersey and is not liable to tax in
Jersey. The company’s parent entity, GS Global Markets, is
subject to corporate tax in the U.S. on its 100% share of the
company’s profits or losses.
Note 10.
Customer and Other Receivables
The table below presents customer and other receivables.
As of
December December January 1
$ in millions 2020 2019 2019
Receivables from customers
and counterparties $049 $057 $ –
Miscellaneous receivables and other 83 57 271
Total $132 $114 $271
In the table above:
Receivables from customers and counterparties consists of
receivables resulting from collateral posted in connection with
derivative transactions.
Miscellaneous receivables and other primarily includes
receivables for allocation of net revenues among GS Group
affiliates for their participation in the company’s business
activities.
Note 11.
Derivative Assets and Liabilities
The table below presents derivative assets.
As of
December December January 1
$ in millions 2020 2019 2019
Interest rates $0,704 $390 $220
Credit 45 10 5
Currencies 186 155 7
Equities 149 113 91
Total $1,084 $668 $323
The table below presents derivative liabilities.
As of
December December January 1
$ in millions 2020 2019 2019
Interest rates $534 $297 $121
Credit 51 16 10
Currencies 100 310 131
Equities 122 188 260
Total $807 $811 $522
Note 12.
Intercompany Loans
The table below presents intercompany loans.
As of
December December January 1
$ in millions 2020 2019 2019
Unsecured loans $14,291 $11,793 $9,526
Total $14,291 $11,793 $9,526
In the table above, unsecured loans included an allowance for
impairment of $6 million as of December 2020, $2 million as of
December 2019 and $3 million as of January 1, 2019. The
company’s allowance for impairment of $6 million as of
December 2020 increased from $2 million as of December 2019,
primarily due to changes in modelling assumptions, such as
probability of default, due to the deteriorating macroeconomic
environment. These financial assets remained in stage 1
throughout the whole year.
Note 13.
Customer and Other Payables
The table below presents customer and other payables.
As of
December December January 1
$ in millions 2020 2019 2019
Payables to customers and
counterparties $– $0– $09
Miscellaneous payables and other 7 94 64
Total $7 $94 $73
In the table above:
Payables to customers and counterparties consists of collateral
received in connection with derivative transactions.
Miscellaneous payables and other primarily includes payables
for allocation of net revenues among GS Group affiliates for
their participation in the company’s business activities.
Note 14.
Unsecured Borrowings
The table below presents unsecured borrowings.
As of
December December January 1
$ in millions 2020 2019 2019
Debt securities issued $14,429 $11,624 $9,118
Intercompany loans – 38 5
Other borrowings 227 – –
Total $14,656 $11,662 $9,123

GOLDMAN SACHS FINANCE CORP INTERNATIONAL LTD
Notes to the Financial Statements
24
Payments on debt securities issued and other borrowings
instruments are typically referenced to underlying financial
assets, which are predominantly interest rates, equities,
currencies and credit-related.
Debt Valuation Adjustment
The company calculates the fair value of debt securities issued
that are designated at fair value through profit or loss by
discounting future cash flows at a rate which incorporates GS
Group’s credit spreads. The table below presents information
about the cumulative net DVA gains/(losses) on such financial
liabilities, which is included in accumulated other
comprehensive income.
As of
December December January 1
$ in millions 2020 2019 2019
Beginning balance $(104) $(330 $ (52)
Debt valuation adjustment for the year (138) (415) 382
Transfer to retained earnings 5 (19) –
Ending balance $(237) $(104) $330
In the table above, net losses of $5 million for 2020 and net gains
of $19 million for 2019 upon early redemption of certain debt
securities issued that were designated at fair value through profit
or loss, have been transferred from accumulated other
comprehensive income to retained earnings.
Hedge Accounting
The company designates certain interest rate swaps as fair value
hedges that are used to manage the interest rate exposure of
certain fixed-rate unsecured long-term borrowings. These
interest rate swaps hedge changes in fair value attributable to the
relevant benchmark interest rate (e.g., London Interbank
Offered Rate), effectively converting fixed-rate obligations into
floating-rate obligations.
The table below presents information about hedging
instruments, which are classified as derivative assets and
liabilities in the balance sheet.
As of
December December January 1
$ in millions 2020 2019 2019
Asset carrying value $107 $65 $30
Liability carrying value $001 $01 $0–
The notional of the company’s hedging instruments was $2.44
billion as of December 2020, $1.96 billion as of December 2019
and $1.64 billion as of January 1, 2019 with contractual maturity
date of greater than 5 years. The average fixed rate of such
instruments was 1.49% for 2020 and 1.24% for 2019.
The table below presents the carrying value of the hedged items
that are currently designated in a hedging relationship and the
related cumulative hedging adjustment (increase/(decrease))
from current and prior hedging relationships included in such
carrying values.
Cumulative
Carrying Hedging
$ in millions value Adjustment
As of December 2020
Unsecured long-term borrowings $2,335 $102
As of December 2019
Unsecured long-term borrowings $1,855 $059
As of January 1, 2019
Unsecured long-term borrowings $1,725 $025
In the table above, cumulative hedging adjustment for items no
longer designated in a hedging relationship were $6 million as
of December 2020, $7 million for December 2019 and $nil for
January 1, 2019.
The table below presents the gains/(losses) from interest rate
derivatives accounted for as hedges, the related hedged
borrowings and the hedge ineffectiveness on these derivatives,
recognised in net revenues.
Year Ended December
$ in millions 2020 2019
Interest rate hedges $ 28 $ 44
Hedged borrowings (22) (46)
Hedge ineffectiveness $(06 $0(2)
Note 15.
Share Capital
The table below presents share capital.
Ordinary shares
Allotted, called up and fully paid of $1 each $ in millions
As of January 1, 2019 5,000,001 $5
Allotted during the year 1 –
As of December 31, 2019 5,000,002 $5
Allotted during the year 5 –
As of December 31, 2020 5,000,007 $5
On December 18, 2020, 4 ordinary shares of $4 were allotted to
GS Global Markets, Inc. for $100,000,000. The total
consideration received was $100,000,000 in cash incorporating
a share premium of $99,999,996.
On December 31, 2020, 1 ordinary share of $1 was allotted to
GS Global Markets, Inc. for $25,000,000. The total
consideration received was $25,000,000 in cash incorporating a
share premium of $24,999,999.
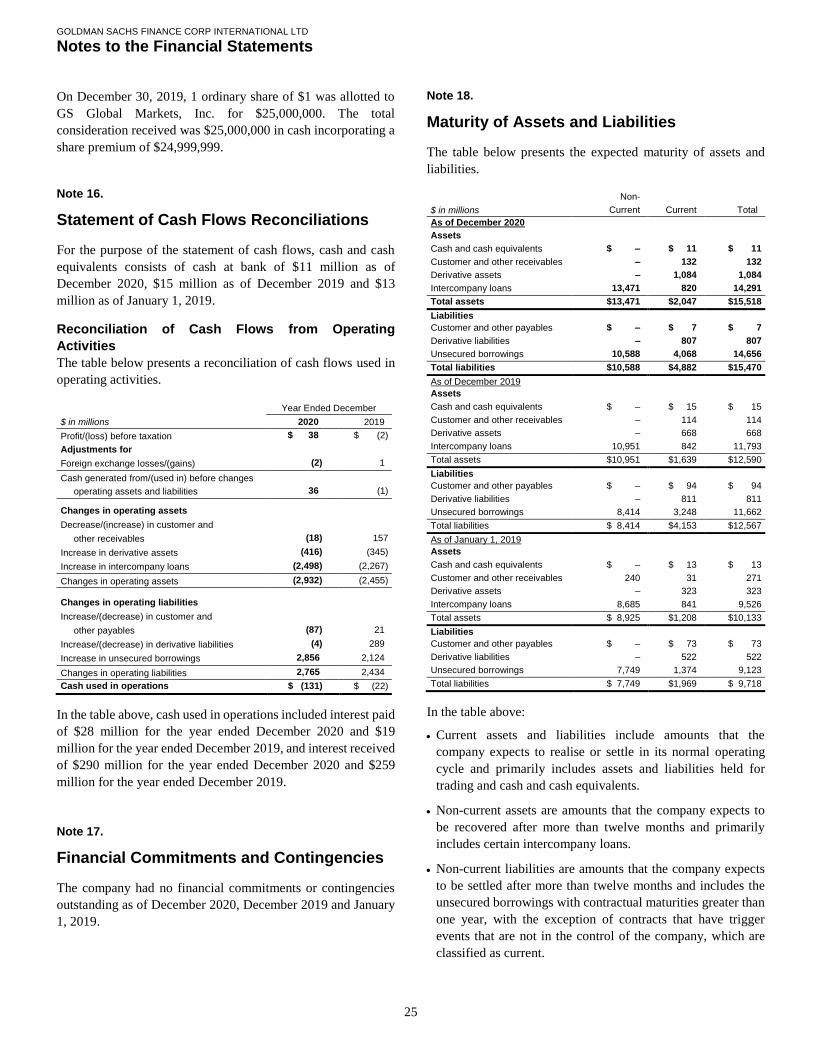
GOLDMAN SACHS FINANCE CORP INTERNATIONAL LTD
Notes to the Financial Statements
25
On December 30, 2019, 1 ordinary share of $1 was allotted to
GS Global Markets, Inc. for $25,000,000. The total
consideration received was $25,000,000 in cash incorporating a
share premium of $24,999,999.
Note 16.
Statement of Cash Flows Reconciliations
For the purpose of the statement of cash flows, cash and cash
equivalents consists of cash at bank of $11 million as of
December 2020, $15 million as of December 2019 and $13
million as of January 1, 2019.
Reconciliation of Cash Flows from Operating
Activities
The table below presents a reconciliation of cash flows used in
operating activities.
Year Ended December
$ in millions 2020 2019
Profit/(loss) before taxation $ 38 $ (2)
Adjustments for
Foreign exchange losses/(gains) (2) 1
Cash generated from/(used in) before changes
in
operating assets and liabilities 36 (1)
Changes in operating assets
Decrease/(increase) in customer and
other receivables (18) 157
Increase in derivative assets (416) (345)
Increase in intercompany loans (2,498) (2,267)
Changes in operating assets (2,932) (2,455)
Changes in operating liabilities
Increase/(decrease) in customer and
other payables (87) 21
Increase/(decrease) in derivative liabilities (4) 289
Increase in unsecured borrowings 2,856 2,124
Changes in operating liabilities 2,765 2,434
Cash used in operations $ (131) $ (22)
In the table above, cash used in operations included interest paid
of $28 million for the year ended December 2020 and $19
million for the year ended December 2019, and interest received
of $290 million for the year ended December 2020 and $259
million for the year ended December 2019.
Note 17.
Financial Commitments and Contingencies
The company had no financial commitments or contingencies
outstanding as of December 2020, December 2019 and January
1, 2019.
Note 18.
Maturity of Assets and Liabilities
The table below presents the expected maturity of assets and
liabilities.
Non-
$ in millions Current Current Total
As of December 2020
Assets
Cash and cash equivalents $00,00– $0,011 $00,011
Customer and other receivables – 132 132
Derivative assets – 1,084 1,084
Intercompany loans 13,471 820 14,291
Total assets $13,471 $2,047 $15,518
Liabilities
Customer and other payables $00,00– $0,007 $00,007
Derivative liabilities – 807 807
Unsecured borrowings 10,588 4,068 14,656
Total liabilities $10,588 $4,882 $15,470
As of December 2019
Assets
Cash and cash equivalents $00,00– $0,015 $00,015
Customer and other receivables – 114 114
Derivative assets – 668 668
Intercompany loans 10,951 842 11,793
Total assets $10,951 $1,639 $12,590
Liabilities
Customer and other payables $00,00– $0,094 $00,094
Derivative liabilities – 811 811
Unsecured borrowings 8,414 3,248 11,662
Total liabilities $08,414 $4,153 $12,567
As of January 1, 2019
Assets
Cash and cash equivalents $00,00– $0,013 $00,013
Customer and other receivables 240 31 271
Derivative assets – 323 323
Intercompany loans 8,685 841 9,526
Total assets $08,925 $1,208 $10,133
Liabilities
Customer and other payables $0,000– $0,073 $00,073
Derivative liabilities – 522 522
Unsecured borrowings 7,749 1,374 9,123
Total liabilities $07,749 $1,969 $09,718
In the table above:
Current assets and liabilities include amounts that the
company expects to realise or settle in its normal operating
cycle and primarily includes assets and liabilities held for
trading and cash and cash equivalents.
Non-current assets are amounts that the company expects to
be recovered after more than twelve months and primarily
includes certain intercompany loans.
Non-current liabilities are amounts that the company expects
to be settled after more than twelve months and includes the
unsecured borrowings with contractual maturities greater than
one year, with the exception of contracts that have trigger
events that are not in the control of the company, which are
classified as current.

GOLDMAN SACHS FINANCE CORP INTERNATIONAL LTD
Notes to the Financial Statements
26
Note 19.
Related Party Disclosures
Parties are considered to be related if one party has the ability to
directly or indirectly control the other party or exercise
significant influence over the party in making financial or
operational decisions. The company’s related parties include:
The company’s parent entities;
Other GS Group affiliates;
Key management personnel of the company; and
Key management personnel of the company’s parent entities.
Key management personnel are defined as those persons having
authority and responsibility for planning, directing and
controlling the activities of the company. Key management
personnel of the company include the directors of the company.
Key Management Compensation Key management personnel are employed by GS Group
affiliates and no compensation is paid by the company.
Transactions with Related Parties
The company’s transactions with related parties primarily
include the following.
Risk Management
The company routinely enters into derivatives with related
parties for risk management, which are recognised in derivative
assets and derivative liabilities.
The company also exchanges cash collateral in connection with
derivative transactions. Cash collateral received is recognised in
customer and other payables. Cash collateral paid is recognised
in customer and other receivables.
Funding Activity
The company has raised funding through debt securities issued
and made unsecured loans to GS Group affiliates. See Note 12
for further details.
Interest-bearing instruments are typically priced based on the
term, currency, size and whether the instrument is secured or
unsecured.
Transfer Pricing
The company participates in the allocation of net revenues
among GS Group affiliates for their involvement in the
company’s business activities.
Related Party Assets and Liabilities
The table below presents assets and liabilities with related
parties.
Other
Parent GS Group
$ in millions entities affiliates Total
As of December 2020
Assets
Customer and other receivables $00,001 $0,131 $00,132
Derivative assets – 917 917
Intercompany loans 13,490 801 14,291
Total assets $13,491 $1,849 $15,340
Liabilities
Customer and other payables $ 0,00 – $0,007 $00,007
Derivative liabilities – 769 769
Unsecured borrowings – 384 384
Total liabilities $ – $1,160 $ 1,160
As of December 2019
Assets
Customer and other receivables $00,00– $0,114 $00,114
Derivative assets – 619 619
Intercompany loans 10,989 804 11,793
Total assets $10,989 $1,537 $12,526
Liabilities
Customer and other payables $00,00– $0,094 $00,094
Derivative liabilities – 732 732
Unsecured borrowings 38 144 182
Total liabilities $00,038 $ 0970 $01,008
As of January 1, 2019
Assets
Customer and other receivables $00,00– $0,271 $ 00271
Derivative assets – 303 303
Intercompany loans 8,703 823 9,526
Total assets $08,703 $1,397 $10,100
Liabilities
Customer and other payables $00,00– $0,073 $00,073
Derivative liabilities – 501 501
Unsecured borrowings 5 – 5
Total liabilities $00,005 $ 0574 $ 00579

GOLDMAN SACHS FINANCE CORP INTERNATIONAL LTD
Notes to the Financial Statements
27
Related Party Income and Expense
The table below presents income and expenses related to
transactions with related parties other than Key Management
Personnel.
Other
Parent GS Group
$ in millions entities affiliates Total
Year Ended December 2020
Net revenues
Interest income $249 $19 $268
Interest expense (1) – (1)
Transfer pricing revenues – 46 46
Impairments on financial assets (4) – (4)
Total net revenues $244 $65 $309
Year Ended December 2019
Net revenues
Interest income $229 $30 $259
Interest expense (3) (3) (6)
Transfer pricing revenues – (22) (22)
Impairments on financial assets – – –
Total net revenues $226 $ 5 $231
Note 20.
Financial Instruments
Financial Assets and Liabilities by Category
The tables below present the carrying value of financial assets
and liabilities by category.
Financial Assets
Mandatorily Amortised
$ in millions at fair value cost Total
As of December 2020
Cash and cash equivalents $0,00– $00,011 $00,011
Customer and other
receivables – 132 132
Derivative assets 1,084 – 1,084
Intercompany loans – 14,291 14,291
Total
$1,084 $14,434 $15,518
As of December 2019
Cash and cash equivalents $0,00– $00,015 $00,015
Customer and other
receivables – 114 114
Derivative assets 668 – 668
Intercompany loans – 11,793 11,793
Total
$0,668 $11,922 $12,590
As of January 1, 2019
Cash and cash equivalents $0,00– $00,013 $00,013
Customer and other
receivables 241 30 271
Derivative assets 323 – 323
Intercompany loans – 9,526 9,526
Total
$0,564 $09,569 $10,133
Financial Liabilities
Held for Designated Amortised
$ in millions Trading at fair value cost Total
As of December 2020
Customer and other payables $ – $ – $0,007 $ 007
Derivative liabilities 807 – – 807
Unsecured borrowings – 11,688 2,968 14,656
Total $807 $11,688 $2,975 $15,470
As of December 2019
Customer and other payables $ – $ – $0,094 $ 094
Derivative liabilities 811 – – 811
Unsecured borrowings – 9,416 2,246 11,662
Total $811 $09,416 $2,340 $12,567
As of January 1, 2019
Customer and other payables $ – $ – $0,073 $ 073
Derivative liabilities 522 – – 522
Unsecured borrowings – 7,387 1,736 9,123
Total $522 $07,387 $1,809 $09,718
In the tables above:
Derivative assets included derivative instruments designated
as hedges of $107 million as of December 2020, $65 million
as of December 2019 and $30 million as of January 1, 2019.
Derivative liabilities included derivative instruments
designated as hedges of $1 million as of both December 2020
and December 2019 and $nil as of January 1, 2019.
Offsetting of Financial Assets and Liabilities
The tables below present financial assets and liabilities that are
subject to enforceable netting agreements and offsetting.
Amounts are only offset in the balance sheet, when the company
currently has a legally enforceable right to set-off the recognised
amounts and an intention either to settle on a net basis, or to
realise the asset and settle the liability simultaneously. In the
tables below:
Gross amounts exclude the effects of both counterparty netting
and collateral, and therefore are not representative of the
company’s economic exposure.
Amounts not offset in the balance sheet include counterparty
netting (i.e., the netting of financial assets and liabilities for a
given counterparty when a legal right of set-off exists under an
enforceable netting agreement), and cash and security
collateral received and posted under enforceable credit support
agreements, that do not meet the criteria for offsetting under
IFRS.
Where the company has received or posted collateral under
credit support agreements, but has not yet determined whether
such agreements are enforceable, the related collateral has not
been included in the amounts not offset in the balance sheet.

GOLDMAN SACHS FINANCE CORP INTERNATIONAL LTD
Notes to the Financial Statements
28
As of December 2020
Amounts not offset in the balance sheet
Amounts Net amount
offset in the presented in
Gross balance the balance Counterparty Cash Security Net
$ in millions amounts sheet sheet netting collateral collateral Amount
Financial Assets
Customer and other receivables $00,049 $ – $00,049 $ – $(49) $ – $ –
Derivative assets 917 – 917 (917) – – –
Financial assets subject to enforceable netting agreements 966 – 966 (917) (49) – –
Financial assets not subject to enforceable netting agreements 14,552 – 14,552 – – – 14,552
Total financial assets $15,518 $ – $15,518 $(917) $(49) $ – $14,552
Financial Liabilities
Customer and other payables $ – $ – $ – $ – $ – $ – $ –
Derivative liabilities 765 – 765 (765) – – –
Unsecured borrowings 226 – 226 (152) (49) – 25
Financial liabilities subject to enforceable netting agreements 991 – 991 (917) (49) – 25
Financial liabilities not subject to enforceable netting agreements 14,479 – 14,479 – – – 14,479
Total financial liabilities $15,470 $ – $15,470 $(917) $(49) $ – $14,504
As of December 2019
Amounts not offset in the balance sheet
Amounts Net amount
offset in the presented in
Gross balance the balance Counterparty Cash Security Net
$ in millions amounts sheet sheet netting Collateral Collateral Amount
Financial Assets
Customer and other receivables $00,057 $ –
$00,057
$ – $(57) $ – $ –
Derivative assets 613 – 613 (613) – – –
Financial assets subject to enforceable netting agreements 670 – 670 (613) (57) – –
Financial assets not subject to enforceable netting agreements 11,920 – 11,920 – – – 11,920
Total financial assets $12,590 $ – $12,590 $(613) $(57) $ – $11,920
Financial Liabilities
Customer and other payables $ – $ – $ – $ – $ – $ – $ –
Derivative liabilities 735 – 735 (613) (57) – 65
Unsecured borrowings – – – – – – –
Financial liabilities subject to enforceable netting agreements 735 – 735 (613) (57) – 65
Financial liabilities not subject to enforceable netting agreements 11,832 – 11,832 – – – 11,832
Total financial liabilities $12,567 $ – $12,567 $(613) $(57) $ – $11,897
As of January 1, 2019
Amounts not offset in the balance sheet
Amounts Net amount
offset in the presented in
Gross balance the balance Counterparty Cash Security Net
$ in millions amounts sheet sheet netting collateral collateral Amount
Financial Assets
Customer and other receivables $00,241 $ – $00,241 $(212) $(8) $ – $0,021
Derivative assets 323 – 323 (293) – – 30
Financial assets subject to enforceable netting agreements 564 – 564 (505) (8) – 51
Financial assets not subject to enforceable netting agreements 9,569 – 9,569 – – – 9,569
Total financial assets $10,133 $ – $10,133 $(505) $(8) $ – $9,620
Financial Liabilities
Customer and other payables $ 8 $ – $ 8 $ – $(8) $ – $ –
Derivative liabilities 522 – 522 (505) – – 17
Unsecured borrowings – – – – – – –
Financial liabilities subject to enforceable netting agreements 530 – 530 (505) (8) – 17
Financial liabilities not subject to enforceable netting agreements 9,188 – 9,188 – – – 9,188
Total financial liabilities $ 9,718 $ – $ 9,718 $(505) $(8) $ – $9,205
Collateral Received and Pledged
The company receives cash as collateral, primarily in
connection with derivative transactions. The company obtains
cash as collateral on an upfront or contingent basis for derivative
instruments to reduce its credit exposure to individual
counterparties.
The company has posted cash collateral of $49 million as of
December 2020, $57 million as of December 2019 and received
cash collateral of $8 million as of January 1, 2019. Amounts
received and posted are mainly in respect of derivative assets
and liabilities, certain customer and other receivables and
payables and unsecured borrowings.

GOLDMAN SACHS FINANCE CORP INTERNATIONAL LTD
Notes to the Financial Statements
29
Note 21.
Fair Value Measurement
The fair value of a financial instrument is the amount that would
be received to sell an asset or paid to transfer a liability in an
orderly transaction between market participants at the
measurement date. Financial assets are marked to bid prices and
financial liabilities are marked to offer prices. Fair value
measurements do not include transaction costs. The company
measures certain financial assets and liabilities as a portfolio
(i.e. based on its net exposure to market and/or credit risks).
IFRS has a three-level hierarchy for disclosure of fair value
measurements. This hierarchy prioritises inputs to the valuation
techniques used to measure fair value, giving the highest priority
to level 1 inputs and the lowest priority to level 3 inputs. A
financial instrument’s level in this hierarchy is based on the
lowest level of input that is significant to its fair value
measurement.
The fair value hierarchy is as follows:
Level 1. Inputs are unadjusted quoted prices in active markets
to which the company had access at the measurement date for
identical, unrestricted assets or liabilities.
Level 2. Inputs to valuation techniques are observable, either
directly or indirectly.
Level 3. One or more inputs to valuation techniques are
significant and unobservable.
The fair values for substantially all of the company’s financial
assets and liabilities that are fair valued on a recurring basis are
based on observable prices and inputs and are classified in level
2 of the fair value hierarchy. Certain level 2 and level 3 financial
assets and liabilities may require valuation adjustments that a
market participant would require to arrive at fair value for
factors, such as GS Group’s credit quality, liquidity and
bid/offer spreads. Valuation adjustments are generally based on
market evidence.
Valuation Techniques and Significant Inputs
Derivatives. The company’s OTC derivatives are bilateral
contracts between two counterparties (bilateral OTC). The
company’s level 2 and level 3 derivatives are valued using
derivative pricing models (e.g., discounted cash flow models,
correlation models, and models that incorporate option pricing
methodologies, such as Monte Carlo simulations). Price
transparency of derivatives can generally be characterised by
product type, as described below.
Interest Rate. In general, the key inputs used to value
interest rate derivatives are transparent, even for most long-
dated contracts. Interest rate swaps and options denominated
in the currencies of leading industrialised nations are
characterised by high trading volumes and tight bid/offer
spreads. Interest rate derivatives that reference indices, such as
an inflation index, or the shape of the yield curve (e.g., 10-year
swap rate vs. 2-year swap rate) are more complex, but the key
inputs are generally observable.
Credit. Price transparency for credit default swaps, including
both single names and baskets of credits, varies by market and
underlying reference entity or obligation. Credit default swaps
that reference indices, large corporates and major sovereigns
generally exhibit the most price transparency. For credit
default swaps with other underliers, price transparency varies
based on credit rating, the cost of borrowing the underlying
reference obligations, and the availability of the underlying
reference obligations for delivery upon the default of the
issuer. Credit default swaps that reference loans, asset-backed
securities and emerging market debt instruments tend to have
less price transparency than those that reference corporate
bonds. In addition, more complex credit derivatives, such as
those sensitive to the correlation between two or more
underlying reference obligations, generally have less price
transparency.
Currency. Prices for currency derivatives based on the
exchange rates of leading industrialised nations, including
those with longer tenors, are generally transparent. The
primary difference between the price transparency of
developed and emerging market currency derivatives is that
emerging markets tend to be only observable for contracts
with shorter tenors.
Equity. Price transparency for equity derivatives varies by
market and underlier. Options on indices and the common
stock of corporates included in major equity indices exhibit the
most price transparency. Equity derivatives generally have
observable market prices, except for contracts with long tenors
or reference prices that differ significantly from current market
prices. More complex equity derivatives, such as those
sensitive to the correlation between two or more individual
stocks, generally have less price transparency.
Liquidity is essential to observability of all product types. If
transaction volumes decline, previously transparent prices and
other inputs may become unobservable. Conversely, even
highly structured products may at times have trading volumes
large enough to provide observability of prices and other inputs.

GOLDMAN SACHS FINANCE CORP INTERNATIONAL LTD
Notes to the Financial Statements
30
Level 2
Level 2 derivatives include OTC derivatives for which all
significant valuation inputs are corroborated by market
evidence. In evaluating the significance of a valuation input, the
company considers, among other factors, a portfolio’s net risk
exposure to that input.
The selection of a particular model to value a derivative depends
on the contractual terms of and specific risks inherent in the
instrument, as well as the availability of pricing information in
the market. For derivatives that trade in liquid markets, model
selection does not involve significant management judgement
because outputs of models can be calibrated to market-clearing
levels.
Valuation models require a variety of inputs, such as contractual
terms, market prices, yield curves, discount rates (including
those derived from interest rates on collateral received and
posted as specified in credit support agreements for
collateralised derivatives), credit curves, measures of volatility
and correlations of such inputs. Significant inputs to the
valuations of level 2 derivatives can be verified to market
transactions, broker or dealer quotations or other alternative
pricing sources with reasonable levels of price transparency.
Consideration is given to the nature of the quotations (e.g.,
indicative or firm) and the relationship of recent market activity
to the prices provided from alternative pricing sources.
Level 3
Level 3 derivatives are valued using models which utilise
observable level 1 and/or level 2 inputs, as well as unobservable
level 3 inputs. Unobservable inputs include certain correlations
and equity volatilities.
Subsequent to the initial valuation of a level 3 derivative, the
company updates the level 2 inputs to reflect observable market
changes and any resulting gains and losses are classified in level
3. Level 3 inputs are changed when corroborated by evidence,
such as similar market transactions, third-party pricing services
and/or broker or dealer quotations or other empirical market
data. In circumstances where the company cannot verify the
model value by reference to market transactions, it is possible
that a different valuation model could produce a materially
different estimate of fair value. See below for further
information about significant unobservable inputs used in the
valuation of level 3 derivatives.
Where there is a difference between the initial transaction price
and the fair value calculated by internal models, a gain or loss is
recognised after initial recognition only to the extent that it
arises from a change in a factor (including time) that market
participants would consider in setting a price.
Valuation Adjustments
Valuation adjustments are integral to determining the fair value
of derivative portfolios and are used to adjust the mid-market
valuations produced by derivative pricing models to the exit
price valuation. These adjustments incorporate bid/offer spreads
and the cost of liquidity. Market-based inputs are generally used
when calibrating valuation adjustments to market-clearing
levels.
Customer and other receivables. Customer and other
receivables measured at fair value consist of hybrid financial
instruments and are generally valued based on discounted cash
flow techniques, which incorporate inputs with reasonable
levels of price transparency, and are generally classified in level
2 because the inputs are observable.
The significant inputs to the valuation of such Customer and
other receivables measured at fair value are the amount and
timing of expected future cash flows and interest rates. The
inputs used to value the embedded derivative component of
hybrid financial instruments are consistent with the inputs used
to value the company’s other derivative instruments. See
“Derivative Instruments” above.
Unsecured Borrowings. Unsecured borrowings consist of
debt securities issued and other borrowings, which are hybrid
financial instruments, and are generally valued based on
discounted cash flow techniques, which incorporate inputs with
reasonable levels of price transparency, and are classified in
level 2 when the inputs are observable. Valuation adjustments
may be made for liquidity and GS Group’s credit quality.
The significant inputs to the valuation of unsecured borrowings
measured at fair value are the amount and timing of expected
future cash flows, interest rates, and the credit spreads of GS
Group. The inputs used to value the embedded derivative
component of hybrid financial instruments are consistent with
the inputs used to value the company’s other derivative
instruments.

GOLDMAN SACHS FINANCE CORP INTERNATIONAL LTD
Notes to the Financial Statements
31
Fair Value of Financial Assets and Liabilities by Level
The table below presents, by level within the fair value
hierarchy, financial assets and liabilities measured at fair value
on a recurring basis.
$ in millions Level 1 Level 2 Level 3 Total
As of December 2020
Financial Assets
Derivative assets $ – $, 938 $ 146 $ 1,084
Total $ – $, 938 $ 146 $ 1,084
Financial Liabilities
Derivative liabilities $ – $, 640 $ 167 $ 807
Unsecured borrowings – 7,283 4,405 11,688
Total $ – $7,923 $4,572 $12,495
Net derivatives $ – $ 298 $ (21) $ 277
As of December 2019
Financial Assets
Derivative assets $ – $ 628 $ 40 $ ,668
Total $ – $ 628 $ 40 $ , 668
Financial Liabilities
Derivative liabilities $ – $, 681 $ 130 $ 811
Unsecured borrowings – 5,955 3,461 9,416
Total $ – $6,636 $3,591 $10,227
Net derivatives $ – $ (53) $ (89) $ (143)
As of January 1, 2019
Financial Assets
Derivative assets $ – $ 316 $ 7 $ ,323
Customer and other receivables – 241 – 241
Total $ – $ 557 $ 7 $ , 564
Financial Liabilities
Derivative liabilities $ – $ 370 $ 152 $ 522
Unsecured borrowings – 5,176 2,211 7,387
Total $ – $5,546 $2,363 $17,909
Net derivatives $ – $ (54) $ (145) $ (199)
In the table above, unsecured borrowings of $715 million as of
December 2019 and $150 million as of January 1, 2019 have
been moved from level 2 to level 3 to more appropriately present
these balances.
Significant Unobservable Inputs Used in Level 3 Fair
Value Measurements
The company’s level 3 debt securities issued are economically
hedged with OTC derivatives. The significant unobservable
inputs used in level 3 fair value measurements have not been
disclosed as the net effect of these inputs to the measurements
of level 3 financial assets and liabilities was not material to the
company’s profit or loss, or other comprehensive income for
both the years ended December 2020 and December 2019, and
net assets as of December 2020, December 2019 and January 1,
2019.
Fair Value Financial Assets and Liabilities Valued
Using Techniques That Incorporate Unobservable
Inputs
The fair value of financial assets and liabilities may be
determined in whole or part using a valuation technique based
on assumptions that are not supported by prices from observable
current market transactions in the same instrument or based on
available observable market data and changing these
assumptions will change the resultant estimate of fair value. For
those financial assets and liabilities that are valued using
unobservable inputs, the net potential impact of using
reasonable possible alternative assumptions for the valuations,
including significant unobservable inputs, was not material as of
December 2020, December 2019 and January 1, 2019 as the
company’s level 3 debt securities issued are economically
hedged with OTC derivatives.
Level 3 Rollforward
The table below presents a summary of the changes in fair value
for all level 3 financial assets and liabilities measured at fair
value on a recurring basis.
Year Ended December
$ in millions 2020 2019
Total financial assets
Beginning balance $ 40 $ 7
Gains/(losses) 118 21
Purchases 58 29
Settlements (82) (20)
Transfers into level 3 15 4
Transfers out of level 3 (3) (1)
Ending balance $ 146 $ 40
Total financial liabilities
Beginning balance $(3,591) $ (2,363)
Gains/(losses) (288) (292)
Sales/Issuances (2,456) (2,019)
Settlements 1,908 1,121
Transfers into level 3 (279) (120)
Transfers out of level 3 134 82
Ending balance $(4,572) $(3,591)
In the table above:
If a financial asset or liability was transferred to level 3 during
a reporting period, its entire gain or loss for the period is
classified in level 3. For level 3 financial assets, increases are
shown as positive amounts, while decreases are shown as
negative amounts. For level 3 financial liabilities, increases are
shown as negative amounts, while decreases are shown as
positive amounts.
Transfers between levels of the fair value hierarchy are
recognised at the beginning of the reporting period in which
they occur. Accordingly, the tables do not include gains or
losses for level 3 financial assets and liabilities that were
transferred out of level 3 prior to the end of the period.

GOLDMAN SACHS FINANCE CORP INTERNATIONAL LTD
Notes to the Financial Statements
32
Level 3 financial liabilities are economically hedged with level
2 and level 3 financial assets and liabilities. Accordingly, level
3 gains or losses that are reported in the table below for a
particular class of financial liability can be partially offset by
gains or losses attributable to level 2 or level 3 in a different
class of financial asset or liability.
The net gains and losses on level 3 financial assets for 2020
and 2019 are reported in “Net revenues” in the income
statement.
The net losses on level 3 financial liabilities of $288 million
for 2020 included losses of $59 million reported in “Debt
valuation adjustment” in the statement of comprehensive
income and losses of $229 million reported in “Net revenues”
in the income statement.
The net losses on level 3 financial liabilities of $292 million
for 2019 included losses of $151 million reported in “Debt
valuation adjustment” in the statement of comprehensive
income and losses of $141 million reported in “Net revenues”
in the income statement.
The table below disaggregates, by the balance sheet line items,
the information for financial liabilities included in the summary
table above.
Year Ended December
$ in millions 2020 2019
Derivative liabilities
Beginning balance $ (130) $ (152)
Gains/(losses) (93) 68
Sales (52) (13)
Settlements 127 (1)
Transfers into level 3 (20) (33)
Transfers out of level 3 1 1
Ending balance $ (167) $ (130)
Unsecured Borrowings
Beginning balance $(3,461) $(2,211)
Gains/(losses) (195) (360)
Issuances (2,404) (2,006)
Settlements 1,781 1,122
Transfer into level 3 (259) (87)
Transfers out of level 3 133 81
Ending balance $(4,405) $(3,461)
In the tables above, level 3 unsecured borrowings have been
increased by $715 million as of December 2019 and $150
million as of January 1, 2019. See “Fair Value of Financial
Assets and Liabilities by Level” above for further information.
Transfers Between Level 2 and Level 3 of the Fair
Value Hierarchy
Year Ended December 2020. Transfers into level 3 for
financial assets and liabilities primarily reflected transfers of
certain equity products from level 2, principally due to reduced
transparency of certain equity volatility and correlation inputs as
a result of a lack of market evidence.
Transfers out of level 3 financial assets and liabilities primarily
reflected transfers of certain equity products to level 2,
principally due to increased transparency of certain equity
volatility and correlation inputs as a result of an increase in the
availability of market evidence.
Year Ended December 2019. Transfers into level 3 for
financial assets and liabilities primarily reflected transfers of
certain equity products from level 2, principally due to reduced
transparency of certain equity volatility and correlation inputs as
a result of a lack of market evidence.
Transfers out of level 3 financial assets and liabilities primarily
reflected transfers of certain equity products to level 2,
principally due to increased transparency of certain equity
volatility and correlation inputs as a result of an increase in the
availability of market evidence.
Fair Value of Financial Assets and Liabilities Not
Measured at Fair Value
The company had financial assets that are not measured at fair
value of $14.43 billion as of December 2020, $11.92 billion as
of December 2019 and $9.57 billion as of January 1, 2019,
which predominately related to intercompany loans. The interest
rates of these loans are variable in nature and approximate
prevailing market interest rates for instruments with similar
terms and characteristics. As such, their carrying values in the
balance sheet are a reasonable approximation of fair value.
The table below presents the company’s financial liabilities that
are not measured at fair value by expected maturity.
As of
December December January 1
$ in millions 2020 2019 2019
Current $0,017 $0,139 $0,078
Non-current 2,958 2,201 1,731
Total $2,975 $2,340 $1,809
In the table above, these financial liabilities predominantly
related to long-term borrowings of $2.96 billion as of December
2020, $2.20 billion as of December 2019 and $1.73 billion as of
January 1, 2019, for which the fair value was $3.02 billion as of
December 2020, $2.19 billion as of December 2019 and $1.57
billion as of January 1, 2019.

GOLDMAN SACHS FINANCE CORP INTERNATIONAL LTD
Notes to the Financial Statements
33
Note 22.
Financial Risk Management and Capital
Management
The company monitors its capital on an ongoing basis. The
company’s objective is to be prudently capitalised in terms of
the amount and composition of its equity base (see Note 15)
compared to the company’s risk exposures. The appropriate
level and composition of equity capital is determined by
considering multiple factors, including the business
environment, conditions in the financial markets and
assessments of future losses due to adverse changes in market
environments. The company is not subject to any externally
imposed capital requirements.
The company is exposed to financial risk through its financial
assets and liabilities. Due to the nature of the company’s
business and the assets and liabilities contained within the
company’s balance sheet, the most important components of
financial risk the directors consider relevant to the company are
market risk, credit risk and liquidity risk. The company, as part
of a global group, adheres to global risk management policies
and procedures.
Market Risk
Market risk is the risk of loss in the value of the company’s
financial assets and liabilities due to changes in market
conditions. Risks are monitored and controlled through strong
GS Group oversight, and independent control and support
functions across the company’s businesses. Categories of
market risk include the following:
Interest rate risk: results from exposures to changes in the
level, slope and curvature of yield curves, the volatilities of
interest rates and credit spreads;
Equity price risk: results from exposures to changes in prices
and volatilities of individual equities, baskets of equities and
equity indices; and
Currency rate risk: results from exposures to changes in spot
prices, forward prices and volatilities of currency rates.
The company is exposed to interest rate, equity price, currency
rate and credit-related risks on its debt securities issued. The
company manages these risks by entering into OTC derivative
transactions for hedging purposes.
The company is exposed to interest rate risk on its unsecured
loans due from GS Group affiliates. If interest rates had been 50
basis points higher or lower and all other variables were held
constant, the company’s interest income from GS Group
affiliates would have been higher/lower by $71 million for 2020
and $59 million for 2019. This has been determined by assuming
that the company’s exposure to interest rate risk at the balance
sheet date was consistent for the whole year.
The company is exposed to changes in GS Group’s credit
spreads on its debt securities issued that are designated at fair
value through profit or loss. The estimated sensitivity to a one
basis point increase in GS Group’s credit spreads on such
financial liabilities was a gain of $5 million as of December
2020, December 2019 and January 1, 2019.
Credit Risk
Credit risk represents the potential for loss due to the default or
deterioration in the credit quality of a counterparty. Credit risk
is managed by reviewing the credit quality of the counterparties
and reviewing, if applicable, the underlying collateral against
which the financial assets are secured.
The company’s maximum exposure to credit risk without taking
account of any collateral held or other credit enhancements is
equivalent to the carrying value of its financial assets as of
December 2020, December 2019 and January 1, 2019.
The company’s credit exposures are described further below.
Derivative Assets. Derivatives are reported at fair value on a
gross by counterparty basis in the company’s financial
statements, unless the company has a current legal right of set-
off and also intends to settle on a net basis. The company enters
into derivative transactions with affiliates for hedging purposes.
The company’s gross exposure of $1.08 billion as of December
2020, $668 million as of December 2019 and $323 million as of
January 1, 2019 is mitigated by counterparty netting of $917
million as of December 2020, $613 million as of December
2019 and $293 million as of January 1, 2019, resulting in a net
credit exposure of $167 million as of December 2020, $55
million as of December 2019 and $30 million as of January 1,
2019.
Intercompany loans and Customer and other
receivables. Intercompany loans and customer and other
receivables primarily relate to unsecured loans and hybrid
financial instruments due from GS Group affiliates which are
considered investment-grade for credit risk management
purposes. The company’s gross credit exposure of $14.42 billion
as of December 2020, $11.91 billion as of December 2019 and
$9.80 billion as of January 1, 2019, and net credit exposure of
$14.37 billion as of December 2020, $11.85 billion as of
December 2019 and $9.58 billion as of January 1, 2019, mainly
related to unsecured loans to affiliates.

GOLDMAN SACHS FINANCE CORP INTERNATIONAL LTD
Notes to the Financial Statements
34
The company has recorded an allowance for impairment on its
unsecured loans to affiliates of $6 million as of December 2020,
$2 million as of December 2019 and $3 million as of January 1,
2019. The company’s hybrid financial instruments are $nil as of
both December 2020 and December 2019, and $241 million as
of January 1, 2019, mitigated by counterparty and cash collateral
netting of $220 million resulting in a net credit exposure of $21
million as of January 1, 2019.
Cash and Cash Equivalents. Cash and cash equivalents
include both interest-bearing and non-interest-bearing deposits.
To mitigate the risk of credit loss, the company places
substantially all of its deposits with highly-rated banks, and as a
result, the allowance for impairment on these balances was $nil
as of December 2020, December 2019 and January 1, 2019. The
company’s gross and net credit exposure was $11 million as of
December 2020, $15 million as of December 2019 and $13
million as of January 1, 2019.
Allowance for Impairment
The allowance for impairment recorded during the year is on
intercompany loans. The company’s expected credit losses of $6
million as of December 2020 increased from $2 million as of
December 2019 primarily due to changes in modelling
assumptions, such as PDs, LGDs and EADs. These financial
assets remained in stage 1 throughout the whole year.
Liquidity Risk
Liquidity risk is the risk that the company does not have
sufficient cash or collateral to make payments to its
counterparties as they fall due. The company manages its
liquidity risk in accordance with GS Group’s comprehensive
and conservative set of liquidity and funding policies to address
company-specific, broader industry or market liquidity stress
events.
Maturity of Financial Liabilities
The tables below present an analysis of the cash flows of
financial liabilities by contractual maturity, except for derivative
liabilities, which are classified as trading/on demand. In the
tables below:
Cash flows by contractual maturity include interest that will
accrue on financial liabilities.
Financial liabilities, with the exception of those that are held
for trading or designated at fair value through profit or loss,
are disclosed at their undiscounted cash flows. The fair values
of financial liabilities held for trading and financial liabilities
designated at fair value through profit or loss have been
disclosed as this is consistent with the values used in the
liquidity risk management of these instruments.
Liquidity risk on derivatives is mitigated through master
netting agreements and cash collateral arrangements.
Unsecured borrowings include certain debt securities issued
that have trigger events that are not in the control of the
company and could be repaid earlier than their contractual
maturities.
Trading/ Less 3 Greater
on than 1-3 months 1 - 5 than
$ in millions demand 1 month months - 1 year years 5 years Total
As of December 2020
Customer and other payables $ 7 $ – $ – $ – $ – $ – $ 7
Derivative liabilities 807 – – – – – 807
Unsecured borrowings 124 82 332 1,647 4,868 7,922 14,975
Total $938 $82 $332 $1,647 $4,868 $7,922 $15,789
As of December 2019
Customer and other payables $ 94 $ – $ – $ – $ – $ – $ 94
Derivative liabilities 811 – – – – – 811
Unsecured borrowings 39 55 213 1,595 3,496 6,514 11,912
Total $944 $55 $213 $1,595 $3,496 $6,514 $12,817
As of January 1, 2019
Customer and other payables $ 73 $ – $ – $ – $ – $ – $ 73
Derivative liabilities 522 – – – – – 522
Unsecured borrowings 5 12 106 460 3,109 5,711 9,403
Total $600 $12 $106 $1,460 $3,109 $5,711 $ 9,998


