Higher Education and Training Department: REPUBLIC OF SOUTH AFRICA higher education & training ANNUAL REPORT NATIONAL SKILLS FUND THE NATIONAL SKILLS FUND IS PROUDLY PART OF THE DEPARTMENT OF HIGHER EDUCATION AND TRAINING
Transcript
Higher Education and TrainingDepartment:
REPUBLIC OF SOUTH AFRICA
higher education& training
AnnuAl reportnational skills fund
the national skills fund is proudly part of the department of higher education and training
1
Funding
our nationto skill
national skills fund
NATIONAL SKILLS FUND ANNUAL REPORT : 20132
table of contents
Part a: GEnEraL inForMation ........................... 5
1. PUBLIC ENTITY’S GENERAL INFORMATION ................................................................ 6
2. LIST OF ABBREVIATIONS/ACRONYMS............................................................................ 6
1. PUBLIC ENTITY’S GENERAL INFORMATION REGISTERED NAME: National Skills Fund
PHYSICAL ADDRESS: 123 Francis Baard Street
PRETORIA
0002
POSTAL ADDRESS: Private Bag X174
PRETORIA
0001
TELEPHONE NUMBER/S: +27 012 312 5911
FAX NUMBER: +27 012 323 0291
WEBSITE ADDRESS: www.dhet.gov.za
EXTERNAL AUDITORS: The Auditor-General of South Africa
Lefika House
300 Middel Street
New Muckleneuk
Pretoria
0001
BANKERS: National Treasury
40 Church Square
Pretoria
0002
First National Bank
215 Francis Baard Street
Pretoria
0002
2. LIST OF ABBREVIATIONS/ACRONYMS
ABET Adult Basic Education and TrainingAGSA Auditor General of South AfricaBBBEE Broad Based Black Economic EmpowermentCFO Chief Financial OfficerDG Director-General of Higher Education and TrainingDHET / Department Department of Higher Education and TrainingDTI Department of Trade and IndustryEO Executive OfficerGEPF Government Employee Pension FundGRAP General Recognised Accounting PracticeHR Human ResourceHRDCSA Human Resource Development Council of South AfricaHRDS / HRDSSA Human Research Development Strategy of South AfricaHSRC Human Science Research CouncilIPAP Industrial Policy Action PlanMTEF Medium Term Expenditure FrameworkNDP National Development PlanNGO Non-governmental OrganisationNSA National Skills AuthorityNSDS National Skills Development StrategyNSF/Fund National Skills Fund, established in terms of section 27(1) of the
Skills Development Act, No. 97 of 1998PAA Public Audit ActPFMA Public Finance Management ActPIC Public Investment CorporationSARS South African Revenue ServicesSCOPA Stranding Committee on Public AccountsSCM Supply Chain ManagementSDA Skills Development Act, No. 97 of 1998SDL Skills Development Levies Act, No. 9 of 1999SETA Sector Education & Training AuthoritySMME Small Medium and Micro EnterprisesTR Treasury RegulationsUN United Nations
PART A General information
7
3. STRATEGIC OVERVIEW
3.1. our ViSion
Funding to skill the nation.
3.2. our MiSSion
To provide funding for national skills development towards a capable workforce for an
inclusive growth path.
3.3. our VaLuES
i Integrity
s Service excellence
p Passion
d Development
o Objective
a Accountability
c Collaborative
3.4. StratEGiC outCoME oriEntatED GoaLS
The strategic goal of the NSF is to provide funds to support projects that are national
priorities in the National Skills Development Strategy (NSDS), that advance the Human
Resource Development Strategy (HRDS) of South Africa and that support the National
Skills Authority in its work.
As a result of the National Skills Fund being listed as a Schedule 3A public entity late
during the current financial year, the National Skills Fund’s strategic orientated goals for
the year are contained in the Department of Higher Education and Training’s strategic
and annual performance plans.
4. LEGISLATIVE AND OTHER MANDATES
4.1 EStaBLiSHED in tErMS oF tHE SkiLLS DEVELoPMEnt aCt
The National Skills Fund was established in 1999 in terms of section 27 of the Skills
Development Act, No 97 of 1998.
The money of the Fund may be used for the primary objectives as defined by the
prescripts of the Skills Development Act, namely:
1. To fund projects identified in the National Skills Development Strategy as national
priorities (section 28(1) of the Skills Development Act);
2. To fund projects related to the achievement of the purposes of the Skills
Development Act as the Director-General determines (section 28(1) of the Skills
Development Act);
PART A General information
NATIONAL SKILLS FUND ANNUAL REPORT : 20138
3. To administer the Fund within the prescribed limit (section 28(3) of the Skills
Development Act). Regulations to prescribe the limit for the administration
of the Fund at 10% of revenue has been approved and published in
Notice No. R.1030, Government Gazette No. 33740 dated 8 November 2010; and
4. To fund any activity undertaken by the Minister to achieve a national standard of
good practice in skills development (section 30B of the Skills Development Act).
The current main revenue sources for the National Skills Fund are:
1. 20 Per cent of the skills development levies as contemplated in the Skills
Development Levies Act; and
2. Interest earned on investments held at the Public Investment Corporation.
The National Skills Fund may also receive revenue from the following sources:
1. The skills development levies collected and transferred to the Fund, in terms of
the Skills Development Levies Act, in respect of those employers or sectors for
which there are no SETAs;
2. Money appropriated by Parliament for the Fund;
3. Donations to the Fund; and
4. Money received from any other source.
4.2 rEtEntion oF aCCuMuLatED SurPLuS
In terms of section 29(3) of the Skills Development Act, the unexpended balance in the
Fund at the end of the financial year must be carried forward to the next financial year
as a credit to the Fund.
4.3 LiStED aS a SCHEDuLE 3a PuBLiC Entity in tErMS oF tHE PFMa
On 12 October 2012, the Minister of Finance listed the National Skills Fund as a Schedule
3A public entity in terms of the Public Finance Management Act, 1999, retrospectively
effective from 1 April 2012 (Notice number 821 in the Government Gazette No. 35759).
Prior to the listing as a public entity, the National Skills Fund operated as a programme
under the Skills Development Branch of the Department of Higher Education and
Training.
4.4 kEy LEGiSLation aPPLiCaBLE to tHE nSF
The following key pieces of legislation are applicable to the NSF:
1. Skills Development Act, 1998 (Act No. 97 of 1998), as amended;
2. Skills Development Levies Act, 1999 (Act No. 9 of 1999), as amended;
3. Public Finance Management Act, 1999 (Act No. 1 of 1999), as amended and
Treasury Regulations; and
4. Public Service Act, 1994 (Act No. 38 of 1994), as amended.
PART A General information
9
5. ORGANISATIONAL STRUCTURE
5.1. ExECutiVE oFFiCEr’S oFFiCE
Mrs. E HortonsECREtaRY
Mr. M MacikamaExECutiVE oFFiCEr
Mr. d Matsimaneassistant diRECtoR
Mrs. Ba khumalosEnioR
pRaCtitionER
Mr. tJ sephaisEnioR
pRaCtitionER
VacantsEnioR
pRaCtitionER
Mr. M MsutwanaintERn
Ms. s MakhesaintERn
Ms. M MakinaintERn
VacantsECREtaRY
Mrs. MM Mosehlaassistant diRECtoR
Mr. Mn sitholeassistant diRECtoR
Mr. nE Ramakokovhuassistant diRECtoR
Mrs. B sipenganedd: offiCE adMin
Mrs. kf HlongwanediRECtoR:
pRoVinCial opERations
Mrs. C khambakodd: BuRsaRiEs
PART A General information
NATIONAL SKILLS FUND ANNUAL REPORT : 201310
5.2. StratEGiC ProjECtS
Mrs. n dlaminisECREtaRY
Mr. M MashabaneDirECtor: SP
Mr. d ZongoContRaCt
Mrs. M MalatjiContRaCt
Mr. H Masemoladd: ClustER 1
Mrs. l Gwebudd: ClustER 2
Mr. k Malulekadd: ClustER 3
Mr. o Molefedd: ClustER 4
Mrs. M Gijimadd: ClustER 5
Mr. p Ramawaassistant diRECtoR
Mr. R Boshieloassistant diRECtoR
Mr. J Magabaneassistant diRECtoR
Mr. J Zuluassistant diRECtoR
Mrs. t Moilaassistant diRECtoR
Mr. t tsotetsipRaCtitionER
Vacantfrozen for Contract
post for sEnioR ClERk
VacantsEnioR
pRaCtitionERfrozen for Contract
post for intern
PART A General information
11
5.3. SECtor SkiLLS SuPPort
Mrs. t MadunasECREtaRY
Mr. F StrydomDirECtor: SSP
Mr. s fredericksdd: ClustER 1
Mr. B Mkhizedd: ClustER 2
Mrs. Vs nkiwanedd: ClustER 3
Mr. GG saulsdd: ClustER 4
Mr. G ferreiraassistant diRECtoR
Mrs. C MboyapRaCtitionER
Mrs. H sebopetsapRaCtitionER
Mr. J nchabalengpRaCtitionER
Mr. E Mothlabaneassistant diRECtoR
Mrs. nM Rannyamaassistant diRECtoR
Mrs. J Mahlabato start 1 June 2013
assistant ManaGER
PART A General information
NATIONAL SKILLS FUND ANNUAL REPORT : 201312
5.4. FINANCE AND ADMINISTRATION
Mr. W MinnieCHiEF FinanCiaL
oFFiCEr
Mr. E sakoassistant diRECtoR:
adMinistRation
Mrs. k tjalepRaCtitionER: supplY CHain
Mr. t Mogotshane sEnioR ClERk:
assEts
Mrs. B BouwersEnioR ClERk: pRoCuREMEnt
Mrs. R koen sEnioR ClERk:
REGistRY
Mrs. R souwitszky sEnioR ClERk:
REGistRY
Mrs. a smitsEnioR
pRaCtitionER: HRM
Mrs. B setuki sEnioR ClERk:
HRM
Ms. C Botha sEnioR ClERk
Mrs. C pieterse sEnioR ClERk
interviewedassistant diRECtoR:
finanCE
Vacantassistant diRECtoR:
finanCE
Vacantfrozen for Contract
post for sEnioR ClERk
VacantsEnioR ClERk
frozen for Contract post for intern
VacantsECREtaRY
frozen for Contract post for intern
Mr. J MogorosEnioR
pRaCtitionER
Mrs. p MalekasEnioR
pRaCtitionER
Mrs. M MonosisEnioR
pRaCtitionER
Mrs. M ferreira dEputY diRECtoR
PART A General information
13
6. FOREWORD BY THE MINISTER
Dr BLaDE nZiManDEMINISTER:
HIGHER EDUCATION AND TRAINING
The true value of money is in its ability to build people.The true value of money is in its ability to build people. Funding towards skills
development provides our citizens, especially the financially needy, with an opportunity
to acquire skills through which they can improve their employment possibilities and
increase our country’s productivity and inclusive economic growth.
The third National Skills Development Strategy (NSDS III) envisages a skilled and capable
workforce that shares in, and contributes to, the benefits and opportunities of economic
expansion and an inclusive growth path. In response to the NSDS III, the NSF made it
their mission to increase access to training and skills development opportunities and
achieve the fundamental transformation of inequities linked to class, race, gender, age
and disability in our society.
NSDS III in April 2011 has brought about a significant increase in the NSF’s performance.
For the first time in the NSF’s history, the Fund’s grants disbursements of R2,6 billion
towards skills development is at par with its annual revenue of R2,7 billion, benefitting
over 95 000 learners. The Fund is set to continue serving as a catalyst for key skills
development projects of national priorities in the future. The Fund ‘s current commitment
of R11,4 billion enables it to fund skills development priorities at optimal levels.
I must commend the National Skills Fund for the strategic focus it has adopted since
the launch of the NSDS III. The fund has enabled the post-school system to drive key
skills strategies including building capacity in fields such as research, skills planning and
career guidance. By so doing the Fund has gone beyond the confines of its original
operations.
The NSF was listed as a Schedule 3A public entity during the financial year, with the
Director General of Higher Education and Training as the Accounting Authority of the
Fund in terms of the Skills Development Act. In the near future, the NSF will focus on
improving its internal capacity, structures and operations as a result of the higher grants
disbursement level and the listing of the NSF as a Schedule 3A public entity.
PART A General information
NATIONAL SKILLS FUND ANNUAL REPORT : 201314
The NSF has received an unqualified audit and this has been the trend for a number of
years. This is proof that the Director-General is hard at work, ensuring good corporate
governance through effective oversight.
I would like to extend my gratitude and appreciation to Mr Gwebinkundla Felix Qonde,
the Director-General, and the accounting authority of the NSF. I would also like to thank
the NSF management and staff for the sacrifices they have made in their quest to ensure
a higher performing and model public entity dedicated towards skilling our nation.
Dr BE Nzimande, MPMinister of Higher Education and Training
Date: 31 May 2013
PART A General information
15
7. FOREWORD BY THE DIRECTOR GENERAL
Mr GWEBinkunDLa QonDEDIRECTOR-GENERAL:
HIGHER EDUCATION AND TRAINING
This report highlights the key achievements of the National Skills Fund during the 2nd
year of the NSDS III and also reflects on the key challenges faced by the NSF.
The focus of the Department since the gazetting of the NSDS III has been to address the
historic underperformance of National Skills Fund through increasing the Fund’s grants
disbursement level towards skills development agreed as that of national priority and
priorities identified by the Director-General as critical for the achievement of the Skills
Development Act.
For the second year in a row under the Department of Higher Education and Training,
the NSF’s grants disbursements towards skills development of national priority has
consistently increased year-on-year to the current level of R2,6 billion per annum. This
represents a 357% overall increase in grants disbursements since the gazetting of the
NSDS III in April 2011.
The increase in the NSF’s performance can be attributed to the shifting of functions
with regards to the Skills Development Act from the Department of Labour to the
new Department of Higher Education and Training during the macro reorganisation
of government in 2009. This shift has seen a greater emphasis on an integrated post
school education system being envisioned in the NSDS III, ensuring closer links between
employers, work places and public training institutions and between both of these and
the skills development funders, namely the NSF and the SETAs. These closer links have
seen a greater focus on strengthening the public training institutions within the post
school education system through funding from the NSF, making the system responsive
to sector, local, regional and national skills needs and priorities, as envisioned in the
NSDS III.
Other important projects funded by the NSF include key academia, research and
development projects towards establishing a credible institutional mechanism for skills
planning in an integrated post school education system, this being done in collaboration
with the Human Science Research Council, the HSRC.
For the year ahead, the NSF will continue to fund skills development projects of
national priority, with specific emphasis on strengthening the institutional capacity
of the 50 public FET colleges and 24 universities with a R6,2 billion commitment
towards these institutions. Capacity will be strengthened through increasing funding
towards increasing student intake, as well as through funding the following key skills
infrastructure developments to address scarce and critical skills of the country:
PART A General information
NATIONAL SKILLS FUND ANNUAL REPORT : 201316
• University of Pretoria
R382 million remains committed towards the University of Pretoria for expanding
the University’s medical and veterinary facilities to increase the number of medical
doctors and veterinaries trained annually. Both skills are scarce and critical skills
for South Africa to address the demands posed by the National Health Insurance
scheme to make health universally accessible to every citizen of the country and
to address an urgent need for food security and general animal health.
• University of Johannesburg
R213 million remains committed towards the University of Johannesburg to
establish work-integrated learning facilities for engineering students, which
includes a training workshop, design centre and industrialisation centre. This
is partly contributing towards resolving lack of graduation in engineering
programme due to lack of work placement opportunities for a large number of
engineering students. This capacity, in the form of a production environment,
will be accessible to engineering students, in need, beyond the University of
Johannesburg.
• Cape Peninsula University of Technology
R106 million remains committed towards the Cape Peninsula University of
Technology for the establishment of renewable energy training facilities for the
production of a set of new skills required for the green economy. This initiative,
being the first of its kind in the country, seeks to respond to the country’s adopted
strategy to promote renewable energy production in order to supplement the
current fossil fuel energy production and gradually reduce the country’s carbon
footprint. The Department has seen it fit to establish this dedicated education
and training capacity for the country to produce high and middle level skills in
the area of renewables.
• 12 new Further Education and Training College Campuses
R1,5 billion is earmarked towards building 12 new FET colleges in areas of high
demand for a public FET college. The 2011 census indicates that there is over
3 million out of school youth of ages between 15 to 25, who are neither
in education, employment nor any kind of training and with less than a
grade 12 qualification. The state and its respective institutions have the ultimate
responsibility, as a last line of defence, to ensure that education and training
opportunities are made available to overcome the skills shortage and high
unemployment in the country.
• National Institute for the Deaf
The National Institute for the Deaf is the only post-school education institute
for deaf people in South Africa and Southern Africa. The NSF funding supports
the construction of additional facilities (hostels and lecture rooms), as well as
addressing curriculum improvements for deaf-friendly skills programmes. The
project will allow for an increased annual intake of deaf students from all over
South Africa and Southern Africa.
The increased grants disbursement level has necessitated the NSF to focus
on improving its internal monitoring and evaluation capacity within the next
financial year. The listing of the NSF as a Schedule 3A public entity also requires
additional capacity with regard to support functions for the Fund.
PART A General information
17
Finally, I wish to thank the Minister of Higher Education and Training,
Dr Blade Nzimande, MP and Deputy Minister of Higher Education and Training,
Mr MC Manana, MP for their leadership and guidance in addressing the
challenges that we as the Department, including the NSF, face in serving the
needs of all South African citizens.
I hereby present this report to the Minister of Higher Education and Training,
Dr Blade Nzimande, MP and Deputy Minister of Higher Education and Training,
Mr MC Manana, MP and invite them to table it in Parliament.
Mr GF QondeDirector-General of Higher Education and Training Accounting Authority of the National Skills Fund
Date: 31 May 2013
PART A General information
NATIONAL SKILLS FUND ANNUAL REPORT : 201318
8. EXECUTIVE OFFICER’S OVERVIEW
Mr MVuyiSi MaCikaMaEXECUTIVE OFFICER:
NATIONAL SKILLS FUND
With the dawn of the third National Skills Development Strategy (NSDS III) on
1 April 2011, a new era has dawned for the Nationals Skills Fund.
Over the last 2 years, since the new NSDS III was launched, the NSF’s
performance has increased significantly
due to deliberate interventions to improve the Fund’s performance under NSDS III.
These deliberate interventions resulted in the Fund becoming more efficient towards
funding the critical skills needs in South Africa. This significant increase in the efficiency
of the NSF can be clearly noted in the NSF’s increase in grants disbursements towards
skills development of national priority under NSDS III:
1) 1st Year of NSDS III (2012 financial year): Grants disbursements increased with
131% from R564 million to R1,3 billion; and
2) 2nd Year of NSDS III (2013 financial year): Grants disbursements increased with
97% from R1,3 billion to R2,6 billion.
For the first time in the NSF’s history, the Fund’s grants disbursements of R2,6 billion
towards skills development is on par with its annual revenue of R2,7 billion, including
interest earned on surpluses invested with the Public Investment Corporation, the PIC.
The NSF’s current high level of performance, has seen over 95 000 learners benefiting
from the various skills development projects funded by the NSF during the 2013
financial year.
The majority of these 95 000 learners are still receiving training on on-going courses
during the 2014 financial year as their training courses extend over periods longer than
one year. The NSF remains committed towards funding these learners over their entire
qualification period. This is to ensure a maximum throughput of learners obtaining their
qualifications and preventing a high drop-out of learners from one academic year to the
next due to a lack of funding to continue studies.
Over and above the NSF’s contribution towards skills training projects, the NSF also
played a pivotal role in funding key projects aimed at growing institutional capacity of
the public sector to expand education and skills training opportunities in the country,
coupled with a credible institutional mechanism for skills planning within an integrated
post school education system.
PART A General information
19
These funding contributions include, amongst others, the following:
• Funding the work of the Special Projects Unit within the DHET aimed at ensuring
skills development are an integral part of the National Infrastructure Plan (NIP);
• Funding the development of a single uniform funding and administration model
for artisan development, creating consistency across the post school education
system in so far as training of artisans is concerned;
• Funding the development of a Recognition of Prior Learning model in particular
for artisan aides in order to unleash tremendous potential of many well trained
people who form part of the workforce, but have no skill mobility due to lack of
formal recognition of their skills;
• Funding the development of a prioritisation model for the development of artisan
trades, involving the identification of priority artisan trades for development to
ensure that the current needs in the country are met;
• Funding the development of the career advisory services provided in
collaboration with SAQA; and
• Funding the development of an integrated Higher Education and Training
Management Information System (HETMIS) and the development of the
Labour Market Intelligence System as critical components in building a credible
institutional mechanism for skills planning.
The NSF’s grants disbursement efficiency is expected to increase over the next
three years until the end of the NSDSIII period (31 March 2016) as the NSF meets its
current contractual commitments of R11,4 billion.
These remaining commitments entail the following:
• R1,6 billion committed towards undergraduate and postgraduate bursaries;
• R2,4 billion committed towards capacity building and expansion of programme
offering beyond the traditional NC(V) and Nated programmes, into skills
programmes, learnerships, apprenticeships, etc. within the 50 public FET
colleges;
• R2,35 billion committed towards skills infrastructure development of national
priority;
• R996 million committed towards 35 projects contributing towards the New
Growth Path;
• R521 million committed towards the Industrial Policy Action Plan implemented
in collaboration with the Department of Trade and Industry;
• R810 million committed towards key Rural Development projects, some
implemented in collaboration with the Department of Rural Development and
Land Reform; AgriSeta and rural-based Cooperatives and Skills development
providers;
• R134 million committed towards Justice and Crime Prevention;
• R372 million committed towards Co-operatives, NGO’s, small enterprises and
others;
• R73 million committed towards Education and Health projects;
PART A General information
NATIONAL SKILLS FUND ANNUAL REPORT : 201320
• R1,15 billion committed towards the Trainee Lay-off Scheme; and
• R939 million committed towards various key academia, research and broader
skills system development projects aimed at establishing a credible institutional
mechanism for skills planning within an integrated post school education system.
The increase in the NSF’s commitments and number of projects necessitates an increase
in the NSF’s monitoring and evaluation capacity. The monitoring and evaluation capacity
constraints of the NSF were clearly identified as an area for improvement within both
the NSDS III, as well as the Green Paper for Post School Education and Training and to
that end, on-going work is underway to address capacity constraints in this area.
On 12 October 2012, the Minister of Finance listed the National Skills Fund as a national
public entity under Schedule 3 Part A of the Public Finance Management Act. Prior to
the listing as a public entity, the NSF operated as a programme under the Department
of Higher Education and Training (DHET). The listing of the NSF necessitates the need
to establish support capacity for the Fund in the following areas: Finance, Supply Chain
Management, Human Resources Management, Legal Services and IT Management.
These support structures are vital towards ensuring the NSF’s core functions are
operating optimally, efficiently and effectively.
I would like to extend my gratitude and appreciation to the Director-General as the
accounting authority of the NSF, Mr Gwebinkundla Felix Qonde, NSF management and
staff for the sacrifices they have made in their quest to ensure a higher performing and
model public entity dedicated towards skilling our nation.
Finally, I wish to thank the Minister of Higher Education and Training, Dr Blade Nzimande,
MP and Deputy Minister of Higher Education and Training, Mr MC Manana, MP for their
leadership and guidance in addressing the challenges that we as the NSF face in serving
the needs of all South African citizens.
Mr M MacikamaExecutive Officer: National Skills Fund
Date: 31 May 2013
21
performance informationpart b
PART B Performance information
NATIONAL SKILLS FUND ANNUAL REPORT : 201322
1. STATEMENT OF RESPONSIBILITY FOR PERFORMANCE INFORMATION
StatEMEnt oF rESPonSiBiLity For PErForManCE inForMation For tHE yEar EnDED 31 MarCH 2013
The Executive Officer is responsible for the preparation of the public entity’s performance
information and for the judgements made in this information.
The Executive Officer is responsible for establishing, and implementing a system
of internal control designed to provide reasonable assurance as to the integrity and
reliability of performance information.
In my opinion, the performance information fairly reflects the actual achievements
against planned objectives, indicators and targets as per the strategic and annual
performance plan of the public entity for the financial year ended 31 March 2013.
The National Skills Fund’s performance information for the year ended 31 March 2013
has been examined by the external auditors and their report is presented on page 65.
The performance information of the entity set out on page 23 to page 33 was approved
by the Director-General of Higher Education and Training, as the accounting authority
of the National Skills Fund.
Mr M MacikamaExecutive Officer: National Skills Fund
Date: 31 May 2013
PART B Performance information
23
2. AUDITOR’S REPORT: PREDETERMINED OBJECTIVES
The AGSA currently performs the necessary audit procedures on the performance
information to provide reasonable assurance in the form of an audit conclusion. The
audit conclusion on the performance against predetermined objectives is included
in the report to management, with material findings being reported under the
Predetermined Objectives heading in the Report on other legal and regulatory requirements
section of the Auditor’s Report.
Refer to page 66 for the Report on other legal and regulatory requirements section of the
Auditor’s Report, published as Part E: Financial Information.
PART B Performance information
NATIONAL SKILLS FUND ANNUAL REPORT : 201324
3. OVERVIEW OF PUBLIC ENTITY’S PERFORMANCE
3.1. SErViCE DELiVEry EnVironMEnt
On 12 October 2012, the National Skills Fund was listed as a Schedule 3A public entity,
retrospectively effective from 1 April 2012. Prior to the listing, the National Skills Fund
operated as a programme under the Skills Development Branch of the Department
of Higher Education and Training and hence its performance information is provided
within the framework of the Department:
• Quarterly monitoring of performance is derived from the annual work plan of
the NSF and ENE targets and reported via Department of Higher Education and
Training;
• Reports of the NSF are discussed in the Department’s senior management
meetings at various levels including a dedicated review session with the
Executive Authority. The NSF is also part of the Annual Review and planning
workshops, where annual performance is discussed and planning of the new
financial year is undertaken; and
• A committee of the National Skills Authority also provides monitoring with
respect to the contribution of the NSF to the targets of the National Skills
Development Strategy.
As a result of forming part of the Department of Higher Education and Training during the
current financial year prior to the listing, the National Skills Fund’s strategic objectives and
annual targets formed part of the Department’s strategic and annual performance plans.
Thus, the National Skills Fund reports on the applicable targets within the Department’s
annual performance plan in this report.
Since the dawn of the NSDS III the National Skills Fund’s performance has increased significantly
seeing the Fund’s grants disbursements towards skills development increasing to R2,6 billion (2012: R1,3 billion) during the current financial year, benefiting over 95 000 learners. For the first time in the Fund’s history its grants disbursements are on par
with its annual income of R2,7 billion.
The majority of these 95 000 learners are still receiving training on on-going courses
during the next financial year as their training courses extend over periods longer than
one year. The NSF remains committed towards funding these learners over their entire
qualification period. This is to ensure a maximum throughput of learners obtaining their
qualifications and preventing a high drop-out of learners from one academic year to the
next due to a lack of funding to continue studies.
The NSF’s increased performance under NSDS III can be clearly noted below:
• 1st Year of NSDS III (2011/12): Grants disbursements increased with 131% from
R564 million to R1,3 billion; and
• 2nd Year of NSDS III (2012/13): Grants disbursements increased with 97% from
R1,3 billion to R2,6 billion.
Furthermore, the NSF has a remaining commitment of R11,4 billion towards the
various skills development projects of national priority. This high level of commitment has
strategically positioned the Fund to maintain its high level of performance during the next
three years until the end of the NSDS III.
The high level of commitment will also result in the Fund putting both its annual income and historic accumulated surpluses to effective use towards skills development
until the end of the NSDS III period.
PART B Performance information
25
3.2. orGaniSationaL EnVironMEnt
The key organisational challenges for the National Skills Fund to overcome during the next
financial year relates to following:
• Overcoming capacity constraints with regards to the initiating and monitoring of
skills development projects;
• Overcoming capacity constraints with regards to support functions required to
establish the NSF as a fully-fledged public entity; and
• Improving the efficiency of the NSF’s financial and management information
systems to ensure timely and accurate reporting.
The Fund has embarked on a process of finalising its expanded structures for approval and
securing funding for the additional positions. The filling of the positions will be supported by
an intense recruitment campaign.
The Fund has also started with procurement of expert assistance in the improvement of the
NSF’s processes, including financial and management information systems.
3.3. kEy PoLiCy DEVELoPMEntS anD LEGiSLatiVE CHanGES
Following publication of the National Skills Development Strategy for 2011-2016
(NSDSIII), the Fund has engaged the National Skills Authority to develop the Strategic
Framework and Criteria for the allocation of funding to support NSDS III. This Strategic
Framework document was approved by the Minister and paved the way for the National
Skills Fund to fund projects under the NSDSIII.
The key programmes of the NSF as set out in the Strategic Framework for the allocation
of funding are the following:
1. Supporting the priorities of the Human Resource Development Strategy of
South Africa;
2. Supporting the priorities of the Minister in consultation with the National Skills
Authority;
3. Funding National Skills Development Strategy III priorities in the following areas:
a. New Economic Growth Path;
b. Industrial Policy Action Plan;
c. Skills to support rural development;
d. Skills for a green economy;
e. Skills for education and health; and
f. Skills to support the justice sector.
4. Funding priorities identified by the Director-General supporting the Skills
Development Act in the following areas:
a. Worker Education;
b. Skills System Institution Capacity Building;
c. Trainee Lay-off Scheme; and
d. Academic profession, research and development.
PART B Performance information
NATIONAL SKILLS FUND ANNUAL REPORT : 201326
5. Priorities to address skills infrastructure in the following areas:
a. Recapitalisation of public delivery infrastructure;
b. Community Education Centres;
c. Skills Development Institutes; and
d. State-owned enterprises.
On 3 December 2012 the Minister of Higher Education and Training published new SETA grant regulations in terms of section 36 of the Skills Development Act (Government
Gazette 35940 Notice No. 990). As per the new SETA grant regulations, the remaining surplus
of the uncommitted discretionary funds from the SETAs must be paid over by the SETA
by 1 October of each year into the National Skills Fund. This regulation might significantly
increase the income of the National Skills Fund, especially during the first year in
which the applicable section relating to the grant regulations will come into effect namely
2014/15.
The White Paper on Post School Education whose purpose is to set out a vision
for a single, coherent, differentiated and articulated post education and training system
will be finalised in the near future subsequent to the publishing of the Green Paper. The
White Paper will have implications for future mandates and objectives of the NSF and the broader skills levy institutions.
The NSF’s current projects are also aligned to the priorities as set out in the National Development Plan 2030.
3.4. StratEGiC outCoME oriEntED GoaLS
The strategic objective of the National Skills Fund is to provide funds to support
projects that are national priorities in the NSDS III, that advance the Human Resource
Development Strategy (HRDS) of South Africa and that support the NSA in its work. The
National Skills Fund’s high level of performance has resulted in the Fund over-achieving
on its strategic outcome oriented goals.
4. PERFORMANCE INFORMATION BY PROGRAMME
4.1. ProGraMME 1: SkiLLS DEVELoPMEnt (nationaL SkiLLS DEVELoPMEnt SErViCES)
Purpose: National Skills Development Services transfers funds to the National Skills Fund
and manages projects identified in the National Skills Development Strategy as national
priorities and other projects related to achieving the purposes of the Skills Development
Act (1998) as determined by the Director-General of Higher Education and Training.
PART B Performance information
27
Strategic objectives, performance indicators planned targets and actual achievements
2012/13:
SKILLS DEVELOPMENT (National Skills Development Services)
Strategic objectives
Performance Indicator
Actual Achievement 2011/2012
Planned Target2012/2013
Actual Achievement2012/2013
Deviation from planned
target to Actual Achievement for
2012/2013
Comment on deviations
Provide funds to support projects that are national priorities in the NSDS, that advance the Human Resource Development Strategy (HRDS) of South Africa and that support the NSA in its work.
Amount earmarked to support projects of national priority
N/A. New indicator for 2012/13 financial year and was not used to measure performance for the 2011/12 financial year.
R2,3 billionearmarked tosupport projectsthat are ofnational priority
R8,833 billion R6,533 billion overachievement
The NSF’s high level of performance in committing funds towards skills development projects of national priority during the past financial year lead to the over-achievement.
Number of projects supported by National Skills Fund
N/A. New indicator for 2012/13 financial year and was not used to measure performance for the 2011/12 financial year.
262 projectssupported byNational SkillsFund by outerYear
157 projects 105 projects underachievement
The NSF funded projects of higher amounts and learner numbers. Hence the NSF over-achieved on the amounts earmarked target and the number of learners trained even though the number of projects as target was not achieved.
Number of learners trained in NSF projects
N/A. New indicator for 2012/13 financial year and was not used to measure performance for the 2011/12 financial year.
32 179 learnerstrained in NSFprojects
95 554 learners 63 375 overachievement
The NSF’s high level of performance of disbursing funds towards skills development projects during the past financial year lead to the over-achievement.
The NSF increased performance under the skills development programme, both with regards to grants disbursements and the number of learners benefitting, contributed towards
the NSF achieving its strategic outcome and mandate to fund skills development of national priority.
PART B Performance information
NATIONAL SKILLS FUND ANNUAL REPORT : 201328
2011/12:
SKILLS DEVELOPMENT (National Skills Development Services)
STRATEGIC OBJECTIVE ACTIVITY NO.
PERFORMANCE INDICATOR ACTIVITIES PERFORMANCE RESULTS (2011-12) REASONS FOR VARIANCE
1. To provide funds for identified priorities that advances the Human Resource Development Strategy (HRDS).
1.1 List of approved prioritised HRDS projects
List of approved prioritised HRDS projects
The list of HRDSA funding areas have been approved by the Minister.
1.2 Minimum number of projects funded
A minimum of one project is funded
Although funding has been provided for in the NSF budget, projects were slow to get off the ground due to protracted procurement processes.
HRDSA in process of appointing a Fund Management institution. Only concluded in May 2012.
2. To provide funds for priorities identified by the Minister after consultation with the NSA and that support the NSA in its advisory work and building the capacity of the social partners (constituencies) to strengthen their role in and delivery of the NSDS.
2.1 List of NSF funding priorities approved by Minister
List of NSF funding priorities approved by Minister
After detailed consultation the NSF Framework and Criteria for the allocation of funds was approved by the Minister. This includes priority areas for which funding will be allocated for the period of the NSDSIII.
2.2 A framework developed in conjunction with the NSA on building the capacity of the social partners (constituencies) to strengthen their role in the delivery of the NSDS
A framework developed in conjunction with the NSA on building the capacity of the social partners (constituencies) to strengthen their role in the delivery of the NSDS.
The framework for building the capacity of NSA constituencies has been endorsed by the NSA. This has since been translated into application guidelines and criteria that allowed NSA constituencies to access NSF funding.
PART B Performance information
29
2011/12:
SKILLS DEVELOPMENT (National Skills Development Services)
STRATEGIC OBJECTIVE ACTIVITY NO.
PERFORMANCE INDICATOR ACTIVITIES PERFORMANCE RESULTS (2011-12) REASONS FOR VARIANCE
3. To provide funds to support projects identified as national priorities in the context of the National Skills Development Strategy (NSDS) and in support of the strategic objectives of government.
3.1 A report on the wrap up of 224 NSDS II projects
Closure of NSDS II projects The original target of NSDS II projects to be closed was 224. This target was determined during March 2011 and was a preliminary estimation. After the final audit commitment list of 2010/2011 it was found that the total remaining open NSDS II projects were 206. Of the 206 projects, 179 (87%) could be successfully closed.
15 of the projects were moved to NSDS III as a result of these projects long contract duration and contributing to the results of the NSDS III, and the necessary interventions are in process to close the remaining 12 projects.
3.2 5-Year NSF funding report compiled
5-Year NSF funding report compiled
5-Year NSF funding report is available. In process to compile 6-year period report (extended NSDS III period, Apr 2005 – March 2011), but not yet completed.
3.3 Impact study commissioned on NSF funding during NSDS II period
Impact study commissioned on NSF funding during NSDS II period
The report on the impact of NSF funding under NSDSII is incorporated into the 5-year funding report compiled by the HSRC.
3.4 A Strategic Framework & Criteria for allocation of funds under NSDS III developed
A Strategic Framework & Criteria for allocation of funds under NSDS III developed and approved by Minister
NSF Strategic Funding Framework & Criteria was approved by the Minister on 04 Aug 2011.
3.5 Grant regulations published by the Minister
Grant regulations published by the Minister
Not achieved. Capacity challenges within the NSF. NSF currently engaged with DHET legal section to resolve the matter.
PART B Performance information
NATIONAL SKILLS FUND ANNUAL REPORT : 201330
2011/12:
SKILLS DEVELOPMENT (National Skills Development Services)
STRATEGIC OBJECTIVE ACTIVITY NO.
PERFORMANCE INDICATOR ACTIVITIES PERFORMANCE RESULTS (2011-12) REASONS FOR VARIANCE
3.6 Approved guidelines Application guidelines and operational manuals developed and approved
These guidelines to be based on the NSF Strategic Funding Framework have not been developed.
Capacity challenges within the NSF. NSF to explore possibilities for sourcing additional capacity.
3.7 Number of Skills for Green projects supported
10 Skills for Green projects supported
Not achieved. Much of the work has centred around discussions with relevant partners to finalise implementation policy and mechanisms.
Renewable energy project in process – targeting 2012/13.
3.8 Number of Industrial Policy Action Plan projects supported
10 Industrial Policy Action Plan projects supported
A total of 16 projects have been supported.
3.9 Number of New Growth Path projects supported
10 New Growth Path projects supported
A total of 17 projects have been supported.
3.10 Number of Skills for Rural Development projects supported
4 Skills for Rural Development projects
A total of 22 projects have been supported.
3.11 Number of Education and Health projects supported
4 Education and Health projects supported
A total of 4 projects were approved under this programme.
PART B Performance information
31
2011/12:
SKILLS DEVELOPMENT (National Skills Development Services)
STRATEGIC OBJECTIVE ACTIVITY NO.
PERFORMANCE INDICATOR ACTIVITIES PERFORMANCE RESULTS (2011-12) REASONS FOR VARIANCE
4. To provide funds to support other projects that are pertinent to the achievement of the purposes of the Skills Development Act, as determined by the Director-General.
4.1 List of other SDA priorities approved
List of other SDA priorities approved
This list has been incorporated into the broader NSF Framework. It is reported under the funding programme DG priorities.
4.2 Number of implementation reports produced
4 implementation reports produced
A detailed implementation report has not been compiled owing to slow take off of projects in this area.
The NSF will work with relevant DHET units to ensure a comprehensive implementation regime is instituted
5. To provide funds for the operations of the NSF.
5.1 Monthly records of financial transactions, assets and liabilities maintained and available
Monthly records of financial transactions, assets and liabilities maintained and available
Monthly NSF Financial reports are compiled. These include detailed income & investment reports as well as expenditure reports from key programme activities.
5.2 Staff development programme approved.
Staff development programme approved
List of NSF staff attending skills development interventions available.
5.3 Systems audit report with recommendations compiled
Systems audit report with recommendations compiled
Noticeable progress achieved. To date a detailed analysis of our Information System has been compiled.
The NSF still requires to conclude analysis of systems to support M&E and applications processing
5.4 Number of Programme funding reports
4 Programme funding reports compiled
BAS Programme funding reports for quarterly disbursements available.
PART B Performance information
NATIONAL SKILLS FUND ANNUAL REPORT : 201332
Strategy to overcome areas of under performance
The NSF will consider reviewing the relevance of the number of projects as an indicator for performance as the indicator does not reflect the true performance of the Fund. The NSF
over-achieved on the number of learners benefitting from the skills development projects and overachieved on the amount earmarked towards skills development projects. This is
due to the fact that NSF funded higher value projects benefitting more learners per project.
Changes to planned targets
No changes were made to planned targets during the 2013 financial year.
Linking performance with budgets
Programme Name
2012/2013 2011/2012
Budget Actual Expenditure (Over)/ Under Expenditure Budget Actual Expenditure (Over)/ Under
The Skills Development Levies and interest received from investments were on par with the amounts estimated. The actual revenue received is in line with the budgeted revenue.
The actual grant disbursements paid is 36% below budget, mainly due to disbursements towards bursaries of R619,422 million paid shortly after year end. The remaining under
expenditure of R848,145 million can be attributed to delays in projects during the 2013 financial year. These projects have however started and will become due in the next financial
year as the Fund meets its current commitments of R11,4 billion.
PART B Performance information
NATIONAL SKILLS FUND ANNUAL REPORT : 201334
35
governancepart c
PART C Governance
NATIONAL SKILLS FUND ANNUAL REPORT : 201336
Date and Time of presentation
Committee Subject
17 April 2012
09:30 – 12:45
Portfolio Committee
on Higher Education
and Training
Briefing by the Department of
Higher Education and Training
on its Annual Performance Plan
2012/13.
16 May 2012
09:30 – 12:45
Portfolio Committee
on Higher Education &
Training
Briefing by Public Service SETA
and Services SETA on their Budget
and Strategic Plans 2012/13.
13 June 2012
09:30 – 12:45
Portfolio Committee
on Higher Education &
Training
Briefing by the Department of
Higher Education and Training
on its 4th quarterly performance
report.
29 August 2012
09h30 – 12h45
Portfolio Committee
on Higher Education
and Training
Briefing by the Department of
Higher Education and Training
on progress report in the
establishment of universities in
Mpumalanga and Northern Cape
and its 1st quarterly performance
report.
1. INTRODUCTION
Corporate governance embodies processes and systems by which public entities are
directed, controlled and held to account. In addition to legislative requirements based
on a public entity’s enabling legislation, corporate governance with regard to public
entities is applied through the precepts of the Public Finance Management Act (PFMA)
and run in tandem with the principles contained in the King’s Report on Corporate
Governance.
Parliament, the Executive and the Accounting Authority of the public entity are
responsible for corporate governance.
2. PORTFOLIO COMMITTEES
For the year under review, the National Skills Fund attended Portfolio Committee
engagements as part of the DHET team since it operated, in all material respects, as a
programme within the Department. This has meant that the committee did not single
out the NSF for specific areas of implementation other than what would have been
applicable to the entire Skills Development Branch under which the NSF operated as a
departmental programme.
The following portfolio committee meetings have been attended:
PART C Governance
37
4. THE ACCOUNTING AUTHORITY
introDuCtion
The Director-General of Higher Education and Training is the Accounting Authority of
the National Skills Fund as stipulated in section 29(1) of the Skills Development Act.
The Director General of Higher Education and Training is responsible for the control
of the Fund and ultimately accountable to the Minister and Parliament for the Fund’s
performance, strategic direction and money spent by the Fund.
Within the framework of the Director-General’s delegations of authority, the day-to-day
operations of the NSF are managed by the Executive Officer.
The NSF further reports through the governance structures set by the Department
of Higher Education and Training. These include the Skills Development Branch
Management Meetings, the Senior Management Meetings and the Ministerial
Management Meetings.
The role of the Accounting Authority is as follows:
As Accounting Authority of the National Skills Fund, the Director-General of Higher
Education and Training has amongst others the following responsibilities:
1. To manage the Fund in accordance with the Public Finance Management Act;
2. Keep a proper record of all financial transactions, assets and liabilities of the Fund;
3. Prepare annual financial statements for the Fund in the prescribed form;
Date and Time of presentation
Committee Subject
04 September 2012
09h30 – 13h00
Portfolio Committee
on Women, Children
and People with
Disabilities
Department to respond to the
issues raised at the public hearings
on the implementation of the
UN Convention on the Rights of
Persons with Disabilities; issues
such as: Access to education
remains a major concern for
children, youth and persons with
disabilities. In terms of higher
education institutions, access
to finance (bursaries) to attain a
tertiary qualification was noted as
a major hindrance along with the
lack of assistive technology.
07 November 2012
09h30 – 12h45
Portfolio Committee
on Higher Education
and Training
Briefing by the W&RSETA, CHIETA,
and FP&M SETA on their 2011/12
Annual Report and Financial
Statements.
3. EXECUTIVE AUTHORITY
As per the requirements of the PFMA, the National Skills Fund reported quarterly to the
Minister of Higher Education and Training as the Executive Authority of the Fund. These
quarterly reports entail the reporting on the NSF’s financial status, compliance with the
PFMA and Treasury Regulations and performance information.
PART C Governance
NATIONAL SKILLS FUND ANNUAL REPORT : 201338
4. Subject to the laws governing the public service, appoint the Executive Officer
of the Fund, who will, upon such appointment, be in the employ of the public
service;
5. To prescribe a limit for the amount that can be used in the administration of the
Fund; and
6. To submit the annual financial statements to the National Skills Authority for
information as soon as possible after they have been prepared.
Composition of the Accounting Authority
The Director-General of Higher Education and Training, Mr Gwebinkundla Felix Qonde,
is the Accounting Authority of the National Skills Fund as per section 29(1) of the Skills
Development Act.
Remuneration of Accounting Authority
The Director-General of Higher Education and Training does not receive any
remuneration in his capacity as the Accounting Authority of the National Skills Fund.
5. RISK MANAGEMENT
The risk management activities of the NSF are covered within the Department of
Higher Education and Training’s comprehensive risk assessment facilitated by the
Directorate: Internal Audit of the Department of Higher Education and Training.
6. INTERNAL CONTROL
Management has focused on improving internal control through its partnership with the
DHET in terms of the Memorandum of Agreement with the latter as well as assistance
from the Internal Audit Unit in DHET.
7. INTERNAL AUDIT AND AUDIT COMMITTEES
kEy aCtiVitiES anD oBjECtiVES oF intErnaL auDit
The objective of the internal audit function is to provide independent, objective assurance
and consulting services designed to add value and improve the NSF operations. It helps
the NSF accomplish its objectives by bringing a systematic, disciplined approach to
evaluate and improve the effectiveness of risk management, control, and governance
processes.
The main activities of Internal Audit are:
• Compile three year rolling strategic and annual audit plan
• Performing internal audit on the following systems:
- Risk management systems:
- Control systems
- Governance systems
• Report to management and the Audit Committee.
PART C Governance
39
auDit Work
The following activities as per audit plan were completed:
• Corporate Governance
• Compliance with laws and regulations
• Review of quarterly monitoring reports on projects
• Audit of funding windows
• Audit of commitments
Key activities and objectives of the Audit Committee
The objective of the Audit Committee is to assist the Accounting Authority in fulfilling
oversight responsibilities regarding the financial reporting process, the system of internal
control and management of risks, the audit process, and the monitoring of compliance
with laws and regulations.
The main activities are:
• Consider the effectiveness of the internal control systems;
• Understand the scope of internal and external auditor’s review of internal
control over financial reporting, and obtain reports on significant findings and
recommendations together with management’s responses;
• Assess whether the Fund’s assets have been properly safeguarded and used;
• Review the NSF risk profile on an annual basis and ensure management is
effectively managing the risks;
• Review the effectiveness of the system for monitoring compliance with laws
and regulations and the results of management’s investigation and follow-up
(including disciplinary action) of any instances of non-compliance; and
• Review the adequacy, reliability and accuracy of the financial information
provided to management and other users of such information and annually
review the Annual Financial Statements and recommend its approval to the
Director-General.
PART C Governance
NATIONAL SKILLS FUND ANNUAL REPORT : 201340
The audit committee consists of the members listed below and should meet at least four times per annum as per its approved terms of reference. During the current year four
meetings were held.
Attendance of audit committee meetings:
Name QualificationsInternal/External
memberIf Internal, position
in DepartmentDate
AppointedNumber of meetings
attendedDate Resigned
Prof. DP van der Nest D Tech External N/A 1/11/2010 4 NA
Ms S Padayachy M Comm External N/A 1/11/2010 3 NA
Mr S Makhubu CA (SA) External N/A 6/6/2011 4 NA
Ms G Maaka-Tlokana BA Hons Internal Director 1/11/2010 4 NA
Mr C Mtshisa BA Hons Internal Acting Deputy Director General: Skills Development
1/11/2010 3 NA
PART C Governance
41
8. COMPLIANCE WITH LAWS AND REGULATIONS
The NSF aims to embed compliance with laws and regulations throughout its
organisation as an integral part of all relevant processes.
To assist with compliance monitoring, the NSF uses the DHET’s Compliance Calendar to
ensure compliance with all required documentation in terms of the PFMA and Treasury
Regulations within legislated deadlines.
The NSF also uses the National Treasury template to assess compliance with laws
and regulations on a quarterly basis as part of the quarterly reporting process to the
Executive Authority.
Action plans to address non-compliance are developed and the implementation thereof
monitored regularly.
The NSF also attends various other committee meetings to keep abreast of laws and
regulations that need to be complied with.
9. FRAUD AND CORRUPTION
The activities of the NSF are covered within the Good Governance Policy, which includes
fraud prevention, compiled by the Directorate: Internal Audit of the Department of
Higher Education and Training.
The NSF uses the whistle blowing policy of the DHET while the Memorandum of
Agreement for shared services with DHET exists.
No cases of fraud have become known to the NSF during the last financial year.
10. MINIMISING CONFLICT OF INTEREST
Through the Memorandum of Agreement with the Department of Higher Education
and Training for shared services, the NSF has permission from the Department of Higher
Education and Training to use its bid committees, which follow the Department’s supply
chain management policy.
11. CODE OF CONDUCT
The NSF employees are bound by the Code of Conduct of the DHET as all NSF employees
are currently employed by the Department of Higher Education and Training.
12. HEALTH SAFETY AND ENVIRONMENTAL ISSUES
The NSF is situated in the offices of the DHET. The building is being upgraded to comply
with the necessary Health Safety and Environmental issues. One major concern is limited
parking and unfriendly access to parking.
13. SOCIAL RESPONSIBILITY
Not applicable to the NSF for the 2013 financial year.
14. MATERIALITY AND SIGNIFICANCE FRAMEWORK
The NSF prepared its Materiality and Significance Framework which has been approved
by the Director-General of Higher Education and Training as the Accounting Authority
of the NSF and submitted to the Minister for concurrence.
PART C Governance
NATIONAL SKILLS FUND ANNUAL REPORT : 201342
15. AUDIT COMMITTEE REPORT
We are pleased to present our report for the financial year ended 31 March 2013.
auDit CoMMittEE rESPonSiBiLity
The Audit Committee reports that it has complied with its responsibilities arising
from Section 51(1)(a)(ii) of the Public Finance Management Act and Treasury
Regulation 27.1. The Audit Committee also reports that it has adopted appropriate formal
terms of reference as its committee charter, has conducted its affairs in compliance with
this charter and has discharged all its responsibilities as contained therein.
tHE EFFECtiVEnESS oF intErnaL ControL
The system of internal control is designed to provide cost-effective assurance that
assets are safeguarded and that liabilities and working capital are effectively managed.
In line with the PFMA requirements, Internal Audit and the Auditor-General South
Africa (AGSA) provide the Audit Committee and management with assurance that the
internal controls are adequate and effective. This is achieved by means of evaluating
the effectiveness of the management of identified risks, as well as the identification of
corrective actions and suggested enhancements to the controls and processes.
The system of internal control was not entirely effective during the year under review,
as several instances of non-compliance with internal controls were reported by both
Internal Audit and the AGSA. It is a concern for the Audit Committee that a number of
the matters raised by the AGSA are repeat findings from one or more previous years.
The Audit Committee will continue to monitor progress against the corrective action
plans implemented by management.
The lack of an integrated financial management system for NSF has resulted in ineffective
control over financial reporting.
tHE QuaLity oF in-yEar ManaGEMEnt anD MontHLy / QuartErLy rEPortS SuBMittED in tErMS oF tHE PFMa
The Audit Committee is satisfied with the content and quality of monthly and quarterly
reports prepared and issued by the Accounting Authority of the National Skills Fund
during the year under review. However, material misstatements were identified in the
financial statements during the audit and corrected by the NSF. There were no findings
on the quality of performance information.
EVaLuation oF FinanCiaL StatEMEntS
The Audit Committee has:
• reviewed and discussed the audited financial statements to be included in the
Annual Report, with the AGSA and the Accounting Officer;
• reviewed the AGSA’s management report and management’s response thereto;
• reviewed changes in accounting policies and practices;
• reviewed the Fund’s compliance with legal and regulatory provisions;
• reviewed significant adjustments resulting from the audit; and
• reviewed information on predetermined objectives to be included in the Annual
Report.
PART C Governance
43
The Audit Committee concurs with, and accepts the AGSA’s conclusions on the
Annual Financial Statements, and is of the opinion that the audited Annual Financial
Statements be accepted and read together with the report of the AGSA. There were very
large misstatements identified during the audit of the financial statements, these were
adjusted by management. Management is urged to expedite the implementation of a
financial management system that will be suitable for the needs of the NSF as the lack
of such a system was a root cause for the misstatements identified.
intErnaL auDit
The Audit Committee is satisfied that the internal audit function is operating effectively
and that it has addressed the risks pertinent to the Fund in its audits. Additional capacity
was obtained for internal audit and they were able to complete all the audits approved
in the coverage plan by the audit committee.
auDitor-GEnEraL SoutH aFriCa
The Audit Committee has met with the Auditor-General South Africa to ensure that
there are no unresolved issues.
ConCLuSion
The Audit Committee congratulates the NSF for achieving an unqualified audit report
for the year under review. Our appreciation is also extended to management, the chief
financial officer and staff for their efforts regarding the financial statements for the year
and to the team from the AGSA for the value they continue to add to the National Skills
Fund. The audit committee will monitor the improvements made by management in
addressing control deficiencies identified by external and internal audit.
Prof D.P. van der nestChairperson of the audit Committee
Date: 31 july 2013
PART C Governance
NATIONAL SKILLS FUND ANNUAL REPORT : 201344
45
human resource managementpart d
PART D Human resource management
NATIONAL SKILLS FUND ANNUAL REPORT : 201346
The NSF is embarking on a process to establish itself as a fully-fledged public entity,
whilst at the same time improving its operations. This will entail a review of the entire
organisation to ensure efficient workforce planning, as well as running an intensive
recruitment campaign to attract and recruit a skilled and capable workforce to address
the current capacity constraints.
All employees are required to sign performance agreements with their immediate
supervisors, which is assessed quarterly and annually. The NSF’s performance
management framework will be reviewed as part of improving the Fund’s operations
during the establishment of the Fund as a fully-fledged public entity.
1. INTRODUCTION
The Nationals Skills Fund has a current funded staff establishment of 61 posts of
which 4 posts are vacant. All employees of the NSF are currently employed by the
Department of Higher Education and Training within public service as the NSF
operated as a programme under the Department prior to its listing as a public entity on
12 October 2012. The NSF refunds the Department for the employee costs incurred by
the Department on behalf of the NSF.
The key HR priorities to be addressed during the next financial year are the following:
• Addressing the current capacity constraints with regards the initiating and
monitoring of projects and with regards to the support services required with
the establishment of the NSF as a fully-fledged public entity will be prioritised
within the next financial year; and
• Transferring NSF employees from the Department of Higher Education and
Training to be employed by the NSF as a public entity.
PART D Human resource management
47
2. HUMAN RESOURCE OVERSIGHT STATISTICS
PErSonnEL CoSt By ProGraMME
Programme Total Expenditure for the Entity (R’000)
Personnel Expenditure (R’000)
Personnel Expenditure as a % of total
Expenditure (R’000)Number of Employees Average Personnel Cost
per Employee (R’000)
Skills Development 2 664 330 17 732 0.67% 58 306
PErSonnEL CoSt By SaLary BanD
Level Personnel Expenditure (R’000)
% of Personnel Expenditure to Total Personnel Cost
(R’000)Number of Employees Average Personnel Cost per
Employee (R’000)
Top Management 3 501 19.7% 5 700
Senior Management 5 318 29.0% 12 428
Skilled 8 913 50.3% 41 217
Semi-skilled 0 0% 0 0
TOTAL 17 732 100% 58 306
PErForManCE rEWarDS
Programme Performance Rewards (R’000)
Personnel Expenditure (R’000)
% of Performance Rewards to Total Personnel Cost (R’000)
Top Management 129 3 501 3.7%
Senior Management 180 5 318 3.4%
Skilled 236 8 913 2.6%
Semi-skilled 0 0 0
TOTAL 545 17 732 3.1%
PART D Human resource management
NATIONAL SKILLS FUND ANNUAL REPORT : 201348
traininG CoStS
Directorate/Business Unit Personnel Expenditure (R’000)
Training Expenditure(R’000)
Training Expenditure as a % of Personnel Cost
NSF staff establishment 17 732 160 0.9%
EMPLoyMEnt anD VaCanCiES
Programme 2012/2013 Number of Employees
2013/2014 Approved Posts
2013/2014Number of Employees
2013/2014 Vacancies
% of Vacancies
Skills Development 42 142 58 84 59%
Programme 2012/2013 Number of Employees
2013/2014 Approved Posts
2013/2014Number of Employees
2013/2014 Vacancies
% of Vacancies
Top Management 4 5 5 0 0%
Senior Management 8 20 12 8 40%
Professional qualified 0 0 0 0 0%
Skilled 30 117 40 76 65%
Semi-skilled 0 0 0 0 0%
Unskilled 0 0 0 0 0%
TOTAL 42 142 57 84 59%
PART D Human resource management
49
EMPLoyMEnt CHanGES
Salary Band Employment at beginning of period Appointments Terminations Employment at end of
the periodTop Management 4 1 0 5
Senior Management 8 4 0 12
Professional qualified 0 0 0 0
Skilled 30 11 0 41
Semi-skilled 0 0 0 0
Unskilled 0 0 0 0
TOTAL 42 16 0 58
rEaSonS For StaFF LEaVinG
Reason Number % of Total Number of Staff Leaving
Death 0 0%
Resignation 0 0%
Dismissal 0 0%
Retirement 0 0%
Ill health 0 0%
Expiry of contract 0 0%
Other 0 0%
TOTAL 0 0%
No staff left during the past financial year.
PART D Human resource management
NATIONAL SKILLS FUND ANNUAL REPORT : 201350
LaBour rELationS: MiSConDuCt anD DiSCiPLinary aCtion
Nature of disciplinary Action Number
Verbal Warning 0
Written Warning 0
Final Written Warning 0
Dismissal 0
EQuity tarGEt anD EMPLoyMEnt EQuity StatuS
Levels MALE
African Coloured Indian White
Current Current Current Current
Top Management 2 0 0 2
Senior Management 4 2 0 0
Professional Qualified 0 0 0 0
Skilled 17 0 0 1
Semi-skilled 0 0 0 0
Unskilled 0 0 0 0
TOTAL 23 2 0 3
Levels FEMALE
African Coloured Indian White
Current Current Current Current
Top Management 1 0 0 0
Senior Management 5 0 0 1
Professional Qualified 0 0 0 0
Skilled 16 0 0 7
Semi-skilled 0 0 0 0
Unskilled 0 0 0 0
TOTAL 22 0 0 8
Levels Disabled Staff
Male Female
Current Current
Top Management 0 0
Senior Management 0 0
Professional Qualified 0 0
Skilled 0 1
Semi-skilled 0 0
Unskilled 0 0
TOTAL 0 1
51
financial informationpart e
annual financial statements | For the year ended 31 March 2013
NATIONAL SKILLS FUND annual RePORt : 201352
STATEMENT OF RESPONSIBILITY
STATEMENT OF RESPONSIBILITY FOR THE ANNUAL FINANCIAL STATEMENTS FOR THE YEAR ENDED 31 MARCH 2013
The Accounting Authority is responsible for the preparation of the public entity’s annual
financial statements and for the judgements made in this information.
The Accounting Authority is responsible for establishing, and implementing a system
of internal control designed to provide reasonable assurance as to the integrity and
reliability of the annual financial statements.
In my opinion, the financial statements fairly reflect the operations of the public entity
for the financial year ended 31 March 2013.
The external auditors are engaged to express an independent opinion on the AFS of the
public entity.
The National Skills Fund’s annual financial statements for the year ended 31 March 2013
have been audited by the external auditors and their report is presented on page 65.
The Annual Financial Statements of the public entity set out on page 69 to page 138
have been approved.
Mr GF Qonde Director-General of Higher Education and Training Accounting Authority of the National Skills Fund
Mr M MacikamaExecutive OfficerNational Skills Fund
Date: 31 May 2013
annual financial statements | For the year ended 31 March 2013
REPORT OF THE EXECUTIVE OFFICER
53
The efficiency of the National Skills Fund in executing its mandate of funding skills
development of national priority and for the achievement of the Skills Development Act
has increased since the implementation of the NSDSIII. As indicated in the graph, The
NSF’s annual grants disbursement towards skills development has increased significantly
since the launch of the NSDS III:
• 1st Year of NSDS III (2012 financial year): Grants disbursements increased with
131% from R564 million to R1.3 billion; and
• 2nd Year of NSDS III (2013 financial year): Grants disbursements increased with
97% from R1.3 billion to R2.6 billion.
These increases within the respective NSDS III years represent a 357% increase in the
grants disbursement rate under the previous NSDS II and are a clear indication that the
NSF’s performance under NSDS III has increased significantly.
For the first time in the NSF’s history, the Fund’s grants disbursements of R2,6 billion
towards skills development is on par with its annual revenue of R2,7 billion.
Spending trends of the public entity, including new and proposed activities
The NSF’s grants disbursement efficiency is expected to increase over the next
three years until the end of the NSDSIII period (31 March 2016) as the NSF meets its
current contractual commitments of R11,4 billion. These commitments entail
commitments towards current skills development projects of national priority.
GENERAL FINANCIAL REVIEW OF THE PUBLIC ENTITY
This report marks the second year of implementation under the new NSDSIII where
the Fund was primarily engaged in increasing skills development funding towards the
skills development projects of national priority as identified in the NSDS III and skills
development projects as identified by the Director-General as priority towards achieving
the Skills Development Act.
Over the last 2 years, since the new NSDS III was launched, the NSF’s performance has increased significantly due to deliberate interventions to improve the Fund’s
performance under NSDS III. These deliberate interventions resulted in the Fund
becoming more efficient towards funding the critical skills needs in South Africa. This
significant increase in the efficiency of the NSF can be clearly noted in the NSF’s increase
in grants disbursements towards skills development of national priority, as illustrated in
annual financial statements | For the year ended 31 March 2013
REPORT OF THE EXECUTIVE OFFICER
NATIONAL SKILLS FUND annual RePORt : 201354
As at 31 March 2013, R1,6 billion remains committed towards bursaries until the end of the NSDS III.
The NSF has a R1,3 billion commitment towards funding undergraduate bursaries via
the National Student Financial Aid Scheme (NSFAS) over the remainder of the NSDS III
period. This will result in an annual contribution of approximately R650 million by the
NSF towards the NSFAS. The NSFAS has financially assisted many financially needy, but
eligible students to obtain their qualification in the past.
The NSF has further committed R262 million towards funding postgraduate bursaries via
the National Research Foundation (NRF) over the remainder of the NSDS III period. This
will result in an annual contribution of approximately R106 million by the NSF towards
the NRF. The increase in PhDs will contribute towards the achieving the objectives as
outlined in the New Growth Path, the Industrial Policy Action Plan and The Department
of Science and Technology’s Ten-Year Innovation Plan.
2. r444 MiLLion DiSBurSED toWarDS FEt CoLLEGE SECtor CaPaCity BuiLDinG, WitH r2,4 BiLLion CoMMitMEnt rEMaininG
The NSF has disbursed R444 million towards the FET colleges for expansion of their current capacity as a national priority identified in the NSDS III. As at 31 March 2013, R2,4 billion remains committed towards FET college sector capacity building until the end of the NSDS III.
Funding towards the FET colleges is aimed at expanding their current interventions
(NCV and Report 191), as well as new interventions such as learnerships, internships and
skills programmes.
As these current commitments become due and are met by the NSF over the next three
years, it is expected that the NSF’s accumulated surpluses will gradually decline towards
the end of the NSDS III period, as illustrated in the graph below:
- 1
2
3
4
5
6
7
8
2013/14
2014/15
2015/16
2016/17
Acc
umul
ated
Res
erve
s R
Billi
ons
The NSF’s R2,6 billion grants disbursements towards skills development projects
during the past financial and remaining R11,.4 billion in contractual commitments can be attributed to the following:
1. r1,23 BiLLion DiSBurSED toWarDS BurSariES, WitH a r1,6 BiLLion CoMMitMEnt rEMaininG
The NSF has disbursed R1,23 billion towards undergraduate and postgraduate bursaries as a priority identified by the Director-General in support of the Higher Education and FET College sectors. This support has benefitted 14 661 and 1143 undergraduate and postgraduate students respectively.
annual financial statements | For the year ended 31 March 2013
REPORT OF THE EXECUTIVE OFFICER
55
remaining towards completion of the skills infrastructure development project.
The expansions of the University of Pretoria’s medical and veterinary facilities
are key public delivery infrastructure that will increase the number of medical
doctors and veterinaries trained annually. Both skills are scarce and critical skills
for South Africa to address the demands posed by the National Health Insurance
scheme to make health universally accessible to every citizen of the country and
to address an urgent need for food security and general animal health.
These skills infrastructure development projects at the University of Pretoria have
already begun in the 2013 financial year and will be on-going during the 2014
financial year to be finalised in 2015/16.
• University of Johannesburg
R213 million remains committed towards the University of Johannesburg to
establish work-integrated learning facilities for engineering students, which
includes a training workshop, design centre and industrialisation centre.
These facilities, as key public delivery infrastructure, are critical to improve the
production of quality engineers at the University of Johannesburg. Engineers are
a scarce and critical skill for South Africa, especially taking cognisance of South
Africa’s ratio of engineers to citizens in comparison with other BRICS countries.
This is partly contributing towards resolving lack of graduation in engineering
programme due to lack of work placement opportunities for a large number of
engineering students. This capacity, in the form of a production environment,
will be accessible to engineering students, in need, beyond the University of
Johannesburg.
This skills infrastructure development project at the University of Johannesburg
has begun shortly after the 2013 financial year-end and will be on-going during
the 2014 financial year to be completed in 2015/16.
This is in line with the National Skills Development Strategy (NSDS III) aimed at promoting
growth within the public FET college system that is responsive to sector, local, regional
and national skills needs and priorities.
3. r54 MiLLion DiSBurSED toWarDS SkiLLS inFraStruCturE DEVELoPMEnt oF nationaL Priority, WitH a r2,35 BiLLion CoMMitMEnt rEMaininG
The NSF’s priorities to address skills infrastructure is intended to contribute to the building and revitalisation of the skills infrastructure that will lead to expanded access and delivery of skills funded through the levy system. The following areas have been prioritised:
• Recapitalisation of public delivery infrastructure;
• Community Education Centres;
• Skills Development Institutes; and
• State-owned enterprises.
During the 2013 financial year, the NSF disbursed R54 million towards skills infrastructure development as national priority of government.
As at 31 March 2013, R2,35 billion remains committed towards the following key skills infrastructure development projects of national priority:
• University of Pretoria
R21 million was disbursed towards the University of Pretoria for expanding the
University’s medical and veterinary facilities, with a R382 million commitment
annual financial statements | For the year ended 31 March 2013
REPORT OF THE EXECUTIVE OFFICER
NATIONAL SKILLS FUND annual RePORt : 201356
neither in education, employment nor any kind of training and with less than a
grade 12 qualification. The state and its respective institutions have the ultimate
responsibility, as a last line of defence, to ensure that education and training
opportunities are made available to overcome the skills shortage and high
unemployment in the country.
The building of the 12 FET College campuses is due to begin within the 2014
financial year.
• National Institute for the Deaf
The National Institute for the Deaf, as a key community education centre, is the
only post-school education institute for deaf people in South Africa and Southern
Africa. The NSF disbursed R33 million towards the building of hostels and lecture
rooms for deaf students and accommodation for hostel managers at the National
Institute for the Deaf, as well as addressing curriculum improvements for deaf-
friendly skills programmes. R44 million remains committed towards completion
of the skills infrastructure development project. The project will allow for an
increased annual intake of deaf students from all over South Africa and Southern
Africa.
The skills infrastructure development project at the National Institute for the
Deaf has already begun in the 2013 financial year and will be on-going during
the 2014 financial year.
• Cape Peninsula University of Technology
R106 million remains committed towards the Cape Peninsula University of
Technology for the establishment of renewable energy training facilities. These
facilities, as key public delivery infrastructure, are critical in the production of a
set of new skills required for the green economy. This initiative, being the first
of its kind in the country, seeks to respond to the country’s adopted strategy to
promote renewable energy production in order to supplement the current fossil
fuel energy production and gradually reduce the country’s carbon footprint. The
Department has seen it fit to establish this dedicated education and training
capacity for the country to produce high and middle level skills in the area of
renewables. The renewable energy is currently an area of growth within the
South African economy.
The renewable energy skills infrastructure development project at the Cape
Peninsula University of Technology will begin during the 2014 financial year to
be completed in 2016/17.
• 12 new Further Education and Training College Campuses
R1,5 billion is earmarked towards building 12 new FET colleges as key public
delivery infrastructure in areas of high demand for a public FET college. The
locations of the new FET campuses were determined based on the density of
the population within each identified area and the unavailability of sufficient
FET college campuses to meet the demand for further education and training
within the identified areas. It is vital to provide South Africans from these areas
with the opportunity towards further education and training by establishing
sufficient campuses closer to their origin. The 2011 census indicates that
there is over 3 million out of school youth of ages between 15 to 25, who are
annual financial statements | For the year ended 31 March 2013
REPORT OF THE EXECUTIVE OFFICER
57
• Vukani Aviation Project, aimed at training 100 learners on the national aviation
cadet programmes.
5. r43 MiLLion DiSBurSED toWarDS tHE iPaP, WitH r521 MiLLion CoMMitMEnt rEMaininG
The NSF has disbursed R43 million towards skills development projects contributing towards achieving the objectives of the Industrial Policy Action Plan (IPAP) as a national priority identified in the NSDS III. As at 31 March 2013, R521 million remains committed towards the following IPAP skills development projects:
• dti Monyetla Work Readiness Programme, contributing towards training call
centre agents. The dti Monyetla programme has benefitted 3 239 learners during
the past financial year to acquire workplace skills as call centre agents;
• dti Tool and Die Initiative Project, aimed at training 1 610 learners as Tool and
Die makers within the manufacturing sector, who are considered pivotal to the
manufacturing industry; and
• dti Unemployed Graduate Programme, aimed at providing unemployed
graduates with the necessary workplace experience required for permanent
employment.
4. r265 MiLLion DiSBurSED toWarDS tHE nEW GroWtH PatH, WitH r766 MiLLion CoMMitMEnt rEMaininG
The NSF has disbursed R265 million towards skills development projects contributing towards achieving the objectives of the New Growth Path as a national priority identified in the NSDS III. As at 31 March 2013, R766 million remains committed towards the New Growth Path skills development projects.
Amongst the various projects contributing towards achieving the New Growth Path, are
the following:
• TRANSNET Rail Engineering Project, aimed at training 1 000 artisans to work on
the railways of South Africa;
• Agri Seta & Commissioner for Land Rights Restitution Project, aimed at providing
skills development to 4 750 learners linked to land restitution, which includes
• SAICA Municipalities Project, aimed at providing financial skills development to
1 000 municipal finance staff;
• Lepelle Northern Water Project, aimed at developing scarce skills in the water
sector in Limpopo, which includes water & waste treatment reticulation,
plumbing, electrical, mechanical and internship programmes;
• Harry Oppenheimer Diamond Training School Project, with 31 students enrolled
on learnerships to obtain practical skills on top and bottom polishing of
diamonds; and
annual financial statements | For the year ended 31 March 2013
REPORT OF THE EXECUTIVE OFFICER
NATIONAL SKILLS FUND annual RePORt : 201358
Amongst these key projects supported are the following:
• Strategic Integrated Projects of the National Infrastructure Plan
Following the launch of the National Infrastructure Plan by the President of
South Africa in February 2012, the Minister of Higher Education and Training,
Dr. Nzimande was allocated the task of developing a skills plan to ensure that skills
were developed both for, as well as through, the projects. As a consequence the
Special Projects Unit was established in the Department in April 2012. The NSF
strengthened the Special Projects Unit technical and general human resource
capacity and information processing capabilities through R1,8 million funding.
The work of the Unit began at a time when the Strategic Integrated Projects (SIPs)
of the National Infrastructure Plan (NIP) were taking shape. As an initial phase the
Unit familiarised themselves with ‘what skills are needed for the SIPs’, secondly
‘when and where are the skills needed’ and finally ‘which of the needed skills are scarce’? An extensive research initiative was undertaken to answer these
questions and results was arrived at by the end of March 2012.
Whilst this work was underway, a process began to conceptualise the framework
within which the demand for skills should be met. In early 2013, a strategy to
meet the demand for skills has been developed.
There is one central initiative underway at this point. The Special Projects Unit
has prepared a project proposal that has been accepted by the European Union
Dialogue Facility. This project will focus on ‘New Skills for New Jobs’ or, because it
is in the context of infrastructure, ‘New Infrastructure Skills for New Infrastructure
Jobs’. This initiative is an investigation into a new way of designing skills that are
anticipated to be needed with the advent of the introduction of new technology.
The Passenger Rail Agency of South Africa (PRASA) will be introducing new
6. r113 MiLLion DiSBurSED toWarDS ruraL DEVELoPMEnt, WitH r810 MiLLion CoMMitMEnt rEMaininG
The NSF has disbursed R113 million towards rural skills development projects as a national priority identified in the NSDS III, with R810 million remaining committed towards the rural skills development projects.
These commitments includes amongst others the following:
• R323 million committed towards the Expanded Public Works Programme (EPWP
Programme) aimed at employing and skilling unemployed people for EPWP
projects until the end of the NSDS III; and
• R79 million committed towards the Sisonke Economic Development Agency
for the provision of skills development programmes to benefit the previously
disadvantaged communities of the Sisonke District Municipality that will alleviate
poverty, reduce unemployment and increase job creation.
7. r165 MiLLion DiSBurSED toWarDS EStaBLiSHinG a CrEDiBLE SkiLLS MECHaniSM WitHin an intEGratED PoSt SCHooL EDuCation SyStEM, WitH r498 MiLLion CoMMitMEnt rEMaininG
The NSF has disbursed R189 million towards various key academia, research and broader
skills system development projects aimed at establishing a credible skills mechanism
within an integrated post school education system, with a remaining commitment of
R939 million as at 31 March 2013.
The investments into the various key projects have taken the process of developing a
credible skills mechanism a long way.
annual financial statements | For the year ended 31 March 2013
REPORT OF THE EXECUTIVE OFFICER
59
• Career advisory services
Through funding the NSF contributed towards the development of career
advisory services provided by SAQA. The project has to date delivered a fully
functional career helpline, specialist software has been deployed to be able to
make call backs to callers, provide a walk-in centre, respond to e-mails and SMSs
and voice interaction. In addition to the above the project has also delivered on
organising a number of career exhibitions notable of which has been the annual
Mandela Day Careers Festival. The DHET through SAQA has also been present
in setting up exhibitions stands organised by various organisers. A substantive
radio project has also been embarked upon using 10 languages and discussing
career related matters through dedicated programming.
• Integrated Higher Education and Training Management Information System
The NSF contributed funding to the development of an integrated Higher
Education and Training Management Information System (HETMIS). This entails
developing HETMIS policy, standards and requirements for the collection,
processing and dissemination of data. The aim of this project to is to replicate
the unit record system of the Higher Education Management Information for
Universities, for the Colleges and SETA sectors. This system will be able to provide
detailed information for the planning and provisioning (supply) of education and
training.
• Labour Market Intelligence System
The NSF funded the development of the Labour Market Intelligence System.
This system will be able to provide strategic demand side information for skills
planning. The HSRC and Wits EPU have been allocated a grant of R 89 million
signalling system and will be using this project to assist them design the skills
required. A second pilot project will be conducted in the Department’s own
infrastructure initiatives. Given that approvals are now in place, the project is due
to commence in July 2013.
There will be much more work required in this space going forward, in particular
in relation to the operation and maintenance of the infrastructure built. There will
also be work required to ensure the skills needed for the economic projects that
flow from the infrastructure are addressed as well as any localisation initiatives
that are established to meet significant input demands. This work lies ahead.
• Single uniform funding and administration model for artisan learners
Through funding, the NSF contributed towards the development of a single
uniform funding and administration model for artisan learners, creating
consistency across the post school education system.
• Recognition of Prior Learning model
Through funding the NSF contributed towards the development of a Recognition
of Prior Learning model in particular for artisan aides.
• Prioritisation model for the development of artisan trades
Through funding the NSF contributed towards the development of a prioritisation
model for the development of artisan trades, involving the identification of
priority artisan trades for development to ensure that the current needs in the
country are met. This has led to the creation of the call centre at the Ekurhuleni
East FET College, which manages this process for the country.
annual financial statements | For the year ended 31 March 2013
REPORT OF THE EXECUTIVE OFFICER
NATIONAL SKILLS FUND annual RePORt : 201360
• Single uniform funding and administration model for artisan learners
• Recognition of Prior Learning model
• Prioritisation model for the development of artisan trades
9. r17 MiLLion DiSBurSED toWarDS SuPPortinG tHE Work oF tHE nationaL SkiLLS autHority, WitH r206 MiLLion rEMaininG aS EarMarkED
The successful delivery of the NSDS III relies on the role played by social partners in the delivery of skills. In consultation with the NSA, the Minister has identified a number of priorities that are to support the NSA in its advisory work and build the capacity of the social partners in the implementation of the NSDS III. These are:
• Review the skills development legislative framework to support the integration of education and training with the national priorities of government (inclusive of the NSF framework);
• Develop frameworks on the mobilisation of business, government, community and labour to take full ownership of the NSDS III;
• Post school education and training that encourages society to support and build a developmental state focussing on rural development and state owned entities;
• Strengthen the monitoring and evaluation functions particularly on the NSDS III performance and governance;
and R18 million respectively for the development of the labour market skills
intelligence system.
8. r7 MiLLion DiSBurSED toWarDS SuPPortinG tHE HuMan rESourCE DEVELoPMEnt StratEGy oF SoutH aFriCa, WitH r235 MiLLion rEMaininG aS EarMarkED
The NSF supports the priorities agreed by the Human Resource Development Council of South Africa (HRDCSA), which oversees the implementation of the Human Resource Development Strategy for South Africa for 2030. The priorities agreed by the Council relate to the following:
• To strengthen and support the expansion of FET access;
• The production of intermediate skills (in particular artisans) and professionals;
• The production of academics and stronger industry-university partnerships in research and development;
• Strengthening foundational learning; and
• Address worker education.
The NSF has disbursed R7 million in the 2013 financial year towards supporting the work of the Human Resource Development Council of South Africa, with a further R235 million earmarked towards the work of the Council until the end of the NSDS III.
The following work of the Artisan and Technician Development Technical Task Team was
funded by the NSF and was recommended to and approved by the HRDCSA:
annual financial statements | For the year ended 31 March 2013
REPORT OF THE EXECUTIVE OFFICER
61
A key health project funded by the NSF is a R70 million commitment towards the Nelson
Mandela Children’s Hospital Trust, aimed at training paediatric nurses and doctors for
the new Nelson Mandela Children’s Hospital.
Capacity constraints and challenges facing the Public Entity
The increase in the NSF’s commitments and number of projects requires an increase in
the NSF’s monitoring and evaluation capacity. The monitoring and evaluation capacity
constraints of the NSF were clearly identified as an area for improvement within both
the NSDS III, as well as the Green Paper for Post School Education and Training.
As a result of the NSF’s listing as a Schedule 3A public entity, the NSF needs to establish
the required support structures, which includes establishing capacity within the
following areas: finance, human resource management, supply chain management,
legal services and IT management.
The support services are currently provided by the Department of Higher Education
and Training.
The establishment of these support structures are vital towards ensuring the NSF’s core
functions are operating optimally, efficiently and effectively. The core functions of the
NSF consist of evaluating and initiating skills development projects of national priority
for funding and monitoring the implementation of those skills development projects.
Discontinued activities / activities to be discontinued
Projects under NSDS II was either aligned to NSDS III for continued funding or closed-off
and discontinued during the 2013 financial year.
• Research, development and innovation to promote beneficiation and bursaries enterprise development opportunities; and
• Revitalisation of the academic position.
The NSF disbursed R17 million towards supporting the work of the National Skills
Authority during the 2013 financial year, with R206 million remaining as earmarked
towards the National Skills Authority until the end of the NSDS III.
10. r317 MiLLion DiSBurSED toWarDS otHEr nationaL anD DirECtor-GEnEraL PrioritiES, WitH r1,7 BiLLion CoMMitMEnt rEMaininG
During the 2013 financial year, the NSF disbursed and committed funds towards the
following national priorities as identified in the NSDS III or identified as priority by
Director-General:
• R131 million disbursed towards Justice and Crime Prevention, with a R134 million
commitment remaining;
• R129 million disbursed towards Co-operatives, NGO’s and small enterprises, with
a R372 million commitment remaining;
• R13 million disbursed towards Education and Health, with a R73 million
commitment remaining;
• R5 million disbursed towards worker education, with a R14 million commitment
remaining; and
• R39 million disbursed towards the Trainee Lay-off Scheme, with a R1,14 billion
commitment remaining towards the Scheme.
annual financial statements | For the year ended 31 March 2013
REPORT OF THE EXECUTIVE OFFICER
NATIONAL SKILLS FUND annual RePORt : 201362
Branch, the NSF has been fully reliant on DHET SCM policies, processes and systems. The
Memorandum of Agreement was engaged with DHET to assist NSF with SCM functions
including utilisation of Bid committees.
• Challenges experienced and how resolved
With the listing of the NSF as a Schedule 3A public entity, it is envisaged that the NSF
will establish its own Supply Chain Management unit under the office of the NSF’s Chief
Financial Officer.
Audit report matters in the previous year and how would be addressed
Inaccurate and untimely financial and performance reporting resulting in non-
compliance with applicable laws and regulations has been identified as an audit report
matter to be addressed by the NSF.
The root causes resulting in inaccurate and untimely financial reporting can be attributed
towards insufficient financial capacity within the Fund and shortcomings in the current
financial system. Both of these root causes will be addressed in the next financial year
through appointing sufficient financial capacity within the Fund and upgrading the
NSF’s financial systems.
The root cause resulting in inaccurate and untimely performance information reporting
can be attributed towards insufficient projects monitoring capacity within the Fund,
shortcomings in the current performance information system and overreliance on
third parties to provide the performance information accurately and timely. These
root causes will be addressed with the establishment of sufficient internal monitoring
capacity within the Fund and improving the NSF’s projects monitoring process towards
being more automated and real-time.
Requests for roll over of funds
The NSF applied for the retention of the net surplus for the 2013 financial year
(R7,68 billion) in terms of section 53 (3) of the PFMA from National Treasury during
the first quarter of the 2014 financial year. This approval has not yet been granted by
National Treasury.
The request was based on the following reasons:
1. The NSF’s current effective utilisation of skills development resources benefitting
over 95 000 learners;
2. The NSF’s current contractual commitments;
3. To prevent the severe disruption of the over 95 000 learners currently receiving
on-going training, as well as legal backlash for cancelling projects;
4. The increased monitoring and evaluation capacity requirements of the NSF; and
5. The increased capacity required to establish the NSF as a fully-fledged Schedule
3A public entity.
Supply chain management
• Unsolicited bid proposals
No unsolicited bid proposals were concluded during the year.
• SCM processes and systems in place
Due to the NSF forming part of the DHET as a programme under the Skills Development
annual financial statements | For the year ended 31 March 2013
REPORT OF THE EXECUTIVE OFFICER
63
Financial management
The NSF’s financial management is sound and compliant to PFMA and National Treasury
regulations. The financial statements have been prepared in accordance with the
effective Standards of Generally Recognised Accounting Practices (GRAP) including any
interpretations, guidelines and directives issued by the Accounting Standards Board.
Other PFMA requirements
The NSF reports through the structures and processes of the Department of Higher
Education and Training in so far as compliance with the PFMA is concerned, namely:
• Basis of Accounting – The NSF prepared its financial statements for 2013
financial year on an accrual basis as required by the PFMA for Schedule 3A public
entities.
• Quarterly reporting – Quarterly reporting for the 2013 financial year formed
part of the quarterly reporting process on performance against the strategic plan
of the Department of Higher Education and Training. For the 2014 financial year
going forward the quarterly reporting will form part of the reporting process on
performance against the separate strategic plan of the NSF. Furthermore the NSF
submits quarterly reports on its cash-flow to National Treasury in the prescribed
format and timeframes.
• Actual revenue and expenditure projections – The relevant information
that forms part of the MTEF & ENE processes are submitted to National Treasury
via the processes of the Department of Higher Education and Training in the
prescribed format and timeframes.
Outlook for the future to address financial challenges
The NSF has current commitments of R11,4 billion towards skills development
projects of national priority as at the end of the 2013 financial year. These commitments
will become due over the remainder of the NSDS III period until 31 March 2016.
These commitments will be funded through the NSF’s current surpluses of R7,68 billion and through the NSF’s future expected income from skills development
levies and interest received on investments.
The NSF’s levy increased with 12% from the 2012 to the 2013 financial year. It is expected
that the future skills development levies will increase with a minimum of inflation
currently at 5.9% per annum until the end of the NSDS III period, namely 31 March 2016.
Thus, a total of R7,6 billion in skills development levy income is expected for the
remainder of the NSDS III period.
Through improved cash flow management, the NSF has increased its ability to operate
at optimal levels of grants disbursement efficiency, whilst ensuring that the Fund is able
to meet its skills development commitments as it becomes due.
Events after the reporting date
There are no events after reporting date.
Economic Viability
As per the Regulation approved by the Executive Authority, the NSF may utilise 10% of
its income towards administration of the Fund. This allocation towards administrative
costs is sufficient for the NSF to fund its operations.
annual financial statements | For the year ended 31 March 2013
REPORT OF THE EXECUTIVE OFFICER
NATIONAL SKILLS FUND annual RePORt : 201364
Exemptions and deviations received from National Treasury
There were no exceptions and deviation received from National Treasury.
Approval
The Annual Financial Statements have been approved by the Accounting Authority.
Mr M MacikamaExecutive Officer: National Skills Fund
Date: 31 May 2013
• Annual financial statements – These statements are compiled by the National
Skills Fund and have been submitted timeously for audit purposes.
• Annual report – Information with regard to the NSF are covered within the
Annual Report of the National Skills Fund.
• Completeness of revenue - Skills Development Levy (SDL) transfers are
recognised when it is probable that future economic benefit can be measured
reliably. This occurs when the Department of Higher Education and Training
(DHET) either makes an allocation or payment, whichever comes first, to the
SETAs and NSF, as required by Section 6 (5) of the Skills Development Levies Act,
1999 (Act No.9 of 1999). The SDL Transfer is measured at the fair value of the
consideration received.
Asset Management
The NSF’s assets are currently managed by the Department of Higher Education and
Training as the NSF operated as a sub-programme under the Department.
Irregular expenditure
The NSF did not incur any irregular expenditure during the 2012/13 financial year.
SCOPA resolutions
There were no new SCOPA resolutions affecting the fund during the reporting period.
annual financial statements | For the year ended 31 March 2013
REPORT OF THE EXTERNAL AUDITOR
65
Auditor-General’s responsibility
3. My responsibility is to express an opinion on these financial statements based on my audit. i conducted my audit in accordance with the public audit act of south africa, 2004 (act no. 25 of 2004) (paa), the general notice issued in terms thereof and international standards on auditing. those standards require that i comply with ethical requirements and plan and perform the audit to obtain reasonable assurance about whether the separate financial statements are free from material misstatement.
4. an audit involves performing procedures to obtain audit evidence about the amounts and disclosures in the separate financial statements. the procedures selected depend on the auditor’s judgement, including the assessment of the risks of material misstatement of the financial statements, whether due to fraud or error. in making those risk assessments, the auditor considers internal control relevant to the entity’s preparation and fair presentation of the financial statements in order to design audit procedures that are appropriate in the circumstances, but not for the purpose of expressing an opinion on the effectiveness of the entity’s internal control. an audit also includes evaluating the appropriateness of accounting policies used and the reasonableness of accounting estimates made by management, as well as evaluating the overall presentation of the financial statements.
5. i believe that the audit evidence i have obtained is sufficient and appropriate to provide a basis for my audit opinion.
REPORT OF THE AUDITOR-GENERAL TO PARLIAMENT ON THE NATIONAL SKILLS FUND
rEPort on tHE FinanCiaL StatEMEntS
Introduction
1. i have audited the financial statements of the national skills fund set out on pages 69 to 138, which comprise the statement of financial position as at 31 March 2013, the statement of financial performance, statement of changes in net assets and the cash flow statement for the year then ended, and the notes, comprising a summary of significant accounting policies and other explanatory information.
Accounting authority’s responsibility for the financial statements
2. the accounting authority is responsible for the preparation and fair presentation of these financial statements in accordance with the south african standard of Generally Recognised accounting practice (sa standards of GRap), the requirements of the public finance Management act of south africa, 1999 (act no. 1 of 1999) (pfMa) and the skills development act (sda), 1998 (act no.97 of 1998), and for such internal control as the accounting authority determines is necessary to enable the preparation of financial statements that are free from material misstatement, whether due to fraud or error.
annual financial statements | For the year ended 31 March 2013
REPORT OF THE EXTERNAL AUDITOR
NATIONAL SKILLS FUND annual RePORt : 201366
rEPort on otHEr LEGaL anD rEGuLatory rEQuirEMEntS
9. in accordance with the paa and the general notice issued in terms thereof, i report the following findings relevant to performance against predetermined objectives, compliance with laws and regulations and internal control, but not for the purpose of expressing an opinion.
Predetermined objectives
10. i performed procedures to obtain evidence about the usefulness and reliability of the information in the annual performance report as set out on pages 26 to 32 of the annual report.
11. the reported performance against predetermined objectives was evaluated against the overall criteria of usefulness and reliability. the usefulness of information in the annual performance report relates to whether it is presented in accordance with the national treasury’s annual reporting principles and whether the reported performance is consistent with the planned objectives. the usefulness of information further relates to whether indicators and targets are measurable (i.e. well defined, verifiable, specific, measurable and time bound) and relevant as required by the national treasury Framework for managing programme performance information (fMppi).
the reliability of the information in respect of the selected objectives is assessed to determine whether it adequately reflects the facts (i.e. whether it is valid, accurate and complete).
Opinion
6. in my opinion, the financial statements present fairly, in all material respects, the financial position of the national skills fund as at 31 March 2013, and its financial performance and cash flows for the year then ended in accordance with the sa standards of GRap and the requirements of the pfMa and sda.
Emphasis of matter
7. i draw attention to the matter below. My opinion is not modified in respect of this matter.
Restatement of corresponding figures
8. as disclosed in notes 19, 23.4 and 26 to the financial statements, the corresponding figures for 31 March 2012 have been restated as a result of errors discovered during 31 March 2013 in the financial statements of the public entity at, and for the year ended, 31 March 2012
annual financial statements | For the year ended 31 March 2013
REPORT OF THE EXTERNAL AUDITOR
67
17. the accounting authority did not ensure that the public entity had and maintained effective, efficient and transparent systems of financial and risk management and internal control as required by section 51(1)(a)(i) of the pfMa.
Revenue management
18. the accounting authority did not take effective and appropriate steps to collect all money due, as required by section 51(1)(b)(i) of the pfMa and treasury Regulation 31.1.2(a) and 31.1.2(e).
Internal control
19. i considered internal control relevant to my audit of the financial statements, annual performance report and compliance with laws and regulations. the matters reported below under the fundamentals of internal control are limited to the significant deficiencies that resulted in the findings on compliance with laws and regulations included in this report.
Leadership
20. the accounting authority did not exercise effective oversight over financial and performance reporting, implementation of proper and effective internal controls and compliance with laws and regulations. action plans to address root causes relating to audit findings were not adequately implemented and regularly monitored which resulted in the recurrence of prior year findings.
12. there were no material findings on the annual performance report concerning the usefulness and reliability of the information.
Additional matter
13. although no material findings concerning the usefulness and reliability of the performance information were identified in the annual performance report, i draw attention to the following matter below.
Material adjustments to the annual performance report
14. Material misstatements in the annual performance report were identified during the audit, all (100%) of which were corrected by management
Compliance with laws and regulations
15. i performed procedures to obtain evidence that the entity has complied with applicable laws and regulations regarding financial matters, financial management and other related matters. My findings on material non-compliance with specific matters in key applicable laws and regulations as set out in the general notice issued in terms of the paa are as follows:
Annual financial statements and performance report
16. the financial statements submitted for auditing were not prepared in accordance with the prescribed financial reporting framework as required by section 55(1)(a) and (b) of the pfMa. Material misstatements on deferred expenses, trade and other payables, provisions and commitments were identified by the auditors in the submitted financial statement, which were subsequently corrected resulting in the financial statements receiving an unqualified audit opinion.
annual financial statements | For the year ended 31 March 2013
REPORT OF THE EXTERNAL AUDITOR
NATIONAL SKILLS FUND annual RePORt : 201368
Financial and performance management
21. the accounting authority did not prepare accurate and reliable financial and performance reports due to a lack of an adequate accounting and performance information management systems, which resulted in misstatements in the annual financial statements and performance information reported, further resulting in non-compliance with laws and regulations.
pretoria
31 July 2013
annual financial statements | For the year ended 31 March 2013
69
Annual Financial Statements for the year ended 31 March 2013
The Annual Financial Statements for the year ended 31 March 2013, have been approved by the Accounting Authority in terms of section 55 (1) (c) of the Public Finance Management
Act (PFMA), No 1 of 1999.
Mr GF QondeDirector General of Higher Education and TrainingAccounting Authority of the National Skills Fund
Date: 31 May 2013
annual financial statements | For the year ended 31 March 2013
NATIONAL SKILLS FUND annual RePORt : 201370
table of contents
1. STATEMENT OF FINANCIAL PERFORMANCE ........................................................................................................................................................................................................................................................... 71
2. STATEMENT OF FINANCIAL POSITION ......................................................................................................................................................................................................................................................................... 72
3. STATEMENT OF COMPARISON OF BUDGET AGAINST ACTUAL AMOUNTS ....................................................................................................................................................................................... 73
4. STATEMENT OF CHANGES IN NET ASSETS ............................................................................................................................................................................................................................................................... 75
** The National Skills Fund’s mandate is to fund skills development as outlined in the Skills Development Act. Hence, the nature of the Fund is developmental and not profit-driven. Therefore, the decrease in the National Skills Fund’s net surplus due to an increase in grants disbursements is a clear indication of the Fund’s increased performance in efficient funding towards skills development.
72 NATIONAL SKILLS FUND ANNUAL REPORT : 2013
annual Financial statements | As at year-end 31 March 2013
Current assets 9 150 206 8 627 646 Deferred expenditure 12 1 721 463 1 309 360 Cash and cash equivalents 13 4 845 117 801 Financial assets at fair value through surplus / (deficit) 14 7 346 649 7 196 658 Trade and other receivables from non-exchange transactions 15 77 249 3 827
totaL aSSEtS 9 150 308 8 627 652
Current liabilities 1 470 030 981 955 Trade and other payables from non-exchange transactions 16.1 830 845 788 687 Trade and other payables from exchange transactions 16.2 14 724 6 496 Provisions 17 624 461 186 772
totaL LiaBiLitiES 1 470 030 981 955
totaL nEt aSSEtS 7 680 278 7 645 697
FunDS ContriButED By:
Capital and reservesAccumulated surplus 7 680 278 7 645 697
totaL CaPitaL anD rESErVES * 7 680 278 7 645 697
* As at year-end the NSF has committed and earmarked its entire accumulated surpluses of R7,680 billion. Through improved performance the NSF has committed and earmarked R3,746 billion against future income, over and above the commitment against the historic accumulated surpluses. Please refer to note 19.
73
annual financial statements | For the year ended 31 March 2013
STATEMENT OF COMPARISION OF BUDGET AGAINST ACTUAL AMOUNTS
nEt SurPLuS For tHE yEar (1 620 217) 34 580 2 338 36 918 1 657 135 -102%
* The budget was prepared on the cash basis and there are no changes between the approved and final budget.
75
annual financial statements | For the year ended 31 March 2013
STATEMENT OF CHANGES IN NET ASSETS
accumulated surplus
Notes r’000
Balance as at 1 april 2011 6 582 222
Net surplus per Statement of Financial Performance 1 063 475
As originally stated 1 135 100
Prior period correction 26.4 (71 625)
Balance at 31 March 2012 7 645 697
Net surplus per Statement of Financial Performance 34 580
Balance at 31 March 2012 * * 7 680 278
* As at year-end the NSF has committed and earmarked its entire accumulated surpluses of R7,681 billion. Through improved performance the NSF has committed and earmarked R3,746 billion against future income, over and above the commitment against the historic accumulated surpluses. Please refer to note 19.
76
annual financial statements | For the year ended 31 March 2013
Levies, interest and penalties received 2 338 898 2 012 559 Other cash receipts from stakeholders - 19 934
Cash paid to stakeholders, suppliers and employees (2 691 262) (1 286 244)Project payments (2 614 796) (1 204 941)Employee costs (14 758) (13 683)Payments to suppliers and other (61 708) (67 620)
Net (increase) / decrease in working capital - (404 469)Cash generated from operations 18 (352 364) 341 780 Finance income 389 518 409 601
net cash inflow from operating activities 37 154 751 381
CaSH FLoW FroM inVEStinG aCtiVitiESAdditions to financial assets at fair value through surplus / (deficit) (149 991) (627 876)Additions to property, plant and equipment (118) (7)
net cash outflow from investing activities (150 109) (627 883)
net (decrease)/increase in cash and cash equivalents (112 955) 123 498 Cash and cash equivalents at beginning of year 117 801 (5 697)Cash and cash equivalents at end of year 13 4 845 117 801
annual financial statements | For the year ended 31 March 2013
ACCOUNTING POLICIES
77
1.1 BaSiS oF PrEParation
The financial statements have been prepared in accordance with the effective Standards
of Generally Recognised Accounting Practices (GRAP) including any interpretations,
guidelines and directives issued by the Accounting Standards Board.
The Accounting Framework of the entity, based on the preceding paragraph, is therefore
as follows:
Standards of GRAP approved and effective:
• GRAP 1: Presentation of financial statements (revised);
• GRAP 2: Cash flow statements (revised);
• GRAP 3: Accounting policies, changes in accounting estimates and errors
(revised);
• GRAP 4: The effects in changes in foreign exchange rates (revised);
• GRAP 5: Borrowing costs ;
• GRAP 6: Consolidated and separate financial statements (revised);
• GRAP 7: Investments in associates (revised);
• GRAP 8: Investments in joint ventures (revised);
• GRAP 9: Revenue from exchange transactions (revised);
• GRAP 10: Financial reporting in hyperinflationary economies (revised);
• GRAP 11: Construction contracts (revised);
• GRAP 12: Inventories (revised);
• GRAP 13: Leases (revised);
• GRAP 14: Events after reporting date (revised);
• GRAP 16: Investment property (revised);
• GRAP 17: Property, plant and equipment (revised);
• GRAP 19: Provisions, contingent liabilities and contingent assets (revised);
• GRAP 21: Impairment of Non-cash-generating Assets;
• GRAP 23: Revenue from Non-exchange Transactions (Taxes and Transfers);
• GRAP 24: Presentation of Budget Information in the Financial Statements;
• GRAP 26: Impairment of Cash-generating Assets;
• GRAP 100: Non-current assets held for sale and discontinued operations
(revised);
• GRAP 101: Agriculture;
• GRAP 102: Intangible assets;
• GRAP 103: Heritage Assets; and
• GRAP 104: Financial Instruments.
annual financial statements | For the year ended 31 March 2013
ACCOUNTING POLICIES
NATIONAL SKILLS FUND annual RePORt : 201378
• IGRAP 8: Agreements for the construction of assets from exchange
transactions.
• IGRAP 9: Distributions of non-cash assets to owners.
• IGRAP 10: Assets received from customers.
• IGRAP 13: Operating leases - Incentives.
• IGRAP 14: Evaluating the substance of transactions involving the legal form of a
lease.
Approved guidelines of standard of GRAP:
• Guide 1: Guideline on Accounting for Public Private Partnerships.
Effective accrual based IPSASs:
• IPSAS 20: Related parties disclosure.
Effective IFRSs and IFRICs that are applied:
• IFRS 4 (AC 141): Insurance contracts.
• IFRS 6 (AC 143): Exploration for and evaluation of mineral resources.
• IAS 12 (AC 102): Income taxes.
• IAS 19 (AC 116): Employee benefits.
• SIC - 21 (AC 421): Income taxes: Recovery of revalued non-depreciable
assets.
Directives issued and effective:
• Directive 1: Repeal of existing transitional provisions in, and consequential
amendments to, standards of GRAP.
• Directive 2: Transitional provisions for the adoption of standards of GRAP by
Public Entities, Municipal Entities and Constitutional Institutions.
• Directive 5: Determining the GRAP reporting framework.
• Directive 7: The application of deemed cost on the adoption of standards of
GRAP.
Interpretations of the standards of GRAP approved:
• IGRAP 1: Applying the probability test on the initial recognition of exchange
revenue.
• IGRAP 2: Changes in existing decommissioning, restoration and similar
liabilities.
• IGRAP 3: Determining whether an arrangement contains a lease.
• IGRAP 4: Rights to interest arising from decommissioning, restoration and
environmental rehabilitation funds.
• IGRAP 5: Applying the restatement approach under the standard of GRAP on
financial reporting in hyperinflationary economies
• IGRAP 6: Loyalty programmes
annual financial statements | For the year ended 31 March 2013
ACCOUNTING POLICIES
79
Correction of errors is applied retrospectively in the period in which the error has occurred
in accordance with GRAP 3 requirements, except to the extent that it is impracticable to
determine the period-specific effects or the cumulative effect of the error. In such cases
the entity shall restate the opening balances of assets, liabilities and net assets for the
earliest period for which retrospective restatement is practicable.
1.3 CritiCaL juDGEMEntS, EStiMationS anD aSSuMPtionS
In the application of the NSF accounting policies management is required to make
judgements, estimations and assumptions about the carrying amounts of assets and
liabilities that are not readily apparent from other sources. The estimates and associated
assumptions are based on past experience and other factors that are considered to be
relevant. Actual results may differ from these estimates.
The estimates and underlying assumptions are reviewed on an ongoing basis. Revisions
to accounting estimates are recognised in the period in which the estimate is revised
if the revision affects only that period, or in the period of the revision and future
periods if the revision affects both current and future periods. Refer to note 25 for more
detail.
1.4 PrESEntation CurrEnCy
These financial statements are presented in South African rand which is the functional
currency of the entity. Figures have been rounded of to the nearest thousand Rand
(R’000).
1.5 GoinG ConCErn aSSuMPtion
These financial statements have been prepared on the going concern basis. In assessing
whether the NSF is a going concern, the Accounting Authority has considered the fact
• SIC - 25 (AC 425): Income taxes: Changes in the tax status of an entity or its
shareholders.
• SIC - 29 (AC 429): Service concession arrangements: Disclosures.
• IFRIC 12 (AC 445): Service concession arrangements.
1.2 CHanGES in aCCountinG PoLiCiES, EStiMatES anD ErrorS
The accounting policies applied are consistent with those used to present the previous
The entity changes an accounting policy only if the change:
• Is required by a standard of GRAP; or
• Results in the Annual Financial Statements providing reliable and more relevant
information about the effects of transactions, other events or conditions, on the
performance or cash flow.
Changes in accounting policies that are affected by management have been applied
retrospectively in accordance with GRAP 3 requirements, except to the extent that it
is impracticable to determine the period-specific effects or the cumulative effect of
the change in policy. In such cases the entity restated the opening balances of assets,
liabilities and net assets for the earliest period for which retrospective restatement is
practicable.
Changes in accounting estimates are applied prospectively in accordance with GRAP 3
requirements. Details of changes in estimates are disclosed in the notes to the Annual
Financial Statements where applicable.
annual financial statements | For the year ended 31 March 2013
ACCOUNTING POLICIES
NATIONAL SKILLS FUND annual RePORt : 201380
1.9 rEVEnuE rECoGnition
Revenue is recognised when it’s probable that future economic benefits or service
potential will flow to the entity, and the entity can measure the benefits reliably.
Accounting policy 1.9.1 on revenue from non-exchange transactions and accounting
policy 1.9.2 on revenue from exchange transactions describes the conditions under
which revenue will be recorded by the management of the entity.
In making their judgement, the management considered the detailed criteria for
recognition of revenue as set out in GRAP 9 (revenue from exchange transactions). The
management of the entity is satisfied that recognition of the revenue in the current year
is appropriate.
1.9.1 Revenue from non-exchange transactions
Revenue from non-exchange transactions refers to transactions where the entity
received revenue from another entity without directly giving approximately equal value
in exchange. Revenue from non-exchange transactions is generally recognised to the
extent that the related receipt or receivable qualifies for recognition as an asset and
there is no obligation or condition to repay the amount.
1.9.1.1 Skills development levy (SDL) income
Skills development levy (SDL) transfers are recognised when it is probable that future
economic benefits can be measured reliably, and occurs when the Department of
Higher Education and Training (DHET) makes the allocation or the payment, whichever
event comes first, to the National Skills Fund (NSF) as required by section 8 of the Skills
Development Levies Act, 1999 (Act No.9 of 1999). SDL income is measured at fair value
of the consideration received and is based on the information supplied by DHET.
that the power to collect skills development levies will enable the NSF to be considered
as a going concern for at least the next twelve months.
1.6 oFFSEttinG
Assets, liabilities, revenues and expenses have not been offset except when offsetting is
required or permitted by the standard of GRAP, IPSAS or GAAP.
1.7 CoMParatiVE inForMation
When the presentation or classification of items in the Annual Financial Statements is
amended, prior period comparative amounts are restated. The nature and reason for the
reclassification is disclosed. Where accounting errors have been identified in the current
year, the correction is made retrospectively as far as is practicable, and the prior year
comparatives are restated accordingly. Where there has been a change in accounting
policy in the current year, the adjustment is made retrospectively as far as is practicable,
and the prior year comparatives are restated accordingly.
1.8 EVEntS aFtEr rEPortinG DatE
Events after the reporting date are those events, both favourable and unfavourable,
that occur between the reporting date and the date when the financial statements are
authorised for issue. Events after reporting date that are classified as adjusting events
have been accounted for in the Annual Financial Statements. Events after reporting date
that have been classified as non-adjusting events have been disclosed in the disclosure
notes to the Annual Financial Statements.
annual financial statements | For the year ended 31 March 2013
ACCOUNTING POLICIES
81
1.9.2.2 Other income
Other income represents interest received by the training providers on the advance
payments affected by NSF based on the approved memorandum of agreement entered
into between the parties. This interest received by the training providers is utilised to
incur project expenditure on behalf of NSF.
Other income is accrued on a time proportion basis, taking into account the principal
amount outstanding and the effective interest rate over the period to maturity.
1.10 ExPEnDiturE
1.10.1 Collection costs paid to SARS
In terms of section 10(2) of the Skills Development Levies Act, 1999 (Act. No. 9 of 1999),
the Accounting Authority must, on a monthly basis as may agreed between SARS and
the Accounting Authority, settle the costs of collection by SARS from the levies paid into
the National Skills Fund. The total amount of the collection costs, may not exceed 2% of
the total amount of the levies collected by SARS.
1.10.2 NSF 10% employee costs and other operating expenses
According to section 28(2) of the Skills Development Act, 1998, the Accounting Authority
approved the utilisation of 10% of the money allocated to the fund in terms of section
8(3)(a) of the Skills Development Levies Act to administer the Fund. The utilisation of
the 10% allocation may be applied for short term employee benefits as well as other
operating expenses.
In terms of section 3(1) and 3(4) of the Skills Development Levies Act, 1999 (Act No. 9 of
1999), registered member companies pay a skills development levy of 1% of the total
payroll cost to the South African Revenue Services (SARS), who collects the levies on
behalf of the Department of Higher Education and Training.
20% of the skills development levies are paid over to the NSF and 80% to the SETAs.
National Skills Fund SDL income is set aside in terms of the Skills Development Act, 1998
(Act No. 97 of 1998) as amended for the purpose of:
2012/13 2011/12Employee costs and other operating expenditure of the NSF 10% 10%
1.9.1.2 State contributions
State contributions represents unconditional grants received from the Department of
Higher Education and Training (DHET) and are measured at fair value of the consideration
received.
1.9.2 Revenue from exchange transactions
Revenue from exchange transactions refers to revenue that accrued to the entity
directly in return for services rendered / goods sold, the value of which approximates
the consideration received or receivable.
1.9.2.1 Finance income
Finance income represents interest earned on investments and is accrued on a time
proportion basis, taking into account the principal amount outstanding and the
effective interest rate over the period to maturity.
annual financial statements | For the year ended 31 March 2013
ACCOUNTING POLICIES
NATIONAL SKILLS FUND annual RePORt : 201382
1.10.4.1 Payments for training of unemployed people
The training of unemployed people is undertaken by selected training contractors on a
basis of a predetermined course fee per day. Upon completion of the training, certified
claims are submitted by training contractors upon which payments are made.
1.10.4.2 Funds allocated to training providers for skills development training
The NSF allocates funds in respect of skills development to training providers in terms
of approved memorandum of agreements entered into between the parties. Funds not
spend by the training providers at year-end are accounted for as pre-paid expenditure
in the financial statements of the NSF until the related eligible project expense are
incurred by the training providers and the relating expenditure recognised. If eligible
expenses are not incurred, the amount allocated to the training providers should be
refunded to the NSF including any accrued interest.
1.10.5 Fruitless and wasteful expenditure
Fruitless and wasteful expenditure means expenditure that was made in vain and would
have been avoided had reasonable care been exercised.
Fruitless and wasteful expenditure is recognised as expenditure in the Statement of
Financial Performance according to the nature of the payment and not as a separate
line item on the face of the statement. If the expenditure is recoverable it is treated as an
asset until it is recovered from the responsible person or written off as irrecoverable in
the Statement of Financial Performance.
1.10.3 Short term employee benefits
Short term employee benefits comprise of salaries, paid annual leave, paid sick leave,
thirteenth cheques, performance bonuses and non-monetary benefits such as medical
care, housing and car allowances. The cost of short term employee benefits are charged
to the Statement of Financial Performance as employee cost in the year to which they
relate, except for non-accumulating benefits which are only recognised when the
specific event occurs.
Short term employee benefits that give rise to a present legal or constructive obligation
are included in the Statement of Financial Position as accruals in the year to which they
relate.
1.10.4 Grant disbursements
Grant disbursements comprise:
• costs that relate directly to the specific contract;
• costs that are attributable to contract activity in general and can be allocated to
the project; and
• such other costs as are specifically chargeable to the NSF under the terms of the
contract.
Grant disbursements are recognised as expenses in the period in which they are incurred.
Grant disbursements includes the following:
annual financial statements | For the year ended 31 March 2013
ACCOUNTING POLICIES
83
1.11 aSSEtS
1.11.1 Property, plant and equipment
The Director-General of the Department of Higher Education and Training is the
Accounting Authority of the Fund in terms of the PFMA and must control the Fund.
Property, plant and equipment comprise mainly of computer equipment, as all other
property, plant and equipment utilised are owned, controlled and disposed of by the
Department of Higher Education and Training. Property, plant and equipment are stated
at historical cost less depreciation. Historical cost includes expenditure that is directly
attributable to the acquisition of the items.
Depreciation is calculated using the straight-line method to allocate their cost to their
residual values over their estimated useful lives, as follows:
Computer equipment 3 years
The assets’ residual values and useful lives are reviewed, and adjusted if appropriate, at
the end of each reporting period.
An asset’s carrying amount is written down immediately to its recoverable amount if the
asset’s carrying amount is greater than its estimated recoverable amount.
Gains and losses on disposals are determined by comparing the proceeds with the
carrying amount and are recognised within net surplus/(deficit) in the Statement of
Financial Performance.
1.10.6 Irregular expenditure
Irregular expenditure comprises expenditure, other than unauthorised expenditure,
incurred in contravention of or that is not in accordance with a requirement of any
applicable legislation, including: the Public Finance Management Act 1 of 1999 (as
amended by Act 29 of 1999); the State tender Board Act, 1968 (Act No. 86 of 1968, or
any regulation made in terms of that Act); or any provincial legislation providing for the
procurement procedures in that provincial government.
Irregular expenditure is recognised as expenditure in the Statement of Financial
Performance. If the expenditure is not condoned by the relevant authority it is treated
as an asset until it is recovered or written off as irrecoverable.
1.10.7 Unauthorised expenditure
Unauthorised expenditure is the overspending of a vote or a main division within a vote;
or expenditure that was not made in accordance with the purpose of a vote or, in the
case of a main division, not in accordance with the purpose of the main division.
When unauthorised expenditure is discovered it is recognised as an asset in the
Statement of Financial Position until such time that the expenditure is either approved
by the relevant authority, recovered from the responsible person or written off as
irrecoverable in the Statement of Financial Performance.
Unauthorised expenditure approved with funding is recognised in the Statement of
Financial Performance when the unauthorised expenditure is approved and the related
funds are received. Where the amount is approved without funding it is recognised
as expenditure, subject to the availability of savings, in the Statement of Financial
Performance on the date of approval.
annual financial statements | For the year ended 31 March 2013
ACCOUNTING POLICIES
NATIONAL SKILLS FUND annual RePORt : 201384
1.11.5 Cash and cash equivalents
Cash includes cash on hand (including petty cash) and cash with banks (including call
deposits). Cash equivalents are short-term highly liquid investments, readily convertible
into known amounts of cash, that are held with registered banking institutions with
maturities of three months or less and are subject to an insignificant risk of change in
value.
In terms of section 29(2) of the Skills Development Act, 1998 (Act No.97 of 1998)
any money in the fund not required for immediate use should be invested with the
Public Investment Corporation (PIC). Cash and cash equivalents are measured at fair
value.
For purposes of the Cash Flow Statement, cash and cash equivalents comprise cash on
hand, deposits held at call with banks and investments in financial instruments.
1.12 LiaBiLitiES
1.12.1 Defined contribution plans
A defined contribution plan is a plan under which the entity pays fixed contributions
into a separate entity. The entity has no legal or constructive obligation to pay further
contributions if the fund does not hold sufficient assets to pay all employees the benefits
relating to service in the current or prior periods.
The NSF provides for retirement benefits for all its permanent employees through a
defined contribution scheme that is subject to the Pension Funds Act, 1956 as amended.
In terms of the Pension Funds Act, the fund is not required to be actuarially valued.
Contributions are at a rate of 13% of pensionable emoluments. The entity’s contributions
1.11.2 Property, plant and equipment acquired by project implementing agencies for NSF special projects
Property, plant and equipment acquired by project implementing agencies for NSF
special projects are capitalised in the financial statements of the respective agencies,
as the agencies control such assets for the duration of the project. Such assets could
however, only be disposed of in terms of an agreement and specific written instructions
by the NSF.
1.11.3 Deferred expenditure
Deferred expenditure represents grant disbursement made in advance to training
providers based on the signed memorandum of agreement between the parties.
Deferred expenditure can be classified as either paid (cash flow payments were made)
or incurred based on the stipulations contained in the memorandum of agreements.
Deferred expenditure paid reflects the outstanding capital amounts as well as accrued
interest received by the training providers at financial year-end. NSF will only be
entitled to the unspent funds, including any accrued interest, at the end of the project
term.
Deferred expenditure is initially recognised at cost and subsequently measured at fair
value less any provision for impairment.
1.11.4 Advances
Amounts advanced are initially recognised at fair value and subsequently measured
at amortised cost using the effective interest method, less provision for impairment.
The provision is made in accordance with IAS 39.64 whereby the recoverability of the
outstanding advance is assessed individually and then collectively after grouping the
assets in financial assets with similar credit risks characteristics.
annual financial statements | For the year ended 31 March 2013
ACCOUNTING POLICIES
85
has been approved, but has not been accrued for or provided for, it is disclosed as
commitments in the notes to the financial statements.
1.12.4 Provisions
In terms of GRAP 19 a provision is defined as a liability of uncertain timing or amount.
Provisions can be distinguished from other liabilities such as payables and accruals,
because there is uncertainty about the timing or amount of the future expenditure
required in settlement.
1.12.4.1 Provision for projects
Due to the nature of the NSF operations, numerous contracts exists that requires
management estimation and judgement to determine the provision amount at financial
year-end relating to possible services rendered on these contracts not yet invoiced /
claimed by the training providers.
Provision for projects are estimated on an annual basis. These estimates and underlying
assumptions are reviewed on an ongoing basis. For purposes of the provision calculations
management deems the training be rendered equally over the original contract term.
These estimates are based on the remaining portion of the contract for a specific year
that has not been invoiced / claimed by the training providers. Actual results may differ
from these estimates. Provisions recognised for the relevant financial year is deducted
from the remaining contract commitment.
1.12.4.2 Provision for levies paid below threshold
Section 4(b) of the Skills Development Levies Act, No. 9 of 1999, stipulates that
employers with a total yearly remuneration expense of below R500 000 are exempt from
contributing skills development levies. In practice it does happen that some of these
to the defined contribution scheme are established in terms of the rules governing the
scheme.
Contributions are recognised in the Statement of Financial Performance in the period
in which the service is rendered by the relevant employees. The entity has no further
payment obligations once the contributions have been paid.
1.12.2 Leave and bonus accruals
The entity has opted to treat its provision for leave and bonus pay as an accrual.
The cost of all short-term employee benefits is recognised during the period in which
the employee renders the related service. Employee entitlements are recognised
when they accrue to employees. An accrual is recognised for the estimated liability as
a result of services rendered by employees up to the reporting date. Accruals related
to employee benefits included in the Statement of Financial Position includes annual
leave, capped leave, thirteenth cheque as well as performance bonus commitments at
year-end (based on current salary rates).
The liability for leave pay is based on the total accrued leave days at year-end and is
shown as an accrual in the Statement of Financial Position. The entity recognises the
expected cost of performance bonuses only when the entity has a present legal or
constructive obligation to make such payment and a reliable estimate can be made.
No accrual is made for post retirement benefits, as the NSF does not provide for such
benefits for its employees.
1.12.3 Accrual for projects
No accrual is made for projects approved at year-end, unless the service in terms of the
contract has been delivered or the contract is of an onerous nature. Where a project
annual financial statements | For the year ended 31 March 2013
ACCOUNTING POLICIES
NATIONAL SKILLS FUND annual RePORt : 201386
1.13.1 Financial assets - classification
A financial asset is any asset that is a cash or contractual right to receive cash. The entities
principle financial assets as reflected on the face of the Statement of Financial Position
are classified as follows:
• Cash and cash equivalents;
• Financial assets at fair value through surplus / (deficit); and
• Trade and other receivables.
In accordance with GRAP 104 the financial assets of the entity are classified as follows
into the categories as allowed by the standard:
Type of financial asset Classification in terms of GRAP 104
Cash and cash equivalents Loans and receivables
Financial assets at fair value through
surplus or deficitHeld at fair value through surplus or deficit
Trade and other receivables Loans and receivables
Cash includes cash on hand (including petty cash) and cash with banks (including call
deposits). Cash equivalents are short-term highly liquid investments, readily convertible
into known amounts of cash, that are held with registered banking institutions with
maturities of three months or less and are subject to an insignificant risk of change in
value. For purposes of the Cash Flow Statement, cash and cash equivalents comprise
cash on hand, deposits held at call with banks and investments in financial instruments.
The entity categorises cash and cash equivalents as financial assets: Loans and
receivables.
exempted employers contribute skills development levies. As a result, they are entitled
to claim their contributions back. There is uncertainty over the timing and amount of
the provision for levies paid below threshold, as the NSF does not know the amount or
time of contributions that will be claimed back in the future. For purposes of calculating
the provision management expects the future claims to be in line with the historic levies
less than threshold claimed back. The historic levies less than thresshold claimed back in
comparison with total skills development levies received is used as a basis for estimating
the provision.
1.12.4.3 Provision for performance bonuses
Performance bonuses are provided for based on the NSF’s past practice to pay annual
performance bonuses. Uncertainty exists over the amount and the timing of the
performance bonuses as NSF has not yet completed the performance assessments at
year-end and determined the performance bonus payable. Management estimates the
performance bonus payable to be in line with the prior period’s performance bonus
paid with an average increase for inflation.
1.13 FinanCiaL inStruMEntS
The entity has various types of financial instruments and these can be broadly
categorised as either financial assets or financial liabilities. The classification of financial
assets and liabilities, into categories, is based on judgement by management.
Financial assets and financial liabilities are recognised on the NSF Statement of
Financial Position when the NSF becomes a party to the contractual provisions of the
instrument.
Financial instruments are initially measured at fair value. Subsequent to initial recognition
these instruments are measured as set out below.
annual financial statements | For the year ended 31 March 2013
ACCOUNTING POLICIES
87
Financial liabilities that are measured at fair value through profit or loss are financial
liabilities that are essentially held for trading (i.e. purchased with the intention to sell
or repurchase in the short term; derivatives other than hedging instruments or are part
of a portfolio of financial instruments where there is recent actual evidence of short-
term profiteering or are derivatives). Financial liabilities that are measured at fair value
through profit or loss are stated at fair value, with any resulted gain or loss recognised in
the Statement of Financial Performance.
Any other financial liabilities are classified as Other Financial Liabilities and are initially
measured at fair value. Other Financial Liabilities are subsequently measured at
amortised cost using the effective interest method, with interest expense recognised
on an effective yield basis.
In accordance with IAS 39.09 the Financial Liabilities of the entity are all classified as
“Other Financial Liabilities”.
1.13.3 Initial and subsequent measurement
1.13.3.1 Financial Assets: Financial assets at fair value through surplus/deficit
Money market financial instruments are initially and subsequently measured at fair value.
It is the policy of NSF to account for changes in the fair value of monetary securities
classified at fair value, through the Statement of Financial Performance. The fair value
adjustment is calculated between the difference of the market value at the end of the
reporting period and the cost of the investment. These investments are revaluated once
a year at the end of the reporting period.
Financial assets at fair value through surplus or deficit are financial assets that meet
either of the following conditions:
• They are classified as held for trading; or
• Upon initial recognition they are designated as at fair value through the
Statement of Financial Performance.
Loans and receivables are non-derivative financial assets with fixed or determinable
payments that are not quoted in an active market. They are included in current assets,
except for maturities greater than twelve months, which are classified as non-current
assets. Loans and receivables are initially measured at cost which represents fair value.
After initial recognition financial assets are measured at amortised cost, using the
effective interest method less provision for impairment.
1.13.2 Financial liabilities - classification
A financial liability is a contractual obligation to deliver cash or another financial asset
to another entity. The entity’s principal financial liabilities relates to accounts payable
which are classified as follows on the face of the Statement of Financial Position:
• Trade and other payables.
There are two main categories of financial liabilities, the classification based on how
they are measured. Financial liabilities may be measured at:
• Fair value through profit or loss; or
• At amortised cost using the effective interest method.
annual financial statements | For the year ended 31 March 2013
ACCOUNTING POLICIES
NATIONAL SKILLS FUND annual RePORt : 201388
A provision for impairment of accounts receivable is established when there is objective
evidence that NSF will not be able to collect all amounts due according to the original
terms of the receivables. The amount of the provision is based on long outstanding non-
active supplier contracts where the recovery of the outstanding amount is uncertain
as no new contracts exist for the recovery of the outstanding balance. Based on past
default experience it is the policy of the entity to provide for 50% of non-active contracts
between 180 days and 270 days outstanding and 100% of non-active contracts
exceeding 270 days.
The carrying amount of the financial asset is reduced by the impairment loss directly for
all financial assets with the exception of trade receivables, where the carrying amount
is reduced through the use of an allowance account. Changes in the carrying amount
of the allowance account are recognised in the Statement of Financial Performance.
When the receivable is uncollectable, it is written off against the allowance account.
Subsequent recoveries of amounts previously written off are credited to the Statement
of Financial Performance.
1.13.5 Impairment and gains and losses from subsequent measurement
With the exception of Available-for-Sale equity instruments, if, in a subsequent
period, the amount of the impairment loss decreases and the decrease can be related
objectively to an event occurring after the impairment was recognised, the previously
recognised impairment loss is reversed through the Statement of Financial Performance
to the extent that the carrying amount of the investment at the date the impairment is
reversed does not exceed what the amortised cost would have been had the impairment
not been recognised.
1.13.3.2 Financial Assets: Trade and other receivables
Trade and other receivables are initially recognised at fair value and subsequently
measured at amortised cost using the effective interest method, less provision for
impairment.
1.13.3.3 Financial liabilities: Trade and other payables
Trade and other payable financial instruments are measured at amortised cost using
the effective interest rate method. Accruals represent goods/services that have been
received together with an accompanied invoice, but final authorisation to affect
payment has not been effected. Accruals are recognised in the Statement of Financial
Position as trade and other payables.
1.13.4 Impairment of financial assets
Financial assets, other than those at fair value through profit or loss, are assessed for
indicators of impairment at each balance sheet date. Financial assets are impaired where
there is objective evidence of impairment of Financial Assets (such as the probability of
insolvency or significant financial difficulties of the debtor). If there is such evidence the
recoverable amount is estimated and an impairment loss is recognised in accordance
with GRAP 104.
Accounts receivable are initially valued at cost, which represents fair value, and
subsequently carried at amortised cost using the effective interest rate method. An
estimate is made for a provision for impairment based on past default experience of
all outstanding amounts at year-end. Bad debts are written off the year in which they
are identified as irrecoverable. Amounts receivable within 12 months from the date of
reporting are classified as current.
annual financial statements | For the year ended 31 March 2013
ACCOUNTING POLICIES
89
1.13.8 Fair value considerations
The fair values at which financial instruments are carried at the balance sheet date have
been determined using available market values. Where market values are not available,
fair values have been calculated by discounting expected future cash flows at prevailing
interest rates. The fair values have been estimated using available market information
and appropriate valuation methodologies, but are not necessarily indicative of the
amounts that the NSF could realise in the normal course of business. The carrying
amounts of financial assets and financial liabilities with a maturity of less than one year
are assumed to approximate their fair value due to the short-term trading cycle of these
items.
1.13.9 Risk management of financial assets and liabilities
It is the policy of the entity to disclose information that enables the user of its financial
statements to evaluate the nature and extent of risks arising from financial instruments
to which the entity is exposed on the reporting date.
Risks and exposure are disclosed as follows:
1.13.9.1 Credit risk:
• Each class of financial instrument is disclosed separately.
• Maximum exposure to credit risk not covered by collateral is specified.
• Financial instruments covered by collateral are specified.
Gains and losses arising from a change in the fair value of available-for-sale financial
assets are recognised in equity, until the investment is disposed of or is determined to
be impaired, at which time the net profit or loss is included in the net profit or loss for
the period.
1.13.6 Derecognition of financial assets
A financial asset or a portion thereof is derecognised when the NSF realises the
contractual rights to the benefits specified in the contract, the rights expire, the NSF
surrenders those rights or otherwise loses control of the contractual rights that comprise
the financial asset. On derecognition, the difference between the carrying amount of
the financial asset and the sum of the proceeds receivable and any prior adjustment
to reflect the fair value of the asset that had been reported in equity is included in net
profit or loss for the period.
If the entity neither transfers nor retains substantially all the risks and rewards of
ownership and continues to control the transferred asset, the entity recognises its
retained interest in the asset and an associated liability for amounts it may have to pay.
If the entity retains substantially all the risks and rewards of ownership of a transferred
financial asset, the entity continues to recognise the financial asset and also recognises
a collateralised borrowing for the proceeds received.
1.13.7 Derecognition of financial liabilities
A financial liability or a part thereof is derecognised when the obligation specified in the
contract is discharged, cancelled, or expires. On derecognition, the difference between
the carrying amount of the financial liability, including related unamortised costs, and
the amount paid for it is included in net profit or loss for the period.
annual financial statements | For the year ended 31 March 2013
ACCOUNTING POLICIES
NATIONAL SKILLS FUND annual RePORt : 201390
with related parties not at arm’s length or not in the ordinary course of business are
disclosed.
1.14.2 Key management personnel
Key management personnel is defined as being individuals with the authority and
responsibility for planning, directing and controlling the activities of the entity, including
those charged with the governance of the entity in accordance with legislation, in
instances where they are required to perform such functions. Close members of the
family of a person are considered to be those family members who may be expected to
influence or be influenced by management in their dealings with the entity.
The Executive Officer of NSF on post level 14 is currently regarded as being at
key management level including senior management on level 13 within the NSF.
Transactions conducted with key management, as well as with close family members
of key management, is regarded as related party transactions. Only transactions
with related parties not at arm’s length or not in the ordinary course of business are
disclosed.
1.15 CoMMitMEntS
Commitments include expenditure approved and contracted as well as expenditure
approved but not yet contracted. Approved and contracted commitments includes
expenditure that has been approved and the contract has been awarded at the reporting
date. Approved but not yet contracted commitments includes expenditure that has
been approved and the contract has yet to be awarded or is awaiting finalisation at the
reporting date.
1.13.9.2 Liquidity risk:
• A maturity analysis for financial assets and liabilities that shows the remaining
contractual maturities.
• Liquidity risk is managed by ensuring that all assets are reinvested at maturity
at competitive interest rates in relation to cash flow requirements. Liabilities are
managed by ensuring that all contractual payments are met on a timeous basis
and, if required, additional new arrangements are established at competitive
rates to ensure that cash flow requirements are met.
• A maturity analysis for financial liabilities (where applicable) that shows the
remaining undiscounted contractual maturities is disclosed in note 20 to the
Annual Financial Statements.
1.14 rELatED PartiES
1.14.1 Related party transactions
Parties are considered to be related if one party has the ability to control the other party
or exercise significant influence over the other party in making financial and operating
decisions or if the related party entity and another entity are subject to common
control.
Related party transactions are classified by the entity as those transactions between
related parties other than transactions that would occur within a normal supplier or
client/recipient relationship on terms and conditions no more or less favourable than
those which it is reasonable to expect the entity would have adopted if dealing with
that individual or entity at arm’s length in the same circumstances. Only transactions
annual financial statements | For the year ended 31 March 2013
ACCOUNTING POLICIES
91
Application of all of the above GRAP standards will be effective from the date as
announced by the Minister of Finance. Currently not all of these dates have been
announced.
Management has considered all of the above-mentioned GRAP standards issued (both
effective and not effective) and anticipates that the adoption of these standards will
not have a significant impact on the financial performance, financial position or cash
flows of the entity since the principals are similar to those already applied under the
equivalent Statements of SA GAAP and embodied into the financial statements.
1.16 ContinGEnt aSSEtS anD ContinGEnt LiaBiLitiES
Management judgement is applied when measuring and disclosing contingent assets
and liabilities. The probability that an inflow or outflow of economic resources will occur
due to past events, which will only be confirmed by the occurrence or non-occurrence
of one or more future events as well as any possible financial impact is disclosed based
on management estimation in the disclosure notes.
1.17 CoMParatiVE FiGurES
Where necessary, comparative figures have been adjusted to conform to changes in
presentation in the current financial year.
1.18 StanDarDS anD aMEnDMEntS to StanDarDS iSSuED But not yEt EFFECtiVE
The following GRAP standards have been issued but are not yet effective and have not
been early adopted by the entity:
• GRAP 18: Segment reporting;
• GRAP 25: Employee benefits (Effective date: Not announced);
• GRAP 105: Transfer of functions between entities under common control
(Effective date: Not announced);
• GRAP 106: Transfers of functions between entities not under common control
(Effective date: Not announced); and
• GRAP 107: Mergers (Effective date: Not announced).
92
annual financial statements | For the year ended 31 March 2013
NOTES TO THE ANNUAL FINANCIAL STATEMENTS
NATIONAL SKILLS FUND annual RePORt : 2013
2012/13 2011/12Notes r’000 r’000
2. SkiLLS DEVELoPMEnt LEViES (non-ExCHanGE rEVEnuE)
In terms of the Skills Development Act and the Skills Development Levies Act, the total levy income per the Statement of Financial Performance is as follows:
Percentage of payroll payable as Skills Development Levy 1% 1%
Skills Development Levies received from SarS (20%):
Skills Development Levies received 2 338 899 2 003 839 Skills Development Levies collected by SARS 11 694 493 10 037 394 Less: Amount withheld by the Department of Higher Education and Training and paid to the SETAs (80%) (9 355 595) (8 033 555)Movement in Provision for levies less than threshold 9 642 8 998 Less: Accrual for UIF contribution to NSF 16.1 (94 520) -
total 2 254 021 2 012 837
3. StatE ContriBution (non-ExCHanGE rEVEnuE)
Transfer payments received from the Department of Higher Education and Training (DHET) - 19 934
4. otHEr inCoME (non-ExCHanGE rEVEnuE)
Provision for impairment reversed 25.2 16 777 -
5. FinanCE inCoME (ExCHanGE rEVEnuE)
Interest incomeInvestments - Public Investment Corporation (PIC) 14 388 786 409 252 Interest - other 731 349
total 389 518 409 601
Finance income from the Public Investment Corporation (PIC) is disclosed net of realised fair value profits of R0,00 million (2012: R0,00 million) relating to financial assets that matured during the current financial year.
93
annual financial statements | For the year ended 31 March 2013
NOTES TO THE ANNUAL FINANCIAL STATEMENTS
2012/13 2011/12Restated
Notes r’000 r’0006. otHEr inCoME (ExCHanGE rEVEnuE)
Interest received from advance payments 38 595 8 720
Interest received is from advance payments made by the NSF to skills development project providers in terms of the agreed Memorandum of Agreements between the parties. In terms of these agreements the interest may be applied to incur training expenditure on behalf of the Fund. On contract finalisation, any remaining accrued interest should be returned to the Fund.
7. Grant DiSBurSEMEntS
nSa Ministerial 17 303 2 922 National Public Dialogue and Advocacy 3 134 2 922 NSA -Constituency Capacity Building 14 169 -
Government Priorities 1 095 713 314 579 New Growth Path 222 087 166 347 Industrial Policy Action Plan 43 385 2 154 Rural Development 113 017 30 163 Education and Health 12 593 26 524 Justice and Crime Prevention 131 032 50 439 Co-operatives and Small Enterprises 129 246 38 952 Public Sector Capacity 444 353 -
DG Priorities 1 447 469 829 823 Worker Education 4 584 1 789 Skills System Capacity Building (2 511) 10 793 Training Lay-off 39 483 10 336 Academia, Research and Development 390 7 706 Bursaries 1 238 398 799 199 DHET Projects 167 125 -
Skills infrastructure 53 950 1 068 Community Education Centres 32 838 1 068 Public Delivery Infrastructure 21 113
HrDSa 6 665 - Research 6 665 -
94
annual financial statements | For the year ended 31 March 2013
NOTES TO THE ANNUAL FINANCIAL STATEMENTS
NATIONAL SKILLS FUND annual RePORt : 2013
2012/13 2011/12Restated
Notes r’000 r’0007. Grant DiSBurSEMEntS (continued)
nSDSii (41 566) 156 557 Critical Skills Support (4 980) 51 186 Industry Support Programme * (3 280) 2 597 Informal Sector Support - 12 156 Discretionary and Innovation (993) 30 736 Strategic Projects * (32 394) 66 384 ABET * 24 (476)Constituency Capacity Building and Advocacy * - (2 699)Social Development * 56 (3 327)
total 2 579 535 1 304 949
* These negative amounts refer to over-provisions relating to projects during the previous 2010/11 and 2011/12 financial year.
Included in the amount for the current financial year is an amount of R5,906 million (2012: R2,152 million) affected through a change in an accounting estimate. Refer to note 25 for more detail.
95
annual financial statements | For the year ended 31 March 2013
NOTES TO THE ANNUAL FINANCIAL STATEMENTS
2012/13 2011/12Notes r’000 r’000
8. EMPLoyEE CoStS
Salaries and wages 15 481 12 094 Basic salaries 12 357 9 781 Performance awards 504 445 Service bonuses 968 739 Other non-pensionable allowances 1 418 1 184 Net movement: Leave accrual 131 (88)Net movement: Service bonus accrual 103 33
Social contributions 2 251 1 957 Provident fund contributions: defined contribution plans 24 1 529 1 356 Medical aid contributions 719 599 Bargaining council 3 2
total 17 732 14 051
Average number of employees 56 37
96
annual financial statements | For the year ended 31 March 2013
NOTES TO THE ANNUAL FINANCIAL STATEMENTS
NATIONAL SKILLS FUND annual RePORt : 2013
2012/13 2011/12Restated
Notes r’000 r’000
9. oPEratinG ExPEnSES
Consultancy and service provider fees * 3 778 5 757 External Auditor’s remuneration 2 612 3 846 Internal Auditor’s remuneration 1 029 - Provision for impairment 15.4 - 995 Telephone and Fax 284 500 Travel and subsistence 3 233 2 606 Printing and Publications - 8 Entertainment 9 - Operating Leases 140 107 Catering (60) 194 Venues and Facilities 4 812 3 919 Stationery 310 259 Office furniture purchases <R5,000 - 39 Computer equipment purchases <R5,000 45 13 Cleaning services 2 2 Training and development 160 14 Repairs and maintenance 36 -Education and training practices SETA 10 -Courier and delivery 1 -Laundry Services 1 -
-total 16 402 18 259
* The consulting and service provider fees relates to services provider to assist with the execution of the cash to accrual conversion, including the implementation of an accrual accounting system.
97
annual financial statements | For the year ended 31 March 2013
NOTES TO THE ANNUAL FINANCIAL STATEMENTS
2012/13 2011/12Notes r’000 r’000
10. ManaGEMEnt FEES anD Bank CHarGES
Bank charges paid to commercial banks 11 7 Management fees paid to Public Investment Corporation (PIC) 14 1 997 2 011
total 2 008 2 018
11. ProPErty, PLant anD EQuiPMEnt Computer
equipment total
r’000 r’000
at 31 March 2013reconciliation of cost to net book value
Cost 125 125 Accumulated depreciation (23) (23)
Carrying value at 31 March 2013 102 102
year ended 31 March 2013reconciliation of opening and closing net book value
Deferred expenditure represents grant disbursement made in advance to training providers based on the signed memorandum of agreement between the parties. Deferred expenditure can be classified as either paid (cash flow payments were made) or incurred based on the stipulations contained in the memorandum of agreements.
Deferred expenditure paid reflects the outstanding capital amounts as well as accrued interest received by the training providers at financial year-end. NSF will only be entitled to the unspent funds, including any accrued interest, at the end of the project term.
12.1 SEta Deferred expenditure at financial year end - paid
MERSETA - Artisan Project 1 973 - MERSETA - Training lay-off 2 519 35 403 FP&M SETA - 1 260 MICT SETA - 348 AGRISETA & Commissioner for Land Rights Restitution 2 617 1 643 PSETA - 4 681
total 7 109 43 335
100
annual financial statements | For the year ended 31 March 2013
NOTES TO THE ANNUAL FINANCIAL STATEMENTS
NATIONAL SKILLS FUND annual RePORt : 2013
2012/13 2011/12Notes r’000 r’000
12.2 SEta Deferred expenditure at financial year end - incurred
FP&M SETA - 514 MERSETA - Artisan Project - 3 480
total - 3 994
13. CaSH anD CaSH EQuiVaLEntS
Cash at bank 4 845 117 801
Cash and cash equivalents at year-end 4 845 117 801
As required in Treasury Regulation 31.2, National Treasury approved the banks where the NSF bank accounts are held. The weighted average interest rate on short term bank deposits was 5.51% for the financial year (2012: 5.79%).
Cash includes cash with commercial banks. Cash equivalents are short term, highly liquid investments that are held with registered banking institutions with maturities of three months or less and that are subject to an insignificant risk of change in value.
For purposes of the Cash Flow Statement, cash and cash equivalents comprise cash on hand, deposits held at call with banks, net of bank overdrafts.
101
annual financial statements | For the year ended 31 March 2013
NOTES TO THE ANNUAL FINANCIAL STATEMENTS
2012/13 2011/12Notes r’000 r’000
14. FinanCiaL aSSEtS at Fair VaLuE tHrouGH SurPLuS / (DEFiCit)
It is the policy of NSF to account for changes in the fair value of monetary securities classified as held for trading through the Statement of Financial Performance. The fair value adjustment is calculated as the difference between the market value at the end of the reporting period and the cost of the investment. These investments are revalued once a year at the end of the reporting period by the Public Investment Corporation (PIC). The latest revaluation was performed on 31 March 2012.
Composition at fair valueInvestments with the Public Investment Corporation (PIC) 7 346 649 7 196 658
Financial assets at fair value through surplus / (deficit) can be reconciled as follows:
Balance at the beginning of the year 7 196 658 6 568 782 Invested during the year 1 853 202 1 870 635 Interest received and capitalised 5 388 786 409 252 Management fees 10 (1 997) (2 011)Withdrawal (2 090 000) (1 650 000)
Closing balance end of year (none of the financial assets are impaired) 7 346 649 7 196 658
The NSF has committed its entire invesment balance as at year-end. Refer to note 19.
NSF assesses at each reporting date whether there is objective evidence that a financial asset or group financial assets are impaired. None of the financial assets at fair value through surplus / (deficit) are impaired on reporting date.
The Skills Development Act Regulations state that the NSF may, if not otherwise specified by the Public Finance Management Act, invest the moneys in accordance with the approved NSF investment policy.
Treasury Regulation 31.3 requires that, unless exempted by the National Treasury, the NSF as a public entity that is listed in Schedule 3A of the Public Finance Management Act must invest surplus funds with the Corporation for Public Deposits. The NSF obtained exemption from National Treasury to invest surplus funds with the Public Investment Corporation (PIC) in accordance the NSF’s investment policy.
102
annual financial statements | For the year ended 31 March 2013
NOTES TO THE ANNUAL FINANCIAL STATEMENTS
NATIONAL SKILLS FUND annual RePORt : 2013
2012/13 2011/12Notes r’000 r’000
15. traDE anD otHEr rECEiVaBLES FroM non-ExCHanGE tranSaCtionS
Current
the carrying and fair value of trade and other receivables are as follows:
annual financial statements | For the year ended 31 March 2013
NOTES TO THE ANNUAL FINANCIAL STATEMENTS
15.2 ageing of trade and other receivables
Trade and other receivables are all considered for impairment. Based on past default experience it is the policy of the entity to provide for 50% of non-active contracts between 180 days and 270 days outstanding and 100% of non-active contracts exceeding 270 days. At 31 March 2013, R77 thousand (2012: R69 thousand) were more than 180 days past due but not impaired due to the immateriality of the amounts as well as the possibility of recovery of these debtors. The ageing is stipulated as follows:
2013 2013 2013 2013 2013Current 31 to 180 days 181 to 270 days over 270 days total
r’000 r’000 r’000 r’000 r’000
Trade debtors 2 231 41 238 - 77 43 546
total 2 231 41 238 - 77 43 546
2012 2012 2012 2012 2012Current 31 to 180 days 181 to 270 days over 270 days total
r’000 r’000 r’000 r’000 r’000
Trade debtors 2 369 - 27 43 2 439
total 2 369 - 27 43 2 439
104
annual financial statements | For the year ended 31 March 2013
NOTES TO THE ANNUAL FINANCIAL STATEMENTS
NATIONAL SKILLS FUND annual RePORt : 2013
15.3 ageing of trade and other receivables impaired
As at 31 March 2013, gross trade and other receivables of R45,142 million (2012: R34,783 million) were impaired and provided for. The amount of the provision is R16,619 million as at 31 March 2013 (2012: R33,396 million). The ageing of the impaired trade and other receivables (net R33,703 million, 2012: R1,388 million) are stipulated as follows:
2013 2013 2013 2013 2013Current 31 to 180 days 181 to 270 days over 270 days total
r’000 r’000 r’000 r’000 r’000
SETA debtors 3 477 - 13 146 17 080 33 703
total 3 477 - 13 146 17 080 33 703
2012 2012 2012 2012 2012Current 31 to 180 days 181 to 270 days over 270 days total
r’000 r’000 r’000 r’000 r’000
SETA debtors 1 143 - - 245 1 388 Advances to training providers for payment of allowances - - - - -
Total 1 143 - - 245 1 388
105
annual financial statements | For the year ended 31 March 2013
NOTES TO THE ANNUAL FINANCIAL STATEMENTS
2012/13 2011/12Notes r’000 r’000
15.4 reconciliation of provision for impairment
Opening balance 33 396 32 401 (Utilised) / Provided during the year 9 - 995 Provision reversed during the year 4 & 25.2 (16 777) -
total 16 619 33 396
Current year provision attributable to:
Social Development training allowances:Opening balance 5 180 4 185 (Utilised) / Provided during the year - 995 Balance at year-end 5 180 5 180 SEta Debtors: PSEta 11 439 28 216 Opening balance 28 216 28 216 (Utilised) / Provided during the year - - Provision reversed during the year (16 777) -
total 16 619 33 396
Trade and other receivables are individually impaired when there is objective evidence that the asset is impaired. The creation and release of the provision for impaired receivables have been included in operating expenses (note 9) and other income (note 4) in the Statement of Financial Performance. Amounts charged to the allowance account are generally written off when there is no expectation of recovering additional cash. The maximum exposure to credit risk at the reporting date is the fair value of each class of receivable as mentioned above.
Credit quality of trade and other receivables
Management considers that all of the above financial assets are of good credit quality. Trade receivables from the SETAs, excluding a portion of the PSETA’s debt, are considered recoverable and of good credit quality. R11,439 million from the PSETA’s trade receivables are not considered recoverable. The maximum exposure to credit risk at reporting date is the fair value of each class of receivables as mentioned above.
106
annual financial statements | For the year ended 31 March 2013
NOTES TO THE ANNUAL FINANCIAL STATEMENTS
NATIONAL SKILLS FUND annual RePORt : 2013
2012/13 2011/12Notes r’000 r’000
16. traDE anD otHEr PayaBLES
16.1 traDE anD oHEr PayaBLES FroM non-ExCHanGE tranSaCtionS
16.2 traDE anD oHEr PayaBLES FroM ExCHanGE tranSaCtionS
Trade payables 2 058 1 536 SARS Payable 4 054 - Other payables due to Department of Labour (DoL) - 661 Other payables due to Department of Higher Education and Training (DHET) 7 490 3 410 Leave and bonus accruals 16.4 1 122 889
total 14 724 6 496
16.3 SEta payables at financial year end
SERVICES SETA 37 068 37 068 FP&M SETA - 1 543 MERSETA - Training Lay-off - 27 907 MICT SETA - 145 AGRISETA & Commissioner for Land Rights Restitution - 1 314 ETDPSETA - 79
total 16.1 37 068 68 056
107
annual financial statements | For the year ended 31 March 2013
NOTES TO THE ANNUAL FINANCIAL STATEMENTS
2012/13 2011/12Notes r’000 r’000
16.4 Leave and bonus accrual
Balance at the beginning of the year 889 944 Amounts utilised during the year (889) (88) Amount recognised during the year 1 122 33
Leave is calculated based on leave days outstanding at year-end and quantified in terms of total cost of employment per employee. The bonus accrual relates to thirteenth cheque commitments owed to NSF employees at financial year-end.
17. ProViSionS
Contract expenditure provisions 17.1 616 313 169 061 Provision for levies less than threshold 17.2 7 644 17 286 Performance bonus provision 17.3 504 425
total 624 461 186 772
108
annual financial statements | For the year ended 31 March 2013
annual financial statements | For the year ended 31 March 2013
NOTES TO THE ANNUAL FINANCIAL STATEMENTS
objectives (2012/13)Carrying value
at the beginning of year
additional provisions
utilised during the year
Carrying value at the end of
yearr’000 r’000 r’000 r’000
17.1 Contract expenditure provisions (continued)
HrDSa - - - - Research - - - -
nSDS ii 42 347 - (42 347) - Social Development Funding Window - - - - ABET Funding Window - - - - Critical Skills Support 2 707 - (2 707) - Industry Support Programme 3 340 - (3 340) - Informal Sector Support - - - - Constituency Capacity Building and Advocacy - - - - Discretionary and Innovation 1 402 - (1 402) - Strategic Projects 34 898 - (34 898) -
total 169 061 616 313 (169 061) 616 313
110
annual financial statements | For the year ended 31 March 2013
NOTES TO THE ANNUAL FINANCIAL STATEMENTS
NATIONAL SKILLS FUND annual RePORt : 2013
objectives (2011/12)Carrying value
at the beginning of year
additional provisions
utilised during the year
Carrying value at the end of
yearr’000 r’000 r’000 r’000
17.1 Contract expenditure provisions (continued)
nSDS iii
Government Priorities - 115 311 - 115 311
New Growth Path - 74 537 - 74 537
Industrial Policy Action Plan - 1 156 - 1 156
Rural Development - 27 675 - 27 675
Education and Health - 1 060 - 1 060
Justice and Crime prevention - 3 390 - 3 390
Co-operatives and Small Enterprises - 7 493 - 7 493
DG Priorities - 11 335 - 11 335
Worker Education - 6 - 6
Skills System Capacity Building - 6 617 - 6 617
Training lay-off - 1 871 - 1 871
Academia, Research and Development - 2 841 - 2 841
Skills infrastructure - 68 - 68
Community Education Centres - 68 - 68
111
annual financial statements | For the year ended 31 March 2013
NOTES TO THE ANNUAL FINANCIAL STATEMENTS
objectives (2011/12)Carrying value
at the beginning of year
additional provisions
utilised during the year
Carrying value at the end of
yearr’000 r’000 r’000 r’000
17.1 Contract expenditure provisions (continued)
nSDS ii 69 054 42 347 (69 054) 42 347
Social Development Funding Window 9 105 - (9 105) -
ABET Funding Window 476 - (476) -
Critical Skills Support - 2 707 - 2 707
Industry Support Programme 3 727 3 340 (3 727) 3 340
Informal Sector Support 3 684 - (3 684) -
Constituency Capacity Building and Advocacy 2 804 - (2 804) -
Discretionary and Innovation - 1 402 - 1 402
Strategic Projects 49 258 34 898 (49 258) 34 898
total 69 054 169 061 (69 054) 169 061
As at 31 March 2013, contract expenditure provisions amounting to R616,313 million (2012: R169,061 million) were recognised. Provisions for projects are estimated on an annual basis. For purposes of the provision calculations management deems the training to be rendered equally over the original contract term. These estimates are based on the remaining portion of the contract for a specific year which has not been invoiced / claimed by the training providers. Provisions recognised for the relevant financial year are deducted from the remaining contractual commitments.
112
annual financial statements | For the year ended 31 March 2013
NOTES TO THE ANNUAL FINANCIAL STATEMENTS
NATIONAL SKILLS FUND annual RePORt : 2013
2012/13 2011/12Notes r’000 r’000
17.2 Provision for levies less than threshold
Balance at the beginning of the year 17 286 26 284 Levies less than threshold provision / (realised) for the year (9 642) (8 998)
Closing carrying amount 7 644 17 286
17.3 Performance bonus provision
Balance at the beginning of the year 425 - Performance bonus paid during the year (425) - Performance bonus provision for the year 504 425
Closing carrying amount 504 425
113
annual financial statements | For the year ended 31 March 2013
NOTES TO THE ANNUAL FINANCIAL STATEMENTS
2012/13 2011/12Restated
Notes r’000 r’000
18. rEConCiLiation oF nEt CaSH FLoW FroM oPEratinG aCtiVitiES to nEt SurPLuS / (DEFiCit)
net surplus / (deficit) as per Statement of Financial Performance 34 580 1 063 475 Adjusted for non-cash items:
Depreciation 22 1 Increase / (decrease) in provisions:
Relating to employment 312 370 Relating to impairment (16 777) 995 Relating to grant disbursement provisions 552 612 100 007 Relating to levy provisions (9 642) (8 998)
Adjusted for items separately disclosedFinance income (389 518) (409 601)
Adjusted for working capital changes: (523 954) (404 469)(Increase) / decrease in trade and other receivables (56 645) 4 140 (Increase) / decrease in deferred expenditure (517 462) (1 095 025)Increase / (decrease) in trade and other payables 50 153 686 416
Cash generated from operations (352 364) 341 780
114
annual financial statements | For the year ended 31 March 2013
NOTES TO THE ANNUAL FINANCIAL STATEMENTS
NATIONAL SKILLS FUND annual RePORt : 2013
2012/13Notes r’000
19. CoMMitMEntS anD EarMarkED FunDS
As at year-end the NSF has committed and earmarked its entire accumulated surpluses of R7,680 billion. Through improved performance the NSF has committed and earmarked R3,746 billion against future income, over and above the commitment against the historic accumualted surpluses.
Approved and contracted 19.1 & 19.7 5 418 640 Approved, not yet contracted 19.2 608 108 Earmarked for recommended projects, approved subsequent to year-end 19.3 437 641 Earmarked for constructive annual recurring commitments 19.4 2 274 768 Earmarked for FET College skills infrastructure development not yet contracted 19.5 1 500 000 Earmarked for Trainee Lay-off Scheme 19.6 1 137 221
total future expenditure 11 376 378
19.1 Approved and contracted commitments are commitments where the NSF has a contractual obligation to fund the skills development projects. With a contractual obligation there is a written agreement with specific terms between the NSF and the third party, whereby the third pary undertakes to perform certain deliverables as outlined in the agreement. Performance on these deliverables will obligate the NSF to make payment.
19.2 Approved, not yet contracted projects, are skills development projects that have been approved by the Director General of Higher Education and Training before year-end of which contracting will take place subsequent to approval after year-end.
19.3 Earmarked for recommended projects, approved subsequent to year-end are skills development projects that the Project Evaluation Committee has recommended to the Director General of Higher Education and Training for approval before year-end, which the Director-General has approved subsequent to year-end. Hence, contracting will take place after year-end.
115
annual financial statements | For the year ended 31 March 2013
NOTES TO THE ANNUAL FINANCIAL STATEMENTS
19.4 Funds earmarked for constructive annual recurring commitments are commitments whereby the NSF commits funds anually towards ongoing skills development projects. Due to this established pattern of past practice the NSF has created a valid expectation on the part of the third parties, that it will continue to fund these skills development projects, until the end of the NSDS III period. Constructive commitment towards these ongoing skills development projects consist of:
2012/13Notes r’000
1. Commitment towards bursaries* 1 506 253 2. Commitment towards training of workers under the Expanded Public Works Programme* 239 853 3. Commitment towards training of workers under the dti Monyetla Programme* 155 346 4. Commitment to support the Human Resource Development Council of South Africa 186 008 5. Commitment to support the National Skills Authority 187 308
2 274 768
* These commitments are limited toward the NSDS III strategic period and are expected to increase annually by inflation, currently estimated at 5.9%.
19.5 The Department of Higher Education and Training has earmarked R1,5 billion from the NSF towards funding skills infrastructure development for the FET Colleges. Contracting will take place after year-end.
19.6 The NSF has initially earmarked R1,2 billion towards the Trainee Lay-off Scheme, of which R1,137 billion are still to be utilised through this Scheme.
116
annual financial statements | For the year ended 31 March 2013
NOTES TO THE ANNUAL FINANCIAL STATEMENTS
NATIONAL SKILLS FUND annual RePORt : 2013
2012/13 2011/12Restated
Notes r’000 r’000
19. CoMMitMEntS anD EarMarkED FunDS (continued)
19.7 Expenditure contracted for at balance sheet date, which will be financed through ordinary trading operations, but not recognised in the Financial Statements is as follows:
objective (2012/13)
nSDS iiinSa Ministerial 18 764 -
NSA Constit Capacity Building 10 057 - National-Public Dialogue & Advocacy 4 378 - Capacity Building 4 330 -
Government Priorities 4 167 654 749 952 New Growth Path 834 166 414 291 Industrial Policy Action Plan 22 851 44 509 Rural Development 444 305 77 076 Education & Health 2 719 10 472 Justice and Crime Prevention 124 063 108 378 Co-operatives, Small Enterprises and NGO’s 372 399 36 783 Public Sector Capacity 2 367 151 58 443
DG - Priorities 646 579 126 944 Worker Education 14 276 16 786 Skills System Capacity Building 72 167 - Training Lay-off 5 550 6 312 Academia, Research & Development - 711 Bursaries 56 668 10 636 DHET Projects 497 918 92 499
117
annual financial statements | For the year ended 31 March 2013
NOTES TO THE ANNUAL FINANCIAL STATEMENTS
2012/13 2011/12Restated
Notes r’000 r’000
19. CoMMitMEntS anD EarMarkED FunDS (continued)
Skills infrastructure 531 731 - Community Education Centres 43 729 - Public Delivery Infrastructure 488 002 -
HrDSa 48 535 - Research 48 535 -
nSDS ii 2 618 2 148 Critical Skills Support 2 618 - Industry Support Programme - 2 148 Discretionary and Innovation - - Strategic Projects - -
administrative commitments 2 759 6 537
Total 5 418 640 885 581
118
annual financial statements | For the year ended 31 March 2013
NOTES TO THE ANNUAL FINANCIAL STATEMENTS
NATIONAL SKILLS FUND annual RePORt : 2013
2012/13 2011/12Restated
Notes r’000 r’000
20. FinanCiaL inStruMEntS
Categories of financial instruments
Except as detailed in the following table, NSF management considers that the carrying amounts of financial assets and financial liabilities recorded at amortised cost in the financial statements approximate their fair values:
Current financial assetsCarrying amount 7 428 743 7 318 286
Cash and cash equivalents 13 4 845 117 801 Financial assets at fair value through surplus / (deficit) 14 7 346 649 7 196 658 Trade and other receivables 15 77 249 3 827
Current financial liabilitiesCarrying amount 845 569 795 183
Trade and other payables 16 845 569 795 183
Current financial assetsFair value 7 428 743 7 318 286
Cash and cash equivalents 13 4 845 117 801 Financial assets at fair value through surplus / (deficit) 14 7 346 649 7 196 658 Trade and other receivables 15 77 249 3 827
Current financial liabilitiesFair value 845 569 795 183
Cash and cash equivalents 13 - - Trade and other payables 16 845 569 795 183
119
annual financial statements | For the year ended 31 March 2013
NOTES TO THE ANNUAL FINANCIAL STATEMENTS
20. FinanCiaL inStruMEntS (continued)
Fair valuesAs indicated above NSF’s financial instruments consist mainly of cash and cash equivalents, investments at fair value, trade and other receivables and trade and other payables. No financial instruments were carried at an amount in excess of its fair value and fair values could be reliably measured for all financial instruments.
Financial assets and financial liabilities are recognised on the entities Statement of Financial Position when the entity becomes party to the contractual provisions of the instrument. The following methods and assumptions are used to determine the fair value of each class of financial instruments:
Cash and cash equivalentsCash and cash equivalents comprise of cash on hand and are subject to an insignificant risk of changes in value. These are initially and subsequently recorded at fair value. The carrying amount of cash and cash equivalents approximate fair value due to the relatively short-term maturity of these financial assets.
Financial assets at fair value through surplus / (deficit)Held for trading financial instruments are initially recorded at fair value plus transaction costs and subsequently measured at fair value through surplus or deficit.
Accounts receivableTrade and other receivables are subsequently measured at amortised cost using the effective interest rate method, less any impairment losses. The carrying amount of accounts receivable, net of allowances for bad debt, approximates fair value due to the relatively short-term maturity of these financial assets.
Accounts payableTrade and other payables are stated at amortised cost, which approximates their fair value due to the relatively short-term maturity of these financial liabilities.
Financial instrument riskIn the course of the NSF operations it is exposed to market, interest rate, credit and liquidity risk. NSF developed a comprehensive risk strategy in order to monitor and control these risks. The risk management process relating to each of these risks are discussed under the headings below:
Market riskForeign exchange riskNSF does not initiate any transactions with international parties and is therefore not exposed to any exchange risk due to currency fluctuations. All transactions are denominated in South African Rand with local vendors.
120
annual financial statements | For the year ended 31 March 2013
NOTES TO THE ANNUAL FINANCIAL STATEMENTS
NATIONAL SKILLS FUND annual RePORt : 2013
20. FinanCiaL inStruMEntS (continued)
Price riskNSF is exposed to equity securities price risk because of investments held and classified as financial assets at fair value through surplus / (deficit) on the Statement of Financial Position. These financial assets are classified as held for trade. NSF is not exposed to commodity price risk.
To manage its price risk arising from equity securities NSF diversifies its portfolio with the Public Investment Corporation (PIC). Diversification of the portfolio is done in accordance with limits set and agreed with PIC.
Cash flow and fair value interest rate riskAs NSF has significant interest bearing assets, the revenue and operating cash flows are substantially depended on changes in market interest rates. As NSF does not have significant interest bearing liabilities, the expenses and cash flows are not substantially dependent on changes in market interest rates.
The NSF exposure to interest rate risk and effective interest rates on financial instruments at reporting date are as follows:
Effective interest rate
Subject to interest rate movement:
Floating
non-interest bearing
r’000
totalr’000
r’000 r’000 r’000year ended 31 March 2013Current financial assets 5.51% 7 346 649 82 094 7 428 743 Cash and cash equivalents n/a - 4 845 4 845 Financial assets at fair value through surplus / (deficit) 5.51% 7 346 649 - 7 346 649 Trade and other receivables n/a - 77 249 77 249
Current financial liabilities n/a - 845 569 845 569 Trade and other payables n/a - 845 569 845 569
121
annual financial statements | For the year ended 31 March 2013
NOTES TO THE ANNUAL FINANCIAL STATEMENTS
20. FinanCiaL inStruMEntS (continued)
Effective interest rate
Subject to interest rate movement:
Floating
non-interest bearing
r’000
totalr’000
r’000 r’000 r’000year ended 31 March 2012Current financial assets 5.79% 7 196 658 121 628 7 318 286 Cash and cash equivalents N/A - 117 801 117 801 Financial assets at fair value through surplus / (deficit) 5.79% 7 196 658 - 7 196 658 Trade and other receivables N/A - 3 827 3 827
Current financial liabilities N/A - 795 183 795 183 Cash and cash equivalents N/A - - - Trade and other payables N/A - 795 183 795 183
Interest rate sensitivityNSF is sensitive to the movements in the money market repo rate which is the primary rate to which the investment portfolios are exposed. The rates of sensitivity are based on management’s assessment of possible changes to the interest rates and is formulated on a 100 basis point movement. If the Money Market Repo increased and decreased at year-end by 100 basis points (2012:100 basis points) respectively, then the income from investments would have increased by R70,470 million (2012: R70,630 million) and decreased by R 70,470 million (2012: R70,630 million) respectively.
Credit riskFinancial assets, which potentially subject NSF to concentrations of credit risk, consist primarily of cash and cash equivalents, investments and accounts receivable. Credit risk arises from the risk that a counterparty may default or not meet its obligations timeously.
NSF management limits its treasury counter-party exposure by only dealing with well-established financial institutions approved by National Treasury through the approval of their investment policy in terms of the Treasury Regulations.
Credit risk with respect to levy paying employers is limited due to the nature of the income received. NSF does not have any material exposure to any individual or counter-party. NSF’s concentration of credit risk is limited to the industry in which the NSF operates. No events occurred in the industry during the financial year that may have an impact on the recovery of trade and other receivables.
122
annual financial statements | For the year ended 31 March 2013
NOTES TO THE ANNUAL FINANCIAL STATEMENTS
NATIONAL SKILLS FUND annual RePORt : 2013
20. FinanCiaL inStruMEntS (continued)
Before training advances are paid to service suppliers, provider vetting, as well as site visits, are conducted by the NSF. A list of successful providers are compiled and approved by the Bid Adjudication Committee (BAC) prior to the disbursement of any funds. The risk of non-performance by these counter parties are also mitigated through the application of a reconciliation process which initiates the clearing of an outstanding provider advance before a second advance will be granted.
The Fund’s maximum exposure to credit risk is equal to the total value of the following assets:
rated non-rated total
2013 r’000 r’000 r’000
Cash and cash equivalents - 4 845 4 845 Financial assets at fair value through surplus / (deficit) 7 346 649 - 7 346 649 Trade and other receivables 77 249 - 77 249
total 7 423 898 4 845 7 428 743
2012Cash and cash equivalents - 117 801 117 801 Financial assets at fair value through surplus/(deficit) 7 196 658 - 7 196 658 Trade and other receivables 3 827 - 3 827
total 7 200 485 117 801 - 7 318 286
Liquidity riskNSF manages liquidity risk through proper management of working capital, capital expenditure and actual vs. forecasted cash flows. Adequate reserves and liquid resources are also maintained.
123
annual financial statements | For the year ended 31 March 2013
NOTES TO THE ANNUAL FINANCIAL STATEMENTS
20. FinanCiaL inStruMEntS (continued)
Forecast liquidity reserve as of 31 March 2013 is as follows:
Closing balance for the period 7 060 902 6 381 862 5 309 780
The table below analyses the financial liabilities that will be settled on a net basis into the relevant maturity groupings based on the remaining period at balance sheet date to the contractual maturity date:
Less than 1 year totalat 31 March 2013 r’000 r’000
Trade and other payables 845 569 845 569
Less than 1 year totalr’000 r’000
at 31 March 2012
Trade and other payables 795 183 795 183
124
annual financial statements | For the year ended 31 March 2013
NOTES TO THE ANNUAL FINANCIAL STATEMENTS
NATIONAL SKILLS FUND annual RePORt : 2013
2012/13 2011/12Notes r’000 r’000
21. ContinGEnt LiaBiLitiES
The following contingent liabilities exist:
Legal claims instituted against the NSF 21.1 1 808 1 882 Application to retain accumulated surplus as at year-end 21.2 7 680 278 7 645 697 SERVICE SETA creditor 21.3 11 312 11 312 ESETA creditor 21.4 1 236 1 236
7 694 634 7 660 127
21.1 The legal claims instituted against the NSF relates to six cases instituted by service providers who rendered skills development training on behalf of the NSF. These claims have been lodged against the Department for failing to grant the service providers permission to proceed with training, breach of contracts as well as alleged inadequate training provided by the service providers. All claims are being investigated by the relevant state attorney.
21.2 The NSF will be applying for the retention of the 31 March 2013 accumulated surplus in terms of section 53 (3) of the PFMA from National Treasury during the first quarter of the 2013/14 financial year. The accumulated surplus as at year-end is therefore disclosed as a contingent liability until the approval has been obtained.
21.3 Services Seta submitted a close-out report on 29 May 2012 in relation to the Artisan project that was approved during 2008. This report is claiming for an additional amount of R11,312 million (2012: R37,068 million included in SETA Payables. Refer to note 16.3). To date, the NSF has not received any corroborative documentation to effect payment on the initial payable recognised, nor supporting documentation to substantiate the additional claim. The NSF will only recognise the additional amount as an accrual as soon as the claim has been verified during the new 2013/14 financial year.
21.4 An amount of R1,236 million is disclosed by ESETA as an contingent asset relating to expenditure incurred for the execution of the critical skills support project for unemployed learners which expired on 31 December 2007. At the reporting date the NSF has not received any formal communication, supporting documentation or any quarterly reports from ESETA supporting this claim. ESETA was in process of re-evaluation of the NSF project as part of the applied administration process. This claim will only be recognise as an accrual as soon as the claim has been substantiated and verified by the NSF.
125
annual financial statements | For the year ended 31 March 2013
NOTES TO THE ANNUAL FINANCIAL STATEMENTS
22. ContinGEnt aSSEtS
2012/13 2011/12Notes r’000 r’000
Legal claims instituted by NSF 22.1 411 526
total 411 526
The following contingent assets exists:
22.1 Legal claims instituted by nSF
The legal claims instituted by the National Skills Fund relates to five cases against services providers who rendered skills development training on behalf of the Fund. These claims relates to service providers failing to deliver the service / training as per contract. The relevant state attorneys have issued summons to the respective service providers and are in the process of being collected.
23. rELatED Party tranSaCtionS
The National Skills Fund reports to the Minister of Higher Education and Training. Accordingly the NSF transact with a number of related parties within the Department of Higher Education and Training.
All related party transactions that aoccurred during the current financial year were at arm’s-length and in the normal course of business, in accordance with the mandate of the National Skills Fund.
126
annual financial statements | For the year ended 31 March 2013
NOTES TO THE ANNUAL FINANCIAL STATEMENTS
NATIONAL SKILLS FUND annual RePORt : 2013
23.1 rELationSHiPS
- Department Department of Higher Education and Training
- Entities under the Department Qualification Council for Trades and Occupations (QCTO) Public Services (PSETA)Agriculture (AGRISETA) Services (SERVICES SETA)Food and Beverages (FOODBEV) Fibre Processing and Manufacturing (FP&M SETA)Media, Information and Communication Technologies (MICTS SETA) National Student Financial Aid Scheme (NSFAS)Manufacturing, Engineering and Related Services (MERSETA) South African Qualifcations Authority (SAQA)
- FEt Colleges under the department Motheo FET College Boland FET College Western Gauteng FET CollegeVuselela FET College North Link FET College Tswane South FET CollegeTaletso FET College College of Cape Town FET College Ikhala FET CollegeOrbit FET College False Bay FET College Ingwe FET CollegeSouth West Gauteng FET College South Cape FET College Central Johannesburg FET CollegeEkurhuleni East FET College Mthashana FET College Lephalale FET CollegeEkurhuleni West FET College Nkangala FET College Northern Cape Urban FET CollegeSekhukhune FET College Gert Sibande FET College East Cape Midlands FET CollegeVhembe FET College Umfolozi FET College Lovedale FET CollegeMopani South East FET College Buffalo City FET College Esayidi FET CollegeWaterberg FET College Flavius Mareka FET College Coastal FET CollegeSedibeng FET College Letaba FET College King Sabata FET CollegeCapricorn FET College King Hintsa FET College Port Elizabeth FET CollegeMaluti FET College Tswane North FET CollegeGoldfields FET College Northern Cape Rural FET College
- Members of senior management Executive OfficerChief Financial OfficerDirector Strategic ProjectsDirector Skills Support ProgramDirector Provincial Operations
127
annual financial statements | For the year ended 31 March 2013
NOTES TO THE ANNUAL FINANCIAL STATEMENTS
23.2 rELatED Party tranSaCtionS anD BaLanCES - ProjECtS
related party other income - interest received
Grants disbursement
expense
accruals Balance at 31 March
2013
Provisions balance at 31 March 2013
Deferred expense balance
at 31 March 2013
AGRISETA - 948 - 2 617 2 617 MICT SETA - 159 - - - MERSETA 60 53 122 - 4 496 4 492 NSFAS 3 308 1 021 193 475 818 - 383 999 PSETA - 12 743 - 2 274 - QCTO - - - - - SERVICES SETA - - 37 068 - - SAQA 246 29 903 - 7 185 15 870 FP&M SETA - 3 894 - - - Motheo FET College - 11 705 - 11 705 29 574 Vuselela FET College - 6 113 - 6 113 6 845 Taletso FET College - 3 845 - 3 845 5 564 Orbit FET College - 10 110 - 10 110 12 204 South West Gauteng FET College 160 11 082 - 11 082 15 712 Ekurhuleni East FET College 1 6 346 - 6 346 14 068 Ekurhuleni West FET College 524 14 538 - 14 538 28 582 Sekhukhune FET College 19 8 727 - 8 727 13 105 Vhembe FET College 23 15 034 - 15 034 27 296 Mopani South East FET College - 12 957 - 12 957 21 119 Waterberg FET College 117 7 810 - 7 810 11 373 Sedibeng FET College 21 4 428 - 4 428 4 428 Capricorn FET College 423 14 043 - 14 043 26 609 Maluti FET College - 8 352 - 8 352 17 309 Goldfields FET College - 4 533 - 4 533 10 213 Boland FET College 64 11 203 - 4 401 11 554 North Link FET College - 3 964 - 3 964 3 964 College of Cape Town FET College - 1 898 - 1 898 7 360 False Bay FET College - 26 343 - 5 127 13 622
128
annual financial statements | For the year ended 31 March 2013
NOTES TO THE ANNUAL FINANCIAL STATEMENTS
NATIONAL SKILLS FUND annual RePORt : 2013
related party other income - interest received
Grants disbursement
expense
accruals Balance at 31 March
2013
Provisions balance at 31 March 2013
Deferred expense balance
at 31 March 2013
23.2 rELatED Party tranSaCtionS anD BaLanCES - ProjECtS (continued)
South Cape FET College - 4 463 - 4 463 8 887 West Coast FET College 44 3 536 - 3 536 7 902 Majuba FET college - 23 401 - 23 401 25 322 Umgungundlovu FET College 4 13 363 - 6 542 7 532 Elanzeni FET College - 3 669 - 3 669 3 669 Elangeni FET College 6 1 744 - 1 744 1 744 Mnambithi FET College 22 8 854 - 8 854 16 082 Thekwini FET College 105 7 709 - 7 709 18 918 Mthashana FET College - 9 706 - 9 706 12 339 Nkangala FET College 16 3 930 - 3 930 3 930 Gert Sibande FET College 4 5 019 - 5 021 4 513 Umfolozi FET College - 17 737 - 17 737 17 737 Buffalo City FET College - 1 390 - 1 390 2 285 Flavius Mareka FET College - 2 828 - 2 828 7 145 Letaba FET College 74 6 239 - 6 239 12 160 King Hintsa FET College 50 14 961 - 9 805 20 057 Tshwane North FET College 71 20 827 - 20 827 20 827 Northern Cape Rural FET College 23 25 776 - 4 541 16 245 Western Gauteng FET College 0 8 233 - 8 233 14 965 Tshwane South FET College - - - - - Ikhala FET College 13 3 606 - 3 606 3 606 Ingwe FET College 57 1 900 - 1 900 4 857 Central Johannesburg FET College 136 7 474 - 7 474 13 188 Lephalale FET College 24 3 732 - 3 732 3 732 Northern Cape Urban FET College 1 6 952 - 6 952 19 660 East Cape Midlands FET College - 9 685 - 5 290 24 541
129
annual financial statements | For the year ended 31 March 2013
NOTES TO THE ANNUAL FINANCIAL STATEMENTS
related party other income - interest received
Grants disbursement
expense
accruals Balance at 31 March
2013
Provisions balance at 31 March 2013
Deferred expense balance
at 31 March 2013
23.2 rELatED Party tranSaCtionS anD BaLanCES - ProjECtS (continued)
Lovedale FET College - 1 331 - 1 331 3 363 Esayidi Fet College 1 12 485 - 12 485 24 649 Coastal FET College 253 21 421 - 21 421 22 757 King Sabata FET College 19 1 122 - 1 122 2 853 Port Elizabeth FET College - - - - - DHET Projects 415 151 072 74 356 10 570 21 675
6 307 1 709 158 587 243 397 645 1 054 620
23.3 rELatED Party tranSaCtionS anD BaLanCES - oPEratinG ExPEnSES
annual financial statements | For the year ended 31 March 2013
NOTES TO THE ANNUAL FINANCIAL STATEMENTS
NATIONAL SKILLS FUND annual RePORt : 2013
23.4 kEy ManaGEMEnt PErSonnEL
number of individuals 2012/13 2011/12
r’000 r’000Short term employee benefits
Post level 14: Executive officer 1Basic salary and social contributions 644 565 Bonuses and performance related payments 87 24 Other short term employee benefits 285 227
Post level 13: Chief Financial officer 1Basic salary and social contributions 154 Not filled in 2012 Bonuses and performance related payments - - Other short term employee benefits 34 -
Post level 13: Director Strategic Projects 1Basic salary and social contributions 596 559 Bonuses and performance related payments - - Other short term employee benefits 243 232
Post level 13: Director Skills Support Program 1Basic salary and social contributions 704 577 Bonuses and performance related payments - - Other short term employee benefits 100 188
Post level 13: Director Provincial operations 1Basic salary and social contributions 545 Not filled in 2012 Bonuses and performance related payments 42 - Other short term employee benefits 67 -
total 3 501 2 372
131
annual financial statements | For the year ended 31 March 2013
NOTES TO THE ANNUAL FINANCIAL STATEMENTS
23.4 kEy ManaGEMEnt PErSonnEL (continued)
Personnel remuneration is paid by the Department of Higher Education and Training and claimed back as part of the 10% administration fee. No transactions were conducted with any family members of key management personnel during the current or previous period under review.
The Chief Financial Officer was appointed 1 January 2013, thus the total remuneration only includes disclosure for 3 months of the 2013 financial year. The Director Provincial Operations were promoted to this posistion on 1 January 2013, the total disclosure includes the total remuneration for 12 months for the 2013 financial year.
24. DEFinED ContriBution PLan
The NSF provides for retirement benefits for all its permanent employees through a defined contribution scheme to the GEPF that is subject to the Pension Funds Act, 1956 as amended. In terms of the Pension Funds Act, the fund is not required to be actuarially valued.
The NSF’s liability is limited to its considerations made. There are 56 employees who are members of the GEPF in which the NSF contribute 13% in every Rand contributed by the employees towards the GEPF.
2012/13 2011/12Notes r’000 r’000
Contributions for the year included in employee cost 8 1 529 1 356
132
annual financial statements | For the year ended 31 March 2013
NOTES TO THE ANNUAL FINANCIAL STATEMENTS
NATIONAL SKILLS FUND annual RePORt : 2013
25. CHanGE in aCCountinG EStiMatE
As defined in GRAP 3 a change in an accounting estimate is an adjustment of the carrying amount of an asset or liability, or the amount of periodic consumption, resulting from reassessing the present status of, and the expected future benefits and obligations associated with, the asset or the liability. Changes in accounting estimates result from new information or new developments and accordingly are not corrections of errors.
25.1 Due to the nature of NSF operations, registered project claims undergo a verification process before the actual payments are made. During the verification process the validity and accuracy of the claims are confirmed, recalculated and communicated with the training providers. Changes identified through this process are accounted for as a change in accounting estimate in terms GRAP 3 in relation to previous year registered accruals included in trade and other payables.
The impact of these adjustments on the Statement of Financial Performance and the Statement of Financial Position for the year ending 31 March 2013 are as follows:
2012/13 2011/12Notes r’000 r’000
Grant DiSBurSEMEntS 7 5 906 (2 152)
Social Development - (709)Industry Support Programme - (1 219)Informal Sector Support - (224)Public Sector 10 - Skills System Capacity Building 6 - Justice and Crime Prevention 105 - Training Layoff 899 - Discretionary and Innovation 31 - Bursaries 4 908 - Industrial Policy Action Plan (74) - New Growth Path 25 - Co-operatives, SMMES (28) - ABET 24 -
The effect of the changes have no impact on the opening balance of deferred expenditure (2012: R0,00million), a decrease on the opening balance of trade and other receivables from R 2,439 million to R2,415 million (2012: R0,00 million), a decrease on the opening balance of trade and other payables from non-exchange transactions from R 794,295 million to R794,124 million (2012: R93,244 million to R91,093 million) as well as a decrease on the opening balance of pre-paid expenses from R 664,600 million to R 658,547 million (2012: R0,00 million) in project expenditure as indicated above.
133
annual financial statements | For the year ended 31 March 2013
NOTES TO THE ANNUAL FINANCIAL STATEMENTS
25. CHanGE in aCCountinG EStiMatE (continued)
25.2 During the current financial year it became evident that the PSETA will be able to provide the NSF with appropriate supporting evidence to substantiate the expenditure incurred under the PSETA project previously funded by the NSF. This is due to substantial efforts from the PSETA to obtain the required information during the current financial year. Once the expenses are verified with the new supporting evidence, the full debtor balance will no longer be refundable by the PSETA to the NSF. The changes identified through the new information from PSETA are accounted for as a change in accounting estimate in terms of GRAP 3 in relation to previous year’s SETA debtors and the related provision for impairment included in trade and other receivables. Changes identified through this verification process are also accounted for as a change in accounting estimate in terms GRAP 3 in relation to previous year registered accruals included in trade and other payables.
The impact of these adjustments on the Statement of Financial Performance and the Statement of Financial Position for the year ending 31 March 2013 are as follows:
2012/13 2011/12Notes r’000 r’000
otHEr inCoME (non-ExCHanGE) 4 16 777 - Provision for impairment reversed 16 777 -
The effect of the changes have no impact on the opening balance of deferred expenditure (2012: no effect), an increase on the opening balance of trade and other receivables from R3,827 million to R20,604 million (2012: no effect) in reversal of impairment as indicated above.
26. Prior PErioD CorrECtion
26.1 Property, plant and equipment expensed that should have been capitalised
As defined in GRAP 17 property, plant and equipment are tangible items that are held for use in the production of goods and services and are expected to be used during more than one reporting period. Depreciation is the systematic allocation of the depreciable amount of an asset over its useful life. During the 2013 financial year it was noted that property, plant and equipment was expensed in 2012, where in fact it should have been capitalised. This also resulted in no depreciation being written off of the the property, plant and equipment acquired in 2012.
Based on the requirements of GRAP 17, the NSF has calculated the impact of the capitalisation and depreciation of property, plant and equipment acquired in 2012 and recognised the items accordingly.
134
annual financial statements | For the year ended 31 March 2013
NOTES TO THE ANNUAL FINANCIAL STATEMENTS
NATIONAL SKILLS FUND annual RePORt : 2013
26. Prior PErioD CorrECtion (continued)
26.2 Expenditure incorrectly disclosed as irregular expenditure in the prior periods
Expenditure amounting to R 174,035 million was incorrectly disclosed as irregular expenditure in 2012 (2011: R 48,408 million). Expenditure incurred does not constitute a contravention of any legislation or regulation, and as such was incorrectly disclosed as irregular expenditure. The prior period error does not impact on the Statement of Financial Position, Statement of Financial Performance and Cash Flow Statement.
26.3 Deferred expenditure recognised that should have been expensed
Grant disbursement expenses amounting to R123,777 million was incorrectly recognised as deferred expenditure in the 2012 financial year. The nature of these grant disbursements are contributions to training providers for the academic year, and as such the value of contributions relating to the months of January 2012 to March 2012 should have been expensed.
Pre-paid expenditure amounting to R 52,147 million was incorrectly recognised and disclosed as grant disbursement expenses in the 2012 financial year. The R 52,147 million was in fact an advance payment that was never recorded as a pre-payment.
26.4 impact of prior period corrections on the financial statements
The impact of the capitalisation and depreciation correction as stated above does render an impact on the Cash Flow Statement, Statement of Financial Performance as well as the Statement of Financial Position for the year ending 31 March 2012. This corrections and the relevant impact is indicated below:
2011/12Notes r’000
CaSHFLoW StatEMEnt
CaSH FLoWS FroM oPEratinG aCtiVitiES
Cash paid to stakeholders, suppliers and employees (1 214 613)As originally stated (1 214 620)Prior period correction 26.1 7
Payments to suppliers and other (67 620)As originally stated (67 627)Prior period correction 26.1 7
135
annual financial statements | For the year ended 31 March 2013
NOTES TO THE ANNUAL FINANCIAL STATEMENTS
26. Prior PErioD CorrECtion (continued)
2011/12Notes r’000
CaSH FLoW FroM inVEStinG aCtiVitiES
Additions to property, plant and equipment (7)As originally stated - Prior period correction 26.1 (7)
StatEMEnt oF FinanCiaL PErForManCE
ExPEnSESDepreciation 1 As originally stated - Prior period correction 26.3 1
Operating expenses 18 259 As originally stated 18 266 Prior period correction (7)
ExPEnSESGrant disbursements 1 304 949 As originally stated 1 233 318 Prior period correction 71 631
nEt SurPLuS For tHE yEar 1 063 475 As originally stated 1 135 100 Prior period correction 26.1 & 26.3 (71 625)
136
annual financial statements | For the year ended 31 March 2013
NOTES TO THE ANNUAL FINANCIAL STATEMENTS
NATIONAL SKILLS FUND annual RePORt : 2013
26. Prior PErioD CorrECtion (continued)
2011/12Notes r’000
StatEMEnt oF FinanCiaL PoSition
non-CurrEnt aSSEtS 6 As originally stated - Prior period correction 26.1 6
ProPErty, PLant anD EQuiPMEnt 6 As originally stated - Prior period correction 26.1 6
CurrEnt aSSEtS 8 627 646 As originally stated 8 699 277 Prior period correction 26.3 (71 631)
DEFErrED ExPEnDiturE 1 309 360 As originally stated 1 380 991 Prior period correction 26.3 (71 631)
totaL aSSEtS 8 627 652 As originally stated 8 699 277 Prior period correction 26.1 & 26.3 (71 625)
137
annual financial statements | For the year ended 31 March 2013
NOTES TO THE ANNUAL FINANCIAL STATEMENTS
26. Prior PErioD CorrECtion (continued)
2011/12Notes r’000
CaPitaL anD rESErVES 7 645 697 As originally stated 7 717 322 Prior period correction 26.1 & 26.3 (71 625)
aCCuMuLatED SurPLuS 7,645,697 As originally stated 7,717,322 Prior period correction 26.1 & 26.3 (71,625)
27. notES to tHE StatEMEnt oF CoMPariSon oF BuDGEt aGainSt aCtuaL aMountS
27.1 rEVEnuE FroM non-ExCHanGE tranSaCtionS
The actual revenue received from non-exchange transactions exceeded the budgeted revenue by 3%, mainly due to an incorrect allocation from SARS between Skills Development Levies collected and Unemployment Insurance Fund levies collected. This resulted in an overpayment of R 94,549 million with regards to Skills Development Levies towards the National Skills Fund.
27.2 rEVEnuE FroM ExCHanGE tranSaCtionS
Th actual revenue received from exchange transactions exceeded the budgeted revenue, mainly due to actual interest of R 35,582 million received from advance payments to training providers that was not budgeted for.
27.3 Grant DiSBurSEMEntS
The actual grant disbursements paid were 36% below budget, partly due to bursaries disbursements of R619,422 million paid shortly after year-end instead of during the year and partly due to projects worth R752,796 million being delayed to the 2013/2014 financial year. In both instances, delays were as a result of reporting delays caused by training providers.
138
annual financial statements | For the year ended 31 March 2013
NOTES TO THE ANNUAL FINANCIAL STATEMENTS
NATIONAL SKILLS FUND annual RePORt : 2013
27. notES to tHE StatEMEnt oF CoMPariSon oF BuDGEt aGainSt aCtuaL aMountS (continued)
27.4 EMPLoyEE CoStS
The actual employee costs are 62% below the budgeted employee costs. This is mainly due to the delay in implementing the “Project Monitoring and Evaluation Structure”, which would have entailed appointing 59 new employees. The delay was deemed necessary as a result of the listing of the National Skills Fund as a schedule 3A public entity. It was decided to re-work the entire organisation structure before any appointments were made.
27.5 oPEratinG ExPEnSES
The actual operating expenses are 62% below the budgeted operating expenses. This saving is driven by the lower than budgeted employee costs, mainly due to the delay in expediting the project monitoring and evaluation structures from the result of the listing of the National Skills Fund as a schedule 3A public entity. The expected structures will be adjusted to address the entire organisation before implementation during the 2013/14 financial year.
27.6 CoLLECtion CoStS to SarS
There was a saving of R50,160 million on the actual SARS collection costs for the year in comparison to the costs budgeted for the year. SARS is allowed to charge up to 2% as collection costs, but have historically only charged 1%, which is the amount budgeted for. SARS invoices the NSF on a monthly basis for the actual costs incurred to collect skills development levies, which were about 0.4%.
27.7 CaPitaL ExPEnDiturE
The actual capital expenditure is below budget as the capital expenditure projects are due for the next financial year with the transition of the NSF from a programme under the Department to a fully fledged public entity.


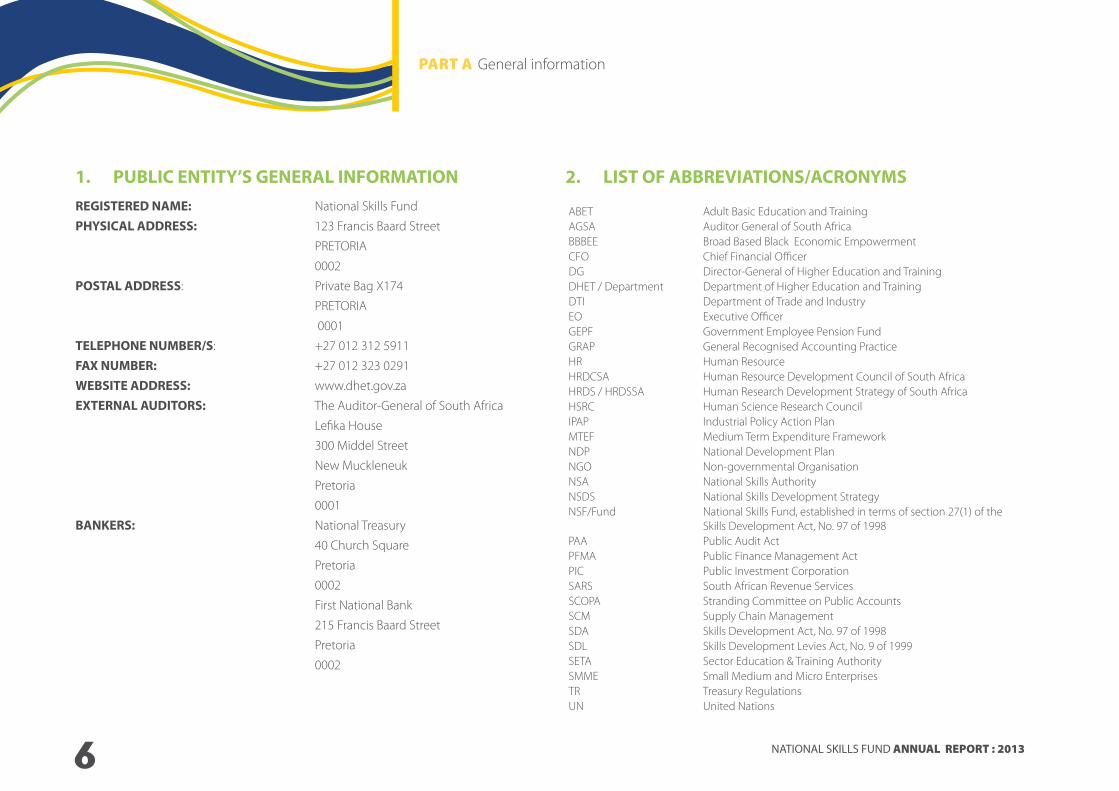
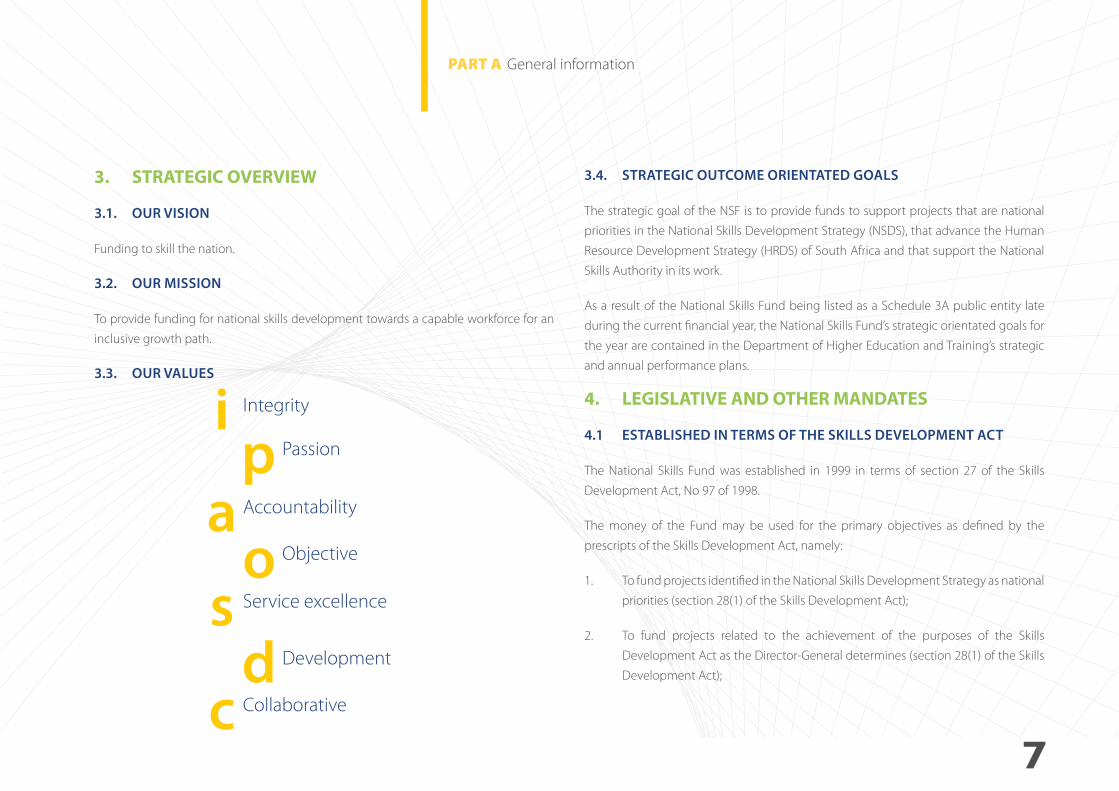

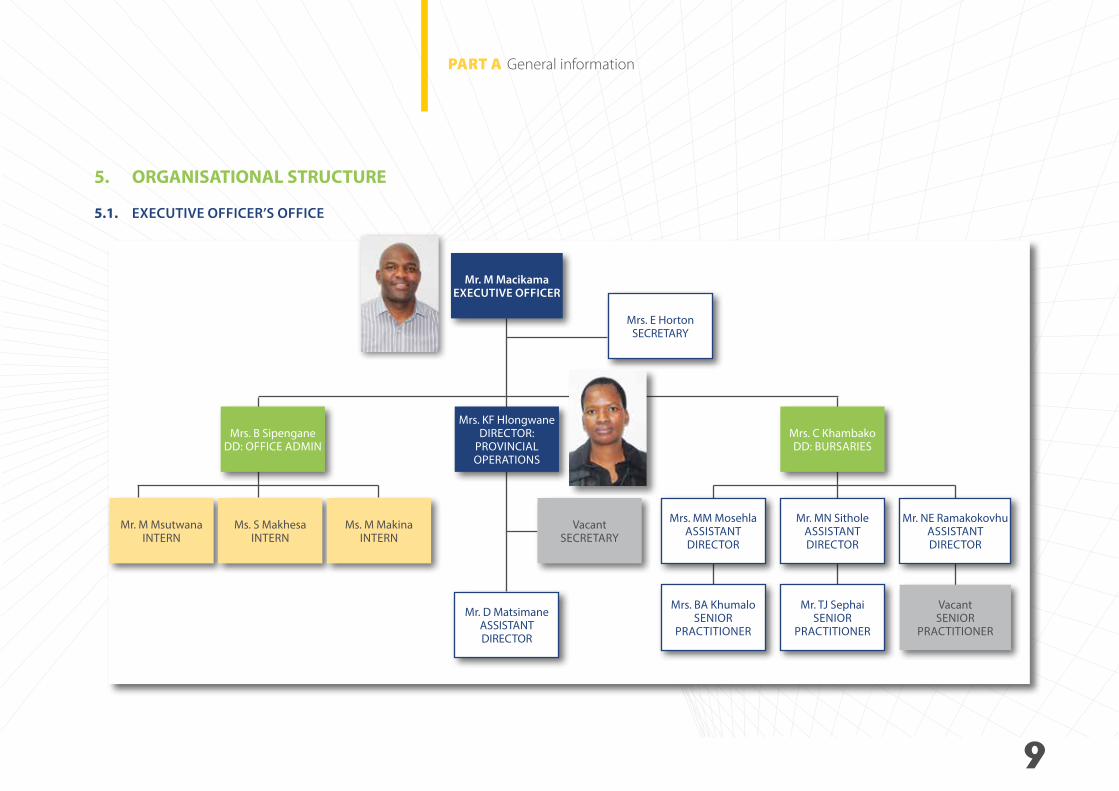
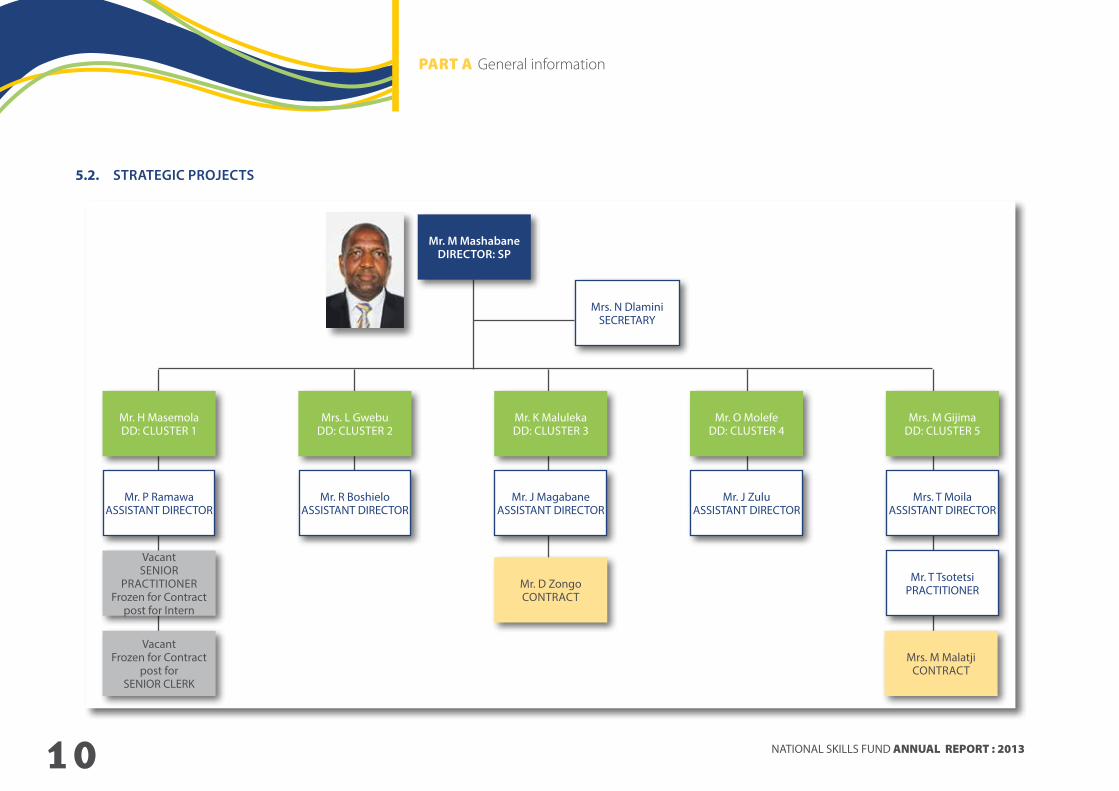
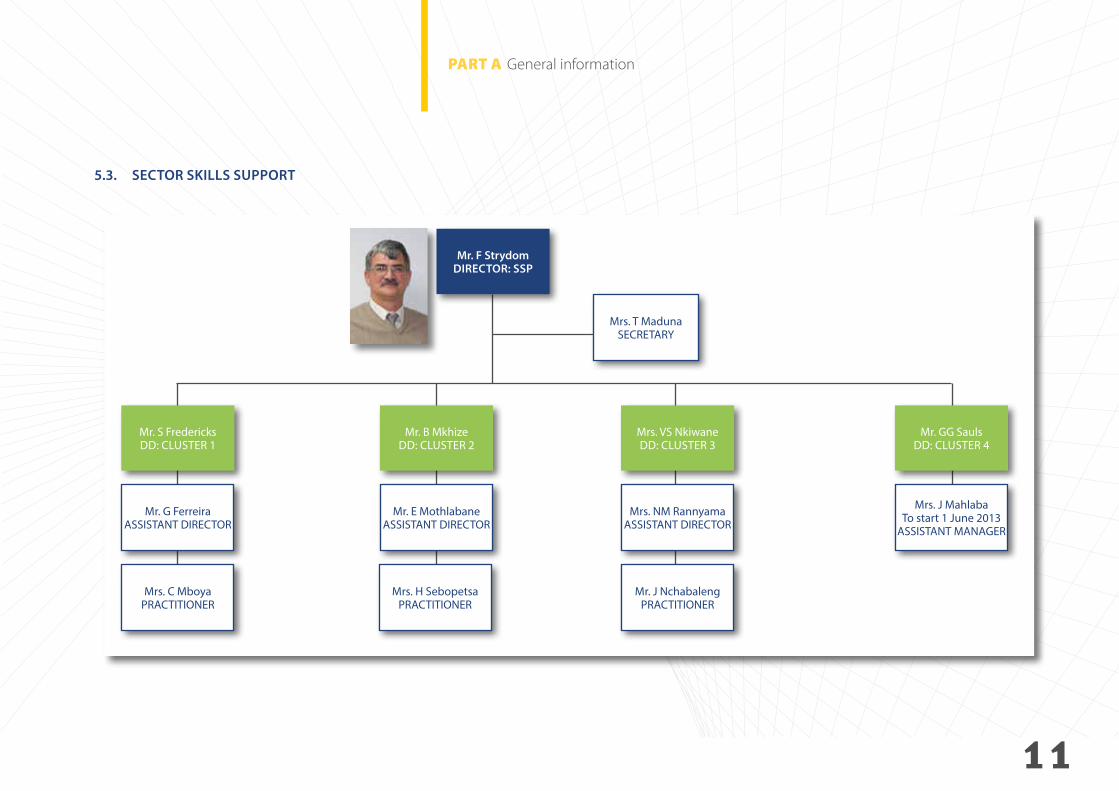
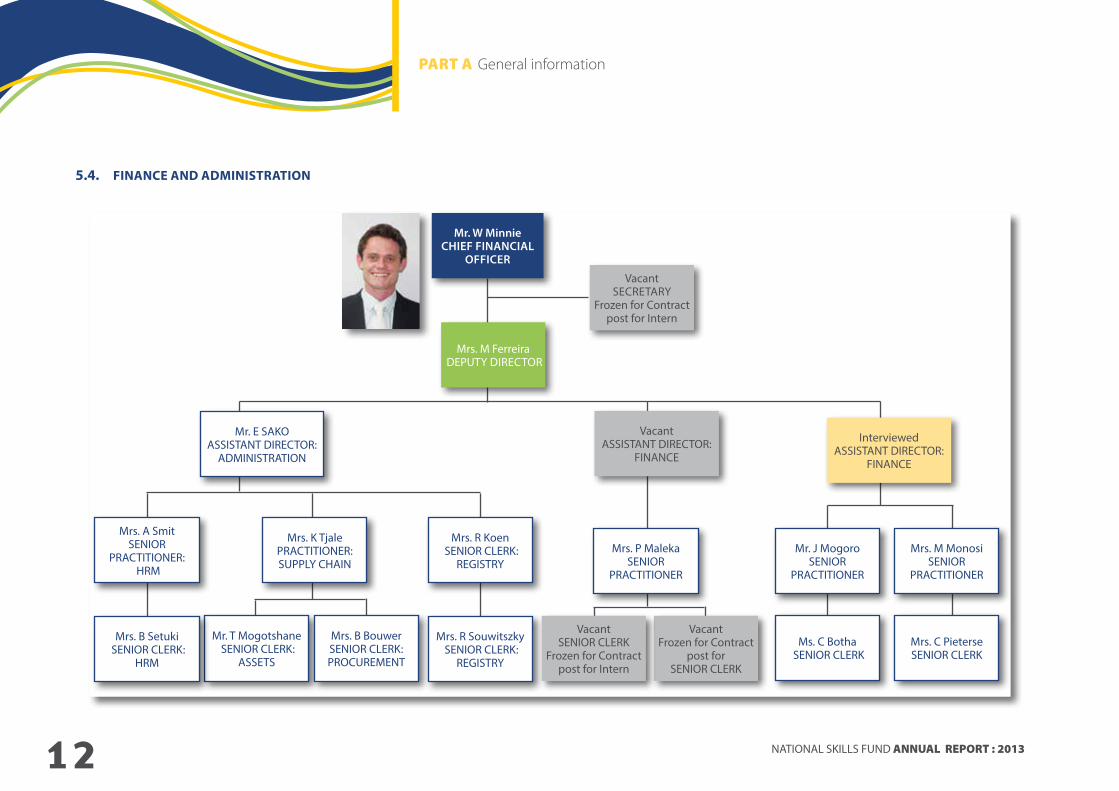


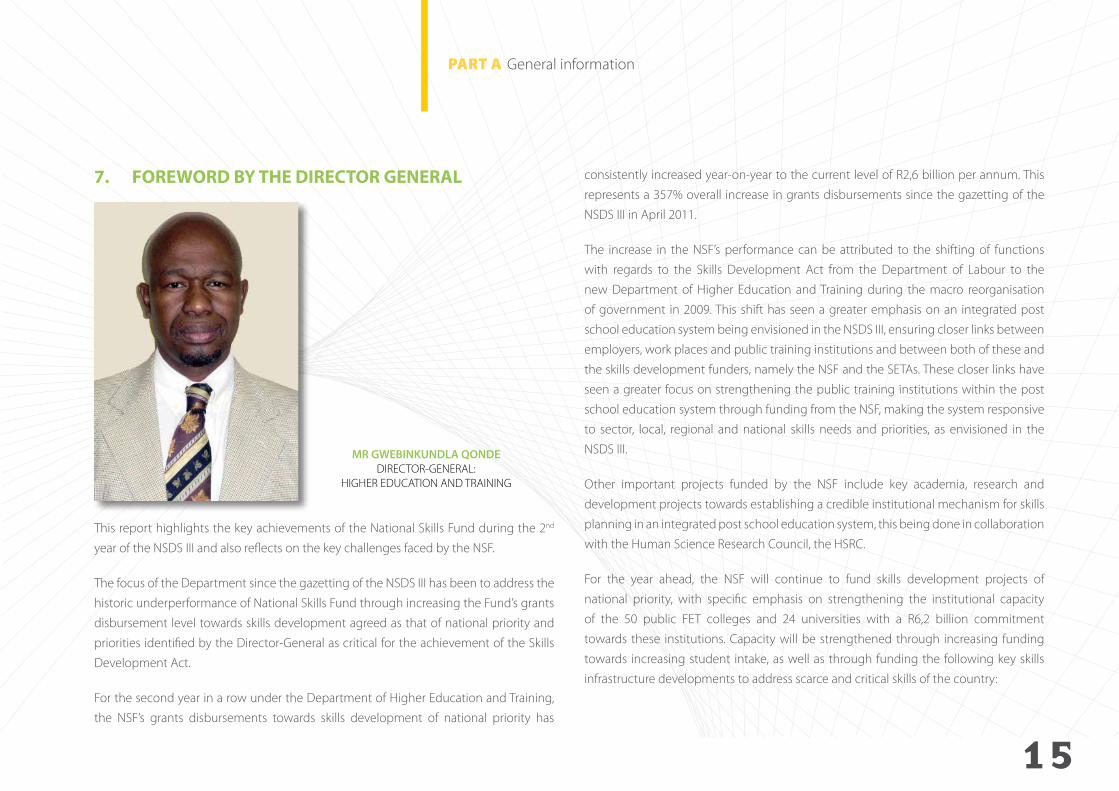


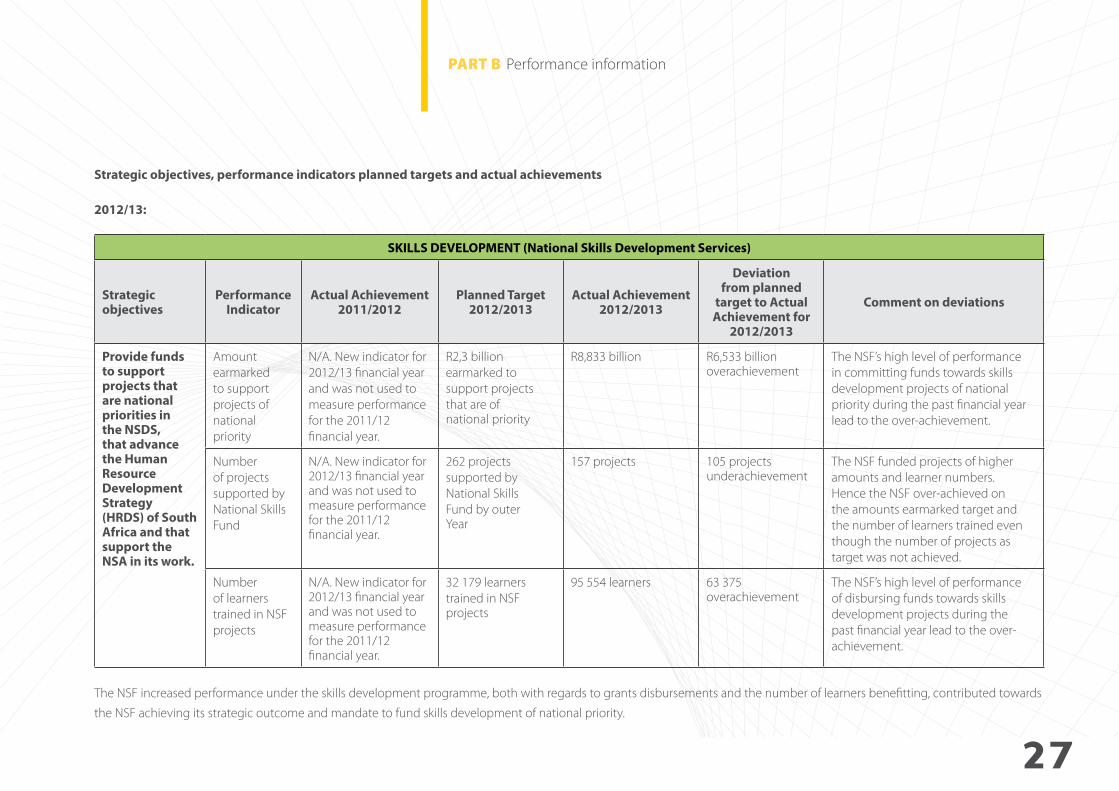
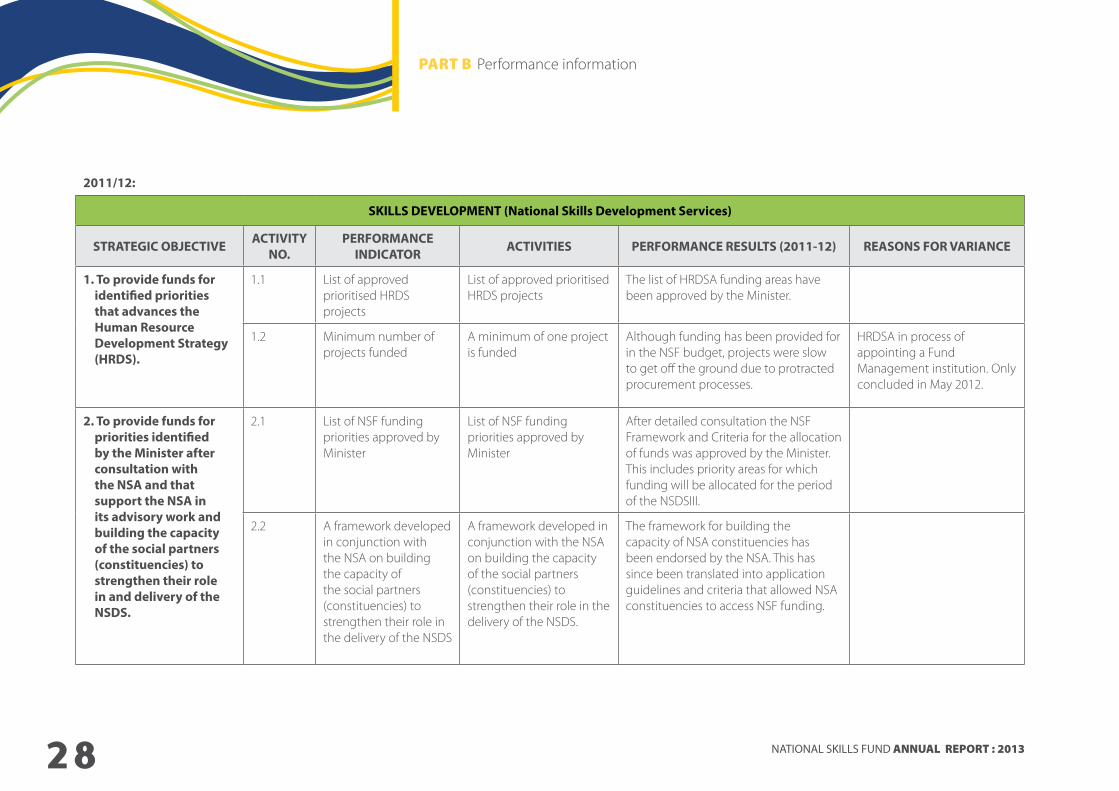
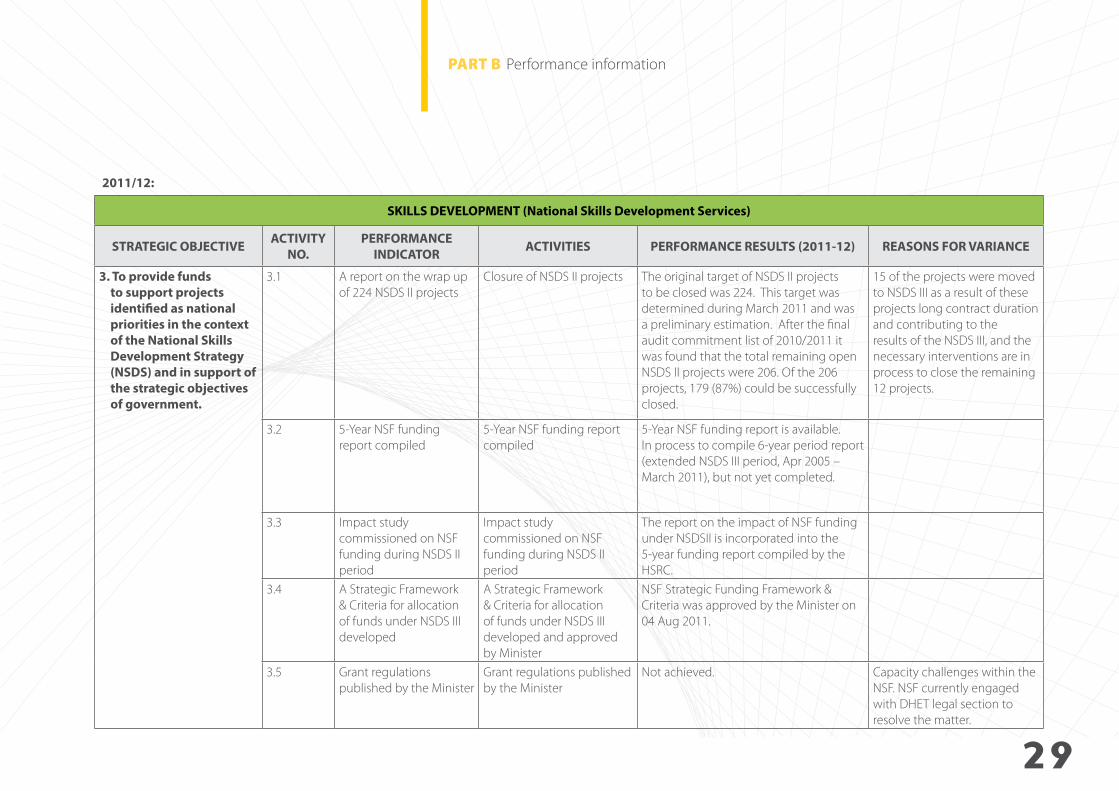
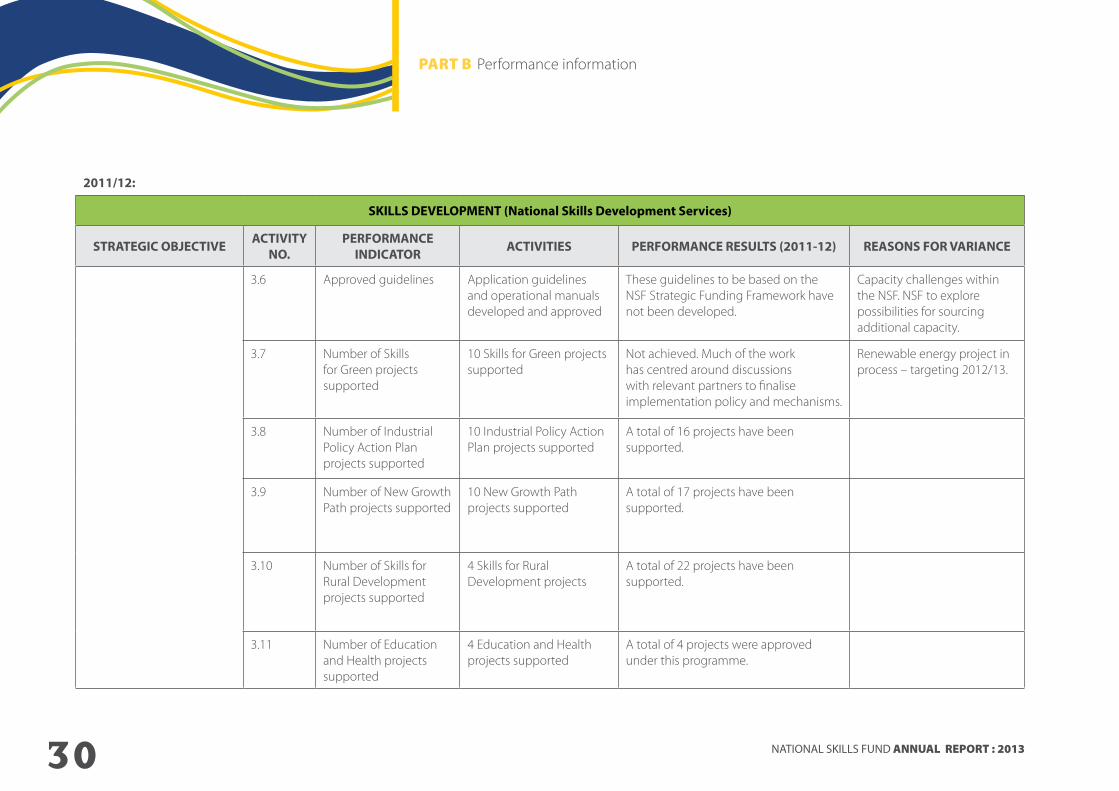
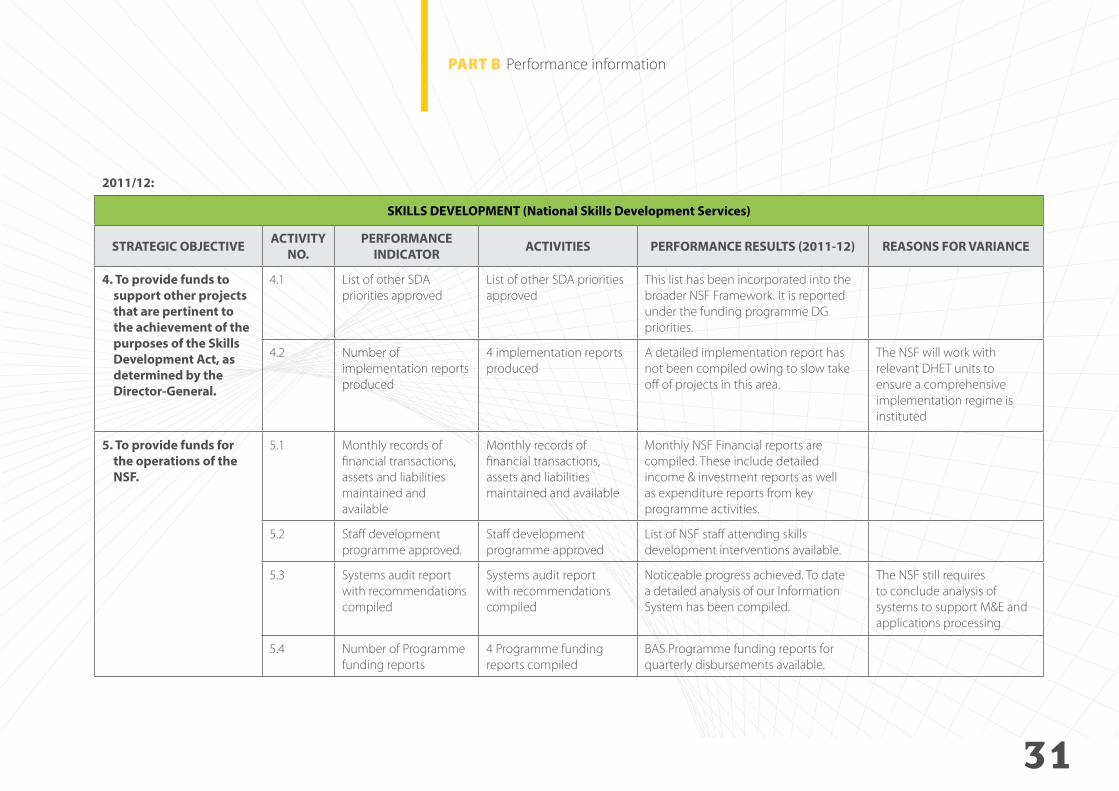
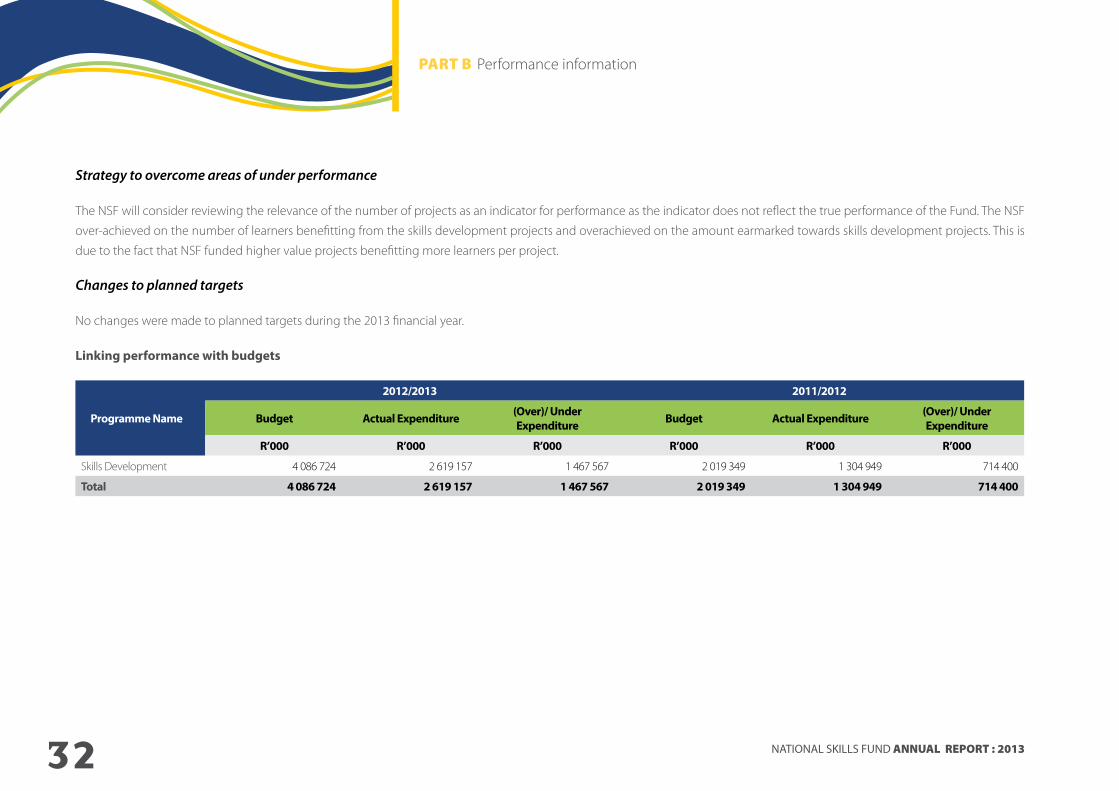
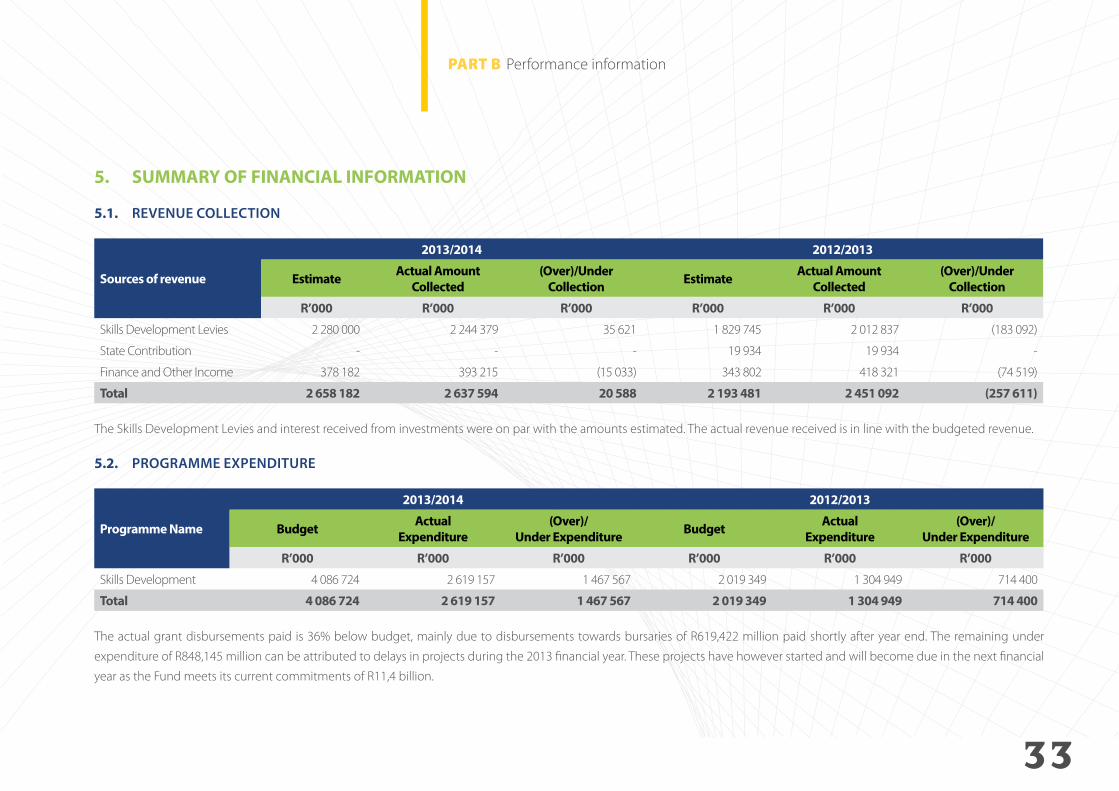


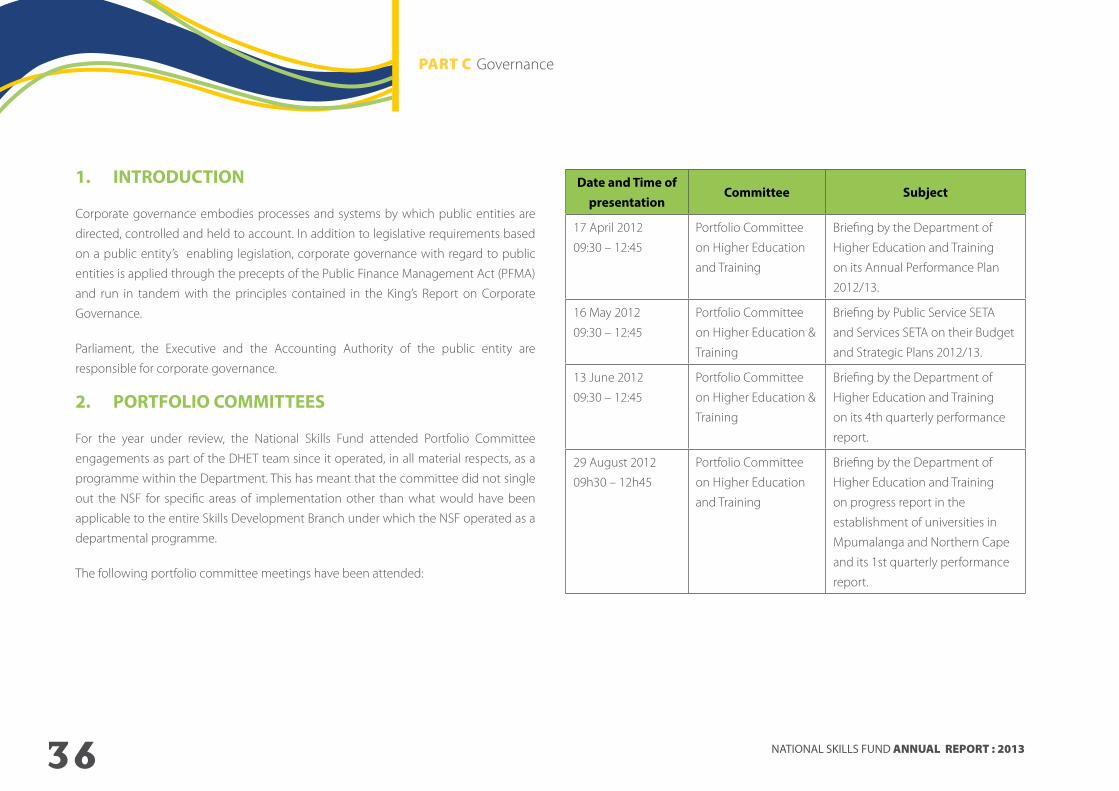
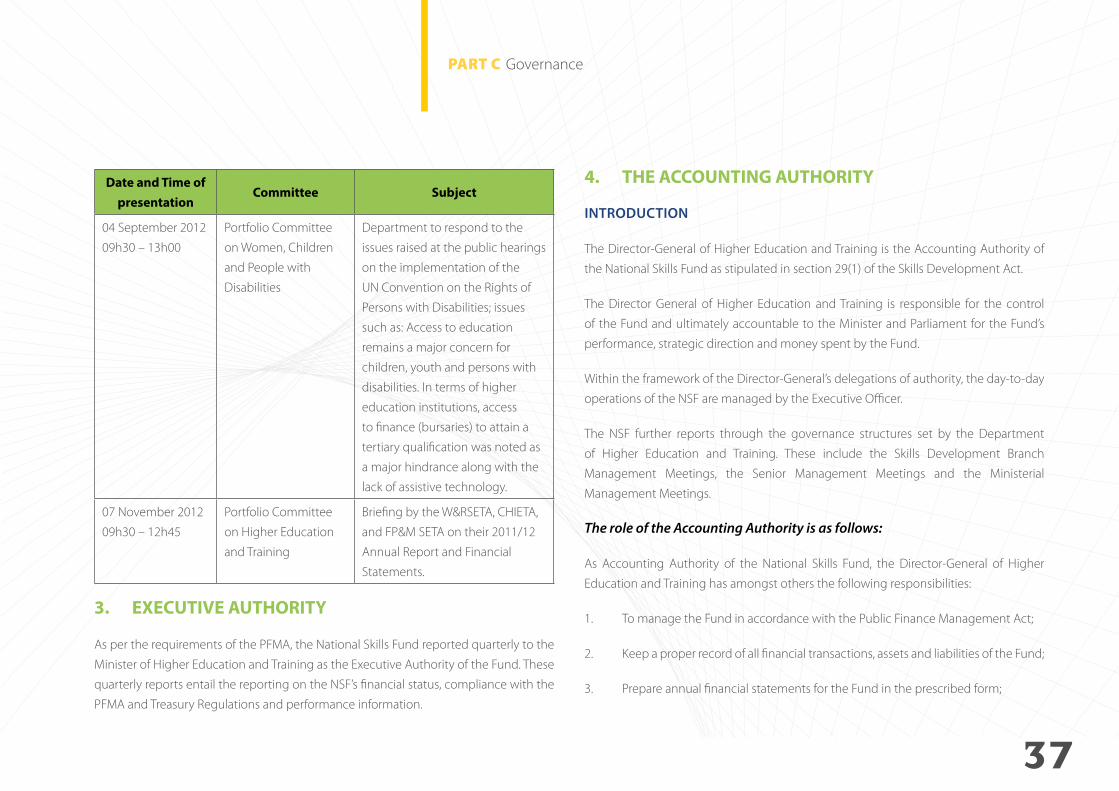
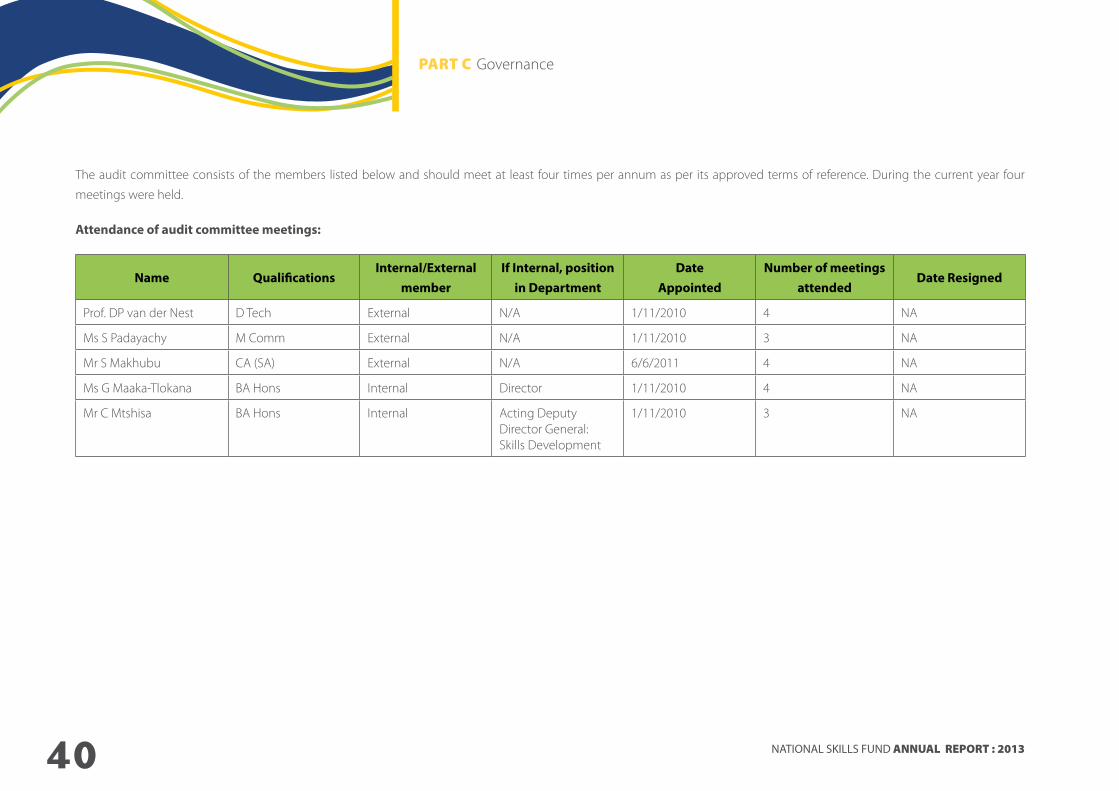


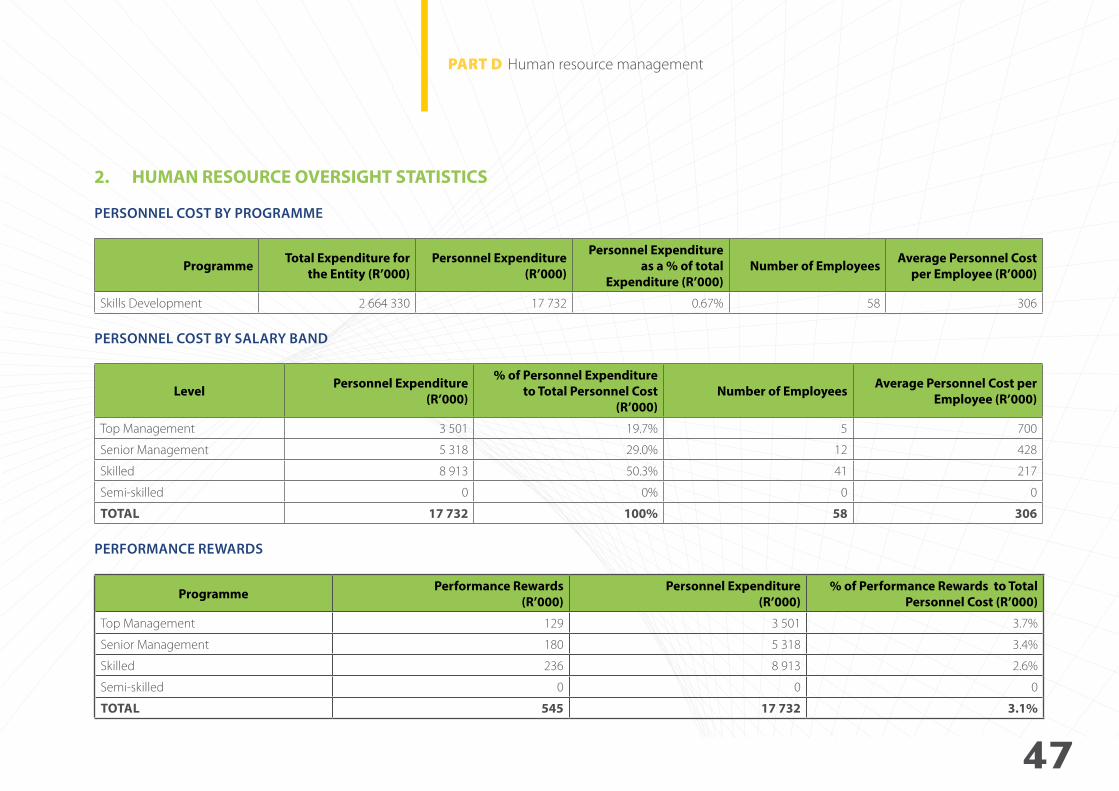
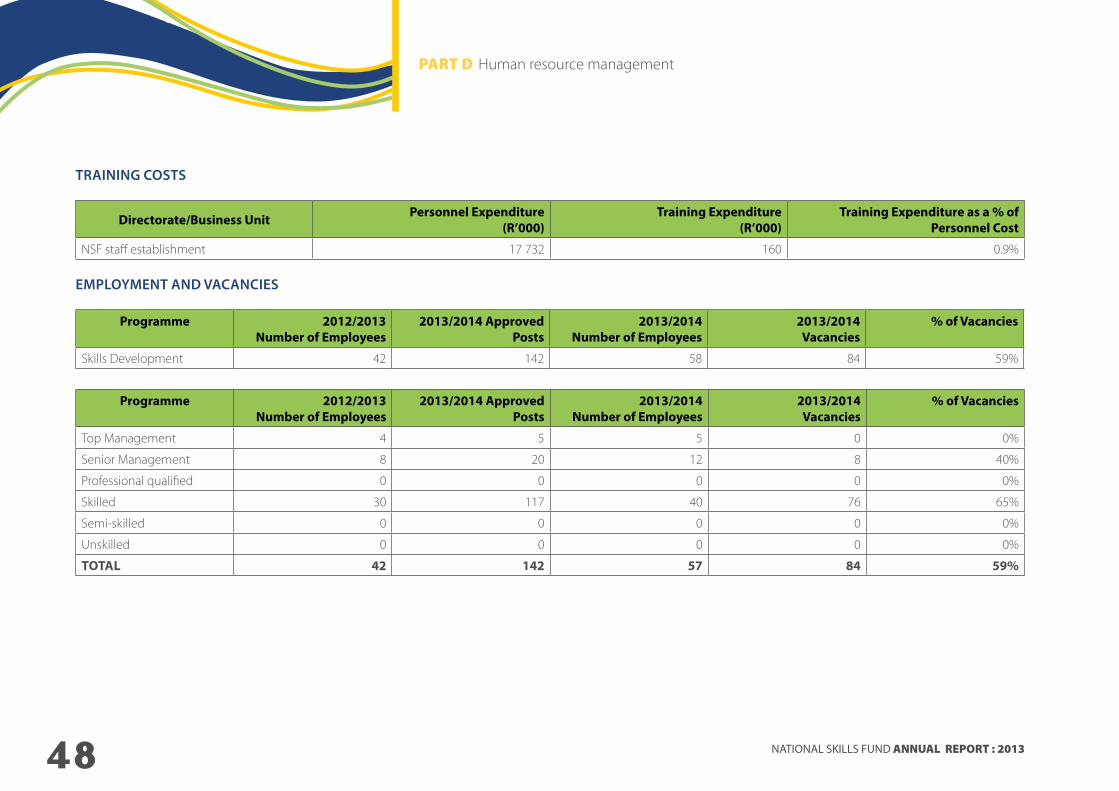
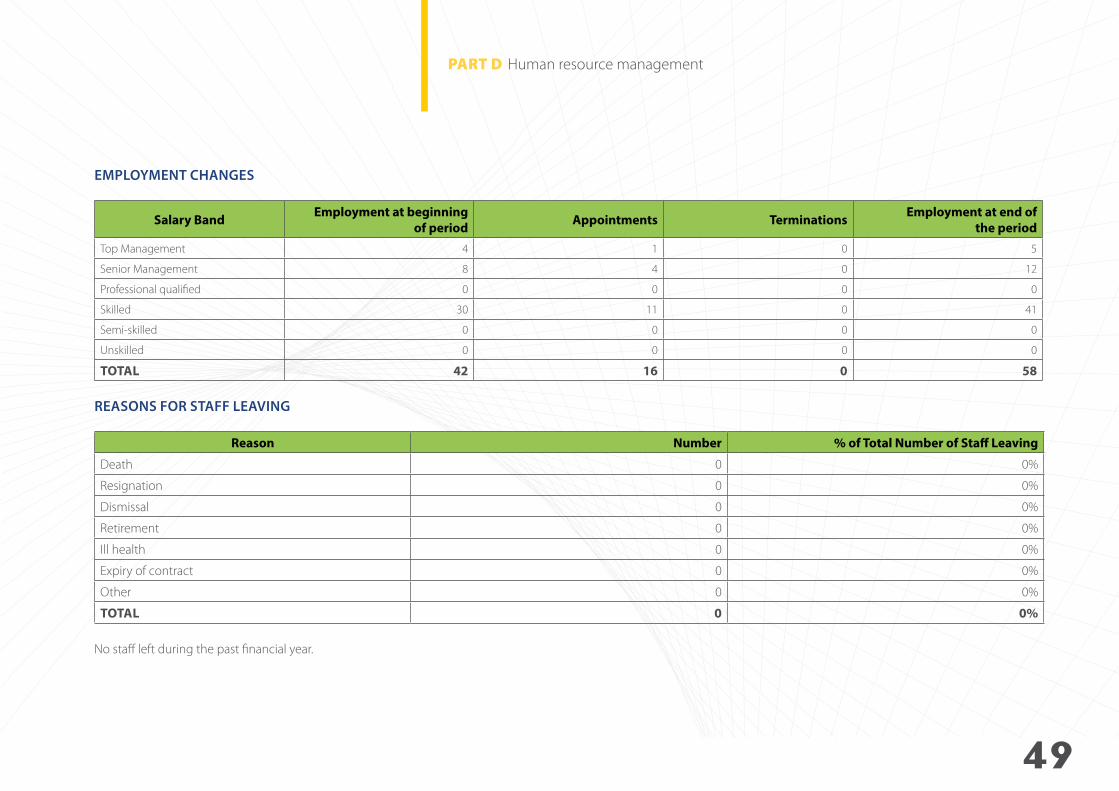
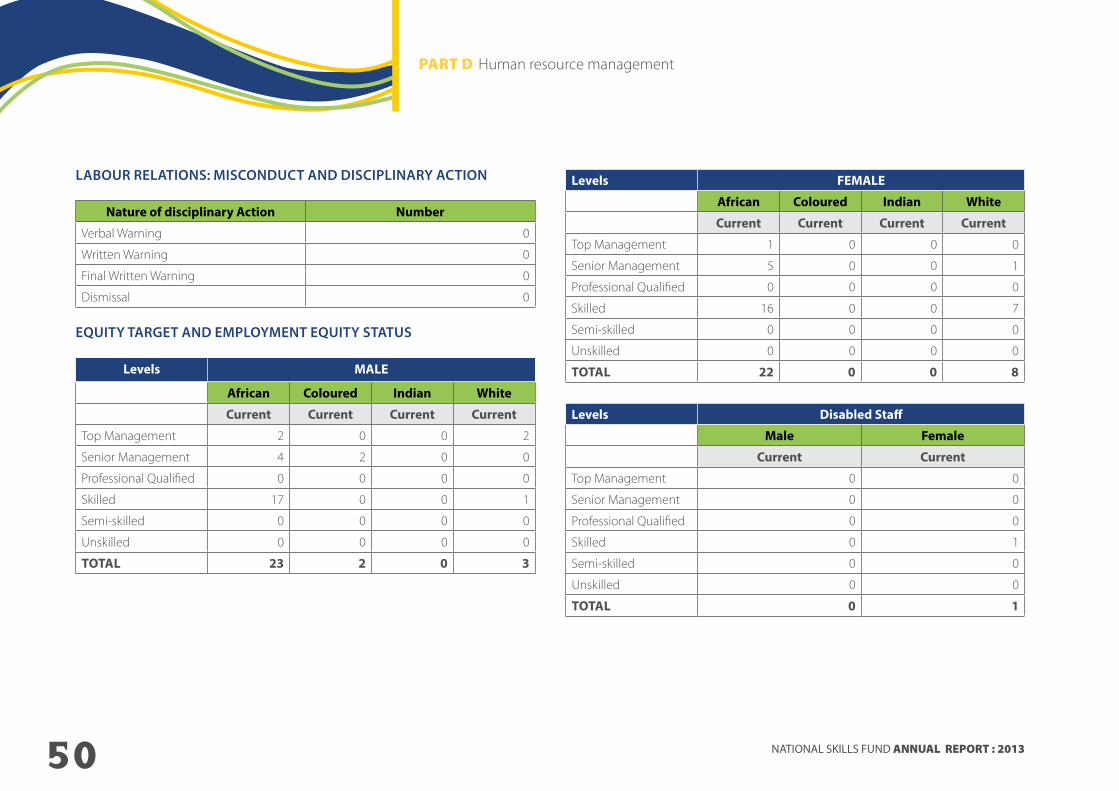

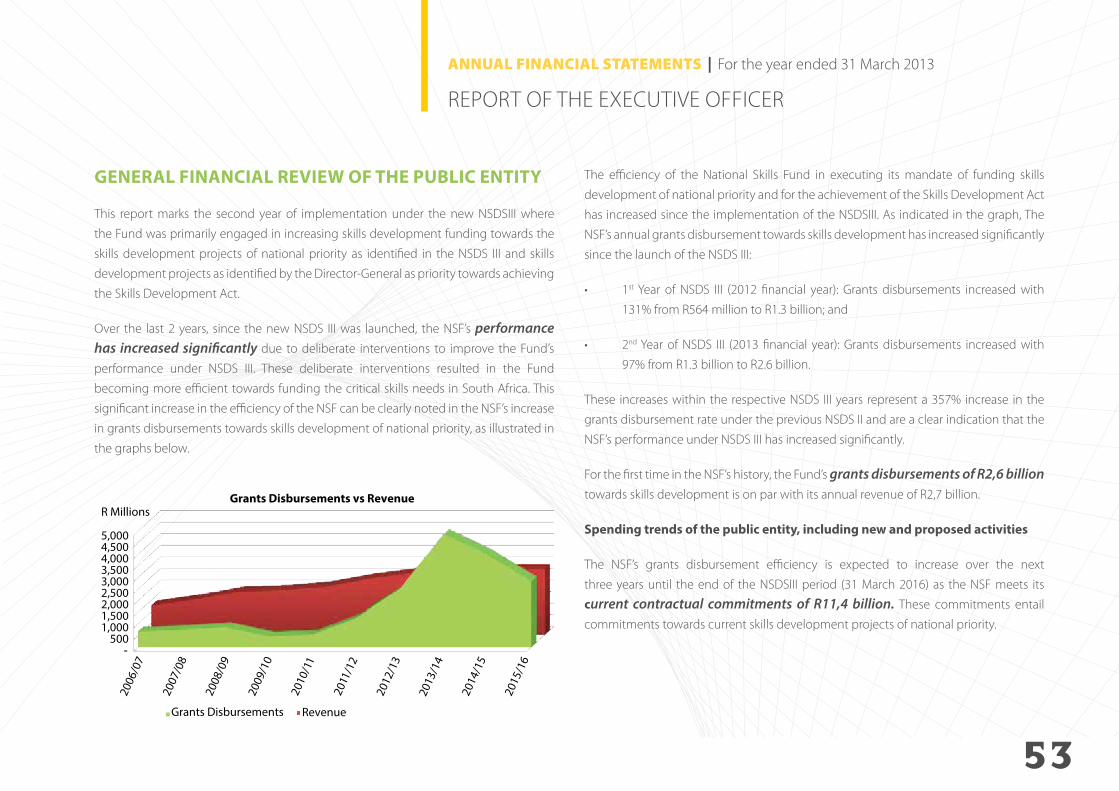
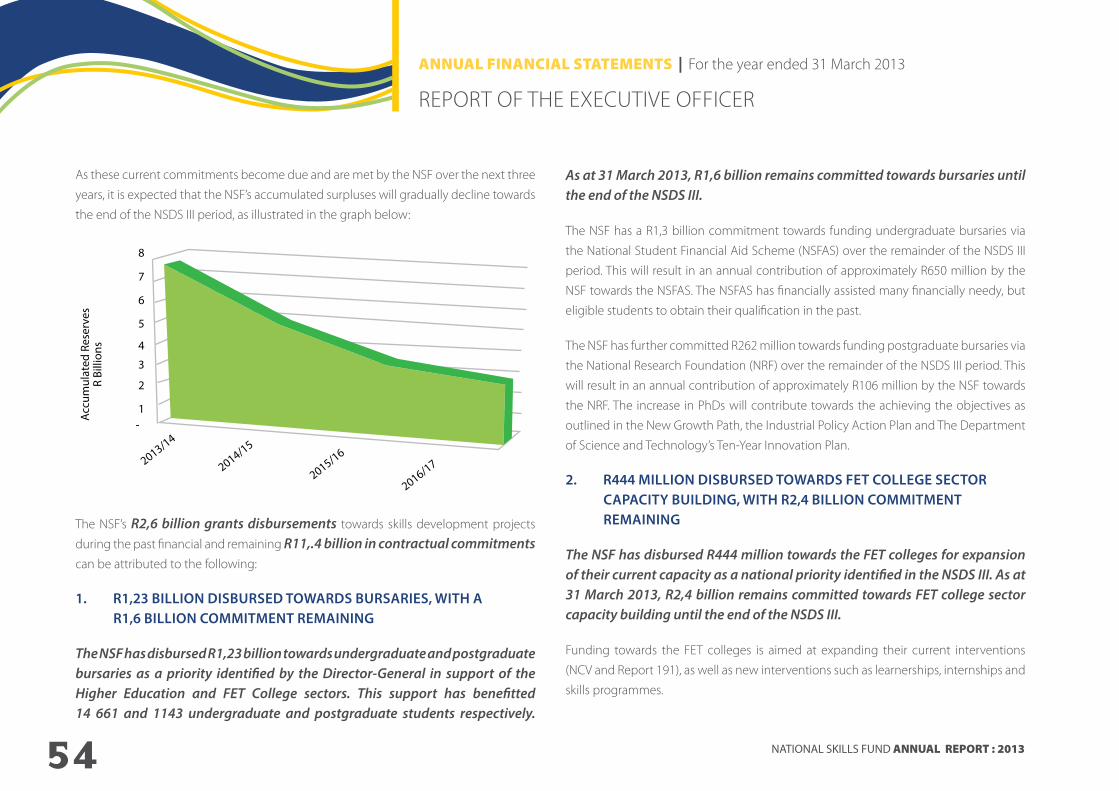


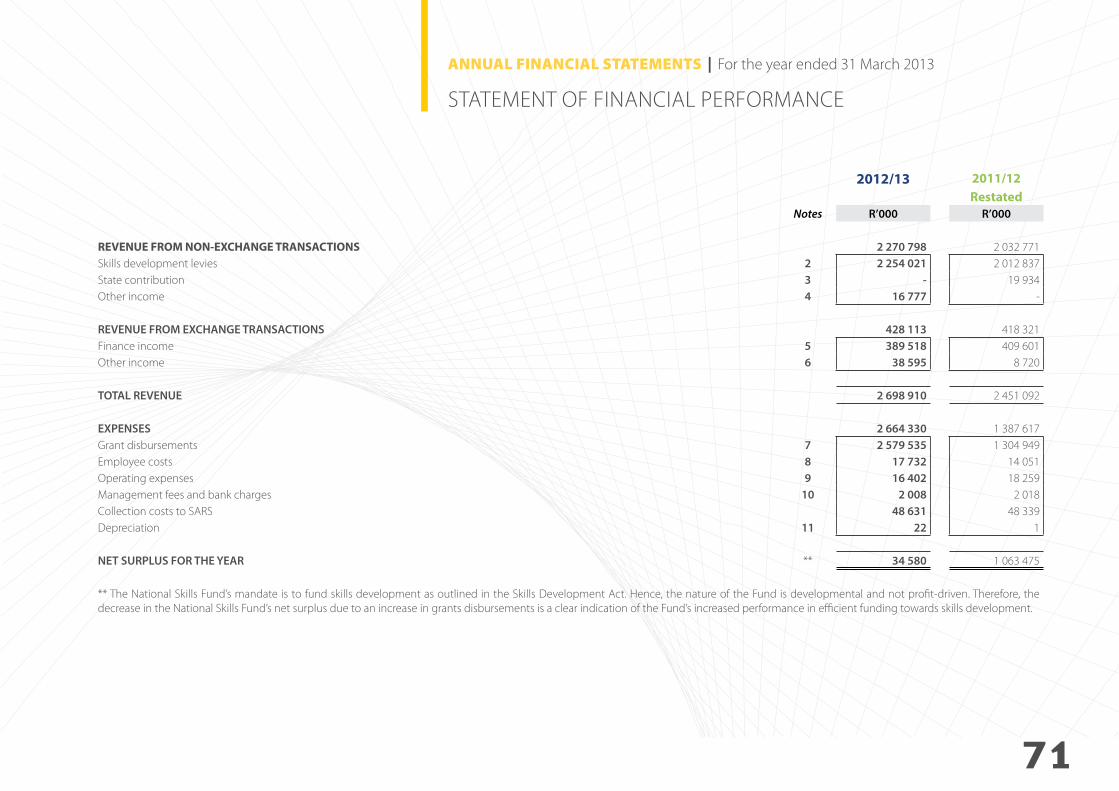
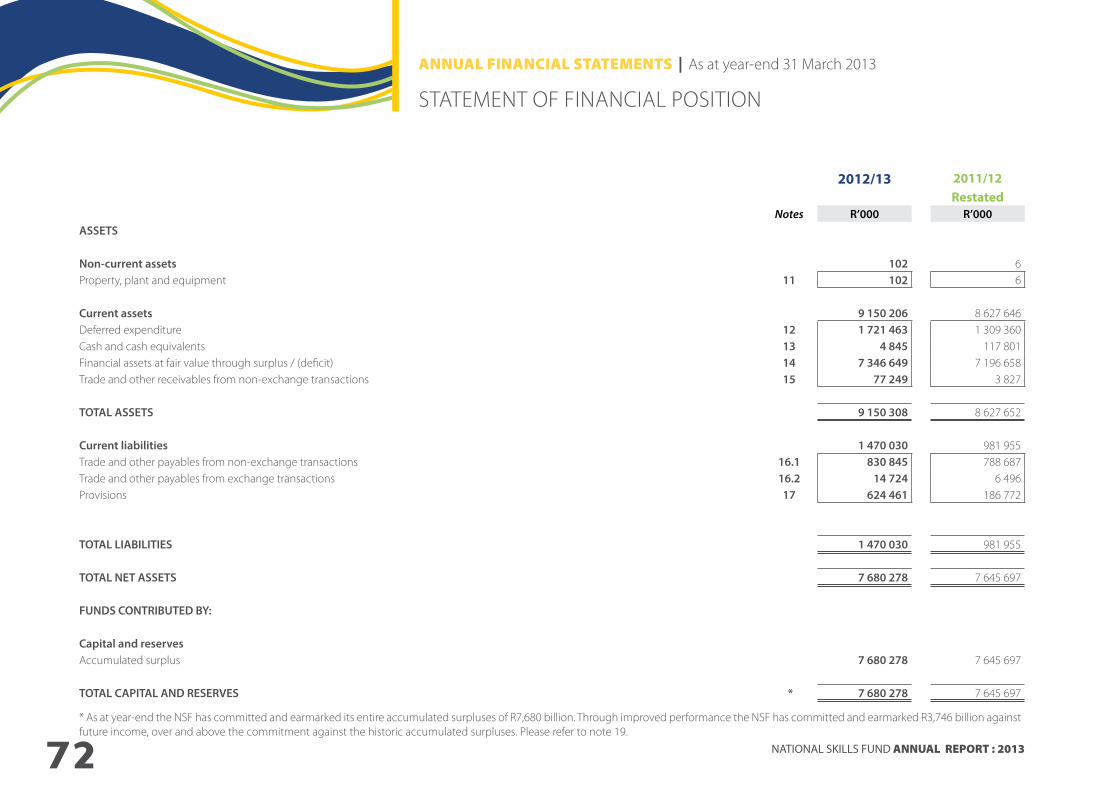
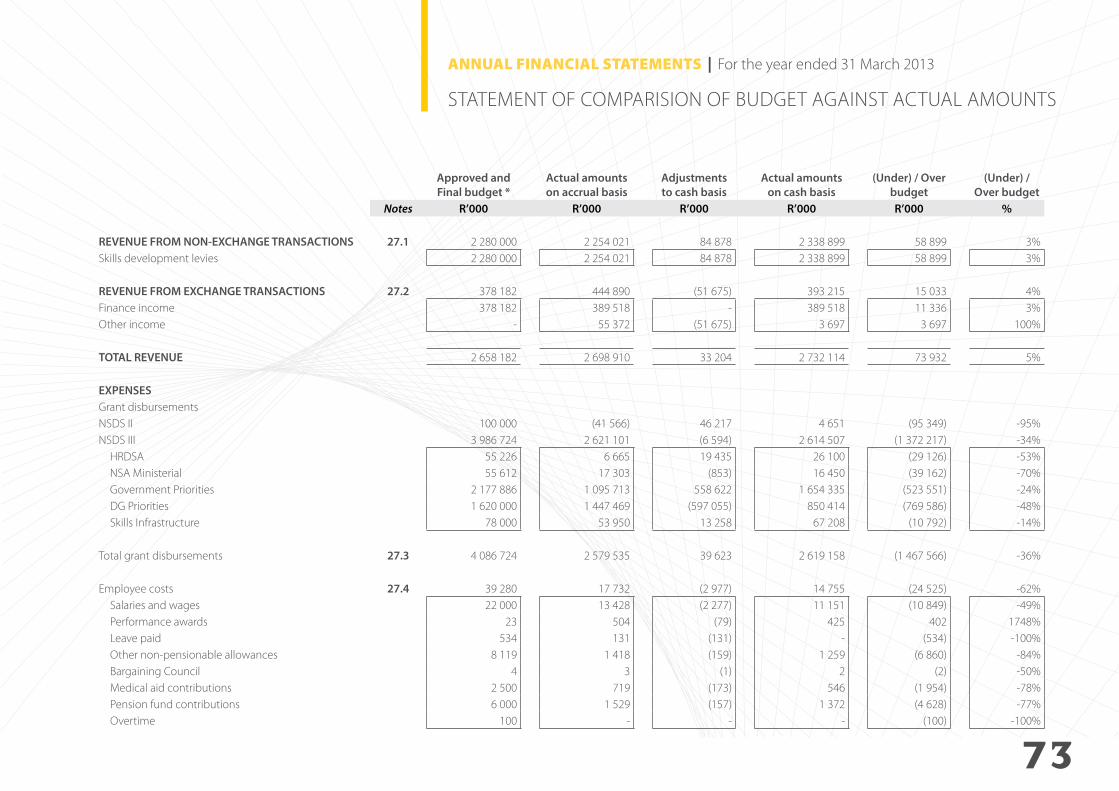
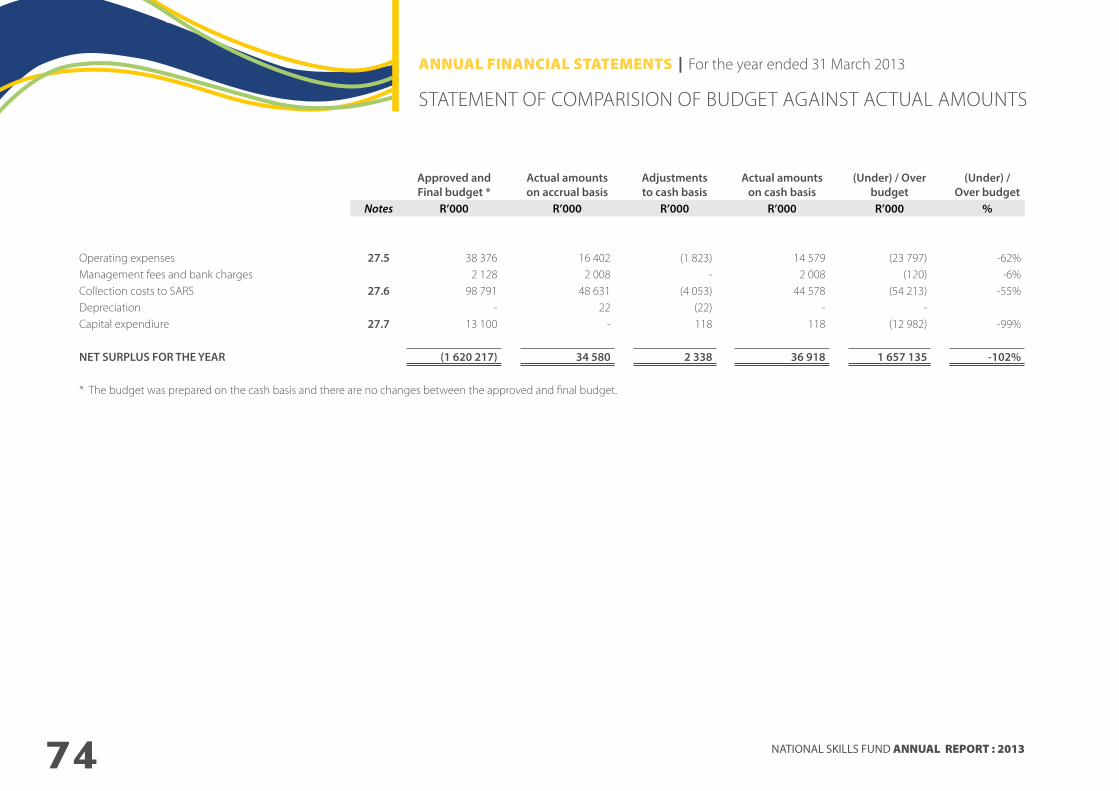
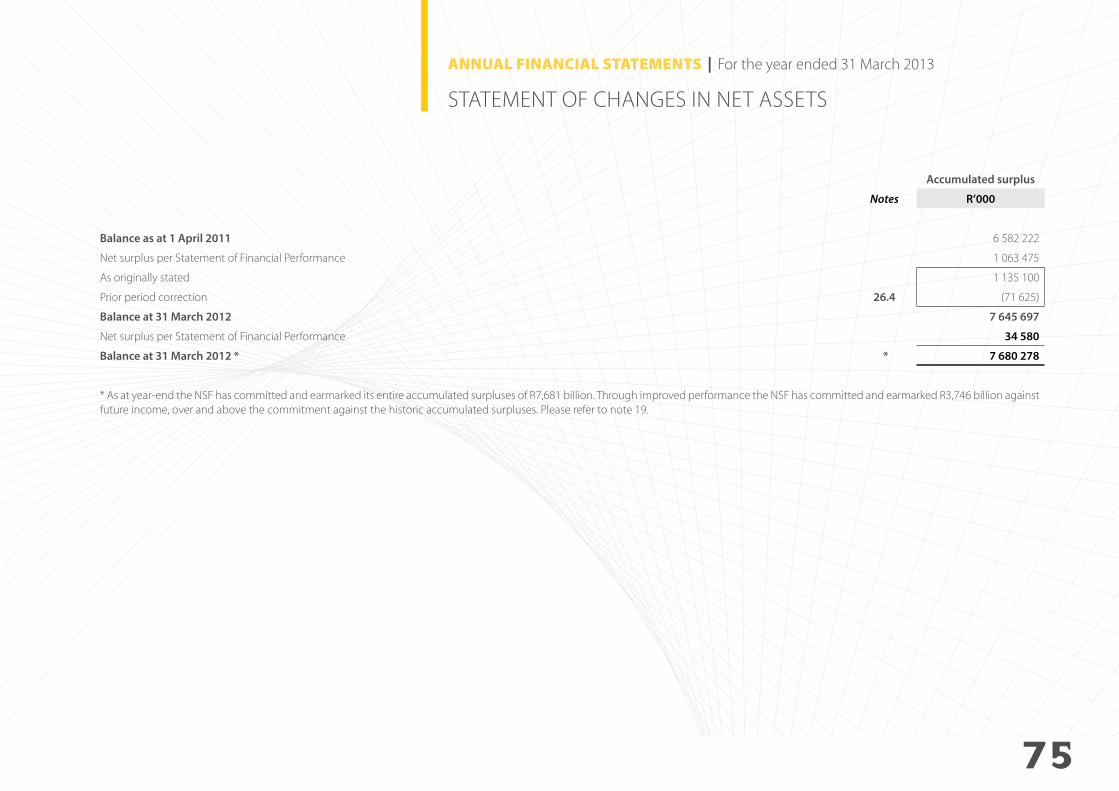

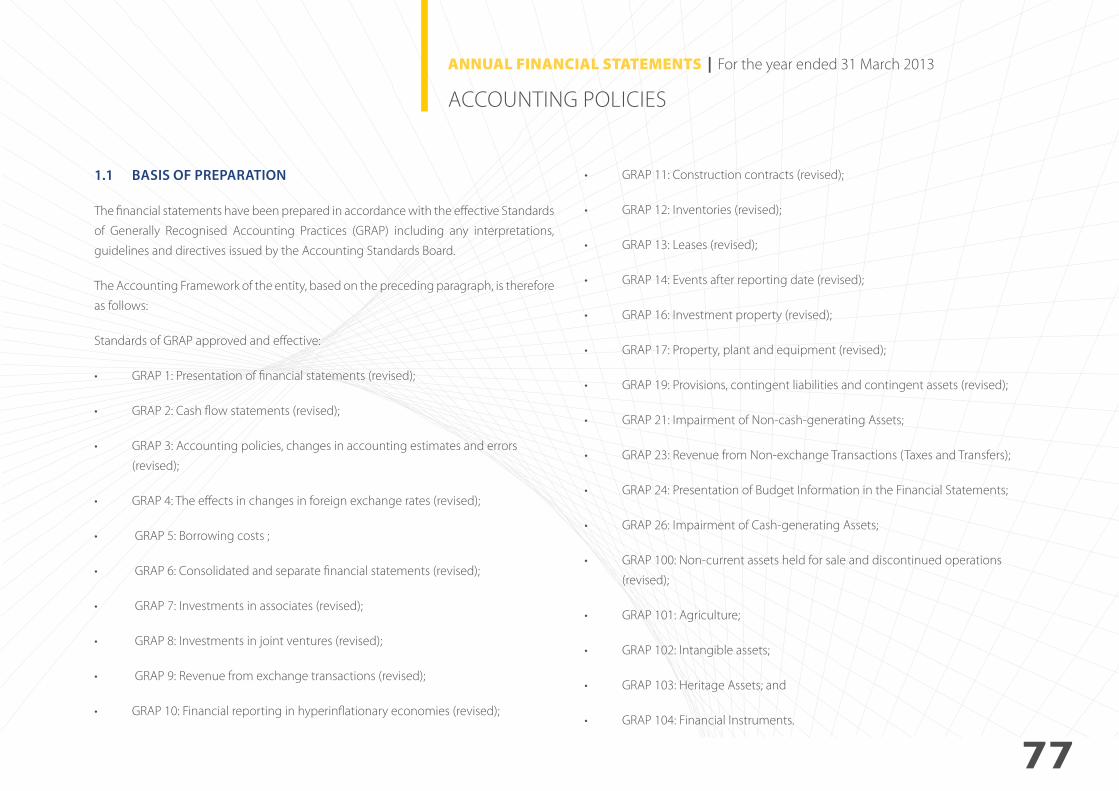
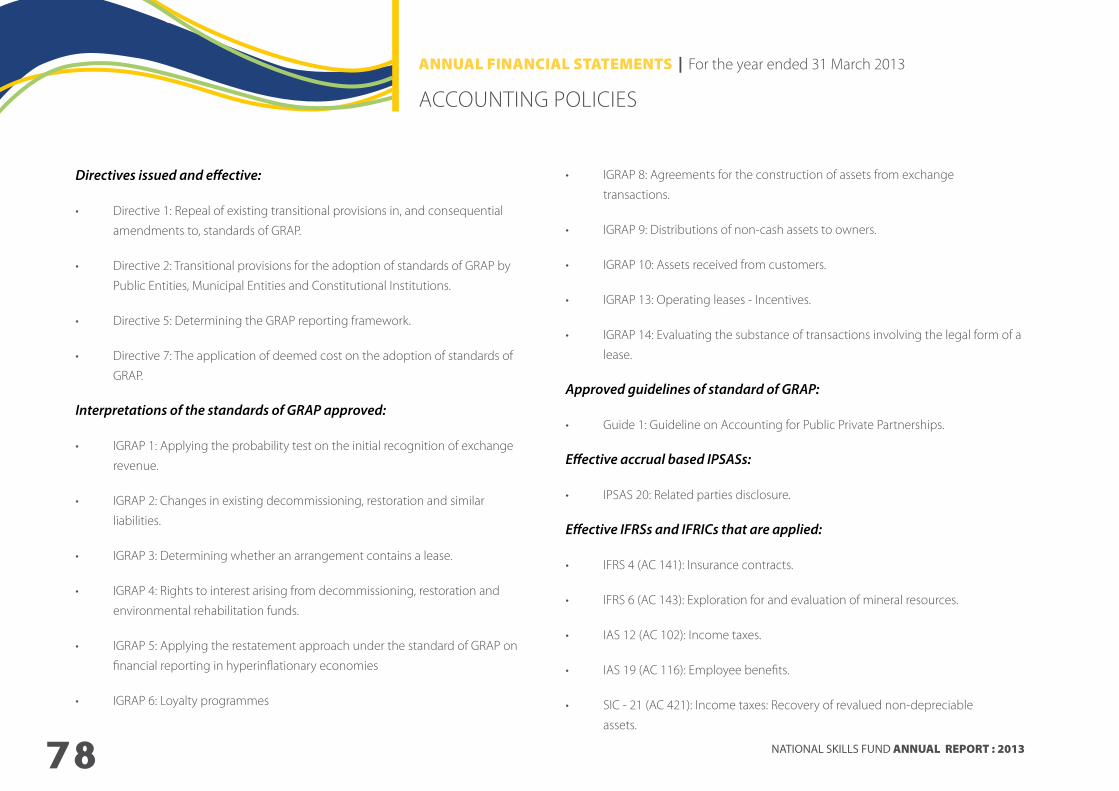
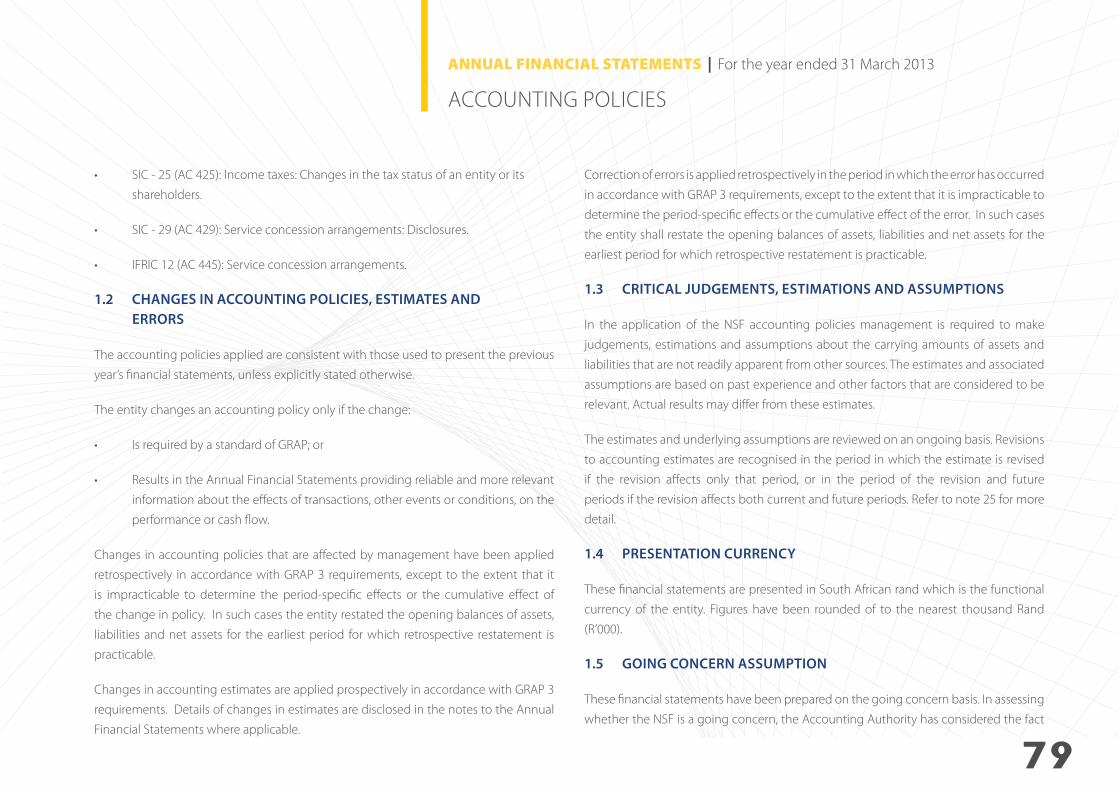


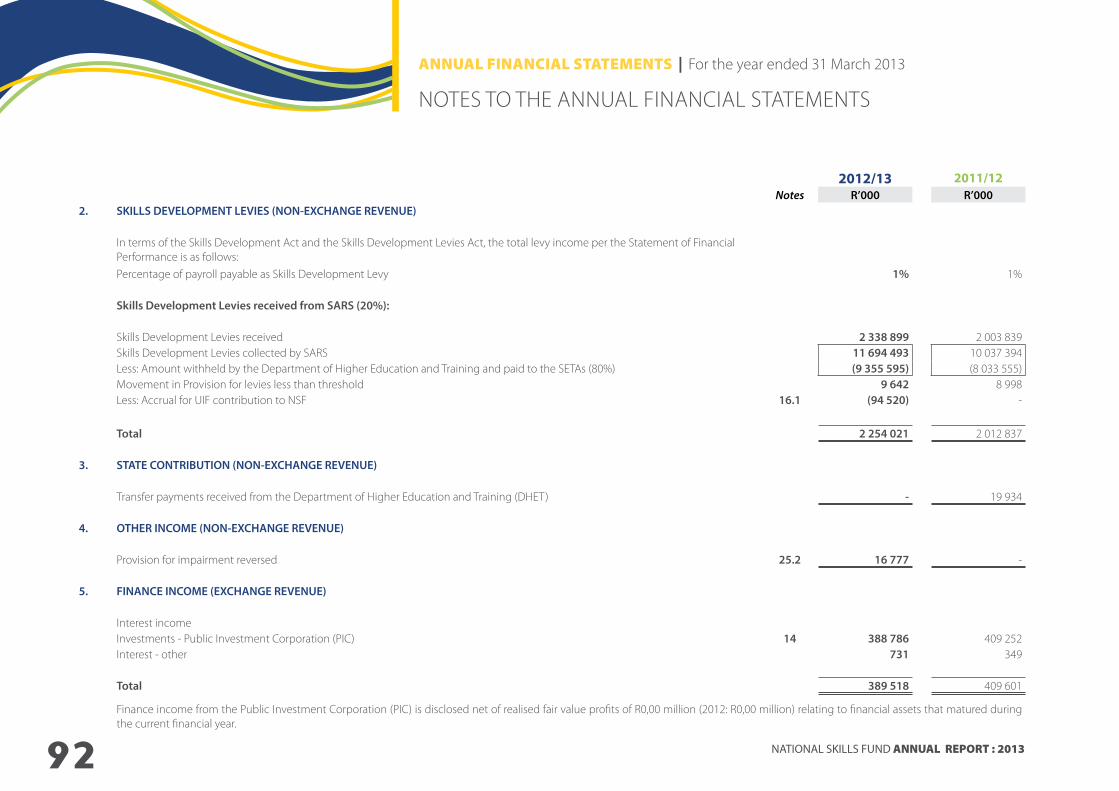
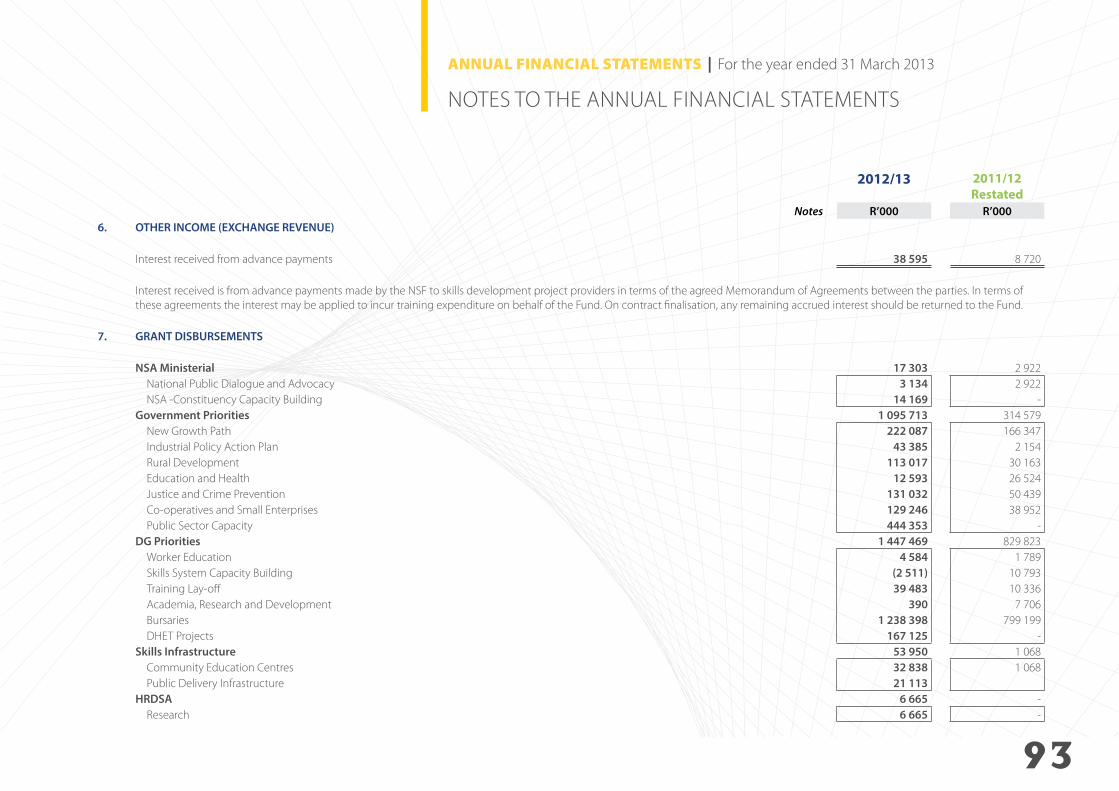

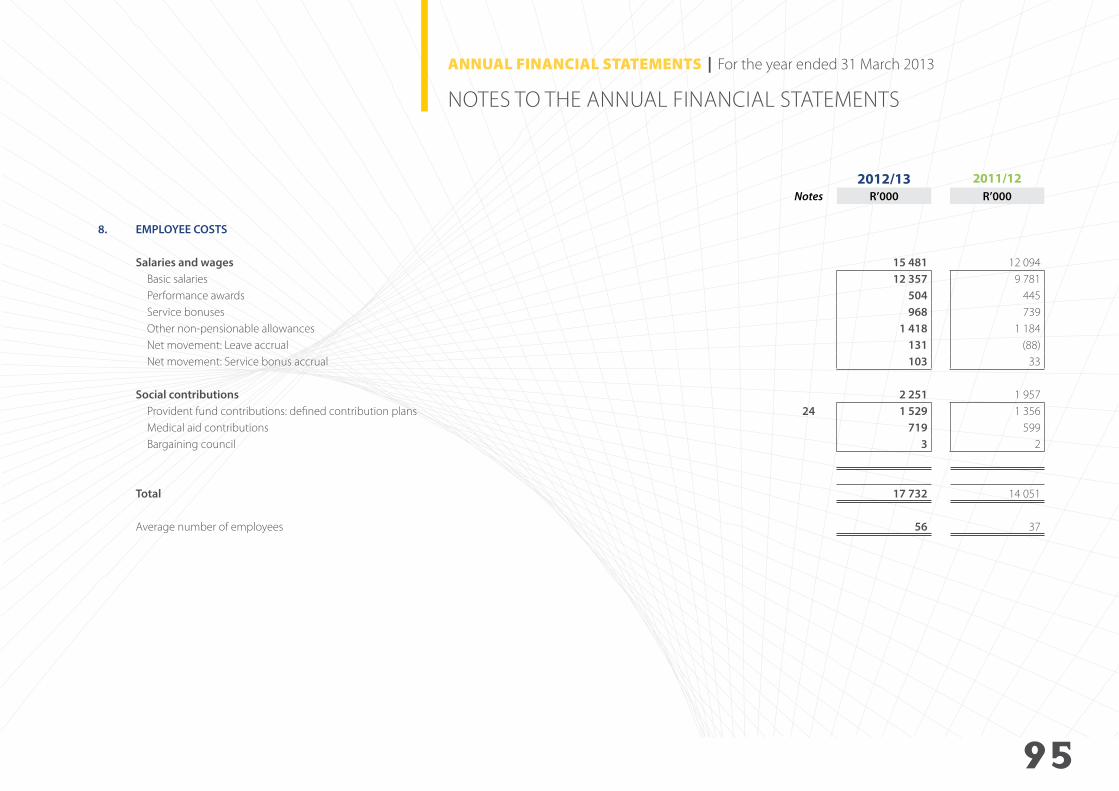

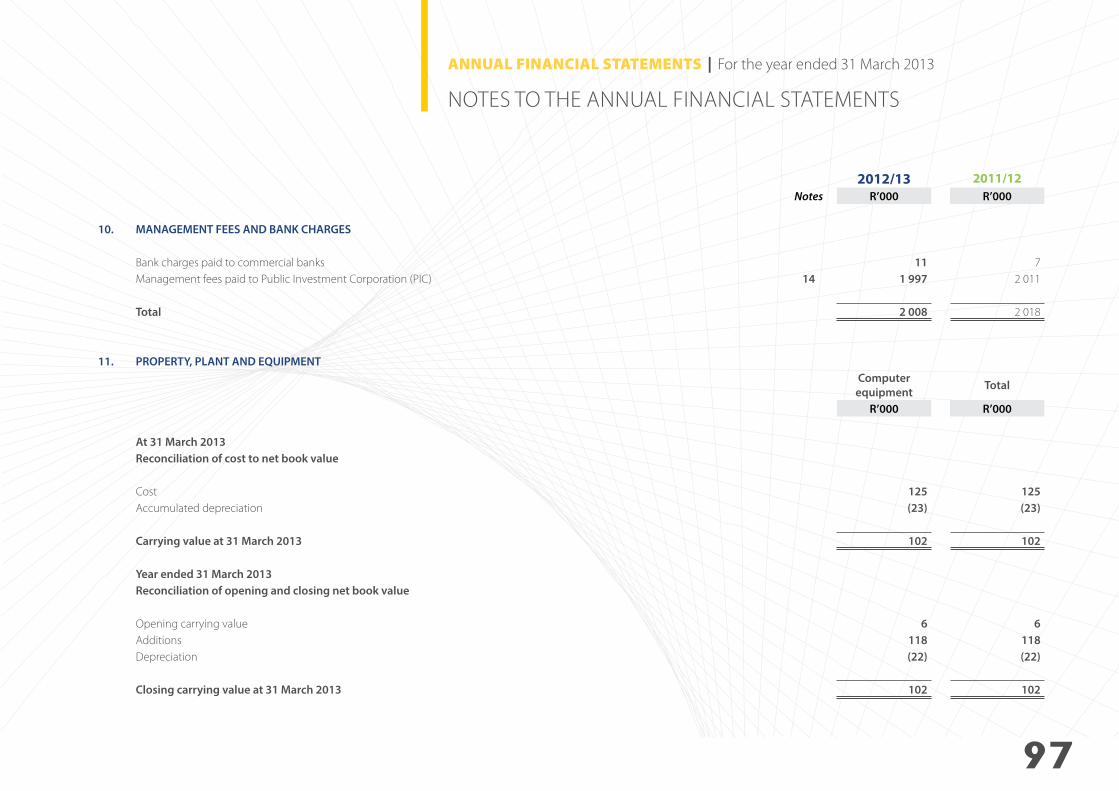
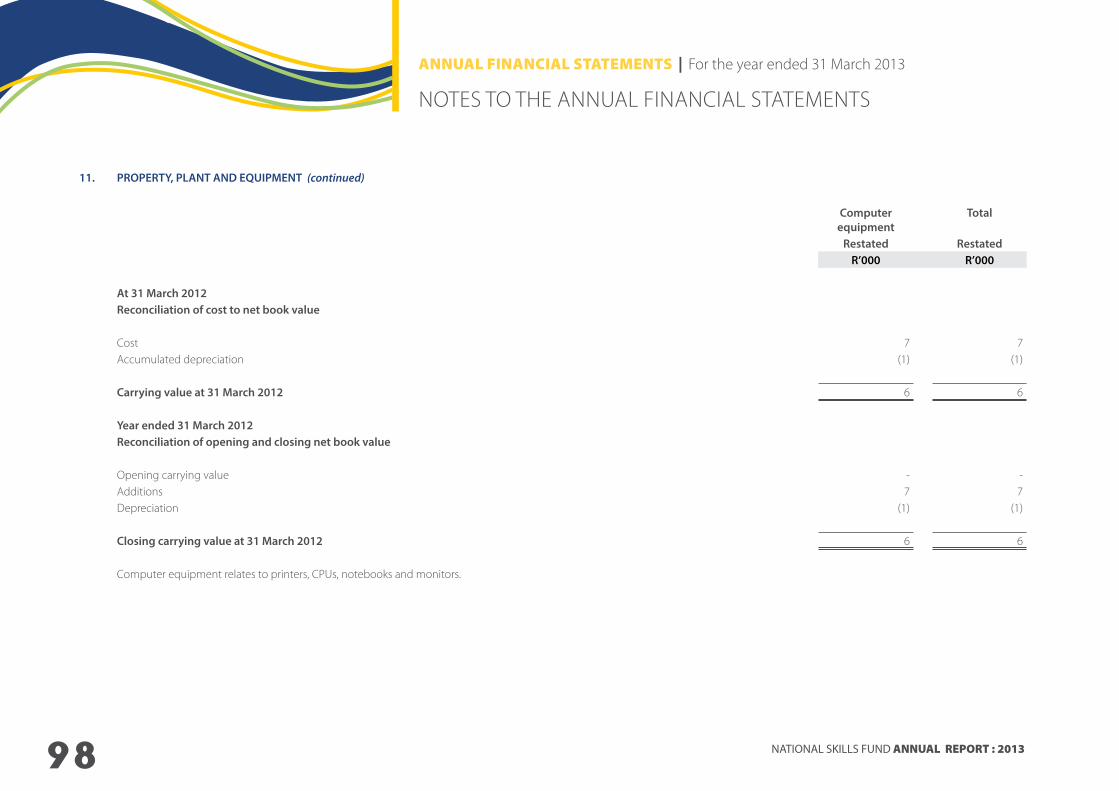
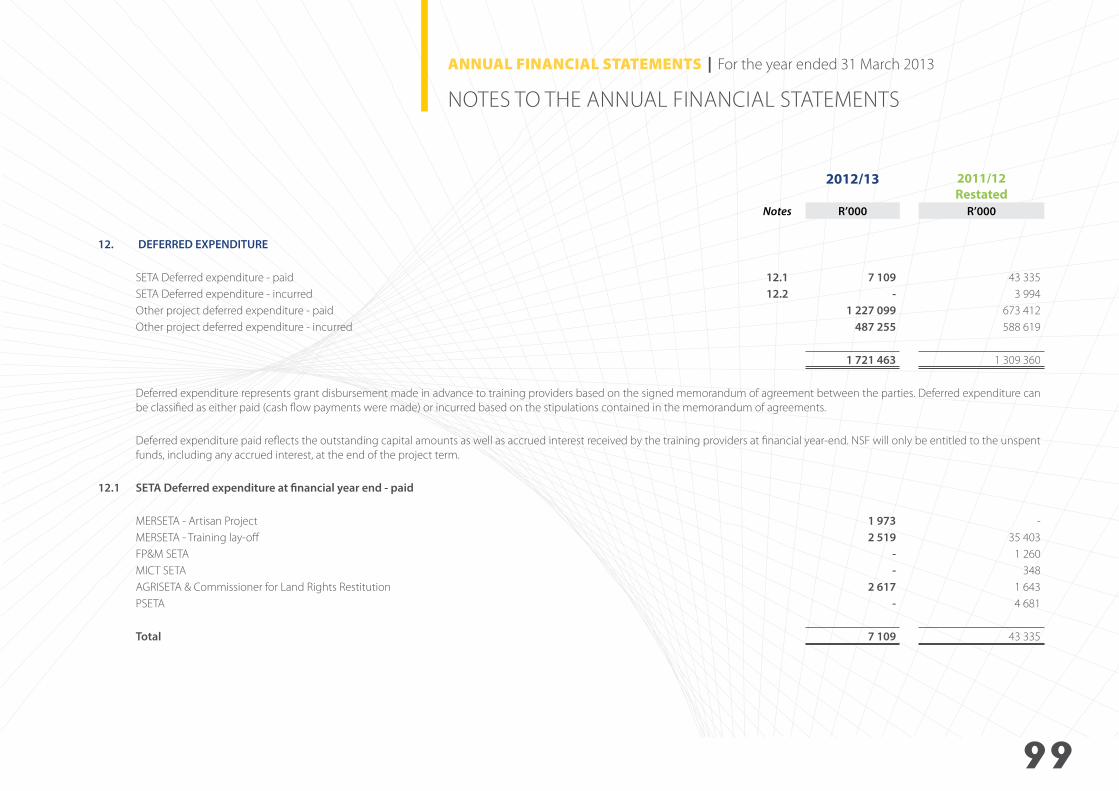

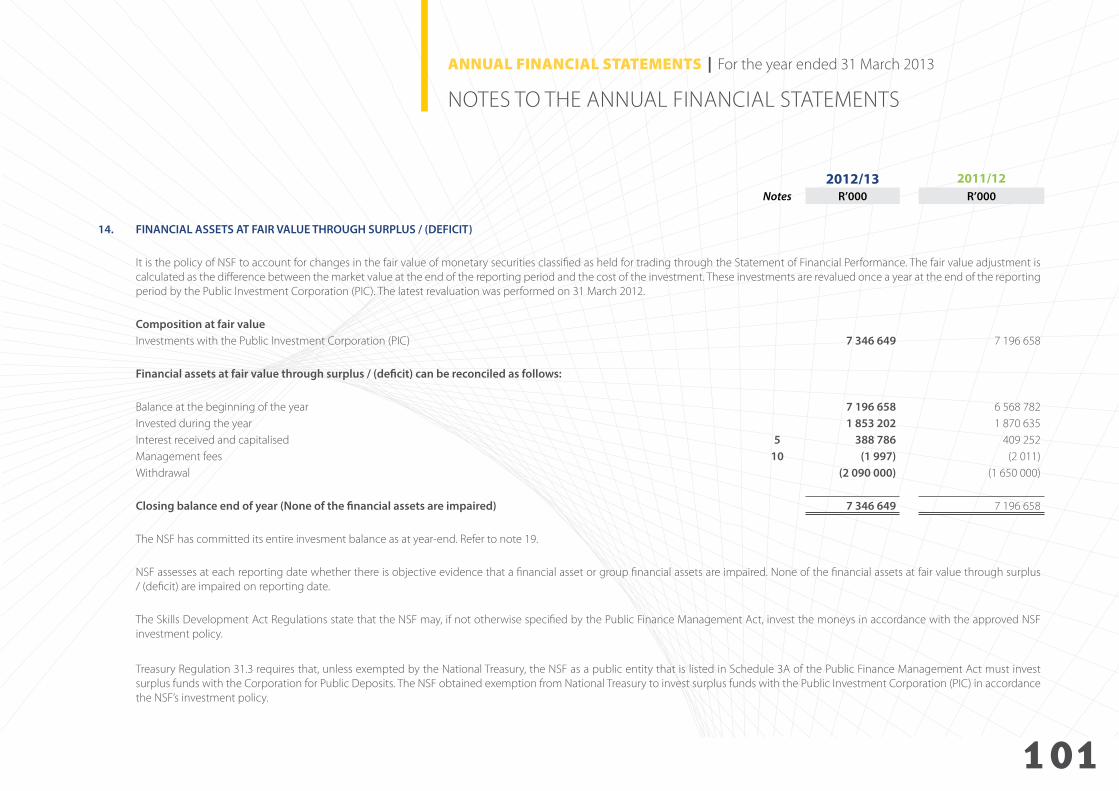

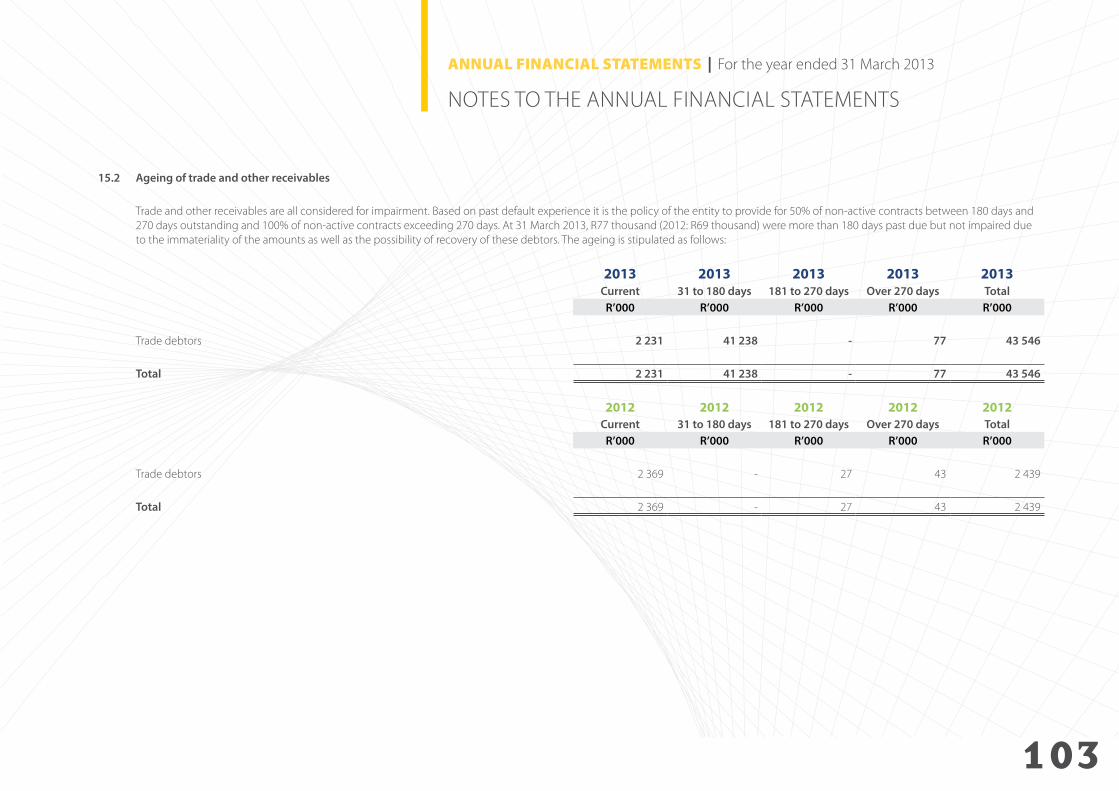
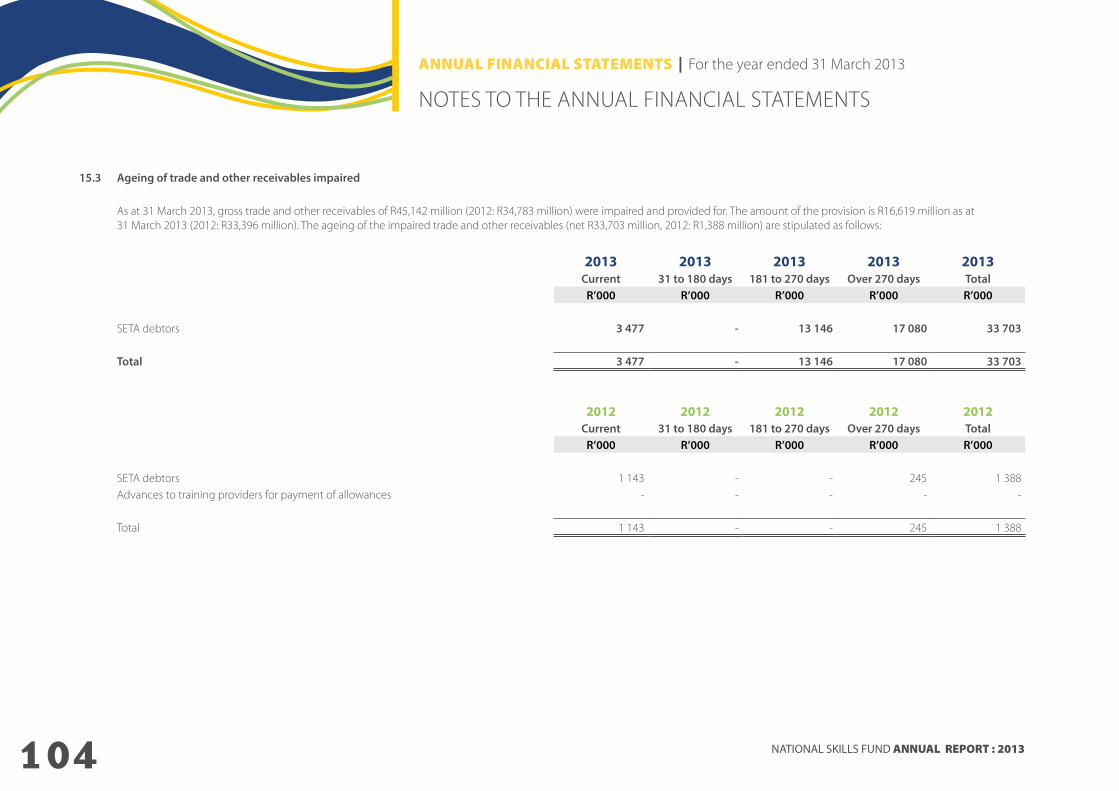
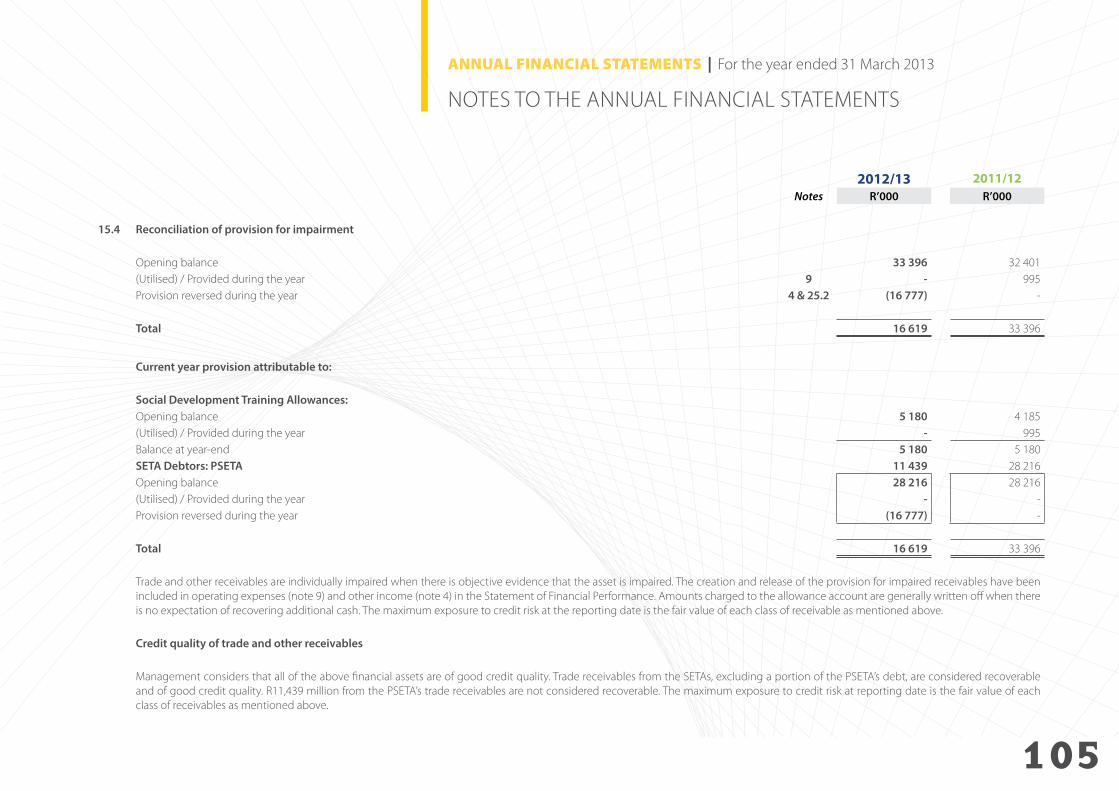

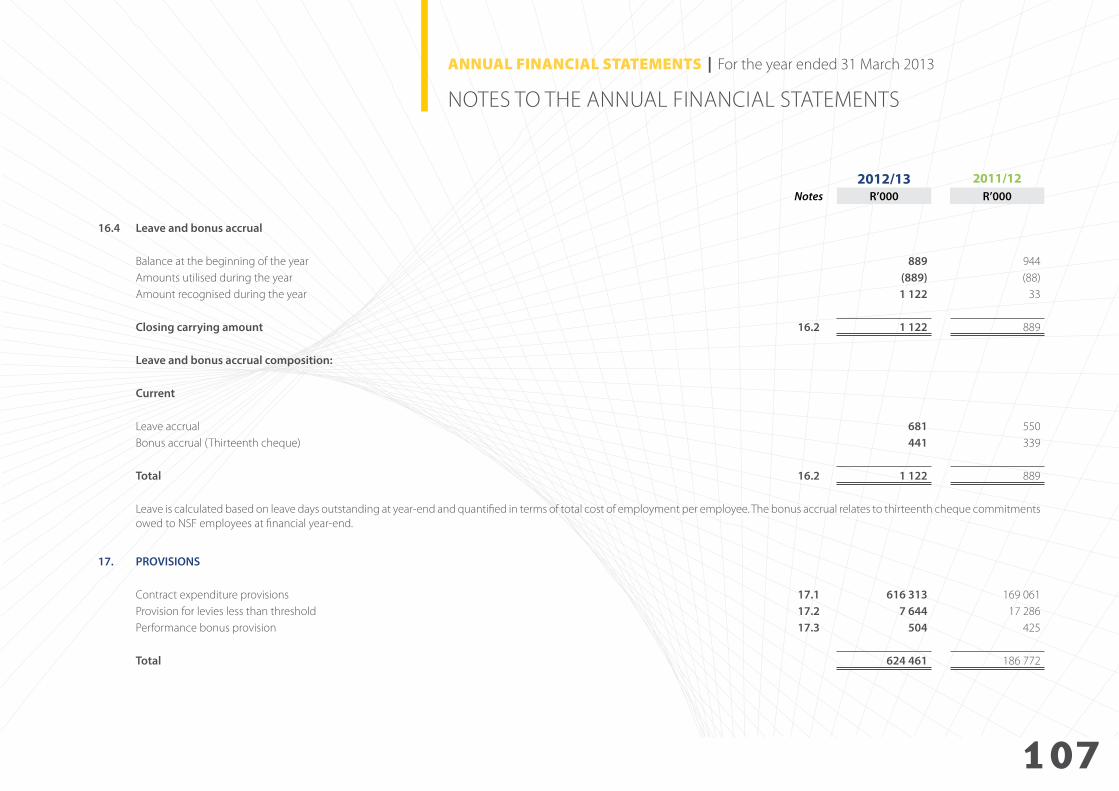
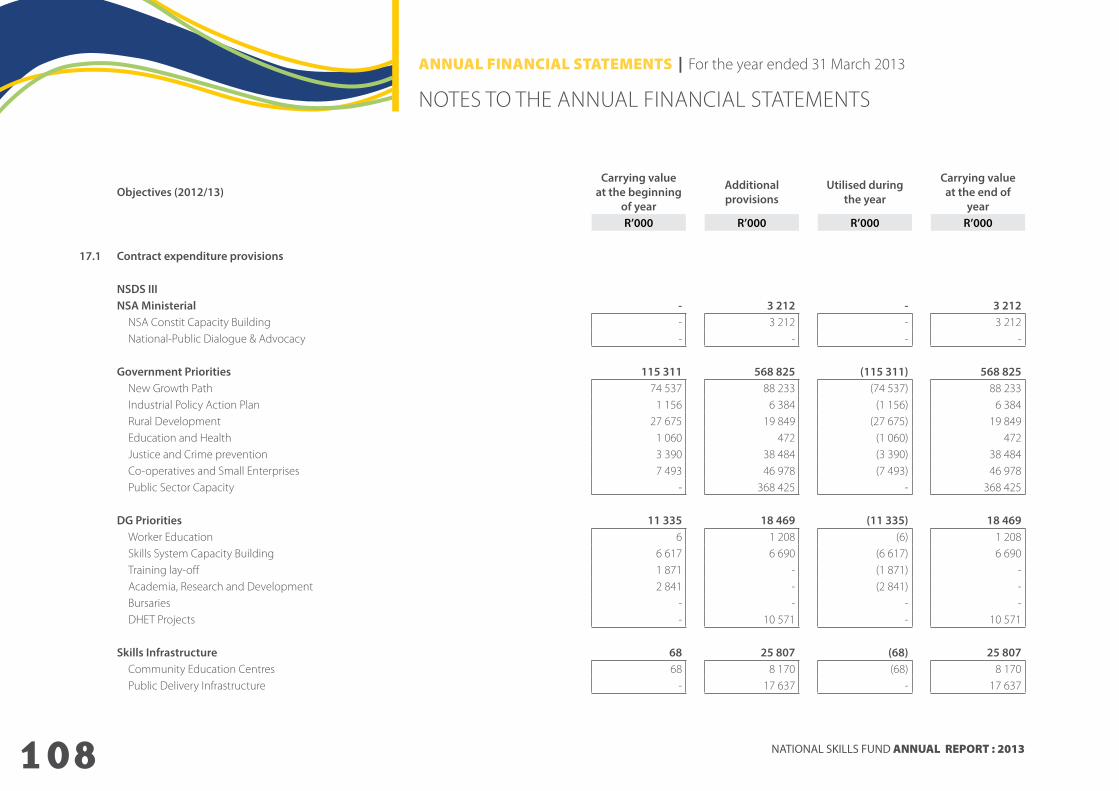
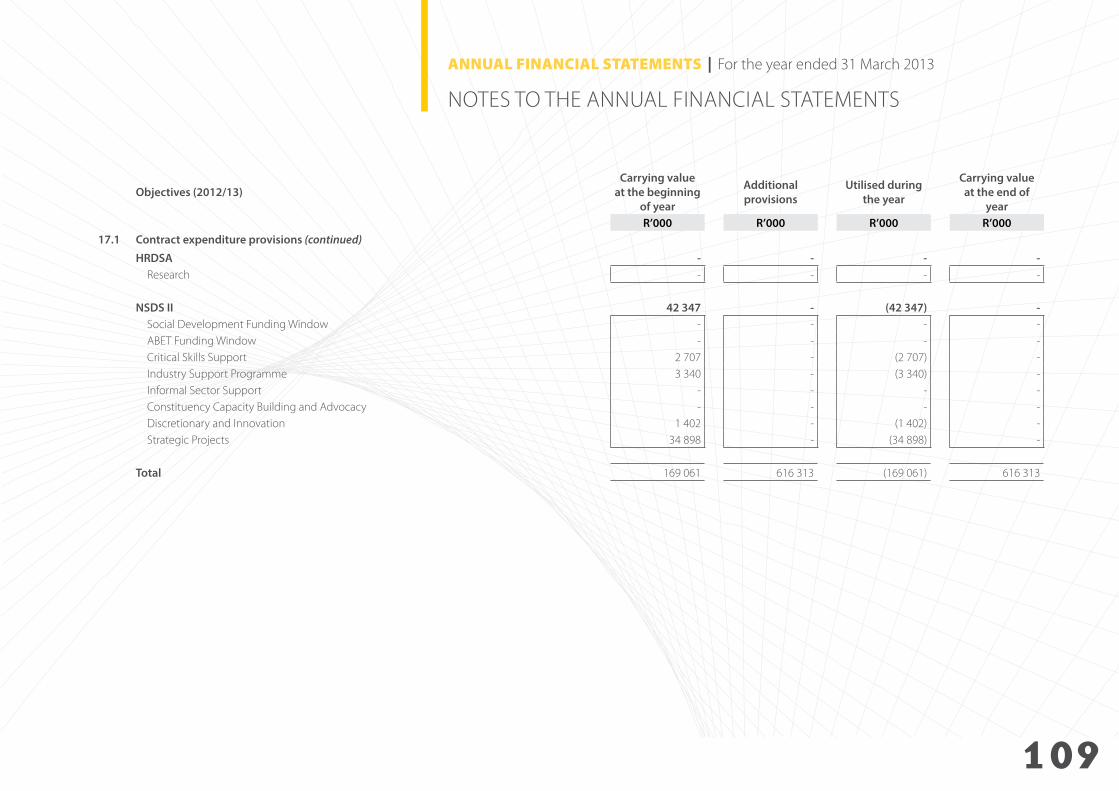
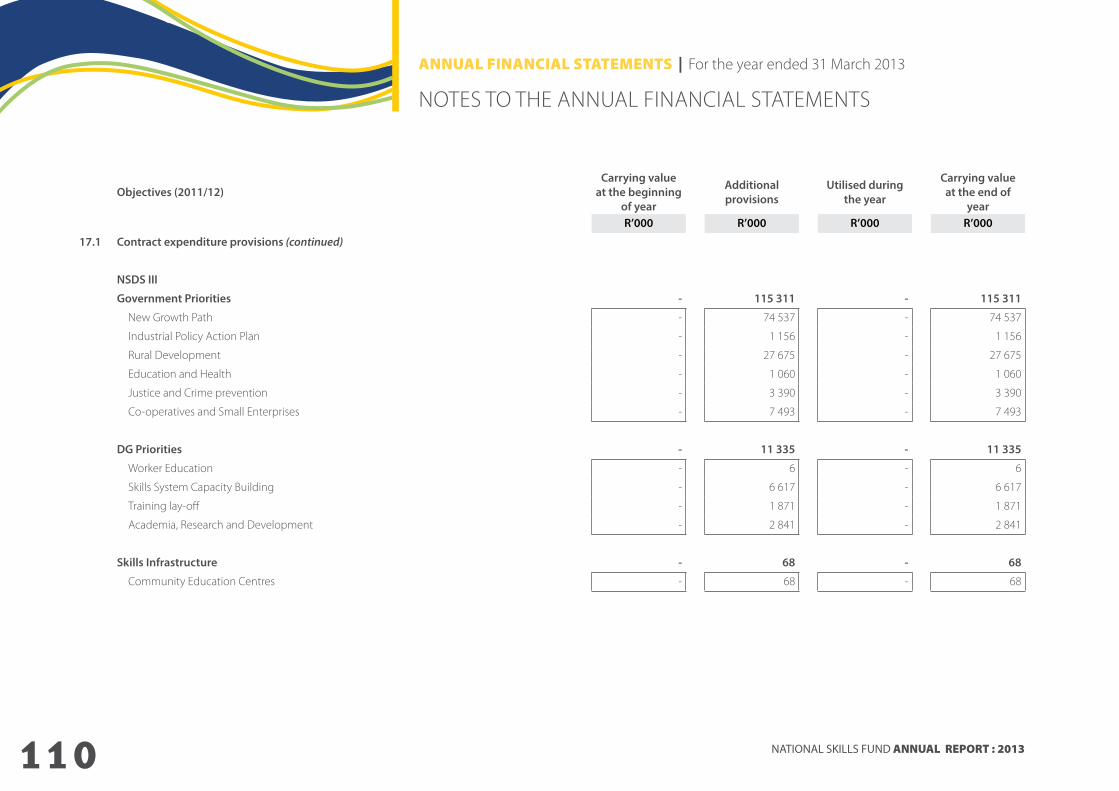
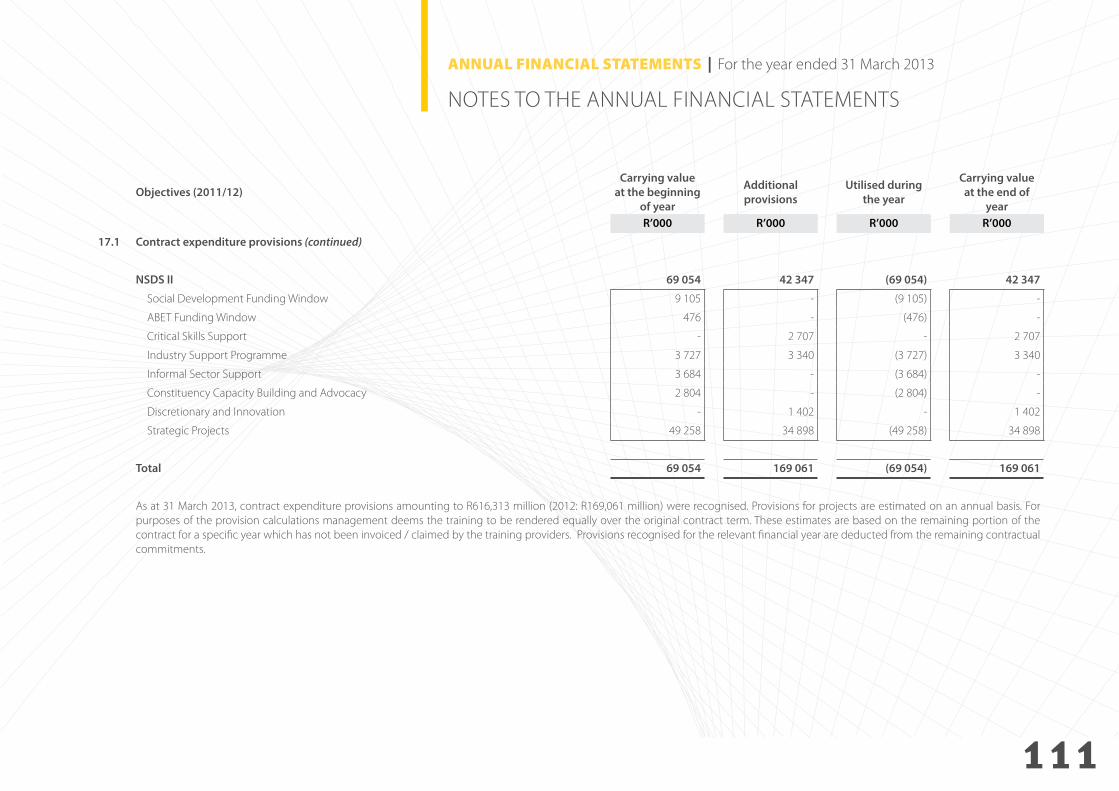
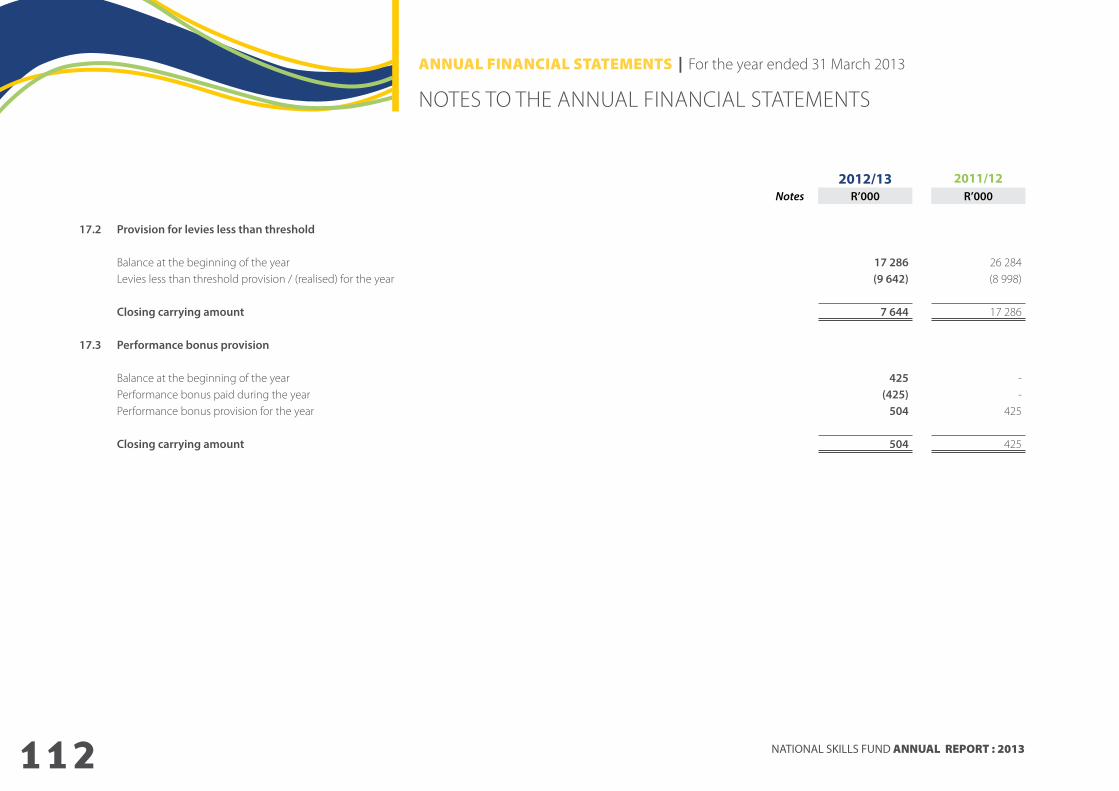
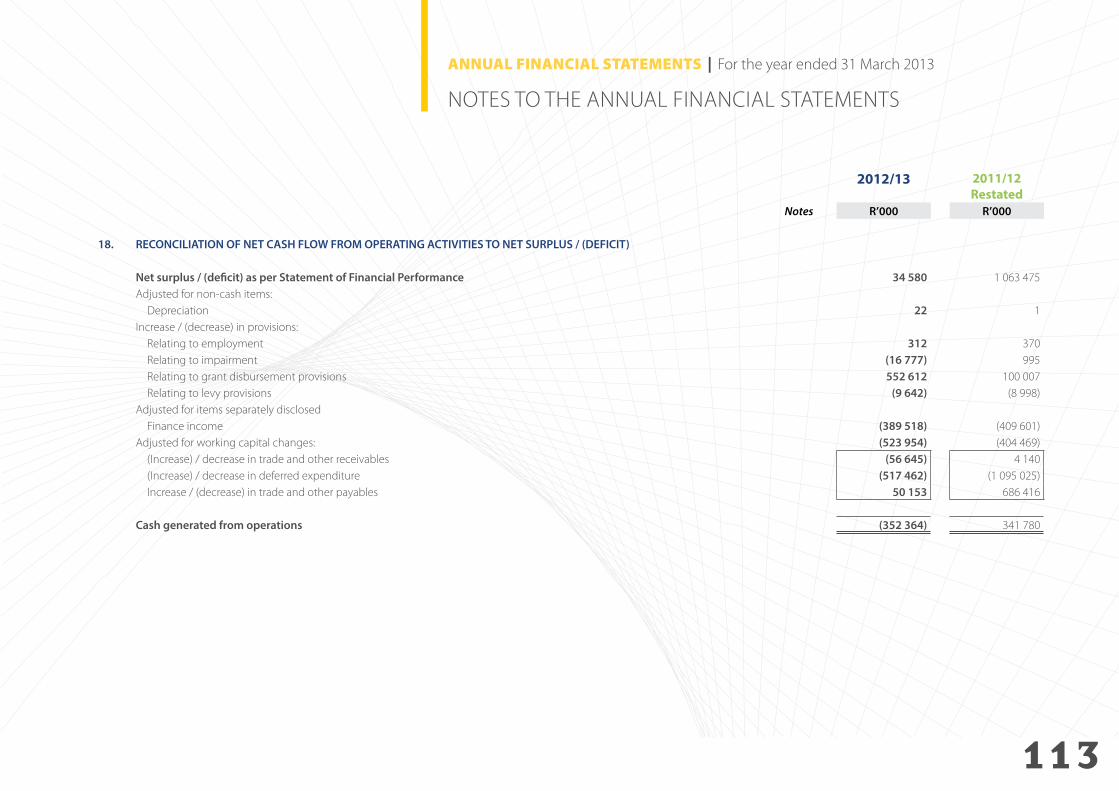
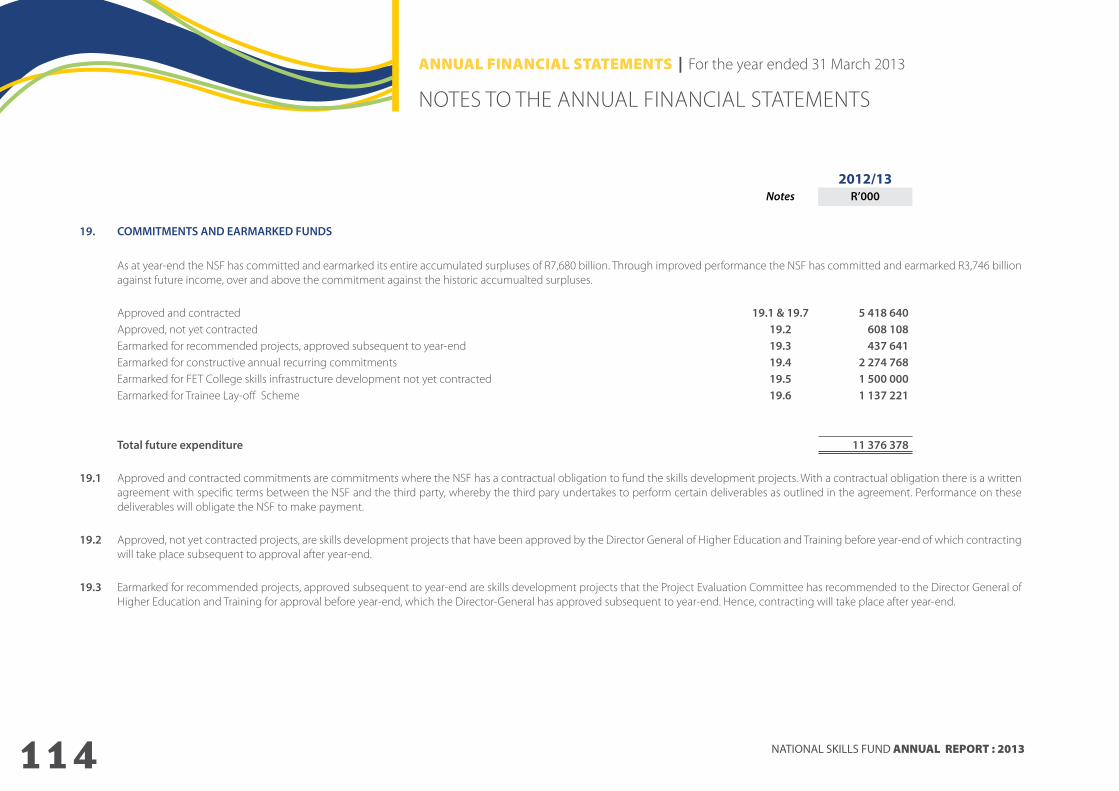

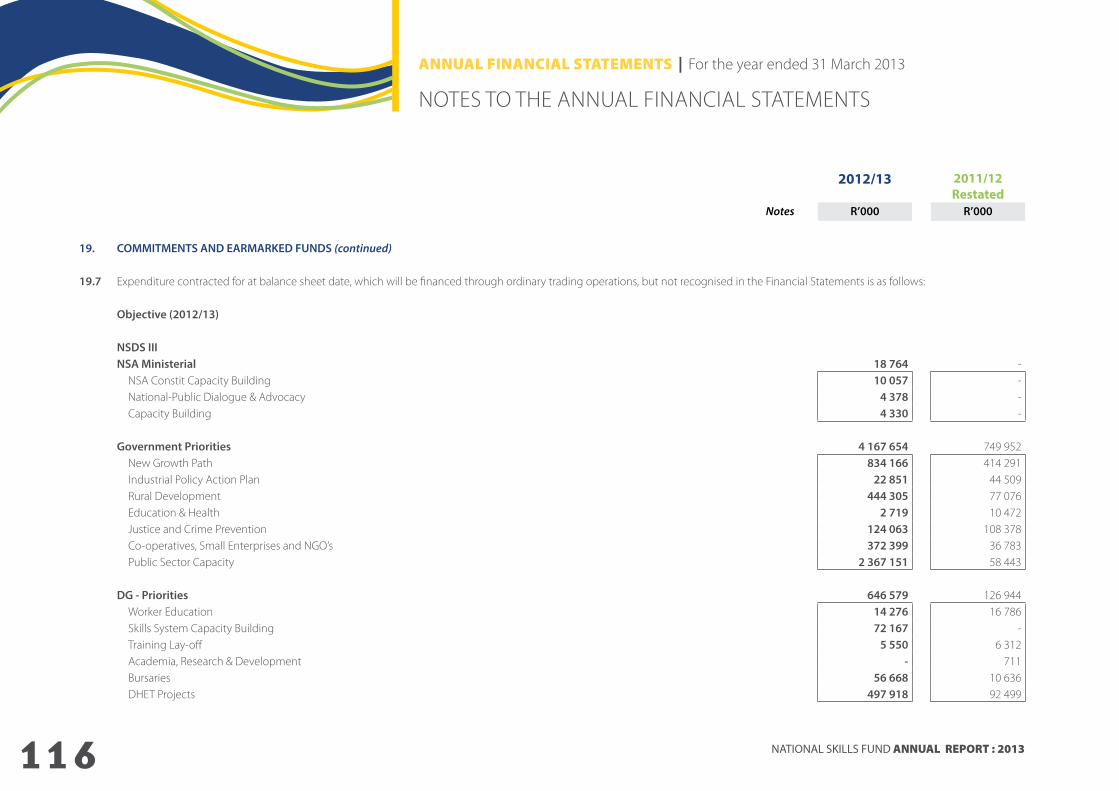
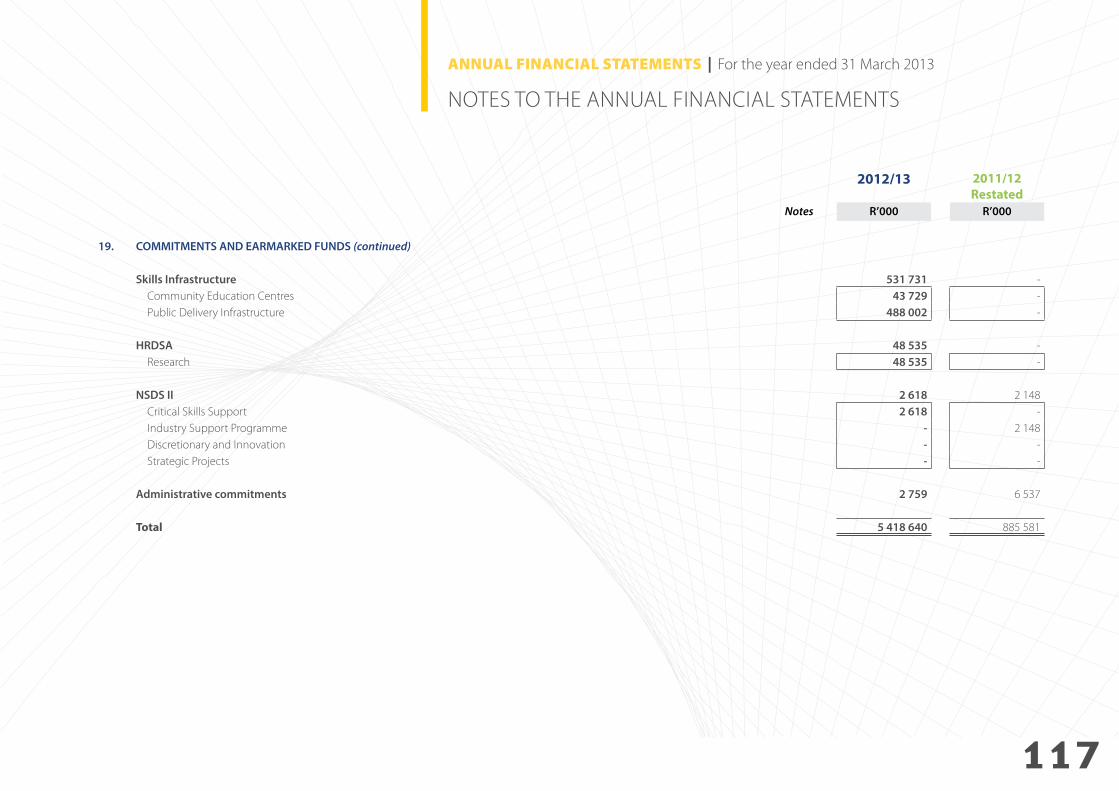
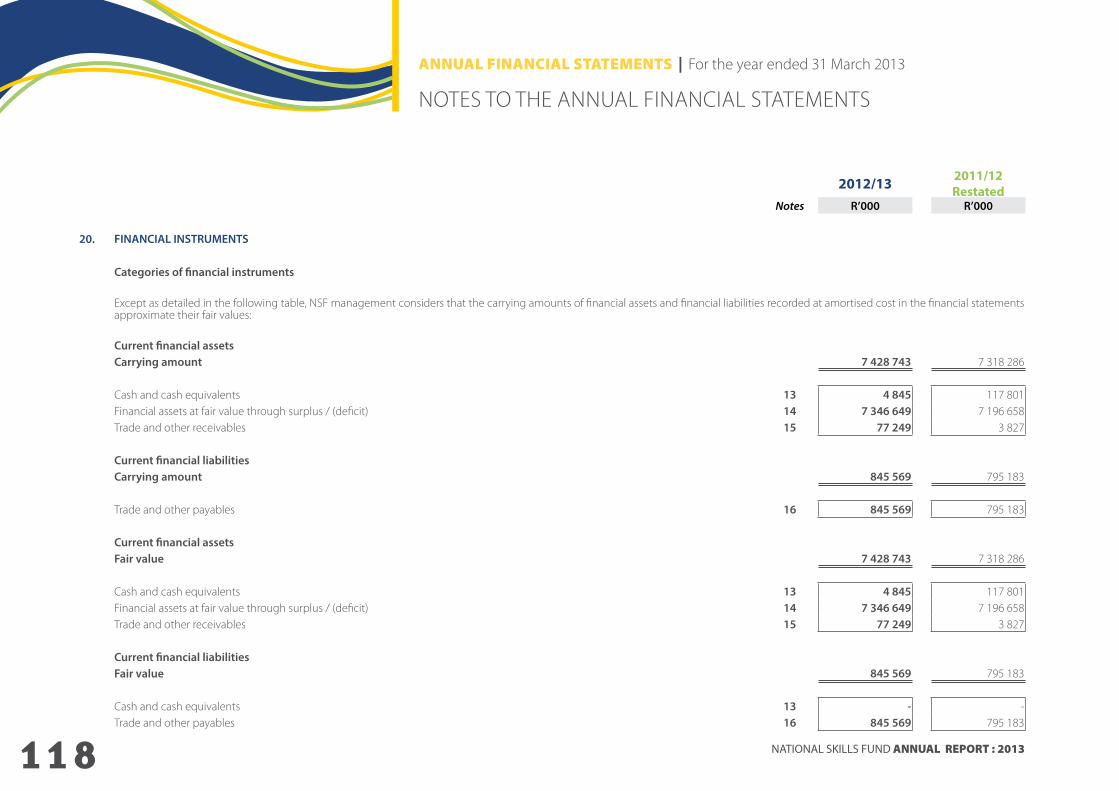


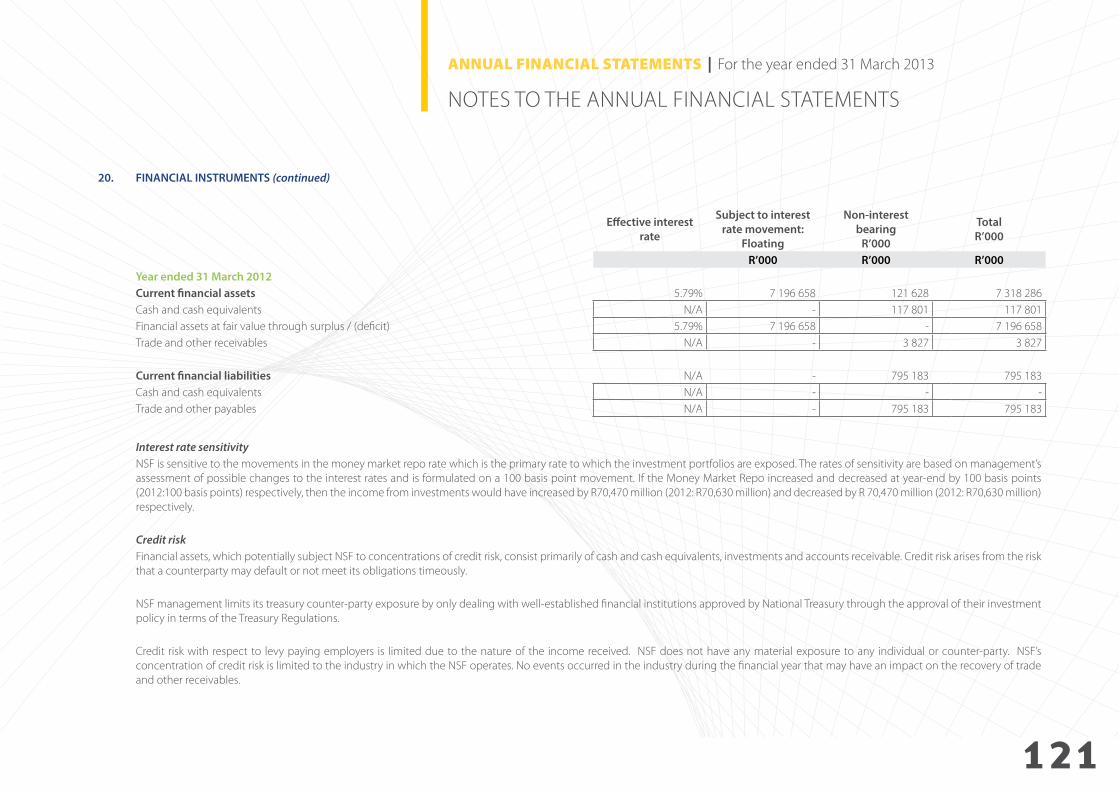
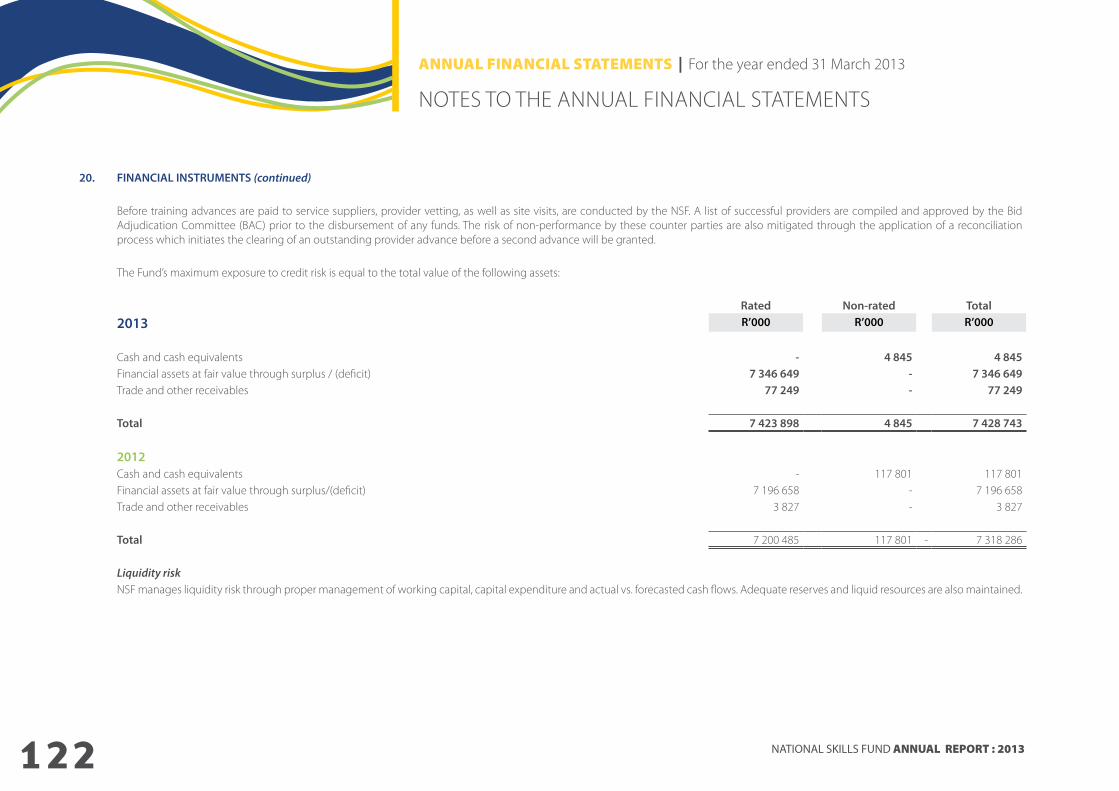
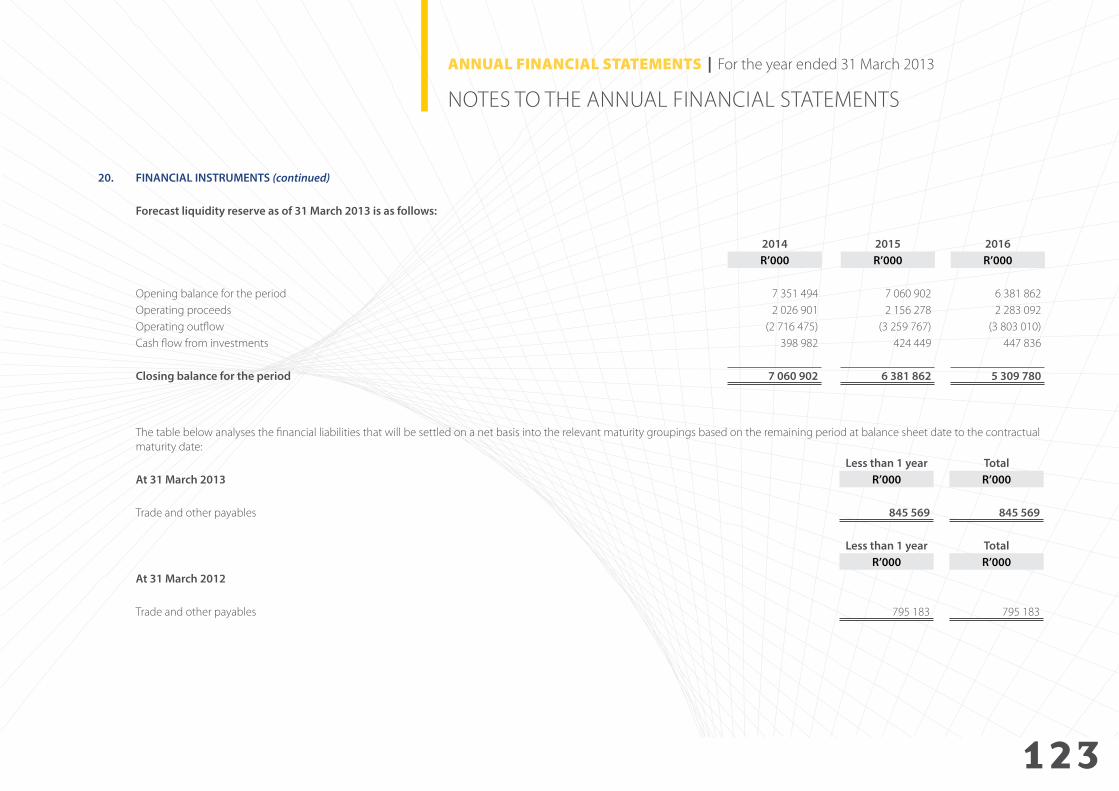
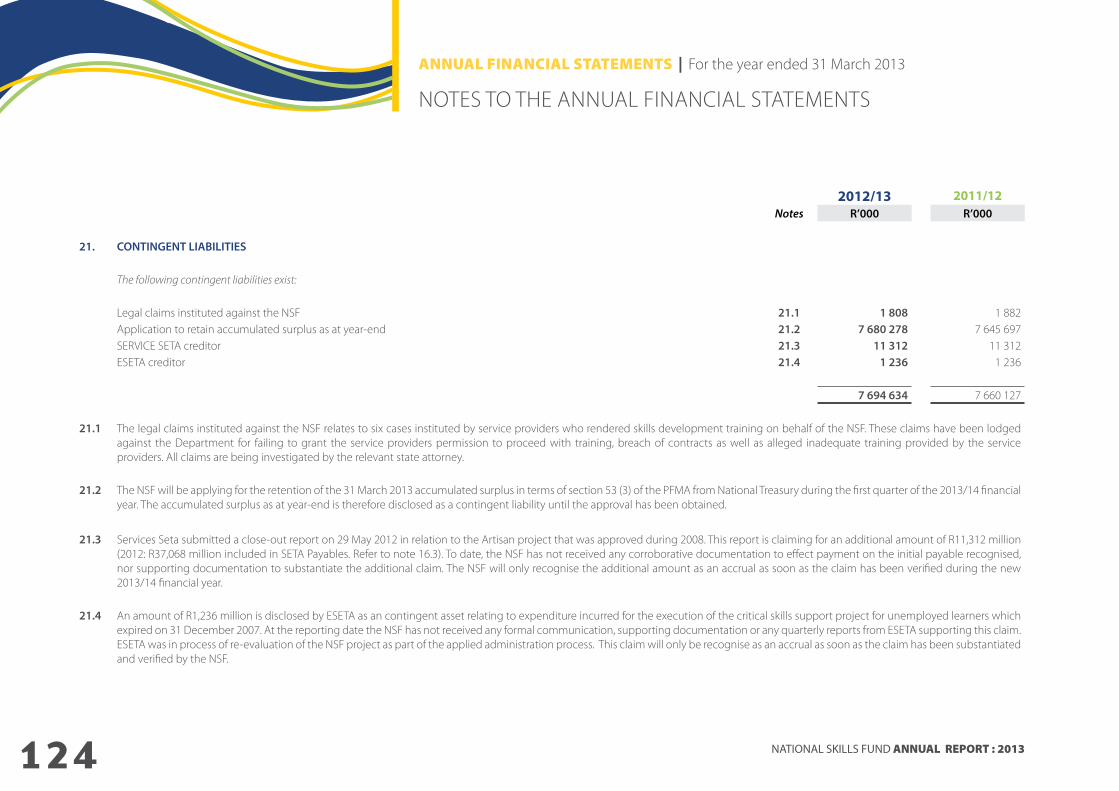

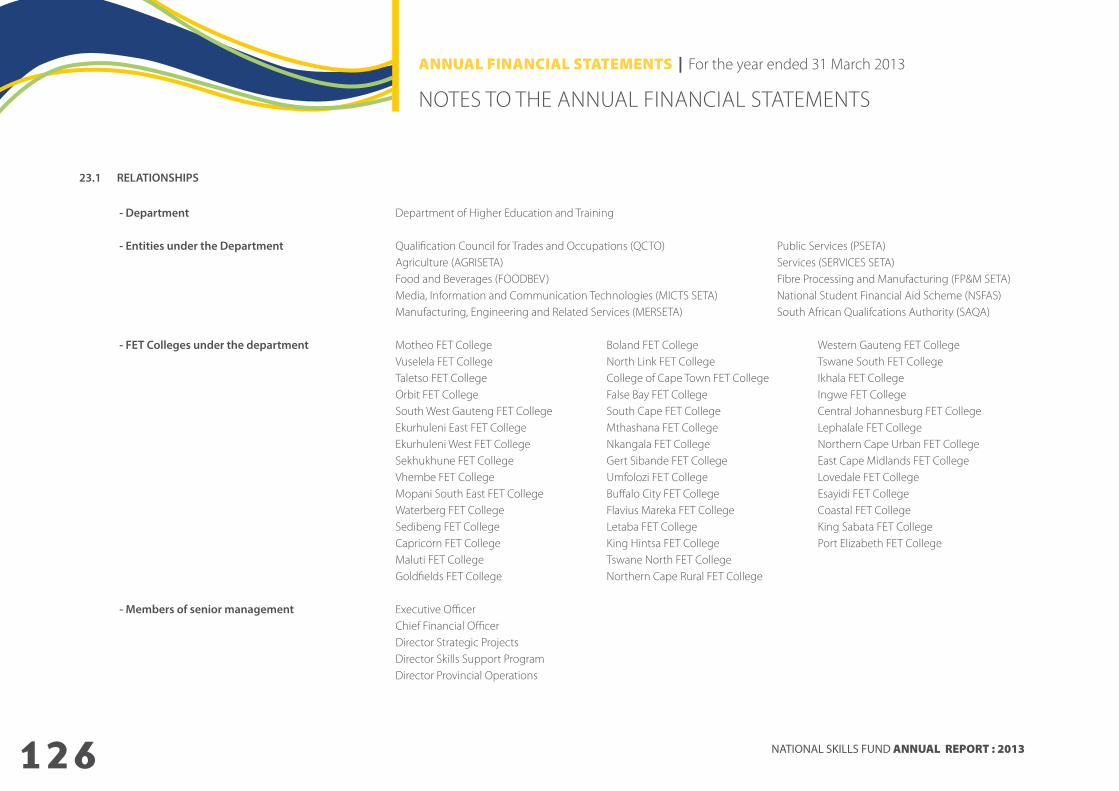
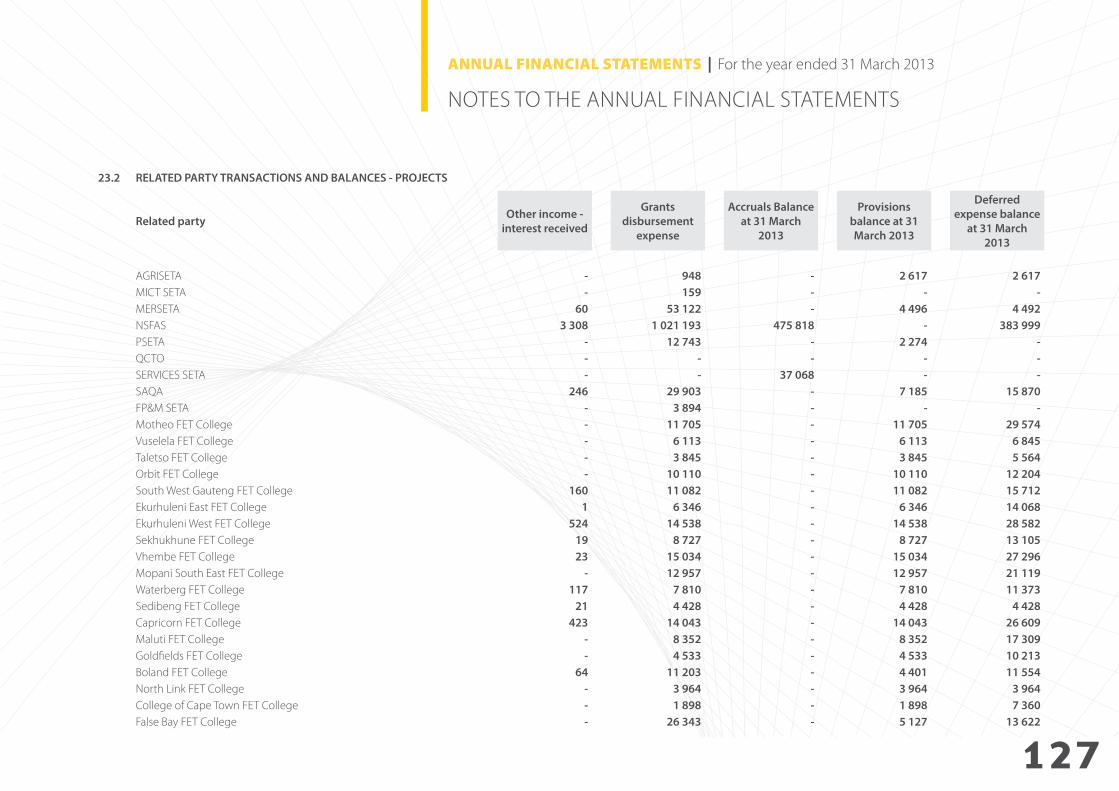
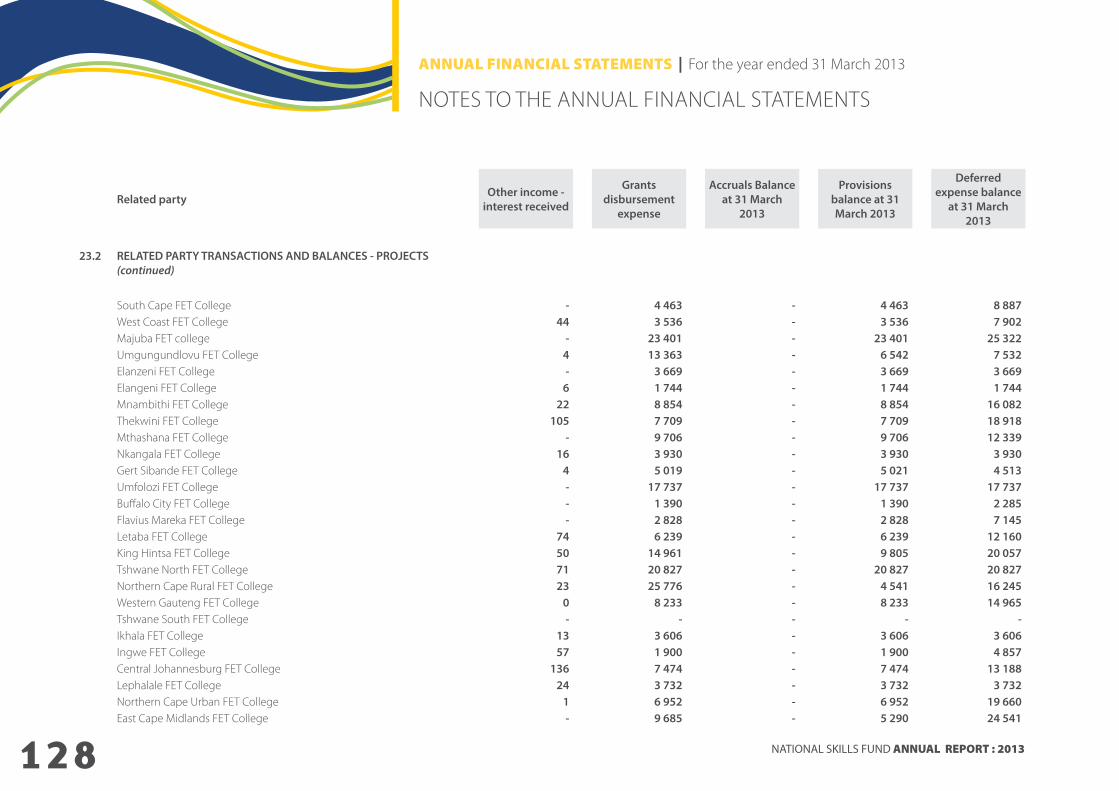
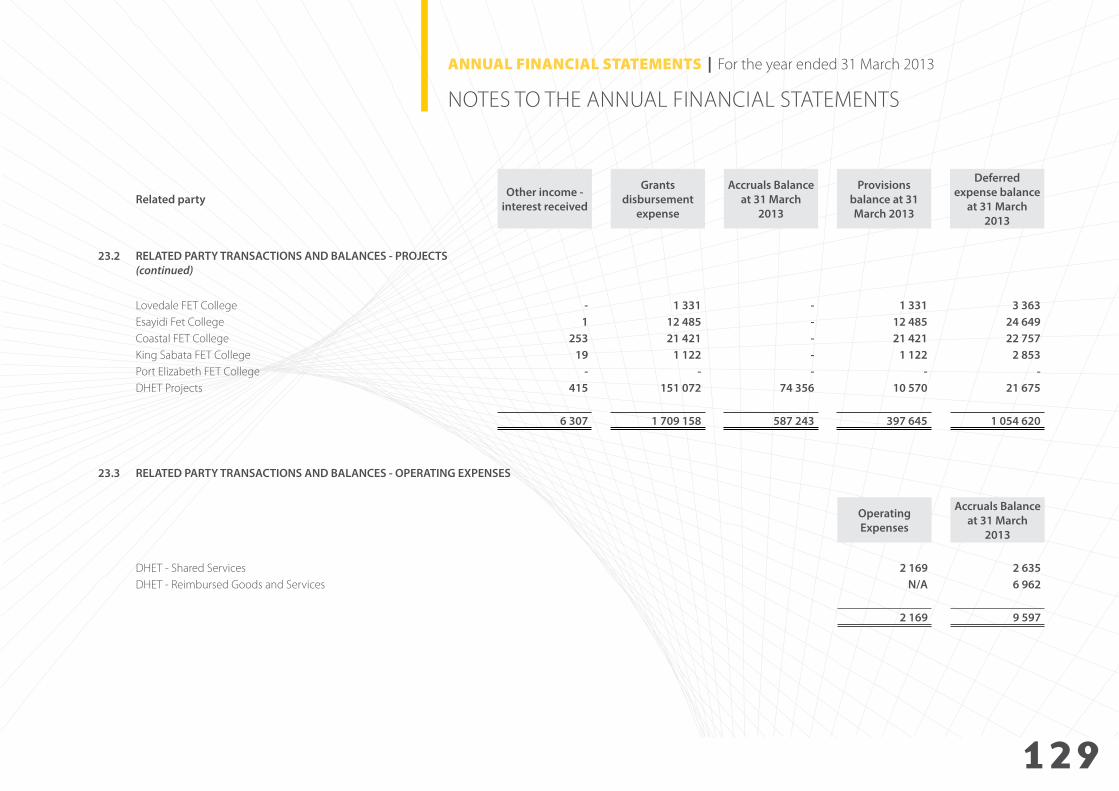
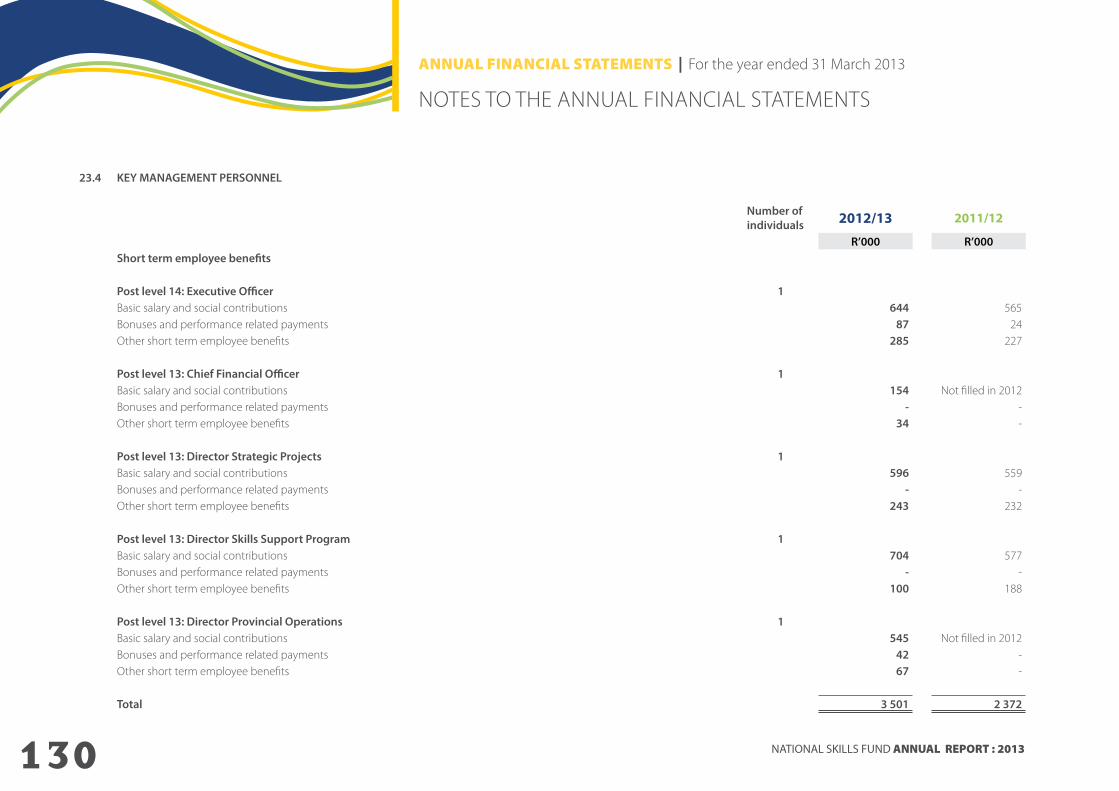

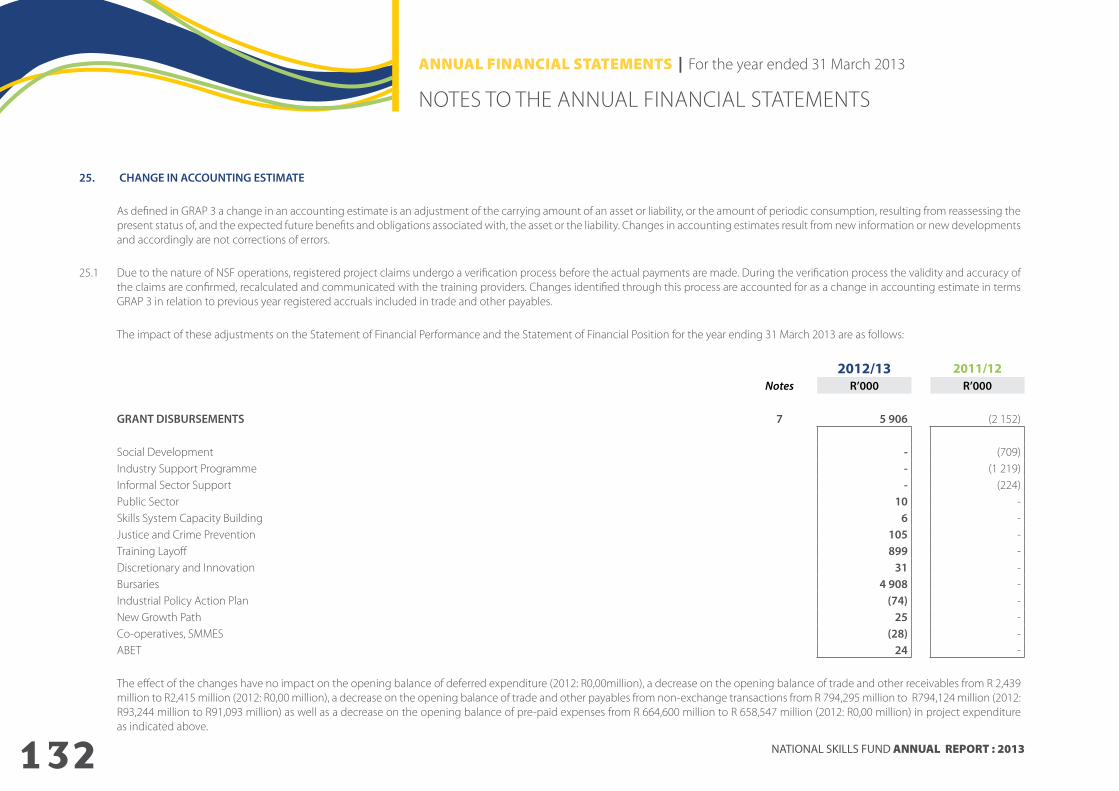
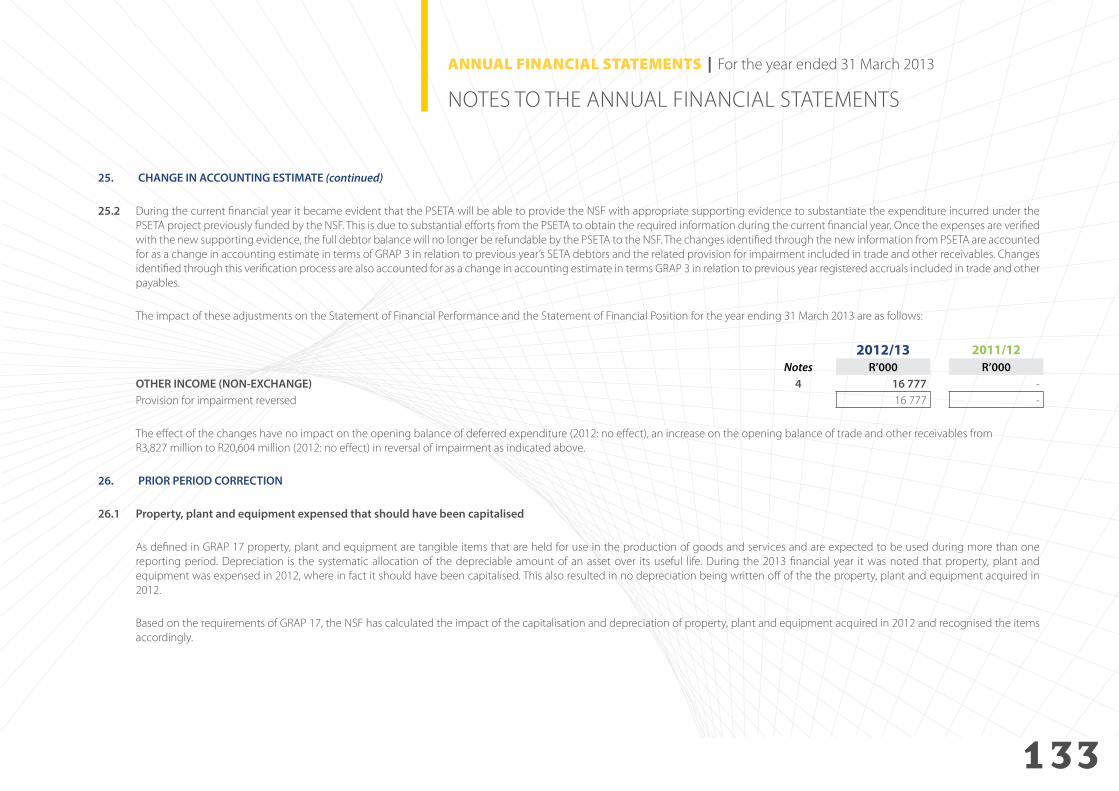
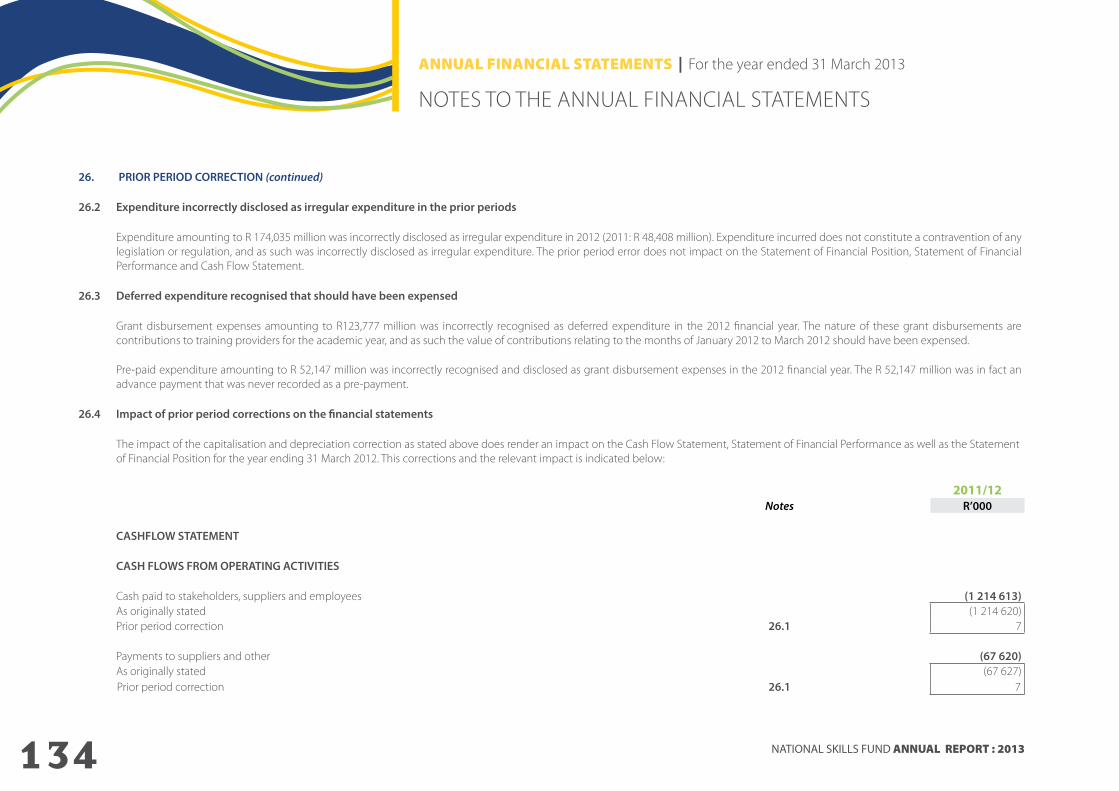
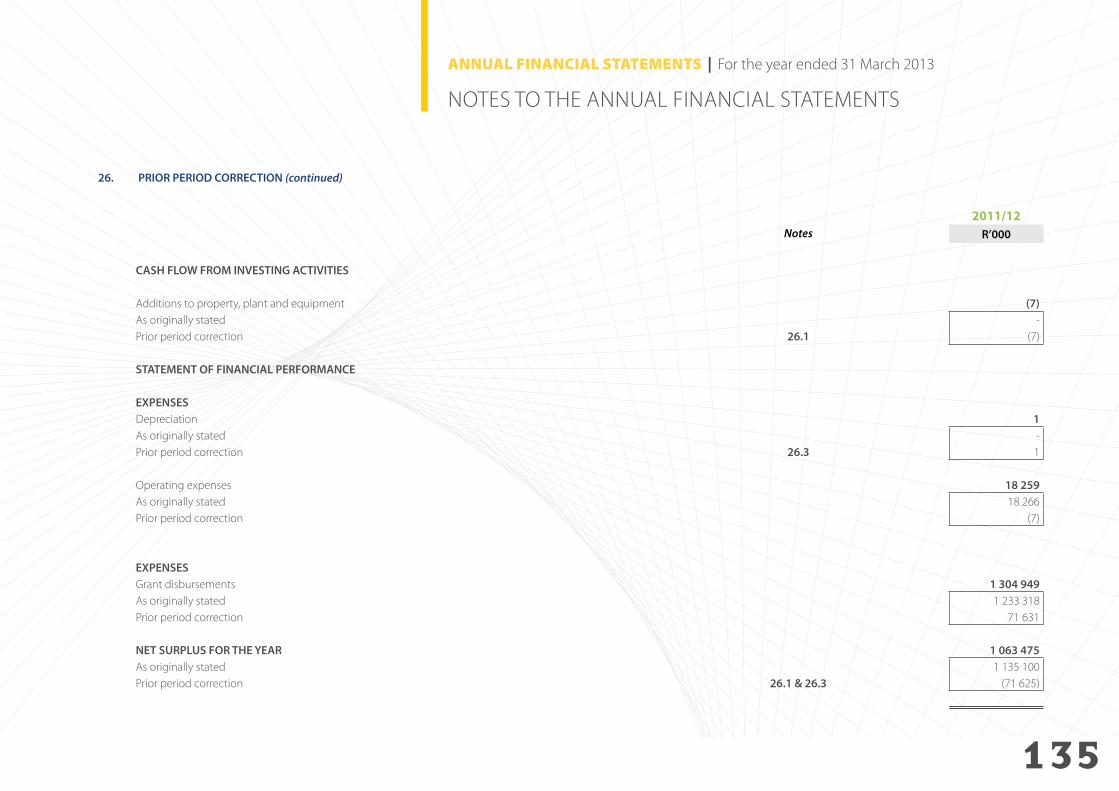
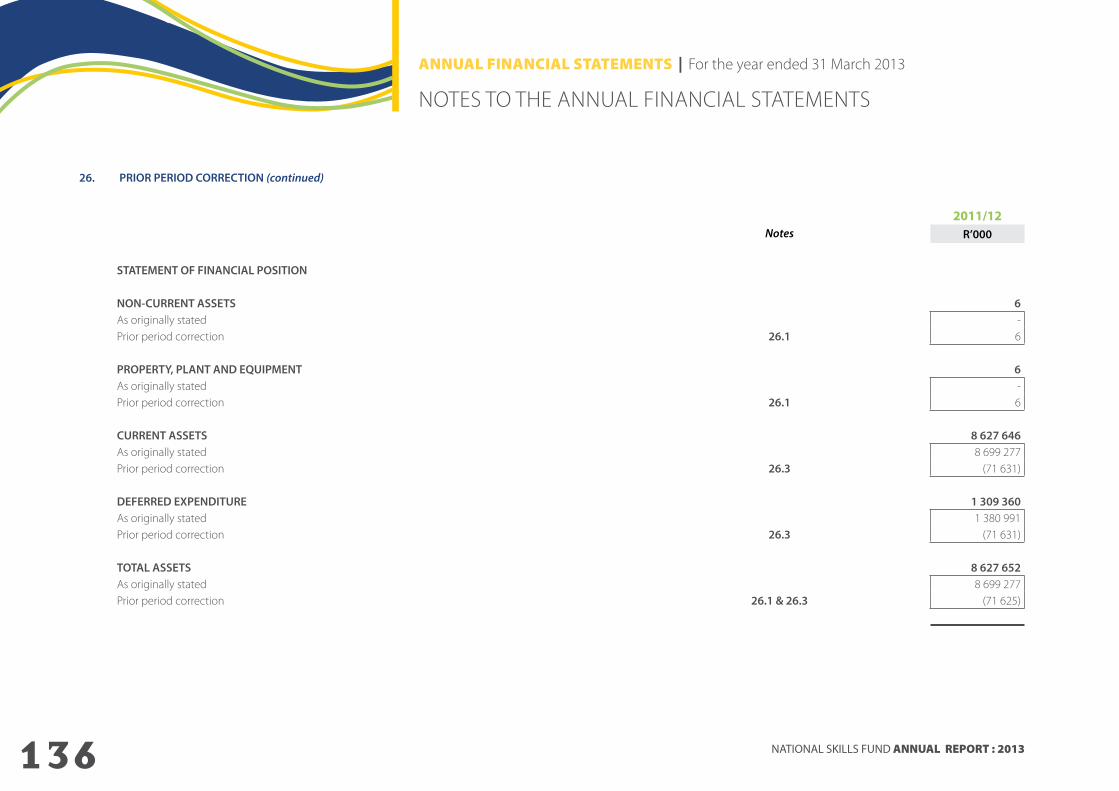
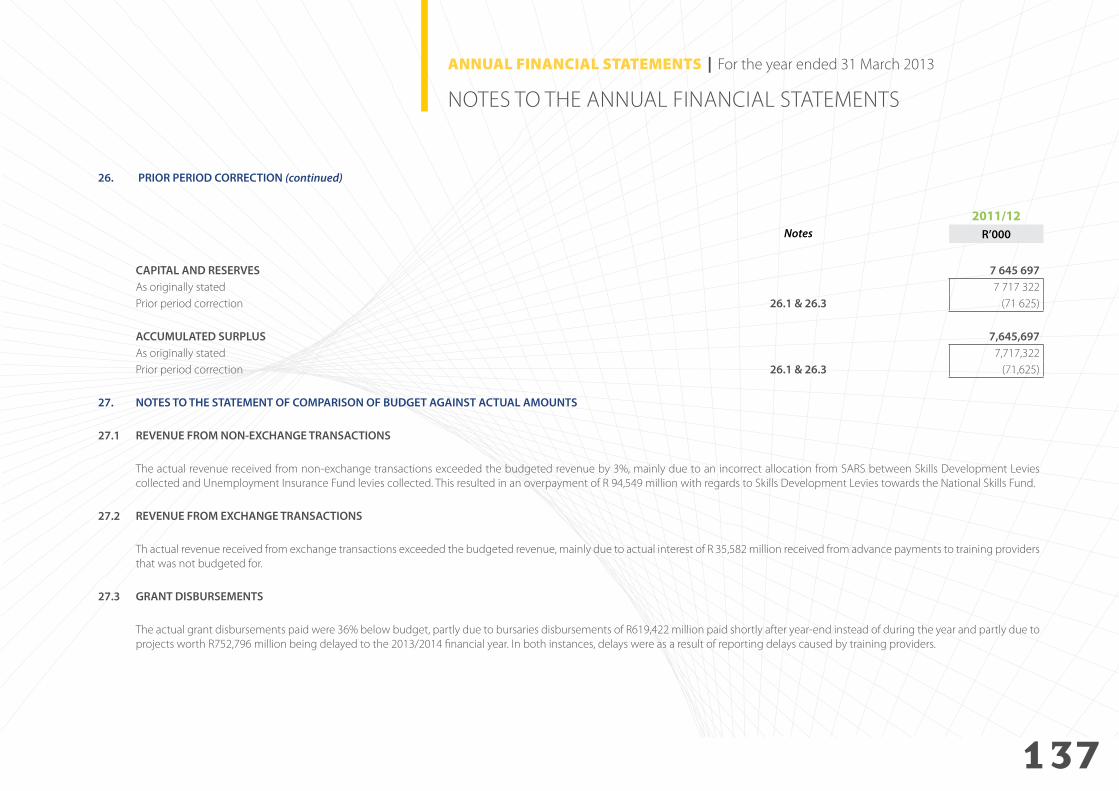


![[Annual Report] FY2010 Annual Report(FULL)](https://static.documents.pub/doc/80x56/58a19c0c1a28abf0428b88ed/annual-report-fy2010-annual-reportfull.jpg)


