Financial Section - 18 - INDEPENDENT AUDITORS’ REPORT Retirement Board Public Employee Retirement System of Idaho Boise, Idaho We have audited the accompanying basic financial statements of the Public Employee Retirement System of Idaho (the “System”), a component unit of the State of Idaho, as of June 30, 2006, and for the year then ended, listed in the foregoing table of contents. These basic financial statements are the responsibility of the System’s management. Our responsibility is to express an opinion on these basic financial statements based on our audit. The prior year summarized comparative information has been derived from the System’s 2005 financial statements and, in our report dated October 19, 2005, we expressed an unqualified opinion on those financial statements. We conducted our audit in accordance with auditing standards generally accepted in the United States of America and the standards applicable to financial audits contained in Government Auditing Standards issued by the Comptroller General of the United States. Those standards require that we plan and perform the audit to obtain reasonable assurance about whether the basic financial statements are free of material misstatement. An audit includes consideration of internal control over financial reporting as a basis for designing audit procedures that are appropriate in the circumstances, but not for the purpose of expressing an opinion on the effectiveness of the Systems’ internal control over financial reporting. Accordingly, we express no such opinion. An audit also includes examining, on a test basis, evidence supporting the amounts and disclosures in the basic financial statements, assessing the accounting principles used and significant estimates made by management, as well as evaluating the overall financial statement presentation. We believe that our audit provides a reasonable basis for our opinion. In our opinion, such basic financial statements present fairly, in all material respects, the plan net assets of the pension and other fund types of the System as of June 30, 2006, and the changes in plan net assets of the pension and other fund types for the year then ended, in conformity with accounting principles generally accepted in the United States of America. The Management’s Discussion and Analysis and required supplementary information listed in the Table of Contents are not a required part of the basic financial statements but are supplementary information required by the Governmental Accounting Standards Board. This supplementary information is the responsibility of the System’s management. We have applied certain limited procedures which consisted principally of inquiries of management regarding the methods of measurement and presentation of the required supplementary information. However, we did not audit the information and we do not express an opinion on it. Our audit was performed for the purpose of forming an opinion on the basic financial statements of the System taken as a whole. The additional supplementary schedules listed in the Table of Contents are presented for purposes of additional analysis and are not a required part of the basic financial statements of the System. The additional supplementary schedules are also the responsibility of the System’s management. Such additional information has been subjected to the auditing procedures Deloitte & Touche LLP Suite 1700 101 South Capitol Boulevard Boise, ID 83702-7717 USA Tel: +1 208 342 9361 Fax: +1 208 342 2199 www.deloitte.com
Transcript
Financial Section
- 18 -
INDEPENDENT AUDITORS’ REPORT
Retirement Board Public Employee Retirement System of Idaho Boise, Idaho
We have audited the accompanying basic financial statements of the Public Employee Retirement System of Idaho (the “System”), a component unit of the State of Idaho, as of June 30, 2006, and for the year then ended, listed in the foregoing table of contents. These basic financial statements are the responsibility of the System’s management. Our responsibility is to express an opinion on these basic financial statements based on our audit. The prior year summarized comparative information has been derived from the System’s 2005 financial statements and, in our report dated October 19, 2005, we expressed an unqualified opinion on those financial statements.
We conducted our audit in accordance with auditing standards generally accepted in the United States of America and the standards applicable to financial audits contained in Government Auditing Standards issued by the Comptroller General of the United States. Those standards require that we plan and perform the audit to obtain reasonable assurance about whether the basic financial statements are free of material misstatement. An audit includes consideration of internal control over financial reporting as a basis for designing audit procedures that are appropriate in the circumstances, but not for the purpose of expressing an opinion on the effectiveness of the Systems’ internal control over financial reporting. Accordingly, we express no such opinion. An audit also includes examining, on a test basis, evidence supporting the amounts and disclosures in the basic financial statements, assessing the accounting principles used and significant estimates made by management, as well as evaluating the overall financial statement presentation. We believe that our audit provides a reasonable basis for our opinion.
In our opinion, such basic financial statements present fairly, in all material respects, the plan net assets of the pension and other fund types of the System as of June 30, 2006, and the changes in plan net assets of the pension and other fund types for the year then ended, in conformity with accounting principles generally accepted in the United States of America.
The Management’s Discussion and Analysis and required supplementary information listed in the Table of Contents are not a required part of the basic financial statements but are supplementary information required by the Governmental Accounting Standards Board. This supplementary information is the responsibility of the System’s management. We have applied certain limited procedures which consisted principally of inquiries of management regarding the methods of measurement and presentation of the required supplementary information. However, we did not audit the information and we do not express an opinion on it.
Our audit was performed for the purpose of forming an opinion on the basic financial statements of the System taken as a whole. The additional supplementary schedules listed in the Table of Contents are presented for purposes of additional analysis and are not a required part of the basic financial statements of the System. The additional supplementary schedules are also the responsibility of the System’s management. Such additional information has been subjected to the auditing procedures
Deloitte & Touche LLP Suite 1700 101 South Capitol Boulevard Boise, ID 83702-7717 USA
applied in our audit of the basic financial statements and, in our opinion, is fairly stated in all material respects when considered in relation to the basic financial statements taken as a whole.
The Introductory Section, Investment Section, Actuarial Section, and Statistical Section listed in the Table of Contents are also presented for the purpose of additional analysis and are not a required part of the basic financial statements of the System. Such additional information has not been subjected to the auditing procedures applied in our audit of the basic financial statements and, accordingly, we express no opinion on it.
In accordance with Government Auditing Standards, we have also issued our report dated October 20, 2006, on our consideration of the System’s internal control over financial reporting and our tests of its compliance with certain provisions of laws, regulations, contracts, and other matters. The purpose of that report is to describe the scope of our testing of internal control over financial reporting and compliance and the results of that testing, and not to provide an opinion on the internal control over financial reporting or on compliance. That report is an integral part of an audit performed in accordance with Government Auditing Standards and should be considered in assessing the results of our audit
October 20, 2006
Financial Section
- 20 -
MANAGEMENT’S DISCUSSION AND ANALYSIS YEAR ENDED JUNE 30, 2006
Management is pleased to provide Management’s Discussion and Analysis (“MD&A”) of the financial activities of the Public Employee Retirement System of Idaho (the “System” or “PERSI”) as of and for the years ended June 30, 2006. This overview and analysis is designed to focus on current known facts and activities and resulting changes. We encourage readers to consider the information presented here in conjunction with information furnished in the Letter of Transmittal, beginning on page 18 of this report.
The System administers six fiduciary funds. These consist of two defined benefit pension trust funds -- the PERSI Base Plan and the Firefighters’ Retirement Fund (“FRF”) -- two defined contribution pension trust funds -- the PERSI Choice Plan 414(k) and 401(k) -- and two Sick Leave Insurance Reserve trust funds -- State and Schools.
Financial Highlights
• Plan net assets for all pension and other funds administered by the System increased $1 billion and $862 million during the fiscal years 2006 and 2005, respectively. The increase in the defined benefit plans was primarily due to the continuation of favorable investment markets. The increase in the Choice Plan 401(k) was due to new contributions in addition to market gains. Each fund experienced an increase in net assets.
2006 2005
PERSI Base Plan 968,875,308$ 788,494,640$ Firefighters’ Retirement Fund 21,543,068 16,814,037 PERSI Choice Plan 414(k) 4,230,900 3,055,242 PERSI Choice Plan 401(k) 42,642,552 35,176,225 Sick Leave Insurance Reserve Fund - State 6,096,669 7,058,583 Sick Leave Insurance Reserve Fund - Schools 9,614,199 11,455,707
Total increase in plan net assets 1,053,002,696$ 862,054,434$
• Assets for the two defined benefit plans, the PERSI Base Plan and the FRF, are pooled for investment purposes. For the fiscal years ended June 30, 2006 and 2005, the rate of return net of investment expenses on the pooled investment assets was as follows (these are plan-level returns). For the defined contribution plans, PERSI Choice Plan 414(k) and 401(k), individual participant returns may vary depending on the investment choices.
2006 2005
PERSI Defined Benefit Plans 11.8% 10.3%PERSI Defined Contribution Plans 11.1% 9.3%Sick Leave Insurance Reserve Fund 4.9% 7.1%
Financial Section
- 21 -
• All of the plans experienced gains as a result of positive market performance. Net investment
income for all of the funds administered by the System for the fiscal years ended June 30, 2006 and 2005, was $1 billion and $819 million, respectively.
2006 2005Net investment income: PERSI Base Plan 969,385,175$ 769,968,881$ Firefighters’ Retirement Fund 26,225,243 21,267,341 PERSI Choice Plan 414(k) 6,715,343 5,519,836 PERSI Choice Plan 401(k) 15,760,870 9,629,286 Sick Leave Insurance Reserve Fund - State 3,512,674 4,930,676 Sick Leave Insurance Reserve Fund - Schools 5,792,037 8,159,124
Total net investment income 1,027,391,342$ 819,475,144$
• As of June 30, 2006 and 2005, the funding ratio (actuarial value of assets divided by actuarial accrued liability) and amortization period (estimated time to payoff unfunded liability) for the unfunded actuarial liability for each of the defined benefit plans were:
2006 Amortization 2005 AmortizationFunding Ratio Period Funding Ratio Period
PERSI Base Plan 95.2% 9.8 years 94.2% 6.2 yearsFirefighters’ Retirement Fund 79.7% 6.5 years 73.5% 9.0 years
For the PERSI Base Plan and the FRF in 2005, contributions and other income of $393.7 million exceeded deductions to net assets of $379.6 million by $14.1 million. However, in 2006, contributions and other income of $417.4 million were exceeded by deductions to net assets of $422.6 by $5.2 million. These changes, combined with investment gains of $995.6 million in 2006 and $791.2 million in 2005, resulted in net assets of the defined benefit plans increasing to $9.4 and $8.5 billion in 2006 and 2005, respectively. For actuarial calculations, the System’s actuary uses market value to determine the actuarial value of assets. For the July 1, 2006 and 2005 valuations, the actuarial value of assets for the PERSI Base Plan was $9.2 billion and $8.2 billion, respectively. The aggregate actuarial liability for all PERSI Base Plan employers was $9.6 billion on July 1, 2006. On an actuarial basis, the assets held as of July 1, 2006, fund 95.2% of this liability.
The System’s funding objective is to meet long-term benefit obligations through contributions and investment income and provide a reserve against market fluctuations. The funding ratio listed above gives an indication of how well this objective has been met at a specific point in time. The higher the funding ratio, the better the plan is funded. For more detailed information and history of the funding ratio, see the Schedule of Funding Progress on page 47 of this report. The actuarial funding ratio for the two defined benefit plans improved primarily because investment performance was above the actuarial expected rate. However, the amortization period for the PERSI Base Plan also increased due to the removal of the future contribution rate increases from the actuarial calculations. The PERSI Board initiated a systematic increase in the employee and employer contribution rates beginning July 1, 2004, to provide a stable funding base and to bring the amortization period below the statutorily required 25-year period for the Base Plan. Because of improving investment markets, the amortization period of the unfunded liability has increased which allowed the PERSI Board to postpone, for a second year, the second of three scheduled rate increases.
Using the Annual Financial Report
This discussion and analysis is intended to serve as an introduction to the System’s financial statements. The financial section is comprised of four components: (1) fund financial statements, (2) notes to financial statements, (3) required supplementary information, and (4) other supplementary schedules.
Financial Section
- 22 -
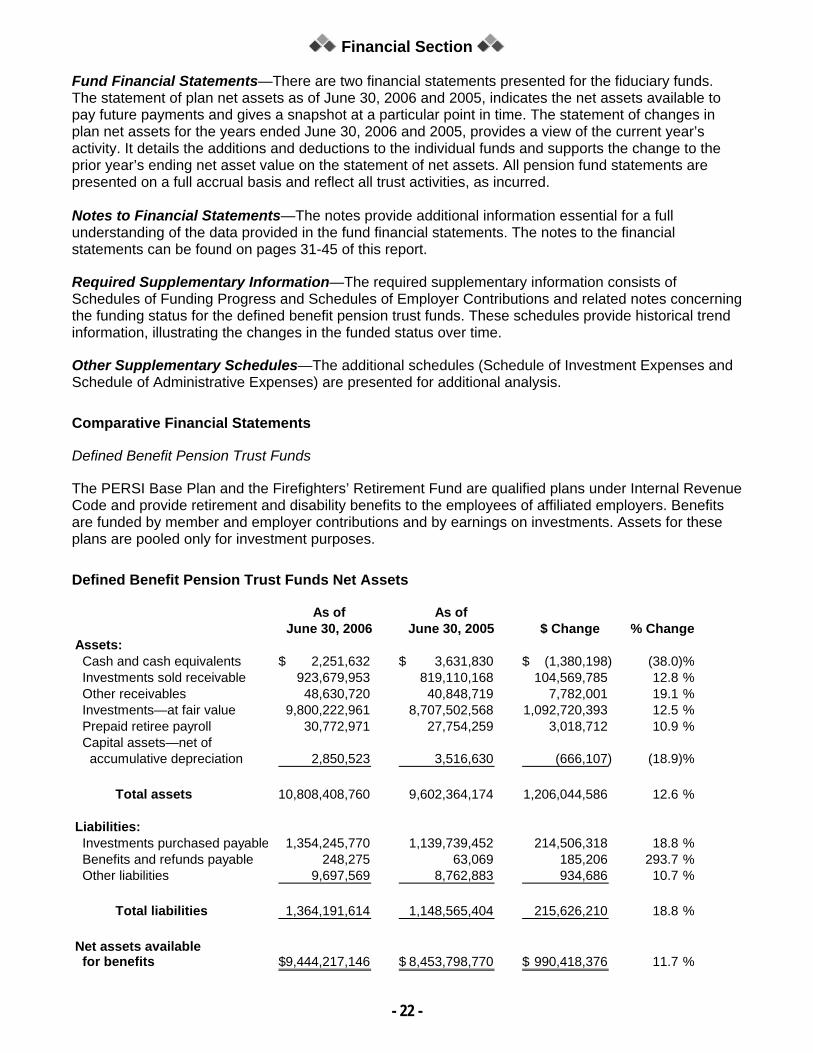
Fund Financial Statements—There are two financial statements presented for the fiduciary funds. The statement of plan net assets as of June 30, 2006 and 2005, indicates the net assets available to pay future payments and gives a snapshot at a particular point in time. The statement of changes in plan net assets for the years ended June 30, 2006 and 2005, provides a view of the current year’s activity. It details the additions and deductions to the individual funds and supports the change to the prior year’s ending net asset value on the statement of net assets. All pension fund statements are presented on a full accrual basis and reflect all trust activities, as incurred. Notes to Financial Statements—The notes provide additional information essential for a full understanding of the data provided in the fund financial statements. The notes to the financial statements can be found on pages 31-45 of this report.
Required Supplementary Information—The required supplementary information consists of Schedules of Funding Progress and Schedules of Employer Contributions and related notes concerning the funding status for the defined benefit pension trust funds. These schedules provide historical trend information, illustrating the changes in the funded status over time.
Other Supplementary Schedules—The additional schedules (Schedule of Investment Expenses and Schedule of Administrative Expenses) are presented for additional analysis.
Comparative Financial Statements
Defined Benefit Pension Trust Funds
The PERSI Base Plan and the Firefighters’ Retirement Fund are qualified plans under Internal Revenue Code and provide retirement and disability benefits to the employees of affiliated employers. Benefits are funded by member and employer contributions and by earnings on investments. Assets for these plans are pooled only for investment purposes.
Defined Benefit Pension Trust Funds Net Assets
As of As ofJune 30, 2006 June 30, 2005 $ Change % Change
Assets: Cash and cash equivalents 2,251,632$ 3,631,830$ (1,380,198)$ (38.0)% Investments sold receivable 923,679,953 819,110,168 104,569,785 12.8 % Other receivables 48,630,720 40,848,719 7,782,001 19.1 % Investments—at fair value 9,800,222,961 8,707,502,568 1,092,720,393 12.5 % Prepaid retiree payroll 30,772,971 27,754,259 3,018,712 10.9 % Capital assets—net of accumulative depreciation 2,850,523 3,516,630 (666,107) (18.9)%
Total assets 10,808,408,760 9,602,364,174 1,206,044,586 12.6 %
Total liabilities 1,364,191,614 1,148,565,404 215,626,210 18.8 %
Net assets available for benefits 9,444,217,146$ 8,453,798,770$ 990,418,376$ 11.7 %
Financial Section
- 23 -
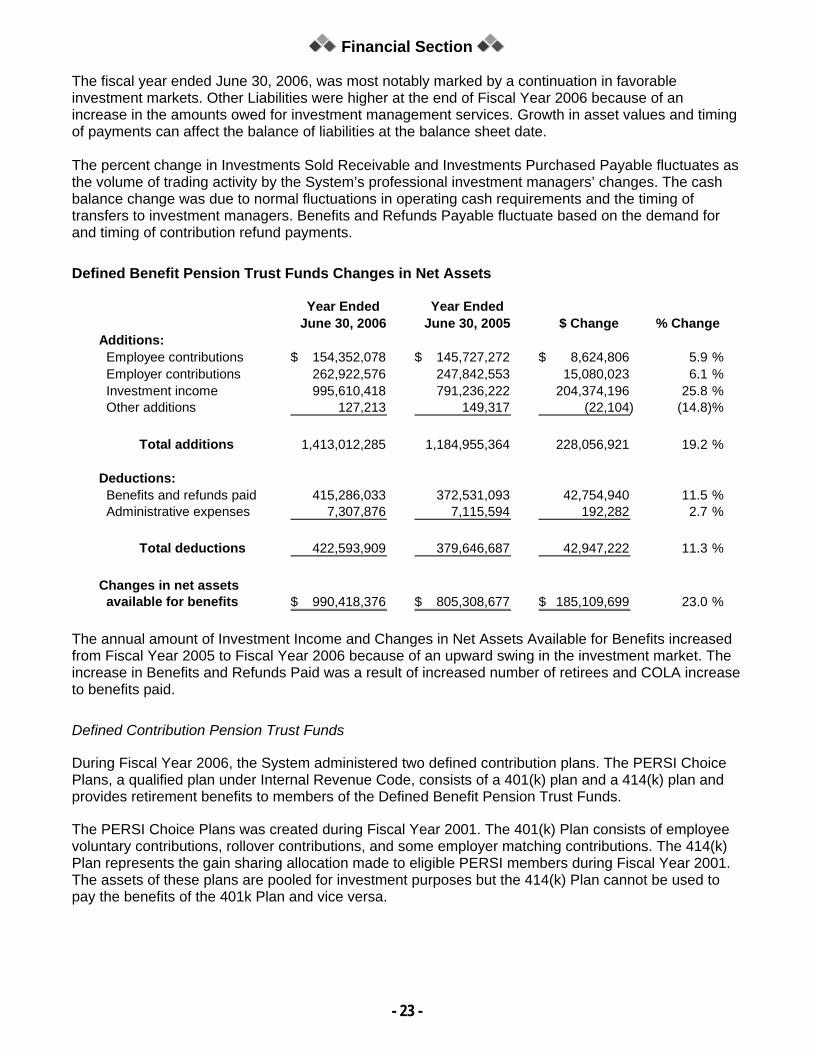
The fiscal year ended June 30, 2006, was most notably marked by a continuation in favorable investment markets. Other Liabilities were higher at the end of Fiscal Year 2006 because of an increase in the amounts owed for investment management services. Growth in asset values and timing of payments can affect the balance of liabilities at the balance sheet date. The percent change in Investments Sold Receivable and Investments Purchased Payable fluctuates as the volume of trading activity by the System’s professional investment managers’ changes. The cash balance change was due to normal fluctuations in operating cash requirements and the timing of transfers to investment managers. Benefits and Refunds Payable fluctuate based on the demand for and timing of contribution refund payments.
Defined Benefit Pension Trust Funds Changes in Net Assets
Year Ended Year EndedJune 30, 2006 June 30, 2005 $ Change % Change
Total deductions 422,593,909 379,646,687 42,947,222 11.3 %
Changes in net assets available for benefits 990,418,376$ 805,308,677$ 185,109,699$ 23.0 %
The annual amount of Investment Income and Changes in Net Assets Available for Benefits increased from Fiscal Year 2005 to Fiscal Year 2006 because of an upward swing in the investment market. The increase in Benefits and Refunds Paid was a result of increased number of retirees and COLA increase to benefits paid.
Defined Contribution Pension Trust Funds
During Fiscal Year 2006, the System administered two defined contribution plans. The PERSI Choice Plans, a qualified plan under Internal Revenue Code, consists of a 401(k) plan and a 414(k) plan and provides retirement benefits to members of the Defined Benefit Pension Trust Funds.
The PERSI Choice Plans was created during Fiscal Year 2001. The 401(k) Plan consists of employee voluntary contributions, rollover contributions, and some employer matching contributions. The 414(k) Plan represents the gain sharing allocation made to eligible PERSI members during Fiscal Year 2001. The assets of these plans are pooled for investment purposes but the 414(k) Plan cannot be used to pay the benefits of the 401k Plan and vice versa.
Financial Section
- 24 -
Defined Contribution Pension Trust Funds Net Assets
As of As ofJune 30, 2006 June 30, 2005 $ Change % Change
Total assets 224,750,826 177,877,374 46,873,452 26.4 %
Net assets available for benefits 224,750,826$ 177,877,374$ 46,873,452$ 26.4 %
Investments increased from Fiscal Year 2005 to Fiscal Year 2006 because of the increase in employee contributions and the continued favorable investment market. Receivables include contributions that are not yet recorded by the recordkeeper at year end and accrued interest and dividends.
Defined Contribution Pension Trust Funds Changes in Net Assets
Year Ended Year EndedJune 30, 2006 June 30, 2005 $ Change % Change
Total additions 54,877,748 45,092,596 9,785,152 21.7 %
Deductions: Benefits and refunds paid 3,963,574 3,403,187 560,387 16.5 % Transfers out 4,040,722 3,457,942 582,780 16.9 %
Total deductions 8,004,296 6,861,129 1,143,167 16.7 %
Changes in net assets available for benefits 46,873,452$ 38,231,467$ 8,641,985$ 22.6 %
Investment Income increased from Fiscal Year 2005 to Fiscal Year 2006 because of an upward swing in the investment market. Transfers In and Out only include rollovers from/to other plans. In Fiscal Year 2005, a large portion of the Transfers In was the result of a defined contribution plan transfer into the PERSI Choice Plans for Bonner County. Employee Contributions grew due to an increase in the number of employees with salary deferrals. Changes in Employer Contributions vary up or down according to individual employers’ desire to match employee contributions.
Financial Section
- 25 -
Other Trust Funds
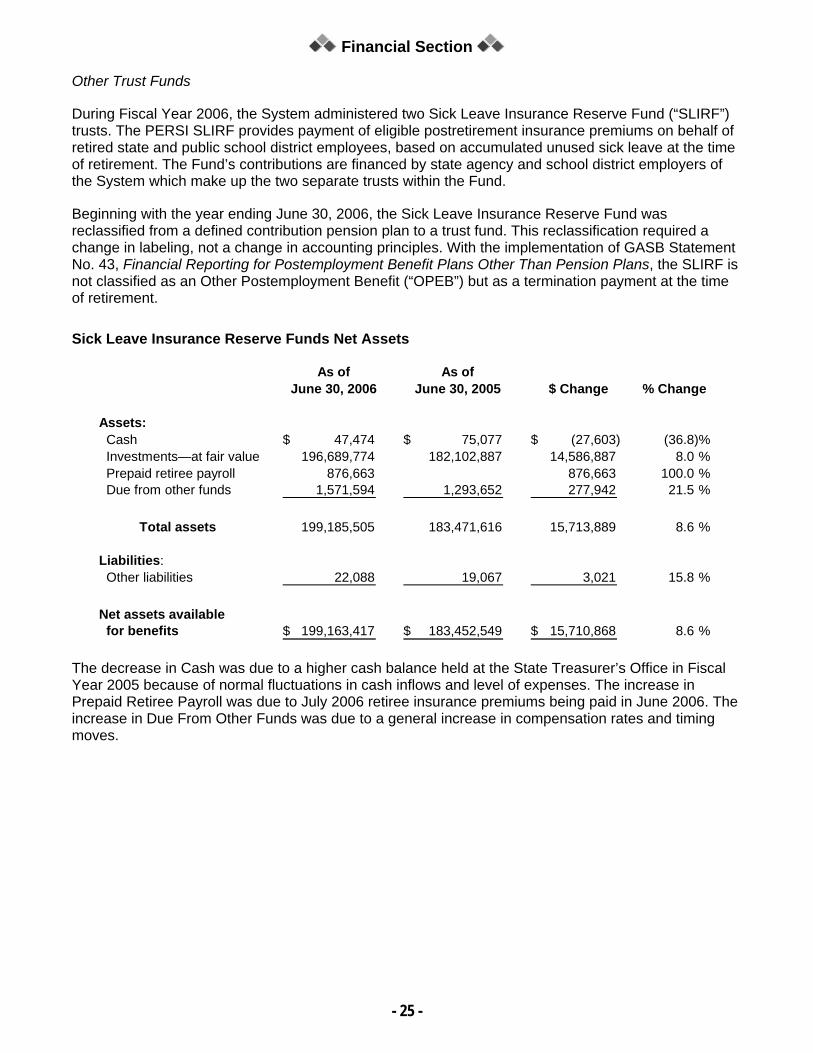
During Fiscal Year 2006, the System administered two Sick Leave Insurance Reserve Fund (“SLIRF”) trusts. The PERSI SLIRF provides payment of eligible postretirement insurance premiums on behalf of retired state and public school district employees, based on accumulated unused sick leave at the time of retirement. The Fund’s contributions are financed by state agency and school district employers of the System which make up the two separate trusts within the Fund.
Beginning with the year ending June 30, 2006, the Sick Leave Insurance Reserve Fund was reclassified from a defined contribution pension plan to a trust fund. This reclassification required a change in labeling, not a change in accounting principles. With the implementation of GASB Statement No. 43, Financial Reporting for Postemployment Benefit Plans Other Than Pension Plans, the SLIRF is not classified as an Other Postemployment Benefit (“OPEB”) but as a termination payment at the time of retirement.
Sick Leave Insurance Reserve Funds Net Assets
As of As ofJune 30, 2006 June 30, 2005 $ Change % Change
Assets: Cash 47,474$ 75,077$ (27,603)$ (36.8)% Investments—at fair value 196,689,774 182,102,887 14,586,887 8.0 % Prepaid retiree payroll 876,663 876,663 100.0 % Due from other funds 1,571,594 1,293,652 277,942 21.5 %
Total assets 199,185,505 183,471,616 15,713,889 8.6 %
Liabilities: Other liabilities 22,088 19,067 3,021 15.8 %
Net assets available for benefits 199,163,417$ 183,452,549$ 15,710,868$ 8.6 %
The decrease in Cash was due to a higher cash balance held at the State Treasurer’s Office in Fiscal Year 2005 because of normal fluctuations in cash inflows and level of expenses. The increase in Prepaid Retiree Payroll was due to July 2006 retiree insurance premiums being paid in June 2006. The increase in Due From Other Funds was due to a general increase in compensation rates and timing moves.
Financial Section
- 26 -
Sick Leave Insurance Reserve Funds Changes in Net Assets
Year Ended Year EndedJune 30, 2006 June 30, 2005 $ Change % Change
Total deductions 10,507,300 10,653,912 (146,612) (1.4)%
Changes in net assets available for benefits 15,710,868$ 18,514,290$ (2,803,422)$ (15.1)%
Investment Income decreased from Fiscal Year 2005 to Fiscal Year 2006 because of more moderate market growth than the prior year. A large portion of the holdings for this fund are in bonds, which did not experience the higher rate of gains. The increase in Other Additions was due to interest earnings on the cash balance held at the State Treasurer’s Office.
Plan Membership
This table reflects PERSI Base Plan and PERSI Choice Plans membership at the beginning and end of the fiscal year.
While the above table reflects changes in active participants, the following table demonstrates the changes in retirees and beneficiaries during the period.
Financial Section
- 27 -
Changes in Retirees and Beneficiaries (Base Plan)
Beginning—June 30, 2005 27,246 Retirements 2,047 Death of retiree/beneficiary (855)
Ending—July 1, 2006 28,438
Investment Activities
Long-term asset growth is vital to the Defined Benefit Plans’ current and continued financial stability. Therefore, trustees have a fiduciary responsibility to act with prudence and discretion when making plan investment decisions. To assist the Board in this area, a comprehensive formal investment policy is updated periodically. As managers are added, specific detailed investment guidelines are developed, adopted, and become part of that manager’s agreement.
Portfolio performance is reviewed monthly by the Board and its consultants. Performance is evaluated individually, by money manager style, and collectively by investment type and for the aggregate portfolio. Investment types include both domestic and international equities, domestic and international fixed income, and real estate.
Economic Factors
PERSI, like any pension fund, has a broad range of opportunities for investment in the open market, as well as many choices for asset allocation and investment managers. For purposes of comparison, the table of Investment Results in the Investment Section of this report indicates various index returns, which are reflective of the market environment available.
As a result of the Fiscal Year 2002 amortization period calculation being 39.3 years, the Board increased contribution rates 1% per year for three years beginning July 2004. The PERSI Board has twice postponed the second year rate increase due to a significant increase in funded status. The remaining two increases are now scheduled for July 1, 2007 and 2008. The maximum amortization period allowed by state law for the Base Plan is 25 years. PERSI’s Base Plan amortization period before any cost of living adjustment (“COLA”) as of July 1, 2006, is 9.8 years.
During Fiscal Year 2006, an actuarial study of PERSI experience was done. An experience study is an analysis of economic assumptions and active member demographics. This study resulted in some changes to the volatility assumptions. Actuarial assumptions are estimates as to the occurrence of future events affecting such things as changes in pension costs, compensation, and rates of investment earnings and are used to measure and budget future costs. The most significant change in the July 1, 2006 experience study was the change in methodology for mortality assumptions. Under the previous static mortality assumptions, it was difficult to accurately predict the growth in longevity over future generations (the 20-year-old of tomorrow will live longer than the 20-year-old of today). By using a “generational mortality” approach, the actuary is able to more accurately predict the growth in longevity by assigning different mortality expectations by year of birth. Currently, the costs to the System caused by growth in longevity were absorbed by the unfunded liability. By moving these costs “inside” the Plan through the generational mortality assumptions, the costs are recognized up front by a charge of approximately $231 million to the unfunded liability and an increase in the normal cost rate of .63% of pay.
Financial Section
28
PUBLIC EMPLOYEE RETIREMENT SYSTEM OF IDAHO
STATEMENTS OF PLAN NET ASSETS—PENSION TRUST FUNDS AND OTHER TRUST FUNDSJUNE 30, 2006 WITH COMPARATIVE FINANCIAL INFORMATION FOR JUNE 30, 2005
Firefighters’PERSI Retirement
Base Plan Fund 414(k) 401(k) State Schools 2006 2005
Total receivables 946,698,163 25,612,510 287,353 827,280 973,425,306 860,840,975 Assets used in plan operations—net 2,850,523 2,850,523 3,516,630 Due from other funds 616,105 955,489 1,571,594 1,293,652 Retiree payroll in process 30,772,971 240,297 636,366 31,649,634 27,754,259
Total assets 10,523,762,526 284,646,234 61,446,573 163,304,253 75,195,660 123,989,845 11,232,345,091 9,963,713,164
(Continued)
PERSI Choice Plan Totals
Pension Trust Funds Other Trust Funds
Reserve FundSick Leave Insurance
Financial Section
- 29 -
PUBLIC EMPLOYEE RETIREMENT SYSTEM OF IDAHO
STATEMENTS OF PLAN NET ASSETS—PENSION TRUST FUNDS AND OTHER TRUST FUNDSJUNE 30, 2006 WITH COMPARATIVE FINANCIAL INFORMATION FOR JUNE 30, 2005
Firefighters’PERSI Retirement
Base Plan Fund 414(k) 401(k) State Schools 2006 2005
LIABILITIES: Accrued liabilities 7,917,290$ 208,685$ $ $ 8,346$ 13,742$ 8,148,063$ 7,488,298$ Benefits and refunds payable 248,275 248,275 63,069 Due to other funds 1,571,594 1,571,594 1,293,652 Investments purchased 1,318,573,759 35,672,011 1,354,245,770 1,139,739,452
Total liabilities 1,328,310,918 35,880,696 8,346 13,742 1,364,213,702 1,148,584,471
NET ASSETS HELD IN TRUST (see unaudited supplementary schedules of funding progress) 9,195,451,608$ 248,765,538$ 61,446,573$ 163,304,253$ 75,187,314$ 123,976,103$ 9,868,131,389$ 8,815,128,693$
See notes to financial statements. (Concluded)
PERSI Choice Plan Totals
Pension Trust Funds Other Trust FundsSick Leave Insurance
Reserve Fund
Financial Section
30
PUBLIC EMPLOYEE RETIREMENT SYSTEM OF IDAHO
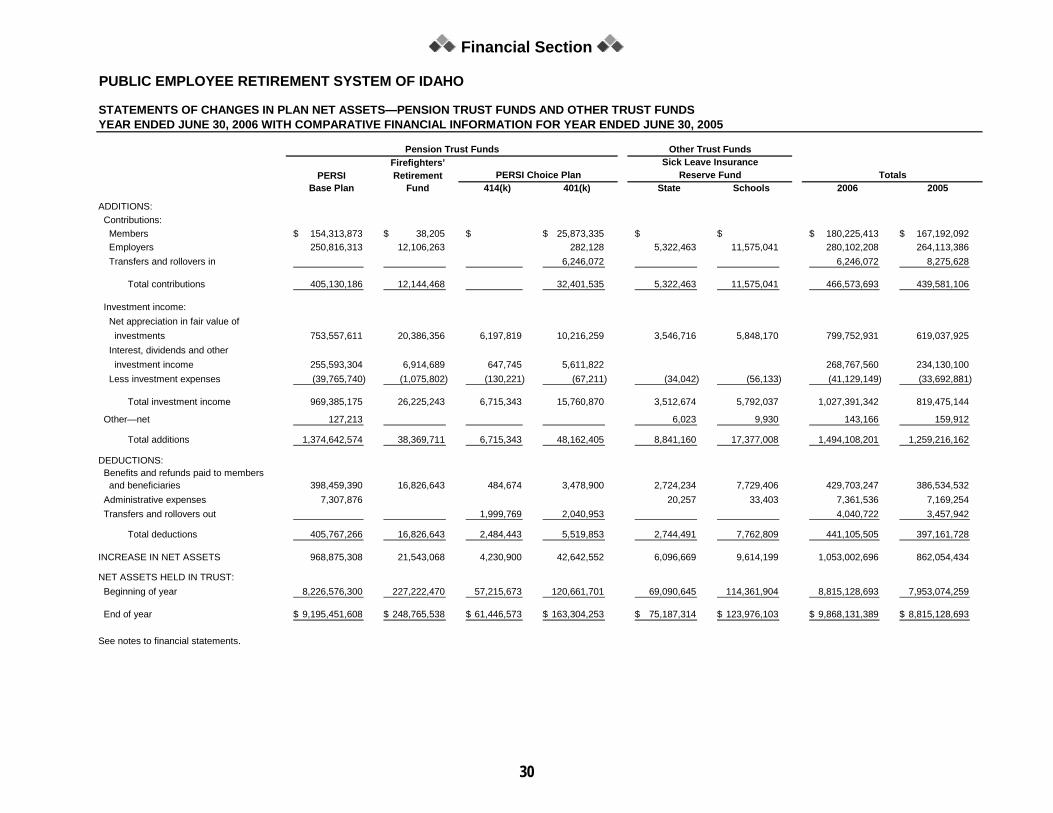
STATEMENTS OF CHANGES IN PLAN NET ASSETS—PENSION TRUST FUNDS AND OTHER TRUST FUNDS YEAR ENDED JUNE 30, 2006 WITH COMPARATIVE FINANCIAL INFORMATION FOR YEAR ENDED JUNE 30, 2005
Firefighters’PERSI Retirement
Base Plan Fund 414(k) 401(k) State Schools 2006 2005
ADDITIONS: Contributions: Members 154,313,873$ 38,205$ $ 25,873,335$ $ $ 180,225,413$ 167,192,092$ Employers 250,816,313 12,106,263 282,128 5,322,463 11,575,041 280,102,208 264,113,386 Transfers and rollovers in 6,246,072 6,246,072 8,275,628
Total contributions 405,130,186 12,144,468 32,401,535 5,322,463 11,575,041 466,573,693 439,581,106
Investment income: Net appreciation in fair value of investments 753,557,611 20,386,356 6,197,819 10,216,259 3,546,716 5,848,170 799,752,931 619,037,925 Interest, dividends and other investment income 255,593,304 6,914,689 647,745 5,611,822 268,767,560 234,130,100 Less investment expenses (39,765,740) (1,075,802) (130,221) (67,211) (34,042) (56,133) (41,129,149) (33,692,881)
Total investment income 969,385,175 26,225,243 6,715,343 15,760,870 3,512,674 5,792,037 1,027,391,342 819,475,144 Other—net 127,213 6,023 9,930 143,166 159,912
Total additions 1,374,642,574 38,369,711 6,715,343 48,162,405 8,841,160 17,377,008 1,494,108,201 1,259,216,162
DEDUCTIONS: Benefits and refunds paid to members and beneficiaries 398,459,390 16,826,643 484,674 3,478,900 2,724,234 7,729,406 429,703,247 386,534,532 Administrative expenses 7,307,876 20,257 33,403 7,361,536 7,169,254 Transfers and rollovers out 1,999,769 2,040,953 4,040,722 3,457,942
Total deductions 405,767,266 16,826,643 2,484,443 5,519,853 2,744,491 7,762,809 441,105,505 397,161,728
INCREASE IN NET ASSETS 968,875,308 21,543,068 4,230,900 42,642,552 6,096,669 9,614,199 1,053,002,696 862,054,434 NET ASSETS HELD IN TRUST: Beginning of year 8,226,576,300 227,222,470 57,215,673 120,661,701 69,090,645 114,361,904 8,815,128,693 7,953,074,259
End of year 9,195,451,608$ 248,765,538$ 61,446,573$ 163,304,253$ 75,187,314$ 123,976,103$ 9,868,131,389$ 8,815,128,693$
See notes to financial statements.
PERSI Choice Plan Totals
Pension Trust Funds Other Trust FundsSick Leave Insurance
Reserve Fund
Financial Section
-31-
PUBLIC EMPLOYEE RETIREMENT SYSTEM OF IDAHO
NOTES TO FINANCIAL STATEMENTS YEAR ENDED JUNE 30, 2006
1. GENERAL DESCRIPTION OF THE FUNDS
General—The Public Employee Retirement System of Idaho (the “System” or “PERSI”) is the administrator of four pension plans including two defined benefit retirement plans, the Public Employee Retirement Fund Base Plan (“PERSI Base Plan”) and the Firefighters’ Retirement Fund (“FRF”); and two defined contribution plans, the Public Employee Retirement Fund Choice Plans 401(k) and 414(k) (“PERSI Choice Plan”). PERSI also administers two Sick Leave Insurance Reserve Trust Funds, one for state employers and one for school district employers.
Reporting Entity—The System is a discretely presented component unit of the State of Idaho and is included in the State of Idaho Comprehensive Annual Financial Report. The basic financial statements of the System include the financial activities of all of the above funds. A retirement board (the “Board”), appointed by the Governor and confirmed by the Idaho Senate, manages the System, which includes selecting the funding agents and establishing funding policy.
Defined Benefit Retirement Plans—The PERSI Base Plan and FRF are both cost-sharing, multiple-employer defined benefit retirement plans that provide benefits based on members’ years of service, age, and highest average salary. In addition, benefits are provided for disability, death, and survivors of eligible members or beneficiaries.
Statutes governing the PERSI Base Plan are Title 59, Chapter 13 of the Idaho Code. Statutes governing FRF are Title 72, Chapter 14 of the Idaho Code.
Members become fully vested in their retirement benefits with five years of credited service (5 months for elected or appointed officials). Members are eligible for retirement benefits upon attainment of the ages specified for their employment classification. The annual service retirement allowance for each month of credited service is 2.0% (2.3% for police/firefighters) of the average monthly salary for the highest consecutive 42 months.
State agencies, school districts, cities, counties, highway districts, water and sewer districts, and other political subdivisions contribute to the System. As of June 30, 2006 and 2005, the number of participating employer units in the PERSI Base Plan was:
2006 2005
Cities 144 143School districts 140 135Highway and water districts 123 121State subdivisions 97 98 Counties 40 40 Other 148 147
692 684
Financial Section
-32-
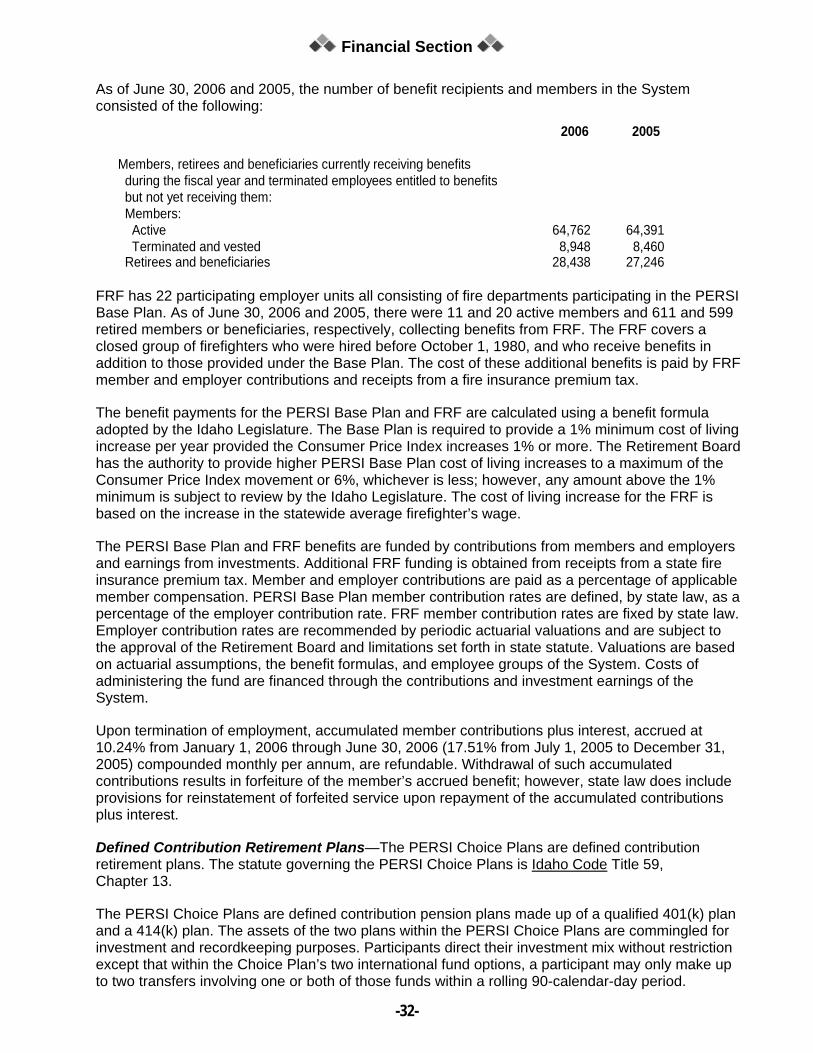
As of June 30, 2006 and 2005, the number of benefit recipients and members in the System consisted of the following:
2006 2005
Members, retirees and beneficiaries currently receiving benefits during the fiscal year and terminated employees entitled to benefits but not yet receiving them: Members: Active 64,762 64,391 Terminated and vested 8,948 8,460 Retirees and beneficiaries 28,438 27,246
FRF has 22 participating employer units all consisting of fire departments participating in the PERSI Base Plan. As of June 30, 2006 and 2005, there were 11 and 20 active members and 611 and 599 retired members or beneficiaries, respectively, collecting benefits from FRF. The FRF covers a closed group of firefighters who were hired before October 1, 1980, and who receive benefits in addition to those provided under the Base Plan. The cost of these additional benefits is paid by FRF member and employer contributions and receipts from a fire insurance premium tax.
The benefit payments for the PERSI Base Plan and FRF are calculated using a benefit formula adopted by the Idaho Legislature. The Base Plan is required to provide a 1% minimum cost of living increase per year provided the Consumer Price Index increases 1% or more. The Retirement Board has the authority to provide higher PERSI Base Plan cost of living increases to a maximum of the Consumer Price Index movement or 6%, whichever is less; however, any amount above the 1% minimum is subject to review by the Idaho Legislature. The cost of living increase for the FRF is based on the increase in the statewide average firefighter’s wage.
The PERSI Base Plan and FRF benefits are funded by contributions from members and employers and earnings from investments. Additional FRF funding is obtained from receipts from a state fire insurance premium tax. Member and employer contributions are paid as a percentage of applicable member compensation. PERSI Base Plan member contribution rates are defined, by state law, as a percentage of the employer contribution rate. FRF member contribution rates are fixed by state law. Employer contribution rates are recommended by periodic actuarial valuations and are subject to the approval of the Retirement Board and limitations set forth in state statute. Valuations are based on actuarial assumptions, the benefit formulas, and employee groups of the System. Costs of administering the fund are financed through the contributions and investment earnings of the System.
Upon termination of employment, accumulated member contributions plus interest, accrued at 10.24% from January 1, 2006 through June 30, 2006 (17.51% from July 1, 2005 to December 31, 2005) compounded monthly per annum, are refundable. Withdrawal of such accumulated contributions results in forfeiture of the member’s accrued benefit; however, state law does include provisions for reinstatement of forfeited service upon repayment of the accumulated contributions plus interest.
Defined Contribution Retirement Plans—The PERSI Choice Plans are defined contribution retirement plans. The statute governing the PERSI Choice Plans is Idaho Code Title 59, Chapter 13.
The PERSI Choice Plans are defined contribution pension plans made up of a qualified 401(k) plan and a 414(k) plan. The assets of the two plans within the PERSI Choice Plans are commingled for investment and recordkeeping purposes. Participants direct their investment mix without restriction except that within the Choice Plan’s two international fund options, a participant may only make up to two transfers involving one or both of those funds within a rolling 90-calendar-day period.
Financial Section
-33-
Participants may also elect to change their salary deferral every pay period. The 401(k) portion of the PERSI Choice Plans is open to all active PERSI Base Plan members and was established February 1, 2001. On May 1, 2001, this Plan became open to voluntary employer matching contributions at rates determined by the employers. Beginning in January 2002, employees could make tax-deferred contributions up to 100% of their gross salary less deductions and subject to the Internal Revenue Service (“IRS”) annual contribution limit. The 414(k) portion of the PERSI Choice Plans was established for gain sharing allocations from the PERSI Base Plan. The gain sharing amount (if any) is based on funding levels in the Base Plan. Eligibility for Gain Sharing requires twelve months of active PERSI Base Plan membership as defined in Idaho statutes and PERSI rules. On February 1, 2001, all eligible Base Plan members who were active as of June 30, 2000, and eligible to receive gain sharing contributions, received an allocation. The System has entered into a contract with ACS HR Solutions, LLC (“ACS”) for plan recordkeeping services. The plan offers eleven investment options, which are mutual or collective funds. The plans include the PERSI Total Return Fund (“PERSI TRF”), seven equity funds, two fixed income funds, and a stable value fund. Participants may allocate their assets in 1% increments among these options; however, if no allocation preference is indicated, a default investment election to the PERSI TRF is made. The PERSI TRF is a unitized fund comprised of investment accounts of the PERSI Base Plan.
The PERSI Choice Plan has all 692 employer units eligible to have participating employees. As of June 30, 2006 and 2005, there were 47,053 and 47,615 participants, respectively, with balances in the PERSI Choice Plans. Some of these participants are in both the 414(k) Plan and the 401(k) Plan. As of June 30, 2006 and 2005, the Choice Plan 414(k) had 40,907 and 42,578 participants, respectively and the Choice Plan 401(k) had 19,624 and 10,707, respectively. The administrative expenses of the PERSI Choice Plans are paid to ACS and funded by the PERSI Base Plan.
Other Trust Funds—In FY 2006, the Sick Leave Insurance Reserve Fund (“SLIRF”) was reclassified from a defined contribution pension plan (subject to Governmental Accounting Standards Board (“GASB”) Statement 43, Financial Reporting for Postemployment Benefit Plans Other Than Pension Plans) to a trust fund. This reclassification resulted only in a change in labeling, not a change in accounting principles. For state and school employers, unused sick leave benefits are subject to the guidance of GASB Statement 16, Accounting for Compensated Absences prior to the time of retirement.
The SLIRF is made up of two trust funds administered by PERSI - a trust for payment of school district employee benefits and a trust for payment of state employee benefits. The statutes governing the SLIRF are Idaho Code, Sections 67-5339, 33-1216, 59-1365, and 33-1228.
The SLIRF is a fund that exists for the payment of unused sick leave benefits that accrue under state law for state employees and school district employees who separate from service by reason of retirement. The assets of the two trusts are commingled for investment purposes. The System administers these trusts on behalf of the participating employers. Employers’ contributions are a percentage of payroll collected each pay cycle and are held in trust for future benefits.
The SLIRF is used to pay eligible postretirement insurance premiums on behalf of former employees based on unused accumulated sick leave at their retirement date. The school districts and the State are responsible for any unfunded benefit obligations, respectively, through contribution rate adjustments.
School District Employees—For school district employees, the unused sick leave amount available for benefit is limited to one-half of their eligible sick leave balance and rate of compensation at retirement.
Financial Section
-34-
State Employees—State employees are limited to the number of allowable hours of sick leave they may use as part of the unused sick leave program as follows:
Credited Hours of Maximum AllowableState Service Sick Leave Hours
0–10,400 (0–5 years) 420 10,401–20,800 (5–10 years) 480 20,801–31,200 (10–15 years) 540 31,201+ (15 years or more) 600
Members may use one-half of sick leave hours accrued up to the allowable maximum multiplied by their rate of compensation at retirement.
The rate for state agency contributions was 0.65% of covered salary at June 30, 2006 and June 30, 2005. The rate for school district contributions was 1.15% of covered salary at June 30, 2005. In April 2006, Rule 552, section 2 — contribution rates for school districts —- was amended. Contribution percentages for fiscal years 2006, 2007, and 2008 are based on the number of days of paid sick leave permitted during the contract year for certified teachers and are as follows:
Beginning July 1, 2006 July 1, 2007 July 1, 2008
9-10 days 1.16% 1.18% 1.21%11-14 days 1.26% 1.35% 1.44%More than 14 days Individual rate to be set by the Retirement Board based
on current cost and actuarial data and reviewed annually.
2. SUMMARY OF SIGNIFICANT ACCOUNTING POLICIES
Basis of Accounting—The System’s basic financial statements are prepared utilizing the accrual basis of accounting. Employee and employer contributions are recognized as additions to net assets when due and receivable, pursuant to formal commitments and statutory or contractual requirements, investment income is recognized when earned, and benefit payments and refunds and other expenses are recorded when the benefits are due and payable in accordance with the plans’ terms. The pension funds are accounted for on a flow of economic resources measurement focus. The System adheres to Statement No. 25 of the GASB Statement No. 25, Financial Reporting for Defined Benefit Pension Plans and Note Disclosures for Defined Contribution Plans.
Investments—The System’s investments are presented at fair value. Purchases and sales are recorded at the trade date. At month end, there may be certain pending trades that were initiated by managers but not confirmed and, therefore, are not included in the fair value of investments. Investments of the PERSI Base Plan, FRF, and the PERSI TRF (an option of the PERSI Choice Plan) are pooled for investment purposes as is disclosed in Note 3.
The Board utilizes and directs individual fund managers to provide whatever investment management and custodial functions the Board has determined best achieves the System’s investment objectives. Each fund manager is generally granted full discretion in making investment decisions, within asset allocation policy, portfolio investment policy, specific investment guidelines and other special restrictions set by the Board. The Board monitors overall investment performance and periodically evaluates the performance of each fund manager. The Board in its administration of the System and management of the investment program is guided by the Idaho Uniform Prudent Investor Act, Sections 68-501 through 68-514 of the Idaho Code and of fiduciary responsibilities in the Idaho Code, Section 59-1301, and is empowered in its sole discretion to limit, control, and
Financial Section
-35-
designate the types and amounts of investments. The Board has adopted an investment policy including policy related to deposit and investment risks identified in GASB Statement No. 40, Deposit and Investment Risk Disclosures.
The fair value of investments is based on published market prices and quotations from major investment brokers, when available. Mortgages have been valued on the basis of their future principal and interest payments discounted at prevailing interest rates for similar instruments of matching duration. The fair value of real estate investments is based on industry practice. For recent acquisitions, cost closely approximates fair value. The fair value of longer term real estate holdings is estimated based on the System’s consultant assessments and/or independent appraisals. Short-term investments are reported at market value, when published market prices and quotations are available, or at cost plus accrued interest, which approximate market value. The fair values of private equity limited partnership investments by their nature have no readily ascertainable market prices. Similar to real estate, cost closely approximates fair value for recent acquisitions. Thereafter, the fair values of limited partnership funds are based on the valuations as presented by the general partner, approved by the funds’ advisory committee, and reviewed by consultants. Generally, the companies within a fund are valued by the general partner, taking into account many factors such as the purchase price, estimated liquidation value, significant events like initial public offerings, bankruptcies, and additional rounds of financing, and other relevant factors. Because of the lack of published market prices for these investments, the estimated fair values may differ significantly from the values that would have been used had a ready market for the investments existed. Although these differences could be material to the individual company values, private equity represents less than 3.1% of total investments.
The System purchases forward currency contracts for certain international investments and United States of America agency-guaranteed collateralized mortgage obligations for the purpose of enhancing liquidity, reducing transaction or other costs, or partially hedging an existing exposure. The System does not incur any costs for forward contracts until the settlement date. Potential future obligations for the forward contracts are not recognized until the contract expiration date.
Use of Estimates—The preparation of the financial statements in conformity with accounting principles generally accepted in the United States of America requires management to make estimates and assumptions that affect the reported amounts of net assets and liabilities, disclosure of contingent liabilities, and the actuarial present value of accumulated plan benefits at the date of the financial statements. Actual results could differ from those estimates. The System utilizes various investment instruments. Investment securities, in general, are exposed to various risks, such as interest rate, credit, and overall market volatility. Due to the level of risk associated with certain investment securities, it is reasonably possible that changes in the values of investment securities will occur in the near term and that such changes could materially affect the amounts reported in the financial statements.
Assets Used in Plan Operations—These assets represent buildings, equipment, and computer software development costs used by the System and are recorded at cost. Depreciation and amortization are provided on the straight-line method over the estimated useful lives of the assets. The estimated useful life for buildings is 30 years. The estimated useful life of the computer software development costs is five years. Computer and technology equipment has a three-year useful life.
Totals—The basic financial statements include certain prior-year summarized comparative information in total. Such information does not include sufficient detail to constitute a presentation in conformity with accounting principles generally accepted in the United States of America. Accordingly, such information should be read in conjunction with the System’s basic financial statements for the year ended June 30, 2005, from which the summarized information was derived.
Financial Section
-36-
3. DEPOSITS AND INVESTMENTS
A. Deposits
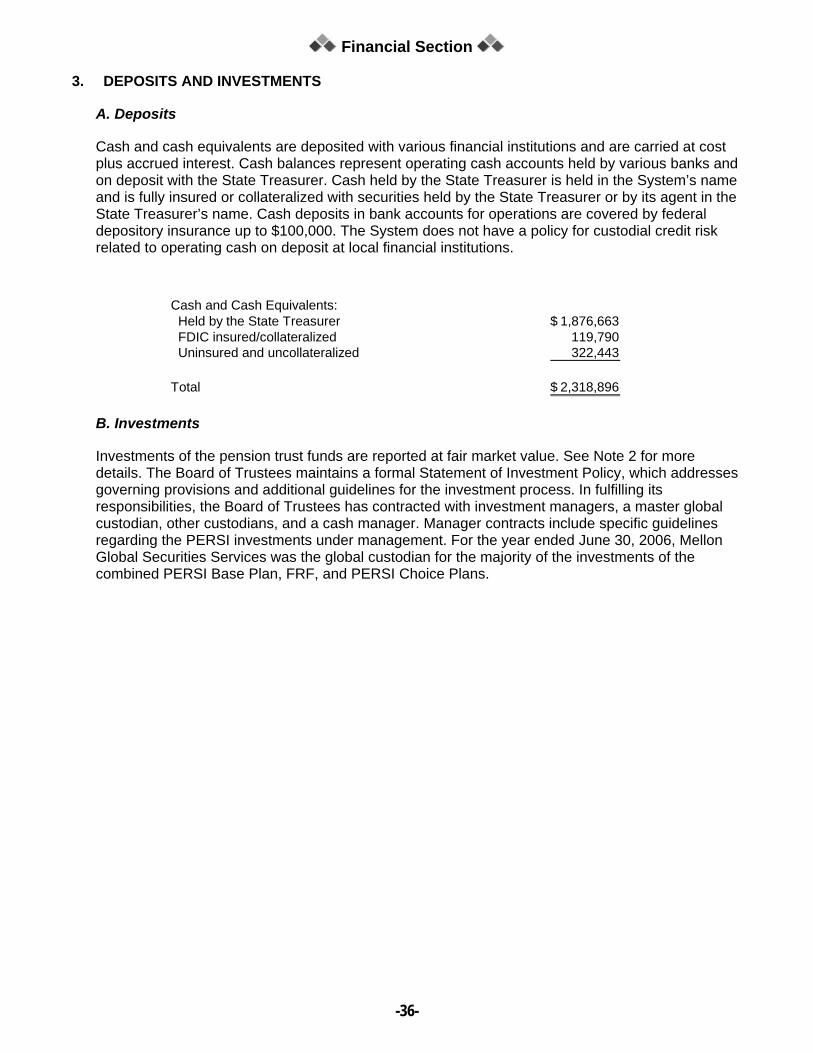
Cash and cash equivalents are deposited with various financial institutions and are carried at cost plus accrued interest. Cash balances represent operating cash accounts held by various banks and on deposit with the State Treasurer. Cash held by the State Treasurer is held in the System’s name and is fully insured or collateralized with securities held by the State Treasurer or by its agent in the State Treasurer’s name. Cash deposits in bank accounts for operations are covered by federal depository insurance up to $100,000. The System does not have a policy for custodial credit risk related to operating cash on deposit at local financial institutions.
Cash and Cash Equivalents: Held by the State Treasurer 1,876,663$ FDIC insured/collateralized 119,790 Uninsured and uncollateralized 322,443
Total 2,318,896$
B. Investments
Investments of the pension trust funds are reported at fair market value. See Note 2 for more details. The Board of Trustees maintains a formal Statement of Investment Policy, which addresses governing provisions and additional guidelines for the investment process. In fulfilling its responsibilities, the Board of Trustees has contracted with investment managers, a master global custodian, other custodians, and a cash manager. Manager contracts include specific guidelines regarding the PERSI investments under management. For the year ended June 30, 2006, Mellon Global Securities Services was the global custodian for the majority of the investments of the combined PERSI Base Plan, FRF, and PERSI Choice Plans.
Financial Section
-37-
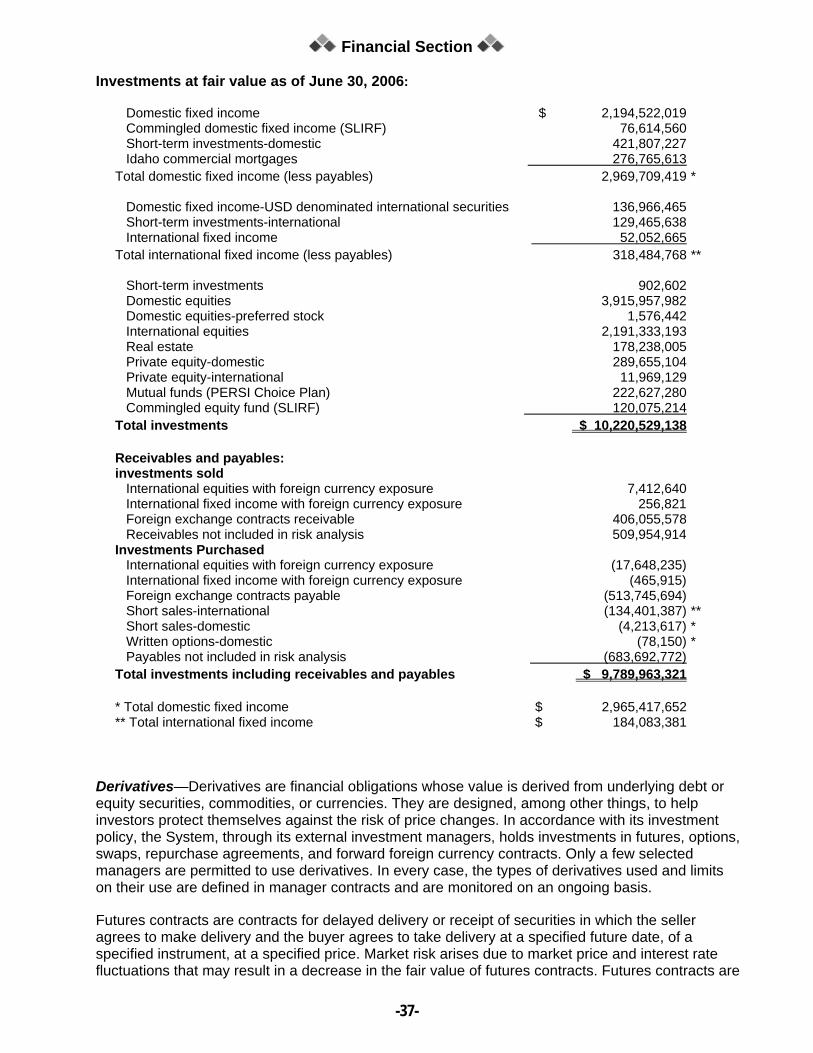
Investments at fair value as of June 30, 2006:
Domestic fixed income $ 2,194,522,019 Commingled domestic fixed income (SLIRF) 76,614,560 Short-term investments-domestic 421,807,227 Idaho commercial mortgages 276,765,613 Total domestic fixed income (less payables) 2,969,709,419 *
Domestic fixed income-USD denominated international securities 136,966,465 Short-term investments-international 129,465,638 International fixed income 52,052,665 Total international fixed income (less payables) 318,484,768 **
Short-term investments 902,602 Domestic equities 3,915,957,982 Domestic equities-preferred stock 1,576,442 International equities 2,191,333,193 Real estate 178,238,005 Private equity-domestic 289,655,104 Private equity-international 11,969,129 Mutual funds (PERSI Choice Plan) 222,627,280 Commingled equity fund (SLIRF) 120,075,214 Total investments $ 10,220,529,138
Receivables and payables: investments sold International equities with foreign currency exposure 7,412,640 International fixed income with foreign currency exposure 256,821 Foreign exchange contracts receivable 406,055,578 Receivables not included in risk analysis 509,954,914 Investments Purchased International equities with foreign currency exposure (17,648,235) International fixed income with foreign currency exposure (465,915) Foreign exchange contracts payable (513,745,694) Short sales-international (134,401,387) ** Short sales-domestic (4,213,617) * Written options-domestic (78,150) * Payables not included in risk analysis (683,692,772) Total investments including receivables and payables $ 9,789,963,321
* Total domestic fixed income $ 2,965,417,652 ** Total international fixed income $ 184,083,381
Derivatives—Derivatives are financial obligations whose value is derived from underlying debt or equity securities, commodities, or currencies. They are designed, among other things, to help investors protect themselves against the risk of price changes. In accordance with its investment policy, the System, through its external investment managers, holds investments in futures, options, swaps, repurchase agreements, and forward foreign currency contracts. Only a few selected managers are permitted to use derivatives. In every case, the types of derivatives used and limits on their use are defined in manager contracts and are monitored on an ongoing basis.
Futures contracts are contracts for delayed delivery or receipt of securities in which the seller agrees to make delivery and the buyer agrees to take delivery at a specified future date, of a specified instrument, at a specified price. Market risk arises due to market price and interest rate fluctuations that may result in a decrease in the fair value of futures contracts. Futures contracts are
Financial Section
-38-
traded on organized exchanges and require initial margin in the form of cash or marketable securities. Each day the net change in the futures contract value is settled in cash with the exchanges. Holders of futures contracts look to the exchange for performance under the contract. Accordingly, the credit risk due to the nonperformance of counterparties to futures contracts is minimal. At June 30, 2006 and 2005, the System had futures contracts with a fair value of $19,345 and $100,264, respectively, which is included in Fixed Income Investments. Cash equivalents and short-term investments in amounts necessary to settle the futures contracts were held in the portfolio so that no leverage was employed, in accordance with the System’s Statement of Investment Policy. At June 30, 2006, the System had the following futures contracts exposure (negative values represent short future positions):
Exposure covered by contract
Cash and cash equivalents-eurodollar 22,955,286$ U.S. Treasury bond futures (4,219,634) U.S. Treasury note futures (17,486,109)
Option contracts are contractual agreements giving the purchaser the right, but not the obligation, to purchase or sell a financial instrument at a specified price within a specified time. The option’s price is usually a small percentage of the underlying asset’s value. Options strategies used by the System are designed to provide exposures to positive market moves and limit exposures to interest rate and currency fluctuations. At June 30, 2006 and 2005, the System had option contracts payable with a fair value of $59,953 and $535,744, respectively that is included in liabilities reported as Investments Purchased. At June 30, 2006, the System had the following options contracts exposure:
Cash and cash equivalents purchased call options 136,013$ Cash and cash equivalents written call options 787 Cash and cash equivalents written put options 180 Fixed income purchased call options 3,563 Fixed income written call options 27,906 Fixed income written put options 50,750
Exposure covered by contract
Swap agreements are derivative transactions whereby two parties agree to “swap” cash flows over a period of time. Each cash flow can be derived from any market index defined in the swap agreement that is based on a notional value which never actually changes hands. The indexes that determine the amount of cash exchanged can be as simple as a fixed or variable interest rate (like the current prime rate), or as complex as algebraic formulas that combine, enhance, or diminish any number of other market indexes. The System does not anticipate additional significant market risk from swap arrangements. At June 30, 2006 and 2005, the System had swap agreements with a fair value of $105,228 and $90,941, respectively that are included in International Fixed Income Investments.
Repurchase agreements are short-term securities used to finance trading. A broker/dealer who offers a repurchase agreement borrows money by selling securities and simultaneously agreeing to buy them back at a higher price at a later time. The dealer invests the money paid for the securities, hoping to get a higher return than he owes on his obligation to repurchase the securities. Repurchase agreements are commonly called “repos,” and they function in a way similar to a secured loan with the securities serving as collateral. All sales of investments under repurchase agreements are for fixed terms. As of June 30, 2006 and 2005, the credit exposure under repurchase agreements that are included in Short-term Investments was $127,895,269 and $62,108,362, respectively.
Financial Section
-39-
Forward Foreign Currency Exchange Contracts are carried at fair value by the System. The System has entered into foreign exchange contracts to purchase or sell currency at various dates in the future at a specific price. Some of the System’s international and real estate investment managers use forward contracts to hedge the exposure of investments to fluctuations in foreign currency. Forward foreign exchange contracts are negotiated between two counterparties. The System could sell the forward contract at a loss, or if it were to continue to hold the contract, the System may make a termination payment to the counterparty to cancel its obligation under the contract and then buy the currency on the open market. The System could also incur a loss if its counterparties failed to perform pursuant to the terms of their contractual obligations. Controls are established by the System and the investment managers to monitor the creditworthiness of the counterparties. The System’s investment managers seek to control this risk through counterparty credit evaluations and approvals, counterparty credit limits, and exposure monitoring procedures. As of June 30, 2006 and 2005, the System had entered into forward currency contracts to sell foreign currencies with a fair value of $910,893,722 and $809,001,906 and had entered into forward currency contracts to buy foreign currencies with a fair value of $910,070,922 and $809,107,799, respectively. Forward currency contracts are receivables or liabilities reported as investments sold or investments purchased. Unrealized gains of $822,800 and unrealized losses of $105,892 at June 30, 2006 and 2005, respectively, were recorded, which represent the gain or loss which would occur from executing these forward foreign currency contracts at June 30, 2006 and 2005, respectively.
Mortgage-Backed Securities—These investments are based on the cash flows from interest and principal payments on the underlying mortgages. As a result, they are sensitive to prepayments, which are likely to occur in declining interest rate environments, thereby reducing the value of the securities. Details regarding interest rate risk for these investments are included in the Interest Rate Risk section below.
TIPS—Treasury Inflation Protected Securities (“TIPS”) are fixed income securities issued by the U.S. Treasury that pay a fixed coupon rate plus an adjustment for subsequent inflation. At June 30, 2006 and 2005, the System had invested in TIPS with a fair value of $815,334,404 and $701,714,595, respectively.
C. Credit Risk
Credit risk is the risk that an issuer or other counterparty to an investment will not fulfill its obligations to the System. The System’s investment policies require each portfolio to maintain a reasonable risk level relative to its benchmark. As of June 30, 2006, the System’s fixed income assets that are not government guaranteed represented 62% of the fixed income portfolio. The System’s fixed income assets are shown with current credit ratings in the table on the following page.
Financial Section
-40-
Credit quality of fixed income securities at fair value:
Credit QualityS&P Rating Level Domestic International Total
Agency(A-1+) $ 1,907,354 $ - $ 1,907,354 AAA 637,416,120 36,436,266 673,852,386 AA 103,335,963 5,519,302 108,855,265 A 203,509,156 12,551,417 216,060,573 BBB 108,487,067 4,809,449 113,296,516 BB 16,206,496 16,206,496 B 32,297,096 88,210 32,385,306 CCC 6,195,394 6,195,394 Not rated 253,827,848 124,678,737 378,506,585 Total credit risk fixed income securities 1,363,182,494 184,083,381 1,547,265,875
U.S. government 1,216,914,064 1,216,914,064 Pooled investments 108,555,481 108,555,481 Idaho mortgages 276,765,613 276,765,613 Total 2,965,417,652$ 184,083,381$ 3,149,501,033$
As a matter of practice, there are no strict limitations for credit risk exposures within the portfolio. Each portfolio is managed in accordance with operational guidelines that are specific as to expected portfolio characteristics that usually, but not always, include credit quality and exposure levels. Per the System’s policy, these characteristics are established and monitored within each portfolio, with variances reported by the manager.
D. Custodial Credit Risk
Custodial credit risk is the risk that in the event of a financial institution or bank failure, the System would not be able to recover the value of their deposits and investments that are in the possession of an outside party. The System mitigates custodial credit risk by requiring in policy, to the extent possible, that investments be clearly marked as to PERSI ownership and be registered in the System’s name. All securities are required to be delivered to a third-party institution mutually agreed upon by the bank and the System.
The System’s short-term investments are created through daily sweeps of excess cash by the System’s custodian, cash manager, and a few selected investment managers into short-term investment funds. Clearwater Advisors, LLC is the System’s cash manager and invests the bulk of the System’s cash in short-term instruments. Clearwater Advisors manages approximately 65% of the System’s short-term investments. Of the short-term investments at June 30, 2006 and 2005, $1,918,764 and $14,004,992, respectively, were held by various counterparties not in the System’s name. The remainder of the pooled short-term investment funds is invested in bank-maintained collective investment funds except collective vehicles held and managed by individual investment managers.
E. Concentration of Credit Risk
Concentration of credit risk is the risk of loss that may be attributed to the magnitude of a government’s investment in a single issuer. The System’s operational guidelines for investments in any corporate entity are stated in each individual manager’s specific portfolio guideline.
In line with policy, the System does not have any investments from a single issuer (excluding explicitly guaranteed governments) that represent more than 5% of the System’s net assets.
Financial Section
-41-
F. Interest Rate Risk
Market or interest rate risk is the greatest risk faced by an investor in the debt securities market. The price of a debt security typically moves in the opposite direction of the change in interest rates. Interest rate risk is the risk that changes in interest rates will adversely affect the fair value of an investment. This risk is managed within the portfolio using the effective duration methodology. The methodology takes into account optionality on bonds and scales the risk of price changes on bonds depending upon the degree of change in rates and the slope of the yield curve. All of the System’s fixed income portfolios are managed in accordance with operational guidelines which include an expected range of interest rate risk in the portfolio. Per the System’s policy, these characteristics are established and monitored within each portfolio, with variances reported by the manager. The reporting of effective duration found in the tables below quantifies the interest rate risk of the System’s fixed income assets. For line items below reported as “N/A,” the duration calculation is not available.
Effective duration of domestic fixed income assets by security type:
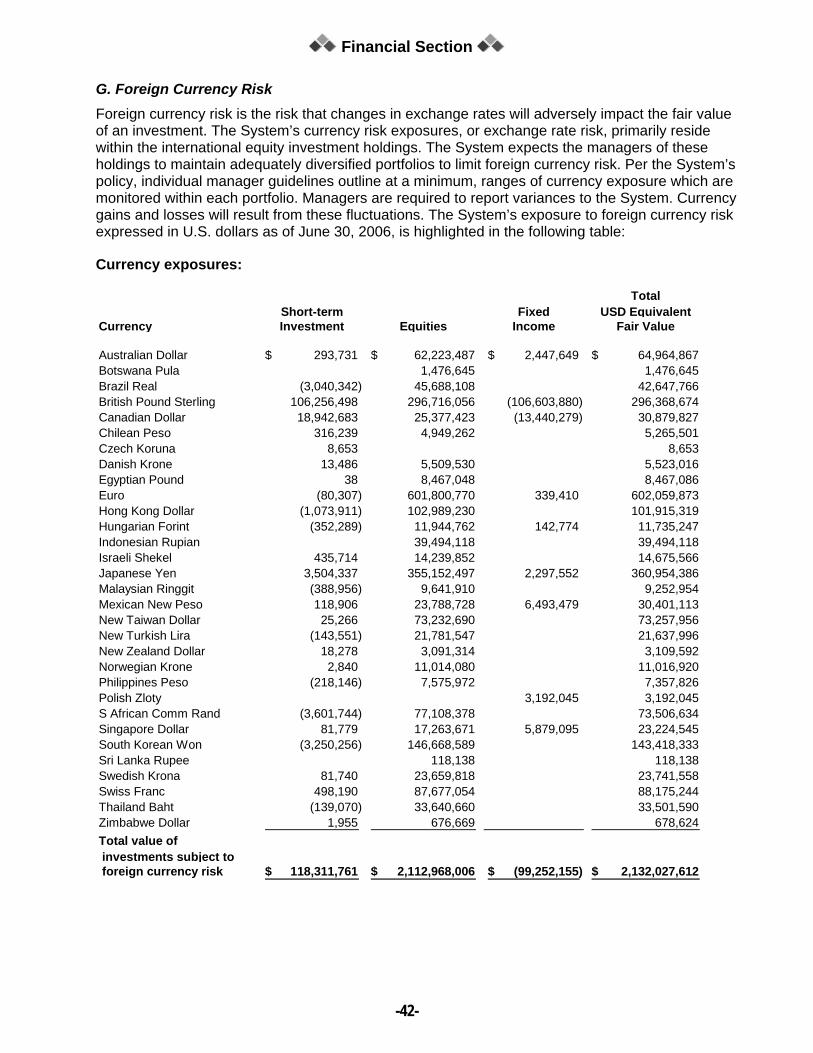
G. Foreign Currency Risk Foreign currency risk is the risk that changes in exchange rates will adversely impact the fair value of an investment. The System’s currency risk exposures, or exchange rate risk, primarily reside within the international equity investment holdings. The System expects the managers of these holdings to maintain adequately diversified portfolios to limit foreign currency risk. Per the System’s policy, individual manager guidelines outline at a minimum, ranges of currency exposure which are monitored within each portfolio. Managers are required to report variances to the System. Currency gains and losses will result from these fluctuations. The System’s exposure to foreign currency risk expressed in U.S. dollars as of June 30, 2006, is highlighted in the following table:
Currency exposures:
TotalShort-term Fixed USD Equivalent
Currency Investment Equities Income Fair Value
Australian Dollar 293,731$ 62,223,487$ 2,447,649$ 64,964,867$ Botswana Pula 1,476,645 1,476,645 Brazil Real (3,040,342) 45,688,108 42,647,766 British Pound Sterling 106,256,498 296,716,056 (106,603,880) 296,368,674 Canadian Dollar 18,942,683 25,377,423 (13,440,279) 30,879,827 Chilean Peso 316,239 4,949,262 5,265,501 Czech Koruna 8,653 8,653 Danish Krone 13,486 5,509,530 5,523,016 Egyptian Pound 38 8,467,048 8,467,086 Euro (80,307) 601,800,770 339,410 602,059,873 Hong Kong Dollar (1,073,911) 102,989,230 101,915,319 Hungarian Forint (352,289) 11,944,762 142,774 11,735,247 Indonesian Rupian 39,494,118 39,494,118 Israeli Shekel 435,714 14,239,852 14,675,566 Japanese Yen 3,504,337 355,152,497 2,297,552 360,954,386 Malaysian Ringgit (388,956) 9,641,910 9,252,954 Mexican New Peso 118,906 23,788,728 6,493,479 30,401,113 New Taiwan Dollar 25,266 73,232,690 73,257,956 New Turkish Lira (143,551) 21,781,547 21,637,996 New Zealand Dollar 18,278 3,091,314 3,109,592 Norwegian Krone 2,840 11,014,080 11,016,920 Philippines Peso (218,146) 7,575,972 7,357,826 Polish Zloty 3,192,045 3,192,045 S African Comm Rand (3,601,744) 77,108,378 73,506,634 Singapore Dollar 81,779 17,263,671 5,879,095 23,224,545 South Korean Won (3,250,256) 146,668,589 143,418,333 Sri Lanka Rupee 118,138 118,138 Swedish Krona 81,740 23,659,818 23,741,558 Swiss Franc 498,190 87,677,054 88,175,244 Thailand Baht (139,070) 33,640,660 33,501,590 Zimbabwe Dollar 1,955 676,669 678,624 Total value of investments subject to foreign currency risk 118,311,761$ 2,112,968,006$ (99,252,155)$ 2,132,027,612$
Financial Section
-43-
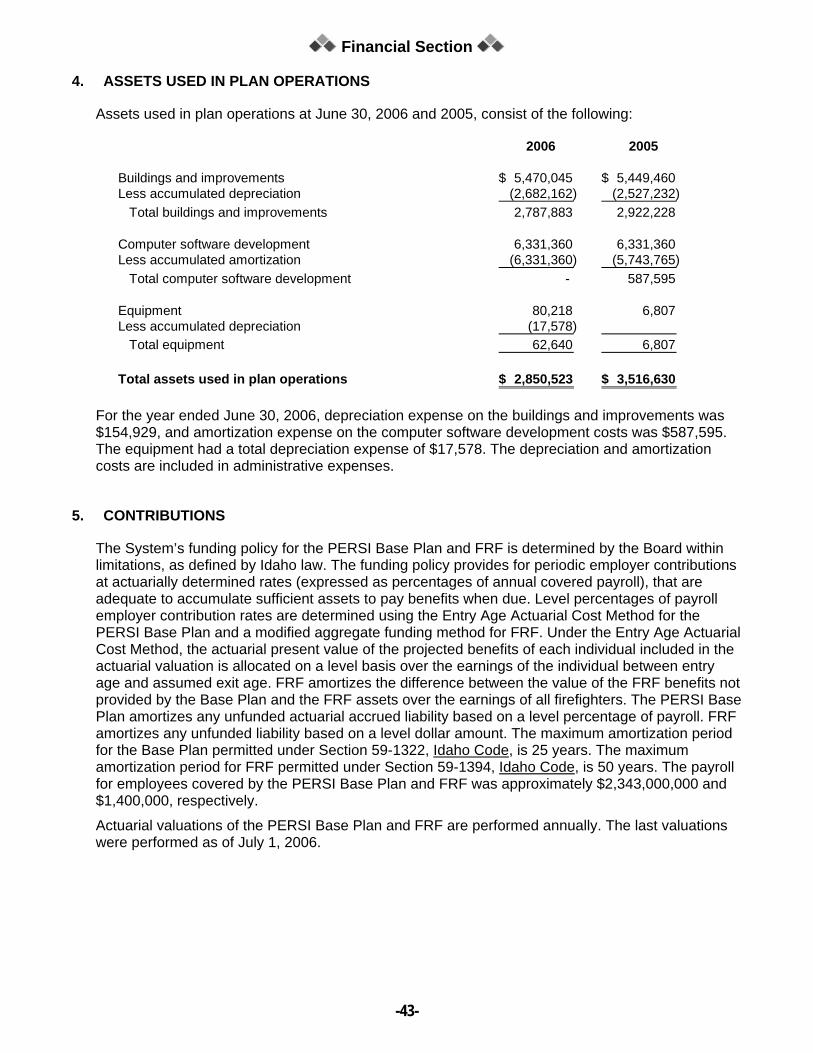
4. ASSETS USED IN PLAN OPERATIONS
Assets used in plan operations at June 30, 2006 and 2005, consist of the following:
2006 2005
Buildings and improvements 5,470,045$ 5,449,460$ Less accumulated depreciation (2,682,162) (2,527,232) Total buildings and improvements 2,787,883 2,922,228
Computer software development 6,331,360 6,331,360 Less accumulated amortization (6,331,360) (5,743,765) Total computer software development - 587,595
Equipment 80,218 6,807 Less accumulated depreciation (17,578) Total equipment 62,640 6,807
Total assets used in plan operations 2,850,523$ 3,516,630$
For the year ended June 30, 2006, depreciation expense on the buildings and improvements was $154,929, and amortization expense on the computer software development costs was $587,595. The equipment had a total depreciation expense of $17,578. The depreciation and amortization costs are included in administrative expenses.
5. CONTRIBUTIONS
The System’s funding policy for the PERSI Base Plan and FRF is determined by the Board within limitations, as defined by Idaho law. The funding policy provides for periodic employer contributions at actuarially determined rates (expressed as percentages of annual covered payroll), that are adequate to accumulate sufficient assets to pay benefits when due. Level percentages of payroll employer contribution rates are determined using the Entry Age Actuarial Cost Method for the PERSI Base Plan and a modified aggregate funding method for FRF. Under the Entry Age Actuarial Cost Method, the actuarial present value of the projected benefits of each individual included in the actuarial valuation is allocated on a level basis over the earnings of the individual between entry age and assumed exit age. FRF amortizes the difference between the value of the FRF benefits not provided by the Base Plan and the FRF assets over the earnings of all firefighters. The PERSI Base Plan amortizes any unfunded actuarial accrued liability based on a level percentage of payroll. FRF amortizes any unfunded liability based on a level dollar amount. The maximum amortization period for the Base Plan permitted under Section 59-1322, Idaho Code, is 25 years. The maximum amortization period for FRF permitted under Section 59-1394, Idaho Code, is 50 years. The payroll for employees covered by the PERSI Base Plan and FRF was approximately $2,343,000,000 and $1,400,000, respectively.
Actuarial valuations of the PERSI Base Plan and FRF are performed annually. The last valuations were performed as of July 1, 2006.
Financial Section
-44-
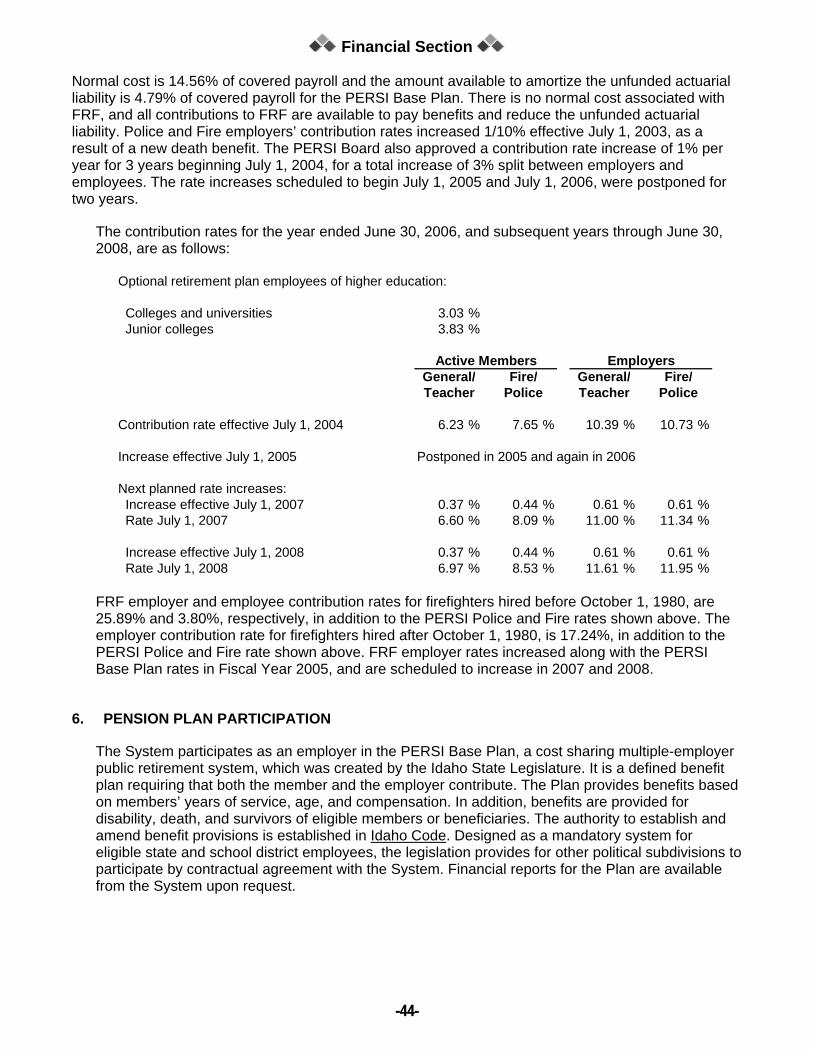
Normal cost is 14.56% of covered payroll and the amount available to amortize the unfunded actuarial liability is 4.79% of covered payroll for the PERSI Base Plan. There is no normal cost associated with FRF, and all contributions to FRF are available to pay benefits and reduce the unfunded actuarial liability. Police and Fire employers’ contribution rates increased 1/10% effective July 1, 2003, as a result of a new death benefit. The PERSI Board also approved a contribution rate increase of 1% per year for 3 years beginning July 1, 2004, for a total increase of 3% split between employers and employees. The rate increases scheduled to begin July 1, 2005 and July 1, 2006, were postponed for two years.
The contribution rates for the year ended June 30, 2006, and subsequent years through June 30, 2008, are as follows:
Optional retirement plan employees of higher education:
Colleges and universities 3.03 % Junior colleges 3.83 %
FRF employer and employee contribution rates for firefighters hired before October 1, 1980, are 25.89% and 3.80%, respectively, in addition to the PERSI Police and Fire rates shown above. The employer contribution rate for firefighters hired after October 1, 1980, is 17.24%, in addition to the PERSI Police and Fire rate shown above. FRF employer rates increased along with the PERSI Base Plan rates in Fiscal Year 2005, and are scheduled to increase in 2007 and 2008.
6. PENSION PLAN PARTICIPATION
The System participates as an employer in the PERSI Base Plan, a cost sharing multiple-employer public retirement system, which was created by the Idaho State Legislature. It is a defined benefit plan requiring that both the member and the employer contribute. The Plan provides benefits based on members’ years of service, age, and compensation. In addition, benefits are provided for disability, death, and survivors of eligible members or beneficiaries. The authority to establish and amend benefit provisions is established in Idaho Code. Designed as a mandatory system for eligible state and school district employees, the legislation provides for other political subdivisions to participate by contractual agreement with the System. Financial reports for the Plan are available from the System upon request.
Financial Section
-45-
After five years of credited service, members become fully vested in retirement benefits earned to date. Members are eligible for retirement benefits upon attainment of the ages specified for their employment classification. For each month of credited service, the annual service retirement allowance is 2.0% (2.3% police/firefighter) of the average monthly salary for the highest consecutive 42 months.
The contribution requirements of the System and its employees are established and may be amended by the PERSI Board of Trustees. For the year ended June 30, 2006, the required contribution rate was 6.23% for general members and 7.65% for police/fighters. The employer rate as a percentage of covered payroll was 10.39% for general members and 10.73% for police/fighter members. PERSI contributions required and paid were $403,583, $392,003, and $361,053 for the three years ended June 30, 2006, 2005, and 2004, respectively.
7. COMMITMENTS
The accrual basis of accounting provides that expenses include only amounts associated with goods and services received and liabilities include only the unpaid amounts associated with such expenses. Accordingly, the System had committed approximately $1,193,794 in outstanding purchase orders and purchase commitments to fund ongoing administrative projects for the System. These amounts are not reported in the basic financial statements at June 30, 2006.
The System had private equity commitments as of June 30, 2006, of $813,394,732, of which $422,775,756 of funding had been provided, leaving an unfunded commitment of $390,618,976 at fiscal year end. The System also had a private real estate commitment as of June 30, 2006 for an amount of $218,000,000. Funding of $128,304,944 had been provided by the end of FY 2006, leaving an unfunded commitment of $89,695,056.
Financial Section
-46-
REQUIRED SUPPLEMENTARY INFORMATION
Financial Section
-47-
PUBLIC EMPLOYEE RETIREMENT SYSTEM OF IDAHO
SCHEDULES OF FUNDING PROGRESS—PUBLIC EMPLOYEERETIREMENT FUND AND FIREFIGHTERS’ RETIREMENT FUNDFISCAL YEARS 2001–2006 (Dollars in millions)
(7)UAAL as a
(1) (2) (3) (4) (5) (6) PercentageActuarial Actuarial Actuarial PV of Unfunded Funded Annual of CoveredValuation Value Accrued Future ORP AAL (UAAL) Ratios Covered Payroll
Date of Assets Liability (AAL) Contributions (2)-(1)-(3) (1) : [(2)-(3)] Payroll (4) : (6)(a.) (b.) (c.) (d.)
(a.) Actuarial present value of benefits less actuarial present value of future normal costs based on entry age actuarial cost method.(b.) Actuarial accrued liabilities less actuarial value of assets and present value of future Optional Retirement Plan (ORP) Contributions. Amounts reported in this table do not include the value of the discretionary COLA or Gain Gain Sharing allocations granted after the valuation date. If negative, amount is referred to as a funding reserve.(c.) Funded Ratio is the ratio of the actuarial value of assets over the actuarial accrued liabilities less the present value of future ORP contributions.(d.) Covered Payroll includes compensation paid to all active employees on which contributions are calculated.
(6)(1) UAAL as a
Actuarial (2) (3) (4) (5) PercentageActuarial Market Actuarial Unfunded Funded Annual of CoveredValuation Value Accrued AAL (UAAL) Ratios Covered Payroll
Date of Assets Liability (AAL) (2)-(1) (1) : (2) Payroll (3) : (5)(e.)
(e.) Annual covered payroll includes compensation paid to all active firefighters hired prior to October 1, 1980. Annual Covered Payroll differs from Active Member Valuation Payroll, which is an annualized compensation of only those members who were active on the actuarial valuation date.
PERSI
FRF
Financial Section
-48-
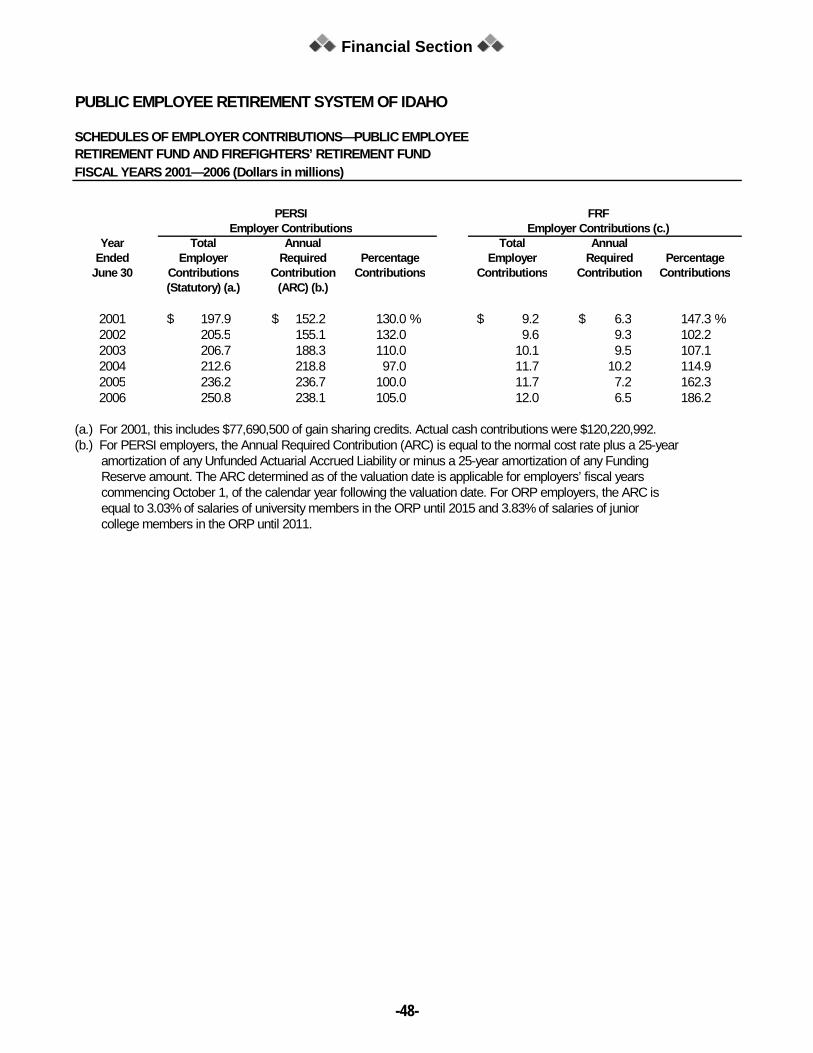
PUBLIC EMPLOYEE RETIREMENT SYSTEM OF IDAHO
SCHEDULES OF EMPLOYER CONTRIBUTIONS—PUBLIC EMPLOYEERETIREMENT FUND AND FIREFIGHTERS’ RETIREMENT FUNDFISCAL YEARS 2001—2006 (Dollars in millions)
Year Total Annual Total AnnualEnded Employer Required Percentage Employer Required Percentage
(a.) For 2001, this includes $77,690,500 of gain sharing credits. Actual cash contributions were $120,220,992.(b.) For PERSI employers, the Annual Required Contribution (ARC) is equal to the normal cost rate plus a 25-year amortization of any Unfunded Actuarial Accrued Liability or minus a 25-year amortization of any Funding Reserve amount. The ARC determined as of the valuation date is applicable for employers’ fiscal years commencing October 1, of the calendar year following the valuation date. For ORP employers, the ARC is equal to 3.03% of salaries of university members in the ORP until 2015 and 3.83% of salaries of junior college members in the ORP until 2011.
Employer ContributionsPERSI FRF
Employer Contributions (c.)
Financial Section
-49-
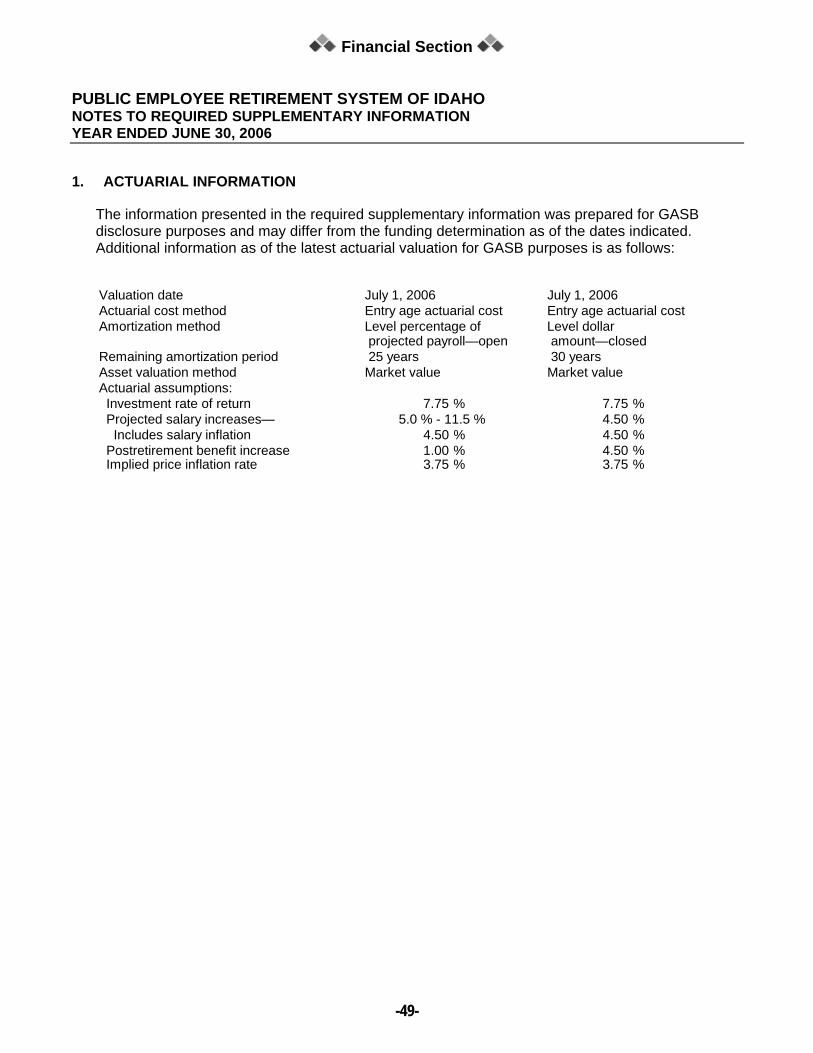
PUBLIC EMPLOYEE RETIREMENT SYSTEM OF IDAHO NOTES TO REQUIRED SUPPLEMENTARY INFORMATION YEAR ENDED JUNE 30, 2006
1. ACTUARIAL INFORMATION
The information presented in the required supplementary information was prepared for GASB disclosure purposes and may differ from the funding determination as of the dates indicated. Additional information as of the latest actuarial valuation for GASB purposes is as follows:
Valuation date July 1, 2006 July 1, 2006Actuarial cost method Entry age actuarial cost Entry age actuarial costAmortization method Level percentage of Level dollar
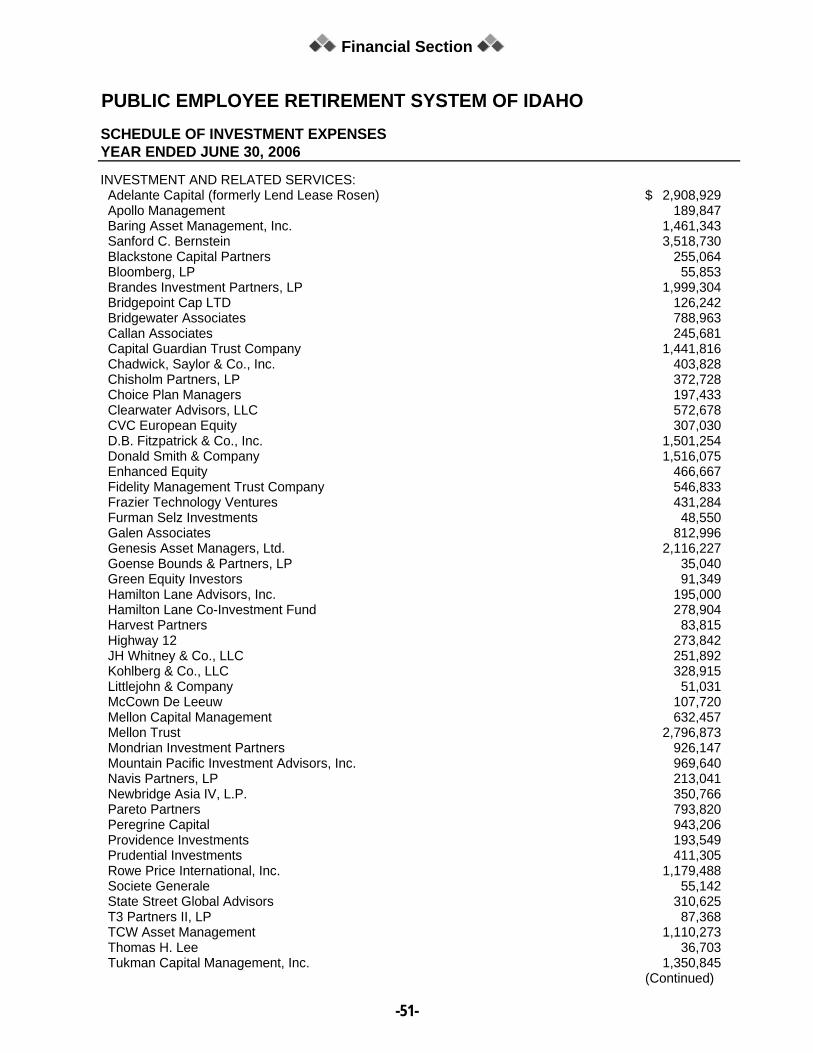
PUBLIC EMPLOYEE RETIREMENT SYSTEM OF IDAHOSCHEDULE OF INVESTMENT EXPENSESYEAR ENDED JUNE 30, 2006
INVESTMENT AND RELATED SERVICES: Adelante Capital (formerly Lend Lease Rosen) 2,908,929$ Apollo Management 189,847 Baring Asset Management, Inc. 1,461,343 Sanford C. Bernstein 3,518,730 Blackstone Capital Partners 255,064 Bloomberg, LP 55,853 Brandes Investment Partners, LP 1,999,304 Bridgepoint Cap LTD 126,242 Bridgewater Associates 788,963 Callan Associates 245,681 Capital Guardian Trust Company 1,441,816 Chadwick, Saylor & Co., Inc. 403,828 Chisholm Partners, LP 372,728 Choice Plan Managers 197,433 Clearwater Advisors, LLC 572,678 CVC European Equity 307,030 D.B. Fitzpatrick & Co., Inc. 1,501,254 Donald Smith & Company 1,516,075 Enhanced Equity 466,667 Fidelity Management Trust Company 546,833 Frazier Technology Ventures 431,284 Furman Selz Investments 48,550 Galen Associates 812,996 Genesis Asset Managers, Ltd. 2,116,227 Goense Bounds & Partners, LP 35,040 Green Equity Investors 91,349 Hamilton Lane Advisors, Inc. 195,000 Hamilton Lane Co-Investment Fund 278,904 Harvest Partners 83,815 Highway 12 273,842 JH Whitney & Co., LLC 251,892 Kohlberg & Co., LLC 328,915 Littlejohn & Company 51,031 McCown De Leeuw 107,720 Mellon Capital Management 632,457 Mellon Trust 2,796,873 Mondrian Investment Partners 926,147 Mountain Pacific Investment Advisors, Inc. 969,640 Navis Partners, LP 213,041 Newbridge Asia IV, L.P. 350,766 Pareto Partners 793,820 Peregrine Capital 943,206 Providence Investments 193,549 Prudential Investments 411,305 Rowe Price International, Inc. 1,179,488 Societe Generale 55,142 State Street Global Advisors 310,625 T3 Partners II, LP 87,368 TCW Asset Management 1,110,273 Thomas H. Lee 36,703 Tukman Capital Management, Inc. 1,350,845
(Continued)
Financial Section
-52-
PUBLIC EMPLOYEE RETIREMENT SYSTEM OF IDAHO
SCHEDULE OF INVESTMENT EXPENSESYEAR ENDED JUNE 30, 2006
INVESTMENT AND RELATED SERVICES (Continued): W. Capital Partners 400,000 Wells Fargo Bank 66,072 Western Asset Management 455,990 Zesiger Capital Group 1,736,788
OTHER ADMINISTRATIVE EXPENSES: Personnel expenses 2,950,424 Operating expenses 2,946,044 Capital outlay 83,394 Building depreciation expense 154,929 Equipment depreciation expense 17,578 Software amortization expense 587,595
6,739,964
SICK LEAVE FUND EXPENSES—Administrative personnel expenses 53,660
7,361,536$
Financial Section
-53-
INDEPENDENT AUDITORS’ REPORT ON INTERNAL CONTROL OVER FINANCIAL REPORTING
AND ON COMPLIANCE AND OTHER MATTERS BASED UPON AN AUDIT PERFORMED IN ACCORDANCE WITH GOVERNMENT AUDITING STANDARDS
Retirement Board Public Employee Retirement System of Idaho Boise, Idaho
We have audited the financial statements of the Public Employee Retirement System of Idaho (the “System”), a component unit of the State of Idaho, as of and for the year ended June 30, 2006, and have issued our report thereon dated October 20, 2006. We conducted our audit in accordance with auditing standards generally accepted in the United States of America and the standards applicable to financial audits contained in Government Auditing Standards, issued by the Comptroller General of the United States.
Internal Control Over Financial Reporting
In planning and performing our audit, we considered the System’s internal control over financial reporting in order to determine our auditing procedures for the purpose of expressing our opinion on the financial statements and not to provide an opinion on the internal control over financial reporting. Our consideration of the internal control over financial reporting would not necessarily disclose all matters in the internal control over financial reporting that might be material weaknesses. A material weakness is a reportable condition in which the design or operation of one or more of the internal control components does not reduce to a relatively low level the risk that misstatements caused by error or fraud in amounts that would be material in relation to the financial statements being audited may occur and not be detected within a timely period by employees in the normal course of performing their assigned functions. We noted no matters involving the internal control over financial reporting and its operation that we consider to be material weaknesses.
Compliance and Other Matters
As part of obtaining reasonable assurance about whether the System’s financial statements are free of material misstatement, we performed tests of its compliance with certain provisions of laws, regulations and contracts, noncompliance with which could have a direct and material effect on the determination of financial statement amounts. However, providing an opinion on compliance with those provisions was not an objective of our audit and, accordingly, we do not express such an opinion. The results of our tests disclosed no instances of noncompliance or other matters that are required to be reported under Government Auditing Standards.
This report is intended solely for the information and use of the Retirement Board, management, and applicable state officials and is not intended to be and should not be used by anyone other than these specified parties.