48
Annual Report 2016

Annual Report2016

RESULTS AT A GLANCE 1
CHAIR AND CHIEF EXECUTIVES’ ANNUAL REPORT 3
FINANCIAL STATEMENTS 9
STATUTORY INFORMATION 37
AUDIT REPORT 40
FIVE YEAR REVIEW 43
CORPORATE DIRECTORY 44
CONTENTS

2016 RESULTS AT A GLANCE KEY FACTS
• Operating Revenue up $0.6m (excluding land sales)
• Land Sales Net Income $0.6m (2015: $0.8m)
• EBITDA $3.2m (2015: $3.3m)
• Operating Profit before Tax $0.5m; up $0.2m on 2015
• $2.8m Positive Operating Net Cash Flow (2015: $2.8m)
• $2.2m Debt Repayment
• 303,000 Passengers; up 12,000 on 2015
• 115,819 aircraft movements; down 8.8% on 2015 (weather impact on pilot training)
2012 2013 2014 2015 20160
20
40
60
80
100
120
140
Aircraft Movements
000s
Lease Rental Income
2012 2013 2014 2015 20160
200
600
400
1,000
800
1,800
1,600
1,400
1,200
$000
s
2012 2013 2014 2015 20160
50
100
150
200
250
300
400
350
Passenger NumbersDomestic International
$000
s
Operating Revenue
2012 2013 2014 2015 20166,000
7,000
9,000
8,000
$000
s
Landing Charges
2012 2013 2014 2015 20160
200
400
600
800
1,000
1,200
1,600
1,400
$000
s
EBITDA
2012 2013 2014 2015 20160
500
2,000
1,500
1,000
2,500
3,500
3,000
$000
s
Aeronautical Revenue
2012 2013 2014 2015 20160
500
1,000
1,500
2,500
2,000
$000
s
Net Profit Before Tax
2012 2013 2014 2015 2016
0
-100
-200
-300
300
200
100
400
600
500
$000
s
Page 1


CHAIR AND CHIEF EXECUTIVES’ 2016 ANNUAL REPORTThe Board and Management of Waikato Regional Airport Limited (WRAL) are pleased to report a solid financial and operational performance for the 2015/2016 financial year with an operating surplus before tax of $0.5m. Key areas of focus were operational efficiency, improvements to passenger experience and debt repayment.
Emphasis was placed on providing an improved passenger experience with the rebrand of the airport terminal bookstore, finalising plans for a new food and beverage offering and completing the new Air New Zealand Regional Lounge.
The dissolution of the joint venture partnership between WRAL’s subsidiary Titanium Park Limited and Titanium Park Development Ltd on 31 March 2016 has created an opportunity for WRAL to reconsider the use of land surrounding the airport. An independent director has been appointed to the board of Titanium Park Limited and the new Board will develop a comprehensive property business plan in the coming year.
Continuing on from previous years, a major focus for the Board and Management has been the ongoing review and implementation of health and safety practices and procedures with the introduction of the new Health and Safety at Work Act 2015.
WRAL Group
The Group Operating Revenue for the 2015/2016 financial year (excluding land sales) is $7.5m up on the prior year by $0.6m. This was primarily driven by a growth in commercial landing charges, increased passenger numbers, car park revenue and tourism funding. Group Operating Expenditure (including depreciation) of $7.6m is $0.1m higher than the prior year due to increased expenditure for tourism related costs, WRAL staff restructuring costs and an increase in depreciation and amortisation expenses. Overall the Group’s Operating Profit before tax of $0.5m is an increase of $0.2m on the prior year.
Net cash flow from Operating and Investing Activities was $2.8m, this is up from the prior year by $0.5m due to land sales. The airport’s core debt facility of $7.4m decreased from the prior year by $2.2m, mostly assisted through land sales. The interest rate hedging facility was closed out during the year to take advantage of lower floating interest rates.
The five yearly valuation of aeronautical infrastructure assets resulted in a valuation of $40.6m, an increase of $6.1m to the asset base. The valuation was completed by Beca using a depreciated replacement cost (DRC) valuation. The total asset revaluation gains were partially offset by an increase in deferred tax liability of $1.7m.
The WRAL Group Balance Sheet remains strong and shows Shareholders’ Equity of $64.4m, up $4.7m on the prior year and is mostly as a result of the aeronautical infrastructure asset revaluation.
Page 3
WRAL Parent
The core purpose and key objectives for the 2015/2016 year has been to operate the airport in an efficient and compliant way whilst maintaining a viable aeronautical business. As shown in the following table, revenue was up on prior year by $0.2m as a result of increased car park revenue and commercial landing charges. Operating expenditure increased by $0.1m mainly due to staff restructuring costs bringing EBITDA in line with the prior year of $2.5m. Overall, WRAL Parent’s Operating Deficit before tax of $0.2m is up on prior year by $0.3m.
WRAL Group 2016$000
2015$000
Variance$000
Operating and Other Revenue 8,079 7,400 679
Direct Expenses (4,858) (4,106) (752)
EBITDA 3,221 3,294 (73)
Depreciation (2,278) (2,101) (177)
Finance Costs (434) (712) 278
Disposals of Assets 2 10 (8)
Operating Surplus before Taxation and before Interest Rate Swap gains 511 491 22
Interest Rate Swap (losses) (21) (202) 181
Operating Surplus before Taxation 490 289 201
Net Cash Flow for Operating & Investment Activities 2,791 2,225 542
WRAL Parent 2016$000
2015$000
Variance$000
Operating and Other Revenue 5,718 5,561 157
Direct Expenses (3,204) (3,095) (109)
EBITDA 2,514 2,466 48
Depreciation (2,257) (2,089) (168)
Finance Costs (430) (674) 244
Disposals of Assets 2 10 (8)
Operating Deficit before Taxation and before Interest Rate Swap losses (171) (287) 116
Interest Rate Swap (losses) (21) (202) 181
Operating Deficit before Taxation (192) (489) 297
Net Cash Flow for Operating & Investment Activities 2,642 752 1,890

Airline and Passenger Numbers
Hamilton Airport Management continued to foster strong and positive relationships with Air New Zealand and other airline partners across operational, marketing and strategic levels.
Air New Zealand continued its strategy of investing in regional services and infrastructure, with the opening of the new Air New Zealand Regional Lounge in June 2016, providing significantly increased lounge space for members. This provides an improved passenger experience within the terminal building alongside the rebrand of the airport’s bookstore and finalised plans for a new café to be operated by Waikato company Mavis & Co.
The withdrawal of Air New Zealand’s 19-seater Beech aircraft saw the cessation of its Hamilton - Auckland service in February 2016. It will also cease operation of Beech aircraft on the Palmerston North route in late August 2016. The replacement Q300 48 seater aircraft will more than double capacity on the route.
Further capacity increases from 1 October 2016 are:
• Hamilton – Christchurch route, an increase of 30% with the introduction of an additional six return flights per week.
• Hamilton – Wellington route, an increase of 10-15% with all peak morning and evening flights to be serviced by the larger 68 seater ATR.
Despite the withdrawal of the Hamilton - Auckland route, passenger numbers have grown in volume from 291,000 in 2014/2015 to 303,000 in 2015/2016. This is primarily due to significant growth on the Wellington and Christchurch sectors and services provided by Kiwi Regional Airlines between Hamilton and Nelson from November 2015. While Kiwi Regional Airlines’ service was well received over the summer months, the decision to cease operations from 31 July 2016 was made.
Airport Operations
Hamilton Airport continues to meet CAA certification obligations regarding safety and security. Operational projects for the 2015/2016 financial year included:
• New and improved general aviation airfield signage that has been installed to assist aircraft during ground movement operations.
• Additional passenger safety control barriers installed on the terminal apron to assist with passenger movements to and from the aircraft.
Hamilton Airport remains New Zealand’s second busiest Civil Aviation Part 139 certified airport in terms of aircraft movements. This is primarily driven by high levels of pilot training flights predominately by CTC Aviation Training. Total movements for the 2015/2016 financial year were 115,819 or an average of 317 movements every day. This is down slightly on the 2014/2015 financial year of 126,717 due to weather and a delay in new pilot intakes.
Titanium Park
WRAL dissolved by mutual agreement its joint venture partnership in Titanium Park, effective 31 March 2016, retaining ownership of critical land adjacent to the airport runway. Despite challenges arising from a tougher than expected economic environment over the past 8 years, the dissolution opens up potential for WRAL to develop land surrounding the airport. The recent construction of the new roundabout on the intersection of State Highways 3 and 21 has improved access into the Western Precinct area. A comprehensive and long-term business plan for all WRAL land is under way.
Page 5

Hamilton & Waikato Tourism
Hamilton & Waikato Tourism (HWT) has had another successful year of operation. Strong and enduring relationships have continued with HWT’s seven partner Councils and tourism operators resulting in a combined investment of $1.6m for tourism, marketing and development activities. HWT finished the year in a sound financial position.
With the first year of additional funding from partner councils, HWT allocated the increased investment to addressing the challenges of the domestic market and broadening its scope to include developing the region’s visitor proposition. A key focus has been the development of a Tourism Opportunities Plan which provides a clear direction to realise the visitor potential of the region in partnership with key stakeholders and agencies.
Key highlights for the year include:
• Investment of $0.4m in HWT’s activities from the region’s tourism industry.
• Expanded investment in domestic campaign activity; Explore Your Own Backyard and Short Escapes.
• Additional investment from WEL Energy Trust to support HWT’s development activities.
• Development of a Tourism Opportunities Plan identifying product development and investment opportunities.
• Participation in Tourism New Zealand’s $1.4m Tour the North campaign in Australia
• Increased focus on attracting conferences through additional Convention Bureau capacity.
• Hosting 137 international and 14 domestic media outlets.
• Hosting 346 international travel trade (individuals).
• Exhibiting at TRENZ in Rotorua with over 300 international buyers attending.
• Preparation of development reports for Sanctuary Mountain Maungatautari and Otorohanga Kiwi House in partnership with owners/stakeholders.
New Zealand’s tourism sector is experiencing exceptional growth with international visitor arrivals and expenditure at its highest level ever. This growth is forecast to continue and estimated to reach four million international arrivals in the next four years. Domestic tourism has also been buoyant and is showing steady growth with domestic guest nights up 5.7% for the past two years.
The Hamilton and Waikato region’s $1.2b visitor industry has shared in this growth with increased commercial guest nights and international visitor expenditure. HWT will continue to work with local government and industry by providing compelling “reasons to visit” within key markets with a focus on overnight stays, minimising seasonality, and encouraging regional dispersal to enable the benefits of tourism to be shared more broadly.
HWT’s Chief Executive Kiri Goulter left June 2016 after seven years’ service. Jason Dawson has been appointed Chief Executive and will join the organisation in August 2016.
Health & Safety
The health and safety of travellers, employees, contractors and airport tenants is of utmost importance to the airport’s Board and Management. Regular safety committee meetings and operational reviews are conducted both internally and with assistance from an independent safety consultant. A high degree of focus has been placed on ensuring health and safety requirements are compliant with the recently introduced Health and Safety at Work Act 2015. During the year there was one lost time injury with three injuries occurring in total.

JOHN SPENCER Chairman
MARK MORGAN Chief Executive
Community Engagement
During the year, Hamilton Airport hosted several preschool and school groups providing guided tours of the airport and its operations.
The Airport Community Liaison Group continued to meet regularly throughout the year with the objective of addressing aircraft air noise raised by the community. The airport maintains a structured Noise Management Plan, being a district planning requirement, to identify possible mitigation measures and forming recommendations for resolution.
Board
During the 2015/2016 financial year James Yearsley attended Board meetings as part of the Institute of Directors Emerging Director program. We thank James for his contribution and support. His knowledge of aerodrome operations and aviation in general was much appreciated.
Conclusion
On behalf of the Board and Management, Hamilton Airport would like to thank our five Shareholders and acknowledge the support from the wider Councils who participate in the support of the regional tourism organisation.
The focus for Hamilton Airport’s future lies in its key objectives of operating an efficient and compliant airport while maximising revenue diversification through its aeronautical and non-aeronautical business opportunities.
Page 7


INDEX TO THE FINANCIAL STATEMENTS
STATEMENT OF COMPREHENSIVE REVENUE AND EXPENSE
STATEMENT OF CHANGES IN EQUITY
BALANCE SHEET
STATEMENT OF CASH FLOWS
NOTES TO THE FINANCIAL STATEMENTS
PERFORMANCE TARGETS AND RESULTS
STATUTORY INFORMATION
AUDIT REPORT
FIVE YEAR REVIEW
CORPORATE DIRECTORY
Page 9

STATEMENT OF COMPREHENSIVE REVENUE AND EXPENSE For the Year Ended 30 June 2016
The attached Statement of Accounting Policies and Notes form part of, and are to be read in conjunction with the Financial Statements.
Note2016$000
2015$000
REVENUE
Operating Revenue 14 7,428 6,854
Other Gains 15 20 16
Land sales - Titanium Park 618 841
Finance income 13 54
Total Revenue 8,079 7,765
EXPENSES
Operating expenses 2,680 2,436
Employee benefit expenses 1,904 1,763
Bad debts written off 2 1
Depreciation and amortisation 18 2,278 2,101
Directors’ fees 28 170 173
Finance costs 434 712
Audit fees 29 98 88
Other losses 15 23 202
Total expenses 7,589 7,476
OPERATING SURPLUS BEFORE TAXATION 490 289
Taxation 19 154 120
OPERATING SURPLUS AFTER TAXATION 336 169
Gain on property revaluation 4,400 -
Total Other Comprehensive Revenue and Expense 4,400 -
TOTAL COMPREHENSIVE REVENUE AND EXPENSE 4,736 169
Total comprehensive revenue and expense attributable to
Equity holders of the parent 4,736 169

STATEMENT OF CHANGES IN EQUITY For the Year Ended 30 June 2016
Note2016$000
2015$000
Balance at 1 July 59,669 59,500
Total comprehensive revenue and expense 4,736 169
BALANCE AT 30 JUNE 64,405 59,669
Total and comprehensive revenue and expense attributable to
Equity holders of the parent 4,736 169
Page 11
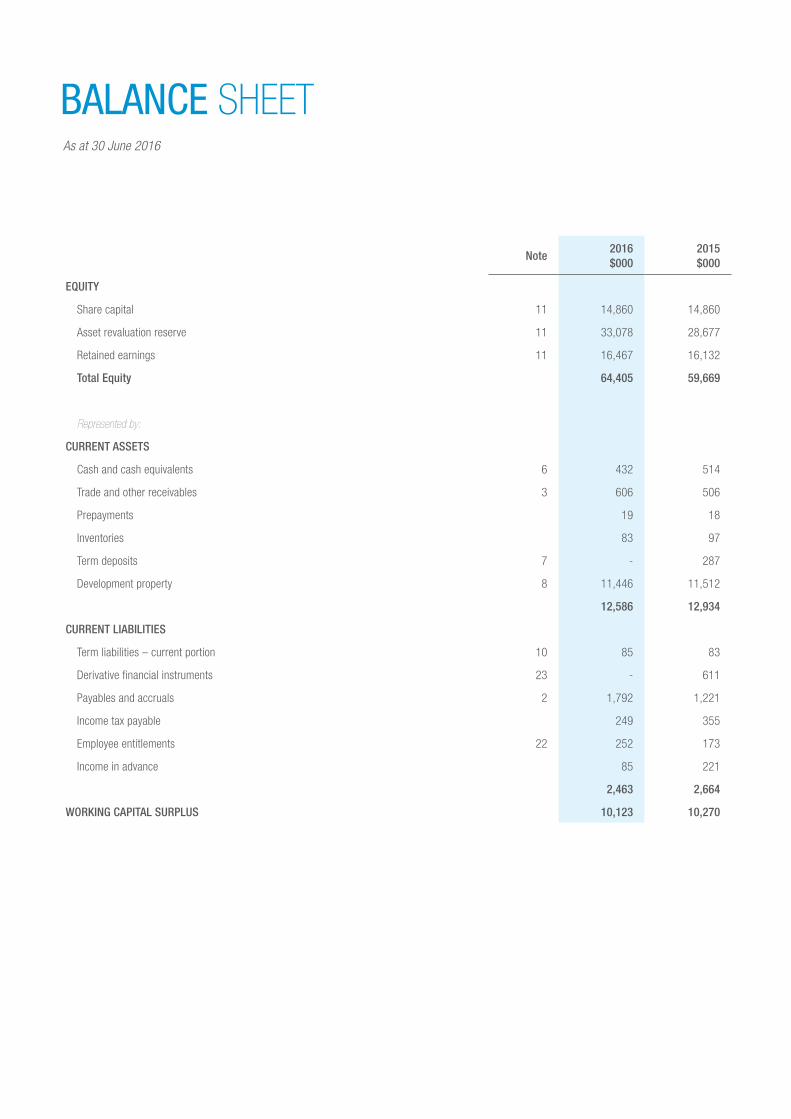
BALANCE SHEET As at 30 June 2016
Note2016$000
2015$000
EQUITY
Share capital 11 14,860 14,860
Asset revaluation reserve 11 33,078 28,677
Retained earnings 11 16,467 16,132
Total Equity 64,405 59,669
Represented by:
CURRENT ASSETS
Cash and cash equivalents 6 432 514
Trade and other receivables 3 606 506
Prepayments 19 18
Inventories 83 97
Term deposits 7 - 287
Development property 8 11,446 11,512
12,586 12,934
CURRENT LIABILITIES
Term liabilities – current portion 10 85 83
Derivative financial instruments 23 - 611
Payables and accruals 2 1,792 1,221
Income tax payable 249 355
Employee entitlements 22 252 173
Income in advance 85 221
2,463 2,664
WORKING CAPITAL SURPLUS 10,123 10,270
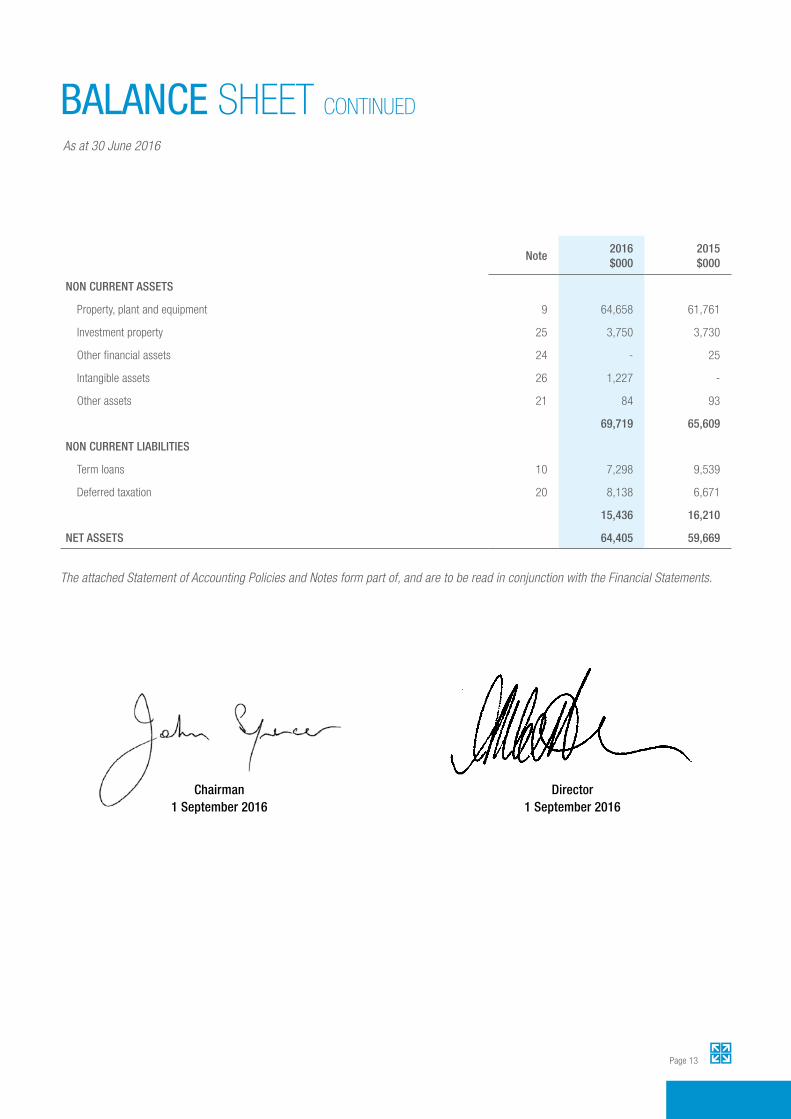
BALANCE SHEET CONTINUED
As at 30 June 2016
The attached Statement of Accounting Policies and Notes form part of, and are to be read in conjunction with the Financial Statements.
Chairman 1 September 2016
Director 1 September 2016
Note2016$000
2015$000
NON CURRENT ASSETS
Property, plant and equipment 9 64,658 61,761
Investment property 25 3,750 3,730
Other financial assets 24 - 25
Intangible assets 26 1,227 -
Other assets 21 84 93
69,719 65,609
NON CURRENT LIABILITIES
Term loans 10 7,298 9,539
Deferred taxation 20 8,138 6,671
15,436 16,210
NET ASSETS 64,405 59,669
Page 13

STATEMENT OF CASH FLOWSFor the Year Ended 30 June 2016
The attached Statement of Accounting Policies and Notes form part of, and are to be read in conjunction with the Financial Statements.
Note2016$000
2015$000
CASH FLOW FROM OPERATING ACTIVITIES
Operating revenue 7,832 7,802
Interest received 13 54
Payments to suppliers and employees (4,245) (4,457)
Income taxes paid (504) (355)
GST (net) 43 63
Interest paid (434) (712)
Costs of development property 66 414
Net cash from operating activities 17 2,771 2,809
CASH FLOW FROM INVESTING ACTIVITIES
Sales of Shares (Paper Plus) 25 -
Purchase of property, plant and equipment (302) (457)
Proceeds from sale of property, plant and equipment 10 -
Funds placed on deposit 287 (127)
Net cash from investing activities 20 (584)
CASH FLOW FROM FINANCING ACTIVITIES
Repayment of borrowings (2,871) (1,973)
Net cash from financing activities (2,871) (1,973)
Net increase in cash and cash equivalents (82) 252
Cash and cash equivalents at the beginning of the year 514 262
CASH AND CASH EQUIVALENTS AT THE END OF THE YEAR 6 432 514
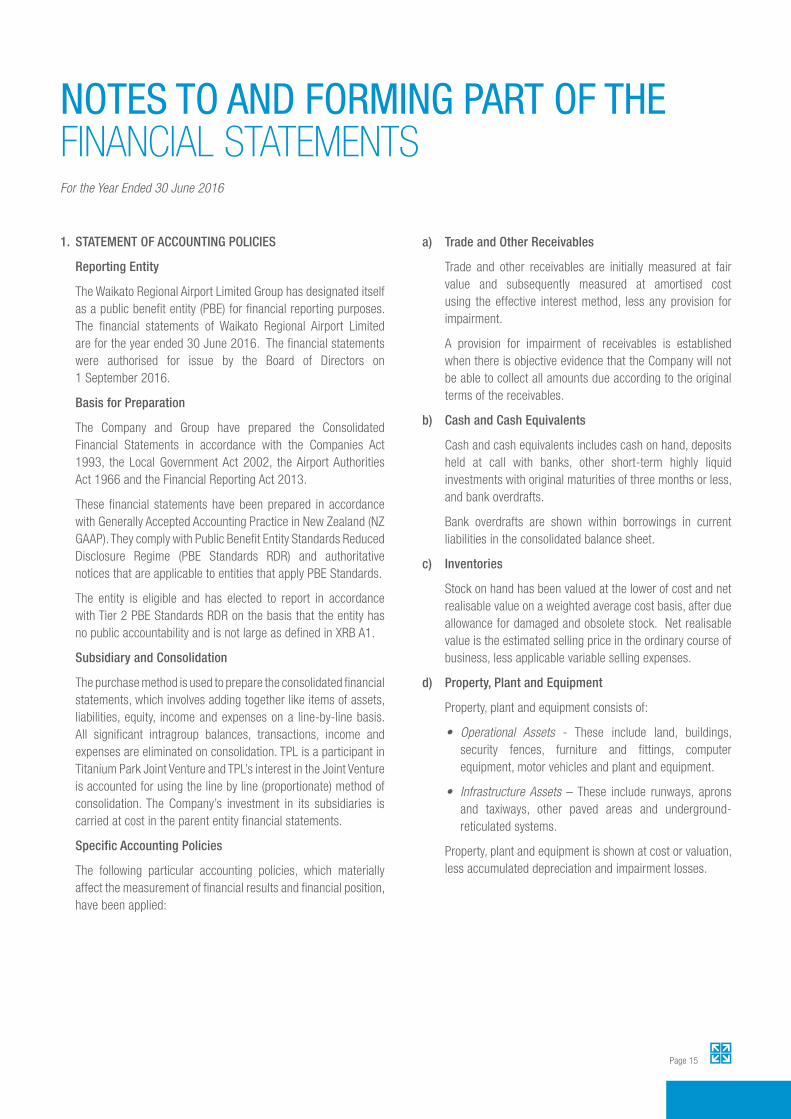
NOTES TO AND FORMING PART OF THE FINANCIAL STATEMENTSFor the Year Ended 30 June 2016
1. STATEMENT OF ACCOUNTING POLICIES
Reporting Entity
The Waikato Regional Airport Limited Group has designated itself as a public benefit entity (PBE) for financial reporting purposes. The financial statements of Waikato Regional Airport Limited are for the year ended 30 June 2016. The financial statements were authorised for issue by the Board of Directors on 1 September 2016.
Basis for Preparation
The Company and Group have prepared the Consolidated Financial Statements in accordance with the Companies Act 1993, the Local Government Act 2002, the Airport Authorities Act 1966 and the Financial Reporting Act 2013.
These financial statements have been prepared in accordance with Generally Accepted Accounting Practice in New Zealand (NZ GAAP). They comply with Public Benefit Entity Standards Reduced Disclosure Regime (PBE Standards RDR) and authoritative notices that are applicable to entities that apply PBE Standards.
The entity is eligible and has elected to report in accordance with Tier 2 PBE Standards RDR on the basis that the entity has no public accountability and is not large as defined in XRB A1.
Subsidiary and Consolidation
The purchase method is used to prepare the consolidated financial statements, which involves adding together like items of assets, liabilities, equity, income and expenses on a line-by-line basis. All significant intragroup balances, transactions, income and expenses are eliminated on consolidation. TPL is a participant in Titanium Park Joint Venture and TPL’s interest in the Joint Venture is accounted for using the line by line (proportionate) method of consolidation. The Company’s investment in its subsidiaries is carried at cost in the parent entity financial statements.
Specific Accounting Policies
The following particular accounting policies, which materially affect the measurement of financial results and financial position, have been applied:
a) Trade and Other Receivables
Trade and other receivables are initially measured at fair value and subsequently measured at amortised cost using the effective interest method, less any provision for impairment.
A provision for impairment of receivables is established when there is objective evidence that the Company will not be able to collect all amounts due according to the original terms of the receivables.
b) Cash and Cash Equivalents
Cash and cash equivalents includes cash on hand, deposits held at call with banks, other short-term highly liquid investments with original maturities of three months or less, and bank overdrafts.
Bank overdrafts are shown within borrowings in current liabilities in the consolidated balance sheet.
c) Inventories
Stock on hand has been valued at the lower of cost and net realisable value on a weighted average cost basis, after due allowance for damaged and obsolete stock. Net realisable value is the estimated selling price in the ordinary course of business, less applicable variable selling expenses.
d) Property, Plant and Equipment
Property, plant and equipment consists of:
• Operational Assets - These include land, buildings, security fences, furniture and fittings, computer equipment, motor vehicles and plant and equipment.
• Infrastructure Assets – These include runways, aprons and taxiways, other paved areas and underground-reticulated systems.
Property, plant and equipment is shown at cost or valuation, less accumulated depreciation and impairment losses.
Page 15

NOTES TO AND FORMING PART OF THE FINANCIAL STATEMENTSFor the Year Ended 30 June 2016
Classification
The ten classifications of property, plant and equipment are: freehold land, freehold buildings, runways, aprons and taxiways, other paved areas, motor vehicles, plant and equipment, computer equipment, furniture and fittings, fencing and underground reticulated systems.
Additions
The cost of an item of property, plant and equipment is recognised as an asset if, and only if, it is probable that future economic benefits or service potential associated with the item will flow to the Company and the cost of the item can be measured reliably.
In most instances, an item of property, plant and equipment is recognised at cost. Where an asset is acquired at no cost, or for a nominal cost, it is recognised at fair value when control over the asset is obtained.
Disposals
Gains and losses on disposals are determined by comparing the proceeds with the carrying amount of the asset. Gains and losses on disposals are included in the surplus/loss.
Subsequent Costs
Costs incurred subsequent to initial acquisition are capitalised only when it is probable that future economic benefits or service potential associated with the item will flow to the Company and the cost of the item can be measured reliably.
Depreciation
Depreciation is provided on a straight line basis on all property, plant and equipment at rates that will write off the cost of the assets over their estimated useful lives.
The estimated useful lives of the major classes of assets are:
Buildings 5 - 59 years
Runways, Aprons and Taxiways 5 - 74 years
Other Paved Areas 9 - 14 years
Motor Vehicles 5 - 15 years
Furniture and Fittings 3 - 50 years
Plant and Equipment 2 - 50 years
Computer Equipment 2 - 6 years
Fencing 10 - 47 years
Reticulated Systems 4 - 74 years
The residual value and useful life of an asset is reviewed, and adjusted if applicable, at each financial year-end. A valuation of runways, aprons & taxiways, other paved areas, and reticulated systems was undertaken on 30 June 2016 and the useful lives of those assets were adjusted at that time to reflect the valuation undertaken on those assets.
Revaluation
Those asset classes that are revalued are valued on a five-yearly valuation cycle on the basis described below. All other assets are carried at depreciated historical cost. The carrying values of revalued items are reviewed at each balance date to ensure that those values are not materially different to fair value.
Operational Land and Buildings
At fair value determined from market-based evidence. All valuations are undertaken or reviewed by an independent registered valuer and are usually carried out on a five-yearly cycle.
Infrastructure Assets
At fair value determined on a depreciated replacement cost basis by an independent registered valuer and are usually carried out on a five-yearly cycle.
e) Intangible Assets
Software Acquisition
Acquired computer software licences are capitalised on the basis of the costs incurred to acquire and bring to use the specific software.

NOTES TO AND FORMING PART OF THE FINANCIAL STATEMENTSFor the Year Ended 30 June 2016
Costs associated with maintaining computer software are recognised as an expense when incurred.
Costs associated with the development and maintenance of the Company’s website are recognised as an expense when incurred.
Amortisation
Computer software licences are amortised on a straight-line basis over their estimated useful life of 3 years. Amortisation begins when the asset is available for use and ceases at the date that the asset is disposed of. The amortisation charge for each period is recognised in the surplus/loss.
Other Intangible Assets
Other Intangible Assets include Designation Assets.
The Light Designation asset has a carrying value of $268k at 30 June 2016 with a remaining amortisation period of four years. The Runway Designation asset has a carrying value of $952k at 30 June 2016 with a remaining amortisation period of 10 years.
f) Taxation
Income tax expense in relation to the surplus or loss for the period comprises current tax and deferred tax.
Current tax is the amount of income tax payable based on the taxable profit for the current year, plus any adjustments to income tax payable in respect of prior years. Current tax is calculated using rates that have been enacted or substantively enacted by balance date.
Deferred tax is the amount of income tax payable or recoverable in future periods in respect of temporary differences and unused tax losses. Temporary differences are differences between the carrying amount of assets and liabilities in the financial statements and the corresponding tax bases used in the computation of taxable profit.
Deferred tax liabilities are generally recognised for all taxable temporary differences. Deferred tax assets are recognised to the extent that it is probable that taxable profits will be available against which the deductible temporary differences
or tax losses can be utilised.
Deferred tax is calculated at the tax rates that are expected to apply in the period when the liability is settled or the asset is realised, using tax rates that have been enacted or substantively enacted by balance date.
Current tax and deferred tax is charged or credited to the statement of comprehensive revenue and expense, except when it relates to items charged or credited directly to equity, in which case the tax is dealt with in equity.
g) Goods and Services Tax
All items in the financial statements are stated exclusive of GST, except for receivables and payables, which are stated on a GST inclusive basis. Where GST is not recoverable as input tax then it is recognised as part of the related asset or expense.
The net amount of GST recoverable from, or payable to, the Inland Revenue Department (IRD) is included as part of receivables or payables in the balance sheet.
The net GST paid to, or received from the IRD, including the GST relating to investing and financing activities, is classified as an operating cash flow in the statement of cash flows. Commitments and contingencies are disclosed exclusive of GST.
h) Investments
Investments in bank deposits are initially measured at fair value plus transaction costs.
After initial recognition, investments in bank deposits are measured at amortised cost using the effective interest method less any provision for impairment.
i) Employee Entitlements
Short-term benefits
Employee benefits that the Company expects to be settled within 12 months of balance date are measured at nominal values based on accrued entitlements at current rates of pay.
Page 17

NOTES TO AND FORMING PART OF THE FINANCIAL STATEMENTSFor the Year Ended 30 June 2016
These include salaries and wages accrued up to balance date, annual leave earned to, but not yet taken at balance date, and sick leave.
The Company recognises a liability and an expense for bonuses where contractually obliged or where there is a past practice that has created a constructive obligation.
j) Statement of Cash Flows
Operating activities include cash received from all income sources of the Company and record the cash payments made for the supply of goods and services.
Investing activities are those activities relating to the acquisition and disposal of non-current assets.
Financing activities comprise the change in equity and debt capital structure of the Company.
The GST (net) component of operating activities reflects the net GST paid and received with the Inland Revenue Department. The GST (net) component has been presented on a net basis, as the gross amounts do not provide meaningful information for financial statement purposes.
k) Operating Leases
Operating lease payments, where the lessors effectively retain substantially all of the risks and benefits of ownerships of the leased items, are recognised in the determination of the operating surplus in equal instalments over the lease term.
There are no non-cancellable operating leases.
l) Revenue
Revenue is measured at the fair value of consideration received.
Revenue from exchange transactions
Operating Revenue
Operating revenue is recognised when earned.
Interest Income
Interest income is recognised using the effective interest method.
Rental Income
Rental income arising on property owned by the Company is accounted for on a straight line basis over the lease term.
Revenue from non-exchange transactions
Council funding
Hamilton and Waikato Tourism Limited receives council funding and it is recognised as revenue when it becomes receivable unless there is an obligation to return the funds if conditions of the grant are not met. If there is such an obligation, the funding is initially recorded as income received in advance and recognised as revenue when conditions of the funding are satisfied.
m) Borrowing Costs
Borrowing costs that are directly attributable to the acquisition, construction or production of a qualifying asset are capitalised as part of the cost of that asset. Capitalisation of borrowing costs ceases when substantially all the activities necessary to prepare the qualifying asset for its intended use are completed.
n) Financial assets
The Company classifies its financial assets into the following four categories:
• Financial assets at fair value through profit or loss
• Held to maturity investments
• Loans and receivables
• Financial assets at fair value through other comprehensive revenue and expense
The classification depends on the purpose for which the investments were acquired. Management determines the classification of its investments at initial recognition and re-evaluates this designation at every reporting date.
Financial assets are initially measured at fair value plus transaction costs unless they are carried at fair value through profit or loss in which case the transaction costs are recognised in the surplus/loss.

NOTES TO AND FORMING PART OF THE FINANCIAL STATEMENTSFor the Year Ended 30 June 2016
Purchases and sales of investments are recognised on trade date, the date on which the Company commits to purchase or sell the asset. Financial assets are derecognised when the rights to receive cash flows from the financial assets have expired or have been transferred and the Company has transferred substantially all the risks and rewards of ownership.
The fair value of financial instruments traded in active markets is based on quoted market prices at the balance sheet date. The quoted market price used is the current bid price.
The fair value of financial instruments that are not traded in an active market are determined using valuation techniques. The Company uses a variety of methods and makes assumptions that are based on market conditions existing at each balance date. Quoted market prices or dealer quotes for similar instruments are used for long term debt instruments held. Other techniques, such as estimated discounted cash-flows, are used to determine fair value for the remaining financial instruments.
Financial assets at fair value through profit or loss
This category has two sub-categories: financial assets held for trading and those designated at fair value through profit or loss at inception. A financial asset is classified in this category if acquired principally for the purpose of selling in the short term or if so designated by management. Derivatives are also categorised as held for trading unless they are designated as hedges. Assets in this category are classified as current assets if they are either held for trading or are expected to be realised within 12 months of the balance sheet date.
After initial recognition they are measured at their fair values. Gains or losses on re-measurement are recognised in the surplus/loss.
Financial assets in this category include interest rate swaps.
Held to maturity
Held to maturity investments are non-derivatives financial assets with fixed or determinable payments and fixed maturities that the Company has the positive intention and ability to hold to maturity.
Loans and receivables
These are non-derivative financial assets with fixed or determinable payments that are not quoted in an active market.
After initial recognition they are measured at amortised cost using the effective interest method. Gains and losses when the asset is impaired or derecognised are recognised in the surplus/loss. Loans and receivables are classified as “trade and other receivables” in the balance sheet.
o) Impairment of financial assets
At each balance sheet date, the Company assesses whether there is any objective evidence that a financial asset or group of financial assets is impaired. Any impairment losses are recognised in the surplus/loss.
p) Accounting for derivative financial instruments
The Company uses derivative financial instruments to manage exposure to interest rate risks arising from financial activities.
Derivatives are initially recognised at fair value on the date a derivative contract is entered into and are subsequently re-measured at their fair value at each balance date.
The gain or loss from re-measuring derivatives at fair value is recognised in the surplus/loss.
The Company is party to financial instruments with off balance sheet risk to meet financing needs. These financial instruments include a bank overdraft facility.
Revenues and expenses in relation to all financial instruments are recognised in the surplus/loss and are shown in the balance sheet at their estimated fair value.
Page 19

NOTES TO AND FORMING PART OF THE FINANCIAL STATEMENTSFor the Year Ended 30 June 2016
q) Investment property
Properties leased to third parties under operating leases are classified as investment property unless the property is held to meet service delivery objectives, rather than to earn rentals or for capital appreciation.
Investment property is measured initially at its cost, including transaction costs.
After initial recognition, the Company measures all investment property at fair value as determined annually by an independent valuer.
Gains or losses arising from a change in the fair value of investment property are recognised in the surplus/loss.
r) Impairment of non-financial assets
Non-financial assets that have an indefinite useful life are not subject to amortisation and are tested annually for impairment. Assets that have a finite useful life are reviewed for impairment whenever events or changes in circumstances indicate that the carrying amount may not be recoverable. An impairment loss is recognised for the amount by which the asset’s carrying amount exceeds its recoverable amount. The recoverable amount is the higher of an asset’s fair value less costs to sell and value in use.
Value in use is depreciated replacement cost for an asset where the future economic benefits or service potential of the asset are not primarily dependent on the assets ability to generate net cash inflows and where the entity would, if deprived of the asset, replace its remaining future economic benefits or service potential.
The value in use for cash generating assets is the present value of expected future cash flows.
If an asset’s carrying amount exceeds its recoverable amount the asset is impaired and the carrying amount is written down to the recoverable amount. For revalued assets the impairment loss is recognised against the revaluation reserve for that class of asset. Where that results in a debit balance in the revaluation reserve, the balance is recognised in the surplus/loss.
For assets not carried at a revalued amount, the total impairment loss is recognised in the surplus/loss.
The reversal of an impairment loss on a revalued asset is credited to the revaluation reserve. However, to the extent that an impairment loss for that class of asset was previously recognised in the surplus/loss, a reversal of the impairment loss is also recognised in the surplus/loss.
For assets not carried at a revalued amount the reversal of an impairment loss is recognised in the surplus/loss.
s) Non-Current assets held for sale
An asset is classified as held for sale if its carrying amount will be recovered principally through a sale transaction rather than continuing use. On classification as ‘Held for Sale’, non-current assets and disposal groups are recognised at the lower of carrying amount and fair value less costs to sell. Impairment losses on initial classification as ‘Held for Sale’ are included in the surplus/loss.
t) Trade and other payables
These amounts represent liabilities for goods and services provided to the Company prior to the end of the financial year which are unpaid. The amounts are unsecured and are usually paid within 30 days.
Trade payables are recognised initially at fair value and subsequently measured at amortised cost using the effective interest method.
u) Borrowings
Borrowings are initially recognised at their fair value. After initial recognition, all borrowings are measured at amortised cost using the effective interest method.
Borrowings are classified as current liabilities unless the Company has an unconditional right to defer settlement of the liability for at least 12 months after the balance sheet date.
NOTES TO AND FORMING PART OF THE FINANCIAL STATEMENTSFor the Year Ended 30 June 2016
v) Share Capital
Ordinary shares are classified as equity. Incremental costs directly attributable to the issue of new shares are shown in equity as a deduction, net of tax, from the proceeds.
w) Critical accounting estimates and assumptions
In preparing these financial statements the Directors and Management have made estimates and assumptions concerning the future. These estimates and assumptions may differ from the subsequent actual results. Estimates and assumptions are continually evaluated and are based on historical experience and other factors, including expectations or future events that are believed to be reasonable under the circumstances. The estimates and assumptions that have a significant risk of causing a material adjustment to the carrying amounts of assets and liabilities within the next financial year are discussed below:
Property, plant and equipment useful lives and residual values
At each balance date the Directors and Management review the useful lives and residual values of its property, plant and equipment. Assessing the appropriateness of useful life and residual value estimates of property, plant and equipment requires the Directors and Management to consider a number of factors such as the physical condition of the asset, expected period of use of the asset by the Directors and Management, and expected disposal proceeds from the future sale of the asset.
An incorrect estimate of the useful life or residual value will impact on the depreciable amount of an asset, therefore impacting on the depreciation expense recognised in the statement of comprehensive revenue and expense, and carrying amount of the asset in the balance sheet. The Directors and Management minimises the risk of this estimation uncertainty by:
• physical inspection of assets;
• asset replacement programmes;
• review of second-hand market prices for similar assets; and
• analysis of prior asset sales
No significant changes have been made to assumptions concerning useful lives and residual values. The carrying amounts of property, plant and equipment are disclosed in note 9.
x) Development property
Development property is stated at the lower of cost and net realisable value. Development property comprises land, infrastructure and other costs incurred that are directly related to the development activity. Net realisable value is the discounted value of forecast sales less estimated costs of completion and the estimated selling expenses. Development property is not depreciated.
y) Changes n Accounting Policies
There have been no changes to accounting policies during the year.
Page 21

2. PAYABLES AND ACCRUALS
2016$000
2015$000
Accounts payable 605 519
Accruals 1,187 702
Total Payables and Accruals 1,792 1,221
3. TRADE AND OTHER RECEIVABLES2016$000
2015$000
Gross trade and other receivables 606 506
Total Trade and Other Receivables 606 506
The carrying amount of receivables that are past due date, but not impaired, whose terms have been renegotiated is nil (2015: nil).
At balance date, all overdue receivables have been assessed for impairment and no provisions are required. As at 30 June 2016, the Company has identified no debtors that are insolvent.
4. COMMITMENTS2016$000
2015$000
Lease commitments
Share generator & cable - 8
Vehicle - -
Office equipment 1 5
1 13
2016$000
2015$000
Operating Lease commitments as leassee
Less than 12 months 1 12
Between 1 and 5 years - 1
Greater than 5 years - -
Total Operating Lease Commitments 1 13
NOTES TO AND FORMING PART OF THE FINANCIAL STATEMENTSFor the Year Ended 30 June 2016

5. CONTINGENT LIABILITIES
The Group has no contingent liabilities (2015: nil).
6. CASH AND CASH EQUIVALENTS
2016$000
2015$000
Cash on hand 7 7
Cash at bank 425 507
Total Cash and Cash Equivalents 432 514
7. TERM DEPOSITS
2016$000
2015$000
Term deposits - 287
Total Term Deposits - 287
8. DEVELOPMENT PROPERTY2016$000
2015$000
Development property 11,446 11,512
Total Development Property 11,446 11,512
Waikato Regional Airport Limited’s subsidiary Titanium Park Limited was a partner in the Titanium Park Joint Venture. The Titanium Park Joint Venture was terminated 31 March 2016 with Titanium Park Limited being transferred 37.2 hectares of land as part of the termination agreement.
NOTES TO AND FORMING PART OF THE FINANCIAL STATEMENTSFor the Year Ended 30 June 2016
Page 23
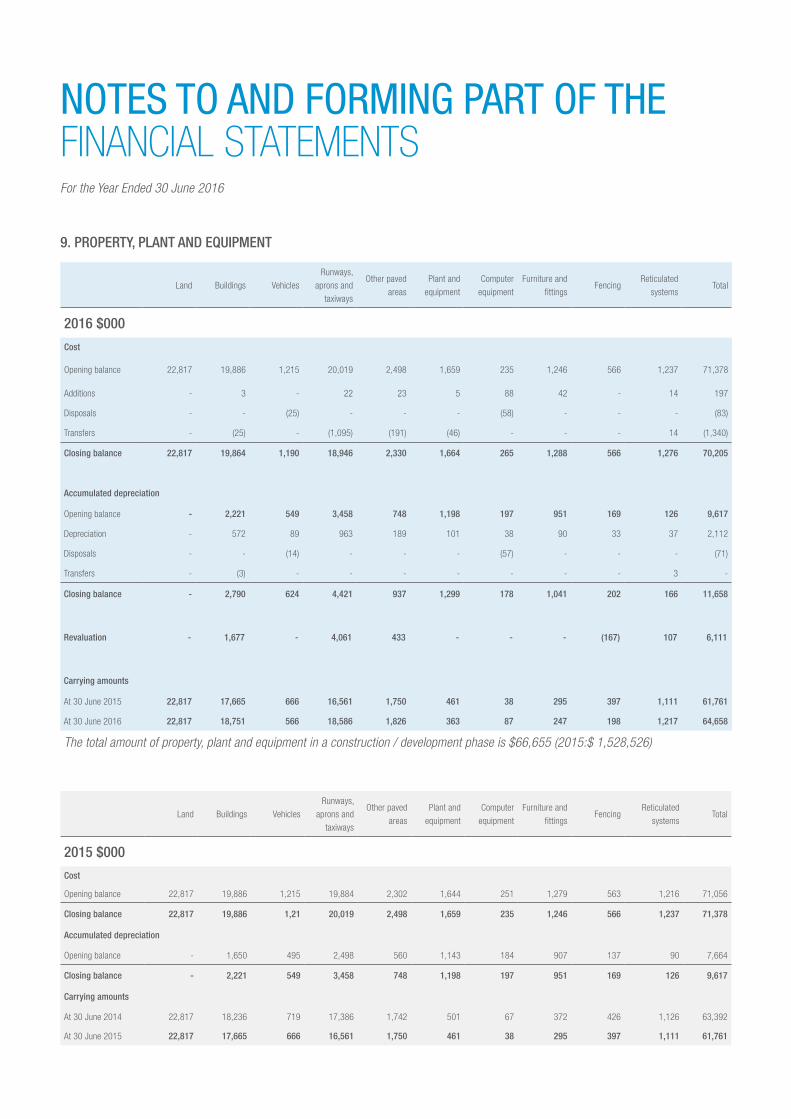
9. PROPERTY, PLANT AND EQUIPMENT
Land Buildings Vehicles
Runways,
aprons and
taxiways
Other paved
areas
Plant and
equipment
Computer
equipment
Furniture and
fittingsFencing
Reticulated
systemsTotal
2016 $000
Cost
Opening balance 22,817 19,886 1,215 20,019 2,498 1,659 235 1,246 566 1,237 71,378
Additions - 3 - 22 23 5 88 42 - 14 197
Disposals - - (25) - - - (58) - - - (83)
Transfers - (25) - (1,095) (191) (46) - - - 14 (1,340)
Closing balance 22,817 19,864 1,190 18,946 2,330 1,664 265 1,288 566 1,276 70,205
Accumulated depreciation
Opening balance - 2,221 549 3,458 748 1,198 197 951 169 126 9,617
Depreciation - 572 89 963 189 101 38 90 33 37 2,112
Disposals - - (14) - - - (57) - - - (71)
Transfers - (3) - - - - - - - 3 -
Closing balance - 2,790 624 4,421 937 1,299 178 1,041 202 166 11,658
Revaluation - 1,677 - 4,061 433 - - - (167) 107 6,111
Carrying amounts
At 30 June 2015 22,817 17,665 666 16,561 1,750 461 38 295 397 1,111 61,761
At 30 June 2016 22,817 18,751 566 18,586 1,826 363 87 247 198 1,217 64,658
The total amount of property, plant and equipment in a construction / development phase is $66,655 (2015:$ 1,528,526)
Land Buildings Vehicles
Runways,
aprons and
taxiways
Other paved
areas
Plant and
equipment
Computer
equipment
Furniture and
fittingsFencing
Reticulated
systemsTotal
2015 $000
Cost
Opening balance 22,817 19,886 1,215 19,884 2,302 1,644 251 1,279 563 1,216 71,056
Closing balance 22,817 19,886 1,21 20,019 2,498 1,659 235 1,246 566 1,237 71,378
Accumulated depreciation
Opening balance - 1,650 495 2,498 560 1,143 184 907 137 90 7,664
Closing balance - 2,221 549 3,458 748 1,198 197 951 169 126 9,617
Carrying amounts
At 30 June 2014 22,817 18,236 719 17,386 1,742 501 67 372 426 1,126 63,392
At 30 June 2015 22,817 17,665 666 16,561 1,750 461 38 295 397 1,111 61,761
NOTES TO AND FORMING PART OF THE FINANCIAL STATEMENTSFor the Year Ended 30 June 2016

Asset class Valuation approach ValuerFair Value
$000
LandFair market, highest and best use basis determined from prevailing market-based evidence and conditions
Quotable Value Limited $22,733
Building and Security Fencing Fair market or, where appropriate, depreciated replacement cost Beca Valuations Ltd $18,949
Runways, Taxiways, Aprons and Other Paved Areas
Optimised depreciated replacement cost Beca Valuations Ltd $20,412
Reticulated Systems Optimised depreciated replacement cost Beca Valuations Ltd $1,217
The effective date of building and security fencing, runways, taxiways, aprons and other paved areas and reticulated systems valuations (excluding land) is 30 June 2016.
All land was revalued with an effective date of 30 June 2013 ($22,732,500).
Neither valuer has an interest or relationship with any party that would impair its objectivity or independence.
10. TERM LIABILITIES
BNZ Bank Loan Facilities
At 30 June 2016 the Company had the following facilities with the BNZ Bank:
i. An overdraft facility of $500,000 repayable on demand. The interest rate on this facility is the BNZ Bank’s market connect overdraft base rate plus a margin.
ii. A Customised Average Rate Loan (CARL) of up to $9,500,000 that matures on 17 October 2017. The amount outstanding on this facility at 30 June 2016 was $6,043,000 (2015: $8,200,000).
iii. A second Customised Average Rate Loan (CARL) of $1,600,000 that matures on 1 February 2018. The amount outstanding on this facility at 30 June 2016 was $1,339,840 (2015: $1,422,400).
The $1.6m CARL facility is secured over buildings at Boyd Road, Hamilton.
VALUATION
NOTES TO AND FORMING PART OF THE FINANCIAL STATEMENTSFor the Year Ended 30 June 2016
Page 25
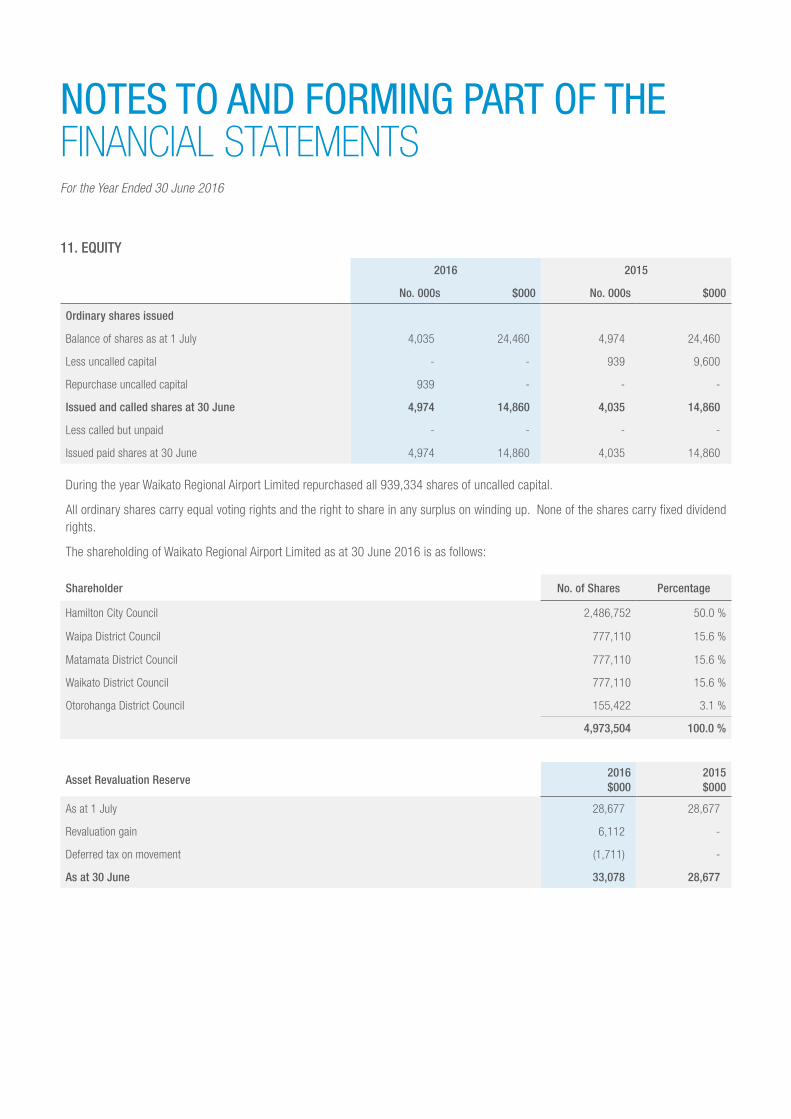
11. EQUITY
2016 2015
No. 000s $000 No. 000s $000
Ordinary shares issued
Balance of shares as at 1 July 4,035 24,460 4,974 24,460
Less uncalled capital - - 939 9,600
Repurchase uncalled capital 939 - - -
Issued and called shares at 30 June 4,974 14,860 4,035 14,860
Less called but unpaid - - - -
Issued paid shares at 30 June 4,974 14,860 4,035 14,860
During the year Waikato Regional Airport Limited repurchased all 939,334 shares of uncalled capital.
All ordinary shares carry equal voting rights and the right to share in any surplus on winding up. None of the shares carry fixed dividend rights.
The shareholding of Waikato Regional Airport Limited as at 30 June 2016 is as follows:
Shareholder No. of Shares Percentage
Hamilton City Council 2,486,752 50.0 %
Waipa District Council 777,110 15.6 %
Matamata District Council 777,110 15.6 %
Waikato District Council 777,110 15.6 %
Otorohanga District Council 155,422 3.1 %
4,973,504 100.0 %
Asset Revaluation Reserve2016$000
2015$000
As at 1 July 28,677 28,677
Revaluation gain 6,112 -
Deferred tax on movement (1,711) -
As at 30 June 33,078 28,677
NOTES TO AND FORMING PART OF THE FINANCIAL STATEMENTSFor the Year Ended 30 June 2016

Asset Revaluation Reserve consists of:2016$000
2015$000
Land 14,428 14,428
Buildings 4,092 2,885
Fencing 232 352
Reticulated systems 777 700
Runway, apron & taxiways 12,388 9,463
Other paved areas 1,161 849
As at 30 June 33,078 28,677
Retained Earnings2016$000
2015$000
As at 1 July 16,132 15,963
Surplus for the year 336 169
As at 30 June 16,468 16,123
12. RELATED PARTY TRANSACTIONS
The following transactions were carried out with related parties on normal commercial terms during the year.
Shareholders
During the financial year the Group received payments from the following shareholders:
• Hamilton City Council, a total of $585,000 (excl GST) for regional tourism funding under a service level agreement and regional campaigns (2015: $392,483).
• Waipa District Council, a total of $150,000 (excl GST) for regional tourism funding under a service level agreement (2015: $100,000).
• Waikato District Council, a total of $150,000 (excl GST) for regional tourism funding under a service level agreement (2015: $100,000).
• Matamata-Piako District Council, a total of $150,000 (excl GST) for regional tourism funding under a service level agreement (2015: $100,000).
• Otorohanga District Council, a total of $60,000 (excl GST) for regional tourism funding under a service level agreement (2015: $40,000).
NOTES TO AND FORMING PART OF THE FINANCIAL STATEMENTSFor the Year Ended 30 June 2016
Page 27

Related Party Nature of transactionsRelationship with company
2016$000
2015$000
TransactionOutstanding
balance as at 30/06/16
TransactionOutstanding
balance as at 30/06/15
Hamilton & Waikato Tourism Limited
Contribution to marketing Subsidiary - - 11 -
Hamilton & Waikato Tourism Limited
Receipt of insurance contribution Subsidiary - - - -
Hamilton & Waikato Tourism Limited
Provision of services under a service level agreement
Subsidiary 40 - 40 -
Hamilton & Waikato Tourism Limited
Receipt of services under a service level agreement
Subsidiary (49) - (49) (9)
(9) - 2 (9)
Key Management Personnel Compensation2016$000
2015$000
Salaries and other short-term employee benefits 798 688
Total Key Management Personnel Compensation 798 688
Key management personnel comprises directors and the Group’s management team. There were no other material related party transactions during the year other than those already disclosed in the notes to these financial statements.
13. EVENTS OCCURRING AFTER BALANCE DATE
Nil.
NOTES TO AND FORMING PART OF THE FINANCIAL STATEMENTSFor the Year Ended 30 June 2016
Subsidiaries
Hamilton & Waikato Tourism Limited, a wholly owned subsidiary of the Company, made the following transactions with the Company during the year:
Related Party Nature of transactionsRelationship with company
2016$000
2015$000
Transaction Year End Transaction Year End
Titanium Park LimitedCash advances to facilitate funding for the Joint Venture operations
Subsidiary (1157) 3,195 48 4,352
Titanium Park LimitedCash advance to facilitate funding for 188 Narrows Road
Subsidiary - 2,919 - 2,919
Titanium Park Limited Interest charged on advances Subsidiary - 2,507 480 2,507
(1,157) 8,621 528 9,778
Subsidiaries
Titanium Park Limited, a wholly owned subsidiary of Waikato Regional Airport Limited, made the following transactions with the Company during the year:

15. OTHER GAINS
Other gains2016$000
2015$000
Gain on disposal of PPE - 6
Gain on changes in fair value of investment property (note 25) 20 10
Total Other Gains 20 16
Other losses2016$000
2015$000
Loss on sale of property, plant and equipment 2 -
Loss on fair value adjustment – interest rate swaps (note 23) 21 202
Total Other Losses 23 202
2016$000
2015$000
Financial Assets at Fair Value through Statement of Comprehensive Revenue and Expense (611)
Financial Assets at Fair Value through Other Comprehensive Revenue and Expense - 25
Loans and Receivables 1,154 1,129
Financial Liabilities Measured at Amortised Cost 7,383 10,661
16. FINANCIAL INSTRUMENTS
The Company’s activities expose it to a variety of financial risks: market risk (including currency risk, fair value interest rate risk, cash flow interest rate risk and price risk), credit risk and liquidity risk. The financial risks relate to the following financial instruments: trade receivables, cash and cash equivalents, trade and other payables and borrowings.
Risk management is carried out by the Company’s Board of Directors. The Board identifies and evaluates financial risks and provides written principles for overall risk management, as well as written policies covering specific areas, such as interest-rate risk, credit risk, and investing excess liquidity.
NOTES TO AND FORMING PART OF THE FINANCIAL STATEMENTSFor the Year Ended 30 June 2016
14. OPERATING REVENUE2016$000
2015$000
Exchange Revenue
Car park 1,591 1,473
Landing charges and departure charges 2,258 2,189
Rentals and concessions 1,566 1,612
Shop trading & other 363 367
Non-exchange revenue
Other 1,650 1,214
Total Operating Revenue 7,428 6,855
Page 29

17. RECONCILIATION OF NET SURPLUS/(DEFICIT) AFTER TAX TO NET CASH FROM OPERATING ACTIVITIES2016$000
2015$000
Surplus/(deficit) after tax Add/(deduct) non cash items 336 169
Depreciation & amortisation 2,278 2,101
Deferred taxation (244) (466)
(Gains)/losses in fair value of investment property (20) 10
Net interest rate swap (gains)/losses 21 202
Add/(deduct) items classified as investing or financing activities
(Gains)/losses on disposal of property, plant & equipment 2 (6)
Add/(deduct) movements in working capital
Trade & other receivables (89) 106
Prepayments (1) 99
Payables & accruals 518 (104)
Employee entitlements 79 (1)
Income in advance (134) (5)
Goods and services taxation 43 63
Inventories 14 18
Development property 66 414
Other assets allocation 10 8
Income tax payable (108) 231
Net Cash from Operating Activities 2,771 2,809
NOTES TO AND FORMING PART OF THE FINANCIAL STATEMENTSFor the Year Ended 30 June 2016

18. DEPRECIATION & AMORTISATION OF ASSETS BY CLASS2016$000
2015$000
Buildings 572 571
Vehicles 89 89
Runways, apron & taxiways 966 960
Other paved areas 189 188
Plant & equipment 101 99
Computer equipment 38 35
Furniture & fittings 90 84
Fencing 32 32
Reticulated systems 37 36
2,114 2,094
Intangible assets – runway designation 162 -
– computer software 2 7
Total Depreciation & Amortisation of Assets 2,278 2,101
19. INCOME TAXATION2016$000
2015$000
Current year 398 544
Prior period adjustment - 36
Movement in temporary differences (244) (460)
154 120
Reconciliation of Effective Tax Rate %2016$000
%2015$000
Surplus for the period excluding income tax 490 289
Prima facie income tax based on domestic tax rate 28.0% 137 28.0% 80
Effect of non-deductible expenses 3.42% 17 8.17% 24
Effect of tax exempt income 0.0% - 0.0% -
Prior period adjustment 0.0% - 12.36% 36
Effect of tax rate change from 30% to 28% 0.0% - (6.96%) (20)
Capital gain on sale 0.0% - 0.0% -
31.42% 154 41.57% 120
NOTES TO AND FORMING PART OF THE FINANCIAL STATEMENTSFor the Year Ended 30 June 2016
Page 31
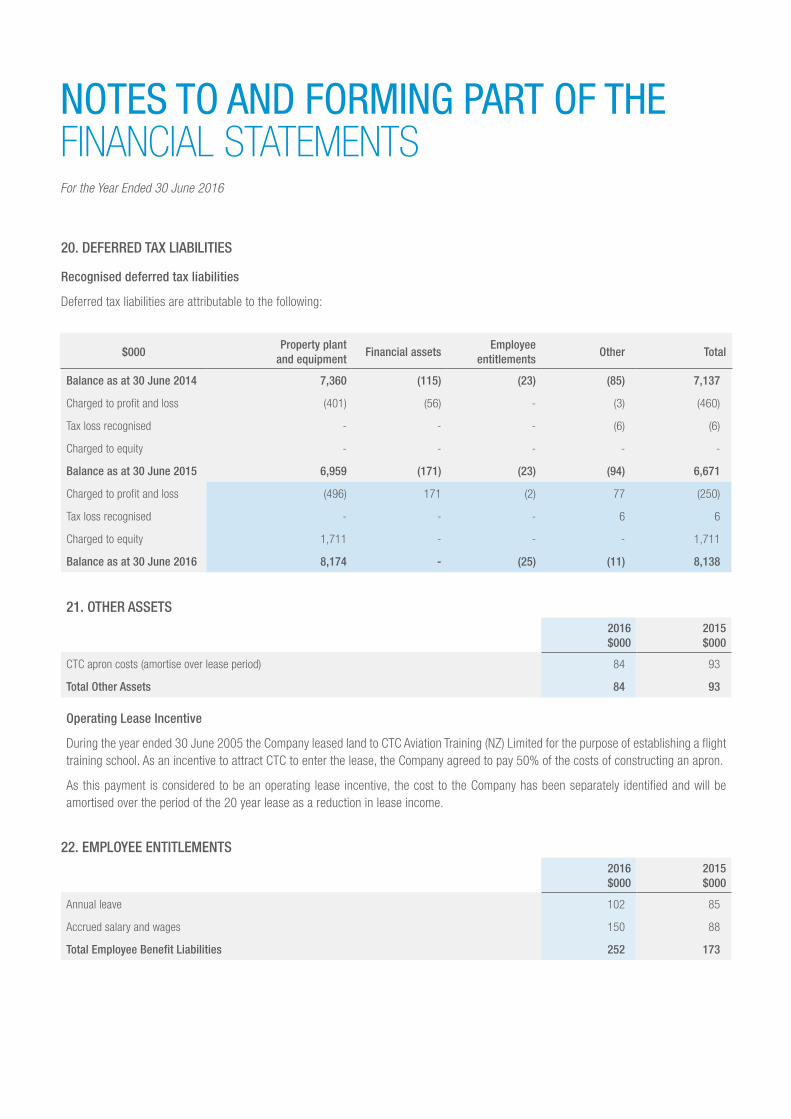
20. DEFERRED TAX LIABILITIES
Recognised deferred tax liabilities
Deferred tax liabilities are attributable to the following:
$000Property plant
and equipmentFinancial assets
Employee entitlements
Other Total
Balance as at 30 June 2014 7,360 (115) (23) (85) 7,137
Charged to profit and loss (401) (56) - (3) (460)
Tax loss recognised - - - (6) (6)
Charged to equity - - - - -
Balance as at 30 June 2015 6,959 (171) (23) (94) 6,671
Charged to profit and loss (496) 171 (2) 77 (250)
Tax loss recognised - - - 6 6
Charged to equity 1,711 - - - 1,711
Balance as at 30 June 2016 8,174 - (25) (11) 8,138
21. OTHER ASSETS2016$000
2015$000
CTC apron costs (amortise over lease period) 84 93
Total Other Assets 84 93
Operating Lease Incentive
During the year ended 30 June 2005 the Company leased land to CTC Aviation Training (NZ) Limited for the purpose of establishing a flight training school. As an incentive to attract CTC to enter the lease, the Company agreed to pay 50% of the costs of constructing an apron.
As this payment is considered to be an operating lease incentive, the cost to the Company has been separately identified and will be amortised over the period of the 20 year lease as a reduction in lease income.
22. EMPLOYEE ENTITLEMENTS2016$000
2015$000
Annual leave 102 85
Accrued salary and wages 150 88
Total Employee Benefit Liabilities 252 173
NOTES TO AND FORMING PART OF THE FINANCIAL STATEMENTSFor the Year Ended 30 June 2016
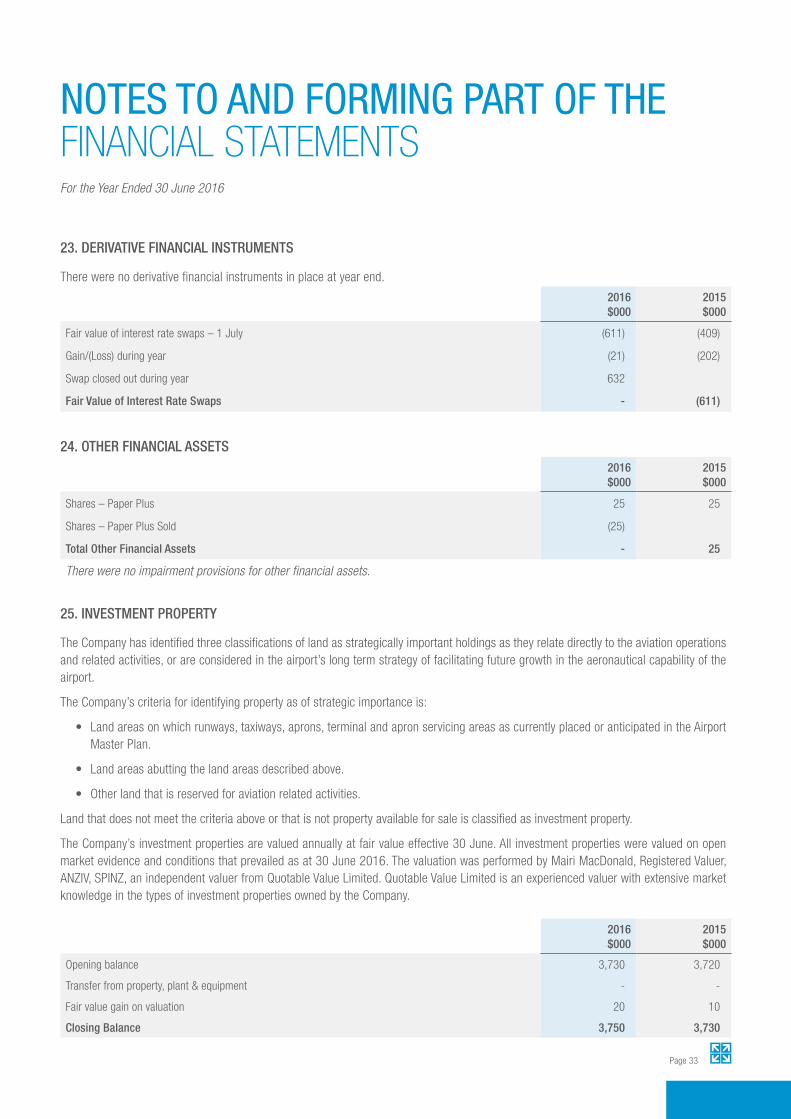
23. DERIVATIVE FINANCIAL INSTRUMENTS
There were no derivative financial instruments in place at year end.
2016$000
2015$000
Fair value of interest rate swaps – 1 July (611) (409)
Gain/(Loss) during year (21) (202)
Swap closed out during year 632
Fair Value of Interest Rate Swaps - (611)
24. OTHER FINANCIAL ASSETS2016$000
2015$000
Shares – Paper Plus 25 25
Shares – Paper Plus Sold (25)
Total Other Financial Assets - 25
There were no impairment provisions for other financial assets.
25. INVESTMENT PROPERTY
The Company has identified three classifications of land as strategically important holdings as they relate directly to the aviation operations and related activities, or are considered in the airport’s long term strategy of facilitating future growth in the aeronautical capability of the airport.
The Company’s criteria for identifying property as of strategic importance is:
• Land areas on which runways, taxiways, aprons, terminal and apron servicing areas as currently placed or anticipated in the Airport Master Plan.
• Land areas abutting the land areas described above.
• Other land that is reserved for aviation related activities.
Land that does not meet the criteria above or that is not property available for sale is classified as investment property.
The Company’s investment properties are valued annually at fair value effective 30 June. All investment properties were valued on open market evidence and conditions that prevailed as at 30 June 2016. The valuation was performed by Mairi MacDonald, Registered Valuer, ANZIV, SPINZ, an independent valuer from Quotable Value Limited. Quotable Value Limited is an experienced valuer with extensive market knowledge in the types of investment properties owned by the Company.
2016$000
2015$000
Opening balance 3,730 3,720
Transfer from property, plant & equipment - -
Fair value gain on valuation 20 10
Closing Balance 3,750 3,730
NOTES TO AND FORMING PART OF THE FINANCIAL STATEMENTSFor the Year Ended 30 June 2016
Page 33

26. INTANGIBLE ASSETS2016$000
2015$000
Acquired Assets
Balance at 1 July 107 107
Additions 107 -
Disposals (108) -
Transfers 1,286 -
Balance at 30 June 1,392 107
Accumulated Amortisation & Impairment Losses
Balance at 1 July 107 100
Amortisation expense 167 7
Disposal (109) -
Balance at 30 June 165 107
Carrying Amounts
Balance at 1 July - 7
Balance at 30 June 1,227 -
27. ASSET IMPAIRMENT
There has been no impairment of assets recognised in 2016 (2015: nil).
28. DIRECTORS’ FEES2016$000
2015$000
Waikato Regional Airport Limited – Board of Directors 104 104
Hamilton & Waikato Tourism Limited – Board of Directors 30 33
Titanium Park Limited 36 36
Total Directors’ Fees 170 173
The Board of Titanium Park Joint Venture no longer has an independent Chairman. Fees paid to the independent Chairman are $0 for the year. The Group’s one half share of those fees is $0 (2015: $5,406).
NOTES TO AND FORMING PART OF THE FINANCIAL STATEMENTSFor the Year Ended 30 June 2016
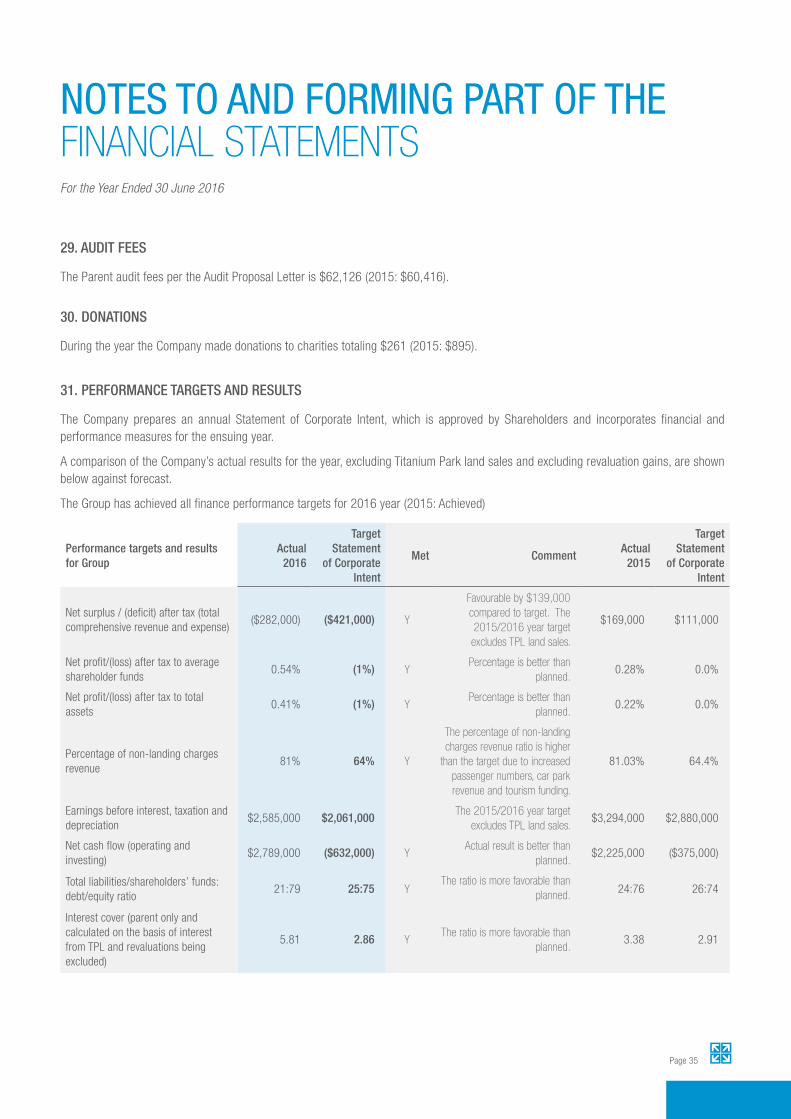
29. AUDIT FEES
The Parent audit fees per the Audit Proposal Letter is $62,126 (2015: $60,416).
30. DONATIONS
During the year the Company made donations to charities totaling $261 (2015: $895).
31. PERFORMANCE TARGETS AND RESULTS
The Company prepares an annual Statement of Corporate Intent, which is approved by Shareholders and incorporates financial and performance measures for the ensuing year.
A comparison of the Company’s actual results for the year, excluding Titanium Park land sales and excluding revaluation gains, are shown below against forecast.
The Group has achieved all finance performance targets for 2016 year (2015: Achieved)
Performance targets and results for Group
Actual2016
TargetStatement
of Corporate Intent
Met CommentActual
2015
TargetStatement
of Corporate Intent
Net surplus / (deficit) after tax (total comprehensive revenue and expense)
($282,000) ($421,000) Y
Favourable by $139,000 compared to target. The 2015/2016 year target excludes TPL land sales.
$169,000 $111,000
Net profit/(loss) after tax to average shareholder funds
0.54% (1%) YPercentage is better than
planned. 0.28% 0.0%
Net profit/(loss) after tax to total assets
0.41% (1%) YPercentage is better than
planned. 0.22% 0.0%
Percentage of non-landing charges revenue
81% 64% Y
The percentage of non-landing charges revenue ratio is higher
than the target due to increased passenger numbers, car park revenue and tourism funding.
81.03% 64.4%
Earnings before interest, taxation and depreciation
$2,585,000 $2,061,000The 2015/2016 year target
excludes TPL land sales.$3,294,000 $2,880,000
Net cash flow (operating and investing)
$2,789,000 ($632,000) YActual result is better than
planned.$2,225,000 ($375,000)
Total liabilities/shareholders’ funds: debt/equity ratio
21:79 25:75 YThe ratio is more favorable than
planned. 24:76 26:74
Interest cover (parent only and calculated on the basis of interest from TPL and revaluations being excluded)
5.81 2.86 YThe ratio is more favorable than
planned. 3.38 2.91
NOTES TO AND FORMING PART OF THE FINANCIAL STATEMENTSFor the Year Ended 30 June 2016
Page 35

NOTES TO AND FORMING PART OF THE FINANCIAL STATEMENTSFor the Year Ended 30 June 2016
Non - Financial Performance targets and results (Group)
2016Target
Comment Met2015
TargetComment
Facilitate Health & Safety meetings every 2 months with representatives from each company department.
Health and Safety meetings are undertaken on monthly basis.
Y New target for 2016
Zero Work Safe notifiable accidents/injuries.
There was one notifiable incident. N New target for 2016
Commission independent review of the company’s Health & Safety framework. Implement recommendations from the independent review to ensure best-practice compliance.
An independent review was undertaken and recommendations completed. Enhancing of existing tenant and contractors H&S control procedures were implemented. All existing H&S frameworks have been updated to include the provisions of the Health and Safety at Work Act 2015 requirements.
Y New target for 2016
To achieve the Airport Certification Standards as required by the Civil Aviation Authority.
Two audits were undertaken by the Civil Aviation Authority of New Zealand (CAA) during the year and the airport continues to meet the Airport Certification Standards.
Y To achieve the Airport Certification Standards as required by the Civil Aviation Authority.
No audits were undertaken by the Civil Aviation Authority of New Zealand (CAA) during the year and the airport continues to meet the Airport Certification Standards.
Ensure airport is operationally available for all scheduled passenger services (except for uncontrollable events)
There have no incidences of scheduled flights being operationally impacted by controllable events.
Y New target for 2016
Facilitate noise management meetings each 4 months in accordance with the Noise Management Plan
Regular meetings have been facilitated every 4 months.
Y New target for 2016
Collect, document and act (where viable) on customer feedback forms to continuously monitor and improve the customer experience. Maintain a database to ensure recurring negative feedback is promptly acted upon.
During the period 1 July 2015 to 30 June 2016, customer feedback cards were positioned in the terminal with 19 cards collected and documented. All items are considered by the management team and addressed where appropriate. Personal complaints are responded to.
Y Collect, document and act (where viable) on customer feedback forms to continuously monitor and improve the customer experience. Maintain a database to ensure recurring negative feedback is promptly acted upon.
Customer feedback cards are positioned in the terminal. From 1 July 2014 to 30 June 2015 there were 32 customer feedback cards collected and documented. All items are considered by the management team and addressed where appropriate. Personal complaints are responded to.

Dividend
The Directors recommend that no dividend be declared.
Directors’ Interests
The following directors have made a general disclosure of interest with respect to any transaction or proposed transaction that may be entered into with other entities on the basis of him being a director, partner, trustee or officer of those entities.
Director Entity Interest
J Spencer Advisory Board for Iron Duke Limited Chair
Derby Street Limited Director
Kiwirail Holdings Limited Chair
Mitre 10 (New Zealand) Limited Director
Mitre 10 Holdings Limited Director
Mitre 10 Imports Limited Director
Mitre 10 Retail Limited Director
Raukawa Iwi Development Limited Chair
Taupo Mega Limited Director
Te Awamutu Mega Limited Director
Tertiary Education Commission Chair
Wellington Mega Limited Director
C da Silva Andrew Johnson Business Trust Trustee
Ata Rangi Pastoral Limited Director
Certus Group Limited Director
Columbus Financial Services Limited Director
Consumer Finance Limited Director
Consumer Insurance Services Limited Director
Coromandel Trust Trustee
Da Silva Advisory Limited Director
Fisher & Paykel Financial Services Limited Director
Director Entity Interest
Fisher & Paykel Finance Holdings Limited Director
Fisher & Paykel Finance Limited Chair
Gardon Limited Director
Guarda Trust Trustee
Homeopathic Trust Trustee
IT Partners Group Limited Director
IT Partners Limited Director
Jarvis Trading Limited Director
Larsen Family Trust Trustee
Lightwire Limited Director
MCC Properties Limited Director
Milk Management Company Limited Director
Ocean Sands Trust Trustee
Retail Financial Services Limited Director
Te Maunga Trust Trustee
Titanium Park Limited Director
Trelise Cooper Group Limited Director
Trelise Cooper Properties Limited Director
Waikato Rental Trust Trustee
STATUTORY INFORMATIONFor the Year Ended 30 June 2016
Continued on following page
Page 37
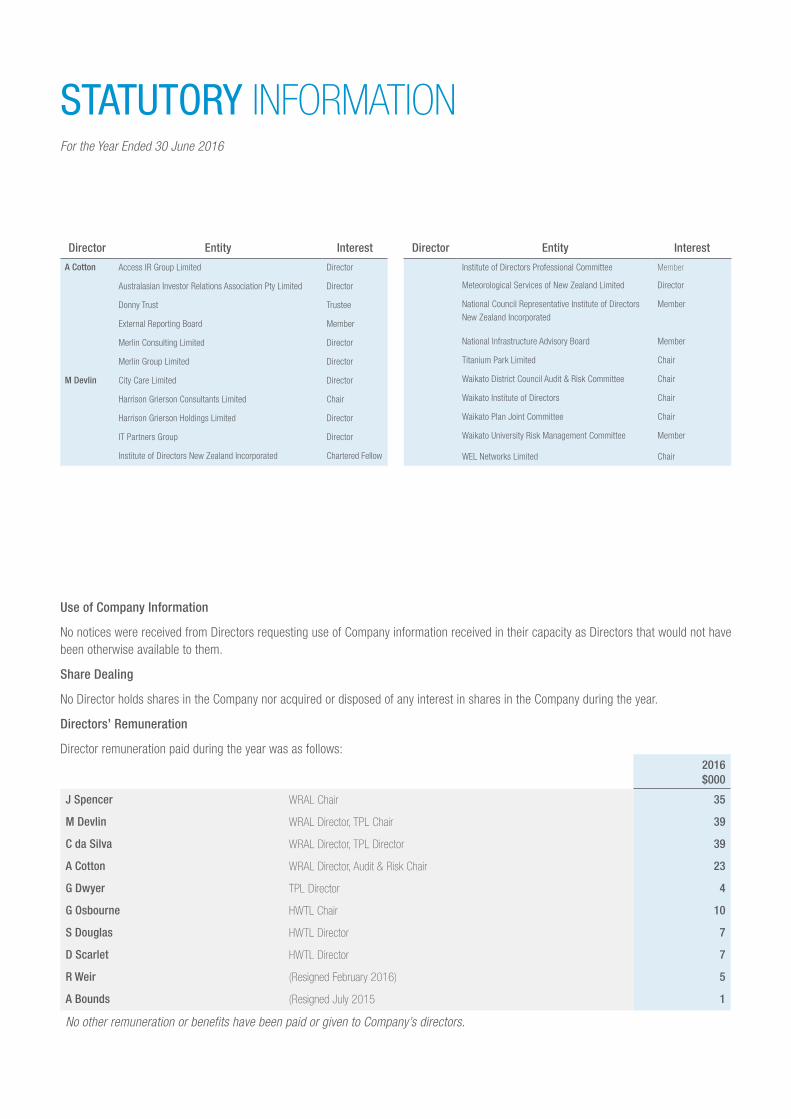
Use of Company Information
No notices were received from Directors requesting use of Company information received in their capacity as Directors that would not have been otherwise available to them.
Share Dealing
No Director holds shares in the Company nor acquired or disposed of any interest in shares in the Company during the year.
Directors’ Remuneration
Director remuneration paid during the year was as follows:
STATUTORY INFORMATIONFor the Year Ended 30 June 2016
2016$000
J Spencer WRAL Chair 35
M Devlin WRAL Director, TPL Chair 39
C da Silva WRAL Director, TPL Director 39
A Cotton WRAL Director, Audit & Risk Chair 23
G Dwyer TPL Director 4
G Osbourne HWTL Chair 10
S Douglas HWTL Director 7
D Scarlet HWTL Director 7
R Weir (Resigned February 2016) 5
A Bounds (Resigned July 2015 1
No other remuneration or benefits have been paid or given to Company’s directors.
Director Entity Interest
Institute of Directors Professional Committee Member
Meteorological Services of New Zealand Limited Director
National Council Representative Institute of Directors
New Zealand Incorporated
Member
National Infrastructure Advisory Board Member
Titanium Park Limited Chair
Waikato District Council Audit & Risk Committee Chair
Waikato Institute of Directors Chair
Waikato Plan Joint Committee Chair
Waikato University Risk Management Committee Member
WEL Networks Limited Chair
Director Entity Interest
A Cotton Access IR Group Limited Director
Australasian Investor Relations Association Pty Limited Director
Donny Trust Trustee
External Reporting Board Member
Merlin Consulting Limited Director
Merlin Group Limited Director
M Devlin City Care Limited Director
Harrison Grierson Consultants Limited Chair
Harrison Grierson Holdings Limited Director
IT Partners Group Director
Institute of Directors New Zealand Incorporated Chartered Fellow

Insurance
Directors’ and Officers’ liability insurance is with Vero Liability Insurance Ltd, with the policy for the parent Company extending to the Company.
Remuneration of Employees
Directors’ and Officers’ liability insurance is with Vero Liability Insurance Ltd, with the policy for the parent Company extending to the Company.
STATUTORY INFORMATIONFor the Year Ended 30 June 2016
Amount of Remuneration Employees
$220,000 - $229,999 1
$180,000 - $189,999 1
$160,000 - $169,999 1
Remuneration includes salary, performance bonuses and motor vehicle allowances received in their capacity as employees.
Page 39
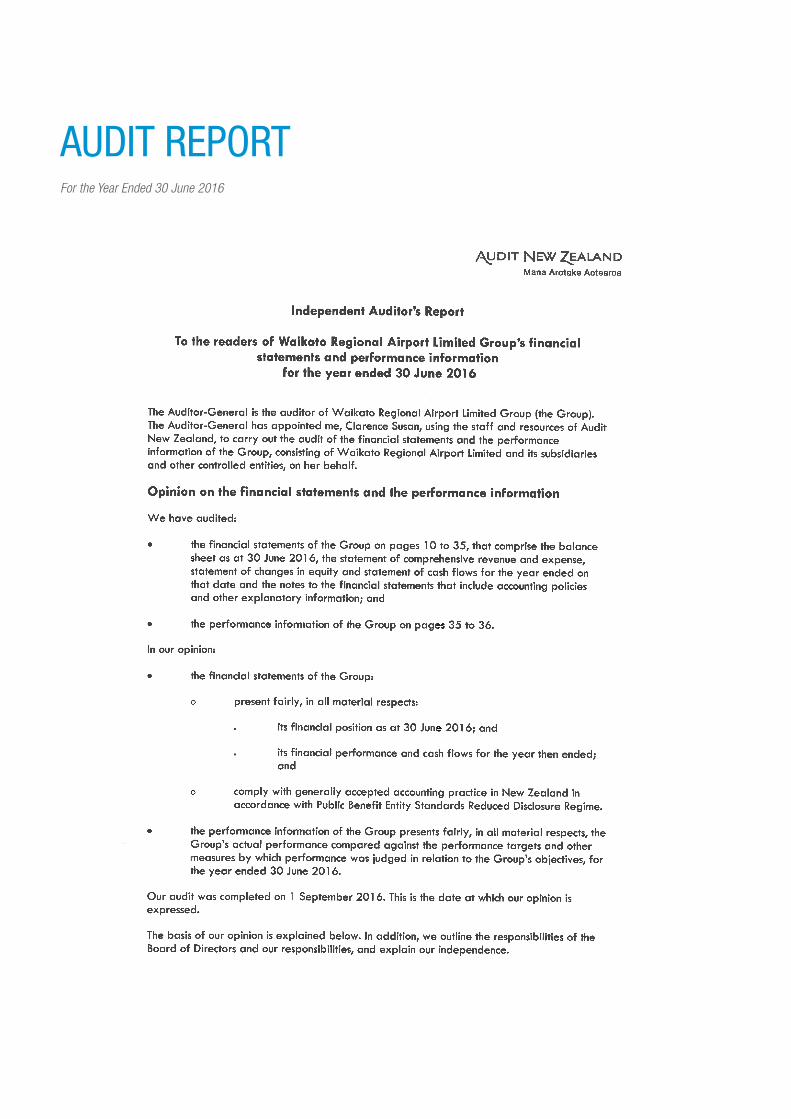
AUDIT REPORTFor the Year Ended 30 June 2016

AUDIT REPORTFor the Year Ended 30 June 2016
Page 41
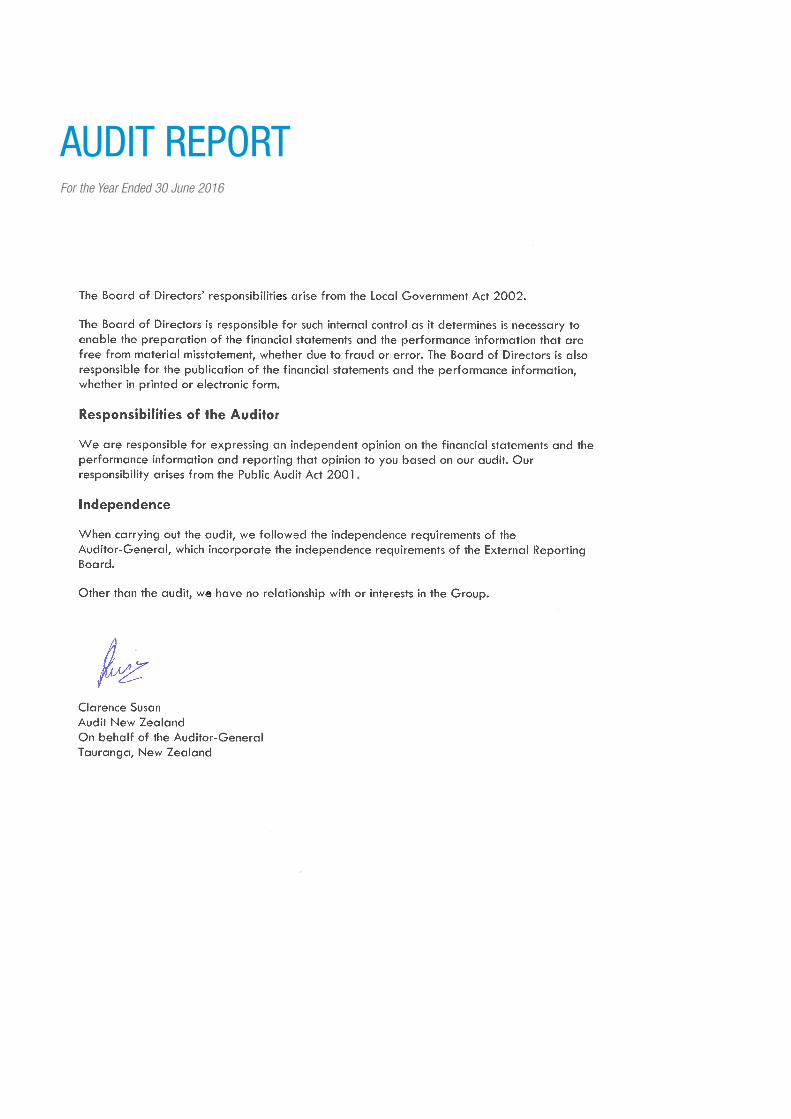
AUDIT REPORTFor the Year Ended 30 June 2016

FIVE YEAR REVIEWFor the Year Ended 30 June 2016
2016$000’s
2015$000’s
2014$000’s
2013$000’s
2012$000’s
Revenue 8,079 7,765 7,022 7,225 7,984
Increase/-Decrease 4% 11% (3%) (10%) 13%
Expenditure 7,589 7,476 7,274 7,475 7,514
Increase/-Decrease 2% 3% (3%) 0% 7%
Operating Surplus before Abnormal Item* and Taxation
470 273 (245) (245) 345
Increase/-Decrease 72% 211% (0%) (171%) 236%
Operating Surplus before Tax Item 490 289 (252) (250) 470
PERFORMANCE INDICATORS
Operating Surplus (after abnormal item and taxation) to Average Shareholder’s Equity
0.54% 0.28% (0.4%) (0.4%) 0.4%
Percentage of Non-Landing Charges Revenue to Total Revenue
85% 81% 82% 81% 82%
Total Equity 64,405 59,669 59,500 59,732 59,162
Total Liabilities 17,899 18,874 20,937 19,967 19,074
Total Assets 82,304 78,543 80,437 79,699 78,235
Net Asset Backing per Share $15.96 $14.79 $14.75 $14.80 $14.67
Shareholders’ Equity Ratio 78% 76% 74% 75% 76%
Passengers
- Domestic 303,135 291,385 294,396 294,512 315,662
- International - - - 11,384 38,406
- Total 303,135 291,385 294,396 305,896 354,068
* Abnormal item includes gains/losses on sale of property, plant and equipment.Page 43
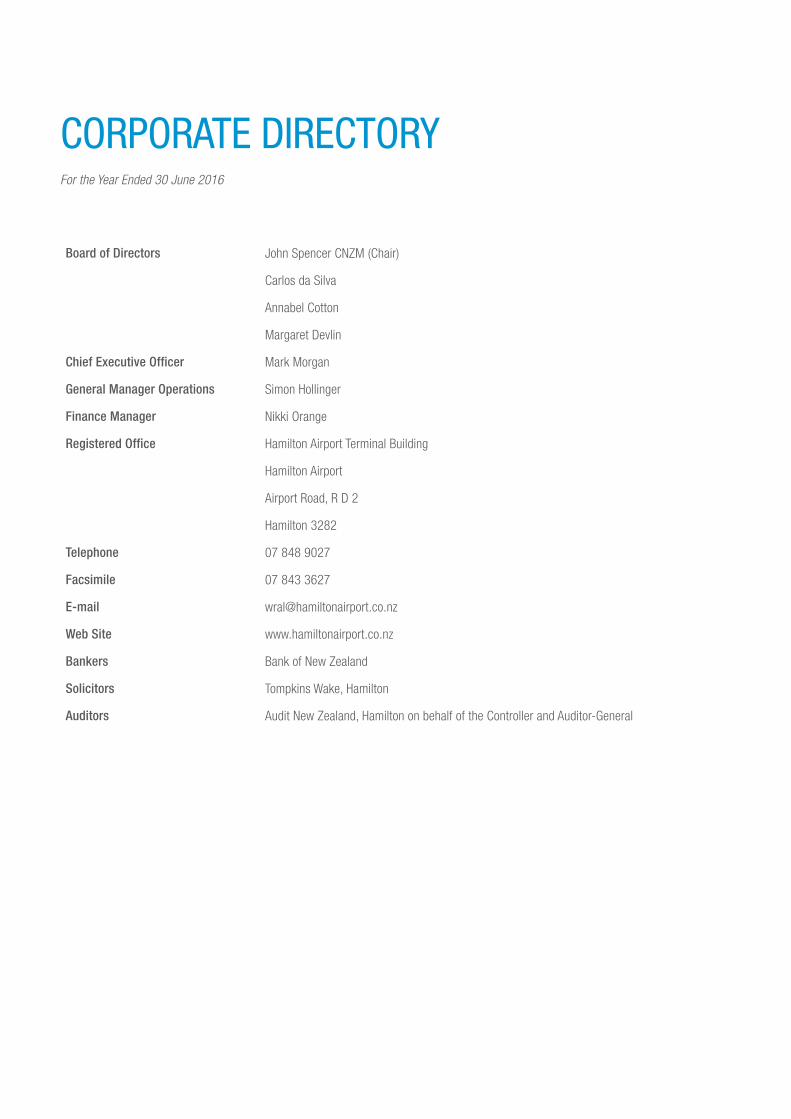
Board of Directors John Spencer CNZM (Chair)
Carlos da Silva
Annabel Cotton
Margaret Devlin
Chief Executive Officer Mark Morgan
General Manager Operations Simon Hollinger
Finance Manager Nikki Orange
Registered Office Hamilton Airport Terminal Building
Hamilton Airport
Airport Road, R D 2
Hamilton 3282
Telephone 07 848 9027
Facsimile 07 843 3627
E-mail [email protected]
Web Site www.hamiltonairport.co.nz
Bankers Bank of New Zealand
Solicitors Tompkins Wake, Hamilton
Auditors Audit New Zealand, Hamilton on behalf of the Controller and Auditor-General
CORPORATE DIRECTORYFor the Year Ended 30 June 2016

Page 45


