52
Annual Report

Annual Report

HUMID INDOOR ENVIRONMENTS, HERE ILLUSTRATED BY THE ERIKSDALSBADET SWIM CENTER IN STOCKHOLM, ARE LOGICAL SITES FOR MUNTERS INSTAL-
LATIONS. THE SWIM CENTER HAS A UNIQUE CEILING DESIGN THAT IS HIGHLY VULNERABLE TO MOISTURE. BY MEASURING EVERY FOUR HOURS,
MUNTERS’ MOISTURE MEASUREMENT SYSTEM CONTROLS THAT THE RIGHT LEVEL OF HUMIDITY IS MAINTAINED.

Munters is the world leader in humidity control,with products and services for dehumidification,humidification, and air cooling.
Munters’ business concept is to be a global,application and service driven niche company inair treatment, from a base in dehumidificationand humidification.
The business is divided into three geographi-cal regions—Europe, Americas, and Asia. Oper-ations in each region are categorized in threeproduct areas: Dehumidification, Moisture Con-trol Services (MCS), and HumiCool.
Production and sales are performed byMunters companies in over countries. As ofyear-end, the Group had , employees.
Munters’ Operations
CONTENTS
President’s Letter 4
Properties of humidity 6
Business Direction 7
Dehumidification 8
Moisture Control Services 10
HumiCool 12
Market 14
Product Development 15
Organization 16
Global Presence 17
Region Europe 18
Region Americas 20
Region Asia 22
Human Resources 24
Quality 25
The Environment 26
The Share 28
Financial Overview 30
Director’s Report 31
Income Statement 36
Cash Flow Statement 37
Balance Sheet 38
Accounting Principles andNotes 40
Auditors’ Report 48
Board of Directors
and Auditors 49
Executive Management 50
HIGHLIGHTS
STRONG GROWTH within MCS and HumiCool
28 QUARTERS of uninterrupted sales growth
CONSOLIDATED NET SALES increased by 23% to SEK 3,179M (2,594)
OPERATING EARNINGS rose by 29% to SEK 306M (237)
NET EARNINGS FOR THE YEAR increased by 27% to SEK 184M (144)
EARNINGS PER SHARE were SEK 7.34 (5.78)
PROPOSED DIVIDEND of SEK 2.30 (1.80)

’
Through the acquisition of the Italian company Euroemme asof January , , Munters went from being a supplier ofcomponents to companies making cooling systems for thepoultry industry to being the leading supplier of entire coolingsystems.
In the Dehumidification product segment, we are moreextensively supplying systems that include heating and coolingin addition to dehumidification. We are expanding our line ofMCS services.
There are several advantages to forward integration. Oneof the most significant is that the potential market is expand-ed, giving Munters room to grow for a long time to come inselected niches. This is important, since Munters now has aleading position in the world market in most of its areas of operation.
The strategy does entail risks, in that Munters is changingits distribution channels, which in several cases also changesthe competitive picture. We are aware of the situation and areprimarily taking advantage of the opportunities inherent in establishing new applications and customer segments.
The strategy is teaching us more about our customers andtheir daily situations and fundamental needs. This knowledgeis vital to achieving efficient design of marketing activities and
product development. The strategy is also compelling us to re-view and improve our selling process. We used to sell mainlycomponents and standard products to OEM customers,whereas we now offer complete products and systems thatsolve the end customer’s problems. This expansion is placingnew demands on our employees and we have initiated varioustraining programs to raise our overall competence.
We are also devoting increasing resources to adapting theGroup’s products to specific customer segments. To do thissuccessfully and cost effectively, Munters’ core technologymust continually be enhanced. Based on the core technology,we must then use standardized components to the fullest pos-sible extent to develop modular units that can be easily assem-bled into customized solutions. It must be possible to flexiblymodify products and modules to suit different climates andspecific customer requirements.
ONE FIFTH OF THE WORLD’S ELECTRICITY
CONSUMPTION IS USED FOR VENTILATION AND AIR
CONDITIONING
The power market all over the world, and particularly in theUnited States, is changing rapidly. Yesterday’s monopolies arebeing broken up, one after the other. The driving forces are
Strengthened position through forward integration
The year added up to a sales increase of percent and percenthigher order intake. Earnings per share climbed percent to SEK.. Average annual growth in earnings per share has been per-cent since the company was listed on the stock exchange in . Munters’ corporate strategy was devised in . It is reevaluated annually and adapted to current company and market conditions. The more extensive provision of complete solutions to our customers’specific moisture problems is a vital component of our strategy. Inthe past, we offered only components and standard products or alimited line of services.

’
more stringent environmental standards and higher demandfor electricity, in part due to the burgeoning of the informa-tion society. Higher usage of computers entails higher powerconsumption. Computers also emit heat, leading to additionalconsumption of energy to air condition the rooms in whichthey are used. Indoor air quality and ventilation standards arealso becoming stricter, raising consumption of electricity stillfurther.
HumiCool is helping to boost the output of gas turbinesthat run generators. The demand for power generation gasturbines is increasing in line with the development of thepower market. One drawback with gas turbines is that outputdeclines as the outdoor temperature rises, which is when theneed for power is most acute—but that is also when Muntersprecoolers have the greatest impact.
Another significant opportunity for Munters is that of re-placing traditional electric-powered air conditioners with sys-tems that combine Munters technologies. In these cases, elec-tricity can be substituted with waste heat or natural gas, whichare cheaper, environmentally friendly alternatives to electricity.
I would like to take the opportunity to explain why MistElimination & Water Treatment, which used to be our fourthproduct segment, was merged with HumiCool during theyear. Market conditions for Mist Elimination & Water Treat-ment declined in the late ’ as deregulation of power andwater monopolies led to dramatically falling investments andweak demand for Munters. Businesses closely linked toHumiCool operations has developed more stably, making themerger of the divisions logical and necessary to adjust totalcosts to prevailing conditions.
GROWING SERVICE
The strategy as applied to MCS, our service business offeringtemporary dehumidification, means that we are expandingour traditional operations to include related services, such asfire damage restoration and, in certain cases, renovation workand project management. One of our overall objectives is thatthe service business—MCS and aftermarket—shall accountfor approximately half of group sales within a few years. Theshare is about percent today.
During the year, we participated actively in the ongoingrestructuring of the market for water damage restoration. Thetrend is that major insurance companies are more often look-ing for fewer but larger partners. The trend benefits Munters,which is the market leader in water damage.
There was strong demand for MCS in Europe followingwidespread floods in England, Sweden, and France. Rapid
expansion of Munters’ capacity in those countries led to highcosts and lower margins during the year. Meanwhile, there wasalmost no weather-related demand in the United States. Theconclusion is once again that demand for MCS worldwide isrelatively stable, even though variations in local markets can besubstantial.
STRONGER POSITION
was a fantastic year of high organic growth and success-ful integration of our largest acquisition so far—Euroemme.Munters further reinforced its market position in the past year.Ongoing internationalization and restructuring are benefitingMunters. We have a global organization, extensive industry expertise, and a robust product portfolio. We have applied thestrategy consistently and built strong positions all over theworld.
I am pleased and proud to report that Munters has nowachieved organic growth in net sales for consecutive quar-ters. I would like to extend sincere thanks to everyone atMunters for excellence and achievement in .
Stockholm, February

Heated airdries the rotor
The rotorturns slowly
Dehumidified air
Wet air is removed
Drive motor
Heater
The humidity in the air isadsorbed inthe rotor
ROTOR THE DEHUMIDIFIER CONTAINS A ROTOR WITH SMALL AIR CHAN-
NELS THAT HAVE A VERY LARGE SURFACE AREA. THE ROTOR IS TREATED
WITH SUBSTANCES THAT EASILY ADSORB MOISTURE, SUCH AS SILICA GEL
AND LITHIUM CHLORIDE.
TWO AIR STREAMS PASS THROUGH SIMULTANEOUSLY THROUGH TWO
SECTORS. THE FIRST IS THE MOIST AIR TO BE DEHUMIDIFIED. THE SEC-
OND IS HOT AIR THAT DRIES THE ROTOR SO IT CAN ADSORB MOISTURE
AGAIN.
product and became an expert in thermodynamics—the inter-play between air, water, and energy. This knowledge was trans-lated into a number of products when he started Munters in.
THE DEHUMIDIFYING ROTOR
Munters introduced a new device to regulate humidity—theMunters dehumidifier. The dehumidifier, still the core of theGroup’s dehumidification and MCS business, contains a rotorwith small air channels and a large surface area. The rotor istreated with substances that easily adsorb moisture, e.g., silicagel and lithium chloride. Two air streams pass simultaneouslythrough two sectors of the slowly rotating rotor. The first is theair to be dehumidified. The second is hot air that dries the ro-tor so it can adsorb moisture again.
Munters’ dehumidifiers are energy efficient and use nofluorocarbons, unlike most other dehumidification methods.
MIST ELIMINATION—A TYPE OF DEHUMIDIFICATION
Mist elimination, one of the methods used by HumiCool, is atype of dehumidification where mist or droplets are removedfrom gas or air. Munters’ mist eliminator is based on a uniquemethod where gas passes through small channels that collectand disperse the droplets.
EVAPORATIVE COOLING AND HUMIDIFICATION
Evaporative cooling makes the air temperature drop when water evaporates—as happens outside after a heavy rain. Fourgrams of water converted to vapor in one cubic meter willlower the temperature by degrees Celsius. With HumiCooltechnology, Munters solutions for evaporative cooling and humidification are used to create the ideal indoor climate forpeople, animals, food, and industrial processes.
Hot dry air Cool humidified air
Pump
Munters is the expert on invisible water—
the moisture in the air around us. Humidity
that is too high or too low isn’t good for
people, animals, crops, or products.
Humidity affects almost everything. Everything that rusts,rots, mildews, or dries out does so due to less than ideal hu-midity. The damage can be extensive and costly, but the cure issimple and cost effective: control humidity to keep it at theright level.
THE PROPERTIES OF HUMIDITY
Air consists of percent oxygen, percent nitrogen, and asmattering of other gases, along with water vapor. Relative hu-midity is the relationship between the amount of water vaporin the air and the maximum amount that the air can hold at aparticular temperature. The warmer it is, the more water vaporair can hold.
People can feel temperature changes by even a degree ortwo and perceive particles in very small concentrations, but weare relatively insensitive to variations in humidity. The mois-ture content of air must change by several hundred percent be-fore we feel the difference. Materials and technical processeson the other hand, are impaired by small variations in humidi-ty long before we feel the change. Many companies are hit byquality and production problems without realizing that theyare caused by variations in humidity.
AIR, WATER, AND ENERGY
In the ’, Carl Munters and Baltzar von Platen inventedthe first refrigerator with no moving parts—the machine thatcould “make ice out of heat.” Carl Munters further refined the
Properties of humidity
CELdek® MUNTERS’ METHOD FOR COOLING AND HUMIDIFYING THE AIR IS
CALLED EVAPORATIVE COOLING. WHEN WARM, DRY AIR PASSES OVER A
WET SURFACE, THE AIR GETS COOLER AND MOISTER DUE TO EVAPORA-
TION.

Business Direction
Munters is the world leader in humidity con-
trol, with products and services for dehu-
midification, humidification, and air cooling
in selected niches. About half of annual
group sales are generated by new applica-
tions. Munters prioritizes product and cus-
tomer segments in which the Group can
achieve a strong global position.
VISION
The Munters vision is to be known in the global market as aquality-conscious company with superior expertise in the fieldof humidity control—the Humidity Expert.
BUSINESS CONCEPT
Munters’ business concept is to be a global, application andservice driven niche company in air treatment, from a base indehumidification and humidification.
OBJECTIVES
With respect to operations, management is focusing onachieving the following medium-term objectives: ● A substantial portion of the Group’s products and services
shall be based on global product platforms● More than half of revenues shall come from end customers● Service—MCS and aftermarket in all Group product seg-
ments—shall account for about half of annual group sales● The Group shall have a comprehensive IT system to facili-
tate rapid communication and information transfer, effi-cient management, and short lead times
● The Group shall offer global training programs that lead tomotivated, highly competent personnel and to the percep-tion of Munters as an attractive employer.
STRATEGY
Executive management works according to the following strategy: ● Concentration on non-cyclical customer segments and ap-
plications with favorable underlying growth● Complete solutions based on the needs of the end customer● Repetition of successful customer installations at new cus-
tomers by means of efficient information transfer within theorganization
● Expansion of the MCS business and increase of the servicecontent
● Establishment of own organizations in all larger geographi-cal markets.
FINANCIAL TARGETS
Munters’ financial targets over one business cycle are:● Net sales growth of percent a year● Operating margin of percent● Capital turnover rate of .
Munters Executive Management sets individual financial tar-gets for the various operational areas: ● Continual sales growth every year● Continual earnings growth every year● Continual improvement of asset turnover ratio.
DIVENDEND POLICY
The Board of Directors intends to apply a dividend policy bywhich future dividends are adapted to Munters’ earnings per-formance, financial position, and other factors that the Boardconsiders relevant. The annual dividend shall correspond toapproximately one third of consolidated net earnings over aperiod of several years.
NET SALES AND GROWTH
OPERATING EARNINGS
AND OPERATING MARGIN
CAPITAL TURNOVER AND
RETURN ON CAPITAL EMPLOYED
0
50
100
150
200
250
300
350
200019991998199719960
2
4
6
8
10
12
14
SEK M %
Operating margin
Operating earnings
0
1
2
3
4
5
200019991998199719960
7
14
21
28
35
Times %
Return on capital employed
Capital Turnover
0
500
1000
1500
2000
2500
3000
3500
200019991998199719960
5
10
15
20
25
30
35
SEK M %
GrowthNet sales

OPTIMAL CURING OF WATER-BASED PAINT IS DEPENDENT ON TEMPERATURE AND HUMIDITY. A CONTROLLED DRYING PROCESS CAN BE ACHIEVED USING
MUNTERS TECHNOLOGY, WITH THE RESULT BEING HIGHER QUALITY AND FEWER REJECTS. CUSTOMERS INCLUDE MOST CAR MAKERS, INCLUDING BMW,
WHOSE MUNICH HEADQUARTERS IS SHOWN IN THE PICTURE.

DehumidificationWithin product area Dehumidification
Munters’ offers products and solutions to
help companies regulate the climate for
production processes and safeguard pro-
ducts and materials by controlling humidity.
Constant, low humidity prevents rust,
mold, frost, and other degradative process-
es. Munters customers gain a more effi-
cient production process and higher quality
for finished products.
MARKET
Munters business concept is to be a global, customer and so-lution driven niche business in air treatment, based on dehu-midification.
Munters dehumidification systems allow manufacturingcompanies to achieve consistently high quality regardless ofchanges in the weather and climate. The technology is energyefficient, environmentally sound, and cost effective. The foodindustry uses Munters dehumidifiers for the production, dis-tribution, and storage of a vast array of products. Grocerystores use the technology to prevent frost build-up in freezercases and on frozen food packages, and to create a comfortableindoor climate.The pharmaceutical industry uses Muntersproducts during production. Pills are vulnerable to moisture,and humidity must be kept low and constant throughout theproduction process. In the car industry, water-based paintsare being used more often and Munters dehumidifiers areused to achieve a controlled drying process.
Munters has a strong market position in its prioritizedcustomer segments of food, pharmaceuticals, electronics andautomobiles. A majority of world-class companies in those in-dustries are repeat customers for Munters.
PRODUCTS AND TECHNOLOGY
Munters supplies everything from small, mobile units to large,integrated solutions. The products are based on the Muntersdehumidifier invented by Carl Munters in the ’s (see page ).MDS, Modular Dehumidification System Modularization in-creases product functionality and enables Munters to rapidlyrespond to specific customer requirements. DryCool System combines dehumidification and air coolingand is used primarily by the food industry. The technology isenergy efficient and cost effective.
Munters dehumidifiers can adsorb substances other thanwater. A variant on the dehumidifier is used to eliminate sol-vents from the air. The most important customer segmenthere is the semiconductor industry. The products are marketedunder the Zeol brand.
THOROUGH MARKET KNOWLEDGE
The dehumidification market is fragmented and none ofMunters’ competitors are global. Munters has a market shareof percent and is the global market leader.
Munters’ strengths compared to its competitors are astrong brand, a complete product line, and a global marketingorganization offering superior expertise in applications andservice. By virtue of its extensive experience, Munters is able toteach the market about the impact of humidity on variousprocesses. Munters’ weaknesses are the relatively high costs in-volved in teaching and informing the market, and unsatisfac-tory efficiency in its European manufacturing. An efficiencyprogram aimed at improving production in Europe began toyield good results toward the end of the year.
BUSINESS DEVELOPMENT
The business grew by percent and there was a significant im-provement in earnings as a result of measures implemented inlate in the United States and in in Europe.
Munters’ strategy for the product segment entails focuson selected customer segments and offering customized totalsolutions to those segments. Munters can create extensive or-ganic growth by systematically repeating successful installa-tions for new customers and educating customers and con-sultants about the opportunities of dehumidificationtechnology.
SEK M
0
200
400
600
800
1000
1200
1400
2000199919981997199619951994
NET SALES
The annual average growth has been 9 percent during the period from 1994 to 2000.

MUNTERS IS A VITAL PARTNER TO INSURANCE COMPANIES IN WATER DAMAGE RESTORATION. FAST ACTION BY MUNTERS CAN MINIMIZE THE COSTS OF
FIRE AND WATER DAMAGE. DUE TO CONSOLIDATION OF THE INDUSTRY, INSURANCE COMPANIES ARE SEEKING OUT FEWER PARTNERS THAT CAN OFFER A
MORE COMPLETE LINE OF SERVICES. THIS BENEFITS MUNTERS, WHICH HAS GLOBAL OPERATIONS AND MORE THAN 250 SERVICE DEPOTS WORLDWIDE.
MUNTERS WORKS WITH MOST MAJOR INSURANCE COMPANIES IN EUROPE, THE UNITED STATES, AND ASIA. THE PHOTOGRAPH SHOWS THE HEADQUAR-
TERS OF THE GENERALIS INSURANCE COMPANY IN TRIESTE, ITALY.
Assicurazioni Generali, Mogliano Veneto, Italy, Graziano Piovesan Fotogramma

Moisture Control Services—MCSThrough product area Moisture Control
Services, MCS, Munters provides services
for water damage restoration, moisture
damage and temporary climate control.
The impact of fire and water damage can
be minimized through fast action from
MCS. MCS has more than 250 service
depots in 20 countries that are ready to
respond around the clock, seven days a
week.
MARKET
The business concept is to be the leading service company inwater damage restoration and temporary dehumidification.
In the area of water and moisture damage restoration,Munters works with leak detection, drying, remediation, andmoisture measurement. The main customers are insurancecompanies and claims adjustors. Munters works with mostmajor insurance companies in Europe, the United States, andAsia. Increasing consolidation in the insurance industry to-ward fewer and larger companies benefits Munters, which isthe worldwide leader. A large service network enables highavailability and fast service. Part of the business consists of dis-aster response following e.g., floods. MCS has reduced its de-pendency on the weather by increasing concentration on ap-plications for industry and construction.
Munters’ temporary climate control services are aimed atensuring correct humidity and temperature for various indus-trial processes. The construction industry must achieve rapid,weather-independent building processes and avoid qualityproblems in the finished building. Munters works with mostmajor European construction firms. Other businesses that uti-lize temporary dehumidification include the petrochemicaland power industries. Munters products are used during sand-blasting and surface treatment of pipelines, tanks, and othersteel structures to prevent corrosion and provide a better basefor protective paint.
PRODUCTS AND TECHNOLOGY
MCS’s business is based on a combination of services andrental of dehumidifiers. Munters’ mobile dehumidifiers areMCS’s most important tool. Moisture measurement systemsfor controlling and monitoring drying processes are other keytools.
GLOBAL MARKET LEADER
The market is highly fragmented and most competitors aresmall, local players. There are however a number of larger, in-ternational service companies that have diversified towardMunters’ traditional business. With a global market share ofapproximately to percent, Munters is the world leader.
Munters’ strengths in the product segment are a strongbrand, proximity to the customer through an extensive servicenetwork, technical expertise, and thorough knowledge of theindustry. Weaknesses are a relatively fixed cost level and lowentry barriers to the market.
BUSINESS DEVELOPMENT
MCS achieved business growth of percent in . Growthwas greatest in England, Sweden, and France, three of theprime European markets. Growth is largely dependent onconsolidation of the insurance industry, leading insurancecompanies to more frequently choose large suppliers as part-ners. Strong growth within MCS brought substantial initialcosts during the year for organizational expansion, resulting ina weak earnings trend. An agreement was signed in Decemberto acquire Mullins Restoration Services in Brisbane, Australia.Mullins operates in the property restoration control segmentand has three depots and sales of approximately SEK M.Mullins joined the Group in January .
Part of Munters’ strategy for MCS is to take a leading po-sition in all markets where it does business and establish itselfas the ”Preferred Service Provider” for key customers. Muntersshall also expand the line of services offered to customers. Tofurther exhance the business and improve customer service,Munters intends additional investments in training and IT.Munters’ long-term objective is for the service business—MCS and aftermarket—to account for about half percent ofgroup sales.
SEK M
0
200
400
600
800
1000
2000199919981997199619951994
NET SALES
The annual average growth has been 12 percent during the period from 1994 to 2000.

HumiCoolWithin product area HumiCool Munters’
sells products and solutions for evaporative
cooling. The technology makes it possible
to cultivate plants and raise poultry in hot,
dry climates. The Mist Elimination & Water
Treatment product segment was merged
with HumiCool as of the first of the year.
MARKET
The business concept is to be a global, customer and solutiondriven niche business in air treatment, based on evaporativecooling technology.
HumiCool’s customers are in the poultry, ventilation, andpower industries. Poultry production is a rapidly growing in-dustry due to increasing consumption of chicken worldwide.HumiCool products are used to cool poultry houses and createan optimal indoor climate, which are critical to achieving highproductivity and quality. Munters delivers complete coolingsystems to the segment, including cooling panels, fans, controlsystems, and water distribution systems.
In the ventilation and air conditioning business, Muntershumidification products are included in climate control sys-tems for cooling and improving air quality in factories, offices,homes, etc.
The car industry is using more water-based paint. Con-stant humidity during the painting process is necessary toeliminate static electricity and achieve a consistent surface fin-ish to the paint. Munters supplies humidification systems tothe automobile industry worldwide.Munters technology is used to achieve higher performanceduring operation of gas turbines for electrical power genera-
tion. The output of a gas turbine can be increased by five tofifteen percent by cooling the intake air.
In Mist Elimination & Water Treatment, Munters pro-vides technologies for purifying emissions from coal-firedpower plants. The products are often used in combinationwith other HumiCool products. Mist eliminators are often in-stalled after HumiCool cooling panels on gas turbine precool-ers that are based on evaporative cooling in order to preventwater droplets from entering the turbine along with the air.
PRODUCTS AND TECHNOLOGY
The method applied by HumiCool is called evaporative cool-ing. It is energy efficient and required investments and operat-ing costs are low. The key products in the HumiCool segmentare the CELdek and GLASdek cooling panels, which are madein several versions in nine plants around the world.
For evaporative cooling to work, the air to be cooled mustbe relatively dry. In DesiCool products, the air first passesthrough a dehumidifier to enable efficient evaporative cooling.This product opens the door to new applications with sub-stantial potential.
In Mist Elimination & Water Treatment, HumiCool sup-plies key components: mist eliminators that remove moistureand chemicals from air, steam, and gas. The product segmentalso supplies components for biological purification of wastewater.
MUNTERS IS THE MARKET LEADER
By marketing complete cooling systems instead of individualcomponents Munters potential increased tenfold. The marketfor cooling systems is estimated at SEK ,B and, after acquir-ing Euroemme, Munters has a market share of approximately percent. HumiCool’s primary strenghts are the strongMunters and CELdek brands, leading technology, extensiveapplications expertise, cost effective production, and a globaldistribution organization. Weaknesses are limited sales to endcustomers and dependence on a limited member of OEM customers.
BUSINESS DEVELOPMENT
HumiCool is Munters’ fastest growing product segment, withgrowth in of percent including the acquisition of Eu-roemme. Growth was strongest in the gas turbine segment.The DesiCool air conditioning system made its market break-through during the year. Munters’ strategy for HumiCool in-cludes setting up operations in new markets, transfer of exist-ing applications to other markets, and continued refinementof the product segment’s market offering.
SEK M
0
200
400
600
800
1000
2000199919981997199619951994
NET SALES
EUROEMME
MIST ELIMINATION & WATER TREATMENT
HUMICOOL
The annual average growth has been 14 percent during the period from 1994 to 2000.

THE LOUVRE IS ONE OF THE MOST PROMINENT ART MUSEUMS IN THE WORLD WITH MORE THAN 200,000 WORKS IN ITS COLLECTIONS. THE MUSEUM’S
BUILDING HISTORY GOES BACK TO THE 13TH CENTURY. THE WORKS HOUSED IN THE LOUVRE INCLUDE THE VENUS DE MILO, NIKE OF SAMOTHRACE
(“WINGED VICTORY”), AND LEONARDO DA VINCI’S WORLD-FAMOUS MONA LISA. THE NEW ENTRANCE, DESIGNED AS A LARGE GLASS PYRAMID, WAS
INAUGURATED IN 1989. MUNTERS SUPPLIES HUMIDIFICATION AND DEHUMIDIFICATION SYSTEMS TO MUSEUMS ALL OVER THE WORLD TO CREATE THE IDEAL
CLIMATE FOR THE WORKS OF ART AND VISITORS ALIKE.
© Yann Arthus-Bertrand “Earth from Above”

ing in larger potential market segments. The acquisition ofEuroemme, by which HumiCool increased its market poten-tial tenfold, was an expression of the strategy.
Munters encounters different competitors in each prod-uct segment. In all of them, the market is fragmented andmade up mainly of small, local players. The competitive situa-tion is described in the sections on each product segment.
CRITICAL MARKET FORCES:
Productivity and quality
Increasing global competition has made productivity andquality more important tools for sharpening the competitiveedge. By controlling humidity, companies can achieve higherproductivity in their processes and improve product quality.
Consolidation in the insurance industry
Intensified consolidation in the insurance industry, with fewerand larger players, has led to the insurance companies seekingout alliances with strategic partners working with water dam-age restoration. This benefits Munters. The Groups compre-hensive service network makes it possible to offer high avail-ability and fast service at competitive prices.
Demands for better indoor environments
In many countries, energy conservation in buildings has led tounsatisfactory ventilation and undesirable effects such as moldand mildew, humidity damage, and allergies. Munters MCSremediates buildings damaged by water. DryCool, DesiCool,and HumiCool products allow increased ventilation com-bined with low energy costs.
The environment and energy
As environmental awareness grows around the world, demandis increasing for environmentally sound, low-energy productsand production processes. In response to higher energy con-sumption and climbing energy prices, market demand forlow-energy alternatives is growing.
Globalization
There is a distinct trend toward globalization in many indus-tries. The pharmaceutical industry, whose products are vulner-able to moisture, is undergoing rapid internationalization. Tomanufacture identical products in different parts of the world,these companies must create identical indoor climates in allproduction plants. This requires strict control of humidity.
Technical progress
The use of electronics sensitive to humidity is increasing in mostindustries. This results in greater sensitivity to humidity in pro-duction and distribution, increasing the need for moisture con-trol. The trend has opened the door for Munters to a new in-dustrial segment.
MarketMunters is active in selected niches of the
global air treatment market. The company
has a world leading position in all three
market segments: Dehumidification, Evap-
orative Cooling, and Water Damage
Restoration.
The total air treatment market is worth nearly SEK 1 trillionper year. Munters is active in niches with a combined worth ofabout SEK B. In a fluctuating world economy, Munters hasshown continued sales growth since , annually and ascompared with the same quarter in the preceding year. Aver-age organic growth during the past five years has been morethan percent a year, compared with underlying growth inthe ventilation and air conditioning industry of about per-cent a year, according to BSRIA (The Building Services Re-search and Information Association, UK).
Munters’ strong, stable growth is mainly attributable to:● Customers in industries with good underlying growth● A wide customer base of mainly global corporations● Non-cyclical customers● Geographical distribution and an extensive line of
applications● That Munters creates much of its own growth.
A wide customer base and the fact that about percent ofMunters’ customers do business in non-cyclical industries aretwo of the main reasons for Munters’ stable growth. The com-pany has a strong position in the pharmaceutical, food, andpower industries. Stability is reinforced through a significantportion of net sales coming from service operations withinMCS and the aftermarkets for each product segment. Teach-ing end users and potential customers about the opportuni-ties inherent in moisture control is a vital tool in Munters’ ef-forts to create its own growth.
The Munters product segment strategy includes expand-
MCS/service 40%
Food 15%Energy 10%
Pharma 5%
Electronics 5%
Other 25%Dehumidi-fication
40%MCS 30%
HumiCool and MistElimination & Water Treatment 30%
NET SALES PER PRODUCT SEGMENT NET SALES PER CUSTOMER SEGMENT

Product DevelopmentIn order to maintain a world leading position
in moisture control, Munters invests signifi-
cant resources in product development.
New products, applications, and services
generate about half the Group’s annual
growth in net sales.
Munters’ product development strategy is to increase the serv-ice content of products and services and to offer total solutionsfor the customer’s problems with moisture, rather than supply-ing components. According to the strategy, a majority of theGroup’s products shall be based on global product platformsthat can be modified to suit various climates and applications.Product development is carried out mainly at Munters R&Ddepartments in Sweden, Germany, the United States, andJapan. R&D may be divided into two main areas:● Development of core components and production methods● Development of new products and product platforms.
THE CORE TECHNOLOGY
Munters’ core technology is based on the sorption rotor andthe cooling panels, GLASdek and CELdek, developed by CarlMunters in the ’. The basic technology hasn’t changed,but the properties and materials of the rotor are continuallydeveloped. A new type of rotor, with up to percent highercapacity, was introduced during the year.
DEHUMIDIFICATION
Developments in the Dehumidification product segment aremoving towards more extensive modularization. Modulariza-tion allows Munters to rapidly design and produce customizedsystems. Improved modular design paved the way for Munters’launch during the year of a new series of units designed for de-partment stores. A new low energy dehumidification system,MED, was also released.
MCS
Operations within MCS are based to a great extent onMunters dehumidifiers, meaning that the product segment is adriving force of product development for the company as awhole. Requirements from MCS include reducing noise, energyuse, and required maintenance for the products. However,good service—best described by the MCS motto “First andFast”—is just as important as the core products. Accordingly,the development within MCS is oriented towards skills enhancement for our employees, aimed at providing betterservice to our customers.
HUMICOOL
Munters continued supplying improved systems for cooling ofintake air to gas turbine driven power plants. Important prod-uct improvements were achieved in the environmentallyfriendly DesiCool products. HumiCool also launched a new,low-energy air humidification system during the year, de-signed for easy, reliable installation. The system makes it possi-ble to maintain the right humidity balance in various produc-tion environments. The product segment also launchedDropStop, with better performance and lower energy con-sumption than competing products. The Humid Air Motor(HAM) system was also launched during the year. The HAMsystem is a completly new method of reducing NOx emissionsfrom diesel engines by humiditying the combastion air. Thesystem is based on a combination of several Munters technolo-gies. Customers are found mainly in the ship-building andshipping industries.
CUSTOMER FOCUSED PRODUCT DEVELOPMENT
Product development at Munters is focused on the customer.In recent years, the company has invested considerable re-sources to adapt the Group’s products for specific customersegments. The MDS dehumidification system is a prime ex-ample of R&D conducted in close collaboration with cus-tomers. MDS is built in modules to make it rapidly customiz-able to the needs of the individual customer fordehumidification, temperature control, and air filtration. Thefoundation for new Munters products is laid through compa-ny presence in a great many markets and a comprehensive ap-plications database.
INFORMATION TECHNOLOGY
Information technique is becoming an increasingly importantproduct development tool. By using IT, Munters can rational-ize the design and construction of new products. An invest-ment program aimed at developing a central, IT system for allEuropean operations was initiated during the year.

OrganizationMunters has a world leading position in
humidity control, with operations in more
than 25 countries. The business is organ-
ized in three regions: Europe, Americas,
and Asia.
Business conditions are different in various parts of the worldwith respect to climate, standards, and industrial structure.Accordingly, Munters has chosen to organize the business inthree geographical regions:
REGION EUROPE
Europe is Munters’ largest region and includes operations inAfrica and the Middle East. The largest markets are Germany,Sweden, Great Britain, Finland, and France.
REGION AMERICAS
Region Americas comprises the United States, Canada, SouthAmerica, and Central America. The United States is by far thelargest market.
REGION ASIA
Munters operations in Asia include production or sales incompany-owned units in Japan, Australia, China, Korea,Thailand, Vietnam and Singapore. Japan is the largest market.Since Asian economic conditions are considerably differentfrom those in other markets, the organization of Region Asia isdivided geographically.
MUNTERS
REGION EUROPE
DEHUMIDIFICATION
MCS
HUMICOOL
DEHUMIDIFICATION
MCS
HUMICOOL
JAPAN
SOUTH EAST ASIA
CHINA
AUSTRALIA
REGION AMERICAS REGION ASIA
THE MUNTERS ORGANIZATION UNDER-
PINS THE CORPORATE STRATEGY OF
BEING GLOBAL, CUSTOMER ORIENTED,
AND HIGHLY SPECIALIZED. OUTSIDE OF
KEY MARKETS, MUNTERS WORKS WITH
STRATEGIC PARTNERS WITH RESPECT
TO SALES AND MARKETING.
Europe 52%
Americas 38%
Asia 10%
Europe 45%
Americas 43%
Asia 12%
NET SALES PER REGION OPERATING EARNINGS PER REGION

SALES AND SERVICE COMPANIES
PRODUCTION PLANTS AND SALES COMPANIES
Global Presence
Munters is a global group operating in all six
world regions.
The international structural transformation of recent years hasled to greater demand for suppliers with global presence. Thistrend benefits Munters, which has a strong brand and wide-spread geographical presence. Although our customers are in-ternational, most contracts are negotiated and drafted locally.Munters has a decentralized organization in which local unitshave great freedom and responsibility for creating their owngrowth. This is complemented by structured cooperation withthe other business units in the Group.
Information technology is an important factor in efficientcooperation and information transfer within the Group. In re-cent years, Munters has invested in new business systems. Theobjective was to facilitate communication and transfer of suc-cessful applications to other markets and enable faster report-ing and decisions. An extensive IT system is an important ele-ment of Munters capacity to enhance customer service.
For example, Munters has installed more than ,
dehumidifier units on customer premises around the world.
They constitute a base for Munters’ aftermarket business andentail in-depth knowledge in the Group related to variousapplications.
PRODUCTION
The Munters strategy entails manufacturing key components,final assembly of products and systems, quality assurance, anddistribution. This ensures that the Group maintains controlover its core technologies and restricts the tying up of capital,resulting in high flexibility. Key components include coolingpanels and dehumidifier rotors, which are manufactured in-house. Munters’ strong position, geographically and relative tocompetitors, yields significant economies of scale in produc-tion, purchasing, and distribution. Munters has productionfacilities in Europe, the United States, Latin America, Asia,and Australia.

THE FIRST OF JULY 2000 WAS OPENING DAY FOR THE ÖRESUND BRIDGE, THE 16 KILOMETER LONG LINK BETWEEN SWEDEN AND DENMARK. THE ÖRESUND
BRIDGE IS THE WORLD’S LONGEST SUSPENSION BRIDGE BUILT FOR COMBINED VEHICLE AND RAIL TRAFFIC. THE FOUR PYLONS THAT SUPPORT THE
BRIDGE ARE 204 METERS HIGH, MAKING THE BRIDGE THE TALLEST STRUCTURE IN SWEDEN. MUNTERS HAS SUPPLIED EQUIPMENT TO MANY BRIDGE PROJ-
ECTS ALL OVER THE WORLD. WITH MUNTERS’ HELP, CORROSION IN VULNERABLE CONSTRUCTION ELEMENTS, SUCH AS FIXTURES FOR SUPPORTING CA-
BLES, CAN BE COMPLETELY PREVENTED.

Region EuropeMunters’ largest region is Europe, which
generates slightly more than half of group
sales. MCS and HumiCool developed
strongly during the year, while Dehumidifi-
cation has weaker growth.
Munters has a strong brand since many years and has a largecustomer base in the European market. The transition fromcomponent supplier to provider of complete solutions is a keystrategy and the acquisition of Euromme was an importantstrategic move. The acquisition puts Munters and HumiCoolcloser to the end customer and makes the company able tooffer solutions tailored to the customer’s needs. As planned,Euroemme was integrated in the organization during the firsthalf of .
Market development for Dehumidification was relativelyweak during the year. Extensive changes were implemented inDehumidification. Focus on raising the product segment’s op-erating margin have begun to show results. A rationalizationprogram was begun under new production management,which resulted in significant improvements in the latter half ofthe year. The year ended with a very strong upswing forDehumidification.
MARKET
MCS demonstrated strong sales trends during the year. Thecontinued consolidation of the insurance industry is leadinginsurance companies to seek out alliances with strategic part-ners in water damage restoration, which benefits Munters.Several partnership agreements with large European insurancecompanies were signed during the year. The widespread floodslast autumn in England, Sweden, and France contributed tohigh capacity utilization in the division. High initial costs inconnection with very rapid expansion in those markets result-ed in a less than satisfactory earnings trend.
Order intake was very strong during the year for Humi-Cool. Demand was strongest for intake air cooling equipment
for gas turbines and cooling equipment for poultry houses andgreenhouses. DropStop, a drop separator for cooling batteriesin ventilation units, was launched during the year. Muntersalso received an large mist elimination order from Germanyinvolving flue gas purification at a coal-fired power plant. Theorder was important where demand has been low in recentyears.
REGION EUROPE
● generates percent of group salesand has employees
● comprises Europe, Africa, and the Middle East, with production in Great Britain, Germany, Sweden, and Italy
● there are service depots in the region
NET SALES AND OPERATING EARNINGS
0
300
600
900
1200
1500
1800
200019991998199719960
30
60
90
120
150
180
SEK M SEK M
Net sales Operating earnings
Except for a weak period mid-year, region Europe is reportingpositive trends for net sales and earnings. Net sales rose by percent to SEK ,M. Corresponding to a percent in-crease in constant currency. Net operating earnings rose by percent to SEK M.

THE J. PAUL GETTY MUSEUM SITS ATOP A CLIFF, WITH A COMMANDING VIEW OVER LOS ANGELES. THE MUSEUM, THE DESIGN OF WHICH WAS MODELED
AFTER THE DANISH ART MUSEUM LOUISIANA, COST MORE THAN ONE BILLION DOLLARS TO BUILD. SINCE ITS OPENING IN 1997, THE MUSEUM HAS BE-
COME ONE OF THE MOST POPULAR TOURIST ATTRACTIONS IN LOS ANGELES. MUNTERS SUPPLIES DEHUMIDIFICATION AND HUMIDIFICATION SYSTEMS TO
MUSEUMS ALL OVER THE WORLD, HELPING CREATE THE IDEAL CLIMATE FOR WORKS OF ART AND THOSE WHO COME TO SEE THEM.
The J. Paul Getty Museum, Los Angeles, Photographer: Scott Frances /Esto, © J. Paul Getty Trust 2000

Region AmericasRegion Americas is the second largest and
fastest growing region within Munters.
About 90 percent of the region’s revenues
are generated in the United States. The
largest product areas are Dehumidification
and HumiCool.
The product segment comprising equipment for cooling ofgas turbines for electrical power generation developed verystrongly during the year. The trend is attributable to risingpower consumption in the United States. The segment is ex-pected to demonstrate continued strong growth in upcomingyears and Munters has made operational investments aimed atmeeting the forecast demand.
Munters changed the distribution chain for HumiCoolproducts during the year. In addition to selling components toOEM customers, Munters is now selling complete cooling sys-tems directly to end customers as well. This has significantlyincreased the product segment’s sales potential and is consis-tent with the corporate strategy of increasing the value contentof our product offering.
During the year, the region introduced e-business as amarketing and sales channel for several products and cus-tomers.
Business in South America is still suffering the aftereffectsof fluctuating exchange rates in the Brazilian market of recentyears, although there is a discernible recovery in progress. Dur-ing the year, Munters invested in the business to enable proac-tive ventures in the region in the next few years.
MARKET
Market trends were strong in all product segments.In the Dehumidification segment, sales of Zeol units to
the semiconductor industry have demonstrated robust devel-opment. The Zeol system is an efficient means of separatingsolvents during painting and oxides during production ofelectronic components. Munters received orders during theyear from the world leaders in the semiconductor industry.Munters’ modular MDS dehumidification system made itsbreakthrough in the American market for industrial dehu-midifiers during the year.
MCS is reporting relatively weak development due to lowweather-related demand, in contrast to high demand in 1999due to an intensive hurricane season.
The HumiCool product segment demonstrated thefastest growth during the year. Demand was especially strongin the segment comprising equipment for pre-coolers for gasturbines and residential comfort cooling. Overcapacity in thepoultry industry resulted in lower demand in the segmentcompared with .
REGION AMERICAS
● generates percent of group sales and has employees
● comprises North and South America, withproduction in the United States, Mexico and Brasil
● there are service depots in the region
NET SALES AND OPERATING EARNINGS
0
250
500
750
1000
1250
1500
200019991998199719960
25
50
75
100
125
150
SEK M SEK M
Net sales Operating earnings
The region experienced strong growth throughout the year.Net sales rose by percent to SEK ,M, corresponding inconstant currency to an increase of percent. Operatingearnings increased by percent to SEK M.

LANDMARK TOWER IN YOKOHAMA IS THE TALLEST BUILDING IN JAPAN. THE 70 STORY, 296 METERS TALL BUILDING WAS INAUGURATED IN 1992. THE ELE-
VATORS IN LANDMARK TOWER REACH SPEEDS OF 45 KM/H, MAKING THEM THE FASTEST IN THE WORLD. MUNTERS SUPPLIES EQUIPMENT TO HUMIDIFY
BUILDINGS ALL OVER THE WORLD. THE JAPANESE CLIMATE IS VERY DRY IN THE WINTER AND INDOOR HUMIDITY IN LANDMARK TOWER IS RAISED USING
PRODUCTS FROM MUNTERS.

Evaporative cooling for residential comfort cooling is used inAustralia, where the climate is hot and dry over much of thecountry. In Japan, a new vapor humidifier, designed for use inhospitals and research laboratories, was developed andlaunched during the year. At the Beijing plant, product devel-opment is in progress for new HumiCool applications for therapidly growing Chinese market.
Demand within MCS rose during the year and the seg-ment further reduced its dependency on the weather.
REGION ASIA
● generates percent of group salesand has employees
● comprises Asia and Australia, withproduction in Australia, Japan, China and Thailand
● in other markets, where Munters has no presence, the company works with strategic partners
● there are service depots in the region
Region AsiaThe Asian markets are characterized by a
climate that alternates between blistering
heat, drought, and dripping humidity. De-
mand has increased for both Dehumidifica-
tion and HumiCool in pace with rising pros-
perity and more stringent demands from
the manufacturing industry. Japan ac-
counts for about half of net sales. An agree-
ment was signed in December on the ac-
quisition of Mullins Restoration in Australia.
China and Australia developed robustly throughout the year.The Japanese market developed well in the dehumidificationsegment, with significant increases in volume. All product seg-ments are reporting higher net sales compared with . Anagreement was signed at the end of the year on the acquisitionof Mullins Restoration Service, which does business on theeast coast of Australia. The acquisition has strengthenedMunters’ position in the moisture and water damage restora-tion segment. The company can now offer insurance compa-nies a full line of services related to water and fire damage.Other highlights during the year included start-up of produc-tion of HumiCool in Thailand, the opening of a new salescompany in Korea, and kickoff of MCS operations in NewZealand.
MARKET
Munters has a strong position in the Dehumidification pro-duct segment. Customers are mainly in electronics, pharma-ceuticals, and other high tech industries. Large portions of theJapanese export industry are included in Munters’ customerportfolio. The DryCool systems, launched during the year inJapan, have been very successful. During the year, MuntersChina received orders for major bridge construction projects atthe Yangtse river.
HumiCool showed strong development during the year.
NET SALES AND OPERATING EARNINGS
0
50
100
150
200
250
300
350
400
450
200019991998199719960
5
10
15
20
25
30
35
40
45
SEK M SEK M
Net sales Operating earnings
The region developed strongly throughout the year. Net sales roseby percent to sek M, corresponding in constant currency toan increase of percent. Operating earnings rose during the period to SEK M () after the year’s earnings were encumberedby costs related to new business establishments in Thailand andKorea.

Human ResourcesMunters’ strong growth requires constant
improvement of the organization and em-
ployees. Munters continually enhances
employee skills in order to provide better
customer service and further sharpen the
company’s competitive edge.
COMPANY CULTURE
Carl Munters was a man of great entrepreneurial spirit and in-novativeness. Today, those qualities are two of the key forceswithin Munters. The company culture also promotes delegatedleadership for a flat and dynamic organization and clear focuson the customer in every aspect of the business. Employeeswork independently and with considerable personal responsi-bility, supported by Munters’ guidelines for the business.
SKILLS ENHANCEMENT
Munters shall contribute to continual enhancement of expert-ise and professional skills among its employees.
New employees are given introductory training inMunters technologies and products. Skills enhancement inthis area is becoming more important as the service compo-nent of Munters’ offering rises. Munters offers several special-ized training programs for technicians, sales engineers, and supervisory employees.
Training programs within MCS are extensive, includingmoisture measurement and construction engineering. Thehighest stage of MCS training is the “Dr Moisture” course,held in cooperation with the Chalmers University of Techno-logy in Gothenburg.
A global manager development program was initiated in
and the first stage was carred out during the year. Theprogram is aimed at enhancing skills in areas such as strategy,market communications, and leadership, and at facilitatingcross-border idea and knowledge transfer within the Group.
INCENTIVE SYSTEMS
Munters applies bonus systems to create incentives towardscreating value in the organization. The employee categoriescovered by the bonus system include sales engineers, techni-cians, and higher managers. The systems are designed to in-crease the portion of performance-based pay and to rewardimprovements against last year, with respect to earningsgrowth, sales growth and capital turnover ratio.
A stock options program for senior officers was carred outin . In connection with subscription of the options,Munters bought back , shares at an average price ofSEK per share to cover the company’s obligations accord-ing to the options program.
The company intends to continue inviting employees tosubscribe to option rights and to expand the number of parti-cipants in the program.
EXPERIENCED EMPLOYEES
On average, Munters employees have been with the companyfor . years. The average number of employees in was,, of whom percent were women and men. Employeeturnover, computed as the number of permanent employeeswho left during the year compared with the average number ofemployees, was percent.
One of Munters’ express objectives is to be an attractiveemployer and hire employees who are highly skilled in theirfields.
AVERAGE NUMBER OF EMPLOYEES AGE DISTRIBUTION NET SALES PER EMPLOYEE
0
500
1000
1500
2000
2500
20001999199819971996
No
0
300
600
900
1200
1500
20001999199819971996
SEK K
0
200
400
600
800
1000
>6151–6041–5031–4021–30<20
No
Women
Men

QualityThe high quality of the company’s products
and services is an important success factor
for Munters. In order to maintain competi-
tiveness and strengthen market position, a
long-term quality effort is in progress at
Munters.
THE QUALITY PROGRAM IN 2000
During the year, Munters carried out several projects aimed atimproving the quality of products, procedures, and services.The largest project involves the plant in Tobo, one of Munters’largest production facilities. The objective of the project,which encompasses the entire production process, is to achieveimprovements in quality and efficiency.
HIGHLIGHTS OF THE QUALITY POLICY
● Munters shall offer high quality goods and services in orderto achieve optimal customer benefit
● Higher production quality shall be achieved through coordi-nation and cooperation between business units and depart-ments within the organization
● Every employee shall understand the importance of theright quality and be responsible for achieving it
● Product development shall be governed by the needs of thecustomer.
Activities that underpin the quality policy include introducto-ry training for employees and contract reviews before agree-ments with business partners are signed.
ISO 9001 CERTIFICATION
Most Munters units are certified under ISO 9001. Certifica-tion entails a requirement to fulfill and assure predeterminedstandards, leading to consistently high quality. Every aspect ofthe production process is documented prior to certification.ISO 9001 works as a management system designed to yieldmore efficient production with fewer production breakdowns.Munters’ goal is to enhance and simplify the quality system sothat becomes an effective tool in daily operations.
Munters works according to a number of clearly defineddevelopment models for product development. Systematic development assures high quality in the finished product.
VALUE-ADDED PER EMPLOYEE
0
100
200
300
400
500
600
20001999199819971996
SEK K
EMPLOYEE TURNOVER
0
5
10
15
20
25
TotalAsiaAmericasEurope
%

The EnvironmentMunters constant endeavor is to offer prod-
ucts that give our customers the opportuni-
ty to lower consumption of natural re-
sources and cut environmentally hazardous
emissions. We also strive to reduce waste
and energy consumption by our customers
and in our own operations.
Munters product area Dehumidification provides solutionsthat eliminate the need to heat storage areas during coldweather, leading to lower use of energy. DryCool and Desi-Cool products use significantly less electricity than conven-tional air conditioning methods. Munters is the world leaderin evaporative cooling, which cools air by adding water. Alter-native methods are usually based on high consumption ofelectricity and the use of fluorocarbons. Munters’ total pro-duction of CELdek has a cooling capacity equal to one millionstandard-size air conditioning units per year, meaning thatMunters is a major global player when it comes to environ-mentally friendly cooling technologies. Within MCS,Munters technologies and fast response make it possible to dryand save buildings damaged by water. The alternative is to teardown and rebuild. That means Munters is contributing to asubstantial drop in the waste of natural resources. Muntersproducts in the Mist Elimination & Water Treatment segmentpurify emissions from coal-fired power plants and constitutethe active component in water purification plants.
ISO 14001 CERTIFICATION IN TOBO, SWEDEN
Munters is intent on reducing the environmental impact of itsproduction processes. Aimed at meeting that target, the com-pany has implemented a comprehensive certification processin the plant in Tobo, Sweden, which is one of Munters’ largestproduction facilities. The reward for dedicated environmentalwork during ISO certification and forthcom-ing registration according to EMAS.
As an ISO certified company, Munters must work
systematically and long-term with environmental efforts andstrive for constant improvments. A survey of energy use (elec-tricity, gas, and oil) at the plant was begun last autumn, aimedat reducing consumption and emissions of hazardous sub-stances.
HIGHLIGHTS OF THE ENVIRONMENTAL POLICY
The Munters Environmental Policy is directed at all emplo-yees of the Group:● Munters’ business is closely linked to the environment, with
respect to products and manufacturing● By supplying low-energy systems based on environmentally
sensitive technologies, Munters can contribute to achievinglong-term, sustainable ecological development
● Environmental efforts shall be based on an environmentalmanagement system that is seamlessly integrated into thecompany’s operations
● Munters shall endeavor to maintain a high environmentalstandard in all activities. Management shall ensure compli-ance with local regulations and set goals aimed at achievingongoing environmental improvements. Munters’ objectiveis to uphold a single corporate standard all over the world
● The entire product life cycle shall be considered whenMunters products are developed
● Munters shall involve its employees and its suppliers in envi-ronmental issues
● The Environmental Policy shall be available to the public● The Environmental Policy shall not be considered a binding
obligation upon Munters. Nevertheless, Munters intends toallocate sufficient resources to meet the objectives of thepolicy
● Executive Management is responsible for implementation ofthe Environmental Policy.
Activities being carried out by Munters within the frameworkof the Environmental Policy include environmental trainingfor employees, reduction of consumption of resources throughrecycling, and supplier assessment based on environmental as-pects.

AIR AND VENTILATION CONTROL ACCOUNTS FOR 20 PERCENT OF THE WORLD’S ELECTRICITY CONSUMPTION. MANY MUNTERS PRODUCTS LEAD TO
LOWER POWER CONSUMPTION AND UTILIZATION OF ALTERNATIVE FORMS OF ENERGY FOR INDUSTRIAL PROCESSES, SUCH AS WASTE HEAT, DISTRICT
HEATING, AND NATURAL GAS.

CAPITAL SHARE
Munters stock has been traded on the O List of the OMStockholm Stock Exchange since October , . Munters’capital stock was SEK ,, as of December , .There were ,, shares outstanding, at par value of SEK each. Each share entitles the shareholder to one vote. All sharesconvey equal rights to a share in the company’s assets and earn-ings.
OWNERSHIP STRUCTURE
As of the end of the period, Munters had , shareholders,compared with , in the preceding year. The ten largestMunters’ shareholders control approximately percent ofcapital stock and votes. The proportion of Swedish institu-tional ownership was approximately percent of capitalstock. Approximately percent of capital stock was foreign-owned.
INCENTIVE PROGRAM AND STOCK BUY-BACK
In May , senior officers were invited to acquire stock op-tions in Munters AB at market value. The exercise period isJanuary –March , and the exercise price is SEK per
share. In all, employees subscribed options. In conjunction with the option program, Munters
bought back , shares at an average price per share ofSEK in order to cover the company’s obligations accordingto the options program.
SHARE PRICE DEVELOPMENT AND TRADING VOLUME
During fiscal , .M shares were traded at a total value ofSEK ,M, meaning that percent of the company’s stockchanged hands. The highest price paid during the period wasSEK on December , and the lowest price paid wasSEK on January , . The price per share climbed dur-ing the period from SEK to SEK , an upturn of per-cent. As of year-end, Munters’ market capitalization was SEK,M.
DIVIDEND
For the financial year, the Board of Directors proposesthat the AGM decide a dividend at SEK . (.) per share.
The Share
ANALYSTS WHO CONTINUALLY MONITOR MUNTERSFIRM ANALYST
Carnegie Gustav Heyman
Cazenove Henrik Olsson
Enskilda Securities Anders Eriksson
Handelsbanken Markets Martin De Verdier
Morgan Stanley Dean Witter Gideon Franklin
Swedbank Markets Mats Larsson
Cheuvreux Peter Karlsson
Nordiska Fondkommission Henrik Alveskog
Warburg Dillon Read Anders Fagerlund
OWNERSHIP STRUCTURESHARE OF CAPITAL
SHAREHOLDER SHARES HELD AND VOTES, %
Robur fonder 2,613,900 10.5
Nordea fonder 2 421,200 9.7
Tapiola Försäkring 1,881,600 7.5
Fidelity fonder 1,463,410 5.9
AMF Pension 1,241,500 5.0
SEB fonder 984,500 3.9
Skandia 881,300 3.5
Första AP-fonden 576,825 2.3
Andra AP-fonden 576,825 2.3
Fjärde AP-Fonden 576,825 2.3
Total, 10 largest shareholders 13,217,885 52.9
Other 11,582,115 46.3
Own shares 200,000 0.8
Total 25,000,000 100
OWNERSHIP STRUCTURE AS OF DECEMBER 31, 2000 TOTAL HOLDINGS
SHAREHOLDING NUMBER OF OWNERS SHARE, % AND VOTES SHARE, %
1 – 500 3,228 79.8 776,106 3.1
501 – 5,000 695 17.2 1,004,375 4.0
5,001 – 50,000 61 1.5 1,211,922 4.8
50,001 – 5,000,000 59 1.5 22,007,597 88.1
Total 4 043 100 25,000,000 100

100
200
300
400
500
600
700
80
100
120
140
160
180
JAN00
FEB MAR APR MAY JUN JUL AUG SEP OCT NOV DEC JAN01
FEB
The share
The Affärsvärlden General Index
Traded no of shares,000's (including late trading)
(c)SIX
SHARE TREND
PER SHARE DATA1 2000 1999 1998
Earnings, SEK 7.34 5.78 4.95
Shareholders’ equity, SEK 31.80 26.20 21.85
Operational cash flow, SEK 10.51 8.78 6.83
Dividend, SEK 2.302 1.80 1.50
P/E ratio, times 23.3 17.6 13.9
Market price, year-end, SEK 171.00 102.00 69.00
1 Counted on 25,000,000 shares.2 As proposed by the Board of Directors.
DIVIDEND POLICY
The Board of Directors intends to apply a dividend policy by which future dividends are adapted to Munters’ earnings performance, financial position, and other factors that the
Board considers relevant. The annual dividend shall correspondto approximately one third of consolidated net earnings over aperiod of several years.

Financial Overview
PRO FORMA1
KEY RATIOS FOR NINE YEARS 2000 1999 1998 1997 1996 1995 1994 1993 1992
Net sales, SEK M 3,179 2,594 2,401 2,197 1,927 1,799 1,681 1,548 1,142
Growth, % 23 8.0 9.3 14.0 7.1 7.0 8.6 35.6 n/s
Operating earnings, SEK M 306 237 205 184 155 81 149 105 62
Operating margin, % 9.6 9.1 8.5 8.4 8.1 4.5 8.8 6.8 5.4
Earnings before tax, SEK M 303 231 198 178 146 66 132 82 13
Equity, SEK M 795 655 545 437 303 242 241 199 139
Return on equity, % 25.3 24.1 25.2 28.2 33.2 17.0 37.2 29.8 n/s
Capital employed, SEK M 1,178 885 681 549 528 542 598 527 536
Return on capital employed, % 29.7 30.3 33.3 34.5 29.3 14.2 26.3 19.7 n/s
Asset turnover ratio 3.1 3.3 3,8 4.1 3.6 3.2 3.0 2.9 n/s
Total assets, SEK M 1,949 1,689 1,252 1,199 1,027 976 975 962 833
Equity ratio, % 40.8 38.8 43.6 36.5 29.5 24.8 24.7 20.7 16.7
Net debt, SEK M 333 230 135 112 225 300 357 332 397
Debt/equity ratio, multiple 0.42 0.35 0.25 0.26 0.74 1.24 1.48 1.67 2.84
Interest coverage ratio, multiple 12.4 13.1 11.6 10.5 7.6 3.2 5.0 3.2 1.2
Operating cash flow, SEK M 263 253 171 211 176 119 187 42 n/s
Investments, SEK M 148 114 109 84 72 88 71 53 37
Average number of employees 2,311 2,086 2,011 1,842 1,779 1,714 1.559 1,538 1,455
See page 29 for key ratios per share
1 Pro forma refers to the group structure created in connection with the initial public offering of stock in the Munters Group in October1997.
2 Excluding items disturbing comparability.3 Not significant.
OPERATING MARGIN
Operating earnings as a percentage of net sales.
RETURN ON CAPITAL EMPLOYED
Operating earnings as a percentage of average capitalemployed.
RETURN ON EQUITY
Net earnings for the year as a percentage of average equity.
EQUITY RATIO
Equity as a percentage of total assets.
DEBT/EQUITY RATIO
Net debt in relation to equity.
NET DEBT
Interest-bearing liabilities including the interest-bearingcomponent of pension commitments, less liquid funds(cash and bank deposits).
INTEREST COVERAGE RATIO
Earnings after financial items plus interest expense, divided by interest expense.
CAPITAL EMPLOYED
Total assets less liquid funds (cash and bank deposits)plus non interest-bearing liabilities (including deferredtax).
EARNINGS PER SHARE
Net earnings for the year in relation to the number ofshares.
EQUITY PER SHARE
Equity at the end of the period in relation to the numberof shares.
ASSET TURNOVER RATIO
Net sales divided by average capital employed.
OPERATING CASH FLOW
Earnings after financial items, excluding associatedcompanies, plus depreciation and changes in operatingworking capital (accounts receivable, inventory, accounts payable, and advances from customers).
ADDED VALUE PER EMPLOYEE (PAGE 26)
Operating earnings plus payroll and payroll expenses divided by the average number of employees.
DEFINITIONS
3
3
3
3
3
2
2
2

The board of directors and president of Munters AB (publ),corporate registration number -, submit here-with the annual report for the fiscal year . Due tochanges made to the legal structure of the company prior tothe initial public offering in , comparisons are againstpro forma figures for and preceding years. The resultsof the year’s operations for the Parent Company and theGroup are shown in the following income statements, bal-ance sheets, and notes to the accounts.
OWNERSHIP STRUCTURE
Munters AB has been traded on the O List of the OMStockholm Stock Exchange since October , .Munters’ ten largest shareholders own percent of capitalstock and votes.
GROUP OPERATIONS
Munters AB is the parent company of a group whose busi-ness is humidity control by means of several methods.Munters’ business concept is to be a global, application andservice oriented niche company in air treatment, based ondehumidification and humidification. Munters prioritizesapplications and customer segments where it can achievestrong global positions. The Parent Company’s operationsare oriented towards Group management, Group reporting,financial management, IT coordination, information, tech-nical coordination, and human resources development.
The business is divided into three geographical regions:Europe, Americas, and Asia. Operations in each region aredivided into product segments: Dehumidification, MoistureControl Services (MCS), and HumiCool. During the year,the former separate product segment Mist Elimination &Water Treatment was integrated with HumiCool.
GROUP ORDER INTAKE, NET SALES, AND EARNINGS
Order intake increased during the year by procent to SEK,M (,). Net sales for the Munters Group rose by
percent to SEK ,M (,). Adjusted for currency fluc-tuations, the increase was percent. Sales vary over theyear, with the second half and particularly the last quarterusually showing the highest sales of the year. As of year-end,backorders amounted to SEK M, SEK M higher thanthe preceding year.
Distribution of Group sales by region is as follows:Europe percent (), Region Americas percent (),and Region Asia percent (). Net sales rose during theyear by percent in Europe, percent in Americas, and
percent in Asia.Consolidated operating earnings, excluding the present
value of received and forthcoming payments of surplusfunds from SPP, amounted to SEK M (), an increaseof percent. Operating earnings were affected positively byexchange rate gains of approximately SEK M.
Consolidated earnings before tax, excluding the presentvalue of received and forthcoming payments of surplusfunds from SPP, increased by percent to SEK M ().Net earnings for the year, including present value of receivedand forthcoming payments of surplus funds from SPP ofSEK M, rose by percent to SEK M () after taxesof slightly more than percent (). Earnings per share in-creased to SEK . (.), an increase of percent.
Improved earnings are attributable to higher sales in allproduct segments, a favorable product mix, and efficiencymeasures. Higher sales were achieved through new prod-ucts, new applications, and a higher value content in ordersdelivered. Efficiency measures included a personnel reduc-tion of employees in the former product segment MistElimination & Water Treatment. This product segment hasbeen integrated with HumiCool. All regions added to theworkforce during the year in response to the increase inbusiness.
Region Europe
Order intake in Region Europe increased during the year by percent to SEK ,M (,). Net sales rose during theyear by percent to SEK ,M (,). Adjusted for cur-rency fluctuations, the increase was percent. Net operat-ing earnings climbed by percent to SEK M ().
Dehumidification is reporting order intake on a par with thepreceding year following recovery in the last quarter. An ef-ficiency program was started in the third quarter aimed atincreasing the product segment’s operating margin. Netsales increased during the year due to a strong conclusion,when a favorable product mix and efficiency measures led tosignificantly improved operating earnings.
MCS experienced strong growth. The proportion of weather-dependent business declined during the first nine months ofthe year. There was serious flooding in the last quarter inEngland, France, Italy, and Sweden, which boosted sales.Business volume due to floods and other disaster responsebusiness amounts to less than percent of total sales for theproduct segment. Order intake and net sales increased sig-nificantly compared with the corrresponding period in thepreceding year. Net operating earnings declined due to highcosts in conjunction with workforce expansion.
HumiCool is reporting sharply increased order intake, netsales, and earnings compared with the preceding year. Euroemme, Italy, acquired in late December , was consolidated with HumiCool as of January , . The for-merly separate product segment Mist Elimination & WaterTreatment was integrated with HumiCool during the year.Growth and earnings improvements refer to deliveries ofcooling equipment for intake air to gas turbines, cooling
’
Directors’ Report

’
Förvaltningsberättelseequipment for poultry houses and greenhouses, and new ap-plications. The acquisition of Euroemme establishedMunters as a supplier of cooling systems for poultry andgreenhouses, rather than a component supplier. Net salesdeclined for Mist Elimination & Water Treatment but earn-ings remained even with the preceding year due to efficiencymeasures during the latter half of the preceding year.
Region Americas
Order intake increased for region Americas by percent toSEK ,M (). Net sales rose by percent to SEK,M (). Adjusted for currency fluctuations, the in-crease was percent. Operating earnings were SEK M(). Earnings were increased through high net sales, a favorable product mix, and a generally good market situation.
Dehumidification is reporting strong order intake and netsales, primarily for dehumidifier units for industrial process-es and Zeol applications for the semiconductor and automo-bile industries. Operating earnings improved substantiallycompared with the preceding year, due to higher sales andefficiency measures carried out in late .
MCS demonstrated increased order intake and net sales andimproved earnings despite no major floods during the year.The favorable performance is attributable to continued in-vestments in the industrial segment and healthy demand inthe water damage restoration segment.
HumiCool experienced excellent growth in order intake andnet sales. Growth came primarily from products for coolingintake air for gas turbines, new applications, and highervalue content in deliveries.
Region Asia
Munters’ operations in Asia demonstrated continued im-provement during the year, except in Japan and SoutheastAsia. Order intake increased by percent to SEK M() and net sales increased by percent to SEK M(). Adjusted for currency fluctuations, the increase in netsales was percent. Net earnings were SEK M (), aftercosts in conjunction with new business establishments inThailand and Korea.
All product areas achieved higher order intake and netsales. Dehumidification developed strongly in China. Thedehumidification business in Japan, which had a weak startto the year, showed improvement during the latter half ofthe year. Order intake, net sales, and net earnings for Humi-Cool have shown positive trends, primarily in Australia andChina. A production unit for CELdek was opened inThailand during the year.
Gross earnings
Munters carries out product development and assemblagein-house, while a large share of component and part manu-facturing is outsourced. Subcontractors are also often usedfor larger service assignments within MCS. Core compo-nents, such as dehumidifier rotors, cooling panels, and mistseparators are produced in the company’s own productionfacilities, and the company also develops the productionmachinery used to manufacture components. Munters’ out-sourcing strategy yields significant flexibility and opportuni-ty to adapt production volume to sales volume. The produc-tion plant in Tobo, Sweden experienced production break-downs during , which led occasionally to delays andquality problems which has caused higher costs. The volumeincreases during the year also meant that certain of Munters’subcontractors had difficulty delivering sufficient quanti-tites in the desired delivery time, resulting in added costs.Higher marginal costs in conjunction with workforce ex-pansion within MCS also resulted in higher costs. In addi-tion, Munters’ strategy of increasing the value content of de-liveries meant that the gross margin was impacted negatively,while operating margin was improved.
Gross earnings for the Group increased during the yearby SEK M to SEK ,M ( ), corresponding to adecline in gross margin of . percent. Gross margin im-proved for Dehumidification, but declined for MCS andHumiCool.
Operating earnings
Operating earnings, including the present value of receivedand forthcoming payments of surplus funds from SPP ofSEK M, were SEK M () corresponding to an operat-ing margin of . percent (.). Excluding surplus fundsfrom SPP, operating earnings were SEK M, equal to anoperating margin of . percent. During the year, SEK Mwas reserved in operating expenses for a legal dispute from.
Selling costs increased by SEK M to SEK M ()and amounted to . percent (.) of net sales. Adminis-trative expenses were SEK M (), corresponding to .
percent (,) of net sales, and research and development ex-penses amounted to SEK M (), equal to . percent (.)of net sales. Development expenses in conjunction with cus-tomer projects and all development expenses within MCSare not reported as development expenses, but rather as anexpense in current operations.
Operating earnings were encumbered during the yearby depreciation of goodwill of SEK M (), reported as ad-ministrative expense. Higher depreciation of goodwill is at-tributable to the acquisition of Euroemme SpA, Italy, in De-cember .

’
Earnings after financial items
Earnings after financial items increased by percent toSEK M (), corresponding to an operating margin of. percent (.). Excluding surplus funds from SPP, operat-ing earnings were SEK M, corresponding to an operat-ing margin of . percent. Financial expenses increased dueto the acquisition of Euroemme, buy-back of ,
shares to cover Munters AB’s obligations pursuant to thestock options program for senior officers, and a higher re-quirement for working capital due to expansion. The finan-cial net includes the company’s share of earnings in associat-ed companies—Polygon AS, Norway and Polygon A/S,Denmark—of SEK M (), and interest expense of SEK M().
Taxes
Tax expense for the year was SEK M (), correspondingto an effective tax rate of . percent (.), which is higherthan the nominal tax rate of 28 percent in Sweden. This isdue primarily to the fact that a significant portion of theGroup’s earnings are generated in foreign subsidiaries incountries with higher tax rates, and because not all deprecia-tion of goodwill is deductible.
additional purchase money paid for the Euroemme acquisi-tion in the amount of SEK M, and a higher requirementfor working capital due to growth in the Group. The Grouphas unutilized credit of approximately SEK M. Consoli-dated equity as of closing day was SEK M (), whichcorresponds to an equity ratio of . percent (.) and adebt/equity ratio of . (.).
Investments and depreciation
The Group’s total investments in fixed assets during the fis-cal year were SEK M (). The majority was for invest-ments in MCS, production, and IT equipment. Deprecia-tion during the period amounted to SEK M (), includ-ing depreciation of goodwill of SEK M ().
Company acquisitions
In September , the Group acquired the assets and lia-bilities of Buildry AB, in bankruptcy. The assets consisted ofa large number of building heaters and boilers used in theconstruction industry to dry and control moisture contentin new construction. Buildry’s operations complementMunters’ MCS business in the Nordic region. The acquisi-tion did not bring any goodwill.
Product development
The Munters Group carries out continual product develop-ment aimed at improving products, developing new prod-ucts, and discovering new applications. One fundamentalprinciple is that development shall take place close to themarket, in collaboration with customers and end users.
Development expenses were SEK M () and werecharged in their entirety against operating earnings for theyear. Development expenses in conjunction with customerprojects and all development expenses within MCS are re-ported as an expense in current operations and not as devel-opment expenses.
Human resources
The average number of employees in the Group was ,
(,) in , including () in Sweden. Costs ofsalary and remuneration for the year were SEK M (),including SEK M () for personnel in Sweden. Thecosts of social benefits regulated by law and collective agree-ment for personnel employed by the Parent Companyamounted to SEK M (). The equivalent cost for employeesof subsidiaries was SEK M ().
During the year, senior officers subscribed stock op-tions in Munters AB, valued at market price. In conjunctionwith subscription of options, Munters bought back ,
shares at an average price per share of SEK to cover thecompany’s obligations pursuant to the options program. Theprogram will thus not lead to any dilution for shareholders.
0
500
1000
1500
2000
Fixed assets
Inventories
Trade receivables
Current receivables
Cash and bank
Shareholders equity
Interest bearing liabilities
Non-interest bearing liabilities
789
795
207
254
729
8988
421
733
85121
655
621
655
351
638
68
528
157
417
82
545
218
489
Year 2000 Year 1999 Year 1998
THE MUNTERS GROUP IS LIGHT ON CAPITAL. THE INVENTORY LEVELS ARE
KEPT LOW THROUGH A WELL DEVELOPED SUPPLY CONCEPT. THE STOCK
TURNOVER RATE MEASURED AS SALES DIVIDED BY THE AVERAGE STOCK
LEVEL, WAS 13.8 TIMES.THE FIXED ASSETS CONSIST TO AROUND SEK150M OF
MCS—EQUIPMENT WHICH IS MOVABLE AND USED WHEREVER THE CUSTOMERS
REQUEST MUNTERS’ SERVICE.
Financial position
Liquid funds were SEK M () and interest-bearing liabil-ities (including PRI pensions) were SEK M (). Netdebt increased during the year by SEK M to SEK M() due to buy-back of shares in the amount of SEK M,

’
OPTIONS PROGRAM
The board intends to propose to the AGM that it resolve toauthorize the board to issue a new options program to sen-ior officers of Munters. The scope and terms of the programare currently being studied and will be presented to theAGM in April .
BUY-BACK OF SHARES
The board intends to propose to the AGM that it resolve togive the board renewed authorization to decide on buy-backof company shares. Such a mandate would mean that theboard would be given the option, until the next ordinaryAGM, to decide on buy-back of company shares, should theboard find the measure appropriate. Such a buy-back maybe executed through the stock exchange or through an offerto shareholders. The board’s mandate is intended to also in-clude the option of transferring shares bought back as al-lowed by law.
PARENT COMPANY OPERATIONS
The Parent Company’s operations comprise group-widefunctions. The company conducts no outside business. Thecompany’s net loss after financial net (excluding surplusfunds from SPP) was SEK ‒M (‒). After net financialincome and expense, dividends from subsidiaries, estimatedpresent value of surplus funds from SPP, and appropria-tions, the Parent Company is reporting earnings before taxof SEK M ().
Equity in the Parent Company as of closing day wasSEK M (), which corresponds to an equity ratio of
percent (). Liquid funds as of year end were SEK M ().Investments during the year amounted to SEK .M (.),and the average number of employees was (). See alsonotes and .
EVENTS AFTER THE REPORT PERIOD
On January 4, , Munters acquired operations in theAustralian company Mullins Restoration, which is active inthe fire damage remediation segment and has three servicedepots, about employees, and net sales of approximatelySEK M. Mullins complements Munters’ MCS operationsand gives Munters a broader line of services in Australia.
BOARD OF DIRECTORS
Munters’ board is made up of seven directors elected by theAGM and two directors and two alternates elected by theunions. The president of the company sits on the board. Of-ficers of the company attend board meetings in a reportingcapacity. Munters’ board of directors had six meetings in at which minutes were kept. At the ordinary meetings,the board of directors addressed standing items on the agen-da at each meeting in accordance with the board’s rules ofprocedure, such as business status, strategic plan, budget,
the annual report, and interim reports. The board also dealswith overarching issues concerning company acquisitions,other investments, and structural and organizational mat-ters.
At the first board meeting of the year, the Group’s audi-tors report their observations from the audit of the Group’sinternal audits and annual accounts. Accordingly, Munters’board has found no need to appoint a separate audit com-mittee.
The board’s compensation committeee, which consistsof the chairman of the board and two directors, deals withand makes decisions concerning salary and other terms ofemployment for the president and personnel who report di-rectly to the president.
ELECTION COMMITTEE
An election committee has been appointed, made up of rep-resentatives of the company’s principal shareholders. Meetingsare convened by the chairman of the board. The task of theelection committee is to present proposals prior to theAGM on election of the board of directors and auditors andtheir fees.
ENVIRONMENTAL IMPACT
The Group conducts business which requires permits ac-cording to the Swedish Environmental Code in the Swedishsubsidiary, Munters Europe AB. The Group’s business re-quiring permits and reports to government agencies affectsthe natural environment surrounding Munters Europe’splant in Tobo through emissions to air and water. For addi-tional environmental information, see page .
EURO HARMONIZATION
Munters’ sales to countries using the euro amounted in year to SEK M, corresponding to percent of theGroup’s total sales; purchases in euro amounted to SEK M.
Munters has its own companies in eight EMU coun-tries, but has customers in all of them and suppliers in most.The introduction of the euro will eventually simplifyMunters’ currency management. Quotations and invoicesto the Group’s customers in EMU countries will successivelybe made in euro as a separate currency.
Munters’ has not decided to list the company’s share ineuro and the company does not intend to issue financial re-ports in euro before .
CURRENCY AND INTEREST EXPOSURE
A significant portion of Munters’ revenues and expenses aregenerated in foreign currency. Consequently, Munters’ rev-enues, earnings, equity, and other items are affected by ex-change rate fluctuations between the Swedish krona andother currencies.
The table below shows Munters’ sensitivity in operat-

’
ing earnings against variations in certain currencies. Theanalysis is based on earnings for year and presumesthat all other factors that can affect earnings are unchanged.
Estimated impact on2000 operating earnings
CHANGE IN: MILLION %
The Swedish krona compared with:USD +/- 1 % 1.6 0.5DEM +/- 1 % 0.3 0.1FRF +/- 1 % 0.4 0.1JPY +/- 1 % 0.2 0.1GBP +/- 1 % 0.1 0.0AUD +/- 1 % 0.3 0.1ITL +/- 1 % 1.2 0.4
The currency fluctuation affects Munters’ revenues, operatingearnings, and equity through transaction exposure and transla-tion exposure.
Transaction exposure
The geographical distribution of Munters’ productionplants results in a significant matching of revenues and ex-penses in local currencies, which limits currency exposure.Munters’ revenues and operating expenses per currency areshown on the table below:
SHARE OF REVENUES SHARE OF EXPENSESCURRENCY IN 2000, % IN 2000, %
USD 38.9 39.3DEM 12.8 13.5SEK 9.0 15.5JPY 5.4 5.1GBP 6.9 8.6FRF 4.5 3.4AUD 2.6 2.0ITL 4.7 5.2
The table shows that Munters had satisfactory matching of revenues andexpenses in each currency. Munters’ policy is to fully hedge all contractednet flows and to hedge approximately 70 percent of forecast flows for theupcoming twelve months in order to minimize the impact of exchangerate fluctuations on Munters’ net earnings.
Translation exposure
When the balance sheets of foreign subsidiaries are translat-ed to Swedish kronor, Munters is exposed to currency fluc-tations (see note ). The effect on Munters’ equity of trans-lation of the financial statements of foreign subsidiaries toSwedish kronor amounts to SEK .M.
Interest exposure
Munters’ profitability is affected by interest rate fluctua-tions. The estimated effect on earnings after financial itemsof a change in the interest rate of one percent is approxi-mately SEK .M.
PROPOSED ALLOCATION OF EARNINGS, SEK
The following earnings are at the disposal of the AnnualGeneral Meeting:
Retained earnings 213,691,933Earnings for the year 101,142,685
Total 314,834,618
The Board of Directors and President propose that earningsbe allocated as follows:
Distributed to shareholders 57,040,000Retained 257,794,618
Total 314,834,618
According to the prepared consolidated balance sheet, non-restricted equity in the group amounts to SEK M.
No allocations to restricted reserves are required.
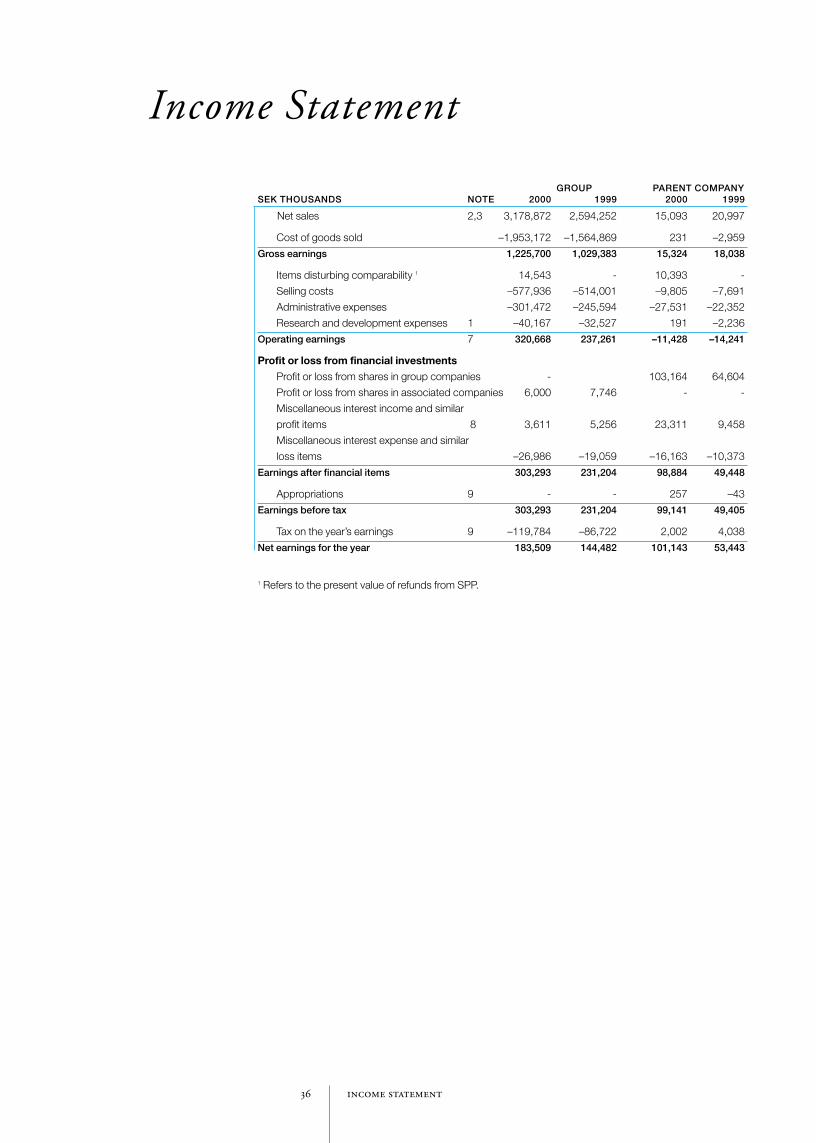
Income Statement
GROUP PARENT COMPANYSEK THOUSANDS NOTE 2000 1999 2000 1999
Net sales 2,3 3,178,872 2,594,252 15,093 20,997
Cost of goods sold –1,953,172 –1,564,869 231 –2,959
Gross earnings 1,225,700 1,029,383 15,324 18,038
Items disturbing comparability 1 14,543 - 10,393 -
Selling costs –577,936 –514,001 –9,805 –7,691
Administrative expenses –301,472 –245,594 –27,531 –22,352
Research and development expenses 1 –40,167 –32,527 191 –2,236
Operating earnings 7 320,668 237,261 –11,428 –14,241
Profit or loss from financial investments
Profit or loss from shares in group companies - 103,164 64,604
Profit or loss from shares in associated companies 6,000 7,746 - -
Miscellaneous interest income and similar
profit items 8 3,611 5,256 23,311 9,458
Miscellaneous interest expense and similar
loss items –26,986 –19,059 –16,163 –10,373
Earnings after financial items 303,293 231,204 98,884 49,448
Appropriations 9 - - 257 –43
Earnings before tax 303,293 231,204 99,141 49,405
Tax on the year’s earnings 9 –119,784 –86,722 2,002 4,038
Net earnings for the year 183,509 144,482 101,143 53,443
1 Refers to the present value of refunds from SPP.

Cash Flow Statement
GROUP PARENT COMPANYSEK THOUSANDS NOTE 2000 1999 2000 1999
Current operations
Operating earnings 320,668 237,261 –11,428 –14,241
Profit or loss from shares in associated companies 6,000 7,746 - -
Profit or loss from shares in group companies - - 103,164 64,604
Interest income 3,611 5,256 23,311 9,458
Interest expense –26,981 –19,059 –16,163 –10,373
303,298 231,204 98,884 49,448
Adjustments for items not included
in cash flow 117,487 152,023 –2,315 1,112
420,785 383,227 96,569 50,560
Tax paid 9 –119,784 –86,722 –2,240 -
Cash flow from current operations before changesin working capital 301,001 296,505 94,329 50,560
Cash flow from changes in working capital
Changes in inventory –46,735 –50,026 - -
Changes in accounts receivable –167,806 –93,798 871 -
Changes in other receivables 135 –8,915 –86,475 –241,387
Changes in accounts payable 69,968 52,596 –1,678 3,571
Changes in other liabilities –19,123 58,392 1,634 63,656
Cash flow from current operations 137,440 254,754 8,681 –123,600
Investing activities
Acquisitions of subsidiaries 12 - - - –138
Investments in intangible assets 10 –6,617 –157,418 -
Investments in tangible assets 11 –169,966 –157,530 –206 –568
Sale of tangible assets 11 8,490 4,557 - -
Investments in financial assets –192 –226 –3,841 -
Sale of financial assets - 1,258 - -
Cash flow from investing activities –168,285 –309,359 –4,047 –706
Financing activities
Received payment for stock option issued 15 4,568 - 4,568 -
Changes in loans 61,710 131,799 48,569 164,137
Dividends paid 15 –45,000 –37,500 –45,000 –37,500
Buy-back of shares 15 –24,842 –24,842 -
Cash flow from financing activities –3,564 94,299 –16,705 126,637
Cash flow for the year –34,409 39,694 –12,071 2,331
Liquid funds at the beginning of the year1 120,722 82,462 22,109 19,778
Exchange difference in liquid funds 1,760 –1,384 - -
Liquid funds at the end of the year 88,073 120,772 10,038 22,109
1 Liquid funds include cash, deposits in postal giro accounts, and bank deposits.

Balance Sheet
PARENT COMPANYSEK THOUSANDS (DECEMBER 31) NOTE 2000 1999 2000 1999
ASSETS
Fixed assets
Intangible assets 10
Patents, licenses. and
similar rights 2,785 3,146 - -
Goodwill 160,029 167,059 - -
162,814 170,205 - -
Tangible assets 11
Buildings and land 165,336 162,081 - -
Machinery and plant 209,943 162,006 - -
Equipment, tools, fixtures and fittings 125,451 106,937 1,296 1,969
New construction in progress and advances
for tangible fixed assets 12,398 9,233 - -
513,128 440,257 1,296 1,969
Financial assets
Participations in group companies 12 - - 182,510 182,510
Participations in associated companies 13 33,652 33,477 - -
Other securities held as fixed assets - - - -
Long-term receivables, group companies - - 44,820 9,892
Other long-term receivables 19,357 10,591 6,282 -
53,009 44,068 233,612 192,402
Total fixed assets 728,951 654,530 234,908 194,371
Current assets
Inventory 1
Raw materials and consumables 126,778 128,620 - -
Work in progress 51,010 29,320 - -
Finished goods and goods for resale 61,889 33,494 - -
Work in progress on another’s account 12,094 11,157 - -
Advances to suppliers 1,831 4,276 - -
253,602 206,867 - -
Current receivables
Accounts receivables 789,203 621,397 1,287 2,158
Receivables from group companies - - 573,243 490,318
Other receivables 58,883 56,528 9,341 5,122
Prepaid expenses and
accrued income 14 30,468 28,554 4,438 1,860
878,554 706,479 588,309 499,458
Cash and bank deposits 88,073 120,772 10,038 22,109
Total current assets 1,220,229 1,034,118 598,347 521,567
Total assets 1,949,180 1,688,648 833,255 715,938
GROUP

PARENT COMPANYSEK THOUSANDS (DECEMBER 31) NOTE 2000 1999 2000 1999
EQUITY AND LIABILITIES
Equity 15
Restricted equity
Capital stock
(25,000,000 shares, par value SEK 5) 125,000 125,000 125,000 125,000
Restricted reserves 205,406 193,553 69,269 64,701
330,406 318,553 194,269 189,701
Non-restricted equity
Non-restricted reserves 281,135 191,533 213,692 198,234
Net earnings for the year 183,509 144,482 101,143 53,442
464,644 336,015 314,835 251,676
Total equity 795,050 654,568 509,104 441,377
Untaxed reserves - - - 257
Provisions
Provisions for pensions and
similar obligations 16 84,238 92,829 31,791 30,753
Provisions for taxes 17 4,412 5,842 - -
Other provisions 18 80,067 57,234 - -
Total provisions 168,717 155,905 31,791 30,753
Long-term liabilities
Liabilities to credit institutes 19 1,651 3,516 - -
Liabilities to group companies 12,968 12,968
Other liabilities 2,373 2,918 - -
Total long-term liabilities 4,024 6,434 12,968 12,968
Current liabilities
Liabilities to credit institutes 19 347,015 282,895 212,220 163,651
Advances from customers 50,102 28,069 - -
Accounts payable 261,795 191,827 4,401 6,078
Liabilities to group companies - - 47,172 42,303
Tax liability 64,513 75,527 3,225 -
Other liabilities 49,702 79,844 - 1,100
Accrued expenses
and deferred income 20 208,262 213,579 12,374 17,451
Total current liabilities 981,389 871,741 279,392 230,583
Total equity and liabilities 1,949,180 1,688,648 833 255 715 938
Pledged assets 21 4,740 4,321 None None
Contingent liabilities 22 40,199 31,776 28,357 25,583
Balance Sheet
GROUP

Accounting Principles and Notes
NOTE 1 ACCOUNTING AND VALUATION PRINCIPLES
Accounting principlesThe Munters Groups’ financial statement are prepared in accordance with the recommendation of theSwedish Financial Accounting Standard Council. These recommendations correspond in all material respectwith the International Accounting Standards Committees (IASC) principles. The accounting principles are un-changed since last year.
Consolidated accountsThe consolidated accounts comprise the Parent Company and all subsidiaries. “Subsidiaries” refers to com-panies where the Parent Company, directly or indirectly, owns more than 50 percent of the votes or over whichit has a controlling influence.
Munters’ consolidated accounts are prepared using the acquisition method in accordance with Recom-mendation RR1 of the Swedish Financial Accounting Standards Council. Assets and liabilities reported bysubsidiaries at date of acquisition are entered at market value in the consolidated balance sheet in accordancewith an acquisition analysis. If the acquisition value of shares in subsidiaries exceeds the estimated marketvalue of the company’s net assets according to the acquisition analysis, the difference constitutes consolidat-ed goodwill.
Untaxed reserves, which appear in the accounts of countries in certain countries, are reported in the groupin part as deferred tax liability and in part as restricted reserves. Deferred tax liability is computed at the pre-vailing tax rate in the country of origin. Accordingly, changes in untaxed reserves are not posted to the consol-idated income statement. Changes in deferred tax liability are added to the year’s tax expense.Intercompany profit is eliminated when the consolidated accounts for the Munters Group are prepared. Tax ef-fects of consolidation are taken into consideration when the year’s tax expense is computed.
Translation of the income statements of foreign subsidiariesMunters’ foreign subsidiaries are independent foreign economic entities. The financial statements of theseeconomic entities are translated in the group to SEK in accordance with Recommendation RR8 of theSwedish Financial Accounting Standards Council. The assets and liabilities of foreign subsidiaries are translat-ed at the closing day rate, while the income statement is translated at the average rate. Translation differencesare posted directly to consolidated equity.
Accounts of associated companies Associated companies are companies in which the Group holds a long-term ownership interest of 20 to 50percent. The accounts of associated companies are prepared using the equity method. Shares in the after taxearnings of associated companies correspond to Munters’ share of the net earnings of associated companiesless dividends received and any depreciation of surplus value. Tax expense of an associated company is re-ported as a part of the Group’s tax expense. The book value of shares in associated companies is adjusted inthe consolidated balance sheet to reflect the share of earnings in the consolidated income statement.
ReceivablesReceivables are reported in the amounts at which they are expected to be paid.
Receivables and liabilities in foreign currencyFor the Parent Company and other Group companies, receivables and liabilities in foreign currency are report-ed in accordance with Recommendation RR8 of the Swedish Financial Accounting Standards Council, mean-ing that all receivables and liabilities in foreign currency are translated at the closing day rate in the consolidat-ed accounts. If an asset or investment is effectively protected against currency fluctuations by a liability in thecorresponding foreign currency, book values are not adjusted.
Valuation and depreciation of tangible and intangible assetsScheduled depreciation is based on the acquisition value and economic lifetime of the asset. Permanent de-clines in value are written down. In accordance with Recommendation RR6 of the Swedish Financial Account-ing Standards Council, financial leasing agreements are distributed by type of asset. Depreciation periods areshown below:
Buildings 25–30 years Patents and similar rights Machinery and equipment 3–10 years (Other intellectual property rights) 3–20 years
Goodwill 5–20 years
Consolidated goodwill is usually written off over a period of 5 to 10 years. Consolidated goodwill with a depre-ciation rate of less than 10 percent per year is attributable to strategically important acquisitions deemed tojustify a longer depreciation period for market or technical reasons. All consolidated goodwill values are reex-amined annually to determine that there is no need for other write-downs.

InventoryInventory is valued at the lower of cost or market value. Required allocations are made for obsoles-cence. Work in progress is valued as the sum of direct labor and materials costs plus a reasonablemarkup for indirect production costs.
Research and development expensesThe Group does not capitalize expenditures for research and development; they are expensed asthey are incurred during the year.
Recognition in revenueRevenue in connection with the sale of goods and provision of services is recognized in revenueupon delivery.
Reserves for warranty expensesAllocations to reserves for warranty expenses are made at a standard rate in an amount equal to theaverage cost of warranty expenses in relation to sales during the past 24 months, adjusted by anamount for known warranty claims in excess of the standard reserve.
TaxesAllocations are made for paid and deferred tax. Paid tax is based on each company’s tax return,while deferred tax takes into account the tax effect of the difference between reported and fiscalvalue. Deferred tax reported in the balance sheet is based on the most recent tax rates.
PensionsThe majority of Group companies have pension commitments or contributed to the costs of em-ployee pensions within the framework of various pension plans. Pension plans may be common toa large number of companies or company-specific. In all cases, reserves for pension liabilities, con-tributions to pension funds, and insurance premiums are based on actuarial computations.
NOTE 2 NET SALES AND OPERATIONS EARNINGS DISTRIBUTION, SEK K
Net sales and earnings per region are distributed by region as follows:
GROUP NET SALES NET OPERATING EARNINGS
2000 1999 2000 1999
Europe 1,674,309 1,403,875 149,682 103,532Americas 1,230,909 970,061 139,603 103,921Asia 335,146 278,665 40,390 41,052Central & eliminated –61,492 –58,349 –9,007 –11,244Total 3,178,872 2,594,252 320,668 237,261
Net sales are distributed by geographical market as follows:
GROUP PARENT COMPANY
NET SALES 2000 1999 2000 1999
Scandinavia 373,466 320,730 3,760 5,009Europe, excluding Scandinavia 1,147,480 989,902 9,573 14,046North America 1,149,364 890,821 1,213 -Other markets 508,562 392,799 547 1,942Total 3,178,872 2,594,252 15,093 20,997
NOTE 3 INTERCOMPANY TRANSACTIONS
Services, i.e., management fees, have been billed by the Parent Company to subsidiaries. All trans-actions between Group companies are on market terms.
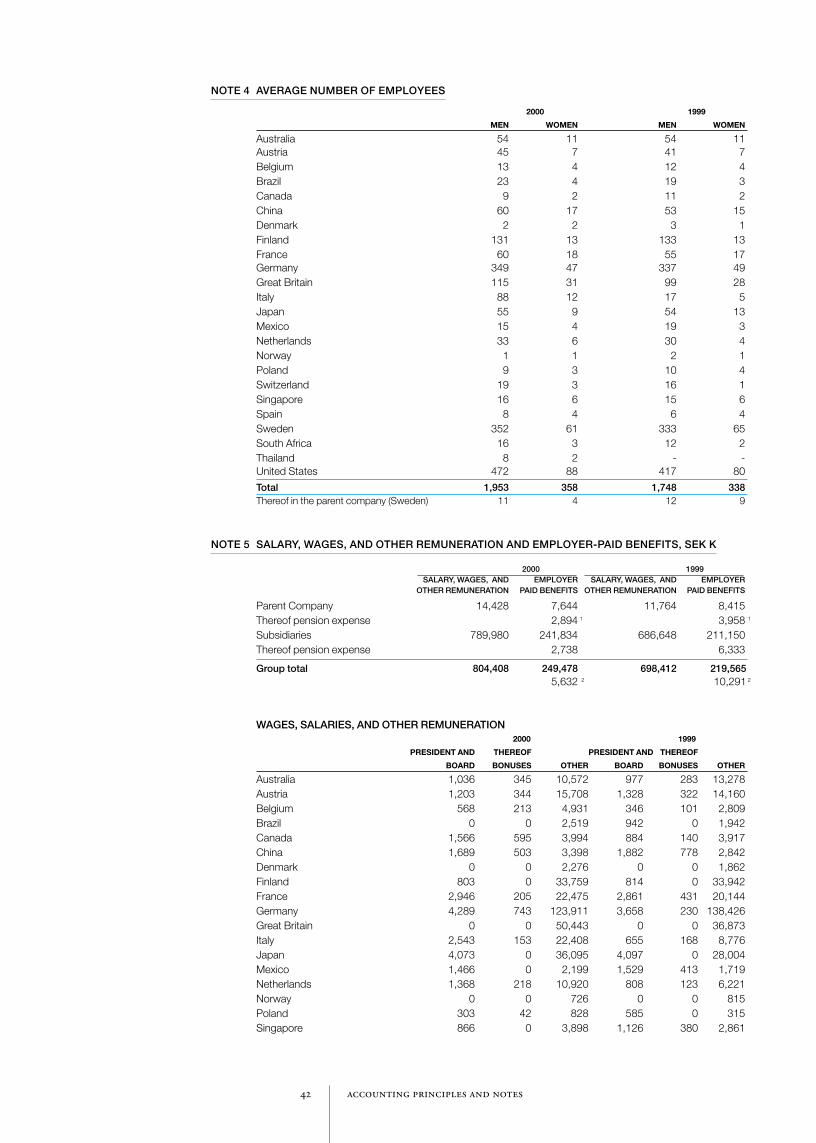
NOTE 4 AVERAGE NUMBER OF EMPLOYEES
2000 1999
MEN WOMEN MEN WOMEN
Australia 54 11 54 11Austria 45 7 41 7Belgium 13 4 12 4Brazil 23 4 19 3Canada 9 2 11 2China 60 17 53 15Denmark 2 2 3 1Finland 131 13 133 13France 60 18 55 17Germany 349 47 337 49Great Britain 115 31 99 28Italy 88 12 17 5Japan 55 9 54 13Mexico 15 4 19 3Netherlands 33 6 30 4Norway 1 1 2 1Poland 9 3 10 4Switzerland 19 3 16 1Singapore 16 6 15 6Spain 8 4 6 4Sweden 352 61 333 65South Africa 16 3 12 2Thailand 8 2 - -United States 472 88 417 80
Total 1,953 358 1,748 338Thereof in the parent company (Sweden) 11 4 12 9
NOTE 5 SALARY, WAGES, AND OTHER REMUNERATION AND EMPLOYER-PAID BENEFITS, SEK K
2000 1999SALARY, WAGES, AND EMPLOYER SALARY, WAGES, AND EMPLOYER
OTHER REMUNERATION PAID BENEFITS OTHER REMUNERATION PAID BENEFITS
Parent Company 14,428 7,644 11,764 8,415Thereof pension expense 2,894 3,958Subsidiaries 789,980 241,834 686,648 211,150Thereof pension expense 2,738 6,333
Group total 804,408 249,478 698,412 219,5655,632 10,291
WAGES, SALARIES, AND OTHER REMUNERATION2000 1999
PRESIDENT AND THEREOF PRESIDENT AND THEREOF
BOARD BONUSES OTHER BOARD BONUSES OTHER
Australia 1,036 345 10,572 977 283 13,278Austria 1,203 344 15,708 1,328 322 14,160Belgium 568 213 4,931 346 101 2,809Brazil 0 0 2,519 942 0 1,942Canada 1,566 595 3,994 884 140 3,917China 1,689 503 3,398 1,882 778 2,842Denmark 0 0 2,276 0 0 1,862Finland 803 0 33,759 814 0 33,942France 2,946 205 22,475 2,861 431 20,144Germany 4,289 743 123,911 3,658 230 138,426Great Britain 0 0 50,443 0 0 36,873Italy 2,543 153 22,408 655 168 8,776Japan 4,073 0 36,095 4,097 0 28,004Mexico 1,466 0 2,199 1,529 413 1,719Netherlands 1,368 218 10,920 808 123 6,221Norway 0 0 726 0 0 815Poland 303 42 828 585 0 315Singapore 866 0 3,898 1,126 380 2,861
2
11
2

2000 1999
PRESIDENT AND THEREOF PRESIDENT AND THEREOF
BOARD BONUSES OTHER BOARD BONUSES OTHER
South Africa 36 0 2,974 34 0 2,765Spain 857 222 2,388 691 159 1,933Sweden 4,692 652 128,684 3,114 606 103,312Switzerland 857 54 8,686 887 149 6,603Thailand 0 0 224 0 0 0United States 2,794 870 276,437 5,412 1,983 232,263
Total 33,955 5,159 770,453 32,630 6,266 665,782Thereof Parent Company (Sweden) 3,897 577 10,531 3,009 606 8,755
INFORMATION IN ACCORDANCE WITH THE INDUSTRY AND COMMERCE STOCK EXCHANGE COMMITTEE’SRECOMMENDATION ON BENEFITS TO SENIOR OFFICERS:
Remuneration to the board of directors:Chairman 275Other directors not employed by Munters 625
President:Salary and other benefits 2,618 (2,259)Thereof bonus 760 (606)
1 Of the Parent Company’s pension expense, 703 (400) refers to the current president and a former president.The capital value of the company’s outstanding pension commitments to the president and other senior officersis 6,458 (4,732). Senior officers are covered by a pension plan under which a pension equal to 70 percent ofpensionable salary will be paid from age 65.
2 Of the Group’s pension expense, 763 (400) refers to the current president and a former president. The capitalvalue of the Group’s outstanding pension commitments to the president and other senior officers is 6,753(4,732). Senior officers are covered by a pension plan under which a pension equal to 70 percent of pensionablesalary will be paid from age 65.
Audit fees during 2000 amounted to 4,621, distributed among the following accounting firms:
GROUP
Ernst & Young 4,439thereof Parent Company 359KPMG 149Other 33
Assignments other than audits:Ernst & Young 1,815thereof Parent Company 266KPMG 144
NOTE 6 CONTRACTUAL SEVERANCE PAY
Senior officers of the Group are entitled to severance notice of six months and are also entitled toseverace pay equal to 12 months’ salary (18 months for the president), if employment is terminatedby the company. The severance payment is offset against salary earned at other employment.

NOTE 7 DEPRECIATION AND WRITE-DOWNS, SEK K
Depreciation for the year has been charged to the income statement as follows:
GROUP PARENT COMPANY
2000 1999 2000 1999
Direct costs 67,548 60,223 - -Selling costs 11,634 10,420 61 21Administrative expenses 23,243 10,878 818 709Research and development expenses 199 376 - -Total 102,624 81,897 879 730
Depreciation of goodwill is reported as an administrative expense.
NOTE 8 MISCELLANEOUS INTEREST INCOME AND SIMILAR PROFIT ITEMS, SEK K
GROUP PARENT COMPANY
2000 1999 2000 1999
Dividends - 52 - -
Interest 3,611 5,204 23,311 9,458
Total 3,611 5,256 23,311 9,458
NOTE 9 TAX ON EARNINGS, SEK K
GROUP PARENT COMPANY
2000 1999 2000 1999
Paid tax as per income statement –115,964 –90,641 –2,240 4,038Deferred tax as per income statement –3,820 3,919 4,242 -
Total –119,784 –86,722 2,002 4,038
Deferred tax on appropriations in the Parent Company for 2000 amounts to SEK -72 thousand (12). Appropriations refer to dissolution of excess depreciation.
NOT 10 INTANGIBLE ASSETS, SEK K
INCOMING THE THE ACCUMU-AND YEAR’S YEAR’S LATED CLOSING CLOSING
ACQUISITION OUTGOING DEPRE- WRITE- DEPRE- BALANCE BALANCEVALUE ASSETS CIATION DOWNS CIATION 2000 1999
Patents, licensesand similar rights, 10 years 6,046 –166 –417 - –2,900 222 2,785 3,146Goodwill, 10 years 3 45,596 4 –3,144 - –35,456 66 7,066 10,140Goodwill, 20 years 156,919 –1,204 –7,678 - - 4,926 152,963 156,919
Total intangible assets 208,561 –1,366 –11,239 - –38,356 5,214 162,814 170,205
3 Fully depreciated amounts were excluded.
NOTE 11 TANGIBLE ASSETS, SEK K
INCOMING THE OUT- ACCUMU-ACQUI- AND OUT- YEAR’S GOING LATED CLOSING CLOSINGSITION GOING TRANS- DEPRE- DEPRE- DEPRE- BALANCE BALANCE
GROUP VALUE ASSETS FERS CIATION CIATION CIATION 2000 1999
Buildings and land 265 296 3 109 623 –11 102 1 274 –103 215 9 350 165 336 162 081
Machinery and plant 4 431 240 47 226 31 638 –45 242 4 558 –269 234 9 757 209 943 162 006
Equipment, tools, fixtures
and fittings 363 625 46 532 –3 088 –35 040 5 844 –256 688 4 266 125 451 106 937
New construction in progress
and advances related to
tangible fixed assets 9 233 30 495 –29 466 - - - 2 136 12 398 9 233
Total tangible assets 1 069 394 127 362 –293 –91 384 11 676 –629 137 25 509 513 128 440 257
4 Thereof Parent Company 3 649 206 - –879 - –1 680 - 1 296 1 969
The assessed value of buildings (in Sweden) is SEK 10,180 thousand. The assessed value of land (in Sweden)is SEK 1,311 thousand.Previously received localization grants amount to SEK 6,613 thousand (5,513) for the Group. Localization
TRANS-LATION DIFFE-RENCE
TRANS-LATION DIFFE-RENCE

grants have reduced the acquisition value of buildings, while other localization grants in the Groupreduce the acquisition value of machinery and equipment.Localization grants attributable to machinery and inventory are utilized at the same rate as depreci-ation on machinery and equipment, i.e., over a period of 10 years. Localization grants not taken upas income amounted to SEK 618 thousand (1,463) as of December 31, 2000. Financial leasing agreements are included in the closing balance for the asset type “Machinery andplant” in the amount of SEK 755 thousand. The acquisition value of those assets is SEK 2,538 thou-sand, and accumulated depreciation is SEK 1,783 thousand. Depreciation charged to the year’s in-come statement amounts to SEK 281 thousand.The minimum lease expense for operational leasing agreements in year 2000 amounts to SEK104,837 thousand. Future minimum leasing charges for operational leases are distributed as follows:
RENTAL PROPERTIES CARS AND OTHER
Charges due in 2001 65,391 30,711Between 2002-2006 116,651 24,222After 2007 33,979 -
NOTE 12 PARTICIPATIONS IN GROUP COMPANIES, SEK K
PROPORTION OF NUMBER OF NOMINAL BOOKEQUITY CUR- PARTICI- VALUE VALUE
RENCY PATIONS SEK K SEK K
AB Carl Munters, Sollentuna, Sweden 100% SEK 600,000 60,000 169,301Munters S.A., France 100% FRF 29,994 300 3,056Munters BV, Netherlands 100% NLG 25 250 41Munters Group Ltd, England 100% GBP 500,000 500 4,323Munters Beteiligungs GmbH, Germany 100% DEM 5 8,000 3,154Munters Group Inc. USA 100% USD 1,050,000 1,050 2,393Munters Norway A.S 100% NOK 50 104 104Munters Holding Italy Srl, Italy 100% ITL 1 89 138
Total 2,180,075 70,293 182,510
For a complete list of Group companies, please see the Annual Report filed with the Swedish Patentand Registration Office.
NOTE 13 PARTICIPATIONS IN ASSOCIATED COMPANIES, SEK K
PROPORTION OF NUMBER OF BOOKEQUITY PARTICIPATIONS VALUE, SEK K
Polygon A/S, Norge 33.33% 11,500 7,710Polygon A/S, Danmark5 38.16% 120 1,357
Total 9,067
Added in the Group 24,209
Total 33,276
5 Including Polygon A/S , Norway, owned by Polygon A/S, Denmark (56.45%).
NOTE 14 PREPAID EXPENSES AND ACCRUED INCOME, SEK K
GROUP PARENT COMPANY2000 1999 2000 1999
Prepaid rent, leasing charges 8,637 5,077 840 928Accrued interest income 370 1,158 - -Accrued insurance and license fees 1,807 5,165 59 513Other items 19,654 17,154 3,539 419
Total 30,468 28,554 4,438 1,860
NOTE 15 EQUITY, SEK KCAPITAL RESTRICTED RESTRICTED
GROUP STOCK RESERVES RESERVES TOTAL
Equity as of Dec. 31, 1999 125,000 193,553 336,015 654,568Dividends –45,000 –45,000Buy-back of shares/stock options program 4,568 –24,842 –20,274Transfers between restricted andnon-restricted equity 5,561 –5,561 0Translation difference 1,724 20,523 22,247Net earnings 183,509 183,509
Equity as of Dec. 31, 2000 125,000 205,406 464,644 795,050
NON-
6
7

CAPITAL STATUTORY RESTRICTEDPARENT COMPANY STOCK RESERVES EQUITY TOTAL
Equity as of Dec. 31,1999 125,000 64,701 251,676 441,377Dividends –45,000 –45,000Group contributions 31,858 31,858Buy-back of shares/stock options program 4,568 –24,842 –20,274Net earnings 101,143 101,143
Equity as of Dec. 31, 2000 125,000 69,269 314,835 509,104
6 Equity method reserve amount to 27,429 (21,949).7 Refers to buy-back of 200,000 shares in the company.
NOTE 16 ALLOCATIONS FOR PENSIONS AND SIMILAR COMMITMENTS, SEK K
GROUP PARENT COMPANY2000 1999 2000 1999
Allocations for FPG/PRI pensions 72,421 64,852 31,791 30,753Other pensions and similar commitments 11,817 27,977 - -
Total 84,238 92,829 31,791 30,753
NOTE 17 ALLOCATIONS FOR TAXES, SEK KGROUP
2000 1999
Deferred tax liability, Group 3,412 4,842Other allocations for taxes 1,000 1,000
Total 4,412 5,842
A deferred tax receivable in the American subsidiary in the amount of SEK 11,566 thousand is in-cluded in other receivables.
NOTE 18 OTHER ALLOCATIONS, SEK KGROUP
2000 1999
Warranty reserve 30,365 24,967Reserve for restructuring costs 20,094 13,147Allocation for rental obligations 19,120 19,120Allocation for legal disputes 10,488 -
Total 80,067 57,234
NOTE 19 LIABILITIES TO CREDIT INSTITUTIONS, SEK KGROUP
2000 1999
Credit line granted 560,000 450,000Unutilized portion –214,730 –129,390Bank guaranties 56,204 –70,338Other loans and leasing obligations 59,600 36,139
Total 348,666 286,411
NOTE 20 ACCRUED EXPENSES AND DEFERRED INCOME, SEK K
NEW GROUP 2000 1999 2000 1999
Vacation pay liability 34,061 29,693 2,118 1,925Employer’s contributions, social 54,984 29,466 1,540 -Other expenses related to personnel 34,396 47,765 5,534 4,740Received, not invoiced 22,231 23,657 430 2,190Accrued interest 893 230 396 157Other items 61,697 82,768 2,356 8,439
Total 208,262 213,579 12,374 17,451
7
PARENT COMPANY
NON-

NOTE 21 PLEDGED ASSETS AND DEBT MATURITY PERIODS, SEK K
WITHINGROUP LIABILITY ONE ONE TO LATER THAN PLEDGED LIABILITYLIABILITY 31 DEC 2000 YEAR FIVE YEARS FIVE YEARS ASSET 31 DEC 1999
Liabilities to credit institutions 348,666 347,015 1,651 - 1 286,411
Total 286,411
PLEDGED ASSETS FOR CREDIT FACILITIES 2000 1999
1 Liens on assets 4,740 4,321
Total pledged assets 4,740 4,321
NOTE 22 CONTINGENT LIABILITIES, SEK KGROUP
2000 1999 2000 1999
Guaranty obligations FPG 1,393 1,307 635 625Discounted bills 23,856 19,678 - -Bank guaranties 7,605 7,759 27,722 24,958Other contingent liabilities 7,345 3,032 - -
Total contingent liabilities 40,199 31,776 28,357 25,583
NOTE 23 EXCHANGE RATES
The following exchange rates were applied in the translation of the financial statements of foreignsubsidiaries.
INCOME STATEMENT BALANCE SHEET(AVERAGE RATE) (CLOSING DAY RATE)
2000 1999 2000 1999
USD 9.1608 8.2635 9.5350 8.5250DEM 431.85 450.59 452.85 437.84GBP 13.8578 13.3696 14.2200 13.7950FRF 128.76 134.35 135.02 130.55JPY 8.503 7.291 8.315 8.345AUD 531.53 533.48 528.25 556.25SGD 531.04 487.36 550.50 512.00FIM 142.06 148.22 148.96 144.03CAD 616.54 556.45 635.50 587.25DKK 113.32 118.52 118.70 115.05
Stockholm, February ,
Berthold Lindqvist Bo Ingemarson Anders JagraeusChairman
Sören Mellstig Sven Ohlsson Lars Spongberg
Bengt-Ola Nygren Håkan Vangbo Lennart EvrellPresident
Auditors’ Report was submitted on March ,
Gunnar Widhagen Carl-Gustaf GutbergAuthorized Authorized Public Accountant Public Accountant
PARENT COMPANY

’
Auditors’ Report
To the Annual General Meeting of Munters ABCorporate Registration Number -
We have audited the annual report, consolidated accounts, accounting records, and the managementof Munters AB by the board of directors and president for the fiscal year . The board of directorsand the president are responsible for the accounts and management of the company. Our responsibilityis to state an opinion on the annual report, consolidated accounts, and management of the companybased on our audit.
The audit was conducted in accordance with generally accepted auditing principles in Sweden.Those standards require that we plan and perform the audit to obtain reasonable assurance that theannual report and consolidated accounts do not contain material error. An audit includes the exami-nation of a selection of records supporting the amounts and disclosures in the financial statements.An audit also includes assessing the accounting principles and their application by the board of direc-tors and the president, as well as evaluating the overall presentation of information in the financialstatements. We examined significant decisions, actions taken, and conditions within the company inorder to determine whether any liability towards the company exists on the part of any director or thepresident and to determine whether they have in some other way acted in contravention of theSwedish Companies Act, the Swedish Annual Accounts Act, or the company’s Articles of Incorpora-tion. We believe that our audit provides a reasonable basis for the opinion stated below.
The annual report and consolidated accounts were prepared in accordance with the Swedish An-nual Accounts Act and thus provide a true and fair picture of the company’s and the group’s resultsand financial position in accordance with generally accepted accounting standards in Sweden.
We recommend that the Annual General Meeting adopt the income statements and balance sheets ofthe parent company and the group and allocate the earnings in the parent company as proposed inthe management report, and discharge the directors and president from liability for the fiscal year.
Stockholm, March ,
Gunnar Widhagen Carl-Gustaf GutbergAuthorized Public Accountant Authorized Public Accountant

Board of Directors
SVEN OHLSSON
DATE OF BIRTH 1944
DIRECTOR SINCE 1997.
CHAIRMAN OF AU-
DIODEV AB, ESSELTE AB,
IVT AB AND HARDFORD
& SCHTOFF AB. DIREC-
TOR OF HEXAGON AB
AND SCHNEIDLER-
FÖRETAGEN AB.
SHARES HELD: 2,000
BENGT-OLA NYGREN
DATE OF BIRTH 1948
DIRECTOR SINCE 1997.
REPRESENTATIVE OF
THE SWEDISH TRADE
UNION CONFEDERA-
TION (CHAIRMAN),
MUNTERS
EUROPE AB.
SHARES HELD: 200
INGE NODFORS
DATE OF BIRTH 1940
ALTERNATE DIRECTOR
SINCE 1997. REPRE-
SENTATIVE OF THE
SWEDISH UNION OF
CLERICAL AND TECH-
NICAL EMPLOYEES IN
INDUSTRY, MUNTERS
EUROPE AB.
SHARES HELD: 200
LARS SPONGBERG
DATE OF BIRTH 1945
DIRECTOR SINCE 1998.
PARTNER IN NORDIC
CAPITAL. DIRECTOR OF
NORDIC CAPITAL’S
PORTFOLIO COMPANIES
AND TELELOGIC.
SHARES HELD: 400
GERT BODIN
DATE OF BIRTH 1955
ALTERNATE DIRECTOR
SINCE 1997. REPRE-
SENTATIVE OF THE
SWEDISH TRADE
UNION CONFEDERA-
TION, MUNTERS
EUROPE AB.
SHARES HELD: 0
HÅKAN VANGBO
DATE OF BIRTH 1940
DIRECTOR SINCE1997.
REPRESENTATIVE OF
THE SWEDISH UNION
OF CLERICAL AND
TECHNICAL EMPLOYEES
IN INDUSTRY,
MUNTERS EUROPE AB.
SHARES HELD: 200
BERTHOLD
LINDQVIST
DATE OF BIRTH 1938
CHAIRMAN SINCE 1997.
DIRECTOR OF PHAR-
MACIA CORP, TRELLE-
BORG AB, SECURITAS
AB, PROBI AB AND
NOVOTEK AB.
SHARES HELD: 1,000
LENNART EVRELL
DATE OF BIRTH 1954
DIRECTOR SINCE 1997.
PRESIDENT AND CEO.
EMPLOYED SINCE 1995.
SHARES HELD: 24,900
INCLUDING 15,000 IN
COMPANIES.
OPTIONS 25,000.
ANDERS JAGRAEUS
DATE OF BIRTH 1945
DIRECTOR SINCE 1997.
PRESIDENT OF THE
MACGREGOR GROUP.
DIRECTOR OF MAC-
GREGOR KAYABA LTD.
SHARES HELD: 1,100
SÖREN MELLSTIG
DATE OF BIRTH 1951
DIRECTOR SINCE 1997.
PRESIDENT AND CEO
OF GAMBRO AB.
DIRECTOR OF THE
MACGREGOR GROUP
AND X-COUNTER.
SHARES HELD: 1,800
INCLUDING 400 IN
COMPANIES
BO INGEMARSON
DATE OF BIRTH 1950
DIRECTOR SINCE 1997.
PRESIDENT OF IF
SKADEFÖRSÄKRINGS AB.
CHAIRMAN OF UPPSALA
AKADEMIFÖRVALTNING.
DIRECTOR OF IVA:S
NÄRINGSLIVSRÅD, VICE
CHAIRMAN OF UPPSALA
UNIVERSITY.
SHARES HELD: 2,000
INDEPENDENT AUDITORS
GUNNAR WIDHAGEN
DATE OF BIRTH 1938, AUTHORIZED
PUBLIC ACCOUNTANT.
ERNST & YOUNG.
COMPANY AUDITOR SINCE 1997.
CARL-GUSTAF GUTBERG
DATE OF BIRTH 1946, AUTHORIZED
PUBLIC ACCOUNTANT.
ERNST & YOUNG.
COMPANY AUDITOR SINCE 1997.
MAGNUS JOHANSSON
DATE OF BIRTH 1965, ALTERNATE.
ERNST & YOUNG.
COMPANY AUDITOR SINCE 1999.
MAGNUS RÖCKLINGER
DATE OF BIRTH 1962, ALTERNATE.
ERNST & YOUNG.
COMPANY AUDITOR SINCE 1997.

Executive Management
LENNART EVRELL
DATE OF BIRTH 1954
PRESIDENT AND CEO.
EMPLOYED SINCE 1995.
SHARES HELD: 24,900,
INCLUDING 15,000 IN
COMPANIES
OPTIONS: 25,000
PAUL DINNAGE
DATE OF BIRTH 1962
VICE PRESIDENT TECHNO-
LOGY.
EMPLOYED SINCE 1985
SHARES HELD: 1,581
OPTIONS: 4,000
ERIK WILLIAMSSON
DATE OF BIRTH 1950
SENIOR VICE PRESIDENT, RE-
GIONAL PRESIDENT ASIA AND
PRESIDENT OF MUNTERS K.K.
EMPLOYED SINCE 1984.
SHARES HELD: 1,181
OPTIONS: 15,000
SÖREN SJÖSTRÖM
DATE OF BIRTH 1945
VICE PRESIDENT HUMAN RE-
SOURCES AND CORPORATE
COMMUNICATION.
EMPLOYED SINCE 2000.
SHARES HELD: 1,000
BERNT INGMAN
DATE OF BIRTH 1954
SENIOR VICE PRESIDENT,
CHIEF FINANCIAL
OFFICER.
EMPLOYED SINCE 1997.
SHARES HELD:
9,552, INCLUDING 3,600 IN
COMPANIES
OPTIONS: 26,000
MIKE MCDONALD
DATE OF BIRTH 1947
SENIOR VICE PRESIDENT,
REGIONAL PRESIDENT
AMERICAS AND PRESIDENT OF
MUNTERS CORPORATION.
EMPLOYED SINCE 1995.
SHARES HELD: 1,000
OPTIONS: 15,000

www.munters.comMunters has companies in more than countries all over the world.
For information about the office nearest you, please see www.munters.com
FINANCIAL INFORMATION
Annual General Meeting and Interim Report January—March, April
Interim Report January—June, August Interim Report January—September, October
Preliminary Accounts Report , February
Annual Report , April

Munters AB (publ)Kung Hans Väg 8, RotebroP.O. Box 430SE-191 24 SollentunaSwedenwww.munters.com C
ITIG
ATE
GR
AM
MA
200
1 P
HO
TO: P
IER
RE
ME
NS
, ÅK
E E
-SS
ON
LIN
DM
AN
, CLA
ES
AXS
TÅL/
GR
EA
T S
HO
TS, W
ES
LEY
HIT
T/TO
NY
STO
NE
, PR
ES
SE
NS
BIL
D
PR
EP
RE
SS
: BIL
DR
EP
RO
P
RIN
TIN
G: C
IVIL
EN


