119
Annual Report INFRASTRUCTURE NSW ANNUAL REPORT 2019-20

Annual Report INFRASTRUCTURE NSW ANNUAL REPORT 2019-20

1 Infrastructure NSW Annual Report 2019-20
Letter to the Premier
30 November 2020
The Hon. Gladys Berejiklian Premier of NSW Parliament House Macquarie Street Sydney NSW 2000
Dear Premier
I am pleased to submit for presentation to Parliament the Infrastructure NSW Annual Report for the financial year ended 30 June 2020.
The report has been prepared in accordance with the Annual Reports (Statutory Bodies) Act 1984, the Public Finance and Audit Act 1983 and the regulations under those Acts.
The financial statements for 2019–20, which form part of the report, have been submitted to and certified by the Auditor-General of New South Wales.
Yours sincerely
Simon Draper Chief Executive Officer

2 Infrastructure NSW Annual Report 2019-20
Contents
Contents ......................................................................................................................................... 2
About us ......................................................................................................................................... 3
Chairman and CEO overview .......................................................................................................... 5
The year in review ......................................................................................................................... 7
Investor Assurance .................................................................................................................................. 7
Strategy, Planning and Innovation .......................................................................................................... 11
Projects NSW ........................................................................................................................................ 16
The Barangaroo Precinct ....................................................................................................................... 22
Restart NSW .......................................................................................................................................... 26
Hawkesbury-Nepean Valley Flood Risk Management Strategy ............................................................... 27
South Creek Sector Review ................................................................................................................... 29
Corporate Support functions................................................................................................................... 30
Governance ................................................................................................................................. 31
Management and structure .................................................................................................................... 31
Internal audit and risk management attestation....................................................................................... 42
Digital Information Security Policy Attestation ......................................................................................... 43
Financial statements................................................................................................................... 44
Statement by the CEO ........................................................................................................................... 44
Independent Auditors Report.................................................................................................................. 45
Financial Statements.............................................................................................................................. 48
Statutory reporting ..................................................................................................................... 97
Human resources................................................................................................................................... 97
Executive levels and remuneration ......................................................................................................... 98
Personnel policies and practices ............................................................................................................ 99
Diversity ............................................................................................................................................... 101
Multicultural policies and services ........................................................................................................ 102
Industrial relations ................................................................................................................................ 102
Annual report production ...................................................................................................................... 102
Privacy................................................................................................................................................. 102
Workplace health and safety ................................................................................................................ 103
Promotion ............................................................................................................................................ 103
Responding to consumers .................................................................................................................... 103
Payments of accounts .......................................................................................................................... 104
Consultants .......................................................................................................................................... 105
Public interest disclosures .................................................................................................................... 111
Government Information (Public Access) Act 2009 ............................................................................... 111
Legal change ....................................................................................................................................... 117
Judicial Decisions ................................................................................................................................ 117

3 Infrastructure NSW Annual Report 2019-20
About us
Infrastructure NSW provides independent, evidence based advice to the NSW Government on infrastructure investment and prioritisation. We are a statutory agency, established under the Infrastructure NSW Act 2011. Infrastructure NSW’s core functions include providing independent and strategic advice to ensure infrastructure investment decisions are underpinned by robust assessment and long-term planning; monitoring NSW’s infrastructure program through independent reviews and expert analysis; recommending infrastructure projects to the NSW Treasurer for funding from the Restart NSW fund; and managing the procurement and delivery of nominated priority projects. Infrastructure NSW is also responsible for the development of Barangaroo and management of its public spaces.
The Act
Infrastructure NSW was established in July 2011 as a statutory body, under the Infrastructure NSW Act 2011. The Act tasks Infrastructure NSW with the following functions:
a) to prepare and submit to the Premier a 20-year State infrastructure strategy
b) to prepare and submit to the Premier 5-year infrastructure plans and other plans requested
by the Premier
c) to prepare and submit to the Premier Sectoral State infrastructure strategy statements
d) to prepare project implementation plans for major infrastructure projects
e) to review and evaluate proposed major infrastructure projects by government agencies or
the private sector and other proposed infrastructure projects (including recommendations
for the role of Infrastructure NSW in the delivery of those projects)
f) to oversee and monitor the delivery of major infrastructure projects and other infrastructure
projects identified in plans adopted by the Premier
g) to carry out or be responsible for the delivery of a specified major infrastructure project in
accordance with an order of the Premier under Part 5
h) to assess the risks involved in planning, funding, delivering and maintaining infrastructure,
and the management of those risks
i) to provide advice to the Premier on economic or regulatory impediments to the efficient
delivery of specific infrastructure projects or infrastructure projects in specific sectors
j) to provide advice to the Premier on appropriate funding models for infrastructure
k) to co-ordinate the infrastructure funding submissions of the State and its agencies to the
Commonwealth Government and to other bodies
l) to carry out reviews of completed infrastructure projects at the request of the Premier

4 Infrastructure NSW Annual Report 2019-20
m) to provide advice on any matter relating to infrastructure that the Premier requests.
Infrastructure NSW also has functions under the Barangaroo Act 2009 including:
a) to promote, procure, facilitate and manage the orderly and economic development and use
of Barangaroo, including the provision and management of infrastructure
b) to promote, procure, organise, manage, undertake, secure, provide and conduct cultural,
educational, residential, commercial, transport, tourist and recreational activities and
facilities at Barangaroo
c) to develop and manage the Barangaroo Reserve and public domain so as to encourage its
use by the public and to regulate the use of those areas
d) to facilitate and provide for appropriate commercial activities within the Barangaroo
Reserve and public domain that are consistent with their use for cultural, educational and
recreational activities and the use and enjoyment of those areas by the public
e) to promote development within Barangaroo that accords with best practice environmental
and town planning standards, is environmentally sustainable and applies innovative
environmental building and public domain design
f) to liaise with Government agencies with respect to the co-ordination and provision of
infrastructure associated with Barangaroo
g) to undertake the delivery of infrastructure associated with Barangaroo or that relates to the
principal functions under this Act of Infrastructure NSW.
Infrastructure NSW is also taken to be a development corporation for the purposes of the Blackwattle Bay precinct that was formerly the responsibility of UrbanGrowth NSW Development Corporation. This function is set out in the Growth Centres (Development Corporations) Act 1974. Vesting of former Urban Growth projects
On 1 July 2020, projects and assets, rights and liabilities relating to the former Urban Growth
Development Corporation were transferred from Infrastructure NSW to other government agencies,
as follows:
1. Redfern-Eveleigh – Infrastructure NSW to Transport for NSW 2. Waterloo Estate – Infrastructure NSW to Land and Housing Corporation (within Department
of Planning, Industry and Environment) 3. Waterloo Metro Quarter & Waterloo Estate Joint Contracts – Infrastructure NSW to Land
and Housing Corporation and Sydney Metro jointly 4. Bays West – Infrastructure NSW to Department of Planning, Industry and Environment 5. White Bay Power Station – Infrastructure NSW to Place Management NSW (within
Department of Planning, Industry and Environment) 6. Parramatta North – Infrastructure NSW to Property NSW (within Department of Planning
Industry and Environment) 7. Cumberland Precinct Transaction with University of Sydney – Infrastructure NSW to
Department of Premier and Cabinet

5 Infrastructure NSW Annual Report 2019-20
Chairman and CEO
overview Throughout 2019-20, Infrastructure NSW continued to provide independent, expert advice to support the NSW Government’s unprecedented infrastructure investment program, with a focus on promoting good practice in capital investment and implementing key recommendations of the 2018 State Infrastructure Strategy.
The COVID-19 pandemic had a profound impact on the State as it has on the whole country. Infrastructure construction and delivery has, however, continued with little delay or disruption. Our organisation played a leadership role to support continued delivery of infrastructure whilst ensuring public health practices were observed. We took the lead on whole of government coordination, monitoring and reporting of infrastructure-related impacts from COVID-19, and ensuring industry and government received consistent and factual information. NSW released commercial principles and an updated infrastructure pipeline in the early months of the pandemic to send a message of continuity to reassure industry of Government’s commitment.
Progress continued apace for some priority infrastructure projects being delivered by the Projects NSW division within Infrastructure NSW. Highlights include completing the Clarence Correction Centre in line with the program and budget, commencing construction on the new Sydney Football Stadium and the Art Gallery of NSW’s Sydney Modern project, receiving planning approval for the new Sydney Fish Market and submitting a planning application for the new Powerhouse Museum at Parramatta.
In 2019-20 we celebrated one year since Infrastructure NSW, Barangaroo Development Authority and UrbanGrowth NSW Development Corporation merged to become one organisation. This merger resulted in significant efficiencies and, despite challenging circumstances, we delivered high quality outcomes by investing in new capabilities and systems and achieving a strong sense of identity and purpose.
In partnership with Lendlease and Crown Resorts, significant progress was made on the remaining elements of Barangaroo South, and the sight-lines issue was resolved by agreement in August 2019. Central Barangaroo, the final stage of the transformation of Barangaroo, is progressing well with Infrastructure NSW working closely with our delivery partner Aqualand to finalise concept plans. A milestone was achieved in June with confirmation from the NSW Environment Protection Authority that the former Millers Point Gasworks land had been successfully remediated. Another highlight was partnering with Lendlease to have Barangaroo certified as Australia’s first carbon neutral precinct.
Infrastructure NSW continued to provide major project assurance during the financial year, with new project registrations increasing to 821 projects and 162 reviews completed, up 31 per cent on last year. This critical program enables Infrastructure NSW to facilitate constructive solutions to issues raised in assurance reviews, to grow capability in the NSW public sector and to keep Government abreast of emerging issues.
Early in the pandemic, we published an updated NSW Infrastructure Pipeline, which brought together all the NSW Government infrastructure projects expected to come to market with a

6 Infrastructure NSW Annual Report 2019-20
minimum capital value of over $50 million. This provided industry with authoritative information to enable planning and resourcing for the next three to five years. The Pipeline is coordinated by the NSW Government Construction Leadership Group, which is led by Infrastructure NSW, to drive reform across government in the development, procurement and delivery of infrastructure projects.
Good progress has been made on the NSW Government Action Plan: a ten-point commitment to the construction sector. One initiative is the development by agencies of Implementation Statements ahead of investment and procurement decisions on major projects.
The Hawkesbury-Nepean Valley Flood Risk Management Strategy is nearing the completion of Phase 1 of the program, with progress achieved in integrating land, road and emergency planning for the Hawkesbury-Nepean Valley, and implementation of the Community Resilience Program to build an aware, prepared and responsive community. The proposal to raise the Warragamba Dam wall for flood mitigation has progressed, with preparations underway for public exhibition of the Environmental Impact Statement.
***
In 2020-21, sound investment in highly productive infrastructure is as vital to the State’s economy as ever. The NSW infrastructure program is an important element of the State’s economic recovery. Infrastructure NSW will continue to support effective delivery of projects in the near-term and also to focus on long-term growth in productivity, prosperity and community well-being. The fires and drought that beset NSW have reinforced the need for durable infrastructure and resilient communities. The coming completion of many long lead-time projects creates the need to consider the next wave of high-value investments. With that in mind, work has commenced on the next State Infrastructure Strategy, expected to be completed in early 2022. We look forward to working with our colleagues and peers in the NSW Government and in industry to create a sustainable infrastructure legacy for NSW.
Graham Bradley AM Chairman
Si�t Chief Executive
7 Infrastructure NSW Annual Report 2019-20
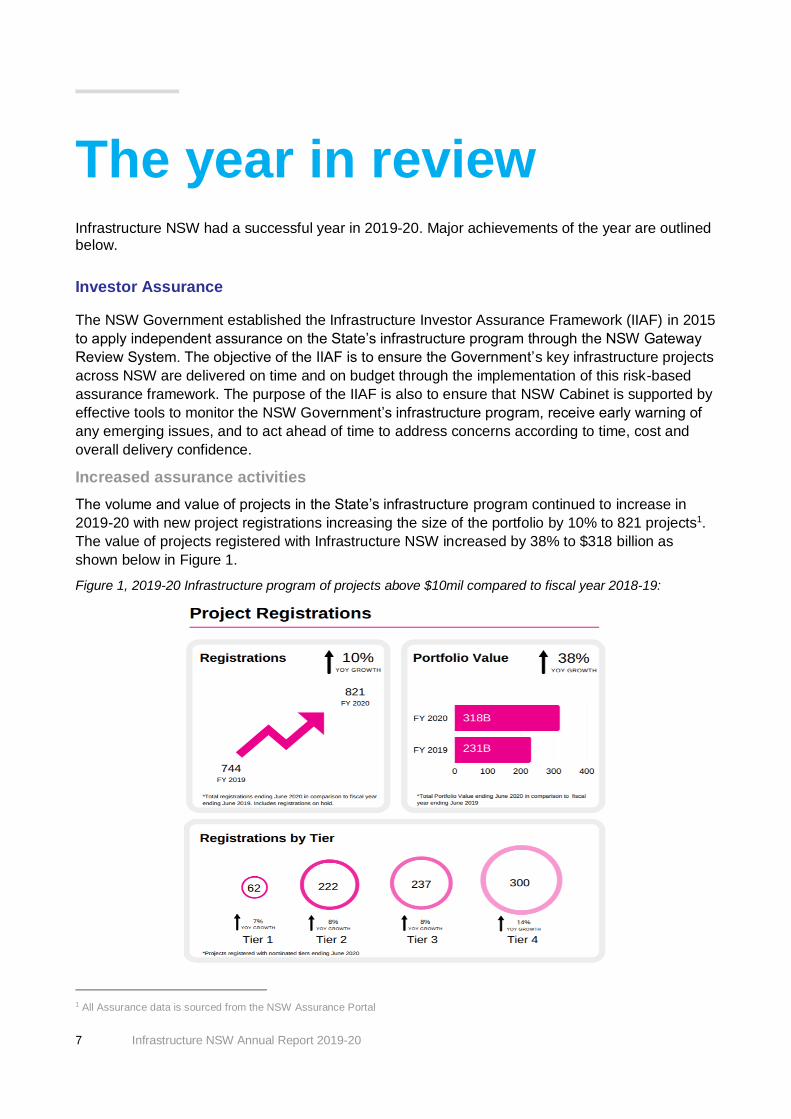
The year in review Infrastructure NSW had a successful year in 2019-20. Major achievements of the year are outlined below.
Investor Assurance
The NSW Government established the Infrastructure Investor Assurance Framework (IIAF) in 2015
to apply independent assurance on the State’s infrastructure program through the NSW Gateway
Review System. The objective of the IIAF is to ensure the Government’s key infrastructure projects
across NSW are delivered on time and on budget through the implementation of this risk-based
assurance framework. The purpose of the IIAF is also to ensure that NSW Cabinet is supported by
effective tools to monitor the NSW Government’s infrastructure program, receive early warning of
any emerging issues, and to act ahead of time to address concerns according to time, cost and
overall delivery confidence.
Increased assurance activities
The volume and value of projects in the State’s infrastructure program continued to increase in
2019-20 with new project registrations increasing the size of the portfolio by 10% to 821 projects1.
The value of projects registered with Infrastructure NSW increased by 38% to $318 billion as
shown below in Figure 1.
Figure 1, 2019-20 Infrastructure program of projects above $10mil compared to fiscal year 2018-19:
1 All Assurance data is sourced from the NSW Assurance Portal

8 Infrastructure NSW Annual Report 2019-20
Monitoring, reporting and reviews
In 2019-20, the Infrastructure Investor Assurance team completed 1,766 periodic reports and
conducted 162 reviews up by 31% from 2018-19. This upward trend is forecasted to continue
in 2020-21, with an anticipated growth in reviews of at least 10% to 180 reviews. Figure 2 and Figure 3 below show the year-on-year increase in assurance review activities.
Figure 2, 2019-20 Gateway Reviews compared to 2018-19:
Figure 3, 2019-20 Health Checks and Deep Dives compared to 2018-19:

9 Infrastructure NSW Annual Report 2019-20
Infrastructure Investor Assurance team
The Infrastructure Investor Assurance team was expanded and restructured in 2019-20 in
response to the increase in assurance activities and to enable a stronger focus on the performance
of the infrastructure program. The data and analytics capability in the team was strengthened to
improve the quality of reporting and the efficiency of assurance processes.
The new structure continues to provide a focus on activities undertaken by specific clusters
through the Cluster Partner Teams and is strengthened by portfolio level performance monitoring
and analytics with the Infrastructure Investment Portfolio Performance and Analytics team as
shown below in Figure 4.
Figure 4, Infrastructure Investor Assurance team structure:
The NSW Assurance Portal
The Reporting and Assurance Portal transitioned to a new system on 1 November 2019. The
system supports the assurance activities of NSW Treasury and Infrastructure NSW. Further work is
underway to digitise the assurance review processes, improve the efficiency of reporting, manage
the expert reviewer panel and minimise duplication of reporting across government.
Co:Lab
Infrastructure NSW commenced a program called the Infrastructure Co:Lab in July 2019. Held
every two months, the Co:Lab involved sessions with representatives from government agencies
and Infrastructure NSW. The Infrastructure Co:Lab was established to respond to the Trends and
Analysis recommendations from 2018, share lessons learnt across government, establish stronger
networks, develop capability and create awareness of systemic issues across the infrastructure
program.
Improving business cases Infrastructure NSW established a program with Government agencies to resolve common issues in business cases. The topics covered in 2019-20 included movement and place, social benefits, stated preference surveys, commercial offsets and benefits realisation. Infrastructure NSW also developed a business case toolkit to improve the quality of business cases, which was maintained and updated through 2020.

10 Infrastructure NSW Annual Report 2019-20
Infrastructure NSW continues to publish summaries of business cases for Tier 1 and Tier 2 projects with a capital value of more than $100 million. This provides transparency to the community of NSW about government decisions to invest in an infrastructure project or program.
Performance reporting An important part of the IIAF is the regular evaluation of the performance of the IIAF. Infrastructure NSW produces annual reports evaluating the performance of the assurance panel of experts, the Delivery Agencies, the projects, and the Infrastructure Investor Assurance team. In 2019-20, three of the five performance reports have been combined into one to eliminate duplication while maintaining compliance with the NSW Gateway Policy. The IIAF Overall Performance Report, together with the IIAF Cluster Assurance Plan (complete) and the IIAF Trends and Insights Report now forms the suite of IIAF Performance Reports.
Machinery-of-Government changes The projects delivered by the Barangaroo Delivery Authority and UrbanGrowth NSW Development Corporation were transferred to Projects NSW (within Infrastructure NSW) in July 2019. The assurance activities for these projects have therefore transferred to NSW Treasury, in accordance with the IIAF, to maintain the integrity and independence of the assurance process.

11 Infrastructure NSW Annual Report 2019-20
Strategy, Planning and Innovation
Infrastructure NSW provides independent and strategic advice to the NSW Government to ensure infrastructure investment decisions are informed by robust assessment and long-term planning. Key initiatives of the Strategy, Planning and Innovation team are outlined below.
Implementation and monitoring of the 2018 State Infrastructure Strategy
In February 2018, Infrastructure NSW submitted its third State Infrastructure Strategy (SIS),
Building Momentum, to the Premier setting out its independent advice on the current state of
NSW’s infrastructure and the needs and priorities over the next 20 years. The NSW Government
accepted 113 of the 122 SIS recommendations and released it on 18 March 2018 in coordination
with respective land use and transport long-term strategies prepared by the Greater Sydney
Commission and Transport for NSW.
Over the 20-year horizon of the 2018 SIS, 79 recommendations were identified as priorities to
address within the short term (0 - 5 years), 21 within the medium term (5 -10 years) and longer
term (10 – 20+ years). A further 13 recommendations were programs identified for implementation
over the 0-10+ years’ timeframe.
Of the 113 recommendations accepted by the NSW Government, five recommendations
(outlined in Table 1 below) were also the sole or joint responsibility of Infrastructure NSW (where
Infrastructure NSW is assisting the lead agency) and were not yet complete by the start of FY19-
20.
Table 1, State Infrastructure Strategy recommendations provided by Infrastructure NSW:
Recommendation 14 Infrastructure NSW recommends that the NSW Government establish a whole-of-government process, led by Infrastructure NSW and in partnership with industry, to identify and deliver major project procurement reforms by mid-2019. The reforms should focus on driving innovation, reducing bid costs and promoting competition.
Recommendation 15 Infrastructure NSW recommends that the NSW Government introduce a revised asset management policy that includes a new assurance model managed by Infrastructure NSW, including updated supporting policy and guidance materials, by the end of 2018.
Recommendation 16 Infrastructure NSW recommends that NSW Treasury update by the end of 2018 the data requirements for asset management plans prepared by agencies as inputs into NSW Treasury’s Capital Investment Planning policy.
Recommendation 21 Infrastructure NSW recommends that NSW Treasury and Infrastructure NSW require consideration of risk to natural hazards and human-related threats and resilience outcomes for new and upgraded infrastructure in project business cases, capital asset planning and assurance processes as a matter of course.
Recommendation 30 Infrastructure NSW recommends that the NSW Government develop a Smart Cities Strategy and program business case during 2018 to identify opportunities to deliver better services through collaboration and embracing the benefits of technology for infrastructure and public services.
Since the start of FY19-20, Infrastructure NSW has made significant progress addressing these 2018 SIS recommendations. Recommendations 14, 15, 16, and 30 are now complete. Significant progress has also been made with respect to Recommendation 21, with efforts ongoing with NSW

12 Infrastructure NSW Annual Report 2019-20
Treasury to embed a draft approach to investment in resilience in business case policies, which will continue to be a focus over the coming year.
The 2018 SIS also recommended the NSW Government to develop a range of sectoral plans and infrastructure strategies. Infrastructure NSW continues to play a role in the implementation of the 2018 SIS by advising NSW Government agencies with the responsibility for developing these strategies.
This advisory role ensures that the sectoral plans and strategies reflect contemporary issues in infrastructure and service delivery and align with the strategic directions and recommendations outlined within the 2018 SIS.
Development of the 2022 State Infrastructure Strategy
The Infrastructure NSW Act 2011 requires Infrastructure NSW to produce a State Infrastructure
Strategy every 5 years and at such other times as the Premier directs, or Infrastructure NSW
considers appropriate. Infrastructure NSW has now commenced development of the next 20-Year
State Infrastructure Strategy expected to be completed by February 2022.
Asset Management
Infrastructure NSW led the development of the new Asset Management Policy for the NSW Public Sector in response to the Government’s acceptance of the State Infrastructure Strategy 2018-2038 recommendation. The success of this work demonstrates a commitment to ensure that a strong asset management framework is in place for NSW to extract maximum benefit from the State’s physical asset portfolio and to ensure that infrastructure spending remains sustainable to meet future service requirements of our customers and communities.
Central to the objectives of the policy, is the building of capability across government to address
the long-term strategic challenges of population growth, climate change, expectations for improved
service delivery, and the aging profile of assets.
The NSW Asset Management Policy is to be effective from the 1 November 2020 for the NSW
Public Sector and will result in:
• an increase in the level of asset management maturity and accountability in line with
contemporary industry standards
• an increase in economic and social value of assets through robust, defensible asset
planning, delivery and asset lifecycle considerations
• improving the financial sustainability of infrastructure sectors through more productive
assets and modern maintenance practices
• prospectively identifying asset maintenance requirements for existing and planned assets in
consideration of criticality and economic outcomes.
Milestones in 2019-20
Infrastructure NSW leads a NSW Asset Management forum in partnership with industry via the Asset Management Council of Australia. Four sessions were held during 2019-20, with over 100 members from over 30 Government agencies, promoting consistency across government and improving the asset management capability within NSW Government agencies.

13 Infrastructure NSW Annual Report 2019-20
In response to the 2019-20 summer bushfire crisis, Infrastructure NSW developed a consolidated NSW Government Impacted Assets Register to provide a single source of truth for stakeholders for the restoration, reconstruction and improvement of infrastructure damaged or destroyed by the fires.
Development of the Infrastructure NSW led Asset Management Assurance Framework in accordance with the requirements of the Asset Management Policy for the NSW Public Sector. The Asset Management Assurance Framework aims to provide a level of confidence to NSW Government that the State’s assets are being effectively managed and performing to an acceptable standard to achieve the intended outcomes for the State and NSW communities.
Infrastructure NSW has led development of a methodology to have a consistent understanding of the size, impact and strategic benefit of maintenance backlog across all infrastructure sectors. The methodology will be implemented with the NSW Asset Management Assurance Framework and be considered in the development of the next State Infrastructure Strategy.
Working with the Construction Sector
The NSW Government Construction Leadership Group (CLG), led by Infrastructure NSW, was
established to drive reform across government in the development, procurement and delivery of
infrastructure and building projects. All the key NSW Government agencies engaged in the delivery
of the large long-term pipeline of infrastructure investment are represented in the CLG.
The CLG developed the NSW Government Action Plan: a ten-point commitment to the construction
sector in June 2018 with the support and input of industry through the Australian Constructors
Association. As CLG is scaling up implementation of commitments under the 10 Point Plan,
Infrastructure NSW has identified a number of areas where it will drive greater focus and line of
sight on implementation outcomes to industry:
• agency development of an Implementation Statements ahead of investment and
procurement decisions on major projects
• gathering evidence of practice changes across industry sectors and tiers including local
employment, early engagement with contractors, measuring contractor performance and
project management capability
• release of a Progress Report based on data collated from Implementation Statements.
Achievements/Milestones in 2019-20
A number of initiatives have been delivered against the 10 Point Plan resulting from the collaborative approach by agencies and industry, including:
• publication of a “whole of government” NSW major project Infrastructure Pipeline portaldetailing the projects over $50 million which are planned or likely to come to market overthe next 3-5 years.
• commencement of cost reimbursements under the NSW Government Bid Costs Policy.
• launch of a paper on Construction Procurement Methods and a number of Practice Notesto guide NSW Government and industry.
• improved collaboration with industry early in the procurement cycle, including holdinginteractive sessions with bidders during the tender period.
14 Infrastructure NSW Annual Report 2019-20
• reduction in industry’s costs and “down-time” by reducing the shortlist of bidders,minimising design requirements and documentary requirements for bidders.
• changes in approach to risk, especially in the utilities space, with agencies proactivelyseeking industry input into utility risk allocation before any tenders are issued andworkshops with industry to identify collaborative approaches to utilities.
• signing of an MOU between Transport for NSW and the Office of Small BusinessCommissioner (OSBC) to establish a dedicated team within the OSBC to provide tailorededucation, training and support to small businesses working on roads projects.
• exceeding the Infrastructure Skills Legacy Program (ISLP) targets across the 14 trialprojects to develop skills, capability and capacity of the construction industry’s workforceincluding women in non-traditional trades, Aboriginal people, apprentices, learning workersand people under 25, which is an encouraging step forward for greater diversity and culturechange in the construction sector. ISLP now mandated through a NSW procurement boarddirection.
• encouraging an increase in the “supply side” capacity on several education, health, roadand rail programs through offering work to the market in packages that enable small andmedium-sized firms to complete.
• Transport for NSW’s regional roads maintenance team ran an innovative recruitmentcampaign that targeted women and Aboriginal candidates for trade-specific roles thatattracted 1,400 applicants. This resulted in 15 female road workers and 23 femaleapprentices and trainees joining Transport for NSW in regional NSW.
• Infrastructure NSW coordinated the NSW Government response to COVID-19 with a strong
focus on maintaining delivery of the infrastructure program through the period March to
June 2020. Infrastructure NSW consulted regularly with delivery agencies to monitor and
resolve impacts of COVID-19 on project delivery, released principles for agencies to apply
on projects to mitigate impacts on industry, and worked closely with industry to share
information on the latest developments and implications for construction.
NSW Major Infrastructure Pipeline
NSW has committed to publish a ‘whole-of-government’ NSW major project pipeline under the NSW Government Action Plan: 10-point commitment to the construction sector, detailing projects which are planned or likely to come to market over the following 5 years.
The purpose of the published pipeline is to provide industry with appropriate lead time and readiness for government engagement, bidding, procurement, contractor partnering, planning and mobilisation of a skilled workforce across the project life cycle.
Industry has indicated that the information they find most useful is expected procurement and construction commencement, noting these are subject to change.
An updated pipeline was released in April 2020 and includes infrastructure projects with an expected project value of over $50 million. The current pipeline has three lists:
1. the “NSW Major Projects Infrastructure Pipeline” provides a forward view of infrastructure
under development by the NSW Government
o criteria: funding for delivery approved and has been publicly announced
2. the “NSW Infrastructure Planning Pipeline” provides a forward view of infrastructure in
planning by the NSW Government.

15 Infrastructure NSW Annual Report 2019-20
o criteria: projects including election commitments that the government is planning but
funding for construction has yet to be approved
3. the "Major Precinct" list shows precincts that will bring together universities, major hospital,
industry leaders and start-ups to deliver more job opportunities across NSW.

16 Infrastructure NSW Annual Report 2019-20
Projects NSW
Projects NSW is a specialist division within Infrastructure NSW that was established in late 2015 to manage the procurement and delivery of nominated priority infrastructure projects. Following Machinery of Government changes that took effect on 1 July 2019, Projects NSW also took on the role of overseeing delivery and management of the Barangaroo precinct and master planning the Blackwattle Bay precinct.
Work Health and Safety, and Environment Management
Infrastructure NSW has a Health, Safety and Environment Framework for the major infrastructure projects it delivers. The Projects NSW division works with delivery partners to ensure the health and safety of workers and others affected by project activities.
Safety performance
Major project delivery: WHS Performance
Projects NSW directly engages delivery partners to deliver priority infrastructure projects. The following table shows their work, health and safety (WHS) performance against key performance indicators:
Table 2, Major projects’ WHS performance against key performance indicators:
HSE Statistics Sydney Modern
Walsh Bay Arts
Precinct
Sydney Football Stadium
Clarence Correctiona
l Centre
Total number of hours worked 62,1182 400,471 144,821.5 N/A
Total number of first aid injuries 03 11 1 N/A
Total number of days/hours lost due to
injury
04 64 hours 0 805
Number of SafeWork NSW inspections 1 1 3 N/A
Number of notifications (including
Improvement Notices or fines) from
SafeWork NSW
0 0 0 N/A
Number of environment notices from the
regulator
0 0 0 N/A
2 Nov 2019-June 2020 3 Feb 2020-June 2020 4 Feb 2020-June 2020 5 June 2019-Apr 2020

17 Infrastructure NSW Annual Report 2019-20
Barangaroo Precinct: WHS Performance
During the reporting period, major construction activities occurred at various locations within the Barangaroo Precinct. While Infrastructure NSW manages the Barangaroo Precinct, Projects NSW did not directly engage any delivery partners to perform those activities.
The following table shows the number WHS Notifiable Incidents6 that occurred at the Barangaroo Precinct during the reporting period:
Table 3, WHS notifiable incidents at the Barangaroo Precinct in 2019-20:
Entity No. of WHS Notifiable Incidents
Barangaroo Crown Resorts 20
Barangaroo Lend Lease One Sydney Harbour 6
Barangaroo Activation and Precinct Management Nil
Managing the risks of COVID-19
Projects NSW ensured that the risks of COVID-19 were effectively managed by our delivery partners. Key risk management initiatives included:
• implementing measures to safeguard the project site, the works and its temporary works
consistent with the NSW Public Health Order and restrictions
• installing additional worker accommodations to enable the social distancing requirements
• maintaining the hygiene standard of the project site, the works and its temporary works,
consistent with the NSW Public Health recommendation
• developing a COVID-19 Safety Plan and COVID Safe requirements.
Safety case study – Sydney Football Stadium
Managing the risks of COVID-19
The Sydney Football Stadium Stage 2 Contractor (John Holland) prepared a COVID-19 Risk Mitigation Plan which has been added as a sub-plan to its WHS Plan for the project.
The purpose of the Plan is to ensure that the project continues to function at a high level even in the worst scenario during this challenging time. It aims to minimise project disruption and potential lost productivity while maintaining a commitment to the safe delivery of the project and protection of the health and wellbeing of the workforce and the community. The COVID-19 Risk Mitigation Plan is consistent with Infrastructure NSW’s and John Holland’s business continuity planning, with additional measures implemented, including:
• deploying additional site accommodation to ensure social distancing requirements can be
maintained for staff and subcontractors and to allow teams to be split to mitigate the risk of
transmission of an incident of infection across an entire work group
• increased cleaning and enhanced hygiene practices onsite including permanent onsite
cleaners
6 Work Health and Safety Act 2011, Pt. 3, ss 35-37

18 Infrastructure NSW Annual Report 2019-20
• encouraging team members with the capacity to work from home to do so, and limiting
visitors to site
• avoiding unnecessary travel
• staggering start times, pre-start sessions and meal breaks to limit large groups of people,
and practicing social distancing
• bringing forward unfixed materials payments under the provisions of the contract to support
early procurement of key materials.
A consultant surveyor associated with the project tested positive for COVID-19 in March 2020. Under site protocols the surveyor had already been self-isolating at home as a primary contact with a family member who was a confirmed case. Workplace procedures worked well as the number of people identified as being of a potential close contact were limited, could be easily identified, and were immediately sent home to self-isolate.
Major project delivery
Projects NSW is responsible for overseeing the design, planning, procurement and delivery of
selected major infrastructure projects on behalf of the NSW Government. Throughout 2019-20,
Projects NSW was responsible for the planning and delivery of eight major infrastructure projects,
with a combined capital investment value at over $4.2 billion.
Achievements throughout 2019-20 are outlined below.
Clarence Correctional Centre
Projects NSW, in partnership with Corrective Services NSW, successfully delivered the Clarence
Correctional Centre, on behalf of the NSW Government. The project saw the construction of a new
1,700 bed correctional centre in northern NSW. After commencing work in July 2017, the Centre
reached technical completion in April 2020, underwent robust testing and commissioning until late
June 2020 and accepted its first inmates on 1 July 2020. The project was delivered in line with the
contracted program and within budget.
The project was delivered as a Public Private Partnership (PPP), with the NorthernPathways
Consortium responsible for the design, construction, and operation and maintenance of the facility
for 20 years. The NSW Government will retain ownership of the facility.
As part of this project, Infrastructure NSW was also responsible for delivery of important utilities
and services including high voltage power which were completed on schedule in November 2019.
Walsh Bay Arts Precinct
Projects NSW, in partnership with Create NSW, continues to lead the delivery of the Walsh Bay
Arts Precinct, a redevelopment of the heritage wharves at Pier 2/3 and Wharf 4/5 to create a public
arts and cultural hub. When complete, the precinct will be home to some of the country’s most
significant arts organisations.
The refurbishment of heritage, waterborne timber structures presents a challenging construction
environment. Despite this, a number of key milestones where reached on Wharf 4/5 works
throughout 2019-20, including the completion of internal demolition work and significant progress

19 Infrastructure NSW Annual Report 2019-20
on the installation of the new internal structures and services. Construction works at Wharf 4/5 are
on track for completion in late 2020.
Following detailed investigations, further design work and budget approval from Government, Pier
2/3 construction works commenced in November 2019 and are on track for completion in late
2021.
Sydney Football Stadium Redevelopment
The redeveloped Sydney Football Stadium will be a modern, world-class venue, ensuring Sydney
has a sporting and entertainment precinct of an international standard and that NSW remains the
number one choice for sporting and entertainment events.
Projects NSW is overseeing the planning, procurement and delivery on behalf of the NSW
Government and the Sydney Cricket and Sports Ground Trust. Demolition of the old stadium was
completed in November 2019 and all stage one works to prepare the site for construction were
completed on schedule in February 2020.
The stage two planning application was submitted and publicly exhibited in July 2019, and
subsequently approved in December 2019. After retendering the stage two works in the second
half of 2019, John Holland were awarded the stage two contract in December 2019. Major
construction work commenced in April 2020 and the first of many construction milestones was
reached in May 2020, with the start of piling. The project remains on track to be complete in time
for the 2022 National Rugby League (NRL) Grand Final.
Sydney Modern
2019-20 saw the Sydney Modern Project, the expansion of the Art Gallery of NSW, moved from
the procurement phase into the delivery phase.
Since returning to the market in May 2019 after the first tender process was not completed,
Projects NSW received competitive bids from four suitable qualified, experienced builders. Richard
Crookes Construction were subsequently announced as the selected contractor for the project in
September 2019 and work commenced in November 2019. Significant progress on site has been
made since then including completion of detailed excavation work and completion of most piling
activity. The structural works are expected to commence in August 2020 and will continue well into
2021, with the project on schedule for completion in 2022.
Stadium Australia
Projects NSW was to oversee the reconfiguration of Stadium Australia into a permanent 70,000-
seat rectangular format with upgraded seating and corporate facilities, and improved playing
conditions and spectator experiences. On 31 May 2020, the NSW Government decided not to
proceed with the Stadium Australia Redevelopment project because of the COVID-19 pandemic
and redirected the $810 million in funding towards a new $3 billion Infrastructure and Job
Acceleration Fund.
Prior to this decision, Projects NSW had successfully obtained planning consent between
September 2019 and April 2020, progressed a smart and innovative design for a complex

20 Infrastructure NSW Annual Report 2019-20
refurbishment and carried out a competitive tender process, putting the project in a position to
award a contract for a managing contractor to begin construction.
Powerhouse Parramatta
In November 2019, Infrastructure NSW received a Project Authorisation Order from the Premier for
the planning, procurement and delivery of the Powerhouse Parramatta project. Following
announcement of the winning entry of the International Design Competition, Projects NSW
engaged the winning architectural team and commenced work to progress the competition design
to a concept design appropriate for a planning application.
The State Significant Development Application was submitted and exhibited in June 2020, with
over 1300 submissions received. In 2020-21, the project team will continue to progress the
planning process and commence a competitive tender process to appoint a delivery partner.
New Sydney Fish Market
The new Sydney Fish Market redevelopment will modernise and improve the Sydney Fish Market,
while retaining its authenticity to create a world-class cultural icon. In 2018, 3XN, BVN and Aspect
Studios were selected to design the new Sydney Fish Market after an international design
competition. This competitive design process was endorsed by the City of Sydney and the
Government Architect NSW.
The project’s business case was approved by Government in September 2019 and funding for its
delivery was committed. The Stage One (concept plan) and Stage Two (design, construction and
operation) State Significant Development Applications were lodged and exhibited in October 2019,
and planning consent was granted in June 2020.
Projects NSW commenced the procurement process to select an early works contractor to
demolish the existing structures and ready the site for construction. The stage one contract was
awarded to Hansen Yuncken in July 2020.
The two-stage procurement process to select a principal contractor to build the new Sydney Fish
Market commenced in December 2019. A shortlist of three contractors were invited to tender in
May 2020 and the successful contractor was announced in October 2020.
Work to progress these significant planning and procurement milestones means the new Sydney
Fish Market remains on track be open in late 2024.
Blackwattle Bay precinct planning
Relocating the Sydney Fish Market to the head of Blackwattle Bay will return this part of the
foreshore to the public. It provides an exciting opportunity to improve pedestrian and cycling links
and connect more of Glebe and Pyrmont to the water as part of the long-awaited revitalisation of
the area. Projects NSW is developing a masterplan for Blackwattle Bay, including the current fish
market site, that will consider design options to deliver community facilities, open space, a
promenade, pedestrian and cycling access as well as new homes, shops and jobs.
Consultation with key stakeholders and the community continued throughout 2019-20 including a
formal consultation period where the community were presented with three options for urban
renewal and asked to provide feedback on their preferred option. Projects NSW will continue to

21 Infrastructure NSW Annual Report 2019-20
finalise the State Significant Precinct Application, the formal planning pathway to rezone the site.
When formalised, the application will be submitted to the Department of Planning, Industry and
Environment for assessment and determination.
Parramatta North Program
The Parramatta North Program is a 42 hectare, whole-of-government urban renewal initiative and
essential enabler in achieving the NSW Government’s vision for the future Westmead Health and
Innovation District.
Priorities in 2019-20 included supporting the Department of Premier and Cabinet (DPC) in
negotiations on a potential transaction with the University of Sydney to develop a large portion of
the Cumberland Precinct (within Parramatta North) to establish a major university, research and
development presence.
Other priorities included progressing relocation planning for existing site-wide mental health
facilities in partnership with NSW Health, and completing enabling works to allow Parramatta Light
Rail to commence construction.
Within the national heritage listed Heritage Core, key strategic planning documents progressed,
and detailed design, approval and tender documents were prepared to deliver priority election
commitments and conservation works. The event program was put on hold due to COVID-19.
On 1 July 2020, the land, assets and responsibility for the Parramatta North Program, moved from
Infrastructure NSW (INSW) into Property & Development NSW, a division of the Housing and
Property group within the Department of Planning, Industry and Environment (DPIE).

22 Infrastructure NSW Annual Report 2019-20
The Barangaroo Precinct
Barangaroo is a large-scale urban regeneration project - transforming a disused container terminal,
previously closed off to the public on the edge of Sydney's CBD, into a spectacular 22-hectare
waterfront precinct. It is a dynamic residential, retail, cultural and financial precinct, with more than
50 per cent of the precinct offering extraordinary public spaces for everyone to enjoy.
Barangaroo is made up of three distinct and interconnected precincts – Barangaroo Reserve, a six-
hectare harbour parkland; Barangaroo South, a dynamic commercial and residential hub; and
Central Barangaroo, the future community and civic focal point of the precinct which includes a
Metro station.
Projects NSW is responsible for the development, management and activation of the precinct in
line with the Barangaroo Act 2009 (NSW). Projects NSW partners with the private sector to meet
these responsibilities and to deliver the vision for Barangaroo - a safe, iconic waterfront destination
that reflects global best practice in architecture, sustainability, and cultural identity.
Progress on Barangaroo South
Barangaroo South is a commercial and residential precinct featuring world class dining, retail, and
premium waterfront office space. Projects NSW continues to oversee the completion of
Barangaroo South, in partnership with Lendlease and Crown Resorts. Throughout 2019-20,
significant progress was made on the remaining elements of Barangaroo South including:
• completion of Daramu House, an innovative timber Tzannes Architects designed building,
was achieved in September 2019.
• in April 2020, an application to modify the Part 3A Concept Plan Approval for Barangaroo,
known as Modification 10, was submitted to the Department of Planning, Industry and
Environment to seek planning consent for additional Gross Floor Area (GFA) for two of the
One Sydney Harbour buildings.
• construction of the first One Sydney Harbour tower commenced in June 2020 and is on
schedule for completion by Q1 2024. The building is designed by the internationally
renowned architect and Pritzker Architecture Prize winner, Renzo Piano.
• construction of public domain, a pier and the adjacent Watermans Cove, Hickson Park and
the foreshore fronting the Crown Sydney was well progressed and remains on track for
staged delivery between July and December 2020.
• Crown Resorts’ construction is proceeding on program for a target completion by
December 2020.

23 Infrastructure NSW Annual Report 2019-20
Progress on Central Barangaroo
Central Barangaroo is the final stage of the transformation of Barangaroo. It is the vital link
between Barangaroo Reserve, Barangaroo South, Millers Point and the western CBD. With a new
Barangaroo Station, Central Barangaroo will bring together retail, commercial and residential uses
connected with a major public waterfront park to become the vibrant community and civic focal
point of the precinct.
In August 2019, Infrastructure NSW reached a settlement with Lendlease and Crown Resorts
regarding the ongoing Barangaroo sight lines dispute. This cleared the path for Projects NSW to
work with all parties to finalise building heights and envelopes for buildings in Central Barangaroo,
which is a prerequisite to commence the planning and development process.
The delivery of Central Barangaroo is now led by Aqualand and Scentre Group following the exit of
Grocon from the project in September 2019. Infrastructure NSW continues to work with Aqualand
to finalise the concept plans for Central Barangaroo. When formalised, the plans will be lodged
with the Department of Planning, Industry and Environment for assessment and determination.
Activation and Precinct Management
The open space at Barangaroo hosts thousands of visitors each year for cultural, art and
educational programs, and public activities based around leisure, recreation and hospitality.
Spaces available include the six-hectare Barangaroo Reserve, Wulugul Walk, and plazas within
the financial and dining hub at Barangaroo South.
The public domain is managed by Projects NSW in accordance with the statutory provisions of the
Barangaroo Delivery Authority Regulation 2015 to ensure Barangaroo continues to deliver a safe,
welcoming and engaging place for its many visitors, workers and residents.
Events, activations and The Cutaway:
Barangaroo hosted and delivered a number of events from 2019 to 2020 before the COVID-19
pandemic forced numerous events to be cancelled or postponed. Some of the highlight events
included:
• Blak Box “Momentum” presented Urban Theatre Projects – 1-17 November 2019 at
Barangaroo Reserve
• Cup Day Festival – 5 November 2019 at Barangaroo South
• Winda Film Festival – 24 November 2019 at Barangaroo Reserve
• NYE 2019 at Barangaroo Reserve
• Sydney Festival “Proclamation” installation – 8-26 January 2020 at Barangaroo Reserve
• The Vigil – 25 January 2020 at Barangaroo Reserve
• WugulOra Morning Ceremony – 26 January 2020 at Barangaroo Reserve.
The Cutaway at Barangaroo continues to develop its reputation as a raw and imposing multi-
purpose venue offering a diverse range of activities across arts, culture, filming, and events. In
2019-20 the Cutaway hosted numerous event and activation activities through early and mid-2020

24 Infrastructure NSW Annual Report 2019-20
before the postponement and cancellation of a significant program of events arising from COVID-
19. Key events included One Fine Day, Finders Keepers Market and The Other Art Fair.
Remediation
Remediation works on the former Millers Point Gasworks land were completed in August 2019 with
site reinstatement works completed in February 2020 within the allocated budget. This remediation
project is one of the largest completed in Australia and required the excavation, treatment and
removal of in excess of 550,000 tonnes of contaminated materials from the site to licenced waste
receiving facilities.
On 18 June 2020, NSW Environment Protection Authority (EPA) determined that the area of the
former gasworks had been successfully remediated and formally ended the Declaration of the area
as being significantly contaminated land. The NSW EPA removal of the Declaration concludes over
a decade of remediation planning and delivery works on this area of Barangaroo.
Sustainability
Barangaroo aims to be sustainable today and for future generations. Its commitment is to be
carbon neutral and water positive, to create zero waste emissions and contribute to community
wellbeing. On 6 December 2019, Barangaroo was announced as the first urban precinct in
Australia to achieve carbon neutral certification under the Australian Climate Active Carbon Neutral
Certification Scheme.
Design excellence
Design excellence is a guiding principle for Barangaroo, as reflected in the exceptional buildings,
landscape and public domain across the 22-hectare site.
In late June 2020, a two-stage national design competition for a new Pavilion, to be located on the
new Pier at Watermans Cove, was launched. The competition seeks to find design ideas that
embrace Barangaroo’s commitment to design excellence, world-class public spaces and
sustainability. The competition will be run through 2020, with a winner expected by the end of
2020.
A select design competition was run to appoint an architect to design a new amenity building, to be
located within the future Hickson Park. The design development now is underway, and the building
will cater to users of Hickson Park and surrounds.
Arts and culture
Projects NSW continued to oversee the delivery of public art, cultural activities and public
programs within the precinct. The Barangaroo Public Art and Cultural Plan is the strategic
framework for Infrastructure NSW and its development partners to guide the commissioning and
management of public art and cultural programming across the precinct.

25 Infrastructure NSW Annual Report 2019-20
Education and visitor services
The Barangaroo Visitor Services team delivered 167 tours with over 1,700 visitors participating in tours, education programs, workshops and school holiday programs.
The internal team delivered 33 educational programs and tours to over 800 primary, high school and tertiary students along with 98 customised cultural tours delivered to 655 participants. A series of successful school holiday programs were delivered throughout the year including the Busy Body Barangaroo Bee program with 87 children learning about bees at Barangaroo and Australia.
Cultural tours and school programs were put on hold in March 2020 due to COVID-19 restrictions.

26 Infrastructure NSW Annual Report 2019-20
Restart NSW
Under the Restart NSW Fund Act 2011, Infrastructure NSW is responsible for assessing projects
for funding from the Restart NSW Fund and making recommendations to the NSW Treasurer.
Restart NSW funds are used to deliver infrastructure that will improve the State’s economic growth
and productivity. They include NSW Government agency-led infrastructure projects and local and
community infrastructure projects delivered by local government, non-government organisations
and other entities, most of whom have participated in a submission-based application process
through targeted funding programs. Thirty per cent of Restart NSW funding is targeted at regional
and rural areas (outside the metropolitan areas of Sydney, Newcastle and Wollongong) over the
lifetime of the fund.
New infrastructure projects considered for funding are subject to a rigorous selection process.
Projects must be supported by a sound Business Case showing the project is economically
justified. The key components of the project assessment framework are:
• a strategic assessment to ensure the project aligns with the Restart NSW Fund Act 2011
criteria and NSW Government priorities.
• an economic assessment to ensure the project will improve economic growth and
productivity (demonstrated by a benefit-cost ratio greater than one).
• confirmation that the project has successfully completed the appropriate business case
development processes, including, where appropriate, relevant assurance review
processes.
Milestones in 2019-20
• Infrastructure NSW administers funding deeds for local and community infrastructure
projects on behalf of the NSW Treasurer to ensure that projects are delivered on time and
on budget.
• during 2019-20, 101 new Restart NSW funded projects commenced following the Funding
Deed execution by NSW Treasury and 83 projects were successfully completed.
• a new Program, critical Drought Infrastructure Fund, for funding Critical Drought initiatives
in Regional NSW was introduced.
• Restart NSW funding approved in 2019-20 will be outlined in the 2020-21 NSW Budget
Papers.

27 Infrastructure NSW Annual Report 2019-20
Hawkesbury-Nepean Valley Flood Risk Management Strategy
Resilient Valley, Resilient Communities - Hawkesbury–Nepean Valley Flood Risk Management Strategy (Flood Strategy) was released by the NSW Government in May 2017. It is a comprehensive long-term plan for the NSW Government, local councils, businesses and the community working together to manage the risk posed by regional Hawkesbury-Nepean flooding. Comprising nine integrated outcomes across the prevent-prepare-respond-recover disaster resilience spectrum, Phase 1 of the program is currently being implemented (2016-2021).
A key element of the Flood Strategy is the proposal to raise the Warragamba Dam wall to create a flood mitigation zone for the temporary storage of flood waters. This would significantly reduce flood risk downstream of Warragamba Dam to lives, homes and communities.
A Climate Change Fund grant of $58 million provides the primary funding for the implementation of the current phase of the work which is being overseen and coordinated by Infrastructure NSW.
The Flood Strategy’s Program has tracked well during 2019-20 with significant progress achieved. The Program completion date has been extended from June 2020 to June 2021, within the current funding commitment.
Milestones in 2019-20
The Flood Strategy recorded the following milestones in 2019-20:
• achieved significant progress in integrating land, road and emergency planning for the
Hawkesbury-Nepean Valley including:
o further work with government agencies and floodplain councils on a new Regional
Land Use Planning Framework
o continuing development and validation of a new ‘agent-based’ flood evacuation
model with CSIRO and international experts
o progress on preparing evacuation road guidelines to support road transport planning
for the floodplain
o preparation of a comprehensive database of current and permissible future
development in the floodplain.
• released a region-wide flood study in July 2019 which used up-to-date science and data to
provide new mapping for decision-makers and accessible, interactive flood maps for the
community on the NSW SES website. The maps allow Hawkesbury-Nepean residents to
identify the flood risk for their suburb for a range of flood events – via both desktop and
mobile platforms (www.myfloodrisk.nsw.gov.au).
• significantly progressed the Community Resilience Program to build an aware, prepared
and responsive community, including:
o delivery and evaluation of the NSW SES Flood. The Risk is Real public safety
campaign – September to November 2019. This resulted in 150,000 video views,
49,000 flood map searches, and 71% of people who saw the campaign taking a
preparedness action.
o a Young People Program including school curriculum resources to support teaching
and learning in ‘Water in the World’ Stage 4 geography which uses flooding in the

28 Infrastructure NSW Annual Report 2019-20
Hawkesbury-Nepean as a case study (released October 2019); and a school
emergency planning project aimed to increase flood awareness and preparedness
in 38 high-risk floodplain schools and their education sector partners.
o ongoing capacity building through the Communities of Concern Program delivering
projects for those groups most vulnerable to flooding, including social housing
tenants, culturally and linguistically diverse communities, family support services,
and people who own animals and livestock.
o received the 2020 EMPA Australia Highly Commended Award for Excellence in
Emergency Communication for the Community Resilience Program.
• tested and provided training for relevant agencies in new ‘ensemble’ weather and flood
prediction tools developed for the Hawkesbury-Nepean Valley by the Bureau of
Meteorology in partnership with Infrastructure NSW.
• reviewed and revised the Hawkesbury-Nepean Valley Flood Emergency Plan 2020-1.0 - a
Sub Plan of the State Emergency Management Plan which was endorsed by the State
Emergency Management Committee in June 2020. The revised plan incorporates into
emergency response planning learnings from the multi-agency catastrophic flood exercises
(June-July 2019), and the February 2020 Hawkesbury-Nepean flood.
• progressed the proposal to raise Warragamba Dam for flood mitigation: the draft
Environmental Impact Statement (EIS) for the proposal was provided for consistency
review to the Department of Planning, Industry and Environment; detailed Concept Designs
were progressed in parallel with the EIS; and preparations are underway for public
exhibition.

29 Infrastructure NSW Annual Report 2019-20
South Creek Sector Review
In 2019-20, Infrastructure NSW continued to lead the South Creek Sector Review, a key recommendation of the State Infrastructure Strategy 2018.
The Greater Sydney Region Plan outlines the vision for the Western Parkland City with development along the spine of South Creek and its tributaries with cool green walkable neighbourhoods and centres with generous open space. The city will leverage off the Western Sydney Airport and health and education precincts to support employment opportunities, with the Aerotropolis as an economic hub. The purpose of the South Creek Sector Review is to advise the NSW Government about options and decisions to help achieve the Government’s vision for a cool green Western Parkland City.
A Strategic Options Business Case was finalised in November 2018 concluding that an integrated land use and water cycle management approach to development (for example, compact urban form and use of water recycling) could best deliver the Government’s WPC vision.
Stage two of the South Creek Sector Review began in 2019 and will be completed in 2020. Key outputs will be considered in the planning and delivery of the Western Parkland City, these include:
• Landscape Led Design Guidelines – a guide for landscape led urban planning to help
preserve the landscape character and help deliver the Western Parkland City vision
• blue / green Infrastructure Framework to define the South Creek Corridor and identify blue
and green elements within the Western Parkland City
• determined that recycled water investments in the Western Parkland City are resilient to
risks and uncertainties (including drought and climate change)
• identified a regional approach to stormwater and waterways management can provide
significant economic benefits
• strategic options analysis of organics pathways for managing food and garden waste.
• residential, commercial and industrial lot layouts, and principles, to help mitigate the urban
heat island effect
• development of a regional flood model for the South Creek catchment to identify impacts of
development on flood behaviour and, if required, identify mitigation measures to manage
the cumulative impacts of flooding in the catchment.
The South Creek Sector Review will transition to the Department of Planning, Industry and
Environment in 2020 where the outputs of the Stage two work will be considered to inform policy
and regulation to support delivery of the Western Parkland City vision.

30 Infrastructure NSW Annual Report 2019-20
Corporate Support functions
2019-20 saw significant organisational change as Urban Growth Development Corporation and Barangaroo Delivery Authority were integrated into Infrastructure NSW. This resulted in increased demands on the internal support functions to manage the structural, physical and cultural consolidation and harmonisation of the three entities, and also to cater for the larger nature of the new organisation.
In February, the support functions were reorganised into two divisions, Finance and Operations and Corporate Services.
The Finance and Operations Division brings together finance, procurement, business systems and ICT, Business Support and the Restart Team.
The Corporate Services Division brings together the areas of legal, corporate communications and public affairs, community and stakeholder engagement for projects, people and culture, audit, risk and safety and business planning. The Division provides the secretariat support for the Infrastructure NSW Board.
Milestones achieved by the Corporate Support functions in 2019-20:
• harmonisation of corporate policies and procedures from across the three organisations,
relocating the three entities to a single Infrastructure NSW office location, and commencing
consolidation of core business systems and ICT environments.
• transitioning former Urban Growth Development Corporation projects and assets to the
most appropriate parts of Government.
• leading the response to COVID-19 for our staff, contractors, visitors and workplace
environment.
• supporting the completion of 83 regional projects funded by Restart NSW, and commencing
101 new regional projects following the Funding Deed execution by Treasury.
• supporting the Barangaroo Team within Projects NSW to resolve the sight lines dispute,
clearing the way for building heights and envelopes for buildings in Central Barangaroo to
be finalised and commencement of the planning and development process.
• supporting Projects NSW on the procurement process for the new Sydney Fish Market.
• rethinking community and stakeholder engagement in response to COVID-19, to deliver a
digital consultation program which supported the planning and delivery of high profile high
risk projects managed by Projects NSW, including Blackwattle Bay master planning,
Powerhouse Museum Parramatta and Barangaroo.
• updating the organisational risk management framework, including a consolidated risk
register which is routinely managed, reviewed, updated and tested.
• promoting staff engagement and supporting diversity initiatives, including celebrating
International Women’s Day and Aboriginal culture at internal staff events.

31 Infrastructure NSW Annual Report 2019-20
Governance Management and structure
Infrastructure NSW’s governance model was established by the Infrastructure NSW Act 2011 and comprises a Board and Chief Executive Officer.
The Board
The Board provides general policies and strategic direction for Infrastructure NSW as well as advice to the Premier and CEO of Infrastructure NSW on infrastructure matters. It comprises an independent Chairman and five private sector members with relevant infrastructure sector experience, all appointed by the Premier, and the heads of the Departments of Premier and Cabinet, Planning, Industry and Environment, and the NSW Treasury.
Graham Bradley, AM
Chairman
Appointed July 2013
Graham Bradley is a professional company director and is currently Non-Executive Chairman of EnergyAustralia Holdings. He is also on the Boards of The Hongkong and Shanghai Banking Corporation, Virgin Australia International Holdings and Ensemble Limited.
In October 2020 Graham retired after 16 years as Chairman and director of HSBC Bank Australia Limited. In March 2020 Graham resigned as chairman from GrainCorp Limited and became director and chairman of United Malt Group Limited, following the newly listed company (United Malt Group Limited—UMG). In July 2020 Graham was appointed as director of In Shine Justice Limited. In April 2017 Graham was appointed as director and chairman of Stilmark Pty Ltd. In November 2017 Graham resigned as director of GI Dynamics, as Chairman of Anglo American Australia Limited in June 2016 and as Chairman and Director of Stockland Corporation Limited in October 2016. Graham was managing director of Perpetual Limited from 1995-2003. Prior to joining Perpetual, Graham was national managing partner of leading national law firm, Blake Dawson (now Ashurst). Before this, Graham was a partner of McKinsey & Company, a leading international firm of management consultants.
Graham was President of the Business Council of Australia from 2009-2011 and Vice President from 2011-2012. He was Deputy President of the Takeovers Panel from 2006-2013. He is a member of the Advisory Council of the Australian School of Business at UNSW and a director of the European Australian Business Council.
Graham also devotes time to a range of non-profit organisations, including the State Library of NSW. Graham was made a member of the Order of Australia in 2009 in recognition of his contribution to business, medical research and the arts.

32 Infrastructure NSW Annual Report 2019-20
Marika Calfas
Private Sector Member
Appointed November 2018
Marika Calfas is the Chief Executive Officer of NSW Ports, the organisation responsible for managing Port Botany, Port Kembla and the intermodal terminals at Cooks River and Enfield in NSW, Australia.
Marika has almost 20 years’ experience in the port sector including in port planning and development.
With a strong belief that ports are crucial to our lives and lifestyles and essential for the nation’s economy, Marika is passionate about driving improvements and efficiencies across port supply chains, informing the wider community and decision makers of the importance and value of ports and identifying new opportunities.
Marika was appointed by the Commonwealth Minister for Infrastructure & Transport to the Expert Panel advising the Australian Government Inquiry into the National Freight and Supply Chain Strategy Priorities in 2017.
Marika is Deputy Chair of Ports Australia, Board member of Infrastructure NSW and Australian Logistics Council and member of Infrastructure Partnerships Australia National Advisory Board and University of Wollongong SMART Advisory Board, and Australia’s representative to PIANC's (International Waterborne Transport Association’s) Environmental Commission.
Marika holds an Engineering Degree (Environmental), Masters of Engineering Management and Masters of Environmental Law. Marika is a Chartered Professional Engineer with Engineers Australia.
Roger Fletcher
Private Sector Member
Appointed 15 July 2011
Roger Fletcher is Managing Director of Fletcher International Exports, a company that exports sheep meats, wool and grain to more than 90 countries worldwide and farms sheep, wheat and cotton and operates an intermodal freight facility in Regional NSW. Roger is also Deputy Chairman of the National Export Lamb, Sheep and Goat Industries Council and a board member of the Australian Meat Industry Council.

33 Infrastructure NSW Annual Report 2019-20
Rod Pearse OAM
Private Sector Member
Appointed 15 July 2011
Rod is a Board member of O'Connell Street Associates, Chair of the Infrastructure NSW Project Assurance Committee and a member of the Infrastructure NSW Audit and Risk Committee. Rod was CEO of Boral Limited (2000 to 2009), a Board Member of the Business Council of Australia (2003 to 2009), a member of the WestConnex Delivery Authority and Sydney Motorway Corporation Board (2013 to 2018) and a member of the COAG Reform Council Expert Panel on Cities (2010 to 2012).
Rod was awarded an Order of Australia (OAM) medal for services to Youth in 2009.
Arlene Tansey
Private Sector Member
Appointed June 2014
Arlene is a Non-Executive Director of Aristocrat Leisure Limited, Wisetech Global, TPG Telecom and Lendlease Investment Management. In October 2020 Arlene retired as board member of Healius. Arlene is also the Chair of Infrastructure NSW’s Audit and Risk Committee.
She is a Fellow of the Australian Institute of Company Directors, a member of Chief Executive Women and a Member of the International Women’s Forum (Australia). Her professional experience is as a senior investment banker, commercial banker and finance and securities lawyer.
Simon Draper
Chief Executive Officer and Co-ordinator General, Infrastructure NSW
Appointed 17 March 2018 by virtue of his position within the NSW public service and consistent with the Infrastructure NSW Act 2011; re-appointed April 2019.
Simon joined Infrastructure NSW in April 2019. Within Government, Simon has previously served as Secretary of the Department of Industry, Deputy Secretary, Economic Policy Group at the Department of Premier and Cabinet and as a Tribunal Member at the Independent Pricing and Regulatory Tribunal.
Prior to joining Government, Simon has extensive senior executive management experience in infrastructure and utility companies. He is a former CEO of Lumo Energy, Chief Executive Officer of Wellington Airport in New Zealand, General Manager Commercial at Integral Energy and Chief Executive Officer of Northern Territory Airports.
Simon has a Bachelor of Economics (Hons) from Sydney University, a Master of Business (Finance) from UTS and has completed the Company Directors Course of the Australian Institute of Company Directors.

34 Infrastructure NSW Annual Report 2019-20
Tim Reardon
Secretary, NSW Department of Premier and Cabinet
Appointed November 2017 by virtue of his position within the NSW public service and consistent with the Infrastructure NSW Act 2011.
Tim Reardon was appointed as the Secretary of the Department of Premier and Cabinet in 2017. He is responsible for leading the public service in NSW and driving the Government’s services, infrastructure and reform priorities.
Prior to his appointment Tim was the Secretary, Transport where he successfully led the Transport Cluster and its 25,000 people on behalf of the NSW community. Tim led the development and delivery of the largest transport infrastructure and services pipeline in a generation, with over $41bn of capital works over a four-year period.
He was also accountable for better integration across transport services, implementing technology and innovation to improve customer service, and driving reforms and long-term planning to make the transport system more customer-focused and efficient. The NSW transport system now delivers far greater service levels for a fast-growing population and economy across the State, and customer satisfaction is at an all-time high.
Tim has 27 years’ experience working in both government and the private sector in NSW and internationally. He is a born and bred New South Welshman and lives in Sydney with his wife and two daughters.
Jim Betts
Secretary, Department of Planning, Industry and Environment
Appointed April 2019 by virtue of his position within the NSW public service and consistent with the Infrastructure NSW Act 2011.
Jim served on the Board of Infrastructure as the CEO of Infrastructure NSW from June 2013 until 2 April 2019.
Jim was appointed as the Secretary, Department of Planning, Industry and Environment in April 2019. He is responsible for key areas such as statutory planning, precincts, open space, biodiversity and conservation, climate change, water, energy, local government, social housing and government-owned property.
This follows almost six years as the Chief Executive Officer for Infrastructure NSW during which he led the development of the 2014 and 2018 State Infrastructure Strategies, chaired the Infrastructure Investor Assurance Committee, was responsible for the delivery of a number of the state’s infrastructure priorities, and coordinated the development of the NSW Government Action Plan: A Ten-Point Commitment to the Construction Sector.
Prior to that, Jim spent five years as the Secretary of the Victorian Department of Transport and four years as Victoria’s Director of Public Transport.

35 Infrastructure NSW Annual Report 2019-20
Michael Pratt, AM
Secretary, NSW Treasury
Appointed 2 August 2017 by virtue of his position within the NSW public service and consistent with the Infrastructure NSW Act 2011.
Michael Pratt AM was appointed as the 27th Secretary of NSW Treasury on 1 August 2017. The Treasury Cluster includes NSW Treasury, NSW Small Business Commission, Destination NSW, Western Parkland City Authority, NSW Procurement, NSW Treasury Corporation, iCare (Insurance & Care NSW) and SAS Trustee Corporation.
As Secretary, Michael is responsible for strategic management of the entirety of the State’s finances, budget, assets, liabilities and financial risk management framework and transformation.
Prior to his role with Treasury, Michael was the NSW Customer Service Commissioner, where he revolutionised the way the Government delivers services - putting the people of NSW at the heart of service delivery in the establishment of Service NSW. He led major service reform across the NSW Government, chairing the NSW Customer Advisory Board - the responsible governance entity for the delivery of State Government services to the citizens of NSW.
Michael Pratt was honoured as a Member of the Order of Australia (AM) in the Queen’s Birthday 2016 Honours List. Michael was recognised as a role model for Australian society for providing significant service to public administration through reforms in customer service and communication and to the finance and banking industry. Michael was also awarded an Honorary Doctorate of Letters in April 2018 from Western Sydney University for his services to the University and to the wider community.
Prior to his role as Customer Service Commissioner Michael was CEO of Consumer and SME Banking, North East Asia, with Standard Chartered Bank. He is a former President of the Australian Institute of Banking & Finance and was the inaugural Joint President of Finsia. Michael’s previous roles also include senior executive positions as Group Executive of Westpac Business & Consumer Banking, CEO of National Australia Bank in Australia, CEO of Bank of New Zealand and CEO of Bank of Melbourne. Michael was also Deputy Chancellor of Western Sydney University.
Prior directorships include Non-Executive Director roles at TAL Dai-ichi Life Australia and Credit Union Australia where he chaired their respective risk committees, Deputy Chair of iCare, MasterCard International Inc New York, MasterCard Asia Pacific, BT Financial Services, Chairman of Bennelong Funds Management, Chairman of Shenzen Credit Corporation and Executive Director of Standard Chartered Bank Hong Kong and China.
Kerrie Mather
Chief Executive Officer, Sydney Cricket and Sports Grounds
Appointed August 2019
Kerrie Mather is responsible for the development and operation of the Sydney Cricket Ground and
Sydney Football Stadium. The SCG is one of the sporting and entertainment world’s most loved
grounds, while the new SFS will give Sydney a world-class rectangular venue when it opens in
2022. The SCG precinct attracts more than 1.5 million visitors a year and is home to Sydney’s
largest annual sporting event, cricket’s New Year’s Test.

36 Infrastructure NSW Annual Report 2019-20
Prior to her appointment in 2018, she was Managing Director and CEO of Sydney Airport.
Previously she was CEO of Macquarie Airports and Board member of Rome, Brussels,
Copenhagen, Birmingham and Bristol Airports. She has significant experience in running major
infrastructure assets with complex operations and consumer-facing businesses in Australia and
internationally. She is recognised for her vision, business transformation experience and
excellence in stakeholder engagement.
Previously she was an Executive Director at Macquarie Group. During the 18 years of her tenure
she worked with Government and private sector clients on projects and transactions across a wide
range of infrastructure sectors including transport, utilities, social infrastructure and regulated
assets.
Kerrie has been recognised with several honours and awards for her achievements and industry
contributions. She is a member of the UNSW Australian School of Business Advisory Board, Chief
Executive Women, Australian Institute of Company Directors, and a Fellow of FINSEA.
Board members that retired during 2019-20
There were no board retirements during 2019-20.
Board meetings
There were 11 board meetings in 2019-20, as shown in the table below.
Table 4, Infrastructure NSW 2019-20 meetings:
*includes delegate attendance
Board Member Meetings Attended
Graham Bradley, AM (Chair) 11
Marika Calfas 10
Roger Fletcher 11
Rod Pearse, OAM 11
Arlene Tansey 9
Simon Draper 11
Tim Reardon* 9
Jim Betts* 5
Michael Pratt, AM* 10
Kerrie Mather (appointed 15 August 2019) 9

37 Infrastructure NSW Annual Report 2019-20
Audit and Risk Committee
There were five audit and risk committee meetings in 2019-20, as shown in the table below.
Table 5, Audit and Risk Committee 2019-20 meetings:
Audit and Risk Committee Member Meetings Attended
Arlene Tansey (Chair) 5
Rod Pearse, OAM 5
Dianne Leeson 4
Kerrie Mather (appointed 18 December 2019) 2
Projects NSW Assurance Committee
There were four Projects NSW Assurance Committee meetings in 2019-20, as shown in the table below.
Table 6, Projects NSW Assurance Committee 2019-20 meetings:
Projects NSW Assurance Committee Member Meetings Attended
Rod Pearse OAM (Chair) 4
Arlene Tansey 4
Dennis Brewer 3
David Riches 4
Organisational structure
Office of the Chief Executive Officer
Investor Assurance
Strategy, Planning & Innovation
Corporate Services
Finance and Operations
Hawkesbury-Nepean Flood Management Directorate
Projects NSW

38 Infrastructure NSW Annual Report 2019-20
Senior management team Infrastructure NSW has a small team of talented and experienced staff who are working to deliver the functions of the organisation. The senior management team is detailed below.
Simon Draper Chief Executive Officer
Experience as outlined in the section: Board.
Marina Grobbelaar Head of Investor Assurance Marina Grobbelaar is the Head of Assurance at Infrastructure NSW, a Deputy Secretary equivalent position. Marina joined the agency in 2017.
With over $200 billion in infrastructure to deliver in NSW, Marina is leading the Assurance team to
ensure major capital projects are delivered in a timely and cost-efficient way through the
implementation of the Infrastructure Investor Assurance Framework (IIAF).
As an executive leader who has worked in the finance and public administration for more than 20
years, Marina has expertise in the strategic management of mega infrastructure portfolios,
including the planning, commissioning, procurement and execution of tailored commercial
arrangements for large infrastructure and service projects across sectors, in Australia and Africa.
Marina has previously held senior roles at NSW Treasury, PricewaterhouseCoopers and HSBC.
Tom Gellibrand
Head of Projects NSW
Tom Gellibrand is the Head of Projects NSW, a Deputy Secretary equivalent position. In this role,
Tom is responsible for the delivery of High Profile High Risk State Government infrastructure
projects.
Prior to joining Infrastructure NSW, Tom was the Acting CEO of Sydney Metro and oversaw
the successful delivery of all aspects of the metro program, including projects under construction
and in planning.
During a career spanning 30 years, Tom has held senior executive positions in the areas of
strategic urban, transport and infrastructure planning. He has also led infrastructure delivery at
both the state and local government level. This work has involved the coordination of the private
and public sectors in the planning and development of land, the provision of urban services, and
the successful delivery of major utility, transport and social infrastructure.
39 Infrastructure NSW Annual Report 2019-20
Clare Gardiner-Barnes Head of Strategy, Planning and Innovation
Clare Gardiner-Barnes is the Head of Strategy, Planning and Innovation at Infrastructure NSW, a
Deputy Secretary equivalent position. In her role Clare is responsible for the 20-year State
Infrastructure Strategy, development of five-year infrastructure plans, provides independent advice
to government on strategic infrastructure issues and opportunities.
As a board member of the NSW Telco Authority and Roads Australia, Clare is committed to
working with industry and across government to support the adoption of new infrastructure
technology. Before taking on infrastructure leadership roles Clare worked in various executive
positions in education and was the Chief Executive of the Department of Children and Families in
the Northern Territory. Clare is an advocate for women in leadership and workforce flexibility.
Maree Abood Head of Hawkesbury-Nepean Valley Flood Risk Management Directorate
Maree has extensive experience in public sector water and natural disaster policy, planning and
infrastructure delivery of state significant programs and policies in both the Sydney metropolitan
and NSW regional areas.
Maree has over 25 years’ experience in academic research, education, private and state
government sectors. Maree joined Infrastructure NSW in 2014 to head up the Hawkesbury-Nepean
Valley Flood Management Taskforce. In 2016, Maree was awarded the 'Premier's Award for
Excellence in Public Service' for Building Infrastructure for leading the delivery of the Hawkesbury-
Nepean Flood Risk Management Strategy.
Maree is responsible for the oversight and implementation of the whole of government Resilient
Valley, Resilient Communities – Hawkesbury- Nepean Valley Flood Risk Management Strategy.
Maree represents Infrastructure NSW on a number of water and State Emergency Management
Committees.
Amanda Jones Chief Operating Officer
Amanda is an Executive with over 30 years’ experience in infrastructure planning and delivery
including water, energy, transport and IT. Her career as an executive in the utilities sector spans
responsibility for corporate governance, capital investment and services, as well as operations,
including being CEO of an Energy Retailer.
Amanda managed the operation of Infrastructure NSW and was responsible for finance, program
support for Projects NSW and Restart NSW, as well as governance, including the role of corporate
secretary.
Amanda left Infrastructure NSW in February 2020 for a secondment with the Department of
Planning Industry and Environment. This position has not been filled with the functions of the role
being undertaken by the Chief Financial and Operating Officer and the Executive Director,
Corporate Services.

40 Infrastructure NSW Annual Report 2019-20
Matt Conrow Chief Financial and Operating Officer
Matt Conrow is the Chief Financial and Operating Officer and joined Infrastructure NSW in March
2020. In this role, Matt is responsible for Infrastructure NSW’s key internal business activities
including financial and commercial performance, business systems and process improvement,
procurement, information technology, and administration of the Restart NSW fund.
Matt is passionate about transforming support and governance functions to unlock additional value
for the people of NSW. Prior to joining Infrastructure NSW Matt spent over a decade in key
financial management roles across the private and public sectors, most recently as Chief Financial
Officer at Service NSW and NSW Treasury. In these roles he has been heavily involved in the
innovation and reform of State financial management, as well as promoting a customer-centric
approach to the provision of corporate and shared services.
Janine Lonergan Executive Director, Corporate Services
Janine leads the Corporate Services Division at Infrastructure NSW. In this role Janine is
responsible for the functional areas of legal, human resources, communications and public affairs,
business planning, Cabinet coordination, safety and governance including the roles of Chief Audit
Executive and Board secretary.
During her career as a government lawyer Janine held senior executive roles providing legal
advice and legislative reform services in areas including water and primary industries. Prior to
moving to Infrastructure NSW Janine led the Office of the Secretary at the Department of Industry
where she worked closely with the executive leadership team and oversaw the Cabinet function.
Janine is passionate about organisational culture and motivating teams.

41 Infrastructure NSW Annual Report 2019-20
Risk management and insurance Infrastructure NSW has appropriate structures, processes and controls in place to identify, assess
and manage material risks that may impact its organisational objectives.
Under the Model Charter adopted by Infrastructure NSW’s Audit and Risk Committee, the
Committee will ensure Infrastructure NSW operates within a risk management framework to
ensures its risk management approach is aligned to international standards and adopted to
organisational specific risks and organisational objectives. The internal audit function of
Infrastructure NSW is outsourced to external advisors KPMG.
Infrastructure NSW uses the NSW Treasury Managed Fund for its insurance requirements
including workers’ compensation, public liability, property and miscellaneous items. During 2019-20
there was one claim made against any of these insurance categories.

42 Infrastructure NSW Annual Report 2019-20
Internal audit and risk management attestation
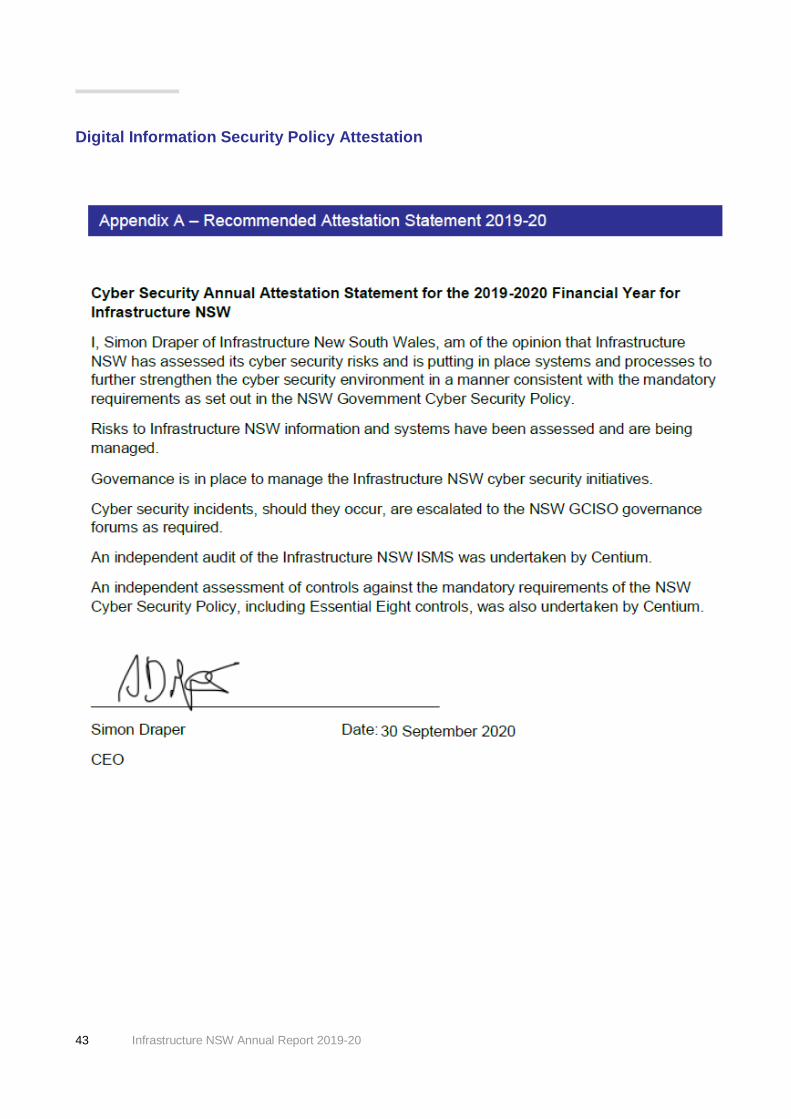
43 Infrastructure NSW Annual Report 2019-20
Digital Information Security Policy Attestation

44 Infrastructure NSW Annual Report 2019-20
Financial statements Statement by the CEO

45 Infrastructure NSW Annual Report 2019-20
Independent Auditors Report

46 Infrastructure NSW Annual Report 2019-20

47 Infrastructure NSW Annual Report 2019-20

48 Infrastructure NSW Annual Report 2019-20
Financial Statements

Infrastructure NSW
Consolidated Financial Statements for the year ended 30 June 2020
49

Infrastructure NSWConsolidated Financial Statements Index
Description Page no
Statements of Comprehensive Income 51
Statements of Financial Position 52
Statements of Changes in Equity 53
Statements of Cash Flows 54
Notes to financial statements
1 Summary of significant accounting policies 55
2 Expenses Excluding Losses 67
3 Revenue 68
4 Gain /(Loss) On Disposal 69
5 Other gain/(loss) 70
6 Program group statements 71
7 Current Assets - Cash And Cash Equivalents 71
8 Current/Non-Current Assets - Receivables and Prepayments 73
9 Current/Non-Current Assets - Inventory 73
10 Property, Plant And Equipment 74
11 Leases 74
12 Intangibles 76
13 Current Assets Held for Sale 76
14 Fair Value measurement of non-financial assets 77
15 Restricted Assets 77
16 Current/Non Current Payables 77
17 Current / Non Current Liabilities - Borrowings 78
18 Current / Non Current Liabilities - Provisions 78
19. Current/Non-Current Liabilities - Other 79
20 Increase/Decrease in Net Assets from Equity Transfers 79
21 Contingent Assets & Liabilities 80
22 Commitment 80
23 Budget Review 80
24 Superannuation 81
25 Reconciliation of Cash Flows from Operating Activities to Net Result 86
26 Financial Instruments 86
27 Related Party Disclosures 90
28 Restructure of Administrative Arrangements 91
29 Discontinued Operations 94
30 Events after the reporting period 94
31 Future Development 95
50

Infrastructure NSW
Statements of Comprehensive Income
for the year ended 30 June 2020
Actual Budget Actual Actual Budget Actual
2020 2020 2019 2020 2020 2019
Notes $'000 $'000 $'000 $'000 $'000 $'000
Continuing operations
Expenses excluding losses
Employee related expenses 2(a) 26,601 50,702 10,143 - - -
Personnel services Expenses 2(a) - - - 24,462 50,702 10,113
Operating expenses 2(b) 46,347 28,189 44,306 46,347 28,189 44,306
Depreciation and amortisation 2(c) 12,720 1,060 212 12,720 1,060 212
Grants and subsidies 2(f) 352 - - 352 - -
Finance costs 2(d) 19,305 101 - 19,305 101 -
Project delivery expenses 2(e) 196,283 220,696 195,212 196,283 220,696 195,212
Total expenses excluding losses 301,608 300,748 249,873 299,469 300,748 249,843
Revenue
Sales of goods and services 3(a) 213,401 266,868 207,629 213,401 266,868 207,629
Other income 3(b) 20,392 - - 20,392 - -
Grants and Contributions 3(c) 228,900 259,796 44,959 228,900 259,796 44,959
Investment Revenue 3(e) 19,796 - - 19,796 - -
3(f) 2,139 89 30 - 89 -
Total revenue 484,628 526,754 252,619 482,489 526,754 252,589
Gain /(loss) on disposal 4 (46) - (4) (46) - (4)
Other gain/(loss)
Gain/(loss) on fair value movement 5 (5,610) - - (5,610) - -
Impairment losses on non financials asset 5 (959) - - (959) - -
Total gains/(losses) (6,615) - (4) (6,615) - (4)
Net result from continuing operations 176,405 226,005 2,741 176,405 226,005 2,741
Net result from discontinued operations 29 (9,025) - - (9,025) - -
NET RESULT 167,380 226,005 2,741 167,380 226,005 2,741
Items that will not be reclassified to net result in subsequent periods:
Other comprehensive Income
10 16,057 - - 16,057 - -
18 15,561 - - 15,561 - -
24 140 - - 140 - -
Total other comprehensive income 31,758 - - 31,758 - -
TOTAL COMPREHENSIVE INCOME 199,138 226,005 2,741 199,138 226,005 2,741
INSW
The “Consolidated” results include the results of the INSW Staff Agency. The accompanying notes form part of these financial statements.
Consolidated
Acceptance by Crown Entity of employee benefits and other liabilities
Net changes in revaluation surplus of property, plant and equipment
Net changes in revaluation surplus arising from changes in restoration liability
Net changes in superannuation actuarial gain/(loss) on defined benefit plans
51

Infrastructure NSW
Statements of Financial Position
as at 30 June 2020
Actual Budget Actual Actual Budget Actual
2020 2020 2019 2020 2020 2019
Notes $'000 $'000 $'000 $'000 $'000 $'000
ASSETS
Current Assets
Cash and cash equivalents 7 313,667 23,320 25,153 313,667 23,320 25,153
Receivables and prepayments 8 41,495 687 7,330 41,495 687 7,330
Inventory 9 245 - - 245 - -
Property, Plant and Equipment held for distribution 10 34,458 - - 34,458 - -
Assets held for sale 13 164,718 - - 164,718 - -
Total Current Assets 554,583 24,007 32,483 554,583 24,007 32,483
Non-Current Assets
Receivables 8 459,143 - - 459,143 - -
Inventory 9 141,812 - - 141,812 - -
Right-of-use Assets 11 4,199 - - 4,199 - -
Property, Plant and Equipment 10 546,113 236,617 256 546,113 236,617 256
Intangibles assets 12 6 8 14 6 8 14
Total Non-Current Assets 1,151,273 236,625 270 1,151,273 236,625 270
Total Assets 1,705,856 260,632 32,752 1,705,856 260,632 32,752
LIABILITIES
Current Liabilities
Payables 16 128,115 8,193 15,987 130,993 8,193 17,036
Borrowings 17 403,671 876 - 403,671 876 -
Provisions 18 5,975 747 1,032 3,572 747 -
Other current liabilities 19 177,297 9,346 1,615 177,297 9,346 1,615
Provisions held for distribution 18 298 - - - - -
Total Current Liabilities 715,356 19,163 18,634 715,533 19,163 18,651
Non-Current Liabilities
Payables 16 49,756 - - 49,756 - -
Borrowings 17 294,881 5,889 - 294,881 5,889 -
Provisions 18 1,178 170 139 1,001 170 122
Other non-current liabilities 19 187,099 - - 187,099 - -
Total Non-Current Liabilities 532,914 6,059 139 532,737 6,059 122
Total Liabilities 1,248,270 25,222 18,774 1,248,270 25,222 18,774
Net Assets 457,587 235,409 13,978 457,587 235,409 13,978
EQUITY
Accumulated funds 425,829 235,409 13,978 425,829 235,409 13,978
Reserves 31,758 - - 31,758 - -
Total Equity 457,587 235,409 13,978 457,587 235,409 13,978
Consolidated INSW
The “Consolidated” results include the results of the INSW Staff Agency. The accompanying notes form part of these financial statements.
52

Infrastructure NSW
Statements of Changes in Equity
for the year ended 30 June 2020
Accumulated Funds
Asset Revaluation
Surplus
Notes $'000 $'000 $'000
Balance at 1 July 2019 13,978 - 13,978
Net result for the year 167,380 - 167,380
Other comprehensive Income
Net changes in revaluation surplus of property, plant and equipment 10 - 16,057 16,057
Net changes in revaluation surplus arising from changes in restoration liability 18 - 15,561 15,561
Net changes in superannuation actuarial gain/(loss) on defined benefit plans 24 - 140 140
Total comprehensive income for the year 167,380 31,758 199,138
Transactions with owners in their capacity as owners
Increase in net assets from administrative restructure 20,29 255,551 - 255,551
Adjustment to net assets from administrative restructure (11,080) - (11,080)
Balance at 30 June 2020 425,829 31,758 457,587
Balance at 1 July 2018 11,237 - 11,237
Net result for the year 2,741 - 2,741
Other comprehensive Income - - -
Total comprehensive income for the year 2,741 - 2,741
Balance at 30 June 2019 13,978 - 13,978
The “Consolidated” results include the results of the INSW Staff Agency. The accompanying notes form part of these financial statements.
INSW/Consolidated
53

Infrastructure NSW
Statements of Cash Flows
for the year ended 30 June 2020
Actual Budget Actual Actual Budget Actual
2020 2020 2019 2020 2020 2019
Notes $'000 $'000 $'000 $'000 $'000 $'000
CASH FLOWS FROM OPERATING ACTIVITIES
Payments
Employee related (26,059) (50,613) (10,078) - - -
Other operating expenses (410,308) (251,987) (253,530) (436,367) (302,600) (263,610)
Finance costs (19,305) (101) - (19,305) (101) -
Grants and Subsidies (352) - - (352) - -
Total payments (456,024) (302,700) (263,609) (456,024) (302,700) (263,610)
Receipts
Sales of goods and services 176,860 266,868 202,437 176,860 266,868 202,437
Grants and Contributions 228,900 259,796 44,959 228,900 259,796 44,959
Interest received 1,115 - - 1,115 - -
Other income - 3,500 - - 3,500 -
Total receipts 406,875 530,164 247,396 406,875 530,164 247,396
NET CASH FLOWS FROM OPERATING ACTIVITIES 25 (49,149) 227,464 (16,213) (49,149) 227,464 (16,213)
CASH FLOWS FROM INVESTING ACTIVITIES
Purchases of property, plant and equipment (16,519) (229,798) (116) (16,519) (229,798) (116)
NET CASH FLOWS FROM INVESTING ACTIVITIES (16,519) (229,798) (116) (16,519) (229,798) (116)
CASH FLOWS FROM FINANCING ACTIVITIES
Proceeds from borrowings 133,345 - - 133,345 - -
Repayment of lease liabilities (2,534) (828) - (2,534) (828) -
NET CASH FLOWS FROM FINANCING ACTIVITIES 130,811 (828) - 130,811 (828) -
NET INCREASE/(DECREASE) IN CASH and CASH EQUIVALENTS 65,143 (3,162) (16,328) 65,143 (3,162) (16,328)
Opening cash and cash equivalents 25,153 26,483 41,481 25,153 26,483 41,481
Cash transferred in as a result of administrative restructuring 20 223,372 - - 223,372 - -
CLOSING CASH AND CASH EQUIVALENTS 7 313,667 23,321 25,153 313,667 23,321 25,153
INSWConsolidated
The “Consolidated” results include the results of the INSW Staff Agency. The accompanying notes form part of these financial statements.
54

Infrastructure NSW
Notes to the Consolidated Financial Statements
for the year ended 30 June 2020
1. Summary of significant accounting policies
(a) Reporting entity
(b) Exemption from preparing financial statements
(c) Basis of preparation
(d) Statement of compliance
(e) Insurance
The financial statements have been prepared on a going concern basis which assumes that repayment of debt will be met, as and when they fall due, without any intention or necessity to liquidate assets or otherwise wind up operations. Management has determined that the going concern basis is appropriate. This determination has taken into consideration the following factors:
• Infrastructure NSW is NSW Government owned; and • Infrastructure NSW borrowing is guaranteed by the NSW Government.
The financial statements and notes comply with Australian Accounting Standards, which include Australian Accounting Interpretations.
The INSW’s insurance activities are conducted through the NSW Treasury Managed Fund Scheme of self insurance for Government entities.The expense (premium) is determined by the fund manager based on past claim experience.
Infrastructure New South Wales (hereafter referred to as INSW) was established in July 2011 as a statutory authority under the Infrastructure NSW Act 2011. It provides independent advice to help the Government identify and prioritise critical public infrastructure across NSW. INSW is a reporting entity, comprising all the entities under its control, namely INSW Staff Agency (Staff Agency).
The Staff Agency is a public service agency established under the Administrative Arrangements Order 2014 and is pursuant to Part 2 of Schedule 1 of the Government Sector Employment Act 2013 (formerly the Infrastructure Special Officers Group (INSW Division) established under the former Public Sector Employment Management Act. The Staff Agency comprises persons who are employed under the Government Sector Employment Act 2013 to enable INSW to exercise its functions.
In the process of preparing the consolidated financial statements for the economic entity consisting of the controlling and controlled entities, all inter-entity transactions and balances have been eliminated.
INSW is a budget dependent Statutory Authority. INSW is a not-for-profit entity (as profit is not its principal objective) and it has no cash generating units. The reporting entity is consolidated as part of the NSW Total State Sector Accounts.
These consolidated financial statements for the year ended 30 June 2020 have been authorised for issue by the Chief Executive Officer on 14 October 2020.
The INSW’s financial statements are general purpose financial statements which have been prepared on an accruals basis and in accordance with:
Property, plant and equipment and certain financial assets and liabilities are measured at fair value. Assets held for sale are measured at lower of carrying value and fair value less cost to sell. Other financial statements items are prepared in accordance with the historical cost convention except where specified otherwise. Assets held for distribution are non-current asset (or disposal group) classified as held for distribution to owners and are measured at the lower of its carrying amount and fair value less costs to distribute. Judgements, key assumptions and estimations management has made are disclosed in the relevant notes to the Financial Statements.
All amounts are rounded to the nearest one thousand dollars and are expressed in Australian currency, which is INSW's presentation and functional currency.
• applicable Australian Accounting Standards (which include Australian Accounting Interpretations)
• the requirements of the Public Finance and Audit Act 1983 and Audit Regulation 2015, and
During 2019, Executive Council approved a Regulation relieving certain agencies from financial reporting requirements under the Public Finance and Audit Act 1983 (the Act). Those agencies are listed in clauses 9 and 12A of the Public Finance and Audit Regulation 2015. Each of those agencies was relieved from the Act's financial reporting requirements for FY2018-19. In addition, each of those agencies is also relieved from the Act's financial reporting requirements for FY2019-20. For INSW this is the case for the Staff Agency.
In June 2019, The NSW Government introduced a Bill to Parliament which dissolved both the Barangaroo Delivery Authority (BDA) and the Urban Growth NSW Development Corporation (UGDC) and transferred the rights, liabilities and functions of both entities to INSW. This bill was passed on the 20th June 2019 and subsequently accented to on 1 July 2019 which operates as the effective date of the legislation.
• Treasurer’s Directions issued under 'the Act'
55

Infrastructure NSW
Notes to the Consolidated Financial Statements
for the year ended 30 June 2020
1. Summary of significant accounting policies (continued)
(f) Accounting for the Goods and Services Tax (GST)
Income, expenses and assets are recognised net of the amount of GST, except that:
(g) Income recognition
Until 30 June 2019
From 1 July 2019
(i) Interest income
(ii) Lease revenue and finance leasesFinance lease revenue is recognised over the lease period to allocate finance income over the lease term on a systematic and rational basis.
(iii) Grants and contributions
Until 30 June 2019
From 1 July 2019
(iv) Sale of goods
Until 30 June 2019
From 1 July 2019
Cash flows are included in the statement of cash flows on a gross basis. However, the GST components of cash flows arising from investing and financing activities which are recoverable from, or payable to, the Australian Taxation Office are classified as operating cash flows.
Income is measured at the fair value of the consideration or contribution received or receivable. Additional comments regarding the accounting policies for the recognition of income are discussed below.
Income from grants to acquire/construct a recognisable non-financial asset to be controlled by INSW is recognised when INSW satisfies its obligations under the transfer. INSW satisfies the performance obligations under the transfer to construct assets over time as the non-financial assets are being constructed. Revenue from grants with sufficiently specific performance obligations is recognised as and when INSW satisfies a performance obligation by transferring the promised goods. Revenue from grants is recognised based on the grant amount specified in the funding agreement/funding approval, and revenue is only recognised to the extent that it is highly probable that a significant reversal will not occur. INSW receives its funding as cluster grant funding received from Department of Premier and Cabinet which receives appropriations from the Consolidated Fund.
Income is recognised in accordance with the requirements of AASB 15 Revenue from Contracts with Customers or AASB 1058 Income of Not-for-Profit Entities, dependent on whether there is a contract with a customer defined by AASB 15 Revenue from Contracts with Customers.
Interest income is calculated by applying the effective interest rate to the gross carrying amount of a financial asset except for financial assets that subsequently become credit-impaired. For financial assets that become credit impaired, the effective interest rate is applied to the amortised cost of the financial asset (i.e. after deducting the loss allowance for expected credit losses).
Sale of goods represent invoiced amounts and includes recoveries from other NSW government agencies for projects being delivered on their behalf by either the project delivery unit of INSW and/ or the investor assurance unit.
• the amount of GST incurred by the INSW as a purchaser that is not recoverable from the Australian Taxation Office is recognised as part ofthe cost of acquisition of an asset or as part of an item of expense, and
• receivables and payables are stated with the amount of GST included.
Revenue from sale of goods is recognised as revenue when INSW transfers the significant risks and rewards of ownership of the goods, usually on delivery of the goods.
Income from grants (other than contribution by owners) is recognised when INSW obtains control over the contribution. INSW is deemed to have assumed control when the grant is received or receivable.
Contributions are recognised at their fair value. Contributions of services are recognised when and only when a fair value of those services can be reliably determined and the services would be purchased if not donated.
Income is recognised in accordance with AASB 111 Construction Contracts, AASB 118 Revenue and AASB 1004 Contributions.
Compliance: INSW did not disclose volunteer services as its not applicable, INSW did not disclose the detailed performance obligations grant revenue requirements as this is not applicable to INSW a brief comment is made in the event this becomes applicable.
Revenue from sale of goods is recognised when INSW satisfies a performance obligation by transferring the promised goods. INSW satisfies its performance obligation when it transfers the significant risks and rewards of ownership of the goods, usually on delivery of the goods.
Revenue from these sales is recognised based on the price specified in the contract, and revenue is only recognised to the extent that it is highly probable that a significant reversal will not occur. Amounts disclosed as revenue are net of returns, trade allowances, rebates and amount collected on behalf of third parties. No element of financing is deemed present as the sales are made with a short credit term. No volume discount or warranty is provided on the sale.
56

Infrastructure NSW
Notes to the Consolidated Financial Statements
for the year ended 30 June 2020
1. Summary of significant accounting policies (continued)(g) Income recognition (continued)
(v) Rendering of services
Until 30 June 2019
(v) Rendering of services (continued)
From 1 July 2019
(h) Expenses
(i) Precinct Management
(ii) Contracted Services
(iii) Grants and subsidies
(i) Projects
(j) Property, Plant & Equipment
(i) Acquisition cost
(ii) Capitalisation thresholds
(iii) Restoration cost
(iv) Maintenance
- Assets of an individual value or a network of a value more than $5,000 are capitalised
Where payment for an asset is deferred beyond normal credit terms, its cost is the cash price equivalent; i.e. the deferred payment amount is effectively discounted over the period of credit.
The present value of the expected cost for the restoration or cost of dismantling of an asset after its use is included in the cost of the respective asset if the recognition criteria for a provision are met.
Day-to-day servicing costs or maintenance are charged as expenses as incurred, except where they relate to the replacement orenhancement of a part or a component of an asset, in which case the costs are capitalised and depreciated.
Property, plant and equipment acquired are initially recognised at cost and subsequently measured at fair value less accumulated depreciation and impairment. Cost is the amount of cash or cash equivalents paid or the fair value of the other consideration given to acquire the asset at the time of its acquisition or construction or, where applicable, the amount attributed to that asset when initially recognised in accordance with the requirements of other Australian Accounting Standards.
Assets acquired at no cost, or for nominal consideration, are initially recognised at their fair value at the date of acquisition.
Revenue from rendering of services is recognised when the service is provided or by reference to the stage of completion (based on labour hours incurred to date).
Rendering of services represent invoiced amounts of the services provided to other NSW government agencies for projects being delivered on their behalf by either the project delivery unit of INSW and/ or the investor assurance unit.
Precinct Management expenses consist of facilities management, security, utilities and activation costs for public domain infrastructureassets. Precinct Management expenses are recognised as expenses in the period in which they are incurred.
Revenue from rendering of services is recognised when INSW satisfies the performance obligation by transferring the promised services, generally construction management services. INSW typically satisfies its performance obligations when the services are performed. The input method is used to recognise the revenue based on the percentage of costs incurred. The payments are typically due in advance. The revenue is measured at the transaction price agreed under the contract. No element of financing is deemed present as payments are due when service is provided.
Contracted Services expenses consist of all the expenditure related to the projects (Hawkesbury Nepean Valley Flood Risk ManagementStrategy and South Creek Corridor Review). All expenses are recognised as expenses in the period in which they are incurred.
Projects expenses are related to the costs incurred on the projects carried out by INSW on behalf of other agencies. These are recognised asexpenses in the period they are incurred.
Projects revenue are the reimbursement received by other agencies to INSW for carrying out projects on their behalf. As these project contracts are enforceable contracts with a customer, and there are sufficiently specific performance obligations, the project revenue arrangements are within the scope of AASB 15. There is a single performance obligation for these projects for INSW to manage and deliver the infrastructure project as specified in the Memorandum of Understanding (MoU). Revenue is recognised when expenditure on the project has incurred, i.e. revenue is recognised over time as the asset is being constructed.
Grants and subsidies expenses consist of all the expenditure related grants paid to the other government agencies. All expenses are recognised as expenses in the period in which they are incurred.
Fair value is the price that would be received to sell an asset in an orderly transaction between market participants at measurement date.
- Property development costs that give rise to an effective and material increase in the future economic benefit of the property are capitalised- Capitalise all costs incurred in property development when assets are completed and ready for service, the costs are capitalised in theinventory account, either directly or from capital work in progress when relevant.
57
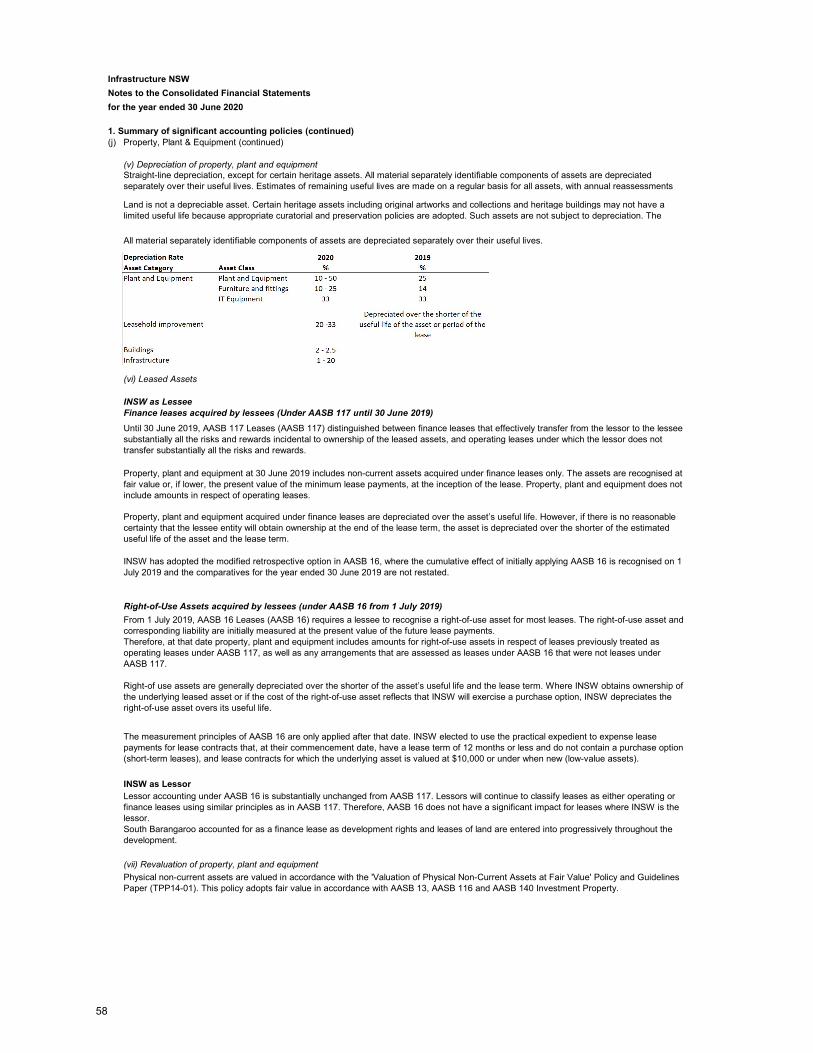
Infrastructure NSW
Notes to the Consolidated Financial Statements
for the year ended 30 June 2020
1. Summary of significant accounting policies (continued)(j) Property, Plant & Equipment (continued)
(v) Depreciation of property, plant and equipment
All material separately identifiable components of assets are depreciated separately over their useful lives.
(vi) Leased Assets
INSW as LesseeFinance leases acquired by lessees (Under AASB 117 until 30 June 2019)
Right-of-Use Assets acquired by lessees (under AASB 16 from 1 July 2019)
INSW as Lessor
(vii) Revaluation of property, plant and equipment
Straight-line depreciation, except for certain heritage assets. All material separately identifiable components of assets are depreciated separately over their useful lives. Estimates of remaining useful lives are made on a regular basis for all assets, with annual reassessments
Land is not a depreciable asset. Certain heritage assets including original artworks and collections and heritage buildings may not have a limited useful life because appropriate curatorial and preservation policies are adopted. Such assets are not subject to depreciation. The
Until 30 June 2019, AASB 117 Leases (AASB 117) distinguished between finance leases that effectively transfer from the lessor to the lessee substantially all the risks and rewards incidental to ownership of the leased assets, and operating leases under which the lessor does not transfer substantially all the risks and rewards.
From 1 July 2019, AASB 16 Leases (AASB 16) requires a lessee to recognise a right-of-use asset for most leases. The right-of-use asset and corresponding liability are initially measured at the present value of the future lease payments.Therefore, at that date property, plant and equipment includes amounts for right-of-use assets in respect of leases previously treated as operating leases under AASB 117, as well as any arrangements that are assessed as leases under AASB 16 that were not leases under AASB 117.
Right-of use assets are generally depreciated over the shorter of the asset’s useful life and the lease term. Where INSW obtains ownership of the underlying leased asset or if the cost of the right-of-use asset reflects that INSW will exercise a purchase option, INSW depreciates the right-of-use asset overs its useful life.
The measurement principles of AASB 16 are only applied after that date. INSW elected to use the practical expedient to expense lease payments for lease contracts that, at their commencement date, have a lease term of 12 months or less and do not contain a purchase option (short-term leases), and lease contracts for which the underlying asset is valued at $10,000 or under when new (low-value assets).
Lessor accounting under AASB 16 is substantially unchanged from AASB 117. Lessors will continue to classify leases as either operating or finance leases using similar principles as in AASB 117. Therefore, AASB 16 does not have a significant impact for leases where INSW is the lessor.South Barangaroo accounted for as a finance lease as development rights and leases of land are entered into progressively throughout the development.
Physical non-current assets are valued in accordance with the 'Valuation of Physical Non-Current Assets at Fair Value' Policy and GuidelinesPaper (TPP14-01). This policy adopts fair value in accordance with AASB 13, AASB 116 and AASB 140 Investment Property.
Property, plant and equipment at 30 June 2019 includes non-current assets acquired under finance leases only. The assets are recognised at fair value or, if lower, the present value of the minimum lease payments, at the inception of the lease. Property, plant and equipment does not include amounts in respect of operating leases.
Property, plant and equipment acquired under finance leases are depreciated over the asset’s useful life. However, if there is no reasonable certainty that the lessee entity will obtain ownership at the end of the lease term, the asset is depreciated over the shorter of the estimated useful life of the asset and the lease term.
INSW has adopted the modified retrospective option in AASB 16, where the cumulative effect of initially applying AASB 16 is recognised on 1 July 2019 and the comparatives for the year ended 30 June 2019 are not restated.
58
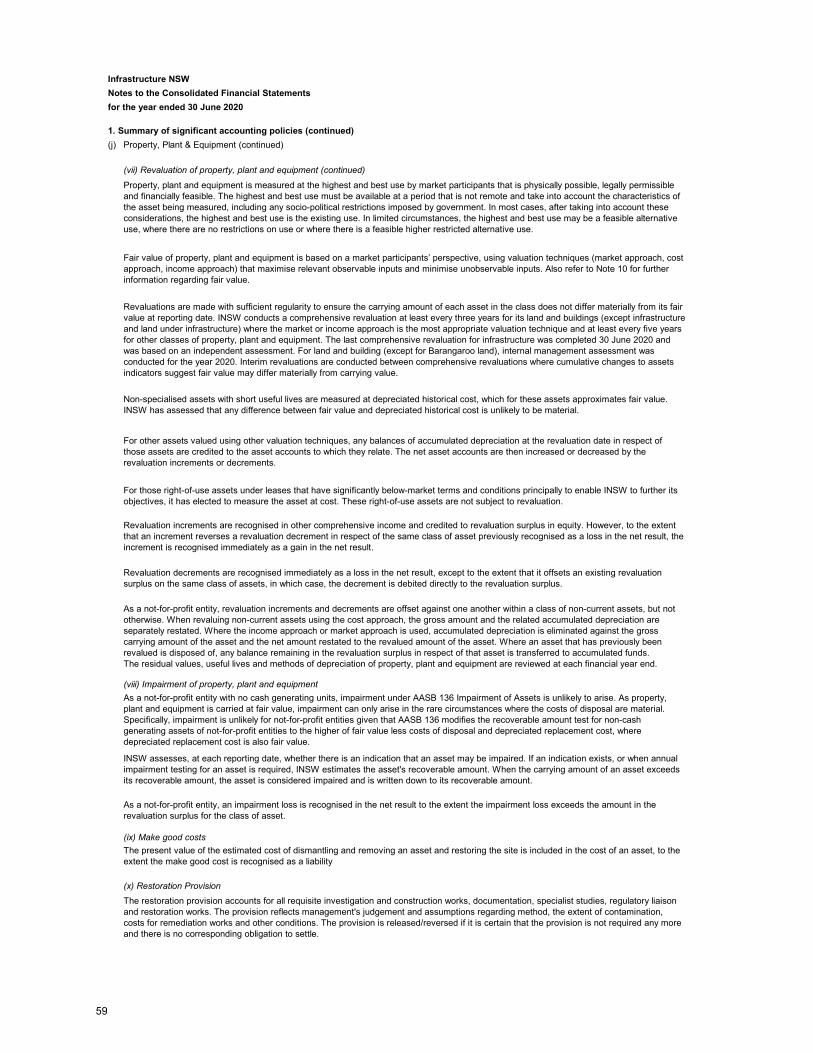
Infrastructure NSW
Notes to the Consolidated Financial Statements
for the year ended 30 June 2020
1. Summary of significant accounting policies (continued)
(j) Property, Plant & Equipment (continued)
(vii) Revaluation of property, plant and equipment (continued)
(viii) Impairment of property, plant and equipment
(ix) Make good costs
(x) Restoration Provision
Property, plant and equipment is measured at the highest and best use by market participants that is physically possible, legally permissible and financially feasible. The highest and best use must be available at a period that is not remote and take into account the characteristics of the asset being measured, including any socio-political restrictions imposed by government. In most cases, after taking into account these considerations, the highest and best use is the existing use. In limited circumstances, the highest and best use may be a feasible alternative use, where there are no restrictions on use or where there is a feasible higher restricted alternative use.
Revaluations are made with sufficient regularity to ensure the carrying amount of each asset in the class does not differ materially from its fair value at reporting date. INSW conducts a comprehensive revaluation at least every three years for its land and buildings (except infrastructure and land under infrastructure) where the market or income approach is the most appropriate valuation technique and at least every five years for other classes of property, plant and equipment. The last comprehensive revaluation for infrastructure was completed 30 June 2020 and was based on an independent assessment. For land and building (except for Barangaroo land), internal management assessment was conducted for the year 2020. Interim revaluations are conducted between comprehensive revaluations where cumulative changes to assets indicators suggest fair value may differ materially from carrying value.
INSW assesses, at each reporting date, whether there is an indication that an asset may be impaired. If an indication exists, or when annual impairment testing for an asset is required, INSW estimates the asset's recoverable amount. When the carrying amount of an asset exceeds its recoverable amount, the asset is considered impaired and is written down to its recoverable amount.
As a not-for-profit entity, an impairment loss is recognised in the net result to the extent the impairment loss exceeds the amount in the revaluation surplus for the class of asset.
As a not-for-profit entity with no cash generating units, impairment under AASB 136 Impairment of Assets is unlikely to arise. As property, plant and equipment is carried at fair value, impairment can only arise in the rare circumstances where the costs of disposal are material. Specifically, impairment is unlikely for not-for-profit entities given that AASB 136 modifies the recoverable amount test for non-cash generating assets of not-for-profit entities to the higher of fair value less costs of disposal and depreciated replacement cost, where depreciated replacement cost is also fair value.
Non-specialised assets with short useful lives are measured at depreciated historical cost, which for these assets approximates fair value. INSW has assessed that any difference between fair value and depreciated historical cost is unlikely to be material.
For other assets valued using other valuation techniques, any balances of accumulated depreciation at the revaluation date in respect of those assets are credited to the asset accounts to which they relate. The net asset accounts are then increased or decreased by the revaluation increments or decrements.
As a not-for-profit entity, revaluation increments and decrements are offset against one another within a class of non-current assets, but not otherwise. When revaluing non-current assets using the cost approach, the gross amount and the related accumulated depreciation are separately restated. Where the income approach or market approach is used, accumulated depreciation is eliminated against the gross carrying amount of the asset and the net amount restated to the revalued amount of the asset. Where an asset that has previously been revalued is disposed of, any balance remaining in the revaluation surplus in respect of that asset is transferred to accumulated funds.The residual values, useful lives and methods of depreciation of property, plant and equipment are reviewed at each financial year end.
Fair value of property, plant and equipment is based on a market participants’ perspective, using valuation techniques (market approach, cost approach, income approach) that maximise relevant observable inputs and minimise unobservable inputs. Also refer to Note 10 for further information regarding fair value.
Revaluation decrements are recognised immediately as a loss in the net result, except to the extent that it offsets an existing revaluation surplus on the same class of assets, in which case, the decrement is debited directly to the revaluation surplus.
The restoration provision accounts for all requisite investigation and construction works, documentation, specialist studies, regulatory liaison and restoration works. The provision reflects management's judgement and assumptions regarding method, the extent of contamination, costs for remediation works and other conditions. The provision is released/reversed if it is certain that the provision is not required any more and there is no corresponding obligation to settle.
The present value of the estimated cost of dismantling and removing an asset and restoring the site is included in the cost of an asset, to theextent the make good cost is recognised as a liability
For those right-of-use assets under leases that have significantly below-market terms and conditions principally to enable INSW to further its objectives, it has elected to measure the asset at cost. These right-of-use assets are not subject to revaluation.
Revaluation increments are recognised in other comprehensive income and credited to revaluation surplus in equity. However, to the extent that an increment reverses a revaluation decrement in respect of the same class of asset previously recognised as a loss in the net result, the increment is recognised immediately as a gain in the net result.
59

Infrastructure NSW
Notes to the Consolidated Financial Statements
for the year ended 30 June 2020
1. Summary of significant accounting policies (continued)
(k) Inventory
(l) Assets held for sale and distribution
(m) Intangible assets
(n) Lease liabilities
(o) Borrowing costs
(p) Financial instruments
Inventories are stated at cost (cost includes acquisition and development costs), adjusted when applicable, for any loss of service potential. A loss of service potential is identified and measured based on the existence of a current replacement cost that is lower than the carryingamount. Inventories (other than those held for distribution) are stated at the lower of cost and net realisable value. Cost includes acquisition and development costs.
INSW recognises intangible assets only if it is probable that future economic benefits will flow to INSW and the cost of the asset can be measured reliably. Intangible assets are measured initially at cost. Where an asset is acquired at no or nominal cost, the cost is its fair value as at the date of acquisition.
Intangible assets are subsequently measured at fair value only if there is an active market. As there is no active market for INSW’s intangible assets, the assets are carried at cost less any accumulated amortisation and impairment losses. All research costs are expensed. Development costs are only capitalised when certain criteria are met.
INSW’s intangible assets are amortised using the straight-line method over a period of four years. Intangible assets are tested for impairment where an indicator of impairment exists. If the recoverable amount is less than its carrying amount the carrying amount is reduced to recoverable amount and the reduction is recognised as an impairment loss.
Assets held for sale and distribution are measured at the lower of carrying amount and fair value less costs to sell. These assets are notdepreciated while they are classified as held for sale and distribution. INSW has certain non-current assets classified as held for sale, wheretheir carrying amount will be recovered principally through a sale transaction not through continuing use. This condition is regarded as met when the sale is highly probable, the asset is available for immediate sale in its present condition and the sale of the asset is expected to becompleted within one year from the date of classification.
A financial instrument is any contract that gives rise to a financial asset of one entity and a financial liability or equity instrument of another entity.Financial assets and financial liabilities are initially measured at fair value. Transaction costs that are directly attributable to the acquisition or issue of financial assets and financial liabilities (other than financial assets and financial liabilities at fair value through profit or loss) are added to or deducted from the fair value of the financial assets or financial liabilities, as appropriate, on initial recognition. Transaction costs directly attributable to the acquisition of financial assets or financial liabilities at fair value through profit or loss are recognised immediately in net result.
INSW determines the classification of its financial assets and liabilities after initial recognition and, when allowed and appropriate, re-evaluates this at each financial year end.
The cost of inventories acquired at no cost or for nominal consideration is the current replacement cost as at the date of acquisition. Currentreplacement cost is the cost INSW would incur to acquire the asset. Net realisable value is the estimated selling price in the ordinary course of business less the estimated costs of completion and the estimated costs necessary to make the sale.
In relation to leases that had previously been classified as ‘operating leases’ under AASB 117, a lease liability is recognised at 1 July 2019 is measured at the present value of the future lease payments, discounted using the interest rate implicit in the lease, or the lessee’s incremental borrowing rate if the interest rate implicit in the lease cannot be readily determined. The weighted average lessee’s incremental borrowing rate applied to the lease liabilities on 1 July 2019 was 1.42%. The corresponding right-of-use asset is initially recorded on transition at an amount equal to the lease liability, adjusted by the amount of any prepaid or accrued lease payments relating to that lease recognised in the statement of financial position as at 30 June 2019. The exception is right of-use assets that are subject to accelerated depreciation. These assets are measured at their fair value at 1 July 2019. For leases previously classified as finance leases INSW recognised the carrying amount of the lease asset and lease liability immediately before transition as the carrying amount of the right of use asset and the lease liability at the date of initial application.
The measurement principles of AASB 16 are only applied after that date. INSW elected to use the practical expedient to expense lease payments for lease contracts that, at their commencement date, have a lease term of 12 months or less and do not contain a purchase option (short-term leases), and lease contracts for which the underlying asset is valued at $10,000 or under when new (low-value assets).
Borrowing Cost consist of interest and other costs incurred in connection with the borrowing of funds. It also includes finance costs related to leases liability. Borrowing costs are recognised as expenses in the period in which they are incurred in accordance with Treasury's Mandate to not-for-profit NSW general government sector entities.
60

Infrastructure NSW
Notes to the Consolidated Financial Statements
for the year ended 30 June 2020
1. Summary of significant accounting policies (continued)
(p) Financial instruments (continued)
(i) Financial assets• Receivables (including Contract Receivables)
(ii) Financial Liabilities
Payables
Financial liabilities at amortised cost (including borrowings and trade payables)
(iii) De-recognition of financial assets and financial liabilities
• where the agency has not transferred substantially all the risks and rewards, if the agency has not retained control.
Continuing involvement that takes the form of a guarantee over the transferred asset is measured at the lower of the original carrying amount of the asset and the maximum amount of consideration that INSW could be required to repay.
A financial liability is derecognised when the obligation specified in the contract is discharged or cancelled or expires. When an existing financial liability is replaced by another from the same lender on substantially different terms, or the terms of an existing liability are substantially modified, such an exchange or modification is treated as the de-recognition of the original liability and the recognition of a new liability. The difference in the respective carrying amounts is recognised in the net result.
• where substantially all the risks and rewards have been transferred; or
Contract receivables relate to INSW’s right to consideration in exchange for goods transferred to customers/works completed, but not collected at the reporting date. Contract liabilities relate to consideration received in advance from customers in respect of projects delivered on behalf of other agencies. The balance of contract liabilities at 30 June 2020 was impacted due to the timing of satisfaction of performance obligations.
Financial liabilities at amortised cost are initially measured at fair value, net of transaction costs. These are subsequently measured at amortised cost using the effective interest method, with interest expense recognised on an effective yield basis.
INSW recognises an allowance for expected credit losses (ECLs) for all debt financial assets not held at fair value through profit and loss. ECLs are based on the difference between the contractual cash flows and the cash flows that INSW expects to receive, discounted at the original effective interest rate.
For Receivables (including contract receivables), INSW applies a simplified approach in calculating ECLs. INSW recognises a loss allowance based on lifetime ECLs at each reporting date. INSW has determined that as there is no historical credit loss experience and the majority of its receivables are inter-government, it has not recognised any ECLs.
Lease liabilities are determined in accordance with AASB 117 until 30 June 2019. From 1 July 2019, lease liabilities are determined in accordance with AASB 16.
When INSW has transferred its rights to receive cash flows from an asset or has entered into a pass-through arrangement, it evaluates if, and to what extent, it has retained the risks and rewards of ownership. Where INSW has neither transferred nor retained substantially all the risks and rewards or transferred control, the asset continues to be recognised to the extent of the INSW's continuing involvement in the asset. In that case, the agency also recognises an associated liability. The transferred asset and the associated liability are measured on a basis that reflects the rights and obligations that the agency has retained.
Contract assets relate to INSW’s right to consideration in exchange for goods transferred to customers/works completed, but not billed at the reporting date in respect of project delivered.
Impairment under AASB 9
Contract Liabilities represents the balance remaining at the year end for which the performance obligations are not yet satisfied for projects being delivered on behalf of other NSW government agencies by the project delivery unit of INSW. INSW issues quarterly claims in advance based on forecast expenditure to these agencies for which the projects are being delivered. INSW draws down against this claim as expenditure is incurred.
Payables represent liabilities for goods and services provided to the agency and other amounts. Payables are initially recognised at fair value. Subsequent measurement is at amortised cost using the effective interest method. Short-term payables with no stated interest rate are measured at the original invoice amount where the effect of discounting is immaterial. Gains and losses are recognised in net result when the liabilities are derecognised as well as through the amortisation process.
Borrowings are classified as current labilities unless the INSW has an unconditional right to deter settlement of the liability for at least 12 months after the reporting date result for the year of de-recognition. Borrowings are classified as current liabilities unless INSW has an unconditional right to defer settlement of the liability for at least 12 months after the reporting date.
A financial asset is derecognised when the contractual rights to the cash flows from the financial assets expire; or if INSW transfers its right to receive cash flows from the asset or has assumed an obligation to pay the received cash flows in full without material delay to a third party under a 'pass-through' arrangement and either:
61

Infrastructure NSW
Notes to the Consolidated Financial Statements
for the year ended 30 June 2020
1. Summary of significant accounting policies (continued)(p) Financial instruments (continued)
(iv) Offsetting financial instruments
(q) Employee benefits and other provisions
(i) Salaries and wages, annual leave and sick leave
(ii) Long service leave and superannuation
(iii) Consequential on-costs
(r) Other Provisions
Unused non-vesting sick leave does not give rise to a liability as it is not considered probable that sick leave taken in the future will be greater than the benefits accrued in the future.
Financial assets and financial liabilities are offset and the net amount is reported in the Statement of Financial Position if there is a currently enforceable legal right to offset the recognised amounts and there is an intention to settle on a net basis, or to realise the assets and settle the liabilities simultaneously.
Employee benefits are provided to the INSW by the INSW Staff Agency. All the former BDA and former UGDC employees in respective Staff Agencies were transferred to INSW Staff agency. The INSW recognises personnel services expenses and provisions for these benefits.
Salaries and wages (including non-monetary benefits) and paid sick leave that are expected to be settled wholly within 12 months after the end of the period in which the employees render the service are recognised and measured at the undiscounted amounts of the benefits.
INSW's liabilities for long service leave and defined benefit superannuation are partly assumed by the Crown Entity and therefore shown partly as part of the non-monetary revenue item described as ''Acceptance by the Crown Entity of employee benefits and other liabilities''. The superannuation expense for the financial year is determined by using the formulae specified in the Treasurer's Directions. The expense for certain superannuation schemes (i.e. Basic Benefit and First State Super) is calculated as a percentage of the employees' salary. For other superannuation schemes (i.e. State Superannuation Scheme and State Authorities Superannuation Scheme), the expense is calculated as a multiple of the employees' superannuation contributions.
Long Service Leave is measured at present value, discounted using commonwealth bond rate at the reporting date. Consideration is given to certain factors based on actuarial review, including expected future wage and salary levels, experience of employee departures, and periods of service. Provisions made for benefits that are not expected to be settled less than 12 months are measured as the present value of estimated future cash flows. Contributions to the defined contribution and defined benefit fund are recognised as an expense as they become payable. Prepaid contributions are recognised as an asset to the extent that a cash refund or a reduction in the future payments is available. Amounts representing unfunded superannuation are recognised as a liability. Actuarial gains and losses are recognised immediately as other Comprehensive Income in the year in which they occur.
Consequential costs to employment are recognised as liabilities and expenses where the employee benefits to which they relate have been recognised. This includes outstanding amounts of payroll tax, workers' compensation insurance premiums and fringe benefits tax.
Provisions are recognised when INSW has a present legal or constructive obligation as a result of a past event; it is probable that an outflow of resources will be required to settle the obligation; and a reliable estimate can be made of the amount of obligation. Provisions are measured at the present value of management’s best estimate of the expenditure required to settle the present obligation at the reporting date. The discount rate used to determine the present value reflects current assessments of the time value of money and the risks specific to the liability. The increase in the provision due to the passage of time is recognised as interest expense.When INSW expects some or all of the provision to be reimbursed, for example, under an insurance contract, the reimbursement is recognised as a separate asset, but only when the reimbursement is virtually certain. The expense relating to a provision is presented net ofany reimbursement in the Statement of Comprehensive Income.
The outstanding amounts of payroll tax, workers’ compensation insurance premiums and fringe benefits tax, which are consequential to employment, are recognised as liabilities and expenses where the employee benefit to which they relate have been recognised.Annual leave is recognised and measured at undiscounted amounts if expected to be settled within 12 months after the end of the period in which the employees services were rendered. Annual leave is required to be measured at fair value (although short-cut methods are permitted). Annual leave liability recognised at undiscounted amounts as an assessment has been made that effect of discounting is immaterial. All annual leave is classified as a current liability even where the entity does not expect to settle the liability within 12 months as the entity does not have an unconditional right to defer settlement.
62

Infrastructure NSW
Notes to the Consolidated Financial Statements
for the year ended 30 June 2020
1. Summary of significant accounting policies (continued)
(s) Equity and reserves
(i) Accumulated Funds
(ii) Revaluation surplus
(iii) Equity transfers
(t) Fair value measurement and hierarchy
(u) Budgeted amounts
(v) Comparative information
The revaluation surplus is used to record increments and decrements on the revaluation of non-current assets. This accords with the INSW’s policy on the revaluation of property, plant and equipment as discussed in Note 10.
The transfer of net assets between entities as a result of an administrative restructure, transfers of programs / functions and parts thereof between NSW public sector entities and 'equity appropriations' are designated or required by AAS to be treated as contributions by owners and recognised as an adjustment to 'Accumulated Funds'. This treatment is consistent with AASB 1004 and Australian Interpretation 1038 Contributions by Owners Made to Wholly-Owned Public Sector Entities.
Transfers arising from an administrative restructure involving not-for-profit and for-profit government entities are recognised at the amount at which the assets and liabilities were recognised by the transferor immediately prior to the restructure. Subject to below, in most instances this will approximate fair value.
All other equity transfers are recognised at fair value, except for intangibles and inventories. Where an intangible has been recognised at (amortised) cost by the transferor because there is no active market, INSW recognises the asset at the transferor’s carrying amount. Where the transferor is prohibited from recognising internally generated intangibles, INSW does not recognise that asset.
The category 'Accumulated Funds' includes all current and prior period retained funds.
INSW 's accounting policy and disclosure require the measurement of fair values for both financial and non-financial assets and liabilities. When measuring fair value, the valuation techniques used maximise the use of relevant observable inputs and minimise the use of unobservable data. Under AASB 13 Fair Value Measurement, INSW categorises for disclosure purposes, the valuation techniques based on the inputs used in the valuation techniques as follows.Level 1 - quoted prices in active markets for identical assets/liabilities that INSW can access at the measurement dateLevel 2 - inputs other than quoted prices included within Level 1 that are observable, either directly or indirectlyLevel 3 - inputs that are not based on observable market data (unobservable inputs)
The budgeted amounts are drawn from the original budgeted financial statements presented to Parliament in respect of the reporting period.Subsequent amendments to the original budget (e.g. adjustment for transfer of functions between entities as a result of Administrative Arrangement Orders) are not reflected in the budgeted amounts. Major variances between the original budgeted amounts and the actual amounts disclosed in the financial statements are explained in note 23.
Except when an Australian Accounting Standard permits or requires otherwise, comparative information is disclosed in respect of the previous period for all amounts reported in INSW's audited 2018-19 financial statements. In addition INSW has disclosed a notional consolidated set of financial statements that includes the former UGDC, BDA and INSW refer to Note 28 for further details.
Fair value is the price that would be received to sell an asset or paid to transfer a liability in an orderly transaction between market participants at the measurement date. The fair value measurement is based on the presumption that the transaction to sell the asset or transfer the liability takes place either in the principal market for the asset or liability or in the absence of a principal market, in the most advantageous market for the asset or liability.
INSW recognises transfers between levels of the fair value hierarchy at the end of the reporting period during which the change has occurred.
PPE valued using level 2 and 3. INSW have some assets that are non-specialised short-live assets and measured at depreciated historical cost as a surrogate for fair value.
63

Infrastructure NSW
Notes to the Consolidated Financial Statements
for the year ended 30 June 2020
1. Summary of significant accounting policies (continued)
(w) Changes in accounting policy, including new or revised Australian Accounting Standards
(i) Effective for the first time in FY2019-20
• immediately, for all other income within the scope of AASB 1058.
AASB 16 Leases
Lessor accounting
INSW applied AASB 15 Revenue from Contracts with Customers, AASB 1058 Income of Not-for-Profit Entities, and AASB 16 Leases for the first time. The nature and effect of the changes as a result of adoption of these new accounting standards are described below.
The adoption of AASB 1058 did not have an impact on Other Comprehensive Income and the Statement of Cash Flows for the financial year.
AASB 15 Revenue from Contracts with Customers
AASB 15 establishes a five-step model to account for revenue arising from contracts with customers and requires that revenue be recognised at an amount that reflects the consideration to which INSW expects to be entitled in exchange for transferring goods or services to a customer. The performance obligation is considered to be satisfied when INSW has delivered the project as a whole or part of it as agreed in the contract.
AASB 16 supersedes AASB 117 Leases, Interpretation 4 Determining whether an Arrangement contains a Lease, Interpretation 115 Operating Leases – Incentives and Interpretation 127 Evaluating the Substance of Transactions Involving the Legal Form of a Lease. The standard sets out the principles for the recognition, measurement, presentation and disclosure of leases and requires lessees to recognise most leases on the balance sheet.
AASB 1058 replaces most of the existing requirements in AASB 1004 Contributions. The scope of AASB 1004 is now limited mainly to contributions by owners (including parliamentary appropriations that satisfy the definition of a contribution by owners), administrative arrangements and liabilities of government departments assumed by other entities. AASB 1058 applies to income with a donation component, i.e. transactions where the consideration to acquire an asset is significantly less than fair value principally to enable a not-for-profit entity to further its objectives; and volunteer services. AASB 1058 adopts a residual approach, meaning that entities first apply other applicable Australian Accounting Standards (e.g. AASB 1004, AASB 15, AASB 16, AASB 9, AASB 137) to a transaction before recognising income. Not-for-profit entities need to determine whether a transaction is/contains a donation (accounted for under AASB 1058) or a contract with a customer (accounted for under AASB 15).
Lessor accounting under AASB 16 is substantially unchanged from AASB 117. Lessors will continue to classify leases as either operating or finance leases using similar principles as in AASB 117. Therefore, AASB 16 does not have a significant impact for leases where INSW is the lessor.
The adoption of AASB 15 did not have an impact on Other Comprehensive Income and the Statement of Cash Flows for the financial year.
Compliance: INSW did not adopt any practical expedients therefore no disclosure taken up. In addition INSW did not include impact statement as there is no impact.
In accordance with the transition provisions in AASB 1058, INSW has adopted AASB 1058 retrospectively with the cumulative effect of initially applying the standard at the date of initial application, i.e. 1 July 2019. INSW has adopted the practical expedient in AASB 1058 whereby existing assets acquired for consideration significantly less than fair value principally to enable INSW to further its objectives, are not restated to their fair value.
In accordance with the transition provisions in AASB 15, INSW has adopted AASB 15 retrospectively with the cumulative effect of initially applying the standard recognised at the date of initial application.
• when the obligations under the transfer is satisfied, for transfers to enable an entity to acquire or construct a recognisable non- financial asset that will be controlled by INSW.
AASB 1058 requires recognition of receipt of an asset, after the recognition of any related amounts in accordance with other Australian Accounting Standards, as income:
AASB 15 supersedes AASB 111 Construction Contracts, AASB 118 Revenue and related Interpretations and it applies, with limited exceptions, to all revenue arising from contracts with customers. AASB 15 establishes a five-step model to account for revenue arising from contracts with customers and requires that revenue be recognised at an amount that reflects the consideration to which an entity expects to be entitled in exchange for transferring goods or services to a customer.
AASB 15 requires entities to exercise judgement, taking into consideration all of the relevant facts and circumstances when applying each step of the model to contracts with their customers. The standard also specifies the accounting for the incremental costs of obtaining a contract and the costs directly related to fulfilling a contract. In addition, the standard requires relevant disclosures.
AASB 1058 Income of Not-for-Profit Entities
64

Infrastructure NSW
Notes to the Consolidated Financial Statements
for the year ended 30 June 2020
1. Summary of significant accounting policies (continued)(w) Changes in accounting policy, including new or revised Australian Accounting Standards (continued)
Lessee accounting
• not reassess whether a contract is, or contains, a lease at 1 July 2019, for those contracts previously assessed under AASB 117 and Interpretation 4
AASB 16 requires INSW to account for all leases under a single on-balance sheet model similar to the accounting for finance leases under AASB 117. As the lessee, INSW recognises a lease liability and right- of-use asset at the inception of the lease. The lease liability is measured at the present value of the future lease payments, discounted using the interest rate implicit in the lease, or the lessee’s incremental borrowing rate if the interest rate implicit in the lease cannot be readily determined. The corresponding right-of-use asset is measured at the value of the lease liability adjusted for lease payments before inception, lease incentives, initial direct costs and estimates ofcosts for dismantling and removing the asset or restoring the site on which it is located.
INSW has adopted the partial retrospective option in AASB 16, where the cumulative effect of initially applying AASB 16 is recognised on 1 July 2019 and the comparatives for the year ended 30 June 2019 are not restated.
The following table reconciles the minimum lease commitments disclosed in Treasury's 30 June 2019 annual financial statements to the amount of lease liabilities recognised on 1 July 2019:
In relation to leases that had previously been classified as ‘operating leases’ under AASB 117, a lease liability is recognised at 1 July 2019 at the present value of the remaining lease payments, discounted using the lessee’s incremental borrowing rate at the date of initial application. The weighted average lessee’s incremental borrowing rate applied to the lease liabilities on 1 July 2019 was 1.42%.
INSW elected to use the practical expedient to expense lease payments for lease contracts that, at their commencement date, have a lease term of 12 months or less and do not contain a purchase option (short-term leases), and lease contracts for which the underlying asset is valued at $10,000 or under when new (low-value assets).
In applying AASB 16 for the first time, INSW has used the following practical expedients permitted by the standard:
• excluding the initial direct costs from the measurement of the right-of- use asset at the date of initial application.
• applying a single discount rate to a portfolio of leases with reasonably similar characteristics
• relying on its previous assessment on whether leases are onerous immediately before the date of initial application as an alternative to performing an impairment review
• not recognise a lease liability and right-of-use-asset for short-term leases that end within 12 months of the date of initial application
The effect of adoption AASB 16 as at 1 July 2019 (increase/ (decrease) is, as follows:
The corresponding right-of-use asset is initially recorded on transition at an amount equal to the lease liability, adjusted by the amount of any prepaid or accrued lease payments relating to that lease recognised in the statement of financial position as at 30 June 2019.
• using hindsight in determining the lease term where the contract contained options to extend or terminate the lease
65

Infrastructure NSW
Notes to the Consolidated Financial Statements
for the year ended 30 June 2020
1. Summary of significant accounting policies (continued)(w) Changes in accounting policy, including new or revised Australian Accounting Standards (continued)
(ii) Issued but not yet effective
AASB 2019-7 Amendments to Australian Accounting Standards – Disclosure of GFS Measures of Key Fiscal Aggregates and GAAP/GFS Reconciliations
NSW public sector entities are not permitted to early adopt new Australian Accounting Standards, unless NSW Treasury determines otherwise.
The following new Australian Accounting Standards have not been applied and are not yet effective, in accordance with the NSW Treasury mandate (TC 20-01):
AASB 2018-6 Amendments to Australian Accounting Standards – Definition of a Business
AASB 2018-7 Amendments to Australian Accounting Standards – Definition of Material
AASB 2019-1 Amendments to Australian Accounting Standards – References to the Conceptual Framework
AASB 2019-2 Amendments to Australian Accounting Standards – Implementation of AASB 1059
AASB 2019-3 Amendments to Australian Accounting Standards - Interest Rate Benchmark Reform
AASB 17 Insurance Contracts
AASB 1059 Service Concession Arrangements: Grantors
AASB 2018-5 Amendments to Australian Accounting Standards – Deferral of AASB 1059
66

Infrastructure NSW
Notes to the Consolidated Financial Statementsfor the year ended 30 June 2020
2020 2019 2020 20192 Expenses Excluding Losses $'000 $'000 $'000 $'000
(a) Employee related expenses
Salaries and wages (including annual leave) 20,104 8,945 - -
Superannuation - defined contributions plans 1,707 636 - -
Long service leave 2,028 15 - -
Workers' compensation insurance 145 25 - -
Payroll tax and fringe benefits tax 1,650 515 - -
Redundancy payments 750 - - -
On-Costs - annual leave and long service leave 217 6 - -
Personnel services expenses - - 26,601 10,113
Employee Related 26,601 10,143 26,601 10,113
(b) Operating expenses
Auditors remuneration - audit of the financial statements 409 122 409 122
Internal audit fees 42 231 42 231
Other contractors 16,543 12,132 16,543 12,132
Boards and committees 138 136 138 136
Fees for services rendered 5,925 1,229 5,925 1,229
Insurance - public liability 135 7 135 7
Expense relating to short-term leases 292 - 292 -
Expense relating to leases of low-value assets 68 - 68 -
Operating lease rental expense - minimum lease payments - 883 - 883
Other expenses 1,886 332 1,886 332
Contracted services - Hawkesbury Nepean Valley Flood Risk Management Strategy 9,392 26,516 9,392 26,516
Contracted services - South Creek Corridor Review 2,277 2,717 2,277 2,717
Precinct management*** 8,802 - 8,802 -
Maintenance expenses * 96 1 96 1
Administration 342 - 342 -
46,347 44,306 46,347 44,306
* There are no employee related maintenance expenses included in Note 2 (a).
*** Precinct Management expenses include facilities management, security, utilities and activation costs for public domain infrastructure assets
(c) Depreciation and amortisation expense
Depreciation
Plant and equipment 1,547 130 1,547 130
Building 3,193 - 3,193 -
Leasehold improvements 108 75 108 75
Infrastructure systems 7,865 - 7,865 -
12,713 205 12,713 205
Amortisation
Intangible 7 7 7 7
Total Depreciation and amortisation 12,720 212 12,720 212
(d) Finance costs
Interest on borrowing measured at amortised cost 18,990 - 18,990 -
Unwinding of discount rate 315 - 315 -
19,305 - 19,305 -
(e) Project delivery expenses
Projects NSW 190,762 195,212 190,762 195,212
Other Project Expenses 5,521 - 5,521 -
196,283 195,212 196,283 195,212
Consolidated INSW
67

Infrastructure NSW
Notes to the Consolidated Financial Statementsfor the year ended 30 June 2020
2 Expenses Excluding Losses (continued)
(e) Project delivery expenses (continued)
2020 2019
Projects NSW detail by project $'000 $'000
Walsh Bay Arts Precinct 98,021 24,708
Sydney Modern Art Gallery 38,922 1,513
Stadium Australia 22,786 1,148
New Grafton Correction Centre 20,293 6,894
Powerhouse Paramatta Museum 9,764 -
Western Sydney Stadium - 128,822
Anzac Memorial Centenary Project 860 5,089
Sydney Football Stadium (SFS) Redevelopment* 116 27,039
Total 190,762 195,212
(f) Grants and subsidies 2020 2019 2020 2019
$'000 $'000 $'000 $'000
Community grants 352 - 352 -
352 - 352 -
3 Revenue
2020 2019 2020 2019
(a) Sale of goods and services $'000 $'000 $'000 $'000
Rendering of Services - Projects NSW 189,786 195,210 189,786 195,210
Rendering of Services - Investor Assurance 9,097 10,379 9,097 10,379
Rendering of Services - Others 14,518 2,040 14,518 2,040
213,401 207,629 213,401 207,629
2020 2019
Projects NSW detail by project $'000 $'000
New Grafton Correction Centre 20,293 6,894
Walsh Bay Arts Precinct 98,021 24,706
Western Sydney Stadium - 128,822
Anzac Memorial Centenary Project - 5,089
Stadium Australia 22,786 1,148
Sydney Football Stadium (SFS) Redevelopment* - 27,039
Sydney Modern Art Gallery 38,922 1,513
Powerhouse Paramatta Museum 9,764 -
Total 189,786 195,210
(b) Other Income
2020 2019 2020 2019
$'000 $'000 $'000 $'000
Development Contribution Income 584 - 584 -
Assets transferred from SCSGT at no consideration 19,422 - 19,422 -
Other Income 386 - 386 -
20,392 - 20,392 -
Other income comprises of income from fees, gain on equity transfer on vesting, development contribution income etc.
Consolidated
*On 5 July 2019, the ownership of SFS land was transferred from the SCSGT to INSW as an equity transfer. Consequently, all project costs incurred in relation to this project from July 2019 havebeen capitalised in INSW’s consolidated financial statements under Inventory under AASB 102.
INSW
Consolidated INSW
The expenses incurred for the Projects NSW are fully reconcilable from other NSW government Agencies for projects being delivered on their behalf by the project delivery unit of Infrastructure NSW
Consolidated INSW
*On 5 July 2019, the ownership of SFS land was transferred from the Sydney Cricket and Sports Ground Trust (SCSGT) to INSW as an equity transfer. Consequently, all project costs incurred inrelation to this project from July 2019 have been capitalised in INSW’s consolidated financial statements under Inventory under AASB 102.
68

Infrastructure NSW
Notes to the Consolidated Financial Statementsfor the year ended 30 June 2020
3 Revenue (continued)
2020 2019 2020 2019
(c) Grants and contributions $'000 $'000 $'000 $'000
Cluster Grant 123,434 - 123,434 -
Grants received from budget dependant agencies 95,904 16,031 95,904 16,031
Developer and affordable housing contributions 1,504 - 1,504 -
Grants from the climate change fund 8,058 24,694 8,058 24,694
Grants from the Restart NSW fund - 4,234 - 4,234
228,900 44,959 228,900 44,959
2020 2019
$'000 $'000
Grants without sufficiently specific performance obligations 228,900 44,959
228,900 44,959
(d) Deemed Appropriations 2020 2019
$'000 $'000
Opening Balance 184,326 -
Add: additions of deemed appropriations 397,652 288,877
Less: expenditure charged against deemed appropriations (310,656) (263,725)
Closing Balance 271,323 25,153
(e) Investment Revenue 2020 2019 2020 2019
$'000 $'000 $'000 $'000
Interest from cash at bank 1,115 - 1,115
Interest from finance leases 18,681 - 18,681 -
19,796 - 19,796 -
(f) Acceptance by the Crown Entity of employee benefits and other liabilities
Long service leave 2,139 30 - -
2,139 30 - -
4 Gain /(Loss) On Disposal
Proceeds from disposal - - - -
Less : Written down value of assets disposed (46) (4) (46) (4)
(46) (4) (46) (4)
On 5 March 2010, former BDA entered into the Stage 1 Project Development Agreement (PDA) with Lend Lease (Millers Point) and Lend Lease Authority for the development of Barangaroo South.
Deemed appropriations are defined by section 4.7 of the Government Sector Finance (GSF) Act. Deemed appropriation money is government money that a GSF agency receives or recovers (including from the Commonwealth or another entity) of a kind prescribed by the GSF Regulations that: (a) forms part of the Consolidated Fund, and (b) is not appropriated under the authority of an Act. Deemed appropriations are a disclosure only and do not change the presentation and the accounting treatment of the related revenue items. The disclosure of deemed appropriations is based on related cash flows. Deemed appropriation includes revenue received or recovered forming part of Consolidated Fund and is not appropriated under the Authority of an Act.
Consolidated INSW
Net Gain/(loss) on disposal of property, plant and equipment and intangible assets
Gain/(loss) on disposal of property, plant and equipment and intangible assets
Consolidated INSW
The Affordable Housing Corporation Plan 2006 sets out development contributions levied on development within the former Redfern Waterloo Authority's Operational Area. The contributions are to specifically fund the provision of refurbishment of affordable housing in the area.
INSW has no impact of application of AASB 1058 on the recognition of grants and contribution for INSW.
69

Infrastructure NSW
Notes to the Consolidated Financial Statementsfor the year ended 30 June 2020
5 Other gain/(loss) 2020 2019 2020 2019
Notes $'000 $'000 $'000 $'000
Gain/(loss) on fair value movement 10 (5,610) - (5,610) -
Impairment losses on non financials assets 11 (959) - (959) -
(6,569) - (6,569) -
6 Program group statements for the year ended 30 June 2020
INSW has two programs groups being :
• Strategy, Planning & Assurance which comprises the following:
- INSW Core operations, Strategy & Planning , Investor Assurance and management of the Restart NSW Fund
- Special projects including the implementation of the Hawkesbury Nepean Flood Management Strategy and the South Creek Corridor Review
Entity's Expenses & Income Project Delivery
Strategy & Planning and
Assurance
Barangaroo Precincts
Growth Centres Total Program
Groups
2020 2020 2020 2020 2020
Expenses excluding losses $'000 $'000 $'000 $'000 $'000
Operating expenses - - - - -
Employee related - 15,780 6,577 4,244 26,601
Other operating expenses - 37,138 26,018 2,496 65,652
Grants and subsidies - - - 352 352
Depreciation and amortisation - 191 9,830 2,699 12,720
Other expenses - Projects NSW 190,762 - - 5,521 196,283
Total expenses excluding losses 190,762 53,109 42,425 15,312 301,608
Revenue
Sale of goods and services 310,111 42,119 9,960 - 362,190
Other income - - 19,653 1,117 20,770
Grants & contributions - - - 101,667 101,667
Total Revenue 310,111 42,119 29,613 102,785 484,628
Other gains/loss - - (6,493) (76) (6,569)
Gain/(loss) on disposal - (46) - - (46)
Net result from continuing operations 119,349 (11,036) (19,305) 87,397 176,405
Net result from discontinued operations - - - (9,025) (9,025)
NET RESULT 119,349 (11,036) (19,305) 78,372 167,380
Items that may be reclassified subsequently to net result:
Net changes in revaluation surplus of property, plant and equipment - - 16,057 - 16,057
Net changes in revaluation surplus arising from changes in restoration liability - - 15,561 - 15,561
Net changes in superannuation actuarial gain/(loss) on defined benefit plans - - - 140 140
Total other comprehensive income - - 31,618 140 31,758
TOTAL COMPREHENSIVE INCOME/(LOSS) 119,349 (11,036) 12,313 78,512 199,138
Following Machinery of Government Changes, two new program groups have been incorporated ‘Barangaroo Precincts’ and ‘Growth Centres’. As these programs were not part of INSW last year there is no comparative information included.
• Project Delivery which incorporates those infrastructure projects being delivered on request from the Premier under INSW's Act including through a Project Authorisation Order or Delegation
Gain/(loss) on fair value movement is related to the valuation of infrastructure assets to its fair value. Impairment losses on Right of Use assets are related to the market changes in rental yields attributed to COVID-19 impacts.
Consolidated INSW
70

Infrastructure NSW
Notes to the Consolidated Financial Statementsfor the year ended 30 June 2020
6 Program group statements for the year ended 30 June 2020 (continued) Project Delivery
Strategy & Planning and
Assurance
Barangaroo Precincts
Growth Centres Total Program
Groups
2019 2019 2019 2019 2019
Expenses excluding losses $'000 $'000 $'000 $'000 $'000
Operating expenses - - - -
Employee Related - 10,143 - - 10,143
Other Operating Expenses - 44,306 - - 44,306
Depreciation and amortisation - 212 - - 212
Other expenses - Projects NSW 195,212 - - 195,212
Total expenses excluding losses 195,212 54,661 - - 249,873
Revenue
Sale of goods and services 195,211 12,419 - - 207,630
Other revenue - - - - -
Grants & contributions - 44,959 - - 44,959
CFE Accepted Liabilities - 30 - - 30
Total Revenue 195,211 57,408 - - 252,619
Gain/ (Loss) on Disposal - (4) - - (4)
NET RESULT (2) 2,743 - - 2,741
TOTAL COMPREHENSIVE INCOME/(LOSS) (2) 2,743 - - 2,741
Entity's Assets & Liabilities
2020 2020 2020 2020 2020
ASSETS $'000 $'000 $'000 $'000 $'000
Current Assets
Cash and cash equivalents - 81,980 10,510 221,177 313,667
Receivables 17,684 9,561 9,342 4,909 41,496
Assets held for Sale - - 164,718 - 164,718
Property, Plant and Equipment held for distribution - - - 34,458 34,458
Inventory held for distribution - - - 245 245
Total Current Assets 17,684 91,541 184,570 260,789 554,584
Non-Current Assets
Receivables - - 439,143 20,000 459,143
Right-of-use Assets - - 3,856 343 4,198
Property, Plant and equipment - 91 534,158 11,864 546,113
Intangibles - 6 - - 6
Inventories 139,890 - - 1,922 141,812
Total Non-Current Assets 139,890 97 977,157 34,129 1,151,273
Total Assets 157,574 91,639 1,161,727 294,918 1,705,856
71

Infrastructure NSW
Notes to the Consolidated Financial Statementsfor the year ended 30 June 2020
6 Program group statements for the year ended 30 June 2020 (continued)
Project Delivery
Strategy & Planning and
Barangaroo Precincts
Growth Centres Total Program
Groups
LIABILITIES 2020 2020 2020 2020 2020
Current Liabilities $'000 $'000 $'000 $'000 $'000
Payables 74,707 12,984 565,488 55,902 709,082
Provisions 13 1,187 4,315 462 5,977
Provisions held for distribution - - - 298 298
Total Current Liabilities 74,720 14,171 569,803 56,662 715,356
Non Current Liabilities
Payables - - 481,937 49,799 531,736
Provisions - 303 379 496 1,178
Total Non Current Liabilities - 303 482,316 50,295 532,914
Total Liabilities 74,720 14,474 1,052,119 106,957 1,248,270
Net Assets 82,853 77,164 109,608 187,961 457,586
2019 2019 2019 2019 2019
ASSETS $'000 $'000 $'000 $'000 $'000
Current Assets
Cash and cash equivalents 8,178 16,974 - - 25,152
Receivables 4,094 3,236 - - 7,330
Total Current Assets 12,272 20,210 - - 32,483
Non-Current Assets
Property, Plant and equipment - 256 - - 256
Intangibles - 14 - - 14
Total Non-Current Assets - 270 - - 270
Total Assets 12,272 20,480 - - 32,753
-
LIABILITIES
Current Liabilities
Payables 10,641 5,346 - - 15,987
Provisions 18 1,014 - - 1,032
Prepaid Income 1,616 - - - 1,616
Total Current Liabilities 12,274 6,360 - - 18,634
Non Current Liabilities
Provisions - 139 - - 139
Total Non Current Liabilities - 139 - - 139
Total Liabilities 12,274 6,500 - - 18,774
Net Assets (2) 13,980 - - 13,978
7 Current Assets - Cash And Cash Equivalents
2020 2019 2020 2019
a) Cash $'000 $'000 $'000 $'000
Cash at bank and on hand 313,667 25,153 313,667 25,153
313,667 25,153 313,667 25,153
For the purpose of the statement of cash flows, cash and cash equivalents include cash at bank and cash in hand
Cash and cash equivalent assets recognised in the statement of financial position 313,667 25,153 313,667 25,153
Closing cash and cash equivalents (per statement of cash flows) 313,667 25,153 313,667 25,153
Refer Note 26 for details regarding credit risk, liquidity risk, and market risk arising from financial instruments.
Cash and cash equivalent assets recognised in the statement of financial position are reconciled at the end of the financial year to the statement of cash flows as follows:
Consolidated INSW
72

Infrastructure NSW
Notes to the Consolidated Financial Statementsfor the year ended 30 June 2020
8 Current/Non-Current Assets - Receivables and Prepayments
2020 2019 2020 2019
Current $'000 $'000 $'000 $'000
Contract receivables 31,583 6,139 31,583 6,139
Less allowance for expected credit loss* (859) - (859) -
Goods and service tax recoverable 3,316 - 3,316 -
Other 159 - 159 -
Prepayment 7,112 - 7,112 -
Finance lease receivable 184 - 184 -
Investor Assurance - 1,191 - 1,191
41,495 7,330 41,495 7,330
Non-Current
Prepayment 20,001 - 20,001 -
Finance lease receivable 439,142 - 439,142 -
459,143 - 459,143 -
*Movement in the allowance for expected credit losses
Balance at the beginning of the year - - - -
Increase in allowance recognised in net results (859) - (859) -
Balance at the end of the year (859) - (859) -
9 Current/Non-Current Assets - Inventory Notes
2020 2019 2020 2019
Current $'000 $'000 $'000 $'000
Inventory held for distribution 29 245 - 245 -
245 - 245 -
Non Current
Work in Progress 141,812 - 141,812 -
141,812 - 141,812 -
Total Inventories 142,057 - 142,057 -
10 Property, Plant And Equipment
Consolidation/ INSWWork in
ProgressLand &
Buildings Infrastructure Plant & Equipment
Leasehold improvements
Total
$'000 $'000 $'000 $'000 $'000 $'000
At 1 July 2019 - fair value
Gross carrying amount - - - 639 854 1,493
Accumulated depreciation and impairment - - - (476) (761) (1,237)
Net carrying amount - - - 163 93 256
At 30 June 2020 - fair value
Gross carrying amount 32,636 247,438 338,845 9,693 270 628,882
Accumulated depreciation and impairment - (4,137) (38,232) (5,810) (133) (48,312)
Net carrying amount 32,636 243,301 300,613 3,883 137 580,570
INSW
Consolidated INSW
Consolidated
Non-current prepayment relates to payment made to Sydney Metro in advance for the Affordable Housing Project. Details regarding credit risk of receivables that are neither past due nor impaired are disclosed in Note 26.
73
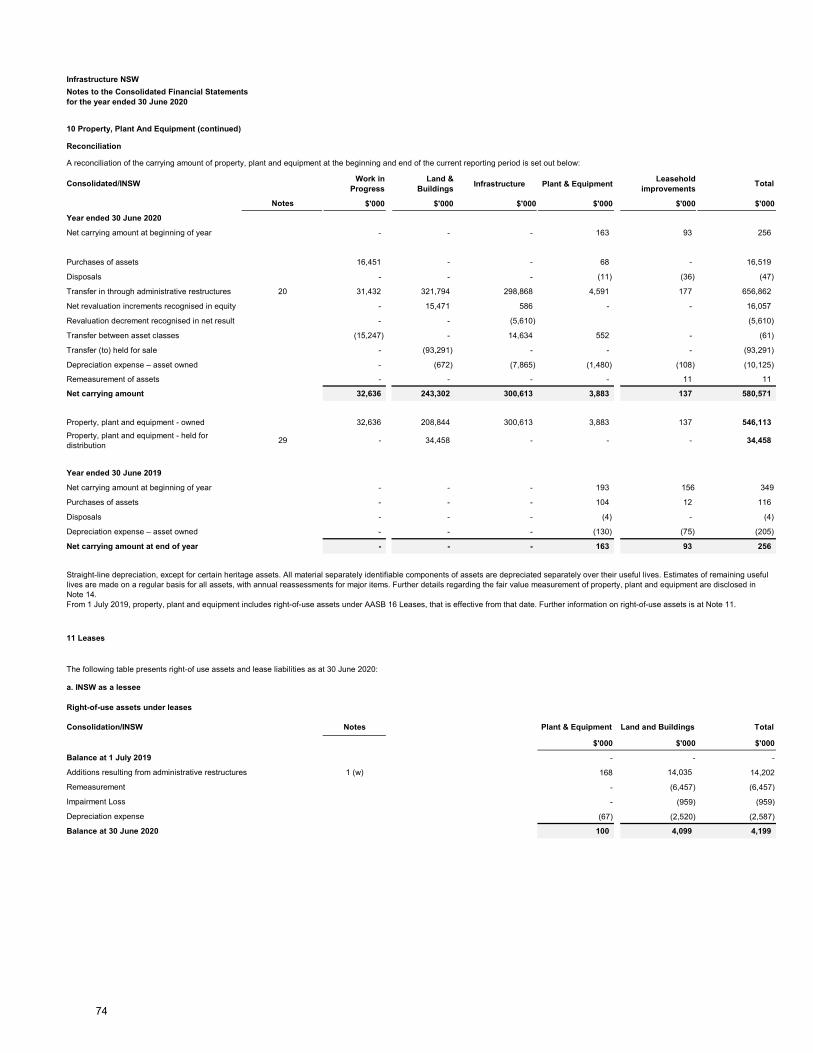
Infrastructure NSW
Notes to the Consolidated Financial Statementsfor the year ended 30 June 2020
10 Property, Plant And Equipment (continued)
Reconciliation
Consolidated/INSWWork in
ProgressLand &
Buildings Infrastructure Plant & Equipment
Leasehold improvements
Total
Notes $'000 $'000 $'000 $'000 $'000 $'000
Year ended 30 June 2020
Net carrying amount at beginning of year - - - 163 93 256
Purchases of assets 16,451 - - 68 - 16,519
Disposals - - - (11) (36) (47)
Transfer in through administrative restructures 20 31,432 321,794 298,868 4,591 177 656,862
Net revaluation increments recognised in equity - 15,471 586 - - 16,057
Revaluation decrement recognised in net result - - (5,610) (5,610)
Transfer between asset classes (15,247) - 14,634 552 - (61)
Transfer (to) held for sale - (93,291) - - - (93,291)
Depreciation expense – asset owned - (672) (7,865) (1,480) (108) (10,125)
Remeasurement of assets - - - - 11 11
Net carrying amount 32,636 243,302 300,613 3,883 137 580,571
Property, plant and equipment - owned 32,636 208,844 300,613 3,883 137 546,113
Property, plant and equipment - held for distribution
29 - 34,458 - - - 34,458
Year ended 30 June 2019
Net carrying amount at beginning of year - - - 193 156 349
Purchases of assets - - - 104 12 116
Disposals - - - (4) - (4)
Depreciation expense – asset owned - - - (130) (75) (205)
Net carrying amount at end of year - - - 163 93 256
11 Leases
The following table presents right-of use assets and lease liabilities as at 30 June 2020:
a. INSW as a lessee
Right-of-use assets under leases
Consolidation/INSW Notes Plant & Equipment Land and Buildings Total
$'000 $'000 $'000
Balance at 1 July 2019 - - -
Additions resulting from administrative restructures 1 (w) 168 14,035 14,202
Remeasurement - (6,457) (6,457)
Impairment Loss - (959) (959)
Depreciation expense (67) (2,520) (2,587)
Balance at 30 June 2020 100 4,099 4,199
A reconciliation of the carrying amount of property, plant and equipment at the beginning and end of the current reporting period is set out below:
Straight-line depreciation, except for certain heritage assets. All material separately identifiable components of assets are depreciated separately over their useful lives. Estimates of remaining useful lives are made on a regular basis for all assets, with annual reassessments for major items. Further details regarding the fair value measurement of property, plant and equipment are disclosed in Note 14.From 1 July 2019, property, plant and equipment includes right-of-use assets under AASB 16 Leases, that is effective from that date. Further information on right-of-use assets is at Note 11.
74

Infrastructure NSW
Notes to the Consolidated Financial Statementsfor the year ended 30 June 2020
11 Leases (continued)
Lease liabilities Notes Consolidated/ INSW
The following table presents liabilities under leases $'000
Balance at 1 July 2019 -
Additions resulting from administrative restructures 1 (w) (14,202)
Remeasurement 5,535
Interest expenses 137
Payments 2,534
Balance at 30 June 2020 (5,996)
The following amounts were recognised in the statement of comprehensive income for the year ended 30 June 2020 in respect of leases where INSW is the lessee: $'000
Depreciation expense of right-of-use assets 2,587
Impairment expense of right-of-use assets 959
Interest expense on lease liabilities 137
Expense relating to short-term leases 292
Expense relating to leases of low-value assets 68
Total amount recognised in the statement of comprehensive income 4,043
a) Future minimum lease payments under non-cancellable leases as at 30 June 2019 are as follows: Operating lease Finance Lease
2019 2019
$'000 $'000
Within one year 3,184 17
Later than one year and not later than five years 3,712 70
Total (excluding GST) 6,896 87
The reconciliation between the total future minimum lease payments for finance leases and their present value as at 30 June 2020 are as follows: 2020
$'000
Total minimum finance lease payments 87
Less: future finance charges 1
Present value of minimum lease payments 88
b. INSW as a lessor
Lessor for finance leases 2020 2019
Future minimum rentals receivable (undiscounted) under non-cancellable lease are as follows: $'000 $'000
Within one year 184 1,367
One to two years 437,823 -
Later than five years 1,320 -
Total (excluding GST) 439,326 1,367
Reconciliation of net investment in leases
Future undiscounted rentals receivable 491,095 1,367
Less: unearned finance income (51,769) -
Net investment in finance leases 439,326 1,367
INSW had total cash outflows for leases of $2.6 million in FY2019-20. INSW has elected to recognise payments for short-term leases and low value leases as expenses on a straight-line basis, instead of recognising a right-of-use asset and lease liability. Short-term leases are leases with a lease term of 12 months or less. Low value assets are assets with a fair value of $10,000 or less when new and comprise mainly of motor vehicle, IT equipment's etc.
75

Infrastructure NSW
Notes to the Consolidated Financial Statementsfor the year ended 30 June 2020
11 Leases (continued)
2020
Included in Financial Statements (Note 8) $'000
Current finance lease receivables 184
Non-current finance lease receivables 439,142
439,326
Included in Financial Statements (Note 17)
Current lease liability 1,639
Non-current lease liability 4,358
5,997
12 Intangibles Consolidated/ INSW
Software (including IT Network design) $'000
At 1 July 2019
Cost (gross carrying amount) 120
Accumulated amortisation and impairment (106)
Net carrying amount 14
At 30 June 2020
Cost (gross carrying amount) 28
Accumulated amortisation and impairment (21)
Net carrying amount 7
Year ended 30 June 2020
Net carrying amount at start of year 14
Amortisation (recognised in 'depreciation and amortisation') (8)
Net carrying amount at end of year 6
2020 2019 2020 2019
13 Current Assets Held for Sale $'000 $'000 $'000 $'000
Current
Asset Held for sale 164,718 - 164,718 -
164,718 - 164,718 -
14 Fair Value measurement of non-financial assets
a) Fair value hierarchy
Level 1 Level 2 Level 3 Total fair value
Property, plant and equipment (Note 10) $'000 $'000 $'000 $'000
Land & Buildings - 243,301 - 243,301
Infrastructure - - 300,613 300,613
- 243,301 300,613 543,914
Consolidated INSW
2020
76

Infrastructure NSW
Notes to the Consolidated Financial Statementsfor the year ended 30 June 2020
14 Fair Value measurement of non-financial assets (continued)
b) Valuation techniques, inputs and processes
Class
Land
Infrastructure
c) Reconciliation of recurring Level 3 fair value measurement Land Infrastructure Total
$'000 $'000 $'000
Fair Value as at 1 July 2019 - - -
Additions due to administrative restructure - 298,868 298,868
Revaluation increments/ decrements recognised in other comprehensive income - 6,196 6,196
Revaluation increments/ decrements recognised in profit and loss account - (5,610) (5,610)
Transfer between asset classes - 14,634 14,634
Depreciation expense - (7,865) (7,865)
Fair value as at 30 June 2020 - 306,223 306,223
15 Restricted Assets 2020 2019 2020 2019
$'000 $'000 $'000 $'000
Cash and Cash Equivalents 38,731 - 38,731 -
38,731 - 38,731 -
16 Current/Non Current Payables 2020 2019 2020 2019
$'000 $'000 $'000 $'000
Current
Creditors 57,615 14,002 57,615 13,846
Deferred Liability 49,880 - 49,880 -
Accrued Expense 8,554 - 8,554 -
GST Payable - 1,779 - 1,779
Interest Payable 6,013 - 6,013 -
Other Payables 5,364 - 5,279 -
Accrued salaries, wages and on costs 632 206 - -
Security deposits and bonds 57 - 57 -
Personal Services - - 3,595 1,411
128,115 15,987 130,993 17,036
Non-Current
Deferred Liability 49,756 - 49,756 -
49,756 - 49,756 -
Details regarding credit risk, liquidity risk and market risk, including a maturity analysis of the above payables are disclosed in Note 26.
Consolidated INSW
Market approach - comparable value of similar land is considered
Current replacement cost approach
Valuation technique
INSW engages an external, independent and qualified valuer to determine the value of the INSW asset portfolio.
Consolidated INSW
Deferred liability is related to the payables to Sydney Metro for development rights due in the year 2021 and 2022.
• Comparable property sales values• Adjustments for scale of site and infrastructure costs
Key Inputs
Due to the unique, specialised nature of these assets, a cost approach using current replacement cost has been applied.
INSW (former UGDC) under the Waterloo Affordable Housing and Developers Contribution Plans receives contribution for all major development within the Redfern Waterloo area. These contributions are held in separate deposits facilities and can be expensed on projects directly related to the specific purposes for which the funds were granted. All interest earned is reinvested in these accounts. The definition of restricted cash is in accordance with Treasury guidelines.
77

Infrastructure NSW
Notes to the Consolidated Financial Statementsfor the year ended 30 June 2020
17 Current / Non Current Liabilities - Borrowings
2020 2019 2020 2019
Current Notes $'000 $'000 $'000 $'000
Lease liability 11 1,639 - 1,639 -
T-Corp borrowings 402,032 - 402,032 -
403,671 - 403,671 -
Non Current
Lease liability 11 4,358 - 4,358 -
T-Corp borrowings 290,523 - 290,523 -
294,881 - 294,881 -
Changes in liabilities arising from financing activities T-Corp borrowings Other Total
$'000 $'000 $'000
Balance as at 1 July 2019 - - -
Acquisition through administrative restructures 20 569,434 - 569,434
Cash flow 123,121 - 123,121
Balance as at 30 June 2020 692,555 - 692,555
The fair value of these unsecured loans as at balance date was $693 million (2019: Nil)
Details regarding credit risk, liquidity risk and market risk, including a maturity analysis of the above borrowing are disclosed in Note 26.
18 Current / Non Current Liabilities - Provisions
Current 2020 2019 2020 2019
Employee benefits and related on-costs $'000 $'000 $'000 $'000
Annual leave 1,949 793 - -
Long service leave 362 126 - -
Leave provision held for distribution 29 298 - - -
Payroll tax 92 113 - -
2,701 1,032 - -
Other Provisions
Restoration Costs 717 - 717 -
Climate Positive Fund 2,384 - 2,384 -
Make good provision 471 - 471 -
3,572 - 3,572 -
6,273 1,032 3,572 -
Non-Current
Employee benefits and related on-costs
Long service leave 177 17 - -
177 17 - -
Other Provisions
Restoration Costs 731 122 731 122
Climate Positive Fund - - - -
Make good provision 270 - 270 -
1,001 122 1,001 122
1,178 139 1,001 122
Aggregate employee benefits and related on-costs
Provisions - current 2,701 1,032 - -
Provisions - non-current 177 17 - -
Accrued salaries, wages and on-costs 16 632 206 - -
3,510 1,255 - -
Consolidated INSW
INSWConsolidated
78

Infrastructure NSW
Notes to the Consolidated Financial Statementsfor the year ended 30 June 2020
18 Current / Non Current Liabilities - Provisions (continued)
Movements in provisions (other than employee benefits)
Movements in each class of provision during the financial year, other than employee benefits, are set out below:
Climate Positive Fund
Restoration Costs Make Good
Provision Total
2020 $'000 $'000 $'000 $'000
Carrying amount at the beginning of the financial year - - - -
Acquisition through administrative restructures 5,456 82,023 10,729 98,208
Additional provisions recognised 1,800 - 13 1,813
Amounts used (4,872) (65,013) (10,000) (79,885)
Amount of provision released during the year - (15,561) - (15,561)
Carrying amount at the end of the financial year 2,384 1,449 742 4,575
19. Current/Non-Current Liabilities - Other2020 2019 2020 2019
Current $'000 $'000 $'000 $'000
Lease receipt in advance 154,195 - 154,195 -
Contract liabilities 22,781 1,615 22,781 1,615
Other 321 - 321 -
177,297 1,615 177,297 1,615
Non Current
Lease receipt in advance 187,099 - 187,099 -
187,099 - 187,099 -
Lease receipts in advance include lease payment received in relation to Central Barangaroo.
20 Increase in Net Assets from Equity Transfers
UGDC transfer to INSW
BDA Transfer to INSW
SFS transfer to INSW
Total
$’000 $’000 $’000 $’000
Current Assets
Cash 217,419 5,953 - 223,372
Receivables 5,749 4,137 - 9,886
Other Assets 370 169 - 539
Assets held for sale 270 71,100 - 71,370
Total Current Assets 223,808 81,359 - 305,167
Non Current Assets
Inventory 94,519 - 31,975 126,494
Receivables - 431,441 - 431,441
Property, plant and equipment 36,024 620,924 - 656,948
Other Assets - 6,280 - 6,280
Total Non Current Assets 130,543 1,058,645 31,975 1,221,163
Total Assets 354,351 1,140,004 31,975 1,526,330
INSW has committed to Barangaroo operating as a Carbon Neutral precinct that will be delivered through a carbon reconciliation and offsetting process, using a proportion of the funds generated by the Estate Levy to purchase Renewable Energy Certificates (RECs) and offsets where appropriate. INSW allocates an amount no greater than $4.90 per annum of the Estate Levy per m2 of GFA for each building which has achieved Practical Completion to Climate Positive Fund provision account. INSW intends to utilise the nationally recognised National Carbon Offset Standard (NCOS) certification process to validate carbon neutrality.
INSW
Financial Year Ended 30 June 2020
Consolidated
The Environment Protection Authority (EPA) has declared the footprint of the former Millers Point Gasworks, which remains under a portion of Hickson Road and Barangaroo, as a remediation site. The provision has been calculated using the Commonwealth Bond rate of 1.025% at 30 June 2020 (2019: 1.025%). Restoration works were completed in May 2020.
79

Infrastructure NSW
Notes to the Consolidated Financial Statementsfor the year ended 30 June 2020
20 Increase in Net Assets from Equity Transfers (continued)UGDC transfer to
INSW BDA Transfer to
INSW SFS transfer to
INSWTotal
Current Liabilities $’000 $’000 $’000 $’000
Creditors 8,802 16,693 - 25,495
Lease receipts in advance - 142,704 - 142,704
Provisions 1,569 95,481 - 97,050
Deferred liability 44,136 - - 44,136
Borrowings - 40,884 - 40,884
Other financial liabilities 17 - - 17
Total Current Liabilities 54,524 295,762 - 350,286
Non Current Liabilities
Lease receipts in advance - 198,932 - 198,932
Provisions 572 2,795 - 3,367
Deferred liability 94,347 - - 94,347
Borrowings - 528,550 - 528,550
Other financial liabilities 70 - - 70
Total Non Current Liabilities 94,989 730,277 - 825,266
Total Liabilities 149,512 1,026,039 - 1,175,552
Increase in Net Assets from Equity Transfer 204,839 113,965 31,975 350,779
21 Contingent Assets & Liabilities
22 Commitment 2020 2019
Capital Commitments $’000 $’000
Aggregate capital expenditure at balance sheet date and not provided for:
Within one year 427,649 -
Later than one year and not later than five years 264,581 -
Total (including GST) 692,230 -
23 Budget Review
General Note
Net result
Assets and liabilities
The actual net result was a surplus of $173.4 million compared to a budgeted surplus of $216.3 million. Key factors contributing to the lower surplus include:
On the 18th August 2019, a settlement was reached in relation to the sight lines dispute with Lendlease (Millers Point) Pty Limited and Crown Sydney Property Pty Limited and as a result appeal proceedings were withdrawn. The commercial terms of this settlement are bound by confidentiality requirements. Depending on the outcome of future events, INSW may have additional financial commitments which did not arise during the FY2019-20 period.
Additionally, on the 5 February 2020, Grocon (CB) Developments Pty Limited and two related entities commenced proceedings in the NSW Supreme Court against INSW in relation to events occurring during and subsequent to the tender for the Central Barangaroo development. INSW is defending the claims. Any liability arising from the claim is covered by INSW’s insurer iCare.
‐ lower provisions due to the utilisation of the Barangaroo restoration provision $84.5 million;
‐ increase in borrowings from additional funding of $33.7 million.
‐ lower cluster grant funding of $173.9million attributed to project expenditure timing and lower operating costs resulting from government saving initiatives;
‐ lower operating expenses of $91.4 million due to lower project expenditures and other efficiency savings;
‐ lower finances costs of $11.7 million due to a decline in interest rates.
The net assets position is lower than budget by $149.9 million and resulted from the following movements in assets and liabilities:
Total assets were below budget by $56.9 millions . The main contributing items were:
‐ higher cash balance due to timing of projects and cash receipts $96.1 million;
‐ lower capital expenditure due to timing of capital projects compared to budget of $164.2 million.
Total Liabilities were higher than budget by $93.0 million. The main contributing items were:
‐ lower employees related expenses of $21.7 million is mainly due to a reduction in headcount resulting from machinery of government changes;
‐ increase in payables and other liabilities of $136.4 million related to Sydney Metro Waterloo transfer and higher accruals at yearend;
The FY2019-20 budget for INSW was presented to Parliament before the restructure of administrative arrangements which transferred the functions of the former BDA and UGDC entities to INSW (see Note 20). Comparison shown in the below note is drawn from the consolidated original budget statements presented to Parliament separately in respect of the FY2019-20 reporting period for all three agencies, as required by NSW Treasury’s Financial Reporting Code and AASB 1055 Budgetary Reporting.
80

Infrastructure NSW
Notes to the Consolidated Financial Statementsfor the year ended 30 June 2020
23 Budget Review (continued)
Cash Flows
24 Superannuation
The Pooled Fund holds in trust the investments of the closed NSW public sector superannuation schemes:
- State Authorities Superannuation Scheme (SASS)
- State Superannuation Scheme (SSS)
- Police Superannuation Scheme (PSS)
- State Authorities Non-contributory Superannuation Scheme (SANCS).
* Administration of the fund and payment to the beneficiaries from fund assets when required in accordance with the fund rules;
* Management and investment of the fund assets; and
* Compliance with other applicable regulations.
- Investment risk - The risk that investment returns will be lower than assumed and the Employer will need to increase contributions to offset this shortfall.
- Longevity risk – The risk that pensioners live longer than assumed, increasing future pensions.
- Pension indexation risk – The risk that pensions will increase at a rate greater than assumed, increasing future pensions.
- Legislative risk - The risk is that legislative changes could be made which increase the cost of providing the defined benefits.
There were no fund amendments, curtailments or settlements during the year.
SASS SANCS SSS Total
Member Number 30-Jun-20 30-Jun-20 30-Jun-20 30-Jun-20
$’000 $’000 $’000 $’000
Contributors - - - -
Deferred benefits - - - -
Pensioners - - - -
Pension fully commuted - - - -
Superannuation Position for AASB 119 purpose
The net cash flow from operating activities was lower than budget by $245.9 million, primarily due to lower grant funds received.
The net cash flows from investing activities was lower than budget by $310.1 million mainly due to lower capital expenditure compared to budget.
The defined benefit Fund assets are invested with independent fund managers and have a diversified asset mix. The Fund has no significant concentration of investment risk or liquidity risk.
These schemes are all defined benefit schemes – at least a component of the final benefit is derived from a multiple of member salary and years of membership. Members receive lump sum or pension benefits on retirement, death, disablement and withdrawal.
All the Schemes are closed to new members.
The schemes in the Pooled Fund are established and governed by the following NSW legislation: Superannuation Act 1916, State Authorities Superannuation Act 1987, Police Regulation (Superannuation) Act 1906, State Authorities Non-Contributory Superannuation Act 1987, and their associated regulations.
The schemes in the Pooled Fund are exempt public sector superannuation schemes under the Commonwealth Superannuation Industry (Supervision) Act 1993 (SIS). The SIS Legislation treats exempt public sector superannuation funds as complying funds for concessional taxation and superannuation guarantee purposes.
Under a Heads of Government agreement, the New South Wales Government undertakes to ensure that the Pooled Fund will conform with the principles of the Commonwealth’s retirement incomes policy relating to preservation, vesting and reporting to members and that members’ benefits are adequately protected.
The New South Wales Government prudentially monitors and audits the Pooled Fund and the Trustee Board activities in a manner consistent with the prudential controls of the SIS legislation. These provisions are in addition to other legislative obligations on the Trustee Board and internal processes that monitor the Trustee Board’s adherence to the principles of the Commonwealth’s retirement incomes policy.
An actuarial investigation of the Pooled Fund is performed every three years. The last actuarial investigation was performed as at 30 June 2018. The next actuarial investigation will be performed as at 30 June 2021.
The Fund's Trustee is responsible for the governance of the Fund. The Trustee has a legal obligation to act solely in the best interests of fund beneficiaries. The Trustee has the following roles:
There are a number of risks to which the Fund exposes the Employer. The more significant risks relating to the defined benefits are:
- Salary growth risk - The risk that wages or salaries (on which future benefit amounts for active members will be based) will rise more rapidly than assumed, increasing defined benefit amounts andthereby requiring additional employer contributions.
The net cash flows from financing activities was higher than budget by $22.7 million mainly due to additional funding and lower repayments than budget.
81

Infrastructure NSW
Notes to the Consolidated Financial Statementsfor the year ended 30 June 2020
24 Superannuation (continued) SASS SANCS SSS Total
30-Jun-20 30-Jun-20 30-Jun-20 30-Jun-20
$’000 $’000 $’000 $’000
Accrued liability (note 1)
Estimated reserve account balance 6 (9) - (3)
- - - -
1. Deficit/(Surplus) 6 (9) - (3)
2. Future service liability (note 2) - - - -
3. Surplus in excess of recovery available from schemes - 3 - 3
(-1. -2. or subject to a minimum of zero) - - - -
4. Net (asset)/liability to be recognised in the statement of financial position (1. +3.) 6 (6) - -
Note 1:
Note 2:
SASS SANCS SSS Total
Financial Year to
30 June 2020$’000
Financial Year to
30 June 2020$’000
Financial Year to
30 June 2020$’000
Financial Year to
30 June 2020$’000
Net Defined Benefit Liability/(Asset) at start of the year 85 15 - 101
Current service cost 36 7 - 43
Net interest on the net defined benefit liability/(asset) 1 0 - 1
Past service cost - - - -
(Gains)/losses arising from settlements - - - -
Actual return on Find assets less Interest income (30) (5) - (35)
Actuarial (gains)/losses arising from changes in demographic assumptions - - - -
Actuarial (gains)/losses arising from changes in financial assumptions - - - -
Actuarial (gains)/losses arising from changes in liability experience (83) (25) - (108)
Adjustment for effect of asset ceiling - 3 - 3
Employer contributions (3) (1) - (5)
Effects of transfer in/out due to business combinations and disposals - - - -
Net Defined Benefit Liability/(Asset) at end of the year 6 (6) - -
Fair value of Fund assets at beginning of the year 651 134 - 784
Interest income 8 2 - 10
Actual return on Fund assets less interest income 30 5 - 35
Employer contributions 3 1 - 5
Contributions by participants 18 - - 18
Benefits paid (678) (122) - (800)
Taxes, premium & expenses paid (38) (11) - (49)
Transfers in/out due to business combination and disposals - - - -
The accrued liability includes a contribution tax provision. This is calculated based on grossing up the deficit/(surplus) less the allowance for past service expenses and insurable death and disability liabilities at a contribution tax rate of 15%.
The Future Service Liability (FSL) does not have to be recognised by an employer. It is only used to determine if an asset ceiling limit should be imposed (AASB 119 para 64). Under AASB 119, any prepaid superannuation asset recognised cannot exceed the present value of any economic benefits that may be available in the form of refunds from the plan or reductions in future contributions to the plan. Where the “surplus in excess of recovery” is zero, no asset ceiling limit is imposed. (Note: this also includes a contribution tax provision).
82

Infrastructure NSW
Notes to the Consolidated Financial Statementsfor the year ended 30 June 2020
24 Superannuation (continued) SASS SANCS SSS Total
Financial Year to
30 June 2020$’000
Financial Year to
30 June 2020$’000
Financial Year to
30 June 2020$’000
Financial Year to
30 June 2020$’000
Contributions to accumulated section - - - -
Settlements - - - -
Exchange rate changes - - - -
Fair value of Fund assets at end of the year (6) 9 - 3
Present value of defined benefit obligations at beginning of the year 736 149 - 885
Current service cost 36 7 - 43
Interest cost 10 2 - 11
Contribution by participants 18 - - 18
Actuarial (gains)/losses arising from changes in demographic assumptions - - - -
Actuarial (gains)/losses arising from changes in financial assumptions - - - -
Actuarial (gains)/losses arising from changes in liability experience (83) (25) - (108)
Benefits paid (678) (122) - (800)
Taxes, premium & expenses paid (38) (11) - (49)
Transfer in/out due to business combinations and disposals - - - -
Contributions to accumulated section - - - -
Past service cost - - - -
Settlements - - - -
Exchange rate changes - - - -
Present value of defined benefit obligations at end of the year 0 - - -
Adjustment for effect of asset ceiling at beginning of the year
Interest on the effect of asset ceiling
Change n the effect of asset ceiling - 3 - 3
Adjustment for effect of asset ceiling at end of the year - 3 - 3
Fair Value of funds' assets
As at 30 June 2020Quoted prices in
active markets for Significant
observable inputsUnobservable
inputs
Total Level 1 Level 2 Level 3
Asset category $’000 $’000 $’000 $’000
Short term securities 4,096,298 1,889,511 2,206,787 -
Australian fixed interest 1,066,448 - 1,066,448 -
International fixed interest 1,909,424 30,408 1,879,015 -
Australian equities 7,294,211 6,901,927 392,284 -
International equities 11,950,330 11,487,308 463,022 -
Property 3,352,466 644,805 16,266 2,691,395
Alternatives 10,522,833 23,408 4,337,075 6,162,350
Total 40,192,010 20,977,367 10,360,897 8,853,745
The percentage invested in each asset class at the reporting date is:
As at 30-Jun-20
Short term securities 10.2%
Australian fixed interest 2.7%
International fixed interest 4.8%
Australian equities 18.1%
The adjustment for the effect of asset ceiling has been determined based on the maximum economic benefit available to the entity in the form of reductions in future employer contributions.
All pooled funds assets are invested by SAS Trustee Authority (STC) at arm's length through independent fund managers, assets are not separately invested for each entity and it is possible or appropriate to disaggregate and attribute fund assets to individual entities. As such, the disclosures below relate to total assets of the Pooled fund.
83

Infrastructure NSW
Notes to the Consolidated Financial Statementsfor the year ended 30 June 2020
24 Superannuation (continued)
International equities 29.7%
Property 8.3%
Alternatives 26.2%
Total 100%
Fair Value of entity's own financial instruments
The fair value of the Pooled Fund assets as at 30 June 2020 includes $36.9 million in NSW government bonds.
Of the direct properties owned by the Pooled Fund:
Health Administration Authority occupies part of a property 50% owned by the Pooled Fund with a fair value (100% interest) of $343 million (30 June 2019: $331 million).
As at 30-Jun-20
Discount Rate 0.87% pa
Salary increase rate (excluding promotional increases) 3.2% pa
Rate of CPI increase
Pensioner mortality
Sensitivity Analysis
Base Case Scenario A Scenario B
-0.5% discount rate
+0.5% discount rate
Discount rate as above as above -0.5% pa as above +0.5% pa
Rate of CPI increase as above as above as above
Salary inflation rate as above as above as above
Defined benefit obligation (A$) - - -
Base Case Scenario C Scenario D
+0.5% rate of CPI increase
-0.5% rate of CPI increase
Discount rate as above as above as above
Rate of CPI increase as above as above +0.5% pa as above -0.5% pa
Salary inflation rate as above as above as above
Defined benefit obligation (A$) - - -
Level 3 - inputs for the asset or liability that are not based on observable market data. The assets in this level are unlisted property; unlisted shares; unlisted infrastructure; distressed debt; hedge funds.
Derivatives, including futures and options, can be used by investment managers. However, each manager's investment mandate clearly states that derivatives may only be used to facilitate efficient cashflow management or to hedge the portfolio against market movements and cannot be used for speculative purposes or gearing of the investment portfolio. As such, managers make limited use of derivatives.
SAS Trustee Authority occupies part of a property 100% owned by the Pooled Fund with a fair value of $340 million (30 June 2019: $316 million).
Level 1 - quoted prices in active markets for identical assets or liabilities. The assets in this level are listed shares; listed unit trusts.
Level 2 - inputs other than quoted prices observable for the asset or liability either directly or indirectly. The assets in this level are cash; notes; government, semi-government and corporate bonds; unlisted trusts where quoted prices are available in active markets for identical assets or liabilities.
The entity's total defined benefit obligation as at 30 June 2020 under several scenarios is presented below. The total defined benefit obligation disclosed is inclusive of the contribution tax provision which is calculated based on the asset level at 30 June 2020.
1.00% for FY2019-20; 0.25% for FY2020-21; 1.50% for FY2021-22; 1.25% for FY2022-23; 1.75% for FY2023-24; 2.00% for FY2024-25 and FY2025-26; 2.25% pa to FY2029-30; 2.50% pa thereafter
The pensioner mortality assumptions are as per the 2018 Actuarial Investigation of the Pooled Fund. These assumptions are disclosed in the actuarial investigation report available from the trustee's website. The report shows the pension mortality rates for each age.
Scenarios A to F relate to sensitivity of the total defined benefit obligation to economic assumptions, and scenarios G and H relate to sensitivity to demographic assumptions.
84

Infrastructure NSW
Notes to the Consolidated Financial Statementsfor the year ended 30 June 2020
24 Superannuation (continued) Base Case Scenario E Scenario F
+0.5% salary increase rate
-0.5% salary increase rate
Discount rate as above as above as above
Rate of CPI increase as above as above as above
Salary inflation rate as above as above +0.5% pa as above -0.5% pa
Defined benefit obligation (A$) - - -
Base Case Scenario E Scenario F
Lower Mortality* Higher Mortality**
Defined benefit obligation (A$) - - -
*Assumes the short term pensioner mortality improvement factors for years 2020-2023 also apply for years after 2023.
**Assumes the long term pensioner mortality improvement factors for years post 2023 also apply for the years 2020 to 2023.
Assets-Liability matching strategies
Funding arrangements
Funding positions are reviewed annually and funding arrangements may be adjusted as required after each annual review.
a) Surplus/deficit
SASS SANCS SSS Total
30-Jun-20 30-Jun-20 30-Jun-20 30-Jun-20
$’000 $’000 $’000 $’000
Accrued benefits*
Net market value of Fund assets 6 (9) - (3)
Net (surplus)/deficit 6 (9) - (3)
b) Contribution recommendations
Recommended contribution rates for the entity are:
SASS SANCS SSS
Multiple of Member Contributions
% of Member SalaryMultiple of Member
Contributions
0.0 0 0.0
c) Economic assumptions
The economic assumptions adopted for 30 June 2020 AASB 1056 Accounting Standard “Superannuation Entities”:
Weighted Average Assumptions
Expected rate of return on Fund assets backing current pension liabilities 7.0% pa
Expected rate of return on Fund assets backing other liabilities 6.0% pa
Expected salary increase rate (excluding promotional salary increases) 3.2% pa
Expected rate of CPI increase 2.0% pa
Funding arrangements are reviewed at least every three years following the release of the triennial actuarial review. Contribution rates are set after discussions between the employer, STC and NSW Treasury.
*There is no allowance for a contribution tax provision within the Accrued Benefits figure for AASB 1056. Allowance for contributions tax is made when settling the contribution rates.
The following is a summary of the 30 June 2020 financial position of the Fund calculated in accordance with AASB 1056 Accounting Standard "Superannuation Entities":
The Trustee monitors its asset-liability risk continuously in setting its investment strategy. It also monitors cashflows to manage liquidity requirements. No explicit asset-liability matching strategy is used by the Trustee.
85

Infrastructure NSW
Notes to the Consolidated Financial Statementsfor the year ended 30 June 2020
24 Superannuation (continued) SASS SANCS SSS Total
d) Expected contributionsFinancial Year to
30 June 2020Financial Year to
30 June 2020Financial Year to
30 June 2020Financial Year to 30
June 2020
$’000 $’000 $’000 $’000
Expected employer contributions - - - -
Maturity profile of defined-benefit obligation
The weighted average duration of the defined obligation is 0 year.
Profit or Loss Impact
Current Service Cost 36 7 - 43
Net Interest 1 0 - 1
Past service cost - - - -
(Gains)/loss on settlement - - - -
Profit or loss components of the Defined Benefit Cost 37 7 - 44
SASS SANCS SSS Total
Financial Year to 30 June 2020
Financial Year to 30 June 2020
Financial Year to 30 June 2020
Financial Year to 30 June 2020
Other Comprehensive Income $’000 $’000 $’000 $’000
Actuarial (gains) losses on liabilities (83) (25) - (108)
Actual return on Fund assets less interest income (30) (5) - (35)
Change in the effect of asset ceiling - 3 - 3
Total remeasurement in Other Comprehensive Income (113) (27) - (140)
25 Reconciliation of Cash Flows from Operating Activities to Net Result
Reconciliation of cash flows from operating activities to the net result as reported in the Statement of Comprehensive Income as follows:
2020 2019 2020 2019
$’000 $'000 $'000 $'000
Net cash used on operating activities (49,149) (16,213) (49,149) (16,213)
Depreciation and amortisation (13,679) (212) (13,679) (212)
Fair valuation adjustments 4,375 - 4,375 -
Remeasurement in superannuation defined liabilities (140) - (140) -
Changes in restoration provisions (15,561) - (15,561) -
Finance Lease Interest Income 7,602 - 7,602 -
Contribution Revenue 19,422 - 19,422 -
Other non cash items 1,854 - 1,854 -
Decrease / (increase) in provisions 95,902 (116) 95,902 (116)
Increase / (decrease) in receivables 36,794 (5,434) 36,794 (5,434)
Decrease / (increase) in payables (19,034) 15,347 (19,034) 15,347
Decrease / (increase) in other liabilities - 9,373 - 9,373
Decrease / (increase) in inventory 99,040 - 99,040 -
Net gain / (loss) on sale of property, plant and equipment and intangible assets (46) (4) (46) (4)
Net result 167,380 2,741 167,380 2,741
26 Financial Instruments
INSWConsolidated
INSW's main risks arising from financial instruments are outlined below, together with the INSW's objectives, policies and processes for measuring and managing risk. Further quantitative and qualitative disclosures are included throughout these financial statements.
The Chief Executive Officer has overall responsibility for the establishment and oversight of risk management and reviews and agrees policies for managing risk. Risk management policies are established to identify and analyse the risks faced by the INSW, to set risk limits and controls and to monitor risks and compliance with policies is reviewed by management on a periodic basis.
INSW's principal financial instruments are outlined below. These financial instruments arise directly from INSW's operations or are required to finance INSW's operations. INSW does not enter into or trade financial instruments, including derivative financial instruments, for speculative purposes.
86

Infrastructure NSW
Notes to the Consolidated Financial Statementsfor the year ended 30 June 2020
26 Financial Instruments (continued)
(a) Financial instrument categories
i. As at 30 June 2020 under AASB 9
Consolidated Carrying Amount
Class: Note Category $'000
Financial Assets
Cash and cash equivalents 7 N/A 313,667
Receivables1 8 Amortised cost 473,525
Financial Liabilities
Payables2 16 Financial liabilities measured at amortised cost 78,235
Borrowings 17 Financial liabilities measured at amortised cost 698,552
INSW
Class: Note Category $'000
Financial Assets
Cash and cash equivalents 7 N/A 313,667
Receivables1 8 Amortised cost 473,525
Class: Note Category $'000
Financial Liabilities
Payables2 16 Financial liabilities measured at amortised cost 81,113
Borrowings 17 Financial liabilities measured at amortised cost 698,552
As at 30 June 2019 under AASB 9
Consolidated Carrying Amount
Financial Assets
Cash and cash equivalents 7 N/A 41,481
Receivables1 8 Amortised cost 12,105
Financial Liabilities
Payables2 16 Financial liabilities measured at amortised cost 26,098
INSW
Financial Assets
Cash and cash equivalents 7 N/A 41,481
Receivables1 8 Amortised cost 12,105
Financial Liabilities
Payables2 16 Financial liabilities measured at amortised cost 27,031
Notes
1) Excludes statutory receivables and prepayments (i.e., not within scope of AASB 7)
2) Excludes statutory payables and unearned revenue (not within scope of AASB 7)
87

Infrastructure NSW
Notes to the Consolidated Financial Statementsfor the year ended 30 June 2020
26 Financial Instruments (continued)
(c) Financial Risks
(i) Credit Risk
Cash and cash equivalents
Receivables
Current <30 Days 30-60 Days 61-90 Days >91 Days Total
Expected credit loss rate - - - - 12% 7%
Estimated total gross carrying amount at default 1,421 605 3,455 49 6,974 12,504
Expected credit loss - - - - 859 859
Receivables (continued)
Current <30 Days 30-60 Days 61-90 Days >91 Days Total
Expected credit loss rate - - - - - -
Estimated total gross carrying amount at default 297 1,104 266 408 2,182 4,257
Expected credit loss - - - - - -
(ii) Liquidity Risk
The table below summarises the maturity profile of INSW's financial liabilities, together with the interest rate exposure.
Maturity Analysis and interest rate exposure of financial liabilities
$000
Weighted Average Effective Interest
RateExposure
Nominal AmountFixed interest
rateNon-interest
bearing< 1 yr 1-5 yrs > 5 yrs
Consolidated
2020
Payables1
Accrued salaries, wages and on costs 632 - 632 632 - -
Creditors 57,615 - 57,615 57,615 - -
Tcorp borrowings 1.94% 692,555 692,555 - 402,032 290,523 -
750,802 692,555 58,247 460,279 290,523 -
Credit risk arises from the financial assets of INSW, including cash and receivables. No collateral is held by INSW. INSW has not granted any financial guarantees.
$'000
Cash comprises cash on hand and bank balances within the NSW Treasury Banking System. Interest is earned on daily bank balances at the monthly average TCorp 11am unofficial cash rate, adjusted for a management fee to NSW Treasury. The TCorpIM Funds cash facility is discussed in market risk below.
INSW considers a financial asset in default when contractual payments for other than inter-government agreements are 90 days past due. However, in certain cases, INSW may also consider a financial asset to be in default when internal or external information indicates that the entity is unlikely to receive the outstanding contractual amounts in full before taking into account any credit enhancements held by the entity.
Maturity Dates
Liquidity risk is the risk that INSW will be unable to meet its payment obligations when they fall due. INSW continuously manages risk through monitoring future cash flows and maturities planning to ensure adequate holding of high quality liquid assets.
The loss allowance for contract receivables as at 30 June 2020 and 30 June 2019 was determined as follows:
30 June 2020
The liabilities are recognised for amounts due to be paid in the future for goods or services received, whether or not invoiced. Amounts owing to suppliers (which are unsecured) are settled in accordance with the policy set out in NSW TC 11/12. For small business suppliers, where terms are not specified, payment is made not later than 30 days from date of receipt of a correctly rendered invoice. For other suppliers, if trade terms are not specified, payment is made no later than the end of the month following the month in which an invoice or a statement is received. For small business suppliers, where payment is not made within the specified time period, simple interest must be paid automatically, unless an existing contract specifies otherwise. For payments to other suppliers, the Head of an Authority (or a person appointed by the Head of an Authority) may automatically pay the supplier simple interest. No interest was paid during the year (2019 Nil).
$'000
30 June 2019
Credit risk arises when there is the possibility of INSW's debtors defaulting on their contractual obligations, resulting in a financial loss to INSW. The maximum exposure to credit risk is generally represented by the carrying amount of the financial assets (net of any allowance for impairment).
88

Infrastructure NSW
Notes to the Consolidated Financial Statementsfor the year ended 30 June 2020
$000
26 Financial Instruments (continued)Weighted Average Effective Interest
RateExposure
(ii) Liquidity Risk (continued) Nominal AmountFixed interest
rateNon-interest
bearing< 1 yr 1-5 yrs > 5 yrs
2019
Payables1
Accrued salaries, wages and on costs 206 - 206 206 - -
Creditors 14,002 - 14,002 14,002 - -
14,208 - 14,208 14,208 - -
INSW
2020
Payables1
Accrued salaries, wages and on costs - - - - - -
Creditors 57,615 - 57,615 57,615 - -
Tcorp borrowings 1.94% 692,555 692,555 - 402,032 290,523 -
750,170 692,555 57,615 459,647 290,523 -
2019
Payables1
Accrued salaries, wages and on costs - - - - - -
Creditors 15,257 - 15,257 15,257 - -
15,257 - 15,257 15,257 - -
Notes
(iii) Market Risk
Interest rate risk
Carrying Amount
Profit Equity Profit Equity
Consolidated $'000 $'000 $'000 $'000 $'000
2020
Financial Assets
Cash and cash equivalents 313,667 (3,137) (3,137) 3,137 3,137
Receivables1 41,495 - - - -
Financial Liabilities
Payables2 128,115 - - - -
2019
Financial Assets
Cash and cash equivalents 25,153 (252) (252) 252 252
Receivables1 7,330 - - - -
Financial Liabilities
Payables2 14,208 - - - -
Interest rate risk is the risk that the fair value or future cash flows of a financial instrument will fluctuate because of changes in market interest rates.
Exposure to interest rate risk arises primarily through INSW's interest bearing liabilities. This risk is minimised by undertaking mainly fixed rate borrowings, primarily with NSW TCorp. INSW does not account for any fixed rate financial instruments at fair value through profit or loss or as available for sale. Therefore, for these financial instruments, a change in interest rates would not affect profit or loss or equity. A reasonably possible change of +/- 1% is used, consistent with current trends in interest rates. The basis will be reviewed annually and amended where there is a structural change in the level of interest rate volatility. INSW's exposure to interest rate risk is set out below.
Maturity Dates
1. The amounts disclosed are the contractual undiscounted cash flows of each class of financial liabilities based on the earliest date on which the entity can be required to pay. The tables include both interest and principal cash flows and therefore will not reconcile to the statement of financial position.
Market risk is the risk that the fair value or future cash flows of a financial instrument will fluctuate because of changes in market prices. INSW's exposure to market risk is primarily through interest rates on cash and cash equivalents. INSW has no exposure to foreign currency risk and does not enter into commodity contracts.
-1%
The effect on profit and equity due to a reasonably possible change in risk variable is outlined in the information below, for interest rate risk. A reasonably possible change of +/- 1% is used, consistent with current trends in interest rates. The basis will be reviewed annually and amended where there is structural change in the level of interest rate volatility. INSW's exposure to interest rate risk is set out below.
+1%
89

Infrastructure NSW
Notes to the Consolidated Financial Statementsfor the year ended 30 June 2020
26 Financial Instruments (continued)
(iii) Market Risk (continued)
Carrying Amount
Profit Equity Profit Equity
INSW $'000 $'000 $'000 $'000 $'000
2020
Financial Assets
Cash and cash equivalents 313,667 (3,137) (3,137) 3,137 3,137
Receivables 41,495 - - - -
Financial Liabilities
Payables 130,993 - - - -
2019
Financial Assets
Cash and cash equivalents 25,153 (252) (252) 252 252
Receivables 7,330 - - - -
Financial Liabilities
Payables 15,257 - - - -
Notes:
1. Excludes statutory receivables and prepayments (i.e. not within scope of AASB 7).
2. Excludes statutory payables and unearned revenue (i.e. not within scope of AASB 7).
(d) Fair value measurement
(i) Fair value compared to carrying amount
27 Related Party Disclosures
a. Compensation of key management personnel
INSW's key management personnel compensation details for the year ended June 2020 are as follows:
2020 2019
Employee benefits: $'000 $'000
Short term employee benefits 3,341 783
Post-employment benefits 166 17
Total remuneration 3,507 800
b. Transactions and outstanding balances with key management personnel of INSW and its parent during the financial year
c. Transactions and outstanding balances with other related parties during the financial year
d. Transactions with government related entities during the financial year
-1% +1%
There were no material transactions or outstanding balances with key management personnel INSW during the financial year
During the 2020 financial year, INSW entered into the following transactions with other entities consolidated as part of the NSW Total State Sector (the ultimate parent) within the normal course of business:
There were no transactions or outstanding balances with other related parties during the financial year.
Fair value is the price that would be received to sell an asset or paid to transfer a liability in an orderly transaction between market participants at the measurement date. The fair value measurement is based on the presumption that the transaction to sell the asset or transfer the liability takes place either in the principal market for the asset or liability or in the absence of a principal market, in the most advantageous market for the asset or liability.
Financial instruments are generally recognised at cost. The amortised cost of financial instruments recognised in the statement of financial position approximates the fair value, because of the short term nature of many of the financial instruments.
In accordance with AASB 124 Related Party Disclosure, key management personnel are those having authority and responsibility for planning, directing and controlling the activities of the entity.
90

Infrastructure NSW
Notes to the Consolidated Financial Statementsfor the year ended 30 June 2020
27 Related Party Disclosures (continued)
d. Transactions with government related entities during the financial year (continued)
Received an equity transfer from the former BDA and former UGDC for their Net Assets as a result of Machinery of Government legislation – refer to Note 28
Received $123.4m of recurrent grants and contributions from the Department of Premier and Cabinet to fund INSW’s operations and transferred-in deliverables from the former UGDC
Received $95.9m in capital grants and contributions for development of the Sydney Football Stadium from Department of Premium and Cabinet
Received the following funding for projects under development disclosed as Sales of Goods and Services:
- $98m for the Walsh Bay Arts Precinct Project via the Department of Premier and Cabinet
- $38.9m for the Sydney Modern Art Gallery Project from the Art Gallery of NSW via the Department of Premier and Cabinet
- $27.7m for the Stadium Australia Project from multiple entities but primarily Venues NSW. Note that this project was cancelled during the reporting period
- $20.3m for the New Grafton Correctional Centre Project via the Department of Justice
- $9.7m for the Powerhouse Museum at Parramatta via the Department of Premier and Cabinet
Transferred the following to the Sydney Metro Authority in relation to the Waterloo Metro Quarter development:
- $95m in assets via equity
- $20m in funding from the Redfern Waterloo Housing Affordability Contribution account
There were also other transactions with various entities which were not individually significant and include the following:
- Sales of Goods and Services income to fund key strategic initiatives and coordination across NSW Government as well as administering the Investor Assurance role
- Expenditure incurred where INSW is acting in a strategic advisory and coordinating capacity
- Borrowings with TCorp to facilitate the Barangaroo Development
- Assumption by the Crown Finance Entity of Long Service Leave entitlements
28 Restructure of Administrative Arrangements
Statements of Comprehensive Income
Actual Actual
Continuing operations 2020 2019 Actual Actual
Expenses excluding losses $'000 $'000 2020 2019
Employee related expenses 26,601 42,440 -
Personnel services Expenses - - 31,897
Operating expenses 46,347 104,471 104,471
Depreciation and amortisation 12,720 9,997 9,997
Grants and subsidies 352 923 923
Finance costs 19,305 17,183 17,183
Project delivery expenses 196,283 213,549 213,549
Total expenses excluding losses 301,608 388,563 378,020
Revenue
Sales of goods and services 213,401 207,629 207,629
Other income 20,392 11,456 11,456
Grants and Contributions 228,900 151,302 48,304
Investment Revenue 19,796 21,784 124,782
Lease Income - 128 128
2,139 30 30
Total revenue 484,628 392,330 - 392,329
Gain /(loss) on disposal (46) 3,112 (46) 3,112
Gain/(loss) on fair value movement (5,610) - (5,610) -
Impairment losses on non financials asset (959) - (959) -
Total gains/(losses) (6,615) 3,112 (6,615) 3,112
Net result from continuing operations 176,405 6,878 (6,615) 17,421
Net result from discontinued operations (9,025) 250 (9,025) 16,357
NET RESULT 167,380 7,128 33,778
Consolidated
INSW
In accordance with the requirements of TPP 09-03, INSW has presented a notional consolidated financial report aggregating the former UGDC and BDA, including comparatives.
Acceptance by Crown Entity of employee benefits and other liabilities
91

Infrastructure NSW
Notes to the Consolidated Financial Statementsfor the year ended 30 June 2020
28 Restructure of Administrative Arrangements (continued)
Statements of Comprehensive Income (continued)
Items that will not be reclassified to net result in subsequent periods: Actual Actual 2020 2019
Other comprehensive Income
16,057 35,237 16,056 35,237
15,561 (303) 15,561 (303)
140 400 140 -
Total other comprehensive income 31,758 35,334 31,757 34,934
TOTAL COMPREHENSIVE INCOME 199,138 42,462 31,757 68,712
Statements of Financial Position
Actual Actual Actual Actual
ASSETS 2020 2019 2020 2019
$'000 $'000 $'000 $'000
Current Assets
Cash and cash equivalents 313,667 248,525 247,585
Receivables and prepayments 41,495 17,385 17,385
Inventory 245 - -
Property, Plant and Equipment held for distribution 34,458 - -
Assets held for sale 164,718 71,370 71,370
Other Assets - 370 370
Total Current Assets 554,583 337,650 336,710
Non-Current Assets
Receivables 459,143 437,721 437,721
Inventory 141,812 94,519 94,519
Right-of-use Assets 4,199 - -
Property, Plant and Equipment 546,113 657,204 657,204
Intangibles assets 6 14 14
Total Non-Current Assets 1,151,273 1,189,458 1,189,458
Total Assets 1,705,856 1,527,108 1,526,168
LIABILITIES
Current Liabilities
Payables 128,115 85,618 88,639
Borrowings 403,671 40,884 40,884
Provisions 5,975 98,082 94,242
Other current liabilities 177,297 144,336 144,336
Provisions held for distribution 298 - -
Total Current Liabilities 715,356 368,920 368,101
Non-Current Liabilities
Payables 49,756 94,350 94,381
Borrowings 294,881 528,550 528,550
Provisions 1,178 3,506 3,357
Other non-current liabilities 187,099 199,002 199,002
Total Non-Current Liabilities 532,914 825,408 825,290
Total Liabilities 1,248,270 1,194,328 1,193,391
Net Assets 457,587 332,780 332,777
Consolidated
Consolidated INSW
Net changes in revaluation surplus of property, plant and equipment
Net changes in revaluation surplus arising from changes in restoration liability
Net changes in superannuation actuarial gain/(loss) on defined benefit plans
92

Infrastructure NSW
Notes to the Consolidated Financial Statementsfor the year ended 30 June 2020
28 Restructure of Administrative Arrangements (continued) Actual Actual
2020 2019
EQUITY $'000 $'000
Accumulated funds 425,829 269,301 422,783 269,298
Reserves 31,758 63,477 31,757 63,477
Total Equity 457,587 332,778 454,540 332,775
Accumulated Funds
Asset Revaluation Surplus
Total
Statements of Changes in Equity $'000 $'000 $'000
Balance at 1 July 2019 13,978 - 13,978
Net result for the year 167,380 - 167,380
Other comprehensive Income
Net changes in revaluation surplus of property, plant and equipment - 16,057 16,057
Net changes in revaluation surplus arising from changes in restoration liability - 15,561 15,561
Net changes in superannuation actuarial gain/(loss) on defined benefit plans - 140 140
Total comprehensive income for the year 167,380 31,757 199,138
Transactions with owners in their capacity as owners
Increase/(decrease) in net assets from administrative restructure 255,551 - 255,551
Adjustment to net assets from administrative restructure (11,080) - (11,080)
Balance at 30 June 2020 425,829 31,757 457,587
Balance at 1 July 2018 260,591 29,724 290,315
-
Net result for the year 7,128 - 7,128
Other comprehensive Income
Net changes in revaluation surplus of property, plant and equipment 1,182 34,055 35,237
Net changes in revaluation surplus arising from changes in restoration liability - (303) (303)
Net changes in superannuation actuarial gain/(loss) on defined benefit plans 400 - 400
Total comprehensive income for the year 8,710 33,752 42,462
Balance at 30 June 2019 269,301 63,477 332,778
Statements of Cash Flows Actual Actual Actual Actual
2020 2019 2020 2019
CASH FLOWS FROM OPERATING ACTIVITIES $'000 $'000 $'000 $'000
Payments
Employee related (26,059) (44,749) - (32,113)
Other operating expenses (410,308) (687,764) (430,221) (700,356)
Finance costs (19,305) (9,136) (17,958) (9,136)
Grants and Subsidies (352) (923) (352) (923)
Total payments (456,024) (742,573) (448,531) (742,528)
Receipts
Sales of goods and services 176,860 202,437 158,173 202,437
Grants and Contributions 228,900 151,302 248,322 151,302
Interest received 1,115 4,520 1,115 4,174
Other income - 46,761 - 46,761
Total receipts 406,875 405,020 407,610 421,031
NET CASH FLOWS FROM OPERATING ACTIVITIES (49,149) (337,553) (40,921) (321,495)
CASH FLOWS FROM INVESTING ACTIVITIES
Purchases of property, plant and equipment (16,519) (156) (16,519) (156)
NET CASH FLOWS FROM INVESTING ACTIVITIES (16,519) (156) (16,519) (156)
Consolidated
Consolidated INSW
93

Infrastructure NSW
Notes to the Consolidated Financial Statementsfor the year ended 30 June 2020
28 Restructure of Administrative Arrangements (continued)
Statements of Cash Flows (continued) Actual Actual
2020 2019
CASH FLOWS FROM FINANCING ACTIVITIES $'000 $'000
Proceeds from borrowings 133,345 197,109 124,469 197,109
Repayment of lease liabilities (2,534) - (1,888) -
NET CASH FLOWS FROM FINANCING ACTIVITIES 130,811 197,109 122,581 197,109
NET INCREASE/(DECREASE) IN CASH and CASH EQUIVALENTS 65,143 (140,598) 65,141 (124,541)
Opening cash and cash equivalents 25,153 389,123 25,153 372,126
Cash transferred in as a result of administrative restructuring 223,372 - 223,372 -
CLOSING CASH AND CASH EQUIVALENTS 313,667 248,525 313,667 247,585
29 Discontinued Operations
A. Asset of disposal group held for distribution
2020 2019
Assets held for distribution $'000 $'000
Property, Plant and Equipment held for distribution 34,458 -
Inventories held for distribution 245 -
Liabilities held for distribution
Employee benefits liabilities 298 -
Total Assets and Liabilities for distribution 34,405 -
Income Statement for the discontinued operations Redfern-Eveleigh Parramatta North
ProgramTotal
$'000 $'000 $'000
Revenue - - -
Other Income - 48 48
Salaries expenses 183 1,554 1,737
Operating Expenses 239 7,097 7,336
Net Result (422) (8,603) (9,025)
B. Equity transfer
2020 2019
Details of the assets and liabilities transferred to other Government Agencies $'000 $'000
Inventories 95,228 -
Total Assets 95,228 -
Book Value of Equity Transfer 95,228 -
30 Events after the reporting period
Consolidated
In June 2020, following a decision by NSW Government acting in its capacity as owner, INSW committed to a plan to transfer management of the following major urban transformation projects to Property NSW and Transport for NSW respectively :
The net contributed capital to be transferred in the Statement of Changes in Equity is $34 million.
On 1 July 2020 through Premier's order, $34million of assets and liabilities in the disposal group held for distribution to owners related to North Parramatta have been transferred to Property NSW and those related to Redfern Eveleigh transferred to Transport for NSW in accordance to TPP 09-03. In addition, the White Bay Power Station is also be transferred to Place Management NSW.
• Redfern Eveleigh • Parramatta North
Accordingly, the assets and liabilities associated with those projects are presented as held-for-distribution at 30 June 2020. The assets and liabilities of each project consist of inventory balances accounted and employee benefit liabilities. The assets and liabilities are expected to transfer during the financial year 2020/21, upon which INSW will record a distribution to owners via an adjustment to contributed capital, on the basis of the transaction is with its shareholders in their capacity as owners.
On the 6th March 2020, following a decision by NSW Government acting in its capacity as owner, INSW transferred the inventories related to project Waterloo Metro to Sydney Metro. In accordance with TPP09-03 this transfer is recorded at book value as an equity transfer.
94

Infrastructure NSW
Notes to the Consolidated Financial Statementsfor the year ended 30 June 2020
31 Future Developments
End of audited financial statements.
INSW does not expect COVID19 to have a significant impact on its finances or liquidity position, control environment or ability to operate. There are no expected impact to the projects at this point in time. Furthermore based on information provided from independent valuation experts there are no material valuation impact expected on its non-current assets and inventories as at the time of signing these financial statements. INSW also believes that there is no material heightened credit risk arising from the impact of COVID on the financial condition of its lessees, customers and other stakeholders.
Several initiatives have been implemented to ensure compliance with Public Health Orders and promote staff safety and wellbeing. This includes the establishment of an INSW COVD-19 response team to stay abreast of new advice, discuss emerging issues and proactively communicate to the broader organisation. Remote working arrangements have been introduced and all employees have been asked to work from home if able. The office remains open as a workplace for those who need to use the facilities, with social distancing protocols in place, increased cleaning and disinfection, placement of hand sanitation stations and guidance on personal hygiene and infection control.
Aside from the above, no other events have occurred after the balance date that would have a material impact on the financial statements.
95

-- This page has intentionally been left blank –

97 Infrastructure NSW Annual Report 2019-20
Statutory reporting Human resources
Following the 2019 State Election, the NSW Government announced significant changes to the
Machinery of Government (MoG). On 1 July 2019, UrbanGrowth NSW Development Corporation
(UGDC) and Barangaroo Delivery Authority (BDA) were abolished with their functions transferring
to Infrastructure NSW. This led to an increase in headcount during the reporting year.
At 30 June 2020, there were 131 employees working for Infrastructure NSW, including a total of 45
senior executives. Infrastructure NSW’s workforce comprises of a multi-disciplinary team of
professionals with a diverse mix of skills and experience that comes from a range of career
backgrounds spanning from across the public and private sector. The workforce is highly skilled
and dedicated to providing critical infrastructure for NSW.
Infrastructure NSW is currently operating under two industrial instruments that set out the working
conditions and entitlements of staff. Former UGDC and BDA staff that transitioned to Infrastructure
NSW are covered under the Crown Employees (Public Service Conditions of Employment) Award
2009, all other staff are covered under the determination Infrastructure NSW Staff Agency
Conditions of Employment, Wages and Allowances June 2018-20217.
The tables below provide additional information on staff headcount.
Table 7, number of employees by category – classification level over three years:
Employees by Category 30 June 2018 30 June 2019 30 June 2020
Male Female Male Female Male Female
Grade 1-2 or equivalent 1 2 0 1 0 0
Grade 3-4 or equivalent 1 2 0 1 2 5
Grade 5-6 or equivalent 1 5 2 1 3 10
Grade 7-8 or equivalent 1 3 1 1 3 11
Grade 9-10 or equivalent 0 3 2 1 8 13
Grade 11-12 or equivalent 2 4 3 11 12 19
Above Grade 12 or equivalent 11 17 10 13
Total number of employees 17 36 18 29 28 58
7 All data for 2018-2019 refers to former Infrastructure NSW (pre-machinery of Government change) and data for 2019-2020 includes the combined organisation – Barangaroo Delivery Authority, Urban Grown Development Corporation and Infrastructure NSW.

98 Infrastructure NSW Annual Report 2019-20
Executive levels and remuneration
Refer to Table 8 for details on the number of executives employed by Infrastructure NSW by
band and gender, and Table 9 for the average remuneration. The tables capture all senior
executives who were employed as at 30 June 2020.
In 2019-2020, a total of 62% of Infrastructure NSW’s employee related expenditure was related
to senior executive employees. This decrease is as a result of the MoG changes and
Infrastructure NSW stabilising their structure to deliver on the government agenda.
Table 8, number of senior executives employed at the end of the reporting year, by band and gender within each band:
Table 9, average remuneration level of senior executives in each band at the end of the reporting year:
*Includes one position determined by SOORT.
2018-19 2019-20
Band Male Female Male Female
Band 3 3 3 2 3
Band 2 4 2 11 3
Band 1 3 8 10 16
Totals 10 13 23 22
Average Remuneration
Band Range ($) 2018-19 ($) 2019-20 ($)
Band 3 $345,551 - $487,050 $489,343 $502,775*
Band 2 $274,701 - $345,550 $318,775 $322,072
Band 1 $192,600 - $274,700 $221,542 $236,417

99 Infrastructure NSW Annual Report 2019-20
Personnel policies and practices
It has been a key priority for Infrastructure NSW to review and adopt human resources policies and
practices to reflect the one identity of Infrastructure NSW. This has included the development of
the Employment Delegations Policy, the implementation of a Performance Development
Framework, a consistent approach to recruitment and the development of a contemporary flexible
culture. The People and Culture team will continue to focus over the next 12 months to further
harmonise policies and practices across Infrastructure NSW with the implementation of a single
payroll system and industrial instrument for staff.
A review of corporate policies and procedures was undertaken during 2019-2020 following the
Machinery of Government changes. A policy harmonisation working group was established to
review all corporate policies, consolidate and develop new ones to replace the multiple existing
policies across the three agencies that now form Infrastructure NSW.
In February 2020, the following sixteen corporate policies were published:
• Code of Ethics and Conduct
• Gifts Benefits and Hospitality
• Fraud and Corruption Control
• Secondary Employment and Private
Interests
• Social Media
• Lobbyist Policy
• Statement of Business Ethics
• Privacy Management Plan
• Respect in the Workplace
• Managing Unsatisfactory
Performance
• Discipline Policy
• Grievance Policy and Procedure
• Public Interest Disclosures Policy and
Procedure
• Flexible Working
• Study Assistance and Leave
• Managing Sick Leave
Formal training on key policies is planned for all Infrastructure NSW employees and contractors in
October 2020.

100 Infrastructure NSW Annual Report 2019-20
Updated Purpose, Vision and Values
In FY20, facilitated workshops were held in order to develop the Purpose, Vision and Values of
Infrastructure NSW, following incorporation of staff and functions from the former Barangaroo
Development Authority and Urban Growth NSW. This meaningful engagement process helped re-
clarify purpose and priorities and promote strong collegiality for the workplace during this time of
change.
People and Culture worked alongside the leadership team, Corporate Communications and all staff
across the organisation to ensure that the new Purpose, Vision and Values are reflected in the
day-to-day activities of the organisation, both internally and externally.
Vision
Community wellbeing through great infrastructure
Purpose
Creating a sustainable infrastructure legacy for NSW
Values
Safety and wellbeing
Collaboration
Truth and courage
Achievement

101 Infrastructure NSW Annual Report 2019-20
Diversity
Infrastructure NSW aligns its policies and practices with the NSW Government’s commitment to a
diverse and inclusive Public Sector workforce.
The recruitment approach of Infrastructure NSW is based on the principles of equal employment
opportunity and a workforce that is reflective of the residents of NSW. During 2019-20,
Infrastructure NSW contributed to a diverse workforce through participating in the Public Service
Commission Aboriginal Intern Program.
Table 10, trends in the representation of Workforce Diversity Groups:
Workforce Diversity Group Benchmark 2018 2019 2020
Women 50% 65.9% 63.8% 61.1%
Aboriginal and/ or Torres Strait Islander People
3.3% 0.0% 0.0% 4.9%
People whose First Language Spoken as a Child was not English
23.2% 20.5% 19.1% 17.4%
People with Disability 5.6% 0.0% 0.0% 2.2%
People with Disability Requiring Work-Related Adjustment
N/A 0.0% 0.0% 1.1%
Note 1: The benchmark of 50% for representation of women across the sector is intended to reflect the gender composition of the NSW community.
Note 2: The NSW Public Sector Aboriginal Employment Strategy 2014 – 17 introduced an aspirational target of 1.8% by 2021 for each of the sector’s salary bands. If the aspirational target of 1.8% is achieved in salary bands not currently at or above 1.8%, the cumulative representation of Aboriginal employees in the sector is expected to reach 3.3%.
Note 3: A benchmark from the Australian Bureau of Statistics (ABS) Census of Population and Housing has been included for People whose First Language Spoken as a Child was not English. The ABS Census does not provide information about first language but does provide information about country of birth. The benchmark of 23.2% is the percentage of the NSW general population born in a country where English is not the predominant language.
Note 4: In December 2017, the NSW Government announced the target of doubling the representation of people with disability in the NSW public sector from an estimated 2.7% to 5.6% by 2027. More information can be found at: Jobs for People with Disability: A plan for the NSW public sector. The benchmark for ‘People with Disability Requiring Work-Related Adjustment’ was not updated.
Workplace Diversity Strategies
Over the last 12 months Infrastructure NSW has recognised our diverse workforce through events
such as International Women’s Day. Infrastructure NSW also delivered a consistent approach to
advertising our position vacancies that reflects the organisation’s commitment to diversity, flexibility
and workplace adjustment.
During the next 12 months Infrastructure NSW plans to deliver numerous initiatives such as
International Women’s Day, cultural competency training and the infrastructure traineeships
targeting disadvantaged youth. Other initiatives include the delivery of Mental Health First Aid
training to ensure we have accredited employees able to provide support and referrals to staff in
challenging times.
Infrastructure NSW will also deliver an updated Flexible Work Policy and develop guides and
resources to assist managers and staff in a flexible work culture.

102 Infrastructure NSW Annual Report 2019-20
Multicultural policies and services
Infrastructure NSW supports the principles of multiculturalism, recognising the value and
contribution of different linguistic, religious and ancestral backgrounds of the residents of NSW and
promote equal rights and responsibilities for all. Infrastructure NSW embeds diversity and inclusion
in everything they do, from recruitment processes, workplace culture, development and health and
wellbeing initiatives.
When planning community engagement, Infrastructure NSW ensures they are culturally sensitive
and inclusive of people from diverse language, cultural and religious backgrounds. Infrastructure
NSW also provides communities members access to a free translation and interpretation service
for all Infrastructure NSW activities and programs.
Infrastructure NSW has commenced work on the Multicultural, Diversity and Inclusion Policy which
incorporates the Multicultural Plan in accordance with the Multicultural NSW Act 2000. A number of
initiatives supporting our approach are planned for next year including the delivery of employee
development programs including cultural competency and diversity and inclusion training for
recruiters. Infrastructure NSW continues to develop and maintain a supportive and inclusive culture
through a range of employee engagement programs and activities.
We celebrate the rich cultural history in Barangaroo. Our Indigenous employees have shared their
knowledge to educate the broader team. Over the past 12 months we have recognised and
supported an inclusive culture through NAIDOC week and Reconciliation week events.
Over the next 12 months Infrastructure NSW plans to continue its work in diversity and inclusivity
through events, initiatives and education. NAIDOC week event will be a major occasion in the
inclusion calendar, and further history and culture information sessions during the year.
Infrastructure NSW will also place its first Aboriginal Intern through the Public Service Commission
program in the next financial year.
Industrial relations
There were no industrial disputes lodged and no working time was lost due to industrial disputes
during the year.
Infrastructure NSW employees are working under two industrial arrangements due to the former
agencies that were consolidated through the Machinery of Government changes, so are now
operating under both the Crown Award and the Infrastructure NSW employment agreement. As
such, Infrastructure NSW employees have inconsistent entitlements which is difficult to manage
and results in inequities. Infrastructure NSW has commenced a harmonisation program to move to
a single industrial instrument to ensure consistent entitlements and benefits to all staff.
Annual report production
The production and printing cost for the 2019–20 Annual Report was nil. A PDF version of the report can be downloaded at infrastructure.nsw.gov.au.
Privacy
Infrastructure NSW's privacy policy, and information about collection and use of personal information, is published on the organisation's website.

103 Infrastructure NSW Annual Report 2019-20
Infrastructure NSW's privacy contact officer can be contacted at:
The Privacy Officer Infrastructure NSW PO Box R220 Royal Exchange NSW 1225
No internal reviews were conducted by or on behalf of Infrastructure NSW under the Privacy and Personal Information Protection Act 1998 or the Health Records and Information Privacy Act 2002 during the 2019-20 reporting period.
Workplace health and safety
Infrastructure NSW is committed to the health, safety and wellbeing of its staff, contractors and the community members we work with.
Infrastructure NSW has a number of corporate health, safety and wellbeing initiatives including:
• an internal Work, Health and Safety (WHS) Committee that reviews and consults on all
work, health and safety issues
• a corporate fitness program
• Influenza vaccinations.
Work Health and Safety Prosecutions
Infrastructure NSW was not a defendant to any prosecutions, either commencing or continuing, under the Work Health and Safety Act 2011 during 2019–20, either on construction projects or otherwise.
Promotion
Simon Draper was the recipient of a Sir James Wolfensohn Public Service Scholarship, managed and funded through the Harvard Club of Australia. He attended the Harvard Kennedy School in Boston, from 10-14 February 2020 under that scholarship, completing the Cutting Edge of Economic Development program.
There were no other promotions undertaken by Infrastructure NSW staff for the year in review 2019-20.
Responding to consumers
Infrastructure NSW provides independent advice to Government, and in that capacity, does not deliver direct services to the public. In relation to Barangaroo, Infrastructure NSW manages the Barangaroo precinct including the public domain, and in that capacity, delivers visitor services directly to the public.

104 Infrastructure NSW Annual Report 2019-20
Payments of accounts
The tables below summarise the account payment performance during 2019-20. During the year, there were no instances where penalty interest was paid and there were no significant events that affected payment performance.
Infrastructure NSW will continue to drive improvements in this area and monitor its payment processes in the coming financial year to ensure that payment targets are met.
Table 11, payments of accounts:
Accounts due or paid within each quarter
Measure Sep Dec Mar Jun
All suppliers
Number of accounts due for payment 1662 1801 1207 1394
Number of accounts paid on time 1211 1381 820 1053
Actual percentage of accounts paid on time (based on number of accounts)
73% 77% 68% 76%
Dollar amount of accounts due for payment
89,911,570 101,048,615 69,199,995 93,096,026
Dollar amount of accounts paid on time 70,539,679 76,371,595 44,819,429 72,764,937
Actual percentage of accounts paid on time (based on $)
78% 76% 65% 78%
Small Business Suppliers
Number of accounts due for payment 93 121 102 118
Number of accounts paid on time 73 102 77 97
Actual percentage of accounts paid on time (based on number of accounts)
78% 84% 75% 82%
Dollar amount of accounts due for payment
648,183 1,241,852 570,037 567,393
Dollar amount of accounts paid on time 500,248 1,033,506 344,052 408,303
Actual percentage of accounts paid on time (based on $)
77% 83% 60% 72%
Number of payments for interest on overdue accounts
- - - -
Interest paid on overdue accounts - - - -
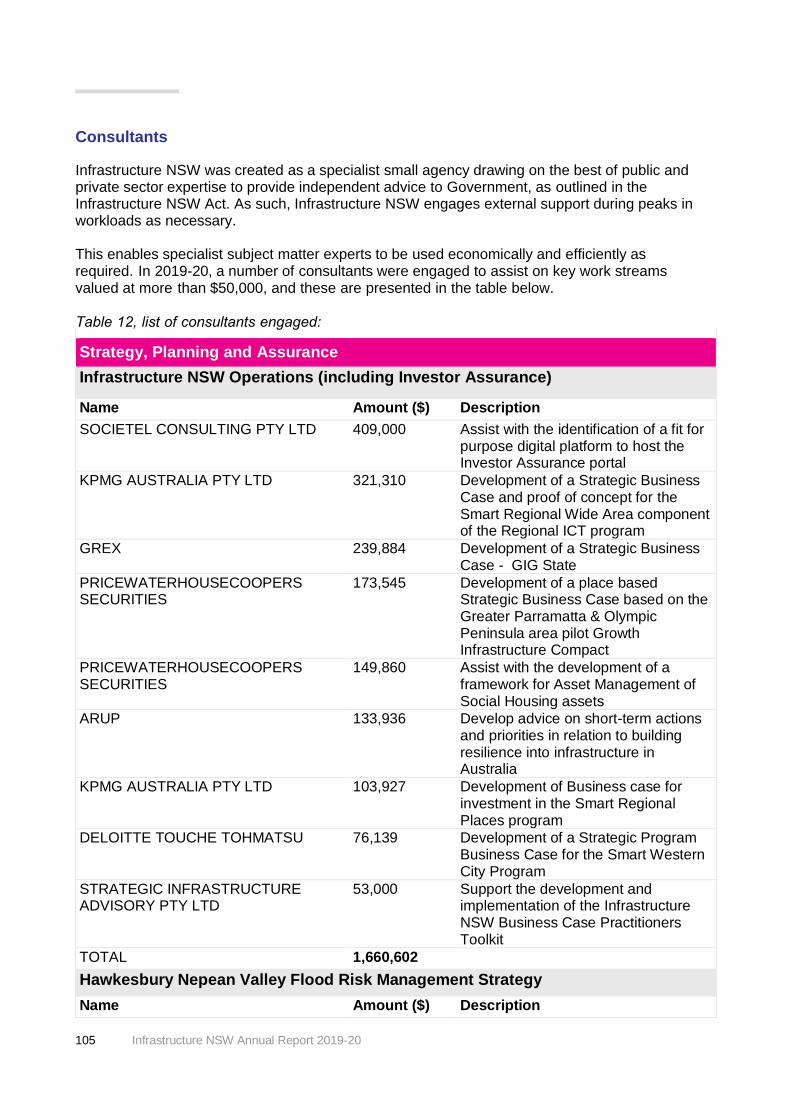
105 Infrastructure NSW Annual Report 2019-20
Consultants
Infrastructure NSW was created as a specialist small agency drawing on the best of public and private sector expertise to provide independent advice to Government, as outlined in the Infrastructure NSW Act. As such, Infrastructure NSW engages external support during peaks in workloads as necessary.
This enables specialist subject matter experts to be used economically and efficiently as required. In 2019-20, a number of consultants were engaged to assist on key work streams valued at more than $50,000, and these are presented in the table below.
Table 12, list of consultants engaged:
Strategy, Planning and Assurance
Infrastructure NSW Operations (including Investor Assurance)
Name Amount ($) Description
SOCIETEL CONSULTING PTY LTD 409,000 Assist with the identification of a fit for purpose digital platform to host the Investor Assurance portal
KPMG AUSTRALIA PTY LTD 321,310 Development of a Strategic Business Case and proof of concept for the Smart Regional Wide Area component of the Regional ICT program
GREX 239,884 Development of a Strategic Business Case - GIG State
PRICEWATERHOUSECOOPERS SECURITIES
173,545 Development of a place based Strategic Business Case based on the Greater Parramatta & Olympic Peninsula area pilot Growth Infrastructure Compact
PRICEWATERHOUSECOOPERS SECURITIES
149,860 Assist with the development of a framework for Asset Management of Social Housing assets
ARUP 133,936 Develop advice on short-term actions and priorities in relation to building resilience into infrastructure in Australia
KPMG AUSTRALIA PTY LTD 103,927 Development of Business case for investment in the Smart Regional Places program
DELOITTE TOUCHE TOHMATSU 76,139 Development of a Strategic Program Business Case for the Smart Western City Program
STRATEGIC INFRASTRUCTURE ADVISORY PTY LTD
53,000 Support the development and implementation of the Infrastructure NSW Business Case Practitioners Toolkit
TOTAL 1,660,602
Hawkesbury Nepean Valley Flood Risk Management Strategy
Name Amount ($) Description

106 Infrastructure NSW Annual Report 2019-20
BUREAU OF METEOROLOGY 189,296 Development and operation of a pilot forecast service for extended lead time flood forecasts for the Hawkesbury Nepean Valley
RHELM 197,443 Assist with the development of a Hawkesbury Nepean Valley flood model
INNER SYDNEY REGIONAL COUNCIL 119,170 Assist with flood awareness and emergency preparedness
ESRI AUSTRALIA PTY LTD 106,500 Assist with the planning and development of a web mapping interface for the flood mapping tool
HYDROBIOLOGY QLD PTY LTD 104,414 Advisory services in relation to the Environmental Impact Statement
BANJO ADVERTISING PTY LTD 277,283 Plan, design and deliver a public awareness communication and behaviour change campaign to support delivery of the HNV Flood Strategy.
DEPARTMENT OF PLANNING, INDUSTRY AND ENVIRONMENT
380,000 Develop a planning and policy framework and development framework to support the HNVFRMS.
DIGITAL SYNDICATE STUDIOS PTY LTD
56,700 Provide animated videos to support the HNVFRMS.
ELTON CONSULTING GROUP PTY LTD
56,022 Provision of graphic design services to support HNVFRMS
EY LIMITED PTY LTD 104,765 Develop web pages to support the design and delivery of the Get Ready for Flood Hawkesbury-Nepean public safety campaign and the School Geography resource.
ROADS AND MARITIME SERVICE 773,063 Undertake evacuation and signage strategy, upgrade a flood evacuation model and develop a road evacuation masterplan to support HNVFRMS.
STATE EMERGENCY SERVICES 195,900 Support INSW for the HNVFRMS in relation to SES statutory functions.
TIGER TAIL PTY LTD 73,500 Plan, facilitate and evaluate a series of forums and workshops to support the School Emergency Management Planning for Flood Project.
WATER NSW 2,350,246 Undertake management, concept and investigation, EIS preparation and environmental approvals for Warragamba Dam raising
WAVEMAKER AUSTRALIA PTY LTD 372,020 Undertake the media planning and buying component of the “Get Ready for Flood Hawkesbury-Nepean” campaign.
WESTERN SYDNEY UNIVERSITY 166,999 Resource development and coordination Services to create the Flooding in the Hawkesbury Nepean Valley: School Geography Resource.
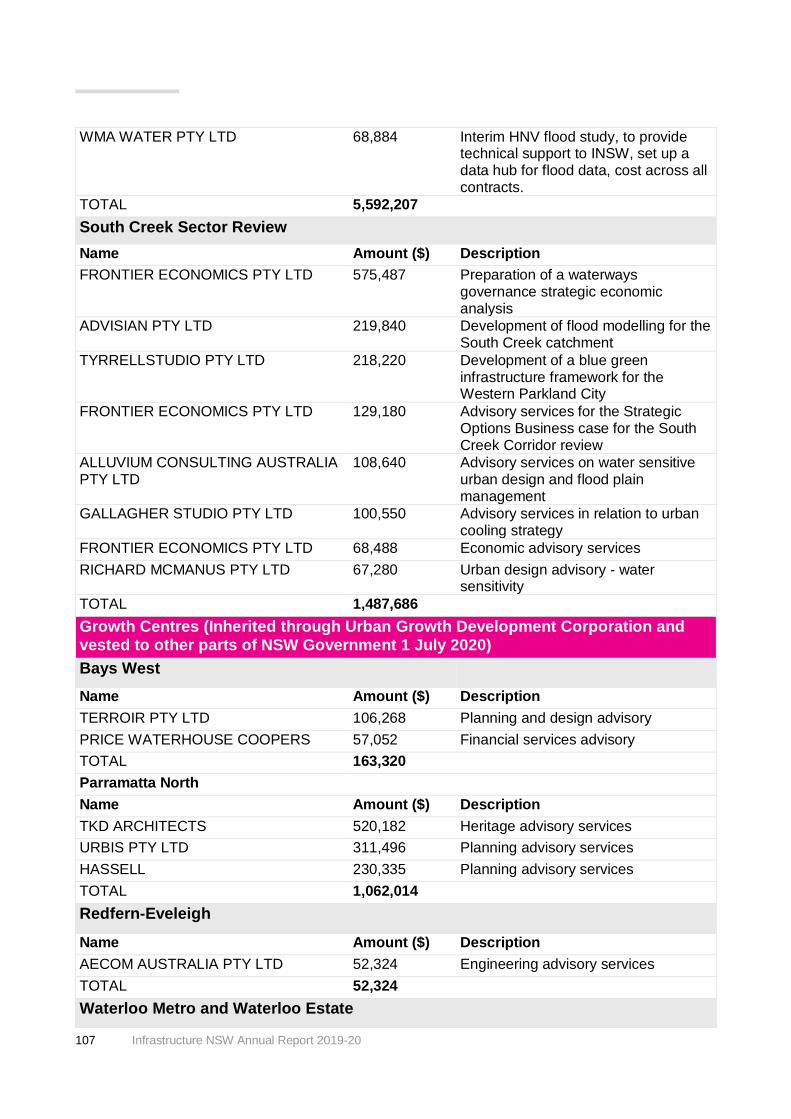
107 Infrastructure NSW Annual Report 2019-20
WMA WATER PTY LTD 68,884 Interim HNV flood study, to provide technical support to INSW, set up a data hub for flood data, cost across all contracts.
TOTAL 5,592,207
South Creek Sector Review
Name Amount ($) Description
FRONTIER ECONOMICS PTY LTD 575,487 Preparation of a waterways governance strategic economic analysis
ADVISIAN PTY LTD 219,840 Development of flood modelling for the South Creek catchment
TYRRELLSTUDIO PTY LTD 218,220 Development of a blue green infrastructure framework for the Western Parkland City
FRONTIER ECONOMICS PTY LTD 129,180 Advisory services for the Strategic Options Business case for the South Creek Corridor review
ALLUVIUM CONSULTING AUSTRALIA PTY LTD
108,640 Advisory services on water sensitive urban design and flood plain management
GALLAGHER STUDIO PTY LTD 100,550 Advisory services in relation to urban cooling strategy
FRONTIER ECONOMICS PTY LTD 68,488 Economic advisory services
RICHARD MCMANUS PTY LTD 67,280 Urban design advisory - water sensitivity
TOTAL 1,487,686
Growth Centres (Inherited through Urban Growth Development Corporation and vested to other parts of NSW Government 1 July 2020)
Bays West
Name Amount ($) Description
TERROIR PTY LTD 106,268 Planning and design advisory
PRICE WATERHOUSE COOPERS 57,052 Financial services advisory
TOTAL 163,320
Parramatta North
Name Amount ($) Description
TKD ARCHITECTS 520,182 Heritage advisory services
URBIS PTY LTD 311,496 Planning advisory services
HASSELL 230,335 Planning advisory services
TOTAL 1,062,014
Redfern-Eveleigh
Name Amount ($) Description
AECOM AUSTRALIA PTY LTD 52,324 Engineering advisory services
TOTAL 52,324
Waterloo Metro and Waterloo Estate

108 Infrastructure NSW Annual Report 2019-20
Name Amount ($) Description
NICHOLAS TURNER PTY LTD 218,731 Design advisory services
ETHOS URBAN PTY LTD 130,485 Planning advisory services
TOTAL 349,216
Project Delivery
New Grafton Correctional Centre
Name Amount ($) Description
NBRS & PARTNERS PTY LTD 702,493 Design advisory services
CURIO PROJECTS PTY LTD 508,431 Provision of Archaeologist/Heritage Services
MINTER ELLISON 130,814 Legal advisory services
TOTAL 1,341,737
Walsh Bay Arts Precinct Project
Name Amount ($) Description
ARUP PTY LTD 100,710 Engineering advisory services
TOTAL 100,710
Stadium Australia Refurbishment
Name Amount ($) Description
POPULOUS DESIGN PTY LTD 9,842,010 Architectural design services
AURECON AUSTRALASIA PTY LTD 3,591,199 Building Design Services
PRICE WATERHOUSE COOPERS 280,619 Development Advisory Services
MOTT MACDONALD AUSTRALIA PTY LTD
214,632 Wind engineering services
COFFEY SERVICES AUSTRALIA PTY LTD
156,429 Geotech assessment
PERFORMANCE BASED CONSULTING PTY LTD
130,050 Fire engineering services
COX ARCHITECTURE PTY LTD 99,820 Architectural services
TRACEY BRUNSTROM & HAMMOND PTY LTD
78,096 Develop Construction methodology and program delivery strategy
ETHOS URBAN PTY LTD 70,838 Planning advisory services
AURECON AUSTRALASIA PTY LTD 70,710 Develop infrastructure management plan
ARUP PTY LTD 68,500 Noise and vibration assessment
JM TRANSPORT CONSULTING 66,100 Traffic and transport advisory
THE UNIVERSITY OF NSW 50,625 Provision of safe movement studies
ETHOS URBAN PTY LTD 50,000 Social and economic strategy advice
TOTAL 14,769,630
Sydney Football Stadium Redevelopment
Name Amount ($) Description
COX ARCHITECTURE PTY LTD 3,094,398 Architectural services
ARUP PTY LTD 703,220 Groundwater Assessment
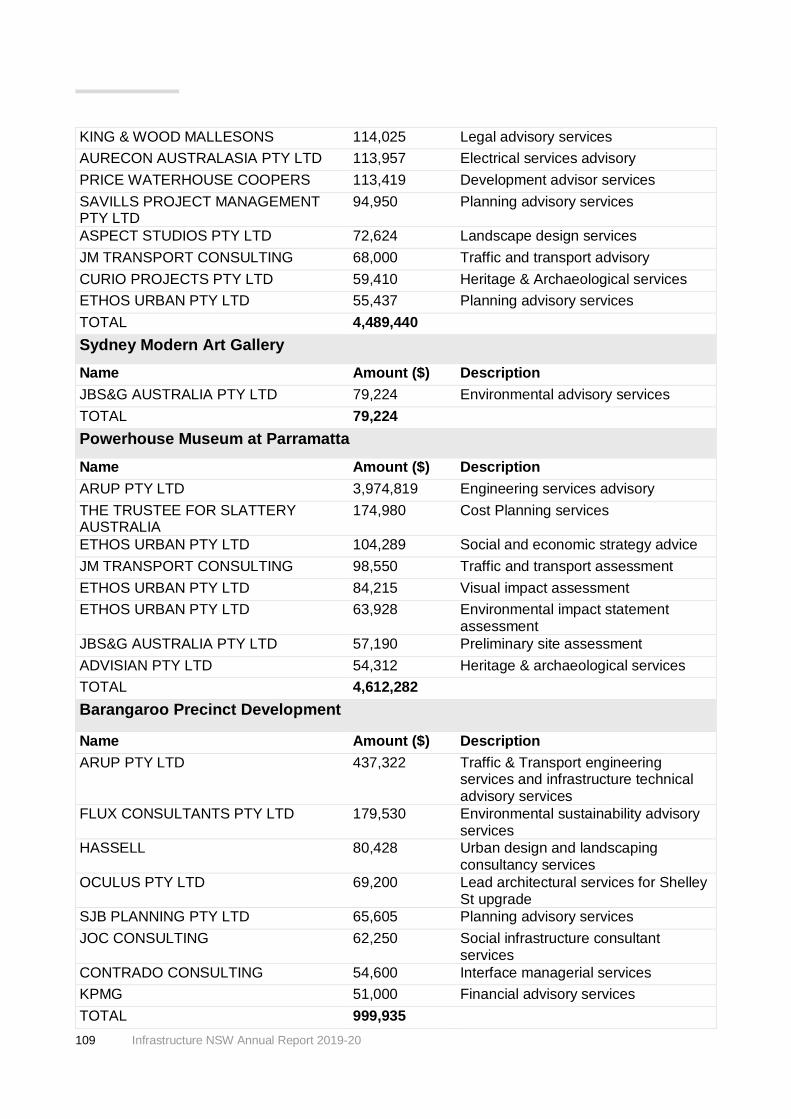
109 Infrastructure NSW Annual Report 2019-20
KING & WOOD MALLESONS 114,025 Legal advisory services
AURECON AUSTRALASIA PTY LTD 113,957 Electrical services advisory
PRICE WATERHOUSE COOPERS 113,419 Development advisor services
SAVILLS PROJECT MANAGEMENT PTY LTD
94,950 Planning advisory services
ASPECT STUDIOS PTY LTD 72,624 Landscape design services
JM TRANSPORT CONSULTING 68,000 Traffic and transport advisory
CURIO PROJECTS PTY LTD 59,410 Heritage & Archaeological services
ETHOS URBAN PTY LTD 55,437 Planning advisory services
TOTAL 4,489,440
Sydney Modern Art Gallery
Name Amount ($) Description
JBS&G AUSTRALIA PTY LTD 79,224 Environmental advisory services
TOTAL 79,224
Powerhouse Museum at Parramatta
Name Amount ($) Description
ARUP PTY LTD 3,974,819 Engineering services advisory
THE TRUSTEE FOR SLATTERY AUSTRALIA
174,980 Cost Planning services
ETHOS URBAN PTY LTD 104,289 Social and economic strategy advice
JM TRANSPORT CONSULTING 98,550 Traffic and transport assessment
ETHOS URBAN PTY LTD 84,215 Visual impact assessment
ETHOS URBAN PTY LTD 63,928 Environmental impact statement assessment
JBS&G AUSTRALIA PTY LTD 57,190 Preliminary site assessment
ADVISIAN PTY LTD 54,312 Heritage & archaeological services
TOTAL 4,612,282
Barangaroo Precinct Development
Name Amount ($) Description
ARUP PTY LTD 437,322 Traffic & Transport engineering services and infrastructure technical advisory services
FLUX CONSULTANTS PTY LTD 179,530 Environmental sustainability advisory services
HASSELL 80,428 Urban design and landscaping consultancy services
OCULUS PTY LTD 69,200 Lead architectural services for Shelley St upgrade
SJB PLANNING PTY LTD 65,605 Planning advisory services
JOC CONSULTING 62,250 Social infrastructure consultant services
CONTRADO CONSULTING 54,600 Interface managerial services
KPMG 51,000 Financial advisory services
TOTAL 999,935

110 Infrastructure NSW Annual Report 2019-20
Blackwattle Bay (New Sydney Fish Markets)
Name Amount ($) Description
AECOM AUSTRALIA PTY LTD 2,495,418 Building services advisory
3XN AUSTRALIA PTY LTD 1,404,298 Architectural design services advisory
MOTT MACDONALD AUSTRALIA 1,212,544 Engineering advisory services
RIDER LEVETT BUCKNALL NSW PTY LTD
312,449 Cost planning services
FRANCIS-JONES MOREHEN THORP PTY LTD
218,110 Urban design advisory
KING & WOOD MALLESONS 186,368 Legal services advisory
URBANITE PTY LTD 147,709 Wayfinging strategy advisory
ROBERTS DAY NSW PTY LTD 144,580 Placemaking advisory services
MURAWIN PTY LTD 144,110 Aboriginal cultural advisory services
ECOPLAN PROJECTS PTY LTD 103,455 Planning advisory services
CITY PEOPLE PTY LTD 86,610 Art and cultural strategy advisory
BRIGGS, BRINDLE & CHAMBERS 77,352 Planning advisory services
CARDNO (NSW/ACT) PTY LTD 70,223 Advice on flooding and water quality
ECO LOGICAL AUSTRALIA PTY LTD 68,991 Ecological advisory services
TERROIR PTY LTD 62,475 Planning and Urban design advisory
JBS&G AUSTRALIA PTY LTD 55,053 Environmental advisory services
TOTAL 6,789,744

111 Infrastructure NSW Annual Report 2019-20
Public interest disclosures
During the year, Infrastructure NSW received no public interest disclosures.
Government Information (Public Access) Act 2009
The intention of the Government Information (Public Access) Act 2009 (GIPA Act) is to make government information more open and readily available to members of the public. Infrastructure NSW complies with this Act.
In 2019-20, Infrastructure NSW received 14 GIPA Act access applications.
Infrastructure NSW provides the following statistical information about the access applications received which is required by Schedule 2 of the Government Information (Public Access) Regulation 2018.
Table 13, number of applications by type of application and outcome:
Access granted in full
Access granted in part
Access refused in full
Information not held
Information already available
Refuse to deal with application
Refuse to confirm/ deny whether information is held
Application withdrawn
Media 3 1 0 0 0 1 0 1
Members of Parliament
0 2 0 0 0 1 0 0
Private sector business
0 1 0 0 0 0 0 0
Not for profit organisations or community groups
0 1 1 0 0 0 0 0
Members of the public (application by legal representative)
0 0 0 1 0 0 0 0
Members of the public (other)
0 1 0 0 0 0 0 0

112 Infrastructure NSW Annual Report 2019-20
Table 14, number of applications by type of application and outcome:
Access granted in full
Access granted in part
Access refused in full
Information not held
Information already available
Refuse to deal with application
Refuse to confirm/ deny whether information is held
Application withdrawn
Personal information applications
0 0 0 0 0 0 0 0
Access applications (other than personal information applications)
3 6 1 1 0 2 0 1
Access applications that are partly personal information applications and partly other
0 0 0 0 0 0 0 0
Table 15, invalid applications:
Reason for invalidity: Number of applications
Application does not comply with formal requirements (section 41 of the GIPA Act)
0
Application is for excluded information of the agency (section 43 of the GIPA Act)
0
Application contravenes restraint order (section 110 of the GIPA Act) 0
Total number of invalid applications received 0
Invalid applications that subsequently became valid applications 0

113 Infrastructure NSW Annual Report 2019-20
Table 16, conclusive presumption of overriding public interest against disclosure: Matters
listed Schedule 1 of the GIPA Act:
Number of times consideration used
Overriding secrecy laws 0
Cabinet information 6
Executive Council information 0
Contempt 0
Legal professional privilege 0
Excluded information 0
Documents affecting law enforcement and public safety 0
Transport safety 0
Adoption 0
Care and protection of children 0
Ministerial code of conduct 0
Aboriginal and environmental heritage 0
Information about complaints to Judicial Commission 0
Information about authorised transactions under Electricity Network Assets (Authorised Transactions) Act 2015 (NSW)
0
Information about authorised transaction under Land and Property Information NSW (Authorised Transaction) Act 2016 (NSW)
0

114 Infrastructure NSW Annual Report 2019-20
Table 17, other public interest considerations against disclosure: matters listed in table to
section 14 of the GIPA Act:
Number of occasions
when application not
successful
Responsible and effective government 5
Law enforcement and security 0
Individual rights, judicial processes and natural justice 5
Business interests of agencies and other persons 3
Environment, culture, economy and general matters 0
Secrecy provisions 0
Exempt documents under interstate Freedom of Information legislation 0
Table 18, timelines:
Number of applications
Decided within the statutory timeframe (20 days plus any extensions) 11
Decided after 35 days (by agreement with applicant) 0
Not decided within time (deemed refusal) 0
Total 11

115 Infrastructure NSW Annual Report 2019-20
Table 19, number of applications reviewed under Part 5 of the GIPA Act (by type of review
and outcome):
Decision varied
Decision upheld
Total
Internal review 0 0
Review by Information Commissioner 0 1 1
Internal review following recommendation under section 93 of GIPA Act
0 0
Review by NSW Civil and Administrative Tribunal 0 0
Total 0 1 1
Table 20, application for review under Part 5 of the GIPA Act (by type of applicant):
Number of applications for review
Applications by access applicants 1
Applications by persons to whom information the subject of access
application relates (see section 54 of the GIPA Act) 0
Table 21, applications transferred to other agencies under Division 2 of Part 4 of the Act (by type
of transfer):
Number of applications transferred
Agency-initiated transfers 1
Applicant-initiated transfers 0

116 Infrastructure NSW Annual Report 2019-20
Authorised Proactive Release of Information Under S.7 (3) of GIPA Act 2009
Under section 7 of the GIPA Act, agencies must identify the kind of government information that can be made publicly available at least every 12 months.
Infrastructure NSW’s program for the proactive release of information involves regularly updating the Infrastructure NSW website and individual project websites to provide information regarding policies, projects and initiatives. We also consider publishing information about the community consultations we undertake and other commonly requested categories of information and the impact, if any, of proactively releasing this information.
During the year, Infrastructure NSW:
• considered the formal access application received
• considered the informal applications received
• determined that there were no particular additional categories of information that were
being regularly or repeatedly requested in the formal applications
• undertook further consultation through team meetings, GIPA briefings and updates.
Below are the details of a review carried out during the reporting year and the details of any information made publicly available by Infrastructure NSW as a result.
Review Carried out
Information made publicly available by the agency
Yes Having conducted this review, it was determined:
• the existing type of information subject to proactive disclosure remain appropriate
• there are no other types of information that should be proactively released
• the methods currently used for proactive release disclosure remain the most
efficient and effective methods available.
Where we can, we share our knowledge freely within government, throughout the development industry and among interested members of the public. We have adopted this practice as an effective way to build and maintain credibility. Our decision to share our intellectual property is also an effective way for us to demonstrate and influence change.
We will review this requirement for proactive release of information within the next 12 months.

117 Infrastructure NSW Annual Report 2019-20
Legal change
The Public Health (COVID-19 Restrictions on Gathering and Movement) Order 2020 was made under the Public Health Act 2010 on 30 March 2020. The Order gave certain Ministerial directions to deal with the public health risk of COVID-19 and its possible consequences and in particular made directions relating to travelling to and from work if that work could not be completed at home. Infrastructure NSW implemented a COVID-19 Response Team which oversaw work from home arrangements, office space and monitored the evolving situation and communicated regularly to staff to ensure compliance with this Order (as amended).
Judicial Decisions
Local Democracy Matters Incorporated v Infrastructure NSW; Waverley Council v Infrastructure NSW (No 4) [2019] NSWLEC 140
This was a costs decision relating to judicial review proceedings bought by Local Democracy Matters Incorporated and Waverley Council challenging the decision of the Minister for Planning to grant development consent for a concept proposal and Stage 1 demolition of the Sydney Football Stadium at Moore Park.
The Court dismissed those proceedings and this costs decision was that each party pay its own costs.

118 Infrastructure NSW Annual Report 2019-20
Contact us For more information or to comment on the Infrastructure NSW Annual Report 2019-20, please contact:
• Telephone: 02 9255 1700
• Email: [email protected]
• Website: www.infrastructure.nsw.gov.au
Business hours: 8.30am – 5.30pm Level 27/201 Kent St, Sydney NSW 2000 Sydney PO Box R220, Royal Exchange, NSW 1225 ABN 85 031 302 516
Disclaimer Infrastructure NSW reasonably believes this document is correct at the date of publication but gives no warranty or representation as to its accuracy or completeness. To the extent permitted by law, Infrastructure NSW including its agents and employees disclaims any liability whatsoever in connection with, reliance upon, or use of this document by any person.


