116
2020
2020

12020

2 2020
3
CONTENTS
Company Information Vision and Core ValuesManagement Structure / Organization ChartJama PunjiChairman's ReviewDirectors' ReportDirectors' Report (Urdu)Statement of Value AdditionPerformance IndicatorsKey Operating and Financial DataVertical AnalysisHorizontal AnalysisStatement of Compliancewith the Listed Companies (Code of Corporate Governance) Regulations, 2019Independent Auditors Review Report to the Members on Statement of Compliance with the Listed Companies (Code of Corporate Governance) Regulations, 2019Independent Auditors' Report to the MembersStatement of Financial Position Statement of Profit or LossStatement of Comprehensive IncomeStatement of Changes in Equity Statement of Cash FlowsNotes to the Financial Statements Pattern of ShareholdingNotice of Annual General MeetingProxy Form
456789
162526283031
32
3536424445464748
101105111
2020
4
COMPANY INFORMATION
Board of DirectorsMr. Khalid Bashir Mr. Muhammad AnwarMr. Ahmad ShafiMr. Amjad Mehmood Mr. Khurram Mazhar KarimMr. Amin Anjum Saleem Mrs. Nazia Maqbool
Audit CommitteeMr. Amin Anjum SaleemMr. Khalid Bashir Mr. Khurram Mazhar Karim
HR & R CommitteeMrs. Nazia Maqbool Mr. Ahmad ShafiMr. Khurram Mazhar Karim
Chief Financial OfficerMr. Asim Siddique
Company SecretaryMr. Naseer Ahmad Chaudhary
Head of Internal AuditSyed Farhan Safdar
AuditorsRiaz Ahmed and CompanyChartered Accountants
Legal AdvisorSyed Masroor Ahmad
Stock Exchange ListingThe Crescent Textile Mills Limited is a listed Companyand its shares are traded on Pakistan Stock Exchange.
The Company's shares are quoted in leading dailies under textile composite sector.
ChairmanChief Executive OfficerDirector Director DirectorIndependent Director Independent Director
ChairmanMemberMember
ChairmanMemberMember
Advocate
BankersAllied Bank Limited Habib Bank Limited MCB Bank LimitedMCB Islamic Bank LimitedNational Bank of Pakistan Standard Chartered Bank (Pakistan) Limited The Bank of PunjabUnited Bank Limited
Mills & Registered OfficeSargodha Road, Faisalabad, Pakistan T: + 92-41-111-105-105 F: + 92-41-8786525E: [email protected]
Share RegistrarCorpTec Associates (Private) Limited,503 - E, Johar Town,Lahore, PakistanT: +92-42-35170336-37F: +92-42-35170338E: [email protected]
www.crescenttextile.com
2020
VISION AND CORE VALUES
VISIONTo be the preferred choice of customers through innovative products and solutions and be a leading contributor to the economy by enhancing value for stakeholders.
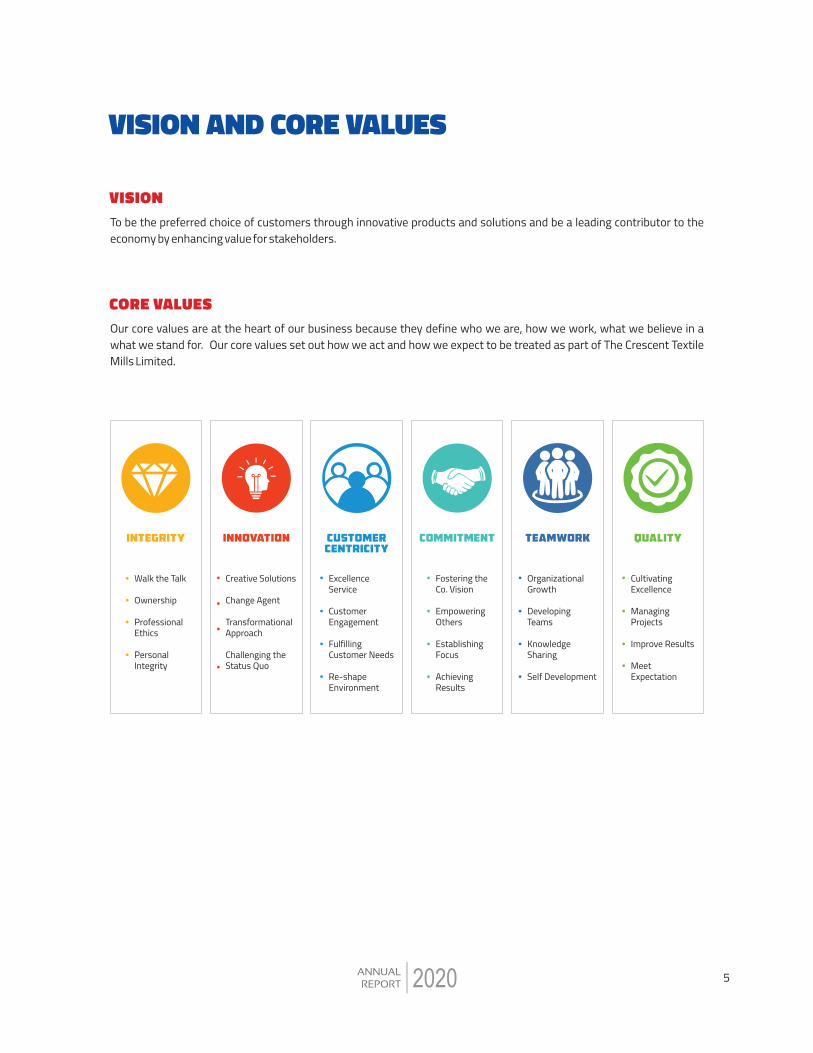
CORE VALUESOur core values are at the heart of our business because they define who we are, how we work, what we believe in awhat we stand for. Our core values set out how we act and how we expect to be treated as part of The Crescent Textile Mills Limited.
INTEGRITY INNOVATION CUSTOMER CENTRICITY
COMMITMENT TEAMWORK QUALITY
Walk the Talk
Ownership
ProfessionalEthics
PersonalIntegrity
Creative Solutions
Change Agent
TransformationalApproach
Challenging theStatus Quo
ExcellenceService
CustomerEngagement
FulfillingCustomer Needs
Re-shapeEnvironment
Fostering theCo. Vision
EmpoweringOthers
EstablishingFocus
AchievingResults
OrganizationalGrowth
DevelopingTeams
KnowledgeSharing
Self Development
CultivatingExcellence
Managing Projects
Improve Results
MeetExpectation
52020

MA
NAG
EMEN
T ST
RUCT
URE
/ O
RGA
NIZ
ATIO
N C
HA
RT
6 2020
Electri
cal &Ele
ctronics
Power
Genera
tionUtil
ities
Boar
d of D
irecto
rs
Hum
an R
esou
rce an
dRe
mun
erat
ion Co
mm
ittee
Head
of In
tern
al Au
dit
Audit
Com
mitt
ee
Chief
Exec
utive
Offi
cer
Opera
tions
Spinni
ng
Weavin
gPro
cessing
Spinni
ng ASpi
nning B
Depu
ty Ch
ief Ex
ecut
ive O
ffice
r
Home
Textile
Engine
ering
Supply
Chain
Out sourcin
gPro
curem
entSys
tem Audit
Invento
ry Pro
duction
Planni
ng & Control
Huma
n Reso
urce
Securit
y& HRF
Talent
Manag
ement
Proces
sedFab
ric &Ma
de Up
Sales
Yarn &
Greige Sales
Busin
ess De
velopm
ent
Financ
e Accoun
ts &Bud
geting
Treasu
ryInfo
rmation
Techno
logy
Exec
utive
Dire
ctor
Oper
ation
s Ex
ecut
ive D
irecto
rBu
sines
s Dev
elopm
ent
Import & Export
Quality
Legal
LW & T
O

72020
CHAIRMAN'S REVIEWfor the year ended June 30, 2020
It gives me immense pleasure to present this report to the shareholders of The Crescent Textile Mills Limited pertaining to the overall performance of the Board and the effectiveness of its role in attaining Company's objectives. During the year the Board committees continued to work with a great measure of proficiency. The Audit Committee has focused in particular on the management and control of risks associated with the business. The Human Resource and Remuneration Committee has ensured that the HR policies regarding performance management, HR staffing, compensation and benefits are market driven and are properly aligned to the company's performance, shareholders' interests and the long-term success of the company.
As required under the Listed Companies (Code of Corporate Governance) Regulations, 2019, the Board has developed a mechanism for the evaluation of performance of the Board of Directors. During the year a comprehensive questionnaire was circulated among all members of the board for the evaluation of performance of the Board of Directors. The purpose of this evaluation is to ensure that the Board's overall performance and effectiveness is measured and benchmarked against expectations in the context of objectives set for the Company.
For the financial year ended June 30, 2020, the Board's overall performance and effectiveness has been assessed as Satisfactory. Improvement is an ongoing process leading to action plans. The overall assessment as Satisfactory is based on an evaluation of integral components including vision, mission and values; engagement in strategic planning; formulation of policies; monitoring the organization's business activities; monitor financial resource management; effective fiscal oversight; equitable treatment of all employees and efficiency in carrying out the Board's business.
The Board of Directors of the Company received agendas and supporting written material including follow up materials in sufficient time prior to the board and its committee meetings. The board meets frequently enough to adequately discharge its responsibilities. The non-executive and independent directors are equally involved in important decisions.
On an overall basis, I believe that the strategic direction of the Company is clear and appropriate. Further, the processes adopted in developing and reviewing the overall corporate strategy and achievement of company's objectives are commendable.
8 2020
Khalid BashirChairman

DIRECTORS' REPORTfor the year ended June 30, 2020
Directors of your Company are pleased to present the Annual Report along with audited Financial Statements of the Company and Auditors' Report thereon for the year ended 30 June, 2020.
Industry OverviewFinancial Year 2020 was a tough year due to challenges to the macro-economy. Consolidation measures to tackle the challenges brought a lot of pressure on the performance of business and industry. The country's GDP growth rate deteriorated to negative 1.2 percent during the year. Pakistan's textile and clothing exports posted a negative growth of six percent to US$12.52 billion during
the year, as compared to US$13.32 billion in the corresponding period. Bedwear exports posted a negative growth of 4.91 percent in value and 2.31 percent in quantity. Readymade garments exports dipped 3.81 percent in value and 10.07 percent in quantity during the year, while knitwear export dropped 3.64 percent in value and 10.11 percent in quantity. The breakout of COVID-19 pandemic has collapsed the demand for the Country's exports during the last four months of financial year. However, subsequent to the year end, the easing of lockdown in the North American and European countries, top export destinations for Pakistani textile goods, helped to revive the sinking exports.
Company's performance A brief financial analysis is presented as under:
VarianceFY 20 FY 19(Rupees in million)Revenue Gross profitOperating costFinance costOther incomeTaxation Net profit after taxEPS (Rs. per share)
(682)(88)(56)(26)
(213)(14)
(205)(2.56)
13,264 1,5491,009
481117143
340.42
13,946 1,637 1,065
507330 157239 2.98
(4.9)(5.4)(5.3)(5.1)
(64.5)(8.9)
(85.8)(85.8)
%
Top line of the Company decreased by 4.9 percent in comparison to last year. The sales revenue decrease was mainly caused by low product demand particularly during last quarter of the financial year due COVID-19 outbreak. In line with dip in sale revenue, gross profit and operating cost also decreased by 5.4 percent and 5.3 percent respectively. Finance cost decreased by 5.1 percent in comparison to last year despite of the increase in average interest rates. During the year the Company closely monitored and managed the exposure to foreign currency risk and uses various available mechanisms, such as minimizing the foreign currency loans and resorting to natural hedging. Other Income squeezed by 64.5 percent due decrease in dividend income and exchange gain on export receivables in corresponding period.
Business SegmentsSpinning segment produced 17 million Kgs of Yarn.
Spinning production decreased by 4.4 percent in comparison to last year. Major reason for low production was plant closure during lock down period. Around 35 percent of yarn produced was utilized in house, rest was sold to the range of textile customers. Raw materials include Pakistani and imported cotton, sustainable materials including BCI and organic cotton, synthetic fibers including acrylic, viscose, polyester. In spinning segment average sale rate improved by 9 percent from Rs 176/lbs to Rs 191/lbs. On the other side, average cotton price also increased by 7 percent from last year. Spinning industry faced a number of challenges throughout the year such as high rate of local cotton due to shortfall in local cotton crop and slow world economic growth.
Weaving segment produced 10 million meters of fabric. Weaving segment production improved by 0.5 percent in comparison to last year. Operational performance
92020

DIRECTORS' REPORTfor the year ended June 30, 2020
improved due increase in capacity utilization by 2 percent and increase in average sale rates by 16 percent. This business segment mainly caters in-house requirement for Processing and Home Textile divisions.
Processing and Home Textile segment operational performance remained depressed due decrease in export sales. Processed fabric and made-ups production decreased by 14 percent and 16 percent respectively in comparison to last year. Average selling rates increased by 9 percent in processed fabric export and by 17 percent in made up export. This increase was mainly attributed to Rupee devaluation during the year. However, in dollar terms average selling rates decreased by 7 percent in processed fabric export and remained stable in made-up export.
COVID-19 Considerations COVID-19 continues to spread as a global pandemic, it has unprecedented impacts including concerns over supply chain disruptions and numerous strategic and operational concerns impacting both the short and long-term plans. The Company had proactively managed relationships with key suppliers and customers. Our major concern was the availability of production inputs. The Company ensured that there were no supply chain disruptions during the lockdown period. Considering the advice regarding reduced travel and avoiding large groups of people, we decided to conduct all meetings including Executive Committee, Management Committee and Plant Operation meetings through video conference. As the safety of employees was a priority during the COVID-19 outbreak, Company made necessary arrangements for the use of technology and related applications in order to enable them to work from home wherever possible.
Corporate Briefing Session (CBS)The Company held CBS on November 26, 2019. The objective behind the company's engagement through this briefing was to give investors (both existing and potential) the right perspective of the Company's business affairs, which will help them make their investment decisions. Investors from all walks of life attended the event and showed great interest in the affairs of the Company. Board continues to value the importance of building strong
investor relations. The Company believes that the relationship with shareholders is crucial in helping us achieve our aims.
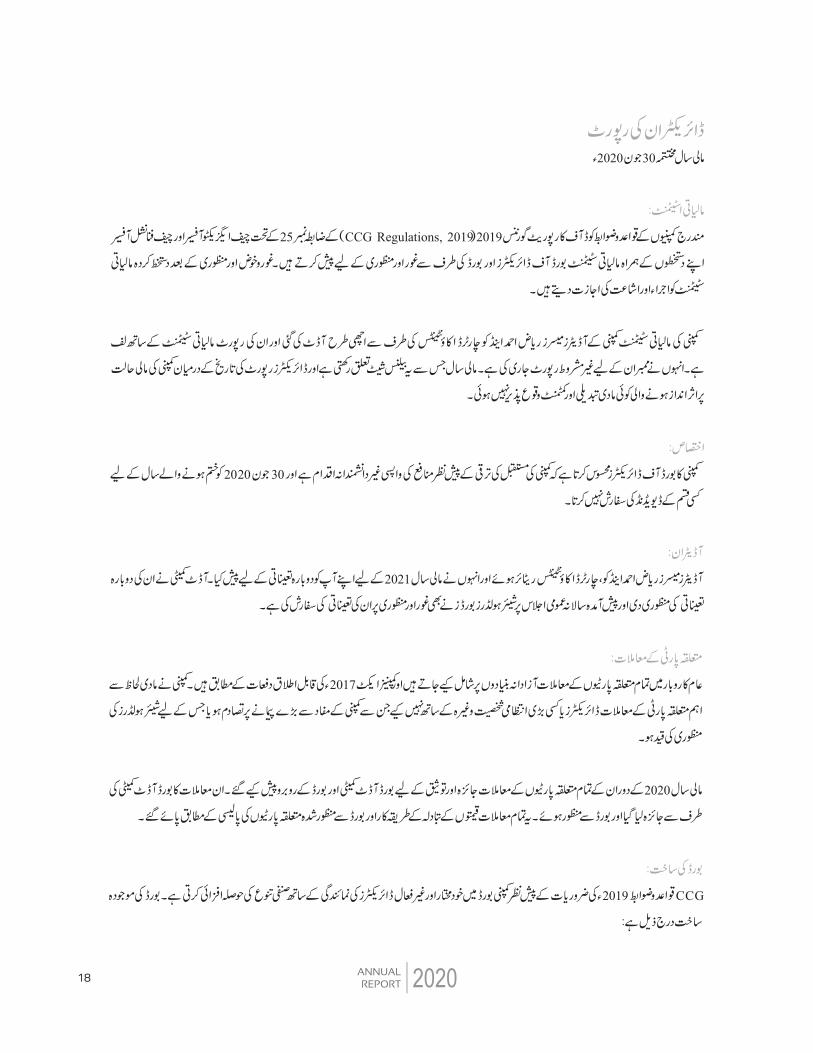
Financial StatementsAs required under regulation 25 of Listed Companies (Code of Corporate Governance) Regulations, 2019 ("CCG Regulations, 2019"), the Chief Executive Officer and the Chief Financial Officer present the financial statements, duly endorsed under their respective signatures, for consideration and approval of the Board of Directors, after consideration and approval, authorize the signing of financial statements for issuance and circulation. The financial statements of the Company have been duly audited by the Messrs Riaz Ahmad and Company, Chartered Accountants and their report is attached with the financial statements. They have issued an unqualified report to the members. No material changes and commitments affecting the financial position of the Company have occurred between the end of the financial year to which these financial statements relate and the date of the Directors' Report.
AppropriationsThe Board of Directors of the company feels that it is prudent to plough back the profits for future growth of the company and do not recommend any dividend for the year ended June 30, 2020.
AuditorsThe auditors Messrs Riaz Ahmad and Company, Chartered Accountants, retire and offer themselves for re-appointment for the year financial 2021. The Audit Committee has recommended their re-appointment which has been endorsed by the Board for shareholders consideration and approval at the forthcoming annual general meeting.
Related Party TransactionsAll the related party transactions are entered on arm's length basis in the ordinary course of business and are in compliance with the applicable provisions of the Companies Act, 2017. There are no materially significant related party transactions made by the Company with Directors or Key Managerial Personnel etc. which may
10 2020

DIRECTORS' REPORTfor the year ended June 30, 2020
have potential conflict with the interest of the Company at large or which warrants the approval of the shareholders.
All related party transactions during the FY20 were placed before the Board Audit Committee (BAC) and the Board for their review and approval. These transactions were reviewed by the BAC and approved by the Board. All these transactions were in line with the transfer pricing methods and the policy for related parties approved by the Board.
Composition of BoardIn line with the requirements of the CCG Regulations, 2019, the Company encourages representation of independent and non-executive directors, as well as gender diversity on its Board. The current composition of the Board is as follows:
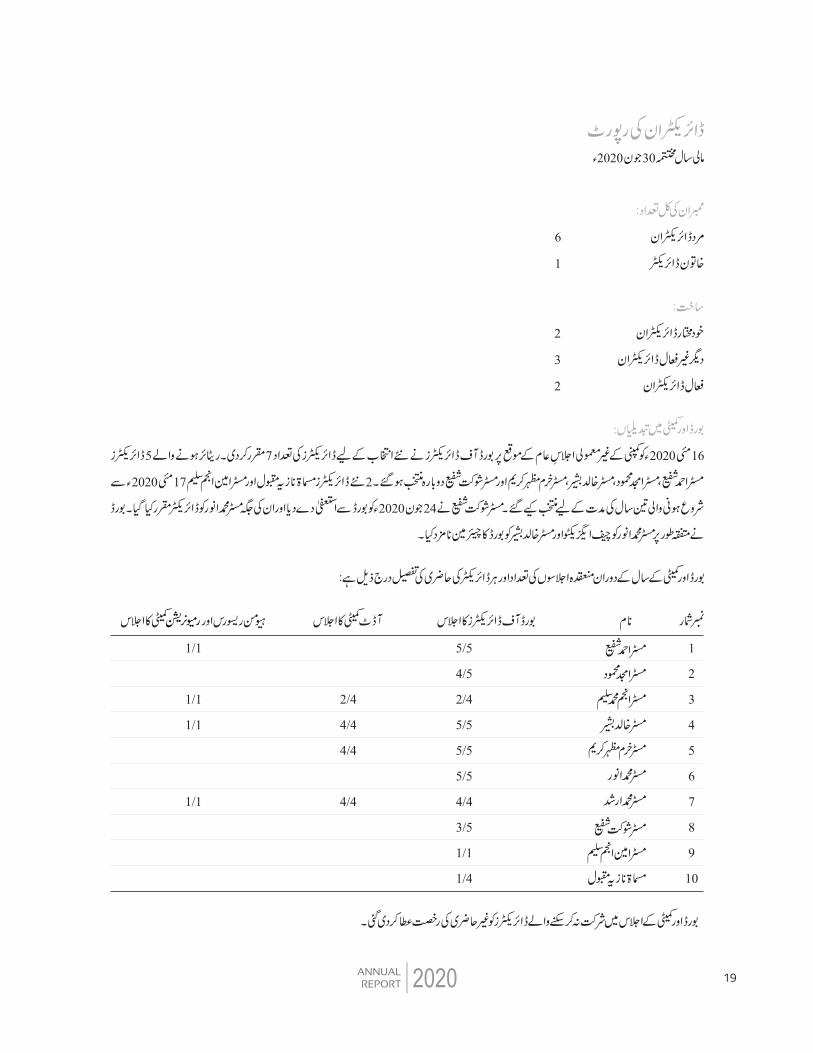
Total number of Directors:Male directors 6Female director 1
Composition:Independent directors 2Other non-executive directors 3Executive directors 2
Changes in the Board and Committees The Board of Directors, fixed the number of Directors, at seven (7) for the fresh election at the EOGM of the Company on May 16, 2020. Five (5) retiring directors namely Mr. Ahmad Shafi, Mr. Amjad Mehmood, Mr. Khalid Bashir, Mr. Khurram Mazhar Karim and Mr. Shaukat Shafi were re-elected. Two new directors namely Mrs. Nazia Maqbool and Mr. Amin Anjum Saleem were elected for a term of three (3) years commencing from May 17, 2020.
Mr. Shaukat Shafi resigned from the board on Jun 24, 2020 and Mr. Muhammad Anwar was appointed as director to fill the casual vacancy. The Board unanimously appointed Mr. Muhammad Anwar as the Chief Executive and Mr. Khalid Bashir as chairman of Board.
Detail of number of board and committee meetings held during the year and attendance by each director is as under:
112020
S# 12345678910
NameMr. Ahmad ShafiMr. Amjad MehmoodMr. Anjum Muhammad SaleemMr. Khalid BashirMr. Khurram Mazhar KarimMr. Muhammad AnwarMr. Muhammad ArshadMr. Shaukat ShafiMr. Amin Anjum SaleemMrs. Nazia Maqbool
Board ofDirectors Meeting
5/5 4/5 2/4 5/5 5/5 5/5 4/4 3/5 1/1 1/1
Audit CommitteeMeeting
2/4 4/4 4/4
4/4
HR & R CommitteeMeeting
1/1
1/1 1/1
1/1
Leave of absence was granted to directors who could not attend some of the Board and Committee meetings.
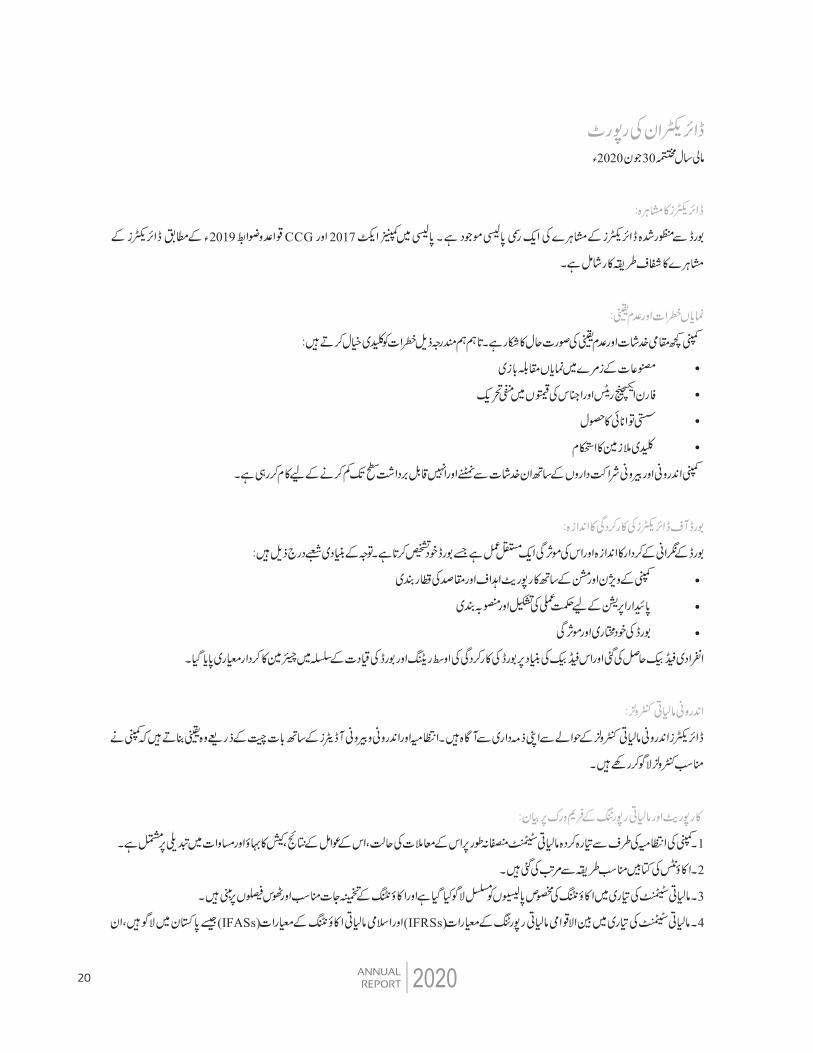
Directors' RemunerationA formal Director's Remuneration policy approved by the
Board is in place. The policy includes transparent procedure for remuneration of directors in accordance with the Companies Act, 2017 and CCG Regulations, 2019.

Principal Risks and UncertaintiesThe Company is exposed to certain inherent risks and uncertainties. However, we consider the following as key risks:
�
�
�
�
The Company works with internal and external stakeholders to mitigate these risks and to reduce these to acceptable level.
Performance Evaluation of Board of DirectorsThe evaluation of the Board's role of oversight and its effectiveness is a continual process, which is appraised by the Board itself. The core areas of focus are:
�
�
�
Individual feedback was obtained and on the basis of that feedback, the average rating of the performance of the Board and role of the Chairman regarding governing the Board was found up to the mark.
Internal Financial ControlsThe directors are aware of their responsibility with respect to internal financial controls. Through discussions with management and auditors (both internal and external), they confirm that adequate controls have been implemented by the Company
Statement on Corporate and Financial Reporting Framework:
a.
b.
c.
d.
e.
f.
g.
h.
i.
j.
DIRECTORS' REPORTfor the year ended June 30, 2020
Significant competition in our product categories;
Adverse movement in foreign exchange rates and commodity prices;
Availability of cheaper energy mix; and
Retention of key employees.
Alignment of corporate goals and objectives with the vision and mission of the Company;
Strategy formulation and planning for sustainable operation; and
The Board's independence and effectiveness
Financial statements prepared by Company's management present fairly its state of affairs, results of its operations, cash flows and changes in equity;
Proper books of accounts have been maintained;
Appropriate accounting policies have been consistently applied, in preparation of financial statements and accounting estimates are based on reasonable and prudent judgment;
International Financial Reporting Standards (IFRSs) and Islamic Financial Accounting Standards (IFASs), as applicable in Pakistan, have been followed in preparation of financial statements and any departure there from has been adequately disclosed and explained;
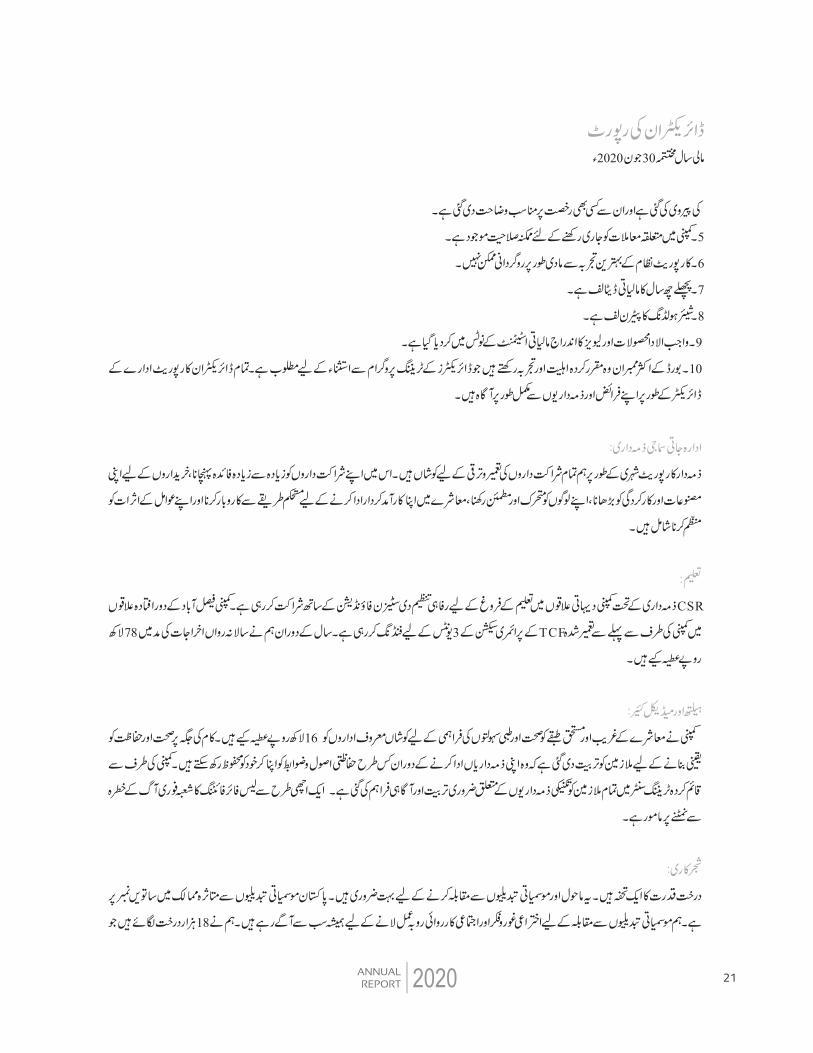
The Company has sound potentials to continue as going concern;
There has been no material departure from best practices of corporate governance;
Financial data of the last six years is attached;
Pattern of Shareholding is attached;
Outstanding taxes and levies are given in the Notes to the Financial Statements; and
The majority of the Board members have the prescribed qualifications and experience required for exemption from training program of Directors. All Directors are fully conversant with their duties and responsibilities as Directors of corporate bodies.
12 2020
Corporate Social Responsibility (CSR)As responsible corporate citizens we strive to build and enhance value for all stakeholders. That includes maximizing returns for our shareholders, enhancing our products and efficiency for our customers, keeping our people motivated, satisfied, practice our business in a sustainable way to do our part in contributing to society and managing the impact of our operations.
EducationUnder the CSR commitment, the Company has been partnering with The Citizen Foundation (TCF), welfare organization for promotion of education in the rural areas. Company has been funding three Units of primary sections of TCF, already built by the Company in remote area of Faisalabad, during the year we paid annual running expense amounting to Rs. 7.8 million.
Health and Medical CareCompany has donated Rs. 1.6 million to reputable institutions engaged in providing health and medical facilities for poor and needy class of the society. To ensure health and safety at the workplace employees are trained to protect themselves by occupational safety rules and procedures while performing jobs. Adequate training and awareness about technical jobs are given to all employees in the 'Training Centre' established by the Company. A well-equipped firefighting department is looking after immediate fire hazardous. Trees PlantationTrees are a gift of nature they are essential for the environment and to combat climate change. Pakistan is the seventh most vulnerable country to climate change. We always remained at the forefront of taking collective action and thinking innovatively to combat climate change. We have planted 18,000 trees which are saving approximately 390 tons of CO2 per year. By planting trees, we are reducing CO2 emissions and contributing towards a healthy, natural living environment within the premises for all our employees and the society at large.
Human Resource DevelopmentTraining, education and development of its people, is a topic of critical importance to the Company. It is an area where we work continuously with formal trainings, development and growth opportunities, performance appraisal and feedback systems. To attract, retain and bring out the best in its people, the Company arranged multiple leadership trainings for its senior management in Pakistan and abroad. During the year, the Company built a culture of rewarding extraordinary performance through initiating reward & recognition programs to encourage a constructive behavior and develop healthy competition amongst all employees. We encourage participation of a large number of female workforces in the Company's growth and d e v e l o p m e n t . T h e C o m p a n y p r o h i b i t s discrimination and harassment of any kind.
Industrial RelationsCompany has a long and established history of keeping its cordial relations at all levels with mutual trust, respect, cooperation and confidence. This ensures and improves ultimate efficiency of the Company. Reasonable opportunities are afforded to the workmen in participating Collective Bargaining Agent (CBA) activities and elect representatives of their choice under free and fair environment.
Every year through a demand notice raised by CBA, Company pays incentive bonus, profit bonus, Hajj expenses of 06 employees, distributes cycle, fan and sewing machines on easy installments. Company has also arranged Fair Price Shop and Canteen facilities for its employees.
Environment ProtectionCrestex aims to conserve water, energy and ecosystems, to reduce greenhouse gas emissions, to minimize waste and to inspire public consciousness in support of environmental sustainability. The Company seeks to identify, measure and understand the direct and indirect impact of its operations and develop innovative and realistic solutions for mitigating those impacts.
DIRECTORS' REPORTfor the year ended June 30, 2020
132020

DIRECTORS' REPORTfor the year ended June 30, 2020
14 2020
ISO 9001:2015 Quality Management SystemsISO 14001:2015 Environment Management SystemsOCS: 2.0 Product & Social Standards, Organic Content StandardGOTS: 5.0 Product & Social, Global Organic Textile Standard GRS 4.0 Product & Social, Global Recycled Standard Oeko-Tex 100 Product Standards for Human EcologySA 8000: 2014 Social AccountabilitySEDEX /SMETA/ETI Ethical Trading Initiative / Ethical Performance Ecolabelling (SWAN) Environmental, Health and Quality RequirementsFair Trade Sustainable Product & Ethical Trade CertificationZDHC Zero Discharge of Hazardous Chemicals Higg Index V3 Social-Chemical & Environment SustainabilityCMIA Sustainable Cotton Trade MarkBCI Sustainable Cotton Trade Mark EAC Egyptian Cotton Trade Mark Supima Cotton Cotton Trade MarkUSA Cotton Cotton Trade Mark
Energy ConservationA focus on energy conservation, waste reduction, water conservation and National Environmental Quality Standards (NEQS) compliance through implementation of sustainability plans continued this year as well.Company is operating effluent treatment plant for processing plant. This plant recycles water and reduces the effluent load in drainage system. Wet scrubbers, effective air pollution control devices, are installed at our Coal Steam Boiler for removing particles and gases from industrial exhaust streams. This results in decontamination, detoxification, and dust removal for the benefit of our environment. Company is also operating caustic recovery plant at our dyeing unit. This plant recovers chemicals and provides cost savings through recycling process. It also reduces hazardous materials in drained water. Conventional tube lights are being replaced with LED lights for the sake of energy conservation, lower maintenance costs, longer life, high durability and reduced carbon
Contribution to National ExchequerDuring the year, the Company contributed Rs. 286 million to national exchequer in the shape of direct and indirect taxes and earned valuable foreign exchange of US$ 50.38 million through the export of its products.
Employees' Retirement BenefitsCompany established an 'Employees' Provident Fund Trust' to manage and control its financial affairs independently. Trust is recognized under Income Tax Laws and its income and contributions are exempt from tax. It receives subscription from employees with equal contribution from the Company. The value of investments of fund as per their financial statement was Rs. 756 million.
Business and operations of the Company are certified for compliance of international standards and regulatory requirements from national and international stakeholders. We have achieved third
party certifications through the accredited agencies for following product, services, and management systems standards:
footprint. Continuous efforts have been made throughout the year to reduce steam leakages and ensure proper insulation to avoid energy losses from the system.
Future OutlookAlthough challenges are high but we are committed to perform in best possible manner and add value to our stakeholders to meet the long-term goals of the Company. For improving quality of our products and get premium on selling prices we will continue to upgrade plant and machinery with the prime objective of reducing imbalance and inefficiencies, reducing utilities and maintenance requirements and develop our human capital.
AcknowledgementThe Board of Directors would like to thank all stakeholders of the company including, customers, shareholders, vendors, government agencies, bankers & all other business associates for their continued support during the year. We place on record our appreciation for the contributions made by the employees at all level.
DIRECTORS' REPORTfor the year ended June 30, 2020
For and on behalf of the Board of Directors
Muhammad AnwarChief Executive Officer
152020
Khalid BashirDirector

2020 30
16 2020
2019 2020
13,264
1,549
1,009
481
117
143
34
0.42
13,946
1,637
1,065
507
330
157
239
2.98
(682)
(88)
(56)
(26)
(213)
(14)
(205)
(2.56)
(4.9)
(5.4)
(5.3)
(5.1)
(64.5)
(8.9)
(85.8)
(85.8)
2020 30
172020
2020 30
18 2020
2020 30
192020
5/5
4/5
2/4
5/5
5/5
5/5
4/4
3/5
1/1
1/4
1
2
3
4
5
6
7
8
9
10
2/4
4/4
4/4
4/4
1/1
1/1
1/1
1/1
2020 30
20 2020
2020 30
212020

2020 30
22 2020
2020 30
232020
2020 30
24 2020
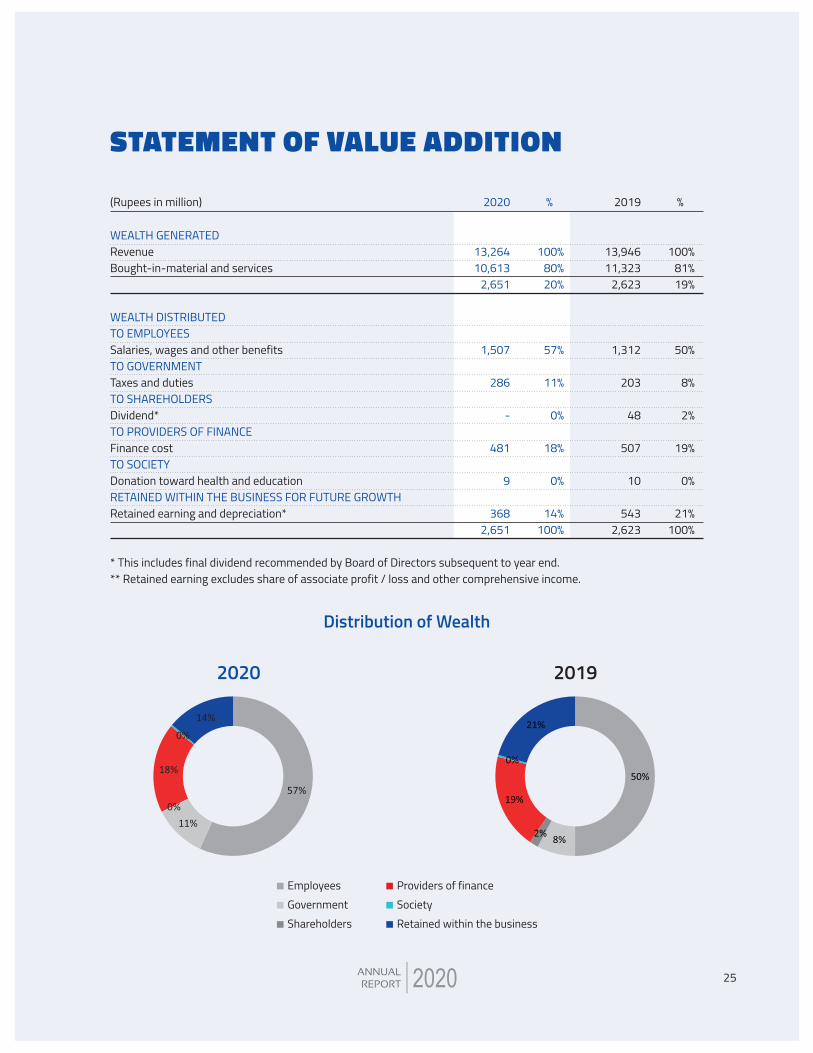
WEALTH GENERATEDRevenueBought-in-material and services
WEALTH DISTRIBUTEDTO EMPLOYEESSalaries, wages and other benefits TO GOVERNMENTTaxes and dutiesTO SHAREHOLDERSDividend*TO PROVIDERS OF FINANCEFinance costTO SOCIETYDonation toward health and educationRETAINED WITHIN THE BUSINESS FOR FUTURE GROWTHRetained earning and depreciation*
* This includes final dividend recommended by Board of Directors subsequent to year end.** Retained earning excludes share of associate profit / loss and other comprehensive income.
2020
13,264 10,613
2,651
1,507
286
-
481
9
368 2,651
(Rupees in million)
STATEMENT OF VALUE ADDITION
25
%
100%80%20%
57%
11%
0%
18%
0%
14%100%
2019
13,946 11,323
2,623
1,312
203
48
507
10
543 2,623
%
100%81%19%
50%
8%
2%
19%
0%
21%100%
2020
Distribution of Wealth
EmployeesGovernmentShareholders
Providers of financeSocietyRetained within the business
2020 2019
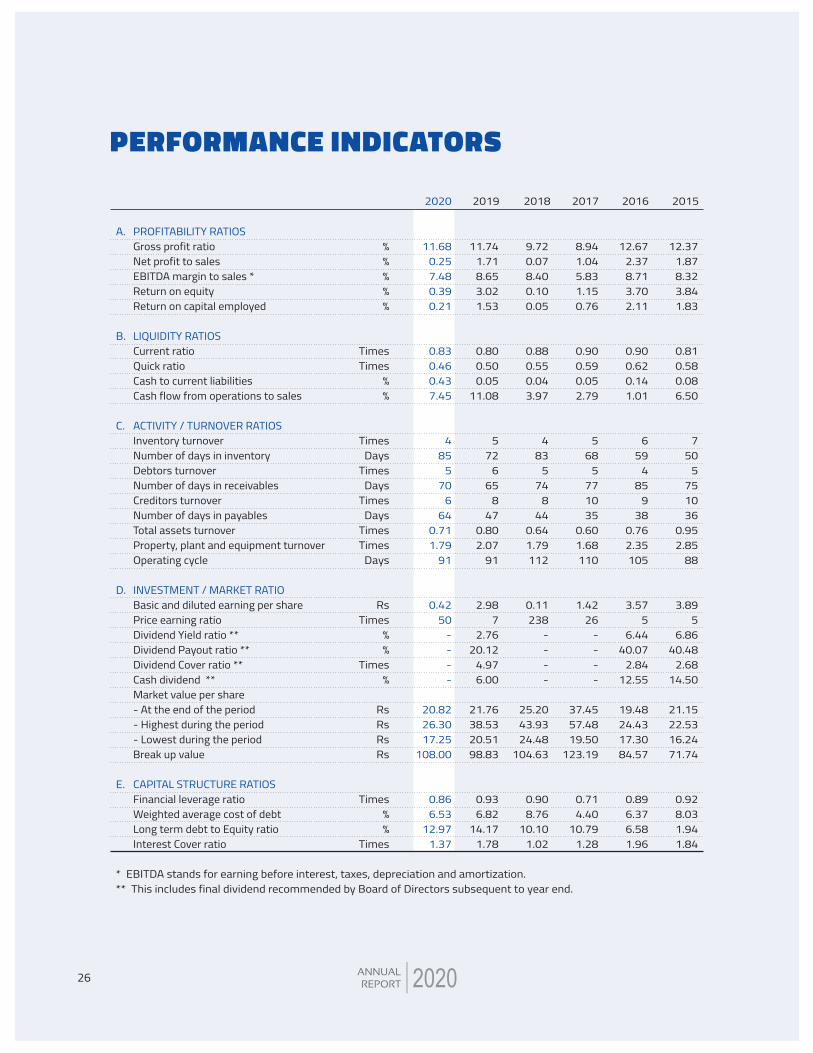
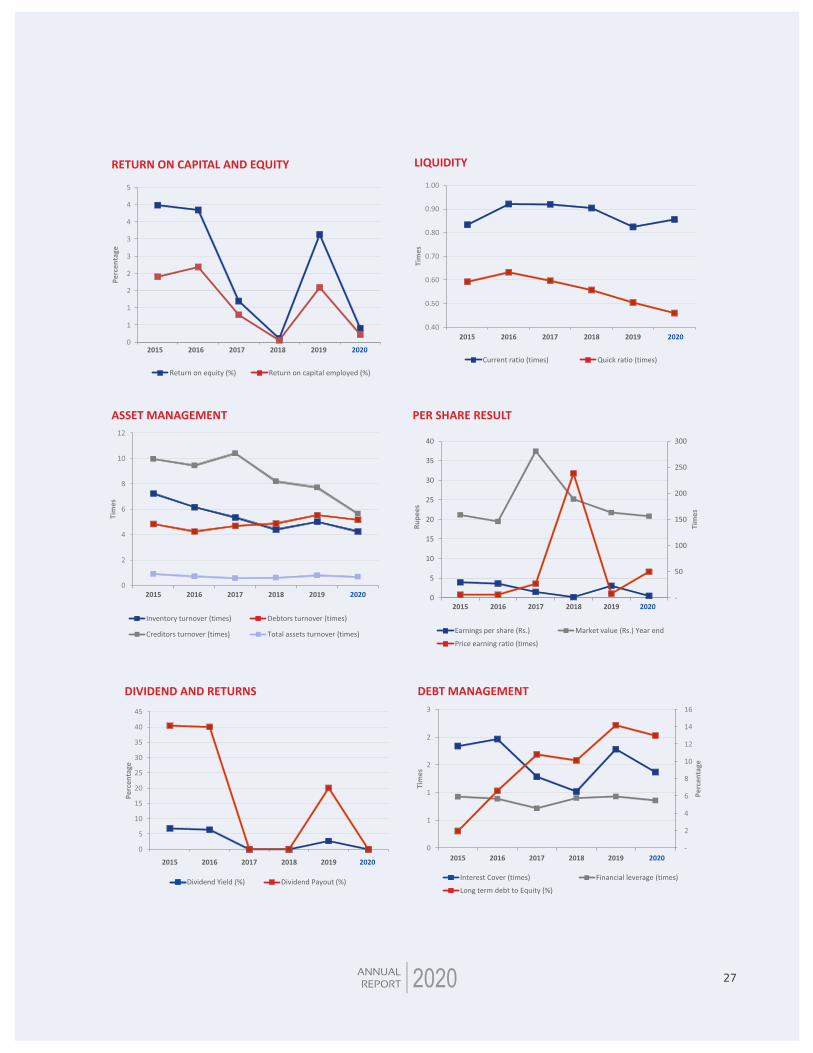
PERFORMANCE INDICATORS
A.
B.
C.
D.
E.
* EBITDA stands for earning before interest, taxes, depreciation and amortization. ** This includes final dividend recommended by Board of Directors subsequent to year end.
2015
12.37 1.87 8.32 3.84 1.83
0.81 0.58 0.08 6.50
7 50
5 75 10 36
0.95 2.85
88
3.89 5
6.86 40.48
2.68 14.50
21.15 22.53 16.24 71.74
0.92 8.03 1.94 1.84
12.67 2.37 8.71 3.70 2.11
0.90 0.62 0.14 1.01
6 59
4 85
9 38
0.76 2.35 105
3.57 5
6.44 40.07
2.84 12.55
19.48 24.43 17.30 84.57
0.89 6.37 6.58 1.96
2016
8.94 1.04 5.83 1.15 0.76
0.90 0.59 0.05 2.79
5 68
5 77 10 35
0.60 1.68 110
1.42 26
- - - -
37.45 57.48 19.50
123.19
0.71 4.40
10.79 1.28
2017
9.72 0.07 8.40 0.10 0.05
0.88 0.55 0.04 3.97
4 83
5 74
8 44
0.64 1.79 112
0.11 238
- - - -
25.20 43.93 24.48
104.63
0.90 8.76
10.10 1.02
2018
11.68 0.25 7.48 0.39 0.21
0.83 0.46 0.43 7.45
4 85
5 70
6 64
0.71 1.79
91
0.42 50
- - - -
20.82 26.30 17.25
108.00
0.86 6.53
12.97 1.37
2020
11.74 1.71 8.65 3.02 1.53
0.80 0.50 0.05
11.08
5 72
6 65
8 47
0.80 2.07
91
2.98 7
2.76 20.12
4.97 6.00
21.76 38.53 20.51 98.83
0.93 6.82
14.17 1.78
2019
%%%%%
TimesTimes
%%
TimesDays
TimesDays
TimesDays
TimesTimes
Days
RsTimes
%%
Times%
RsRsRsRs
Times%%
Times
PROFITABILITY RATIOSGross profit ratioNet profit to salesEBITDA margin to sales *Return on equityReturn on capital employed
LIQUIDITY RATIOSCurrent ratioQuick ratioCash to current liabilities Cash flow from operations to sales
ACTIVITY / TURNOVER RATIOSInventory turnoverNumber of days in inventoryDebtors turnoverNumber of days in receivablesCreditors turnoverNumber of days in payablesTotal assets turnoverProperty, plant and equipment turnoverOperating cycle
INVESTMENT / MARKET RATIOBasic and diluted earning per sharePrice earning ratioDividend Yield ratio **Dividend Payout ratio **Dividend Cover ratio **Cash dividend **Market value per share - At the end of the period- Highest during the period- Lowest during the periodBreak up value
CAPITAL STRUCTURE RATIOSFinancial leverage ratioWeighted average cost of debtLong term debt to Equity ratioInterest Cover ratio
26 2020
2015 2016 2017 2018 2019 2020
2015 2016 2017 2018 2019 2020
2015 2016 2017 2018 2019 2020
2015 2016 2017 2018 2019 2020
40
35
30
25
20
15
10
5
0
300
250
200
150
100
50
-2016 2017 2018 2019 20202015
2015 2016 2017 2018 2019 2020
Debtors turnover (times)
Earnings per share (Rs.)
5
4
4
3
3
2
2
1
1
0
1.00
0.90
0.80
0.70
0.60
0.50
0.40
12
10
8
6
4
2
0
16
14
12
8
6
2
-
27
10
4
2020
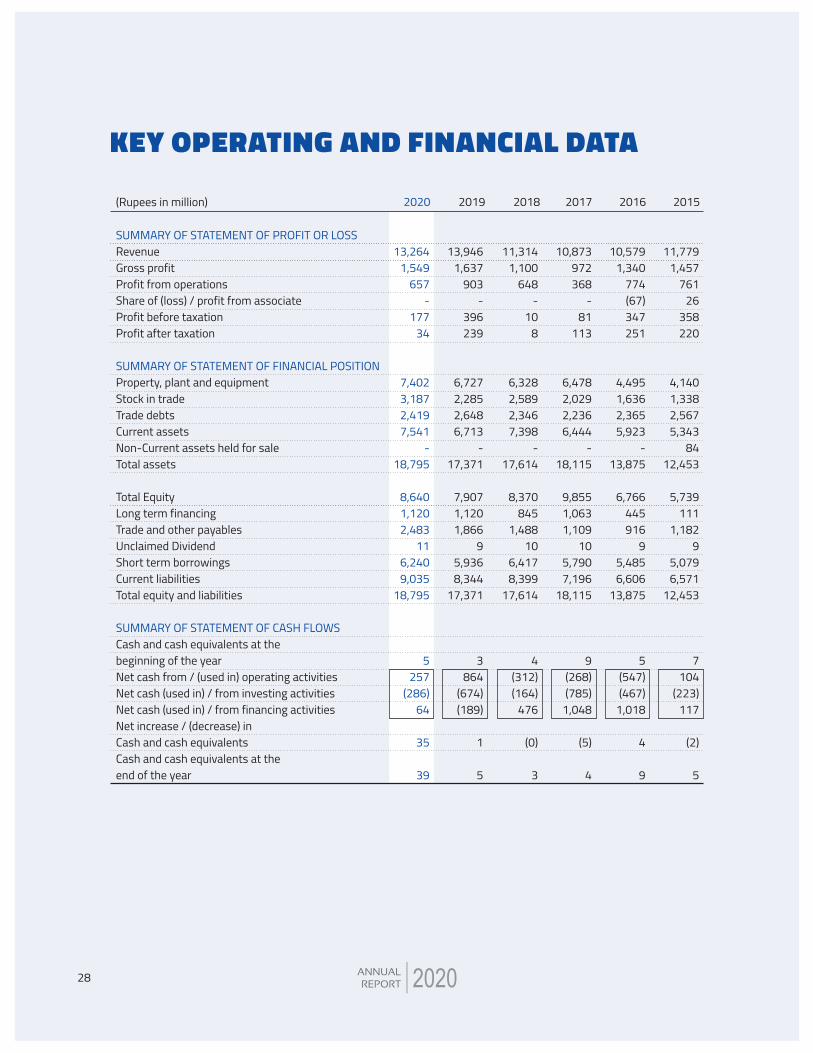
SUMMARY OF STATEMENT OF PROFIT OR LOSS RevenueGross profitProfit from operationsShare of (loss) / profit from associateProfit before taxation Profit after taxation
SUMMARY OF STATEMENT OF FINANCIAL POSITION Property, plant and equipmentStock in tradeTrade debtsCurrent assetsNon-Current assets held for saleTotal assets
Total EquityLong term financingTrade and other payablesUnclaimed DividendShort term borrowingsCurrent liabilitiesTotal equity and liabilities
SUMMARY OF STATEMENT OF CASH FLOWSCash and cash equivalents at the beginning of the yearNet cash from / (used in) operating activitiesNet cash (used in) / from investing activitiesNet cash (used in) / from financing activitiesNet increase / (decrease) inCash and cash equivalentsCash and cash equivalents at the end of the year
KEY OPERATING AND FINANCIAL DATA
(Rupees in million)
13,264 1,549
657 -
177 34
7,402 3,187 2,419
7,541 -
18,795
8,640 1,120 2,483
11 6,240
9,035 18,795
5 257
(286)64
35
39
2020 201520162017
11,779 1,457
761 26
358 220
4,140 1,338 2,567
5,343 84
12,453
5,739 111
1,182 9
5,079 6,571
12,453
7 104
(223)117
(2)
5
10,579 1,340
774 (67) 347 251
4,495 1,636 2,365 5,923
- 13,875
6,766 445 916
9 5,485 6,606
13,875
5 (547)(467)
1,018
4
9
10,873 972 368
- 81
113
6,478 2,029 2,236
6,444 -
18,115
9,855 1,063 1,109
10 5,790
7,196 18,115
9 (268)(785)
1,048
(5)
4
2018
11,314 1,100
648 -
10 8
6,328 2,589 2,346 7,398
- 17,614
8,370 845
1,488 10
6,417 8,399
17,614
4 (312)(164)
476
(0)
3
2019
13,946 1,637
903 -
396 239
6,727 2,285 2,648 6,713
- 17,371
7,907 1,120 1,866
9 5,936 8,344
17,371
3 864
(674)(189)
1
5
28 2020
Rs.
in m
illio
n
2015 2016 2017 2018 2019 2020
Rs.
in m
illio
n
Shareholders' equity (Rs. in million)2015 2016 2017 2018 2019 2020
12,000
02015 2016 2017 2018 2019 2020
140
120
100
80
60
40
20
-
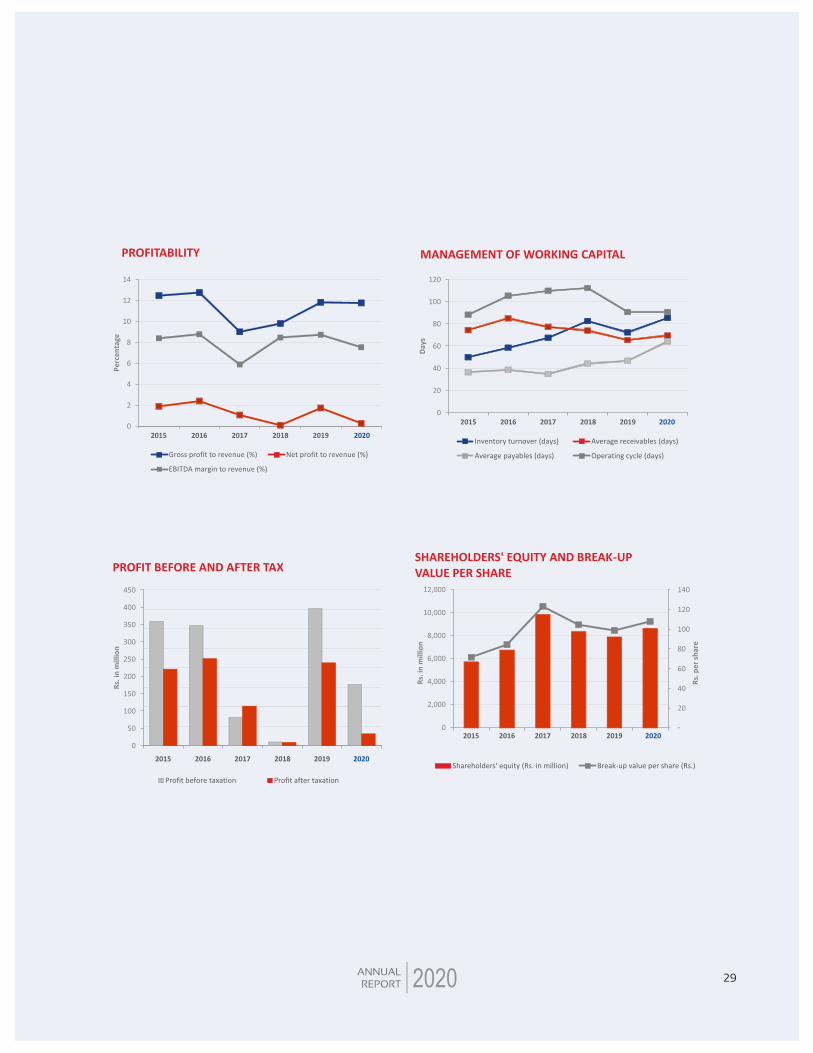
Gross profit to revenue (%) Net profit to revenue (%)
EBITDA margin to revenue (%)
2015 2016 2017 2018 2019 2020
450
400
350
300
250
200
150
100
50
0
292020
10,000
8,000
6,000
4,000
2,000

VERTICAL ANALYSISfor the last six financial years
STATEMENT OF FINANCIAL POSITION Property, plant and equipmentIntangible assetsInvestment in an associateLong term investmentsLong term loans and advancesLong term deposits and prepayments Deferred income tax assetStores, spare parts and loose toolsStock in tradeTrade debtsLoans and advancesShort term deposits and prepaymentsAccrued interestOther receivablesShort term investmentsCash & bank balancesNon-Current assets held for saleTOTAL ASSETS
Issued, subscribed and paid up share capitalPremium on issue of right sharesFair value reserveSurplus on revaluation of operating fixed assetsRevenue reservesShareholders equityLong term financingLiabilities against assets subject to finance leaseDeferred income tax liabilityTrade and other payablesUnclaimed DividendAccrued mark-up Short term borrowingsCurrent portion of non-current liabilitiesProvision for taxationTOTAL EQUITY AND LIABILITIES
STATEMENT OF PROFIT OR LOSSRevenueCost of salesGross profitDistribution costAdministrative expensesOther expensesOther incomeProfit from operationsFinance costShare of (loss) / profit from associateProfit before taxationTaxationProfit after taxation
2020 % 2016 2015 %%2017 %2018 % 2019
6,727 6 -
3,792 1
30 103 265
2,285 2,648
754 71
5 291 390
4 -
17,371
800 200 524
3,567 2,815 7,907 1,120
- -
1,866 9
120 5,936
275 138
17,371
13,946 12,309
1,637 679 345
42 330 903 507
- 396 157 239
7,402 20
- 3,693
- 29
110 234
3,187 2,419
800 84
6 296 477
39 -
18,795
800 200 673
4,161 2,805 8,640
1,120 - -
2,483 11
101 6,240
35 166
18,795
13,264 11,715
1,549 574 392
43 117 657 481
- 177 143
34
38.7 0.0
- 21.8
0.0 0.2 0.6 1.5
13.2 15.2
4.3 0.4 0.0 1.7 2.2 0.0
- 100
4.6 1.2 3.0
20.5 16.2 45.5
6.4 - -
10.7 0.1 0.7
34.2 1.6 0.8
100
100.0 88.3 11.7
4.9 2.5 0.3 2.4 6.5 3.6
- 2.8 1.1 1.7
39.4 0.1
- 19.7
0.0 0.2 0.6 1.2
17.0 12.9
4.3 0.4 0.0 1.6 2.5 0.2
- 100
4.3 1.1 3.6
22.1 14.9 46.0
6.0 - -
13.2 0.1 0.5
33.2 0.2 0.9
100
100.0 88.3 11.7
4.3 3.0 0.3 0.9 5.0 3.6
- 1.3 1.1 0.3
4,140 -
336 2,541
4 5 -
177 1,338 2,567
418 23
5 744
66 5
84 12,453
615 62
462 2,291 2,310 5,739
100 11 32
1,182 9
85 5,079
112 104
12,453
11,779 10,322
1,457 648 234
63 249 761 429
26 358 138 220
33.2 -
2.7 20.4
0.0 0.0
- 1.4
10.7 20.6
3.4 0.2 0.0 6.0 0.5 0.0 0.7
100
4.9 0.5 3.7
18.4 18.5 46.1
0.8 0.1 0.3 9.5 0.1 0.7
40.8 0.9 0.8
100
100.0 87.6 12.4
5.5 2.0 0.5 2.1 6.5 3.6 0.2 3.0 1.2 1.9
4,495 - -
3,449 3 5 -
185 1,636 2,365
469 29
4 1,130
94 9 -
13,875
800 200
1,004 2,214 2,548 6,766
445 -
58 916
9 60
5,485 66 70
13,875
10,579 9,239 1,340
633 283
26 376 774 360 (67) 347
96 251
32.4 - -
24.9 0.0 0.0
- 1.3
11.8 17.0
3.4 0.2 0.0 8.1 0.7 0.1
- 100
5.8 1.4 7.2
16.0 18.4 48.8
3.2 -
0.4 6.6 0.1 0.4
39.5 0.5 0.5
100
100.0 87.3 12.7
6.0 2.7 0.2 3.6 7.3 3.4
(0.6) 3.3 0.9 2.4
6,478 18
- 5,167
2 5 -
192 2,029 2,236
577 62
4 1,253
88 4 -
18,115
800 200
2,719 3,575 2,561 9,855
1,063 - 0
1,109 10 65
5,790 190
31 18,115
10,873 9,901
972 644 300
10 350 368 287
- 81
(32) 113
35.8 0.1
- 28.5
0.0 0.0
- 1.1
11.2 12.3
3.2 0.3 0.0 6.9 0.5 0.0
- 100
4.4 1.1
15.0 19.7 14.1 54.4
5.9 -
0.0 6.1 0.1 0.4
32.0 1.1 0.2
100
100.0 91.1
8.9 5.9 2.8 0.1 3.2 3.4 2.6
- 0.7
(0.3) 1.0
6,328 12
- 3,736
1 10
128 198
2,589 2,346
687 61
3 1,416
94 3 -
17,614
800 200
1,226 3,568 2,577 8,370
845 - -
1,488 10 86
6,417 258 141
17,614
11,314 10,214
1,100 468 295
14 325 648 638
- 10
2 8
35.9 0.1
- 21.2
0.0 0.1 0.7 1.1
14.7 13.3
3.9 0.3 0.0 8.0 0.5 0.0
- 100
4.5 1.1 7.0
20.3 14.6 47.5
4.8 - -
8.4 0.1 0.5
36.4 1.5 0.8
100
100.0 90.3
9.7 4.1 2.6 0.1 2.9 5.7 5.6
- 0.1 0.0 0.1
%(Rupees in million)
30 2020
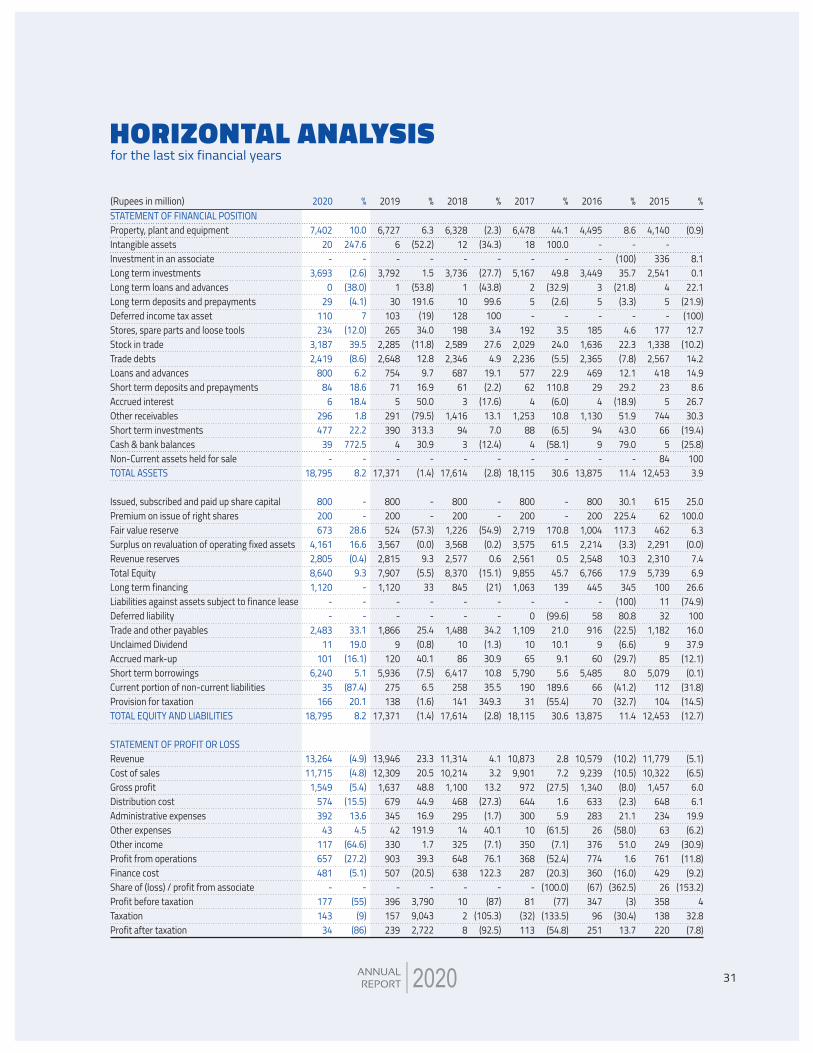
HORIZONTAL ANALYSIS
STATEMENT OF FINANCIAL POSITION Property, plant and equipmentIntangible assetsInvestment in an associateLong term investmentsLong term loans and advancesLong term deposits and prepayments Deferred income tax assetStores, spare parts and loose toolsStock in tradeTrade debtsLoans and advancesShort term deposits and prepaymentsAccrued interestOther receivablesShort term investmentsCash & bank balancesNon-Current assets held for saleTOTAL ASSETS
Issued, subscribed and paid up share capitalPremium on issue of right sharesFair value reserveSurplus on revaluation of operating fixed assetsRevenue reservesTotal EquityLong term financingLiabilities against assets subject to finance leaseDeferred liabilityTrade and other payablesUnclaimed DividendAccrued mark-up Short term borrowingsCurrent portion of non-current liabilitiesProvision for taxationTOTAL EQUITY AND LIABILITIES
STATEMENT OF PROFIT OR LOSSRevenueCost of salesGross profitDistribution costAdministrative expensesOther expensesOther incomeProfit from operationsFinance costShare of (loss) / profit from associateProfit before taxationTaxationProfit after taxation
for the last six financial years
(Rupees in million) %
(0.9)
8.1 0.1
22.1 (21.9) (100) 12.7
(10.2) 14.2 14.9
8.6 26.7 30.3
(19.4) (25.8)
100 3.9
25.0 100.0
6.3 (0.0)
7.4 6.9
26.6 (74.9)
100 16.0 37.9
(12.1) (0.1)
(31.8) (14.5) (12.7)
(5.1) (6.5)
6.0 6.1
19.9 (6.2)
(30.9) (11.8)
(9.2) (153.2)
4 32.8 (7.8)
2019
6,727 6 -
3,792 1
30 103 265
2,285 2,648
754 71
5 291 390
4 -
17,371
800 200 524
3,567 2,815 7,907 1,120
- -
1,866 9
120 5,936
275 138
17,371
13,946 12,309
1,637 679 345
42 330 903 507
- 396 157 239
%
6.3 (52.2)
- 1.5
(53.8) 191.6
(19) 34.0
(11.8) 12.8
9.7 16.9 50.0
(79.5) 313.3
30.9 -
(1.4)
- -
(57.3) (0.0)
9.3 (5.5)
33 - -
25.4 (0.8) 40.1 (7.5)
6.5 (1.6) (1.4)
23.3 20.5 48.8 44.9 16.9
191.9 1.7
39.3 (20.5)
- 3,790 9,043 2,722
2020
7,402 20
- 3,693
0 29
110 234
3,187 2,419
800 84
6 296 477
39 -
18,795
800 200 673
4,161 2,805 8,640 1,120
- -
2,483 11
101 6,240
35 166
18,795
13,264 11,715
1,549 574 392
43 117 657 481
- 177 143
34
%
10.0 247.6
- (2.6)
(38.0) (4.1)
7 (12.0)
39.5 (8.6)
6.2 18.6 18.4
1.8 22.2
772.5 -
8.2
- -
28.6 16.6 (0.4)
9.3 - - -
33.1 19.0
(16.1) 5.1
(87.4) 20.1
8.2
(4.9) (4.8) (5.4)
(15.5) 13.6
4.5 (64.6) (27.2)
(5.1) -
(55) (9)
(86)
2017
6,478 18
- 5,167
2 5 -
192 2,029 2,236
577 62
4 1,253
88 4 -
18,115
800 200
2,719 3,575 2,561 9,855 1,063
- 0
1,109 10 65
5,790 190
31 18,115
10,873 9,901
972 644 300
10 350 368 287
- 81
(32) 113
%
44.1 100.0
- 49.8
(32.9) (2.6)
- 3.5
24.0 (5.5) 22.9
110.8 (6.0) 10.8 (6.5)
(58.1) -
30.6
- -
170.8 61.5
0.5 45.7 139
- (99.6)
21.0 10.1
9.1 5.6
189.6 (55.4)
30.6
2.8 7.2
(27.5) 1.6 5.9
(61.5) (7.1)
(52.4) (20.3)
(100.0) (77)
(133.5) (54.8)
2015
4,140 -
336 2,541
4 5 -
177 1,338 2,567
418 23
5 744
66 5
84 12,453
615 62
462 2,291 2,310 5,739
100 11 32
1,182 9
85 5,079
112 104
12,453
11,779 10,322
1,457 648 234
63 249 761 429
26 358 138 220
2016
4,495 - -
3,449 3 5 -
185 1,636 2,365
469 29
4 1,130
94 9 -
13,875
800 200
1,004 2,214 2,548 6,766
445 -
58 916
9 60
5,485 66 70
13,875
10,579 9,239 1,340
633 283
26 376 774 360 (67) 347
96 251
%
8.6 -
(100) 35.7
(21.8) (3.3)
- 4.6
22.3 (7.8) 12.1 29.2
(18.9) 51.9 43.0 79.0
- 11.4
30.1 225.4 117.3
(3.3) 10.3 17.9 345
(100) 80.8
(22.5) (6.6)
(29.7) 8.0
(41.2) (32.7)
11.4
(10.2) (10.5)
(8.0) (2.3) 21.1
(58.0) 51.0
1.6 (16.0)
(362.5) (3)
(30.4) 13.7
2018
6,328 12
- 3,736
1 10
128 198
2,589 2,346
687 61
3 1,416
94 3 -
17,614
800 200
1,226 3,568 2,577 8,370
845 - -
1,488 10 86
6,417 258 141
17,614
11,314 10,214
1,100 468 295
14 325 648 638
- 10
2 8
%
(2.3) (34.3)
- (27.7) (43.8)
99.6 100 3.4
27.6 4.9
19.1 (2.2)
(17.6) 13.1
7.0 (12.4)
- (2.8)
- -
(54.9) (0.2)
0.6 (15.1)
(21) - -
34.2 (1.3) 30.9 10.8 35.5
349.3 (2.8)
4.1 3.2
13.2 (27.3)
(1.7) 40.1 (7.1) 76.1
122.3 -
(87) (105.3)
(92.5)
312020
STATEMENT OF COMPLIANCEwith Listed Companies (Code of Corporate Governance) Regulations, 2019
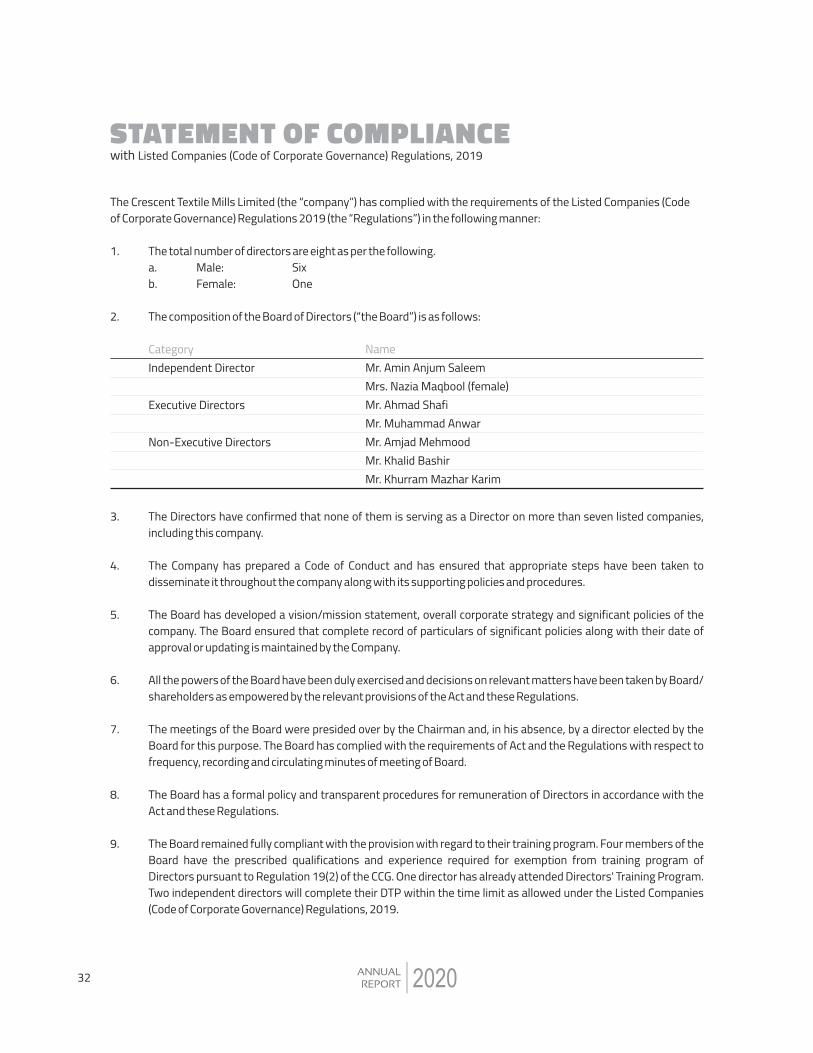
The Crescent Textile Mills Limited (the �company�) has complied with the requirements of the Listed Companies (Code of Corporate Governance) Regulations 2019 (the �Regulations�) in the following manner:
1.
2.
The total number of directors are eight as per the following.a. Male: Sixb. Female: One
The composition of the Board of Directors (�the Board�) is as follows:
CategoryIndependent Director
Executive Directors
Non-Executive Directors
NameMr. Amin Anjum SaleemMrs. Nazia Maqbool (female)Mr. Ahmad ShafiMr. Muhammad AnwarMr. Amjad MehmoodMr. Khalid BashirMr. Khurram Mazhar Karim
3.
4.
5.
6.
7.
8.
9.
The Directors have confirmed that none of them is serving as a Director on more than seven listed companies, including this company.
The Company has prepared a Code of Conduct and has ensured that appropriate steps have been taken to disseminate it throughout the company along with its supporting policies and procedures.
The Board has developed a vision/mission statement, overall corporate strategy and significant policies of the company. The Board ensured that complete record of particulars of significant policies along with their date of approval or updating is maintained by the Company.
All the powers of the Board have been duly exercised and decisions on relevant matters have been taken by Board/ shareholders as empowered by the relevant provisions of the Act and these Regulations.
The meetings of the Board were presided over by the Chairman and, in his absence, by a director elected by the Board for this purpose. The Board has complied with the requirements of Act and the Regulations with respect to frequency, recording and circulating minutes of meeting of Board.
The Board has a formal policy and transparent procedures for remuneration of Directors in accordance with the Act and these Regulations.
The Board remained fully compliant with the provision with regard to their training program. Four members of the Board have the prescribed qualifications and experience required for exemption from training program of Directors pursuant to Regulation 19(2) of the CCG. One director has already attended Directors' Training Program. Two independent directors will complete their DTP within the time limit as allowed under the Listed Companies (Code of Corporate Governance) Regulations, 2019.
32 2020
10.
11.
12.
13.
14.
15.
16.
17.
18.
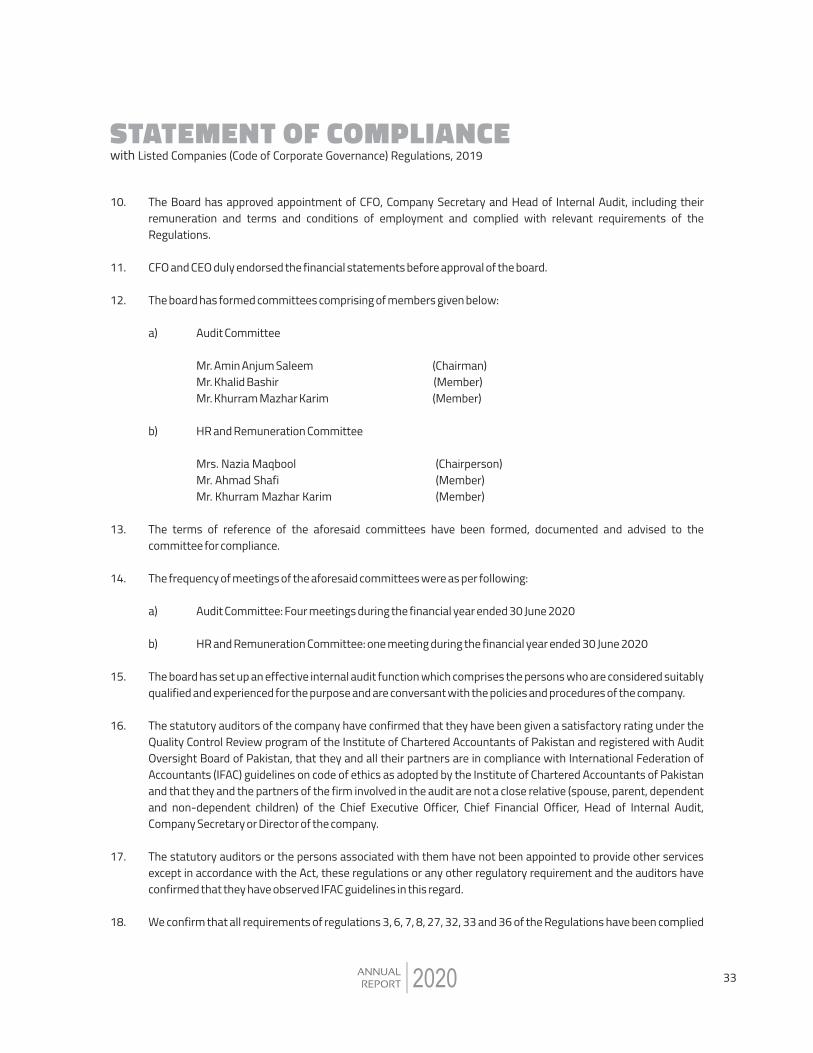
The Board has approved appointment of CFO, Company Secretary and Head of Internal Audit, including their remuneration and terms and conditions of employment and complied with relevant requirements of the Regulations.
CFO and CEO duly endorsed the financial statements before approval of the board.
The board has formed committees comprising of members given below:
a) Audit Committee
Mr. Amin Anjum Saleem (Chairman) Mr. Khalid Bashir (Member) Mr. Khurram Mazhar Karim (Member)
b) HR and Remuneration Committee
Mrs. Nazia Maqbool (Chairperson) Mr. Ahmad Shafi (Member) Mr. Khurram Mazhar Karim (Member)
The terms of reference of the aforesaid committees have been formed, documented and advised to the committee for compliance.
The frequency of meetings of the aforesaid committees were as per following:
a) Audit Committee: Four meetings during the financial year ended 30 June 2020
b) HR and Remuneration Committee: one meeting during the financial year ended 30 June 2020
The board has set up an effective internal audit function which comprises the persons who are considered suitably qualified and experienced for the purpose and are conversant with the policies and procedures of the company.
The statutory auditors of the company have confirmed that they have been given a satisfactory rating under the Quality Control Review program of the Institute of Chartered Accountants of Pakistan and registered with Audit Oversight Board of Pakistan, that they and all their partners are in compliance with International Federation of Accountants (IFAC) guidelines on code of ethics as adopted by the Institute of Chartered Accountants of Pakistan and that they and the partners of the firm involved in the audit are not a close relative (spouse, parent, dependent and non-dependent children) of the Chief Executive Officer, Chief Financial Officer, Head of Internal Audit, Company Secretary or Director of the company.
The statutory auditors or the persons associated with them have not been appointed to provide other services except in accordance with the Act, these regulations or any other regulatory requirement and the auditors have confirmed that they have observed IFAC guidelines in this regard.
We confirm that all requirements of regulations 3, 6, 7, 8, 27, 32, 33 and 36 of the Regulations have been complied
STATEMENT OF COMPLIANCEwith Listed Companies (Code of Corporate Governance) Regulations, 2019
332020

Sr. #
1.
Requirement
Nomination Committee:The Board may constitute a separate committee, designated as the Nomination Committee (NC) of such number and class of directors, as it may deem appropriate in its circumstances.
Risk Management Committee:The Board may constitute the Risk Management Committee (RMC), of such number and class of directors, as it may deem appropriate in its circumstances, to carry out review of effectiveness of risk management procedures and present a report to the Board.
Reg. #
29(1)
30(1)
Explanation for Non-compliance
Currently the Board has not constituted a separate NC and the functions are being performed by the HR committee.
Currently the Board has not constituted the RMC and the Company's Risk Manager performs the requisite functions and apprises the Board accordingly.
19.
with, except for the Independent directors in which fraction is not rounded up as one because the fraction 0.33 was less than 0.5.
Explanation for non-compliance with requirements, other than regulations 3, 6, 7, 8, 27, 32, 33 and 36 are below:
Muhammad AnwarChief Executive Officer
For and on behalf of the Board of Directors
STATEMENT OF COMPLIANCEwith Listed Companies (Code of Corporate Governance) Regulations, 2019
34 2020
Khalid BashirChairman
I N D E P E N D E N T A U D I T O R S ' R E V I E W R E P O R T TO THE MEMBERS ON STATEMENT OF COMPLIANCEwith Listed Companies (Code of Corporate Governance) Regulations, 2019
We have reviewed the enclosed Statement of Compliance with the Listed Companies (Code of Corporate Governance) Regulations, 2019 (the Regulations) prepared by the Board of Directors of The Crescent Textile Mills Limited (the Company) for the year ended 30 June 2020 in accordance with the requirements of regulation 36 of the Regulations.
The responsibility for compliance with the Regulations is that of the Board of Directors of the Company. Our responsibility is to review whether the Statement of Compliance reflects the status of the Company's compliance with the provisions of the Regulations and report if it does not and to highlight any non-compliance with the requirements of the Regulations. A review is limited primarily to inquiries of the Company's personnel and review of various documents prepared by the Company to comply with the Regulations.
As a part of our audit of the financial statements we are required to obtain an understanding of the accounting and internal control systems sufficient to plan the audit and develop an effective audit approach. We are not required to consider whether the Board of Directors' statement on internal control covers all risks and controls or to form an opinion on the effectiveness of such internal controls, the Company's corporate governance procedures and risks.
The Regulations require the Company to place before the Audit Committee, and upon recommendation of the Audit Committee, place before the Board of Directors for their review and approval, its related party transactions. We are only required and have ensured compliance of this requirement to the extent of the approval of the related party transactions by the Board of Directors upon recommendation of the Audit Committee.
Based on our review, nothing has come to our attention which causes us to believe that the Statement of Compliance does not appropriately reflect the Company's compliance, in all material respects, with the requirements contained in the Regulations as applicable to the Company for the year ended 30 June 2020.
352020
RIAZ AHMAD & COMPANYChartered Accountants
Date: September 30, 2020Faisalabad

INDEPENDENT AUDITOR'S REPORT TO THE MEMBERS
OpinionWe have audited the annexed financial statements of The Crescent Textile Mills Limited (the Company), which comprise the statement of financial position as at 30 June 2020, and the statement of profit or loss, the statement of comprehensive income, the statement of changes in equity, the statement of cash flows for the year then ended, and notes to the financial statements, including a summary of significant accounting policies and other explanatory information, and we state that we have obtained all the information and explanations which, to the best of our knowledge and belief, were necessary for the purposes of the audit.
In our opinion and to the best of our information and according to the explanations given to us, the statement of financial position, the statement of profit or loss, the statement of comprehensive income, the statement of changes in equity and the statement of cash flows together with the notes forming part thereof conform with the accounting and reporting standards as applicable in Pakistan and give the information required by the Companies Act, 2017 (XIX of 2017), in the manner so required and respectively give a true and fair view of the state of the Company's affairs as at 30 June 2020 and of the profit, other comprehensive income, the changes in equity and its cash flows for the year then ended.
Basis for OpinionWe conducted our audit in accordance with International Standards on Auditing (ISAs) as applicable in Pakistan. Our responsibilities under those standards are further described in the Auditor's Responsibilities for the Audit of the Financial Statements section of our report. We are independent of the Company in accordance with the International Ethics Standards Board for Accountants' Code of Ethics for Professional Accountants as adopted by the Institute of Chartered Accountants of Pakistan (the Code) and we have fulfilled our other ethical responsibilities in accordance with the Code. We believe that the audit evidence we have obtained is sufficient and appropriate to provide a basis for our opinion.
Key Audit MattersKey audit matters are those matters that, in our professional judgment, were of most significance in our audit of the financial statements of the current period. These matters were addressed in the context of our audit of the financial statements as a whole, and in forming our opinion thereon, and we do not provide a separate opinion on these matters.
Following are the key audit matters:
36 2020
Sr. #
1.
Key audit matters
Inventory existence and valuationInventories as at 30 June 2020 amounting to Rupees 3,420.070 million, break up of which is as follows:
-
-
Inventories are stated at lower of cost and net realizable value.
We identified existence and valuation of inventories as a key audit matter due to their size, representing 18.20% of the total assets of the Company as at 30 June 2020, and the judgment involved in valuation.
How the matter was addressed in our audit
Our procedures over existence and valuation of inventories included, but were not limited to:
�
�
Stores, spare parts and loose tools of Rupees 233.516 million
Stock-in-trade of Rupees 3,186.554 million
To test the quantity of inventories at all locations, we assessed the corresponding inventory observation instructions and participated in inventory counts on sites. Based on samples, we performed test counts and compared the quantities counted by us with the results of the counts of the management.
For a sample of inventory items, re-performed the weighted average cost calculation and compared the weighted average cost appearing on valuation sheets.
2.
For further information on inventories, refer to the following:
-
-
Investments in equity securitiesAs at 30 June 2020, the Company carried its portfolio of investments as follows:
-
-
Due to materiality of investments in the context of the financial statements as a whole and the requirements of applicable accounting and reporting standards relating to classification, measurement and disclosures of investments, they are considered to be the area which had the greatest effect on our overall audit strategy and allocation of resources in planning and completing our audit.
�
�
�
�
�
Our procedures included, but were not limited to:
�
�
�
�
�
We tested that the ageing report used by management correctly aged inventory items by agreeing a sample of aged inventory items to the last recorded invoice.
On a sample basis, we tested the net realizable value of inventory items to recent selling prices and re-performed the calculation of the inventory write down, if any.
In the context of our testing of the calculation, we analyzed individual cost components and traced them back to the corresponding underlying documents.
We also made enquiries of management, including those outside of the finance function, and considered the results of our testing above to determine whether any specific write downs were required.
We also assessed the adequacy of the disclosures made in respect of the accounting policies and related notes to the financial statements.
We documented and assessed the processes and controls in place to record investment transactions and to value the portfolio.
We agreed the valuation of all of quoted investments from prices quoted on Pakistan Stock Exchange Limited.
We agreed the holding of all quoted investments from the Account Balance Report of Central Depository Company of Pakistan Limited.
We verified the accuracy of management's judgement used in classification of quoted investments.
We evaluated the independent professional
Summary of significant accounting policies, Inventories (Note 2.10 to the financial statements).
Stores, spare parts and loose tools (Note 17) and Stock-in-trade (Note 18) to the financial statements.
Quoted investments carried at fair value through other comprehensive income amounting to Rupees 1,007.278 million.
Un-quoted investments carried at fair value through other comprehensive income amounting to Rupees 3,162.849 million.
INDEPENDENT AUDITOR'S REPORT TO THE MEMBERS
372020

3.
Investments in unquoted equity securities are accounted for as financial assets at fair value through other comprehensive income and are subject to fair valuation at each reporting date. Significant un-quoted investments as at 30 June 2020 are valued on the basis of valuation carried out during the year by an independent professional valuer. With reference to the valuation, management estimated the fair value of these un-quoted investments at Rupees 3,162.675 million at year end.
The fair value was determined based on the discounted cash flow method. The valuations involved significant judgements and estimates from management, including future business growth driven by future expansion plans, future products selling prices and operating costs of the investee, discount rate, etc.
For further information, refer to the following:
-
-
-
Revenue recognition The Company recognized revenue of Rupees 13,264.005 million for the year ended 30 June 2020.
We identified recognition of revenue as a key audit matter because revenue is one of the key performance indicator of the Company and gives rise to an inherent risk that revenue could be subject to misstatement to meet expectations or targets.
�
�
�
�
�
�
Our procedures included, but were not limited to:
�
Summary of significant accounting policies, financial instruments-equity investments (Note 2.9 to the financial statements). Long term investments (Note 13 to the financial statements).
Short term investments (Note 24 to the financial statements).
valuer's competence, capabi l it ies and objectivity.
We assessed the valuation methodology used by the independent professional valuer to estimate the fair value of the investments.
We checked, on a sample basis, the accuracy and reasonableness of the input data provided by management to the independent professional valuer, to supporting evidence, such as approved budgets and considering the reasonableness of these budgets by comparing the budgets to the historical results and market data.
We assessed the reasonableness of cash flows projection, performing audit procedures on management's assumptions such as the future business growth driven by future expansion plan, future products selling prices and operating costs, discount rate by comparing the assumptions to historical results and published market and industry data. We agreed holding of all un-quoted investments from physical share certificates in hand.
We performed sensit iv ity analysis in consideration of the potential impact of reasonably possible upside or downside changes in these key assumptions.
We verified the accuracy of management calculation used for the impairment testing.
We obtained an understanding of the process relating to recognition of revenue and testing the design, implementation and operating effectiveness of key internal controls over recording of revenue;
INDEPENDENT AUDITOR'S REPORT TO THE MEMBERS
38 2020

For further information on revenue recognition, refer to the following:
-
-
�
�
�
�
�
We compared a sample of revenue transactions recorded during the year with sales orders, sales invoices, delivery documents and other relevant underlying documents;
We compared a sample of revenue transactions recorded around the year-end with the sales orders, sales invoices, delivery documents and other relevant underlying documentation to assess if the related revenue was recorded in the appropriate accounting period;
We assessed whether the accounting policies for revenue recognition complies with the requirements of IFRS 15 'Revenue from Contracts with Customers';
We compared the detail of a sample of journal entries posted to revenue accounts during the year, which met certain specific risk-based cr iteria, with the relevant underlying documentation;
We also considered the appropriateness of disclosures in the financial statements.
INDEPENDENT AUDITOR'S REPORT TO THE MEMBERS
39
Summary of significant accounting policies, Revenue from contracts with customers (Note 2.13 to the financial statements).
Revenue (Note 26 to the financial statements).
2020
Information Other than the Financial Statements and Auditor's Report ThereonManagement is responsible for the other information. The other information comprises the information included in the annual report, but does not include the financial statements and our auditor's report thereon.
Our opinion on the financial statements does not cover the other information and we do not express any form of assurance conclusion thereon.
In connection with our audit of the financial statements, our responsibility is to read the other information and, in doing so, consider whether the other information is materially inconsistent with the financial statements or our knowledge obtained in the audit or otherwise appears to be materially misstated. If, based on the work we have performed, we conclude that there is a material misstatement of this other information, we are required to report that fact. We have nothing to report in this regard.
Responsibilities of Management and Board of Directors for the Financial StatementsManagement is responsible for the preparation and fair presentation of the financial statements in accordance with the accounting and reporting standards as applicable in Pakistan and the requirements of Companies Act, 2017 (XIX of 2017) and for such internal control as management determines is necessary to enable the preparation of financial statements that are free from material misstatement, whether due to fraud or error.

In preparing the financial statements, management is responsible for assessing the Company's ability to continue as a going concern, disclosing, as applicable, matters related to going concern and using the going concern basis of accounting unless management either intends to liquidate the Company or to cease operations, or has no realistic alternative but to do so.
Board of directors is responsible for overseeing the Company's financial reporting process.
Auditor's Responsibilities for the Audit of the Financial StatementsOur objectives are to obtain reasonable assurance about whether the financial statements as a whole are free from material misstatement, whether due to fraud or error, and to issue an auditor's report that includes our opinion. Reasonable assurance is a high level of assurance, but is not a guarantee that an audit conducted in accordance with ISAs as applicable in Pakistan will always detect a material misstatement when it exists. Misstatements can arise from fraud or error and are considered material if, individually or in the aggregate, they could reasonably be expected to influence the economic decisions of users taken on the basis of these financial statements.
As part of an audit in accordance with ISAs as applicable in Pakistan, we exercise professional judgment and maintain professional skepticism throughout the audit. We also:
� Identify and assess the risks of material misstatement of the financial statements, whether due to fraud or error, design and perform audit procedures responsive to those risks, and obtain audit evidence that is sufficient and appropriate to provide a basis for our opinion. The risk of not detecting a material misstatement resulting from fraud is higher than for one resulting from error, as fraud may involve collusion, forgery, intentional omissions, misrepresentations, or the override of internal control.
� Obtain an understanding of internal control relevant to the audit in order to design audit procedures that are appropriate in the circumstances, but not for the purpose of expressing an opinion on the effectiveness of the Company's internal control.
� Evaluate the appropriateness of accounting policies used and the reasonableness of accounting estimates and related disclosures made by management.
� Conclude on the appropriateness of management's use of the going concern basis of accounting and, based on the audit evidence obtained, whether a material uncertainty exists related to events or conditions that may cast significant doubt on the Company's ability to continue as a going concern. If we conclude that a material uncertainty exists, we are required to draw attention in our auditor's report to the related disclosures in the financial statements or, if such disclosures are inadequate, to modify our opinion. Our conclusions are based on the audit evidence obtained up to the date of our auditor's report. However, future events or conditions may cause the Company to cease to continue as a going concern.
� Evaluate the overall presentation, structure and content of the financial statements, including the disclosures, and whether the financial statements represent the underlying transactions and events in a manner that achieves fair presentation.
We communicate with the board of directors regarding, among other matters, the planned scope and timing of the audit
INDEPENDENT AUDITOR'S REPORT TO THE MEMBERS
40 2020
and significant audit findings, including any significant deficiencies in internal control that we identify during our audit.
We also provide the board of directors with a statement that we have complied with relevant ethical requirements regarding independence, and to communicate with them all relationships and other matters that may reasonably be thought to bear on our independence, and where applicable, related safeguards.
From the matters communicated with the board of directors, we determine those matters that were of most significance in the audit of the financial statements of the current period and are therefore the key audit matters. We describe these matters in our auditor's report unless law or regulation precludes public disclosure about the matter or when, in extremely rare circumstances, we determine that a matter should not be communicated in our report because the adverse consequences of doing so would reasonably be expected to outweigh the public interest benefits of such communication.
Report on Other Legal and Regulatory Requirements
Based on our audit, we further report that in our opinion:
a) proper books of account have been kept by the Company as required by the Companies Act, 2017 (XIX of 2017);
b) the statement of financial position, the statement of profit or loss, the statement of comprehensive income, the statement of changes in equity and the statement of cash flows together with the notes thereon have been drawn up in conformity with the Companies Act, 2017 (XIX of 2017) and are in agreement with the books of account and returns;
c) investments made, expenditure incurred and guarantees extended during the year were for the purpose of the Company's business; and
d) Zakat deductible at source under the Zakat and Ushr Ordinance, 1980 (XVIII of 1980), was deducted and deposited in Central Zakat Fund established under section 7 of that Ordinance.
The engagement partner on the audit resulting in this independent auditor's report is Liaqat Ali Panwar.
INDEPENDENT AUDITOR'S REPORT TO THE MEMBERS
412020
RIAZ AHMAD & COMPANYChartered Accountants
Date: September 30, 2020Faisalabad
2019
1,000,000
800,000
200,169 523,811
3,567,457 2,815,298 7,906,735
1,120,213
1,865,597 9,435
119,940 5,935,657
274,858 138,368
8,343,855 9,464,068
17,370,803
2020
1,000,000
800,000
200,169 673,438
4,160,766 2,805,331 8,639,704
1,120,213
2,482,544 11,232
100,604 6,239,650
34,727 166,194
9,034,951 10,155,164
18,794,868
Note
3
4.14.1
54.2
6
7
896
10
Muhammad AnwarChief Executive Officer
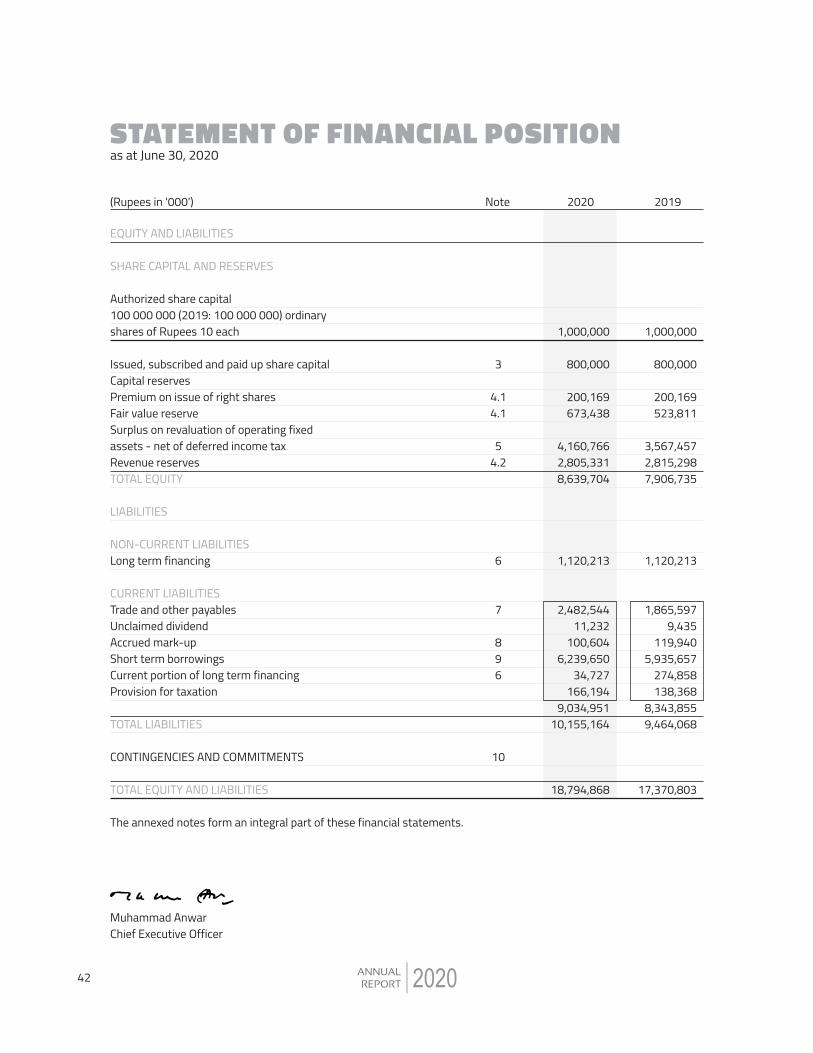
STATEMENT OF FINANCIAL POSITION as at June 30, 2020
(Rupees in '000')
EQUITY AND LIABILITIES
SHARE CAPITAL AND RESERVES
Authorized share capital100 000 000 (2019: 100 000 000) ordinary shares of Rupees 10 each
Issued, subscribed and paid up share capitalCapital reservesPremium on issue of right sharesFair value reserveSurplus on revaluation of operating fixedassets - net of deferred income taxRevenue reservesTOTAL EQUITY
LIABILITIES
NON-CURRENT LIABILITIESLong term financing
CURRENT LIABILITIESTrade and other payablesUnclaimed dividendAccrued mark-upShort term borrowingsCurrent portion of long term financing Provision for taxation
TOTAL LIABILITIES
CONTINGENCIES AND COMMITMENTS
TOTAL EQUITY AND LIABILITIES
The annexed notes form an integral part of these financial statements.
42 2020

2019
6,726,762 5,806
3,792,196 500
29,962 102,906
10,658,132
265,357 2,284,668 2,647,825
753,660 70,973
4,771 290,591 390,358
4,468 6,712,671
17,370,803
2020
7,401,664 20,180
3,693,231 310
28,737 109,643
11,253,765
233,516 3,186,554 2,419,493
800,033 84,145
5,651 295,830 476,896
38,985 7,541,103
18,794,868
Note
111213141516
171819202122232425
(Rupees in '000')
ASSETS
NON-CURRENT ASSETSProperty, plant and equipmentIntangible assetLong term investmentsLong term loans and advancesLong term deposits and prepaymentsDeferred income tax asset
CURRENT ASSETSStores, spare parts and loose toolsStock-in-tradeTrade debtsLoans and advancesShort term deposits and prepaymentsAccrued interestOther receivablesShort term investmentCash and bank balances
TOTAL ASSETS
STATEMENT OF FINANCIAL POSITION as at June 30, 2020
Asim SiddiqueChief Financial Officer
432020
Khalid BashirDirector
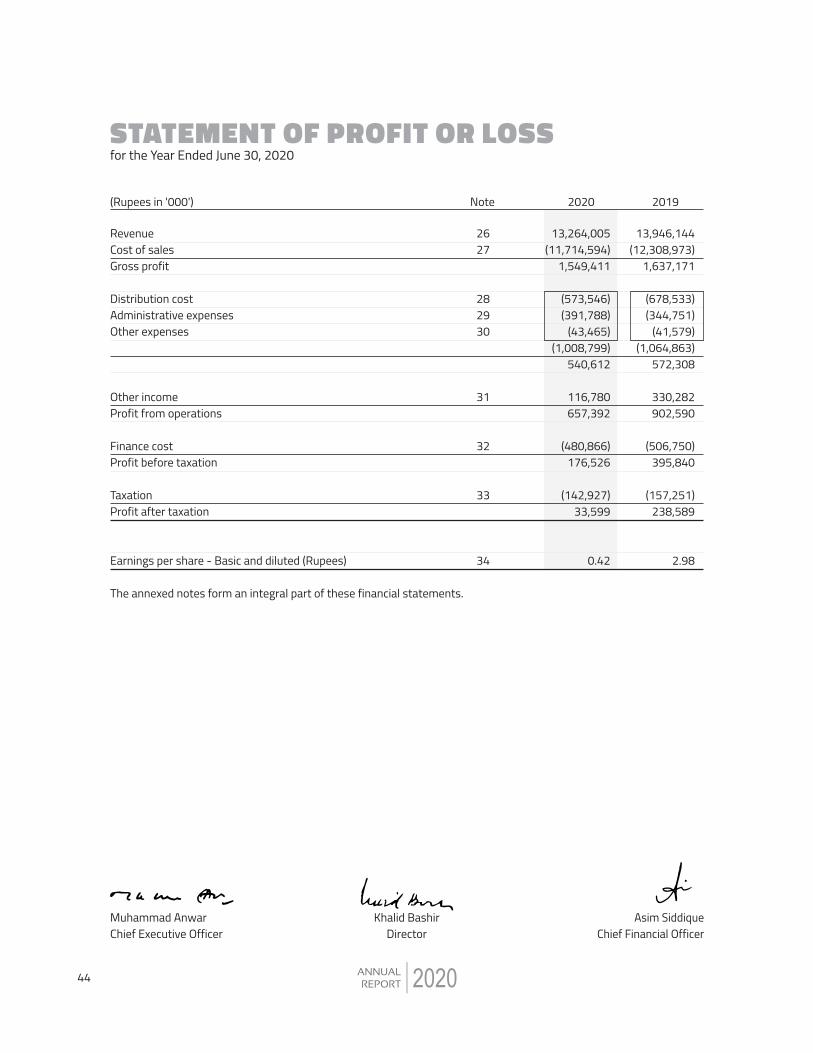
STATEMENT OF PROFIT OR LOSSfor the Year Ended June 30, 2020
2020 2019Note(Rupees in '000')
RevenueCost of salesGross profit
Distribution costAdministrative expensesOther expenses
Other incomeProfit from operations
Finance costProfit before taxation
TaxationProfit after taxation
Earnings per share - Basic and diluted (Rupees)
The annexed notes form an integral part of these financial statements.
13,946,144 (12,308,973)
1,637,171
(678,533) (344,751)
(41,579) (1,064,863)
572,308
330,282 902,590
(506,750) 395,840
(157,251) 238,589
2.98
13,264,005 (11,714,594)
1,549,411
(573,546) (391,788)
(43,465) (1,008,799)
540,612
116,780 657,392
(480,866) 176,526
(142,927) 33,599
0.42
2627
282930
31
32
33
34
Muhammad AnwarChief Executive Officer
Asim SiddiqueChief Financial Officer
44 2020
Khalid BashirDirector
2020 2019(Rupees in '000')
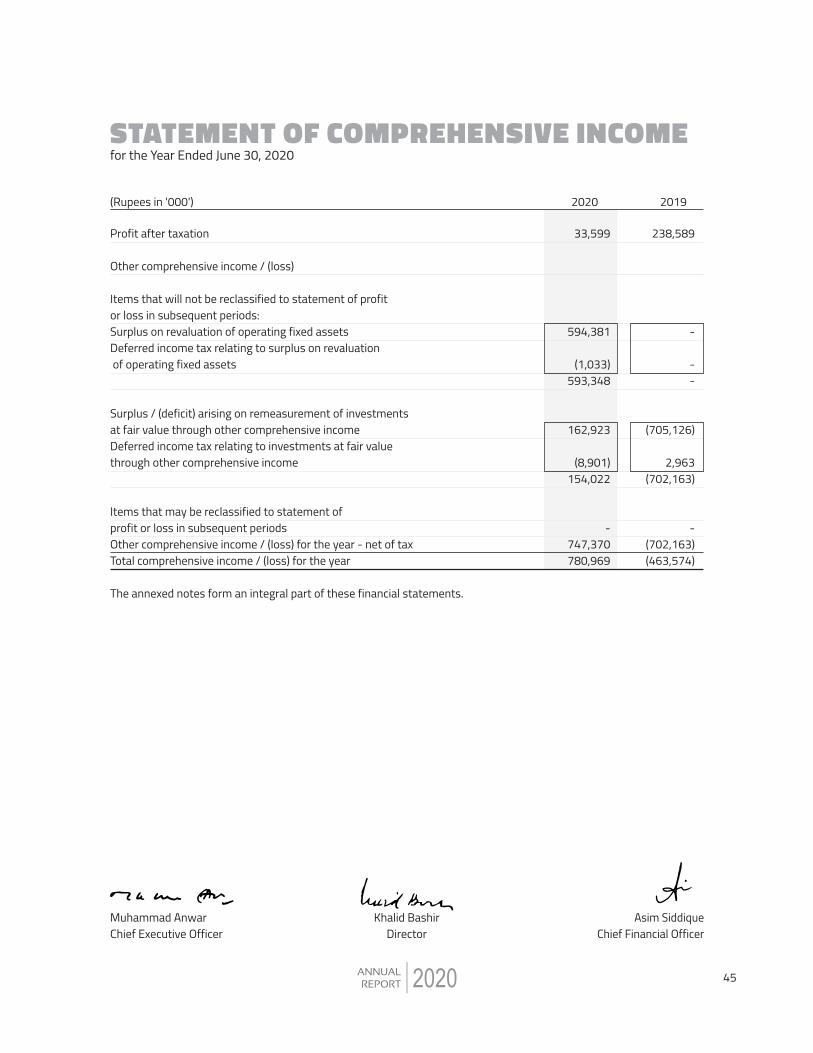
STATEMENT OF COMPREHENSIVE INCOMEfor the Year Ended June 30, 2020
Muhammad AnwarChief Executive Officer
Asim SiddiqueChief Financial Officer
45
Profit after taxation
Other comprehensive income / (loss)
Items that will not be reclassified to statement of profitor loss in subsequent periods:Surplus on revaluation of operating fixed assetsDeferred income tax relating to surplus on revaluation of operating fixed assets
Surplus / (deficit) arising on remeasurement of investmentsat fair value through other comprehensive incomeDeferred income tax relating to investments at fair valuethrough other comprehensive income
Items that may be reclassified to statement ofprofit or loss in subsequent periodsOther comprehensive income / (loss) for the year - net of taxTotal comprehensive income / (loss) for the year
The annexed notes form an integral part of these financial statements.
238,589
-
- -
(705,126)
2,963 (702,163)
- (702,163) (463,574)
33,599
594,381
(1,033) 593,348
162,923
(8,901) 154,022
- 747,370 780,969
2020
Khalid BashirDirector
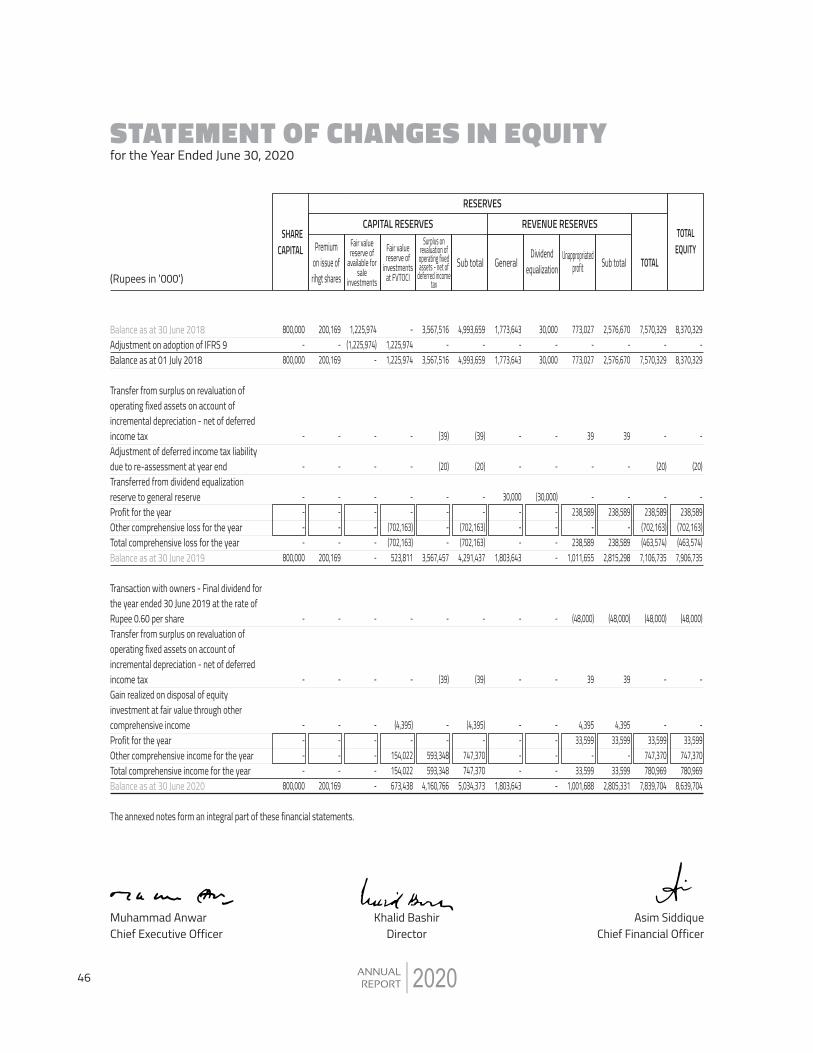
STATEMENT OF CHANGES IN EQUITY for the Year Ended June 30, 2020
Muhammad AnwarChief Executive Officer
Asim SiddiqueChief Financial Officer
46 2020
(Rupees in '000')
Fair valuereserve of
available forsale
investments
GeneralDividend
equalizationUnappropriated
profit Sub total TOTALPremium
on issue ofrihgt shares
SHARECAPITAL
TOTALEQUITY
REVENUE RESERVES
RESERVES
3,567,516 -
3,567,516
(39)
(20)
- - - -
3,567,457
-
(39)
- -
593,348 593,348
4,160,766
4,993,659 -
4,993,659
(39)
(20)
- -
(702,163) (702,163)
4,291,437
-
(39)
(4,395) -
747,370 747,370
5,034,373
1,773,643 -
1,773,643
-
-
30,000 - - -
1,803,643
-
-
- - - -
1,803,643
30,000 -
30,000
-
-
(30,000) - - - -
-
-
- - - - -
773,027 -
773,027
39
-
- 238,589
- 238,589
1,011,655
(48,000)
39
4,395 33,599
- 33,599
1,001,688
2,576,670 -
2,576,670
39
-
- 238,589
- 238,589
2,815,298
(48,000)
39
4,395 33,599
- 33,599
2,805,331
7,570,329 -
7,570,329
-
(20)
- 238,589
(702,163) (463,574)
7,106,735
(48,000)
-
- 33,599
747,370 780,969
7,839,704
1,225,974 (1,225,974)
-
-
-
- -
- - -
-
-
- - - - -
200,169 -
200,169
-
-
- - - -
200,169
-
-
- - - -
200,169
800,000 -
800,000
-
-
- - - -
800,000
-
-
- - - -
800,000
Sub total
CAPITAL RESERVESSurplus on
revaluation ofoperating fixedassets - net of
deferred incometax
8,370,329 -
8,370,329
-
(20)
- 238,589
(702,163) (463,574)
7,906,735
(48,000)
-
- 33,599
747,370 780,969
8,639,704
- 1,225,974 1,225,974
-
-
- -
(702,163) (702,163)
523,811
-
-
(4,395) -
154,022 154,022 673,438
Fair valuereserve of
investmentsat FVTOCI
Khalid BashirDirector
Balance as at 30 June 2018Adjustment on adoption of IFRS 9Balance as at 01 July 2018
Transfer from surplus on revaluation ofoperating fixed assets on account ofincremental depreciation - net of deferredincome taxAdjustment of deferred income tax liabilitydue to re-assessment at year endTransferred from dividend equalizationreserve to general reserveProfit for the yearOther comprehensive loss for the year Total comprehensive loss for the yearBalance as at 30 June 2019
Transaction with owners - Final dividend forthe year ended 30 June 2019 at the rate ofRupee 0.60 per shareTransfer from surplus on revaluation ofoperating fixed assets on account ofincremental depreciation - net of deferredincome taxGain realized on disposal of equityinvestment at fair value through othercomprehensive incomeProfit for the yearOther comprehensive income for the year Total comprehensive income for the yearBalance as at 30 June 2020
The annexed notes form an integral part of these financial statements.

STATEMENT OF CASH FLOWSfor the Year Ended June 30, 2020
CASH FLOWS FROM OPERATING ACTIVITIES
Cash generated from operationsFinance cost paid Income tax paidDividend paid Workers' profit participation fund paidNet decrease in long term loans and advances Net decrease / (increase) in long term deposits and prepaymentsNet cash generated from operating activities
CASH FLOWS FROM INVESTING ACTIVITIESCapital expenditure on property, plant, equipment and intangible assetProceeds from sale of property, plant and equipmentProceeds from sale of investmentDividends receivedNet cash used in investing activities
CASH FLOWS FROM FINANCING ACTIVITIESProceeds from long term financingRepayment of long term financingShort term borrowings - netNet cash from / (used in) financing activities
Net increase in cash and cash equivalents
Cash and cash equivalents at the beginning of the year
Cash and cash equivalents at the end of the year (note 25)
The annexed notes form an integral part of these financial statements.
2020 2019
1,545,886 (472,349) (189,986)
(78) (85) 582
(19,686) 864,284
(731,317) 46,710
- 10,550
(674,057)
550,001 (258,039) (481,134) (189,172)
1,055
3,413
4,468
988,051 (499,287) (173,372)
(46,203) (13,732)
190 1,225
256,872
(307,352) 12,775
7,507 853
(286,217)
- (240,131)
303,993 63,862
34,517
4,468
38,985
35
Note(Rupees in '000')
Muhammad AnwarChief Executive Officer
Asim SiddiqueChief Financial Officer
472020
Khalid BashirDirector
NOTES TO THE FINANCIAL STATEMENTS
THE COMPANY AND ITS ACTIVITIES The Crescent Textile Mills Limited (the Company) is a public limited company incorporated in Pakistan under the Companies Act, 1913 (Now Companies Act, 2017). The registered office of the Company is situated at Sargodha Road, Faisalabad, Punjab. Its shares are quoted on Pakistan Stock Exchange Limited. The Company is engaged in the business of textile manufacturing comprising of spinning, combing, weaving, dyeing, bleaching, printing, stitching, buying, selling and otherwise dealing in yarn, cloth and other goods and fabrics made from raw cotton and synthetic fiber(s) and to generate, accumulate, distribute, supply and sale of electricity. Head office and production units are situated at Sargodha Road, Faisalabad, Punjab except for the weaving unit which is situated at Industrial Estate, Hattar, Tehsil Khanpur, District Haripur, Khyber Pakhtunkhwah, stitching unit which is situated at Chak No. 66 J.B., Dhandra Road, Airport Chowk, Jhang Road, Faisalabad, Punjab and liaison office situated at 8th Floor, Sidco Avenue Centre, 264-R.A. Lines, Stretchen Road, Karachi, Sindh. Impact of COVID-19 on these financial statements The pandemic of COVID-19 which rapidly spread all across the world has not only endangered human lives but has also adversely impacted the global economy. In March 2020, the Federal Government and the Provincial Governments announced a temporary lockdown as a measure to reduce the spread of the COVID�19. Complying with the lockdown, the Company temporarily suspended its operations from 25 March 2020 to 05 April 2020. The lockdown caused disruptions in supply chain including supply of goods to the customers resulting in a decline in sales. Subsequent to the year ended 30 June 2020, due to significant reduction in outbreak, demand for the Company�s goods is fast reverting back to normal levels. Moreover, at the start of outbreak, State Bank of Pakistan vide its circular No. ERD/M&PRD/PR/01/2020-32 dated 26 March 2020 allowed deferment of principal repayments on loan obligations due to banks by a period of one year. The Company has availed this opportunity and the repayments of long term financing from Pak Libya Holding Company (Private) Limited, The Bank of Punjab and National Bank of Pakistan as given in Note 6 have been deferred for one year. The Company has also assessed expected credit losses on receivable balances due to the pandemic situation and a suitable allowance for expected credit losses has been made as given in Note 19. Apart from these, according to management�s assessment, there is no other significant accounting impact of the effects of COVID-19 in these financial statements.
SUMMARY OF SIGNIFICANT ACCOUNTING POLICIES The significant accounting policies applied in the preparation of these financial statements are set out below. These policies have been consistently applied to all years presented, unless otherwise stated: Basis of preparation Statement of compliance
"These financial statements have been prepared in accordance with the accounting and reporting standards as applicable in Pakistan. The accounting and reporting standards applicable in Pakistan comprise of:
International Financial Reporting Standards (IFRSs) issued by the International Accounting Standards Board (IASB) and Islamic Financial Accounting Standards (IFASs) issued by the Institute of Chartered Accountants of Pakistan (ICAP), as notified under the Companies Act, 2017; and
Provisions of and directives issued under the Companies Act, 2017.
1.
1.1
2.
2.1
a)
-
-
for the Year Ended June 30, 2020
202048

NOTES TO THE FINANCIAL STATEMENTS
Where provisions of and directives issued under the Companies Act, 2017 differ from the IFRSs and IFASs, the provisions of and directives issued under the Companies Act, 2017 have been followed."
Accounting convention These financial statements have been prepared under the historical cost convention, except for the freehold and leasehold land measured at revalued amounts and certain financial instruments carried at fair value. Critical accounting estimates and judgments The preparation of financial statements in conformity with the approved accounting standards requires the use of certain critical accounting estimates. It also requires the management to exercise its judgment in the process of applying the Company's accounting policies. Estimates and judgments are continually evaluated and are based on historical experience and other factors, including expectations of future events that are believed to be reasonable under the circumstances. The areas where various assumptions and estimates are significant to the Company's financial statements or where judgments were exercised in application of accounting policies are as follows:
Financial instruments � fair value The fair value of some financial instruments that are not traded in an active market is determined by using valuation techniques based on assumptions that are dependent on conditions existing at the reporting date. Useful lives, patterns of economic benefits and impairments The estimates for revalued amounts, of different classes of property, plant and equipment, are based on valuation performed by external professional valuer and recommendation of technical teams of the Company. The said recommendations also include estimates with respect to residual values and depreciable lives. Further, the Company reviews the value of the assets including intangible asset for possible impairment on an annual basis. Estimates with respect to residual values and useful lives and pattern of flow of economic benefits are based on the analysis of the management of the Company. Any change in the estimates in future years might affect the carrying amounts of the respective items of property, plant and equipment along with intangible asset with a corresponding effect on the depreciation charge and impairment. Inventories Net realizable value of inventories is determined with reference to currently prevailing selling prices less estimated expenditure to make sales.
Income tax In making the estimates for income tax currently payable by the Company, the management takes into account the current income tax law and the decisions of appellate authorities on certain issues in the past. Recovery of deferred income tax assets Deferred income tax assets are recognized for deductible temporary differences only if the Company considers it is probable that future taxable amounts will be available to utilize those temporary differences and losses. Allowance for expected credit lossesThe allowance for expected credit losses assessment requires a degree of estimation and judgement. It is based on the lifetime expected credit loss, based on the Company's experience of actual credit loss in past years.
b)
c)
for the Year Ended June 30, 2020
2020 49
NOTES TO THE FINANCIAL STATEMENTS
Revenue from contracts with customers involving sale of goods When recognizing revenue in relation to the sale of goods to customers, the key performance obligation of the Company is considered to be the point of delivery of the goods to the customer, as this is deemed to be the time that the customer obtains control of the promised goods and therefore the benefits of unimpeded access. Standard, interpretation and amendments to published approved accounting standards that are effective in current year and are relevant to the CompanyFollowing standard, interpretation and amendments to published approved accounting standards are mandatory for the Company�s accounting periods beginning on or after 01 July 2019:
IFRS 16 'Leases'Amendments to IFRS 9 'Financial Instruments'IFRIC 23 'Uncertainty over Income Tax Treatments'Annual Improvements to IFRSs: 2015 � 2017 Cycle The amendments and interpretation listed above do not have any impact on the amounts recognized in prior periods and are not expected to significantly affect the current or future periods. However the implications of IFRS 16 are given hereunder:
IFRS 16 �Leases� is effective for annual periods beginning on or after 01 January 2019. This standard replaces IAS 17 �Leases� and for lessees eliminates the classifications of operating leases and finance leases. Except for short-term leases and leases of low value assets, right-of-use assets and corresponding lease liabilities are recognised in the statement of financial position. Straight-line operating lease expense recognition is replaced with a depreciation charge for the right-of-use assets and an interest expense on the recognised lease liabilities. For lessor accounting, the standard does not substantially change how a lessor accounts for leases.
As per SRO 431(I)/2007 dated 22 May 2007, the Securities and Exchange Commission of Pakistan directed that the Islamic Financial Accounting Standard 2 (IFAS 2), issued by the Institute of Chartered Accountants of Pakistan, shall be followed in regard to the financial statements by companies while accounting for Ijarah (Lease) transactions as defined in IFAS 2. As where provisions of and directives issued under the Companies Act, 2017 differ from the IFRSs, the provisions of and directives issued under the Companies Act, 2017 have been followed. Therefore, the Company is not required to account for operating leases (Ijarah) under IFRS 16. Standard and amendments to published approved accounting standards that are effective in current year but not relevant to the CompanyThere are other standard and amendments to published approved accounting standards that are mandatory for accounting periods beginning on or after 01 July 2019 but are considered not to be relevant or do not have any significant impact on the Company's financial statements and are therefore not detailed in these financial statements. Amendments to published approved accounting standards that are not yet effective but relevant to the Company Following amendments to existing standards have been published and are mandatory for the Company�s accounting periods beginning on or after 01 July 2020 or later periods:
d)
����
e)
f)
for the Year Ended June 30, 2020
202050
NOTES TO THE FINANCIAL STATEMENTS
Interest Rate Benchmark Reform which amended IFRS 7 'Financial Instruments: Disclosures', IFRS 9 'Financial Instruments' and IAS 39 'Financial Instruments: Recognition and Measurement', is applicable for annual financial periods beginning on or after 01 January 2020. The G20 asked the Financial Stability Board (FSB) to undertake a fundamental review of major interest rate benchmarks. Following the review, the FSB published report setting out its recommended reforms of some major interest rate benchmarks such as Interbank Offer Rates (IBORs). Public authorities in many jurisdictions have since taken steps to implement those recommendations. This has in turn led to uncertainty about the long-term viability of some interest rate benchmarks. In these amendments, the term �interest rates benchmarks reform' refers to the market-wide reform of an interest rate benchmark including its replacement with an alternative benchmark rate, such as that resulting from the FSB's recommendations set out in its July 2014 report 'Reforming Major Interest Rate Benchmarks' (the reform). The amendments made provided relief from the potential impacts of the uncertainty caused by the reform. A company shall apply these exceptions to all hedging relationships directly affected by interest rate benchmark reform. The amendments are not likely to affect the financial statements of the Company. Amendments to IFRS 16 'Leases' (effective for annual periods beginning on or after 01 June 2020). Under pervious requirements of IFRS 16, lessee assesses whether rent concessions are leased modifications, if so, apply the specific guidance on accounting for lease modifications. This generally involves remeasuring these lease liabilities using the revised lease payments and revised discount rates. In light of the effects of the COVID-19 pandemic and the fact that many lessees are applying the standard for the first time in their financial statements, the IASB has provided an optional practical expedient for lessees. Under the practical expedient, lessees are not required to assess whether eligible rent concessions are lease modifications, and instead are permitted to account for as if these were not lease modifications. Rent concessions are eligible for the practical expedient if these occur as a direct consequence of the COVID-19 pandemic and if following criteria are met: the change in lease payments results in revised consideration for the lease that is substantially same as, or less than, the considerations for the lease immediately preceding the change; any reduction in lease payments affects only payments originally due on or before 30 June 2021; and there is no substantive change to the other terms and conditions of the lease.
The above amendments are not likely to affect the financial statements of the Company.
Amendments to IAS 1 'Presentation of Financial Statements' and IAS 8 'Accounting Policies, Changes in Accounting Estimates and Errors' (effective for annual periods beginning on or after 01 January 2020). The amendments are intended to make the definition of material in IAS 1 easier to understand and are not intended to alter the underlying concept of materiality in IFRSs. In addition, the IASB has also issued guidance on how to make materiality judgments when preparing their general purpose financial statements in accordance with IFRSs. The amendments are not likely to affect the financial statements of the Company.
Amendments to IAS 1 'Presentation of Financial Statements' (effective for annual periods beginning on or after 01 January 2022). These amendments have been added to further clarify when a liability is classified as current. These amendments also changes the aspect of classification of liability as non-current by requiring the assessment of the entity's right at the end of the reporting period to defer the settlement of liability for at least twelve months after the reporting period. An entity shall apply these amendments retrospectively in accordance with IAS 8. The amendments are not likely to affect the financial statements of the Company.
-
-
for the Year Ended June 30, 2020
2020 51

NOTES TO THE FINANCIAL STATEMENTS
Amendments to IAS 37 'Provisions, Contingent Liabilities and Contingent Assets' (effective for annual periods beginning on or after 01 January 2022). These amendments clarify what comprise the cost of fulfilling a contract. Cost of fulfilling a contract is relevant when determining whether a contract is onerous. An entity is required to apply the amendments to contracts for which it has not yet fulfilled all its obligations at the beginning of the annual reporting period in which it first applies the amendments (the date of initial application). Restatement of comparative information is not required, instead the amendments require an entity to recognize the cumulative effect of initially applying the amendments as an adjustment to opening balance of retained earnings or other component of equity, as appropriate, at the date of initial application. The amendments are not likely to affect the financial statements of the Company. Amendments to IAS 16 'Property, Plant and Equipment' (effective for annual periods beginning on or after 01 January 2022). These amendments clarify that sales proceeds and cost of items produced while bringing an item of property, plant and equipment to the location and condition necessary for it to be capable of operating in the manner intended by management, are recognized in profit or loss in accordance with applicable standards. The entity measures the cost of those items applying the measurement requirements of IAS 2 'Inventories'. The standard also removes the requirement of deducting the net sales proceeds from cost of testing. An entity shall apply these amendments retrospectively, but only to items of property, plant and equipment which are brought to the location and condition necessary for them to be capable of operating in the manner intended by management on or after the beginning of the earliest period presented in the financial statements in which the entity first applies the amendments. The entity shall recognize the cumulative effect of initially applying the amendments as an adjustment to the opening balance of retained earnings (or other component of equity, as appropriate) at the beginning of that earliest period presented. The amendments are not likely to affect the financial statements of the Company. On 14 May 2020, IASB issued Annual Improvements to IFRSs: 2018 - 2020 Cycle, incorporating amendments to three IFRSs more specifically in IFRS 9 'Financial Instruments', and IFRS 16 'Leases', relevant to the Company. The amendments are effective for annual periods beginning on or after 01 January 2022. The amendments have no significant impact on the Company's financial statements and have therefore not been analyzed in detail. On 29 March 2018, the IASB has issued a revised Conceptual Framework. The new Framework: reintroduces the terms stewardship and prudence; introduces a new asset definition that focuses on rights and a new liability definition that is likely to be broader than the definition it replaces, but does not change the distinction between a liability and an equity instrument; removes from the asset and liability definitions references to the expected flow of economic benefits�this lowers the hurdle for identifying the existence of an asset or liability and puts more emphasis on reflecting uncertainty in measurement; discusses historical cost and current value measures, and provides some guidance on how the IASB would go about selecting a measurement basis for a particular asset or liability; states that the primary measure of financial performance is profit or loss, and that only in exceptional circumstances will the IASB use other comprehensive income and only for income or expenses that arise from a change in the current value of an asset or liability; and discusses uncertainty, de-recognition, unit of account, the reporting entity and combined financial statements. The Framework is not an IFRS and does not override any standard, so nothing will change in the short term. The revised Framework will be used in future standard-setting decisions, but no changes will be made to current IFRSs. Preparers might also use the Framework to assist them in developing accounting policies where an issue is not addressed by an IFRS. It is effective for annual periods beginning on or after 01 January 2020 for preparers that develop an accounting policy based on the Framework.
for the Year Ended June 30, 2020
202052

Standards and amendments to published approved accounting standards that are not yet effective and not considered relevant to the CompanyThere are other standards and amendments to published approved accounting standards that are mandatory for accounting periods beginning on or after 01 July 2020 but are considered not to be relevant or do not have any significant impact on the Company�s financial statements and are therefore not detailed in these financial statements.
Employees retirement benefitThe Company operates a recognized provident fund for all its permanent employees. Equal monthly contributions are made to the fund both by the Company and the employees at the rate of 6.25 percent of the basic salary plus cost of living allowance. Obligation for contributions to defined contribution plan is recognized as an expense in the statement of profit or loss as and when incurred. Employees are eligible under the scheme on completion of prescribed qualifying period of service.
ProvisionsProvisions are recognized when the Company has a legal or constructive obligation as a result of past events and it is probable that an outflow of resources embodying economic benefits will be required to settle the obligations and a reliable estimate of the amount can be made. Provisions are reviewed at each reporting date and adjusted to reflect the current best estimate.
Dividend and other appropriationsDividend distribution to the Company's shareholders is recognized as a liability in the Company's financial statements in the period in which the dividends are declared and other appropriations are recognized in the period in which these are approved by the Board of Directors.
Taxation
CurrentProvision for current tax is based on the taxable income for the year determined in accordance with the prevailing law for taxation of income. The charge for current tax is calculated using prevailing tax rates or tax rates expected to apply to the profit for the year, if enacted. The charge for current tax also includes adjustments, where considered necessary, to provision for tax made in previous years arising from assessments framed during the year for such years.
DeferredDeferred tax is accounted for using the liability method in respect of all temporary differences arising from differences between the carrying amount of assets and liabilities in the financial statements and the corresponding tax bases used in the computation of the taxable profit. Deferred tax liabilities are generally recognized for all taxable temporary differences and deferred tax assets to the extent that it is probable that taxable profits will be available against which the deductible temporary differences, unused tax losses and tax credits can be utilized.
Deferred tax is calculated at the rates that are expected to apply to the period when the differences reverse based on tax rates that have been enacted or substantively enacted by the reporting date. Deferred tax is charged or credited in the statement of profit or loss, except to the extent that it relates to items recognized in other
NOTES TO THE FINANCIAL STATEMENTS for the Year Ended June 30, 2020
g)
2.2
2.3
2.4
2.5
2020 53
comprehensive income or directly in equity. In this case, the tax is also recognized in other comprehensive income or directly in equity, respectively.
Property, plant and equipment Operating fixed assets and depreciation
a)
b)
2.6
2.6.1
NOTES TO THE FINANCIAL STATEMENTS for the Year Ended June 30, 2020
202054
Cost / Revalued amount Operating fixed assets are stated at cost less accumulated depreciation and any identified impairment loss, except freehold land which is stated at revalued amount less any identified impairment loss and leasehold land which is stated at revalued amount less accumulated depreciation and any identified impairment loss. Capital work-in-progress is stated at cost less any identified impairment loss. Cost of operating fixed assets consists of historical cost, borrowing cost pertaining to the erection / construction period of qualifying assets and directly attributable costs of bringing the assets to working condition.
Increases in the carrying amounts arising on revaluation of operating fixed assets are recognized, net of deferred income tax, in other comprehensive income and accumulated in revaluation surplus in shareholders' equity. To the extent that increase reverses a decrease previously recognized in the statement of profit or loss, the increase is first recognized in the statement of profit or loss. Decreases that reverse previous increases of the same asset are first recognized in other comprehensive income to the extent of the remaining surplus attributable to the asset; all other decreases are charged to the statement of profit or loss. Each year, the difference between depreciation based on the revalued carrying amount of the asset charged to the statement of profit or loss and depreciation based on the asset's original cost, net of deferred income tax, is reclassified from surplus on revaluation of operating fixed assets to unappropriated profit.
Valuations are performed frequently enough to ensure that the fair value of a revalued asset does not differ materially from its carrying amount.
Subsequent costs are included in the asset's carrying amount or recognized as a separate asset, as appropriate, only when it is probable that future economic benefits associated with the item will flow to the Company and the cost of the item can be measured reliably. All other repair and maintenance costs are charged to statement of profit or loss during the period in which they are incurred.
Depreciation Depreciation on operating fixed assets is charged from the month in which an asset is acquired while no depreciation is charged for the month in which the asset is disposed of. Depreciation is charged to the statement of profit or loss on reducing balance method, except leasehold land on which depreciation is charged on straight line method to write off the cost of operating fixed assets over their expected useful lives at the rates mentioned in Note 11.1. The residual values and useful lives are reviewed by the management, at each financial year-end and adjusted if impact on depreciation is significant.

NOTES TO THE FINANCIAL STATEMENTS for the Year Ended June 30, 2020
c)
Assets subject to ijarah contracts Leases, where a significant portion of the risks and rewards of ownership are retained by the lessor are classified as ijarah contracts. Payments made under ijarah contracts are charged to the statement of profit or loss on a straight line basis over the lease term. Intangible asset and amortization Intangible asset represents the cost of computer software acquired and is stated at cost less accumulated amortization and any identified impairment loss. Amortization is charged to the statement of profit or loss on straight line basis so as to write off the cost of an asset over its estimated useful life. Amortization is charged from the month in which the asset is acquired or capitalized while no amortization is charged for the month in which the asset is disposed of. Intangible asset is amortized over a period of three years.
The Company assesses at each reporting date whether there is any indication that intangible asset may be impaired. If such indication exists, the carrying amount of such asset is reviewed to assess whether it is recorded in excess of its recoverable amount. When carrying value exceeds the respective recoverable amount, asset is written down to its recoverable amount and resulting impairment is recognized in the statement of profit or loss. When an impairment loss is recognized, the amortization charge is adjusted in the future periods to allocate the asset's revised carrying amount over its estimated useful life.
Financial Instruments
Recognition of financial instruments The Company initially recognizes financial assets on the date when they are originated. Financial liabilities are initially recognized on the trade date when the entity becomes a party to the contractual provisions of the instrument.
Classification and measurement of financial instruments
Investments and other financial assets
a)
��
2.7
2.8
2.9
i)
ii)
2020 55
De-recognition An item of property, plant and equipment is de-recognized upon disposal or when no future economic benefits are expected from its use or disposal. Any gain or loss arising on de-recognition of the asset is included in the statement of profit or loss in the year the asset is de-recognized.
ClassificationThe Company classifies its financial assets in the following measurement categories:
those to be measured subsequently at fair value through other comprehensive income, andthose to be measured at amortized cost The classification depends on the Company�s business model for managing the financial assets and the contractual terms of the cash flows.

NOTES TO THE FINANCIAL STATEMENTS for the Year Ended June 30, 2020
b)
For assets measured at fair value, gains and losses will be recorded in other comprehensive income. For investments in debt instruments, this will depend on the business model in which the investment is held. For investments in equity instruments, this will depend on whether the Company has made an irrevocable election at the time of initial recognition to account for the equity investment at fair value through other comprehensive income. The Company reclassifies debt investments when and only when its business model for managing those assets changes. MeasurementAt initial recognition, the Company measures a financial asset at its fair value plus transaction costs that are directly attributable to the acquisition of the financial asset. Financial assets with embedded derivatives are considered in their entirety when determining whether their cash flows are solely payment of principal and interest.
Debt instrumentsSubsequent measurement of debt instruments depends on the Company�s business model for managing the asset and the cash flow characteristics of the asset. The Company classifies its debt instruments into following measurement category:
Amortized costFinancial assets that are held for collection of contractual cash flows where those cash flows represent solely payments of principal and interest are measured at amortized cost. Interest income from these financial assets is included in other income using the effective interest rate method. Any gain or loss arising on de-recognition is recognized directly in profit or loss and presented in other income / (other expenses) together with foreign exchange gains and losses.
Equity instrumentsThe Company subsequently measures all equity investments at fair value for financial instruments quoted in an active market, the fair value corresponds to a market price (level 1). For financial instruments that are not quoted in an active market, the fair value is determined using valuation techniques including reference to recent arm�s length market transactions or transactions involving financial instruments which are substantially the same (level 2), or discounted cash flow analysis including, to the greatest possible extent, assumptions consistent with observable market data (level 3). The Company classifies its equity instruments into following measurement category:
Fair Value Through Other Comprehensive Income (FVTOCI)Where the Company�s management has elected to present fair value gains and losses on equity investments in other comprehensive income, there is no subsequent reclassification of fair value gains and losses to profit or loss. Impairment losses (and reversal of impairment losses) on equity investments measured at FVTOCI are not reported separately from other changes in fair value.
Financial liabilities
Classification and measurementFinancial liabilities are classified at amortized cost. These are also subsequently measured at amortized cost using the effective interest method.
202056
NOTES TO THE FINANCIAL STATEMENTS for the Year Ended June 30, 2020
Impairment of financial assetsThe Company assesses on a forward looking basis the expected credit losses associated with its debt instruments carried at amortized cost. The impairment methodology applied depends on whether there has been a significant increase in credit risk.
For trade debts and other receivables, the Company applies the simplified approach permitted by IFRS 9, which requires expected lifetime losses to be recognized from initial recognition of the receivables.
De-recognition
Financial assetsThe Company de-recognizes a financial asset when the contractual rights to the cash flows from the asset expire, or it transfers the rights to receive the contractual cash flows in a transaction in which substantially all of the risks and rewards of ownership of the financial asset are transferred, or it neither transfers nor retains substantially all of the risks and rewards of ownership and does not retain control over the transferred asset. Any interest in such de-recognized financial assets that is created or retained by the Company is recognized as a separate asset or liability.
Financial liabilitiesThe Company de-recognizes a financial liability (or a part of financial liability) from its statement of financial position when the obligation specified in the contract is discharged or cancelled or expired.
Offsetting of financial instrumentsFinancial assets and financial liabilities are set off and the net amount is reported in the financial statements when there is a legal enforceable right to set off and the Company intends either to settle on a net basis or to realize the assets and to settle the liabilities simultaneously.
InventoriesInventories, except for stock in transit and waste materials, are stated at lower of cost and net realizable value. Net realizable value signifies the estimated selling price in the ordinary course of business less the estimated costs of completion and the estimated costs necessary to make a sale. Cost is determined as follows:
Stores, spare parts and loose toolsUsable stores, spare parts and loose tools are valued principally at moving average cost, while items considered obsolete are carried at nil value. Items-in-transit are stated at invoice amount plus other charges paid thereon.
Stock-in-tradeStock of raw materials, except for stock-in-transit, is valued principally at the lower of weighted average cost and net realizable value.
Stocks-in-transit are valued at cost comprising invoice value plus other charges paid thereon. Cost of work-in-process and finished goods comprises of cost of direct materials, labour and appropriate manufacturing overheads.
iii)
iv)
v)
2.10
2020 57
NOTES TO THE FINANCIAL STATEMENTS for the Year Ended June 30, 2020
Stock of waste materials is stated at net realizable value.
Cash and cash equivalentsCash and cash equivalents comprise cash in hand, cash at banks on current and saving accounts along with other short term highly liquid instruments that are readily convertible into known amounts of cash and which are subject to insignificant risk of changes in values.
BorrowingsFinancing and borrowings are initially recognized at fair value of the consideration received, net of transaction costs. These are subsequently measured at amortized cost using the effective interest method. Any difference between the proceeds (net of transaction costs) and the redemption value is recognized in the statement of profit or loss over the period of borrowing using the effective interest method.
Revenue from contracts with customers
Revenue recognition
Sale of goodsRevenue from the sale of goods is recognized at the point in time when the customer obtains control of the goods, which is generally at the time of delivery. Related Government grant is recognized when there is reasonable assurance that Company will comply with the conditions attached to it and grant will be received.
Rendering of servicesRevenue from a contract to provide services is recognized over time as the services are rendered based on either a fixed price or an hourly rate.
InterestInterest income is recognized as interest accrues using the effective interest method. This is a method of calculating the amortized cost of a financial asset and allocating the interest income over the relevant period using the effective interest rate, which is the rate that exactly discounts estimated future cash receipts through the expected life of the financial asset to the net carrying amount of the financial asset.
RentRevenue is recognized when rent is accrued.
Sale of electricityRevenue from sale of electricity is recognized at time of transmission
DividendDividend on equity investments is recognized when right to receive the dividend is established.
Other revenueOther revenue is recognized when it is received or when the right to receive payment is established.
2.11
2.12
2.13
i)
202058
NOTES TO THE FINANCIAL STATEMENTS for the Year Ended June 30, 2020
Contract assets Contract assets arise when the Company performs its performance obligations by transferring goods to a customer before the customer pays its consideration or before payment is due. Contract assets are treated as financial assets for impairment purposes. Right of return assets Right of return assets represents the right to recover inventory sold to customers and is based on an estimate of customers who may exercise their right to return the goods and claim a refund. Such rights are measured at the value at which the inventory was previously carried prior to sale, less expected recovery costs and any impairment.
Contract liabilities Contract liability is the obligation of the Company to transfer goods to a customer for which the Company has received consideration from the customer. If a customer pays consideration before the Company transfers goods, a contract liability is recognized when the payment is made. Contract liabilities are recognized as revenue when the Company performs its performance obligations under the contract. Trade and other receivablesTrade receivables are initially recognized at fair value and subsequently measured at amortized cost using the effective interest method, less any allowance for expected credit losses. Trade receivables generally do not include amounts overdue by 365 days.
The Company has applied the simplified approach to measure expected credit losses, which uses a lifetime expected loss allowance. Actual credit loss experience over past years is used to base the calculation of expected credit loss. Other receivables are recognized at amortized cost, less any allowance for expected credit losses. Trade and other payables Liabilities for trade and other amounts payable are initially recognized at fair value, which is normally the transaction cost.
Derivative financial instrumentsDerivatives are initially recognized at fair value. Any directly attributable transaction costs are recognized in the statement of profit or loss as incurred. These are subsequently remeasured at fair value on regular basis and at each reporting date as a minimum, with all their gains and losses, realized and unrealized, recognized in the statement of profit or loss.
Borrowing cost Interest, mark-up and other charges on long term finances are capitalized up to the date of commissioning of respective qualifying assets acquired out of the proceeds of such long term finances. All other interest, mark-up and other charges are recognized in the statement of profit or loss. Share capitalOrdinary shares are classified as share capital. Incremental costs directly attributable to the issue of new shares are shown in equity as a deduction, net of tax.
ii)
iii)
iv)
2.14
2.15
2.16
2.17
2.18
2020 59
Impairment of non-financial assets Assets that have an indefinite useful life are not subject to depreciation and are tested annually for impairment. Assets that are subject to depreciation are reviewed for impairment at each reporting date or whenever events or changes in circumstances indicate that the carrying amount may not be recoverable. An impairment loss is recognized for the amount for which asset's carrying amount exceeds its recoverable amount. Recoverable amount is the higher of an asset�s fair value less costs to sell and value in use. For the purposes of assessing impairment, assets are grouped at the lowest levels for which there are separately identifiable cash flows (cash-generating units). Non-financial assets that suffered an impairment are reviewed for possible reversal of the impairment at each reporting date. Reversals of the impairment losses are restricted to the extent that the asset�s carrying amount does not exceed the carrying amount that would have been determined, net of depreciation or amortization, if impairment losses had not been recognized. An impairment loss or reversal of impairment loss is recognized in the statement of profit or loss.
Functional and presentation currency along with foreign currency transactions and translation Items included in the financial statements of the Company are measured using the currency of the primary economic environment in which the Company operates (the functional currency). The financial statements are presented in Pak Rupees, which is the Company�s functional and presentation currency. All monetary assets and liabilities in foreign currencies are translated into Pak Rupees at exchange rates prevailing at the reporting date. Transactions in foreign currencies are translated into Pak Rupees at exchange rates prevailing at the dates of the transactions. Foreign exchange gains and losses resulting from the settlement of such transactions and from the translation at year end exchange rates of monetary assets and liabilities denominated in foreign currencies are charged or credited to statement of profit or loss. Non-monetary assets and liabilities that are measured in terms of historical cost in a foreign currency are translated into Pak Rupees at exchange rates prevailing at the date of transaction. Non-monetary assets and liabilities denominated in foreign currency that are stated at fair value are translated into Pak Rupees at exchange rates prevailing at the date when fair values are determined.
Segment reporting Segment reporting is based on the operating (business) segments of the Company. An operating segment is a component of the Company that engages in business activities from which it may earn revenues and incur expenses, including revenues and expenses that relate to the transactions with any of the Company's other components. An operating segment's operating results are reviewed regularly by the Chief Executive Officer to make decisions about resources to be allocated to the segment and assess its performance, and for which discrete financial information is available. Segment results that are reported to the Chief Executive Officer include items directly attributable to a segment as well as those that can be allocated on a reasonable basis. Those income, expenses, assets, liabilities and other balances which cannot be allocated to a particular segment on a reasonable basis are reported as unallocated.
The Company's reportable business segments comprise of Spinning (Producing different quality of yarn using natural and artificial fibers), Weaving (Producing different quality of greige fabric using yarn), Processing and Home Textile (Processing greige fabric for production of printed and dyed fabric and manufacturing of home textile articles) and Power Generation (Generating and distributing power). Transactions among the business segments are recorded at arm's length prices using admissible valuation methods. Inter segment sales and purchases are eliminated from the total.
2.19
2.20
2.21
NOTES TO THE FINANCIAL STATEMENTS for the Year Ended June 30, 2020
202060

Earnings per share The Company presents Earnings Per Share (EPS) data for its ordinary shares. EPS is calculated by dividing the profit attributable to ordinary shareholders of the Company by the weighted average number of ordinary shares outstanding during the year.
Contingent assets Contingent assets are disclosed when the Company has a possible asset that arises from past events and whose existence will only be confirmed by the occurrence or non-occurrence of one or more uncertain future events not wholly within the control of the Company. Contingent assets are not recognized until their realization becomes certain. Contingent liabilities Contingent liability is disclosed when the Company has a possible obligation as a result of past events whose existence will only be confirmed by the occurrence or non-occurrence of one or more uncertain future events not wholly within the control of the Company. Contingent liabilities are not recognized, only disclosed, unless the possibility of a future outflow of resources is considered remote. In the event that the outflow of resources associated with a contingent liability is assessed as probable, and if the size of the outflow can be reliably estimated, a provision is recognized in the financial statements.
2.22
2.23
2.24
NOTES TO THE FINANCIAL STATEMENTS for the Year Ended June 30, 2020
2020
Ordinary shares of the Company held by related parties: 3.1
4 878 0021 648 500
755 985 110
5 8987 288 495
4 878 0021 648 500
755 985 110
5 8987 288 495
The Crescent Textile Mills Limited-Employees Provident Fund-Trustee Suraj Cotton Mills Limited Premier Insurance Limited Crescent Group (Private) LimitedShakarganj Limited
(Number of Shares) 2020 2019
ISSUED, SUBSCRIBED AND PAID UP SHARE CAPITAL3.
Ordinary shares of Rupees 10 eachfully paid in cash
Ordinary shares of Rupees 10 eachissued as fully paid bonus shares
505,712
294,288 800,000
505,712
294,288 800,000
2020 2019(Rupees in '000')
50 571 213
29 428 787
80 000 000
50 571 213
29 428 787
80 000 000
2020 2019(Number of Shares)
61
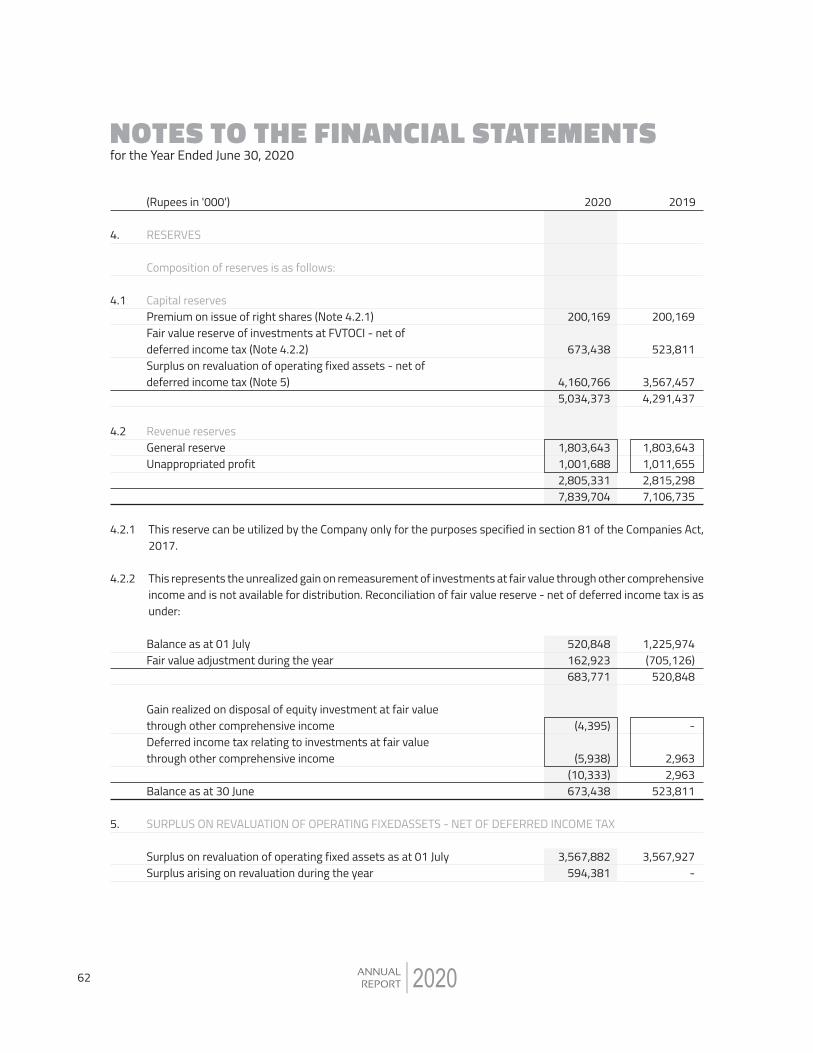
NOTES TO THE FINANCIAL STATEMENTS for the Year Ended June 30, 2020
2020
2020 2019(Rupees in '000')
RESERVES
Composition of reserves is as follows:
Capital reservesPremium on issue of right shares (Note 4.2.1)Fair value reserve of investments at FVTOCI - net ofdeferred income tax (Note 4.2.2)Surplus on revaluation of operating fixed assets - net ofdeferred income tax (Note 5)
Revenue reservesGeneral reserveUnappropriated profit
Balance as at 01 JulyFair value adjustment during the year
Gain realized on disposal of equity investment at fair valuethrough other comprehensive incomeDeferred income tax relating to investments at fair valuethrough other comprehensive income
Balance as at 30 June
SURPLUS ON REVALUATION OF OPERATING FIXEDASSETS - NET OF DEFERRED INCOME TAX
Surplus on revaluation of operating fixed assets as at 01 July Surplus arising on revaluation during the year
4.
4.1
4.2
4.2.1
4.2.2
5.
200,169
673,438
4,160,766 5,034,373
1,803,643 1,001,688 2,805,331 7,839,704
520,848 162,923 683,771
(4,395)
(5,938) (10,333) 673,438
3,567,882 594,381
200,169
523,811
3,567,457 4,291,437
1,803,643 1,011,655 2,815,298 7,106,735
1,225,974 (705,126)
520,848
-
2,963 2,963
523,811
3,567,927 -
This reserve can be utilized by the Company only for the purposes specified in section 81 of the Companies Act, 2017. This represents the unrealized gain on remeasurement of investments at fair value through other comprehensive income and is not available for distribution. Reconciliation of fair value reserve - net of deferred income tax is as under:
62

NOTES TO THE FINANCIAL STATEMENTS for the Year Ended June 30, 2020
20202020
2020 2019(Rupees in '000')
Transferred to unappropriated profit in respect of incremental depreciationcharged during the year - net of deferred income tax Related deferred income tax liability
Less:Deferred income tax liability as at 01 JulyAdjustment of deferred income tax liability due to surplusarising on revaluation during the yearAdjustment of deferred income tax liability due tore-assessment at year endIncremental depreciation charged during the year transferredto the statement of profit or loss
LONG TERM FINANCING
From banking companies - secured (Note 6.1)Less: Current portion shown under current liabilities
5.1
6.
39 5
44 4,162,219
425
1,033
-
(5) 1,453
4,160,766
1,154,940 34,727
1,120,213
This represents surplus resulting from revaluation of freehold land and leasehold land carried out on 30 June 2020 by Messrs Hamid Mukhtar and Company (Private) Limited, an independent valuer enrolled on panel of the State Bank of Pakistan (SBP) as per the basis stated in Note 11.1.1. Previously revaluation was carried out on 30 June 2007, 30 June 2013 and 30 June 2017 by an independent valuer.
39 6
45 3,567,882
411
-
20
(6) 425
3,567,457
1,395,071 274,858
1,120,213
63
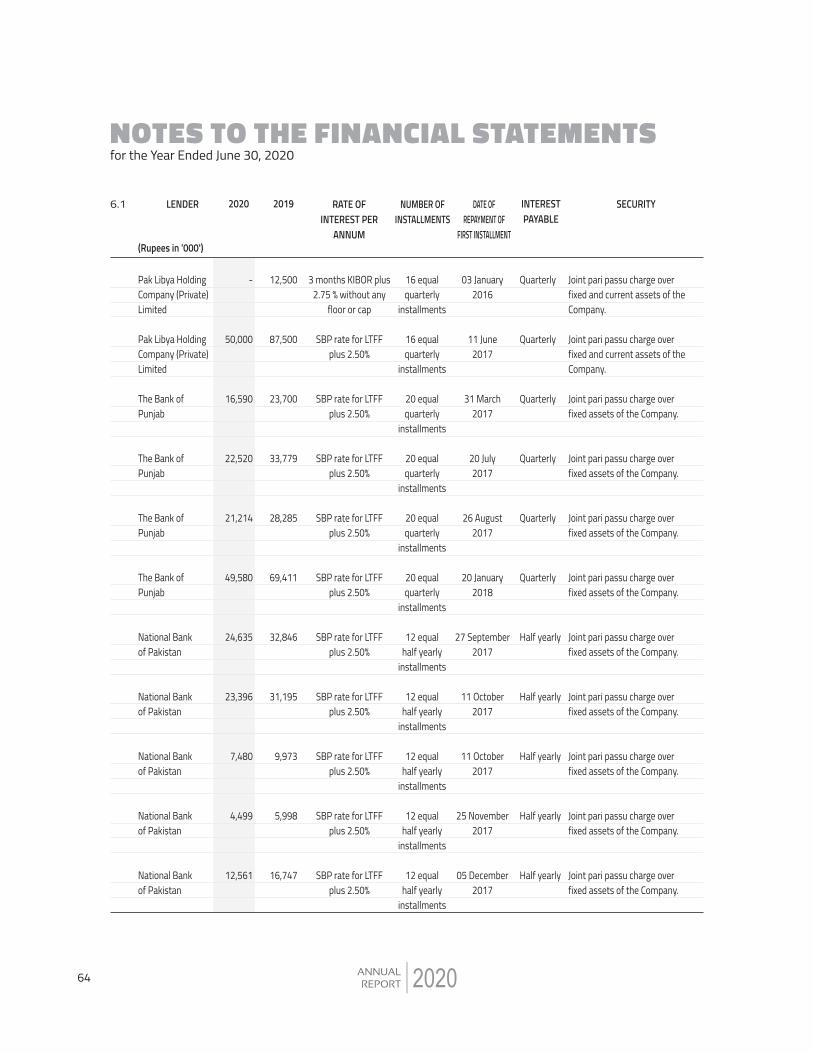
NOTES TO THE FINANCIAL STATEMENTS for the Year Ended June 30, 2020
2020
Pak Libya HoldingCompany (Private)Limited
Pak Libya HoldingCompany (Private)Limited
The Bank ofPunjab
The Bank of Punjab
The Bank ofPunjab
The Bank ofPunjab
National Bankof Pakistan
National Bankof Pakistan
National Bankof Pakistan
National Bankof Pakistan
National Bankof Pakistan
3 months KIBOR plus2.75 % without any
floor or cap
SBP rate for LTFFplus 2.50%
SBP rate for LTFFplus 2.50%
SBP rate for LTFFplus 2.50%
SBP rate for LTFFplus 2.50%
SBP rate for LTFFplus 2.50%
SBP rate for LTFFplus 2.50%
SBP rate for LTFFplus 2.50%
SBP rate for LTFFplus 2.50%
SBP rate for LTFFplus 2.50%
SBP rate for LTFFplus 2.50%
-
50,000
16,590
22,520
21,214
49,580
24,635
23,396
7,480
4,499
12,561
12,500
87,500
23,700
33,779
28,285
69,411
32,846
31,195
9,973
5,998
16,747
16 equalquarterly
installments
16 equalquarterly
installments
20 equalquarterly
installments
20 equalquarterly
installments
20 equalquarterly
installments
20 equalquarterly
installments
12 equalhalf yearly
installments
12 equalhalf yearly
installments
12 equalhalf yearly
installments
12 equalhalf yearly
installments
12 equalhalf yearly
installments
03 January 2016
11 June 2017
31 March 2017
20 July 2017
26 August 2017
20 January 2018
27 September 2017
11 October 2017
11 October 2017
25 November 2017
05 December 2017
Quarterly
Quarterly
Quarterly
Quarterly
Quarterly
Quarterly
Half yearly
Half yearly
Half yearly
Half yearly
Half yearly
Joint pari passu charge overfixed and current assets of theCompany.
Joint pari passu charge overfixed and current assets of theCompany.
Joint pari passu charge overfixed assets of the Company.
Joint pari passu charge overfixed assets of the Company.
Joint pari passu charge overfixed assets of the Company.
Joint pari passu charge overfixed assets of the Company.
Joint pari passu charge overfixed assets of the Company.
Joint pari passu charge overfixed assets of the Company.
Joint pari passu charge overfixed assets of the Company.
Joint pari passu charge overfixed assets of the Company.
Joint pari passu charge overfixed assets of the Company.
6.1 LENDER 2020 2019 RATE OFINTEREST PER
ANNUM
NUMBER OFINSTALLMENTS
DATE OFREPAYMENT OF
FIRST INSTALLMENT
INTERESTPAYABLE
SECURITY
(Rupees in '000')
64

NOTES TO THE FINANCIAL STATEMENTS for the Year Ended June 30, 2020
20202020
6.1 LENDER 2020 2019 RATE OFINTEREST PER
ANNUM
NUMBER OFINSTALLMENTS
DATE OFREPAYMENT OF
FIRST INSTALLMENT
INTERESTPAYABLE
SECURITY
(Rupees in '000')
National Bankof Pakistan
National Bankof Pakistan
National Bankof Pakistan
National Bankof Pakistan
National Bankof Pakistan
National Bankof Pakistan
National Bankof Pakistan
National Bankof Pakistan
Pak Libya HoldingCompany (Private)Limited
Pak Libya HoldingCompany (Private)Limited
The Bank ofPunjab
SBP rate for LTFFplus 2.50%
SBP rate for LTFFplus 2.50%
SBP rate for LTFFplus 2.50%
SBP rate for LTFFplus 2.50%
SBP rate for LTFFplus 2.50%
SBP rate for LTFFplus 2.50%
SBP rate for LTFFplus 2.50%
SBP rate for LTFFplus 2.50%
Pak Libya's spread 2%plus SBP's spread 2%
3 months KIBOR plus2.5% without any floor
or cap
SBP rate for LTFFplus 2.50%
119,219
131,537
14,374
11,241
36,026
26,870
18,449
26,571
173,724
26,277
31,575
153,282
169,119
18,481
14,452
46,320
34,548
23,720
33,214
173,724
26,277
33,238
12 equalhalf yearly
installments
12 equalhalf yearly
installments
12 equalhalf yearly
installments
12 equalhalf yearly
installments
12 equalhalf yearly
installments
12 equalhalf yearly
installments
12 equalhalf yearly
installments
12 equalhalf yearly
installments
20 equalquarterly
installments
22 equalquarterly
installments
20 equalquarterly
installments
13 January 2018
25 January 2018
26 January 2018
26 January 2018
07 February 2018
14 February 2018
23 April 2018
29 December 2018
23 December 2021
10 June2022
27 March2020
Half yearly
Half yearly
Half yearly
Half yearly
Half yearly
Half yearly
Half yearly
Half yearly
Quarterly
Quarterly
Quarterly
Joint pari passu charge overfixed assets of the Company.
Joint pari passu charge overfixed assets of the Company.
Joint pari passu charge overfixed assets of the Company.
Joint pari passu charge overfixed assets of the Company.
Joint pari passu charge overfixed assets of the Company.
Joint pari passu charge overfixed assets of the Company.
Joint pari passu charge overfixed assets of the Company.
Joint pari passu charge overfixed assets of the Company.
Joint pari passu charge over fixed and current assets of theCompany.
Joint pari passu charge over fixed and current assets of theCompany.
First pari passu charge overpresent and future fixed assentsof the company.
65
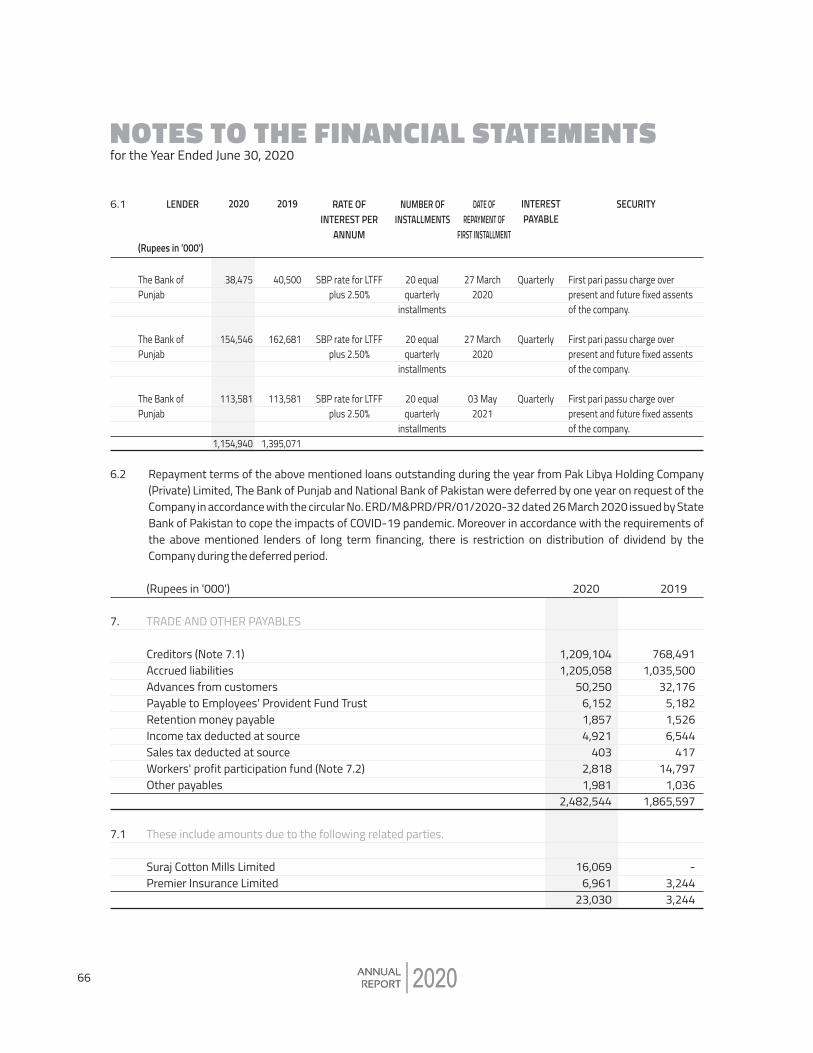
NOTES TO THE FINANCIAL STATEMENTS for the Year Ended June 30, 2020
20202020
6.1 LENDER 2020 2019 RATE OFINTEREST PER
ANNUM
NUMBER OFINSTALLMENTS
DATE OFREPAYMENT OF
FIRST INSTALLMENT
INTERESTPAYABLE
SECURITY
(Rupees in '000')
The Bank of Punjab
The Bank of Punjab
The Bank of Punjab
SBP rate for LTFFplus 2.50%
SBP rate for LTFFplus 2.50%
SBP rate for LTFFplus 2.50%
38,475
154,546
113,581
1,154,940
40,500
162,681
113,581
1,395,071
20 equalquarterly
installments
20 equalquarterly
installments
20 equalquarterly
installments
27 March2020
27 March2020
03 May2021
Quarterly
Quarterly
Quarterly
First pari passu charge overpresent and future fixed assentsof the company.
First pari passu charge overpresent and future fixed assentsof the company.
First pari passu charge overpresent and future fixed assentsof the company.
Repayment terms of the above mentioned loans outstanding during the year from Pak Libya Holding Company (Private) Limited, The Bank of Punjab and National Bank of Pakistan were deferred by one year on request of the Company in accordance with the circular No. ERD/M&PRD/PR/01/2020-32 dated 26 March 2020 issued by State Bank of Pakistan to cope the impacts of COVID-19 pandemic. Moreover in accordance with the requirements of the above mentioned lenders of long term financing, there is restriction on distribution of dividend by the Company during the deferred period.
6.2
1,209,104 1,205,058
50,250 6,152 1,857 4,921
403 2,818 1,981
2,482,544
16,069 6,961
23,030
TRADE AND OTHER PAYABLES
Creditors (Note 7.1)Accrued liabilitiesAdvances from customersPayable to Employees' Provident Fund TrustRetention money payableIncome tax deducted at sourceSales tax deducted at sourceWorkers' profit participation fund (Note 7.2)Other payables
These include amounts due to the following related parties.
Suraj Cotton Mills LimitedPremier Insurance Limited
2020 2019(Rupees in '000')
7.
7.1
768,4911,035,500
32,176 5,182 1,526 6,544
417 14,797
1,036 1,865,597
- 3,244 3,244
66
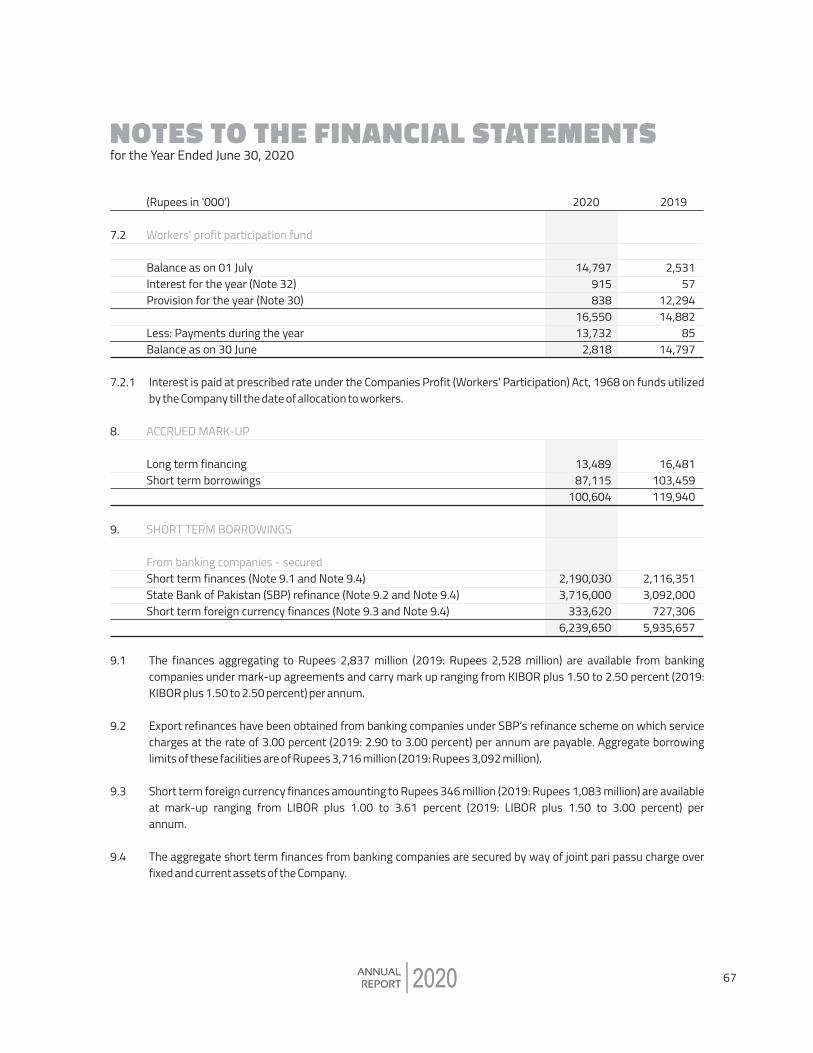
NOTES TO THE FINANCIAL STATEMENTS for the Year Ended June 30, 2020
20202020
2020 2019(Rupees in '000')
14,797 915 838
16,550 13,732
2,818
Workers' profit participation fund
Balance as on 01 JulyInterest for the year (Note 32)Provision for the year (Note 30)
Less: Payments during the yearBalance as on 30 June
7.2
2,531 57
12,294 14,882
85 14,797
Interest is paid at prescribed rate under the Companies Profit (Workers' Participation) Act, 1968 on funds utilized by the Company till the date of allocation to workers.
7.2.1
ACCRUED MARK-UP
Long term financingShort term borrowings
SHORT TERM BORROWINGS From banking companies - securedShort term finances (Note 9.1 and Note 9.4) State Bank of Pakistan (SBP) refinance (Note 9.2 and Note 9.4) Short term foreign currency finances (Note 9.3 and Note 9.4)
8.
9.
16,481 103,459 119,940
2,116,351 3,092,000
727,306 5,935,657
13,489 87,115
100,604
2,190,030 3,716,000
333,620 6,239,650
The finances aggregating to Rupees 2,837 million (2019: Rupees 2,528 million) are available from banking companies under mark-up agreements and carry mark up ranging from KIBOR plus 1.50 to 2.50 percent (2019: KIBOR plus 1.50 to 2.50 percent) per annum. Export refinances have been obtained from banking companies under SBP�s refinance scheme on which service charges at the rate of 3.00 percent (2019: 2.90 to 3.00 percent) per annum are payable. Aggregate borrowing limits of these facilities are of Rupees 3,716 million (2019: Rupees 3,092 million). Short term foreign currency finances amounting to Rupees 346 million (2019: Rupees 1,083 million) are available at mark-up ranging from LIBOR plus 1.00 to 3.61 percent (2019: LIBOR plus 1.50 to 3.00 percent) per annum. The aggregate short term finances from banking companies are secured by way of joint pari passu charge over fixed and current assets of the Company.
9.1
9.2
9.3
9.4
67
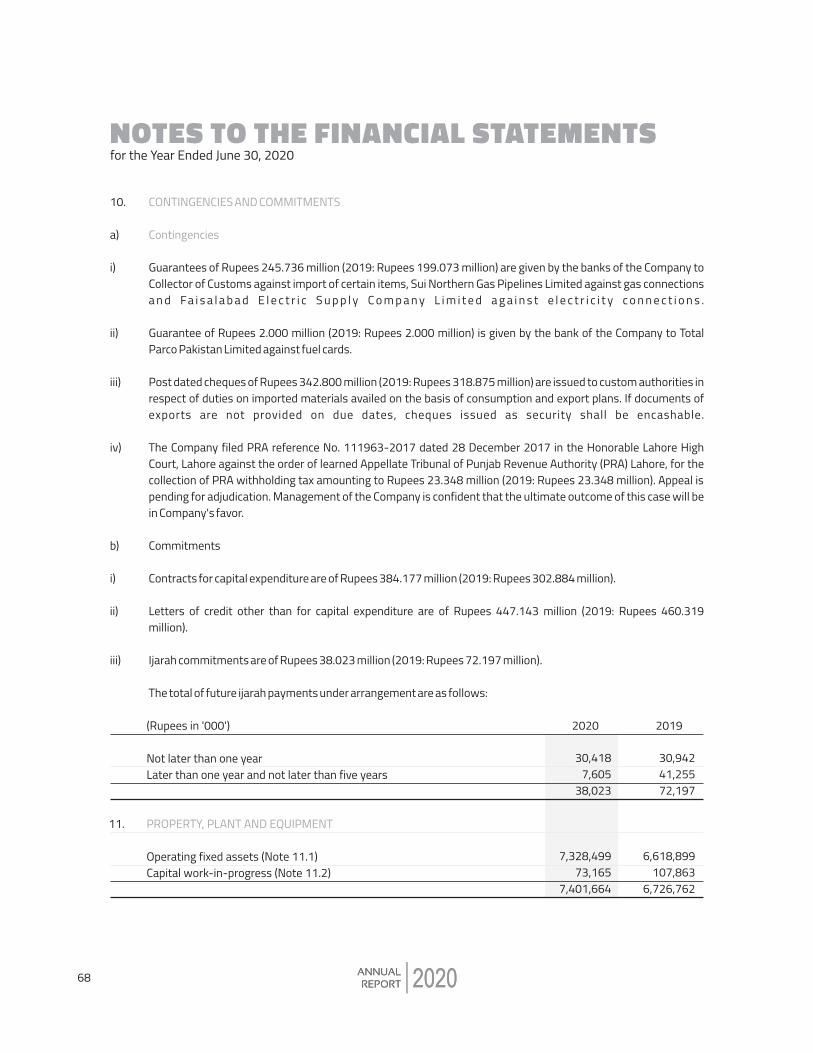
NOTES TO THE FINANCIAL STATEMENTS for the Year Ended June 30, 2020
20202020
CONTINGENCIES AND COMMITMENTS
Contingencies Guarantees of Rupees 245.736 million (2019: Rupees 199.073 million) are given by the banks of the Company to Collector of Customs against import of certain items, Sui Northern Gas Pipelines Limited against gas connections a n d Fa i s a l a b a d E l e c t r i c S u p p l y C o m p a n y L i m i t e d a g a i n s t e l e c t r i c i t y c o n n e c t i o n s . Guarantee of Rupees 2.000 million (2019: Rupees 2.000 million) is given by the bank of the Company to Total Parco Pakistan Limited against fuel cards. Post dated cheques of Rupees 342.800 million (2019: Rupees 318.875 million) are issued to custom authorities in respect of duties on imported materials availed on the basis of consumption and export plans. If documents of exports are not provided on due dates, cheques issued as security shall be encashable. The Company filed PRA reference No. 111963-2017 dated 28 December 2017 in the Honorable Lahore High Court, Lahore against the order of learned Appellate Tribunal of Punjab Revenue Authority (PRA) Lahore, for the collection of PRA withholding tax amounting to Rupees 23.348 million (2019: Rupees 23.348 million). Appeal is pending for adjudication. Management of the Company is confident that the ultimate outcome of this case will be in Company's favor.
Commitments Contracts for capital expenditure are of Rupees 384.177 million (2019: Rupees 302.884 million). Letters of credit other than for capital expenditure are of Rupees 447.143 million (2019: Rupees 460.319 million). Ijarah commitments are of Rupees 38.023 million (2019: Rupees 72.197 million). The total of future ijarah payments under arrangement are as follows:
10.
a)
i)
ii)
iii)
iv)
b)
i)
ii)
iii)
2020 2019(Rupees in '000')
Not later than one yearLater than one year and not later than five years
PROPERTY, PLANT AND EQUIPMENT
Operating fixed assets (Note 11.1)Capital work-in-progress (Note 11.2)
30,942 41,255 72,197
6,618,899 107,863
6,726,762
30,4187,605
38,023
7,328,499 73,165
7,401,664
11.
68

NOTES TO THE FINANCIAL STATEMENTS for the Year Ended June 30, 2020
20202020
Operating fixed assets 11.1
Land-Freehold
Land-Leasehold
Buildings onfreehold land
Buildings onleasehold land
Plant andmachinery
Factory toolsand
equipment
Gas andelectric
InstallationsVehicles Stand-by
equipmentTotalOffice
equipment
Furnitureand
fixtures(Rupees in '000')
3,569,765 -
3,569,765
3,569,765
- - - -
- - - -
3,569,765
3,569,765 -
3,569,765
3,569,765 99,783
586,095
- - - -
4,255,643
4,255,643 -
4,255,643 -
8,441 (1,536)
6,905
6,905
- - - -
- - -
(95) 6,810
8,441 (1,631)
6,810
6,810 -
8,286
- - -
(95) 15,001
16,727 (1,726) 15,001
1.01
407,143 (276,898)
130,245
130,245
- - - -
(987) 926 (61)
(11,525) 118,659
406,156 (287,497)
118,659
118,659 89,268
-
(192) 166 (26)
(12,703) 195,198
495,232 (300,034)
195,198 5,10
130,778 (56,635)
74,143
74,143
- - - -
(4,157) 4,075
(82) (6,744) 67,317
126,621 (59,304)
67,317
67,317 -
-
- - -
(6,098) 61,219
126,621 (65,402)
61,219 5,10
5,618,694 (3,236,603)
2,382,091
2,382,091
(1,675) 694
(981) 653,476
(176,543) 145,776 (30,767)
(254,786) 2,749,033
6,093,952 (3,344,919)
2,749,033
2,749,033 213,804
-
(16,309) 12,513 (3,796)
(278,023) 2,681,018
6,291,447 (3,610,429)
2,681,018 10
30,717 (21,523)
9,194
9,194
- - - -
- - -
(1,839) 7,355
30,717 (23,362)
7,355
7,355 2,434
-
- - -
(1,773) 8,016
33,151 (25,135)
8,016 20
100,552 (71,193)
29,359
29,359
- - -
3,246
- - -
(6,210) 26,395
103,798 (77,403)
26,395
26,395 224
-
- - -
(5,299) 21,320
104,022 (82,702)
21,320 20
7,247 (5,973)
1,274
1,274
- - - -
- - -
(255) 1,019
7,247 (6,228)
1,019
1,019 -
-
- - -
(204) 815
7,247 (6,432)
815 20
38,293 (32,034)
6,259
6,259
- - -
7,420
- - -
(5,614) 8,065
45,713 (37,648)
8,065
8,065 3,517
-
- - -
(5,136) 6,446
49,230 (42,784)
6,446 50
113,523 (106,295)
7,228
7,228
1,675 (694)
981 -
(1,675) 760
(915) (788)
6,506
113,523 (107,017)
6,506
6,506 -
-
- - -
(651) 5,855
113,523 (107,668)
5,855 10
10,091,068 (3,837,665)
6,253,403
6,253,403
- - -
698,189
(192,961) 158,360 (34,601)
(298,092) 6,618,899
10,596,296 (3,977,397)
6,618,899
6,618,899 449,837
594,381
(23,456) 15,522 (7,934)
(326,684) 7,328,499
11,617,058 (4,288,559)
7,328,499
65,915 (28,975)
36,940
36,940
- - -
34,047
(9,599) 6,823
(2,776) (10,236)
57,975
90,363 (32,388)
57,975
57,975 40,807
-
(6,955) 2,843
(4,112) (16,702)
77,968
124,215 (46,247)
77,968 20
At 30 June 2018Cost / revalued amountAccumulated depreciationNet book value
Year ended 30 June 2019Opening net book value Segregation in proper headsCostAccumulated depreciation
AdditionsDisposals:Cost Accumulated depreciation
Depreciation chargeClosing net book value
At 30 June 2019Cost / revalued amountAccumulated depreciationNet book value
Year ended 30 June 2020Opening net book value AdditionsEffect of surplus on revaluationas at 30 June 2020Disposals:Cost Accumulated depreciation
Depreciation chargeClosing net book value
At 30 June 2020Cost / revalued amountAccumulated depreciationNet book valueAnnual rate of depreciation (%)
69
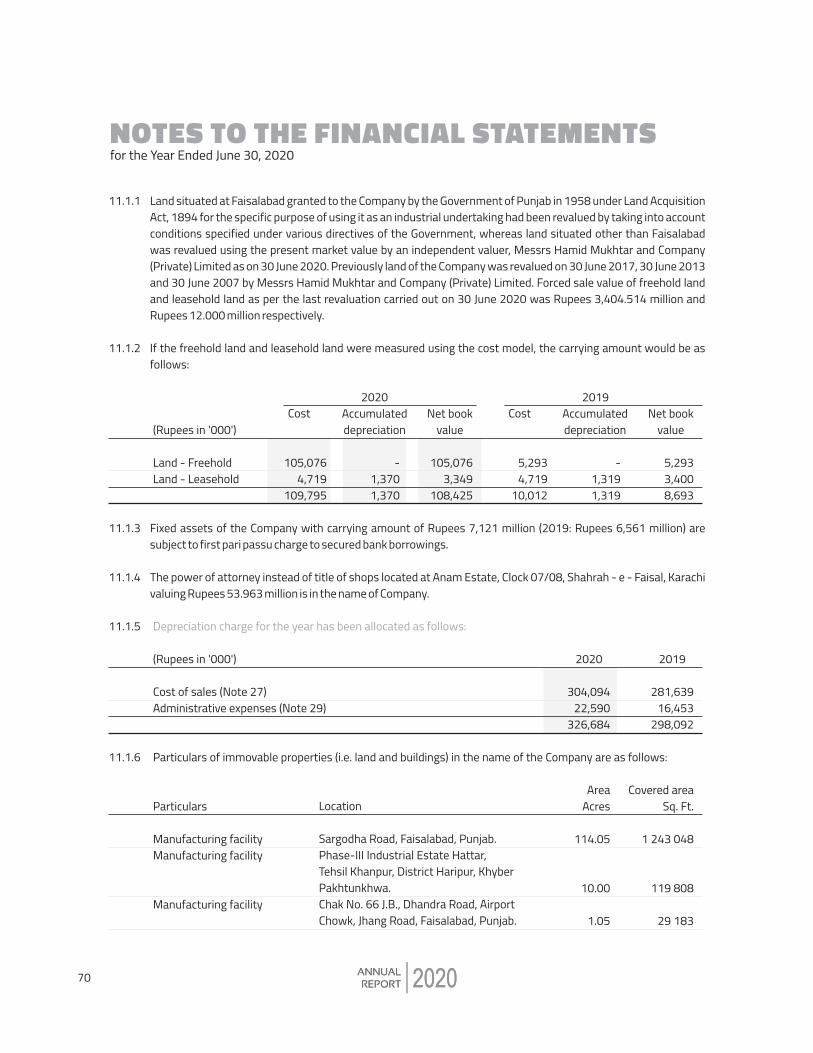
NOTES TO THE FINANCIAL STATEMENTS for the Year Ended June 30, 2020
20202020
11.1.1
11.1.2
Land situated at Faisalabad granted to the Company by the Government of Punjab in 1958 under Land Acquisition Act, 1894 for the specific purpose of using it as an industrial undertaking had been revalued by taking into account conditions specified under various directives of the Government, whereas land situated other than Faisalabad was revalued using the present market value by an independent valuer, Messrs Hamid Mukhtar and Company (Private) Limited as on 30 June 2020. Previously land of the Company was revalued on 30 June 2017, 30 June 2013 and 30 June 2007 by Messrs Hamid Mukhtar and Company (Private) Limited. Forced sale value of freehold land and leasehold land as per the last revaluation carried out on 30 June 2020 was Rupees 3,404.514 million and Rupees 12.000 million respectively. If the freehold land and leasehold land were measured using the cost model, the carrying amount would be as follows:
2020 2019Cost Net book
valueCost Accumulated
depreciation Net book
value(Rupees in '000')
5,293 3,400 8,693
105,076 3,349
108,425
- 1,319 1,319
- 1,370 1,370
5,293 4,719
10,012
105,076 4,719
109,795
Land - Freehold Land - Leasehold
Accumulated depreciation
11.1.3
11.1.4
Fixed assets of the Company with carrying amount of Rupees 7,121 million (2019: Rupees 6,561 million) are subject to first pari passu charge to secured bank borrowings.
The power of attorney instead of title of shops located at Anam Estate, Clock 07/08, Shahrah - e - Faisal, Karachi valuing Rupees 53.963 million is in the name of Company.
Depreciation charge for the year has been allocated as follows: 11.1.5
11.1.6
2020 2019(Rupees in '000')
22,590 326,684
304,094 Cost of sales (Note 27) Administrative expenses (Note 29)
Particulars of immovable properties (i.e. land and buildings) in the name of the Company are as follows:
281,639 16,453
298,092
Area Acres
114.05
10.00
1.05
Particulars
Manufacturing facilityManufacturing facility
Manufacturing facility
Covered area Sq. Ft.
1 243 048
119 808
29 183
Location
Sargodha Road, Faisalabad, Punjab.Phase-III Industrial Estate Hattar, Tehsil Khanpur, District Haripur, KhyberPakhtunkhwa.Chak No. 66 J.B., Dhandra Road, AirportChowk, Jhang Road, Faisalabad, Punjab.
70

NOTES TO THE FINANCIAL STATEMENTS for the Year Ended June 30, 2020
20202020
Area Covered area Acres
0.10 2.99
Particulars
Shops
Guest House
Sq. Ft.
4 500 5 302
Location
Anam Estate, Clock 07/08,Shahrah - e - Faisal, Karachi, Sindh.Pindi Point, Murree, Punjab.
Detail of operating fixed assets, exceeding the book value of Rupees 500,000, disposed of during the year is as follows:11.1.7
(Rupees in '000')
Accumulateddepreciation
Net bookvalue
Saleproceeds
(Loss) /gainCostQty Mode of disposal Particulars of purchasersDescription
Plant and machinery
Card Crossroll MK-5Pin Beater withCondensorContamination Sorter
Vehicles
Suzuki WagonR FD-18-724
Suzuki WagonR LEA-18A-9724
Suzuki WagonR LEA-18A-6639
Suzuki WagonR LEA-19-6692
Aggregate of other itemsof property, plant andequipment with individualbook values not exceedingRupees 500,000
1
11
1
1
1
1
1,848
1,700 5,535 9,083
1,089
1,159
1,159
1,144 4,551
9,822 23,456
1,124
746 4,818 6,688
319
306
306
201 1,132
7,702 15,522
724
954 717
2,395
770
853
853
943 3,419
2,120 7,934
415
150 70
635
980
1,043
1,043
1,043 4,109
8,031 12,775
(309)
(804) (647)
(1,760)
210
190
190
100 690
5,911 4,841
Negotiation
NegotiationNegotiation
Company'spolicy
Company'spolicy
Company'spolicy
Company'spolicy
Adnan Idress, Faisalabad.
Zeeshan Traders, Faisalabad.Zeeshan Traders, Faisalabad.
Mr. Rizwan ul Haq, Faisalabad(Company's Employee).
Mr. Mustafa Kamal Pasha, Faisalabad(Company's Employee).
Mr. Imran Ali, Faisalabad(Company's Employee).
Mr. Awais Abubakar, Faisalabad(Company's Employee).
71
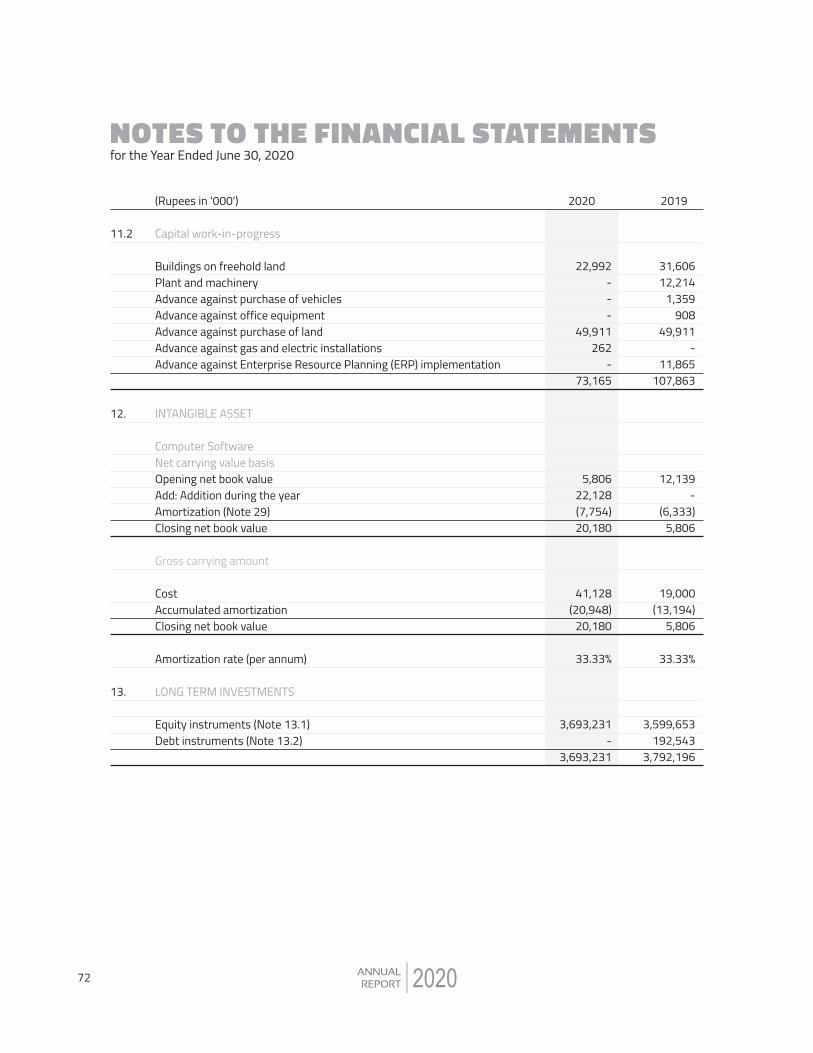
NOTES TO THE FINANCIAL STATEMENTS for the Year Ended June 30, 2020
2020
Capital work-in-progress
Buildings on freehold landPlant and machineryAdvance against purchase of vehiclesAdvance against office equipmentAdvance against purchase of landAdvance against gas and electric installationsAdvance against Enterprise Resource Planning (ERP) implementation
INTANGIBLE ASSET
Computer SoftwareNet carrying value basisOpening net book valueAdd: Addition during the yearAmortization (Note 29)Closing net book value
Gross carrying amount
Cost Accumulated amortization Closing net book value Amortization rate (per annum)
LONG TERM INVESTMENTS
Equity instruments (Note 13.1)Debt instruments (Note 13.2)
11.2
12.
13.
31,606 12,214
1,359 908
49,911 -
11,865 107,863
12,139 -
(6,333) 5,806
19,000 (13,194)
5,806
33.33%
3,599,653 192,543
3,792,196
2020 2019(Rupees in '000')
22,992 - - -
49,911 262
- 73,165
5,806 22,128 (7,754) 20,180
41,128 (20,948)
20,180
33.33%
3,693,231 -
3,693,231
72
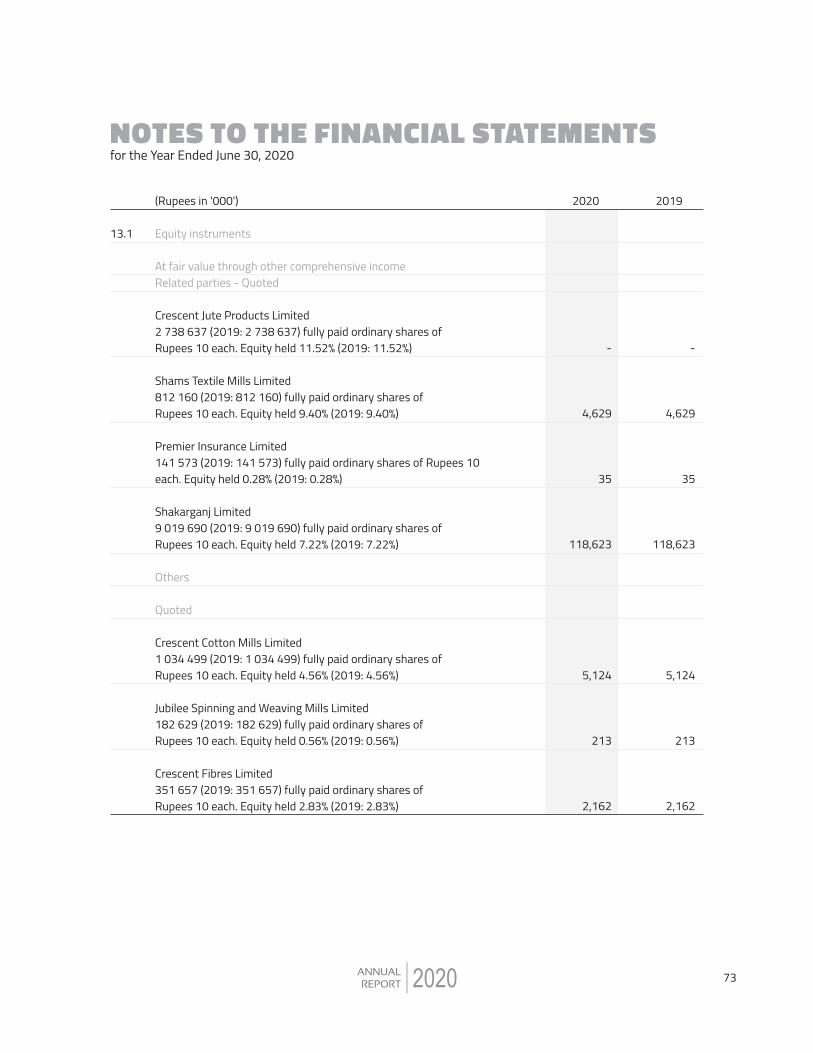
NOTES TO THE FINANCIAL STATEMENTS for the Year Ended June 30, 2020
2020
Equity instruments
At fair value through other comprehensive income Related parties - Quoted
Crescent Jute Products Limited2 738 637 (2019: 2 738 637) fully paid ordinary shares ofRupees 10 each. Equity held 11.52% (2019: 11.52%)
Shams Textile Mills Limited812 160 (2019: 812 160) fully paid ordinary shares ofRupees 10 each. Equity held 9.40% (2019: 9.40%)
Premier Insurance Limited 141 573 (2019: 141 573) fully paid ordinary shares of Rupees 10 each. Equity held 0.28% (2019: 0.28%)
Shakarganj Limited 9 019 690 (2019: 9 019 690) fully paid ordinary shares of Rupees 10 each. Equity held 7.22% (2019: 7.22%)
Others
Quoted
Crescent Cotton Mills Limited 1 034 499 (2019: 1 034 499) fully paid ordinary shares ofRupees 10 each. Equity held 4.56% (2019: 4.56%)
Jubilee Spinning and Weaving Mills Limited 182 629 (2019: 182 629) fully paid ordinary shares of Rupees 10 each. Equity held 0.56% (2019: 0.56%)
Crescent Fibres Limited351 657 (2019: 351 657) fully paid ordinary shares of Rupees 10 each. Equity held 2.83% (2019: 2.83%)
-
4,629
35
118,623
5,124
213
2,162
2020 2019(Rupees in '000')
-
4,629
35
118,623
5,124
213
2,162
13.1
73
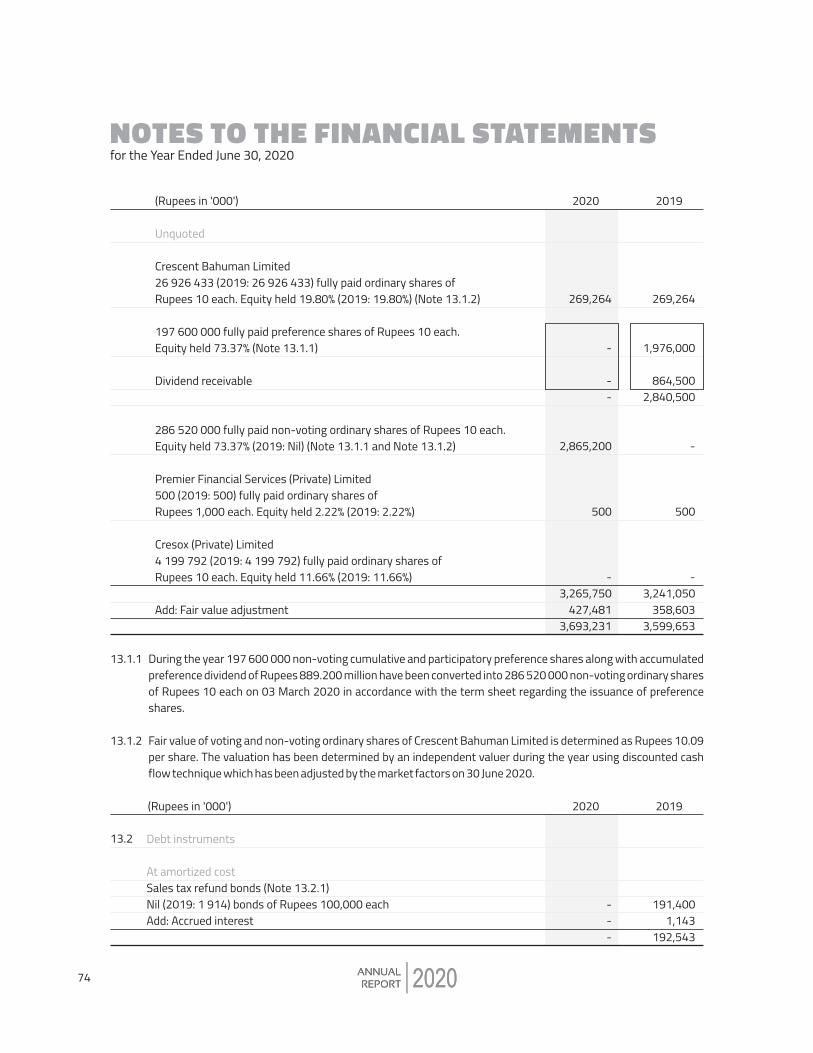
During the year 197 600 000 non-voting cumulative and participatory preference shares along with accumulated preference dividend of Rupees 889.200 million have been converted into 286 520 000 non-voting ordinary shares of Rupees 10 each on 03 March 2020 in accordance with the term sheet regarding the issuance of preference shares. Fair value of voting and non-voting ordinary shares of Crescent Bahuman Limited is determined as Rupees 10.09 per share. The valuation has been determined by an independent valuer during the year using discounted cash flow technique which has been adjusted by the market factors on 30 June 2020.
13.1.1
13.1.2
Debt instruments
At amortized costSales tax refund bonds (Note 13.2.1)Nil (2019: 1 914) bonds of Rupees 100,000 eachAdd: Accrued interest
13.2
2020 2019(Rupees in '000')
---
191,400 1,143
192,543
NOTES TO THE FINANCIAL STATEMENTS for the Year Ended June 30, 2020
20202020
Unquoted
Crescent Bahuman Limited26 926 433 (2019: 26 926 433) fully paid ordinary shares ofRupees 10 each. Equity held 19.80% (2019: 19.80%) (Note 13.1.2)
197 600 000 fully paid preference shares of Rupees 10 each.Equity held 73.37% (Note 13.1.1)
Dividend receivable
286 520 000 fully paid non-voting ordinary shares of Rupees 10 each. Equity held 73.37% (2019: Nil) (Note 13.1.1 and Note 13.1.2)
Premier Financial Services (Private) Limited500 (2019: 500) fully paid ordinary shares ofRupees 1,000 each. Equity held 2.22% (2019: 2.22%)
Cresox (Private) Limited4 199 792 (2019: 4 199 792) fully paid ordinary shares of Rupees 10 each. Equity held 11.66% (2019: 11.66%)
Add: Fair value adjustment
269,264
1,976,000
864,500 2,840,500
-
500
- 3,241,050
358,603 3,599,653
2020 2019(Rupees in '000')
269,264
-
- -
2,865,200
500
- 3,265,750
427,481 3,693,231
74
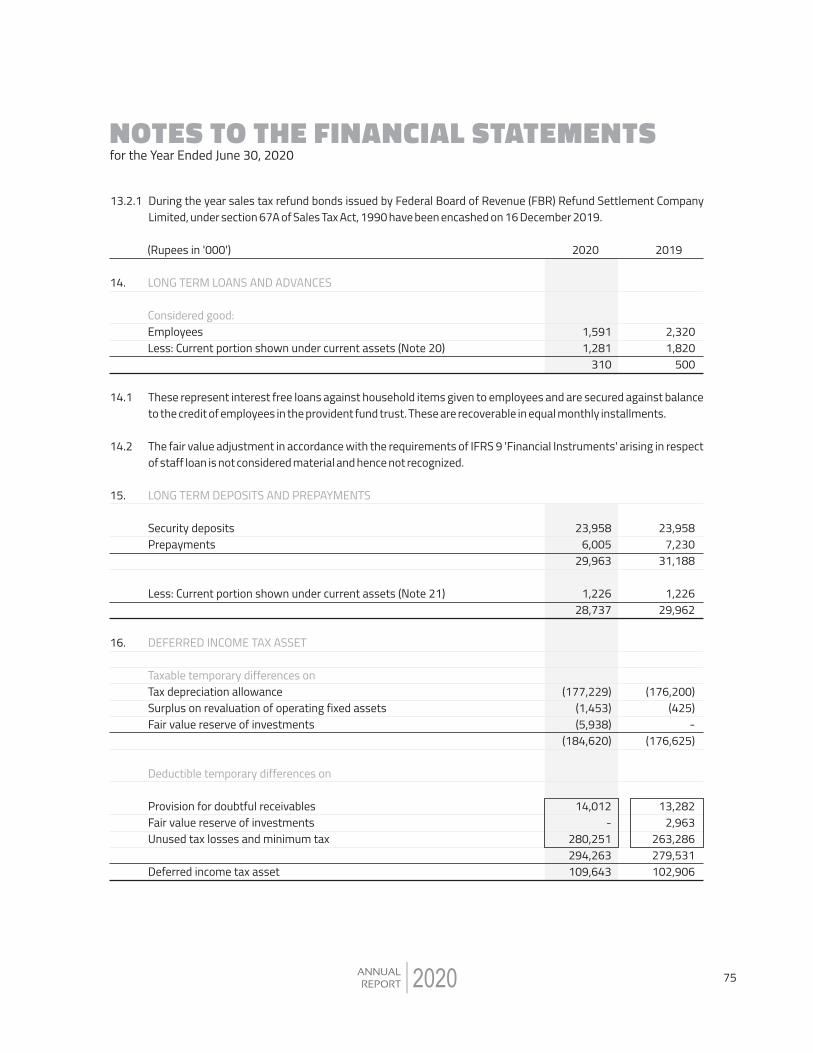
During the year sales tax refund bonds issued by Federal Board of Revenue (FBR) Refund Settlement Company Limited, under section 67A of Sales Tax Act, 1990 have been encashed on 16 December 2019.
13.2.1
NOTES TO THE FINANCIAL STATEMENTS for the Year Ended June 30, 2020
2020
14. LONG TERM LOANS AND ADVANCES Considered good: Employees Less: Current portion shown under current assets (Note 20)
2020 2019(Rupees in '000')
1,591 1,281
310
2,320 1,820
500
These represent interest free loans against household items given to employees and are secured against balance to the credit of employees in the provident fund trust. These are recoverable in equal monthly installments.
The fair value adjustment in accordance with the requirements of IFRS 9 'Financial Instruments' arising in respect of staff loan is not considered material and hence not recognized.
14.1
14.2
15.
16.
23,958 6,005
29,963
1,226 28,737
(177,229) (1,453) (5,938)
(184,620)
14,012 -
280,251 294,263 109,643
LONG TERM DEPOSITS AND PREPAYMENTS
Security depositsPrepayments
Less: Current portion shown under current assets (Note 21)
DEFERRED INCOME TAX ASSET
Taxable temporary differences onTax depreciation allowanceSurplus on revaluation of operating fixed assetsFair value reserve of investments
Deductible temporary differences on
Provision for doubtful receivablesFair value reserve of investmentsUnused tax losses and minimum tax
Deferred income tax asset
23,958 7,230
31,188
1,226 29,962
(176,200) (425)
- (176,625)
13,282 2,963
263,286 279,531 102,906
75
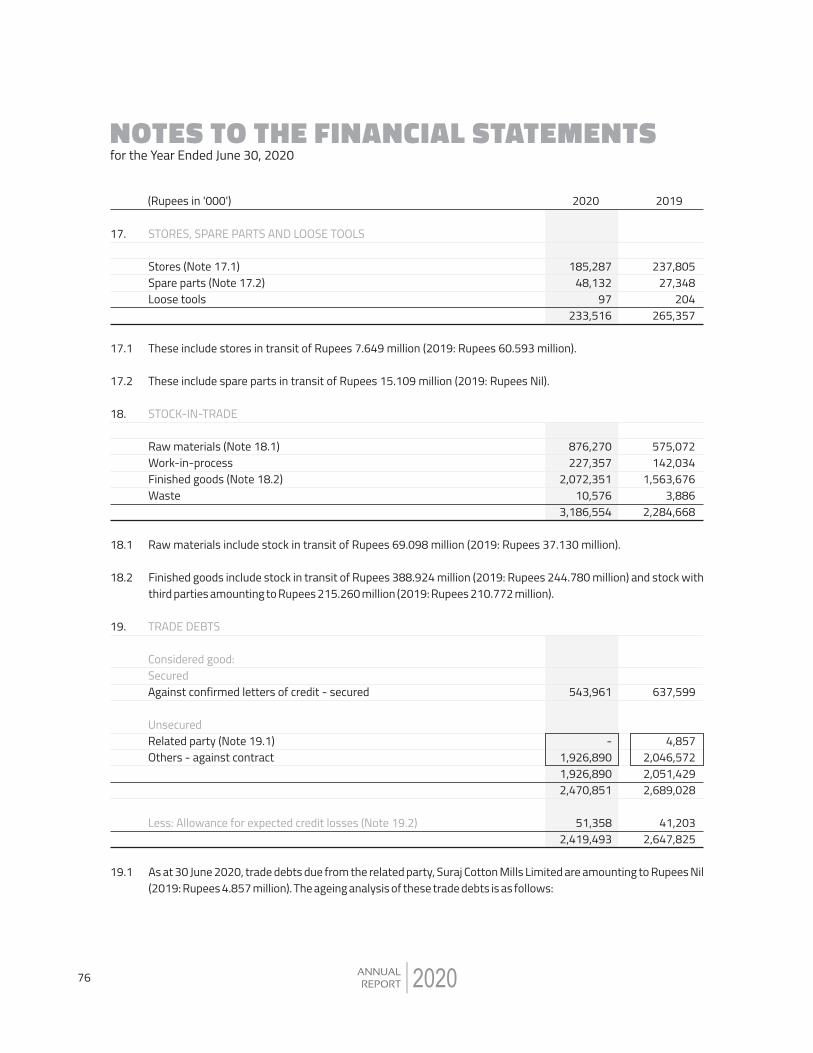
19. TRADE DEBTS
Considered good:SecuredAgainst confirmed letters of credit - secured
UnsecuredRelated party (Note 19.1)Others - against contract
Less: Allowance for expected credit losses (Note 19.2)
543,961
- 1,926,890 1,926,890 2,470,851
51,358 2,419,493
637,599
4,857 2,046,572 2,051,429 2,689,028
41,203 2,647,825
NOTES TO THE FINANCIAL STATEMENTS for the Year Ended June 30, 2020
2020
17.
17.1
17.2
18.
18.1
185,287 48,132
97 233,516
876,270 227,357
2,072,351 10,576
3,186,554
Stores (Note 17.1)Spare parts (Note 17.2)Loose tools
These include stores in transit of Rupees 7.649 million (2019: Rupees 60.593 million). These include spare parts in transit of Rupees 15.109 million (2019: Rupees Nil). STOCK-IN-TRADE
Raw materials (Note 18.1)Work-in-processFinished goods (Note 18.2)Waste
Raw materials include stock in transit of Rupees 69.098 million (2019: Rupees 37.130 million).
237,805 27,348
204 265,357
575,072 142,034
1,563,676 3,886
2,284,668
STORES, SPARE PARTS AND LOOSE TOOLS
2020 2019(Rupees in '000')
Finished goods include stock in transit of Rupees 388.924 million (2019: Rupees 244.780 million) and stock with third parties amounting to Rupees 215.260 million (2019: Rupees 210.772 million).
18.2
As at 30 June 2020, trade debts due from the related party, Suraj Cotton Mills Limited are amounting to Rupees Nil (2019: Rupees 4.857 million). The ageing analysis of these trade debts is as follows:
19.1
76
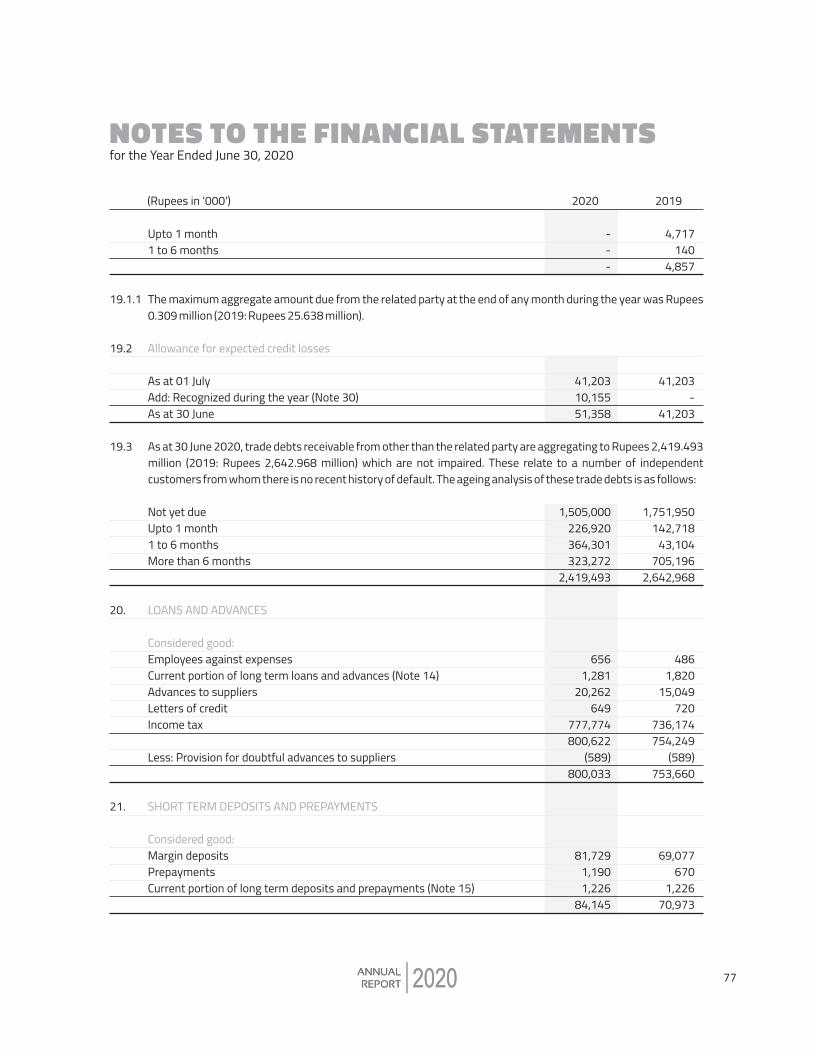
NOTES TO THE FINANCIAL STATEMENTS for the Year Ended June 30, 2020
20202020
Upto 1 month1 to 6 months
Allowance for expected credit losses As at 01 July Add: Recognized during the year (Note 30) As at 30 June
Not yet dueUpto 1 month1 to 6 monthsMore than 6 months
LOANS AND ADVANCES
Considered good:Employees against expensesCurrent portion of long term loans and advances (Note 14)Advances to suppliers Letters of creditIncome tax
Less: Provision for doubtful advances to suppliers
SHORT TERM DEPOSITS AND PREPAYMENTS
Considered good:Margin depositsPrepaymentsCurrent portion of long term deposits and prepayments (Note 15)
2020 2019(Rupees in '000')
---
41,203 10,155 51,358
1,505,000 226,920 364,301 323,272
2,419,493
656 1,281
20,262 649
777,774 800,622
(589) 800,033
81,729 1,190 1,226
84,145
4,717 140
4,857
41,203 -
41,203
1,751,950 142,718
43,104 705,196
2,642,968
486 1,820
15,049 720
736,174 754,249
(589) 753,660
69,077 670
1,226 70,973
The maximum aggregate amount due from the related party at the end of any month during the year was Rupees 0.309 million (2019: Rupees 25.638 million).
19.1.1
19.2
As at 30 June 2020, trade debts receivable from other than the related party are aggregating to Rupees 2,419.493 million (2019: Rupees 2,642.968 million) which are not impaired. These relate to a number of independent customers from whom there is no recent history of default. The ageing analysis of these trade debts is as follows:
19.3
20.
21.
77
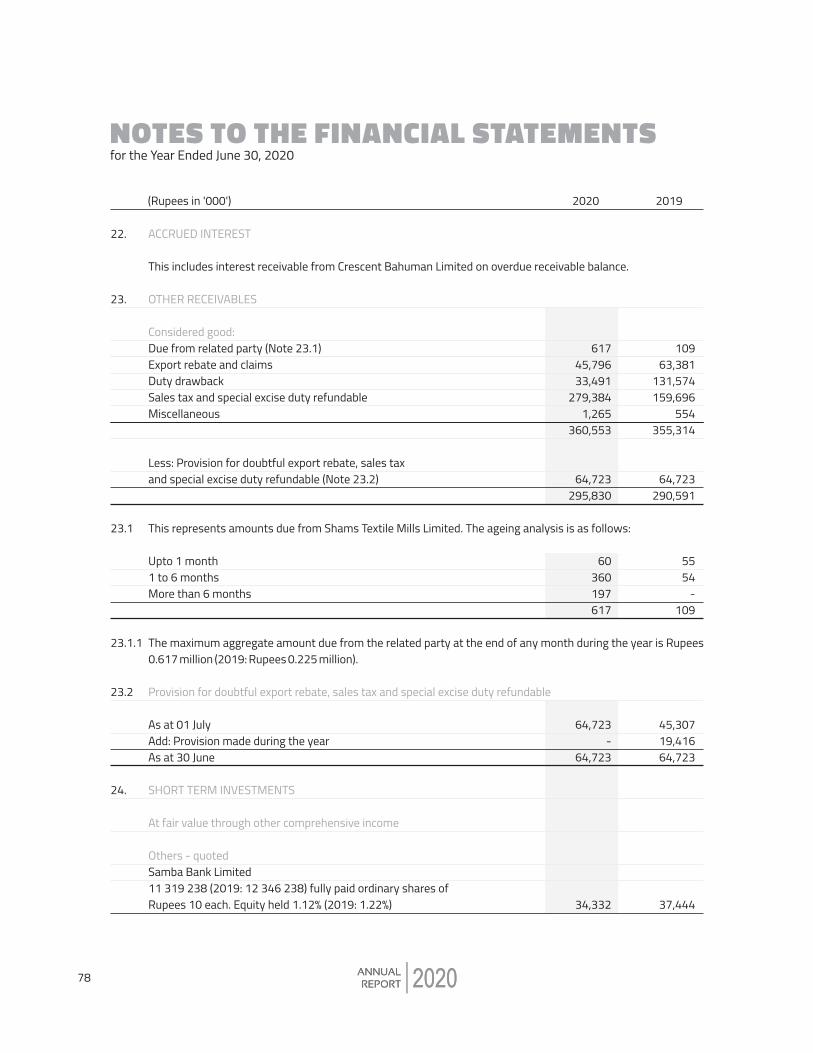
NOTES TO THE FINANCIAL STATEMENTS for the Year Ended June 30, 2020
20202020
ACCRUED INTEREST
This includes interest receivable from Crescent Bahuman Limited on overdue receivable balance.
OTHER RECEIVABLES
Considered good:Due from related party (Note 23.1)Export rebate and claimsDuty drawbackSales tax and special excise duty refundableMiscellaneous
Less: Provision for doubtful export rebate, sales tax and special excise duty refundable (Note 23.2)
This represents amounts due from Shams Textile Mills Limited. The ageing analysis is as follows:
Upto 1 month1 to 6 monthsMore than 6 months
Provision for doubtful export rebate, sales tax and special excise duty refundable As at 01 JulyAdd: Provision made during the yearAs at 30 June SHORT TERM INVESTMENTS At fair value through other comprehensive income Others - quoted Samba Bank Limited 11 319 238 (2019: 12 346 238) fully paid ordinary shares ofRupees 10 each. Equity held 1.12% (2019: 1.22%)
2020 2019(Rupees in '000')
617 45,796 33,491
279,384 1,265
360,553
64,723 295,830
60 360 197 617
64,723 -
64,723
34,332
109 63,381
131,574 159,696
554 355,314
64,723 290,591
55 54
- 109
45,307 19,416 64,723
37,444
The maximum aggregate amount due from the related party at the end of any month during the year is Rupees 0.617 million (2019: Rupees 0.225 million).
22.
23.
23.1
23.1.1
23.2
24.
78
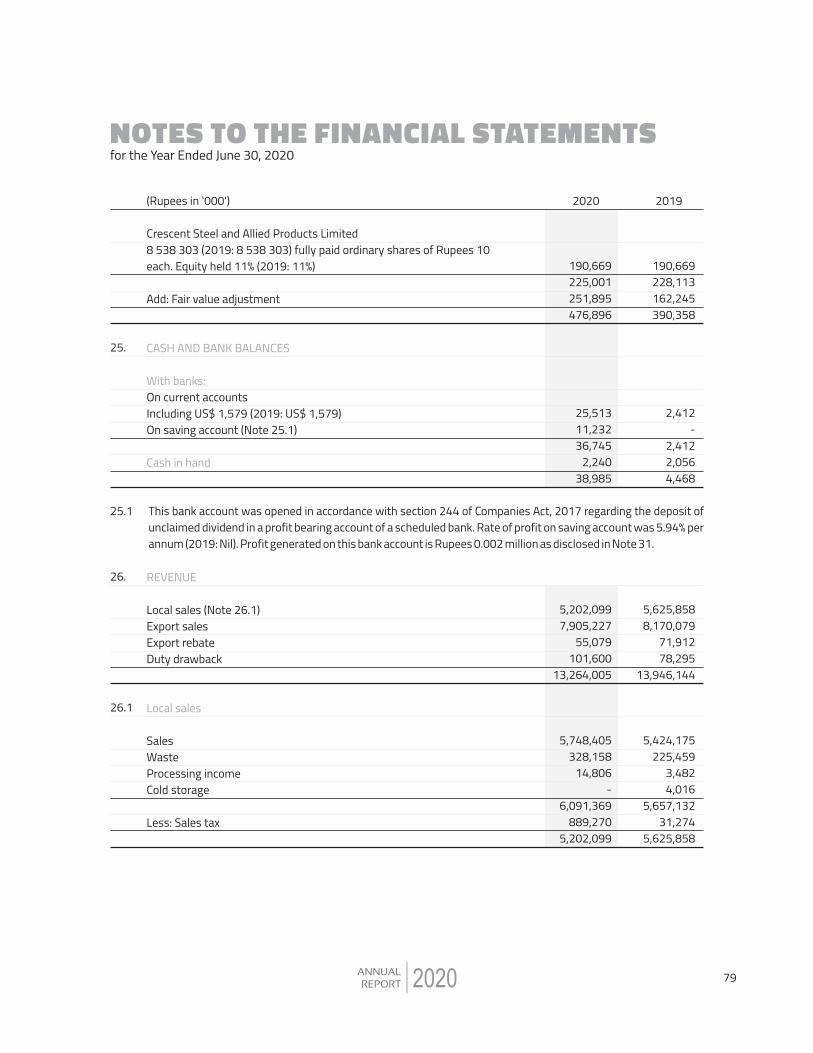
NOTES TO THE FINANCIAL STATEMENTS for the Year Ended June 30, 2020
2020
2020 2019(Rupees in '000')
Crescent Steel and Allied Products Limited 8 538 303 (2019: 8 538 303) fully paid ordinary shares of Rupees 10each. Equity held 11% (2019: 11%)
Add: Fair value adjustment
CASH AND BANK BALANCES
With banks: On current accounts Including US$ 1,579 (2019: US$ 1,579) On saving account (Note 25.1)
Cash in hand
190,669 228,113 162,245 390,358
25.
190,669 225,001 251,895 476,896
2,412 -
2,412 2,056 4,468
25,513 11,232 36,745
2,240 38,985
This bank account was opened in accordance with section 244 of Companies Act, 2017 regarding the deposit of unclaimed dividend in a profit bearing account of a scheduled bank. Rate of profit on saving account was 5.94% per annum (2019: Nil). Profit generated on this bank account is Rupees 0.002 million as disclosed in Note 31.
REVENUE
Local sales (Note 26.1) Export sales Export rebate Duty drawback
Local sales
SalesWasteProcessing incomeCold storage
Less: Sales tax
5,625,858 8,170,079
71,912 78,295
13,946,144
5,424,175 225,459
3,482 4,016
5,657,132 31,274
5,625,858
25.1
26.
26.1
5,202,099 7,905,227
55,079 101,600
13,264,005
5,748,405 328,158
14,806 -
6,091,369 889,270
5,202,099
79
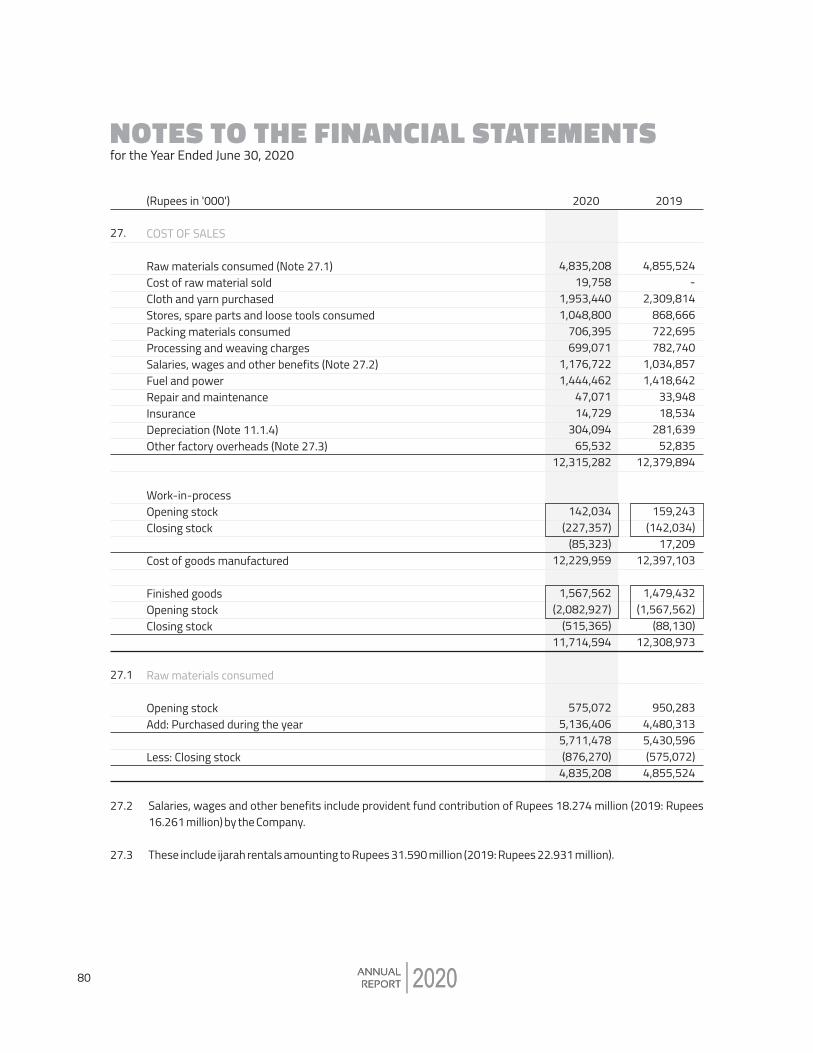
NOTES TO THE FINANCIAL STATEMENTS for the Year Ended June 30, 2020
20202020
2020 2019(Rupees in '000')
COST OF SALES
Raw materials consumed (Note 27.1)Cost of raw material soldCloth and yarn purchasedStores, spare parts and loose tools consumedPacking materials consumedProcessing and weaving chargesSalaries, wages and other benefits (Note 27.2)Fuel and powerRepair and maintenanceInsuranceDepreciation (Note 11.1.4)Other factory overheads (Note 27.3)
Work-in-processOpening stockClosing stock
Cost of goods manufactured
Finished goodsOpening stockClosing stock
Raw materials consumed
Opening stockAdd: Purchased during the year
Less: Closing stock
4,855,524 -
2,309,814 868,666 722,695 782,740
1,034,857 1,418,642
33,948 18,534
281,639 52,835
12,379,894
159,243 (142,034)
17,209 12,397,103
1,479,432 (1,567,562)
(88,130) 12,308,973
950,283 4,480,313 5,430,596 (575,072)
4,855,524
27.
27.1
4,835,208 19,758
1,953,440 1,048,800
706,395 699,071
1,176,722 1,444,462
47,071 14,729
304,094 65,532
12,315,282
142,034 (227,357)
(85,323) 12,229,959
1,567,562 (2,082,927)
(515,365) 11,714,594
575,072 5,136,406 5,711,478 (876,270)
4,835,208
27.2
27.3
Salaries, wages and other benefits include provident fund contribution of Rupees 18.274 million (2019: Rupees 16.261 million) by the Company.
These include ijarah rentals amounting to Rupees 31.590 million (2019: Rupees 22.931 million).
80

NOTES TO THE FINANCIAL STATEMENTS for the Year Ended June 30, 2020
20202020
DISTRIBUTION COST
Salaries, wages and other benefits (Note 28.1)Freight and shipmentPostageDuties and other chargesCommission to selling agentsAdvertisement
ADMINISTRATIVE EXPENSES
Salaries, wages and other benefits (Note 29.1)Meeting fee to directorsTravelling, conveyance and entertainmentRent, rates and taxesRepair and maintenanceInsurancePrinting and stationeryCommunication and advertisementSubscriptionLegal and professional Auditor's remuneration (Note 29.2)Amortization (Note 12)Depreciation (Note 11.1.4)Other charges
Auditor's remuneration
Audit feeHalf yearly reviewOther certification feesReimbursable expenses
44,155 267,044
11,126 106,637 247,425
2,146 678,533
232,594 560
17,612 2,815
20,840 1,412 3,284 4,010
12,242 5,519 1,925 6,333
16,453 19,152
344,751
1,500 300
75 50
1,925
28.
28.1
29.
29.1
29.2
Salaries, wages and other benefits include provident fund contribution of Rupees 1.427 million (2019: Rupees 1.377 million) by the Company.
2020 2019(Rupees in '000')
57,611 177,826
13,010 101,313 221,478
2,308 573,546
272,995 720
11,910 3,086
27,753 1,886 3,478 4,752
13,072 8,233 2,525 7,754
22,590 11,034
391,788
1,900 300 275
50 2,525
Salaries, wages and other benefits include provident fund contribution of Rupees 7.561 million (2019: Rupees 7.409 million) by the Company.
81

NOTES TO THE FINANCIAL STATEMENTS for the Year Ended June 30, 2020
2020
OTHER EXPENSES
Donations (Note 30.1 and Note 30.2)Provision for doubtful other receivables Allowance for expected credit losses (Note 19)Workers' profit participation fund (Note 7.2)De-recognition of accrued interest on debt instrumentsNet exchange loss
OTHER INCOME
Income from financial assetsDividend income (Note 31.1)Net exchange gain on export billsMark-up on overdue receivables (Note 31.2)Profit on saving accountInterest income on sales tax refund bonds
Income from non-financial assets
Sale of empties and scrapRental incomeGain on sale of property, plant and equipment
Dividend income
From related parties:Shams Textile Mills Limited
9,869 19,416
- 12,294
- -
41,579
109,350 142,276
47,715 -
1,143 300,484
15,776 1,913
12,109 29,798
330,282
1,909
30.
30.1
31.
31.1
The Company has made donations exceeding Rupees 1 million or 10% of total donation, whichever is higher, to The Citizens Foundation amounting to Rupees 7.800 million (2019: Rupees 7.800 million).
There is no interest of any director or his / her spouse in donee's fund.
2020 2019(Rupees in '000')
9,399 -
10,155 838
1,143 21,930 43,465
25,553 -
67,904 2 -
93,459
16,586 1,894 4,841
23,321 116,780
853
82
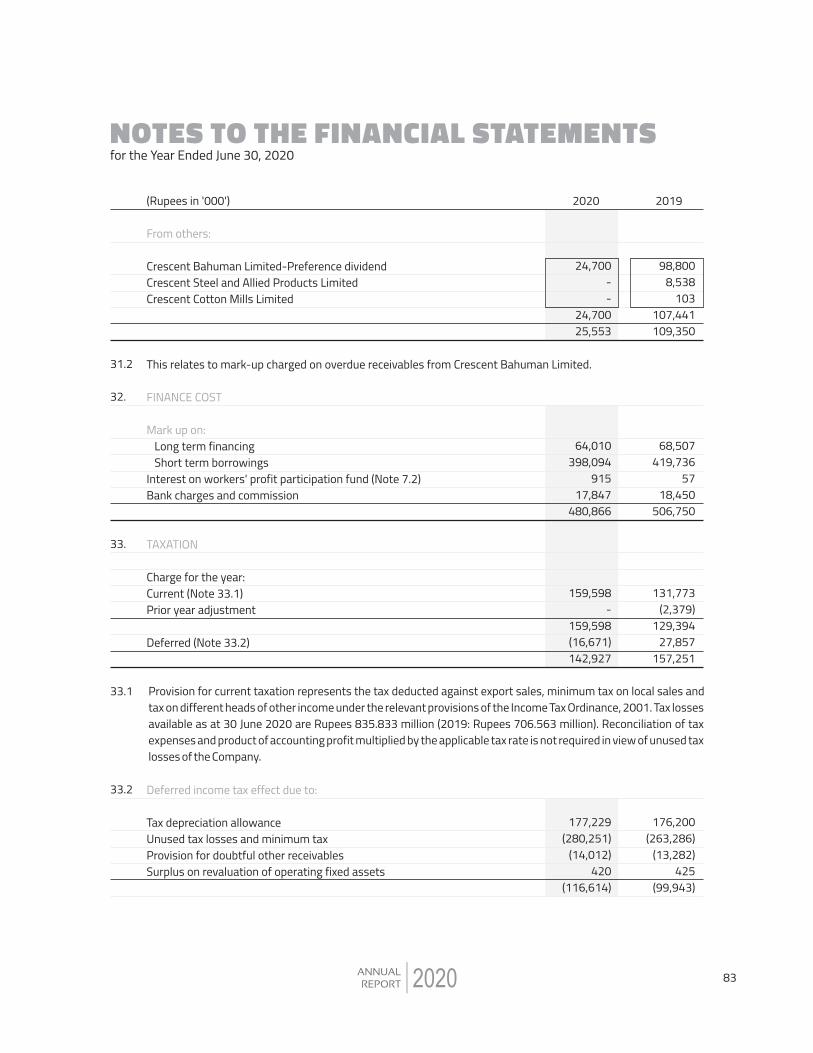
NOTES TO THE FINANCIAL STATEMENTS for the Year Ended June 30, 2020
2020
From others:
Crescent Bahuman Limited-Preference dividendCrescent Steel and Allied Products LimitedCrescent Cotton Mills Limited
This relates to mark-up charged on overdue receivables from Crescent Bahuman Limited.
FINANCE COST
Mark up on: Long term financing Short term borrowingsInterest on workers' profit participation fund (Note 7.2)Bank charges and commission
TAXATION
Charge for the year:Current (Note 33.1)Prior year adjustment
Deferred (Note 33.2)
Deferred income tax effect due to:
Tax depreciation allowanceUnused tax losses and minimum taxProvision for doubtful other receivablesSurplus on revaluation of operating fixed assets
98,800 8,538
103 107,441 109,350
68,507 419,736
57 18,450
506,750
131,773 (2,379)
129,394 27,857
157,251
176,200 (263,286)
(13,282) 425
(99,943)
31.2
32.
33.
33.1
33.2
2020 2019(Rupees in '000')
24,700 - -
24,700 25,553
64,010 398,094
915 17,847
480,866
159,598 -
159,598 (16,671) 142,927
177,229 (280,251)
(14,012) 420
(116,614)
Provision for current taxation represents the tax deducted against export sales, minimum tax on local sales and tax on different heads of other income under the relevant provisions of the Income Tax Ordinance, 2001. Tax losses available as at 30 June 2020 are Rupees 835.833 million (2019: Rupees 706.563 million). Reconciliation of tax expenses and product of accounting profit multiplied by the applicable tax rate is not required in view of unused tax losses of the Company.
83

NOTES TO THE FINANCIAL STATEMENTS for the Year Ended June 30, 2020
2020
Opening balance as at 01 July Adjustment of surplus on revaluation of operating fixed assets due tore-assessment at year end
EARNINGS PER SHARE - BASIC AND DILUTED There is no dilutive effect on the basic earnings per share which is based on: Profit attributable to ordinary shareholders (Rupees in thousand) Weighted average number of ordinary shares (Numbers) Earnings per share (Rupees)
CASH GENERATED FROM OPERATIONS
Profit before taxation
Adjustments for non-cash charges and other items:Depreciation AmortizationGain on sale of property, plant and equipmentDividend incomeDe-recognition / (recognition) of accrued interest on debt instrumentsProvision for doubtful other receivablesAllowance for expected credit lossesProvision for workers' profit participation fundFinance costProfit on saving accountWorking capital changes (Note 35.1)
Working capital changes
Decrease / (increase) in current assets:- Stores, spare parts and loose tools- Stock-in-trade- Trade debts- Loans and advances- Short term deposits and prepayments- Accrued interest - Other receivables
Increase in trade and other payables
127,820
(20) 27,857
238,589 80 000 000
2.98
395,840
298,092 6,333
(12,109) (109,350)
(1,143) 19,416
- 12,294
506,750 -
429,763 1,545,886
(67,327) 304,290
(301,487) (8,266)
(10,259) (1,590)
149,215 64,576
365,187 429,763
34.
35.
35.1
2020 2019(Rupees in '000')
99,943
- (16,671)
33,599 80 000 000
0.42
176,526
326,684 7,754
(4,841) (25,553)
1,143 -
10,155 838
480,866 2
14,477 988,051
31,841 (901,886)
132,495 (4,773)
(13,172) (880)
186,159 (570,216)
584,693 14,477
84
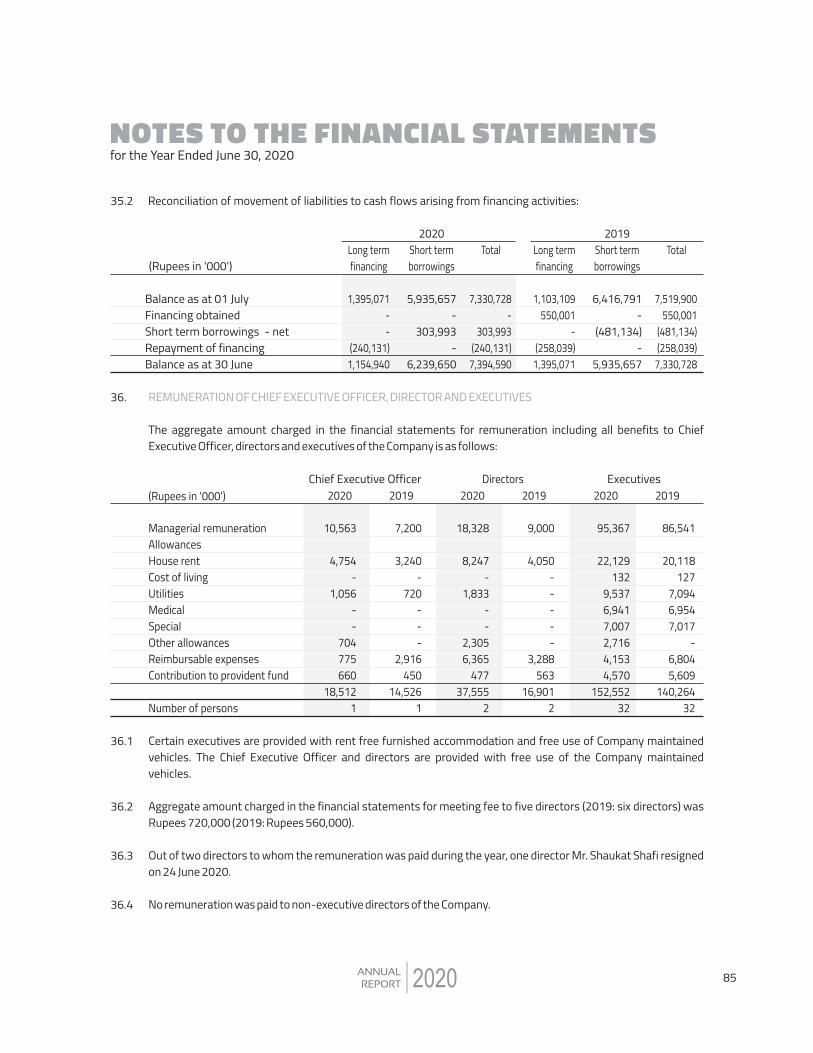
NOTES TO THE FINANCIAL STATEMENTS for the Year Ended June 30, 2020
2020
Reconciliation of movement of liabilities to cash flows arising from financing activities:35.2
36. REMUNERATION OF CHIEF EXECUTIVE OFFICER, DIRECTOR AND EXECUTIVES
The aggregate amount charged in the financial statements for remuneration including all benefits to Chief Executive Officer, directors and executives of the Company is as follows:
Chief Executive Officer2020 2019
7,200
3,240 -
720 - - -
2,916 450
14,526 1
10,563
4,754 -
1,056 - -
704 775 660
18,512 1
Directors2020 2019 2020 2019
Executives
95,367
22,129 132
9,537 6,941 7,007 2,716 4,153 4,570
152,552 32
86,541
20,118 127
7,094 6,954 7,017
- 6,804 5,609
140,264 32
9,000
4,050 - - - - -
3,288 563
16,901 2
18,328
8,247 -
1,833 - -
2,305 6,365
477 37,555
2
Managerial remuneration AllowancesHouse rentCost of livingUtilitiesMedicalSpecialOther allowancesReimbursable expensesContribution to provident fund
Number of persons
(Rupees in '000')
(Rupees in '000')
Balance as at 01 JulyFinancing obtainedShort term borrowings - netRepayment of financingBalance as at 30 June
6,416,791 -
(481,134) -
5,935,657
7,519,900 550,001
(481,134) (258,039)
7,330,728
1,103,109 550,001
- (258,039)
1,395,071
Short termborrowings
Long termfinancing
Total2019
5,935,657 -
303,993 -
6,239,650
7,330,728 -
303,993 (240,131)
7,394,590
1,395,071 - -
(240,131) 1,154,940
Short termborrowings
Long termfinancing
Total2020
36.1
36.2
36.3
36.4
Certain executives are provided with rent free furnished accommodation and free use of Company maintained vehicles. The Chief Executive Officer and directors are provided with free use of the Company maintained vehicles.
Aggregate amount charged in the financial statements for meeting fee to five directors (2019: six directors) was Rupees 720,000 (2019: Rupees 560,000).
Out of two directors to whom the remuneration was paid during the year, one director Mr. Shaukat Shafi resigned on 24 June 2020.
No remuneration was paid to non-executive directors of the Company.
85
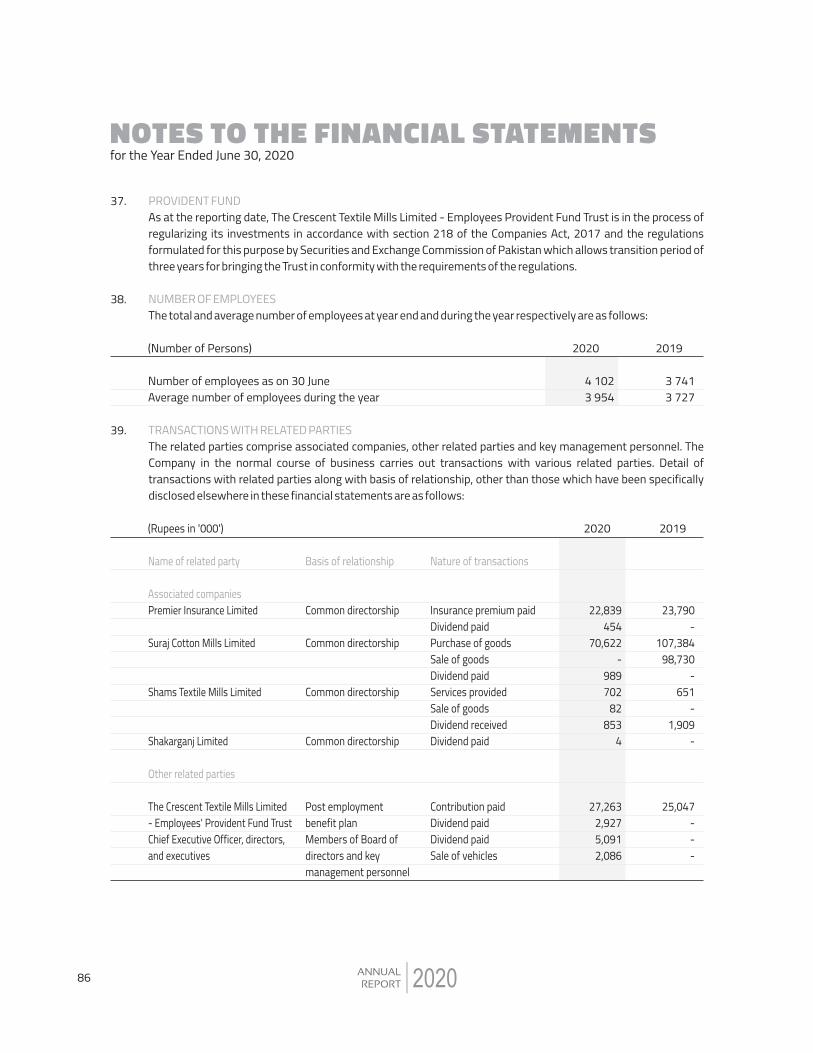
NOTES TO THE FINANCIAL STATEMENTS for the Year Ended June 30, 2020
2020
38.
37. PROVIDENT FUNDAs at the reporting date, The Crescent Textile Mills Limited - Employees Provident Fund Trust is in the process of regularizing its investments in accordance with section 218 of the Companies Act, 2017 and the regulations formulated for this purpose by Securities and Exchange Commission of Pakistan which allows transition period of three years for bringing the Trust in conformity with the requirements of the regulations. NUMBER OF EMPLOYEESThe total and average number of employees at year end and during the year respectively are as follows:
Number of employees as on 30 June Average number of employees during the year
2020 2019(Number of Persons)
4 1023 954
3 7413 727
39. TRANSACTIONS WITH RELATED PARTIESThe related parties comprise associated companies, other related parties and key management personnel. The Company in the normal course of business carries out transactions with various related parties. Detail of transactions with related parties along with basis of relationship, other than those which have been specifically disclosed elsewhere in these financial statements are as follows:
Name of related party
Associated companiesPremier Insurance Limited
Suraj Cotton Mills Limited
Shams Textile Mills Limited
Shakarganj Limited
Other related parties
The Crescent Textile Mills Limited- Employees' Provident Fund TrustChief Executive Officer, directors,and executives
22,839
454 70,622
- 989 702
82 853
4
27,263 2,927 5,091 2,086
23,790
- 107,384
98,730 -
651 -
1,909 -
25,047 - - -
Basis of relationship Common directorship
Common directorship
Common directorship
Common directorship
Post employmentbenefit planMembers of Board ofdirectors and keymanagement personnel
Nature of transactions
Insurance premium paidDividend paidPurchase of goods Sale of goods Dividend paid Services providedSale of goodsDividend receivedDividend paid
Contribution paidDividend paidDividend paidSale of vehicles
(Rupees in '000') 2020 2019
86
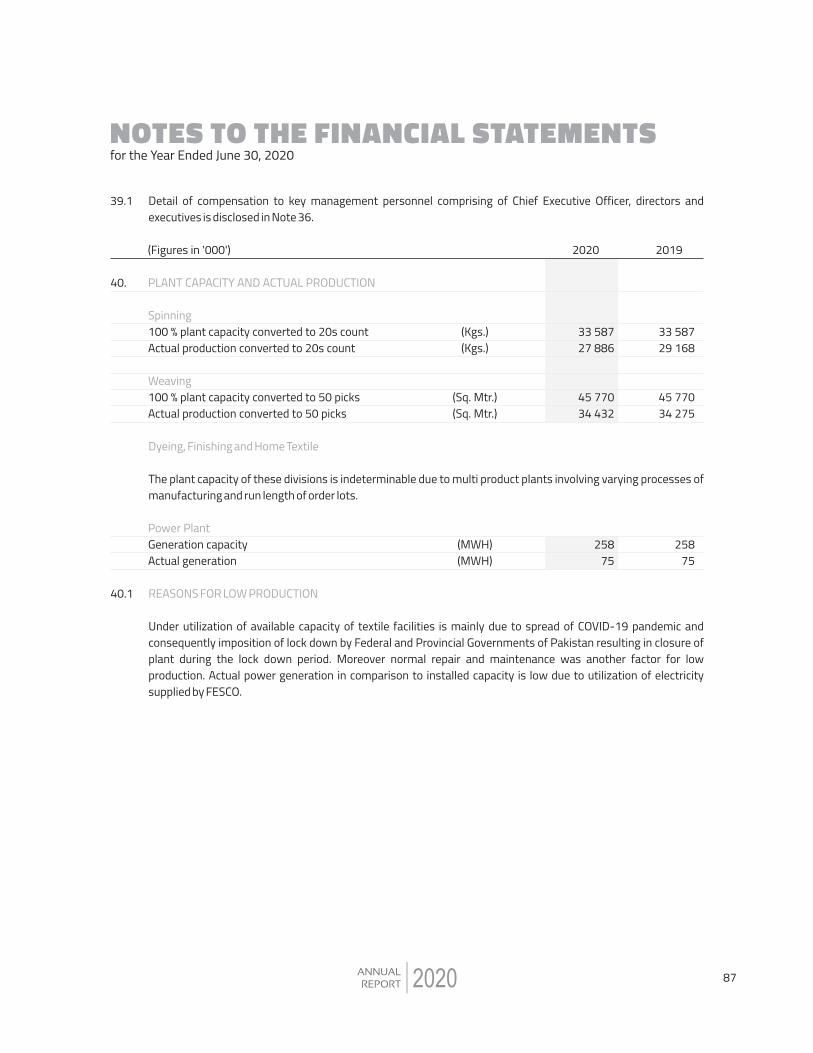
NOTES TO THE FINANCIAL STATEMENTS for the Year Ended June 30, 2020
2020
39.1 Detail of compensation to key management personnel comprising of Chief Executive Officer, directors and executives is disclosed in Note 36.
PLANT CAPACITY AND ACTUAL PRODUCTION Spinning 100 % plant capacity converted to 20s count Actual production converted to 20s count Weaving 100 % plant capacity converted to 50 picks Actual production converted to 50 picks
Power PlantGeneration capacityActual generation
2020 2019(Figures in '000')
33 58727 886
45 77034 432
25875
33 58729 168
45 77034 275
25875
40.
40.1
(Kgs.)(Kgs.)
(Sq. Mtr.)(Sq. Mtr.)
(MWH)(MWH)
Dyeing, Finishing and Home Textile
The plant capacity of these divisions is indeterminable due to multi product plants involving varying processes of manufacturing and run length of order lots.
REASONS FOR LOW PRODUCTION
Under utilization of available capacity of textile facilities is mainly due to spread of COVID-19 pandemic and consequently imposition of lock down by Federal and Provincial Governments of Pakistan resulting in closure of plant during the lock down period. Moreover normal repair and maintenance was another factor for low production. Actual power generation in comparison to installed capacity is low due to utilization of electricity supplied by FESCO.
87
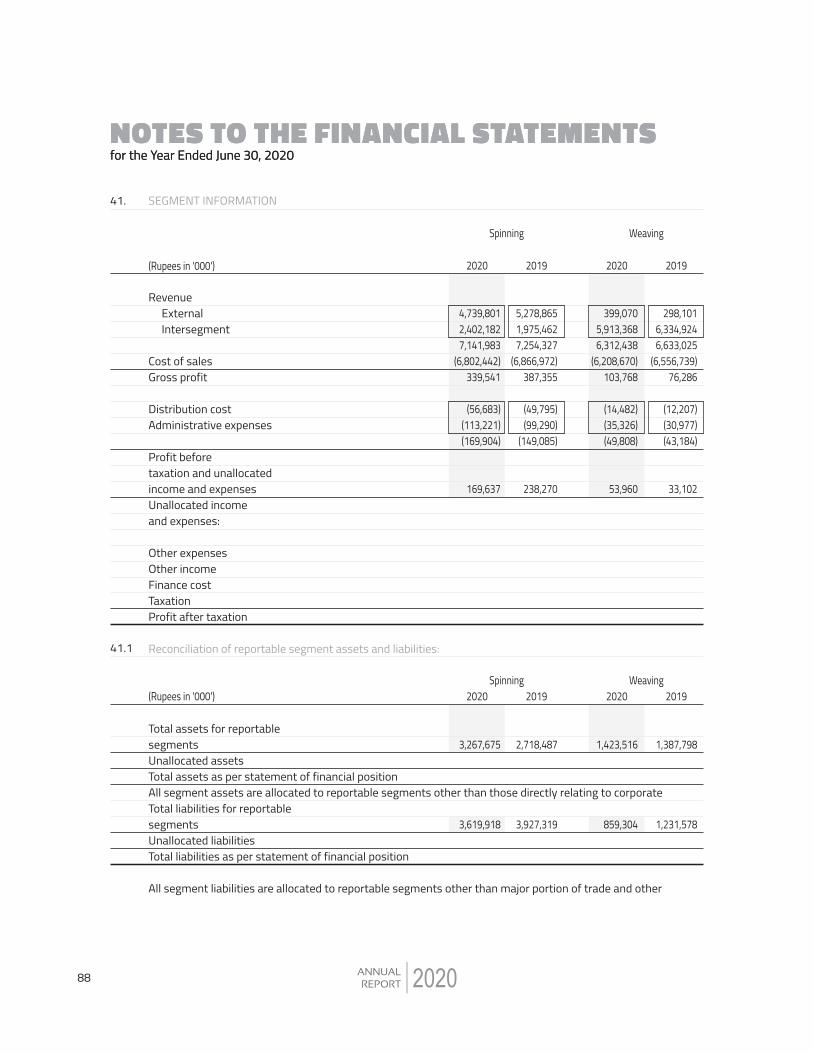
NOTES TO THE FINANCIAL STATEMENTS for the Year Ended June 30, 2020
2020
NOTES TO THE FINANCIAL STATEMENTS for the Year Ended June 30, 2020
SEGMENT INFORMATION 41.
(Rupees in '000')
Revenue External Intersegment
Cost of salesGross profit
Distribution costAdministrative expenses
Profit beforetaxation and unallocatedincome and expensesUnallocated income and expenses:
Other expensesOther incomeFinance cost TaxationProfit after taxation
Reconciliation of reportable segment assets and liabilities:
Total assets for reportablesegmentsUnallocated assetsTotal assets as per statement of financial positionAll segment assets are allocated to reportable segments other than those directly relating to corporate Total liabilities for reportablesegmentsUnallocated liabilitiesTotal liabilities as per statement of financial position
All segment liabilities are allocated to reportable segments other than major portion of trade and other
41.1
(Rupees in '000')
2020 2019
Spinning
5,278,865 1,975,462 7,254,327
(6,866,972) 387,355
(49,795) (99,290)
(149,085)
238,270
2,718,487
3,927,319
Spinning2020 2019
4,739,801 2,402,182 7,141,983
(6,802,442) 339,541
(56,683) (113,221) (169,904)
169,637
3,267,675
3,619,918
2020 2019
Weaving
298,101 6,334,924 6,633,025
(6,556,739) 76,286
(12,207) (30,977) (43,184)
33,102
1,387,798
1,231,578
Weaving2020 2019
399,070 5,913,368 6,312,438
(6,208,670) 103,768
(14,482) (35,326) (49,808)
53,960
1,423,516
859,304
88
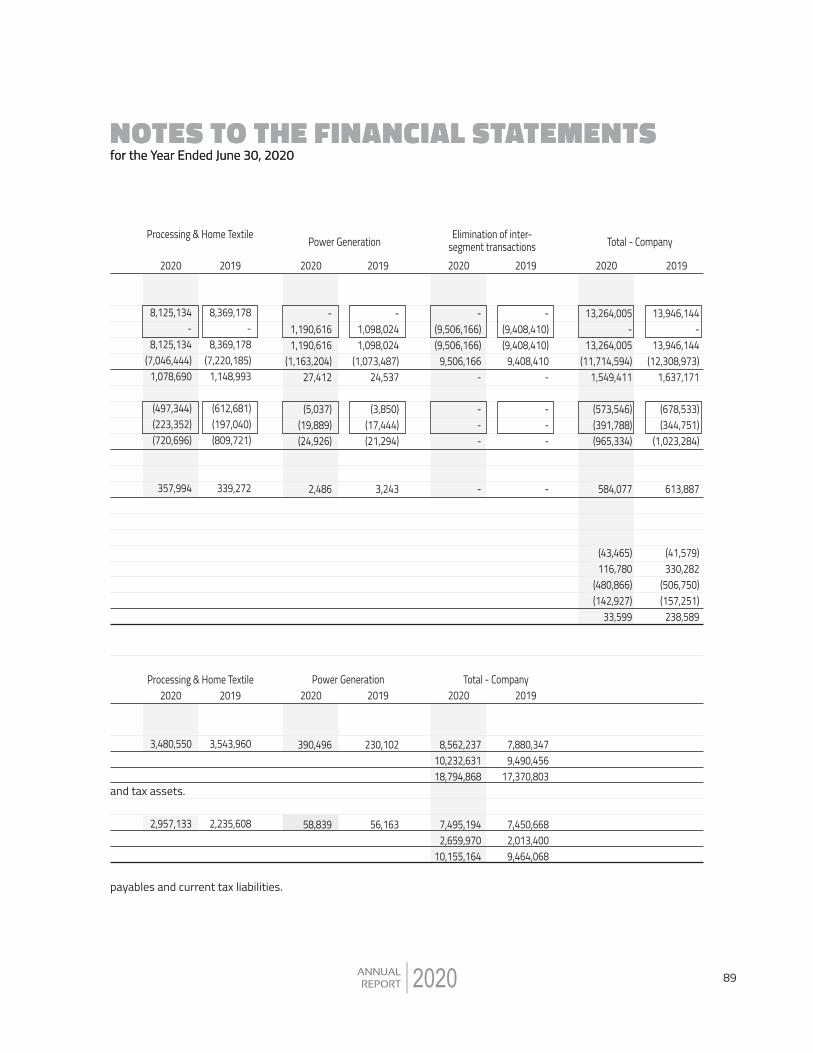
NOTES TO THE FINANCIAL STATEMENTS for the Year Ended June 30, 2020
2020
NOTES TO THE FINANCIAL STATEMENTS for the Year Ended June 30, 2020
Total - Company
2020 2019
13,946,144 -
13,946,144 (12,308,973)
1,637,171
(678,533) (344,751)
(1,023,284)
613,887
(41,579) 330,282
(506,750) (157,251)
238,589
13,264,005 -
13,264,005 (11,714,594)
1,549,411
(573,546) (391,788) (965,334)
584,077
(43,465) 116,780
(480,866) (142,927)
33,599
and tax assets.
payables and current tax liabilities.
- (9,408,410) (9,408,410)
9,408,410 -
- - -
-
7,880,347 9,490,456
17,370,803
7,450,668 2,013,400 9,464,068
Elimination of inter-segment transactions
20192020
Total - Company2020 2019
- (9,506,166) (9,506,166)
9,506,166 -
- - -
-
8,562,237 10,232,631 18,794,868
7,495,194 2,659,970
10,155,164
- 1,098,024 1,098,024
(1,073,487) 24,537
(3,850) (17,444) (21,294)
3,243
230,102
56,163
Power Generation
2020 2019
Power Generation2020 2019
- 1,190,616 1,190,616
(1,163,204) 27,412
(5,037) (19,889) (24,926)
2,486
390,496
58,839
2020 2019
8,369,178 -
8,369,178 (7,220,185)
1,148,993
(612,681) (197,040) (809,721)
339,272
3,543,960
2,235,608
Processing & Home Textile2020 2019
8,125,134 -
8,125,134 (7,046,444)
1,078,690
(497,344) (223,352) (720,696)
357,994
3,480,550
2,957,133
Processing & Home Textile
89
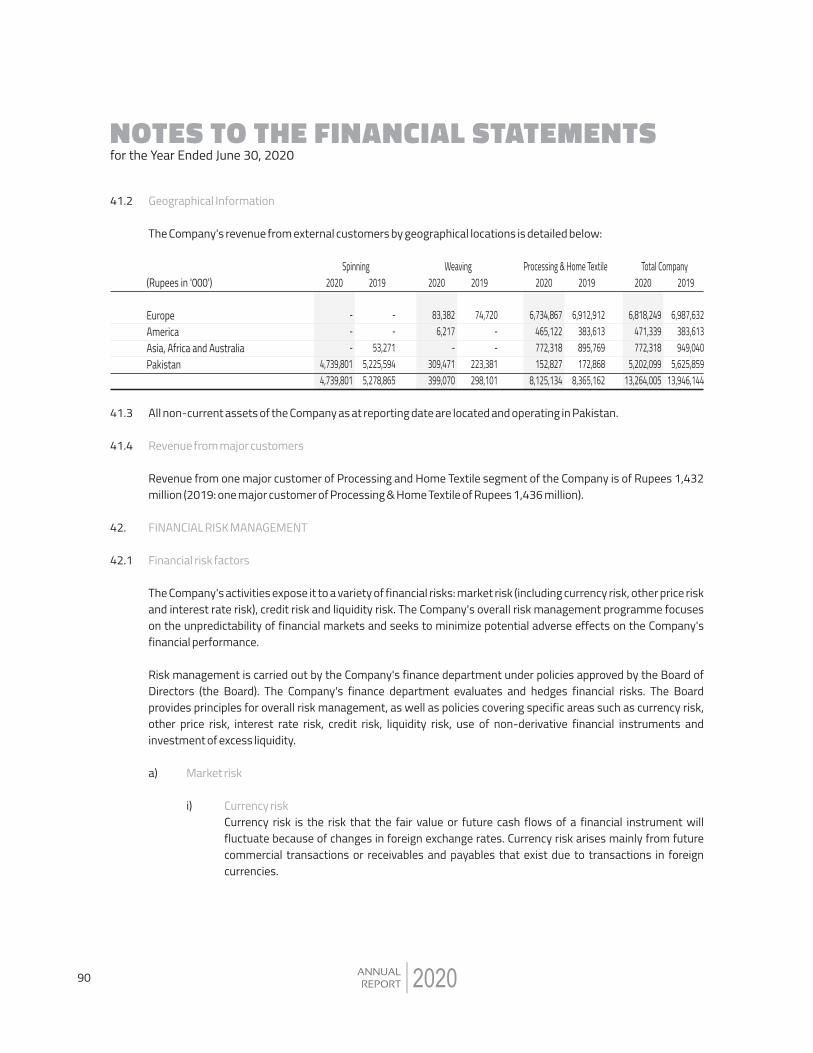
NOTES TO THE FINANCIAL STATEMENTS for the Year Ended June 30, 2020
2020
Geographical Information The Company's revenue from external customers by geographical locations is detailed below:
41.2
(Rupees in '000')
EuropeAmerica Asia, Africa and AustraliaPakistan
All non-current assets of the Company as at reporting date are located and operating in Pakistan.
Revenue from major customers
Revenue from one major customer of Processing and Home Textile segment of the Company is of Rupees 1,432 million (2019: one major customer of Processing & Home Textile of Rupees 1,436 million).
FINANCIAL RISK MANAGEMENT
Financial risk factors
The Company's activities expose it to a variety of financial risks: market risk (including currency risk, other price risk and interest rate risk), credit risk and liquidity risk. The Company's overall risk management programme focuses on the unpredictability of financial markets and seeks to minimize potential adverse effects on the Company's financial performance.
Risk management is carried out by the Company's finance department under policies approved by the Board of Directors (the Board). The Company's finance department evaluates and hedges financial risks. The Board provides principles for overall risk management, as well as policies covering specific areas such as currency risk, other price risk, interest rate risk, credit risk, liquidity risk, use of non-derivative financial instruments and investment of excess liquidity.
41.3
41.4
42.
42.1
Market risk a)
Currency risk Currency risk is the risk that the fair value or future cash flows of a financial instrument will fluctuate because of changes in foreign exchange rates. Currency risk arises mainly from future commercial transactions or receivables and payables that exist due to transactions in foreign currencies.
i)
Total Company2020 2019
6,987,632 383,613 949,040
5,625,859 13,946,144
6,818,249 471,339 772,318
5,202,099 13,264,005
Processing & Home Textile2020 2019
6,912,912 383,613 895,769 172,868
8,365,162
6,734,867 465,122 772,318 152,827
8,125,134
Weaving2020 2019
74,720 - -
223,381 298,101
83,382 6,217
- 309,471 399,070
Spinning2020 2019
- -
53,271 5,225,594 5,278,865
- - -
4,739,801 4,739,801
90
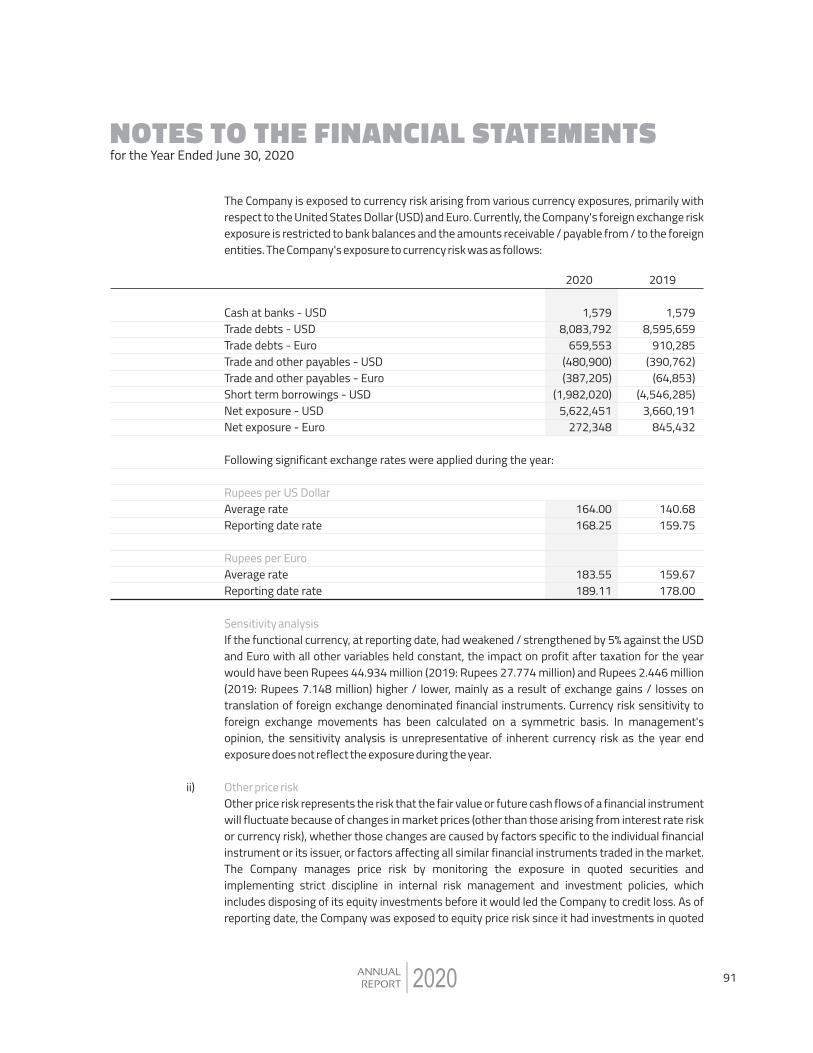
NOTES TO THE FINANCIAL STATEMENTS for the Year Ended June 30, 2020
2020
2020 2019
1,579 8,083,792
659,553 (480,900) (387,205)
(1,982,020) 5,622,451
272,348
164.00168.25
183.55189.11
Cash at banks - USDTrade debts - USDTrade debts - EuroTrade and other payables - USDTrade and other payables - EuroShort term borrowings - USDNet exposure - USDNet exposure - Euro
Following significant exchange rates were applied during the year:
Rupees per US Dollar Average rate Reporting date rate Rupees per Euro Average rate Reporting date rate
1,579 8,595,659
910,285 (390,762)
(64,853) (4,546,285)
3,660,191 845,432
140.68159.75
159.67178.00
Sensitivity analysis If the functional currency, at reporting date, had weakened / strengthened by 5% against the USD and Euro with all other variables held constant, the impact on profit after taxation for the year would have been Rupees 44.934 million (2019: Rupees 27.774 million) and Rupees 2.446 million (2019: Rupees 7.148 million) higher / lower, mainly as a result of exchange gains / losses on translation of foreign exchange denominated financial instruments. Currency risk sensitivity to foreign exchange movements has been calculated on a symmetric basis. In management's opinion, the sensitivity analysis is unrepresentative of inherent currency risk as the year end exposure does not reflect the exposure during the year.
Other price risk Other price risk represents the risk that the fair value or future cash flows of a financial instrument will fluctuate because of changes in market prices (other than those arising from interest rate risk or currency risk), whether those changes are caused by factors specific to the individual financial instrument or its issuer, or factors affecting all similar financial instruments traded in the market. The Company manages price risk by monitoring the exposure in quoted securities and implementing strict discipline in internal risk management and investment policies, which includes disposing of its equity investments before it would led the Company to credit loss. As of reporting date, the Company was exposed to equity price risk since it had investments in quoted
ii)
The Company is exposed to currency risk arising from various currency exposures, primarily with respect to the United States Dollar (USD) and Euro. Currently, the Company's foreign exchange risk exposure is restricted to bank balances and the amounts receivable / payable from / to the foreign entities. The Company's exposure to currency risk was as follows:
91
2020
NOTES TO THE FINANCIAL STATEMENTS for the Year Ended June 30, 2020
securities amounting to Rupees 1,007.277 million (2019: Rupees 879.802 million). The carrying value of investments subject to equity price risk is based on quoted market prices as of the reporting date. Market prices are subject to fluctuation and consequently the amount realized in the subsequent sale of an investment may significantly differ from the reported market value.
Sensitivity analysisThe table below summarizes the impact of increase / decrease in the Pakistan Stock Exchange Limited (PSX) Index on the Company's equity (fair value reserve of FVTOCI investments). The analysis is based on the assumption that the equity index had increased / decreased by 5% with all other variables of FVTOCI instruments held constant and all the Company's equity instruments moved according to the historical correlation with the index:
Impact on statement of othercomprehensive income (fair value reserve)
2020 2019
50,364 (50,364)
PSX 100 (5% increase)PSX 100 (5% decrease)
43,990 (43,990)
Equity (fair value reserve) would increase / decrease as a result of gains / losses on equity investments classified as FVTOCI.
Interest rate riskThis represents the risk that the fair value or future cash flows of a financial instrument will fluctuate because of changes in market interest rates.
The Company's interest rate risk arises from long term financing, short term borrowings, trade debts of Crescent Bahuman Limited (CBL) and bank deposit in saving account. Financial instruments at variable rates expose the Company to cash flow interest rate risk. Financial instruments at fixed rate expose the Company to fair value interest rate risk.
At the reporting date, the interest rate profile of the Company�s interest bearing financial instruments was:
iii)
Index
(Rupees in '000')
92
2020
NOTES TO THE FINANCIAL STATEMENTS for the Year Ended June 30, 2020
2020 2019(Rupees in '000')
-
1,128,663 3,716,000
480,012 11,232
26,277 2,523,650
191,400
1,356,2943,092,000
501,719 -
38,7772,843,657
Fixed rate instruments
Financial assetsSales tax refund bonds
Financial liabilitiesLong term financingShort term borrowings
Floating rate instruments
Financial assetsTrade debts-CBLDeposit on saving account
Financial liabilitiesLong term financingShort term borrowings
Fair value sensitivity analysis for fixed rate instruments The Company does not account for any fixed rate financial assets and liabilities at fair value through profit or loss. Therefore, a change in interest rate at the reporting date would not affect profit or loss of the Company.
Cash flow sensitivity analysis for variable rate instruments If interest rates at the year end date, fluctuates by 1% higher / lower with all other variables held constant, profit after taxation for the year would have been Rupees 19.557 million (2019: Rupees 22.617 million) lower / higher mainly as a result of higher / lower interest expense / income on floating rate financial instruments. This analysis is prepared assuming the amounts of financial instruments outstanding at reporting dates were outstanding for the whole year.
Credit risk Credit risk represents the risk that one party to a financial instrument will cause a financial loss for the other party by failing to discharge an obligation. Credit risk of the Company mainly arises from investments, trade debts, deposits, bank balances, accrued interest, loans, advances and other receivables. The carrying amount of financial assets represents the maximum credit exposure. The maximum exposure to credit risk at the reporting date was as follows:
b)
93
360,985 - - - -
360,985
Non-derivative financial liabilities: Long term financing Trade and other payables Unclaimed dividend Accrued mark-up Short term borrowings
874,590 - - - -
874,590
62,923 - - -
2,263,999 2,326,922
28,630 2,418,000
11,232 100,604
4,151,623 6,710,089
1,327,128 2,418,000
11,232 100,604
6,415,623 10,272,587
1,154,940 2,418,000
11,232 100,604
6,239,650 9,924,426
1-2 years More than2 years
6-12months
6 monthsor less
Contractualcash flows
Carryingamount(Rupees in '000')
The credit quality of financial assets that are neither past due nor impaired can be assessed by reference to external credit ratings (if available) or to historical information about counterparty default rate. The Company kept its surplus funds with banks having good credit rating ranging from A1+ to A-1 in short term and AAA to A in long term. The Company's exposure to credit risk and allowance for expected credit losses related to trade debts is disclosed in Note 19.
Liquidity risk Liquidity risk is the risk that an entity will encounter difficulty in meeting obligations associated with financial liabilities. The Company manages liquidity risk by maintaining sufficient cash and the availability of funding through an adequate amount of committed credit facilities. At 30 June 2020, the Company had Rupees 659 million (2019: Rupees 767 million) available borrowing limits from financial institutions and Rupees 38.985 million (2019: Rupees 4.468 million) cash and bank balances. The management believes the liquidity risk to below. Following are the contractual maturities of financial liabilities, including interest payments. The amounts disclosed in the table are undiscounted cash flows:
4,170,127 1,591
105,687 2,419,493
5,651 1,882
25,513 6,729,944
3,990,011 2,320
93,035 2,647,825
4,771 663
2,412 6,741,037
Investments Loans and advances Deposits Trade debts Accrued interest Other receivables Bank balances
c)
2020 2019(Rupees in '000')
2020
NOTES TO THE FINANCIAL STATEMENTS for the Year Ended June 30, 2020
94
Contractual maturities of financial liabilities as at 30 June 2020:
NOTES TO THE FINANCIAL STATEMENTS for the Year Ended June 30, 2020
2020
Contractual maturities of financial liabilities as at 30 June 2019:
1-2 years More than2 years
6-12months
6 monthsor less
Contractualcash flows
Carryingamount(Rupees in '000')
368,927 - - - -
368,927
872,745 - - - -
872,745
176,167 - - -
921,465 1,097,632
163,060 1,806,481
9,435 119,940
5,282,580 7,381,496
1,580,899 1,806,481
9,435 119,940
6,204,045 9,720,800
1,395,071 1,806,481
9,435 119,940
5,935,657 9,266,584
Non-derivative financial liabilities:
Long term financingTrade and other payablesUnclaimed dividendAccrued mark-upShort term borrowings
The contractual cash flows relating to the above financial liabilities have been determined on the basis of interest rates / mark-up rates effective as at 30 June. The rates of interest / mark-up have been disclosed in Note 6 and 9 to these financial statements.
Financial instruments by categories42.2
(Rupees in '000') 2020 2019
1,591
105,687 2,419,493
5,651 1,882
38,985 2,573,289
4,170,127 6,743,416
1,154,940 2,418,000
11,232 100,604
6,239,650 9,924,426
2,320
93,035 2,647,825
4,771 663
4,468 2,753,082
3,990,011 6,743,093
1,395,071 1,806,481
9,435 119,940
5,935,657 9,266,584
Financial assets as per statement of financial position At amortized cost Loans and advances Deposits Trade debts Accrued interest Other receivables Cash and bank balances
At fair value through other comprehensive income
Investments
Financial liabilities as per statement of financial position At amortized cost Long term financing Trade and other payables Unclaimed dividend Accrued mark-up Short term borrowings
95
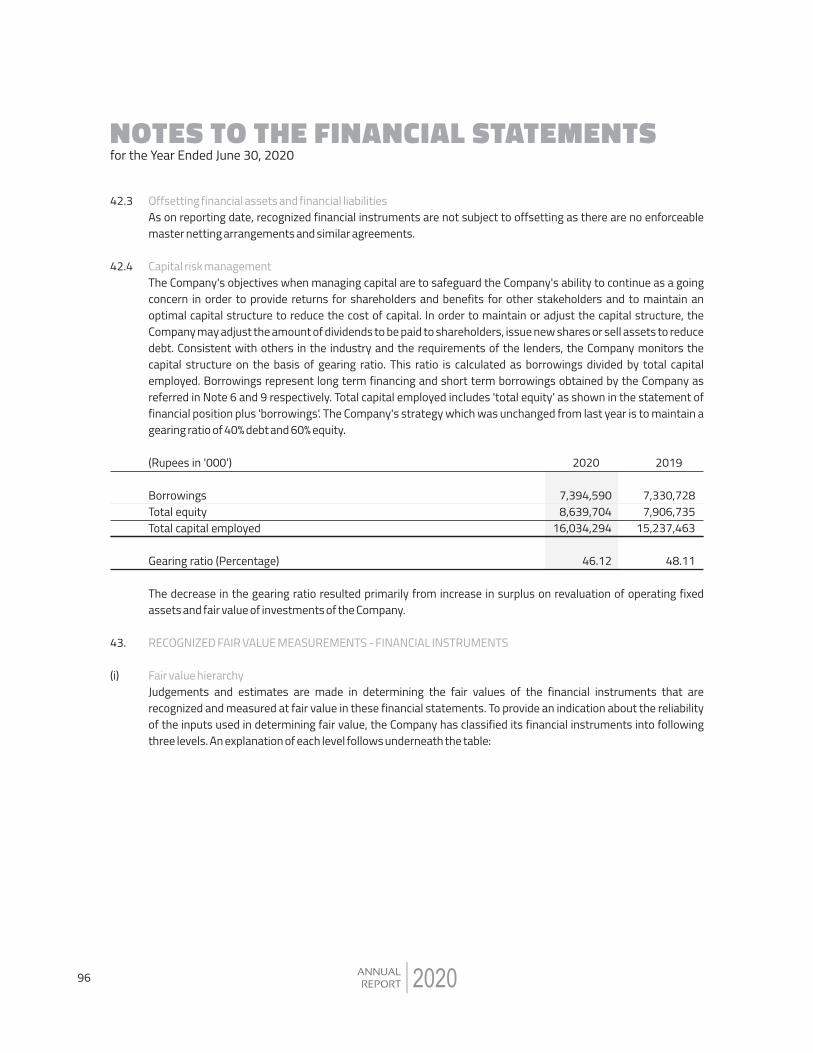
NOTES TO THE FINANCIAL STATEMENTS for the Year Ended June 30, 2020
2020
Offsetting financial assets and financial liabilitiesAs on reporting date, recognized financial instruments are not subject to offsetting as there are no enforceable master netting arrangements and similar agreements.
Capital risk managementThe Company's objectives when managing capital are to safeguard the Company's ability to continue as a going concern in order to provide returns for shareholders and benefits for other stakeholders and to maintain an optimal capital structure to reduce the cost of capital. In order to maintain or adjust the capital structure, the Company may adjust the amount of dividends to be paid to shareholders, issue new shares or sell assets to reduce debt. Consistent with others in the industry and the requirements of the lenders, the Company monitors the capital structure on the basis of gearing ratio. This ratio is calculated as borrowings divided by total capital employed. Borrowings represent long term financing and short term borrowings obtained by the Company as referred in Note 6 and 9 respectively. Total capital employed includes 'total equity' as shown in the statement of financial position plus 'borrowings'. The Company's strategy which was unchanged from last year is to maintain a gearing ratio of 40% debt and 60% equity.
42.3
42.4
2020 2019(Rupees in '000')
7,394,590 8,639,704
16,034,294
46.12
7,330,728 7,906,735
15,237,463
48.11
Borrowings Total equity Total capital employed
Gearing ratio (Percentage)
The decrease in the gearing ratio resulted primarily from increase in surplus on revaluation of operating fixed assets and fair value of investments of the Company.
RECOGNIZED FAIR VALUE MEASUREMENTS - FINANCIAL INSTRUMENTS
Fair value hierarchy Judgements and estimates are made in determining the fair values of the financial instruments that are recognized and measured at fair value in these financial statements. To provide an indication about the reliability of the inputs used in determining fair value, the Company has classified its financial instruments into following three levels. An explanation of each level follows underneath the table:
43.
(i)
96
NOTES TO THE FINANCIAL STATEMENTS for the Year Ended June 30, 2020
2020
3,162,849 3,162,849
2,245,709 2,245,709
4,170,127 4,170,127
3,125,511 3,125,511
- -
- -
Financial assets - recurring fair value measurement
At 30 June 2020At fair value through othercomprehensive income
At 30 June 2019At fair value through othercomprehensive income
1,007,278 1,007,278
879,802 879,802
(Rupees in '000') Level 2 Level 3Level 1 Total
The above table does not include fair value information for financial assets and financial liabilities not measured at fair value if the carrying amounts are a reasonable approximation of fair value. Due to the short term nature, carrying amounts of certain financial assets and financial liabilities are considered to be the same as their fair value. For the majority of the non-current receivables, the fair values are also not significantly different to their carrying amounts. There were no transfers between levels 1 and 2 for recurring fair value measurements during the year. Further there was no transfer out of level 3 measurements.
The Company�s policy is to recognize transfers into and transfers out of fair value hierarchy levels as at the end of the reporting period.
Level 1: The fair value of financial instruments traded in active markets (such as publicly traded derivatives and equity securities) is based on quoted market prices at the end of the reporting period. The quoted market price used for financial assets held by the Company is the current bid price. These instruments are included in level 1. Level 2: The fair value of financial instruments that are not traded in an active market (for example, over-the-counter derivatives) is determined using valuation techniques which maximize the use of observable market data and rely as little as possible on entity-specific estimates. If all significant inputs required to fair value an instrument are observable, the instrument is included in level 2.
Level 3: If one or more of the significant inputs is not based on observable market data, the instrument is included in level 3. This is the case for unlisted equity securities. Valuation techniques used to determine fair valuesSpecific valuation techniques used to value financial instruments include the use of quoted market prices for listed securities and discounted cash flow method for most of the unlisted securities.
Fair value measurements using significant unobservable inputs (level 3)Following table presents the changes in level 3 items for the period ended 30 June 2020:
ii)
iii)
97
2020
NOTES TO THE FINANCIAL STATEMENTS for the Year Ended June 30, 2020
Unlisted equity securities(Rupees in '000')
2,245,709 1,976,000
1,976,000 889,200
27,940 3,162,849
Balance as on 30 June 2019 Less: Preference shares converted into non-voting ordinary shares Add: Non-voting ordinary shares converted from preference shares Dividend converted into non-voting ordinary shares Surplus recognized in other comprehensive income Balance as on 30 June 2020
Relationship ofunobservable
inputs tofair value
Range of inputs(probability weightedaverage)
30 June 2020
Fairvalue at
30 June 201930 June 2020
Description
(Rupees in '000')
Unobservableinputs
There were no significant inter-relationships between unobservable inputs that materially affect fair value. Moreover, the remaining unquoted investment representing shares of Premier Financial Services (Private) Limited having carrying value of Rupees 0.174 million (2019: Rupees 0.445 million) have been valued at breakup value of shares due to its meager cost. Valuation process Previously the investments in Crescent Bahuman Limited (CBL) included unlisted ordinary shares and non-voting cumulative and participatory preference shares. On 03 March 2020, all preferences shares along with accumulated dividend have been converted into non-voting ordinary shares at a price of Rupees 10 per non-voting ordinary share. The value of investments in Crescent Bahuman Limited is based on a valuation analysis carried out by an external investment advisor engaged by the Company during the year. The independent valuer reports directly to the Chief Financial Officer. Discussions of valuation processes and results are held between the Chief Financial Officer and the valuation team at least once every year. The management has adjusted the value of investment on the basis of market factors as at 30 June 2020.
Valuation inputs and relationships to fair valueFollowing table summarizes the quantitative information about the significant unobservable inputs used in level 3 fair value measurements of unquoted investments in Crescent Bahuman Limited.
iv)
3,162,675
At fair value through other comprehensive income
Crescent Bahuman Limited 2,245,264 Revenuegrowth factor
Risk adjusteddiscount rate
6.20%
13.60%
Increase / decrease in revenuegrowth factor by 0.05% anddecrease / increase in discountrate by 1% would increase /decrease fair value by Rupees+ 564.385 million / - 502.884million.
98

The Company�s policy is to recognize transfers into and transfers out of fair value hierarchy levels as at the end of the reporting period. There were no transfers between levels 1 and 2 for recurring fair value measurements during the year. Further, there was no transfer in and out of level 3 measurements. Valuation techniques used to determine level 2 fair valuesThe Company obtains independent valuation for its freehold and leasehold land (classified as property, plant and equipment) at least in every three years. The management updates the assessment of the fair value of each property, taking into account the most recent independent valuations. The management determines property�s value within a range of reasonable fair value estimates. The best evidence of fair value is current prices in an active market for similar properties. Valuation processes The fair value of freehold and leasehold land has been determined as on 30 June 2020 by Messrs Hamid Mukhtar and Company (Private) Limited, an independent valuer enrolled on panel of SBP as per basis stated in Note 11.1.1 to the financial statements.
(ii)
NOTES TO THE FINANCIAL STATEMENTS for the Year Ended June 30, 2020
2020
The main level 3 inputs used by the Company are derived and evaluated as follows:
Discount rates for financial instruments are determined using a capital asset pricing model to calculate a rate that reflects current market assessments of the time value of money and the risk specific to the asset.
Earnings growth factor for unlisted equity securities are estimated based on market information for similar types of companies.
RECOGNIZED FAIR VALUE MEASUREMENTS - NON-FINANCIAL ASSETS
Fair value hierarchy Judgements and estimates are made in determining the fair values of the non-financial assets that are recognized and measured at fair value in the financial statements. To provide an indication about the reliability of the inputs used in determining fair value, the Company has classified its non-financial assets into the following three levels:
44.
(i)
- - -
---
4,255,643 15,001
4,270,644
3,569,765 6,810
3,576,575
At 30 June 2020Land - freeholdLand - leaseholdTotal
At 30 June 2019Land - freehold Land - leasehold Total
(Rupees in '000') Level 2 Level 3Level 1 Total
---
- - -
4,255,643 15,001
4,270,644
3,569,765 6,810
3,576,575
99
NOTES TO THE FINANCIAL STATEMENTS for the Year Ended June 30, 2020
2020
DATE OF AUTHORIZATION FOR ISSUE These financial statements were authorized for issue by the Board of Directors of the Company in their meeting held on September 30, 2020. CORRESPONDING FIGURES Corresponding figures have been rearranged and reclassified, wherever necessary, for the purpose of comparison. However, no significant rearrangements or reclassifications have been made.
GENERAL Figures have been rounded off to the nearest thousand of Rupees unless otherwise stated.
45.
46.
47.
Muhammad AnwarChief Executive Officer
Asim SiddiqueChief Financial Officer
Khalid BashirDirector
100
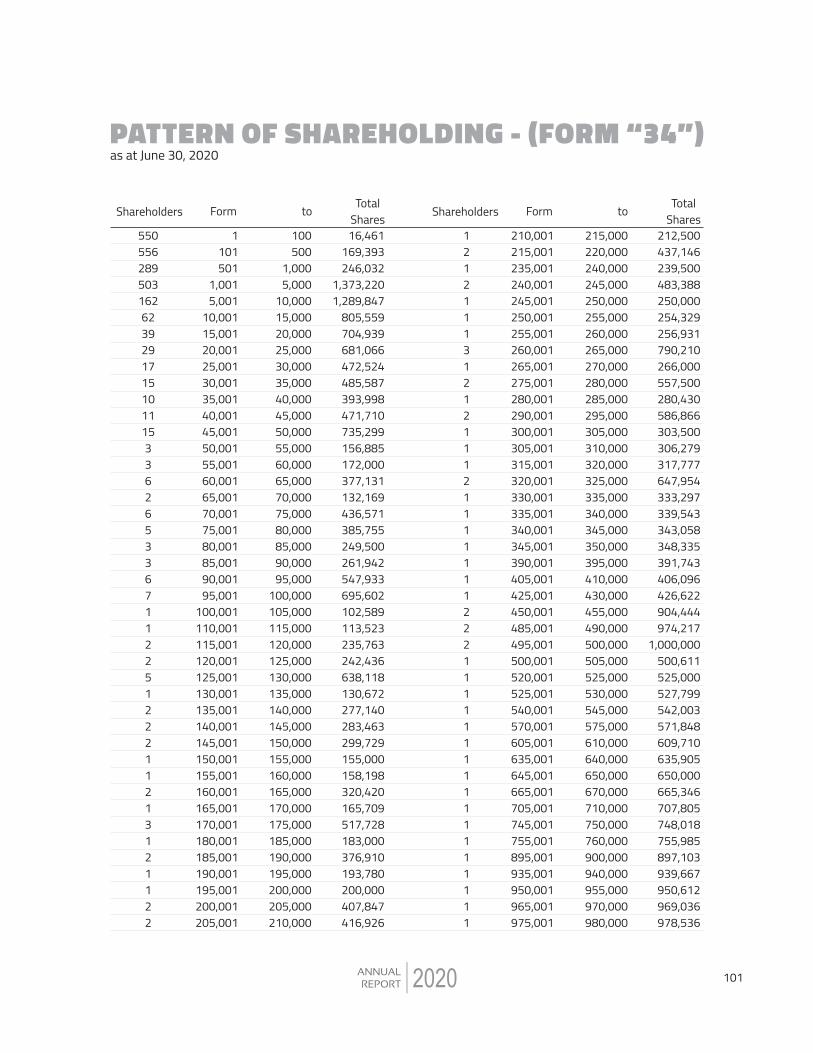
PATTERN OF SHAREHOLDING - (FORM �34�)as at June 30, 2020
1212111312121112111111122211111111111111111
5505562895031626239291715101115336265336711225122211213121122
Shareholders Total
SharesForm to Shareholders
TotalShares
Form to
1101501
1,0015,001
10,00115,00120,00125,00130,00135,00140,00145,00150,00155,00160,00165,00170,00175,00180,00185,00190,00195,001
100,001110,001115,001120,001125,001130,001135,001140,001145,001150,001155,001160,001165,001170,001180,001185,001190,001195,001200,001205,001
210,001215,001235,001240,001245,001250,001255,001260,001265,001275,001280,001290,001300,001305,001315,001320,001330,001335,001340,001345,001390,001405,001425,001450,001485,001495,001500,001520,001525,001540,001570,001605,001635,001645,001665,001705,001745,001755,001895,001935,001950,001965,001975,001
100500
1,0005,000
10,00015,00020,00025,00030,00035,00040,00045,00050,00055,00060,00065,00070,00075,00080,00085,00090,00095,000
100,000105,000115,000120,000125,000130,000135,000140,000145,000150,000155,000160,000165,000170,000175,000185,000190,000195,000200,000205,000210,000
215,000220,000240,000245,000250,000255,000260,000265,000270,000280,000285,000295,000305,000310,000320,000325,000335,000340,000345,000350,000395,000410,000430,000455,000490,000500,000505,000525,000530,000545,000575,000610,000640,000650,000670,000710,000750,000760,000900,000940,000955,000970,000980,000
16,461169,393246,032
1,373,2201,289,847
805,559704,939681,066472,524485,587393,998471,710735,299156,885172,000377,131132,169436,571385,755249,500261,942547,933695,602102,589113,523235,763242,436638,118130,672277,140283,463299,729155,000158,198320,420165,709517,728183,000376,910193,780200,000407,847416,926
212,500437,146239,500483,388250,000254,329256,931790,210266,000557,500280,430586,866303,500306,279317,777647,954333,297339,543343,058348,335391,743406,096426,622904,444974,217
1,000,000500,611525,000527,799542,003571,848609,710635,905650,000665,346707,805748,018755,985897,103939,667950,612969,036978,536
2020 101
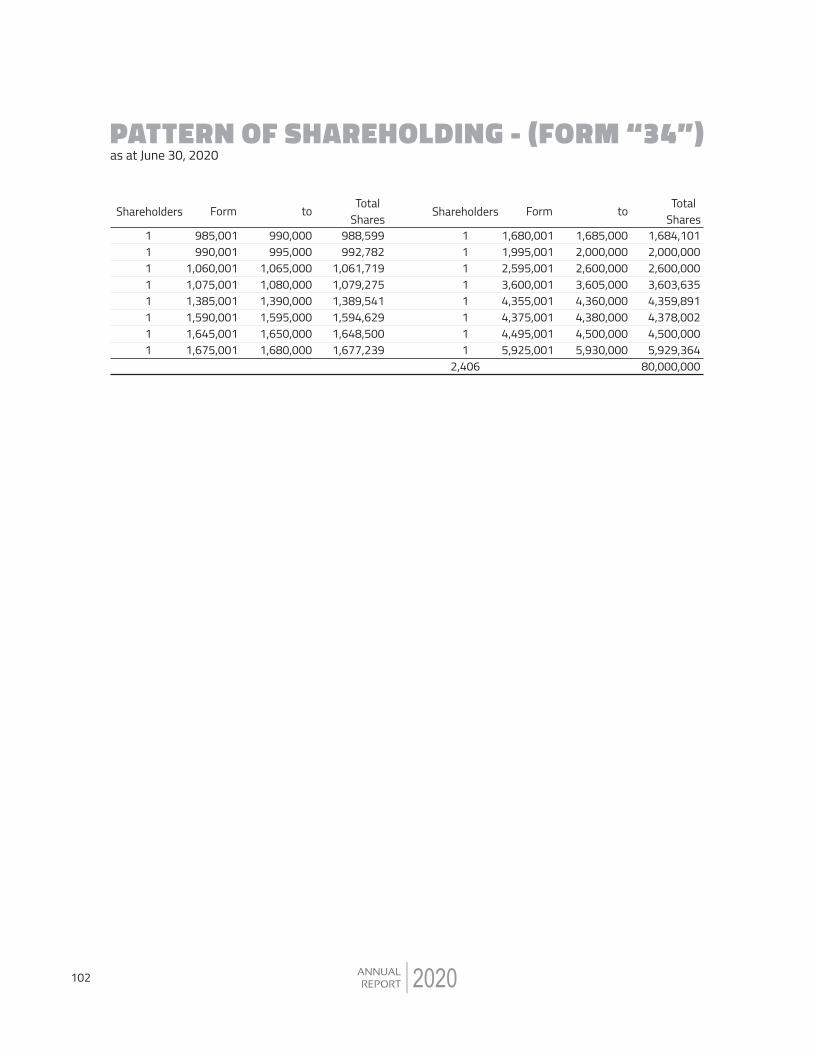
as at June 30, 2020
11111111
2,406
Shareholders Total
SharesForm to Shareholders
TotalShares
Form to
985,001990,001
1,060,0011,075,0011,385,0011,590,0011,645,0011,675,001
1,680,0011,995,0012,595,0013,600,0014,355,0014,375,0014,495,0015,925,001
990,000995,000
1,065,0001,080,0001,390,0001,595,0001,650,0001,680,000
1,685,0002,000,0002,600,0003,605,0004,360,0004,380,0004,500,0005,930,000
988,599992,782
1,061,7191,079,2751,389,5411,594,6291,648,5001,677,239
1,684,1012,000,0002,600,0003,603,6354,359,8914,378,0024,500,0005,929,364
80,000,000
PATTERN OF SHAREHOLDING - (FORM �34�)
11111111
2020102

as at June 30, 2020
Categories of Shareholders % ageTotalCDCPhysical
PATTERN OF SHAREHOLDING - (FORM �34�)
Directors, Chief Executive Officer, Their Spouses and Minor Childern
Chief Executive OfficerMr. Muhammad Anwar
DirectorsMr. Amin Anjum SaleemMr. Ahmad ShafiMr. Amjad MahmoodMr. Khalid BashirMr. Khurram Mazhar KarimMrs. Nazia Maqbool
Director's SpousesBegum Tanveer Khalid BashirMr. Nadeem MaqboolMrs. Abida AnwarMrs. Mehreen AhmadMrs. Naheed Amjad
Associated Companies, Undertakings & Related PartiesShakarganj LimitedCrescent Group (Private) LimitedSuraj Cotton Mills LimitedTrustees The Crescent Textile Mills Employees Provident Fund TrustPremier Insurance Limited
NIT & ICP CDC- Trustee National Investment (Unit) Trust
Mutual Funds TRI-Star Mutual Fund Limited
Banks, NBFCs, DFIs, Takaful, Pension FundsBanksPension Funds
897,103
25,360 3,603,635
102,589 992,782 165,709 571,848
343,058 339,543
33,326 64,000
426,622 7,565,575
5,898 110
1,648,500 4,878,002
755,985 7,288,495
1,684,101 1,684,101
383 383
267,807 188,340 456,147
1.12
0.03 4.50 0.13 1.24 0.21 0.71
0.43 0.42 0.04 0.08 0.53 9.46
0.01 0.00 2.06 6.10 0.94 9.11
2.11 2.11
0.00 0.00
0.33 0.24 0.57
897,103
25,360 3,603,635
102,589 992,782 165,709 571,848
343,058 339,543
33,326 64,000
426,622 7,565,575
- -
1,648,500 4,878,002
755,985 7,282,487
1,684,101 1,684,101
383 383
255,552 188,340 443,892
-
- - - - - -
- - - - - -
5,898 110
- - -
6,008
- -
- -
12,255 -
12,255
(Number of shares held)
1 -
1.1-
1.2-
1.3-
2-
3-
4-
5-
2020 103

as at June 30, 2020
% ageTotalCDCPhysical
Insurance Companies
Modarabas
Other Companies, Corporate Bodies, Trust etc.Other Companies, Corporate Bodies Trust
General PublicGeneral Public (Local)General Public (Foreigner)
Shareholders More Than 5.00%Umair AmanullahCS Capital (Private) LimitedTrustees The Crescent Textile Mills Employees Provident Fund TrustCrescent Cotton Mills Limited
6-
7-
8-
9-
292,685
842
18,731,434 5,434
18,736,868
43,971,783 3,121
43,974,904 80,000,000
4,500,000 5,929,364 4,878,002 4,359,891
0.37
0.00
23.41 0.01
23.42
54.96 0.00
54.97 100.00
5.63 7.41 6.10 5.45
291,981
-
18,679,059 -
18,679,059
41,048,969 3,121
41,052,090 76,999,568
704
842
52,375 5,434
57,809
2,922,814 -
2,922,814 3,000,432
PATTERN OF SHAREHOLDING - (FORM �34�)
(Number of shares held)
2020104

Notice is hereby given that the 71st Annual General Meeting (AGM) of the members of The Crescent Textile Mills Limited (the "Company") will be held on Wednesday, October 28, 2020 at 10:00 am at the registered office of the Company, Sargodha Road, Faisalabad, to transact the following Ordinary Business:
1
2
Notes:
1.
2.
Shareholders are advised to mention Name, CNIC Number, Folio CDC Account Number, Cell Number and E-mail ID for their identification.
To receive, consider and adopt the Audited Financial Statements of the Company for the year ended June 30, 2020 together with the Chairman's Review, Directors' and Auditors' Reports thereon.
To appoint Auditors of the Company and fix their remuneration. The members are hereby notified that the Audit Committee and the Board of directors have recommended the name of retiring auditors M/s. Riaz Ahmad and Company Chartered Accountants who being eligible have offered themselves for re-appointment.
Book Closure:
The Share Transfer Books of the Company will remain closed from October 22, 2020 to October 28, 2020 (both days inclusive). Transfers received in order at the office of our Share Registrar, M/s. CorpTec Associates (Pvt) Limited, 503-E, Johar Town, Lahore by the close of business on October 21, 2020, will be treated in time for the purposes of entitlement to attend, speak and vote at the AGM.
In light of COVID-19 situation, the Securities and Exchange Commission of Pakistan ("SECP") in terms of its Circular No. 5 dated March 17, 2020 and Circular No. 25 dated August 31, 2020, has advised the companies to modify their usual planning for general meetings for safety and wellbeing of shareholders and the public at large with minimal physical interaction.
Hence, shareholders who are interested to attend the AGM through electronic means, are hereby requested to get themselves registered with the Company Secretary Office by providing the required details at the earliest but not later than 72 hours before the time of AGM through following means:
NOTICE OF ANNUAL GENERAL MEETING
Registered Office:Sargodha Road,Faisalabad:T:+92-41-111-105-105F:+92-41-878 65 25Dated: October 07, 2020
By Order of the BoardNaseer Ahmad Chaudhary
Company Secretary
2020
Mobile / WhatsAap No. 0300-6600765
E-mail address: [email protected]
a)
b)
105
For attending the meeting:
i)
ii)
For Appointing Proxies
i)
ii)
iii)
iv)
v)
a.
b.
In case of Individuals, the account holder and/or sub-account holder and their registration details are uploaded as per the CDC Regulations, shall authenticate his/her identity by showing his/her original CNIC or, original Passport at the time of attending the Meeting.
In case of corporate entity, the Board's resolution/power of attorney with specimen signature of the nominee shall be produced (unless it has been provided earlier) at the time of the Meeting.
In case of individuals, the account holder and/or sub-account holder and their registration details are uploaded as per the CDC Regulations, shall submit the proxy form as per above requirements.
The proxy form shall be witnessed by two persons, whose names, addresses and CNIC numbers shall be mentioned on the form.
Attested copies of the CNIC or the passport of beneficial owners and the proxy shall be furnished with the proxy form.
The proxy shall produce his original CNIC or original passport at the time of the Meeting.
In case of corporate entity, the Board's resolution/power of attorney with specimen signature shall be furnished (unless it has been provided earlier) along with proxy form to the Company.
NOTICE OF ANNUAL GENERAL MEETING
2020
3.
4.
5.
Upon receipt of above information from interested shareholders, the Company will provide login credentials to participate in AGM via electronic means.
Shareholders may provide their comments or suggestions relating to agenda items of AGM through Email / WhatsApp No mentioned above.
Shareholders are encouraged to consolidate their attendance and participation through proxies.
A member entitled to attend and vote at this meeting may appoint any other member as his/her proxy to attend and vote instead of him/her and a proxy so appointed shall have the same rights, as respects attending, speaking and voting at the AGM as are available to the members. A Proxy must be a member of the Company.
The instrument appointing a proxy and the power of attorney or other authority under which it is signed or a notarial attested copy of the power of attorney must be deposited at the Registered Office of the Company at least 48 hours before the time of the meeting. Proxy Forms, in English and Urdu languages, have been dispatched to the members along with the notice of AGM.
Members who have deposited their shares into Central Depository Company of Pakistan Limited ("CDC") will further have to follow the under mentioned guidelines as laid down by the Securities and Exchange Commission of Pakistan.
106
6.
7.
8.
9.
NOTICE OF ANNUAL GENERAL MEETING
CNIC/IBAN for E-Dividend Payment
The provisions of Section 242 of the Companies Act, 2017 require the listed companies that any dividend payable in cash shall only be paid through electronic mode directly into the bank account designated by the entitled shareholders. Accordingly, the shareholders holding physical shares are requested to provide the Company's Share Registrar at the address given herein above, electronic dividend mandate on E-Dividend Form provided in the annual report and also available on website of the Company. In the case of shares held in CDC, the same information should be provided to the CDS participants for updating and forwarding to the Company. In case of non-submission, all future dividend payments may be withheld.
Zakat Declarations
The members of the Company are required to submit Declaration for Zakat exemption in terms of Zakat and Ushr Ordinance, 1980.
Circulations of Annual Reports through CD/DVD/USB/Email
Pursuant to the Securities and Exchange Commission of Pakistan's notification S.R.O 470(I)/2016 dated May 31, 2016, the shareholders of The Crescent Textile Mills Limited had accorded their consent for transmission of annual reports including annual audited accounts, notices of annual general meetings and other information contained therein of the Company through CD or DVD or USB instead of transmitting the same in hard copies. The shareholders who wish to receive hard copy of the aforesaid documents may send to the Company Secretary / Share Registrar, the Standard Request Form available on the website of the Company and the Company will supply hard copies of the aforesaid document to the shareholders on demand, free of cost, within one week of such demand. The shareholders who intend to receive the annual report including the notice of meeting through e-mail are requested to provide their written consent on the Standard Request Form available on the Company's website: www.crescenttextile.com.
Tax Deductions
Pursuant to the provisions of Finance Act, 2020 effective form July 1, 2020, the deduction of income tax from dividend payments shall be made on the basis of following categories of shareholders at the rates prescribed under section 150 of the Income Tax Ordinance, 2001:
S.No Category of Shareholders1. Shareholders appearing in Active Taxpayers' List (ATL)2. Shareholders not appearing in Active Taxpayers' List (ATL)
Tax deduction will be made on the basis of Active Taxpayers' List provided on the website of Federal Board of Revenue.
Members seeking exemption from deduction of tax on dividend payment or are eligible for deduction at a reduced rate are requested to submit a valid withholding tax exemption certificate or necessary documentary evidence, as the case may be.
2020 107

NOTICE OF ANNUAL GENERAL MEETING
10.
11.
12.
13.
14.
The shareholders who have joint shareholdings shall be dealt separately as appearing in ATL or not appearing in ATL and in such particular situation, tax will be deducted according to proportionate shareholding of joint shareholders. If the share is not ascertainable then each account holder will be assumed to hold equal proportion of shares and the deduction will be made accordingly. Therefore, in order to avoid deduction of tax at a higher rate, the joint account holders are requested to provide the below details of their shareholding to the Share Registrar of the Company latest by the AGM date.
Unclaimed Dividend and Bonus Shares
Shareholders, who by any reason, could not claim their dividend or bonus shares or did not collect their physical shares, if any, are advised to contact our Share Registrar M/s CorpTec Associates (Private) Limited, 503-E, Johar Town, Lahore, to collect/enquire about their unclaimed dividend or pending shares, if any.
Deposit Of Physical Shares Into CDC Account
The Shareholders having physical shareholding may open CDC sub-account with any of the brokers or Investor Account directly with CDC to place their physical shares into script-less form, this will facilitate them in many ways including safe custody and sale of shares, any time they want, as the trading of physical shares is not permitted as perexisting regulations of the stock exchange. Further, Section 72 of the Act states that after the commencement of the Act from a date notified by the SECP, a company having share capital, shall have shares in book-entry form only. Every existing company shall be required to replace its physical shares with book-entry form in a manner as may be specified and from the date notified by the SECP, within a period not exceeding four years from the commencement of the Act.
Video Conference Facility
Pursuant to the provisions of the Companies Act, 2017, the shareholders residing in a city and holding at least 10% of the total paid up share capital may demand the Company to provide the facility of video-link for participating in the AGM. The demand for video-link facility shall be received by the Share Registrar at the address given hereinabove at least seven (7) days prior to the date of the meeting on the Standard Form available on the Company's website: www.crescenttextile.com.
Change of address
Members are requested to promptly notify to the Company's Share Registrar of any change in their addresses.
Placement of Financial Statements and Other Information on Company's website
The Company has placed a copy of the Notice of AGM, Annual Financial Statements for the year ended June 30, 2020 along with Auditors and Directors Reports thereon, Chairman's Review and other information on the website of the Company: www.crescenttextile.com.
2020
Folio / CDCAccount No.
Name ofShareholder
CNIC Shareholding TotalShares
Principal / JointShareholder
108

2020 109

2020110
71st Annual General Meeting
Registered Office:Sargodha Road,Faisalabad, Pakistan
PROXY FORM
Affix Revenue
Stamp of Rs. 5/-
Member�s Signature
As witness my hand this day of 2020.
Witness�s SignatureName:CNIC:Address:
Witness�s SignatureName:CNIC:Address:
I/We being member(s) of
The Crescent Textile Mills Limited and holder of shares
as per Registered Folio # / CDC Participant ID # / Sub A/C # / Investor A/C #
do hereby appoint
of or failing him
of who is also member of the Company vide Registered
Folio # as my/our Proxy to attend, speak and vote for me / us and on my / our
behalf at the 71st Annual General Meeting of the Company to be held on Wednesday the October 28, 2020 at
10:00 a.m. at Registered Office Sargodha Road, Faisalabad and at any adjournment thereof.
CNIC #
CDC A/C #Date:
Place: Faisalabad
In case of individuals, the account holder or sub-account holder and / or the person whose securities are in group account and their registration details are uploaded as per the Regulations, shall submit the proxy form as per the above requirement.The proxy form shall be witnessed by two persons whose names, addresses and CNIC numbers shall be mentioned on the form. Attested copies of CNIC or the passport of the beneficial owners and the proxy shall be furnished with the proxy form.The proxy shall produce his original CNIC or original passport at the time of the Meeting. In case of corporate entity, the Board of Directors' resolution / power of attorney with specimen signatures shall be submitted (unless it has been provided earlier) along with proxy form to the Company.
i)
ii)iii)iv)v)
A member eligible to attend and vote in this meeting may appoint another member as proxy to attend and vote in the meeting. Proxies in order to be effective must be received by the company at the Registered Office not later than 48 hours before the time for holding the meeting.CDC account holders will further have to follow the following guidelines:
Note:1
2
1112020

112 2020
1
2
2020 28
71
2020
1132020

114 2020

Mills & Registered OfficeSargodha Road,Faisalabad,Pakistan T:+92-41-111-105-105F:+92-41-8786525E: [email protected]
Share RegisterCorpTec Associates (Pvt)Limited,503-E, Johar Town,Lahore, PakistanT:+92-42-35170336-7F:+92-42-35170338E: [email protected]
www.ctm.com.pk


