44
OFYP Orientation & First-Year Programs 2007 Annual Report
OFYP Orientation & First-Year Programs
2007 Annual Report
Orientation & First-Year Programs
Dear University Partners: In an effort to support the transition and persistence of first-year students, Orientation & First-Year Programs (OFYP) provides a variety of programs and services. In addition to supporting our office mission, OFYP contributes and supports the University of Minnesota’s mission of education, research and outreach by “helping individuals respond to their changing environments, and by making the knowledge and resources created and preserved at the University accessible to the citizens of the state, the nation, and the world” (University of Minnesota web page, March 11, 2008). All programs are implemented with a student-centered approach while ensuring a seamless transition as University community members. The 2007 program cycle proved to be very exciting! We served first-year students including: freshmen, transfer and graduates, as well as parents of first-year students. Our major programmatic areas were orientation, MyU first-year and transfer web portals, New Student Weekend, Kick-It!, online orientation, First-Year Photo Project, Gopher Guide, as well as other electronic and print communications. The goal of the OFYP 2007 Annual Report is to provide program statistics and a big picture of the programs and services offered in an effort to fulfill our office mission. The very nature of our work is in collaboration. I invite you to learn more about many of the accomplishments of OFYP by reading the following pages. Your feedback is also welcome as we truly appreciate the support we receive campus-wide and value you as our partners in ensuring that students have a successful transition to collegiate life. Sincerely,
Beth M. Lingren Clark, Ph.D. Director of Orientation & First-Year Programs Resource: History and Mission section of the University of Minnesota web page, March 11, 2008: http://www1.umn.edu/twincities/01_abt_gen_hist.php
Orientation & First-Year Programs
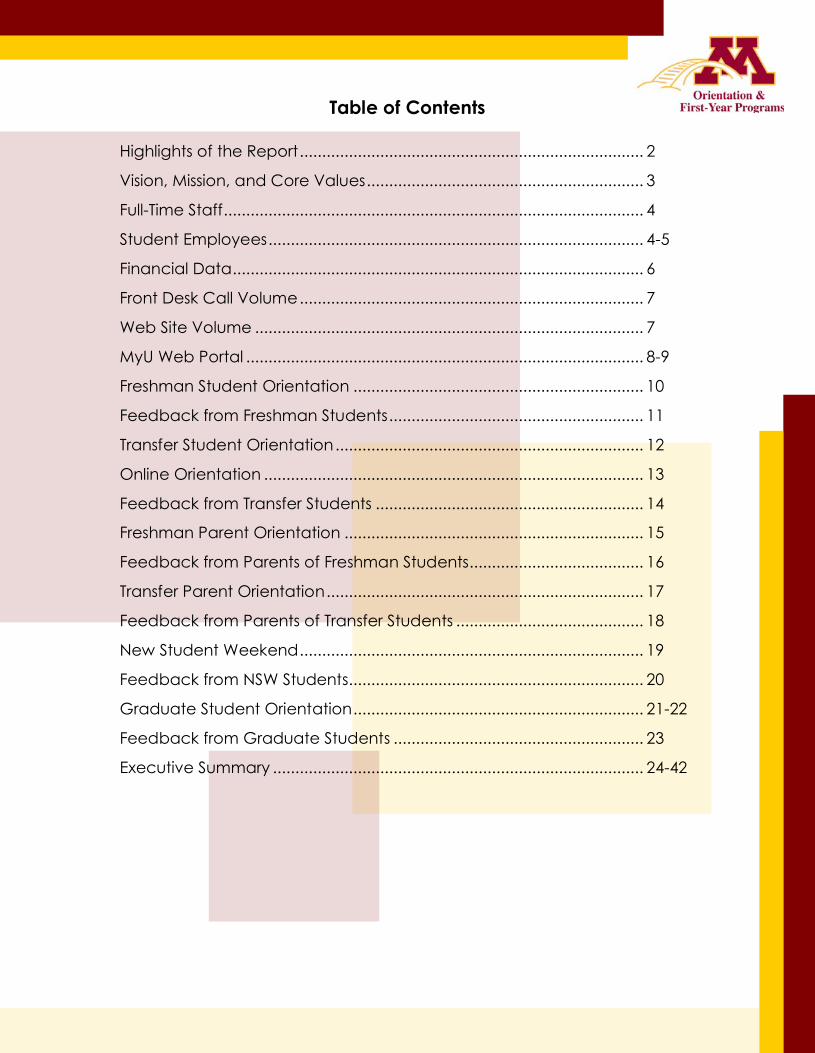
Table of Contents
Highlights of the Report............................................................................. 2
Vision, Mission, and Core Values.............................................................. 3
Full-Time Staff.............................................................................................. 4
Student Employees.................................................................................... 4-5
Financial Data............................................................................................ 6
Front Desk Call Volume............................................................................. 7
Web Site Volume ....................................................................................... 7
MyU Web Portal ......................................................................................... 8-9
Freshman Student Orientation ................................................................. 10
Feedback from Freshman Students......................................................... 11
Transfer Student Orientation..................................................................... 12
Online Orientation ..................................................................................... 13
Feedback from Transfer Students ............................................................ 14
Freshman Parent Orientation ................................................................... 15
Feedback from Parents of Freshman Students....................................... 16
Transfer Parent Orientation....................................................................... 17
Feedback from Parents of Transfer Students .......................................... 18
New Student Weekend............................................................................. 19
Feedback from NSW Students.................................................................. 20
Graduate Student Orientation................................................................. 21-22
Feedback from Graduate Students ........................................................ 23
Executive Summary ................................................................................... 24-42
Orientation & First-Year Programs
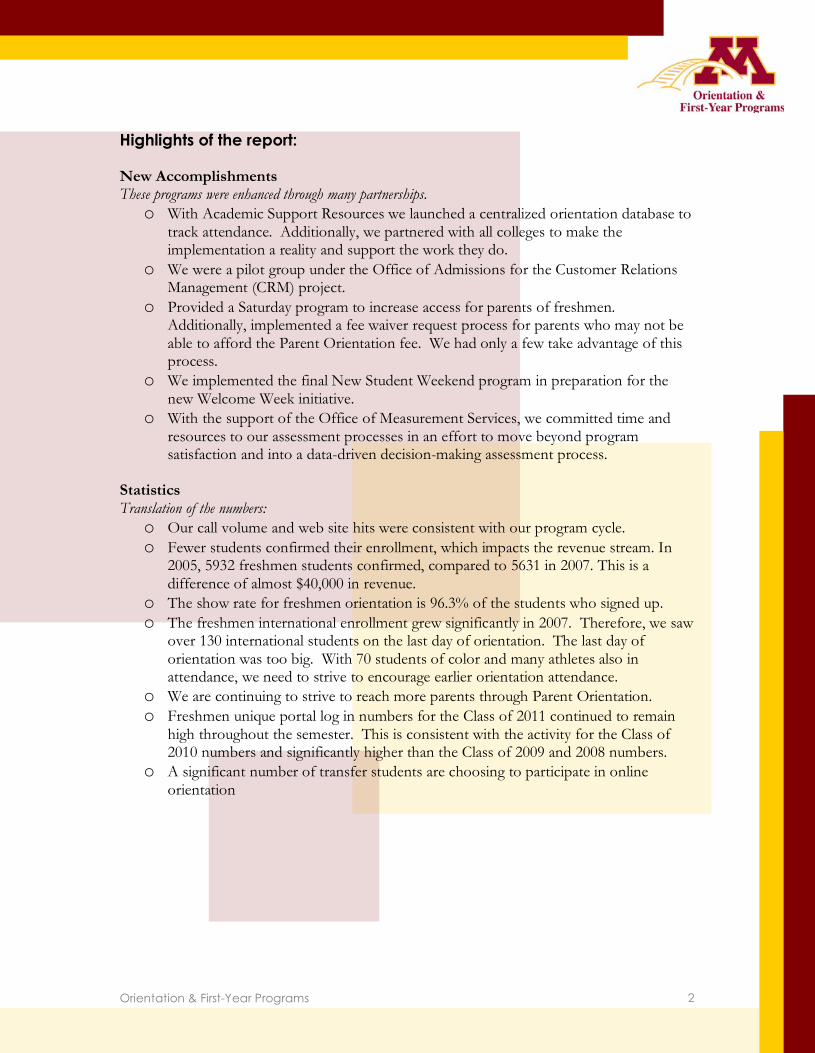
Highlights of the report: New Accomplishments These programs were enhanced through many partnerships.
o With Academic Support Resources we launched a centralized orientation database to track attendance. Additionally, we partnered with all colleges to make the implementation a reality and support the work they do.
o We were a pilot group under the Office of Admissions for the Customer Relations Management (CRM) project.
o Provided a Saturday program to increase access for parents of freshmen. Additionally, implemented a fee waiver request process for parents who may not be able to afford the Parent Orientation fee. We had only a few take advantage of this process.
o We implemented the final New Student Weekend program in preparation for the new Welcome Week initiative.
o With the support of the Office of Measurement Services, we committed time and resources to our assessment processes in an effort to move beyond program satisfaction and into a data-driven decision-making assessment process.
Statistics Translation of the numbers:
o Our call volume and web site hits were consistent with our program cycle. o Fewer students confirmed their enrollment, which impacts the revenue stream. In
2005, 5932 freshmen students confirmed, compared to 5631 in 2007. This is a difference of almost $40,000 in revenue.
o The show rate for freshmen orientation is 96.3% of the students who signed up. o The freshmen international enrollment grew significantly in 2007. Therefore, we saw
over 130 international students on the last day of orientation. The last day of orientation was too big. With 70 students of color and many athletes also in attendance, we need to strive to encourage earlier orientation attendance.
o We are continuing to strive to reach more parents through Parent Orientation. o Freshmen unique portal log in numbers for the Class of 2011 continued to remain
high throughout the semester. This is consistent with the activity for the Class of 2010 numbers and significantly higher than the Class of 2009 and 2008 numbers.
o A significant number of transfer students are choosing to participate in online orientation
2

Orientation & First-Year Programs
Vision, Mission, and Core Values Vision
All entering students will experience a seamless transition and become engaged community members. Mission
The mission of OFYP is to provide quality transitional experiences, in collaboration with other University departments that maximize students’ potential for personal and academic success and assist them in adjusting to the challenges presented by collegiate life. Core Values
Student Success Dedicated to the success of each individual. Building Community Celebrating diversity, encouraging responsibility and creating a sense of belonging. Collaboration Strengthening our work by building internal and external relationships. Leadership Developing the leader within us all. Commitment to Excellence Pursuing our work with professionalism, innovation, scholarship, and integrity.
3
Orientation & First-Year Programs
OFYP Staff Program Year 2007
September 2006 - August 2007
Full-Time Staff Beth Lingren Clark, Ph.D., Director Katie Granholm, Orientation Coordinator Focus: Transfer and Parent Orientation Nikki Grosz, Assistant Director Focus: Operations, Gopher Guide and Office Manager Lisa Gruszka, Associate Director Focus: Orientation Programs and Graduate Student Orientation Bill O’Connor, Assistant Director Focus: Communication, Marketing, and Public Relations Jenny Rachmaciej, Associate Director Focus: New Student Weekend and First-Year Programs Joanne Reeck, Orientation Coordinator Focus: Freshman Orientation Office Assistants
Academic Year Shannon Gilligan Bethany Habinek Allie Muench Kelly Schweitzer (Spring) (Austin Wellman) *resigned October
Summer Stephen Courchane Jessie Shoemaker Matt Skolnick
Communications & Technology Intern Dan Nordin
First-Year Operations Assistant Shannon Gilligan
4

Orientation & First-Year Programs
Orientation Coordinators
Brandon Creager Mike Traxinger
Orientation Leaders Ian Bell Ashleigh Boerboom Jordan Bronston Samone Derks Bengi Durgunoglu Brittany Hildebrandt Megan Hines Jeff Kang Jacinta Krych Josh Mortensen Tim Normandt Kelly O’Connor
Charles Okolo Lori Pokela Rachel Schaefbauer Me’osha Solsberry Robin Spoehr Connor Stowe Ross Thomas Ben Thies Nathan Waldvogel Austin Wellman Sarah Woessner Blia Xiong
Orientation Check-In Staff Kelly Burke Corey Christofel Kristina Fiedler Angela Kell Grace Kinder
Nikki Koenig Katie Proulx Katie Rasmusson Liz Sierminski Michelle Staack
Orientation Program Assistants (OPA’s) Natalie Bervig Mike Mello
Mike Sawers Heidi Tackmann
New Student Weekend Coordinators Natalie Bervig Mike Sawers
New Student Weekend Co-Chairs Martha Aurelius Jason Bergeron TJ Brinkman Shane Dennis Lindsey Dole Justin Fernandez
Claire Flitcroft (Clarissa Gennarelli) *resigned August Leigh Kirschner Nikki Koenig Ashleigh Lincoln Jill Ryan
5

Orientation & First-Year Programs
OFYP Financial Data In Fiscal Year 2007, 73% of Orientation & First-Year Programs budget was Confirmation and Orientation Fees from Freshman, Transfer and Graduate Students, 16% was Sales generated by New Student Weekend and Parent Orientation fees, and 11% was O/M (State) Funds.
Confirmation/Orientation Fees: 73% of budget Freshman (NHS): Freshman Confirmation Fee $160 Spring 2007: 57 students Fall 2007: 5631 students Transfer (NAS): Transfer Confirmation Fee $70 Spring 2007: 738 students Fall 2007: 2040 students Graduate: Graduate Orientation Fee $40 Fall 2006: 1169 students Spring 2007: 67 students Summer 2007: 88 students Sales: 16 % of budget O/M (State): 11% of budget
6

Orientation & First-Year Programs
Summer 2007 Front Desk Call Volume From May through August, the front desk answered 3,543 phone calls from new students, their parents, and members of the University community. This continues the downward trend we have observed the past 2 years. (The summer of 2006 we received 3,762 calls, and summer of 2005, we received 4,335 phone calls, in the same time frame.) OFYP Website Volume
As expected, we saw a large increase in the amount of traffic to our website occur in Spring and Summer.
7

Orientation & First-Year Programs
MyU Web Portal
Over the course of the 2007 calendar year, Orientation & First-Year Programs maintained up to three transitional MyU portal views at a single time. At the beginning of the year, we maintained the view for current first-year students (Class of 2010) as well as the view for transfer students who were beginning classes in the spring semester. After a couple weeks into the semester, transfer students were rolled into the larger undergraduate view. From that point, we only had to maintain the current first-year students (Class of 2010) until we launched the view for incoming first-year students (Class of 2011) at the end of March. The next cycle of the transfer view for students beginning in fall began around mid-May. Students who had just completed their first year (Class of 2010) were rolled into the undergraduate view by mid-June. From that point, both the views for incoming first-year (Class of 2011) and transfer students were active. Transfer students who began classes in the fall were rolled into the undergraduate portal by mid-September. A couple weeks thereafter, transfer students who would begin classes in spring 2008 began to filter into the transfer view. Both the view for current (Class of 2011) and transfer students continued through the end of the calendar year.
8
Orientation & First-Year Programs
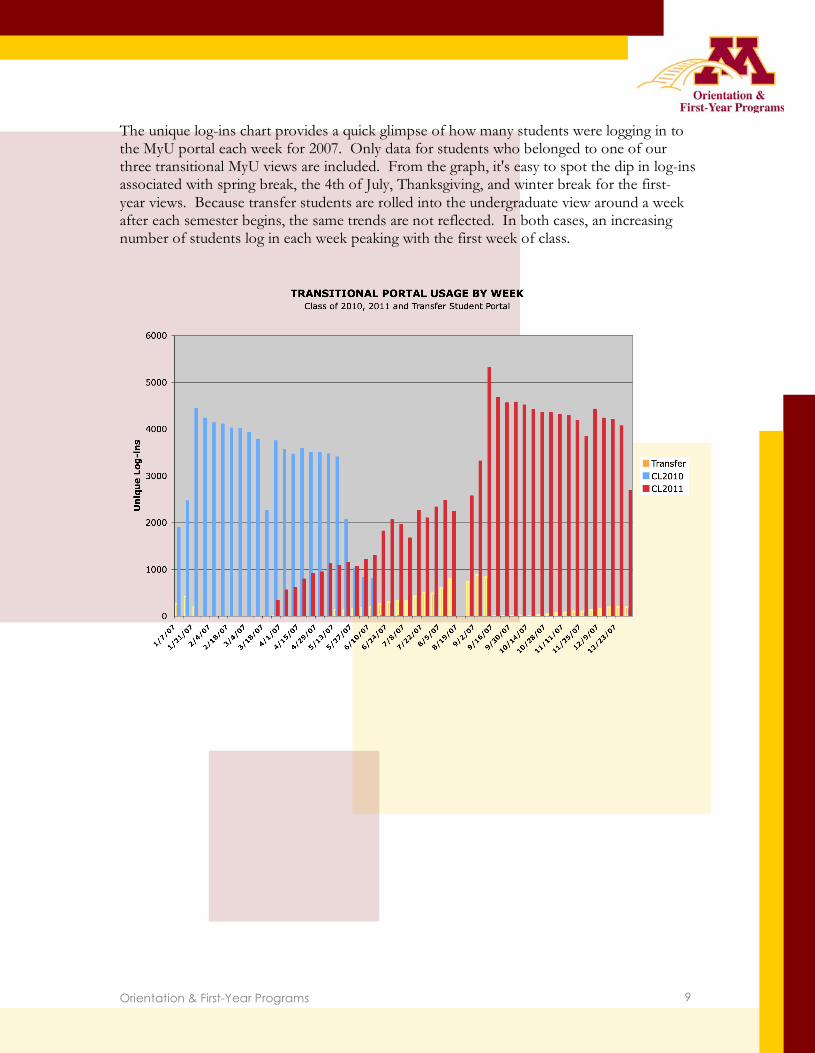
The unique log-ins chart provides a quick glimpse of how many students were logging in to the MyU portal each week for 2007. Only data for students who belonged to one of our three transitional MyU views are included. From the graph, it's easy to spot the dip in log-ins associated with spring break, the 4th of July, Thanksgiving, and winter break for the first-year views. Because transfer students are rolled into the undergraduate view around a week after each semester begins, the same trends are not reflected. In both cases, an increasing number of students log in each week peaking with the first week of class.
9

Orientation & First-Year Programs
Freshman Student Orientation
New first-year students enrolling in fall, attend a two-day, overnight orientation experience during June, July or August. Based on a small group model, students learn about what to expect from the University of Minnesota, meet with their college of enrollment, and register for classes. Students enrolling in the spring attend a one-day orientation program during the beginning of January. All confirmed freshman students pay $160 confirmation fee. Spring 2007:
College: Check-In List (College):
Actual Checked-In (OFYP): % Show:
CLA 43 42 98% IT 9 7 78% Totals: 52 49 94% *57 students confirmed they were attending the U of M. 85.9% of the students who confirmed actually attended Orientation. Fall 2007:
College: Check-In List (College):
Actual Checked-In (OFYP): % Show:
CLA 2739 2651 96.7% IT 823 789 95.8% CSOM 451 432 95.7% CEHD 681 656 96.3% CBS 331 315 95.1% CFANS 305 289 94.7% CDes 90 90 100.0% Totals: 5420 5222 96.3% *5632 students confirmed they were attending the U of M. 92.7% of the students who confirmed actually attended Orientation. * For additional detail, see “07 Orientation Dates.xls”, tab “Freshmen ‘07” * Note: Check-In list numbers include unknown small number of duplicates due to student’s rescheduling of Orientation Dates.
10

Orientation & First-Year Programs
What students said….
I liked how everyone was helpful and answered any questions that were asked. I also like how the orientation leaders did the puzzle play. It showed a lot about things that some people would see in college when they come here. I like how they show everyone what U of M is and what the environment they expect should be. I really did enjoy my first experience staying on campus and meeting people in my class, as well as older students. While Orientation may have been tiring, finally getting to speak to my student community advisors and choose my schedule made me really excited about coming to school next year. Orientation was very organized and helpful to all students: those that know everything about the U and those who haven't even activated their student e-mails. It is obvious that the OFYP leaders listen to the students and use their feedback to improve each year. Good work everyone!
- 2007 Orientation Leaders
“
” “ ”
“ ”
11
Orientation & First-Year Programs
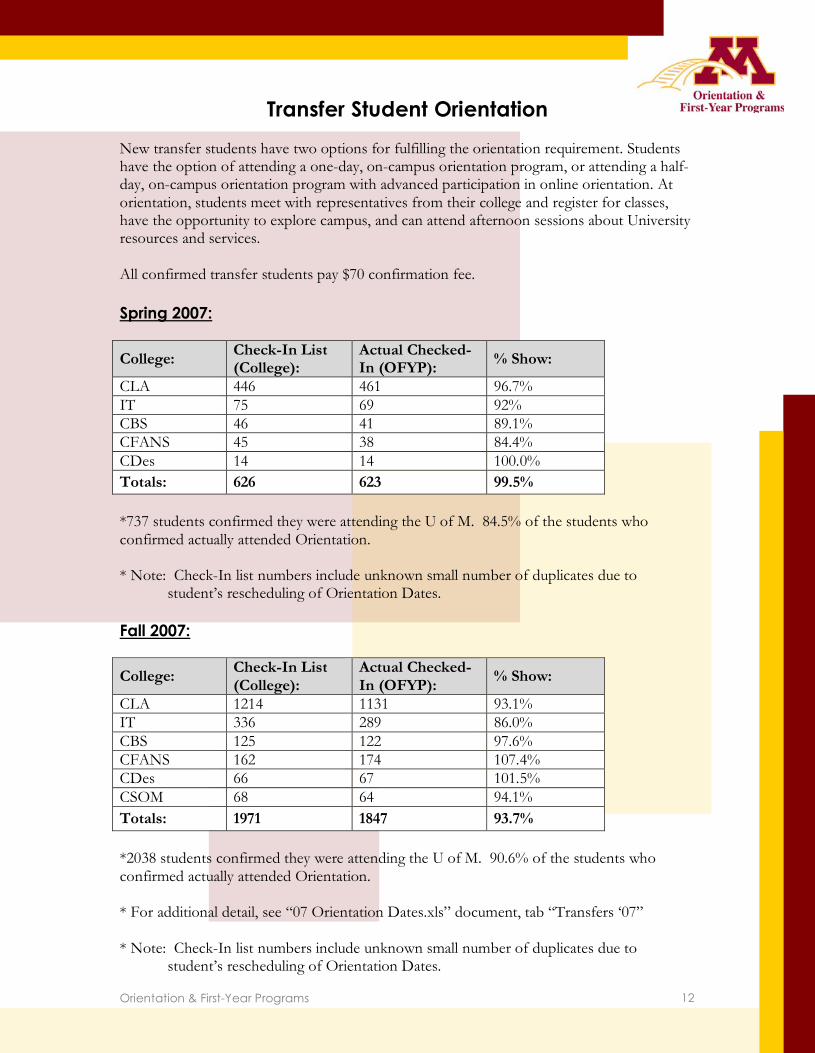
Transfer Student Orientation New transfer students have two options for fulfilling the orientation requirement. Students have the option of attending a one-day, on-campus orientation program, or attending a half-day, on-campus orientation program with advanced participation in online orientation. At orientation, students meet with representatives from their college and register for classes, have the opportunity to explore campus, and can attend afternoon sessions about University resources and services. All confirmed transfer students pay $70 confirmation fee. Spring 2007:
College: Check-In List (College):
Actual Checked-In (OFYP): % Show:
CLA 446 461 96.7% IT 75 69 92% CBS 46 41 89.1% CFANS 45 38 84.4% CDes 14 14 100.0% Totals: 626 623 99.5% *737 students confirmed they were attending the U of M. 84.5% of the students who confirmed actually attended Orientation. * Note: Check-In list numbers include unknown small number of duplicates due to student’s rescheduling of Orientation Dates. Fall 2007:
College: Check-In List (College):
Actual Checked-In (OFYP): % Show:
CLA 1214 1131 93.1% IT 336 289 86.0% CBS 125 122 97.6% CFANS 162 174 107.4% CDes 66 67 101.5% CSOM 68 64 94.1% Totals: 1971 1847 93.7% *2038 students confirmed they were attending the U of M. 90.6% of the students who confirmed actually attended Orientation. * For additional detail, see “07 Orientation Dates.xls” document, tab “Transfers ‘07” * Note: Check-In list numbers include unknown small number of duplicates due to student’s rescheduling of Orientation Dates.
12

Orientation & First-Year Programs
Online Orientation Fall 2007
New transfer students have two options for fulfilling the orientation requirement. Students have the option of attending a one-day, on-campus orientation program, or attending a half-day, on-campus orientation program with advanced participation in online orientation. The online orientation program, administered through WebCT Vista, consists of content regarding University resources, services, and policies, as well as separate content provided by the student's college of enrollment. Completion of online orientation allows students to shorten their on-campus orientation day and takes the place of the afternoon sessions.
Attended # Completed Online Orientation
% Completed Online Orientation
2006 2005
CBS 121 85 70% 98% 61%
CDes 68 33 49% 58% 24%*
CFANS 153 62 41% 46% 23%**
CLA 1106 724 65% 75% 34%
CSOM 60 26 43% 57% NA
IT 272 137 50% 50% 15%
1780
* CALA & CHE students ** CNR & COAFES students
13
Orientation & First-Year Programs
What Students Said….
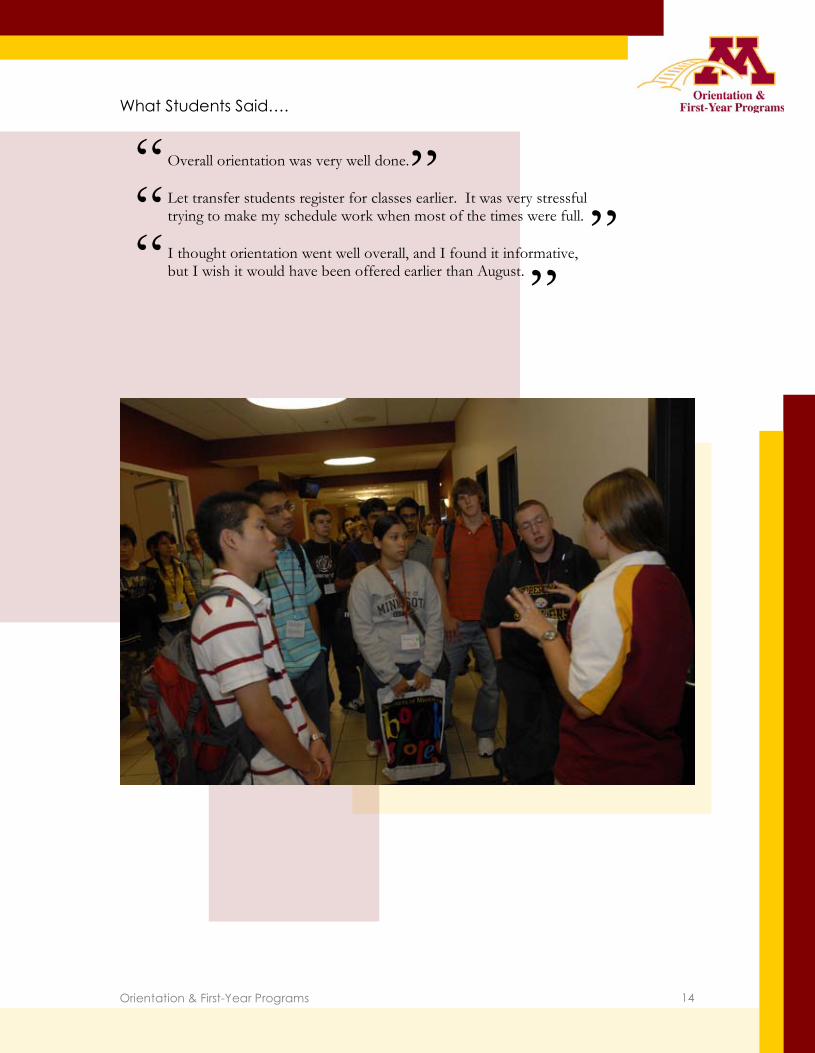
Overall orientation was very well done. Let transfer students register for classes earlier. It was very stressful trying to make my schedule work when most of the times were full. I thought orientation went well overall, and I found it informative, but I wish it would have been offered earlier than August.
“ ” “ ” “ ”
14

Orientation & First-Year Programs
Freshman Parent Orientation Parents of new students are invited to attend an optional parent orientation program. This one-day program runs concurrent to freshmen orientation and provides parents the opportunity to learn more about tuition, financial aid, and billing; health and safety; their student’s college of enrollment; housing; and typical first-year transition issues. Spring 2007: The cost of this program to parents is $0. Spring 2007 Data is unavailable. Fall 2007: Program Costs: Parent Orientation Day Program: $25 Parent Orientation Day Program- Onsite: $35 Parent Orientation Day Program- Child: $10 Evening Parent Program: $25 Day Program:
• Total parents attended: 3777 (includes 34 children) • 399 parents registered on-site
15

Orientation & First-Year Programs
What Parents Said…
Being a 20 year faculty member I was skeptical of learning much. I was wrong! I learned about tuition, finance, housing, etc. Things which I would never pick up otherwise. Thanks for a great job and making me even more proud to be associated with the U. My child is in good hands! With children at two other Universities this has been the best Freshman/Parent Orientation by far! Overall, great job. Efficiency and on-time was awesome. Enough time to pause and think but no time to get bored or twiddle thumbs! Amazing! Great Job overall! We learned a lot! Makes us feel more comfortable sending our child here.
“ ” “ ” “
” “ ”
16
Orientation & First-Year Programs
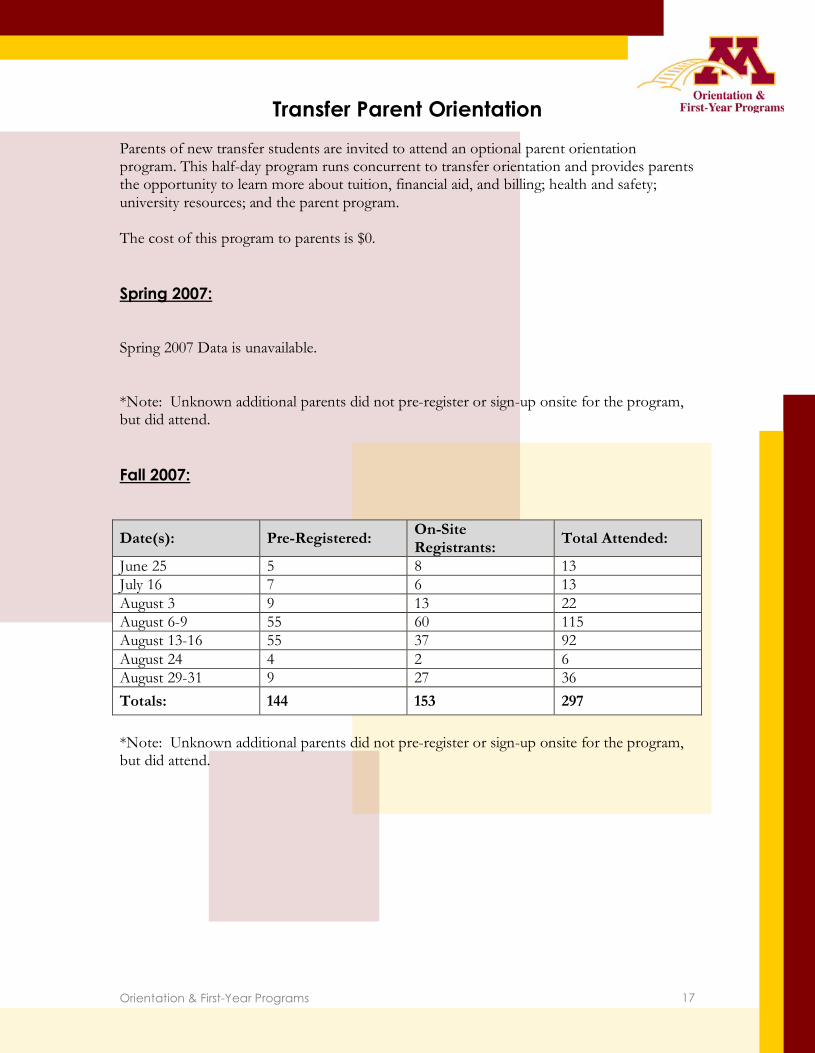
Transfer Parent Orientation Parents of new transfer students are invited to attend an optional parent orientation program. This half-day program runs concurrent to transfer orientation and provides parents the opportunity to learn more about tuition, financial aid, and billing; health and safety; university resources; and the parent program. The cost of this program to parents is $0. Spring 2007: Spring 2007 Data is unavailable. *Note: Unknown additional parents did not pre-register or sign-up onsite for the program, but did attend. Fall 2007:
Date(s): Pre-Registered: On-Site Registrants: Total Attended:
June 25 5 8 13 July 16 7 6 13 August 3 9 13 22 August 6-9 55 60 115 August 13-16 55 37 92 August 24 4 2 6 August 29-31 9 27 36 Totals: 144 153 297 *Note: Unknown additional parents did not pre-register or sign-up onsite for the program, but did attend.
17
Orientation & First-Year Programs
What Parents Said…
Very informative! Moved right along- excellent speakers! Well organized and very informative (without info overkill). Loved the separate program from the student. I attended this program to get info, but did not attend to "hold hands" with my daughter all day.
“ ” “ ” “ ”
18
Orientation & First-Year Programs
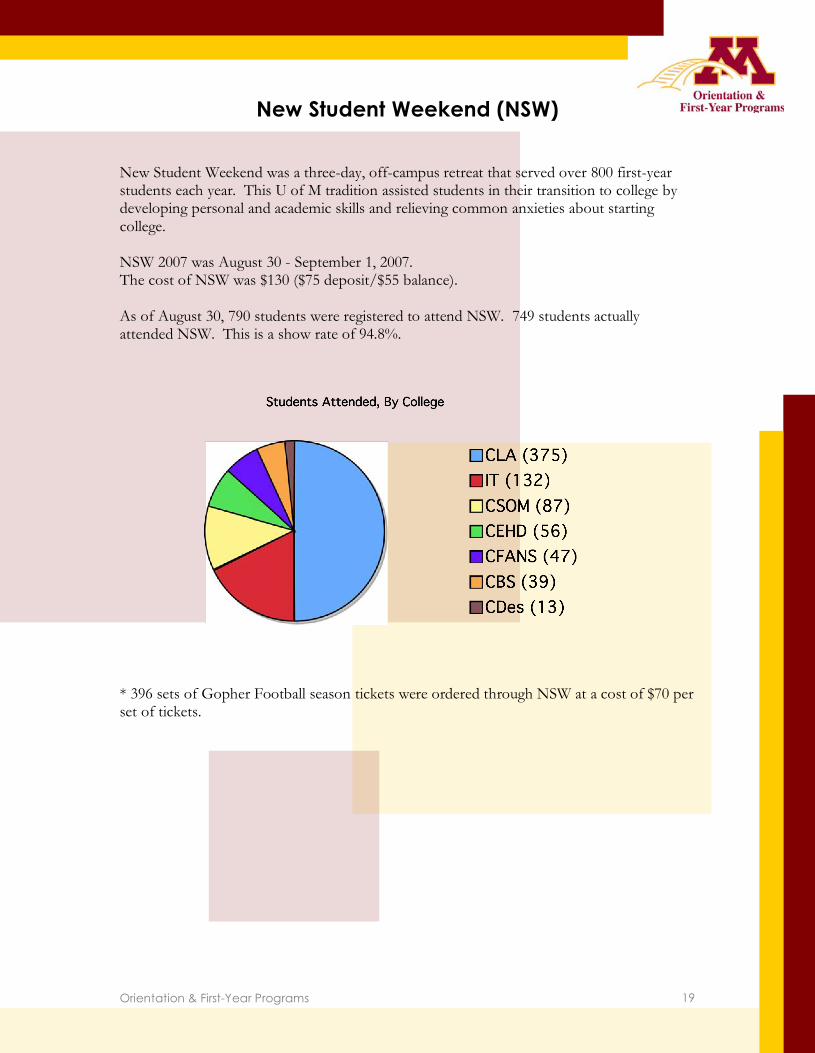
New Student Weekend (NSW) New Student Weekend was a three-day, off-campus retreat that served over 800 first-year students each year. This U of M tradition assisted students in their transition to college by developing personal and academic skills and relieving common anxieties about starting college. NSW 2007 was August 30 - September 1, 2007. The cost of NSW was $130 ($75 deposit/$55 balance). As of August 30, 790 students were registered to attend NSW. 749 students actually attended NSW. This is a show rate of 94.8%.
* 396 sets of Gopher Football season tickets were ordered through NSW at a cost of $70 per set of tickets.
19
Orientation & First-Year Programs
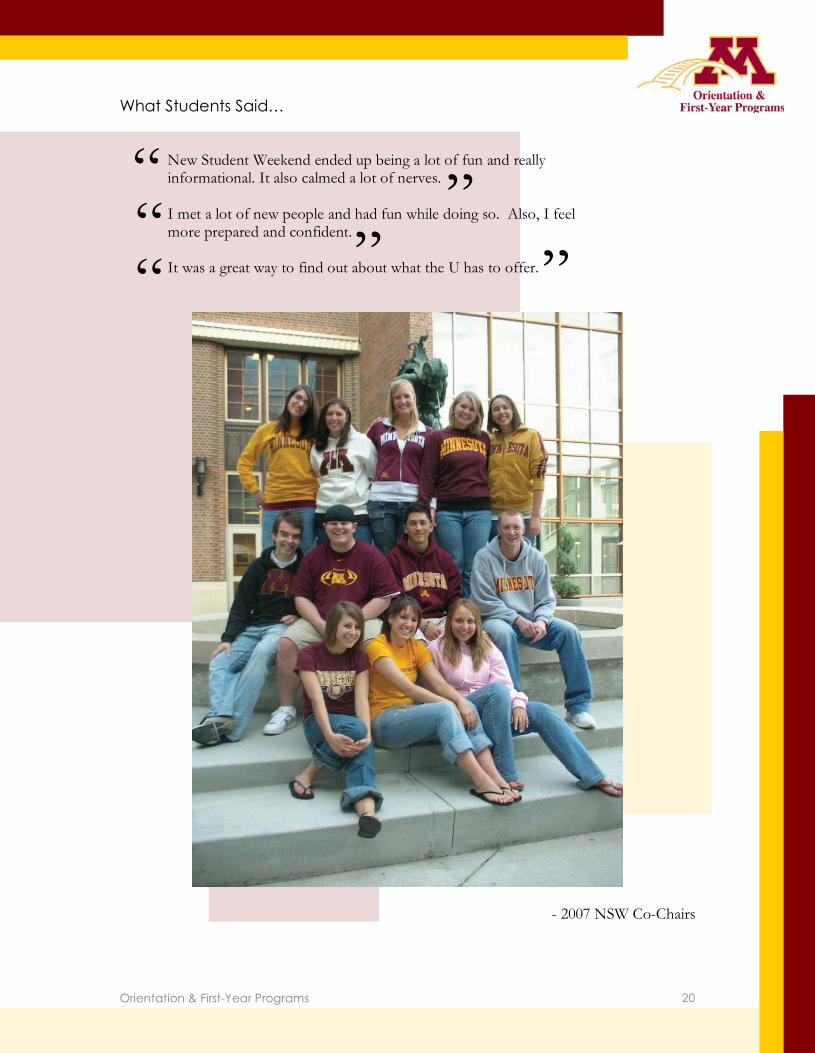
What Students Said…
New Student Weekend ended up being a lot of fun and really informational. It also calmed a lot of nerves.
I met a lot of new people and had fun while doing so. Also, I feel more prepared and confident. It was a great way to find out about what the U has to offer.
- 2007 NSW Co-Chairs
“ ” “ ” “ ”
20

Orientation & First-Year Programs
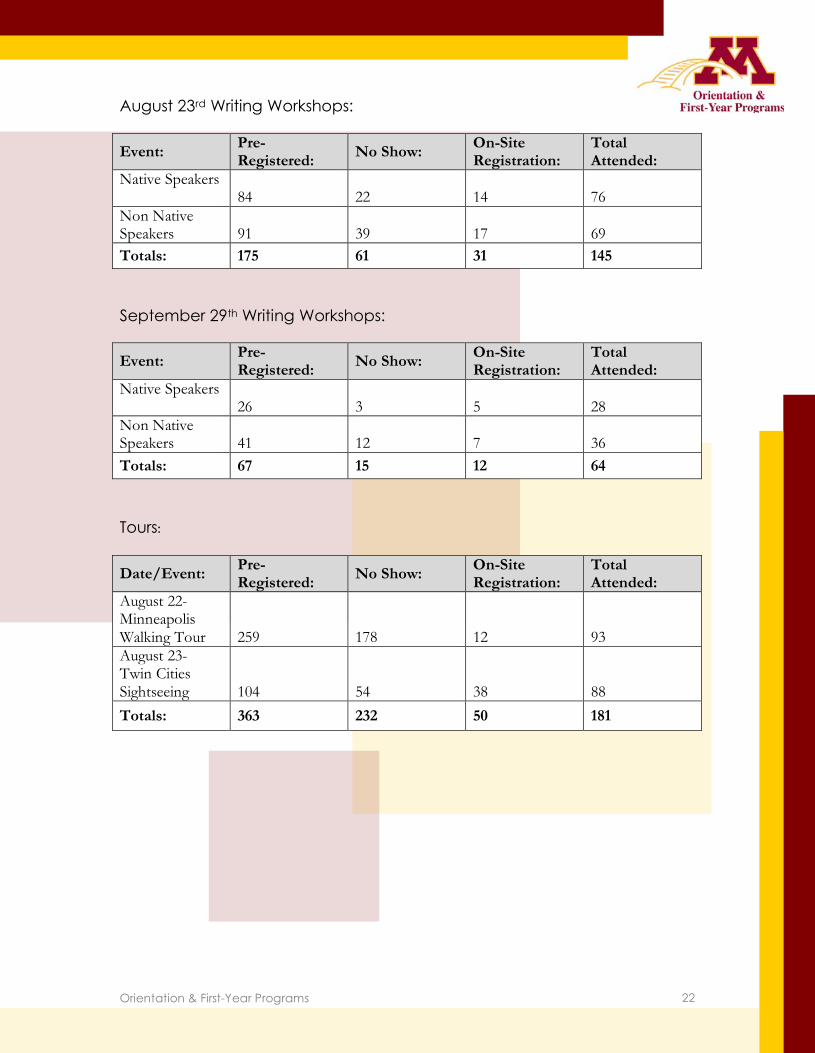
Graduate Student Orientation (GSO) Graduate Student Orientation is made up of 3 major components: Welcome Day, Writing Workshops, and tours. Each fall 2 identical Welcome Days are available for new graduate students to select from. This program includes a resource fair, presentations on academic integrity, health and benefits, and how to have a successful relationship with your faculty adviser. In addition, we offer two writing workshops for English and non-native speakers of English. We have a similar programming in January. Finally, there is a campus tour and a Twin Cities sightseeing tour as part of the summer program. OFYP works closely with the Council of Graduate Students and the Graduate School to plan and promote these programs. The GSO Orientation Fee assessed to invited students was $40. *Note: These are not all unique students. Some students may have attended the Welcome Day and/or a Writing Workshop and/or a Tour. Spring 2007:
Date/Event: Pre-Registered: No Show: On-Site
Registration: Total Attended:
January 10- Native Writing Workshop
17
4
0
13
January 11- Non Native Writing Workshop
10
2
3
11
January 12- Welcome Day
29
7
1
23
Totals: 56 13 4 47 Fall 2007: * We had a total of 706 students register to attend at least one Graduate Student Orientation program. Actual attendance numbers are the following. Welcome Days:
Date: Pre-Registered: No Show: On-Site
Registration: Total Attended:
August 21 272 52 23 243 August 22 220 42 34 212 Totals: 492 94 57 455
21
Orientation & First-Year Programs
August 23rd Writing Workshops:
Event: Pre-Registered: No Show: On-Site
Registration: Total Attended:
Native Speakers 84
22
14
76
Non Native Speakers
91
39
17
69
Totals: 175 61 31 145 September 29th Writing Workshops:
Event: Pre-Registered: No Show: On-Site
Registration: Total Attended:
Native Speakers 26
3
5
28
Non Native Speakers
41
12
7
36
Totals: 67 15 12 64 Tours:
Date/Event: Pre-Registered: No Show: On-Site
Registration: Total Attended:
August 22- Minneapolis Walking Tour
259
178
12
93
August 23- Twin Cities Sightseeing
104
54
38
88
Totals: 363 232 50 181
22
Orientation & First-Year Programs
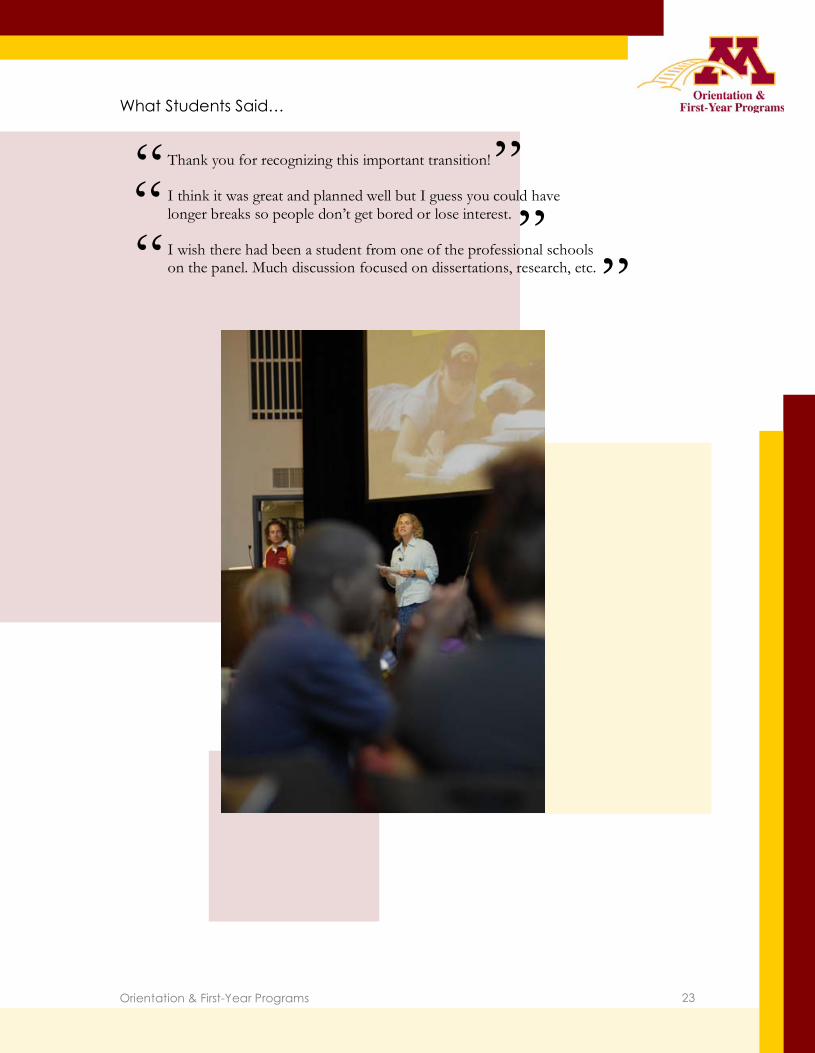
What Students Said…
Thank you for recognizing this important transition! I think it was great and planned well but I guess you could have longer breaks so people don’t get bored or lose interest. I wish there had been a student from one of the professional schools on the panel. Much discussion focused on dissertations, research, etc.
“ ” “ ” “ ”
23
Orientation & First-Year Programs
Executive Summary
Prepared by Office of Measurement Services
24
II NNTTEEGGRRAATTEEDD AASSSSEESSSSMM EENNTT
OOFF OORRII EENNTTAATTII OONN AANNDD
FFII RRSSTT--YYEEAARR PPRROOGGRRAAMM SS
SSeemmii--AAnnnnuuaall RReeppoorr tt FFaall ll 22000077
Index Executive Summary…………………………………………………… 1 - 7
Background……………..……………………………………. …….1
Method…………………… …………………………………………2 Outcome Areas: Key Findings…………………………………..3 - 7 Appendix A: Summary Tables…..…….……………………………..9 - 14
Executive Summary Fall 2007
Orientation and First-Year Programs (OFYP) at the University of Minnesota provides support to entering students by offering information and building
community in order to ease their transition to the University. In order to determine the effectiveness of orientation programs for transfer students, graduate students, freshman, and parents, OFYP collects feedback from program attendees. In the Fall of 2006, OFYP began conducting assessments that align program events to the goals of OFYP, allowing for comparisons across groups and improved data utilization. Assessments were continued for the Fall of 2007, thus allowing OFYP to again compare across programs and compare results from year to year. In 2006, OFYP identified five major outcome areas in which to assess across all programs. Assessment results within each of these outcome areas were used to establish goals for the following academic year. The major outcome areas are:
• Who is utilizing our services? • Are we communicating effectively? • Are attendees satisfied with program components? • Can we justify program content? • Did the attendees feel welcome?
OFYP utilized the data collected in 2006-2007 to establish goals for the orientation programs held in 2007 and 2008. These goals include:
• Create a profile of program attendees and respondents • Utilize benchmarks to establish measures for continuous improvement • Provide appropriate orientation experiences to first generation students, students
of color, students with high financial need and their parents • Enhance services to transfer students (living/learning community, web-
orientation, increased communication) • Work with graduate school to coordinate messages, timing of orientation, and
web portal content for graduate students
Background
Office of Measurement Services Fall 2007
1

The following findings are reported on only the questions that are aligned across more than one OFYP assessment. The percentages are based on the exclusion of “Not Applicable” responses. Due to the overall high mean rankings for all programs, we focused on percentages in this report to see the breakdown between response options. Means can be found in Appendix A and in the individual reports for each program provided to program leaders, separate from this analysis. Many OFYP program goals are directed to the entering freshman class. The specificity of program content differs greatly from other OFYP programs; therefore, there are few aligned questions included in the Freshman Orientation Evaluation. However, it is important that OFYP know their entering class, so they can determine if the feedback they are receiving is representative of the population. This report utilizes data collected by University of Minnesota, Office of Institutional Research. Entering Student Profile According to the 10th day report, Fall 2007 new freshman enrollment at the Twin Cities campus was 5,280. This report details: • Average high school rank: 84.8%, up 1.6% from 2006 • Average ACT Composite score: 25.9, up 0.7 from 2006 • 44% are in the top 10% of their high school class, up 5.2% from 2006 • 83.7% are in the top 25% of their high school class, up 5.2 from 2006 • 96 are National Merit Scholars, up 22 from 2006. • 20.1% are students of color, down 0.01% from 2006 • 55.7% are female; 44.3% are male • 59% are Minnesota Residents, down 6% from 2006 • 38% are from the Metro area, down 9% from 2006 • 21% are from the greater Minnesota area up 3% from 2006 • 28% are Wisconsin residents, up 4% from 2006 • 2.2% are South Dakota residents, up 0.03% from 2006 • 2.01% are North Dakota residents. up 0.03% from 2006 • 8% are from other states and countries • 4,294 (81.3%) live in University residence halls or apartments • 986 (18.7%) live off campus and commute Enrollment by College: • Carlson School of Management = 435 (8.2%), up 0.06% from 2006 • Education and Human Development = 645 (12.2%), down 0.06% from 2006 • Institute of Technology = 801 (15.2%), equal to 2006 • Biological Sciences = 327 (6.2%), down 0.07% from 2006 • Liberal Arts = 2,685 (50.9%), up 0.11% from 2006 • Design = 88 (1.7%), up 0.01% from 2006
Method
Office of Measurement Services Fall 2007
2
• Food, Agriculture and Natural Resource Sciences = 299 (5.6%), down 0.08% from 2006
The Freshman Orientation Evaluation was given online to 4,236 incoming freshman, which is almost 80% of the incoming freshman class. The response rate is up 5 percent this year. This data collection effort reports: • 21% are students of color, up 3% from 2006 • 54.7% are female; 42.1% are male, equal to 2006 • 63.5% are Minnesota Residents, up 4.1% from 2006 • 44.6% are from the Metro area, up 4.6% • 19% are from the greater Minnesota area, equal to 2006 • 20.8% are Wisconsin residents, down 5.2% from 2006 • 3.4% are North Dakota or South Dakota residents, down 1% • 8% are from other states and countries, up 4.8% from 2006 Overall, the Freshman Orientation evaluation is a representative sample of the incoming 2007 freshman, Class of 2011. Who is utilizing our services? Common demographic characteristics of the orientation groups are as follows:
• The typical freshman student is from the seven county Twin Cities area, female, white, and 17 – 19 years old, and enrolled in the College of Liberal Arts.
• The typical transfer student is from the seven county Twin Cities area, male, white, 20 – 24 years old, and enrolled in the College of Liberal Arts.
• The typical graduate student is from outside the United States, female, white, and 20 – 24 years old.
• The typical parent was from seven county Twin Cities area, female, white, and had a student who was 17 – 19 years old and enrolled in the College of Liberal Arts.
Interesting Shift: In 2006, the majority of freshmen were female and the majority of graduate student were from the seven county Twin Cities area. See Tables 1-5 for more information.
Office of Measurement Services Fall 2007
3

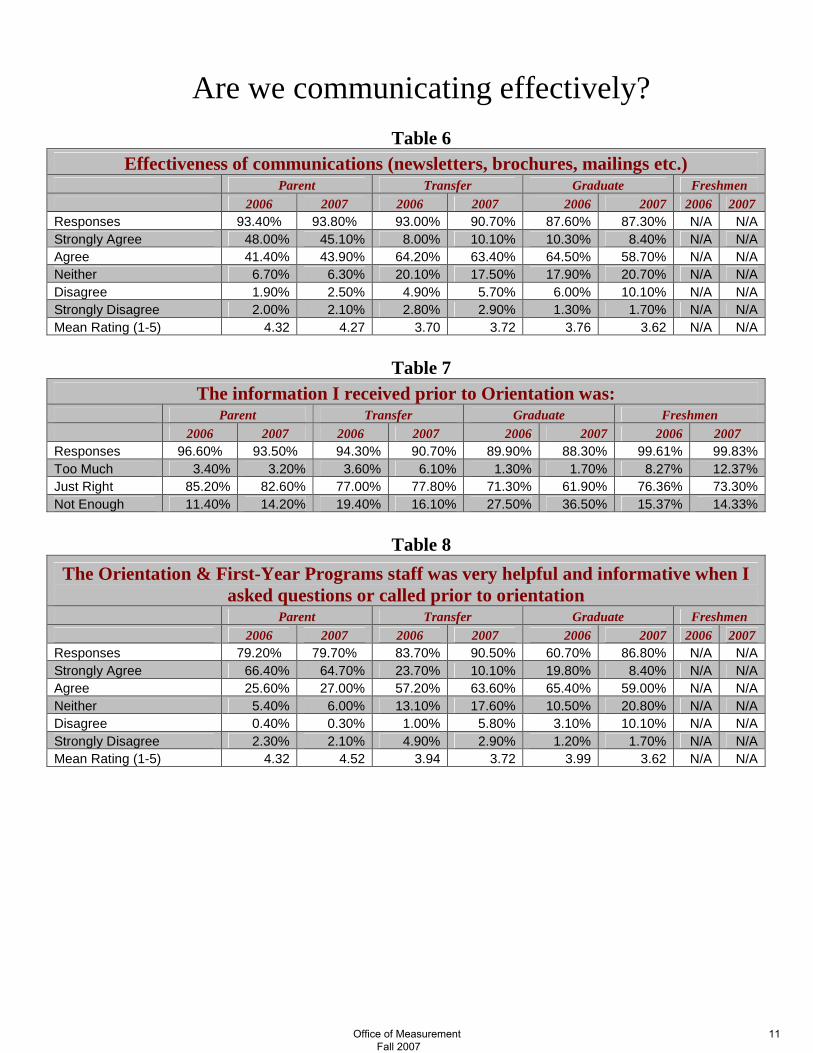
Are we communicating effectively? Overall in 2007, there were only slight increases or decreases in the percentage of respondents who agreed with the following communication questions for Transfer Orientation. Parent Orientation did see some jump in positive ratings. However, there were substantial decreases in percentage of respondent agreement in all questions for Graduate Orientation. Effectiveness of communications (newsletters, brochures, mailings etc.) � Parent Orientation sustains the highest level of agreement at 99%, with over an 8%
increase from 2006. The Orientation and First-Year program Staff was very helpful and informative when I asked questions or called prior to orientation. � Parent Orientation sustained the highest level of agreement at 91.7%. � All Orientations suffered from some decreases in level of agreement. � Both Transfer and Graduate Orientation’s level of agreement decreased substantially
from 2006 to 2007. The information I received prior to Orientation was: � Parent Orientation sustains the highest level of agreement at 82.6% who reported
“Just Right.” � Transfer Orientation saw a minimal increase in agreement for “Just Right.” However,
with the effort to increase communications to this group, there was a three percent drop in “Not enough” and a three percent increase in “Too much.”
� Over thirty-five percent of graduate students felt they did not receive enough information prior to orientation. This is up nine percent from 2006 and remains the stakeholder group who is requesting more information.
Although more information has been sent to graduate students over the past year through email, there remain a high percentage who report they are not getting enough information. A cross-tabulation was run to see if those who are not getting enough information also are reporting that the communications are not effective. The highlighted area shows that of the 63 students who are not getting enough information, 31 find the communication to be effective. This data tells us that the communication method is working, but graduate students still want more.
Agreed Neutral Disagreed Total
Too Much 1 2 0 3
Just Right 86 19 4 109
Not Enough 31 16 16 63
Total 118 37 20
Outcome Areas: Key Findings
Office of Measurement Services Fall 2007
4
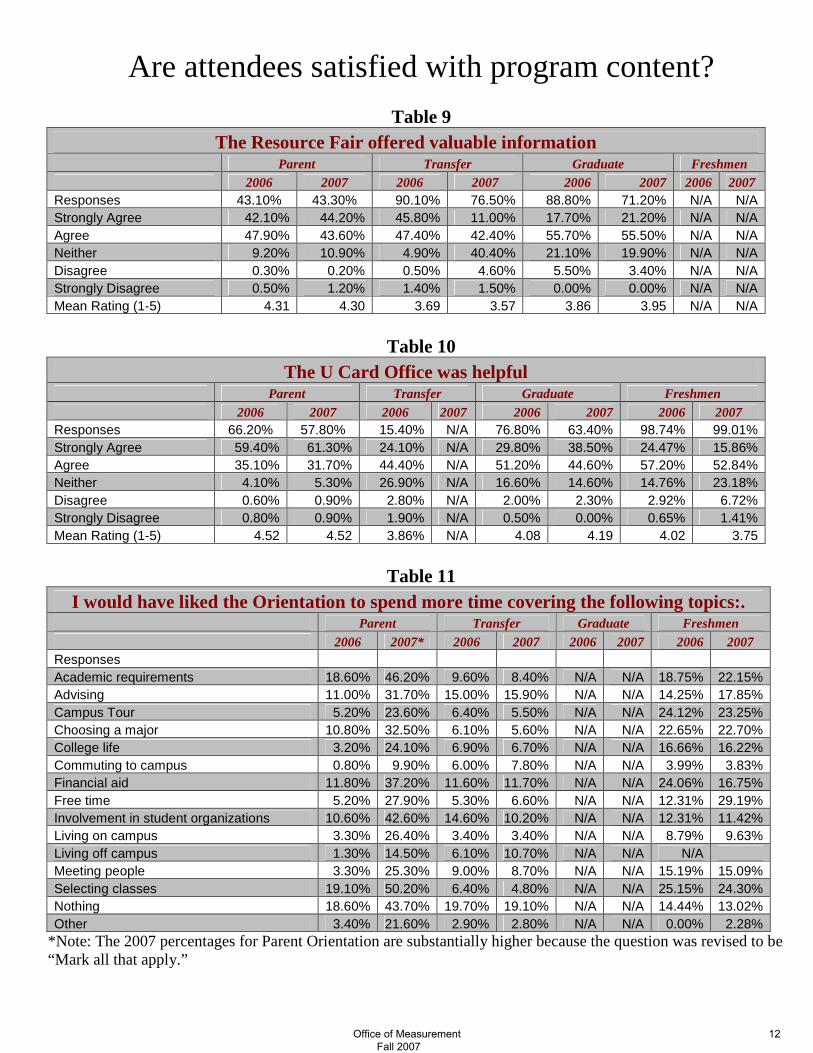
Are attendees satisfied with program components? This year Graduate Orientation increased agreement levels for all questions concerning program components. Transfer Orientation suffered a couple substantial decreases and Parent Orientation had either very slight increases and decreases for all questions. The quality of food provided during Orientation was good. � Only 63% of transfer students agreed that the quality of food provided during
Orientation was good. This is a 13.8% decrease. The Resource Fair offered valuable information. � Transfer orientation agreement decreased 7.8%. The U Card Office was helpful. � 81% or more parents, graduate students and freshmen thought the U Card Office was
helpful. � Graduate and Freshmen Orientation level of agreement increased at least 12% from
2006. The check-in process was smooth and effective. � 74% or more Parents, Graduate Students or Transfer Students thought the check-in
process was smooth and effective. � Agreement levels for Transfer Orientation decreased 18.7%.
Recommendation: It would be worthwhile to see if content that was omitted or added this year may have had anything to do with this drop. If the fair content did not change, it may be that the needs of transfer students are changing.
Office of Measurement Services Fall 2007
5
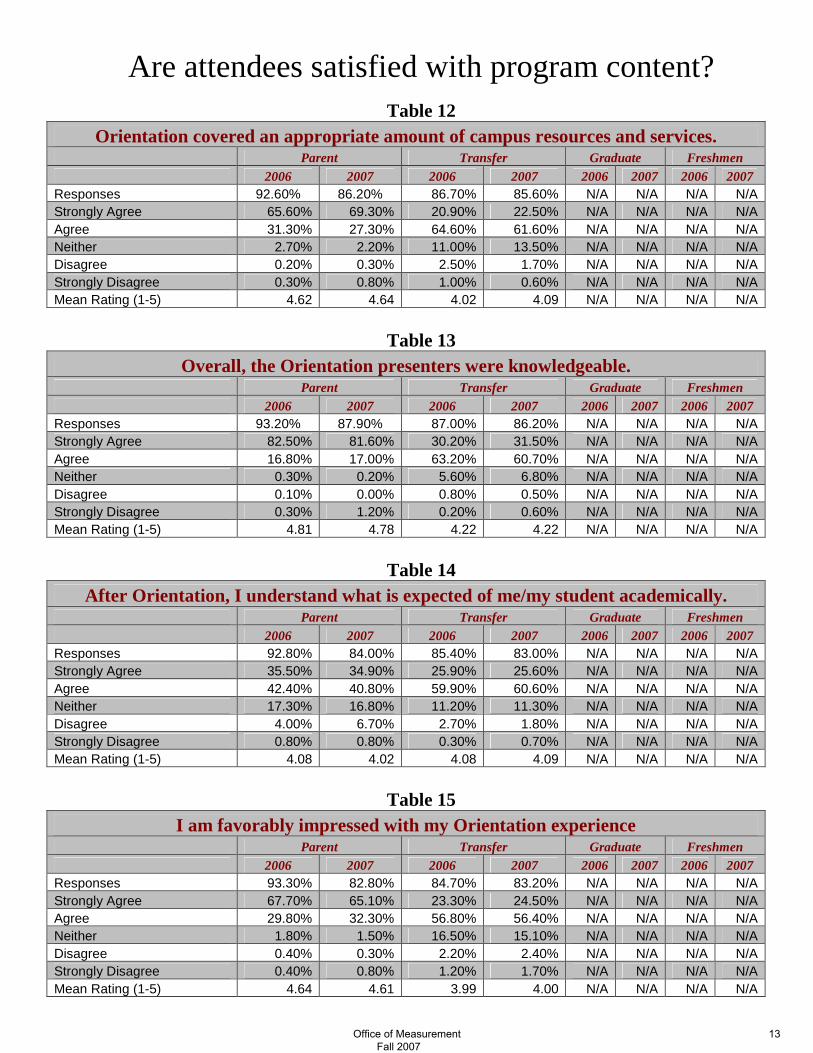
Can we justify program content? Trends have emerged when analyzing the question, “I would have liked orientation to spend more time covering the following topics:” For the past two years each stakeholder group has had many respondents select that they would like more time spent on the following topics:
Parents � Classroom experience � Involvement in student organizations � Selecting classes � Academic requirements Freshmen � Classroom experience � Campus Tour � Choosing a major � Selecting classes � Free Time Transfer � Advising � Financial aide � Involvement in student organizations *This year a notable number transfer students wanted more information on Study Abroad, Transfer of courses, and Living off campus than in 2006.
Orientation covered an appropriate amount of campus resources and services. � Both groups (Parent and Transfer) reported higher levels of agreement with this item,
96.6% and 84.1%, respectively. After Orientation, I understand what is expected of me/my student academically. � Transfer students reported higher levels of agreement with this item, bringing the
total percentage of those who agree to 86.2%, up 5.2% from 2006.
Office of Measurement Services Fall 2007
6
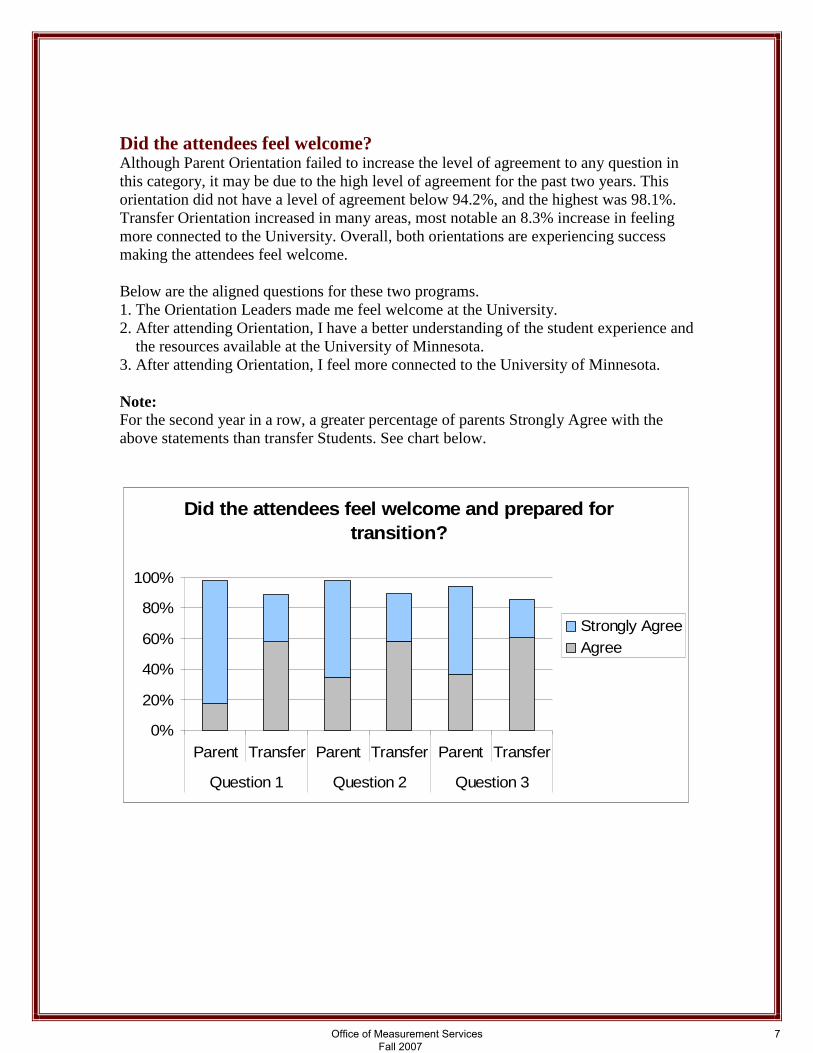
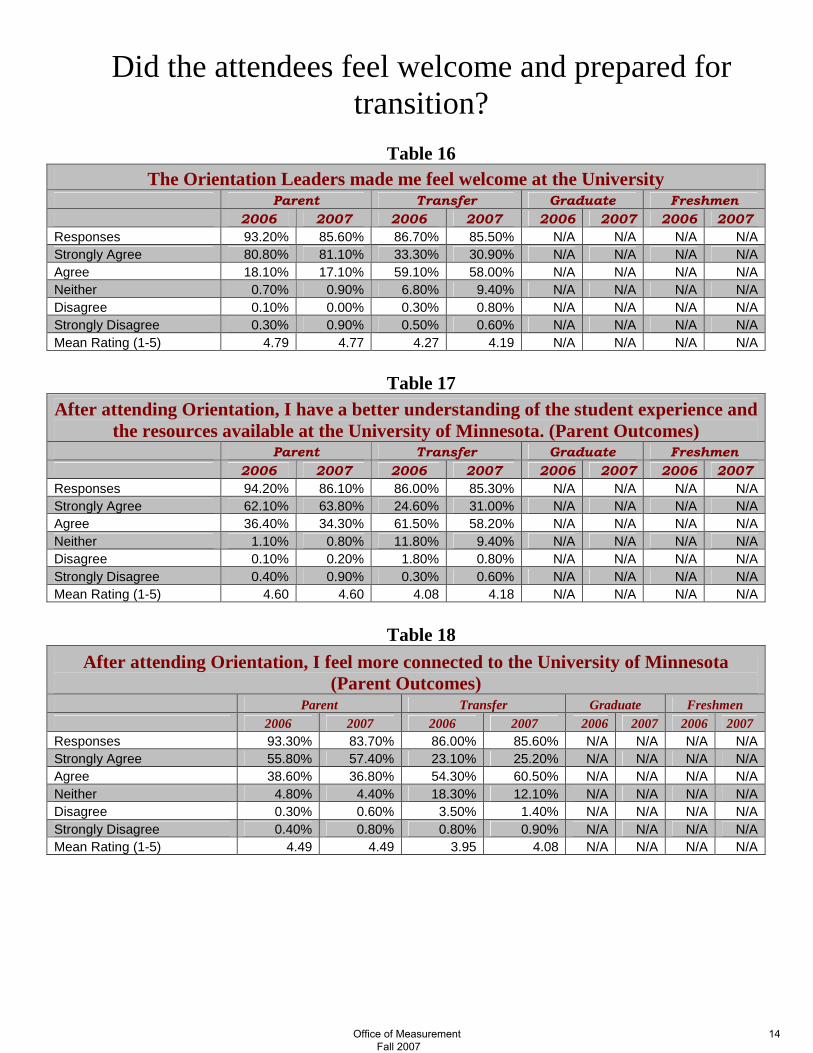
Did the attendees feel welcome? Al though Parent Orientation failed to increase the level of agreement to any question in this category, it may be due to the high level of agreement for the past two years. This orientation did not have a level of agreement below 94.2%, and the highest was 98.1%. Transfer Orientation increased in many areas, most notable an 8.3% increase in feeling more connected to the University. Overall, both orientations are experiencing success making the attendees feel welcome. Below are the aligned questions for these two programs. 1. The Orientation Leaders made me feel welcome at the University. 2. After attending Orientation, I have a better understanding of the student experience and the resources available at the University of Minnesota. 3. After attending Orientation, I feel more connected to the University of Minnesota. Note: For the second year in a row, a greater percentage of parents Strongly Agree with the above statements than transfer Students. See chart below.
Did the attendees feel welcome and prepared for transition?
0%
20%
40%
60%
80%
100%
Parent Transfer Parent Transfer Parent Transfer
Question 1 Question 2 Question 3
Strongly AgreeAgree
Office of Measurement Services Fall 2007
7

Appendix A

Who is utilizing our services?
Table 1 I am from:
Parent Transfer Graduate Freshmen 2006 2007 2006 2007 2006 2007 2006 2007
Responses 97.90% 94.90% 95.40% 92.00% 98.50% 93.20% 100.00% 100.00% Seven county Twin Cities area 30.70% 37.00% 61.50% 62.90% 25.90% 21.50% 40.51% 44.57% Greater Minnesota 19.10% 18.10% 16.00% 15.60% 8.70% 8.90% 18.89% 18.93% Wisconson 36.40% 29.40% 7.60% 8.50% 7.20% 6.30% 25.86% 20.80% North or South Dakota 5.00% 5.30% 2.70% 2.50% 3.00% 1.60% 4.46% 3.43% Other Midwestern States 6.40% 7.20% 1.30% 1.90% 9.50% 11.00% 4.07% 3.75% Elsewhere in the United States 2.20% 2.70% 4.20% 4.60% 23.60% 23.00% 2.17% 2.71% From Outside the United States 0.30% 0.30% 6.60% 3.90% 22.10% 27.70% 1.01% 1.51%
Table 2
Gender Parent Transfer Graduate Freshmen 2006 2007 2006 2007 2006 2007 2006 2007
Responses 96.60% 95.10% 94.70% 88.90% 98.90% 93.20% Male 46.40% 43.40% 48.70% 51.20% 38.60% 44.50% 54.73% 42.12% Female 53.60% 56.60% 51.30% 48.70% 61.40% 55.50% 42.11% 54.79% Transgender 0.00% 0.00% 0.00% 0.10% 0.00% 0.00% 0.02% 0.05%
Table 3
Ethnicity Parent Transfer Graduate Freshmen 2006 2007 2006 2007 2006 2007 2006 2007
Responses 95.00% 92.20% 94.10% 86.80% 96.30% 88.80% Decline Choice N/A N/A N/A N/A N/A N/A 2.19% 1.68% American Indian/Alaska Native 1.10% 0.50% 0.90% 0.50% 0.80% 1.10% 0.59% 0.76% Asian/Pacific Islander 2.90% 3.10% 7.00% 7.50% 17.50% 23.60% 9.91% 10.46% Black/African American 1.70% 1.80% 4.60% 3.60% 2.70% 3.80% 3.35% 3.82% Hispanic/Chicano/Latino/Mexican 1.30% 1.30% 2.70% 1.70% 3.10% 1.60% 1.41% 2.03% Multiracial 1.60% 1.50% 0.60% 1.50% 0.40% 2.70% 1.41% 1.58% white (non-hispanic) 90.90% 91.40% 8.12% 83.30% 72.80% 62.60% 76.92% 75.24% Other 0.60% 0.50% 3.00% 1.80% 2.70% 4.40% 1.31% 1.35%
Office of Measurement Fall 2007
9

Who is utilizing our services?
Table 4 Age
Parent Transfer Graduate Freshmen 2006 2007 2006 2007 2006 2007 2006 2007
Responses 96.70% 95.20% 94.90% 89.30% 92.50% 86.80% 17-19 99.90% 99.80% 23.30% 21.90% 0.00% 0.00% 96.10% 94.69% 20-24 0.10% 0.10% 58.70% 59.80% 53.80% 53.40% 0.67% 1.04% 25-30 0.00% 0.00% 13.30% 12.70% 30.00% 29.80% 0.10% 0.40% 31-40 0.00% 0.10% 2.70% 4.80% 9.70% 9.60% 0.00% 0.28% 41-50 0.00% 0.00% 1.70% 0.70% 4.90% 5.60% 0.00% 0.19% Over 50 0.00% 0.00% 0.30% 0.10% 1.60% 1.70% 0.00% 0.07%
Table 5
College of Enrollment Parent Transfer Graduate Freshmen 2006 2007 2006 2007 2006 2007 2006 2007
Responses 96.60% 94.90% 96.00% 91.30% N/A N/A N/A N/A CBS 5.60% 5.10% 7.90% 7.90% N/A N/A N/A N/A CSOM 7.50% 9.40% 2.50% 2.90% N/A N/A N/A N/A Design 0.00% 2.90% 5.10% 4.10% N/A N/A N/A N/A Dental Hygiene 0.00% 7.20% 0.30% 0.00% N/A N/A N/A N/A CEHD 0.00% 0.00% 1.80% 0.10% N/A N/A N/A N/A CFANS 0.00% 6.80% 10.90% 8.00% N/A N/A N/A N/A IT 16.50% 15.70% 19.50% 18.00% N/A N/A N/A N/A CLA 56.50% 52.90% 52.10% 59.00% N/A N/A N/A N/A Nursing 0.30% 0.00% 0.00% 0.00% N/A N/A N/A N/A
Office of Measurement Fall 2007
10
Are we communicating effectively?
Table 6 Effectiveness of communications (newsletters, brochures, mailings etc.)
Parent Transfer Graduate Freshmen 2006 2007 2006 2007 2006 2007 2006 2007
Responses 93.40% 93.80% 93.00% 90.70% 87.60% 87.30% N/A N/A Strongly Agree 48.00% 45.10% 8.00% 10.10% 10.30% 8.40% N/A N/A Agree 41.40% 43.90% 64.20% 63.40% 64.50% 58.70% N/A N/A Neither 6.70% 6.30% 20.10% 17.50% 17.90% 20.70% N/A N/A Disagree 1.90% 2.50% 4.90% 5.70% 6.00% 10.10% N/A N/A Strongly Disagree 2.00% 2.10% 2.80% 2.90% 1.30% 1.70% N/A N/A Mean Rating (1-5) 4.32 4.27 3.70 3.72 3.76 3.62 N/A N/A
Table 7
The information I received prior to Orientation was: Parent Transfer Graduate Freshmen 2006 2007 2006 2007 2006 2007 2006 2007
Responses 96.60% 93.50% 94.30% 90.70% 89.90% 88.30% 99.61% 99.83% Too Much 3.40% 3.20% 3.60% 6.10% 1.30% 1.70% 8.27% 12.37% Just Right 85.20% 82.60% 77.00% 77.80% 71.30% 61.90% 76.36% 73.30% Not Enough 11.40% 14.20% 19.40% 16.10% 27.50% 36.50% 15.37% 14.33%
Table 8
The Orientation & First-Year Programs staff was very helpful and informative when I asked questions or called prior to orientation
Parent Transfer Graduate Freshmen 2006 2007 2006 2007 2006 2007 2006 2007
Responses 79.20% 79.70% 83.70% 90.50% 60.70% 86.80% N/A N/A Strongly Agree 66.40% 64.70% 23.70% 10.10% 19.80% 8.40% N/A N/A Agree 25.60% 27.00% 57.20% 63.60% 65.40% 59.00% N/A N/A Neither 5.40% 6.00% 13.10% 17.60% 10.50% 20.80% N/A N/A Disagree 0.40% 0.30% 1.00% 5.80% 3.10% 10.10% N/A N/A Strongly Disagree 2.30% 2.10% 4.90% 2.90% 1.20% 1.70% N/A N/A Mean Rating (1-5) 4.32 4.52 3.94 3.72 3.99 3.62 N/A N/A
Office of Measurement Fall 2007
11
Are attendees satisfied with program content?
Table 9 The Resource Fair offered valuable information
Parent Transfer Graduate Freshmen 2006 2007 2006 2007 2006 2007 2006 2007
Responses 43.10% 43.30% 90.10% 76.50% 88.80% 71.20% N/A N/A Strongly Agree 42.10% 44.20% 45.80% 11.00% 17.70% 21.20% N/A N/A Agree 47.90% 43.60% 47.40% 42.40% 55.70% 55.50% N/A N/A Neither 9.20% 10.90% 4.90% 40.40% 21.10% 19.90% N/A N/A Disagree 0.30% 0.20% 0.50% 4.60% 5.50% 3.40% N/A N/A Strongly Disagree 0.50% 1.20% 1.40% 1.50% 0.00% 0.00% N/A N/A Mean Rating (1-5) 4.31 4.30 3.69 3.57 3.86 3.95 N/A N/A
Table 10
The U Card Office was helpful Parent Transfer Graduate Freshmen 2006 2007 2006 2007 2006 2007 2006 2007
Responses 66.20% 57.80% 15.40% N/A 76.80% 63.40% 98.74% 99.01% Strongly Agree 59.40% 61.30% 24.10% N/A 29.80% 38.50% 24.47% 15.86% Agree 35.10% 31.70% 44.40% N/A 51.20% 44.60% 57.20% 52.84% Neither 4.10% 5.30% 26.90% N/A 16.60% 14.60% 14.76% 23.18% Disagree 0.60% 0.90% 2.80% N/A 2.00% 2.30% 2.92% 6.72% Strongly Disagree 0.80% 0.90% 1.90% N/A 0.50% 0.00% 0.65% 1.41% Mean Rating (1-5) 4.52 4.52 3.86% N/A 4.08 4.19 4.02 3.75
Table 11
I would have liked the Orientation to spend more time covering the following topics:. Parent Transfer Graduate Freshmen 2006 2007* 2006 2007 2006 2007 2006 2007
Responses Academic requirements 18.60% 46.20% 9.60% 8.40% N/A N/A 18.75% 22.15% Advising 11.00% 31.70% 15.00% 15.90% N/A N/A 14.25% 17.85% Campus Tour 5.20% 23.60% 6.40% 5.50% N/A N/A 24.12% 23.25% Choosing a major 10.80% 32.50% 6.10% 5.60% N/A N/A 22.65% 22.70% College life 3.20% 24.10% 6.90% 6.70% N/A N/A 16.66% 16.22% Commuting to campus 0.80% 9.90% 6.00% 7.80% N/A N/A 3.99% 3.83% Financial aid 11.80% 37.20% 11.60% 11.70% N/A N/A 24.06% 16.75% Free time 5.20% 27.90% 5.30% 6.60% N/A N/A 12.31% 29.19% Involvement in student organizations 10.60% 42.60% 14.60% 10.20% N/A N/A 12.31% 11.42% Living on campus 3.30% 26.40% 3.40% 3.40% N/A N/A 8.79% 9.63% Living off campus 1.30% 14.50% 6.10% 10.70% N/A N/A N/A Meeting people 3.30% 25.30% 9.00% 8.70% N/A N/A 15.19% 15.09% Selecting classes 19.10% 50.20% 6.40% 4.80% N/A N/A 25.15% 24.30% Nothing 18.60% 43.70% 19.70% 19.10% N/A N/A 14.44% 13.02% Other 3.40% 21.60% 2.90% 2.80% N/A N/A 0.00% 2.28%
*Note: The 2007 percentages for Parent Orientation are substantially higher because the question was revised to be “Mark all that apply.”
Office of Measurement Fall 2007
12
Are attendees satisfied with program content?
Table 12 Orientation covered an appropriate amount of campus resources and services.
Parent Transfer Graduate Freshmen 2006 2007 2006 2007 2006 2007 2006 2007
Responses 92.60% 86.20% 86.70% 85.60% N/A N/A N/A N/A Strongly Agree 65.60% 69.30% 20.90% 22.50% N/A N/A N/A N/A Agree 31.30% 27.30% 64.60% 61.60% N/A N/A N/A N/A Neither 2.70% 2.20% 11.00% 13.50% N/A N/A N/A N/A Disagree 0.20% 0.30% 2.50% 1.70% N/A N/A N/A N/A Strongly Disagree 0.30% 0.80% 1.00% 0.60% N/A N/A N/A N/A Mean Rating (1-5) 4.62 4.64 4.02 4.09 N/A N/A N/A N/A
Table 13
Overall, the Orientation presenters were knowledgeable. Parent Transfer Graduate Freshmen 2006 2007 2006 2007 2006 2007 2006 2007
Responses 93.20% 87.90% 87.00% 86.20% N/A N/A N/A N/A Strongly Agree 82.50% 81.60% 30.20% 31.50% N/A N/A N/A N/A Agree 16.80% 17.00% 63.20% 60.70% N/A N/A N/A N/A Neither 0.30% 0.20% 5.60% 6.80% N/A N/A N/A N/A Disagree 0.10% 0.00% 0.80% 0.50% N/A N/A N/A N/A Strongly Disagree 0.30% 1.20% 0.20% 0.60% N/A N/A N/A N/A Mean Rating (1-5) 4.81 4.78 4.22 4.22 N/A N/A N/A N/A
Table 14
After Orientation, I understand what is expected of me/my student academically. Parent Transfer Graduate Freshmen 2006 2007 2006 2007 2006 2007 2006 2007
Responses 92.80% 84.00% 85.40% 83.00% N/A N/A N/A N/A Strongly Agree 35.50% 34.90% 25.90% 25.60% N/A N/A N/A N/A Agree 42.40% 40.80% 59.90% 60.60% N/A N/A N/A N/A Neither 17.30% 16.80% 11.20% 11.30% N/A N/A N/A N/A Disagree 4.00% 6.70% 2.70% 1.80% N/A N/A N/A N/A Strongly Disagree 0.80% 0.80% 0.30% 0.70% N/A N/A N/A N/A Mean Rating (1-5) 4.08 4.02 4.08 4.09 N/A N/A N/A N/A
Table 15
I am favorably impressed with my Orientation experience Parent Transfer Graduate Freshmen 2006 2007 2006 2007 2006 2007 2006 2007
Responses 93.30% 82.80% 84.70% 83.20% N/A N/A N/A N/A Strongly Agree 67.70% 65.10% 23.30% 24.50% N/A N/A N/A N/A Agree 29.80% 32.30% 56.80% 56.40% N/A N/A N/A N/A Neither 1.80% 1.50% 16.50% 15.10% N/A N/A N/A N/A Disagree 0.40% 0.30% 2.20% 2.40% N/A N/A N/A N/A Strongly Disagree 0.40% 0.80% 1.20% 1.70% N/A N/A N/A N/A Mean Rating (1-5) 4.64 4.61 3.99 4.00 N/A N/A N/A N/A
Office of Measurement Fall 2007
13
Did the attendees feel welcome and prepared for transition?
Table 16
The Orientation Leaders made me feel welcome at the University Parent Transfer Graduate Freshmen
2006 2007 2006 2007 2006 2007 2006 2007
Responses 93.20% 85.60% 86.70% 85.50% N/A N/A N/A N/A Strongly Agree 80.80% 81.10% 33.30% 30.90% N/A N/A N/A N/A Agree 18.10% 17.10% 59.10% 58.00% N/A N/A N/A N/A Neither 0.70% 0.90% 6.80% 9.40% N/A N/A N/A N/A Disagree 0.10% 0.00% 0.30% 0.80% N/A N/A N/A N/A Strongly Disagree 0.30% 0.90% 0.50% 0.60% N/A N/A N/A N/A Mean Rating (1-5) 4.79 4.77 4.27 4.19 N/A N/A N/A N/A
Table 17
After attending Orientation, I have a better understanding of the student experience and the resources available at the University of Minnesota. (Parent Outcomes) Parent Transfer Graduate Freshmen
2006 2007 2006 2007 2006 2007 2006 2007
Responses 94.20% 86.10% 86.00% 85.30% N/A N/A N/A N/A Strongly Agree 62.10% 63.80% 24.60% 31.00% N/A N/A N/A N/A Agree 36.40% 34.30% 61.50% 58.20% N/A N/A N/A N/A Neither 1.10% 0.80% 11.80% 9.40% N/A N/A N/A N/A Disagree 0.10% 0.20% 1.80% 0.80% N/A N/A N/A N/A Strongly Disagree 0.40% 0.90% 0.30% 0.60% N/A N/A N/A N/A Mean Rating (1-5) 4.60 4.60 4.08 4.18 N/A N/A N/A N/A
Table 18
After attending Orientation, I feel more connected to the University of Minnesota (Parent Outcomes)
Parent Transfer Graduate Freshmen 2006 2007 2006 2007 2006 2007 2006 2007
Responses 93.30% 83.70% 86.00% 85.60% N/A N/A N/A N/A Strongly Agree 55.80% 57.40% 23.10% 25.20% N/A N/A N/A N/A Agree 38.60% 36.80% 54.30% 60.50% N/A N/A N/A N/A Neither 4.80% 4.40% 18.30% 12.10% N/A N/A N/A N/A Disagree 0.30% 0.60% 3.50% 1.40% N/A N/A N/A N/A Strongly Disagree 0.40% 0.80% 0.80% 0.90% N/A N/A N/A N/A Mean Rating (1-5) 4.49 4.49 3.95 4.08 N/A N/A N/A N/A
Office of Measurement Fall 2007
14

Notes

This report was created by:
Orientation & First-Year Programs 300 Washington Avenue SE
315 Coffman Memorial Union Minneapolis, Minnesota 55455
www.ofyp.umn.edu


