192

Annual Report of Packages Limited 2013
Contents04 Company Profile
06 Company Information
09 Organogram
10 Business Divisions
15 Entity Rating
16 Board of Directors
18 Management Committees
20 Vision
21 Mission Statement
22 Policies
24 Core Values
25 Code of Conduct
26 Decade at a Glance
28 Horizontal and Vertical Analysis
32 Value Added and its Distribution
33 Sources and Application of Funds
34 Corporate Social Responsibility
37 Corporate Calendar
38 Notice of Annual General Meeting
40 Directors’ Report to the Shareholders
48 Shareholders’ Information
56 Statement of Compliance with the
Code of Corporate Governance
58 Review Report on Statement of
Compliance with Best Practices of
Code of Corporate Governance
59 Auditors’ Report to the Members
61 Financial Statements
118 Directors’ Report on the
Consolidated Financial Statements
121 Auditors’ Report to the Members on
the Consolidated Financial Statements
122 Consolidated Financial Statements
187 Form of Proxy
2

Annual Report of Packages Limited 2013
3
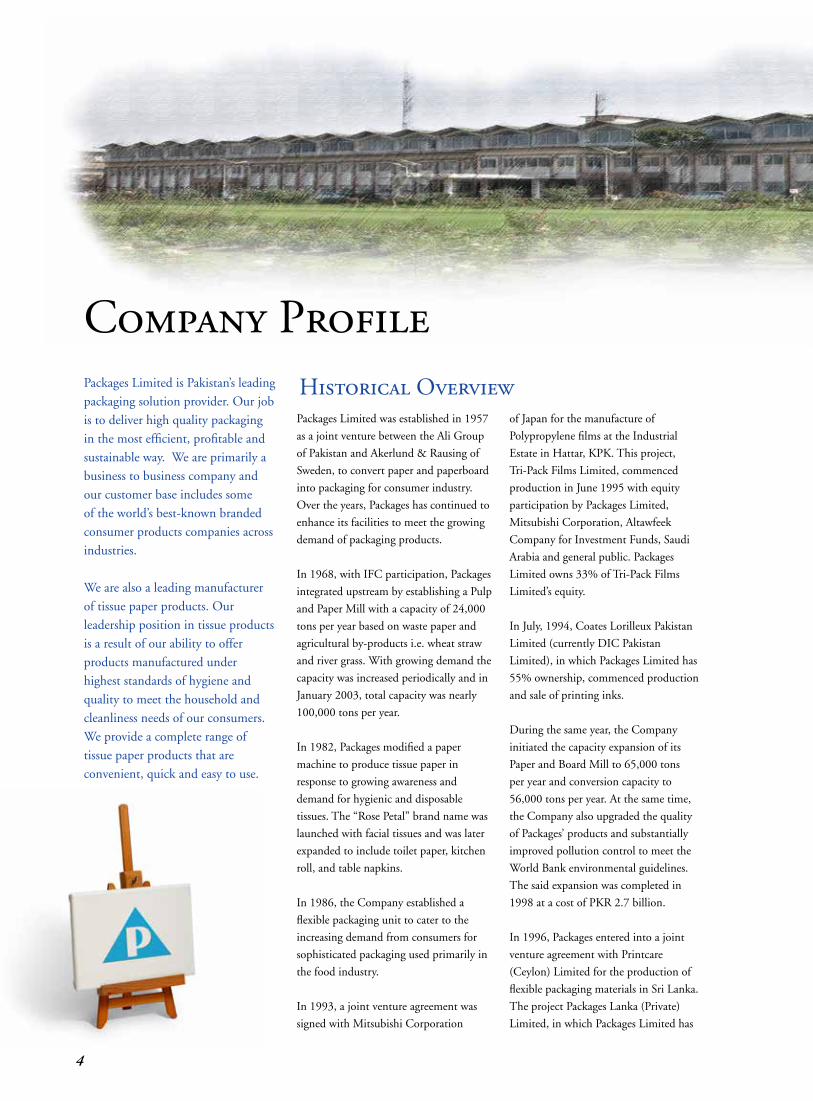
Company Profile
Packages Limited was established in 1957
as a joint venture between the Ali Group
of Pakistan and Akerlund & Rausing of
Sweden, to convert paper and paperboard
into packaging for consumer industry.
Over the years, Packages has continued to
enhance its facilities to meet the growing
demand of packaging products.
In 1968, with IFC participation, Packages
integrated upstream by establishing a Pulp
and Paper Mill with a capacity of 24,000
tons per year based on waste paper and
agricultural by-products i.e. wheat straw
and river grass. With growing demand the
capacity was increased periodically and in
January 2003, total capacity was nearly
100,000 tons per year.
In 1982, Packages modified a paper
machine to produce tissue paper in
response to growing awareness and
demand for hygienic and disposable
tissues. The “Rose Petal” brand name was
launched with facial tissues and was later
expanded to include toilet paper, kitchen
roll, and table napkins.
In 1986, the Company established a
flexible packaging unit to cater to the
increasing demand from consumers for
sophisticated packaging used primarily in
the food industry.
In 1993, a joint venture agreement was
signed with Mitsubishi Corporation
Historical OverviewPackages Limited is Pakistan’s leading packaging solution provider. Our job is to deliver high quality packaging in the most efficient, profitable and sustainable way. We are primarily a business to business company and our customer base includes some of the world’s best-known branded consumer products companies across industries.
We are also a leading manufacturer of tissue paper products. Our leadership position in tissue products is a result of our ability to offer products manufactured under highest standards of hygiene and quality to meet the household and cleanliness needs of our consumers. We provide a complete range of tissue paper products that are convenient, quick and easy to use.
of Japan for the manufacture of
Polypropylene films at the Industrial
Estate in Hattar, KPK. This project,
Tri-Pack Films Limited, commenced
production in June 1995 with equity
participation by Packages Limited,
Mitsubishi Corporation, Altawfeek
Company for Investment Funds, Saudi
Arabia and general public. Packages
Limited owns 33% of Tri-Pack Films
Limited’s equity.
In July, 1994, Coates Lorilleux Pakistan
Limited (currently DIC Pakistan
Limited), in which Packages Limited has
55% ownership, commenced production
and sale of printing inks.
During the same year, the Company
initiated the capacity expansion of its
Paper and Board Mill to 65,000 tons
per year and conversion capacity to
56,000 tons per year. At the same time,
the Company also upgraded the quality
of Packages’ products and substantially
improved pollution control to meet the
World Bank environmental guidelines.
The said expansion was completed in
1998 at a cost of PKR 2.7 billion.
In 1996, Packages entered into a joint
venture agreement with Printcare
(Ceylon) Limited for the production of
flexible packaging materials in Sri Lanka.
The project Packages Lanka (Private)
Limited, in which Packages Limited has
4
79% ownership, commenced production
in 1998.
During 1999-2000, Packages successfully
completed the expansion of the flexible
packaging line by installing a new
rotogravure printing machine and
enhancing the carton line by putting up a
new Lemanic rotogravure inline printing
and cutting creasing machine. In addition,
a new 8 color Flexo graphic printing
machine was also installed in the flexible
packaging line in 2001.
Packages commenced production of
corrugated boxes from its plant in Karachi
in 2002.
In 2005, the Company embarked upon
its Paper & Board expansion plan at
a new site ‘Bulleh Shah Paper Mills’
(curently Bulleh Shah Packaging (Private)
Limited), almost tripling its capacity from
100,000 tons per annum to 300,000
tons per annum. Capacity expansion at
Bulleh Shah Paper Mills was completed
in two phases., In the first phase, Brown
Board Machine PM-6 along-with high
yield straw pulping & OCC plants and
its back processes such as 11 MW Power
House, Gas Turbine and Primary Effluent
Treatment Plant were capitalized and
commercial operations were commenced
during the year 2007. Second phase
comprising of Writing and Printing Paper
Machine PM-7, De-inking Pulp Plant,
41MW Power House, Steam Turbine and
Secondary Effluent Treatment Plant was
completed in the year 2009.
In 2008, the Company embarked upon
capacity expansion in its tissue division
through installation of a new tissue paper
manufacturing machine PM-9 with
production capacity of 33,000 tons per
annum. With this capacity expansion,
the Company is now in a position to take
benefit from export potential of tissue
products in the international market,
particularly the Middle East.
During 2011, a lamination machine was
installed in the flexible department at a
cost of PKR 96 million. This is Pakistan’s
first high speed solvent-less automatic
lamination machine. It has turret winders
for automatic reel and a capacity of 450
meters per minute.
The rebuild project of Paper Machine
PM-6, installed at Bulleh Shah Paper
Mills, was completed in the second
quarter of 2011 leading to capacity
expansion of 30,000 tons. The machine
started commercial operations with
enhanced capability of producing high
value added liquid packaging and
bleached board.
Moreover, the Corrugator Machine in
Kasur Plant was upgraded in 2011 to
improve efficiency, reliability, enhance
capacity and reduce waste. This upgrade
activity resulted in increased capacity of
14%.
In 2012, to enable continuous growth
and technical development in the Paper
& Paperboard segment, Packages signed a
50/50 Joint Venture agreement with Stora
Enso OYJ Group of Finland in its 100%
wholly owned subsidiary, Bulleh Shah
Packaging (Private) Limited. The Joint
Venture included Paper & Paperboard and
Corrugated business operations at Kasur
and Karachi and involved initial equity
participation by Stora Enso OYJ Group
of 35% by way of subscription of right
shares with a commitment to increase the
shareholding to 50% at a later stage.
In the same year, Packages also invested
in a New Rotogravure Machine for
its Flexible Packaging Business with a
total estimated project cost of PKR 326
million as part of the Company’s efforts to
remain abreast of improved technological
developments in the Packaging business.
Year 2013The Joint Venture Agreement with Stora Enso OYJ Group, signed in 2012, was implemented in 2013 and Packages completed the transfer of assets and related obligations of Paper & Paperboard and Corrugated business operations to Bulleh Shah Packaging (Private) Limited along with cash equity injection. Packages now holds 65% equity in Bulleh Shah Packaging (Private) Limited. The joint venture partner, Stora Enso OYJ Group, is actively involved in providing technical expertise to further enhance the Paper & Paperboard and Corrugated business operations.
Annual Report of Packages Limited 2013
5
Company Information
Board of Directors
Towfiq Habib Chinoy (Chairman)(Non-Executive Director)
Syed Hyder Ali(Chief Executive & Managing Director)(Executive Director)
Alamuddin Bullo(Non-Executive Director)
Khalid Yacob(Executive Director)
Mats Nordlander(Non-Executive Director)
Muhammad Aurangzeb(Independent Director)
Shamim Ahmad Khan(Non-Executive Director)
Syed Aslam Mehdi(Executive Director)
Syed Shahid Ali(Non-Executive Director)
Tariq Iqbal Khan (Non-Executive Director)
Advisor
Syed Babar Ali
Company Secretary
Adi J. Cawasji
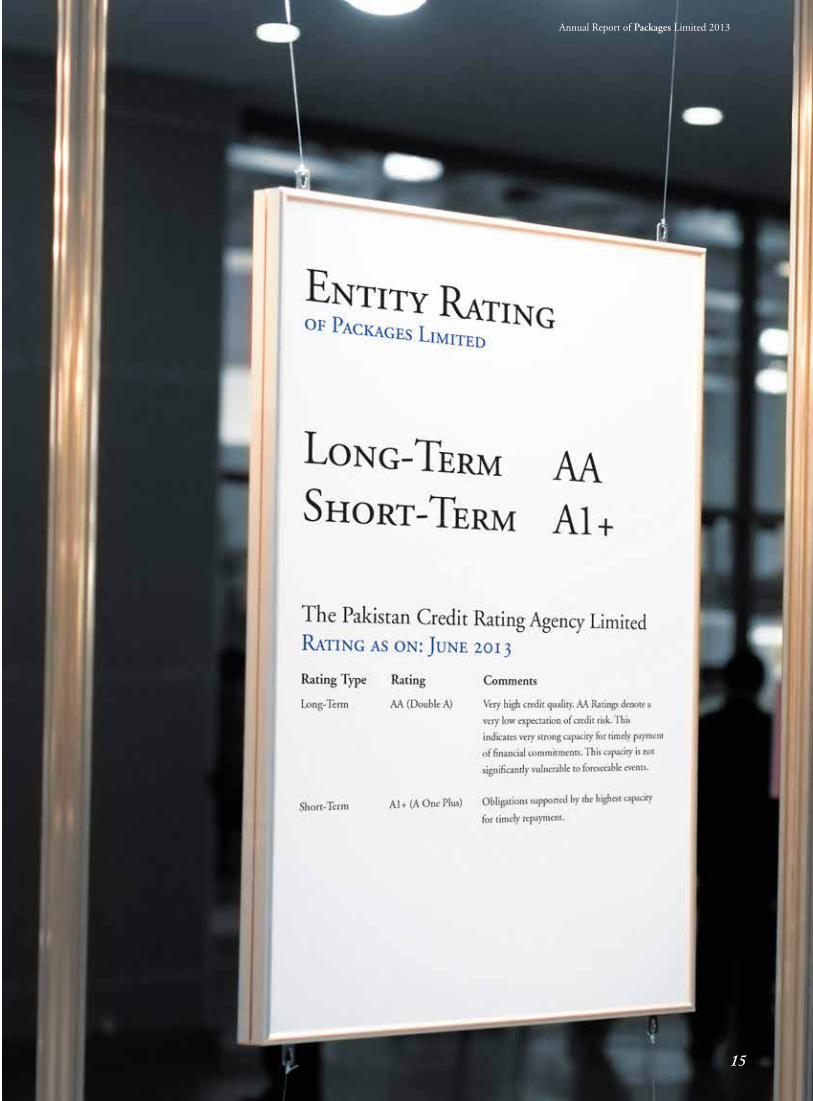
Rating Agency
PACRA
Company Credit Rating
Long-Term: AA
Short-Term: A1+
Auditors
A.F. Ferguson & Co.Chartered Accountants
Legal Advisors
Hassan & Hassan – LahoreOrr, Dignam & Co. – Karachi
Shares Registrar
FAMCO Associates (Pvt.) Limited
8-F, Next to Hotel Faran
Nursery, Block 6, P.E.C.H.S.,
Shahrah-e-Faisal
Karachi-75400
PABX : (021) 34380101
: (021) 34380102
Fax : (021) 34380106
Email : [email protected]
Bankers & Lenders
Allied Bank Limited
Askari Bank Limited
Bank Alfalah Limited
Bank Al-Habib Limited
BankIslami Pakistan Limited
Barclays Bank PLC, Pakistan
Citibank N.A.
Deutsche Bank A.G.
Dubai Islamic Bank Pakistan Limited
Faysal Bank Limited
Habib Bank Limited
Habib Metropolitan Bank Limited
HSBC Bank Middle East Limited
International Finance Corporation (IFC)
JS Bank Limited
MCB Bank Limited
Meezan Bank Limited
National Bank of Pakistan
NIB Bank Limited
Samba Bank Limited
Silk Bank Limited
Soneri Bank Limited
Standard Chartered Bank (Pakistan)
Limited
The Bank of Punjab
The Bank of Tokyo - Mitsubishi UFJ,
Limited
United Bank Limited
Head Office & Works
Shahrah-e-Roomi,
P.O. Amer Sidhu,
Lahore - 54760, Pakistan
PABX : (042) 35811541-46
: (042) 35811191-94
Fax : (042) 35811195
: (042) 35820147
Offices:
Registered Office & Regional Sales office
4th Floor, The Forum
Suite No. 416 - 422, G-20, Block 9,
Khayaban-e-Jami, Clifton,
Karachi-75600, Pakistan
PABX : (021) 35874047-49
: (021) 35378650-52
: (021) 35831618, 35833011
Fax : (021) 35860251
Regional Sales Office
2nd Floor, G.D. Arcade
73-E, Fazal-ul-Haq Road, Blue Area,
Islamabad-44000, Pakistan
PABX : (051) 2276765
: (051) 2276768
: (051) 2278632
Fax : (051) 2829411
Zonal Sales Offices
C-2, Hassan Arcade Nusrat Road,
Multan Cantt. 60000, Pakistan
Tel & Fax : (061) 4504553
9th Floor State Life Building,
2-Liaquat Road,
Faisalabad - Pakistan
Tel : (041) 2540842
Fax : (041) 2540815
Web Presence
www.packages.com.pk
6

“Never before in history has
innovation offered promise of so much
to so many in so short a time.”
– Bill Gates
Annual Report of Packages Limited 2013
7

“We can’t solve problems by using the same kind of thinking we used when we created them.”– Albert Einstein
8
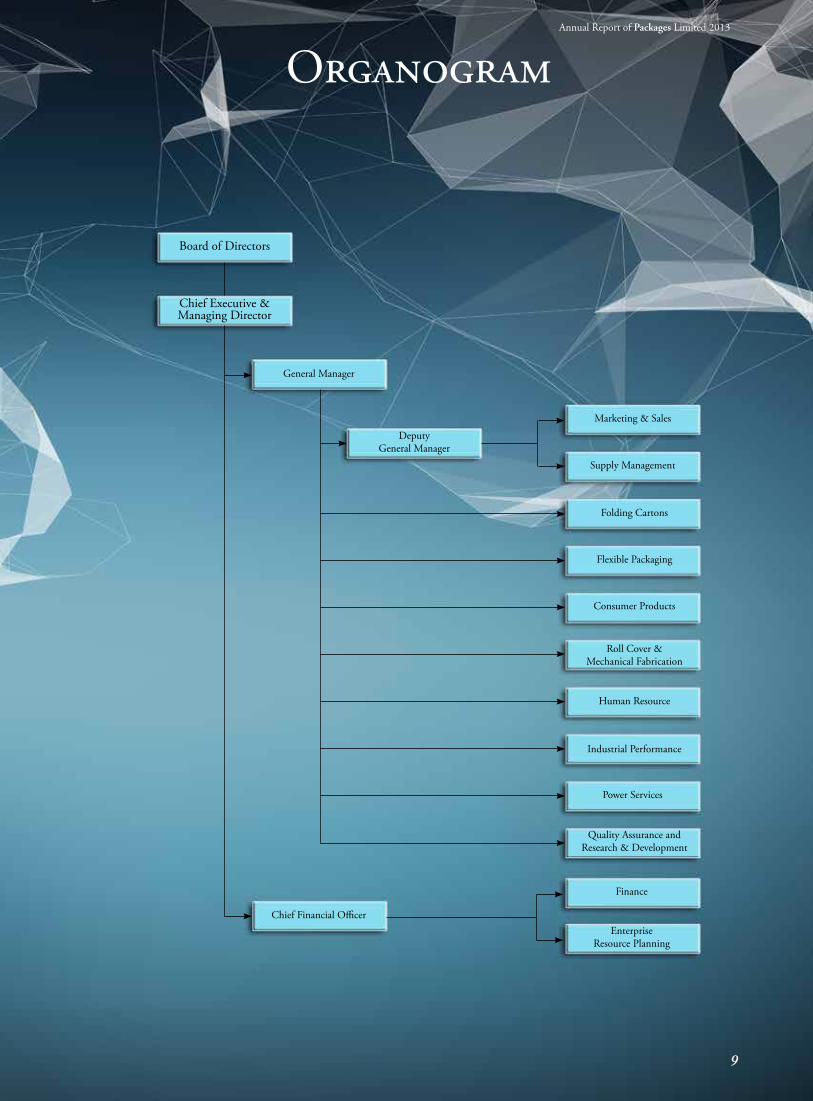
Flexible Packaging
Folding Cartons
Consumer Products
Roll Cover & Mechanical Fabrication
Human Resource
Marketing & Sales
Supply Management
Power Services
Quality Assurance and Research & Development
Industrial Performance
Chief Financial Officer
Chief Executive & Managing Director
Board of Directors
General Manager
DeputyGeneral Manager
EnterpriseResource Planning
Finance
OrganogramAnnual Report of Packages Limited 2013
9
Business DivisionsPackaging Division
Packages provides multi-dimensional and multi
product packaging solutions to its clients that are
involved in manufacturing consumer products
across industries
The Packaging Division comprises of two business
units based on packaging material categories:
• FoldingCartons
• FlexiblePackaging
Folding CartonsWith over 56 years of experience in providing reliable service and quality, Folding Cartons business provides a wide range of packaging products to tobacco, pharmaceutical, Fast Moving Consumer Goods, personal & home care and food industries.
Folding Cartons business is equipped with state of the art machinery and a dedicated and qualified workforce that is supported by strong backward and lateral integration. These factors contribute to provide high volumes and consistent quality at a competitive price for our customers.
The Folding Cartons business unit is divided into two main functions:
i) Planning and Developmentii) Operations
Planning and Development
The Folding Cartons business unit comprises of a fully dedicated team for planning and product development that remains in constant communication with the sales team and the customers.
The planning department is in constant contact with the sales team of Packages to assure the delivery of the produced cartons to the customers as per commitment. The smart allocation of jobs on the machines makes it possible to
achieve these targets. The planning team also works for the raw material planning and procurement as per the production requirements.
The development team monitors the potential of market growth and assures client’s satisfaction throughout the development process; which commences from the making of a blank sample at the start, through to the art proofing and finally reaching towards the bulk production. The team places immense focus on innovation, efficiency and hard work.
Operations
The Folding Cartons operations team works dedicatedly to meet the market’s demand. The ever enthusiastic labor and a highly skillful management makes it possible to cater to the market efficiently and meet customer demands.
Folding Cartons operations are divided into the following departments;
• RotogravurePrinting
• OffsetPrinting
• Cutting&Creasing
• Folding&Gluing
Rotogravure Printing
The Rotogravure process is a type of intaglio process in which the actual image is etched into the surface of a metallic cylinder. The image consists of tiny cells (or wells) engraved into the cylinder. The print quality of image using gravure is often superior to other printing processes and is the preferred method when large print runs are required.
Rotogravure printing primarily caters to the tobacco industry which has always been the biggest stakeholder for folding carton business. Two state-of-art machines, Lemanic 82-H and Riviera DR-67, have been installed to achieve in-line printing, conversion (embossing, rotary cutting and creasing) and quality inspection. These machines are fully capable of meeting the demands of the tobacco industry.
Offset Printing
Offsetprintingisacommonlyusedprinting technique in which the image is transferred(or“offset”)fromaprintingplate to a rubber blanket, then to the substrate (paper or board). It is the most commonly used method today, and has many advantages over other forms of printing, especially when printing of intricate designs is required.
10
The Folding Cartons business has the world’sbestsheet-feedoffsetprintingpresses, which has double coater (UV and Water base Varnish) option as its unique feature.
Cutting & Creasing:
The Folding Cartons business unit is capable of making the cutting-creasing dies by itself. The machines are from a most renowned maker – ELCEDE Germany. The integrated line starts its working from receiving the drawings from the development team, followed by the software designing and physical shaping of the cutting creasing rules.
Finally these rules are inserted into the imported timber that marks the completion of a die. These dies meet the international standards and considering their performance, a demand for these dies has already intrigued the local market.
The completed dies are then placed into the cutting creasing machines where the printed sheets are converted to cartons. The department is running a fleet of top line cutting creasing machines imported from a world known brand – BOBST.
The department is also capable of providing the Hot Foil Stamping on an automatic machine, whereby cartons get a glowing print, making them extremely unique when they are placed with differentcartonsonamarketshelf.
In 2013, the Cutting and Creasing department procured a new Die-cutter Machine, EXPERT CUT 106PE from BOBST Switzerland at a total cost of PKR 105 million. This machine started its bulk production in March, 2013. This state of the art machine has been designed to maximize the productivity along with lowering the production costs compared to any previous model. Using a host of features, the new machine runs more consistently, cuts down the process waste and reduces the tooling cost by ensuring a consistent pressure throughout the die bed.
Folding & Gluing
The cut creased cartons are transferred to the Folding Gluing area where the fast running gluing machines glue these cartons.
The department is also capable of making paper cups of several sizes.
Market Segment
The increased focus of market on product differentiationandattractivepackagingis driving demand for our products. The success of the business can easily be determined by witnessing the loyalty of the customers. The capabilities of the team are well understood by the market and thus all sorts of developmental work and packing modifications are addressed to us. Folding Cartons business works firmly to deliver the best carton board
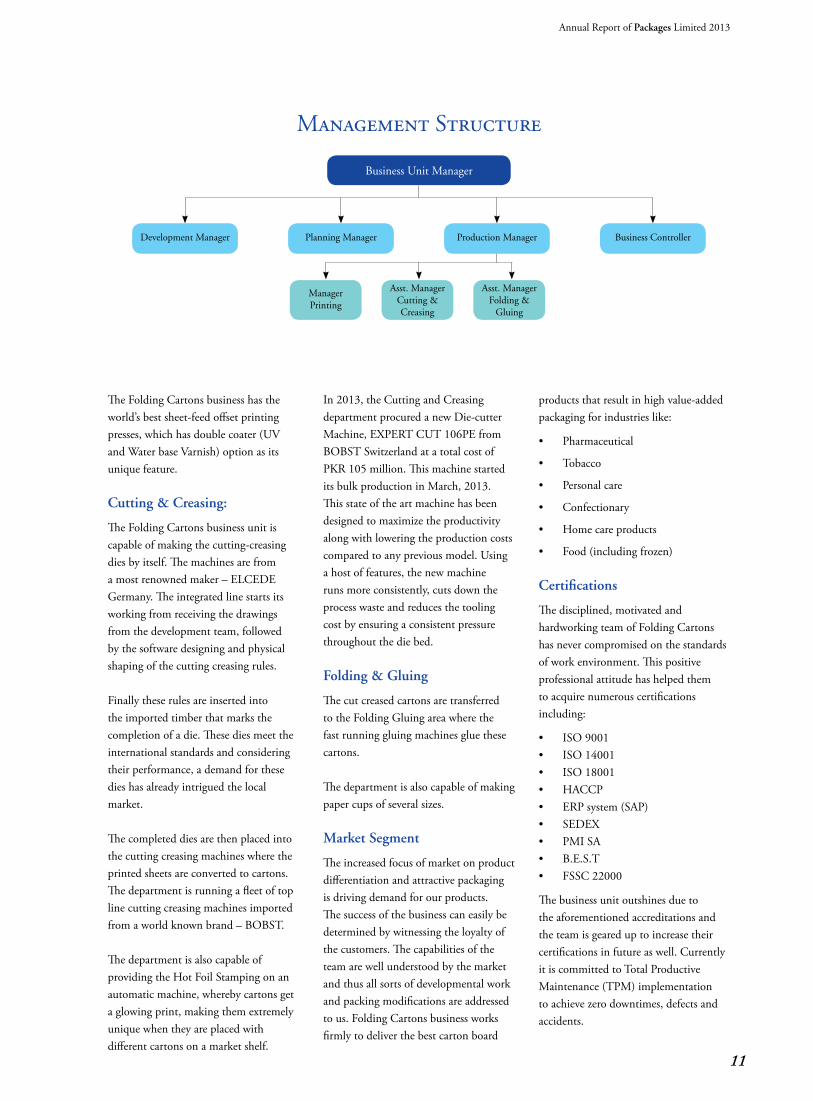
Management Structure
Business Unit Manager
Development Manager
ManagerPrinting
Asst. ManagerCutting & Creasing
Asst. ManagerFolding &
Gluing
Production ManagerPlanning Manager Business Controller
products that result in high value-added packaging for industries like:
• Pharmaceutical
• Tobacco
• Personalcare
• Confectionary
• Homecareproducts
• Food(includingfrozen)
Certifications
The disciplined, motivated and hardworking team of Folding Cartons has never compromised on the standards of work environment. This positive professional attitude has helped them to acquire numerous certifications including:
• ISO9001• ISO14001• ISO18001• HACCP• ERPsystem(SAP)• SEDEX• PMISA• B.E.S.T• FSSC22000
The business unit outshines due to the aforementioned accreditations and the team is geared up to increase their certifications in future as well. Currently it is committed to Total Productive Maintenance (TPM) implementation to achieve zero downtimes, defects and accidents.
Annual Report of Packages Limited 2013
11
Flexible PackagingTo accommodate increasing demand for sophisticated packaging, Packages established a Flexible Packaging business unitin1986atitsLahorePlant.
Flexible Packaging business provides a one stop packaging solution by providing high quality detailed graphics in Flexographic and Rotogravure printing. Flexible packaging business also provides lamination for plastic films, aluminum foil, paper, multi-layer blown film extrusion for high speed technology in multi-lane slitting, standalone spout inserted bags, poly-bags, zipper-bags, sleeves and ice cream-cones.
Operations
Flexible Packaging produces high quality packaging films and laminates providing Flexographic and Rotogravure Printing, Lamination, Extrusion, Slitting, Bag & Sleeve and Cone Making.
Flexographic printing line
On Flexographic line, up to eight colors flexographic printing can be done on paper, poly-coated paper and films. Packages has the ability to print real life images on materials like Polyethylene, OPP, Special paper and Polyester. Video Mounter System has eliminated the mis-registration from the print and the state of the art technology allows color accurate digital proof.
Rotogravure Printing Line
The Rotogravure printing line has upto ten colors and the latest in-house cylinder making and engraving facilities. These particularly suit food packaging where colorful package designs and preservation of food quality are important considerations.
Lamination
Flexible Packaging business unit has both solvent base and solvent less laminators that can laminate BOPP, Polyester, Al-foil, Met OPP, Met PET and Paper. The business unit also helps customers indevelopingcosteffectivelaminatestomatch their needs.
Packages is honored to be the sole supplier of soap wrappers for the entire soap industry in Pakistan.
Extrusion
Flexible Packaging business unit has its own multi-layer extrusion facility that canextrudepolyethyleneofdifferentgrades and colors. Flexible Packaging business unit also has the biggest blown film extruder with the highest per hour capacity in Pakistan.
Slitting
The flexible line has efficient high speed slitting machines ready to be used on customer packing machines. These machines slits jumbo reels into smaller reels according to customer requirements.
Finishing
Bag & Sleeve making – Bag making is an integral part of the flexible line that provides a wide variety of bag constructions such as Side Seal, Double Side Seal, Bottom Seal, Three Side Seal, Bottom Gusset Bags and Side Gusset Bags.
Cone Making – There are five high speed machines which produce cones in all sizes. Packages is the exclusive producer of cones in Pakistan.
Market Segmentation
The Flexible Packaging business caters to a wide range of customers across industries including food, soaps & detergents, pharmaceuticals, pesticides and personal & home care.
Certifications
As a part of an environmental friendly organization, Flexible Packaging businessunitisalsoworkingon4R’sofpackaging i.e. Reduce, Re-use, Recycle and Recover.
Flexible Packaging business unit is a responsible organization certified for properly implementing Quality ManagementSystemISO9000,Environment Management System ISO 14000andHygieneManagementSystemHACCP.
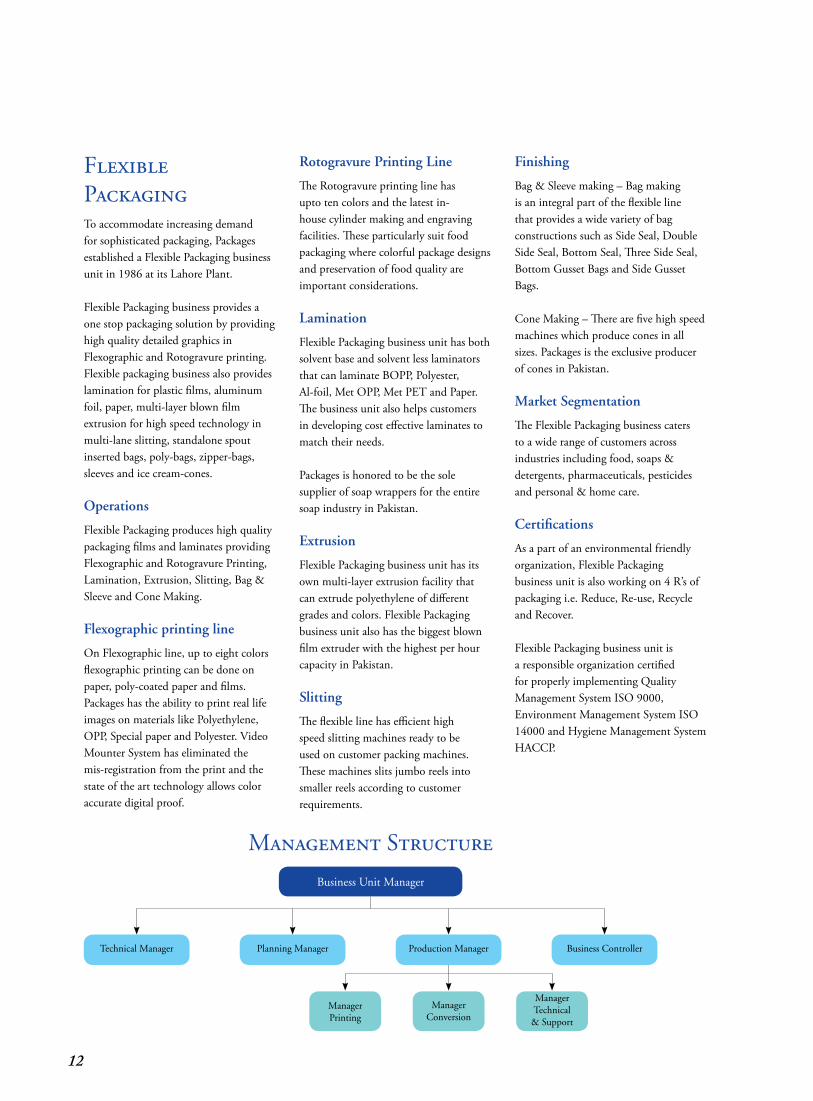
Business Unit Manager
Technical Manager
Manager Printing
Manager Conversion
Manager Technical
& Support
Production ManagerPlanning Manager Business Controller
Management Structure
12
Consumer Products DivisionPackages started commercial production of tissue and other consumer products in 1982 at the Lahore Plant. We currently provide a complete range of tissue and personal hygiene products that are convenient, quick and easy to use; ranging from facial tissues to tissue rolls, table napkins, pocket packs, kitchen rolls, wet tissues, party packs, paper plates, cups and adult diapers. We provide consumers complete convenience with tissue and paper products for every
occasion. With its high-quality tissue and consumer products, business unit makes life more comfortable for consumers every day.
Operations
Tissue manufacturing activity is carried out at Paper Machine (PM-9) with a production capacity of 100 tons per day.
Conversion includes making of facial box tissue, tissue rolls, napkins, party packs, kitchen rolls, pocket packs, paper cups and plates.
We place great emphasis on product development, after assessing the demands and needs of our consumers; continuously working on providing improved and innovative products to our consumers.
Brands
Key brands of Consumer Products Division are: • RosePetal
• Tulip
• DoubleHorse
Business Unit Manager
TissueManufacturing
Manager
Senior Brand Manager
Maintenance Manager
National Sales Manager
TissueConversion
Manager
Business Controller
Management Structure
Annual Report of Packages Limited 2013
13
ServicesPackages believes that its entire operations have to be in line with the needs of the customer. Our operations are supported by excellent service departments who consistently strive to deliver what the customers need on timely basis.
Customer Services Department (CSD)
Our service does not end once the contract has been signed; our Customer Services Department (CSD) comprehensively monitors processes to ensure on-time delivery to the customer and follows new orders from Pre-Press up to final delivery to make sure our product exceeds customer’s expectations. CSD also arranges development activities as well as technical support and after-sales support to customers. Customer complaints are followed by proper feedback and management reporting. With these activities, our customers are given due attention and the essential quick response all the time.
Pre-Press Department
Pre-Press is the nerve center of Packages Limited where concepts and ideas are developed and woven with marketing strategies of customers to attract the end users of the products produced by customers.
The department has been revolutionized over the last 16 years and now has pre-press production designers and computer artists who make the soft copies of the designs. These halftone images and texts are simultaneously directed from computers to: • Imagesetters;
• Platemakingdevices(CDI,DigitalSystem for Flexo);
• Digitalengravingmachines
In the Art and Camera Department, Packages has high-tech computer systems where digital files are produced instead of photographic negatives. For achieving high quality in all of printing methods (Roto,FlexoandOffset),Pre-Pressdepartment is equipped with the latest technology in cylinder, photo polymer and plate making equipment which provides support to various production departments.
Pre-press converts the packaging design according to the technical requirements of any printing technique like Gravure, FlexographyandOffsetwithoutcompromising the creative integrity of designs.
Combining know-how in the pre-press area, vector & raster data and the latest technology in hardware and software, our pre-press team is able to provide the highest possible service.
Research & Development
For many years Research & Development has led the way for Packages with focus on innovation. The rapid globalization of business is bringing about dramatic changes in packaging, challenging traditional ways and existing business models. Our belief that only timely innovations and continual development can help us survive in this competition is our strongest foothold.
With rejuvenated vigor, the Research and Development department at Packages is working to gain competitive edge in its category. The mantra of collaborative working for business development has again helped in sustaining customers and confirming its dependency as reliable business partner. Its continuous interaction with customers makes it easier to understand their demands and comply accordingly
and at the same time helping our units in process optimization, reducing costs and developing new packaging solutions. But this is not the end; customers need proactive measures, eco-friendly solutions, and compliance to international packaging regulations. Who else would understand and materialize it better than R&D because we know that keeping abreast with the latest developments and timely homework assures our existence in this competitive climate.
Supply Management
Supply Management function came into existence to provide one window operation to the Business Units encompassing material procurement, logistics (for incoming materials and outgoing finished goods), warehousing, miscellaneous services and waste sales. In order to rationalize the vendor base and to include quality vendors, vendor development has also become one of the integral activities of the division.
14
Annual Report of Packages Limited 2013
15
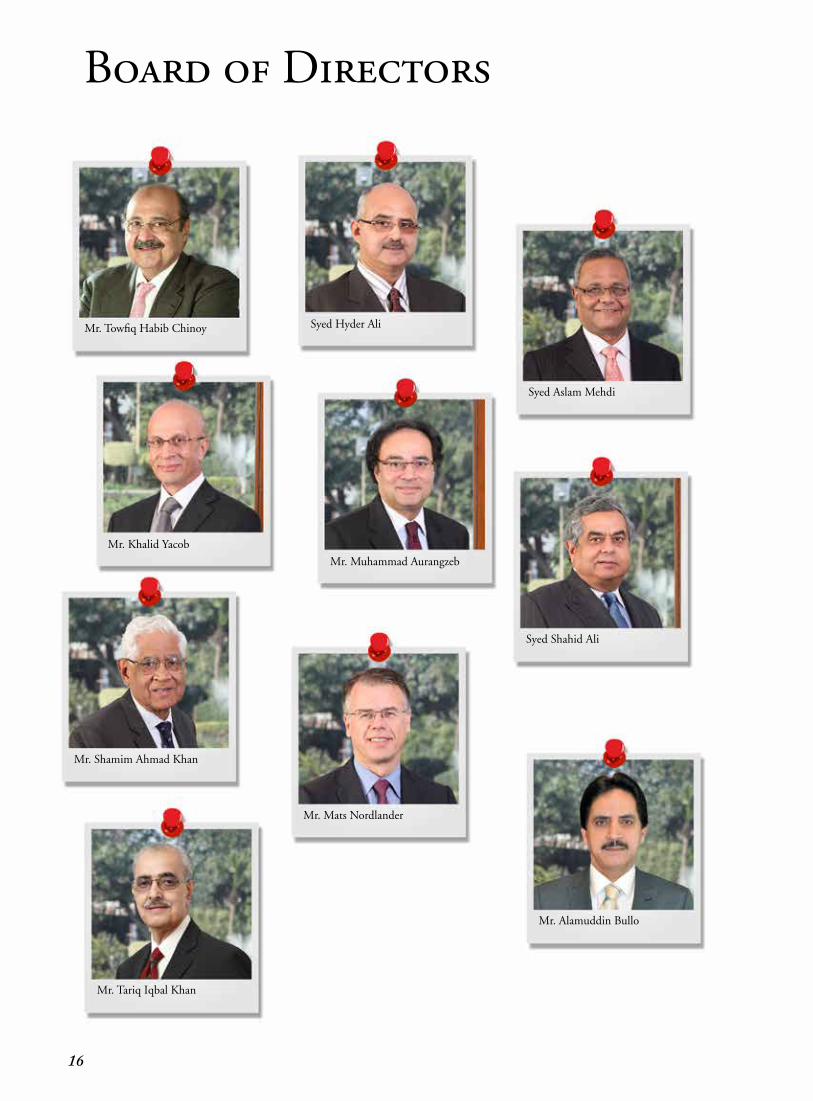
Board of Directors
Mr. Towfiq Habib Chinoy
Mr. Khalid Yacob
Mr. Shamim Ahmad Khan
Mr. Mats Nordlander
Mr. Alamuddin Bullo
Mr. Tariq Iqbal Khan
Mr. Muhammad Aurangzeb
Syed Shahid Ali
Syed Hyder Ali
Syed Aslam Mehdi
16
Mr. Towfiq Habib ChinoyMr. Towfiq Habib Chinoy, Non executive Director, has been associated with the Company as Chairman of the Board of Directors since 2008. He holds chairmanship of Jubilee General Insurance Company Limited and HBL Asset Management Limited. He also holds directorship of Linde Pakistan Limited, IGI Investment Bank Limited, International Steels Limited, Jubilee Life Insurance Company Limited and Pakistan Center for Philanthropy. He is also serving as Trustee of Mohatta Palace
Gallery Trust.
Syed Hyder AliSyed Hyder Ali joined Packages Limited in July 1987 and presently holds the position of Managing Director of the Company. He has done his Masters in Sciences from Institute of Paper Chemistry and has also served as Mill Manager of Paper and Board operations of the Company. He holds directorship in several other companies including IGI Insurance Limited, International Steels Limited, Nestle Pakistan Limited, Packages Lanka (Private) Limited, Sanofi-Aventis Pakistan Limited, KSB Pumps Company Limited, Tri-Pack Films Limited, Bulleh Shah Packaging (Private) Limited and Tetra Pak Pakistan Limited. He is also serving on the Board of several philanthropic, educational, charitable and business support organizations including Pakistan Centre for Philanthropy, National Management Foundation, Syed Maratib Ali Religious & Charitable Trust, Pakistan Business Council and Babar Ali Foundation. He is also board member of Ali Institute of Education, International Chamber of Commerce and Lahore University of Management Sciences.
Syed Aslam MehdiSyed Aslam Mehdi joined the Company in 1980 and currently holds the position of Director and General Manager of the Company. He has a Masters degree in Business Administration from Institute of Business Administration, Karachi and has served Packages Group Companies in various capacities over the years. Currently he also holds directorship of DIC Pakistan Limited, Bulleh Shah Packaging (Private) Limited and Packages Lanka (Private) Limited.
Mr. Khalid YacobMr. Khalid Yacob joined Packages Limited in 1988 and currently holds the position of Director and Finance Manager of the Company. He is a fellow member of Institute of Chartered Accountants in England & Wales and Institute of Chartered Accountants
of Pakistan and has been associated at senior management positions in A.F. Ferguson & Co, Chartered Accountants, Pakistan and Whinney Murray & Co, Chartered Accountants, Riyadh, Saudi Arabia. He has vast experience in financial planning and budgeting, financial forecasting and analysis, asset investment, taxation, computer services, client development and staff management. He also holds directorship of IGI Investment Bank Limited, Bulleh Shah Packaging (Private) Limited, Tri-Pack Films Limited and Tetra Pak Pakistan Limited.
Mr. Muhammad AurangzebMr. Muhammad Aurangzeb is an Independent Director of the Company and has over 25 years of banking experience. He has served as Non-executive Director of RBS Berhad and was also a member of the Risk Management, Remuneration and Nominating Committee, all of which are sub-committees of the Board of Directors of RBS Berhad. He has also served on Boards of various business schools, Aga Khan Foundation and ABN AMRO Foundation. Presently he is Executive Vice President of Morgan Chase for whole of Asia.
Syed Shahid AliSyed Shahid Ali is currently associated with the Company as Non-executive Director. He also holds directorship of several other companies including Treet Corporation Limited, Treet Assets (Private) Limited, Treet Power Limited, Loads Limited, IGI Insurance Limited, Ali Automobiles Limited, First Treet Manufacturing Modaraba, Global Econo Trade (Private) Limited, Multiple Auto Parts Industries (Private) Limited, Specialized Auto parts Industries (Private) Limited, Specialized Motorcycles (Private) Limited. He is also actively involved in social and cultural activities and holds senior positions on the governing boards of several hospitals and philanthropic organizations including Liaquat National Hospital.
Mr. Shamim Ahmad KhanMr. Shamim Ahmad Khan is associated with the Company as Non-executive Director. He has served various government organizations in different capacities namely Securities and Exchange Commission of Pakistan and Ministry of Commerce. He has also been engaged with consultancy assignments for Asian Development Bank and other organizations. Currently, Mr. Khan holds directorship of Abbott Laboratories Pakistan Limited and IGI Insurance Limited and is a member of Advisory Committee of Centre for International Private Enterprise Pakistan.
Mr. Mats Nordlander
Mr. Nordlander is associated with the Company as a Non-executive Director. He is Executive Vice President at Renewable Packaging, also having Regional responsibility for Asia Pacific. He is also member of the Board of Directors of several Stora Enso subsidiaries. He did Diploma in Mechanical Engineering as well as a PED diploma from IMD business school. He is also member of the Stora Enso Group Executive Team since September 2007, member of Swedish Industrial Board of Axcel private equity fund, Vice Chairman of the Board of Swedish Forest Industrial Federation and also member of the Board of Industrikraft.
Mr. Alamuddin BulloMr. Alamuddin Bullo is associated with the Company as a Non-executive Director. He is presently the Chairman of State Life Insurance Corporation of Pakistan. He is also a Director on the Board of Fauji Fertilizer Company Limited, The Hub Power Company Limited, Orix Leasing Pakistan Limited, Sui Northern Gas Company Limited, Pakistan Cables Limited and Security Papers Limited. He has held position in the District Management Group and was recently the Chief Secretary Azad Jammu and Kashmir.
Mr. Tariq Iqbal KhanMr. Tariq Iqbal Khan is associated with the Company as a Non-executive Director. He is a Fellow member of the Institute of Chartered Accountants of Pakistan, with diversified experience of more than 40 years. He has held leading policy-making positions in various associations and institutions in the country, including being a Founding Director and President of Islamabad Stock Exchange, Commissioner and Acting Chairman Securities and Exchange Commission of Pakistan and Managing Director/Chairman at Investment Corporation of Pakistan/National Investment Trust. He is currently a member on the Board of International Steels Limited, Lucky Cement Limited, National Refinery Limited, PICIC Insurance Company, Silkbank Limited, FFC Energy Limited and Gadoon Textile Mills Limited.
Annual Report of Packages Limited 2013
17
Management Committees
Executive CommitteeSyed Hyder Ali Chairman(Executive Director)
Syed Aslam Mehdi Member (Executive Director)
Khalid Yacob Member (Executive Director)
Executive Committee is involved in day to day operations of the Company and is authorized to conduct every business except the businesses to be carried out by the Board of Directors asrequiredbysection196oftheCompaniesOrdinance,1984.TheExecutive Committee meets periodically to review operating performance of the Company against pre-defined objectives, commercial business decisions and investment and funding requirements.
Audit CommitteeShamim Ahmad Khan Chairman (Non-Executive Director)
Alamuddin Bullo Member(Non-Executive Director)
Mats Nordlander Member(Non-Executive Director)
Muhammad Aurangzeb Member(Independent Director)
Syed Aslam Mehdi Member(Executive Director)
Syed Shahid Ali Member(Non-Executive Director)
Adi J. Cawasji Secretary(Company Secretary)
The terms of reference of the Audit Committee is derived from the Code of Corporate Governance applicable to listed companies in Pakistan. The Audit Committee is, among other things, responsible for recommending to the Board of Directors the appointment of external auditors by the Company’s shareholders and considering any questions of resignation or removal of external auditors, audit fees and
provision by external auditors of any service to the Company in addition to audit of its financial statements. In the absence of strong grounds to proceed otherwise, the Board of Directors act in accordance with the recommendations of the Audit Committee in all these matters.
The terms of reference of the Audit Committee also includes the following:
a. Determination of appropriate measures to safeguard the Company’s assets;
b. Review of quarterly, half-yearly and annual financial statements of the Company, prior to their approval by the Board of Directors, focusing on:
• Majorjudgmentalareas;• Significantadjustments
resulting from the audit;• Thegoing-concern
assumption;• Anychangesinaccounting
policies and practices;• Compliancewithapplicable
accounting standards; • Compliancewithlisting
regulations and other statutory and regulatory requirements; and
• Significantrelatedpartytransactions.
c. Review of preliminary announcements of results prior to publication;
d. Facilitating the external audit and discussion with external auditors of major observations arising from interim and final audits and any matter that the auditors may wish to highlight (in the absence of management, where necessary);
e. Review of management letter issued by external auditors and management’s response thereto;
f. Ensuring coordination between the internal and external auditors of the Company;
g. Review of the scope and extent of internal audit and ensuring that the internal audit function has adequate resources and is appropriately placed within the Company;
h. Consideration of major findings of internal investigations of activities characterized by fraud, corruption and abuse of power and management’s response thereto;
i. Ascertaining that the internal control systems including financial and operational controls, accounting systems for timely and appropriate recording of purchases and sales, receipts and payments, assets and liabilities and the reporting structure are adequate and effective;
j. Review of the Company’s statement on internal control systems prior to endorsement by the Board of Directors and internal audit reports;
k. Instituting special projects, value for money studies or other investigations on any matter specified by the Board of Directors, in consultation with the Chief Executive Officer and to consider remittance of any matter to the external auditors or to any other external body;
l. Determination of compliance with relevant statutory requirements;
m. Monitoring compliance with the best practices of corporate governance and identification of significant violations thereof; and
n. Consideration of any other issue or matter as may be assigned by the Board of Directors.
18
Human Resource and Remuneration (HR & R) CommitteeTowfiq Habib Chinoy Chairman(Non-Executive Director)
Alamuddin Bullo Member(Non-Executive Director)
Shamim Ahmad Khan Member(Non-Executive Director)
Syed Hyder Ali Member(Executive Director)
Syed Aslam Mehdi Member(Executive Director)
Asma Javed Secretary
This Committee is responsible for:
(i) Recommending human resource management policies to the Board;
(ii) Recommending to the Board the selection, evaluation, compensation (including retirement benefits) and succession planning of the CEO;
(iii) Recommending to the Board the selection, evaluation, compensation (including retirements benefits) of COO, CFO, Company Secretary and Head of Internal Audit; and
(iv) Consideration and approval on recommendations of CEO on such matters for key management positions who report directly to CEO or COO.
Business Strategy CommitteeSyed Hyder Ali Chairman(Executive Director)
Syed Aslam Mehdi Member (Executive Director)
Khalid Yacob Member (Executive Director)
This Committee is responsible for:
a) Formulation of business strategy, review of risks and their mitigation plan;
b) Staying abreast of developments and trends in the Industry to assist the Board in planning for future capital intensive investments and growth of the Company;
c) Evaluation of proposed projects and funding thereof; and
d) Investment portfolio analysis and strategic business dimension.
System and Technology CommitteeSyed Aslam Mehdi Chairman(Executive Director)
Khalid Yacob Member(Executive Director)
Suleman Javed Member
This Committee is responsible for:
a) Devising the I.T strategy within the organization to keep all information systems of the Company updated in a fast changing environment. This committee is also responsible for evaluating ERP solutions and data archiving solutions to achieve Company’s overall goal towards Green Office Project;
b) Reviewing and recommending information technology proposals suggested by management;
c) Promoting awareness of all stakeholders on needs for investment in technology and related research work; and
d) Reviewing and assessing Company’s systems and procedures, recommending proposals on technological innovations including plant up-gradation, technology improvements etc. with relevant cost benefit analysis.
Annual Report of Packages Limited 2013
19
Our Vision
Position ourselves to be a regional player of quality packaging and consumer products.
Improve on contemporary measures including cost, quality, service, speed of delivery and mobilization.
Keep investing in technology, systems and human resourcetoeffectivelymeetthechallengeseverynewdawn brings.
Develop relationships with all our stakeholders based on sustainable cooperation, upholding ethical values, which the shareholders, management and employees represent and continuously strive for.
20
To be a leader in the markets we serve by providing quality products and superior service to our customers, while learning from their feedback to set even higher standards for our products.
To be a Company that continuously enhances its superior technological competence to provide innovative solutions to customer needs.
To be a Company that attracts and retains outstanding people by creating a culture that fosters openness, innovation, promotes individual growth, rewards initiative and performance.
To be a Company which combines its people, technology, management systems and market opportunities to achieve profitable growth while providing fair returns to its investors.
To be a Company that endeavors to set the highest standards in corporate ethics in serving the society.
Mission Statement
Annual Report of Packages Limited 2013
21
Integrated Management System (IMS) PolicyWe intend to be a world class Company that not only delivers quality goods & services but also takes care of its personnel health, safety & environment as a whole.
We are committed to achieving this by:
1. Complying with all applicable laws and regulatory requirements.
2. Setting objectives and targets for reviewing and improving management systems.
3. DevelopinganeffectiveIMSsystemto prevent incidents/accidents, ill health, pollution, waste reduction, hazards and environmental impacts.
4. Ensuringthatallfoodrelatedpackaging material is produced, stored and delivered in safe and hygienic condition as per relevant requirements
5. Continually improving our Environment, Health & Safety (EHS) and food safety management systemeffectiveness.
6. Creating a safe and work friendly environment for all stakeholders.
7. Implementing individual accountability to comply with IMS requirements.
This policy is applicable to each individual whether employee, contractor/sub-contractor, suppliers, visitors and all other stake holders of Company.
Quality PolicyPackages Limited is strongly committed to produce quality products that confirm to consumer’s requirements at a competitive price.
We shall continually improve our Quality Management System (QMS)and quality performance of all business processes.
We shall set quality objectives at all levels and allocate appropriate resources to achieve them.
We shall ensure all employees are well aware of company quality policy and are motivated to apply it in their areas of responsibility.
Statement of Ethical PracticesIt is the basic principle of Packages Limited to obey the law of the land and comply with its legal system. Accordingly every director and employee of the Company shall obey the law. Any director and employee guilty of violation will be liable to disciplinary consequences because of the violation of his / her duties.
Employees must avoid conflicts of interest between their private financial activities and conduct of Company’s business.
All business transactions on behalf of Packages Limited must be reflected accordingly in the accounts of the Company. The image and reputation of Packages Limited is determined by the way each and every one of us acts and conducts himself / herself at all times.
We are an equal opportunity employer. Our employees are entitled to a safe and healthy workplace.
Every manager and supervisor shall be responsible to see that there is no violation of laws within his / her area of responsibility which proper supervision could have prevented. The manager and supervisor shall still be responsible if he / she delegates particular tasks.
Total Productive Maintenance (TPM) PolicyWe believe that TPM provides the life cycle approach of improving the overall performance of the machine/equipment through:
• Improvingproductivitybyhighlymotivatedstaff/workers
• Satisfyingthecustomerneedsbydelivering the right quantity at right time with desired quality.
We are committed to follow the TPM principles to enhance our competitive position in the market and hence financial position by achieving:
• Zeroaccidents
• Zerobreakdowns
• Zerodefects
Policies
22

“Innovation is the specific instrument of entrepreneurship- the act that endows resources with a new capacity to create wealth.”– Peter Drucker
Annual Report of Packages Limited 2013
23
Core Values
Underlying everything we do and everything we believe in is a set of core values. These guide us to deal with every aspect of any issue we might encounter in our personal and professional lives. These values help us grow inside & outside, personally and as an organization.
Good GovernanceWe are committed to running our business successfully and efficiently, providing long-term benefits to our employees and shareholders, and enriching the lives of those whom we serve by fulfilling our corporate responsibility to the best of our ability. We expect excellence from all processes, whether they relate to policy formation and accounting procedures or product development and customer service.
Work EnvironmentOur policies and core values are aimed towards creating an informal yet stimulating team-oriented work environment with a culture of sharing and open communication. We cherish the diversity of viewpoint of every individual; we realises this encourages innovation and develops character. All employees have the right to a stress and injury free work environment. We ensure our employee health and safety by providing various in-house facilities such asagymandmakingsurethatallstaffunderstand and uphold our safety policy.
All our employees are permitted and encouragedtoaffordtimeandattentionto personal concerns.
Our PeopleThe success of any organization is largely dependent on the people working for it. Each member of our team is considered equally important and provided constant training, motivation and guidance. Wepossessadedicatedstaffofthehighest caliber committed to making our business a success. We ensure that every employee has the opportunity for maximum professional development. To achieve this goal, we seek to provide challenging work prospects for all employees. Each person is compensated and rewarded for his or her performance and hard work on a strict merit basis.
ConservationWe expect and encourage our employees to actively participate in community service and to take care of the environment entrusted to us as citizens sharing the earth’s resources.
Customer SatisfactionWe are customer-driven; we go the extra mile to make sure our clients’ expectations are met and exceeded on every issue. We partner with leading companies to arm ourselves with the latest technology and provide customers with innovative solutions in the most cost-effectivemanneravailable.
Ethical BehaviorWe make it clear that being a sincere, honest and decent human being takes precedence over everything else. In the Packages family, there is an all round respect for elders, tolerance for equals andaffectionforyoungsters.Managersare expected to lead from the front, train junior colleagues through delegation, resolve conflicts quickly, be visible at all times and act as role models for others.
Whistleblowing PolicyWe are committed to high standards of ethical, moral and legal business conduct. In line with our commitment to open communication, this policy aims to provide an avenue for employees to raise concerns and reassurance that they will be protected from reprisals or victimization for whistleblowing.
This whistleblowing policy is intended toprotectthestaffiftheyraiseconcernssuch as:
• incorrectfinancialreporting;
• unlawfulactivity;
• activitiesthatarenotinlinewithPackages’ policy, including the Code of Conduct; or
• activitieswhichotherwiseamountto serious improper conduct.
During the year 2013, this Policy has been implemented, posters developed anddisplayedatdifferentlocationsintheCompany’s premises including Lahore, Karachi and Islamabad offices and placed on the Company’s website.
24
Code of Conduct
Packages Limited has built a reputation for conducting its business with integrity, in accordance with high standards of ethical behavior and in compliance with the laws and regulations that govern our business. This reputation is among our most valuable assets and ultimately depends upon the individual actions of each of our employees all over the country.
Packages Limited Code of Conduct (Code) has been prepared to assist each ofusinoureffortstonotonlymaintainbut enhance this reputation. It provides guidance for business conduct in a number of areas and references to more detailed corporate policies for further direction.
The adherence of all employees to high standards of integrity and ethical behavior is mandatory and benefits all stakeholders viz. our customers, our communities, our shareholders and ourselves.
The Company carefully checks for compliance with the Code by providing suitable information, prevention and control tools and ensuring transparency in all transactions and behaviors by taking creative measures if and as required.
The Code applies to all affiliates, employees and others who act for us countrywide, within all sectors, regions, areas and functions.
General Principles• Compliancewiththelaw,
regulations, statutory provisions, ethical integrity and fairness is a constant commitment and duty of all Packages employees and characterises the conduct of the organization.
• TheCompany’sbusinessandactivities have to be carried out in a transparent, honest and fair way, in good faith and in full compliance. Any form of discrimination, corruption, forced or child labour is rejected. Particular attention is paid to the acknowledgment and safeguarding of the dignity, freedom and equality of human beings.
• Allemployees,withoutanydistinction or exception whatsoever, respect the principles and contents of the Code in their actions and behaviours while performing their functions according to their responsibilities, because compliance with the Code is fundamental for the quality of their working and professional performance. Relationships among employees, at all levels, must be characterized by honesty, fairness, cooperation, loyalty and mutual respect.
• Thebeliefthatoneisactinginfavor or to the advantage of the Company can never, in any way, “justifynoteveninpart”anybehaviours that conflict with the principles and content of the Code.
• TheCodeaimsatguidingthe“Packagesteam”withrespecttostandards of conduct expected
in areas where improper activities could result in adverse consequences to the Company, harm its reputation or diminish its competitive advantage.
• Everyemployeeisexpectedtoadhere to, and firmly inculcate in his/her everyday conduct, this mandatory framework; any contravention or deviation will be regarded as misconduct and may attract disciplinary action in accordance with the Company service rules and relevant laws.
Annual Report of Packages Limited 2013
25
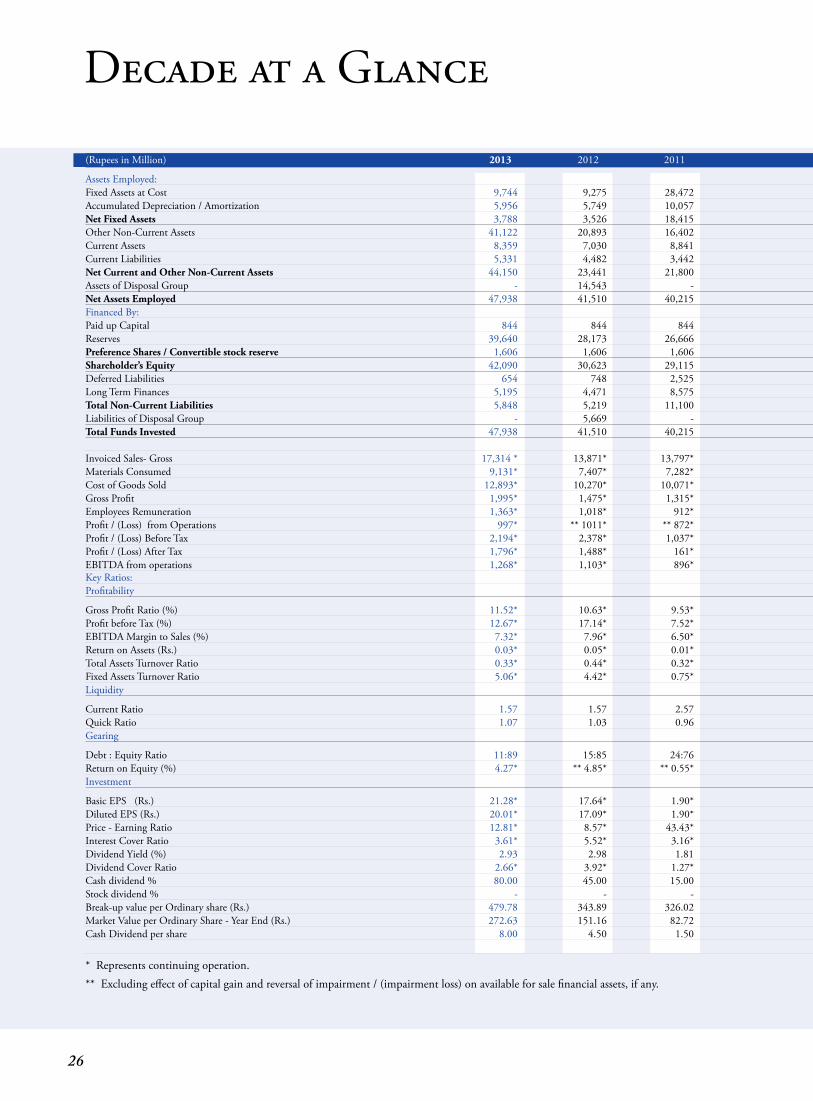
Decade at a Glance
* Represents continuing operation. **Excludingeffectofcapitalgainandreversalofimpairment/(impairmentloss)onavailableforsalefinancialassets,ifany.
(Rupees in Million) 2013 2012 2011 2010 2009 2008 2007 2006 2005 2004
Assets Employed: Fixed Assets at Cost 9,744 9,275 28,472 27,749 26,887 25,789 23,691 18,217 10,925 7,578Accumulated Depreciation / Amortization 5,956 5,749 10,057 9,101 7,605 6,323 5,502 4,984 4,633 4,277Net Fixed Assets 3,788 3,526 18,415 18,648 19,282 19,466 18,189 13,233 6,292 3,301Other Non-Current Assets 41,122 20,893 16,402 12,442 8,347 8,645 10,413 6,026 770 749Current Assets 8,359 7,030 8,841 8,534 7,979 6,923 4,837 3,414 4,559 2,425Current Liabilities 5,331 4,482 3,442 2,421 1,743 5,617 1,965 2,312 2,336 1,749Net Current and Other Non-Current Assets 44,150 23,441 21,800 18,555 14,583 9,952 13,285 7,128 2,993 1,425Assets of Disposal Group - 14,543 - - - - - - - -Net Assets Employed 47,938 41,510 40,215 37,204 33,865 29,418 31,473 20,361 9,285 4,726Financed By: Paid up Capital 844 844 844 844 844 844 734 699 699 475Reserves 39,640 28,173 26,666 24,480 20,967 15,429 17,437 12,974 7,037 3,716Preference Shares / Convertible stock reserve 1,606 1,606 1,606 1,606 1,606 - - - - - Shareholder’s Equity 42,090 30,623 29,115 26,930 23,417 16,273 18,171 13,673 7,736 4,192Deferred Liabilities 654 748 2,525 2,317 2,478 841 956 688 547 527Long Term Finances 5,195 4,471 8,575 7,956 7,971 12,304 12,347 6,000 1,001 6Total Non-Current Liabilities 5,848 5,219 11,100 10,274 10,448 13,145 13,302 6,688 1,548 534Liabilities of Disposal Group - 5,669 - - - - - - - -Total Funds Invested 47,938 41,510 40,215 37,204 33,865 29,418 31,473 20,361 9,285 4,726
Invoiced Sales- Gross 17,314* 13,871* 13,797* 21,837 16,533 14,301 10,540 9,028 8,163 6,893Materials Consumed 9,131* 7,407* 7,282* 10,211 8,685 7,639 5,108 4,247 3,521 2,710Cost of Goods Sold 12,893* 10,270* 10,071* 17,733 13,736 11,281 7,829 6,552 5,746 4,678Gross Profit 1,995* 1,475* 1,315* 803 307 943 1,199 1,295 1,353 1,309Employees Remuneration 1,363* 1,018* 912* 1,502 1,229 1,033 835 758 651 576Profit / (Loss) from Operations 997* **1011* **872* (104) (384)** 405 588 758 902 789Profit / (Loss) Before Tax 2,194* 2,378* 1,037* (317) 5,770 (308) 4,633 6,348 1,330 1,187Profit / (Loss) After Tax 1,796* 1,488* 161* (332) 4,064 (196) 4,326 6,101 1,015 958EBITDA from operations 1,268* 1,103* 896* 1,242 719 955 1,167 1,098 1,217 1,246Key Ratios: Profitability
Gross Profit Ratio (%) 11.52* 10.63* 9.53* 3.68 1.86 6.60 11.38 14.34 16.57 18.98Profit before Tax (%) 12.67* 17.14* 7.52* (1.45) 34.90 (2.15) 43.96 70.31 16.29 17.21EBITDA Margin to Sales (%) 7.32* 7.96* 6.50* 5.68 14.91 6.68 11.08 12.17 14.91 18.07Return on Assets (Rs.) 0.03* 0.05* 0.01* (0.01) 0.11 (0.01) 0.13 0.27 0.09 0.15Total Assets Turnover Ratio 0.33* 0.44* 0.32* 0.55 0.46 0.41 0.32 0.40 0.70 1.06Fixed Assets Turnover Ratio 5.06* 4.42* 0.75* 1.22 0.86 1.26 1.01 2.92 2.70 2.32Liquidity
Current Ratio 1.57 1.57 2.57 3.52 4.58 1.23 2.46 1.48 1.95 1.39Quick Ratio 1.07 1.03 0.96 1.57 1.72 0.43 0.97 0.55 1.30 0.54Gearing
Debt : Equity Ratio 11:89 15:85 24:76 23:77 25:75 44:56 40:60 30:70 11:89 00:100Return on Equity (%) 4.27* **4.85* **0.55* (1.23) (13.05)** (1.20) 4.39** 14.80** 13.12 22.84Investment
Basic EPS (Rs.) 21.28* 17.64* 1.90* (3.94) 48.16 (2.32) 58.96 87.30 16.24 19.68Diluted EPS (Rs.) 20.01* 17.09* 1.90* (3.94) 44.72 (2.32) - - - -Price - Earning Ratio 12.81* 8.57* 43.43* (32.65) 2.99 (34.98) 6.17 2.41 12.44 10.10Interest Cover Ratio 3.61* 5.52* 3.16* 0.74 5.55 0.81 13.84 92.93 9.18 9.93Dividend Yield (%) 2.93 2.98 1.81 2.53 2.26 - - 2.86 2.97 4.27Dividend Cover Ratio 2.66* 3.92* 1.27* (1.21) 14.82 - - 14.55 2.42 2.37Cash dividend % 80.00 45.00 15.00 32.50 32.50 - - 60.00 60.00 85.00Stock dividend % - - - - - - 15.00 5.00 - - Break-up value per Ordinary share (Rs.) 479.78 343.89 326.02 300.12 258.49 192.85 247.65 195.66 110.71 88.18Market Value per Ordinary Share - Year End (Rs.) 272.63 151.16 82.72 128.61 144.00 81.19 363.80 210.00 202.00 198.85Cash Dividend per share 8.00 4.50 1.50 3.25 3.25 - - 6.00 6.00 8.50
26
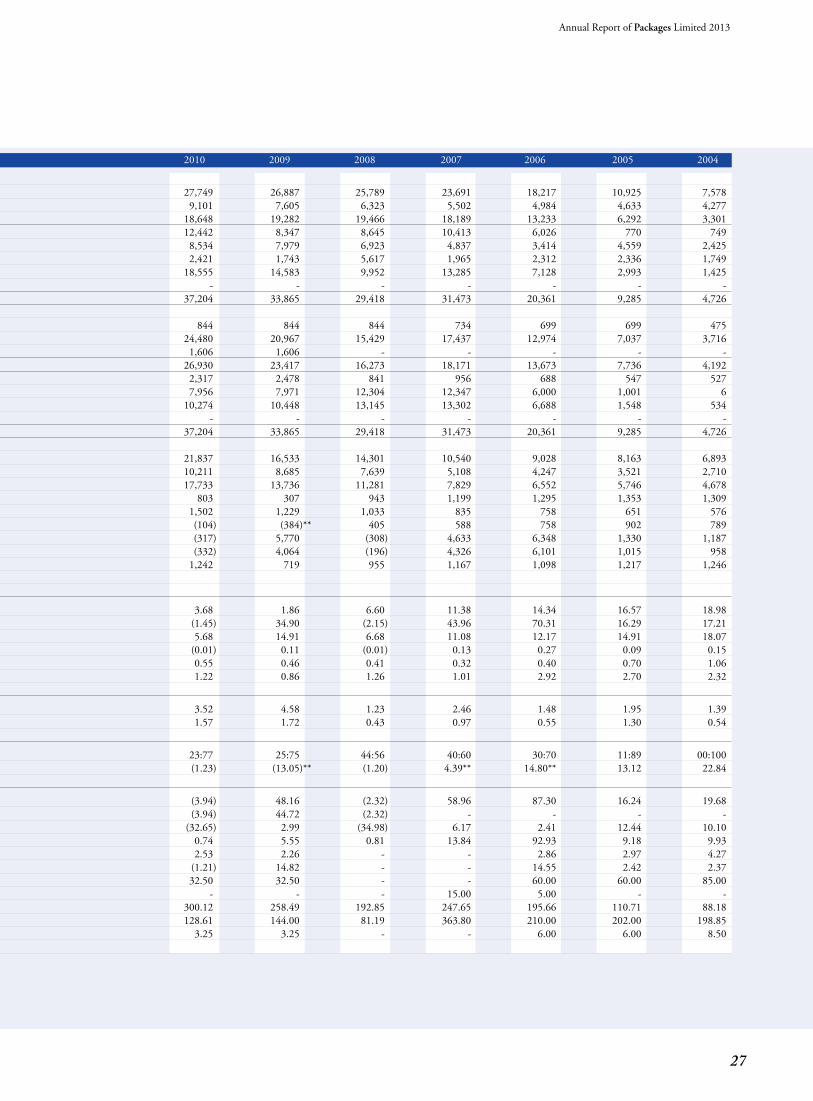
(Rupees in Million) 2013 2012 2011 2010 2009 2008 2007 2006 2005 2004
Assets Employed: Fixed Assets at Cost 9,744 9,275 28,472 27,749 26,887 25,789 23,691 18,217 10,925 7,578Accumulated Depreciation / Amortization 5,956 5,749 10,057 9,101 7,605 6,323 5,502 4,984 4,633 4,277Net Fixed Assets 3,788 3,526 18,415 18,648 19,282 19,466 18,189 13,233 6,292 3,301Other Non-Current Assets 41,122 20,893 16,402 12,442 8,347 8,645 10,413 6,026 770 749Current Assets 8,359 7,030 8,841 8,534 7,979 6,923 4,837 3,414 4,559 2,425Current Liabilities 5,331 4,482 3,442 2,421 1,743 5,617 1,965 2,312 2,336 1,749Net Current and Other Non-Current Assets 44,150 23,441 21,800 18,555 14,583 9,952 13,285 7,128 2,993 1,425Assets of Disposal Group - 14,543 - - - - - - - -Net Assets Employed 47,938 41,510 40,215 37,204 33,865 29,418 31,473 20,361 9,285 4,726Financed By: Paid up Capital 844 844 844 844 844 844 734 699 699 475Reserves 39,640 28,173 26,666 24,480 20,967 15,429 17,437 12,974 7,037 3,716Preference Shares / Convertible stock reserve 1,606 1,606 1,606 1,606 1,606 - - - - - Shareholder’s Equity 42,090 30,623 29,115 26,930 23,417 16,273 18,171 13,673 7,736 4,192Deferred Liabilities 654 748 2,525 2,317 2,478 841 956 688 547 527Long Term Finances 5,195 4,471 8,575 7,956 7,971 12,304 12,347 6,000 1,001 6Total Non-Current Liabilities 5,848 5,219 11,100 10,274 10,448 13,145 13,302 6,688 1,548 534Liabilities of Disposal Group - 5,669 - - - - - - - -Total Funds Invested 47,938 41,510 40,215 37,204 33,865 29,418 31,473 20,361 9,285 4,726
Invoiced Sales- Gross 17,314* 13,871* 13,797* 21,837 16,533 14,301 10,540 9,028 8,163 6,893Materials Consumed 9,131* 7,407* 7,282* 10,211 8,685 7,639 5,108 4,247 3,521 2,710Cost of Goods Sold 12,893* 10,270* 10,071* 17,733 13,736 11,281 7,829 6,552 5,746 4,678Gross Profit 1,995* 1,475* 1,315* 803 307 943 1,199 1,295 1,353 1,309Employees Remuneration 1,363* 1,018* 912* 1,502 1,229 1,033 835 758 651 576Profit / (Loss) from Operations 997* **1011* **872* (104) (384)** 405 588 758 902 789Profit / (Loss) Before Tax 2,194* 2,378* 1,037* (317) 5,770 (308) 4,633 6,348 1,330 1,187Profit / (Loss) After Tax 1,796* 1,488* 161* (332) 4,064 (196) 4,326 6,101 1,015 958EBITDA from operations 1,268* 1,103* 896* 1,242 719 955 1,167 1,098 1,217 1,246Key Ratios: Profitability
Gross Profit Ratio (%) 11.52* 10.63* 9.53* 3.68 1.86 6.60 11.38 14.34 16.57 18.98Profit before Tax (%) 12.67* 17.14* 7.52* (1.45) 34.90 (2.15) 43.96 70.31 16.29 17.21EBITDA Margin to Sales (%) 7.32* 7.96* 6.50* 5.68 14.91 6.68 11.08 12.17 14.91 18.07Return on Assets (Rs.) 0.03* 0.05* 0.01* (0.01) 0.11 (0.01) 0.13 0.27 0.09 0.15Total Assets Turnover Ratio 0.33* 0.44* 0.32* 0.55 0.46 0.41 0.32 0.40 0.70 1.06Fixed Assets Turnover Ratio 5.06* 4.42* 0.75* 1.22 0.86 1.26 1.01 2.92 2.70 2.32Liquidity
Current Ratio 1.57 1.57 2.57 3.52 4.58 1.23 2.46 1.48 1.95 1.39Quick Ratio 1.07 1.03 0.96 1.57 1.72 0.43 0.97 0.55 1.30 0.54Gearing
Debt : Equity Ratio 11:89 15:85 24:76 23:77 25:75 44:56 40:60 30:70 11:89 00:100Return on Equity (%) 4.27* **4.85* **0.55* (1.23) (13.05)** (1.20) 4.39** 14.80** 13.12 22.84Investment
Basic EPS (Rs.) 21.28* 17.64* 1.90* (3.94) 48.16 (2.32) 58.96 87.30 16.24 19.68Diluted EPS (Rs.) 20.01* 17.09* 1.90* (3.94) 44.72 (2.32) - - - -Price - Earning Ratio 12.81* 8.57* 43.43* (32.65) 2.99 (34.98) 6.17 2.41 12.44 10.10Interest Cover Ratio 3.61* 5.52* 3.16* 0.74 5.55 0.81 13.84 92.93 9.18 9.93Dividend Yield (%) 2.93 2.98 1.81 2.53 2.26 - - 2.86 2.97 4.27Dividend Cover Ratio 2.66* 3.92* 1.27* (1.21) 14.82 - - 14.55 2.42 2.37Cash dividend % 80.00 45.00 15.00 32.50 32.50 - - 60.00 60.00 85.00Stock dividend % - - - - - - 15.00 5.00 - - Break-up value per Ordinary share (Rs.) 479.78 343.89 326.02 300.12 258.49 192.85 247.65 195.66 110.71 88.18Market Value per Ordinary Share - Year End (Rs.) 272.63 151.16 82.72 128.61 144.00 81.19 363.80 210.00 202.00 198.85Cash Dividend per share 8.00 4.50 1.50 3.25 3.25 - - 6.00 6.00 8.50
Annual Report of Packages Limited 2013
27
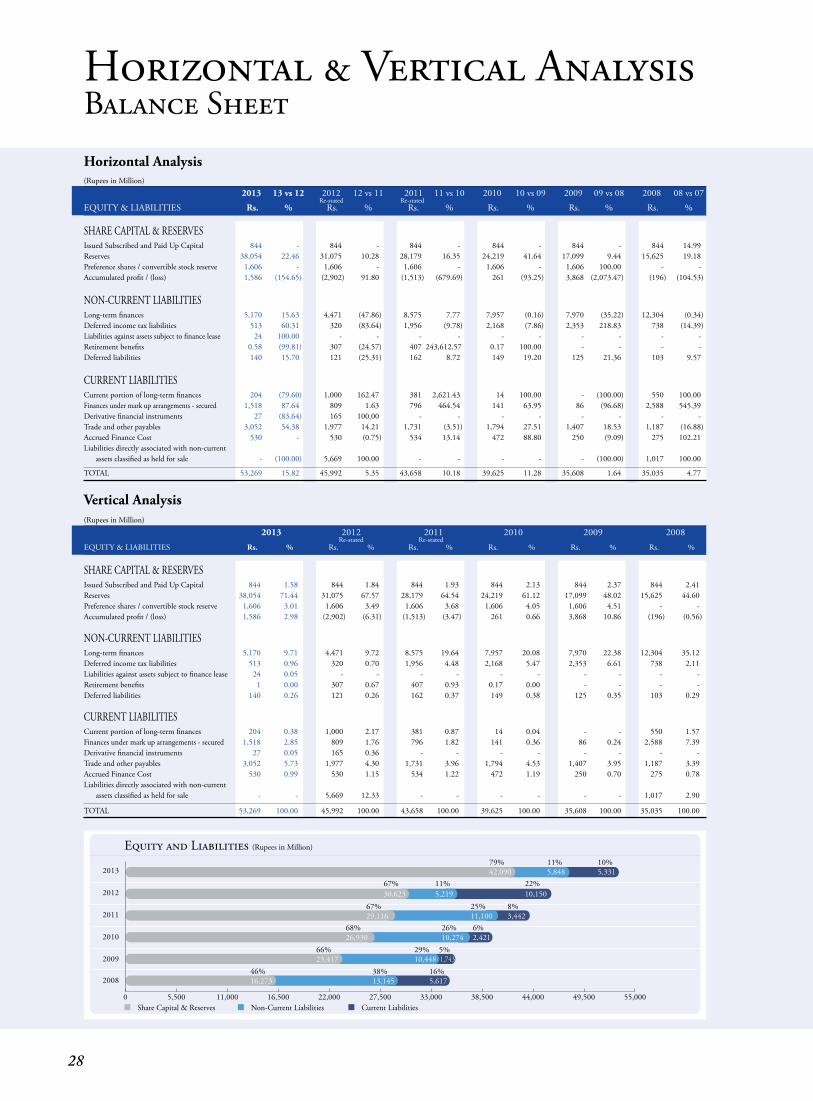
Horizontal & Vertical AnalysisBalance Sheet
(Rupees in Million)
2013 13 vs 12 2012 12vs11 2011 11vs10 2010 10vs09 2009 09vs08 2008 08vs07 Re-stated Re-stated EQUITY & LIABILITIES Rs. % Rs. % Rs. % Rs. % Rs. % Rs. %
SHARE CAPITAL & RESERVES Issued Subscribed and Paid Up Capital 844 - 844 - 844 - 844 - 844 - 844 14.99Reserves 38,054 22.46 31,075 10.28 28,179 16.35 24,219 41.64 17,099 9.44 15,625 19.18Preference shares / convertible stock reserve 1,606 - 1,606 - 1,606 - 1,606 - 1,606 100.00 - - Accumulated profit / (loss) 1,586 (154.65) (2,902) 91.80 (1,513) (679.69) 261 (93.25) 3,868 (2,073.47) (196) (104.53) NON-CURRENT LIABILITIES Long-term finances 5,170 15.63 4,471 (47.86) 8,575 7.77 7,957 (0.16) 7,970 (35.22) 12,304 (0.34)Deferred income tax liabilities 513 60.31 320 (83.64) 1,956 (9.78) 2,168 (7.86) 2,353 218.83 738 (14.39)Liabilities against assets subject to finance lease 24 100.00 - - - - - - - - - - Retirement benefits 0.58 (99.81) 307 (24.57) 407243,612.57 0.17 100.00 - - - -Deferred liabilities 140 15.70 121 (25.31) 162 8.72 149 19.20 125 21.36 103 9.57 CURRENT LIABILITIES Current portion of long-term finances 204 (79.60) 1,000 162.47 381 2,621.43 14 100.00 - (100.00) 550 100.00Finances under mark up arrangements - secured 1,518 87.64 809 1.63 796 464.54 141 63.95 86 (96.68) 2,588 545.39Derivative financial instruments 27 (83.64) 165 100.00 - - - - - - - - Trade and other payables 3,052 54.38 1,977 14.21 1,731 (3.51) 1,794 27.51 1,407 18.53 1,187 (16.88)Accrued Finance Cost 530 - 530 (0.75) 534 13.14 472 88.80 250 (9.09) 275 102.21Liabilities directly associated with non-current assets classified as held for sale - (100.00) 5,669 100.00 - - - - - (100.00) 1,017 100.00
TOTAL 53,269 15.82 45,992 5.35 43,658 10.18 39,625 11.28 35,608 1.64 35,035 4.77
Vertical Analysis (Rupees in Million)
2013 2012 2011 2010 2009 2008 Re-stated Re-stated EQUITY & LIABILITIES Rs. % Rs. % Rs. % Rs. % Rs. % Rs. %
SHARE CAPITAL & RESERVES Issued Subscribed and Paid Up Capital 844 1.58 844 1.84 844 1.93 844 2.13 844 2.37 844 2.41Reserves 38,054 71.44 31,075 67.57 28,179 64.54 24,219 61.12 17,099 48.02 15,625 44.60Preference shares / convertible stock reserve 1,606 3.01 1,606 3.49 1,606 3.68 1,606 4.05 1,606 4.51 - -Accumulated profit / (loss) 1,586 2.98 (2,902) (6.31) (1,513) (3.47) 261 0.66 3,868 10.86 (196) (0.56) NON-CURRENT LIABILITIES Long-term finances 5,170 9.71 4,471 9.72 8,575 19.64 7,957 20.08 7,970 22.38 12,304 35.12Deferred income tax liabilities 513 0.96 320 0.70 1,956 4.48 2,168 5.47 2,353 6.61 738 2.11Liabilities against assets subject to finance lease 24 0.05 - - - - - - - - - - Retirement benefits 1 0.00 307 0.67 407 0.93 0.17 0.00 - - - -Deferred liabilities 140 0.26 121 0.26 162 0.37 149 0.38 125 0.35 103 0.29 CURRENT LIABILITIES Current portion of long-term finances 204 0.38 1,000 2.17 381 0.87 14 0.04 - - 550 1.57Finances under mark up arrangements - secured 1,518 2.85 809 1.76 796 1.82 141 0.36 86 0.24 2,588 7.39Derivative financial instruments 27 0.05 165 0.36 - - - - - - - - Trade and other payables 3,052 5.73 1,977 4.30 1,731 3.96 1,794 4.53 1,407 3.95 1,187 3.39Accrued Finance Cost 530 0.99 530 1.15 534 1.22 472 1.19 250 0.70 275 0.78Liabilities directly associated with non-current assets classified as held for sale - - 5,669 12.33 - - - - - - 1,017 2.90
TOTAL 53,269 100.00 45,992 100.00 43,658 100.00 39,625 100.00 35,608 100.00 35,035 100.00
Horizontal Analysis
0 5,500 11,000 16,500 22,000 27,500 33,000 38,500 44,000 49,500 55,000
2013
2012
2011
2010
2009
2008
42,09079%
67%
68%
66%
46% 38% 16%
29% 5%
26% 6%
25% 8%
11% 10%
67% 11% 22%5,331
10,150
3,442
2,421
1,743
5,617
5,848
5,219
11,100
10,274
10,448
13,145
30,623
29,116
26,930
23,417
16,273
Share Capital & Reserves Non-Current Liabilities Current Liabilities
Equity and Liabilities (Rupees in Million)
28
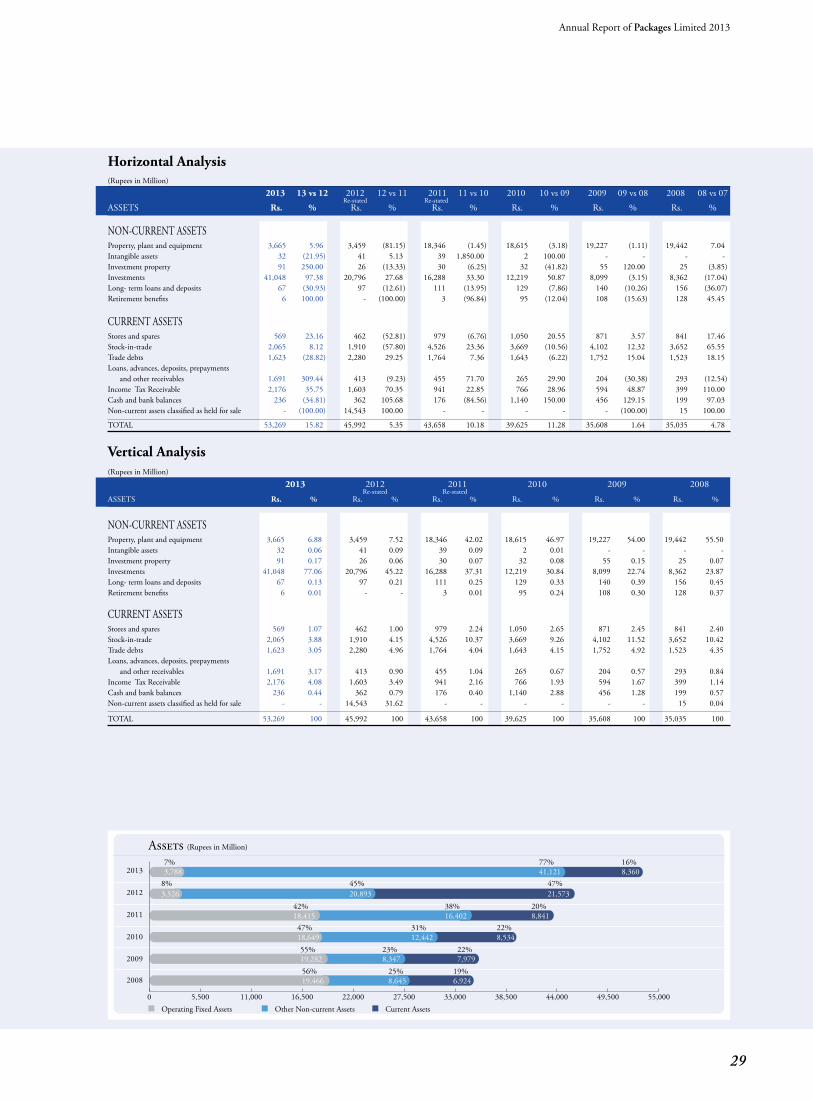
(Rupees in Million)
2013 13 vs 12 2012 12vs11 2011 11vs10 2010 10vs09 2009 09vs08 2008 08vs07 Re-stated Re-stated ASSETS Rs. % Rs. % Rs. % Rs. % Rs. % Rs. %
NON-CURRENT ASSETS Property, plant and equipment 3,665 5.96 3,459 (81.15) 18,346 (1.45) 18,615 (3.18) 19,227 (1.11) 19,442 7.04Intangible assets 32 (21.95) 41 5.13 39 1,850.00 2 100.00 - - - -Investment property 91 250.00 26 (13.33) 30 (6.25) 32 (41.82) 55 120.00 25 (3.85)Investments 41,048 97.38 20,796 27.68 16,288 33.30 12,219 50.87 8,099 (3.15) 8,362 (17.04)Long- term loans and deposits 67 (30.93) 97 (12.61) 111 (13.95) 129 (7.86) 140 (10.26) 156 (36.07)Retirement benefits 6 100.00 - (100.00) 3 (96.84) 95 (12.04) 108 (15.63) 128 45.45 CURRENT ASSETS Stores and spares 569 23.16 462 (52.81) 979 (6.76) 1,050 20.55 871 3.57 841 17.46Stock-in-trade 2,065 8.12 1,910 (57.80) 4,526 23.36 3,669 (10.56) 4,102 12.32 3,652 65.55Trade debts 1,623 (28.82) 2,280 29.25 1,764 7.36 1,643 (6.22) 1,752 15.04 1,523 18.15Loans, advances, deposits, prepayments and other receivables 1,691 309.44 413 (9.23) 455 71.70 265 29.90 204 (30.38) 293 (12.54)Income Tax Receivable 2,176 35.75 1,603 70.35 941 22.85 766 28.96 594 48.87 399 110.00Cash and bank balances 236 (34.81) 362 105.68 176 (84.56) 1,140 150.00 456 129.15 199 97.03Non-current assets classified as held for sale - (100.00) 14,543 100.00 - - - - - (100.00) 15 100.00
TOTAL 53,269 15.82 45,992 5.35 43,658 10.18 39,625 11.28 35,608 1.64 35,035 4.78
Vertical Analysis (Rupees in Million)
2013 2012 2011 2010 2009 2008 Re-stated Re-stated ASSETS Rs. % Rs. % Rs. % Rs. % Rs. % Rs. %
NON-CURRENT ASSETS Property, plant and equipment 3,665 6.88 3,459 7.52 18,346 42.02 18,615 46.97 19,227 54.00 19,442 55.50Intangible assets 32 0.06 41 0.09 39 0.09 2 0.01 - - - -Investment property 91 0.17 26 0.06 30 0.07 32 0.08 55 0.15 25 0.07 Investments 41,048 77.06 20,796 45.22 16,288 37.31 12,219 30.84 8,099 22.74 8,362 23.87Long- term loans and deposits 67 0.13 97 0.21 111 0.25 129 0.33 140 0.39 156 0.45Retirement benefits 6 0.01 - - 3 0.01 95 0.24 108 0.30 128 0.37 CURRENT ASSETS Stores and spares 569 1.07 462 1.00 979 2.24 1,050 2.65 871 2.45 841 2.40Stock-in-trade 2,065 3.88 1,910 4.15 4,526 10.37 3,669 9.26 4,102 11.52 3,652 10.42Trade debts 1,623 3.05 2,280 4.96 1,764 4.04 1,643 4.15 1,752 4.92 1,523 4.35Loans, advances, deposits, prepayments and other receivables 1,691 3.17 413 0.90 455 1.04 265 0.67 204 0.57 293 0.84Income Tax Receivable 2,176 4.08 1,603 3.49 941 2.16 766 1.93 594 1.67 399 1.14Cash and bank balances 236 0.44 362 0.79 176 0.40 1,140 2.88 456 1.28 199 0.57Non-current assets classified as held for sale - - 14,543 31.62 - - - - - - 15 0.04
TOTAL 53,269 100 45,992 100 43,658 100 39,625 100 35,608 100 35,035 100
Horizontal Analysis
0 5,500 11,000 16,500 22,000 27,500 33,000 38,500 44,000 49,500 55,000
2013
2012
2011
2010
2009
2008
3,7887%
42%
47%
55%
56% 25% 19%
23% 22%
31% 22%
38% 20%
77% 16%
8% 45% 47%8,360
21,573
8,841
8,534
7,979
6,924
41,121
20,893
16,402
12,442
8,347
8,645
3,526
18,415
18,649
19,282
19,466
Operating Fixed Assets Other Non-current Assets Current Assets
Assets (Rupees in Million)
Annual Report of Packages Limited 2013
29
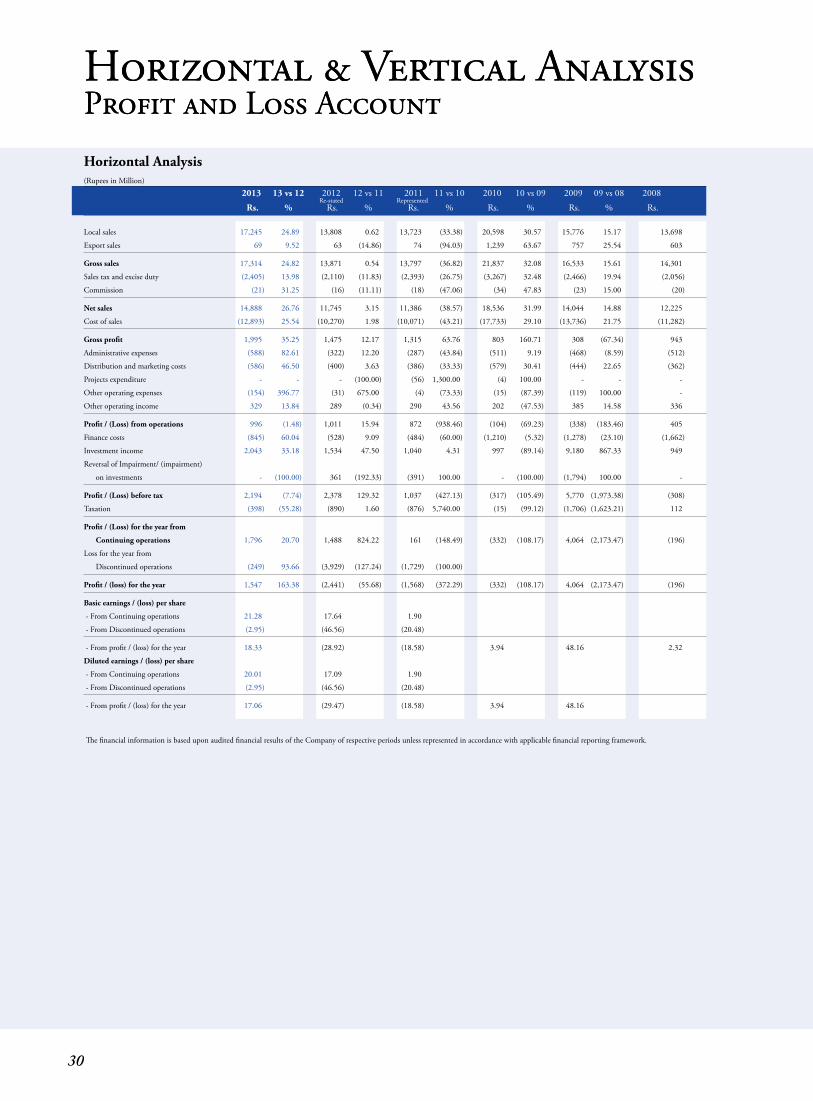
Horizontal & Vertical AnalysisProfit and Loss Account
(Rupees in Million)
2013 13 vs 12 2012 12vs11 2011 11vs10 2010 10vs09 2009 09vs08 2008 Re-stated Represented Rs. % Rs. % Rs. % Rs. % Rs. % Rs.
Local sales 17,245 24.89 13,808 0.62 13,723 (33.38) 20,598 30.57 15,776 15.17 13,698
Export sales 69 9.52 63 (14.86) 74 (94.03) 1,239 63.67 757 25.54 603
Gross sales 17,314 24.82 13,871 0.54 13,797 (36.82) 21,837 32.08 16,533 15.61 14,301
Sales tax and excise duty (2,405) 13.98 (2,110) (11.83) (2,393) (26.75) (3,267) 32.48 (2,466) 19.94 (2,056)
Commission (21) 31.25 (16) (11.11) (18) (47.06) (34) 47.83 (23) 15.00 (20)
Net sales 14,888 26.76 11,745 3.15 11,386 (38.57) 18,536 31.99 14,044 14.88 12,225
Cost of sales (12,893) 25.54 (10,270) 1.98 (10,071) (43.21) (17,733) 29.10 (13,736) 21.75 (11,282)
Gross profit 1,995 35.25 1,475 12.17 1,315 63.76 803 160.71 308 (67.34) 943
Administrative expenses (588) 82.61 (322) 12.20 (287) (43.84) (511) 9.19 (468) (8.59) (512)
Distribution and marketing costs (586) 46.50 (400) 3.63 (386) (33.33) (579) 30.41 (444) 22.65 (362)
Projects expenditure - - - (100.00) (56) 1,300.00 (4) 100.00 - - -
Other operating expenses (154) 396.77 (31) 675.00 (4) (73.33) (15) (87.39) (119) 100.00 -
Other operating income 329 13.84 289 (0.34) 290 43.56 202 (47.53) 385 14.58 336
Profit / (Loss) from operations 996 (1.48) 1,011 15.94 872 (938.46) (104) (69.23) (338) (183.46) 405
Finance costs (845) 60.04 (528) 9.09 (484) (60.00) (1,210) (5.32) (1,278) (23.10) (1,662)
Investment income 2,043 33.18 1,534 47.50 1,040 4.31 997 (89.14) 9,180 867.33 949
Reversal of Impairment/ (impairment)
on investments - (100.00) 361 (192.33) (391) 100.00 - (100.00) (1,794) 100.00 -
Profit / (Loss) before tax 2,194 (7.74) 2,378 129.32 1,037 (427.13) (317) (105.49) 5,770 (1,973.38) (308)
Taxation (398) (55.28) (890) 1.60 (876) 5,740.00 (15) (99.12) (1,706)(1,623.21) 112
Profit / (Loss) for the year from
Continuing operations 1,796 20.70 1,488 824.22 161 (148.49) (332) (108.17) 4,064 (2,173.47) (196)
Loss for the year from
Discontinued operations (249) 93.66 (3,929) (127.24) (1,729) (100.00)
Profit / (loss) for the year 1,547 163.38 (2,441) (55.68) (1,568) (372.29) (332) (108.17) 4,064 (2,173.47) (196)
Basic earnings / (loss) per share
- From Continuing operations 21.28 17.64 1.90
- From Discontinued operations (2.95) (46.56) (20.48)
- From profit / (loss) for the year 18.33 (28.92) (18.58) 3.94 48.16 2.32
Diluted earnings / (loss) per share
- From Continuing operations 20.01 17.09 1.90
- From Discontinued operations (2.95) (46.56) (20.48)
- From profit / (loss) for the year 17.06 (29.47) (18.58) 3.94 48.16
The financial information is based upon audited financial results of the Company of respective periods unless represented in accordance with applicable financial reporting framework.
Horizontal Analysis
Horizontal & Vertical AnalysisProfit and Loss Account
30
0 10 20 30 40 50 60 70 80 90 100
2013*
2012*
2011*
2010
2009
2008
53% 3% 13% 7% 6%
3% 11% 5% 4%
2% 12% 5% 4%
7% 14% 5% 6%
8% 10% 6% 8%
6% 7% 6% 12%
5%
7%
5%
14%
13%
12%
53%
53%
47%
53%
53%
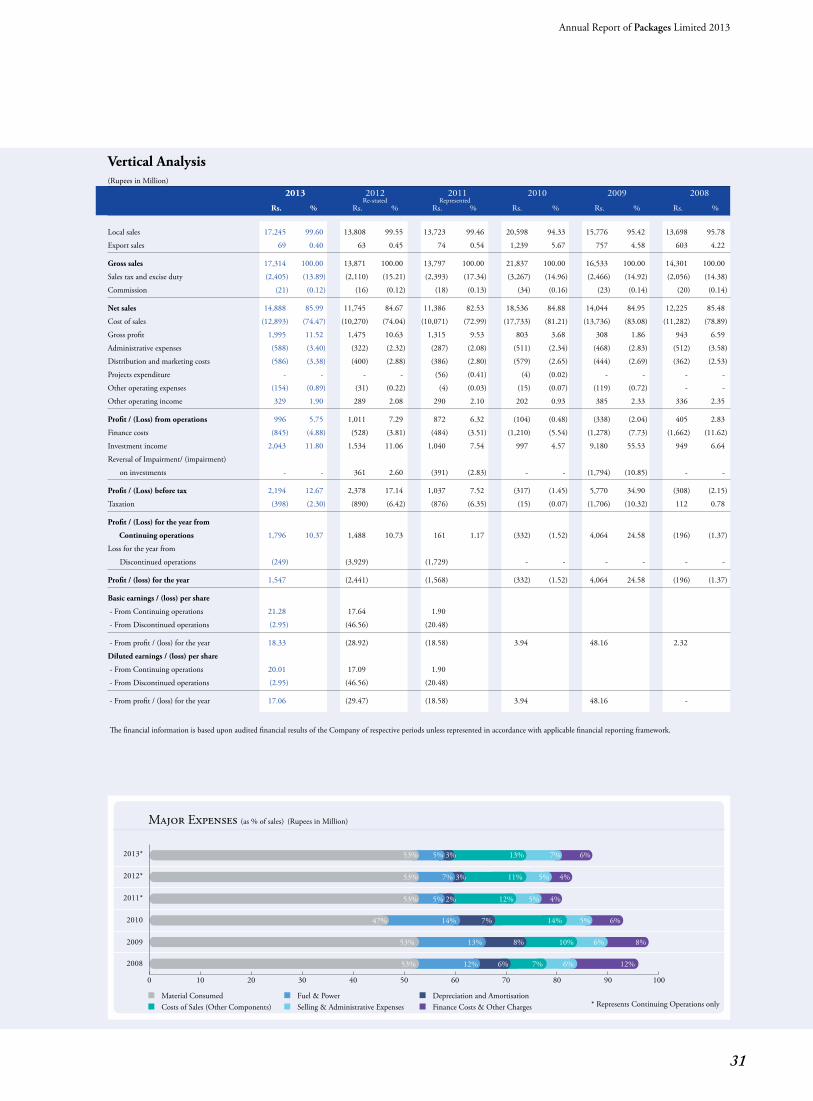
Material Consumed Fuel & Power Depreciation and AmortisationCosts of Sales (Other Components) Selling & Administrative Expenses Finance Costs & Other Charges * Represents Continuing Operations only
Major Expenses (as % of sales) (Rupees in Million)
(Rupees in Million)
2013 2012 2011 2010 2009 2008 Re-stated Represented Rs. % Rs. % Rs. % Rs. % Rs. % Rs. %
Local sales 17,245 99.60 13,808 99.55 13,723 99.46 20,598 94.33 15,776 95.42 13,698 95.78
Export sales 69 0.40 63 0.45 74 0.54 1,239 5.67 757 4.58 603 4.22
Gross sales 17,314 100.00 13,871 100.00 13,797 100.00 21,837 100.00 16,533 100.00 14,301 100.00
Sales tax and excise duty (2,405) (13.89) (2,110) (15.21) (2,393) (17.34) (3,267) (14.96) (2,466) (14.92) (2,056) (14.38)
Commission (21) (0.12) (16) (0.12) (18) (0.13) (34) (0.16) (23) (0.14) (20) (0.14)
Net sales 14,888 85.99 11,745 84.67 11,386 82.53 18,536 84.88 14,044 84.95 12,225 85.48
Cost of sales (12,893) (74.47) (10,270) (74.04) (10,071) (72.99) (17,733) (81.21) (13,736) (83.08) (11,282) (78.89)
Gross profit 1,995 11.52 1,475 10.63 1,315 9.53 803 3.68 308 1.86 943 6.59
Administrative expenses (588) (3.40) (322) (2.32) (287) (2.08) (511) (2.34) (468) (2.83) (512) (3.58)
Distribution and marketing costs (586) (3.38) (400) (2.88) (386) (2.80) (579) (2.65) (444) (2.69) (362) (2.53)
Projects expenditure - - - - (56) (0.41) (4) (0.02) - - - -
Other operating expenses (154) (0.89) (31) (0.22) (4) (0.03) (15) (0.07) (119) (0.72) - -
Other operating income 329 1.90 289 2.08 290 2.10 202 0.93 385 2.33 336 2.35
Profit / (Loss) from operations 996 5.75 1,011 7.29 872 6.32 (104) (0.48) (338) (2.04) 405 2.83
Finance costs (845) (4.88) (528) (3.81) (484) (3.51) (1,210) (5.54) (1,278) (7.73) (1,662) (11.62)
Investment income 2,043 11.80 1,534 11.06 1,040 7.54 997 4.57 9,180 55.53 949 6.64
Reversal of Impairment/ (impairment)
on investments - - 361 2.60 (391) (2.83) - - (1,794) (10.85) - -
Profit / (Loss) before tax 2,194 12.67 2,378 17.14 1,037 7.52 (317) (1.45) 5,770 34.90 (308) (2.15)
Taxation (398) (2.30) (890) (6.42) (876) (6.35) (15) (0.07) (1,706) (10.32) 112 0.78
Profit / (Loss) for the year from
Continuing operations 1,796 10.37 1,488 10.73 161 1.17 (332) (1.52) 4,064 24.58 (196) (1.37)
Loss for the year from
Discontinued operations (249) (3,929) (1,729) - - - - - -
Profit / (loss) for the year 1,547 (2,441) (1,568) (332) (1.52) 4,064 24.58 (196) (1.37)
Basic earnings / (loss) per share
- From Continuing operations 21.28 17.64 1.90
- From Discontinued operations (2.95) (46.56) (20.48)
- From profit / (loss) for the year 18.33 (28.92) (18.58) 3.94 48.16 2.32
Diluted earnings / (loss) per share
- From Continuing operations 20.01 17.09 1.90
- From Discontinued operations (2.95) (46.56) (20.48)
- From profit / (loss) for the year 17.06 (29.47) (18.58) 3.94 48.16 -
The financial information is based upon audited financial results of the Company of respective periods unless represented in accordance with applicable financial reporting framework.
Vertical Analysis
Annual Report of Packages Limited 2013
31
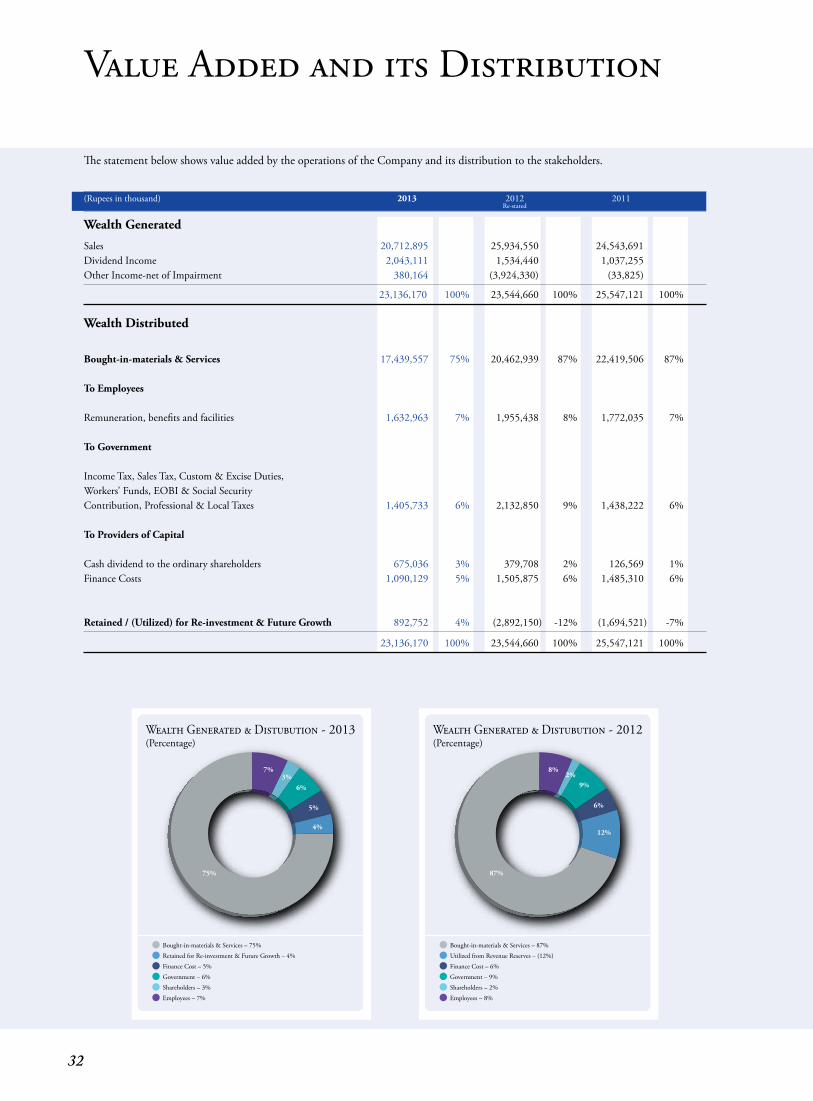
Value Added and its Distribution
The statement below shows value added by the operations of the Company and its distribution to the stakeholders. (Rupees in thousand) 2013 2012 2011 Re-stated
Wealth Generated
Sales 20,712,895 25,934,550 24,543,691Dividend Income 2,043,111 1,534,440 1,037,255Other Income-net of Impairment 380,164 (3,924,330) (33,825)
23,136,170 100% 23,544,660 100% 25,547,121 100% Wealth Distributed
Bought-in-materials & Services 17,439,557 75% 20,462,939 87% 22,419,506 87% To Employees Remuneration, benefits and facilities 1,632,963 7% 1,955,438 8% 1,772,035 7% To Government Income Tax, Sales Tax, Custom & Excise Duties, Workers’ Funds, EOBI & Social Security Contribution, Professional & Local Taxes 1,405,733 6% 2,132,850 9% 1,438,222 6% To Providers of Capital Cash dividend to the ordinary shareholders 675,036 3% 379,708 2% 126,569 1%Finance Costs 1,090,129 5% 1,505,875 6% 1,485,310 6% Retained / (Utilized) for Re-investment & Future Growth 892,752 4% (2,892,150) -12% (1,694,521) -7%
23,136,170 100% 23,544,660 100% 25,547,121 100%
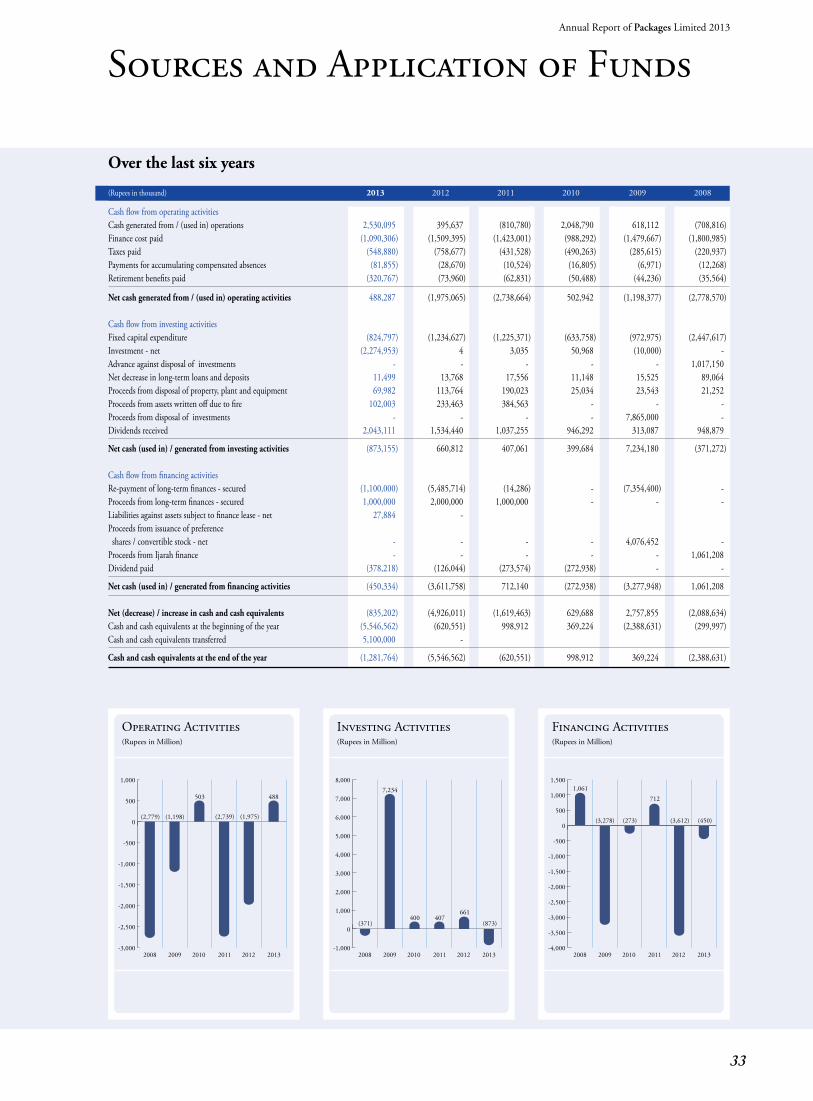
Bought-in-materials & Services – 87%
Utilized from Revenue Reserves – (12%)
Finance Cost – 6%
Government – 9%
Shareholders – 2%
Employees – 8%
Wealth Generated & Distubution - 2012(Percentage)
87%
8%
6%
9%2%
12%
Bought-in-materials & Services – 75%
Retained for Re-investment & Future Growth – 4%
Finance Cost – 5%
Government – 6%
Shareholders – 3%
Employees – 7%
Wealth Generated & Distubution - 2013(Percentage)
75%
7%
5%
6%3%
4%
32
Sources and Application of Funds
Over the last six years
(Rupees in thousand) 2013 2012 2011 2010 2009 2008
Cash flow from operating activities Cash generated from / (used in) operations 2,530,095 395,637 (810,780) 2,048,790 618,112 (708,816)Finance cost paid (1,090,306) (1,509,395) (1,423,001) (988,292) (1,479,667) (1,800,985)Taxes paid (548,880) (758,677) (431,528) (490,263) (285,615) (220,937)Payments for accumulating compensated absences (81,855) (28,670) (10,524) (16,805) (6,971) (12,268)Retirement benefits paid (320,767) (73,960) (62,831) (50,488) (44,236) (35,564)
Net cash generated from / (used in) operating activities 488,287 (1,975,065) (2,738,664) 502,942 (1,198,377) (2,778,570) Cash flow from investing activities Fixed capital expenditure (824,797) (1,234,627) (1,225,371) (633,758) (972,975) (2,447,617)Investment - net (2,274,953) 4 3,035 50,968 (10,000) -Advance against disposal of investments - - - - - 1,017,150Net decrease in long-term loans and deposits 11,499 13,768 17,556 11,148 15,525 89,064Proceeds from disposal of property, plant and equipment 69,982 113,764 190,023 25,034 23,543 21,252Proceedsfromassetswrittenoffduetofire 102,003 233,463 384,563 - - -Proceeds from disposal of investments - - - - 7,865,000 -Dividends received 2,043,111 1,534,440 1,037,255 946,292 313,087 948,879
Net cash (used in) / generated from investing activities (873,155) 660,812 407,061 399,684 7,234,180 (371,272) Cash flow from financing activities Re-payment of long-term finances - secured (1,100,000) (5,485,714) (14,286) - (7,354,400) -Proceeds from long-term finances - secured 1,000,000 2,000,000 1,000,000 - - -Liabilities against assets subject to finance lease - net 27,884 - Proceeds from issuance of preference shares / convertible stock - net - - - - 4,076,452 -Proceeds from Ijarah finance - - - - - 1,061,208Dividend paid (378,218) (126,044) (273,574) (272,938) - -
Net cash (used in) / generated from financing activities (450,334) (3,611,758) 712,140 (272,938) (3,277,948) 1,061,208 Net (decrease) / increase in cash and cash equivalents (835,202) (4,926,011) (1,619,463) 629,688 2,757,855 (2,088,634)Cash and cash equivalents at the beginning of the year (5,546,562) (620,551) 998,912 369,224 (2,388,631) (299,997)Cash and cash equivalents transferred 5,100,000 -
Cash and cash equivalents at the end of the year (1,281,764) (5,546,562) (620,551) 998,912 369,224 (2,388,631)
201320122011201020092008-3,000
-2,500
-2,000
-1,500
-1,000
-500
0
500
1,000
(2,779) (1,198)
503
(1,975)
488
(2,739)
Operating Activities (Rupees in Million)
-1,000
0
1,000
2,000
3,000
4,000
5,000
6,000
7,000
8,000
201320122011201020092008
(371)
7,234
400661
(873)407
Investing Activities (Rupees in Million)
-4,000
-3,500
-3,000
-2,500
-2,000
-1,500
-1,000
-500
0
500
1,000
1,500
201320122011201020092008
1,061
(3,278) (273) (3,612) (450)
712
Financing Activities (Rupees in Million)
Annual Report of Packages Limited 2013
33
Corporate Social ResponsibilityCorporateSocialResponsibility(CSR)is
about capacity building for sustainable
livelihoods. It respects cultural differences
and finds the business opportunities
in building the skills of employees, the
community and the Government. In a
nutshell,CSRisaboutbusiness“giving
back to society”. Packages activities
inthefieldofCSRareanimportant
part of corporate sustainability. As
successful members of the community,
we have a responsibility to help those
that are less fortunate and contribute
tothecommongood.CSRpracticeat
Packages is an evidence of commitment
to its stakeholders. On daily basis, we
strive to safeguard the health and well
being of our employees, neighbours and
customers, as well as the communities in
which we live, work and operate. Our
workisbasedontheCodeofConduct,
which provides the basis for our approach
to such issues as environment, health
and safety, employee relations, human
rights, business ethics and community
involvement.
EnvironmentPackages aims to increase the quality of life for people at all levels of society, conserve energy and preserve precious environmental resources. The idea is to go “Green”inPakistan.Moreover,westrivetominimizeenergy consumption and wherever possible, use environment friendly sources of energy.
Packages is a member of the global network of green offices project of the World Wide Fund for Nature and the first Company in Pakistan to be awarded Green Office Diploma in the manufacturing sector. Green Office is an environmental service for offices. With its help, workplaces are able to reduce their burden on the environment, achieve savings and slow down environmental changes.
We have already phased out CFC’s (Chlorofluorocarbon’s) gases according to Montreal Protocol and have been reducing the consumption of HCFC’s by replacing them with approved gases to controlthegreenhouseeffect.
We have conducted detailed energy audits that identify projects that can efficiently use, reduce or recycle energy. Packages is also working on proper utilisation of solar technology and as a first step the Company has replaced all its street lights with solar backed LED lights. Production lights were also replaced by more efficient LED systems. Moreover, the Company is also embarking on solar solutions for its offices to further reduce its energy costs.
Packages strives for outstanding Environmental performance and health and safety records by not only ensuring strict regulatory compliance, but also by developing operational practices. The prime areas focused in 2013 were Food Safety, Fire Safety, Customer Audits and Training and Development.
34
Other than certifications, Packages was also awarded the Fire Safety Award 2013 given by National Forum for Environment and Health (NFEH) and the Environmental Excellence Award 2013 presented by NFEH.
Being an ardent supporter of environmental friendly initiatives, Packagesstartedoffitsenvironmentalcampaign ‘DARE TO CARE’ with full vigor and zest. This campaign was launched as a part of the Earth DayCelebrationswith192countriesaround the globe as a gesture to combat environment change and deforestation.
Our management gathered on 22nd April 2013 to rekindle the spirit of environmental concern amongst each other and give back to mother earth by replenishing its natural resources.
The campaign aimed to encourage employees across Packages to make small changes to their working habits to positively impact the environment and to promote the idea of sustainable way of working.
The campaign had an array of activities: A Plantation Drive, Scavenger Hunt, Setting up a Green Corner, Junk Modeling Competition and Nature Photography Competition.
Health and safetySound environmental practices are an important component of Packages corporate culture. On daily basis we strive to safeguard the health and well being of our employees, neighbors and customers, as well as the communities where we live, work and in which we operate.
One of the corporate objectives of the Company is to provide safe and healthy work place to its employees and other stakeholders. The provision of a safe working environment is of paramount importance at Packages. Safety statistics fill an important function in the Company’s health and safety activities and form the basis of risk analysis and continuous improvements.
Our main procedures in safety include a comprehensive risk assessment and control procedure, permit to work, log out tag out, incident reporting, emergency response, and compliance evaluation procedures. All new entrants go through safety orientation program and sign an affidavit of their awareness. We carry both external and internal trainings regarding occupational health and safety.
We are also making progress in our focus areas of behavior based safety and controlling risks with engineering as well as administrative controls and thus minimizing the risks of injuries and accidents.
SocietyIt’s our mission to create opportunities so people can live better. We consider it our responsibility to make a positive impact in the communities we serve. Whether it’s through the grants we provide to various organizations that share our mission or throughtheinspiringvolunteerefforts,weare passionate about helping people live better.
Packages visualises a clear connection between the growth of the Company and the strength of the communities where we operate. We strive to contribute to societal welfare through providing educational opportunities, employment, sponsoring various events, promoting culture, arts and organizing events and awareness campaigns.
Community welfare schemesMakingadifferenceisimportanttoallof us at Packages. We are proud of our 56-year history of corporate giving, supporting groups working for progressive socialchangeinvariousarenas.Weofferedour contributions to various hospitals, trusts and non-profit organizations during the year.
Promoting Traditional Mela CulturePackages is an organization which always looksforwardtoarrangedifferenteventsto promote traditional activities within the society. Women and children Mela is one of these activities which Packages has been organizing for the last many years. The objective of this event is to provide entertainment to the family members of our employees and the residents of our vicinity keeping in view the cultural aspect of our society. More than 1,000 families participate in this event every year and enjoytherealtasteofa“Mela”.
Rose FestivalPromotion of natural beauty always remains at top priority in Packages and the prime example of it is the most famous and colorful event, “The Packages RoseFestival”.Weconductthiseventin our gardens every year where there are more than three hundred types of Roses bloom their beautiful colors to welcome the distinguished guests from local community, customers, vendors and employees.Adisplayofdifferentkindsofpeacocks is an essential part of this event where these beautiful birds attract the audience, especially children, by making arch of their naturally colored wings.
Annual Report of Packages Limited 2013
35
Sports ActivitiesThe Management believes in the maxim, “Ahealthybodyhasahealthymind”andtherefore promotion of sports always plays a vital role in our CSR initiatives. To carry out all these sports activities, we have in house sports complex. Some of these activities aim to promote sports at grass root level within the country are:
• JaffarMemorialInterSchoolHockeyTournament
• BabarAliFoundationInterSchoolFootball Tournament
• BabarAliFoundationInterSchoolHockey Tournament for Girls
Besidesthis,Packagesofferssportsfacilitiesfor its employees as well. Every year, inter departmental tournament starts the sports year of Packages and ends with the annual sports day celebrations. These sports activities also provide a platform to the employees to become part of the Packages Sports Teams which represents the Companyindifferentsportscompetition.
Human CapitalEmployee Initiatives
Our greatest asset is our employees. We are committed to attracting, retaining, and developing the highest quality and most dedicated work force. So we strive to hire and promote people on the basis of their qualifications, performance, and abilities, and are determined to provide equal opportunities to our employees and work environment free of any form of discrimination.
Trainings
Packages has both local and international training programs for its employees. Employee training needs are periodically reviewed, various in-house and customized training programs are arranged for production, marketing, human resource, supply management and finance personnel.
IncontinuationtoCompany’seffortsfor capacity building of top talent, we organized Certificate Program in Business Management in collaboration with Lahore University of Management Sciences (LUMS). The objective of this programme is to provide essential management knowledge, skills and tools that will enhance performance and prepare individuals for higher roles & responsibilities. It also focuses on developing competencies necessary to respond to changing business environment.
Packages is also recognised as a training organization as it is one of the platinum rated training providers for “Association ofCharteredAccountants-UK”.Wealso provide necessary apprenticeships to industrial diploma holders in our production departments.
Healthcare and Fitness facilities
The health and welfare of our employees has always been a matter of utmost importance and significance at Packages. We provide comprehensive medical coverage to our executive employees and their families in our medical centre i.e. an operation theatre, a pathology laboratory and a pharmacy.
The Company also invested in a sports complex for indoor games such as Badminton, Squash and Table . and a Gymnasium with state of the art fitness equipment for its employees.
During the year 2013, the Company has also established a fitness gym for it’s non-executive employees to provide them with better fitness opportunities.
Fair Price ShopPackages has also established a fair price shop for its employees to facilitate them in the purchase of their grocery items. Packages is spending a good amount of money as subsidy on the pulses for the workers.FairPriceshopisalsoofferingother general stores and clothing items on no profit no loss basis to employees. Workers may get these items on monthly credit as well.
ScholarshipsWeoffermeritscholarships to the children of our employees to appreciate their talent and promote healthy competition in the form of monitory reimbursements that vary with the level of education.
Hajj FacilityEvery year, Packages has the privilege to send 10 of its employees for Hajj through ballot. This includes 7 employees from non-executivestaffand3fromexecutiveandmanagementstaff.Companybearsallexpenses of theses employees pertaining to thisreligiousoffering.
Long Service AwardsPackages gives awards to its employees as a token of appreciation for their continued association with the Company based on their services.
36
Corporate Calendar
Major Events and Meetings Date
Audit Committee and BOD meetings to consider annual accounts of the Company for
the year ended December 31, 2012 March 18, 2013
Transfer of assets and related obligations of Paper & Paperboard and Corrugated Boxes
businesses of the Company to Bulleh Shah Packaging (Private) Limited April 01, 2013
Audit Committee and BOD meetings to consider quarterly accounts of the Company
for the quarter ended March 31, 2013 April 23, 2013
Annual General Meeting of shareholders to consider annual accounts of the Company
for the year ended December 31, 2012 and dividend announcement April 30, 2013
Induction of Stora Enso OYJ as joint venture partner of Packages Limited in
Bulleh Shah Packaging (Private) Limited May 31, 2013
Audit Committee and BOD meetings to consider half yearly accounts of the Company
for the period ended June 30, 2013 August 26, 2013
Audit Committee and BOD meetings to consider quarterly accounts of the Company
for the period ended September 30, 2013 October 25, 2013
Annual Report of Packages Limited 2013
37
Notice of Annual General Meeting
Noticeisherebygiventhatthe59thAnnual General Meeting of Packages Limited will be held on Thursday, April 3,2014at10.30a.m.attheBeachLuxury Hotel, Moulvi Tamizuddin Khan Road, Karachi to transact the following ordinary business :-
1. To confirm the Minutes of the 58th Annual General Meeting of the Company held on April 30, 2013.
2. To receive and adopt the Audited Financial Statements of the Company for the year ended December 31, 2013 together with the Directors’ and Auditors’ Reports thereon.
3. To consider and approve the payment of cash dividend for the year ended December 31, 2013 as recommended by the Board of Directors -
a) to the preference share/convertible stock holder (International Finance Corporation) at the rate of Rs.19(10%)perpreferenceshare/convertible stock of Rs.190intermsoftheSubscription Agreement between Packages Limited and International Finance Corporation; and
b) to the ordinary shareholders at the rate of Rs. 8 (80%) per ordinary share of Rs. 10.
4. ToappointAuditorsfortheyear2014andtofixtheirremuneration.
By Order of the Board
Karachi Adi J. CawasjiFebruary19,2014 CompanySecretary
Notes :
1. The Share Transfer Books of the Company will remain closed fromMarch20,2014toApril3,2014(bothdaysinclusive)andthe final dividend will be paid to the shareholders whose names will appear in the Register of Members onMarch19,2014.
2. A member entitled to attend and vote at the meeting may appoint a proxy in writing to attend the meeting and vote on the member’s behalf. A Proxy need not be a member of the Company.
3. Duly completed forms of proxy must be deposited with the Company Secretary at the Registered Office of the Company at4thFloor,TheForum,Suite#416-422,G-20,Block9,Khayaban-e-Jami, Clifton, Karachi-75600 not laterthan48hoursbeforethetimeappointed for the meeting.
4. Shareholders(Non-CDC)arerequested to promptly notify the Company’s Registrar of any change in their addresses and submit, if applicable to them, the Non-deductionofZakatFormCZ-50with the Registrar of the Company M/s FAMCO Associates (Pvt.) Limited, 8-F, Next to Hotel Faran, Nursery, Block 6, P.E.C.H.S., Shahrah-e-Faisal,Karachi-75400.All the Shareholders holding their shares through the CDC are requested to please update their addressesandZakatstatuswiththeir Participants. This will assist in the prompt receipt of Dividend.
5. As instructed by the Securities and Exchange Commission of Pakistan (SECP) vide its letter No.EMD/D-II/Misc/2009-1342datedApril4,2013dividendwarrantscannotbe issued without insertion of CNIC numbers. Thus, all those shareholders holding physical shares who have not submitted their valid CNICs are requested to send a photocopy of their valid CNIC/National Tax Numbers along with the folio numbers to the Company’s Shares Registrar. No dividend will be payable unless the CNIC Number is printed on the dividend warrants, therefore, please provide the Company with your CNIC Numbers, failing which the Company will not be responsible if it is not able to pay the dividends.
6. In order to make the process of payment of cash dividend more efficient, SECP vide its CircularNo.8(4)SM/CDC2008dated April 5, 2013 has issued instructions so that the shareholders can get their dividend credited in their respective bank accounts electronically without any delay. The shareholders may, therefore, authorize the Company to credit the dividend directly to their bank account for all future dividends declared by the Company. Accordingly, all non-CDC shareholders are requested to send their bank account details to the Company’s Shares Registrar at the address given above. Shareholders who hold shares with Participant/Central Depository Company of Pakistan Limited (CDC) are advised to provide the mandate to the concerned Stock Broker /Central Depository Company of Pakistan Limited (CDC).
7. Any individual beneficial owner of the Central Depository Company, entitled to vote at this meeting, must bring his/her Computerized National Identity Card (CNIC) with him/her to prove his/her identity, and in case of proxy must enclose an attested copy of his/her CNIC. The representatives of corporate bodies should bring attested copy of board of directors’ resolution/power of attorney and/or all such documents required under Circular No.1 dated January 26, 2000 issued by the Securities and Exchange Commission of Pakistan for the purpose.
8. Form of proxy is attached in the Annual Report and should be witnessed by two persons whose names, addresses and CNIC Numbers are mentioned on the forms.
38

Notice of Annual General Meeting
“There is no doubt that creativity is the most important human resource of all. Without creativity, there would be no progress, and we would be forever repeating the same patterns.”– Edward de Bono
Annual Report of Packages Limited 2013
39
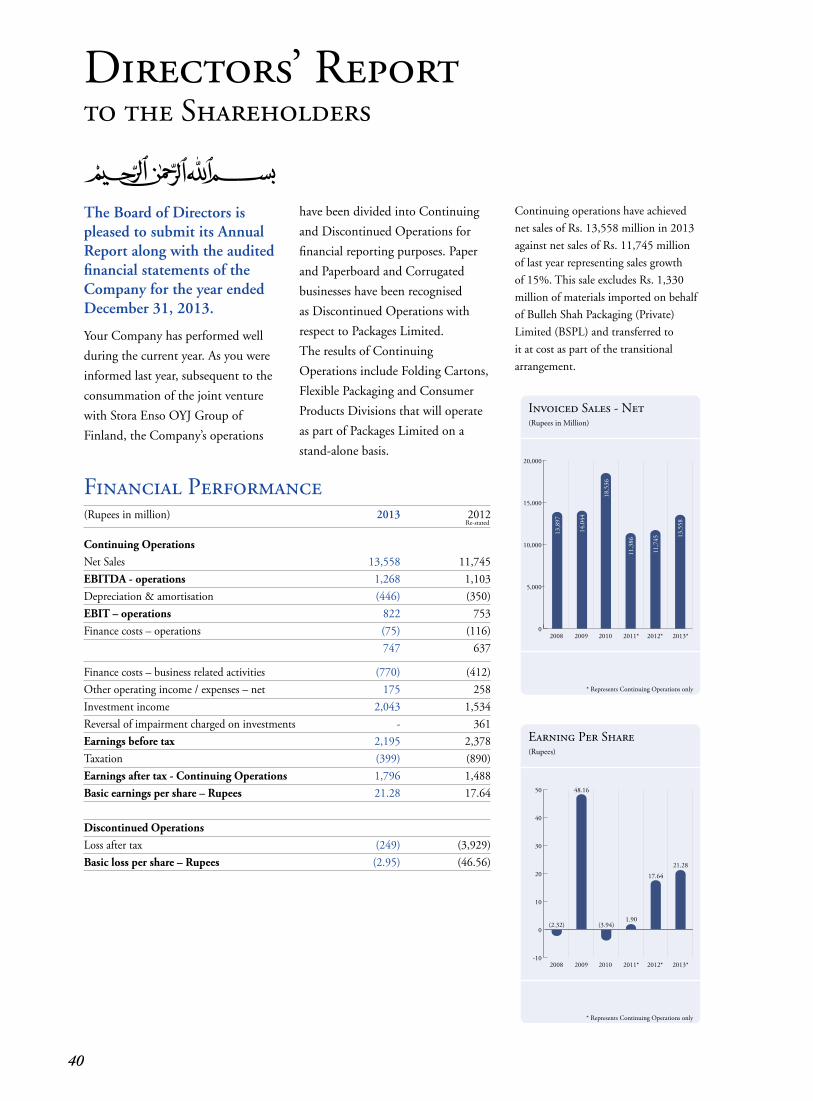
Directors’ Reportto the Shareholders
The Board of Directors is pleased to submit its Annual Report along with the audited financial statements of the Company for the year ended December 31, 2013.
Your Company has performed well
during the current year. As you were
informed last year, subsequent to the
consummation of the joint venture
with Stora Enso OYJ Group of
Finland, the Company’s operations
have been divided into Continuing
and Discontinued Operations for
financial reporting purposes. Paper
and Paperboard and Corrugated
businesses have been recognised
as Discontinued Operations with
respect to Packages Limited.
The results of Continuing
Operations include Folding Cartons,
Flexible Packaging and Consumer
Products Divisions that will operate
as part of Packages Limited on a
stand-alone basis.
Financial Performance(Rupees in million) 2013 2012 Re-stated
Continuing Operations Net Sales 13,558 11,745EBITDA - operations 1,268 1,103Depreciation & amortisation (446) (350)EBIT – operations 822 753Finance costs – operations (75) (116) 747 637
Finance costs – business related activities (770) (412)Other operating income / expenses – net 175 258Investment income 2,043 1,534Reversal of impairment charged on investments - 361Earnings before tax 2,195 2,378Taxation (399) (890)Earnings after tax - Continuing Operations 1,796 1,488Basic earnings per share – Rupees 21.28 17.64
Discontinued Operations Loss after tax (249) (3,929)Basic loss per share – Rupees (2.95) (46.56)
Continuing operations have achieved
net sales of Rs. 13,558 million in 2013
against net sales of Rs. 11,745 million
of last year representing sales growth
of 15%. This sale excludes Rs. 1,330
million of materials imported on behalf
of Bulleh Shah Packaging (Private)
Limited (BSPL) and transferred to
it at cost as part of the transitional
arrangement.
2013*2012*2011*201020092008
Invoiced Sales - Net (Rupees in Million)
0
5,000
10,000
15,000
20,000
13,8
97
14,0
44
18,5
36
11,7
45 13,5
58
11,3
86
* Represents Continuing Operations only
2013*2012*2011*201020092008-10
0
10
20
30
40
50
(2.32) (3.94)
17.64
21.28
1.90
Earning Per Share(Rupees)
48.16
* Represents Continuing Operations only
40
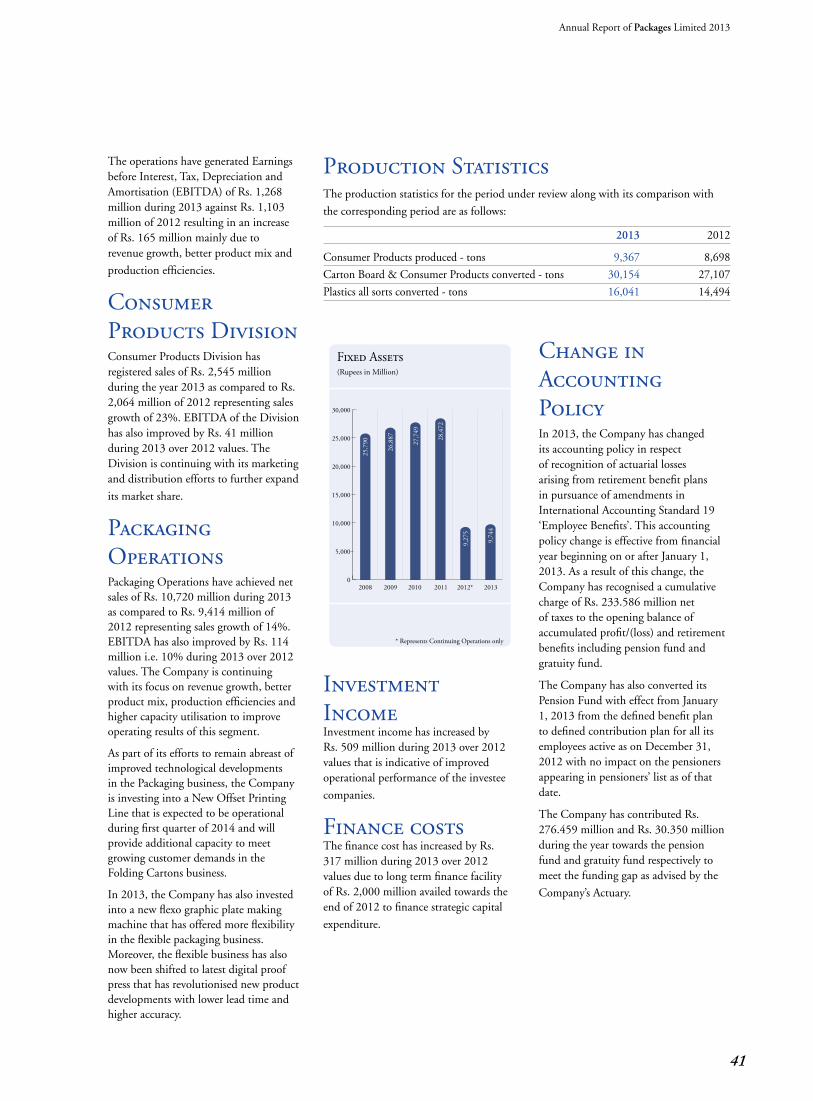
The operations have generated Earnings before Interest, Tax, Depreciation and Amortisation (EBITDA) of Rs. 1,268 million during 2013 against Rs. 1,103 million of 2012 resulting in an increase of Rs. 165 million mainly due to revenue growth, better product mix and
production efficiencies.
Consumer Products DivisionConsumer Products Division has registered sales of Rs. 2,545 million during the year 2013 as compared to Rs. 2,064 million of 2012 representing sales growth of 23%. EBITDA of the Division has also improved by Rs. 41 million during 2013 over 2012 values. The Division is continuing with its marketing and distribution efforts to further expand
its market share.
Packaging OperationsPackaging Operations have achieved net sales of Rs. 10,720 million during 2013 as compared to Rs. 9,414 million of 2012 representing sales growth of 14%. EBITDA has also improved by Rs. 114 million i.e. 10% during 2013 over 2012 values. The Company is continuing with its focus on revenue growth, better product mix, production efficiencies and higher capacity utilisation to improve operating results of this segment.
As part of its efforts to remain abreast of improved technological developments in the Packaging business, the Company is investing into a New Offset Printing Line that is expected to be operational during first quarter of 2014 and will provide additional capacity to meet growing customer demands in the Folding Cartons business.
In 2013, the Company has also invested into a new flexo graphic plate making machine that has offered more flexibility in the flexible packaging business. Moreover, the flexible business has also now been shifted to latest digital proof press that has revolutionised new product developments with lower lead time and higher accuracy.
Production StatisticsThe production statistics for the period under review along with its comparison with
the corresponding period are as follows:
2013 2012
Consumer Products produced - tons 9,367 8,698Carton Board & Consumer Products converted - tons 30,154 27,107Plastics all sorts converted - tons 16,041 14,494
Investment IncomeInvestment income has increased by Rs. 509 million during 2013 over 2012 values that is indicative of improved operational performance of the investee
companies.
Finance costsThe finance cost has increased by Rs. 317 million during 2013 over 2012 values due to long term finance facility of Rs. 2,000 million availed towards the end of 2012 to finance strategic capital
expenditure.
Change in Accounting PolicyIn 2013, the Company has changed its accounting policy in respect of recognition of actuarial losses arising from retirement benefit plans in pursuance of amendments in International Accounting Standard 19 ‘Employee Benefits’. This accounting policy change is effective from financial year beginning on or after January 1, 2013. As a result of this change, the Company has recognised a cumulative charge of Rs. 233.586 million net of taxes to the opening balance of accumulated profit/(loss) and retirement benefits including pension fund and gratuity fund.
The Company has also converted its Pension Fund with effect from January 1, 2013 from the defined benefit plan to defined contribution plan for all its employees active as on December 31, 2012 with no impact on the pensioners appearing in pensioners’ list as of that date.
The Company has contributed Rs. 276.459 million and Rs. 30.350 million during the year towards the pension fund and gratuity fund respectively to meet the funding gap as advised by the
Company’s Actuary.
20132012*2011201020092008
Fixed Assets(Rupees in Million)
0
5,000
10,000
15,000
20,000
25,000
30,000
25,7
90
26,8
87
27,7
49
9,27
5
9,74
4
28,4
72
* Represents Continuing Operations only
Annual Report of Packages Limited 2013
41
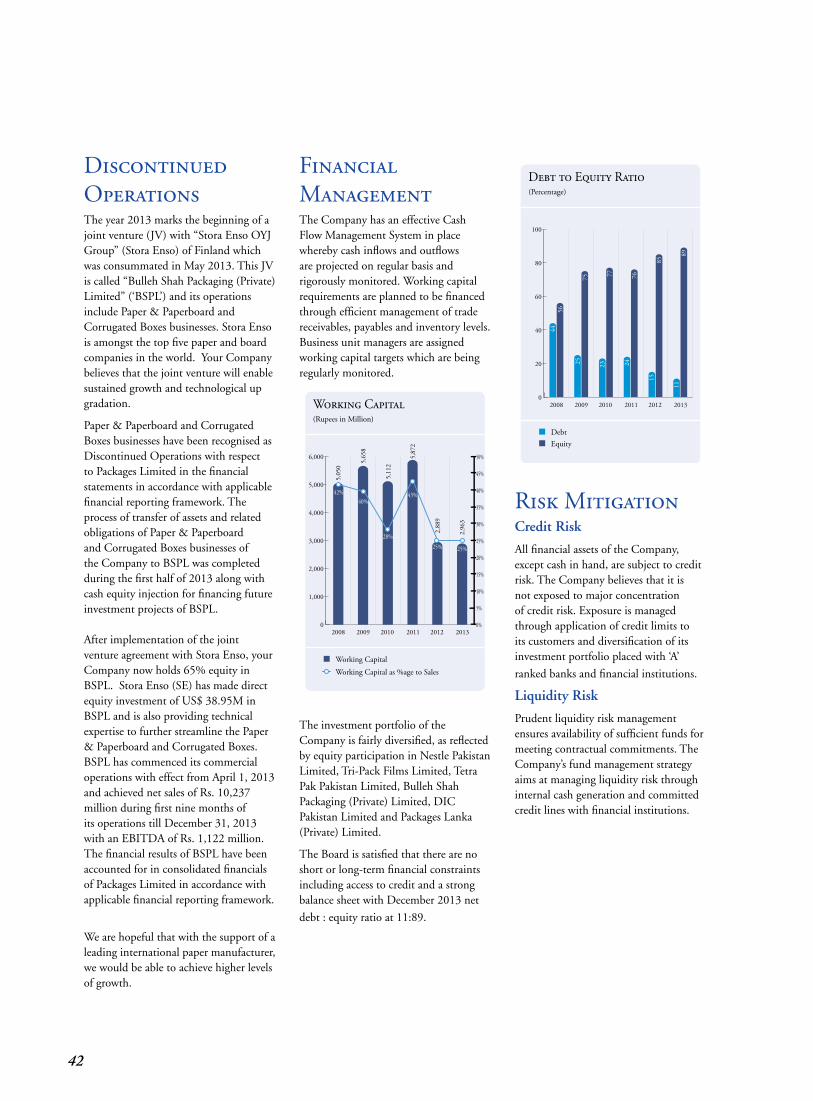
Discontinued OperationsThe year 2013 marks the beginning of a joint venture (JV) with “Stora Enso OYJ Group” (Stora Enso) of Finland which was consummated in May 2013. This JV is called “Bulleh Shah Packaging (Private) Limited” (‘BSPL’) and its operations include Paper & Paperboard and Corrugated Boxes businesses. Stora Enso is amongst the top five paper and board companies in the world. Your Company believes that the joint venture will enable sustained growth and technological up gradation.
Paper & Paperboard and Corrugated Boxes businesses have been recognised as Discontinued Operations with respect to Packages Limited in the financial statements in accordance with applicable financial reporting framework. The process of transfer of assets and related obligations of Paper & Paperboard and Corrugated Boxes businesses of the Company to BSPL was completed during the first half of 2013 along with cash equity injection for financing future investment projects of BSPL.
After implementation of the joint venture agreement with Stora Enso, your Company now holds 65% equity in BSPL. Stora Enso (SE) has made direct equity investment of US$ 38.95M in BSPL and is also providing technical expertise to further streamline the Paper & Paperboard and Corrugated Boxes. BSPL has commenced its commercial operations with effect from April 1, 2013 and achieved net sales of Rs. 10,237 million during first nine months of its operations till December 31, 2013 with an EBITDA of Rs. 1,122 million. The financial results of BSPL have been accounted for in consolidated financials of Packages Limited in accordance with applicable financial reporting framework.
We are hopeful that with the support of a leading international paper manufacturer, we would be able to achieve higher levels of growth.
0
1,000
2,000
3,000
4,000
5,000
6,000
201320122011201020092008
Working Capital (Rupees in Million)
5,05
0
42%40%
28%
43%
25% 25%
5,65
8
5,11
2
2,88
9
2,96
3
5,87
2
0%
5%
10%
15%
20%
25%
30%
35%
40%
45%
50%
Working CapitalWorking Capital as %age to Sales
201320122011201020092008
Debt to Equity Ratio(Percentage)
DebtEquity
0
20
40
60
80
100
4456
75 77 76
85
89
25 23 24
15
11
Financial ManagementThe Company has an effective Cash Flow Management System in place whereby cash inflows and outflows are projected on regular basis and rigorously monitored. Working capital requirements are planned to be financed through efficient management of trade receivables, payables and inventory levels. Business unit managers are assigned working capital targets which are being regularly monitored.
The investment portfolio of the Company is fairly diversified, as reflected by equity participation in Nestle Pakistan Limited, Tri-Pack Films Limited, Tetra Pak Pakistan Limited, Bulleh Shah Packaging (Private) Limited, DIC Pakistan Limited and Packages Lanka (Private) Limited.
The Board is satisfied that there are no short or long-term financial constraints including access to credit and a strong balance sheet with December 2013 net
debt : equity ratio at 11:89.
Risk Mitigation Credit Risk
All financial assets of the Company, except cash in hand, are subject to credit risk. The Company believes that it is not exposed to major concentration of credit risk. Exposure is managed through application of credit limits to its customers and diversification of its investment portfolio placed with ‘A’
ranked banks and financial institutions.
Liquidity Risk
Prudent liquidity risk management ensures availability of sufficient funds for meeting contractual commitments. The Company’s fund management strategy aims at managing liquidity risk through internal cash generation and committed credit lines with financial institutions.
42
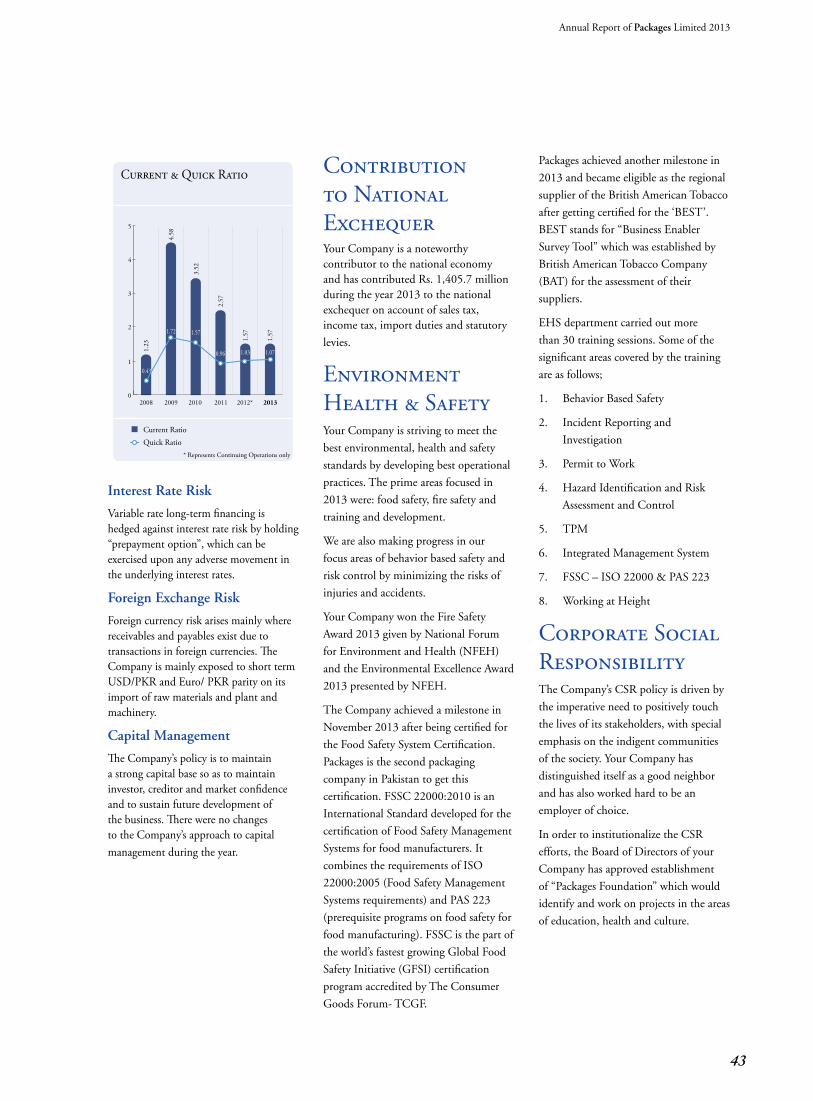
Interest Rate Risk
Variable rate long-term financing is hedged against interest rate risk by holding “prepaymentoption”,whichcanbeexercised upon any adverse movement in the underlying interest rates.
Foreign Exchange Risk
Foreign currency risk arises mainly where receivables and payables exist due to transactions in foreign currencies. The Company is mainly exposed to short term USD/PKR and Euro/ PKR parity on its import of raw materials and plant and machinery.
Capital Management
The Company’s policy is to maintain a strong capital base so as to maintain investor, creditor and market confidence and to sustain future development of the business. There were no changes to the Company’s approach to capital management during the year.
20132012*2011201020092008
Current & Quick Ratio
1.23
0.43
1.72 1.57
0.96 1.03 1.07
4.58
3.52
1.57
1.57
2.57
Current RatioQuick Ratio
0
1
2
3
4
5
* Represents Continuing Operations only
Contribution to National ExchequerYour Company is a noteworthy contributor to the national economy and has contributed Rs. 1,405.7 million during the year 2013 to the national exchequer on account of sales tax, income tax, import duties and statutory
levies.
Environment Health & Safety Your Company is striving to meet the
best environmental, health and safety
standards by developing best operational
practices. The prime areas focused in
2013 were: food safety, fire safety and
training and development.
We are also making progress in our
focus areas of behavior based safety and
risk control by minimizing the risks of
injuries and accidents.
Your Company won the Fire Safety
Award 2013 given by National Forum
for Environment and Health (NFEH)
and the Environmental Excellence Award
2013 presented by NFEH.
The Company achieved a milestone in
November 2013 after being certified for
the Food Safety System Certification.
Packages is the second packaging
company in Pakistan to get this
certification. FSSC 22000:2010 is an
International Standard developed for the
certification of Food Safety Management
Systems for food manufacturers. It
combines the requirements of ISO
22000:2005 (Food Safety Management
Systems requirements) and PAS 223
(prerequisite programs on food safety for
food manufacturing). FSSC is the part of
the world’s fastest growing Global Food
Safety Initiative (GFSI) certification
program accredited by The Consumer
Goods Forum- TCGF.
Packages achieved another milestone in
2013 and became eligible as the regional
supplier of the British American Tobacco
after getting certified for the ‘BEST’.
BEST stands for “Business Enabler
Survey Tool” which was established by
British American Tobacco Company
(BAT) for the assessment of their
suppliers.
EHS department carried out more
than 30 training sessions. Some of the
significant areas covered by the training
are as follows;
1. Behavior Based Safety
2. Incident Reporting and
Investigation
3. Permit to Work
4. Hazard Identification and Risk
Assessment and Control
5. TPM
6. Integrated Management System
7. FSSC – ISO 22000 & PAS 223
8. Working at Height
Corporate Social ResponsibilityThe Company’s CSR policy is driven by
the imperative need to positively touch
the lives of its stakeholders, with special
emphasis on the indigent communities
of the society. Your Company has
distinguished itself as a good neighbor
and has also worked hard to be an
employer of choice.
In order to institutionalize the CSR
efforts, the Board of Directors of your
Company has approved establishment
of “Packages Foundation” which would
identify and work on projects in the areas
of education, health and culture.
Annual Report of Packages Limited 2013
43
Retirement FundsThere are three retirement funds
currently being operated by the
Company namely Provident Fund,
Gratuity Fund and Pension Fund.
The value of investments of provident,
gratuity and pension funds based on
their audited accounts as on December
31, 2013 were the following:
Provident Fund Rs. 1,361.466 million
Gratuity Fund Rs. 280.321 million
Pension Fund Rs. 1,354.105 million
With effect from January 1, 2013, the Board of Trustees of the Pension Fund converted the defined benefit plan to defined contribution plan for all its employees active as on December 31, 2012 subject to necessary regulatory approvals. The conversion scheme was approved by the taxation authorities on February 22, 2013 and respective employees consent with the conversion scheme was also obtained during the year 2013. There has been no effect of such conversion on the pensioners appearing in pensioner’s list of the Fund as of December 31, 2012. Such conversion has been accounted for in accordance with provisions of relevant financial reporting
framework.
AppropriationIn view of the positive financial results of the Company during the year 2013, the Board
of Directors of the Company has recommended cash dividend of 80 percent (i.e. Rs. 8
per share). Accordingly, the following appropriations have been made:
(Rupees in thousand)
Total Comprehensive Income for the year 2013 after appropriationofpreferencedividend/returnofRs.412.050M 1,567,788Accumulatedprofitbroughtforward 17,928
Available for appropriation 1,585,716Transfer to General Reserve 700,000Cash Dividend 675,036
Tobecarriedforwardto2014 210,680
AuditorsThe present auditors M/s A.F. Ferguson & Co., Chartered Accountants retire and offer themselves for reappointment. They have confirmed achieving satisfactory rating by the Institute of Chartered Accountants of Pakistan (ICAP) and compliance with the Guidelines on the Code of Ethics of the International Federation of Accountants (IFAC) as adopted by ICAP.
As suggested by the Audit Committee, the Board of Directors has recommended their reappointment as Auditors of the Company for the year ending December
31, 2014, at a fee to be mutually agreed.
Compliance with the Code of Corporate GovernanceThe requirements of the Code of Corporate Governance set out by the Karachi, Lahore and Islamabad Stock Exchanges in their Listing Regulations have been adopted by the Company and have been duly complied with. A Statement to this effect is annexed to the
Report.
Material ChangesThere have been no material changes since December 31, 2013 and the Company has not entered into any commitment, which would affect its financial position at the date except for those mentioned in the audited financial statements of the Company for the year
ended December 31, 2013.
Changes in the Composition of Board and its Audit CommitteeDuring the year 2013, two casual vacancies arose on the Board of Directors of the Company which were duly filled by the Board as follows:
1. Mr. Wazir Ali Khoja, nominee of National Investment Trust Limited, resigned from the Board of Directors of the Company on June 14, 2013 and Mr. Tariq Iqbal Khan was nominated by National Investment Trust Limited on the Board of Directors of the Company in his place.
2. Mr. Shahid Aziz Siddiqui, nominee of State Life Insurance Corporation of Pakistan, resigned from the Board of Directors of the Company on September 23, 2013 and Mr. Alamuddin Bullo was nominated by State Life Insurance Corporation of Pakistan on the Board of Directors of the Company in his place.
The Board wishes to place on record its appreciation of the valuable services rendered by outgoing Directors during the tenure of their office and welcomes the new Directors who will hold office for the remainder of the term of outgoing members.
The Board has decided to induct Mr. Alamuddin Bullo, a non-executive Director, as a member of the Audit
Committee.
44
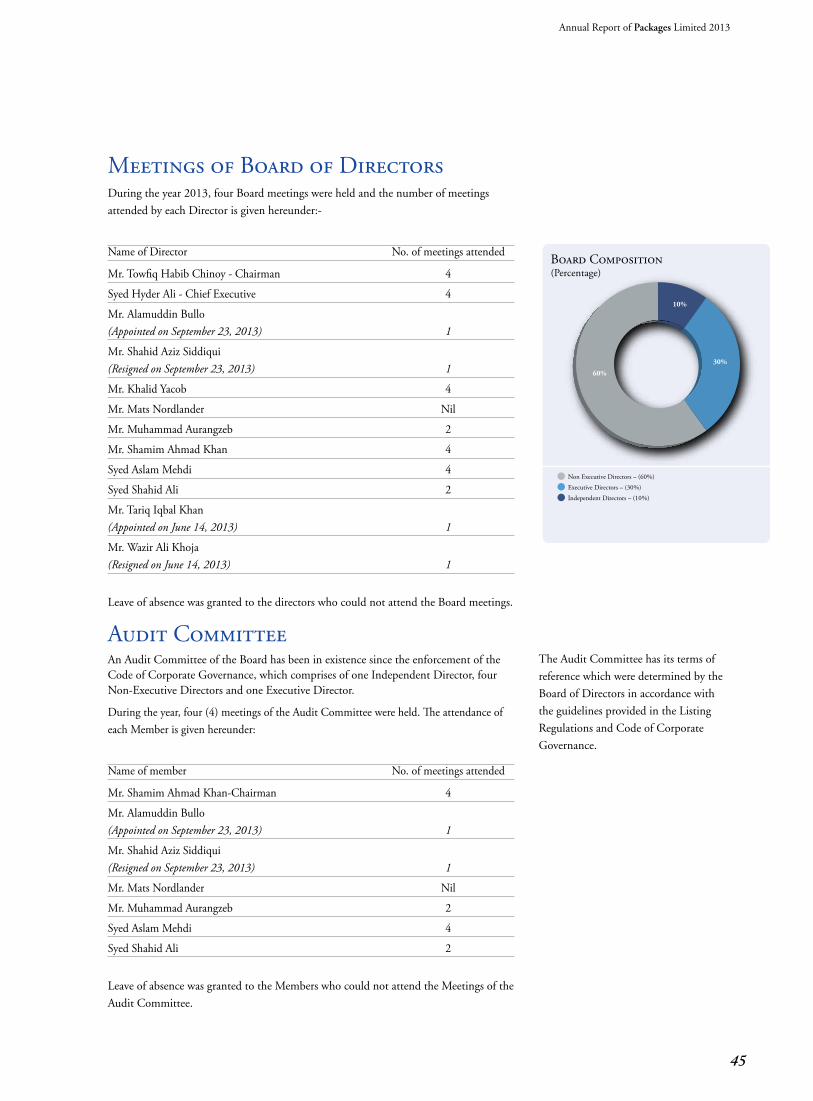
Non Executive Directors – (60%)
Executive Directors – (30%)
Board Composition(Percentage)
60%
30%
10%
Independent Directors – (10%)
Meetings of Board of DirectorsDuring the year 2013, four Board meetings were held and the number of meetings
attended by each Director is given hereunder:-
Name of Director No. of meetings attended
Mr.TowfiqHabibChinoy-Chairman 4
SyedHyderAli-ChiefExecutive 4
Mr. Alamuddin Bullo(Appointed on September 23, 2013) 1
Mr. Shahid Aziz Siddiqui(Resigned on September 23, 2013) 1
Mr.KhalidYacob 4
Mr. Mats Nordlander Nil
Mr. Muhammad Aurangzeb 2
Mr.ShamimAhmadKhan 4
SyedAslamMehdi 4
Syed Shahid Ali 2
Mr. Tariq Iqbal Khan(Appointed on June 14, 2013) 1
Mr. Wazir Ali Khoja (Resigned on June 14, 2013) 1
Leave of absence was granted to the directors who could not attend the Board meetings.
Audit CommitteeAn Audit Committee of the Board has been in existence since the enforcement of the Code of Corporate Governance, which comprises of one Independent Director, four Non-Executive Directors and one Executive Director.
Duringtheyear,four(4)meetingsoftheAuditCommitteewereheld.Theattendanceofeach Member is given hereunder:
Name of member No. of meetings attended
Mr.ShamimAhmadKhan-Chairman 4
Mr. Alamuddin Bullo(Appointed on September 23, 2013) 1
Mr. Shahid Aziz Siddiqui (Resigned on September 23, 2013) 1
Mr. Mats Nordlander Nil
Mr. Muhammad Aurangzeb 2
SyedAslamMehdi 4
Syed Shahid Ali 2
Leave of absence was granted to the Members who could not attend the Meetings of the
Audit Committee.
The Audit Committee has its terms of
reference which were determined by the
Board of Directors in accordance with
the guidelines provided in the Listing
Regulations and Code of Corporate
Governance.
Annual Report of Packages Limited 2013
45
Corporate and Financial Reporting Framework• Thefinancialstatementstogether
with the notes thereon have been drawn up by the management in conformity with the Companies Ordinance, 1984. These Statements present fairly the Company’s state of affairs, the results of its operations, cash flow and changes in equity.
• Properbooksofaccounthavebeenmaintained by the Company.
• Appropriateaccountingpolicieshave been consistently applied in the preparation of financial statements and accounting estimates are based on reasonable and prudent judgment.
• InternationalAccountingStandards,as applicable in Pakistan, have been followed in the preparation of the financial statements.
• Thesystemofinternalcontrolis sound in design and has been effectively implemented and monitored and is being continuously reviewed by the internal audit function.
• TherearenodoubtsupontheCompany’s ability to continue as a going concern.
• Therehasbeennomaterialdeparture from the Best Practices of Corporate Governance, as detailed in the Listing Regulations.
• Thekeyoperatingandfinancialdata for the last ten years is annexed.
The Directors, CEO, CFO, Company Secretary, Head of Internal Audit, other executive employees and their spouses or minor children did not carry out any trade in the shares of the Company during the year. For the purpose of this regulation, executives are considered as those employees having annual basic salary of more than Rs. 500,000/-; being the threshold for the year 2013 set by the
Board.
Pattern of ShareholdingA statement of the pattern of shareholding of different classes of shareholders as at December 31, 2013 is included in the annexed shareholders’
information.
Future Outlook The management remains confident that the economy would improve in the future and the Company shall be able to maintain its market position. It is expected that the trend of shift from unpacked to packed products would gain accelerated momentum with growing middle class, urbanization and a changing life style.
Consumer Products Division is striving to not only regain its market share but also to enhance the market size through advertisement, extensive trade and distribution program. The Division is also actively focusing on its Away From Home (AFH) category.
With the start-up of new offset printing line during first quarter of 2014, the Company is confident of getting deeper penetration into this segment of packaging business.
(Towfiq Habib Chinoy)
Chairman
Lahore, February 19, 2014
The Company is also evaluating various options for reduction of its energy costs and has already embarked on installation of a solar solution for its offices.
Despite the rising raw material prices and electricity and gas shortages, your Company is improving shareholder’s value through tight cost control, product and process optimisation, price rationalisation and efficient working capital management.
In respect of Paper & Paperboard and Corrugated Boxes businesses, the management believes that the new joint venture shall bring considerable value to its shareholders.
Company’s Staff and CustomersThe management is thankful to the Company’s stakeholders especially its customers for their continuing confidence in its products and services.
The management also wishes to express its gratitude to all the Company’s employees who have worked tirelessly and delivered outstanding performance in the backdrop of the economic recession and a difficult business situation. We appreciate their hard work,
loyalty and dedication.
(Syed Hyder Ali)
Chief Executive & Managing Director
Lahore, February 19, 2014
46

“You see things; and you say, ‘Why?’ But I dream things that never were; and I say, ‘Why not’?”
– George Bernard Shaw
Annual Report of Packages Limited 2013
47
Shareholders’ Information
Registered Office
4th Floor, The Forum
Suite # 416-422, G-20, Block 9
Khayaban-e-Jami, Clifton
Karachi-75600
PABX :(21) 35831618
:(21) 35831664
:(21) 35833011
:(21) 35874047 - 49
Fax :(21) 35860251
Shares Registrar
FAMCO Associates (Pvt.) Limited
8-F, Next to Hotel Faran
Nursery, Block 6, P.E.C.H.S.,
Shahrah-e-Faisal
Karachi-75400
PABX :(21) 34380101-2
Fax :(21) 34380106
Listing on Stock Exchanges
Packages equity shares are listed on
Karachi, Lahore and Islamabad Stock
Exchanges.
Listing Fees
The annual listing fee for the financial
year 2013-14 has been paid to all
the three stock exchanges within the
prescribed time limit.
Stock Code
The stock code for dealing in equity
shares of Packages at KSE, LSE and ISE
is PKGS.
Shares Registrar
Packages’ shares department is operated
by FAMCO Associates (Pvt.) Limited
and serves about 3,765 shareholders. It
is managed by a well-experienced team
of professionals and is equipped with
the necessary infrastructure in terms of
computer facilities and comprehensive
set of systems and procedures for
conducting the Registration function.
The Shares Registrar has online
connectivity with Central Depository
Company of Pakistan Limited. It
undertakes activities pertaining to
dematerialization of shares, share
transfers, transmissions, issue of
duplicate/re-validated dividend warrants,
issue of duplicate/ replaced share
certificates, change of address and other
related matters.
For assistance, shareholders may contact
either the Registered Office or the Shares
Registrar.
Contact persons:
Mr. S.M. Munawar Moosvi
PABX :(21) 35831618
:(21) 35831664
:(21) 35833011
Fax :(21) 35860251
Mr. Ovais Khan
PABX :(21) 34380101-2
Fax :(21) 34380106
Service Standards
Packages has always endeavored to provide investors with prompt services. Listed below are various investor services and the maximum time limits set for their execution: For requests received through post Over the counter
Transfer of shares 30 days after receipt 30 days after receiptTransmission of shares 30 days after receipt 30 days after receiptIssue of duplicate share certificates 30 days after receipt 30 days after receiptIssue of duplicate dividend warrants 5 days after receipt 5 days after receiptIssue of revalidated dividend warrants 5 days after receipt 5 days after receiptChange of address 2 days after receipt 15 minutes
Well qualified personnel of the Shares Registrar have been entrusted with the responsibility of ensuring that services are rendered within the set time limits.
48
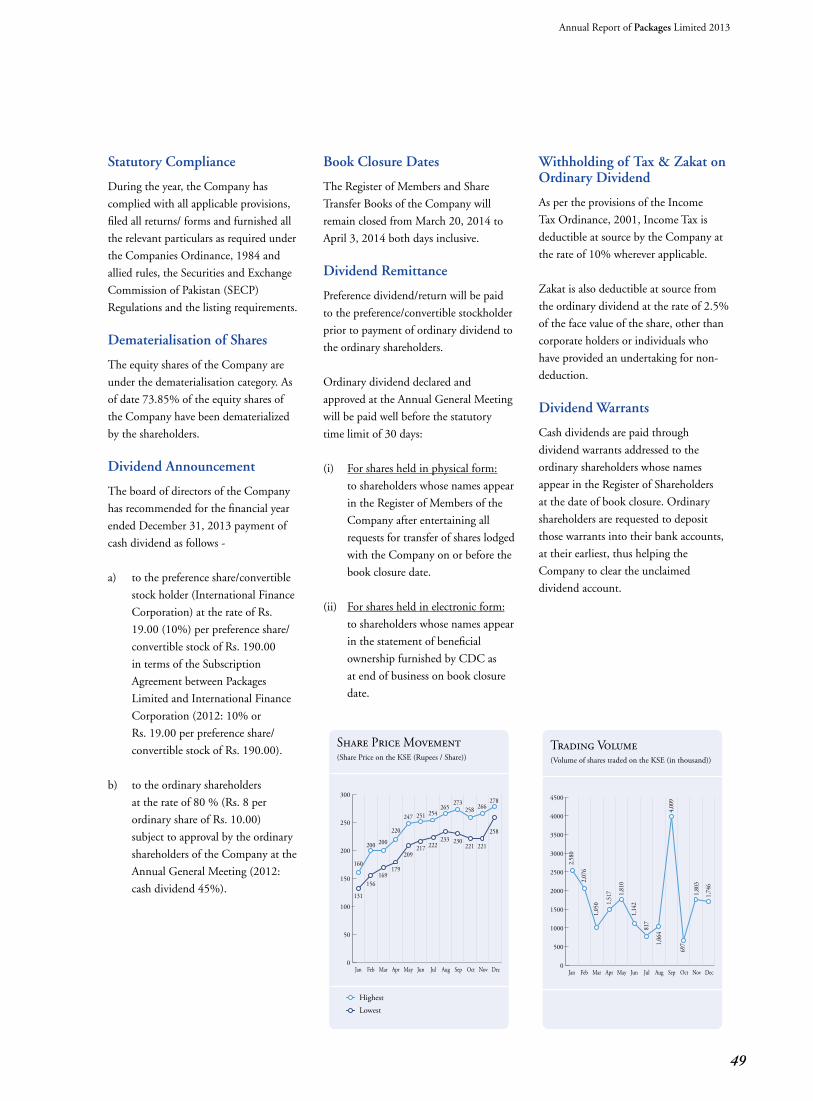
Share Price Movement(Share Price on the KSE (Rupees / Share))
Jan Feb Mar Apr May Jun Jul Aug Sep Oct Nov Dec0
50
100
150
200
250
300
160
200 200
220
247 251 254265
273258 266
278
131
156169
179
209217 222
233 230221 221
258
HighestLowest
Trading Volume(Volume of shares traded on the KSE (in thousand))
Jan Feb Mar Apr May Jun Jul Aug Sep Oct Nov Dec
2,58
0
2,07
6
1,05
0 1,51
7 1,81
0
1,14
2
817
1,06
4
4,00
9
697
1,80
3
1,74
6
0
500
1000
1500
2000
2500
3000
3500
4000
4500
Statutory Compliance
During the year, the Company has
complied with all applicable provisions,
filed all returns/ forms and furnished all
the relevant particulars as required under
the Companies Ordinance, 1984 and
allied rules, the Securities and Exchange
Commission of Pakistan (SECP)
Regulations and the listing requirements.
Dematerialisation of Shares
The equity shares of the Company are
under the dematerialisation category. As
of date 73.85% of the equity shares of
the Company have been dematerialized
by the shareholders.
Dividend Announcement
The board of directors of the Company
has recommended for the financial year
ended December 31, 2013 payment of
cash dividend as follows -
a) to the preference share/convertible
stock holder (International Finance
Corporation) at the rate of Rs.
19.00 (10%) per preference share/
convertible stock of Rs. 190.00
in terms of the Subscription
Agreement between Packages
Limited and International Finance
Corporation (2012: 10% or
Rs. 19.00 per preference share/
convertible stock of Rs. 190.00).
b) to the ordinary shareholders
at the rate of 80 % (Rs. 8 per
ordinary share of Rs. 10.00)
subject to approval by the ordinary
shareholders of the Company at the
Annual General Meeting (2012:
cash dividend 45%).
Book Closure Dates
The Register of Members and Share
Transfer Books of the Company will
remain closed from March 20, 2014 to
April 3, 2014 both days inclusive.
Dividend Remittance
Preference dividend/return will be paid
to the preference/convertible stockholder
prior to payment of ordinary dividend to
the ordinary shareholders.
Ordinary dividend declared and
approved at the Annual General Meeting
will be paid well before the statutory
time limit of 30 days:
(i) For shares held in physical form:
to shareholders whose names appear
in the Register of Members of the
Company after entertaining all
requests for transfer of shares lodged
with the Company on or before the
book closure date.
(ii) For shares held in electronic form:
to shareholders whose names appear
in the statement of beneficial
ownership furnished by CDC as
at end of business on book closure
date.
Withholding of Tax & Zakat on Ordinary Dividend
As per the provisions of the Income
Tax Ordinance, 2001, Income Tax is
deductible at source by the Company at
the rate of 10% wherever applicable.
Zakat is also deductible at source from
the ordinary dividend at the rate of 2.5%
of the face value of the share, other than
corporate holders or individuals who
have provided an undertaking for non-
deduction.
Dividend Warrants
Cash dividends are paid through
dividend warrants addressed to the
ordinary shareholders whose names
appear in the Register of Shareholders
at the date of book closure. Ordinary
shareholders are requested to deposit
those warrants into their bank accounts,
at their earliest, thus helping the
Company to clear the unclaimed
dividend account.
Annual Report of Packages Limited 2013
49
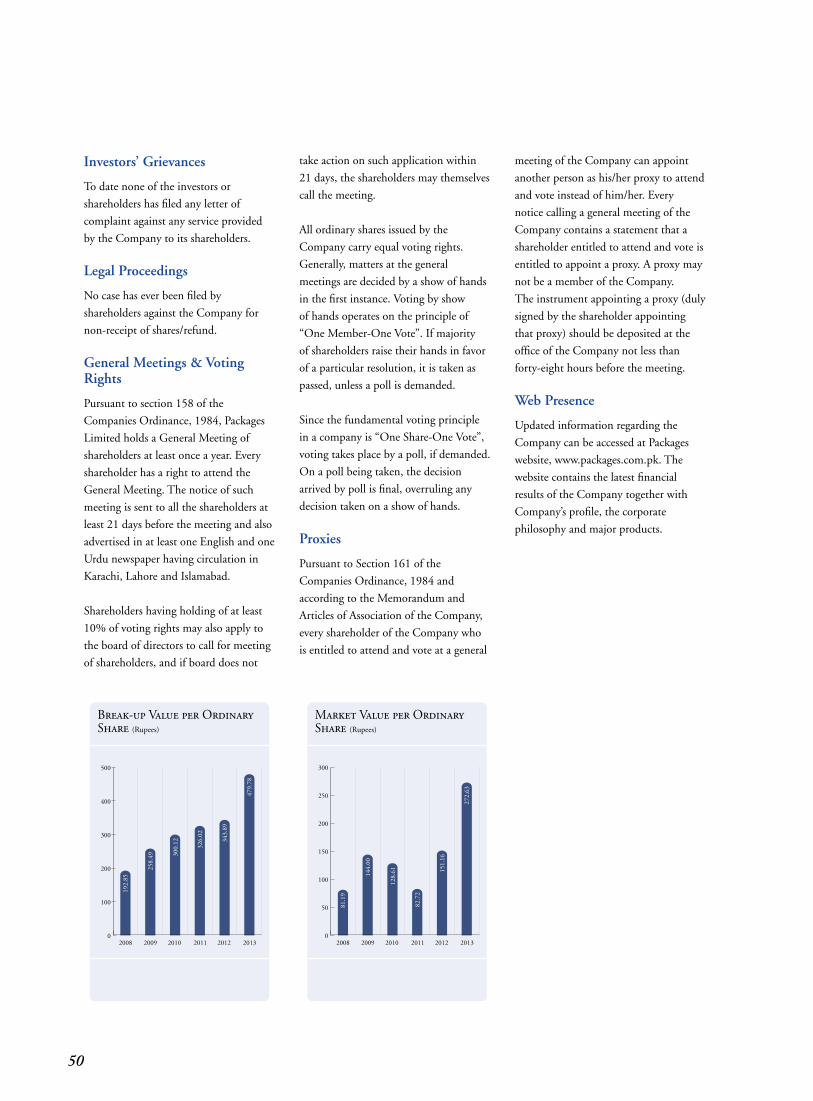
Investors’ Grievances
To date none of the investors or
shareholders has filed any letter of
complaint against any service provided
by the Company to its shareholders.
Legal Proceedings
No case has ever been filed by
shareholders against the Company for
non-receipt of shares/refund.
General Meetings & Voting Rights
Pursuant to section 158 of the
Companies Ordinance, 1984, Packages
Limited holds a General Meeting of
shareholders at least once a year. Every
shareholder has a right to attend the
General Meeting. The notice of such
meeting is sent to all the shareholders at
least 21 days before the meeting and also
advertised in at least one English and one
Urdu newspaper having circulation in
Karachi, Lahore and Islamabad.
Shareholders having holding of at least
10% of voting rights may also apply to
the board of directors to call for meeting
of shareholders, and if board does not
take action on such application within
21 days, the shareholders may themselves
call the meeting.
All ordinary shares issued by the
Company carry equal voting rights.
Generally, matters at the general
meetings are decided by a show of hands
in the first instance. Voting by show
of hands operates on the principle of
“One Member-One Vote”. If majority
of shareholders raise their hands in favor
of a particular resolution, it is taken as
passed, unless a poll is demanded.
Since the fundamental voting principle
in a company is “One Share-One Vote”,
voting takes place by a poll, if demanded.
On a poll being taken, the decision
arrived by poll is final, overruling any
decision taken on a show of hands.
Proxies
Pursuant to Section 161 of the
Companies Ordinance, 1984 and
according to the Memorandum and
Articles of Association of the Company,
every shareholder of the Company who
is entitled to attend and vote at a general
meeting of the Company can appoint
another person as his/her proxy to attend
and vote instead of him/her. Every
notice calling a general meeting of the
Company contains a statement that a
shareholder entitled to attend and vote is
entitled to appoint a proxy. A proxy may
not be a member of the Company.
The instrument appointing a proxy (duly
signed by the shareholder appointing
that proxy) should be deposited at the
office of the Company not less than
forty-eight hours before the meeting.
Web Presence
Updated information regarding the
Company can be accessed at Packages
website, www.packages.com.pk. The
website contains the latest financial
results of the Company together with
Company’s profile, the corporate
philosophy and major products.
201320122011201020092008
Break-up Value per OrdinaryShare (Rupees)
192.
85
258.
49 300.
12 343.
89
479.
78
326.
02
0
100
200
300
400
500
201320122011201020092008
Market Value per OrdinaryShare (Rupees)
81.1
9
144.
00
128.
61 151.
16
272.
63
82.7
2
0
50
100
150
200
250
300
50

1
“A business has to be evolving, it has to be fun, and it has to exercise your creative interests.”– Richard Branson
Annual Report of Packages Limited 2013
51
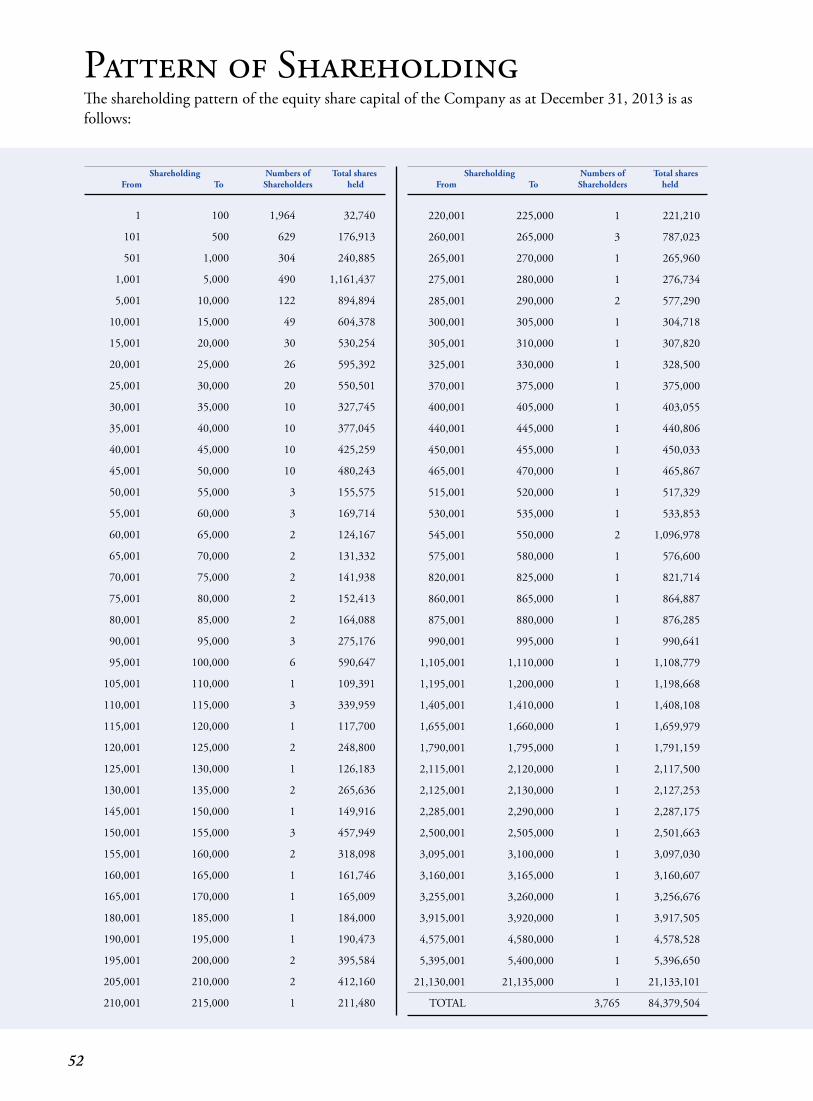
1 100 1,964 32,740
101 500 629 176,913
501 1,000 304 240,885
1,001 5,000 490 1,161,437
5,001 10,000 122 894,894
10,001 15,000 49 604,378
15,001 20,000 30 530,254
20,001 25,000 26 595,392
25,001 30,000 20 550,501
30,001 35,000 10 327,745
35,001 40,000 10 377,045
40,001 45,000 10 425,259
45,001 50,000 10 480,243
50,001 55,000 3 155,575
55,001 60,000 3 169,714
60,001 65,000 2 124,167
65,001 70,000 2 131,332
70,001 75,000 2 141,938
75,001 80,000 2 152,413
80,001 85,000 2 164,088
90,001 95,000 3 275,176
95,001 100,000 6 590,647
105,001 110,000 1 109,391
110,001 115,000 3 339,959
115,001 120,000 1 117,700
120,001 125,000 2 248,800
125,001 130,000 1 126,183
130,001 135,000 2 265,636
145,001 150,000 1 149,916
150,001 155,000 3 457,949
155,001 160,000 2 318,098
160,001 165,000 1 161,746
165,001 170,000 1 165,009
180,001 185,000 1 184,000
190,001 195,000 1 190,473
195,001 200,000 2 395,584
205,001 210,000 2 412,160
210,001 215,000 1 211,480
220,001 225,000 1 221,210
260,001 265,000 3 787,023
265,001 270,000 1 265,960
275,001 280,000 1 276,734
285,001 290,000 2 577,290
300,001 305,000 1 304,718
305,001 310,000 1 307,820
325,001 330,000 1 328,500
370,001 375,000 1 375,000
400,001 405,000 1 403,055
440,001 445,000 1 440,806
450,001 455,000 1 450,033
465,001 470,000 1 465,867
515,001 520,000 1 517,329
530,001 535,000 1 533,853
545,001 550,000 2 1,096,978
575,001 580,000 1 576,600
820,001 825,000 1 821,714
860,001 865,000 1 864,887
875,001 880,000 1 876,285
990,001 995,000 1 990,641
1,105,001 1,110,000 1 1,108,779
1,195,001 1,200,000 1 1,198,668
1,405,001 1,410,000 1 1,408,108
1,655,001 1,660,000 1 1,659,979
1,790,001 1,795,000 1 1,791,159
2,115,001 2,120,000 1 2,117,500
2,125,001 2,130,000 1 2,127,253
2,285,001 2,290,000 1 2,287,175
2,500,001 2,505,000 1 2,501,663
3,095,001 3,100,000 1 3,097,030
3,160,001 3,165,000 1 3,160,607
3,255,001 3,260,000 1 3,256,676
3,915,001 3,920,000 1 3,917,505
4,575,001 4,580,000 1 4,578,528
5,395,001 5,400,000 1 5,396,650
21,130,001 21,135,000 1 21,133,101
TOTAL 3,765 84,379,504
Shareholding Numbers of Total shares From To Shareholders held
Shareholding Numbers of Total shares From To Shareholders held
Pattern of ShareholdingThe shareholding pattern of the equity share capital of the Company as at December 31, 2013 is as follows:
52
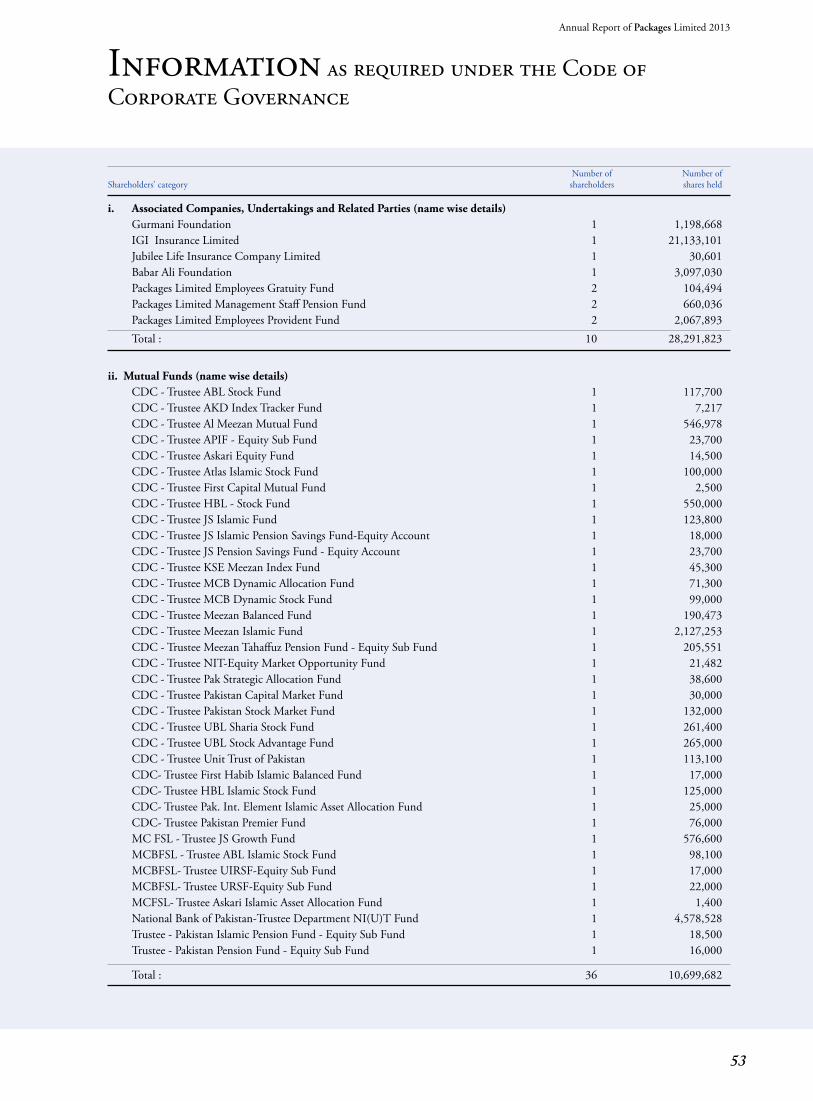
Number of Number ofShareholders’ category shareholders shares held
i. Associated Companies, Undertakings and Related Parties (name wise details) GurmaniFoundation 1 1,198,668 IGI Insurance Limited 1 21,133,101 Jubilee Life Insurance Company Limited 1 30,601 BabarAliFoundation 1 3,097,030 PackagesLimitedEmployeesGratuityFund 2 104,494 PackagesLimitedManagementStaffPensionFund 2 660,036 PackagesLimitedEmployeesProvidentFund 2 2,067,893 Total: 10 28,291,823
ii. Mutual Funds (name wise details) CDC - Trustee ABL Stock Fund 1 117,700 CDC - Trustee AKD Index Tracker Fund 1 7,217 CDC-TrusteeAlMeezanMutualFund 1 546,978 CDC - Trustee APIF - Equity Sub Fund 1 23,700 CDC-TrusteeAskariEquityFund 1 14,500 CDC - Trustee Atlas Islamic Stock Fund 1 100,000 CDC - Trustee First Capital Mutual Fund 1 2,500 CDC - Trustee HBL - Stock Fund 1 550,000 CDC - Trustee JS Islamic Fund 1 123,800 CDC - Trustee JS Islamic Pension Savings Fund-Equity Account 1 18,000 CDC - Trustee JS Pension Savings Fund - Equity Account 1 23,700 CDC-TrusteeKSEMeezanIndexFund 1 45,300 CDC - Trustee MCB Dynamic Allocation Fund 1 71,300 CDC-TrusteeMCBDynamicStockFund 1 99,000 CDC-TrusteeMeezanBalancedFund 1 190,473 CDC - Trustee Meezan Islamic Fund 1 2,127,253 CDC-TrusteeMeezanTahaffuzPensionFund-EquitySubFund 1 205,551 CDC-TrusteeNIT-EquityMarketOpportunityFund 1 21,482 CDC - Trustee Pak Strategic Allocation Fund 1 38,600 CDC - Trustee Pakistan Capital Market Fund 1 30,000 CDC - Trustee Pakistan Stock Market Fund 1 132,000 CDC-TrusteeUBLShariaStockFund 1 261,400 CDC - Trustee UBL Stock Advantage Fund 1 265,000 CDC - Trustee Unit Trust of Pakistan 1 113,100 CDC- Trustee First Habib Islamic Balanced Fund 1 17,000 CDC- Trustee HBL Islamic Stock Fund 1 125,000 CDC- Trustee Pak. Int. Element Islamic Asset Allocation Fund 1 25,000 CDC- Trustee Pakistan Premier Fund 1 76,000 MC FSL - Trustee JS Growth Fund 1 576,600 MCBFSL-TrusteeABLIslamicStockFund 1 98,100 MCBFSL- Trustee UIRSF-Equity Sub Fund 1 17,000 MCBFSL- Trustee URSF-Equity Sub Fund 1 22,000 MCFSL-TrusteeAskariIslamicAssetAllocationFund 1 1,400 NationalBankofPakistan-TrusteeDepartmentNI(U)TFund 1 4,578,528 Trustee - Pakistan Islamic Pension Fund - Equity Sub Fund 1 18,500 Trustee - Pakistan Pension Fund - Equity Sub Fund 1 16,000
Total: 36 10,699,682
Information as required under the Code of Corporate Governance
Annual Report of Packages Limited 2013
53
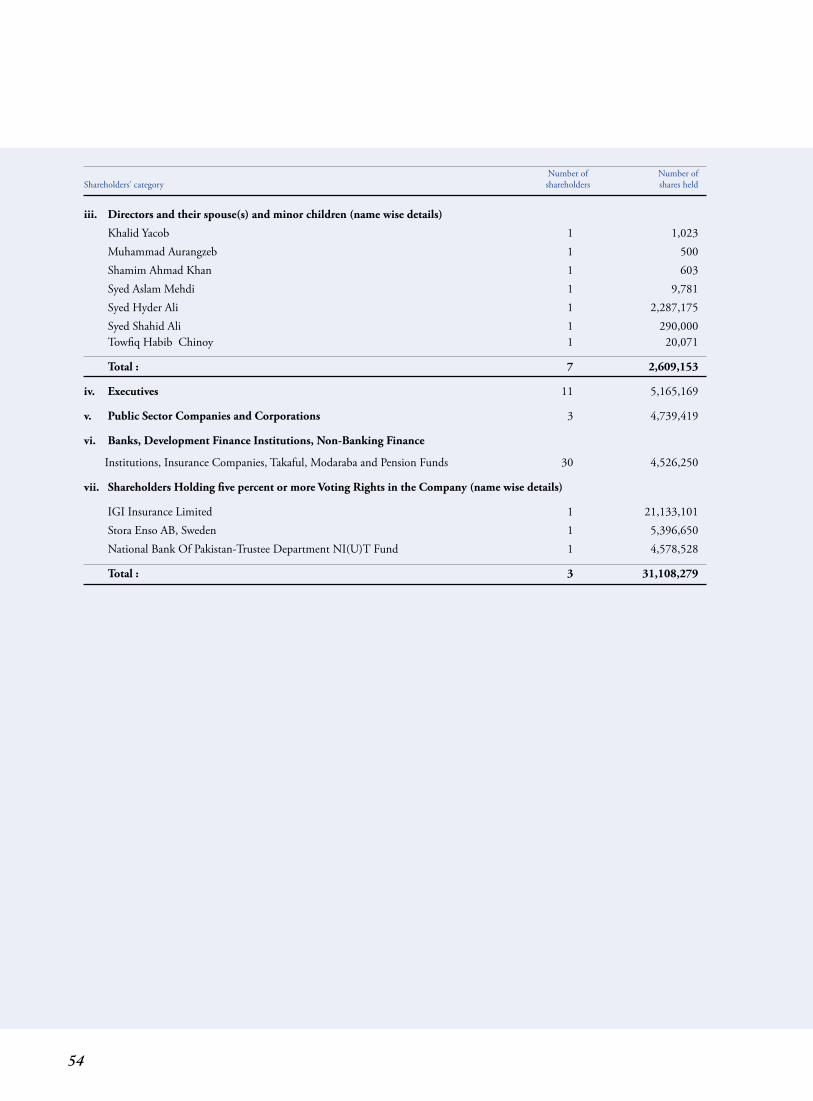
Number of Number ofShareholders’ category shareholders shares held
iii. Directors and their spouse(s) and minor children (name wise details)
Khalid Yacob 1 1,023 Muhammad Aurangzeb 1 500 Shamim Ahmad Khan 1 603 SyedAslamMehdi 1 9,781 Syed Hyder Ali 1 2,287,175 SyedShahidAli 1 290,000 Towfiq Habib Chinoy 1 20,071
Total : 7 2,609,153
iv. Executives 11 5,165,169
v. Public Sector Companies and Corporations 3 4,739,419
vi. Banks, Development Finance Institutions, Non-Banking Finance
Institutions,InsuranceCompanies,Takaful,ModarabaandPensionFunds 30 4,526,250
vii. Shareholders Holding five percent or more Voting Rights in the Company (name wise details)
IGI Insurance Limited 1 21,133,101 StoraEnsoAB,Sweden 1 5,396,650 NationalBankOfPakistan-TrusteeDepartmentNI(U)TFund 1 4,578,528
Total : 3 31,108,279
54
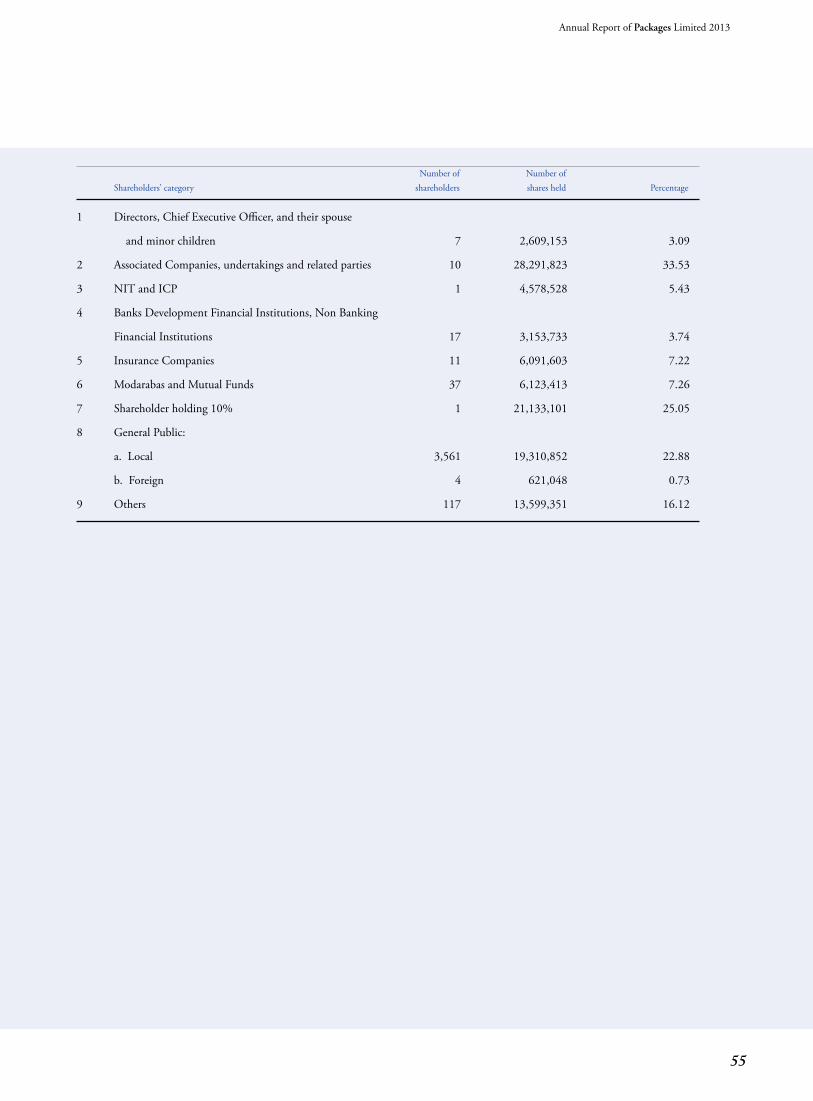
Number of Number of Shareholders’ category shareholders shares held Percentage
1 Directors, Chief Executive Officer, and their spouse
andminorchildren 7 2,609,153 3.09
2 AssociatedCompanies,undertakingsandrelatedparties 10 28,291,823 33.53
3 NITandICP 1 4,578,528 5.43
4 BanksDevelopmentFinancialInstitutions,NonBanking
FinancialInstitutions 17 3,153,733 3.74
5 InsuranceCompanies 11 6,091,603 7.22
6 ModarabasandMutualFunds 37 6,123,413 7.26
7 Shareholder holding 10% 1 21,133,101 25.05
8 General Public:
a.Local 3,561 19,310,852 22.88
b.Foreign 4 621,048 0.73
9 Others 117 13,599,351 16.12
Annual Report of Packages Limited 2013
55
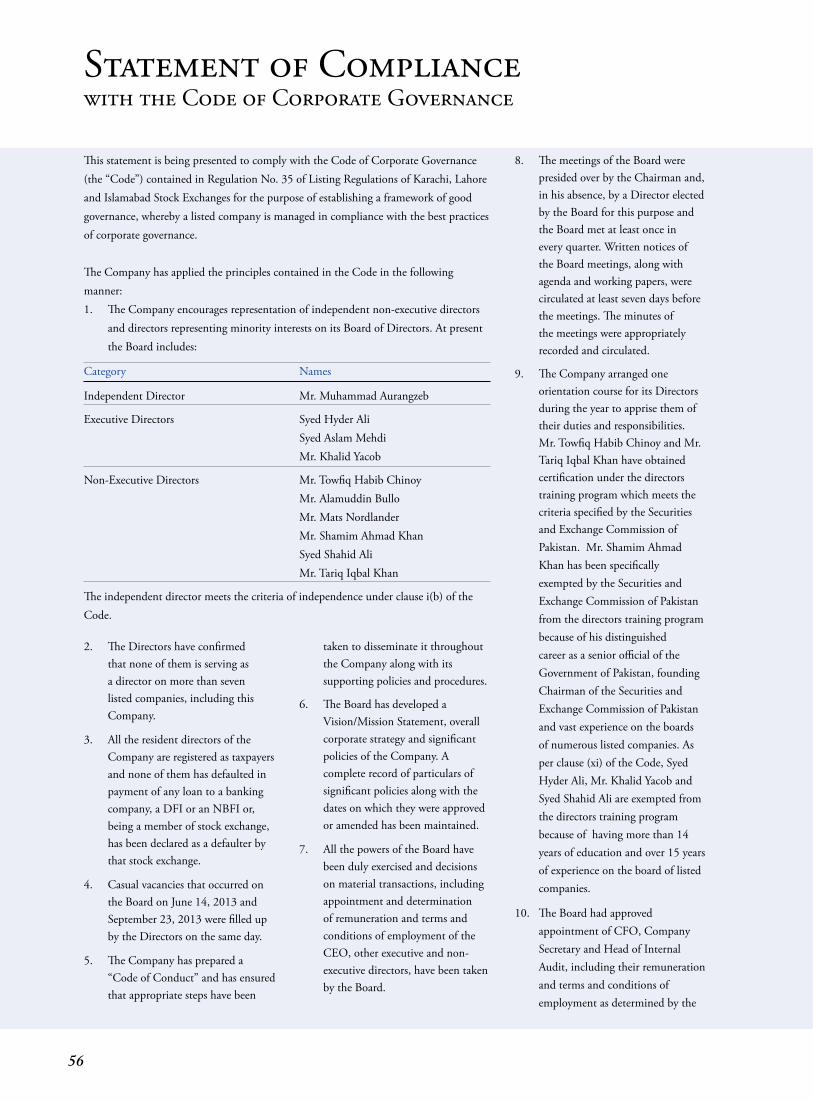
Statement of Compliancewith the Code of Corporate Governance
This statement is being presented to comply with the Code of Corporate Governance (the“Code”)containedinRegulationNo.35ofListingRegulationsofKarachi,Lahoreand Islamabad Stock Exchanges for the purpose of establishing a framework of good governance, whereby a listed company is managed in compliance with the best practices of corporate governance.
The Company has applied the principles contained in the Code in the following manner:1. The Company encourages representation of independent non-executive directors
and directors representing minority interests on its Board of Directors. At present the Board includes:
Category Names
Independent Director Mr. Muhammad Aurangzeb
Executive Directors Syed Hyder Ali Syed Aslam Mehdi Mr. Khalid Yacob
Non-Executive Directors Mr. Towfiq Habib Chinoy Mr. Alamuddin Bullo Mr. Mats Nordlander Mr. Shamim Ahmad Khan Syed Shahid Ali Mr. Tariq Iqbal Khan
The independent director meets the criteria of independence under clause i(b) of the Code.
2. The Directors have confirmed that none of them is serving as a director on more than seven listed companies, including this Company.
3. All the resident directors of the Company are registered as taxpayers and none of them has defaulted in payment of any loan to a banking company, a DFI or an NBFI or, being a member of stock exchange, has been declared as a defaulter by that stock exchange.
4. CasualvacanciesthatoccurredontheBoardonJune14,2013andSeptember 23, 2013 were filled up by the Directors on the same day.
5. The Company has prepared a “CodeofConduct”andhasensuredthat appropriate steps have been
taken to disseminate it throughout the Company along with its supporting policies and procedures.
6. The Board has developed a Vision/Mission Statement, overall corporate strategy and significant policies of the Company. A complete record of particulars of significant policies along with the dates on which they were approved or amended has been maintained.
7. All the powers of the Board have been duly exercised and decisions on material transactions, including appointment and determination of remuneration and terms and conditions of employment of the CEO, other executive and non-executive directors, have been taken by the Board.
8. The meetings of the Board were presided over by the Chairman and, in his absence, by a Director elected by the Board for this purpose and the Board met at least once in every quarter. Written notices of the Board meetings, along with agenda and working papers, were circulated at least seven days before the meetings. The minutes of the meetings were appropriately recorded and circulated.
9. TheCompanyarrangedoneorientation course for its Directors during the year to apprise them of their duties and responsibilities. Mr. Towfiq Habib Chinoy and Mr. Tariq Iqbal Khan have obtained certification under the directors training program which meets the criteria specified by the Securities and Exchange Commission of Pakistan. Mr. Shamim Ahmad Khan has been specifically exempted by the Securities and Exchange Commission of Pakistan from the directors training program because of his distinguished career as a senior official of the Government of Pakistan, founding Chairman of the Securities and Exchange Commission of Pakistan and vast experience on the boards of numerous listed companies. As per clause (xi) of the Code, Syed Hyder Ali, Mr. Khalid Yacob and Syed Shahid Ali are exempted from the directors training program becauseofhavingmorethan14years of education and over 15 years of experience on the board of listed companies.
10. The Board had approved appointment of CFO, Company Secretary and Head of Internal Audit, including their remuneration and terms and conditions of employment as determined by the
56
CEO. However, there was no new appointment made during the year.
11. The Directors’ Report for this year has been prepared in compliance with the requirements of the Code and fully describes the salient matters required to be disclosed.
12. The financial statements of the Company were duly endorsed by CEO and CFO before approval of the Board.
13. The Directors, CEO and executives do not hold any interest in the shares of the Company other than that disclosed in the pattern of shareholding.
14. TheCompanyhascompliedwithall the corporate and financial reporting requirements of the Code.
15. The Board has formed an Audit Committee. It comprises of six members including one independent director, one executive director and four non-executive directors including the chairman.
16. The meetings of the Audit Committee were held at least once every quarter prior to approval of interim and final results of the Company. The terms of reference of the Committee have been formed and advised to the Committee for compliance.
17. The Board has formed a Human Resource and Remuneration (HR&R) Committee. It comprises of five members, of whom three are non-executive directors, including the Chairman.
18. TheBoardhassetupaneffectiveinternal audit function manned by suitably qualified and experienced personnel for the purpose and are conversant with the policies and procedures of the Company.
19. ThestatutoryauditorsoftheCompany have confirmed that they have been given a satisfactory rating under the quality control review program of the ICAP, that they or any of the partners of the firm, their spouses and minor children do not hold shares of the Company and that the firm and all its partners are in compliance with International Federation of Accountants (IFAC) guidelines on code of ethics as adopted by the ICAP.
20. The statutory auditors or the persons associated with them have not been appointed to provide other services except in accordance with the listing regulations and the auditors have confirmed that they have observed IFAC guidelines in this regard.
21. The ‘closed period’, prior to the announcement of interim/final results, and business decisions, whichmaymateriallyaffectthemarket price of the Company’s securities, was determined and intimated to directors, employees and stock exchanges.
22. Material/price sensitive information has been disseminated among all market participants at once through stock exchanges.
23. We confirm that all other material principles enshrined in the Code have been complied with.
( Towfiq Habib Chinoy )Chairman
Lahore:February19,2014
Annual Report of Packages Limited 2013
57
Review Report to the Memberson Statement of Compliance with Best Practices of Code of Corporate Governance
Regulation 35(x) of the Listing Regulations requires the Company to place before the Board of Directors for their consideration and approval related party transactions distinguishing between transactions carried out on terms equivalent to those that prevail in arm’s length transactions and transactions which are not executed at arm’s length price, recording proper justification for using such alternate pricing mechanism. Further, all such transactions are also required to be separately placed before the audit committee. We are only required and have ensured compliance of requirement to the extent of approval of related party transactions by the Board of Directors and placement of such transactions before the audit committee.
We have not carried out any procedures to determine whether the related party transactions were undertaken at arm’s length price or not.
We have reviewed the Statement of Compliance with the best practices contained in the Code of Corporate Governance prepared by the Board of Directors of Packages Limited (‘The Company’) to comply with the Listing Regulation No. 35 of the Karachi, Lahore and Islamabad Stock Exchanges, where the Company is listed.
The responsibility for compliance with the Code of Corporate Governance is that of the Board of Directors of the Company. Our responsibility is to review, to the extent where such compliance can be objectively verified, whether the Statement of Compliance reflects the status of the Company’s compliance with the provisions of the Code of Corporate Governance and report if it does not. A review is limited primarily to inquiries of the Company personnel and review of various documents prepared by the Company to comply with the Code.
As part of our audit of financial statements we are required to obtain an understanding of the accounting and internal control systems sufficient to plantheauditanddevelopaneffectiveaudit approach. We are not required to consider whether the Board’s statement on internal control covers all risks and controls, or to form an opinion on the effectivenessofsuchinternalcontrols,the Company’s corporate governance procedures and risks.
Based on our review nothing has come to our attention, which causes us to believe that the Statement of Compliance does not appropriately reflect the Company’s compliance, in all material respects, with the best practices contained in the Code of Corporate Governance as applicable to the Company for the year ended December 31, 2013.
A.F. Ferguson & Co.Chartered AccountantsLahore,February19,2014
Name of engagement partner: Asad Aleem Mirza
58
Auditors’ Report to the Members
(b) in our opinion
(i) the balance sheet and profit and loss account together with the notes thereon have been drawn up in conformity with the Companies Ordinance, 1984,andareinagreementwith the books of account and are further in accordance with accounting policies consistently applied except for the changes resulted on initial application of standards, amendments, or an interpretation to the existing standards as stated in note 2.2.1 and change in accounting policy asreferredtoinnote4.7totheannexed financial statements, with which we concur;
(ii) the expenditure incurred during the year was for the purpose of the Company’s business; and
(iii) the business conducted, investments made and the expenditure incurred during the year were in accordance with the objects of the Company;
(c) in our opinion and to the best of our information and according to the explanations given to us, the balance sheet, profit and loss account, statement of comprehensive income, statement of changes in equity and cash flow statement together with the notes forming part thereof conform with approved accounting standards as applicable in Pakistan, and, give the information required by the CompaniesOrdinance,1984,inthemanner so required and respectively give a true and fair view of the state of theCompany’saffairsasatDecember31, 2013 and of the profit, total comprehensive income, changes in equity and its cash flows for the year then ended; and
We have audited the annexed balance sheet of Packages Limited as at December 31, 2013 and the related profit and loss account, statement of comprehensive income, statement of changes in equity and cash flow statement together with the notes forming part thereof, for the year then ended and we state that we have obtained all the information and explanations which, to the best of our knowledge and belief, were necessary for the purposes of our audit.
It is the responsibility of the Company’s management to establish and maintain a system of internal control, and prepare and present the above said statements in conformity with the approved accounting standards and the requirements of the CompaniesOrdinance,1984.Ourresponsibility is to express an opinion on these statements based on our audit.
We conducted our audit in accordance with the auditing standards as applicable in Pakistan. These standards require that we plan and perform the audit to obtain reasonable assurance about whether the above said statements are free of any material misstatement. An audit includes examining, on a test basis, evidence supporting the amounts and disclosures in the above said statements. An audit also includes assessing the accounting policies and significant estimates made by management, as well as, evaluating the overall presentation of the above said statements. We believe that our audit provides a reasonable basis for our opinion and, after due verification, we report that:
(a) in our opinion, proper books of account have been kept by the Company as required by the CompaniesOrdinance,1984;
(d) inouropinionZakatdeductibleatsourceundertheZakatandUshrOrdinance,1980,wasdeductedbythe Company and deposited in the CentralZakatFundestablishedundersection 7 of that Ordinance.
A.F. Ferguson & Co.Chartered AccountantsLahore,February19,2014
Name of engagement partner: Asad Aleem Mirza
Annual Report of Packages Limited 2013
59

“Creativity is contagious. Pass it on.” – Albert Einstein
Annual Report of Packages Limited 2013
Financial StatementsFor the year ended December 31, 2013
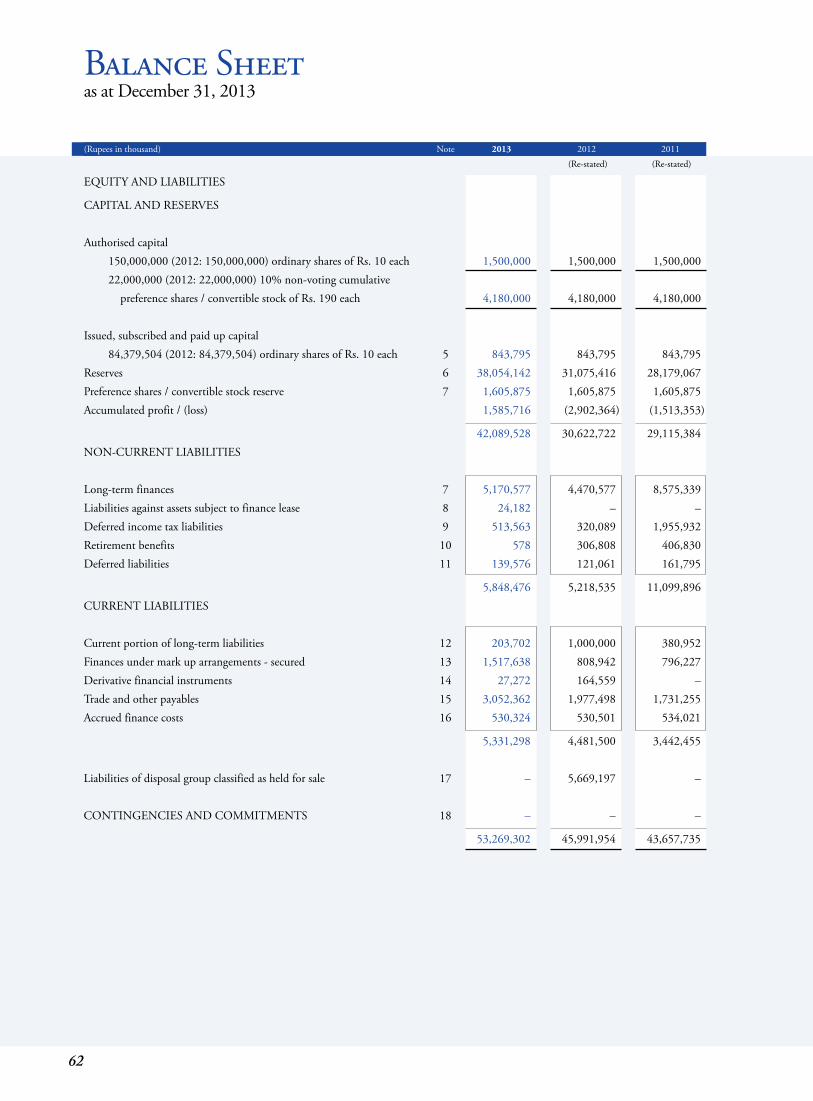
62
Balance Sheetas at December 31, 2013
(Rupees in thousand) Note 2013 2012 2011
(Re-stated) (Re-stated)
EQUITY AND LIABILITIES
CAPITAL AND RESERVES Authorised capital 150,000,000 (2012: 150,000,000) ordinary shares of Rs. 10 each 1,500,000 1,500,000 1,500,000 22,000,000 (2012: 22,000,000) 10% non-voting cumulative preference shares / convertible stock of Rs. 190 each 4,180,000 4,180,000 4,180,000 Issued, subscribed and paid up capital 84,379,504 (2012: 84,379,504) ordinary shares of Rs. 10 each 5 843,795 843,795 843,795 Reserves 6 38,054,142 31,075,416 28,179,067 Preference shares / convertible stock reserve 7 1,605,875 1,605,875 1,605,875 Accumulated profit / (loss) 1,585,716 (2,902,364) (1,513,353)
42,089,528 30,622,722 29,115,384 NON-CURRENT LIABILITIES Long-term finances 7 5,170,577 4,470,577 8,575,339 Liabilities against assets subject to finance lease 8 24,182 – – Deferred income tax liabilities 9 513,563 320,089 1,955,932 Retirement benefits 10 578 306,808 406,830 Deferred liabilities 11 139,576 121,061 161,795
5,848,476 5,218,535 11,099,896 CURRENT LIABILITIES Current portion of long-term liabilities 12 203,702 1,000,000 380,952 Finances under mark up arrangements - secured 13 1,517,638 808,942 796,227 Derivative financial instruments 14 27,272 164,559 – Trade and other payables 15 3,052,362 1,977,498 1,731,255 Accrued finance costs 16 530,324 530,501 534,021
5,331,298 4,481,500 3,442,455 Liabilities of disposal group classified as held for sale 17 – 5,669,197 –
CONTINGENCIES AND COMMITMENTS 18 – – –
53,269,302 45,991,954 43,657,735
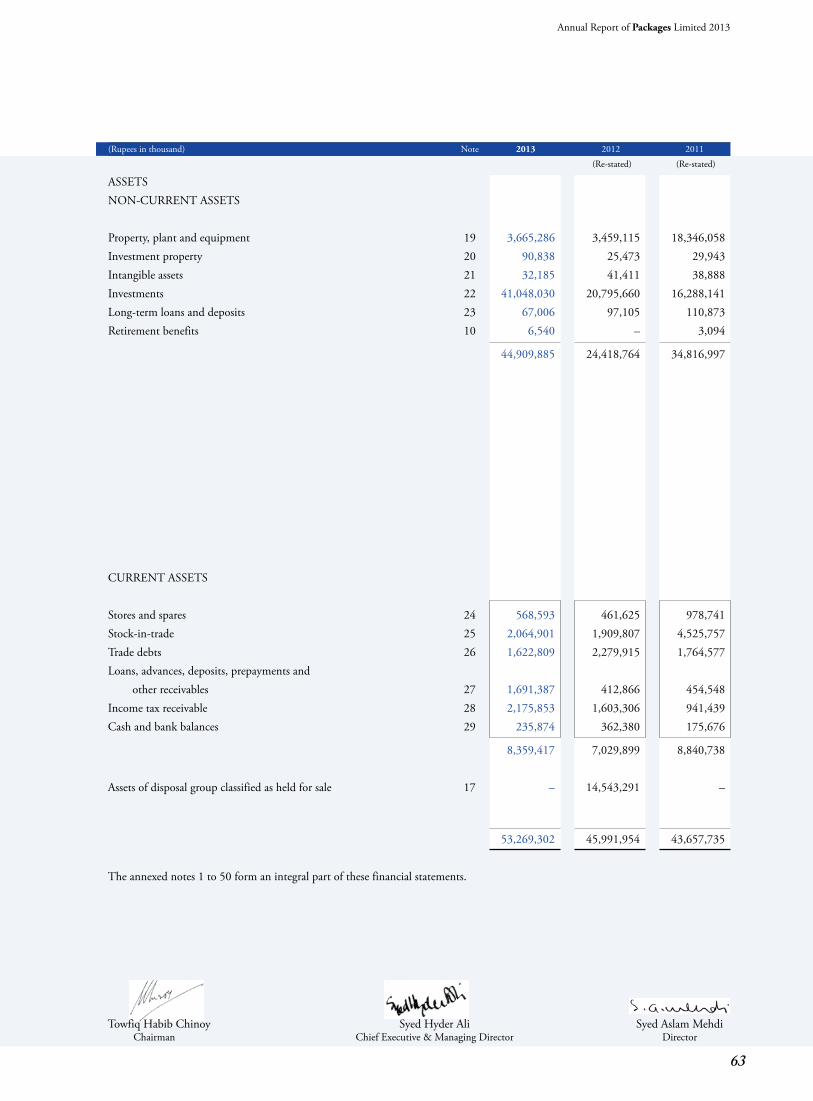
63
Annual Report of Packages Limited 2013
(Rupees in thousand) Note 2013 2012 2011
(Re-stated) (Re-stated)
ASSETS NON-CURRENT ASSETS Property, plant and equipment 19 3,665,286 3,459,115 18,346,058 Investment property 20 90,838 25,473 29,943 Intangible assets 21 32,185 41,411 38,888 Investments 22 41,048,030 20,795,660 16,288,141 Long-term loans and deposits 23 67,006 97,105 110,873 Retirement benefits 10 6,540 – 3,094
44,909,885 24,418,764 34,816,997
CURRENT ASSETS Stores and spares 24 568,593 461,625 978,741 Stock-in-trade 25 2,064,901 1,909,807 4,525,757 Trade debts 26 1,622,809 2,279,915 1,764,577 Loans, advances, deposits, prepayments and other receivables 27 1,691,387 412,866 454,548 Income tax receivable 28 2,175,853 1,603,306 941,439 Cash and bank balances 29 235,874 362,380 175,676
8,359,417 7,029,899 8,840,738 Assets of disposal group classified as held for sale 17 – 14,543,291 –
53,269,302 45,991,954 43,657,735
The annexed notes 1 to 50 form an integral part of these financial statements.
Towfiq Habib Chinoy Syed Hyder Ali Syed Aslam Mehdi Chairman Chief Executive & Managing Director Director
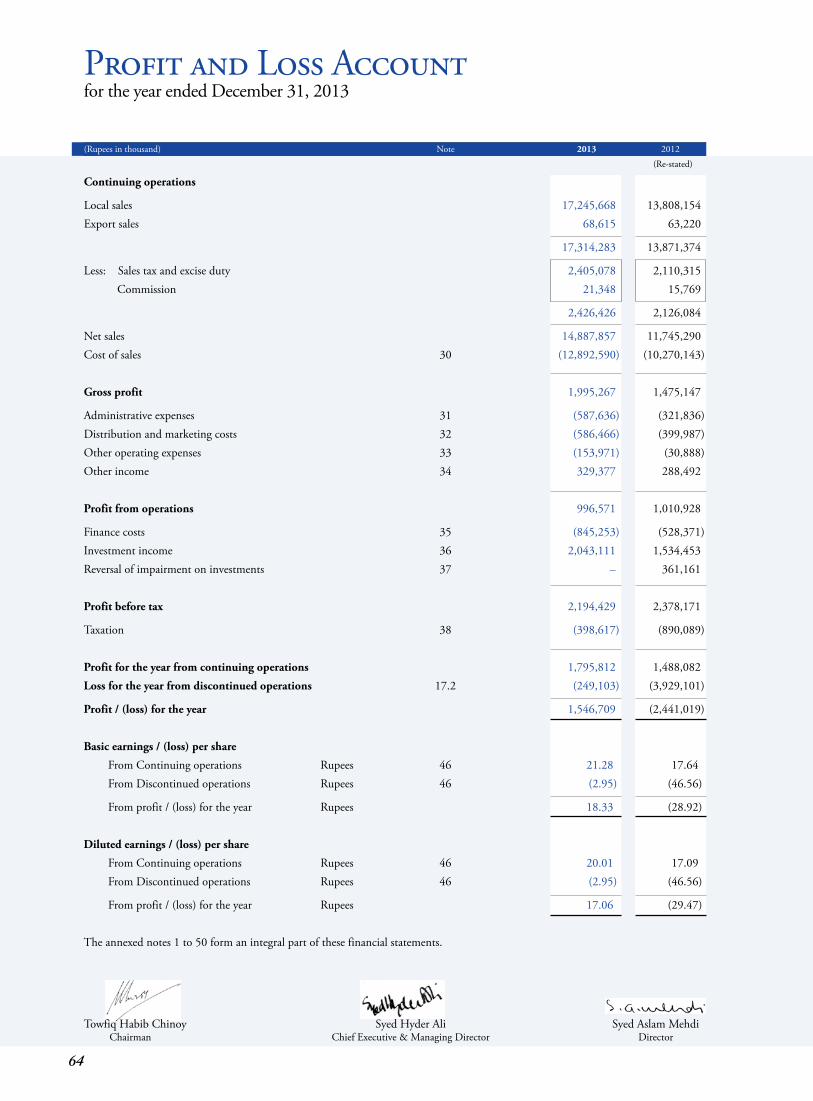
64
Profit and Loss Accountfor the year ended December 31, 2013
(Rupees in thousand) Note 2013 2012
(Re-stated)
Continuing operations
Local sales 17,245,668 13,808,154 Export sales 68,615 63,220
17,314,283 13,871,374
Less: Sales tax and excise duty 2,405,078 2,110,315 Commission 21,348 15,769
2,426,426 2,126,084
Net sales 14,887,857 11,745,290 Cost of sales 30 (12,892,590) (10,270,143) Gross profit 1,995,267 1,475,147
Administrative expenses 31 (587,636) (321,836)Distribution and marketing costs 32 (586,466) (399,987)Other operating expenses 33 (153,971) (30,888)Other income 34 329,377 288,492 Profit from operations 996,571 1,010,928
Finance costs 35 (845,253) (528,371)Investment income 36 2,043,111 1,534,453 Reversal of impairment on investments 37 – 361,161 Profit before tax 2,194,429 2,378,171
Taxation 38 (398,617) (890,089) Profit for the year from continuing operations 1,795,812 1,488,082 Loss for the year from discontinued operations 17.2 (249,103) (3,929,101)
Profit / (loss) for the year 1,546,709 (2,441,019) Basic earnings / (loss) per share From Continuing operations Rupees 46 21.28 17.64 From Discontinued operations Rupees 46 (2.95) (46.56)
From profit / (loss) for the year Rupees 18.33 (28.92) Diluted earnings / (loss) per share From Continuing operations Rupees 46 20.01 17.09 From Discontinued operations Rupees 46 (2.95) (46.56)
From profit / (loss) for the year Rupees 17.06 (29.47) The annexed notes 1 to 50 form an integral part of these financial statements.
Towfiq Habib Chinoy Syed Hyder Ali Syed Aslam Mehdi Chairman Chief Executive & Managing Director Director
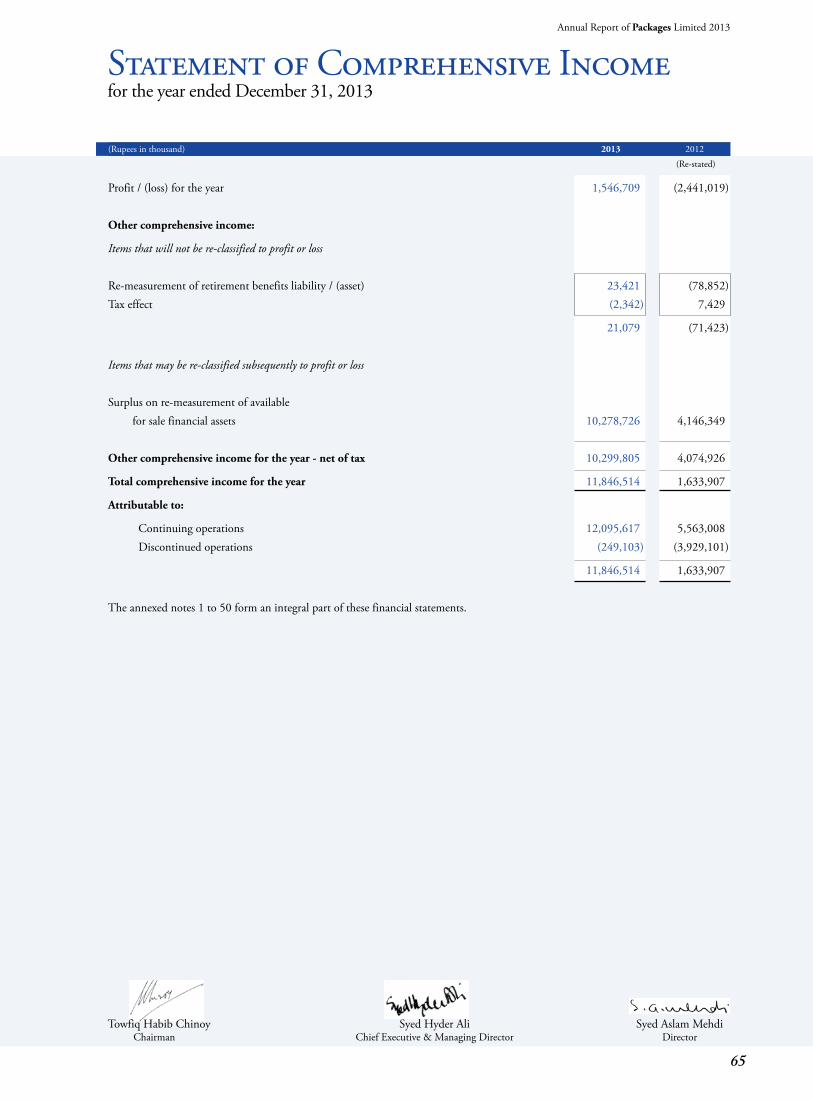
65
Annual Report of Packages Limited 2013
(Rupees in thousand) 2013 2012
(Re-stated)
Profit / (loss) for the year 1,546,709 (2,441,019) Other comprehensive income:
Items that will not be re-classified to profit or loss Re-measurement of retirement benefits liability / (asset) 23,421 (78,852)Tax effect (2,342) 7,429
21,079 (71,423) Items that may be re-classified subsequently to profit or loss Surplus on re-measurement of available for sale financial assets 10,278,726 4,146,349 Other comprehensive income for the year - net of tax 10,299,805 4,074,926
Total comprehensive income for the year 11,846,514 1,633,907
Attributable to:
Continuing operations 12,095,617 5,563,008 Discontinued operations (249,103) (3,929,101)
11,846,514 1,633,907 The annexed notes 1 to 50 form an integral part of these financial statements.
Statement of Comprehensive Incomefor the year ended December 31, 2013
Towfiq Habib Chinoy Syed Hyder Ali Syed Aslam Mehdi Chairman Chief Executive & Managing Director Director
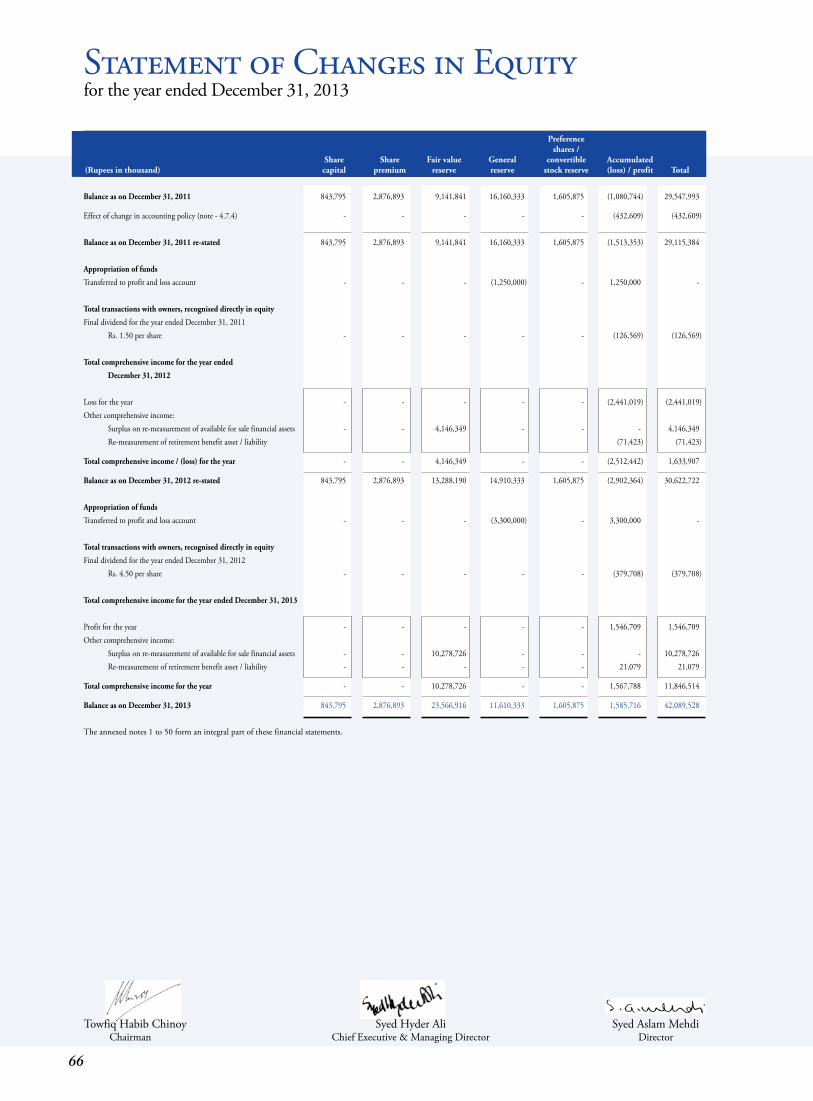
66
Preference shares / Share Share Fair value General convertible Accumulated (Rupees in thousand) capital premium reserve reserve stock reserve (loss) / profit Total
Statement of Changes in Equityfor the year ended December 31, 2013
Towfiq Habib Chinoy Syed Hyder Ali Syed Aslam Mehdi Chairman Chief Executive & Managing Director Director
Balance as on December 31, 2011 843,795 2,876,893 9,141,841 16,160,333 1,605,875 (1,080,744) 29,547,993
Effect of change in accounting policy (note - 4.7.4) - - - - - (432,609) (432,609)
Balance as on December 31, 2011 re-stated 843,795 2,876,893 9,141,841 16,160,333 1,605,875 (1,513,353) 29,115,384 Appropriation of funds
Transferred to profit and loss account - - - (1,250,000) - 1,250,000 - Total transactions with owners, recognised directly in equity Final dividend for the year ended December 31, 2011 Rs. 1.50 per share - - - - - (126,569) (126,569) Total comprehensive income for the year ended
December 31, 2012
Loss for the year - - - - - (2,441,019) (2,441,019)Other comprehensive income: Surplus on re-measurement of available for sale financial assets - - 4,146,349 - - - 4,146,349 Re-measurement of retirement benefit asset / liability (71,423) (71,423)
Total comprehensive income / (loss) for the year - - 4,146,349 - - (2,512,442) 1,633,907
Balance as on December 31, 2012 re-stated 843,795 2,876,893 13,288,190 14,910,333 1,605,875 (2,902,364) 30,622,722 Appropriation of funds
Transferred to profit and loss account - - - (3,300,000) - 3,300,000 - Total transactions with owners, recognised directly in equity Final dividend for the year ended December 31, 2012 Rs. 4.50 per share - - - - - (379,708) (379,708) Total comprehensive income for the year ended December 31, 2013 Profit for the year - - - - - 1,546,709 1,546,709 Other comprehensive income: Surplus on re-measurement of available for sale financial assets - - 10,278,726 - - - 10,278,726 Re-measurement of retirement benefit asset / liability - - - - - 21,079 21,079
Total comprehensive income for the year - - 10,278,726 - - 1,567,788 11,846,514
Balance as on December 31, 2013 843,795 2,876,893 23,566,916 11,610,333 1,605,875 1,585,716 42,089,528 The annexed notes 1 to 50 form an integral part of these financial statements.
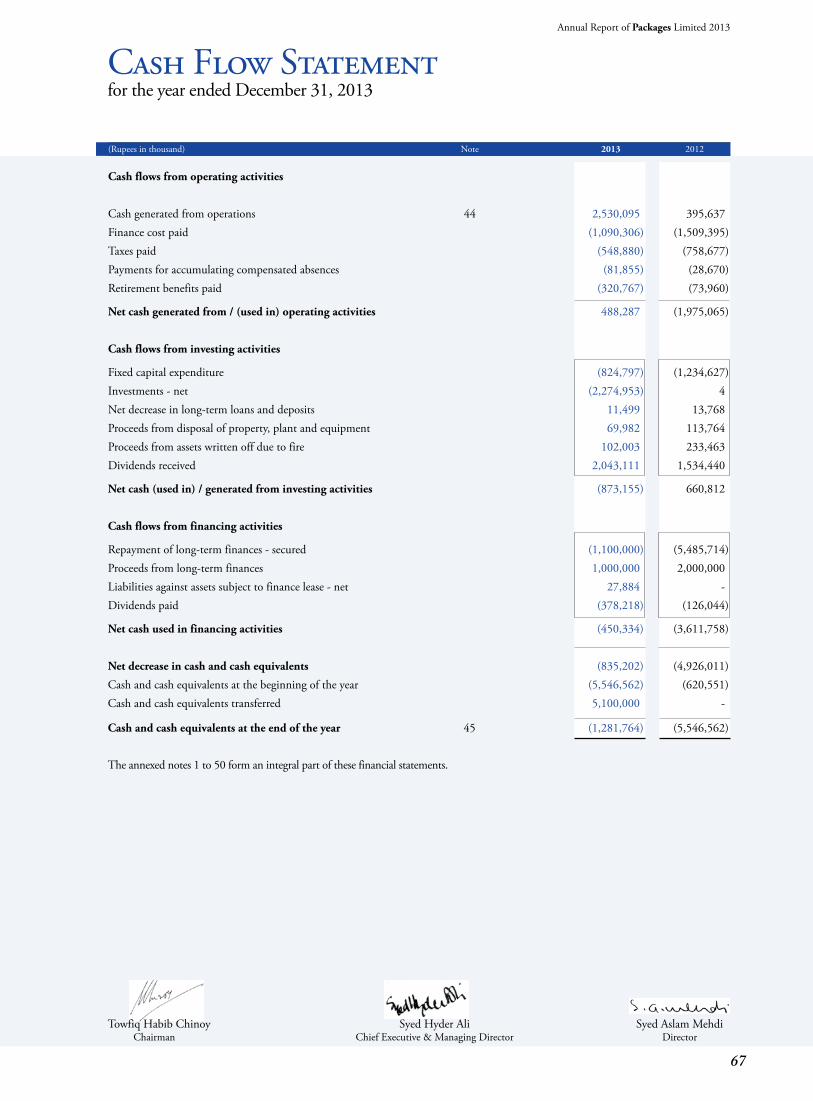
67
Annual Report of Packages Limited 2013
Cash Flow Statement for the year ended December 31, 2013
Towfiq Habib Chinoy Syed Hyder Ali Syed Aslam Mehdi Chairman Chief Executive & Managing Director Director
(Rupees in thousand) Note 2013 2012
Cash flows from operating activities
Cash generated from operations 44 2,530,095 395,637 Finance cost paid (1,090,306) (1,509,395)Taxes paid (548,880) (758,677)Payments for accumulating compensated absences (81,855) (28,670)Retirement benefits paid (320,767) (73,960)
Net cash generated from / (used in) operating activities 488,287 (1,975,065) Cash flows from investing activities
Fixed capital expenditure (824,797) (1,234,627)Investments - net (2,274,953) 4 Net decrease in long-term loans and deposits 11,499 13,768 Proceeds from disposal of property, plant and equipment 69,982 113,764 Proceeds from assets written off due to fire 102,003 233,463 Dividends received 2,043,111 1,534,440
Net cash (used in) / generated from investing activities (873,155) 660,812 Cash flows from financing activities
Repayment of long-term finances - secured (1,100,000) (5,485,714)Proceeds from long-term finances 1,000,000 2,000,000 Liabilities against assets subject to finance lease - net 27,884 - Dividends paid (378,218) (126,044)
Net cash used in financing activities (450,334) (3,611,758) Net decrease in cash and cash equivalents (835,202) (4,926,011)Cash and cash equivalents at the beginning of the year (5,546,562) (620,551)Cash and cash equivalents transferred 5,100,000 -
Cash and cash equivalents at the end of the year 45 (1,281,764) (5,546,562) The annexed notes 1 to 50 form an integral part of these financial statements.
68
1. Legal status and nature of business
Packages Limited (‘The Company’) is a public limited Company incorporated in Pakistan and is listed on Karachi, Lahore and Islamabad Stock Exchanges. It is principally engaged in the manufacture and sale of paper, packaging materials and tissue products.
The Company entered into 50/50 Joint Venture Agreement (the “JV Agreement”) on September 17, 2012 with ‘Stora Enso
OYJ Group’ (‘Stora Enso’) of Finland in its wholly owned subsidiary Bulleh Shah Packaging (Private) Limited (‘BSPL’). The Joint Venture includes Paper & Paperboard and Corrugated business operations at Kasur and Karachi and involves initial equity participation of Stora Enso of 35% by way of subscription of right shares with a commitment to increase the shareholding to 50% at a later stage subject to certain conditions being met. The agreed value for 100% of the Joint Venture Company is USD 107.5 million on a cash and debt free basis with additional equity to be subscribed by Stora Enso through right shares in the Joint Venture Company of USD 17.5 million, based on the financial results of second half of 2012 and first half of 2013. Packages Limited shall continue to hold minimum 50% ownership and future profits of the Joint Venture.
Pursuant to the Agreement, the Company, during the year, transferred the assets and corresponding liabilities of its Kasur and
Karachi operations to BSPL along with certain cash contribution. Upon initial equity participation of 35% by Stora Enso in BSPL, the Company has derecognised its investment in BSPL owing to loss of control and recognised an investment in jointly controlled entity, with Stora Enso as the Joint Venture partner.
As a result, the Company’s operations have been divided into Continuing and Discontinued operations in accordance with
the requirements of International Financial Reporting Standard (IFRS) 5, ‘Non-current assets held for sale and Discontinued operations’. Paper and Paperboard and Corrugated businesses have been classified as Discontinued operations because these form part of the Joint Venture. Continuing operations include Folding Cartons, Flexible Packaging and Consumer Products businesses.
Moreover, the Company also closed down its Paper and Paperboard operations in Lahore, in addition to the above mentioned
transaction, during the prior year. The Paper and Paperboard operations in Lahore have also been classified as a discontinued operation as reflected in note 17.2
of these financial statements, in accordance with the requirements of IFRS 5. This has not been classified as held for sale as it does not meet the criteria for being classified as held for sale under IFRS 5.
The figures of the prior period have been represented in accordance with the requirements of IFRS 5, wherever relevant. 2. Basis of preparation
2.1 These financial statements have been prepared in accordance with the requirements of the Companies Ordinance, 1984 (the Ordinance) and the approved accounting standards as applicable in Pakistan. Approved accounting standards comprise of such International Financial Reporting Standards (IFRS) issued by the International Accounting Standards Board and Islamic Financial Accounting Standards (IFAS) issued by the Institute of Chartered Accountants of Pakistan as are notified under the Companies Ordinance, 1984, provisions of and directives issued under the Companies Ordinance, 1984. Wherever the requirements of the Companies Ordinance, 1984 or directives issued by Securities and Exchange Commission of Pakistan differ with the requirements of IFRS or IFAS, the requirements of the Companies Ordinance, 1984 or the requirements of the said directives prevail.
2.2 Initial application of standards, amendments or an interpretation to existing standards
The following amendments to existing standards have been published that are applicable to the Company’s financial statements covering annual periods, beginning on or after the following dates:
2.2.1 Amendments to published standards effective in current year
New and amended standards, and interpretations mandatory for the first time for the financial year beginning January 1, 2013:
Annual improvements to IFRSs 2011 are applicable on accounting periods beginning on or after January 1, 2013. This set of amendments includes changes to five standards: IFRS 1, ‘First time adoption’, IAS 1, ‘Financial statement presentation’, IAS
Notes to and Forming Part of the Financial Statementsfor the year ended December 31, 2013
69
Annual Report of Packages Limited 2013
16, ‘Property, plant and equipment’, IAS 32, ‘Financial instruments; Presentation’ and IAS 34, ‘Interim financial reporting’. The application of these amendments have no material impact on the Company’s financial statements.
- IFRS 7 (Amendments), ‘Financial instruments: Disclosures’, on offsetting financial assets and financial liabilities is applicable
on accounting periods beginning on or after January 1, 2013. The amendment includes new disclosures to facilitate comparison between those entities that prepare IFRS financial statements to those that prepare financial statements in accordance with US GAAP. The application of this amendment has no material impact on the Company’s financial statements.
- IFRS 10 - ‘Consolidated financial statements’ is applicable on accounting periods beginning on or after January 1, 2013.
This standard builds on existing principles by identifying the concept of control as the determining factor in whether an entity should be included within the consolidated financial statements. The standard provides additional guidance to assist in determining control where this is difficult to assess. This IFRS is under consideration of the relevant Committee of the Institute of Chartered Accountants of Pakistan. The company has yet to assess the impact of these changes on its financial statements.
- IFRS 11 - ‘Joint arrangements’ is applicable on accounting periods beginning on or after January 1, 2013. IFRS 11 is a more
realistic reflection of joint arrangements by focusing on the rights and obligations of the parties to the arrangement rather than its legal form. There are two types of joint arrangement: joint operations and joint ventures. Joint operations arise where a joint operator has rights to the assets and obligations relating to the arrangement and therefore accounts for its share of assets, liabilities, revenue and expenses. Joint ventures arise where the joint operator has rights to the net assets of the arrangement and therefore equity accounts for its interest. Proportional consolidation of joint ventures is no longer allowed. This IFRS is under consideration of the relevant Committee of the Institute of Chartered Accountants of Pakistan. The application of these amendments has no material impact on the Company’s financial statements.
- IFRS 12 - ‘Disclosures of interests in other entities’. This is applicable on accounting periods beginning on or after January
1, 2013. This standard includes the disclosure requirements for all forms of interests in other entities, including joint arrangements, associates, special purpose vehicles and other off balance sheet vehicles. This IFRS is under consideration of the relevant Committee of the Institute of Chartered Accountants of Pakistan. The application of this standard has no material impact on the Company’s financial statements.
- Amendments to IFRS 10, 11 and 12 on transition guidance are applicable on accounting periods beginning on or after January
1, 2013. These amendments also provide additional transition relief in IFRSs 10, 11 and 12, limiting the requirement to provide adjusted comparative information to only the preceding comparative period. For disclosures related to unconsolidated structured entities, the amendments will remove the requirement to present comparative information for periods before IFRS 12 is first applied. The application of this amendment has no material impact on the Company’s financial statements.
- IFRS 13 - ‘Fair value measurement’. This is applicable on accounting periods beginning on or after January 1, 2013. This
standard aims to improve consistency and reduce complexity by providing a precise definition of fair value and a single source of fair value measurement and disclosure requirements for use across IFRSs. The requirements, which are largely aligned between IFRSs and US GAAP, do not extend the use of fair value accounting but provide guidance on how it should be applied where its use is already required or permitted by other standards within IFRSs or US GAAP. This IFRS is under consideration of the relevant Committee of the Institute of Chartered Accountants of Pakistan. Application of this standard has no material impact on the Company’s financial statements.
- IAS 1 (Amendments), ‘Financial statement presentation’ regarding other comprehensive income. This is applicable on
accounting periods beginning on or after July 01, 2012. The main change resulting from these amendments is a requirement for entities to group items presented in other comprehensive income (OCI) on the basis of whether they are potentially recycled to profit or loss (reclassification adjustments). The amendments do not address which items are presented in OCI. The application of this amendment has no material impact on the Company’s financial statements.
- IAS 19 (Amendments), ‘Employee benefits’ is applicable on accounting periods beginning on or after January 1, 2013. These
amendments eliminate the corridor approach and calculate finance costs on a net funding basis. IAS 19 (revised) amends the accounting for employment benefits. The Company has applied the standard retrospectively in accordance with the transition provisions of the standard. The impact on the Company has been explained in note 4.7.
70
- IAS 27 (Revised 2011), ‘Separate financial statements’ is applicable on accounting periods beginning on or after January 1, 2013. It includes the provisions on separate financial statements that are left after the control provisions of IAS 27 which have been included in the new IFRS 10. The application of this standard has no material impact on the Company’s financial statements.
- IAS 28 (Revised 2011), ‘Associates and joint ventures’ is applicable on accounting periods beginning on or after January 1,
2013. It includes the requirements for associates and joint ventures that have to be equity accounted following the issue of IFRS 11. The application of this standard has no material impact on the Company’s financial statements.
2.2.2 Standards, amendments and interpretations to existing standards that are not yet effective and have not been early
adopted by the Company The following amendments and interpretations to existing standards have been published and are mandatory for the Company’s
accounting periods beginning on or after January 1, 2014 or later periods, but the Company has not early adopted them: - IFRS 9 - ‘Financial instruments’ - classification and measurement. This is applicable on accounting periods beginning on
or after January 1, 2015. This standard on classification and measurement of financial assets and financial liabilities will replace IAS 39, ‘Financial instruments: Recognition and measurement’. IFRS 9 has two measurement categories: amortised cost and fair value. All equity instruments are measured at fair value. A debt instrument is measured at amortised cost only if the entity is holding it to collect contractual cash flows and the cash flows represent principal and interest. For liabilities, the standard retains most of the IAS 39 requirements. These include amortised-cost accounting for most financial liabilities, with bifurcation of embedded derivatives. The main change is that, in cases where the fair value option is taken for financial liabilities, the part of a fair value change due to an entity’s own credit risk is recorded in other comprehensive income rather than the income statement, unless this creates an accounting mismatch. This change will mainly affect financial institutions. The Company shall apply these amendments from January 1, 2014 and does not expect to have a material impact on its financial statements.
- Annual improvements 2012 applicable for annual periods beginning on or after July 1, 2014. These amendments include
changes from the 2010-12 cycle of the annual improvements project, that affect 7 standards: IFRS 2, ‘Share-based payment’, IFRS 3, ‘Business Combinations’, IFRS 8, ‘Operating segments’, IFRS 13, ‘Fair value measurement’, IAS 16, ‘Property, plant and equipment’ and IAS 38, ‘Intangible assets’, Consequential amendments to IFRS 9, ‘Financial instruments’, IAS 37, ‘Provisions, contingent liabilities and contingent assets’, and IAS 39, Financial instruments – Recognition and measurement’.
- Annual improvements 2013 applicable for annual periods beginning on or after July 1, 2014. The amendments include
changes from the 2011-13 cycle of the annual improvements project that affect 4 standards: IFRS 1, ‘First time adoption’, IFRS 3, ‘Business combinations’, IFRS 13, ‘Fair value measurement’ and IAS 40, ‘Investment property’.
- IAS 19 (Amendments), ‘Employee benefits’ is applicable on accounting periods beginning on or after July 1, 2014.These
narrow scope amendments apply to contributions from employees or third parties to defined benefit plans. The objective of the amendments is to simplify the accounting for contributions that are independent of the number of years of employee service, for example, employee contributions that are calculated according to a fixed percentage of salary. The Company does not expect to have a material impact on its financial statements from this amendment.
- IAS 32 (Amendments), ‘Financial instruments: Presentation’, on offsetting financial assets and financial liabilities is applicable
on accounting periods beginning on or after January 1, 2014. These amendments update the application guidance in IAS 32, ‘Financial instruments: Presentation’, to clarify some of the requirements for offsetting financial assets and financial liabilities on the balance sheet. The Company shall apply these amendments from January 1, 2014 and does not expect to have a material impact on its financial statements.
- IAS 36 (Amendment), ‘Impairment of assets’ on recoverable amount disclosures is applicable on accounting period beginning
on or after January 1, 2014. This amendment addresses the disclosure of information about the recoverable amount of impaired assets if that amount is based on fair value less costs of disposal. The Company shall apply these amendments from January 1, 2014 and does not expect to have a material impact on its financial statements.
- IAS 39 (Amendment), ‘Financial Instruments: Recognition and Measurement’ on novation of derivatives is applicable
on accounting period beginning on or after January 1, 2014. This amendment provides relief from discontinuing hedge
71
Annual Report of Packages Limited 2013
accounting when novation of a hedging instrument to a central counter party meets specified criteria. The Company shall apply these amendments from January 1, 2014 and does not expect to have a material impact on its financial statements.
- ‘IFRIC 21, ‘Levies’, sets out the accounting for an obligation to pay a levy that is not income tax. The interpretation
addresses what the obligating event is that give rise to pay a levy and when should a liability be recognised. The Company is not currently subjected to significant levies so the impact on the Company is not material.
3. Basis of measurement
3.1 These financial statements have been prepared under the historical cost convention except for revaluation of certain financial instruments at fair value and recognition of certain employee retirement benefits at present value.
3.2 The Company’s significant accounting policies are stated in note 4. Not all of these significant policies require the management
to make difficult, subjective or complex judgments or estimates. The following is intended to provide an understanding of the policies the management considers critical because of their complexity, judgment and estimation involved in their application and their impact on these financial statements. Judgments and estimates are continually evaluated and are based on historical experience, including expectations of future events that are believed to be reasonable under the circumstances. These judgments involve assumptions or estimates in respect of future events and the actual results may differ from these estimates. The areas involving a higher degree of judgments or complexity or areas where assumptions and estimates are significant to the financial statements are as follows:
i) Estimated useful lives of property, plant and equipment - note 4.2 ii) Provision for employees’ retirement benefits - note 4.7 & 10 iii) Loss recognised on the re-measurement of assets of disposal group - note 17.1.2 iv) Provision for taxation - note 38 4. Significant accounting policies
The significant accounting policies adopted in the preparation of these financial statements are set out below. These policies have been consistently applied to all the years presented, unless otherwise stated.
4.1 Taxation
Current
Provision of current tax is based on the taxable income for the year determined in accordance with the prevailing law for taxation of income. The charge for current tax is calculated using prevailing tax rates or tax rates expected to apply to the profit for the year, if enacted. The charge for current tax also includes adjustments, where considered necessary, to provision for tax made in previous years arising from assessments framed during the year for such years.
Deferred
Deferred tax is accounted for using the balance sheet liability method in respect of all temporary differences arising from differences between the carrying amount of assets and liabilities in the financial statements and the corresponding tax bases used in the computation of the taxable profit. Deferred tax liabilities are generally recognised for all taxable temporary differences and deferred tax assets are recognised to the extent that it is probable that taxable profits shall be available against which the deductible temporary differences, unused tax losses and tax credits can be utilised.
Deferred tax is calculated at the rates that are expected to apply to the period when the differences reverse based on tax rates
that have been enacted or substantively enacted by the balance sheet date. Deferred tax is charged or credited in the profit and loss account, except in the case of items credited or charged to equity in which case it is included in equity.
4.2 Property, plant and equipment
Property, plant and equipment, except freehold land, are stated at cost less accumulated depreciation and any identified impairment loss. Freehold land is stated at cost less any identified impairment loss. Cost in relation to certain plant and machinery signifies historical cost, gains and losses transferred from equity on qualifying cash flow hedges as referred to in note 4.17 and borrowing costs as referred to in note 4.20.
72
Depreciation on all property, plant and equipment is charged to profit on the straight-line method so as to write off the depreciable amount of an asset over its estimated useful life at the following annual rates:
- Buildings 2.5% to 20% - Plant and machinery 6.25% to 33.33% - Other equipments 10% to 33.33% - Furniture and fixtures 10% to 20% - Vehicles 20% The assets’ residual values and useful lives are reviewed, at each financial year end, and adjusted if impact on depreciation is
significant. The Company’s estimate of the residual value of its property, plant and equipment as at December 31, 2013 has not required any adjustment as its impact is considered insignificant.
Depreciation on additions to property, plant and equipment is charged from the month in which an asset is acquired or
capitalised while no depreciation is charged for the month in which the asset is disposed off. The Company assesses at each balance sheet date whether there is any indication that property, plant and equipment may
be impaired. If such indication exists, the carrying amounts of such assets are reviewed to assess whether they are recorded in excess of their recoverable amount. Where carrying amounts exceed the respective recoverable amount, assets are written down to their recoverable amounts and the resulting impairment loss is recognised in profit and loss account. The recoverable amount is the higher of an asset’s fair value less costs to sell and value in use. Where an impairment loss is recognised, the depreciation charge is adjusted in the future periods to allocate the asset’s revised carrying amount over its estimated useful life.
Subsequent costs are included in the asset’s carrying amount or recognised as a separate asset, as appropriate, only when it is
probable that future economic benefits associated with the item shall flow to the Company and the cost of the item can be measured reliably. All other repair and maintenance costs are charged to profit and loss account during the period in which they are incurred.
The gain or loss on disposal or retirement of an asset represented by the difference between the sale proceeds and the carrying
amount of the asset is recognised as an income or expense. Capital work-in-progress is stated at cost less any identified impairment loss. 4.3 Investment property
Property not held for own use or for sale in the ordinary course of business is classified as investment property. The investment property of the Company comprises land and buildings and is valued using the cost method i.e. at cost less any accumulated depreciation and any identified impairment loss.
Depreciation on buildings is charged to profit on the straight line method so as to write off the depreciable amount of building
over its estimated useful life at the rates ranging from 3.33% to 6.67% per annum. Depreciation on additions to investment property is charged from the month in which a property is acquired or capitalised while no depreciation is charged for the month in which the property is disposed off.
The assets’ residual values and useful lives are reviewed, at each financial year end, and adjusted if impact on depreciation is
significant. The Company’s estimate of the residual value of its investment property as at December 31, 2013 has not required any adjustment as its impact is considered insignificant.
The Company assesses at each balance sheet date whether there is any indication that investment property may be impaired.
If such indication exists, the carrying amounts of such assets are reviewed to assess whether they are recorded in excess of their recoverable amount. Where carrying amounts exceed the respective recoverable amount, assets are written down to their recoverable amount and the resulting impairment loss is recognised in profit and loss account. The recoverable amount is the higher of an asset’s fair value less costs to sell and value in use. Where an impairment loss is recognised, the depreciation charge is adjusted in the future periods to allocate the asset’s revised carrying amount over its estimated useful life.
73
Annual Report of Packages Limited 2013
The gain or loss on disposal or retirement of an asset represented by the difference between the sale proceeds and the carrying amount of the asset is recognised as an income or expense.
4.4 Intangible assets
Expenditure incurred to acquire computer software and SAP Enterprise Resource Planning (ERP) System are capitalised as intangible assets and stated at cost less accumulated amortisation and any identified impairment loss. Intangible assets are amortised using the straight line method over a period of three to five years.
Development costs are recognised as intangible assets when the following criteria are met: - it is technically feasible to complete the intangible asset so that it will be available for use; - management intends to complete the intangible asset and use or sell it; - there is an ability to use or sell the intangible asset; - it can be demonstrated how the intangible asset will generate probable future economic benefits; - adequate technical, financial and other resources to complete the development and to use or sell the intangible asset are
available; and - the expenditure attributable to the intangible asset during its development can be reliably measured. Other development expenditures that do not meet these criteria are recognised as an expense as incurred. Development costs
previously recognised as an expense are not recognised as an asset in a subsequent period. Amortisation on additions to intangible assets is charged from the month in which an asset is acquired or capitalised while no
amortisation is charged for the month in which the asset is disposed off. The Company assesses at each balance sheet date whether there is any indication that intangible assets may be impaired. If
such indication exists, the carrying amounts of such assets are reviewed to assess whether they are recorded in excess of their recoverable amount. Where carrying amounts exceed the respective recoverable amount, assets are written down to their recoverable amounts and the resulting impairment loss is recognised in profit and loss account. The recoverable amount is the higher of an asset’s fair value less costs to sell and value in use. Where an impairment loss is recognised, the amortisation charge is adjusted in the future periods to allocate the asset’s revised carrying amount over its estimated useful life.
4.5 Leases
(1) The Company is the lessee:
Finance leases
Leases where the Company has substantially all the risks and rewards of ownership are classified as finance leases. Asset subject to finance lease are initially recognised at the lower of present value of minimum lease payments under the lease agreements and the fair value of the assets. Subsequently these assets are stated at cost less accumulated depreciation and any identified impairment loss.
The related rental obligations, net of finance charges, are included in liabilities against assets subject to finance lease. The
liabilities are classified as current and long-term depending upon the timing of the payment. Each lease payment is allocated between the liability and finance charges so as to achieve a constant rate on the balance
outstanding. The interest element of the rental is charged to profit over the lease term. Assets acquired under a finance lease are depreciated over the useful life of the asset on a straight-line method at the rates given
in note 4.2. Depreciation of leased assets is charged to profit and loss account. Depreciation on additions to leased assets is charged from the month in which an asset is acquired while no depreciation is
charged for the month in which the asset is disposed off.
74
Operating leases
Leases including Ijarah financing where a significant portion of the risks and rewards of ownership are retained by the lessor are classified as operating leases. Payments made under operating leases (net of any incentives received from the lessor) are charged to profit on a straight-line basis over the lease / Ijarah term unless another systematic basis is representative of the time pattern of the Company’s benefit.
(2) The Company is the lessor:
Operating leases
Assets leased out under operating leases are included in investment property as referred to in note 20. They are depreciated over their expected useful lives on a basis consistent with similar owned property, plant and equipment. Rental income (net of any incentives given to lessees) is recognised on a straight-line basis over the lease term.
4.6 Investments
Investments intended to be held for less than twelve months from the balance sheet date or to be sold to raise operating capital, are included in current assets, all other investments are classified as non-current. Management determines the appropriate classification of its investments at the time of the purchase and re-evaluates such designation on a regular basis.
Investments in equity instruments of subsidiaries, associates and joint ventures
Investments in subsidiaries and associates where the Company has significant influence are measured at cost in the Company’s financial statements. Cost in relation to investments made in foreign currency is determined by translating the consideration paid in foreign currency into Pak rupees at exchange rates prevailing on the date of transactions.
The Company is required to issue consolidated financial statements along with its separate financial statements, in accordance
with the requirements of IAS 27 ‘Consolidated and Separate Financial Statements’. Investments in associates, and joint ventures, in the consolidated financial statements, are being accounted for using the equity method.
At each balance sheet date, the Company reviews the carrying amounts of the investments in subsidiaries and associates to
assess whether there is any indication that such investments have suffered an impairment loss. If any such indication exists, the recoverable amount is estimated in order to determine the extent of the impairment loss, if any. In making an estimate of recoverable amount of these investments, the management considers future stream of cash flows and an estimate of the terminal value of these investments. Impairment losses are recognised as expense in the profit and loss account.
Investments in subsidiaries, associates and joint ventures, that suffered an impairment, are reviewed for possible reversal of
impairment at each reporting date. Impairment losses recognised in the profit and loss account on investments in subsidiaries and associates are reversed through the profit and loss account.
Other investments
The other investments made by the Company are classified for the purpose of measurement into the following categories: Held to maturity
Investments with fixed maturity that the management has the intent and ability to hold to maturity are classified as held to maturity and are initially measured at cost and at subsequent reporting dates measured at amortised cost using the effective yield method.
Available for sale
The financial assets including investments in associated undertakings where the Company does not have significant influence that are intended to be held for an indefinite period of time or may be sold in response to the need for liquidity are classified as available for sale.
75
Annual Report of Packages Limited 2013
Investments classified as available for sale are initially measured at cost, being the fair value of consideration given. At subsequent reporting dates, these investments are remeasured at fair value (quoted market price), unless fair value cannot be reliably measured. The investments for which a quoted market price is not available are measured at cost as it is not possible to apply any other valuation methodology. Unrealised gains and losses arising from the changes in the fair value are included in fair value reserves in the period in which they arise.
All purchases and sales of investments are recognised on the trade date which is the date that the Company commits to
purchase or sell the investment. Cost of purchase includes transaction cost. At each balance sheet date, the Company reviews the carrying amounts of the investments to assess whether there is any
indication that such investments have suffered an impairment loss. If any such indication exists, the recoverable amount is estimated in order to determine the extent of the impairment loss, if any. Impairment losses are recognised as expense in the profit and loss account. In respect of ‘available for sale’ financial assets, cumulative impairment loss less any impairment loss on that financial asset previously recognised in profit and loss account, is removed from equity and recognised in the profit and loss account. Impairment losses recognised in the profit and loss account on equity instruments are not reversed through the profit and loss account.
4.7 Employee retirement benefits
The main features of the schemes operated by the Company for its employees are as follows: 4.7.1 Defined benefit plans
(a) Gratuity plan
There is an approved funded defined benefit gratuity plan for all employees. Monthly contributions are made to this fund on the basis of actuarial recommendations at the rate of 4.5 percent per annum of basic salaries. The latest actuarial valuation for the gratuity scheme was carried out as at December 31, 2013. The actual return on plan assets during the year was Rs. 64.008 million. The actual return on plan assets represent the difference between the fair value of plan assets at the beginning of the year and end of the year adjustments for contributions made by the Company as reduced by benefits paid during the year.
The future contribution rates of these plans include allowances for deficit and surplus. Projected unit credit method, using the
following significant assumptions, is used for valuation of this scheme: Discount rate 12.5 percent per annum; Expected rate of increase in salary level 10.5 percent per annum; Expected mortality rate SLIC (2001-2005) mortality table; and Expected rate of return 11 percent per annum. Plan assets include long-term Government bonds, equity instruments of listed companies and term deposits with banks.
Return on Government bonds and debt is at fixed rates, however, due to increased volatility of share prices in recent months, there is no clear indication of return on equity shares, therefore, it has been assumed that the yield on equity shares would match the return on debt.
The Company is expected to contribute Rs. 13.17 million to the gratuity fund in the next financial year. Actuarial gains and losses arising from experience adjustments and changes in actuarial assumptions are charged or credited
to equity in other comprehensive income in the period in which they arise. Past service costs are recognized immediately in income.
(b) Pension Plan
All the executive staff participates in the pension plan of the Company. On December 26, 2012, the Board of Trustees of the pension fund decided to convert the Defined Benefit Plan to Defined Contribution Plan for all its active employees with effect from January 1, 2013 with no impact on the pensioners appearing on the pensioners’ list as of that date. The proposed scheme was approved for implementation by the Commissioner Inland Revenue on February 22, 2013 and employees consent to the proposed scheme was sought and obtained.
76
Consequently, the pension plan / fund currently operate two different plans for its employees: - Defined contribution plan for all active employees; and - Defined benefit plan for pensioners who have retired before December 31, 2012. In respect of the defined contribution plan, the Company contributes 20% of members’ monthly salary to the scheme;
whereas, an employee may or may not opt to contribute 6% of his monthly salary to the scheme. The obligation in respect of the defined benefit plan is determined by the Fund’s Actuary at each year end. Any funding gap
identified by the Fund’s Actuary is paid by the Company from time to time. The last actuarial valuation was carried out as at December 31, 2013.
Actuarial gains and losses arising from experience adjustments and changes in actuarial assumptions for the defined benefit
plan are charged or credited to equity in other comprehensive income in the period in which they arise. Past service costs are recognized immediately in income.
(c) Accumulating compensated absences
The Company provides for accumulating compensated absences when the employees render services that increase their entitlement to future compensated absences. The executives and workers are entitled to earned annual leaves and medical leaves on the basis of their service with the Company. The annual leaves can be encashed at the time the employee leaves the Company on the basis of gross salary while no encashment is available for medical leaves to executives.
The Company uses the valuation performed by an independent actuary as the present value of its accumulating compensated
absences. Projected unit credit method, using the following significant assumptions, has been used for valuation of accumulating
compensated absences: Discount rate 12.5 percent per annum; Expected rate of increase in salary level 10.5 percent per annum; and Expected mortality rate SLIC (2001-2005) mortality table. 4.7.2 Defined contribution plan
There is an approved contributory provident fund for all employees. Equal monthly contributions are made by the Company and the employees to the fund. The nature of contributory pension fund has been explained in note 4.7.1 (b) above.
Retirement benefits are payable to staff on completion of prescribed qualifying period of service under these schemes. As per the Joint Venture agreement with Stora Enso, all accumulated balances due and payable to the employees in respect
of pension, gratuity and provident fund maintained with Company as a consequence of cessation of their employment with Company were transferred by Company’s Funds to BSPL’s Funds or directly paid to the employees. This has been treated as a settlement as per IAS 19 - Employee Benefits.
4.7.3 Pension plan is a multi-employer plan formed by the Company in collaboration with Tri Pack Films Limited and DIC
Pakistan Limited. Similarly, Gratuity plan is also a multi-employer plan formed by the Company in collaboration with DIC Pakistan Limited. Contribution by the companies is based on the respective number of employees of each company. Packages reports its proportionate share of the plan’s commitments, managed assets and costs, in accordance with guidance provided by IAS 19 - Employee Benefits, regarding defined benefit plans, based on the number of its employees participating in the plans.
4.7.4 Change in Accounting Policy
During the year, the Company has changed its accounting policy in respect to recognition of actuarial gains and losses, past service costs and expected return on plan assets, whereby with effect from current year, the Company has recognized:
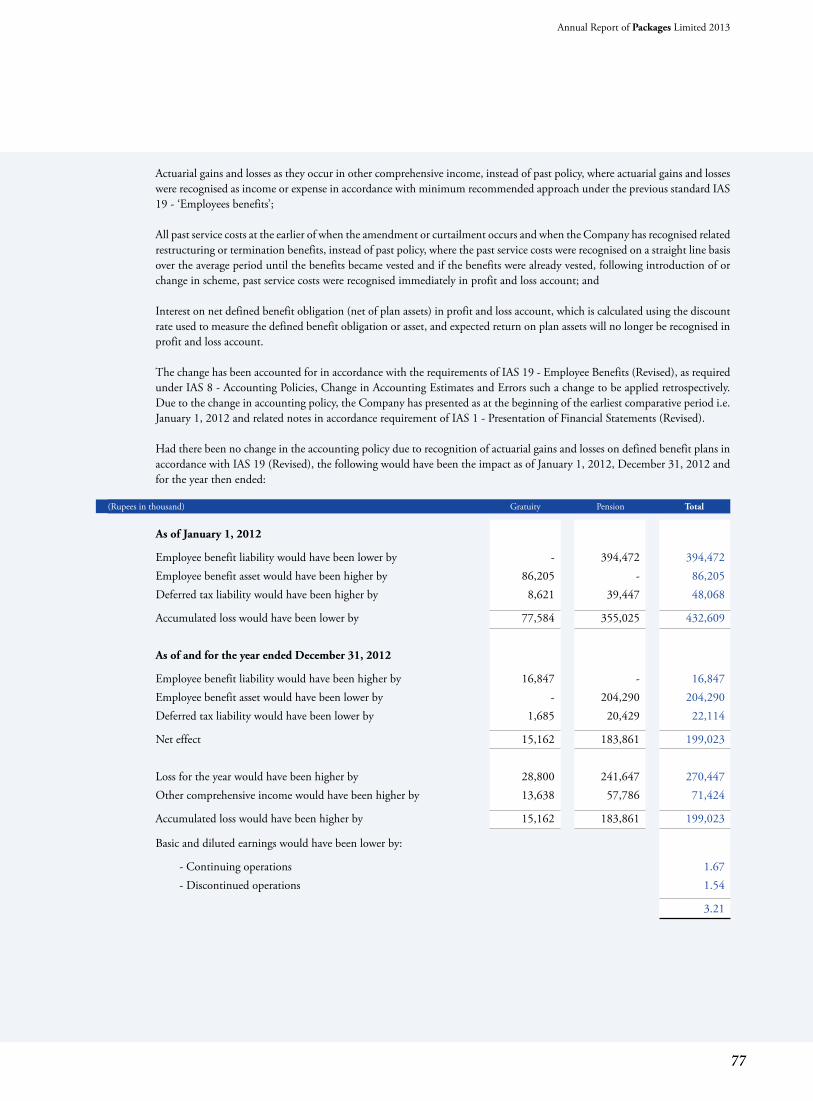
77
Annual Report of Packages Limited 2013
Actuarial gains and losses as they occur in other comprehensive income, instead of past policy, where actuarial gains and losses were recognised as income or expense in accordance with minimum recommended approach under the previous standard IAS 19 - ‘Employees benefits’;
All past service costs at the earlier of when the amendment or curtailment occurs and when the Company has recognised related
restructuring or termination benefits, instead of past policy, where the past service costs were recognised on a straight line basis over the average period until the benefits became vested and if the benefits were already vested, following introduction of or change in scheme, past service costs were recognised immediately in profit and loss account; and
Interest on net defined benefit obligation (net of plan assets) in profit and loss account, which is calculated using the discount
rate used to measure the defined benefit obligation or asset, and expected return on plan assets will no longer be recognised in profit and loss account.
The change has been accounted for in accordance with the requirements of IAS 19 - Employee Benefits (Revised), as required
under IAS 8 - Accounting Policies, Change in Accounting Estimates and Errors such a change to be applied retrospectively. Due to the change in accounting policy, the Company has presented as at the beginning of the earliest comparative period i.e. January 1, 2012 and related notes in accordance requirement of IAS 1 - Presentation of Financial Statements (Revised).
Had there been no change in the accounting policy due to recognition of actuarial gains and losses on defined benefit plans in
accordance with IAS 19 (Revised), the following would have been the impact as of January 1, 2012, December 31, 2012 and for the year then ended:
(Rupees in thousand) Gratuity Pension Total
As of January 1, 2012
Employee benefit liability would have been lower by - 394,472 394,472 Employee benefit asset would have been higher by 86,205 - 86,205 Deferred tax liability would have been higher by 8,621 39,447 48,068
Accumulated loss would have been lower by 77,584 355,025 432,609 As of and for the year ended December 31, 2012
Employee benefit liability would have been higher by 16,847 - 16,847 Employee benefit asset would have been lower by - 204,290 204,290 Deferred tax liability would have been lower by 1,685 20,429 22,114
Net effect 15,162 183,861 199,023 Loss for the year would have been higher by 28,800 241,647 270,447 Other comprehensive income would have been higher by 13,638 57,786 71,424
Accumulated loss would have been higher by 15,162 183,861 199,023
Basic and diluted earnings would have been lower by:
- Continuing operations 1.67 - Discontinued operations 1.54
3.21
78
4.8 Stores and spares
Stores and spares are valued at moving average cost, while items considered obsolete are carried at nil value. Items in transit are valued at cost comprising invoice value plus other charges paid thereon.
Provision is made in the financial statements for obsolete and slow moving stores and spares based on management estimate. 4.9 Stock-in-trade
Stock of raw materials, except for those in transit, work-in-process and finished goods are valued principally at the lower of cost and net realisable value. Cost of raw materials is determined using the weighted average cost method. Cost of work-in-process and finished goods comprises direct production costs such as raw materials, consumables and labour as well as production overheads such as employee wages, depreciation, maintenance, etc. The production overheads are measured based on a standard cost method, which is reviewed regularly to ensure relevant measures of utilisation, production lead time etc.
Materials in transit are stated at cost comprising invoice value plus other charges paid thereon. If the expected sales price less completion costs and costs to execute sales (net realisable value) is lower than the carrying
amount, a write-down is recognised for the amount by which the carrying amount exceeds its net realisable value. Provision is made in the financial statements for obsolete and slow moving stock in trade based on management estimate.
4.10 Financial instruments
Financial assets and financial liabilities are recognised at the time when the Company becomes a party to the contractual provisions of the instrument and derecognised when the Company loses control of contractual rights that comprise the financial assets and in the case of financial liabilities when the obligation specified in the contract is discharged, cancelled or expired. Any gain or loss on derecognition of financial assets and financial liabilities is included in the profit and loss account for the year.
Financial instruments carried on the balance sheet include loans, investments, trade and other debts, cash and bank balances,
borrowings, trade and other payables, accrued expenses and unclaimed dividends. All financial assets and liabilities are initially measured at cost, which is the fair value of consideration given and received respectively. These financial assets and liabilities are subsequently measured at fair value or cost as the case may be. The particular recognition methods adopted are disclosed in the individual policy statements associated with each item.
4.11 Offsetting of financial assets and liabilities
Financial assets and liabilities are offset and the net amount is reported in the financial statements only when there is a legally enforceable right to set off the recognised amount and the Company intends either to settle on a net basis or to realise the assets and to settle the liabilities simultaneously.
4.12 Trade debts
Trade debts are amounts due from customers for merchandise sold or services performed in the ordinary course of business. If collection is expected in one year or less (or in the normal operating cycle of the business if longer), they are classified as current assets. If not, they are presented as non-current assets.
Trade debts are recognized initially at fair value and subsequently measured at amortised cost using the effective interest method, less an estimate made for doubtful debts based on a review of all outstanding amounts at the year end. Bad debts are written off when identified.
4.13 Cash and cash equivalents
Cash and cash equivalents are carried in the balance sheet at cost. For the purpose of cash flow statement, cash and cash equivalents comprise cash in hand, demand deposits, other short term highly liquid investments that are readily convertible to known amounts of cash and which are subject to an insignificant risk of change in value and finances under mark up arrangements. In the balance sheet, finances under mark up arrangements are included in current liabilities.
79
Annual Report of Packages Limited 2013
4.14 Non-current assets / disposal group held-for-sale
Non-current assets are classified as assets held-for-sale when their carrying amount is to be recovered principally through a sale transaction and a sale is considered highly probable. They are stated at the lower of carrying amount and fair value less cost to sell.
4.15 Borrowings
Borrowings are recognised initially at fair value (proceeds received), net of transaction costs incurred. Borrowings are subsequently carried at amortised cost; any difference between the proceeds (net of transaction costs) and the redemption value is recognised in the income statement over the period of the borrowings using the effective interest method.
Fees paid on the establishment of loan facilities are recognised as transaction costs of the loan to the extent that it is probable
that some or all of the facility will be drawn down. In this case, the fee is deferred until the draw-down occurs. To the extent there is no evidence that it is probable that some or all of the facility will be drawn down, the fee is capitalised as a pre-payment for liquidity services and amortised over the period of the facility to which it relates.
Finance costs are accounted for on an accrual basis and are shown as accrued finance cost to the extent of the amount
remaining unpaid. 4.16 Trade and other payables
Trade payables are obligations to pay for goods or services that have been acquired in the ordinary course of business from suppliers. Accounts payable are classified as current liabilities if payment is due within one year or less (or in the normal operating cycle of the business if longer). If not, they are presented as non-current liabilities.
Liabilities for creditors and other costs payable are initially recognised at cost which is the fair value of the consideration to be
paid in future for goods and/ or services, whether or not billed to the Company and subsequently measured at amortised cost using the effective interest method.
4.17 Derivative financial instruments
These are initially recorded at cost on the date a derivative contract is entered into and are remeasured to fair value at subsequent reporting dates. The method of recognising the resulting gain or loss depends on whether the derivative is designated as a hedging instrument, and if so, the nature of the item being hedged. The Company designates certain derivatives as cash flow hedges.
The Company documents at the inception of the transaction the relationship between the hedging instruments and hedged
items, as well as its risk management objective and strategy for undertaking various hedge transactions. The Company also documents its assessment, both at hedge inception and on an ongoing basis, of whether the derivatives that are used in hedging transactions are highly effective in offsetting changes in cash flow of hedged items.
The effective portion of changes in the fair value of derivatives that are designated and qualify as cash flow hedges are
recognised in statement of other comprehensive income. The gain or loss relating to the ineffective portion is recognised immediately in the profit and loss account.
Amounts accumulated in equity are recognised in profit and loss account in the periods when the hedged item shall affect
profit or loss. However, when the forecast hedged transaction results in the recognition of a non-financial asset or liability, the gains and losses previously deferred in equity are transferred from equity and included in the initial measurement of the cost of the asset or liability.
4.18 Revenue recognition
Revenue is recognised on dispatch of goods or on the performance of services.
Return on deposits is accrued on a time proportion basis by reference to the principal outstanding and the applicable rate of return.
Dividend income and entitlement of bonus shares are recognised when right to receive such dividend and bonus shares is established.
80
4.19 Foreign currency transactions and translation
Foreign currency transactions are translated into Pak Rupees using the exchange rates prevailing at the dates of the transactions. All monetary assets and liabilities in foreign currencies are translated into Pak Rupees at the rates of exchange prevailing at the balance sheet date. Foreign exchange gains and losses on translation are recognised in the profit and loss account. All non-monetary items are translated into Pak Rupees at exchange rates prevailing on the date of transaction or on the date when fair values are determined.
The financial statements are presented in Pak Rupees, which is the Company’s functional and presentation currency. 4.20 Borrowing costs
General and specific borrowing costs directly attributable to the acquisition, construction or production of qualifying assets, which are assets that necessarily take a substantial period of time to get ready for their intended use or sale, are added to the cost of those assets, until such time as the assets are substantially ready for their intended use or sale.
Investment income earned on the temporary investment of specific borrowings pending their expenditure on qualifying assets
is deducted from the borrowing costs eligible for capitalisation. All other borrowing / finance costs are recognised in profit and loss account in the period in which they are incurred. 4.21 Dividend
Dividend distribution to the Company’s shareholders is recognised as a liability in the period in which the dividends are approved.
4.22 Compound financial instruments
Compound financial instruments issued by the Company represent preference shares / convertible stock that can be converted into ordinary shares or can be settled in cash.
The liability component of a compound financial instrument is recognised initially at the fair value of a similar liability that
does not have an equity conversion option. The equity component is recognised initially at the difference between the fair value of the compound financial instrument as a whole and the fair value of the liability component. Any directly attributable transaction costs are allocated to the liability and equity components in proportion to their initial carrying amounts.
Subsequent to initial recognition, the liability component of a compound financial instrument is measured at amortised cost
using the effective interest method. The equity component of a compound financial instrument is not re-measured subsequent to initial recognition except on conversion or expiry.
4.23 Provisions
Provisions for environmental restoration, restructuring costs and legal claims are recognised when: (i) the Company has a present legal or constructive obligation as a result of past events; (ii) it is probable that an outflow of resources shall be required to settle the obligation; and (iii) the amount has been reliably estimated. Restructuring provisions include lease termination penalties and employee termination payments and such other costs that
are necessarily entailed by the restructuring and not associated with on-going activities of the Company. Provisions are not recognised for future operating losses.
Where there are a number of similar obligations, the likelihood that an outflow shall be required in settlement is determined
by considering the class of obligations as a whole. A provision is recognised even if the likelihood of an outflow with respect to any one item included in the same class of obligations may be small.
Provisions are measured at the present value of the expenditures expected to be required to settle the obligation using a pre-tax
rate that reflects current market assessments of the time value of money and the risks specific to the obligation. The increase in the provision due to passage of time is recognised as interest expense.
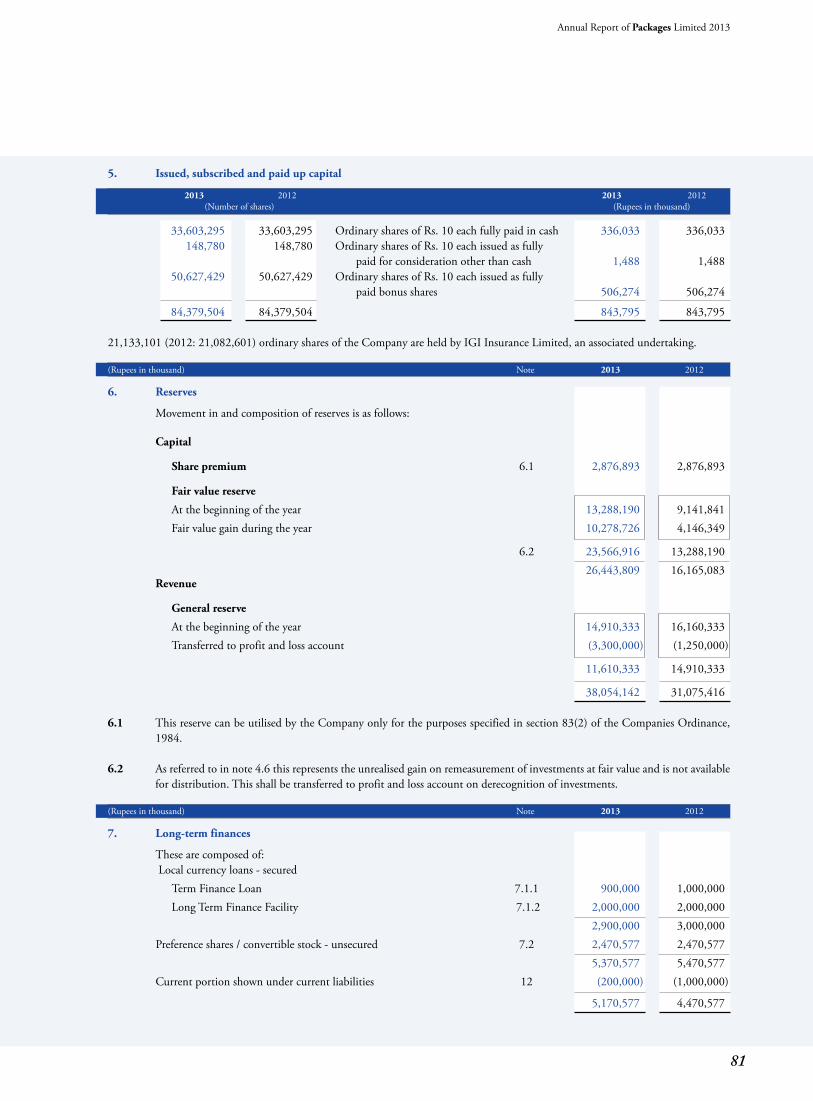
81
Annual Report of Packages Limited 2013
5. Issued, subscribed and paid up capital
2013 2012 2013 2012 (Number of shares) (Rupees in thousand)
33,603,295 33,603,295 Ordinary shares of Rs. 10 each fully paid in cash 336,033 336,033 148,780 148,780 Ordinary shares of Rs. 10 each issued as fully paid for consideration other than cash 1,488 1,488 50,627,429 50,627,429 Ordinary shares of Rs. 10 each issued as fully paid bonus shares 506,274 506,274
84,379,504 84,379,504 843,795 843,795 21,133,101 (2012: 21,082,601) ordinary shares of the Company are held by IGI Insurance Limited, an associated undertaking. (Rupees in thousand) Note 2013 2012
6. Reserves
Movement in and composition of reserves is as follows: Capital
Share premium 6.1 2,876,893 2,876,893
Fair value reserve At the beginning of the year 13,288,190 9,141,841 Fair value gain during the year 10,278,726 4,146,349
6.2 23,566,916 13,288,190 26,443,809 16,165,083
Revenue
General reserve At the beginning of the year 14,910,333 16,160,333 Transferred to profit and loss account (3,300,000) (1,250,000)
11,610,333 14,910,333
38,054,142 31,075,416 6.1 This reserve can be utilised by the Company only for the purposes specified in section 83(2) of the Companies Ordinance,
1984. 6.2 As referred to in note 4.6 this represents the unrealised gain on remeasurement of investments at fair value and is not available
for distribution. This shall be transferred to profit and loss account on derecognition of investments.
(Rupees in thousand) Note 2013 2012
7. Long-term finances
These are composed of: Local currency loans - secured
Term Finance Loan 7.1.1 900,000 1,000,000 Long Term Finance Facility 7.1.2 2,000,000 2,000,000 2,900,000 3,000,000 Preference shares / convertible stock - unsecured 7.2 2,470,577 2,470,577 5,370,577 5,470,577 Current portion shown under current liabilities 12 (200,000) (1,000,000)
5,170,577 4,470,577
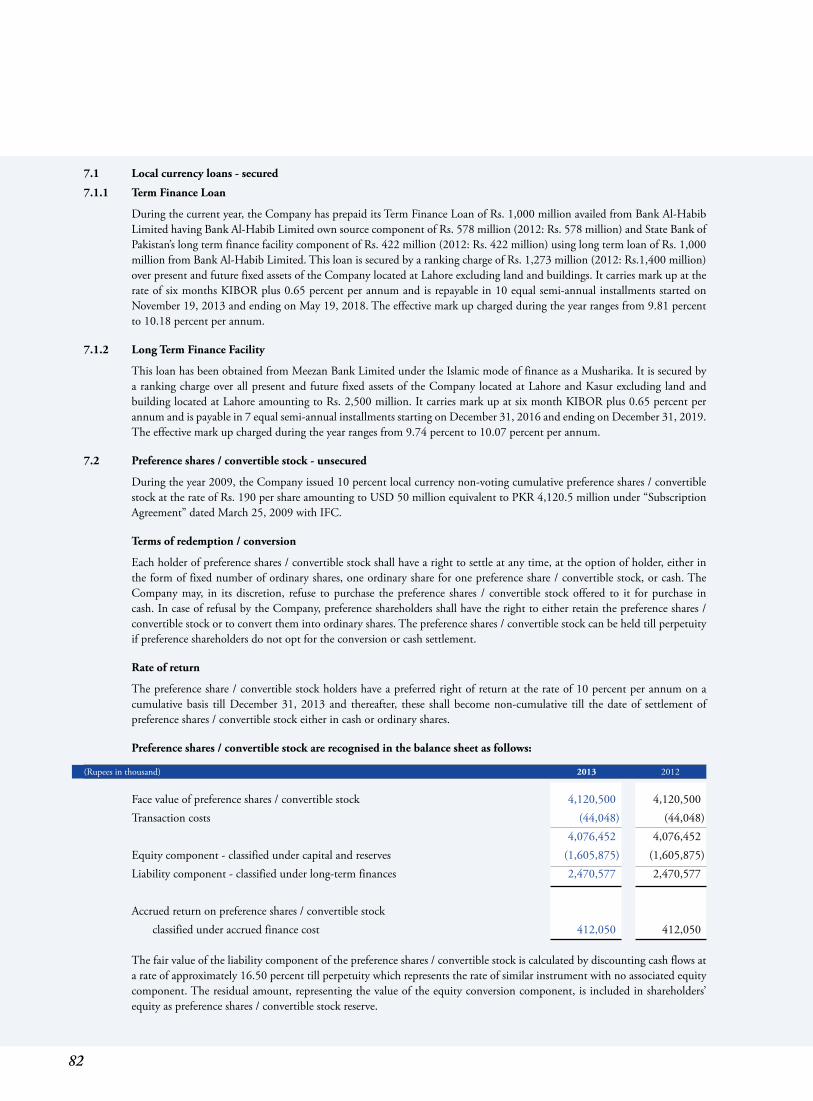
82
7.1 Local currency loans - secured
7.1.1 Term Finance Loan
During the current year, the Company has prepaid its Term Finance Loan of Rs. 1,000 million availed from Bank Al-Habib Limited having Bank Al-Habib Limited own source component of Rs. 578 million (2012: Rs. 578 million) and State Bank of Pakistan’s long term finance facility component of Rs. 422 million (2012: Rs. 422 million) using long term loan of Rs. 1,000 million from Bank Al-Habib Limited. This loan is secured by a ranking charge of Rs. 1,273 million (2012: Rs.1,400 million) over present and future fixed assets of the Company located at Lahore excluding land and buildings. It carries mark up at the rate of six months KIBOR plus 0.65 percent per annum and is repayable in 10 equal semi-annual installments started on November 19, 2013 and ending on May 19, 2018. The effective mark up charged during the year ranges from 9.81 percent to 10.18 percent per annum.
7.1.2 Long Term Finance Facility
This loan has been obtained from Meezan Bank Limited under the Islamic mode of finance as a Musharika. It is secured by a ranking charge over all present and future fixed assets of the Company located at Lahore and Kasur excluding land and building located at Lahore amounting to Rs. 2,500 million. It carries mark up at six month KIBOR plus 0.65 percent per annum and is payable in 7 equal semi-annual installments starting on December 31, 2016 and ending on December 31, 2019. The effective mark up charged during the year ranges from 9.74 percent to 10.07 percent per annum.
7.2 Preference shares / convertible stock - unsecured
During the year 2009, the Company issued 10 percent local currency non-voting cumulative preference shares / convertible stock at the rate of Rs. 190 per share amounting to USD 50 million equivalent to PKR 4,120.5 million under “Subscription Agreement” dated March 25, 2009 with IFC.
Terms of redemption / conversion
Each holder of preference shares / convertible stock shall have a right to settle at any time, at the option of holder, either in the form of fixed number of ordinary shares, one ordinary share for one preference share / convertible stock, or cash. The Company may, in its discretion, refuse to purchase the preference shares / convertible stock offered to it for purchase in cash. In case of refusal by the Company, preference shareholders shall have the right to either retain the preference shares / convertible stock or to convert them into ordinary shares. The preference shares / convertible stock can be held till perpetuity if preference shareholders do not opt for the conversion or cash settlement.
Rate of return
The preference share / convertible stock holders have a preferred right of return at the rate of 10 percent per annum on a cumulative basis till December 31, 2013 and thereafter, these shall become non-cumulative till the date of settlement of preference shares / convertible stock either in cash or ordinary shares.
Preference shares / convertible stock are recognised in the balance sheet as follows:
(Rupees in thousand) 2013 2012
Face value of preference shares / convertible stock 4,120,500 4,120,500 Transaction costs (44,048) (44,048) 4,076,452 4,076,452 Equity component - classified under capital and reserves (1,605,875) (1,605,875)Liability component - classified under long-term finances 2,470,577 2,470,577 Accrued return on preference shares / convertible stock classified under accrued finance cost 412,050 412,050
The fair value of the liability component of the preference shares / convertible stock is calculated by discounting cash flows at
a rate of approximately 16.50 percent till perpetuity which represents the rate of similar instrument with no associated equity component. The residual amount, representing the value of the equity conversion component, is included in shareholders’ equity as preference shares / convertible stock reserve.
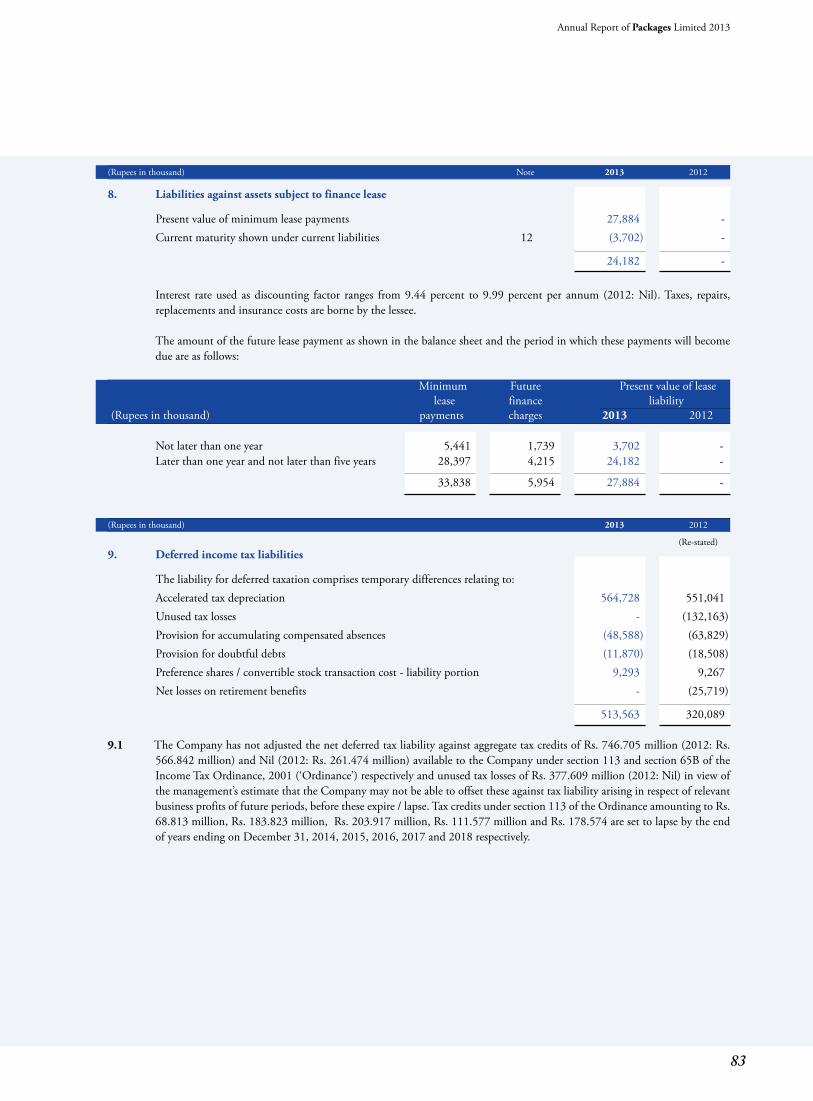
83
Annual Report of Packages Limited 2013
(Rupees in thousand) Note 2013 2012
8. Liabilities against assets subject to finance lease
Present value of minimum lease payments 27,884 - Current maturity shown under current liabilities 12 (3,702) -
24,182 -
Interest rate used as discounting factor ranges from 9.44 percent to 9.99 percent per annum (2012: Nil). Taxes, repairs, replacements and insurance costs are borne by the lessee.
The amount of the future lease payment as shown in the balance sheet and the period in which these payments will become
due are as follows: Minimum Future Present value of lease lease finance liability (Rupees in thousand) payments charges 2013 2012 Not later than one year 5,441 1,739 3,702 - Later than one year and not later than five years 28,397 4,215 24,182 -
33,838 5,954 27,884 -
(Rupees in thousand) 2013 2012
(Re-stated) 9. Deferred income tax liabilities
The liability for deferred taxation comprises temporary differences relating to: Accelerated tax depreciation 564,728 551,041 Unused tax losses - (132,163)Provision for accumulating compensated absences (48,588) (63,829)Provision for doubtful debts (11,870) (18,508)Preference shares / convertible stock transaction cost - liability portion 9,293 9,267 Net losses on retirement benefits - (25,719)
513,563 320,089 9.1 The Company has not adjusted the net deferred tax liability against aggregate tax credits of Rs. 746.705 million (2012: Rs.
566.842 million) and Nil (2012: Rs. 261.474 million) available to the Company under section 113 and section 65B of the Income Tax Ordinance, 2001 (‘Ordinance’) respectively and unused tax losses of Rs. 377.609 million (2012: Nil) in view of the management’s estimate that the Company may not be able to offset these against tax liability arising in respect of relevant business profits of future periods, before these expire / lapse. Tax credits under section 113 of the Ordinance amounting to Rs. 68.813 million, Rs. 183.823 million, Rs. 203.917 million, Rs. 111.577 million and Rs. 178.574 are set to lapse by the end of years ending on December 31, 2014, 2015, 2016, 2017 and 2018 respectively.
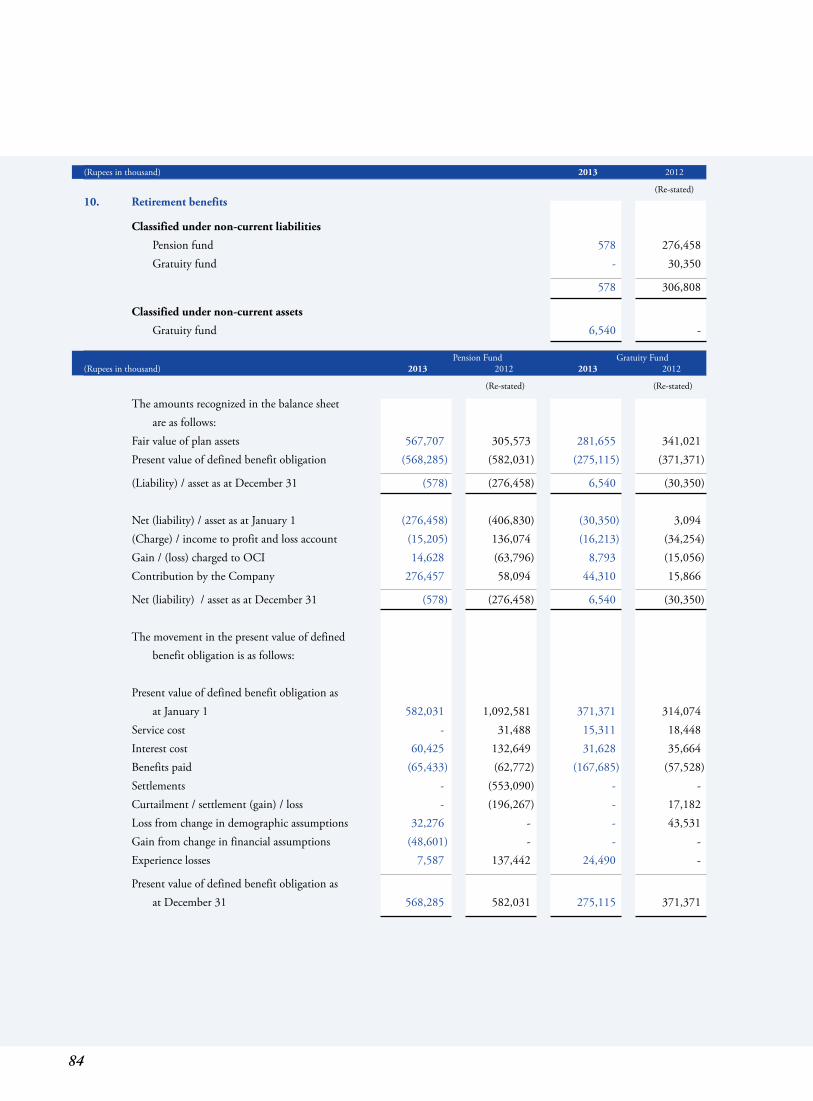
84
(Rupees in thousand) 2013 2012
(Re-stated) 10. Retirement benefits
Classified under non-current liabilities Pension fund 578 276,458 Gratuity fund - 30,350
578 306,808
Classified under non-current assets Gratuity fund 6,540 -
Pension Fund Gratuity Fund
(Rupees in thousand) 2013 2012 2013 2012
(Re-stated) (Re-stated)
The amounts recognized in the balance sheet are as follows: Fair value of plan assets 567,707 305,573 281,655 341,021 Present value of defined benefit obligation (568,285) (582,031) (275,115) (371,371)
(Liability) / asset as at December 31 (578) (276,458) 6,540 (30,350) Net (liability) / asset as at January 1 (276,458) (406,830) (30,350) 3,094 (Charge) / income to profit and loss account (15,205) 136,074 (16,213) (34,254)Gain / (loss) charged to OCI 14,628 (63,796) 8,793 (15,056)Contribution by the Company 276,457 58,094 44,310 15,866
Net (liability) / asset as at December 31 (578) (276,458) 6,540 (30,350) The movement in the present value of defined benefit obligation is as follows: Present value of defined benefit obligation as at January 1 582,031 1,092,581 371,371 314,074 Service cost - 31,488 15,311 18,448 Interest cost 60,425 132,649 31,628 35,664 Benefits paid (65,433) (62,772) (167,685) (57,528)Settlements - (553,090) - - Curtailment / settlement (gain) / loss - (196,267) - 17,182 Loss from change in demographic assumptions 32,276 - - 43,531 Gain from change in financial assumptions (48,601) - - - Experience losses 7,587 137,442 24,490 -
Present value of defined benefit obligation as at December 31 568,285 582,031 275,115 371,371
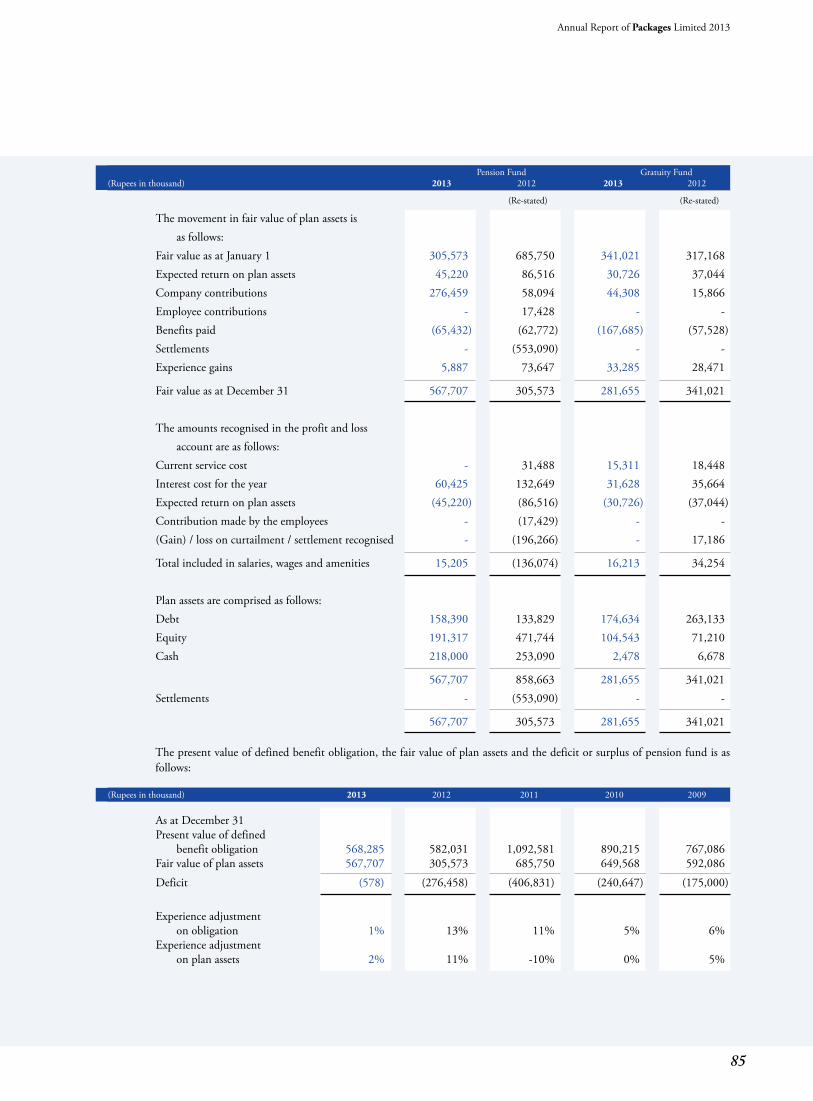
85
Annual Report of Packages Limited 2013
Pension Fund Gratuity Fund (Rupees in thousand) 2013 2012 2013 2012
(Re-stated) (Re-stated)
The movement in fair value of plan assets is as follows: Fair value as at January 1 305,573 685,750 341,021 317,168 Expected return on plan assets 45,220 86,516 30,726 37,044 Company contributions 276,459 58,094 44,308 15,866 Employee contributions - 17,428 - - Benefits paid (65,432) (62,772) (167,685) (57,528)Settlements - (553,090) - - Experience gains 5,887 73,647 33,285 28,471
Fair value as at December 31 567,707 305,573 281,655 341,021 The amounts recognised in the profit and loss account are as follows: Current service cost - 31,488 15,311 18,448 Interest cost for the year 60,425 132,649 31,628 35,664 Expected return on plan assets (45,220) (86,516) (30,726) (37,044)Contribution made by the employees - (17,429) - - (Gain) / loss on curtailment / settlement recognised - (196,266) - 17,186
Total included in salaries, wages and amenities 15,205 (136,074) 16,213 34,254 Plan assets are comprised as follows: Debt 158,390 133,829 174,634 263,133 Equity 191,317 471,744 104,543 71,210 Cash 218,000 253,090 2,478 6,678
567,707 858,663 281,655 341,021 Settlements - (553,090) - -
567,707 305,573 281,655 341,021 The present value of defined benefit obligation, the fair value of plan assets and the deficit or surplus of pension fund is as
follows: (Rupees in thousand) 2013 2012 2011 2010 2009
As at December 31 Present value of defined benefit obligation 568,285 582,031 1,092,581 890,215 767,086 Fair value of plan assets 567,707 305,573 685,750 649,568 592,086
Deficit (578) (276,458) (406,831) (240,647) (175,000)
Experience adjustment on obligation 1% 13% 11% 5% 6%Experience adjustment on plan assets 2% 11% -10% 0% 5%
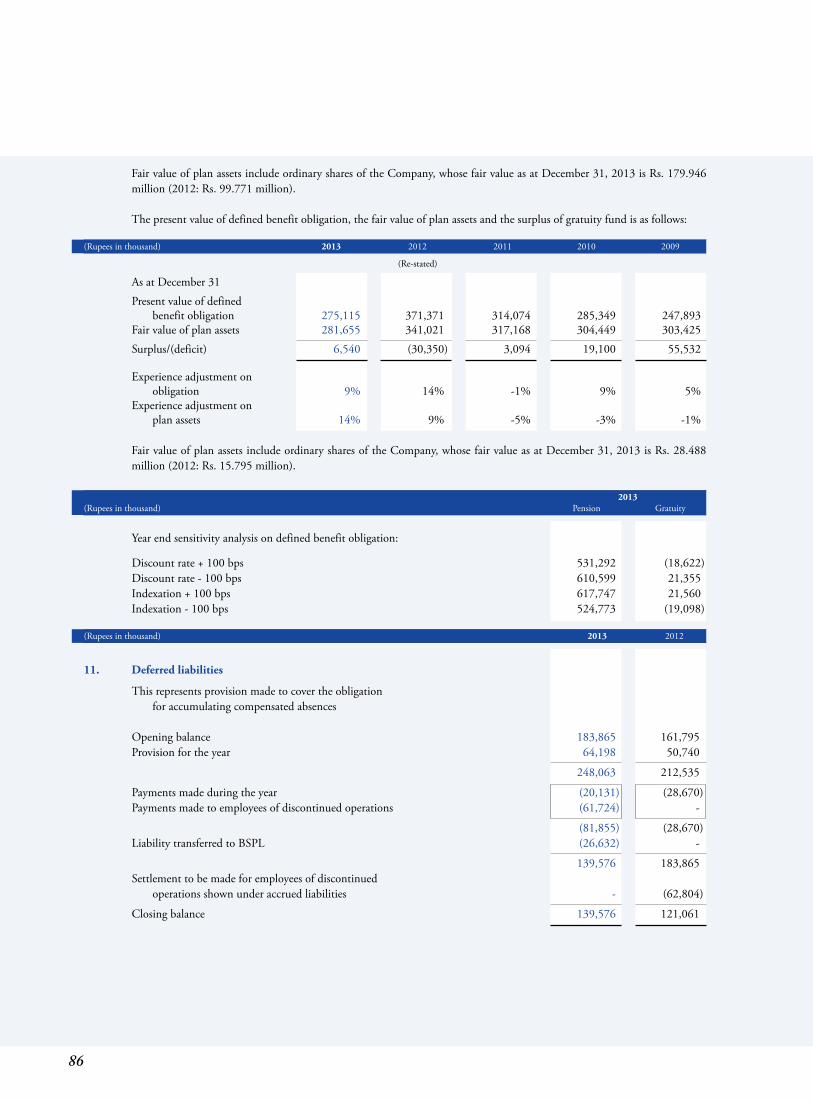
86
Fair value of plan assets include ordinary shares of the Company, whose fair value as at December 31, 2013 is Rs. 179.946 million (2012: Rs. 99.771 million).
The present value of defined benefit obligation, the fair value of plan assets and the surplus of gratuity fund is as follows: (Rupees in thousand) 2013 2012 2011 2010 2009
(Re-stated)
As at December 31
Present value of defined benefit obligation 275,115 371,371 314,074 285,349 247,893 Fair value of plan assets 281,655 341,021 317,168 304,449 303,425
Surplus/(deficit) 6,540 (30,350) 3,094 19,100 55,532
Experience adjustment on obligation 9% 14% -1% 9% 5%Experience adjustment on plan assets 14% 9% -5% -3% -1%
Fair value of plan assets include ordinary shares of the Company, whose fair value as at December 31, 2013 is Rs. 28.488
million (2012: Rs. 15.795 million).
2013(Rupees in thousand) Pension Gratuity
Year end sensitivity analysis on defined benefit obligation:
Discount rate + 100 bps 531,292 (18,622) Discount rate - 100 bps 610,599 21,355 Indexation + 100 bps 617,747 21,560 Indexation - 100 bps 524,773 (19,098) (Rupees in thousand) 2013 2012
11. Deferred liabilities
This represents provision made to cover the obligation for accumulating compensated absences Opening balance 183,865 161,795 Provision for the year 64,198 50,740
248,063 212,535
Payments made during the year (20,131) (28,670) Payments made to employees of discontinued operations (61,724) -
(81,855) (28,670) Liability transferred to BSPL (26,632) -
139,576 183,865 Settlement to be made for employees of discontinued operations shown under accrued liabilities - (62,804)
Closing balance 139,576 121,061
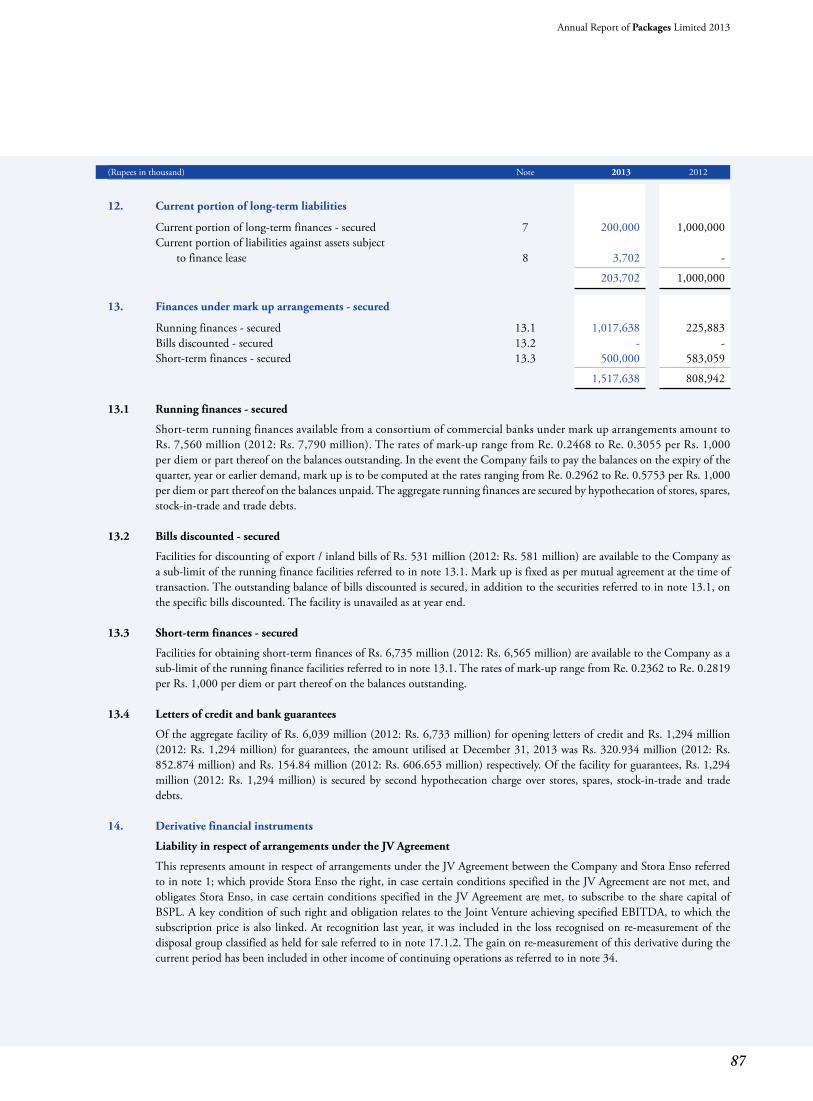
87
Annual Report of Packages Limited 2013
(Rupees in thousand) Note 2013 2012
12. Current portion of long-term liabilities
Current portion of long-term finances - secured 7 200,000 1,000,000 Current portion of liabilities against assets subject to finance lease 8 3,702 -
203,702 1,000,000
13. Finances under mark up arrangements - secured
Running finances - secured 13.1 1,017,638 225,883 Bills discounted - secured 13.2 - - Short-term finances - secured 13.3 500,000 583,059
1,517,638 808,942 13.1 Running finances - secured
Short-term running finances available from a consortium of commercial banks under mark up arrangements amount to Rs. 7,560 million (2012: Rs. 7,790 million). The rates of mark-up range from Re. 0.2468 to Re. 0.3055 per Rs. 1,000 per diem or part thereof on the balances outstanding. In the event the Company fails to pay the balances on the expiry of the quarter, year or earlier demand, mark up is to be computed at the rates ranging from Re. 0.2962 to Re. 0.5753 per Rs. 1,000 per diem or part thereof on the balances unpaid. The aggregate running finances are secured by hypothecation of stores, spares, stock-in-trade and trade debts.
13.2 Bills discounted - secured
Facilities for discounting of export / inland bills of Rs. 531 million (2012: Rs. 581 million) are available to the Company as a sub-limit of the running finance facilities referred to in note 13.1. Mark up is fixed as per mutual agreement at the time of transaction. The outstanding balance of bills discounted is secured, in addition to the securities referred to in note 13.1, on the specific bills discounted. The facility is unavailed as at year end.
13.3 Short-term finances - secured
Facilities for obtaining short-term finances of Rs. 6,735 million (2012: Rs. 6,565 million) are available to the Company as a sub-limit of the running finance facilities referred to in note 13.1. The rates of mark-up range from Re. 0.2362 to Re. 0.2819 per Rs. 1,000 per diem or part thereof on the balances outstanding.
13.4 Letters of credit and bank guarantees
Of the aggregate facility of Rs. 6,039 million (2012: Rs. 6,733 million) for opening letters of credit and Rs. 1,294 million (2012: Rs. 1,294 million) for guarantees, the amount utilised at December 31, 2013 was Rs. 320.934 million (2012: Rs. 852.874 million) and Rs. 154.84 million (2012: Rs. 606.653 million) respectively. Of the facility for guarantees, Rs. 1,294 million (2012: Rs. 1,294 million) is secured by second hypothecation charge over stores, spares, stock-in-trade and trade debts.
14. Derivative financial instruments
Liability in respect of arrangements under the JV Agreement
This represents amount in respect of arrangements under the JV Agreement between the Company and Stora Enso referred to in note 1; which provide Stora Enso the right, in case certain conditions specified in the JV Agreement are not met, and obligates Stora Enso, in case certain conditions specified in the JV Agreement are met, to subscribe to the share capital of BSPL. A key condition of such right and obligation relates to the Joint Venture achieving specified EBITDA, to which the subscription price is also linked. At recognition last year, it was included in the loss recognised on re-measurement of the disposal group classified as held for sale referred to in note 17.1.2. The gain on re-measurement of this derivative during the current period has been included in other income of continuing operations as referred to in note 34.
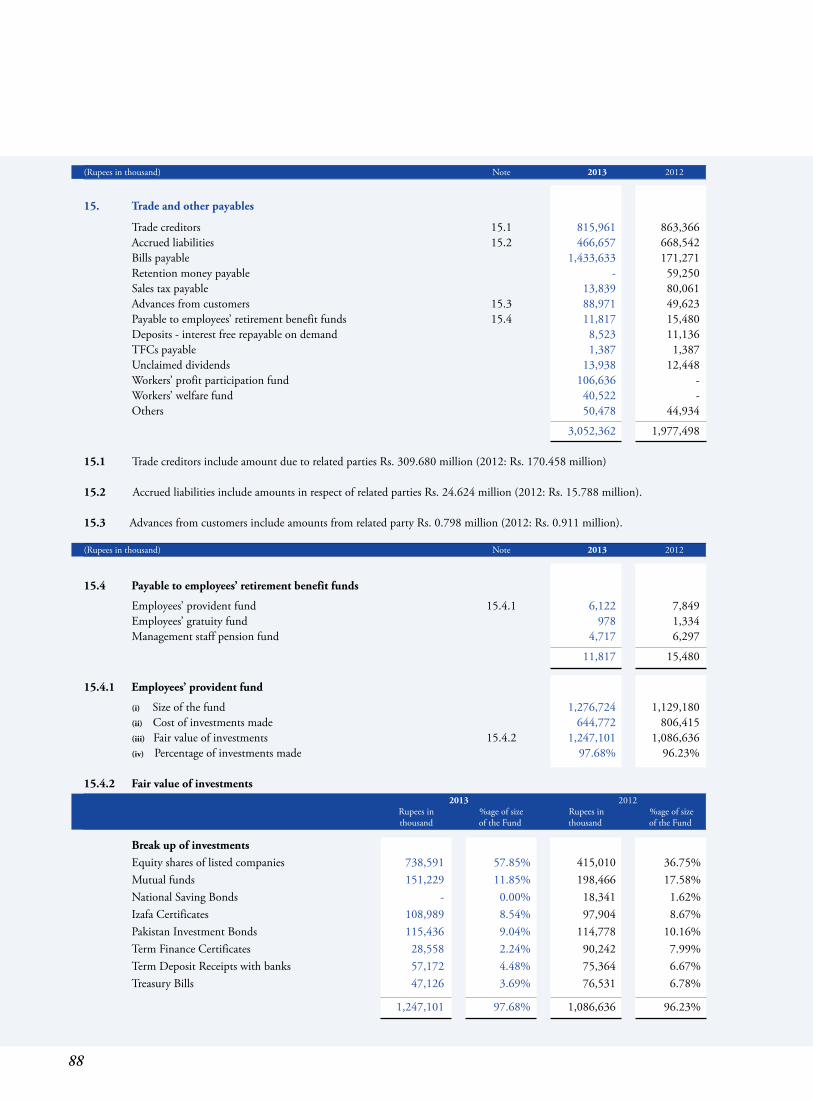
88
(Rupees in thousand) Note 2013 2012
15. Trade and other payables
Trade creditors 15.1 815,961 863,366 Accrued liabilities 15.2 466,657 668,542 Bills payable 1,433,633 171,271 Retention money payable - 59,250 Sales tax payable 13,839 80,061 Advances from customers 15.3 88,971 49,623 Payable to employees’ retirement benefit funds 15.4 11,817 15,480 Deposits - interest free repayable on demand 8,523 11,136 TFCs payable 1,387 1,387 Unclaimed dividends 13,938 12,448 Workers’ profit participation fund 106,636 - Workers’ welfare fund 40,522 - Others 50,478 44,934
3,052,362 1,977,498 15.1 Trade creditors include amount due to related parties Rs. 309.680 million (2012: Rs. 170.458 million) 15.2 Accrued liabilities include amounts in respect of related parties Rs. 24.624 million (2012: Rs. 15.788 million). 15.3 Advances from customers include amounts from related party Rs. 0.798 million (2012: Rs. 0.911 million). (Rupees in thousand) Note 2013 2012
15.4 Payable to employees’ retirement benefit funds
Employees’ provident fund 15.4.1 6,122 7,849 Employees’ gratuity fund 978 1,334 Management staff pension fund 4,717 6,297
11,817 15,480 15.4.1 Employees’ provident fund
(i) Size of the fund 1,276,724 1,129,180 (ii) Cost of investments made 644,772 806,415 (iii) Fair value of investments 15.4.2 1,247,101 1,086,636 (iv) Percentage of investments made 97.68% 96.23% 15.4.2 Fair value of investments
2013 2012 Rupees in %age of size Rupees in %age of size thousand of the Fund thousand of the Fund
Break up of investments Equity shares of listed companies 738,591 57.85% 415,010 36.75%Mutual funds 151,229 11.85% 198,466 17.58%National Saving Bonds - 0.00% 18,341 1.62%Izafa Certificates 108,989 8.54% 97,904 8.67%Pakistan Investment Bonds 115,436 9.04% 114,778 10.16%Term Finance Certificates 28,558 2.24% 90,242 7.99%Term Deposit Receipts with banks 57,172 4.48% 75,364 6.67%Treasury Bills 47,126 3.69% 76,531 6.78%
1,247,101 97.68% 1,086,636 96.23%
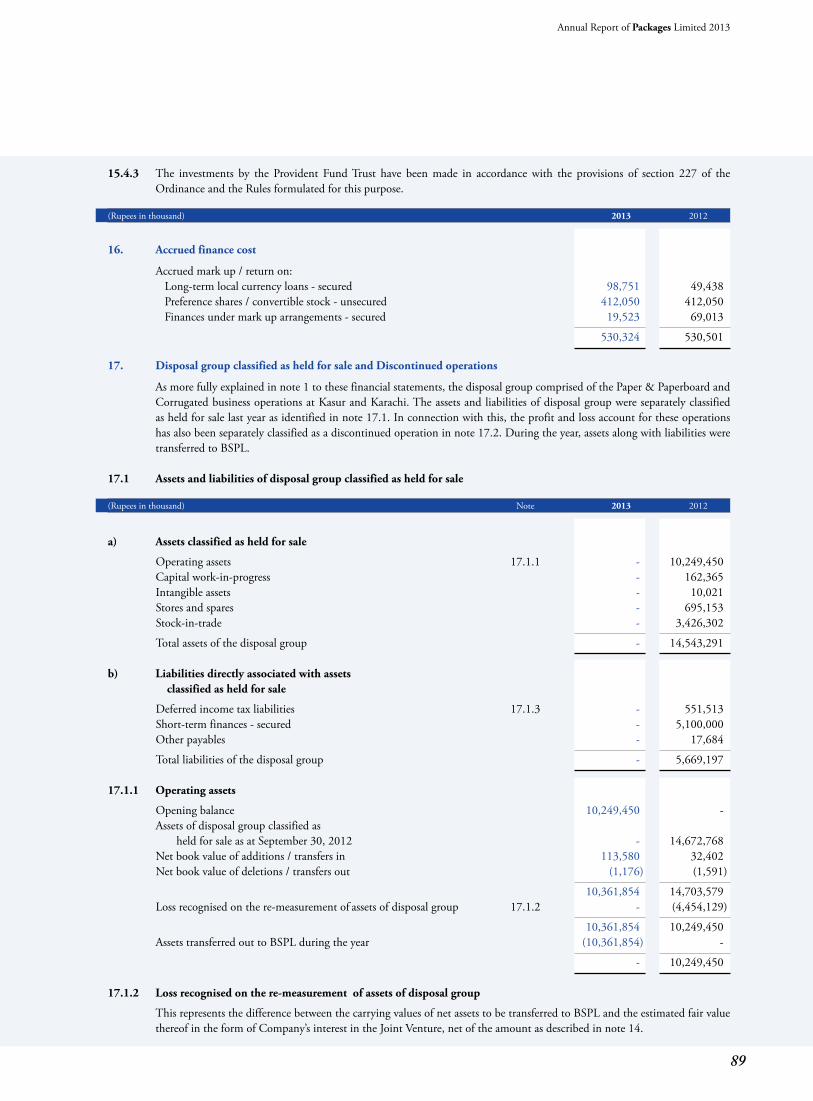
89
Annual Report of Packages Limited 2013
15.4.3 The investments by the Provident Fund Trust have been made in accordance with the provisions of section 227 of the Ordinance and the Rules formulated for this purpose.
(Rupees in thousand) 2013 2012
16. Accrued finance cost
Accrued mark up / return on: Long-term local currency loans - secured 98,751 49,438 Preference shares / convertible stock - unsecured 412,050 412,050 Finances under mark up arrangements - secured 19,523 69,013
530,324 530,501 17. Disposal group classified as held for sale and Discontinued operations
As more fully explained in note 1 to these financial statements, the disposal group comprised of the Paper & Paperboard and Corrugated business operations at Kasur and Karachi. The assets and liabilities of disposal group were separately classified as held for sale last year as identified in note 17.1. In connection with this, the profit and loss account for these operations has also been separately classified as a discontinued operation in note 17.2. During the year, assets along with liabilities were transferred to BSPL.
17.1 Assets and liabilities of disposal group classified as held for sale (Rupees in thousand) Note 2013 2012
a) Assets classified as held for sale
Operating assets 17.1.1 - 10,249,450 Capital work-in-progress - 162,365 Intangible assets - 10,021 Stores and spares - 695,153 Stock-in-trade - 3,426,302
Total assets of the disposal group - 14,543,291 b) Liabilities directly associated with assets classified as held for sale
Deferred income tax liabilities 17.1.3 - 551,513 Short-term finances - secured - 5,100,000 Other payables - 17,684
Total liabilities of the disposal group - 5,669,197 17.1.1 Operating assets
Opening balance 10,249,450 - Assets of disposal group classified as held for sale as at September 30, 2012 - 14,672,768 Net book value of additions / transfers in 113,580 32,402 Net book value of deletions / transfers out (1,176) (1,591)
10,361,854 14,703,579 Loss recognised on the re-measurement of assets of disposal group 17.1.2 - (4,454,129)
10,361,854 10,249,450 Assets transferred out to BSPL during the year (10,361,854) -
- 10,249,450 17.1.2 Loss recognised on the re-measurement of assets of disposal group
This represents the difference between the carrying values of net assets to be transferred to BSPL and the estimated fair value thereof in the form of Company’s interest in the Joint Venture, net of the amount as described in note 14.
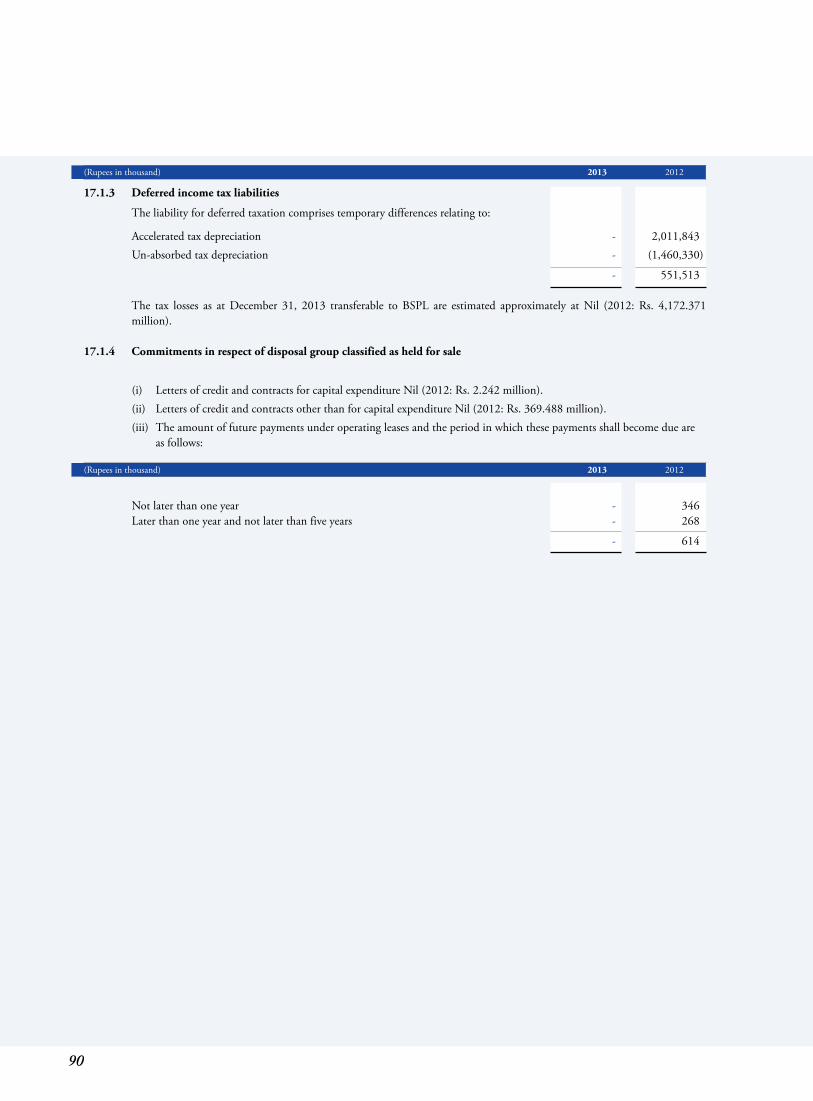
90
(Rupees in thousand) 2013 2012
17.1.3 Deferred income tax liabilities
The liability for deferred taxation comprises temporary differences relating to:
Accelerated tax depreciation - 2,011,843 Un-absorbed tax depreciation - (1,460,330)
- 551,513 The tax losses as at December 31, 2013 transferable to BSPL are estimated approximately at Nil (2012: Rs. 4,172.371
million). 17.1.4 Commitments in respect of disposal group classified as held for sale
(i) Letters of credit and contracts for capital expenditure Nil (2012: Rs. 2.242 million). (ii) Letters of credit and contracts other than for capital expenditure Nil (2012: Rs. 369.488 million). (iii) The amount of future payments under operating leases and the period in which these payments shall become due are
as follows:
(Rupees in thousand) 2013 2012
Not later than one year - 346 Later than one year and not later than five years - 268
- 614
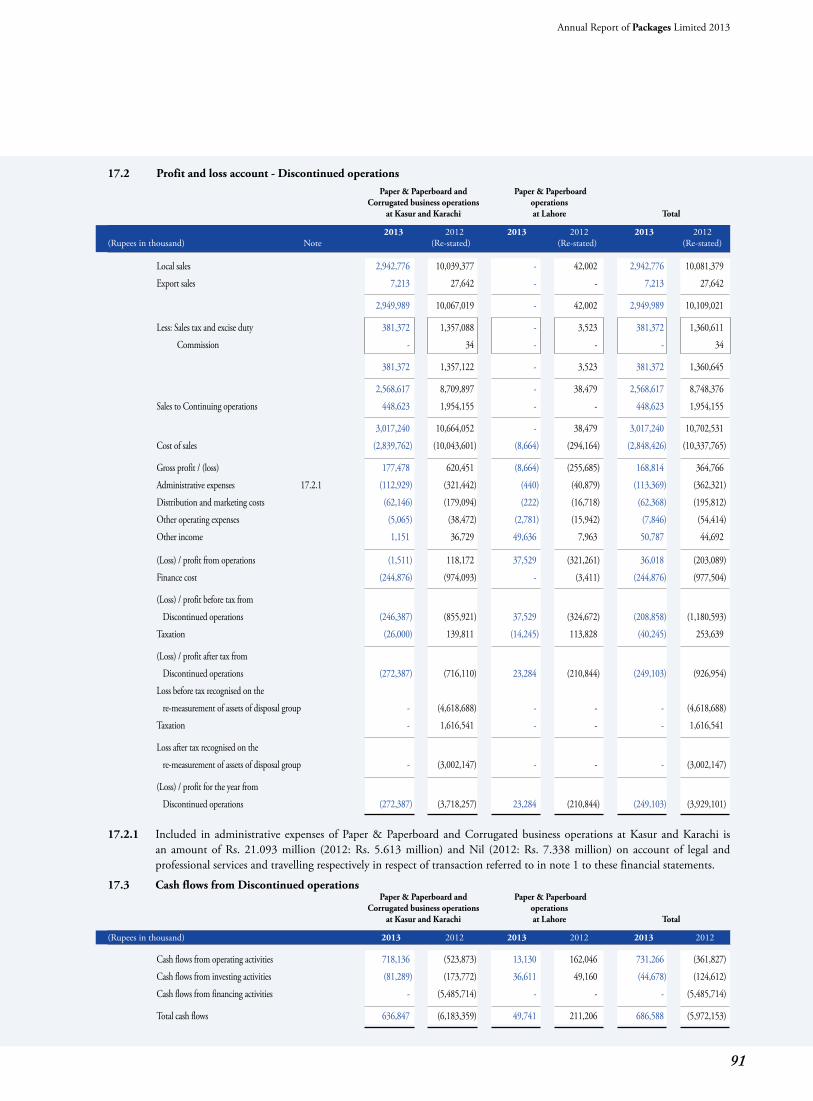
91
Annual Report of Packages Limited 2013
17.2 Profit and loss account - Discontinued operations Paper & Paperboard and Paper & Paperboard Corrugated business operations operations at Kasur and Karachi at Lahore Total
2013 2012 2013 2012 2013 2012(Rupees in thousand) Note (Re-stated) (Re-stated) (Re-stated)
Local sales 2,942,776 10,039,377 - 42,002 2,942,776 10,081,379
Export sales 7,213 27,642 - - 7,213 27,642
2,949,989 10,067,019 - 42,002 2,949,989 10,109,021
Less: Sales tax and excise duty 381,372 1,357,088 - 3,523 381,372 1,360,611
Commission - 34 - - - 34
381,372 1,357,122 - 3,523 381,372 1,360,645
2,568,617 8,709,897 - 38,479 2,568,617 8,748,376
Sales to Continuing operations 448,623 1,954,155 - - 448,623 1,954,155
3,017,240 10,664,052 - 38,479 3,017,240 10,702,531
Cost of sales (2,839,762) (10,043,601) (8,664) (294,164) (2,848,426) (10,337,765)
Gross profit / (loss) 177,478 620,451 (8,664) (255,685) 168,814 364,766
Administrative expenses 17.2.1 (112,929) (321,442) (440) (40,879) (113,369) (362,321)
Distribution and marketing costs (62,146) (179,094) (222) (16,718) (62,368) (195,812)
Other operating expenses (5,065) (38,472) (2,781) (15,942) (7,846) (54,414)
Other income 1,151 36,729 49,636 7,963 50,787 44,692
(Loss) / profit from operations (1,511) 118,172 37,529 (321,261) 36,018 (203,089)
Finance cost (244,876) (974,093) - (3,411) (244,876) (977,504)
(Loss) / profit before tax from
Discontinued operations (246,387) (855,921) 37,529 (324,672) (208,858) (1,180,593)
Taxation (26,000) 139,811 (14,245) 113,828 (40,245) 253,639
(Loss) / profit after tax from
Discontinued operations (272,387) (716,110) 23,284 (210,844) (249,103) (926,954)
Loss before tax recognised on the
re-measurement of assets of disposal group - (4,618,688) - - - (4,618,688)
Taxation - 1,616,541 - - - 1,616,541
Loss after tax recognised on the
re-measurement of assets of disposal group - (3,002,147) - - - (3,002,147)
(Loss) / profit for the year from
Discontinued operations (272,387) (3,718,257) 23,284 (210,844) (249,103) (3,929,101)
17.2.1 Included in administrative expenses of Paper & Paperboard and Corrugated business operations at Kasur and Karachi is an amount of Rs. 21.093 million (2012: Rs. 5.613 million) and Nil (2012: Rs. 7.338 million) on account of legal and professional services and travelling respectively in respect of transaction referred to in note 1 to these financial statements.
17.3 Cash flows from Discontinued operations Paper & Paperboard and Paper & Paperboard Corrugated business operations operations at Kasur and Karachi at Lahore Total
(Rupees in thousand) 2013 2012 2013 2012 2013 2012
Cash flows from operating activities 718,136 (523,873) 13,130 162,046 731,266 (361,827)
Cash flows from investing activities (81,289) (173,772) 36,611 49,160 (44,678) (124,612)
Cash flows from financing activities - (5,485,714) - - - (5,485,714)
Total cash flows 636,847 (6,183,359) 49,741 211,206 686,588 (5,972,153)
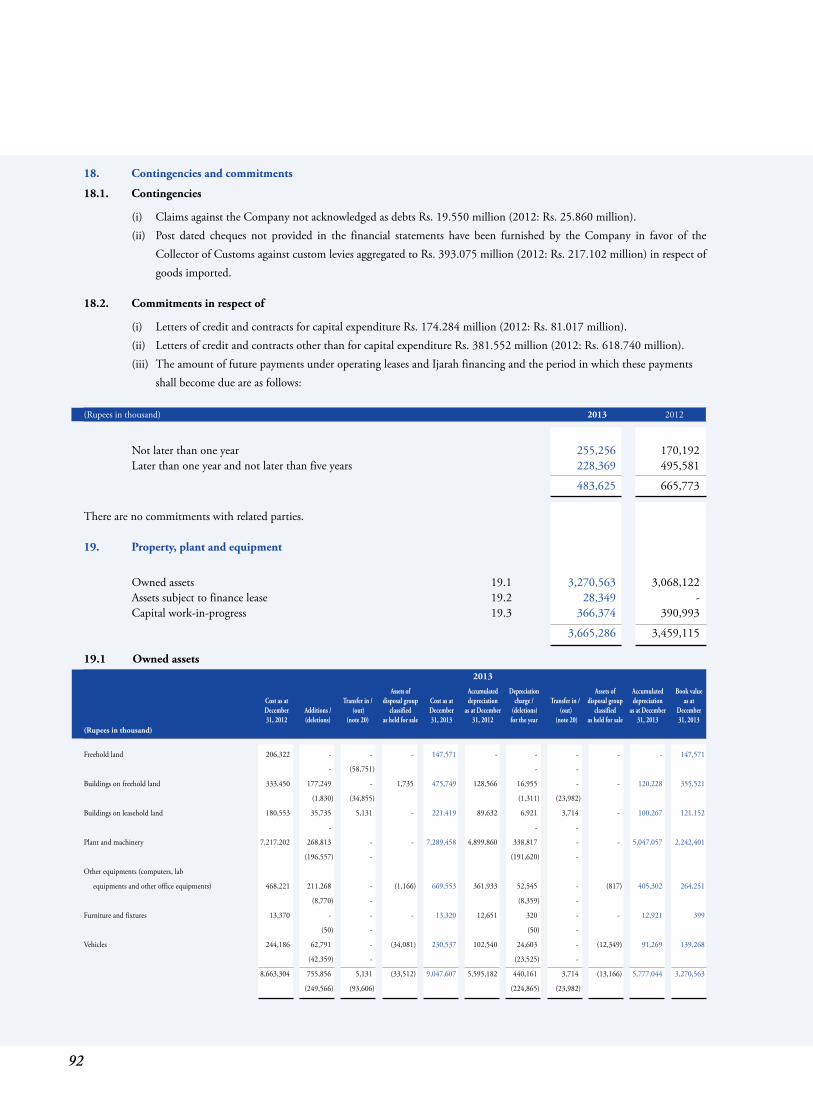
92
18. Contingencies and commitments
18.1. Contingencies
(i) Claims against the Company not acknowledged as debts Rs. 19.550 million (2012: Rs. 25.860 million). (ii) Post dated cheques not provided in the financial statements have been furnished by the Company in favor of the
Collector of Customs against custom levies aggregated to Rs. 393.075 million (2012: Rs. 217.102 million) in respect of goods imported.
18.2. Commitments in respect of
(i) Letters of credit and contracts for capital expenditure Rs. 174.284 million (2012: Rs. 81.017 million). (ii) Letters of credit and contracts other than for capital expenditure Rs. 381.552 million (2012: Rs. 618.740 million). (iii) The amount of future payments under operating leases and Ijarah financing and the period in which these payments
shall become due are as follows: (Rupees in thousand) 2013 2012
Not later than one year 255,256 170,192 Later than one year and not later than five years 228,369 495,581
483,625 665,773 There are no commitments with related parties. 19. Property, plant and equipment
Owned assets 19.1 3,270,563 3,068,122 Assets subject to finance lease 19.2 28,349 - Capital work-in-progress 19.3 366,374 390,993
3,665,286 3,459,115
19.1 Owned assets 2013
Assets of Accumulated Depreciation Assets of Accumulated Book value Cost as at Transfer in / disposal group Cost as at depreciation charge / Transfer in / disposal group depreciation as at December Additions / (out) classified December as at December (deletions) (out) classified as at December December 31, 2012 (deletions) (note 20) as held for sale 31, 2013 31, 2012 for the year (note 20) as held for sale 31, 2013 31, 2013(Rupees in thousand)
Freehold land 206,322 - - - 147,571 - - - - - 147,571
- (58,751) - -
Buildings on freehold land 333,450 177,249 - 1,735 475,749 128,566 16,955 - - 120,228 355,521
(1,830) (34,855) (1,311) (23,982)
Buildings on leasehold land 180,553 35,735 5,131 - 221,419 89,632 6,921 3,714 - 100,267 121,152
- - -
Plant and machinery 7,217,202 268,813 - - 7,289,458 4,899,860 338,817 - - 5,047,057 2,242,401
(196,557) - (191,620) -
Other equipments (computers, lab
equipments and other office equipments) 468,221 211,268 - (1,166) 669,553 361,933 52,545 - (817) 405,302 264,251
(8,770) - (8,359) -
Furniture and fixtures 13,370 - - - 13,320 12,651 320 - - 12,921 399
(50) - (50) -
Vehicles 244,186 62,791 - (34,081) 230,537 102,540 24,603 - (12,349) 91,269 139,268
(42,359) - (23,525) -
8,663,304 755,856 5,131 (33,512) 9,047,607 5,595,182 440,161 3,714 (13,166) 5,777,044 3,270,563
(249,566) (93,606) (224,865) (23,982)
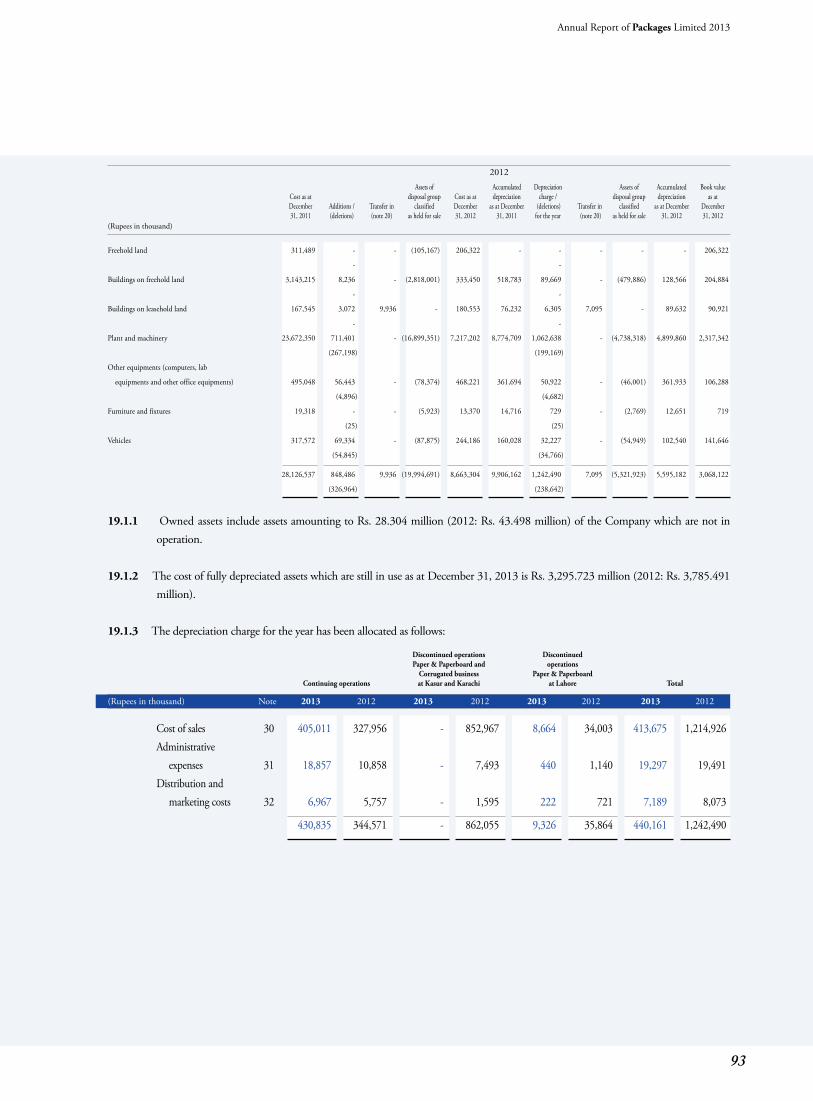
93
Annual Report of Packages Limited 2013
2012 Assets of Accumulated Depreciation Assets of Accumulated Book value Cost as at disposal group Cost as at depreciation charge / disposal group depreciation as at December Additions / Transfer in classified December as at December (deletions) Transfer in classified as at December December 31, 2011 (deletions) (note 20) as held for sale 31, 2012 31, 2011 for the year (note 20) as held for sale 31, 2012 31, 2012(Rupees in thousand)
Freehold land 311,489 - - (105,167) 206,322 - - - - - 206,322
- -
Buildings on freehold land 3,143,215 8,236 - (2,818,001) 333,450 518,783 89,669 - (479,886) 128,566 204,884
- -
Buildings on leasehold land 167,545 3,072 9,936 - 180,553 76,232 6,305 7,095 - 89,632 90,921
- -
Plant and machinery 23,672,350 711,401 - (16,899,351) 7,217,202 8,774,709 1,062,638 - (4,738,318) 4,899,860 2,317,342
(267,198) (199,169)
Other equipments (computers, lab
equipments and other office equipments) 495,048 56,443 - (78,374) 468,221 361,694 50,922 - (46,001) 361,933 106,288
(4,896) (4,682)
Furniture and fixtures 19,318 - - (5,923) 13,370 14,716 729 - (2,769) 12,651 719
(25) (25)
Vehicles 317,572 69,334 - (87,875) 244,186 160,028 32,227 - (54,949) 102,540 141,646
(54,845) (34,766)
28,126,537 848,486 9,936 (19,994,691) 8,663,304 9,906,162 1,242,490 7,095 (5,321,923) 5,595,182 3,068,122
(326,964) (238,642)
19.1.1 Owned assets include assets amounting to Rs. 28.304 million (2012: Rs. 43.498 million) of the Company which are not in operation.
19.1.2 The cost of fully depreciated assets which are still in use as at December 31, 2013 is Rs. 3,295.723 million (2012: Rs. 3,785.491
million). 19.1.3 The depreciation charge for the year has been allocated as follows:
Discontinued operations Discontinued Paper & Paperboard and operations Corrugated business Paper & Paperboard Continuing operations at Kasur and Karachi at Lahore Total
(Rupees in thousand) Note 2013 2012 2013 2012 2013 2012 2013 2012
Cost of sales 30 405,011 327,956 - 852,967 8,664 34,003 413,675 1,214,926 Administrative expenses 31 18,857 10,858 - 7,493 440 1,140 19,297 19,491 Distribution and marketing costs 32 6,967 5,757 - 1,595 222 721 7,189 8,073
430,835 344,571 - 862,055 9,326 35,864 440,161 1,242,490
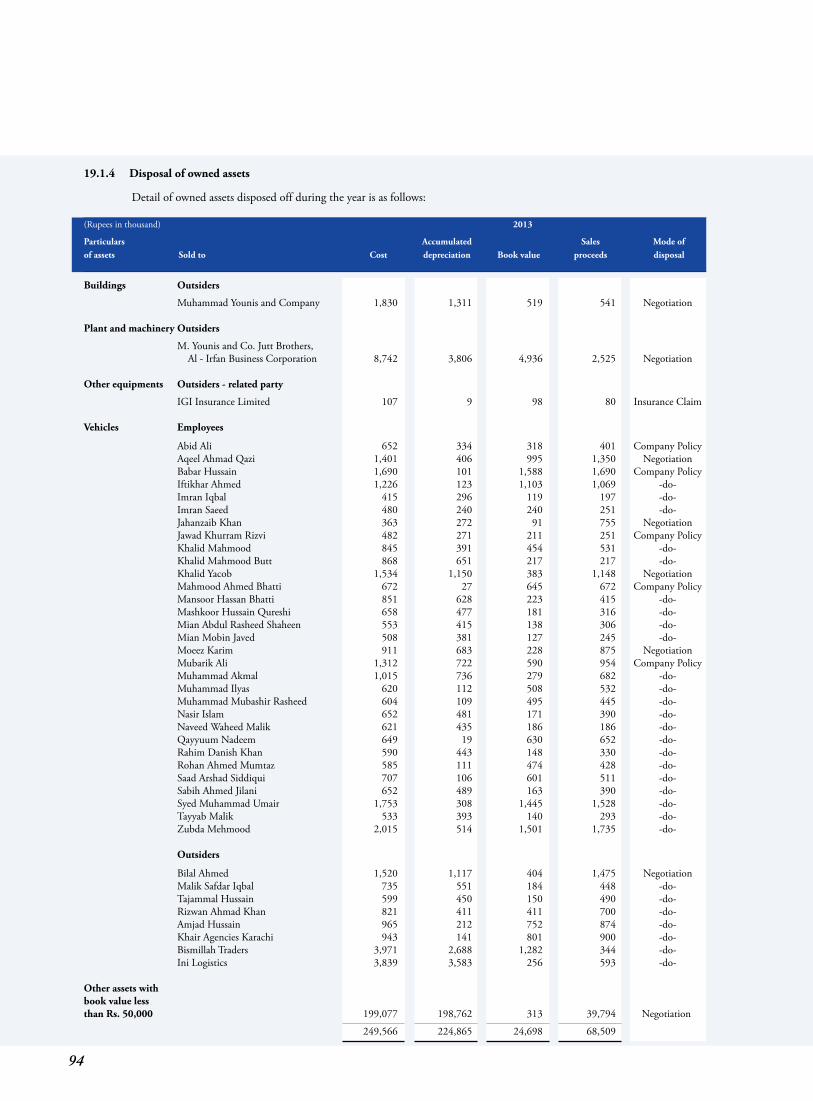
94
19.1.4 Disposal of owned assets Detail of owned assets disposed off during the year is as follows: (Rupees in thousand) 2013
Particulars Accumulated Sales Mode ofof assets Sold to Cost depreciation Book value proceeds disposal
Buildings Outsiders
Muhammad Younis and Company 1,830 1,311 519 541 Negotiation Plant and machinery Outsiders
M. Younis and Co. Jutt Brothers, Al - Irfan Business Corporation 8,742 3,806 4,936 2,525 Negotiation Other equipments Outsiders - related party
IGI Insurance Limited 107 9 98 80 Insurance Claim Vehicles Employees
Abid Ali 652 334 318 401 Company Policy Aqeel Ahmad Qazi 1,401 406 995 1,350 Negotiation Babar Hussain 1,690 101 1,588 1,690 Company Policy Iftikhar Ahmed 1,226 123 1,103 1,069 -do- Imran Iqbal 415 296 119 197 -do- Imran Saeed 480 240 240 251 -do- Jahanzaib Khan 363 272 91 755 Negotiation Jawad Khurram Rizvi 482 271 211 251 Company Policy Khalid Mahmood 845 391 454 531 -do- Khalid Mahmood Butt 868 651 217 217 -do- Khalid Yacob 1,534 1,150 383 1,148 Negotiation Mahmood Ahmed Bhatti 672 27 645 672 Company Policy Mansoor Hassan Bhatti 851 628 223 415 -do- Mashkoor Hussain Qureshi 658 477 181 316 -do- Mian Abdul Rasheed Shaheen 553 415 138 306 -do- Mian Mobin Javed 508 381 127 245 -do- Moeez Karim 911 683 228 875 Negotiation Mubarik Ali 1,312 722 590 954 Company Policy Muhammad Akmal 1,015 736 279 682 -do- Muhammad Ilyas 620 112 508 532 -do- Muhammad Mubashir Rasheed 604 109 495 445 -do- Nasir Islam 652 481 171 390 -do- Naveed Waheed Malik 621 435 186 186 -do- Qayyuum Nadeem 649 19 630 652 -do- Rahim Danish Khan 590 443 148 330 -do- Rohan Ahmed Mumtaz 585 111 474 428 -do- Saad Arshad Siddiqui 707 106 601 511 -do- Sabih Ahmed Jilani 652 489 163 390 -do- Syed Muhammad Umair 1,753 308 1,445 1,528 -do- Tayyab Malik 533 393 140 293 -do- Zubda Mehmood 2,015 514 1,501 1,735 -do- Outsiders
Bilal Ahmed 1,520 1,117 404 1,475 Negotiation Malik Safdar Iqbal 735 551 184 448 -do- Tajammal Hussain 599 450 150 490 -do- Rizwan Ahmad Khan 821 411 411 700 -do- Amjad Hussain 965 212 752 874 -do- Khair Agencies Karachi 943 141 801 900 -do- Bismillah Traders 3,971 2,688 1,282 344 -do- Ini Logistics 3,839 3,583 256 593 -do- Other assets with book value less than Rs. 50,000 199,077 198,762 313 39,794 Negotiation
249,566 224,865 24,698 68,509
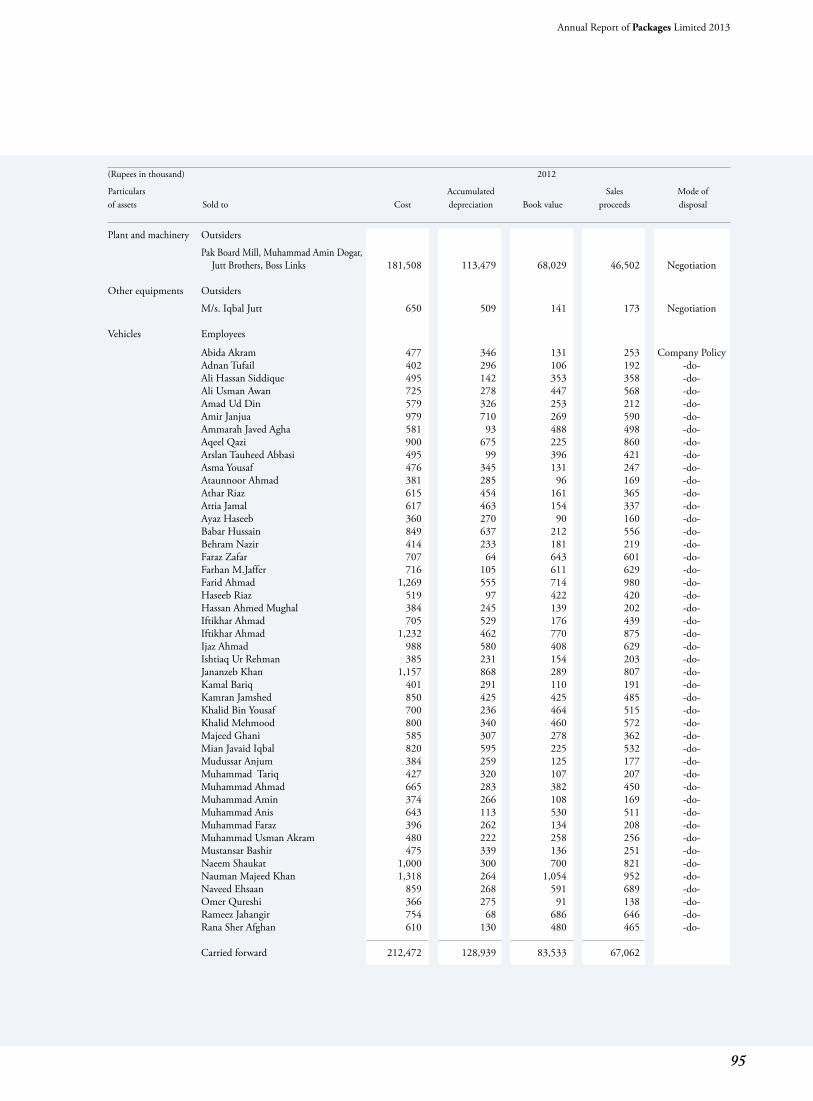
95
Annual Report of Packages Limited 2013
(Rupees in thousand) 2012
Particulars Accumulated Sales Mode ofof assets Sold to Cost depreciation Book value proceeds disposal
Plant and machinery Outsiders
Pak Board Mill, Muhammad Amin Dogar, Jutt Brothers, Boss Links 181,508 113,479 68,029 46,502 Negotiation Other equipments Outsiders
M/s. Iqbal Jutt 650 509 141 173 Negotiation Vehicles Employees
Abida Akram 477 346 131 253 Company Policy Adnan Tufail 402 296 106 192 -do- Ali Hassan Siddique 495 142 353 358 -do- Ali Usman Awan 725 278 447 568 -do- Amad Ud Din 579 326 253 212 -do- Amir Janjua 979 710 269 590 -do- Ammarah Javed Agha 581 93 488 498 -do- Aqeel Qazi 900 675 225 860 -do- Arslan Tauheed Abbasi 495 99 396 421 -do- Asma Yousaf 476 345 131 247 -do- Ataunnoor Ahmad 381 285 96 169 -do- Athar Riaz 615 454 161 365 -do- Attia Jamal 617 463 154 337 -do- Ayaz Haseeb 360 270 90 160 -do- Babar Hussain 849 637 212 556 -do- Behram Nazir 414 233 181 219 -do- Faraz Zafar 707 64 643 601 -do- Farhan M.Jaffer 716 105 611 629 -do- Farid Ahmad 1,269 555 714 980 -do- Haseeb Riaz 519 97 422 420 -do- Hassan Ahmed Mughal 384 245 139 202 -do- Iftikhar Ahmad 705 529 176 439 -do- Iftikhar Ahmad 1,232 462 770 875 -do- Ijaz Ahmad 988 580 408 629 -do- Ishtiaq Ur Rehman 385 231 154 203 -do- Jananzeb Khan 1,157 868 289 807 -do- Kamal Bariq 401 291 110 191 -do- Kamran Jamshed 850 425 425 485 -do- Khalid Bin Yousaf 700 236 464 515 -do- Khalid Mehmood 800 340 460 572 -do- Majeed Ghani 585 307 278 362 -do- Mian Javaid Iqbal 820 595 225 532 -do- Mudussar Anjum 384 259 125 177 -do- Muhammad Tariq 427 320 107 207 -do- Muhammad Ahmad 665 283 382 450 -do- Muhammad Amin 374 266 108 169 -do- Muhammad Anis 643 113 530 511 -do- Muhammad Faraz 396 262 134 208 -do- Muhammad Usman Akram 480 222 258 256 -do- Mustansar Bashir 475 339 136 251 -do- Naeem Shaukat 1,000 300 700 821 -do- Nauman Majeed Khan 1,318 264 1,054 952 -do- Naveed Ehsaan 859 268 591 689 -do- Omer Qureshi 366 275 91 138 -do- Rameez Jahangir 754 68 686 646 -do- Rana Sher Afghan 610 130 480 465 -do- Carried forward 212,472 128,939 83,533 67,062
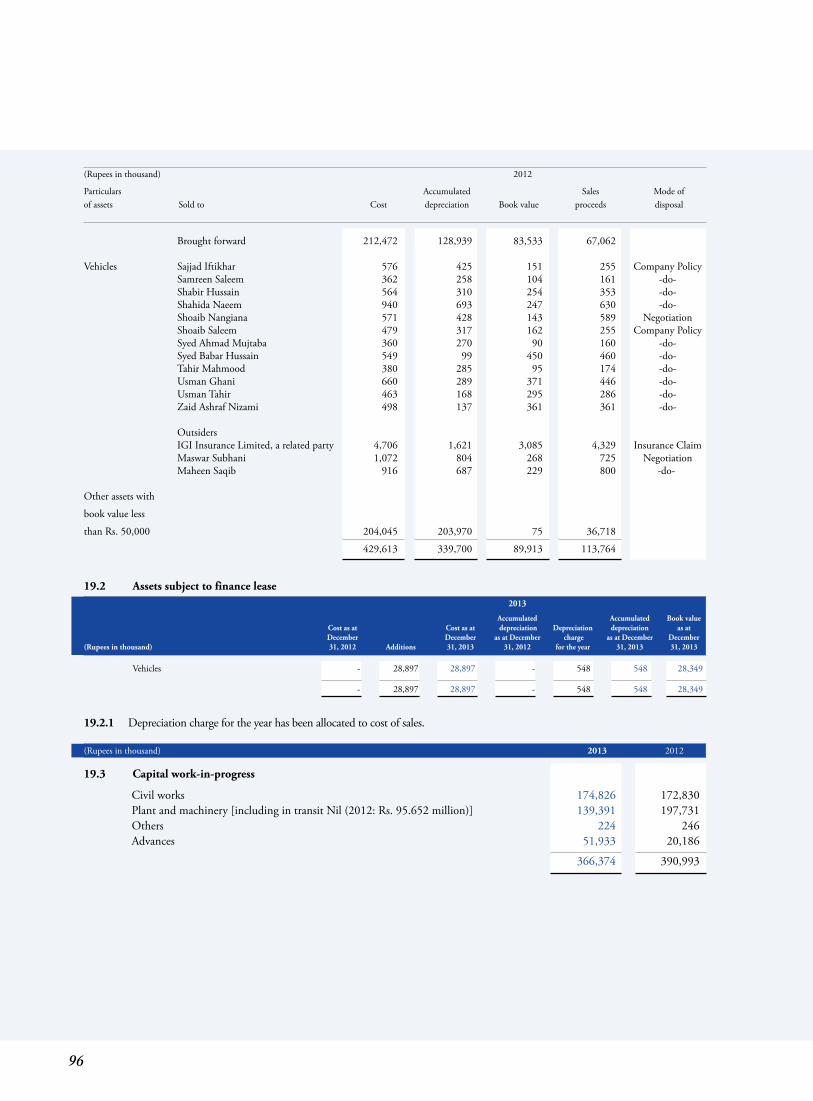
96
(Rupees in thousand) 2012
Particulars Accumulated Sales Mode ofof assets Sold to Cost depreciation Book value proceeds disposal
Brought forward 212,472 128,939 83,533 67,062 Vehicles Sajjad Iftikhar 576 425 151 255 Company Policy Samreen Saleem 362 258 104 161 -do- Shabir Hussain 564 310 254 353 -do- Shahida Naeem 940 693 247 630 -do- Shoaib Nangiana 571 428 143 589 Negotiation Shoaib Saleem 479 317 162 255 Company Policy Syed Ahmad Mujtaba 360 270 90 160 -do- Syed Babar Hussain 549 99 450 460 -do- Tahir Mahmood 380 285 95 174 -do- Usman Ghani 660 289 371 446 -do- Usman Tahir 463 168 295 286 -do- Zaid Ashraf Nizami 498 137 361 361 -do- Outsiders IGI Insurance Limited, a related party 4,706 1,621 3,085 4,329 Insurance Claim Maswar Subhani 1,072 804 268 725 Negotiation Maheen Saqib 916 687 229 800 -do- Other assets with
book value less
than Rs. 50,000 204,045 203,970 75 36,718
429,613 339,700 89,913 113,764
19.2 Assets subject to finance lease 2013
Accumulated Accumulated Book value Cost as at Cost as at depreciation Depreciation depreciation as at December December as at December charge as at December December(Rupees in thousand) 31, 2012 Additions 31, 2013 31, 2012 for the year 31, 2013 31, 2013
Vehicles - 28,897 28,897 - 548 548 28,349
- 28,897 28,897 - 548 548 28,349
19.2.1 Depreciation charge for the year has been allocated to cost of sales. (Rupees in thousand) 2013 2012
19.3 Capital work-in-progress
Civil works 174,826 172,830 Plant and machinery [including in transit Nil (2012: Rs. 95.652 million)] 139,391 197,731 Others 224 246 Advances 51,933 20,186
366,374 390,993
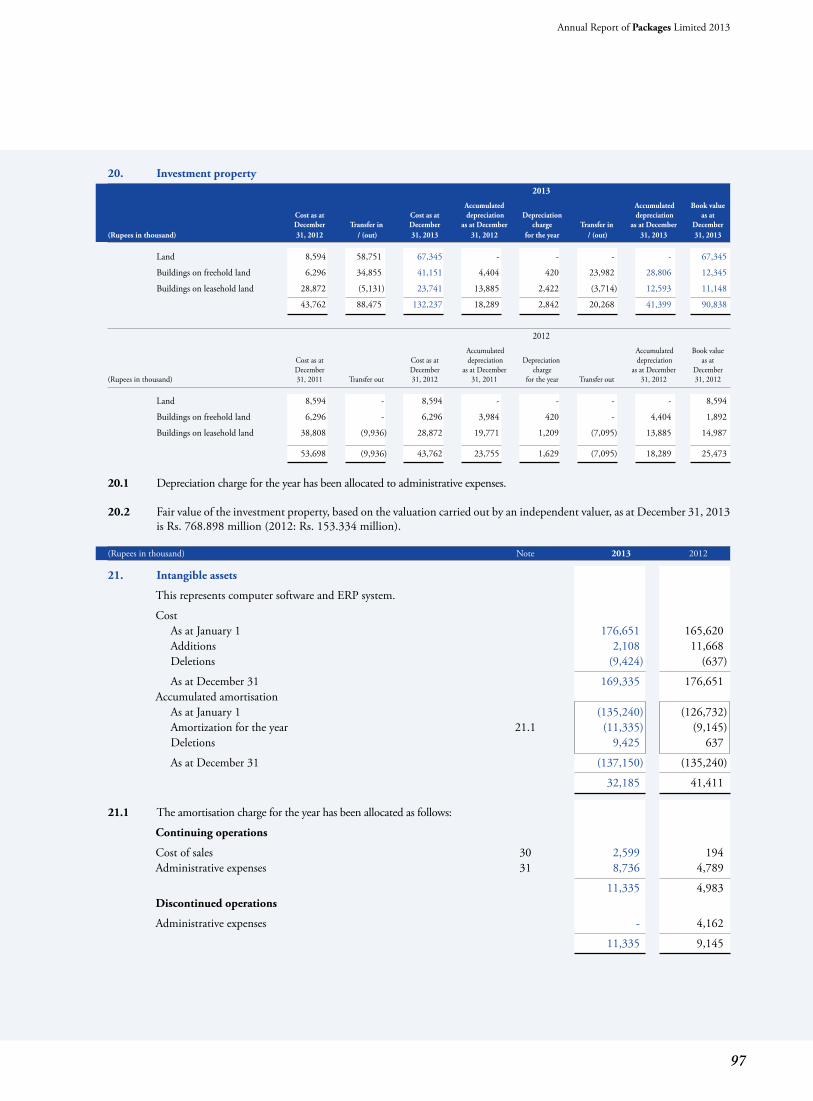
97
Annual Report of Packages Limited 2013
20. Investment property 2013
Accumulated Accumulated Book value Cost as at Cost as at depreciation Depreciation depreciation as at December Transfer in December as at December charge Transfer in as at December December(Rupees in thousand) 31, 2012 / (out) 31, 2013 31, 2012 for the year / (out) 31, 2013 31, 2013
Land 8,594 58,751 67,345 - - - - 67,345
Buildings on freehold land 6,296 34,855 41,151 4,404 420 23,982 28,806 12,345
Buildings on leasehold land 28,872 (5,131) 23,741 13,885 2,422 (3,714) 12,593 11,148
43,762 88,475 132,237 18,289 2,842 20,268 41,399 90,838
2012 Accumulated Accumulated Book value Cost as at Cost as at depreciation Depreciation depreciation as at December December as at December charge as at December December(Rupees in thousand) 31, 2011 Transfer out 31, 2012 31, 2011 for the year Transfer out 31, 2012 31, 2012
Land 8,594 - 8,594 - - - - 8,594
Buildings on freehold land 6,296 - 6,296 3,984 420 - 4,404 1,892
Buildings on leasehold land 38,808 (9,936) 28,872 19,771 1,209 (7,095) 13,885 14,987
53,698 (9,936) 43,762 23,755 1,629 (7,095) 18,289 25,473
20.1 Depreciation charge for the year has been allocated to administrative expenses. 20.2 Fair value of the investment property, based on the valuation carried out by an independent valuer, as at December 31, 2013
is Rs. 768.898 million (2012: Rs. 153.334 million).
(Rupees in thousand) Note 2013 2012
21. Intangible assets
This represents computer software and ERP system.
Cost As at January 1 176,651 165,620 Additions 2,108 11,668 Deletions (9,424) (637)
As at December 31 169,335 176,651 Accumulated amortisation As at January 1 (135,240) (126,732) Amortization for the year 21.1 (11,335) (9,145) Deletions 9,425 637
As at December 31 (137,150) (135,240)
32,185 41,411 21.1 The amortisation charge for the year has been allocated as follows:
Continuing operations
Cost of sales 30 2,599 194 Administrative expenses 31 8,736 4,789
11,335 4,983 Discontinued operations
Administrative expenses - 4,162
11,335 9,145
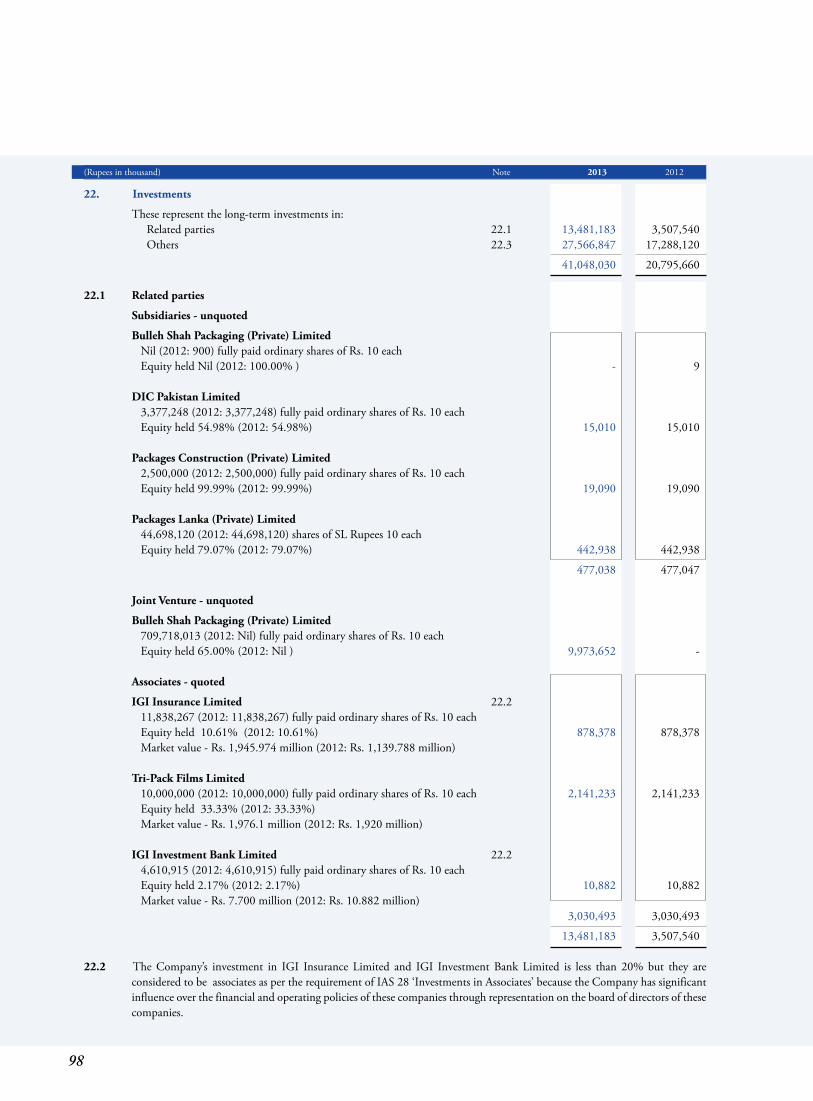
98
(Rupees in thousand) Note 2013 2012
22. Investments
These represent the long-term investments in: Related parties 22.1 13,481,183 3,507,540 Others 22.3 27,566,847 17,288,120
41,048,030 20,795,660 22.1 Related parties
Subsidiaries - unquoted
Bulleh Shah Packaging (Private) Limited Nil (2012: 900) fully paid ordinary shares of Rs. 10 each Equity held Nil (2012: 100.00% ) - 9 DIC Pakistan Limited 3,377,248 (2012: 3,377,248) fully paid ordinary shares of Rs. 10 each Equity held 54.98% (2012: 54.98%) 15,010 15,010 Packages Construction (Private) Limited 2,500,000 (2012: 2,500,000) fully paid ordinary shares of Rs. 10 each Equity held 99.99% (2012: 99.99%) 19,090 19,090 Packages Lanka (Private) Limited 44,698,120 (2012: 44,698,120) shares of SL Rupees 10 each Equity held 79.07% (2012: 79.07%) 442,938 442,938
477,038 477,047
Joint Venture - unquoted
Bulleh Shah Packaging (Private) Limited 709,718,013 (2012: Nil) fully paid ordinary shares of Rs. 10 each Equity held 65.00% (2012: Nil ) 9,973,652 - Associates - quoted
IGI Insurance Limited 22.2 11,838,267 (2012: 11,838,267) fully paid ordinary shares of Rs. 10 each Equity held 10.61% (2012: 10.61%) 878,378 878,378 Market value - Rs. 1,945.974 million (2012: Rs. 1,139.788 million) Tri-Pack Films Limited 10,000,000 (2012: 10,000,000) fully paid ordinary shares of Rs. 10 each 2,141,233 2,141,233 Equity held 33.33% (2012: 33.33%) Market value - Rs. 1,976.1 million (2012: Rs. 1,920 million) IGI Investment Bank Limited 22.2 4,610,915 (2012: 4,610,915) fully paid ordinary shares of Rs. 10 each Equity held 2.17% (2012: 2.17%) 10,882 10,882 Market value - Rs. 7.700 million (2012: Rs. 10.882 million) 3,030,493 3,030,493
13,481,183 3,507,540 22.2 The Company’s investment in IGI Insurance Limited and IGI Investment Bank Limited is less than 20% but they are
considered to be associates as per the requirement of IAS 28 ‘Investments in Associates’ because the Company has significant influence over the financial and operating policies of these companies through representation on the board of directors of these companies.
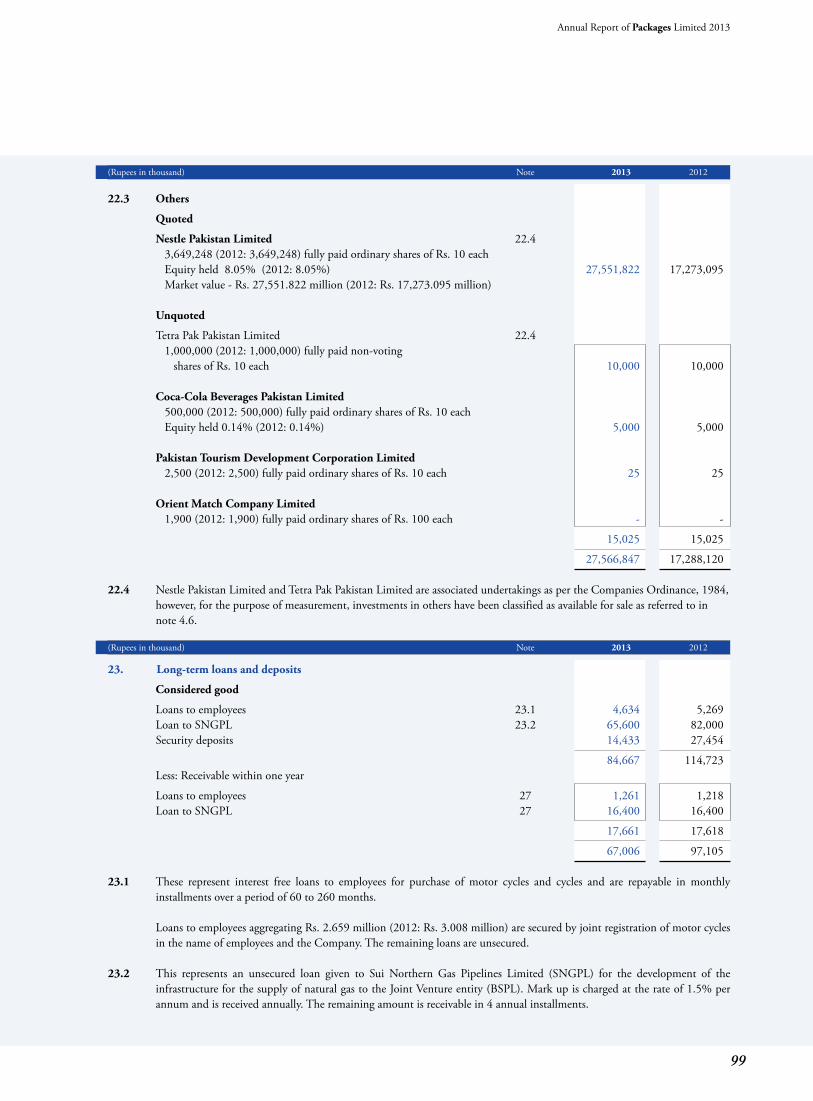
99
Annual Report of Packages Limited 2013
(Rupees in thousand) Note 2013 2012
22.3 Others
Quoted
Nestle Pakistan Limited 22.4 3,649,248 (2012: 3,649,248) fully paid ordinary shares of Rs. 10 each Equity held 8.05% (2012: 8.05%) 27,551,822 17,273,095 Market value - Rs. 27,551.822 million (2012: Rs. 17,273.095 million) Unquoted
Tetra Pak Pakistan Limited 22.4 1,000,000 (2012: 1,000,000) fully paid non-voting shares of Rs. 10 each 10,000 10,000 Coca-Cola Beverages Pakistan Limited 500,000 (2012: 500,000) fully paid ordinary shares of Rs. 10 each Equity held 0.14% (2012: 0.14%) 5,000 5,000 Pakistan Tourism Development Corporation Limited 2,500 (2012: 2,500) fully paid ordinary shares of Rs. 10 each 25 25 Orient Match Company Limited 1,900 (2012: 1,900) fully paid ordinary shares of Rs. 100 each - -
15,025 15,025
27,566,847 17,288,120 22.4 Nestle Pakistan Limited and Tetra Pak Pakistan Limited are associated undertakings as per the Companies Ordinance, 1984,
however, for the purpose of measurement, investments in others have been classified as available for sale as referred to in note 4.6.
(Rupees in thousand) Note 2013 2012
23. Long-term loans and deposits
Considered good
Loans to employees 23.1 4,634 5,269 Loan to SNGPL 23.2 65,600 82,000 Security deposits 14,433 27,454
84,667 114,723 Less: Receivable within one year
Loans to employees 27 1,261 1,218 Loan to SNGPL 27 16,400 16,400
17,661 17,618
67,006 97,105 23.1 These represent interest free loans to employees for purchase of motor cycles and cycles and are repayable in monthly
installments over a period of 60 to 260 months. Loans to employees aggregating Rs. 2.659 million (2012: Rs. 3.008 million) are secured by joint registration of motor cycles
in the name of employees and the Company. The remaining loans are unsecured. 23.2 This represents an unsecured loan given to Sui Northern Gas Pipelines Limited (SNGPL) for the development of the
infrastructure for the supply of natural gas to the Joint Venture entity (BSPL). Mark up is charged at the rate of 1.5% per annum and is received annually. The remaining amount is receivable in 4 annual installments.
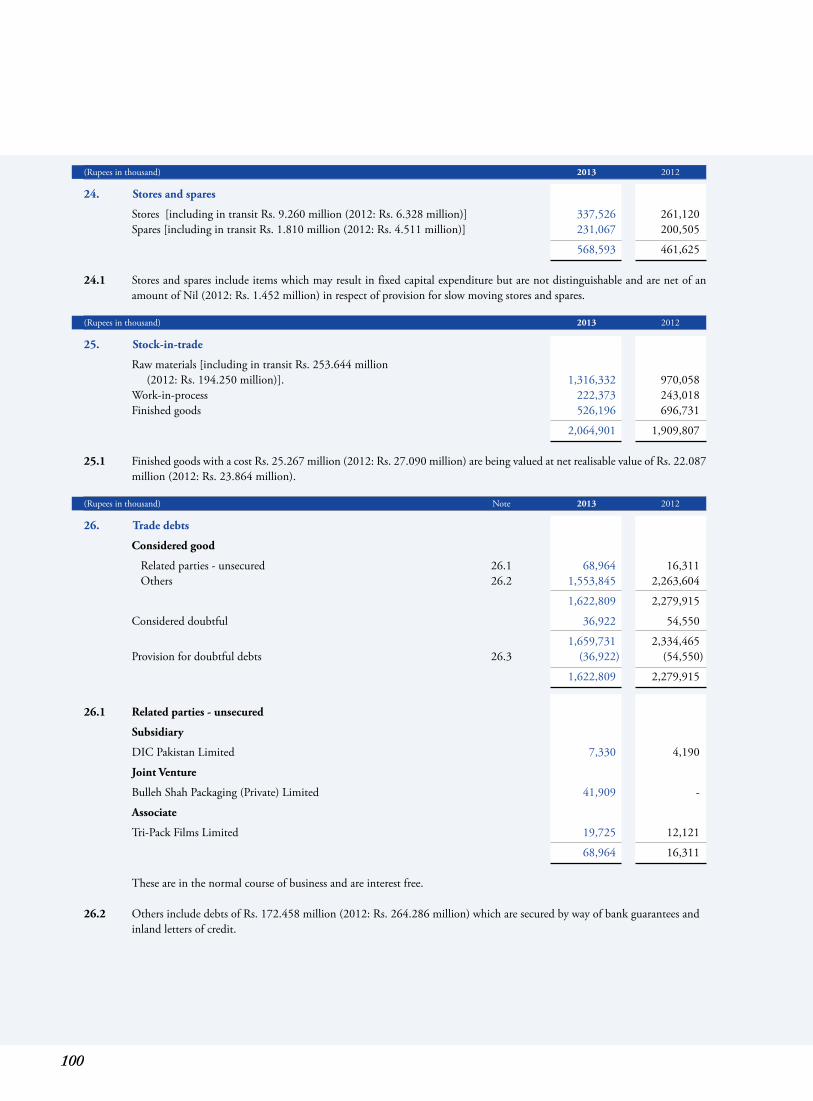
100
(Rupees in thousand) 2013 2012
24. Stores and spares
Stores [including in transit Rs. 9.260 million (2012: Rs. 6.328 million)] 337,526 261,120 Spares [including in transit Rs. 1.810 million (2012: Rs. 4.511 million)] 231,067 200,505
568,593 461,625 24.1 Stores and spares include items which may result in fixed capital expenditure but are not distinguishable and are net of an
amount of Nil (2012: Rs. 1.452 million) in respect of provision for slow moving stores and spares.
(Rupees in thousand) 2013 2012
25. Stock-in-trade
Raw materials [including in transit Rs. 253.644 million (2012: Rs. 194.250 million)]. 1,316,332 970,058 Work-in-process 222,373 243,018 Finished goods 526,196 696,731
2,064,901 1,909,807 25.1 Finished goods with a cost Rs. 25.267 million (2012: Rs. 27.090 million) are being valued at net realisable value of Rs. 22.087
million (2012: Rs. 23.864 million). (Rupees in thousand) Note 2013 2012
26. Trade debts
Considered good
Related parties - unsecured 26.1 68,964 16,311 Others 26.2 1,553,845 2,263,604
1,622,809 2,279,915
Considered doubtful 36,922 54,550
1,659,731 2,334,465 Provision for doubtful debts 26.3 (36,922) (54,550)
1,622,809 2,279,915
26.1 Related parties - unsecured
Subsidiary
DIC Pakistan Limited 7,330 4,190
Joint Venture
Bulleh Shah Packaging (Private) Limited 41,909 -
Associate
Tri-Pack Films Limited 19,725 12,121
68,964 16,311 These are in the normal course of business and are interest free. 26.2 Others include debts of Rs. 172.458 million (2012: Rs. 264.286 million) which are secured by way of bank guarantees and
inland letters of credit.
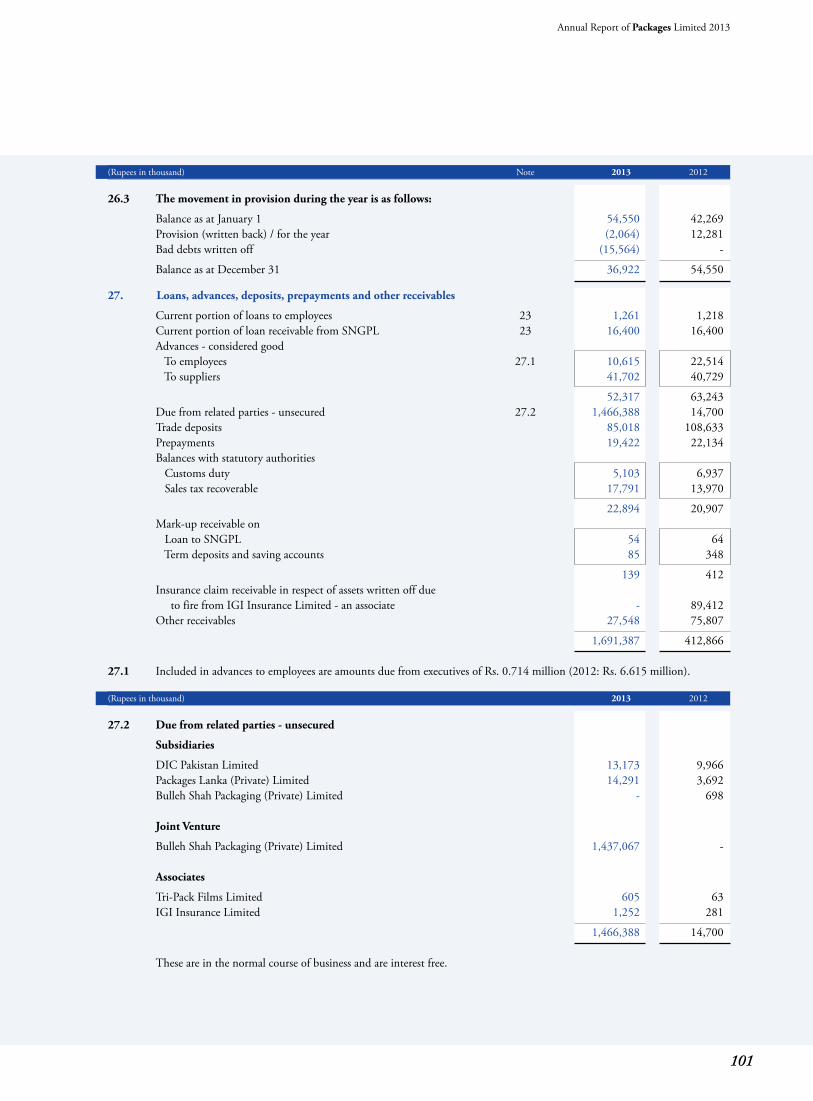
101
Annual Report of Packages Limited 2013
(Rupees in thousand) Note 2013 2012
26.3 The movement in provision during the year is as follows:
Balance as at January 1 54,550 42,269 Provision (written back) / for the year (2,064) 12,281 Bad debts written off (15,564) -
Balance as at December 31 36,922 54,550 27. Loans, advances, deposits, prepayments and other receivables
Current portion of loans to employees 23 1,261 1,218 Current portion of loan receivable from SNGPL 23 16,400 16,400 Advances - considered good To employees 27.1 10,615 22,514 To suppliers 41,702 40,729
52,317 63,243 Due from related parties - unsecured 27.2 1,466,388 14,700 Trade deposits 85,018 108,633 Prepayments 19,422 22,134 Balances with statutory authorities Customs duty 5,103 6,937 Sales tax recoverable 17,791 13,970
22,894 20,907 Mark-up receivable on Loan to SNGPL 54 64 Term deposits and saving accounts 85 348
139 412 Insurance claim receivable in respect of assets written off due to fire from IGI Insurance Limited - an associate - 89,412 Other receivables 27,548 75,807
1,691,387 412,866 27.1 Included in advances to employees are amounts due from executives of Rs. 0.714 million (2012: Rs. 6.615 million). (Rupees in thousand) 2013 2012
27.2 Due from related parties - unsecured
Subsidiaries
DIC Pakistan Limited 13,173 9,966 Packages Lanka (Private) Limited 14,291 3,692 Bulleh Shah Packaging (Private) Limited - 698 Joint Venture
Bulleh Shah Packaging (Private) Limited 1,437,067 - Associates
Tri-Pack Films Limited 605 63 IGI Insurance Limited 1,252 281
1,466,388 14,700
These are in the normal course of business and are interest free.
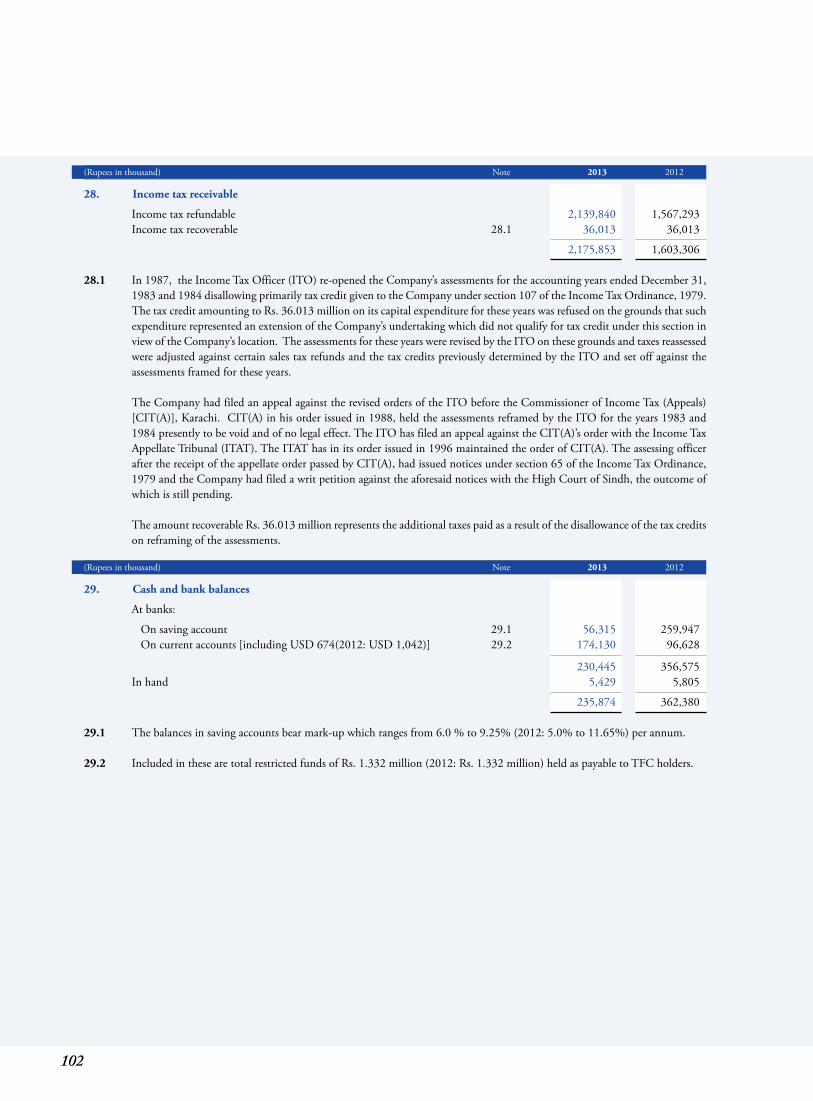
102
(Rupees in thousand) Note 2013 2012
28. Income tax receivable
Income tax refundable 2,139,840 1,567,293 Income tax recoverable 28.1 36,013 36,013
2,175,853 1,603,306 28.1 In 1987, the Income Tax Officer (ITO) re-opened the Company’s assessments for the accounting years ended December 31,
1983 and 1984 disallowing primarily tax credit given to the Company under section 107 of the Income Tax Ordinance, 1979. The tax credit amounting to Rs. 36.013 million on its capital expenditure for these years was refused on the grounds that such expenditure represented an extension of the Company’s undertaking which did not qualify for tax credit under this section in view of the Company’s location. The assessments for these years were revised by the ITO on these grounds and taxes reassessed were adjusted against certain sales tax refunds and the tax credits previously determined by the ITO and set off against the assessments framed for these years.
The Company had filed an appeal against the revised orders of the ITO before the Commissioner of Income Tax (Appeals)
[CIT(A)], Karachi. CIT(A) in his order issued in 1988, held the assessments reframed by the ITO for the years 1983 and 1984 presently to be void and of no legal effect. The ITO has filed an appeal against the CIT(A)’s order with the Income Tax Appellate Tribunal (ITAT). The ITAT has in its order issued in 1996 maintained the order of CIT(A). The assessing officer after the receipt of the appellate order passed by CIT(A), had issued notices under section 65 of the Income Tax Ordinance, 1979 and the Company had filed a writ petition against the aforesaid notices with the High Court of Sindh, the outcome of which is still pending.
The amount recoverable Rs. 36.013 million represents the additional taxes paid as a result of the disallowance of the tax credits
on reframing of the assessments.
(Rupees in thousand) Note 2013 2012
29. Cash and bank balances
At banks:
On saving account 29.1 56,315 259,947 On current accounts [including USD 674(2012: USD 1,042)] 29.2 174,130 96,628
230,445 356,575 In hand 5,429 5,805
235,874 362,380 29.1 The balances in saving accounts bear mark-up which ranges from 6.0 % to 9.25% (2012: 5.0% to 11.65%) per annum. 29.2 Included in these are total restricted funds of Rs. 1.332 million (2012: Rs. 1.332 million) held as payable to TFC holders.
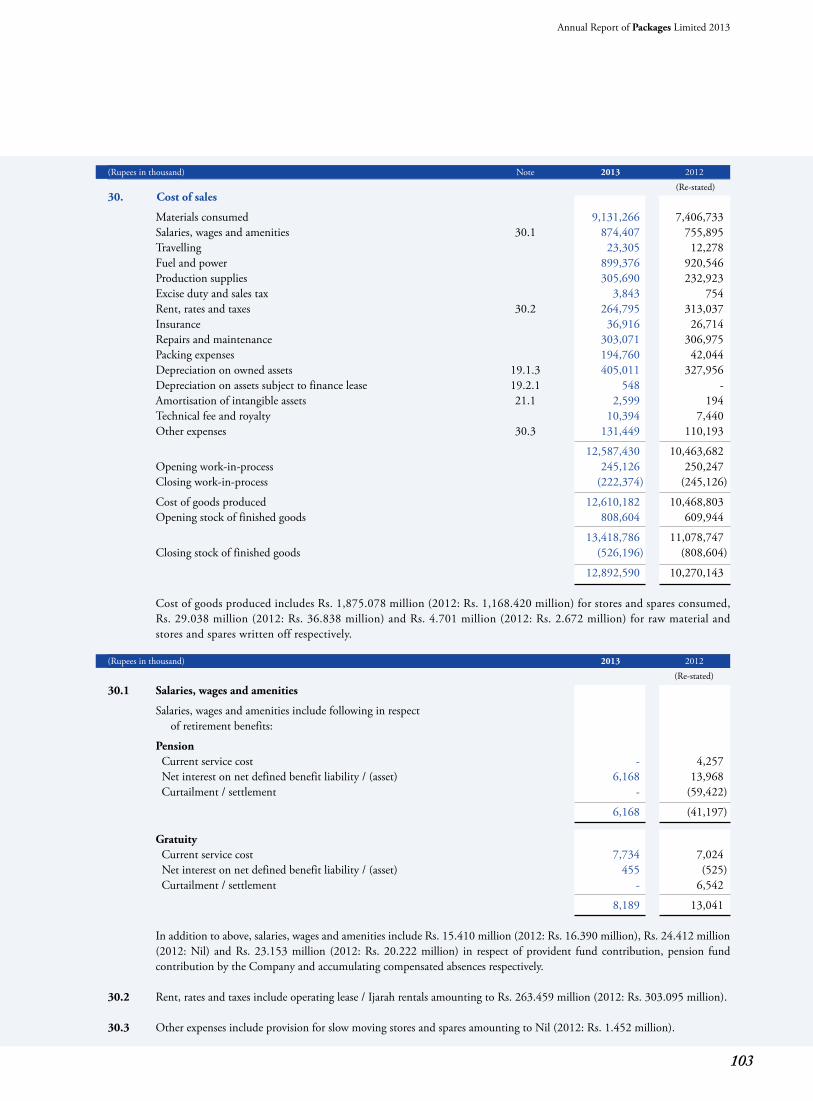
103
Annual Report of Packages Limited 2013
(Rupees in thousand) Note 2013 2012
(Re-stated) 30. Cost of sales
Materials consumed 9,131,266 7,406,733 Salaries, wages and amenities 30.1 874,407 755,895 Travelling 23,305 12,278 Fuel and power 899,376 920,546 Production supplies 305,690 232,923 Excise duty and sales tax 3,843 754 Rent, rates and taxes 30.2 264,795 313,037 Insurance 36,916 26,714 Repairs and maintenance 303,071 306,975 Packing expenses 194,760 42,044 Depreciation on owned assets 19.1.3 405,011 327,956 Depreciation on assets subject to finance lease 19.2.1 548 - Amortisation of intangible assets 21.1 2,599 194 Technical fee and royalty 10,394 7,440 Other expenses 30.3 131,449 110,193
12,587,430 10,463,682 Opening work-in-process 245,126 250,247 Closing work-in-process (222,374) (245,126)
Cost of goods produced 12,610,182 10,468,803 Opening stock of finished goods 808,604 609,944
13,418,786 11,078,747 Closing stock of finished goods (526,196) (808,604)
12,892,590 10,270,143 Cost of goods produced includes Rs. 1,875.078 million (2012: Rs. 1,168.420 million) for stores and spares consumed,
Rs. 29.038 million (2012: Rs. 36.838 million) and Rs. 4.701 million (2012: Rs. 2.672 million) for raw material and stores and spares written off respectively.
(Rupees in thousand) 2013 2012
(Re-stated)
30.1 Salaries, wages and amenities
Salaries, wages and amenities include following in respect of retirement benefits:
Pension Current service cost - 4,257 Net interest on net defined benefit liability / (asset) 6,168 13,968 Curtailment / settlement - (59,422)
6,168 (41,197)
Gratuity Current service cost 7,734 7,024 Net interest on net defined benefit liability / (asset) 455 (525) Curtailment / settlement - 6,542
8,189 13,041 In addition to above, salaries, wages and amenities include Rs. 15.410 million (2012: Rs. 16.390 million), Rs. 24.412 million
(2012: Nil) and Rs. 23.153 million (2012: Rs. 20.222 million) in respect of provident fund contribution, pension fund contribution by the Company and accumulating compensated absences respectively.
30.2 Rent, rates and taxes include operating lease / Ijarah rentals amounting to Rs. 263.459 million (2012: Rs. 303.095 million). 30.3 Other expenses include provision for slow moving stores and spares amounting to Nil (2012: Rs. 1.452 million).
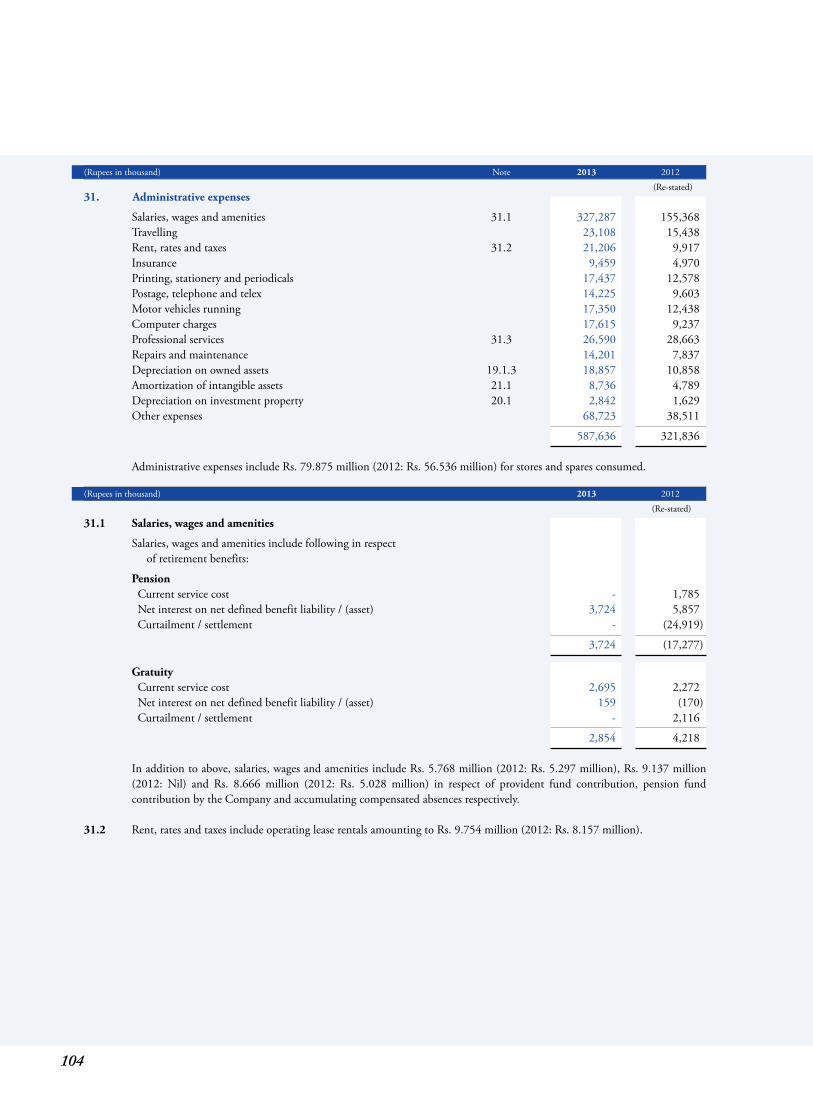
104
(Rupees in thousand) Note 2013 2012
(Re-stated) 31. Administrative expenses
Salaries, wages and amenities 31.1 327,287 155,368 Travelling 23,108 15,438 Rent, rates and taxes 31.2 21,206 9,917 Insurance 9,459 4,970 Printing, stationery and periodicals 17,437 12,578 Postage, telephone and telex 14,225 9,603 Motor vehicles running 17,350 12,438 Computer charges 17,615 9,237 Professional services 31.3 26,590 28,663 Repairs and maintenance 14,201 7,837 Depreciation on owned assets 19.1.3 18,857 10,858 Amortization of intangible assets 21.1 8,736 4,789 Depreciation on investment property 20.1 2,842 1,629 Other expenses 68,723 38,511
587,636 321,836 Administrative expenses include Rs. 79.875 million (2012: Rs. 56.536 million) for stores and spares consumed. (Rupees in thousand) 2013 2012
(Re-stated)
31.1 Salaries, wages and amenities
Salaries, wages and amenities include following in respect of retirement benefits:
Pension Current service cost - 1,785 Net interest on net defined benefit liability / (asset) 3,724 5,857 Curtailment / settlement - (24,919)
3,724 (17,277)
Gratuity Current service cost 2,695 2,272 Net interest on net defined benefit liability / (asset) 159 (170) Curtailment / settlement - 2,116
2,854 4,218
In addition to above, salaries, wages and amenities include Rs. 5.768 million (2012: Rs. 5.297 million), Rs. 9.137 million (2012: Nil) and Rs. 8.666 million (2012: Rs. 5.028 million) in respect of provident fund contribution, pension fund contribution by the Company and accumulating compensated absences respectively.
31.2 Rent, rates and taxes include operating lease rentals amounting to Rs. 9.754 million (2012: Rs. 8.157 million).
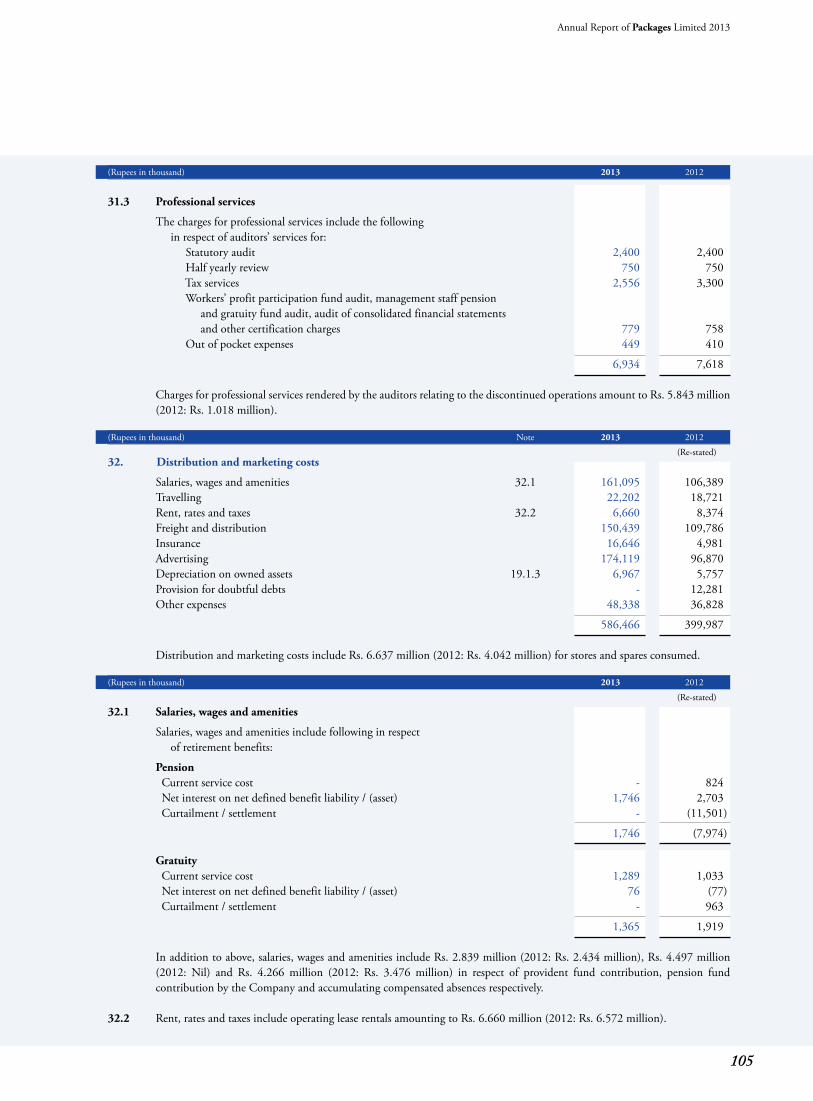
105
Annual Report of Packages Limited 2013
(Rupees in thousand) 2013 2012
31.3 Professional services
The charges for professional services include the following in respect of auditors’ services for: Statutory audit 2,400 2,400 Half yearly review 750 750 Tax services 2,556 3,300 Workers’ profit participation fund audit, management staff pension and gratuity fund audit, audit of consolidated financial statements and other certification charges 779 758 Out of pocket expenses 449 410
6,934 7,618 Charges for professional services rendered by the auditors relating to the discontinued operations amount to Rs. 5.843 million
(2012: Rs. 1.018 million). (Rupees in thousand) Note 2013 2012
(Re-stated) 32. Distribution and marketing costs
Salaries, wages and amenities 32.1 161,095 106,389 Travelling 22,202 18,721 Rent, rates and taxes 32.2 6,660 8,374 Freight and distribution 150,439 109,786 Insurance 16,646 4,981 Advertising 174,119 96,870 Depreciation on owned assets 19.1.3 6,967 5,757 Provision for doubtful debts - 12,281 Other expenses 48,338 36,828
586,466 399,987 Distribution and marketing costs include Rs. 6.637 million (2012: Rs. 4.042 million) for stores and spares consumed. (Rupees in thousand) 2013 2012
(Re-stated)
32.1 Salaries, wages and amenities
Salaries, wages and amenities include following in respect of retirement benefits:
Pension Current service cost - 824 Net interest on net defined benefit liability / (asset) 1,746 2,703 Curtailment / settlement - (11,501)
1,746 (7,974)
Gratuity Current service cost 1,289 1,033 Net interest on net defined benefit liability / (asset) 76 (77) Curtailment / settlement - 963
1,365 1,919 In addition to above, salaries, wages and amenities include Rs. 2.839 million (2012: Rs. 2.434 million), Rs. 4.497 million
(2012: Nil) and Rs. 4.266 million (2012: Rs. 3.476 million) in respect of provident fund contribution, pension fund contribution by the Company and accumulating compensated absences respectively.
32.2 Rent, rates and taxes include operating lease rentals amounting to Rs. 6.660 million (2012: Rs. 6.572 million).
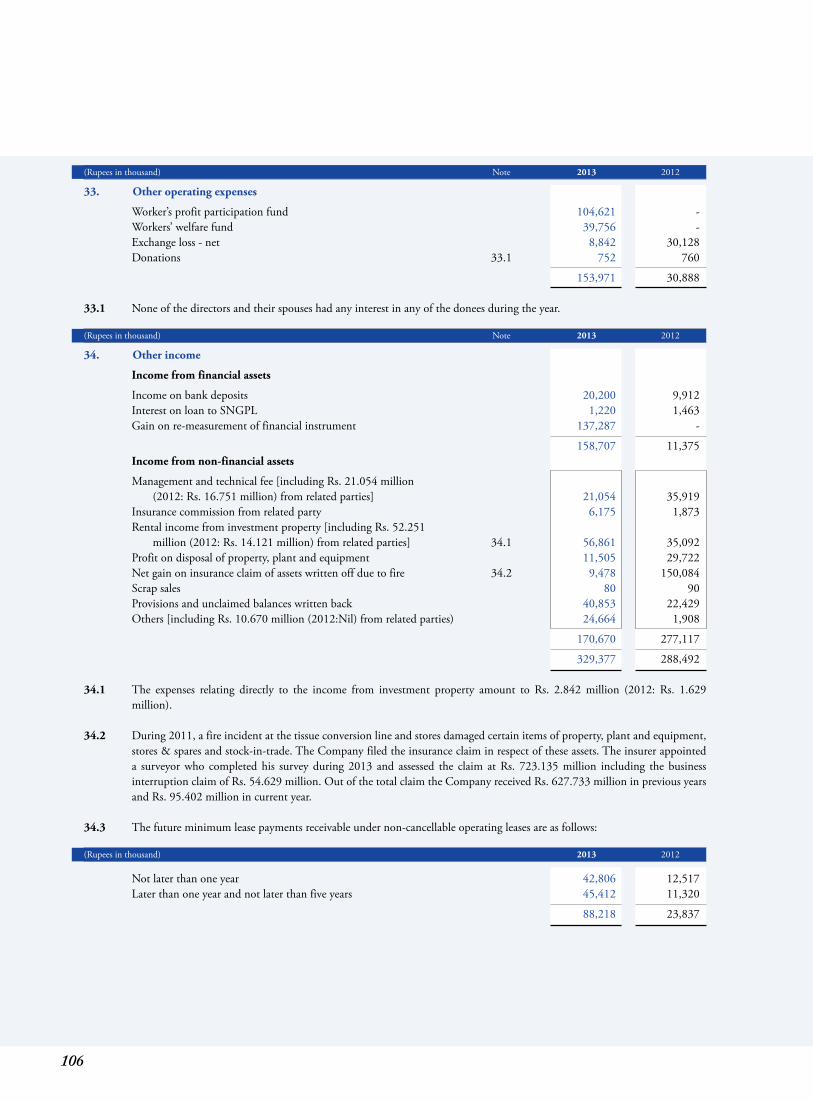
106
(Rupees in thousand) Note 2013 2012
33. Other operating expenses
Worker’s profit participation fund 104,621 - Workers’ welfare fund 39,756 - Exchange loss - net 8,842 30,128 Donations 33.1 752 760
153,971 30,888 33.1 None of the directors and their spouses had any interest in any of the donees during the year. (Rupees in thousand) Note 2013 2012
34. Other income
Income from financial assets
Income on bank deposits 20,200 9,912 Interest on loan to SNGPL 1,220 1,463 Gain on re-measurement of financial instrument 137,287 -
158,707 11,375 Income from non-financial assets
Management and technical fee [including Rs. 21.054 million (2012: Rs. 16.751 million) from related parties] 21,054 35,919 Insurance commission from related party 6,175 1,873 Rental income from investment property [including Rs. 52.251 million (2012: Rs. 14.121 million) from related parties] 34.1 56,861 35,092 Profit on disposal of property, plant and equipment 11,505 29,722 Net gain on insurance claim of assets written off due to fire 34.2 9,478 150,084 Scrap sales 80 90 Provisions and unclaimed balances written back 40,853 22,429 Others [including Rs. 10.670 million (2012:Nil) from related parties) 24,664 1,908
170,670 277,117
329,377 288,492 34.1 The expenses relating directly to the income from investment property amount to Rs. 2.842 million (2012: Rs. 1.629
million). 34.2 During 2011, a fire incident at the tissue conversion line and stores damaged certain items of property, plant and equipment,
stores & spares and stock-in-trade. The Company filed the insurance claim in respect of these assets. The insurer appointed a surveyor who completed his survey during 2013 and assessed the claim at Rs. 723.135 million including the business interruption claim of Rs. 54.629 million. Out of the total claim the Company received Rs. 627.733 million in previous years and Rs. 95.402 million in current year.
34.3 The future minimum lease payments receivable under non-cancellable operating leases are as follows: (Rupees in thousand) 2013 2012
Not later than one year 42,806 12,517 Later than one year and not later than five years 45,412 11,320
88,218 23,837
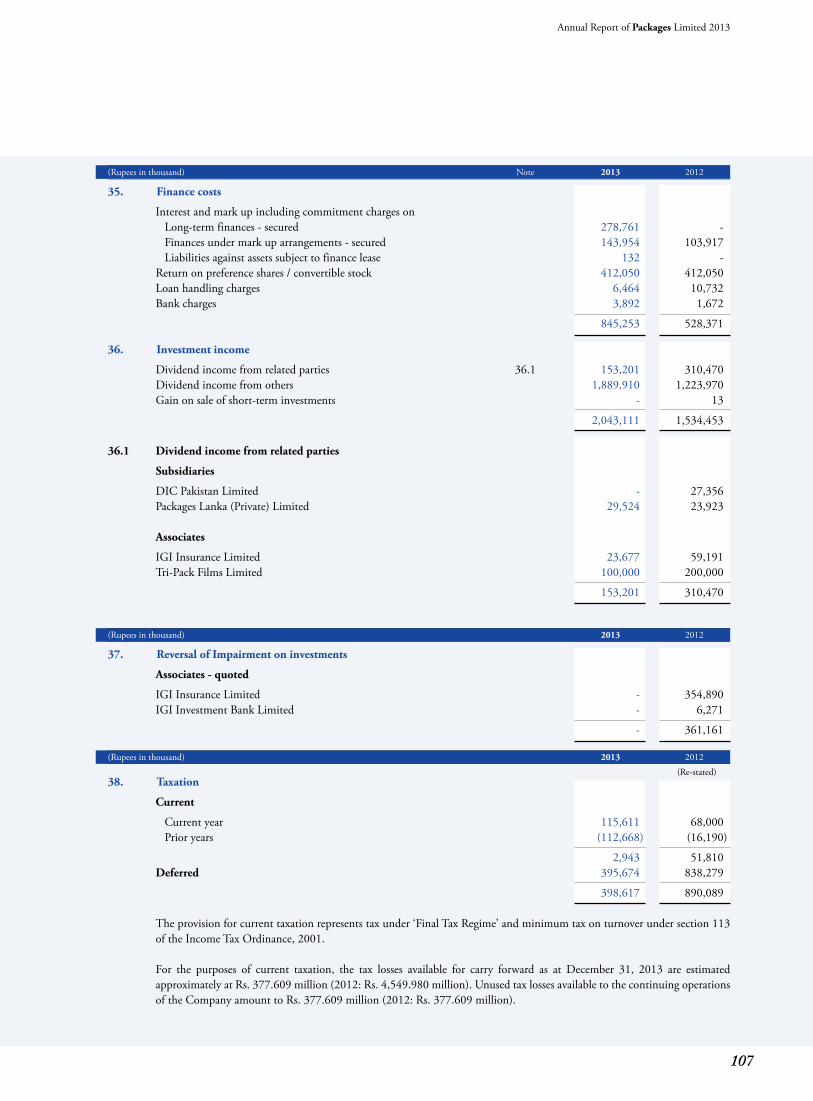
107
Annual Report of Packages Limited 2013
(Rupees in thousand) Note 2013 2012
35. Finance costs
Interest and mark up including commitment charges on Long-term finances - secured 278,761 - Finances under mark up arrangements - secured 143,954 103,917 Liabilities against assets subject to finance lease 132 - Return on preference shares / convertible stock 412,050 412,050 Loan handling charges 6,464 10,732 Bank charges 3,892 1,672
845,253 528,371 36. Investment income
Dividend income from related parties 36.1 153,201 310,470 Dividend income from others 1,889,910 1,223,970 Gain on sale of short-term investments - 13
2,043,111 1,534,453 36.1 Dividend income from related parties
Subsidiaries
DIC Pakistan Limited - 27,356 Packages Lanka (Private) Limited 29,524 23,923 Associates
IGI Insurance Limited 23,677 59,191 Tri-Pack Films Limited 100,000 200,000
153,201 310,470 (Rupees in thousand) 2013 2012
37. Reversal of Impairment on investments
Associates - quoted
IGI Insurance Limited - 354,890 IGI Investment Bank Limited - 6,271
- 361,161
(Rupees in thousand) 2013 2012
(Re-stated) 38. Taxation
Current
Current year 115,611 68,000 Prior years (112,668) (16,190)
2,943 51,810 Deferred 395,674 838,279
398,617 890,089 The provision for current taxation represents tax under ‘Final Tax Regime’ and minimum tax on turnover under section 113
of the Income Tax Ordinance, 2001. For the purposes of current taxation, the tax losses available for carry forward as at December 31, 2013 are estimated
approximately at Rs. 377.609 million (2012: Rs. 4,549.980 million). Unused tax losses available to the continuing operations of the Company amount to Rs. 377.609 million (2012: Rs. 377.609 million).
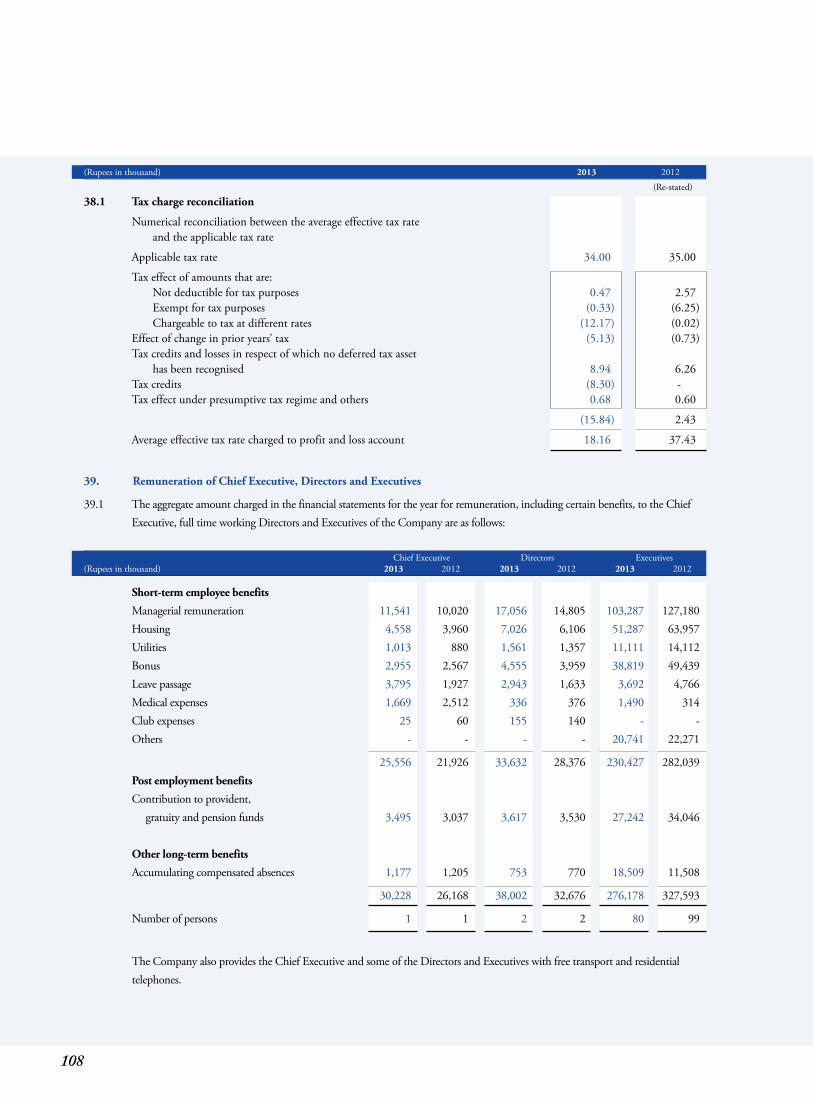
108
(Rupees in thousand) 2013 2012
(Re-stated)
38.1 Tax charge reconciliation
Numerical reconciliation between the average effective tax rate and the applicable tax rate
Applicable tax rate 34.00 35.00
Tax effect of amounts that are: Not deductible for tax purposes 0.47 2.57 Exempt for tax purposes (0.33) (6.25) Chargeable to tax at different rates (12.17) (0.02) Effect of change in prior years’ tax (5.13) (0.73) Tax credits and losses in respect of which no deferred tax asset has been recognised 8.94 6.26 Tax credits (8.30) - Tax effect under presumptive tax regime and others 0.68 0.60
(15.84) 2.43
Average effective tax rate charged to profit and loss account 18.16 37.43
39. Remuneration of Chief Executive, Directors and Executives
39.1 The aggregate amount charged in the financial statements for the year for remuneration, including certain benefits, to the Chief Executive, full time working Directors and Executives of the Company are as follows: Chief Executive Directors Executives (Rupees in thousand) 2013 2012 2013 2012 2013 2012
Short-term employee benefits
Managerial remuneration 11,541 10,020 17,056 14,805 103,287 127,180 Housing 4,558 3,960 7,026 6,106 51,287 63,957 Utilities 1,013 880 1,561 1,357 11,111 14,112 Bonus 2,955 2,567 4,555 3,959 38,819 49,439 Leave passage 3,795 1,927 2,943 1,633 3,692 4,766 Medical expenses 1,669 2,512 336 376 1,490 314 Club expenses 25 60 155 140 - - Others - - - - 20,741 22,271
25,556 21,926 33,632 28,376 230,427 282,039 Post employment benefits
Contribution to provident, gratuity and pension funds 3,495 3,037 3,617 3,530 27,242 34,046 Other long-term benefits
Accumulating compensated absences 1,177 1,205 753 770 18,509 11,508
30,228 26,168 38,002 32,676 276,178 327,593
Number of persons 1 1 2 2 80 99
The Company also provides the Chief Executive and some of the Directors and Executives with free transport and residential telephones.
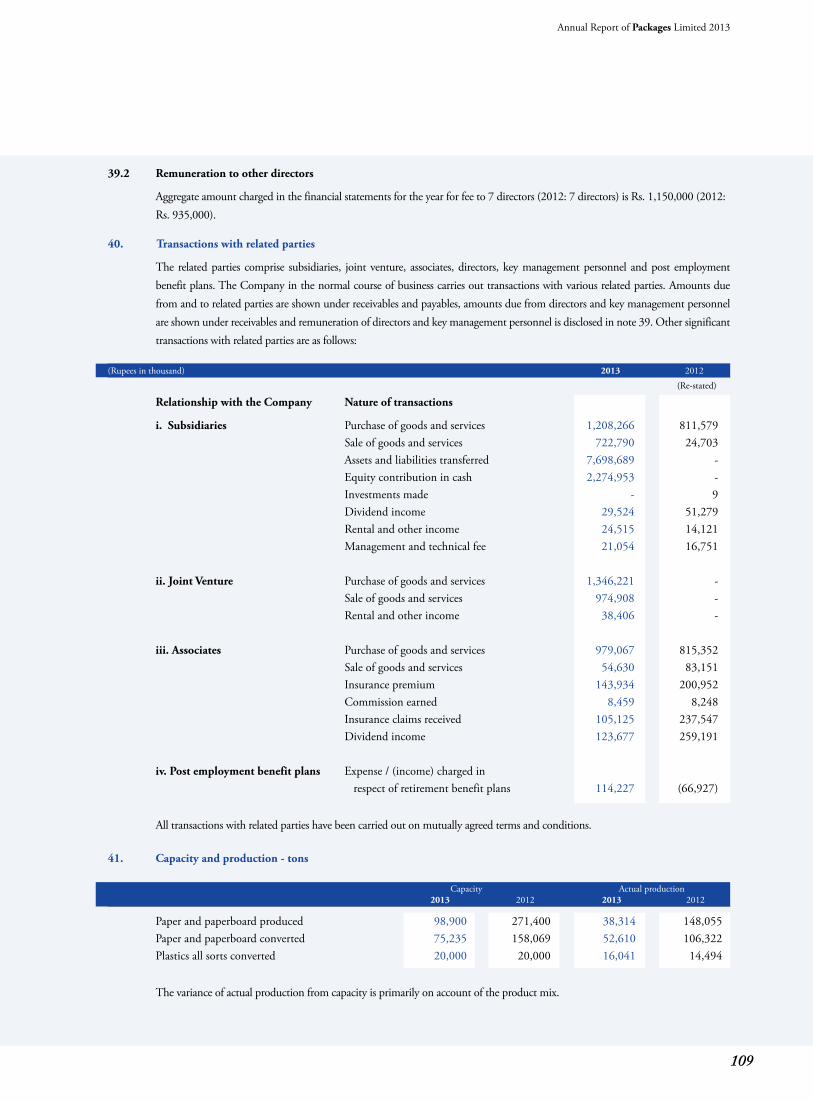
109
Annual Report of Packages Limited 2013
39.2 Remuneration to other directors
Aggregate amount charged in the financial statements for the year for fee to 7 directors (2012: 7 directors) is Rs. 1,150,000 (2012: Rs. 935,000). 40. Transactions with related parties
The related parties comprise subsidiaries, joint venture, associates, directors, key management personnel and post employment benefit plans. The Company in the normal course of business carries out transactions with various related parties. Amounts due from and to related parties are shown under receivables and payables, amounts due from directors and key management personnel are shown under receivables and remuneration of directors and key management personnel is disclosed in note 39. Other significant transactions with related parties are as follows:
(Rupees in thousand) 2013 2012
(Re-stated)
Relationship with the Company Nature of transactions
i. Subsidiaries Purchase of goods and services 1,208,266 811,579 Sale of goods and services 722,790 24,703 Assets and liabilities transferred 7,698,689 - Equity contribution in cash 2,274,953 - Investments made - 9 Dividend income 29,524 51,279 Rental and other income 24,515 14,121 Management and technical fee 21,054 16,751 ii. Joint Venture Purchase of goods and services 1,346,221 - Sale of goods and services 974,908 - Rental and other income 38,406 - iii. Associates Purchase of goods and services 979,067 815,352 Sale of goods and services 54,630 83,151 Insurance premium 143,934 200,952 Commission earned 8,459 8,248 Insurance claims received 105,125 237,547 Dividend income 123,677 259,191 iv. Post employment benefit plans Expense / (income) charged in respect of retirement benefit plans 114,227 (66,927) All transactions with related parties have been carried out on mutually agreed terms and conditions. 41. Capacity and production - tons
Capacity Actual production 2013 2012 2013 2012
Paper and paperboard produced 98,900 271,400 38,314 148,055 Paper and paperboard converted 75,235 158,069 52,610 106,322 Plastics all sorts converted 20,000 20,000 16,041 14,494 The variance of actual production from capacity is primarily on account of the product mix.
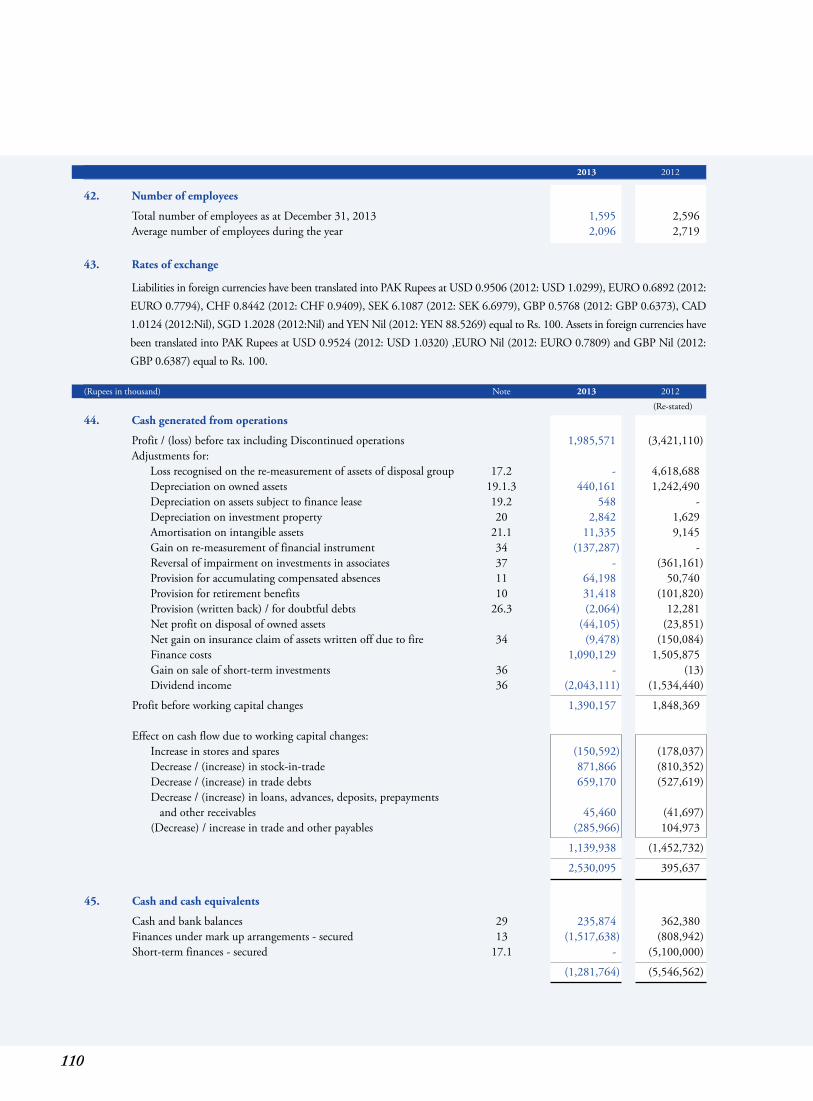
110
2013 2012
42. Number of employees
Total number of employees as at December 31, 2013 1,595 2,596 Average number of employees during the year 2,096 2,719 43. Rates of exchange
Liabilities in foreign currencies have been translated into PAK Rupees at USD 0.9506 (2012: USD 1.0299), EURO 0.6892 (2012: EURO 0.7794), CHF 0.8442 (2012: CHF 0.9409), SEK 6.1087 (2012: SEK 6.6979), GBP 0.5768 (2012: GBP 0.6373), CAD 1.0124 (2012:Nil), SGD 1.2028 (2012:Nil) and YEN Nil (2012: YEN 88.5269) equal to Rs. 100. Assets in foreign currencies have been translated into PAK Rupees at USD 0.9524 (2012: USD 1.0320) ,EURO Nil (2012: EURO 0.7809) and GBP Nil (2012: GBP 0.6387) equal to Rs. 100.
(Rupees in thousand) Note 2013 2012
(Re-stated)
44. Cash generated from operations
Profit / (loss) before tax including Discontinued operations 1,985,571 (3,421,110) Adjustments for: Loss recognised on the re-measurement of assets of disposal group 17.2 - 4,618,688 Depreciation on owned assets 19.1.3 440,161 1,242,490 Depreciation on assets subject to finance lease 19.2 548 - Depreciation on investment property 20 2,842 1,629 Amortisation on intangible assets 21.1 11,335 9,145 Gain on re-measurement of financial instrument 34 (137,287) - Reversal of impairment on investments in associates 37 - (361,161) Provision for accumulating compensated absences 11 64,198 50,740 Provision for retirement benefits 10 31,418 (101,820) Provision (written back) / for doubtful debts 26.3 (2,064) 12,281 Net profit on disposal of owned assets (44,105) (23,851) Net gain on insurance claim of assets written off due to fire 34 (9,478) (150,084) Finance costs 1,090,129 1,505,875 Gain on sale of short-term investments 36 - (13) Dividend income 36 (2,043,111) (1,534,440)
Profit before working capital changes 1,390,157 1,848,369 Effect on cash flow due to working capital changes: Increase in stores and spares (150,592) (178,037) Decrease / (increase) in stock-in-trade 871,866 (810,352) Decrease / (increase) in trade debts 659,170 (527,619) Decrease / (increase) in loans, advances, deposits, prepayments and other receivables 45,460 (41,697) (Decrease) / increase in trade and other payables (285,966) 104,973
1,139,938 (1,452,732)
2,530,095 395,637 45. Cash and cash equivalents
Cash and bank balances 29 235,874 362,380 Finances under mark up arrangements - secured 13 (1,517,638) (808,942) Short-term finances - secured 17.1 - (5,100,000)
(1,281,764) (5,546,562)
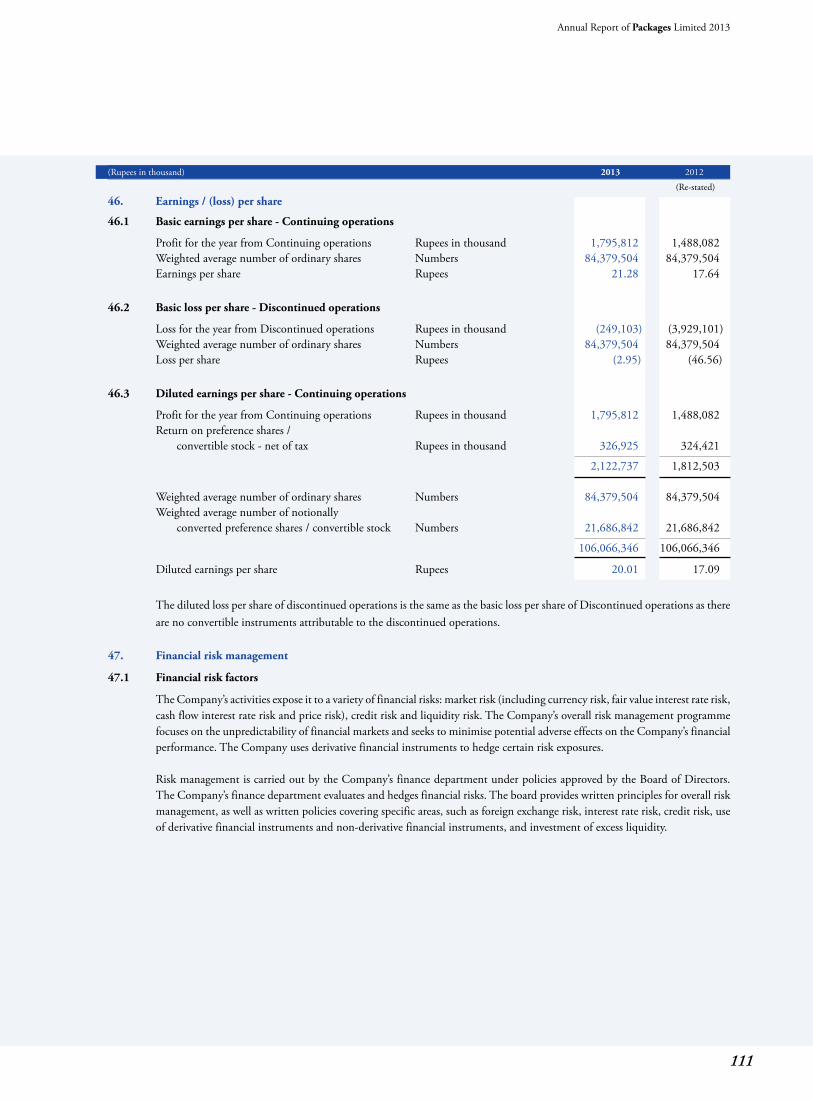
111
Annual Report of Packages Limited 2013
(Rupees in thousand) 2013 2012
(Re-stated)
46. Earnings / (loss) per share
46.1 Basic earnings per share - Continuing operations
Profit for the year from Continuing operations Rupees in thousand 1,795,812 1,488,082 Weighted average number of ordinary shares Numbers 84,379,504 84,379,504 Earnings per share Rupees 21.28 17.64 46.2 Basic loss per share - Discontinued operations
Loss for the year from Discontinued operations Rupees in thousand (249,103) (3,929,101) Weighted average number of ordinary shares Numbers 84,379,504 84,379,504 Loss per share Rupees (2.95) (46.56) 46.3 Diluted earnings per share - Continuing operations
Profit for the year from Continuing operations Rupees in thousand 1,795,812 1,488,082 Return on preference shares / convertible stock - net of tax Rupees in thousand 326,925 324,421
2,122,737 1,812,503 Weighted average number of ordinary shares Numbers 84,379,504 84,379,504 Weighted average number of notionally converted preference shares / convertible stock Numbers 21,686,842 21,686,842
106,066,346 106,066,346
Diluted earnings per share Rupees 20.01 17.09
The diluted loss per share of discontinued operations is the same as the basic loss per share of Discontinued operations as there are no convertible instruments attributable to the discontinued operations.
47. Financial risk management
47.1 Financial risk factors
The Company’s activities expose it to a variety of financial risks: market risk (including currency risk, fair value interest rate risk, cash flow interest rate risk and price risk), credit risk and liquidity risk. The Company’s overall risk management programme focuses on the unpredictability of financial markets and seeks to minimise potential adverse effects on the Company’s financial performance. The Company uses derivative financial instruments to hedge certain risk exposures. Risk management is carried out by the Company’s finance department under policies approved by the Board of Directors. The Company’s finance department evaluates and hedges financial risks. The board provides written principles for overall risk management, as well as written policies covering specific areas, such as foreign exchange risk, interest rate risk, credit risk, use of derivative financial instruments and non-derivative financial instruments, and investment of excess liquidity.
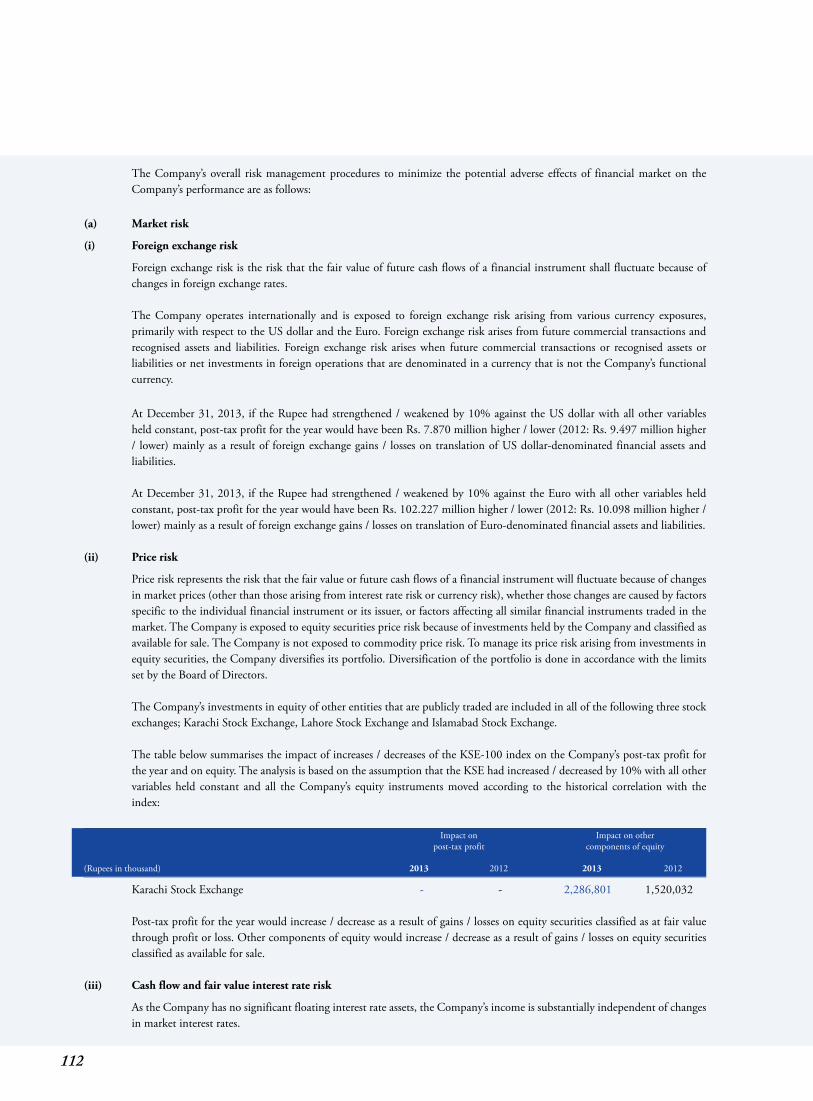
112
The Company’s overall risk management procedures to minimize the potential adverse effects of financial market on the Company’s performance are as follows:
(a) Market risk
(i) Foreign exchange risk
Foreign exchange risk is the risk that the fair value of future cash flows of a financial instrument shall fluctuate because of changes in foreign exchange rates. The Company operates internationally and is exposed to foreign exchange risk arising from various currency exposures, primarily with respect to the US dollar and the Euro. Foreign exchange risk arises from future commercial transactions and recognised assets and liabilities. Foreign exchange risk arises when future commercial transactions or recognised assets or liabilities or net investments in foreign operations that are denominated in a currency that is not the Company’s functional currency.
At December 31, 2013, if the Rupee had strengthened / weakened by 10% against the US dollar with all other variables held constant, post-tax profit for the year would have been Rs. 7.870 million higher / lower (2012: Rs. 9.497 million higher / lower) mainly as a result of foreign exchange gains / losses on translation of US dollar-denominated financial assets and liabilities. At December 31, 2013, if the Rupee had strengthened / weakened by 10% against the Euro with all other variables held constant, post-tax profit for the year would have been Rs. 102.227 million higher / lower (2012: Rs. 10.098 million higher / lower) mainly as a result of foreign exchange gains / losses on translation of Euro-denominated financial assets and liabilities.
(ii) Price risk
Price risk represents the risk that the fair value or future cash flows of a financial instrument will fluctuate because of changes in market prices (other than those arising from interest rate risk or currency risk), whether those changes are caused by factors specific to the individual financial instrument or its issuer, or factors affecting all similar financial instruments traded in the market. The Company is exposed to equity securities price risk because of investments held by the Company and classified as available for sale. The Company is not exposed to commodity price risk. To manage its price risk arising from investments in equity securities, the Company diversifies its portfolio. Diversification of the portfolio is done in accordance with the limits set by the Board of Directors. The Company’s investments in equity of other entities that are publicly traded are included in all of the following three stock exchanges; Karachi Stock Exchange, Lahore Stock Exchange and Islamabad Stock Exchange. The table below summarises the impact of increases / decreases of the KSE-100 index on the Company’s post-tax profit for the year and on equity. The analysis is based on the assumption that the KSE had increased / decreased by 10% with all other variables held constant and all the Company’s equity instruments moved according to the historical correlation with the index:
Impact on Impact on other post-tax profit components of equity
(Rupees in thousand) 2013 2012 2013 2012
Karachi Stock Exchange - - 2,286,801 1,520,032 Post-tax profit for the year would increase / decrease as a result of gains / losses on equity securities classified as at fair value through profit or loss. Other components of equity would increase / decrease as a result of gains / losses on equity securities classified as available for sale.
(iii) Cash flow and fair value interest rate risk
As the Company has no significant floating interest rate assets, the Company’s income is substantially independent of changes in market interest rates.
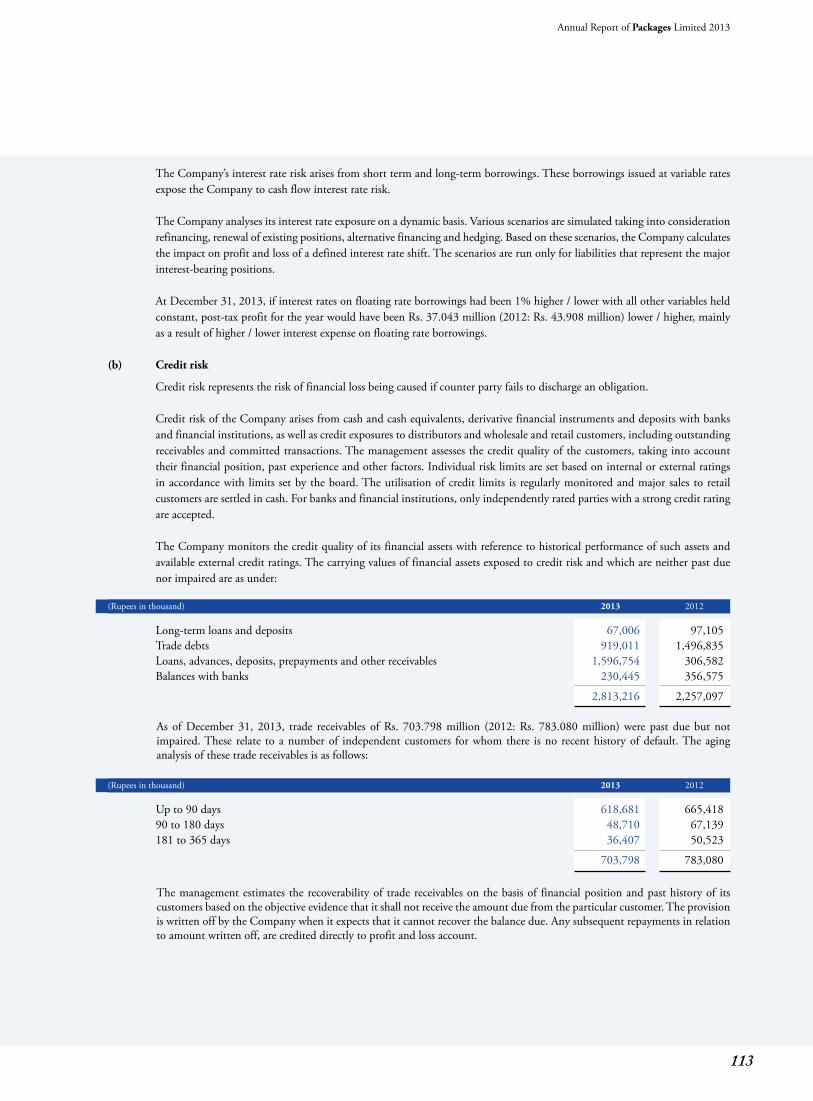
113
Annual Report of Packages Limited 2013
The Company’s interest rate risk arises from short term and long-term borrowings. These borrowings issued at variable rates expose the Company to cash flow interest rate risk. The Company analyses its interest rate exposure on a dynamic basis. Various scenarios are simulated taking into consideration refinancing, renewal of existing positions, alternative financing and hedging. Based on these scenarios, the Company calculates the impact on profit and loss of a defined interest rate shift. The scenarios are run only for liabilities that represent the major interest-bearing positions. At December 31, 2013, if interest rates on floating rate borrowings had been 1% higher / lower with all other variables held constant, post-tax profit for the year would have been Rs. 37.043 million (2012: Rs. 43.908 million) lower / higher, mainly as a result of higher / lower interest expense on floating rate borrowings.
(b) Credit risk
Credit risk represents the risk of financial loss being caused if counter party fails to discharge an obligation. Credit risk of the Company arises from cash and cash equivalents, derivative financial instruments and deposits with banks and financial institutions, as well as credit exposures to distributors and wholesale and retail customers, including outstanding receivables and committed transactions. The management assesses the credit quality of the customers, taking into account their financial position, past experience and other factors. Individual risk limits are set based on internal or external ratings in accordance with limits set by the board. The utilisation of credit limits is regularly monitored and major sales to retail customers are settled in cash. For banks and financial institutions, only independently rated parties with a strong credit rating are accepted. The Company monitors the credit quality of its financial assets with reference to historical performance of such assets and available external credit ratings. The carrying values of financial assets exposed to credit risk and which are neither past due nor impaired are as under:
(Rupees in thousand) 2013 2012
Long-term loans and deposits 67,006 97,105 Trade debts 919,011 1,496,835 Loans, advances, deposits, prepayments and other receivables 1,596,754 306,582 Balances with banks 230,445 356,575
2,813,216 2,257,097
As of December 31, 2013, trade receivables of Rs. 703.798 million (2012: Rs. 783.080 million) were past due but not impaired. These relate to a number of independent customers for whom there is no recent history of default. The aging analysis of these trade receivables is as follows:
(Rupees in thousand) 2013 2012
Up to 90 days 618,681 665,418 90 to 180 days 48,710 67,139 181 to 365 days 36,407 50,523
703,798 783,080 The management estimates the recoverability of trade receivables on the basis of financial position and past history of its
customers based on the objective evidence that it shall not receive the amount due from the particular customer. The provision is written off by the Company when it expects that it cannot recover the balance due. Any subsequent repayments in relation to amount written off, are credited directly to profit and loss account.
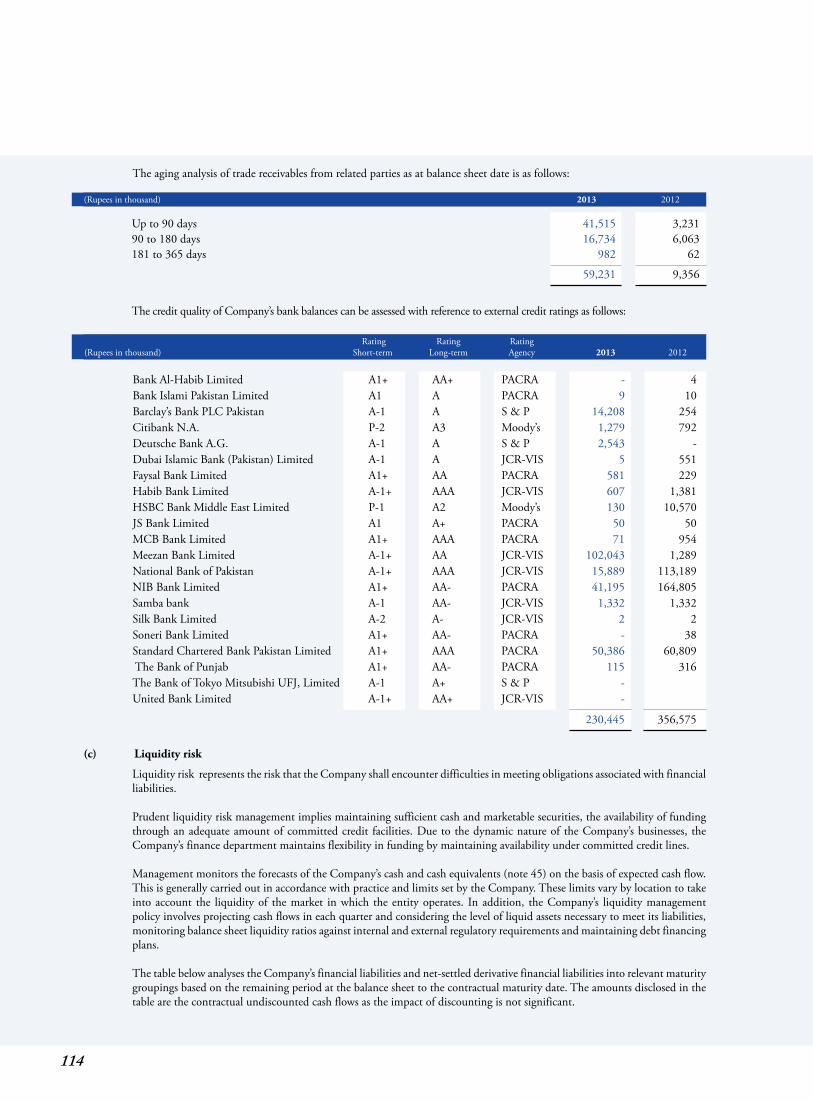
114
The aging analysis of trade receivables from related parties as at balance sheet date is as follows:
(Rupees in thousand) 2013 2012
Up to 90 days 41,515 3,231 90 to 180 days 16,734 6,063 181 to 365 days 982 62
59,231 9,356 The credit quality of Company’s bank balances can be assessed with reference to external credit ratings as follows: Rating Rating Rating(Rupees in thousand) Short-term Long-term Agency 2013 2012
Bank Al-Habib Limited A1+ AA+ PACRA - 4 Bank Islami Pakistan Limited A1 A PACRA 9 10 Barclay’s Bank PLC Pakistan A-1 A S & P 14,208 254 Citibank N.A. P-2 A3 Moody’s 1,279 792 Deutsche Bank A.G. A-1 A S & P 2,543 - Dubai Islamic Bank (Pakistan) Limited A-1 A JCR-VIS 5 551 Faysal Bank Limited A1+ AA PACRA 581 229 Habib Bank Limited A-1+ AAA JCR-VIS 607 1,381 HSBC Bank Middle East Limited P-1 A2 Moody’s 130 10,570 JS Bank Limited A1 A+ PACRA 50 50 MCB Bank Limited A1+ AAA PACRA 71 954 Meezan Bank Limited A-1+ AA JCR-VIS 102,043 1,289 National Bank of Pakistan A-1+ AAA JCR-VIS 15,889 113,189 NIB Bank Limited A1+ AA- PACRA 41,195 164,805 Samba bank A-1 AA- JCR-VIS 1,332 1,332 Silk Bank Limited A-2 A- JCR-VIS 2 2 Soneri Bank Limited A1+ AA- PACRA - 38 Standard Chartered Bank Pakistan Limited A1+ AAA PACRA 50,386 60,809 The Bank of Punjab A1+ AA- PACRA 115 316 The Bank of Tokyo Mitsubishi UFJ, Limited A-1 A+ S & P - United Bank Limited A-1+ AA+ JCR-VIS -
230,445 356,575 (c) Liquidity risk
Liquidity risk represents the risk that the Company shall encounter difficulties in meeting obligations associated with financial liabilities.
Prudent liquidity risk management implies maintaining sufficient cash and marketable securities, the availability of funding
through an adequate amount of committed credit facilities. Due to the dynamic nature of the Company’s businesses, the Company’s finance department maintains flexibility in funding by maintaining availability under committed credit lines.
Management monitors the forecasts of the Company’s cash and cash equivalents (note 45) on the basis of expected cash flow.
This is generally carried out in accordance with practice and limits set by the Company. These limits vary by location to take into account the liquidity of the market in which the entity operates. In addition, the Company’s liquidity management policy involves projecting cash flows in each quarter and considering the level of liquid assets necessary to meet its liabilities, monitoring balance sheet liquidity ratios against internal and external regulatory requirements and maintaining debt financing plans.
The table below analyses the Company’s financial liabilities and net-settled derivative financial liabilities into relevant maturity
groupings based on the remaining period at the balance sheet to the contractual maturity date. The amounts disclosed in the table are the contractual undiscounted cash flows as the impact of discounting is not significant.
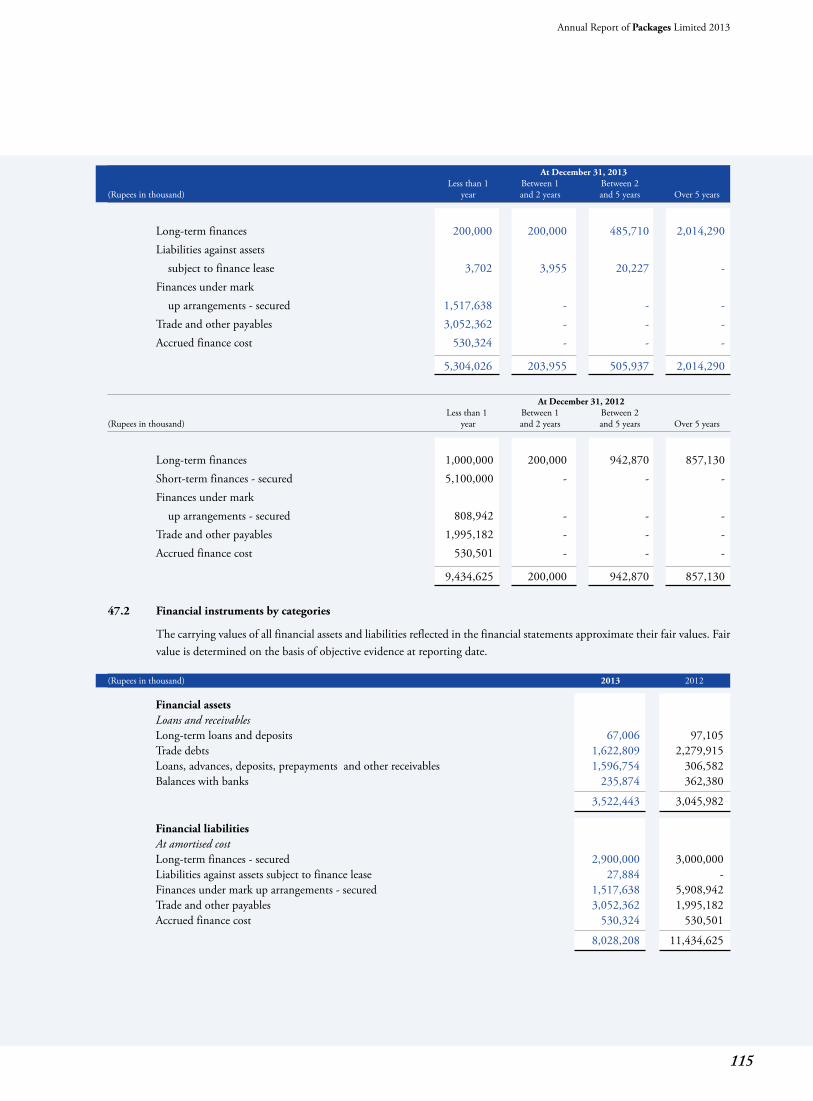
115
Annual Report of Packages Limited 2013
At December 31, 2013 Less than 1 Between 1 Between 2 (Rupees in thousand) year and 2 years and 5 years Over 5 years
Long-term finances 200,000 200,000 485,710 2,014,290 Liabilities against assets subject to finance lease 3,702 3,955 20,227 - Finances under mark up arrangements - secured 1,517,638 - - - Trade and other payables 3,052,362 - - - Accrued finance cost 530,324 - - -
5,304,026 203,955 505,937 2,014,290
At December 31, 2012 Less than 1 Between 1 Between 2 (Rupees in thousand) year and 2 years and 5 years Over 5 years
Long-term finances 1,000,000 200,000 942,870 857,130 Short-term finances - secured 5,100,000 - - - Finances under mark up arrangements - secured 808,942 - - - Trade and other payables 1,995,182 - - - Accrued finance cost 530,501 - - -
9,434,625 200,000 942,870 857,130
47.2 Financial instruments by categories
The carrying values of all financial assets and liabilities reflected in the financial statements approximate their fair values. Fair value is determined on the basis of objective evidence at reporting date.
(Rupees in thousand) 2013 2012
Financial assets Loans and receivables Long-term loans and deposits 67,006 97,105 Trade debts 1,622,809 2,279,915 Loans, advances, deposits, prepayments and other receivables 1,596,754 306,582 Balances with banks 235,874 362,380
3,522,443 3,045,982
Financial liabilities At amortised cost Long-term finances - secured 2,900,000 3,000,000 Liabilities against assets subject to finance lease 27,884 - Finances under mark up arrangements - secured 1,517,638 5,908,942 Trade and other payables 3,052,362 1,995,182 Accrued finance cost 530,324 530,501
8,028,208 11,434,625
116
47.3 Capital risk management
The Company’s objectives when managing capital are to safeguard the Company’s ability to continue as a going concern in order to provide returns for shareholders and benefits for other stakeholders and to maintain an optimal capital structure to reduce the cost of capital.
The Company manages its capital structure and makes adjustments to it in the light of changes in economic conditions. In
order to maintain or adjust the capital structure, the Company may adjust the amount of dividends paid to shareholders or issue new shares. Consistent with the others in industry, the Company monitors capital on the basis of the gearing ratio. This ratio is calculated as net debt divided by total capital. Net debt is calculated as total borrowings including the current and non-current borrowings as disclosed in note 7 less cash and cash equivalents as disclosed in note 45. Total capital is calculated as equity as shown in the balance sheet plus net debt. The gearing ratio as at year end is as follows:
(Rupees in thousand) 2013 2012
Long-term finances 5,170,577 4,470,577 Current portion of long term finances 200,000 1,000,000 Cash and cash equivalents 1,281,764 5,546,562
Net debt 6,652,341 11,017,139 Total equity 42,089,528 30,622,722
Total capital 48,741,869 41,639,861
Gearing ratio 14% 26% 47.4 Fair value estimation
The fair value of financial instruments traded in active markets is based on quoted market prices at the balance sheet date. The quoted market price used for financial assets held by the Company are the current bid prices.
The financial instruments that are not traded in active market are carried at cost and are tested for impairment according to
IAS 39. The fair value of interest rate swaps is calculated as the present value of the estimated future cash flows. The carrying amount less impairment provision of trade receivables and payables are assumed to approximate their fair values.
The fair value of financial liabilities for disclosure purposes is estimated by discounting the future contractual cash flows at the current market interest rate that is available to the Company for similar financial instruments.
48. Date of authorisation for issue
These financial statements were authorised for issue on February 19, 2014 by the Board of Directors of the Company. 49. Non-Adjusting events after the balance sheet date
The Board of Directors has proposed a final cash dividend for the year ended December 31, 2013 of Rs. 8.00 per share (2012: Rs. 4.50 per share), amounting to Rs. 675.036 million (2012: Rs. 379.708 million) at its meeting held on February 19, 2014 for approval of the members at the Annual General Meeting to be held on April 03, 2014. The Board has also recommended to transfer Rs. 700 million from accumulated profit to general reserves (2012: Rs. 3,300 million from general reserves to accumulated profit).
50. Corresponding figures
Corresponding figures have been re-arranged and re-classified, wherever necessary, for the purposes of comparison. However, no significant re-classifications have been made.
Towfiq Habib Chinoy Syed Hyder Ali Syed Aslam Mehdi Chairman Chief Executive & Managing Director Director
Annual Report of Packages Limited 2013 | Consolidated Financial Statements 2013
Consolidated Financial StatementsFor the year ended December 31, 2013
118
The Directors of Packages Limited are pleased to present the audited consolidated financial statements of the Group for the year ended December 31, 2013.
Directors’ Report on the Consolidated Financial StatementsFor The Year Ended December 31, 2013
Group resultsThe comparison of annual audited results for the year 2013 as against year 2012 is as follows:
(Rupees in million) 2013 2012 Re-stated
Continuing operations:Invoiced Sales – Net 16,685 14,270Profit from operations 1,373 1,224Share of profit in associates and joint venture 181 209Reversal of impairment on investments 11 632Investment income 1,889 1,224Profit after tax 2,034 2,232
Discontinued operations:Operating Loss after tax (213) (883)Loss on re-measurement of Disposal Group after tax - (3,002)
Continuing operationsDuring the year 2013, Continuing Operations have achieved net sales of Rs. 16,685 million against net sales of Rs. 14,270 million achieved during last year indicating sales growth of 17%. This sale excludes Rs. 743 million of materials imported on behalf of “Bulleh Shah Packaging (Private) Limited ‘BSPL’ and transferred to it at cost as a transitional arrangement subsequent to its recognition as jointly controlled entity.
Continued Operations have achieved Profit from operations of Rs. 1,373 million during 2013 as against that of Rs. 1,224 million achieved during 2012 representing an increase of Rs. 149 million i.e. 12%.Investment income has also increased by Rs. 665 million during 2013 that is indicative of improved operational performance of the investee companies.
In 2013, the Group has also changed its accounting policy in respect of recognition of actuarial losses arising from retirement benefit plans in pursuance of amendments in International Accounting Standard 19 ‘Employee Benefits’ that are effective from financial years beginning on or after January 1, 2013 and recognized a cumulative charge of Rs. 235.551 million net of taxes to the opening balance of accumulated profit/(loss) and retirement benefits including pension fund and gratuity fund.
Discontinued operationsPaper & Paperboard and Corrugated Boxes businesses have been recognized as Discontinued Operations in these financial statements in accordance with applicable financial reporting framework. The process of transfer of assets and related obligations of Paper & Paperboard and Corrugated Boxes businesses of the Company to Bulleh Shah Packaging (Private) Limited was completed during the first half of 2013 along with cash equity injection for financing future investment projects of BSPL. After Implementation of the joint venture agreement with Stora Enso A.B of Sweden, the Parent Company now holds 65% equity in BSPL. Stora Enso (SE) has made direct equity investment of US$ 38.95M in BSPL and is also actively providing technical expertise to further streamline the operations.
A brief review of the operational performance of the Group entities is as follows:
Bulleh Shah Packaging (Private) LimitedBulleh Shah Packaging (Private) Limited is a non-listed private limited company. It is principally engaged in the manufacturing and conversion of Paper & paperboard products. The entity has started its commercial operations in April 2013 upon transfer of Paper & Paperboard and Corrugated Boxes businesses from Packages Limited. The Company has achieved sales of Rs. 10,237 million during first nine months of its commercial operations till December 31, 2013 with profit before tax of Rs. 181 million that is indicative of stabilising mill operations and timely price rationalisation with customers. As part of management’s strategy to overcome the power shortage and to supply uninterrupted power to the operations, the Company has also signed the contract for bio-mass boiler which is expected to
119
Annual Report of Packages Limited 2013 | Consolidated Financial Statements 2013
be in operation during first half of 2015. Moving forward, the Management will also continue its focus on tighter cost controls and operational efficiencies to further improve the Company’s operating results.
DIC Pakistan LimitedDIC Pakistan Limited is a non-listed public limited subsidiary of Packages Limited. It is principally engaged in manufacturing, processing and selling of industrial inks. The Company has achieved net sales of Rs. 2,650 million during the year 2013 as compared to Rs. 2,188 million of last year representing sales growth of 21%. The Company has generated profit before tax of Rs. 249 million during the year 2013 as against Rs. 130 million of 2012 resulting from sales growth and operational efficiencies. Moving forward, the Company will continue its focus on improving operating results through tighter operating cost control, product diversification, price rationalization and better working capital management.
(Towfiq Habib Chinoy) Chairman
Lahore, February 19, 2014
Packages Lanka (Private) Limited Packages Lanka (Private) Limited is a Sri Lanka based subsidiary of Packages Limited. It is primarily engaged in production of flexible packaging solutions. The Company has achieved turnover of SLR 1,522 million during the year 2013 as compared to SLR 1,423 million of 2012. The Company has generated profit before tax of SLR 51 million in the year 2013 as compared to SLR 92 million of 2012. This decline in profit is mainly attributable to increase in depreciation charge and finance cost resulting from capitalisation of new printing line towards the end of the year 2012. With installation of new printing line, the management is confident of consolidating its market share in the increasingly competitive local market and will be able to recover investment costs through enhanced sales.
(Syed Hyder Ali)Chief Executive & Managing Director
Lahore, February 19, 2014

121
Annual Report of Packages Limited 2013 | Consolidated Financial Statements 2013
Auditors’ Report to the Members
Our audit was conducted in accordance with the International Standards on Auditing and accordingly included such tests of accounting records and such other auditing procedures as we considered necessary in the circumstances.
As stated in notes 2.2.1 and 4.9 to the annexed consolidated financial statements, the Group has changed its accounting policies on initial application of standards, amendments or interpretations to existing standards and employee retirement benefits respectively.
The Group’s share of net income from investments accounted for under equity method of Rs. 180.543 million shown in the consolidated profit and loss account and note 22.2 to the consolidated financial statements include profit of Rs. 177.332 million, representing Group’s share in three of its associates, based on unaudited financial statements of these associates.
We have audited the annexed consolidated financial statements comprising consolidated balance sheet of Packages Limited (the holding company) and its subsidiary companies (the Group) as at December 31, 2013 and the related consolidated profit and loss account, consolidated statement of comprehensive income, consolidated statement of changes in equity and consolidated cash flow statement together with the notes forming part thereof, for the year then ended. We have also expressed separate opinions on the financial statements of Packages Limited and its subsidiary companies except for Packages Lanka (Private) Limited which was audited by other firm of auditors, whose report has been furnished to us and our opinion in so far as it relates to the amounts included for such company, is based solely on the report of such other auditors. These financial statements are the responsibility of the holding company’s management. Our responsibility is to express an opinion on these financial statements based on our audit.
Except for the effect, if any, of the matter referred to in the preceding paragraph, in our opinion the consolidated financial statements present fairly the financial position of Packages Limited and its subsidiary companies (the Group) as at December 31, 2013 and the results of their operations for the year then ended.
A.F. Ferguson & Co.Chartered AccountantsLahore, February 19, 2014
Name of engagement partner: Asad Aleem Mirza
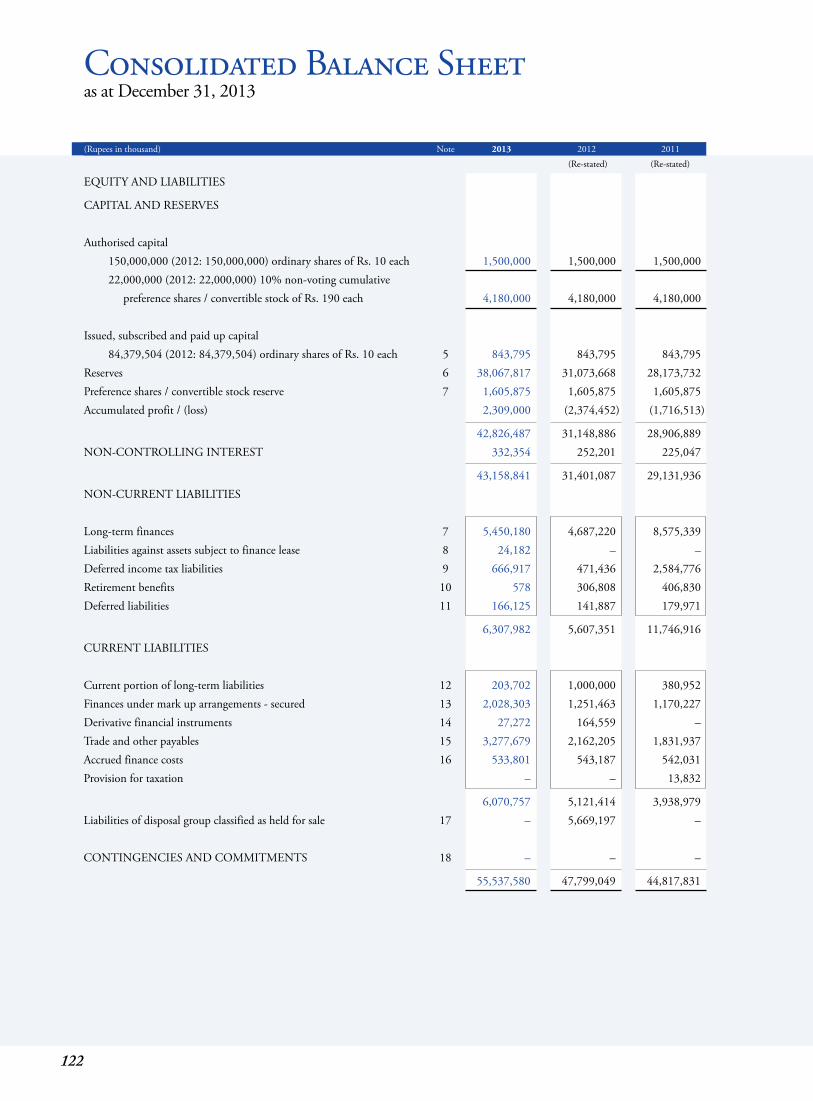
122
Consolidated Balance Sheetas at December 31, 2013
(Rupees in thousand) Note 2013 2012 2011
(Re-stated) (Re-stated)
EQUITY AND LIABILITIES
CAPITAL AND RESERVES Authorised capital 150,000,000 (2012: 150,000,000) ordinary shares of Rs. 10 each 1,500,000 1,500,000 1,500,000 22,000,000 (2012: 22,000,000) 10% non-voting cumulative preference shares / convertible stock of Rs. 190 each 4,180,000 4,180,000 4,180,000 Issued, subscribed and paid up capital 84,379,504 (2012: 84,379,504) ordinary shares of Rs. 10 each 5 843,795 843,795 843,795 Reserves 6 38,067,817 31,073,668 28,173,732 Preference shares / convertible stock reserve 7 1,605,875 1,605,875 1,605,875 Accumulated profit / (loss) 2,309,000 (2,374,452) (1,716,513)
42,826,487 31,148,886 28,906,889 NON-CONTROLLING INTEREST 332,354 252,201 225,047
43,158,841 31,401,087 29,131,936 NON-CURRENT LIABILITIES Long-term finances 7 5,450,180 4,687,220 8,575,339 Liabilities against assets subject to finance lease 8 24,182 – – Deferred income tax liabilities 9 666,917 471,436 2,584,776 Retirement benefits 10 578 306,808 406,830 Deferred liabilities 11 166,125 141,887 179,971
6,307,982 5,607,351 11,746,916 CURRENT LIABILITIES Current portion of long-term liabilities 12 203,702 1,000,000 380,952 Finances under mark up arrangements - secured 13 2,028,303 1,251,463 1,170,227 Derivative financial instruments 14 27,272 164,559 – Trade and other payables 15 3,277,679 2,162,205 1,831,937 Accrued finance costs 16 533,801 543,187 542,031 Provision for taxation – – 13,832
6,070,757 5,121,414 3,938,979 Liabilities of disposal group classified as held for sale 17 – 5,669,197 – CONTINGENCIES AND COMMITMENTS 18 – – –
55,537,580 47,799,049 44,817,831
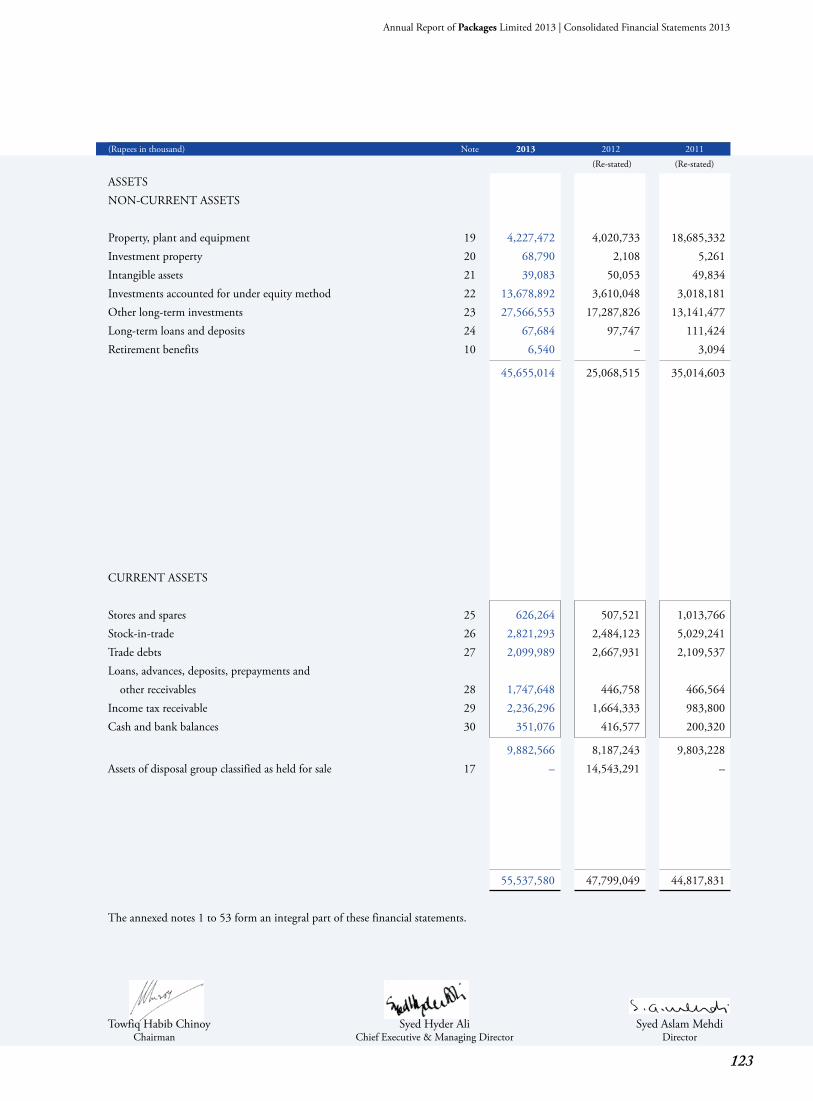
123
Annual Report of Packages Limited 2013 | Consolidated Financial Statements 2013
(Rupees in thousand) Note 2013 2012 2011
(Re-stated) (Re-stated)
ASSETS NON-CURRENT ASSETS Property, plant and equipment 19 4,227,472 4,020,733 18,685,332 Investment property 20 68,790 2,108 5,261 Intangible assets 21 39,083 50,053 49,834 Investments accounted for under equity method 22 13,678,892 3,610,048 3,018,181 Other long-term investments 23 27,566,553 17,287,826 13,141,477 Long-term loans and deposits 24 67,684 97,747 111,424 Retirement benefits 10 6,540 – 3,094
45,655,014 25,068,515 35,014,603 CURRENT ASSETS Stores and spares 25 626,264 507,521 1,013,766 Stock-in-trade 26 2,821,293 2,484,123 5,029,241 Trade debts 27 2,099,989 2,667,931 2,109,537 Loans, advances, deposits, prepayments and other receivables 28 1,747,648 446,758 466,564 Income tax receivable 29 2,236,296 1,664,333 983,800 Cash and bank balances 30 351,076 416,577 200,320
9,882,566 8,187,243 9,803,228 Assets of disposal group classified as held for sale 17 – 14,543,291 –
55,537,580 47,799,049 44,817,831
The annexed notes 1 to 53 form an integral part of these financial statements.
Towfiq Habib Chinoy Syed Hyder Ali Syed Aslam Mehdi Chairman Chief Executive & Managing Director Director
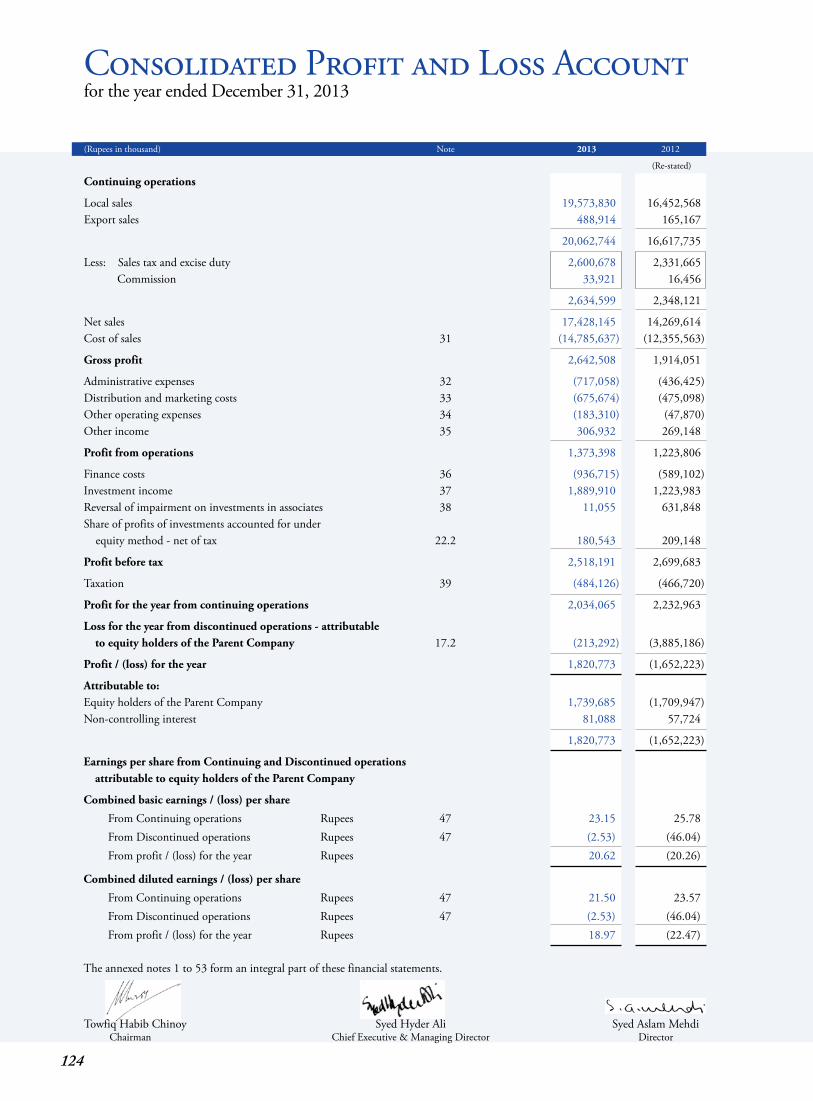
124
Consolidated Profit and Loss Accountfor the year ended December 31, 2013
(Rupees in thousand) Note 2013 2012 (Re-stated)
Continuing operations
Local sales 19,573,830 16,452,568 Export sales 488,914 165,167
20,062,744 16,617,735
Less: Sales tax and excise duty 2,600,678 2,331,665 Commission 33,921 16,456
2,634,599 2,348,121
Net sales 17,428,145 14,269,614 Cost of sales 31 (14,785,637) (12,355,563)
Gross profit 2,642,508 1,914,051
Administrative expenses 32 (717,058) (436,425)Distribution and marketing costs 33 (675,674) (475,098)Other operating expenses 34 (183,310) (47,870)Other income 35 306,932 269,148
Profit from operations 1,373,398 1,223,806
Finance costs 36 (936,715) (589,102)Investment income 37 1,889,910 1,223,983 Reversal of impairment on investments in associates 38 11,055 631,848 Share of profits of investments accounted for under equity method - net of tax 22.2 180,543 209,148
Profit before tax 2,518,191 2,699,683
Taxation 39 (484,126) (466,720)
Profit for the year from continuing operations 2,034,065 2,232,963
Loss for the year from discontinued operations - attributable to equity holders of the Parent Company 17.2 (213,292) (3,885,186)
Profit / (loss) for the year 1,820,773 (1,652,223)
Attributable to: Equity holders of the Parent Company 1,739,685 (1,709,947)Non-controlling interest 81,088 57,724
1,820,773 (1,652,223)
Earnings per share from Continuing and Discontinued operations attributable to equity holders of the Parent Company
Combined basic earnings / (loss) per share From Continuing operations Rupees 47 23.15 25.78 From Discontinued operations Rupees 47 (2.53) (46.04) From profit / (loss) for the year Rupees 20.62 (20.26)
Combined diluted earnings / (loss) per share From Continuing operations Rupees 47 21.50 23.57 From Discontinued operations Rupees 47 (2.53) (46.04) From profit / (loss) for the year Rupees 18.97 (22.47) The annexed notes 1 to 53 form an integral part of these financial statements.
Towfiq Habib Chinoy Syed Hyder Ali Syed Aslam Mehdi Chairman Chief Executive & Managing Director Director
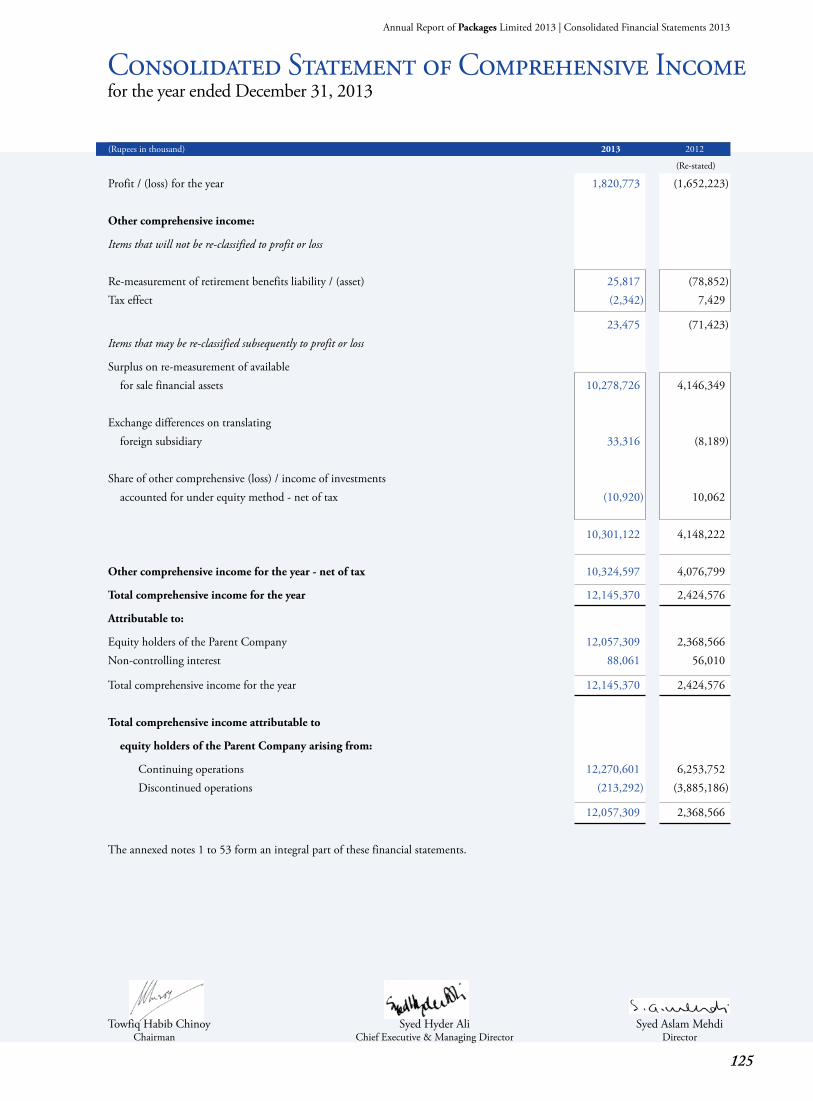
125
Annual Report of Packages Limited 2013 | Consolidated Financial Statements 2013
(Rupees in thousand) 2013 2012 (Re-stated)
Profit / (loss) for the year 1,820,773 (1,652,223) Other comprehensive income:
Items that will not be re-classified to profit or loss Re-measurement of retirement benefits liability / (asset) 25,817 (78,852)Tax effect (2,342) 7,429
23,475 (71,423)Items that may be re-classified subsequently to profit or loss
Surplus on re-measurement of available for sale financial assets 10,278,726 4,146,349 Exchange differences on translating foreign subsidiary 33,316 (8,189) Share of other comprehensive (loss) / income of investments accounted for under equity method - net of tax (10,920) 10,062 10,301,122 4,148,222 Other comprehensive income for the year - net of tax 10,324,597 4,076,799
Total comprehensive income for the year 12,145,370 2,424,576
Attributable to:
Equity holders of the Parent Company 12,057,309 2,368,566 Non-controlling interest 88,061 56,010
Total comprehensive income for the year 12,145,370 2,424,576 Total comprehensive income attributable to
equity holders of the Parent Company arising from:
Continuing operations 12,270,601 6,253,752 Discontinued operations (213,292) (3,885,186)
12,057,309 2,368,566 The annexed notes 1 to 53 form an integral part of these financial statements.
Consolidated Statement of Comprehensive Incomefor the year ended December 31, 2013
Towfiq Habib Chinoy Syed Hyder Ali Syed Aslam Mehdi Chairman Chief Executive & Managing Director Director
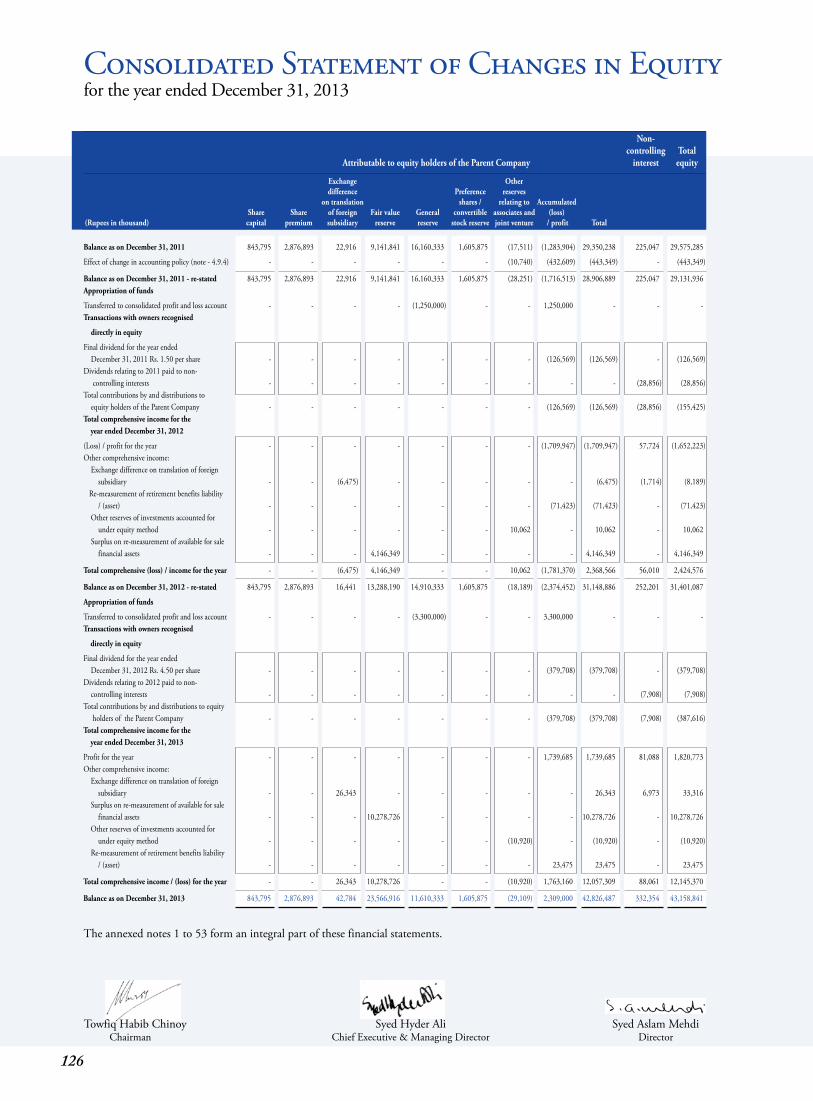
126
Non- controlling Total Attributable to equity holders of the Parent Company interest equity
Exchange Other difference Preference reserves on translation shares / relating to Accumulated Share Share of foreign Fair value General convertible associates and (loss) (Rupees in thousand) capital premium subsidiary reserve reserve stock reserve joint venture / profit Total
Consolidated Statement of Changes in Equityfor the year ended December 31, 2013
Towfiq Habib Chinoy Syed Hyder Ali Syed Aslam Mehdi Chairman Chief Executive & Managing Director Director
Balance as on December 31, 2011 843,795 2,876,893 22,916 9,141,841 16,160,333 1,605,875 (17,511) (1,283,904) 29,350,238 225,047 29,575,285
Effect of change in accounting policy (note - 4.9.4) - - - - - - (10,740) (432,609) (443,349) - (443,349)
Balance as on December 31, 2011 - re-stated 843,795 2,876,893 22,916 9,141,841 16,160,333 1,605,875 (28,251) (1,716,513) 28,906,889 225,047 29,131,936 Appropriation of funds
Transferred to consolidated profit and loss account - - - - (1,250,000) - - 1,250,000 - - - Transactions with owners recognised
directly in equity
Final dividend for the year ended December 31, 2011 Rs. 1.50 per share - - - - - - - (126,569) (126,569) - (126,569)Dividends relating to 2011 paid to non- controlling interests - - - - - - - - - (28,856) (28,856)Total contributions by and distributions to equity holders of the Parent Company - - - - - - - (126,569) (126,569) (28,856) (155,425)Total comprehensive income for the year ended December 31, 2012
(Loss) / profit for the year - - - - - - - (1,709,947) (1,709,947) 57,724 (1,652,223)Other comprehensive income: Exchange difference on translation of foreign subsidiary - - (6,475) - - - - - (6,475) (1,714) (8,189) Re-measurement of retirement benefits liability / (asset) - - - - - - - (71,423) (71,423) - (71,423) Other reserves of investments accounted for under equity method - - - - - - 10,062 - 10,062 - 10,062 Surplus on re-measurement of available for sale financial assets - - - 4,146,349 - - - - 4,146,349 - 4,146,349
Total comprehensive (loss) / income for the year - - (6,475) 4,146,349 - - 10,062 (1,781,370) 2,368,566 56,010 2,424,576
Balance as on December 31, 2012 - re-stated 843,795 2,876,893 16,441 13,288,190 14,910,333 1,605,875 (18,189) (2,374,452) 31,148,886 252,201 31,401,087
Appropriation of funds
Transferred to consolidated profit and loss account - - - - (3,300,000) - - 3,300,000 - - - Transactions with owners recognised
directly in equity
Final dividend for the year ended December 31, 2012 Rs. 4.50 per share - - - - - - - (379,708) (379,708) - (379,708)Dividends relating to 2012 paid to non- controlling interests - - - - - - - - - (7,908) (7,908)Total contributions by and distributions to equity holders of the Parent Company - - - - - - - (379,708) (379,708) (7,908) (387,616)Total comprehensive income for the year ended December 31, 2013
Profit for the year - - - - - - - 1,739,685 1,739,685 81,088 1,820,773 Other comprehensive income: Exchange difference on translation of foreign subsidiary - - 26,343 - - - - - 26,343 6,973 33,316 Surplus on re-measurement of available for sale financial assets - - - 10,278,726 - - - - 10,278,726 - 10,278,726 Other reserves of investments accounted for under equity method - - - - - - (10,920) - (10,920) - (10,920) Re-measurement of retirement benefits liability / (asset) - - - - - - - 23,475 23,475 - 23,475
Total comprehensive income / (loss) for the year - - 26,343 10,278,726 - - (10,920) 1,763,160 12,057,309 88,061 12,145,370
Balance as on December 31, 2013 843,795 2,876,893 42,784 23,566,916 11,610,333 1,605,875 (29,109) 2,309,000 42,826,487 332,354 43,158,841
The annexed notes 1 to 53 form an integral part of these financial statements.
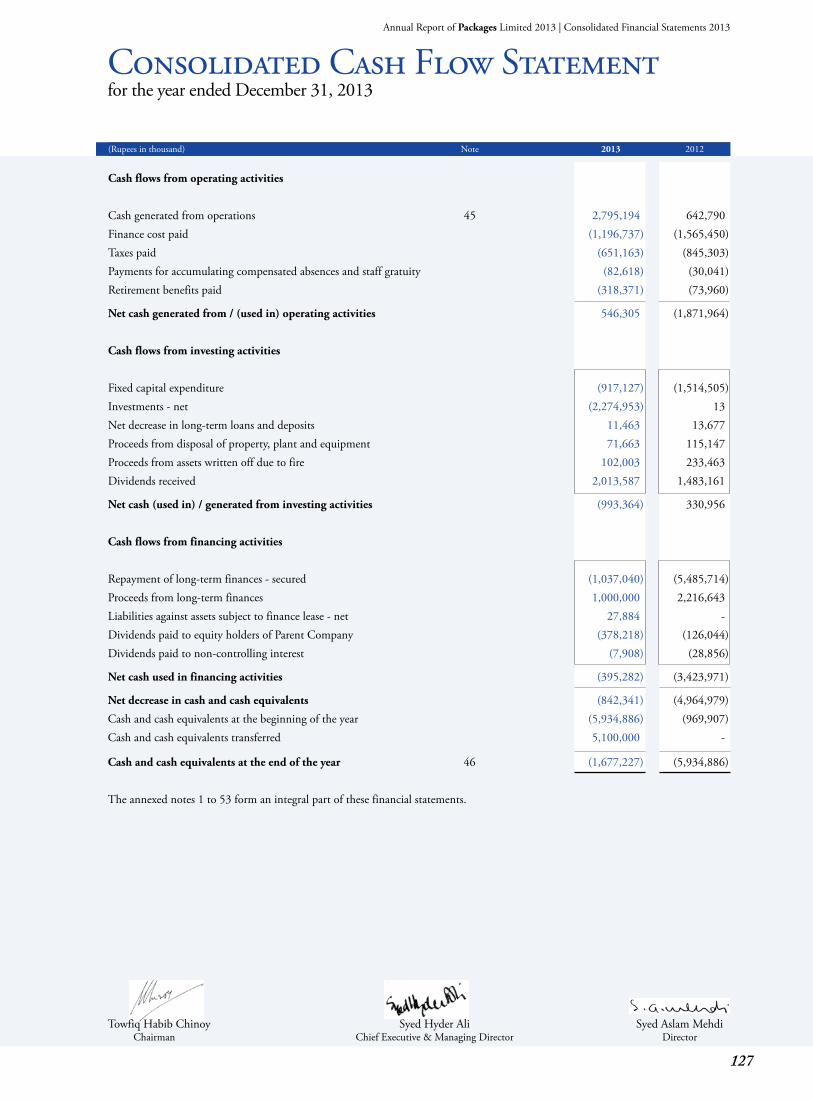
127
Annual Report of Packages Limited 2013 | Consolidated Financial Statements 2013
Consolidated Cash Flow Statement for the year ended December 31, 2013
Towfiq Habib Chinoy Syed Hyder Ali Syed Aslam Mehdi Chairman Chief Executive & Managing Director Director
(Rupees in thousand) Note 2013 2012
Cash flows from operating activities
Cash generated from operations 45 2,795,194 642,790 Finance cost paid (1,196,737) (1,565,450)Taxes paid (651,163) (845,303)Payments for accumulating compensated absences and staff gratuity (82,618) (30,041)Retirement benefits paid (318,371) (73,960)
Net cash generated from / (used in) operating activities 546,305 (1,871,964) Cash flows from investing activities Fixed capital expenditure (917,127) (1,514,505)Investments - net (2,274,953) 13 Net decrease in long-term loans and deposits 11,463 13,677 Proceeds from disposal of property, plant and equipment 71,663 115,147 Proceeds from assets written off due to fire 102,003 233,463 Dividends received 2,013,587 1,483,161
Net cash (used in) / generated from investing activities (993,364) 330,956 Cash flows from financing activities Repayment of long-term finances - secured (1,037,040) (5,485,714)Proceeds from long-term finances 1,000,000 2,216,643 Liabilities against assets subject to finance lease - net 27,884 - Dividends paid to equity holders of Parent Company (378,218) (126,044)Dividends paid to non-controlling interest (7,908) (28,856)
Net cash used in financing activities (395,282) (3,423,971)
Net decrease in cash and cash equivalents (842,341) (4,964,979)Cash and cash equivalents at the beginning of the year (5,934,886) (969,907)Cash and cash equivalents transferred 5,100,000 -
Cash and cash equivalents at the end of the year 46 (1,677,227) (5,934,886) The annexed notes 1 to 53 form an integral part of these financial statements.
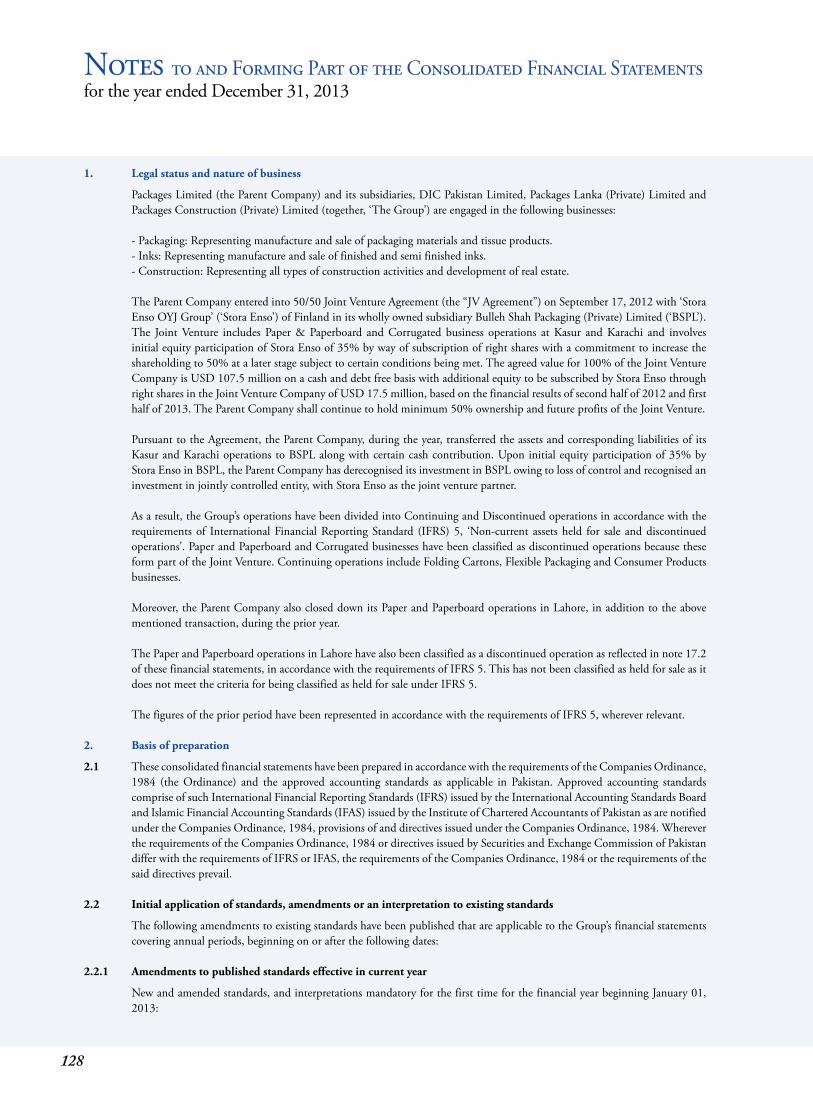
128
1. Legal status and nature of business
Packages Limited (the Parent Company) and its subsidiaries, DIC Pakistan Limited, Packages Lanka (Private) Limited and Packages Construction (Private) Limited (together, ‘The Group’) are engaged in the following businesses:
- Packaging: Representing manufacture and sale of packaging materials and tissue products. - Inks: Representing manufacture and sale of finished and semi finished inks. - Construction: Representing all types of construction activities and development of real estate.
The Parent Company entered into 50/50 Joint Venture Agreement (the “JV Agreement”) on September 17, 2012 with ‘Stora
Enso OYJ Group’ (‘Stora Enso’) of Finland in its wholly owned subsidiary Bulleh Shah Packaging (Private) Limited (‘BSPL’). The Joint Venture includes Paper & Paperboard and Corrugated business operations at Kasur and Karachi and involves initial equity participation of Stora Enso of 35% by way of subscription of right shares with a commitment to increase the shareholding to 50% at a later stage subject to certain conditions being met. The agreed value for 100% of the Joint Venture Company is USD 107.5 million on a cash and debt free basis with additional equity to be subscribed by Stora Enso through right shares in the Joint Venture Company of USD 17.5 million, based on the financial results of second half of 2012 and first half of 2013. The Parent Company shall continue to hold minimum 50% ownership and future profits of the Joint Venture.
Pursuant to the Agreement, the Parent Company, during the year, transferred the assets and corresponding liabilities of its Kasur and Karachi operations to BSPL along with certain cash contribution. Upon initial equity participation of 35% by Stora Enso in BSPL, the Parent Company has derecognised its investment in BSPL owing to loss of control and recognised an investment in jointly controlled entity, with Stora Enso as the joint venture partner.
As a result, the Group’s operations have been divided into Continuing and Discontinued operations in accordance with the requirements of International Financial Reporting Standard (IFRS) 5, ‘Non-current assets held for sale and discontinued operations’. Paper and Paperboard and Corrugated businesses have been classified as discontinued operations because these form part of the Joint Venture. Continuing operations include Folding Cartons, Flexible Packaging and Consumer Products businesses.
Moreover, the Parent Company also closed down its Paper and Paperboard operations in Lahore, in addition to the above mentioned transaction, during the prior year.
The Paper and Paperboard operations in Lahore have also been classified as a discontinued operation as reflected in note 17.2 of these financial statements, in accordance with the requirements of IFRS 5. This has not been classified as held for sale as it does not meet the criteria for being classified as held for sale under IFRS 5.
The figures of the prior period have been represented in accordance with the requirements of IFRS 5, wherever relevant. 2. Basis of preparation
2.1 These consolidated financial statements have been prepared in accordance with the requirements of the Companies Ordinance, 1984 (the Ordinance) and the approved accounting standards as applicable in Pakistan. Approved accounting standards comprise of such International Financial Reporting Standards (IFRS) issued by the International Accounting Standards Board and Islamic Financial Accounting Standards (IFAS) issued by the Institute of Chartered Accountants of Pakistan as are notified under the Companies Ordinance, 1984, provisions of and directives issued under the Companies Ordinance, 1984. Wherever the requirements of the Companies Ordinance, 1984 or directives issued by Securities and Exchange Commission of Pakistan differ with the requirements of IFRS or IFAS, the requirements of the Companies Ordinance, 1984 or the requirements of the said directives prevail.
2.2 Initial application of standards, amendments or an interpretation to existing standards
The following amendments to existing standards have been published that are applicable to the Group’s financial statements covering annual periods, beginning on or after the following dates:
2.2.1 Amendments to published standards effective in current year
New and amended standards, and interpretations mandatory for the first time for the financial year beginning January 01, 2013:
Notes to and Forming Part of the Consolidated Financial Statementsfor the year ended December 31, 2013
129
Annual Report of Packages Limited 2013 | Consolidated Financial Statements 2013
- Annual improvements to IFRSs 2011 are applicable on accounting periods beginning on or after January 1, 2013. This set of
amendments includes changes to five standards: IFRS 1, ‘First time adoption’, IAS 1, ‘Financial statement presentation’, IAS 16, ‘Property plant and equipment’, IAS 32, ‘Financial instruments; Presentation’ and IAS 34, ‘Interim financial reporting’. The application of these amendments have no material impact on the Group’s financial statements.
- IFRS 7 (Amendments), ‘Financial instruments: Disclosures’, on offsetting financial assets and financial liabilities is applicable
on accounting periods beginning on or after January 01, 2013. The amendment includes new disclosures to facilitate comparison between those entities that prepare IFRS financial statements to those that prepare financial statements in accordance with US GAAP. The application of this amendment has no material impact on the Group’s financial statements.
- IFRS 10 - ‘Consolidated financial statements’ is applicable on accounting periods beginning on or after January 01, 2013.
This standard builds on existing principles by identifying the concept of control as the determining factor in whether an entity should be included within the consolidated financial statements. The standard provides additional guidance to assist in determining control where this is difficult to assess. The Group has not adopted this IFRS yet as it is under consideration of the relevant Committee of the Institute of Chartered Accountants of Pakistan. The Group has yet to assess the impact of these changes on its financial statements.
- IFRS 11 - ‘Joint arrangements’ is applicable on accounting periods beginning on or after January 01, 2013. IFRS 11 is a more
realistic reflection of joint arrangements by focusing on the rights and obligations of the parties to the arrangement rather than its legal form. There are two types of joint arrangement: joint operations and joint ventures. Joint operations arise where a joint operator has rights to the assets and obligations relating to the arrangement and therefore accounts for its share of assets, liabilities, revenue and expenses. Joint ventures arise where the joint operator has rights to the net assets of the arrangement and therefore equity accounts for its interest. Proportional consolidation of joint ventures is no longer allowed. The Group has not adopted this IFRS yet as it is under consideration of the relevant Committee of the Institute of Chartered Accountants of Pakistan. The Group has yet to assess the impact of these changes on its financial statements.
- IFRS 12 - ‘Disclosures of interests in other entities’. This is applicable on accounting periods beginning on or after January
01, 2013. This standard includes the disclosure requirements for all forms of interests in other entities, including joint arrangements, associates, special purpose vehicles and other off balance sheet vehicles. The Group has not adopted this IFRS yet as it is under consideration of the relevant Committee of the Institute of Chartered Accountants of Pakistan. The Group has yet to assess the impact of these changes on its financial statements.
- Amendments to IFRS 10, 11 and 12 on transition guidance are applicable on accounting periods beginning on or after January
01, 2013. These amendments also provide additional transition relief in IFRSs 10, 11 and 12, limiting the requirement to provide adjusted comparative information to only the preceding comparative period. For disclosures related to unconsolidated structured entities, the amendments will remove the requirement to present comparative information for periods before IFRS 12 is first applied. The application of this amendment has no material impact on the Group’s financial statements.
- IFRS 13 - ‘Fair value measurement’. This is applicable on accounting periods beginning on or after January 01, 2013.
This standard aims to improve consistency and reduce complexity by providing a precise definition of fair value and a single source of fair value measurement and disclosure requirements for use across IFRSs. The requirements, which are largely aligned between IFRSs and US GAAP, do not extend the use of fair value accounting but provide guidance on how it should be applied where its use is already required or permitted by other standards within IFRSs or US GAAP. The Group has not adopted this IFRS yet as it is under consideration of the relevant Committee of the Institute of Chartered Accountants of Pakistan. The Group has yet to assess the impact of these changes on its financial statements.
- IAS 1 (Amendments), ‘Financial statement presentation’ regarding other comprehensive income. This is applicable on
accounting periods beginning on or after July 01, 2012. The main change resulting from these amendments is a requirement for entities to group items presented in other comprehensive income (OCI) on the basis of whether they are potentially recycled to profit or loss (reclassification adjustments). The amendments do not address which items are presented in OCI. The application of this amendment has no material impact on the Group’s financial statements.
- IAS 19 (Amendments), ‘Employee benefits’ is applicable on accounting periods beginning on or after January 01, 2013. These amendments eliminate the corridor approach and calculate finance costs on a net funding basis. IAS 19 (revised) amends the accounting for employment benefits. The Group has applied the standard retrospectively in accordance with the transition provisions of the standard. The impact on the Group has been explained in note 4.9.
130
- IAS 27 (Revised 2011), ‘Separate financial statements’ is applicable on accounting periods beginning on or after January 1, 2013. It includes the provisions on separate financial statements that are left after the control provisions of IAS 27 which have been included in the new IFRS 10. The application of this standard has no material impact on the Group’s financial statements. The Group has not adopted the revised IAS 27 yet as new IFRS 10 is under consideration of the relevant Committee of the Institute of Chartered Accountants of Pakistan. The Group has yet to assess the impact of these changes on its financial statements.
- IAS 28 (Revised 2011), ‘Associates and joint ventures’ is applicable on accounting periods beginning on or after January 1,
2013. It includes the requirements for associates and joint ventures that have to be equity accounted following the issue of IFRS 11. The Group has not adopted the revised IAS 28 yet as new IFRS 11 is under consideration of the relevant Committee of the Institute of Chartered Accountants of Pakistan. The Group has yet to assess the impact of these changes on its financial statements.
2.2.2 Standards, amendments and interpretations to existing standards that are not yet effective and have not been early adopted by the Group
The following amendments and interpretations to existing standards have been published and are mandatory for the Group’s accounting periods beginning on or after January 1, 2014 or later periods, but the Group has not early adopted them:
- IFRS 9 - ‘Financial instruments’ - classification and measurement. This is applicable on accounting periods beginning on
or after January 01, 2015. This standard on classification and measurement of financial assets and financial liabilities will replace IAS 39, ‘Financial instruments: Recognition and measurement’. IFRS 9 has two measurement categories: amortised cost and fair value. All equity instruments are measured at fair value. A debt instrument is measured at amortised cost only if the entity is holding it to collect contractual cash flows and the cash flows represent principal and interest. For liabilities, the standard retains most of the IAS 39 requirements. These include amortised-cost accounting for most financial liabilities, with bifurcation of embedded derivatives. The main change is that, in cases where the fair value option is taken for financial liabilities, the part of a fair value change due to an entity’s own credit risk is recorded in other comprehensive income rather than the income statement, unless this creates an accounting mismatch. This change will mainly affect financial institutions. The Group shall apply these amendments from January 01, 2014 and does not expect to have a material impact on its financial statements.
- Annual improvements 2012 applicable for annual periods beginning on or after July 1, 2014. These amendments include
changes from the 2010-12 cycle of the annual improvements project, that affect seven standards: IFRS 2, ‘Share-based payment’, IFRS 3, ‘Business Combinations’, IFRS 8, ‘Operating segments’, IFRS 13, ‘Fair value measurement’, IAS 16, ‘Property, plant and equipment’ and IAS 38, ‘Intangible assets’, Consequential amendments to IFRS 9, ‘Financial instruments’, IAS 37, ‘Provisions, contingent liabilities and contingent assets’, and IAS 39, Financial instruments – Recognition and measurement’.
- Annual improvements 2013 applicable for annual periods beginning on or after July 1, 2014. The amendments include changes from the 2011-13 cycle of the annual improvements project that affect four standards: IFRS 1, ‘First time adoption’, IFRS 3, ‘Business combinations’, IFRS 13, ‘Fair value measurement’ and IAS 40, ‘Investment property’.
- IAS 19 (Amendments), ‘Employee benefits’ is applicable on accounting periods beginning on or after July 1, 2014.These
narrow scope amendments apply to contributions from employees or third parties to defined benefit plans. The objective of the amendments is to simplify the accounting for contributions that are independent of the number of years of employee service, for example, employee contributions that are calculated according to a fixed percentage of salary. The Group does not expect to have a material impact on its financial statements from this amendment.
- IAS 32 (Amendments), ‘Financial instruments: Presentation’, on offsetting financial assets and financial liabilities is applicable
on accounting periods beginning on or after January 01, 2014. These amendments update the application guidance in IAS 32, ‘Financial instruments: Presentation’, to clarify some of the requirements for offsetting financial assets and financial liabilities on the balance sheet. The Group shall apply these amendments from January 01, 2014 and does not expect to have a material impact on its financial statements.
- IAS 36 (Amendment), ‘Impairment of assets’ on recoverable amount disclosures is applicable on accounting period beginning
on or after January 01, 2014. This amendment addresses the disclosure of information about the recoverable amount of
131
Annual Report of Packages Limited 2013 | Consolidated Financial Statements 2013
impaired assets if that amount is based on fair value less costs of disposal. The Group shall apply these amendments from January 01, 2014 and does not expect to have a material impact on its financial statements.
- IAS 39 (Amendment), ‘Financial Instruments: Recognition and Measurement’ on novation of derivatives is applicable on accounting period beginning on or after January 01, 2014. This amendment provides relief from discontinuing hedge accounting when novation of a hedging instrument to a central counter party meets specified criteria. The Group shall apply these amendments from January 01, 2014 and does not expect to have a material impact on its financial statements.
- IFRIC 21, ‘Levies’, sets out the accounting for an obligation to pay a levy that is not income tax. The interpretation addresses what the obligating event is that gives rise to pay a levy and when should a liability be recognised. The Group is not currently subjected to significant levies so the impact on the Group is not material.
3. Basis of measurement
3.1 These financial statements have been prepared under the historical cost convention except for revaluation of certain financial instruments at fair value and recognition of certain employee retirement benefits at present value.
3.2 The Group’s significant accounting policies are stated in note 4. Not all of these significant policies require the management
to make difficult, subjective or complex judgments or estimates. The following is intended to provide an understanding of the policies the management considers critical because of their complexity, judgment and estimation involved in their application and their impact on these financial statements. Judgments and estimates are continually evaluated and are based on historical experience, including expectations of future events that are believed to be reasonable under the circumstances. These judgments involve assumptions or estimates in respect of future events and the actual results may differ from these estimates. The areas involving a higher degree of judgments or complexity or areas where assumptions and estimates are significant to the financial statements are as follows:
i) Estimated useful lives of property, plant and equipment - note 4.3
ii) Provision for employees’ retirement benefits - note 4.9 & 10 iii) Loss recognised on the re-measurement of assets of disposal group - note 17.1.2 iv) Provision for taxation - note 39 4. Significant accounting policies
The significant accounting policies adopted in the preparation of these financial statements are set out below. These policies have been consistently applied to all the years presented, unless otherwise stated.
4.1 Principles of consolidation
a) Subsidiaries
Subsidiaries are all entities over which the Group has the power to govern the financial and operating policies, generally accompanying a shareholding of more than one half of the voting rights. The existence and effect of potential voting rights that are currently exercisable or convertible are considered when assessing whether the group controls another entity. The Group also assesses existence of control where it does not have more than 50% of the voting power but is able to govern the financial and operating policies by virtue of de-facto control.
De-facto control may arise in circumstances where the size of the Group’s voting rights relative to the size and dispersion of holdings of other shareholders give the Group the power to govern the financial and operating policies.
Subsidiaries are fully consolidated from the date on which control is transferred to the Group. They are de-consolidated from the date that control ceases.
The Group applies the acquisition method to account for business combinations. The consideration transferred for the acquisition of a subsidiary is the fair values of the assets transferred, the liabilities incurred to the former owners of the acquiree and the equity interests issued by the Group. The consideration transferred includes the fair value of any asset or liability resulting from a contingent consideration arrangement. Identifiable assets acquired and liabilities and contingent liabilities assumed in a business combination are measured initially at their fair values at the acquisition date. The Group recognises any non-controlling interest in the acquiree on an acquisition-by-acquisition basis, either at fair value or at the non-controlling interest’s proportionate share of the recognised amounts of acquiree’s identifiable net assets.
132
Acquisition-related costs are expensed as incurred.
If the business combination is achieved in stages, the acquisition date carrying value of the acquirer’s previously held equity interest in the acquiree is re-measured to fair value at the acquisition date; any gains or losses arising from such re-measurement are recognised in consolidated profit and loss account.
Any contingent consideration to be transferred by the Group is recognised at fair value at the acquisition date. Subsequent changes to the fair value of the contingent consideration that is deemed to be an asset or liability is recognised in accordance with IAS 39 either in consolidated profit and loss account or as a change to other comprehensive income. Contingent consideration that is classified as equity is not re-measured, and its subsequent settlement is accounted for within equity.
Goodwill is initially measured as the excess of the aggregate of the consideration transferred and the fair value of non-controlling interest over the net identifiable assets acquired and liabilities assumed. If this consideration is lower than the fair value of the net assets of the subsidiary acquired, the difference is recognised in consolidated profit and loss account.
Inter company transactions, balances and unrealized gains on transactions between group companies are eliminated. Unrealized losses are also eliminated but considered an impairment indicator of the asset transferred. Accounting policies of subsidiaries have been changed where necessary to ensure consistency with the policies adopted by the Group.
b) Changes in ownership interests in subsidiaries without change of control
Transactions with non-controlling interests that do not result in loss of control are accounted for as equity transactions – i.e. as transactions with the owners in their capacity as owners. The difference between fair value of any consideration paid and the relevant share acquired of the carrying value of net assets of the subsidiary is recorded in equity. Gains or losses on disposals to non-controlling interests are also recorded in equity.
c) Disposal of subsidiaries
When the Group ceases to have control, any retained interest in the entity is remeasured to its fair value at the date when control is lost, with the change in carrying amount recognised in consolidated profit and loss account. The fair value is the initial carrying amount for the purposes of subsequently accounting for the retained interest as an associate, joint venture or financial asset. In addition, any amounts previously recognised in other comprehensive income in respect of that entity are accounted for as if the Group had directly disposed of the related assets or liabilities. This may mean that amounts previously recognised in other comprehensive income are reclassified to consolidated profit and loss account.
d) Associates
Associates are all entities over which the Group has significant influence but not control, generally accompanying a shareholding of between 20% and 50% of the voting rights. Investments in associates are accounted for using the equity method of accounting. Under the equity method, the investment is initially recognised at cost, and the carrying amount is increased or decreased to recognise the investor’s share of the profit or loss of the investee after the date of acquisition. The Group’s investment in associates includes goodwill identified on acquisition.
If the ownership interest in an associate is reduced but significant influence is retained, only a proportionate share of the amounts previously recognised in other comprehensive income is reclassified to consolidated profit and loss account where appropriate.
The Group’s share of post-acquisition profit or loss is recognised in the consolidated profit and loss account, and its share of post-acquisition movements in other comprehensive income is recognised in other comprehensive income with a corresponding adjustment to the carrying amount of the investment. When the Group’s share of losses in an associate equals or exceeds its interest in the associate, including any other unsecured receivables, the Group does not recognise further losses, unless it has incurred legal or constructive obligations or made payments on behalf of the associate.
The Group determines at each reporting date whether there is any objective evidence that the investment in the associate is impaired. If this is the case, the Group calculates the amount of impairment as the difference between the recoverable amount of the associate and its carrying value and recognises the amount adjacent to share of profit / (loss) of associates in the consolidated profit and loss account.
133
Annual Report of Packages Limited 2013 | Consolidated Financial Statements 2013
Profits and losses resulting from upstream and downstream transactions between the Group and its associate are recognised in the Group’s financial statements only to the extent of unrelated investor’s interests in the associates. Unrealised losses are eliminated unless the transaction provides evidence of an impairment of the asset transferred. Accounting policies of associates have been changed where necessary to ensure consistency with the policies adopted by the Group.
Dilution gains and losses arising in investments in associates are recognised in the consolidated profit and loss account.
e) Joint ventures
A joint venture is a contractual arrangement whereby two or more parties undertake an economic activity that is subject to joint control. The Group’s interest in joint venture represents the jointly controlled entity. The Group accounts for joint venture investments under the equity method which is consistent with the Group’s treatment of associates.
4.2 Taxation
Current
Provision of current tax is based on the taxable income for the year determined in accordance with the prevailing law for taxation of income. The charge for current tax is calculated using prevailing tax rates or tax rates expected to apply to the profit for the year, if enacted. The charge for current tax also includes adjustments, where considered necessary, to provision for tax made in previous years arising from assessments framed during the year for such years.
Deferred
Deferred tax is accounted for using the balance sheet liability method in respect of all temporary differences arising from differences between the carrying amount of assets and liabilities in the financial statements and the corresponding tax bases used in the computation of the taxable profit. Deferred tax liabilities are generally recognised for all taxable temporary differences and deferred tax assets are recognised to the extent that it is probable that taxable profits shall be available against which the deductible temporary differences, unused tax losses and tax credits can be utilised.
Deferred tax is calculated at the rates that are expected to apply to the period when the differences reverse based on tax rates that have been enacted or substantively enacted by the balance sheet date. Deferred tax is charged or credited in the consolidated profit and loss account, except in the case of items credited or charged to equity in which case it is included in equity.
Provision is not made for taxation which would become payable if retained profits of subsidiaries were distributed to the
Parent Company, as it is not the intention to distribute more than the dividends, the tax on which is included in the financial statements.
4.3 Property, plant and equipment
Property, plant and equipment, except freehold land, are stated at cost less accumulated depreciation and any identified impairment loss. Freehold land is stated at cost less any identified impairment loss. Property, plant and equipment acquired under finance leases are capitalized at the lease’s commencement at the lower of the present value of minimum lease payments under the lease arrangements and the fair value of the leased property. Cost in relation to certain plant and machinery signifies historical cost, gains and losses transferred from equity on qualifying cash flow hedges as referred to in note 4.19 and borrowing costs as referred to in note 4.22.
Depreciation on all property, plant and equipment is charged to profit on the straight-line method so as to write off the depreciable amount of an asset over its estimated useful life at the following annual rates:
- Buildings 2.5% to 20% - Plant and machinery 6.25% to 33.33% - Other equipments 10% to 33.33% - Furniture and fixtures 10% to 20% - Vehicles 20%
134
The assets’ residual values and useful lives are reviewed, at each financial year end, and adjusted if impact on depreciation is significant. The Group’s estimate of the residual value of its property, plant and equipment as at December 31, 2013 has not required any adjustment as its impact is considered insignificant.
Depreciation on additions to property, plant and equipment is charged from the month in which an asset is acquired or capitalised while no depreciation is charged for the month in which the asset is disposed off.
The Group assesses at each balance sheet date whether there is any indication that property, plant and equipment may be impaired. If such indication exists, the carrying amounts of such assets are reviewed to assess whether they are recorded in excess of their recoverable amount. Where carrying amounts exceed the respective recoverable amount, assets are written down to their recoverable amounts and the resulting impairment loss is recognised in profit and loss account. The recoverable amount is the higher of an asset’s fair value less costs to sell and value in use. Where an impairment loss is recognised, the depreciation charge is adjusted in the future periods to allocate the asset’s revised carrying amount over its estimated useful life.
Subsequent costs are included in the asset’s carrying amount or recognised as a separate asset, as appropriate, only when it
is probable that future economic benefits associated with the item shall flow to the Group and the cost of the item can be measured reliably. All other repair and maintenance costs are charged to profit and loss account during the period in which they are incurred.
The gain or loss on disposal or retirement of an asset represented by the difference between the sale proceeds and the carrying amount of the asset is recognised as an income or expense.
Capital work-in-progress is stated at cost less any identified impairment loss.
4.4 Investment property
Property not held for own use or for sale in the ordinary course of business is classified as investment property. The investment property of the Group comprises land and buildings and is valued using the cost method i.e. at cost less any accumulated depreciation and any identified impairment loss.
Depreciation on buildings is charged to profit on the straight line method so as to write off the depreciable amount of building
over its estimated useful life at the rates ranging from 3.33% to 6.67% per annum. Depreciation on additions to investment property is charged from the month in which a property is acquired or capitalised while no depreciation is charged for the month in which the property is disposed off.
The assets’ residual values and useful lives are reviewed, at each financial year end, and adjusted if impact on depreciation is
significant. The Group’s estimate of the residual value of its investment property as at December 31, 2013 has not required any adjustment as its impact is considered insignificant.
The Group assesses at each balance sheet date whether there is any indication that investment property may be impaired. If
such indication exists, the carrying amounts of such assets are reviewed to assess whether they are recorded in excess of their recoverable amount. Where carrying amounts exceed the respective recoverable amount, assets are written down to their recoverable amount and the resulting impairment loss is recognised in profit and loss account. The recoverable amount is the higher of an asset’s fair value less costs to sell and value in use. Where an impairment loss is recognised, the depreciation charge is adjusted in the future periods to allocate the asset’s revised carrying amount over its estimated useful life.
The gain or loss on disposal or retirement of an asset represented by the difference between the sale proceeds and the carrying
amount of the asset is recognised as an income or expense. 4.5 Intangible assets
Expenditure incurred to acquire computer software and SAP Enterprise Resource Planning (ERP) System are capitalised as intangible assets and stated at cost less accumulated amortisation and any identified impairment loss. Intangible assets are amortised using the straight line method over a period of three to five years.
135
Annual Report of Packages Limited 2013 | Consolidated Financial Statements 2013
Development costs are recognised as intangible assets when the following criteria are met:
- it is technically feasible to complete the intangible asset so that it will be available for use; - management intends to complete the intangible asset and use or sell it; - there is an ability to use or sell the intangible asset; - it can be demonstrated how the intangible asset will generate probable future economic benefits; - adequate technical, financial and other resources to complete the development and to use or sell the intangible asset are
available; and - the expenditure attributable to the intangible asset during its development can be reliably measured.
Other development expenditures that do not meet these criteria are recognised as an expense as incurred. Development costs
previously recognised as an expense are not recognised as an asset in a subsequent period.
Amortisation on additions to intangible assets is charged from the month in which an asset is acquired or capitalised while no amortisation is charged for the month in which the asset is disposed off.
The Group assesses at each balance sheet date whether there is any indication that intangible assets may be impaired. If such indication exists, the carrying amounts of such assets are reviewed to assess whether they are recorded in excess of their recoverable amount. Where carrying amounts exceed the respective recoverable amount, assets are written down to their recoverable amounts and the resulting impairment loss is recognised in profit and loss account. The recoverable amount is the higher of an asset’s fair value less costs to sell and value in use. Where an impairment loss is recognised, the amortisation charge is adjusted in the future periods to allocate the asset’s revised carrying amount over its estimated useful life.
4.6 Leases
(1) The Group is the lessee:
Finance leases
Leases where the Group has substantially all the risks and rewards of ownership are classified as finance leases. Asset subject to finance lease are initially recognised at the lower of present value of minimum lease payments under the lease agreements and the fair value of the assets. Subsequently these assets are stated at cost less accumulated depreciation and any identified impairment loss.
The related rental obligations, net of finance charges, are included in liabilities against assets subject to finance lease. The liabilities are classified as current and long term depending upon the timing of the payment.
Each lease payment is allocated between the liability and finance charges so as to achieve a constant rate on the balance outstanding. The interest element of the rental is charged to profit over the lease term.
Assets acquired under a finance lease are depreciated over the useful life of the asset on a straight-line method at the rates given in note 4.3. Depreciation of leased assets is charged to consolidated profit and loss account.
Depreciation on additions to leased assets is charged from the month in which an asset is acquired while no depreciation is charged for the month in which the asset is disposed off.
Operating leases
Leases including Ijarah financing where a significant portion of the risks and rewards of ownership are retained by the lessor are classified as operating leases. Payments made under operating leases (net of any incentives received from the lessor) are charged to profit on a straight-line basis over the lease / Ijarah term unless another systematic basis is representative of the time pattern of the Group’s benefit.
(2) The Group is the lessor:
Operating leases
Assets leased out under operating leases are included in investment property as referred to in note 20. They are depreciated over their expected useful lives on a basis consistent with similar owned property, plant and equipment. Rental income (net of any incentives given to lessees) is recognised on a straight-line basis over the lease term.
136
4.7 Goodwill
Goodwill represents the excess of the cost of an acquisition over the fair value of the Group’s share of the net identifiable assets of the acquired subsidiary / associate at the date of acquisition. Goodwill on acquisitions of subsidiaries is included in ‘intangible assets’. Goodwill on acquisitions of associates and joint ventures is included in ‘investments in associates’ and ‘investments in joint ventures’ respectively and is tested for impairment as part of the overall balance. Separately recognised goodwill is tested annually for impairment and carried at cost less accumulated impairment losses. Impairment losses on goodwill are not reversed. Gains and losses on the disposal of an entity include the carrying amount of goodwill relating to the entity sold.
4.8 Investments
Investments intended to be held for less than twelve months from the balance sheet date or to be sold to raise operating capital, are included in current assets, all other investments are classified as non-current. Management determines the appropriate classification of its investments at the time of the purchase and re-evaluates such designation on a regular basis.
Investments in equity instruments of associates and joint ventures
Investments in equity instruments of associates and joint ventures are accounted for using the equity method of accounting and are initially recognised at cost. The Group’s investment in associates and joint ventures includes goodwill (net of any accumulated impairment loss) identified on acquisition. The Group’s share of its associates’ and joint venture’s post-acquisition profits or losses is recognised in the consolidated profit and loss account, and its share of post-acquisition movements in reserves is recognised in reserves. The cumulative post-acquisition movements are adjusted against the carrying amount of the investment. When the Group’s share of losses in an associate or joint venture equals or exceeds its interest in the associate or joint venture, including any other unsecured receivables, the Group does not recognise further losses, unless it has incurred obligations or made payments on behalf of the associate or joint venture. Unrealised gains on transactions between the Group and its associates or joint ventures are eliminated to the extent of the Group’s interest in the associates or joint ventures. Unrealised losses are also eliminated unless the transaction provides evidence of an impairment of the asset transferred.
Other investments
The other investments made by the Group are classified for the purpose of measurement into the following categories:
Held to maturity
Investments with fixed maturity that the management has the intent and ability to hold to maturity are classified as held to maturity and are initially measured at cost and at subsequent reporting dates measured at amortised cost using the effective yield method.
Available for sale
The financial assets including investments in associated undertakings where the Group does not have significant influence that are intended to be held for an indefinite period of time or may be sold in response to the need for liquidity are classified as available for sale.
Investments classified as available for sale are initially measured at cost, being the fair value of consideration given. At subsequent reporting dates, these investments are remeasured at fair value (quoted market price), unless fair value cannot be reliably measured. The investments for which a quoted market price is not available, are measured at cost as it is not possible to apply any other valuation methodology. Unrealised gains and losses arising from the changes in the fair value are included in fair value reserves in the period in which they arise.
All purchases and sales of investments are recognised on the trade date which is the date that the Group commits to purchase or sell the investment. Cost of purchase includes transaction cost.
At each balance sheet date, the Group reviews the carrying amounts of the investments to assess whether there is any indication that such investments have suffered an impairment loss. If any such indication exists, the recoverable amount is estimated in order to determine the extent of the impairment loss, if any. Impairment losses are recognised as an expense in the consolidated profit and loss account. In respect of ‘available for sale’ financial assets, cumulative impairment loss less any impairment loss on that financial asset previously recognised in consolidated profit and loss account, is removed from equity and recognised in the consolidated profit and loss account. Impairment losses recognised in the consolidated profit and loss account on equity instruments are not reversed through the consolidated profit and loss account.
137
Annual Report of Packages Limited 2013 | Consolidated Financial Statements 2013
4.9 Employee retirement benefits
The main features of the schemes operated by the Group for its employees are as follows:
4.9.1 Defined benefit plans
(a) Gratuity plan
There is an approved funded defined benefit gratuity plan for all employees. Monthly contributions are made to this fund on the basis of actuarial recommendations at the rate of 4.5 percent per annum of basic salaries. The latest actuarial valuation for the gratuity scheme was carried out as at December 31, 2013. The actual return on plan assets during the year was Rs. 64.008 million. The actual return on plan assets represent the difference between the fair value of plan assets at the beginning of the year and end of the year adjustments for contributions made by the Group as reduced by benefits paid during the year.
The future contribution rates of these plans include allowances for deficit and surplus. Projected unit credit method, using the following significant assumptions, is used for valuation of this scheme:
Discount rate 12.5 percent per annum; Expected rate of increase in salary level 10.5 percent per annum; Expected mortality rate SLIC (2001-2005) mortality table; and Expected rate of return 11 percent per annum.
Plan assets include long-term Government bonds, equity instruments of listed companies and term deposits with banks.
Return on Government bonds and debt is at fixed rates. However, due to increased volatility of share prices in recent months, there is no clear indication of return on equity shares, therefore, it has been assumed that the yield on equity shares would match the return on debt.
The Group is expected to contribute Rs. 13.17 million to the gratuity fund in the next financial year.
Actuarial gains and losses arising from experience adjustments and changes in actuarial assumptions are charged or credited to equity in other comprehensive income in the period in which they arise. Past service costs are recognized immediately in consolidated profit and loss account.
(b) Pension Plan
All the executive staff participates in the pension plan of the Group. On December 26, 2012, the Board of Trustees of the pension fund decided to convert the Defined Benefit Plan to Defined Contribution Plan for all its active employees with effect from January 01, 2013 with no impact on the pensioners appearing on the pensioners’ list as of that date. The proposed scheme was approved for implementation by the Commissioner Inland Revenue on February 22, 2013 and employees consent to the proposed scheme was sought and obtained.
Consequently, the pension plan / fund currently operates two different plans for its employees: - Defined contribution plan for all active employees; and - Defined benefit plan for pensioners who have retired before December 31, 2012.
In respect of the defined contribution plan, the Group contributes 20% of members’ monthly salary to the scheme; whereas,
an employee may or may not opt to contribute 6% of his monthly salary to the scheme.
The obligation in respect of the defined benefit plan is determined by the Fund’s Actuary at each year end. Any funding gap identified by the Fund’s Actuary is paid by the Group from time to time. The last actuarial valuation was carried out as at December 31, 2013.
Actuarial gains and losses arising from experience adjustments and changes in actuarial assumptions for the defined benefit
plan are charged or credited to equity in other comprehensive income in the period in which they arise. Past service costs are recognised immediately in the consolidated profit and loss account.
138
(c) Accumulating compensated absences
The Group provides for accumulating compensated absences when the employees render services that increase their entitlement to future compensated absences. The executives and workers are entitled to earned annual leaves and medical leaves on the basis of their service with the Group. The annual leaves can be encashed at the time the employee leaves the Group on the basis of gross salary while no encashment is available for medical leaves to executives.
The Group uses the valuation performed by an independent actuary as the present value of its accumulating compensated absences.
Projected unit credit method, using the following significant assumptions, has been used for valuation of accumulating
compensated absences:
Discount rate 12.5 percent per annum; Expected rate of increase in salary level 10.5 percent per annum; and Expected mortality rate SLIC (2001-2005) mortality table.
4.9.2 Defined contribution plan
There is an approved contributory provident fund for all employees. Equal monthly contributions are made by the Group and the employees to the fund. The nature of contributory pension fund has been explained in note 4.9.1 (b) above.
Retirement benefits are payable to staff on completion of prescribed qualifying period of service under these schemes.
As per the Joint Venture agreement with Stora Enso, all accumulated balances due and payable to the employees in respect of pension, gratuity and provident fund maintained with Parent Company as a consequence of cessation of their employment with Parent Company were transferred by Parent Company’s Funds to BSPL’s Funds or directly paid to the employees. This has been treated as a settlement as per IAS 19 - Employee Benefits.
4.9.3 Pension plan is a multi-employer plan formed by the Parent Company in collaboration with Tri Pack Films Limited and DIC
Pakistan Limited. Similarly, Gratuity plan is also a multi-employer plan formed by the Parent Company in collaboration with DIC Pakistan Limited. Contribution by the companies is based on the respective number of employees of each Group. Each Group Company reports its proportionate share of the plan’s commitments, managed assets and costs, in accordance with guidance provided by IAS 19 - Employee Benefits, regarding defined benefit plans, based on the number of its employees participating in the plans.
4.9.4 Change in Accounting Policy
During the year, the Group has changed its accounting policy in respect to recognition of actuarial gains and losses, past service costs and expected return on plan assets, whereby with effect from current year, the Group has recognized:
Actuarial gains and losses as they occur in other comprehensive income, instead of past policy, where actuarial gains and losses were recognised as an income or expense in accordance with minimum recommended approach under the previous standard IAS 19 - Employees benefits;
All past service costs at the earlier of when the ammendment or curtailment occurs and when the Group has recognised related restructuring or termination benefits, instead of past policy, where the past service costs were recognised on a straight line basis over the average period until the benefits became vested and if the benefits were already vested, following introduction of or change in scheme, past service costs were recognised immediately in consolidated profit and loss account; and
Interest on net defined benefit obligation (net of plan assets) in consolidated profit and loss account, which is calculated using the discount rate used to measure the defined benefit obligation or asset, and expected return on plan assets will no longer be recognised in consolidated profit and loss account.
The change has been accounted for in accordance with the requirements of IAS 19 - Employee Benefits (Revised), as required under IAS 8 - Accounting Policies, Change in Accounting Estimates and Errors such a change to be applied retrospectively. Due to the change in accounting policy, the Group has presented as at the beginning of the earliest comparative period i.e. January 01, 2012 and related notes in accordance with the requirement of IAS 1 - Presentation of Financial Statements (Revised).
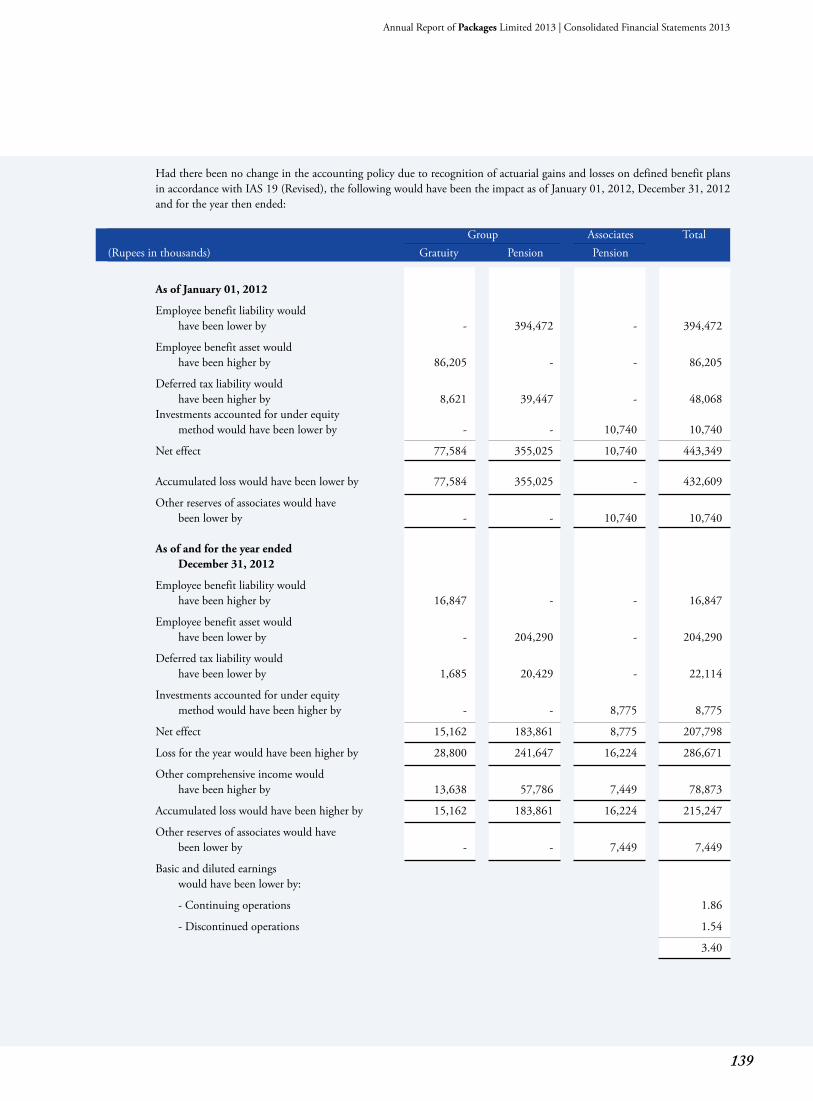
139
Annual Report of Packages Limited 2013 | Consolidated Financial Statements 2013
Had there been no change in the accounting policy due to recognition of actuarial gains and losses on defined benefit plans in accordance with IAS 19 (Revised), the following would have been the impact as of January 01, 2012, December 31, 2012 and for the year then ended:
Group Associates Total (Rupees in thousands) Gratuity Pension Pension
As of January 01, 2012
Employee benefit liability would have been lower by - 394,472 - 394,472
Employee benefit asset would have been higher by 86,205 - - 86,205
Deferred tax liability would have been higher by 8,621 39,447 - 48,068
Investments accounted for under equity method would have been lower by - - 10,740 10,740
Net effect 77,584 355,025 10,740 443,349 Accumulated loss would have been lower by 77,584 355,025 - 432,609
Other reserves of associates would have been lower by - - 10,740 10,740 As of and for the year ended December 31, 2012
Employee benefit liability would have been higher by 16,847 - - 16,847
Employee benefit asset would have been lower by - 204,290 - 204,290
Deferred tax liability would have been lower by 1,685 20,429 - 22,114
Investments accounted for under equity method would have been higher by - - 8,775 8,775
Net effect 15,162 183,861 8,775 207,798
Loss for the year would have been higher by 28,800 241,647 16,224 286,671
Other comprehensive income would have been higher by 13,638 57,786 7,449 78,873
Accumulated loss would have been higher by 15,162 183,861 16,224 215,247
Other reserves of associates would have been lower by - - 7,449 7,449
Basic and diluted earnings would have been lower by:
- Continuing operations 1.86
- Discontinued operations 1.54
3.40
140
4.10 Stores and spares
Stores and spares are valued at moving average cost, while items considered obsolete are carried at nil value. Items in transit are valued at cost comprising invoice value plus other charges paid thereon.
Provision is made in the consolidated financial statements for obsolete and slow moving stores and spares based on management estimate.
4.11 Stock-in-trade
Stock of raw materials, except for those in transit, work-in-process and finished goods are valued principally at the lower of cost and net realisable value. Cost of raw materials is determined using the weighted average cost method. Cost of work-in-process and finished goods comprises direct production costs such as raw materials, consumables and labour as well as production overheads such as employee wages, depreciation, maintenance, etc. The production overheads are measured based on a standard cost method, which is reviewed regularly to ensure relevant measures of utilisation, production lead time etc.
Materials in transit are stated at cost comprising invoice value plus other charges paid thereon. If the expected sales price less completion costs and costs to execute sales (net realisable value) is lower than the carrying
amount, a write-down is recognised for the amount by which the carrying amount exceeds its net realisable value. Provision is made in the consolidated financial statements for obsolete and slow moving stock in trade based on management estimate.
4.12 Financial instruments
Financial assets and financial liabilities are recognised at the time when the Group becomes a party to the contractual provisions of the instrument and derecognised when the Group loses control of contractual rights that comprise the financial assets and in the case of financial liabilities when the obligation specified in the contract is discharged, cancelled or expired. Any gain or loss on derecognition of financial assets and financial liabilities is included in the consolidated profit and loss account for the year.
Financial instruments carried on the consolidated balance sheet include loans, investments, trade and other debts, cash and bank balances, borrowings, trade and other payables, accrued expenses and unclaimed dividends. All financial assets and liabilities are initially measured at cost, which is the fair value of consideration given and received respectively. These financial assets and liabilities are subsequently measured at fair value or cost as the case may be. The particular recognition methods adopted are disclosed in the individual policy statements associated with each item.
4.13 Offsetting of financial assets and liabilities
Financial assets and liabilities are offset and the net amount is reported in the financial statements only when there is a legally enforceable right to set off the recognised amount and the Group intends either to settle on a net basis or to realise the assets and to settle the liabilities simultaneously.
4.14 Trade debts
Trade debts are amounts due from customers for merchandise sold or services performed in the ordinary course of business. If collection is expected in one year or less (or in the normal operating cycle of the business if longer), they are classified as current assets. If not, they are presented as non-current assets.
Trade debts are recognized initially at fair value and subsequently measured at amortised cost using the effective interest
method, less an estimate made for doubtful debts based on a review of all outstanding amounts at the year end. Bad debts are written off when identified.
4.15 Cash and cash equivalents
Cash and cash equivalents are carried in the consolidated balance sheet at cost. For the purpose of cash flow statement, cash and cash equivalents comprise cash in hand, demand deposits, other short term highly liquid investments that are readily convertible to known amounts of cash and which are subject to an insignificant risk of change in value and finances under mark up arrangements. In the balance sheet, finances under mark up arrangements are included in current liabilities.
141
Annual Report of Packages Limited 2013 | Consolidated Financial Statements 2013
4.16 Non-current assets / disposal group held-for-sale
Non-current assets are classified as assets held-for-sale when their carrying amount is to be recovered principally through a sale transaction and a sale is considered highly probable. They are stated at the lower of carrying amount and fair value less cost to sell.
4.17 Borrowings
Borrowings are recognised initially at fair value (proceeds received), net of transaction costs incurred. Borrowings are subsequently carried at amortised cost; any difference between the proceeds (net of transaction costs) and the redemption value is recognised in the consolidated profit and loss account over the period of the borrowings using the effective interest method.
Fees paid on the establishment of loan facilities are recognised as transaction costs of the loan to the extent that it is probable
that some or all of the facility will be drawn down. In this case, the fee is deferred until the draw-down occurs. To the extent there is no evidence that it is probable that some or all of the facility will be drawn down, the fee is capitalised as a pre-payment for liquidity services and amortised over the period of the facility to which it relates.
Finance costs are accounted for on an accrual basis and are shown as accrued finance cost to the extent of the amount
remaining unpaid. 4.18 Trade and other payables
Trade payables are obligations to pay for goods or services that have been acquired in the ordinary course of business from suppliers. Accounts payable are classified as current liabilities if payment is due within one year or less (or in the normal operating cycle of the business if longer). If not, they are presented as non-current liabilities.
Liabilities for creditors and other costs payable are initially recognised at cost which is the fair value of the consideration to be paid in future for goods and / or services, whether or not billed to the Group and subsequently measured at amortised cost using the effective interest method.
4.19 Derivative financial instruments
These are initially recorded at cost on the date a derivative contract is entered into and are remeasured to fair value at subsequent reporting dates. The method of recognising the resulting gain or loss depends on whether the derivative is designated as a hedging instrument, and if so, the nature of the item being hedged. The Group designates certain derivatives as cash flow hedges.
The Group documents at the inception of the transaction the relationship between the hedging instruments and hedged items,
as well as its risk management objective and strategy for undertaking various hedge transactions. The Group also documents its assessment, both at hedge inception and on an ongoing basis, of whether the derivatives that are used in hedging transactions are highly effective in offsetting changes in cash flow of hedged items.
The effective portion of changes in the fair value of derivatives that are designated and qualify as cash flow hedges are recognised in statement of other comprehensive income. The gain or loss relating to the ineffective portion is recognised immediately in the consolidated profit and loss account.
Amounts accumulated in equity are recognised in the consolidated profit and loss account in the periods when the hedged item shall affect profit or loss. However, when the forecast hedged transaction results in the recognition of a non-financial asset or liability, the gains and losses previously deferred in equity are transferred from equity and included in the initial measurement of the cost of the asset or liability.
4.20 Revenue recognition
Revenue is recognised on dispatch of goods or on the performance of services.
Return on deposits is accrued on a time proportion basis by reference to the principal outstanding and the applicable rate of return.
142
Dividend income and entitlement of bonus shares are recognised when right to receive such dividend and bonus shares is established.
4.21 Foreign currency transactions and translation
Foreign currency transactions are translated into Pak Rupees using the exchange rates prevailing at the dates of the transactions. All monetary assets and liabilities in foreign currencies are translated into Pak Rupees at the rates of exchange prevailing at the consolidated balance sheet date. Foreign exchange gains and losses on translation are recognised in the consolidated profit and loss account. All non-monetary items are translated into Pak Rupees at exchange rates prevailing on the date of transaction or on the date when fair values are determined. Foreign exchange gains and losses are recognised in the consolidated profit and loss account except in case of items recognised in other comprehensive income or equity in which case it is included in other comprehensive income or equity respectively.
The results and financial position of all the group entities (none of which has the currency of a hyper-inflationary economy) that have a functional currency different from the presentation currency are translated into the presentation currency as follows:
(a) assets and liabilities for each balance sheet presented are translated at the closing rate at the date of that balance sheet;
(b) income and expenses for each profit and loss account are translated at average exchange rates (unless this average is not a
reasonable approximation of the cumulative effect of the rates prevailing on the transaction dates, in which case income and expenses are translated at the rate on the dates of the transactions); and
(c) all resulting exchange differences are recognised in other comprehensive income. Goodwill and fair value adjustments arising on the acquisition of a foreign entity are treated as assets and liabilities of the
foreign entity and translated at the closing rate. Exchange differences arising are recognised in other comprehensive income.
The financial statements are presented in Pak Rupees, which is the Group’s functional and presentation currency.
4.22 Borrowing costs
General and specific borrowing costs directly attributable to the acquisition, construction or production of qualifying assets, which are assets that necessarily take a substantial period of time to get ready for their intended use or sale, are added to the cost of those assets, until such time as the assets are substantially ready for their intended use or sale. Investment income earned on the temporary investment of specific borrowings pending their expenditure on qualifying assets is deducted from the borrowing costs eligible for capitalisation.
All other borrowing / finance costs are recognised in the consolidated profit and loss account in the period in which they are incurred.
4.23 Dividend
Dividend distribution to the Group’s shareholders is recognised as a liability in the period in which the dividends are approved.
4.24 Compound financial instruments
Compound financial instruments issued by the Group represent preference shares / convertible stock that can be converted into ordinary shares or can be settled in cash.
The liability component of a compound financial instrument is recognised initially at the fair value of a similar liability that does not have an equity conversion option. The equity component is recognised initially at the difference between the fair value of the compound financial instrument as a whole and the fair value of the liability component. Any directly attributable transaction costs are allocated to the liability and equity components in proportion to their initial carrying amounts.
143
Annual Report of Packages Limited 2013 | Consolidated Financial Statements 2013
Subsequent to initial recognition, the liability component of a compound financial instrument is measured at amortised cost using the effective interest method. The equity component of a compound financial instrument is not re-measured subsequent to initial recognition except on conversion or expiry.
4.25 Segment reporting
Operating segments are reported in a manner consistent with the internal reporting provided to the chief operating decision-maker. The chief operating decision-maker, who is responsible for allocating resources and assessing performance of the operating segments, has been identified as the Board of Directors of the Parent Company.
4.26 Provisions
Provisions for environmental restoration, restructuring costs and legal claims are recognised when:
(i) the Group has a present legal or constructive obligation as a result of past events; (ii) it is probable that an outflow of resources shall be required to settle the obligation; and (iii) the amount has been reliably estimated. Restructuring provisions include lease termination penalties and employee termination payments and such other costs that are
necessarily entailed by the restructuring and not associated with on-going activities of the Group. Provisions are not recognised for future operating losses.
Where there are a number of similar obligations, the likelihood that an outflow shall be required in settlement is determined
by considering the class of obligations as a whole. A provision is recognised even if the likelihood of an outflow with respect to any one item included in the same class of obligations may be small.
Provisions are measured at the present value of the expenditures expected to be required to settle the obligation using a pre-tax
rate that reflects current market assessments of the time value of money and the risks specific to the obligation. The increase in the provision due to passage of time is recognised as interest expense.
5. Issued, subscribed and paid up capital
2013 2012 2013 2012 (Number of shares) (Rupees in thousand)
33,603,295 33,603,295 Ordinary shares of Rs. 10 each fully paid in cash 336,033 336,033 148,780 148,780 Ordinary shares of Rs. 10 each issued as fully paid for consideration other than cash 1,488 1,488 50,627,429 50,627,429 Ordinary shares of Rs. 10 each issued as fully paid bonus shares 506,274 506,274
84,379,504 84,379,504 843,795 843,795 21,133,101 (2012: 21,082,601) ordinary shares of the Parent Company are held by IGI Insurance Limited, an associated undertaking.
144
(Rupees in thousand) Note 2013 2012 (Re-stated)6. Reserves
Movement in and composition of reserves is as follows:
Capital
Share premium 6.1 2,876,893 2,876,893
Exchange difference on translation of foreign subsidiary At the beginning of the year 16,441 22,916 Exchange difference for the year 26,343 (6,475)
42,784 16,441 Fair value reserve At the beginning of the year 13,288,190 9,141,841 Fair value gain during the year 10,278,726 4,146,349
6.2 23,566,916 13,288,190
26,486,593 16,181,524 Revenue
General reserve At the beginning of the year 14,910,333 16,160,333 Transferred to consolidated profit and loss account (3,300,000) (1,250,000)
11,610,333 14,910,333 Other reserves relating to associates and Joint Ventures At the beginning of the year (18,189) (28,251) (Loss) / income during the year (10,920) 10,062
(29,109) (18,189)
11,581,224 14,892,144
38,067,817 31,073,668
6.1 This reserve can be utilised by the Parent Company only for the purposes specified in section 83(2) of the Companies Ordinance, 1984.
6.2 As referred to in note 4.8 this represents the unrealised gain on remeasurement of investments at fair value and is not available
for distribution. This shall be transferred to the consolidated profit and loss account on derecognition of investments.
(Rupees in thousand) Note 2013 2012
7. Long-term finances
These are composed of: Local currency loans - secured
Term Finance Loan 7.1.1 900,000 1,000,000 Long Term Finance Facility 7.1.2 2,000,000 2,000,000 Term Loan 7.1.3 279,603 216,643
3,179,603 3,216,643 Preference shares / convertible stock - unsecured 7.2 2,470,577 2,470,577
5,650,180 5,687,220 Current portion shown under current liabilities 12 (200,000) (1,000,000)
5,450,180 4,687,220
145
Annual Report of Packages Limited 2013 | Consolidated Financial Statements 2013
7.1 Local currency loans - secured
7.1.1 Term Finance Loan
During the current year, the Parent Company has prepaid its Term Finance Loan of Rs. 1,000 million availed from Bank Al-Habib Limited having Bank Al-Habib Limited own source component of Rs. 578 million (2012: Rs. 578 million) and State Bank of Pakistan’s long term finance facility component of Rs. 422 million (2012: Rs. 422 million) using long term loan of Rs. 1,000 million from Bank Al-Habib Limited. This loan is secured by a ranking charge of Rs. 1,273 million (2012: Rs. 1,400 million) over present and future fixed assets of the Parent Company located at Lahore excluding land and buildings. It carries mark up at the rate of six month KIBOR plus 0.65 percent per annum and is repayable in 10 equal semi-annual installments started on November 19, 2013 and ending on May 19, 2018. The effective mark up charged during the year ranges from 9.81 percent to 10.18 percent per annum.
7.1.2 Long Term Finance Facility
This loan has been obtained from Meezan Bank Limited under the Islamic mode of finance as a Musharika. It is secured by a ranking charge over all present and future fixed assets of the Parent Company located at Lahore and Kasur excluding land and buildings located at Lahore amounting to Rs. 2,500 million. It carries mark up at six month KIBOR plus 0.65 percent per annum and is repayable in 7 equal semi-annual installments starting from December 31, 2016 and ending on December 31, 2019. The effective mark up charged during the year ranges from 9.74 percent to 10.07 percent per annum.
7.1.3 Term Loan
Term loan has been obtained from MCB Bank Limited Sri Lanka and is repayable over seven years including two years grace period.
7.2 Preference shares / convertible stock - unsecured
During the year 2009, the Parent Company issued 10 percent local currency non-voting cumulative preference shares / convertible stock at the rate of Rs. 190 per share amounting to USD 50 million equivalent to PKR 4,120.5 million under “Subscription Agreement” dated March 25, 2009 with IFC.
Terms of redemption / conversion
Each holder of preference shares / convertible stock shall have a right to settle at any time, at the option of holder, either in the form of fixed number of ordinary shares, one ordinary share for one preference share / convertible stock, or cash. The Parent Company may, in its discretion, refuse to purchase the preference shares / convertible stock offered to it for purchase in cash. In case of refusal by the Parent Company, preference shareholders shall have the right to either retain the preference shares / convertible stock or to convert them into ordinary shares. The preference shares / convertible stock can be held till perpetuity if preference shareholders do not opt for the conversion or cash settlement.
Rate of return
The preference share / convertible stock holders have a preferred right of return at the rate of 10 percent per annum on a cumulative basis till December 31, 2013 and thereafter, these shall become non-cumulative till the date of settlement of preference shares / convertible stock either in cash or ordinary shares.
Preference shares / convertible stock are recognised in the balance sheet as follows: (Rupees in thousand) 2013 2012
Face value of preference shares / convertible stock 4,120,500 4,120,500 Transaction costs (44,048) (44,048) 4,076,452 4,076,452 Equity component - classified under capital and reserves (1,605,875) (1,605,875)Liability component - classified under long-term finances 2,470,577 2,470,577 Accrued return on preference shares / convertible stock classified under accrued finance cost 412,050 412,050
146
The fair value of the liability component of the preference shares / convertible stock is calculated by discounting cash flows at a rate of approximately 16.50 percent till perpetuity which represents the rate of similar instrument with no associated equity component. The residual amount, representing the value of the equity conversion component, is included in shareholders equity as preference shares / convertible stock reserve.
(Rupees in thousand) Note 2013 2012
8. Liabilities against assets subject to finance lease
Present value of minimum lease payments 27,884 - Current maturity shown under current liabilities 12 (3,702) -
24,182 -
Interest rate used as discounting factor ranges from 9.44 percent to 9.99 percent per annum (2012: Nil). Taxes, repairs, replacements and insurance costs are borne by the lessee.
The amount of the future payment of the lease as shown in the balance sheet and the period in which these payments will
become due are as follows: Minimum Future Present value of lease lease finance liability (Rupees in thousand) payments charge 2013 2012
Not later than one year 5,441 1,739 3,702 - Later than one year and not later than five years 28,397 4,215 24,182 -
33,838 5,954 27,884 -
(Rupees in thousand) 2013 2012 (Re-stated)9. Deferred income tax liabilities
The liability for deferred taxation comprises temporary differences relating to: Accelerated tax depreciation 590,924 570,758 Unused tax losses - (132,405)Provision for accumulating compensated absences (54,482) (68,252)Provision for doubtful debts (12,202) (19,308)Preference shares / convertible stock transaction cost - liability portion 9,293 9,267 Provision for slow moving items (391) (3,135)Provision for doubtful receivables (693) (1,270)Investments in associates and Joint Ventures 164,000 165,000 Exchange difference - 1,198 Effect of qualifying payment (28,367) (23,675)Provision for unfunded defined benefit plan (1,165) (1,023)Net losses on retirement benefits - (25,719)
666,917 471,436 9.1 The Group has not adjusted the net deferred tax liability against aggregate tax credits of Rs. 746.705 million (2012: Rs.
566.842 million) and Nil (2012: Rs. 261.474 million) available to the Parent Company under section 113 and section 65B of the Income Tax Ordinance, 2001 (‘Ordinance’) respectively and unused tax losses of Rs. 377.609 million (2012: Nil) in view of the management’s estimate that the Parent Company may not be able to offset these against tax liability arising in respect of relevant business profits of future periods, before these expire / lapse. Tax credits under section 113 of the Ordinance amounting to Rs. 68.813 million, Rs. 183.823 million, Rs. 203.917 million, Rs. 111.577 million and Rs. 178.574 are set to lapse by the end of years ending on December 31, 2014, 2015, 2016, 2017 and 2018 respectively.
147
Annual Report of Packages Limited 2013 | Consolidated Financial Statements 2013
(Rupees in thousand) 2013 2012 (Re-stated)10. Retirement benefits
Classified under non-current liabilities
Pension fund 578 276,458 Gratuity fund - 30,350
578 306,808
Classified under non-current assets
Gratuity fund 6,540 -
Pension Fund Gratuity Fund (Rupees in thousand) 2013 2012 2013 2012
(Re-stated) (Re-stated)
The amounts recognised in the consolidated balance sheet are as follows: Fair value of plan assets 567,707 305,573 281,655 341,021 Present value of defined benefit obligation (568,285) (582,031) (275,115) (371,371)
(Liability) / asset as at December 31 (578) (276,458) 6,540 (30,350) Net (liability) / asset as at January 1 (276,458) (406,830) (30,350) 3,094 (Charge) / income to consolidated profit and loss account (15,205) 136,074 (16,213) (34,254)Gain / (loss) charged to consolidated OCI 14,628 (63,796) 8,793 (15,056)Contribution by the Group 276,457 58,094 44,310 15,866
Net (liability) / asset as at December 31 (578) (276,458) 6,540 (30,350) The movement in the present value of defined benefit obligation is as follows: Present value of defined benefit obligation as at January 1 582,031 1,092,581 371,371 314,074 Service cost - 31,488 15,311 18,448 Interest cost 60,425 132,649 31,628 35,664 Benefits paid (65,433) (62,772) (167,685) (57,528)Settlements - (553,090) - - Curtailment / settlement (gain) / loss - (196,267) - 17,182 Loss from change in demographic assumptions 32,276 - - 43,531 Gain from change in financial assumptions (48,601) - - - Experience losses 7,587 137,442 24,490 -
Present value of defined benefit obligation as at December 31 568,285 582,031 275,115 371,371
148
Pension Fund Gratuity Fund (Rupees in thousand) 2013 2012 2013 2012
(Re-stated) (Re-stated)
The movement in fair value of plan assets is as follows: Fair value as at January 1 305,573 685,750 341,021 317,168 Expected return on plan assets 45,220 86,516 30,726 37,044 Group contributions 276,459 58,094 44,308 15,866 Employee contributions - 17,428 - - Benefits paid (65,432) (62,772) (167,685) (57,528)Settlements - (553,090) - - Experience gains 5,887 73,647 33,285 28,471
Fair value as at December 31 567,707 305,573 281,655 341,021 The amounts recognised in the consolidated profit and loss account are as follows: Current service cost - 31,488 15,311 18,448 Interest cost for the year 60,425 132,649 31,628 35,664 Expected return on plan assets (45,220) (86,516) (30,726) (37,044)Contribution made by the employees - (17,429) - - (Gain) / loss on curtailment / settlement recognised - (196,266) - 17,186
Total included in salaries, wages and amenities 15,205 (136,074) 16,213 34,254 Plan assets are comprised as follows: Debt 158,390 133,829 174,634 263,133 Equity 191,317 471,744 104,543 71,210 Cash 218,000 253,090 2,478 6,678
567,707 858,663 281,655 341,021 Settlements - (553,090) - -
567,707 305,573 281,655 341,021 The present value of defined benefit obligation, the fair value of plan assets and the deficit or surplus of pension fund is as
follows: (Rupees in thousand) 2013 2012 2011 2010 2009
As at December 31 Present value of defined benefit obligation 568,285 582,031 1,092,581 890,215 767,086 Fair value of plan assets 567,707 305,573 685,750 649,568 592,086
Deficit (578) (276,458) (406,831) (240,647) (175,000)
Experience adjustment on obligation 1% 13% 11% 5% 6%Experience adjustment on plan assets 2% 11% -10% 0% 5%
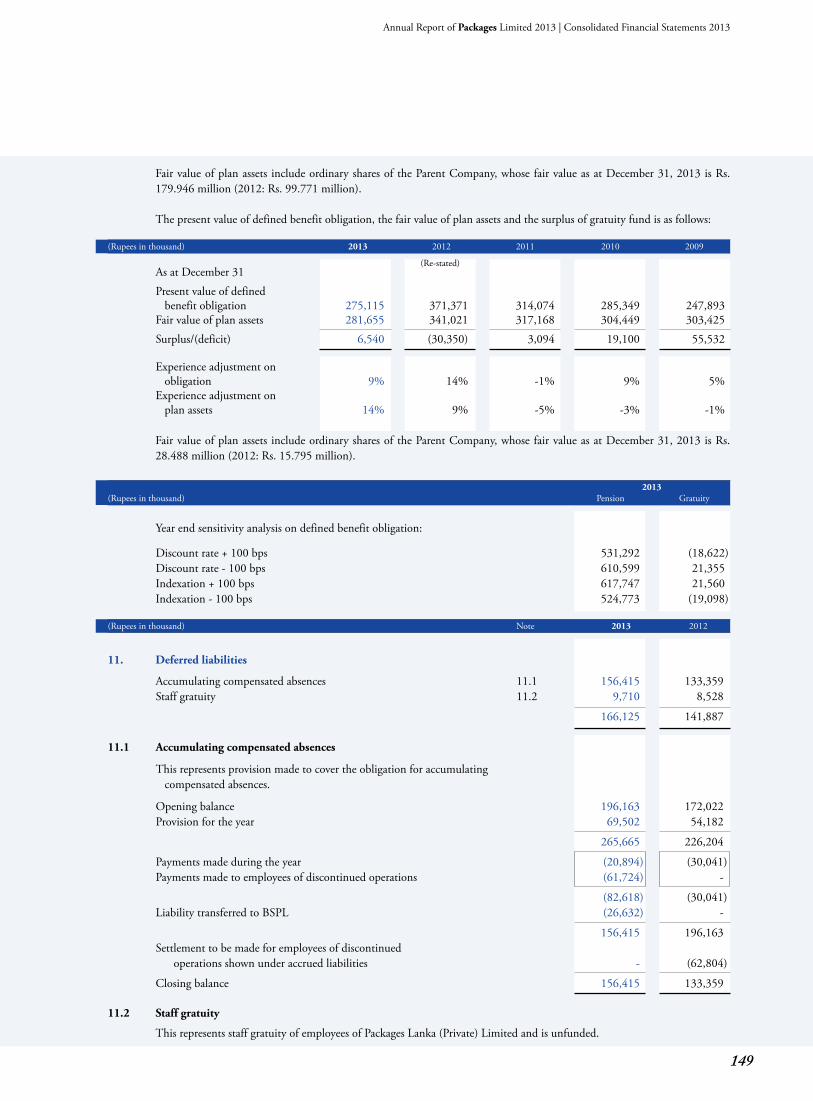
149
Annual Report of Packages Limited 2013 | Consolidated Financial Statements 2013
Fair value of plan assets include ordinary shares of the Parent Company, whose fair value as at December 31, 2013 is Rs. 179.946 million (2012: Rs. 99.771 million).
The present value of defined benefit obligation, the fair value of plan assets and the surplus of gratuity fund is as follows: (Rupees in thousand) 2013 2012 2011 2010 2009
As at December 31
Present value of defined benefit obligation 275,115 371,371 314,074 285,349 247,893 Fair value of plan assets 281,655 341,021 317,168 304,449 303,425
Surplus/(deficit) 6,540 (30,350) 3,094 19,100 55,532
Experience adjustment on obligation 9% 14% -1% 9% 5%Experience adjustment on plan assets 14% 9% -5% -3% -1%
Fair value of plan assets include ordinary shares of the Parent Company, whose fair value as at December 31, 2013 is Rs.
28.488 million (2012: Rs. 15.795 million).
2013(Rupees in thousand) Pension Gratuity
Year end sensitivity analysis on defined benefit obligation:
Discount rate + 100 bps 531,292 (18,622) Discount rate - 100 bps 610,599 21,355 Indexation + 100 bps 617,747 21,560 Indexation - 100 bps 524,773 (19,098) (Rupees in thousand) Note 2013 2012
11. Deferred liabilities
Accumulating compensated absences 11.1 156,415 133,359 Staff gratuity 11.2 9,710 8,528
166,125 141,887
11.1 Accumulating compensated absences
This represents provision made to cover the obligation for accumulating compensated absences.
Opening balance 196,163 172,022 Provision for the year 69,502 54,182
265,665 226,204
Payments made during the year (20,894) (30,041) Payments made to employees of discontinued operations (61,724) -
(82,618) (30,041) Liability transferred to BSPL (26,632) -
156,415 196,163 Settlement to be made for employees of discontinued operations shown under accrued liabilities - (62,804)
Closing balance 156,415 133,359
11.2 Staff gratuity
This represents staff gratuity of employees of Packages Lanka (Private) Limited and is unfunded.
(Re-stated)
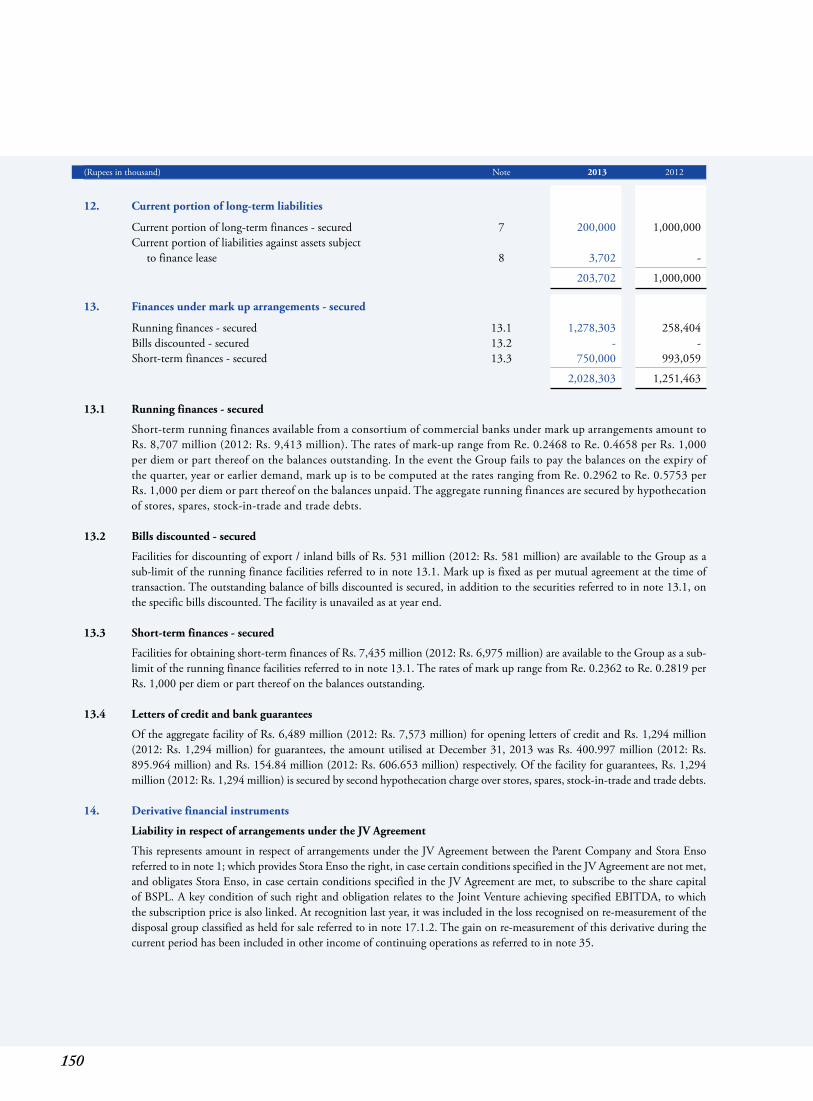
150
(Rupees in thousand) Note 2013 2012
12. Current portion of long-term liabilities
Current portion of long-term finances - secured 7 200,000 1,000,000 Current portion of liabilities against assets subject to finance lease 8 3,702 -
203,702 1,000,000
13. Finances under mark up arrangements - secured
Running finances - secured 13.1 1,278,303 258,404 Bills discounted - secured 13.2 - - Short-term finances - secured 13.3 750,000 993,059
2,028,303 1,251,463 13.1 Running finances - secured
Short-term running finances available from a consortium of commercial banks under mark up arrangements amount to Rs. 8,707 million (2012: Rs. 9,413 million). The rates of mark-up range from Re. 0.2468 to Re. 0.4658 per Rs. 1,000 per diem or part thereof on the balances outstanding. In the event the Group fails to pay the balances on the expiry of the quarter, year or earlier demand, mark up is to be computed at the rates ranging from Re. 0.2962 to Re. 0.5753 per Rs. 1,000 per diem or part thereof on the balances unpaid. The aggregate running finances are secured by hypothecation of stores, spares, stock-in-trade and trade debts.
13.2 Bills discounted - secured
Facilities for discounting of export / inland bills of Rs. 531 million (2012: Rs. 581 million) are available to the Group as a sub-limit of the running finance facilities referred to in note 13.1. Mark up is fixed as per mutual agreement at the time of transaction. The outstanding balance of bills discounted is secured, in addition to the securities referred to in note 13.1, on the specific bills discounted. The facility is unavailed as at year end.
13.3 Short-term finances - secured
Facilities for obtaining short-term finances of Rs. 7,435 million (2012: Rs. 6,975 million) are available to the Group as a sub-limit of the running finance facilities referred to in note 13.1. The rates of mark up range from Re. 0.2362 to Re. 0.2819 per Rs. 1,000 per diem or part thereof on the balances outstanding.
13.4 Letters of credit and bank guarantees
Of the aggregate facility of Rs. 6,489 million (2012: Rs. 7,573 million) for opening letters of credit and Rs. 1,294 million (2012: Rs. 1,294 million) for guarantees, the amount utilised at December 31, 2013 was Rs. 400.997 million (2012: Rs. 895.964 million) and Rs. 154.84 million (2012: Rs. 606.653 million) respectively. Of the facility for guarantees, Rs. 1,294 million (2012: Rs. 1,294 million) is secured by second hypothecation charge over stores, spares, stock-in-trade and trade debts.
14. Derivative financial instruments
Liability in respect of arrangements under the JV Agreement
This represents amount in respect of arrangements under the JV Agreement between the Parent Company and Stora Enso referred to in note 1; which provides Stora Enso the right, in case certain conditions specified in the JV Agreement are not met, and obligates Stora Enso, in case certain conditions specified in the JV Agreement are met, to subscribe to the share capital of BSPL. A key condition of such right and obligation relates to the Joint Venture achieving specified EBITDA, to which the subscription price is also linked. At recognition last year, it was included in the loss recognised on re-measurement of the disposal group classified as held for sale referred to in note 17.1.2. The gain on re-measurement of this derivative during the current period has been included in other income of continuing operations as referred to in note 35.
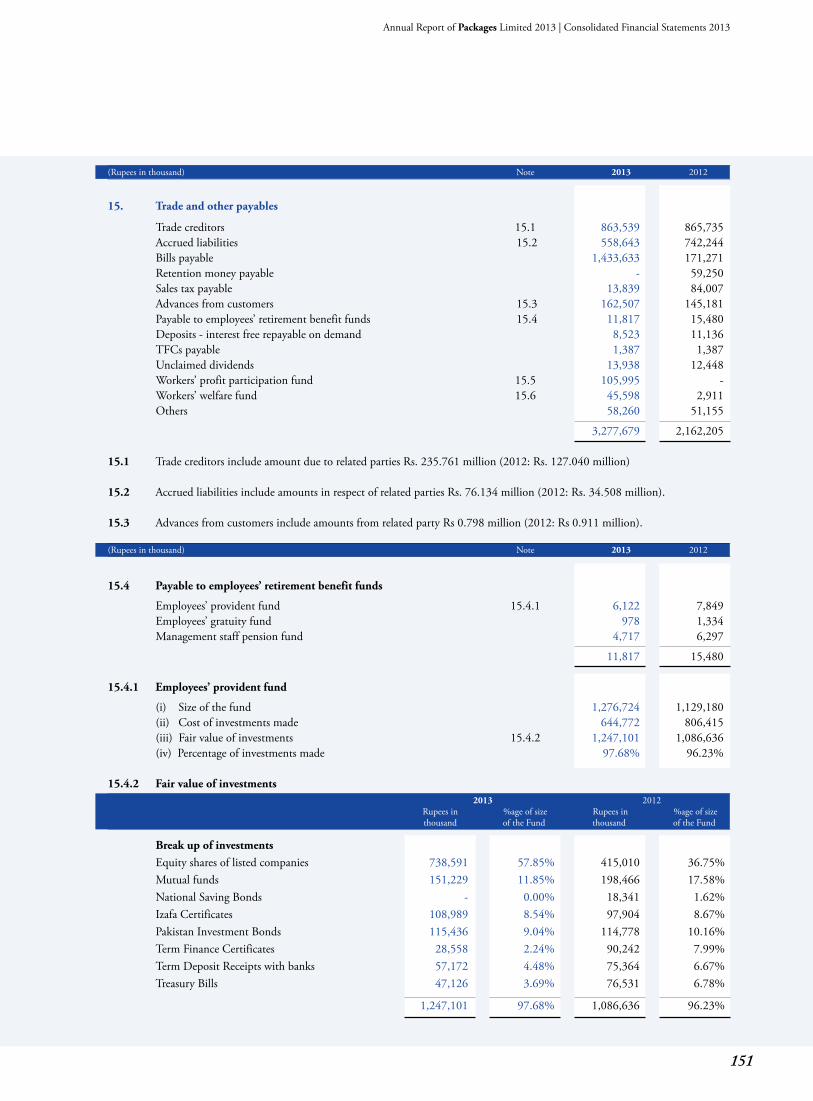
151
Annual Report of Packages Limited 2013 | Consolidated Financial Statements 2013
(Rupees in thousand) Note 2013 2012
15. Trade and other payables
Trade creditors 15.1 863,539 865,735 Accrued liabilities 15.2 558,643 742,244 Bills payable 1,433,633 171,271 Retention money payable - 59,250 Sales tax payable 13,839 84,007 Advances from customers 15.3 162,507 145,181 Payable to employees’ retirement benefit funds 15.4 11,817 15,480 Deposits - interest free repayable on demand 8,523 11,136 TFCs payable 1,387 1,387 Unclaimed dividends 13,938 12,448 Workers’ profit participation fund 15.5 105,995 - Workers’ welfare fund 15.6 45,598 2,911 Others 58,260 51,155
3,277,679 2,162,205 15.1 Trade creditors include amount due to related parties Rs. 235.761 million (2012: Rs. 127.040 million) 15.2 Accrued liabilities include amounts in respect of related parties Rs. 76.134 million (2012: Rs. 34.508 million). 15.3 Advances from customers include amounts from related party Rs 0.798 million (2012: Rs 0.911 million). (Rupees in thousand) Note 2013 2012
15.4 Payable to employees’ retirement benefit funds
Employees’ provident fund 15.4.1 6,122 7,849 Employees’ gratuity fund 978 1,334 Management staff pension fund 4,717 6,297
11,817 15,480 15.4.1 Employees’ provident fund
(i) Size of the fund 1,276,724 1,129,180 (ii) Cost of investments made 644,772 806,415 (iii) Fair value of investments 15.4.2 1,247,101 1,086,636 (iv) Percentage of investments made 97.68% 96.23% 15.4.2 Fair value of investments
2013 2012 Rupees in %age of size Rupees in %age of size thousand of the Fund thousand of the Fund
Break up of investments Equity shares of listed companies 738,591 57.85% 415,010 36.75%Mutual funds 151,229 11.85% 198,466 17.58%National Saving Bonds - 0.00% 18,341 1.62%Izafa Certificates 108,989 8.54% 97,904 8.67%Pakistan Investment Bonds 115,436 9.04% 114,778 10.16%Term Finance Certificates 28,558 2.24% 90,242 7.99%Term Deposit Receipts with banks 57,172 4.48% 75,364 6.67%Treasury Bills 47,126 3.69% 76,531 6.78%
1,247,101 97.68% 1,086,636 96.23%
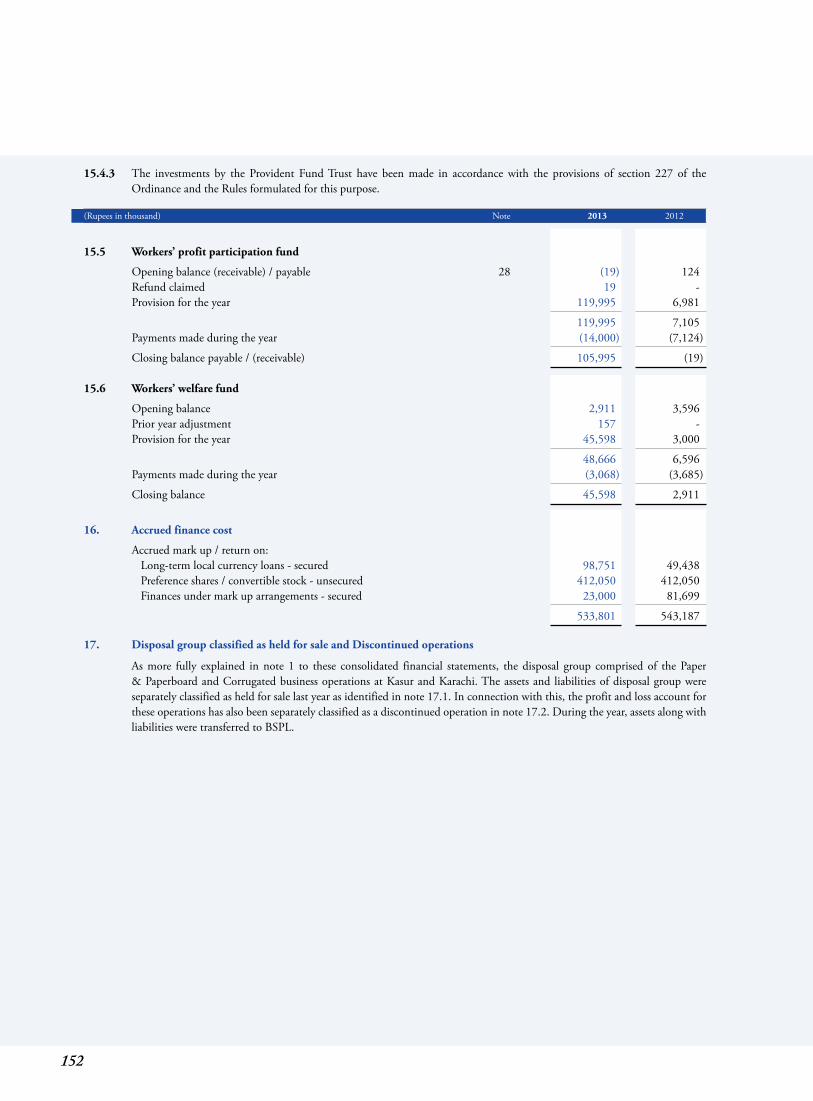
152
15.4.3 The investments by the Provident Fund Trust have been made in accordance with the provisions of section 227 of the Ordinance and the Rules formulated for this purpose.
(Rupees in thousand) Note 2013 2012
15.5 Workers’ profit participation fund
Opening balance (receivable) / payable 28 (19) 124 Refund claimed 19 - Provision for the year 119,995 6,981
119,995 7,105 Payments made during the year (14,000) (7,124)
Closing balance payable / (receivable) 105,995 (19) 15.6 Workers’ welfare fund
Opening balance 2,911 3,596 Prior year adjustment 157 - Provision for the year 45,598 3,000
48,666 6,596 Payments made during the year (3,068) (3,685)
Closing balance 45,598 2,911
16. Accrued finance cost
Accrued mark up / return on: Long-term local currency loans - secured 98,751 49,438 Preference shares / convertible stock - unsecured 412,050 412,050 Finances under mark up arrangements - secured 23,000 81,699
533,801 543,187
17. Disposal group classified as held for sale and Discontinued operations
As more fully explained in note 1 to these consolidated financial statements, the disposal group comprised of the Paper & Paperboard and Corrugated business operations at Kasur and Karachi. The assets and liabilities of disposal group were separately classified as held for sale last year as identified in note 17.1. In connection with this, the profit and loss account for these operations has also been separately classified as a discontinued operation in note 17.2. During the year, assets along with liabilities were transferred to BSPL.
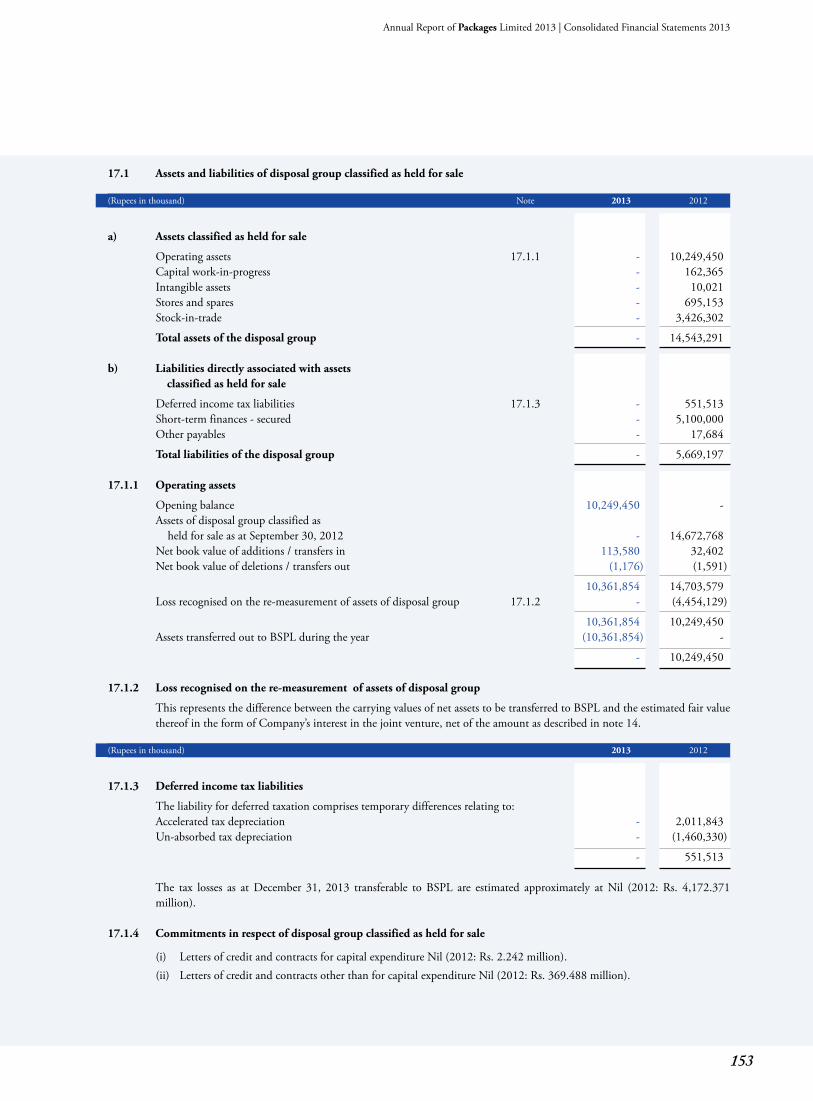
153
Annual Report of Packages Limited 2013 | Consolidated Financial Statements 2013
17.1 Assets and liabilities of disposal group classified as held for sale (Rupees in thousand) Note 2013 2012
a) Assets classified as held for sale
Operating assets 17.1.1 - 10,249,450 Capital work-in-progress - 162,365 Intangible assets - 10,021 Stores and spares - 695,153 Stock-in-trade - 3,426,302
Total assets of the disposal group - 14,543,291 b) Liabilities directly associated with assets classified as held for sale
Deferred income tax liabilities 17.1.3 - 551,513 Short-term finances - secured - 5,100,000 Other payables - 17,684
Total liabilities of the disposal group - 5,669,197 17.1.1 Operating assets
Opening balance 10,249,450 - Assets of disposal group classified as held for sale as at September 30, 2012 - 14,672,768 Net book value of additions / transfers in 113,580 32,402 Net book value of deletions / transfers out (1,176) (1,591)
10,361,854 14,703,579 Loss recognised on the re-measurement of assets of disposal group 17.1.2 - (4,454,129)
10,361,854 10,249,450 Assets transferred out to BSPL during the year (10,361,854) -
- 10,249,450 17.1.2 Loss recognised on the re-measurement of assets of disposal group
This represents the difference between the carrying values of net assets to be transferred to BSPL and the estimated fair value thereof in the form of Company’s interest in the joint venture, net of the amount as described in note 14.
(Rupees in thousand) 2013 2012
17.1.3 Deferred income tax liabilities
The liability for deferred taxation comprises temporary differences relating to: Accelerated tax depreciation - 2,011,843 Un-absorbed tax depreciation - (1,460,330)
- 551,513
The tax losses as at December 31, 2013 transferable to BSPL are estimated approximately at Nil (2012: Rs. 4,172.371 million).
17.1.4 Commitments in respect of disposal group classified as held for sale
(i) Letters of credit and contracts for capital expenditure Nil (2012: Rs. 2.242 million). (ii) Letters of credit and contracts other than for capital expenditure Nil (2012: Rs. 369.488 million).
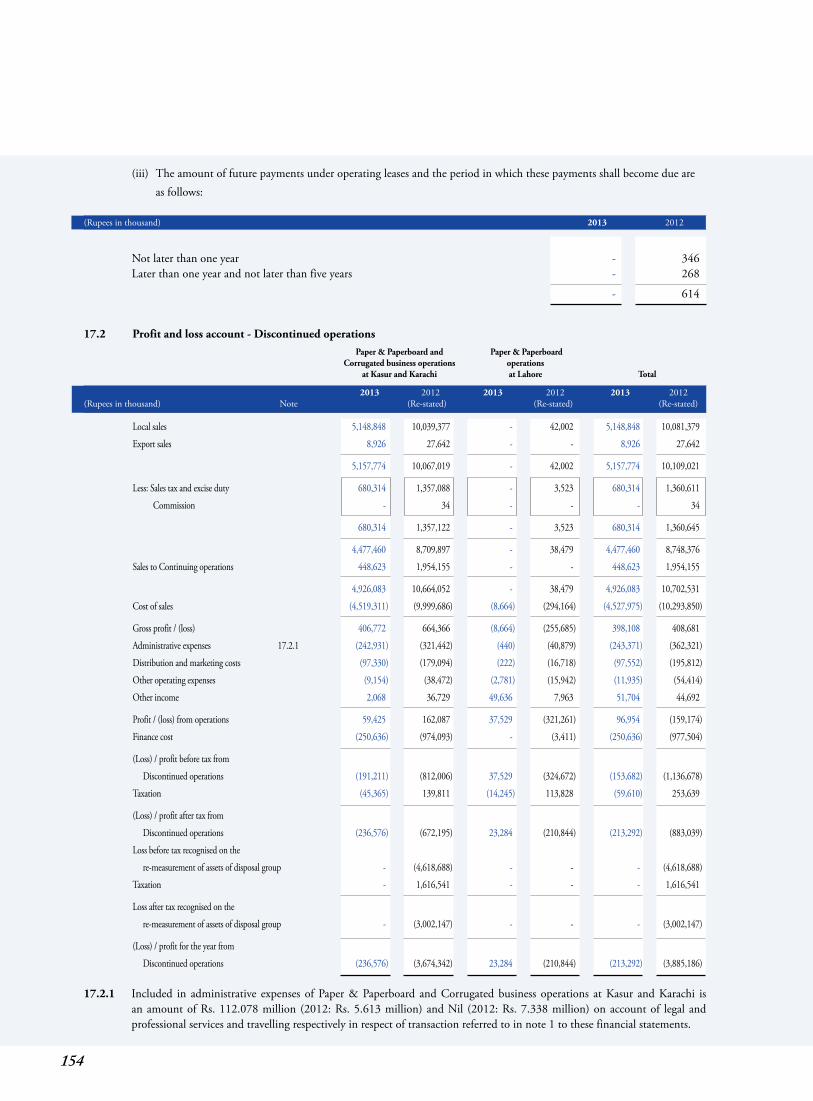
154
(iii) The amount of future payments under operating leases and the period in which these payments shall become due are as follows:
(Rupees in thousand) 2013 2012
Not later than one year - 346 Later than one year and not later than five years - 268
- 614
17.2 Profit and loss account - Discontinued operations Paper & Paperboard and Paper & Paperboard Corrugated business operations operations at Kasur and Karachi at Lahore Total
2013 2012 2013 2012 2013 2012(Rupees in thousand) Note (Re-stated) (Re-stated) (Re-stated)
Local sales 5,148,848 10,039,377 - 42,002 5,148,848 10,081,379
Export sales 8,926 27,642 - - 8,926 27,642
5,157,774 10,067,019 - 42,002 5,157,774 10,109,021
Less: Sales tax and excise duty 680,314 1,357,088 - 3,523 680,314 1,360,611
Commission - 34 - - - 34
680,314 1,357,122 - 3,523 680,314 1,360,645
4,477,460 8,709,897 - 38,479 4,477,460 8,748,376
Sales to Continuing operations 448,623 1,954,155 - - 448,623 1,954,155
4,926,083 10,664,052 - 38,479 4,926,083 10,702,531
Cost of sales (4,519,311) (9,999,686) (8,664) (294,164) (4,527,975) (10,293,850)
Gross profit / (loss) 406,772 664,366 (8,664) (255,685) 398,108 408,681
Administrative expenses 17.2.1 (242,931) (321,442) (440) (40,879) (243,371) (362,321)
Distribution and marketing costs (97,330) (179,094) (222) (16,718) (97,552) (195,812)
Other operating expenses (9,154) (38,472) (2,781) (15,942) (11,935) (54,414)
Other income 2,068 36,729 49,636 7,963 51,704 44,692
Profit / (loss) from operations 59,425 162,087 37,529 (321,261) 96,954 (159,174)
Finance cost (250,636) (974,093) - (3,411) (250,636) (977,504)
(Loss) / profit before tax from
Discontinued operations (191,211) (812,006) 37,529 (324,672) (153,682) (1,136,678)
Taxation (45,365) 139,811 (14,245) 113,828 (59,610) 253,639
(Loss) / profit after tax from
Discontinued operations (236,576) (672,195) 23,284 (210,844) (213,292) (883,039)
Loss before tax recognised on the
re-measurement of assets of disposal group - (4,618,688) - - - (4,618,688)
Taxation - 1,616,541 - - - 1,616,541
Loss after tax recognised on the
re-measurement of assets of disposal group - (3,002,147) - - - (3,002,147)
(Loss) / profit for the year from
Discontinued operations (236,576) (3,674,342) 23,284 (210,844) (213,292) (3,885,186)
17.2.1 Included in administrative expenses of Paper & Paperboard and Corrugated business operations at Kasur and Karachi is an amount of Rs. 112.078 million (2012: Rs. 5.613 million) and Nil (2012: Rs. 7.338 million) on account of legal and professional services and travelling respectively in respect of transaction referred to in note 1 to these financial statements.
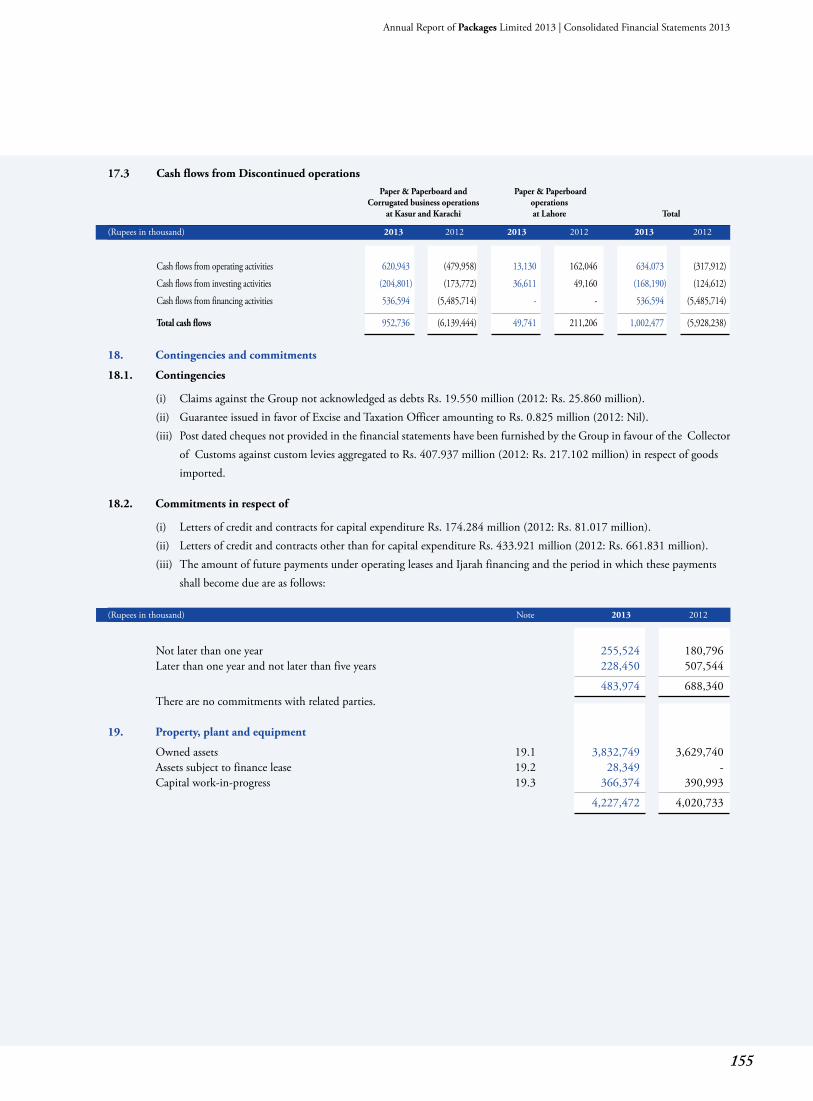
155
Annual Report of Packages Limited 2013 | Consolidated Financial Statements 2013
17.3 Cash flows from Discontinued operations Paper & Paperboard and Paper & Paperboard Corrugated business operations operations at Kasur and Karachi at Lahore Total
(Rupees in thousand) 2013 2012 2013 2012 2013 2012
Cash flows from operating activities 620,943 (479,958) 13,130 162,046 634,073 (317,912)
Cash flows from investing activities (204,801) (173,772) 36,611 49,160 (168,190) (124,612)
Cash flows from financing activities 536,594 (5,485,714) - - 536,594 (5,485,714)
Total cash flows 952,736 (6,139,444) 49,741 211,206 1,002,477 (5,928,238)
18. Contingencies and commitments
18.1. Contingencies
(i) Claims against the Group not acknowledged as debts Rs. 19.550 million (2012: Rs. 25.860 million). (ii) Guarantee issued in favor of Excise and Taxation Officer amounting to Rs. 0.825 million (2012: Nil). (iii) Post dated cheques not provided in the financial statements have been furnished by the Group in favour of the Collector of Customs against custom levies aggregated to Rs. 407.937 million (2012: Rs. 217.102 million) in respect of goods imported. 18.2. Commitments in respect of
(i) Letters of credit and contracts for capital expenditure Rs. 174.284 million (2012: Rs. 81.017 million). (ii) Letters of credit and contracts other than for capital expenditure Rs. 433.921 million (2012: Rs. 661.831 million). (iii) The amount of future payments under operating leases and Ijarah financing and the period in which these payments
shall become due are as follows: (Rupees in thousand) Note 2013 2012
Not later than one year 255,524 180,796 Later than one year and not later than five years 228,450 507,544
483,974 688,340 There are no commitments with related parties.
19. Property, plant and equipment
Owned assets 19.1 3,832,749 3,629,740 Assets subject to finance lease 19.2 28,349 - Capital work-in-progress 19.3 366,374 390,993
4,227,472 4,020,733
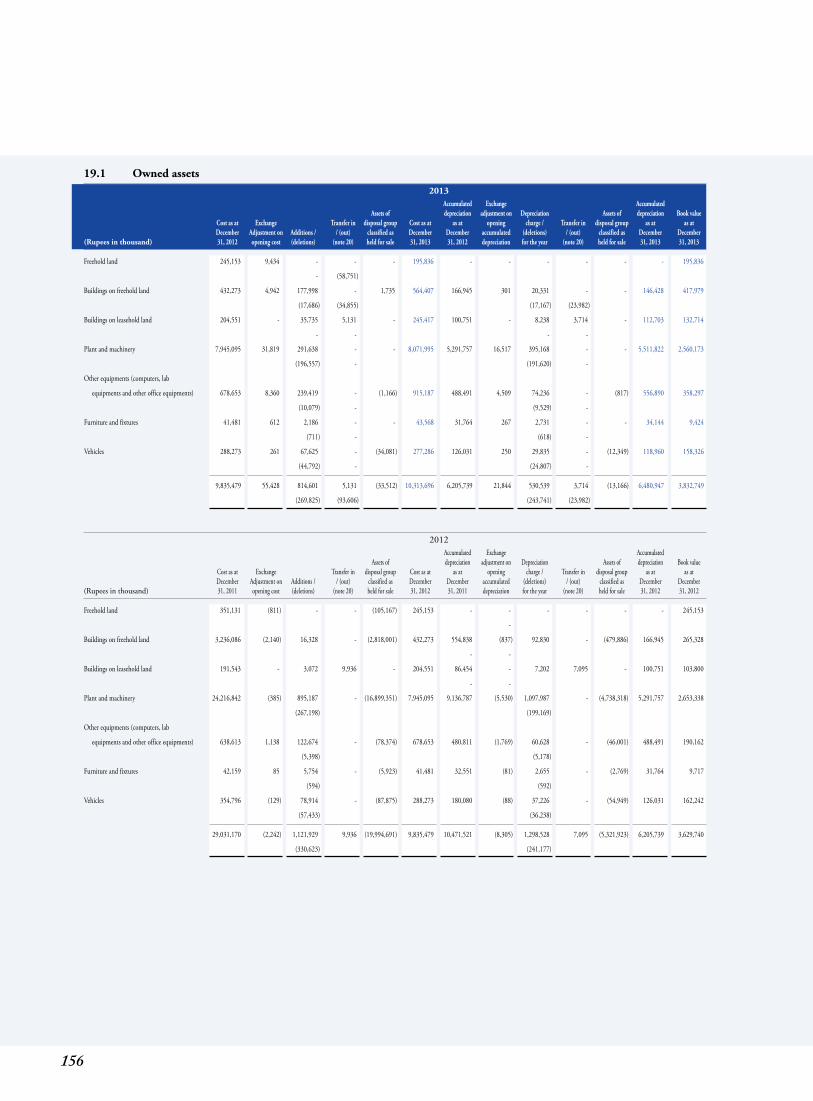
156
19.1 Owned assets 2013 Accumulated Exchange Accumulated Assets of depreciation adjustment on Depreciation Assets of depreciation Book value Cost as at Exchange Transfer in disposal group Cost as at as at opening charge / Transfer in disposal group as at as at December Adjustment on Additions / / (out) classified as December December accumulated (deletions) / (out) classified as December December (Rupees in thousand) 31, 2012 opening cost (deletions) (note 20) held for sale 31, 2013 31, 2012 depreciation for the year (note 20) held for sale 31, 2013 31, 2013
Freehold land 245,153 9,434 - - - 195,836 - - - - - - 195,836
- (58,751)
Buildings on freehold land 432,273 4,942 177,998 - 1,735 564,407 166,945 301 20,331 - - 146,428 417,979
(17,686) (34,855) (17,167) (23,982)
Buildings on leasehold land 204,551 - 35,735 5,131 - 245,417 100,751 - 8,238 3,714 - 112,703 132,714
- - - -
Plant and machinery 7,945,095 31,819 291,638 - - 8,071,995 5,291,757 16,517 395,168 - - 5,511,822 2,560,173
(196,557) - (191,620) -
Other equipments (computers, lab
equipments and other office equipments) 678,653 8,360 239,419 - (1,166) 915,187 488,491 4,509 74,236 - (817) 556,890 358,297
(10,079) - (9,529) -
Furniture and fixtures 41,481 612 2,186 - - 43,568 31,764 267 2,731 - - 34,144 9,424
(711) - (618) -
Vehicles 288,273 261 67,625 - (34,081) 277,286 126,031 250 29,835 - (12,349) 118,960 158,326
(44,792) - (24,807) -
9,835,479 55,428 814,601 5,131 (33,512) 10,313,696 6,205,739 21,844 530,539 3,714 (13,166) 6,480,947 3,832,749
(269,825) (93,606) (243,741) (23,982)
2012 Accumulated Exchange Accumulated Assets of depreciation adjustment on Depreciation Assets of depreciation Book value Cost as at Exchange Transfer in disposal group Cost as at as at opening charge / Transfer in disposal group as at as at December Adjustment on Additions / / (out) classified as December December accumulated (deletions) / (out) classified as December December (Rupees in thousand) 31, 2011 opening cost (deletions) (note 20) held for sale 31, 2012 31, 2011 depreciation for the year (note 20) held for sale 31, 2012 31, 2012
Freehold land 351,131 (811) - - (105,167) 245,153 - - - - - - 245,153
-
Buildings on freehold land 3,236,086 (2,140) 16,328 - (2,818,001) 432,273 554,838 (837) 92,830 - (479,886) 166,945 265,328
- -
Buildings on leasehold land 191,543 - 3,072 9,936 - 204,551 86,454 - 7,202 7,095 - 100,751 103,800
- -
Plant and machinery 24,216,842 (385) 895,187 - (16,899,351) 7,945,095 9,136,787 (5,530) 1,097,987 - (4,738,318) 5,291,757 2,653,338
(267,198) (199,169)
Other equipments (computers, lab
equipments and other office equipments) 638,613 1,138 122,674 - (78,374) 678,653 480,811 (1,769) 60,628 - (46,001) 488,491 190,162
(5,398) (5,178)
Furniture and fixtures 42,159 85 5,754 - (5,923) 41,481 32,551 (81) 2,655 - (2,769) 31,764 9,717
(594) (592)
Vehicles 354,796 (129) 78,914 - (87,875) 288,273 180,080 (88) 37,226 - (54,949) 126,031 162,242
(57,433) (36,238)
29,031,170 (2,242) 1,121,929 9,936 (19,994,691) 9,835,479 10,471,521 (8,305) 1,298,528 7,095 (5,321,923) 6,205,739 3,629,740
(330,623) (241,177)
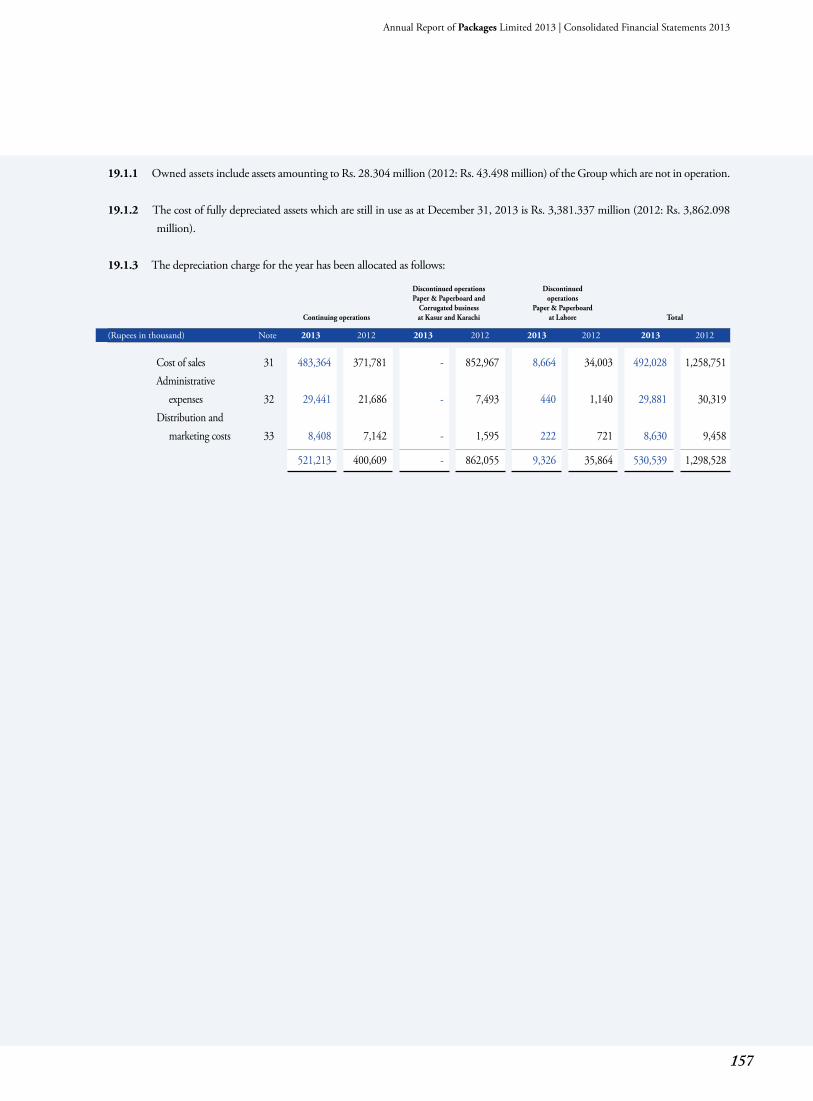
157
Annual Report of Packages Limited 2013 | Consolidated Financial Statements 2013
19.1.1 Owned assets include assets amounting to Rs. 28.304 million (2012: Rs. 43.498 million) of the Group which are not in operation. 19.1.2 The cost of fully depreciated assets which are still in use as at December 31, 2013 is Rs. 3,381.337 million (2012: Rs. 3,862.098
million). 19.1.3 The depreciation charge for the year has been allocated as follows:
Discontinued operations Discontinued Paper & Paperboard and operations Corrugated business Paper & Paperboard Continuing operations at Kasur and Karachi at Lahore Total
(Rupees in thousand) Note 2013 2012 2013 2012 2013 2012 2013 2012
Cost of sales 31 483,364 371,781 - 852,967 8,664 34,003 492,028 1,258,751 Administrative expenses 32 29,441 21,686 - 7,493 440 1,140 29,881 30,319 Distribution and marketing costs 33 8,408 7,142 - 1,595 222 721 8,630 9,458
521,213 400,609 - 862,055 9,326 35,864 530,539 1,298,528
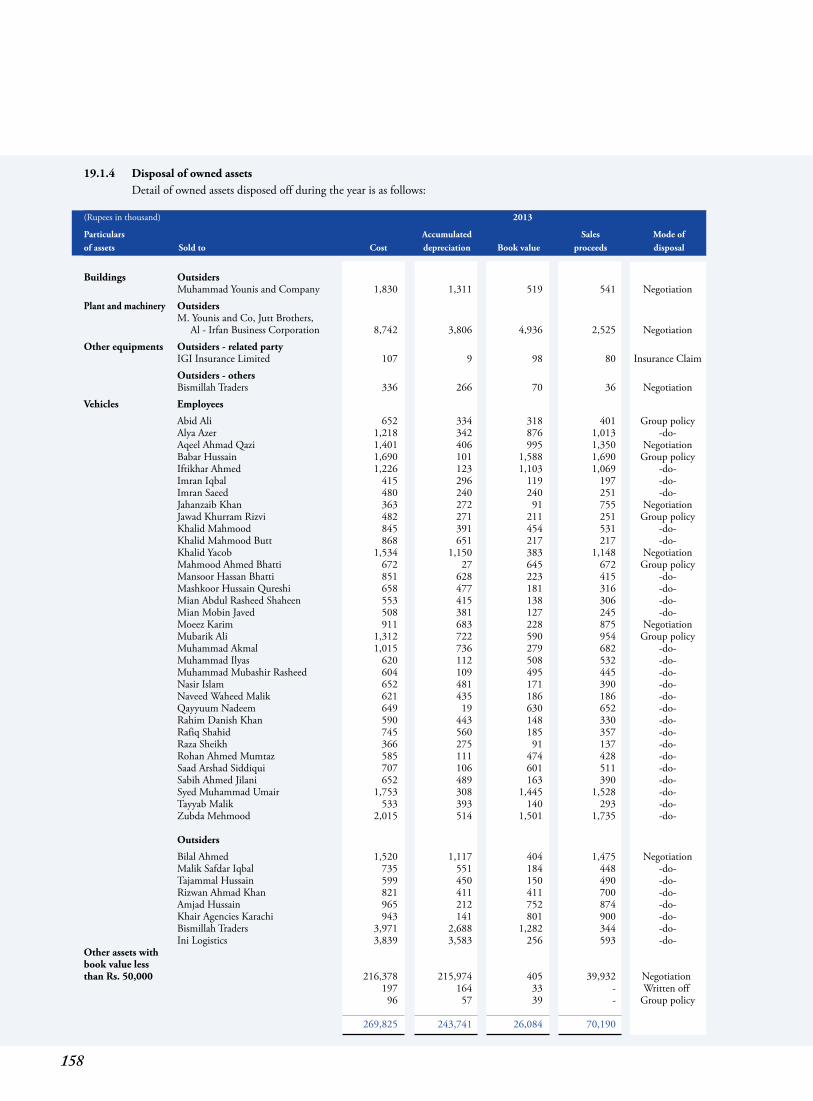
158
19.1.4 Disposal of owned assets Detail of owned assets disposed off during the year is as follows: (Rupees in thousand) 2013
Particulars Accumulated Sales Mode ofof assets Sold to Cost depreciation Book value proceeds disposal
Buildings Outsiders Muhammad Younis and Company 1,830 1,311 519 541 Negotiation Plant and machinery Outsiders M. Younis and Co, Jutt Brothers, Al - Irfan Business Corporation 8,742 3,806 4,936 2,525 Negotiation Other equipments Outsiders - related party IGI Insurance Limited 107 9 98 80 Insurance Claim Outsiders - others Bismillah Traders 336 266 70 36 Negotiation Vehicles Employees Abid Ali 652 334 318 401 Group policy Alya Azer 1,218 342 876 1,013 -do- Aqeel Ahmad Qazi 1,401 406 995 1,350 Negotiation Babar Hussain 1,690 101 1,588 1,690 Group policy Iftikhar Ahmed 1,226 123 1,103 1,069 -do- Imran Iqbal 415 296 119 197 -do- Imran Saeed 480 240 240 251 -do- Jahanzaib Khan 363 272 91 755 Negotiation Jawad Khurram Rizvi 482 271 211 251 Group policy Khalid Mahmood 845 391 454 531 -do- Khalid Mahmood Butt 868 651 217 217 -do- Khalid Yacob 1,534 1,150 383 1,148 Negotiation Mahmood Ahmed Bhatti 672 27 645 672 Group policy Mansoor Hassan Bhatti 851 628 223 415 -do- Mashkoor Hussain Qureshi 658 477 181 316 -do- Mian Abdul Rasheed Shaheen 553 415 138 306 -do- Mian Mobin Javed 508 381 127 245 -do- Moeez Karim 911 683 228 875 Negotiation Mubarik Ali 1,312 722 590 954 Group policy Muhammad Akmal 1,015 736 279 682 -do- Muhammad Ilyas 620 112 508 532 -do- Muhammad Mubashir Rasheed 604 109 495 445 -do- Nasir Islam 652 481 171 390 -do- Naveed Waheed Malik 621 435 186 186 -do- Qayyuum Nadeem 649 19 630 652 -do- Rahim Danish Khan 590 443 148 330 -do- Rafiq Shahid 745 560 185 357 -do- Raza Sheikh 366 275 91 137 -do- Rohan Ahmed Mumtaz 585 111 474 428 -do- Saad Arshad Siddiqui 707 106 601 511 -do- Sabih Ahmed Jilani 652 489 163 390 -do- Syed Muhammad Umair 1,753 308 1,445 1,528 -do- Tayyab Malik 533 393 140 293 -do- Zubda Mehmood 2,015 514 1,501 1,735 -do- Outsiders Bilal Ahmed 1,520 1,117 404 1,475 Negotiation Malik Safdar Iqbal 735 551 184 448 -do- Tajammal Hussain 599 450 150 490 -do- Rizwan Ahmad Khan 821 411 411 700 -do- Amjad Hussain 965 212 752 874 -do- Khair Agencies Karachi 943 141 801 900 -do- Bismillah Traders 3,971 2,688 1,282 344 -do- Ini Logistics 3,839 3,583 256 593 -do- Other assets with book value less than Rs. 50,000 216,378 215,974 405 39,932 Negotiation 197 164 33 - Written off 96 57 39 - Group policy 269,825 243,741 26,084 70,190
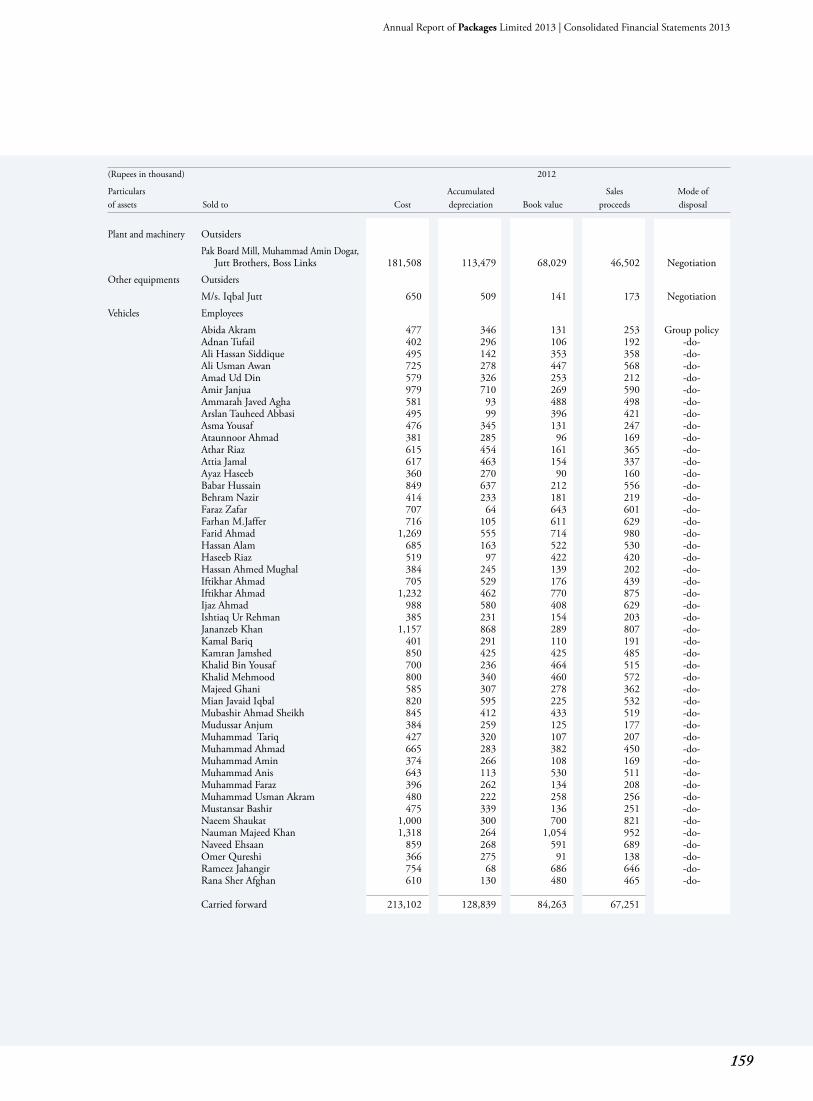
159
Annual Report of Packages Limited 2013 | Consolidated Financial Statements 2013
(Rupees in thousand) 2012
Particulars Accumulated Sales Mode ofof assets Sold to Cost depreciation Book value proceeds disposal
Plant and machinery Outsiders Pak Board Mill, Muhammad Amin Dogar, Jutt Brothers, Boss Links 181,508 113,479 68,029 46,502 Negotiation Other equipments Outsiders M/s. Iqbal Jutt 650 509 141 173 Negotiation Vehicles Employees Abida Akram 477 346 131 253 Group policy Adnan Tufail 402 296 106 192 -do- Ali Hassan Siddique 495 142 353 358 -do- Ali Usman Awan 725 278 447 568 -do- Amad Ud Din 579 326 253 212 -do- Amir Janjua 979 710 269 590 -do- Ammarah Javed Agha 581 93 488 498 -do- Arslan Tauheed Abbasi 495 99 396 421 -do- Asma Yousaf 476 345 131 247 -do- Ataunnoor Ahmad 381 285 96 169 -do- Athar Riaz 615 454 161 365 -do- Attia Jamal 617 463 154 337 -do- Ayaz Haseeb 360 270 90 160 -do- Babar Hussain 849 637 212 556 -do- Behram Nazir 414 233 181 219 -do- Faraz Zafar 707 64 643 601 -do- Farhan M.Jaffer 716 105 611 629 -do- Farid Ahmad 1,269 555 714 980 -do- Hassan Alam 685 163 522 530 -do- Haseeb Riaz 519 97 422 420 -do- Hassan Ahmed Mughal 384 245 139 202 -do- Iftikhar Ahmad 705 529 176 439 -do- Iftikhar Ahmad 1,232 462 770 875 -do- Ijaz Ahmad 988 580 408 629 -do- Ishtiaq Ur Rehman 385 231 154 203 -do- Jananzeb Khan 1,157 868 289 807 -do- Kamal Bariq 401 291 110 191 -do- Kamran Jamshed 850 425 425 485 -do- Khalid Bin Yousaf 700 236 464 515 -do- Khalid Mehmood 800 340 460 572 -do- Majeed Ghani 585 307 278 362 -do- Mian Javaid Iqbal 820 595 225 532 -do- Mubashir Ahmad Sheikh 845 412 433 519 -do- Mudussar Anjum 384 259 125 177 -do- Muhammad Tariq 427 320 107 207 -do- Muhammad Ahmad 665 283 382 450 -do- Muhammad Amin 374 266 108 169 -do- Muhammad Anis 643 113 530 511 -do- Muhammad Faraz 396 262 134 208 -do- Muhammad Usman Akram 480 222 258 256 -do- Mustansar Bashir 475 339 136 251 -do- Naeem Shaukat 1,000 300 700 821 -do- Nauman Majeed Khan 1,318 264 1,054 952 -do- Naveed Ehsaan 859 268 591 689 -do- Omer Qureshi 366 275 91 138 -do- Rameez Jahangir 754 68 686 646 -do- Rana Sher Afghan 610 130 480 465 -do- Carried forward 213,102 128,839 84,263 67,251
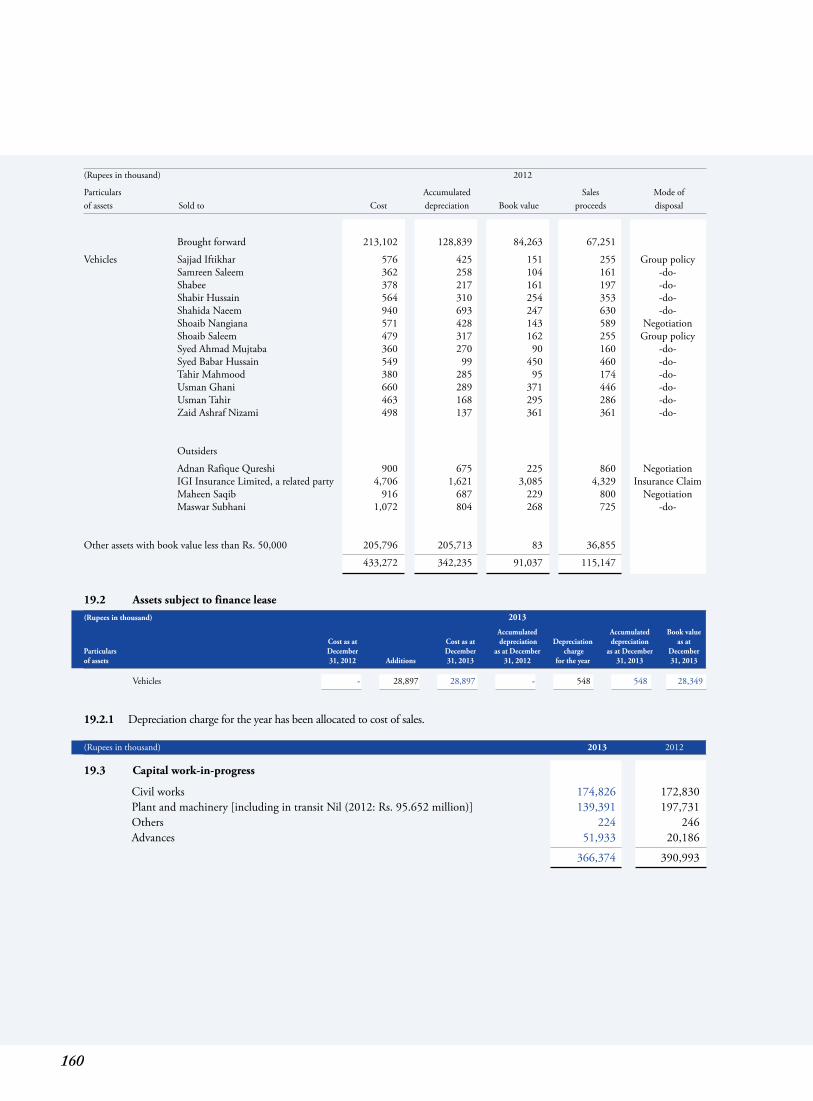
160
(Rupees in thousand) 2012
Particulars Accumulated Sales Mode ofof assets Sold to Cost depreciation Book value proceeds disposal
Brought forward 213,102 128,839 84,263 67,251
Vehicles Sajjad Iftikhar 576 425 151 255 Group policy Samreen Saleem 362 258 104 161 -do- Shabee 378 217 161 197 -do- Shabir Hussain 564 310 254 353 -do- Shahida Naeem 940 693 247 630 -do- Shoaib Nangiana 571 428 143 589 Negotiation Shoaib Saleem 479 317 162 255 Group policy Syed Ahmad Mujtaba 360 270 90 160 -do- Syed Babar Hussain 549 99 450 460 -do- Tahir Mahmood 380 285 95 174 -do- Usman Ghani 660 289 371 446 -do- Usman Tahir 463 168 295 286 -do- Zaid Ashraf Nizami 498 137 361 361 -do- Outsiders
Adnan Rafique Qureshi 900 675 225 860 Negotiation IGI Insurance Limited, a related party 4,706 1,621 3,085 4,329 Insurance Claim Maheen Saqib 916 687 229 800 Negotiation Maswar Subhani 1,072 804 268 725 -do- Other assets with book value less than Rs. 50,000 205,796 205,713 83 36,855
433,272 342,235 91,037 115,147
19.2 Assets subject to finance lease (Rupees in thousand) 2013
Accumulated Accumulated Book value Cost as at Cost as at depreciation Depreciation depreciation as atParticulars December December as at December charge as at December Decemberof assets 31, 2012 Additions 31, 2013 31, 2012 for the year 31, 2013 31, 2013
Vehicles - 28,897 28,897 - 548 548 28,349
19.2.1 Depreciation charge for the year has been allocated to cost of sales. (Rupees in thousand) 2013 2012
19.3 Capital work-in-progress
Civil works 174,826 172,830 Plant and machinery [including in transit Nil (2012: Rs. 95.652 million)] 139,391 197,731 Others 224 246 Advances 51,933 20,186
366,374 390,993
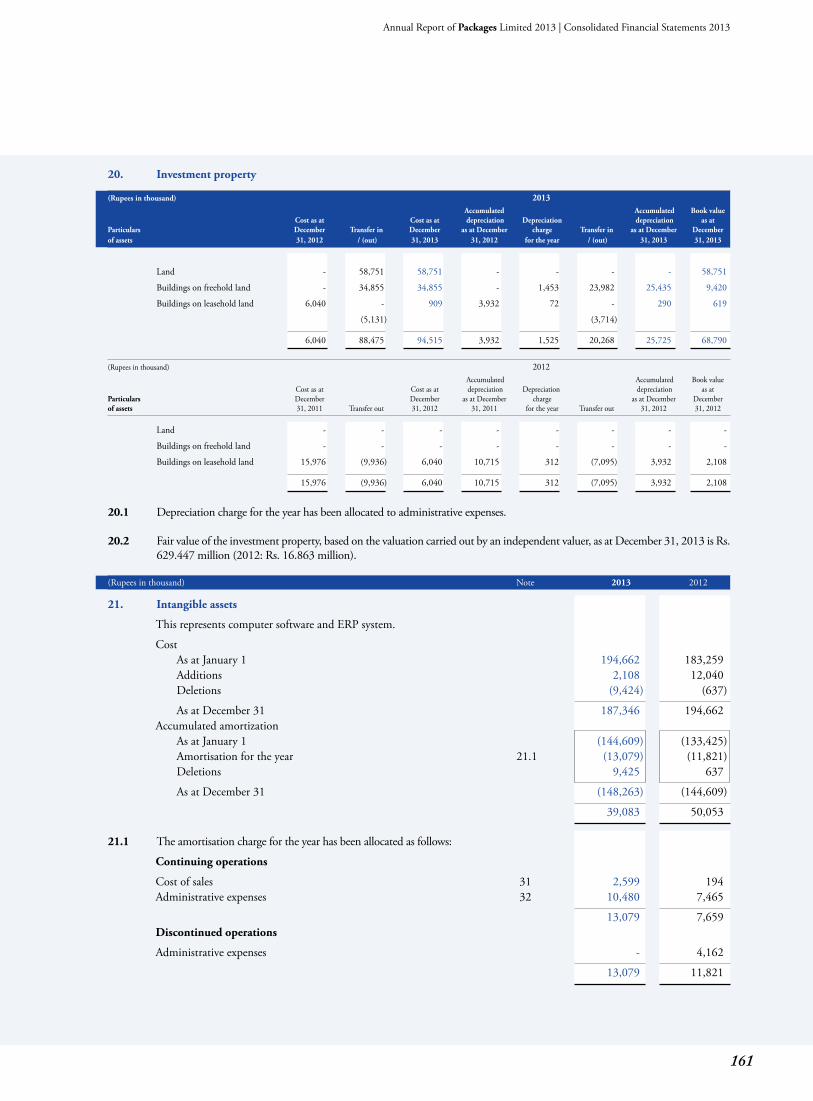
161
Annual Report of Packages Limited 2013 | Consolidated Financial Statements 2013
20. Investment property
(Rupees in thousand) 2013 Accumulated Accumulated Book value Cost as at Cost as at depreciation Depreciation depreciation as atParticulars December Transfer in December as at December charge Transfer in as at December Decemberof assets 31, 2012 / (out) 31, 2013 31, 2012 for the year / (out) 31, 2013 31, 2013
Land - 58,751 58,751 - - - - 58,751
Buildings on freehold land - 34,855 34,855 - 1,453 23,982 25,435 9,420
Buildings on leasehold land 6,040 - 909 3,932 72 - 290 619
(5,131) (3,714)
6,040 88,475 94,515 3,932 1,525 20,268 25,725 68,790
(Rupees in thousand) 2012 Accumulated Accumulated Book value Cost as at Cost as at depreciation Depreciation depreciation as atParticulars December December as at December charge as at December Decemberof assets 31, 2011 Transfer out 31, 2012 31, 2011 for the year Transfer out 31, 2012 31, 2012
Land - - - - - - - -
Buildings on freehold land - - - - - - - -
Buildings on leasehold land 15,976 (9,936) 6,040 10,715 312 (7,095) 3,932 2,108
15,976 (9,936) 6,040 10,715 312 (7,095) 3,932 2,108
20.1 Depreciation charge for the year has been allocated to administrative expenses. 20.2 Fair value of the investment property, based on the valuation carried out by an independent valuer, as at December 31, 2013 is Rs.
629.447 million (2012: Rs. 16.863 million).
(Rupees in thousand) Note 2013 2012
21. Intangible assets
This represents computer software and ERP system.
Cost As at January 1 194,662 183,259 Additions 2,108 12,040 Deletions (9,424) (637)
As at December 31 187,346 194,662 Accumulated amortization As at January 1 (144,609) (133,425) Amortisation for the year 21.1 (13,079) (11,821) Deletions 9,425 637
As at December 31 (148,263) (144,609)
39,083 50,053 21.1 The amortisation charge for the year has been allocated as follows:
Continuing operations
Cost of sales 31 2,599 194 Administrative expenses 32 10,480 7,465
13,079 7,659 Discontinued operations
Administrative expenses - 4,162
13,079 11,821
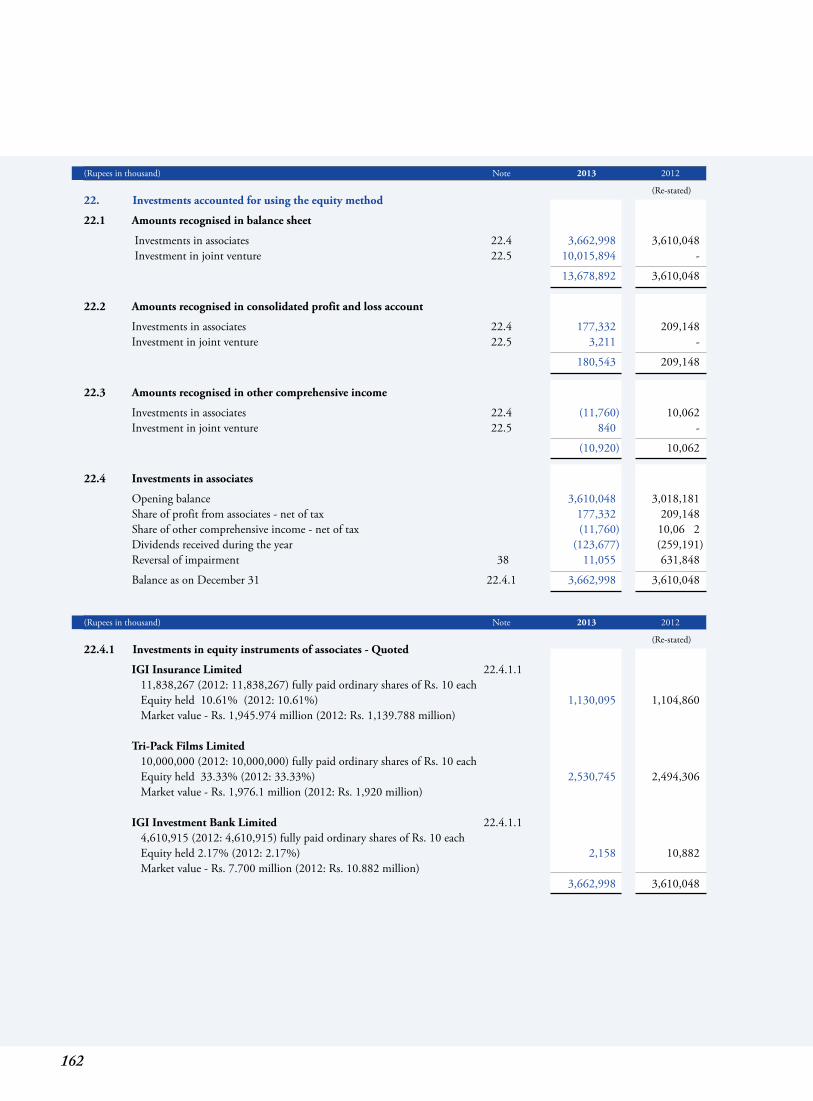
162
(Rupees in thousand) Note 2013 2012
(Re-stated)22. Investments accounted for using the equity method
22.1 Amounts recognised in balance sheet
Investments in associates 22.4 3,662,998 3,610,048 Investment in joint venture 22.5 10,015,894 -
13,678,892 3,610,048 22.2 Amounts recognised in consolidated profit and loss account
Investments in associates 22.4 177,332 209,148 Investment in joint venture 22.5 3,211 -
180,543 209,148 22.3 Amounts recognised in other comprehensive income
Investments in associates 22.4 (11,760) 10,062 Investment in joint venture 22.5 840 -
(10,920) 10,062 22.4 Investments in associates
Opening balance 3,610,048 3,018,181 Share of profit from associates - net of tax 177,332 209,148 Share of other comprehensive income - net of tax (11,760) 10,06 2 Dividends received during the year (123,677) (259,191) Reversal of impairment 38 11,055 631,848
Balance as on December 31 22.4.1 3,662,998 3,610,048
(Rupees in thousand) Note 2013 2012
(Re-stated)22.4.1 Investments in equity instruments of associates - Quoted
IGI Insurance Limited 22.4.1.1 11,838,267 (2012: 11,838,267) fully paid ordinary shares of Rs. 10 each Equity held 10.61% (2012: 10.61%) 1,130,095 1,104,860 Market value - Rs. 1,945.974 million (2012: Rs. 1,139.788 million) Tri-Pack Films Limited 10,000,000 (2012: 10,000,000) fully paid ordinary shares of Rs. 10 each Equity held 33.33% (2012: 33.33%) 2,530,745 2,494,306 Market value - Rs. 1,976.1 million (2012: Rs. 1,920 million) IGI Investment Bank Limited 22.4.1.1 4,610,915 (2012: 4,610,915) fully paid ordinary shares of Rs. 10 each Equity held 2.17% (2012: 2.17%) 2,158 10,882 Market value - Rs. 7.700 million (2012: Rs. 10.882 million) 3,662,998 3,610,048
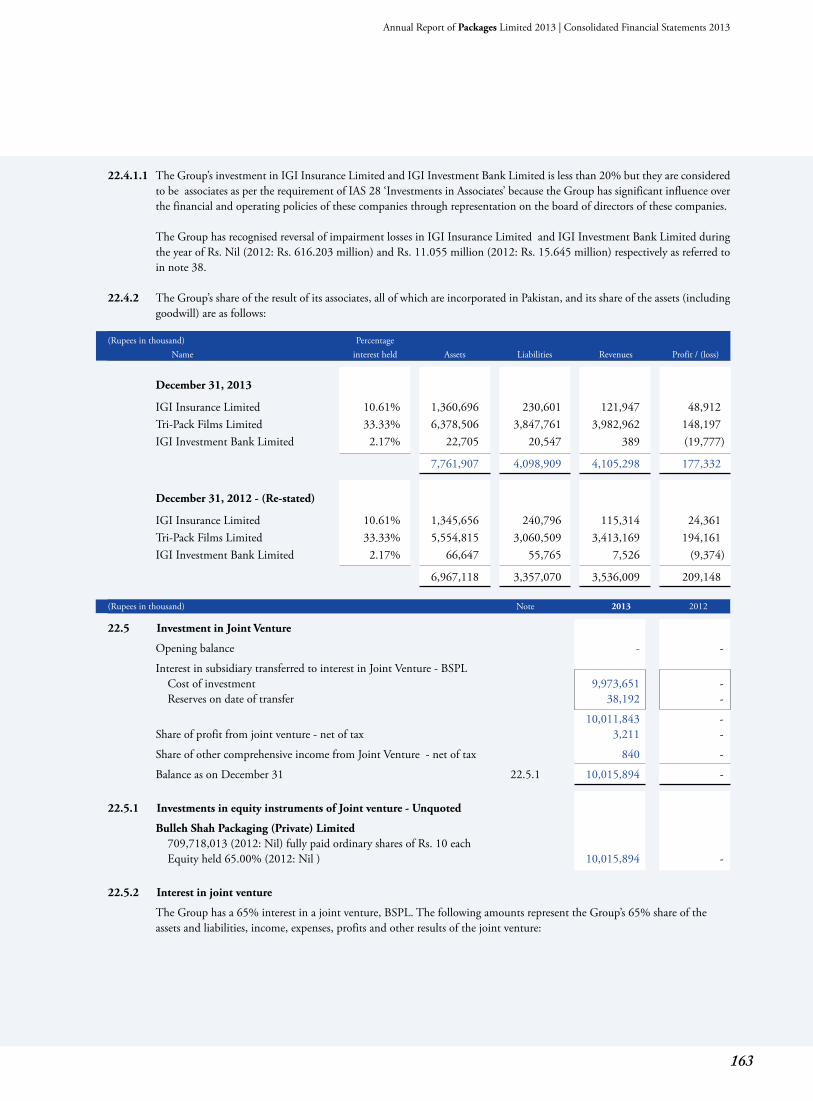
163
Annual Report of Packages Limited 2013 | Consolidated Financial Statements 2013
22.4.1.1 The Group’s investment in IGI Insurance Limited and IGI Investment Bank Limited is less than 20% but they are considered to be associates as per the requirement of IAS 28 ‘Investments in Associates’ because the Group has significant influence over the financial and operating policies of these companies through representation on the board of directors of these companies.
The Group has recognised reversal of impairment losses in IGI Insurance Limited and IGI Investment Bank Limited during the year of Rs. Nil (2012: Rs. 616.203 million) and Rs. 11.055 million (2012: Rs. 15.645 million) respectively as referred to in note 38.
22.4.2 The Group’s share of the result of its associates, all of which are incorporated in Pakistan, and its share of the assets (including
goodwill) are as follows:
(Rupees in thousand) Percentage Name interest held Assets Liabilities Revenues Profit / (loss)
December 31, 2013
IGI Insurance Limited 10.61% 1,360,696 230,601 121,947 48,912 Tri-Pack Films Limited 33.33% 6,378,506 3,847,761 3,982,962 148,197 IGI Investment Bank Limited 2.17% 22,705 20,547 389 (19,777)
7,761,907 4,098,909 4,105,298 177,332 December 31, 2012 - (Re-stated)
IGI Insurance Limited 10.61% 1,345,656 240,796 115,314 24,361 Tri-Pack Films Limited 33.33% 5,554,815 3,060,509 3,413,169 194,161 IGI Investment Bank Limited 2.17% 66,647 55,765 7,526 (9,374)
6,967,118 3,357,070 3,536,009 209,148
(Rupees in thousand) Note 2013 2012
22.5 Investment in Joint Venture
Opening balance - -
Interest in subsidiary transferred to interest in Joint Venture - BSPL Cost of investment 9,973,651 - Reserves on date of transfer 38,192 -
10,011,843 - Share of profit from joint venture - net of tax 3,211 -
Share of other comprehensive income from Joint Venture - net of tax 840 -
Balance as on December 31 22.5.1 10,015,894 - 22.5.1 Investments in equity instruments of Joint venture - Unquoted
Bulleh Shah Packaging (Private) Limited 709,718,013 (2012: Nil) fully paid ordinary shares of Rs. 10 each Equity held 65.00% (2012: Nil ) 10,015,894 - 22.5.2 Interest in joint venture
The Group has a 65% interest in a joint venture, BSPL. The following amounts represent the Group’s 65% share of the assets and liabilities, income, expenses, profits and other results of the joint venture:
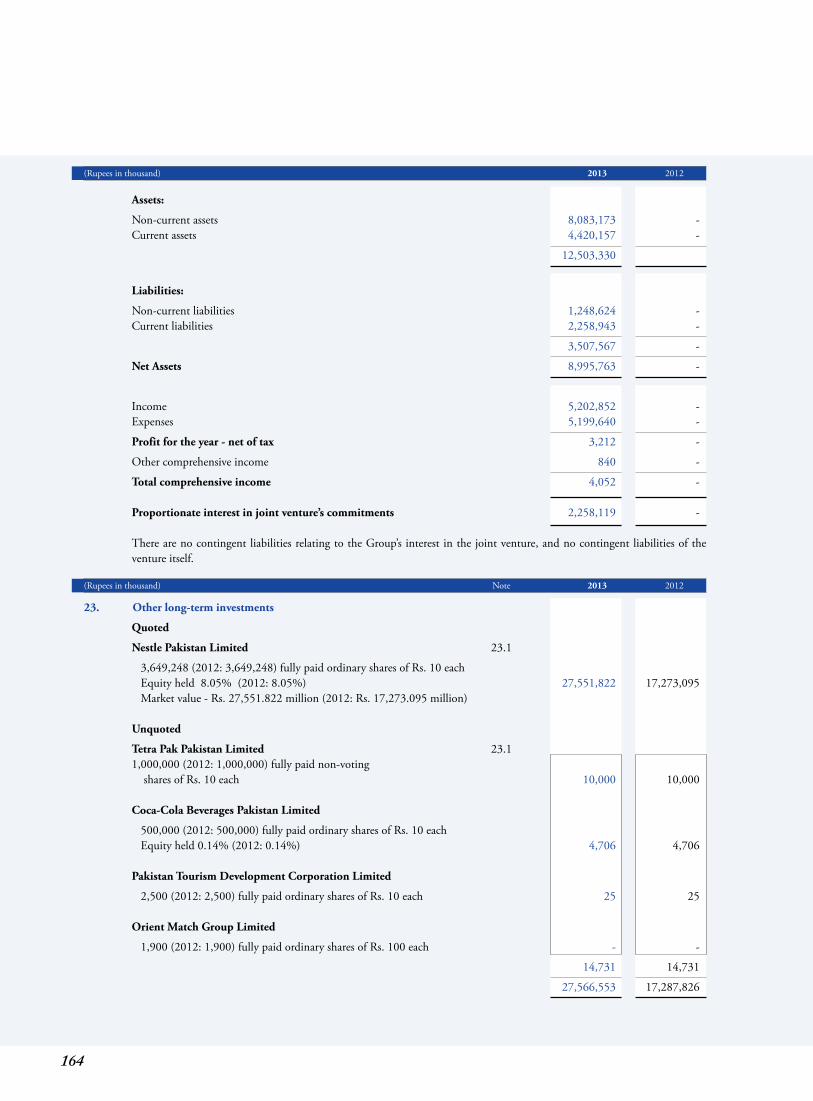
164
(Rupees in thousand) 2013 2012
Assets:
Non-current assets 8,083,173 - Current assets 4,420,157 -
12,503,330
Liabilities:
Non-current liabilities 1,248,624 - Current liabilities 2,258,943 -
3,507,567 -
Net Assets 8,995,763 -
Income 5,202,852 - Expenses 5,199,640 -
Profit for the year - net of tax 3,212 -
Other comprehensive income 840 -
Total comprehensive income 4,052 - Proportionate interest in joint venture’s commitments 2,258,119 - There are no contingent liabilities relating to the Group’s interest in the joint venture, and no contingent liabilities of the
venture itself.
(Rupees in thousand) Note 2013 2012
23. Other long-term investments
Quoted
Nestle Pakistan Limited 23.1
3,649,248 (2012: 3,649,248) fully paid ordinary shares of Rs. 10 each Equity held 8.05% (2012: 8.05%) 27,551,822 17,273,095 Market value - Rs. 27,551.822 million (2012: Rs. 17,273.095 million) Unquoted
Tetra Pak Pakistan Limited 23.1 1,000,000 (2012: 1,000,000) fully paid non-voting shares of Rs. 10 each 10,000 10,000 Coca-Cola Beverages Pakistan Limited
500,000 (2012: 500,000) fully paid ordinary shares of Rs. 10 each Equity held 0.14% (2012: 0.14%) 4,706 4,706 Pakistan Tourism Development Corporation Limited
2,500 (2012: 2,500) fully paid ordinary shares of Rs. 10 each 25 25 Orient Match Group Limited
1,900 (2012: 1,900) fully paid ordinary shares of Rs. 100 each - -
14,731 14,731
27,566,553 17,287,826
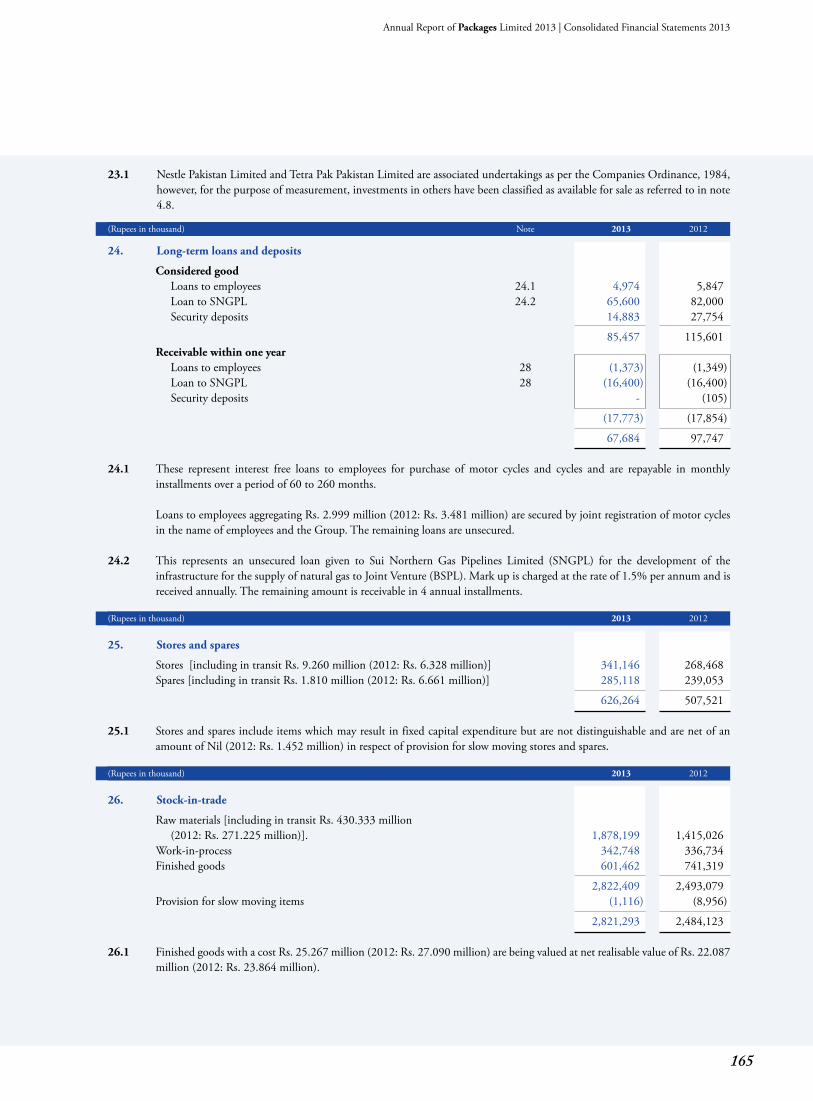
165
Annual Report of Packages Limited 2013 | Consolidated Financial Statements 2013
23.1 Nestle Pakistan Limited and Tetra Pak Pakistan Limited are associated undertakings as per the Companies Ordinance, 1984, however, for the purpose of measurement, investments in others have been classified as available for sale as referred to in note 4.8.
(Rupees in thousand) Note 2013 2012
24. Long-term loans and deposits
Considered good Loans to employees 24.1 4,974 5,847 Loan to SNGPL 24.2 65,600 82,000 Security deposits 14,883 27,754
85,457 115,601 Receivable within one year Loans to employees 28 (1,373) (1,349) Loan to SNGPL 28 (16,400) (16,400) Security deposits - (105)
(17,773) (17,854)
67,684 97,747 24.1 These represent interest free loans to employees for purchase of motor cycles and cycles and are repayable in monthly
installments over a period of 60 to 260 months. Loans to employees aggregating Rs. 2.999 million (2012: Rs. 3.481 million) are secured by joint registration of motor cycles
in the name of employees and the Group. The remaining loans are unsecured. 24.2 This represents an unsecured loan given to Sui Northern Gas Pipelines Limited (SNGPL) for the development of the
infrastructure for the supply of natural gas to Joint Venture (BSPL). Mark up is charged at the rate of 1.5% per annum and is received annually. The remaining amount is receivable in 4 annual installments.
(Rupees in thousand) 2013 2012
25. Stores and spares
Stores [including in transit Rs. 9.260 million (2012: Rs. 6.328 million)] 341,146 268,468 Spares [including in transit Rs. 1.810 million (2012: Rs. 6.661 million)] 285,118 239,053
626,264 507,521 25.1 Stores and spares include items which may result in fixed capital expenditure but are not distinguishable and are net of an
amount of Nil (2012: Rs. 1.452 million) in respect of provision for slow moving stores and spares. (Rupees in thousand) 2013 2012
26. Stock-in-trade
Raw materials [including in transit Rs. 430.333 million (2012: Rs. 271.225 million)]. 1,878,199 1,415,026 Work-in-process 342,748 336,734 Finished goods 601,462 741,319
2,822,409 2,493,079 Provision for slow moving items (1,116) (8,956)
2,821,293 2,484,123 26.1 Finished goods with a cost Rs. 25.267 million (2012: Rs. 27.090 million) are being valued at net realisable value of Rs. 22.087
million (2012: Rs. 23.864 million).
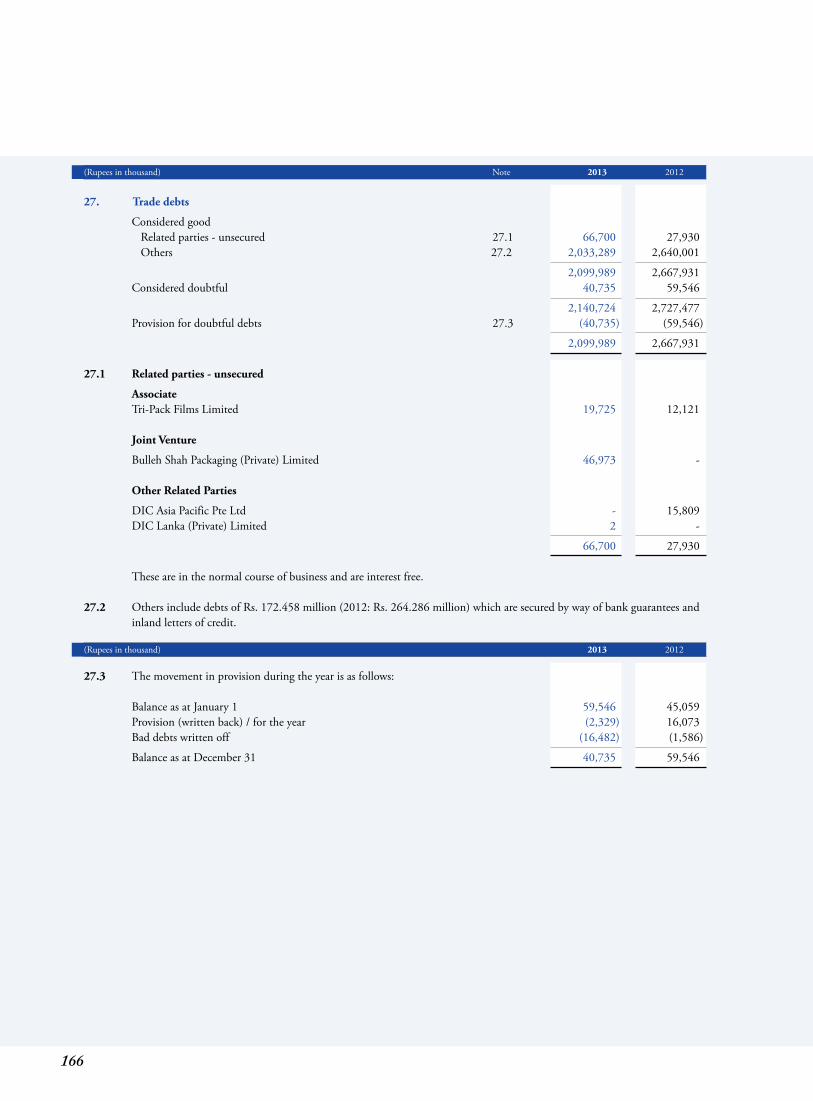
166
(Rupees in thousand) Note 2013 2012
27. Trade debts
Considered good Related parties - unsecured 27.1 66,700 27,930 Others 27.2 2,033,289 2,640,001
2,099,989 2,667,931 Considered doubtful 40,735 59,546
2,140,724 2,727,477 Provision for doubtful debts 27.3 (40,735) (59,546)
2,099,989 2,667,931 27.1 Related parties - unsecured
Associate Tri-Pack Films Limited 19,725 12,121 Joint Venture
Bulleh Shah Packaging (Private) Limited 46,973 - Other Related Parties
DIC Asia Pacific Pte Ltd - 15,809 DIC Lanka (Private) Limited 2 -
66,700 27,930 These are in the normal course of business and are interest free. 27.2 Others include debts of Rs. 172.458 million (2012: Rs. 264.286 million) which are secured by way of bank guarantees and
inland letters of credit. (Rupees in thousand) 2013 2012
27.3 The movement in provision during the year is as follows: Balance as at January 1 59,546 45,059 Provision (written back) / for the year (2,329) 16,073 Bad debts written off (16,482) (1,586)
Balance as at December 31 40,735 59,546
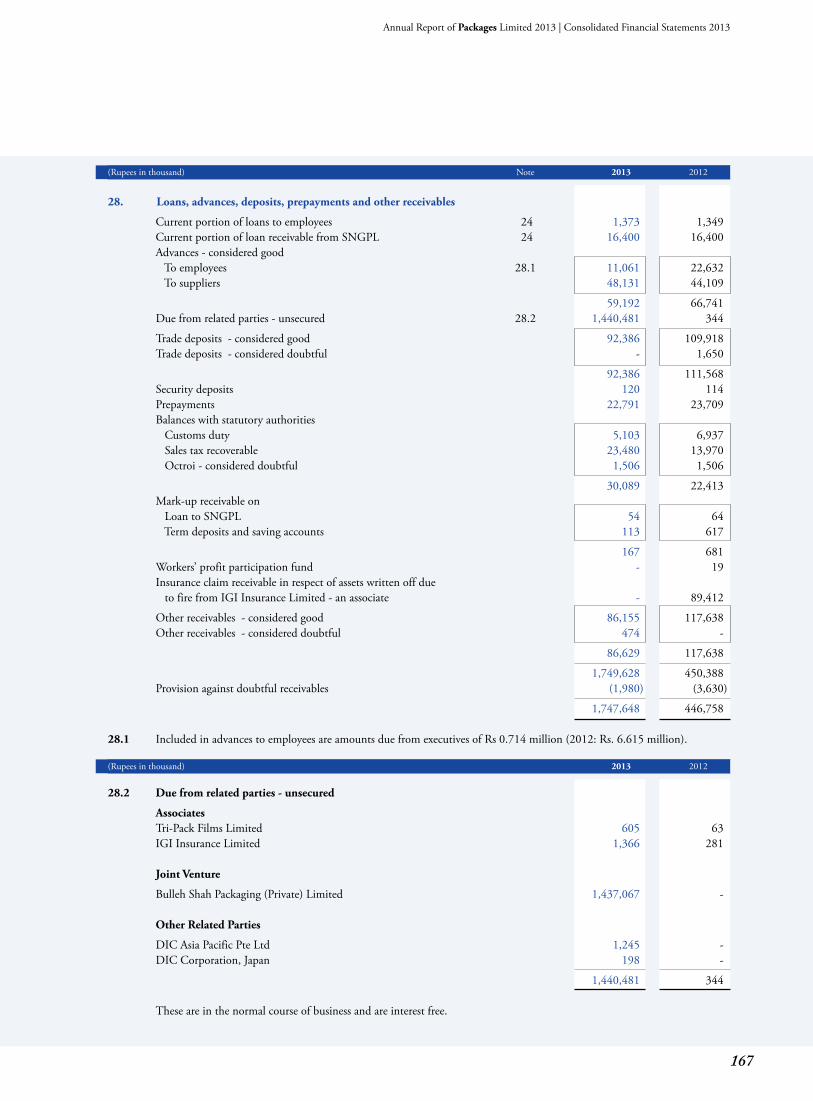
167
Annual Report of Packages Limited 2013 | Consolidated Financial Statements 2013
(Rupees in thousand) Note 2013 2012
28. Loans, advances, deposits, prepayments and other receivables
Current portion of loans to employees 24 1,373 1,349 Current portion of loan receivable from SNGPL 24 16,400 16,400 Advances - considered good To employees 28.1 11,061 22,632 To suppliers 48,131 44,109
59,192 66,741 Due from related parties - unsecured 28.2 1,440,481 344
Trade deposits - considered good 92,386 109,918 Trade deposits - considered doubtful - 1,650
92,386 111,568 Security deposits 120 114 Prepayments 22,791 23,709 Balances with statutory authorities Customs duty 5,103 6,937 Sales tax recoverable 23,480 13,970 Octroi - considered doubtful 1,506 1,506
30,089 22,413 Mark-up receivable on Loan to SNGPL 54 64 Term deposits and saving accounts 113 617
167 681 Workers’ profit participation fund - 19 Insurance claim receivable in respect of assets written off due to fire from IGI Insurance Limited - an associate - 89,412
Other receivables - considered good 86,155 117,638 Other receivables - considered doubtful 474 -
86,629 117,638
1,749,628 450,388 Provision against doubtful receivables (1,980) (3,630)
1,747,648 446,758 28.1 Included in advances to employees are amounts due from executives of Rs 0.714 million (2012: Rs. 6.615 million).
(Rupees in thousand) 2013 2012
28.2 Due from related parties - unsecured
Associates Tri-Pack Films Limited 605 63 IGI Insurance Limited 1,366 281 Joint Venture
Bulleh Shah Packaging (Private) Limited 1,437,067 - Other Related Parties
DIC Asia Pacific Pte Ltd 1,245 - DIC Corporation, Japan 198 -
1,440,481 344 These are in the normal course of business and are interest free.
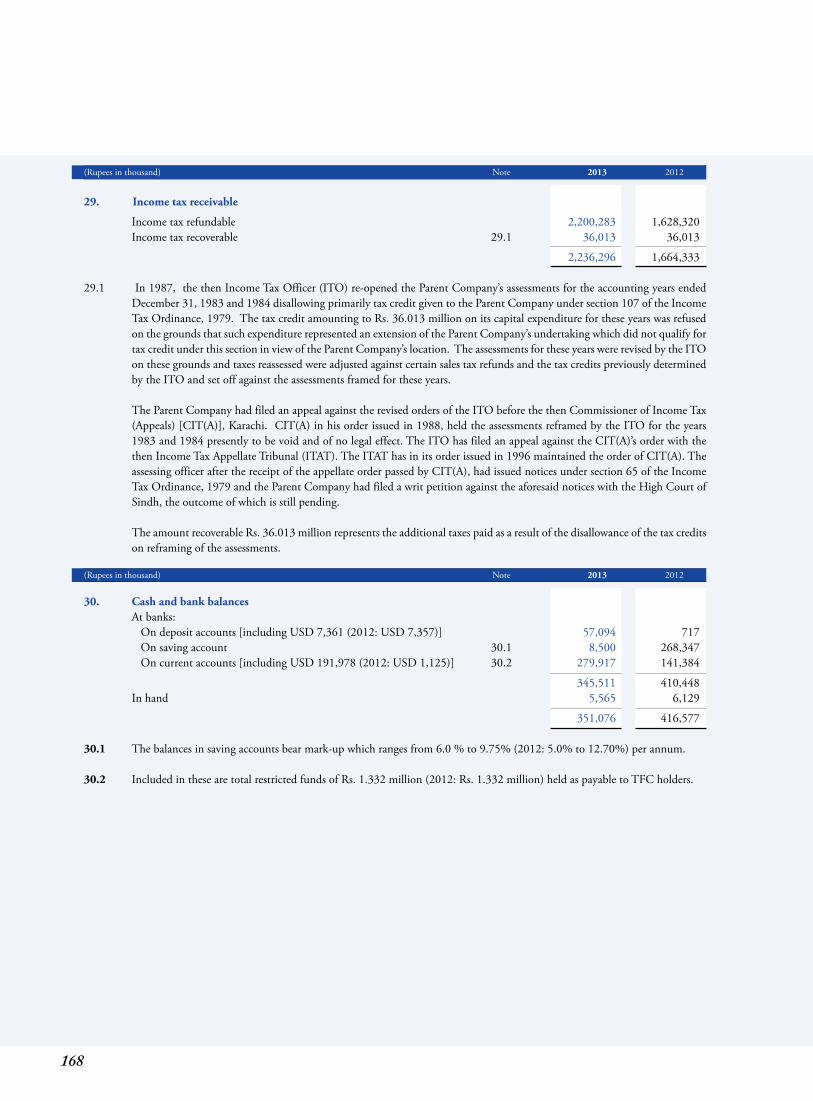
168
(Rupees in thousand) Note 2013 2012
29. Income tax receivable
Income tax refundable 2,200,283 1,628,320 Income tax recoverable 29.1 36,013 36,013
2,236,296 1,664,333 29.1 In 1987, the then Income Tax Officer (ITO) re-opened the Parent Company’s assessments for the accounting years ended
December 31, 1983 and 1984 disallowing primarily tax credit given to the Parent Company under section 107 of the Income Tax Ordinance, 1979. The tax credit amounting to Rs. 36.013 million on its capital expenditure for these years was refused on the grounds that such expenditure represented an extension of the Parent Company’s undertaking which did not qualify for tax credit under this section in view of the Parent Company’s location. The assessments for these years were revised by the ITO on these grounds and taxes reassessed were adjusted against certain sales tax refunds and the tax credits previously determined by the ITO and set off against the assessments framed for these years.
The Parent Company had filed an appeal against the revised orders of the ITO before the then Commissioner of Income Tax
(Appeals) [CIT(A)], Karachi. CIT(A) in his order issued in 1988, held the assessments reframed by the ITO for the years 1983 and 1984 presently to be void and of no legal effect. The ITO has filed an appeal against the CIT(A)’s order with the then Income Tax Appellate Tribunal (ITAT). The ITAT has in its order issued in 1996 maintained the order of CIT(A). The assessing officer after the receipt of the appellate order passed by CIT(A), had issued notices under section 65 of the Income Tax Ordinance, 1979 and the Parent Company had filed a writ petition against the aforesaid notices with the High Court of Sindh, the outcome of which is still pending.
The amount recoverable Rs. 36.013 million represents the additional taxes paid as a result of the disallowance of the tax credits
on reframing of the assessments. (Rupees in thousand) Note 2013 2012
30. Cash and bank balances At banks: On deposit accounts [including USD 7,361 (2012: USD 7,357)] 57,094 717 On saving account 30.1 8,500 268,347 On current accounts [including USD 191,978 (2012: USD 1,125)] 30.2 279,917 141,384
345,511 410,448 In hand 5,565 6,129
351,076 416,577 30.1 The balances in saving accounts bear mark-up which ranges from 6.0 % to 9.75% (2012: 5.0% to 12.70%) per annum. 30.2 Included in these are total restricted funds of Rs. 1.332 million (2012: Rs. 1.332 million) held as payable to TFC holders.
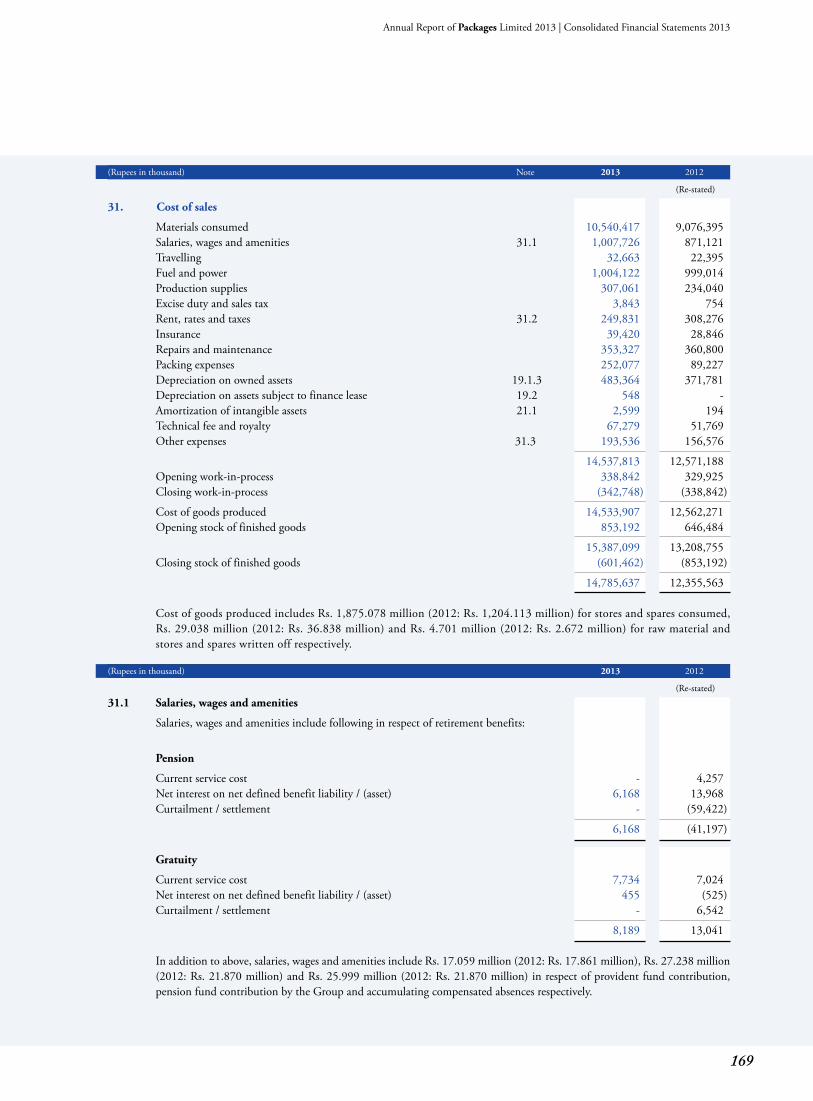
169
Annual Report of Packages Limited 2013 | Consolidated Financial Statements 2013
(Rupees in thousand) Note 2013 2012
(Re-stated)
31. Cost of sales
Materials consumed 10,540,417 9,076,395 Salaries, wages and amenities 31.1 1,007,726 871,121 Travelling 32,663 22,395 Fuel and power 1,004,122 999,014 Production supplies 307,061 234,040 Excise duty and sales tax 3,843 754 Rent, rates and taxes 31.2 249,831 308,276 Insurance 39,420 28,846 Repairs and maintenance 353,327 360,800 Packing expenses 252,077 89,227 Depreciation on owned assets 19.1.3 483,364 371,781 Depreciation on assets subject to finance lease 19.2 548 - Amortization of intangible assets 21.1 2,599 194 Technical fee and royalty 67,279 51,769 Other expenses 31.3 193,536 156,576
14,537,813 12,571,188 Opening work-in-process 338,842 329,925 Closing work-in-process (342,748) (338,842)
Cost of goods produced 14,533,907 12,562,271 Opening stock of finished goods 853,192 646,484
15,387,099 13,208,755 Closing stock of finished goods (601,462) (853,192)
14,785,637 12,355,563 Cost of goods produced includes Rs. 1,875.078 million (2012: Rs. 1,204.113 million) for stores and spares consumed,
Rs. 29.038 million (2012: Rs. 36.838 million) and Rs. 4.701 million (2012: Rs. 2.672 million) for raw material and stores and spares written off respectively.
(Rupees in thousand) 2013 2012
(Re-stated)
31.1 Salaries, wages and amenities
Salaries, wages and amenities include following in respect of retirement benefits:
Pension
Current service cost - 4,257 Net interest on net defined benefit liability / (asset) 6,168 13,968 Curtailment / settlement - (59,422)
6,168 (41,197)
Gratuity
Current service cost 7,734 7,024 Net interest on net defined benefit liability / (asset) 455 (525) Curtailment / settlement - 6,542
8,189 13,041 In addition to above, salaries, wages and amenities include Rs. 17.059 million (2012: Rs. 17.861 million), Rs. 27.238 million
(2012: Rs. 21.870 million) and Rs. 25.999 million (2012: Rs. 21.870 million) in respect of provident fund contribution, pension fund contribution by the Group and accumulating compensated absences respectively.
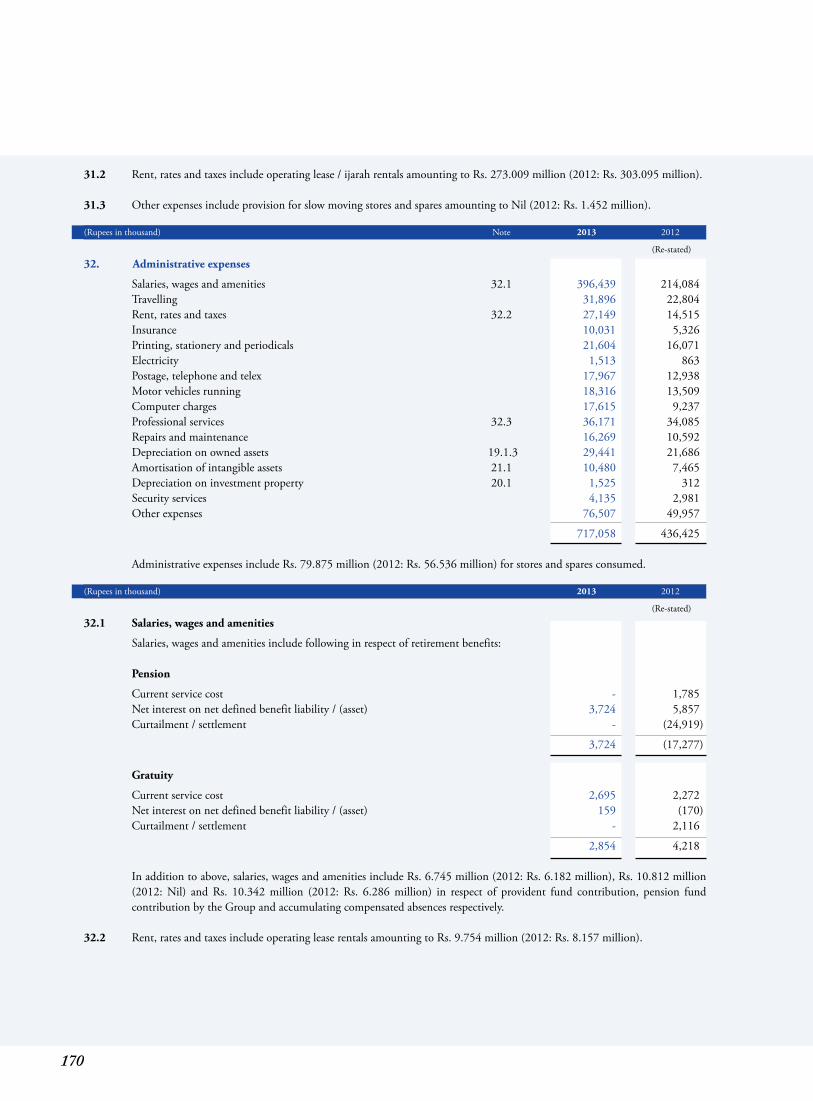
170
31.2 Rent, rates and taxes include operating lease / ijarah rentals amounting to Rs. 273.009 million (2012: Rs. 303.095 million). 31.3 Other expenses include provision for slow moving stores and spares amounting to Nil (2012: Rs. 1.452 million). (Rupees in thousand) Note 2013 2012
(Re-stated)
32. Administrative expenses
Salaries, wages and amenities 32.1 396,439 214,084 Travelling 31,896 22,804 Rent, rates and taxes 32.2 27,149 14,515 Insurance 10,031 5,326 Printing, stationery and periodicals 21,604 16,071 Electricity 1,513 863 Postage, telephone and telex 17,967 12,938 Motor vehicles running 18,316 13,509 Computer charges 17,615 9,237 Professional services 32.3 36,171 34,085 Repairs and maintenance 16,269 10,592 Depreciation on owned assets 19.1.3 29,441 21,686 Amortisation of intangible assets 21.1 10,480 7,465 Depreciation on investment property 20.1 1,525 312 Security services 4,135 2,981 Other expenses 76,507 49,957
717,058 436,425 Administrative expenses include Rs. 79.875 million (2012: Rs. 56.536 million) for stores and spares consumed. (Rupees in thousand) 2013 2012
(Re-stated)
32.1 Salaries, wages and amenities
Salaries, wages and amenities include following in respect of retirement benefits: Pension
Current service cost - 1,785 Net interest on net defined benefit liability / (asset) 3,724 5,857 Curtailment / settlement - (24,919)
3,724 (17,277)
Gratuity
Current service cost 2,695 2,272 Net interest on net defined benefit liability / (asset) 159 (170) Curtailment / settlement - 2,116
2,854 4,218
In addition to above, salaries, wages and amenities include Rs. 6.745 million (2012: Rs. 6.182 million), Rs. 10.812 million (2012: Nil) and Rs. 10.342 million (2012: Rs. 6.286 million) in respect of provident fund contribution, pension fund contribution by the Group and accumulating compensated absences respectively.
32.2 Rent, rates and taxes include operating lease rentals amounting to Rs. 9.754 million (2012: Rs. 8.157 million).
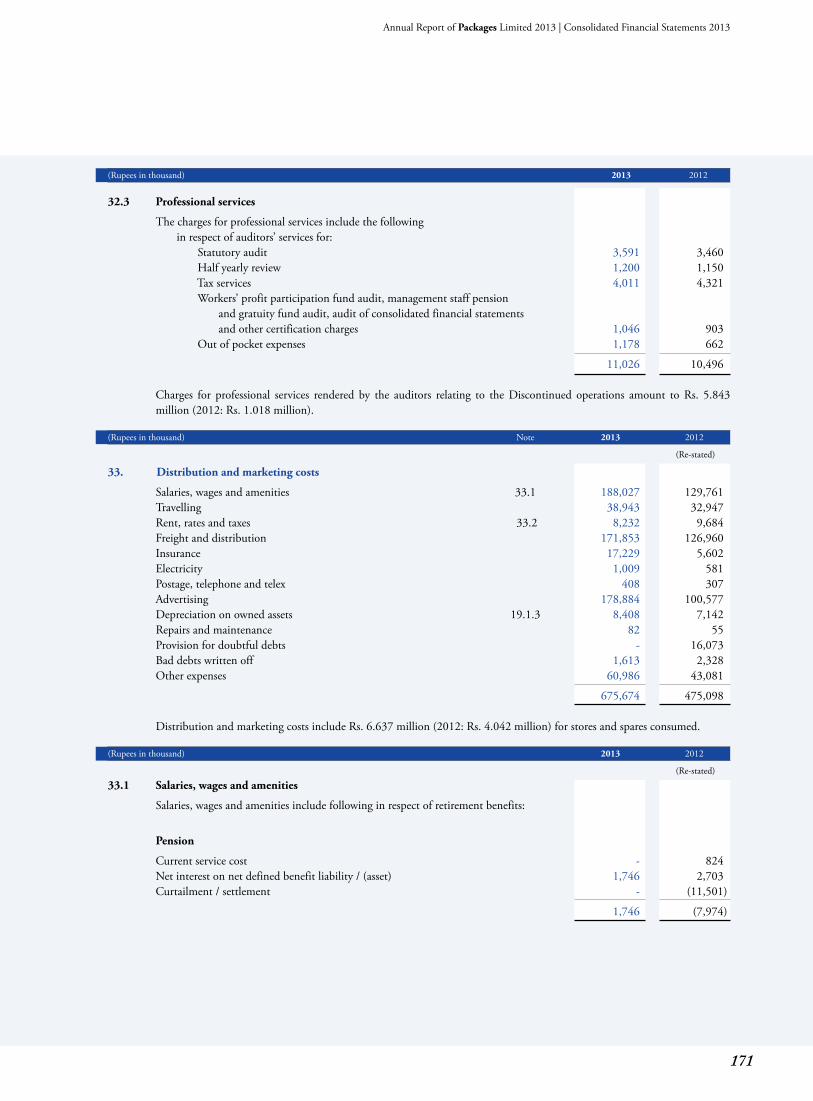
171
Annual Report of Packages Limited 2013 | Consolidated Financial Statements 2013
(Rupees in thousand) 2013 2012
32.3 Professional services
The charges for professional services include the following in respect of auditors’ services for: Statutory audit 3,591 3,460 Half yearly review 1,200 1,150 Tax services 4,011 4,321 Workers’ profit participation fund audit, management staff pension and gratuity fund audit, audit of consolidated financial statements and other certification charges 1,046 903 Out of pocket expenses 1,178 662
11,026 10,496 Charges for professional services rendered by the auditors relating to the Discontinued operations amount to Rs. 5.843
million (2012: Rs. 1.018 million). (Rupees in thousand) Note 2013 2012
(Re-stated)
33. Distribution and marketing costs
Salaries, wages and amenities 33.1 188,027 129,761 Travelling 38,943 32,947 Rent, rates and taxes 33.2 8,232 9,684 Freight and distribution 171,853 126,960 Insurance 17,229 5,602 Electricity 1,009 581 Postage, telephone and telex 408 307 Advertising 178,884 100,577 Depreciation on owned assets 19.1.3 8,408 7,142 Repairs and maintenance 82 55 Provision for doubtful debts - 16,073 Bad debts written off 1,613 2,328 Other expenses 60,986 43,081
675,674 475,098 Distribution and marketing costs include Rs. 6.637 million (2012: Rs. 4.042 million) for stores and spares consumed.
(Rupees in thousand) 2013 2012
(Re-stated)
33.1 Salaries, wages and amenities
Salaries, wages and amenities include following in respect of retirement benefits:
Pension
Current service cost - 824 Net interest on net defined benefit liability / (asset) 1,746 2,703 Curtailment / settlement - (11,501)
1,746 (7,974)
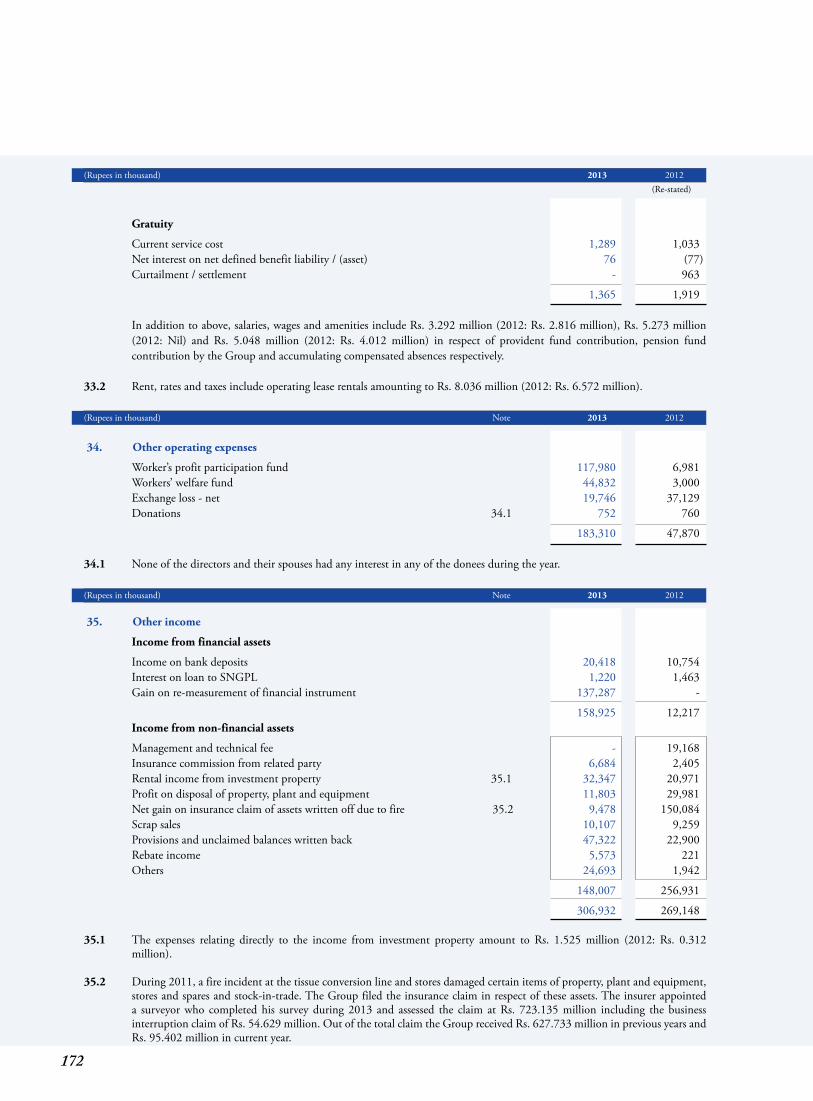
172
(Rupees in thousand) 2013 2012 (Re-stated)
Gratuity
Current service cost 1,289 1,033 Net interest on net defined benefit liability / (asset) 76 (77) Curtailment / settlement - 963
1,365 1,919 In addition to above, salaries, wages and amenities include Rs. 3.292 million (2012: Rs. 2.816 million), Rs. 5.273 million
(2012: Nil) and Rs. 5.048 million (2012: Rs. 4.012 million) in respect of provident fund contribution, pension fund contribution by the Group and accumulating compensated absences respectively.
33.2 Rent, rates and taxes include operating lease rentals amounting to Rs. 8.036 million (2012: Rs. 6.572 million). (Rupees in thousand) Note 2013 2012
34. Other operating expenses
Worker’s profit participation fund 117,980 6,981 Workers’ welfare fund 44,832 3,000 Exchange loss - net 19,746 37,129 Donations 34.1 752 760
183,310 47,870 34.1 None of the directors and their spouses had any interest in any of the donees during the year. (Rupees in thousand) Note 2013 2012
35. Other income
Income from financial assets
Income on bank deposits 20,418 10,754 Interest on loan to SNGPL 1,220 1,463 Gain on re-measurement of financial instrument 137,287 -
158,925 12,217 Income from non-financial assets
Management and technical fee - 19,168 Insurance commission from related party 6,684 2,405 Rental income from investment property 35.1 32,347 20,971 Profit on disposal of property, plant and equipment 11,803 29,981 Net gain on insurance claim of assets written off due to fire 35.2 9,478 150,084 Scrap sales 10,107 9,259 Provisions and unclaimed balances written back 47,322 22,900 Rebate income 5,573 221 Others 24,693 1,942
148,007 256,931
306,932 269,148
35.1 The expenses relating directly to the income from investment property amount to Rs. 1.525 million (2012: Rs. 0.312 million).
35.2 During 2011, a fire incident at the tissue conversion line and stores damaged certain items of property, plant and equipment,
stores and spares and stock-in-trade. The Group filed the insurance claim in respect of these assets. The insurer appointed a surveyor who completed his survey during 2013 and assessed the claim at Rs. 723.135 million including the business interruption claim of Rs. 54.629 million. Out of the total claim the Group received Rs. 627.733 million in previous years and Rs. 95.402 million in current year.
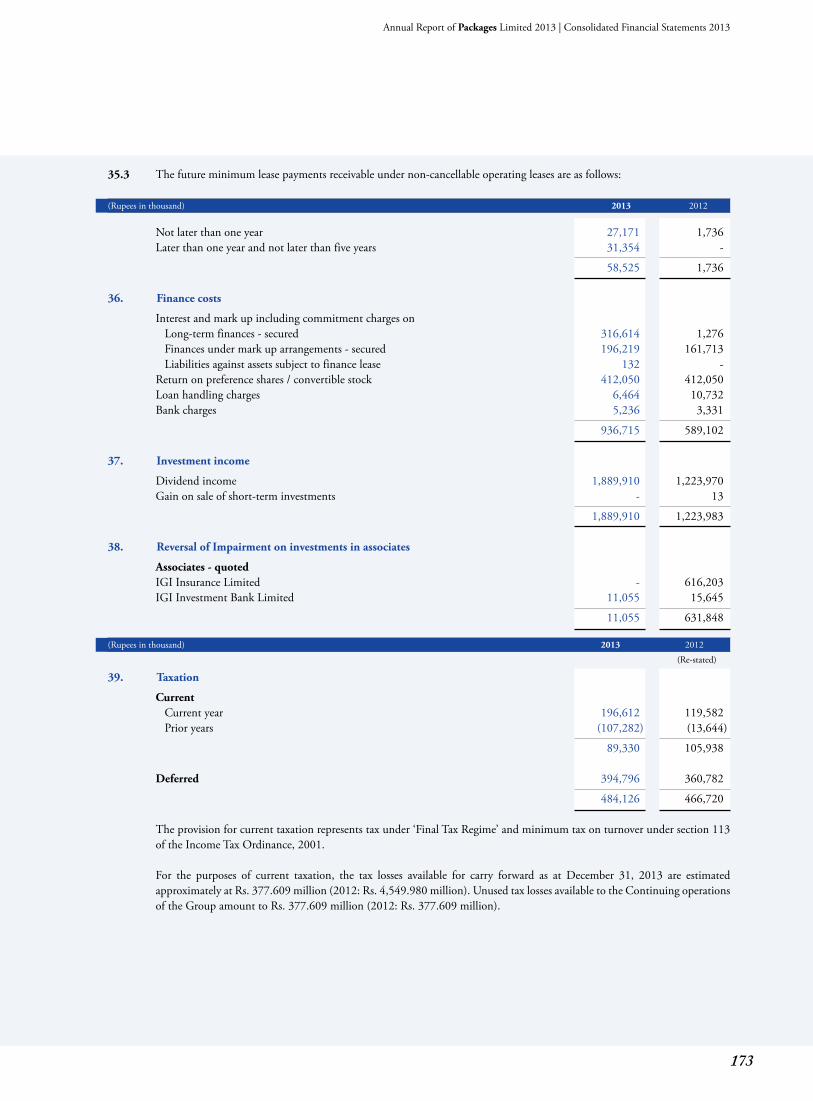
173
Annual Report of Packages Limited 2013 | Consolidated Financial Statements 2013
35.3 The future minimum lease payments receivable under non-cancellable operating leases are as follows: (Rupees in thousand) 2013 2012
Not later than one year 27,171 1,736 Later than one year and not later than five years 31,354 -
58,525 1,736
36. Finance costs
Interest and mark up including commitment charges on Long-term finances - secured 316,614 1,276 Finances under mark up arrangements - secured 196,219 161,713 Liabilities against assets subject to finance lease 132 - Return on preference shares / convertible stock 412,050 412,050 Loan handling charges 6,464 10,732 Bank charges 5,236 3,331
936,715 589,102 37. Investment income
Dividend income 1,889,910 1,223,970 Gain on sale of short-term investments - 13
1,889,910 1,223,983 38. Reversal of Impairment on investments in associates
Associates - quoted IGI Insurance Limited - 616,203 IGI Investment Bank Limited 11,055 15,645
11,055 631,848
(Rupees in thousand) 2013 2012
(Re-stated)
39. Taxation
Current Current year 196,612 119,582 Prior years (107,282) (13,644)
89,330 105,938 Deferred 394,796 360,782
484,126 466,720
The provision for current taxation represents tax under ‘Final Tax Regime’ and minimum tax on turnover under section 113 of the Income Tax Ordinance, 2001.
For the purposes of current taxation, the tax losses available for carry forward as at December 31, 2013 are estimated
approximately at Rs. 377.609 million (2012: Rs. 4,549.980 million). Unused tax losses available to the Continuing operations of the Group amount to Rs. 377.609 million (2012: Rs. 377.609 million).
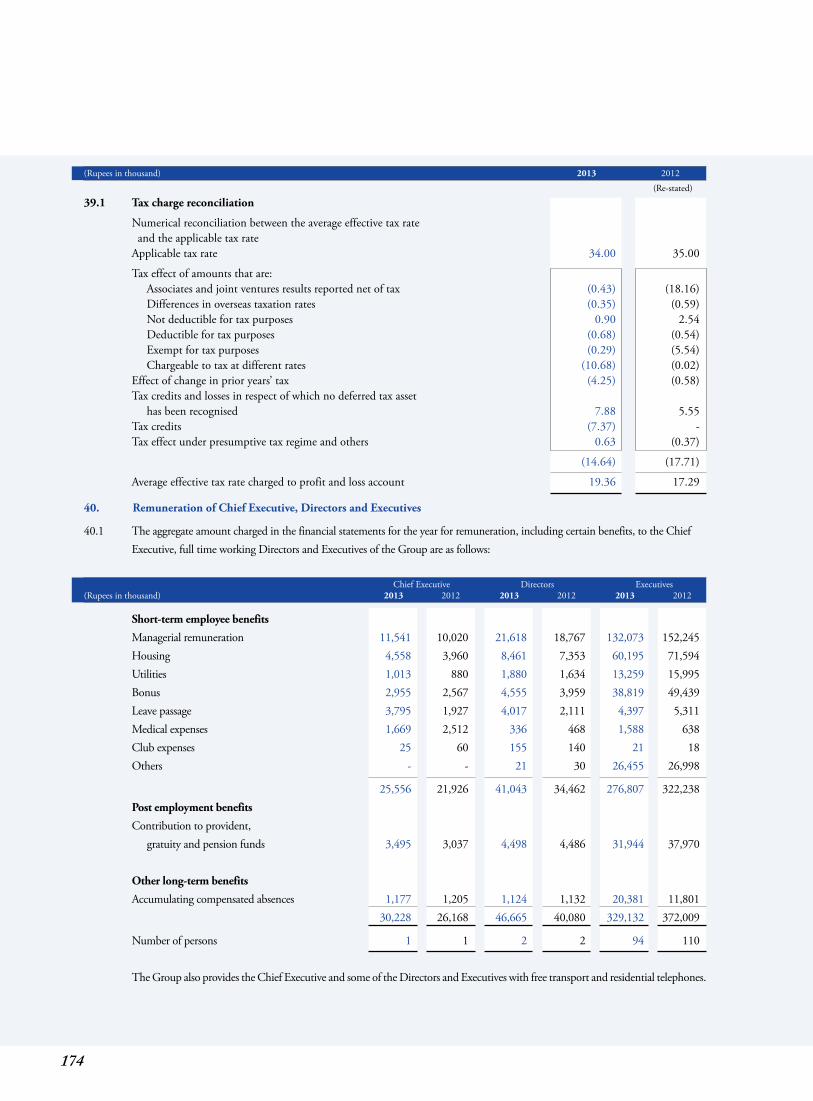
174
(Rupees in thousand) 2013 2012
(Re-stated)
39.1 Tax charge reconciliation
Numerical reconciliation between the average effective tax rate and the applicable tax rate Applicable tax rate 34.00 35.00
Tax effect of amounts that are: Associates and joint ventures results reported net of tax (0.43) (18.16) Differences in overseas taxation rates (0.35) (0.59) Not deductible for tax purposes 0.90 2.54 Deductible for tax purposes (0.68) (0.54) Exempt for tax purposes (0.29) (5.54) Chargeable to tax at different rates (10.68) (0.02) Effect of change in prior years’ tax (4.25) (0.58) Tax credits and losses in respect of which no deferred tax asset has been recognised 7.88 5.55 Tax credits (7.37) - Tax effect under presumptive tax regime and others 0.63 (0.37)
(14.64) (17.71)
Average effective tax rate charged to profit and loss account 19.36 17.29
40. Remuneration of Chief Executive, Directors and Executives
40.1 The aggregate amount charged in the financial statements for the year for remuneration, including certain benefits, to the Chief Executive, full time working Directors and Executives of the Group are as follows: Chief Executive Directors Executives (Rupees in thousand) 2013 2012 2013 2012 2013 2012
Short-term employee benefits
Managerial remuneration 11,541 10,020 21,618 18,767 132,073 152,245 Housing 4,558 3,960 8,461 7,353 60,195 71,594 Utilities 1,013 880 1,880 1,634 13,259 15,995 Bonus 2,955 2,567 4,555 3,959 38,819 49,439 Leave passage 3,795 1,927 4,017 2,111 4,397 5,311 Medical expenses 1,669 2,512 336 468 1,588 638 Club expenses 25 60 155 140 21 18 Others - - 21 30 26,455 26,998
25,556 21,926 41,043 34,462 276,807 322,238 Post employment benefits
Contribution to provident, gratuity and pension funds 3,495 3,037 4,498 4,486 31,944 37,970 Other long-term benefits
Accumulating compensated absences 1,177 1,205 1,124 1,132 20,381 11,801 30,228 26,168 46,665 40,080 329,132 372,009
Number of persons 1 1 2 2 94 110 The Group also provides the Chief Executive and some of the Directors and Executives with free transport and residential telephones.
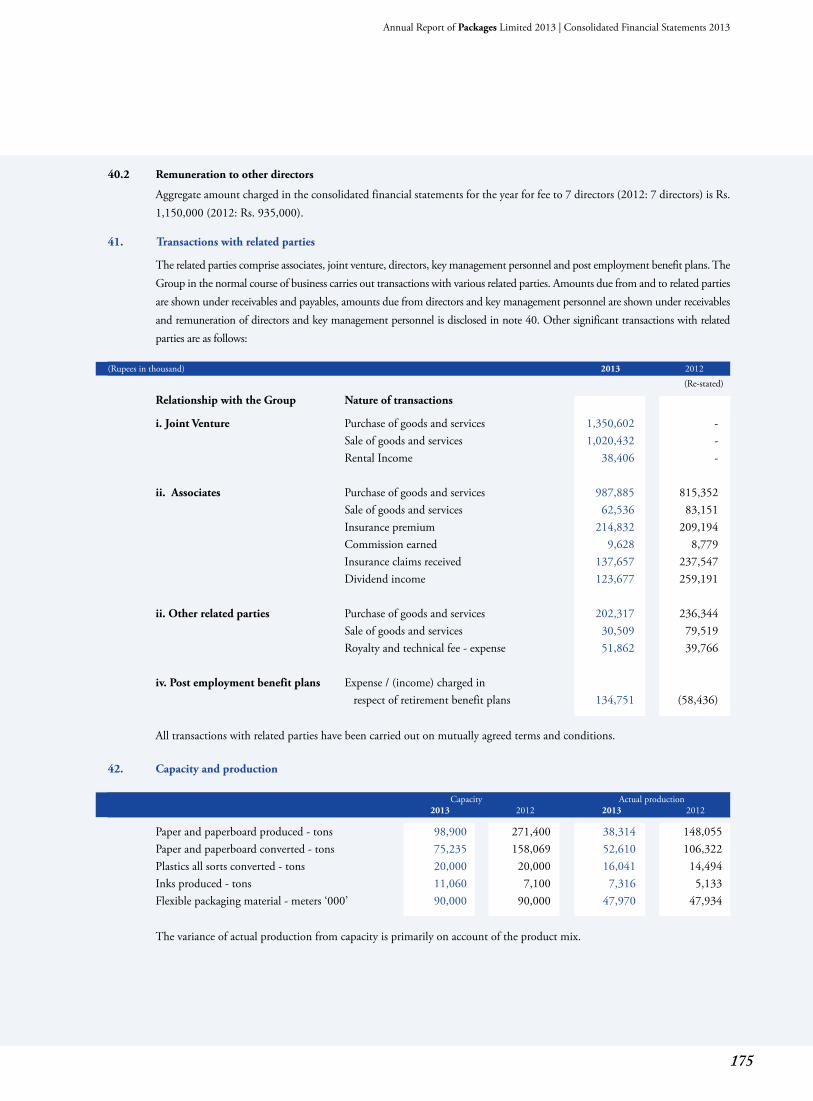
175
Annual Report of Packages Limited 2013 | Consolidated Financial Statements 2013
40.2 Remuneration to other directors
Aggregate amount charged in the consolidated financial statements for the year for fee to 7 directors (2012: 7 directors) is Rs. 1,150,000 (2012: Rs. 935,000).
41. Transactions with related parties
The related parties comprise associates, joint venture, directors, key management personnel and post employment benefit plans. The Group in the normal course of business carries out transactions with various related parties. Amounts due from and to related parties are shown under receivables and payables, amounts due from directors and key management personnel are shown under receivables and remuneration of directors and key management personnel is disclosed in note 40. Other significant transactions with related parties are as follows:
(Rupees in thousand) 2013 2012
(Re-stated)
Relationship with the Group Nature of transactions
i. Joint Venture Purchase of goods and services 1,350,602 - Sale of goods and services 1,020,432 - Rental Income 38,406 -
ii. Associates Purchase of goods and services 987,885 815,352 Sale of goods and services 62,536 83,151 Insurance premium 214,832 209,194 Commission earned 9,628 8,779 Insurance claims received 137,657 237,547 Dividend income 123,677 259,191 ii. Other related parties Purchase of goods and services 202,317 236,344 Sale of goods and services 30,509 79,519 Royalty and technical fee - expense 51,862 39,766 iv. Post employment benefit plans Expense / (income) charged in respect of retirement benefit plans 134,751 (58,436) All transactions with related parties have been carried out on mutually agreed terms and conditions. 42. Capacity and production
Capacity Actual production 2013 2012 2013 2012
Paper and paperboard produced - tons 98,900 271,400 38,314 148,055 Paper and paperboard converted - tons 75,235 158,069 52,610 106,322 Plastics all sorts converted - tons 20,000 20,000 16,041 14,494 Inks produced - tons 11,060 7,100 7,316 5,133 Flexible packaging material - meters ‘000’ 90,000 90,000 47,970 47,934 The variance of actual production from capacity is primarily on account of the product mix.
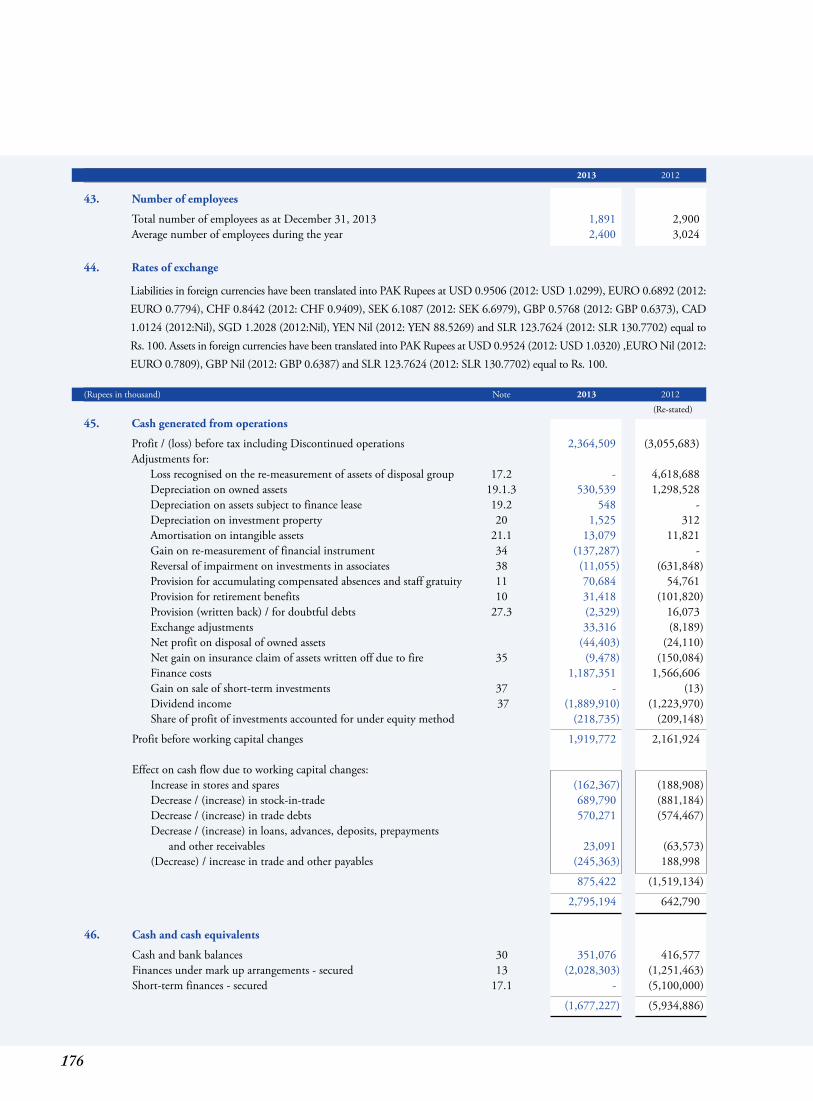
176
2013 2012
43. Number of employees
Total number of employees as at December 31, 2013 1,891 2,900 Average number of employees during the year 2,400 3,024 44. Rates of exchange
Liabilities in foreign currencies have been translated into PAK Rupees at USD 0.9506 (2012: USD 1.0299), EURO 0.6892 (2012: EURO 0.7794), CHF 0.8442 (2012: CHF 0.9409), SEK 6.1087 (2012: SEK 6.6979), GBP 0.5768 (2012: GBP 0.6373), CAD 1.0124 (2012:Nil), SGD 1.2028 (2012:Nil), YEN Nil (2012: YEN 88.5269) and SLR 123.7624 (2012: SLR 130.7702) equal to Rs. 100. Assets in foreign currencies have been translated into PAK Rupees at USD 0.9524 (2012: USD 1.0320) ,EURO Nil (2012: EURO 0.7809), GBP Nil (2012: GBP 0.6387) and SLR 123.7624 (2012: SLR 130.7702) equal to Rs. 100.
(Rupees in thousand) Note 2013 2012
(Re-stated)
45. Cash generated from operations
Profit / (loss) before tax including Discontinued operations 2,364,509 (3,055,683) Adjustments for: Loss recognised on the re-measurement of assets of disposal group 17.2 - 4,618,688 Depreciation on owned assets 19.1.3 530,539 1,298,528 Depreciation on assets subject to finance lease 19.2 548 - Depreciation on investment property 20 1,525 312 Amortisation on intangible assets 21.1 13,079 11,821 Gain on re-measurement of financial instrument 34 (137,287) - Reversal of impairment on investments in associates 38 (11,055) (631,848) Provision for accumulating compensated absences and staff gratuity 11 70,684 54,761 Provision for retirement benefits 10 31,418 (101,820) Provision (written back) / for doubtful debts 27.3 (2,329) 16,073 Exchange adjustments 33,316 (8,189) Net profit on disposal of owned assets (44,403) (24,110) Net gain on insurance claim of assets written off due to fire 35 (9,478) (150,084) Finance costs 1,187,351 1,566,606 Gain on sale of short-term investments 37 - (13) Dividend income 37 (1,889,910) (1,223,970) Share of profit of investments accounted for under equity method (218,735) (209,148)
Profit before working capital changes 1,919,772 2,161,924 Effect on cash flow due to working capital changes: Increase in stores and spares (162,367) (188,908) Decrease / (increase) in stock-in-trade 689,790 (881,184) Decrease / (increase) in trade debts 570,271 (574,467) Decrease / (increase) in loans, advances, deposits, prepayments and other receivables 23,091 (63,573) (Decrease) / increase in trade and other payables (245,363) 188,998
875,422 (1,519,134)
2,795,194 642,790 46. Cash and cash equivalents
Cash and bank balances 30 351,076 416,577 Finances under mark up arrangements - secured 13 (2,028,303) (1,251,463) Short-term finances - secured 17.1 - (5,100,000)
(1,677,227) (5,934,886)
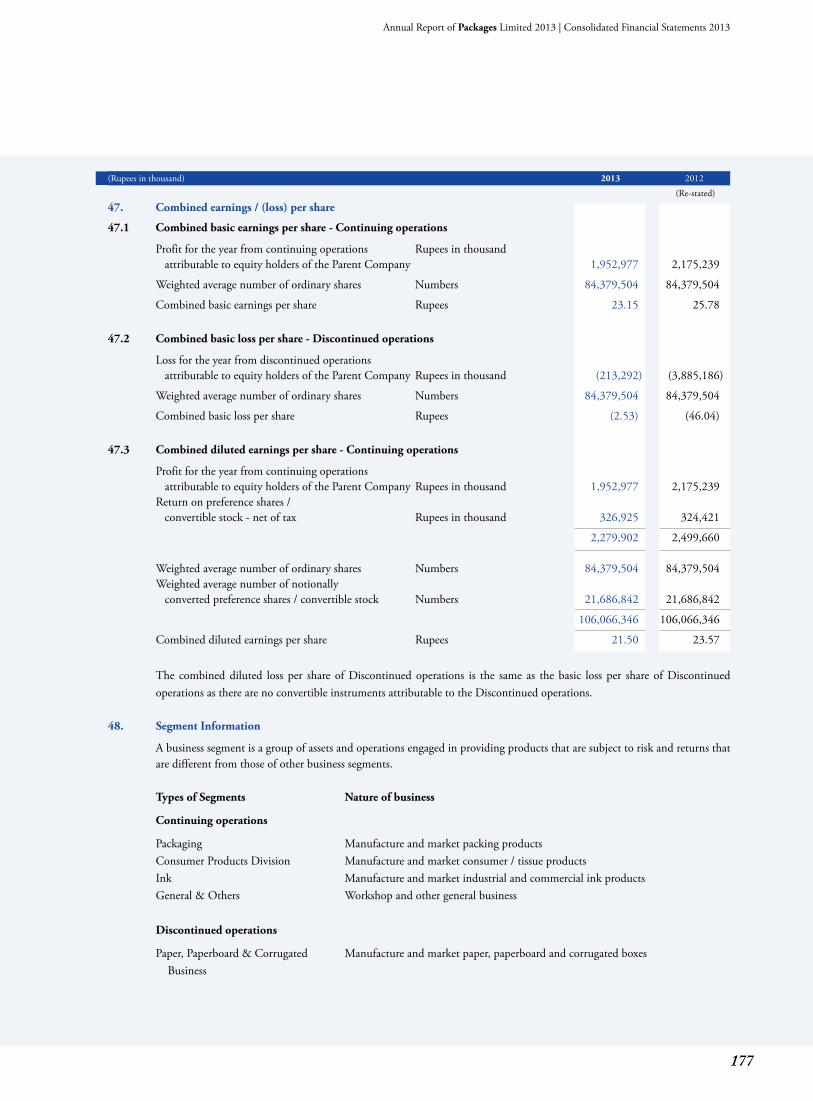
177
Annual Report of Packages Limited 2013 | Consolidated Financial Statements 2013
(Rupees in thousand) 2013 2012
(Re-stated)
47. Combined earnings / (loss) per share
47.1 Combined basic earnings per share - Continuing operations
Profit for the year from continuing operations Rupees in thousand attributable to equity holders of the Parent Company 1,952,977 2,175,239
Weighted average number of ordinary shares Numbers 84,379,504 84,379,504
Combined basic earnings per share Rupees 23.15 25.78 47.2 Combined basic loss per share - Discontinued operations
Loss for the year from discontinued operations attributable to equity holders of the Parent Company Rupees in thousand (213,292) (3,885,186)
Weighted average number of ordinary shares Numbers 84,379,504 84,379,504
Combined basic loss per share Rupees (2.53) (46.04) 47.3 Combined diluted earnings per share - Continuing operations
Profit for the year from continuing operations attributable to equity holders of the Parent Company Rupees in thousand 1,952,977 2,175,239 Return on preference shares / convertible stock - net of tax Rupees in thousand 326,925 324,421
2,279,902 2,499,660 Weighted average number of ordinary shares Numbers 84,379,504 84,379,504 Weighted average number of notionally converted preference shares / convertible stock Numbers 21,686,842 21,686,842
106,066,346 106,066,346
Combined diluted earnings per share Rupees 21.50 23.57
The combined diluted loss per share of Discontinued operations is the same as the basic loss per share of Discontinued operations as there are no convertible instruments attributable to the Discontinued operations.
48. Segment Information
A business segment is a group of assets and operations engaged in providing products that are subject to risk and returns that are different from those of other business segments.
Types of Segments Nature of business
Continuing operations
Packaging Manufacture and market packing products Consumer Products Division Manufacture and market consumer / tissue products Ink Manufacture and market industrial and commercial ink products General & Others Workshop and other general business Discontinued operations
Paper, Paperboard & Corrugated Manufacture and market paper, paperboard and corrugated boxes Business
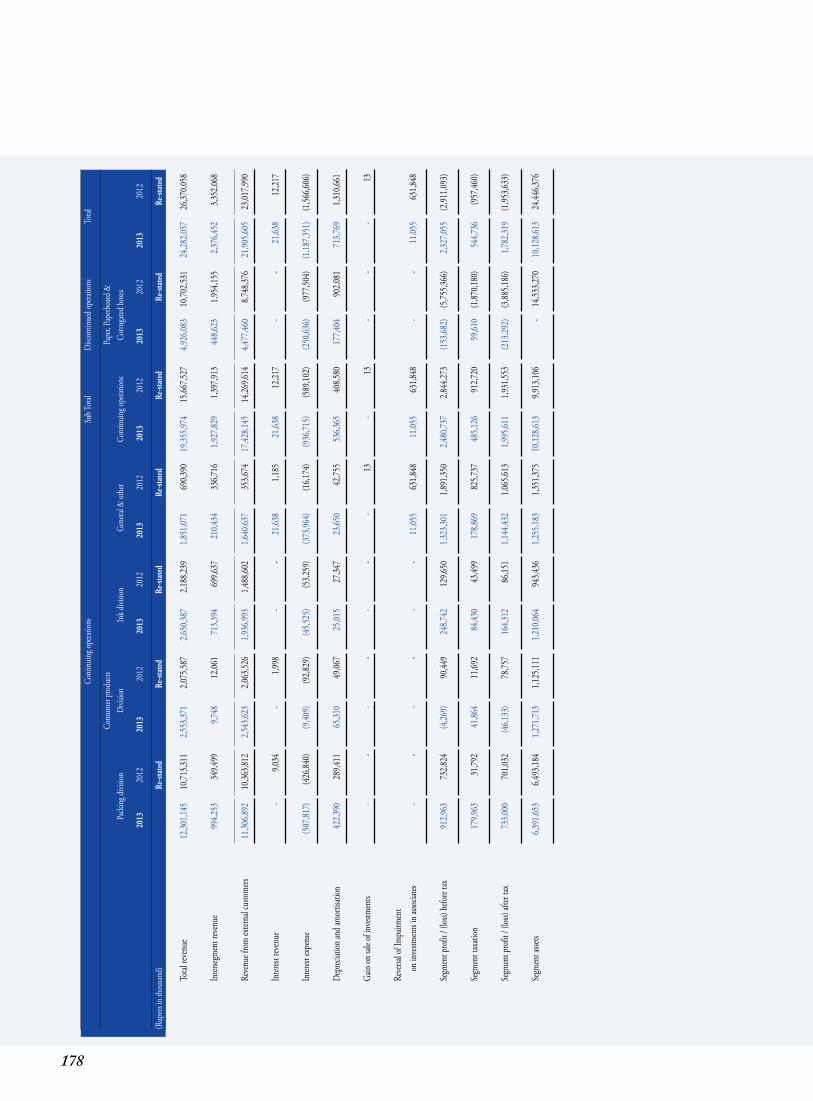
178
C
ontin
uing o
perat
ions
Sub T
otal
Disco
ntinu
ed op
eratio
ns
Total
Cons
umer
prod
ucts
Pa
per, P
aperb
oard
&
Pack
ing di
vision
Di
vision
In
k divi
sion
Gene
ral &
othe
r Co
ntinu
ing op
eratio
ns
Corru
gated
boxe
s
20
13
2012
20
13
2012
20
13
2012
20
13
2012
20
13
2012
20
13
2012
20
13
2012
(Rup
ees in
thou
sand)
Re-st
ated
Re-st
ated
Re-st
ated
Re-st
ated
Re-st
ated
Re-st
ated
Re-st
ated
To
tal re
venu
e 12
,301,1
45
10,71
3,311
2,
553,3
71
2,07
5,587
2,
650,3
87
2,18
8,239
1,
851,0
71
690,3
90
19,35
5,974
15
,667,5
27
4,92
6,083
10
,702,5
31
24,28
2,057
26
,370,0
58
In
terseg
ment
reve
nue
994,2
53
349,4
99
9,74
8 12
,061
713,3
94
699,6
37
210,4
34
336,7
16
1,92
7,829
1,
397,9
13
448,6
23
1,95
4,155
2,
376,4
52
3,35
2,068
Re
venu
e fro
m ex
terna
l cus
tomers
11
,306,8
92
10,36
3,812
2,
543,6
23
2,06
3,526
1,
936,9
93
1,48
8,602
1,
640,6
37
353,6
74
17,42
8,145
14
,269,6
14
4,47
7,460
8,
748,3
76
21,90
5,605
23
,017,9
90
In
terest
reve
nue
-
9,03
4 -
1,
998
-
-
21,63
8 1,
185
21,63
8 12
,217
-
-
21,63
8 12
,217
In
terest
expe
nse
(507
,817)
(4
26,84
0)
(9,40
9)
(92,8
29)
(45,5
25)
(53,2
59)
(373
,964)
(1
6,174
) (9
36,71
5)
(589
,102)
(2
50,63
6)
(977
,504)
(1
,187,3
51)
(1,56
6,606
)
De
prec
iation
and a
morti
sation
42
2,390
28
9,411
65
,310
49,06
7 25
,015
27,34
7 23
,650
42,75
5 53
6,365
40
8,580
17
7,404
90
2,081
71
3,769
1,
310,6
61
Ga
in on
sale
of inv
estme
nts
-
-
-
-
-
-
-
13
-
13
-
-
-
13
Re
versa
l of I
mpair
ment
on
inve
stmen
ts in
assoc
iates
-
-
-
-
-
-
11,05
5 63
1,848
11
,055
631,8
48
-
-
11,05
5 63
1,848
Se
gmen
t pro
fit /
(loss)
befor
e tax
91
2,963
73
2,824
(4
,269)
90
,449
248,7
42
129,6
50
1,32
3,301
1,
891,3
50
2,48
0,737
2,
844,2
73
(153
,682)
(5
,755,3
66)
2,32
7,055
(2
,911,0
93)
Se
gmen
t tax
ation
17
9,963
31
,792
41,86
4 11
,692
84,43
0 43
,499
178,8
69
825,7
37
485,1
26
912,7
20
59,61
0 (1
,870,1
80)
544,7
36
(957
,460)
Se
gmen
t pro
fit /
(loss)
after
tax
733,0
00
701,0
32
(46,1
33)
78,75
7 16
4,312
86
,151
1,14
4,432
1,
065,6
13
1,99
5,611
1,
931,5
53
(213
,292)
(3
,885,1
86)
1,78
2,319
(1
,953,6
33)
Se
gmen
t asse
ts 6,
391,6
53
6,49
3,184
1,
271,7
13
1,12
5,111
1,
210,0
64
943,4
36
1,25
5,183
1,
351,3
75
10,12
8,613
9,
913,1
06
-
14,53
3,270
10
,128,6
13
24,44
6,376
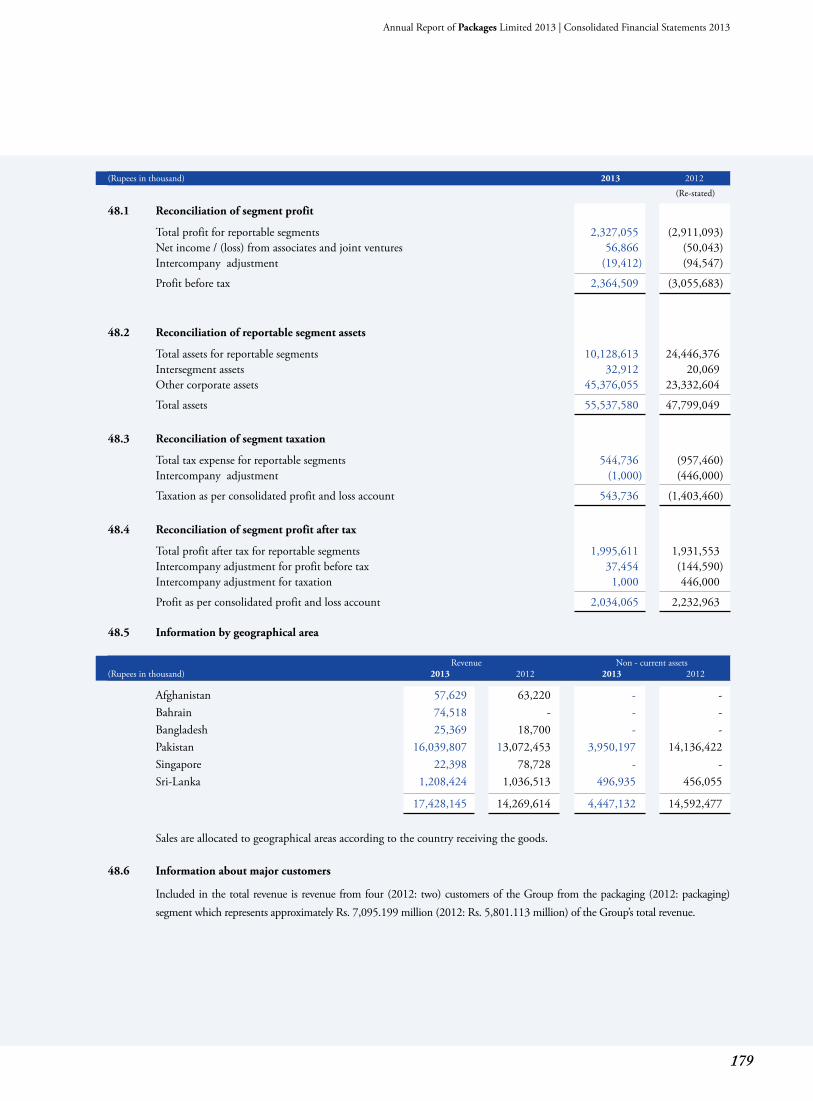
179
Annual Report of Packages Limited 2013 | Consolidated Financial Statements 2013
(Rupees in thousand) 2013 2012
(Re-stated)
48.1 Reconciliation of segment profit
Total profit for reportable segments 2,327,055 (2,911,093) Net income / (loss) from associates and joint ventures 56,866 (50,043) Intercompany adjustment (19,412) (94,547)
Profit before tax 2,364,509 (3,055,683)
48.2 Reconciliation of reportable segment assets
Total assets for reportable segments 10,128,613 24,446,376 Intersegment assets 32,912 20,069 Other corporate assets 45,376,055 23,332,604
Total assets 55,537,580 47,799,049 48.3 Reconciliation of segment taxation
Total tax expense for reportable segments 544,736 (957,460) Intercompany adjustment (1,000) (446,000)
Taxation as per consolidated profit and loss account 543,736 (1,403,460)
48.4 Reconciliation of segment profit after tax
Total profit after tax for reportable segments 1,995,611 1,931,553 Intercompany adjustment for profit before tax 37,454 (144,590) Intercompany adjustment for taxation 1,000 446,000
Profit as per consolidated profit and loss account 2,034,065 2,232,963
48.5 Information by geographical area
Revenue Non - current assets(Rupees in thousand) 2013 2012 2013 2012
Afghanistan 57,629 63,220 - - Bahrain 74,518 - - - Bangladesh 25,369 18,700 - - Pakistan 16,039,807 13,072,453 3,950,197 14,136,422 Singapore 22,398 78,728 - - Sri-Lanka 1,208,424 1,036,513 496,935 456,055
17,428,145 14,269,614 4,447,132 14,592,477 Sales are allocated to geographical areas according to the country receiving the goods.
48.6 Information about major customers
Included in the total revenue is revenue from four (2012: two) customers of the Group from the packaging (2012: packaging) segment which represents approximately Rs. 7,095.199 million (2012: Rs. 5,801.113 million) of the Group’s total revenue.
180
49. Financial risk management
49.1 Financial risk factors
The Group’s activities expose it to a variety of financial risks: market risk (including currency risk, fair value interest rate risk, cash flow interest rate risk and price risk), credit risk and liquidity risk. The Group’s overall risk management programme focuses on the unpredictability of financial markets and seeks to minimise potential adverse effects on the Group’s financial performance. The Group uses derivative financial instruments to hedge certain risk exposures. Risk management is carried out by the Group’s finance department under policies approved by the board of directors. The Group’s finance department evaluates and hedges financial risks. The board provides written principles for overall risk management, as well as written policies covering specific areas, such as foreign exchange risk, interest rate risk, credit risk, use of derivative financial instruments and non-derivative financial instruments, and investment of excess liquidity. The Group’s overall risk management procedures to minimize the potential adverse effects of financial market on the Group’s performance are as follows:
(a) Market risk
(i) Foreign exchange risk
Foreign exchange risk is the risk that the fair value of future cash flows of a financial instrument shall fluctuate because of changes in foreign exchange rates. The Group operates internationally and is exposed to foreign exchange risk arising from various currency exposures, primarily with respect to the US dollar and the Euro. Foreign exchange risk arises from future commercial transactions and recognised assets and liabilities and net investments in foreign operations that are denominated in a currency that is not the Group’s functional currency.
At December 31, 2013, if the Rupee had strengthened / weakened by 10% against the US dollar with all other variables held constant, post-tax profit for the year would have been Rs. 3.506 million higher / lower (2012: Rs. 10.196 million higher / lower) mainly as a result of foreign exchange losses / gains on translation of US dollar-denominated financial assets and liabilities.
At December 31, 2013, if the Rupee had strengthened / weakened by 10% against the Euro with all other variables held constant, post-tax profit for the year would have been Rs. 102.257 million (2012: Rs. 10.098 million) higher / lower, mainly as a result of foreign exchange losses / gains on translation of Euro-denominated financial assets and liabilities. At December 31, 2013, if the Rupee had strengthened / weakened by 10% against the Sri Lankan rupee with all other variables held constant, other component of equity would have been Rs. 65.804 million (2012: Rs. 49.588 million) lower / higher, mainly as a result of foreign exchange losses / gains on translation of net assets of Packages Lanka (Private) Limited, denominated in Sri Lankan Rupee.
(ii) Price risk
Price risk represents the risk that the fair value or future cash flows of a financial instrument will fluctuate because of changes in market prices (other than those arising from interest rate risk or currency risk), whether those changes are caused by factors specific to the individual financial instrument or its issuer, or factors affecting all similar financial instruments traded in the market. The Group is exposed to equity securities price risk because of investments held by the Group and classified as available for sale. The Group is not exposed to commodity price risk. To manage its price risk arising from investments in equity securities, the Group diversifies its portfolio. Diversification of the portfolio is done in accordance with the limits set by the Board of Directors.
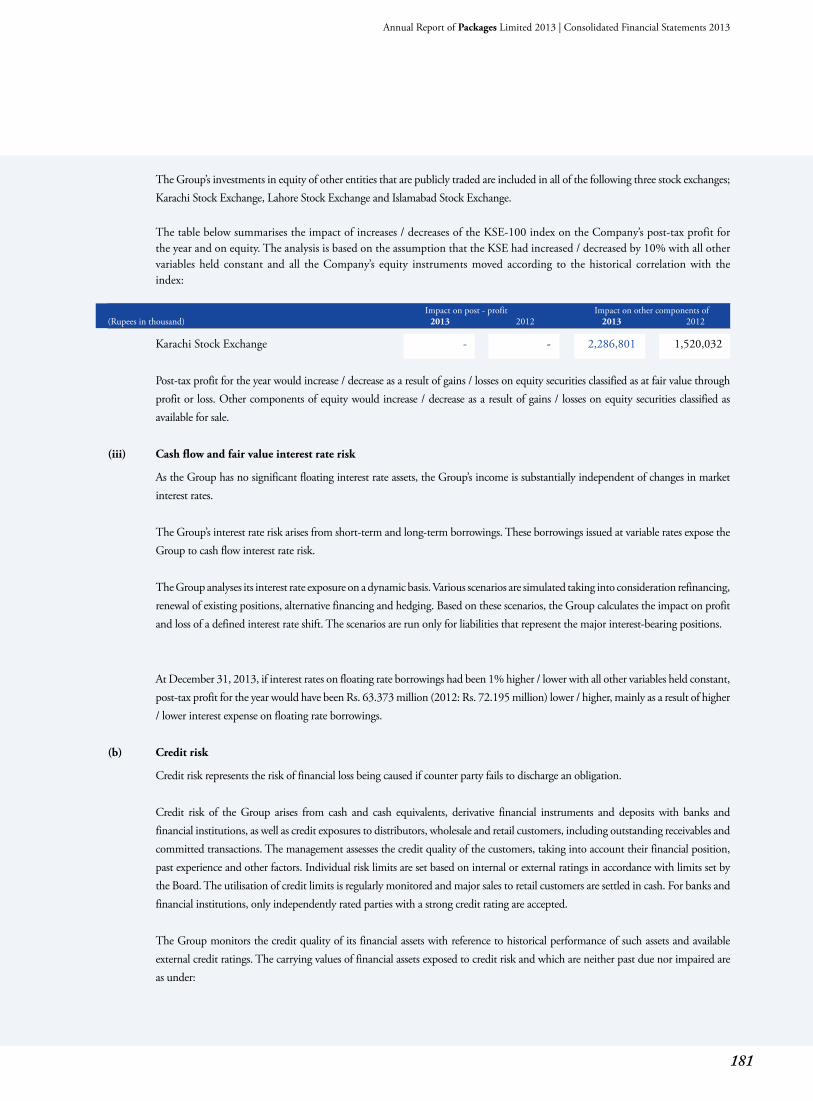
181
Annual Report of Packages Limited 2013 | Consolidated Financial Statements 2013
The Group’s investments in equity of other entities that are publicly traded are included in all of the following three stock exchanges; Karachi Stock Exchange, Lahore Stock Exchange and Islamabad Stock Exchange.
The table below summarises the impact of increases / decreases of the KSE-100 index on the Company’s post-tax profit for the year and on equity. The analysis is based on the assumption that the KSE had increased / decreased by 10% with all other variables held constant and all the Company’s equity instruments moved according to the historical correlation with the index:
Impact on post - profit Impact on other components of(Rupees in thousand) 2013 2012 2013 2012
Karachi Stock Exchange - - 2,286,801 1,520,032 Post-tax profit for the year would increase / decrease as a result of gains / losses on equity securities classified as at fair value through profit or loss. Other components of equity would increase / decrease as a result of gains / losses on equity securities classified as available for sale.
(iii) Cash flow and fair value interest rate risk
As the Group has no significant floating interest rate assets, the Group’s income is substantially independent of changes in market interest rates. The Group’s interest rate risk arises from short-term and long-term borrowings. These borrowings issued at variable rates expose the Group to cash flow interest rate risk. The Group analyses its interest rate exposure on a dynamic basis. Various scenarios are simulated taking into consideration refinancing, renewal of existing positions, alternative financing and hedging. Based on these scenarios, the Group calculates the impact on profit and loss of a defined interest rate shift. The scenarios are run only for liabilities that represent the major interest-bearing positions.
At December 31, 2013, if interest rates on floating rate borrowings had been 1% higher / lower with all other variables held constant, post-tax profit for the year would have been Rs. 63.373 million (2012: Rs. 72.195 million) lower / higher, mainly as a result of higher / lower interest expense on floating rate borrowings.
(b) Credit risk
Credit risk represents the risk of financial loss being caused if counter party fails to discharge an obligation. Credit risk of the Group arises from cash and cash equivalents, derivative financial instruments and deposits with banks and financial institutions, as well as credit exposures to distributors, wholesale and retail customers, including outstanding receivables and committed transactions. The management assesses the credit quality of the customers, taking into account their financial position, past experience and other factors. Individual risk limits are set based on internal or external ratings in accordance with limits set by the Board. The utilisation of credit limits is regularly monitored and major sales to retail customers are settled in cash. For banks and financial institutions, only independently rated parties with a strong credit rating are accepted. The Group monitors the credit quality of its financial assets with reference to historical performance of such assets and available external credit ratings. The carrying values of financial assets exposed to credit risk and which are neither past due nor impaired are as under:
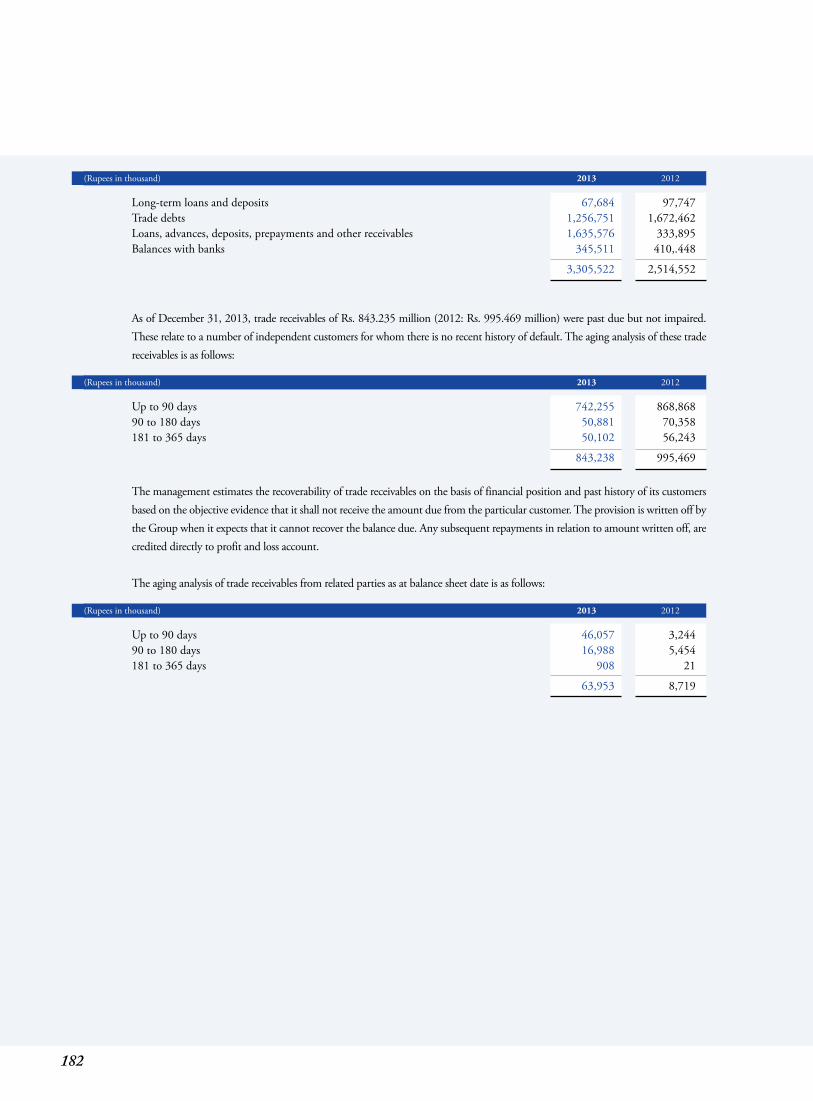
182
(Rupees in thousand) 2013 2012
Long-term loans and deposits 67,684 97,747 Trade debts 1,256,751 1,672,462 Loans, advances, deposits, prepayments and other receivables 1,635,576 333,895 Balances with banks 345,511 410,.448
3,305,522 2,514,552
As of December 31, 2013, trade receivables of Rs. 843.235 million (2012: Rs. 995.469 million) were past due but not impaired. These relate to a number of independent customers for whom there is no recent history of default. The aging analysis of these trade receivables is as follows:
(Rupees in thousand) 2013 2012
Up to 90 days 742,255 868,868 90 to 180 days 50,881 70,358 181 to 365 days 50,102 56,243
843,238 995,469
The management estimates the recoverability of trade receivables on the basis of financial position and past history of its customers based on the objective evidence that it shall not receive the amount due from the particular customer. The provision is written off by the Group when it expects that it cannot recover the balance due. Any subsequent repayments in relation to amount written off, are credited directly to profit and loss account. The aging analysis of trade receivables from related parties as at balance sheet date is as follows:
(Rupees in thousand) 2013 2012
Up to 90 days 46,057 3,244 90 to 180 days 16,988 5,454 181 to 365 days 908 21
63,953 8,719
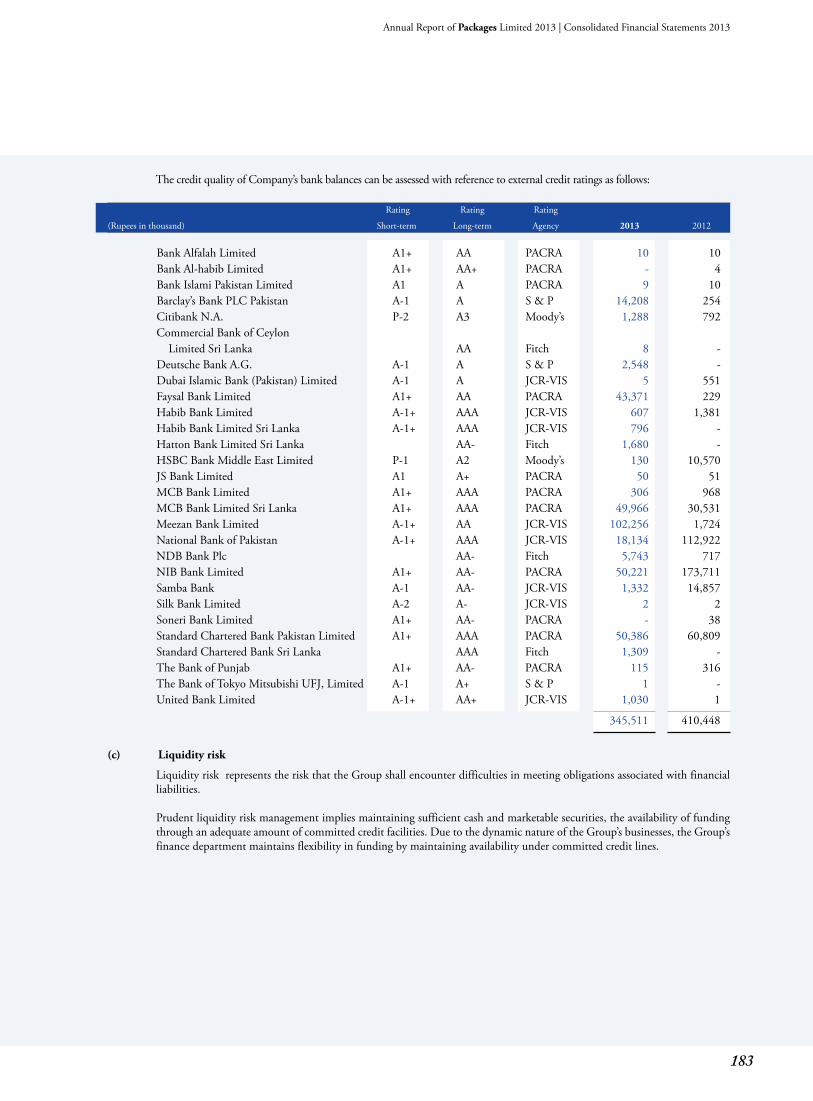
183
Annual Report of Packages Limited 2013 | Consolidated Financial Statements 2013
The credit quality of Company’s bank balances can be assessed with reference to external credit ratings as follows: Rating Rating Rating
(Rupees in thousand) Short-term Long-term Agency 2013 2012
Bank Alfalah Limited A1+ AA PACRA 10 10 Bank Al-habib Limited A1+ AA+ PACRA - 4 Bank Islami Pakistan Limited A1 A PACRA 9 10 Barclay’s Bank PLC Pakistan A-1 A S & P 14,208 254 Citibank N.A. P-2 A3 Moody’s 1,288 792 Commercial Bank of Ceylon Limited Sri Lanka AA Fitch 8 - Deutsche Bank A.G. A-1 A S & P 2,548 - Dubai Islamic Bank (Pakistan) Limited A-1 A JCR-VIS 5 551 Faysal Bank Limited A1+ AA PACRA 43,371 229 Habib Bank Limited A-1+ AAA JCR-VIS 607 1,381 Habib Bank Limited Sri Lanka A-1+ AAA JCR-VIS 796 - Hatton Bank Limited Sri Lanka AA- Fitch 1,680 - HSBC Bank Middle East Limited P-1 A2 Moody’s 130 10,570 JS Bank Limited A1 A+ PACRA 50 51 MCB Bank Limited A1+ AAA PACRA 306 968 MCB Bank Limited Sri Lanka A1+ AAA PACRA 49,966 30,531 Meezan Bank Limited A-1+ AA JCR-VIS 102,256 1,724 National Bank of Pakistan A-1+ AAA JCR-VIS 18,134 112,922 NDB Bank Plc AA- Fitch 5,743 717 NIB Bank Limited A1+ AA- PACRA 50,221 173,711 Samba Bank A-1 AA- JCR-VIS 1,332 14,857 Silk Bank Limited A-2 A- JCR-VIS 2 2 Soneri Bank Limited A1+ AA- PACRA - 38 Standard Chartered Bank Pakistan Limited A1+ AAA PACRA 50,386 60,809 Standard Chartered Bank Sri Lanka AAA Fitch 1,309 - The Bank of Punjab A1+ AA- PACRA 115 316 The Bank of Tokyo Mitsubishi UFJ, Limited A-1 A+ S & P 1 - United Bank Limited A-1+ AA+ JCR-VIS 1,030 1
345,511 410,448 (c) Liquidity risk
Liquidity risk represents the risk that the Group shall encounter difficulties in meeting obligations associated with financial liabilities.
Prudent liquidity risk management implies maintaining sufficient cash and marketable securities, the availability of funding
through an adequate amount of committed credit facilities. Due to the dynamic nature of the Group’s businesses, the Group’s finance department maintains flexibility in funding by maintaining availability under committed credit lines.
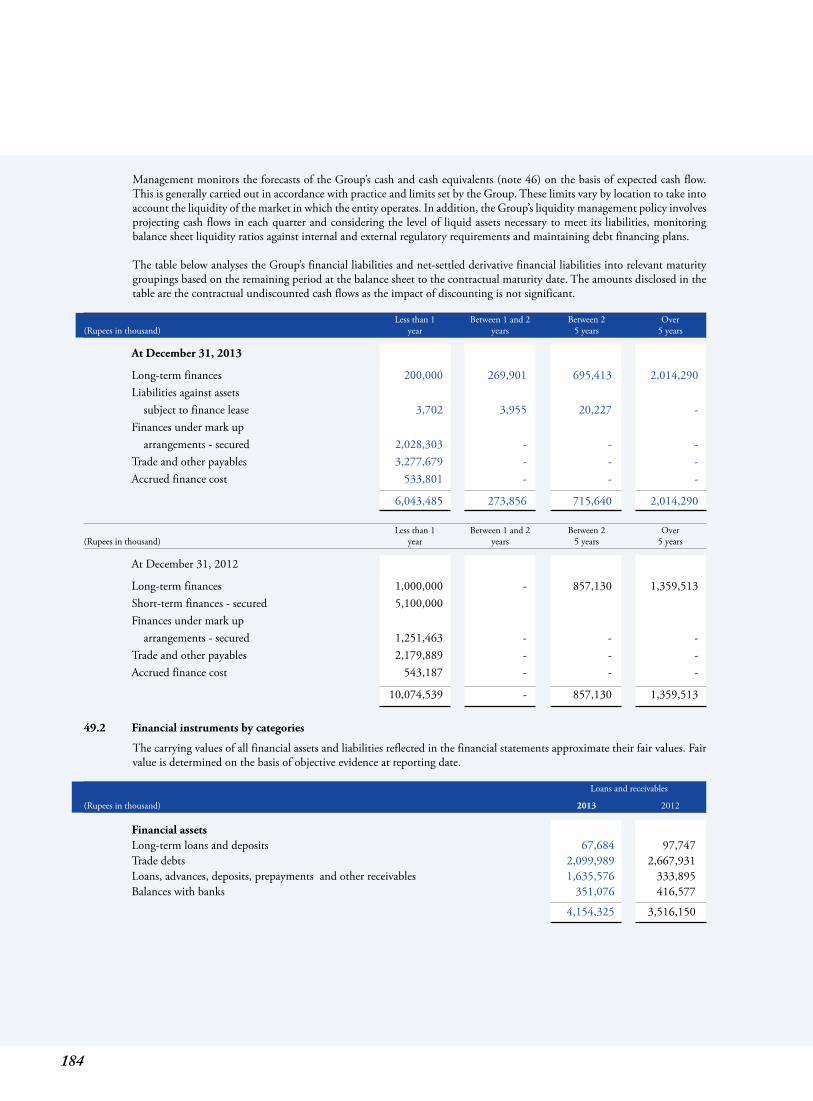
184
Management monitors the forecasts of the Group’s cash and cash equivalents (note 46) on the basis of expected cash flow. This is generally carried out in accordance with practice and limits set by the Group. These limits vary by location to take into account the liquidity of the market in which the entity operates. In addition, the Group’s liquidity management policy involves projecting cash flows in each quarter and considering the level of liquid assets necessary to meet its liabilities, monitoring balance sheet liquidity ratios against internal and external regulatory requirements and maintaining debt financing plans.
The table below analyses the Group’s financial liabilities and net-settled derivative financial liabilities into relevant maturity groupings based on the remaining period at the balance sheet to the contractual maturity date. The amounts disclosed in the table are the contractual undiscounted cash flows as the impact of discounting is not significant.
Less than 1 Between 1 and 2 Between 2 Over(Rupees in thousand) year years 5 years 5 years
At December 31, 2013
Long-term finances 200,000 269,901 695,413 2,014,290 Liabilities against assets subject to finance lease 3,702 3,955 20,227 - Finances under mark up arrangements - secured 2,028,303 - - - Trade and other payables 3,277,679 - - - Accrued finance cost 533,801 - - -
6,043,485 273,856 715,640 2,014,290 Less than 1 Between 1 and 2 Between 2 Over(Rupees in thousand) year years 5 years 5 years
At December 31, 2012
Long-term finances 1,000,000 - 857,130 1,359,513 Short-term finances - secured 5,100,000 Finances under mark up arrangements - secured 1,251,463 - - - Trade and other payables 2,179,889 - - - Accrued finance cost 543,187 - - -
10,074,539 - 857,130 1,359,513
49.2 Financial instruments by categories
The carrying values of all financial assets and liabilities reflected in the financial statements approximate their fair values. Fair value is determined on the basis of objective evidence at reporting date.
Loans and receivables
(Rupees in thousand) 2013 2012
Financial assets Long-term loans and deposits 67,684 97,747 Trade debts 2,099,989 2,667,931 Loans, advances, deposits, prepayments and other receivables 1,635,576 333,895 Balances with banks 351,076 416,577
4,154,325 3,516,150
185
Annual Report of Packages Limited 2013 | Consolidated Financial Statements 2013
At amortised cost
(Rupees in thousand) 2013 2012
Financial liabilities Long-term finances - secured 3,179,603 3,216,643 Liabilities against assets subject to finance lease 27,884 - Finances under mark up arrangements - secured 2,028,303 6,351,463 Trade and other payables 3,277,679 2,179,889 Accrued finance cost 533,801 543,187
9,047,270 12,291,182
49.3 Capital risk management
The Group’s objectives when managing capital are to safeguard the Group’s ability to continue as a going concern in order to provide returns for shareholders and benefits for other stakeholders and to maintain an optimal capital structure to reduce the cost of capital.
The Group manages its capital structure and makes adjustments to it in the light of changes in economic conditions. In
order to maintain or adjust the capital structure, the Group may adjust the amount of dividends paid to shareholders or issue new shares. Consistent with the others in industry, the Group monitors capital on the basis of the gearing ratio. This ratio is calculated as net debt divided by total capital. Net debt is calculated as total borrowings including the current and non-current borrowings as disclosed in note 7 less cash and cash equivalents as disclosed in note 46. Total capital is calculated as equity as shown in the balance sheet plus net debt. The gearing ratio as at year end is as follows:
(Rupees in thousand) 2013 2012
Long-term finances 5,450,180 4,687,220 Current portion of long term finances 200,000 1,000,000 Cash and cash equivalents 1,677,227 5,934,886
Net debt 7,327,407 11,622,106 Total equity 42,826,487 31,148,886
Total capital 50,153,894 42,770,992
Gearing ratio 15% 27%
49.4 Fair value estimation
The fair value of financial instruments traded in active markets is based on quoted market prices at the balance sheet date. The quoted market price used for financial assets held by the Group are the current bid prices.
The financial instruments that are not traded in active market are carried at cost and are tested for impairment according to
IAS 39. The fair value of interest rate swaps is calculated as the present value of the estimated future cash flows. The carrying amount less impairment provision of trade receivables and payables are assumed to approximate their fair values.
The fair value of financial liabilities for disclosure purposes is estimated by discounting the future contractual cash flows at the current market interest rate that is available to the Group for similar financial instruments.
186
50. Detail of subsidiaries
Accounting Percentage Country of Name of the subsidiaries year end of holding incorporation
Packages Lanka (Private) Limited December 31, 2013 79.07% Sri-Lanka DIC Pakistan Limited December 31, 2013 54.98% Pakistan Packages Construction (Private) Limited December 31, 2013 99.99% Pakistan
51. Date of authorisation for issue
These financial statements were authorised for issue on February 19, 2014 by the Board of Directors of the Parent Company.
52. Non-Adjusting events after the balance sheet date
The Board of Directors of the Parent Company has proposed a final cash dividend for the year ended December 31, 2013 of Rs. 8.00 per share (2012: Rs. 4.50 per share), amounting to Rs. 675.036 million (2012: Rs. 379.708 million) at its meeting held on February 19, 2014 for approval of the members at the Annual General Meeting to be held on April 03, 2014. The board has also recommended to transfer Rs. 700 million from accumulated profit to general reserves (2012: Rs. 3,300 million from general reserves to accumulated profit).
53. Corresponding figures
Corresponding figures have been re-arranged and re-classified, wherever necessary, for the purposes of comparison. However, no significant re-classifications have been made.
Towfiq Habib Chinoy Syed Hyder Ali Syed Aslam Mehdi Chairman Chief Executive & Managing Director Director
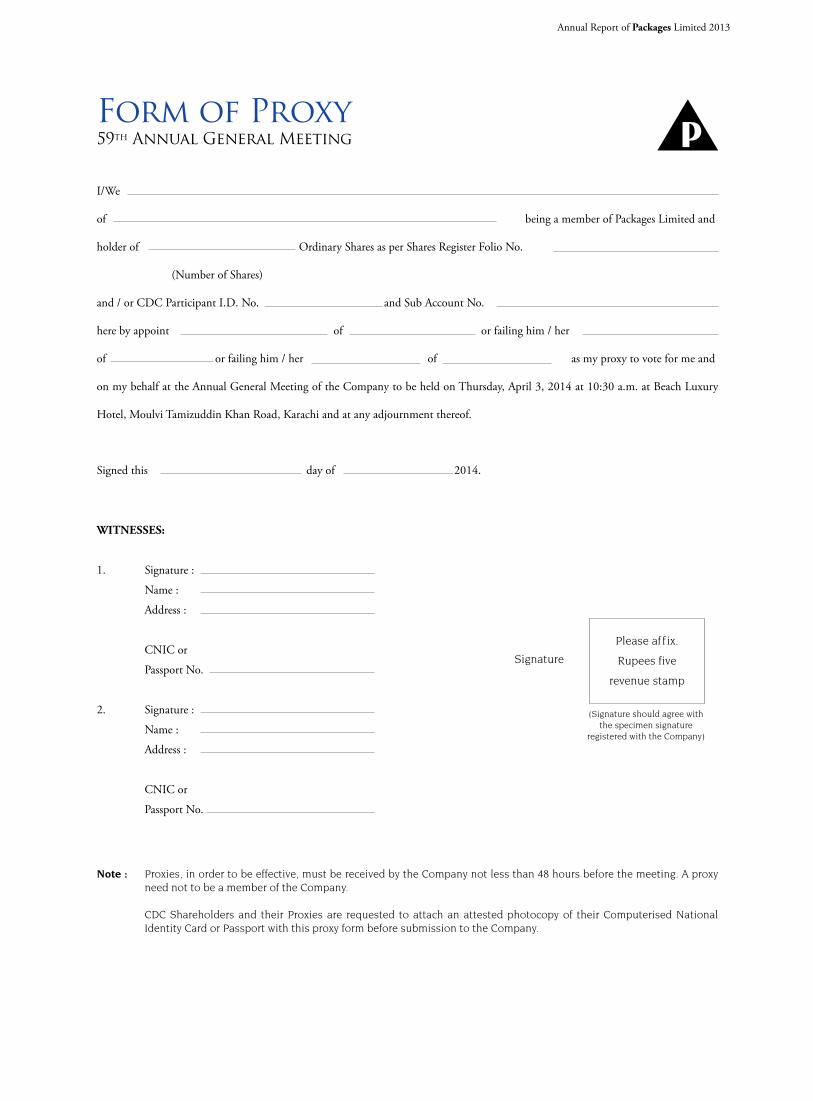
Annual Report of Packages Limited 2013
Form of Proxy59th Annual General Meeting
I/We
of being a member of Packages Limited and
holder of Ordinary Shares as per Shares Register Folio No.
(Number of Shares)
and / or CDC Participant I.D. No. and Sub Account No.
here by appoint of or failing him / her
of or failing him / her of as my proxy to vote for me and
on my behalf at the Annual General Meeting of the Company to be held on Thursday, April 3, 2014 at 10:30 a.m. at Beach Luxury
Hotel, Moulvi Tamizuddin Khan Road, Karachi and at any adjournment thereof.
Signed this day of 2014.
WITNESSES:
1. Signature :
Name :
Address :
CNIC or
Passport No.
2. Signature :
Name :
Address :
CNIC or
Passport No.
Note : Proxies, in order to be effective, must be received by the Company not less than 48 hours before the meeting. A proxy need not to be a member of the Company.
CDC Shareholders and their Proxies are requested to attach an attested photocopy of their Computerised National Identity Card or Passport with this proxy form before submission to the Company.
Signature
(Signature should agree withthe specimen signature
registered with the Company)
Please af f ix.
Rupees five
revenue stamp

AFFIX
CORRECT
POSTAGE
The Company Secretary
PACKAGES LIMITED4th Floor, The ForumSuite # 416 - 422G-20, Block 9, Khayaban-e-Jami,Clifton, Karachi - 75600


2


