451
- 1 -
| Date post: | 13-Apr-2015 |
| Category: |
Documents |
| Upload: | joaquin-vicente-ramos-rodriguez |
| View: | 77 times |
| Download: | 1 times |

- 1 -
- 2 -
ACKNOWLEDGMENTS
The present report has been prepared as part of the mandate given to the Social Protection Committee (SPC) by the Treaty on the Functioning of the European Union to monitor the social situation in the European Union and the development of social protection policies (art. 160 of TFEU). The Directorate-General for Employment, Social Affairs and Inclusion provided the necessary analysis and calculations used in the report with the extensive assistance and data provision of Eurostat. The report is a result of a collaborative effort led by the Secretariats of the Social Protection Committee (Dimo Iliev) and its Indicators' Subgroup (Kornelia Kozovska). The principal authors are Kornelia Kozovska, Dimo Iliev, Maya Carr-Hill, Caterina Astarita, Dijana Ror Boone, Valdis Zagorskis, Elodie Fazi. The members of the SPC and its Indicators Subgroup contributed extensively to the drafting of the report and its key messages. The views of the European social partners and of the Social Platform are annexed to the report. The Working Party on Public Health at Senior level made a valuable contribution to this report. The report was approved by the Social Protection Committee on 30 January 2013.
- 3 -
TABLE OF CONTENTS
THE WAY AHEAD: KEY MESSAGES TO THE EPSCO COUNCIL ON THE SOCIAL SITUATION IN THE EUROPEAN
UNION ................................................................................................................................................................................. - 8 -
INTRODUCTION................................................................................................................................................................ - 12 -
1. MACRO-ECONOMIC AND LABOUR MARKET CONTEXT ........................................................................................... - 14 -
2. THE SOCIAL SITUATION IN THE EUROPEAN UNION AND KEY SOCIAL TRENDS TO WATCH ............................. - 22 -
2.1 The Social Situation in Europe ................................................................................................................. - 22 -
Progress towards the Europe 2020 headline target on poverty and social exclusion ........ - 22 -
Income poverty risk increases in almost half of Member States .................................................. - 25 -
Material deprivation remains a serious challenge in many Member States ............................ - 27 -
The number of (quasi-)jobless households in Europe continues to increase ......................... - 28 -
Persistence and depth of poverty is substantially worsening ....................................................... - 30 -
Number of children living in poverty or social exclusion persistently rise ............................. - 36 -
Deteriorating effectiveness of adequate income support systems for those furthest away
from the labour market.................................................................................................................................. - 40 -
Long-standing income inequalities exacerbated by the crisis ....................................................... - 43 -
Steady share of working poor with strong divergence across Member States ...................... - 49 -
Long-term unemployment remains stable but at historical highs .............................................. - 52 -
Youth exclusion – one of the biggest challenges for the future ..................................................... - 58 -
More emphasis on active ageing needed ................................................................................................ - 61 -
Pensions avert poverty for many though divergence in adequacy and effectiveness remains -
63 -
Housing costs and homelessness are on the rise ................................................................................ - 67 -
Access to health and health outcomes ..................................................................................................... - 70 -
2.2. Take up of benefits ....................................................................................................................................... - 71 -
Mixed trends in unemployment benefit recipients ............................................................................ - 72 -
Pressure on social assistance schemes persists .................................................................................. - 72 -

- 4 -
Few countries show combined pressure on both unemployment benefits and social
assistance ............................................................................................................................................................. - 73 -
Countries undergoing a shift towards social assistance schemes................................................ - 73 -
Countries with downward trends in social benefits recipients .................................................... - 74 -
Potential gaps in social benefits' coverage in some Member States ........................................... - 74 -
2.3. Key social trends to watch and positive developments ................................................................ - 79 -
3. RECENT EVOLUTION OF SOCIAL PROTECTION EXPENDITURE ............................................................................. - 82 -
3.1. Evolution of social protection expenditure ................................................................................... - 82 -
3.2. Composition of spending ...................................................................................................................... - 86 -
3.3. Social protection expenditure by type and conditionality of provision ............................ - 88 -
4. RECENT SOCIAL POLICY DEVELOPMENTS ACROSS THE EU ................................................................................. - 99 -
4.1. Child poverty .................................................................................................................................................. - 99 -
4.1.1. Shielding children and families from the crisis' worst effects ........................................... - 99 -
4.1.2. Trends show spending cuts and targeting on the most vulnerable ............................. - 100 -
4.1.3. Significant short and long term impacts .................................................................................. - 102 -
4.2. Active inclusion .......................................................................................................................................... - 102 -
4.2.1. Adequate income support.............................................................................................................. - 103 -
4.2.2. Inclusive labour markets ................................................................................................................ - 105 -
4.2.3. Access to quality services .............................................................................................................. - 107 -
4.2.4. Comprehensive strategies ............................................................................................................. - 108 -
4.2.5. Structural changes – reforming delivery and administrations ...................................... - 109 -
4.2.6. Stakeholder involvement ............................................................................................................... - 109 -
4.2.7. Further challenges for successful active inclusion strategies ......................................... - 110 -
4.3. Pensions ......................................................................................................................................................... - 111 -
4.3.1. Increases of statutory retirement age, equalisation and links to life expectancy .. - 113 -
4.3.2. Limiting access to early retirement ........................................................................................... - 113 -
4.3.3. Pension measures in support of working beyond retirement age ............................... - 114 -
4.3.4. Reforms in pension financing ....................................................................................................... - 115 -

- 5 -
4.4. Health care systems .................................................................................................................................. - 116 -
4.4.1. Recent health care developments in the EU ........................................................................... - 116 -
4.4.2. Further challenges for health care systems ........................................................................... - 121 -
4.4.3. Policy conclusions ............................................................................................................................. - 122 -
4.5. Long-term care ........................................................................................................................................... - 122 -
4.5.1. Long-term care developments in the EU ................................................................................. - 123 -
4.5.2. Recent reforms in long-term care systems ............................................................................. - 124 -
REFERENCES ................................................................................................................................................................. - 128 -
ANNEX 1. COUNTRY PROFILES ................................................................................................................................... - 132 -
BELGIUM ................................................................................................................................................................ - 132 -
BULGARIA ............................................................................................................................................................. - 144 -
CZECH REPUBLIC ............................................................................................................................................... - 155 -
DENMARK ............................................................................................................................................................. - 168 -
GERMANY .............................................................................................................................................................. - 179 -
ESTONIA................................................................................................................................................................. - 186 -
IRELAND ................................................................................................................................................................ - 200 -
GREECE ................................................................................................................................................................... - 211 -
SPAIN ....................................................................................................................................................................... - 221 -
FRANCE .................................................................................................................................................................. - 233 -
ITALY ....................................................................................................................................................................... - 244 -
CYPRUS ................................................................................................................................................................... - 253 -
LATVIA .................................................................................................................................................................... - 265 -
LITHUANIA ........................................................................................................................................................... - 276 -
LUXEMBOURG ..................................................................................................................................................... - 287 -
HUNGARY .............................................................................................................................................................. - 298 -
MALTA .................................................................................................................................................................... - 310 -
NETHERLANDS ................................................................................................................................................... - 323 -
AUSTRIA ................................................................................................................................................................. - 335 -

- 6 -
POLAND .................................................................................................................................................................. - 346 -
PORTUGAL ............................................................................................................................................................ - 357 -
ROMANIA ............................................................................................................................................................... - 369 -
SLOVENIA .............................................................................................................................................................. - 379 -
SLOVAKIA .............................................................................................................................................................. - 389 -
FINLAND ................................................................................................................................................................ - 401 -
SWEDEN ................................................................................................................................................................. - 412 -
UNITED KINGDOM ............................................................................................................................................. - 423 -
ANNEX 2. LIST OF DEFINITIONS AND DATA SOURCES ............................................................................................ - 435 -
ANNEX 3. VIEWS OF THE EUROPEAN SOCIAL PARTNERS AND THE SOCIAL PLATFORM .................................. - 438 -

- 7 -
Abbreviation Full name
EU27 European Union (27 countries) BE Belgium BG Bulgaria CZ Czech Republic DK Denmark DE Germany EE Estonia IE Ireland EL Greece ES Spain FR France IT Italy CY Cyprus LV Latvia LT Lithuania LU Luxembourg HU Hungary MT Malta NL Netherlands AT Austria PL Poland PT Portugal RO Romania SI Slovenia SK Slovakia FI Finland SE Sweden UK United Kingdom

- 8 -
Prepared for the EPSCO Council, these key conclusions and policy messages are anticipated for
referral to the European Council to nourish discussions on the social situation in the EU at the
Spring European Council. They are based on the Annual Report monitoring the social situation in
the EU prepared by the SPC under article 160 of the TFEU and on its work within the open
method of co-ordination. The Committee consulted the European social partners and the Social
Platform on its Annual report and annexed their views thereof.
Key conclusions on the social situation in the European Union
The Union faces an historical opportunity to put in place a coherent and integrated policy
answer to the challenges it faces: stabilising its public finances and lowering public debt, putting
the economy on a path to inclusive growth, increasing employment and reducing poverty and
social exclusion.
The social situation in the EU is worsening:
The number of people at risk of poverty or social exclusion in the EU accounts for nearly
one-fourth of the population.
Current levels of poverty and social exclusion jeopardise the achievement of the EU 2020
headline target
There is a need to improve the quality of fiscal consolidation and the resilience of social
protection systems with a new sense of urgency. The emphasis needs to shift from short-
term measures to structural reforms with the right pace and sequence in order to spur
economic growth, promote high level of employment and guarantee adequate social protection.
The role of social protection is fundamental for safeguarding human capital and well-being in
Europe and thus for prospects of future competitiveness and economic recovery. Social policies
alone cannot deliver on the Europe 2020 poverty target; this objective must be underpinned by
other public policies including in the economic, employment, tax and education fields.
The very essence of social protection is to shield against important lifetime risks through a
set of universal policies and benefits accessible to all and targeted measures addressing
specific needs. Social protection policies pursue a wider political objective and should not
exclusively focus on poverty reduction.
I. Social trends to watch in the EU
1. 1. The Union faces a rare combination of recession or weak growth in many Member States,
falling income levels and substantial financial consolidation programmes reducing social
transfers and services. The combined impact of these factors deepens poverty and inequalities
THE WAY AHEAD: KEY MESSAGES TO THE EPSCO
COUNCIL ON THE SOCIAL SITUATION IN THE EUROPEAN
UNION

- 9 -
with marked differences across Member States threatening to create a dangerous polarisation
within the Union.
2. 2. In 2011, 119.6 million people in the EU, or 24.2% of the population, were at risk of
poverty or social exclusion, compared with 23.4% in 2010 and 23.5% in 2008. 17% of the EU27
population were at risk of income poverty. 8.8% of the population were severely materially
deprived, indicating living conditions constrained by a lack of resources such as not being able to
afford to pay their bills, keep their home adequately warm, or face essential unexpected
expenses. 10% of the population aged 0-59 lived in households where the adults worked less
than 20% of their total work potential during the past year. Income inequality has been
widening in many Member States. This may result in significant parts of the European
population becoming entrenched in poverty.
3. 3. Against this background, there are four key EU "social trends to watch" established by
the Social Protection Performance Monitor (see graph below):
Increase in poverty and social exclusion for the overall population (registered in 13
Member States)
Increase in the number of children living in poverty and social exclusion
(registered in 10 Member States)
Increase in the working poor (registered in 12 Member States)
Increase in the poverty risk for the population living in quasi-jobless households
(registered in 12 Member States)
4. Cumulative objectives of Member States fall significantly below the target of reducing by 20
million the number of people living in poverty or social exclusion. The current economic
stagnation and little or no progress in national targets in a number of Member States makes the
achievement of the Europe 2020 headline target highly unlikely if current policies are continued
unchanged. The steadily increasing number of children living in poverty or social exclusion
poses serious concerns for the current well-being of children and the long-term impact this will
have for Europe's future generations. Preventing and tackling child poverty and social exclusion
as well as promoting child well-being must be one of the Member States' key priorities.
5. The stabilisation effects of social protection benefits witnessed in the early years of the
current crisis underline the unique social dimension of Europe. With the deterioration in the
employment situation in some Member States and the growing number of unemployed and their
longer stay in unemployment, more people are in need of social transfers. Data collected by the
SPC on the take-up of benefits shows that in some Member States, the growth in unemployment
is not always matched by similar trends in benefit recipients which may lead to a potential gap
in coverage.

- 10 -
II. Measures to improve the social situation
Promoting active inclusion
6. In a context of rising unemployment and in particular long-term unemployment, the adequacy
and eligibility criteria of social protection benefits need to respond to the two-fold challenge of
stimulating those able to work to return quickly to the labour market and ensuring adequate
income support for persons in need both in and out of the labour market. The provision of
accessible and effective services is essential. Youth exclusion is a new social challenge with
important implications for future sustainability of social protection systems.
Ensuring adequate and sustainable pensions
7. Pensions must permit the maintenance of a decent and adequate standard of living after
retirement. Reforms in some Member States have improved the sustainability of pensions to the
detriment of future pension adequacy, resulting in potential increases in pensioner poverty.
High accrual rates are the best incentive for prolonging contributory periods. Labour markets
must be more inclusive and deliver higher employment rates for older workers and young
people in order to raise effective retirement ages, extend working lives and secure better future
pensions.
Accessible, sustainable and high-quality health and long-term care services
8. Improving the long-term sustainability of health care systems and its capacity to ameliorate
health outcomes may require structural reforms reviewing both financing and access to services
as well as strengthening health promotion and disease prevention. Health policies should pursue
effectiveness and expenditure control in an integrated fashion. Comprehensive measures
tackling the social gradient in health need to accompany structural reforms in order to ensure
accessibility, quality and effectiveness.
9. Due to demographic developments and changing social patterns, long-term care has become a
key issue for Member States' policies. An affordable, need-oriented system of social services is
required in order to offer adequate care for the elderly and people with disabilities, as well as to
support informal care-givers.
Financing of social protection policies
10. To improve competitiveness, sustainability and job creation, Member States consider
different policy alternatives including shifting the financing of social security away from labour
to taxation or changing the fiscal pressure on enterprises. While there is no one-size-fits-all
approach, reforms in social protection financing should be assessed for their impacts on, inter
alia, equity, coverage, effectiveness and governance of the overall system. Earnings-related
benefits will require continued financing by employers and employees and the state where this
applies. The blending of different sources of social security financing should not create
segmented financing and delivery of benefits. Social partners must be involved in the decision-
making process.

- 11 -
III. Towards social policies investing across the lifecycle
11. 11. Social protection systems are indispensable for economic recovery, prosperity and social
cohesion. Rapid short-term reforms may induce higher future costs through the extended
provision of benefits, retraining schemes and social programmes necessitated by prolonged
unemployment spells and increasing poverty. Improving the quality of fiscal consolidation
measures requires that both Member States and the Commission assess the impacts of major
policy and spending decisions in line with Article 9 of the Treaty on the Functioning of the
European Union.
12. Efficiency and effectiveness aims of social spending need to be pursued in tandem. The fact
that similar levels of social spending achieve significantly different results in terms of social
protection, poverty reduction and inclusion underlines the need for bolder measures to enhance
effectiveness of spending and policies. Member States need to identify benefits and services
whose funding should be protected at all costs as well as those whose effectiveness can be
improved at a lower budgetary expense. In this context it is important to collect, analyse and
exchange information on new efficient and effective methods to deliver social services.
Key social trends in 2010-2011 - Number of Member States showing significant
improvements or deterioration in key social indicators (reference period 2010-
2011)

- 12 -
This is the first annual report prepared by the Social Protection Committee (SPC) in the context
of the reinvigorated1 social open method of coordination (OMC). It follows twelve years of active
SPC work which produced a number of Joint Reports on Social Protection and Social Inclusion2
with the European Commission and advanced the mutual learning and policy exchange in the
field of social protection and social inclusion.
The SPC is a Committee of high level officials from all EU Member States and the Commission as
established by Article 160 of the Treaty on the Functioning of the European Union. The SPC has
the following mandate:
i) to monitor the social situation and the development of social protection policies in the
Member States and the Union;
ii) to promote the exchange of information, experience and good practice between Member
States and with the Commission
iii) to prepare reports, formulate opinions or undertake other work within its fields of
competence, at the request of either the Council or the Commission or on its own initiative
Over the years, the Committee has developed a deep understanding of social protection and
social inclusion issues at the European level and in particular in the areas of poverty reduction
and social inclusion, pensions, healthcare and long-term care. It regularly addresses its advice to
the EU Council of Ministers (hereafter "Council") on these issues through its opinions and
reports. Since the Lisbon European Council (March 2000), the SPC is at the core of EU
cooperation in the social field, especially through the open method of coordination. Since the
adoption in 2010 of the Europe 2020 strategy and its headline target on poverty reduction and
social inclusion, the SPC plays a key role in following the social dimension of the EU strategy and
in advising the Council on the recommendations to be issued to Member States.
This report makes use of a new instrument called the 'Social Protection Performance Monitor'
(SPPM) adopted by the SPC in October 2012 following the political endorsement of the EPSCO
Council in the same month.3 One of the monitor's main objectives is to help the Committee
identify the main social trends to watch and key positive social developments in the European
Union as part of its mission to monitor the social situation in the European Union. These trends
are identified on the basis of a dashboard of main social indicators which are monitored
annually for statistically significant changes in the most recent year and with respect to 2008 as
the base year4 for monitoring progress of the Europe 2020 Strategy. After identifying the 'trends
1 Council document 10405/11
2 http://ec.europa.eu/social/main.jsp?catId=758&langId=en 3 Council document 13723/12 4 Due to the structure of the survey on which most of the key social data is based (i.e. EU-SILC), a large
part of the main social indicators available in 2010, when the Europe 2020 Strategy was adopted,
INTRODUCTION

- 13 -
to watch', the SPC will implement an in-depth review (thematic review) of the leading causes
and possible policy solutions on each trend.
The SPPM responds to the European Council requests for reinforced monitoring of social policy
and a strengthened evidence base. An integral part of the instrument is following the trajectories
towards reaching the poverty and social exclusion reduction target set by the European Council.
On the eve of the publication of the Commission initiative on "Social Investment"5, this report
highlights key areas of success of social protection policies in the midst of the economic and
financial crisis and draws the attention of policymakers to the importance of making the right
choices for social investment.
Chapter 1 of the report looks at the overall macro-economic and labour market context in which
social protection policies develop. Chapter 2 presents the social situation in the European Union
and key social trends to watch. Chapter 3 looks into the evolution of resources and expenditure
for social protection policies – a follow up of the detailed analysis undertaken by the SPC in its
2008 Joint Report on Social Protection and Social Inclusion. The issue of financing and
expenditure of social protection acquires particular relevance in times of fiscal consolidation
and the search for better effectiveness and efficiency gains. The SPC will undertake a more in-
depth review on this topic in 2013. Chapter 4 summarises the key policy developments that took
place over the last year within the three strands of the social OMC. It draws upon the National
Social Reports submitted by 22 Member States in 2012 and is complemented by the results of
the SPC thematic reviews carried out in the course of the same year.
referred to 2008 as the most recent year of data available. This is the reason why monitoring of progress takes 2008 as a baseline year.
5 Expected to be adopted in February 2013.

- 14 -
According to the Commission's autumn European Economic Forecast, real GDP is set to contract
by 0.3% in the EU and 0.4% in the euro area in 2012. However, strong policy actions and
substantial advances in the architecture of the Economic and Monetary Union have helped to
stabilise the economy in several Member States. Moreover, fiscal deficits are expected to fall to
3.6% of GDP in the EU and 3.3% in the euro area on the back of consolidation plans
implemented in the course of the year.
In the first half of 2013, growth is expected to gradually return: GDP is projected to increase by
0.4% in the EU and 0.1% in the euro area, although large divergences across Member States will
remain. An adjustment of economic imbalances (reflected e. g. in the improvement of current-
account balances in deficit countries) is under way, together with structural reforms. This will
pave the way for a stronger and more evenly distributed economic expansion in 2014. GDP
growth in 2014 is projected at 1.6% in the EU and at 1.4% in the euro area.
Employment is expected to be lower in comparison with 2011 as highlighted by the Autumn
2012 EU Employment and Social Situation Quarterly Review (European Commission 2012c). In
the EU the employment rate went down by 0.2 % over the year to the second quarter of 2012,
while EU GDP was 0.3% down compared to the second quarter of 2011. In the euro area,
declines were of 0.6 % and 0.5 % respectively.
Most EU Member States have been on the verge of or in recession since late 2011 and the overall
economic sentiment is at its lowest level in three years. In this context, job-finding prospects
remain poor compared to pre-crisis years. The fall in economic activity stems from further
decline in domestic demand, whereas increased exports cushioned it slightly.
1. MACRO-ECONOMIC AND LABOUR MARKET CONTEXT

- 15 -
Figure 1. Change in GDP – Second quarter 2012, compared to second quarter 2007
Source: Eurostat, National Accounts [namq_gdp_k]
Note: Seasonally-adjusted data except for EL; data for EE, IE, LU refer to the 2007q1-2012q1 period.
Millions of national currency, chain-linked volumes, reference year 2005 (including 'euro fixed' series for
euro area countries).
Even more worrying is the fact that unemployment is still on the rise and has reached a new
record high above 26 million (26.061 million) in November 2012 (+0.6 % compared to October
2012), corresponding to an unemployment rate of 10.7 %. The continuous increase in
unemployment in the EU in the 20 months to November 2012 has led to a second upsurge in
unemployment, with close to 3.5 million more people out of work (+15.7 %). In the three
months to November 20126, unemployment was up in 18 Member States (see Figure 2). The
highest rises were recorded in Cyprus (+1.7 pps to 14.0 %), Greece (+1.3 pps by September
2012, to 26.0 %), Spain (+1.0 pps to 26.6 %), Italy (+0.6 pp to 11.1 %) and Denmark (+0.5 pp to
7.9 %). Over the same period, the unemployment rate remained stable in two countries and fell
in a further seven. Over the three months to November 2012, the largest decreases were
recorded in two Baltic countries - Latvia, Estonia, Romania and Ireland.
6 For EL and UK: September 2012; for EE and HU: October 2012; for LV: 2012q3.

- 16 -
Figure 2. Change in unemployment rate (%) over the last 12 months and last three
months to November 2012
Source: Eurostat, Series on unemployment; data seasonally adjusted [une_rt_m]
Notes: Data for EL up to Sep 12; UK: Moving average Aug-Sep-Oct 12; EE and HU: Moving average Sep-Oct-
Nov 12; BE, BG, FR, CZ, DK, IE, ES, FR, CY, LV, LT, LU, MT, PL, PT, SI, SK quarterly data up to 12Q3. Last 3-
month change value for LV = -1.6. Last 3-month change value for EE = -0.6. Last 12-month change value for
EE = -2.6.
With diverging trajectories, the gap between EU Member States in terms of unemployment rates
is continuing to widen. There is now an all-time record gap of 22.1 pps between the Member
State with the lowest rate of unemployment (Austria, 4.5 %) and that with the highest (Spain,
26.6 %). Most of the divergence has occurred between euro area countries. (European
Commission, 2012e)
Men fared worse than women during the downturn (from late 2008 onward). Employment
losses in construction and manufacturing were largely male-dominated. In contrast, some of the
few sources of employment growth in recent years were in female-dominated jobs in the service
industry, health, social care, and education. Female unemployment in the EU was higher than
male unemployment at the start of the downturn. It increased as the downturn progressed,
though not by as much as male unemployment. There was a slower re-absorption of women
than men when the signs of recovery set in (see Figure 3). These trends have resulted in a
progressive levelling down of the gender unemployment gap. However, this apparently more

- 17 -
equal outcome for women and men is largely due to a worsening in the employment
situation of both men and women, a little more for men than women in terms of
unemployment rates.
Figure 3. Unemployment rate by sex in the EU-27, monthly averages, 2007-2012
Source: Eurostat - LFS
The number of long-term unemployed consequently reached 10.7 million in the first quarter of
2012. Long-term unemployment accounts for 4.5% of the active population (up by 0.4 pp over
the year) at EU level and grew in the majority of Member States, reaching in some cases a
historically high level, although the pace of the increase is gradually declining. The proportion
of those among the active population who have been unemployed for more than one year has
reached its highest level in the past decade, both in the EU (4.5%) as a whole and in seven
individual Member States, namely in Greece (12.3 %), Spain (10.3%), Ireland (9.6%), Portugal
(6.9%), the UK (2.8%), Cyprus (2.7%) and Denmark (2.2 %). Long-term unemployment is
expected to continue to grow, owing to the recent surge in the number of recently unemployed
people.
Although not rising further over recent months, youth unemployment is still at a dramatic
level with the youth unemployment rate in the EU at 22.5 % in July. Migrants in the EU suffered
the most from rising unemployment, while older workers have maintained their position in the
labour market, according to EU aggregates, even during the crisis.
4,0
5,0
6,0
7,0
8,0
9,0
10,0
11,0
12,0
20
07
M0
1
20
07
M0
4
20
07
M0
7
20
07
M1
0
20
08
M0
1
20
08
M0
4
20
08
M0
7
20
08
M1
0
20
09
M0
1
20
09
M0
4
20
09
M0
7
20
09
M1
0
20
10
M0
1
20
10
M0
4
20
10
M0
7
20
10
M1
0
20
11
M0
1
20
11
M0
4
20
11
M0
7
20
11
M1
0
20
12
M0
1
20
12
M0
4
20
12
M0
7
20
12
M1
0
Males
Females

- 18 -
Since June 2012, the level of pessimism among EU consumers, regarding prospects of
employment over the next 12 months, has been on the rise, a trend noted in 21 Member States.
Unemployment expectations remain well above the long-term average at EU level, as the index
has been peaking at 40 points or above from August, a level not seen since early 2010.
Employers are not very optimistic either and a majority of them expect decreases in
employment over the coming months in all major sectors. This echoes the trend foreseen by the
Economic Sentiment Indicator (ESI): it has been below 100 points since August 2011, pointing to
a rather unfavourable business climate in the EU. However, the decrease in the ESI came to a
halt in October, at 86.2.
As the most recent European Commission analysis (European Commission, 2012b) highlighted,
all employment and social indicators point to a growing divergence between, on the one
hand, the Southern and peripheral European countries which seem to be trapped in a
vicious circle of recession; and on the other hand, most of the Countries of Northern and
central Europe which have shown better resilience until now. Part of this is driven by overall
economic performance but much of this is in itself the result of how labour markets and social
systems reacted to the severe global downturn. The decline of household disposable income
was strongest (larger than 4%) in the Southern countries, Ireland, Hungary and the Baltic
States as can be seen from Figure 4. It resulted from the further deterioration of labour market
conditions, and from the weakening of the welfare systems’ protective capacity over time. In
these countries, declining incomes affect the living conditions of a large part of the population,
and in 2012 the decline of private consumption is expected to weaken already bleak growth
prospects. In the Baltic States the rebound of the economic and labour market situation has
contributed to the stabilisation of incomes overall after 2010, but long-term unemployment and
poverty remain at high levels. This strong decline is in stark contrast with the situation observed
in Northern and Continental countries where the combined effect of robust automatic
stabilisers (reinforced by initial discretionary measures) and generally more resilient
labour markets helped mitigate the impact of the recession’s impact on overall household
incomes and private demand. While household incomes in these countries kept increasing
during the crisis, some population groups were more affected than others by rising
unemployment.
Further to the asymmetric shocks of the crisis, the different institutional structures displayed
very different resistance to the generally experienced major shock from the initial financial
crisis: very often countries with relatively unsegmented labour markets and strong
welfare systems have fared better than those with highly segmented labour markets and
weak welfare provisions. Initial public debt and deficit levels, the property markets situation,
and subsequent developments following the reaction of financial markets often compounded the
(in)ability to cope with the shock. The implementation of fiscal consolidation measures which
followed has been an important factor in social deterioration.

- 19 -
Figure 4. Evolution of Gross Household Disposable Income in real terms
(2005=100) 2005 to 2011 (2012 forecast)
Source: DG ECFIN-Ameco, European Commission (2012)
Member States' budget forecasts show that social contributions are expected to decrease in the
period 2011-2015 in 15 MS while only in 9 MS is some increase expected. Social payments, on
the other hand, are expected to decrease in 18 MS in the range of between 0.1pp and 3.5 pp of
GDP in the period 2011-2015. Only 7 MS are expecting to increase slightly their social payments.
While the current economic context requires fiscal adjustments, some of the MS which register
the lowest social protection expenditure in the EU are seeing some of the greatest forecasted
decreases in spending, casting doubt on the ability of these systems to respond to the high rates
of demand (e.g. high poverty rates, low efficiency of social transfers in reducing poverty).

- 20 -
Figure 5. Social contributions and social payments7 (2011-2015)
2011 2012 2013 2014 2015p.p. change
(2011-2015)2011 2012 2013 2014 2015
p.p. change
(2011-2015)
BE 16,7 17,0 17,1 17,1 17,1 0,4 BE 25,2 25,8 25,9 25,8 25,7 0,5
BG 7,3 7,1 7,0 6,8 6,7 -0,6 BG 13,7 13,7 13,3 12,8 12,3 -1,4
CZ 15,5 15,4 14,8 15,2 15,4 -0,1 CZ 19,9 20,0 19,9 19,6 19,2 -0,7
DK* 1,0 1,0 0,9 0,8 0,8 -0,2 DK 19,0 19,3 19,2 19,0 18,7 -0,3
DE 16,9 17,0 16,5 16,5 16,5 -0,4 DE 24,5 24,5 24,5 24,5 24,5 0
EE 12,3 11,9 11,7 11,3 11,3 -1,0 EE 13,4 13,4 13,2 13,0 12,8 -0,6
IE 6,6 6,2 6,1 6,0 5,8 -0,8 IE 18,0 17,3 16,5 15,3 14,5 -3,5
EL 12,8 : : : : : EL 21,9 : : : : :
ES 13,0 13,2 12,7 12,4 12,2 -0,8 ES 18,0 18,6 18,6 18,3 17,9 -0,1
FR 18,8 18,7 18,2 18,2 18,2 -0,6 FR 25,6 25,8 25,6 25,3 25,0 -0,6
IT 13,7 13,8 13,7 13,7 13,7 0 IT 22,1 22,5 22,4 22,3 22,2 0,1
CY 9,5 9,5 9,4 10,1 10,0 0,5 CY 15,3 15,2 15,5 15,7 15,8 0,5
LV 8,8 8,8 8,0 7,6 7,4 -1,4 LV 11,4 11,0 10,2 9,6 9,1 -2,3
LT 10,2 10,1 9,7 9,7 9,7 -0,5 LT 13,2 12,9 12,5 11,6 10,6 -2,6
LU 11,9 12,0 12,1 12,0 11,8 -0,1 LU 19,8 20,4 20,5 20,5 20,3 0,5
HU : : : : : : HU : : : : : :
MT 7,6 7,7 7,7 7,7 7,7 0,1 MT 13,8 13,7 13,5 13,1 12,8 -1,0
NL 15,5 16,0 16,2 16,4 16,3 0,8 NL 23,3 23,9 24,0 24,1 24,1 0,8
AT 16,2 16,3 16,3 16,3 16,3 0,1 AT 24,5 25,1 25,0 24,7 24,4 -0,1
PL 11,4 12,3 12,5 12,6 12,6 1,2 PL 16,2 16,0 15,8 15,8 15,7 -0,5
PT 12,3 12,0 11,9 11,8 11,6 -0,7 PT 22,1 21,8 21,6 21,2 20,9 -1,2
RO 8,8 8,6 9,2 : : 0,4 RO 12,6 12,1 11,8 11,9 12,3 -0,3
SI 15,5 15,4 15,1 15,0 15,0 -0,5 SI 20,1 19,8 19,3 18,7 18,3 -1,8
SK 12,5 11,9 11,8 11,6 11,5 -1,0 SK 18,5 18,3 18,1 18,0 17,7 -0,8
FI 12,4 12,5 12,5 12,6 12,6 0,2 FI 20,3 20,8 20,9 21,0 21,0 0,7
SE 7,6 7,6 7,5 7,5 7,5 -0,1 SE 17,7 18,2 18,0 17,4 16,9 -0,8
UK 6,6 6,7 6,7 6,7 6,7 0,1 UK 13,3 13,6 13,8 13,3 12,9 -0,4
Revenue: Social contributions (ESA Code: D.61), % of GDP Expenditure: Social payments (Social transfers in kind and Social
transfers other than in kind), % in GDP
Source: National Stability and Convergence Programmes, 2012
The 2012 Social Climate Eurobarometer shows that the overall perception of Europeans with
regards to the current situation has remained stable in the last 3 years. The most positive
perceptions are found in the Benelux and Nordic countries, along with Austria and
Germany while the most negative perceptions are registered in Southern and Eastern
Member States. The largest improvements in public perception of the social climate have been
registered in LV, FR, DK, RO and DE while the largest declines are found in IT, EL and CY.
Europeans are more pessimistic in relation to the employment situation and the national
economy relative to 2011, with the proportion expecting the situation to worsen increasing from
33% to 42% and from 36% to 42%, respectively. As was the case in 2011, the large majority of
Europeans expect either deterioration or no change in the five areas of social protection and
inclusion with small minorities anticipating improvements.
7 Social contributions (ESA D.61) comprise actual social contributions (D.611) and imputed social
contributions (D.612). Social payments equals the sum between social transfers in kind supplied via market producers (D.6311, D.63121, D.63131) and social transfers other than in kind (D.62). For more information, refer to: http://circa.europa.eu/irc/dsis/nfaccount/info/data/esa95/en/een00534.htm

- 21 -
In a longer-term perspective, Europe’s population is ageing. By 2030, it is estimated that 23.5%
of the total European population will be 65 or older (Giannakouris, 2010). By 2030, the EU-27
population as a whole is projected to increase to 509.1 million according to the highest growth
scenarios (the dependency ratio is expected to rise from 28.4% in 2008 to 41.9% in 2030) which
will lead to new challenges for social protection systems. The EU has to increase its overall
employment rate to reduce the risk that a smaller workforce will have to support a growing
number of dependents, with negative effects on the sustainability of social expenditure. The
employment rate is particularly low for women (62.3% against 75% for men aged 20-64 in
2011) and older workers aged 55-64 (47.4% in 2011). In order to reach the overall EU
employment rate target of 75% of the Europe 2020 Strategy, it is necessary to increase female
participation rates. This is especially important in the southern Member States, many of which
are characterised both by low female employment rates and low fertility rates.

- 22 -
2.1 The Social Situation in Europe
Progress towards the Europe 2020 headline target on poverty and
social exclusion
The commitment made in 2010 by the EU Heads of States and Government, to lift at least 20
million people out of being at risk of poverty or social exclusion in the context of the Europe
2020 strategy, was a significant step forward. It stressed the importance of inclusive growth for
the future of Europe, and it has introduced a new monitoring and accountability scheme8.
The definition of the EU poverty and social exclusion headline target is based on a combination
of three indicators – the at-risk-of-poverty rate, severe material deprivation rate, and share of
people living in very low work intensity households. It considers people who find themselves in
any of these three categories and, while very broad, it reflects the multiple facets of poverty and
social exclusion across Europe. This definition extends the customary concept of relative income
poverty to cover the non-monetary dimension of poverty and labour market exclusion.
All 27 EU Member States have now set national targets for contributing to the Europe 2020
objective on poverty and social exclusion reduction9. Most recent Eurostat figures10 available for
the EU 27 population living in poverty or social exclusion, as defined by the Europe 2020
poverty and social exclusion target, show that 119.5 million people living in the EU (24.1 %
of the EU population) were at risk of poverty or social exclusion in 2011, an increase of
nearly 4 million from 2010 (Figure 6). After some slight positive developments in 2009
towards the EU 2020 target, the number of people living in poverty or social exclusion is back to
above 2008 levels.
8 COM(2010)758 final
9 For the exact definition of the national targets, please refer to the country profiles in Annex 1.
10 The main data source on poverty and social exclusion, the EU Survey on Income and Living Conditions
(EU-SILC), has a significant time lag. 2010 (t) data refers to income and employment for 2009 (t-1) while
only the information on living conditions and material deprivation specifically, refers to 2010 (t). Thus,
the most recent data available currently presents only the initial impact of the crisis on households.
2. THE SOCIAL SITUATION IN THE EUROPEAN UNION AND
KEY SOCIAL TRENDS TO WATCH

- 23 -
Figure 6. Evolution of the population at risk of poverty or social exclusion (Europe
2020 headline target), 2008 – 2011
Source: Eurostat (EU-SILC)
Extraction date: 04.02.2013
Notes: AROPE – at risk of poverty or social exclusion rate; AROP - at-risk-of-poverty rate; VLWI - share of
population living in very low work intensity households ((quasi)-jobless households); SMD - severe material
deprivation rate. For the at-risk-of poverty rate, the income reference year is the calendar year prior to the
survey year (i.e. 2010) except for the United Kingdom (survey year) and Ireland (12 months preceding the
survey). Similarly, the very low work intensity rate refers to the previous calendar year (i.e. 2010) while for
the severe material deprivation rate, the reference is the current year (i.e. 2011).
As it can be seen from Table 1, in 2011 13 Member States have experienced an increase in the
proportion of their population living in poverty or social exclusion increasing. For most
countries the increase since 2010 is rather small (1-2 percentage points) with the exception of
Italy and Greece where the increase since 2010 is of the range of 3.7pp and 3.5pp, respectively.
A similar situation is also observed when looking at progress since 2008. Only 4 MS are showing
some positive developments – Romania, Portugal and Poland have registered consistent
improvement since 2008 while Austria has also shown positive developments which stabilised
in 2011.

- 24 -
Table 1. At risk of poverty or social exclusion, in %, changes 2010-2011 and 2008-
2011
EU27 BE BG CZ DK DE EE IE EL ES FR IT CY LV
2011 24,2 21,0 49,1 15,3 18,9 19,9 23,1 29,9 31,0 27,0 19,3 28,2 23,5 40,1
2010-2011
change in pp ~ ~ ~0,9
~ ~1,4 4,2 3,3 1,5
~3,7
~2,0
2008-2011
change in pp ~ ~4,3
~2,6
~1,3 6,2 2,9 4,1
~2,9 1,1 6,3
LT LU HU MT NL AT PL PT RO SI SK FI SE UK
2011 33,4 16,8 31,0 21,4 15,7 16,9 27,2 24,4 40,3 19,3 20,6 17,9 16,1 22,7
2010-2011
change in pp ~ ~1,1 1,1 0,6
~-0,6 -0,9 -1,1 1,0
~1,0 1,1
~2008-2011
change in pp5,8 1,3 2,8 1,8 0,8 -1,7 -3,3 -1,6 -3,9
~ ~ ~1,2
~
Source: Eurostat (EU-SILC)
Extraction date: 04.02.2013
Notes: i) Latest data available for Ireland refers to 2010 and changes are for the periods 2009-2010 and
2008-2010. ii) Only statistically significant changes have been marked in green/red (positive/negative
changes). For the change 2010-2011, provisional computations of significance of net change done by
Eurostat have been used11. For the change 2008-2011, a 1pp threshold has been used. "~" refers to stable
performance (i.e. statistically insignificant change). iii) For the at-risk-of poverty rate, the income reference
year is the calendar year prior to the survey year (i.e. 2010) except for the United Kingdom (survey year) and
Ireland (12 months preceding the survey). Similarly, the very low work intensity rate refers to the previous
calendar year (i.e. 2010) while for the severe material deprivation rate, the reference is the current year (i.e.
2011).
In 2011 the population at risk of poverty or social exclusion ranged from close to 50% in
Bulgaria, and around 40% in Romania and Latvia, to between 15% and 16% in the Czech
Republic, Sweden and Austria (see Figure 7).
11
Please note that results for BE are provisional and could be revised at a later stage.

- 25 -
Figure 7. At risk of poverty or social exclusion rate (in %), 2011
Source: Eurostat (EU-SILC)
Extraction date: 04.02.2013
Note: Figures for Ireland refer to 2010. For the at-risk-of poverty rate, the income reference year is the
calendar year prior to the survey year (i.e. 2010) except for the United Kingdom (survey year) and Ireland
(12 months preceding the survey). Similarly, the very low work intensity rate refers to the previous calendar
year (i.e. 2010) while for the severe material deprivation rate, the reference is the current year (i.e. 2011).
Income poverty risk increases in almost half of Member States
This clear overall worsening of household circumstances across Europe is linked in many
Member States to an increase in income poverty (Bulgaria, Spain, Hungar). Between 2010 and
2011 the overall level of income poverty has increased in 14 Member States while in most
of the remaining countries the situation has remained stagnant. In a few countries there is
some improvement registered (LU, LV and UK). However, in LV and UK the decrease in income
poverty has been accompanied by a significant drop in the poverty threshold indicating a
possible overall deterioration in the income conditions of the population.
Table 2. At-risk-of-poverty rate, in %, and at-risk-of-poverty threshold for single
person household, in pps, changes 2010-2011 and 2008-2011
EU27 BE BG CZ DK DE EE IE EL ES FR IT CY LV
2011 16,9 15,3 22,3 9,8 13,0 15,8 17,5 16,1 21,4 21,8 14,0 19,6 14,5 19,3
2010-2011
change in pp ~0,7 1,6 0,8
~ ~1,7 1,1 1,3 1,1
~1,4
~-2,0
2008-2011
change in pp ~ ~ ~ ~1,2
~-2,0
~1,3 2,2 1,3
~-1,2 -6,3
2011 - 10.776 3.427 5.944 11.122 10.955 4.491 9.705 6.930 7.736 10.826 9.255 11.580 3.484
2010-2011
change in %-
~ ~ ~ ~ ~ ~-8 -8,3
~ ~ ~ ~ ~
2008-2011
change in %- 7,3 19,9
~5,3
~ ~-11
~-7,6
~ ~ ~-20,0
At-risk-of-poverty rate (in %)
At-risk-of-poverty threshold for a single person household (in pps)

- 26 -
LT LU HU MT NL AT PL PT RO SI SK FI SE UK
2011 20,0 13,6 13,8 15,4 11,0 12,6 17,7 18,0 22,2 13,6 13,0 13,7 14,0 16,2
2010-2011
change in pp ~-0,9 1,5
~0,7
~ ~ ~1,1 0,9 1
~1,1 -0,9
2008-2011
change in pp ~ ~1,4
~ ~ ~ ~ ~-1,2 1,3 2,1
~1,8 -2,5
2011 3.690 16.195 4.190 8.359 11.326 12.035 4.873 5.722 2.159 8.512 5.280 10.600 11.102 10.114
2010-2011
change in % ~ ~ ~5,2
~ ~7,3
~ ~ ~5,9
~ ~ ~
2008-2011
change in %-11,5
~5,9
~ ~8,2 20,6
~17,5
~30,1 6,7
~-9,1
At-risk-of-poverty rate (in %)
At-risk-of-poverty threshold for a single person household (in pps)
Source: Eurostat (EU-SILC)
Extraction date: 04.02.2013
Note: i) Latest data available for Ireland refers to 2010 and changes are for the periods 2009-2010 and 2008-
2010. ii)For the change 2010-2011 of the at-risk-of-poverty rate, provisional computations of significance of
net change done by Eurostat have been used12. For the change 2008-2011, a 1pp threshold has been used. For
the poverty threshold, a 5% net change threshold has been used. "~" refers to stable performance (i.e.
statistically insignificant change). iii) For the at-risk-of poverty rate, the income reference year is the
calendar year prior to the survey year (i.e. 2010) except for the United Kingdom (survey year) and Ireland
(12 months preceding the survey).
This phenomenon can be observed in the substantial decline in Lithuania and Latvia’s poverty
threshold between 2008 and 2011 by 20% and 11.5% respectively (although in the past year the
level has remained stable). Decreases in the poverty rate that are accompanied by a drop in the
poverty threshold, as observed in Latvia for example, do not necessarily indicate that people’s
income situation has improved. In other countries, where increases in the rate of risk of poverty
are accompanied by a rise in the poverty threshold (in comparison to 2008), as is the case in
Bulgaria and Hungary, a greater inequality in the income distribution is becoming evident.
In every age group, women are more likely to live in poverty than men. Single mothers, older
women and migrant women are particularly vulnerable. In 2011, the rate of poverty for women
stood at 17,1% across the EU, compared to 16,1% for men. Women face a greater risk of poverty
than men in all Member States except for Ireland, Malta, Denmark, Luxembourg, Lithuania and
Hungary. Women spend less time in employment than their male counterparts, due to taking
care of children and/or family members. They are more likely to work part time and/or in
temporary jobs, and more likely to exit early from the labour market after childbearing. Women
earn less over their working life on average. In this context, the intra-household distribution of
income has particular consequence for women's risk of poverty. Where household income is
shared, the impact of gender inequalities in earnings is mitigated. A different picture emerges in
later years, as women are more likely to live longer and, consequently, live alone. Women’s
12
Please note that results for BE are provisional and could be revised at a later stage.

- 27 -
lower lifetime earnings tend to be reflected in lower pension entitlements, and those in
retirement find their income depressed.
Material deprivation remains a serious challenge in many Member
States
Severe material deprivation rates, which complement income-based poverty measures, provide
an estimate of the proportion of people whose living conditions are severely affected by a lack of
resources. They reflect the differences in living standards across EU countries, as the national
level depends as much on the level of development as on the social policies operating
redistribution. The severe material deprivation rate provides a headcount of the number of
people who cannot afford 4 out of the following 9 items: to pay their rent, mortgage or utility
bills, keep their home adequately warm, face unexpected expenses, eat meat or proteins
regularly, go on holiday, buy a television, a washing machine, a car or a telephone.
8.8 % of Europeans live in these difficult conditions in 2011. The levels differ widely from more
than 40% in Bulgaria to as low as 1,2% in Luxembourg and Sweden. In a few Member States
low living standards is a much more serious problem than income poverty (e.g. Romania,
Latvia, Hungary). While in Romania recent improvements show a positive development, the
worsening situation in Hungary and Latvia suggest an alarming further deterioration for people
with already low living standards.

- 28 -
Table 3. Severe material deprivation rate, in %, changes 2010-2011 and 2008-
2011
EU27 BE BG CZ DK DE EE IE EL ES FR IT CY LV
2011 8,8 5,7 43,6 6,1 2,6 5,3 8,7 7,5 15,2 3,9 5,2 11,2 10,7 30,9
2010-2011
change in pp ~-0,2 -2,1
~ ~0,8
~1,4 3,6 -0,1
~4,3 1,1 3,5
2008-2011
change in pp ~ ~2,4
~ ~ ~3,8 2,0 4,0 1,4
~3,7 1,9 11,9
LT LU HU MT NL AT PL PT RO SI SK FI SE UK
2011 18,5 1,2 23,1 6,3 2,5 3,9 13,0 8,3 29,4 6,1 10,6 3,2 1,2 5,1
2010-2011
change in pp-1,0 0,7 1,5 0,6 0,3
~-1,2 -0,7 -1,6
~-0,8 0,4
~ ~2008-2011
change in pp6,2
~5,2 2,3 1,0 -2,5 -4,7 -1,4 -3,5
~-1,2
~ ~ ~
Source: Eurostat (EU-SILC)
Extraction date: 04.02.2013
Note: i) Latest data available for Ireland refers to 2010 and changes are for the periods 2009-2010 and 2008-
2010. ii) Only statistically significant changes have been marked in green/red (positive/negative changes).
For the change 2010-2011, provisional computations of significance of net change done by Eurostat have
been used13. For the change 2008-2011, a 1pp threshold has been used. "~" refers to stable performance (i.e.
statistically insignificant change). iii) For the material deprivation indicator, the reference year is the survey
year.
The number of (quasi-)jobless households in Europe continues to
increase
The most immediate changes due to the crisis were registered in the number of people living in
very low work intensity households, hereafter referred to as (quasi-)jobless households. With
the current increasing unemployment rate, people who live in households where no one works
is increasing in parallel. As evident from Table 4, increases in the (quasi-)jobless rate between
2010 and 2011 have been registered in 11 Member States (Belgium, Bulgaria, Denmark, Estonia,
Greece, Spain, Lithuania, Luxembourg, Netherlands, Slovenia, Finland and Sweden), in some
cases by 3pp or above (Bulgaria, Greece, Lithuania).
13
Please note that results for BE are provisional and could be revised at a later stage.

- 29 -
Table 4. Population living in quasi-jobless households, in %, changes 2010-2011
and 2008-2011
EU27 BE BG CZ DK DE EE IE EL ES FR IT CY LV
2011 10,0 13,7 11,0 6,6 11,4 11,1 9,9 22,9 11,8 12,2 9,3 10,4 4,5 12,2
2010-2011
change in pp ~1,1 3,1
~1,1
~1,0 3,1 4,3 2,4
~ ~ ~ ~
2008-2011
change in pp1,0 2,0 2,9
~3,1
~4,6 9,3 4,4 6,0
~ ~ ~7,1
LT LU HU MT NL AT PL PT RO SI SK FI SE UK
2011 12,3 5,8 12,1 8,3 8,7 8,0 6,9 8,2 6,7 7,6 7,6 9,8 6,8 11,5
2010-2011
change in pp3,1 0,3
~ ~0,5
~-0,4 -0,4 -0,1 0,7
~0,7 0,9 -1,6
2008-2011
change in pp7,2 1,1
~ ~ ~ ~-1 1,9 -1,5
~2,4 2,5 1,4 1,1
Source: Eurostat (EU-SILC)
Extraction date: 04.02.2013
Note: i) Latest data available for Ireland refers to 2010 and changes are for the periods 2009-2010 and 2008-
2010. ii) Only statistically significant changes have been marked in green/red (positive/negative changes)
with a 1pp threshold. "~" refers to stable performance (i.e. statistically insignificant change. iii) The (quasi-
)jobless households or very low work intensity rate refers to the previous calendar year (i.e. 2010).
In some countries (Figure 8) the share of people in (quasi-jobless) households increased by a
similar proportion to the fall in the employment rate or in a few even more strongly (e.g. Greece,
Spain). This could be due to declines in employment predominantly affecting workers living
in the most vulnerable households, such as single households (including lone parents), single
breadwinner couples, or couples where both are employed in similar jobs with little possibility
to increase work intensity.
- 30 -
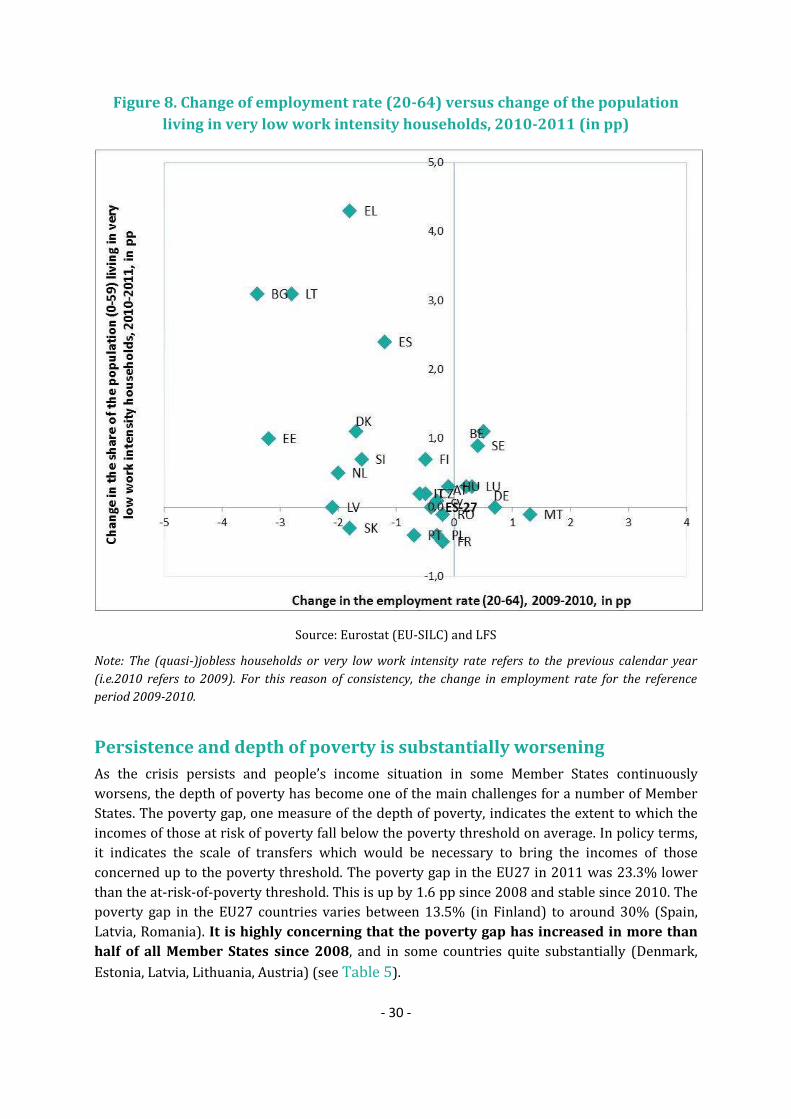
Figure 8. Change of employment rate (20-64) versus change of the population
living in very low work intensity households, 2010-2011 (in pp)
Source: Eurostat (EU-SILC) and LFS
Note: The (quasi-)jobless households or very low work intensity rate refers to the previous calendar year
(i.e.2010 refers to 2009). For this reason of consistency, the change in employment rate for the reference
period 2009-2010.
Persistence and depth of poverty is substantially worsening
As the crisis persists and people’s income situation in some Member States continuously
worsens, the depth of poverty has become one of the main challenges for a number of Member
States. The poverty gap, one measure of the depth of poverty, indicates the extent to which the
incomes of those at risk of poverty fall below the poverty threshold on average. In policy terms,
it indicates the scale of transfers which would be necessary to bring the incomes of those
concerned up to the poverty threshold. The poverty gap in the EU27 in 2011 was 23.3% lower
than the at-risk-of-poverty threshold. This is up by 1.6 pp since 2008 and stable since 2010. The
poverty gap in the EU27 countries varies between 13.5% (in Finland) to around 30% (Spain,
Latvia, Romania). It is highly concerning that the poverty gap has increased in more than
half of all Member States since 2008, and in some countries quite substantially (Denmark,
Estonia, Latvia, Lithuania, Austria) (see Table 5).
- 31 -
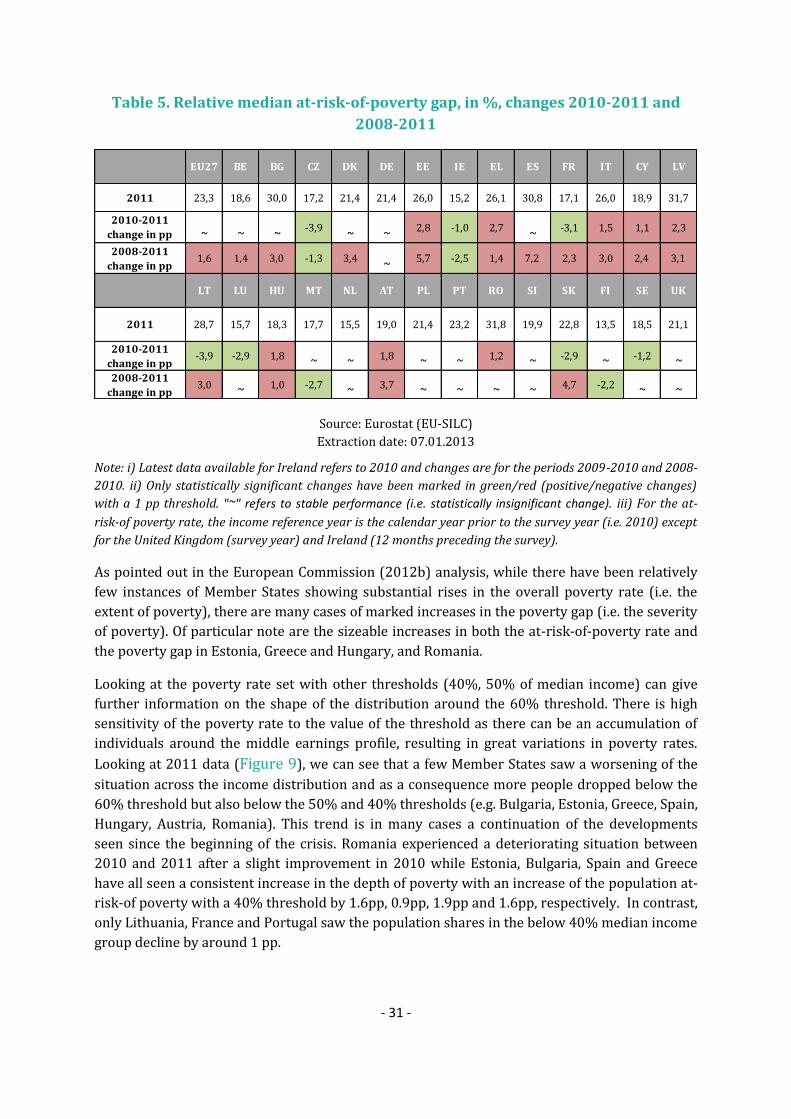
Table 5. Relative median at-risk-of-poverty gap, in %, changes 2010-2011 and
2008-2011
EU27 BE BG CZ DK DE EE IE EL ES FR IT CY LV
2011 23,3 18,6 30,0 17,2 21,4 21,4 26,0 15,2 26,1 30,8 17,1 26,0 18,9 31,7
2010-2011
change in pp ~ ~ ~-3,9
~ ~2,8 -1,0 2,7
~-3,1 1,5 1,1 2,3
2008-2011
change in pp1,6 1,4 3,0 -1,3 3,4
~5,7 -2,5 1,4 7,2 2,3 3,0 2,4 3,1
LT LU HU MT NL AT PL PT RO SI SK FI SE UK
2011 28,7 15,7 18,3 17,7 15,5 19,0 21,4 23,2 31,8 19,9 22,8 13,5 18,5 21,1
2010-2011
change in pp-3,9 -2,9 1,8
~ ~1,8
~ ~1,2
~-2,9
~-1,2
~2008-2011
change in pp3,0
~1,0 -2,7
~3,7
~ ~ ~ ~4,7 -2,2
~ ~
Source: Eurostat (EU-SILC)
Extraction date: 07.01.2013
Note: i) Latest data available for Ireland refers to 2010 and changes are for the periods 2009-2010 and 2008-
2010. ii) Only statistically significant changes have been marked in green/red (positive/negative changes)
with a 1 pp threshold. "~" refers to stable performance (i.e. statistically insignificant change). iii) For the at-
risk-of poverty rate, the income reference year is the calendar year prior to the survey year (i.e. 2010) except
for the United Kingdom (survey year) and Ireland (12 months preceding the survey).
As pointed out in the European Commission (2012b) analysis, while there have been relatively
few instances of Member States showing substantial rises in the overall poverty rate (i.e. the
extent of poverty), there are many cases of marked increases in the poverty gap (i.e. the severity
of poverty). Of particular note are the sizeable increases in both the at-risk-of-poverty rate and
the poverty gap in Estonia, Greece and Hungary, and Romania.
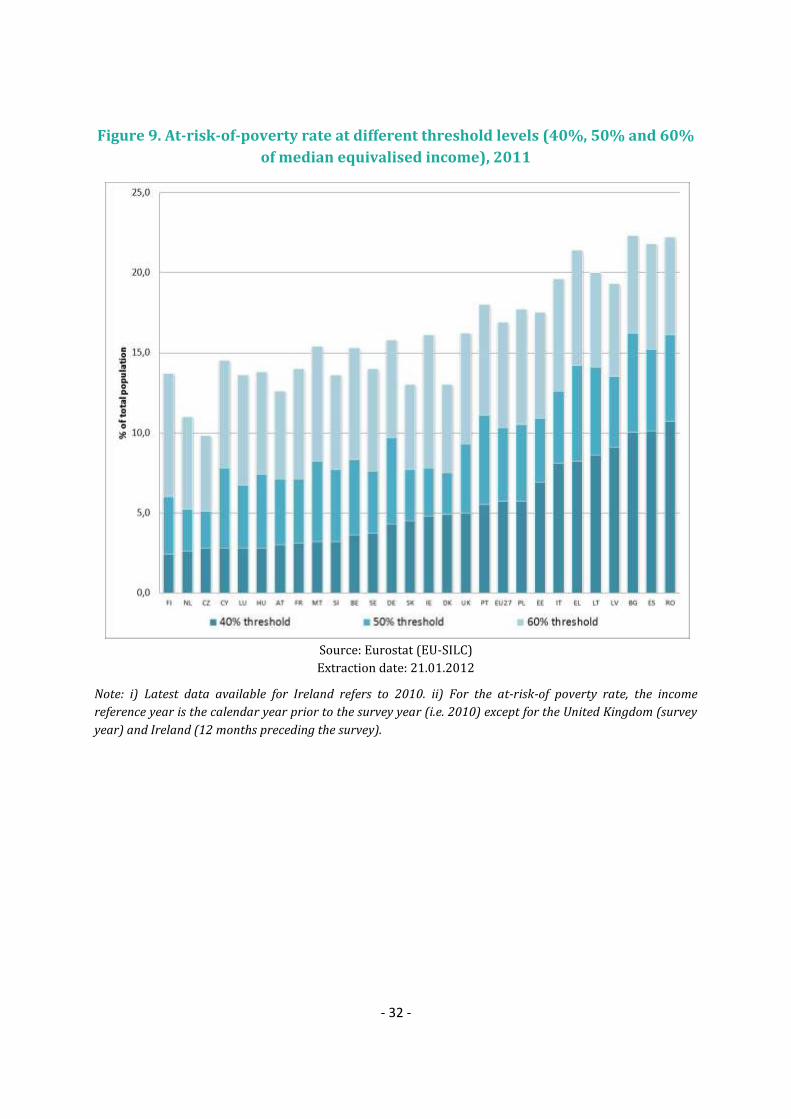
Looking at the poverty rate set with other thresholds (40%, 50% of median income) can give
further information on the shape of the distribution around the 60% threshold. There is high
sensitivity of the poverty rate to the value of the threshold as there can be an accumulation of
individuals around the middle earnings profile, resulting in great variations in poverty rates.
Looking at 2011 data (Figure 9), we can see that a few Member States saw a worsening of the
situation across the income distribution and as a consequence more people dropped below the
60% threshold but also below the 50% and 40% thresholds (e.g. Bulgaria, Estonia, Greece, Spain,
Hungary, Austria, Romania). This trend is in many cases a continuation of the developments
seen since the beginning of the crisis. Romania experienced a deteriorating situation between
2010 and 2011 after a slight improvement in 2010 while Estonia, Bulgaria, Spain and Greece
have all seen a consistent increase in the depth of poverty with an increase of the population at-
risk-of poverty with a 40% threshold by 1.6pp, 0.9pp, 1.9pp and 1.6pp, respectively. In contrast,
only Lithuania, France and Portugal saw the population shares in the below 40% median income
group decline by around 1 pp.
- 32 -
Figure 9. At-risk-of-poverty rate at different threshold levels (40%, 50% and 60%
of median equivalised income), 2011
Source: Eurostat (EU-SILC)
Extraction date: 21.01.2012
Note: i) Latest data available for Ireland refers to 2010. ii) For the at-risk-of poverty rate, the income
reference year is the calendar year prior to the survey year (i.e. 2010) except for the United Kingdom (survey
year) and Ireland (12 months preceding the survey).
- 33 -
The dynamics of poverty – exploring transitions in and out of
poverty
The temporal dimension of poverty and social exclusion is a key dimension to take into
account to better understand the varying nature of poverty and processes leading to it. In-
depth analysis of the longitudinal EU-SILC data undertaken by the European Commission
(2012b) shows that the time spent in poverty – or deprivation – differs a lot between
individuals and countries. Some individuals might be at risk of experiencing a downward
spiral and be trapped in a process of long term exclusion while others might easily get out of
poverty. Poverty spells can also be recurrent, with multiple entries and exits.
When considering a multi-annual period instead of a single year, it appears that the share of
individuals who have been poor for at least one year during the period is much greater than
the risk of poverty rate measured in a single year. This means that a large share of people at-
risk-of-poverty are poor for a short period while others might remain poor for a longer
period. Among the working age population (18-64) in the Member States for which
longitudinal data is available, 27% had been at-risk-of-poverty for at least one year in the
period 2006 to 2009, a much higher figure than the annual cross-sectional risk of poverty
rate (14% on average between 2006 and 2009 in these same Member States). Similarly, 28%
of the population were reported as suffering from material deprivation in at least one of the
periods, which is, again, much higher than the average material deprivation rate of 17%
during the period.
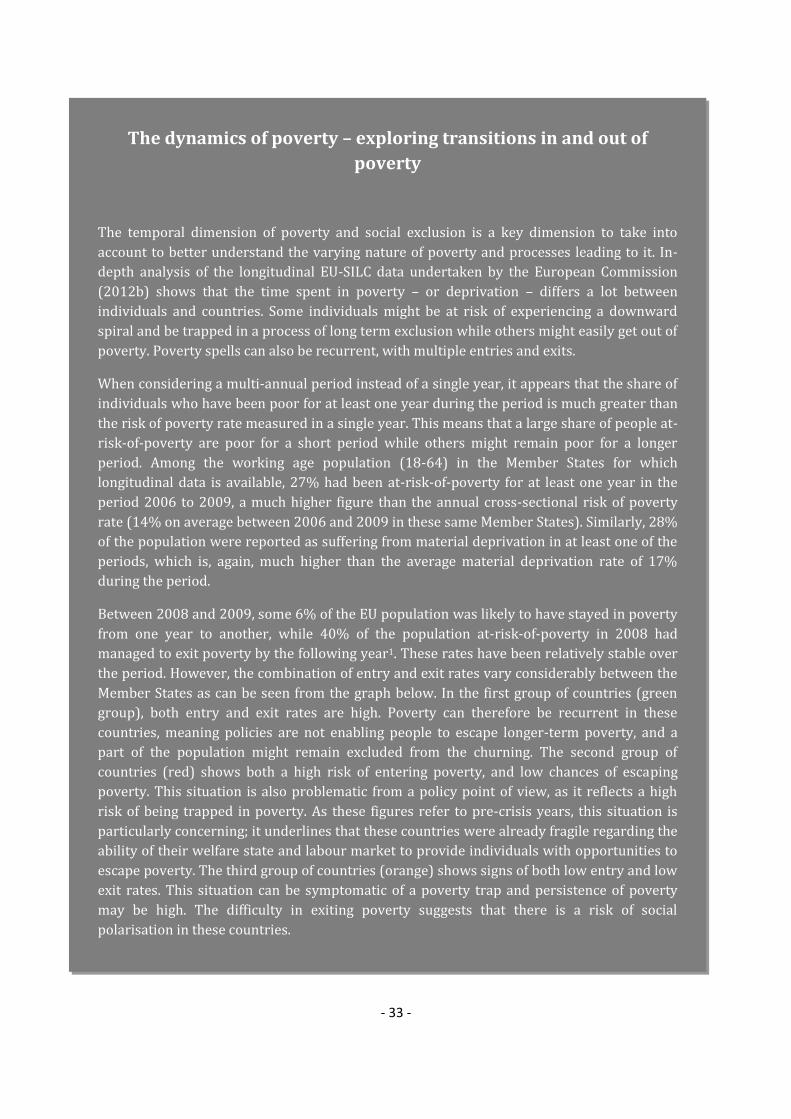
Between 2008 and 2009, some 6% of the EU population was likely to have stayed in poverty
from one year to another, while 40% of the population at-risk-of-poverty in 2008 had
managed to exit poverty by the following year1. These rates have been relatively stable over
the period. However, the combination of entry and exit rates vary considerably between the
Member States as can be seen from the graph below. In the first group of countries (green
group), both entry and exit rates are high. Poverty can therefore be recurrent in these
countries, meaning policies are not enabling people to escape longer-term poverty, and a
part of the population might remain excluded from the churning. The second group of
countries (red) shows both a high risk of entering poverty, and low chances of escaping
poverty. This situation is also problematic from a policy point of view, as it reflects a high
risk of being trapped in poverty. As these figures refer to pre-crisis years, this situation is
particularly concerning; it underlines that these countries were already fragile regarding the
ability of their welfare state and labour market to provide individuals with opportunities to
escape poverty. The third group of countries (orange) shows signs of both low entry and low
exit rates. This situation can be symptomatic of a poverty trap and persistence of poverty
may be high. The difficulty in exiting poverty suggests that there is a risk of social
polarisation in these countries.

- 34 -
Poverty churning: entry and exit rates from the risk of poverty among the
18-64 population
Source: Eurostat (EU-SILC) longitudinal UDB 2009 v.2 of March 2012, DG EMPL calculations
The risk of poverty might sometimes be considered as volatile in a temporal perspective. For
this reason, it is interesting to cross the results with those expressing transitions into and out
of material deprivation, which can play the role of a complementary measure of economic
hardship. In terms of material deprivation, each year on average 7% of the EU population that
had not been deprived the year before become deprived and, symmetrically, among those who
were deprived, 34% cease to be deprived the following year. With regard to the risk of
material deprivation, entry and exits rates can also be presented diagrammatically. The
grouping of Member States differs slightly from the risk of poverty grouping due to the
different reference period for income and deprivation and the fact that the spread of material
deprivation rates among the EU is much broader than the spread of the risk of poverty, with
generally higher rates of entry (and lower exits) in the new compared with the old Member
States.

- 35 -
Combination of entry and exit rates from deprivation among the 18-64
population
Source: Eurostat (EU-SILC) longitudinal UDB 2009 v.2 of March 2012, DG EMPL calculations
______________________________________________
1 The entry rate into poverty (resp. deprivation) at time t is defined as the ratio (A/B) between
(A) the number of individuals not at-risk-of-poverty (resp. non deprived) at time t-1 and who
are at-risk-of-poverty at time t (resp. deprived) and (B) the number of individuals who were
not at-risk-of-poverty at time t-1. Symmetrically, the exit rate is defined as the ratio between
(A) the number of people who are not at-risk-of-poverty (resp. deprived) at time t and who are
at-risk-of-poverty (resp. deprived) at time t-1 and (B) the number of individuals who were at-
risk-of-poverty (resp. deprived) at time t-1. The value of the exit rate is much higher than the
value of the entry rate, because it refers by definition to populations which are of different
sizes (the population not at-risk-of-poverty for the first, the population at risk in the second).

- 36 -
Number of children living in poverty or social exclusion persistently
rise
Europe's social and economic future greatly depends on its capacity to break the transmission of
disadvantage across generations. Children (0-17) remain more at risk of poverty or social
exclusion than the overall population with a rate of 27% compared to 24.1% in the EU in
2011. Only in a minority of countries (Cyprus, Denmark, Finland, Slovenia and Sweden) are
children less at risk than the total population. In 19 MS the situation has worsened since 2008
(see Error! Reference source not found.). The combination of insufficient earnings from
parental work and inadequate support for households with children together with fiscal
consolidation measures which in some cases have negatively affected income support and the
provision of services for families have played a substantial role in worsening the situation of
families with children. Furthermore, in a number of countries the last two decades have seen a
shift in poverty and social exclusion risks away from the elderly towards younger generations
and children.
Table 6. Children (0-17) at risk of poverty or social exclusion (in %), changes
2010-2011 and 2008-2011
EU27 BE BG CZ DK DE EE IE EL ES FR IT CY LV
2011 27,0 23,3 51,8 20,0 16,0 19,9 24,8 37,6 30,4 30,6 23,0 32,3 21,8 43,6
2010-2011
change in pp ~ ~2,0 1,1
~-1,8
~6,2
~0,8
~3,4
~1,6
2008-2011
change in pp ~2,0 7,6 1,4 3,3
~5,4 11,0 1,7 4,3 1,6 3,2
~10,4
LT LU HU MT NL AT PL PT RO SI SK FI SE UK
2011 33,4 21,7 39,6 25,8 18,0 19,2 29,8 28,6 49,1 17,3 26,0 16,1 15,9 26,9
2010-2011
change in pp ~ ~ ~ ~1,1
~-1,0
~0,4 2,1
~1,9 1,4 -2,8
2008-2011
change in pp4,0
~6,2 2,3 2,5 -1,2 -3,1
~-2,1 2,0 1,7 1,0 1,3 -2,7
Source: Eurostat (EU-SILC)
Extraction date: 04.02.2013
Note: i) Latest data available for Ireland refers to 2010 and changes are for the periods 2009-2010 and 2008-
2010. ii) Percentage point changes for 2010-2011 and 2008-2011 have been calculated. Only statistically
significant changes have been marked in green/red (positive/negative changes). ). For the change 2010-2011,
provisional computations of significance of net change done by Eurostat have been used14. For the change
2008-2011, a 1pp threshold has been used "~" refers to stable performance (i.e. statistically insignificant
change). iii) For the at-risk-of poverty rate, the income reference year is the calendar year prior to the survey
year (i.e. 2010) except for the United Kingdom (survey year) and Ireland (12 months preceding the survey).
Similarly, the very low work intensity rate refers to the previous calendar year (i.e. 2010) while for the severe
material deprivation rate, the reference is the current year (i.e. 2011).
14
Please note that results for BE are provisional and could be revised at a later stage.

- 37 -
Living in (quasi-) jobless households can be particularly problematic for children because
of the possible impacts on their current and future life, including a precarious income
situation and a greater difficulty to find their own place in the labour market later in life. In
2011, 8.8% of children in the EU lived in households with very low work intensity. However, this
proportion varied greatly across Member States, ranging from less than 4% in Cyprus and
Luxembourg, to between 12% and 14% in Belgium, Bulgaria, Latvia, Hungary and the United
Kingdom and up to 25.5%15 in Italy. The situation has worsened with the crisis: between 2008
and 2011, the number of children living in (quasi-) jobless households increased substantially in
a number of countries: Latvia (+7.9 pp), Lithuania (7.7pp), Spain (+6.3 pp), Estonia (+5.3 pp),
Bulgaria (+4.6 pp) and Denmark (+4.6 pp). Children living in households with very low work
intensity are also particularly vulnerable, with a risk of poverty rate of 70.4% in 2011. Other
groups of children particularly exposed to the risk of poverty include children from households
with migrant background, Roma children, street and homeless children. Children living in a
migrant household (where at least one parent was born abroad) face a poverty risk of at least
30%16, which is two to five times higher than the risk faced by children whose parents were both
born in the country of residence.
Indicators of material deprivation among children provide a broader, complementary vision of
children's well-being and living conditions. Based on a special EU-SILC ad-hoc module on child
deprivation in 2009, results show that on average 5.9% of households in the EU cannot afford
new clothes for their children with as much as 35% in BG, 25.2% in Romania and 24.5% in
Latvia. 34.5% of children in Bulgaria cannot afford to eat fresh fruits and vegetables once a day;
the situation is serious if not as acute in Romania (23.8%), Hungary (17.2%) and Latvia (15.4%).
In some countries almost one in every five children does not have a suitable place to study or do
homework in their home because the household cannot afford it (Bulgaria 19.7%, Romania
24.8%). Almost one in every two households in BG cannot afford leisure activities for their
children such as swimming, playing an instrument or participating in a youth organisation, while
this is the case for 12% in the whole EU11.
As highlighted in the 2012 SPC Advisory Report on "Tackling and preventing child poverty,
promoting child well-being"17, while the size and effectiveness of social expenditure dedicated to
children vary considerably across the EU, there could be some potential efficiency gains in
spending towards children. Affordable childcare, along with appropriate tax and benefit
incentives, is a very important factor in enabling parents, and especially mothers, to work. The
cost of childcare plays a critical role for second earners’ decisions in relation to labour market
15 2010 figure 16 Child Poverty and Well-Being in the EU, Current Status and Way Forward, Social Protection Committee,
European Commission, 2008 17 In 2012 the SPC produced an Advisory Report on "Tackling and preventing child poverty, promoting
child well-being" which contributed to the development of a Recommendation on child poverty under preparation by the European Commission for 2013. A special conference on "Investing in Children: Preventing and Tackling Child Poverty and Social Exclusion, Promoting Children's Well-being" was organised by the Cypriot Presidency in October 2012 which focused on the promotion of a European discussion on child well-being, the prevention and tackling of child poverty and social exclusion and was based to a large extent on the knowledge base and mutual learning developed in the context of the SPC work. For the conference background document as well as the conference report and presentations, see conference website.

- 38 -
participation (see Richardson, 2012)18 . Work pays for the ‘average’ female second earner before
childcare expenses are taken into account (Bettio and Verashchgina, 2009). However, once
childcare expenses are included in the calculation, this statement may not hold true. The higher
the implicit tax imposed by childcare expenses on mothers who wish to work, the higher the
employment penalty associated with motherhood, and the higher the financial disincentive to
seek paid employment. Indeed, the difference in net income gain, before and after out-of-pocket
childcare expenses are incurred, correlates positively and significantly with the gap in
employment rates between non-mothers and mothers of young children (Bettio and
Verashchgina 2009). Affordable childcare services therefore play a critical role in fostering
female employment.
Salanauskaite and Verbist (2011) explore to what extent a country’s effectiveness in reducing
child poverty risk can be attributed to the size of family cash transfers (i.e. both benefits and tax
instruments) or to their design. Their results confirm that the level of expenditure is of high
importance. Nevertheless, the exact impact of size and design depends highly on the
composition of the selected measures (universal, categorical, income selectivity) and on the
parametric choices of the policies’ inner design (i.e. thresholds, benefit size determination, etc.).
Higher income poverty reduction is not necessarily achieved by the most extensive universal
benefits or exclusively means-tested transfers. Aside from benefits design and size criteria,
policy alignment to national characteristics is of high importance.
Education and other quality services are the gateways to break the cycle of disadvantage and to
give children better life chances. They can support the development of children’s personal and
social skills essential for their future employability, lifelong learning and interpersonal activities.
High quality education and training is widely recognised as improving democratic participation,
tolerance and respect of diversity, social integration, cohesion and inclusion, community-
building, achieving better individual and public health, reduced crime, a cleaner environment,
and a better quality of life. Education systems offer opportunities to reduce social inequalities
and exclusion but may also widen differences if equity and education access and quality
requirements are not met. The education gap has been widening between children in
households from a lower and those from a better socio-economic background19.
18 Linda Richardson (2012) has extended the OECD‘s 2007 study of childcare costs to assess how government policies affecting the affordability of childcare have changed since 2004. The paper documents how the costs of childcare for parents interact with tax and transfer policies to determine the financial incentives of parents to seek paid employment. 19 See Early Childhood Education and Care in Europe: Tackling Social and Cultural Inequalities. EACEA P9,
Eurydice 2009

- 39 -
Improving the measurement of child material deprivation in the EU
The main limitations of the current material deprivation (MD) EU indicators are the
small number of items (nine) on which they are based and the weak reliability of some
of these items. This is a primary reason why a thematic module on MD was included in
the 2009 wave of EU-SILC. A second important reason for this is the need to respond to
the willingness of EU countries and the European Commission to complement the
current set of EU social protection and social inclusion indicators with additional
measures reflecting the situation of children; the 2009 MD module therefore includes
specific children’s items. A report assessing the 2009 EU-SILC MD data was produced in
2012 by a team of researchers participating in the EU-funded “Second Network for the
analysis of EU-SILC (Net-SILC2)”. This report proposes an analytical framework for
developing robust EU MD indicators for the whole population as well as for children.
An important outcome of this report is a proposal for a new EU MD indicator related to
children (aged 1-15) consisting of 18 items: 13 child-specific MD items2 and five MD
items affecting the households in which children live and that are likely to impact on
their living conditions3. The figure below provides the distribution of national child MD
rates calculated on the basis of this indicator with a threshold set at three deprivations
(out of 18). National proportions of deprived children vary hugely across EU countries,
from 3-7% in Sweden, Denmark, the Netherlands, Finland and Luxembourg to more
than 70% in Bulgaria and Romania. The EU average is 21%.
Percentage of materially deprived children, children aged 1-15, EU-27,
2009
Source: EU-SILC 2009

- 40 -
Deteriorating effectiveness of adequate income support systems for
those furthest away from the labour market
There is a much stronger relationship between (quasi-)joblessness and income poverty risk than
between (quasi-)joblessness and severe material deprivation. (Quasi-)joblessness affects
earnings and therefore incomes but may be only a temporary situation. Material deprivation is
more likely to reflect purchasing power over the longer term (since it includes possession of
consumer durables which may have been purchased in the past when the household had a
higher income level) (Lelkes and Gasior, 2012). Member States differ substantially in terms
of the minimum safety nets they provide to jobless or quasi-jobless households, especially
relative to the at-risk-of-poverty threshold. Only a few countries provide these households with
a minimum income and related (e.g. housing) benefits that are sufficient to lift them close to or
above the threshold of 60% of the median national income. The poverty risk for people living in
(quasi-)jobless households ranges between as much as 76.2% in BG to around 40% in Denmark
and Luxembourg. Between 2010 and 2011, 12 Member States experienced a significant
worsening of the poverty risk for quasi-jobless households with increases as high as 15pp in
Greece, 7.5pp in Belgium and 7pp in Romania. The trend since the beginning of the crisis
confirms this evolution with up to 18 Member States seeing an increased poverty risk for (quasi-
)jobless households with particularly high increases in Belgium, Greece, Hungary, Poland,
Slovakia and Sweden (see Table 7). If looked at together with the parallel evolution of the
(quasi-)jobless households rate (see Table 4) and with the evolution of the long-term
unemployment rate (see Table 11), these trends could suggest that income support levels of
last resort schemes are worsening while the number of people counting on them is
increasing. Furthermore, the adequacy of minimum safety nets is further affected by the fact
that significant shares of people who are entitled to social assistance do not actually receive
Reading note: Countries are ranked according to children’s national material deprivation
rates. In 2009, the deprivation rate in Sweden was 3% among children.
1 Guio, A.-C., Gordon, D. and Marlier, E. (2012), “Measuring material deprivation in the EU: Indicators for the whole population and child-specific indicators”, Eurostat Methodologies and working paper, Publications office of the European Union, Luxembourg, available at:
http://epp.eurostat.ec.europa.eu/cache/ITY_OFFPUB/KS-RA-12-018/EN/KS-RA-12-018-EN.PDF ;
2 The 13 children items consist of 12 “enforced lacked” items (i.e., items lacked due to insufficient resources and not to choices or lifestyle preferences): some new clothes; two pairs of shoes; fresh fruits and vegetables daily; meat, chicken or fish daily; suitable books; outdoor leisure equipment; indoor games; leisure activities; celebrations; invite friends; school trips; and holiday. The 13th item is the absence in the dwelling of a place for children to do their homework.
3 The five household items are: worn-out furniture (enforced lack); computer and internet (enforced lack); a car (enforced lack); arrears; adequate heating of the home.

- 41 -
these benefits, partly due to administrative complexities, lack of information and stigma. Some
countries (Denmark, Cyprus, Latvia, Luxembourg, Malta, Portugal, Finland and the United
Kingdom) are registering improvement in the most recent year suggesting better efficiency of
safety nets in terms of income support in these countries. However, positive improvements need
to be seen alongside the general dynamics in the income distribution, especially in countries
where the median income has fallen as is the case in Latvia and the United Kingdom, for
example.
Table 7. At-risk-of-poverty rate for the population living in very low work
intensity households, in %, changes 2010-2011 and 2008-2011
EU27 BE BG CZ DK DE EE IE EL ES FR IT CY LV
2011 57,7 62,9 76,2 58,3 41,4 68,7 72,8 38,8 54,1 60,4 54,3 57,4 48,6 68,1
2010-2011
change in pp ~7,5
~ ~-3,0 1,4 2,9 -7,2 15,0 3,3
~2,5 -1,9 -3,6
2008-2011
change in pp1,9 8,2 -1,6 2,9
~4,5 -9,5 -7,8 13,8 5,2 4,2 4,4 -7,5 -14,9
LT LU HU MT NL AT PL PT RO SI SK FI SE UK
2011 64,7 41,0 56,3 61,2 42,6 54,3 56,9 54,6 51,6 58,1 65,6 57,7 63,5 47,8
2010-2011
change in pp ~-4,9 3,5 -1,7 5,9
~ ~-3,3 7,0 2,0 4,1 -2,3 1,9 -9,5
2008-2011
change in pp-1,7 -8,4 7,8
~2,9 4,1 7,7 1,4 1,2 3,1 12,5 1,4 12,1 -15,3
Source: Eurostat (EU-SILC)
Note: i) Latest data available for Ireland refers to 2010 and changes are for the periods 2009-2010 and 2008-
2010. ii) Only statistically significant changes have been marked in green/red (positive/negative changes)
with a 1pp threshold. "~" refers to stable performance (i.e. statistically insignificant change). iii) For the at-risk-
of poverty rate, the income reference year is the calendar year prior to the survey year (i.e. 2010) except for
the United Kingdom (survey year) and Ireland (12 months preceding the survey).
Adequate minimum income schemes are essential for addressing the underlying social problems
of people furthest from the labour market. Multiple disadvantages require multiple and
integrated solutions. Comprehensive active inclusion strategies are an essential element for
addressing these challenges and providing enabling social support and personalised pathways
towards employment while ensuring that those who cannot work can live in dignity and
participate in society (see section 4.2. Active inclusion).
The impact of social transfers on poverty reduction varies greatly across Member States. In
2011, it ranged from 13.7% in Greece to 54.2% in Denmark. These large differences highlight
the potential for improvement in the size and effectiveness of social protection
expenditure. Between 2010 and 2011, the impact decreased by more than 5pp in Bulgaria and
Estonia, both countries with rather low impact in general (17.9% and 29.7% respectively),
although overall Estonia has improved the impact of its social protection expenditure since 2008
by 8.7pp. A similar deterioration since 2008 has been observed in the Czech Republic, Hungary,
Poland and Sweden while improvements were registered in Ireland, Spain, Latvia, Lithuania and
Luxembourg.

- 42 -
Table 8. Impact of social transfers (excluding pensions) on poverty reduction, in
%, changes 2010-2011 and 2008-2011
EU27 BE BG CZ DK DE EE IE EL ES FR IT CY LV
201135,2 45,0 17,7 45,6 54,2 37,1 29,7 60,1 13,7 26,8 43,3 19,7 37,8 29,3
2010-2011
change in pp ~ ~ -5,9 ~ ~ ~ -6,8 ~ ~ ~ ~ ~ ~ ~
2008-2011
change in pp ~ ~ ~ -9,4 ~ ~ 8,7 5,7 ~ 8,2 ~ ~ 7,5 14,1
LT LU HU MT NL AT PL PT RO SI SK FI SE UK
201137,1 50,0 52,2 32,8 47,4 49,4 26,6 29,1 23,7 43,8 33,3 50,0 49,8 46,9
2010-2011
change in pp ~ ~ ~ ~ ~ ~ ~ ~ ~ ~ -6,1 ~ ~ ~2008-2011
change in pp 10,6 6,8 -7,0 ~ ~ ~ -6,1 ~ ~ ~ -7,4 ~ -7,4 11,6
Source: Eurostat (EU-SILC)
Notes: i) Latest data available for Ireland refers to 2010 and changes are for the periods 2009-2010 and
2008-2010. Ii) Only statistically significant changes have been marked in green/red (positive/negative
changes) with a 5 pp threshold. "~" refers to stable performance (i.e. statistically insignificant change)
Such a measure of the impact of social transfers does not take into account non-cash benefits
such as transfers in kind. A number of Member States provide public services to those furthest
away from the labour market which contribute to general welfare and are not detected in purely
income-based measures. However, if we look into the expenditure on such in-kind services
(Figure 10), we can see that the countries which generally achieve a low impact of social
transfers on poverty reduction are also those that tend to spend less on in-kind services.

- 43 -
Figure 10. Benefits in kind, % of GDP, 2008 and 2010
Source: Eurostat (Esspros)
Long-standing income inequalities exacerbated by the crisis
A long-term view on income inequality shows that despite the clear redistributive effect of social
protection, inequalities have increased in most EU countries. Upsurges in inequalities occurred
for the most part between the mid-1980s and the mid-1990s. Over the last 10 years inequalities
have remained relatively stable in most countries, with a few exceptions. Behind these overall
developments however, divergent trends have been observed at different levels of the income
distribution. In most countries, large income gains among the 10% top earners meant their
incomes grew relatively faster than middle incomes. In some countries, low incomes caught up
with median incomes, while in other countries inequalities also widened at the bottom of the
distribution. A recent OECD paper (Bonesmo Fredrikson, 2012) on income inequality in the EU
highlights how the within-country dimension rather than the between-country dimension is
more important for explaining most overall EU income inequality. It also demonstrates that EU
enlargement is not the only explanation since inequality has also increased over the last 25
years within the original 'core' 8 European countries for which comparable data is available
(Denmark, France, Germany, Greece, Italy, Luxemburg, the Netherlands and the UK).

- 44 -
The potential dangers of increasing income inequality are highlighted in an OECD report (2011)
which details why it should be a cause for concern for policy makers. Disenfranchisement felt
among certain sections of society can unravel the social contract. Social mobility is
jeopardised by increasing income inequality: intergenerational earnings mobility is low
in countries with high inequality such as the United Kingdom and Italy whereas it is higher in
Nordic countries where income is distributed more evenly. The report underlines the
significance of this for economic performance as a whole and the potential for income inequality
to fuel protectionist sentiments.
Table 9. Income quintile ratio (S80/S20), changes 2010-2011 and 2008-2011
EU27 BE BG CZ DK DE EE IE EL ES FR IT CY LV
2011 5,1 3,9 6,5 3,5 4,4 4,5 5,3 5,3 6,0 6,8 4,6 5,6 4,3 6,6
2010-2011 %
change ~ ~10,2
~ ~ ~6,0 26,2 7,1
~ ~7,7
~ ~
2008-2011 %
change ~ ~ ~ ~22,2 -6,3 6,0 20,5
~25,9
~9,8
~-9,6
LT LU HU MT NL AT PL PT RO SI SK FI SE UK
2011 5,8 4,0 3,9 4,1 3,8 3,8 5,0 5,7 6,2 3,5 3,8 3,7 3,6 5,3
2010-2011 %
change-20,5
~14,7
~ ~ ~ ~ ~ ~ ~ ~ ~ ~ ~2008-2011 %
change ~ ~8,3
~-5,0
~ ~-6,6 -11,4
~11,8
~ ~-5,4
Source: Eurostat (EU-SILC)
Extraction date: 04.02.2013
Notes: i) Latest data available for Ireland refers to 2010 and changes are for the periods 2009-2010 and
2008-2010. ii) Percentage changes for 2010-2011 and 2008-2011 have been calculated. Only statistically
significant changes have been marked in green/red (positive/negative changes) with a 5% threshold. "~" refers
to stable performance (i.e. statistically insignificant change). iii) The income reference year is the calendar year
prior to the survey year (i.e. 2010) except for the United Kingdom (survey year) and Ireland (12 months
preceding the survey).
The crisis and the large fiscal consolidation efforts in many Member States have raised concerns
about the prospect of inequalities increasing. Income inequality is here measured using the
S80/S20 ratio which is the ratio of total income received by the 20% of the country's population
with the highest income compared to that received by the 20% of the country's population with
the lowest income; the higher the ratio the greater the inequality. Member States which
experienced considerable increases in income inequality between 2010 and 2011 are Bulgaria,
Greece, Estonia, Italy and Hungary, with increases of 10%, 7.1%, 6%, 7.7% and 14.7%
respectively (see Table 9). Ireland has also seen a strong deterioration. Lithuania has reported a
significant decrease of -20.5% in income inequality in the same period. Between 2008 and 2011,
Denmark (22.2%), Spain (25.9%) and France (11.8) witnessed very strong increases in income
inequalities.

- 45 -
Cross-country differences in the level of disposable income can be traced to differences in labour
market outcomes, household compositions, concentration of capital income and differences in
the progressivity of tax and transfer systems. Available evidence highlights the large variation
across Member States in net cash support for low-income households. The design of the tax-
benefit system is crucial in determining the way and extent to which it affects income
inequalities and addresses social risks. Important features include the progressivity of taxes and
benefits and the degree of targeting and conditionality of benefits, which can create disincentive
effects if badly designed.
The issue of effectiveness of social protection policies is also linked to income inequality. The
aforementioned 2011 OECD report highlighted how, confronted with rising inequalities,
social protection tax-benefit systems are no longer able to deliver the same level of
protection as in the 1990s. This is mainly due to the rising number of beneficiaries, to
budgetary restrictions and to changes in eligibility rules. In this sense, the reduced capacity of
these systems has in some cases contributed to widening the household income gap.
There is a risk that the direct effects of the crisis, along with the fiscal consolidation measures
taken to address it, could interact with, and worsen, existing inequalities of income and access to
services. Social measures embedded in well-designed fiscal consolidation plans which
incorporate redistributive effects can contribute to the reduction of inequalities by preserving
the life-time chances of current and future generations. Social protection transfers and
investing in the provision of quality services (such as affordable childcare, education, and
other social services of general interest) remain crucial to employability prospects and
social mobility of different income groups as they indirectly reduce inequalities.
The fiscal consolidation measures undertaken in Member States since the beginning of the crisis
have had different impacts on households. A recent paper by Avram et al. (2012), using the
Euromod tax-benefit model, examines the distributional impact of fiscal consolidation measures
of the tax and benefit system in 9 Member States and concludes that overall these measures have
contributed to a significant drop in household incomes in the countries reviewed (from -1.6% in
Italy to -11.6% in Greece between 2008 and 2012.) However, these measures had progressive
impact in Greece (although incomes decreased substantially even for the bottom deciles), Spain,
Italy, Latvia, Romania and the United Kingdom. In Lithuania and Portugal, the effect was
concentrated on the medium income deciles while in Estonia it was clearly regressive. The
picture is less clear-cut when looking at different sub groups; pensioners were impacted more
negatively in Spain (especially low-income pensioners), Romania and Estonia, while children
were the most affected in Lithuania, Latvia, Romania and Portugal. Indeed the OECD 2012
Economic Outlook warned that the composition of consolidation needs to take account of equity
implications, pointing to a forthcoming working paper which will show that some of the most
frequently employed consolidation instruments tend to widen the static income distribution if
not designed carefully.
As the 2011 SPC Report on the social impact of the crisis highlighted, inequalities of income,
access and outcomes are a result of long-term socio-economic developments and not the crisis
alone. They overlap with other consequences of the crisis and exacerbate the distributional
impact of current fiscal consolidation measures. Social protection systems are the most
powerful tool aside from taxation in reducing inequalities and yet are increasingly under

- 46 -
stress. For this reason it is imperative that the implications of social security system reforms for
inequalities need to be assessed and vice versa. The design of current fiscal consolidation
programmes should maintain and improve the inequality reduction capacity of social
protection systems and their implementation must not produce the effects of reducing
life-time chances, education, and perspectives for future generations. An intergenerational
long-term vision approach needs to be adopted in order to avoid the exacerbation of inequalities
for coming generations and to avoid future strains on the capacity of social protection systems to
cope.
It is important to note that studying income inequality does not encapsulate wealth inequality,
and specifically the distribution of assets and capital. The lack of comparable data on this means
that the analysis here can only provide a partial picture and may therefore be underestimating
inequality across Europe.
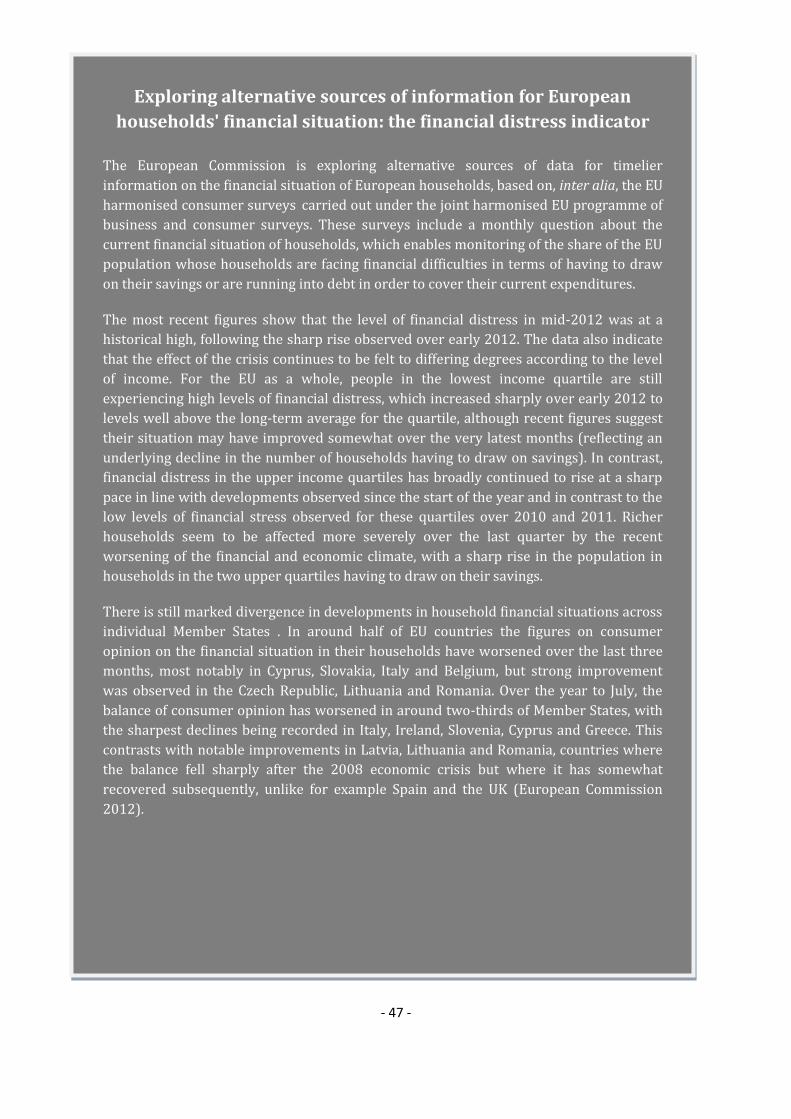
- 47 -
Exploring alternative sources of information for European
households' financial situation: the financial distress indicator
The European Commission is exploring alternative sources of data for timelier
information on the financial situation of European households, based on, inter alia, the EU
harmonised consumer surveys carried out under the joint harmonised EU programme of
business and consumer surveys. These surveys include a monthly question about the
current financial situation of households, which enables monitoring of the share of the EU
population whose households are facing financial difficulties in terms of having to draw
on their savings or are running into debt in order to cover their current expenditures.
The most recent figures show that the level of financial distress in mid-2012 was at a
historical high, following the sharp rise observed over early 2012. The data also indicate
that the effect of the crisis continues to be felt to differing degrees according to the level
of income. For the EU as a whole, people in the lowest income quartile are still
experiencing high levels of financial distress, which increased sharply over early 2012 to
levels well above the long-term average for the quartile, although recent figures suggest
their situation may have improved somewhat over the very latest months (reflecting an
underlying decline in the number of households having to draw on savings). In contrast,
financial distress in the upper income quartiles has broadly continued to rise at a sharp
pace in line with developments observed since the start of the year and in contrast to the
low levels of financial stress observed for these quartiles over 2010 and 2011. Richer
households seem to be affected more severely over the last quarter by the recent
worsening of the financial and economic climate, with a sharp rise in the population in
households in the two upper quartiles having to draw on their savings.
There is still marked divergence in developments in household financial situations across
individual Member States . In around half of EU countries the figures on consumer
opinion on the financial situation in their households have worsened over the last three
months, most notably in Cyprus, Slovakia, Italy and Belgium, but strong improvement
was observed in the Czech Republic, Lithuania and Romania. Over the year to July, the
balance of consumer opinion has worsened in around two-thirds of Member States, with
the sharpest declines being recorded in Italy, Ireland, Slovenia, Cyprus and Greece. This
contrasts with notable improvements in Latvia, Lithuania and Romania, countries where
the balance fell sharply after the 2008 economic crisis but where it has somewhat
recovered subsequently, unlike for example Spain and the UK (European Commission
2012).
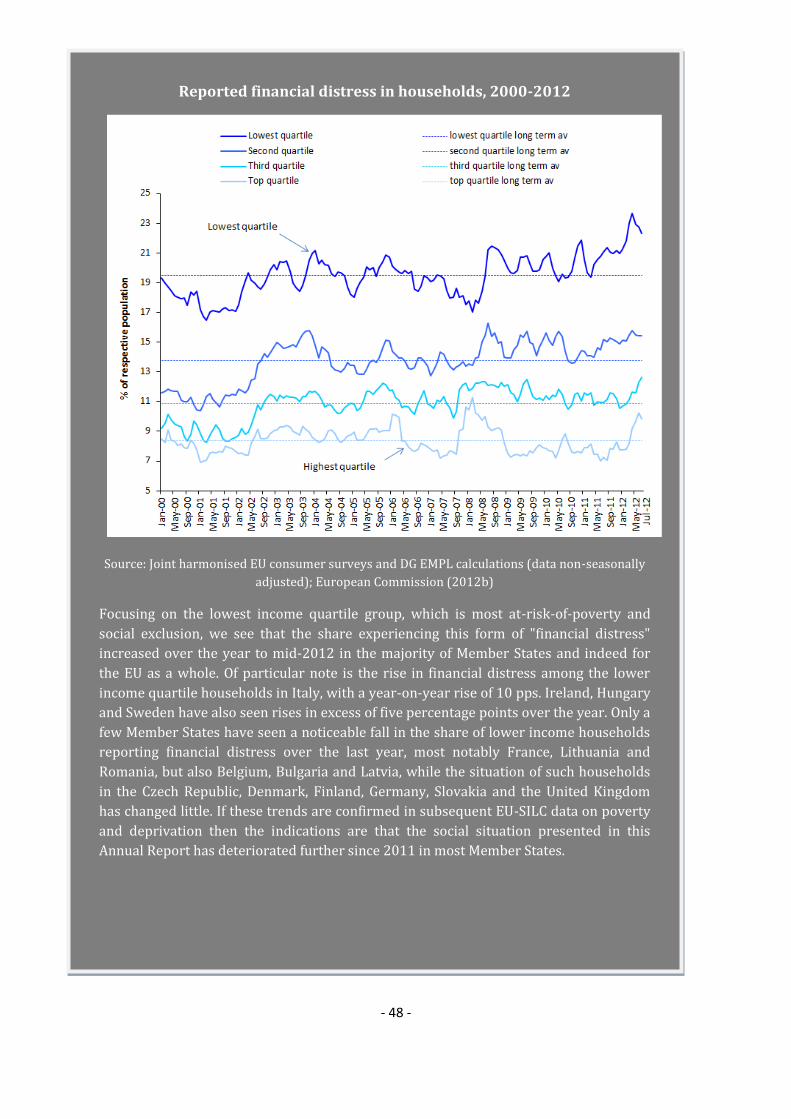
- 48 -
Reported financial distress in households, 2000-2012
Source: Joint harmonised EU consumer surveys and DG EMPL calculations (data non-seasonally
adjusted); European Commission (2012b)
Focusing on the lowest income quartile group, which is most at-risk-of-poverty and
social exclusion, we see that the share experiencing this form of "financial distress"
increased over the year to mid-2012 in the majority of Member States and indeed for
the EU as a whole. Of particular note is the rise in financial distress among the lower
income quartile households in Italy, with a year-on-year rise of 10 pps. Ireland, Hungary
and Sweden have also seen rises in excess of five percentage points over the year. Only a
few Member States have seen a noticeable fall in the share of lower income households
reporting financial distress over the last year, most notably France, Lithuania and
Romania, but also Belgium, Bulgaria and Latvia, while the situation of such households
in the Czech Republic, Denmark, Finland, Germany, Slovakia and the United Kingdom
has changed little. If these trends are confirmed in subsequent EU-SILC data on poverty
and deprivation then the indications are that the social situation presented in this
Annual Report has deteriorated further since 2011 in most Member States.
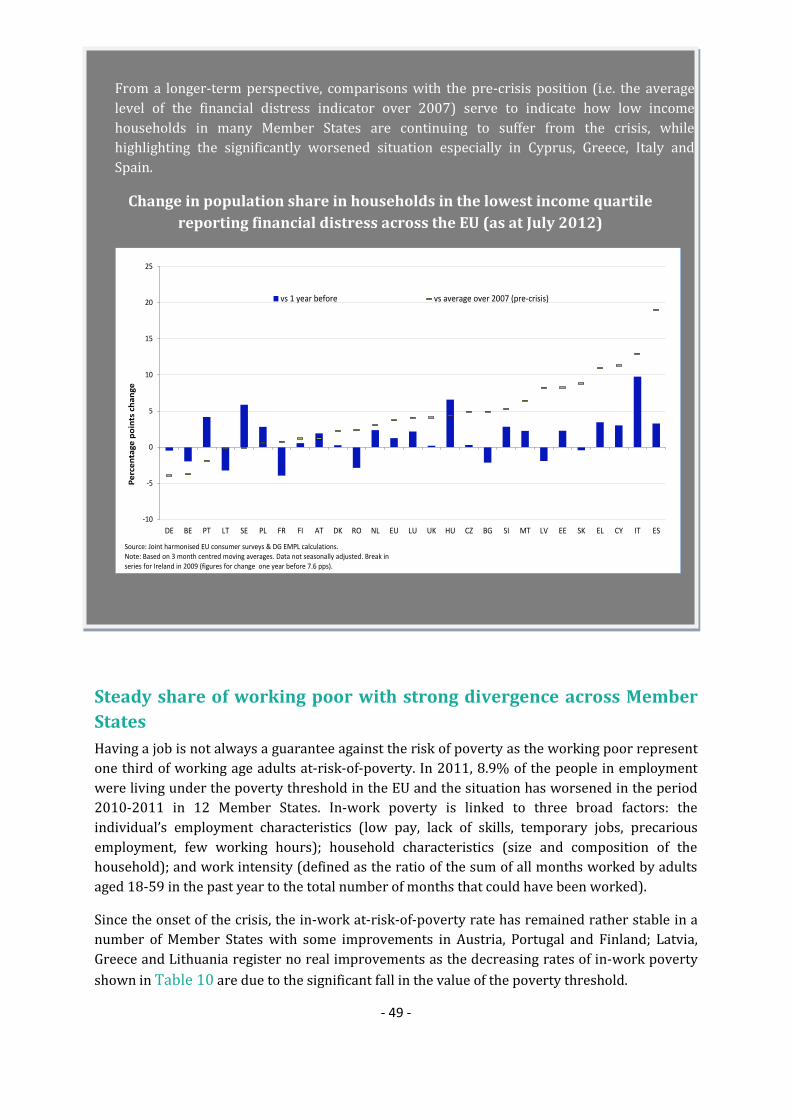
- 49 -
Steady share of working poor with strong divergence across Member
States
Having a job is not always a guarantee against the risk of poverty as the working poor represent
one third of working age adults at-risk-of-poverty. In 2011, 8.9% of the people in employment
were living under the poverty threshold in the EU and the situation has worsened in the period
2010-2011 in 12 Member States. In-work poverty is linked to three broad factors: the
individual’s employment characteristics (low pay, lack of skills, temporary jobs, precarious
employment, few working hours); household characteristics (size and composition of the
household); and work intensity (defined as the ratio of the sum of all months worked by adults
aged 18-59 in the past year to the total number of months that could have been worked).
Since the onset of the crisis, the in-work at-risk-of-poverty rate has remained rather stable in a
number of Member States with some improvements in Austria, Portugal and Finland; Latvia,
Greece and Lithuania register no real improvements as the decreasing rates of in-work poverty
shown in Table 10 are due to the significant fall in the value of the poverty threshold.
From a longer-term perspective, comparisons with the pre-crisis position (i.e. the average
level of the financial distress indicator over 2007) serve to indicate how low income
households in many Member States are continuing to suffer from the crisis, while
highlighting the significantly worsened situation especially in Cyprus, Greece, Italy and
Spain.
Change in population share in households in the lowest income quartile
reporting financial distress across the EU (as at July 2012)
-10
-5
0
5
10
15
20
25
DE BE PT LT SE PL FR FI AT DK RO NL EU LU UK HU CZ BG SI MT LV EE SK EL CY IT ES
Pe
rce
nta
ge
po
ints
ch
an
ge
Source: Joint harmonised EU consumer surveys & DG EMPL calculations.Note: Based on 3 month centred moving averages. Data not seasonally adjusted. Break in series for Ireland in 2009 (figures for change one year before 7.6 pps).
vs 1 year before vs average over 2007 (pre-crisis)

- 50 -
Table 10. In-work at-risk-of-poverty rate (18-64) in %, changes 2010-2011 and
2008-2011
EU27 BE BG CZ DK DE EE IE EL ES FR IT CY LV
2011 8,9 4,2 8,2 4,0 6,4 7,7 7,9 7,6 11,9 12,3 7,6 10,7 7,2 9,3
2010-2011
change in pp ~-0,3
~0,3
~0,5 1,4 2,2 -1,9 -0,4 1,4 1,3
~-0,4
2008-2011
change in pp ~ ~ ~ ~1,3
~ ~1,1 -2,4 1,6
~1,8 1,2 -1,7
LT LU HU MT NL AT PL PT RO SI SK FI SE UK
2011 10,1 9,9 6,1 6,0 5,5 5,4 11,1 10,3 19,0 6,0 6,3 3,9 6,9 7,9
2010-2011
change in pp-2,2 -0,7 0,8
~0,4
~ ~0,6 1,7 0,7 0,6
~ ~1,1
2008-2011
change in pp ~ ~ ~1,0
~-1,0
~-1,5 1,3
~ ~-1,2
~ ~
Source: Eurostat (EU-SILC)
Extraction date: 06.11.2012
Note: i) Latest data available for Ireland refers to 2010 and changes are for the periods 2009-2010 and 2008-
2010. ii) Percentage changes for 2010-2011 and 2008-2011 have been calculated. Only statistically
significant changes have been marked in green/red (positive/negative changes). For the change 2010-2011,
provisional computations of significance of net change done by Eurostat have been used20. For the change
2008-2011, a 1pp threshold has been used "~" refers to stable performance (i.e. statistically insignificant
change). iii) For the at-risk-of poverty rate, the income reference year is the calendar year prior to the survey
year (i.e. 2010) except for the United Kingdom (survey year) and Ireland (12 months preceding the survey).
Families with low work intensity reflect situations where there are too few adults who are in
paid work or who are not working enough hours to achieve an adequate income for all family
members. Low work intensity thus leads to in-work poverty (European Commission, 2012b).
Households working at only half of their potential (typically, a one-breadwinner couple) face a
risk of poverty that is four times higher than those working at their full potential. This risk is
significantly higher where there are children. The employment of mothers is recognised as an
important strategy in reducing child poverty. It is, therefore, important to facilitate full-time
participation in the labour market of lone parents and to enable progress for male-breadwinner
couples (and one-and half male breadwinner couples) towards dual-earner couples. Affordable
childcare is a key element for achieving this.
Income from work tends to be higher for dual earner couples. During a downturn these
households are better protected as a second earner can help the family cope with spells of
unemployment. There is some evidence that this is what has happened in the EU (Bettio et al.
2012). By the end of 2009, dual-earner couples had lost considerable ground (-5.1%), mainly to
the benefit of female breadwinner couples (+4.7%), while male breadwinner couples more or
less retained their share (+0.4%). In each country the loss in share of dual earner households
was very similar to the gain in share of female breadwinner households suggesting that a
20
Please note that results for BE are provisional and could be revised at a later stage.

- 51 -
significant number of working women managed to retain their job while their partner
lost his because of the economic crisis. These figures are clear signs of the importance of
female labour market attachment and suggest that households perceive the value of the
woman’s income in insuring family members against the risk of poverty. This downturn may
therefore accelerate the long-term transition in women’s income role from second earners to co-
primary earners (Bettio et al. 2012).
Since 2000, the rise in temporary work, part-time work (including involuntary part-time
working) along with sometimes stagnating wages has increased the number of individuals with
low yearly earnings. These trends have particularly affected women and the young. Current
figures show that more than 40% of young employees in the EU have temporary jobs, a share
that increased during the economic downturn. In the first quarter of 2012, the percentage stood
at 40.6%, as against 13.1% for the entire working-age population.
Figure 11. In-work at-risk-of-poverty rate by contract type, 2010-2011
Source: Eurostat (EU-SILC)
Extraction date: 04.02.2013
Note: i) Latest data available for Ireland refers to 2010 and changes are for the periods 2009-2010 and 2008-
2010. ii) For the at-risk-of poverty rate, the income reference year is the calendar year prior to the survey
year (i.e. 2010) except for the United Kingdom (survey year) and Ireland (12 months preceding the survey).
The poverty risk for people working in temporary jobs varies greatly in Member States – from
3.3% in Malta to more than 20% in Estonia, Luxembourg and Sweden – and has increased
strikingly in some Member States (12.7pp in Estonia, 6.3pp in Hungary). Given the increase of
temporary contracts in the unstable economic climate and their concentration among

- 52 -
young people, the long–term consequences both for future employment opportunities as
well as for the potential of raising living standards is concerning.
Household composition is another important factor leading to higher rates of in-work at-risk-of
poverty. Having dependent children increases the incidence of poverty among those employed
to more than 10% while the risk almost doubles (to 18%) for single parents. A further important
factor is related to the level of labour market participation of all adults in the household. 21
Long-term unemployment remains stable but at historical highs
At EU aggregate level, the number of long-term unemployed (those who have been unemployed
for more than 12 months) has increased continuously in recent years due to the economic
recession. In 2011 there were nearly 10 million long-term unemployed Europeans (accounting
for 4.1% of the active population). This is an increase of 3.7 million or 60.8% in comparison to
2008, while total unemployment rose by less than 40% in the same period. The countries with
the lowest rate of long-term unemployment (less than 2%) in 2011 were Austria, Luxembourg,
Netherlands, the Nordic countries (Sweden, Finland, Denmark) and Cyprus. At the other end of
the spectrum are the Baltic States, Ireland, Greece, Spain and Slovakia, with 7% or more of the
active population being unemployed for at least one year (see Table 11 below). Drawing on
experience from earlier recessions and taking into account recent increases in overall
unemployment, there is a risk that long-term unemployment will continue to rise, thereby
remaining a policy challenge for several years.
Table 11. Long-term unemployment rate (in %), changes 2010-2011 and 2008-
2011
EU27 BE BG CZ DK DE EE IE EL ES FR IT CY LV
2011 4.1 3.5 6.3 2.7 1.8 2.8 7.1 8.6 8.8 9.0 4.0 4.4 1.6 8.8
2010-2011
change in pp ~ ~1.5
~ ~ ~ ~1.9 3.1 1.7
~ ~ ~ ~
2008-2011
change in pp1.5
~3.4
~1.3 -1.2 5.4 6.9 5.2 7.0 1.1 1.3 1.1 6.7
LT LU HU MT NL AT PL PT RO SI SK FI SE UK
2011 8.0 1.4 5.2 3.0 1.5 1.1 3.6 6.2 3.1 3.6 9.2 1.7 1.4 2.7
2010-2011
change in pp ~ ~ ~ ~ ~ ~ ~ ~ ~ ~ ~ ~ ~ ~2008-2011
change in pp6.8
~1.6
~ ~ ~1.2 2.2
~1.7 2.5
~ ~1.3
Source: Eurostat, (LFS)
21 A detailed analysis of in-work poverty in the European Union is available in the 2011 Employment and
Social Developments in Europe report by the European Commission.

- 53 -
Note: Percentage changes for 2010-2011 and 2008-2011 have been calculated. Only statistically significant
changes have been marked in green/red (positive/negative changes) with a 1pp threshold. "~" refers to
stable performance (i.e. statistically insignificant change).
As can be observed from Table 11 above, long-term unemployment has remained rather stable
between 2010 and 2011 with only four Member States registering increases above 1pp. On the
other hand, between 2008 and 2011, the long-term unemployment rate increased in the great
majority of Member States, with the notable exceptions of Germany (-1.2pp). Moreover, the
long-term unemployment rate increased only marginally in Austria, Belgium, the Netherlands,
Finland, Malta and the Czech Republic. In other countries the increase has been more
substantial, and particularly so in Greece, the Baltic countries, Ireland and Spain where it was
between 5 and 7pps.
Long-term unemployment will most likely continue to grow due to the surge in the number of
recently unemployed people (overall unemployment rate increased from 9.5% in 2011 Q1 to
10.6% in 2012 Q3). The chances of an unemployed person finding a job fell further in the first
quarter of 2012. Indeed there was an increase in the rate of transition to long-term
unemployment which reached 40%. This means that, under the present labour market
conditions, two out of five unemployed persons in the EU on average will remain unemployed
for more than one year (European Commission 2012b).
Figure 12. Unemployment and long-term unemployment rates in % of active
population (15-74), 2011
Source: Eurostat (LFS)
In 2011 at EU level, women and men experienced very similar rates of long-term unemployment
(respectively 4.1 and 4.2%). This represents a significant change compared with the situation in
2000 when women were, on average, much more affected than men (4.8% against 3.5%). This
was the result of the sharp increase of the rate among men (from 2.4% to 4.2% during 2008-11)
compared to the more moderate increase among women (from 2.8% to 4.1%) which is
- 54 -
consistent with the evidence on the stronger impact of the crisis on sectors where men are over-
represented, notably construction and manufacturing. The share of low skilled among the long-
term unemployed is higher for men than for women (45.1% vs. 33.7% in 2011), whereas long-
term unemployed women are more often high skilled than men (19.1% vs. 9.5% in 2011).
The long-term unemployed have fewer chances to return to employment and therefore it is
better to prevent people staying in unemployment if they are to return to a job. Based on an
analysis of the longitudinal EU Labour Force Survey, while only one in five of the very short-term
unemployed (<6 months) is still unemployed after one year, almost every second long-term
unemployed remains in the same status after a year. Among short-term unemployed (<12
months), one quarter stays unemployed.
Long-term unemployment for young people increased more strongly than for adults.. One out of
three young unemployed aged 15-24 were looking for a job for more than a year in 2011,
compared to 22% at the onset of the crisis, an increase registered in the majority of Member
States (23 out of 27). In Romania and Italy the rate for young persons is three times the overall
rate, and twice the rate in Slovakia, Bulgaria, Greece, Cyprus and Luxembourg. In 2011, more
than 15% of economically active young people had been unemployed for more than twelve
months in Greece, Slovakia and Spain (and between 10 and 15% in Italy, Ireland, Bulgaria and
Lithuania) due to both the high rate of overall unemployment among young people (around 30%
in 2011) and the high incidence of long-term unemployment among the young (close to 50%,
except in Spain). Albeit from relatively low levels, long-term unemployment increased
significantly for the highly educated young across the EU between 2008 and 2011, more than
doubling their share among the active population.
At the other end of the spectrum, a few countries had a lower rate of long-term unemployment
among young people than among the average population (Finland, Netherlands, Germany and
Denmark). In those countries less than 2% of young people are long-term unemployed, which is
also the case in Austria and Sweden. In Finland and Sweden, this low rate is achieved despite a
high overall rate of unemployment among young (active) persons (more than 20%) since only a
very small proportion of those unemployed stay in that situation for more than a year
(respectively 5 and 6%). The low incidence of long-term unemployment among young
people in these two countries is achieved through specific measures for young people
(reinforced during the crisis) such as youth guarantee schemes involving early
intervention, guidance and individual plans, providing young people with work experience,
personal advisors for early school leavers, and so on22.
Long-term unemployment is dependent upon a number of factors related to the previous job:
the sector of activity, the type of contract, the occupation. Indeed, the European Commission
(2012b) estimates that a substantial proportion of the long-term unemployed have never
actually had a job – around 1.8 million of the (almost) 10 million long-term unemployed in 2011.
This raises significant policy issues since it means that a part of the long-term unemployed
have no work experience and are likely to need various forms of support in order to ensure
that they enter the labour market. Moreover, it raises issues concerning access to benefits and
22 European Commission, 2010, EEO Review on Youth employment measures
- 55 -
the risk of social and economic marginalisation given that, in most Member States, access to
unemployment benefits is usually restricted to those who have previously worked.
Unemployment has worrisome social costs – lower life contentment, poorer health, a greater
sense of disillusionment with economic and social trends and a far more pessimistic assessment
of labour market prospects. The important point about all these identified social effects is that,
once established, they become increasingly difficult to eradicate (Saunders, 2002). In fact, past
experiences of recessions in the EU and other parts of the world show that long-term
unemployment continues to rise after total unemployment has peaked, and takes a long time
before starting to decline. For instance, during the 1990's in the EU, while overall unemployment
had already started to decline in 1995 (following the increases during the period 1991-94) the
number of long-term unemployed decreased only from 1998. There is also evidence from
previous recessions that sharp increases in unemployment are not only long lasting, but are also
not completely reversed in subsequent recoveries (OECD, 2009).
One of the most significant challenges for social policy over the next years will involve far
more than lowering unemployment back to its former levels, because this in itself will not
unwind the cumulative social effects that accompany the rise in unemployment. In some
countries, increasing numbers of people are moving onto long-term sickness and disability
benefits or early retirement schemes. Of these people, many are likely never to enter or return to
the labour market. Moreover, workers in some sectors/occupations (such as in the construction
sector, where the incidence of long-term unemployment was previously limited), experienced
double disadvantage: higher probability of becoming unemployed, and if unemployed, higher
chance of becoming long-term unemployed. This underlines the role of job creation policies,
especially in growing sectors, to ensure new places for both the short-term and long-term
unemployed as well as activation measures focusing on re-training in order to adapt workers'
skills to the new needs of the labour market. Although job creation is highly needed to reduce
long-term

- 56 -
Exploring transitions to and from unemployment: despite the
impact of the crisis, some stable patterns across countries
In-depth analysis of the longitudinal EU Labour Force Survey (LFS) done by the
European Commission (2012b) shows that there are two large groups of countries for
which the patterns are quite stable (between 2006-07 and 2010-11):
some countries are characterised in both years by a relatively high exit rate out
of unemployment and moderate inflows into unemployment. This is typically
the case of the NL. It also characterises SE, FI and to a certain extent FR and CY
(inflows into unemployment mainly attributed to the large influx of EU
workers) even if in those countries both transition rates slightly worsened;
there are countries with low labour market dynamics (relatively low inflows
into unemployment but low return to employment) and where both transition
rates worsened: IT, BG, SK, RO and to a certain extent, HU;
On the contrary, few countries have been subject to strong changes in the transition
rates between employment and unemployment:
ES, with an originally high return rate to employment but high inflows into
unemployment and where both transitions rates worsened very strongly;
EL, which originally had low dynamics (relatively low inflows into
unemployment but low return to employment) and where both transition rates
also worsened very strongly;
and CZ and EE, countries which had moderate return rates to employment and
where (contrary to all other countries for which data is available) the return
rate to employment improved substantially.
Transition rates between employment and unemployment between 2006
and 2007
Source: Eurostat, LFS ad-hoc transitions calculations
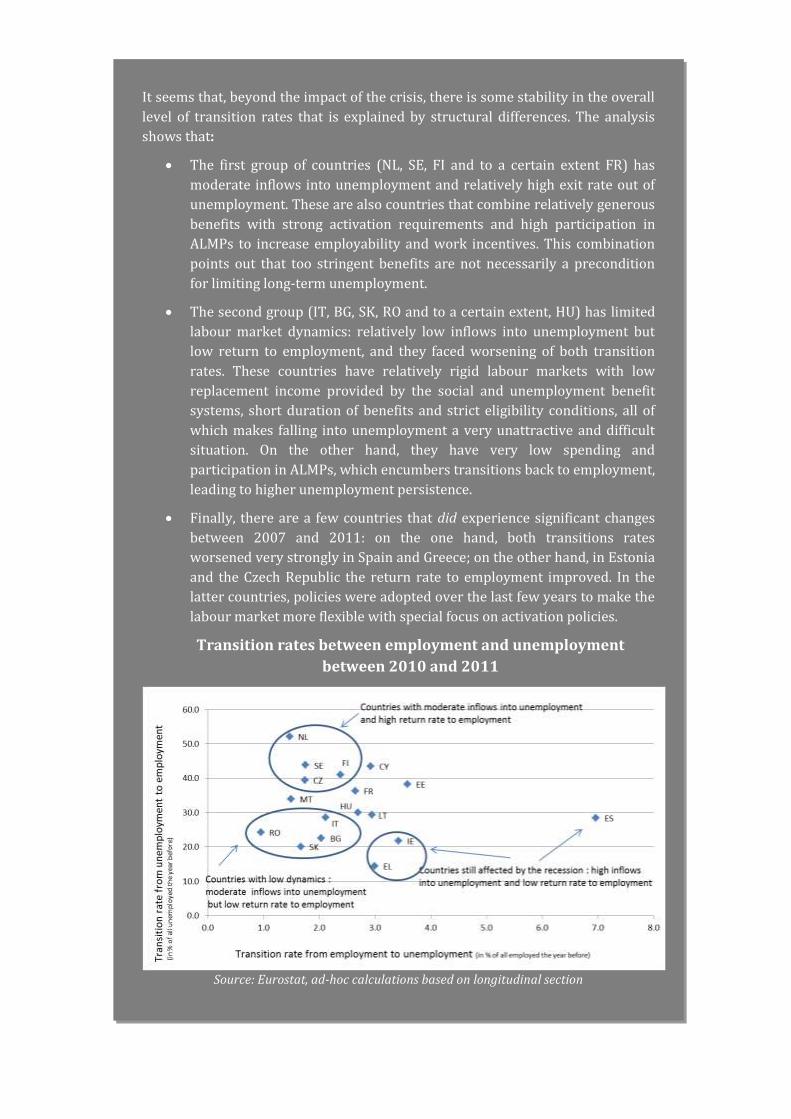
- 57 -
It seems that, beyond the impact of the crisis, there is some stability in the overall
level of transition rates that is explained by structural differences. The analysis
shows that:
The first group of countries (NL, SE, FI and to a certain extent FR) has
moderate inflows into unemployment and relatively high exit rate out of
unemployment. These are also countries that combine relatively generous
benefits with strong activation requirements and high participation in
ALMPs to increase employability and work incentives. This combination
points out that too stringent benefits are not necessarily a precondition
for limiting long-term unemployment.
The second group (IT, BG, SK, RO and to a certain extent, HU) has limited
labour market dynamics: relatively low inflows into unemployment but
low return to employment, and they faced worsening of both transition
rates. These countries have relatively rigid labour markets with low
replacement income provided by the social and unemployment benefit
systems, short duration of benefits and strict eligibility conditions, all of
which makes falling into unemployment a very unattractive and difficult
situation. On the other hand, they have very low spending and
participation in ALMPs, which encumbers transitions back to employment,
leading to higher unemployment persistence.
Finally, there are a few countries that did experience significant changes
between 2007 and 2011: on the one hand, both transitions rates
worsened very strongly in Spain and Greece; on the other hand, in Estonia
and the Czech Republic the return rate to employment improved. In the
latter countries, policies were adopted over the last few years to make the
labour market more flexible with special focus on activation policies.
Transition rates between employment and unemployment
between 2010 and 2011
Source: Eurostat, ad-hoc calculations based on longitudinal section
- 58 -
There has not been any deepening of inactivity rates in the EU as a whole. This is despite
unfavourable labour market conditions including increasing unemployment and long-term
unemployment. Unlike unemployment, inactivity rates in the EU have recently decreased, a
trend driven by female labour market participation. Women have continued the gradual
increase of their participation in the labour market during the downturn and their inactivity rate
has fallen to the 35% mark. Male inactivity rates, in contrast, have remained stable since the
downturn. The gender gap in these inactivity rates remains wide despite reducing from 14.2pp
in 2008 to 12.7pp in 2011.
Youth exclusion – one of the biggest challenges for the future
The youth unemployment ratio23 has remained rather stable between 2010 and 2011 (see Table
12). It increased substantially only in 3 countries (Greece, Spain and Portugal). However, since
the beginning of the crisis a significant increase has been witnessed in all but 5 Member States
with the highest changes observed in Greece and Spain and significant highs in the Baltics,
Ireland and Portugal.
23 The reason for looking at both youth unemployment rates and ratios is that a use of only the
unemployment rate can produce a distorted picture when comparing the youth labour markets of different countries. More precisely, one difficulty with using the unemployment rate as an indicator for the labour market performance, especially of young people, is that it shows the number of unemployed youth as a percentage of the youth labour force, i.e. those who are either employed or unemployed but actively looking for work. Using the youth labour force as a denominator can lead to distortions when comparing countries with great differences in youth activity rates or when activity rates change significantly over time. For instance, youth unemployment rates for two countries with identical numbers of youth and unemployed youth will differ if one country has a higher share of youth not available for the labour market because of, for example, a higher number of youth in education. More concretely, the country with a higher share of youth in education (or otherwise inactive) will display a higher youth unemployment rate.

- 59 -
Table 12. Youth unemployment ratio (15-24), changes 2010-2011 and 2008-2011
EU27 BE BG CZ DK DE EE IE EL ES FR IT CY LV
20119.1 6.0 7.3 5.4 9.6 4.5 9.1 11.7 13.0 19.0 8.4 8.0 8.7 11.2
2010-2011
change in pp ~ -1.3 ~ ~ ~ ~ -3.5 ~ 3.0 1.2 ~ ~ 2.0 -2.7
2008-2011
change in pp 2.2 ~ 3.5 2.3 3.8 -1.0 4.1 5.0 6.3 7.3 1.3 1.4 4.9 5.6
LT LU HU MT NL AT PL PT RO SI SK FI SE UK
20119.6 4.2 6.4 7.1 5.3 5.0 8.7 11.7 7.4 5.9 10.0 10.1 12.0 12.4
2010-2011
change in pp ~ ~ ~ ~ ~ ~ ~ 3.5 ~ ~ ~ ~ -1.0 ~
2008-2011
change in pp 5.5 -1.0 1.4 ~ 1.4 ~ 3.0 4.9 1.7 1.4 3.8 1.3 1.3 3.2
Source: Eurostat, EU-LFS
Note: Only statistically significant changes have been marked in green/red (positive/negative changes) with
a 1pp threshold. "~" refers to stable performance (i.e. statistically insignificant change).
The gloomy outlook for the young implies growing risks of long-term unemployment and lasting
inactivity. The labour market situation of young people and their exclusion from social security
rights is becoming an increasingly urgent social matter. Among the young people between 15
and 24 looking for work, one out of five or 5.5 million cannot find a job. Over the last year, the
unemployment rate for young people increased in the large majority of countries to levels of 30
% and over in BG, IT, PT and SK and over 50% in EL and ES. Only in AT, DE, MT and NL the
unemployment rates remain below 15% (European Commission, 2012d).
Long-term unemployment for young people increased stronger than for adults and now affects
one out of three young unemployed, compared to 22% at the onset of the crisis. Albeit from
relatively low levels, long-term unemployment increased even for the highly educated young
between 2008 and 2011. Analysis by the European Commission (2012d) shows that the difficult
labour market situation is reflected in a rise in inactivity among young people of roughly 1.5 pp,
most of which took the form of labour market withdrawal rather than continued enrolment in
education. Among the roughly 7.5 million young (an increase of 600,000 in three years) who are
neither in employment nor in education or training (NEET), there are more and more university
graduates who cannot find a first job.
The developments that have taken place since spring 2008 may have serious consequences as
the delayed transition to the labour market and frequent periods of unemployment
during a person's early working life may have lasting adverse effects on future
employment and wage prospects. Long-term unemployment, detachment from the labour
market and education or training may also intensify, leading to poverty and social exclusion, and
other social challenges.
Young people are particularly vulnerable to social exclusion and poverty as they move towards
an independent life away from the parental household, a key step which involves looking for
work and establishing their own household. For many, however, this is far from easy. Even if
they find employment, they often start with low-paid jobs, which can make sustaining a

- 60 -
household difficult. As Ward et al (2009) highlight, the process of achieving autonomy is
influenced by public policies in a number of areas, including employment, education, housing
and social protection, and the outcomes have important implications for society as revealed in
fertility and demographic trends. While high unemployment rates have led to an increase in the
number of low-income families and jobless households, and with a higher share of young people
at risk of poverty or social exclusion than for the general population, the immediate and longer-
term health and well-being of young people has been adversely affected, with
unemployment, impoverishment and family disruptions significantly increasing the risk
of mental health problems such as depression, alcohol misuse, and suicide.
Table 13. Early school leavers (in %), changes 2010-2011 and 2008-201124
EU27 BE BG CZ DK DE EE IE EL ES FR IT CY LV
201113.5 12.3 12.8 4.9 9.6 11.5 10.9 10.6 13.1 26.5 12.0 18.2 11.2 11.8
2010-2011
change in pp ~ ~ -1.1 ~ -1.4 ~ ~ ~ ~ -1.9 ~ ~ -1.4 -1.5
2008-2011
change in pp -1.4 ~ -2 ~ -2.9 ~ -3.1 ~ -1.7 -5.4 ~ -1.5 -2.5 -3.7
LT LU HU MT NL AT PL PT RO SI SK FI SE UK
20117.9 6.2 11.2 33.5 9.1 8.3 5.6 23.2 17.5 4.2 5.0 9.8 6.7 15.0
2010-2011
change in pp ~ ~ ~ -3.4 ~ ~ ~ -5.5 ~ ~ ~ ~ ~ ~2008-2011
change in pp ~ -7.2 ~ -4.6 -2.3 -1.8 ~ -12.2 1.6 ~ -1.0 ~ -1.2 -2
Source: Eurostat, EU-LFS
Note: Only statistically significant changes have been marked in green/red (positive/negative changes) with
a 1pp threshold. "~" stands for stable performance (i.e. statistically insignificant change).
Early school leaving increases the prospect of young people entering the labour market without
adequate skills, who then may face unemployment or in-work poverty. Still, one out of every six
early school leavers has completed only compulsory education or less. Across Europe, early
school leaver rates range from as low as around 4-5% in the Czech Republic, Slovenia and
Slovakia to as much as 26.5% in Spain25 and 33.5% in Malta (Table 12). Changes since 2008
have been positive in many countries, most notably in Portugal, and in the past year further
improvements have occurred and stabilised. School drop-out rates are much higher for children
with a Roma or migrant background and also for children with special needs (Social Protection
Committee, 2012). Early school leaving also shows a strong correlation with poverty-associated
factors such as learning difficulties, discrimination, rejection by peers, hampered mobility,
24 The Maltese series on ESL are under review by the Maltese Statistical Office and Eurostat. The review
concerns the classification of certain qualifications at secondary level. The revision applies to all years covered (2006-2011) and would mean a reduction of about 9 percentage points for the 2011 rate of early school leavers.
25 Although Spain has seen significant change in the percentages of early school leavers between 2008 (31.9%) compared to 2011 (26.5%).
- 61 -
school accessibility or ghettoisation. Cost barriers preventing participation in education remain
significant and can be reduced. Financial support (for transport costs or study equipment) can
enable disadvantaged children to continue with their studies.
The 2012 SPC Advisory Report on child poverty highlighted the importance of following a
comprehensive approach to tackle early school-leaving. This means integrated multi-level
responses linking the home, the child, the school, adult education, community and relevant
services. Schools, social and employment services and parents should combine their efforts and
work together to prevent early school leaving. Offering a greater variety of education and
training possibilities, both formal and informal as well as after school programmes, creating
permeable and flexible education pathways, forming smaller classes and preparing
individualised education plans, may help reduce early school-leaving. Providing quality
vocational training options, educational experimental frameworks aimed at boosting the
attractiveness of schools and enhancing motivation of pupils as well as special programmes for
children with specific needs are vital to combat disadvantages. Making available transfers to
alternative or non-formal education, raising the compulsory schooling age or making secondary
schools universally accessible will improve the flexibility of education systems.
More emphasis on active ageing needed
The changing demographic context implies major social and economic consequences for the EU
including significant challenges for the labour supply and social protection systems. During 2012
the European Year for Active Ageing and Solidarity between Generations has endeavoured to
raise awareness of the contribution that older people make to society. The aim of the 'active
ageing' approach is to enhance this contribution by optimising opportunities for improving
physical, social, and mental well-being throughout the life course. Within this remit the SPC this
year produced guiding principles for active ageing, setting out how active ageing needs to be
promoted in the areas of employment, participation in society and independent living.26
Employment rates of older workers (aged 55-64) have recorded a significant increase in the last
decade, mainly due to changes in the labour supply, the labour market and pension reforms.
Developments in recent years show a mixed picture (see Table 15). Between 2010 and 2011,
employment rates for this age group has improved most strongly for Estonia (+3.4pp), Latvia
and Poland (both +2.9pp), and the Netherlands (+2.4pp) and decreased most significantly for
Slovenia and Greece (-3.8pp and -2.9pp respectively). Since 2008, thirteen Member States have
witnessed an improvement in employment rates of older workers, with the largest changes in
Germany (+6.2pp), Luxembourg (+5.2pp), Hungary (+4.4pp) and Belgium (+4.2pp). Almost the
same number of Member States (11) saw a reduction in their older worker employment levels
between 2008 and 2011, most prominently in Latvia and Estonia (-8.3pp and -5.2pp
respectively). In Estonia, Latvia and Lithuania there are, however, signs of positive development
in 2011.
26
Insert reference
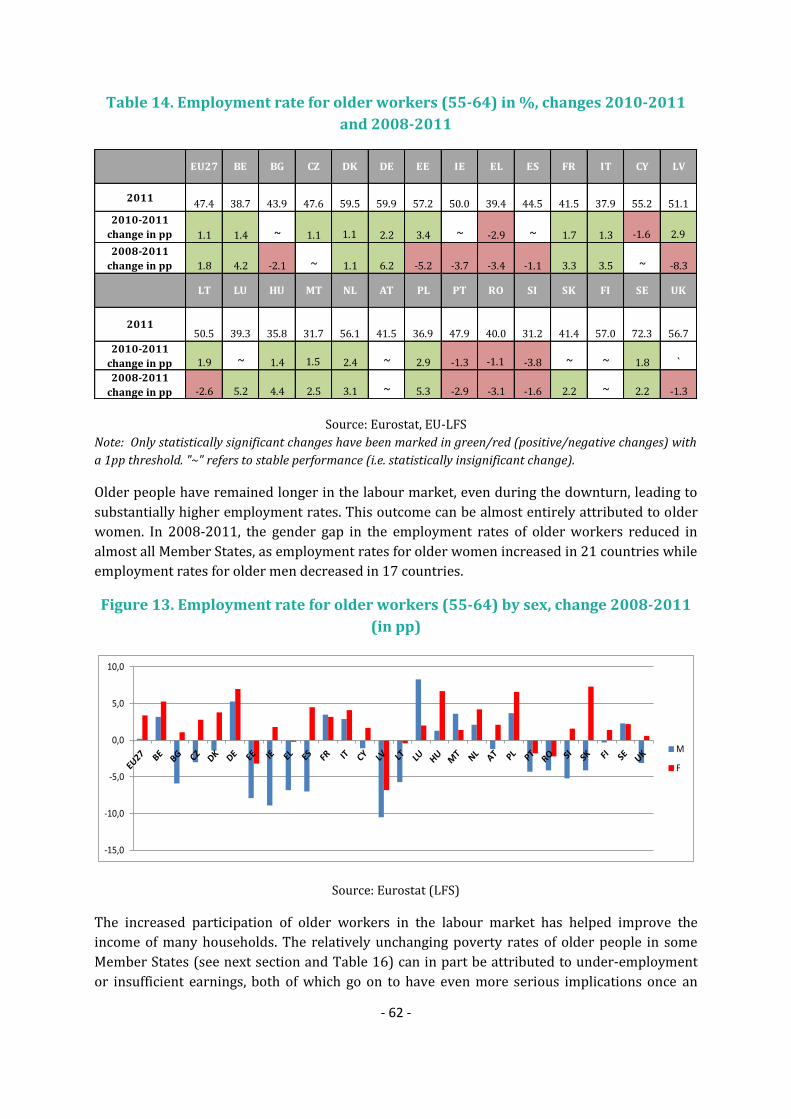
- 62 -
Table 14. Employment rate for older workers (55-64) in %, changes 2010-2011
and 2008-2011
EU27 BE BG CZ DK DE EE IE EL ES FR IT CY LV
201147.4 38.7 43.9 47.6 59.5 59.9 57.2 50.0 39.4 44.5 41.5 37.9 55.2 51.1
2010-2011
change in pp 1.1 1.4 ~ 1.1 1.1 2.2 3.4 ~ -2.9 ~ 1.7 1.3 -1.6 2.9
2008-2011
change in pp 1.8 4.2 -2.1 ~ 1.1 6.2 -5.2 -3.7 -3.4 -1.1 3.3 3.5 ~ -8.3
LT LU HU MT NL AT PL PT RO SI SK FI SE UK
201150.5 39.3 35.8 31.7 56.1 41.5 36.9 47.9 40.0 31.2 41.4 57.0 72.3 56.7
2010-2011
change in pp 1.9 ~ 1.4 1.5 2.4 ~ 2.9 -1.3 -1.1 -3.8 ~ ~ 1.8 `2008-2011
change in pp -2.6 5.2 4.4 2.5 3.1 ~ 5.3 -2.9 -3.1 -1.6 2.2 ~ 2.2 -1.3
Source: Eurostat, EU-LFS
Note: Only statistically significant changes have been marked in green/red (positive/negative changes) with
a 1pp threshold. "~" refers to stable performance (i.e. statistically insignificant change).
Older people have remained longer in the labour market, even during the downturn, leading to
substantially higher employment rates. This outcome can be almost entirely attributed to older
women. In 2008-2011, the gender gap in the employment rates of older workers reduced in
almost all Member States, as employment rates for older women increased in 21 countries while
employment rates for older men decreased in 17 countries.
Figure 13. Employment rate for older workers (55-64) by sex, change 2008-2011
(in pp)
-15,0
-10,0
-5,0
0,0
5,0
10,0
M
F
Source: Eurostat (LFS)
The increased participation of older workers in the labour market has helped improve the
income of many households. The relatively unchanging poverty rates of older people in some
Member States (see next section and Table 16) can in part be attributed to under-employment
or insufficient earnings, both of which go on to have even more serious implications once an
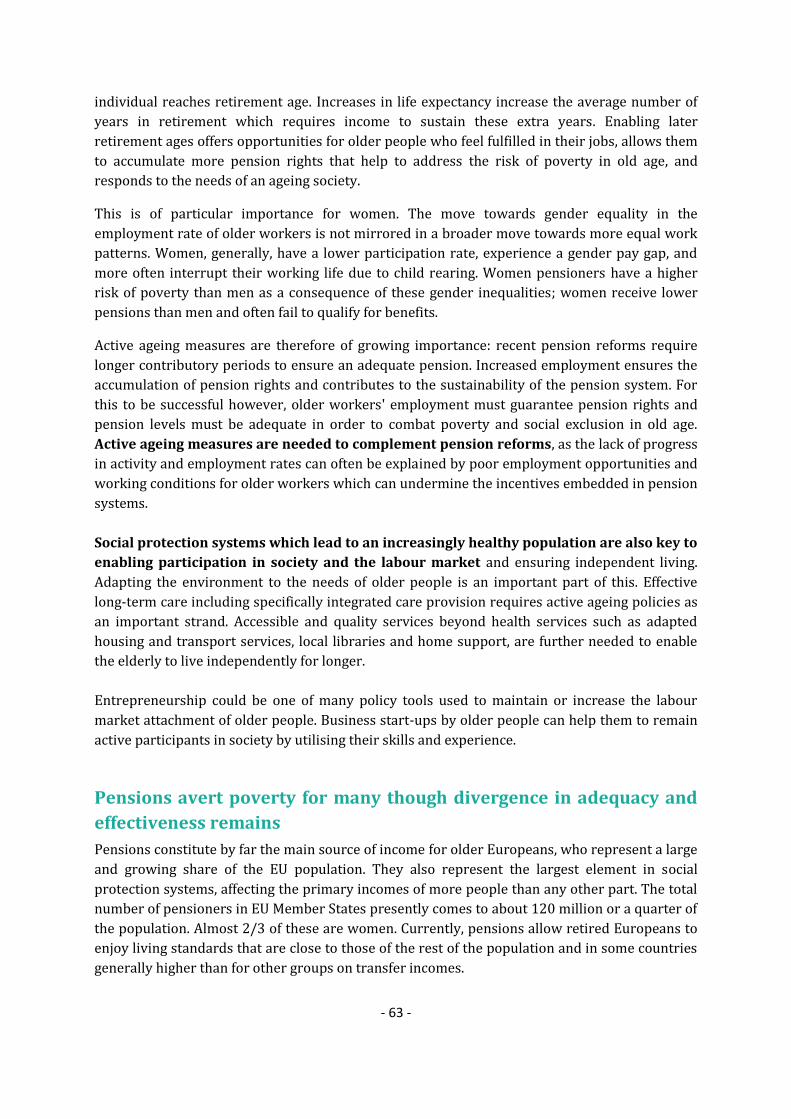
- 63 -
individual reaches retirement age. Increases in life expectancy increase the average number of
years in retirement which requires income to sustain these extra years. Enabling later
retirement ages offers opportunities for older people who feel fulfilled in their jobs, allows them
to accumulate more pension rights that help to address the risk of poverty in old age, and
responds to the needs of an ageing society.
This is of particular importance for women. The move towards gender equality in the
employment rate of older workers is not mirrored in a broader move towards more equal work
patterns. Women, generally, have a lower participation rate, experience a gender pay gap, and
more often interrupt their working life due to child rearing. Women pensioners have a higher
risk of poverty than men as a consequence of these gender inequalities; women receive lower
pensions than men and often fail to qualify for benefits.
Active ageing measures are therefore of growing importance: recent pension reforms require
longer contributory periods to ensure an adequate pension. Increased employment ensures the
accumulation of pension rights and contributes to the sustainability of the pension system. For
this to be successful however, older workers' employment must guarantee pension rights and
pension levels must be adequate in order to combat poverty and social exclusion in old age.
Active ageing measures are needed to complement pension reforms, as the lack of progress
in activity and employment rates can often be explained by poor employment opportunities and
working conditions for older workers which can undermine the incentives embedded in pension
systems.
Social protection systems which lead to an increasingly healthy population are also key to
enabling participation in society and the labour market and ensuring independent living.
Adapting the environment to the needs of older people is an important part of this. Effective
long-term care including specifically integrated care provision requires active ageing policies as
an important strand. Accessible and quality services beyond health services such as adapted
housing and transport services, local libraries and home support, are further needed to enable
the elderly to live independently for longer.
Entrepreneurship could be one of many policy tools used to maintain or increase the labour
market attachment of older people. Business start-ups by older people can help them to remain
active participants in society by utilising their skills and experience.
Pensions avert poverty for many though divergence in adequacy and
effectiveness remains
Pensions constitute by far the main source of income for older Europeans, who represent a large
and growing share of the EU population. They also represent the largest element in social
protection systems, affecting the primary incomes of more people than any other part. The total
number of pensioners in EU Member States presently comes to about 120 million or a quarter of
the population. Almost 2/3 of these are women. Currently, pensions allow retired Europeans to
enjoy living standards that are close to those of the rest of the population and in some countries
generally higher than for other groups on transfer incomes.

- 64 -
The adequacy of pensions is measured by their ability to prevent poverty, the degree to which
they replace income before retirement and how they compare to the average incomes of people
below pensionable age.
Table 15. At risk of poverty or social exclusion rate for the elderly (65+) in %,
changes 2010-2011 and 2008-2011
EU27 BE BG CZ DK DE EE IE EL ES FR IT CY LV
201120.5 21.6 61.1 10.7 16.6 15.3 17.0 12.9 29.3 22.3 11.5 24.2 40.4 33.2
2010-2011
change in pp ~ ~ -2.8 ~ -1.8 ~ -2.0 -5.0 2.6 ~ -1.3 3.9 -1.9 -4.5
2008-2011
change in pp -2.7 -1.3 -4.4 -1.8 -2.0 ~ -23.9 -9.6 1.2 -5.9 -2.4 ~ -8.7 -24.9
LT LU HU MT NL AT PL PT RO SI SK FI SE UK
201132.5 4.7 18.0 21.5 6.9 n.a 24.7 24.5 35.3 24.2 14.5 19.8 18.6 22.7
2010-2011
change in pp 2.5 -1.4 1.2 ~ ~ : ~ -1.6 -4.6 1.4 -2.2 ~ 2.7 ~2008-2011
change in pp -5.6 ~ ~ -4.9 -2.8 : -2.2 -3.2 -13.9 ~ -7.4 -4.1 3.1 -5.8
Source: Eurostat (EU-SILC)
Note: i) Latest data available for Ireland refers to 2010 and changes are for the periods 2009-2010 and 2008-
2010.ii) Only statistically significant changes have been marked in green/red (positive/negative changes)
with a 1pp threshold. "~" stands for stable performance (i.e. statistically insignificant change).iii) For the at-
risk-of poverty rate, the income reference year is the calendar year prior to the survey year (i.e. 2010) except
for the United Kingdom (survey year) and Ireland (12 months preceding the survey). Similarly, the very low
work intensity rate refers to the previous calendar year (i.e. 2010) while for the severe material deprivation
rate, the reference is the current year (i.e. 2011).
Since the beginning of the crisis the income situation of the elderly was better than for other
sections of the population in many Member States due to the stability of the pension income. 17
Member States saw the share of elderly at risk of poverty or social exclusion decrease with more
than 1pp between 2008 and 2011 (Table 15). There are, however, a few countries which since
2008 have had increasing rates of poverty or social exclusion of the elderly (Greece and
Sweden). Countries which saw increases between 2010 and 2011 include Bulgaria, Greece, Italy,
Lithuania, Hungary, Slovenia and Sweden; of these Bulgaria has a share in 2011 of close to 60%
of older people living in poverty or social exclusion and Lithuania and Greece around 30%; for
the other countries this share is only between 17% and 25%.

- 65 -
Table 16. Median relative income ratio of elderly people, changes 2010-2011 and
2008-2011
EU27 BE BG CZ DK DE EE IE EL ES FR IT CY LV
20110.89 0.74 0.72 0.82 0.72 0.90 0.75 0.86 0.81 0.83 1.01 0.92 0.65 0.85
2010-2011 %
change ~ ~ ~ ~ ~ ~ ~ 10.3 ~ ~ ~ ~ ~ 10.4
2008-2011 %
change ~ ~ 9.1 ~ ~ ~ 21.0 16.2 -5.8 6.4 ~ ~ 6.6 57.4
LT LU HU MT NL AT PL PT RO SI SK FI SE UK
20110.87 1.05 1.00 0.80 0.87 0.93 0.94 0.87 1.01 0.87 0.86 0.78 0.77 0.81
2010-2011 %
change -5.4 ~ ~ ~ ~ ~ ~ 6.1 ~ ~ ~ ~ ~ ~
2008-2011 %
change 22.5 8.2 ~ 9.6 ~ ~ ~ ~ 18.8 ~ 8.9 8.3 ~ 9.5
Source: Eurostat (EU-SILC)
Note: i) Latest data available for Ireland refers to 2010 and changes are for the periods 2009-2010 and 2008-
2010.ii] Only statistically significant changes have been marked in green/red (positive/negative changes)
with a 5% threshold. "~" stands for stable performance (i.e. statistically insignificant change). Iii] The income
reference year is the calendar year prior to the survey year (i.e. 2010) except for the United Kingdom (survey
year) and Ireland (12 months preceding the survey).
Pension systems play a key role in allowing people to maintain their living standards in old age
at a level comparable to that achieved during working life. The median relative income of older
people has been rather stable in most Member States (see Table 16). The relative median
income ratio reached 89% for the EU-27 in 2011. There are however substantial differences
across countries, both in the levels and in the trends. In Cyprus the relative median income ratio
is 65% (in 2011), while in Denmark, Estonia, Belgium and Bulgaria it lies between 70% and 75%
(in 2011). This can be due to low pension entitlements relative to the disposable income of the
active age group or high disposable income (perhaps due to low tax) relative to pension
entitlements. At the other end of the spectrum, France, Luxembourg, Hungary and Romania in
2011 recorded a relative median equivalised income for people over 65 that was greater than
that for younger cohorts.
Twelve countries have seen the ratio increase since 2008 by more than 5% (Bulgaria, Estonia,
Spain, Cyprus, Latvia, Lithuania, Luxembourg, Malta, Romania, Slovakia, Finland and the United
Kingdom). A decrease was only registered in Greece.
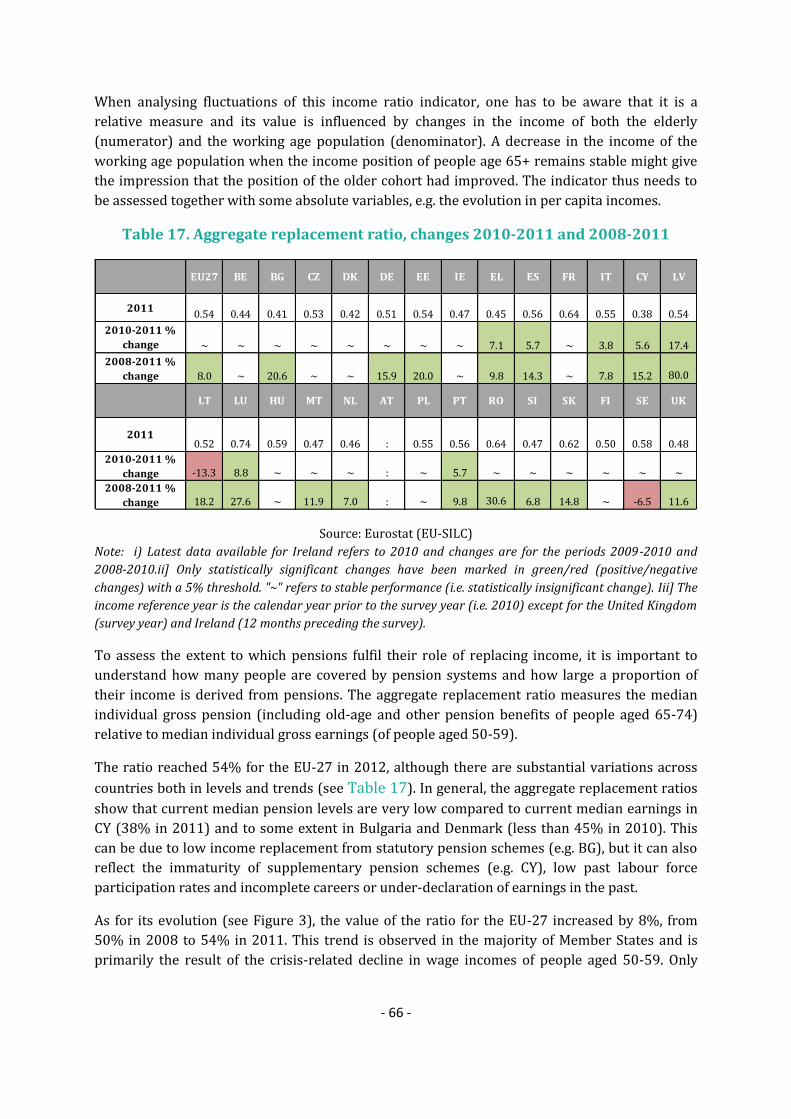
- 66 -
When analysing fluctuations of this income ratio indicator, one has to be aware that it is a
relative measure and its value is influenced by changes in the income of both the elderly
(numerator) and the working age population (denominator). A decrease in the income of the
working age population when the income position of people age 65+ remains stable might give
the impression that the position of the older cohort had improved. The indicator thus needs to
be assessed together with some absolute variables, e.g. the evolution in per capita incomes.
Table 17. Aggregate replacement ratio, changes 2010-2011 and 2008-2011
EU27 BE BG CZ DK DE EE IE EL ES FR IT CY LV
20110.54 0.44 0.41 0.53 0.42 0.51 0.54 0.47 0.45 0.56 0.64 0.55 0.38 0.54
2010-2011 %
change ~ ~ ~ ~ ~ ~ ~ ~ 7.1 5.7 ~ 3.8 5.6 17.4
2008-2011 %
change 8.0 ~ 20.6 ~ ~ 15.9 20.0 ~ 9.8 14.3 ~ 7.8 15.2 80.0
LT LU HU MT NL AT PL PT RO SI SK FI SE UK
20110.52 0.74 0.59 0.47 0.46 : 0.55 0.56 0.64 0.47 0.62 0.50 0.58 0.48
2010-2011 %
change -13.3 8.8 ~ ~ ~ : ~ 5.7 ~ ~ ~ ~ ~ ~
2008-2011 %
change 18.2 27.6 ~ 11.9 7.0 : ~ 9.8 30.6 6.8 14.8 ~ -6.5 11.6
Source: Eurostat (EU-SILC)
Note: i) Latest data available for Ireland refers to 2010 and changes are for the periods 2009-2010 and
2008-2010.ii] Only statistically significant changes have been marked in green/red (positive/negative
changes) with a 5% threshold. "~" refers to stable performance (i.e. statistically insignificant change). Iii] The
income reference year is the calendar year prior to the survey year (i.e. 2010) except for the United Kingdom
(survey year) and Ireland (12 months preceding the survey).
To assess the extent to which pensions fulfil their role of replacing income, it is important to
understand how many people are covered by pension systems and how large a proportion of
their income is derived from pensions. The aggregate replacement ratio measures the median
individual gross pension (including old-age and other pension benefits of people aged 65-74)
relative to median individual gross earnings (of people aged 50-59).
The ratio reached 54% for the EU-27 in 2012, although there are substantial variations across
countries both in levels and trends (see Table 17). In general, the aggregate replacement ratios
show that current median pension levels are very low compared to current median earnings in
CY (38% in 2011) and to some extent in Bulgaria and Denmark (less than 45% in 2010). This
can be due to low income replacement from statutory pension schemes (e.g. BG), but it can also
reflect the immaturity of supplementary pension schemes (e.g. CY), low past labour force
participation rates and incomplete careers or under-declaration of earnings in the past.
As for its evolution (see Figure 3), the value of the ratio for the EU-27 increased by 8%, from
50% in 2008 to 54% in 2011. This trend is observed in the majority of Member States and is
primarily the result of the crisis-related decline in wage incomes of people aged 50-59. Only

- 67 -
Sweden has seen a worsening of the income position of pensioners in comparison to the working
population 50-59 since 2008 and the same applies to Lithuania between 2010 and 2011.
During 2011 and 2012 the SPC carried out a major piece of work on pension adequacy alongside
the work of the Economic Policy Committee (EPC) on pension sustainability. It analysed the
future adequacy and sustainability of pensions by assessing theoretical replacement rates
(TRRs). Some of the main conclusions related to the fact that future levels of pensions in relation
to earnings (income replacement levels) will depend on different factors, notably the pace of
accrual of pension entitlements (which is linked to developments in the labour market), the
maturation of pension schemes and the effect of reforms. However, most Member States are in
a situation where reforms of statutory schemes will lead to a decrease of replacement
rates at given retirement ages. This most probably reflects reforms that have lowered future
benefit levels at a fixed retirement age in order to cope with increasing longevity and the
expenditure this would otherwise entail. As a result many Member States have also increased
incentives to work longer. Measures include increasing the retirement age, flexible retirement
options, increasing contributory periods needed for a full pension, and designing work
incentives into pension schemes. These offer ways and means to bring effective retirement ages
into line with expected increases in life expectancy.
Housing costs and homelessness are on the rise
Having a decent home is an essential need27 and access to affordable and quality housing is one
of the main determinants of well-being and social participation. Housing policies provide low-
income families with a roof over their head even when they lack resources. Although Member
States face different housing deprivation problems, the recent mortgage crisis has reduced the
affordability and supply of housing in Europe. Especially in EU-12 many owners live in bad
quality flats and houses, requiring urgent renovation (Tarki, 2011). Housing affordability is an
important dimension considering that housing costs represent a significant proportion of
people’s expenses. For a significant part of the population these costs represent more than 40%
of their disposable income, which significantly reduces their capacity to adequately cope with
needs besides accommodation, even if the relevance of a relatively high housing cost burden on
household welfare depends on the level of household income.
27 Social housing and housing support are recognised as essential services in support of active inclusion
policies in the 2010 Joint Report on Social Protection and Social Inclusion

- 68 -
Table 18. Housing cost overburden rate, in %, changes 2010-2011 and 2008-2011
EU27 BE BG CZ DK DE EE IE EL ES FR IT CY LV
201111.0 10.6 9.0 9.5 19.9 : 7.4 5.7 24.3 12.1 5.3 5.3 2.8 12.4
2010-2011
change in pp 1.0 1.7 3.1 ~ -2.0 : 1.4 1.7 6.2 ~ ~ ~ ~ ~
2008-2011
change in pp ~ -1.9 -4.3 -3.3 2.8 : 3.8 2.4 2.1 4.1 1.2 1.2 1.2 4.0
LT LU HU MT NL AT PL PT RO SI SK FI SE UK
201110.7 4.2 11.8 2.8 14.5 4.8 10.2 7.2 9.9 4.7 8.4 4.4 7.9 16.4
2010-2011
change in pp ~ ~ ~ ~ ~ ~ 1.1 3.0 -5.1 ~ ~ ~ 1.4 ~
2008-2011
change in pp 5.9 ~ ~ ~ ~ ~ ~ ~ -8.8 ~ 2.8 ~ ~ ~
Source: Eurostat (EU-SILC)
Note: i) Latest data available for Ireland refers to 2010 and changes are for the periods 2009-2010 and
2008-2010 ii)Only statistically significant changes have been marked in green/red (positive/negative
changes) with a 1pp threshold. "~" stands for stable performance (i.e. statistically insignificant change).
Between 2010 and 2011, the housing cost overburden rate has increased in 8 Member States, in
Greece as high as by 6pp and in Bulgaria and Portugal with 3.1pp and 3pp, respectively. This is
to a large extent a consistent trend in these countries since 2008 while only very few countries
show improvements (Denmark, Czech Republic and Romania).
A 2012 report by Feantsa, the European Federation of National Organisations Working with the
Homeless, finds that there is a general trend of increasing homelessness in much of the EU.
This is reflected in the perceptions of European citizens. In 2010, three out of four people in the
EU thought that homelessness had increased in their country over the previous three years.28
This perception was particularly strong in the Central and Eastern European Member States as
well as in Spain and in Greece. At EU level, rising levels of homelessness are described as one of
the major impacts of the current financial and economic crisis (European Commission, 2012a).
Much analysis concentrates on the significance of the crisis in explaining growing levels of
homelessness, though Feantsa research demonstrates that this is not always the case. Collected
evidence shows that the majority of homeless people in Europe appear to be white, middle aged
and male with long-standing health problems. Nonetheless, the socioeconomic profile of
homeless people has expanded as a result of the crisis and the new vulnerabilities caused by
unemployment, cuts in welfare and exposure to the collapse of housing bubbles (Feantsa, 2012).
More women, single parent or large families, older people, Roma and other ethnic minorities
(e.g. in SE, UK) are reported to encounter episodes of homelessness. It is also rising in some
parts of the rural population (e.g. in BU, SE) although homelessness still remains a
predominantly urban phenomenon. A stronger risk for homelessness has been identified for
both intra-EU migrants (e.g. in Ireland, Netherlands, Sweden, United Kingdom) and third country
28
Special Eurobarometer on Poverty and Social Exclusion no. 355 (wave 74.1) 2010, question 30.2.

- 69 -
migrants (e.g. in Spain, Italy, Netherlands). Unemployed and low income people (e.g. in Finland,
France) are increasingly exposed to homelessness. The same applies to young people (e.g. in
Estonia, France, United Kingdom), especially those neither in employment nor in education
(NEETs).
During 2012, SPC delegates responded to a questionnaire on homelessness and housing
exclusion. Findings show that the current economic and financial crisis appears to have had an
impact on homelessness. Budget cuts - where applicable - have reduced the capacity of welfare
states to alleviate and prevent homelessness. In the current economic climate, more people are
at risk of being exposed to longer periods of homelessness and its detrimental effects. Other
factors identified to have contributed to the rising numbers of homelessness are the mortgage
crisis, intra-EU and third country migration, the growing number of single households and
consequences linked to the ageing society. Family breakdowns and deinstitutionalisation
without adequate support remain as the main drivers of homelessness.
There seem to be an insufficient supply of affordable housing – both social and rental housing –
in a number of Member States. The crisis has negatively affected the construction of new social
housing and has often led to the sale of existing stocks; while private rental housing market in
certain areas remains limited. The waiting time for social housing has lengthened in many
Member States including in Ireland, Luxembourg and the United Kingdom.
Rising housing prices combined with uncertain financial markets have increased the
vulnerability of homeowners in a number of Member States. Households that are struggling with
mortgage and rent arrears, high utility bills and over-indebtedness and are not receiving
sufficient support will in the end face repossession and eviction. This risk seems to be
particularly critical in Spain, France, Greece, Hungary, Ireland, Italy but it is also hitting other
Member States. Evidence suggests that the number of both evictions and repossessions has risen
sharply.
Applying a broad definition of homelessness and putting into place integrated homelessness
strategies helps address the multidimensional and dynamic nature of homelessness and the
subsequent need for comprehensive policy solutions. There seems to be a shift towards the use
of wider policy definitions of homelessness based on the ETHOS definition29 e.g. in Germany,
Denmark, Luxembourg, the Netherlands, Sweden, Finland and the United Kingdom. Single policy
definitions are still widely missing in countries such as Bulgaria, Cyprus, Estonia, Slovakia,
Lithuania, Malta, Romania and Slovenia.
While integrated strategies to diminish homelessness are in many instances lacking, a growing
number of Member States have adopted national (e.g. Denmark, Finland, France, Ireland,
Portugal, Sweden) or regional (e.g. Germany, Spain, United Kingdom) homelessness strategies,
sometimes with a focus on big cities such as in the Netherlands.
29
The European Typology of Homelessness and Housing Exclusion classifies homeless people according to four living situations: rooflessnessness, houselessness, and living in insecure or inadequate housing.

- 70 -
Access to health and health outcomes
Health status is a key determinant of the well-being and labour market participation of the
individual. A healthy population is associated with better educational attainment, better earning
and wages, higher labour market participation and a higher number of hours worked in adult
age. Health is also shown to be positively associated with economic growth and social welfare.
On average, 3,2 % of Europeans reported unmet need for medical care in 2010 (they had to wait,
or it was too expensive or too far away). There are significant differences among Member States,
with Latvia as high as 16,1 % and Romania – 12, 2% while Denmark, Spain, Slovenia, Austria,
Netherlands and Luxembourg are below 1%. There is a clear income gradient as those in the
lowest income quintiles more often report an unmet need for medical care. While in most cases
the share of this population has remained rather stable both in the last available year (2010-
2011) as well as since 2008, a few countries report some increases – Belgium, Estonia, Greece,
Hungary, Romania (see Table 19). Fiscal consolidation measures and budgetary cuts effecting
health care budgets could be part of the reasons for the increase in a subset of these countries.
Some improvements since 2008 are registered in Bulgaria, Sweden and Lithuania.
Table 19. Self-reported unmet need for medical care30, in %, changes 2010-2011
and 2008-2011
EU27 BE BG CZ DK DE EE IE EL ES FR IT CY LV
2011 :1.5 9.9 1.1 0.9 1.8 7.4 2.3 7.6 0.6 2.4 6.0 4.4 16.1
2010-2011
change in pp:
1.1 ~ ~ ~ ~ 2.5 ~ 2.1 ~ ~ ~ ~ ~
2008-2011
change in pp:
1.0 -5.5 ~ ~ ~ ~ ~ 2.0 ~ ~ ~ 1.5 6.1
LT LU HU MT NL AT PL PT RO SI SK FI SE UK
20113.2 0.6 2.7 1.1 0.5 0.4 8.1 1.5 12.2 0.1 2.2 4.5 1.3 1.3
2010-2011
change in pp 0.6 0.0 1.0 -0.5 0.1 -0.3 -0.4 -0.6 1.2 ~ ~ ~ ~ ~2008-2011
change in pp -2.4 0.1 -0.7 1.1 0.3 -0.4 1.8 0.4 1.2 ~ ~ 3.7 -1.2 ~
Source: Eurostat (EU-SILC)
Note: i) Latest data available for Ireland refers to 2010 and changes are for the periods 2009-2010 and
2008-2010 ii)Only statistically significant changes have been marked in green/red (positive/negative
changes) with a 1pp threshold. "~" stands for stable performance (i.e. statistically insignificant change).
In general the number of healthy life years is greater for women than for men. Men have seen an
increase in their healthy life years in a number of countries for which the latest data from 2011
is available. Romania and Slovenia saw worrisome trends since 2008, both for men and women,
where women show only small changes or no improvement in healthy life expectancy (see
Table 20 and Table 21). Overall, the number of healthy life years has increased more slowly than
life expectancy. Data does not yet show the real impact of the crisis on health conditions and
30 This indicator is defined on the basis on self-reported unmet need related to three reasons – too far to
travel, waiting list, too expensive.

- 71 -
health expectancy but anecdotal evidence suggests worrisome trends in many of the countries
hit hardest.
Table 20. Healthy life years at 65 – males, 2011 and % change over 2008
EU27 BE BG CZ DK DE EE IE EL ES FR IT CY LV
20118.7 10.4 8.6 8.4 12.4 6.7 5.6 11.1 8.8 9.7 9.0 10.1 10.2 4.8
% change to
2008 ~ ~ ~ 12.0 ~ 6.3 40.0 19.4 ~ ~ ~ 32.9 8.5 ~
LT LU HU MT NL AT PL PT RO SI SK FI SE UK
20116.1 11.5 6.0 12.0 10.4 8.3 6.7 7.9 5.3 6.2 3.5 8.4 13.9 10.9
% change to
2008 5.2 7.5 7.1 ~ 5.1 12.2 ~ 17.9 -32.1 -32.6 16.7 5.0 6.1 ~
Source: Eurostat
Note: i) Latest data available for EU27 BE IE EL FR IT CY MT PL UK refers to 2010 and changes are for the
periods 2008-2010 ii) Only statistically significant changes have been marked in green/red
(positive/negative changes) with a 5% threshold. "~" stands for stable performance (i.e. statistically
insignificant change). Iii)Processing 2011 census data introduce a break in population series for following
countries: SK, CZ, LV, LT, BG, PT, PL, CH and IE. For Cyprus this break occurred in 2010.
Table 21. Healthy life years at 65 – females, 2011 and % change over 2008
EU27 BE BG CZ DK DE EE IE EL ES FR IT CY LV
20118.8 9.7 9.7 8.7 13.0 7.3 5.7 11.2 8.1 9.3 9.8 9.9 8.1 5.0
% change to
2008 ~ -6.7 ~ 6.1 ~ 9.0 35.7 8.7 ~ 6.9 ~ 39.4 ~ ~
LT LU HU MT NL AT PL PT RO SI SK FI SE UK
20116.7 11.8 6.0 11.9 9.9 8.3 7.5 6.4 4.7 6.9 2.9 8.6 15.2 11.8
% change to
2008 ~ ~ -6.3 ~ ~ 10.7 ~ 16.4 -40.5 -26.6 7.4 ~ 8.6 ~
Source: Eurostat
Note: i) Latest data available for EU27 BE IE EL FR IT CY MT PL UK refers to 2010 and changes are for the
periods 2008-2010 ii) Only statistically significant changes have been marked in green/red
(positive/negative changes) with a 5% threshold. "~" stands for stable performance (i.e. statistically
insignificant change). Iii) Processing 2011 census data introduce a break in population series for following
countries: SK, CZ, LV, LT, BG, PT, PL, CH and IE. For Cyprus this break occurred in 2010.
2.2. Take up of benefits
The crisis has led to an increased dependence upon social transfers in many Member States as
automatic stabilisers came into place during the first phase of recession in the EU. As economic
recovery is still to come and as fiscal consolidation packages are acting upon stronger targeting,
- 72 -
the importance of following up on the capacity of welfare systems to address the needs of the
population becomes more and more apparent.
The SPC started an ad-hoc collection of administrative data on benefit recipients for different
social schemes (unemployment, social assistance, early retirement and disability) in order to get
timelier information on the general trends in Member States. It used this information in its
evaluation of the social impact of the crisis31. Administrative data on the take-up of different
social benefits gives a picture of the pressure on social security systems, even though it does not
offer cross-country comparability due to diversity of concepts and underlying definitions. Based
on the SPC data collection launched in July 2012, Member States sent their updates of the data
on benefit recipients for the four different social schemes mentioned above. The following
sections analyse the major trends registered in the past year with regards to these four broad
categories of social transfers. Detailed country trends can be found in the country profiles in
Annex 1. Although only indicative, the trends observed illustrate that the pressure on social
security systems is still growing as Member States are implementing fiscal consolidation
measures.
Mixed trends in unemployment benefit recipients
While in 2011 in the majority of countries the number of unemployment benefit recipients was
going down, this trend reversed in some Member States in 2012 (Spain, Netherlands, Portugal,
Sweden), mostly due to the increase in unemployment. Overall in 2012 there was still a strong
pressure on unemployment benefit schemes across the EU as the unemployment situation was
not improving. The most significant decreases in recipients of unemployment benefits have been
observed in Hungary (-63% between June 2011 and June 2012), Czech Republic (-18% between
June 2011 and June 2012), Romania (-17% between June 2011 and June 2012), Estonia (-17%
between June 2011 and June 2012) for unemployment insurance recipients, Slovenia (-13%
between May 2011 and May 2012). The most significant increases have been observed in Cyprus
(27% between July 2011 and July 2012), Greece (24% between June 2011 and June 2012),
Portugal (27% between July 2011 and July 2012), Netherlands (13% between April 2011 and
April 2012) and Sweden (9% between May 2011 and May 2012).
Pressure on social assistance schemes persists
Pressure on social assistance schemes, sometimes termed schemes of last-resort, remains strong
even though the picture is very mixed. Increases in the number of social assistance beneficiaries
have been reported by Bulgaria, Czech Republic, Denmark, Portugal. Czech Republic registered
an increase of 17% between June 2011 and June 2012 and Denmark saw an increase of 7.7% in
the same period while Bulgaria –4% and Portugal -4,5%.
31 Add references to the SPC Crisis monitoring reports

- 73 -
Few countries show combined pressure on both unemployment benefits
and social assistance
In comparison to 2011, when BG and CY registered combined pressure on both unemployment
benefits and social assistance schemes, recent data for 2012 show that in Bulgaria the trend still
persists, while in Cyprus recipients of social assistance significantly decreased (-35%) for the
period from June 2011 and June 2012. The new country that saw notable pressure on both
schemes is Portugal, with an increase of 24% in the number of unemployment benefit recipients
and an increase of 5% of social assistance recipients for the period between June 2011 and June
2012.
Figure 14. Evolution of the number of benefit recipients and number of
unemployed (in 1000) – the example of Bulgaria
Source: Data on number of unemployed from Eurostat (ILO definition, in 1000 persons, seasonally
adjusted); data on number of benefit recipients collected from Member States through SPC delegates
Countries undergoing a shift towards social assistance schemes
In three Member States (Hungary, Czech Republic and Romania) a decrease in the number of
unemployment benefit recipients has been accompanied by an increase in social assistance
beneficiaries: Hungary registered a decrease of -53.8% in the number of unemployment benefit
recipients which shifted towards an increase of 9% in the number of social assistance recipients
between April 2011 and April 201232. The Czech Republic saw a drop of -18.3% in the number of
unemployment beneficiaries and an increase of 17% in the number of social assistance
recipients for the period June 2011 to June 2012. In Romania, a 17.1% decrease in the number of
unemployment benefits recipients was recorded for the period between June 2011 and June
2012 with an increase of 6% of social assistance recipients for the same period. Both Hungary
32 However there has been a slight decrease of -1.5% in the period of June 2011 and June 2012.

- 74 -
and the Czech Republic showed similar trends in 2011 as well. This could suggest there is
movement from unemployment benefits to social assistance schemes perhaps because long-
term unemployment or shortened lengths of unemployment benefit receipt. This movement
increases pressure on social protection systems.
Figure 15. Evolution of the number of benefit recipients and number of
unemployed (in 1000) – the example of the Czech Republic
Source: Data on number of unemployed from Eurostat (ILO definition, in 1000 persons, seasonally
adjusted); data on number of benefit recipients collected from Member States through SPC delegates
Countries with downward trends in social benefits recipients
For the period between June 2011 and June 2012 four Member States reported decreasing
numbers of beneficiaries on both unemployment benefit and social assistance schemes. Estonia
registered a decrease of -17% in the number of unemployment beneficiaries and at the same
time -14% in the number of social assistance recipients. Hungary saw a decrease of -64% in the
number of unemployment beneficiaries and -1.5% in the number of social assistance recipients.
Latvia registered a 7% decrease in unemployment beneficiaries and a 24% drop in the number
of social assistance recipients. Slovenia registered -8% fall in the number of unemployment
beneficiaries and similarly -8% in the number of social assistance recipients.
Potential gaps in social benefits' coverage in some Member States
With the deterioration in the employment situation in some Member States and the growing
number of unemployed and their longer stay in unemployment, more people are in need of
social transfers. In some Member States, the growth in unemployment is not always matched by
similar trends in benefit recipients which may lead to a potential lack of social benefits coverage.
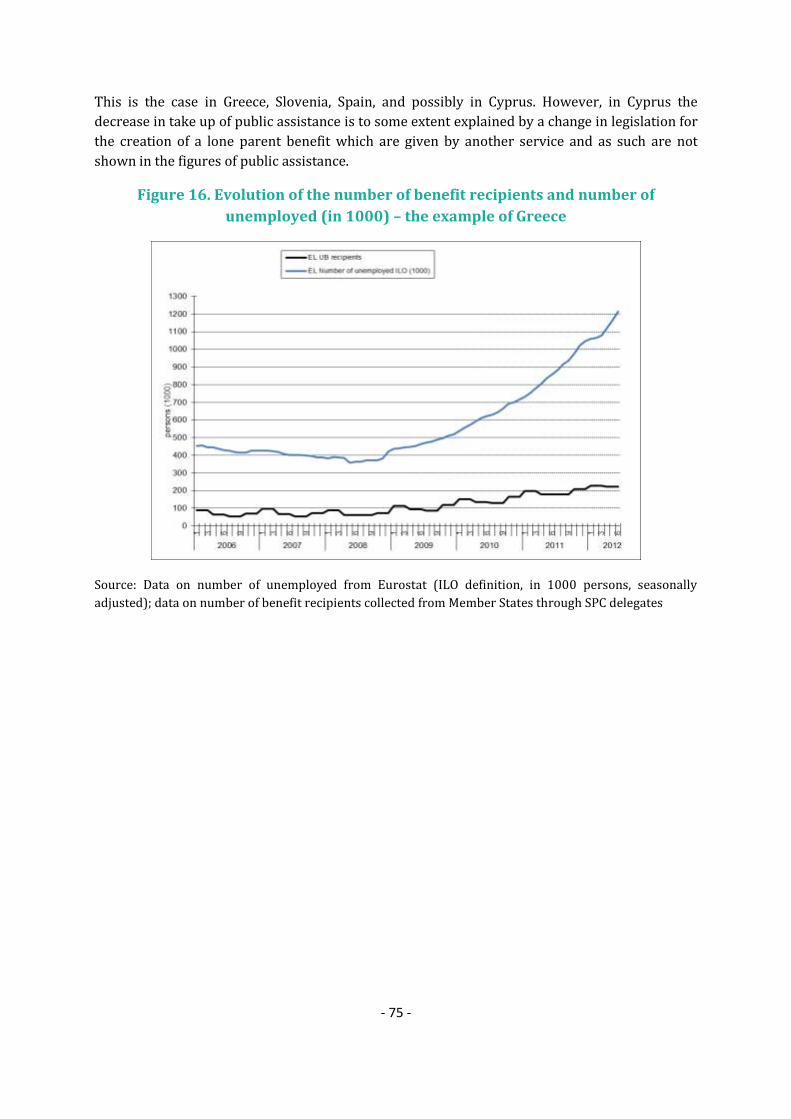
- 75 -
This is the case in Greece, Slovenia, Spain, and possibly in Cyprus. However, in Cyprus the
decrease in take up of public assistance is to some extent explained by a change in legislation for
the creation of a lone parent benefit which are given by another service and as such are not
shown in the figures of public assistance.
Figure 16. Evolution of the number of benefit recipients and number of
unemployed (in 1000) – the example of Greece
Source: Data on number of unemployed from Eurostat (ILO definition, in 1000 persons, seasonally
adjusted); data on number of benefit recipients collected from Member States through SPC delegates
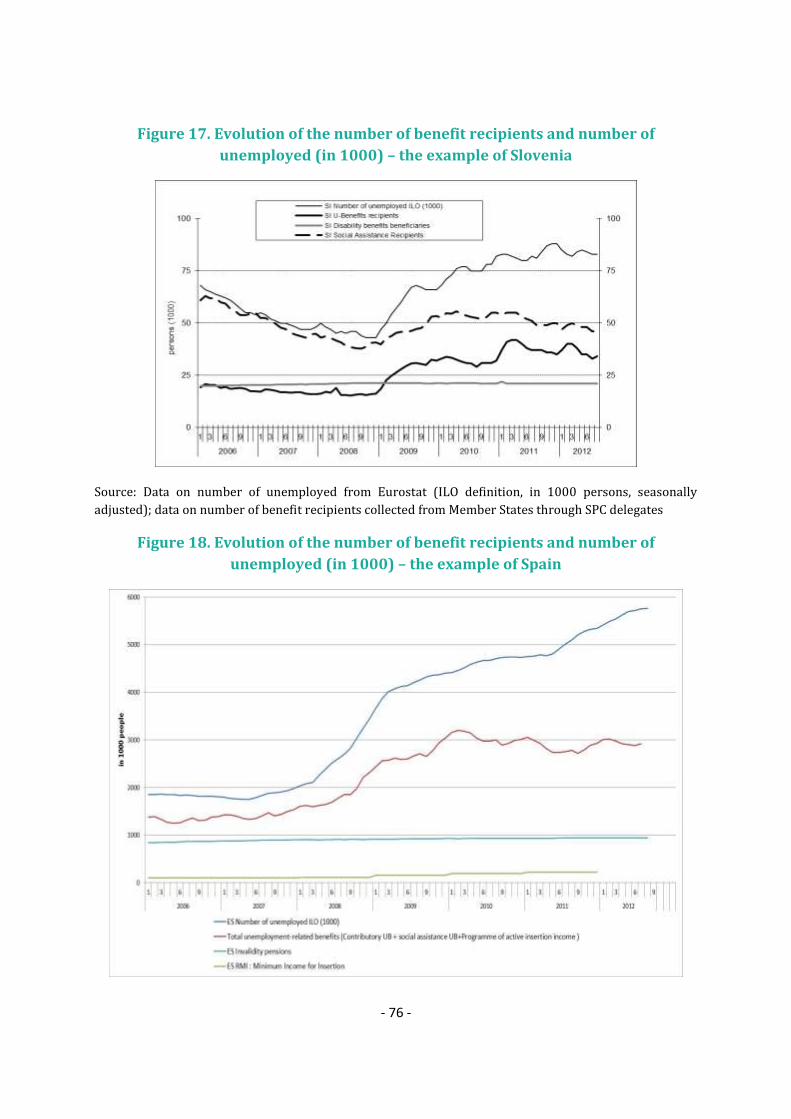
- 76 -
Figure 17. Evolution of the number of benefit recipients and number of
unemployed (in 1000) – the example of Slovenia
Source: Data on number of unemployed from Eurostat (ILO definition, in 1000 persons, seasonally
adjusted); data on number of benefit recipients collected from Member States through SPC delegates
Figure 18. Evolution of the number of benefit recipients and number of
unemployed (in 1000) – the example of Spain

- 77 -
Source: Data on number of unemployed from Eurostat (ILO definition, in 1000 persons, seasonally
adjusted); data on number of benefit recipients collected from Member States through SPC delegates
Figure 19. Evolution of the number of benefit recipients and number of
unemployed (in 1000) – the example of Cyprus
Source: Data on number of unemployed from Eurostat (ILO definition, in 1000 persons, seasonally
adjusted); data on number of benefit recipients collected from Member States through SPC delegates

- 78 -
Main findings from the Eurofound 2011 European Quality of Life Survey confirm a worrisome picture around Europe
People with low incomes are more likely to have experienced negative
financial consequences in the previous 12 months and to report more difficulties in making ends meet. This group also report more problems with work–life balance, health and access to health services.
Unemployment – and long-term unemployment in particular – has a huge impact on subjective well-being. The highest level of social exclusion is found among the long-term unemployed.
Women working full time are more likely than men to report problems with work–life balance, which highlights the issue in an increasingly female labour force. Also, women tend to be less satisfied than men with some public services, especially long-term care and health services.
Countries that report a better quality of life are those in the Northern and Western parts of the EU, while those expressing more disadvantages are mainly from Southern and Eastern Europe.
Optimism about the future was expressed by fewer than 30% of people in Greece, Slovakia and Portugal, and by over 80% in Denmark and Sweden.
Over one in three respondents said that their financial situation was worse
than 12 months previously – particularly people with low incomes, and those in the 50 to 64 age bracket.
The most vulnerable groups – the lowest income quartile, the unemployed, older people in Central and Eastern Europe – showed the greatest decline in subjective well-being between successive surveys.
Family continues to play a major role in all countries as the basis of social contacts and the main source of support in meeting daily or urgent needs. Involvement in unpaid work, notably childcare and care of the elderly, remains at a high level.
There is declining trust in public institutions, specifically in governments and parliaments at national level. This is particularly evident in countries most affected by the economic crisis.
------------------------------------------------ The European Quality of Life Survey measures resources and living conditions through objective and descriptive indicators, but also incorporates subjective information: an important part of the analysis focuses on the relationship between reported views and attitudes on one side, and resources and living conditions on the other. In concrete terms, the survey’s core focus is on the domains of employment, economic resources, family life, community life, health, and housing and local environment.
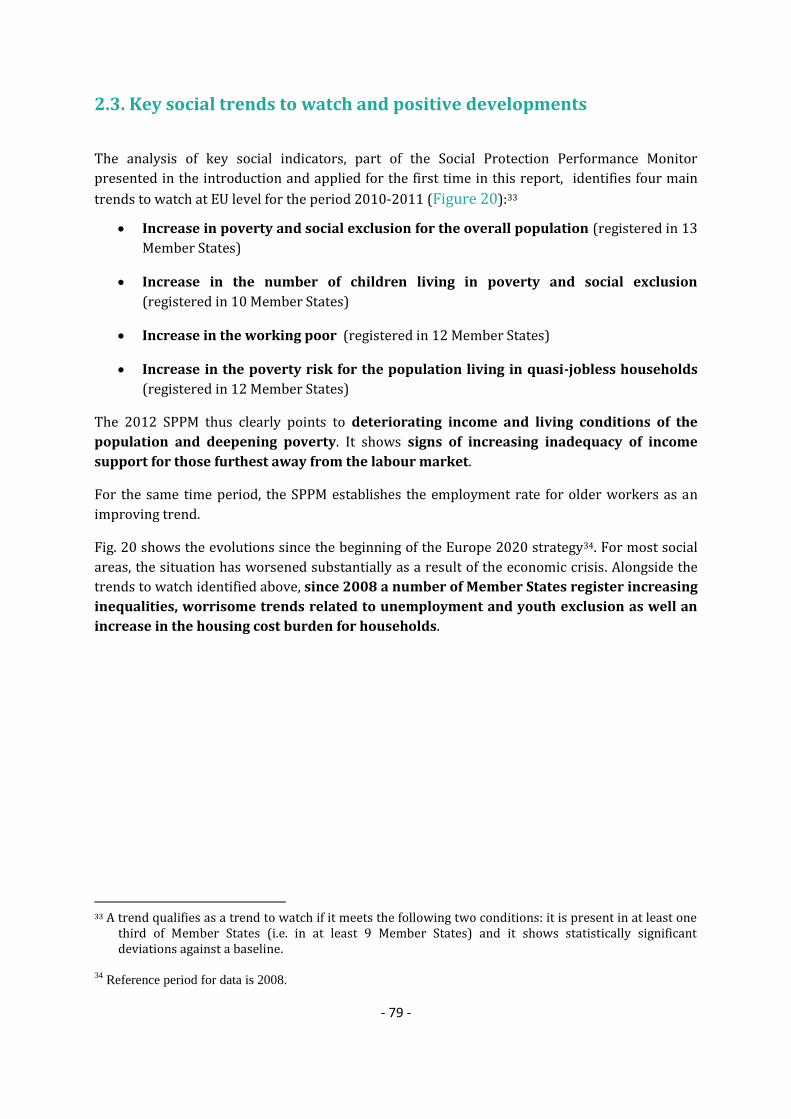
- 79 -
2.3. Key social trends to watch and positive developments
The analysis of key social indicators, part of the Social Protection Performance Monitor
presented in the introduction and applied for the first time in this report, identifies four main
trends to watch at EU level for the period 2010-2011 (Figure 20):33
Increase in poverty and social exclusion for the overall population (registered in 13
Member States)
Increase in the number of children living in poverty and social exclusion
(registered in 10 Member States)
Increase in the working poor (registered in 12 Member States)
Increase in the poverty risk for the population living in quasi-jobless households
(registered in 12 Member States)
The 2012 SPPM thus clearly points to deteriorating income and living conditions of the
population and deepening poverty. It shows signs of increasing inadequacy of income
support for those furthest away from the labour market.
For the same time period, the SPPM establishes the employment rate for older workers as an
improving trend.
Fig. 20 shows the evolutions since the beginning of the Europe 2020 strategy34. For most social
areas, the situation has worsened substantially as a result of the economic crisis. Alongside the
trends to watch identified above, since 2008 a number of Member States register increasing
inequalities, worrisome trends related to unemployment and youth exclusion as well an
increase in the housing cost burden for households.
33 A trend qualifies as a trend to watch if it meets the following two conditions: it is present in at least one
third of Member States (i.e. in at least 9 Member States) and it shows statistically significant deviations against a baseline.
34 Reference period for data is 2008.
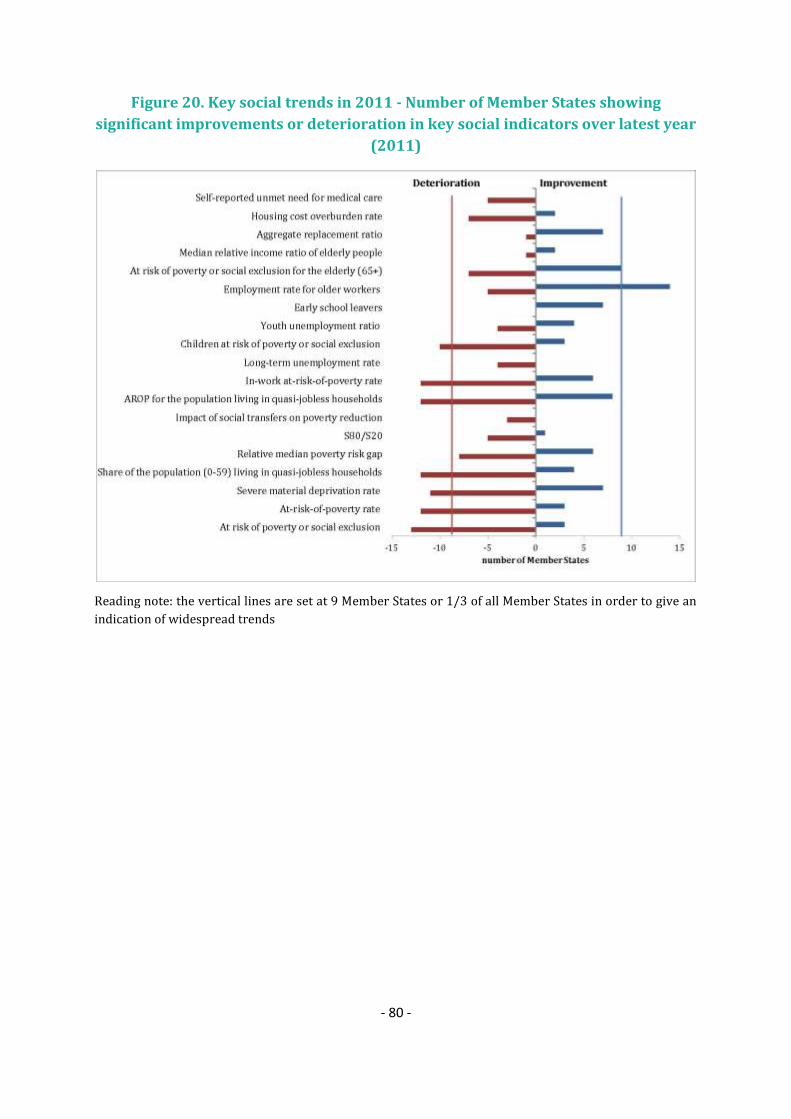
- 80 -
Figure 20. Key social trends in 2011 - Number of Member States showing
significant improvements or deterioration in key social indicators over latest year
(2011)
Reading note: the vertical lines are set at 9 Member States or 1/3 of all Member States in order to give an
indication of widespread trends

- 81 -
Figure 21. Key social trends since 2008 - Number of Member States showing
significant improvements or deterioration in key social indicators since 2008
Reading note: the vertical lines are set at 9 Member States or 1/3 of all Member States in order to give an
indication of widespread trends

- 82 -
The SPC has been looking at social protection financing and the effectiveness and efficiency of
social protection expenditure as an important element of its work, most recently in the 2008
Joint Report on Social Protection and Social Inclusion. As the economic and financial crisis has
led to political and economic choices with important implications for social protection financing
and expenditure, a more in-depth reflection will be taken up by the SPC in 2013.
3.1. Evolution of social protection expenditure
During the crisis social expenditure has evolved through two distinct phases35. In the first phase
(2007-2009), social security systems responded to the increased needs of the population and
generally increased their social spending; for the second one (2010-2014), fiscal consolidation
measures have started to be put in place in order to address deficit issues. In order to explore
the evolution of social expenditure two different datasets will be employed: ESSPROS until 2010
and AMECO from 2011 onwards36.
First phase of the crisis (2007-2009): Between 2007 and 2009, total social expenditure at the
EU level as percentage of GDP37 increased markedly (see Figure 22). Starting from 26.1% (and
ranging between 12.1% in Estonia and 30.9% in France) the EU-27 average reached 29.6%
(ranging from 16.9% in Latvia to 33.2% in Denmark). More specifically, in all Member States the
total social expenditure rose already in 2007 or 2008, but the most significant increases were
registered in 2009: in some Member States the rate of growth of total social expenditure
between 2008 and 2009 was larger than 20%. Examples are Estonia (+29%), Ireland (+23%),
Latvia (+33%) and Lithuania (+32%). In most cases, this increase was determined by the
combined effect of a rise of the total social expenditure and a decline in GDP38,39. In Denmark,
Estonia, Latvia, Lithuania, Finland and Sweden the GDP decrease was higher than the increase in
expenditure.
35 The academic and institutional literature on the recent financial and economic crisis frequently
attempted to identify a timeline of the events. The distinction in different phases varies according to policy investigated: monetary (e. g. ECB, 2011) or fiscal (e.g. Hemerijck and Vandenbrouck, 2012) and with their subcategories. Although each Member State experienced a peculiar path and, although, in some cases expansionary and consolidation policies were contemporaneous, the above mentioned distinction seems to find broad agreement [e.g. Adema et al. (2011), Prasad et al. (2011), OECD (2012)].
36 Please note that the two datasets are not directly comparable. 37 Total social expenditure (Eurostat's ESSPROS) includes administration costs, other expenditure,
sickness and healthcare, disability, old age, survivors, family, unemployment, housing and social inclusion benefit.
38 In some cases, it is also due to a contemporary decrease in both expenditure and GDP, as in Hungary for the period 2008-2009, or in the case of Greece, Spain and Romania for the period 2009-2010 when considering real values expressed in national currency, or to a contemporary increase in both social expenditure and GDP, as in the case of Poland and Portugal for the period 2008-2009.
39 It is worth mentioning, though, that the driving force behind the rise in expenditure as a percentage of GDP might be different when referring respectively to nominal/real terms and in national currency/euro.
3. RECENT EVOLUTION OF SOCIAL PROTECTION
EXPENDITURE

- 83 -
Figure 22. Total Social Expenditure, % of GPD, 2007- 2009
Source: Eurostat (Esspros)
Second phase of the crisis (2010-2014)40: ESSPROS data show that in 2010, the EU-27
average of the total social protection expenditure as a percentage of GDP reached 29.4%,
ranging from 17.1% in Bulgaria and Estonia to 33.8% in France. Compared to 2009, at EU-27
level the percentage of GDP devoted to social protection benefits decreased by 0.8%. Specifically,
thirteen Member States reduced their expenditure, with the largest decrease experienced in
Lithuania (-10%). Some Member States raised the percentage of GDP devoted to social
expenditure, such as in Ireland which registered an increase of 7.9%.
40 The analysis of years 2013 and 2014 is based on financial spending projections and therefore the
analysis could change depending on actual spending in Member States.
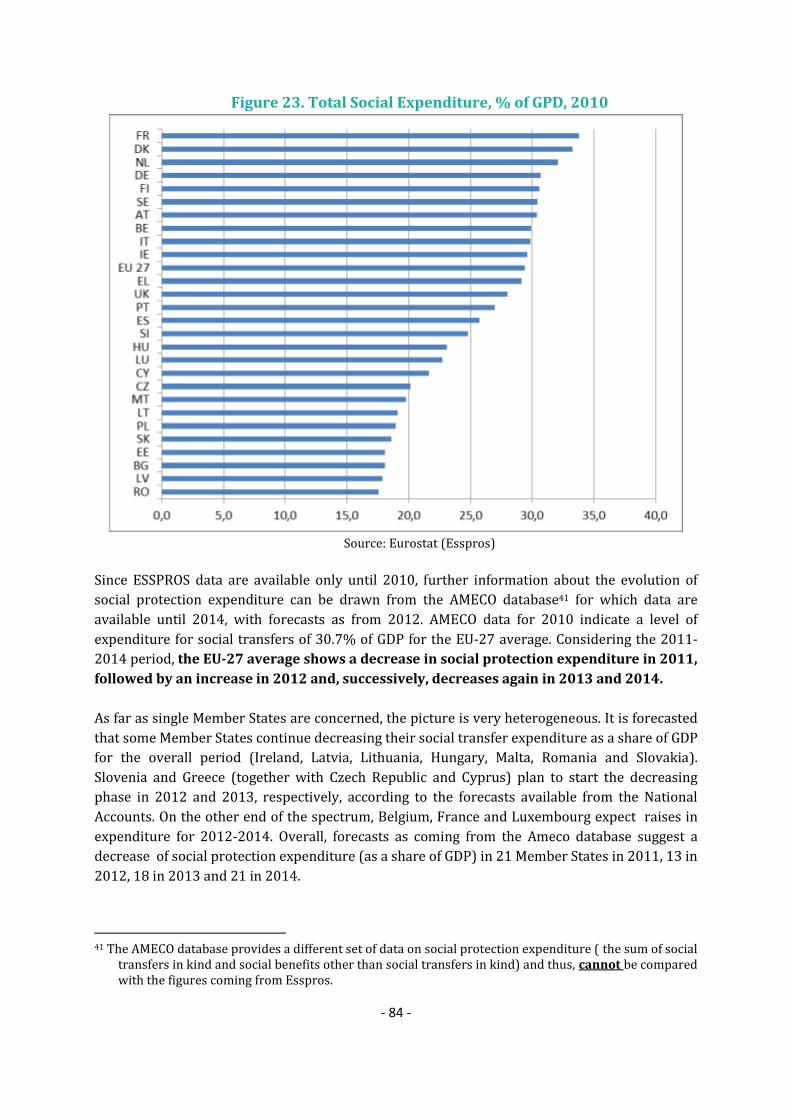
- 84 -
Figure 23. Total Social Expenditure, % of GPD, 2010
Source: Eurostat (Esspros)
Since ESSPROS data are available only until 2010, further information about the evolution of
social protection expenditure can be drawn from the AMECO database41 for which data are
available until 2014, with forecasts as from 2012. AMECO data for 2010 indicate a level of
expenditure for social transfers of 30.7% of GDP for the EU-27 average. Considering the 2011-
2014 period, the EU-27 average shows a decrease in social protection expenditure in 2011,
followed by an increase in 2012 and, successively, decreases again in 2013 and 2014.
As far as single Member States are concerned, the picture is very heterogeneous. It is forecasted
that some Member States continue decreasing their social transfer expenditure as a share of GDP
for the overall period (Ireland, Latvia, Lithuania, Hungary, Malta, Romania and Slovakia).
Slovenia and Greece (together with Czech Republic and Cyprus) plan to start the decreasing
phase in 2012 and 2013, respectively, according to the forecasts available from the National
Accounts. On the other end of the spectrum, Belgium, France and Luxembourg expect raises in
expenditure for 2012-2014. Overall, forecasts as coming from the Ameco database suggest a
decrease of social protection expenditure (as a share of GDP) in 21 Member States in 2011, 13 in
2012, 18 in 2013 and 21 in 2014.
41 The AMECO database provides a different set of data on social protection expenditure ( the sum of social
transfers in kind and social benefits other than social transfers in kind) and thus, cannot be compared with the figures coming from Esspros.

- 85 -
As this description of the evolution of social protection expenditure highlights, there is a broad
diversity among the Member States. Both the onset of the crisis and the starting point of the
response vary according to economic factors and their development over time. Nevertheless, at
EU-27 level, the trend observed in the rate of change of total social expenditure (total social
benefits) and GDP (see Figure 24 and Figure 25) seem to confirm the above mentioned
distinction between two phases.
Figure 24. EU-27 Total Social Expenditure,% of GDP, 2007- 2010
Source: Eurostat (Esspros)
Note: the rate of change for both expenditure and GDP has been calculated on the basis of the two
variables expressed in real terms, with the base year 2000, and national currencies.

- 86 -
Figure 25 . Total Benefit Expenditure, % of GDP and y-o-y rate of change, 2007-
2014
Source: AMECO
Note: the rate of change for both the expenditure and GDP has been calculated on the basis of the two
variables expressed in real terms, with basis year 2005, and national currencies.
3.2. Composition of spending
In 2007-2010, the EU-27 average total expenditure registered a decrease in 2007, a strong
increase in 2008-2009 and, again, a slight decrease in 2010. Most of the social protection
expenditure subcomponents followed a similar pattern (see Figure 26) with the exception of
housing/social exclusion and administrative costs/'other expenditure'. The most significant
changes occurred in 2009. Since unemployment benefits act more than the other
subcomponents as automatic stabilisers, they unsurprisingly peaked with an increase compared
to the previous year of 35% for the EU-27 average. The increase was also due to discretional
policies implemented in several Member States to preserve income levels after a job loss and to
keep people out of poverty42. The most evident case of this is Estonia for which unemployment
benefits as a percentage of GDP moved from 0.1% in 2007 to 0.3% and, then, to 1.2% in 2009.
Between 2008 and 2009, an increase of over 100% was registered in Latvia and Lithuania. The
crisis also triggered a significant rise of housing/social exclusion and family/children
expenditure levels that increased by 13% and 11% for the EU-27 average, respectively.
42 For a detailed description of policies linked to unemployment benefits see European Employment Observatory
Review (2011).

- 87 -
Sickness/disability and old age/survivors both increased by 10% and 8%, although the 2009
peak for the latter was higher.
Figure 26. Evolution of main social protection expenditure subcomponents, % of
GDP, EU27 average, 2007-2010
Source: Eurostat (Esspros)
In 2010, most of the Member States implemented fiscal consolidation measures with direct
impact on social spending. 19 out of 27 Member States diminished the level of expenditure on
family and children benefits, with the largest decrease in Lithuania (–21.4%). Unemployment
benefits were reduced in 13 Member States with the greatest decrease in Estonia (-39%). There
are also signs of reduced spending on sickness/health care (e.g. moderating demand), and for
old age pensions (e.g. reviewing the method of indexation or temporarily frozen pensions
benefits).
In terms of the relative importance of each subcomponent for the total social expenditure43 (see
Figure 27), in 2010 old age and survivors maintained the highest value with 43.3% at the EU-27
level, followed by sickness/healthcare/disability, with almost 36% of the total. The other
subcomponents covered a lower share ranging from 3.5% for housing and social exclusion to
5.8% for unemployment. Between 2008 and 2009 the relative importance of all the expenditure
categories decreased in favour of unemployment, housing and social exclusion benefits. This is
particularly clear for unemployment benefits whose relative importance increased in all
Member States apart from Italy. On the contrary, the weight of administrative expenditure has
been increasing in Germany, Malta and in the Netherlands. Furthermore, in the Czech Republic,
Germany, France, the Netherlands, Slovakia and the United Kingdom the relative importance of
sickness/disability, old age/disability and family/children decreased in favour of
unemployment, housing and social benefits.
43
Measured as the percentage of each subcomponent on the total expenditure.

- 88 -
Figure 27. Social protection sub-functions as % of total social expenditure,
2010
Source: Eurostat (Esspros)
3.3. Social protection expenditure by type and conditionality of
provision
Social security programmes can be classified according to the type of provision and to eligibility
conditions. On the one hand, there are benefits in cash and in kind, i.e. monetary flow or services
offered to the eligible individual. It is also important to distinguish between universal and
targeted benefits depending on whether eligibility is linked or not to a household/individual
income threshold.
3.3.1. In cash and in kind benefits
In 2010, in-cash and in-kind benefits accounted for respectively 18.2% and 10% of GDP at the
EU-27 level. In terms of the share of the total benefit expenditure this translates into 64.6% for
in-cash benefits and 35.4% for in-kind benefits. The data for 2010 shows that a higher total
amount of social protection benefits corresponds to a higher usage of in-kind benefits. Member
States are very heterogeneous in this respect and the share of social protection in kind for total
benefits ranges from 21.1% in Poland to 45.9% in Ireland.

- 89 -
Figure 28. Social protection benefits as % of GDP vs. share of social
protection benefit in kind on total social protection benefits (2010)
Source: Eurostat (ESSPROS)

- 90 -
Figure 29: Composition of social protection expenditure by function and by
type of provision (in cash/in kind) relative to GDP, 2010
Source: Eurostat (Esspros)
3.3.2. Non means tested and means tested benefits
In 2010, means tested benefits accounted for 3.1% of the GDP for the EU-27 average, whereas
non-means tested benefits accounted for 25.2% of the GDP. These percentages translate
respectively into 10.2% and 89.2% of the total benefit expenditure. There is wide diversity
across Member States; in some Member States means tested benefits reached relatively high
values, such as in Ireland (7.6% of GDP or 26.7% of social protection benefits) and Spain (4% of
GDP or 16.1% of social protection benefits). In the Czech Republic and Estonia the percentage of
means-tested benefits of the GDP was lower than 0.5% (i.e. less than 2% in terms of the share of
the total social protection benefits).
The share of non-means tested benefits of total social protection benefits was higher in 2012 in
all Member States for sickness/health benefits (ranging from 82.8% in Malta to 100% in
Belgium, Bulgaria, Czech Republic, Denmark, Estonia, Cyprus, Lithuania, Luxembourg, Slovenia,
Slovakia, Finland and Sweden), old age (the minimum registered in Spain with 81.6%) and
survivors' benefits (with a minimum of 81.0% in France). There are some exceptions where
values registered as significantly lower than the EU27 average of 70%, this characterised
invalidity benefits (for which Ireland has a share of 46.6%), family/children benefits (for which
Poland, Portugal and Slovenia have a share lower than 45%) and unemployment (for which the

- 91 -
Netherlands registers a share of 29.6%). At the other end of the spectrum, Romania is the only
country with an unemployment benefit system completely means tested.
Figure 30. Composition of social protection expenditure by function and
conditionality (means-tested/not means-tested) relative to GDP (2010)
Source: Eurostat (Esspros)

- 92 -
A look back 2000-2010: Is social expenditure counter-cyclical? Drawing conclusions about the behaviour of social protection expenditure in terms of pro-
cyclicality or counter-cyclicality is not a simple task. On the one hand, although social
protection policy holds considerable weight in overall fiscal policy, the literature that
specifically analyses it or its subcomponents is not as wide as would be expected (for a
review of the literature in this field see Prasad and Gerecke (2011)). One of the main
difficulties in assessing social policies with respect to the cycle is distinguishing between
automatic stabilisers and discretionary measures. The boundary between these two
elements is not always clear cut and there is a debate on which social expenditure
subcomponents should be considered as automatic stabilisers.
Academic literature proposes a wide set of possible explanations for the pro-cyclical
behaviour of fiscal policies in general, while in full agreement on the sub-optimality of
such behaviour. On the one hand, ‘pro-cyclical’ fiscal policy in crisis times may easily find a
rationale in the inevitable trade-off between cyclical stabilisation and the need to contain
budgetary imbalance. In other terms "the main explanation for pro-cyclical fiscal policy in
bad times is an unsound starting fiscal position, which requires a correction irrespective
of the prevailing cyclical conditions" (ECFIN (2006)). On the other hand, pro-cyclical fiscal
policies in "good" times are more puzzling (several explanations are at the basis of a pro-
cyclical behaviour of fiscal policies. For an up-to-date review of literature on this see
ECFIN (2006, p.199) or Prasad and Gerecke (2011, pg. 229-230)).
The European Commission produced detailed analysis of the behaviour of social
expenditure and its subcomponents with respect to the cycle in its 2012 Employment and
Social Developments in Europe report. Using a panel dataset for the period 1995-2009 to
estimate alternative measures of the degree of pro-cyclicality/counter-cyclicality, the
findings suggest that, on average, a certain grade of counter-cyclicality is observed for
each sub-component of social expenditure. Specifically, using the output gap as a proxy for
the cycle the highest degree of counter-cyclicality is shown by pensions followed by
unemployment benefits. Using unemployment to proxy the cycle the countercyclical effect
is larger when it comes to unemployment, followed by pensions. The effect of
unemployment benefits is predictable as unemployment benefits are widely recognised as
automatic stabilisers. On the other hand, pensions' spending, in principle linked to
structural/demographic spending, can be used in periods of crisis to protect older
workers and free up jobs for the youth, in which case it increases. Given these general
conclusions, the study also ascertains that Member States are heterogeneous in shaping
the pattern of social expenditure with respect to the economic cycle.
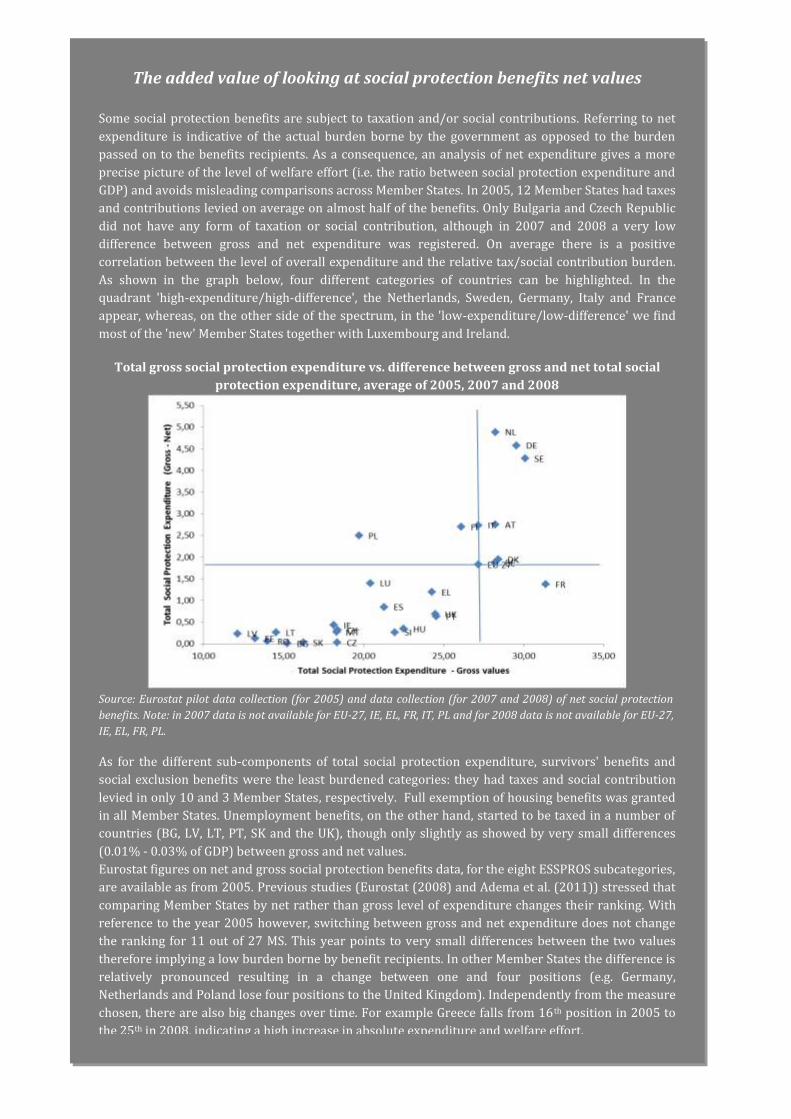
- 93 -
The added value of looking at social protection benefits net values Some social protection benefits are subject to taxation and/or social contributions. Referring to net
expenditure is indicative of the actual burden borne by the government as opposed to the burden
passed on to the benefits recipients. As a consequence, an analysis of net expenditure gives a more
precise picture of the level of welfare effort (i.e. the ratio between social protection expenditure and
GDP) and avoids misleading comparisons across Member States. In 2005, 12 Member States had taxes
and contributions levied on average on almost half of the benefits. Only Bulgaria and Czech Republic
did not have any form of taxation or social contribution, although in 2007 and 2008 a very low
difference between gross and net expenditure was registered. On average there is a positive
correlation between the level of overall expenditure and the relative tax/social contribution burden.
As shown in the graph below, four different categories of countries can be highlighted. In the
quadrant 'high-expenditure/high-difference', the Netherlands, Sweden, Germany, Italy and France
appear, whereas, on the other side of the spectrum, in the 'low-expenditure/low-difference' we find
most of the 'new' Member States together with Luxembourg and Ireland.
Total gross social protection expenditure vs. difference between gross and net total social
protection expenditure, average of 2005, 2007 and 2008
Source: Eurostat pilot data collection (for 2005) and data collection (for 2007 and 2008) of net social protection
benefits. Note: in 2007 data is not available for EU-27, IE, EL, FR, IT, PL and for 2008 data is not available for EU-27,
IE, EL, FR, PL.
As for the different sub-components of total social protection expenditure, survivors' benefits and
social exclusion benefits were the least burdened categories: they had taxes and social contribution
levied in only 10 and 3 Member States, respectively. Full exemption of housing benefits was granted
in all Member States. Unemployment benefits, on the other hand, started to be taxed in a number of
countries (BG, LV, LT, PT, SK and the UK), though only slightly as showed by very small differences
(0.01% - 0.03% of GDP) between gross and net values.
Eurostat figures on net and gross social protection benefits data, for the eight ESSPROS subcategories,
are available as from 2005. Previous studies (Eurostat (2008) and Adema et al. (2011)) stressed that
comparing Member States by net rather than gross level of expenditure changes their ranking. With
reference to the year 2005 however, switching between gross and net expenditure does not change
the ranking for 11 out of 27 MS. This year points to very small differences between the two values
therefore implying a low burden borne by benefit recipients. In other Member States the difference is
relatively pronounced resulting in a change between one and four positions (e.g. Germany,
Netherlands and Poland lose four positions to the United Kingdom). Independently from the measure
chosen, there are also big changes over time. For example Greece falls from 16th position in 2005 to
the 25th in 2008, indicating a high increase in absolute expenditure and welfare effort.

- 94 -
Measuring social expenditure: an exploratory attempt to decompose the
driving forces behind its cross-time and cross-country evolution
Different forces drive the development of the welfare state and, consequently, shape the pattern of social
protection expenditure. Demographic, policy and economic development are the most relevant.
Academic and institutional literature, in order to conduct cross-country and cross-time analysis, often
refer to the 'welfare effort' (i.e. social expenditure expressed as a percentage of GDP) as a key variable.
One of the advantages of choosing this measure lies in the fact that it allows for comparability. This
metric however, is, on the one hand, influenced both by changes in expenditure and in GDP and, on the
other hand, conceals demographic, political and economic aspects, which become more relevant as the
time span considered increases.
In order to give a more detailed picture of the evolution of social expenditure, in principle, the following
indicator can be used (see for example Aláez et al., 2008). The formula decomposes 'welfare effort' into
three different components:
(Social Expenditure)/GDP = (Social Expenditure)/(Dependent Population)*(Dependent
Population)/Population* Population/GDP
- Welfare standard (the ratio between social expenditure and the dependent population) is a measure of
the per capita level of protection guaranteed by the government to the dependent population, i.e. to the
population who is in need of a particular kind of social benefit or is entitled to obtain it.
- Incidence (the ratio between the dependent population and population) is a measure of the degree of
welfare need, i.e. a measure of the degree of urgency or importance of the situation that the social
expenditure aims to counteract. It gives an indication of the level of pressure the government faces.
- Economic context (the ratio between the population and GDP) is the inverse of GDP per capita and is a
measure of a country's standard of living.
The current analysis focuses only on one of the social expenditure components: unemployment benefits,
chosen because it is considered to be the most reactive in times of crisis. We also recognise that in
countries where there is a lot of movement of beneficiaries between or within different types of benefits,
the trends observed might offer only a partial explanation. The data and methodology for constructing
the four elements of the formula are as follows:
- Unemployment benefits: ESSPROS data have been used. Specifically, both unemployment benefits (in
the second element of the formula) and GDP (in the fourth element of the formula) are indicated in
national currencies. The values are expressed in real terms with 2000 as the reference year in order to
allow for cross-time comparison.
- Dependent population: Eurostat's figures of unemployed people and EU-SILC figures of unemployment
benefits recipients were considered. Using one rather than the other source implies a trade-off between
the time span and the accuracy of the variable and, consequently, implies measuring two slightly
different occurrences. Ideally, the reference variable should cover a long period and, at the same time,
reflect the concept of ‘dependent population’, i.e. the population entitled to or receiving the benefit. Our
sources allow for just one of these features at a time. On the one hand, Eurostat data covers the period
1995-2009 although the number of unemployed does not correspond to the number of people entitled
to obtain unemployment benefits. On the other hand, EU-SILC data, spanning 2004-2010 (with t-1 as the
income reference period), allow for extrapolating the weighted number of individuals who declared
receiving unemployment benefits.
- 95 -
- Population. The use of two options for the dependent population requires using, as well, two
options for the overall population, i.e. Eurostat's labour force (defined as the sum between the
employed and unemployed) and EU-SILC total adult population, properly weighted and eligible for
unemployment benefits. In the third term of the formula, when the first option is applied, it equals
to the unemployment rate.
Two Member States have been selected for the analysis: Luxembourg and Ireland. With respect to
unemployment benefits, on average, they present respectively a low (0.8% of the GDP) and medium
(1.9% of the GDP) level of 'welfare effort'. Luxembourg shows consistency between Eurostat's
number of unemployed people and EU-SILC's number of unemployment benefits recipients,
whereas Ireland shows a higher number of benefits recipients (as for most of the Member States).
Observations emerging from the analysis::
- 'Welfare effort' and 'welfare standard' are not univocally correlated: when the expenditure
decreases, the per capita value may increase or not. These differences could be attributed to
specific policy changes as well as to some automatic effects.
- Both pro-cyclical and counter-cyclical movements of the 'welfare effort' and 'welfare standard' can
be observed
- Using LFS data rather than EU-SILC micro data results in different trends, even when the values of
the two time series are consistent. This in principle reflects at least partly the developments in non-
coverage of unemployment benefits.
More in detail:
- In Luxembourg, between 1995 and 2001, 'welfare effort' and 'welfare standard' followed the same
increasing pattern with the exception of 1999 (when 'welfare standard' continued to increase and
'welfare effort' registered a small drop) supported by an improvement in the level of
unemployment and GDP per capita. Starting in 2002 and until 2004, 'welfare effort' and 'welfare
standard' diverged, the former reaching one of the highest values of the entire time series, the latter
one of the lowest. Indeed, in 2004, Luxembourg experienced also the second highest rate of
unemployment (5.04%). In 2005, both 'welfare effort' and 'welfare standard' increased again as the
welfare need decreased and the economic situation improved. In 2006 and 2007 while the
economic context continued to improve a decrease in both 'welfare effort' and 'welfare standard'
was registered, whereas during the crisis, 2008 and 2009, a reverse situation emerged with a
deteriorated situation in terms of welfare need and GDP per capita and an increase in 'welfare
effort' and 'welfare standard'.
- In Ireland 'welfare effort' decreased between 1995 and 1999, followed by a period of constant
expenditure between 2000 and 2007, and then by a drastic increase in 2008 and 2009. Whereas the
trend of the 'welfare effort' is rather constant, 'welfare standard' always increased, thanks to the
good economic performance expressed by the high rate of per capita GDP growth and the
consequent diminishing pressure of unemployment and the 'incidence' of dependent population.
During the years of the crisis, 'welfare effort' increased, and managed to maintain the level of
'welfare standard' as it was in 1999-2000, despite the increase of the 'incidence" up to 11.9% in
2009.

- 96 -
EU-SILC data suggest a slightly different picture, in terms of trends for Luxembourg and Spain,
whereas it confirms the findings for Ireland. For Luxembourg, in the period 2003-2009 welfare
effort always decreased from 330 euro per capita to 232 euro per capita, whereas the 'incidence'
rate always increased starting from 1.9% and reaching 4.3%. For Spain, 'welfare standard'
increased in 2004 and 2005, in correspondence with an improvement in the "incidence" and in
the GDP per capita. Successively 'welfare standard' started to decrease up to 2008.
This exercise shows how an analysis of the 'welfare effort' can be enriched with additional useful
information. "Welfare standard", "incidence" and "economic context" disclose further insights on
how policy choices, demographic evolution, welfare needs, standard of living concur to determine
the level of social expenditure expressed as a percentage of GDP. It can be the case that an
improvement in terms of incidence and/or of standard of living is translated into an increase of
the level of per capita expenditure rather than into an increase of the overall expenditure. This
reflects a specific kind of policy that tends to allocate more resources to the ones that are still in
need and gives a flavour also of the pro-cyclicality or counter-cyclicality of the policy decisions. In
the process of ameliorating the information delivered by the indicators commonly used to
describe how the welfare state evolves, this exercise could represent a first step that can be
further improved and completed. Eurostat's data, even as proxies, can be used to extend this
exercise to other Member States and to other subcomponents of expenditure such as old age
pensions. Further information for most of the expenditure subcomponents can be drawn from EU-
SILC. In the future, another source of information that can be exploited in order to construct the
indicator should be the administrative data on benefits recipients as collected by the Member
States through the ad hoc SPC questionnaire, at least for cross-time comparison regarding
unemployment, disability and social assistance.
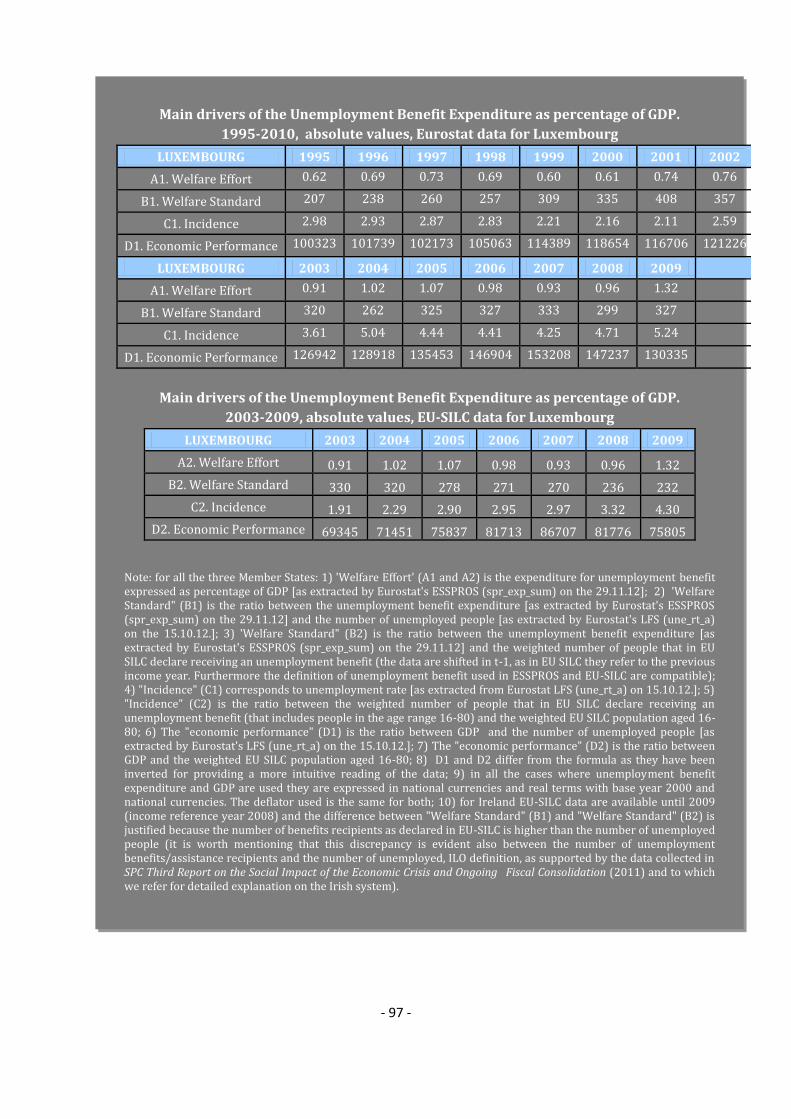
- 97 -
Main drivers of the Unemployment Benefit Expenditure as percentage of GDP.
1995-2010, absolute values, Eurostat data for Luxembourg
LUXEMBOURG 1995 1996 1997 1998 1999 2000 2001 2002
A1. Welfare Effort 0.62 0.69 0.73 0.69 0.60 0.61 0.74 0.76
B1. Welfare Standard 207 238 260 257 309 335 408 357
C1. Incidence 2.98 2.93 2.87 2.83 2.21 2.16 2.11 2.59
D1. Economic Performance 100323 101739 102173 105063 114389 118654 116706 121226
LUXEMBOURG 2003 2004 2005 2006 2007 2008 2009
A1. Welfare Effort 0.91 1.02 1.07 0.98 0.93 0.96 1.32
B1. Welfare Standard 320 262 325 327 333 299 327
C1. Incidence 3.61 5.04 4.44 4.41 4.25 4.71 5.24
D1. Economic Performance 126942 128918 135453 146904 153208 147237 130335
Main drivers of the Unemployment Benefit Expenditure as percentage of GDP.
2003-2009, absolute values, EU-SILC data for Luxembourg
LUXEMBOURG 2003 2004 2005 2006 2007 2008 2009
A2. Welfare Effort 0.91 1.02 1.07 0.98 0.93 0.96 1.32
B2. Welfare Standard 330 320 278 271 270 236 232
C2. Incidence 1.91 2.29 2.90 2.95 2.97 3.32 4.30
D2. Economic Performance 69345 71451 75837 81713 86707 81776 75805
Note: for all the three Member States: 1) 'Welfare Effort' (A1 and A2) is the expenditure for unemployment benefit expressed as percentage of GDP [as extracted by Eurostat's ESSPROS (spr_exp_sum) on the 29.11.12]; 2) 'Welfare Standard" (B1) is the ratio between the unemployment benefit expenditure [as extracted by Eurostat's ESSPROS (spr_exp_sum) on the 29.11.12] and the number of unemployed people [as extracted by Eurostat's LFS (une_rt_a) on the 15.10.12.]; 3) 'Welfare Standard" (B2) is the ratio between the unemployment benefit expenditure [as extracted by Eurostat's ESSPROS (spr_exp_sum) on the 29.11.12] and the weighted number of people that in EU SILC declare receiving an unemployment benefit (the data are shifted in t-1, as in EU SILC they refer to the previous income year. Furthermore the definition of unemployment benefit used in ESSPROS and EU-SILC are compatible); 4) "Incidence" (C1) corresponds to unemployment rate [as extracted from Eurostat LFS (une_rt_a) on 15.10.12.]; 5) "Incidence" (C2) is the ratio between the weighted number of people that in EU SILC declare receiving an unemployment benefit (that includes people in the age range 16-80) and the weighted EU SILC population aged 16-80; 6) The "economic performance" (D1) is the ratio between GDP and the number of unemployed people [as extracted by Eurostat's LFS (une_rt_a) on the 15.10.12.]; 7) The "economic performance" (D2) is the ratio between GDP and the weighted EU SILC population aged 16-80; 8) D1 and D2 differ from the formula as they have been inverted for providing a more intuitive reading of the data; 9) in all the cases where unemployment benefit expenditure and GDP are used they are expressed in national currencies and real terms with base year 2000 and national currencies. The deflator used is the same for both; 10) for Ireland EU-SILC data are available until 2009 (income reference year 2008) and the difference between "Welfare Standard" (B1) and "Welfare Standard" (B2) is justified because the number of benefits recipients as declared in EU-SILC is higher than the number of unemployed people (it is worth mentioning that this discrepancy is evident also between the number of unemployment benefits/assistance recipients and the number of unemployed, ILO definition, as supported by the data collected in SPC Third Report on the Social Impact of the Economic Crisis and Ongoing Fiscal Consolidation (2011) and to which we refer for detailed explanation on the Irish system).

- 98 -
Main drivers of the Unemployment Benefit Expenditure as percentage of GDP.
1995-2010, absolute values, Eurostat data for Ireland
IRELAND 1995 1996 1997 1998 1999 2000 2001 2002
A1. Welfare Effort 2.72 2.61 2.19 1.84 1.54 1.27 1.21 1.31
B1. Welfare Standard 975 1016 1104 1275 1522 1810 1900 1880
C1. Incidence 12.19 11.60 9.75 7.47 5.60 4.19 3.96 4.46
D1. Economic Performance 43726 45245 49166 51751 55539 59888 62063 64084
IRELAND 2003 2004 2005 2006 2007 2008 2009 2010
A1. Welfare Effort 1.31 1.32 1.26 1.28 1.37 1.81 3.06 B1. Welfare Standard 1866 1946 1930 1992 2056 1829 1618
C1. Incidence 4.58 4.51 4.41 4.44 4.55 6.29 11.84
D1. Economic Performance 65099 66357 67720 68907 68471 63167 62583
Main drivers of the Unemployment Benefit Expenditure as percentage of GDP.
2003-2008, absolute values, EU-SILC data for Ireland
IRELAND 2003 2004 2005 2006 2007 2008
A2. Welfare Effort 1.31 1.32 1.26 1.28 1.37 1.81
B2. Welfare Standard 549 613 653 627 536 533
C2. Incidence 9.38 8.68 8.05 8.92 11.24 13.97
D2. Economic Performance 39201 40295 41835 43571 44112 41038

- 99 -
4.1. Child poverty
The need to sustain investment in children and families, shielding them from the worst effects of
the crisis whilst stepping up prevention efforts, has been an underlying concern in many
Member States over the last years, as reflected in a number of National Reform Programmes and
National Social Reports. Two Member States (UK, EL) have set explicit national targets or sub-
targets related to children as their contribution to the overall EU poverty target, while one (IE) is
planning to adopt a child poverty sub-target (yet to be defined). A few specifically mentioned
addressing poverty and social exclusion among families and children as a key element in
reaching their overall 2020 target (BG, HU, MT, BE). Promoting child well-being and breaking
the transmission of disadvantage across generations are also recognised as important priorities
by various countries in their NRPs and NSRs (including AT, BG, CY, DK, FI, LU, HU, MT, PL, UK).
Important reforms in support of children and families took place over the last years at local,
regional and national levels, aiming in particular at facilitating support to parents' access to the
labour market, and enhancing preventive approaches through early intervention and increased
support to families. Such changes have taken place in a context of increasingly scarce resources,
where key interventions have often been affected by budget cuts and/or refocused on the most
vulnerable children and families.
4.1.1. Shielding children and families from the crisis' worst effects
Multi-dimensional programmes were adopted, amended or further developed in a number of
countries. The Social Emergency Plan adopted in PT has identified as one of its five priority
areas the needs of families facing poverty and social exclusion arising from unemployment,
over-indebtedness, social or family breakdown. The UK published a new child poverty strategy
in April 2011. In Belgium, the Federation Wallonia-Brussels has adopted a Children's Rights
Plans (2011-2014) which addresses information, education and training about children's rights
as well as the fight against social inequalities and discrimination. Estonia adopted a National
Strategy of Children and Families 2012-2020 "Smart Parents, Great Children, Strong Society",
the main objective of which is improving children and families' well-being and quality of living,
thereby promoting a higher birth rate. To achieve the main objective, five strategic objectives
have been set with the relevant indicators, of which child poverty is one.
Income support measures were strengthened or expanded in a number of Member States, in
particular during the crisis' initial phase.
Increases in child benefits and childcare subsidies took place in a number of countries. A new
lone parent allowance was introduced in Cyprus as from January 2012, based on income and the
number of dependent children. Child benefits and childcare subsidies were raised in Finland in 1
4. RECENT SOCIAL POLICY DEVELOPMENTS ACROSS THE EU
- 100 -
January 2012, in line with the national pensions' index. An income tax deduction for parents
whose children attend private schools at kindergarten, primary or secondary level, was
increased in 2012 in MT. Maternal leave has been extended in MT (from 14 to 16 weeks in 2012
and to 18 weeks in 2013) and SK, where related income replacement was increased by 5% in
2011 and 2012. Housing allowance was raised in SE for households with children and for youths
as of January 2012.
Support for parents' access to the labour market and incentives to work were enhanced in a
number of countries, including in the UK through the Universal Credit introduced for 2013-2017
as part of the Welfare Reform Act, and in LV, where the tax burden for low wage earners and
families with children was decreased.
Investment in education, and specifically in early childhood education and care has been
sustained in a number of countries, thus reflecting a growing awareness of the fundamental role
of the pre-school years in shaping children's cognitive and social skills, irrespective of parents'
employment status.
Funding for an expansion in childcare places was increased in Austria and Poland. In Finland, an
additional appropriation for pre-school, morning and afternoon activities was proposed. LU will
increase childcare places for children between 0 and 12 to 35,000 by 2015. Financial support to
childcare provision was strengthened in DE as a result of the commitment to provide for a
judiciable right to childcare from 2013 onwards.
Improving disadvantaged children's access to ECEC was also a strong policy focus in 2012 as
well as supporting women's labour market participation. In Cyprus a new programme was
implemented in 2012, which should subsidize childcare for 1200 unemployed or economically
inactive women (conditioned upon their labour market participation). The UK extended the
offer of 15 hours of free early education to 40% of all two year olds and introduced a pupil
premium targeting additional funding on the poorest school students. In Hungary, as part of the
National Strategy for Roma Integration 2012-2020, municipalities will cover crèches and
kindergarten allowances for disadvantaged children.
Further steps were taken to improve the quality of alternative care and support to children
growing up out of their family environment (such as in Bulgaria, Poland, Romania). The Polish
Ministry of Labour and Social Policy has prepared a government funded program, whose goal is
to cover the expenses associated with the family assistants, coordinators of the family foster
care and trainings for foster families and people running family-type children's homes. Support
to families and their social participation was also enhanced in a number of countries, such as
the UK, where the newly adopted child poverty strategy puts a strong focus on prevention, early
intervention and support to families.
4.1.2. Trends show spending cuts and targeting on the most vulnerable
However, fiscal consolidation packages have resulted in reduced spending on (cash) income
support measures in many Member States. Front line child services have often been negatively
affected, especially in the core areas of health, education and social services. These reforms are
taking place in a general context of placing stronger emphasis on conditionality as well as
- 101 -
targeting measures towards the most
vulnerable children and families. The
following trends should be
underlined:
- a tightening of eligibility rules
and cuts in coverage, including the
introduction of income based criteria
for child benefits in Cyprus (with an
income ceiling of 1.2 million euro)
and the UK; limitation of child-related
support to low income households to
two children per family from 2012
onwards in the Netherlands; the
freezing of the income threshold
based for eligibility calculation in
Poland from 2004 until
October44/November45 2012, reforms
related to the universal child
allowance in LT; withdrawal of the
One Parent Family Payment in IE
once the child reaches the age of
seven (as announced in the 2012
budget); limitation of a maternity
grant to the first child only in the UK;
withdrawal of the family allowance in
cases where children above 16 have
left school in HU.
- a reduction in the level of benefits
received, including the absence of
indexation of family allowances in HU
and of child related support for low
income families in the NL for 2012;
cut of 10% in 2010 and 2011 in the
rate of universal child benefits in IE -
with a compensation for those on
social welfare in 2010; cuts in child
and family benefits in Romania; the
freezing of child benefit and reduced
tax credits for many families in the
44
Change of criteria in the Social Assistance system
45 Change of criteria in the Family Benefit system
Learning from Peer reviews: Combating
child poverty through promoting the socio-
cultural participation of clients of the
Public Centres of Social Action/Welfare
The peer review held in Belgium 20-21 September
2012 focused on socio-cultural participation
measures as part of a larger system designed for
the welfare and well-being of clients of the Public
Centres for Social Action/Welfare (PCSA/W). Each
municipality in Belgium has one of these centres.
The centres caters for individuals and families with
insufficient means of income from work or welfare
benefits and also operates as a general resource for
people in need of assistance with a range of
problems. The PCSA/W operates with a holistic
view or perspective of clients and their needs.
The Belgian federal support for participation by
disadvantaged children is being channelled through
the PCSA/W. The measure focuses on all minor
clients of the PCSA/Ws, with enabling participation
by minors in social, recreational, cultural, sporting,
and civic activities as the main objective. The range
of ‘participation’ is very broad, including in social
programmes, educational support, psychological or
paramedical support.
The peer review found the Belgian policy a good
example of interaction between the local level and a
strong national framework. In particular, the
Belgian scheme incorporates flexible funding
arrangements that can accommodate varying local
conditions and priorities, leading to better
targeting of the measures. All of these are grounds
to claim that the Belgian strategy on socio-cultural
participation can be described as ‘multi-level’ and
multi-domain. This means among other things that
(childhood) poverty and social exclusion are
addressed in the life domains where they appear.
Children’s access to and participation in socio-
cultural activities is also seen in the context of early
learning and subsequent development and as such
have a strong orientation to prevention and social
investment. For further information see the peer
review website.

- 102 -
UK, a reduction of child benefits by 5% in DK;
- the cancellation of specific support schemes, such as support to grants related to
birth/maternity and health in ES in 2011;
- an increased use of conditionality in child and family benefits, such as linking the receipt of
means-tested benefits to children's school attendance in BG, as provided for in the Family
Benefits for Children Act; in Greece, universal large family benefits will be removed from 2013
on and be replaced by a means-tested benefit.
- as regards services and in particular early childhood education and care, changes in the
capacity or modalities of delivery (e.g. the average size of groups in kindergartens in Hungary
has increased) as well as higher costs (a few Member States have increased the parental
contribution to childcare costs, such as the NL, where the parental contribution was raised by
16.25%, albeit these costs will mostly be borne by higher income households) and changes in
eligibility (e.g. refocusing Sure Start Children's Centres on those most in need in the UK).
4.1.3. Significant short and long term impacts
Besides the increase in child poverty and social exclusion directly resulting from higher
unemployment rates, concerns have emerged that the impact of enhanced support to parents'
access to the labour market in terms of child poverty reduction will highly depend on families'
capacities to find stable jobs in a context of high unemployment, and that any positive impact
could be offset by reductions in direct cash support measures.
In the longer term, a key question concerns the consequences of current reforms on the design
of child and family support, in other words whether policy changes introduced in a crisis context
will become permanent. In particular, there are signs that the most universal forms of child
allowances are being abandoned or cut in a number of countries, shifting support measures
towards those most in need. “A key element in developing effective strategies is to carefully
combine both universal policies aimed at promoting the well-being of all children and
preventing poverty arising with targeted policies aimed at alleviating poverty and social
exclusion” (Frazer and Marlier, 2012a). Such a refocus thus raises important questions as to how
to maintain an adequate balance between universal and targeted forms of support, combining
effectiveness, efficiency and equity in the long run. It is important to address the risk that
investment in successful long-term universal policies is cut back and consequently weakened
and that an overreliance is placed on short-term targeted policies.
4.2. Active inclusion
The Recommendation concerning the active inclusion of people most excluded from the labour
market was adopted by the Commission on 3 October 2008 (2008/867/EC). The overall aim of
active inclusion strategies is to "facilitate the integration into sustainable, quality employment of
those who can work and provide resources which are sufficient to live in dignity, together with
support for social participation, for those who cannot"46. This strategy encompasses three key
46 Commission recommendation of 3 October 2008 (2008/867/EC), article 1
- 103 -
and equally important pillars, namely adequate income support, inclusive labour markets, and
access to quality services.
The SPC ran a thematic surveillance in February and April 2012 on Member States' active
inclusion strategies with a view to respond to the AGS 2012 which considered active inclusion as
among the policy answers to the social consequences of the crisis. This section is based on
fifteen Member States that presented their active inclusion strategies (AT, BE, BG, CY, DE, ES, IE,
FI, FR, HU, LU, PT, RO, SE and SI).
While Member States face different challenges when implementing active inclusion policies, the
approach is developed in a general context of an increased unemployment and a decline in the
progress towards the three indicators of the EU poverty and social exclusion target.
4.2.1. Adequate income support
Ensuring an adequate income for those in and out of the labour market is an effective tool to
promote social inclusion, offset the worst effects of the crisis and spur aggregate demand.
However there are persisting differences in the level of coverage of social assistance and
minimum income schemes. The crisis has exerted some pressure on income support
expenditures but in different directions, with some countries considering strong adequate
livelihoods an important factor to maintain, while in others expenditure cuts have hit welfare
spending.
Policies which tighten the eligibility criteria, include a means-testing facet or result in poverty
and unemployment traps, risk undermining this pillar of the active inclusion strategy.
Adequate income reforms for both the employed and unemployed
Some Member States increased the amount of income support (BE, DE, SI) or maintained it (FR,
SE) as a universal benefit. Coverage of beneficiaries was improved in SI. Social assistance
reforms in CY and PT aim to provide a minimum income for those in need with additional
schemes for vulnerable groups and inactive persons.
Since the 2009 reform in France, the social assistance benefit system forms the core of the
activation strategy. This universal means-tested benefit aims to simplify the social benefits
system (by combining the minimum income and the single parent allowance) and remove
financial disincentives to work, or “unemployment traps” by guaranteeing an exit from the
benefits system only when earned income exceeds the benefits threshold. So far the new system
has had a stronger impact in reducing the intensity of poverty rather than the rate of poverty
itself.
In Romania the impact of social transfers in reducing poverty (excluding pensions) remains
significantly below the EU average for efficiency of transfers in the EU on average for both the
overall as well as for children (21% compared to 41% for the EU). The new law adopted in 2011
seeks to streamline social benefits and improve the efficiency of social protection by achieving a
more coordinated system and result-based approach.

- 104 -
Due to on-going fiscal consolidation in Ireland, there was a reduction in the basic rate of income
support in 2010 and 2011 but not in 2012. Both Austria and Ireland re-directed resources made
available through cost-containment measures (extension of working lives and institutional
optimisation of delivery) towards their adequacy objective.
Finland acknowledges that households living on basic benefits are unable to meet reasonable
minimum living costs, but that a rise in benefits to the level of 60% of the median income would
reduce incentives to work. New steps to tackle financial disincentives to work (the
“unemployment / inactivity trap”) have been adopted, such as wage subsidies for low-income
earners to guarantee a better income when in employment or a slower withdrawal of social
assistance benefits (FR, DE, HU). In Germany a minimum wage has been introduced in ten
sectors of the economy, at a level lower than wages with the aim of providing incentives to work.
Due to the high tax wedge in DE, social security contributions for low earners are being reduced.
Stricter targeting and increased conditionality
Member States are also increasing means-tested benefits (including France, Slovenia, Romania)
and are reinforcing criteria for qualifying for benefits (Ireland, Belgium, Slovenia, among others).
While these policies are effective tools to control public expenditure, there can be significant
negative impact in both the short and long-term such as withdrawing income support from
those just above the poverty line and reducing coverage. Particularly among elderly people there
is less take-up of means-tested benefits, due in part to the stigma attached. Aside from the
possible consequences of increasing child and pensioner poverty, efficiency savings may be
reduced through future costs in social and health care systems.
The social reform in RO and SI introduced means-tested social assistance benefits. In Slovenia
there is now a wide range of means-tested benefits (child benefit, social assistance, income
support and public scholarship) as well as subsidies and payments (relating to child care facility
fees, school meals, school transport, rents, health care insurance and long-term care services).
Stricter conditions for access to benefits are coupled with an IT system to detect fraud. Aside
from income, the means-testing system also takes ownership of property and movable assets
into account. In Greece, a pilot Minimum Income Guarantee scheme is planned to be developed
in two (pilot) regions from 2014 onwards. The universal child support payment in Ireland has
been supplemented by a means-tested element.
Hungary is phasing out early and disability pension-like benefits and changing disability
pensions to rehabilitation benefits which are now combined with vocational rehabilitation. The
new social benefit system aims to provide work opportunities for the long-term
unemployed/inactive instead of social assistance, with active participation required.
Part of the stricter criteria for qualifying for social assistance is becoming active in the labour
market or actively job searching. In Belgium for example beneficiaries of minimum income are
activated through a temporary job but their salaries are exempted from social contributions.
While the activation component is now found in most Member States to varying degrees,
significant efforts have been made in several Member States (including AT, IT, SI, UK) to make
the provision of cash benefits conditional upon activation. Further analysis is needed to
investigate the positive and negative effects of establishing conditionality and automatic
sanctions on the activation agenda and the provision of cash benefits.

- 105 -
Sanctions are sometimes put in place for those that are voluntarily inactive (such as in Austria,),
usually in the form of a withdrawal of benefits (CY) or a discontinuation of benefits for a set
period (3 months in the case of DE) if reasonable training or work programmes are refused. In
RO and BG means-tested family allowances are now reduced or discontinued if the child does
not attend school regularly.
4.2.2. Inclusive labour markets
Linking activation policies with measures to improve social assistance and social services and
the inclusiveness of labour markets facilitates the labour market participation of particular
vulnerable groups. DE and AT concentrate their efforts on enhancing labour market attachment
inter alia of older workers and of persons with health impairments aged 50+. Other Member
States concentrate their efforts on other groups such as newly arrived immigrants (SE), long-
term unemployed (DE, IE), or people furthest from the labour market (SI, FR, BE).
The participation of employers in the schemes detailed below is crucial for the successful
integration of people in the labour market. The willingness of employers to participate in
programmes seeking to increase employment participation for older workers or for people
furthest from the labour market proves a key challenge for the successful implementation of
many schemes (DE, AT, SI, IE). Policy efforts can include subsidies or grants to stimulate
employers' participation in hiring long-term recipients of social assistance (SI, RO).
Inclusion in the labour market both supported and compelled
As discussed above, inclusion in the labour market has been a primary focus for many Member
States whereby the granting of income support is now largely conditioned to the recipient’s
active involvement in job searching for those who can work. While this can leads to an emphasis
on part-time or unstable jobs, it is assistance into secure employment which ensures long-term
labour market attachment.
Employment programmes, inclusive training, and social activation programmes are found in
many Member States (including PT, LU, SI, HU) often with an emphasis on involving social
enterprises.
In Sweden the main measures include the design of 'introduction plans' and a new individual
benefit designed to promote labour market participation and gender equality.. These reforms
(and measures aimed at newly arrived immigrants detailed below) are linked to the national
employment target of 80% for women and men aged 20-64 by 2020 which is expected to be
achieved in groups with a weak foothold in the labour market.
While public work schemes and training grants in Hungary and Latvia provide significant
sources of income for the unemployed they lack effective activation and job prospects upon
completion.
In France there are plans to provide more individualised support for jobseekers and return-to-
work targets. Until now limited internal resources have resulted in inadequate support for
activation measures and restricted their effectiveness.

- 106 -
For job-seekers in some countries an individual integration agreement for following a training
programme and taking up work (Germany) or a social contract balancing rights and
responsibilities (Ireland) has been introduced.
Measures promoting labour market participation of specific groups
Measures to promote better inclusion in the labour market of persons with specific needs are
particularly important. Finland noted that the cost of providing basic security for one
marginalised person for forty years is estimated at EUR750,000.
For older persons, prevention against loss of skills and retraining programmes is key to their
integration and the sustainability of pension systems. In AT part-time working arrangements for
older workers is coupled with public subsidies. Measures taken in Germany will facilitate the
combination of work and pension receipt.
Another focus is on assisting those with health and disability impairments to become active in
the labour market. In DK, a major reform of disability pensions restricts access to those above 40
and establishes rehabilitation teams in each municipality, with the aim of supporting health,
employment, education and social services to facilitate labour market entry for beneficiaries.
Measures in AT include preventive support through the Fit2Work programme for people with
health impairments and the "National Action Plan on Disability" 2012-2020 which includes 250
measures to be implemented in the fields of disability policies, anti-discrimination, accessibility,
health and rehabilitation, education, employment, independent living and awareness rising. In
Malta, an Inclusive Employment Unit has been set up to provide specialised, individual support
to persons with disabilities. Employers receive grants equivalent to 50% of wage costs for
employing disadvantaged categories of persons, and even more in the case of disabled persons
through the ESF funding.
To tackle youth unemployment and marginalisation, Spain has introduced new training
contracts for workers aged 16-30, improved professional training and support into self-
employment. Greece have drastically reduced the minimum wage (-32%) for youth less than 25
years old to help their insertion into the labour market. Bulgaria and Luxembourg promote
measures to facilitate the transition from academic to professional life for young people or
motivate them to return to school. The Finnish government is introducing a Social Guarantee to
provide each person younger than 25 years and each recent graduate under 30 years of age a
place to study, a traineeship, workshop or job. An extra ‘Skill Programme for Young Adults’ with
substantial funding is also proposed. Through ESF funds in Malta, labour market integration of
young people has been addressed by means of advertising means through media and through a
specifically created website.
In Ireland, the ESF supports programmes aimed at making immigrants financially independent
and more socially integrated through employment or further education and training. With a
view to fostering the labour market integration of new arrivals, Sweden plans further evaluation
and improvement of immigrant and refugee reception systems and language training. Newly
arrived immigrants are enrolled either in education or work programmes and subsidies are
given to employers who hire unemployed immigrants.

- 107 -
4.2.3. Access to quality services
The current economic and financial situation has clearly highlighted the fundamental role of
social services across Europe. In areas such as health care, childcare, care for the elderly,
assistance to disabled persons and social housing, these services provide an essential safety net
for citizens. However, cuts in social spending in the context of the budget consolidation
programmes have a strong impact on the availability of social and health support services for
the general public, and particularly for those in need. These cuts coincide with a greater demand
for social services at a time when 24.2% of the EU population is at risk of poverty or social
exclusion. This can lead to a decrease in the access and quality of social services received by
disadvantaged groups. Reports from the European Anti-Poverty Network have called for
attention with regards to the downsizing of welfare services, health services, and front-line
social care services in some Member States.
Although social protection provisions or transfers that promote equal opportunities, e.g.
affordable childcare, education, access to some social services etc., may not be well reflected in
existing measures of inequality, they remain crucial to the employability prospects and social
mobility of disadvantaged groups, and thus indirectly to reducing actual inequality while
minimising the strain put on the welfare state.
Access to services supporting integration in labour market
Access to quality basic services (such as healthcare, childcare, housing, transportation) is key to
providing support for those furthest from the labour market in their reintegration into working
life as well as ensuring social participation for those who cannot work.
Direct assumption of medical expenses for those with few resources (Luxembourg) or providing
health care coverage for social assistance recipients (Belgium, France) can help individuals to
become active in the labour market.
Care duties can represent a significant obstacle to labour market participation and have a role to
play in the disproportionately high levels of female poverty. In Germany, where a lack of child
care facilities inhibits female labour market participation particularly in the western Länder,
numbers of early child care facilities are being increased to accommodate next years’ guarantee
of a child care place for every child aged one to three. Those receiving social assistance in France
qualify for child care support. A new fund was created in Austria as an interim solution to cover
the rising costs in long-term care for the period 2011 to 2016, and the expansion of child
facilities continues. Bulgaria plans to replicate its successes in de-institutionalising child care by
developing a National Strategy for Long-term Care which will enlarge the social services
available for the elderly. In Cyprus, the cost of care services for dependents is reimbursed for
formerly unemployed/inactive women that enter the labour market.
In Portugal there are facilities dedicated to the support of children, the elderly dependent
population and people with disabilities as well as a programme to support housing for the
elderly and a National Network of Integrated Long Term Care. Similarly, a package of support in
the Slovenian social reform includes subsidies and payments relating to child care facility fees,
school meals, school transport, rents, health care insurance and long-term care services.
- 108 -
Although access to housing is an important component of supporting those furthest from the
labour market, it was mentioned by few Member States. Luxembourg adopted a National
Strategy Against Homelessness and Exclusion caused by Housing.
4.2.4. Comprehensive strategies
The active inclusion approach successfully tackles poverty and social inclusion when the three
strands are fused in the right mix. However, across the whole of the EU fully integrated and
comprehensive strategies which take into account the interrelated impacts on the social and
economic inclusion of disadvantaged people are only evident in seven Member States (DK, FI,
FR, MT, NL, PL, SE) for those who can work and in two Member States (NL, SI) for those who
cannot (Frazer and Marlier, 2012).
Providing integrated services tailored to individual needs brings more people into employment
and increases the efficiency and effectiveness of spending. Member States have presented
forward-looking approaches integrating the three pillars of active inclusion through using
integrated services (one-stop shops), targeted services (training package including regarding
children), and moving beyond labour activation (through the approach of social activation).
Integrated and tailored services
Bulgaria has developed a National Strategy for Reducing Poverty and Promoting Social Inclusion
2020 to address all challenges (income support, access to services and active labour market
measures, access to health and education, etc.) in a comprehensive manner.
Additional tailored support for minimum income recipients is now offered in some Member
States (Luxembourg, Hungary). Luxembourg’s 2011 social aid law aimed to modernize
applicable concepts, administration and instruments in this area. An annual budget allocation of
around €16,5 million has been set aside, with 50% borne by the State and 50% by the
communes. In Belgium there is an integration of the three pillars through a single provider,
‘public centres’, which also act as the employer when social assistant beneficiaries are placed in
temporary jobs.
The aim in Ireland and Cyprus is to move away from passive support to an approach based on
tailored clients' needs. For Cyprus this entails introducing individualised activation measures for
public assistance recipients, starting with improving their social skills and self-esteem and
providing tailor-made training and support, and in Ireland the approach will be a streamlined
institutional set up for providing individual support combining income support, employment
services and community employment programmes. To tackle youth unemployment and
marginalisation, Spain has introduced new training contracts for workers aged 16-30, improved
professional training towards a dual system, incentives to SMEs hiring with permanent
contracts, (especially young workers) and support into self-employment.
One stop-shops can help simplify the social benefit system thereby encouraging take-up of
existing services and benefits. Romania took steps to simplify administrative procedures by
setting up a single point of submission and by establishing a single application form to claim

- 109 -
social assistance benefits. A key feature of Slovenia's reform is the 'single entry point' provided
by the Centres for Social Work.
Beyond labour market activation
A few Member States look beyond labour market activation and consider social activation an
important dimension of active inclusion (Slovenia, Belgium, Germany, France). For example
Belgium provides access to cultural and leisure services, with a special attention to vulnerable
children, with an aim to promote social activation as part of an integration pathway.
4.2.5. Structural changes – reforming delivery and administrations
In order to respond to the challenges of effective active inclusion, some Member States have
undertaken significant structural reforms or precipitated a shift in authority.
The new social assistance law in Romania aimed to establish a framework for a better allocation
of the financial and human resources in the system, including the decentralized structures of
local public administration and a more unitary approach to the social assistance system.
Ireland also plans to reform its social protection system, and move towards a comprehensive
active inclusion strategy. The new approach is to move away from fragmented service delivery
and passive support to an approach based on: i) integrated service with activation as a key
priority, ii) personalised approach, iii) use of social contracts, iv) robust IT support, and v)
centralised administration centres.
In Sweden reform measures shift the responsibilities for activation measures from the
municipalities to the Swedish Public Employment Service in order to harmonise the quality of
introduction measures, strengthen personal incentives for taking up jobs and provide adequate
individualized guidance.
Some Member States identified a need to cooperate more formally between different
departments on an inter-ministerial level in order to deliver better on the active inclusion
strategy (Cyprus, Luxembourg).
4.2.6. Stakeholder involvement
The importance of stakeholder involvement has been highlighted in a number of Commission
Recommendations. Trade unions, employers and local authorities can play an active role in
improving the inclusiveness of the labour markets, and social enterprises and community
organisations reach out to socially excluded persons. Measures can be identified in a number of
Member States.
No involvement or very limited involvement of relevant actors47 in the development,
implementation and evaluation of active inclusion strategies is reported by larger civil society
organizations (such as EAPN, Eurodiaconia, Eurocities).48
47 Including those affected by poverty and social exclusion, civil society organizations, non-governmental
organisations and service providers.

- 110 -
Some countries ensure discussion of strategies with key stakeholders (Bulgaria, Luxembourg,
Romania). The aforementioned Social Guarantee measure in Finland aims to have broad
cooperation and common responsibility with authorities, trade unions, organisations and youth,
in a 'Public-Private-People-Partnership'. Social enterprises are identified as possible actors in
the activating process if commissioned to provide 'introduction guides' in Sweden or as
potential employers of specific groups (Slovenia).
4.2.7. Further challenges for successful active inclusion strategies
Challenges that Member States face include in-work poverty, inadequate take-up of benefits, the
challenge of achieving the right balance between universal and conditional benefits, and
problems related to the vertical coordination of active inclusion policies.
In-work poverty remains a major concern at a rate of 8,9% in 2011 across the EU with as many
as 9 MS with a rate of in-work poverty above this average.
Inadequate take-up of benefit schemes remains an issue in many Member States. This inhibits
the effectiveness of social policies and can increase future costs on the social protection system.
France identifies low-take up rates of the social assistance benefit system, and particularly
among the working poor. Luxembourg endeavours to tackle this problem through inviting
eligible parents of the Guaranteed Minimum Income mechanism to information meetings and
providing a Welcoming Service.
As the current crisis exerts strong pressure on public budgets, the generalisation of
conditionality is gaining ground. Yet, there were no evaluations reported by Member States
concerning the overall cost-benefit gains of reinforced conditionality regarding access to
benefits.
Problems related to the vertical coordination (local, regional, national) of active inclusion
policies were also highlighted as key conditions for successful active inclusion strategies.
48
Based on the informal consultation conducted among the members of the Social Stakeholders Dialogue by the European Commission in April-May 2012.
- 111 -
In all Member States, significant challenges remain in reaching groups experiencing the deepest
forms of poverty (such as the homeless and Roma) with social assistance and access to services.
4.3. Pensions
Over the last year, many MS continued to reform their pension systems with a view to improving
their adequacy and sustainability in the long run, in particular by enabling longer working lives.
The rationale for reform was underpinned by the findings of the SPC's Pensions Adequacy
A recent Eurofound study points out concrete ways to improve debt advisory services in a context of increasing over-indebtedness across
Europe A recent Eurofound study on "Household debt advisory services in the European Union" shows that many EU citizens are struggling to service their mortgages or consumer credit, and to pay their rent and utility bills. In 2010, more than one in four persons reported that they felt at risk of becoming over-indebted, while 11.6% were in arrears with payments related to such debts or bills (up from 9.9% in 2007). For many people, the economic and financial crisis has resulted in a fall in income due to reduced working hours or unemployment. In autumn 2008, one out of every five households in the EU reported a major drop in income over the previous year. Households who made long-term financial commitments in better times are now often unable to service their debts. Some people may fall behind with utility bills because of reduced income and other bills, a common occurrence among the unemployed who face higher utility bills, not least as a result of increased time spent at home. Poor households are more likely to take out small loans to service payments, finance emergency home repairs and pay for goods. Such small, easily accessible loans often come with high interest rates or encourage consumers to buy products they cannot afford. Missed payments can easily spiral out of control, with cumulative interest payments, fines and administrative costs. For those new to debt problems and those who live in chronic poverty, debt advisory services can help to get their finances – and often their lives – back on track. When no help is available there are costs for the household and for society, as over-indebtedness can lead to, or be a symptom of, a broad range of problems, including social and health issues such as depression and relationship breakdown. The crisis has generated challenges because of increased demand for support services in the face of reduced resources. The study identifies successful debt counselling measures and ways to improve access to services and finds that the quality of debt advisory services can be enhanced by offering tailored approaches, leaving the household in control as much as possible and building relationships of trust between all the stakeholders involved.
- 112 -
Report, EPC's Ageing Report and the White Paper "An Agenda for Adequate, Safe and Sustainable
Pensions" of the European Commission, all published in the first half of 2012. Moreover, the
thrust of these reports reflected pension messages in the Annual Growth Survey and were
backed by Country Specific Recommendations on pensions aimed at 17 Member States. The
main directions of reform were: a) higher pensionable ages reflecting gains in life expectancy; b)
restricted access to early retirement schemes; c) incentives to work beyond pensionable age; d)
a shift in some Member States towards defined contribution plans and adjustments in pre-
funded financing.
Reflecting on the balance between adequacy and sustainability after more than a decade of
reforms the SPC's Pensions Adequacy Report observed that while great advances in the
sustainability of public pensions have been achieved adequacy outcomes are less impressive and
largely contingent on changes in people’s retirement and long-term savings behaviour. The
report's analysis of the change in replacement rates for a given career length demonstrated that
greater sustainability of public pensions in most Member States has, to a significant extent, been
achieved through reductions in future adequacy. It therefore concluded that the challenge now is
to devise means by which people can recoup the decline in replacement rates.
To that end Member States are already opening routes for people to improve their pension
entitlements by working longer and retiring later. The report highlighted that if pension systems
sufficiently and sensibly reward working longer and discourage early retirement they can help
ensure that longer working careers with fewer career breaks become the key avenue to better
adequacy. As documented in the report this is the case in many Member States.
The report also observes that the success of pension reforms that raise the pensionable age and
possibly link this or the benefit level to longevity gains will depend on whether they are
underpinned by work place and labour market measures that enable and encourage women and
men to work longer. In its analysis there are clear limits to how much age management practices
in employment can be influenced by incentive structures in pensions. Therefore tackling the
pension adequacy challenge will require determined efforts to promote longer and healthier
working lives through workplace measures.
Another key result of the analysis is that about a fifth of people aged 65 or older have pension
incomes just below or just above the poverty risk threshold, and consequently relatively small
increases or decreases in their pensions can lead to important variations in the poverty rates of
the elderly. The ability of the EU to achieve its goal of reducing the number of people at risk of
poverty or social exclusion by 20 million by 2020 will therefore in part very much depend on the
extent to which pension systems continue to help prevent poverty for older people.
Finally, the report highlighted that an important part of the adequacy challenge is gender
specific: As women live longer than men they constitute close to two thirds of pensioners, but
pension outcomes for women are currently significantly lower than for men. This generally
results from gender differences in employment, pay and the duration of working life, which is in
turn related to gender differences in care and housework. In some national systems credits for
labour market absence due to maternity and child care, derived pension rights and survivors'
pensions help to mitigate current lower pension outcomes for women. However, the present
trend in pension reforms towards defined-contribution plans in both pay-as-you-go and pre-

- 113 -
funded schemes and a greater role for occupational and personal pensions would tend to be
unfavourable for many women unless much greater gender equality is achieved in labour
markets and in private pension coverage.
4.3.1. Increases of statutory retirement age, equalisation and links to life
expectancy
In late 2011 and 2012, more Member States adopted or accelerated changes to increase the
pensionable age. In total, 21 out of 27 Member States have now legislated current or future
increases. While most governments are looking to offset the impact of structural longevity
growth by ad hoc adjustments in the eligibility age, an explicit link between the pensionable age
and life expectancy has now been introduced in several Member States. In some cases, age
increases have been accompanied by equalisation of pensionable ages for men and women.
In Poland, a gradual increase and equalisation of retirement age was legislated in May 2012. An
increase of 3 months per year will result in a pensionable age of 67 for men by 2020 and for
women by 2040. Italy passed a pension reform where the pension age will be swiftly equalised
for all categories, including private sector female employees, and raised to 67 by 2021. The
Slovenian pension reform adopted in December 2012 provides that pensionable age will be
equalised and increased to 65 years by 2020.
Latvia adopted a reform, which envisages a faster-than-expected increase of pensionable age to
65 years by 2020. The Netherlands has raised the statutory pension age to 67 by 2023, and
envisages to accelerate this to 2021. In Spain the schedule for raising pensionable age will be
accelerated, aiming to reach 67 by 2027. Greece legislated an instant increase of the pensionable
age to 67 as of 2013; at the same time old age retirement requirements (in terms of both length
of insurance and pensionable age) become stricter for all categories.
More countries are moving beyond the practice of ad hoc pension age reforms by introducing an
explicit and sustainable link to life expectancy. Several Member States (Denmark, Greece, Italy,
Luxembourg, Netherlands, Spain, Slovakia) have introduced some type of review clause to link
the pensionable age to life expectancy gains in the future. As a rule, this mechanism will kick in
after the present round of ad hoc increases, and entails a review of statutory retirement age
every 2-5 years, based on developments in life expectancy. Czech Republic has legislated an
open-ended increase of the pension age (2 months per year). Finland and Sweden have
introduced a flexible pension age, where benefit levels are reduced when life expectancy grows.
Cyprus has introduced an automatic adjustment of the statutory retirement age every 5 years in
line with changes in life expectancy at the statutory retirement age, to be applied in 2018. While
having accelerated the gradual increase of the statutory retirement age (62 as of 2017) and full
rate age (67 as of 2022), France has reintroduced, with an additional contribution, the
possibility of taking up a pension at age 60 from 1 November 2012, provided that people have
worked since an early age and completed contributions for a full pension.
4.3.2. Limiting access to early retirement
In order to prolong working lives and reduce early exit, most Member States are taking steps to
restrict access to early retirement. The main reform measures in this respect involve stricter
- 114 -
eligibility conditions for early pensions (minimum age, contribution record, benefit level) and
stronger focus on activation measures.
Belgium has started to gradually increase the minimum age and contribution record for early
retirement and pre-retirement schemes, while the system of part-time pre-retirement has been
discontinued. Italy has linked age and contribution requirements for early pensions to changes
in life expectancy and introduced a benefit level criterion: in the future, retirement before 70
will only be possible if the pension entitlement exceeds a defined minimum. In Spain, the early
retirement age will rise concurrently with the introduction of greater disincentives for all kinds
of early retirement, particularly partial retirement. In Hungary, the option of early retirement
has been removed as a general rule. Cyprus has introduced actuarial reduction of pension
entitlements from the General Social Insurance Scheme by 0.5% per month for retirements
earlier than the statutory retirement age (between 63-65) in line with the planned increase in
the minimum age for entitlement to an unreduced pension to reach 65 (by 6 months per year),
between 2013 and 2016.
Austria has introduced reforms to reduce the number of invalidity pensions. In Denmark,
disability pension reform plans require that all activation possibilities are exhausted before
early retirement can be considered.
Many Member States have also narrowed the scope of non-contributory periods (e.g. for care,
studies, military service) for the purpose of establishing minimum insurance records.
4.3.3. Pension measures in support of working beyond retirement age
Other policy options to enable and encourage longer working lives include abolishment or
postponement of mandatory retirement and financial incentives to work beyond the minimum
pension age. In countries with increasingly flexible retirement rules a shift of the focus from
retirement age to retirement income may take place49.
Bulgaria and the United Kingdom abolished provisions on default retirement in 2012. In France,
the age at which private employers can send a worker into retirement without his/her consent
has been raised from 65 to 70.
Many pension systems include incentives for working beyond pensionable age, e.g. in the form of
higher pension accrual rate in the case of delayed retirement. In Finland, a progressive increase
in the accrual rate (4.5%) for contributions paid between ages 63 and 68 introduced in the 2005
reform seeks to provide strong financial incentives to stay in the labour market. In France and
Luxembourg, the accrual rate is now up to 5% for those prolonging their working career. In
addition to this in Luxembourg, pension income can be supplemented by income from work
without a reduction of pension provisions.
49 ASISP Synthesis Report 2012, http://socialprotection.eu/

- 115 -
4.3.4. Reforms in pension financing
Among the more notable developments in pension financing, Italy brought forward the
transition to the Notional Defined Contribution (NDC) system originally legislated in 1995. The
Italian pension reform adopted in December 2011 significantly accelerated the phasing-in of the
NDC system. Since January 2012, the NDC method applies to all newly paid contributions,
including those of older cohort workers, previously exempt from NDC (on a pro-rata basis).
After some reversal during the crisis, pre-funded provisions are on the rise again, as several
Member States reinforced statutory funded pillars and Czech Republic became the latest country
to introduce one in November 2011. Czech Republic passed a law establishing a statutory
funded pillar as of 2013, managed by private funds under the supervision of financial market
regulator. Contributions paid into
the new scheme will amount to 5%
of income, with a parallel lowering
of contributions to the PAYG
scheme by 3pp. Everyone will have
a possibility to opt in (up to age 35
or throughout the first half of 2013
for older cohorts).
Some Member States which
suspended or reduced contribution
rates to their mandatory funded
pillar during the crisis have
reversed suspensions (Estonia) or
outlined plans to do so (Latvia).
In the United Kingdom, efforts are
underway to increase the coverage
of supplementary pension schemes.
Starting from October 2012, up to
11 million workers will be
automatically enrolled into a
workplace pension with the option
of opting out.
Learning though Peer reviews: Age friendly
services and products – An opportunity for social
and economic development
The Peer Review held in Poland on 29 – 30 October
discussed how encouraging older people to participate
in social activities, developing goods and services
tailored to their needs, and supporting their economic
activity can contribute to their quality of life, and
provide national social and economic development.
Key lessons identified in the peer review were related to
extending careers and enhancing productivity growth
financial incentives, such as rewarding delays in taking
pensions, and implementing age-management policies
to help people manage care responsibilities at home and
stay in work for longer . In addition tailor-made Active
Labour Market Measures for older workers should be
developed, especially for the skill development of less
educated/skilled workers, drawing on older people’s
ideas and input in their design. Participation in local
community activities should be encouraged as this
contributes to older people’s personal satisfaction and
sense of self-worth, which has a positive outcome not
just on life expectancy but also on the quality of life
during old age. Rethinking policies for older people is
often the remit of several ministries, including social,
health, employment and finance. By coordinating their
policies more effective public sector interventions,
improvement in the lives of older people and more
sustainable public systems can be realised. For further
information see the peer review website.

- 116 -
4.4. Health care systems
4.4.1. Recent health care developments in the EU
Health, together with long-term care, is one of the three strands of the open method for co-
ordination in social protection and inclusion (social OMC). In June 2011, the Council renewed the
EU objectives applicable to this strand of the social OMC.
Accessible, high-quality and sustainable health care and long-term care by ensuring:
– (j) access for all to adequate health and long-term care and that the need for care does
not lead to poverty and financial dependency; and that inequities in access to care and in health
outcomes are addressed;
– (k) quality in health and long-term care and by adapting care, including developing
preventive care, to the changing needs and preferences of society and individuals, notably by
developing quality standards reflecting best international practice and by strengthening the
responsibility of health professionals and of patients and care recipients;
– (l) that adequate and high quality health and long-term care remains affordable and
financially sustainable by promoting a rational use of resources, notably through appropriate
incentives for users and providers, good governance and coordination between care systems
and public and private institutions. Long-term sustainability and quality require the promotion
of healthy and active life styles and good human resources for the care sector.
Health policies are a responsibility of Member States. Their coordination at EU level is ensured
through the specific objective applicable to the health strand of the social OMC and by the
relevant guidelines adopted by Council as part of the broad economic and employment
guidelines. The social OMC health-specific objective effectively covers all the elements related to
health policy and thus constitutes a comprehensive coordination benchmark for the
development of health policies at EU level. Underlining this are the four health-specific Council
Recommendations issued in July 2012 to AT, BE, BG, CY, DE and the NL. The Council asked these
Member States to implement health-care reforms (AT, CY, and the NL regarding long-term care),
curb age-related health expenditure (BE, BG), or enhance the efficiency (DE) or quality (BG) of
public spending in health care. EL, IE, PT and RO are implementing memorandums of
understanding which relate to health policy.
The Social Protection Committee carried out a thematic review on health policy in September
2012 to examine the latest health policy developments reported by its Members in their
National Social Reports and National Reform Programmes. This chapter presents an overview of
the key highlights from this review. As Member States have different starting positions and face
different economic and health challenges, their reform efforts and concrete measures differ to
reflect country-specific circumstances.

- 117 -
For all Member States, the development of their health policies in 2011-2012 continues to take
place in a context marked by economic slowdown and the need to control public expenditures
with a view to ensure fiscal sustainability and debt reduction. The distinctive features of health
care include certain spending inertia which is influenced by factors such as developments in
health technology, demographic ageing and new induced demand for health care. At the same
time, Member States guarantee constitutionally or in other legal forms equal access to health
care services. It is therefore becoming increasingly challenging to achieve sustained expenditure
control through efficiency savings and greater effectiveness while at the same time improving
the equity with which services are accessed and distributed. Patterns emerging from the
thematic review suggest that the actions taken by Member States in order to match these
realities can be identified in three broad policy approaches.
Implementation of rapid cost-saving measures to reduce public health
expenditure
Implementing rapid cost-saving measures offers the advantage of achieving a quick effect on
health spending. This is particularly relevant for Member States currently experiencing severe
economic conditions or tight fiscal targets. The identified measures include the reduction of both
pharmaceutical and medical supplies expenditure and the introduction of co-payments for
services and drugs.
• Reducing pharmaceutical and medical supplies expenditure
Increasing the use of generic drugs has been employed in AT, BE, CZ, EL, ES, FR, HU, LU, PT, SE,
SI and SK as a way to reduce expenditures for pharmaceuticals. This can be a useful cost-saving
tool providing that the quality or effectiveness of the prescription service is not reduced. ES and
PT introduced laws in 2011 and 2012 respectively which generalise the writing of regular
prescriptions with international non-propriety names (generic drugs).
The centralisation of the procurement system has been undertaken as another effective measure
for reducing both the cost of drugs and of medical supplies in EL, ES, HR, HU and SI. Hospitals
buying medicines as a group can bring down prices and save money for individual hospitals. CZ
introduced reforms to allow for agreed maximum prices and for electronic price auctions.
• Introduction of co-payments
ES, FR, NL, PT and SI have either introduced or increased co-payments or lowered
reimbursements for the user. In SE, there is a proposal to couple co-payments to the general
price index. This can help raise immediate funds and control demand. In most MS introducing
these changes also entails exemptions to protect vulnerable or low-income users or to respond
to a particular pattern of consumption of health care services by some categories of patients
(pregnant women, children, chronically-ill patients). Introducing exemptions from co-payments
will improve equity in health, but can potentially reduce the overall capacity of co-payments to
raise revenues or to moderate health demand. Exemptions from co-payments are usually
granted on an ad-hoc basis which further diminishes the capability of public authorities to
anticipate and monitor the rhythm of health care spending.

- 118 -
Although short-term cost-saving measures can help bring health care costs down, they need to
be complemented by careful long-term planning of structural reforms which address the real
financing needs of the health care systems in order to successfully combine quality, effectiveness
and efficiency.
Structural reforms in health care systems
Some MS are undertaking structural reforms to ensure the long-term sustainability in terms of
both efficiency and effectiveness. These recent structural reforms can be identified in three
areas: governance of health care systems, the streamlining of clinical practice and the
organisation of health care delivery and financing.
• Reviewing the governance of health care systems
The results of the SPC review point to a shift in the decision-making capacity in health care
policy and delivery between different levels of government in Member States (AT, FI, FR, BE).
The emergence of this new policy pattern illustrates a direction of reforms on-going in those
Member States' health care systems which have been decentralised both in terms of
organisation, financing and delivery of health care services. This suggests a trend of identifying
decentralised health governance as a significant 'expenditure driver' with a lesser capacity to
make efficiency gains and retain overall effectiveness.
Finland for example is reorganising the municipalities with the goal of forming bigger,
economically robust municipalities which can produce and finance the required social and
health services while also allowing better monitoring of quality and equity of access. LT have
plans to change the financing mechanism through which municipalities provide public health
programmes. This will become a State function in the future. FR reports positive experience in
containing health expenditure growth due to national government powers of setting the ceiling
for health insurance expenditure (ONDAM). A national monitoring tool includes an alert
mechanism with a corrective instrument in case of serious risk of overshoot. Since 2000, the
growth of health expenditures in FR was reduced from 7% to less than 3% per year.
Austria, in response to its Council recommendation to "align responsibilities across the federal,
regional and local levels of government" and to improve the "organisation, financing and
efficiency of health care", has adopted framework goals to better coordinate health-related
action. Reform to strengthen central governance is also to include a partnership targeting
system and a cost reduction path for public health expenditure.
In the case of Belgium, while the regions are competent for important parts of the health system
(including health promotion and disease prevention), a central institute will be set up to
strengthen consultation between different levels of government in the area of health. Similarly,
inefficiencies in exchanging knowledge and best practice between the regions in Denmark have
led the government to establish a central committee to investigate incentives in the health care
system. Although Sweden does not envisage changes in the overall governance arrangements
between central and local levels, it has initiated reforms with regard to the setup of central
government agencies in the health sector.

- 119 -
• Streamlining of clinical practice
Health practitioners are responsible for the allocation of a large proportion of health systems
resources. With more or better information about the health care systems than other parties,
this situation is often referred to as "information asymmetry". To control for this, policies have
been developed to rationalise the prescription patterns with a view to impact on health supply.
Clinical guidelines standardise the prescription behaviour of physicians by setting a
recommended pattern of prescription and medical tests per disease. Some Member States,
including Denmark and Portugal, report on recently introducing clinical guidelines with varying
levels of enforcement.
• Delivery and financing of health care
Many Member States (BE, CZ, EE, ES, HU, IE, LT, LU, LV, PT and UK) reported structural reforms
in the organisation of health care, their financing and delivery. This ranged from a
reorganisation of hospitals (LT), an increase in outpatient care, strengthened ambulatory
services and a renewed focus on primary care. The latter approach in particular can improve the
sustainability of health care.
Fiscal sustainability of health systems has been a particular focus for CY, DE, EL, ES, FR and the
NL. To limit structural expenditure growth the NL introduced controlled health expenditure
development in hospital health care through administrative agreements with health insurers,
hospitals and medical specialists. In DE significant health reforms have fixed the income-related
contribution rate by law for both employers and employees. A supplementary non-income
related premium surcharge can now be imposed by statutory health insurance funds on their
members when the money received from the Health Fund does not suffice; this measure aims to
reduce the burden on labour costs. Similarly, CZ seeks to increase competition between health
insurance funds. CZ, EL and SK have introduced (and CY is currently implementing) diagnosis-
related groups (DRGs) as a preferred payment mechanism for in-patient care with the view to
harmonise costs per disease across the hospital sector and base the hospital budgeting on
standardised scales of hospital costs.
Cyprus amended legislation related to the national health insurance system. Health insurance
will cover the entire population and will be financed through contributions from employers,
employees, pensioners and the State. In the new model, general practitioners will be paid
according to the number of enrolled patients with the amount of remuneration dependent on
patient-based considerations ('capitation'), and they will act as 'gate keepers', while specialists
will receive a fee-for-service within global budget limits per specialty. Inpatient care will be paid
using DRGs to control hospital spending. The Health Insurance Organisation is proceeding with
the implementation of the new system on the basis of a roadmap, which includes provisions for
setting up the information technology system that will support the entire health insurance
system.

- 120 -
Spain developed new legislation which provides for a harmonised clarification of the insured
person status, so that being a recipient of healthcare and social services is effectively tied to
participation in the social security system. Tax funding is based on a progressive social solidarity
scheme so that it is proportionate to the individual's income. The legislation also includes a
range of measures related to human resources in the National Healthcare System, such as
general criteria of regulation of the payment system, training and a State Register of Healthcare
Professionals.
France has introduced measures to raise more revenues in the health insurance fund with a
view to reduce its structural deficit. In addition to measures to control expenditure (lower
reimbursements for certain medical undertakings such as tests and drugs, a lower ceiling for
sickness benefits) the French authorities are also mobilising additional resources through the
introduction of new taxes or tax increases on sugary drinks, alcoholic beverages, and tobacco, on
the pharmaceutical industry and also on private complementary health insurance. FR has also
eliminated certain tax and social exemptions ("niches") and directed these revenues mainly to
its health insurance system.
Greece is reforming the hospital management (introduction of IT systems, creation of internal
control functions in hospitals, development of electronic medical records and introduction of
DRG's) and consolidating the health section of insurance funds. It is also review the delivery
channels of health care.
In Croatia health contributions were lowered in May 2012 from 15% to 13% to reduce the tax
wedge but the corresponding gap in health insurance revenues has not been closed.
A further structural trend identified in the SPC review was the increased use of private
provision, private hospital management, and / or private insurance in order to reduce public
expenditure (in CZ, PT, BG and MT among others). This can restructure the role of public
provision and expenditure thereby improving long-term fiscal sustainability. However,
increased private provision can introduce new incentives for health demand which can have a
future negative knock-on effect on public expenditure. There are also issues of quality and
equity of access regarding private provision. For example, elderly persons rely more on
secondary services which are not typically covered by private insurance; this is an important
consideration in the face of demographic ageing. An OECD report (OECD Health Working Paper
No. 58) suggests that the level of inequalities in health consumption is directly related to the
share of private provision and private insurance.
All these experiences point to the need to examine the impact of structural reforms.
Improving equity in health and enhancement of patients' choice
The review highlights the prominence of improving equity in health in most MS health policies.
The UK for example has enshrined in law the requirement to reduce health inequalities in access
and outcomes. Improving access to medical services has been undertaken in many MS (AT, BE,
BG, DK, IE, FI, FR, SE, SI). DK introduced a new patient right guaranteeing a diagnosis within one
month. Equal access was guaranteed in FI where the above-mentioned re-centralisation process
is also integral to its goal of reducing health inequalities.

- 121 -
AT took steps to ensure marginalised persons are covered by the statutory health insurance. In
July 2012 FR facilitated access to state medical assistance (AME) for foreigners in an irregular
situation and increased the number of beneficiaries eligible for a financial allowance to acquire
private complementary health insurance for people who are slightly above the income ceiling to
qualify for free public supplementary coverage (CMU-C).
Measures to improve affordability have been also undertaken. While LV has significantly
extended compensation systems for low-income persons, co-payments have been abolished for
this group in ES and on certain health services and interpretation services in DK. Taking a more
dynamic perspective, BE and Luxembourg have implemented a maximum health bill and
extended the third party payer system for low income households to tackle the barrier of pre-
financing medical fees. Similarly, DE grants a tax-financed social compensation to individuals
paying a health insurance premium exceeding 2% of their individual income. For this purpose a
tax subsidy of EUR 2bn has been foreseen until 2014.
Neighbourhood health centres have been extended in deprived areas in BE. Waiting lists have
been tackled in IE, DK, SE, and SI, using various methods including differentiated maximum
waiting times according to need (DK), financial incentives for county councils that are successful
in managing waiting times and a statutory health care guarantee (SE). HR implements 'National
waiting lists' in order to include all hospitals in a single data base for waiting lists and distribute
patients' referrals to different hospitals. IT programmes such as "E-waiting lists" and "E-
scheduling" are used to schedule medical appointments and prevent double scheduling of
medical visits.
Reforms in the provision of primary care have strengthened these services and improved access
and patient choice (IE, LV, SE). BG ensured 24 hour service to patients in hospitals and provided
funds for mobile surgeries in settlements with predominantly Roma population to promote
preventive examinations and tests.
In some Member States patient choice is central to improving equity in health (for example FI,
SE, UK). FI introduced the freedom to choose where to be treated. In SE, measures were taken to
strengthen access to information through public reporting supported by professionals’ quality
registers with the aim of providing transparent comparisons of results, quality and efficiency to
drive systematic improvement and foster equity of services.
4.4.2. Further challenges for health care systems
The on-going economic crisis urges member states to consider how they can invest in their
health systems in a sustainable way: taking into account both short and long term impacts of
policies. A strong trend arising from the SPC health review was the policy focus on health
promotion and prevention in almost all Member States. Increased attention on psychiatric care
is apparent, with measures reported such as more consistent treatment and support for children
who live with family members with a mental illness (DK) and improving the integration of
psychiatric patients into the community (BE). Challenges related to the management of chronic
diseases are also high on the agenda. Many countries are currently reflecting on how their health
systems - which have been focused on acute diseases and care in the past - can also deal with
chronic diseases.

- 122 -
A particular concern highlighted by several Member States (DE, EE, FI and LV) in the review was
the phenomenon of staff depletion due to emigration – or ageing – of skilled health workers,
particularly physicians and specialists. This poses a significant challenge to the development of
health systems and raises the possibility of growing future regional inequalities. To counteract
this, wage increases and support for young GPs have been employed (for example in HU) as an
effective short-term measure. In the face of fiscal constraints however this can mean added
pressure on the fiscal sustainability of the health system. Another method is the cross-border
health provision employed in the UK and MT. DE decided to address the lack of physicians
through legislative measures (the GKV-VSTG act) introducing performance based payments for
physicians working in under-served medical areas.
4.4.3. Policy conclusions
• Policy makers will need to distinguish between the pursuit of effectiveness and the
pursuit of expenditure control. Better understanding of the exact health benefits secured from
reduced expenditure is needed in order to avoid cost-control measures resulting in negative
impacts on individual health status.
• Although cost-saving measures offer potential efficiency gains, and therefore appear
effective in the short-term as expenditure declines, cutting spending in the present does not
guarantee decreased future costs. Users may only seek medical help at a critical stage if only
hospital care – at a higher cost – can be prescribed. Further, the efficiency gains of such
measures on health expenditure growth will be more tangible if structural reforms reviewing
both the financing of the system and its effectiveness in improving health outcomes are also
undertaken.
• Commitment to equity in health is essential if an increase in patients’ participation in the
system’s financing is desired. Comprehensive measures tackling the social gradient in health
need to accompany structural reforms in order to ensure quality, effectiveness and
inclusiveness. Member States need to deploy timely educational interventions to address in the
long-term the lack of medical staff, which is a serious threat to the normal functioning and equity
of health care systems.
• The result of this review shows that the Member States need to discuss ways of
evaluating and monitoring the improving performance of healthcare systems without using
scoring methods. The SPC/ISG would need to develop analytical tools for this purpose.
4.5. Long-term care
Demographic and epidemiological transitions will result in dramatic changes in the health needs
of the European population. In all Member States, there is a steep increase in the need for long-
term care (LTC). These trends reflect two interrelated processes: one involves the growth in
factors that increase the prevalence of long-term disability in a population (and therefore calls
for preventive measures to help reduce the pressure on the system); the second involves the
change in the capacity of the informal support system to address these needs. The search for
effective LTC policies is therefore one of the most pressing challenges facing modern European
society.

- 123 -
Long-term care (LTC) includes activities undertaken for persons that are not fully capable of
self-care on a long-term basis, by informal and formal caregivers, including family, friends,
professionals and paraprofessionals (health, social, and others), and by traditional caregivers
and volunteers. It encompasses a broad array of services such as personal care, household
chores, life management, assistive devices, home modifications, and more advanced
technologies. This wide range of services, whether delivered in homes, in communities or in
institutional settings, is designed to minimize, restore, or compensate for the loss of independent
physical or mental functioning. Although LTC does not include prevention, management of
chronic disease, rehabilitation and acute care in general, it is necessary to ensure access of the
long-term care population to these services.
Due to this specific complexity, the delivery of needed long-term care is often fragmented and
uncoordinated, which can cause inefficiency in funding and delivery and can also create
confusion, discomfort and distress for people with disabilities and their families. These
problems indicate a need to strengthen linkages and improve coordination between a broad
range of care services, the priority of which should be to develop a ‘person-centred’ approach,
i.e. that the dignity, participation and empowerment of the older person in need of care and
assistance are supported and respected .
As stated in previous SPC documents, and in line with the agreed objectives of the OMC, Member
States are committed to developing accessible, high-quality and financially sustainable long-
term care systems (see the introduction of the health care section for the full objectives). . This
section seeks to provide an overview of the main measures reported by EU Member States in the
thematic review and National Social Reports and draws on the long-term care literature.
4.5.1. Long-term care developments in the EU
All Member States recognise that, the number of people with care and assistance needs
continually increases (including AT, CY, CZ, DK, HU, IE, LU, MT, and SE). Consequently, although
long-term care implies a high cost for the public sector, Member States not only regard long-
term care as a ‘cost factor’ but as investment. Nevertheless, efforts aiming at rationalising costs
and at simplifying the design and provision of LTC services are being developed and
implemented. In this context, more could be done to strengthen the exchange of information
regarding the concrete measures put in place by Member States to reform their legislations and
integrate services as the reports provided by Member States (and the thematic review attached
to them) only provide a general outline.

- 124 -
4.5.2. Recent reforms in long-term care systems
In 2012 the NL received a CSR on implementing long-term care reform outlined in the delivered
blueprint. A recent coalition agreement introduces major reform in Dutch long-term care with
the main goal of decreasing the percentage of long-term care expenditure of the GNP and to
bend the growth-curve of long-term care expenditure. To realise this, locally delivered and
tailored forms of care by health care suppliers in cooperation with informal caregivers and
family are envisaged. LTC will only be available for those who cannot afford to pay for this care
themselves, with priority placed on providing LTC to people who need it for medical reasons.
Major parts of the long term care now covered by the Exceptional Medical Expenses Act (AWBZ)
will be decentralised and delegated to the local authorities. Specific parts of the AWBZ will be
carried over to the health insurance act. The remaining one third of the present AWBZ – for
those who cannot participate in society - will be centrally managed.
• Decentralisation of services
In order to improve efficiency, ensure LTC services fully match the needs of recipients and foster
integration of social and health services, some Member States seek to pursue the
decentralisation of competences. This concerns the fields of residential care, mental health care,
psychiatric nursing homes, care support allowances for people with disabilities, hospital
infrastructures, prevention and organisation of primary care and subsidies are used to support
local authorities and providers (AT, BE, BG, CY, CZ, DK, EE, ES, FI, FR, HR, LT, NL, SE, SI, SK, UK).
Some are revising their legislation and developing new evaluation mechanisms to match the
care needs of users to the most appropriate support available (Czech Republic, Malta, Cyprus). In
Eastern European countries, the transition from the traditional institutional care to community
and family-based services mainly takes place by expanding the range of services such as day
care centres, social rehabilitation and integration centres, protected housing, development of the
model for services provided in the home environment (Bulgaria).
• Importance of integrating LTC and basic health and social services
Member States are committed to further integrating social and health services in order to ensure
the most cost-effective use of LTC services as well as the shortest possible waiting period for the
decision on the granting of care allowance (AT). New services have been developed for short-
term stays, home support and personal care, with, among others, an extension of home care
services such as care attendance, temporary care, informal care and regional service centres.
Likewise, the number of “assisted living residences” and “day-care centres” has substantially
increased in recent years (BE).
Shortage of space, out-of-date infrastructures (HU, LT), lack of financial resources (EE, PT) and
low standards of quality requirements (EE) have been reported in Member States. Inadequate
social care and social rehabilitation, insufficient amount of employees and low remuneration
have also been pointed out as obstacles to the provision of qualitative long-term social care and
social rehabilitation services. Finally, because of the increasing demand for long term care, the
threat of shortages of care workers and volunteers is also highlighted in the national reports
(NL). This will obviously hamper the restructuring and shift of approach needed for more
accessible, equitable and sustainable systems.

- 125 -
• Monitoring the quality of LTC services
There are currently very few established indicators on long-term care system performance
within the WHO and Eurostat datasets. As a result, the monitoring of performance of long-term
care systems is not systematically arranged in EU Member States. Some have nevertheless put in
place monitoring mechanisms including objective and verifiable lists of quality indicators for
home care (AT - incorporated into an updated survey used for qualified health and nursing staff,
DK – including 7 indicators concerning effects and 16 background indicators concerning, among
other things, expenses to fund home-care services), integrated databases of LTC services
recipients (BG, HU, MT, NL, SI), as well as a relevant monitoring authority to control the
adequacy of social standards (FI, IE, LT, LU). In order to increase quality aspects within the
social field, including long-term care, some Member States are planning the launch of new
supervising agencies (SE).
Since the provision of LTC is often a shared responsibility between health and social services,
different data collecting systems co-exist in some member states and the evaluation of service
quality is therefore made more complex. In order to improve the data collection system, health
statistics modules are being developed based on e-Health Information Systems (i.e. digitally
based), which should facilitate and simplify the process (EE). The use of electronic care systems
in other Member States has already become the foundation for the national data gathering in the
area of long-term care (DK).
• Addressing the determinants of long-term disability and supporting
rehabilitation
The burden of chronic diseases among Europeans around retirement age is substantial and will
increase due to the ageing of the population and lifestyle risks. The burden of the major chronic
diseases (cardiovascular disease, cancer, respiratory diseases, diabetes and depression)
increases with age in both men and women. Although their occurrence is highest in the
population over 75 years of age, the prevalence and morbidity of chronic diseases is in many
European countries already considerable in older people of working age. There are few EU
countries where on average people reach the age of 65 (the retirement age in many countries)
without activity limitations due to health problems.
The major chronic diseases (cardiovascular diseases, cancers, chronic lung disease, diabetes and
depression) are known to be susceptible to preventive efforts, for instance by eliminating their
risk factors, such as smoking, alcohol abuse, obesity and sedentary lifestyles - while taking into
account their underlying socio-economic causes.
Therefore, there is still considerable scope to reduce disease prevalence and premature death in
people around retirement age by policies that implement effective efforts to prevent diseases
and disability, throughout the life course. This in turn would play a major role in sustainability of
long-term care systems.

- 126 -
As the major non communicable diseases that affect the European region share these common
modifiable lifestyle risk factors, an integrated and inter-sectoral approach is needed that reaches
across ‘health’ boundaries (health in all policies) to prevent non-communicable diseases as a
group. Because the burden of chronic diseases varies considerably between as well as within the
EU Member States, the necessary policy response can vary between and even within EU
countries.
Member States seem to put less emphasis (in their reporting) on the pressing and well-
documented need to strengthen public health, health promotion and disease prevention in order
to achieve long-term improvements in populations’ health. However, some do mention their
intention to step up efforts on health promotion, disease prevention and rehabilitation (AT, BE,
BG, DK, FI, FR, MT, PT, ES) and initiatives are being taken or strengthened on specific age-related
diseases, such as dementia (BE, BG, EE, MT, NL, SE), Alzheimer (FR) or chronic diseases (BE).
Noticeably, Finland reported the fact that their LTC approach builds on the ‘health in all policies’
approach which means that health arguments are taken into account in all decision making with
relevance to the determinants of health at all levels of governance. Finally, the health
consequences of social isolation identified in the literature can receive less policy attention.
Often, declines in cognitive functioning are triggered by disuse (lack of practice), illness (such as
depression), behavioural factors (such as the use of alcohol and medications), psychological
factors (such as lack of motivation, low expectations and lack of confidence), and social factors
(such as loneliness and isolation), rather than ageing per se. It is therefore important to include
all of these drivers of bad health into consideration when developing effective long-term care
strategies.
• Changes in the capacity of the informal support system to address LTC
needs
In most Member States, persons requiring long-term care can make use of the care provided by
the system of social services or informal carers at home, or a combination of both. The offer is
sometimes complemented by commercial services (CZ). Informal carers provide the bulk of care
to older people in need of care and assistance (depending on the countries 70% to 90% of care
needs are covered by informal carers). Informal carers, many of whom are family members and
in particular women, provide a high amount of the care work, many as support for a beloved
relative. They are nevertheless a particularly vulnerable group and are at a high risk of burn out,
abuse and/or social exclusion. The quality of life of the informal carer is closely linked to the
quality of life of the older person in need of care and assistance. Services therefore have to
consider support for informal carers as an integral part of the quality improvement process, as
well as the need to improve cooperation between formal and informal care. Yet, while 17
member states are looking to move care away from institutions and inpatient facilities, just 11
appear to be taking active measures to provide better support for informal and family carers
(AT, BE, BG, EE, ES, MT, NL, SE, SI, SK, UK).
Here there is a potential risk that informal carers may be expected to replace existing services
before adequate support, training and social protection is extended to them. Further down the
line, this could lead in some cases to the intergenerational transmission of poverty or
worklessness as a result of providing care and a reduced capacity to be active in the labour
market.

- 127 -
In light of this, some Member States have started to subsidise the cost of replacement care by a
substitute professional or home care for people with disabilities, if the main carer is unable to
carry out her/his duties. Measures have also been strengthened or put in place in order to allow
informal carers to maintain their benefits and rights: pension insurance for the duration of care
for close relatives (AT), specific leave arrangements and informal care premiums (BE), the
provision of employment services (EE) or special voluntary agreement (ES). Training and
recruitment (NL) programmes and enhanced financial support for existing training courses have
also been developed for the staff working within elderly care (AT, BE, EE, SE). In other Member
States, initiatives have been taken to strengthen good governance and managerial practices for
managers at the institutional level who are close to the employees and citizens in the municipal
elderly care sector in their daily lives (DK). These initiatives include education in recognized
practice-management training and establishment of a centre for welfare leadership (DK) to
strengthen the practice-oriented public management in welfare areas through the collection and
dissemination of knowledge. Finally, others have opted for training programme aiming to
change the attitudes of carers towards care giving (HU).

- 128 -
REFERENCES
Avram, S., Figari, F., Leventi, C., Levy, H., Navicke, J., Matsaganis, M., Militaru, E., Paulus, A.,
Rastrigina, O. and H Sutherland (2012). "The distributional impact of fiscal consolidation in
Europe." SSO paper.
Avram, S., Sutherland, H., Tasseva, I. and A. Tumino (2011). "Income protection and poverty risk
for the unemployed in Europe." Social Situation Observatory Research note 1/2011.
Adema, W. and and Ladaique, M. (2009). “How Expensive is the Welfare State?: Gross and Net
Indicators in the OECD Social Expenditure Database (SOCX)”, OECD Social, Employment and
Migration Working Papers, No. 92, OECD Publishing.
Adema, W., Fron, P. and Ladaique, M. (2011). "Is the European Welfare State Really More
Expensive? Indicators on Social Spending, 1980-2012; and a Manual to the OECD Social
Expenditure Database (SOCX)" OECD Social, Employment and Migration Working Papers, No. 124,
OECD Publishing.
Aláez, R., Díaz de Basurto, P. and Olaskoaga, J. (2008). "The drawbacks on welfare effort in
measuring social spending trends", WP 0802, Departamento de Economía, Universidad Pública
de Navarra.
Benetrix, A. and Lane, P. (2012). “Fiscal cyclicality and EMU,” mimeo, Trinity College Dublin.
Bonesmo Fredriksen, K. (2012), “Income Inequality in the European Union”, OECD Economics
Department Working Papers, No. 952, OECD Publishing.
European Central Bank (2011). “The ECB’s non-standard measures – impact and phasing-out”,
article in the Monthly Bulletin, July.
European Commission – Directorate General Economic and Monetary Affairs (2006). "Public
Finance in EMU 2006"
European Commission – Eurostat (2012). “ESSPROS Manual and user guidelines”, 2012 edition.
European Employment Observatory (2011). “Adapting unemployment benefit systems to the
economic cycle, 2011”.
Cantillon, B. (2011). "The paradox of the social investment state: growth, employment and
poverty in the Lisbon era." Journal of European Social Policy, 21:432.
Dolls, Fuest and Peich (2012) “Social Protection as Automatic Stabilizer: US vs. Europe”.
Eurohealth (2012). "Health systems and the financial crisis."
ECFIN (2006) "Public Finance in EMU 2006"

- 129 -
European Commission (2011a). Employment and Social Developments in Europe 2011.
Luxembourg: Publications Office of the European Union.
European Commission (2011b). The State of Men's Health in Europe. Luxembourg: Publications
Office of the European Union. http://ec.europa.eu/health/population_groups/docs/men_health_report_en.pdf
European Commission (2012a). EU Employment and Social Situation: Quarterly Review. June
2012.
European Commission (2012b). Employment and Social Developments in Europe 2012.
Luxembourg: Publications Office of the European Union.
European Commission (2012c). EU Employment and Social Situation: Quarterly Review.
September 2012.
European Commission (2012d). Labour Market Fact Sheet – November 2012.
Eurofound (2012). "Household debt advisory services in the European Union."
http://www.eurofound.europa.eu/areas/socialprotection/householdebts.htm
Eurofound (2012). Third European Quality of Life Survey. Impact of the crisis on Europe’s citizens:
Trends in quality of life. Luxembourg: Publications Office of the European Union, 2012.
FEANTSA (2012). On the Way Home? FAENTSA Monitoring Report on Homelessness and Homeless
Policies in Europe.
Figari, F., M. Matsaganis and H. Sutherland (2011) "Are European social safety nets tight enough?
Coverage and adequacy of minimum income schemes in 14 EU countries. " GINI Discussion Paper
2. Amsterdam, AIAS.
Ferrarini, T. and K. Nelson (2003). "Taxation of social insurance and redistribution: a
comparative analysis of ten welfare states." Journal of European Social Policy, 13: 21.
Ferreira, F. and M. A. Lugo (2012). "Multidimensional poverty analysis: looking for a middle
ground." ECINEQ WP 2012 – 251
Frazer, H. and E. Marlier (2012). "Assessment of progress towards the Europe 2020 social
inclusion objectives. Main findings and suggestions on the way forward.", available from:
http://ec.europa.eu/social/main.jsp?catId=1025&langId=en.
Frazer, H. and Marlier, E. (2012a). “Current situation in relation to child poverty and child well-
being: EU policy context, key challenges ahead and ways forward”, Independent background
paper prepared for the Cypriot EU Presidency Conference on Investing in Children: Preventing
and Tackling Child Poverty and Social Exclusion, Promoting Children’s Well-Being (Nicosia, 18-19
October 2012), available at Conference web-site.
Guio, A.C, Gordon, D. and E. Marlier (2012) "Measuring material deprivation in the EU: Indicators
for the whole population and child-specific indicators." Eurostat Methodologies and Working
Papers.
Hanappi and Müllbacher (2012) "A Note on Automatic Stabilizers in Austria"

- 130 -
Hemerijck, A. and Vandenbroucke, F. (2012). Social Investment and the Euro Crisis: The
Necessity of a Unifying Social Policy Concept. Intereconomics, 47(4), 200-206.
Immervoll, H. and L. Richardson (2011), “Redistribution Policy and Inequality Reduction in
OECD Countries: What Has Changed in Two Decades?” OECD Social, Employment and Migration
Working Papers, No. 122, OECD Publishing.
in 't Veld, J., Larch, M. and Vandeweyer, M. (2012). "Automatic Fiscal Stabilisers: What they are and
what they do" European Economy - Economic Papers 452, Directorate General Economic and
Monetary Affairs, European Commission.
IZA Report (2010) "The Role of Social Protection as an Economic Stabiliser: Lessons from the Current Crisis"
ISSA Report (2012) "Coping with the Crisis: Managing Social Security in Uncertain Times"
Mattonetti, M.L. (2009). "Net expenditure on social protection benefits." Statistics in Focus
102/2009, Eurostat.
Lelkes, O. and K. Gasior. (2012) "Income poverty and social exclusion in the EU." European
Centre for Social Welfare Policy and Research. Policy Brief.
OECD (2009) Employment Outlook: Tackling the Jobs Crisis. OECD Publishing.
OECD (2012). “Social Spending after the Crisis, Social Expenditure (SOCX) Data Update 2012”.
Pension Adequacy Report 2012
Prasad, N., and Gerecke, M. (2010). Social Security Spending in Times of Crisis. Global Social Policy,
10(2), 218-247
Saunders, P. (2002) "The direct and indirect effects of unemployment on poverty and
inequality." Social Policy Research Centre Discussion Paper No. 110, University of New South
Wales, Australia.
Salanauskaite and Verbist (2011)
Social Protection Committee (2012). The social impact of the economic crisis and ongoing fiscal
consolidation – third report of the Social Protection Committee. Luxembourg: Publications Office
of the European Union.
Social Protection Committee (2012). Advisory Report to the European Commission on Tackling
and Preventing Child Poverty, Promoting Child Well-being.
Tarki (2011) "Child well-being in the European Union – Better monitoring instruments for
better policies."
World Health Organization (2011). Impact of the economic crises on mental health.

- 131 -
The 2012 Ageing Report: Economic and budgetary projections for the EU27 Member States (2010-
2060). Joint report by the European Commission and the Economic Policy Committee.
http://ec.europa.eu/economy_finance/publications/european_economy/2012/pdf/ee-2012-2_en.pdf
Turrini, A. (2008). Fiscal policy and the cycle in the Euro Area: The role of government revenue
and expenditure. European Economy 323. The European Commission.
Lane (2012) "Fiscal Cyclicality and EMU". Ludger Schuknecht (2011) “Fiscal Activism in Booms, Busts and Beyond 2011”.
Bonesmo Fredriksen, K. (2012), “Income Inequality in the European Union”, OECD Economics Department Working Papers, No. 952, OECD Publishing. http://dx.doi.org/10.1787/5k9bdt47q5zt-en OECD bi-annual forecast ("OECD Economic outlook") November 2012 OECD, (2011) ‘Divided We Stand: Why Inequality Keeps Rising’ http://www.oecd.org/dataoecd/40/58/49170768.pdf SPC (2011). The social impact of the economic crisis and on-going fiscal consolidation crisis report.

- 132 -
ANNEX 1. COUNTRY PROFILES
BELGIUM
1. 2012 NATIONAL SOCIAL REPORT (NSR): KEY ISSUES
Belgium registers higher than average inflation (3.5% in 2011, and 2.2% in 2012). Job creation is
stalling, unemployment rates (7.5%) are below EU average, but unemployment hits heavily on
young people, older people and migrants. With regards to the indicators of Social Inclusion, BE
performs better than EU average on all indicators but "low work intensity households". It should
also be noted that there are strong disparities between the federated entities on the issues
mentioned above.
The NSR indicates that due to the late finalisation of the guidance for the report the relevant
stakeholders were not consulted for the drafting of the report as such, but, when needed, were
consulted on the policy developments reported.
The NSR indicates that the overall priorities for social protection policy are: (i) maintaining a
strong social security (providing an adequate government subsidy to the system so that it can
continue to meet its commitments, continuing to link benefit levels to the development of the
standard of living to the extent possible, a.o. by increasing small pensions and minimum income,
fighting against fraud, etc.); (ii) increasing the employment rate (active labour market policies,
increasing the effective retirement age, reforming the pensions system etc.); (iii) limiting the
growth of expenditures in the health care sector while safeguarding the accessibility of health
care and the quality of the health care system; (iv) fostering the reform of the State (further
devolution of powers to the federated entities).
The NSR also indicates that budgetary stability remains the overarching principle of the
government's actions.
Broadly speaking, the challenges identified in the NSR correspond to the challenges identified by
the Commission50. The Commission, however, also highlights some other issues (e.g. decreasing
participation in Lifelong Learning and vocational training)
As regards "Poverty", the NSR refers to the NRP for Belgium’s strategy aimed at reaching its
Europe 2020 target (reducing the number of people at risk of poverty or social exclusion by at
least 380.000 people): there is one general priority (4.5.1 Guaranteeing social protection) and
there are three specific policy priorities: reducing child poverty (4.5.2), active inclusion of
people far from the labour market (4.5.3) and the fight against inadequate housing and
homelessness (4.5.4). The NRP lists the most important measures taken in these areas. In
addition, the NSR presents a series of developments. It mentions the Roma strategy and
50 SWD(2012) 314 final

- 133 -
announces a study launched at federal level on the role of Public Centres for Social Welfare in
the integration of migrants (results to be published in 2012).
It also recalls the intention of the government to ensure gender equality in every policy
initiatives, with regards, in particular, to combat poverty among single parents. On the same
topic, it recalls that family allowances have been increased in 2008 for lone parents, who also
enjoy, since 2010, increased reimbursements with regards to healthcare.
Finally, the NSR announces the reduction of tax levies (on low and middle income) in 2013 and
the reform of the levies on social income for workers under the "right to social integration"
regime having recently found a job, in the framework of the fight against poverty among
workers.
The NSR insists on the necessity to ensure coordinated action between the federal and the
federated entities, a.o. through the Belgian platform against poverty and social exclusion. The
NSR also mentions the existence of Regional plans and actions, with, a.o. the appointment of a
sole Minister for coordinating the fight against poverty in Flanders, the publication of the
Brussels poverty report every 2 years (Region Bruxelles-Capitale) or the preparation of a "Social
Cohesion Plan 2014-2019" in Wallonia.
With regards to Pensions, the NSR presents the actions taken, e.g. for ensuring the viability of
the system. On this issue, the NSR mentions the decision of increasing to 62 in 2016 (60 today)
the age for early retirement, and of passing to 40 in 2016 (35 today) the required length of
career for early retirement. Other elements of reform are presented, such as pension bonus,
change in the calculation of periods of inactivity or interruption periods, etc.
It mentions measures such as increasing the amounts for minimum pensions, or suppressing the
income limit (professional income) for retired workers with a career of 42 years in 2013, as
actions taken to ensure the adequacy of pension levels.
Finally, it indicates an upcoming proposal of the Government aiming at ensuring that all
workers, from the beginning of their career, receive each year an indication of the amounts of
their future pension rights. The information related to the individuals pensions rights (1st pillar
(three pension schemes) and 2nd pillar) would be merged into one single database, providing
the workers with a one-stop-shop for information on their rights and situation.
On healthcare, the NSR presents a series of actions aiming notably at improving the financial
accessibility for people (increasing reimbursement levels for heavy pathologies, extending the
coverage of the "third-party-paying" system for families with modest income, etc.), in order to
ensure equality of access to healthcare, irrespective of the socio-economic situation of the
patient. Actions have also been taken to limit the "growth norm" (which allows the healthcare
budget to increase yearly by a percentage above inflation).
On the "preventive side", actions have been taken on vaccination and screening for certain
diseases such as cancers. Reform of the psychiatric care is well underway (with pilot projects for
insertion of patients into the society). Day care and Home care for the elderly have been
developed and broadened (fostering care provision at home), and training for care providers has

- 134 -
been strengthened. The NSR indicates that actions will continue on these strands (prevention,
vaccination, reducing costs, improving coverage, etc.).
The role of the General Practitioner will also be strengthened, through the implementation of e-
health (electronic medical file, data sharing, etc.). Collaboration and mergers between hospitals
will be encouraged, and greater geographical coverage and balance between 1st line and 2d line
offer will be fostered. Budget balance will be maintained notably through increased use of
generic medicine.
With the State reform, and the devolution of powers to the Communities, a Consultation Institute
will be put in place, to promote consistent action on healthcare between Federal and federated
levels.
Apart from the issue of "low work intensity households" (where BE performs worse than EU
average), the 3 issues that could be highlighted as particularly worrying and on which there are
strong disparities between the federated entities (Federal level, Regions and Communities) are
the following: (i) Risk of poverty among pensioners (the risk existed already before the reform
of the pension system, and should be further assessed taking the reform into account); (ii)
Labour market integration and social inclusion of specific target groups (older workers, young
people, non-EU national, Roma); (iii) Decreasing participation in Lifelong learning and
vocational training (in a context of skills mismatches and shortages in some professions).
The measures implemented and the evolutions announced go in the right direction. The fact that
the Federal level, as well as the Regions and Communities, are involved both in the elaboration
and implementation, makes it sometimes difficult to ensure consistency and coordination. This
will also be reinforced with the reform of the State, and the devolution of more powers to the
Federated entities.
2. NATIONAL 2020 TARGET FOR THE REDUCTION OF POVERTY AND SOCIAL EXCLUSION
" Belgium is aspiring to reduce the number of people faced with poverty and social exclusion by
380,000 come the year 2020, compared with the reference year (2008)."
Source: National Reform Programme (2011)

- 135 -
2a. Progress towards the 2020 national target for the reduction of poverty and
social exclusion
Source: Eurostat (EU-SILC)
Note: i) Progress on the target is monitored on the basis of the EU SILC data with a base year 2008 and
target data year 2018;
ii) AROPE - at-risk-of-poverty or social exclusion rate; AROP - at-risk-of-poverty rate; VLWI - share of
population living in very low work intensity households; SMD - severe material deprivation rate;
iii) For the at-risk-of poverty rate (AROP), the income reference year is the calendar year prior to the
survey year (i.e. 2010) except for the United Kingdom (survey year) and Ireland (12 months preceding the
survey). Similarly, the very low work intensity rate (VLWI) refers to the income reference year prior to the
survey (i.e. 2010) while for the severe material deprivation rate (SMD), the reference is the current year (i.e.
2011).

- 136 -
2b. Composition of the population at risk of poverty or social exclusion (2011)
Source: Eurostat (EU-SILC)
Note: i) AROP - at-risk-of-poverty rate; VLWI - share of population living in very low work intensity
households ((quasi)-jobless households); SMD - severe material deprivation rate; the red overlap indicates
the share of the population which accumulates all three conditions,
ii) For the at-risk-of poverty rate (AROP), the income reference year is the calendar year prior to the
survey year (i.e. 2010) except for the United Kingdom (survey year) and Ireland (12 months preceding the
survey). Similarly, the very low work intensity rate (VLWI) refers to the income reference year prior to the
survey (i.e. 2010) while for the severe material deprivation rate (SMD), the reference is the current year (i.e.
2011).

- 137 -
2005 2006 2007 2008 2009 2010 2011
AROP total % of total pln 14,8 14,7 15,2 14,7 14,6 14,6 15,3
1000 persons 1,537 1,531 1,59 1,554 1,549 1,566 1,657
VLWI total % of total pln 15,1 14,3 13,8 11,7 12,3 12,6 13,7
1000 persons 1,244 1,178 1,138 967 1,021 1,053 1,152
SMD total % of total pln 6,5 6,4 5,7 5,6 5,2 5,9 5,7
1000 persons 673 672 602 595 555 628 615
AROP + VLWI
% of total pln 3,6 3,6 3,8 3,0 3,5 3,3 4,5
1000 persons 377 374 395 320 372 352 483
AROP + SMD % of total pln 1,2 0,9 1,3 1,3 1,1 1,2 1,3
1000 persons 129 90 131 137 116 128 141
AROP + SMD + VLWI
% of total pln 2,5 2,8 2,3 2,0 2,1 2,2 2,2
1000 persons 256 290 237 211 219 232 242
SMD + VLWI % of total pln 0,9 0,9 0,7 0,4 0,5 0,6 0,4
1000 persons 97 89 69 44 55 68 45
2c. At risk of poverty or social exclusion rate for specific groups, 2011
Total
At risk of poverty or social
exclusion, in %
Children (0-17) 23,3
Working age (18-64) 20,0
Elderly (65+) 21,6
Employed 6,1
Unemployed 57,2
Inactive 42,9
Single male 33,0
Single female 30,0
Single elderly (65+) 22,5
Single parent households 52,9
Large families (2 adults and 3+ children) 19,4
EU-migrant (EU 27) 28,5
Non-EU migrants (non-EU27) 52,4
Source: Eurostat (EU-SILC)

- 138 -
3. MAIN SOCIAL INDICATORS
BE % 2005 2006 2007 2008 2009 2010 2011 2010 2011
At risk of poverty or social exclusion 22,6 21,5 21,6 20,8 20,2 20,8 21,0 23,6 24.2
At-Risk-of-Poverty rate 14,8 14,7 15,2 14,7 14,6 14,6 15,3 16.4 16.9
Severe Material Deprivation rate 6,5 6,4 5,7 5,6 5,2 5,9 5,7 8,3 8.8
Share of people living in very low work
intensity households 15,1 14,3 13,8 11,7 12,3 12,6 13,7 10.0 10.0
Impact of social transfers on poverty
reduction (excl. pensions)(in%) 47,7 45,1 44,7 45,6 45,3 45,3 45,0 36,7 35,2
Value of threshold (single HH) - in PPS 9.320 9.707 9.787 10.046 10.494 10.398 10.776 N/A N/A
Value of threshold (2 adults + 2 children) -
in PPS 19.572 20.385 20.552 21.096 22.038 21.836 22.629 N/A N/A
At risk of poverty or social exclusion 23,7 21,4 21,6 21,3 20,5 23,2 23,3 27,1 27.0
At-Risk-of-Poverty rate 18,1 15,3 16,9 17,2 16,6 18,3 18,7 20.5 20.6
Severe Material Deprivation rate 8,5 9,4 7,0 7,3 6,5 7,7 8,2 9,7 10.0
Share of people living in very low work
intensity households 13,4 13,0 12,2 8,9 11,0 12,0 13,9 9.1 8.8
Impact of social transfers on poverty
reduction (excl. pensions) 46,3 47,2 46,2 45,6 48,6 42,5 44,7 41,4 40,5
At risk of poverty or social exclusion 21,9 20,7 20,7 20,1 19,3 20,0 20,0 23,5 24.3
At-Risk-of-Poverty rate 12,0 12,2 12,6 12,2 12,1 12,1 12,9 15.2 16.0
Severe Material Deprivation rate 6,5 6,2 5,9 5,7 5,3 6,0 5,6 8,3 8.9
Share of people living in very low work
intensity households (18-59) 15,7 14,8 14,4 12,7 12,8 12,9 13,6 10.3 10,5
In-work at-risk-of poverty rate 3.9 4.0 4.3 4.7 4.5 4.4 4.1 8.4 8.9
Impact of social transfers on poverty
reduction (excl. pensions) 55,6 53,1 52,3 53,1 51,8 52,9 51,1 38,7 37,0
At risk of poverty or social exclusion 23,3 25,2 25,0 22,9 23,1 21,0 21,6 20,0 20.5
At-Risk-of-Poverty rate 21,4 23,2 23,0 21,2 21,6 19,4 20,2 16.0 16.0
Severe Material Deprivation rate 3,6 3,3 3,6 3,2 3,1 2,8 2,6 6,6 7.2
Relative median income ratio of elderly 0.73 0.71 0.74 0.74 0.74 0.75 0.74 0.88 0.89
Aggregate replacement ratio 0.42 0.42 0.44 0.45 0.45 0.46 0.44 0.53 0.54
2000 2005 2006 2007 2008 2009 2010 2009 2010
Sickness/Health care 6,0 7,5 7,2 7,2 7,5 8,1 8,0 8,4 8,3
Invalidity 2,3 2,0 1,9 1,8 1,9 2,1 2,1 2,3 2,2
Old age and survivors 10,4 10,6 10,6 10,2 10,8 11,6 11,3 12,7 12,7
Family/Children 2,1 2,0 2,0 2,1 2,1 2,2 2,2 2,3 2,3
Unemployment 2,9 3,4 3,4 3,3 3,3 3,8 3,8 1,8 1,7
Housing and Social exclusion n.e.c. 0,5 0,5 0,6 0,9 0,9 1,0 1,0 1,0 1,0
Total 24,2 26,0 25,7 25,5 26,5 28,9 28,4 28,5 28,2
Means-tested
Sickness/Health care 0,1 0,1 0,1 0,0 0,0 0,0 0,0 0,1 0,1
Invalidity 0,4 0,5 0,4 0,4 0,5 0,5 0,5 0,5 0,5
Old age and survivors 0,2 0,2 0,2 0,1 0,1 0,1 0,1 0,6 0,6
Family/Children 0,0 0,0 0,0 0,0 0,0 0,0 0,0 0,6 0,6
Unemployment 0,0 0,0 0,0 0,0 0,0 0,0 0,0 0,4 0,4
Housing and Social exclusion n.e.c. 0,2 0,3 0,4 0,7 0,8 0,8 0,8 0,9 1,0
Total 0,9 1,0 1,1 1,2 1,4 1,4 1,4 3,0 3,1
Non-means tested
Sickness/Health care 5,9 7,4 7,1 7,2 7,5 8,1 8,0 8,3 8,2
Invalidity 1,9 1,5 1,4 1,4 1,5 1,6 1,6 1,8 1,8
Old age and survivors 10,2 10,5 10,4 10,1 10,7 11,5 11,1 12,1 12,1
Family/Children 2,1 2,0 2,0 2,1 2,1 2,2 2,2 1,7 1,7
Unemployment 2,9 3,4 3,4 3,3 3,3 3,8 3,8 1,4 1,3
Housing and Social exclusion n.e.c. 0,2 0,2 0,2 0,2 0,2 0,2 0,2 0,1 0,1
Total 23,3 25,0 24,6 24,3 25,2 27,5 26,9 25,4 25,2
Elderly (65+)
Social expenditure
(in % of GDP)
EU27
Children (0-17)
Working age
(18-64)
Total population
Source: Eurostat (EU-SILC, ESSPROS for social expenditure data)
Note: For non-means tested the aggregation Housing and Social Exclusion n.e.c is based only on Housing. The
total figures of social expenditure include all benefits excluding administrative costs.

- 139 -
4. LONG-TERM ADEQUACY OF PENSIONS: THEORETICAL REPLACEMENT RATES (2010-
2050)
Theoretical replacement rates (TRR): Net 2010 Net 2050 Difference Gross2010 Gross2050 Difference
40 years career: average income earner
(basecase) 74 75,9 1,9
51,3
(90/0/10)*
52,7
(78/0/22)* 1,4
Low income85,2 82,1 -3,1
59,2
(91/0/9)*
57,8
(80/0/20)* -1,4
High income54,2 53,1 -1,1
34,3
(87/0/13)*
33,34
(75/0/25)* -1,0
Lower / higher future rates of return74,3 / 77,8 51,6 / 54,1
Lower / higher future wage growth84,4 / 52,6 58,7 / 36,5
38 years career: average income72,9 69,41 -3,5 50,1 47,85 -2,3
Low / high income74,7 / 48,3 52.1 / 31.13
42 years career: average income76,7 77,82 1,1 54,2 55,73 1,5
Low / high income86,1 / 56.81 60,7 / 35.5
10 years after retirement67,5 70,5 3,0 46,8 47,9 1,1
Female worker with 3 years of career
break for childcare 73,7 74,2 0,5 51,1 51,6 0,5
3 years of career break for
unemployment 69 72,5 3,5 46,3 49,0 2,7
10 years out of the labour market67,2 66,3 -0,9 40,8 40,7 -0,1
2010 2050 Difference EU27 2010 EU27 2050 Difference
Benefit ratio (Public pensions) 39,2 38,3 -0,944,7 37,0 -7,7
Gross replacement rate at retirement
(Public pensions): : : 48,0 39,1 -8,9
Note: *: Share of statutory DB-NDC / statutory funded / occupational and other supplementary pensions
Source: Joint SPC/EC report on Pension Adequacy in the European Union (2010-2050)
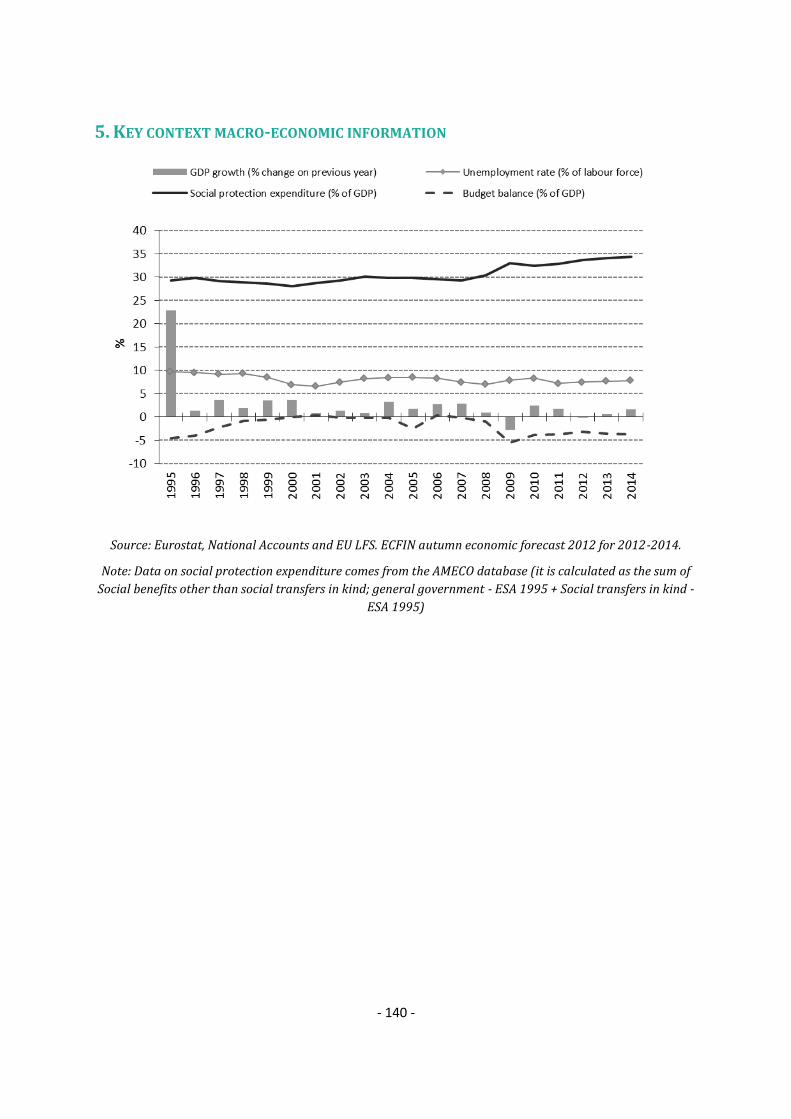
- 140 -
5. KEY CONTEXT MACRO-ECONOMIC INFORMATION
Source: Eurostat, National Accounts and EU LFS. ECFIN autumn economic forecast 2012 for 2012-2014.
Note: Data on social protection expenditure comes from the AMECO database (it is calculated as the sum of
Social benefits other than social transfers in kind; general government - ESA 1995 + Social transfers in kind -
ESA 1995)

- 141 -
6. TRENDS IN TAKE-UP OF SELECTED BENEFITS51
Number of unemployed
Definition Unemployed according to ILO definition - Total
Unit Thousands of persons - seasonally adjusted
Source Eurostat
Unemployment benefit recipients
Definition Full-time unemployed with an unemployment benefit
Unit Thousands of persons
Source Administrative data National Employment Office; FPS Social Security on the basis
of the NEO website
51
These data have been collected by the SPC in the context of monitoring the social impact of the crisis. It includes only a selection of benefits which have been considered most reactive to the crisis. The number of unemployed (standard definition by the ILO) and the number of persons with overdue debt repayments are given as a background.

- 142 -
Comment
This number is the sum of a number of different administrative categories of
unemployed: after full-time employment, after studies, after voluntary part-time
employment, different categories of early retirement and unemployed with social
or familial difficulties
Recipients of social assistance benefits/means-tested minimum income
Definition Social assistance benefit recipients (right to social integration)
Unit Thousands of persons
Source Federal Public Service for Social Integration
Comments
These figures cover recipients of the general social assistance benefit for people
on active age (recht op maatschappelijke integratie / droit à l’intégration
sociale) . Not included are beneficiaries of the specific social assistance scheme
for people with a handicap and of the social assistance scheme for the elderly.
Number of persons with overdue debt repayments
Definition Persons with at least one not regularized overdue debt repayment
Unit Thousands of persons
Source National Bank of Belgium, Central Credit Register, credits for individuals;
http://www.nbb.be/pub/04_00_00_00_00/04_00_00_00_00.htm?l=en
Comments These figures supply very timely information; however they have the
disadvantage that it is not really clear which social reality is behind the figures.
Number of disability benefit recipients
Definition People with a disability benefit in the social security schemes for the workers in
the private sector and for the self employed
Unit Thousands of persons (31 December of each year)
Source National Institute for Health and Disability Insurance (RIZIV/INAMI)
Comment Figures do not cover civil servants retired for reasons of disability and
beneficiaries of disability benefits due to occupational hazards.

- 143 -
6. SUMMARY OF SPECIFIC KEY SOCIAL CHALLENGES AND PARTICULARLY GOOD SOCIAL
OUTCOMES
Social policy areas Challenges
Poverty and social inclusion Improve the social inclusion of specific target groups such as
migrants, in particular non-EU nationals and Roma
High risk of poverty for lone parents
Tackle the issue of "Low-work intensity households" whose
rates are above EU average rates, and keep on increasing
Pensions Need to reform the retirement and pre-retirement system to
safeguard financial sustainability over the long-term while
ensuring adequacy of pensions in light of high risk of income
poverty rates for the elderly
Low effective retirement age– bridge the gap between
effective and statutory retirement age
Health and long-term care Address growth of health expenditure– specifically age-
related health expenditure without affecting adversely the
accessibility and quality of health care and long term care
Effectiveness and efficiency
of social protection systems
Address high age-related expenditure
Fight social fraud
Particularly good social outcomes
Some improvement in the employment rate of older workers

- 144 -
BULGARIA
1. 2012 NATIONAL SOCIAL REPORT (NSR): KEY ISSUES
Bulgaria (BG) experiences significant socio-economic challenges – rising unemployment rate,
increasing long-term unemployment and citizens with the highest risk of poverty or social
exclusion, almost twice the EU average (23.4%). Elderly, children and Roma represent the most
affected groups. BG has the highest rate of severe material deprivation in the EU (35% vs. 8% for
2010). About a third of the elderly are at risk of poverty, which is twice the EU average, and their
rate of severe material deprivation is almost 7 times higher than the EU average. The share of
children at risk of poverty and social exclusion is the second highest in the EU. BG is currently
placed among the Member States with the lowest impact of social transfers on poverty reduction
(27.1% of the population was at risk of poverty before transfers in 2010, and 20.7% after
transfers).
According to the National Social Report (NSR), an interinstitutional working group with
participation of all stakeholders was established within the Ministry of Labour and Social Policy.
The relevant stakeholders have been consulted before drafting the NSR.
The NSR identifies several key priorities in order to overcome the existing challenges. These are
related to reducing poverty and promoting social inclusion, improving the adequacy and
sustainability of the pension system in order to improve quality of life and ensure dignified
ageing as well as ensuring equal and effective access to quality health care, transitioning from
institutional to community-based long-term care and expanding access to services for children,
elderly persons and people with disabilities. The NSR priorities are in line with those
determined by the Commission52.
One of the main measures taken to reduce poverty and social exclusion was the increase in the
minimum wage. According to the NSR, as of September 1, 2011 new minimum wage for the
country equal to BGN 270 has been determined. Thus, in 2011 it has increased by 12.5%
compared to the previous level of BGN 240. A new increase in the minimum wage by 7.4% (BGN
290) came into force as of May 1, 2012, thus the total increase on monthly basis compared to
2010 is 18.1%. Other measures include promoting self-help initiatives, providing funding to
support self-employment and improving literacy skills of unskilled persons. The National
Programme "Activation of the Inactive Persons" represents the main measure aimed to
overcome the high unemployment among the Roma population. Under this programme
mediators identify inactive persons for registration in labour offices to enable their inclusion in
vocational training and employment. As a result, 8,248 unemployed persons, including
discouraged persons, have been registered in the labour offices. Specialised job fairs aimed at
the Roma community have also been organised with the aim of promoting awareness of the
Roma for vacant jobs and providing opportunities for a direct contact with employers.
52
Commission Staff Working Document - Assessment of the 2012 national reform programme and convergence programme for BG
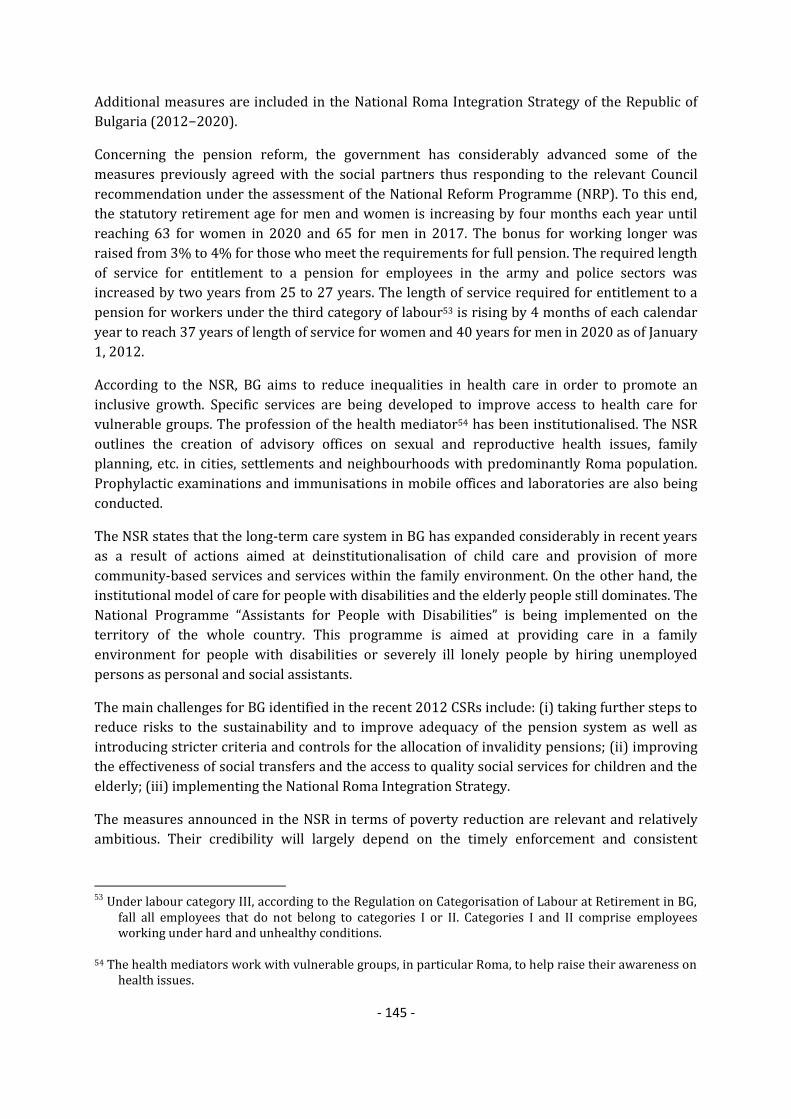
- 145 -
Additional measures are included in the National Roma Integration Strategy of the Republic of
Bulgaria (2012−2020).
Concerning the pension reform, the government has considerably advanced some of the
measures previously agreed with the social partners thus responding to the relevant Council
recommendation under the assessment of the National Reform Programme (NRP). To this end,
the statutory retirement age for men and women is increasing by four months each year until
reaching 63 for women in 2020 and 65 for men in 2017. The bonus for working longer was
raised from 3% to 4% for those who meet the requirements for full pension. The required length
of service for entitlement to a pension for employees in the army and police sectors was
increased by two years from 25 to 27 years. The length of service required for entitlement to a
pension for workers under the third category of labour53 is rising by 4 months of each calendar
year to reach 37 years of length of service for women and 40 years for men in 2020 as of January
1, 2012.
According to the NSR, BG aims to reduce inequalities in health care in order to promote an
inclusive growth. Specific services are being developed to improve access to health care for
vulnerable groups. The profession of the health mediator54 has been institutionalised. The NSR
outlines the creation of advisory offices on sexual and reproductive health issues, family
planning, etc. in cities, settlements and neighbourhoods with predominantly Roma population.
Prophylactic examinations and immunisations in mobile offices and laboratories are also being
conducted.
The NSR states that the long-term care system in BG has expanded considerably in recent years
as a result of actions aimed at deinstitutionalisation of child care and provision of more
community-based services and services within the family environment. On the other hand, the
institutional model of care for people with disabilities and the elderly people still dominates. The
National Programme “Assistants for People with Disabilities” is being implemented on the
territory of the whole country. This programme is aimed at providing care in a family
environment for people with disabilities or severely ill lonely people by hiring unemployed
persons as personal and social assistants.
The main challenges for BG identified in the recent 2012 CSRs include: (i) taking further steps to
reduce risks to the sustainability and to improve adequacy of the pension system as well as
introducing stricter criteria and controls for the allocation of invalidity pensions; (ii) improving
the effectiveness of social transfers and the access to quality social services for children and the
elderly; (iii) implementing the National Roma Integration Strategy.
The measures announced in the NSR in terms of poverty reduction are relevant and relatively
ambitious. Their credibility will largely depend on the timely enforcement and consistent
53
Under labour category III, according to the Regulation on Categorisation of Labour at Retirement in BG, fall all employees that do not belong to categories I or II. Categories I and II comprise employees working under hard and unhealthy conditions.
54 The health mediators work with vulnerable groups, in particular Roma, to help raise their awareness on health issues.

- 146 -
implementation. In this regard, a comprehensive and integrated approach would raise the
effectiveness of social transfers.
2. NATIONAL 2020 TARGET FOR THE REDUCTION OF POVERTY AND SOCIAL EXCLUSION
"Reducing the number of people living in poverty by 260.000 people"
Source: National Reform Programme (2011)
2.a Progress towards the 2020 national target for the reduction of poverty and
social exclusion
Source: Eurostat (EU-SILC)
Note: i) Progress on the target is monitored on the basis of the EU SILC data with a base year 2008 and
target data year 2018;
ii) AROP - at-risk-of-poverty rate; For the at-risk-of poverty rate (AROP), the income reference year
is the calendar year prior to the survey year (i.e. 2010) except for the United Kingdom (survey year) and
Ireland (12 months preceding the survey).

- 147 -
2b. Composition of the population at risk of poverty or social exclusion (2011)
Source: Eurostat (EU-SILC)
Note: i) AROP - at-risk-of-poverty rate; VLWI - share of population living in very low work intensity
households ((quasi)-jobless households); SMD - severe material deprivation rate; the red overlap indicates
the share of the population which accumulates all three conditions,
ii) For the at-risk-of poverty rate (AROP), the income reference year is the calendar year prior to the
survey year (i.e. 2010) except for the United Kingdom (survey year) and Ireland (12 months preceding the
survey). Similarly, the very low work intensity rate (VLWI) refers to the income reference year prior to the
survey (i.e. 2010) while for the severe material deprivation rate (SMD), the reference is the current year (i.e.
2011).
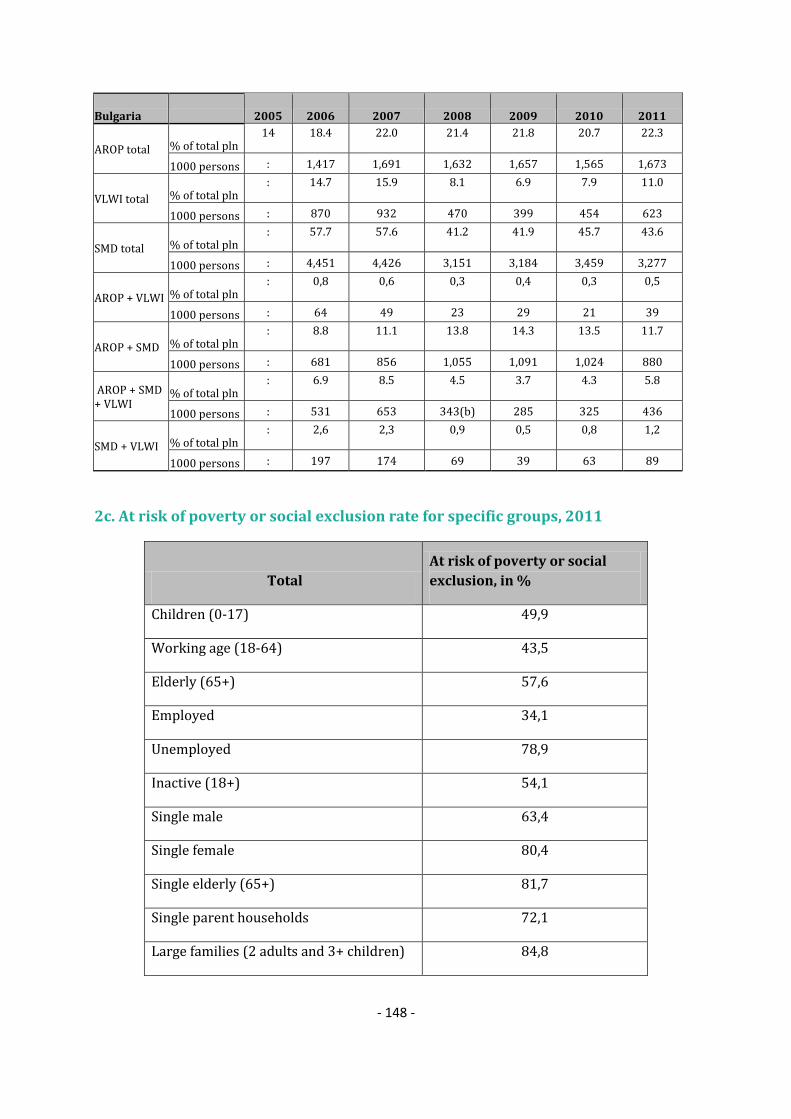
- 148 -
Bulgaria 2005 2006 2007 2008 2009 2010 2011
AROP total % of total pln 14 18.4 22.0 21.4 21.8 20.7 22.3
1000 persons : 1,417 1,691 1,632 1,657 1,565 1,673
VLWI total % of total pln : 14.7 15.9 8.1 6.9 7.9 11.0
1000 persons : 870 932 470 399 454 623
SMD total % of total pln : 57.7 57.6 41.2 41.9 45.7 43.6
1000 persons : 4,451 4,426 3,151 3,184 3,459 3,277
AROP + VLWI % of total pln : 0,8 0,6 0,3 0,4 0,3 0,5
1000 persons : 64 49 23 29 21 39
AROP + SMD % of total pln : 8.8 11.1 13.8 14.3 13.5 11.7
1000 persons : 681 856 1,055 1,091 1,024 880
AROP + SMD + VLWI
% of total pln : 6.9 8.5 4.5 3.7 4.3 5.8
1000 persons : 531 653 343(b) 285 325 436
SMD + VLWI % of total pln : 2,6 2,3 0,9 0,5 0,8 1,2
1000 persons : 197 174 69 39 63 89
2c. At risk of poverty or social exclusion rate for specific groups, 2011
Total
At risk of poverty or social
exclusion, in %
Children (0-17) 49,9
Working age (18-64) 43,5
Elderly (65+) 57,6
Employed 34,1
Unemployed 78,9
Inactive (18+) 54,1
Single male 63,4
Single female 80,4
Single elderly (65+) 81,7
Single parent households 72,1
Large families (2 adults and 3+ children) 84,8

- 149 -
EU-migrant (EU 27)(18+) 24,0
Non-EU migrants (non-EU27)(18+) 53,6
Source: Eurostat (EU-SILC)
3. MAIN SOCIAL INDICATORS
BG % 2005 2006 2007 2008 2009 2010 2011 2010 2011
At risk of poverty or social exclusion : 61,3 60,7 44,8 46,2 49,2 49,1 23,6 24.2
At-Risk-of-Poverty rate 14,0 18,4 22,0 21,4 21,8 20,7 22,3 16.4 16.9
Severe Material Deprivation rate : 57.7 57.6 41.2 41.9 45.7 43.6 8,3 8.8
Share of people living in very low work
intensity households : 14,7 15,9 8,1 6,9 7,9 11,0 10.0 10.0
Impact of social transfers on poverty
reduction (excl. pensions) 17,6 25,5 13,7 21,0 17,4 23,6 17,9 36,7 35,2
Value of threshold (single HH) - in PPS 2.253 1.920 1.979 2.859 3.451 3.528 3.427 N/A N/A
Value of threshold (2 adults + 2 children) -
in PPS 4.731 4.032 4.157 6.004 7.247 7.408 7.197 N/A N/A
At risk of poverty or social exclusion : 61,0 60,8 44,2 47,3 49,8 51,8 27,1 27.0
At-Risk-of-Poverty rate 18,0 25,0 29,9 25,5 24,9 26,8 28,9 20.5 20.6
Severe Material Deprivation rate : 57.6 58.3 40.8 43.6 46.5 45.6 9,7 10.0
Share of people living in very low work
intensity households : 16,7 18,7 9,4 7,5 10,3 14,0 9.1 8.8
Impact of social transfers on poverty
reduction (excl. pensions) 25,0 23,1 11,8 18,0 17,3 21,6 17,2 41,4 40,5
At risk of poverty or social exclusion : 58,1 57,9 39,5 40,6 45,0 45,2 23,5 24.3
At-Risk-of-Poverty rate 12,0 16,2 19,4 17,0 16,4 16,0 18,2 15.2 16.0
Severe Material Deprivation rate : 54.2 54.9 36.2 37.1 42.2 40.3 8,3 8.9
Share of people living in very low work
intensity households (18-59) : 14,1 15,1 7,7 6,7 7,3 10,1 10.3 10,5
In-work at-risk-of poverty rate : 5,5 5,9 7,6 7,5 7,7 8,2 8.4 8.9
Impact of social transfers on poverty
reduction (excl. pensions) 20,0 24,3 14,5 24,1 21,2 28,9 20,9 38,7 37,0
At risk of poverty or social exclusion : 73,7 71,1 65,5 66,0 63,9 61,1 20,0 20.5
At-Risk-of-Poverty rate 18,0 19,9 23,9 33,8 39,3 32,2 30,9 16.0 16.0
Severe Material Deprivation rate : 70.7 67.2 61.0 58.4 58.1 53.7 6,6 7.2
Relative median income ratio of elderly 0,84 0,79 0,78 0,66 0,63 0,74 0,72 0.88 0.89
Aggregate replacement ratio 0,60 0,37 0,37 0,34 0,34 0,43 0,41 0.53 0.54
2000 2005 2006 2007 2008 2009 2010 2009 2010
Sickness/Health care : 4,2 3,6 3,7 4,4 3,9 4,2 8,4 8,3
Invalidity : 1,2 1,3 1,1 1,2 1,4 1,4 2,3 2,2
Old age and survivors : 7,5 7,3 7,0 7,4 8,6 9,0 12,7 12,7
Family/Children : 1,0 1,0 1,2 1,3 2,0 2,0 2,3 2,3
Unemployment : 0,3 0,3 0,3 0,3 0,5 0,6 1,8 1,7
Housing and Social exclusion n.e.c. : 0,4 0,3 0,3 0,3 0,2 0,3 1,0 1,0
Total : 14,6 13,8 13,7 15,0 16,7 17,6 28,5 28,2
Means-tested
Sickness/Health care : 0,0 0,0 0,0 0,0 0,0 0,0 0,1 0,1
Invalidity : 0,0 0,0 0,0 0,0 0,0 0,0 0,5 0,5
Old age and survivors : 0,0 0,0 0,0 0,0 0,0 0,0 0,6 0,6
Family/Children : 0,6 0,5 0,4 0,4 0,6 0,6 0,6 0,6
Unemployment : 0,0 0,0 0,0 0,0 0,0 0,0 0,4 0,4
Housing and Social exclusion n.e.c. : 0,4 0,3 0,3 0,3 0,1 0,2 0,9 1,0
Total : 1,0 0,8 0,7 0,7 0,7 0,8 3,0 3,1
Non-means tested
Sickness/Health care : 4,2 3,6 3,7 4,4 3,9 4,2 8,3 8,2
Invalidity : 1,2 1,3 1,1 1,2 1,4 1,4 1,8 1,8
Old age and survivors : 7,4 7,2 7,0 7,4 8,6 9,0 12,1 12,1
Family/Children : 0,4 0,5 0,8 0,9 1,4 1,4 1,7 1,7
Unemployment : 0,3 0,3 0,3 0,3 0,5 0,6 1,4 1,3
Housing and Social exclusion n.e.c. : 0,0 0,0 0,1 0,1 0,1 0,1 0,1 0,1
Total : 13,6 12,9 13,0 14,3 15,9 16,8 25,4 25,2
EU27
Social expenditure
(in % of GDP)
Children (0-17)
Working age
(18-64)
Elderly (65+)
Total population
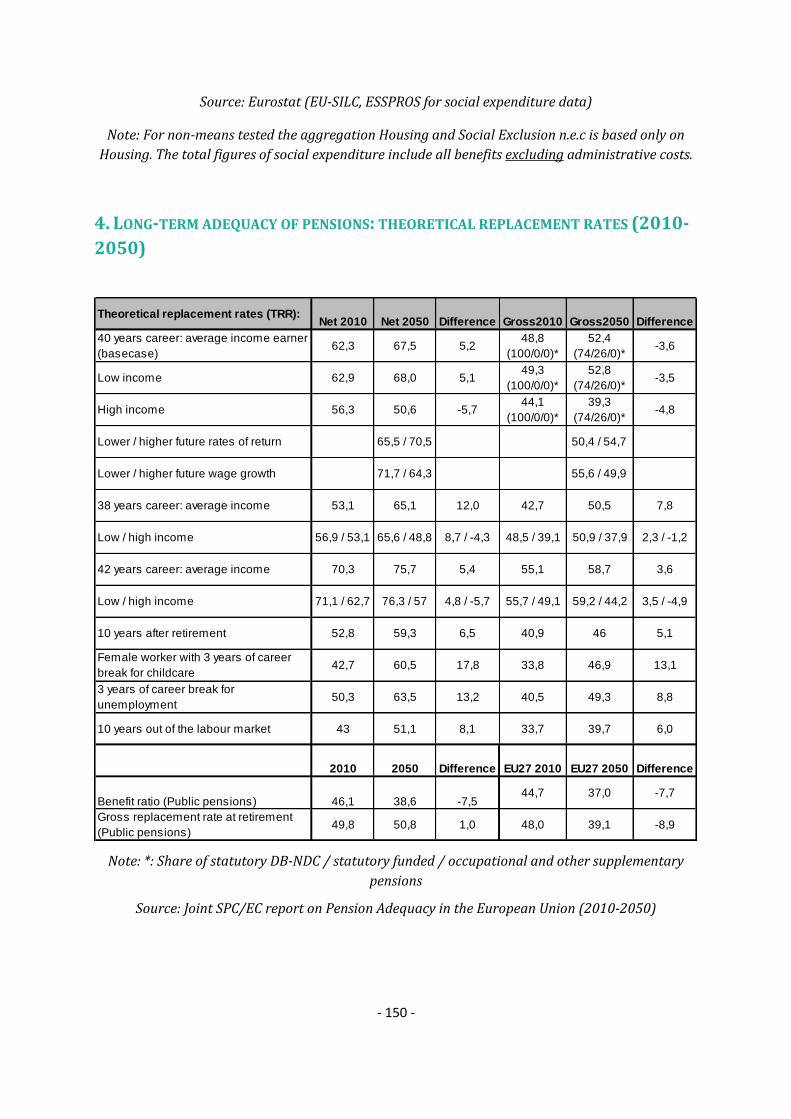
- 150 -
Source: Eurostat (EU-SILC, ESSPROS for social expenditure data)
Note: For non-means tested the aggregation Housing and Social Exclusion n.e.c is based only on
Housing. The total figures of social expenditure include all benefits excluding administrative costs.
4. LONG-TERM ADEQUACY OF PENSIONS: THEORETICAL REPLACEMENT RATES (2010-
2050)
Theoretical replacement rates (TRR): Net 2010 Net 2050 Difference Gross2010 Gross2050 Difference
40 years career: average income earner
(basecase)62,3 67,5 5,2
48,8
(100/0/0)*
52,4
(74/26/0)*-3,6
Low income 62,9 68,0 5,149,3
(100/0/0)*
52,8
(74/26/0)*-3,5
High income 56,3 50,6 -5,744,1
(100/0/0)*
39,3
(74/26/0)*-4,8
Lower / higher future rates of return 65,5 / 70,5 50,4 / 54,7
Lower / higher future wage growth 71,7 / 64,3 55,6 / 49,9
38 years career: average income 53,1 65,1 12,0 42,7 50,5 7,8
Low / high income 56,9 / 53,1 65,6 / 48,8 8,7 / -4,3 48,5 / 39,1 50,9 / 37,9 2,3 / -1,2
42 years career: average income 70,3 75,7 5,4 55,1 58,7 3,6
Low / high income 71,1 / 62,7 76,3 / 57 4,8 / -5,7 55,7 / 49,1 59,2 / 44,2 3,5 / -4,9
10 years after retirement 52,8 59,3 6,5 40,9 46 5,1
Female worker with 3 years of career
break for childcare42,7 60,5 17,8 33,8 46,9 13,1
3 years of career break for
unemployment50,3 63,5 13,2 40,5 49,3 8,8
10 years out of the labour market 43 51,1 8,1 33,7 39,7 6,0
2010 2050 Difference EU27 2010 EU27 2050 Difference
Benefit ratio (Public pensions) 46,1 38,6 -7,544,7 37,0 -7,7
Gross replacement rate at retirement
(Public pensions)49,8 50,8 1,0 48,0 39,1 -8,9
Note: *: Share of statutory DB-NDC / statutory funded / occupational and other supplementary
pensions
Source: Joint SPC/EC report on Pension Adequacy in the European Union (2010-2050)

- 151 -
5. KEY CONTEXT MACRO-ECONOMIC INFORMATION
Source: Eurostat, National Accounts and EU LFS. ECFIN autumn economic forecast 2012 for 2012-
2014.
Note: Data on social protection expenditure comes from the AMECO database ( it is calculated as
the sum of Social benefits other than social transfers in kind; general government - ESA 1995 +
Social transfers in kind - ESA 1995)

- 152 -
6. TRENDS IN TAKE-UP OF SELECTED BENEFITS55
Number of unemployed
Definition Unemployment according to ILO definition - Total
Unit thousands of persons - seasonally adjusted
Source Eurostat
Unemployment recipients
Definition U benefits beneficiaries
Unit thousands of beneficiaries
Source Source: National Social Security Institute
Comment The number of the unemployed benefits beneficiaries increased due to the
economic crisis and the higher unemployment rate.
55
This data has been collected by the SPC in the context of monitoring the social impact of the crisis. It includes only a selection of benefits which have been considered most reactive to the crisis. The number of unemployed refers to the standard definition by the ILO and is given as background information.

- 153 -
Recipients of social assistance benefits/means-tested minimum Income
Definition Monthly social assistance benefit recipients
Unit thousands of recipients
Source Social assistance Agency
Comment There are not big differences in the number of the monthly social assistance
benefit recipients.
Disability benefits recipients
Definition Monthly disability benefit recipients
Unit thousands of recipients
Source Social assistance Agency
Comment There is a little increase in the number of the monthly disability benefit
recipients
7. SUMMARY OF SPECIFIC KEY SOCIAL CHALLENGES AND PARTICULARLY GOOD SOCIAL
OUTCOMES
Social policy areas Challenges
Poverty and social inclusion Reducing very high levels of poverty and social exclusion and
high income inequalities
Promoting social inclusion and Roma integration
Improving access to social services for children and elderly
and people with disabilities
Pensions Improving sustainability of the pension system
Improving the adequacy of the pension system
Equalising statutory retirement ages for men and women
Loose eligibility for allocation of invalidity pensions
Health and long-term care Ensure equal and effective access to quality healthcare
Facilitate transitioning from institutional to community-
based long-term care
Effectiveness and efficiency Improving effectiveness of social security system to
encourage declared work

- 154 -
of social protection systems Improving effectiveness of social transfers to alleviate
poverty
Particularly good social outcomes
Some improvement in the employment rates of older
workers
- 155 -
CZECH REPUBLIC
1. 2012 NATIONAL SOCIAL REPORT (NSR): KEY ISSUES
The Czech Republic faces a number of socio-economic challenges. In 2011 the real GDP growth
was 1.9% and the government deficit was 3.1%. There is still a challenge of consolidation of
public finances including the sustainability of the pension system. Both the employment (70.9%)
and unemployment (6.7 % in the first quarter of 2012) rates are better than the EU average.
However, there is a significant impact of parenthood on employment. Unemployment is the main
determinant of poverty (41.2% in 2010). On the rise is child poverty (15.2%). On the other hand,
poverty of older people (75+) decreased to 7.2% (8.7% in 2010), and for women to 10.8%
(12.3% in 2010). Overall the level of poverty and social exclusion is low but increased to 15.3%
(14.4% in 2010).
The report informs about consultations with the relevant stakeholders including social
partners that are members of the Inter-Ministerial Coordination Group for the EU Affairs of the
Ministry of Labour and of the Social Inclusion Committee of the same ministry.
The main socio-economic priorities identified by the Report correspond to the priorities
identified by the Commission56. In the field of social inclusion the Report focuses on enhancing
the employability and activation of socially excluded persons and people in risk of social
exclusion, improving the system of social assistance and its effectiveness, supporting access to
key social services, improving the system of care for children and focusing on the territorial
dimension of social exclusion. Both, social services and the system of social and legal protection
of children are currently undergoing the transformation, the results of which are expected in
2013 and 2014. In the field of pensions these priorities are the fiscal sustainability and longer-
term stability of the pension system, fair distribution of the intergenerational burden,
strengthening the principle of equity, ensuring diversification of income by a multi-pillar system
and ensuring protection against poverty in old age. In the field of health and long-term care
these priorities are making the public health insurance more effective, improving organisation
and quality of healthcare, support e-Health and information technologies and to set up the
system of coordinated health and social care.
Measures proposed to reduce poverty and social exclusion are based on the understanding
that employment is the best way out of poverty and social exclusion, as well as the fact that
poverty levels are low in the Czech Republic and concentrated around specific groups. In this
vein, measures focus on supporting employability, in particular for the most disadvantaged
groups. Particular attention is paid to on-going changes in the field of social assistance aimed at
increasing its effectiveness and motivating people to take-up employment. In addition the
reform of public employment services in force from January 2012 unified both systems of social
assistance and unemployment benefits in one place. The whole reform of public employment
services has been aimed at increasing the quality and effectiveness of active employment policy 56 SWD(2012) 303 final

- 156 -
tools, namely counselling, training, job-search assistance and more individualized approach to
the most disadvantage persons on the labour market.
The government adopted the Strategy of Fight against Social Exclusion for 2011-2015. The
strategy is multi-dimensional and if properly implemented it could help to reduce poverty and
social exclusion. It is highly relevant especially for Roma. The Agency for Social Inclusion in
Roma localities (financed also by the ESF) deals particularly with the establishment of local
partnerships, which provide support to municipalities in the process of social inclusion. Its
activities are largely limited to a few socially excluded localities. From its position as a supra-
departmental body, the Agency is also involved in the preparation of national strategies on social
protection and social inclusion.
The Czech Republic faces a challenge of low equity of compulsory education and widespread
practice of educating Roma children out of mainstream schools in so called practical basic
schools (almost 1/3 of its pupils are Roma) that limits their chances to get fully-fledged
education and good employment prospects. Therefore attention is paid to equal opportunities in
education. The amendments of several legislative norms in the field of education and the
intention to support participation of disadvantaged children in pre-school education are
mentioned in the Report. The Government is currently preparing a follow-up document to the
National Action Plan for Inclusive Education based on the European Court of Human Rights
judgement “D. H. and Others against the Czech Republic” titled ‘Education Development Strategy
until 2020’, which will be completed by the end of 2013. The Strategy envisages among other
things legislative and non-legislative measures to eliminate discrimination against Roma in the
education system. Measures planned will come into force from 2014 onwards.
As regard pensions, several important measures were adopted in 2011/2012 as part of the
pension reform aimed at ensuring a higher long-term financial sustainability and are gradually
implemented. A set of parametric changes was adopted through the so called "small pension
reform" of the public PAYG pillar: change of the calculation of pensions to improve link between
contributions and pensions on high-income participants (on the basis of the Constitutional Court
decision). Additional measures are further gradual increase of the retirement age and its faster
unification for women with men, tightening early retirement reduction (for retirees more than 1
year before statutory retirement age), adjustment of the regular system for increasing the
pensions by a more precise specification in the law with additional temporary lower index for
2013-2015. The CSR 2012 stressed that even if this reform strengthens a link between the
statutory retirement age and life expectancy, it does not include a mechanism that would ensure
a timely response to future changes.
As regards the so called "big pension reform" that starts in 2013, the new semi-mandatory
(based on partly opting out from public pillar) funded pillar has been created with the aim to
diversify sources of financing pensions and to contribute to higher average pensions. This is
dependent on the proportion of workers participating in the new pillar and on the expected rate
of return over the long run. Immediate impact on the state budget will be negative as the pillar is
based on a transfer of 3 p.p. of the existing premium from the public pillar. However, there is
defined source of financing in the state budget – part of the VAT revenue.

- 157 -
Regarding healthcare and long-term care, the Report informs about reform measures (legislative
changes) aimed at improving long-term financial sustainability of the system, such as a
definition of the scope of care paid by the public health insurance and the rules for the
identification of above-standard services to be paid by the patients, and the specification of the
rights and obligations of patients. Moreover, the new legislation on the emergency services
determining clear rules for cooperation between the services and hospitals was adopted.
As regards the system of health and social long-term care, preparatory works are on-going for
legal changes based on amendments to existing laws in social and health field that would
establish a complex system. Coordination of at present separated systems is necessary also with
a view of rapidly ageing population.
The three main challenges for the Czech Republic are supporting employability of the
disadvantaged groups by increasing the quality and effectiveness of training, job-search
assistance, individualized services and increased provision of childcare services, improving
financial sustainability of pension system and establishing a complex system of health and social
services that would be financially sustainable with a view of rapidly ageing population.
As regards the adequacy of the measures in terms of poverty reduction, they are relevant but
still more efforts need to be done to improve and increase the quality and effectiveness of
training, job-search assistance and individualised services and targeted social services for the
most disadvantaged groups and localities. Moreover, measures on inclusive education and early
care need effective implementation and increased funding. As far as the Czech target on poverty
is concerned, it is possible to assume that it will be reached.
2. NATIONAL 2020 TARGET FOR THE REDUCTION OF POVERTY AND SOCIAL EXCLUSION
"- to keep the number of people at risk of poverty, material deprivation, or living in jobless
households in 2020 at the same level as in 2008;
- to reduce the number of people at risk of poverty, material deprivation, or living in jobless
households by 30, 000."
Source: National Reform Programme (2011)

- 158 -
2.a Progress towards the 2020 national target for the reduction of poverty and
social exclusion
Source: Eurostat (EU-SILC)
Note: i) Progress on the target is monitored on the basis of the EU SILC data with a base year 2008 and
target data year 2018;
ii) AROPE - at-risk-of-poverty or social exclusion rate; AROP - at-risk-of-poverty rate; VLWI - share of
population living in very low work intensity households; SMD - severe material deprivation rate
iii) For the at-risk-of poverty rate (AROP), the income reference year is the calendar year prior to the
survey year (i.e. 2010) except for the United Kingdom (survey year) and Ireland (12 months preceding the
survey). Similarly, the very low work intensity rate (VLWI) refers to the income reference year prior to the
survey (i.e. 2010) while for the severe material deprivation rate (SMD), the reference is the current year (i.e.
2011).
2b. Composition of the population at risk of poverty or social exclusion (2011)
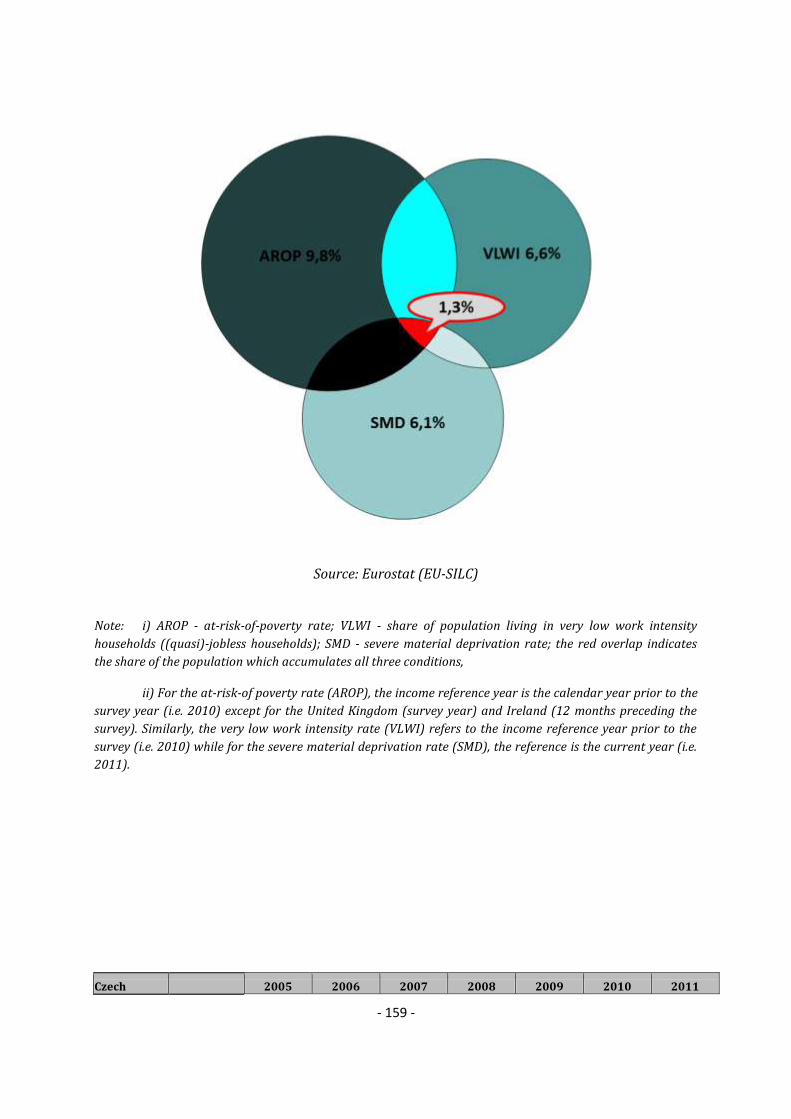
- 159 -
Source: Eurostat (EU-SILC)
Note: i) AROP - at-risk-of-poverty rate; VLWI - share of population living in very low work intensity
households ((quasi)-jobless households); SMD - severe material deprivation rate; the red overlap indicates
the share of the population which accumulates all three conditions,
ii) For the at-risk-of poverty rate (AROP), the income reference year is the calendar year prior to the
survey year (i.e. 2010) except for the United Kingdom (survey year) and Ireland (12 months preceding the
survey). Similarly, the very low work intensity rate (VLWI) refers to the income reference year prior to the
survey (i.e. 2010) while for the severe material deprivation rate (SMD), the reference is the current year (i.e.
2011).
Czech 2005 2006 2007 2008 2009 2010 2011
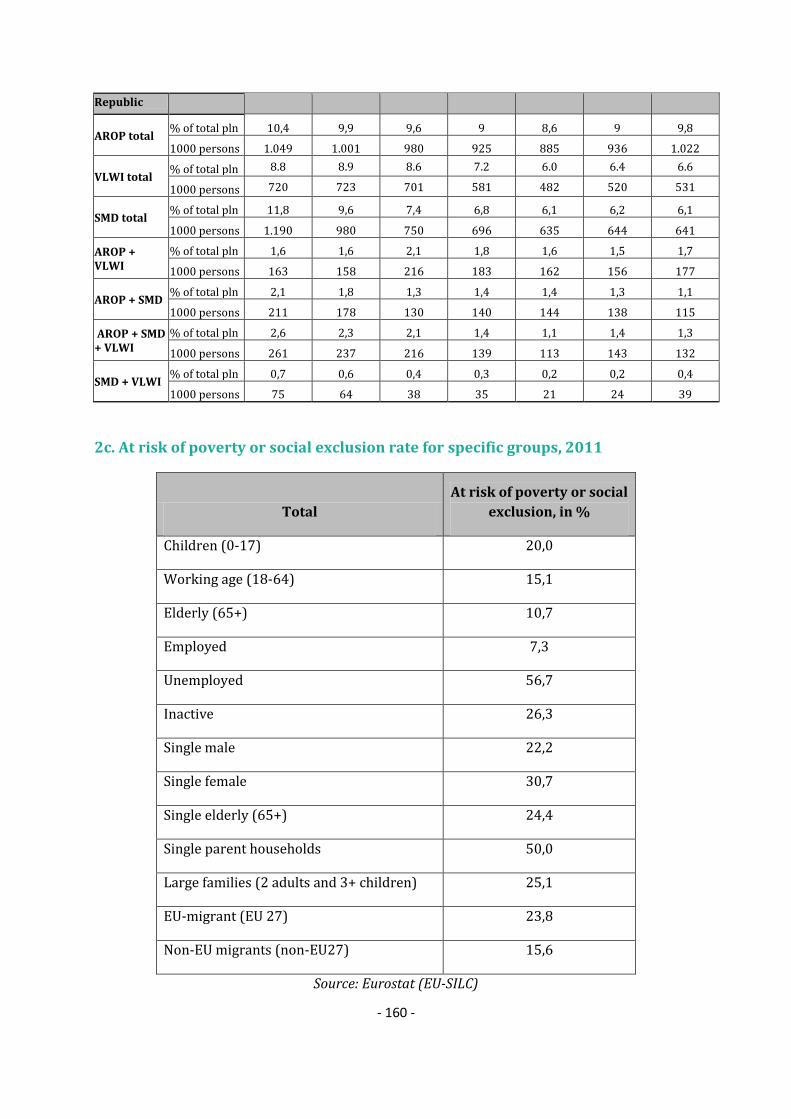
- 160 -
Republic
AROP total % of total pln 10,4 9,9 9,6 9 8,6 9 9,8
1000 persons 1.049 1.001 980 925 885 936 1.022
VLWI total % of total pln 8.8 8.9 8.6 7.2 6.0 6.4 6.6
1000 persons 720 723 701 581 482 520 531
SMD total % of total pln 11,8 9,6 7,4 6,8 6,1 6,2 6,1
1000 persons 1.190 980 750 696 635 644 641
AROP + VLWI
% of total pln 1,6 1,6 2,1 1,8 1,6 1,5 1,7
1000 persons 163 158 216 183 162 156 177
AROP + SMD % of total pln 2,1 1,8 1,3 1,4 1,4 1,3 1,1
1000 persons 211 178 130 140 144 138 115
AROP + SMD + VLWI
% of total pln 2,6 2,3 2,1 1,4 1,1 1,4 1,3
1000 persons 261 237 216 139 113 143 132
SMD + VLWI % of total pln 0,7 0,6 0,4 0,3 0,2 0,2 0,4
1000 persons 75 64 38 35 21 24 39
2c. At risk of poverty or social exclusion rate for specific groups, 2011
Total
At risk of poverty or social
exclusion, in %
Children (0-17) 20,0
Working age (18-64) 15,1
Elderly (65+) 10,7
Employed 7,3
Unemployed 56,7
Inactive 26,3
Single male 22,2
Single female 30,7
Single elderly (65+) 24,4
Single parent households 50,0
Large families (2 adults and 3+ children) 25,1
EU-migrant (EU 27) 23,8
Non-EU migrants (non-EU27) 15,6
Source: Eurostat (EU-SILC)

- 161 -
3. MAIN SOCIAL INDICATORS
CZ % 2005 2006 2007 2008 2009 2010 2011 2010 2011
At risk of poverty or social exclusion 19,6 18,0 15,8 15,3 14,0 14,4 15,3 23,6 24.2
At-Risk-of-Poverty rate 10,4 9,9 9,6 9,0 8,6 9,0 9,8 16.4 16.9
Severe Material Deprivation rate 11,8 9,6 7,4 6,8 6,1 6,2 6,1 8,3 8.8
Share of people living in very low work
intensity households 8,8 8,9 8,6 7,2 6,0 6,4 6,6 10.0 10.0
Impact of social transfers on poverty
reduction (excl. pensions)(in%) 50,9 54,2 52,2 55,0 52,0 50,3 45,6 36,7 35,2
Value of threshold (single HH) - in PPS4.585 4.956 5.305 5.835 6.062 5.793 5.944 N/A N/A
Value of threshold (2 adults + 2 children) -
in PPS 9.628 10.409 11.140 12.254 12.731 12.166 12.482 N/A N/A
At risk of poverty or social exclusion 25,6 22,7 21,5 18,6 17,2 18,9 20,0 27,1 27.0
At-Risk-of-Poverty rate 17,6 16,5 16,6 13,2 13,3 14,3 15,2 20.5 20.6
Severe Material Deprivation rate 15,3 12,2 10,0 8,3 7,4 8,6 8 9,7 10.0
Share of people living in very low work
intensity households 9,1 8,6 10,0 7,6 6,1 7,0 6,9 9.1 8.8
Impact of social transfers on poverty
reduction (excl. pensions) 47,1 48,4 46,1 55,6 47,4 45,0 43,7 41,4 40,5
At risk of poverty or social exclusion 19,0 17,8 15,3 15,0 13,7 14,1 15,1 23,5 24.3
At-Risk-of-Poverty rate 9,4 8,8 8,6 8,3 7,6 8,1 9,1 15.2 16.0
Severe Material Deprivation rate 10,9 9,3 6,8 6,5 5,9 6,0 5,8 8,3 8.9
Share of people living in very low work
intensity households (18-59) 8,8 8,9 8,2 7,1 5,9 6,2 6,4 10.3 10,5
In-work at-risk-of poverty rate 3,5 3,5 3,3 3,6 3,2 3,7 4,1 8.4 8.9
Impact of social transfers on poverty
reduction (excl. pensions) 52,8 56,9 54,3 55,4 54,5 52,6 47,7 38,7 37,0
At risk of poverty or social exclusion 14,7 12,7 10,9 12,5 11,7 10,1 10,7 20,0 20.5
At-Risk-of-Poverty rate 5,3 5,9 5,5 7,4 7,2 6,8 6,6 16.0 16.0
Severe Material Deprivation rate 10,8 8,0 6,5 6,4 5,7 4,3 5,4 6,6 7.2
Relative median income ratio of elderly 0,83 0,82 0,81 0,79 0,78 0,82 0,82 0.88 0.89
Aggregate replacement ratio 0,51 0,52 0,51 0,51 0,51 0,54 0,53 0.53 0.54
2000 2005 2006 2007 2008 2009 2010 2009 2010
Sickness/Health care 6,1 6,3 6,0 5,9 5,8 6,4 6,3 8,4 8,3
Invalidity 1,4 1,4 1,5 1,4 1,4 1,5 1,5 2,3 2,2
Old age and survivors 7,9 7,6 7,5 7,7 8,0 9,0 9,2 12,7 12,7
Family/Children 1,5 1,3 1,3 1,6 1,4 1,4 1,3 2,3 2,3
Unemployment 0,6 0,6 0,6 0,6 0,6 1,0 0,8 1,8 1,7
Housing and Social exclusion n.e.c. 0,6 0,6 0,3 0,2 0,3 0,3 1,0 1,0
Total 18,2 17,8 17,4 17,5 17,5 19,7 19,5 28,5 28,2
Means-tested
Sickness/Health care 0,0 0,0 0,0 0,0 0,0 0,0 0,0 0,1 0,1
Invalidity 0,0 0,0 0,0 0,0 0,0 0,0 0,0 0,5 0,5
Old age and survivors 0,0 0,0 0,0 0,0 0,0 0,0 0,0 0,6 0,6
Family/Children 0,9 0,5 0,5 0,4 0,2 0,2 0,2 0,6 0,6
Unemployment 0,0 0,0 0,0 0,0 0,0 0,0 0,0 0,4 0,4
Housing and Social exclusion n.e.c. 0,5 0,4 0,4 0,2 0,1 0,1 0,2 0,9 1,0
Total 1,4 1,0 0,9 0,6 0,4 0,4 0,4 3,0 3,1
Non-means tested
Sickness/Health care 6,1 6,3 6,0 5,9 5,8 6,4 6,3 8,3 8,2
Invalidity 1,4 1,4 1,5 1,4 1,4 1,5 1,5 1,8 1,8
Old age and survivors 7,9 7,6 7,5 7,7 8,0 9,0 9,2 12,1 12,1
Family/Children 0,7 0,8 0,8 1,2 1,1 1,2 1,1 1,7 1,7
Unemployment 0,6 0,6 0,6 0,6 0,6 1,0 0,8 1,4 1,3
Housing and Social exclusion n.e.c. 0,1 0,1 0,1 0,1 0,1 0,2 0,1 0,1 0,1
Total 16,8 16,8 16,5 16,9 17,1 19,3 19,1 25,4 25,2
Social expenditure
(in % of GDP)
EU27
Children (0-17)
Working age
(18-64)
Elderly (65+)
Total population
Source: Eurostat (EU-SILC, ESSPROS for social expenditure data)
Note: For non-means tested the aggregation Housing and Social Exclusion n.e.c is based only on
Housing. The total figures of social expenditure include all benefits excluding administrative costs.

- 162 -
4. LONG-TERM ADEQUACY OF PENSIONS: THEORETICAL REPLACEMENT RATES (2010-
2050)
Theoretical replacement rates (TRR): Net 2010 Net 2050 Difference Gross2010 Gross2050 Difference
40 years career: average income earner
(basecase)70,6 43,1 -27,5
55,1
(100/0/0)*
33,4
(100/0/0)*-21,6
Low income 87,2 54,9 -32,372,1
(100/0/0)*
45
(100/0/0)*-27,1
High income 42,5 26,6 -15,931,5
(100/0/0)*
19,5
(100/0/0)*-12,0
Lower / higher future rates of return 43,1 / 43,1 33,4 / 33,4
Lower / higher future wage growth 43,1 / 43,1 33,4 / 33,4
38 years career: average income 60,3 34,2 -26,1 47 26,5 -20,5
Low / high income 74,9 / 35,4 44 / 20,8 (-30,8/-14,6) 61,9 / 26,1 36,1 / 15,2 (-25,8/-10,9)
42 years career: average income 80,2 53,9 -26,3 63,1 41,8 -21,3
Low / high income 94,3 / 46,3 68 / 33,6 (-26,3/-12,8) 77,2 / 34,7 55,7 / 24,6 (-21,5/-10,1)
10 years after retirement 61,1 37,9 -23,2 47,3 29,4 -17,9
Female worker with 3 years of career
break for childcare51,5 59,5 8,0 33,8 46,1 12,3
3 years of career break for
unemployment57,6 58,8 1,2 43,8 45,6 1,8
10 years out of the labour market 50,1 28,9 -21,2 39,1 22,4 -16,7
2010 2050 Difference EU27 2010 EU27 2050 Difference
Benefit ratio (Public pensions) 26,2 25,2 -1,044,7 37,0 -7,7
Gross replacement rate at retirement
(Public pensions)28,5 25,4 -3,2 48,0 39,1 -8,9
Source: Joint SPC/EC report on Pension Adequacy in the European Union (2010-2050);
Note: *: Share of statutory DB-NDC / statutory funded / occupational and other supplementary
pensions

- 163 -
5. KEY CONTEXT MACRO-ECONOMIC INFORMATION
Source: Eurostat, National Accounts and EU LFS. ECFIN autumn economic forecast 2012 for 2012-
2014.
Note: Data on social protection expenditure comes from the AMECO database (it is calculated as
the sum of Social benefits other than social transfers in kind; general government - ESA 1995 +
Social transfers in kind - ESA 1995)
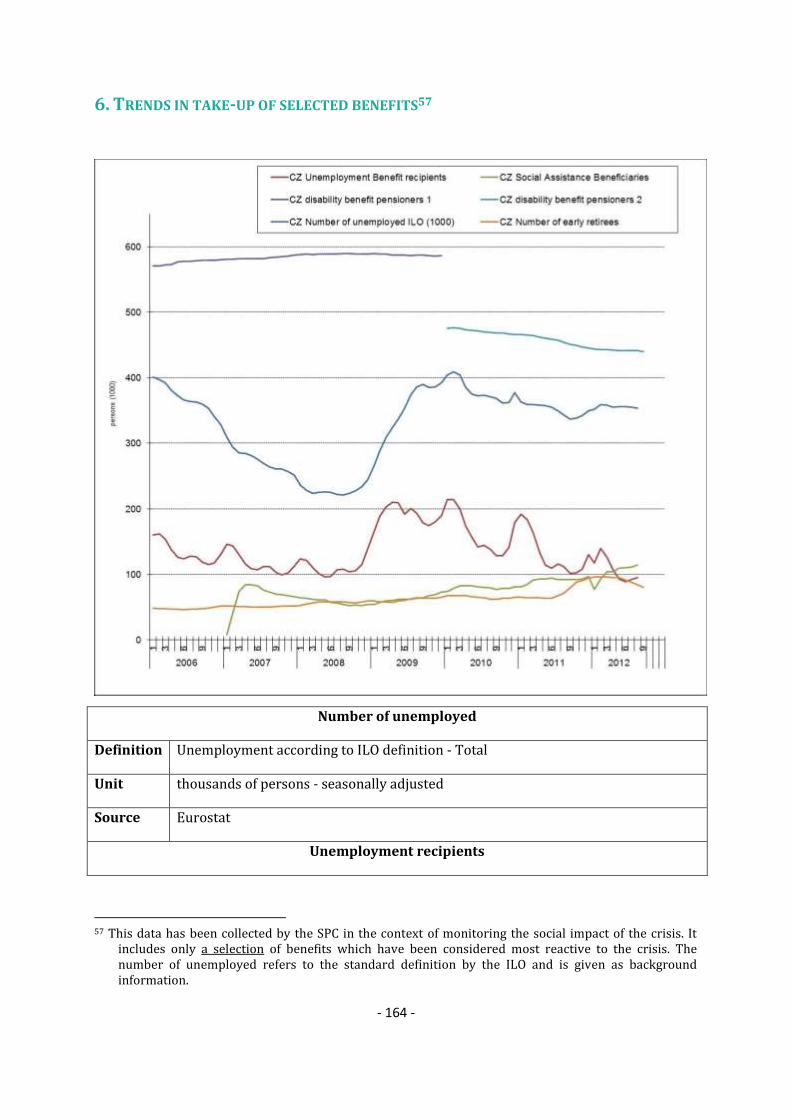
- 164 -
6. TRENDS IN TAKE-UP OF SELECTED BENEFITS57
Number of unemployed
Definition Unemployment according to ILO definition - Total
Unit thousands of persons - seasonally adjusted
Source Eurostat
Unemployment recipients
57 This data has been collected by the SPC in the context of monitoring the social impact of the crisis. It
includes only a selection of benefits which have been considered most reactive to the crisis. The number of unemployed refers to the standard definition by the ILO and is given as background information.

- 165 -
Definition Unemployment Benefit recipients
Unit thousands of recipients
Source www.mpsv.cz (Ministry of Labour and Social Affairs)
Comment
Unemployment benefits - due to worse economic situation, there was a significant
growth of number of unemployment benefits recipients at the end of 2008 (e.g.
from the reason of mass laying-off) and during the 1st quarter of 2009. The declines
in summer months of the following years were induced mainly by the impact of
traditional element – seasonal works. On the other hand, increased numbers at the
turn of years have been connected rather with layoffs at the end of the year. Since
June 2011, the numbers of beneficiaries have been nearly similar to those ones in
before-crisis years. Annual decrease in 2012 was partly caused by relevant
legislative changes.
Recipients of social assistance benefits/means-tested minimum Income
Definition Number of recipients of Social Assistance Benefits/means-tested minimum income
Unit thousands of beneficiaries
Source www.mpsv.cz (Ministry of Labour and Social Affairs)
Comment
After the introduction of the new System of Assistance in Material Need (starting
2007), there was a slight decrease of the number of beneficiaries of assistance in
material need benefits (or more precisely of allowance for living) since the 2nd
quarter of 2007 mainly due to favourable economic development. The impact of
global economic crisis became evident in this statistics since the end of 2008, more
intensively during 2009 and the 1st half of 2010. After stagnation in the 2nd half of
2010, there has been another significant increase since February 2011. It may be
explained by legislative changes in the system of State Social Support (the reduction
of entitlement to social allowance affected the system of assistance in material need
in the form of growth of its number of beneficiaries). With regard to full cancelation
of social allowance in State Social Support since 2012 and the increase of amounts
of the living and subsistence minimum, the number of beneficiaries has increased
significantly (except specific situation in January 2012 when new IS was
introduced). The curve for „social assistance beneficiaries“ is in the graph provided
only for the period of time 2007-2012 and reflects the development of the number
of allowance for living recipients (see the Act No. 111/2006 Coll., on Assistance in
material need, as amended, that is in effect from 01/01/2007); till the end of 2006
the system of social assistance benefits was regulated quite differently and, because
of this fact, there is no reasonable comparability.
Disability benefits recipients
Definition Number of pensioners (disability benefits full+partial )

- 166 -
Unit thousands of pensioners
Comment
From the beginning of 2010 the new types of disability were implemented to the social
system. Currently three levels of disability are differentiated (the 1st , 2nd , 3rd )
instead of the former two levels (full disability, partial disability). The 3rd level is equal
to the full disability while the partial disability was split in the current 1st and 2nd level.
From January 2010 all receivers of disability pension older than 65 years of age are no
more implicated in the number of disability pensioners. They are implicated in the
number of old age pensioners. This change is displayed in the drop of number of
disability pensioners in January 2010 .
According to these changes, new data (starting January 2010) are being presented
separately.
7. SUMMARY OF SPECIFIC KEY SOCIAL CHALLENGES AND PARTICULARLY GOOD SOCIAL
OUTCOMES
Social policy areas Challenges
Poverty and social inclusion Enhancing the employability and activation of people at risk
of social exclusion
Improving the system of social assistance and its
effectiveness
Improving system of care for children
The territorial dimension of social exclusion
Access to key social services
Pensions Sustainability of the pension system
Longer term stability of the pension system– effective
participation of younger workers in the proposed funded
scheme
Strengthening the principle of equity and achieving a fairer
distribution of the intergenerational burden – proposed
plans to allow early exit pose a challenge for this
Ensuring diversification of income by a multi-pillar system
Ensuring protection against poverty in old-age
Health and long-term care Effectiveness of public health insurance
Organisation and quality of healthcare

- 167 -
Supporting e-Health and information technologies
Setting up the system of coordinated health and social care
Effectiveness and efficiency
of social protection systems
Improve the effectiveness of social assistance system
Particularly good social outcomes
Some improvement in reducing the intensity of poverty risk
Some improvement in reducing the number of early school
leavers

- 168 -
DENMARK
1. 2012 NATIONAL SOCIAL REPORT (NSR): KEY ISSUES
In the years to come, Denmark will face the challenge to expand the work-force in the light of the
demographic development which constitutes a major socio-economic challenge with
increased pressure on public finances towards 2020. The employment rate in 2011 was 75.7 %
and the unemployment rate 7.6 %. Unemployment has more than doubled from its record low
of 3.3% in 2008 and vulnerable groups in particular have been among the hardest hit. The at-
risk of poverty and exclusion rate in Denmark is clearly below the EU average (in 2010 the total
rate was 18.3% compared to 23.5 % in the EU). However, the rate has increased compared to
the levels in 2008 and certain groups are more exposed than others.
During the process of drafting the NSR, the relevant stakeholders have been consulted and
the list of consulted NGOs and Social Partners is annexed to the report.
In the NSR the main socio-economic priority is identified as implementation of reforms in the
fields of social protection and social security, which must contribute to increasing employment
in order to ensure the financial sustainability threatened by demographic ageing. The main
priority identified corresponds to the analysis of the Commission58, in which the considerable
challenge of demographic ageing was recognised and the increase of the labour supply
highlighted as the key priority to ensure future welfare and fiscal sustainability. Other priorities
identified in the NSR are (i) the prevention of the vicious circle of transmitting poverty across
generations, (ii) finding a balance between the sustainability and adequacy of pensions and raise
the overall replacement rates and to (iii) ensure better cost efficiency in healthcare. Moreover,
one of the central aims of the government is to provide all children with equal opportunities.
Some key measures to increase social inclusion and reduce poverty are well outlined in the
NSR and are part the of government's policies, such as the reform of the cash benefits system
which came into force on the 1st of January 2012. This reform implies that the lowest cash
benefits have been discontinued which is expected to lead to increased levels of benefits for
approx. 16,000 all-year recipients of the benefits. Other targets have been to improve the living
conditions of marginalized citizens and to decrease the negative consequences of poverty and
social exclusion. Measures implemented are for example to strengthen the efforts in the
disadvantaged housing sector aiming to create equal opportunities for children in socially
vulnerable families and an expansion of the volunteer debt counselling service. Moreover, the
development of national poverty indicators would help in developing concrete initiatives for
those suffering from poverty. This has been recognised already in Denmark's national 2020
Strategy from February 2010 and the new government has continued to focus on poverty
reduction and indicated that measurements and poverty thresholds will be developed. In May
2012 the Government established a committee of experts with the view of finding methods on
58
SWD(2012) 304 final
- 169 -
how to define and measure poverty. The main purpose is to combat child poverty and long term
poverty.
As regards pensions, a major reform has been adopted in December 2011. The main purpose of
the reform is to increase the labour supply in light of the demographic development. The main
elements of the reform are a speed-up of the implementation by 5 years of an already enacted
gradual increase of the eligible age for public old age pension from 65 to 67 years and Voluntary
Early Retirement Pay (VERP) from 60 to 62 years, a further increase of the eligible age for VERP
to 64 years resulting in a reduction of the maximum time in the VERP-scheme from five to three
years, and maintaining the linkage introduced by the Welfare Reform in 2006 whereby the
eligible age for public old age pension and VERP are linked to life expectancy. These changes are
gradually taking place and will be fully phased in by 2023 when the access to the VERP scheme
will be possible from the age of 64 and the minimum pensionable age will be 67. Another reform,
agreed upon by political parties representing a majority in the Parliament, is a reform of the
public disability pension scheme. The main element is to radically decrease the number of
people under 40 years of age who are awarded a disability pension. Instead, vulnerable and
disadvantaged young people will be supported through a more holistic approach in so-called
resource-courses and through establishing rehabilitation teams, which combines the efforts of
different sectors and departments (e.g. education, health and social inclusion). A bill will be
tabled this autumn (2012).
For health and long-term care, the NSR refers to the Government's 2012 Finance Act (chapter
on better and equal access to health care) as the main source, which encompasses the recent
initiatives. The main ones are to support more free and equal access to health care (e.g.
abolishing of co-payments for services in the health care system) and to emphasize stronger
preventive measures (e.g. increased duties on excessive goods such as tobacco, alcohol and
sweets and promoting earlier access to psychiatric treatment).
As regard to long term care a special funding on dissemination of best practice on rehabilitation
issues has been provided. Rehabilitation provides elderly people with increased quality and
helps them live a healthier, better and more independent life. In 2011, about 90 percent of the
Danish municipalities used training as an alternative to the also free of charge conventional
compensatory home-care services.
In Denmark there has been an increase throughout the 00’s in the number of people living in
risk of poverty. One of the main challenges is the recent increase in long-term risk of poverty
and especially the intergenerational aspect, as an increased number of children live in families
affected by long-term risk of poverty. This is especially challenging with the increased pressure
on the sustainability of the general welfare and social protection systems. In addition, most
vulnerable groups have been among the hardest hit due to the crisis, which is linked to a
deterioration of their position in the labour market. This is emphasized in the NSR as well and
measures have been taken to improve the living conditions of marginalized citizens.
The measures identified to reduce poverty in the NSR are targeted towards the most vulnerable
groups and with early intervention strategies in place they seem relevant and credible. They
also correspond well to the key challenges.

- 170 -
On this background initiatives towards the 2020-target will also have an impact on the number
of people at risk of poverty, Finally, it can be stated that the NSR provides a much more
detailed analysis of the social inclusion priorities and poverty challenges than the NRP.
Whereas the NRP concentrates on fiscal sustainability and labour supply as such, the NSR
focuses much more on the social aspects of those overarching challenges in the labour market
and pension systems. This follows from the fact that the 2020-target is linked to the LWI-
indicator and initiatives described in the NRP are consequently focused on employment.
Therefore, the NSR brings added value to the NRP.
2. NATIONAL 2020 TARGET FOR THE REDUCTION OF POVERTY AND SOCIAL EXCLUSION
"Reduce the number of people in households with low work intensity by 22,000 towards 2020."
Source: National Reform Programme (2011)
2.a Progress towards the 2020 national target for the reduction of poverty and
social exclusion
Source: Eurostat (EU-SILC)
Note: i) VLWI - share of population living in very low work intensity households; ii) Progress on the
target is monitored on the basis of the EU SILC data with a base year 2008 and target data year
2018;
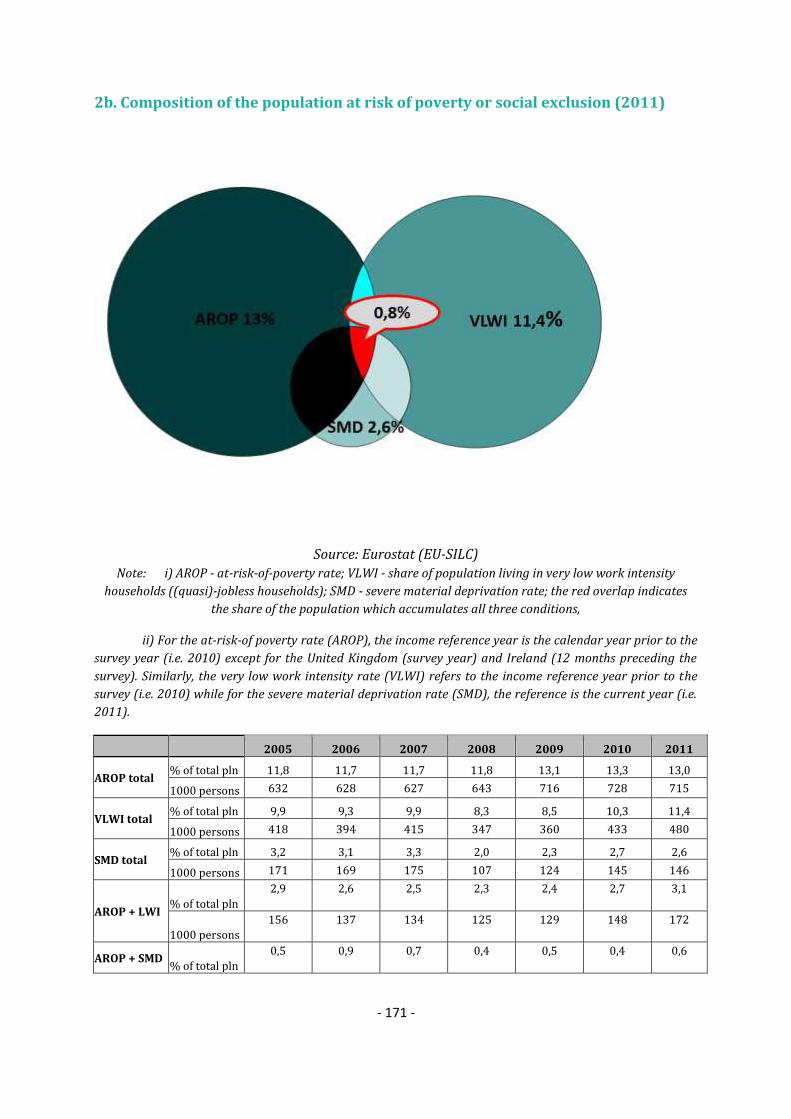
- 171 -
2b. Composition of the population at risk of poverty or social exclusion (2011)
Source: Eurostat (EU-SILC)
Note: i) AROP - at-risk-of-poverty rate; VLWI - share of population living in very low work intensity
households ((quasi)-jobless households); SMD - severe material deprivation rate; the red overlap indicates
the share of the population which accumulates all three conditions,
ii) For the at-risk-of poverty rate (AROP), the income reference year is the calendar year prior to the
survey year (i.e. 2010) except for the United Kingdom (survey year) and Ireland (12 months preceding the
survey). Similarly, the very low work intensity rate (VLWI) refers to the income reference year prior to the
survey (i.e. 2010) while for the severe material deprivation rate (SMD), the reference is the current year (i.e.
2011).
2005 2006 2007 2008 2009 2010 2011
AROP total % of total pln 11,8 11,7 11,7 11,8 13,1 13,3 13,0
1000 persons 632 628 627 643 716 728 715
VLWI total % of total pln 9,9 9,3 9,9 8,3 8,5 10,3 11,4
1000 persons 418 394 415 347 360 433 480
SMD total % of total pln 3,2 3,1 3,3 2,0 2,3 2,7 2,6
1000 persons 171 169 175 107 124 145 146
AROP + LWI % of total pln
2,9 2,6 2,5 2,3 2,4 2,7 3,1
1000 persons
156 137 134 125 129 148 172
AROP + SMD % of total pln
0,5 0,9 0,7 0,4 0,5 0,4 0,6
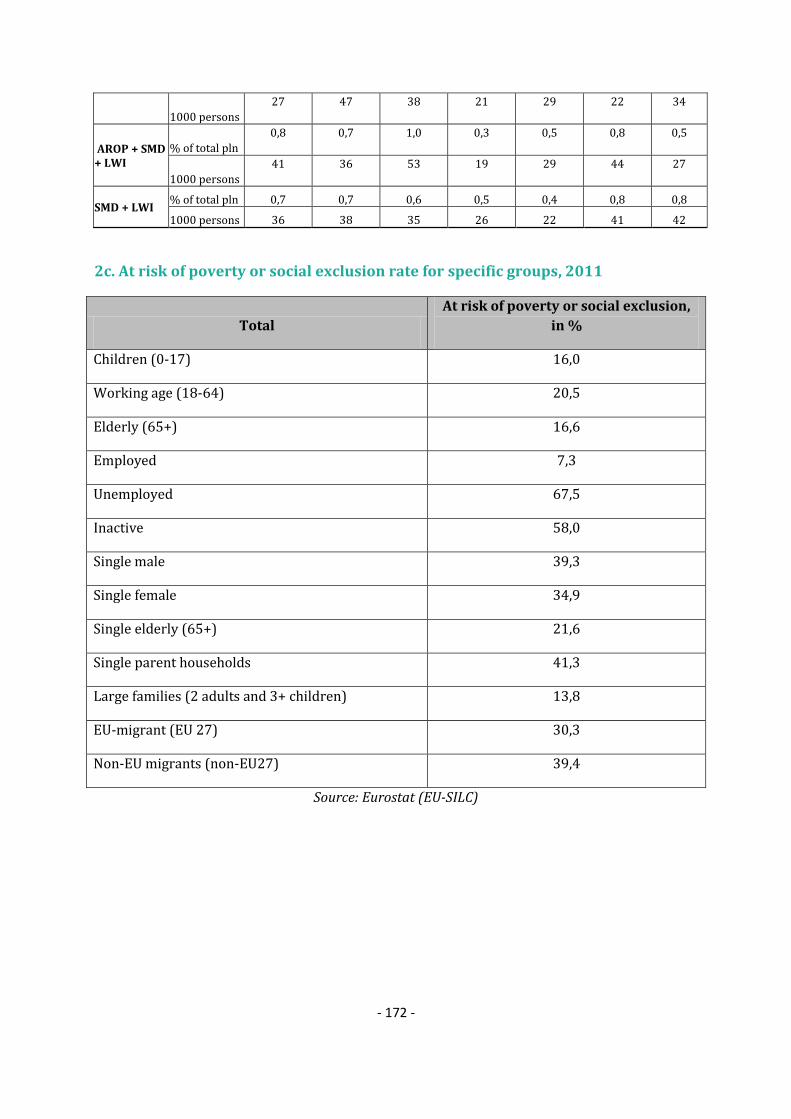
- 172 -
1000 persons
27 47 38 21 29 22 34
AROP + SMD + LWI
% of total pln
0,8 0,7 1,0 0,3 0,5 0,8 0,5
1000 persons
41 36 53 19 29 44 27
SMD + LWI % of total pln 0,7 0,7 0,6 0,5 0,4 0,8 0,8
1000 persons 36 38 35 26 22 41 42
2c. At risk of poverty or social exclusion rate for specific groups, 2011
Total
At risk of poverty or social exclusion,
in %
Children (0-17) 16,0
Working age (18-64) 20,5
Elderly (65+) 16,6
Employed 7,3
Unemployed 67,5
Inactive 58,0
Single male 39,3
Single female 34,9
Single elderly (65+) 21,6
Single parent households 41,3
Large families (2 adults and 3+ children) 13,8
EU-migrant (EU 27) 30,3
Non-EU migrants (non-EU27) 39,4
Source: Eurostat (EU-SILC)

- 173 -
3. MAIN SOCIAL INDICATORS
DK % 2005 2006 2007 2008 2009 2010 2011 2010 2011
At risk of poverty or social exclusion 17,2 16,7 16,8 16,3 17,6 18,3 18,9 23,6 24.2
At-Risk-of-Poverty rate 11,8 11,7 11,7 11,8 13,1 13,3 13,0 16.4 16.9
Severe Material Deprivation rate 3,2 3,1 3,3 2,0 2,3 2,7 2,6 8,3 8.8Share of people living in very low work
intensity households 9,9 9,3 9,9 8,3 8,5 10,3 11,4 10.0 10.0
Impact of social transfers on poverty
reduction (excl. pensions)(in%) 60,5 58,2 56,8 57,6 58,0 54,3 54,2 36,7 35,2
Value of threshold (single HH) - in PPS 9.513 9.688 10.121 10.561 10.750 10.713 11.122 N/A N/A
Value of threshold (2 adults + 2
children) - in PPS 19.976 20.345 21.254 22.177 22.575 22.498 23.356 N/A N/A
At risk of poverty or social exclusion 15,6 14,5 14,2 12,7 14,0 15,1 16,0 27,1 27.0
At-Risk-of-Poverty rate 10,4 9,9 9,6 9,1 10,6 10,9 10,2 20.5 20.6
Severe Material Deprivation rate 3,9 4,3 4,8 2,5 2,1 3,1 3,3 9,7 10.0
Share of people living in very low work
intensity households 7,5 7,1 6,8 4,3 5,4 7,3 8,9 9.1 8.8
Impact of social transfers on poverty
reduction (excl. pensions)(in%) 58,7 59,3 59,8 58,8 56,4 54,6 60,3 41,4 40,5
At risk of poverty or social exclusion 17,7 17,1 17,4 17,1 18,1 19,5 20,5 23,5 24.3
At-Risk-of-Poverty rate 11,0 11,0 10,9 11,3 12,2 12,9 13,1 15.2 16.0
Severe Material Deprivation rate 3,7 3,2 3,3 2,0 2,7 2,9 2,9 8,3 8.9
Share of people living in very low work
intensity households (18-59) 10,8 10,3 11,1 9,8 9,8 11,4 12,3 10.3 10,5
In-work at-risk-of poverty rate 4.8 4.5 4.2 5.0 5.9 6.3 6.3 8.4 8.9
Impact of social transfers on poverty
reduction (excl. pensions)(in%) 61,5 60,1 58,9 59,4 58,9 56,1 56,5 38,7 37,0
At risk of poverty or social exclusion 17,8 18,3 18,3 18,6 20,6 18,4 16,6 20,0 20.5
At-Risk-of-Poverty rate 17,6 17,4 17,7 18,1 20,1 17,7 16,0 16.0 16.0
Severe Material Deprivation rate 0,2 1,1 0,8 0,9 0,9 0,9 1,1 6,6 7.2
Relative median income ratio of elderly 0.70 0.71 0.70 0.70 0.71 0.71 0.72 0.88 0.89
Aggregate replacement ratio 0.35 0.37 0.39 0.41 0.42 0.44 0.42 0.53 0.54
2000 2005 2006 2007 2008 2009 2010 2009 2010
Sickness/Health care 5,7 6,1 6,1 6,4 6,7 7,5 7,3 8,4 8,3
Invalidity 3,4 4,2 4,2 4,2 4,4 4,9 4,8 2,3 2,2
Old age and survivors 10,7 11,0 10,8 10,7 11,0 12,0 12,2 12,7 12,7
Family/Children 3,7 3,8 3,7 3,7 3,8 4,2 4,0 2,3 2,3
Unemployment 3,0 2,5 2,1 1,6 1,4 2,1 2,4 1,8 1,7
Housing and Social exclusion n.e.c. 1,7 1,7 1,5 1,4 1,5 1,6 1,6 1,0 1,0
Total 28,1 29,4 28,5 28,0 28,6 32,3 32,4 28,5 28,2
Means-tested
Sickness/Health care 0,0 0,0 0,0 0,0 0,0 0,0 0,0 0,1 0,1
Invalidity 0,0 0,0 0,0 0,0 0,0 0,0 0,0 0,5 0,5
Old age and survivors 0,0 0,0 0,0 0,0 0,0 0,0 0,0 0,6 0,6
Family/Children 0,1 0,2 0,2 0,2 0,2 0,2 0,2 0,6 0,6
Unemployment 0,0 0,0 0,0 0,0 0,0 0,0 0,0 0,4 0,4
Housing and Social exclusion n.e.c. 0,7 0,7 0,7 0,7 0,7 0,7 0,8 0,9 1,0
Total 0,8 0,9 0,8 0,9 0,9 1,0 1,0 3,0 3,1
Non-means tested
Sickness/Health care 5,7 6,1 6,1 6,4 6,7 7,5 7,3 8,3 8,2
Invalidity 3,4 4,2 4,2 4,2 4,4 4,9 4,8 1,8 1,8
Old age and survivors 10,7 11,0 10,8 10,7 11,0 12,0 12,2 12,1 12,1
Family/Children 3,5 3,6 3,5 3,5 3,6 3,9 3,8 1,7 1,7
Unemployment 3,0 2,5 2,1 1,6 1,4 2,1 2,4 1,4 1,3
Housing and Social exclusion n.e.c. 1,0 1,0 0,8 0,7 0,8 0,9 0,9 0,1 0,1
Total 27,2 28,5 27,6 27,1 27,7 31,3 31,4 25,4 25,2
EU 27
Social expenditure
(in % of GDP)
Children (0-17)
Working age
(18-64)
Elderly (65+)
Total population
Source: Eurostat (EU-SILC, ESSPROS for social expenditure data)
Note: For non-means tested the aggregation Housing and Social Exclusion n.e.c is based only on
Housing. The total figures of social expenditure include all benefits excluding administrative costs.
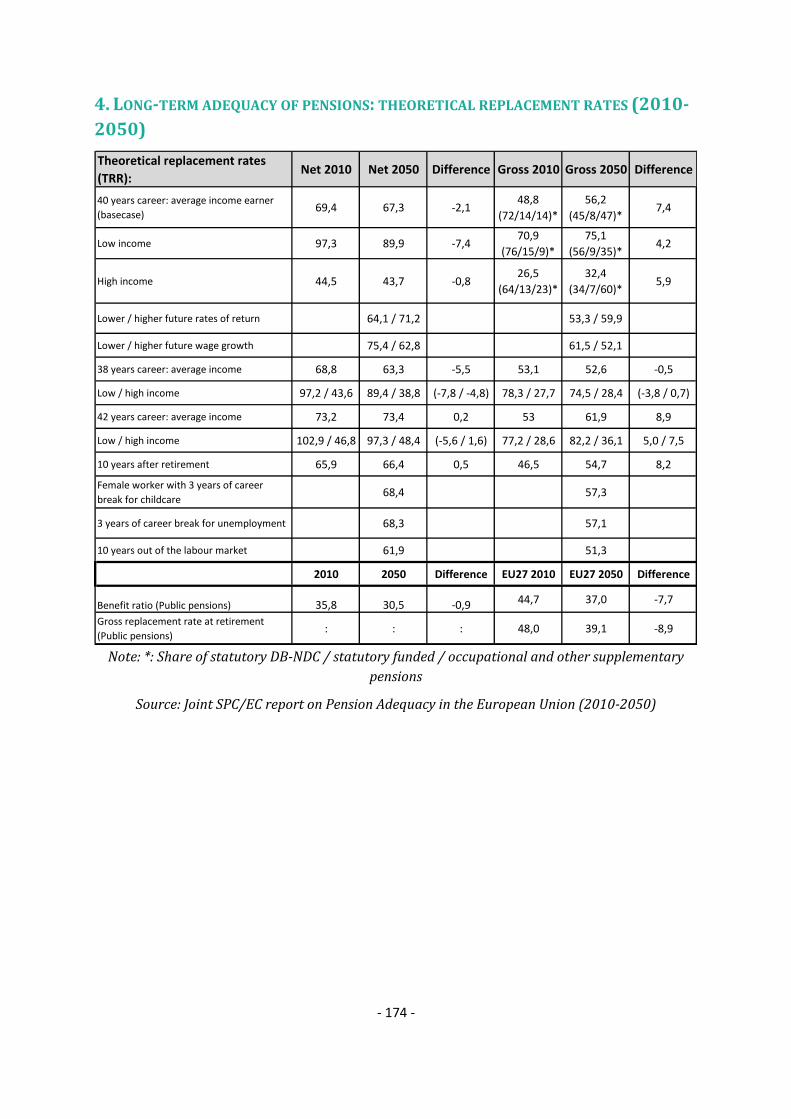
- 174 -
4. LONG-TERM ADEQUACY OF PENSIONS: THEORETICAL REPLACEMENT RATES (2010-
2050)
Theoretical replacement rates
(TRR): Net 2010 Net 2050 Difference Gross 2010 Gross 2050 Difference
40 years career: average income earner
(basecase)69,4 67,3 -2,1
48,8
(72/14/14)*
56,2
(45/8/47)*7,4
Low income 97,3 89,9 -7,470,9
(76/15/9)*
75,1
(56/9/35)*4,2
High income 44,5 43,7 -0,826,5
(64/13/23)*
32,4
(34/7/60)*5,9
Lower / higher future rates of return 64,1 / 71,2 53,3 / 59,9
Lower / higher future wage growth 75,4 / 62,8 61,5 / 52,1
38 years career: average income 68,8 63,3 -5,5 53,1 52,6 -0,5
Low / high income 97,2 / 43,6 89,4 / 38,8 (-7,8 / -4,8) 78,3 / 27,7 74,5 / 28,4 (-3,8 / 0,7)
42 years career: average income 73,2 73,4 0,2 53 61,9 8,9
Low / high income 102,9 / 46,8 97,3 / 48,4 (-5,6 / 1,6) 77,2 / 28,6 82,2 / 36,1 5,0 / 7,5
10 years after retirement 65,9 66,4 0,5 46,5 54,7 8,2
Female worker with 3 years of career
break for childcare68,4 57,3
3 years of career break for unemployment 68,3 57,1
10 years out of the labour market 61,9 51,3
2010 2050 Difference EU27 2010 EU27 2050 Difference
Benefit ratio (Public pensions) 35,8 30,5 -0,9 44,7 37,0 -7,7
Gross replacement rate at retirement
(Public pensions): : : 48,0 39,1 -8,9
Note: *: Share of statutory DB-NDC / statutory funded / occupational and other supplementary
pensions
Source: Joint SPC/EC report on Pension Adequacy in the European Union (2010-2050)

- 175 -
5. KEY CONTEXT MACRO-ECONOMIC INFORMATION
Source: Eurostat, National Accounts and EU LFS. ECFIN autumn economic forecast 2012 for 2012-
2014.
Note: Data on social protection expenditure comes from the AMECO database ( it is calculated as
the sum of Social benefits other than social transfers in kind; general government - ESA 1995 +
Social transfers in kind - ESA 1995)

- 176 -
6. TRENDS IN TAKE-UP OF SELECTED BENEFITS59
Number of unemployed
Definition Unemployment according to ILO definition - Total
Unit thousands of persons - seasonally adjusted
Source Eurostat
Unemployment recipients
Definition U benefits recipients, full time recipients.
Unit full time persons recipients (both passive and active recipients)
Source http://www.jobindsats.dk/sw167.asp
Comment The monthly recipients of 2012 are also listed. If the recipients are only to be based on
a whole year basis, these can be ignored and only 2011 data be used.
Recipients of social assistance benefits/means-tested minimum Income
Definition numbers of recipients of cash benefits
Unit both passive and active recipients
59 This data has been collected by the SPC in the context of monitoring the social impact of the crisis. It
includes only a selection of benefits which have been considered most reactive to the crisis. The number of unemployed refers to the standard definition by the ILO and is given as a background information.

- 177 -
Source http://www.jobindsats.dk/sw9990.asp
Comment
Both recipients and full time recipients are listed as the numbers can then be
compared (with unemployment benefits) as these are measured in full time recipients.
The update includes a change in the numbers back in time due to the abolishment of
the lowest cash benefits by January 1st 2012. As it is a headcount, all recipients of the
lowest cash benefits are now listed as recipients of the same cash benefit back in time
as it would otherwise mean a change in the level of recipients as from 1/1 2012 when
all recipients became recipients of the same level of benefit.
Disability benefits recipients
Definition Disability benefit recipients
Unit thousands of recipients
Comment
Figures do not include people who reached statutory retirement age due to
comparability reasons; the data until January 2011 represent an estimation, because the
calculation of the accurate share of disability pensioners only existed for one month
(December).
7. SUMMARY OF SPECIFIC KEY SOCIAL CHALLENGES AND PARTICULARLY GOOD SOCIAL
OUTCOMES
Social policy areas Challenges
Poverty and social inclusion Increase in long-term risk of poverty, especially so for
children
Equal opportunities for all children
Improving the employability of people with a migrant
background
Pensions Demographic ageing: increasing labour supply to ensure
welfare and fiscal sustainability
Reforming the disability pension
Finding a balance between sustainability and adequacy of
pensions
Raising the overall replacement rates
Health and long-term care Cost efficiency in healthcare

- 178 -
Effectiveness and efficiency
of social protection systems
Implementing reforms in social protection and social
security in order to increase employment to ensure welfare
and fiscal sustainability
Particularly good social outcomes
Fairly good progress in ensuring high labour market
participation for older workers
Good progress in reducing early school leavers
Improvements in the income and living conditions of the
elderly
Decrease in the poverty risk of people living in households
with very low work intensity

- 179 -
GERMANY
1. NATIONAL 2020 TARGET FOR THE REDUCTION OF POVERTY AND SOCIAL EXCLUSION
1.a Progress towards the 2020 national target for the reduction of poverty and
social exclusion
Source: Eurostat (LFS)
"Germany has defined the quantitative target related to the number of people living in
households affected by long-term unemployment. The number of long-term unemployed people
(unemployed for more than one year) shall be reduced by 20% until 2020 (taking the 2008
average as a basis). Taking the current data this corresponds to a reduction of 320.000 long-
term unemployed (annual average 2008:1.62 million). If there are two people living in a job-less
household- in a conservative approach- the number of people at- risk-of-poverty will be reduced
by 640.000 people."
Source: National Reform Programme (2012)

- 180 -
1b. Composition of the population at risk of poverty or social exclusion (2011)
Source: Eurostat (EU-SILC)
Note: i) AROP - at-risk-of-poverty rate; VLWI - share of population living in very low work intensity
households ((quasi)-jobless households); SMD - severe material deprivation rate; the red overlap indicates
the share of the population which accumulates all three conditions,
ii) For the at-risk-of poverty rate (AROP), the income reference year is the calendar year prior to the
survey year (i.e. 2010) except for the United Kingdom (survey year) and Ireland (12 months preceding the
survey). Similarly, the very low work intensity rate (VLWI) refers to the income reference year prior to the
survey (i.e. 2010) while for the severe material deprivation rate (SMD), the reference is the current year (i.e.
2011).
2005 2006 2007 2008 2009 2010 2011
AROP total % of total pln 12,2 12,5 15,2 15,2 15,5 15,6 15,8
1000 persons 9.960 10.232 12.371 12.389 12.590 12.648 12.814
VLWI total % of total pln 11,9 13,5 11,4 11,6 10,8 11,1 11,1
1000 persons 7.294 8.248 6.983 7.044 6.538 6.695 6.637
SMD total % of total pln 4,6 5,1 4,8 5,5 5,4 4,5 5,3

- 181 -
1000 persons 3.733 4.138 3.947 4.442 4.360 3.672 4.323
AROP + LWI % of total pln 3,2 3,5 3,6 3,8 3,6 3,9 3,7
1000 persons 2.617 2.829 2.894 3.113 2.944 3.183 3.026
AROP + SMD % of total pln 1,1 0,9 1,2 1,4 1,3 1,1 1,7
1000 persons 890 747 998 1.142 1.024 917 1.349
AROP + SMD + LWI
% of total pln 1,2 1,2 1,3 1,7 1,8 1,6 1,9
1000 persons 1.008 969 1.024 1.408 1.450 1.333 1.542
SMD + LWI % of total pln 0,5 0,8 0,7 0,6 0,5 0,4 0,3
1000 persons 442 661 601 460 402 286 242
1c. At risk of poverty or social exclusion rate for specific groups, 2011
Total
At risk of poverty or social
exclusion, in %
Children (0-17) 19,9
Working age (18-64) 21,3
Elderly (65+) 15,3
Employed 9,3
Unemployed 82,3
Inactive 41,0
Single male 38,4
Single female 37,2
Single elderly (65+) 26,1
Single parent households 48,2
Large families (2 adults and 3+ children) 21,3
EU-migrant (EU 27) 16,7
Non-EU migrants (non-EU27) 31,7
Source: Eurostat (EU-SILC)

- 182 -
2. MAIN SOCIAL INDICATORS
DE % 2005 2006 2007 2008 2009 2010 2011 2010 2011
At risk of poverty or social exclusion 18,4 20,2 20,6 20,1 20,0 19,7 19,9 23,6 24.2
At-Risk-of-Poverty rate 12,2 12,5 15,2 15,2 15,5 15,6 15,8 16.4 16.9
Severe Material Deprivation rate 4,6 5,1 4,8 5,5 5,4 4,5 5,3 8,3 8.8
Share of people living in very low work
intensity households 11,9 13,5 11,4 11,6 10,8 11,1 11,1 10.0 10.0
Impact of social transfers on poverty
reduction (excl. pensions)(in%) 47,2 51,4 38,7 37,2 35,7 35,5 37,1 36,7 35,2
Value of threshold (single HH) - in PPS 9.391 9.100 10.395 10.804 10.772 10.635 10.955 N/A N/A
Value of threshold (2 adults + 2 children) -
in PPS 19.720 19.110 21.829 22.689 22.622 22.333 23.005 N/A N/A
At risk of poverty or social exclusion 17,9 20,9 19,7 20,1 20,4 21,7 19,9 27,1 27.0
At-Risk-of-Poverty rate 12,2 12,4 14,1 15,2 15,0 17,5 15,6 20.5 20.6
Severe Material Deprivation rate 5,2 5,9 5,4 6,9 7,1 5,2 5,4 9,7 10.0
Share of people living in very low work
intensity households 8,9 10,9 9,1 9,0 9,0 8,9 8,6 9.1 8.8
Impact of social transfers on poverty
reduction (excl. pensions)(in%) 59,2 63,3 53,6 50,3 50,8 46,6 52,7 41,4 40,5
At risk of poverty or social exclusion 19,6 21,9 21,9 21,5 21,1 20,8 21,3 23,5 24.3
At-Risk-of-Poverty rate 11,9 12,6 15,2 15,4 15,8 15,6 16,4 15.2 16.0
Severe Material Deprivation rate 4,9 5,7 5,5 6,1 5,8 5,2 6,0 8,3 8.9
Share of people living in very low work
intensity households (18-59) 12,9 14,4 12,1 12,3 11,3 11,8 11,8 10.3 10,5
In-work at-risk-of poverty rate 4,8 5,5 7,4 7,1 6,8 7,1 7,7 8.4 8.9
Impact of social transfers on poverty
reduction (excl. pensions)(in%) 49,4 53,0 40,4 38,2 36,3 37,3 37,2 38,7 37,0
At risk of poverty or social exclusion 14,5 13,5 16,8 15,5 16,0 14,8 15,3 20,0 20.5
At-Risk-of-Poverty rate 13,4 12,5 16,2 14,9 15,0 14,1 14,2 16.0 16.0
Severe Material Deprivation rate 2,6 2,1 2,2 2,1 2,5 2,1 3,2 6,6 7.2
Relative median income ratio of elderly 0,94 0,93 0,87 0,87 0,88 0,89 0,90 0.88 0.89
Aggregate replacement ratio 0,46 0,46 0,46 0,44 0,47 0,49 0,51 0.53 0.54
2000 2005 2006 2007 2008 2009 2010 2009 2010
Sickness/Health care 8,4 8,3 8,1 8,0 8,3 9,7 9,5 8,4 8,3
Invalidity 2,4 2,4 2,3 2,2 2,3 2,4 2,4 2,3 2,2
Old age and survivors 12,0 12,3 11,9 11,4 11,4 12,2 11,8 12,7 12,7
Family/Children 3,3 3,1 2,9 2,8 2,8 3,2 3,2 2,3 2,3
Unemployment 2,1 2,1 1,8 1,5 1,4 1,9 1,7 1,8 1,7
Housing and Social exclusion n.e.c. 0,5 0,8 0,8 0,8 0,7 0,8 0,8 1,0 1,0
Total 28,7 29,0 27,9 26,8 27,0 30,2 29,4 28,5 28,2
Means-tested
Sickness/Health care 0,1 0,1 0,0 0,0 0,0 0,0 0,0 0,1 0,1
Invalidity 0,6 0,7 0,7 0,7 0,7 0,8 0,7 0,5 0,5
Old age and survivors 0,1 0,0 0,0 0,0 0,0 0,0 0,0 0,6 0,6
Family/Children 1,1 1,1 1,0 1,0 1,0 1,1 1,1 0,6 0,6
Unemployment 0,6 0,9 0,9 0,8 0,8 0,8 0,8 0,4 0,4
Housing and Social exclusion n.e.c. 0,5 0,8 0,8 0,8 0,7 0,8 0,8 0,9 1,0
Total 2,9 3,5 3,5 3,3 3,3 3,6 3,5 3,0 3,1
Non-means tested
Sickness/Health care 8,3 8,2 8,1 8,0 8,2 9,7 9,5 8,3 8,2
Invalidity 1,8 1,7 1,6 1,6 1,6 1,7 1,7 1,8 1,8
Old age and survivors 11,9 12,3 11,9 11,4 11,4 12,2 11,8 12,1 12,1
Family/Children 2,1 2,1 1,8 1,8 1,8 2,1 2,1 1,7 1,7
Unemployment 1,6 1,2 1,0 0,8 0,7 1,1 0,9 1,4 1,3
Housing and Social exclusion n.e.c. 0,0 0,0 0,0 0,0 0,0 0,0 0,0 0,1 0,1
Total 25,8 25,5 24,4 23,5 23,7 26,6 25,9 25,4 25,2
Social expenditure
(in % of GDP)
EU27
Children (0-17)
Working age
(18-64)
Elderly (65+)
Total population
Source: Eurostat (EU-SILC, ESSPROS for social expenditure data)
Note: For non-means tested the aggregation Housing and Social Exclusion n.e.c is based only on
Housing. The total figures of social expenditure include all benefits excluding administrative costs.

- 183 -
3. LONG-TERM ADEQUACY OF PENSIONS: THEORETICAL REPLACEMENT RATES (2010-
2050)
Theoretical replacement rates (TRR): Net 2010 Net 2050 Difference Gross2010 Gross2050 Difference
40 years career: average income earner
(basecase)59,1 63,7 4,6
41,9
(100/0/0)*
45,7
(73/0/27)*3,8
Low income 53,9 59,7 5,841,9
(100/0/0)*
45,7
(73/0/27)*3,8
High income 51,1 49,5 -1,631,4
(100/0/0)*
34,3
(73/0/27)*2,9
Lower / higher future rates of return 61,2 / 66,5 43,8 / 47,9
Lower / higher future wage growth 67,7 / 60,6 48,8 / 43,3
38 years career: average income 52,1 57,2 5,1 37 40,1 3,1
Low / high income 47,5 / 45,8 56,9 / 45 9,4 / -0,8 37 / 28 43,2 / 30,2 6,2 / 2,2
42 years career: average income 69,5 70,6 1,1 49,3 51,7 2,4
Low / high income 63,4 / 60,1 67,7 / 54,7 4,3 / -5,4 49,3 / 37,6 51,7 / 38,9 2,4 / 1,3
10 years after retirement 59,1 61,2 2,1 41,9 43,7 1,8
Female worker with 3 years of career
break for childcare62,1 72,5 10,4 44,0 53,7 9,7
3 years of career break for
unemployment57 68 11,0 40,5 49,5 9,0
10 years out of the labour market 44,3 47,7 3,4 31,4 33,5 2,1
2010 2050 Difference EU27 2010 EU27 2050 Difference
Benefit ratio (Public pensions) 47,0 38,1 -8,944,7 37,0 -7,7
Gross replacement rate at retirement
(Public pensions) 40,5 34,5 -6,0 48,0 39,1 -8,9
Note: *: Share of statutory DB-NDC / statutory funded / occupational and other supplementary
pensions
Source: Joint SPC/EC report on Pension Adequacy in the European Union (2010-2050)
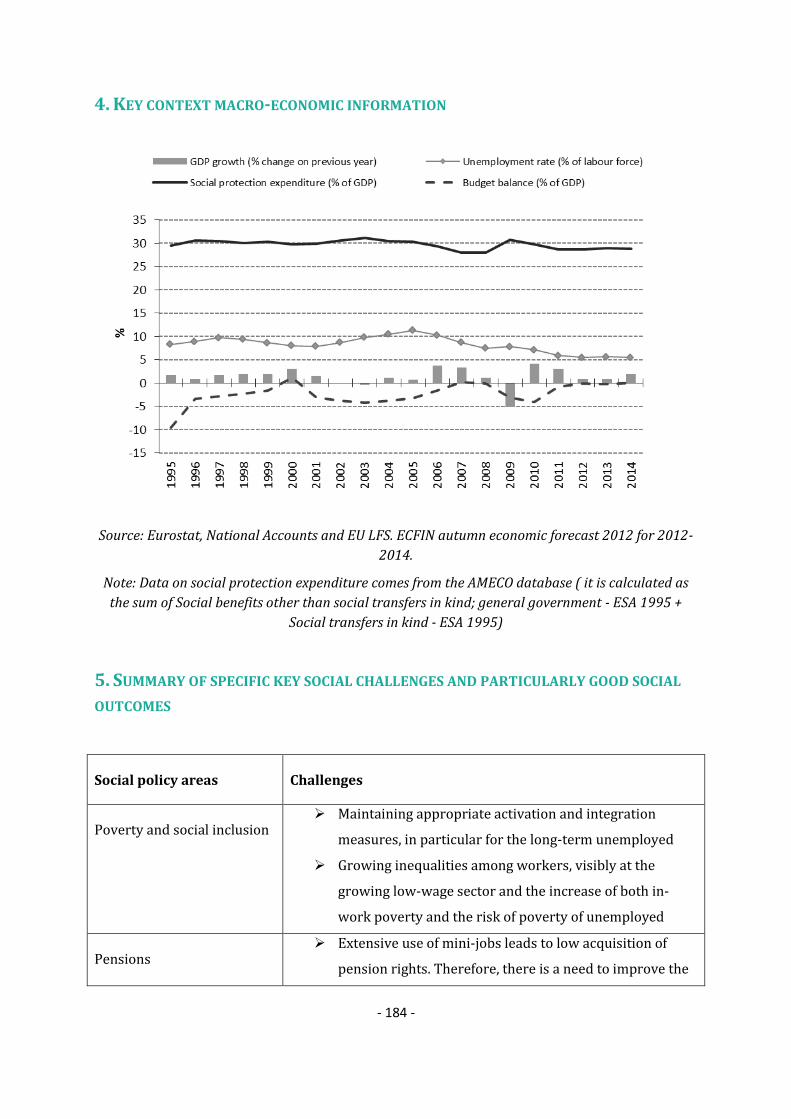
- 184 -
4. KEY CONTEXT MACRO-ECONOMIC INFORMATION
Source: Eurostat, National Accounts and EU LFS. ECFIN autumn economic forecast 2012 for 2012-
2014.
Note: Data on social protection expenditure comes from the AMECO database ( it is calculated as
the sum of Social benefits other than social transfers in kind; general government - ESA 1995 +
Social transfers in kind - ESA 1995)
5. SUMMARY OF SPECIFIC KEY SOCIAL CHALLENGES AND PARTICULARLY GOOD SOCIAL
OUTCOMES
Social policy areas Challenges
Poverty and social inclusion Maintaining appropriate activation and integration
measures, in particular for the long-term unemployed
Growing inequalities among workers, visibly at the
growing low-wage sector and the increase of both in-
work poverty and the risk of poverty of unemployed
Pensions Extensive use of mini-jobs leads to low acquisition of
pension rights. Therefore, there is a need to improve the
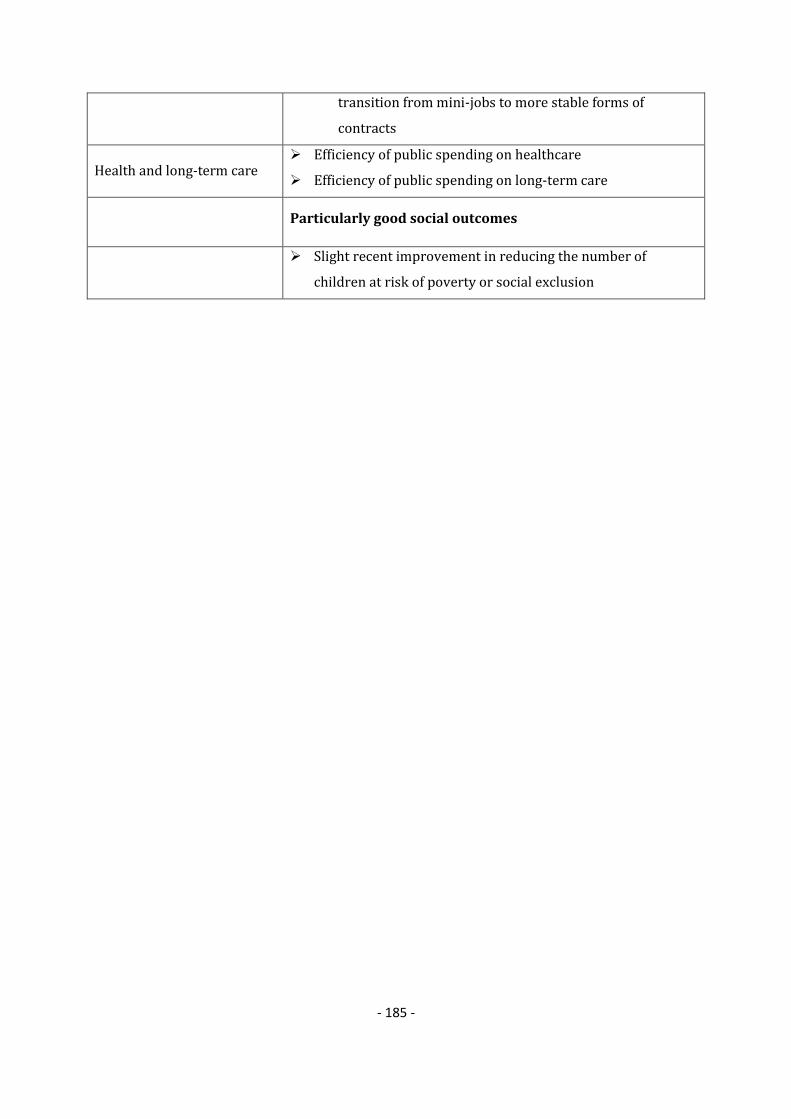
- 185 -
transition from mini-jobs to more stable forms of
contracts
Health and long-term care Efficiency of public spending on healthcare
Efficiency of public spending on long-term care
Particularly good social outcomes
Slight recent improvement in reducing the number of
children at risk of poverty or social exclusion

- 186 -
ESTONIA 1. 2012 NATIONAL SOCIAL REPORT (NSR): KEY ISSUES
The Estonian economy continues to grow up to 1.7% in 2012 and up to 3% in 2013 that will
lower unemployment to below 10% in 2013 and increase employment. The labour market
challenges are long-term unemployment, youth unemployment and lack of skills or mismatch.
Approximately every fourth person not at work lived below the at-risk-of-poverty threshold in
2009 and in 2010, nearly 80% of households with children and no working members and more
than a third of single parent households were living in relative poverty in 2010.
The Report is based and contains information on numerous strategies and reforms that are
formulated as a result of specific lengthy consultations and working group meetings with
stakeholders.
The priorities in the NSR largely correspond to the ones identified by the Commission. The NSR
identifies as priorities improving financial coping of children and families with children and
enhancing the efficiency of child welfare system that are included in the Action Programme of
the Government for years 2011 to 2015. Decreasing unemployment, especially long-term and
youth unemployment are prioritized in the "Estonia 2020" strategy and the Government
programme.
The Government programme aims to improve the quality of life of the disabled and the "Estonia
2020” strategy refers to the application of programmes for increasing the employment of
disabled people and provision of active labour market measures. Creating opportunities for the
elderly to lead a more flexible and high-quality life when retired is addressed in the Government
programme with the "Estonia 2020" strategy emphasizing a need to provide measures for
helping elderly people return to the labour market.
A number of new measures will help to reduce poverty and social exclusion. For improving the
subsistence of children and families a Green Book of family allowances and services shall be
developed by the end of 2013 to ensure better financial coping for families, to lower the risk of
poverty and to increase employment. The Child Protection Act that will establish a structure for
the child welfare system that supports an effective and coordinated provision of services is
being updated by the end of 2013. A strategy for Active Ageing 2013-2020 is being finalised.
With a pilot project Provision of Need-Based Services to Persons with Multiple Problems the
capability of local governments in solving more complicated customer cases of long-term
unemployed shall be strengthened. Based on the results of that pilot project, in 2013 a concept
of measures for supporting the employment and work of people with multiple problems shall be
worked out. A project offering support to young people leaving substitute homes and families
will result in drafting a more extensive follow-up care programme in 2013.
The incapacity for work scheme will be reorganised to link it with employment services by the
end of 2013. Thereby people with health problems will be prevented from falling out of the
labour market, and the ones who have left due to health problems will be helped to return to the
labour market. Changes to the rehabilitation system that aim to develop and restore
- 187 -
independent coping of people and support their employment will be presented to the
Government of the Republic by the end of the 1st quarter 2013.
For improving sustainability of social expenditure Estonia decided in 2011 to increase the
retirement age to 65 by 2026. As a response to the crisis state pension insurance pillar's
indexation rules were amended, switching between compulsory funded pension funds was
eased and the voluntary funded pillar's tax regulation was amended. In order to improve
sustainability of the social insurance system financing, the Government intends to propose a
new incapacity for work scheme that allows to reform old-age pensions on favourable
conditions, superannuated pensions and also the survivors’ and incapacity for work pensions of
different special pensions’ acts.
There have been a number of reforms in Estonian health care system recently. These include the
strengthening of the primary health care by giving more independence to family nurses, revising
primary health care financing system to motivate provision of more preventive and health
promotion services. Furthermore, the reform aims at optimizing the hospital network by
developing strong special care competence centres, developing network of nursing care and
long-term care providers to meet rising needs of aging population and to support the increase in
efficiency of acute care.
The development of an e-health system to sustain rational use of resources and minimize useless
duplications in health care system is also foreseen. The health policy in the Government Action
Programme 2011-2015 aims to ensure longer and healthier lives of the Estonian people and
high-quality medical care in the case of health problems.
Major reforms in the long-term care had been prepared and approved before 2010. In 2011
Estonia elaborated voluntary quality framework for local government social services.
The main socio-economic challenges are long-term unemployment, youth unemployment and
lack of skills or mismatch.
The NSR entails planned measures improving the subsistence of children and families,
addressing the problems of people with multiple problems and reorganising the incapacity for
work scheme that are relevant and seem ambitious in terms of poverty reduction.
2. NATIONAL 2020 TARGET FOR THE REDUCTION OF POVERTY AND SOCIAL EXCLUSION
"Reducing the at-risk-of-poverty rate after social transfers to 16.5% by 2015 and to 15% by
2020. Attaining the objective would mean that approximately 61,860 people have to bring out of
the risk-of-poverty " According to the calculations of the Government Office, a reduction of at-
risk-of-poverty rate from 17.5% in 2010 (income year) to 15% in 2020 (income year) means
bringing 36 248 persons out of at-risk-of-poverty. (Response to the Commission letter in 2012).
Source: National Reform Programme (2011), 2011 ISG questionnaire
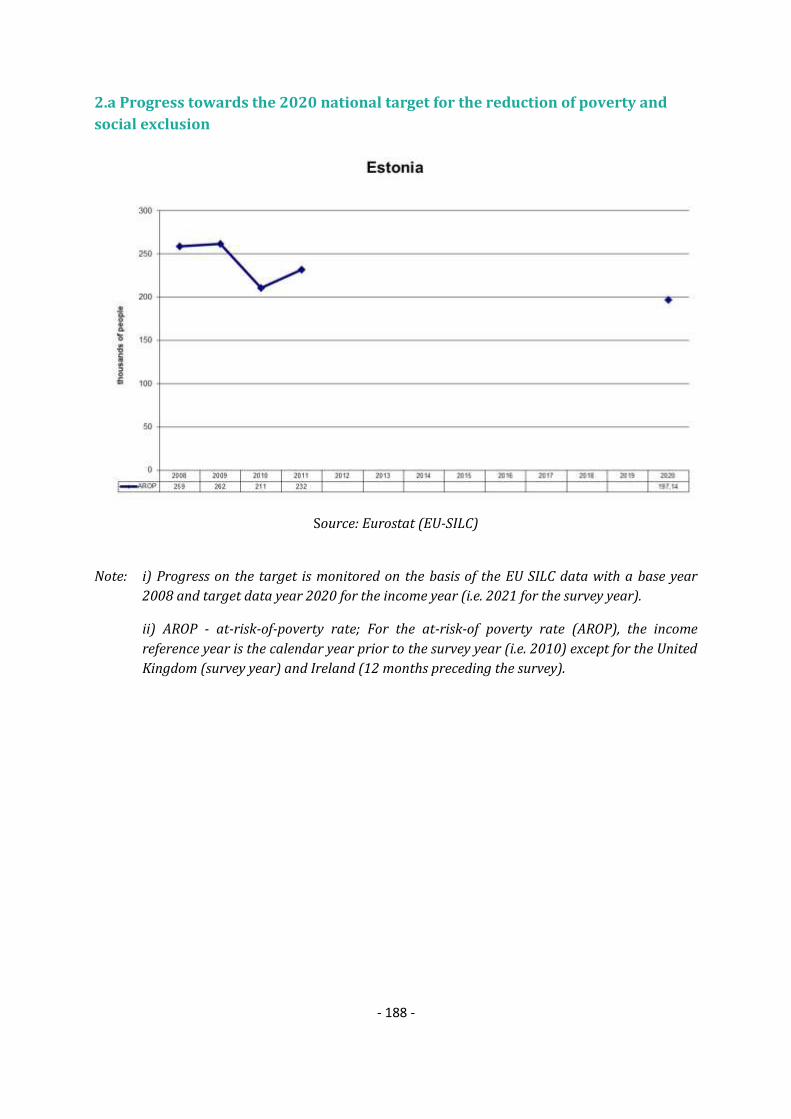
- 188 -
2.a Progress towards the 2020 national target for the reduction of poverty and
social exclusion
Source: Eurostat (EU-SILC)
Note: i) Progress on the target is monitored on the basis of the EU SILC data with a base year
2008 and target data year 2020 for the income year (i.e. 2021 for the survey year).
ii) AROP - at-risk-of-poverty rate; For the at-risk-of poverty rate (AROP), the income
reference year is the calendar year prior to the survey year (i.e. 2010) except for the United
Kingdom (survey year) and Ireland (12 months preceding the survey).

- 189 -
2b. Composition of the population at risk of poverty or social exclusion (2011)
Source: Eurostat (EU-SILC)
Note: i) AROP - at-risk-of-poverty rate; VLWI - share of population living in very low work intensity
households ((quasi)-jobless households); SMD - severe material deprivation rate; the red overlap indicates
the share of the population which accumulates all three conditions,
ii) For the at-risk-of poverty rate (AROP), the income reference year is the calendar year prior to the
survey year (i.e. 2010) except for the United Kingdom (survey year) and Ireland (12 months preceding the
survey). Similarly, the very low work intensity rate (VLWI) refers to the income reference year prior to the
survey (i.e. 2010) while for the severe material deprivation rate (SMD), the reference is the current year (i.e.
2011).
2005 2006 2007 2008 2009 2010 2011
AROP total % of total pln 18,3 18,3 19,4 19,5 19,7 15,8 17,5
1000 persons 245 244 258 259 262 211 232
VLWI total % of total pln 9,4 7,0 6,2 5,3 5,6 8,9 9,9
1000 persons 99 74 64 55 58 92 102
SMD total % of total pln 12,4 7,0 5,6 4,9 6,2 9,0 8,7

- 190 -
1000 persons 166 94 75 65 83 119 115
AROP + VLWI
% of total pln 3,4 2,9 2,7 2,2 1,8 2,9 3,2
1000 persons 46 39 36 30 24 39 43
AROP + SMD % of total pln 3,6 2,6 2,6 2,0 2,1 2,8 2,3
1000 persons 48 35 34 26 28 38 31
AROP + SMD + VLWI
% of total pln 2,4 1,6 1,3 1,1 1,4 1,9 2,4
1000 persons 32 21 17 15 19 26 32
SMD + VLWI % of total pln 0,3 0,1 0,0 0,1 0,1 0,4 0,4
1000 persons 4 1 0 1 1 5 6
2c. At risk of poverty or social exclusion rate for specific groups, 2011
Total
Risk of poverty and social
exclusion for different
population sub-groups, %
Children (0-17) 24,8
Working age (18-64) 24,2
Elderly (65+) 17,0
Employed 11,7
Unemployed 62,6
Inactive (18 and older) 43,4
Single male 39,4
Single female 26,4
Single elderly (65+) 27,0
Single parent households 41,7
Large families (2 adults and 3+ children) 29,1
EU-migrant (EU 27) 15,1
Non-EU migrants (non-EU27)(18+) 26,3
Source: Eurostat (EU-SILC)

- 191 -
3. MAIN SOCIAL INDICATORS
EE % 2005 2006 2007 2008 2009 2010 2011 2010 2011
At risk of poverty or social exclusion 25,9 22 22 21,8 23,4 21,7 23,1 23,6 24.2
At-Risk-of-Poverty rate 18,3 18,3 19,4 19,5 19,7 15,8 17,5 16.4 16.9
Severe Material Deprivation rate 12,4 7,0 5,6 4,9 6,2 9,0 8,7 8,3 8.8
Share of people living in very low work
intensity households 9,4 7,0 6,2 5,3 5,6 8,9 9,9 10.0 10.0
Impact of social transfers on poverty
reduction (excl. pensions)(in%) 24,4 25,6 23,0 21,1 23,9 36,5 29,7 36,7 35,2
Value of threshold (single HH) - in PPS 2.832 3.377 3.895 4.538 4.794 4.490 4.491 N/A N/A
Value of threshold (2 adults + 2 children) -
in PPS 5.957 7.091 8.180 9.530 10.068 9.429 9.431 N/A N/A
At risk of poverty or social exclusion 28,4 24,1 20,1 19,4 24,5 24,0 24,8 27,1 27.0
At-Risk-of-Poverty rate 21,3 20,1 18,2 17,1 20,6 17,3 19,5 20.5 20.6
Severe Material Deprivation rate 12,7 7,6 4,1 5,3 7,0 10,7 9,1 9,7 10.0
Share of people living in very low work
intensity households 9,7 6,5 4,5 3,8 4,5 8,4 9,1 9.1 8.8
Impact of social transfers on poverty
reduction (excl. pensions)(in%) 31,5 34,3 35,5 35,0 30,6 44,4 35,9 41,4 40,5
At risk of poverty or social exclusion 24,2 19,8 19,1 17,5 19,9 21,8 24,2 23,5 24.3
At-Risk-of-Poverty rate 16,8 15,9 16,1 15,0 15,8 15,6 18,0 15.2 16.0
Severe Material Deprivation rate 11,6 6,8 5,5 4,5 6,1 9,1 9,3 8,3 8.9
Share of people living in very low work
intensity households (18-59) 9,3 7,2 6,7 5,8 5,9 9,0 10,2 10.3 10,5
In-work at-risk-of poverty rate 7,5 7,8 7,9 7,4 8,3 6,7 8,2 8.4 8.9
Impact of social transfers on poverty
reduction (excl. pensions)(in%) 25,0 27,4 25,1 24,6 28,2 37,6 30,2 38,7 37,0
At risk of poverty or social exclusion 29,2 27,8 35,4 40,9 35,6 19,0 17,0 20,0 20.5
At-Risk-of-Poverty rate 20,3 25,1 33,2 39,0 33,9 15,1 13,1 16.0 16.0
Severe Material Deprivation rate 14,9 7,4 7,9 5,8 5,6 6,6 5,8 6,6 7.2
Relative median income ratio of elderly 0,73 0,69 0,65 0,62 0,66 0,73 0,75 0.88 0.89
Aggregate replacement ratio 0,47 0,49 0,47 0,45 0,52 0,55 0,54 0.53 0.54
2000 2005 2006 2007 2008 2009 2010 2009 2010
Sickness/Health care 4,4 4,0 3,7 4,0 4,8 5,4 4,8 8,4 8,3
Invalidity 0,9 1,2 1,1 1,1 1,5 1,9 1,9 2,3 2,2
Old age and survivors 6,2 5,4 5,4 5,2 6,4 8,1 7,9 12,7 12,7
Family/Children 1,6 1,5 1,5 1,4 1,8 2,3 2,3 2,3 2,3
Unemployment 0,2 0,2 0,1 0,1 0,3 1,2 0,8 1,8 1,7
Housing and Social exclusion n.e.c. 0,4 0,1 0,1 0,1 0,1 0,2 0,2 1,0 1,0
Total 13,6 12,4 12,0 12,0 14,8 19,1 17,9 28,5 28,2
Means-tested
Sickness/Health care 0,0 0,0 0,0 0,0 0,0 0,0 0,0 0,1 0,1
Invalidity 0,0 0,0 0,0 0,0 0,0 0,0 0,0 0,5 0,5
Old age and survivors 0,0 0,0 0,0 0,0 0,0 0,0 0,0 0,6 0,6
Family/Children 0,0 0,0 0,0 0,0 0,0 0,0 0,0 0,6 0,6
Unemployment 0,0 0,0 0,0 0,0 0,0 0,0 0,0 0,4 0,4
Housing and Social exclusion n.e.c. 0,3 0,1 0,1 0,1 0,1 0,1 0,2 0,9 1,0
Total 0,3 0,1 0,1 0,1 0,1 0,1 0,2 3,0 3,1
Non-means tested
Sickness/Health care 4,4 4,0 3,7 4,0 4,8 5,4 4,8 8,3 8,2
Invalidity 0,9 1,2 1,1 1,1 1,5 1,9 1,9 1,8 1,8
Old age and survivors 6,2 5,4 5,4 5,2 6,4 8,1 7,9 12,1 12,1
Family/Children 1,6 1,5 1,5 1,4 1,8 2,3 2,3 1,7 1,7
Unemployment 0,2 0,2 0,1 0,1 0,3 1,2 0,8 1,4 1,3
Housing and Social exclusion n.e.c. 0,0 0,0 0,0 0,0 0,0 0,0 0,0 0,1 0,1
Total 13,3 12,2 11,9 11,9 14,7 19,0 17,7 25,4 25,2
Social expenditure
(in % of GDP)
EU27
Children (0-17)
Working age
(18-64)
Elderly (65+)
Total population
Source: Eurostat (EU-SILC, ESSPROS for social expenditure data)
Note: For non-means tested the aggregation Housing and Social Exclusion n.e.c is based only on
Housing. The total figures of social expenditure include all benefits excluding administrative costs.

- 192 -
4. LONG-TERM ADEQUACY OF PENSIONS: THEORETICAL REPLACEMENT RATES (2010-
2050)
Theoretical replacement rates (TRR): Net 2010 Net 2050 Difference Gross2010 Gross2050 Difference
40 years career: average income earner
(basecase)46,2 50,1 3,9
36,4
(100/0/0)*
40,2
(55/45/0)*3,8
Low income 64,9 56,4 -8,552,6
(100/0/0)*
46,3
(61/39/0)*-6,3
High income 26,6 34,5 7,920,4
(100/0/0)*
27,1
(50/50/0)*6,7
Lower / higher future rates of return 47,8 / 52,6 38,5 / 42,3
Lower / higher future wage growth 51,6 / 49,9 41,9 / 39,7
38 years career: average income 40,5 44,8 4,3 31,9 36 4,1
Low / high income 57,5 / 22,9 50,6 / 31,1 (-6,9 / 8,2) 46,6 / 17,5 41,5 / 24,5 (-5,1 / 7)
42 years career: average income 57,9 58,9 1,0 45,6 47,4 1,8
Low / high income 83,5 / 35,3 66 / 40,7 (-17,5 / 5,4) 67,7 / 27,1 54,2 / 31,9 (-13,5 / 4,8)
10 years after retirement 40,9 39,6 -1,3 32,8 32,3 -0,5
Female worker with 3 years of career
break for childcare43,9 48,4 4,5 34,6 38,9 4,3
3 years of career break for
unemployment44,1 47,4 3,3 34,8 38,1 3,3
10 years out of the labour market 39,2 41,2 2,0 30,9 33,1 2,2
2010 2050 Difference EU27 2010 EU27 2050 Difference
Benefit ratio (Public pensions) 38,7 23,0 -15,844,7 37,0 -7,7
Gross replacement rate at retirement
(Public pensions) 36,0 22,4 -13,6 48,0 39,1 -8,9
Note: *: Share of statutory DB-NDC / statutory funded / occupational and other supplementary
pensions;
Source: Joint SPC/EC report on Pension Adequacy in the European Union (2010-2050)
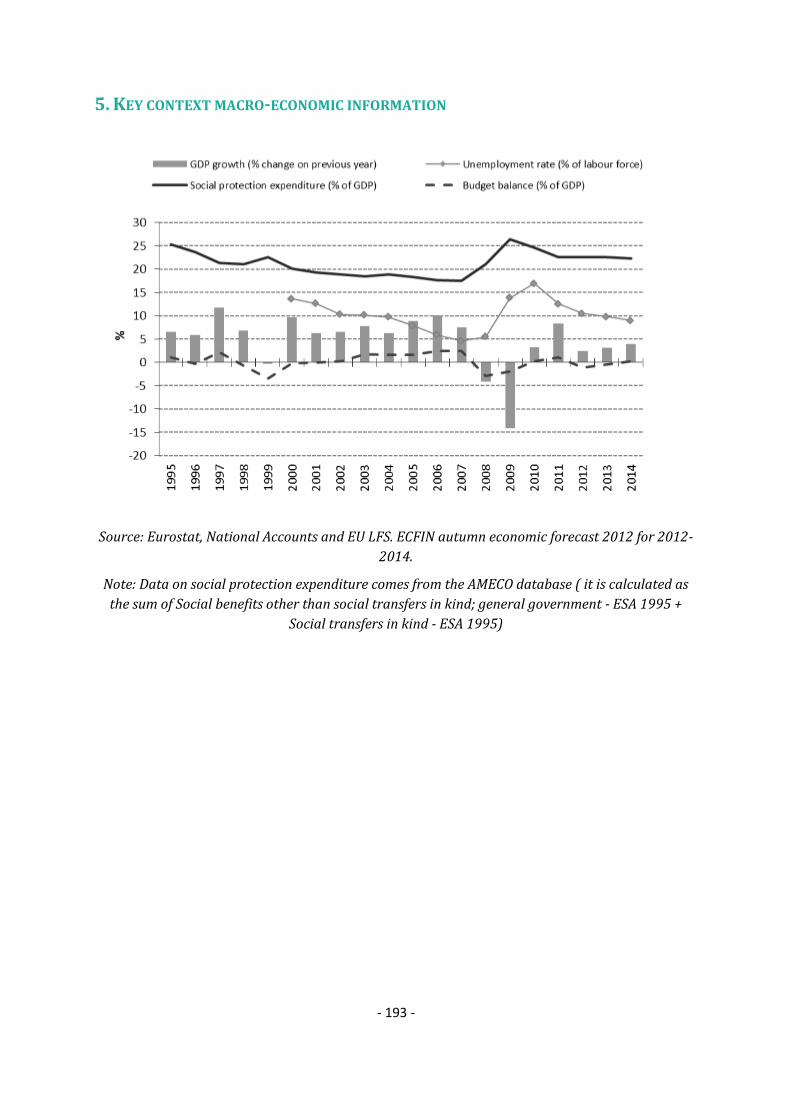
- 193 -
5. KEY CONTEXT MACRO-ECONOMIC INFORMATION
Source: Eurostat, National Accounts and EU LFS. ECFIN autumn economic forecast 2012 for 2012-
2014.
Note: Data on social protection expenditure comes from the AMECO database ( it is calculated as
the sum of Social benefits other than social transfers in kind; general government - ESA 1995 +
Social transfers in kind - ESA 1995)

- 194 -
6. TRENDS IN TAKE-UP OF SELECTED BENEFITS60
Number of unemployed
Definition Unemployment according to ILO definition - Total
Unit Thousands of persons - seasonally adjusted
Source Eurostat
Unemployment insurance benefit
Definition Unemployment insurance benefit recipients
60 These data has been collected by the SPC in the context of monitoring the social impact of the crisis. It
includes only a selection of benefits which have been considered most reactive to the crisis. The number of unemployed refers to the standard definition by the ILO and is given as a background.
- 195 -
Unit thousands of recipients (monthly)
Source
Estonian Unemployment Insurance Fund
Additional sources:
Ministry of Social Affairs “Employment and working life in Estonia 2009–2010”
(http://www.sm.ee/fileadmin/meedia/Dokumendid/V2ljaanded/Toimetised/
2010/series_20109eng.pdf)
Ministry of Social Affairs “Employment and working life in Estonia 2010–
2011”;(http://www.sm.ee/fileadmin/meedia/Dokumendid/V2ljaanded/Toim
etised/2012/series_20122eng.pdf)
Statistics Estonia “Statistical Yearbook 2012” (http://www.stat.ee/publication-
download-pdf?publication_id=29873 )
Comment
Unemployment insurance benefit recipients - unemployed persons who
received a payment of unemployment insurance benefit during the specified
period. Unemployment insurance is a type of compulsory insurance,
unemployment insurance is financed from unemployment insurance premiums
paid by the insured persons (employees) and the employers. The
unemployment insurance benefit is paid to unemployed persons whose
unemployment insurance period in the three preceding years is at least 12
months and whose last relationship did not end on their own initiative or
mutual agreement. In 2009, the rapid growth in the number of recipients of
the unemployment insurance benefit can be associated with the fast increase in
the number of the registered unemployed. The effect of the economic crisis on
the labour market of Estonia has been very strong in 2009 and in the beginning
of 2010. In two years, the number of registered unemployed persons increased
by over five times, reaching the maximum level in March 2010. In 2009, the
unemployment insurance benefit was paid to over 57 thousand persons, which
was 3.7 times more than in 2008. In the same period, the proportion of new
persons receiving unemployment insurance benefits among new registered
unemployed persons increased from 33% to 45%.
In 2010, after the first months, the number of unemployment insurance benefit
recipients started to decrease. However, the unemployment insurance benefit
was paid in total to 61,012 persons in 2010. In 2011, the respective number
decreased by 47% and the unemployment insurance benefit was paid to
32,104 persons. Compared to 2010, the number of new recipients of
unemployment insurance benefit also decreased by 39% (from 32,363 to
19,830).
The decrease in the number of recipients is caused by the falling
unemployment rate - after the 1st quarter of 2010, Estonia experienced the
rapid decrease in the unemployment rate.

- 196 -
Unemployment allowance
Definition Unemployment allowance recipients
Unit thousands of recipients (monthly)
Source
Unemployment Insurance Fund;
Additional sources:
Ministry of Social Affairs “Employment and working life in Estonia 2009–2010”
http://www.sm.ee/fileadmin/meedia/Dokumendid/V2ljaanded/Toimetised/
2010/series_20109eng.pdf
Ministry of Social Affairs “Employment and working life in Estonia 2010–
2011”;
http://www.sm.ee/fileadmin/meedia/Dokumendid/V2ljaanded/Toimetised/
2012/series_20122eng.pdf
Comment
Unemployment allowance is paid to unemployed persons who have worked for
at least 180 days during the previous 12 months or have been engaged for at
least 180 days in activities that are considered as equivalent of work (e.g.
studies, military service) (Labour Market Services and Benefits Act). The
unemployment allowance is paid for a maximum period of 270 days. The
unemployment allowance will be increased (31-fold daily unemployment
allowance rate is 65,41 EUR at 2012; it will be raised to 101,68 EUR at 2013).
In 2009, the unemployment allowance was paid two times more than in 2008
(to 46,376 unemployed persons in 2009). The increase in the number of
persons who received the unemployment allowance was predictable as the
number of registered unemployment persons increased as well. The number of
new persons receiving the unemployment allowance also increased two times
compared to 2008 (from 18,600 persons in 2008 to 38,179 persons in 2009),
but the proportion of new persons receiving the unemployment allowance
among new registered unemployed persons decreased from 39% in 2008 to
32% in 2009.
In 2011, unemployment allowance was paid to 30,449 unemployed persons
which is 32.9% less than in 2010. The number of recipients of unemployment
allowance started to decrease at the beginning of 2010 and became stable
during the last months of 2011. In 2012, the number of recipients of
unemployment allowance continued to decrease. The number of new
recipients of unemployment allowance has also decreased. In 2011, the
number of new recipients of unemployment allowanced decreased to 21,717
persons, which is 25% less than 2010. On the average, new recipients of
unemployment allowance formed 27% of new registered unemployed persons
in 2011 (31% in 2010).
- 197 -
Recipients of social assistance benefits/means-tested minimum Income
Definitio
n Subsistence benefit (to maintain subsistence level) receivers
Unit Number of granted applications (thousands, cumulative during the year)
Source Ministry of Social Affairs
Commen
t
These series is cumulative during the year.
Definition: A person living alone or a family whose monthly disposable income,
after deduction of the fixed expenses connected with permanent dwelling during
the current month, is below the subsistence level has right to receive a
subsistence benefit. The number of recipients of subsistence benefit continuously
decreased until 2008 (because of the general wage increase, introduction of
unemployment insurance benefit, increased employment rate, decrease of
unemployed persons). From the end of 2008, the number of recipients of
subsistence benefit started to increase as a result of the rapid increase in the
number of unemployed persons. In 2009, the total number of satisfied
applications for subsistence benefit was 1.8 times more than in 2008. The growth
has been continued in 2010. The main changes in the number of benefit recipients
were caused by the increase in unemployment: among the recipients the number
of families with at least one unemployed person has been increased.
In 2011, the increase of subsistence benefit recipients slowed down and in 2011,
the number of applications decreased by 2.1 compared to the respective number
in 2010. The decrease has been continued in the first half of 2012: at the end of
the 2nd quarter of 2012 there were over 77 thousand satisfied applications, which
is 14% less than the same period in 2010. The years 2011 and 2012 are more
comparable than the previous years, because the subsistence level increased (by
20%) from the beginning of 2011.
Note: In April 2010, a new social services and benefit register (STAR) was
introduced. Therefore the data from the 2nd quarter 2010 is not fully comparable
with the previous data.
Disability benefits recipients
Definitio
n Recipients of benefits for disabled persons
Unit Thousands of recipients at the end of quarter
Source Social Insurance Fund
Commen
t
Disability is the loss of or an abnormality in an anatomical, physiological or
mental structure of function of a person, which in conjunction with different
relational and environmental restrictions prevents participation in social life on

- 198 -
equal bases with others. From 2008 the disabled adult allowance was replaced by
disability allowance for a person of working age and disability allowance for a
person of retirement age. Therefore the indicator since 2008 includes recipients
of three types of benefits: recipients of the allowance for disabled persons of at
least 16 years of age, for disabled persons of working age and for disabled persons
of retirement age. The number of receivers of the disabled adult allowances has
been gradually increasing each year, reaching over 110,000 persons in 2008 and
over 115,000 persons in 2009. The growth has continued in 2010, reaching over
120,000 persons and over 124,000 in 2011. At the end of 2nd quarter of 2012, the
number of receivers of the disabled adult allowance was over 125,000.
Incapacity for work
Definitio
n Receivers of pension for incapacity for work
Unit Thousands of recipients at the end of quarter
Source Social Insurance Board
Commen
t
The right for the pension for incapacity for work has a person, who is at least 16
years of age and has been declared to be permanently incapable to work, loss of
whose working capacity is 40 to 100 per cent and who by the initial date of
granting of the pension has acquired the following pensionable service or
accumulation period in Estonia. The number of incapacity for work pensioners
has also growing trend. At the end of 2009 there were over 77,000 and at the end
of the 2010 there were over 83,000 persons receiving the incapacity for work
pension. The number of incapacity of work pensioners has increased also during
the 2011 by reaching over 90,000 persons and the growth has continued in the
1st half of 2012 by reaching over 92,000.
7. SUMMARY OF SPECIFIC KEY SOCIAL CHALLENGES AND PARTICULARLY GOOD SOCIAL
OUTCOMES
Social policy areas Challenges
Poverty and social inclusion Address increasing poverty and social exclusion
Effectiveness and efficiency
of social protection systems
Improving incentives to work by streamlining the social
benefits system and increasing flexibility in the allocation of
disability, unemployment and parental benefits, while
ensuring adequate social protection

- 199 -
Improving the delivery of social services while better
targeting family and parental benefits and removing
distortionary tax exemptions related to children
Particularly good social outcomes
Improvement in the number of healthy life years of men and
women at 65

- 200 -
IRELAND 1. 2012 NATIONAL SOCIAL REPORT (NSR): KEY ISSUES
The primary socio-economic challenges facing Ireland can be headlined under three topics: high
unemployment (14.8% in q1 2012)61 and in particular long term unemployment (60.6% of total
unemployed), increasing youth unemployment (31.1% in q3 2012) and upward trends in
poverty. Due to reported time-lags the Irish government reports insufficient time for
consultation with stakeholders. The Irish government wants to review the process and to
address this in future reports.
The main socio-economic priorities of the Irish government are outlined in the EU/ECB/IMF
Troika Memorandum of Understanding62. A structural reform package was introduced to
underpin growth and to reform (amongst others) social security spending and policy to facilitate
the adjustment to the labour market and strengthen activation measures, to reduce the risk of
long term unemployment and to tackle unemployment and poverty traps.
The Irish government's plan to tackle poverty is set out in its National Action Plan for Social
Inclusion 2007-2016. In the National Reform Programme 2012 Update, Ireland’s national social
target for poverty reduction is to reduce consistent poverty63 to 4 per cent (interim target) and
to 2 per cent or less by 2020, from the 2010 baseline rate of 6.2 per cent. In line with this
national target, Ireland’s contribution to the Europe 2020 target is to lift at least 200,000 people
out of the risk of poverty and exclusion between 2012 and 2020 from the 2010 baseline.
Ireland's approach is based on three overlapping areas: income support, activation and access to
services. Further to this, activation within Pathways to Work (2012 policy statement on labour
market activation) will see more engagement and activation of unemployed people with a view
to reducing poverty.
Welfare Payments' nominal values were maintained in the Budget 2012, acting as a safeguard
against poverty. Reforms of welfare payments include a restructuring of how child income
support and working age supports are provided. This is intended to assist low income families
and the take-up of employment.
Initiatives to improve access to services include both access to financial services and an
affordable energy policy published in 2011. The main aims of the latter are to tackle energy
poverty, provide income support to access energy and energy efficiency measures. Policies to
tackle in-work poverty include the elimination of poverty traps in the welfare system, provision
of in-work cash and non-cash supports for low earners.
61 Please note, due to the date of the authoring of this report, some of the statistics may be out of date.
62 Council Implementing decision 2011/77/EU.
63 People are regarded as being in consistent poverty if (i) their income is below 60 per cent of median income and (ii) they experience basic deprivation (i.e. the enforced lack of two or more items from a set of 11 items representing basic living standards).
- 201 -
A number of reforms to State pensions are underway. In order to provide for changing
demographics and sustainable pensions, the Government have increased State pension age. In
2014, the State pension transition, which was payable for one year between the ages of 65 and
66, is being abolished. State pension age will now be standardised at 66. This will increase to 67
in 2021 and 68 in 2028.
Legislation in 2010 and 2011 provided for a sovereign annuity backed by a sovereign bond to be
available to pension funds. A sovereign annuity is new type of annuity product where payments
under the policy will be directly linked to the proceeds of Euro denominated bonds issued by
any EU Member States. This initiative widens the options available to pension schemes.
Healthcare and long-term care is also subject to reform and restructuring in present and
forthcoming policy. The current government's broad policy aim is to provide a 'single tier' health
system supported by universal health insurance "based on need, not income". The main thrust of
this will be a strengthening of primary care facilities and the reform of the acute hospital sector.
The main government policy regarding long-term care is to maintain people in their homes for
as long as possible, with homecare packages and homecare support services. When this is no
longer possible, access is possible to long-term residential care. New guidelines for both
community and residential care have been published in 2011 and 2012. The sustainability of
current available financial support for long-term residential is under review.
The sustainability of other health care policies is also under examination by the Heath Service
Executive, with savings of €750m required in 2012, in areas such as staff pay/hours, drug
purchasing and increased levies for private insurance companies. Additional funding, however,
will be provided for free General Practitioner care for people with specified illnesses, child
welfare and National Clinical Care Programmes.
Three main challenges: 1) persistently high long-term unemployment and high percentage of the
population in jobless households64 feed into an increase in poverty. 2) Activation of the young
unemployed, particularly the low skilled. 3) The sustainability of current health and long-term
care policies is a major challenge in view of required budget cuts.
Adequacy of measures: Social transfers contribute greatly to diminishing poverty rates in
Ireland. However, they have hitherto been unlinked to activation. The Pathways to Work seeks to
change that and lead people from dependency on social transfers to gainful employment.
Evidence within the NSR demonstrates how those in work are least likely to be at-risk-of-
poverty. As previously stated reforms in pensions, while more sustainable, may lead to
increased poverty in older people, especially women (whose social contribution record may not
be as complete as a man's and will therefore receive a diminished state pension). Reforms in the
healthcare system and long-term care system are expected to increase efficiency, improve
delivery and reduce cost and waste.
There are thematic overlaps between the NSR and the NRP. The NSR adds value by looking more
closely at the social dimension of the EU 2020 strategy and by examining healthcare policy and
pensions in particular.
64 Ireland has the highest percentage of the population in jobless households in the EU at 23 per cent
(2010). This rate has risen from 15 per cent in 2007.
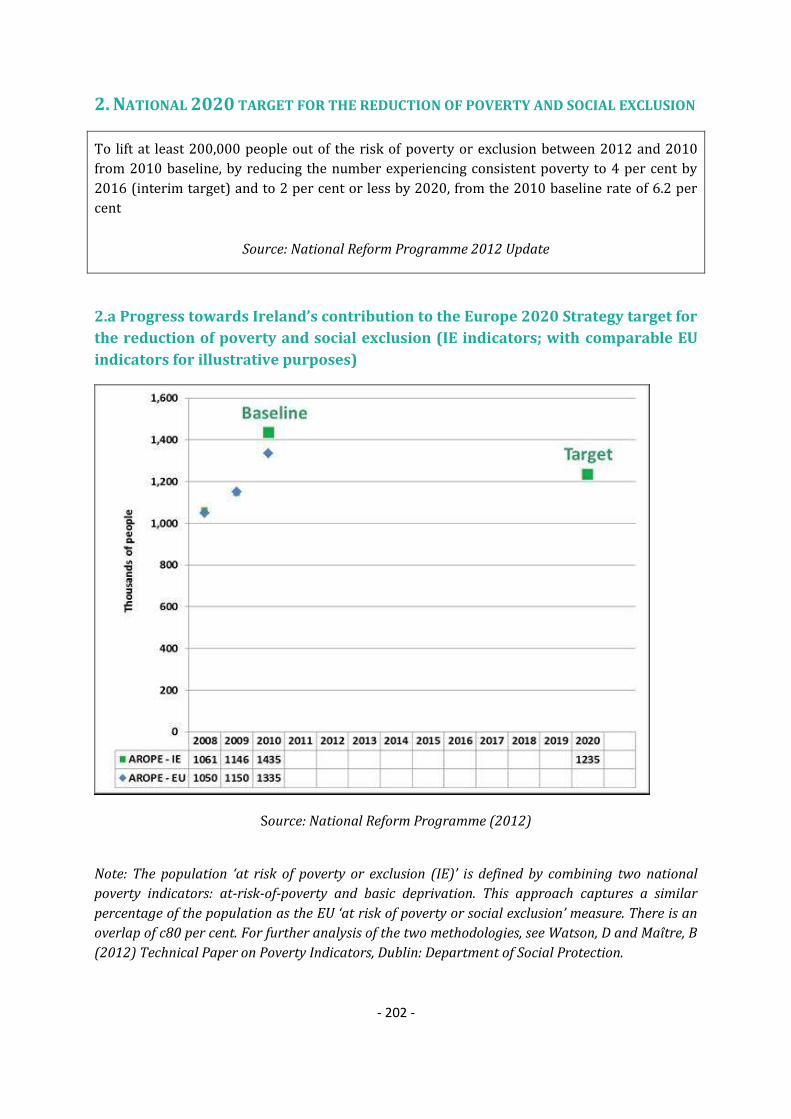
- 202 -
2. NATIONAL 2020 TARGET FOR THE REDUCTION OF POVERTY AND SOCIAL EXCLUSION
To lift at least 200,000 people out of the risk of poverty or exclusion between 2012 and 2010
from 2010 baseline, by reducing the number experiencing consistent poverty to 4 per cent by
2016 (interim target) and to 2 per cent or less by 2020, from the 2010 baseline rate of 6.2 per
cent
Source: National Reform Programme 2012 Update
2.a Progress towards Ireland’s contribution to the Europe 2020 Strategy target for
the reduction of poverty and social exclusion (IE indicators; with comparable EU
indicators for illustrative purposes)
Source: National Reform Programme (2012)
Note: The population ‘at risk of poverty or exclusion (IE)’ is defined by combining two national
poverty indicators: at-risk-of-poverty and basic deprivation. This approach captures a similar
percentage of the population as the EU ‘at risk of poverty or social exclusion’ measure. There is an
overlap of c80 per cent. For further analysis of the two methodologies, see Watson, D and Maître, B
(2012) Technical Paper on Poverty Indicators, Dublin: Department of Social Protection.

- 203 -
2b. Composition of the population at risk of poverty or social exclusion (EU
indicators) (2010)
Source: Eurostat (EU-SILC)
Note: i) AROP - at-risk-of-poverty rate; VLWI - share of population living in very low work intensity
households ((quasi)-jobless households); SMD - severe material deprivation rate; the red overlap indicates
the share of the population which accumulates all three conditions,
ii) For the at-risk-of poverty rate (AROP), the income reference year is the calendar year prior to the
survey year (i.e. 2010) except for the United Kingdom (survey year) and Ireland (12 months preceding the
survey). Similarly, the very low work intensity rate (VLWI) refers to the income reference year prior to the
survey (i.e. 2010) while for the severe material deprivation rate (SMD), the reference is the current year (i.e.
2011).
2005 2006 2007 2008 2009 2010
AROPE % of total pln
25.0 23.3 23.1 23.7 25.7 29.9
1000 persons
1,038 991 1,005 1,050 1,150 1,335
AROP total % of total pln
19.7 18.5 17.2 15.5 15.0 16.1
1000 persons
819 787 751 686 670 716
VLWI total % of total pln
14.6 12.8 14.2 13.6 19.8 22.9
1000 persons
510 459 526 509 739 847
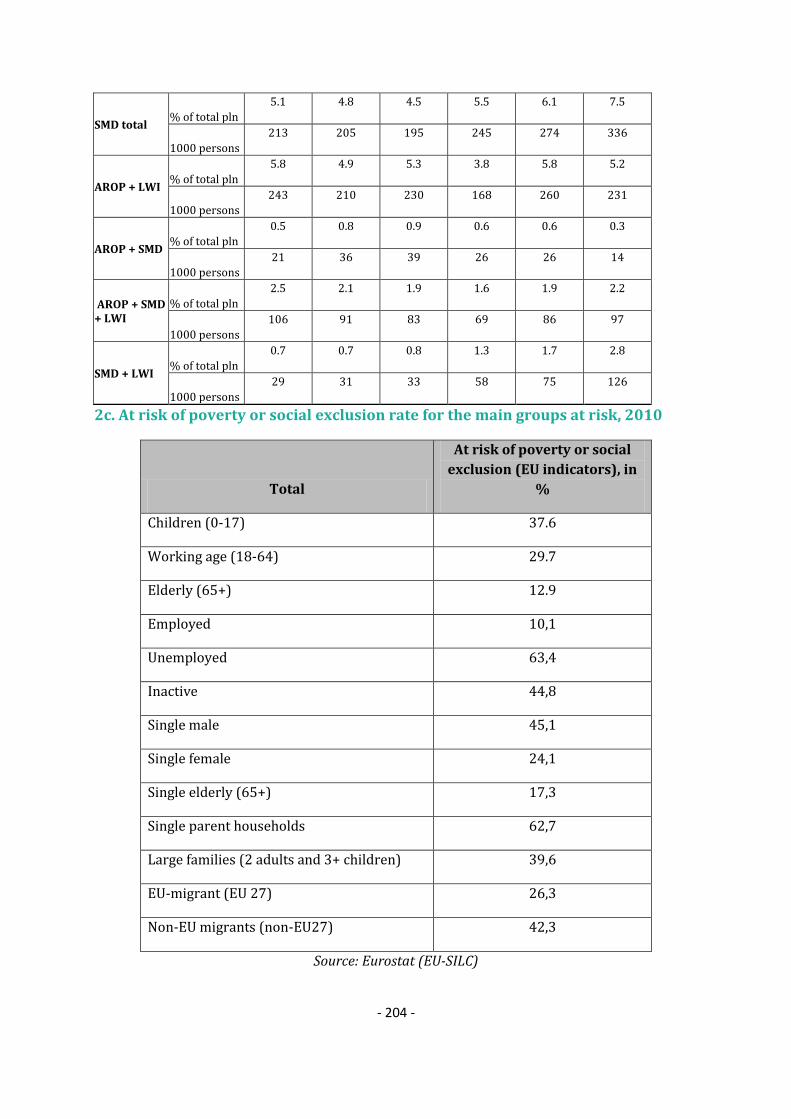
- 204 -
SMD total % of total pln
5.1 4.8 4.5 5.5 6.1 7.5
1000 persons
213 205 195 245 274 336
AROP + LWI % of total pln
5.8 4.9 5.3 3.8 5.8 5.2
1000 persons
243 210 230 168 260 231
AROP + SMD % of total pln
0.5 0.8 0.9 0.6 0.6 0.3
1000 persons
21 36 39 26 26 14
AROP + SMD + LWI
% of total pln
2.5 2.1 1.9 1.6 1.9 2.2
1000 persons
106 91 83 69 86 97
SMD + LWI % of total pln
0.7 0.7 0.8 1.3 1.7 2.8
1000 persons
29 31 33 58 75 126
2c. At risk of poverty or social exclusion rate for the main groups at risk, 2010
Total
At risk of poverty or social
exclusion (EU indicators), in
%
Children (0-17) 37.6
Working age (18-64) 29.7
Elderly (65+) 12.9
Employed 10,1
Unemployed 63,4
Inactive 44,8
Single male 45,1
Single female 24,1
Single elderly (65+) 17,3
Single parent households 62,7
Large families (2 adults and 3+ children) 39,6
EU-migrant (EU 27) 26,3
Non-EU migrants (non-EU27) 42,3
Source: Eurostat (EU-SILC)

- 205 -
3. MAIN SOCIAL INDICATORS
IE % 2005 2006 2007 2008 2009 2010 2011 2010 2011
At risk of poverty or social exclusion 25.0 23.3 23.1 23.7 25.7 29.9 : 23,6 24.2
At-Risk-of-Poverty rate 19.7 18.5 17.2 15.5 15.0 16.1 : 16.4 16.9
Severe Material Deprivation rate 5.1 4.8 4.5 5.5 6.1 7.5 : 8,3 8.8
Share of people living in very low work
intensity households14.6 12.8 14.2 13.6 19.8 22.9 :
10.0 10.0
Impact of social transfers on poverty
reduction (excl. pensions)(in%) 39,0 43,6 48,0 54,4 60,0 60,1 36,7 35,2
Value of threshold (single HH) - in PPS 9,048 9,563 10,633 10,901 10,556 9,705 : N/A N/A
Value of threshold (2 adults + 2 children) -
in PPS19,000 20,082 22,329 22,893 22,167 20,381 :
N/A N/A
At risk of poverty or social exclusion 29.9 28.0 26.2 26.6 31.4 37.6 : 27,1 27.0
At-Risk-of-Poverty rate 23.0 22.5 19.2 18.0 18.8 19.7 : 20.5 20.6
Severe Material Deprivation rate 8.6 7.4 7.6 6.8 8.4 10.6 : 9,7 10.0
Share of people living in very low work
intensity households18.7 15.4 15.7 15.0 23.4 25.5 :
9.1 8.8
Impact of social transfers on poverty
reduction (excl. pensions)(in%) 42,5 44,9 50,6 55,2 59,7 61,8:
41,4 40,5
At risk of poverty or social exclusion 21.4 20.5 20.7 22.6 24.8 29.7 : 23,5 24.3
At-Risk-of-Poverty rate 16.0 15.3 14.4 13.4 13.2 15.5 : 15.2 16.0
Severe Material Deprivation rate 4.2 4.3 3.7 5.6 5.8 7.1 : 8,3 8.9
Share of people living in very low work
intensity households (18-59)12.7 11.6 13.6 13.0 18.2 21.7 :
10.3 10,5
In-work at-risk-of poverty rate 5.9 6.2 5.5 6.3 4.9 7.5 : 8.4 8.9
Impact of social transfers on poverty
reduction (excl. pensions)(in%) 41,2 45,9 50,3 56,6 61,4 60,1:
38,7 37,0
At risk of poverty or social exclusion 33.4 27.7 28.7 22.5 17.9 12.9 : 20,0 20.5
At-Risk-of-Poverty rate 32.8 26.9 28.3 21.1 16.2 10.6 : 16.0 16.0
Severe Material Deprivation rate 1.8 1.7 1.2 2.2 2.6 2.7 : 6,6 7.2
Relative median income ratio of elderly 0.66 0.70 0.69 0.74 0.78 0.86 : 0.88 0.89
Aggregate replacement ratio 0.46 0.38 0.49 0.49 0.48 0.47 : 0.53 0.54
2000 2005 2006 2007 2008 2009 2010 2009 2010
Sickness/Health care 5,4 6,9 7,0 7,2 8,5 10,7 12,3 8,4 8,3
Invalidity 0,7 0,9 0,9 1,0 1,1 1,3 1,3 2,3 2,2
Old age and survivors 3,5 4,6 4,7 4,8 5,6 6,4 6,6 12,7 12,7
Family/Children 1,8 2,5 2,5 2,6 3,1 3,6 3,7 2,3 2,3
Unemployment 1,3 1,3 1,3 1,4 1,8 3,1 3,5 1,8 1,7
Housing and Social exclusion n.e.c. 0,6 0,7 0,7 0,7 0,9 0,9 0,9 1,0 1,0
Total 13,1 16,7 17,0 17,6 21,0 26,0 28,3 28,5 28,2
Means-tested
Sickness/Health care 0,6 0,9 1,0 1,0 1,2 1,5 1,7 0,1 0,1
Invalidity 0,3 0,4 0,4 0,5 0,6 0,7 0,7 0,5 0,5
Old age and survivors 0,7 0,7 0,7 0,7 0,8 0,9 1,0 0,6 0,6
Family/Children 0,8 0,8 0,9 0,9 1,1 1,3 1,4 0,6 0,6
Unemployment 0,5 0,5 0,5 0,6 0,7 1,3 1,8 0,4 0,4
Housing and Social exclusion n.e.c. 0,6 0,7 0,7 0,7 0,9 0,9 0,9 0,9 1,0
Total 3,5 4,0 4,1 4,4 5,3 6,7 7,6 3,0 3,1
Non-means tested
Sickness/Health care 4,8 6,0 6,0 6,2 7,3 9,2 10,6 8,3 8,2
Invalidity 0,4 0,5 0,5 0,5 0,6 0,6 0,6 1,8 1,8
Old age and survivors 2,7 3,9 4,0 4,0 4,8 5,4 5,6 12,1 12,1
Family/Children 1,0 1,6 1,6 1,7 2,0 2,3 2,2 1,7 1,7
Unemployment 0,7 0,8 0,8 0,8 1,1 1,8 1,7 1,4 1,3
Housing and Social exclusion n.e.c. 0,0 0,0 0,0 0,0 0,0 0,0 0,0 0,1 0,1
Total 9,6 12,7 12,9 13,3 15,7 19,3 20,8 25,4 25,2
Social expenditure
(in % of GDP)
EU27
Total population
Children (0-17)
Working age
(18-64)
Elderly (65+)
Source: Eurostat (EU-SILC, ESSPROS for social expenditure data)
Note: For non-means tested the aggregation Housing and Social Exclusion n.e.c is based only on
Housing. The total figures of social expenditure include all benefits excluding administrative costs.

- 206 -
4. LONG-TERM ADEQUACY OF PENSIONS: THEORETICAL REPLACEMENT RATES (2010-
2050)
Theoretical replacement rates (TRR): Net 2010 Net 2050 Difference Gross2010 Gross2050 Difference
40 years career: average income earner
(basecase)85,8 69,0 -16,8
73,1
(38/0/62)*
58,6
(47/0/53)*-14,5
Low income 99,1 83,8 -15,388,3
(48/0/52)*
72,9
(58/0/42)*-15,4
High income 61,9 49,6 -12,346,4
(30/0/70)*
37,1
(38/0/62)*-9,3
Lower / higher future rates of return 65,4 / 73,3 54/64,2
Lower / higher future wage growth 75 / 64,5 66,4 / 52,7
38 years career: average income 82 67,5 -14,5 71,2 56,6 -14,6
Low / high income 96,1 / 60,8 82,4 / 47,7 (-13,7/-13,1) 86,8 / 45,6 70,9 / 35,6 (-15,9/-10)
42 years career: average income 87,7 71,4 -16,3 75,2 61,7 -13,5
Low / high income 99 / 61,4 85,9 / 52,4 (-13 / -9) 89,7 / 47,2 76 / 39,4 (-13,6/-7,8)
10 years after retirement 78,7 65,5 -13,2 66,6 54,1 -12,5
Female worker with 3 years of career
break for childcare81,3 66,8 -14,5 69 55,7 -13,3
3 years of career break for
unemployment79,7 66,8 -12,9 67,1 55,7 -11,4
10 years out of the labour market 74,1 61,8 -12,3 62,3 49,2 -13,1
2010 2050 Difference EU27 2010 EU27 2050 Difference
Benefit ratio (Public pensions) : : : 44,7 37,0 -7,7
Gross replacement rate at retirement
(Public pensions) 37,3 38,0 0,7 48,0 39,1 -8,9
Note: *: Share of statutory DB-NDC / statutory funded / occupational and other supplementary
pensions;
Source: Joint SPC/EC report on Pension Adequacy in the European Union (2010-2050)

- 207 -
5. KEY CONTEXT MACRO-ECONOMIC INFORMATION
Source: Eurostat, National Accounts and EU LFS. ECFIN autumn economic forecast 2012 for 2012-
2014.
Note: Data on social protection expenditure comes from the AMECO database (it is calculated as
the sum of Social benefits other than social transfers in kind; general government - ESA 1995 +
Social transfers in kind - ESA 1995)

- 208 -
6. TRENDS IN TAKE-UP OF SELECTED BENEFITS65
Number of unemployed
Definition Unemployment according to ILO definition - Total
Unit thousands of persons - seasonally adjusted
Source Eurostat
Unemployment recipients
Definition Unemployment Benefits recipients
Unit thousands of recipients
Source Central Statistics Office
Recipients of social assistance benefits/means-tested minimum Income
Definition Emergency Social Assistance recipients
65 This data has been collected by the SPC in the context of monitoring the social impact of the crisis. It
includes only a selection of benefits which have been considered most reactive to the crisis. The number of unemployed refers to the standard definition by the ILO and is given as background information.

- 209 -
Unit thousands of beneficiaries
Source Social Welfare Quarterly Statistical Reports
Disability benefits recipients
Definition Illness, Disability & Caring recipients
Unit thousands of beneficiaries
Source Social Welfare Quarterly Statistical Reports
7. SUMMARY OF SPECIFIC KEY SOCIAL CHALLENGES AND PARTICULARLY GOOD SOCIAL
OUTCOMES
Social policy areas Challenges
Poverty and social inclusion Facilitating the adjustment to the labour market (NSR,
2012)
Strengthening activation measures, particularly for
jobless households, the young and low skilled (NSR,
2012)
Reducing the risk of long-term unemployment and
household joblessness (NSR, 2012)
Tackling energy poverty (NSR, 2012)
Pensions Sustainability of the tax incentive scheme for
supplementary pension provision (NSR, 2012)
Health and long-term care Providing a single tier health system supported by
universal health insurance based on need (NSR, 2012)
Sustainability of current health and long-term care
policies (NSR, 2012)
Effectiveness and efficiency
of social protection systems
Tackling unemployment and poverty traps (NSR, 2012)
Particularly good social outcomes

- 210 -
Increased effectiveness of social transfers in reducing
the at-risk-of-poverty rate from 54 per cent to 60 per
cent, one of the best performances in the EU
Reduction in the at risk of poverty or social exclusion rate
among older people from 22.5 per cent in 2008 to 12.9
per cent in 2010, well below the EU average

- 211 -
GREECE 1. NATIONAL SOCIAL REPORT (NSR): KEY ISSUES
The overall social and economic context in Greece is extremely difficult as well as challenging; it
is only in 2014 that positive annual growth rates are expected to return after six successive
years of negative growth. With regard to the social impact of the crisis, unemployment rate has
reached 23.1% in May 2012 (Eurostat) with the young and female population being severely
affected (53.8% and 26.8% respectively, Eurostat - May 2012). Poverty and social exclusion
constitutes a serious risk for the unemployed, the elderly and the working population as well as
for the children.
The Hellenic National Social Report (NSR) was submitted without consulting relevant
stakeholders (social partners, NGOs).
The main socio-economic priorities identified in the report66 are the following: a) removing
barriers to labour market access; b) efficiency of the active employment policies for vulnerable
groups, including promotion of social economy; c) effectiveness of the social expenditure
transfers in reducing poverty (e.g. social safety net against poverty and social exclusion); and d)
implementation of an active inclusion policy largely accepted by the Greek population and
shared by the main stakeholders.
The priorities identified by the Commission67 are mostly related to the improvement of the
sustainability of public finances rather than focusing on the social challenges. It is expected
however, that the structural reforms under the Economic Adjustment Programme contribute to
an increase in employment and limiting poverty and social exclusion in the medium term. In the
short term, the shrinkage of the disposable income due to austerity measures has added to the
factors increasing poverty and social exclusion and created a fragile social situation.
The Greek government is implementing a series of measures in order to address the extremely –
severe social situation. A new solidarity contribution has been introduced due to the increased
expenditure for unemployment benefits (increased number of the recipients). Some benefits are
means-tested (Law 12.11.2012), others have been reduced (e.g. family benefits for public sector
employees) or abolished (large family benefits) while for some others the prerequisites for
eligibility have become stricter (e.g. the old age solidarity benefit - EKAS). The prolongation of
the period of the insurance coverage for the unemployed and the creation of an unemployment
assistance for long term unemployed are another important social measures.
With regard to the active inclusion policy strand, the main measures to limit the social impact of
the crisis are supported by the European Social Fund and consist of existing measures such as
the employment promotion programmes for the vulnerable groups implemented by the Greek
Manpower Organization (OAED) and of new measures such as the regional integrated
programmes for the support of employment (TOPSA) and the local actions of social inclusion for
66
http://ec.europa.eu/social/main.jsp?langId=en&catId=758
67 http://ec.europa.eu/europe2020/pdf/nd/swd2012_greece_en.pdf

- 212 -
vulnerable social groups (TOPEKO). High priority merits the new initiative to promote an eco-
system for social economy.
Regarding pensions, Greece faced a significant challenge to ensure the long-term sustainability
of its public finances at the back of its ageing population and the additional public debt crisis. For
Greece, the increase in age-related expenditure over the long-term was projected to be over 10
p.p. of GDP in 2060, while at the same time the working-age population (15-64) was projected to
drop by 18%, compared with 15% for the EU as a whole by 206068.As a result, one of the
priorities of the first Economic Adjustment Programme for Greece was the reform of pensions.
Since then, there is an on-going procedure to reform the pensions' system. The latest reforms in
the field consist of the following: a) an overhaul of the auxiliary/supplementary pensions, b) the
introduction of the new annual pension adjustment rule, c) an overhaul of the conditions for
disability pensions and the creation of a centralised certification and monitoring agency and d)
the modification of the list of arduous and hazardous professions. d) increasing the “retrirement
age” (N.4093 / 12.11.12) from 65 to 67 years old.
A health reform is being implemented since 2010 as a response to the provisions of the first
Economic Adjustment Programme. The establishment of a single fund for the provision of
healthcare (EOPYY) aims at reducing the administrative burden of the sector and increasing the
bargaining power towards procurement suppliers. Measures to improve the cost-effectiveness
of the administration in the health sector include the regionalisation of the responsibility of
pharmaceutical procurement, improvements in the human resources management and
assessment and merging all health-related activities under one ministry. Audits and internal
controls are conducted in major hospitals. Measures to achieve cost savings in the
pharmaceuticals include the establishment of electronic prescriptions and the favouring of the
use of generic medicines.
The main challenge for Greece at the moment is to limit the social impact of the crisis in the
context of the austerity measures taken and the squeeze of public finances. The establishment of
a social safety net to combat poverty and social exclusion should be the first priority
accompanied by the improvement of the effectiveness of social transfers in combating poverty.
The second priority is the development and implementation of an integrated active inclusion
strategy; and the third one is to safeguard the adequacy of pensions both in terms of poverty
avoidance and maintenance of income after retirement.
In the current socio-economic context, the measures adopted may be credible but are not
adequate to achieve the target of poverty and social exclusion reduction and to secure a
significant counterbalance to the austerity measures undertaken.
The NSR reprises the socio-economic context and the reform situation available also in the NRP
and provides an update with newly adopted or envisaged developments following the
submission of the NRP. It dds information to the NRP in coherence with the Hellenic Stability
and Growth Programme 2011-2014.
68 EPC-SPC Joint Report on pensions – country profiles (2010)
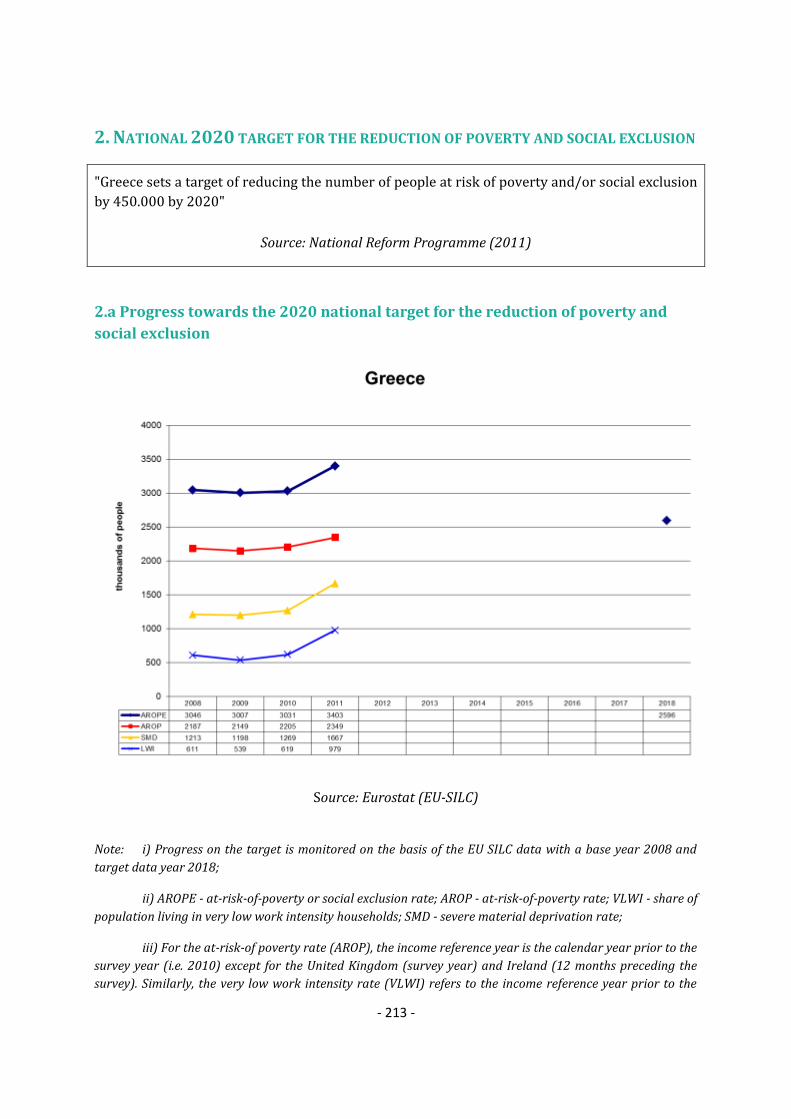
- 213 -
2. NATIONAL 2020 TARGET FOR THE REDUCTION OF POVERTY AND SOCIAL EXCLUSION
"Greece sets a target of reducing the number of people at risk of poverty and/or social exclusion
by 450.000 by 2020"
Source: National Reform Programme (2011)
2.a Progress towards the 2020 national target for the reduction of poverty and
social exclusion
Source: Eurostat (EU-SILC)
Note: i) Progress on the target is monitored on the basis of the EU SILC data with a base year 2008 and
target data year 2018;
ii) AROPE - at-risk-of-poverty or social exclusion rate; AROP - at-risk-of-poverty rate; VLWI - share of
population living in very low work intensity households; SMD - severe material deprivation rate;
iii) For the at-risk-of poverty rate (AROP), the income reference year is the calendar year prior to the
survey year (i.e. 2010) except for the United Kingdom (survey year) and Ireland (12 months preceding the
survey). Similarly, the very low work intensity rate (VLWI) refers to the income reference year prior to the
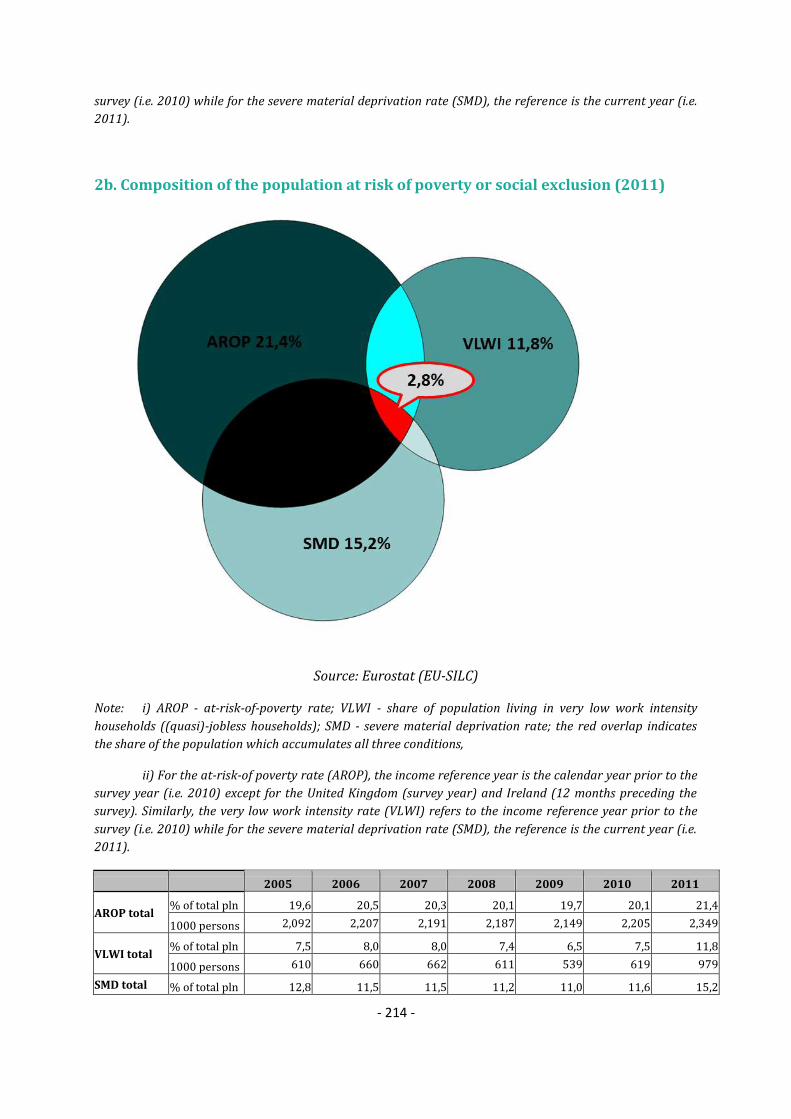
- 214 -
survey (i.e. 2010) while for the severe material deprivation rate (SMD), the reference is the current year (i.e.
2011).
2b. Composition of the population at risk of poverty or social exclusion (2011)
Source: Eurostat (EU-SILC)
Note: i) AROP - at-risk-of-poverty rate; VLWI - share of population living in very low work intensity
households ((quasi)-jobless households); SMD - severe material deprivation rate; the red overlap indicates
the share of the population which accumulates all three conditions,
ii) For the at-risk-of poverty rate (AROP), the income reference year is the calendar year prior to the
survey year (i.e. 2010) except for the United Kingdom (survey year) and Ireland (12 months preceding the
survey). Similarly, the very low work intensity rate (VLWI) refers to the income reference year prior to the
survey (i.e. 2010) while for the severe material deprivation rate (SMD), the reference is the current year (i.e.
2011).
2005 2006 2007 2008 2009 2010 2011
AROP total % of total pln 19,6 20,5 20,3 20,1 19,7 20,1 21,4
1000 persons 2,092 2,207 2,191 2,187 2,149 2,205 2,349
VLWI total % of total pln 7,5 8,0 8,0 7,4 6,5 7,5 11,8
1000 persons 610 660 662 611 539 619 979
SMD total % of total pln 12,8 11,5 11,5 11,2 11,0 11,6 15,2

- 215 -
1000 persons 1,365 1,236 1,238 1,213 1,198 1,269 1,667
AROP + VLWI
% of total pln 1,6 1,7 1,5 1,1 1,0 1,2 2,1
1000 persons 175 184 157 122 107 134 227
AROP + SMD % of total pln 4,8 4,8 5,5 5,2 5,3 6,1 6,3
1000 persons 511 517 592 564 576 669 693
AROP + SMD + VLWI
% of total pln 1,0 1,0 1,1 1,1 0,8 1,0 2,8
1000 persons 106 105 119 124 85 108 303
SMD + VLWI % of total pln 0,4 0,3 0,4 0,3 0,2 0,4 0,6
1000 persons 38 37 39 31 26 43 67
2c. At risk of poverty or social exclusion rate for specific groups, 2011
Total
At risk of poverty or social
exclusion, in %
Children (0-17) 30,4
Working age (18-64) 31,6
Elderly (65+) 29,3
Employed 17,7
Unemployed 64,3
Inactive 47,5
Single male 36,4
Single female 40,7
Single elderly (65+) 38,5
Single parent households 55,7
Large families (2 adults and 3+ children) 32,5
EU-migrant (EU 27) 29,5
Non-EU migrants (non-EU27) 57,5
Source: Eurostat (EU-SILC)

- 216 -
3. MAIN SOCIAL INDICATORS
EL % 2005 2006 2007 2008 2009 2010 2011 2010 2011
At risk of poverty or social exclusion 29,4 29,3 28,3 28,1 27,6 27,7 31,0 23,6 24.2
At-Risk-of-Poverty rate 19,6 20,5 20,3 20,1 19,7 20,1 21,4 16.4 16.9
Severe Material Deprivation rate 12,8 11,5 11,5 11,2 11,0 11,6 15,2 8,3 8.8
Share of people living in very low work
intensity households 7,5 8,0 8,0 7,4 6,5 7,5 11,8 10.0 10.0
Impact of social transfers on poverty
reduction (excl. pensions)(in%) 13,3 12,4 14,3 13,7 13,2 15,5 13,7 36,7 35,2
Value of threshold (single HH) - in PPS 6.450 6.697 6.873 7.219 7.575 7.559 6.930 N/A N/A
Value of threshold (2 adults + 2 children) -
in PPS 13.546 14.064 14.433 15.160 15.908 15.874 14.552 N/A N/A
At risk of poverty or social exclusion 26,0 27,9 28,2 28,7 30,0 28,7 30,4 27,1 27.0
At-Risk-of-Poverty rate 20,4 22,6 23,3 23,0 23,7 23,0 23,7 20.5 20.6
Severe Material Deprivation rate 10,1 9,5 9,7 10,4 12,2 12,2 16,4 9,7 10.0
Share of people living in very low work
intensity households 4,2 4,3 4,6 3,9 2,7 3,9 7,2 9.1 8.8
Impact of social transfers on poverty
reduction (excl. pensions)(in%) 9,7 9,2 14,0 10,9 6,0 10,9 10,6 41,4 40,5
At risk of poverty or social exclusion 27,9 28,4 27,8 27,9 27,1 27,7 31,6 23,5 24.3
At-Risk-of-Poverty rate 17,1 18,4 18,7 18,7 18,1 19,0 20,0 15.2 16.0
Severe Material Deprivation rate 11,7 10,6 10,2 10,4 10,3 11,2 15,4 8,3 8.9
Share of people living in very low work
intensity households (18-59) 8,5 9,2 9,1 8,4 7,7 8,5 13,2 10.3 10,5
In-work at-risk-of poverty rate 12.7 13.7 14.1 14.2 13.7 13.9 11.9 8.4 8.9
Impact of social transfers on poverty
reduction (excl. pensions)(in%) 13,6 12,8 13,4 13,8 13,0 14,4 13,0 38,7 37,0
At risk of poverty or social exclusion 37,9 33,8 30,6 28,1 26,8 26,7 29,3 20,0 20.5
At-Risk-of-Poverty rate 27,9 25,6 22,9 22,3 21,4 21,3 23,6 16.0 16.0
Severe Material Deprivation rate 19,4 16,4 17,4 14,8 12,1 12,4 13,1 6,6 7.2
Relative median income ratio of elderly 0.79 0.82 0.83 0.86 0.86 0.84 0.81 0.88 0.89
Aggregate replacement ratio 0.49 0.49 0.40 0.41 0.41 0.42 0.45 0.53 0.54
2000 2005 2006 2007 2008 2009 2010 2009 2010
Sickness/Health care 6,0 6,7 6,9 6,8 7,4 8,0 8,2 8,4 8,3
Invalidity 1,1 1,2 1,1 1,2 1,2 1,3 1,3 2,3 2,2
Old age and survivors 11,3 12,4 12,4 12,5 12,9 13,6 14,1 12,7 12,7
Family/Children 1,7 1,6 1,5 1,5 1,6 1,8 1,8 2,3 2,3
Unemployment 1,4 1,2 1,1 1,1 1,3 1,6 1,7 1,8 1,7
Housing and Social exclusion n.e.c. 1,2 1,1 1,1 1,1 1,1 1,1 1,0 1,0 1,0
Total 22,7 24,2 24,1 24,1 25,4 27,4 28,2 28,5 28,2
Means-tested
Sickness/Health care 0,0 0,0 0,0 0,0 0,0 0,0 0,0 0,1 0,1
Invalidity 0,2 0,2 0,2 0,2 0,2 0,2 0,2 0,5 0,5
Old age and survivors 0,3 0,4 0,4 0,4 0,5 0,5 0,5 0,6 0,6
Family/Children 0,6 0,5 0,5 0,5 0,5 0,6 0,6 0,6 0,6
Unemployment 0,0 0,0 0,0 0,0 0,0 0,0 0,0 0,4 0,4
Housing and Social exclusion n.e.c. 0,9 0,7 0,7 0,6 0,7 0,6 0,5 0,9 1,0
Total 2,0 1,9 1,8 1,8 1,9 2,0 1,9 3,0 3,1
Non-means tested
Sickness/Health care 6,0 6,7 6,9 6,8 7,4 8,0 8,2 8,3 8,2
Invalidity 0,9 1,0 0,9 1,0 1,0 1,1 1,1 1,8 1,8
Old age and survivors 11,0 11,9 11,9 12,1 12,4 13,1 13,6 12,1 12,1
Family/Children 1,0 1,1 1,0 1,0 1,0 1,3 1,2 1,7 1,7
Unemployment 1,4 1,2 1,1 1,0 1,3 1,6 1,7 1,4 1,3
Housing and Social exclusion n.e.c. 0,4 0,4 0,4 0,4 0,4 0,4 0,5 0,1 0,1
Total 20,7 22,3 22,3 22,3 23,5 25,4 26,3 25,4 25,2
Elderly (65+)
Social expenditure
(in % of GDP)
EU27
Children (0-17)
Working age
(18-64)
Total population
Source: Eurostat (EU-SILC, ESSPROS for social expenditure data)
Note: For non-means tested the aggregation Housing and Social Exclusion n.e.c is based only on
Housing. The total figures of social expenditure include all benefits excluding administrative costs.
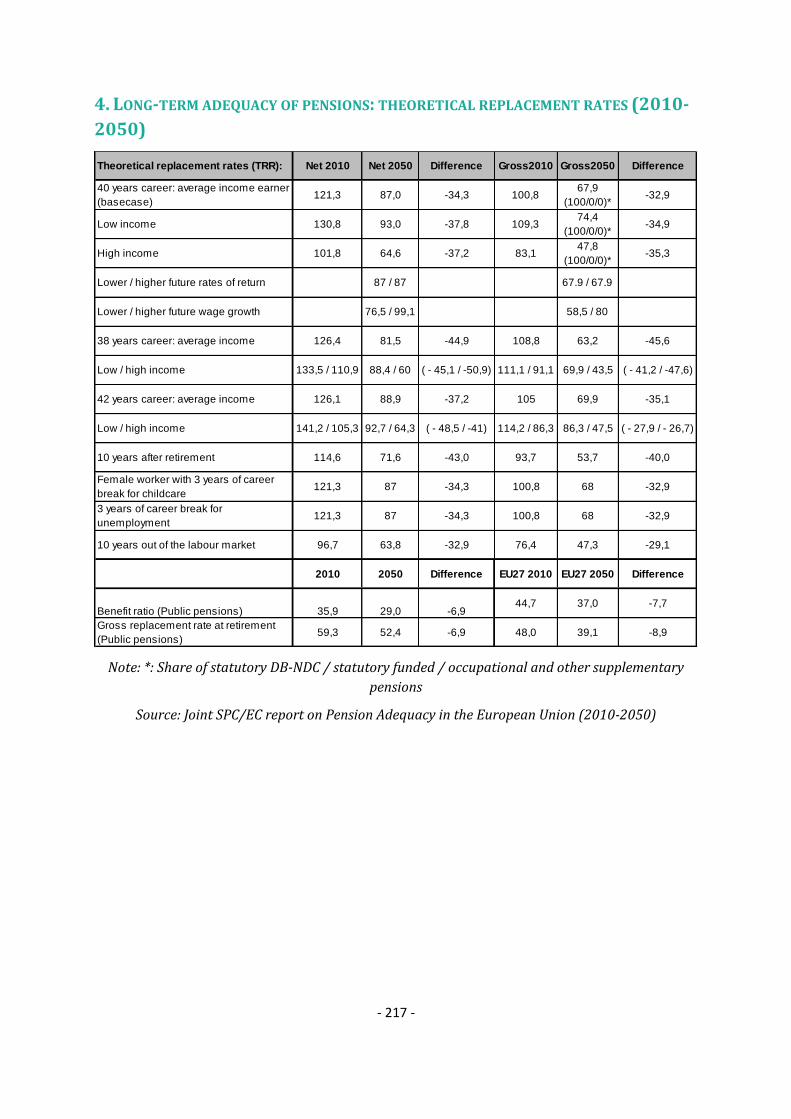
- 217 -
4. LONG-TERM ADEQUACY OF PENSIONS: THEORETICAL REPLACEMENT RATES (2010-
2050)
Theoretical replacement rates (TRR): Net 2010 Net 2050 Difference Gross2010 Gross2050 Difference
40 years career: average income earner
(basecase)121,3 87,0 -34,3 100,8
67,9
(100/0/0)*-32,9
Low income 130,8 93,0 -37,8 109,374,4
(100/0/0)*-34,9
High income 101,8 64,6 -37,2 83,147,8
(100/0/0)*-35,3
Lower / higher future rates of return 87 / 87 67.9 / 67.9
Lower / higher future wage growth 76,5 / 99,1 58,5 / 80
38 years career: average income 126,4 81,5 -44,9 108,8 63,2 -45,6
Low / high income 133,5 / 110,9 88,4 / 60 ( - 45,1 / -50,9) 111,1 / 91,1 69,9 / 43,5 ( - 41,2 / -47,6)
42 years career: average income 126,1 88,9 -37,2 105 69,9 -35,1
Low / high income 141,2 / 105,3 92,7 / 64,3 ( - 48,5 / -41) 114,2 / 86,3 86,3 / 47,5 ( - 27,9 / - 26,7)
10 years after retirement 114,6 71,6 -43,0 93,7 53,7 -40,0
Female worker with 3 years of career
break for childcare121,3 87 -34,3 100,8 68 -32,9
3 years of career break for
unemployment121,3 87 -34,3 100,8 68 -32,9
10 years out of the labour market 96,7 63,8 -32,9 76,4 47,3 -29,1
2010 2050 Difference EU27 2010 EU27 2050 Difference
Benefit ratio (Public pensions) 35,9 29,0 -6,944,7 37,0 -7,7
Gross replacement rate at retirement
(Public pensions) 59,3 52,4 -6,9 48,0 39,1 -8,9
Note: *: Share of statutory DB-NDC / statutory funded / occupational and other supplementary
pensions
Source: Joint SPC/EC report on Pension Adequacy in the European Union (2010-2050)

- 218 -
5. KEY CONTEXT MACRO-ECONOMIC INFORMATION
Source: Eurostat, National Accounts and EU LFS. ECFIN autumn economic forecast 2012 for 2012-
2014.
Note: Data on social protection expenditure comes from the AMECO database ( it is calculated as
the sum of Social benefits other than social transfers in kind; general government - ESA 1995 +
Social transfers in kind - ESA 1995)
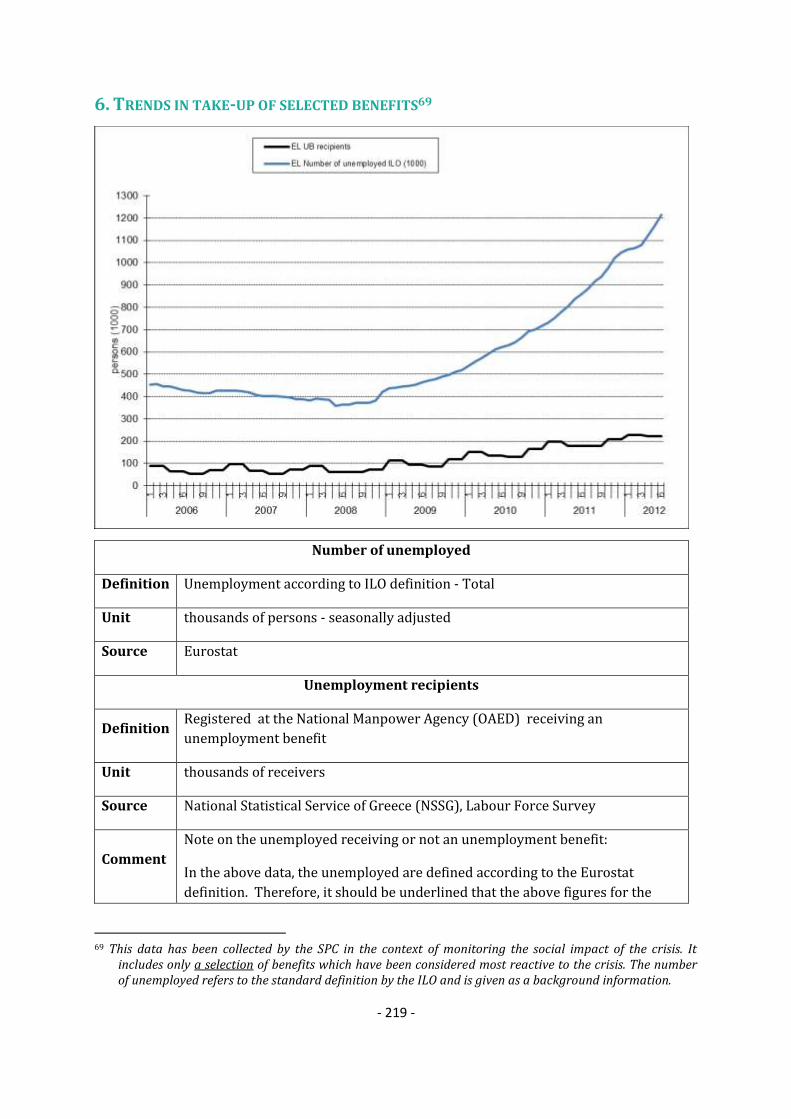
- 219 -
6. TRENDS IN TAKE-UP OF SELECTED BENEFITS69
Number of unemployed
Definition Unemployment according to ILO definition - Total
Unit thousands of persons - seasonally adjusted
Source Eurostat
Unemployment recipients
Definition Registered at the National Manpower Agency (OAED) receiving an
unemployment benefit
Unit thousands of receivers
Source National Statistical Service of Greece (NSSG), Labour Force Survey
Comment
Note on the unemployed receiving or not an unemployment benefit:
In the above data, the unemployed are defined according to the Eurostat
definition. Therefore, it should be underlined that the above figures for the
69 This data has been collected by the SPC in the context of monitoring the social impact of the crisis. It
includes only a selection of benefits which have been considered most reactive to the crisis. The number of unemployed refers to the standard definition by the ILO and is given as a background information.

- 220 -
registered unemployed (receiving or not an unemployment benefit) are lower
enough than the figures of the National Manpower Agency for the registered
unemployed, largely due to the fact that only recipients classified as
“unemployment” according to the Eurostat definition are taken into account. ”
7. SUMMARY OF SPECIFIC KEY SOCIAL CHALLENGES AND PARTICULAR GOOD SOCIAL
OUTCOMES
Social policy areas Challenges
Poverty and social inclusion Establishment of a social safety net to
combat poverty and social exclusion
Efficiency of active employment measures
towards vulnerable groups
Implementing an active inclusion policy
accepted by the population and shared by
main stakeholders
Pensions Safeguard pension adequacy
Health and long-term care Maintain universal access and improve
the quality of care delivery in a
framework of health expenditure
rationalisation
Effectiveness and efficiency of social
protection systems
Increasing effectiveness of social
expenditure transfers in reducing poverty
Particularly good social outcomes
Promotion of social economy with the
implementation of new legislation and
establishment of the Registry for social
enterprises

- 221 -
SPAIN 1. NATIONAL SOCIAL REPORT (NSR): KEY ISSUES
The Spanish economy has suffered a deep economic and financial crisis in the latest years, with
strong negative impact in employment and social conditions. The number of people at risk of
poverty or social exclusion increased to 12.37 million in 2011 (27% for the general population,
30.6% for children) and so did the number of people at-risk-of-poverty after social transfers,
except for the elderly, which decreased to 20.8% in 2011. The share of people living in
households with low work intensity increased up to 12.2 % (9.8 % for children) in 2011. Severe
material deprivation went up to 3.9% in 2011. Also, unemployed poverty rate increased to
40.4% and in-work poverty to 12.3 % in 2011, the third highest level in the EU.
The NSR indicates that the relevant stakeholders in the field of social policies have been
consulted during the different policy processes that are described in the report.
The two main socio-economic priorities underlined by the Spanish Government in the NRP 2012
are: in one hand, the reduction of unemployment, to be achieved through job creation and new
labour market reforms; and in the other hand, the reduction of fiscal unbalances in the public
administration, to be achieved through structural reforms and budget austerity measures,
combined with higher taxation. Both aspects are also related to the priority of ensuring the
sustainability of the Social Security System. In addition, we are seeing increases pressure on
social services and programs of minimum income guarantee.
According to the report, special attention needs to be paid to specific groups, notably women
(particularly in terms of activity, occupation, wage and working conditions in general), young
people (mainly in the areas of occupation and training) and children (with emphasis in low work
intensity households).
The NSR refers to the new labour market reform as the key measure to promote access to
inclusive labour markets, an element for active inclusion underlined in the NRP 2011 and
previously in the National Action Plan for Social Inclusion 2008-2010. The aim of the reform
according to the Government is to promote stability through indefinite contracts, and internal
flexibility within companies. It includes new contract models for part-time, teleworking, and the
training and learning contract, meant to set the grounds for dual vocational training. It also
includes specific measures oriented to labour integration of women and young people, to be
added to existing specific measures70.
In the field of income support, the report informs on the revision of existing actions providing a
combination of labour market measures with financial support, such as the PREPARA
programme, mostly oriented to support unemployed who have exhausted entitlement to
benefits or allowances, have dependents or are long-term unemployed, and the RAI/RMI
70E.g. Comprehensive Plan to combat trafficking for sexual exploitation 2009-2012, or the job placement
programme for women victims of gender violence by Royal Decree 1917/2008.
- 222 -
contributions, mainly focused on people with difficulties to find a job or in financial need. The
revisions are the result of evaluations conducted with the purpose to improve efficiency in the
use of resources and coordination among public services. Specific provisions have also been
taken for mortgage debtors without resources, to prevent evictions of families in a particular
risk of exclusion.
As for the access to public social services, the NSR refers in broad terms to the reforms that
the Government would like to undertake in the field of education, health and social services. It
reports also on the approval of the Strategy for Social Inclusion of Roma Population in Spain
2012-2020.
As regards pensions, the statutory retirement age has been increased by 2 years and the
contribution period taken into account by 10 years. The NSR informs also on the 1% increase of
old-age pensions in 2012, after it was frozen in 2011 due to the economic crisis. Other important
measures have been approved affecting expenditure and fostering future revenues. The main
measures will enter into force in 2013, with gradualism in some cases until 2022 and 2027. A
sustainability factor is envisaged after 2027 to link the fundamental parameters to life
expectancy evolution. The reform has been a significant step towards sustainability.
Nevertheless, the projected increase in age-related public expenditure will still be higher than
the EU average by 2060.
To ensure the sustainability of the national health care system and improve the quality and
safety of its services, measures include the categorization of common services, the redefinition
of the pharmaceutical coverage, and the review of the contribution system for beneficiaries.
On long-term care, the NSR points to the need to reform the System of Attention to
Dependency, with a view to ensure its sustainability and administrative coordination. In the
interim, the rights for moderate dependents (grade I) have been postponed until 2014 due to
budgetary constraints, and the coverage has been reviewed.
At the same time, a Strategy to Address Chronicity has been approved by the Inter-territorial
Council to respond to changing health care needs caused by aging population and increased
chronicity of health conditions and activity limitations. Other plans approved in this period are
the Spanish Strategy on Disability 2012-2020 and the National Drug Strategy, as well as the new
Joint Protocol for healthcare action against gender violence in the NHS.
The main challenges in terms of social inclusion in order to reach the targets for the reduction of
poverty and social exclusion in Spain are in the one hand, the high levels of child poverty, Spain
being among countries with highest increases of child poverty and social exclusion (30.6% as
against to 27% of the overall population in Spain). In the other hand, in-work poverty rates in
Spain are among the highest in Europe (after Greece and Lithuania). Moreover, the in-work
poverty rate for young people reached 14 % in 2010, even further above the EU average, and the
in-work poverty rate for temporary workers was four times higher than for permanent workers.
Also the at-risk of poverty rates for the unemployed have increased in 2011 up to 40,4%. Finally,
the employability of vulnerable groups remains a big challenge.

- 223 -
The NSR puts the emphasis on the reform of the labour market as a key factor to improve access
to inclusive labour markets; however, this approach has been highly contested by the social
partners due to the potential effect of precariousness and limitation of labour guarantees. Also,
the reform may not cover all the elements at stake within the framework of active social
inclusion. The regulatory development of the reform, as well as the preliminary results and
impact, should be carefully monitored, altogether with other related measures such as the
development of the model of dual vocational training and the plans against irregular labour and
Social Security fraud.
The report also mentions a significant number of actions under preparation, notably the new
Action Plan for Social Inclusion 2013-2016, but also specific action plans for vulnerable groups
such as women71, youth72, and children73. It will be necessary to follow up on the publication of
the concrete measures, implementation plans and budgetary provisions, and on the
consultations and coordination between the various institutional actors.
As for the rest, the majority of actions are the continuation of existing policies, programmes and
networks. The fiscal consolidation efforts to reduce national and regional deficit have clearly
made difficult to maintain or further develop concrete measures to reduce poverty and social
exclusion. Although the efforts for evaluation and rationalisation are relevant, attention should
be paid to potential negative effects when reducing certain areas and levels of coverage.
Even if the NRP addresses key crucial challenges, it does not provide all the elements that would
be useful for the assessment of poverty reduction and social inclusion. The NSR has the added
value to provide details on progress achieved in this particular area, complementing the NRP.
2. NATIONAL 2020 TARGET FOR THE REDUCTION OF POVERTY AND SOCIAL EXCLUSION
"Spain has adopted the objective of reducing by 1.4-1.5 million (in 2009-2019) the number of people at risk of poverty or social exclusion on the basis of an aggregate indicator that includes people living below the relative poverty threshold, people suffering severe material deprivation and people in households with low or zero work intensity"
Source: National Reform Programme (2011)
71E.g. Employment Plan for Women, Special Plan for Non-wage Discrimination between Men and Women,
Strategic Plan of equal opportunities, National Strategy to eradicate Violence against Women, Comprehensive Strategy against Trafficking for Sexual Exploitation, etc.
72 E.g. Strategy for Youth Employment and Entrepreneurship, linked to the future plans for dual vocational training
73 E.g. Comprehensive Plan for Family Support (PIAF), II National Strategic Plan for Children and Adolescents 2012-2015 (PENIA)

- 224 -
2.a Progress towards the 2020 national target for the reduction of poverty and
social exclusion
Source: Eurostat (EU-SILC)
Note: i) Progress on the target is monitored on the basis of the EU SILC data with a base year 2008 and
target data year 2018;
ii) AROPE - at-risk-of-poverty or social exclusion rate; AROP - at-risk-of-poverty rate; VLWI - share of
population living in very low work intensity households; SMD - severe material deprivation rate;
iii) For the at-risk-of poverty rate (AROP), the income reference year is the calendar year prior to the
survey year (i.e. 2010) except for the United Kingdom (survey year) and Ireland (12 months preceding the
survey). Similarly, the very low work intensity rate (VLWI) refers to the income reference year prior to the
survey (i.e. 2010) while for the severe material deprivation rate (SMD), the reference is the current year (i.e.
2011).

- 225 -
2b. Composition of the population at risk of poverty or social exclusion (2011)
Source: Eurostat (EU-SILC)
Note: i) AROP - at-risk-of-poverty rate; VLWI - share of population living in very low work intensity
households ((quasi)-jobless households); SMD - severe material deprivation rate; the red overlap indicates
the share of the population which accumulates all three conditions,
ii) For the at-risk-of poverty rate (AROP), the income reference year is the calendar year prior to the
survey year (i.e. 2010) except for the United Kingdom (survey year) and Ireland (12 months preceding the
survey). Similarly, the very low work intensity rate (VLWI) refers to the income reference year prior to the
survey (i.e. 2010) while for the severe material deprivation rate (SMD), the reference is the current year (i.e.
2011).
ES 2005 2006 2007 2008 2009 2010 2011
AROP total % of total pln 19,7 19,9 19,7 19,6 19,5 20,7 21,8
1000 persons 8.439 8.692 8.756 8.862 8.885 9.487 9.986
VLWI total % of total pln 6,5 6,0 6,3 6,2 7,0 9,8 12,2
1000 persons 2.206 2.073 2.190 2.187 2.500 3.510 4.360
SMD total % of total pln 3,4 3,4 3,0 2,5 3,5 4,0 3,9
1000 persons 1.473 1.490 1.329 1.150 1.582 1.814 1.777
AROP + VLWI
% of total pln 2,4 2,4 2,1 2,2 2,4 3,5 4,6
1000 persons 1.045 1.062 950 1.005 1.097 1.596 2.117

- 226 -
AROP + SMD % of total pln 1,3 1,5 1,2 1,0 1,1 1,4 1,0
1000 persons 575 655 552 432 496 655 437
AROP + SMD +VLWI
% of total pln 0,5 0,4 0,5 0,4 0,7 0,9 1,1
1000 persons 208 175 235 194 335 407 517
SMD +VLWI % of total pln 0,1 0,1 0,1 0,1 0,1 0,1 0,4
1000 persons 38 34 45 34 52 68 164
2c. At risk of poverty or social exclusion rate for specific groups, 2011
Total
At risk of poverty or social exclusion,
in %
Children (0-17) 30,6
Working age (18-64) 27,2
Elderly (65+)74 22,3
Employed 13,8
Unemployed 58,3
Inactive 42,5
Single male 29,4
Single female 29,9
Single elderly (65+) 26,5
Single parent households 44,8
Large families (2 adults and 3+ children) 42,6
EU-migrant (EU 27) 31,6
Non-EU migrants (non-EU27) 44,5
Source: Eurostat (EU-SILC)
74
When referring to the people at risk of poverty or social inclusion indicator at old age (65+), this measure does not include imputed rent due to the ownership of a house in the definition of income. It is important to highlight that when interpreting this indicator for Spain, it is overestimating the number of elderly living in poverty or social exclusion as most of the elderly in Spain own the house where they live in.

- 227 -
3. MAIN SOCIAL INDICATORS
75
ES % 2005 2006 2007 2008 2009 2010 2011 2010 2011
At risk of poverty or social exclusion 23,4 23,3 23,1 22,9 23,4 25,5 27,0 23,6 24.2
At-Risk-of-Poverty rate 19,7 19,9 19,7 19,6 19,5 20,7 21,8 16.4 16.9
Severe Material Deprivation rate 3,4 3,4 3,0 2,5 3,5 4,0 3,9 8,3 8.8
Share of people living in very low work
intensity households 6,5 6,0 6,3 6,2 7,0 9,8 12,2 10.0 10.0
Impact of social transfers on poverty
reduction (excl. pensions)(in%) 17,9 16,7 17,6 18,7 20,1 26,3 26,8 36,7 35,2
Impact of social transfers on poverty
reduction (incl. pensions)(in%) 48,8 48,3 49,1 48,7 50,0 51,7 51,3
Value of threshold (single HH) - in PPS 6.993 7.560 7.871 8.369 8.384 7.995 7.736 N/A N/A
Value of threshold (2 adults + 2 children) -
in PPS 14.685 15.877 16.529 17.575 17.607 16.789 16.247 N/A N/A
At risk of poverty or social exclusion 26,6 26,5 26,4 26,3 26,2 29,8 30,6 27,1 27.0
At-Risk-of-Poverty rate 24,2 24,5 24,3 24,4 23,7 26,2 27,2 20.5 20.6
Severe Material Deprivation rate 4,4 4,4 3,1 3,2 4,6 5,6 4,2 9,7 10.0
Share of people living in very low work
intensity households 4,9 4,3 4,3 3,5 5,0 8,3 9,8 9.1 8.8
Impact of social transfers on poverty
reduction (excl. pensions)(in%) 15,1 14,3 15,6 15,3 17,1 22,7 21,8 41,4 40,5
At risk of poverty or social exclusion 20,8 20,1 20,6 20,7 21,9 25,1 27,2 23,5 24.3
At-Risk-of-Poverty rate 16,1 16,0 16,4 16,4 16,9 19,0 20,5 15.2 16.0
Severe Material Deprivation rate 3,2 3,0 2,9 2,6 3,5 4,0 4,1 8,3 8.9
Share of people living in very low work
intensity households (18-59) 7,0 6,6 6,9 6,9 7,6 10,3 12,9 10.3 10,5
In-work at-risk-of poverty rate 10,4 9,9 10,7 10,6 11,4 12,6 12,2 8.4 8.9
Impact of social transfers on poverty
reduction (excl. pensions)(in%) 22,2 21,2 21,2 23,0 24,6 29,9 30,3 38,7 37,0
At risk of poverty or social exclusion 30,4 32,4 29,7 28,2 26,1 22,6 22,3 20,0 20.5
At-Risk-of-Poverty rate 29,3 30,7 28,2 27,4 25,2 21,7 20,8 16.0 16.0
Severe Material Deprivation rate 3,2 3,9 3,5 1,7 2,0 2,0 2,6 6,6 7.2
Relative median income ratio of elderly 0,75 0,74 0,77 0,78 0,80 0,83 0,83 0.88 0.89
Aggregate replacement ratio 0,56 0,49 0,47 0,49 0,49 0,53 0,56 0.53 0.54
2000 2005 2006 2007 2008 2009 2010 2009 2010
Sickness/Health care 5,8 6,3 6,3 6,4 6,8 7,3 7,2 8,4 8,3
Invalidity 1,6 1,5 1,5 1,5 1,6 1,7 1,8 2,3 2,2
Old age and survivors 8,9 8,5 8,5 8,5 8,9 10,0 10,7 12,7 12,7
Family/Children 1,0 1,2 1,2 1,3 1,4 1,5 1,5 2,3 2,3
Unemployment 2,0 2,2 2,1 2,1 2,5 3,7 3,5 1,8 1,7
Housing and Social exclusion n.e.c. 0,3 0,4 0,4 0,4 0,4 0,4 0,5 1,0 1,0
Total 19,5 20,1 20,0 20,2 21,6 24,7 25,2 28,5 28,2
Means-tested
Sickness/Health care 0,0 0,0 0,0 0,0 0,0 0,0 0,0 0,1 0,1
Invalidity 0,3 0,4 0,4 0,4 0,4 0,4 0,5 0,5 0,5
Old age and survivors 1,1 1,1 1,1 1,1 1,4 1,7 1,9 0,6 0,6
Family/Children 0,3 0,4 0,4 0,4 0,3 0,4 0,4 0,6 0,6
Unemployment 0,5 0,5 0,5 0,4 0,4 0,6 0,9 0,4 0,4
Housing and Social exclusion n.e.c. 0,3 0,4 0,4 0,4 0,4 0,4 0,5 0,9 1,0
Total 2,5 2,7 2,7 2,7 2,9 3,6 4,0 3,0 3,1
Non-means tested
Sickness/Health care 5,8 6,3 6,3 6,4 6,8 7,3 7,2 8,3 8,2
Invalidity 1,3 1,2 1,2 1,2 1,2 1,3 1,3 1,8 1,8
Old age and survivors 7,8 7,5 7,3 7,3 7,5 8,3 8,8 12,1 12,1
Family/Children 0,7 0,8 0,8 0,9 1,0 1,1 1,2 1,7 1,7
Unemployment 1,5 1,7 1,6 1,6 2,1 3,1 2,7 1,4 1,3
Housing and Social exclusion n.e.c. 0,0 0,0 0,0 0,0 0,0 0,0 0,0 0,1 0,1
Total 17,1 17,4 17,3 17,4 18,6 21,1 21,1 25,4 25,2
Social expenditure
(in % of GDP)
EU27
Children (0-17)
Working age (18-
64)
Elderly (65+)
Total population
75
When referring to the at-risk-of-poverty rate for 65+ or the share of elderly living in poverty or social exclusion, these measures do not include imputed rent due to the ownership of a house in the definition of income. It is important to highlight that when interpreting these
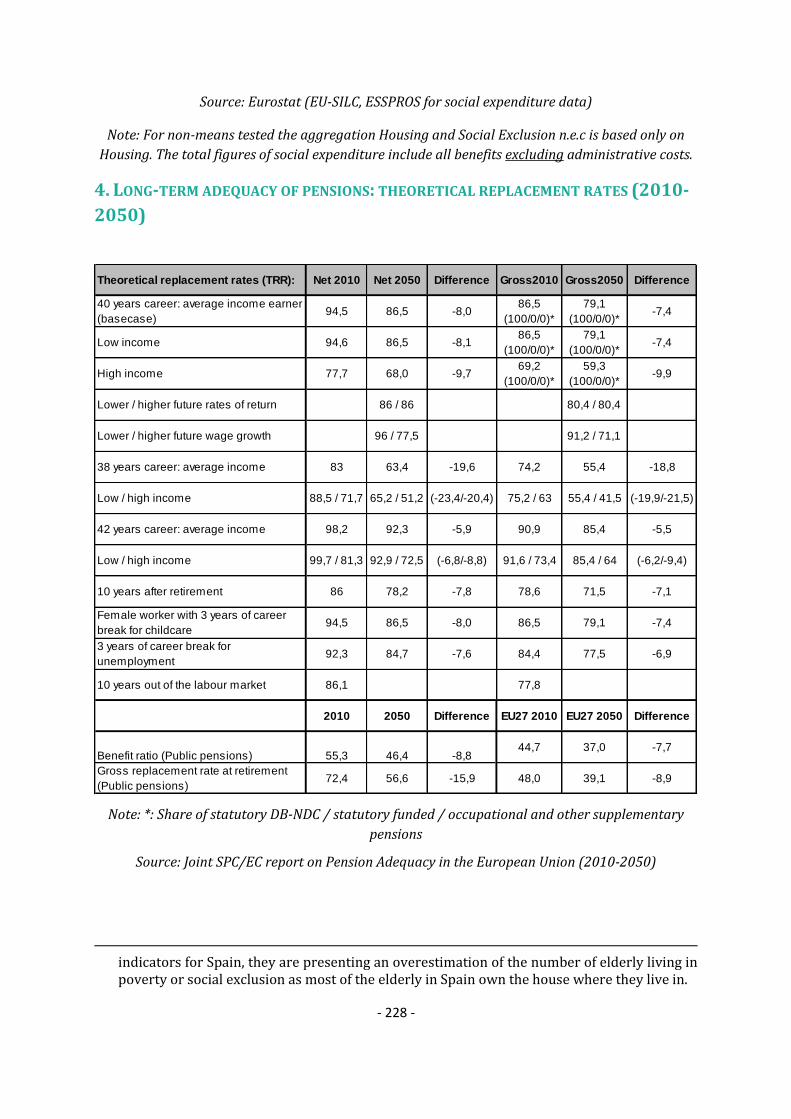
- 228 -
Source: Eurostat (EU-SILC, ESSPROS for social expenditure data)
Note: For non-means tested the aggregation Housing and Social Exclusion n.e.c is based only on
Housing. The total figures of social expenditure include all benefits excluding administrative costs.
4. LONG-TERM ADEQUACY OF PENSIONS: THEORETICAL REPLACEMENT RATES (2010-
2050)
Theoretical replacement rates (TRR): Net 2010 Net 2050 Difference Gross2010 Gross2050 Difference
40 years career: average income earner
(basecase)94,5 86,5 -8,0
86,5
(100/0/0)*
79,1
(100/0/0)*-7,4
Low income 94,6 86,5 -8,186,5
(100/0/0)*
79,1
(100/0/0)*-7,4
High income 77,7 68,0 -9,769,2
(100/0/0)*
59,3
(100/0/0)*-9,9
Lower / higher future rates of return 86 / 86 80,4 / 80,4
Lower / higher future wage growth 96 / 77,5 91,2 / 71,1
38 years career: average income 83 63,4 -19,6 74,2 55,4 -18,8
Low / high income 88,5 / 71,7 65,2 / 51,2 (-23,4/-20,4) 75,2 / 63 55,4 / 41,5 (-19,9/-21,5)
42 years career: average income 98,2 92,3 -5,9 90,9 85,4 -5,5
Low / high income 99,7 / 81,3 92,9 / 72,5 (-6,8/-8,8) 91,6 / 73,4 85,4 / 64 (-6,2/-9,4)
10 years after retirement 86 78,2 -7,8 78,6 71,5 -7,1
Female worker with 3 years of career
break for childcare94,5 86,5 -8,0 86,5 79,1 -7,4
3 years of career break for
unemployment92,3 84,7 -7,6 84,4 77,5 -6,9
10 years out of the labour market 86,1 77,8
2010 2050 Difference EU27 2010 EU27 2050 Difference
Benefit ratio (Public pensions) 55,3 46,4 -8,844,7 37,0 -7,7
Gross replacement rate at retirement
(Public pensions)72,4 56,6 -15,9 48,0 39,1 -8,9
Note: *: Share of statutory DB-NDC / statutory funded / occupational and other supplementary
pensions
Source: Joint SPC/EC report on Pension Adequacy in the European Union (2010-2050)
indicators for Spain, they are presenting an overestimation of the number of elderly living in poverty or social exclusion as most of the elderly in Spain own the house where they live in.

- 229 -
5. KEY CONTEXT MACRO-ECONOMIC INFORMATION
Source: Eurostat, National Accounts and EU LFS. ECFIN autumn economic forecast 2012 for 2012-
2014.
Note: Data on social protection expenditure comes from the AMECO database ( it is calculated as
the sum of Social benefits other than social transfers in kind; general government - ESA 1995 +
Social transfers in kind - ESA 1995)

- 230 -
6. TRENDS IN TAKE-UP OF SELECTED BENEFITS

- 231 -
Number of unemployed
Definition Unemployment according to ILO definition - Total
Unit thousands of persons - seasonally adjusted
Source Eurostat
Unemployment benefit recipients
Definition Number of Unemployment Benefits Total (In Thousands)
Unit 1) Contributory Unemployment Benefit 2) Social Assistance Unemployment Benefit 3)
Programme of active insertion income
Comment Unemployment Benefits include: 1) contributory unemployment benefit, 2) social
assistance unemployment benefit and 3) programme of active insertion income.
Recipients of social assistance benefits/means-tested minimum Income
Definition RMI : Minimum Income for Insertion (holders)
Unit thousands of beneficiaries
Source Autonomous Communities
Comment
RMI : Minimum Income for Insertion. Within the “minimum income schemes” this benefit
called the “Ingreso Mínimo / Renta Mínima de Inserción” is implemented in the 17
Autonomous Communities / regions and in the cities of Ceuta and Melilla. There is no
national legislation defining it; it is established in each region through an specific law in
which different requirements and conditions are defined to obtain the RMI. Its general
aim is to alleviate poverty by means of cash benefits for basic living needs, although some
other supports are provided such us guidance, training in order to get the social
integration of the holders.

- 232 -
7. SUMMARY OF SPECIFIC KEY SOCIAL CHALLENGES AND PARTICULARLY GOOD SOCIAL
OUTCOMES
Social policy areas Challenges
Poverty and social inclusion Very strong deterioration in the income and living conditions
of the population (especially for children) and increase in
inequality
The employability of vulnerable groups
Ensuring effective child and family support services
Pensions Raising retirement age in line with life expectancy
Improving working conditions for older people
Particularly good social outcomes
Some improvement in reducing the number early school
leavers
Some improvement in increasing the number of healthy life
years at 65 for females

- 233 -
FRANCE
1. 2012 NATIONAL SOCIAL REPORT (NSR): KEY ISSUES
In a context of sluggish economic growth and high segmentation of the labour market, the share
of the population at risk of poverty or social exclusion rose by 0.8 pp. (at 19.3) in 2011
compared with 2009. The unemployment rate (9.7% - 2011) should stand above 10% in 2012
and youth unemployment (23% - 2011) is persistently above the EU average since 2003. Social
transfers still have a strong impact on poverty in France. In 2011, 14% of the population was at
risk of poverty after social transfer (pensions excluded) (EU average: 16.9%).
The National Reform Programme (NRP) maintains focus on labour market participation, access
to housing and effective access to rights. The NSR recalls two overall objectives: a high level of
protection for all and the financial consolidation of the social protection regime. Three national
stakeholders have been consulted on the NSR, including the Conseil national de lutte contre la
pauvreté et l'exclusion sociale. No revised NRP/NSR has been sent after the presidential and
national elections held in spring 2012.
While the share of people at risk of poverty or social exclusion is generally lower in France than
in EU (19,2% against 23,4%), Commission analysis76 shows that additional efforts could be
targeted to reduce poverty among vulnerable groups such as non-EU nationals (47.4% - 32.5%
on EU average in 2010), people living in urban deprived areas (32.4% - 2009, national data) and
18-25 year-olds (24.5% - 21.2% on EU average). The NSR does not refer to measures targeted to
those groups with the exception of a dedicated programme for youth in the field of social
economy. Child poverty is also a concern, especially for children living in single-parent or
numerous families.
Concerning poverty and social inclusion, the NSR focuses on measures already legislated. Both
documents put a strong emphasis on the social benefit reform that came into force in 2009 with
the RSA (Revenu de solidarité active) which guarantees recipients an increase in their income if
they return to employment and ensures additional resources for poor workers. On the basis of
the conclusions of the national Conference held on December 2012, the new government
announced that a multiannual Plan against Poverty and for the Social inclusion will be
elaborated at the beginning of 2013.
The NRP also focuses on various measures improving access to rights and on the national
strategy against homelessness and housing unfit for habitation. To this respect, the new
government intends to take quick action with measures such as rent control in some areas and a
programme for housing including the mobilisation of state owned land for local projects.
76 Commission Staff Working Document SWD (2012) 0313 Assessment of the 2012 National Reform
Programme and Stability Programme for France

- 234 -
The NSR emphasizes two other policy fields: social experimentations and social economy (better
access to finance, promoting social entrepreneurship among youth and territorial
experimentations to develop networking, capacity building and links with local needs).
The NSR focuses on the 2010 pension reform’s impact on sustainability which foresees a gradual
increase in the minimum retirement age from 60 to 62 by 2018 (latest “2011 plan”: 2017 as the
government decided to accelerate the pace) and in the full pension age (from 65 to 67 by 2023,
latest “2011 plan”: 2022), combined with the increase in the contribution period in line with
gains in life expectancy. . The new government re-established the former retirement age at full
rate for people who began working early and having reached a full contribution record (110,000
in 2013 vs. 50,000 previously, measure financed by additional social contribution). A negotiation
with social partners is announced in 2013 to improve equity, eligibility and sustainability of
retirement schemes, based on assessment from the Conseil d’orientation des retraites and
proposals prepared by an ad hoc Commission. The pension system performs relatively well on
adequacy indicators. The poverty rate for people aged 65 and more is much lower than for the
whole population, well below the EU average (9.7% in 2010 vs. 15.9%).
The last important reform of the French health care system was passed in 2009 (building on
decentralisation and managerialisation trends). Since then, the main measures have been
essentially financial. The NSR dedicates a long chapter to the issue of efficiency in health
spending and to cost-management measures resulting in a significant decrease in the pace of
health expenditure. Concerning accessibility, the NSR mentions the recent increase in the ceiling
of resources for beneficiaries of the subsidized supplementary sickness private insurance (ACS).
The priorities of the new government are to provide better access to healthcare by limiting
excessive fees and to improve the organisation of proximity care (by restructuring emergency
care, addressing the misdistribution of doctors and promoting teamwork between doctors).
In spite of a national debate in 2011, the long-term care reform has been postponed due to
budgetary constraints. The NSR mentions a specific measure authorizing higher annual spending
for residential care in 2012, compared to other health expenditure, and on-going reflections on
this issue, particularly on the question of the adjustment of supply to needs, the definition of
personalized care pathway and the question of de-institutionalisation.
Access to employment with particular attention to the socio-economic integration of young
people and visible minorities, and access to decent and affordable housing, particularly in
hardest hit urban areas, are persistent challenges in spite of initiatives undertaken. The 2010
pension reform is a step in the right direction but might not ensure the sustainability of the
system by 2018 and afterwards. The adequacy may become a problem in the long run due to the
combination of the reforms and broken careers. Problems of accessibility in the health care
system (health inequalities and uneven distribution of doctors) are to be addressed.
The key measure of the French active inclusion policy (RSA) does not have significant effects on
return to employment in the context of the crisis. It has had so far a stronger impact on reducing
the intensity of poverty (among low-wage earners) than on the poverty rate itself, due to the
amount of the benefit and lower take-up rates than expected among the working poor. Tackling
the shortcomings identified by the evaluation report is a key challenge. (Social economy and

- 235 -
social experimentations provide good opportunities to test socially innovative approaches but
their contribution to poverty reduction has not been sufficiently measured yet.)
2. NATIONAL 2020 TARGET FOR THE REDUCTION OF POVERTY AND SOCIAL EXCLUSION
The national fight against poverty calls for a reduction of the rate anchored at a point in time by
one third over the five years from 2007 to 2012"
Source: National Reform Programme (2012)
2a. Progress towards the 2020 national target for the reduction of poverty and
social exclusion
Source: Eurostat (EU-SILC)

- 236 -
Note: i) Progress on the target is monitored on the basis of the EU SILC data with a base year 2008 and
target data year 2018;
ii) AROPE - at-risk-of-poverty or social exclusion rate; AROP - at-risk-of-poverty rate; VLWI - share of
population living in very low work intensity households; SMD - severe material deprivation rate;
iii) For the at-risk-of poverty rate (AROP), the income reference year is the calendar year prior to the
survey year (i.e. 2010) except for the United Kingdom (survey year) and Ireland (12 months preceding the
survey). Similarly, the very low work intensity rate (VLWI) refers to the income reference year prior to the
survey (i.e. 2010) while for the severe material deprivation rate (SMD), the reference is the current year (i.e.
2011).
2b. Composition of the population at risk of poverty or social exclusion (2011)
Source: Eurostat (EU-SILC)
Note: i) AROP - at-risk-of-poverty rate; VLWI - share of population living in very low work intensity
households ((quasi)-jobless households); SMD - severe material deprivation rate; the red overlap indicates
the share of the population which accumulates all three conditions,

- 237 -
ii) For the at-risk-of poverty rate (AROP), the income reference year is the calendar year prior to the
survey year (i.e. 2010) except for the United Kingdom (survey year) and Ireland (12 months preceding the
survey). Similarly, the very low work intensity rate (VLWI) refers to the income reference year prior to the
survey (i.e. 2010) while for the severe material deprivation rate (SMD), the reference is the current year (i.e.
2011).
2005 2006 2007 2008 2009 2010 2011
AROP total % of total pln 13,0 13,2 13,1 12,7 12,9 13,3 14,0
1000 persons 7,678 7,812 7,874 7,626 (b) 7,82 8,099 8,605
VLWI total % of total pln 8,6 9,1 9,5 8,8 8,3 9,8 9,3
1000 persons 3,978 4,206 4,485 4,069 3,873 4,585 4,346
SMD total % of total pln 5,3 5,0 4,7 5,4 5,6 5,8 5,2
1000 persons 3,12 2,946 2,824 3,253 3,372 3,53 3,211
AROP + VLWI
% of total pln 2,1 2,6 2,7 2,1 2,0 2,6 2,6
1000 persons 1.235 1.545 1.631 1.294 1.213 1.580 1.573
AROP + SMD % of total pln 1,2 1,2 1,1 1,1 1,6 1,5 1,6
1000 persons 721 722 662 677 944 885 960
AROP + SMD + VLWI
% of total pln 1,2 1,1 1,0 1,2 1,2 1,5 1,3
1000 persons 683 648 626 745 721 924 789
SMD + VLWI % of total pln 0,6 0,4 0,4 0,5 0,4 0,3 0,3
1000 persons 327 217 256 292 265 207 211
2c. At risk of poverty or social exclusion rate for specific groups, 2011
Total
At risk of poverty or social exclusion,
in %
Children (0-17) 23,0
Working age (18-64) 20,1
Elderly (65+) 11,5
Employed 9,9
Unemployed 55,7
Inactive (18+) 43,7
Single male 27,7
Single female 25,7
Single elderly (65+) 16,7
Single parent households 46,6

- 238 -
Large families (2 adults and 3+ children) 25,3
EU-migrant (EU 27) 20,2
Non-EU migrants (non-EU27) 38,6
Source: Eurostat (EU-SILC)
3. MAIN SOCIAL INDICATORS
FR % 2005 2006 2007 2008 2009 2010 2011 2010 2011
At risk of poverty or social exclusion 18,9 18,8 19,0 18,6 18,5 19,2 19,3 23,6 24.2
At-Risk-of-Poverty rate 13,0 13,2 13,1 12,7 12,9 13,3 14,0 16.4 16.9
Severe Material Deprivation rate 5,3 5,0 4,7 5,4 5,6 5,8 5,2 8,3 8.8
Share of people living in very low work
intensity households 8,6 9,1 9,5 8,8 8,3 9,8 9,3 10.0 10.0
Impact of social transfers on poverty
reduction (excl. pensions)(in%) 50,0 47,0 50,4 46,0 46,3 47,2 43,3 36,7 35,2
Value of threshold (single HH) - in PPS 8.702 8.989 9.089 10.547 10.529 10.711 10.826 N/A N/A
Value of threshold (2 adults + 2 children) -
in PPS 18.274 18.877 19.087 22.149 22.110 22.494 22.736 N/A N/A
At risk of poverty or social exclusion 19,4 18,1 19,6 21,4 21,2 22,6 23,0 27,1 27.0
At-Risk-of-Poverty rate 14,4 13,9 15,3 15,9 16,8 17,9 18,8 20.5 20.6
Severe Material Deprivation rate 6,2 5,6 5,4 6,6 6,5 7,0 7,0 9,7 10.0
Share of people living in very low work
intensity households 6,9 6,9 7,7 7,4 6,5 8,8 8,2 9.1 8.8
Impact of social transfers on poverty
reduction (excl. pensions)(in%) 57,6 54,9 58,5 54,6 51,4 50,8 47,5 41,4 40,5
At risk of poverty or social exclusion 18,8 19,4 19,7 18,9 18,9 19,7 20,1 23,5 24.3
At-Risk-of-Poverty rate 11,6 12,1 12,3 11,8 11,8 12,4 13,5 15.2 16.0
Severe Material Deprivation rate 5,4 5,3 4,8 5,5 5,9 6,0 5,2 8,3 8.9
Share of people living in very low work
intensity households (18-59) 9,2 9,9 10,3 9,3 9,0 10,2 9,7 10.3 10,5
In-work at-risk-of poverty rate 6.1 6.0 6.4 6.6 (b) 6.6 6.2 7.6 8.4 8.9
Impact of social transfers on poverty
reduction (excl. pensions)(in%) 52,7 49,6 50,4 46,6 47,8 49,4 43,8 38,7 37,0
At risk of poverty or social exclusion 18,5 17,5 15,2 13,9 13,4 12,8 11,5 20,0 20.5
At-Risk-of-Poverty rate 16,4 16,1 13,1 11,7 11,9 10,6 9,7 16.0 16.0
Severe Material Deprivation rate 3,5 2,9 3,4 3,3 3,2 3,4 2,9 6,6 7.2
Relative median income ratio of elderly 0.90 0.88 0.91 0.97 (b) 0.96 0.99 1.01 0.88 0.89
Aggregate replacement ratio 0.57 0.58 0.60 0.66 (b) 0.66 0.67 0.64 0.53 0.54
2000 2005 2006 2007 2008 2009 2010 2009 2010
Sickness/Health care 8,0 8,8 8,7 8,6 8,7 9,2 9,2 8,4 8,3
Invalidity 1,6 1,8 1,9 1,8 1,8 1,9 2,0 2,3 2,2
Old age and survivors 12,3 13,0 13,0 13,0 13,4 14,3 14,4 12,7 12,7
Family/Children 2,5 2,5 2,6 2,6 2,6 2,7 2,7 2,3 2,3
Unemployment 2,0 2,2 2,1 1,9 1,9 2,1 2,2 1,8 1,7
Housing and Social exclusion n.e.c. 1,3 1,3 1,4 1,3 1,4 1,6 1,6 1,0 1,0
Total 27,7 29,6 29,6 29,3 29,7 31,9 32,0 28,5 28,2
Means-tested
Sickness/Health care 0,1 0,1 0,1 0,1 0,1 0,1 0,1 0,1 0,1
Invalidity 0,4 0,4 0,3 0,3 0,3 0,4 0,4 0,5 0,5
Old age and survivors 0,4 0,7 0,8 0,7 0,8 0,8 0,8 0,6 0,6
Family/Children 0,9 0,9 0,6 0,6 0,6 0,6 0,5 0,6 0,6
Unemployment 0,2 0,2 0,2 0,2 0,2 0,2 0,1 0,4 0,4
Housing and Social exclusion n.e.c. 1,3 1,3 1,4 1,3 1,4 1,6 1,6 0,9 1,0
Total 3,3 3,5 3,4 3,3 3,3 3,6 3,6 3,0 3,1
Non means-tested
Sickness/Health care 7,9 8,7 8,6 8,5 8,6 9,1 9,2 8,3 8,2
Invalidity 1,3 1,4 1,5 1,5 1,5 1,6 1,6 1,8 1,8
Old age and survivors 11,9 12,3 12,2 12,3 12,6 13,5 13,5 12,1 12,1
Family/Children 1,7 1,6 2,0 2,0 2,0 2,1 2,1 1,7 1,7
Unemployment 1,8 2,1 1,9 1,7 1,7 2,0 2,1 1,4 1,3
Housing and Social exclusion n.e.c. 0,0 0,0 0,0 0,0 0,0 0,0 0,0 0,1 0,1
Total 24,5 26,1 26,2 26,0 26,4 28,3 28,5 25,4 25,2
Social expenditure
(in % of GDP)
EU27
Children (0-17)
Working age
(18-64)
Elderly (65+)
Total population
Source: Eurostat (EU-SILC, ESSPROS for social expenditure data)
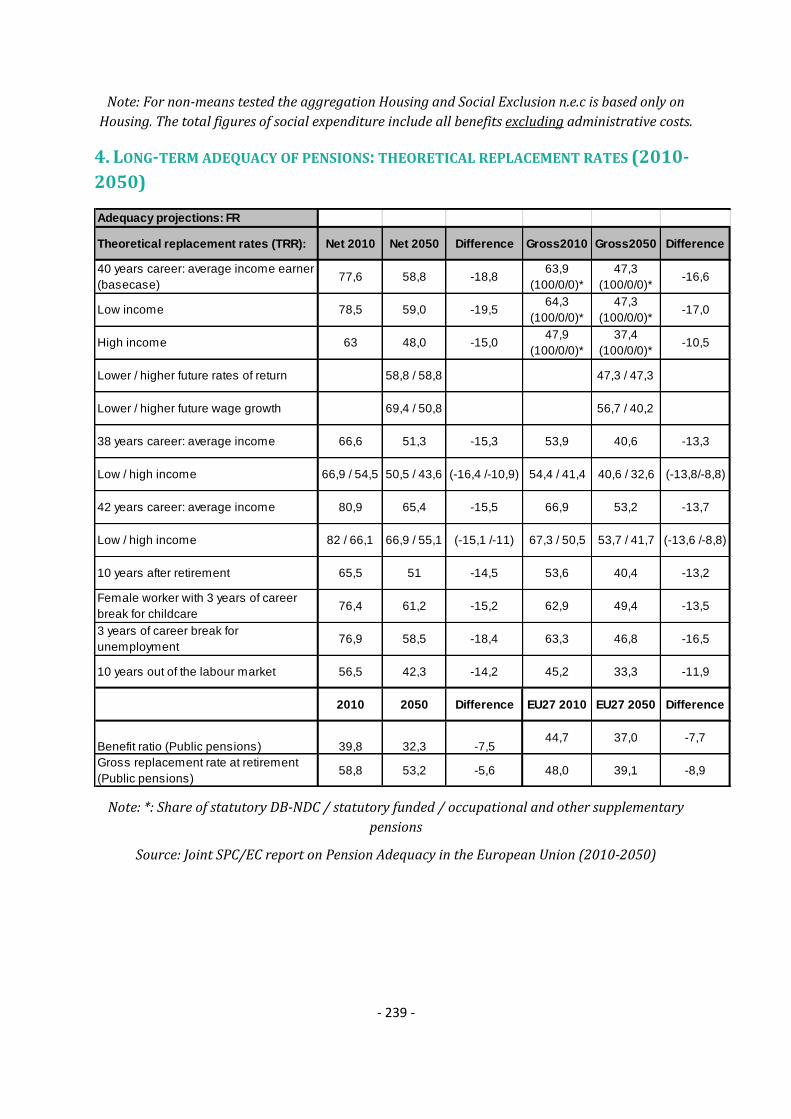
- 239 -
Note: For non-means tested the aggregation Housing and Social Exclusion n.e.c is based only on
Housing. The total figures of social expenditure include all benefits excluding administrative costs.
4. LONG-TERM ADEQUACY OF PENSIONS: THEORETICAL REPLACEMENT RATES (2010-
2050)
Adequacy projections: FR
Theoretical replacement rates (TRR): Net 2010 Net 2050 Difference Gross2010 Gross2050 Difference
40 years career: average income earner
(basecase)77,6 58,8 -18,8
63,9
(100/0/0)*
47,3
(100/0/0)*-16,6
Low income 78,5 59,0 -19,564,3
(100/0/0)*
47,3
(100/0/0)*-17,0
High income 63 48,0 -15,047,9
(100/0/0)*
37,4
(100/0/0)*-10,5
Lower / higher future rates of return 58,8 / 58,8 47,3 / 47,3
Lower / higher future wage growth 69,4 / 50,8 56,7 / 40,2
38 years career: average income 66,6 51,3 -15,3 53,9 40,6 -13,3
Low / high income 66,9 / 54,5 50,5 / 43,6 (-16,4 /-10,9) 54,4 / 41,4 40,6 / 32,6 (-13,8/-8,8)
42 years career: average income 80,9 65,4 -15,5 66,9 53,2 -13,7
Low / high income 82 / 66,1 66,9 / 55,1 (-15,1 /-11) 67,3 / 50,5 53,7 / 41,7 (-13,6 /-8,8)
10 years after retirement 65,5 51 -14,5 53,6 40,4 -13,2
Female worker with 3 years of career
break for childcare76,4 61,2 -15,2 62,9 49,4 -13,5
3 years of career break for
unemployment76,9 58,5 -18,4 63,3 46,8 -16,5
10 years out of the labour market 56,5 42,3 -14,2 45,2 33,3 -11,9
2010 2050 Difference EU27 2010 EU27 2050 Difference
Benefit ratio (Public pensions) 39,8 32,3 -7,544,7 37,0 -7,7
Gross replacement rate at retirement
(Public pensions)58,8 53,2 -5,6 48,0 39,1 -8,9
Note: *: Share of statutory DB-NDC / statutory funded / occupational and other supplementary
pensions
Source: Joint SPC/EC report on Pension Adequacy in the European Union (2010-2050)

- 240 -
5. KEY CONTEXT MACRO-ECONOMIC INFORMATION
Source: Eurostat, National Accounts and EU LFS. ECFIN autumn economic forecast 2012 for 2012-
2014.
Note: Data on social protection expenditure comes from the AMECO database (it is calculated as
the sum of Social benefits other than social transfers in kind; general government - ESA 1995 +
Social transfers in kind - ESA 1995)

- 241 -
6. TRENDS IN TAKE-UP OF SELECTED BENEFITS77
77
This data has been collected by the SPC in the context of monitoring the social impact of the crisis. It includes only a selection of benefits which have been considered most reactive to the crisis. The number of unemployed refers to the standard definition by the ILO and is given as background information.

- 242 -
Number of unemployed
Definition Unemployment according to ILO definition - Total
Unit Thousands of persons - seasonally adjusted
Source Eurostat
Unemployment benefit 1
Definition persons entitled to U insurance scheme ARE: (Allocation de Retour à l'Emploi)
Unit thousands of beneficiaries Seasonally adjusted
Source Pôle Emploi
Comment
Changes in eligibility rules in january 2006 and april 2009 Condition d'éligibilité en vigueur
: Le demandeur d’emploi doit justifier de 122 jours d’affiliation ou 610 heures de travailau
cours des :- 28 mois qui précèdent la fin du contrat de travail (terme du préavis) pour les
moins de 50 ans - 36 mois qui précèdent la fin du contrat de travail (terme du préavis) pour
les 50 ans et plus
Unemployment benefit 2
Definition persons entitled to U assistance scheme ASS: (Allocation de Solidarité Spécifique)
Unit thousands of beneficiaries Seasonally adjusted (France Métropolitaine)
Source Pôle Emploi
Link http://www.unedic.org/Etudes/etudes
Comment
Définition : L’allocation de solidarité spécifique (ASS), instituée en 1984, est une allocation
chômage s’adressant aux chômeurs ayant épuisé leurs droits à l’assurance chômage, et qui
justifient d’au moins cinq années d’activité salariée au cours des dix dernières années
précédant la rupture de leur contrat de travail.
Recipients of social assistance benefits/means-tested minimum Income
Definition Households entitled to social assistance Benefit (RSA since Q2/2009)
Unit thousands of beneficiaries (France métropolitaine)
Source CNAF
Comment
A new social assistance scheme, revenu de solidarité active (RSA), has been introduced in
June 2009. It replaces two former social assistance benefits, the former minimum income
scheme (Revenu minimum d’insertion, RMI), and the lone parents benefit (Allocation de
parent isolé, API), and the various in-work benefits which were related to these two social
assistance benefits. Notably for these reasons, the data on RMI and the data on RSA are not
fully comparable.
Disability benefits recipients
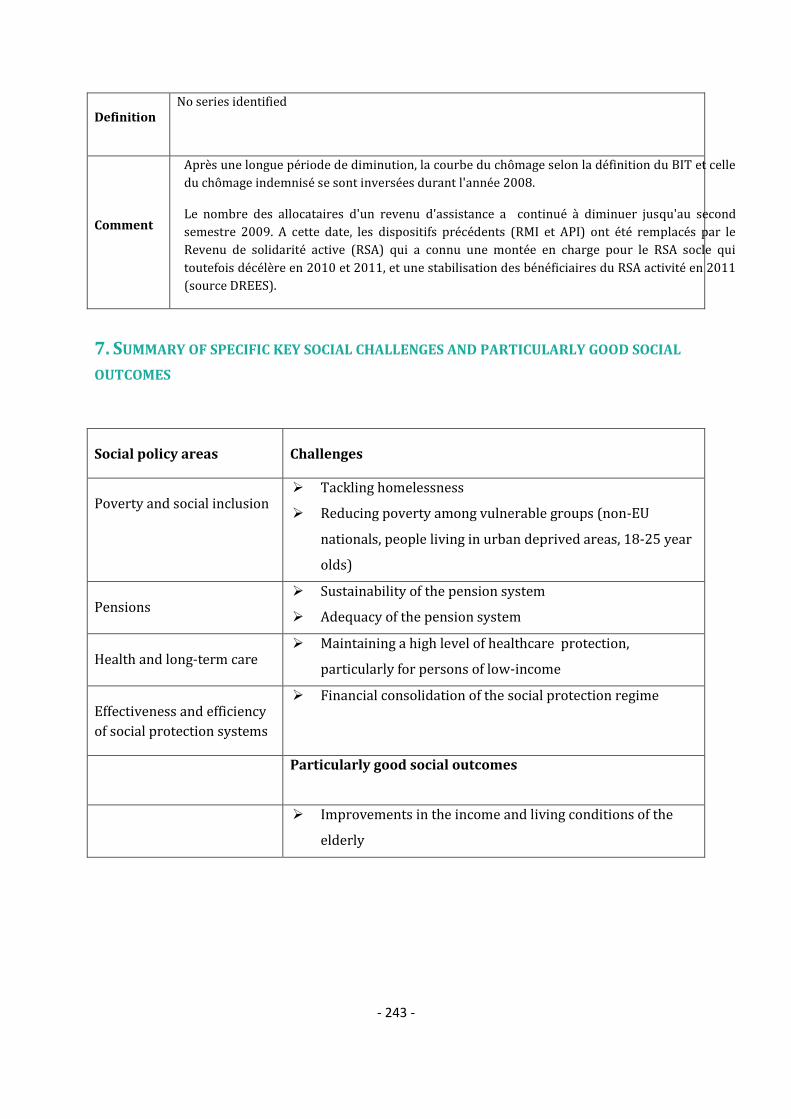
- 243 -
Definition No series identified
Comment
Après une longue période de diminution, la courbe du chômage selon la définition du BIT et celle
du chômage indemnisé se sont inversées durant l'année 2008.
Le nombre des allocataires d'un revenu d'assistance a continué à diminuer jusqu'au second
semestre 2009. A cette date, les dispositifs précédents (RMI et API) ont été remplacés par le
Revenu de solidarité active (RSA) qui a connu une montée en charge pour le RSA socle qui
toutefois décélère en 2010 et 2011, et une stabilisation des bénéficiaires du RSA activité en 2011
(source DREES).
7. SUMMARY OF SPECIFIC KEY SOCIAL CHALLENGES AND PARTICULARLY GOOD SOCIAL
OUTCOMES
Social policy areas Challenges
Poverty and social inclusion Tackling homelessness
Reducing poverty among vulnerable groups (non-EU
nationals, people living in urban deprived areas, 18-25 year
olds)
Pensions Sustainability of the pension system
Adequacy of the pension system
Health and long-term care Maintaining a high level of healthcare protection,
particularly for persons of low-income
Effectiveness and efficiency
of social protection systems
Financial consolidation of the social protection regime
Particularly good social outcomes
Improvements in the income and living conditions of the
elderly

- 244 -
ITALY
1. NATIONAL 2020 TARGET FOR THE REDUCTION OF POVERTY AND SOCIAL EXCLUSION
"To reduce the number of people at-risk-of-poverty or social exclusion by 2.2 million by 2020"
Source: National Reform Programme (2011)
1.a Progress towards the 2020 national target for the reduction of poverty and
social exclusion
Source: Eurostat (EU-SILC)
Note: i) Progress on the target is monitored on the basis of the EU SILC data with a base year 2008 and
target data year 2018;
ii) AROPE - at-risk-of-poverty or social exclusion rate; AROP - at-risk-of-poverty rate; VLWI - share of
population living in very low work intensity households; SMD - severe material deprivation rate;
iii) For the at-risk-of poverty rate (AROP), the income reference year is the calendar year prior to the
survey year (i.e. 2010) except for the United Kingdom (survey year) and Ireland (12 months preceding the
survey). Similarly, the very low work intensity rate (VLWI) refers to the income reference year prior to the
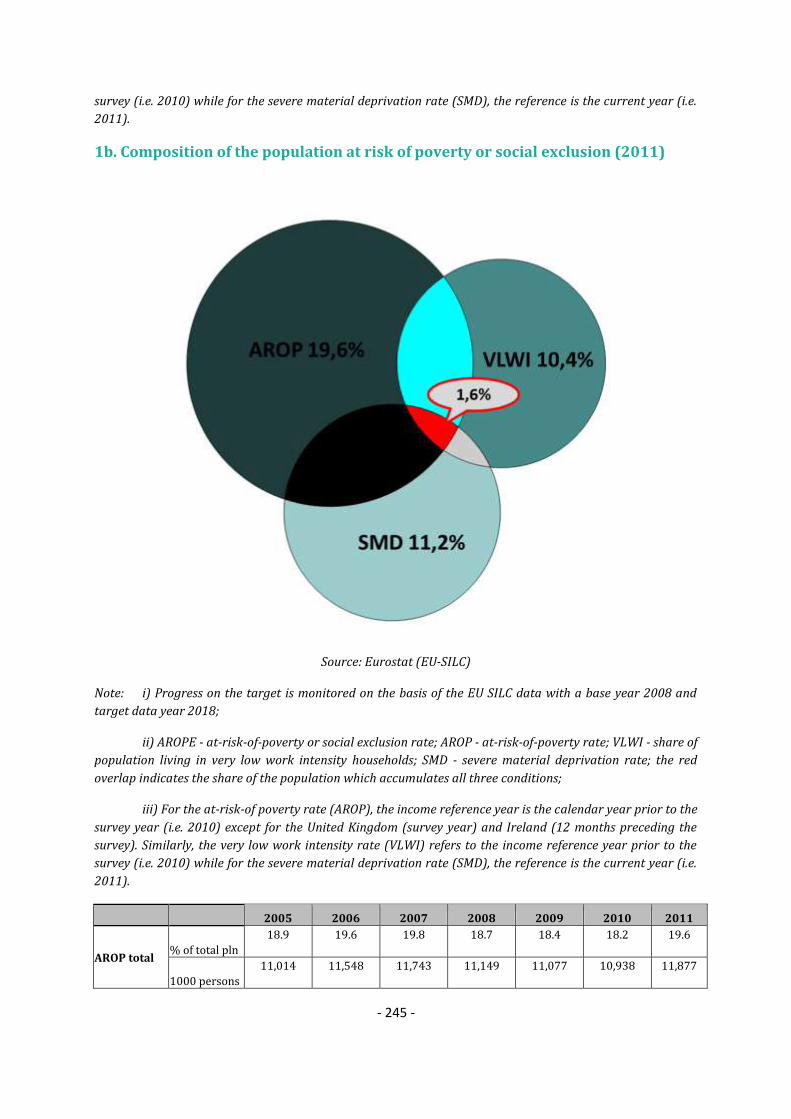
- 245 -
survey (i.e. 2010) while for the severe material deprivation rate (SMD), the reference is the current year (i.e.
2011).
1b. Composition of the population at risk of poverty or social exclusion (2011)
Source: Eurostat (EU-SILC)
Note: i) Progress on the target is monitored on the basis of the EU SILC data with a base year 2008 and
target data year 2018;
ii) AROPE - at-risk-of-poverty or social exclusion rate; AROP - at-risk-of-poverty rate; VLWI - share of
population living in very low work intensity households; SMD - severe material deprivation rate; the red
overlap indicates the share of the population which accumulates all three conditions;
iii) For the at-risk-of poverty rate (AROP), the income reference year is the calendar year prior to the
survey year (i.e. 2010) except for the United Kingdom (survey year) and Ireland (12 months preceding the
survey). Similarly, the very low work intensity rate (VLWI) refers to the income reference year prior to the
survey (i.e. 2010) while for the severe material deprivation rate (SMD), the reference is the current year (i.e.
2011).
2005 2006 2007 2008 2009 2010 2011
AROP total % of total pln
18.9 19.6 19.8 18.7 18.4 18.2 19.6
1000 persons
11,014 11,548 11,743 11,149 11,077 10,938 11,877

- 246 -
VLWI total % of total pln
10.3 10.8 10.0 9.8 8.8 10.2 10.4
1000 persons
4,548 4,803 4,442 4,344 3,922 4,514 4,631
SMD total % of total pln
6.4 6.3 6.8 7.5 7.0 6.9 11.2
1000 persons
3,762 3,696 4,039 4,494 4,211 4,173 6,790
AROP + LWI % of total pln
2,7 2,9 2,9 2,6 2,1 2,7 2,8
1000 persons
1.570 1.730 1.696 1.553 1.284 1.641 1.718
AROP + SMD % of total pln
2,4 2,4 2,7 2,7 2,7 2,3 3,6
1000 persons
1.378 1.415 1.582 1.635 1.596 1.369 2.214
AROP + SMD + LWI
% of total pln
1,3 1,3 1,1 1,3 1,0 1,4 1,6
1000 persons
778 738 680 752 623 836 944
SMD + LWI % of total pln
0,3 0,3 0,3 0,3 0,4 0,3 0,6
1000 persons
199 169 173 197 248 187 352
1c. At risk of poverty or social exclusion rate for specific groups, 2011
Total
At risk of poverty or social exclusion,
in %
Children (0-17) 32,3
Working age (18-64) 28,4
Elderly (65+) 24,2
Employed 16,0
Unemployed 68,1
Inactive 41,5
Single male 29,3
Single female 37,3
Single elderly (65+) 34,9
Single parent households 45,7
Large families (2 adults and 3+ children) 42,0
EU-migrant (EU 27) 44,5

- 247 -
Non-EU migrants (non-EU27) 40,7
Source: Eurostat (EU-SILC)
2. MAIN SOCIAL INDICATORS
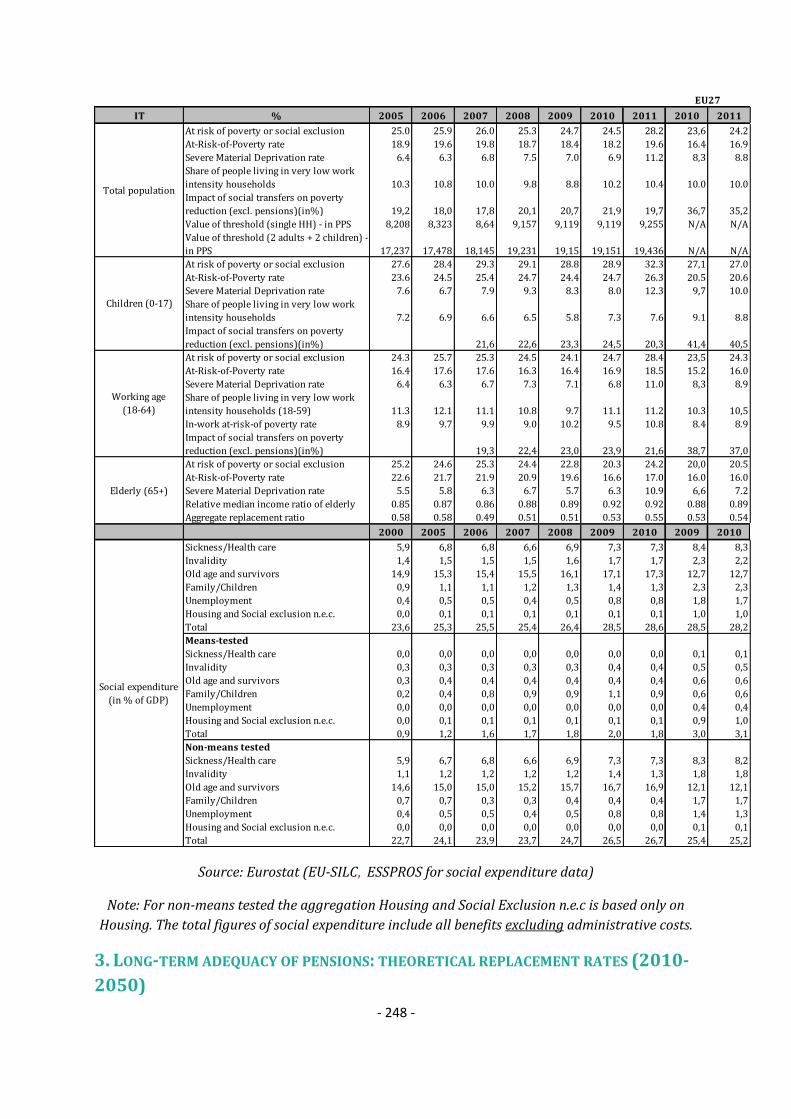
- 248 -
IT % 2005 2006 2007 2008 2009 2010 2011 2010 2011
At risk of poverty or social exclusion 25.0 25.9 26.0 25.3 24.7 24.5 28.2 23,6 24.2
At-Risk-of-Poverty rate 18.9 19.6 19.8 18.7 18.4 18.2 19.6 16.4 16.9
Severe Material Deprivation rate 6.4 6.3 6.8 7.5 7.0 6.9 11.2 8,3 8.8
Share of people living in very low work
intensity households 10.3 10.8 10.0 9.8 8.8 10.2 10.4 10.0 10.0
Impact of social transfers on poverty
reduction (excl. pensions)(in%) 19,2 18,0 17,8 20,1 20,7 21,9 19,7 36,7 35,2
Value of threshold (single HH) - in PPS 8,208 8,323 8,64 9,157 9,119 9,119 9,255 N/A N/A
Value of threshold (2 adults + 2 children) -
in PPS 17,237 17,478 18,145 19,231 19,15 19,151 19,436 N/A N/A
At risk of poverty or social exclusion 27.6 28.4 29.3 29.1 28.8 28.9 32.3 27,1 27.0
At-Risk-of-Poverty rate 23.6 24.5 25.4 24.7 24.4 24.7 26.3 20.5 20.6
Severe Material Deprivation rate 7.6 6.7 7.9 9.3 8.3 8.0 12.3 9,7 10.0
Share of people living in very low work
intensity households 7.2 6.9 6.6 6.5 5.8 7.3 7.6 9.1 8.8
Impact of social transfers on poverty
reduction (excl. pensions)(in%) 21,6 22,6 23,3 24,5 20,3 41,4 40,5
At risk of poverty or social exclusion 24.3 25.7 25.3 24.5 24.1 24.7 28.4 23,5 24.3
At-Risk-of-Poverty rate 16.4 17.6 17.6 16.3 16.4 16.9 18.5 15.2 16.0
Severe Material Deprivation rate 6.4 6.3 6.7 7.3 7.1 6.8 11.0 8,3 8.9
Share of people living in very low work
intensity households (18-59) 11.3 12.1 11.1 10.8 9.7 11.1 11.2 10.3 10,5
In-work at-risk-of poverty rate 8.9 9.7 9.9 9.0 10.2 9.5 10.8 8.4 8.9
Impact of social transfers on poverty
reduction (excl. pensions)(in%) 19,3 22,4 23,0 23,9 21,6 38,7 37,0
At risk of poverty or social exclusion 25.2 24.6 25.3 24.4 22.8 20.3 24.2 20,0 20.5
At-Risk-of-Poverty rate 22.6 21.7 21.9 20.9 19.6 16.6 17.0 16.0 16.0
Severe Material Deprivation rate 5.5 5.8 6.3 6.7 5.7 6.3 10.9 6,6 7.2
Relative median income ratio of elderly 0.85 0.87 0.86 0.88 0.89 0.92 0.92 0.88 0.89
Aggregate replacement ratio 0.58 0.58 0.49 0.51 0.51 0.53 0.55 0.53 0.54
2000 2005 2006 2007 2008 2009 2010 2009 2010
Sickness/Health care 5,9 6,8 6,8 6,6 6,9 7,3 7,3 8,4 8,3
Invalidity 1,4 1,5 1,5 1,5 1,6 1,7 1,7 2,3 2,2
Old age and survivors 14,9 15,3 15,4 15,5 16,1 17,1 17,3 12,7 12,7
Family/Children 0,9 1,1 1,1 1,2 1,3 1,4 1,3 2,3 2,3
Unemployment 0,4 0,5 0,5 0,4 0,5 0,8 0,8 1,8 1,7
Housing and Social exclusion n.e.c. 0,0 0,1 0,1 0,1 0,1 0,1 0,1 1,0 1,0
Total 23,6 25,3 25,5 25,4 26,4 28,5 28,6 28,5 28,2
Means-tested
Sickness/Health care 0,0 0,0 0,0 0,0 0,0 0,0 0,0 0,1 0,1
Invalidity 0,3 0,3 0,3 0,3 0,3 0,4 0,4 0,5 0,5
Old age and survivors 0,3 0,4 0,4 0,4 0,4 0,4 0,4 0,6 0,6
Family/Children 0,2 0,4 0,8 0,9 0,9 1,1 0,9 0,6 0,6
Unemployment 0,0 0,0 0,0 0,0 0,0 0,0 0,0 0,4 0,4
Housing and Social exclusion n.e.c. 0,0 0,1 0,1 0,1 0,1 0,1 0,1 0,9 1,0
Total 0,9 1,2 1,6 1,7 1,8 2,0 1,8 3,0 3,1
Non-means tested
Sickness/Health care 5,9 6,7 6,8 6,6 6,9 7,3 7,3 8,3 8,2
Invalidity 1,1 1,2 1,2 1,2 1,2 1,4 1,3 1,8 1,8
Old age and survivors 14,6 15,0 15,0 15,2 15,7 16,7 16,9 12,1 12,1
Family/Children 0,7 0,7 0,3 0,3 0,4 0,4 0,4 1,7 1,7
Unemployment 0,4 0,5 0,5 0,4 0,5 0,8 0,8 1,4 1,3
Housing and Social exclusion n.e.c. 0,0 0,0 0,0 0,0 0,0 0,0 0,0 0,1 0,1
Total 22,7 24,1 23,9 23,7 24,7 26,5 26,7 25,4 25,2
Elderly (65+)
Social expenditure
(in % of GDP)
EU27
Children (0-17)
Working age
(18-64)
Total population
Source: Eurostat (EU-SILC, ESSPROS for social expenditure data)
Note: For non-means tested the aggregation Housing and Social Exclusion n.e.c is based only on
Housing. The total figures of social expenditure include all benefits excluding administrative costs.
3. LONG-TERM ADEQUACY OF PENSIONS: THEORETICAL REPLACEMENT RATES (2010-
2050)

- 249 -
Theoretical replacement rates (TRR): Net 2010 Net 2050 Difference Gross2010 Gross2050 Difference
40 years career: average income earner
(basecase)89,5 69,1 -20,4 80,2 58,8 -21,4
Low income 89,8 70,5 -19,3 80,2 58,8 -21,4
High income 86,5 55,8 -30,7 76,1 44,5 -31,6
Lower / higher future rates of return 69,1/69,1 58,8/58,8
Lower / higher future wage growth 81,7/59,8 71,3/49,3
38 years career: average income 83,4 63,4 -20,0 73,8 52,9 -20,9
Low / high income 84/81,4 65,2/51,2 (-18,8 / -30,2) 73,8/70,3 52,9/40,4 (-20,9 / -29,9)
42 years career: average income 89,3 75,6 -13,7 80 65,6 -14,4
Low / high income 89,6 / 86,7 76,6 / 61,6 (-13 / -25,1) 80 / 76,4 65,6 / 49,8 (-14,4 / -26,6)
10 years after retirement 84,4 60,9 -23,5 74,9 50,3 -24,6
Female worker with 3 years of career
break for childcare78,7 69,6 -9,1 68,3 59,3 -9,0
3 years of career break for
unemployment85,6 76,1 -9,5 81,5 71,8 -9,7
10 years out of the labour market 70,5 55,1 -15,4 60,3 44,3 -16,0
2010 2050 Difference EU27 2010 EU27 2050 Difference
Benefit ratio (Public pensions) 48,5 45,4 -3,144,7 37,0 -7,7
Gross replacement rate at retirement
(Public pensions)79,5 66,0 -13,6 48,0 39,1 -8,9
Note: *: Share of statutory DB-NDC / statutory funded / occupational and other supplementary
pensions
Source: Joint SPC/EC report on Pension Adequacy in the European Union (2010-2050)

- 250 -
4. KEY CONTEXT MACRO-ECONOMIC INFORMATION
Source: Eurostat, National Accounts and EU LFS. ECFIN spring economic forecast 2012 for 2012-
2014.
Note: Data on social protection expenditure comes from the AMECO database ( it is calculated as
the sum of Social benefits other than social transfers in kind; general government - ESA 1995 +
Social transfers in kind - ESA 1995)

- 251 -
5. TRENDS IN TAKE-UP OF SELECTED BENEFITS78
Number of unemployed
Definition Unemployment according to ILO definition - Total
Unit thousands of persons - seasonally adjusted
Source Eurostat
Unemployment recipients
Definition Unemployment Benefit recipients ; Unemployment assistance recipients
Unit Thousands of recipients
Source Inps (http://inps.it)
Comment (*) Recipients with at least one day in the month of benefit in thousands. Claims for
transfer payments can only be made by those who have made employment insurance
contributions for an appropriate period. In order to receive benefit a person must be
78 These data has been collected by the SPC in the context of monitoring the social impact of the crisis. It
includes only a selection of benefits which have been considered most reactive to the crisis. The number of unemployed refers to the standard definition by the ILO and is given as a background.
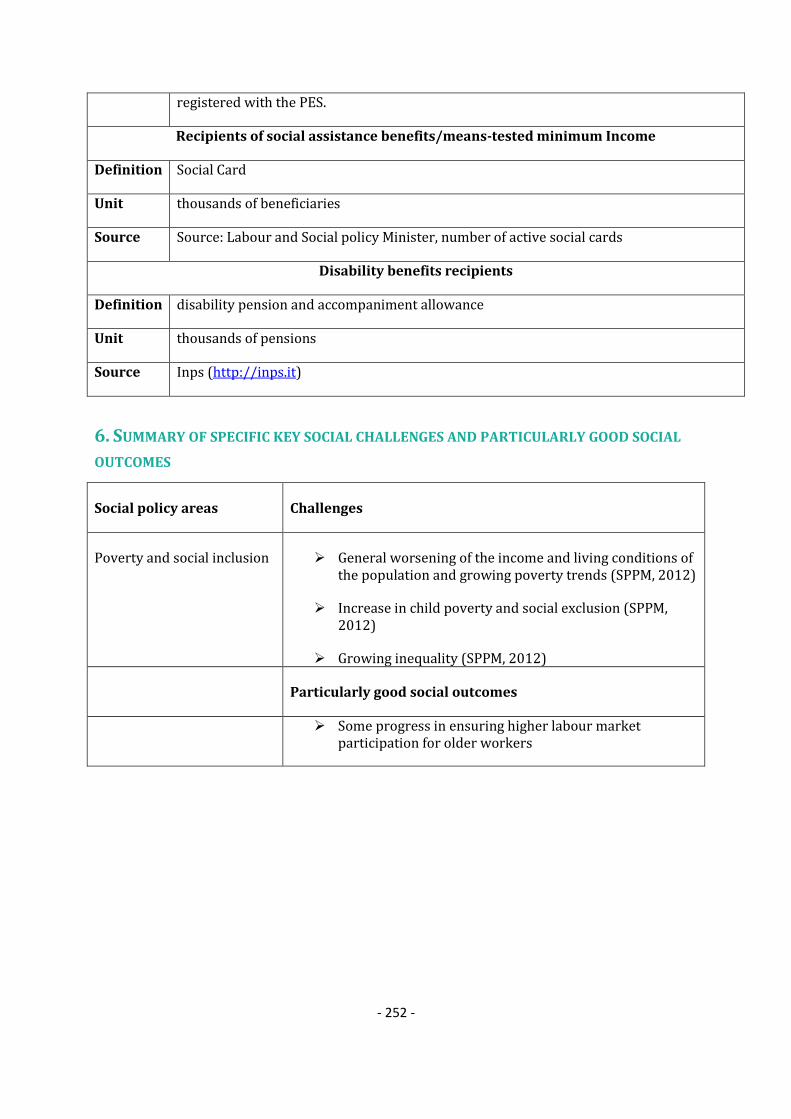
- 252 -
registered with the PES.
Recipients of social assistance benefits/means-tested minimum Income
Definition Social Card
Unit thousands of beneficiaries
Source Source: Labour and Social policy Minister, number of active social cards
Disability benefits recipients
Definition disability pension and accompaniment allowance
Unit thousands of pensions
Source Inps (http://inps.it)
6. SUMMARY OF SPECIFIC KEY SOCIAL CHALLENGES AND PARTICULARLY GOOD SOCIAL
OUTCOMES
Social policy areas Challenges
Poverty and social inclusion General worsening of the income and living conditions of the population and growing poverty trends (SPPM, 2012)
Increase in child poverty and social exclusion (SPPM, 2012)
Growing inequality (SPPM, 2012)
Particularly good social outcomes
Some progress in ensuring higher labour market
participation for older workers

- 253 -
CYPRUS
1. 2012 NATIONAL SOCIAL REPORT (NSR): KEY ISSUES
The worsening external economic environment and tightening macroeconomic conditions are
creating new challenges for Cyprus. The Cypriot labour market has been adversely affected, with
unemployment reaching historically high figures (12% in 2012Q3), particularly youth
unemployment (29.3% in 2012Q3). The risk of poverty and exclusion increased in 2011 whilst
the economic strain on certain population groups, such as the unemployed and single parents, is
expected to intensify. Cyprus officially applied for financial assistance from the EFSF/ESM in
June 2012.
As regards consultation with stakeholders, a questionnaire was circulated to social partners and
civil society, requesting their views on the impact of the crisis and on the consultation process in
policy making. Their answers were taken into account.
In general, the socio-economic priorities identified in the Report correspond to those identified
in the Commission analysis79. The Report highlights that the main priority is to secure a decent
standard of living for vulnerable people and the wider population through labour market
integration, income support and provision of enabling services. Active inclusion is also
emphasised by the Commission, for single parents and public assistance recipients in particular.
Ensuring the sustainability of the pension system and the adequacy of pensions is another
priority highlighted in the Report. The Commission also identifies the sustainability of the
pension system as priority, in parallel to improving the adequacy of income of the elderly.
According to the Report, the expansion of healthcare and long-term care provision is under
consideration, for elderly persons in particular. The implementation of the National Health
Insurance System (NHIS) fostering universal coverage and equal treatment receives prominent
attention by the Commission.
The main measures taken by the government to reduce poverty and social exclusion, reported in
the National Reform Programme (NRP), target the following groups: (i) the elderly, through
income support and care services; (ii) children, through income support to families, care
services and support in education; (iii) the working poor, though compensatory measures and
actions to reduce the gender pay gap; (iv) the unemployed and inactive, though activation
measures; (v) other disadvantaged individuals (public assistance recipients, disabled, migrants),
through activation measures, income support, provision of enabling services. Most measures are
part of pre-existing policies, which have been revisited or updated.
The Report further describes (i) the reform of the Public Assistance Law aiming to cover the
needs of disadvantaged persons in an efficient manner, promoting activation measures and
providing incentives to take up work, while setting up separate schemes for the elderly, asylum
79 Commission Staff Working Document – Assessment of the 2012 National Reform Programme and
Stability Programme for Cyprus.

- 254 -
seekers, disabled, working poor; (ii) a scheme for the promotion of volunteerism in the social
sphere and the coverage of social care needs; (iii) a scheme for the further involvement of local
authorities in social welfare. These are either new or strongly revisited pre-existing
policies/measures.
With regard to pensions, in March 2009 the amendment of the Social Insurance legislation
brought stricter eligibility criteria for pension entitlement. Two important structural measures
came into force in 2011, i.e. the enactment of contributions of public sector employees to their
pensions and the inclusion in the General Social Insurance Fund of newcomers to the public
sector. These measures, together with other contributory measures, came as a response to the
2011 Country Specific Recommendation (CSR) on pension sustainability. In addition, the Report
presents the measures implemented with a view to reducing the elderly poverty risk, i.e. the
continuation of the income support scheme and the Easter grant. These measures have been in
place since 2009 and 2008 respectively, and their implementation continued as a response to
the 2011 and 2012 CSR on pension adequacy.
The Report also includes reference to a series of initiatives in progress: an actuarial study on the
fragmentation of minimum income from pensions and the lessening of disincentives to remain in
employment; new legislation on upgrading the investment policy of the General Social Insurance
Fund. On 28/12/2012 the legislation for the Establishment, Registration, Activities and
Supervision of Institutions for Occupational Retirement Provision came into force. The
legislation consolidates and replaces the Provident Funds laws of 1981 to 2005 and the
Activities and the Supervision of Institutions for Occupational Retirement Provision laws of
2006 and 2007. The new legislation regulates all provident funds and not just those with over
100 members and establishes a single supervisory and investment framework in order to
further safeguard the rights of the members.
As concerns healthcare and long-term care, according to the NSR, efforts are being made to
maintain and expand the existing provision of healthcare services. There is reference to the
creation of Health Centres in urban and rural areas as a positive policy measure. As regards to
the care provision to the elderly, the Report notes that the Ministry of Health is examining the
implementation of alternative structures and the expansion of community care services.
With regard to progress made in the implementation of the National Health Insurance System
(NHIS), which was the subject of a 2011 and 2012 CSR, the NSR points to the relevant section in
the NRP. Nevertheless, in June 2012 the Council of Ministers reached a decision with the aim of
facilitating and expediting the NHIS implementation, while having regard to the continued
economic recession and the pressure that the implementation of the new System would impose
on public finances. This decision mainly provides for the NHIS’ co-financing, through a
combination of contributions from all contributor groups and a system of patient co-payments,
in a manner that will not impose any further burden on the Government’s healthcare
expenditure. Also, the decision provides for the financing of the IT system which is to support
the NHIS on the basis of a BOT (Build-Operate-Transfer) method, thus nullifying the need for a
relevant upfront investment on the part of the Government.
Acting on this decision, the Health Insurance Organization (HIO) has drafted a roadmap which
puts the commencement of the new System in 2015Q3. Based on this roadmap, the HIO has

- 255 -
completed the NHIS amending legislation, which has taken the road to legal review and
approval, while it is also proceeding with the drafting of the relevant regulations The HIO is
currently carrying out an update of the actuarial study. The award of the tender for the IT-
infrastructure is conditional upon the results of the study. The HIO is currently carrying out n
update of the actuarial study. The award of the tender for the IT-infrastructure is conditional
upon the results of the study. Meanwhile, the Organization is also investigating ways in which to
further shorten the time required for the NHIS implementation.
Based on the above, a key challenge for Cyprus will be to address the increasing risk of poverty
and social exclusion of the unemployed and inactive. Proceeding to reform public assistance
with a view to making it efficient and linked to activation measures will be challenging as well.
Ensuring the long-term sustainability of the pension system while providing adequate pensions
and supporting the elderly poor is of primary importance. As concerns healthcare, the challenge
will be to maintain the momentum towards NHIS implementation
Overall, the measures implemented or planned are in the right direction. Considering the
current context of financial constraints and increasing unemployment and risk of poverty and
exclusion, a more consistent and strategically-oriented policy effort would be beneficial.
2. NATIONAL 2020 TARGET FOR THE REDUCTION OF POVERTY AND SOCIAL EXCLUSION
"Reduce the number of people at risk of poverty and social exclusion by 27.000 people or
decrease the percentage of people at-risk-of-poverty and social exclusion from 22,4% to 19,3%
by 2020"
Source: National Reform Programme (2011)

- 256 -
2a. Progress towards the 2020 national target for the reduction of poverty and
social exclusion
Source: Eurostat (EU-SILC)
Note: i) Progress on the target is monitored on the basis of the EU SILC data with a base year 2008 and
target data year 2018;
ii) AROPE - at-risk-of-poverty or social exclusion rate; AROP - at-risk-of-poverty rate; VLWI - share of
population living in very low work intensity households; SMD - severe material deprivation rate;
iii) For the at-risk-of poverty rate (AROP), the income reference year is the calendar year prior to the
survey year (i.e. 2010) except for the United Kingdom (survey year) and Ireland (12 months preceding the
survey). Similarly, the very low work intensity rate (VLWI) refers to the income reference year prior to the
survey (i.e. 2010) while for the severe material deprivation rate (SMD), the reference is the current year (i.e.
2011).

- 257 -
2b. Composition of the population at risk of poverty or social exclusion (2011)
Source: Eurostat (EU-SILC)
Note: i) Progress on the target is monitored on the basis of the EU SILC data with a base year 2008 and
target data year 2018;
ii) AROPE - at-risk-of-poverty or social exclusion rate; AROP - at-risk-of-poverty rate; VLWI - share of
population living in very low work intensity households; SMD - severe material deprivation rate; the red
overlap indicates the share of the population which accumulates all three conditions;
iii) For the at-risk-of poverty rate (AROP), the income reference year is the calendar year prior to the
survey year (i.e. 2010) except for the United Kingdom (survey year) and Ireland (12 months preceding the
survey). Similarly, the very low work intensity rate (VLWI) refers to the income reference year prior to the
survey (i.e. 2010) while for the severe material deprivation rate (SMD), the reference is the current year (i.e.
2011).
2005 2006 2007 2008 2009 2010 2011
AROP total % of total pln
16.1 15.6 15.5 (b) 15.7 15.3 15.3 14.5
1000 persons
120 119 120 (b) 123 121 122 122
VLWI total % of total pln
4.4 3.8 3.7 (b) 4.2 3.8 4.4 4.5

- 258 -
1000 persons
27 24 24 (b) 27 25 29 31
SMD total % of total pln
12.2 12.6 13.3 (b) 8,8 9.5 9.6 10.7
1000 persons
90 96 103 (b) 69 75 77 90
AROP + VLWI
% of total pln
1,3 0,7 0,8 (b) 1,1 0,9 1,4 1,2
1000 persons
10 5 6 (b) 9 7 11 10
AROP + SMD % of total pln
3,6 4,0 4,1 (b) 2,5 2,4 3,0 2,8
1000 persons
26 31 32 (b) 20 19 24 24
AROP + SMD + VLWI
% of total pln
0,8 0,5 0,8 (b) 0,8 0,6 0,5 0,6
1000 persons
6 4 6 (b) 7 5 4 5
SMD + VLWI % of total pln
0,2 0,3 0,2 (b) 0,2 0,4 0,3 0,2
1000 persons
1 2 1 (b) 2 3 2 2
2c. At risk of poverty or social exclusion rate for specific groups, 2011
Total
Risk of poverty or social
exclusion for different
population sub-groups, %
Children (0-17) 21,8
Working age (18-64) 20,8
Elderly (65+) 40,4
Employed 14,3
Unemployed 52,0
Inactive 31,7
Single male 30,7
Single female 45,0
Single elderly (65+) 55,0
Single parent households 38,9
Large families (2 adults and 3+ children) 24,5
EU-migrant (EU 27) 24,1
Non-EU migrants (non-EU27) 38,5
Source: Eurostat (EU-SILC)

- 259 -
3. MAIN SOCIAL INDICATORS
CY % 2005 2006 2007 2008 2009 2010 2011 2010 2011
At risk of poverty or social exclusion 25.3 25.4 25.2 22.4 22.9 22.9 23.5 23,6 24.2
At-Risk-of-Poverty rate 16.1 15.6 15.5 15.7 15.3 15.3 14.5 16.4 16.9
Severe Material Deprivation rate 12.2 12.6 13.3 8.8 9.5 9.6 10.7 8,3 8.8
Share of people living in very low work
intensity households 4.4 3.8 3.7 4.2 3.8 4.4 4.5 10.0 10.0
Impact of social transfers on poverty
reduction (excl. pensions)(in%) 32,2 34,2 26,2 30,2 34,3 34,9 37,8 36,7 35,2
Value of threshold (single HH) - in PPS 8,866 9,817 10,951 11,299 11,342 11,207 11,580 N/A N/A
Value of threshold (2 adults + 2 children) -
in PPS 18,618 20,616 22,997 23,728 23,818 23,536 24,318 N/A N/A
At risk of poverty or social exclusion 22.1 21.3 20.8 21.0 20.6 20.0 21.8 27,1 27.0
At-Risk-of-Poverty rate 12.8 11.5 12.4 14.4 12.6 12.8 12.0 20.5 20.6
Severe Material Deprivation rate 12.1 12.1 11.7 9.1 9.2 10.4 13.5 9,7 10.0
Share of people living in very low work
intensity households 3.5 3.0 2.8 3.2 3.0 3.0 2.8 9.1 8.8
Impact of social transfers on poverty
reduction (excl. pensions)(in%) 37,3 43,3 37,7 42,4 49,6 51,0 49,6 41,4 40,5
At risk of poverty or social exclusion 21.3 21.4 21.1 18.0 19.3 20.2 20.8 23,5 24.3
At-Risk-of-Poverty rate 11.1 10.6 10.1 10.4 10.7 11.4 11.0 15.2 16.0
Severe Material Deprivation rate 11.8 12.3 12.7 8.3 9.6 9.9 10.6 8,3 8.9
Share of people living in very low work
intensity households (18-59) 4.7 4.1 4.0 4.6 4.1 4.9 5.1 10.3 10,5
In-work at-risk-of poverty rate 6.4 7.2 6.3 5.9 6.4 6.8 7.3 8.4 8.9
Impact of social transfers on poverty
reduction (excl. pensions) 32,2 34,2 34,0 37,3 40,6 38,7 43,9 38,7 37,0
At risk of poverty or social exclusion 54.2 55.6 55.6 49.1 46.6 42.3 40.4 20,0 20.5
At-Risk-of-Poverty rate 50.3 51.9 50.6 46.4 44.4 40.0 36.9 16.0 16.0
Severe Material Deprivation rate 14.2 15.3 19.4 10.6 9.4 7.1 6.0 6,6 7.2
Relative median income ratio of elderly 0.57 0.57 0.57 0.61 0.63 0.65 0.65 0.88 0.89
Aggregate replacement ratio 0.29 0.28 0.29 0.33 0.37 0.36 0.38 0.53 0.54
2000 2005 2006 2007 2008 2009 2010 2009 2010
Sickness/Health care 4,0 4,5 4,6 4,5 4,5 5,1 5,0 8,4 8,3
Invalidity 0,5 0,7 0,7 0,7 0,7 0,8 0,7 2,3 2,2
Old age and survivors 7,1 8,3 8,3 8,3 8,4 9,3 9,7 12,7 12,7
Family/Children 0,9 2,1 1,9 1,9 2,1 2,2 2,1 2,3 2,3
Unemployment 1,1 1,1 1,2 0,9 1,0 1,0 1,1 1,8 1,7
Housing and Social exclusion n.e.c. 1,1 1,2 1,3 1,6 1,9 2,5 2,7 1,0 1,0
Total 14,6 18,0 18,2 17,8 18,6 20,8 21,3 28,5 28,2
Means-tested
Sickness/Health care 0,0 0,0 0,0 0,0 0,0 0,0 0,0 0,1 0,1
Invalidity 0,0 0,0 0,0 0,0 0,0 0,0 0,0 0,5 0,5
Old age and survivors 0,0 0,6 0,6 0,6 0,6 0,7 0,9 0,6 0,6
Family/Children 0,0 0,0 0,0 0,0 0,0 0,0 0,0 0,6 0,6
Unemployment 0,0 0,0 0,0 0,0 0,0 0,0 0,0 0,4 0,4
Housing and Social exclusion n.e.c. 0,8 0,9 1,0 1,3 1,6 2,1 2,2 0,9 1,0
Total 0,9 1,5 1,6 1,8 2,2 2,8 3,0 3,0 3,1
Non-means tested
Sickness/Health care 4,0 4,5 4,6 4,5 4,5 5,1 5,0 8,3 8,2
Invalidity 0,5 0,7 0,7 0,7 0,7 0,8 0,7 1,8 1,8
Old age and survivors 7,0 7,7 7,8 7,7 7,8 8,6 8,9 12,1 12,1
Family/Children 0,9 2,1 1,9 1,9 2,1 2,2 2,1 1,7 1,7
Unemployment 1,1 1,1 1,2 0,9 1,0 1,0 1,1 1,4 1,3
Housing and Social exclusion n.e.c. 0,2 0,3 0,3 0,3 0,4 0,4 0,5 0,1 0,1
Total 13,7 16,4 16,6 16,0 16,4 18,0 18,3 25,4 25,2
Elderly (65+)
Social expenditure
(in % of GDP)
Children (0-17)
Working age
(18-64)
Total population
Source: Eurostat (EU-SILC, ESSPROS for social expenditure data)
Note: For non-means tested the aggregation Housing and Social Exclusion n.e.c is based only on
Social Exclusion. The total figures of social expenditure include all benefits excluding
administrative costs.

- 260 -
4. LONG-TERM ADEQUACY OF PENSIONS: THEORETICAL REPLACEMENT RATES (2010-
2050)
Theoretical replacement rates (TRR):
Net 2010
Net 2050
Difference Gross2010 Gross2050 Difference
40 years career: average income earner (base case)
57 70 13 50
(100/0/0)* 60
(100/0/0)* 10
Low income 60 66 6 56
(100/0/0)* 59
(100/0/0)* 3
High income 48 55 7 38
(100/0/0)* 44
(100/0/0)* 6
Lower / higher future rates of return
70 / 70 60 / 60
Lower / higher future wage growth 70 / 70 60 / 60
38 years career: average income 57 67 10 50 57 7
Low / high income 60 / 48 64 / 53 (4 / 5) 56 / 38 58 / 42 (2 / 4)
42 years career: average income 56 72 16 49 61 12
Low / high income 60 / 51 68 / 58 (8 / 7) 56 / 41 61 / 47 (5 / 6)
10 years after retirement 56 68 12 50 54 4
Female worker with 3 years of career break for childcare
53 64 11 49 56 7
3 years of career break for unemployment
53 66 13 46 56 10
10 years out of the labour market 42 54 12 37 46 9
2010 2050 Difference EU27 2010
EU27 2050
Difference
Benefit ratio (Public pensions) 43,3 45,2 1,9 44,7 37,0 -7,7
Gross replacement rate at retirement (Public pensions)
45,3 52,3 7,0 48,0 39,1 -8,9
Note: *: Share of statutory DB-NDC / statutory funded / occupational and other supplementary
pensions
Source: Joint SPC/EC report on Pension Adequacy in the European Union (2010-2050)
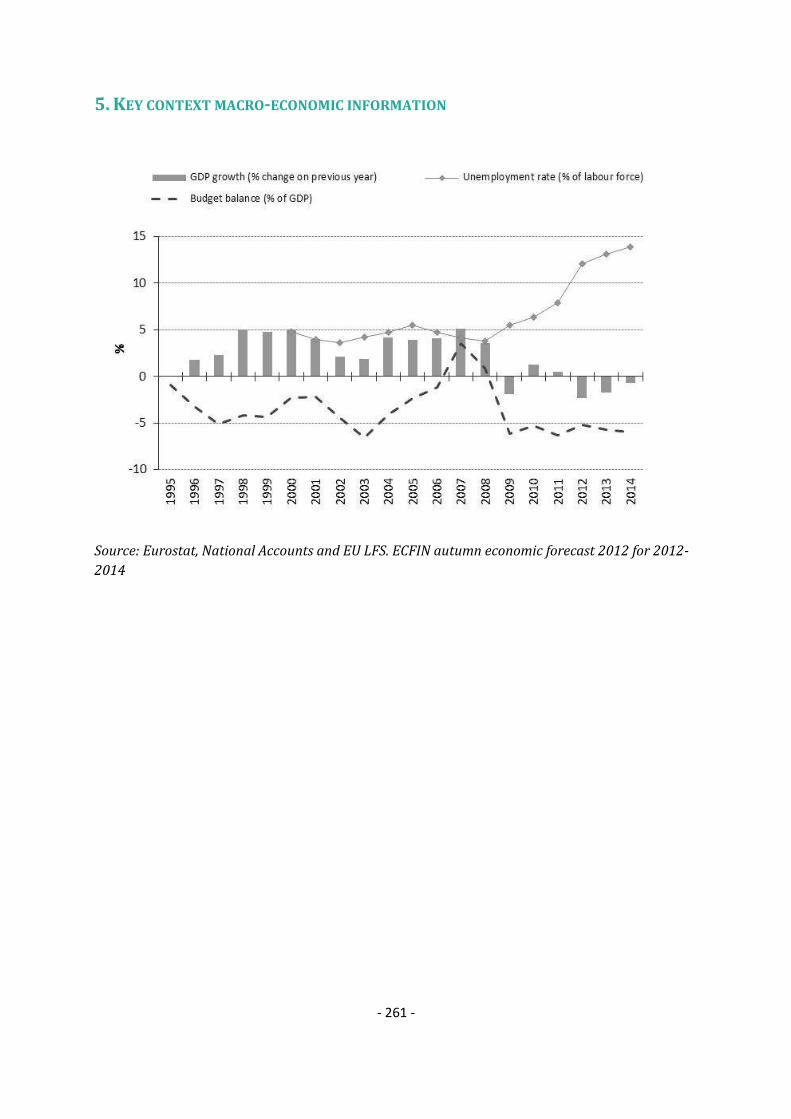
- 261 -
5. KEY CONTEXT MACRO-ECONOMIC INFORMATION
Source: Eurostat, National Accounts and EU LFS. ECFIN autumn economic forecast 2012 for 2012-
2014

- 262 -
6. TRENDS IN TAKE-UP OF SELECTED BENEFITS80
Number of unemployed
Definition Unemployment according to ILO definition - Total
Unit thousands of persons - seasonally adjusted
Source Eurostat
Unemployment benefit (1)
Definition Number of applicants for unemployment benefit
Unit thousands of applicants
Source Social Insurance Services, Ministry of Labour and Social Insurance
Comment
CY UB applicants refer to the number of applicants for unemployment benefit from
Social Insurance Services. Some of those applicants can be rejected due to the
qualifying contribution conditions of the unemployment benefit. The un-
smoothness of the number of applicants is due to the seasonality effect of the
80
This data has been collected by the SPC in the context of monitoring the social impact of the crisis. It includes only a selection of benefits which have been considered most reactive to the crisis. The number of unemployed refers to the standard definition by the ILO and is given as background information.

- 263 -
hospitality industry.
Unemployment benefit (2)
Definition Number of beneficiaries for unemployment benefit
Unit thousands of applicants
Source Social Insurance Services, Ministry of Labour and Social Insurance
Comment
CY UB beneficiaries refer to the number of beneficiaries for unemployment benefit
from Social Insurance Services at the corresponding period. The unsmoothness of
the number of beneficiaries is due to the seasonality effect of the hospitality
industry.
Social assistance benefit - Recipients of social assistance benefits/means-tested
minimum Income
Definition Number of public assistance beneficiaries
Unit thousands of beneficiaries
Source Social Welfare Services, Ministry of Labour and Social Insurance
Comment
With the revised Public Assistance and Services Law [L.95(1)/2006] there have
been amendments which financially reinforce public assistance recipients and
encourage their integration into the labour market. In comparison to 2011, in June
2012, there was a registered decrease in public assistance recipients. This
decrease is attributed to the fact that as of June 2012 single parents are benefited
from the single parents benefit and as such single parents are not registered under
the public assistance scheme. It should be mentioned that the cases of public
assistance with a nature of distress “unemployment” have been increased over the
last years with 1293 cases in December 2011 reaching the 1.440 in August 2012.

- 264 -
7. SUMMARY OF SPECIFIC KEY SOCIAL CHALLENGES AND PARTICULARLY GOOD SOCIAL
OUTCOMES
Social policy areas Challenges
Poverty and social inclusion Promoting active inclusion
High at-risk-of-poverty rate of elderly persons
Securing a decent standard of living for vulnerable
people and the wider population through labour market
integration, income support and provision of enabling
services
Pensions Sustainability of the pension system
Adequacy of the pension system
Increasing effective retirement age, including by aligning
statutory retirement age with life expectancy
Health and long-term care Expansion of healthcare provision – implementing a
financially sustainable national healthcare system which
provides universal coverage
The expansion of long-term care provision, particularly
for elderly persons
Particularly good social outcomes
Improvement in reducing the number of early school
leavers
Improvement in the impact of social transfers on poverty
reduction
Increasing the number of healthy life years at 65 for men
and women

- 265 -
LATVIA
1. 2012 NATIONAL SOCIAL REPORT (NSR): KEY ISSUES
Latvian economy is recovering from a severe recession. Although, the economic and labour
market outlook is generally positive, significant socio-economic challenges remain. Long-term
unemployment and youth unemployment are among the worst in the EU. Income inequality and
poverty is persistently high with unemployed and families with children being particularly
affected. Material deprivation has increased significantly during recent years. Poor accesses to
health care and underdeveloped long term care remain significant challenges.
The Latvian National Social Report (NSR) does not inform whether the relevant stakeholders
were consulted in the drafting of the report.
The NSR identifies several priorities in the area of social inclusion: stabilization of the labour
market, improving the targeting of social protection, improving the demographic situation by
creating favourable environment (family) for the development of a child, rights of the disabled
people, education reforms and supporting access to basic goods and services to the poor (food,
housing, health, education, transport). The main challenge related to pensions is to ensure the
sustainability of the social insurance system in the medium and long term. The NSR does not
address the medium and long term adequacy of the pensions system which was identified as a
challenge in the Commission analysis81. The sustainability of the pension system is regarded
primarily in terms of financial sustainability (Social Insurance budget) and not in a broader
sense (pension expenditure as a percentage of GDP). The main health care priorities identified
by NSR are quality of primary care, to improve the access to outpatient care, morbidity and
mortality reduction and health promotion. The main priority of the long term care is to create
pre-conditions for effective, transparent and client oriented social care.
At the onset of the crisis the government launched the Emergency Social Safety Net Strategy
(ESSN) (2009-2011) to mitigate the impacts of the recession on the most vulnerable. Most
measures of the strategy were continued also in 2012 including the temporary co-financing of
government for municipalities to deal with the expenses of GMI and housing benefit payments to
people. In 2013 the government along with Union of Local Municipalities have agreed to
decrease the guaranteed minimum income level (GMI) at the same time enabling the
municipalities to set up higher GMI level in the local areas but not higher as income level of poor
person. Regarding the future, the primary focus of the poverty reduction policies are to: improve
access to the labour market, decrease tax burden for low wage earners and families with
children and fight discrimination. An improvement of social assistance system is being planned
in order to increase incentives to work.
Improving the situation in the State Social Insurance budget is the main motivation for pension
reform. The Parliament adopted the following changes in the pension legislation: the pension
81 Commission Staff Working Document 'Assessment of the 2012 national reform programme and
convergence programme for Latvia'. COM(2012) 320 (final)

- 266 -
age will be increased gradually starting from 2014 reaching 65 years in 2025 (from current 62),
the early retirement age will increase gradually starting in 2014 to reach 63 years in 2025. The
minimum length of contribution period to qualify for a pension will be increased from current
10 years to 15 years in 2014, and to 20 years in 2025. During crisis the contributions to the
second pension pillar (mandatory private funded pensions) were maintained to 2% in 2012 of
the contribution object but will be increase to 4% as of 2013, to 5% in 2015 and to 6% in 2016.
Major health care reforms were implemented to strengthen primary health care and rationalize
the use and provision of hospital care. The Emergency Social Safety Net Strategy neutralised
patient co-payments paid by poor people (income below 90 LVL per month) and low-income
patients (income below 120-150 LVL per month). In 2012-2013, most measures of the ESSN in
health are continued but the co-payments are covered only for the poor. To improve
accessibility to primary health care, the ESSNS supplemented the General Practitioners'
practices with second nurse. Plans are developed to link entitlement to health care with tax
payments with exception for several groups (children, retired, unemployed etc.).
In the area of long term care, the main measures are development of community based care (ESF
financed projects) and establishment of a Working Group with the aim to submit proposals for
integrated social care and social rehabilitation services (with elements of health care). The
proposals will serve as an input for the development of long term care strategy.
The key challenge awaiting Latvian policy makers is to design tax and benefit system that could
better protect the poorand at the same time maintain incentives to work. Ensuring effective
system of social assistance and providing adequate support and activation to the long term
unemployed is a particular challenge. Tackling poor access to health care and low health status
of the population is a long-standing issue.
Regarding future, the few measures planned mirror the insufficient priority given to poverty
reduction. Even though significant increase in employment is not expected in medium term, the
authorities view employment as answer for poverty and undermine access to services and
adequate income support. The NRP plans mention tax policy as one of the main instruments to
tackle poverty through i.a. increasing non-taxable PIT threshold, increasing tax reliefs for
dependants or introducing progressive income taxes. These considerations, however, were not
reflected in the recent tax changes and PIT (as of 2013) and VAT (mid 2012) rates where
decreased instead. . Overall, a strategic framework for poverty reduction or active inclusion
could enhance the Government actions in this area.
2. NATIONAL 2020 TARGET FOR THE REDUCTION OF POVERTY AND SOCIAL EXCLUSION
"To lift 121,000 people out of the risk of poverty or exclusion by 2020"
Source: National Reform Programme (2011)

- 267 -
2.a Progress towards the 2020 national target for the reduction of poverty and
social exclusion
Source: Eurostat (EU-SILC)
Note: i) Progress on the target is monitored on the basis of the EU SILC data with a base year 2008 and
target data year 2018;
ii) AROP - at-risk-of-poverty rate; VLWI - share of population living in very low work intensity
households;
iii) For the at-risk-of poverty rate (AROP), the income reference year is the calendar year prior to the
survey year (i.e. 2010) except for the United Kingdom (survey year) and Ireland (12 months preceding the
survey). Similarly, the very low work intensity rate (VLWI) refers to the income reference year prior to the
survey (i.e. 2010).

- 268 -
2b. Composition of the population at risk of poverty or social exclusion (2011)
Source: Eurostat (EU-SILC)
Note: i) Progress on the target is monitored on the basis of the EU SILC data with a base year 2008 and
target data year 2018;
ii) AROPE - at-risk-of-poverty or social exclusion rate; AROP - at-risk-of-poverty rate; VLWI - share of
population living in very low work intensity households; SMD - severe material deprivation rate; the red
overlap indicates the share of the population which accumulates all three conditions;
iii) For the at-risk-of poverty rate (AROP), the income reference year is the calendar year prior to the
survey year (i.e. 2010) except for the United Kingdom (survey year) and Ireland (12 months preceding the
survey). Similarly, the very low work intensity rate (VLWI) refers to the income reference year prior to the
survey (i.e. 2010) while for the severe material deprivation rate (SMD), the reference is the current year (i.e.
2011).
2005 2006 2007 2008 2009 2010 2011
AROP total % of total pln 19,2 23,1 21,2 25,6 25,7 21,3 19,3
1000 persons 427 520 472 573 573 474 425
VLWI total % of total pln 8,1 7,0 6,1 5,1 6,7 12,2 12,2

- 269 -
1000 persons 140 124 107 91 118 213 209
SMD total % of total pln 38,9 30,6 24,9 19,0 21,9 27,4 30,9
1000 persons 865 688 555 425 489 609 682
AROP + LWI % of total pln 1,1 0,9 1,2 1,2 1,6 1,9 1,8
1000 persons 24 21 26 28 36 43 41
AROP + SMD % of total pln 9,3 9,3 8,4 9,1 8,2 7,4 7,2
1000 persons 206 209 187 205 183 164 158
AROP + SMD + LWI
% of total pln 3,7 3,6 2,5 2,2 2,7 4,9 4,6
1000 persons 82 81 55 48 60 110 102
SMD + LWI % of total pln 0,9 0,4 0,3 0,1 0,3 1,0 1,4
1000 persons 20 10 8 3 6 23 30
2c. At risk of poverty or social exclusion rate for specific groups, 2011
Total
At risk of poverty or social exclusion,
in %
Children (0-17) 43,6
Working age (18-64) 40,9
Elderly (65+) 33,2
Employed 27,1
Unemployed 73,7
Inactive 54,1
Single male 52,8
Single female 45,0
Single elderly (65+) 39,7
Single parent households 65,6
Large families (2 adults and 3+ children) 56,0
EU-migrant (EU 27) 35,0
Non-EU migrants (non-EU27) 41,3
Source: Eurostat (EU-SILC)
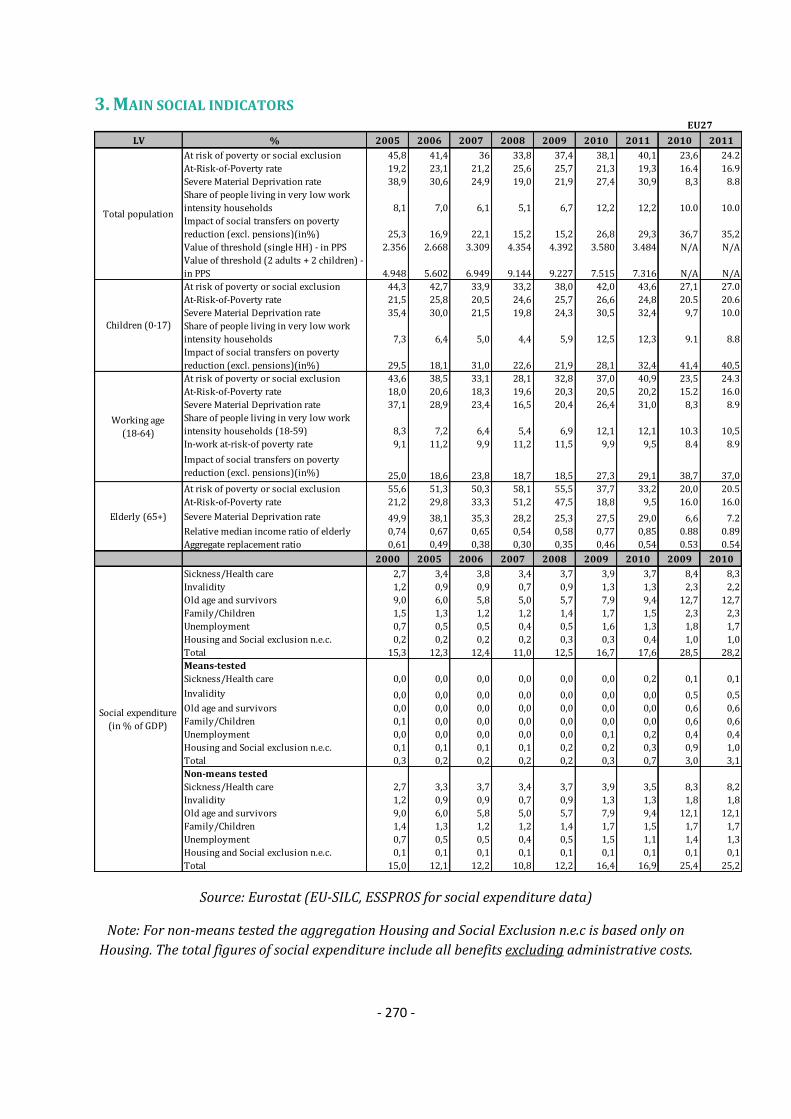
- 270 -
3. MAIN SOCIAL INDICATORS
LV % 2005 2006 2007 2008 2009 2010 2011 2010 2011
At risk of poverty or social exclusion 45,8 41,4 36 33,8 37,4 38,1 40,1 23,6 24.2
At-Risk-of-Poverty rate 19,2 23,1 21,2 25,6 25,7 21,3 19,3 16.4 16.9
Severe Material Deprivation rate 38,9 30,6 24,9 19,0 21,9 27,4 30,9 8,3 8.8
Share of people living in very low work
intensity households 8,1 7,0 6,1 5,1 6,7 12,2 12,2 10.0 10.0
Impact of social transfers on poverty
reduction (excl. pensions)(in%) 25,3 16,9 22,1 15,2 15,2 26,8 29,3 36,7 35,2
Value of threshold (single HH) - in PPS 2.356 2.668 3.309 4.354 4.392 3.580 3.484 N/A N/A
Value of threshold (2 adults + 2 children) -
in PPS 4.948 5.602 6.949 9.144 9.227 7.515 7.316 N/A N/A
At risk of poverty or social exclusion 44,3 42,7 33,9 33,2 38,0 42,0 43,6 27,1 27.0
At-Risk-of-Poverty rate 21,5 25,8 20,5 24,6 25,7 26,6 24,8 20.5 20.6
Severe Material Deprivation rate 35,4 30,0 21,5 19,8 24,3 30,5 32,4 9,7 10.0
Share of people living in very low work
intensity households 7,3 6,4 5,0 4,4 5,9 12,5 12,3 9.1 8.8
Impact of social transfers on poverty
reduction (excl. pensions)(in%) 29,5 18,1 31,0 22,6 21,9 28,1 32,4 41,4 40,5
At risk of poverty or social exclusion 43,6 38,5 33,1 28,1 32,8 37,0 40,9 23,5 24.3
At-Risk-of-Poverty rate 18,0 20,6 18,3 19,6 20,3 20,5 20,2 15.2 16.0
Severe Material Deprivation rate 37,1 28,9 23,4 16,5 20,4 26,4 31,0 8,3 8.9
Share of people living in very low work
intensity households (18-59) 8,3 7,2 6,4 5,4 6,9 12,1 12,1 10.3 10,5
In-work at-risk-of poverty rate 9,1 11,2 9,9 11,2 11,5 9,9 9,5 8.4 8.9
Impact of social transfers on poverty
reduction (excl. pensions)(in%) 25,0 18,6 23,8 18,7 18,5 27,3 29,1 38,7 37,0
At risk of poverty or social exclusion 55,6 51,3 50,3 58,1 55,5 37,7 33,2 20,0 20.5
At-Risk-of-Poverty rate 21,2 29,8 33,3 51,2 47,5 18,8 9,5 16.0 16.0
Severe Material Deprivation rate 49,9 38,1 35,3 28,2 25,3 27,5 29,0 6,6 7.2
Relative median income ratio of elderly 0,74 0,67 0,65 0,54 0,58 0,77 0,85 0.88 0.89
Aggregate replacement ratio 0,61 0,49 0,38 0,30 0,35 0,46 0,54 0.53 0.54
2000 2005 2006 2007 2008 2009 2010 2009 2010
Sickness/Health care 2,7 3,4 3,8 3,4 3,7 3,9 3,7 8,4 8,3
Invalidity 1,2 0,9 0,9 0,7 0,9 1,3 1,3 2,3 2,2
Old age and survivors 9,0 6,0 5,8 5,0 5,7 7,9 9,4 12,7 12,7
Family/Children 1,5 1,3 1,2 1,2 1,4 1,7 1,5 2,3 2,3
Unemployment 0,7 0,5 0,5 0,4 0,5 1,6 1,3 1,8 1,7
Housing and Social exclusion n.e.c. 0,2 0,2 0,2 0,2 0,3 0,3 0,4 1,0 1,0
Total 15,3 12,3 12,4 11,0 12,5 16,7 17,6 28,5 28,2
Means-tested
Sickness/Health care 0,0 0,0 0,0 0,0 0,0 0,0 0,2 0,1 0,1
Invalidity 0,0 0,0 0,0 0,0 0,0 0,0 0,0 0,5 0,5
Old age and survivors 0,0 0,0 0,0 0,0 0,0 0,0 0,0 0,6 0,6
Family/Children 0,1 0,0 0,0 0,0 0,0 0,0 0,0 0,6 0,6
Unemployment 0,0 0,0 0,0 0,0 0,0 0,1 0,2 0,4 0,4
Housing and Social exclusion n.e.c. 0,1 0,1 0,1 0,1 0,2 0,2 0,3 0,9 1,0
Total 0,3 0,2 0,2 0,2 0,2 0,3 0,7 3,0 3,1
Non-means tested
Sickness/Health care 2,7 3,3 3,7 3,4 3,7 3,9 3,5 8,3 8,2
Invalidity 1,2 0,9 0,9 0,7 0,9 1,3 1,3 1,8 1,8
Old age and survivors 9,0 6,0 5,8 5,0 5,7 7,9 9,4 12,1 12,1
Family/Children 1,4 1,3 1,2 1,2 1,4 1,7 1,5 1,7 1,7
Unemployment 0,7 0,5 0,5 0,4 0,5 1,5 1,1 1,4 1,3
Housing and Social exclusion n.e.c. 0,1 0,1 0,1 0,1 0,1 0,1 0,1 0,1 0,1
Total 15,0 12,1 12,2 10,8 12,2 16,4 16,9 25,4 25,2
Elderly (65+)
Social expenditure
(in % of GDP)
EU27
Children (0-17)
Working age
(18-64)
Total population
Source: Eurostat (EU-SILC, ESSPROS for social expenditure data)
Note: For non-means tested the aggregation Housing and Social Exclusion n.e.c is based only on
Housing. The total figures of social expenditure include all benefits excluding administrative costs.

- 271 -
4. LONG-TERM ADEQUACY OF PENSIONS: THEORETICAL REPLACEMENT RATES (2010-
2050)
Theoretical replacement rates (TRR): Net
2010
Net
2050 Difference Gross2010 Gross2050 Difference
40 years career: average income earner
(basecase) 80,4 55,3 -25,1
63,9
(100/0/0)*
43,6
(61/39/0)* -20,3
Low income 86,8 58,5 -28,3 63,9
(100/0/0)*
43,6
(61/39/0)* -20,3
High income 57 39,8 -17,2 47,5
(100/0/0)*
32,8
(61/39/0)* -14,7
Lower / higher future rates of return 52,8 /
58,3 41,2 / 46,5
Lower / higher future wage growth 59,5 /
52,2 47,7 / 40,5
38 years career: average income 65,9 50,2 -15,7 48,2 38,6 -9,6
Low / high income 65,6 /
46,7
51,7 /
35,9
(-13,9/-
10,8) 48,2 / 36,2 38,6 / 29 (-9,6/-7,2)
42 years career: average income 77,6 61,2 -16,4 58,3 49,4 -8,9
Low / high income 82 / 54,9 65 / 44,3 (-17/-10,6) 58,3 / 43 49,4 / 37,1 (-8,9/-5,9)
10 years after retirement 68,8 47,5 -21,3 51,1 35,9 -15,2
Female worker with 3 years of career
break for childcare 56,8 44,8 -12,0 40,3 33,2 -7,1
3 years of career break for
unemployment 59,4 44,9 -14,5 42,3 33,4 -8,9
10 years out of the labour market 63,5 43,7 -19,8 47,5 32,2 -15,3
2010 2050 Difference EU27
2010
EU27
2050 Difference
Benefit ratio (Public pensions) : : : 44,7 37,0 -7,7
Gross replacement rate at retirement
(Public pensions) 48,2 15,8 -32,4 48,0 39,1 -8,9
Note: *: Share of statutory DB-NDC / statutory funded / occupational and other supplementary
pensions
Source: Joint SPC/EC report on Pension Adequacy in the European Union (2010-2050)
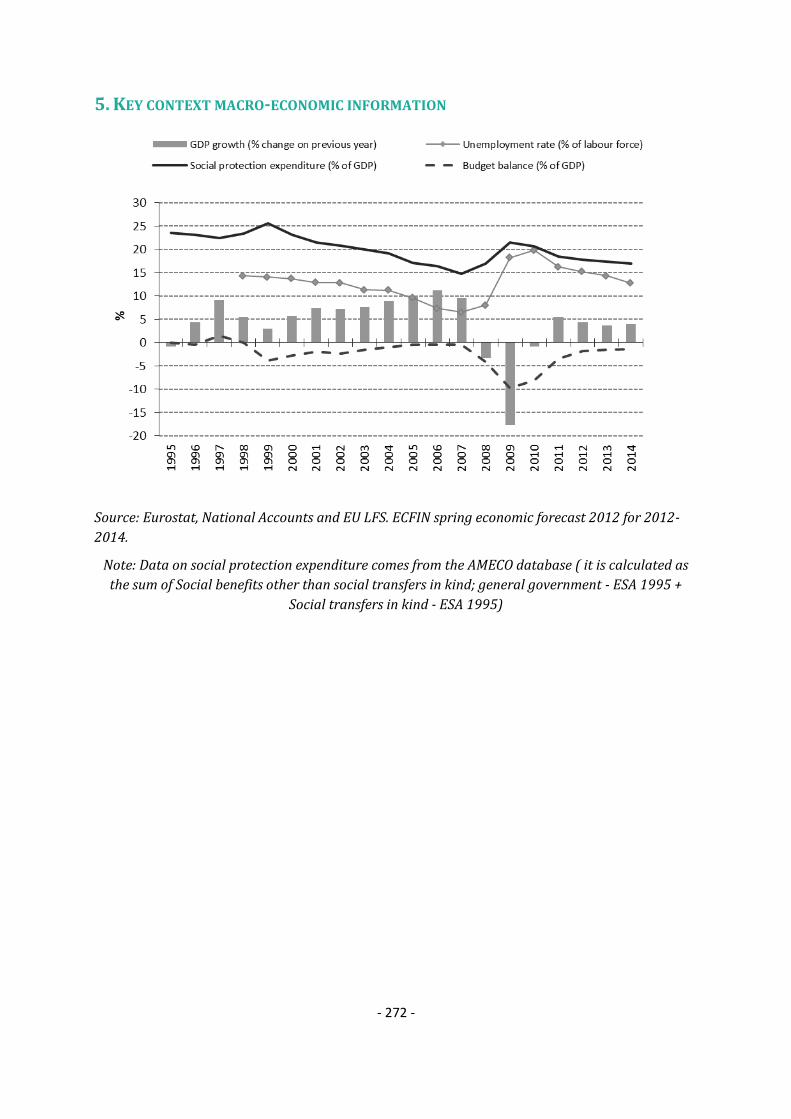
- 272 -
5. KEY CONTEXT MACRO-ECONOMIC INFORMATION
Source: Eurostat, National Accounts and EU LFS. ECFIN spring economic forecast 2012 for 2012-
2014.
Note: Data on social protection expenditure comes from the AMECO database ( it is calculated as
the sum of Social benefits other than social transfers in kind; general government - ESA 1995 +
Social transfers in kind - ESA 1995)

- 273 -
6. TRENDS IN TAKE-UP OF SELECTED BENEFITS82
Number of unemployed
Definition Unemployment according to ILO definition - Total
Unit Thousands of persons - seasonally adjusted
Source Eurostat
Unemployment recipients
Definition persons receiving unemployment benefit
Unit thousands of recipients
Source State Social Insurance Agency
Recipients of social assistance benefits/means-tested minimum Income
Definition persons in household receiving municipal GMI benefit
Unit thousands of recipients
Source annual statistical reports from local municipalities
82
This data has been collected by the SPC in the context of monitoring the social impact of the crisis. It includes only a selection of benefits which have been considered most reactive to the crisis. The number of unemployed refers to the standard definition by the ILO and is given as background information.
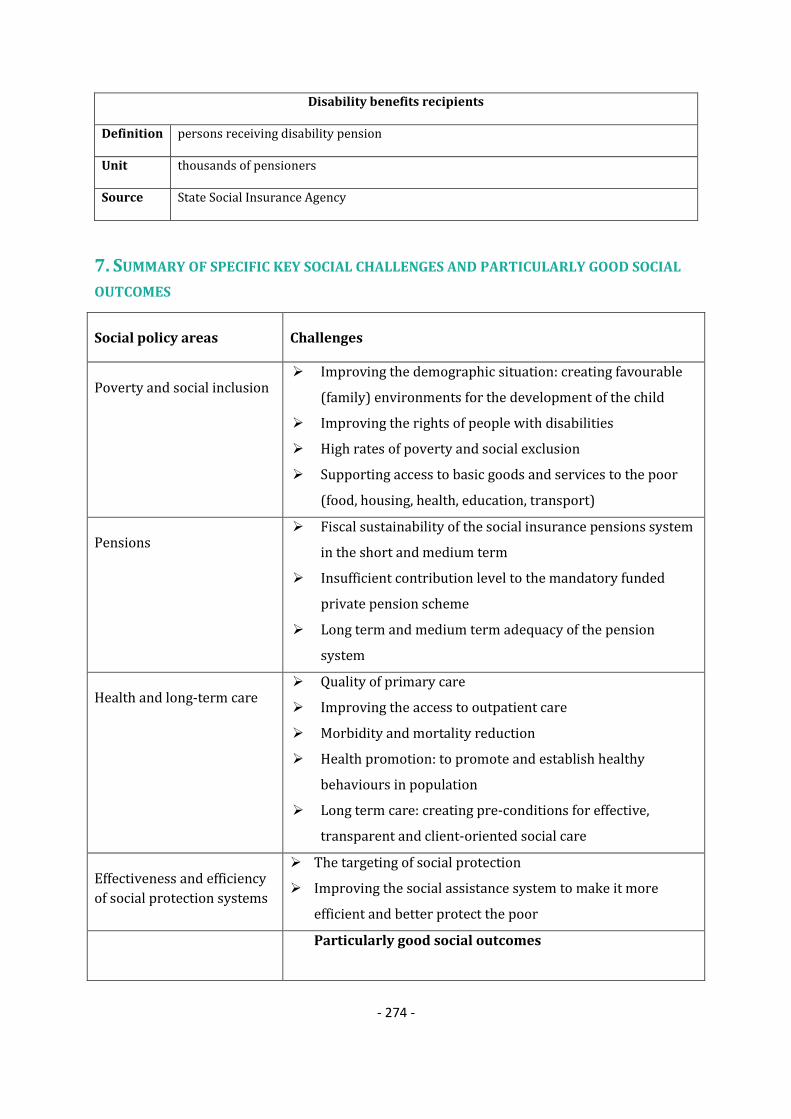
- 274 -
Disability benefits recipients
Definition persons receiving disability pension
Unit thousands of pensioners
Source State Social Insurance Agency
7. SUMMARY OF SPECIFIC KEY SOCIAL CHALLENGES AND PARTICULARLY GOOD SOCIAL
OUTCOMES
Social policy areas Challenges
Poverty and social inclusion Improving the demographic situation: creating favourable
(family) environments for the development of the child
Improving the rights of people with disabilities
High rates of poverty and social exclusion
Supporting access to basic goods and services to the poor
(food, housing, health, education, transport)
Pensions Fiscal sustainability of the social insurance pensions system
in the short and medium term
Insufficient contribution level to the mandatory funded
private pension scheme
Long term and medium term adequacy of the pension
system
Health and long-term care Quality of primary care
Improving the access to outpatient care
Morbidity and mortality reduction
Health promotion: to promote and establish healthy
behaviours in population
Long term care: creating pre-conditions for effective,
transparent and client-oriented social care
Effectiveness and efficiency
of social protection systems
The targeting of social protection
Improving the social assistance system to make it more
efficient and better protect the poor
Particularly good social outcomes

- 275 -
Some improvement in reducing the working poor
Improvement in reducing the number of early school
leavers
- 276 -
LITHUANIA
1. EVALUATION OF THE 2012 NATIONAL SOCIAL REPORT (NSR)
Lithuania went through a deep recession in 2009 (GDP decreased by 14.8 %) and returned to
growth in 2010 (+1.4 %) and 2011 (+5.9 %). The Commission services’ 2012 autumn forecast
projects real GDP to grow by 2.9 % in 2012 and by 3.1% in 2013. Employment continued to
grow and the unemployment rate decreased to 13.3%. Social insurance pensions, cut at the
beginning of the crisis, have been brought back to pre-crisis levels. The deficit of the social
insurance provider SoDra is projected to further decrease on the back of an improved
performance of the labour market and reduced pension payments due to gradual increase in
retirement age. Income inequality that was the highest in EU in 2010 decreased in 2011. But
fiscal consolidation continues and the 2012 budget contains substantial cuts in expenditure
(spending on goods and services and social benefits are declining). Real wages are still declining
(they are expected to stabilise only at the end of 2013); the public sector wage freeze has been
maintained for a third year. The at-risk-of-poverty rate in 2011 increased for families with 3 and
more children, for children under 18 and young people (18-24), for people 65+ and for people
living in rural areas.
According the NSR, the priorities established by the Government of Lithuania for 2012 and the
key reforms to be frontloaded in the short-term period (concerning employment, health and
social protection area) are related to fostering employment (particularly, among youth) and
optimisation of the health care network. The NSR focuses also on the rapid economic growth and
economic financial crisis which led to increased differentiation in population income. These
priorities partially meet the challenges that were identified in the SWD 2012 – the necessity to
increase labour force participation and labour mobility (particularly among the youth and the
unskilled workers) and to pay more attention to a new challenge that has arisen in the form of
income inequality and poverty.
The social assistance reform is already on-going since January 2012 and it has a number of
measures to improve work incentives and to reduce long-term dependency on social assistance
(in-work benefits for the long-term unemployed, gradual decrease of social benefits for non-
working recipients of workable age), to increase coverage of social assistance (possibility to
compensate heating and other costs for people renting a dwelling, repealed obligation to be
registered in the labour exchange for 6 months before applying for cash social assistance) and
to present some new methods for calculating the benefit amount (the social benefit for the first
household member is higher than before, but social benefits for other family members will
gradually decrease; when granting cash social assistance, charity in cash and student's
scholarship are not included in the income of a family). In cooperation with communities, NGO's,
elders, volunteers and other stakeholders 5 pilot municipalities will provide cash social
assistance more efficiently. Restoration of pensions (old age, disability, survivors and orphan's)
to pre-crisis levels should also contribute to poverty reduction.
- 277 -
Furthermore, the Government approved the Inter-institutional Action Plan to Promote Non-
discrimination for 2012–2014. Ministry of Social Security and Labour formed a working group
for drafting a new National Programme for Social Integration of the Disabled for 2013–2019.
The third National Programme of Equal Opportunities for Women and Men 2010–2014 is
consistently implemented.
The pension reform (significant increase of the retirement age since 2012, amendments to the
Law on Pension accumulation) and the removal of fiscal disincentives for pensioners to work
(no additional reductions for their pensions since 2012,) – are going in line with the country-
specific recommendations of 2011 and 2012, but no legislation on comprehensive pension
system reform has been adopted. Isolated steps have been taken as a response to the Guidelines
for the reorganization of the State Social Insurance and Pension System adopted by the
Parliament on 24/05/2011. The pension reform is not underpinned with active ageing measures
though the national active ageing strategy expires in 2013.
The restructuring of health care institutions, efforts to balance the health insurance budget and
measures to reduce the prices of pharmaceuticals, as well as the financing of prophylactic health
programmes have been positive recent achievements. The political decisions and measures were
successful in alcohol and traffic accidents control and contributed to increased average life
expectancy and reduced infant mortality. The levels of primary care and outpatient care were
strengthened by transposing funds and professionals from the in-patient care. Amendments to
the Law on Local Self-Government (concerning public health financing) are submitted for the
Parliament.
Since 2010, the infrastructure of social services has changed because of a reform in the country
with part of the responsibilities shifting to local government. Deinstitutionalisation process is
under preparation. In 2011 the program targeted at the modernisation of infrastructure of
institutional social care establishments was approved. In the period 2013 – 2015, 21 pilot
municipalities (out of 60) would implement ''The Integrated Support Development Program''
(targeted on integrated social and health services at home for elderly and disabled people with
severe disabilities).
Poverty reduction measures are limited in terms of ambition, although they are in part both
credible and relevant. Significant gaps can be identified in terms of reducing poverty and social
exclusion according to Lithuania's national 2020 targets. The social assistance reform focuses on
saving social expenditure rather than on redirecting it to the most needy and, as such, is not
likely to have a decisive positive impact on the reduction of poverty and social exclusion.
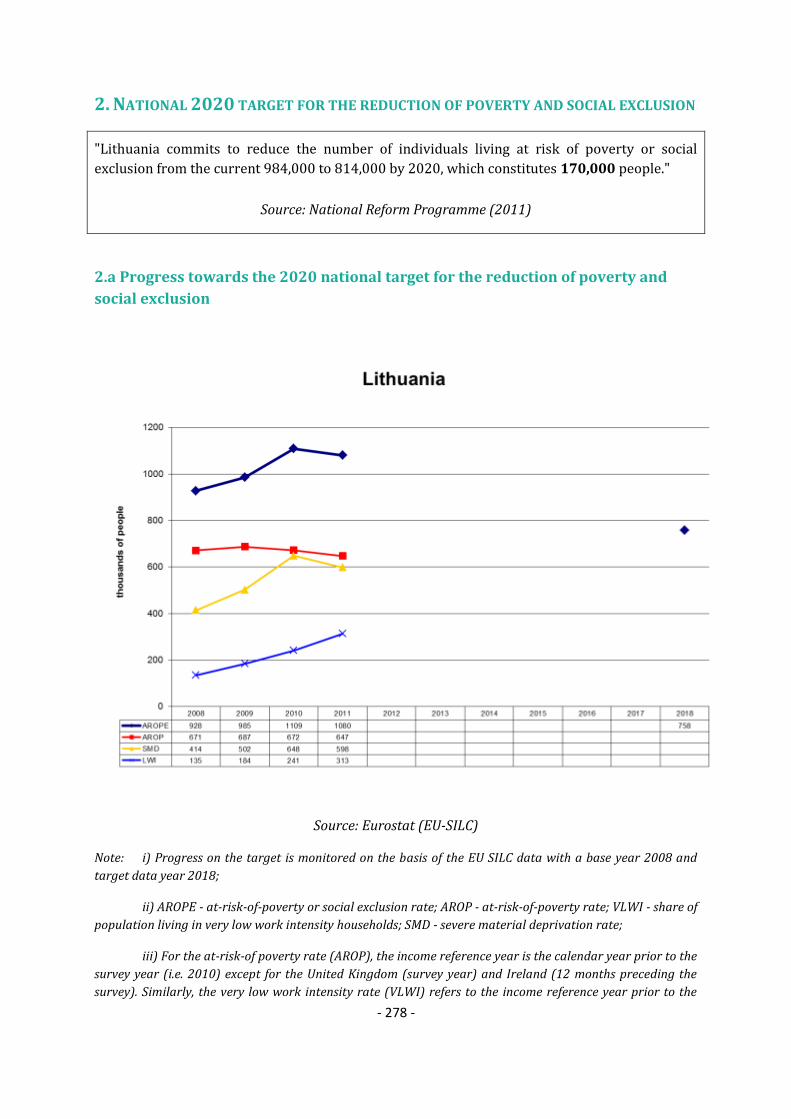
- 278 -
2. NATIONAL 2020 TARGET FOR THE REDUCTION OF POVERTY AND SOCIAL EXCLUSION
"Lithuania commits to reduce the number of individuals living at risk of poverty or social
exclusion from the current 984,000 to 814,000 by 2020, which constitutes 170,000 people."
Source: National Reform Programme (2011)
2.a Progress towards the 2020 national target for the reduction of poverty and
social exclusion
Source: Eurostat (EU-SILC)
Note: i) Progress on the target is monitored on the basis of the EU SILC data with a base year 2008 and
target data year 2018;
ii) AROPE - at-risk-of-poverty or social exclusion rate; AROP - at-risk-of-poverty rate; VLWI - share of
population living in very low work intensity households; SMD - severe material deprivation rate;
iii) For the at-risk-of poverty rate (AROP), the income reference year is the calendar year prior to the
survey year (i.e. 2010) except for the United Kingdom (survey year) and Ireland (12 months preceding the
survey). Similarly, the very low work intensity rate (VLWI) refers to the income reference year prior to the

- 279 -
survey (i.e. 2010) while for the severe material deprivation rate (SMD), the reference is the current year (i.e.
2011).
2b. Composition of the population at risk of poverty or social exclusion (2011)
Source: Eurostat (EU-SILC)
Note: i) Progress on the target is monitored on the basis of the EU SILC data with a base year 2008 and
target data year 2018;
ii) AROPE - at-risk-of-poverty or social exclusion rate; AROP - at-risk-of-poverty rate; VLWI - share of
population living in very low work intensity households; SMD - severe material deprivation rate; the red
overlap indicates the share of the population which accumulates all three conditions;
iii) For the at-risk-of poverty rate (AROP), the income reference year is the calendar year prior to the
survey year (i.e. 2010) except for the United Kingdom (survey year) and Ireland (12 months preceding the
survey). Similarly, the very low work intensity rate (VLWI) refers to the income reference year prior to the
survey (i.e. 2010) while for the severe material deprivation rate (SMD), the reference is the current year (i.e.
2011).
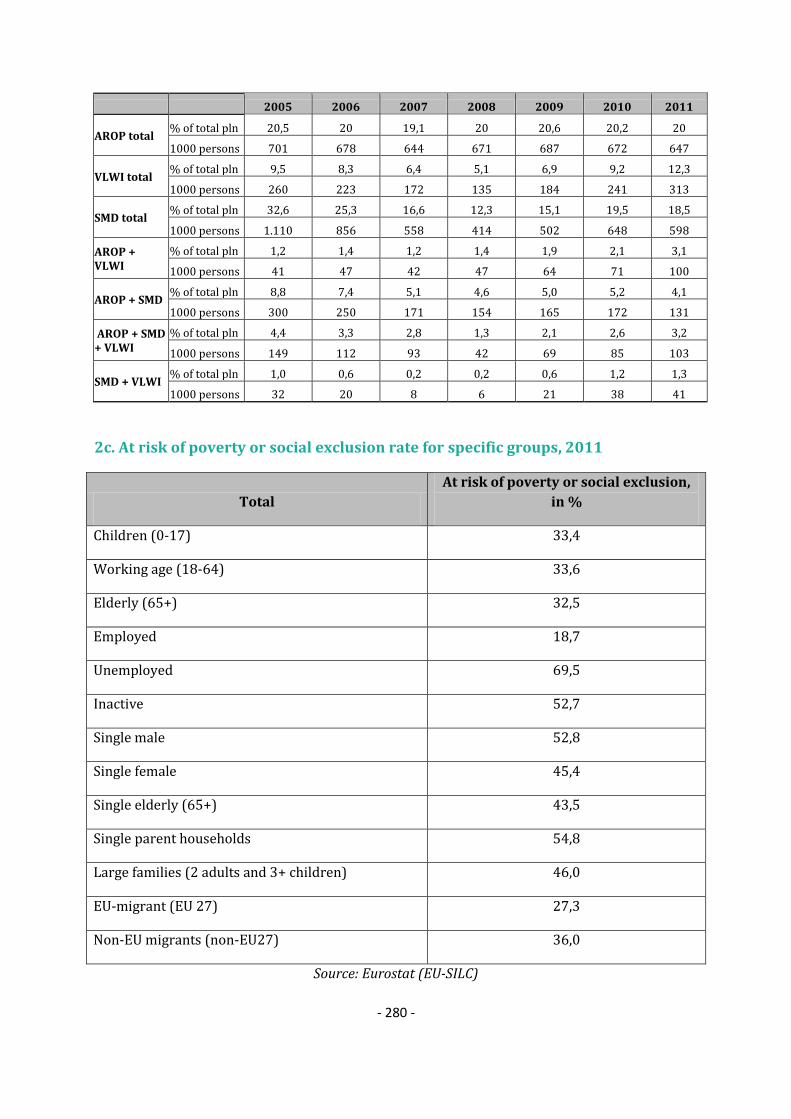
- 280 -
2005 2006 2007 2008 2009 2010 2011
AROP total % of total pln 20,5 20 19,1 20 20,6 20,2 20
1000 persons 701 678 644 671 687 672 647
VLWI total % of total pln 9,5 8,3 6,4 5,1 6,9 9,2 12,3
1000 persons 260 223 172 135 184 241 313
SMD total % of total pln 32,6 25,3 16,6 12,3 15,1 19,5 18,5
1000 persons 1.110 856 558 414 502 648 598
AROP + VLWI
% of total pln 1,2 1,4 1,2 1,4 1,9 2,1 3,1
1000 persons 41 47 42 47 64 71 100
AROP + SMD % of total pln 8,8 7,4 5,1 4,6 5,0 5,2 4,1
1000 persons 300 250 171 154 165 172 131
AROP + SMD + VLWI
% of total pln 4,4 3,3 2,8 1,3 2,1 2,6 3,2
1000 persons 149 112 93 42 69 85 103
SMD + VLWI % of total pln 1,0 0,6 0,2 0,2 0,6 1,2 1,3
1000 persons 32 20 8 6 21 38 41
2c. At risk of poverty or social exclusion rate for specific groups, 2011
Total
At risk of poverty or social exclusion,
in %
Children (0-17) 33,4
Working age (18-64) 33,6
Elderly (65+) 32,5
Employed 18,7
Unemployed 69,5
Inactive 52,7
Single male 52,8
Single female 45,4
Single elderly (65+) 43,5
Single parent households 54,8
Large families (2 adults and 3+ children) 46,0
EU-migrant (EU 27) 27,3
Non-EU migrants (non-EU27) 36,0
Source: Eurostat (EU-SILC)

- 281 -
3. MAIN SOCIAL INDICATORS
LT % 2005 2006 2007 2008 2009 2010 2011 2010 2011
At risk of poverty or social exclusion 41,0 35,9 28,7 27,6 29,5 33,4 33,4 23,6 24.2
At-Risk-of-Poverty rate 20,5 20,0 19,1 20,0 20,6 20,2 20,0 16.4 16.9
Severe Material Deprivation rate 32,6 25,3 16,6 12,3 15,1 19,5 18,5 8,3 8.8
Share of people living in very low work
intensity households 9,5 8,3 6,4 5,1 6,9 9,2 12,3 10.0 10.0
Impact of social transfers on poverty
reduction (excl. pensions)(in%) 21,5 24,8 25,1 26,5 29,9 36,5 37,1 36,7 35,2
Value of threshold (single HH) - in PPS 2.304 2.772 3.428 4.170 4.382 3.615 3.690 N/A N/A
Value of threshold (2 adults + 2 children) -
in PPS 4.847 5.821 7.199 8.756 9.202 7.593 7.750 N/A N/A
At risk of poverty or social exclusion 42,5 37,2 29,9 29,4 31,0 34,3 33,4 27,1 27.0
At-Risk-of-Poverty rate 27,2 25,1 22,1 22,8 23,7 23,3 24,3 20.5 20.6
Severe Material Deprivation rate 32,2 24,0 15,9 12,3 14,8 19,7 15,9 9,7 10.0
Share of people living in very low work
intensity households 8,4 7,5 6,4 3,6 5,2 5,5 11,3 9.1 8.8
Impact of social transfers on poverty
reduction (excl. pensions)(in%) 19,8 22,5 24,3 29,8 36,5 46,6 40,0 41,4 40,5
At risk of poverty or social exclusion 39,3 34,2 25,8 24,5 27,5 34,0 33,6 23,5 24.3
At-Risk-of-Poverty rate 19,0 17,8 15,6 16,8 18,5 21,8 20,7 15.2 16.0
Severe Material Deprivation rate 30,8 24,2 15,8 11,3 14,3 18,5 17,6 8,3 8.9
Share of people living in very low work
intensity households (18-59) 10,0 8,5 6,4 5,5 7,5 10,3 12,7 10.3 10,5
In-work at-risk-of poverty rate 10,2 10,1 8,1 9,5 10,6 12,4 10,1 8.4 8.9
Impact of social transfers on poverty
reduction (excl. pensions)(in%) 23,4 28,2 30,4 30,9 31,7 33,7 37,8 38,7 37,0
At risk of poverty or social exclusion 46,1 41,3 39,1 38,1 35,8 30,0 32,5 20,0 20.5
At-Risk-of-Poverty rate 17,0 22,0 29,8 29,5 25,2 10,2 12,1 16.0 16.0
Severe Material Deprivation rate 40,5 31,5 20,8 16,5 18,6 23,7 24,9 6,6 7.2
Relative median income ratio of elderly 0,81 0,74 0,69 0,71 0,73 0,92 0,87 0.88 0.89
Aggregate replacement ratio 0,47 0,44 0,40 0,44 0,48 0,60 0,52 0.53 0.54
2000 2005 2006 2007 2008 2009 2010 2009 2010
Sickness/Health care 4,5 3,9 4,1 4,3 4,6 5,5 4,7 8,4 8,3
Invalidity 1,3 1,3 1,3 1,4 1,6 2,1 1,8 2,3 2,2
Old age and survivors 7,3 5,9 5,7 6,5 6,9 9,0 8,1 12,7 12,7
Family/Children 1,3 1,1 1,1 1,2 1,8 2,8 2,2 2,3 2,3
Unemployment 0,3 0,4 0,4 0,4 0,4 0,9 0,8 1,8 1,7
Housing and Social exclusion n.e.c. 0,5 0,2 0,2 0,2 0,2 0,4 0,7 1,0 1,0
Total 15,2 12,8 12,9 14,0 15,6 20,6 18,3 28,5 28,2
Means-tested
Sickness/Health care 0,0 0,0 0,0 0,0 0,0 0,0 0,0 0,1 0,1
Invalidity 0,0 0,0 0,0 0,0 0,0 0,0 0,0 0,5 0,5
Old age and survivors 0,0 0,0 0,0 0,0 0,0 0,0 0,0 0,6 0,6
Family/Children 0,2 0,1 0,1 0,1 0,1 0,1 0,3 0,6 0,6
Unemployment 0,0 0,0 0,0 0,0 0,0 0,0 0,0 0,4 0,4
Housing and Social exclusion n.e.c. 0,4 0,2 0,1 0,1 0,1 0,3 0,7 0,9 1,0
Total 0,7 0,3 0,2 0,2 0,3 0,5 1,0 3,0 3,1
Non-means tested
Sickness/Health care 4,5 3,9 4,1 4,3 4,6 5,5 4,7 8,3 8,2
Invalidity 1,3 1,3 1,3 1,4 1,6 2,1 1,8 1,8 1,8
Old age and survivors 7,3 5,9 5,7 6,5 6,9 9,0 8,0 12,1 12,1
Family/Children 1,1 1,1 1,0 1,1 1,7 2,6 1,9 1,7 1,7
Unemployment 0,3 0,4 0,4 0,4 0,4 0,9 0,8 1,4 1,3
Housing and Social exclusion n.e.c. 0,1 0,0 0,1 0,0 0,0 0,0 0,0 0,1 0,1
Total 14,5 12,5 12,6 13,8 15,3 20,1 17,3 25,4 25,2
Elderly (65+)
Social expenditure
(in % of GDP)
EU27
Children (0-17)
Working age (18-
64)
Total population
Source: Eurostat (EU-SILC, ESSPROS for social expenditure data)
Note: For non-means tested the aggregation Housing and Social Exclusion n.e.c is based only on
Housing. The total figures of social expenditure include all benefits excluding administrative costs.

- 282 -
4. LONG-TERM ADEQUACY OF PENSIONS: THEORETICAL REPLACEMENT RATES (2010-
2050)
Theoretical replacement rates (TRR): Net
2010
Net
2050 Difference Gross2010 Gross2050 Difference
40 years career: average income earner
(basecase) 61,5 60,3 -1,2
47,7
(96/4/0)*
47,1
(87/13/0)* -0,6
Low income 78,9 74,7 -4,2 63,1
(97/3/0)*
60,2
(90/10/0)* -2,9
High income 39,2 38,1 -1,1 29,8
(94/6/0)*
29,1
(84/16/0)* -0,7
Lower / higher future rates of return 59 / 62 46,3 / 48,2
Lower / higher future wage growth 62,2 /
58,9 48,6 / 46
38 years career: average income 54,4 52,3 -2,1 40,7 40,8 0,1
Low / high income 67,6 /
36,9 64,7 / 33
(-2,9 / -
3,9) 52,3 / 26,8 52,1 / 25,2
(-0,2 / -
1,6)
42 years career: average income 76,8 72,5 -4,3 59,7 56,7 -3,0
Low / high income 95,7 /
51,1
89,9 /
45,8
(-5,8 / -
5,3) 76,8 / 38,8 72,5 / 34,9
(-4,3 / -
3,9)
10 years after retirement 67,6 58,6 -9,0 52,6 45,7 -6,9
Female worker with 3 years of career
break for childcare 49,8 58,6 8,8 36,3 45,8 9,5
3 years of career break for
unemployment 51,1 56,1 5,0 38,2 43,8 5,6
10 years out of the labour market 48 46,2 -1,8 37,3 36,1 -1,2
2010 2050 Difference EU27
2010
EU27
2050 Difference
Benefit ratio (Public pensions) 38,7 34,9 -3,7 44,7 37,0 -7,7
Gross replacement rate at retirement
(Public pensions) 38,2 35,7 -2,5 48,0 39,1 -8,9
Note: *: Share of statutory DB-NDC / statutory funded / occupational and other supplementary
pensions
Source: Joint SPC/EC report on Pension Adequacy in the European Union (2010-2050)

- 283 -
5. KEY CONTEXT MACRO-ECONOMIC INFORMATION
Source: Eurostat, National Accounts and EU LFS. ECFIN spring economic forecast 2012 for 2012-
2014.
Note: Data on social protection expenditure comes from the AMECO database ( it is calculated as
the sum of Social benefits other than social transfers in kind; general government - ESA 1995 +
Social transfers in kind - ESA 1995)

- 284 -
6. TRENDS IN TAKE-UP OF SELECTED BENEFITS83
Unemployment recipients
Definition Unemployment benefit recipients
Unit thousands of recipients
Source National Labour Exchange.
Comment
The unemployed have possibility to receive unemployment benefit if he has a
minimum period of insurance: 18 months within 3 years preceding
unemployment. (There are exceptions for certain groups of unemployed people
who contributed but have not acquired the necessary social insurance record due
to important reasons). The duration of payment of Unemployment Insurance
Benefit depends on the length of the insurance record: Service years Duration less
than 25 years 6 months ; 25 - 30 years -7 months, 30 - 35 years- 8 months; 35
years and over-9 months. The duration of payment is prolonged for additional 2
months for elderly persons within 5 years till pension age.
Recipients of social assistance benefits/means-tested minimum Income
83 This data has been collected by the SPC in the context of monitoring the social impact of the crisis. It
includes only a selection of benefits which have been considered most reactive to the crisis. The number of unemployed refers to the standard definition by the ILO and is given as background information.

- 285 -
Definition number of recipients of social benefit
Unit thousands of recipients
Source Ministry of Social Security and Labour, The Social Assistance Information System.
Comment
Families and single residents are entitled to Social Benefit if either single resident
or one spouse works or does not work because they are full-time students or
pensioners, or individuals above retirement age, or disabled, or nursing a disabled
or sick family member, or registered at the local office as unemployed and
receiving Unemployment Benefit or are long-term unemployed (more than 6
months), or taking care of a child under the age of 3 years or under the age of 8
years, or family is raising three or more children, etc.
Recipients of social assistance benefits/means-tested minimum Income
Definition All disability pensions
Unit thousands of pensioners
Comment Work incapacity pensioners under retirement age
Early Retirement
Definition The number of recipients of early retirement pensions, thousand
Unit thousands of pensioners
Comment
Persons are eligible for early retirement pension if: they acquired an insurance
period of 30 years, they are registered as unemployed for at least 12 months, the
age is less than 5 years to retirement age, have no other incomes, do not receive
any other pension or benefit. Since 1 January 2012 the requirement for persons to
be registered as unemployed for at least 12 months has been abolished.
7. SUMMARY OF SPECIFIC KEY SOCIAL CHALLENGES AND PARTICULARLY GOOD SOCIAL
OUTCOMES
Social policy areas Challenges
Poverty and social inclusion Strengthening the links between the social assistance
reform and activation measures for the most vulnerable, to
reduce poverty and social exclusion
Tackling the poverty trap and the unemployment trap
Fostering employment, particularly among the youth

- 286 -
Pensions Adopting legislation on a comprehensive pension system
reform
Aligning the statutory retirement age with life expectancy
A need for the establishment of clear rules for the
indexation of pensions
Improving complementary savings schemes
Underpinning pension reform with active ageing measures
Health and long-term care Optimisation of the health care network, particularly by
improving accessibility and quality provision of social care
and health care services at home
Effectiveness and efficiency
of social protection systems
Strengthening the links between the social assistance reform
and activation measures to improve efficiency
Improving the efficiency and provision of cash social
assistance
Particularly good social outcomes
Improvement in reducing inequality
Some progress in access to health care and improving
healthy life years at 65 for males
Progress in improving the poverty reduction impact of social
transfers

- 287 -
LUXEMBOURG
1. 2012 NATIONAL SOCIAL REPORT (NSR): KEY ISSUES
The economic and financial crisis has resulted in a drop in economic growth and a deterioration
of public finances in Luxembourg and the pre-crises level of economy has not been reached yet.
Expected increase in pension expenditure will challenge the long-term fiscal sustainability. The
employment rate of older workers (39.3% in 2011) is still well below the EU average (47.4%),
although the general trend is characterized by a sensitive increase in the participation of older
worker to the labour market (25.6% in 2011). The youth unemployment rate (16.4% in 2011) is
relatively high in comparison to the low overall unemployment rate (4.8%) in Luxembourg, but
is well below EU average (21.4%). In general, the employment rate is70.1% in 2011, above the
EU average of 68.6%. Even if the share of early school leavers is below 10% in 2011 (6.2%), the
education system faces specific challenges due to the multilingualism demands of the system,
the high proportion of immigrants in the population, and the high demand for skilled workers on
the labour market.
The share of people at risk of poverty or social exclusion was 16.8% of the total population in
2011, well below EU average (24.2%). Particularly, the at-risk-of- poverty rate of 13.6% (2011)
is in line with past year observations, and the rate is below EU average in 2011(16.9%). The in-
work at risk of poverty rate has (is at 9.9% in 2011, higher than the EU average in 2011 of 8.9%,
but constant over the past years. Finally the severe material deprivation rate of 1.2% in 2011 is
far below EU average in 2010 (8.8%).
Stakeholders have been consulted on the draft NSR and only one NGO, Caritas Luxembourg, has
reacted and sent comments on 27 April 2012. Trade-unions OGB-L and LCGB transmitted their
position on 30 April 2012.
Luxembourg has an active inclusion policy in the framework of the social protection and
assistance system. Several social inclusion measures have already been introduced, such as
awareness actions concerning childcare possibilities and childcare vouchers, and more
activation of minimum income beneficiaries.
The NSR focus on labour market participation and work intensity in households as the way to lift
people out of poverty or social exclusion. The labour market measures concentrate on the
increase of participation rates among older workers , single parents and women, education
outcome and the employability of youth. Much attention is given to better education and the
fight against school dropout. The implementation of several measures to improve the
educational performance, the employability and the labour market position of youth continues
and is extended.
The NSR sees the activation of minimum income beneficiaries as a particular challenge and
refers also to the NRP in which the activation of minimum income beneficiaries in general and of
young beneficiaries in particular is formulated as a priority for action by the Service National d
'Action Sociale (SNAS). The report mentions the following financial incentives in order to
- 288 -
promote the employment of those outside the labour market: employers can get subsidies to
provide jobs for minimum income ("revenu minimum garanti" – RMG) beneficiaries after
activation and RMG beneficiaries can take up a job without losing automatically their RMG rights
(up to 130% of the RMG). The government recognised that high housing costs, pose a particular
social problem in Luxembourg, and the NSR mentions the preparation of a law proposal to
promote sustainable housing and living.
The bill on pension reform is based largely on voluntary measures to stimulate an increase in
the retirement age. Challenges regarding the comparatively high replacement rate are cautiously
addressed and the reduction of the accrual rate (up to 15%) can be fully compensated by
postponement of the retirement age by at most three years. The NSR contains a section on the
reform proposals for the system on work incapacity for people with partly reduced working
capacity who are unable to continue working in their last professional occupation. At present
one out of three of the concerned persons remains in employment. The reform focuses to
increase this relative share to 2/3, while impacting positively the participation rate of older
workers and thus reducing the unemployment.
The NSR 2012 includes an overview of the healthcare reform as well as a short chapter on long
term-care. Concerning health the first objective, namely access to health promotion, disease
prevention and curative care, the NSR clearly states that these objectives have been pursued in
the past and will be pursued also in future. The social aid law which became effective as of 1
January 2011 supports access to health care to people at risk of poverty as around 13% of the
social aid dispensed was spent on health costs. Concerning the more rational use of financial
resources, several efforts have been taken and will be undertaken to face challenges in this field.
The health care reform aims at controlling the costs in the health care sector by my means of
concentration of resources and better steering of the system.
In the field of long-term care an evaluation of the so called "dependency insurance" has been
started with the objective to better coordinate home care, short term residential care and long
term care.
The main outstanding challenges identified are (i) ensuring the long-term sustainability of the
pension system by strengthening the proposed pension reform and to increase the participation
rate of older workers, (ii) tackling the high number of youth unemployment by reinforcing
training and education measures aimed at better matching young people's qualifications to
labour demand (iii) reducing the risk of poverty and social exclusion, putting emphasis on
special population groups and facilitating the access to affordable and quality housing.
The measures introduced are relevant and credible in terms of reducing the risk of poverty or
social exclusion. As most of the measures were implemented recently, it is difficult to assess
their impact for the time being. Figures on in-work poverty show clearly that the situation of
specific groups at risk such as, for instance vulnerable immigrants and vulnerable single-parent
families, needs to be more addressed, in particular by helping to increase the work intensity of
these households. To tackle the problem of homelessness and housing exclusion the government
will draw up a national integrated strategy in collaboration with non-governmental
organisations and the communes Concerning the pension reform, Luxembourg is taking steps in
the right direction, but the reform does not seem to constitute a sufficient guarantee for the

- 289 -
long-term sustainability of the system. LU has already taken relevant and credible measures to
tackle youth unemployment but a coherent strategy is still missing in order to strengthen the
collaboration at regional level and to improve the effectiveness of employment services. Young
jobseekers would also benefit from more investment in training and education. However, new
projects, such as the “Maison de l’Orientation” and the project “Anelo” are concrete collaboration
projects between all the services involved in tackling the issue of youth unemployment.
2. NATIONAL 2020 TARGET FOR THE REDUCTION OF POVERTY AND SOCIAL EXCLUSION
"Luxembourg aims to reduce the number of persons under the threat of poverty or social
exclusion by 6,000 people by 2020"
Source: National Reform Programme (2012)
2.a Progress towards the 2020 national target for the reduction of poverty and
social exclusion
Source: Eurostat (EU-SILC)
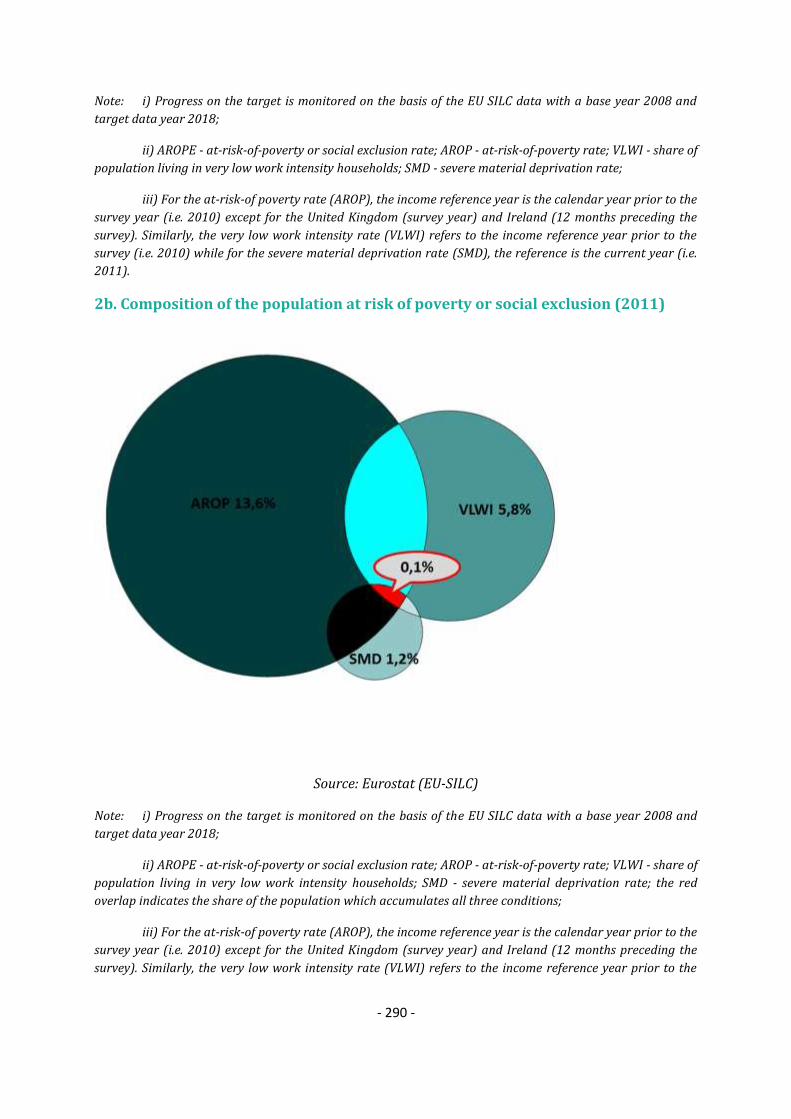
- 290 -
Note: i) Progress on the target is monitored on the basis of the EU SILC data with a base year 2008 and
target data year 2018;
ii) AROPE - at-risk-of-poverty or social exclusion rate; AROP - at-risk-of-poverty rate; VLWI - share of
population living in very low work intensity households; SMD - severe material deprivation rate;
iii) For the at-risk-of poverty rate (AROP), the income reference year is the calendar year prior to the
survey year (i.e. 2010) except for the United Kingdom (survey year) and Ireland (12 months preceding the
survey). Similarly, the very low work intensity rate (VLWI) refers to the income reference year prior to the
survey (i.e. 2010) while for the severe material deprivation rate (SMD), the reference is the current year (i.e.
2011).
2b. Composition of the population at risk of poverty or social exclusion (2011)
Source: Eurostat (EU-SILC)
Note: i) Progress on the target is monitored on the basis of the EU SILC data with a base year 2008 and
target data year 2018;
ii) AROPE - at-risk-of-poverty or social exclusion rate; AROP - at-risk-of-poverty rate; VLWI - share of
population living in very low work intensity households; SMD - severe material deprivation rate; the red
overlap indicates the share of the population which accumulates all three conditions;
iii) For the at-risk-of poverty rate (AROP), the income reference year is the calendar year prior to the
survey year (i.e. 2010) except for the United Kingdom (survey year) and Ireland (12 months preceding the
survey). Similarly, the very low work intensity rate (VLWI) refers to the income reference year prior to the

- 291 -
survey (i.e. 2010) while for the severe material deprivation rate (SMD), the reference is the current year (i.e.
2011).
2005 2006 2007 2008 2009 2010 2011
AROP total % of total pln 13,7 14,1 13,5 13,4 14,9 14,5 13,6
1000 persons 61 64 62 62 71 71 68
VLWI total % of total pln 5,7 5,2 5,0 4,7 6,3 5,5 5,8
1000 persons 21 19 19 18 24 22 24
SMD total % of total pln 1,8 1,1 0,8 0,7 1,1 0,5 1,2
1000 persons 8 5 4 3 5 3 6
AROP +V LWI
% of total pln 1,3 1,7 1,6 1,6 2,1 2,0 1,8
1000 persons 6 8 7 8 10 10 9
AROP + SMD % of total pln 0,6 0,7 0,5 0,3 0,5 0,3 0,6
1000 persons 3 3 2 1 2 1 3
AROP + SMD + VLWI
% of total pln 0,5 0,3 0,2 0,2 0,3 0,1 0,1
1000 persons 2 1 1 1 2 1 1
SMD + VLWI % of total pln 0,1 0,1 0,0 0,0 0,0 0,0 0,1
1000 persons 0 0 0 0 0 0 0
2c. At risk of poverty or social exclusion rate for specific groups, 2011
Total
At risk of poverty or social exclusion,
in %
Children (0-17) 21,7
Working age (18-64) 17,6
Elderly (65+) 4,7
Employed 10,4
Unemployed 61,4
Inactive 29,6
Single male 24,1
Single female 19,8
Single elderly (65+) 6,4
Single parent households 50,2
Large families (2 adults and 3+ children) 27,8
EU-migrant (EU 27) 16,4

- 292 -
Non-EU migrants (non-EU27) 40,2
Source: Eurostat (EU-SILC)
3. MAIN SOCIAL INDICATORS
LU % 2005 2006 2007 2008 2009 2010 2011 2010 2011
At risk of poverty or social exclusion 17,3 16,5 15,9 15,5 17,8 17,1 16,8 23,6 24.2
At-Risk-of-Poverty rate 13,7 14,1 13,5 13,4 14,9 14,5 13,6 16.4 16.9
Severe Material Deprivation rate 1,8 1,1 0,8 0,7 1,1 0,5 1,2 8,3 8.8
Share of people living in very low work
intensity households 5,7 5,2 5,0 4,7 6,3 5,5 5,8 10.0 10.0
Impact of social transfers on poverty
reduction (excl. pensions)(in%) 42,4 40,3 42,3 43,2 44,8 50,2 50,0 36,7 35,2
Value of threshold (single HH) - in PPS 16.538 15.851 16.108 16.166 16.221 16.049 16.195 N/A N/A
Value of threshold (2 adults + 2 children) -
in PPS 34.730 33.287 33.827 33.948 34.065 33.702 34.010 N/A N/A
At risk of poverty or social exclusion 22,8 20,4 21,2 20,9 23,7 22,3 21,7 27,1 27.0
At-Risk-of-Poverty rate 20,2 19,6 19,9 19,8 22,3 21,4 20,3 20.5 20.6
Severe Material Deprivation rate 3,3 1,6 0,7 0,9 1,2 0,2 1,2 9,7 10.0
Share of people living in very low work
intensity households 3,0 3,1 3,5 3,1 4,1 3,2 2,9 9.1 8.8
Impact of social transfers on poverty
reduction (excl. pensions)(in%) 43,4 40,2 40,1 41,2 43,7 50,3 50,0 41,4 40,5
At risk of poverty or social exclusion 17,3 16,8 16,0 15,8 18,2 17,5 17,6 23,5 24.3
At-Risk-of-Poverty rate 12,8 13,5 12,7 12,9 14,2 13,9 13,1 15.2 16.0
Severe Material Deprivation rate 1,7 1,1 0,9 0,7 1,3 0,7 1,4 8,3 8.9
Share of people living in very low work
intensity households (18-59) 6,7 5,9 5,6 5,2 7,1 6,4 6,9 10.3 10,5
In-work at-risk-of poverty rate 9.8 10.3 9.3 9.4 10.1 10.6 9.8 8.4 8.9
Impact of social transfers on poverty
reduction (excl. pensions)(in%) 43,4 42,3 44,8 44,9 46,2 50,5 50,8 38,7 37,0
At risk of poverty or social exclusion 8,0 8,3 7,2 5,4 6,2 6,1 4,7 20,0 20.5
At-Risk-of-Poverty rate 7,8 7,9 7,2 5,4 6,0 5,9 4,7 16.0 16.0
Severe Material Deprivation rate 0,2 0,4 0,6 0,0 0,2 0,1 0,0 6,6 7.2
Relative median income ratio of elderly 0.96 0.96 0.96 0.97 1.01 1.05 1.05 0.88 0.89
Aggregate replacement ratio 0.63 0.66 0.61 0.58 0.62 0.68 0.74 0.53 0.54
2000 2005 2006 2007 2008 2009 2010 2009 2010
Sickness/Health care 4,8 5,5 5,1 4,9 5,3 6,0 5,7 8,4 8,3
Invalidity 2,5 2,8 2,6 2,3 2,4 2,7 2,5 2,3 2,2
Old age and survivors 7,5 7,8 7,3 7,1 7,6 8,5 8,1 12,7 12,7
Family/Children 3,1 3,6 3,4 3,1 4,2 4,2 4,0 2,3 2,3
Unemployment 0,6 1,1 1,0 0,9 1,0 1,3 1,3 1,8 1,7
Housing and Social exclusion n.e.c. 0,3 0,6 0,6 0,6 0,6 0,8 0,8 1,0 1,0
Total 18,9 21,3 20,0 19,0 21,0 23,6 22,3 28,5 28,2
Means-tested
Sickness/Health care 0,0 0,0 0,0 0,0 0,0 0,0 0,0 0,1 0,1
Invalidity 0,1 0,0 0,0 0,0 0,0 0,0 0,0 0,5 0,5
Old age and survivors 0,1 0,0 0,0 0,0 0,0 0,0 0,0 0,6 0,6
Family/Children 0,5 0,0 0,0 0,0 0,0 0,0 0,0 0,6 0,6
Unemployment 0,0 0,0 0,0 0,0 0,0 0,0 0,0 0,4 0,4
Housing and Social exclusion n.e.c. 0,3 0,6 0,6 0,6 0,6 0,8 0,8 0,9 1,0
Total 1,0 0,6 0,6 0,6 0,6 0,9 0,8 3,0 3,1
Non means-tested
Sickness/Health care 4,8 5,5 5,1 4,9 5,3 6,0 5,7 8,3 8,2
Invalidity 2,4 2,8 2,6 2,3 2,4 2,7 2,5 1,8 1,8
Old age and survivors 7,4 7,8 7,3 7,0 7,5 8,5 8,0 12,1 12,1
Family/Children 2,7 3,6 3,4 3,1 4,2 4,2 4,0 1,7 1,7
Unemployment 0,6 1,1 1,0 0,9 1,0 1,3 1,3 1,4 1,3
Housing and Social exclusion n.e.c. 0,0 0,0 0,0 0,0 0,0 0,0 0,0 0,1 0,1
Total 17,9 20,7 19,4 18,4 20,4 22,7 21,5 25,4 25,2
Elderly (65+)
Social expenditure
(in % of GDP)
EU27
Children (0-17)
Working age
(18-64)
Total population
Source: Eurostat (EU-SILC, ESSPROS for social expenditure data)

- 293 -
Note: For non-means tested the aggregation Housing and Social Exclusion n.e.c is based only on
Housing. The total figures of social expenditure include all benefits excluding administrative costs.
4. LONG-TERM ADEQUACY OF PENSIONS: THEORETICAL REPLACEMENT RATES (2010-
2050)
Theoretical replacement rates
(TRR): Net 2010 Net 2050 Difference Gross2010 Gross2050 Difference
40 years career: average income
earner (basecase) 99,9 83,0 -16,9
91,2
(100/0/0)*
71,7
(100/0/0)* -19,5
Low income 105,6 86,4 -19,2 97,6
(100/0/0)*
76,9
(100/0/0)* -20,7
High income 77,7 64,9 -12,8 65,5
(100/0/0)*
51,4
(100/0/0)* -14,1
Lower / higher future rates of
return 83,0/83,0 71,7/71,7
Lower / higher future wage
growth 83,0/83,0 71,7/71,7
38 years career: average income 95,4 78,9 -16,5 85,7 67,4 -18,3
Low / high income 100,6 /
73,9
82,2 /
61,9 (-18,4 / -12) 92,0 / 61,3 72,5 / 48,2
(-19,5 / -
13,1)
42 years career: average income 99,9 83,0 -16,9 91,2 71,7 -19,5
Low / high income 105,6/77,7 86,4 /
64,9
(-19,2 / -
12,8) 97,6 / 65,6 76,9 / 51,4
(-20,7 / -
14,2)
10 years after retirement 99,9 78,3 -21,6 91,2 66,6 -24,6
Female worker with 3 years of
career break for childcare 99,9 83,0 -16,9 91,2 71,7 -19,5
3 years of career break for
unemployment 97 80,4 -16,6 87,7 68,9 -18,8
10 years out of the labour market 86,9 71,5 -15,4 76,0 59,7 -16,3
2010 2050 Difference EU27 2010 EU27 2050 Difference
Benefit ratio (Public pensions) 58,7 53,7 -5,0 44,7 37,0 -7,7
Gross replacement rate at
retirement (Public pensions) 78,3 63,2 -15,1 48,0 39,1 -8,9

- 294 -
Note: *: Share of statutory DB-NDC / statutory funded / occupational and other supplementary
pensions;
Source: Joint SPC/EC report on Pension Adequacy in the European Union (2010-2050)
Figures refer to a constant policy scenario based on the 2012 legislation assuming that the pension
adjustment mechanism will only act partly to the evolution of the average level of wages once
financial resources are insufficient
5. KEY CONTEXT MACRO-ECONOMIC INFORMATION
Source: Eurostat, National Accounts and EU LFS. ECFIN autumn economic forecast 2012 for 2012-
2014.
Note: Data on social protection expenditure comes from the AMECO database ( it is calculated as
the sum of Social benefits other than social transfers in kind; general government - ESA 1995 +
Social transfers in kind - ESA 1995)

- 295 -
6. TRENDS IN TAKE-UP OF SELECTED BENEFITS84
Number of unemployed
Definition Unemployment according to ILO definition - Total
Unit thousands of persons - seasonally adjusted
Source Eurostat
Unemployment recipients
Definition No serie identified
Recipients of social assistance benefits/means-tested minimum Income
Definition Total des communautés domestiques bénéficiaires du revenu minimum
garanti (allocation complémentaire)
Unit thousands of beneficiaries
Source IGSS
84 These data has been collected by the SPC in the context of monitoring the social impact of the crisis. It
includes only a selection of benefits which have been considered most reactive to the crisis. The number of unemployed refers to the standard definition by the ILO and is given as a background.

- 296 -
Disability benefits recipients
Definition Total des pensions d'invalidité du régime général de pension (permanente,
transitoire et indemnité attente)
Unit thousands of beneficiaries
Source IGSS
Comment up to the age of 65
Early retirement
Definition Early retirement beneficiaries
Unit thousands of beneficiaries
Source IGSS
Comment Total des pensions anticipées du régime général de pension (pension anticipée à 57 ans,
pension anticipée à 60 ans) - up to the age of 65
7. SUMMARY OF SPECIFIC KEY SOCIAL CHALLENGES AND PARTICULARLY GOOD SOCIAL
OUTCOMES
Social policy areas Challenges
Poverty and social inclusion Reducing the risk of poverty and social exclusion by putting
emphasis on special population groups, in particular by
helping to increase their work intensity
Facilitating the access to affordable and quality housing
Pensions Strengthening the proposed pension reform by taking
additional measures to increase the participation rate of
older workers
Ensuring the long-term sustainability of the pension system
by preventing early retirement
Taking further steps to increase the effective retirement age
including through linking the statutory retirement age to life
expectancy to ensure the long-term sustainability of the
pension system

- 297 -
Health and long-term care Ensure the long-term care insurance;
Anticipate future risks arising including demographic
change;
Improve the coordination of care between the home sector,
the stationary acute sector and long-term one;
Promote and implement quality control system of benefits;
Bring transparency in the financing of long-term care
benefits
Particularly good social outcomes
Some progress in reducing the number of early school
leavers since 2008
Some improvement in the employment rate of older
workers
- 298 -
HUNGARY
1. 2012 NATIONAL SOCIAL REPORT (NSR): KEY ISSUES
One of the most important structural problems of the Hungarian economy which hinders
potential growth is the very low level of activity (2011: 62.7%) and employment (2011: 60.7%,).
The main challenges of the social protection and social inclusion field - beside low employment -
are weak social cohesion, increasing poverty (risk of poverty or exclusion increased from 28.2 in
2008 to 29.9% in 2010, and the proportion of those affected by material deprivation from 17.9
in 2008 to 21.6% in 2010) and aging of the population. Sustainability of the social protection
systems, strengthening social cohesion and mitigating poverty depend on a great extent on
whether employment can be increased persistently and significantly.
Hungary's National Social Report (NSR) was consulted with the respective sides of the National
Economic and Social Council, as well as the Hungarian Medical Chamber, the Hungarian
Pharmaceutical Chamber and the Hungarian Chamber of Health Professionals.
The NSR identifies priorities in the fields of social inclusion, pensions and health care. In the field
of social inclusion 1) Decreasing the rate of people living in poverty or social exclusion, with
special emphasis on the Roma population 2) Preventing the inheritance of poverty and social
exclusion and 3) Improving the equal access to social-economic goods are the main priorities,
mainly in line with the Commission's assessment85. However, according to the Commission, the
effectiveness of social protection systems decreased. The key priority of the pension system is to
maintain the sustainability of pensions without using extra budgetary resources. In the field of
health care the main priority is moving away from the hospital-centric model towards new
models of care, to a better organised, more effective system, which meets the requirements of
quality, equity and sustainability.
As regards poverty and social inclusion, the report repeats interventions listed in HU Roma
strategy, covering the issues of child well-being, education, employment, health, housing and
anti-discrimination. The Integrated Education Programme and comprehensive territorial early
childhood programmes continue. In regards of housing benefits, these have been extended and
urban/settlement rehabilitation programmes are to be launched. The implementation of major
equal opportunity legislation for ensuring desegregation measures on local level has been
delaying.
According to the new law on public education, compulsory kindergarten attendance from age 3
will be introduced from next school year. The implementation of this measure will need
significant capacity enlargement. Extra-curricular integrative and capacity developing “Tanoda”
type programmes, Second Chance type educational programmes for drop outs, and scholarship
programs for the disadvantaged and Roma youth continue. Roma boarding school programs are
85 SWD(2012) 317 final ( http://ec.europa.eu/europe2020/pdf/nd/swd2012_hungary_en.pdf )
- 299 -
to be extended in tertiary education as well as programmes aiming to reinforce the participation
of disadvantaged students in sport and leisure activities have to be launched.
In the field of employment, several measures have been implemented. In the framework of
integrated ALMP programmes job centres provide training, job search assistance and targeted
employment subsidies for inactive/long-term unemployed groups (co-financed by ESF).
Enhancement of social land programs and support of social economy for transition into open
labour market integration are carried out. Learning by doing type of training for social and child
protection qualifications for Roma women are to be provided as well. Wide range of public
employment programs was launched, however their effectiveness is not proven; the activation
elements need to be strengthened.
In 2009 retirement age was set at the age of 62 for both men and women. This retirement age
will increase step by step to 65 to be completed by 2022. In line with increasing the retirement
age, on one hand further restriction rules have been applied for early retirement options
(conversion of pensions to social benefits). On the other hand new regulation was introduced for
women earning eligibility by 40 years of service without reaching official retirement age.
The main feature of the measures taken was the transforming the mandatory private pension
pillar in order to reduce central state budget deficit, as well as to ensure proper balance between
actual contributions and expenditures. From 2012 onwards, the method of indexation of
pensions shall be changed: the annual pension increase is set by planned consumer price index
in the future. Revision of the present rules of the system took place during the year, different
options were examined, but finally the present updated rules remained. In accordance with the
new health care strategy approved in July 2011, major steps were taken in order to introduce
the territorial re-organisation of health care. 8 territorial units have been created, providing
progressive care from the primary to the highest levels. A key element of the proposed model is
patient pathway management. Strengthening of the institutional system of public health has
been started through merging a number of institutions, and the establishment of a public health
institute is in progress. Hospitals have been taken over by central government from
regional/county authorities.
As of 1 September 2011, the public health product tax was introduced. In order to enhance the
retention of health professionals in the country, the development of a career model based on
homogenous career groups is in progress.
In the field of long term care, a Strategy for deinstitutionalisation has been launched, the
implementation of which is co-financed by EU funds. Due to launched activation (public work)
schemes cuts in social benefit system and weakened social protection have been emerged (at
least on a short term) which risk the achievement of the poverty target. Setting up of the
monitoring system of the NSIS is under way and remains essential.
The implementation of measures for closing routes to early retirement and transfer of disability
pensions into benefits needs to be closely monitored: recipients have to receive proper services
for activation. The transformation of the mandatory private pension pillar poses a long-term
adequacy challenge. The measures are adequately set, however the details of implementation
will prove their effectiveness.

- 300 -
2. NATIONAL 2020 TARGET FOR THE REDUCTION OF POVERTY AND SOCIAL EXCLUSION
"Hungary aims to reduce the level of poverty among families with children, the number of
people living in severe material deprivation, and the number of people living in households with
low work intensity by 20 per cent each. Taking the overlaps into consideration, this means that
Hungary plans to reduce the number of those affected by the three indicators by approximately
5 percentage points, or by 450 thousand people, to 23.5 per cent by 2020."
Source: National Reform Programme (2011)
2a. Progress towards the 2020 national target for the reduction of poverty and
social exclusion
Source: Eurostat (EU-SILC)
Note: i) Progress on the target is monitored on the basis of the EU SILC data with a base year 2008 and
target data year 2018;
ii) AROPE - at-risk-of-poverty or social exclusion rate; AROP - at-risk-of-poverty rate; VLWI - share of
population living in very low work intensity households; SMD - severe material deprivation rate;
iii) For the at-risk-of poverty rate (AROP), the income reference year is the calendar year prior to the
survey year (i.e. 2010) except for the United Kingdom (survey year) and Ireland (12 months preceding the
survey). Similarly, the very low work intensity rate (VLWI) refers to the income reference year prior to the

- 301 -
survey (i.e. 2010) while for the severe material deprivation rate (SMD), the reference is the current year (i.e.
2011).
2b. Composition of the population at risk of poverty or social exclusion (2011)
Source: Eurostat (EU-SILC)
Note: i) Progress on the target is monitored on the basis of the EU SILC data with a base year 2008 and
target data year 2018;
ii) AROPE - at-risk-of-poverty or social exclusion rate; AROP - at-risk-of-poverty rate; VLWI - share of
population living in very low work intensity households; SMD - severe material deprivation rate; the red
overlap indicates the share of the population which accumulates all three conditions;
iii) For the at-risk-of poverty rate (AROP), the income reference year is the calendar year prior to the
survey year (i.e. 2010) except for the United Kingdom (survey year) and Ireland (12 months preceding the
survey). Similarly, the very low work intensity rate (VLWI) refers to the income reference year prior to the
survey (i.e. 2010) while for the severe material deprivation rate (SMD), the reference is the current year (i.e.
2011).
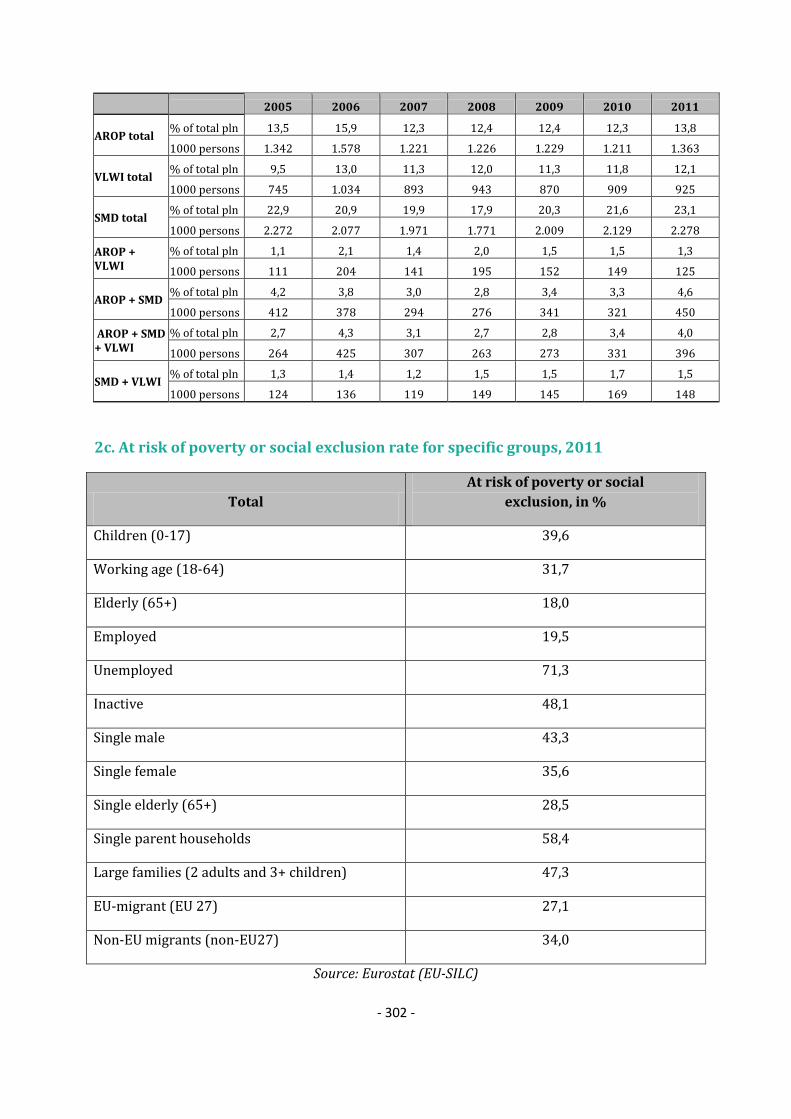
- 302 -
2005 2006 2007 2008 2009 2010 2011
AROP total % of total pln 13,5 15,9 12,3 12,4 12,4 12,3 13,8
1000 persons 1.342 1.578 1.221 1.226 1.229 1.211 1.363
VLWI total % of total pln 9,5 13,0 11,3 12,0 11,3 11,8 12,1
1000 persons 745 1.034 893 943 870 909 925
SMD total % of total pln 22,9 20,9 19,9 17,9 20,3 21,6 23,1
1000 persons 2.272 2.077 1.971 1.771 2.009 2.129 2.278
AROP + VLWI
% of total pln 1,1 2,1 1,4 2,0 1,5 1,5 1,3
1000 persons 111 204 141 195 152 149 125
AROP + SMD % of total pln 4,2 3,8 3,0 2,8 3,4 3,3 4,6
1000 persons 412 378 294 276 341 321 450
AROP + SMD + VLWI
% of total pln 2,7 4,3 3,1 2,7 2,8 3,4 4,0
1000 persons 264 425 307 263 273 331 396
SMD + VLWI % of total pln 1,3 1,4 1,2 1,5 1,5 1,7 1,5
1000 persons 124 136 119 149 145 169 148
2c. At risk of poverty or social exclusion rate for specific groups, 2011
Total
At risk of poverty or social
exclusion, in %
Children (0-17) 39,6
Working age (18-64) 31,7
Elderly (65+) 18,0
Employed 19,5
Unemployed 71,3
Inactive 48,1
Single male 43,3
Single female 35,6
Single elderly (65+) 28,5
Single parent households 58,4
Large families (2 adults and 3+ children) 47,3
EU-migrant (EU 27) 27,1
Non-EU migrants (non-EU27) 34,0
Source: Eurostat (EU-SILC)

- 303 -
3. MAIN SOCIAL INDICATORS
HU % 2005 2006 2007 2008 2009 2010 2011 2010 2011
At risk of poverty or social exclusion 32,1 31,4 29,4 28,2 29,6 29,9 31,0 23,6 24.2
At-Risk-of-Poverty rate 13,5 15,9 12,3 12,4 12,4 12,3 13,8 16.4 16.9
Severe Material Deprivation rate 22,9 20,9 19,9 17,9 20,3 21,6 23,1 8,3 8.8
Share of people living in very low work intensity
households 9,5 13,0 11,3 12,0 11,3 11,8 12,1 10.0 10.0
Impact of social transfers on poverty reduction
(excl. pensions)(in%) 54,1 46,3 58,0 59,2 57,1 56,7 52,2 36,7 35,2
Value of threshold (single HH) - in PPS 3.337 3.646 3.894 3.958 4.102 4.012 4.190 N/A N/A
Value of threshold (2 adults + 2 children) - in PPS 7.007 7.657 8.178 8.312 8.614 8.424 8.799 N/A N/A
At risk of poverty or social exclusion 38,4 37,7 34,1 33,4 37,2 38,7 39,6 27,1 27.0
At-Risk-of-Poverty rate 19,9 24,8 18,8 19,7 20,6 20,3 23,0 20.5 20.6
Severe Material Deprivation rate 27,5 24,8 24,4 21,5 25,5 28,8 29,8 9,7 10.0
Share of people living in very low work intensity
households 9,6 14,0 10,0 11,1 11,9 13,8 14,1 9.1 8.8
Impact of social transfers on poverty reduction
(excl. pensions)(in%) 55,0 43,6 57,8 57,7 55,5 57,2 51,6 41,4 40,5
At risk of poverty or social exclusion 32,1 31,1 29,8 29,1 30,2 30,5 31,7 23,5 24.3
At-Risk-of-Poverty rate 13,2 14,5 11,6 12,0 11,9 11,9 13,6 15.2 16.0
Severe Material Deprivation rate 22,2 20,2 19,0 17,6 20,1 21,3 23,1 8,3 8.9
Share of people living in very low work intensity
households (18-59) 9,4 12,7 11,7 12,3 11,1 11,2 11,5 10.3 10,5
In-work at-risk-of poverty rate 8,8 6,9 5,8 5,8 6,2 5,4 6,1 8.4 8.9
Impact of social transfers on poverty reduction
(excl. pensions)(in%) 54,6 49,1 59,3 60,3 58,0 57,0 52,3 38,7 37,0
At risk of poverty or social exclusion 23,9 23,9 21,1 17,5 17,5 16,8 18,0 20,0 20.5
At-Risk-of-Poverty rate 6,5 9,4 6,1 4,3 4,6 4,1 4,5 16.0 16.0
Severe Material Deprivation rate 19,9 18,6 17,2 14,4 14,6 14,1 15,5 6,6 7.2
Relative median income ratio of elderly 1,01 0,94 0,97 1,00 1,02 1,01 1,00 0.88 0.89
Aggregate replacement ratio 0,61 0,54 0,58 0,61 0,62 0,60 0,59 0.53 0.54
2000 2005 2006 2007 2008 2009 2010 2009 2010
Sickness/Health care 5,5 6,4 6,4 5,7 5,6 5,7 5,7 8,4 8,3
Invalidity 1,9 2,1 2,2 2,1 2,1 2,1 1,9 2,3 2,2
Old age and survivors 8,1 9,1 9,3 9,8 10,2 10,5 10,5 12,7 12,7
Family/Children 2,6 2,5 2,8 2,8 2,9 3,0 2,9 2,3 2,3
Unemployment 0,8 0,6 0,7 0,8 0,8 1,0 0,9 1,8 1,7
Housing and Social exclusion n.e.c. 0,7 0,7 0,7 1,1 0,9 0,8 0,6 1,0 1,0
Total 19,5 21,5 22,0 22,3 22,5 23,0 22,5 28,5 28,2
Means-tested
Sickness/Health care 0,1 0,1 0,1 0,1 0,1 0,1 0,1 0,1 0,1
Invalidity 0,0 0,0 0,0 0,0 0,0 0,0 0,0 0,5 0,5
Old age and survivors 0,1 0,0 0,0 0,0 0,0 0,0 0,0 0,6 0,6
Family/Children 0,3 0,3 0,1 0,1 0,1 0,1 0,1 0,6 0,6
Unemployment 0,2 0,1 0,1 0,2 0,3 0,3 0,3 0,4 0,4
Housing and Social exclusion n.e.c. 0,6 0,6 0,6 1,0 0,7 0,7 0,6 0,9 1,0
Total 1,3 1,1 1,0 1,4 1,2 1,2 1,1 3,0 3,1
Non-means tested
Sickness/Health care 5,3 6,3 6,3 5,6 5,5 5,6 5,6 8,3 8,2
Invalidity 1,8 2,1 2,1 2,1 2,1 2,1 1,9 1,8 1,8
Old age and survivors 8,0 9,1 9,3 9,7 10,2 10,4 10,4 12,1 12,1
Family/Children 2,3 2,3 2,7 2,7 2,8 2,9 2,8 1,7 1,7
Unemployment 0,6 0,5 0,5 0,5 0,6 0,7 0,7 1,4 1,3
Housing and Social exclusion n.e.c. 0,1 0,1 0,1 0,1 0,1 0,1 0,1 0,1 0,1
Total 18,2 20,3 21,0 20,8 21,2 21,8 21,5 25,4 25,2
Elderly (65+)
Social expenditure
(in % of GDP)
EU27
Children (0-17)
Working age
(18-64)
Total population
Source: Eurostat (EU-SILC, ESSPROS for social expenditure data)
Note: For non-means tested the aggregation Housing and Social Exclusion n.e.c is based only on
Housing. The total figures of social expenditure include all benefits excluding administrative costs.

- 304 -
4. LONG-TERM ADEQUACY OF PENSIONS: THEORETICAL REPLACEMENT RATES (2010-
2050)
Theoretical replacement rates (TRR): Net
2010
Net
2050 Difference Gross2010 Gross2050 Difference
40 years career: average income earner
(basecase) 100,1 75 -25
60,2
(100/0/0)*
62,3
(64/36/0)* 2,1
Low income 83 75 -8 59,5
(100/0/0)*
62,3
(64/36/0)* 2,8
High income 88,2 56,3 -31,9 49
(100/0/0)*
46,8
(64/36/0)* -2,2
Lower / higher future rates of return 70,9 /
79,9 58,9 / 66,3
Lower / higher future wage growth 83,7 /
68,7 69,4 / 57
38 years career: average income 83,3 65,5 -17,8 50,1 54,4 4,3
Low / high income 71,8 /
76,7
65,5 /
49,3
(-6,3/-
27,4) 51,5 / 42,6 54,4 / 40,9 (2,9/-1,7)
42 years career: average income 111,5 87,2 -24,3 67 72,4 5,4
Low / high income 96 / 102 87,2 /
65,4
(-8,8/-
36,6) 68,8 / 56,7 72,4 / 54,4 (3,6/-2,3)
10 years after retirement 107,3 59,2 -48,1 70,2 49,1 -21,1
Female worker with 3 years of career
break for childcare 66,1 70,8 4,7 41,9 58,7 16,8
3 years of career break for
unemployment 81,0 72,5 -8,5 48,8 60,2 11,4
10 years out of the labour market 48,2 55 6,8 29,0 45,6 16,6
2010 2050 Difference EU27
2010
EU27
2050 Difference
Benefit ratio (Public pensions) 31,2 26,6 -4,6 44,7 37,0 -7,7
Gross replacement rate at retirement
(Public pensions) 38,4 40,3 1,9 48,0 39,1 -8,9
Note: *: Share of statutory DB-NDC / statutory funded / occupational and other supplementary
pensions,
Source: Joint SPC/EC report on Pension Adequacy in the European Union (2010-2050)
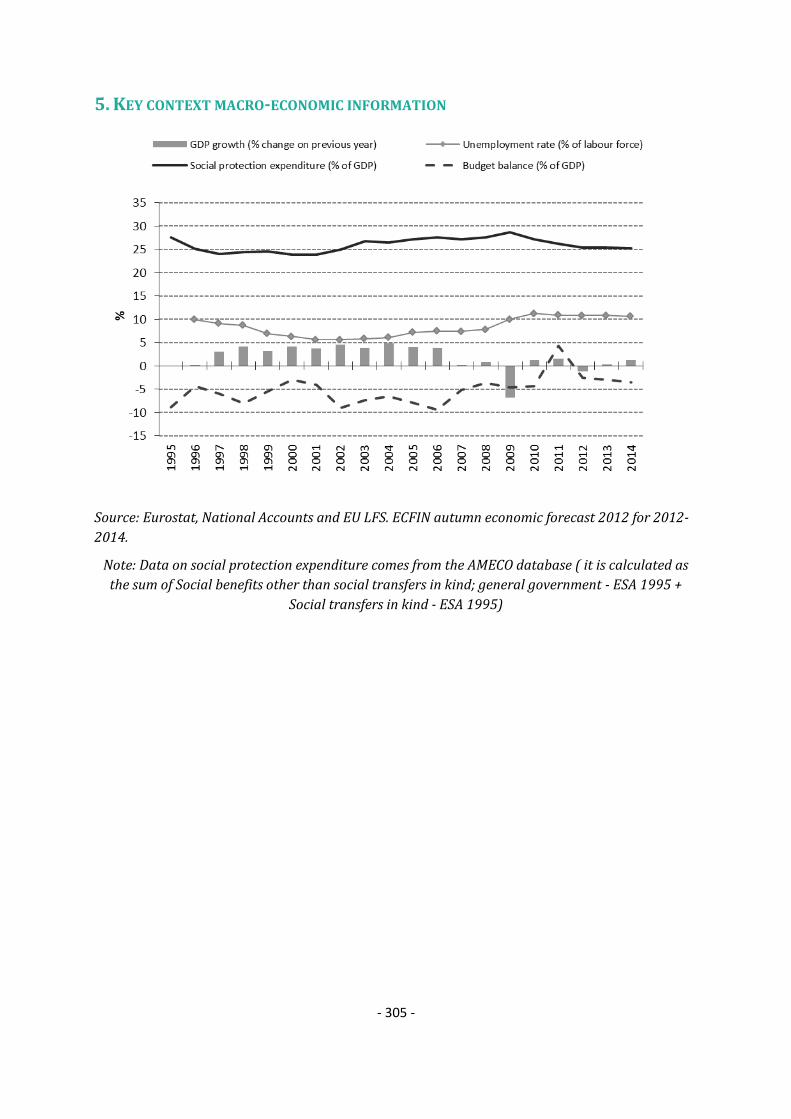
- 305 -
5. KEY CONTEXT MACRO-ECONOMIC INFORMATION
Source: Eurostat, National Accounts and EU LFS. ECFIN autumn economic forecast 2012 for 2012-
2014.
Note: Data on social protection expenditure comes from the AMECO database ( it is calculated as
the sum of Social benefits other than social transfers in kind; general government - ESA 1995 +
Social transfers in kind - ESA 1995)

- 306 -
6. TRENDS IN TAKE-UP OF SELECTED BENEFITS86
86
This data has been collected by the SPC in the context of monitoring the social impact of the crisis. It includes only a selection of benefits which have been considered most reactive to the crisis. The number of unemployed refers to the standard definition by the ILO and is given as a background information.

- 307 -
Number of unemployed
Definition Unemployment according to ILO definition - Total
Unit thousands of persons - seasonally adjusted
Source Eurostat
Unemployment recipients
Definition Unemployment Benefit recipients
Unit thousands of recipients at the end of the given month
Comment
At the end of 2010 data from 2008 till 2010 about jobseekers' allowance were modified
because of the changes in the functioning of the IT system, which revised the number of
recipients of unemployment benefit.
On the other hand data of 2006, 2007 were also modified because we have found
significant differences between this number of HU jobseekers allowance, assistance
receivers and number of recipients of jobseekers allowance, assistance (were registered
by PES).
According to the modified Employment Act, from 1st September 2011 the eligibilities
and duration of the jobseekers' allowance and assistance were changed. Eligible for
jobseekers’ allowance is based on their previous employment (at least 360 day within
the last 3 years). The amount is 60% of statutory minimum wage prevailing at the time
of submission of the application. The duration of this benefit consists of only one part
can last at least 36 days and no more than 90 days. Type “a” and “b” of jobseekers'
assistance were ceased to exist. One of eligibilities of jobseekers' assistance within 5
years before retirement were changed. (Act IV. of 1991).
Recipients of social assistance benefits/means-tested minimum Income
Definition Recipients of regular social assistance
Unit thousands of recipients
Source Hungarian Treasury
Comment
Regular social assistance is an income supplement provision in the form of cash, provided by the
local government of the settlement. Its aim to guarantee a minimal standard of living for those
who have no income. From the 1 July 2006 the conditions of the provision and the way of
calculation of the amount of support changed. Before that the local government awarded regular
social assistance to a person who was over 18 years of age, was of active age, and had lost at least
67 per cent of his or her working ability or received blind persons’ benefit, or to a person who
was of active age but not in employment, in the case that their subsistence was not provided by
other means. By the new terms for the support is entitled only one person in a family. The
assessing of the entitlement and the amount of the assistance based on the income projected to
the consumer unit instead of the previous income per capita. The consumer unit is the rate which
shows the structure of consumption within a family. The first major member of the family and

- 308 -
the disabled child’s rate is 1,0 while the ratio of the companion (spouse) and a child is lower (0,9-
0,7). The amount of support is variable and supplements the family’s effective total income to the
limit of the entitlement. The regular social assistance from 1 January 2009 was changed to
benefit for active aged which consist of the regular social assistance and the "support for to be
ready to work" (from 1st September 2011 employment substituting benefit). The change in the
benefit system was built up completely until 31 March 2009. Persons capable of performing work
are entitled to employment substituting benefit. Persons who belong to this scope are obliged to
cooperate with the Public Employment Service and to take part in public work. The employment
substituting benefit is paid, when the person is not involved into public work. The amount of the
benefit is fixed, it is equal to the 80 % of the minimum old-age pension.
Persons incapable of performing work are entitled to regular social assistance (health impaired,
people who have less than five years to the retirement age, as well as persons who bring up a
child under 14, and the attendance of the child at an institution providing daily care is not
ensured. Furthermore, the competent municipality may set other conditions in its local decree
connected to the family circumstances, health or mental status of the claimant, in which case the
person entitled to benefit for persons in active age is defined as a person incapable of performing
work.). The calculation of regular social assistance is determined on the grounds of the
composition and income of the family. Only one person in a family can be eligible to the benefit
for persons in active age, except for the case when two claimants are entitled to different cash
benefits (one person is entitled to employment substituting benefit, the other to regular social
assistance).
Disability benefits recipients
Definition Disability subsidy recipients
Unit thousands of recipients
Source Hungarian Treasury (www.allamkincstar.gov.hu)
Comment Financial support for severely disabled persons over the age of 18, who are unable to care for
themselves or need permanent assistance from others.
- 309 -
7. SUMMARY OF SPECIFIC KEY SOCIAL CHALLENGES AND PARTICULARLY GOOD SOCIAL
OUTCOMES
Social policy areas Challenges
Poverty and social inclusion High rate of people living in poverty or social exclusion,
particularly the Roma population
Preventing the inheritance of poverty and social exclusion
Improving equal access to socio-economic goods
Pensions Maintaining sustainability without using extra budgetary
resources
Health and long-term care Moving away from hospital-centric model to new models of
care: providing a better organised, more effective system
underpinned by quality, equity and sustainability
Particularly good social outcomes
Good progress in ensuring high labour market
participation for older workers
Some progress in improving healthy life years at 65 for
males

- 310 -
MALTA
1. 2012 NATIONAL SOCIAL REPORT (NSR): KEY CHALLENGES
In 2010, the Maltese economy rebounded relatively strongly after a contraction in real GDP in
2009, with the positive momentum carried into 2011. However, in the second half of 2011 the
economy gradually lost steam. Private consumption growth slowed down considerably in the
last quarter of 2011 and turned negative in the first two quarters of 2012. This development
together with a decline in investment dampened domestic demand which led to negative
growth in real GDP during the last quarter of 2011 and the first quarter of 2012 (0.5% and 1.2%
respectively). Performance in the labour market was rather encouraging. The unemployment
rate in 2011 stood at 6.5% (6.1% for men and 7.1% for women), down by 0.4 percentage points
from the previous year. Growth in employment increased by 2.5 per cent in 2011 with the
number of employees increasing by 2.7 % while the number of self-employed increased by
0.8%.87 Nevertheless, the employment rate is still one of the lowest in the EU at 61.5% in 2011,
mainly owing to a low employment rate of females in the labour market, in spite of the
significant gains recorded over the past decade. The overall rate of people living at risk of
poverty or social exclusion stands at 21.4% of the population increasing by 1.1 percentage
points since the previous year.
The 2012 NSR was drafted through a wide range of stakeholder involvement including
government departments and other related entities as well as representatives from the
voluntary organisations sector employed in the field of combating poverty and social exclusion.
A consultation session with the Employment, Social Policy and Health Sectoral Committee of the
Malta-EU Steering Action Committee (MEUSAC) took place on the 3rd April 2012. Regular
contacts will be maintained with civil society in order to ensure their on-going contribution and
support towards the realisation of the objectives set out in the 2012 NSR.
The main socio-economic priorities identified by the report are (i) increasing the overall
employment rate, particularly through the inclusion of women and vulnerable groups within the
labour market; (ii) pursuing the commitment to reduce early school leaving and educational
underachievement; (iii) combating the intergenerational transmission of poverty and social
exclusion; (iv) reforming the social protection system to ensure its sustainability, adequacy and
comprehensiveness; (v) improving access, quality and adequacy of health and long-term care.
Most of these priorities correspond to the challenges identified by the Commission88. The
Maltese 2012 NSR identifies children, the elderly and people living in jobless households as the
key vulnerable groups to be addressed. Children and young people are being addressed through
several measures including the publication of the National Children Policy, which was launched
for consultation in 2011. Following public consultations, the government is currently evaluating
the feedback received from respondents so that a review of the Children Policy will be
87 Employment and self-employment statistics as per Eurostat National Accounts concept
88 SWD(2012) 321 final

- 311 -
undertaken . It aims to improve the well-being, rights and obligations, protection, active
participation, inclusion, creativity and leisure of children and young people. To reach this aim it
proposes a number of key policy actions under these different areas.
The promotion of active ageing and the prevention of poverty and social exclusion amongst the
elderly is seen by Malta as an important issue which it is addressing through measures which
secure adequate income, sustain health and well-being, and promote active participation in
society. During this year, an ad hoc inter-ministerial committee has been setup and it is carrying
out discussions with a view to drawing up a comprehensive active ageing strategy for Malta.
This strategy will address active ageing through the implementation of actions aimed at
increasing old age security, improving health and well-being, and increasing their active
participation in society.
Jobless households are also a major priority for Malta. The provision of adequate income
support through a review of the social security system, as well as the taxation system is
currently underway. Malta is also working towards providing access to inclusive labour markets
through investment in the creative economy and human capital. Finally, the Maltese government
is focusing on providing access to quality social services with the aim to enhance the work life
balance and consolidate family friendly measures, as well as increase the affordability of social
services, and housing.
The 2006/7 pension reform implemented a set of reforms directed to secure the sustainability
and adequacy of the pension of future generations. Among these reforms there was the gradual
increase of the pensionable age to 65 by 2026, as well as the gradual increase in the required
contribution period to reach 40 years by 2026 as opposed to the current 30 years. This reform
also envisaged a five yearly report (prepared by the Pensions Working Group) which should
monitor the implementation of these measures and make recommendations.
The first Strategic Review was tabled in the Maltese Parliament on 14 December 2010 following
which additional consultations with all social partners were carried out. A post-consultation
report was subsequently presented to the Minister for Justice, Dialogue and the Family in March
2012 that largely upheld the findings and the recommendations of the 2010 Strategic Report.
Malta has already acted on three of the recommendations made in the report, namely in that
Malta has set up a National Commission for Financial Literacy; a Pensions Strategy Unit was set
up within the Department of Social Security; and parenting credits are being granted to parents
born between 1st January 1952 and 31st December 1961 (such credits were already granted to
parents born in 1962 or after).
Although Malta took action on the development of an active ageing strategy by appointing an ad
hoc inter-ministerial committee tasked with developing such a strategy, and also developed a
legislative framework through which private pension savings could be regulated (although this
legislation is yet to be implemented), the Government does not plan to accelerate any further the
increases in retirement age as it is expected that through positive increases in the effective
retirement age, brought about by the 2006/7 reforms, the gap between the effective retirement
age and life expectancy will not increase until 2030.

- 312 -
Malta’s strategy for promoting health and long-term care services is focused around increasing
the public’s accessibility to a wide range of services, promoting and advancing the quality of
these services, and also guaranteeing financial sustainability. The main reforms undertaken in
the healthcare and long-term care sectors in recent years include the enhancement of access to
information on health services through the implementation of the myHealth Record system and
the extension of the ‘Pharmacy of Your Choice’ scheme. Malta has also adopted a pricing policy
using external reference pricing for medicines purchased by the government and supplied free
of charge. The local and regional health centres are being refurbished to provide better services
to patients without the need to enter the Mater Dei Hospital. In recent years the government also
embarked on the development of health care standards and guidelines and the upgrading of
healthcare facilities. Recently the government launched the National Cancer Plan 2011-2015 and
is also developing an Oncology Centre at Mater Dei Hospital. In terms of financial sustainability,
the focus is on measures to improve governance and efficiency and which add healthy life years
rather than transferring part of the cost to the patients, or limiting the supply of health and long
term care services.
The main challenges for Malta include: (i) guaranteeing the sustainability and adequacy of the
healthcare system and of long-term care, as well as pensions and other social protection
systems, especially due to the impact of changing social dynamics; (ii) improving the quality of
education and training systems, with the aim to reduce the rate of early school leavers while at
the same time increase the rate of tertiary educational attainment; (iii) trying to reduce the
number of people at risk of poverty and social exclusion, especially in the case of children, single
parent households, and the elderly, thus reversing the current trend while at the same time
increasing the employment rate, especially of women and older workers.
The measures proposed to reduce the risk of poverty or social exclusion seem to be relevant and
credible, although more can be done in terms of ambition. The focus on education to alleviate
poverty is adequate; however more needs to be done to address in-work poverty, and the
increasing levels of poverty in certain societal groups, especially children, the elderly and single
parent households.
2. NATIONAL 2020 TARGET FOR THE REDUCTION OF POVERTY AND SOCIAL EXCLUSION
"The projections in hand indicate that Malta’s proposed national target will be to lift around
6,560 people out of risk of poverty and exclusion."
Source: National Reform Programme (2011)

- 313 -
2a. Progress towards the 2020 national target for the reduction of poverty and
social exclusion
Source: Eurostat (EU-SILC)
Note: i) Progress on the target is monitored on the basis of the EU SILC data with a base year 2008 and
target data year 2018;
ii) AROPE - at-risk-of-poverty or social exclusion rate; AROP - at-risk-of-poverty rate; VLWI - share of
population living in very low work intensity households; SMD - severe material deprivation rate;
iii) For the at-risk-of poverty rate (AROP), the income reference year is the calendar year prior to the
survey year (i.e. 2010) except for the United Kingdom (survey year) and Ireland (12 months preceding the
survey). Similarly, the very low work intensity rate (VLWI) refers to the income reference year prior to the
survey (i.e. 2010) while for the severe material deprivation rate (SMD), the reference is the current year (i.e.
2011).

- 314 -
2b. Composition of the population at risk of poverty or social exclusion (2011)
Source: Eurostat (EU-SILC)
Note: i) Progress on the target is monitored on the basis of the EU SILC data with a base year 2008 and
target data year 2018;
ii) AROPE - at-risk-of-poverty or social exclusion rate; AROP - at-risk-of-poverty rate; VLWI - share of
population living in very low work intensity households; SMD - severe material deprivation rate; the red
overlap indicates the share of the population which accumulates all three conditions;
iii) For the at-risk-of poverty rate (AROP), the income reference year is the calendar year prior to the
survey year (i.e. 2010) except for the United Kingdom (survey year) and Ireland (12 months preceding the
survey). Similarly, the very low work intensity rate (VLWI) refers to the income reference year prior to the
survey (i.e. 2010) while for the severe material deprivation rate (SMD), the reference is the current year (i.e.
2011).
2005 2006 2007 2008 2009 2010 2011
AROP total % of total pln 13,9 14,0 14,8 15,0 15,3 15,0 15,4
1000 persons 55 56 60 61 62 62 64
VLWI total % of total pln 9,6 9,2 9,2 8,2 8,4 8,4 8,3

- 315 -
1000 persons 31 30 30 26 27 27 27
SMD total % of total pln 5,5 3,7 4,2 4,0 4,7 5,7 6,3
1000 persons 22 15 17 16 19 23 26
AROP + VLWI
% of total pln 3,4 3,3 3,4 2,8 2,7 2,8 2,8
1000 persons 14 13 14 11 11 11 12
AROP + SMD % of total pln 0,9 0,7 0,4 0,4 1,0 1,2 1,4
1000 persons 4 3 2 2 4 5 6
AROP + SMD + VLWI
% of total pln 1,1 0,9 1,4 1,2 1,1 1,3 1,1
1000 persons 4 3 6 5 5 6 5
SMD + VLWI % of total pln 0,6 0,3 0,4 0,4 0,5 0,3 0,3
1000 persons 2 1 2 1 2 1 1
2c. At risk of poverty or social exclusion rate for specific groups, 2011
Total
At risk of poverty or social
exclusion, in %
Children (0-17) 25,8
Working age (18-64) 20,1
Elderly (65+) 21,5
Employed 10,3
Unemployed 59,5
Inactive 31,9
Single male 35,2
Single female 29,5
Single elderly (65+) 21,3
Single parent households 62,0
Large families (2 adults and 3+ children) 33,8
EU-migrant (EU 27) 24,7
Non-EU migrants (non-EU27) 23,4
Source: Eurostat (EU-SILC)

- 316 -
3. MAIN SOCIAL INDICATORS
MT % 2005 2006 2007 2008 2009 2010 2011 2010 2011
At risk of poverty or social exclusion 20,2 19,1 19,4 19,6 20,2 20,3 21,4 23,6 24.2
At-Risk-of-Poverty rate 13,9 14,0 14,8 15,0 15,3 15,0 15,4 16.4 16.9
Severe Material Deprivation rate 5,5 3,7 4,2 4,0 4,7 5,7 6,3 8,3 8.8
Share of people living in very low work
intensity households 9,6 9,2 9,2 8,2 8,4 8,4 8,3 10.0 10.0
Impact of social transfers on poverty
reduction (excl. pensions)(in%) 29,4 33,6 30,2 33,9 33,8 33,6 32,8 36,7 35,2
Value of threshold (single HH) - in PPS 7.044 7.253 7.464 7.994 8.270 7.944 8.359 N/A N/A
Value of threshold (2 adults + 2 children) -
in PPS 14.792 15.231 15.674 16.788 17.368 16.682 17.554 N/A N/A
At risk of poverty or social exclusion 22,8 20,8 23,1 23,5 25,5 24,3 25,8 27,1 27.0
At-Risk-of-Poverty rate 16,7 16,7 19,0 19,3 20,9 19,9 21,1 20.5 20.6
Severe Material Deprivation rate 6,3 4,4 5,8 5,6 6,5 6,5 7,0 9,7 10.0
Share of people living in very low work
intensity households 9,8 8,3 9,4 9,2 8,9 8,6 8,3 9.1 8.8
Impact of social transfers on poverty
reduction (excl. pensions)(in%) 34,3 37,7 31,9 34,4 33,4 32,8 30,4 41,4 40,5
At risk of poverty or social exclusion 17,9 17,1 17,5 17,0 17,9 18,8 20,1 23,5 24.3
At-Risk-of-Poverty rate 11,1 11,2 12,3 11,8 12,5 12,9 13,1 15.2 16.0
Severe Material Deprivation rate 5,0 3,3 3,9 3,7 4,3 5,7 6,5 8,3 8.9
Share of people living in very low work
intensity households (18-59) 9,5 9,5 9,2 7,8 8,2 8,4 8,3 10.3 10,5
In-work at-risk-of poverty rate 4.0 4.1 4.5 5.0 5.7 5.6 6.1 8.4 8.9
Impact of social transfers on poverty
reduction (excl. pensions)(in%) 33,5 38,1 33,9 38,9 36,9 35,8 35,8 38,7 37,0
At risk of poverty or social exclusion 27,1 26,3 23,1 26,4 23,2 21,5 21,5 20,0 20.5
At-Risk-of-Poverty rate 23,4 24,2 20,7 24,7 20,9 18,0 18,1 16.0 16.0
Severe Material Deprivation rate 6,2 4,3 3,0 3,0 4,1 4,7 4,6 6,6 7.2
Relative median income ratio of elderly 0.75 (b) 0.79 0.77 0.73 0.76 0.81 0.80 0.88 0.89
Aggregate replacement ratio 0.48 0.47 0.48 0.42 0.47 0.46 0.47 0.53 0.54
2000 2005 2006 2007 2008 2009 2010 2009 2010
Sickness/Health care 4,8 5,4 5,3 5,2 5,5 6,1 5,7 8,4 8,3
Invalidity 0,9 1,2 1,1 1,1 1,0 0,9 0,9 2,3 2,2
Old age and survivors 8,3 9,3 9,5 9,3 9,5 10,3 10,7 12,7 12,7
Family/Children 1,5 1,2 1,1 1,1 1,2 1,3 1,2 2,3 2,3
Unemployment 0,4 0,6 0,6 0,5 0,5 0,6 0,5 1,8 1,7
Housing and Social exclusion n.e.c. 0,4 0,4 0,5 0,6 0,6 0,6 0,5 1,0 1,0
Total 16,3 18,2 18,1 17,8 18,2 19,7 19,6 28,5 28,2
Means-tested
Sickness/Health care 0,8 1,0 1,0 0,9 0,9 1,0 1,0 0,1 0,1
Invalidity 0,2 0,2 0,2 0,2 0,2 0,2 0,2 0,5 0,5
Old age and survivors 0,4 0,4 0,4 0,4 0,3 0,3 0,3 0,6 0,6
Family/Children 1,4 1,0 1,0 0,9 0,4 0,4 0,4 0,6 0,6
Unemployment 0,4 0,4 0,4 0,4 0,3 0,4 0,4 0,4 0,4
Housing and Social exclusion n.e.c. 0,3 0,3 0,3 0,4 0,3 0,3 0,3 0,9 1,0
Total 3,4 3,2 3,2 3,1 2,5 2,7 2,6 3,0 3,1
Non means-tested
Sickness/Health care 4,0 4,5 4,3 4,3 4,5 5,1 4,7 8,3 8,2
Invalidity 0,8 1,0 1,0 0,9 0,8 0,7 0,7 1,8 1,8
Old age and survivors 7,9 9,0 9,1 9,0 9,1 9,9 10,4 12,1 12,1
Family/Children 0,1 0,1 0,1 0,1 0,9 0,8 0,8 1,7 1,7
Unemployment 0,1 0,2 0,2 0,1 0,2 0,2 0,2 1,4 1,3
Housing and Social exclusion n.e.c. 0,1 0,2 0,2 0,2 0,3 0,3 0,2 0,1 0,1
Total 13,0 15,0 14,9 14,6 15,7 17,1 17,0 25,4 25,2
Elderly (65+)
Social expenditure
(in % of GDP)
EU27
Children (0-17)
Working age
(18-64)
Total population
Source: Eurostat (EU-SILC, ESSPROS for social expenditure data)
Note: For non-means tested the aggregation Housing and Social Exclusion n.e.c is based only on
Housing. The total figures of social expenditure include all benefits excluding administrative costs.

- 317 -
4. LONG-TERM ADEQUACY OF PENSIONS: THEORETICAL REPLACEMENT RATES (2010-
2050)
Theoretical replacement rates (TRR): Net
2010
Net
2050 Difference Gross2010 Gross2050 Difference
40 years career: average income earner
(basecase) 79,7 70,5 -9,2
67,3
(100/0/0)*
59,5
(100/0/0)* -7,8
Low income 77,7 71,1 -6,6 67,3
(100/0/0)*
61,9
(100/0/0)* -5,4
High income 43,2 39,6 -3,6 32,9
(100/0/0)*
29,8
(100/0/0)* -3,1
Lower / higher future rates of return 70,5 /
70,5 59,5 / 59,5
Lower / higher future wage growth 76,8 /
61,1 64,6 / 51,7
38 years career: average income 79,7 67,4 -12,3 67,3 56,5 -10,8
Low / high income 77,7 /
43,2
67,6 /
37,9
(-10,1/-
5,3) 67,3 / 32,9 58,8 / 28,3 (-8,5/-4,6)
42 years career: average income 79,7 70,5 -9,2 67,3 59,5 -7,8
Low / high income 77,7 /
43,2
71,1 /
39,6 (-6,6/-3,6) 67,3 / 32,9 61,9 / 29,8 (-5,4/-3,1)
10 years after retirement 73,8 68,2 -5,6 61,8 57,4 -4,4
Female worker with 3 years of career
break for childcare 79,7 70,5 -9,2 67,3 59,5 -7,8
3 years of career break for
unemployment 79,7 70,5 -9,2 67,3 59,5 -7,8
10 years out of the labour market 79,7 67,3
2010 2050 Difference EU27
2010
EU27
2050 Difference
Benefit ratio (Public pensions) 51,2 47,6 -3,6 44,7 37,0 -7,7
Gross replacement rate at retirement
(Public pensions) 58,5 51,6 -6,9 48,0 39,1 -8,9
Note: *: Share of statutory DB-NDC / statutory funded / occupational and other supplementary
pensions
Source: Joint SPC/EC report on Pension Adequacy in the European Union (2010-2050)

- 318 -
5. KEY CONTEXT MACRO-ECONOMIC INFORMATION
Source: Eurostat, National Accounts and EU LFS. ECFIN autumn economic forecast 2012 for 2012-
2014.
Note: Data on social protection expenditure comes from the AMECO database ( it is calculated as
the sum of Social benefits other than social transfers in kind; general government - ESA 1995 +
Social transfers in kind - ESA 1995)
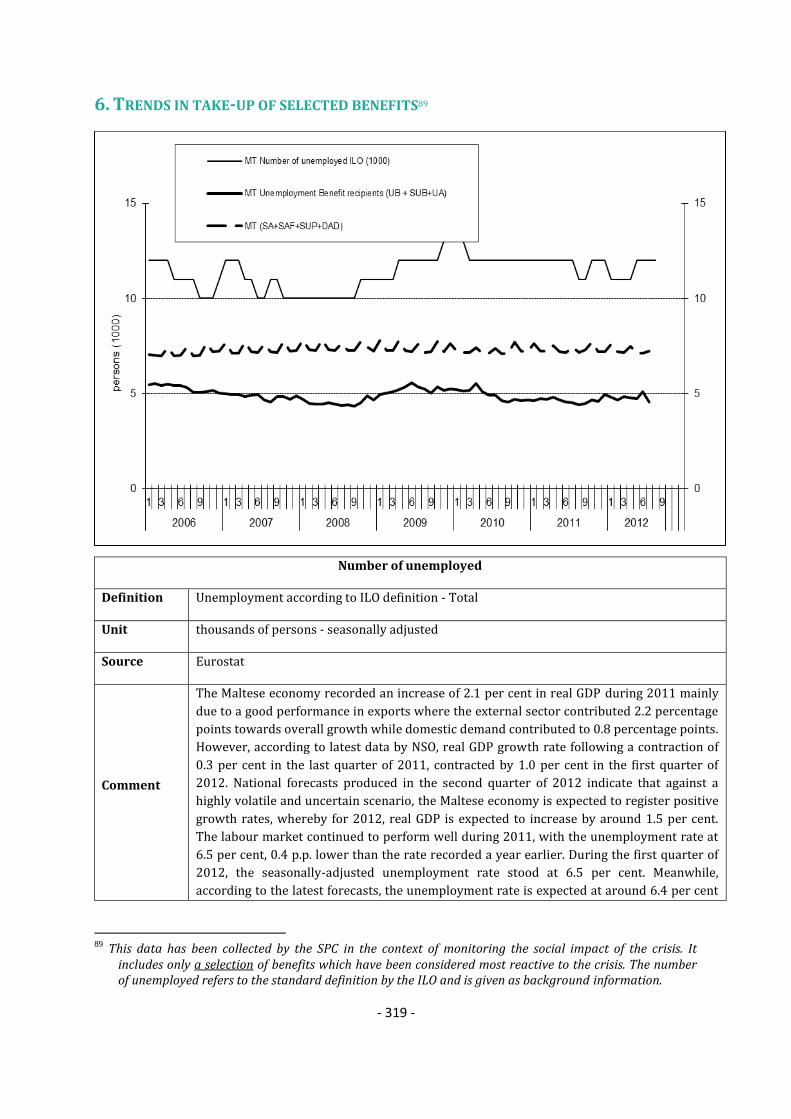
- 319 -
6. TRENDS IN TAKE-UP OF SELECTED BENEFITS89
Number of unemployed
Definition Unemployment according to ILO definition - Total
Unit thousands of persons - seasonally adjusted
Source Eurostat
Comment
The Maltese economy recorded an increase of 2.1 per cent in real GDP during 2011 mainly
due to a good performance in exports where the external sector contributed 2.2 percentage
points towards overall growth while domestic demand contributed to 0.8 percentage points.
However, according to latest data by NSO, real GDP growth rate following a contraction of
0.3 per cent in the last quarter of 2011, contracted by 1.0 per cent in the first quarter of
2012. National forecasts produced in the second quarter of 2012 indicate that against a
highly volatile and uncertain scenario, the Maltese economy is expected to register positive
growth rates, whereby for 2012, real GDP is expected to increase by around 1.5 per cent.
The labour market continued to perform well during 2011, with the unemployment rate at
6.5 per cent, 0.4 p.p. lower than the rate recorded a year earlier. During the first quarter of
2012, the seasonally-adjusted unemployment rate stood at 6.5 per cent. Meanwhile,
according to the latest forecasts, the unemployment rate is expected at around 6.4 per cent
89
This data has been collected by the SPC in the context of monitoring the social impact of the crisis. It includes only a selection of benefits which have been considered most reactive to the crisis. The number of unemployed refers to the standard definition by the ILO and is given as background information.

- 320 -
in 2012.
Unemployment recipients
Definition 1) Unemployment Benefit - UB; 2) Special Unemployment Benefit - SUB; 3) Unemployment
Assistance - UA
Unit thousands of recipients
Source Ministry of Justice, Dialogue and the Family
Comment
1) Unemployment benefit is paid to persons who are registering as unemployed under the
Part 1 register as held by the Employment & Training Corporation who have paid or
credited an accumulation of fifty (50) social security contributions in total and an average of
twenty (20) social security contributions in the preceding two (2) years prior to their claim.
The unemployment benefit rate which is paid for a maximum of six (6) months may be
increased to a special unemployment benefit rate; 2) If a person who is in receipt of
Unemployment Benefit satisfies the conditions for the award of unemployment assistance,
his benefit is increased to a Special Unemployment Benefit.; 3) Head of household who is
seeking employment and is registering for work under Part 1 of the register with ETC is
eligible for this benefit.
Due to the favourable conditions in the registered economic activity a declining trend in the
number of unemployment benefit recipients was observed from the second quarter 2010
and continued well throughout 2011. As from the third quarter 2011 till second quarter
2012, the number of persons eligible for unemployment related benefits gradually
increased, surpassing the 5,000 figure by the end of the second quarter in 2012. The
number of persons registered as unemployed, as at the end of June 2012 stood at 6,697, an
increase of 485, or 7.8 per cent over the corresponding month in 2011. This has not been
mirrored by a similar increase in the numbers of persons in receipt of Social Assistance (SA)
and other related benefits. Throughout years 2011 and 2012, this group of benefits
recorded a similar trend as in the year before. SA benefits in Malta are means tested and
therefore, an increase in unemployment does not automatically lead to an equal increase in
these benefits.
Recipients of social assistance benefits/means-tested minimum Income
Definition
1) Social Assistance - SA; 2) Social Assistance for Carers - SAF; 3) Supplementary Allowance
- SPA (only low income earners are being considered as related to the crisis); 4) Social
Assistance for Drug Addicts - DAD
Unit thousands of beneficiaries
Source Ministry of Justice, Dialogue and the Family
Comment
1) Head of Households, who are incapable of work due to medical reasons, or are
unemployed and seeking employment, given that they fulfill the means and capital
resources tests; 2) ATo be entitled for this benefit, claimant must either be single or a
widow (male or female), who are taking care of a sick relative by themselves on a full time
basis. Relatives must be the parents, grand-parents, brothers, sisters, uncles, aunts, brothers
or sisters’ in-laws and father/mother in laws. Claimants and patients are to give proof that
they are residing in the same residence. Case will be referred for a medical examination; 3)
Supplementary Allowance is payable to households where the total income of the members

- 321 -
falls below the limits outlined by the Social Security Act from time to time. In this regard,
not all Supplementary Allowance beneficiaries here are related to the economic crisis but
only beneficiaries on low household income. SPA is paid every 13 weeks (roughly each 3
months), being Dec/Jan, Mar/Apr, Jun/Jul, and Sep/Oct; 4) A person who is undergoing a
drug or alcohol rehabilitation therapeutic programme is eligible for this benefit. An official
document from the institution concerned is received by the Department confirming date
when programme was initiated.
Disability benefits recipients
Definitio
n
1) Disability Pension - SHP; 2) Pension for the visually impaired - BLD; 3) Disablement Pension
(termed as Injury Pension in Social Security Act CAP 318)- DP; 4) Invalidity Pension - IP
Unit thousands of beneficiaries
Source Ministry for Justice, Dialogue and the Family
Comment
1) Payable to citizens of Malta over 16 years of age. Various types of disabilities are listed under
the Social Security Act; 2) Claimant must be 14 years of age or over, and provide a medical
certificate from an ophthalmologist from Mater Dei Hospital explaining the patient’s visual
medical condition. This Benefit is means tested. Claimant’s income, together with the rate of
Pension
for the Visually Impaired must not exceed the National Minimum Wage as applicable to an 18-
year-old person; 3) Payable if injury or disease caused or contracted whilst at work is considered
to cause a loss of physical or mental faculty calculated between 20% & 89%. Rates awarded
according to degree of Disability. Where the degree of disablement is assessed at 90% and over,
the person concerned is automatically awarded an Invalidity Pension at the full rate. 4) Payable
to persons deemed permanently incapable for suitable full-time or regular part-time
employment. Various rates according to different conditions.
7. SUMMARY OF SPECIFIC KEY SOCIAL CHALLENGES AND PARTICULARLY GOOD SOCIAL
OUTCOMES
Social policy areas Challenges
Poverty and social inclusion Increasing the employment rate through the inclusion of
women and vulnerable groups in the labour market
The intergenerational transmission of poverty and social
exclusion
Low provision and affordability of childcare and out-of-
school centres
Pensions The low effective and statutory retirement age
Long-term sustainability of the pension system: inflexible
statutory retirement age vis-à-vis life expectancy

- 322 -
Encouraging private pension savings
Low participation of older workers in the labour force
The use of early retirement schemes
Health and long-term care Improving access, quality and adequacy of health and long-
term care
Effectiveness and efficiency
of social protection systems
The sustainability, adequacy and comprehensiveness of the
social protection system
Particularly good social outcomes
Some progress in ensuring high labour market participation
for older workers
Good progress in reducing early school leavers
- 323 -
NETHERLANDS
1. 2012 NATIONAL SOCIAL REPORT (NSR): KEY ISSUES
The Netherlands performs relatively well regarding social inclusion. Employment rates are high,
while unemployment and at-risk-of-poverty rates are relatively low. However, the economic
crisis triggered rising unemployment and an increased dependency on benefits, which also
increased the risk of poverty. Structurally, the Netherlands is facing a growing labour shortage
due to its rapidly ageing population. The main social inclusion challenge is to increase the labour
market participation and working hours of women, people aged 60 and older, (partially)
disabled, long-term unemployed, single parents and people with a migrant background.
In the process of drafting the National Social Report (NSR) most relevant stakeholders were
consulted, including the provincial government, local governments and stakeholder
organisations on the terrain of social inclusion and poverty.
The Dutch NSR does not identify specific challenges related to reaching the EU poverty target,
these are reported on in the National Reform Programme. The main socio-economic priorities in
the report are based on the guiding principle of the Dutch care-taker government, namely that
labour market participation is key in both preventing poverty and social exclusion and curative
since getting a job or working more hours is often the solution to getting out of poverty.
Therefore, emphasis is placed on increasing employment and employability. This means
equipping people with the necessary skills and helping them to find paid work. These
responsibilities are placed at the level of municipalities in order to ensure customisation. This
does not, however, mean that people do not have a responsibility themselves in finding a job.
The NSR states that all policy initiatives for promoting labour market participation specified in
the National Reform Programme (NRP) will be relevant to promoting social inclusion and
reducing poverty.
In reducing poverty and social exclusion, the focus of the government is to increase
employability and labour market participation among specific population subgroups (as
mentioned above). Active inclusion is and has been, according to the Dutch government, the key
solution in fighting poverty. Key measures stated in the NSR are:
Integral support in helping vulnerable groups. Responsibility is mainly laid down in
municipalities but an integrated approach in cooperation with national governments,
stakeholders and knowledge institutions is promoted.
Employers approach:
o The Work and Income (implementation structure) Act (SUWI) has been adapted in
order to give service to employers at an effective level (30 labour market regions).
o 1.4 million euros have been invested to register jobseekers and vacancies (UWV +
municipalities) in one system.

- 324 -
o Financial support for different initiatives aimed at improving cooperation between
nationwide employers and municipalities.
Social Return on Investment: After July 2011 all central government contracts exceeding
250,000 euros are obliged to contain a social return condition. This means that people with a
large distance to the labour market must be deployed in the execution of the contract.
Single parent families: A specific exemption from the obligation to work for single parents
(mainly women) with children up to the age of 5 was introduced in 2009.
Stimulating social participation and combating poverty are considered to be the responsibility of
local governments. The national government mainly contributes by facilitating local
governments and other organisations among others through subsidies, dissemination of
knowledge, guidelines, booklets and organising conferences.
The Dutch pension system is not discussed in the NSR. The NSR refers to the NRP as far as the
Dutch pension system is concerned.
With a view to ensuring the sustainability of public finances, but also to improving participation,
the government reached an agreement to raise the statutory retirement age to 66 in 2018 and to
67 in 2022. After that year the pension age will be connected to life expectancy. When increasing
pension age, company measures are left to the initiative of social partners.
In addition to the increase in pension age mentioned above the Netherlands undertook several
measures in order to limit early retirement. Measures will be taken in order to stimulate labour
market participation of elderly people.
Due to the resignation of the Dutch government, the part on the health care and long term care
were initially not included in the NSR, but send in at a later date in September 2012.
The Dutch government introduced controlled health expenditure development in hospital health
care to limit structural expenditure growth through administrative agreements with health
insurers, hospitals and medical specialists. In 2011, an agreement was made between healthcare
providers and healthcare insurers regarding a controlled expenditure development in hospital
healthcare. The intention is to limit the structural expenditure growth in hospital healthcare in
the period 2012 to 2015 and thereby bring stability to the sector. Other agreements on access,
quality and sustainability are for example administrative agreements and personal contribution
for medical aids (walking ad hearing aids).
Also a major reform of long term care will take place in the next few years. The main goal of the
reform is to decrease the percentage of long term care expenditure of the GNP and to bend the
growth-curve of long term care expenditure. To realize this, a shift is needed towards more
“made to measure” forms of care, delivered closer to home, by health care suppliers in
cooperation with informal caregivers and family. Long term care should only be available for
those who cannot afford to pay for this care themselves. The government gives priority to
providing long term care to people who need this for medical reasons. Major parts of the long
term care now covered by the Exceptional Medical Expenses Act (AWBZ) will be decentralized
and delegated to the local authorities. Specific parts of the AWBZ will be carried over to the
health insurance act. Approximately one third of the present AWBZ will remain. All these

- 325 -
changes in the Dutch Long term care system make a strong appeal to the responsibility of each
Dutch citizen.
A main challenge that remains arises from recent restrictive measures that affect vulnerable
groups. Active inclusion is seen as the key solution in order to fight poverty. An increased labour
market participation of these vulnerable groups seems necessary in order to be able to cope
with the ageing of the Dutch population. The measures planned and taken in the field of social
inclusion and poverty, as written down in the NSR, seem to be adequate in relation to the
challenges. Although the NSR contains no specific indicators in order to evaluate the adequacy of
the given measures in terms of poverty reduction, they are considered realistic and possible to
implement (some of them already being implemented). In addition, the European Commission
stresses the importance of dealing with the group of people aged 60-65. The employment gap is
substantially higher for this age-group.
2. NATIONAL 2020 TARGET FOR THE REDUCTION OF POVERTY AND SOCIAL EXCLUSION
"The government’s aim is to have more people actively involved in society by reducing the
number of people in households with low work intensity. This will reduce the number of people
at risk of poverty and social exclusion. Based on a CPB estimate of labour participation in 2020,
the government has set the following target: to reduce the number of people (aged 0 to 64) in a
jobless household by 100,000 by 2020."
Source: National Reform Programme (2011)

- 326 -
2.a Progress towards the 2020 national target for the reduction of poverty and
social exclusion
Source: Eurostat (EU-SILC)
Note: i) Progress on the target is monitored on the basis of the EU SILC data with a base year
2008 and target data year 2018;
ii) VLWI - share of population living in very low work intensity households; For the very low
work intensity rate (VLWI) refers to the income reference year prior to the survey (i.e. 2010).
2b. Composition of the population at risk of poverty or social exclusion (2011)

- 327 -
Source: Eurostat (EU-SILC)
Note: i) Progress on the target is monitored on the basis of the EU SILC data with a base year 2008 and
target data year 2018;
ii) AROPE - at-risk-of-poverty or social exclusion rate; AROP - at-risk-of-poverty rate; VLWI - share of
population living in very low work intensity households; SMD - severe material deprivation rate; the red
overlap indicates the share of the population which accumulates all three conditions;
iii) For the at-risk-of poverty rate (AROP), the income reference year is the calendar year prior to the
survey year (i.e. 2010) except for the United Kingdom (survey year) and Ireland (12 months preceding the
survey). Similarly, the very low work intensity rate (VLWI) refers to the income reference year prior to the
survey (i.e. 2010) while for the severe material deprivation rate (SMD), the reference is the current year (i.e.
2011).
2005 2006 2007 2008 2009 2010 2011
AROP total % of total pln 10,7 9,7 10,2 10,5 11,1 10,3 11,0
1000 persons 1,741 1,582 1,65 1,713 1,816 1,694 1,816
VLWI total % of total pln 9,7 10,7 9,5 8,1 8,3 8,2 8,7
1000 persons 1,289 1,419 1,246 1,053 1,083 1,068 1,128
SMD total % of total pln 2,5 2,3 1,7 1,5 1,4 2,2 2,5
1000 persons 403 370 279 252 237 366 407
AROP + LWI % of total pln 2,4 2,4 2,1 2,0 2,8 1,8 2,0
1000 persons 394 392 338 332 456 292 337
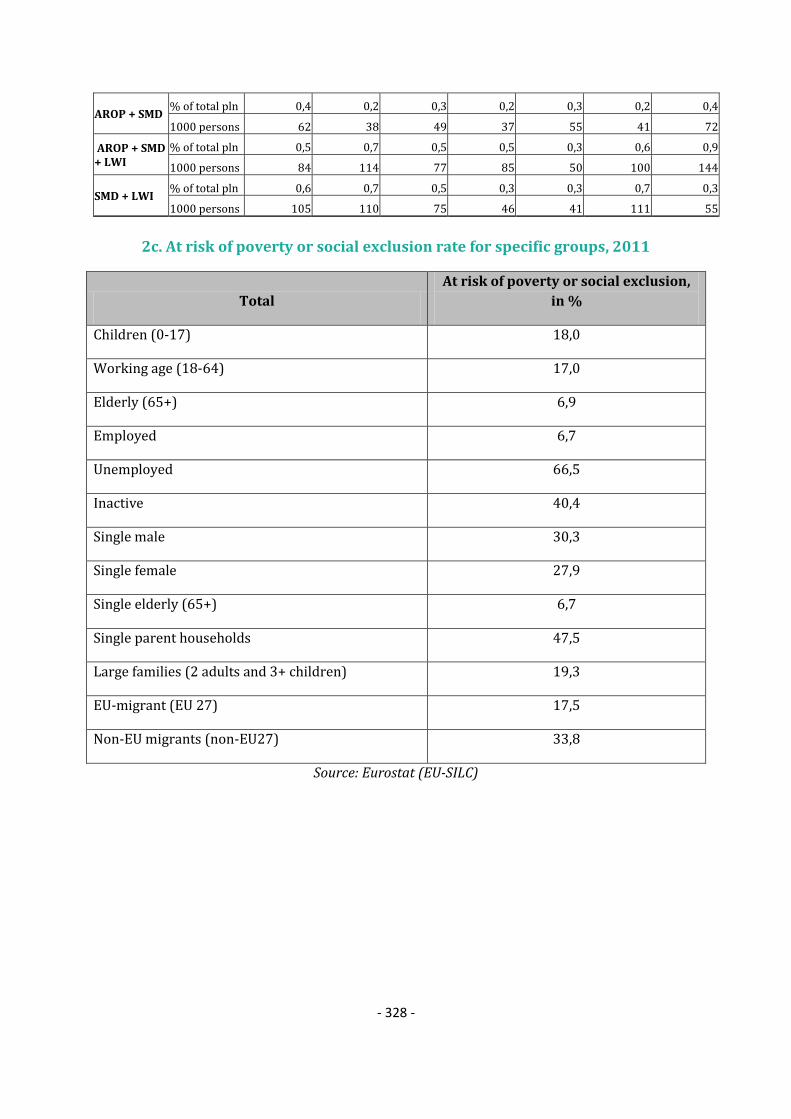
- 328 -
AROP + SMD % of total pln 0,4 0,2 0,3 0,2 0,3 0,2 0,4
1000 persons 62 38 49 37 55 41 72
AROP + SMD + LWI
% of total pln 0,5 0,7 0,5 0,5 0,3 0,6 0,9
1000 persons 84 114 77 85 50 100 144
SMD + LWI % of total pln 0,6 0,7 0,5 0,3 0,3 0,7 0,3
1000 persons 105 110 75 46 41 111 55
2c. At risk of poverty or social exclusion rate for specific groups, 2011
Total
At risk of poverty or social exclusion,
in %
Children (0-17) 18,0
Working age (18-64) 17,0
Elderly (65+) 6,9
Employed 6,7
Unemployed 66,5
Inactive 40,4
Single male 30,3
Single female 27,9
Single elderly (65+) 6,7
Single parent households 47,5
Large families (2 adults and 3+ children) 19,3
EU-migrant (EU 27) 17,5
Non-EU migrants (non-EU27) 33,8
Source: Eurostat (EU-SILC)
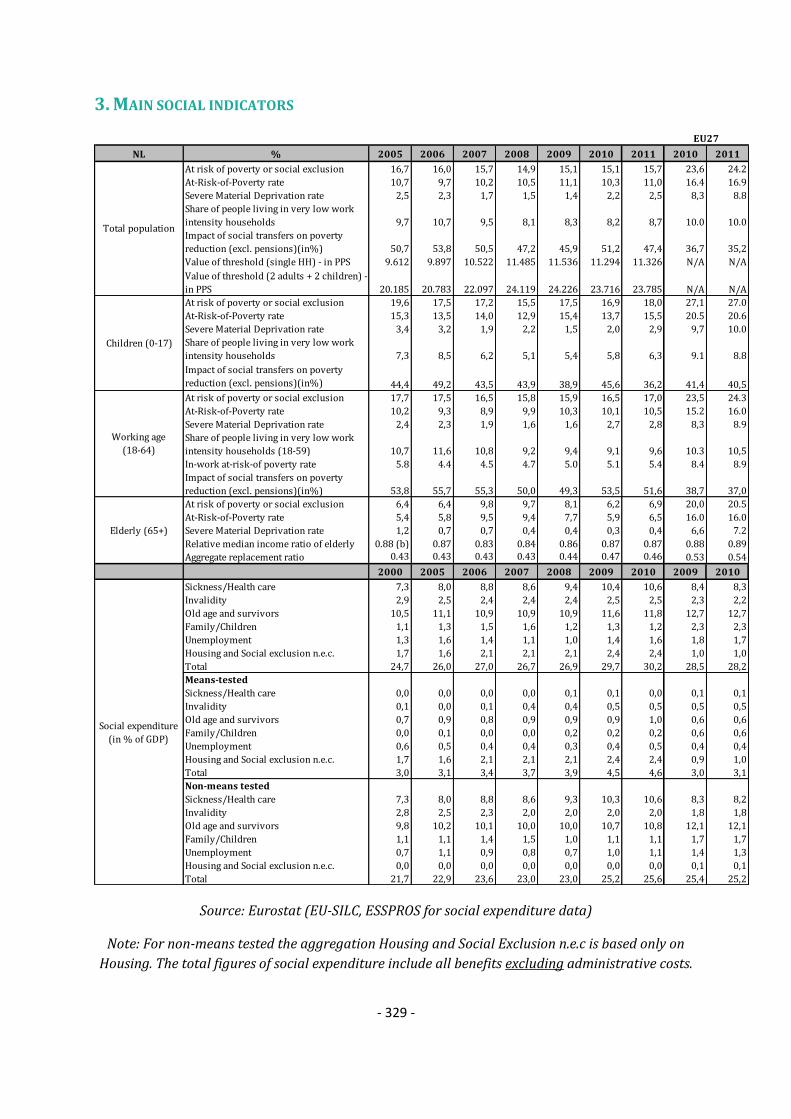
- 329 -
3. MAIN SOCIAL INDICATORS
NL % 2005 2006 2007 2008 2009 2010 2011 2010 2011
At risk of poverty or social exclusion 16,7 16,0 15,7 14,9 15,1 15,1 15,7 23,6 24.2
At-Risk-of-Poverty rate 10,7 9,7 10,2 10,5 11,1 10,3 11,0 16.4 16.9
Severe Material Deprivation rate 2,5 2,3 1,7 1,5 1,4 2,2 2,5 8,3 8.8
Share of people living in very low work
intensity households 9,7 10,7 9,5 8,1 8,3 8,2 8,7 10.0 10.0
Impact of social transfers on poverty
reduction (excl. pensions)(in%) 50,7 53,8 50,5 47,2 45,9 51,2 47,4 36,7 35,2
Value of threshold (single HH) - in PPS 9.612 9.897 10.522 11.485 11.536 11.294 11.326 N/A N/A
Value of threshold (2 adults + 2 children) -
in PPS 20.185 20.783 22.097 24.119 24.226 23.716 23.785 N/A N/A
At risk of poverty or social exclusion 19,6 17,5 17,2 15,5 17,5 16,9 18,0 27,1 27.0
At-Risk-of-Poverty rate 15,3 13,5 14,0 12,9 15,4 13,7 15,5 20.5 20.6
Severe Material Deprivation rate 3,4 3,2 1,9 2,2 1,5 2,0 2,9 9,7 10.0
Share of people living in very low work
intensity households 7,3 8,5 6,2 5,1 5,4 5,8 6,3 9.1 8.8
Impact of social transfers on poverty
reduction (excl. pensions)(in%) 44,4 49,2 43,5 43,9 38,9 45,6 36,2 41,4 40,5
At risk of poverty or social exclusion 17,7 17,5 16,5 15,8 15,9 16,5 17,0 23,5 24.3
At-Risk-of-Poverty rate 10,2 9,3 8,9 9,9 10,3 10,1 10,5 15.2 16.0
Severe Material Deprivation rate 2,4 2,3 1,9 1,6 1,6 2,7 2,8 8,3 8.9
Share of people living in very low work
intensity households (18-59) 10,7 11,6 10,8 9,2 9,4 9,1 9,6 10.3 10,5
In-work at-risk-of poverty rate 5.8 4.4 4.5 4.7 5.0 5.1 5.4 8.4 8.9
Impact of social transfers on poverty
reduction (excl. pensions)(in%) 53,8 55,7 55,3 50,0 49,3 53,5 51,6 38,7 37,0
At risk of poverty or social exclusion 6,4 6,4 9,8 9,7 8,1 6,2 6,9 20,0 20.5
At-Risk-of-Poverty rate 5,4 5,8 9,5 9,4 7,7 5,9 6,5 16.0 16.0
Severe Material Deprivation rate 1,2 0,7 0,7 0,4 0,4 0,3 0,4 6,6 7.2
Relative median income ratio of elderly 0.88 (b) 0.87 0.83 0.84 0.86 0.87 0.87 0.88 0.89
Aggregate replacement ratio 0.43 0.43 0.43 0.43 0.44 0.47 0.46 0.53 0.54
2000 2005 2006 2007 2008 2009 2010 2009 2010
Sickness/Health care 7,3 8,0 8,8 8,6 9,4 10,4 10,6 8,4 8,3
Invalidity 2,9 2,5 2,4 2,4 2,4 2,5 2,5 2,3 2,2
Old age and survivors 10,5 11,1 10,9 10,9 10,9 11,6 11,8 12,7 12,7
Family/Children 1,1 1,3 1,5 1,6 1,2 1,3 1,2 2,3 2,3
Unemployment 1,3 1,6 1,4 1,1 1,0 1,4 1,6 1,8 1,7
Housing and Social exclusion n.e.c. 1,7 1,6 2,1 2,1 2,1 2,4 2,4 1,0 1,0
Total 24,7 26,0 27,0 26,7 26,9 29,7 30,2 28,5 28,2
Means-tested
Sickness/Health care 0,0 0,0 0,0 0,0 0,1 0,1 0,0 0,1 0,1
Invalidity 0,1 0,0 0,1 0,4 0,4 0,5 0,5 0,5 0,5
Old age and survivors 0,7 0,9 0,8 0,9 0,9 0,9 1,0 0,6 0,6
Family/Children 0,0 0,1 0,0 0,0 0,2 0,2 0,2 0,6 0,6
Unemployment 0,6 0,5 0,4 0,4 0,3 0,4 0,5 0,4 0,4
Housing and Social exclusion n.e.c. 1,7 1,6 2,1 2,1 2,1 2,4 2,4 0,9 1,0
Total 3,0 3,1 3,4 3,7 3,9 4,5 4,6 3,0 3,1
Non-means tested
Sickness/Health care 7,3 8,0 8,8 8,6 9,3 10,3 10,6 8,3 8,2
Invalidity 2,8 2,5 2,3 2,0 2,0 2,0 2,0 1,8 1,8
Old age and survivors 9,8 10,2 10,1 10,0 10,0 10,7 10,8 12,1 12,1
Family/Children 1,1 1,1 1,4 1,5 1,0 1,1 1,1 1,7 1,7
Unemployment 0,7 1,1 0,9 0,8 0,7 1,0 1,1 1,4 1,3
Housing and Social exclusion n.e.c. 0,0 0,0 0,0 0,0 0,0 0,0 0,0 0,1 0,1
Total 21,7 22,9 23,6 23,0 23,0 25,2 25,6 25,4 25,2
Elderly (65+)
Social expenditure
(in % of GDP)
EU27
Children (0-17)
Working age
(18-64)
Total population
Source: Eurostat (EU-SILC, ESSPROS for social expenditure data)
Note: For non-means tested the aggregation Housing and Social Exclusion n.e.c is based only on
Housing. The total figures of social expenditure include all benefits excluding administrative costs.
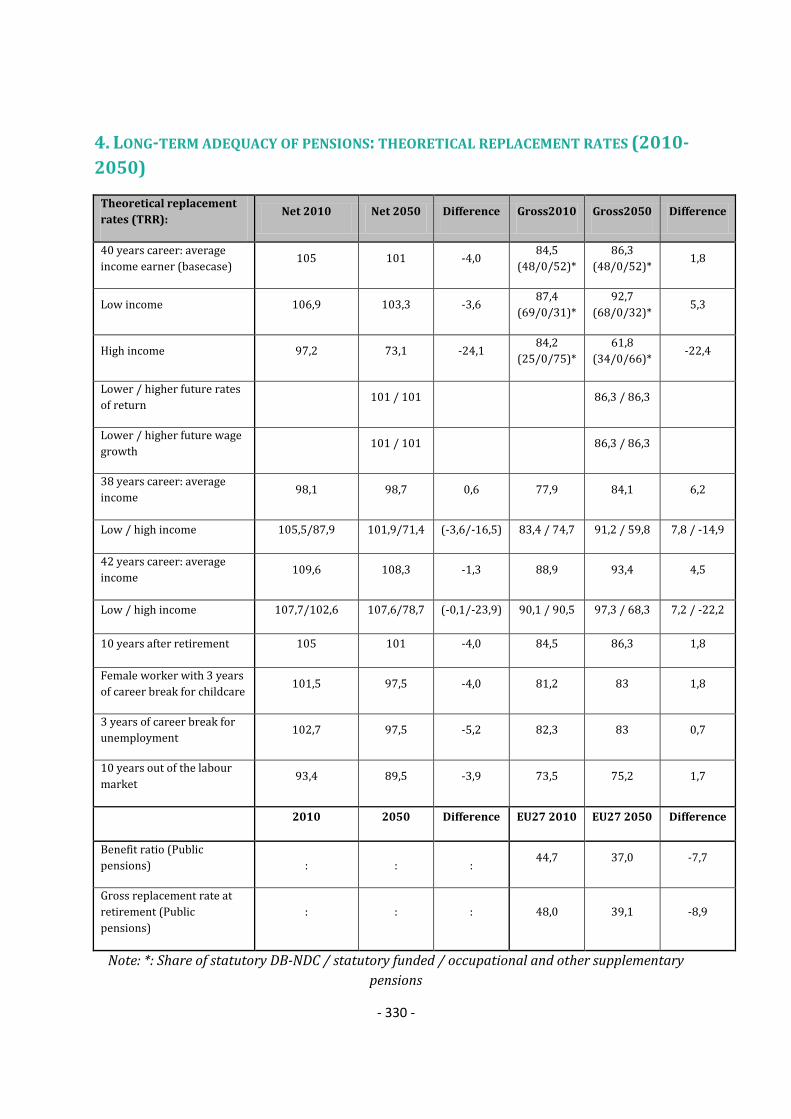
- 330 -
4. LONG-TERM ADEQUACY OF PENSIONS: THEORETICAL REPLACEMENT RATES (2010-
2050)
Theoretical replacement
rates (TRR): Net 2010 Net 2050 Difference Gross2010 Gross2050 Difference
40 years career: average
income earner (basecase) 105 101 -4,0
84,5
(48/0/52)*
86,3
(48/0/52)* 1,8
Low income 106,9 103,3 -3,6 87,4
(69/0/31)*
92,7
(68/0/32)* 5,3
High income 97,2 73,1 -24,1 84,2
(25/0/75)*
61,8
(34/0/66)* -22,4
Lower / higher future rates
of return 101 / 101 86,3 / 86,3
Lower / higher future wage
growth 101 / 101 86,3 / 86,3
38 years career: average
income 98,1 98,7 0,6 77,9 84,1 6,2
Low / high income 105,5/87,9 101,9/71,4 (-3,6/-16,5) 83,4 / 74,7 91,2 / 59,8 7,8 / -14,9
42 years career: average
income 109,6 108,3 -1,3 88,9 93,4 4,5
Low / high income 107,7/102,6 107,6/78,7 (-0,1/-23,9) 90,1 / 90,5 97,3 / 68,3 7,2 / -22,2
10 years after retirement 105 101 -4,0 84,5 86,3 1,8
Female worker with 3 years
of career break for childcare 101,5 97,5 -4,0 81,2 83 1,8
3 years of career break for
unemployment 102,7 97,5 -5,2 82,3 83 0,7
10 years out of the labour
market 93,4 89,5 -3,9 73,5 75,2 1,7
2010 2050 Difference EU27 2010 EU27 2050 Difference
Benefit ratio (Public
pensions) : : : 44,7 37,0 -7,7
Gross replacement rate at
retirement (Public
pensions)
: : : 48,0 39,1 -8,9
Note: *: Share of statutory DB-NDC / statutory funded / occupational and other supplementary
pensions

- 331 -
Source: Joint SPC/EC report on Pension Adequacy in the European Union (2010-2050)
5. KEY CONTEXT MACRO-ECONOMIC INFORMATION
Source: Eurostat, National Accounts and EU LFS. ECFIN autumn economic forecast 2012 for 2012-
2014.
Note: Data on social protection expenditure comes from the AMECO database ( it is calculated as
the sum of Social benefits other than social transfers in kind; general government - ESA 1995 +
Social transfers in kind - ESA 1995)
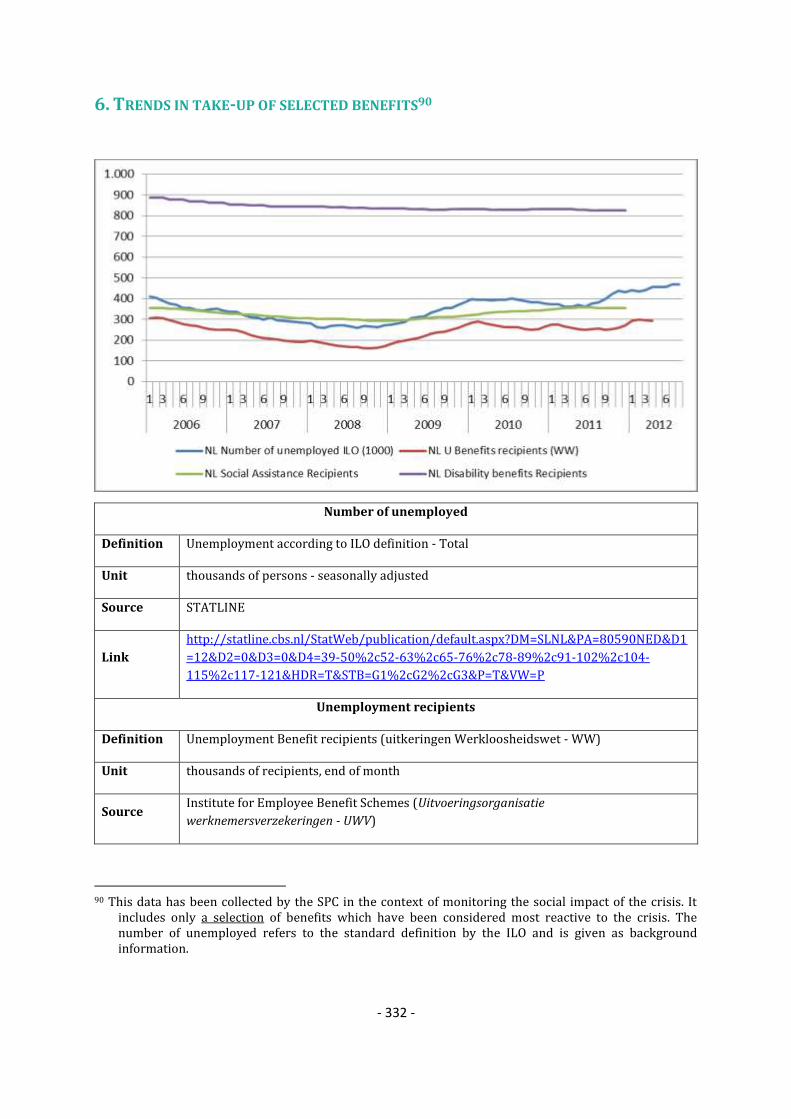
- 332 -
6. TRENDS IN TAKE-UP OF SELECTED BENEFITS90
Number of unemployed
Definition Unemployment according to ILO definition - Total
Unit thousands of persons - seasonally adjusted
Source STATLINE
Link
http://statline.cbs.nl/StatWeb/publication/default.aspx?DM=SLNL&PA=80590NED&D1
=12&D2=0&D3=0&D4=39-50%2c52-63%2c65-76%2c78-89%2c91-102%2c104-
115%2c117-121&HDR=T&STB=G1%2cG2%2cG3&P=T&VW=P
Unemployment recipients
Definition Unemployment Benefit recipients (uitkeringen Werkloosheidswet - WW)
Unit thousands of recipients, end of month
Source Institute for Employee Benefit Schemes (Uitvoeringsorganisatie
werknemersverzekeringen - UWV)
90 This data has been collected by the SPC in the context of monitoring the social impact of the crisis. It
includes only a selection of benefits which have been considered most reactive to the crisis. The number of unemployed refers to the standard definition by the ILO and is given as background information.

- 333 -
Link http://statline.cbs.nl/StatWeb/publication/?DM=SLNL&PA=37506WWM&D1=0&D2=0
&D3=0&D4=96-171&HDR=T&STB=G1,G2,G3&VW=T
Recipients of social assistance benefits/means-tested minimum Income
Definition Social assistance recipients, younger than 65 years of age (uitkeringen Wet Werk en
Bijstand (WWB) en Wet Investeren in Jongeren (WIJ), jonger dan 65 jaar)
Unit thousands of recipients, end of month
Source Statistics Netherlands (Centraal Bureau voor de Statistiek - CBS)
Link http://statline.cbs.nl/StatWeb/publication/?DM=SLNL&PA=80724NED&D1=0&D2=0&
D3=0&D4=0&D5=96-167&VW=T
Disability benefits recipients
Definition Disability benefit recipients (uitkeringen Arbeidsongeschiktheidswetten - AO)
Unit thousands of recipients, end of month
Source Institute for Employee Benefit Schemes (Uitvoeringsorganisatie
werknemersverzekeringen - UWV)
Link http://statline.cbs.nl/StatWeb/publication/default.aspx?DM=SLNL&PA=80903NED&D1=0&D2=
0&D3=0&D4=0&D5=0&D6=0&D7=a&HDR=T&STB=G1%2cG2%2cG3%2cG4%2cG5%2cG6&P=T
&VW=P

- 334 -
7. SUMMARY OF SPECIFIC KEY SOCIAL CHALLENGES AND PARTICULARLY GOOD SOCIAL
OUTCOMES
Social policy areas Challenges
Poverty and social inclusion Labour market participation: promoting active inclusion,
especially of vulnerable groups (older people, women,
people with disabilities and migrants), to prevent poverty
and social exclusion
Mismatch of social housing rents and household income
Pensions Low statutory retirement age: a need to link it to life
expectancy
Low effective retirement age
Mismatch between second pension pillar and the increase in
the statutory retirement age
Health and long-term care Limit structural expenditure growth in hospital health care
Decrease % of LTC expenditure of the GNP
Decentralization of LTC to local authorities
Tightening the eligibility criteria.
Particularly good social outcomes
Good progress in ensuring high labour market participation
for older workers
Some progress in improving healthy life years at 65 for
males

- 335 -
AUSTRIA
1. 2012 NATIONAL SOCIAL REPORT (NSR): KEY ISSUES
Austria's labour market performance and most social inclusion indicators generally present a
rather favourable picture. However, women are over-represented in low-wage and part-time
employment, which leads to higher poverty rates especially in old-age. The low-skilled, who
represent about half of the unemployed, and migrants also face a relatively high poverty risk. In
this context, the strong influence of socio-economic background on education achievements is a
challenge. The employment rate of older workers is low, as is the effective retirement age, but
increased slightly over the last years. While the health system generally provides relatively
equal access to high quality services, increasing efficiency to ensure the financial sustainability is
a challenge.
In all policy areas covered by the NSR, Austria has well developed structures for consulting all
relevant stakeholders. They have, however, not directly been consulted on the NSR itself.
The main socio-economic priorities identified by the report are (i) inclusion of people furthest
from the labour market, ensuring affordable access to high quality services and maintaining the
good social safety net, (ii) increasing the effective retirement age by promoting health at the
workplace, reforming early retirement schemes, and by prioritising prevention, (iii) establishing
healthcare framework targets, reforming the governance of the healthcare system, focussing on
health promotion and prevention, and (iv) sustainable financing and quality of long-term care.
Overall, the priorities chosen address the challenges identified by the Commission91. In the area
of pensions, however, the recommended earlier harmonisation of statutory retirement age
between men and women and linking the latter to life expectancy are not addressed. Another
issue omitted in the NSR but included in the NRP is the high inter-generational transmission of
educational attainment and achievement gaps between young people with a migrant
background compared to natives.
Austria has a tradition in focussing on (re-)integration into the labour market as a preferred way
of combating or preventing poverty and social exclusion. Active labour market policies also
aim at combating in-work poverty. Measures focus on improved employment opportunities,
qualification and counselling especially for long-term unemployed, disadvantaged groups,
migrants and women. An expansion of childcare facilities and all-day care at school is also
foreseen. According to the NSR, the objective must be that all parents in AT shall have the
opportunity of working full-time. Rather comprehensive policies aim at preventing youth
unemployment, notably through an education and training guarantee and apprenticeship
coaching. To keep older people longer in employment, schemes to prevent incapacity to work
and in-work top-up benefits have been launched. PES measures have recently been expanded to
recipients of means-tested minimum income. To promote life-long learning, financial support for
91 SWD(2012) 306 final
- 336 -
further education or training leave is available, and a new type of qualification bonus for
participation in longer-term trainings has recently been introduced.
Austria’s main driver for reforming the pension system is to meet the challenge of demographic
ageing and to ensure adequate pensions for all. The reform measures focus on raising the
effective retirement age mainly by reducing the inflow into early exit channels and keeping
people longer in employment. In reaction to last year’s CSR on pensions, the government has
enacted reforms to restrict access to the early retirement scheme with deductions, as well as to
the invalidity pension scheme for people under 50. These reforms go hand in hand with a
weakening of vocational protection and the introduction of a more streamlined system for
assessing applications for invalidity pensions.
In June 2012 new long-term healthcare framework targets were decided and the cornerstones
of the planned hospital and healthcare reform were agreed upon by the relevant stakeholders at
the end of December 2012. This reform concerns the distribution of responsibilities between the
national and regional administrations and social security institutions. Access was improved
through a transparent waiting list management in 2011 and the inclusion of recipients of the
means-tested minimum income in the regular healthcare insurance. An Austrian Quality
Strategy was agreed between the relevant actors in 2010. A sickness insurance fund package
was adopted in 2011 to ensure stable finances. Measures of containing drug costs have shown
first positive results.
For long-term care, a new fund was created as an interim solution to cover the rising costs in
this area in the period 2011 to 2016, and a working group is to deliver proposals for long-term
financing by the end of 2012. In 2011, a re-organisation of competencies for the payment of cash
benefits led to a substantial reduction of involved institutions from 303 to 7. Measures aiming at
improving the quality of care are continued.
Important challenges for Austria in the three OMC policy areas are the relatively high at-risk-
of-poverty rate of women and the low skilled, as well as in-work poverty and the strong
influence of socio-economic background on educational attainment. Another main challenge lies
in raising the effective retirement age in order to ensure financial sustainability and adequacy of
the pension system. Furthermore, it is important to enhance health prevention and increase
efficiency in the health system through integrated planning, monitoring and financing, and to
develop a sustainable model for financing long-term care services.
While the Austrian social inclusion policies focus on relatively ambitious and relevant measures
to support labour market integration, they do not convincingly address the quality of work and
inequalities in education. Recent reforms regarding pensions go into the right direction but it is
questionable if they fully match the demographic challenges. In health and long-term care, there
has been some recent progress in developing solutions, although the necessary reforms are still
to be decided and implemented.
The NSR provides added value to the NRP, as it presents a more detailed analysis based on
national indicators, which were developed in addition to the ones used by EUROSTAT. The NSR
also covers health and long-term care in detail, which is not the case in the NRP.

- 337 -
2. NATIONAL 2020 TARGET FOR THE REDUCTION OF POVERTY AND SOCIAL EXCLUSION
"To reduce the number of individuals living in poverty or at risk of poverty within the next ten
years by at least 235,000."
National Reform Programme (2012)
2a. Progress towards the 2020 national target for the reduction of poverty and
social exclusion
Source: Eurostat (EU-SILC)
Note: i) Progress on the target is monitored on the basis of the EU SILC data with a base year 2008 and
target data year 2018;
ii) AROPE - at-risk-of-poverty or social exclusion rate; AROP - at-risk-of-poverty rate; VLWI - share of
population living in very low work intensity households; SMD - severe material deprivation rate;
iii) For the at-risk-of poverty rate (AROP), the income reference year is the calendar year prior to the
survey year (i.e. 2010) except for the United Kingdom (survey year) and Ireland (12 months preceding the
survey). Similarly, the very low work intensity rate (VLWI) refers to the income reference year prior to the
survey (i.e. 2010) while for the severe material deprivation rate (SMD), the reference is the current year (i.e.
2011).

- 338 -
2b. Composition of the population at risk of poverty or social exclusion (2011)
Source: Eurostat (EU-SILC)
Note: i) Progress on the target is monitored on the basis of the EU SILC data with a base year 2008 and
target data year 2018;
ii) AROPE - at-risk-of-poverty or social exclusion rate; AROP - at-risk-of-poverty rate; VLWI - share of
population living in very low work intensity households; SMD - severe material deprivation rate;
iii) For the at-risk-of poverty rate (AROP), the income reference year is the calendar year prior to the
survey year (i.e. 2010) except for the United Kingdom (survey year) and Ireland (12 months preceding the
survey). Similarly, the very low work intensity rate (VLWI) refers to the income reference year prior to the
survey (i.e. 2010) while for the severe material deprivation rate (SMD), the reference is the current year (i.e.
2011).
Austria 2005 2006 2007 2008 2009 2010 2011
AROP total % of total pln 12,3 12,6 12,0 12,4 12,0 12,1 12,6
1000 persons 1.005 1.027 986 1.018 993 1.004 1.051
VLWI total % of total pln 6,5 8,0 8,1 7,8 7,2 7,7 8,0
1000 persons 418 516 523 503 461 497 519
SMD total % of total pln 3,0 3,6 3,3 6,4 4,8 4,3 3,9
1000 persons 248 293 269 524 395 356 325
AROP +VLWI total
% of total pln 1,8 2,0 1,9 1,6 1,5 2,0 2,2
1000 persons 145 164 157 136 121 166 181
AROP + SMD % of total pln 0,8 0,6 0,8 1,3 1,3 1,2 1,0
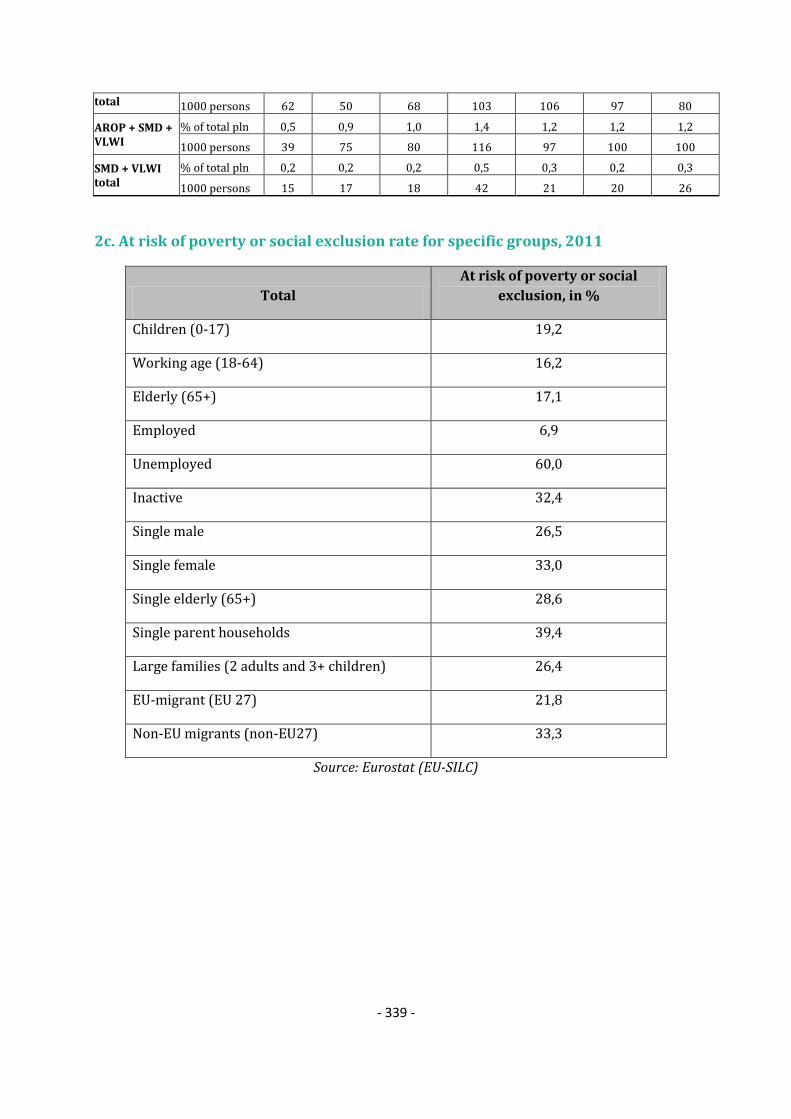
- 339 -
total 1000 persons 62 50 68 103 106 97 80
AROP + SMD + VLWI
% of total pln 0,5 0,9 1,0 1,4 1,2 1,2 1,2
1000 persons 39 75 80 116 97 100 100
SMD + VLWI total
% of total pln 0,2 0,2 0,2 0,5 0,3 0,2 0,3
1000 persons 15 17 18 42 21 20 26
2c. At risk of poverty or social exclusion rate for specific groups, 2011
Total
At risk of poverty or social
exclusion, in %
Children (0-17) 19,2
Working age (18-64) 16,2
Elderly (65+) 17,1
Employed 6,9
Unemployed 60,0
Inactive 32,4
Single male 26,5
Single female 33,0
Single elderly (65+) 28,6
Single parent households 39,4
Large families (2 adults and 3+ children) 26,4
EU-migrant (EU 27) 21,8
Non-EU migrants (non-EU27) 33,3
Source: Eurostat (EU-SILC)

- 340 -
3. MAIN SOCIAL INDICATORS
AT % 2005 2006 2007 2008 2009 2010 2011 2010 2011
At risk of poverty or social exclusion 16,8 17,8 16,7 18,6 17,0 16,6 16,9 23,6 24.2
At-Risk-of-Poverty rate 12,3 12,6 12,0 12,4 12,0 12,1 12,6 16.4 16.9
Severe Material Deprivation rate 3,0 3,6 3,3 6,4 4,8 4,3 3,9 8,3 8.8
Share of people living in very low work
intensity households 6,5 8,0 8,1 7,8 7,2 7,7 8,0 10.0 10.0
Impact of social transfers on poverty
reduction (excl. pensions)(in%)49,6 49,8 51,4 49,4 50,2 49,8 49,4
36,7 35,2
Value of threshold (single HH) - in PPS 10.458 10.452 10.686 11.124 11.315 11.451 12.035 N/A N/A
Value of threshold (2 adults + 2 children) -
in PPS 21.961 21.950 22.441 23.359 23.761 24.047 25.274 N/A N/A
At risk of poverty or social exclusion 18,5 19,3 18,5 20,4 17,5 18,8 19,2 27,1 27.0
At-Risk-of-Poverty rate 14,9 14,7 14,8 14,9 13,4 14,3 15,4 20.5 20.6
Severe Material Deprivation rate 3,6 4,2 3,7 7,3 5,6 5,7 5,6 9,7 10.0
Share of people living in very low work
intensity households 4,7 7,0 6,2 5,8 5,9 6,0 6,7 9.1 8.8
Impact of social transfers on poverty
reduction (excl. pensions) 58,5 59,9 59,0 58,7 62,9 61,1 57,9 41,4 40,5
At risk of poverty or social exclusion 16,5 17,4 16,7 18,4 17,1 16,1 16,2 23,5 24.3
At-Risk-of-Poverty rate 11,1 11,0 10,6 10,9 10,8 10,7 11,0 15.2 16.0
Severe Material Deprivation rate 3,1 3,8 3,4 6,6 5,0 4,5 3,9 8,3 8.9
Share of people living in very low work
intensity households (18-59) 7,2 8,4 8,8 8,4 7,6 8,3 8,5 10.3 10,5
In-work at-risk-of poverty rate 6,7 6,3 6,1 6,4 6,0 5,0 5,4 8.4 8.9
Impact of social transfers on poverty
reduction (excl. pensions) 51,3 52,6 54,5 52,4 51,1 51,8 52,8 38,7 37,0
At risk of poverty or social exclusion 15,9 17,3 15,1 17,3 16,4 15,8 20,0 20.5
At-Risk-of-Poverty rate 14,3 16,2 14,0 15,0 15,1 15,2 16,0 16.0 16.0
Severe Material Deprivation rate 2,1 2,1 2,1 4,4 2,8 2,0 2,0 6,6 7.2
Relative median income ratio of elderly 0,95 0,94 0,93 0,92 0,91 0,91 0,93 0.88 0.89
Aggregate replacement ratio 0.68 0.65 0.62 0.68 0.64 0.64 0.53 0.54
2000 2005 2006 2007 2008 2009 2010 2009 2010
Sickness/Health care 7,0 7,1 6,9 7,0 7,2 7,6 7,4 8,4 8,3
Invalidity 2,7 2,4 2,3 2,2 2,1 2,3 2,2 2,3 2,2
Old age and survivors 13,2 13,4 13,3 13,2 13,6 14,6 14,6 12,7 12,7
Family/Children 2,9 3,0 2,8 2,7 2,8 3,1 3,1 2,3 2,3
Unemployment 1,3 1,6 1,6 1,4 1,4 1,7 1,7 1,8 1,7
Housing and Social exclusion n.e.c. 0,3 0,4 0,4 0,4 0,4 0,4 0,4 1,0 1,0
Total 27,4 27,8 27,4 26,9 27,6 29,7 29,5 28,5 28,2
Means-tested
Sickness/Health care 0,1 0,1 0,1 0,1 0,1 0,1 0,1 0,1 0,1
Invalidity 0,2 0,3 0,3 0,3 0,4 0,4 0,5 0,5 0,5
Old age and survivors 0,7 0,6 0,6 0,6 0,7 0,7 0,7 0,6 0,6
Family/Children 0,2 0,2 0,2 0,2 0,2 0,2 0,3 0,6 0,6
Unemployment 0,3 0,3 0,3 0,2 0,2 0,3 0,3 0,4 0,4
Housing and Social exclusion n.e.c. 0,2 0,3 0,3 0,3 0,3 0,4 0,4 0,9 1,0
Total 1,7 1,8 1,9 1,8 1,9 2,1 2,1 3,0 3,1
Non-means tested
Sickness/Health care 6,9 7,0 6,9 6,9 7,2 7,5 7,4 8,3 8,2
Invalidity 2,4 2,1 2,0 1,8 1,8 1,8 1,8 1,8 1,8
Old age and survivors 12,5 12,8 12,7 12,6 12,9 13,9 13,9 12,1 12,1
Family/Children 2,7 2,7 2,6 2,5 2,6 2,8 2,8 1,7 1,7
Unemployment 1,1 1,3 1,3 1,2 1,2 1,5 1,4 1,4 1,3
Housing and Social exclusion n.e.c. 0,1 0,1 0,1 0,1 0,1 0,1 0,1 0,1 0,1
Total 25,7 26,0 25,5 25,1 25,7 27,6 27,4 25,4 25,2
Elderly (65+)
Social
expenditure (in
% of GDP)
EU27
Children (0-17)
Working age
(18-64)
Total population
Source: Eurostat (EU-SILC, ESSPROS for social expenditure data)

- 341 -
Note: For non-means tested the aggregation Housing and Social Exclusion n.e.c is based only on
Housing. The total figures of social expenditure include all benefits excluding administrative costs.
4. LONG-TERM ADEQUACY OF PENSIONS: THEORETICAL REPLACEMENT RATES (2010-
2050)
Theoretical replacement rates (TRR): Net
2010
Net
2050 Difference Gross2010 Gross2050 Difference
40 years career: average income earner
(basecase) 85 88,7 3,7
69,9
(100/0/0)*
68,8
(100/0/0)* -1,1
Low income 83,7 83,8 0,1 69,9
(100/0/0)*
68,8
(100/0/0)* -1,1
High income 77,2 72,1 -5,1 63,9
(100/0/0)*
51,8
(100/0/0)* -12,1
Lower / higher future rates of return 88,7 /
88,7 68,8 / 68,8
Lower / higher future wage growth 87 / 89,4 69,1 / 68,2
38 years career: average income 77,2 79,3 2,1 60,7 59,5 -1,2
Low / high income 73 / 68,2 75 / 64,8 ( - 2 / -3,4) 59,7 / 54 59,9 / 45,5 ( 0,2 / -8,5)
42 years career: average income 87,9 97,7 9,8 73,4 78,3 4,9
Low / high income 88 / 80,4 95,5 /
80,4 ( - 7,5 / 0) 71,9 / 66,5 78,3 / 59,2
( - 6,4 / -
7,3)
10 years after retirement 75,2 80,3 5,1 60,4 59,4 -1,0
Female worker with 3 years of career
break for childcare 83 87,9 4,9 67,5 67,9 0,4
3 years of career break for
unemployment 84,4 86,8 2,4 69,2 66,8 -2,4
10 years out of the labour market 70,1 70,7 0,6 52,5 51,6 -0,9
2010 2050 Difference EU27
2010
EU27
2050 Difference
Benefit ratio (Public pensions) 42,3 36,5 -5,8 44,7 37,0 -7,7
Gross replacement rate at retirement
(Public pensions) 47,7 40,3 -7,5 48,0 39,1 -8,9
Note: *: Share of statutory DB-NDC / statutory funded / occupational and other supplementary
pensions
Source: Joint SPC/EC report on Pension Adequacy in the European Union (2010-2050)
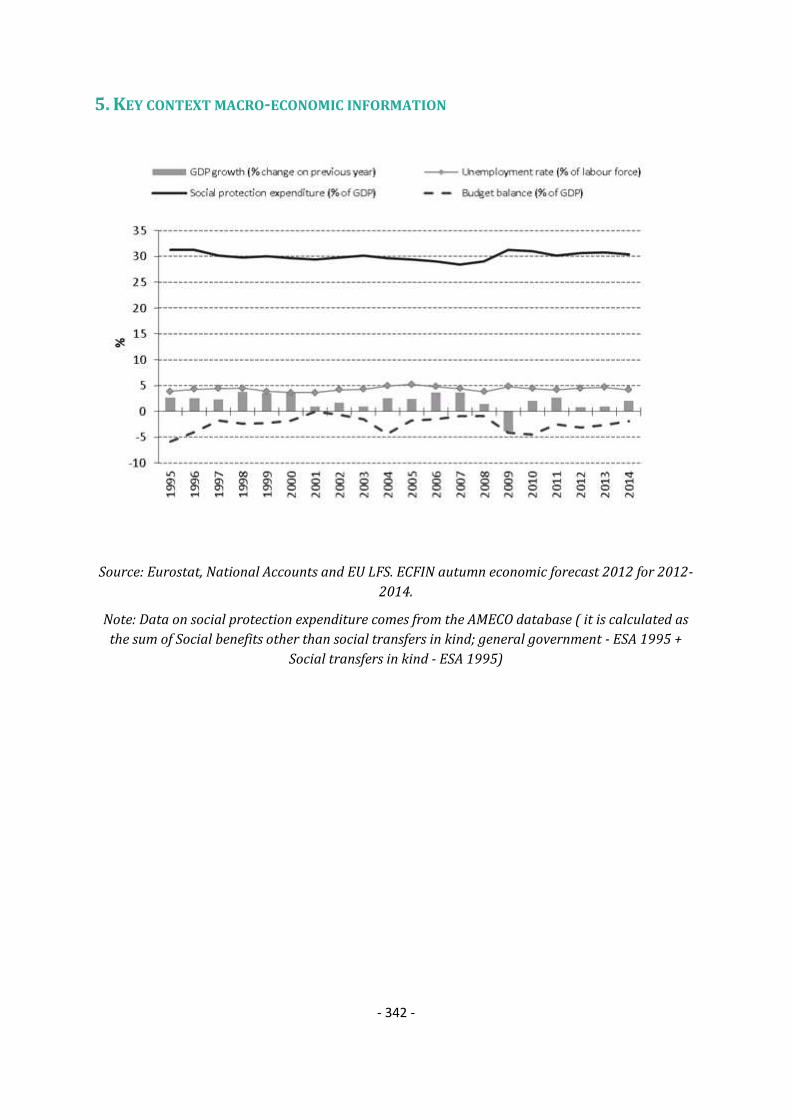
- 342 -
5. KEY CONTEXT MACRO-ECONOMIC INFORMATION
Source: Eurostat, National Accounts and EU LFS. ECFIN autumn economic forecast 2012 for 2012-
2014.
Note: Data on social protection expenditure comes from the AMECO database ( it is calculated as
the sum of Social benefits other than social transfers in kind; general government - ESA 1995 +
Social transfers in kind - ESA 1995)

- 343 -
6. TRENDS IN TAKE-UP OF SELECTED BENEFITS92
Recipients of social assistance benefits/means-tested minimum Income*
Quarterly data (changes in % to the year
2008):
Q1 09 4.7% Q1 10 9.8% - -
Q2 09 7.1% - - - -
Q3 09 10.6% Q3 10 11,0% Q3 11 27,0%
Q4 09 8.7% - - Q4 11 37,0%
*The increase between 2010 and 2011 can mainly be explained by the
introduction of the means-tested minimum income scheme, reinforced
information policy as well as statistical improvements
92 This data has been collected by the SPC in the context of monitoring the social impact of the crisis. It
includes only a selection of benefits which have been considered most reactive to the crisis. The number of unemployed refers to the standard definition by the ILO and is given as background information.

- 344 -
Unemployment recipients
Definition Unemployment Benefit recipients ; Unemployment assistance recipients
Unit thousands of recipients
Source Public Employment Service Austria (AMS)
Comment
An unemployed person is defined as someone without employment who has registered as seeking
work with the public employment service (AMS) and is both willing and able to work. Claims for
transfer payments can only be made by those who have made employment insurance contributions
for an appropriate period. For example, those who have interrupted their working careers for a long
period of time (in particular returners) and school leavers receive no unemployment insurance
benefit. In order to receive benefit a person must be registered with the AMS. To be entitled to claim
unemployment benefit, a person must be able and willing to work, available for work but
unemployed and have been in insured employment for the appropriate qualifying period.
Unemployment assistance, which is payable on expiry of entitlement to unemployment benefit,
combines the principles of social insurance and welfare. Firstly, the rate of the income support is
calculated on the basis of the unemployment benefit previously received. Secondly, applicants must
be in serious need of financial support, after taking the income of the partner and exemption limits
into account.
Recipients of social assistance benefits/means-tested minimum Income
Definition Number of recipients of Social Assistance Benefits/means-tested minimum income
Unit quarterly data (changes in % to the previous year)
Source Social Departments of the Federal Provinces
Comment
Figures include between six and nine Federal Provinces; the data of the cities with municipal
departments is missing in one of them. The provinces register very diverse trends. - Social assistance
is defined, implemented and administered by the Federal Provinces (Bundesländer); according to
the Austrian Constitution each province has its own Social Assistance Act, but there are some
common basic principles: social assistance is granted in individual situations of need if a person’s
own resources and payments from third parties are no longer sufficient to allow for a decent way of
life. Eligibility depends on household resources; other relatives have a duty under family law to
provide financial support. All resources are considered in the means and income test (apart from
family benefits). In order to realize the objective of combating poverty in all relevant fields of policy,
a means-tested minimum income has been introduced as a reform of the social assistance scheme.
The federal government and the provincial governments laid down the salient points of a means-
tested minimum income which has been subsequently implemented in the corresponding national
and provincial legislation. Since the 1st of September 2010 the laws for the means-tested minimum
income were introduced in in 7 of 9 federal provinces. The other two provinces have introduced the
minimum income scheme until October 2011.
Disability benefits recipients
Definition Disability benefit recipients
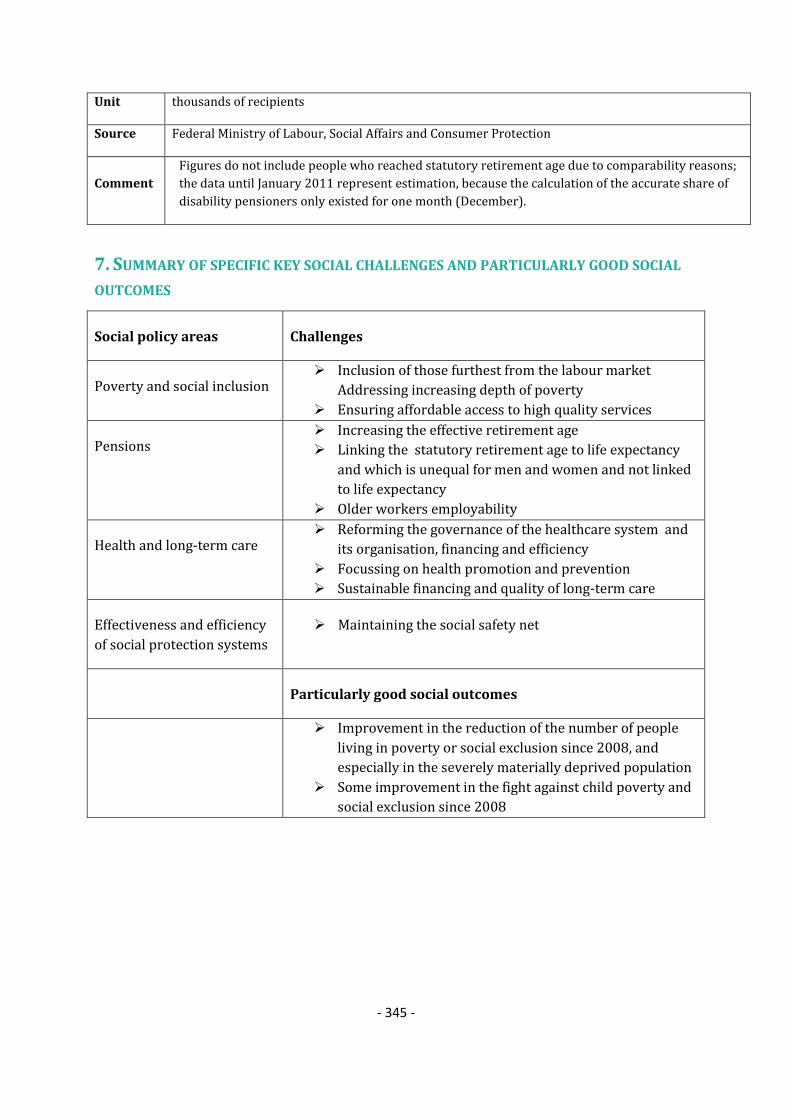
- 345 -
Unit thousands of recipients
Source Federal Ministry of Labour, Social Affairs and Consumer Protection
Comment
Figures do not include people who reached statutory retirement age due to comparability reasons;
the data until January 2011 represent estimation, because the calculation of the accurate share of
disability pensioners only existed for one month (December).
7. SUMMARY OF SPECIFIC KEY SOCIAL CHALLENGES AND PARTICULARLY GOOD SOCIAL
OUTCOMES
Social policy areas Challenges
Poverty and social inclusion Inclusion of those furthest from the labour market
Addressing increasing depth of poverty
Ensuring affordable access to high quality services
Pensions Increasing the effective retirement age
Linking the statutory retirement age to life expectancy
and which is unequal for men and women and not linked
to life expectancy
Older workers employability
Health and long-term care Reforming the governance of the healthcare system and
its organisation, financing and efficiency
Focussing on health promotion and prevention
Sustainable financing and quality of long-term care
Effectiveness and efficiency
of social protection systems
Maintaining the social safety net
Particularly good social outcomes
Improvement in the reduction of the number of people
living in poverty or social exclusion since 2008, and
especially in the severely materially deprived population
Some improvement in the fight against child poverty and
social exclusion since 2008
- 346 -
POLAND
1. 2012 NATIONAL SOCIAL REPORT (NSR): KEY ISSUES
Poland faces a number of socio-economic challenges. The budgetary deficit (5.0% in 2011) has
to be further reduced in order to achieve long-term sustainability of public finances. A very low
labour force participation rate (64.8%), especially among older workers (36.9%) and women
(57.6%), is another major concern in the medium to long term. Increasing youth unemployment
(25.8%) is still to be tackled. Poverty and social exclusion, in particular among children (29.8%),
need further efforts. Access to work remains only a partial remedy to reduce poverty as the level
of in-work poverty is high (11.1%).
The NSR does not explicitly identify main socio-economic priorities. The document concentrates
rather on the measures undertaken to reduce negative effects of demographic changes and to
ensure financial stability of both pension and health care systems. Some measures are being
implemented to facilitate access of young people to the labour market and to support labour
mobility. In relation to the ageing of population and increase of the retirement age, the Report
underlines the necessity of providing the adequate health care infrastructure.
Financial stability of the pension system and adequacy of pensions are considered as the main
priorities to guarantee the equilibrium of public finances. Poland addressed the 2011 Country
Specific Recommendation by adopting in May 2012 a pension reform and raising the statutory
retirement age to 67, for men by 2020 and for women by 2040. Further changes foresee
harmonisation of the length of the retirement insurance entitling to the lowest pension, changes
in the principles for calculation of a possible disability pension and a pension in case of receiving
benefits prior to achieving the retirement age. New measures are planned to cover pension
contribution of self-employed women from the state budget during their maternity leave. Polish
government plans also a reform of the Agricultural Social Insurance Fund (KRUS). In order to
safeguard the financial stability of the pension system, Poland decreased (from 7.3% to 2.3%)
pension contributions paid to the second pillar (open pension funds managed by private
investment companies). The main argument was to lower the budget subsidies to the pension
system and thus to lower the public debt. As a compensation of the reduction of the pension
system’s funded part, a new incentive in the form of partial exempt of income tax for the non-
compulsory contribution payments on saving accounts was introduced.
In terms of healthcare system the Report identifies priorities arising from the ageing of
population: geriatric care, long-term care and special care of dependent persons. The Strategy of
Development of Geriatric Care System was prepared to improve adequacy of measures, a new
'white profession' of health care assistant as a part of the medical staff was created and better
co-ordination of complex care is planned to meet standards and objectives of National Health
Programme for 2007-2015 and Health Development Strategy 2007-2013. Both the Ministry of
Health and the Polish Parliament are preparing legislation to improve the structural efficiency
and financial sustainability of the health care and long-term care system and to establish a new
Care Provisions Fund for the persons reliant on care.

- 347 -
The main challenges for Poland include: (i) reducing poverty, in particular among children,
through a coherent active inclusion policy; (ii) decreasing in-work poverty through i.a. ensuring
adequate income support; (iii) creating conditions for healthy and active ageing, especially in the
context of the reforms of the pension and health care systems.
Poland set out an ambitious poverty reduction target of 1.5 million people by 2020.
2. NATIONAL 2020 TARGET FOR THE REDUCTION OF POVERTY AND SOCIAL EXCLUSION
"Lowering of people at risk of poverty and/or exclusion and/or living in households of working
people or of low labour intensity by 1.5 million"
Source: National Reform Programme (2011)
2a. Progress towards the 2020 national target for the reduction of poverty and
social
exclusion
Source: Eurostat (EU-SILC)
Note: i) Progress on the target is monitored on the basis of the EU SILC data with a base year 2008 and
target data year 2018;
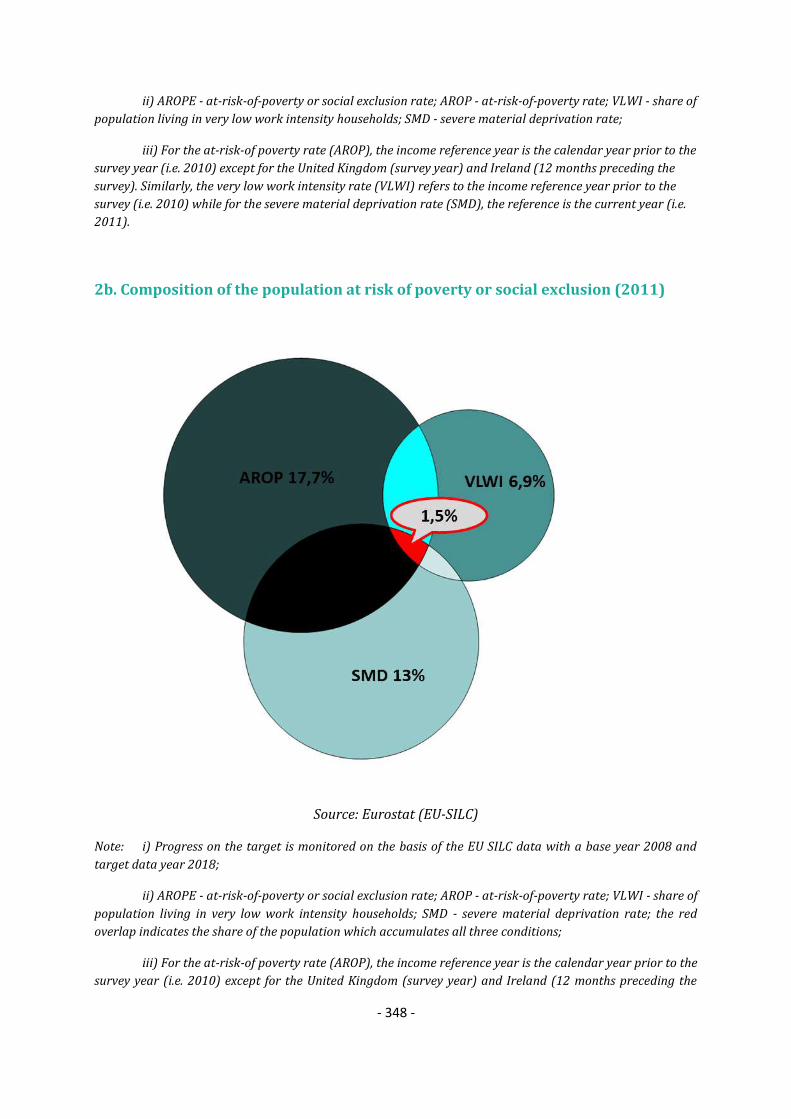
- 348 -
ii) AROPE - at-risk-of-poverty or social exclusion rate; AROP - at-risk-of-poverty rate; VLWI - share of
population living in very low work intensity households; SMD - severe material deprivation rate;
iii) For the at-risk-of poverty rate (AROP), the income reference year is the calendar year prior to the
survey year (i.e. 2010) except for the United Kingdom (survey year) and Ireland (12 months preceding the
survey). Similarly, the very low work intensity rate (VLWI) refers to the income reference year prior to the
survey (i.e. 2010) while for the severe material deprivation rate (SMD), the reference is the current year (i.e.
2011).
2b. Composition of the population at risk of poverty or social exclusion (2011)
Source: Eurostat (EU-SILC)
Note: i) Progress on the target is monitored on the basis of the EU SILC data with a base year 2008 and
target data year 2018;
ii) AROPE - at-risk-of-poverty or social exclusion rate; AROP - at-risk-of-poverty rate; VLWI - share of
population living in very low work intensity households; SMD - severe material deprivation rate; the red
overlap indicates the share of the population which accumulates all three conditions;
iii) For the at-risk-of poverty rate (AROP), the income reference year is the calendar year prior to the
survey year (i.e. 2010) except for the United Kingdom (survey year) and Ireland (12 months preceding the

- 349 -
survey). Similarly, the very low work intensity rate (VLWI) refers to the income reference year prior to the
survey (i.e. 2010) while for the severe material deprivation rate (SMD), the reference is the current year (i.e.
2011).
2005 2006 2007 2008 2009 2010 2011
AROP total % of total pln 20,5 19,1 17,3 16,9 17,1 17,6 17,7
1000 persons 7.756 7.215 6.540 6.353 6.435 6.588 6.623
VLWI total % of total pln 14,2 12,3 10,0 7,9 6,9 7,3 6,9
1000 persons 4.446 3.862 3.104 2.444 2.102 2.211 2.073
SMD total % of total pln 33,8 27,6 22,3 17,7 15,0 14,2 13,0
1000 persons 12.752 10.445 8.415 6.680 5.625 5.331 4.885
AROP + VLWI
% of total pln 1,4 1,5 1,3 1,3 1,3 1,5 1,6
1000 persons 525 557 475 499 492 568 608
AROP + SMD % of total pln 7,4 6,4 5,4 4,7 4,6 4,3 4,0
1000 persons 2.782 2.416 2.042 1.758 1.728 1.616 1.490
AROP + SMD + VLWI
% of total pln 4,8 3,8 2,7 1,9 1,7 1,8 1,5
1000 persons 1.814 1.453 1.026 704 655 684 571
SMD + VLWI % of total pln 2,5 1,9 1,4 0,9 0,5 0,4 0,4
1000 persons 938 706 532 322 177 168 145
2c. At risk of poverty or social exclusion rate for specific groups, 2011
At risk of poverty or social
exclusion, in %
Children (0-17) 29,8
Working age (18-64) 27,0
Elderly (65+) 24,7
Employed 17,4
Unemployed 60,3
Inactive 42,8
Single male 42,2
Single female 37,8
Single elderly (65+) 33,5
Single parent households 46,4
Large families (2 adults and 3+ children) 44,4

- 350 -
EU-migrant (EU 27) 25,6
Non-EU migrants (non-EU27) 36,4
Source: Eurostat (EU-SILC)
3. MAIN SOCIAL INDICATORS
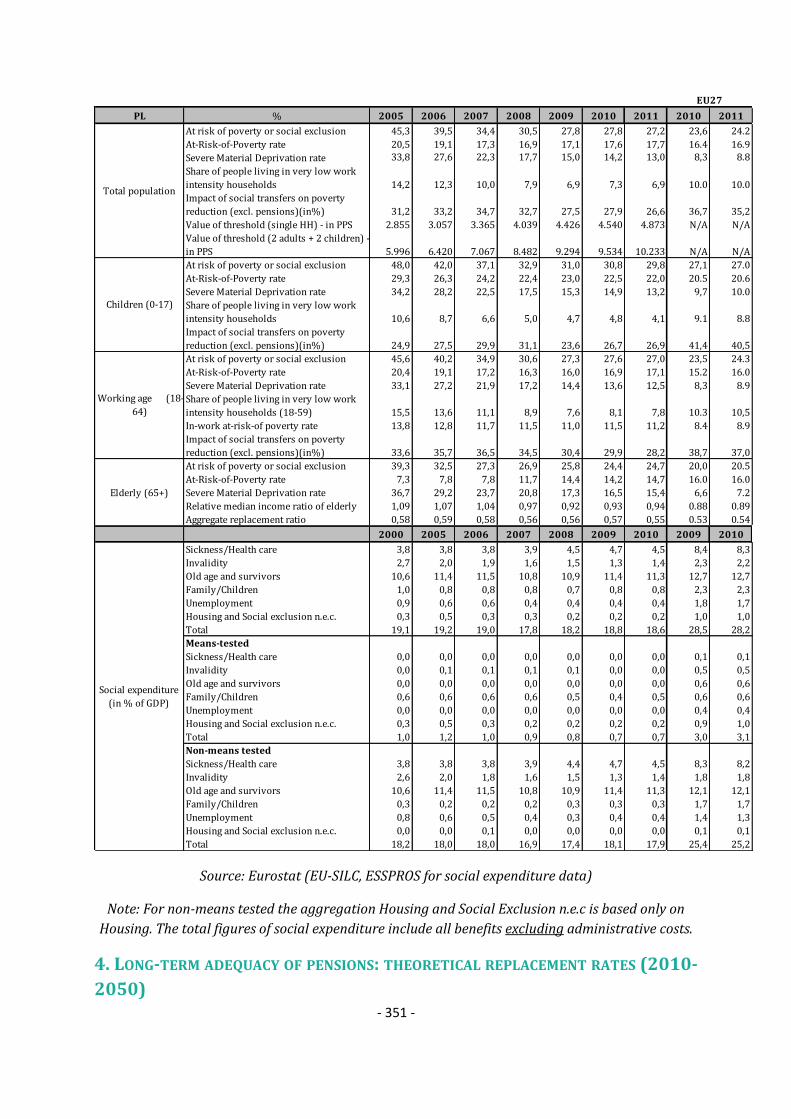
- 351 -
PL % 2005 2006 2007 2008 2009 2010 2011 2010 2011
At risk of poverty or social exclusion 45,3 39,5 34,4 30,5 27,8 27,8 27,2 23,6 24.2
At-Risk-of-Poverty rate 20,5 19,1 17,3 16,9 17,1 17,6 17,7 16.4 16.9
Severe Material Deprivation rate 33,8 27,6 22,3 17,7 15,0 14,2 13,0 8,3 8.8
Share of people living in very low work
intensity households 14,2 12,3 10,0 7,9 6,9 7,3 6,9 10.0 10.0
Impact of social transfers on poverty
reduction (excl. pensions)(in%) 31,2 33,2 34,7 32,7 27,5 27,9 26,6 36,7 35,2
Value of threshold (single HH) - in PPS 2.855 3.057 3.365 4.039 4.426 4.540 4.873 N/A N/A
Value of threshold (2 adults + 2 children) -
in PPS 5.996 6.420 7.067 8.482 9.294 9.534 10.233 N/A N/A
At risk of poverty or social exclusion 48,0 42,0 37,1 32,9 31,0 30,8 29,8 27,1 27.0
At-Risk-of-Poverty rate 29,3 26,3 24,2 22,4 23,0 22,5 22,0 20.5 20.6
Severe Material Deprivation rate 34,2 28,2 22,5 17,5 15,3 14,9 13,2 9,7 10.0
Share of people living in very low work
intensity households 10,6 8,7 6,6 5,0 4,7 4,8 4,1 9.1 8.8
Impact of social transfers on poverty
reduction (excl. pensions)(in%) 24,9 27,5 29,9 31,1 23,6 26,7 26,9 41,4 40,5
At risk of poverty or social exclusion 45,6 40,2 34,9 30,6 27,3 27,6 27,0 23,5 24.3
At-Risk-of-Poverty rate 20,4 19,1 17,2 16,3 16,0 16,9 17,1 15.2 16.0
Severe Material Deprivation rate 33,1 27,2 21,9 17,2 14,4 13,6 12,5 8,3 8.9
Share of people living in very low work
intensity households (18-59) 15,5 13,6 11,1 8,9 7,6 8,1 7,8 10.3 10,5
In-work at-risk-of poverty rate 13,8 12,8 11,7 11,5 11,0 11,5 11,2 8.4 8.9
Impact of social transfers on poverty
reduction (excl. pensions)(in%) 33,6 35,7 36,5 34,5 30,4 29,9 28,2 38,7 37,0
At risk of poverty or social exclusion 39,3 32,5 27,3 26,9 25,8 24,4 24,7 20,0 20.5
At-Risk-of-Poverty rate 7,3 7,8 7,8 11,7 14,4 14,2 14,7 16.0 16.0
Severe Material Deprivation rate 36,7 29,2 23,7 20,8 17,3 16,5 15,4 6,6 7.2
Relative median income ratio of elderly 1,09 1,07 1,04 0,97 0,92 0,93 0,94 0.88 0.89
Aggregate replacement ratio 0,58 0,59 0,58 0,56 0,56 0,57 0,55 0.53 0.54
2000 2005 2006 2007 2008 2009 2010 2009 2010
Sickness/Health care 3,8 3,8 3,8 3,9 4,5 4,7 4,5 8,4 8,3
Invalidity 2,7 2,0 1,9 1,6 1,5 1,3 1,4 2,3 2,2
Old age and survivors 10,6 11,4 11,5 10,8 10,9 11,4 11,3 12,7 12,7
Family/Children 1,0 0,8 0,8 0,8 0,7 0,8 0,8 2,3 2,3
Unemployment 0,9 0,6 0,6 0,4 0,4 0,4 0,4 1,8 1,7
Housing and Social exclusion n.e.c. 0,3 0,5 0,3 0,3 0,2 0,2 0,2 1,0 1,0
Total 19,1 19,2 19,0 17,8 18,2 18,8 18,6 28,5 28,2
Means-tested
Sickness/Health care 0,0 0,0 0,0 0,0 0,0 0,0 0,0 0,1 0,1
Invalidity 0,0 0,1 0,1 0,1 0,1 0,0 0,0 0,5 0,5
Old age and survivors 0,0 0,0 0,0 0,0 0,0 0,0 0,0 0,6 0,6
Family/Children 0,6 0,6 0,6 0,6 0,5 0,4 0,5 0,6 0,6
Unemployment 0,0 0,0 0,0 0,0 0,0 0,0 0,0 0,4 0,4
Housing and Social exclusion n.e.c. 0,3 0,5 0,3 0,2 0,2 0,2 0,2 0,9 1,0
Total 1,0 1,2 1,0 0,9 0,8 0,7 0,7 3,0 3,1
Non-means tested
Sickness/Health care 3,8 3,8 3,8 3,9 4,4 4,7 4,5 8,3 8,2
Invalidity 2,6 2,0 1,8 1,6 1,5 1,3 1,4 1,8 1,8
Old age and survivors 10,6 11,4 11,5 10,8 10,9 11,4 11,3 12,1 12,1
Family/Children 0,3 0,2 0,2 0,2 0,3 0,3 0,3 1,7 1,7
Unemployment 0,8 0,6 0,5 0,4 0,3 0,4 0,4 1,4 1,3
Housing and Social exclusion n.e.c. 0,0 0,0 0,1 0,0 0,0 0,0 0,0 0,1 0,1
Total 18,2 18,0 18,0 16,9 17,4 18,1 17,9 25,4 25,2
Elderly (65+)
Social expenditure
(in % of GDP)
EU27
Children (0-17)
Working age (18-
64)
Total population
Source: Eurostat (EU-SILC, ESSPROS for social expenditure data)
Note: For non-means tested the aggregation Housing and Social Exclusion n.e.c is based only on
Housing. The total figures of social expenditure include all benefits excluding administrative costs.
4. LONG-TERM ADEQUACY OF PENSIONS: THEORETICAL REPLACEMENT RATES (2010-
2050)
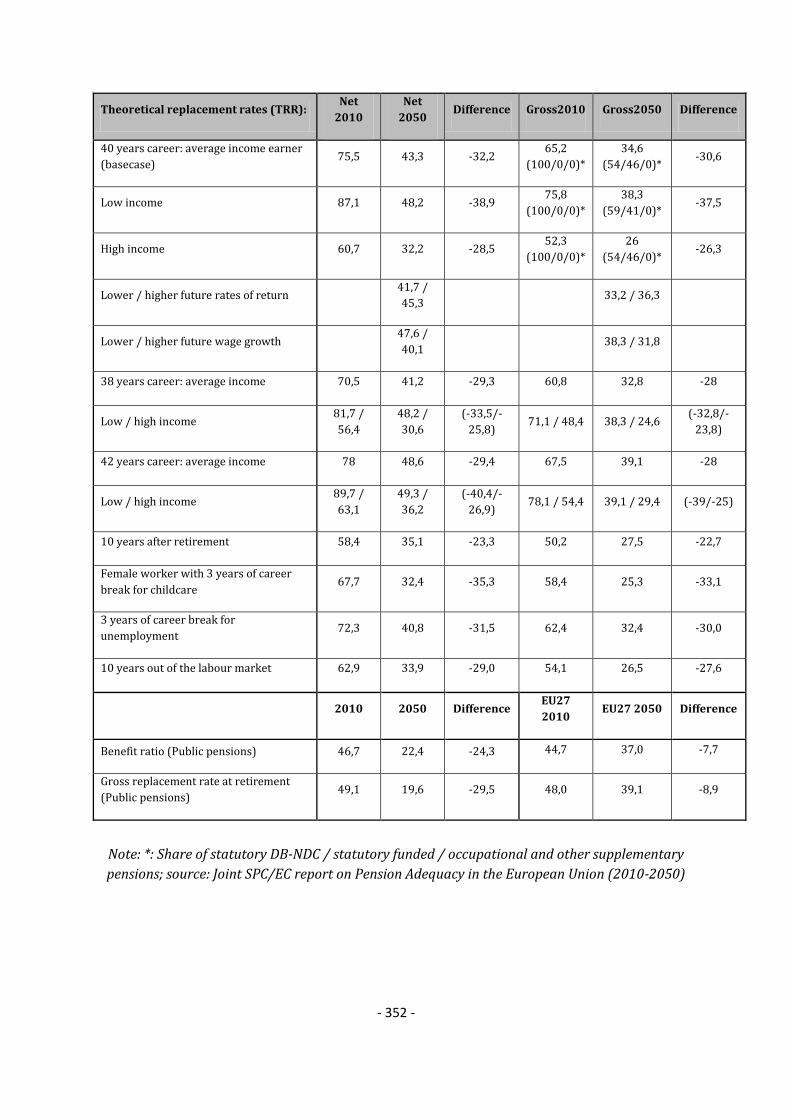
- 352 -
Theoretical replacement rates (TRR): Net
2010
Net
2050 Difference Gross2010 Gross2050 Difference
40 years career: average income earner
(basecase) 75,5 43,3 -32,2
65,2
(100/0/0)*
34,6
(54/46/0)* -30,6
Low income 87,1 48,2 -38,9 75,8
(100/0/0)*
38,3
(59/41/0)* -37,5
High income 60,7 32,2 -28,5 52,3
(100/0/0)*
26
(54/46/0)* -26,3
Lower / higher future rates of return 41,7 /
45,3 33,2 / 36,3
Lower / higher future wage growth 47,6 /
40,1 38,3 / 31,8
38 years career: average income 70,5 41,2 -29,3 60,8 32,8 -28
Low / high income 81,7 /
56,4
48,2 /
30,6
(-33,5/-
25,8) 71,1 / 48,4 38,3 / 24,6
(-32,8/-
23,8)
42 years career: average income 78 48,6 -29,4 67,5 39,1 -28
Low / high income 89,7 /
63,1
49,3 /
36,2
(-40,4/-
26,9) 78,1 / 54,4 39,1 / 29,4 (-39/-25)
10 years after retirement 58,4 35,1 -23,3 50,2 27,5 -22,7
Female worker with 3 years of career
break for childcare 67,7 32,4 -35,3 58,4 25,3 -33,1
3 years of career break for
unemployment 72,3 40,8 -31,5 62,4 32,4 -30,0
10 years out of the labour market 62,9 33,9 -29,0 54,1 26,5 -27,6
2010 2050 Difference EU27
2010 EU27 2050 Difference
Benefit ratio (Public pensions) 46,7 22,4 -24,3 44,7 37,0 -7,7
Gross replacement rate at retirement
(Public pensions) 49,1 19,6 -29,5 48,0 39,1 -8,9
Note: *: Share of statutory DB-NDC / statutory funded / occupational and other supplementary
pensions; source: Joint SPC/EC report on Pension Adequacy in the European Union (2010-2050)

- 353 -
5. KEY CONTEXT MACRO-ECONOMIC INFORMATION
Source: Eurostat, National Accounts and EU LFS. ECFIN autumn economic forecast 2012 for 2012-
2014.
Note: Data on social protection expenditure comes from the AMECO database ( it is calculated as
the sum of Social benefits other than social transfers in kind; general government - ESA 1995 +
Social transfers in kind - ESA 1995)

- 354 -
6. TRENDS IN TAKE-UP OF SELECTED BENEFITS93
Number of unemployed
Definition Unemployment according to ILO definition - Total
Unit thousands of persons - seasonally adjusted
Source Eurostat
Link http://nui.epp.eurostat.ec.europa.eu/nui/show.do?dataset=lmhu_m&lang=
en
Unemployment recipients
Definition UB recipients - stock
Unit thousands of recipients
93 This data has been collected by the SPC in the context of monitoring the social impact of the crisis. It
includes only a selection of benefits which have been considered most reactive to the crisis. The number of unemployed refers to the standard definition by the ILO and is given as background information.

- 355 -
Source administrative data, Ministry of Labour and Social Policy
Link http://www.psz.praca.gov.pl./main.php?do=ShowPage&nPID=867997&pT
=details&sP=CONTENT,objectID,867970
Social assistance benefits
Definition Social assistance beneficiaries
Unit total number of beneficiaries of monetary and non-monetary assistance
Source GUS, Statistical Yearbook 2002-2011
Disability benefits recipients
Definition Disability benefit recipients
Unit
total number of beneficiaries of pensions resulting from an inability to work
(annual averages), from both non-agricultural social security system and
farmers social insurance system
Source GUS, Statistical Yearbook 2002-2011.
7. SUMMARY OF SPECIFIC KEY SOCIAL CHALLENGES AND PARTICULARLY GOOD SOCIAL
OUTCOMES
Social policy areas Challenges
Poverty and social inclusion Levels of persons at-risk-of-poverty and/or material
deprivation
Levels of households with no workers or low intensity work
In-work poverty
Low labour market participation of women
Low enrolment rates of children in early childcare and pre-
school education
Pensions Entrenched practices of early retirement
The special pension scheme for miners
The current structure of the farmers' pension scheme
(KRUS) in not sufficiently reflecting individual incomes
Health and long-term care Providing an adequate healthcare structure
Improving geriatric care, long-term care and special care of

- 356 -
dependent persons
Particularly good social outcomes
Some improvement in the income and living conditions of
the population and of children specifically
- 357 -
PORTUGAL
1. 2012 NATIONAL SOCIAL REPORT (NSR): KEY ISSUES
The current economic and social situation in Portugal is characterized by an increase of the
unemployment rate which reached 14% in the last quarter of 2011. Also, there has been a
decrease of the available income of families, and a deepening of over-indebtedness. Both child
and elderly poverty rates are high (22.4% and 20% respectively for 2011), while the report also
shows a significant income inequality (33.7% in 2010 and 34.2% in 2011),as well as high levels
of material deprivation (8.3% in 2011), though consistently decreasing from 2008 (9.7% )
For drafting the NSR, the social partners and organisations active in the social economy sector
were consulted. The Portuguese government signed a tripartite agreement with the social
partners, at the beginning of 2012. The main features of this agreement are presented in the
report. The report underlines the need to improve the efficacy and the efficiency of the social
expenditure, centred around four factors: i) harmonisation of access to the non-contributory
social benefits; ii) rationalisation and optimisation of the administrative structure reinforcing
the fight against fraud and contributory evasion; iii) the restructuration of unemployment
benefits and safeguarding older workers with longer professional trajectories; iv) the structural
reinforcement of the social security system and of its sustainability.
Referring to the Memorandum of Understating, the SWD underlines the fact that an important
feature of the Economic Adjustment Programme is the emphasis on mitigating negative social
impacts of the austerity measures. In particular, tax increases and benefit reforms are designed
to minimise the impact on the lowest-income groups. This concern is specially reflected on the
measures included in the Social Emergency Programme (PES), and reflected in various social
policy measures aimed at combatting poverty that have been taken by the government.
In order to combat poverty and to promote social inclusion, the government has adopted three
sets of measures. Firstly, it has increased on a temporary basis the amount of unemployment
benefits for couples where both partners are unemployed and have dependent children by 10%.
The report also mentions that ALMP measures have been reinforced. In 2012 the government
has also created a hiring incentives programme called Estímulo 2012.Despite the indexation of
benefits has been suspended the amount of the lower pensions was updated and the
government also decided for the non-application of the suspension in the payment of Christmas
and holiday allowances for these pensions. Moreover, the Solidarity Supplement for the Elderly
was maintained. Secondly, it has implemented a network of social canteens and it has given
specific support to access energy and public transport for low-income families. The government
reintroduced the exemption of consultation fees to access National Health Service to most
disadvantaged families and expressed the intention to continue enlarging the network of social
services, as well as facilitate and improve access to social services. The creation of the rental
social market is also foreseen.

- 358 -
A third set of poverty measures consists of a focus on the need to develop the social economy. To
engage the organizations from the social economy sector, the Portuguese government signed a
Cooperation Protocol that aims to reinforce the partnership approach as a new form of social
intervention. This also enables social institutions to have more stability and sustainability as it
provides multi-annual measures that include: to enable access to a Credit Line specifically
created to support those institutions that may be facing more difficulties; more flexibility and
versatility in their response capacities (by increasing the capacity in Nursery and Residential
Structures and the number and range of home support services); and more freedom in the
management of vacancies, provided that they are not subject to a protocol with the State.
As far as pension reform is concerned no reforms were adopted recently. However, in 2012
Portugal has suspended the flexibility scheme rules concerning the pensionable age anticipation.
This will have a positive impact on the sustainability of the system by contributing to contain
pension expenditure. In the field of health-care a large number of actions and initiatives were
taken and implemented, in order to improve the sustainability and quality of the health system
and aiming to:
• Guarantee to all citizens the access to a family doctor;
• Transfer some care, presently provided in hospitals, to proximity services, both at the primary
healthcare level and at the long-term care network;
• Reorganise the hospital network;
• Develop the public health sector, mainly in terms of epidemiologic surveillance systems;
• Maximize clinical research and innovation in health;
• Develop clinical guidelines, based on scientific evidence and cost-effective principles;
• Ensure structures and mechanisms for health accreditation, aiming to the certification and
public recognition of the quality level in healthcare services;
• Develop information technologies in health;
• Ensure the exemption of ‘moderating’ fees to all those citizens, who really need that
exemption; recently, the percentage of citizens covered has increased, with the inclusion of all
new-unemployed, their wives/husbands and dependent children;
• Grant hospital management to the private and social sectors, whenever felt more efficient,
though not changing the public nature of provided care;
• Develop programmes to reduce costs in hospitals, through measures not affecting the quality
of healthcare;
• Increase the market share of generics and dematerialize prescriptions.
Taking into account the on-going fiscal consolidation as well as and the rise of the
unemployment rate (from 12% in 2010 to 14% in the last quarter of 2011), the three major
challenges for Portugal are the following: the improvement of the efficacy and efficiency of the
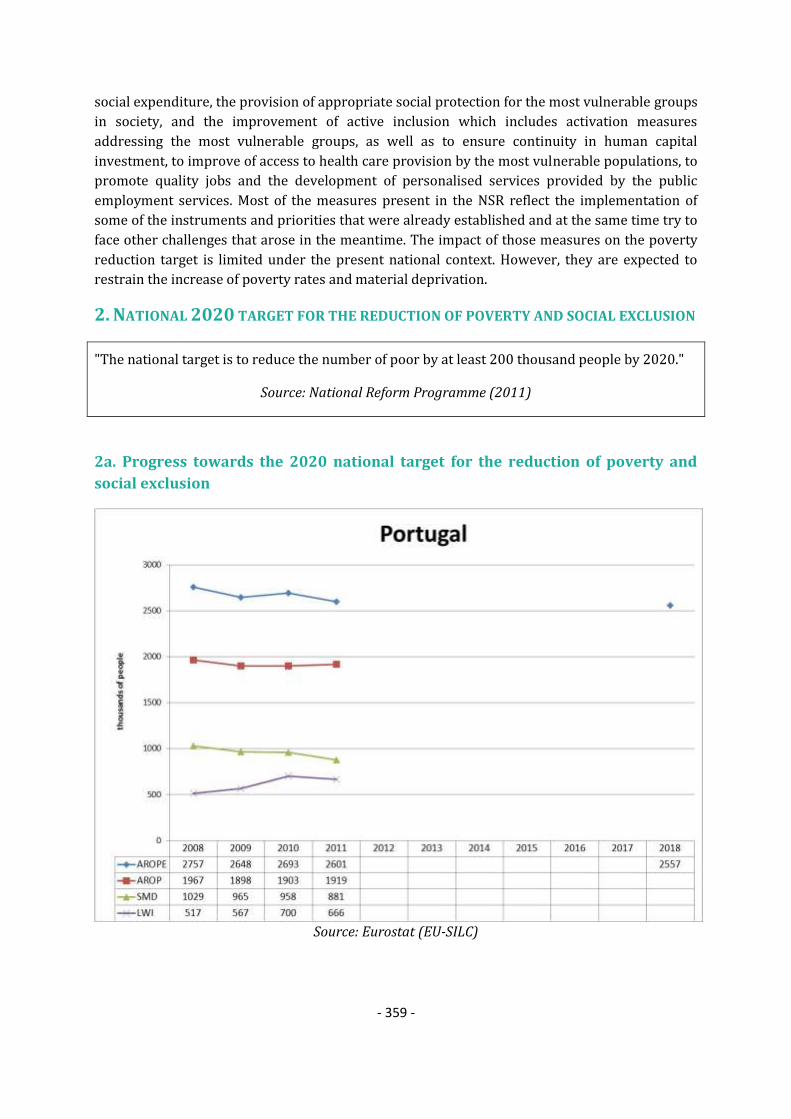
- 359 -
social expenditure, the provision of appropriate social protection for the most vulnerable groups
in society, and the improvement of active inclusion which includes activation measures
addressing the most vulnerable groups, as well as to ensure continuity in human capital
investment, to improve of access to health care provision by the most vulnerable populations, to
promote quality jobs and the development of personalised services provided by the public
employment services. Most of the measures present in the NSR reflect the implementation of
some of the instruments and priorities that were already established and at the same time try to
face other challenges that arose in the meantime. The impact of those measures on the poverty
reduction target is limited under the present national context. However, they are expected to
restrain the increase of poverty rates and material deprivation.
2. NATIONAL 2020 TARGET FOR THE REDUCTION OF POVERTY AND SOCIAL EXCLUSION
"The national target is to reduce the number of poor by at least 200 thousand people by 2020."
Source: National Reform Programme (2011)
2a. Progress towards the 2020 national target for the reduction of poverty and
social exclusion
Source: Eurostat (EU-SILC)

- 360 -
Note: i) Progress on the target is monitored on the basis of the EU SILC data with a base year 2008 and
target data year 2018;
ii) AROPE - at-risk-of-poverty or social exclusion rate; AROP - at-risk-of-poverty rate; VLWI - share of
population living in very low work intensity households; SMD - severe material deprivation rate;
iii) For the at-risk-of poverty rate (AROP), the income reference year is the calendar year prior to the
survey year (i.e. 2010) except for the United Kingdom (survey year) and Ireland (12 months preceding the
survey). Similarly, the very low work intensity rate (VLWI) refers to the income reference year prior to the
survey (i.e. 2010) while for the severe material deprivation rate (SMD), the reference is the current year (i.e.
2011).
2b. Composition of the population at risk of poverty or social exclusion (2011)
Source: Eurostat (EU-SILC)
Note: i) Progress on the target is monitored on the basis of the EU SILC data with a base year 2008 and
target data year 2018;
ii) AROPE - at-risk-of-poverty or social exclusion rate; AROP - at-risk-of-poverty rate; VLWI - share of
population living in very low work intensity households; SMD - severe material deprivation rate; the red
overlap indicates the share of the population which accumulates all three conditions;
iii) For the at-risk-of poverty rate (AROP), the income reference year is the calendar year prior to the
survey year (i.e. 2010) except for the United Kingdom (survey year) and Ireland (12 months preceding the
survey). Similarly, the very low work intensity rate (VLWI) refers to the income reference year prior to the
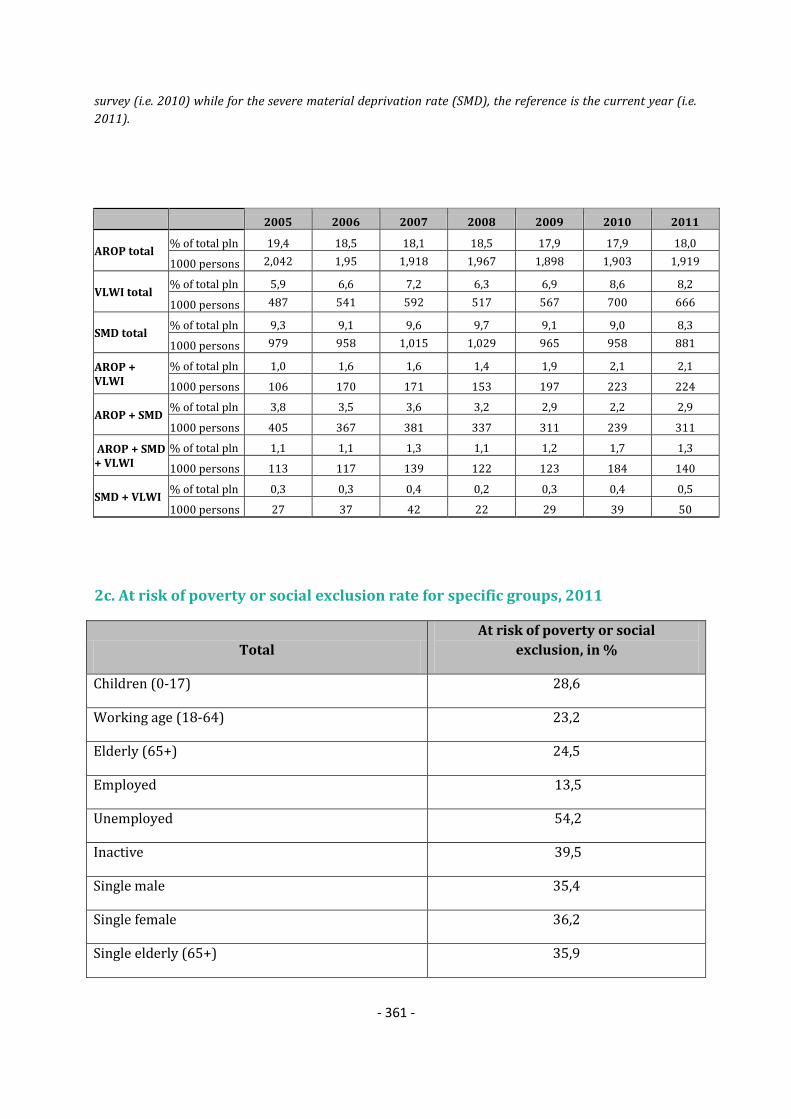
- 361 -
survey (i.e. 2010) while for the severe material deprivation rate (SMD), the reference is the current year (i.e.
2011).
2005 2006 2007 2008 2009 2010 2011
AROP total % of total pln 19,4 18,5 18,1 18,5 17,9 17,9 18,0
1000 persons 2,042 1,95 1,918 1,967 1,898 1,903 1,919
VLWI total % of total pln 5,9 6,6 7,2 6,3 6,9 8,6 8,2
1000 persons 487 541 592 517 567 700 666
SMD total % of total pln 9,3 9,1 9,6 9,7 9,1 9,0 8,3
1000 persons 979 958 1,015 1,029 965 958 881
AROP + VLWI
% of total pln 1,0 1,6 1,6 1,4 1,9 2,1 2,1
1000 persons 106 170 171 153 197 223 224
AROP + SMD % of total pln 3,8 3,5 3,6 3,2 2,9 2,2 2,9
1000 persons 405 367 381 337 311 239 311
AROP + SMD + VLWI
% of total pln 1,1 1,1 1,3 1,1 1,2 1,7 1,3
1000 persons 113 117 139 122 123 184 140
SMD + VLWI % of total pln 0,3 0,3 0,4 0,2 0,3 0,4 0,5
1000 persons 27 37 42 22 29 39 50
2c. At risk of poverty or social exclusion rate for specific groups, 2011
Total
At risk of poverty or social
exclusion, in %
Children (0-17) 28,6
Working age (18-64) 23,2
Elderly (65+) 24,5
Employed 13,5
Unemployed 54,2
Inactive 39,5
Single male 35,4
Single female 36,2
Single elderly (65+) 35,9

- 362 -
Single parent households 39,0
Large families (2 adults and 3+ children) 42,3
EU-migrant (EU 27) 12,8
Non-EU migrants (non-EU27) 34,4
Source: Eurostat (EU-SILC)

- 363 -
3. MAIN SOCIAL INDICATORS
PT % 2005 2006 2007 2008 2009 2010 2011 2010 2011
At risk of poverty or social exclusion 26,1 25,0 25,0 26,0 24,9 25,3 24,4 23,6 24.2
At-Risk-of-Poverty rate 19,4 18,5 18,1 18,5 17,9 17,9 18,0 16.4 16.9
Severe Material Deprivation rate 9,3 9,1 9,6 9,7 9,1 9,0 8,3 8,3 8.8
Share of people living in very low work
intensity households 5,9 6,6 7,2 6,3 6,9 8,6 8,2 10.0 10.0
Impact of social transfers on poverty
reduction (excl. pensions)(in%) 24,5 26,3 25,2 25,7 26,3 32,2 29,1 36,7 35,2
Value of threshold (single HH) - in PPS 4.942 5.157 5.349 5.702 5.644 5.839 5.722 N/A N/A
Value of threshold (2 adults + 2 children) -
in PPS 10.378 10.830 11.233 11.974 11.853 12.261 12.016 N/A N/A
At risk of poverty or social exclusion 28,8 25,5 26,9 29,5 28,7 28,7 28,6 27,1 27.0
At-Risk-of-Poverty rate 23,7 20,8 20,9 22,8 22,9 22,4 22,4 20.5 20.6
Severe Material Deprivation rate 9,9 9,6 11,8 11,8 10,5 10,8 11,3 9,7 10.0
Share of people living in very low work
intensity households 3,8 4,4 5,1 5,8 6,2 7,9 7,1 9.1 8.8
Impact of social transfers on poverty
reduction (excl. pensions)(in%) 23,5 25,2 22,9 24,3 25,4 30,4 27,5 41,4 40,5
At risk of poverty or social exclusion 23,4 22,9 23,1 24,5 23,5 24,1 23,2 23,5 24.3
At-Risk-of-Poverty rate 15,9 15,7 15,2 16,3 15,8 15,7 16,2 15.2 16.0
Severe Material Deprivation rate 8,0 7,7 8,6 8,9 8,3 8,3 7,6 8,3 8.9
Share of people living in very low work
intensity households (18-59) 6,7 7,3 7,9 6,5 7,2 8,8 8,6 10.3 10,5
In-work at-risk-of poverty rate 11.5 10.4 9.3 11.3 10.3 9.6 10.2 8.4 8.9
Impact of social transfers on poverty
reduction (excl. pensions)(in%) 29,3 31,1 30,9 30,3 30,7 37,7 33,6 38,7 37,0
At risk of poverty or social exclusion 33,2 32,2 30,0 27,7 26,0 26,1 24,5 20,0 20.5
At-Risk-of-Poverty rate 27,6 26,1 25,5 22,3 20,1 21,0 20,0 16.0 16.0
Severe Material Deprivation rate 13,4 13,3 10,7 10,1 10,6 9,6 7,7 6,6 7.2
Relative median income ratio of elderly 0.77 0.79 0.80 0.83 0.85 0.82 0.87 0.88 0.89
Aggregate replacement ratio 0.60 0.59 0.47 0.51 0.50 0.53 0.56 0.53 0.54
2000 2005 2006 2007 2008 2009 2010 2009 2010
Sickness/Health care 6,0 6,9 6,7 6,4 6,5 7,3 7,0 8,4 8,3
Invalidity 2,4 2,3 2,3 2,3 2,1 2,2 2,1 2,3 2,2
Old age and survivors 8,3 11,0 11,3 11,3 11,9 13,0 13,2 12,7 12,7
Family/Children 1,0 1,2 1,2 1,2 1,3 1,5 1,5 2,3 2,3
Unemployment 0,7 1,3 1,3 1,1 1,0 1,4 1,4 1,8 1,7
Housing and Social exclusion n.e.c. 0,3 0,2 0,3 0,3 0,3 0,3 0,3 1,0 1,0
Total 18,6 22,9 23,0 22,6 23,2 25,6 25,5 28,5 28,2
Means-tested
Sickness/Health care 0,0 0,0 0,0 0,0 0,0 0,0 0,0 0,1 0,1
Invalidity 0,2 0,2 0,2 0,2 0,2 0,2 0,2 0,5 0,5
Old age and survivors 0,4 0,9 0,5 0,5 0,6 0,7 0,7 0,6 0,6
Family/Children 0,4 0,9 0,9 0,9 1,0 1,2 1,2 0,6 0,6
Unemployment 0,2 0,2 0,2 0,2 0,2 0,3 0,2 0,4 0,4
Housing and Social exclusion n.e.c. 0,3 0,2 0,3 0,3 0,3 0,3 0,3 0,9 1,0
Total 1,4 2,5 2,1 2,1 2,3 2,7 2,7 3,0 3,1
Non means-tested
Sickness/Health care 6,0 6,9 6,7 6,4 6,5 7,3 7,0 8,3 8,2
Invalidity 2,2 2,0 2,1 2,1 2,0 2,0 1,9 1,8 1,8
Old age and survivors 7,9 10,1 10,8 10,8 11,3 12,3 12,4 12,1 12,1
Family/Children 0,6 0,2 0,2 0,3 0,2 0,3 0,3 1,7 1,7
Unemployment 0,5 1,1 1,1 1,0 0,9 1,1 1,2 1,4 1,3
Housing and Social exclusion n.e.c. 0,0 0,0 0,0 0,0 0,0 0,0 0,0 0,1 0,1
Total 17,2 20,4 20,9 20,5 20,9 22,9 22,8 25,4 25,2
Elderly (65+)
Social expenditure
(in % of GDP)
EU27
Children (0-17)
Working age
(18-64)
Total population
Source: Eurostat (EU-SILC, ESSPROS for social expenditure data)
Note: For non-means tested the aggregation Housing and Social Exclusion n.e.c is based only on
Housing. The total figures of social expenditure include all benefits excluding administrative costs.

- 364 -
4. LONG-TERM ADEQUACY OF PENSIONS: THEORETICAL REPLACEMENT RATES (2010-
2050)
Theoretical replacement rates (TRR): Net 2010 Net
2050 Difference Gross2010 Gross2050 Difference
40 years career: average income earner
(basecase) 85,8 65,9 -19,9
72,5
(100/0/0)*
58,7
(100/0/0)* -13,9
Low income 81,7 66,6 -15,1 72,6
(100/0/0)*
59,3
(100/0/0)* -13,3
High income 85,2 47,4 -37,8 67,7
(100/0/0)*
42,1
(100/0/0)* -25,6
Lower / higher future rates of return 65,9 /
65,9 58,7 / 58,7
Lower / higher future wage growth 76 / 57,6 67,7 / 51,3
38 years career: average income 83,9 63,7 -20,2 70,9 32,8 -38,1
Low / high income 79,8 / 81,6 64 / 45,2 (-15,8/-
36,4) 70,9 / 64,8 57,4 / 40,3
(-13,5/-
24,5)
42 years career: average income 103,8 82,2 -21,6 90,8 39,1 -51,7
Low / high income 102,3/97,4 82,6 /
58,7
(-19,7/-
38,7) 90,8 / 85,7 73 / 51,8 (-17,9/-34)
10 years after retirement 78 52,1 -25,9 65,5 46,2 -19,3
Female worker with 3 years of career
break for childcare 83,8 64,5 -19,3 70,7 57,4 -13,3
3 years of career break for
unemployment 85,7 65,1 -20,6 72,4 57,9 -14,5
10 years out of the labour market 64,4 52,1 -12,3 54,4 46,4 -8,0
2010 2050 Difference EU27
2010
EU27
2050 Difference
Benefit ratio (Public pensions) : : : 44,7 37,0 -7,7
Gross replacement rate at retirement
(Public pensions) 56,9 48,2 -8,7 48,0 39,1 -8,9
Note: *: Share of statutory DB-NDC / statutory funded / occupational and other supplementary
pensions; Source: Joint SPC/EC report on Pension Adequacy in the European Union (2010-2050)

- 365 -
5. KEY CONTEXT MACRO-ECONOMIC INFORMATION
Source: Eurostat, National Accounts and EU LFS. ECFIN autumn economic forecast 2012 for 2012-
2014.
Note: Data on social protection expenditure comes from the AMECO database (it is calculated as
the sum of Social benefits other than social transfers in kind; general government - ESA 1995 +
Social transfers in kind - ESA 1995)

- 366 -
6. TRENDS IN TAKE-UP OF SELECTED BENEFITS94
Number of unemployed
Definition Unemployment according to ILO definition - Total
Unit thousands of persons - seasonally adjusted
Source Eurostat
Unemployment recipients
Definition "Unemployment + social unemployment" beneficiaries
Unit thousands of recipients /benefits paid
Source Institute for Informatics and Statistics of Social Security
Link http://www2.seg-social.pt/left.asp?02.21.03.04.02.02
Comment
Entitlement to the unemployment benefit depends on the following conditions: to have
been bound by a work-contract or a similar agreement; to be capable of and available for
work; to be involuntarily unemployed; to be registered as a job seeker with the
Employment Centre of their residence area; to fulfil the qualifying period - to have
94 These data has been collected by the SPC in the context of monitoring the social impact of the crisis. It
includes only a selection of benefits which have been considered most reactive to the crisis. The number of unemployed refers to the standard definition by the ILO and is given as a background.

- 367 -
completed, at least 360 days with registered earnings within the 24 months immediately
prior to the date of unemployment. Unemployment Social Benefit: It is granted in case
beneficiaries have not completed the qualifying period required for unemployment
benefit and fulfil the requirements to be entitled to this benefit, in the case to Initial
unemployment social benefit (to have completed at least 180 days with registered
earnings within the 12 months immediately prior to the date of unemployment) or to have
exhausted entitlement periods for unemployment benefit, in the case of unemployment
social benefit paid following the unemployment benefit.
Recipients of social assistance benefits/means-tested minimum Income
Definition "Social assistance / Social Integration Income" beneficiaries
Unit thousands of recipients
Source Institute for Informatics and Statistics of Social Security
http://www2.seg-social.pt/left.asp?02.21.03.09.02
Comment
Important changes were introduced in the Portuguese Means-Testing Scheme, firstly
through Statutory Decree 70/2010 of 16 June 2010, and, more recently, through Statutory
Decree 133/2012 of 27 June 2012, redefining non-contributory social benefits entitlement
conditions, namely those concerning Social Integration Income (portuguese minimum
income scheme). The benefit paid by Social Security corresponds to a differential between
the individual’s income and a minimum income threshold taken as the baseline. This
minimum income is indexed to IAS, an indexation mechanism for social supports that
replaces the national minimum salary as a reference for calculating and adjusting
pensions, benefits and contributions. Individuals and families who want to have access to
this benefit, have to fulfil a number of conditions: legal place of residency in Portugal; aged
18 or over , availability for employment, occupational training or integration activities;
not having earnings of one’s own or from the family superior to minimum income
established by law.
Disability benefits recipients
Definition "Disability pension + Disability social pension"
Unit thousands of recipients
Source Institute for Informatics and Statistics of Social Security
Link http://www2.seg-social.pt/left.asp?02.21.03.05.02.02
Comment Disability or Invalidity pension: is a monthly cash benefit designed to protect the insured
persons covered by all the social security schemes against permanent incapacity for work.

- 368 -
7. SUMMARY OF SPECIFIC KEY SOCIAL CHALLENGES AND PARTICULARLY GOOD SOCIAL
OUTCOMES
Particularly good social outcomes
Some improvement in the income and living conditions of
the population
Improvement in reducing the number of early school
leavers
Some increase in the number of healthy life years expected
at 65 for men and women
Social policy areas Challenges
Poverty and social inclusion Implementing measures that stimulate active inclusion to
combat poverty and inequalities
Targeting policy measures for groups and situations of
greater vulnerability
Pensions Adequacy of the pension system
Sustainability of the pension system
Health and long-term care Improving clinical quality
Improvement in the access to health care for the most
vulnerable groups
Prevention and the promotion of healthy lifestyles
Achieving health gains in population
- 369 -
ROMANIA
1. 2012 NATIONAL SOCIAL REPORT (NSR): KEY ISSUES
Real GDP has grown in 2011 by 2.5%, after two years of decline. In 2012, it is projected to grow
by 1.4%, and domestic demand is expected to be the main growth factor. The employment rate
(20-64 year-olds) continued its downward trend since 2009. The value of this indicator was
62.8% in 2011 compared to 63.5% in 2009. The unemployment rate registered an increase
starting with 2008, reaching 7.4% in 201195. Roma and young people remain the main
vulnerable groups. In terms of poverty, Romania registers one of the highest at-risk-of-poverty-
or-social-exclusion rate for the total population (41.4% as compared to 23.4 % for EU27 in
2010)96. Additionally, 31% of Romanians suffered from severe material deprivation in 2010,
compared to 8.1% in the EU27. The most affected are the children and the elderly.
The NSR identifies several priorities with direct impact on social inclusion and social protection.
These priorities are mainly related to increasing the employment rate in general, promoting the
active inclusion of vulnerable groups with special focus on Roma, improving the efficiency of the
social assistance system, increasing the sustainability of the pension system, reforming the
national healthcare system and increasing the quality of the social infrastructure. The priorities
identified in the NSR are in line with those identified by the Commission97.
Romania continues its efforts to implement measures in order to reduce poverty and social
exclusion. The NSR lists several on-going projects designed to reduce social exclusion (with
focus on children and young people), as well as projects, financed mainly through the ESF, that
aim to facilitate the access of the most vulnerable to the labour market. In terms of legislation, a
new Social Assistance Law was adopted at the end of 2011. The expected outcome is that
poverty should decrease as a result of a better targeting of the social assistance towards people
in need. Another positive development is represented by the adoption of the National Strategy
for Roma Inclusion (2012-2020) and its six sectorial actions plans. Moreover, the draft Law on
Social Economy is currently being finalised.
In the framework of the Memorandum of Understanding signed between the EC and Romania,
one of the commitments concerns the pension reform. Consequently, a new law reforming the
pension system entered into force in January 2011. The reform integrates special schemes in the
social insurance system, it introduces a mechanism for recalculating special pensions and it
foresees an increase of the retirement age to 65 years for men and 63 years for women by 2030.
Also, early retirement is more strictly regulated, while disability pensions are granted under
more severe conditions. The reforms are expected to bring important savings to the system and
to reduce the number of beneficiaries. Concerning the private pension system, the Parliament
95 Data calculated based on ILO definition
96 EUROSTAT
97 SWD(2012) 325 final
- 370 -
adopted legislation which establishes the Guarantee Fund (GF). On the one hand, the GF has the
task to guarantee the payment of benefits if the pension funds fail to fulfil their payment
obligations and, on the other hand, to finance pensions in case the pension fund companies come
under strain because of increased longevity.
The reforms in the healthcare sector in Romania concern the continuation of hospital
reorganisation, the introduction of the co-payment mechanism for medical services and the
adoption of the new Law on the organisation of the healthcare system. A Strategy on primary
healthcare assistance and medical care services in the rural area for the period 2012-2020 was
finalised. In order to ensure the quality of medical services, the process of accreditation of
hospitals started; additionally, efforts to develop, modernize and provide medical units with
equipment, medical devices and specific means of transportation are continued.
Long term care services represent a component of social services system. They are provided for
persons with disabilities, elderly in situation of dependency, persons in terminal phase and
chronically ill ones, being organized as residential institutions, day care centres and domiciliary
care units and financed from the state and local budgets. For all these type of care services, since
2005 there were elaborated minimum quality standards which will be revised, according to the
provisions of the new law regarding the quality framework in social services area approved in
2012 ( Law no.197/2012). Health insurance fund covers also some expenses for home health
care services, for a period of 90 days/year.
In order to establish a coherent and integrated long term care system, for the first time, the term
“ long term care” was defined in the framework law on social assistance adopted in December
2011( Law no. 292/2011), major step in reforming the social assistance system in Romania.
While macro-economic policies focus on the need for austerity cuts, the key actions to address
the main social inclusion challenges are to i) reform the social assistance system, ii) promote
active inclusion through inclusive labour markets, with special attention on Roma, iii) develop
the social infrastructure as well as reform the pension and the healthcare systems. However, it
would be necessary to pursue a comprehensive, right-based approach, with more clarity on how
to achieve the economic and social objectives and more focus on the adequacy of income, quality
of jobs and ensuring access to services for all.
Romania registers one of the highest risks of poverty or social exclusion in Europe, the value of
this indicator being 40,3% in Romania compared with 24,2% EU average and almost one in
three Romanians suffered from severe material deprivation. Given the size and intensity of the
phenomenon of poverty and the social exclusion in Romania, the poverty target could have been
more ambitious. The measures announced in the NSR in terms of poverty reduction are relevant
and relatively ambitious. Nevertheless, their credibility depends to a large extent on their
implementation progress.
The NSR follows up on the social inclusion objectives identified in the NRP and contains more
detailed intervention areas and measures targeting disadvantaged groups. It also recognises the
need to increase the efficiency of the implementation process. The OMC objectives in the area of
social inclusion, pensions, health and long-term care are reiterated and specific actions are
planned with a view to ensure financial sustainability and accessibility of resources.

- 371 -
2. NATIONAL 2020 TARGET FOR THE REDUCTION OF POVERTY AND SOCIAL EXCLUSION
"The national target is to reduce by 580,000 the number of people at risk of poverty and social
exclusion, by the year 2020, as compared to the year 2008, meaning a reduction by approx.. 15%
of the number of people living in poverty". For the monitoring of the national target in Romania,
the indicator is the relative poverty rate or the number of people at risk of poverty.
Source: National Reform Programme (2011)
2.a Progress towards the 2020 national target for the reduction of poverty and
social exclusion
2008 2009 2010 2011 2012 2013 2014 2015 2016 2017 2018
AROP 4988 4745 4522 4748 4408
0
1000
2000
3000
4000
5000
6000
tho
us
an
ds
of
pe
op
le
Romania
Source: Eurostat (EU-SILC)
Note: i) Progress on the target is monitored on the basis of the EU SILC data with a base year
2008 and target data year 2018;
ii) AROP - at-risk-of-poverty rate; For the at-risk-of poverty rate (AROP), the income
reference year is the calendar year prior to the survey year (i.e. 2010) except for the United
Kingdom (survey year) and Ireland (12 months preceding the survey).

- 372 -
2b. Composition of the population at risk of poverty or social exclusion (2011)
Source: Eurostat (EU-SILC)
Note: i) Progress on the target is monitored on the basis of the EU SILC data with a base year 2008 and
target data year 2018;
ii) AROPE - at-risk-of-poverty or social exclusion rate; AROP - at-risk-of-poverty rate; VLWI - share of
population living in very low work intensity households; SMD - severe material deprivation rate; the red
overlap indicates the share of the population which accumulates all three conditions;
iii) For the at-risk-of poverty rate (AROP), the income reference year is the calendar year prior to the
survey year (i.e. 2010) except for the United Kingdom (survey year) and Ireland (12 months preceding the
survey). Similarly, the very low work intensity rate (VLWI) refers to the income reference year prior to the
survey (i.e. 2010) while for the severe material deprivation rate (SMD), the reference is the current year (i.e.
2011).
2005 2006 2007 2008 2009 2010 2011
AROP - total % of total pln : : 24,8 23,4 22,4 21,1 22,2
1000 persons : : 5.347 4.988 4.745 4.522 4.748
VLWI total % of total pln : : 8,4 8,2 7,7 6,8 6,7
1000 persons : : 1.466 1.413 1.299 1.176 1.135
SMD total % of total pln : : 36,5 32,9 32,2 31,0 29,4

- 373 -
1000 persons : : 7.879 7.023 6.817 6.643 6.286
AROP + VLWI
% of total pln : : 0,9 0,9 1,0 0,8 1,0
1000 persons : : 201 191 202 166 204
AROP + SMD % of total pln : : 14,1 11,8 11,6 10,9 11,2
1000 persons : : 3.041 2.527 2.456 2.334 2.393
AROP + SMD + VLWI
% of total pln : : 3,0 2,4 2,0 1,7 1,8
1000 persons : : 645 521 429 357 378
SMD +VLWI % of total pln : : 1,2 1,2 1,1 1,1 0,9
1000 persons : : 255 248 235 235 187
2c. At risk of poverty or social exclusion rate for specific groups, 2011
Total
At risk of poverty or social exclusion,
in %
Children (0-17) 49,1
Working age (18-64) 39,0
Elderly (65+) 35,3
Employed 33,7
Unemployed 72,8
Inactive 48,9
Single male 44,2
Single female 51,9
Single elderly (65+) 48,8
Single parent households 62,0
Large families (2 adults and 3+ children) 74,0
EU-migrant (EU 27) /
Non-EU migrants (non-EU27) /
Source: Eurostat (EU-SILC)

- 374 -
3. MAIN SOCIAL INDICATORS
RO % 2005 2006 2007 2008 2009 2010 2011 2010 2011
At risk of poverty or social exclusion : : 45,9 44,2 43,1 41,4 40,3 23,6 24.2
At-Risk-of-Poverty rate : : 24,8 23,4 22,4 21,1 22,2 16.4 16.9
Severe Material Deprivation rate : : 36,5 32,9 32,2 31,0 29,4 8,3 8.8
Share of people living in very low work
intensity households : : 8,4 8,2 7,7 6,8 6,7 10.0 10.0
Impact of social transfers on poverty
reduction (excl. pensions)(in%) 19,7 23,8 23,0 23,3 23,7 36,7 35,2
Value of threshold (single HH) - in PPS : : 1.728 1.836 2.064 2.122 2.159 N/A N/A
Value of threshold (2 adults + 2 children) -
in PPS : : 3.625 3.860 4.337 4.455 4.534 N/A N/A
At risk of poverty or social exclusion : : 50,5 51,2 52,0 48,7 49,1 27,1 27.0
At-Risk-of-Poverty rate : : 32,8 32,9 32,9 31,3 32,9 20.5 20.6
Severe Material Deprivation rate : : 40,4 39,2 40,3 36,7 35,8 9,7 10.0
Share of people living in very low work
intensity households : : 6,5 6,3 5,6 4,3 4,6 9.1 8.8
Impact of social transfers on poverty
reduction (excl. pensions)(in%) 20,4 24,2 21,9 20,6 22,0 41,4 40,5
At risk of poverty or social exclusion : : 42,0 41,0 40,5 39,7 39,0 23,5 24.3
At-Risk-of-Poverty rate : : 21,1 20,0 19,8 19,2 21,0 15.2 16.0
Severe Material Deprivation rate : : 32,7 29,8 29,6 29,0 27,7 8,3 8.9
Share of people living in very low work
intensity households (18-59) : : 9,0 8,8 8,3 7,6 7,3 10.3 10,5
In-work at-risk-of poverty rate : : 17,3 16,8 17,3 17,0 18,6 8.4 8.9
Impact of social transfers on poverty
reduction (excl. pensions)(in%) 21,9 26,5 25,0 26,2 25,8 38,7 37,0
At risk of poverty or social exclusion : : 57,7 49,2 43,1 39,9 35,3 20,0 20.5
At-Risk-of-Poverty rate : : 30,6 26,0 21,0 16,7 14,1 16.0 16.0
Severe Material Deprivation rate : : 48,9 38,9 33,8 32,4 28,6 6,6 7.2
Relative median income ratio of elderly : : 0,76 0,85 0,93 0,97 1,01 0.88 0.89
Aggregate replacement ratio : : 0,43 0,49 0,55 0,65 0,64 0.53 0.54
2000 2005 2006 2007 2008 2009 2010 2009 2010
Sickness/Health care 3,3 3,8 3,3 3,5 3,5 4,1 4,4 8,4 8,3
Invalidity 1,1 1,1 1,1 1,3 1,4 1,6 1,6 2,3 2,2
Old age and survivors 5,8 5,8 5,7 6,0 7,1 8,8 8,8 12,7 12,7
Family/Children 1,5 1,8 1,8 1,7 1,5 1,7 1,7 2,3 2,3
Unemployment 1,0 0,4 0,3 0,3 0,2 0,4 0,6 1,8 1,7
Housing and Social exclusion n.e.c. 0,1 0,3 0,3 0,4 0,3 0,2 0,3 1,0 1,0
Total 12,7 13,2 12,4 13,2 14,1 16,9 17,4 28,5 28,2
Means-tested
Sickness/Health care 0,0 0,0 0,0 0,0 0,0 0,0 0,0 0,1 0,1
Invalidity 0,0 0,0 0,0 0,0 0,0 0,0 0,0 0,5 0,5
Old age and survivors 0,0 0,0 0,0 0,0 0,0 0,1 0,2 0,6 0,6
Family/Children 0,1 0,2 0,2 0,1 0,1 0,1 0,2 0,6 0,6
Unemployment 1,0 0,4 0,3 0,3 0,2 0,4 0,6 0,4 0,4
Housing and Social exclusion n.e.c. 0,1 0,3 0,3 0,4 0,3 0,2 0,3 0,9 1,0
Total 1,2 0,9 0,8 0,8 0,7 0,9 1,2 3,0 3,1
Non-means tested
Sickness/Health care 3,3 3,7 3,2 3,5 3,5 4,1 4,4 8,3 8,2
Invalidity 1,0 1,1 1,1 1,3 1,4 1,6 1,6 1,8 1,8
Old age and survivors 5,8 5,8 5,7 6,0 7,1 8,6 8,6 12,1 12,1
Family/Children 1,4 1,6 1,6 1,5 1,4 1,6 1,5 1,7 1,7
Unemployment 0,0 0,0 0,0 0,0 0,0 0,0 0,0 1,4 1,3
Housing and Social exclusion n.e.c. 0,0 0,0 0,0 0,0 0,0 0,0 0,0 0,1 0,1
Total 11,5 12,3 11,7 12,3 13,4 16,0 16,2 25,4 25,2
Elderly (65+)
Social expenditure
(in % of GDP)
EU27
Children (0-17)
Working age
(18-64)
Total population
Source: Eurostat (EU-SILC, ESSPROS for social expenditure data)
Note: For non-means tested the aggregation Housing and Social Exclusion n.e.c is based only on
Housing. The total figures of social expenditure include all benefits excluding administrative costs.

- 375 -
4. LONG-TERM ADEQUACY OF PENSIONS: THEORETICAL REPLACEMENT RATES (2010-
2050)
Theoretical replacement rates (TRR): Net
2010
Net
2050 Difference Gross2010 Gross2050 Difference
40 years career: average income earner
(basecase) 70,7 45 -25,7
51,4
(100/0/0)*
31,5
(75/25/0)* -19,9
Low income 55,2 45 -10,2 35,9
(100/0/0)*
31,5
(75/25/0)* -4,4
High income 85,3 33,3 -52 67,8
(100/0/0)*
23,7
(75/25/0)* -44,1
Lower / higher future rates of return 43,9 /
46,2 30,8 / 32,4
Lower / higher future wage growth 53 / 38,5 37,2 / 27
38 years career: average income 69,2 43,3 -25,9 49,9 30,4 -19,5
Low / high income 53,6 / 84 43,3 /
32,3
(-10,3/-
51,7) 34,2 / 66,2 30,4 / 22,8
(-3,8/-
43,4)
42 years career: average income 72,3 66,5 -5,8 53,2 47,1 -6,1
Low / high income 56,8 /
86,9
67,2 /
47,3 10,4/-39,6 37,2 / 68,2 47,1 / 35,4 9,9/-32,8
10 years after retirement 64,2 32,9 -31,3 44,4 23 -21,4
Female worker with 3 years of career
break for childcare 61,4 43,3 -18,1 42,4 30,3 -12,1
3 years of career break for
unemployment 69,3 42,4 -26,9 50 29,8 -20,2
10 years out of the labour market 58,7 33,4 -25,3 47,5 23,4 -24,1
2010 2050 Difference EU27
2010
EU27
2050 Difference
Benefit ratio (Public pensions) 38,7 28,1 -10,6 44,7 37,0 -7,7
Gross replacement rate at retirement
(Public pensions) 41,6 29,8 -11,8 48,0 39,1 -8,9
Note: *: Share of statutory DB-NDC / statutory funded / occupational and other supplementary
pensions; Source: Joint SPC/EC report on Pension Adequacy in the European Union (2010-2050)

- 376 -
5. KEY CONTEXT MACRO-ECONOMIC INFORMATION
Source: Eurostat, National Accounts and EU LFS. ECFIN autumn economic forecast 2012 for 2012-
2014.
Note: Data on social protection expenditure comes from the AMECO database ( it is calculated as
the sum of Social benefits other than social transfers in kind; general government - ESA 1995 +
Social transfers in kind - ESA 1995)
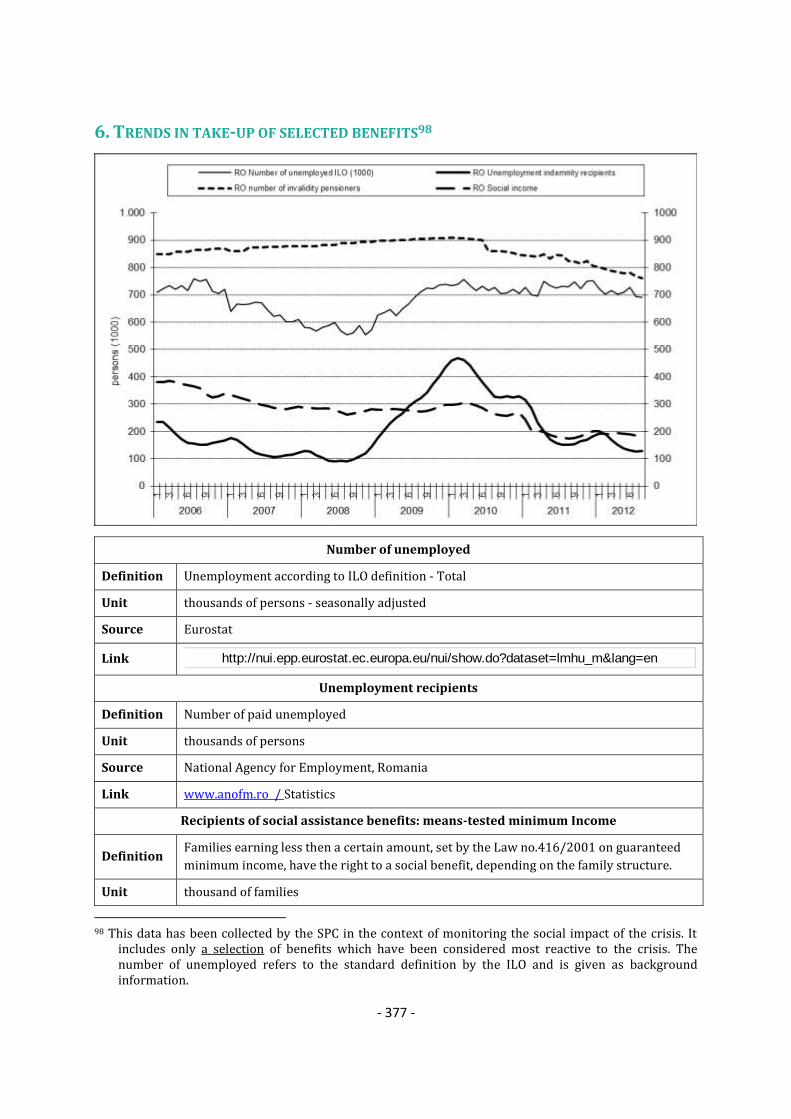
- 377 -
6. TRENDS IN TAKE-UP OF SELECTED BENEFITS98
Number of unemployed
Definition Unemployment according to ILO definition - Total
Unit thousands of persons - seasonally adjusted
Source Eurostat
Link http://nui.epp.eurostat.ec.europa.eu/nui/show.do?dataset=lmhu_m&lang=en
Unemployment recipients
Definition Number of paid unemployed
Unit thousands of persons
Source National Agency for Employment, Romania
Link www.anofm.ro / Statistics
Recipients of social assistance benefits: means-tested minimum Income
Definition Families earning less then a certain amount, set by the Law no.416/2001 on guaranteed
minimum income, have the right to a social benefit, depending on the family structure.
Unit thousand of families
98 This data has been collected by the SPC in the context of monitoring the social impact of the crisis. It
includes only a selection of benefits which have been considered most reactive to the crisis. The number of unemployed refers to the standard definition by the ILO and is given as background information.

- 378 -
Source Ministry of Labour, Family and Social Protection
Comment www.mmuncii.ro, Family / Social inclusion, Social Assistance and Family Policies /
Studies and indicators / Analysis on minimum guaranteed income
Disability benefits recipients
Definition Average Number of pensioners (thousand)
Unit thousands of pensioners
Source State social insurance - ROMANIA
http://www.cnpas.org / Social Indicators
7. SUMMARY OF SPECIFIC KEY SOCIAL CHALLENGES AND PARTICULARLY GOOD SOCIAL
OUTCOMES
Social policy areas Challenges
Poverty and social inclusion High risk of poverty or social exclusion
Tackle unemployment (particularly youth
unemployment) through activation
measures and human capital
development
Pensions The large reduction in the number of
contributors to the pension system
Encouraging active ageing
Health and long-term care Improving access to healthcare for
vulnerable persons
Efficiency of healthcare system
Effectiveness and efficiency of social
protection systems
Coordination, flexibility and targeting of
social protection systems
Particularly good social outcomes
Some improvement in the income and
living conditions of the population
Some improvement in reducing inequality
Some improvement in reducing the
housing cost overburden rate for
households

- 379 -
SLOVENIA
1. 2012 NATIONAL SOCIAL REPORT (NSR): KEY ISSUES
Slovenia faces a significant number of socio-economic challenges. Real GDP has fallen
considerably more abruptly than in the euro area as a whole as a result of the global economic
and financial crisis. In 2009, real GDP had fallen 8% below the peak reached in 2008. There was
a small increase of 1.4% in 2010 followed by decrease by -0.2% in 2011. For 2012 a further fall
(-1.4%99) is foreseen. As the budget deficit remains high (6.4% in 2011) a major challenge is to
ensure the long-term financial sustainability of social security systems along with adequate
social protection and social inclusion of Slovenia's citizens. The labour market situation in
Slovenia has also been worsening. In 2011 the general unemployment rate increased to 8.1%,
youth unemployment rose to 15.3% and at risk of poverty rate also rose to 13.6%. Labour
market skills mismatch remains high. In addition, Slovenia is one of the Member States with the
fastest aging population (old-age dependency ratio SI: 23% in 2007, 62% in 2060, compared
with EU: 25% in 2007, 53% in 2060).
During the preparation of NSR 2012 the relevant stakeholders were consulted. The Ministry
of Labour, Family and Social Affairs published a draft 2012 NSR for public discussion on its web
site and issued a call to social partners, NGOs, experts and interested public to send their
comments on the draft document. Eight responses were received.
For 2012 Slovenia's main priority is to achieve consolidation of public finances. The new Public
Finance Balance Act, introduced in order to consolidate public finances, takes precedence over
all other policy priorities including those in the social policy field and also diminishes some
social transfers and subsidies. Priorities in social policy field are: to balance social security
system budgets – pensions, social support, health; increase the level of employment as the best
protection against poverty; provide support to the most vulnerable; make the healthcare system
more flexible and more focused on healthcare needs by providing quality, safe, accessible and
efficient services and a single long-term care system. This corresponds with the priorities
identified by the Commission (SWD(2012) 327 final).
The measures to combat poverty and social exclusion in Slovenia have been formulated on the
presumption that participation in the labour market offers the best protection against poverty
and social exclusion. Therefore in 2012, measures are aimed at encouraging inclusion in the
labour market through an active employment policy and social activation programmes. Slovenia
is in the process of amending the Labour Market Regulation Act. The changes aim inter alia to
achieve greater flexibility in the labour market by allowing the unemployed and pensioners to
engage in temporary and part-time jobs, to provide dismissed workers with assistance and the
possibility to engage in active employment measures in order to quickly find a new job, and to
reduce the unemployment trap by reducing unemployment allowances. Negotiations with social
partners have already started.
99 European Economic Forecast – Spring 2012 (EC, 2012)

- 380 -
The social activation programmes announced in 2011 were launched in 2012, as the Social
Benefits Act, which provides their legal basis, was postponed to 1 January 2012. The
programmes are intended for people most distant from the labour market and for long-term
recipients of financial social assistance. Increased attention will also be paid to activating other
financial social assistance recipients capable for work, who will be addressed through a range of
employment programmes. The 2012 objective is to increase the participation of financial social
assistance recipients in the active employment policy programmes by 50% in comparison with
2011 (13,198 participations).
Pensions, healthcare and long-term care also have an impact on poverty. The Slovenian National
Assembly has passed the Pension reform in December 2012 which will be implemented on
January 1 2013. The amended legislation stipulates stricter retirement conditions. Via
transitional periods, the reform raises the retirement age to 65 years for both genders
(retirement will also be possible at 60 years of age on the basis of 40 years of service without the
purchase of additional years). It also extends the period for calculating the pension basis from
the current 18 to 24. The introduction of so-called informative accounts will for the first time
enable access to data on the value of the projected pension.
In 2012 the priority in healthcare is the proposal for organisation of a network of healthcare
providers covering all three levels. Moreover, emphasis is being placed also on the preparation
of the Strategy for Planning and Development of Human Resources in Health Care. In 2011
projects were launched to improve access to healthcare and to reduce disparities in health. They
are intended to improve the efficiency, accessibility and quality of healthcare through ensuring
emergency medical treatment at the primary healthcare level, upgrading the work of family
medicine teams by creating new career development paths, and to promote the safe and correct
use of medicines and their prescription. Slovenia aims to improve access to healthcare services
for citizens by taking the geographic, quality and financial aspects of accessibility as well as
safety and efficiency into account.
A new regulatory framework for long-term care has been in preparation for some time, which
takes into account both the growing demand for various types of assistance for older people and
the need to increase the supply of such services. The draft Act that is expected to be adopted in
2013 provides a legal framework for ensuring the financial sustainability of the system and
improving the accessibility and quality of long-term care in Slovenia.
In summary, the main challenges in the field of social inclusion for Slovenia are pension reform
(to ensure long term sustainability and adequacy), implementation of measures to facilitate
inclusion in the labour market, and improved quality and accessibility of healthcare and long
term care services.
While the measures Slovenia intends to implement in order to combat poverty are relevant, it is
premature to assess their impact on identified challenges fully. The Slovenian government will
intensively monitor the effects of the new legislation and its impact on the social situation of
individuals and families, with special emphasis on most vulnerable groups, and if necessary
amend the legislation.

- 381 -
2. NATIONAL 2020 TARGET FOR THE REDUCTION OF POVERTY AND SOCIAL EXCLUSION
"40,000 people out of poverty (in comparison with the reference year 2008, when 360,000
people experienced poverty)."
Source: National Reform Programme (2011)
2.a Progress towards the 2020 national target for the reduction of poverty and
social exclusion
Source: Eurostat (EU-SILC)
Note: i) Progress on the target is monitored on the basis of the EU SILC data with a base year 2008 and
target data year 2018;
ii) AROPE - at-risk-of-poverty or social exclusion rate; AROP - at-risk-of-poverty rate; VLWI - share of
population living in very low work intensity households; SMD - severe material deprivation rate;
iii) For the at-risk-of poverty rate (AROP), the income reference year is the calendar year prior to the
survey year (i.e. 2010) except for the United Kingdom (survey year) and Ireland (12 months preceding the
survey). Similarly, the very low work intensity rate (VLWI) refers to the income reference year prior to the

- 382 -
survey (i.e. 2010) while for the severe material deprivation rate (SMD), the reference is the current year (i.e.
2011).
2b. Composition of the population at risk of poverty or social exclusion (2011)
Source: Eurostat (EU-SILC)
Note: i) Progress on the target is monitored on the basis of the EU SILC data with a base year 2008 and
target data year 2018;
ii) AROPE - at-risk-of-poverty or social exclusion rate; AROP - at-risk-of-poverty rate; VLWI - share of
population living in very low work intensity households; SMD - severe material deprivation rate; the red
overlap indicates the share of the population which accumulates all three conditions;
iii) For the at-risk-of poverty rate (AROP), the income reference year is the calendar year prior to the
survey year (i.e. 2010) except for the United Kingdom (survey year) and Ireland (12 months preceding the
survey). Similarly, the very low work intensity rate (VLWI) refers to the income reference year prior to the
survey (i.e. 2010) while for the severe material deprivation rate (SMD), the reference is the current year (i.e.
2011).

- 383 -
SI 2005 2006 2007 2008 2009 2010 2011
AROP total % of total pln 12,2 11,6 11,5 12,3 11,3 12,7 13,6
1000 persons 238 233 225 241 223 254 273
VLWI total % of total pln 8,6 6,9 7,2 6,7 5,6 6,9 7,6
1000 persons 134 109 114 105 88 111 121
SMD total % of total pln 5,1 5,1 5,1 6,7 6,1 5,9 6,1
1000 persons 100 102 100 130 121 119 122
AROP + VLWI
% of total pln 2,4 2,0 2,0 1,9 1,3 2,1 2,3
1000 persons 47 41 39 37 26 41 46
AROP + SMD % of total pln 1,2 1,3 1,3 1,6 1,4 1,5 1,4
1000 persons 24 27 26 32 28 31 29
AROP + SMD + VLWI
% of total pln 0,9 0,8 0,9 1,1 0,9 1,1 1,2
1000 persons 18 15 17 21 18 21 24
SMD + VLWI % of total pln 0,2 0,2 0,2 0,2 0,2 0,1 0,3
1000 persons 4 4 4 5 4 3 6
2c. At risk of poverty or social exclusion rate for specific groups, 2011
Total
At risk of poverty or social
exclusion, in %
Children (0-17) 17,3
Working age (18-64) 18,7
Elderly (65+) 24,2
Employed 9,5
Unemployed 57,7
Inactive 24,0
Single male 42,8
Single female 49,1
Single elderly (65+) 47,6
Single parent households 38,7
Large families (2 adults and 3+ children) 20,4
EU-migrant (EU 27) 25,1
Non-EU migrants (non-EU27) 27,2
Source: Eurostat (EU-SILC)
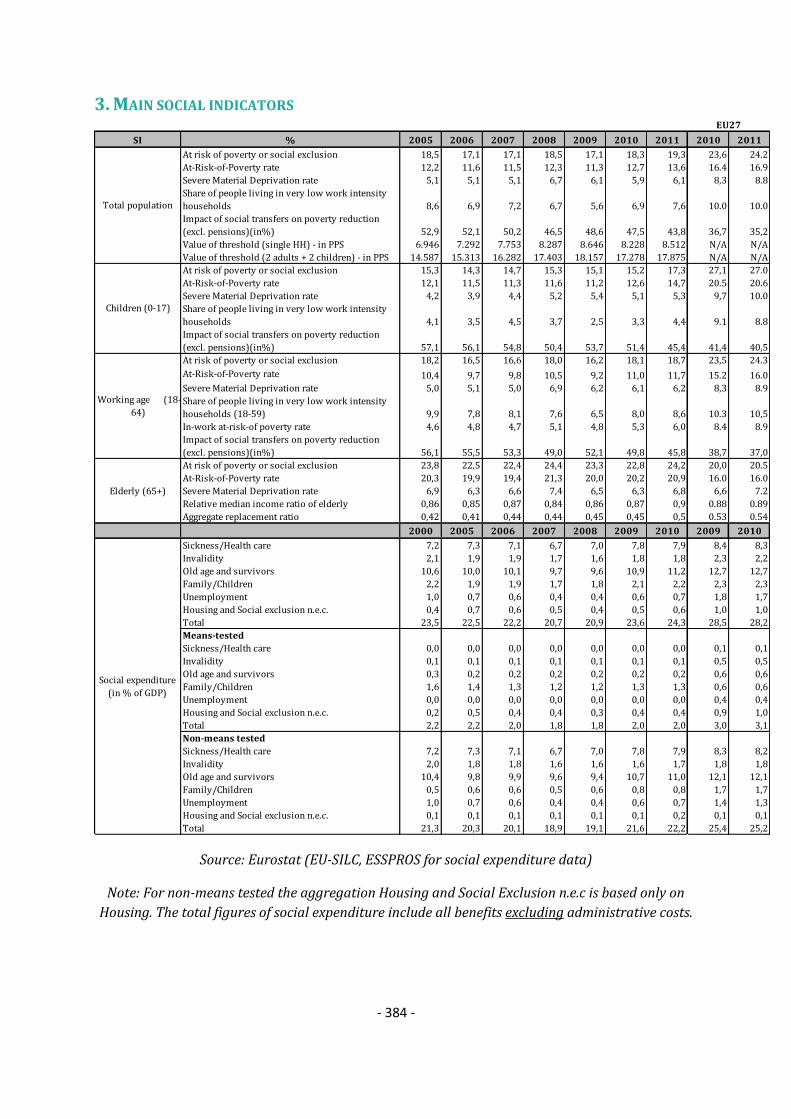
- 384 -
3. MAIN SOCIAL INDICATORS
SI % 2005 2006 2007 2008 2009 2010 2011 2010 2011
At risk of poverty or social exclusion 18,5 17,1 17,1 18,5 17,1 18,3 19,3 23,6 24.2
At-Risk-of-Poverty rate 12,2 11,6 11,5 12,3 11,3 12,7 13,6 16.4 16.9
Severe Material Deprivation rate 5,1 5,1 5,1 6,7 6,1 5,9 6,1 8,3 8.8
Share of people living in very low work intensity
households 8,6 6,9 7,2 6,7 5,6 6,9 7,6 10.0 10.0
Impact of social transfers on poverty reduction
(excl. pensions)(in%) 52,9 52,1 50,2 46,5 48,6 47,5 43,8 36,7 35,2
Value of threshold (single HH) - in PPS 6.946 7.292 7.753 8.287 8.646 8.228 8.512 N/A N/A
Value of threshold (2 adults + 2 children) - in PPS 14.587 15.313 16.282 17.403 18.157 17.278 17.875 N/A N/A
At risk of poverty or social exclusion 15,3 14,3 14,7 15,3 15,1 15,2 17,3 27,1 27.0
At-Risk-of-Poverty rate 12,1 11,5 11,3 11,6 11,2 12,6 14,7 20.5 20.6
Severe Material Deprivation rate 4,2 3,9 4,4 5,2 5,4 5,1 5,3 9,7 10.0
Share of people living in very low work intensity
households 4,1 3,5 4,5 3,7 2,5 3,3 4,4 9.1 8.8
Impact of social transfers on poverty reduction
(excl. pensions)(in%) 57,1 56,1 54,8 50,4 53,7 51,4 45,4 41,4 40,5
At risk of poverty or social exclusion 18,2 16,5 16,6 18,0 16,2 18,1 18,7 23,5 24.3
At-Risk-of-Poverty rate 10,4 9,7 9,8 10,5 9,2 11,0 11,7 15.2 16.0
Severe Material Deprivation rate 5,0 5,1 5,0 6,9 6,2 6,1 6,2 8,3 8.9
Share of people living in very low work intensity
households (18-59) 9,9 7,8 8,1 7,6 6,5 8,0 8,6 10.3 10,5
In-work at-risk-of poverty rate 4,6 4,8 4,7 5,1 4,8 5,3 6,0 8.4 8.9
Impact of social transfers on poverty reduction
(excl. pensions)(in%) 56,1 55,5 53,3 49,0 52,1 49,8 45,8 38,7 37,0
At risk of poverty or social exclusion 23,8 22,5 22,4 24,4 23,3 22,8 24,2 20,0 20.5
At-Risk-of-Poverty rate 20,3 19,9 19,4 21,3 20,0 20,2 20,9 16.0 16.0
Severe Material Deprivation rate 6,9 6,3 6,6 7,4 6,5 6,3 6,8 6,6 7.2
Relative median income ratio of elderly 0,86 0,85 0,87 0,84 0,86 0,87 0,9 0.88 0.89
Aggregate replacement ratio 0,42 0,41 0,44 0,44 0,45 0,45 0,5 0.53 0.54
2000 2005 2006 2007 2008 2009 2010 2009 2010
Sickness/Health care 7,2 7,3 7,1 6,7 7,0 7,8 7,9 8,4 8,3
Invalidity 2,1 1,9 1,9 1,7 1,6 1,8 1,8 2,3 2,2
Old age and survivors 10,6 10,0 10,1 9,7 9,6 10,9 11,2 12,7 12,7
Family/Children 2,2 1,9 1,9 1,7 1,8 2,1 2,2 2,3 2,3
Unemployment 1,0 0,7 0,6 0,4 0,4 0,6 0,7 1,8 1,7
Housing and Social exclusion n.e.c. 0,4 0,7 0,6 0,5 0,4 0,5 0,6 1,0 1,0
Total 23,5 22,5 22,2 20,7 20,9 23,6 24,3 28,5 28,2
Means-tested
Sickness/Health care 0,0 0,0 0,0 0,0 0,0 0,0 0,0 0,1 0,1
Invalidity 0,1 0,1 0,1 0,1 0,1 0,1 0,1 0,5 0,5
Old age and survivors 0,3 0,2 0,2 0,2 0,2 0,2 0,2 0,6 0,6
Family/Children 1,6 1,4 1,3 1,2 1,2 1,3 1,3 0,6 0,6
Unemployment 0,0 0,0 0,0 0,0 0,0 0,0 0,0 0,4 0,4
Housing and Social exclusion n.e.c. 0,2 0,5 0,4 0,4 0,3 0,4 0,4 0,9 1,0
Total 2,2 2,2 2,0 1,8 1,8 2,0 2,0 3,0 3,1
Non-means tested
Sickness/Health care 7,2 7,3 7,1 6,7 7,0 7,8 7,9 8,3 8,2
Invalidity 2,0 1,8 1,8 1,6 1,6 1,6 1,7 1,8 1,8
Old age and survivors 10,4 9,8 9,9 9,6 9,4 10,7 11,0 12,1 12,1
Family/Children 0,5 0,6 0,6 0,5 0,6 0,8 0,8 1,7 1,7
Unemployment 1,0 0,7 0,6 0,4 0,4 0,6 0,7 1,4 1,3
Housing and Social exclusion n.e.c. 0,1 0,1 0,1 0,1 0,1 0,1 0,2 0,1 0,1
Total 21,3 20,3 20,1 18,9 19,1 21,6 22,2 25,4 25,2
Elderly (65+)
Social expenditure
(in % of GDP)
EU27
Children (0-17)
Working age (18-
64)
Total population
Source: Eurostat (EU-SILC, ESSPROS for social expenditure data)
Note: For non-means tested the aggregation Housing and Social Exclusion n.e.c is based only on
Housing. The total figures of social expenditure include all benefits excluding administrative costs.
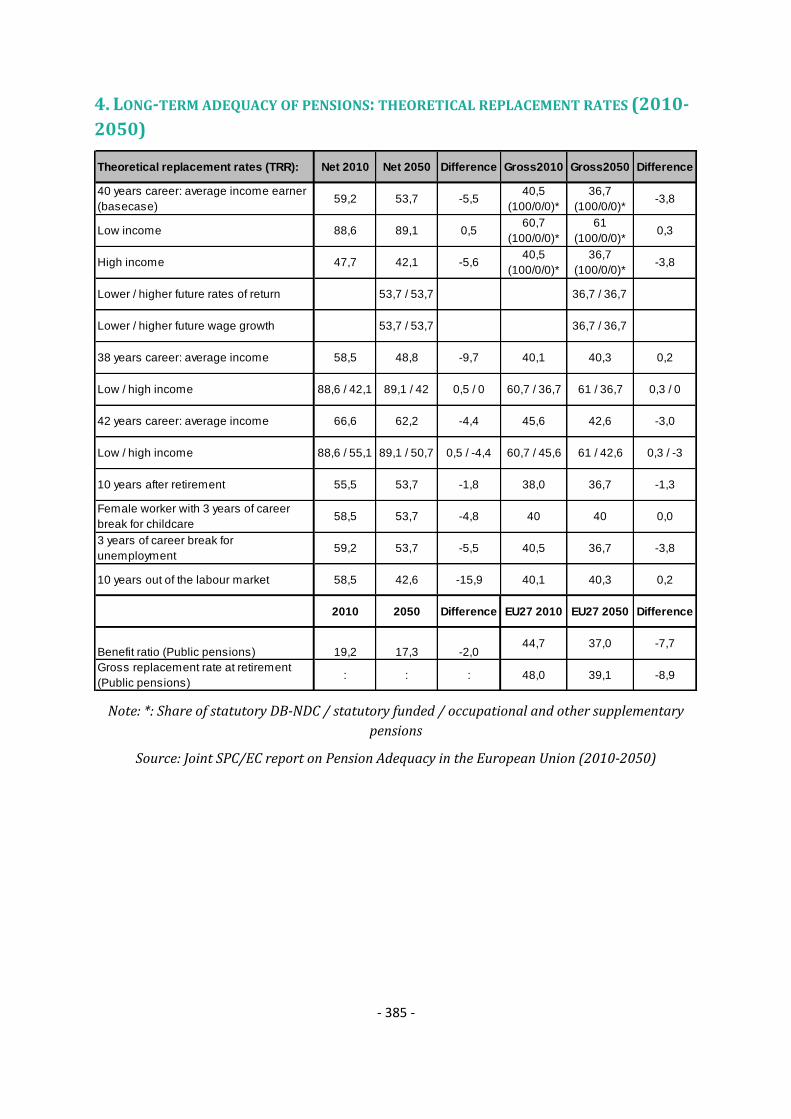
- 385 -
4. LONG-TERM ADEQUACY OF PENSIONS: THEORETICAL REPLACEMENT RATES (2010-
2050)
Theoretical replacement rates (TRR): Net 2010 Net 2050 Difference Gross2010 Gross2050 Difference
40 years career: average income earner
(basecase)59,2 53,7 -5,5
40,5
(100/0/0)*
36,7
(100/0/0)*-3,8
Low income 88,6 89,1 0,560,7
(100/0/0)*
61
(100/0/0)*0,3
High income 47,7 42,1 -5,640,5
(100/0/0)*
36,7
(100/0/0)*-3,8
Lower / higher future rates of return 53,7 / 53,7 36,7 / 36,7
Lower / higher future wage growth 53,7 / 53,7 36,7 / 36,7
38 years career: average income 58,5 48,8 -9,7 40,1 40,3 0,2
Low / high income 88,6 / 42,1 89,1 / 42 0,5 / 0 60,7 / 36,7 61 / 36,7 0,3 / 0
42 years career: average income 66,6 62,2 -4,4 45,6 42,6 -3,0
Low / high income 88,6 / 55,1 89,1 / 50,7 0,5 / -4,4 60,7 / 45,6 61 / 42,6 0,3 / -3
10 years after retirement 55,5 53,7 -1,8 38,0 36,7 -1,3
Female worker with 3 years of career
break for childcare58,5 53,7 -4,8 40 40 0,0
3 years of career break for
unemployment59,2 53,7 -5,5 40,5 36,7 -3,8
10 years out of the labour market 58,5 42,6 -15,9 40,1 40,3 0,2
2010 2050 Difference EU27 2010 EU27 2050 Difference
Benefit ratio (Public pensions) 19,2 17,3 -2,044,7 37,0 -7,7
Gross replacement rate at retirement
(Public pensions): : : 48,0 39,1 -8,9
Note: *: Share of statutory DB-NDC / statutory funded / occupational and other supplementary
pensions
Source: Joint SPC/EC report on Pension Adequacy in the European Union (2010-2050)

- 386 -
5. KEY CONTEXT MACRO-ECONOMIC INFORMATION
Source: Eurostat, National Accounts and EU LFS. ECFIN spring economic forecast 2012 for 2012-
2014.
Note: Data on social protection expenditure comes from the AMECO database (it is calculated as
the sum of Social benefits other than social transfers in kind; general government - ESA 1995 +
Social transfers in kind - ESA 1995)

- 387 -
6. TRENDS IN TAKE-UP OF SELECTED BENEFITS100
Number of unemployed
Definition Unemployment according to ILO definition - Total
Unit thousands of persons - seasonally adjusted
Source Eurostat
Unemployment recipients
Definition
Unemployment benefit is an insurance based benefit that can be claimed by the unemployed
who was employed (insured) before for at least 9 months in the last 24 months and did not
lose the job by own fault. Statutory basis for unemployment insurance is Labour Market
Regulation Act (Official gazette RS, no. 80/2010).
Unit thousands of recipients
Source The Ministry of Labour, Family and Social Affairs (MLFSA) of Slovenia
100 This data has been collected by the SPC in the context of monitoring the social impact of the crisis. It
includes only a selection of benefits which have been considered most reactive to the crisis. The number of unemployed refers to the standard definition by the ILO and is given as background information.
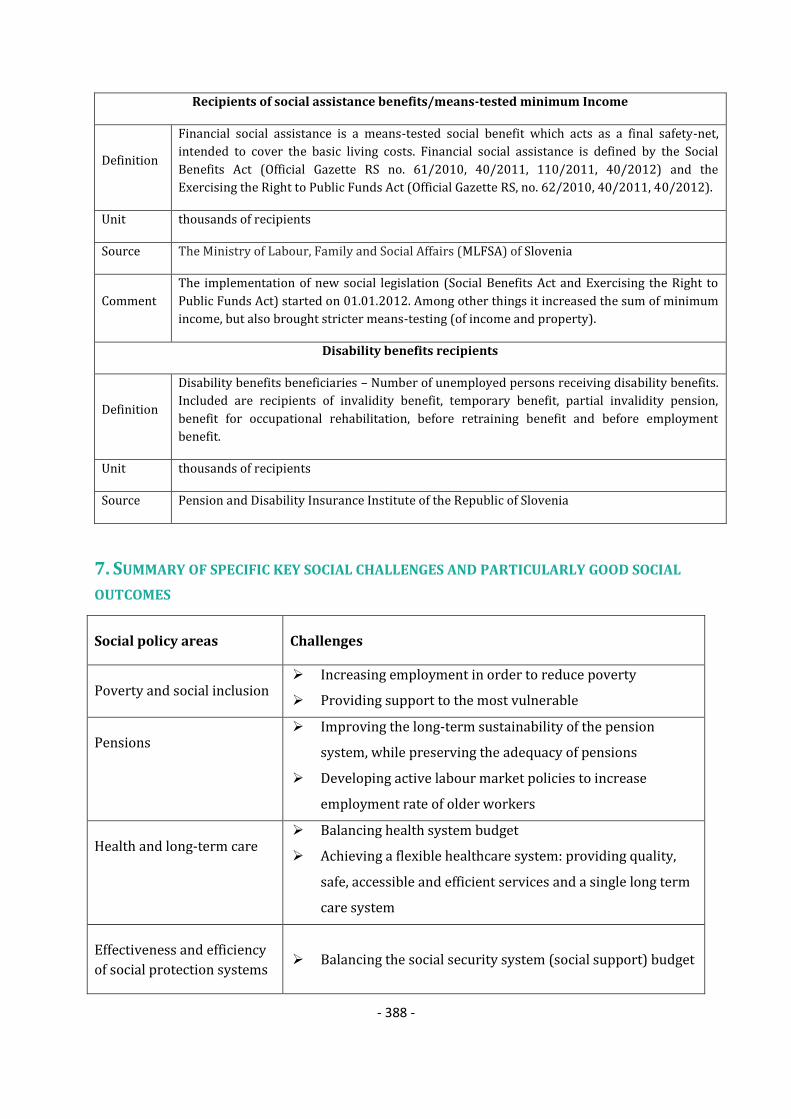
- 388 -
Recipients of social assistance benefits/means-tested minimum Income
Definition
Financial social assistance is a means-tested social benefit which acts as a final safety-net,
intended to cover the basic living costs. Financial social assistance is defined by the Social
Benefits Act (Official Gazette RS no. 61/2010, 40/2011, 110/2011, 40/2012) and the
Exercising the Right to Public Funds Act (Official Gazette RS, no. 62/2010, 40/2011, 40/2012).
Unit thousands of recipients
Source The Ministry of Labour, Family and Social Affairs (MLFSA) of Slovenia
Comment
The implementation of new social legislation (Social Benefits Act and Exercising the Right to
Public Funds Act) started on 01.01.2012. Among other things it increased the sum of minimum
income, but also brought stricter means-testing (of income and property).
Disability benefits recipients
Definition
Disability benefits beneficiaries – Number of unemployed persons receiving disability benefits.
Included are recipients of invalidity benefit, temporary benefit, partial invalidity pension,
benefit for occupational rehabilitation, before retraining benefit and before employment
benefit.
Unit thousands of recipients
Source Pension and Disability Insurance Institute of the Republic of Slovenia
7. SUMMARY OF SPECIFIC KEY SOCIAL CHALLENGES AND PARTICULARLY GOOD SOCIAL
OUTCOMES
Social policy areas Challenges
Poverty and social inclusion Increasing employment in order to reduce poverty
Providing support to the most vulnerable
Pensions Improving the long-term sustainability of the pension
system, while preserving the adequacy of pensions
Developing active labour market policies to increase
employment rate of older workers
Health and long-term care Balancing health system budget
Achieving a flexible healthcare system: providing quality,
safe, accessible and efficient services and a single long term
care system
Effectiveness and efficiency
of social protection systems
Balancing the social security system (social support) budget
- 389 -
SLOVAKIA
1. 2012 NATIONAL SOCIAL REPORT (NSR): KEY ISSUES
Slovakia faces a number of socio-economic challenges. Unemployment (13.6%), particularly
among the young (33.5%) and low-skilled (39.2%), is very high, long-term unemployment
(9.2%) remains the highest in the EU and the quality of the education and training is low.
Poverty and social exclusion affect in particular the marginalized Roma communities (above
90%). The budget deficit remains high (4.8% in 2011) requiring continuing consolidation, also
by addressing inefficiencies in the tax system and collection. Public administration suffers from
high turnover of staff and insufficient capacity building.
The relevant stakeholders were consulted for the drafting of the NSR through the standard
procedure for government documents.
The main socio-economic priorities identified by the report are (i) tackling high unemployment,
especially long-term unemployment and unemployment of youth, (ii) reducing risk of poverty
and social exclusion, especially in marginalised communities such as the Roma, (iii) further
reforming the pension system to ensure its sustainability and adequacy of the pensions, (iv)
optimising the efficiency of health expenditure while improving access to quality healthcare, (v)
to improve quality of social services by setting up a multi-resource system of their financing
These priorities correspond to the challenges identified by the Commission.101
Important measures aimed at reducing poverty and social inclusion were put on ice in 2011
because of the early parliamentary elections. A few measures were implemented to reduce the
administrative complexity in provision of assistance in material need and to extend the
possibility of obtaining the activation benefit for people in material need. A legislative intent for
an act on socially excluded communities was prepared but further work on the bill stalled.
In September 2011, Slovakia adopted a law introducing several changes to the fully funded
pension pillar, thereby implementing the relevant part of the 2011 Country Specific
Recommendation (CSR) on the long-term sustainability of public finances. Among the most
important were: (i) the introduction of default participation by new labour market entrants in
the fully funded pillar with an opt-out period of two years, (ii) the elimination of guarantees
from fund types that do not invest exclusively in bonds or money-market instruments, with
extension of the benchmarking period for the purely bond-based funds, (iii) the introduction of
an indexed investment fund, and (iv) reduction of the minimum contribution period from 15 to
10 years. The changes create a better environment for more risk-seeking behaviour by the
pension management companies with a view to delivering adequate pensions in the long run
through higher returns. The conditions for early retirement were further tightened. In August
2012, Slovakia adopted further substantial changes in the pay as you go pension pillar and in the
fully funded pillar, continuing the implementation of the relevant part of the 2011 CSR.
101
SWD(2012) 327 final

- 390 -
In pay as you go pension pillar the retirement age will be increased in line with gains in life
expectancy (from 2017) and pension indexation will be progressively linked to the inflation rate
of a retiree consumption basket. Slovakia has weaken the link between earnings and subsequent
pensions directly in the pension formula through adjustment of coefficients for reduction and
increasing average pension point (coefficient for reduction is gradually decreasing from 84% to
60% and coefficient for increasing is gradually rising from 16% to 22% in the period 2013-
2018).
In fully funded pillar from September 2012 the contribution rate to the second pillar was
reduced from 9% to 4% as part of consolidation strategy. The contribution rate will start to
increase in 2017 by 0.25% each year until it reaches target level of 6% in 2024. Until 2017,
savers can contribute voluntarily to the second pillar with tax allowance up to 2 % of tax base.
Changes with validity from January 2013: (i) the participation is voluntary for new labour
entrants with the possibility to decide till 35 years. (ii) the obligation of managing four pension
funds has been changed. Pension fund management companies obligatory offer one bond-based
guaranteed fund and one stock-based not-guaranteed fund. Decision about creating an arbitrary
number of other pension funds (including or excluding guarantees) have been left up to pension
fund management company. (iii) the assessment period for providing guarantees in bond-based
guaranteed fund has been extended to 10 years and in another guaranteed fund, if any, it is 15
years at the most. (iv) The maximum performance fee is 10 % of evaluation of the assets in all
pension funds and maximum management fee 0.3 % of average yearly net asset value in all
pension funds.
A reform of pharmaceutical drugs legislation was adopted with a result of the prices for
medicines being the second lowest in the European Union. Ceilings on quarterly co-payments on
drugs were introduced for certain vulnerable categories of population (retired and seriously
handicapped people). In April 2011, the obligation of a prior authorisation from a general
practitioner before visiting a specialist was abolished with the aim of cutting the red tape for
doctors and patients.
An amendment of the Act on Social Services ensured individual right to choose the provider of
social services. A significant change in supporting the provision of the social services was to start
financing of some social services from the state budget. In November 2011, the Slovak
government approved a Strategy of Deinstitutionalisation of Social Services and Foster Care with
the aim of supporting community and family-based care as opposed to institutional care.
The main challenges for Slovakia include: (i) improvement of the effectiveness of active labour
market policies and enhance the administrative capacity of the public employment service, (ii)
inclusion of marginalised communities such as the Roma into mainstream education and labour
market, including provision of quality early childhood education and care, (iii) improvement of
the quality and labour market relevance of the education and training system, including the
reform of vocational education and training and improvement in the quality of higher education.
The measures adopted are relevant in terms of reducing the risk of poverty or social exclusion.
However, to achieve any tangible effects, much more needs to be done to improve and

- 391 -
strengthen the active labour market policies and targeted social services for the most
disadvantaged groups and localities. Moreover, measures on pre-school education and inclusive
education of Roma children will require effective implementation and sufficient funding.
The added value of the NSR when compared to the National Reform Programme (NRP) is
limited. It reiterates information already available in NRP while giving some extra details or
updates in terms of analysis of the situation and measures envisaged.
2. NATIONAL 2020 TARGET FOR THE REDUCTION OF POVERTY AND SOCIAL EXCLUSION
"The Slovak Government will promote social inclusion, in particular by reducing poverty, with a view to achieving at least 170 thousand fewer people who are at risk of poverty and exclusion."
Source: National Reform Programme (2011)
2.a Progress towards the 2020 national target for the reduction of poverty and
social exclusion
Source: Eurostat (EU-SILC)
Note: i) Progress on the target is monitored on the basis of the EU SILC data with a base year 2008 and
target data year 2018;
ii) AROPE - at-risk-of-poverty or social exclusion rate; AROP - at-risk-of-poverty rate; VLWI - share of
population living in very low work intensity households; SMD - severe material deprivation rate;

- 392 -
iii) For the at-risk-of poverty rate (AROP), the income reference year is the calendar year prior to the
survey year (i.e. 2010) except for the United Kingdom (survey year) and Ireland (12 months preceding the
survey). Similarly, the very low work intensity rate (VLWI) refers to the income reference year prior to the
survey (i.e. 2010) while for the severe material deprivation rate (SMD), the reference is the current year (i.e.
2011).
2b. Composition of the population at risk of poverty or social exclusion (2011)
Source: Eurostat (EU-SILC)
Note: i) Progress on the target is monitored on the basis of the EU SILC data with a base year 2008 and
target data year 2018;
ii) AROPE - at-risk-of-poverty or social exclusion rate; AROP - at-risk-of-poverty rate; VLWI - share of
population living in very low work intensity households; SMD - severe material deprivation rate; the red
overlap indicates the share of the population which accumulates all three conditions;
iii) For the at-risk-of poverty rate (AROP), the income reference year is the calendar year prior to the
survey year (i.e. 2010) except for the United Kingdom (survey year) and Ireland (12 months preceding the
survey). Similarly, the very low work intensity rate (VLWI) refers to the income reference year prior to the
survey (i.e. 2010) while for the severe material deprivation rate (SMD), the reference is the current year (i.e.
2011).
2005 2006 2007 2008 2009 2010 2011
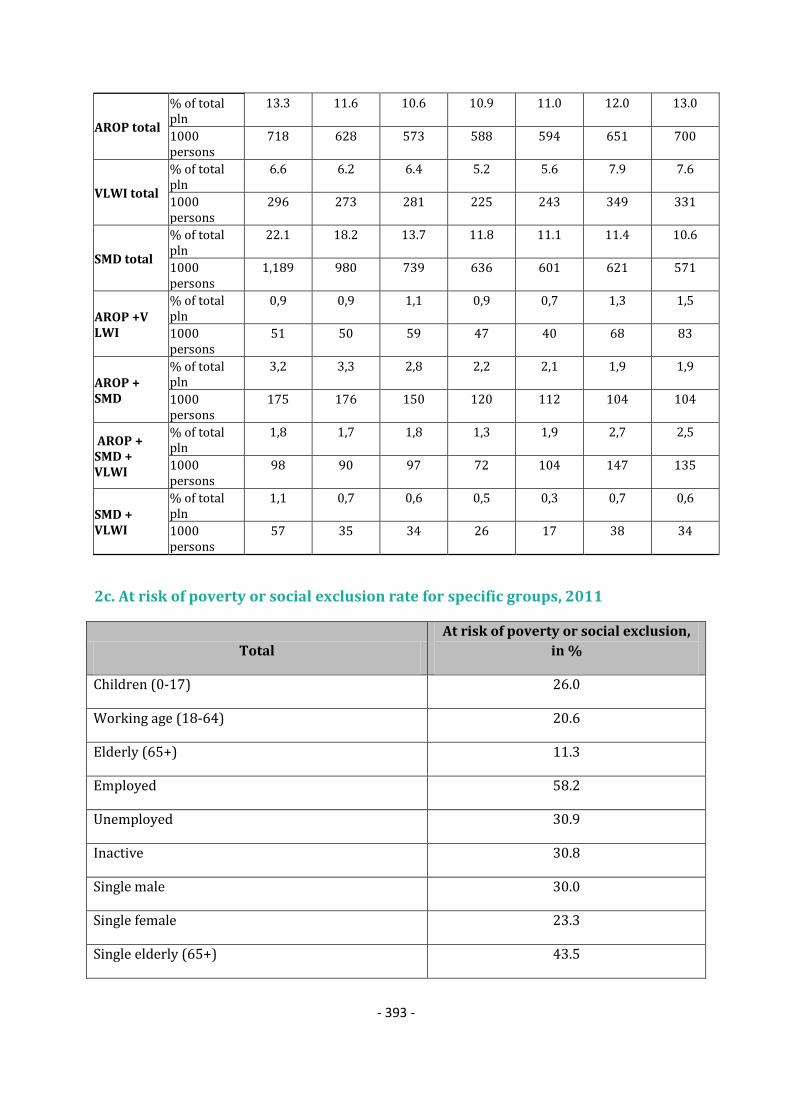
- 393 -
AROP total
% of total pln
13.3 11.6 10.6 10.9 11.0 12.0 13.0
1000 persons
718 628 573 588 594 651 700
VLWI total
% of total pln
6.6 6.2 6.4 5.2 5.6 7.9 7.6
1000 persons
296 273 281 225 243 349 331
SMD total
% of total pln
22.1 18.2 13.7 11.8 11.1 11.4 10.6
1000 persons
1,189 980 739 636 601 621 571
AROP +V LWI
% of total pln
0,9 0,9 1,1 0,9 0,7 1,3 1,5
1000 persons
51 50 59 47 40 68 83
AROP + SMD
% of total pln
3,2 3,3 2,8 2,2 2,1 1,9 1,9
1000 persons
175 176 150 120 112 104 104
AROP + SMD + VLWI
% of total pln
1,8 1,7 1,8 1,3 1,9 2,7 2,5
1000 persons
98 90 97 72 104 147 135
SMD + VLWI
% of total pln
1,1 0,7 0,6 0,5 0,3 0,7 0,6
1000 persons
57 35 34 26 17 38 34
2c. At risk of poverty or social exclusion rate for specific groups, 2011
Total
At risk of poverty or social exclusion,
in %
Children (0-17) 26.0
Working age (18-64) 20.6
Elderly (65+) 11.3
Employed 58.2
Unemployed 30.9
Inactive 30.8
Single male 30.0
Single female 23.3
Single elderly (65+) 43.5

- 394 -
Single parent households 36.4
Large families (2 adults and 3+ children) 23.8
EU-migrant (EU 27) 22.6
Non-EU migrants (non-EU27) 26.0
Source: Eurostat (EU-SILC)

- 395 -
3. MAIN SOCIAL INDICATORS
SK % 2005 2006 2007 2008 2009 2010 2011 2010 2011
At risk of poverty or social exclusion 32.0 26.7 21.3 20.6 19.6 20.6 20.6 23,6 24.2
At-Risk-of-Poverty rate 13.3 11.6 10.6 10.9 11.0 12.0 13.0 16.4 16.9
Severe Material Deprivation rate 22.1 18.2 13.7 11.8 11.1 11.4 10.6 8,3 8.8
Share of people living in very low work
intensity households 6.6 6.2 6.4 5.2 5.6 7.9 7.6 10.0 10.0
Impact of social transfers on poverty
reduction (excl. pensions)(in%) 39,3 42,0 41,8 40,8 35,7 39,4 33,3 36,7 35,2
Value of threshold (single HH) - in PPS 2,394 2,772 3,365 4,058 4,711 4,984 5,28 N/A N/A
Value of threshold (2 adults + 2
children) - in PPS 5,027 5,821 7,066 8,521 9,894 10,465 11,088 N/A N/A
At risk of poverty or social exclusion 35.0 30.4 25.8 24.3 23.7 25.3 26.0 27,1 27.0
At-Risk-of-Poverty rate 18.9 17.1 17.0 16.7 16.8 18.8 21.2 20.5 20.6
Severe Material Deprivation rate 23.6 19.9 16.3 12.6 12.7 13.5 12.4 9,7 10.0
Share of people living in very low work
intensity households 4.8 4.4 5.5 4.4 5.4 8.0 7.3 9.1 8.8
Impact of social transfers on poverty
reduction (excl. pensions)(in%) 37,3 38,1 30,3 35,8 28,6 41,4 40,5
At risk of poverty or social exclusion 31.6 25.8 20.1 19.3 18.5 20.2 20.6 23,5 24.3
At-Risk-of-Poverty rate 12.7 10.6 9.2 9.5 9.6 11.2 12.4 15.2 16.0
Severe Material Deprivation rate 21.2 17.1 12.3 10.8 10.6 11.0 10.3 8,3 8.9
Share of people living in very low work
intensity households (18-59) 7.2 6.7 6.7 5.4 5.6 7.9 7.8 10.3 10,5
In-work at-risk-of poverty rate 8.9 6.3 4.9 5.8 5.2 5.7 6.3 8.4 8.9
Impact of social transfers on poverty
reduction (excl. pensions) 45,9 43,5 39,2 41,4 34,7 38,7 37,0
At risk of poverty or social exclusion 29.0 25.6 22.0 21.9 19.7 16.7 14.5 20,0 20.5
At-Risk-of-Poverty rate 7.1 8.5 9.6 9.9 10.8 7.7 6.3 16.0 16.0
Severe Material Deprivation rate 24.6 21.0 17.7 15.3 11.7 11.1 9.7 6,6 7.2
Relative median income ratio of elderly 0.85 0.85 0.81 0.79 0.81 0.83 0.86 0.88 0.89
Aggregate replacement ratio 0.55 0.57 0.54 0.54 0.55 0.61 0.62 0.53 0.54
2000 2005 2006 2007 2008 2009 2010 2009 2010
Sickness/Health care 6,5 4,8 4,8 4,7 5,1 5,8 5,6 8,4 8,3
Invalidity 1,4 1,3 1,3 1,3 1,4 1,5 1,6 2,3 2,2
Old age and survivors 7,0 7,1 6,9 6,8 6,6 7,8 7,8 12,7 12,7
Family/Children 1,7 1,7 1,6 1,5 1,5 1,7 1,8 2,3 2,3
Unemployment 0,9 0,5 0,5 0,6 0,6 1,0 0,9 1,8 1,7
Housing and Social exclusion n.e.c. 1,2 0,5 0,6 0,5 0,4 0,4 0,5 1,0 1,0
Total 18,8 15,9 15,7 15,4 15,5 18,2 18,0 28,5 28,2
Means-tested
Sickness/Health care 0,0 0,0 0,0 0,0 0,0 0,0 0,0 0,1 0,1
Invalidity 0,2 0,2 0,2 0,2 0,1 0,2 0,2 0,5 0,5
Old age and survivors 0,1 0,2 0,3 0,3 0,3 0,3 0,3 0,6 0,6
Family/Children 0,9 0,0 0,0 0,0 0,0 0,0 0,0 0,6 0,6
Unemployment 0,0 0,0 0,0 0,0 0,0 0,0 0,0 0,4 0,4
Housing and Social exclusion n.e.c. 1,2 0,5 0,5 0,5 0,3 0,4 0,4 0,9 1,0
Total 2,4 0,9 1,0 1,0 0,8 0,9 0,9 3,0 3,1
Non-means tested
Sickness/Health care 6,5 4,8 4,8 4,7 5,1 5,8 5,6 8,3 8,2
Invalidity 1,2 1,2 1,2 1,1 1,3 1,4 1,4 1,8 1,8
Old age and survivors 6,9 6,9 6,6 6,5 6,4 7,5 7,5 12,1 12,1
Family/Children 0,8 1,7 1,6 1,5 1,4 1,7 1,7 1,7 1,7
Unemployment 0,9 0,5 0,5 0,6 0,6 1,0 0,9 1,4 1,3
Housing and Social exclusion n.e.c. 0,0 0,0 0,1 0,0 0,0 0,0 0,0 0,1 0,1
Total 16,4 15,0 14,7 14,5 14,8 17,4 17,1 25,4 25,2
EU27
Social expenditure
(in % of GDP)
Children (0-17)
Working age
(18-64)
Elderly (65+)
Total population
Source: Eurostat (EU-SILC, ESSPROS for social expenditure data)
Note: For non-means tested the aggregation Housing and Social Exclusion n.e.c is based only on
Housing. The total figures of social expenditure include all benefits excluding administrative costs.

- 396 -
4. LONG-TERM ADEQUACY OF PENSIONS: THEORETICAL REPLACEMENT RATES (2010-
2050)
Theoretical replacement rates (TRR): Net 2010 Net 2050 Difference Gross2010 Gross2050 Difference
40 years career: average income earner
(basecase)74,6 65,4 -9,2
58,7
(100/0/0)*
51,3
(52/48/0)*-7,5
Low income 78,2 64,6 -13,665
(100/0/0)*
53,5
(54/46/0)*-11,5
High income 56,2 50,7 -5,542,7
(100/0/0)*
38
(51/49/0)*-4,7
Lower / higher future rates of return 60,8 / 70,7 47,7 / 55,5
Lower / higher future wage growth 72,9 / 59,6 57,2 / 46,8
38 years career: average income 63,8 58,2 -5,6 50,2 45,6 -4,6
Low / high income 66,9 / 48 57,5 / 45,1 (-9,4/-2,9) 55,6 / 36,4 47,6 / 33,8 (-8/-2,6)
42 years career: average income 86,4 73,1 -13,3 68 57,3 -10,7
Low / high income 90,5 / 64,9 72,2 / 56,6 (-18,3/-8,3) 75,3 / 49,3 59,7 / 42,5 (-15,5/-6,8)
10 years after retirement 70 53,8 -16,2 54,2 41,9 -12,3
Female worker with 3 years of career
break for childcare52,1 53,6 1,5 41 42 1,0
3 years of career break for
unemployment53,6 51 -2,6 42,2 40 -2,2
10 years out of the labour market 56 47,6 -8,4 44,1 37,3 -6,8
2010 2050 Difference EU27 2010 EU27 2050 Difference
Benefit ratio (Public pensions) 43,7 29,7 -14,144,7 37,0 -7,7
Gross replacement rate at retirement
(Public pensions)50,7 40,2 -10,5 48,0 39,1 -8,9
Note: *: Share of statutory DB-NDC / statutory funded / occupational and other supplementary
pensions
Source: Joint SPC/EC report on Pension Adequacy in the European Union (2010-2050)

- 397 -
5. KEY CONTEXT MACRO-ECONOMIC INFORMATION
Source: Eurostat, National Accounts and EU LFS. ECFIN autumn economic forecast 2012 for 2012-
2014.
Note: Data on social protection expenditure comes from the AMECO database ( it is calculated as
the sum of Social benefits other than social transfers in kind; general government - ESA 1995 +
Social transfers in kind - ESA 1995)

- 398 -
6. TRENDS IN TAKE-UP OF SELECTED BENEFITS102
Number of unemployed
Definition Unemployment according to ILO definition - Total
Unit thousands of persons - seasonally adjusted
Source Eurostat
Unemployment recipients
Definition Unemployment Benefit recipients ; Unemployment assistance recipients
Unit thousands of recipients
Source Social Insurance Agency
Link http://www.socpoist.sk/pocet-poberatelov-davok-v-nezamestnanosti/1662s
Comment
The development in number of the recipients had been stabilized for period 2006 to 2008,
however the first higher rising occurred in December 2008. Then the number of
recipients increased dramatically till the August 2009 and then followed month-to-month
drop since September to the end of Year 2009. The effect of economic crisis and recession
102 These data has been collected by the SPC in the context of monitoring the social impact of the crisis. It
includes only a selection of benefits which have been considered most reactive to the crisis. The number of unemployed refers to the standard definition by the ILO and is given as a background.

- 399 -
was the main reason (particularly growth of unemployment) of negative trend in Year
2009. Part of recipients who finished the supportive period of disbursement of the
unemployment benefit could be transfer into social assistance benefit (benefit in material
need), if they are still unemployed. The new softer eligibility criteria on unemployment
benefit have come into effect since 1 September 2010. The minimum necessary condition
of unemployment insurance decreased from 3 years from the last four years into 2 years
from the last three years. Nevertheless, no dramatic changes in number of the recipients
(oscillated around 40 thousand) have come in Year 2011 and 2012 (Jan-Aug).
Recipients of social assistance benefits/means-tested minimum Income
Definition Number of recipients of Social Assistance Benefits/means-tested minimum income
Unit quarterly data (changes in % to the previous year)
Source Centre Offiice of Labour, Social Affairs and Familly
Link http://www.upsvar.sk/statistiky/socialne-davky-statistiky.html?page_id=10826
Comment
Recipients are defined as recipients of benefits. In the system of assistance in material
need (social assistance) we are talking about the recipient, which is the range of jointly
assessed persons, i.e. individual, family with children, families without children, etc. This
means that for one recipient of assistance in material need may be more of jointly
assessed persons. In Year 2011 and 2012 (Jan-Aug) was evident slight decline in number
of the recipients of material need.
Disability benefits recipients
Definitio
n Disability benefit recipients
Unit thousands of recipients
Source Social Insurance Agency
Commen
t
The development of recipients had been stabilized in period 2006 to 2010, but soft increased
could be seen since 1 October 2006, as reaction to the Resolution of Constitutional Court of the
Slovak Republic. However, in Year 2010 coming another modest growth of recipients, because
lighter conditions have come into effect since 1 January 2010 (the minimum pension period on
invalidity benefit will be required from all career, not only from last 10 years). This trend
continued in Year 2011 and 2012 (Jan-Aug).

- 400 -
7. SUMMARY OF SPECIFIC KEY SOCIAL CHALLENGES AND PARTICULARLY GOOD SOCIAL
OUTCOMES
Social policy areas Challenges
Poverty and social inclusion High unemployment, especially long-term unemployment
and unemployment of youth
Reducing risk of poverty and social exclusion, especially in
marginalised communities such as the Roma
Improving access to and quality of schooling and pre-school
education of vulnerable groups, including Roma
Health and long-term care Optimising the efficiency of health expenditure while
improving access to quality healthcare
Particularly good social outcomes
Some increase in the number of healthy life years expected
at the age of 65 for men and women

- 401 -
FINLAND
1. EVALUATION OF THE 2012 NATIONAL SOCIAL REPORT (NSR)
The unemployment is remaining stably at around 8 % and youth unemployment is at high level,
around 20 %. On average, productivity and living standards in Finland rank very well on the
European comparison. However, health inequalities have grown in Finland, the difference in life
expectancy between different income groups has grown to 12.5 years for men and to 6.8 years
for women. The gap between the richest and the poorest of the society has grown in Finland
since mid-1980s. In March 2012, the Government decided on EUR 1.2 billion of spending cuts
and EUR 1.1 billion of tax increases in order to restore long-term balance of public finances.
However, fiscal consolidation has not so far affected benefit levels or social expenditure.
In the process of drafting the NSR most relevant stakeholders were consulted. Participants in the
hearing represented various governmental organs, representatives of municipalities, non-
governmental organizations, labour market organizations as well as representatives from expert
bodies and advocacy groups (pensions, health, and social insurance).
The NSR identifies main priorities in the area of social inclusion. They relate to three major
themes: firstly, reducing poverty, social exclusion and inequality, secondly, prolonging working
careers, and thirdly, promoting health and reducing health disparities These themes cover a
wide range of issues such as inclusion, homelessness and poverty relating to the first theme,
disability pensions, quality of work and youth unemployment relating to the second theme, and
linked to the third theme, access to services and regional differences. These issues require a
holistic approach across administrative fields. All these priorities and the holistic approach
correspond well to the main challenge as set out in the Commission assessment103 ; full
utilization of labour force.
The primary way to reduce poverty is through labour market participation, as poverty in Finland
is clearly related to weak labour market attachment. In addition, the Government has taken
measures to ameliorate the financial situation of people living on basic benefits. The measures
include: some allowances have been linked to changes in the cost-of-living-index, a guarantee
pension was introduced, basic unemployment allowance and labour market subsidy were
increased and spouse's earnings will no longer have an effect on labour market subsidy. Labour
market and rehabilitation opportunities of people with partial work ability and other groups
weakly engaged in the labour market will be improved through a programme prepared during
2012.
As a new measure to tackle the difficult situation of young people the government introduced a
social guarantee for the youth that will be fully implemented in 2013. The NSR does not mention
it explicitly, but a fixed-term pilot programme targeting long-term unemployment by
transferring the management of an individual's employment support to the municipality after
103 See SWD(2012)312 final – Part 1 – Section 3.

- 402 -
500 days of unemployment, will be launched in September 2012. As a part of coordinated
policies taxation has been shifted away from labour. However, it is stated in the NSR that any
rise consumption taxes, as is planned for the VAT, is known to negatively affect the purchasing
power of the low-income families.
Finland has raised the age of eligibility for the 'unemployment pathway to retirement', whereby
older unemployed persons have an extra-long period of income-related unemployment benefit
before retiring, by one year and the age limit for the part-time pension by one year as well. The
reforms reflect the CSR given in 2011, and the measures will affect the effective retirement age.
Main motivation for these measures is to prolong the length of working careers. The aim is to
achieve an effective retirement age of 62.4 years by 2025.
The guarantee pension was introduced in March 2011 and it has increased the income level of
poor elderly people – women and immigrants especially. Although the NSR does not mention all
measures taken in the area of pension policy, it is worth mentioning the development of
complementary private savings to enhance retirement incomes and the Government's proposal
to change the rules of taxation concerning the complementary private savings.
In addition to the measures taken, Finland has established a working group that is negotiating a
major pension reform by 2017. The labour market organizations expressed their support to
longer working careers through the development of the pension system and well-being at work.
The NSR highlights a key policy challenge: the increase of health inequalities between regions
and socioeconomic groups. These are mainly due to differences in behavioural aspects of way of
life. Moreover, regional differences in waiting times in primary care are mainly due to difficulties
in recruitment of primary care physicians and in the relatively high burden of co-payments for
public health services to poor households contribute to health inequalities. The Ministry of
Social Affairs and Health is restructuring the social welfare and health care system which fall
partly under the responsibility of the municipalities. While doing this, the policy makers need to
ensure that the reform reduces regional and socioeconomic discrepancies in health care.
The NSR shows that Finland is determined to reform the health system to improve its cost-
efficiency and sustainability. Finland has introduced maximum waiting times and uniform
criteria for non-urgent health care that has resulted in elimination of excessively long waiting
lists to non-urgent surgery and specialist care. There is a strong emphasis on quality and patient
safety in the new Health Care Act.
Another key challenge is to ensure the employability of people with partial work capacity, as
they represent a group that has a bigger challenge to secure a job.
The Government has set the reduction of poverty to be one of their main targets. Finland has
chosen to monitor its national target using the EU-definition indicator of people at-risk-of
poverty or social exclusion (based on EU-SILC). In addition, Finland will also keep an eye on
auxiliary information (for example the share of population living below 50% of median income,
poverty gap development and changes in income inequalities). It is uncertain whether the
European target will be reached.

- 403 -
2. NATIONAL 2020 TARGET FOR THE REDUCTION OF POVERTY AND SOCIAL EXCLUSION
"The quantitative target of the Europe 2020 Strategy will be achieved in Finland if the number of
people at risk of poverty and social exclusion can be reduced by around 150,000 people" (NRP
2012)
Source: National Reform Programme (2012)
2.a Progress towards the 2020 national target for the reduction of poverty and
social exclusion
Source: Eurostat (EU-SILC)
Note: i) Progress on the target is monitored on the basis of the EU SILC data with a base year 2008 and
target data year 2018;
ii) AROPE - at-risk-of-poverty or social exclusion rate; AROP - at-risk-of-poverty rate; VLWI - share of
population living in very low work intensity households; SMD - severe material deprivation rate;
iii) For the at-risk-of poverty rate (AROP), the income reference year is the calendar year prior to the
survey year (i.e. 2010) except for the United Kingdom (survey year) and Ireland (12 months preceding the
survey). Similarly, the very low work intensity rate (VLWI) refers to the income reference year prior to the
survey (i.e. 2010) while for the severe material deprivation rate (SMD), the reference is the current year (i.e.
2011).
2b. Composition of the population at risk of poverty or social exclusion (2011)

- 404 -
Source: Eurostat (EU-SILC)
Note: i) Progress on the target is monitored on the basis of the EU SILC data with a base year 2008 and
target data year 2018;
ii) AROPE - at-risk-of-poverty or social exclusion rate; AROP - at-risk-of-poverty rate; VLWI - share of
population living in very low work intensity households; SMD - severe material deprivation rate; the red
overlap indicates the share of the population which accumulates all three conditions;
iii) For the at-risk-of poverty rate (AROP), the income reference year is the calendar year prior to the survey
year (i.e. 2010) except for the United Kingdom (survey year) and Ireland (12 months preceding the survey).
Similarly, the very low work intensity rate (VLWI) refers to the income reference year prior to the survey (i.e.
2010) while for the severe material deprivation rate (SMD), the reference is the current year (i.e. 2011).
2005 2006 2007 2008 2009 2010 2011
AROP total % of total pln 11,7 12,6 13 13,6 13,8 13,1 13,7
1000 persons 603 650 676 709 725 692 725
VLWI total % of total pln 9,8 8,9 8,7 7,3 8,2 9,1 9,8
1000 persons 401 363 350 296 329 364 389

- 405 -
SMD total % of total pln 3,8 3,3 3,6 3,5 2,8 2,8 3,2
1000 persons 195 172 185 181 148 150 170
AROP + VLWI
% of total pln 2,7 2,7 2,4 2,4 2,9 3,2 3,4
1000 persons 141 140 125 127 151 170 178
AROP + SMD % of total pln 0,8 1,0 1,0 1,0 0,6 0,6 0,6
1000 persons 40 49 51 51 29 30 33
AROP + SMD + VLWI
% of total pln 1,0 0,8 1,0 0,8 1,1 0,9 0,9
1000 persons 49 43 52 39 59 49 46
SMD +VLWI % of total pln 0,6 0,5 0,5 0,4 0,3 0,4 0,6
1000 persons 33 24 26 18 18 19 30
2c. At risk of poverty or social exclusion rate for specific groups, 2011
Total
At risk of poverty or social
exclusion, in %
Children (0-17) 16,1
Working age (18-64) 18,0
Elderly (65+) 19,8
Employed 4,9
Unemployed 62,0
Inactive 43,0
Single male 40,4
Single female 38,0
Single elderly (65+) 39,4
Single parent households 35,7
Large families (2 adults and 3+ children) 17,9
EU-migrant (EU 27) 20,4
Non-EU migrants (non-EU27) 49,1
Source: Eurostat (EU-SILC)
3. MAIN SOCIAL INDICATORS
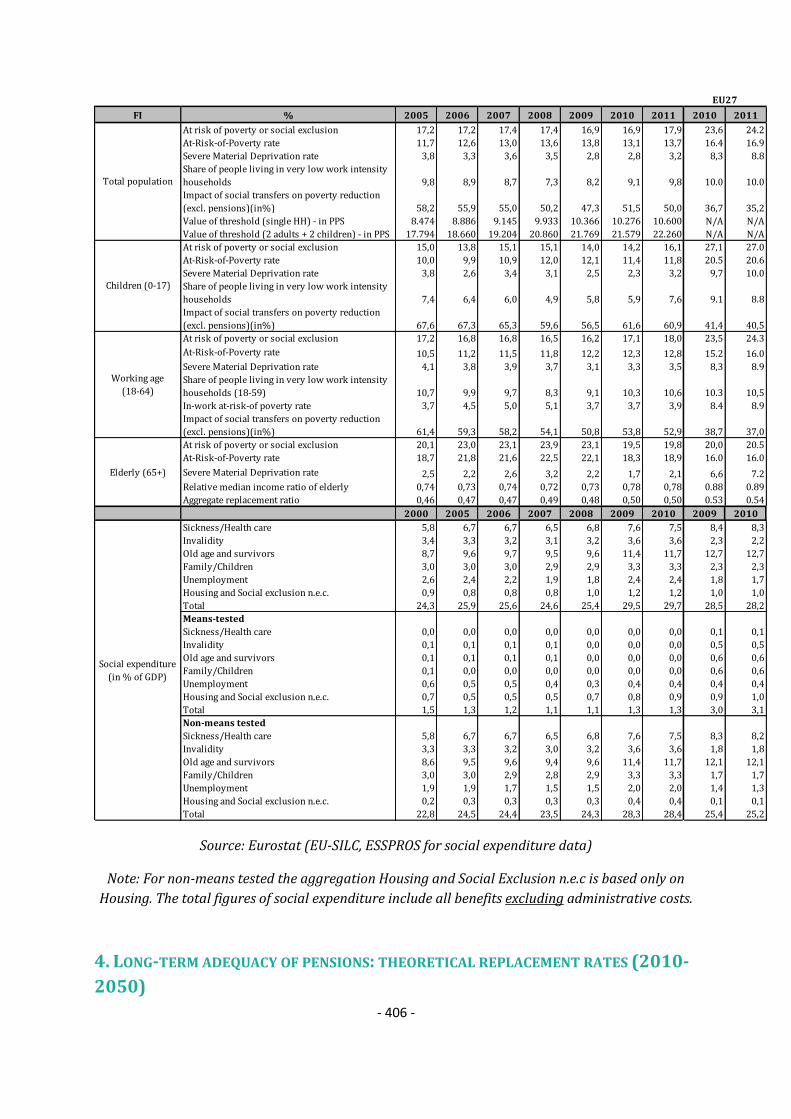
- 406 -
FI % 2005 2006 2007 2008 2009 2010 2011 2010 2011
At risk of poverty or social exclusion 17,2 17,2 17,4 17,4 16,9 16,9 17,9 23,6 24.2
At-Risk-of-Poverty rate 11,7 12,6 13,0 13,6 13,8 13,1 13,7 16.4 16.9
Severe Material Deprivation rate 3,8 3,3 3,6 3,5 2,8 2,8 3,2 8,3 8.8
Share of people living in very low work intensity
households 9,8 8,9 8,7 7,3 8,2 9,1 9,8 10.0 10.0
Impact of social transfers on poverty reduction
(excl. pensions)(in%) 58,2 55,9 55,0 50,2 47,3 51,5 50,0 36,7 35,2
Value of threshold (single HH) - in PPS 8.474 8.886 9.145 9.933 10.366 10.276 10.600 N/A N/A
Value of threshold (2 adults + 2 children) - in PPS 17.794 18.660 19.204 20.860 21.769 21.579 22.260 N/A N/A
At risk of poverty or social exclusion 15,0 13,8 15,1 15,1 14,0 14,2 16,1 27,1 27.0
At-Risk-of-Poverty rate 10,0 9,9 10,9 12,0 12,1 11,4 11,8 20.5 20.6
Severe Material Deprivation rate 3,8 2,6 3,4 3,1 2,5 2,3 3,2 9,7 10.0
Share of people living in very low work intensity
households 7,4 6,4 6,0 4,9 5,8 5,9 7,6 9.1 8.8
Impact of social transfers on poverty reduction
(excl. pensions)(in%) 67,6 67,3 65,3 59,6 56,5 61,6 60,9 41,4 40,5
At risk of poverty or social exclusion 17,2 16,8 16,8 16,5 16,2 17,1 18,0 23,5 24.3
At-Risk-of-Poverty rate 10,5 11,2 11,5 11,8 12,2 12,3 12,8 15.2 16.0
Severe Material Deprivation rate 4,1 3,8 3,9 3,7 3,1 3,3 3,5 8,3 8.9
Share of people living in very low work intensity
households (18-59) 10,7 9,9 9,7 8,3 9,1 10,3 10,6 10.3 10,5
In-work at-risk-of poverty rate 3,7 4,5 5,0 5,1 3,7 3,7 3,9 8.4 8.9
Impact of social transfers on poverty reduction
(excl. pensions)(in%) 61,4 59,3 58,2 54,1 50,8 53,8 52,9 38,7 37,0
At risk of poverty or social exclusion 20,1 23,0 23,1 23,9 23,1 19,5 19,8 20,0 20.5
At-Risk-of-Poverty rate 18,7 21,8 21,6 22,5 22,1 18,3 18,9 16.0 16.0
Severe Material Deprivation rate 2,5 2,2 2,6 3,2 2,2 1,7 2,1 6,6 7.2
Relative median income ratio of elderly 0,74 0,73 0,74 0,72 0,73 0,78 0,78 0.88 0.89
Aggregate replacement ratio 0,46 0,47 0,47 0,49 0,48 0,50 0,50 0.53 0.54
2000 2005 2006 2007 2008 2009 2010 2009 2010
Sickness/Health care 5,8 6,7 6,7 6,5 6,8 7,6 7,5 8,4 8,3
Invalidity 3,4 3,3 3,2 3,1 3,2 3,6 3,6 2,3 2,2
Old age and survivors 8,7 9,6 9,7 9,5 9,6 11,4 11,7 12,7 12,7
Family/Children 3,0 3,0 3,0 2,9 2,9 3,3 3,3 2,3 2,3
Unemployment 2,6 2,4 2,2 1,9 1,8 2,4 2,4 1,8 1,7
Housing and Social exclusion n.e.c. 0,9 0,8 0,8 0,8 1,0 1,2 1,2 1,0 1,0
Total 24,3 25,9 25,6 24,6 25,4 29,5 29,7 28,5 28,2
Means-tested
Sickness/Health care 0,0 0,0 0,0 0,0 0,0 0,0 0,0 0,1 0,1
Invalidity 0,1 0,1 0,1 0,1 0,0 0,0 0,0 0,5 0,5
Old age and survivors 0,1 0,1 0,1 0,1 0,0 0,0 0,0 0,6 0,6
Family/Children 0,1 0,0 0,0 0,0 0,0 0,0 0,0 0,6 0,6
Unemployment 0,6 0,5 0,5 0,4 0,3 0,4 0,4 0,4 0,4
Housing and Social exclusion n.e.c. 0,7 0,5 0,5 0,5 0,7 0,8 0,9 0,9 1,0
Total 1,5 1,3 1,2 1,1 1,1 1,3 1,3 3,0 3,1
Non-means tested
Sickness/Health care 5,8 6,7 6,7 6,5 6,8 7,6 7,5 8,3 8,2
Invalidity 3,3 3,3 3,2 3,0 3,2 3,6 3,6 1,8 1,8
Old age and survivors 8,6 9,5 9,6 9,4 9,6 11,4 11,7 12,1 12,1
Family/Children 3,0 3,0 2,9 2,8 2,9 3,3 3,3 1,7 1,7
Unemployment 1,9 1,9 1,7 1,5 1,5 2,0 2,0 1,4 1,3
Housing and Social exclusion n.e.c. 0,2 0,3 0,3 0,3 0,3 0,4 0,4 0,1 0,1
Total 22,8 24,5 24,4 23,5 24,3 28,3 28,4 25,4 25,2
Elderly (65+)
Social expenditure
(in % of GDP)
EU27
Children (0-17)
Working age
(18-64)
Total population
Source: Eurostat (EU-SILC, ESSPROS for social expenditure data)
Note: For non-means tested the aggregation Housing and Social Exclusion n.e.c is based only on
Housing. The total figures of social expenditure include all benefits excluding administrative costs.
4. LONG-TERM ADEQUACY OF PENSIONS: THEORETICAL REPLACEMENT RATES (2010-
2050)

- 407 -
Theoretical replacement rates (TRR): Net 2010 Net 2050 Difference Gross2010 Gross2050 Difference
40 years career: average income earner
(basecase)68,9 62 -6,9
61,8
(100/0/0)*
54,4
(100/0/0)*-7,4
Low income 72,3 62,7 -9,666,7
(100/0/0)*
54,4
(100/0/0)*-12,3
High income 63,4 51,7 -11,755,8
(100/0/0)*
42,8
(100/0/0)*-13,0
Lower / higher future rates of return 62 / 62 54,4 / 54,4
Lower / higher future wage growth 63,3 / 60,8 55,8 / 53,1
38 years career: average income 60,8 55,3 -5,5 53,2 47,4 -5,8
Low / high income 66,3 / 56,6 57,2 / 46,1 (-9,1/-10,5) 58,9 / 48,4 47,4 / 36,7 (-11,5/-11,7)
42 years career: average income 74,7 68,5 -6,2 68,1 61,4 -6,7
Low / high income 77,5 / 69,4 68,2 / 57,8 (-9,3/-11,6) 73,1 / 62,2 61,4 / 49,8 (-11,7/-12,4)
10 years after retirement 60,2 54,7 -5,5 52,5 46,3 -6,2
Female worker with 3 years of career
break for childcare64,7 61,3 -3,4 57,2 53,7 -3,5
3 years of career break for
unemployment65,9 60,3 -5,6 58,5 52,7 -5,8
10 years out of the labour market 54,4 51,3 -3,1 46,3 42,8 -3,5
2010 2050 Difference EU27 2010 EU27 2050 Difference
Benefit ratio (Public pensions) 49,4 45,3 -4,144,7 37,0 -7,7
Gross replacement rate at retirement
(Public pensions)51,8 45,1 -6,7 48,0 39,1 -8,9
Note: *: Share of statutory DB-NDC / statutory funded / occupational and other supplementary
pensions; Source: Joint SPC/EC report on Pension Adequacy in the European Union (2010-2050)
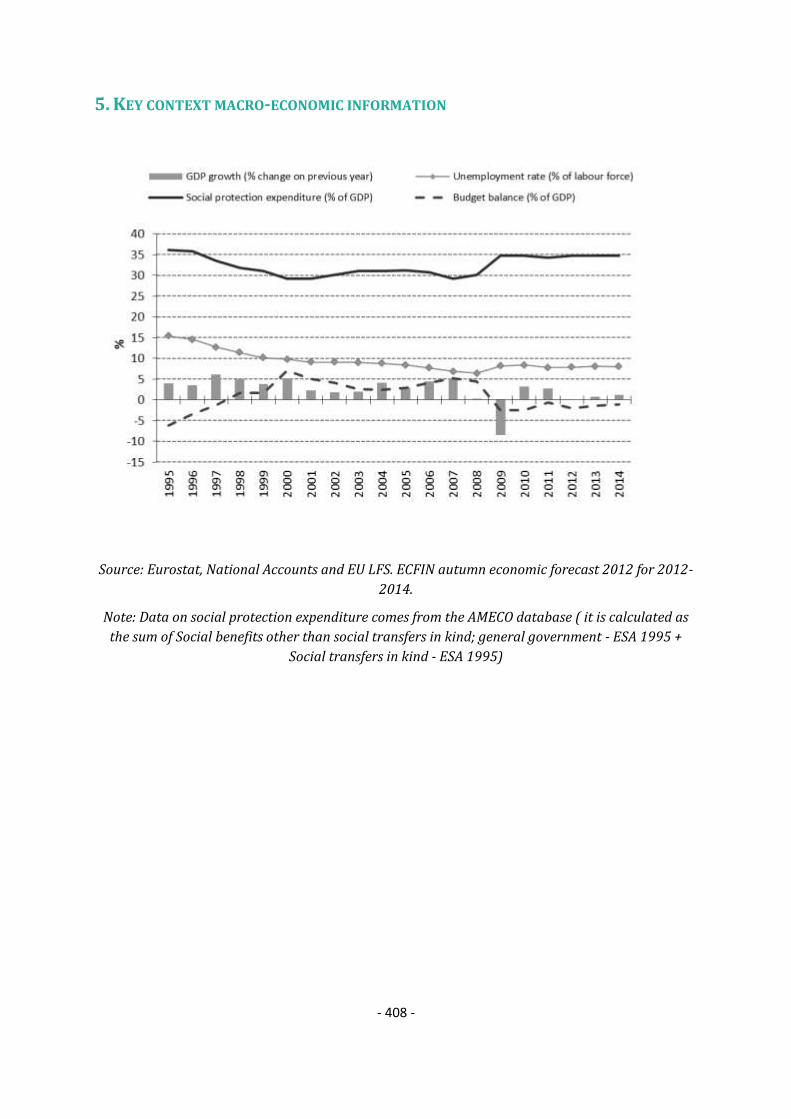
- 408 -
5. KEY CONTEXT MACRO-ECONOMIC INFORMATION
Source: Eurostat, National Accounts and EU LFS. ECFIN autumn economic forecast 2012 for 2012-
2014.
Note: Data on social protection expenditure comes from the AMECO database ( it is calculated as
the sum of Social benefits other than social transfers in kind; general government - ESA 1995 +
Social transfers in kind - ESA 1995)

- 409 -
6. TRENDS IN TAKE-UP OF SELECTED BENEFITS104
Number of unemployed
Definition Unemployment according to ILO definition - Total
Unit thousands of persons - seasonally adjusted
Source Eurostat
Unemployment recipients
Definition Earnings-related unemployment allowance; Basic unemployment allowance; Labour
market support
Unit thousands of recipients, at the end of the month
Source Social Insurance Institution and the Financial Supervisory Authority (FIN-FSA)
Comment
Earnings-related unemployment allowance is paid for those who fullfil the eligibility
criteria: Employment conditions and are member of an unemployment fund. This is
voluntary, you have to pay an annual fee. In the case of unemployment the allowance is
related to your salary. Most of the funds are managed by trade unions. Basic unemployment
allowance is like earnings-related allowance, but the difference is that you are not a
member of an unemployment fund. The allowance is flat rate and low. Starting from 2010,
basic and earnings-related unemployment allowances are payable not only during
104 This data has been collected by the SPC in the context of monitoring the social impact of the crisis. It
includes only a selection of benefits which have been considered most reactive to the crisis. The number of unemployed refers to the standard definition by the ILO and is given as background information.

- 410 -
unemployment but also during participation in a measure of active labour market policy.
Labour market support is flat rate benefit (and low) for those who do not qualify for the
eligibility rules of the benefits mentioned above. In practice they are young people and
those who have received the allowances mentioned above for the maximum period (500
days). Persons aged 18-24 are entitled to this benefit during labour-market-measures.
Total number of people receiving unemployment benefits decreased until autumn 2008.
After that, the number increased until the beginning of 2010. Since then, the number of
recipients has stayed at the same level except for seasonal variation.
Recipients of social assistance benefits/means-tested minimum Income
Definition Recipients of social assistance (households)
Unit thousands of recipients
Source National Institute for Health and Welfare (THL)
Comment
In 2010, on average 119,000 households per month received social assistance. The number
of households per month receiving social assistance grew rapidly in the first part of 2009,
but subsequently the growth rate came to halt. The numbers were, however, decidedly
more than 10 per cent higher than during the downturn before 2008. The same trend is also
visible in the unemployment benefits. Until the beginning of 2009, the annual trends in both
benefits had been falling throughout the 2000s.
Disability benefits recipients
Definition Recipients of disability pension (earnings-related schemes) at the end of the month
Unit thousands of recipients
Source Finnish Centre for Pensions
Comment
The number of people receiving disability pension has decreased since the beginning of
2009. From autumn 2010 to autumn 2012 number of recipients decreased by 9 %. People
don't apply for disability pension as much as before. This is mainly due to the pension
reform in 2005, which for example changed the retirement age from 65 to 63-68 years. The
pension take up has changed after 2005, but the reform also included some technical
changes to the pension system. For example, disability pension is converted to old age
pension in earlier age than before.

- 411 -
7. SUMMARY OF SPECIFIC KEY SOCIAL CHALLENGES AND PARTICULARLY GOOD SOCIAL
OUTCOMES
Social policy areas Challenges
Poverty and social inclusion Reducing poverty, social exclusion and inequality: active
inclusion and homelessness
Pensions Improving the employment rate of older workers
Reducing early exit pathways
Increasing the effective retirement age by accounting for life
expectancy
Prolonging working careers: disability pensions, quality of
work, youth unemployment
Health and long-term care Promoting health: access to services and regional
differences
Reducing health disparities: access to services and regional
differences
Particularly good social outcomes
Some improvement in reducing the share of working poor
since 2008
Some improvements in the average healthy life years at 65
for males since 2008

- 412 -
SWEDEN
1. 2012 NATIONAL SOCIAL REPORT (NSR): KEY ISSUES
Sweden’s national social report 2012, focus on the third strand of the Social OMC covering high-
quality and sustainable healthcare and long-term care, since the other strands, namely
combating poverty and social inclusion as well as adequate and sustainable pensions, are
described in the national reform program. Sweden has an employment rate of 80% (2011) and
an unemployment rate of 7,5% (2011) but there exist groups with a weak attachment on the
labour market, such as the foreign born and the youth. The overall policy objective of the
Swedish Government is strongly focused on reducing social exclusion through labour market
inclusion. Sweden has a relatively low and stable at-risk of poverty social exclusion rate (15%,
2010) and the social security system remain stable. There is a slight improvement in the overall
at-risk-of-poverty and social-exclusion indicator in 2010. The improvement has not fully
reached the elderly (especially women), in-work poverty for women, child poverty and the
impact of social expenditure in reducing child poverty. The fact that elderly women often have
had shorter working lives and thus qualified for relatively low-income pension, are relatively
older than men and to a larger extent than men live in a single person household are factors
explaining the high risk of poverty in this group. In the future, the problem is projected to
decrease to a certain degree as women currently in active ages work and earn pension rights in
parity with men.
The EPC-SPC report on pensions shows that the Swedish pension system is one of the most
financially sustainable in the EU but that an actuarial pensions system like the Swedish system
could face a long-term adequacy challenge if people live longer but do not work longer. It should
be noted that the labour force participation for older people (55-64) is the highest in the EU
(72,3% in 2011) and the average exit age from the labour market is also among the highest in
the EU.
The NSR does not mention if stakeholders have been consulted. The NRP process involved
stakeholder consultations. However, some Swedish stakeholders have put forward scope for
improved stakeholder involvement in the NRP process.
The NSR refers to the following main socio-economic priorities included in the NRP:
measures to improve the foothold on the labour market of the foreign born and the youth,
prevent long-term unemployment, support to persons with disabilities to find, get and keep a
job, return to the labour market of persons on long-term sick leave and increased housing
allowance for families with children. The measures mainly correspond with the priorities
identified by the Commission although the Commission has identified the need to handle the
challenges in a more comprehensive way by introducing more determined efforts105.
105
SWD(2012) 328 final

- 413 -
The Swedish Government's primary goal is to reduce social exclusion by promoting full
employment. The NRP mentions specifically that "the value of work, which provides freedom,
community security and opportunities cannot be emphasised enough". A key reform highlighted
in the NRP (that the NRS refers to) is the reformed reception system for refugees and their
families geared towards a quicker establishment on the labour market by a stronger focus on
labour market introduction than the previous introduction system. The Government has
introduced several measures to promote labour market participation among groups with
difficulties to enter and remain on the labour market, including increased allocation to the Public
Employment Office in order to improve support and mediation for those at risk of long-term
unemployment.
Sweden reformed its pension system in 1999. The NRP mentions that the Swedish Government
has appointed an investigation with the mandate to perform an analysis of the current
retirement-related age limits, and identify obstacles to a longer working life. The investigator
will present its analysis and suggestions in April 2013.
Concerning healthcare the NSR mentions that the Swedish Government is investing in patient
choice systems and in reducing healthcare waiting-times. Examples of measures aimed at
reducing the waiting lists include the statuary healthcare guarantee and extra financial
incentives. The initiatives are supplemented by special measures in specific fields such as
psychiatry, dental healthcare and elderly care. As regards long-term care new national
fundamental values in elderly care were introduced in 2011. As part of the implementation the
Government issues performance based financial incentives so that the municipalities can
introduce and implement local "dignity guarantees". The purpose of these local guarantees is to
make operational ethical guidelines for how elderly care is to be run by the municipalities who
are responsible for elderly care in Sweden. The Government and the Swedish Association of
Local Authorities and Regions have entered into an agreement aimed at improving the situation
for the most ill elderly persons. Performance based financial support (48 million EUR during 4
years).
The Government has taken several measures to improve the foothold on the labour market for
the youth and persons born abroad, which is acknowledge as a main challenge. Although the
measures are relevant and credible it is too early to see the results of the measures implemented
in 2011 and 2012. However, previous measures in the field have not generated any significant
and lasting positive effects.
Another important challenge is the increased at risk of poverty levels for certain vulnerable
groups like the elderly (especially women), in-work poverty for women and impact of social
expenditure in reducing child poverty. The NRP contain some measures directed to improve the
situation for child households with the weakest economy. Income support for families
strengthens single- parent households more than it benefits two-parent households. These
measures were implemented in 2010 and 2012 and are not yet reflected in the statistics. The
overall policy focus on labour market inclusion is not always an effective or realistic method of
reducing the risk of poverty for all vulnerable groups such as elderly women with low pension
earnings and single households with children. Therefore the Swedish government also has taken
some measures to improve the standard for groups who have a weak financial situation in spite
of improved opportunities to provide for themselves.

- 414 -
In an actuarial pension system like the Swedish system a longer life expectancy will lead to
lower pensions unless working lives are prolonged. A key focus for Sweden therefore is to
promote a longer working life which is also the goal for the inquiry regarding current
retirement-related age limits and obstacles to a longer working life.
2. NATIONAL 2020 TARGET FOR THE REDUCTION OF POVERTY AND SOCIAL EXCLUSION
"Promoting social inclusion by reducing the percentage of women and men aged 20-64 who are
not in the labour force (except full-time students), the long-term unemployed or those on long-
term sick leave to well under 14 per cent by 2020."
Source: National Reform Programme (2011)
2.a Progress towards the 2020 national target for the reduction of poverty and
social exclusion
Source: Eurostat (EU-SILC)
Note: i) Progress on the target is monitored on the basis of the EU SILC data with a base year 2008 and
target data year 2018;

- 415 -
ii) AROPE - at-risk-of-poverty or social exclusion rate; AROP - at-risk-of-poverty rate; VLWI - share of
population living in very low work intensity households; SMD - severe material deprivation rate;
iii) For the at-risk-of poverty rate (AROP), the income reference year is the calendar year prior to the
survey year (i.e. 2010) except for the United Kingdom (survey year) and Ireland (12 months preceding the
survey). Similarly, the very low work intensity rate (VLWI) refers to the income reference year prior to the
survey (i.e. 2010) while for the severe material deprivation rate (SMD), the reference is the current year (i.e.
2011).
2b. Composition of the population at risk of poverty or social exclusion (2011)
Source: Eurostat (EU-SILC)
Note: i) Progress on the target is monitored on the basis of the EU SILC data with a base year 2008 and
target data year 2018;
ii) AROPE - at-risk-of-poverty or social exclusion rate; AROP - at-risk-of-poverty rate; VLWI - share of
population living in very low work intensity households; SMD - severe material deprivation rate; the red
overlap indicates the share of the population which accumulates all three conditions;
iii) For the at-risk-of poverty rate (AROP), the income reference year is the calendar year prior to the survey
year (i.e. 2010) except for the United Kingdom (survey year) and Ireland (12 months preceding the survey).
Similarly, the very low work intensity rate (VLWI) refers to the income reference year prior to the survey (i.e.
2010) while for the severe material deprivation rate (SMD), the reference is the current year (i.e. 2011).
SE 2005 2006 2007 2008 2009 2010 2011
AROP total % of total pln 9,5 12,3 10,5 12,2 13,3 12,9 14
1000 persons 874 1.125 959 1.121 1.215 1.212 1.333

- 416 -
VLWI total % of total pln 7,5 6,6 5,9 5,4 6,2 5,9 6,8
1000 persons 534 475 409 381 430 418 482
SMD total % of total pln 2,3 2,1 2,2 1,4 1,6 1,3 1,2
1000 persons 216 192 197 132 144 125 112
AROP + VLWI
% of total pln 1,5 1,7 1,3 1,8 2,2 2,3 2,8
1000 persons 133 154 120 165 204 213 267
AROP + SMD % of total pln 0,3 0,5 0,3 0,3 0,3 0,2 0,3
1000 persons 30 49 29 26 26 23 32
AROP + SMD + VLWI
% of total pln 0,5 0,4 0,7 0,3 0,5 0,5 0,4
1000 persons 48 32 60 31 43 44 38
SMD + VLWI % of total pln 0,4 0,4 0,4 0,2 0,1 0,1 0,1
1000 persons 41 35 33 14 14 12 13
2c. At risk of poverty or social exclusion rate for specific groups, 2011
Total
At risk of poverty or social
exclusion, in %
Children (0-17) 15,9
Working age (18-64) 15,4
Elderly (65+) 18,6
Employed 7,2
Unemployed 53,1
Inactive 42,5
Single male 28,4
Single female 39,6
Single elderly (65+) 36,7
Single parent households 41,7
Large families (2 adults and 3+ children) 16,0
EU-migrant (EU 27) 17,8
Non-EU migrants (non-EU27) 36,0
Source: Eurostat (EU-SILC)

- 417 -
3. MAIN SOCIAL INDICATORS
SE % 2005 2006 2007 2008 2009 2010 2011 2010 2011
At risk of poverty or social exclusion 14,4 16,3 13,9 14,9 15,9 15,0 16,1 23,6 24.2
At-Risk-of-Poverty rate 9,5 12,3 10,5 12,2 13,3 12,9 14,0 16.4 16.9
Severe Material Deprivation rate 2,3 2,1 2,2 1,4 1,6 1,3 1,2 8,3 8.8
Share of people living in very low work intensity
households 7,5 6,6 5,9 5,4 6,2 5,9 6,8 10.0 10.0
Impact of social transfers on poverty reduction
(excl. pensions)(in%) 66,9 57,6 61,8 57,2 50,0 51,7 49,8 36,7 35,2
Value of threshold (single HH) - in PPS 8.648 9.068 9.545 10.680 11.258 10.897 11.102 N/A N/A
Value of threshold (2 adults + 2 children) - in PPS 18.162 19.042 20.045 22.427 23.642 22.884 23.313 N/A N/A
At risk of poverty or social exclusion 14,9 18,5 14,9 14,6 15,1 14,5 15,9 27,1 27.0
At-Risk-of-Poverty rate 10,2 15,0 12,0 12,9 13,1 13,1 14,5 20.5 20.6
Severe Material Deprivation rate 3,2 2,8 3,2 1,7 1,7 1,3 1,3 9,7 10.0
Share of people living in very low work intensity
households 6,0 5,4 5,5 4,0 4,2 4,8 5,4 9.1 8.8
Impact of social transfers on poverty reduction
(excl. pensions)(in%) 71,5 59,0 64,7 62,2 56,9 58,4 54,7 41,4 40,5
At risk of poverty or social exclusion 15,1 16,5 14,5 14,8 15,6 15,0 15,4 23,5 24.3
At-Risk-of-Poverty rate 9,1 11,4 10,2 11,2 12,1 11,9 12,5 15.2 16.0
Severe Material Deprivation rate 2,3 2,1 2,2 1,5 1,8 1,5 1,3 8,3 8.9
Share of people living in very low work intensity
households (18-59) 8,1 7,2 6,0 6,0 7,0 6,4 7,3 10.3 10,5
In-work at-risk-of poverty rate 5,5 7,4 6,5 6,8 7,0 6,6 6,9 8.4 8.9
Impact of social transfers on poverty reduction
(excl. pensions)(in%) 67,0 59,3 61,8 59,1 52,2 54,1 52,8 38,7 37,0
At risk of poverty or social exclusion 11,3 11,9 10,4 15,5 18,0 15,9 18,6 20,0 20.5
At-Risk-of-Poverty rate 10,1 11,3 9,9 15,0 17,7 15,5 18,2 16.0 16.0
Severe Material Deprivation rate 1,3 0,9 0,6 0,8 0,5 0,7 0,6 6,6 7.2
Relative median income ratio of elderly 0,81 0,85 0,81 0,78 0,77 0,79 0,77 0.88 0.89
Aggregate replacement ratio 0,60 0,62 0,63 0,62 0,60 0,60 0,58 0.53 0.54
2000 2005 2006 2007 2008 2009 2010 2009 2010
Sickness/Health care 7,8 7,9 7,8 7,5 7,5 7,9 7,4 8,4 8,3
Invalidity 3,9 4,6 4,5 4,4 4,3 4,6 4,2 2,3 2,2
Old age and survivors 11,5 12,2 11,8 11,6 12,1 13,2 12,6 12,7 12,7
Family/Children 2,6 2,9 3,0 2,9 3,0 3,2 3,1 2,3 2,3
Unemployment 2,1 1,8 1,6 1,1 0,9 1,3 1,4 1,8 1,7
Housing and Social exclusion n.e.c. 1,3 1,1 1,1 1,1 1,1 1,2 1,2 1,0 1,0
Total 29,3 30,5 29,8 28,6 28,9 31,4 29,9 28,5 28,2
Means-tested
Sickness/Health care 0,0 0,0 0,0 0,0 0,0 0,0 0,0 0,1 0,1
Invalidity 0,1 0,0 0,0 0,0 0,0 0,0 0,0 0,5 0,5
Old age and survivors 0,2 0,0 0,0 0,0 0,0 0,0 0,0 0,6 0,6
Family/Children 0,0 0,0 0,0 0,0 0,0 0,0 0,0 0,6 0,6
Unemployment 0,0 0,0 0,0 0,0 0,0 0,0 0,0 0,4 0,4
Housing and Social exclusion n.e.c. 1,0 0,9 0,8 0,8 0,8 0,8 0,8 0,9 1,0
Total 1,4 0,9 0,8 0,8 0,8 0,9 0,8 3,0 3,1
Non-means tested
Sickness/Health care 7,8 7,9 7,8 7,5 7,5 7,9 7,4 8,3 8,2
Invalidity 3,7 4,6 4,5 4,4 4,3 4,6 4,2 1,8 1,8
Old age and survivors 11,3 12,2 11,7 11,6 12,1 13,2 12,6 12,1 12,1
Family/Children 2,6 2,9 3,0 2,9 3,0 3,2 3,1 1,7 1,7
Unemployment 2,1 1,8 1,6 1,1 0,9 1,3 1,4 1,4 1,3
Housing and Social exclusion n.e.c. 0,2 0,3 0,3 0,3 0,3 0,3 0,4 0,1 0,1
Total 27,9 29,7 29,0 27,8 28,2 30,5 29,1 25,4 25,2
Elderly (65+)
Social expenditure
(in % of GDP)
EU27
Children (0-17)
Working age
(18-64)
Total population
Source: Eurostat (EU-SILC, ESSPROS for social expenditure data)
Note: For non-means tested the aggregation Housing and Social Exclusion n.e.c is based only on
Housing. The total figures of social expenditure include all benefits excluding administrative costs.

- 418 -
4. LONG-TERM ADEQUACY OF PENSIONS: THEORETICAL REPLACEMENT RATES (2010-
2050)
Theoretical replacement
rates (TRR): Net 2010 Net 2050 Difference Gross2010 Gross2050 Difference
40 years career: average income
earner (basecase) 60,3 53,0 -7,3
63,6
(76/2/22)*
54,6
(62/13/24)* -9
Low income 82,9 53,2 -29,7 72,4
(79/2/19)*
54,6
(62/13/24)* -17,8
High income 57,5 47,9 -9,6 53,7
(62/2/36)*
45,7
(52/11/38)* -8,0
Lower / higher future rates of
return 51,3 / 55 52,6 / 57
Lower / higher future wage
growth 64,6 / 45,1 67,2 / 45,9
38 years career: average income 54,7 47,7 -7,0 56,9 48,4 -8,5
Low / high income 57,9 / 53,5 47,3 / 42,8 (-10,6/-
10,7) 59,9 / 49,5 48,4 / 40,6 (-11,5/-8,9)
42 years career: average income 66,4 63 -3,4 72,5 61,6 -10,9
Low / high income 86,7 / 65,4 62,6 / 55,8 (-24,1/-9,6) 86,3 / 61,9 61,6 / 51,3 (-24,7/-
10,6)
10 years after retirement 58,6 46,3 -12,3 51,7 52,5 0,8
Female worker with 3 years of
career break for childcare 60,1 52,3 -7,8 63,3 53,8 -9,5
3 years of career break for
unemployment 59,7 50,8 -8,9 62,6 52 -10,6
10 years out of the labour
market 57,9 41,2 -16,7 53,2 40,9 -12,3
2010 2050 Difference EU27 2010 EU27 2050 Difference
Benefit ratio (Public pensions) 35,3 26,4 -8,9 44,7 37,0 -7,7
Gross replacement rate at
retirement (Public pensions) 35,4 22,7 -12,7 48,0 39,1 -8,9
Note: *: Share of statutory DB-NDC / statutory funded / occupational and other supplementary
pensions
Source: Joint SPC/EC report on Pension Adequacy in the European Union (2010-2050)

- 419 -
5. KEY CONTEXT MACRO-ECONOMIC INFORMATION
Source: Eurostat, National Accounts and EU LFS. ECFIN autumn economic forecast 2012 for 2012-
2014.
Note: Data on social protection expenditure comes from the AMECO database ( it is calculated as
the sum of Social benefits other than social transfers in kind; general government - ESA 1995 +
Social transfers in kind - ESA 1995)

- 420 -
6. TRENDS IN TAKE-UP OF SELECTED BENEFITS106
Number of unemployed
Definition Unemployment according to ILO definition - Total
Unit thousands of persons - seasonally adjusted
Source Eurostat
Unemployment recipients
Definition Unemployment benefit; labour market measures
Unit thousands of recipients, measured in full year equivalents
Source Statistics Sweden
Recipients of social assistance benefits/means-tested minimum Income
Definition Subsistence allowance
106
This data has been collected by the SPC in the context of monitoring the social impact of the crisis. It includes only a selection of benefits which have been considered most reactive to the crisis. The number of unemployed refers to the standard definition by the ILO and is given as background information.
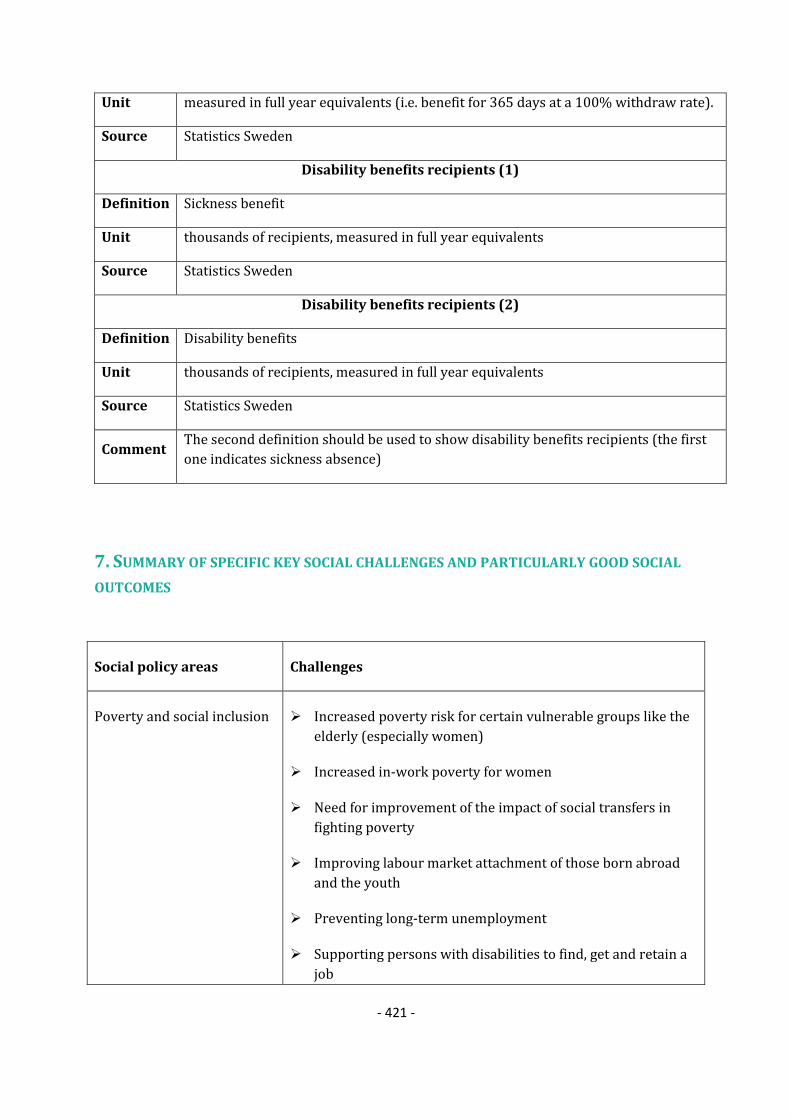
- 421 -
Unit measured in full year equivalents (i.e. benefit for 365 days at a 100% withdraw rate).
Source Statistics Sweden
Disability benefits recipients (1)
Definition Sickness benefit
Unit thousands of recipients, measured in full year equivalents
Source Statistics Sweden
Disability benefits recipients (2)
Definition Disability benefits
Unit thousands of recipients, measured in full year equivalents
Source Statistics Sweden
Comment The second definition should be used to show disability benefits recipients (the first
one indicates sickness absence)
7. SUMMARY OF SPECIFIC KEY SOCIAL CHALLENGES AND PARTICULARLY GOOD SOCIAL
OUTCOMES
Social policy areas Challenges
Poverty and social inclusion Increased poverty risk for certain vulnerable groups like the
elderly (especially women)
Increased in-work poverty for women
Need for improvement of the impact of social transfers in
fighting poverty
Improving labour market attachment of those born abroad
and the youth
Preventing long-term unemployment
Supporting persons with disabilities to find, get and retain a
job

- 422 -
Increasing the rate of return to the labour market of persons
on long-term sick leave
Increasing housing allowance for families with children
Pensions Long term adequacy challenge in the pension system unless
working life is prolonged
Particularly good social outcomes
Good progress in ensuring high labour market
participation for older workers
Progress in reducing the early school leavers
Some improvement in the healthy life years at 65 for men
and women

- 423 -
UNITED KINGDOM
1. 2012 NATIONAL SOCIAL REPORT (NSR): KEY ISSUES
The UK faces growing labour market challenges. Unemployment was 7.8% in the third quarter of
2012 and increasingly long-term in nature with interventions increasingly focussed on long-
term workless In particular young people are hardest hit by the crisis. In 2011, almost one out of
five young people was jobless. The share of young people who are neither in employment nor in
education or training (NEET) continues to rise. In 2010 the NEET rate for 18-24 year-olds was
17.7% and has further increased to 18.4% in 2011. Worklessness is particularly high among
parents. The UK has the second highest rate of children in the EU living in a household where no-
one works (2011: 17.3%).
On the draft of the NSR the relevant stakeholders have been consulted in line with the UK
Government Code of Practice on Consultation.
The UK's main socio-economic priorities, as set out in the NSR, are: (i) Supporting families, (ii)
Supporting young people from disadvantaged backgrounds, (iii) Tackling worklessness, (iv)
Supporting the most disadvantaged adults, (v) Providing adequate and sustainable pensions,
and (vi) Ensuring accessible, high-quality and sustainable healthcare and long-term care. These
priorities correspond to the main challenges identified by the Commission.
In 2011-12, the UK launched a number of new programmes to tackle poverty and social
exclusion, key of which are the Social Justice strategy published in March 2012 and the Universal
Credit due in autumn 2013 (see below). For the early years of children the most important
measures include improving parenting skills and promoting early intervention and preventive
services for children from disadvantaged backgrounds.
For disadvantaged young people a Participation Strategy, 'Building Engagement, Building
Futures', has been published in December 2011. The focus is on tackling behavioural problems
and on strengthening the role of schools in preventing young people falling out of mainstream
provision.
On worklessness the NSR refers to the UK's new welfare reform Universal Credit. The main
elements of the Universal Credit are to simplify welfare, improve work incentives and thereby
help more people get into work. The Work Programme, introduced in June 2011, provides
training for people furthest away from the labour market. To boost youth employment the
government has launched the Youth Contract in April 2012. The Youth Contract will offer
voluntary work experience placements, wage incentives to employers recruiting 18-24 year-olds
from the Work Programme (in England), and incentive payments for small firms who take on
their first young apprentices. The Youth Contract builds on the National Apprenticeship
Programme, published in 2011, with nearly half-million-apprenticeship starts for young people
and adults in the 2010/11 academic year alone.

- 424 -
For the most disadvantaged adults the government has announced new plans including a series
of new measures to tackle rough sleeping, a new approach to rehabilitation for offenders, and
publishing a new drug strategy.
For older people, the NSR sets out the new reform plans of the UK government. As part of these
reforms state pension age will be equalised for both genders by 2018 and will rise to 66 by 2020.
The UK Government have announced that State Pension age will increase to 67 between 2026
and 2028, and is also considering how to make sure State Pension age continues to keep pace
with increases in life expectancy. These changes are not yet law and will require the approval of
Parliament. From October 2012, workers will begin to be automatically enrolled into a range of
occupational pension schemes (with a possibility to opt-out), with full implementation by 2018.
As part of this reform the government has introduced a low cost, defined contribution, pension
scheme, the National Employment Savings Trust (NEST), targeted at lower earners, small
employers, and employers with high labour churn. Budget 2012 also announced that the UK
government will reform the State Pension into a single tier pension for future pensioners.
In the area of healthcare and long-term care the UK government has committed to make the
National Health Service (NHS) more patient-focused and accountable in England. The
government has also committed to increasing healthcare spending in real terms and improving
efficiency to continue to deliver a high quality, accessible service. On long-term care the
government set out its reform plans in England in the Caring for our Future White Paper
published in July 2012.
Scotland will continue to drive up efficiency and productivity in the NHS and achieve a further
£300 million of efficiency saving in 2011/12, retained for re-investment in NHS care. Plans
include reducing the number of senior managers in the NHS by 25% this Parliament. In Wales
and Northern Ireland a broad range of work is underway to improve social care.
Overall, the UK has an ambitious welfare reform agenda to tackle poverty and social exclusion
and the government has already taken steps to implement measures. However, the success of
these reforms depends upon getting benefit recipients into stable jobs. It will be also important
to ensure that declining amount of social benefits will not translate into increased child poverty.
Despite having one of the highest female participation rates, providing viable childcare options
is a further critical success factor to enable and to encourage women with children to take up
work, or to increase their working hours. The government has already established a commission
on childcare to improve the affordability and accessibility of childcare for working families. New
plans on childcare changes are set to be announced in January 2013.
The White Paper caring for our future, and the draft Care and Support Bill, provide a framework
for planned reform of long-term care to better meet the needs of older people in an ageing
society. Work has begun to meet the challenges identified.

- 425 -
2. NATIONAL 2020 TARGET FOR THE REDUCTION OF POVERTY AND SOCIAL EXCLUSION
"The Government is committed to making wide-ranging social reforms, including transforming
children’s life chances, reforming welfare systems, improving education, increasing social
mobility and tackling child poverty. The UK Government is responsible for policies in this area in
England and when policy areas are reserved to Parliament in the devolution settlements, for
example the welfare system which is only devolved in Northern Ireland. The Devolved
Administrations are responsible for their own policy direction in all other areas, for example
education.
Current level of performance against objectives:
The latest indicators that the Government identified in the Child Poverty Strategy are set out in
the table below:
Indicator Target Current level Reference period
Relative low income: proportion of
children who live in households where
income is less than 60 per cent of median
household income before housing cost for
the financial year.
Less than
10 per
cent by
2020-21
18 per cent
2010-2011
Absolute low income: proportion of
children who live in households where
income is less than 60 per cent of median
income before housing costs for 2010-11
adjusted for prices.
Less than 5
per
cent by
2020-21
11 per
cent107
2010-2011
Low income and material deprivation:
proportion of children living in households
who experience material deprivation and
live in households where income is less
than 70 per cent of median household net
household income for the financial year.
Less than 5
per
cent by
2020-21
14 per cent
2010-2011
Persistent poverty: proportion of children
living in households where income is less
than 60 per cent of median equivalised net
income before housing costs for the
financial year in at least three of the
previous four years.
To be
defined in
regulations
by
2015
12 per cent 2005-2008
Source: National Reform Programme (2012), additional information from the Member State
107 Currently measured relative to median equivalised net household income before housing costs for
1998-99, adjusted for prices.

- 426 -
2a. Progress towards the 2020 national target for the reduction of poverty and
social exclusion
Source: UK HBAI
Note: i) The target on persistent low income for children will be set by regulation in 2015. ii)
reference is made to the financial year (April – March)

- 427 -
2b. Composition of the population at risk of poverty or social exclusion (2011)
Source: Eurostat (EU-SILC)
Note: i) Progress on the target is monitored on the basis of the EU SILC data with a base year 2008 and
target data year 2018;
ii) AROPE - at-risk-of-poverty or social exclusion rate; AROP - at-risk-of-poverty rate; VLWI - share of
population living in very low work intensity households; SMD - severe material deprivation rate; the red
overlap indicates the share of the population which accumulates all three conditions;
iii) For the at-risk-of poverty rate (AROP), the income reference year is the calendar year prior to the survey
year (i.e. 2010) except for the United Kingdom (survey year) and Ireland (12 months preceding the survey).
Similarly, the very low work intensity rate (VLWI) refers to the income reference year prior to the survey (i.e.
2010) while for the severe material deprivation rate (SMD), the reference is the current year (i.e. 2011).
2005 2006 2007 2008 2009 2010 2011
AROP total % of total pln
19,0 19,0 18,6 18,7 17,3 17,1 16,2
1000 persons
11.157 11.346 11.138 11.335 10.526 10.519 10.010
VLWI total % of total pln
12,8 12,0 10,3 10,4 12,6 13,1 11,5
1000 persons
5.921 5.610 4.822 4.905 5.941 6.206 5.452
SMD total % of total pln
5,3 4,5 4,2 4,5 3,3 4,8 5,1

- 428 -
1000 persons
3.083 2.704 2.491 2.739 2.034 2.972 3.137
AROP + VLWI
% of total pln
4,6 4,5 3,6 3,9 4,9 4,4 3,0
1000 persons
2.708 2.672 2.163 2.356 2.983 2.707 1.845
AROP + SMD % of total pln
1,0 0,8 0,9 1,0 0,7 0,6 1,0
1000 persons
607 453 511 593 417 390 604
AROP + SMD + VLWI
% of total pln
1,6 1,7 1,6 1,2 1,1 1,4 1,2
1000 persons
963 989 969 748 690 856 762
SMD +VLWI % of total pln
0,7 0,6 0,5 0,8 0,5 1,1 0,9
1000 persons
389 363 312 463 333 679 581
2c. At risk of poverty or social exclusion rate for specific groups, 2011
Total
At risk of poverty or social exclusion,
in %
Children (0-17) 26,9
Working age (18-64) 21,4
Elderly (65+) 22,7
Employed 10,0
Unemployed 69,3
Inactive 51,4
Single male 32,8
Single female 34,4
Single elderly (65+) 30,6
Single parent households 60,2
Large families (2 adults and 3+ children) 32,3
EU-migrant (EU 27) 21,4
Non-EU migrants (non-EU27) 34,9
Source: Eurostat (EU-SILC)

- 429 -
3. MAIN SOCIAL INDICATORS
UK % 2005 2006 2007 2008 2009 2010 2011 2010 2011
At risk of poverty or social exclusion 24.8 23.7 22.6 23.2 22.0 23.1 22.7 23,6 24.2
At-Risk-of-Poverty rate 19.0 19.0 18.6 18.7 17.3 17.1 16.2 16.4 16.9
Severe Material Deprivation rate 5.3 4.5 4.2 4.5 3.3 4.8 5.1 8,3 8.8
Share of people living in very low work
intensity households 12.8 12.0 10.3 10.4 12.6 13.1 11.5 10.0 10.0
Impact of social transfers on poverty
reduction (excl. pensions)(in%) 37,9 36,9 37,4 35,3 43,1 44,8 46,9 36,7 35,2
Value of threshold (single HH) - in PPS 10,137 10,578 11,267 11,126 10,25 10,238 10,114 N/A N/A
Value of threshold (2 adults + 2
children) - in PPS 21,287 22,214 23,66 23,364 21,526 21,499 21,239 N/A N/A
At risk of poverty or social exclusion 31.2 30.1 27.6 29.6 27.4 29.7 26.9 27,1 27.0
At-Risk-of-Poverty rate 22.9 23.8 23.0 24.0 20.7 20.3 18.0 20.5 20.6
Severe Material Deprivation rate 8.0 7.1 6.3 6.5 4.4 7.3 7.1 9,7 10.0
Share of people living in very low work
intensity households 16.6 15.4 13.7 13.8 16.1 17.1 14.0 9.1 8.8
Impact of social transfers on poverty
reduction (excl. pensions)(in%) 43,6 39,5 51,6 54,4 57,4 41,4 40,5
At risk of poverty or social exclusion 22.2 20.7 19.6 19.7 19.8 21.2 21.4 23,5 24.3
At-Risk-of-Poverty rate 16.2 15.5 15.1 14.7 14.8 14.9 14.1 15.2 16.0
Severe Material Deprivation rate 5.2 4.3 4.0 4.7 3.6 5.0 5.5 8,3 8.9
Share of people living in very low work
intensity households (18-59) 11.4 10.7 9.0 9.1 11.3 11.6 10.5 10.3 10,5
In-work at-risk-of poverty rate 8.1 7.7 7.9 8.0 6.3 6.7 7.7 8.4 8.9
Impact of social transfers on poverty
reduction (excl. pensions)(in%) 38,9 38,0 44,4 45,2 47,8 38,7 37,0
At risk of poverty or social exclusion 25.9 27.5 27.9 28.5 23.1 22.3 22.7 20,0 20.5
At-Risk-of-Poverty rate 17.9 17.6 17.1 17.1 16.3 16.3 15.1 16.0 16.0
Severe Material Deprivation rate 5.9 5.0 4.6 5.1 3.8 5.5 5.9 6,6 7.2
Relative median income ratio of elderly 0.74 0.73 0.74 0.74 0.80 0.81 0.81 0.88 0.89
Aggregate replacement ratio 0.42 0.45 0.44 0.43 0.44 0.48 0.48 0.53 0.54
2000 2005 2006 2007 2008 2009 2010 2009 2010
Sickness/Health care 6,5 7,9 8,0 7,6 7,8 8,8 8,6 8,4 8,3
Invalidity 2,4 2,3 2,4 2,5 2,7 2,9 2,8 2,3 2,2
Old age and survivors 12,4 11,5 11,3 10,5 10,9 11,9 11,5 12,7 12,7
Family/Children 1,8 1,6 1,5 1,6 1,7 1,9 1,9 2,3 2,3
Unemployment 0,8 0,7 0,6 0,5 0,6 0,8 0,7 1,8 1,7
Housing and Social exclusion n.e.c. 1,6 1,6 1,6 1,4 1,4 1,7 1,7 1,0 1,0
Total 25,5 25,6 25,5 24,0 25,2 28,1 27,1 28,5 28,2
Means-tested
Sickness/Health care 0,1 0,0 0,0 0,0 0,0 0,1 0,1 0,1 0,1
Invalidity 0,7 0,8 0,9 0,8 0,8 0,8 0,8 0,5 0,5
Old age and survivors 0,9 1,1 1,1 1,1 1,1 1,2 1,2 0,6 0,6
Family/Children 0,5 0,3 0,3 0,3 0,2 0,2 0,2 0,6 0,6
Unemployment 0,3 0,2 0,2 0,1 0,2 0,3 0,3 0,4 0,4
Housing and Social exclusion n.e.c. 1,6 1,5 1,5 1,3 1,3 1,6 1,7 0,9 1,0
Total 4,0 4,0 3,9 3,6 3,7 4,2 4,2 3,0 3,1
Non-means tested
Sickness/Health care 6,5 7,9 8,0 7,6 7,8 8,7 8,5 8,3 8,2
Invalidity 1,7 1,5 1,5 1,7 2,0 2,1 2,0 1,8 1,8
Old age and survivors 11,5 10,4 10,2 9,4 9,8 10,7 10,3 12,1 12,1
Family/Children 1,3 1,3 1,2 1,3 1,4 1,7 1,6 1,7 1,7
Unemployment 0,5 0,5 0,5 0,4 0,4 0,6 0,5 1,4 1,3
Housing and Social exclusion n.e.c. 0,0 0,1 0,1 0,1 0,1 0,1 0,0 0,1 0,1
Total 21,5 21,6 21,5 20,5 21,5 23,9 22,9 25,4 25,2
Elderly (65+)
Social expenditure
(in % of GDP)
EU27
Children (0-17)
Working age
(18-64)
Total population
Source: Eurostat (EU-SILC, ESSPROS for social expenditure data)
Note: For non-means tested the aggregation Housing and Social Exclusion n.e.c is based only on
Housing. The total figures of social expenditure include all benefits excluding administrative costs.

- 430 -
4. LONG-TERM ADEQUACY OF PENSIONS: THEORETICAL REPLACEMENT RATES (2010-
2050)
Theoretical replacement rates (TRR): Net
2010
Net
2050 Difference Gross2010 Gross2050 Difference
40 years career: average income earner
(basecase) 77,2 75,1 -2,1
64,6
(62/0/38)*
62,6
(59/0/41)* -2,0
Low income 87,1 89,9 2,8 73,9
(66/0/34)*
76,3
(66/0/34)* 2,4
High income 54,1 50,4 -3,7 43,4
(57/0/43)*
40,4
(52/0/48)* -3,0
Lower / higher future rates of return 71,2 /
79,9 58,8 / 67,1
Lower / higher future wage growth 81,9 / 70 69,1 / 57,7
38 years career: average income 70,9 72,7 1,8 58,8 60,3 1,5
Low / high income 78 / 51 87,3 /
48,7 9,3 / -2,3 65,9 / 40,7 73,7 / 38,8 7,8 / -1,9
42 years career: average income 80,3 77,6 -2,7 67,1 64,9 -2,2
Low / high income 90,5 /
56,1
92,6 /
52,2 2,1 / -3,9 77,2 / 45,1 79 / 42 1,8 / -3,1
10 years after retirement 72,1 68,8 -3,3 58,2 55,5 -2,7
Female worker with 3 years of career
break for childcare 71,5 76,2 4,7 59,7 63,6 3,9
3 years of career break for
unemployment 76,6 76,8 0,2 64,0 64,2 0,2
10 years out of the labour market 63,4 63,6 0,2 51,5 51,6 0,1
2010 2050 Difference EU27
2010
EU27
2050 Difference
Benefit ratio (Public pensions) : : : 44,7 37,0 -7,7
Gross replacement rate at retirement
(Public pensions) 5,1 5,3 0,2 48,0 39,1 -8,9
Note: *: Share of statutory DB-NDC / statutory funded / occupational and other supplementary
pensions
Source: Joint SPC/EC report on Pension Adequacy in the European Union (2010-2050)

- 431 -
5. KEY CONTEXT MACRO-ECONOMIC INFORMATION
Source: Eurostat, National Accounts and EU LFS. ECFIN autumn economic forecast 2012 for 2012-
2014.
Note: Data on social protection expenditure comes from the AMECO database ( it is calculated as
the sum of Social benefits other than social transfers in kind; general government - ESA 1995 +
Social transfers in kind - ESA 1995)

- 432 -
6. TRENDS IN TAKE-UP OF SELECTED BENEFITS108
Number of unemployed
Definition Unemployment according to ILO definition - Total
Unit thousands of persons - seasonally adjusted
Source Eurostat
Link http://appsso.eurostat.ec.europa.eu/nui/show.do?dataset=une_nb_m&lang=en
Unemployment recipients
Definition Job Seekers Allowance (claimants)
Unit thousands of claimants
108 This data has been collected by the SPC in the context of monitoring the social impact of the crisis. It
includes only a selection of benefits which have been considered most reactive to the crisis. The number of unemployed refers to the standard definition by the ILO and is given as background information.
.

- 433 -
Source ONS
Comment Jobseeker’s Allowance is the main benefit for people of working age who are out of work or work
less than 16 hours a week on average.
Recipients of social assistance benefits/means-tested minimum Income
Definition Income Support
Unit thousands of claimants
Source DWP (WPLS)
Comment Income Support is intended to help people on low incomes who do not have to be available for
employment. It can normally be claimed by people who are: aged 16 or over; not working or
working under 16 hours per week (and/or with a partner working under 24 hours); not required to
be available for full-time employment; and in receipt of insufficient income to meet prescribed
needs. The main types of people who receive it are lone parents, the long and short-term sick,
people with disabilities and other special groups. The data here exclude claimants on Minimum
Income Guarantee (MIG) part of income support for persons over 60 (MIG was replaced with
Pension Credit in Oct 2003).
Disability benefits recipients
Definition Incapacity and Invalidity Benefits
Unit Disability Living Allowance (thousands of recipients)
Source DWP (WPLS)
Comment Disability Living Allowance (DLA) provides a non-contributory, non means-tested and tax-free
contribution towards the disability-related extra costs of severely disabled people who claim
help with those costs before the age of 65. It replaced and extended Attendance Allowance and
Mobility Allowance for people in this age group from April 1992.Income related incapacity and
invalidity related benefits (these include historic benefits: Sickness Benefit, Invalidity Benefit,
Credits Only, and current benefits including Incapacity Benefit, Employment Support Allowance,
and Severe Disability Allowance (working age)) Note: Incapacity Benefit replaced Sickness
Benefit and Invalidity Benefit from 13 April 1995. It is paid to people who are assessed as being
incapable of work and who meet certain contribution conditions.

- 434 -
7. SUMMARY OF SPECIFIC KEY SOCIAL CHALLENGES AND PARTICULARLY GOOD SOCIAL
OUTCOMES
Social policy areas Challenges
Poverty and social inclusion Supporting families
Ensuring child poverty does not increase due to planned
welfare reforms
Supporting young people from disadvantaged backgrounds
Tackling joblessness by facilitating labour market
integration
Supporting the most disadvantaged adults
Facilitating access to childcare services
Pensions Providing adequate and sustainable pensions
Health and long-term care Ensuring accessible, high-quality and sustainable healthcare
and long-term care
Effectiveness and efficiency
of social protection systems
Some improvement in decreasing inequality since 2008
Some improvement in the effectiveness of social transfers
Particularly good social outcomes
Higher than average female employment rate;
Extension of early education to 40% of 2 year olds
providing 15 hours free nursery care in 2013;
Additional investment of GBP 300 million in childcare
services as the Universal Credit comes in (autumn 2013).
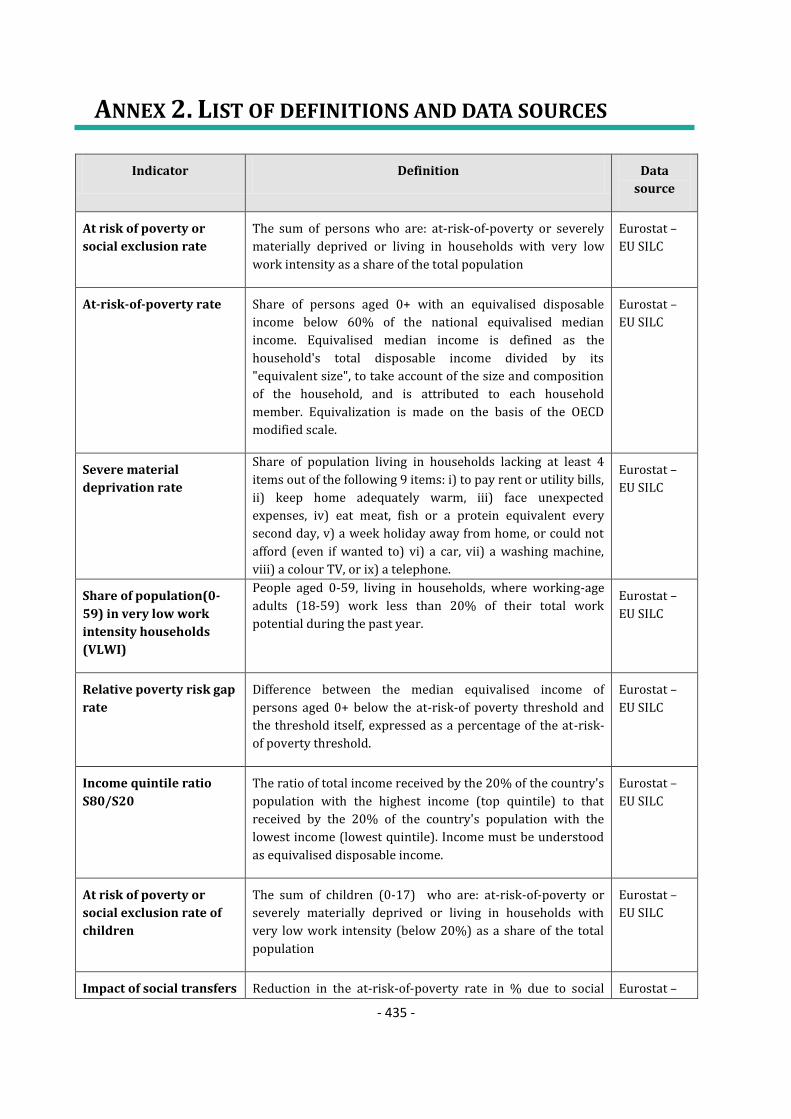
- 435 -
ANNEX 2. LIST OF DEFINITIONS AND DATA SOURCES
Indicator Definition Data
source
At risk of poverty or
social exclusion rate
The sum of persons who are: at-risk-of-poverty or severely
materially deprived or living in households with very low
work intensity as a share of the total population
Eurostat –
EU SILC
At-risk-of-poverty rate Share of persons aged 0+ with an equivalised disposable
income below 60% of the national equivalised median
income. Equivalised median income is defined as the
household's total disposable income divided by its
"equivalent size", to take account of the size and composition
of the household, and is attributed to each household
member. Equivalization is made on the basis of the OECD
modified scale.
Eurostat –
EU SILC
Severe material
deprivation rate
Share of population living in households lacking at least 4
items out of the following 9 items: i) to pay rent or utility bills,
ii) keep home adequately warm, iii) face unexpected
expenses, iv) eat meat, fish or a protein equivalent every
second day, v) a week holiday away from home, or could not
afford (even if wanted to) vi) a car, vii) a washing machine,
viii) a colour TV, or ix) a telephone.
Eurostat –
EU SILC
Share of population(0-
59) in very low work
intensity households
(VLWI)
People aged 0-59, living in households, where working-age
adults (18-59) work less than 20% of their total work
potential during the past year.
Eurostat –
EU SILC
Relative poverty risk gap
rate
Difference between the median equivalised income of
persons aged 0+ below the at-risk-of poverty threshold and
the threshold itself, expressed as a percentage of the at-risk-
of poverty threshold.
Eurostat –
EU SILC
Income quintile ratio
S80/S20
The ratio of total income received by the 20% of the country's
population with the highest income (top quintile) to that
received by the 20% of the country's population with the
lowest income (lowest quintile). Income must be understood
as equivalised disposable income.
Eurostat –
EU SILC
At risk of poverty or
social exclusion rate of
children
The sum of children (0-17) who are: at-risk-of-poverty or
severely materially deprived or living in households with
very low work intensity (below 20%) as a share of the total
population
Eurostat –
EU SILC
Impact of social transfers Reduction in the at-risk-of-poverty rate in % due to social Eurostat –

- 436 -
(excluding pensions) on
poverty reduction
transfers, calculated as the percentage difference between the
at-risk-of-poverty rate before and after social transfers
EU SILC
At-risk-of-poverty rate
for the population living
in very low work
intensity households
Share of persons aged (0-59) with an equivalised disposable
income below 60% of the national equivalised median
income who live in households where working-age adults
(18-59) work less than 20% of their total work potential
during the past year.
Eurostat –
EU SILC
In-work at-risk-of-
poverty rate
Individuals (18-64) who are classified as employed according
to their most frequent activity status and are at risk of
poverty. The distinction is made between “wage and salary
employment plus self-employment” and “wage and salary
employment” only.
Eurostat –
EU SILC
Long-term
unemployment rate
(active population, 15+)
Total long-term unemployed population (≥12 months'
unemployment; ILO definition) as a proportion of total active
population.
Eurostat –
LFS
Youth unemployment ratio
Total unemployed young people (ILO definition), 15-24 years,
as a share of total population in the same age group (i.e.
persons aged 15-24 who were without work during the
reference week, were currently available for work and were
either actively seeking work in the past four weeks or had
already found a job to start within the next three months as a
percentage of the total population in the same age group).
Eurostat - LFS
Early leavers from education and training
Share of persons aged 18 to 24 who have only lower
secondary education (their highest level of education or
training attained is 0, 1 or 2 according to the 1997
International Standard Classification of Education – ISCED
97) and have not received education or training in the four
weeks preceding the survey.
Eurostat – LFS
Employment rate of
older workers
Persons in employment in age group 55-64, as a proportion of
total population in the same age group.
Eurostat –
LFS
At risk of poverty or social exclusion rate of the elderly
The sum of elderly (65+) who are: at-risk-of-poverty or severely materially deprived or living in households with very low work intensity as a share of the total population in the same age group.
Eurostat – EU SILC
Median relative income ratio of elderly people
Median equivalised disposable income of people aged 65+ as a ratio of income of people aged 0-64.
Eurostat – EU SILC
Aggregate replacement ratio
Median individual pension income of 65-74 relative to median individual earnings of 50-59, excluding other social benefits109
Eurostat – EU SILC
109 Pension income covers pensions from basic (first pillar) schemes, means-tested welfare schemes; early retirement widow's (first pillar) and other old age-related schemes. Other social benefits includes: unemployment-related benefits; family-related benefits; benefits relating to sickness or invalidity; education-related allowances; any other

- 437 -
Housing cost overburden rate
Percentage of the population living in a household where total housing costs (net of housing allowances) represent more than 40% of the total disposable household income (net of housing allowances).
Eurostat – EU SILC
Share of the population with self-reported unmet need for medical care
Total self-reported unmet need for medical examination for
the following three reasons: financial barriers + waiting times
+ too far to travel.
Eurostat – EU SILC
Healthy life years at 65 Number of years that a person at 65 is still expected to live in a healthy condition. To be interpreted jointly with life expectancy (included in the SPPM contextual information).
Eurostat
GDP growth/ GDP per capita (in PPS)
Gross domestic product (GDP) is a measure of the economic activity, defined as the value of all goods and services produced less the value of any goods or services used in their creation.
The calculation of the annual growth rate of GDP at constant prices is intended to allow comparisons of the dynamics of economic development both over time and between economies of different sizes, irrespective of price levels.
Eurostat
Public debt
General government consolidated gross debt as a percentage of GDP.
Eurostat - General Government data
Employment rate Persons in employment in age group 15 to 64 as a proportion of total population in the same age group.
Eurostat-LFS
Unemployment rate Unemployed population as a proportion of total active population aged 15 years or more.
Eurostat-LFS
Social protection expenditure (by types of risk)
The annual percentage of gross domestic product spent on social protection.
Social protection encompasses “all interventions from public or private bodies intended to relieve households and individuals of the burden of a defined set of risks or needs, provided that there is neither a simultaneous reciprocal nor an individual arrangement involved”.
Eurostat - Esspros
Old age dependency ratio
Ratio between the total number of people aged 65 and over and the number of persons of working age (aged 15 to 64).
Eurostat
personal social benefits. Work income includes income from wage and salary employment and income from self-employment.

- 438 -
ANNEX 3. VIEWS OF THE EUROPEAN SOCIAL PARTNERS AND
THE SOCIAL PLATFORM
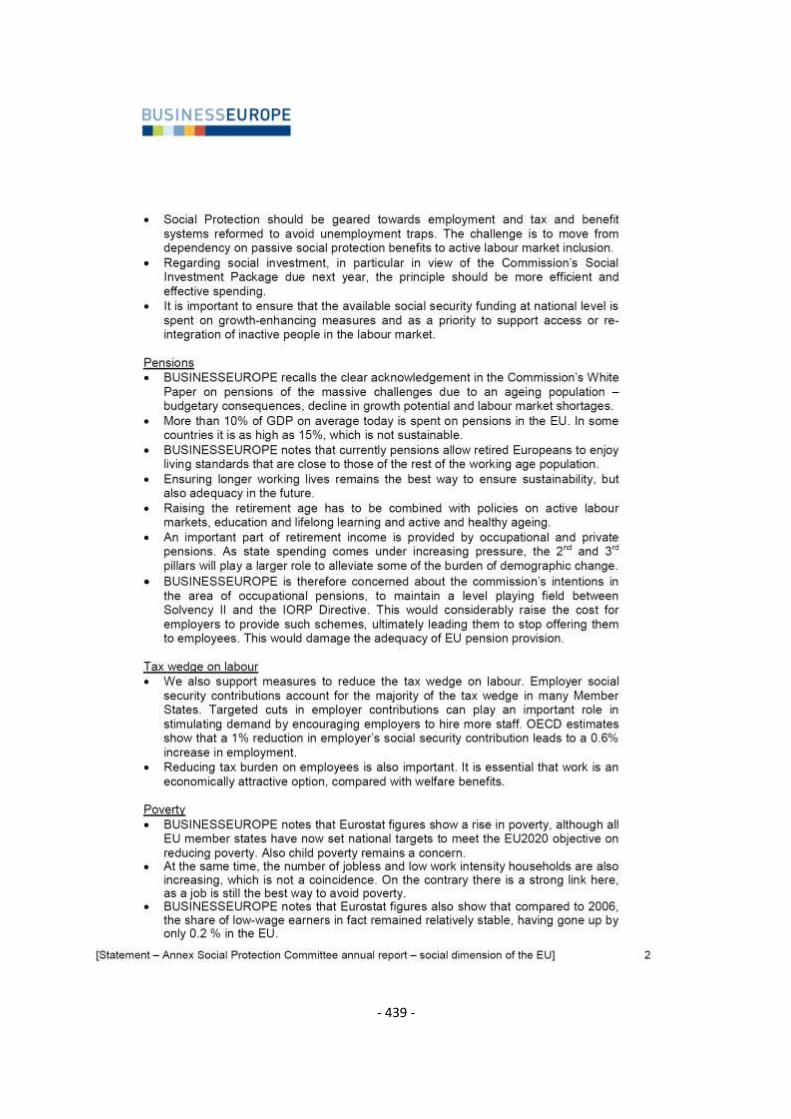
- 439 -

- 440 -
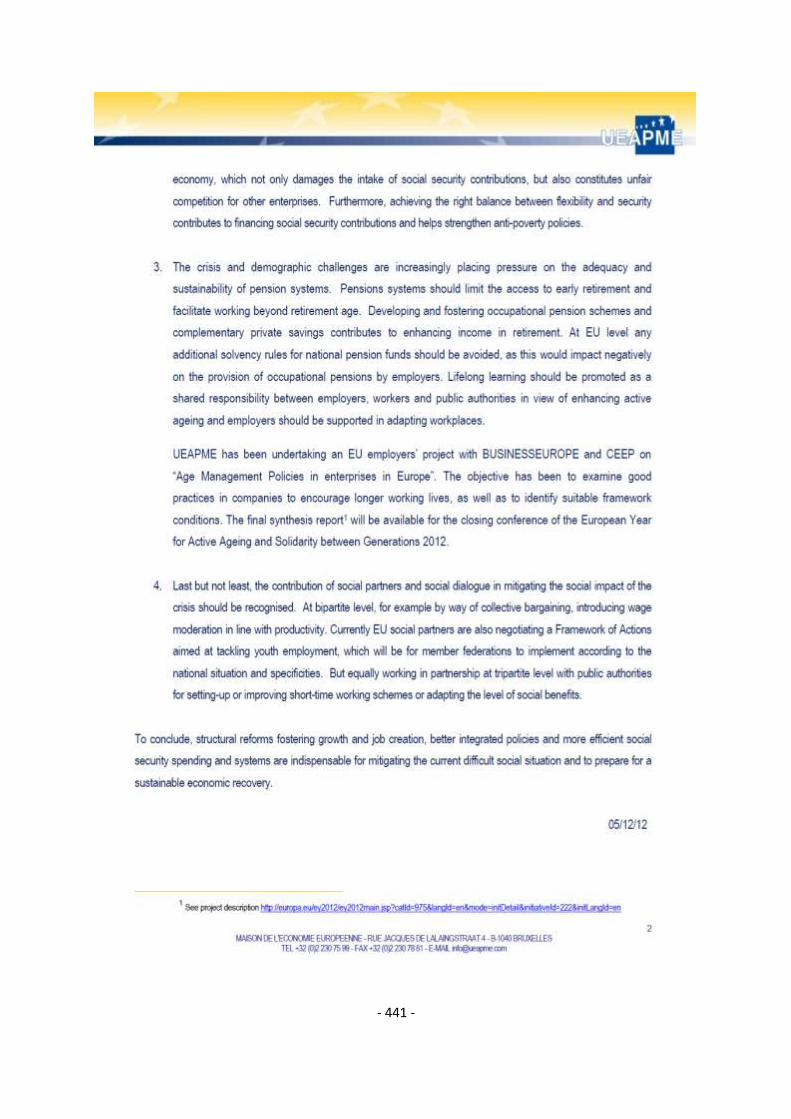
- 441 -
- 442 -

- 443 -

- 444 -
With 10.7% of the EU population without a jobi, unemployment has reached a historically high
level, while poverty has drastically increased to almost 120 million people and is deepening in
many member statesii. Current austerity policies at EU as well as national level are at least
partially responsible.
We therefore call on the EU and member states to put social considerations on an equal
footing with fiscal and economic priorities in all components of EU governance and of the
European Semester.iii This is the only road for Europe to efficiently and effectively combat
inequalities and poverty for the well-being of all.
WHY: INCREASING INEQUALITIES AND SOCIAL EXCLUSION
There is a persistent and increasing level of poverty and social exclusion. Next to this, inequality is also growing because of policies implemented over more than 20 years. This has contributed to deeper social and wealth disparities and to weaker social cohesion. A) Inequalities in income and wealth
Income and wealth inequalities have gone up as a result of changes in the distribution of wages
and salaries combined with the weakening (in many member states) of redistributive policies
and mechanisms through taxes, benefits and services. The income gap has increased, with the
reduction of medium incomes and salaries at the lower end. Income inequality in OECD
countries is at its highest level for the past half century. The average income of the richest 10%
of the population is about nine times that of the poorest 10%. Meanwhile redistribution through
transfers has become less effective as rates for personal income tax for the wealthiest fell from
60-70% to only 40% in most major OECD countries, whilst social protection levels have been
reduced.iv This results not only in higher relative and absolute poverty, but also in increasing
social polarisation.v
Broader social consequences of the economic crisis are emerging. According to the experience of
NGOs, the first half of 2012 saw requests for food aid and general social support in some
countries doubling compared to those registered for the whole of 2009. 75% of those asking for
help were unemployed.vi 20% of people being assisted by the NGOs report skipping a meal once
a week. Other NGOs are reporting a constant increase in the demand for their debt-counselling
services and notice that over indebtedness often appears to be a consequence of low levels of
income and inflexible working conditions.vii
B) Inequalities in education
The reduction of numbers of public school teachers and higher tuition fees to access schools and
universities - for example a 50% increase of tuition fees in the UK and Spain - make it more
difficult to access quality education for children and young people coming from low-income
Social Platform contribution to the annual SPC report for 2012:
Threats to social cohesion in Europe
Key messages

- 445 -
families. Austerity measures have also been targeting education services in several countries,
particularly in countries under Troika supervision.viii
Increasing segregation and streaming undermine commitments to a comprehensive universal
education system. Roma children are discriminated and excluded from mainstream education
and are over-represented in alternative systems. Early school drop-outs of Roma girls are
particularly high in several member states.ix Children from lower socio-economic backgrounds
as well as young migrant or youth with ethnic minority background are over-represented in the
category of “drop-outs”x. Only 9% of Europeans with disabilities go to universityxi, due to lack of
accessibility and reasonable accommodation and 61% of lesbian, gay, bisexual or transgender
youth face bullying at schoolsxii.
C) Inequalities in health
Privatisation of public health institutions and cuts in health budgets, provoke further
inequalities. The reduction of health spending per capita in Europe is likely to foster health
inequalities as the costs– particularly out of pocket health expenditure - are shifted to
households.
Some member states are transferring part of their health services or responsibilities to the
private for profit sector, as a way to finance their health care systems. xiii Having complementary
health insurance is becoming an essential component to receive more than very rudimentary
medical care and to access affordable hospitalisation and medical care. Some of these schemes
apply age limits, do not insure complex risks or are too expensive. In practice this means
denying people the right to benefit from quality health care, which is a fundamental service of
general interest.
In Portugal, there is a decrease of public co-payment of medicines.xiv In some countries CSOs
responsible for long-term care are facing increasing difficulties, as families are unable to pay for
services.xv In Greece, infectious diseases like TB and HIV (related to a large extent to increasing
poverty) are spreading rapidly.xvi In Spain, undocumented migrants and people over 26 years
old who have not been able to enter the labour market, are excluded from receiving public care.
xvii
WHO and other key research highlight overwhelming evidence that more equal societies do
better for everybody, including reduced levels of obesity, child deaths, mental health as well as
higher life expectation levels.xviii
D) Inequalities in access to housing and increasing homelessness
Housing affordability is worsening in many contexts, and austerity measures are impacting upon
housing support and homeless services in a range of countries. 5.2 % of the EU population live in
severe housing deprivation. 11 % live in a household where the total housing costs represent
more than 40% of the total disposable household income - rising to 26% in the market-rate
rental sector. xix

- 446 -
Increasingly unsolvable housing demand (due to cuts in social and housing allowances, rise of
long term unemployment) and supply constraint (due to cuts in public spending for affordable
house building and higher taxes on social housing organisations) combined with rising energy
prices at the global and local level, make it increasingly difficult for a significant part of the
population to find decent and affordable accommodation.
The number of Europeans facing rental or mortgage arrears is increasing in many member
states. 10.9% were unable to make a scheduled rental or mortgage payment in the past yearxx. In
Spain, 350,000 families have already been evicted from their homes since 2008 because they
cannot repay their mortgage. Those evicted must still pay the remaining debt as well as judicial
fees. Measures were introduced to protect certain households but the target group is very
limited, leaving many in a very vulnerable position.xxi In England there has been a 33% rise in
court orders to evict private tenants in England over the past two yearsxxii. High unemployment,
underemployment, cuts to housing benefit and rising rents (as demand for rental property
increases) are contributing to this situation.
Homelessness remains an unacceptable reality in all EU member states. There is evidence of
increasing levels of homelessness over the past 5 years in at least 15 member statesxxiii. In
Portugal, Spain and Greece service providers estimate an increase of 25-30% since the onset of
the financial crisis. In parts of the UK, the progress in reducing the levels that has been made in
recent decades is being reversed. At the same time, some governments, such as those of Finland,
Scotland and the Netherlands have been successful in reducing homelessness by implementing
effective strategies. It is important that all member states invest in such strategies to tackle
homelessness, and avert the human, societal and economic costs that it entails.
E) Inequalities between women and men
The crisis has halted the gains made across Europe in integrating women in the labour market.
Women’s employment rate was increasing steadily until 2008 when the crisis hit Europe, but it
has stagnated ever since.xxiv While the difference between overall women and men’s
employment rates is narrowing, this is not a sign of increasing gender equality. It reflects the
deteriorating employment situation of both women and men, and the sharper impact on male
employment early on in the crisis. The gap is closing due to levelling downwards, not because of
catch-up.
As a response to the crisis, across Europe public sector jobs and wages have been cut. Women
account on average for almost 70% of public sector workers, anything that happens to public
sector jobs and wages is a major threat for gender equality in employment. Significant personnel
cuts in the public sector have been reported, among others, in Greece (-25%), Portugal (-10%)
and Romania (-10%).xxv In the UK, 710,000 public sector jobs will be lost by 2017 and it is
estimated that around twice as many women as men will lose their jobs.xxvi In some countries,
the cutbacks have focused on female-dominated sectors, such as education, health and social
work.xxvii
Austerity has reduced access to and financing of childcare services and care services for the
elderly and other dependents. In some countries access to public day-care for children has been
limited to families where both parents are employed, leading to an increased care-work load on
the unemployed and limiting their possibility to look for a job.xxviii In Ireland public beds in

- 447 -
nursing homes have been reducedxxix. In the Netherlands programmes to facilitate disabled
persons have been cutxxx. In 2010 28.3% of women’s inactivity and part time work was
explained by the lack of care services against 27.9% in 2009. In Bulgaria it even increased to
31.3% in 2010 from 20.8% in 2008 and in the Czech Republic to 16.7% from 13.3%.xxxi
HOW: POLICY PROPOSALS
To respond to the deteriorating and preoccupying social situation in Europe, we propose the
following actions to be taken to support an inclusive growth with quality jobs, adequate social
protection systems and accessible public services, while ensuring poverty reduction and social
inclusion. This should be financed by fairer distribution/tax systems and supported by EU funds.
A) Develop a true and integrated poverty strategy at EU and national level
The EU and its member states must develop an integrated strategy to combat poverty and social
exclusion at both European and national level as a core policy in itself that is evidence-based,
with a clear set of tools and with an appropriate budgetxxxii to ensure an immediate and
sustainable reduction of poverty. It should tackle the multidimensional nature of poverty and
promote prevention through universal services as well as alleviation. We cannot wait for
poverty and social exclusion to be challenged as a mere result of economic and employment
policies.
As part of such a poverty strategy, member states urgently need to implement all pillars of the
Active Inclusion Strategy. This requires the elaboration of a common definition of “adequate
minimum income” as well as concrete measures to implement this through the adoption of an
EU Directive on guaranteeing adequate minimum income for all. It would ensure universal
income support throughout the life cycle, enhancing protection against social risks, and should
be coordinated with an EU unemployment insurance package.
Furthermore, countries should be encouraged to set sub-targets for poverty reduction amongst
groups most at risk of poverty or social exclusionxxxiii. Of particular importance would be a
requirement on governments to monitor and report on how their policy choices are contributing
to reducing poverty amongst groups most at risk. Where progress is not being made there
should be a mechanism to have the policy initiatives revised so as to achieve the targets set.
The European Semester and the related tools need to take up their role in this integrated
poverty strategy. The engagement of national social and antipoverty NGOs will be crucial to
develop and implement effective Country Specific Recommendations. The Commission should
follow up on how previous Recommendations in the field of poverty and social exclusion,
education and employment have been implemented and should take action towards member
states in case of non-implementation.
B) Invest in services of general interest and strengthen social protection
In the richest economic region of the world, it is now time for a long-term social investment
strategy. Last year the Commission pointed out that in-kind benefits would have the potential to
reduce the poverty gap by 80% on average.xxxiv Services of general interest have a wide range of
long-term gains, often in the form of avoided costs. Investing in prevention, early and integrated
action and social infrastructures is crucial and economically sound.xxxv Empirical evidence
shows that maintaining sufficient level of public spending in social, health and educational

- 448 -
infrastructures and social protection can not only help improve the social situation but also
would support growth and save costs in the long-term.xxxvi Cutting social and health services
and care will lower their quality, not meet the current demographic challenges and threaten the
economic recovery prospects for Europe as they are sectors with a high potential of job creation.
Therefore, the EU and member states should invest in:
Universal coverage: Ensuring universal and targeted coverage at adequate levels through
the life cycle in social protection, income support and universal access to inclusive public
services; inclusive education and life-long learning.
Quality, accessible and affordable social and health services and infrastructures, in
particular in the field of education, housing, care, health and employment.
Promoting financial inclusion, covering access to bank accounts, credit, savings and
insurance, as well as the growing problem of over-indebtedness which has increased as a
consequence of the financial and economic crisis and is also due to unfair credit and
lending practices.xxxvii According to the European Commission, 30 million people in
Europe do not have access to basic financial services.xxxviii
Care policies that both ensure that the fundamental rights of care users are respected
and that care workers enjoy quality employment and decent working conditions.xxxix
C) Mainstream social targets in all other policies and protect social budgets when developing policies to tackle macro-economic imbalances
The success of social policies depends on how they are combined with and integrated in other
policies. Therefore, the social impact of main policy actions across the EU, and in particular of
financial and economic policies, has to be assessed on a regular basis, in close cooperation with
social ministries, social departments at the Commission and the SPC. Although the EU and many
member states carry out ex-ante social impact assessments, there is little evidence that this is
being used systematically to “poverty/social inclusion-proof’’ policies - the current austerity and
macroeconomic measures in particular. This would create the space to mainstream social
targets in all policy fields and create for example the opportunity to measure how EU-driven
austerity package have impacted the social sphere of life, health and well-being, even if a policy
as such cannot be called ‘social policy’.
Very important in this context is the need to recognise and monitor the effect of cumulative ‘hits’
where a range of decisions are made that impact on the same group and that have a
disproportionate effect. Furthermore, particular attention should be paid to the most
disadvantaged groups in each country.
Social, economic and cultural rights are closely interwoven with the economic objectives of the
EU.xl As social exclusion increases the risk of experiencing discriminationxli it is crucial to
recognise social, economic and cultural rights to enable access to fundamental rights. Protection
against discrimination on the grounds of social status must be equally ensured as with other
grounds of discrimination.

- 449 -
D) Look into and develop alternative sources of financing and funding for social policies
National authorities must adopt approaches to raising revenue that do not negatively affect low
income groups disproportionately, e.g. avoiding flat tax regimes and increases in VAT,
particularly on basic goods and services. The shifting of the tax burden from labour to
consumption caused proportionately larger losses on low-income households in several
countries. These households spend a relatively higher part of their income on essential goods,
like energy.
The EU and member states should promote fairer re-distribution through tax justice, while
ensuring sustainable financing in the context of fiscal consolidation by supporting increased
revenue through a higher focus on progressive income tax, and on taxes on capital and
environmental risks. Attention should be paid to taxing social risks for example: taxation on
alcohol, cigarettes and foods high in fat or sugar, whilst ensuring that the poor are not
disproportionately affected.
A bigger EU budget fuelled by the revenues of financial transaction taxes or other schemes not
based on national contributions, is fundamental for greater social cohesion. In parallel, a re-
orientation of the lending policy of the EIB towards small scale social and health infrastructures
(schools, affordable housing, hospital, training centres for NEETs) is necessaryxlii.
In as much as we must strive for alternative sources of funding, it is crucial to maximize the
resources that can be extracted from the resources we already have. The case for more stringent
fiscal policies, namely limiting tax evasion and avoidance is especially powerful in times of
austerity.xliii
E) Ensure a wide inclusive and democratic process to decide upon economic and social
priorities
The current process around the Europe 2020 Strategy and the economic governance is clearly
suffering from a democratic deficit. The decisions are prepared and made between the European
Commission and the heads of state. There is neither social nor civil dialogue at EU level on the
decisions taken in the economic governance and the Europe 2020 strategy.
The European Parliament has to be given real co-decision power in the EU economic
governance. Also the national parliaments and local and regional authorities have to be involved
more.
Further EU integration could make the EU more social and closer to citizens’ aspirations only if
decisions are discussed and debated by a wide range of stakeholders, including NGOs and social
partners. They therefore have to be consulted when discussing a greater economic and
monetary union. Any plan for a closer economic union should also have elements about better
integration of national and EU CSOs in the decision making process.
Furthermore a proper civil dialogue at both EU and national level will reinforce legitimacy,
accountability and adequacy of measures proposed. CSOs working with and for people in
difficult situations are witnessing the worsening social situation daily, and are gathering facts
and expertise beyond the official statistics
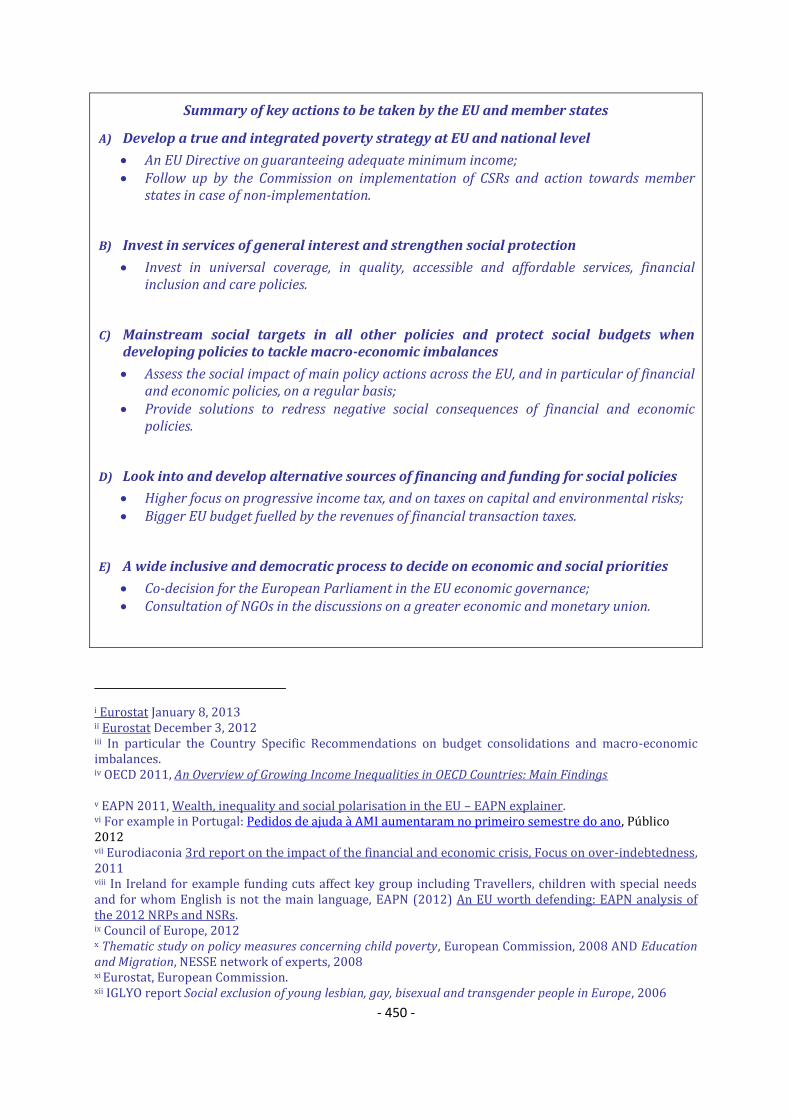
- 450 -
Summary of key actions to be taken by the EU and member states
A) Develop a true and integrated poverty strategy at EU and national level
An EU Directive on guaranteeing adequate minimum income; Follow up by the Commission on implementation of CSRs and action towards member
states in case of non-implementation.
B) Invest in services of general interest and strengthen social protection
Invest in universal coverage, in quality, accessible and affordable services, financial inclusion and care policies.
C) Mainstream social targets in all other policies and protect social budgets when developing policies to tackle macro-economic imbalances
Assess the social impact of main policy actions across the EU, and in particular of financial and economic policies, on a regular basis;
Provide solutions to redress negative social consequences of financial and economic policies.
D) Look into and develop alternative sources of financing and funding for social policies
Higher focus on progressive income tax, and on taxes on capital and environmental risks; Bigger EU budget fuelled by the revenues of financial transaction taxes.
E) A wide inclusive and democratic process to decide on economic and social priorities
Co-decision for the European Parliament in the EU economic governance; Consultation of NGOs in the discussions on a greater economic and monetary union.
i Eurostat January 8, 2013 ii Eurostat December 3, 2012 iii In particular the Country Specific Recommendations on budget consolidations and macro-economic imbalances. iv OECD 2011, An Overview of Growing Income Inequalities in OECD Countries: Main Findings
v EAPN 2011, Wealth, inequality and social polarisation in the EU – EAPN explainer. vi For example in Portugal: Pedidos de ajuda à AMI aumentaram no primeiro semestre do ano, Público 2012 vii Eurodiaconia 3rd report on the impact of the financial and economic crisis, Focus on over-indebtedness, 2011 viii In Ireland for example funding cuts affect key group including Travellers, children with special needs and for whom English is not the main language, EAPN (2012) An EU worth defending: EAPN analysis of the 2012 NRPs and NSRs. ix Council of Europe, 2012 x Thematic study on policy measures concerning child poverty, European Commission, 2008 AND Education and Migration, NESSE network of experts, 2008 xi Eurostat, European Commission. xii IGLYO report Social exclusion of young lesbian, gay, bisexual and transgender people in Europe, 2006

- 451 -
xiii For example Poland and the Netherlands (see AGE presentation to Insurance Dialogue Group – 9th March 2011). xiv Observatório Português dos Sistemas de Saúde 2012 xv EAPN (2012) An EU worth defending: EAPN analysis of the 2012 NRPs and NSRs. xvi For more information please see: http://www.pepharm.gr/
xviihttp://www.boe.es/boe/dias/2012/04/24/pdfs/BOE-A-2012-5403.pdf
xviii Wilkinson K and Pickett K 2009, The Spirit Level: Why more equal societies almost always do better. xix EU SILC/Eurostat AND Eurofound, 3nd European Quality of Life Survey - Overburden means that housholds dedicate at least 40% of their disposable income to housing related expenditures: rent, mortgages, utilities, maintenance. xxEurofound, 3nd European Quality of Life Survey- Quality of life in Europe: Impacts of the crisis xxi http://www.bbc.co.uk/news/business-20299384 xxii Crisis (2012) See http://www.crisis.org.uk/news.php/495/private-tenants-see-eviction-orders-soar xxiii FEANTSA Report 2012, On the way home? xxiv Eurostat xxv ILO 2012. Public sector adjustments in Europe. Scope, effects and policy issues. xxvi Fawcett Society 2012. The Impact of Austerity on Women. Fawcett Policy Briefing, March 2012, p.6 xxvii Gonzales Gago, Maria 2011. Women, gender equality and the economic crisis in Spain; EWL Survey Portugal, EWL Survey Greece AND European Parliament 2011, Gender aspects of the economic downturn and financial crisis. p. 138 xxviii EWL Survey Portugal xxix Barry & Conroy/TASK 2012, p. 6; National Council of Women in Ireland 2012, p. 27 xxx Nederlandse Vrouwenraad, 2012. xxxi Eurostat xxxii No progress on the poverty target can be expected, without a commitment by member states to back the EC proposal of 25% of Cohesion on ESF and 20% of ESF on poverty reduction, EU Money for Poverty reduction xxxiii The groups targeted in this process might vary somewhat from country to country but are likely to include children, migrants, ethnic minorities, working poor and homeless people and people experiencing discrimination on all grounds, including the six grounds protected by Article 19 of the Treaty on the Functioning of the European Union as well as social status and other grounds included in the Article 21of the Charter of Fundamental Rights xxxiv AGS 2012 Progress Report on Europe 2020 - OECD (2011) The impact of publicly provided services on
the distribution of resources; Report for the European Commission.
xxxv See in particular the evaluation of supported housing programme in the UK (Birmingham) xxxvi Many research is now conducted to measure the economic impact of investing in social infrastructures. See for instance for the social housing sector “The case for public investment in affordable housing in London” xxxvii See Social Platform recommendations on financial inclusion, November 2012 xxxviii Flash Eurobarometer 282, Consumers’ Views on Switching Providers xxxix See Social Platform recommendations on care xl Opinion of the Management Board of the EU Agency for Fundamental Rights on the European Commission’s proposal for a new Multi-annual Framework (2013-2017) for the Agency. See also The European Parliament’s report on the European Platform against poverty and social exclusion (2011/2052(INI) xli see Equinet Europe’s opinion: addressing poverty and discrimination: two sides of the one coin, 2010. xlii One of CECODHAS Housing Europe’s proposal for the forthcoming social investment package xliii The UK has recently seen a strong social response to the rather modest tax contribution of multinationals like Starbucks, Google and Amazon while funding for the National Health System is being cut. - The 2012 UK budget included a cut in the top rate of tax for the reiches from 50% to 45%, and no action to close tax loopholes, so wealthy individuals pay as little as 1-5% tax due to ingenious, but legal tax avoidance schemes on which a raft of finance and legal firms make very large profits, EAPN (2012) An EU worth defending – EAPN analysis of the 2012 National Reform Prorammes and National Social Reports.


