136
2011 ANNUAL REPORT ROAD TO SUCCESS
| Date post: | 27-May-2018 |
| Category: |
Documents |
| Upload: | trinhtuong |
| View: | 214 times |
| Download: | 0 times |

2011ANNUAL REPORT
ROAD TOSUCCESS

Dear Shareholders:
RAVI SALIGRAM
President and Chief Executive Offi cerMarch 2012
• Technology & Document Solutions—Services which are related to print and managing technology assets as more business customers seek cost-effective solutions rather than just products.
• New Channels—Managing the offi ce supply category for retailers in order to expand our retail presence without investment in brick and mortar.
• Mexico—Continue to open additional stores in this growth market where we already have a strong position.
We engaged our employees at every level of the company to ensure ownership and alignment. As the momentum builds, I see the excitement of our team and feel their drive to make our plans come to fruition.
2012 is the year of action, relentless focus, and strong execution. Our leadership team is dedicated to driving the business with the highest sense of urgency to achieve consistent, predictable results, and allow us to fulfi ll our core mission to provide workplace innovation that enables customers to work better. I am encouraged that we are seeing some stabilization in the business as we navigate this “Road to Success,” and I believe that the journey will lead us to a strong, diverse company that creates signifi cant long-term shareholder value.
Sincerely,
2011 was a challenging year for Offi ceMax®. In addition to a tough economic and competitive environment coupled with tepid customer demand, we also faced issues inherent to Offi ceMax which we have largely corrected. We developed a long-term strategy, took signifi cant steps toward rebuilding our talent and capabilities, and along the way have repositioned the company for improved performance in 2012 and beyond. Specifi cally, we strengthened the management team at various levels, continued to improve processes and systems, and restructured parts of our business to focus our resources and streamline the cost structure.
We now have a robust, clear strategic direction that has broad ownership and championship throughout the company, which we call our “Road to Success.” The two major prongs of our strategy are, fi rst, to strengthen and increase profi tability in our core businesses in existing geographies; and second, to pilot and implement a series of strategic and disruptive moves intended to spur growth, address the strategic issues of unproductive retail space and formats, customer migration to online in certain categories, and margin gaps versus the leading offi ce products player.
In addition to our strategic initiative to signifi cantly enhance our Digital and multichannel capabilities, we are also investing in fi ve key growth adjacencies expected to help strengthen the core business:
• Jan/San—This area includes cleaning and breakroom product essentials which are conducive to employee wellness and safety.
• Small and Medium Business—We have created a standalone sales unit to take advantage of this underpenetrated, high-margin market.

STRATEGIC AND OPERATIONAL INITIATIVES
PURSUE TUCK-INACQUISITIONS
FOCUS I.T. SPEND ON GROWTH ENABLERS
LEVERAGE PARTNERSHIPS & ALLIANCES
ACHIEVE POSITIVE FREE CASH FLOW
CONTINUE TO DRIVE COST EFFICIENCIES
IMPROVE INTERNATIONALPROFITABILITY
IMPROVE STOREPRODUCTIVITY
DRIVE SALES FORCE PRODUCTIVITY
DEVELOP DIGITAL GROWTH ENGINE
ACCELERATE FIVE GROWTH ADJACENCIES
LEARNING, GROWTH, PEOPLE
STRONG EXECUTION
TOP TALENT
COMMITTED TO INNOVATION
SERVICEORIENTATION
Leadership and Teamwork
CUSTOMERSEGMENTATION
MULTI-CHANNELEXPERIENCES
ENHANCE WORKPLACEEXPERIENCE
CUSTOMER SATISFACTION
Creating “Win-Win” Relationships with Customers
2012STRENGTHENFOUNDATION
2013–2015GAIN MOMENTUM
2016 & BEYONDPROFITABLE GROWTH
FINANCIAL PERFORMANCE
Sustainable Profi table Growth
Workplace innovation that enables customers to work better.
Road to Success

Executive Team Profi le
JIM BARR, Executive Vice President and Chief Digital Offi cer
Jim Barr joined Offi ceMax in November 2011. He is responsible for all aspects of the company’s e-commerce business and for driving its multi-channel digital strategy. Prior to joining Offi ceMax, Mr. Barr was chief executive offi cer of an e-commerce consulting fi rm and, prior to that position, president of Sears Holdings Corporation’s online division.
BRUCE BESANKO, Executive Vice President, Chief Financial Offi cer and Chief Administrative Offi cer
Bruce Besanko joined Offi ceMax in February 2009. He is responsible for managing the company’s fi nancial practices, including fi nancial analysis, planning, investing and budgeting. Before joining Offi ceMax, Mr. Besanko served as executive vice president of fi nance and chief fi nancial offi cer for Circuit City Stores, Inc., and, prior to that position, senior vice president of fi nance and chief fi nancial offi cer for The Yankee Candle Company, Inc.
MATT BROAD, Executive Vice President, General Counsel
Matt Broad joined Boise Cascade Corporation in 1984 as counsel in the legal department. In 1989, Mr. Broad was appointed corporate secretary of Boise Cascade Offi ce Products Corporation.In 2004, Mr. Broad was appointed executive vice president, general counsel of Offi ceMax.
RANDY BURDICK, Executive Vice President and Chief Information Offi cer
Randy Burdick joined Offi ceMax in March 2005 as senior vice president and chief information offi cer. He is responsible for the company’s overall information technology strategy and the development, implementation and support of programs to uphold it. Prior to joining Offi ceMax, Mr. Burdick served as group information offi cer of Hewlett-Packard.
JOHN KENNING, Executive Vice President and President of Contract
John Kenning joins Offi ceMax effective April 2012. He will oversee the Contract business. Prior to joining Offi ceMax, Mr. Kenning was president, North America Commercial for ADT Security Services.
MICHAEL LEWIS, Executive Vice President and President of Retail
Michael Lewis joined Offi ceMax in May 2011. He has full responsibility for the retail P&L and all aspects of the retail business, including merchandising, store operations and real estate. Prior to joining Offi ceMax, Mr. Lewis served as global head of a Merchandising Center for Wal-Mart Stores, Inc. and, prior to that role, as president of its Midwest division.
STEVE PARSONS, Executive Vice President and Chief Human Resources Offi cer
Steve Parsons joined Offi ceMax in July 2011. He is responsible for all aspects of human resources for the company’s global operations, including talent management, compensation and benefi ts, training, leadership development, recruitment, diversity, and internal and corporate communications. Prior to joining Offi ceMax, Mr. Parsons served as senior vice president, human resources and labor relations of Rite Aid Corporation.
REUBEN SLONE, Executive Vice President, Supply Chain and General Manager, Services
Reuben Slone joined Offi ceMax in November 2004 as executive vice president, supply chain. He is responsible for inventory management, supply chain operations and strategic sourcing. In 2011, Mr. Slone took on oversight for Services, where he is responsible for developing processes, operational standards and a differentiated brand proposition for ImPress and Managed Print Services, the two arms of the company’s print services and solutions business. Prior to joining Offi ceMax, Mr. Slone held various executive positions with Whirlpool Corporation and General Motors Company.

2011 OFFICEMAX® ANNUAL REPORT // ROAD TO SUCCESS // I
SALES AT-A-GLANCE
CONTRACT SEGMENT: $3.62 BILLION RETAIL SEGMENT: $3.50 BILLION
BILLION / FY11$7.12
57% 92% 51%68%
32%32%
8% 6%11%
43%
68% U.S.32% International
92% U.S.8% Mexico
57% Supplies & Paper32% Technology*11% Furniture
51% Technology*43% Supplies & Paper6% Furniture
*Technology includes ink & toner.
Table of Contents
Sales At-a-Glance ......................................................................................................................................... I
Strengthening the Core ..............................................................................................................................IV
Growing Our Contract Business ...............................................................................................................VI
Changing Needs of Our Retail Customers ............................................................................................. XII
Enhancing Digital and E-Commerce Experiences ............................................................................. XVIII
Embracing Corporate Social Responsibility .........................................................................................XXII

OFFICEMAX® IS PROUD TO ACHIEVE ETHISPHERE’S 2012 ETHICS INSIDE® CERTIFICATION
Ethics Inside Certifi ed Companies not only have implemented adequate systems and programs to reasonably prevent compliance failures, but can also demonstrably prove a superior organizational culture that promotes ethical and sustainable business practices; putting Ethisphere’s credo of “Good. Smart. Business. Profi t.” into real business practice.

// III

IV // 2011 OFFICEMAX® ANNUAL REPORT // ROAD TO SUCCESS // THE FOUR PILLARS
Strengthening the CoreIn 2012, we will strengthen the foundation, improve our capabilities and aim to build momentum. By 2016, our goal is to be an enterprise that is well on its way to generating sustainable profi table growth. In order to heighten our chances of success, we will focus on four strategic pillars.
1. Optimize Retail to improve ROIC.
Pursuing strategic partnerships and alliances is an important goal. We’re looking at a range of partners who are focused on providing offerings that are attractive to the small business customers who shop our stores. We aim to utilize retail space more effectively and drive traffi c into our stores.
Early in 2012, we began piloting RadioShack Mobile™ in 18 stores, which allows customers to fi nd a complete mobile solution in one convenient location. We will continue to seek out new partnerships that will assist in defi ning our stores as one-stop destinations for all of our customers’ technology needs.
2. Leverage Contract globally to improve margins.
Our primary goal is to drive profi table growth throughout our contract business. Approximately two-thirds of our contract business is in the United States, where we are a leading provider of offi ce products and solutions. We have a real opportunity to grow in new sectors, services and segments while defending margins in the core business across North America and into Australia and New Zealand. We are committed to driving cost and operational synergies as well as integration and effi ciency of these operations.

// V
3. Build our digital business through multi-channel emphasis.
Creating seamless transactions—regardless of the channel through which they come—is a primary initiative. We are working toward a system where customers will be able to buy products online and pick up their orders in their local Offi ceMax® store, or have orders delivered at a time that’s convenient for them. With our Offi ceMax ImPress® Mobile application, customers can locate our stores and send a print document from their smart phones and other mobile devices. We are excited about these technological enhancements and the future innovations that are coming to better serve our customers.
4. Accelerate fi ve growth adjacencies.
JAN/SAN // We realize the opportunity that lies in this large and fragmented market and will grow this business both organically and with strategic partnerships and acquisitions.
SMB // Small and Medium Business is another primary focus, and we have a dedicated sales team to acquire and retain customers.
TECHNOLOGY & DOCUMENT SOLUTIONS // We will continue to invest in our services to boost sales in both retail and contract with Print-On-Demand, Managed Print Services and the latest in technology brands for work and play.
NEW CHANNELS // Our continued focus on Store-in-Store contracts will include grocery and drug store chains in the U.S.
MEXICO // We’ve delivered strong growth in the last several years,and we continue to expand our store base in this promising market.
As we go forward, we will focus on enhancing the core by ensuring the website table stakes are met, and we will invest in technology platforms that are scalable and enable us to deliver new functionality more rapidly. We will provide the appropriate level of choice for our SMB customers to create an endless aisle of products and services while recognizing our loyal customers whenever and wherever they shop to build brand affi nity.
We are confi dent that we have a clear road map for success to strengthen the core. We are focused on our four foundational pillars, and we will continue to leave no stone unturned to drive cost effi ciencies. //

VI // 2011 OFFICEMAX® ANNUAL REPORT // ROAD TO SUCCESS // CONTRACT
Growing Our Contract BusinessIn 2011, we laid the building blocks for growing our business-to-business sector. We began website improvements that gave our customers enhanced search, better website analytics and a new pricing tool to streamline the purchasing process and cut overall costs. 2012 is about continuing on this road to success, and the initiatives detailed below—Small and Medium Businesses (SMB), Jan/San and Technology & Document Solutions are going to lead the way.
One of the major growth adjacencies in our Contract business is precision focus on small and medium businesses. We have the right offering, strategic focus and dedicated resources to help this key customer population succeed.
We will continue to position ourselves to our business customers as one source for a multitude of cost-effective workplace products and services with our Integrated Solutions. We plan on increasing our Jan/San product offerings, another growth adjacency, as well as our focus on healthcare and higher education verticals. Offi ceMax offers products and tools designed for these businesses, and the expert guidance to help customers increase productivity while decreasing costs.
SMB—A GROWTH ADJACENCY FOR SMALL AND MEDIUM BUSINESSES
The value proposition for the small- and medium-size business markets is simple. We want to be a partner that supports our customer through low prices, broad product selection and valuable services that will make their business work better.

// VII

VIII // 2011 OFFICEMAX® ANNUAL REPORT // ROAD TO SUCCESS // CONTRACT
Australia
Profi le:
Leader in educationand government
Strategies:
• Optimize Australia & New Zealand synergies
• Improve sales force productivity
• Strengthen client relationships
New Zealand
Profi le:
#1 Player in B2B sales
Strategies:
• Maintain leadership position
• Grow new sectors, services and segments
• Increase Small Offi ce/Home Offi ce (SOHO) penetration
INTERNATIONAL CONTRACT REVENUE BILLION / FY11$1.2
Canada
Profi le:
Concentration in large & enterprise
Strategies:
• Integrate Canada & U.S. support services
• Rationalize cost structure
• Grow in new sectors, segments and services
Another growth adjacency is our Technology & Document Solutions. We know that customers are less interested in buying individual technology and document products, and more interested in fi nding complete and professional, customized solutions that help them enhance their work effi ciencies and address key initiatives in cost reduction and sustainability. With the joint consultative solutioning of Managed Print Services and Offi ceMax ImPress®, Offi ceMax is uniquely positioned to manage the entire life cycle of content and document workfl ow; from creation to optimization of the output to storage and/or destruction. Lastly, the B2B technology sales gives contract customers of all sizes a single point of contact for purchase, delivery and installation of technology products. Our investment in these programs helps us successfully meet the evolving needs of our customers.
Our Contract business reach extends beyond the U.S. We just renewed our strategic alliance with Lyreco, based in Europe, for another three years to work jointly on global Contract accounts. Additionally, Canada, Australia and New Zealand continue to be key players in our portfolio. With these strategies in place, and knowledgeable leaders at the ready, 2012 promises to be a year of moving toward long-term profi table growth in the Contract division at Offi ceMax. //

// IX
“ The overall package we got from Offi ceMax® was by far the superior solution for our university. Offi ceMax really listened to us when we said we wanted to create a partnership, and they delivered a solution that really hit on every aspect we wanted in terms of supporting the academic part of the university, supporting our friends and alumni, delivering a great product, a great solution, and a great price that we felt no one else could offer other than Offi ceMax.”
BRETT ANDERSON, VICE PRESIDENT FOR UNIVERSITY ADVANCEMENT, COLORADO STATE UNIVERSITY
NOVATION® AWARD
Offi ceMax® received the Novation® 2011 Support Services Supplier of the Year award.


// XI

XII // 2011 OFFICEMAX® ANNUAL REPORT // ROAD TO SUCCESS // RETAIL
Changing Needs of Our Retail CustomersWhile it’s been a tumultuous year of ups and downs in our Retail business, behind the scenes we’ve been laying the groundwork for success in 2012. We’ve been focusing on changing our price perception, forging strategic partnerships and investing in products and services to help our customers. Today, our commitment to retail growth has never been stronger.
In late 2011, we began transforming the look and feel inside the chain to do a better job of communicating the great values and competitive pricing we offer. New signage has visually larger price points, value-driven messages and a strong brand presence. Our customers are especially focused on technology, so we continually update our assortment to help meet their changing needs.
As a continuation of the efforts to transform our technology business, we began piloting RadioShack Mobile™ in 18 stores. This venture allows customers to fi nd a complete mobile solution, and the partnership complements our expanded TechWorld offerings, which include the latest cutting-edge technology—more PCs, tablets and beyond—as well as certifi ed tech associates trained to assist customers with their technological needs.
Ctrlcenter® and Offi ceMax ImPress® Print and Document Services are additional components of our growth effort. Ctrlcenter offers a trusted source of tech support—including computer check-ups, tune-ups, software installation and repairs—to customers in every store across the chain. Offi ceMax ImPress provides professional copy and print solutions, ranging from binding and fi nishing to producing letterhead, envelopes, business cards and more. Additionally, customers can place orders from their mobile device, online or in store, and Offi ceMax ImPress will contact them when their order is complete and ready for pick up. This is another innovation that helps our customers work better.

// XIII
MEXICO—A GROWTH ADJACENCY WITH OUR NEIGHBOR TO THE SOUTH
Offi ceMax® Mexico is a well-positioned retailer with thousands of brand name and private label products, including cutting-edge technology and more than 80 stores.
Store-in-Store and New Channel Development
We’ve continued growing our new channels, and this momentum will continue as we build the organization and infrastructure for future growth. We have more than a dozen accounts, including Safeway, supplying more than 5,000 retail outlets with stationery and everyday offi ce supply products. Our primary focus is grocery and drug channels where our retail partners can leverage our experience and our merchandising expertise.
As we continue to grow, we will explore bringing a range of partners into our stores who will provide offerings that are attractive to our customers. We believe that the combination of our brand along with their brands will not only be a way to utilize space more effectively, but will act as a powerful magnet to build traffi c and make our stores a highly attractive destination. //
In 2011, store associates from Frisco, Texas, put the very products they sell in their stores to great use. Twice a week, associates volunteered by helping with schoolwork and mentoring students at the Bright Elementary homework club. At the closing event, Offi ceMax® provided the community with $500 gift cards, in addition to all of the supplies donated throughout the semester. “It was a great experience,” says David Teitelbaum, Retail District Manager. “We defi nitely plan on doing this again.”
STARS OF TEXAS


// XV


// XVII
PREMIUM BRANDS
Our exclusive premium brands provide our customers with innovative products focused on productivity and style. TUL® pens are designed for effortless fl ow, and TUL accessories create beautiful work while beautifying a desktop. Colorful DiVOGA® accessories invigorate any workspace. [IN]PLACE® fi ling products redefi ne and simplify the art of organization. And, Offi ceMax® work essentials perfectly pair quality and value. These are just a few examples of the private brands we offer. They all have one unifying mission: to help our customers become more effi cient and productive, because we want our customers to work smarter, not harder.

XVIII // 2011 OFFICEMAX® ANNUAL REPORT // ROAD TO SUCCESS // DIGITAL/E-COMMERCE
Enhancing Digital and E-Commerce ExperiencesWe started the momentum in 2011, and in 2012, our digital and e-commerce customer experiences will continue being strengthened to drive forward our online presence.
Our strategies in 2012 are designed to build the foundation for growth of our e-commerce websites (Offi ceMaxSolutions.com, Offi ceMax.com and Reliable.com) and to focus on creating a seamless multi-channel experience. We are investing in improving both our online and multi-channel experiences for our customers by enhancing our infrastructure and adding talent to our team.
Clearly, there are areas where immediate focus on enhancement can improve customers’ experience. Improving online content, assortment and search capabilities is crucial. We are investing in digital platforms and processes so that we can deliver products and experiences more rapidly.
Focusing more on small business customers is essential in 2012. Part of the road to success is to provide the products and services that will help make us a preferred destination online and invest in connecting our experiences across channels seamlessly. We’re doing the work to enable customers to buy products online and pick up their orders in their local Offi ceMax® storeor have them delivered at a convenient time. We will continue to optimize our Offi ceMax ImPress® Mobile application—today customers can locate our stores and send a print document from their smart phones and other mobile devices. Other enhancements are being developed.

// XIX
The multi-channel experience—which offers customers multiple ways in which to buy products, including in a store, on the web or through a catalog—drives a signifi cant portion of online industry sales. For every dollar that’s transacted online, there can be multiple dollars that are driven from the web into stores. People like to do research online and then go into the store and speak with an associate to complete their transaction. Creating strong multi-channel experiences is good not only for customers but also good for our business model.
Offi ceMax® transacts billions of dollars in online sales to customers of our Contract and Retail businesses, and has a brand awareness and scale advantages that smaller competitors do not enjoy. We believe that the strategies we have in place will enable us to grow our online channel over the next several years of our strategic plan. //
DELIVERING LIFE-SAVING HELP
While on their Sheboygan, Wisconsin route, Delivery Specialists Doug Clark and John Martin jumped into action to help a man trapped in his overturned truck after a car accident. These two associates take our commitment of thinking customer fi rst to a whole new level.
THE MULTI-CHANNEL EXPERIENCE
online
store
online
catalog
store
catalog
online
catalog
store


// XXI

XXII // 2011 OFFICEMAX® ANNUAL REPORT // ROAD TO SUCCESS // CORPORATE SOCIAL RESPONSIBILITY
Embracing Corporate Social ResponsibilityFrom suppliers to associates, our commitment to diversity and inclusion is at the core of everything we do at Offi ceMax®. With an array of diverse suppliers and a broad spectrum of talent within our company, we provide our customers with fresh perspectives and innovative solutions to help them work better.
By offering products provided by certifi ed Minority- and Women-Owned Business Enterprises (MWBE) and sustaining numerous strategic alliances with SBA-certifi ed Small Businesses, we can help other companies reach their diversity spend objectives.
Donating our time and resources helps us build and sustain a strong community for our associates and customers. Offi ceMax GoodworksSM encompasses various programs focused on providing products and supplies or driven by fi nancial contributions and thousands of volunteer hours. All of our charitable programs fall under the Offi ceMax Goodworks umbrella.
In 2011, the Offi ceMax Charitable Foundation provided a $1 million grant to support Freedom Middle School and Youth Crossroads as they seek to improve education by boosting classroom and community services for the school’s students and their families. The Foundation also gave $150,000 each to Adopt A Classroom and the Kids in Need Foundation, and over $290,000 in grants to various nonprofi ts across the country.

// XXIII
Additionally, 2011 marked the fi fth anniversary of A Day Made Better, a one-day event that is helping to erase teacher-funded classrooms. Each year, associates from across the company help surprise more than 1,000 teachers nationally by gifting them with over $1,000 in school supplies.
Our Code of Business Conduct and Ethics sets the standards by which we measure ourselves every day. We act with integrity and accountability when we hold ourselves and our colleagues to these principles. In 2011, we engaged Corpedia to conduct a review and benchmark the Offi ceMax ethics and compliance program. We are proud to report that the company met or exceeded industry requirements, standards and best practices and was awarded Ethics Inside® certifi cation.
Our enduring commitment to the environment is of great importance at Offi ceMax, too. Over the last several years, we’ve reduced our CO2 emissions, electricity and fuel consumption signifi cantly. In recognition of our efforts, we received the 2010 Supply & Demand Chain Green Award.
We have a great deal to be proud of in building and sustaining a diverse working environment dedicated to giving back to the communities in which we live, work and serve. In 2012, we remain focused on our commitment to the environment, and we look forward to continued success with our targeted philanthropic approach. //
SPOTLIGHT ON DIVERSITY
As Vice President, Chief Diversity Offi cer for Offi ceMax®, Carolynn Brooks provides strategic direction for Workforce Diversity, Supplier Diversity, Workforce Compliance and Community Relations. She was recently recognized and profi led in Diversity Business Journal as a 2011 executive woman worth watching.

XXIV // 2011 OFFICEMAX® ANNUAL REPORT // ROAD TO SUCCESS // CORPORATE SOCIAL RESPONSIBILITY
2011 Materials Performance Metrics
Percentage of total products with recycled content* 21%
Percentage of business papers offered containing 46%at least 30 percent post-consumer fi ber**
Percentage of catalog paper containing at 69%least 10 percent post-consumer fi ber
* Data pertains to items featured in our full-line Offi ce Products catalog.** Business papers are defi ned as cut-size printer and/or copier paper.
Total CO2 emissions (metric tons)
2011 303,869
2005 521,137
Total electricity consumption (KwH)
2011 429,041,561
2005 739,711,395
2011 131,780
2005
Total gasoline consumption (gallons)
399,199
Total diesel fuel consumption (gallons)
2011 1,421,025
2005 1,640,309
Total biodiesel fuel consumption (gallons)
2011 15,013
2005 4,899
Offi ceMax® is committed to supplying our products and services in a manner with sensitivity to environmental issues throughout our business systems. Responsible environmental stewardship is a component of our success as a company.
Environmental Performance Metrics

// XXV


UNITED STATESSECURITIES AND EXCHANGE COMMISSION
Washington, DC 20549
FORM 10-KAnnual Report Pursuant to Sections 13 or 15(d)
of the Securities Exchange Act of 1934È ANNUAL REPORT PURSUANT TO SECTION 13 OR 15(d) OF THE SECURITIES
EXCHANGE ACT OF 1934For the fiscal year ended December 31, 2011
OR
‘ TRANSITION REPORT PURSUANT TO SECTION 13 OR 15(d) OF THE SECURITIESEXCHANGE ACT OF 1934
For the transition period from toCommission File Number: 1-5057
OFFICEMAX INCORPORATED(Exact name of registrant as specified in its charter)
Delaware 82-0100960(State or other jurisdiction ofincorporation or organization)
(I.R.S. EmployerIdentification No.)
263 Shuman Boulevard,Naperville, Illinois 60563
(Address of principal executive offices) (Zip Code)
(630) 438-7800(Registrant’s telephone number, including area code)
Securities registered pursuant to Section 12(b) of the Act:Title of each class Name of each exchange on which registeredCommon Stock, $2.50 par valueAmerican & Foreign Power Company Inc.
Debentures, 5% Series due 2030
New York Stock ExchangeNew York Stock Exchange
Indicate by check mark if the registrant is a well-known seasoned issuer, as defined in Rule 405 of the Securities Act. Yes ‘ No ÈIndicate by check mark if the registrant is not required to file reports pursuant to Section 13 or Section 15(d) of the Act. Yes ‘ No ÈIndicate by check mark whether the registrant (1) has filed all reports required to be filed by Section 13 or 15(d) of the Securities Exchange
Act of 1934 during the preceding 12 months (or for such shorter period that the registrant was required to file such reports), and (2) has beensubject to such filing requirements for the past 90 days. Yes È No ‘
Indicate by check mark whether the registrant has submitted electronically and posted on its corporate Web site, if any, every Interactive DataFile required to be submitted and posted pursuant to Rule 405 of Regulation S-T during the preceding 12 months (or for such shorter period that theregistrant was required to submit and post such files). Yes È No ‘
Indicate by check mark if disclosure of delinquent filers pursuant to Item 405 of Regulation S-K is not contained herein, and will not becontained, to the best of registrant’s knowledge, in definitive proxy or information statements incorporated by reference in Part III of thisForm 10-K or any amendment to this Form 10-K. ‘
Indicate by check mark whether the registrant is a large accelerated filer, an accelerated filer, a non-accelerated filer or a smaller reportingcompany. See the definitions of “large accelerated filer,” “accelerated filer” and “smaller reporting company” in Rule 12b-2 of the Exchange Act.Large accelerated filer È Accelerated filer ‘
Non-accelerated filer ‘ Smaller reporting company ‘
Indicate by check mark whether the registrant is a shell company (as defined in Rule 12b-2 of the Act). Yes ‘ No È
The aggregate market value of the voting common stock held by nonaffiliates of the registrant, computed by reference to the price at which thecommon stock was sold as of the close of business on June 25, 2011, was $1,088,968,714. Registrant does not have any nonvoting common equitysecurities.
Indicate the number of shares outstanding of each of the registrant’s classes of common stock as of the latest practicable date.Class Shares Outstanding as of February 10, 2012
Common Stock, $2.50 par value 86,166,416Document incorporated by reference
Portions of the registrant’s proxy statement relating to its 2012 annual meeting of shareholders to be held on April 30, 2012 (“OfficeMaxIncorporated’s proxy statement”) are incorporated by reference into Part III of this Form 10-K.

TABLE OF CONTENTS
PART IItem 1. Business . . . . . . . . . . . . . . . . . . . . . . . . . . . . . . . . . . . . . . . . . . . . . . . . . . . . . . . . . . . . . . . . . . . . . . 1Item 1A. Risk Factors . . . . . . . . . . . . . . . . . . . . . . . . . . . . . . . . . . . . . . . . . . . . . . . . . . . . . . . . . . . . . . . . . . . 5Item 1B. Unresolved Staff Comments . . . . . . . . . . . . . . . . . . . . . . . . . . . . . . . . . . . . . . . . . . . . . . . . . . . . . . . 9Item 2. Properties . . . . . . . . . . . . . . . . . . . . . . . . . . . . . . . . . . . . . . . . . . . . . . . . . . . . . . . . . . . . . . . . . . . . . 10Item 3. Legal Proceedings . . . . . . . . . . . . . . . . . . . . . . . . . . . . . . . . . . . . . . . . . . . . . . . . . . . . . . . . . . . . . . . 11Item 4. (Removed and Reserved) . . . . . . . . . . . . . . . . . . . . . . . . . . . . . . . . . . . . . . . . . . . . . . . . . . . . . . . . . 11
Executive Officers of the Registrant . . . . . . . . . . . . . . . . . . . . . . . . . . . . . . . . . . . . . . . . . . . . . . . . 12
PART IIItem 5. Market for Registrant’s Common Equity, Related Stockholder Matters and Issuer Purchases of
Equity Securities . . . . . . . . . . . . . . . . . . . . . . . . . . . . . . . . . . . . . . . . . . . . . . . . . . . . . . . . . . . . . . 14Item 6. Selected Financial Data . . . . . . . . . . . . . . . . . . . . . . . . . . . . . . . . . . . . . . . . . . . . . . . . . . . . . . . . . . 16Item 7. Management’s Discussion and Analysis of Financial Condition and Results of Operations . . . . . 18Item 7A. Quantitative and Qualitative Disclosures About Market Risk . . . . . . . . . . . . . . . . . . . . . . . . . . . . . 41Item 8. Financial Statements and Supplementary Data . . . . . . . . . . . . . . . . . . . . . . . . . . . . . . . . . . . . . . . . 42Item 9. Changes in and Disagreements With Accountants on Accounting and Financial Disclosure . . . . . 83Item 9A. Controls and Procedures . . . . . . . . . . . . . . . . . . . . . . . . . . . . . . . . . . . . . . . . . . . . . . . . . . . . . . . . . . 83Item 9B. Other Information . . . . . . . . . . . . . . . . . . . . . . . . . . . . . . . . . . . . . . . . . . . . . . . . . . . . . . . . . . . . . . . 83
PART III`Item 10. Directors, Executive Officers and Corporate Governance . . . . . . . . . . . . . . . . . . . . . . . . . . . . . . . . 84Item 11. Executive Compensation . . . . . . . . . . . . . . . . . . . . . . . . . . . . . . . . . . . . . . . . . . . . . . . . . . . . . . . . . 84Item 12. Security Ownership of Certain Beneficial Owners and Management and Related Stockholder
Matters . . . . . . . . . . . . . . . . . . . . . . . . . . . . . . . . . . . . . . . . . . . . . . . . . . . . . . . . . . . . . . . . . . . . . 84Item 13. Certain Relationships and Related Transactions, and Director Independence . . . . . . . . . . . . . . . . . 85Item 14. Principal Accountant Fees and Services . . . . . . . . . . . . . . . . . . . . . . . . . . . . . . . . . . . . . . . . . . . . . . 85
PART IVItem 15. Exhibits, Financial Statement Schedules . . . . . . . . . . . . . . . . . . . . . . . . . . . . . . . . . . . . . . . . . . . . . 86
Signatures . . . . . . . . . . . . . . . . . . . . . . . . . . . . . . . . . . . . . . . . . . . . . . . . . . . . . . . . . . . . . . . . . . . . . 87Index to Exhibits . . . . . . . . . . . . . . . . . . . . . . . . . . . . . . . . . . . . . . . . . . . . . . . . . . . . . . . . . . . . . . . . 89

PART I
ITEM 1. BUSINESS
As used in this Annual Report on Form 10-K for the fiscal year ended December 31, 2011, the terms“OfficeMax,” the “Company,” “we” and “our” refer to OfficeMax Incorporated and its consolidated subsidiariesand predecessors. Our Securities and Exchange Commission (“SEC”) filings, which include this Annual Reporton Form 10-K, Quarterly Reports on Form 10-Q, Current Reports on Form 8-K and all related amendments tothose reports, are available free of charge on our website at investor.officemax.com by clicking on “SEC filings.”Our SEC filings are available as soon as reasonably practicable after we electronically file such material with, orfurnish it to, the SEC.
General Overview
OfficeMax is a leader in both business-to-business and retail office products distribution. We provide officesupplies and paper, print and document services, technology products and solutions and office furniture to large,medium and small businesses, government offices and consumers. OfficeMax customers are served byapproximately 29,000 associates through direct sales, catalogs, the Internet and retail stores located throughoutthe United States, Canada, Australia, New Zealand, Mexico, the U.S. Virgin Islands and Puerto Rico. Ourcommon stock trades on the New York Stock Exchange under the ticker symbol OMX, and our corporateheadquarters is in Naperville, Illinois.
OfficeMax Incorporated (formerly Boise Cascade Corporation) was organized as Boise Payette LumberCompany of Delaware, a Delaware corporation, in 1931 as a successor to an Idaho corporation formed in 1913.In 1957, the Company’s name was changed to Boise Cascade Corporation. On December 9, 2003, Boise CascadeCorporation acquired 100% of the voting securities of OfficeMax, Inc. That acquisition more than doubled thesize of our office products distribution business and expanded that business into the U.S. retail channel. Inconnection with the sale of our paper, forest products and timberland assets described below, the Company’sname was changed from Boise Cascade Corporation to OfficeMax Incorporated, and the names of our officeproducts segments were changed from Boise Office Solutions, Contract and Boise Office Solutions, Retail toOfficeMax, Contract and OfficeMax, Retail. The Boise Cascade Corporation and Boise Office Solutions nameswere used in documents furnished to or filed with the SEC prior to the sale of our paper, forest products andtimberland assets.
On October 29, 2004, we sold our paper, forest products and timberland assets to affiliates of BoiseCascade, L.L.C., a new company formed by Madison Dearborn Partners LLC (the “Sale”). With the Sale, wecompleted the Company’s transition, begun in the mid-1990s, from a predominately commodity manufacturing-based company to an independent office products distribution company. On October 29, 2004, as part of the Sale,we invested $175 million in the securities of affiliates of Boise Cascade, L.L.C. Due to restructurings conductedby those affiliates, our investment is currently in Boise Cascade Holdings, L.L.C. (the “Boise Investment”).
The accompanying consolidated financial statements include the accounts of OfficeMax and all majority-owned subsidiaries, except our 88%-owned subsidiary that formerly owned assets in Cuba that were confiscatedby the Cuban government in the 1960s, which is accounted for as an investment due to various asset restrictions.We also consolidate the variable interest entities in which the Company is the primary beneficiary. All significantintercompany balances and transactions have been eliminated in consolidation.
Fiscal Year
The Company’s fiscal year-end is the last Saturday in December. Due primarily to statutory requirements,the Company’s international businesses maintain calendar years with December 31 year-ends, with our majority-owned joint venture in Mexico reporting one month in arrears. Fiscal year 2011 ended on December 31, 2011,
1

fiscal year 2010 ended on December 25, 2010, and fiscal year 2009 ended on December 26, 2009. Fiscal year2011 included 53 weeks for our U.S. businesses. Fiscal years 2010 and 2009 included 52 weeks for our U.S.businesses.
Segments
The Company manages its business using three reportable segments: OfficeMax, Contract (“Contractsegment” or “Contract”); OfficeMax, Retail (“Retail segment” or “Retail”); and Corporate and Other. TheContract segment markets and sells office supplies and paper, technology products and solutions, office furnitureand print and document services directly to large corporate and government offices, as well as to small andmedium-sized offices through field salespeople, outbound telesales, catalogs, the Internet and, primarily inforeign markets, through office products stores. The Retail segment markets and sells office supplies and paper,print and document services, technology products and solutions and office furniture to small and medium-sizedbusinesses and consumers through a network of retail stores. Management reviews the performance of theCompany based on these segments. We present information pertaining to each of our segments and thegeographic areas in which they operate in Note 14, “Segment Information,” of the Notes to ConsolidatedFinancial Statements in “Item 8. Financial Statements and Supplementary Data” of this Form 10-K.
Contract
We distribute a broad line of items for the office, including office supplies and paper, technology productsand solutions, office furniture and print and document services through our Contract segment. Contract sellsdirectly to large corporate and government offices, as well as to small and medium-sized offices in the UnitedStates, Canada, Australia, New Zealand and Puerto Rico. This segment markets and sells through fieldsalespeople, outbound telesales, catalogs, the Internet and, primarily in foreign markets, through office productsstores. The majority of the products sold by this segment are purchased from outside manufacturers or fromindustry wholesalers. We also source substantially all of our private label products direct from manufacturers.We purchase office papers primarily from Boise White Paper, L.L.C., under a paper supply contract entered intoon June 25, 2011. (See Note 15, “Commitments and Guarantees,” of the Notes to Consolidated FinancialStatements in “Item 8. Financial Statements and Supplementary Data” of this Form 10-K for additionalinformation related to the paper supply contract.)
As of the end of the year, Contract operated 38 distribution centers in the U.S., Puerto Rico, Canada,Australia and New Zealand as well as four customer service and outbound telesales centers in the U.S. Contractalso operated 47 office products stores in Canada, Hawaii, Australia and New Zealand.
Contract sales were $3.6 billion for 2011 and 2010 and $3.7 billion for 2009.
Retail
Retail is a retail distributor of office supplies and paper, print and document services, technology productsand solutions and office furniture. In addition, this segment contracts with large national retail chains to supplyoffice and school supplies to be sold in their stores. Our retail office products stores feature OfficeMax ImPress,an in-store module devoted to print-for-pay and related services. Our Retail segment has operations in the UnitedStates, Puerto Rico and the U.S. Virgin Islands. Our Retail segment also operates office products stores inMexico through a 51%-owned joint venture. The majority of the products sold by this segment are purchasedfrom outside manufacturers or from industry wholesalers. We also source substantially all of our private labelproducts direct from manufacturers. As mentioned above, we purchase office papers primarily from Boise WhitePaper, L.L.C., under a paper supply contract entered into on June 25, 2011. (See Note 15, “Commitments andGuarantees,” of the Notes to Consolidated Financial Statements in “Item 8. Financial Statements andSupplementary Data” of this Form 10-K for additional information related to the paper supply contract.)
2

As of the end of the year, our Retail segment operated 978 stores in the U.S., Puerto Rico, the U.S. VirginIslands, and Mexico, three large distribution centers in the U.S., and one small distribution center in Mexico.Each store offers approximately 10,000 stock keeping units (SKUs) of name-brand and OfficeMax private-branded merchandise and a variety of business services targeted at serving the small business customer, includingOfficeMax ImPress. In addition to our in-store ImPress capabilities, our Retail segment operated six OfficeMaxImPress print on demand facilities with enhanced fulfillment capabilities as of the end of the year. These 8,000square foot operations are located within some of our Contract distribution centers, and serve the print anddocument needs of our large contract customers in addition to supporting our retail stores by providing servicesthat cannot be deployed at every retail store.
Retail sales were $3.5 billion for 2011 and 2010 and $3.6 billion for 2009.
CompetitionDomestic and international office products markets are highly and increasingly competitive. Customers
have many options when purchasing office supplies and paper, print and document services, technology productsand solutions and office furniture. We compete with contract stationers, office supply superstores includingStaples and Office Depot, mass merchandisers such as Wal-Mart and Target, wholesale clubs such as Costco,computer and electronics superstores such as Best Buy, Internet merchandisers such as Amazon.com, direct-maildistributors, discount retailers, drugstores and supermarkets, as well as the direct marketing efforts ofmanufacturers, including some of our suppliers. The other large office supply superstores have increased theirpresence in close proximity to our stores in recent years and are expected to continue to do so in the future. Inaddition, many of our competitors have expanded their office products assortment, and we expect they willcontinue to do so. We anticipate increasing competition from our two domestic office supply superstorecompetitors and various other competitors for print-for-pay and related services. Increased competition in theoffice products markets, together with increased advertising, has heightened price awareness among end-users.Such heightened price awareness has led to margin pressure on office products and impacted the results of bothour Retail and Contract segments. In addition to price, competition is also based on customer service, the qualityand breadth of product selection and convenient locations. Some of our competitors are larger than us and havegreater financial resources, which affords them greater purchasing power, increased financial flexibility and morecapital resources for expansion and improvement, which may enable them to compete more effectively.
We believe our excellent customer service and the efficiency and convenience for our customers of ourcombined contract and retail distribution channels gives our Contract segment a competitive advantage amongbusiness-to-business office products distributors. Our ability to network our distribution centers into an integratedsystem enables us to serve large national accounts that rely on us to deliver consistent products, prices andservices to multiple locations, and to meet the needs of medium and small businesses at a competitive cost.
We believe our Retail segment competes favorably based on the quality of our customer service, ourinnovative store formats, the breadth and depth of our merchandise offering and our everyday low prices, as wellas our specialized service offerings, including OfficeMax ImPress, and our ability to create office productmerchandise solutions for other retailers to incorporate into their stores.
Seasonal InfluencesThe Company’s business is seasonal, with Retail showing a more pronounced seasonal trend than Contract.
Sales in the second quarter are historically the slowest of the year. Sales are stronger during the first, third andfourth quarters that include the important new-year office supply restocking month of January, theback-to-school period and the holiday selling season, respectively.
Environmental MattersOur discussion of environmental matters is presented under the caption “Environmental” in “Item 7.
Management’s Discussion and Analysis of Financial Condition and Results of Operations” of this Form 10-K. In
3

addition, certain environmental matters are discussed in Note 16, “Legal Proceedings and Contingencies,” of theNotes to Consolidated Financial Statements in “Item 8. Financial Statements and Supplementary Data” of thisForm 10-K.
Capital Investment
Information concerning our capital expenditures is presented under the caption “Investment Activities” in“Item 7. Management’s Discussion and Analysis of Financial Condition and Results of Operations” of thisForm 10-K.
Acquisitions and Divestitures
We engage in acquisition and divestiture discussions with other companies and make acquisitions anddivestitures from time to time. It is our policy to review our operations periodically and to dispose of assets thatdo not meet our criteria for return on investment.
Geographic Areas
Our discussion of financial information by geographic area is presented in Note 14, “Segment Information,”of the Notes to Consolidated Financial Statements in “Item 8. Financial Statements and Supplementary Data” ofthis Form 10-K.
Identification of Executive Officers
Information with respect to our executive officers is set forth as the last item of Part I of this Form 10-K.
Employees
On December 31, 2011, we had approximately 29,000 employees, including approximately 10,000 part-timeemployees.
4

ITEM 1A. RISK FACTORS
Cautionary and Forward-Looking Statements
This Annual Report on Form 10-K contains forward-looking statements. Statements that are not historical orcurrent facts, including statements about our expectations, anticipated financial results and future businessprospects, are forward-looking statements. You can identify these statements by our use of words such as “may,”“expect,” “believe,” “should,” “plan,” “anticipate” and other similar expressions. You can find examples of thesestatements throughout this report, including “Item 7. Management’s Discussion and Analysis of FinancialCondition and Results of Operations” of this Form 10-K. We cannot guarantee that our actual results will beconsistent with the forward-looking statements we make in this report. We have listed below some of theinherent risks and uncertainties that could cause our actual results to differ materially from those we project. Wedo not assume an obligation to update any forward-looking statement.
Current macroeconomic conditions have had and may continue to have an impact on our business andour financial condition. Economic conditions, both domestically and abroad, directly influence our operatingresults. Current and future economic conditions that affect consumer and business spending, including the levelof unemployment, energy costs, inflation, availability of credit and the financial condition and growth prospectsof our customers may continue to adversely affect our business and the results of our operations. We maycontinue to face challenges if macroeconomic conditions do not improve or if they worsen.
The impact of the weak economy on our customers could adversely impact the overall demand for ourproducts and services, which would have a negative effect on our revenues, as well as impact our customers’ability to pay their obligations, which could have a negative effect on our bad debt expense and cash flows.
In addition, we sponsor noncontributory defined benefit pension plans covering certain terminatedemployees, vested employees, retirees, and some active employees (the “Pension Plans”). The Pension Plans areunder-funded and we may be required to make contributions in subsequent years in order to maintain requiredfunding levels, which would have an adverse impact on our cash flows and our financial results. Additionalfuture contributions of common stock or cash to the Pension Plans, financial market performance and IRSfunding requirements could materially change these expected payments.
Our business may be adversely affected by the actions of and risks associated with our third-partyvendors. We use and resell many manufacturers’ branded items and services and are therefore dependent on theavailability and pricing of key products and services including ink, toner, paper and technology products. As areseller, we cannot control the supply, design, function, cost or vendor-required conditions of sale of many of theproducts we offer for sale. Disruptions in the availability of these products or the products and services weconsume may adversely affect our sales and result in customer dissatisfaction. Further, we cannot control the costof manufacturers’ products, and cost increases must either be passed along to our customers or will result inerosion of our earnings. Failure to identify desirable products and make them available to our customers whendesired and at attractive prices could have an adverse effect on our business and our results of operations. Inaddition, a material interruption in service by the carriers that ship goods within our supply chain may adverselyaffect our sales. Many of our vendors are small or medium sized businesses which are impacted by currentmacroeconomic conditions, both in the U.S. and Asia. We may have no warning before a vendor fails, whichmay have an adverse effect on our business and results of operations.
Our product offering also includes many of our own proprietary branded products. While we have focusedon the quality of our proprietary branded products, we rely on third party manufacturers for these products. Suchthird-party manufacturers may prove to be unreliable, the quality of our globally sourced products may not meetour expectations, such products may not meet applicable regulatory requirements which may require us to recallthose products, or such products may infringe upon the intellectual property rights of third parties. Furthermore,economic and political conditions in areas of the world where we source such products may adversely affect theavailability and cost of such products. In addition, our proprietary branded products compete with other
5

manufacturers’ branded items that we offer. As we continue to increase the number and types of proprietarybranded products that we sell, we may adversely affect our relationships with our vendors, who may decide toreduce their product offerings through OfficeMax and increase their product offerings through our competitors.Finally, if any of our customers are harmed by our proprietary branded products, they may bring product liabilityand other claims against us. Any of these circumstances could have an adverse effect on our business andfinancial performance.
Intense competition in our markets could harm our ability to maintain profitability. Domestic andinternational office products markets are highly and increasingly competitive. Customers have many optionswhen purchasing office supplies and paper, print and document services, technology products and solutions andoffice furniture. We compete with contract stationers, office supply superstores including Staples and OfficeDepot, mass merchandisers such as Wal-Mart and Target, wholesale clubs such as Costco, computer andelectronics superstores such as Best Buy, Internet merchandisers such as Amazon.com, direct-mail distributors,discount retailers, drugstores and supermarkets. In addition, an increasing number of manufacturers of computerhardware, software and peripherals, including some of our suppliers, have expanded their own direct marketingefforts. The other large office supply superstores have increased their presence in close proximity to our stores inrecent years and are expected to continue to do so in the future. In addition, many of our competitors haveexpanded their office products assortment, and we expect they will continue to do so. We anticipate increasingcompetition from our two domestic office supply superstore competitors and various other competitors forprint-for-pay and related services. Increased competition in the office products markets, together with increasedadvertising, has heightened price awareness among end-users. Such heightened price awareness has led to marginpressure on office products and impacted the results of both our Retail and Contract segments. In addition toprice, competition is also based on customer service, differentiation from competitors, the quality and breadth ofproduct selection and convenient locations. Some of our competitors are larger than us and have greater financialresources, which afford them greater purchasing power, increased financial flexibility and more capital resourcesfor expansion and improvement, which may enable them to compete more effectively.
We may be unable to generate additional sales through new distribution opportunities or replace lostsales. Our long-term success depends, in part, on our ability to expand our product sales in a manner thatachieves appropriate sales and profit levels. This could include selling our products through other retailers,opening new stores or entering into novel distribution arrangements. We have also increased our investments andresources in selling our service offerings and through our digital channel. Failure to increase our sales and furtherutilize our core assets could result in company restructurings and associated charges relating to severance andimpairment of assets.
When we sell our products through other retailers we rely on those retailers to provide an appropriatecustomer experience and our sales are dependent on the foot traffic and sales of the retail partner. Although wemay have influence over the appearance of the area within the store where our products appear, we have nocontrol over store marketing, staffing or any other aspects of our retail partners’ operations.
Although we frequently test new store designs, formats, sizes and market areas, if we are unable to generatethe required sales or profit levels, as a result of macroeconomic or operational challenges, we may not open newstores. Similarly, we will only continue to operate existing stores if they meet required sales or profit levels. Inthe current macroeconomic environment, the results of our existing stores are impacted not only by a reducedsales environment, but by a number of things that are not within our control, such as loss of traffic resulting fromstore closures by other significant retailers in the stores’ immediate vicinity. If our stores performance suffers, wemay be subject to impairment charges. In addition, if we are required to close stores, we will incur additionalcosts. These items could adversely affect our financial results.
Our international operations expose us to the unique risks inherent in foreign operations. Our foreignoperations encounter risks similar to those faced by our U.S. operations, as well as risks inherent in foreignoperations, such as local customs and regulatory constraints, foreign trade policies, competitive conditions,foreign currency fluctuations and unstable political and economic conditions.
6

We may be unable to attract and retain qualified associates. We attempt to attract and retain an appropriatelevel of personnel in both field operations and corporate functions. We face many external risks and internalfactors in meeting our labor needs, including competition for qualified personnel, prevailing wage rates, as wellas rising employee benefit costs, including insurance costs and compensation programs. Failure to attract andretain sufficient qualified personnel could interfere with our ability to implement our strategies and adequatelyprovide services to customers.
We are more leveraged than some of our competitors, which could adversely affect our business plans. Arelatively greater portion of our cash flow is used to service financial obligations including leases and to satisfyPension Plans funding obligations (discussed previously). This reduces the funds we have available for workingcapital, capital expenditures, acquisitions, new stores, store remodels and other purposes. Similarly, our relativelygreater leverage increases our vulnerability to, and limits our flexibility in planning for, adverse economic andindustry conditions and creates other competitive disadvantages compared with other companies with relativelyless leverage.
Compromises of our information security affecting customer or associate data may adversely affect ourbusiness. Through our sales and marketing activities, we collect and store certain personal information that ourcustomers provide to purchase products or services, enroll in promotional programs, register on our website, orotherwise communicate and interact with us. We also gather and retain information about our associates in thenormal course of business. We may share information about such persons with vendors that assist with certainaspects of our business. Despite instituted safeguards for the protection of such information, we cannot be certainthat all of our systems are entirely free from vulnerability to attack. Computer hackers may attempt to penetrateour networks or our vendors’ network security and, if successful, misappropriate confidential customer orbusiness information. In addition, a Company employee, contractor or other third party with whom we dobusiness may attempt to circumvent our security measures in order to obtain such information or inadvertentlycause a breach involving such information. Loss of customer or business information could disrupt ouroperations and expose us to claims from customers, financial institutions, payment card associations and otherpersons, which could have a material adverse effect on our business, financial condition and results of operations.
We cannot ensure systems and technology will be fully integrated or updated. We cannot ensure oursystems and technology will be successfully updated. We have plans to continue to update the financial reportingplatform as well as other technology and systems. We will be implementing ongoing upgrades over the nextseveral years which is a complicated and difficult endeavor. Failure to successfully complete these upgradescould have an adverse impact on our business and results of operations. Over the last several years, we havepartially integrated the systems of our Contract and Retail businesses. If we do not ultimately fully integrate oursystems, it may constrain our ability to provide the level of service our customers demand which could therebycause us to operate inefficiently. In addition, if we are unable to continually add software and hardware,effectively manage and upgrade our systems and network infrastructure, and develop disaster recovery plans, ourbusiness could be disrupted, thus subjecting us to liability and potentially harming our reputation. Any disruptionto the Internet or our technology infrastructure, including a disruption affecting our Web sites and informationsystems, may cause a decline in our customer satisfaction, jeopardize accurate financial reporting, impact oursales volumes or result in increased costs.
We retained responsibility for certain liabilities of the sold paper, forest products and timberlandbusinesses. In connection with the Sale, we agreed to assume responsibility for certain liabilities of thebusinesses we sold. These obligations include liabilities related to environmental, health and safety, tax, litigationand employee benefit matters. Some of these retained liabilities could turn out to be significant, which couldhave an adverse effect on our results of operations. Our exposure to these liabilities could harm our ability tocompete with other office products distributors, who would not typically be subject to similar liabilities. Inparticular, we are exposed to risks arising from our ability to meet the funding obligations of our Pension Plansand withdrawal requests from participants pursuant to legacy benefit plans, each of which could require cash tobe redirected and adversely impact our cash flows and financial results.
7

Our investment in Boise Cascade Holdings, L.L.C. subjects us to the risks associated with the buildingproducts industry and the U.S. housing market. When we sold our paper, forest products and timberland assets,we purchased an equity interest in Boise Cascade Holdings, L.L.C. This continuing interest subjects us to marketrisks associated with the building products industry. This industry is subject to cyclical market pressures.Historical prices for products have been volatile, and industry participants have limited influence over the timingand extent of price changes. The relationship between supply and demand in this industry significantly affectsproduct pricing. Demand for building products is driven mainly by factors such as new construction andremodeling rates, business and consumer credit availability, interest rates and weather. The recent falloff in U.S.housing starts has resulted in lower building products shipments and prices. The supply of building productsfluctuates based on manufacturing capacity. Excess manufacturing capacity, both domestically and abroad, canresult in significant variations in product prices. Our ability to realize the carrying value of our equity interest inBoise Cascade Holdings, L.L.C. is dependent upon many factors, including the operating performance of BoiseCascade, L.L.C. and other market factors that may not be specific to Boise Cascade Holdings, L.L.C. due in partto the fact that there is not a liquid market for our equity interest.
Our obligation to purchase paper from Boise White Paper L.L.C. concentrates our supply of an importantproduct primarily with a single supplier. When we sold our paper, forest products and timberland assets, weagreed to purchase substantially all of our requirements of paper for resale from Boise Cascade, L.L.C., or itsaffiliates or assigns, currently Boise White Paper L.L.C., on a long term basis. Under the new Paper PurchaseAgreement which we entered into on June 25, 2011 and which has an initial term that expires at the end of 2017,this restriction continues to apply until the end of 2012, after which we will have greater flexibility to purchasepaper from other paper suppliers. The price we pay for this paper is market based and therefore subject tofluctuations in the supply and demand for the products. In addition, until the restriction period ends, our purchaseobligation limits our ability to take advantage of spot purchase opportunities and exposes us to potentialinterruptions in supply, which could impact our ability to compete effectively with our competitors, who wouldnot typically be restricted in this way.
We have substantial business operations in states in which the regulatory environment is particularlychallenging. Our operations in California and other heavily regulated states with relatively more aggressiveenforcement efforts expose us to a particularly challenging regulatory environment, including, without limitation,consumer protection laws, advertising regulations, escheat, and employment and wage and hour regulations. Thisregulatory environment requires the Company to maintain a heightened compliance effort and exposes us todefense costs, possible fines and penalties, and liability to private parties for monetary recoveries and attorneys’fees, any of which could have an adverse effect on our business and results of operations.
We are subject to certain legal proceedings that may adversely affect our results of operations andfinancial condition. We are periodically involved in various legal proceedings, which may involve state andfederal governmental inquiries and investigations, employment, tort, consumer litigation and intellectual propertylitigation. In addition, we may be subject to investigations by regulatory agencies and customers audits. Theselegal proceedings, investigations and audits could expose us to significant defense costs, fines, penalties, andliability to private parties for monetary recoveries and attorneys’ fees, any of which could have a materialadverse effect on our business and results of operations.
Our results may be adversely affected by disruptions or catastrophic events. Unforeseen events, includingpublic health issues and natural disasters such as earthquakes, hurricanes and other adverse weather and climateconditions, whether occurring in the United States or abroad, could disrupt our operations, disrupt the operationsof our suppliers or customers, have an adverse impact on consumer spending and confidence levels or result inpolitical or economic instability. Moreover, in the event of a natural disaster or public health issue, we may berequired to suspend operations in some or all of our locations, which could have a material adverse effect on ourbusiness, financial condition and results of operations. These events could also reduce demand for our productsor make it difficult or impossible to receive products from suppliers.
8

Fluctuations in our effective tax rate may adversely affect our results of operations. We are a multi-national, multi-channel provider of office products and services. As a result, our effective tax rate is derived froma combination of applicable tax rates in the various countries, states and other jurisdictions in which we operate.Our effective tax rate may be lower or higher than our tax rates have been in the past due to numerous factors,including the sources of our income, any agreements we may have with taxing authorities in variousjurisdictions, and the tax filing positions we take in various jurisdictions.
ITEM 1B. UNRESOLVED STAFF COMMENTS
None.
9

ITEM 2. PROPERTIES
The majority of OfficeMax facilities are rented under operating leases. (For more information about ouroperating leases, see Note 8, “Leases,” of the Notes to Consolidated Financial Statements in “Item 8. FinancialStatements and Supplementary Data” of this Form 10-K.) Our properties are in good operating condition and aresuitable and adequate for the operations for which they are used. We constantly evaluate the real estate market todetermine the best locations for new stores. We analyze our existing stores and markets on a case by case basis.We conduct regular reviews of our real estate portfolio to identify underperforming facilities, and close thosefacilities that are no longer strategically or economically viable, (For more information about facilities closures,see Note 2, “Facilities Closures Reserves, ” of the Notes to Consolidated Financial Statements in “Item 8.Financial Statements and Supplementary Data” of this Form 10-K.)
Our facilities by segment are presented in the following table.
Contract
As of the end of the year, Contract operated 38 distribution centers in 18 states, Puerto Rico, Canada,Australia and New Zealand. The following table sets forth the locations of these facilities.
Arizona . . . . . . . . . . . . . . . . . . . . 1 Maine . . . . . . . . . . . . . . . . . . . 1 Texas . . . . . . . . . . . . . . . . . . . . 1California . . . . . . . . . . . . . . . . . . 2 Maryland . . . . . . . . . . . . . . . . . 1 Utah . . . . . . . . . . . . . . . . . . . . . 1Colorado . . . . . . . . . . . . . . . . . . . 1 Michigan . . . . . . . . . . . . . . . . . 1 Washington . . . . . . . . . . . . . . . 1Florida . . . . . . . . . . . . . . . . . . . . . 1 Minnesota . . . . . . . . . . . . . . . . 1 Puerto Rico . . . . . . . . . . . . . . . 1Georgia . . . . . . . . . . . . . . . . . . . . 1 North Carolina . . . . . . . . . . . . 1 Canada . . . . . . . . . . . . . . . . . . . 7Hawaii . . . . . . . . . . . . . . . . . . . . . 1 Ohio . . . . . . . . . . . . . . . . . . . . . 1 Australia . . . . . . . . . . . . . . . . . 8Illinois . . . . . . . . . . . . . . . . . . . . . 1 Pennsylvania . . . . . . . . . . . . . . 1 New Zealand . . . . . . . . . . . . . . 3Kansas . . . . . . . . . . . . . . . . . . . . . 1
Contract also operated 46 office products stores in Hawaii (2), Canada (24), Australia (3) and New Zealand(17) and four customer service and outbound telesales centers in Illinois (2), Oklahoma and Virginia.
Retail
As of the end of the year, Retail operated 978 stores in 47 states, Puerto Rico, the U.S. Virgin Islands andMexico. The following table sets forth the locations of these facilities.
Alabama . . . . . . . . . . . . . . . . . . . 11 Maine . . . . . . . . . . . . . . . . . . . 1 Oregon . . . . . . . . . . . . . . . . . . 12Alaska . . . . . . . . . . . . . . . . . . . . 3 Maryland . . . . . . . . . . . . . . . . 1 Pennsylvania . . . . . . . . . . . . . 28Arizona . . . . . . . . . . . . . . . . . . . 43 Massachusetts . . . . . . . . . . . . 10 Rhode Island . . . . . . . . . . . . . 1Arkansas . . . . . . . . . . . . . . . . . . 2 Michigan . . . . . . . . . . . . . . . . 40 South Carolina . . . . . . . . . . . . 6California . . . . . . . . . . . . . . . . . . 70 Minnesota . . . . . . . . . . . . . . . 40 South Dakota . . . . . . . . . . . . . 4Colorado . . . . . . . . . . . . . . . . . . 29 Mississippi . . . . . . . . . . . . . . . 5 Tennessee . . . . . . . . . . . . . . . . 18Connecticut . . . . . . . . . . . . . . . . 3 Missouri . . . . . . . . . . . . . . . . . 29 Texas . . . . . . . . . . . . . . . . . . . 73Florida . . . . . . . . . . . . . . . . . . . . 59 Montana . . . . . . . . . . . . . . . . . 3 Utah . . . . . . . . . . . . . . . . . . . . 14Georgia . . . . . . . . . . . . . . . . . . . 30 Nebraska . . . . . . . . . . . . . . . . 10 Virginia . . . . . . . . . . . . . . . . . 26Hawaii . . . . . . . . . . . . . . . . . . . . 8 Nevada . . . . . . . . . . . . . . . . . . 14 Washington . . . . . . . . . . . . . . 19Idaho . . . . . . . . . . . . . . . . . . . . . 6 New Jersey . . . . . . . . . . . . . . . 2 West Virginia . . . . . . . . . . . . . 2Illinois . . . . . . . . . . . . . . . . . . . . 59 New Mexico . . . . . . . . . . . . . . 9 Wisconsin . . . . . . . . . . . . . . . 35Indiana . . . . . . . . . . . . . . . . . . . . 14 New York . . . . . . . . . . . . . . . . 29 Wyoming . . . . . . . . . . . . . . . . 2Iowa . . . . . . . . . . . . . . . . . . . . . . 9 North Carolina . . . . . . . . . . . . 27 Puerto Rico . . . . . . . . . . . . . . 13Kansas . . . . . . . . . . . . . . . . . . . . 11 North Dakota . . . . . . . . . . . . . 3 U.S. Virgin Islands . . . . . . . . 2Kentucky . . . . . . . . . . . . . . . . . . 6 Ohio . . . . . . . . . . . . . . . . . . . . 52 Mexico(a) . . . . . . . . . . . . . . . . 82Louisiana . . . . . . . . . . . . . . . . . . 2 Oklahoma . . . . . . . . . . . . . . . . 1
(a) Locations operated by our 51%-owned joint venture in Mexico, Grupo OfficeMax.
10

Retail also operated three large distribution centers in Alabama, Nevada and Pennsylvania; and one smalldistribution center in Mexico through our joint venture.
ITEM 3. LEGAL PROCEEDINGS
Information concerning legal proceedings is set forth in Note 16, “Legal Proceedings and Contingencies,” ofthe Notes to Consolidated Financial Statements in “Item 8. Financial Statements and Supplementary Data” of thisForm 10-K, and is incorporated herein by reference.
ITEM 4. (REMOVED AND RESERVED)
11

EXECUTIVE OFFICERS OF THE REGISTRANT
Our executive officers are elected by the Board of Directors and hold office until a successor is chosen orqualified or until their earlier resignation or removal. The following lists our executive officers and gives a briefdescription of their business experience as of February 24, 2012:
Ravichandra K. Saligram, 55, was elected as Chief Executive Officer and President of the Company, aswell as a director of the Company, on November 8, 2010. Until his election as Chief Executive Officer andPresident of the Company, Mr. Saligram had been Executive Vice President, ARAMARK Corporation(“ARAMARK”), a global professional services company, since November 2006, President, ARAMARKInternational since June 2003, and ARAMARK’S Chief Globalization Officer since June 2009. Mr. Saligramheld the position of Senior Vice President, ARAMARK from November 2004 until November 2006. From 1994until 2002, Mr. Saligram served in various capacities for the InterContinental Hotels Group, a global hospitalitycompany, including as President of Brands & Franchise, North America; Chief Marketing Officer & ManagingDirector, Global Strategy; President, International; and President, Asia Pacific. Earlier in his career, Mr. Saligramheld various general and brand management positions with S. C. Johnson & Son, Inc. in the United States andoverseas. Since 2006, he has been a director of Church & Dwight Co., Inc., a consumer and specialty productscompany.
James Barr IV, 49, was first elected an officer of the Company on November 14, 2011. He has served asexecutive vice president and chief digital officer since that time. From March 2010 to November 2011, Mr. Barrserved as chief executive officer of Barr & Associates, a provider of ecommerce consulting services. Prior tothat, from January 2008 to March 2010, he served as president, online for Sears Holdings Corporation, adepartment store. In this position he held full P&L accountability for multi-channel strategy and online sites suchas sears.com and kmart.com. From 1996 to 2008, Mr. Barr held various positions at Microsoft Corporation, acomputer software company. He served as Microsoft Corporation’s general manager, e-commerce andmarketplaces from 2001 to 2008. In that position he had full business responsibility and led the globalbusiness-to-consumer e-commerce strategy.
Bruce H. Besanko, 53, was first elected an officer of the Company in February 2009. Mr. Besanko hasserved as executive vice president and chief financial officer of the Company since that time, and as chiefadministrative officer since October 2009. Mr. Besanko previously served as executive vice president and chieffinancial officer of Circuit City Stores, Inc. (“Circuit City”), a leading specialty retailer of consumer electronicsand related services, from July 2007 to February 2009. Prior to that, Mr. Besanko served as senior vice president,finance and chief financial officer for The Yankee Candle Company, Inc., a leading designer, manufacturer,wholesaler and retailer of premium scented candles, since April 2005. He also served as vice president, financefor Best Buy Co., Inc., a retailer of consumer electronics, home office products, entertainment software,appliances and related services, from 2002 to 2005. On November 10, 2008, Circuit City and several of itssubsidiaries filed voluntary petitions for relief under Chapter 11 of the United States Bankruptcy Code in theUnited States Bankruptcy Court for the Eastern District of Virginia. Circuit City’s Chapter 11 plan of liquidationwas confirmed by the Bankruptcy Court on September 14, 2010. Pursuant to the plan of liquidation, Circuit Cityand its subsidiaries are liquidating their remaining assets.
Matthew R. Broad, 52, was first elected an officer of the Company in October 2004 and has served asexecutive vice president, general counsel since that time. Prior to that time Mr. Broad served as associate generalcounsel for Boise Cascade Corporation.
Michael J. Lewis, 61, was first elected an officer of the Company on May 2, 2011. Mr. Lewis has served asexecutive vice president and president of retail since that time. From 2010 until early 2011, Mr. Lewis served asglobal head of a Merchandising Center for Wal-Mart Stores, Inc. (“Wal-Mart”), an international mass-merchandise retailer, and was responsible for brand management and supply chain and supported allmerchandising for Wal-Mart private brands in the grocery and personal care businesses. Prior to that, Mr. Lewis
12

was President of Wal-Mart’s Midwest division from 2005 to 2010, with responsibility for more than 850Wal-Mart stores and more than 250,000 associates. He also served as President of the Retail Division of NashFinch Company, a national, wholesale food distributor, from 2003 to 2005. Prior to that, Mr. Lewis was thePresident of Conquest Management Corporation, an investment and management consulting firm specializing ingrowth strategies for major retail and consumer goods companies, from 1995 to 2003.
Deborah A. O’Connor, 49, was first elected an officer of the Company in July 2008. Since that time,Ms. O’Connor has been senior vice president, finance and chief accounting officer of the Company.Ms. O’Connor previously served as senior vice president and controller of the ServiceMaster Company, acompany providing residential and commercial lawn care, landscape maintenance, termite and pest control, homewarranty, cleaning and disaster restoration, furniture repair, and home inspection services, from December 1999to December 2007.
Stephen B. Parsons, 47, was first elected an officer of the Company on July 25, 2011. He has served asexecutive vice president and chief human resources officer since that time. From February 2008 to July 2011,Mr. Parsons served as senior vice president, human resources and labor relations, of Rite Aid Corporation (“RiteAid”), a retail drug store chain. In that role, he was responsible for all aspects of human resources and changemanagement, serving 92,000 associates across more than 4,700 stores and 12 distribution centers. From June2007 to February 2008 he served as group vice president, human resources for Rite Aid. From June 2005 until itsacquisition by Rite Aid in June 2007, Mr. Parsons served as senior vice president, human resources, of BrooksEckerd Pharmacy, North America’s fourth largest retail drug store chain prior to its acquisition by Rite Aid.
Reuben E. Slone, 49, was first elected an officer of the Company in November 2004 and has served asexecutive vice president, supply chain since that time and as general manager, services since October 2011.Previously, Mr. Slone served as vice president, global supply chain for Whirlpool Corporation, a home appliancemanufacturer (“Whirlpool”), from 2003 to 2004, as vice president, North American region supply chain forWhirlpool from 2001 to 2003 and as vice president, eBusiness for Whirlpool from 2000 to 2001. Before joiningWhirlpool, Mr. Slone held various executive positions with General Motors Company, a major automaker.
13

PART II
ITEM 5. MARKET FOR REGISTRANT’S COMMON EQUITY, RELATEDSTOCKHOLDER MATTERS AND ISSUER PURCHASES OF EQUITYSECURITIES
Our common stock is listed on the New York Stock Exchange (the “Exchange”). The Exchange requireseach listed company to make an annual report available to its shareholders. We are making this Form 10-Kavailable to our shareholders in lieu of a separate annual report. The reported high and low sales prices for ourcommon stock, as well as the frequency and amount of dividends paid on such stock, are included in Note 17,“Quarterly Results of Operations (unaudited),” of the Notes to Consolidated Financial Statements in “Item 8.Financial Statements and Supplementary Data” of this Form 10-K. Due to the challenging economicenvironment, and to conserve cash, we suspended our cash dividends in the fourth quarter of 2008. See thediscussion of dividend payment limitations under the caption “Financing Arrangements” in “Item 7.Management’s Discussion and Analysis of Financial Condition and Results of Operations,” of this Form 10-K.The approximate number of holders of our common stock, based upon actual record holders on February 10,2012, was 11,875.
We maintain a corporate governance page on our website that includes key information about our corporategovernance initiatives. That information includes our Corporate Governance Guidelines, Code of Ethics andcharters for our Audit, Executive Compensation and Governance and Nominating Committees, as well as ourCommittee of Outside Directors. The corporate governance page can be found at investor.officemax.com byclicking on “Corporate Governance.” You also may obtain copies of these policies, charters and codes bycontacting our Investor Relations Department, 263 Shuman Boulevard, Naperville, Illinois 60563, or by calling(630) 864-6800.
Information concerning securities authorized for issuance under our equity compensation plans is includedin “Item 12. Security Ownership of Certain Beneficial Owners and Management and Related StockholderMatters” of this Form 10-K.
Stock Repurchases
Information concerning our stock repurchases during the three months ended December 31, 2011, ispresented in the following table.
Period
Total Numberof Shares
Purchased(a)Average PricePaid per Share
Total Numberof Shares
Purchased as Partof Publicly
Announced Plansor Programs
Maximum Numberof Shares That May YetBe Purchased Underthe Plans or Programs
September 25 – October 22 . . . . . . . . . . . 4,136 $4.89 — —October 23 – November 26 . . . . . . . . . . . 17,293 5.10 — —November 27 – December 31 . . . . . . . . . 966 4.46 — —
Total . . . . . . . . . . . . . . . . . . . . . . . . . . . . . 22,395 $5.03 — —
(a) All stock was withheld to satisfy minimum statutory tax withholding obligations upon vesting of restrictedstock awards.
14

Performance Graph
The following graph compares the five-year cumulative total return (assuming dividend reinvestment) forthe Standard & Poor’s SmallCap 600 Index, the Standard & Poor’s SmallCap 600 Specialty Retail Index andOfficeMax.
0
50
100
150
200
2006 2007 2008 2009 2010 2011
DO
LL
AR
S
OfficeMax Incorporated
S&P SmallCap 600 Index
S&P 600 Specialty Retail Index
ANNUAL RETURN PERCENTAGEYears Ending
Company\Index Name Dec 07 Dec 08 Dec 09 Dec 10 Dec 11
OfficeMax Incorporated . . . . . . . . . . . . . . . . . . . . . . . . . . . . . . . . . . . . –57.62 –62.75 82.26 32.60 -74.75S&P SmallCap 600 Index . . . . . . . . . . . . . . . . . . . . . . . . . . . . . . . . . . . –0.30 –34.26 33.53 25.76 0.02S&P 600 Specialty Retail Index . . . . . . . . . . . . . . . . . . . . . . . . . . . . . . –37.54 –36.51 77.65 40.68 2.72
INDEXED RETURNSYears Ending
Company\Index NameBase Period
Dec 06 Dec 07 Dec 08 Dec 09 Dec 10 Dec 11
OfficeMax Incorporated . . . . . . . . . . . . . . . . . . . . . . $100 $42.38 $15.78 $28.77 $ 38.15 $ 9.63S&P SmallCap 600 Index . . . . . . . . . . . . . . . . . . . . 100 99.70 65.54 87.52 110.07 110.09S&P 600 Specialty Retail Index . . . . . . . . . . . . . . . 100 62.46 39.65 70.44 99.10 101.80
15

ITEM 6. SELECTED FINANCIAL DATA
The following table sets forth our selected financial data for the years indicated and should be read inconjunction with the disclosures in “Item 7. Management’s Discussion and Analysis of Financial Condition andResults of Operations” and “Item 8. Financial Statements and Supplementary Data” of this Form 10-K.
2011(a) 2010(b) 2009(c) 2008(d) 2007(e)
(millions, except per-share amounts)
Assets:Current assets . . . . . . . . . . . . . . . . . . . . . . . . . . . . . . . . . . . . . . . . . $1,939 $2,014 $2,021 $ 1,855 $2,205Property and equipment, net . . . . . . . . . . . . . . . . . . . . . . . . . . . . . . 365 397 422 491 581Goodwill . . . . . . . . . . . . . . . . . . . . . . . . . . . . . . . . . . . . . . . . . . . . . — — — — 1,217Timber notes receivable . . . . . . . . . . . . . . . . . . . . . . . . . . . . . . . . . 899 899 899 899 1,635Other . . . . . . . . . . . . . . . . . . . . . . . . . . . . . . . . . . . . . . . . . . . . . . . . 866 769 728 929 646
Total assets . . . . . . . . . . . . . . . . . . . . . . . . . . . . . . . . . . . . . . . $4,069 $4,079 $4,070 $ 4,174 $6,284
Liabilities and shareholders’ equity:Current liabilities . . . . . . . . . . . . . . . . . . . . . . . . . . . . . . . . . . . . . . $1,013 $1,044 $1,092 $ 1,184 $1,371Long-term debt, less current portion . . . . . . . . . . . . . . . . . . . . . . . . 229 270 275 290 349Non-recourse debt . . . . . . . . . . . . . . . . . . . . . . . . . . . . . . . . . . . . . . 1,470 1,470 1,470 1,470 1,470Other . . . . . . . . . . . . . . . . . . . . . . . . . . . . . . . . . . . . . . . . . . . . . . . . 756 645 702 918 783Noncontrolling interest . . . . . . . . . . . . . . . . . . . . . . . . . . . . . . . . . . 32 49 28 22 32OfficeMax shareholders’ equity—preferred stock . . . . . . . . . . . . . 29 31 36 43 50OfficeMax shareholders’ equity—other . . . . . . . . . . . . . . . . . . . . . 540 570 467 247 2,229
Total liabilities and shareholders’ equity . . . . . . . . . . . . . . . . $4,069 $4,079 $4,070 $ 4,174 $6,284
Net sales . . . . . . . . . . . . . . . . . . . . . . . . . . . . . . . . . . . . . . . . . . . . . $7,121 $7,150 $7,212 $ 8,267 $9,082
Net income (loss) attributable to OfficeMax and noncontrollinginterest . . . . . . . . . . . . . . . . . . . . . . . . . . . . . . . . . . . . . . . . . . . . . $ 38 $ 74 $ (1) $(1,666) $ 212
Joint venture results attributable to noncontrolling interest . . . . . . (3) (3) 2 8 (5)
Net income (loss) attributable to OfficeMax . . . . . . . . . . . . . . . . . $ 35 $ 71 $ 1 $(1,658) $ 207Preferred dividends . . . . . . . . . . . . . . . . . . . . . . . . . . . . . . . . . . . . . (2) (2) (3) (4) (4)
Net income (loss) available to OfficeMax commonshareholders . . . . . . . . . . . . . . . . . . . . . . . . . . . . . . . . . . . . . . . . $ 33 $ 69 $ (2) $(1,662) $ 203
Basic net income (loss) per common share . . . . . . . . . . . . . . . . . . $ 0.38 $ 0.81 $ (0.03) $(21.90) $ 2.70Diluted net income (loss) per common share . . . . . . . . . . . . . . . . . $ 0.38 $ 0.79 $ (0.03) $(21.90) $ 2.66Cash dividends declared per common share . . . . . . . . . . . . . . . . . . $ — $ — $ — $ 0.45 $ 0.60
See notes on following page.
16
Notes to Selected Financial Data
The company’s fiscal year-end is the last Saturday in December. For our U.S. businesses, there were 53weeks in 2011 and 52 weeks for all other years presented.
(a) 2011 included the following pre-tax items:
• $11.2 million charge for impairment of fixed assets associated with certain of our Retail stores in the U.S.
• $5.6 million charge for costs related to Retail store closures in the U.S.
• $14.9 million charge for severance and other costs incurred in connection with various companyreorganizations.
(b) 2010 included the following pre-tax items:
• $11.0 million charge for impairment of fixed assets associated with certain of our Retail stores in the U.S.
• $13.1 million charge for costs related to Retail store closures in the U.S., partially offset by a $0.6million severance reserve adjustment.
• $9.4 million favorable adjustment of a reserve associated with our legacy building materialsmanufacturing facility near Elma, Washington due to the sale of the facility’s equipment and thetermination of the lease.
(c) 2009 included the following items:
• $17.6 million pre-tax charge for impairment of fixed assets associated with certain of our Retailstores in the U.S. and Mexico. Our minority partner’s share of this charge of $1.2 million isincluded in joint venture results attributable to noncontrolling interest.
• $31.2 million pre-tax charge for costs related to Retail store closures in the U.S. and Mexico. Ourminority partner’s share of this charge of $0.5 million is included in joint venture resultsattributable to noncontrolling interest.
• $18.1 million pre-tax charge for severance and other costs incurred in connection with variouscompany reorganizations.
• $2.6 million pre-tax gain related to the Company’s Boise Investment.
• $4.4 million pre-tax gain related to interest earned on a tax escrow balance established in a priorperiod in connection with our legacy Voyageur Panel business.
• $14.9 million of income tax benefit from the release of a tax uncertainty reserve upon resolution ofan issue under Internal Revenue Service (“IRS”) appeal regarding the deductibility of interest oncertain of our industrial revenue bonds.
(d) 2008 included the following pre-tax items:
• $1,364.4 million charge for impairment of goodwill, trade names and fixed assets. Our minoritypartner’s share of this charge of $6.5 million is included in joint venture results attributable tononcontrolling interest.
• $735.8 million charge for non-cash impairment of the timber installment note receivable due fromLehman Brothers Holdings, Inc. and $20.4 million of related interest expense.
• $27.9million charge for severance and costs associatedwith the termination of certain store and site leases.
• $20.5 million gain related to the Company’s Boise Investment, primarily attributable to the sale ofa majority interest in its paper and packaging and newsprint businesses.
(e) 2007 included the following items:
• $32.4 million pre-tax income related to a paper agreement with affiliates of Boise Cascade Holdings,L.L.C. we entered into in connection with the Sale. This agreement was terminated in early 2008.
• $1.1 million after-tax loss related to the sale of OfficeMax’s Contract operations in Mexico toGrupo OfficeMax, our 51%-owned joint venture.
17

ITEM 7. MANAGEMENT’S DISCUSSION AND ANALYSIS OF FINANCIALCONDITION AND RESULTS OF OPERATIONS
The following discussion contains statements about our future financial performance. These statements areonly predictions. Our actual results may differ materially from these predictions. In evaluating these statements,you should review “Item 1A. Risk Factors” of this Form 10-K, including “Cautionary and Forward-LookingStatements.”
Overall Summary
Sales for 2011 were $7,121.2 million, compared to $7,150.0 million for 2010, a decrease of 0.4%. Sales for2011 benefitted from favorable foreign currency rate changes ($91 million) and from an extra week in fiscal year2011 ($86 million) compared to fiscal year 2010. Fiscal year 2011 included 53 weeks for our U.S. businesses,while fiscal year 2010 included 52 weeks. After adjusting for the favorable foreign currency impact and thefavorable impact of the extra week (“53rd week”), sales declined by 2.9% compared to 2010. Sales and grossprofit margins declined in both our Contract and Retail segments. Consolidated gross profit margin decreased by0.5% of sales (50 basis points) to 25.4% of sales in 2011 compared to 25.9% of sales in 2010, as lower customermargins and increased delivery and freight expense were partially offset by lower occupancy expenses. Operatingexpenses for 2011 increased compared to the prior year due to the impact of the extra week, the impact of foreignexchange rates and the impact of favorable settlements in 2010, but were benefitted by lower incentivecompensation expense. We reported operating income of $86.5 million in 2011 compared to $146.5 million in2010. The 53rd week added $8 million of operating income and $.06 of diluted earnings per share in 2011.
As noted in the discussion and analysis that follows, our operating results were impacted by a number ofsignificant items in both years. These items included charges for asset impairments, store closures and severance,partially offset by income related to legacy items. If we eliminate these items, our adjusted operating income for2011 was $118.2 million compared to an adjusted operating income of $160.6 million for 2010. The reported netincome available to OfficeMax common shareholders was $32.8 million, or $0.38 per diluted share, in 2011compared to a reported net loss available to OfficeMax common shareholders $68.6 million, or $0.79 per dilutedshare, in 2010. If we eliminate the impact of significant items from both years, adjusted net income available toOfficeMax common shareholders for 2011 was $53.3 million, or $0.61 per diluted share, compared to$77.3 million, or $0.89 per diluted share, for 2010.
Results of Operations, Consolidated($ in millions)
2011 2010 2009
Sales . . . . . . . . . . . . . . . . . . . . . . . . . . . . . . . . . . . . . . . . . . . . . . . . . . . . . . . . . . . $7,121.2 $7,150.0 $7,212.1Gross profit . . . . . . . . . . . . . . . . . . . . . . . . . . . . . . . . . . . . . . . . . . . . . . . . . . . . . . 1,809.2 1,849.7 1,737.6Operating, selling and general and administrative expenses . . . . . . . . . . . . . . . . 1,691.0 1,689.1 1,674.7Asset impairments . . . . . . . . . . . . . . . . . . . . . . . . . . . . . . . . . . . . . . . . . . . . . . . . . 11.2 11.0 17.6Other operating expenses, net . . . . . . . . . . . . . . . . . . . . . . . . . . . . . . . . . . . . . . . . 20.5 3.1 49.3
Total operating expenses . . . . . . . . . . . . . . . . . . . . . . . . . . . . . . . . . . . . . . . . . . . . 1,722.7 1,703.2 1,741.6Operating income (loss) . . . . . . . . . . . . . . . . . . . . . . . . . . . . . . . . . . . . . . . . . . . . $ 86.5 $ 146.5 $ (4.0)Net income (loss) available to OfficeMax common shareholders . . . . . . . . . . . . $ 32.8 $ 68.6 $ (2.2)Gross profit margin . . . . . . . . . . . . . . . . . . . . . . . . . . . . . . . . . . . . . . . . . . . . . . . . 25.4% 25.9% 24.1%Operating, selling and general and administrative expenses
Percentage of sales . . . . . . . . . . . . . . . . . . . . . . . . . . . . . . . . . . . . . . . . . . . . 23.7% 23.7% 23.2%
18

In addition to assessing our operating performance as reported under U.S. generally accepted accountingprinciples (“GAAP”), we evaluate our results of operations before non-operating legacy items and certainoperating items that are not indicative of our core operating activities such as severance, facility closures andadjustments, and asset impairments. We believe our presentation of financial measures before, or excluding,these items, which are non-GAAP measures, enhances our investors’ overall understanding of our recurringoperational performance and provides useful information to both investors and management to evaluate theongoing operations and prospects of OfficeMax by providing better comparisons. Whenever we use non-GAAPfinancial measures, we designate these measures as “adjusted” and provide a reconciliation of the non-GAAPfinancial measures to the most closely applicable GAAP financial measure. Investors are encouraged to reviewthe related GAAP financial measures and the reconciliation of these non-GAAP financial measures to their mostdirectly comparable GAAP financial measure. In the following tables, we reconcile our non-GAAP financialmeasures to our reported GAAP financial results.
Although we believe the non-GAAP financial measures enhance an investor’s understanding of ourperformance, our management does not itself, nor does it suggest that investors should, consider such non-GAAPfinancial measures in isolation from, or as a substitute for, financial information prepared in accordance withGAAP. The non-GAAP financial measures we use may not be consistent with the presentation of similarcompanies in our industry. However, we present such non-GAAP financial measures in reporting our financialresults to provide investors with an additional tool to evaluate our operating results in a manner that focuses onwhat we believe to be our ongoing business operations.
NON-GAAP RECONCILIATION FOR 2011(a)
Operatingincome
Net incomeavailable toOfficeMaxcommon
shareholders
Dilutedincomeper
commonshare
(millions, except per-share amounts)
As reported . . . . . . . . . . . . . . . . . . . . . . . . . . . . . . . . . . . . . . . . $ 86.5 $32.8 $ 0.38Store asset impairment charge . . . . . . . . . . . . . . . . . . . . . . . . . 11.2 6.8 0.08Store closure and severance charges . . . . . . . . . . . . . . . . . . . . . 20.5 13.6 0.16
As adjusted . . . . . . . . . . . . . . . . . . . . . . . . . . . . . . . . . . . . . . . . $118.2 $53.3 $ 0.61
NON-GAAP RECONCILIATION FOR 2010(a)
Operatingincome(loss)
Net income (loss)available toOfficeMaxcommon
shareholders
Dilutedincome(loss)per
commonshare
(millions, except per-share amounts)
As reported . . . . . . . . . . . . . . . . . . . . . . . . . . . . . . . . . . . . . . . . $146.5 $68.6 $ 0.79Store asset impairment charge . . . . . . . . . . . . . . . . . . . . . . . . . 11.0 6.7 0.08Store closure charges and severance adjustments . . . . . . . . . . . 12.5 7.8 0.09Reserve adjustments related to legacy facility . . . . . . . . . . . . . (9.4) (5.8) (0.07)
As adjusted . . . . . . . . . . . . . . . . . . . . . . . . . . . . . . . . . . . . . . . . $160.6 $77.3 $ 0.89
19

NON-GAAP RECONCILIATION FOR 2009(a)
Operatingincome(loss)
Net income(loss)
available toOfficeMaxcommon
shareholders
Dilutedincome(loss)per
commonshare
(millions, except per-share amounts)
As reported . . . . . . . . . . . . . . . . . . . . . . . . . . . . . . . . . . . . . . . . . . . . . . . $ (4.0) $ (2.2) $(0.03)Store asset impairment charge . . . . . . . . . . . . . . . . . . . . . . . . . . . . . . . . 17.6 10.0 0.12Store closure and severance charges . . . . . . . . . . . . . . . . . . . . . . . . . . . 49.3 30.0 0.39Interest income from a legacy tax escrow . . . . . . . . . . . . . . . . . . . . . . . — (2.7) (0.04)Boise Cascade Holdings, L.L.C. distribution . . . . . . . . . . . . . . . . . . . . — (1.6) (0.02)Release of income tax uncertainty reserve . . . . . . . . . . . . . . . . . . . . . . — (14.9) (0.18)
As adjusted . . . . . . . . . . . . . . . . . . . . . . . . . . . . . . . . . . . . . . . . . . . . . . . $62.9 $ 18.6 $ 0.24
(a) Totals may not foot due to rounding.
These items are described in more detail in this Management’s Discussion and Analysis.
At the end of the 2011 fiscal year, we had $427.1 million in cash and cash equivalents and $633.2 million inavailable (unused) borrowing capacity under our revolving credit facilities. At year-end, we had outstandingrecourse debt of $268.2 million (both current and long-term) and non-recourse obligations of $1,470.0 millionrelated to the timber securitization notes. There is no recourse against OfficeMax on the securitized timber notespayable as recourse is limited to proceeds from the applicable pledged installment notes receivable andunderlying guarantees. There were no borrowings on our revolving credit facilities in 2011.
The funded status of our pension plans declined in 2011. Our pension obligations exceeded the assets heldin trust to fund them by $329.6 million at year-end 2011, a decrease in funded status of $149.4 million, comparedto the $180.2 million under funding that existed at year-end 2010. This reduction in funded status was due to adecrease in the discount rate applied to the liability and weaker than anticipated returns on investments.
For full year 2011, operations provided $50.1 million of cash, while capital expenditures (including systemsand infrastructure investments) and debt payments used $69.6 million and $6.1 million, respectively.
Outlook
Based on the current environment and our 2011 trends, we expect that total sales for the full year will be flatto slightly higher than 2011, including the favorable impact of foreign currency translation in 2012 and excludingthe benefit of the 53rd week in 2011. Additionally, we expect that the adjusted operating income margin rate forthe full year will be in line with the prior year.
We anticipate cash flow from operations in 2012 to be in line with or slightly higher than capitalexpenditures. We expect capital expenditures to be approximately $75 million to $100 million, primarily relatedto technology, ecommerce and infrastructure investments and upgrades as well as growth and profitabilityinitiatives. We anticipate a net reduction in our retail store count for the year with up to thirty-five store closuresand one to two store openings in U.S., as well as eight to nine store openings and one to two store closures inMexico.
20

Operating Results
2011 Compared with 2010
Sales for 2011 decreased 0.4% to $7,121.2 million, compared to $7,150.0 million for 2010, and included thefavorable impact of currency exchange rates relating to our international subsidiaries and the favorable impact ofan extra week in fiscal year 2011 in our domestic subsidiaries. On a local currency basis, sales declined 1.7%.After adjusting for the favorable impact of foreign currency rates ($91 million) and the favorable impact of theextra week in U.S. operations ($86 million), sales declined by 2.9%. These declines are the result of thecompetitive environment for our products, lower sales in our existing Contract business, and weak store traffic inour Retail segment. The sales declines also included an unfavorable impact from inclement weather in the U.S.during the first quarter of 2011.
Gross profit margin decreased by 0.5% of sales (50 basis points) to 25.4% of sales in 2011 compared to25.9% of sales in 2010, due to lower customer margins from more promotional activities, customer incentivesand continued economic pressures on our consumers’ spending as well as increased delivery and freight expensefrom higher fuel costs and higher import duties associated with purchases in prior periods. These declines werepartially offset by lower occupancy expenses. The extra week in U.S. operations resulted in a $28 millionfavorable impact to gross profit in 2011 compared to 2010.
Operating, selling and general and administrative expenses of 23.7% of sales in 2011 were flat as a percent ofsales as compared to the prior year. These expenses as a percent of sales were flat in the Contract segment, andincreased slightly in the Retail segment. For 2011, operating, selling and general and administrative expensesincreased $1.9 million compared to the prior year due to the unfavorable impact of foreign exchange rates($21 million), the unfavorable impact of the extra week in U.S. operations ($20 million) and the unfavorable impactof tax and legal settlements in 2010 ($14 million) that did not recur in 2011. These items were partially offset bylower incentive compensation expense ($45 million), as the Company did not meet its earnings targets under theincentive compensation plans for 2011. Favorable settlements in 2010 included $9 million of favorable sales/use taxsettlements and adjustments through the year as well as a $5 million gain related to the resolution of a legal dispute.
As noted above, our results for 2011 include several significant items, as follows:
• We recognized a non-cash impairment charge of $11.2 million associated with leasehold improvementsand other assets at certain of our Retail stores in the U.S. After tax, this charge reduced net incomeavailable to OfficeMax common shareholders by $6.8 million, or $0.08 per diluted share.
• We recorded $14.9 million of severance charges ($13.9 million in Contract, $0.3 million in Retail and$0.7 million in Corporate) related primarily to reorganizations in Canada, Australia, New Zealand, andthe U.S. sales and supply chain organizations. In addition, we recorded $5.6 million of charges in ourRetail segment related to store closures in the U.S. After tax, the cumulative effect of these itemsreduced net income by $13.6 million or $0.16 per diluted share.
Interest income was $44.0 million and $42.6 million for 2011 and 2010, respectively. The increase was dueprimarily to increases in cash balances and interest rates in our international businesses. Interest expense was$73.1 million and $73.3 million in 2011 and 2010, respectively.
For 2011, we recognized income tax expense of $19.5 million on pre-tax income of $57.6 million (aneffective tax expense rate of 33.9%) compared to income tax expense of $41.9 million on pre-tax income of$115.7 million (an effective tax expense rate of 36.2%) for 2010. The effective tax rate in both years wasimpacted by the effects of state income taxes, income items not subject to tax, non-deductible expenses and themix of domestic and foreign sources of income. In 2011, the Company recorded an increase ($10.8 million) tothe valuation allowances relating to several state net operating losses. This negative impact was offset by otherone time favorable rate changes and other items related to nondeductible permanent items.
21

We reported net income attributable to OfficeMax and noncontrolling interest of $38.1 million for 2011.After adjusting for joint venture earnings attributable to noncontrolling interest and preferred dividends, wereported net income available to OfficeMax common shareholders of $32.8 million, or $0.38 per diluted share.Adjusted net income available to OfficeMax common shareholders, as discussed above, was $53.3 million, or$0.61 per diluted share, for 2011 compared to $77.3 million, or $0.89 per diluted share, for 2010.
2010 Compared with 2009
Sales for 2010 decreased 0.9% to $7,150.0 million from $7,212.1 million for 2009, which included theimpact of favorable currency exchange rates relating to our international subsidiaries. On a local currency basis,sales declined 2.9%. Both our Contract and Retail segments experienced year-over-year sales declines in achallenging economic environment with increased competitive intensity including higher levels of promotionalactivity.
Gross profit margin increased by 1.8% of sales (180 basis points) to 25.9% of sales in 2010 compared to 24.1%of sales in 2009. The gross profit margins increased in both our Contract and Retail segments due to our profitabilityinitiatives and reduced inventory shrinkage expense. We benefited from $15 million of inventory shrinkage reserveadjustments due to the positive results from our physical inventory counts. Retail segment gross profit margins alsobenefitted from a sales mix shift to higher-margin products and lower occupancy and freight costs.
Operating, selling and general and administrative expenses increased 0.5% of sales to 23.7% of sales in2010 from 23.2% of sales in 2009. The increase was in our Contract segment, as the Retail segment operating,selling and general and administrative expenses as a percent of sales remained flat. The increase was the result ofhigher expenses related to our growth and profitability initiatives which were partially offset by favorable trendsin workers compensation and medical benefit expenses, lower payroll-related expenses and favorable sales anduse tax and legal settlements in Retail. On a consolidated basis, we recognized $9 million of favorable sales/usetax settlements and adjustments through the year as well as a $5 million gain related to the resolution of a legaldispute. These items compare to approximately $10 million of income realized in the prior year related tofavorable property tax settlements and the resolution of a dispute with a service provider.
As noted above, our results for 2010 include several significant items, as follows:
• We recognized a non-cash impairment charge of $11.0 million associated with leasehold improvementsand other assets at certain of our Retail stores in the U.S. After tax, this charge reduced net incomeavailable to OfficeMax common shareholders by $6.7 million, or $0.08 per diluted share.
• We recorded $13.1 million of charges in our Retail segment related to store closures in the U.S offsetby income of $0.6 million in our Retail segment to adjust previously established severance reserves.After tax, the cumulative effect of these items was a reduction of net income available to OfficeMaxcommon shareholders of $7.8 million, or $0.09 per diluted share.
• We recorded income of $9.4 million related to the adjustment of a reserve associated with our legacybuilding materials manufacturing facility near Elma, Washington due to the sale of the facility’sequipment and the termination of the lease. This item increased net income available to OfficeMaxcommon shareholders by $5.8 million, or $0.07 per diluted share.
In addition, our results for 2009 include several significant items, as follows:
• We recognized a non-cash impairment charge of $17.6 million associated with leasehold improvementsand other assets at certain of our Retail stores in the U.S. and Mexico. After tax and noncontrollinginterest, these charges reduced net income (loss) available to OfficeMax common shareholders by$10.0 million or $0.12 per diluted share.
• We recorded $31.2 million of charges in our Retail segment related to store closures. We also recorded$18.1 million of severance and other charges, principally related to reorganizations of our U.S. and
22

Canadian Contract sales forces, customer fulfillment centers and customer service centers, as well as astreamlining of our Retail store staffing. These charges are recorded by segment in the followingmanner: Contract $15.3 million, Retail $2.1 million and Corporate and Other $0.7 million. After taxand noncontrolling interest, the cumulative effect of these items was a reduction of net income (loss)available to OfficeMax common shareholders by $30.0 million, or $0.39 per diluted share.
• “Other income (expense), net” in the Consolidated Statement of Operations included income of$2.6 million from a distribution on the Boise Investment related to our tax liability on allocatedearnings. This distribution was much larger in the prior year due to a significant tax gain realized byBoise Cascade, L.L.C. on the sales of its paper and packaging and newsprint businesses. After tax, thisitem increased net income (loss) available to OfficeMax common shareholders $1.6 million, or $0.02per diluted share.
• We recorded $4.4 million of interest income related to a tax escrow balance established in a priorperiod in connection with our legacy Voyager Panel business which we sold in 2004. After tax, thisitem increased net income (loss) available to OfficeMax common shareholders by $2.7 million, or$0.04 per diluted share.
• In the fourth quarter, the U.S. Internal Revenue Service conceded an issue under appeals regarding thedeductibility of interest on certain of our industrial revenue bonds. Upon the resolution of this matter,we released $14.9 million in tax uncertainty reserves which increased net income (loss) available toOfficeMax common shareholders by $0.18 per diluted share.
Interest income was $42.6 million and $47.3 million for 2010 and 2009, respectively. The decrease was dueprimarily to $4.4 million of interest income recorded in 2009 related to a tax escrow balance established in aprior period in connection with the sale of our legacy Voyageur Panel business. Interest expense decreased to$73.3 million in 2010 from $76.4 million in 2009. The decrease in interest expense was due primarily to reduceddebt resulting from payments made in 2009 and 2010.
For 2010, we recognized income tax expense of $41.9 million on pre-tax income of $115.7 million(effective tax expense rate of 36.2%) compared to income tax benefit of $28.8 million on a pre-tax loss of$30.3 million (effective tax benefit rate of 94.8%) for 2009. The effective tax rate in both years was impacted bythe effects of state income taxes, income items not subject to tax, non-deductible expenses and the mix ofdomestic and foreign sources of income as well as low levels of profitability in 2009. The effective tax rate in2009 also included $14.9 million from the release of a tax reserve upon the resolution of our claim that intereston certain of our industrial revenue bonds was fully tax deductible.
We reported net income attributable to OfficeMax and noncontrolling interest of $73.9 million for 2010.After adjusting for joint venture earnings attributable to noncontrolling interest and preferred dividends, wereported net income available to OfficeMax common shareholders of $68.6 million, or $0.79 per diluted share.Adjusted net income available to OfficeMax common shareholders, as discussed above, was $77.3 million, or$0.89 per diluted share, for 2010 compared to $18.6 million, or $0.24 per diluted share, for 2009.
Segment Discussion
We report our results using three reportable segments: Contract; Retail; and Corporate and Other.
Our Contract segment distributes a broad line of items for the office, including office supplies and paper,technology products and solutions, office furniture and print and document services. Contract sells directly tolarge corporate and government offices, as well as to small and medium-sized offices in the United States,Canada, Australia and New Zealand. This segment markets and sells through field salespeople, outboundtelesales, catalogs, the Internet and in some markets, including Canada, Australia and New Zealand, throughoffice products stores.
23

Our Retail segment is a retail distributor of office supplies and paper, print and document services,technology products and solutions and office furniture. In addition, this segment contracts with large nationalretail chains to supply office and school supplies to be sold in their stores. Our retail office supply stores featureOfficeMax ImPress, an in-store module devoted to print-for-pay and related services. Retail has operations in theUnited States, Puerto Rico and the U.S. Virgin Islands. Retail also operates office products stores in Mexicothrough a 51%-owned joint venture.
Our Corporate and Other segment includes support staff services and certain other legacy expenses as wellas the related assets and liabilities. The income and expense related to certain assets and liabilities that arereported in the Corporate and Other segment have been allocated to the Contract and Retail segments.
Management evaluates the segments’ performances using segment income (loss) which is based onoperating income (loss) after eliminating the effect of certain operating items that are not indicative of our coreoperations such as severances, facility closures and adjustments, and asset impairments. These certain operatingitems are reported on the asset impairments and the other operating expenses lines in the ConsolidatedStatements of Operations.
Contract($ in millions)
2011 2010 2009
Sales . . . . . . . . . . . . . . . . . . . . . . . . . . . . . . . . . . . . . . . . . . . . . . . . . . . . . . . . $3,624.1 $3,634.2 $3,656.7Gross profit . . . . . . . . . . . . . . . . . . . . . . . . . . . . . . . . . . . . . . . . . . . . . . . . . . . 809.5 827.0 762.4
Gross profit margin . . . . . . . . . . . . . . . . . . . . . . . . . . . . . . . . . . . . . . . . . 22.3% 22.8% 20.8%Operating, selling and general and administrative expenses . . . . . . . . . . . . . 731.8 732.7 704.4
Percentage of sales . . . . . . . . . . . . . . . . . . . . . . . . . . . . . . . . . . . . . . . . . 20.2% 20.2% 19.2%
Segment income . . . . . . . . . . . . . . . . . . . . . . . . . . . . . . . . . . . . . . . . . . . . . . . $ 77.7 $ 94.3 $ 58.0Percentage of sales . . . . . . . . . . . . . . . . . . . . . . . . . . . . . . . . . . . . . . . . . 2.1% 2.6% 1.6%
Sales by Product LineOffice supplies and paper . . . . . . . . . . . . . . . . . . . . . . . . . . . . . . . . . . . . $2,076.0 $2,086.6 $2,138.5Technology products . . . . . . . . . . . . . . . . . . . . . . . . . . . . . . . . . . . . . . . . 1,142.2 1,185.5 1,174.0Office furniture . . . . . . . . . . . . . . . . . . . . . . . . . . . . . . . . . . . . . . . . . . . . 405.9 362.1 344.2
Sales by GeographyUnited States . . . . . . . . . . . . . . . . . . . . . . . . . . . . . . . . . . . . . . . . . . . . . . $2,449.3 $2,482.5 $2,583.1International . . . . . . . . . . . . . . . . . . . . . . . . . . . . . . . . . . . . . . . . . . . . . . 1,174.8 1,151.7 1,073.6
Sales Growth . . . . . . . . . . . . . . . . . . . . . . . . . . . . . . . . . . . . . . . . . . . . . . . . . . (0.3)% (0.6)% (15.2)%
2011 Compared with 2010
Contract segment sales for 2011 decreased 0.3% (2.6% in local currencies) to $3,624.1 million from$3,634.2 million for 2010, and included the favorable impact of currency exchange rates relating to ourinternational subsidiaries and the favorable impact of an extra week in fiscal year 2011 in our domesticsubsidiaries. After adjusting for the favorable impact of foreign currency rates ($84 million) and the favorableimpact of the extra week ($35 million), sales declined by 3.5%. U.S. Contract sales for 2011 declined 1.3%compared to 2010 (2.7% after adjusting for the impact of the extra week) due to a continued, highly competitiveenvironment in the U.S. A decline in sales to existing customers, including a significant decrease in sales to theU.S. federal government, was partially offset by increased favorable impact of sales to newly acquired customersoutpacing the reduction in sales due to lost customers. Fourth quarter of 2011 results trended favorably as thedecline in sales to existing customers for the fourth quarter was lower than that for the third quarter and sales tonewly acquired customers outpaced the reduction in sales due to lost customers. U.S. Contract sales trendedpositive by 0.2 % for the fourteen week period ended December 31, 2011 compared to the same fourteen weekperiod in 2010. International sales for 2011 increased 2.0%, but declined 5.3% on a local currency basis. The
24

declines are the result of decreased sales to existing customers and several large customers that were not retainedin both Canada and Australia.
Contract segment gross profit margin decreased 0.5% of sales (50 basis points) to 22.3% of sales for 2011compared to 22.8% of sales for the previous year. The decrease in gross profit margins occurred both in the U.S.and internationally. U.S. gross profit margins decreased due to lower customer margins and increased freight anddelivery expenses from higher fuel costs, which were partially offset by lower occupancy expenses. Thecontinued highly competitive U.S. market has resulted in downward pressure on customer margins. The extraweek in U.S. operations resulted in a $7 million favorable impact to gross profit in 2011 compared to 2010.International margin declines resulted from lower customer margins due to increased competitive marketconditions in Canada, and higher freight expense from higher fuel costs, which were partially offset by lowerinventory shrink expense and lower occupancy expense.
Contract segment operating, selling and general and administrative expenses of 20.2% of sales for 2011were flat to the prior year as lower incentive compensation expense was offset by the deleveraging of expensesfrom the lower sales and the unfavorable impact of sales/use tax settlements in 2010. Contract segment operating,selling and general and administrative expenses of $731.8 million in 2011 decreased $0.9 million from the prioryear as the unfavorable impact of foreign currency rates ($20 million) and the unfavorable impact of the extraweek ($7 million) were offset by lower incentive compensation expense ($20 million) and lower payroll andadvertising expenses.
Contract segment income was $77.7 million, or 2.1% of sales, for 2011, compared to $94.3 million, or 2.6%of sales, for 2010. The decrease in segment income was primarily attributable to the decline in sales and thelower gross profit margin. The impact of the 53rd week was negligible on operating income.
2010 Compared with 2009
Contract segment sales for 2010 decreased 0.6% to $3,634.2 million from $3,656.7 million for 2009,reflecting a 4.3% decline on a local currency basis which was partially offset by a favorable impact from changesin foreign currency exchange rates. The U.S. sales decline of 3.9% reflected a challenging U.S. economicrecovery, which continues to impact our customers’ buying trends, as well as an intensely competitiveenvironment. Sales to existing customers declined 6.2% in 2010, an improvement from the 14.7% decline in2009. For the year, increased sales to newly acquired customers outpaced reduced sales due to lost customers.International sales declined 5.2% on a local currency basis in 2010, primarily as a result of decreased sales toexisting customers and continued international economic weakness.
Contract segment gross profit margin increased 2.0% of sales (200 basis points) to 22.8% of sales for 2010compared to 20.8% of sales for the previous year. The increases in gross profit margins occurred both in the U.S.and internationally. U.S. gross profit margins increased due to strong disciplines instituted to monitor bothcustomer profitability and product costs as well as reduced delivery costs. 2010 also benefited from the reversalof inventory shrinkage reserves due to favorable results from our annual physical inventory counts of $3.5million. International margin improvements resulted from improved product margins resulting from a strongback-to-school season in Australia, favorable foreign exchange rate impact on Canadian paper purchases andprofitability initiatives related to our own private label products.
Contract segment operating, selling and general and administrative expenses increased 1.0% of sales to20.2% for 2010 from 19.2% of sales a year earlier. The increase was primarily due to costs associated withgrowth and profitability initiatives associated with our managed-print-services, customer service centers andbusiness-to-business website, partially offset by favorable trends in workers compensation and medical benefitexpenses as well as lower payroll costs from the reorganization of our U.S. sales force and U.S. customer serviceoperations.
Contract segment income was $94.3 million, or 2.6% of sales, for 2010, compared to $58.0 million, or 1.6%of sales, for 2009. The increase in segment income was primarily attributable to the increased gross profit margin
25

partially offset by higher operating, selling and general and administrative expenses due primarily to increasedspending on our growth and profitability initiatives.
Retail($ in millions)
2011 2010 2009
Sales . . . . . . . . . . . . . . . . . . . . . . . . . . . . . . . . . . . . . . . . . . . . . . . . . . . . . . . . . . . $3,497.1 $3,515.8 $3,555.4Gross profit . . . . . . . . . . . . . . . . . . . . . . . . . . . . . . . . . . . . . . . . . . . . . . . . . . . . . . 999.7 1,022.7 975.2
Gross profit margin . . . . . . . . . . . . . . . . . . . . . . . . . . . . . . . . . . . . . . . . . . . . 28.6% 29.1% 27.4%Operating, selling and general and administrative expenses . . . . . . . . . . . . . . . . 924.4 918.8 930.3
Percentage of sales . . . . . . . . . . . . . . . . . . . . . . . . . . . . . . . . . . . . . . . . . . . . 26.4% 26.1% 26.1%
Segment income . . . . . . . . . . . . . . . . . . . . . . . . . . . . . . . . . . . . . . . . . . . . . . . . . . $ 75.3 $ 103.9 $ 44.9Percentage of sales . . . . . . . . . . . . . . . . . . . . . . . . . . . . . . . . . . . . . . . . . . . . 2.2% 3.0% 1.3%
Sales by Product LineOffice supplies and paper . . . . . . . . . . . . . . . . . . . . . . . . . . . . . . . . . . . . . . . $1,489.8 $1,468.7 $1,446.9Technology products . . . . . . . . . . . . . . . . . . . . . . . . . . . . . . . . . . . . . . . . . . . 1,793.3 1,834.6 1,872.6Office furniture . . . . . . . . . . . . . . . . . . . . . . . . . . . . . . . . . . . . . . . . . . . . . . . 214.0 212.5 235.9
Sales by GeographyUnited States . . . . . . . . . . . . . . . . . . . . . . . . . . . . . . . . . . . . . . . . . . . . . . . . . $3,222.4 $3,287.5 $3,369.6International . . . . . . . . . . . . . . . . . . . . . . . . . . . . . . . . . . . . . . . . . . . . . . . . . 274.7 228.3 185.8
Sales GrowthTotal sales growth . . . . . . . . . . . . . . . . . . . . . . . . . . . . . . . . . . . . . . . . . . . . . (0.5)% (1.1)% (10.2)%Same-location sales growth . . . . . . . . . . . . . . . . . . . . . . . . . . . . . . . . . . . . . . (1.5)% (0.8)% (11.0)%
2011 Compared with 2010
Retail segment sales for 2011 decreased by 0.5% (0.7% in local currencies) to $3,497.1 million from$3,515.8 million for 2010, and included the favorable impact of currency exchange rates relating to our Mexicosubsidiary and the favorable impact of an extra week in fiscal year 2011 in our domestic subsidiaries. Afteradjusting for the favorable impact of foreign currency rates ($8 million) and the favorable impact of the extraweek ($52 million), sales declined by 2.2%. The sales declines reflect challenging economic conditions and anincreased promotional environment as well as significant decline in certain technology categories. Same-storesales declined by 1.5% in 2011, which included a U.S. same-store sales decline of 2.8%, partially offset by a14.2% same-store sales increase in Mexico, on a local currency basis. The U.S. same-store sales decline reflectedweaker back-to-school sales and continued weakness in store traffic, which was partially offset by slightly higheraverage ticket and a favorable holiday season. We ended 2011 with 978 stores. In the U.S., we closed twenty-tworetail stores during 2011 and opened none, ending the year with 896 retail stores, while Grupo OfficeMax, ourmajority-owned joint venture in Mexico, opened five stores during 2011 and closed two, ending the year with 82retail stores.
Retail segment gross profit margin decreased 0.5% of sales (50 basis points) to 28.6% of sales for 2011compared to 29.1% of sales for 2010. The gross profit margin declines were the result of lower customer marginsin Mexico, higher freight and delivery expense from increased fuel costs and higher inventory markdowns, whichwere partially offset by lower occupancy expenses. We had slightly higher customer margins in the U.S.reflecting the product-mix shift to supplies sales. Higher promotional activity resulted in increased sales butplaced continued pressure on margins. The extra week in U.S. operations resulted in a $21 million favorableimpact to gross profit in 2011 compared to 2010.
Retail segment operating, selling and general and administrative expenses increased 0.3% of sales to 26.4%of sales for 2011 from 26.1% of sales for 2010 as lower incentive compensation expense was more than offset bythe deleveraging impact of the lower sales and the unfavorable impact of sales/use tax and legal settlements in
26

2010. Retail segment operating, selling and general and administrative expenses of $924.4 million in 2011increased $5.6 million from the prior year as the unfavorable impact of the extra week ($13 million), theunfavorable impact of sales/use tax and legal settlements in 2010 ($12 million) and the unfavorable impact offoreign currency rates ($1 million) were partially offset by lower incentive compensation expense ($23 million).In addition, lower advertising expenses and lower store fixture and equipment-related costs were more than offsetby higher overhead associated with our profitability initiatives.
Retail segment income was $75.3 million, or 2.2% of sales, for 2011, compared to $103.9 million, or 3.0%of sales, for 2010. The decrease in segment income was primarily attributable to the sales decline, the lowergross profit margins and the increased operating expenses as noted above which was partially offset by continuedimprovement in our Mexican joint venture’s earnings. There was $8 million of segment income resulting fromthe 53rd week.
2010 Compared with 2009
Retail segment sales for 2010 decreased by 1.1% (1.5% on a local currency basis) to $3,515.8 million from$3,555.4 million for 2009 reflecting challenging economic conditions and increased promotional activity. U.S.same-store sales declined 2.2% for 2010 primarily due to continued weaker consumer and small businessspending and reduced technology sales. Mexico same-store sales for 2010 increased 15.7% on a local currencybasis year-over-year due to unusually lower sales in 2009 resulting from the weakened economy and the H1N1flu epidemic as well as new sales initiatives in 2010. U.S. store traffic was lower compared to the prior year assales declined across all major product categories, but average ticket amounts were up due to a mix shift withinthe technology products category to higher-priced items. We ended 2010 with 997 stores. In the U.S., we closedfifteen retail stores during 2010 and opened none, ending the year with 918 retail stores, while Grupo OfficeMax,our majority-owned joint venture in Mexico, opened two stores and closed none, ending the year with 79 retailstores.
Retail segment gross profit margin increased 1.7% of sales (170 basis points) to 29.1% of sales for 2010compared to 27.4% of sales for the previous year. The gross profit margin increase was due to our product andpricing initiatives and a sales mix shift to the higher-margin supplies category (which was slightly offset by anunfavorable mix shift within the technology category) as well as reduced inventory shrinkage expense, loweroccupancy costs due to rent reductions, resulting from lease renewals and renegotiations, and closed stores andlower freight expense. The reduced inventory shrinkage expense included the reversal of inventory shrinkagereserves due to favorable results from our annual physical inventory counts of $11.5 million.
Retail segment operating, selling and general and administrative expenses of 26.1% of sales for 2010 wereflat compared to 2009. Fiscal 2010 benefited from favorable trends in workers compensation and medical benefitexpenses, sales/use tax and legal settlements as well as reduced payroll expenses due to closed stores and storestaffing reductions. These benefits were offset by increased expenses resulting from our print-for-pay and newchannel growth initiatives and the impact of property tax and other settlements in 2009.
Retail segment income was $103.9 million, or 3.0% of sales, for 2010, compared to $44.9 million, or 1.3%of sales, for 2009. The increase in segment income was primarily attributable to the improved gross profitmargins as noted above and significant improvement in our Mexican joint venture’s earnings, which waspartially offset by the increased costs from our long-term growth initiatives.
Corporate and Other
Corporate and Other expenses were $35.5 million, $28.2 million and $40.7 million for 2011, 2010 and 2009,respectively. These expenses were lower in 2010 as there was $9.4 million of income associated with our legacybuilding materials manufacturing facility near Elma, Washington. In addition, the benefit of lower incentivecompensation expense ($3 million) was offset by increased pension expense in 2011 compared to 2010, whilepension expense was lower in 2010 than 2009.
27

Liquidity and Capital Resources
At the end of fiscal year 2011, the total liquidity available for OfficeMax was $1,060.3 million. Thisincludes cash and cash equivalents of $427.1 million, including $126.2 million in foreign cash balances, andborrowing availability of $633.2 million. The borrowing availability included $580.3 million from our creditagreement associated with the Company and certain of our subsidiaries in the U.S., Puerto Rico and Canada and$52.9 million from our credit agreement associated with our subsidiaries in Australia and New Zealand. At theend of fiscal year 2011, the Company was in compliance with all covenants under the two credit agreements. Thecredit agreement associated with the Company and certain of our subsidiaries in the U.S., Puerto Rico andCanada expires on October 7, 2016 and the credit agreement associated with our subsidiaries in Australia andNew Zealand expires on March 15, 2013. At the end of fiscal year 2011, we had $268.2 million of short-term andlong-term recourse debt and $1,470.0 million of non-recourse timber securitization notes outstanding.
Under certain circumstances there are restrictions on our ability to repatriate certain amounts of foreign cashbalances. If the Company chose to repatriate certain unrestricted foreign cash balances, it could result in arepatriation provision of approximately $2.5 million in excess of the amount already accrued and $4.0 million incash taxes due.
Our primary ongoing cash requirements relate to working capital, expenditures for property and equipment,technology enhancements and upgrades, lease obligations, pension funding and debt service. We expect to fundthese requirements through a combination of available cash balance and cash flow from operations. We also haverevolving credit facilities as additional liquidity. The following sections of this Management’s Discussion andAnalysis of Financial Condition and Results of Operations discuss in more detail our operating, investing, andfinancing activities, as well as our financing arrangements.
Operating Activities
Our operating activities provided cash of $53.7 million in 2011 compared to $88.1 million in 2010. Cashfrom operations for 2011 was lower than the prior year primarily reflecting a lower level of earnings and $13.5million of net tax payments in 2011 (international and state payments) versus net tax refunds of $5.0 million in2010. Changes in accounts payable and accrued liabilities includes an unfavorable impact from paying the 2010incentive compensation accrual in 2011 and recording a significantly reduced accrual for 2011 incentivecompensation expense. This change was offset by reduced legal and advertising payments in 2011.
Total company inventory decreased slightly year over year, primarily due to a decrease in internationalinventory. In addition to the changes discussed above, accounts payable and accrued liabilities also reflected areduction in accounts payable from the timing and mix of purchases. Accounts receivable at the end of 2011 washigher in our domestic businesses, primarily attributable to higher vendor receivables from increased vendor-supported promotional activity, and increased customer receivables from a shift in the timing of sales.
Our operating activities generated cash of $88.1 million in 2010. Cash from operations in 2010 was net of$44.4 million of payments of loans on company-owned life insurance policies (“COLI policies”) as well as $72.4million of increased working capital primarily from larger holdings of our international inventories and thetiming of repayments and obligations.
Cash from operations in 2011 and 2010 included the impact of approximately $55 million and $58 million,respectively, of incentive compensation payments made associated with the achievement of incentive planperformance targets for 2010 and 2009, respectively. The Company accrued a minimal amount of incentivecompensation in 2011, as performance targets were generally not achieved. Therefore, 2012 incentivecompensation payments will be minimal.
28

We sponsor noncontributory defined benefit pension plans covering certain terminated employees, vestedemployees, retirees, and some active employees, primarily in Contract. Pension expense was $10.9 million,$7.3 million and $14.1 million for the years ended December 31, 2011, December 25, 2010 and December 26,2009, respectively. In 2011, 2010 and 2009, we made cash contributions to our pension plans totaling$3.3 million, $3.4 million and $6.8 million, respectively. In 2009, we also contributed 8.3 million shares ofOfficeMax common stock to our qualified pension plans. The estimated minimum required funding contributionin 2012 is $28.5 million and the expense is projected to be $3.3 million compared to expense of $10.9 million in2011. In addition, we may elect to make additional voluntary contributions. See “Critical Accounting Estimates”in this Management’s Discussion and Analysis of Financial Condition and Results of Operations for moreinformation.
Investing Activities
In 2011, capital spending of $69.6 million consisted of system improvements relating to our growthinitiatives, overall software enhancements and infrastructure improvements, as well as spending on new stores inMexico. In 2010, capital spending of $93.5 million consisted of technology enhancements including an upgradeto our financial systems platform and improvements in the telephony software and hardware used by our callcenters. We also invested in leasehold improvements. This spending was partially offset by proceeds from thesale of assets associated with closed facilities. Details of the capital investment by segment are included in thefollowing table:
Capital Investment
2011 2010 2009
(millions)
Contract . . . . . . . . . . . . . . . . . . . . . . . . . . . . . . . . . . . . . . . . . . . . . . . . . . . . . . . . . . . . . . . . $26.0 $61.2 $18.0Retail . . . . . . . . . . . . . . . . . . . . . . . . . . . . . . . . . . . . . . . . . . . . . . . . . . . . . . . . . . . . . . . . . . 35.8 32.3 20.3Corporate and Other . . . . . . . . . . . . . . . . . . . . . . . . . . . . . . . . . . . . . . . . . . . . . . . . . . . . . . . 7.8 — —
Total . . . . . . . . . . . . . . . . . . . . . . . . . . . . . . . . . . . . . . . . . . . . . . . . . . . . . . . . . . . . . . . . . . . $69.6 $93.5 $38.3
We expect our capital investments in 2012 to be approximately $100 million. Our capital spending in 2012will be primarily for maintenance and investment in our systems, infrastructure and growth and profitabilityinitiatives.
Financing Activities
Our financing activities used cash of $18.0 million in 2011, $28.5 million in 2010 and $60.6 million in2009. Preferred dividend payments totaled $3.3 million in 2011, $2.7 million in 2010 and $3.1 million in 2009.No dividends were paid on our common stock in 2011, 2010 or 2009, as our quarterly cash dividend on ourcommon stock was suspended in December 2008 due to the challenging economic environment and to conservecash. We had net debt payments of $6.1 million, $22.5 million and $57.7 million in 2011, 2010 and 2009,respectively.
Financing Arrangements
We lease our store space and certain other property and equipment under operating leases. These operatingleases are not included in debt; however, they represent a significant commitment. Our obligations underoperating leases are shown in the “Contractual Obligations” section of this Management’s Discussion andAnalysis of Financial Condition and Results of Operations.
Our debt structure consists of credit agreements, note agreements, and other borrowings as described below.For more information, see the “Contractual Obligations” and “Disclosures of Financial Market Risks” sections ofthis Management’s Discussion and Analysis of Financial Condition and Results of Operations.
29

Credit Agreements
On October 7, 2011, we entered into a Second Amended and Restated Loan and Security Agreement (the“North American Credit Agreement”) with a group of banks. The North American Credit Agreement amendedboth our existing credit agreement that we are party to along with certain of our subsidiaries in the U.S. (the“U.S. Credit Agreement”) and our existing credit agreement to which our subsidiary in Canada is a party (the“Canadian Credit Agreement”) and consolidated them into a single credit agreement. The North American CreditAgreement permits us to borrow up to a maximum of $650 million, (U.S. dollars) of which $50 million isallocated to our Canadian subsidiary, and $600 million is allocated to the Company and its other participatingU.S. subsidiaries, subject to a borrowing base calculation that limits availability to a percentage of eligible tradeand credit card receivables plus a percentage of the value of eligible inventory less certain reserves. The NorthAmerican Credit Agreement may be increased (up to a maximum of $850 million) at our request and theapproval of the lenders participating in the increase, or may be reduced from time to time at our request, in eachcase according to the terms detailed in the North American Credit Agreement. Letters of credit, which may beissued under the North American Credit Agreement up to a maximum of $250 million, reduce availableborrowing capacity. Stand-by letters of credit issued under the North American Credit Agreement totaled$51.9 million at the end of fiscal year 2011. At the end of fiscal year 2011, the maximum aggregate borrowingamount available under the North American Credit Agreement was $632.2 million and availability under theNorth American Credit Agreement totaled $580.3 million. At the end of fiscal year 2011, we were in compliancewith all covenants under the North American Credit Agreement. The North American Credit Agreement expireson October 7, 2016 and allows the payment of dividends, subject to availability restrictions and if no default hasoccurred.
Borrowings under the U.S. Credit Agreement were subject to interest at rates based on either the prime rateor the London Interbank Offered Rate (“LIBOR”). Margins were applied to the applicable borrowing rates andletter of credit fees under the U.S. Credit Agreement depending on the level of average availability. Fees onletters of credit issued under the U.S. Credit Agreement were charged at a weighted average rate of 0.875%. TheCompany was also charged an unused line fee of 0.25% under the U.S. Credit Agreement on the amount bywhich the maximum available credit exceeded the average daily outstanding borrowings and letters of credit.
Borrowings under the North American Credit Agreement are subject to interest at rates based on either theprime rate, the federal funds rate, LIBOR or the Canadian Dealer Offered Rate. An additional percentage, whichvaries depending on the level of average borrowing availability, is added to the applicable rates. Fees on letters ofcredit issued under the North American Credit Agreement are charged at rates between 1.25% and 2.25%depending on the type of letter of credit (i.e., stand-by or commercial) and the level of average borrowingavailability. The Company is also charged an unused line fee of between 0.375% and 0.5% on the amount bywhich the maximum available credit exceeds the average daily outstanding borrowings and letters of credit. Thefees on letters of credit were 1.75% and the unused line fee was 0.5% at December 31, 2011.
On March 15, 2010, the Company’s five wholly-owned subsidiaries based in Australia and New Zealandentered into a Facility Agreement (the “Australia/New Zealand Credit Agreement”) with a financial institutionbased in those countries. The Australia/New Zealand Credit Agreement permits the subsidiaries in Australia andNew Zealand to borrow up to a maximum of A$80 million subject to a borrowing base calculation that limitsavailability to a percentage of eligible accounts receivable plus a percentage of the value of certain ownedproperties, less certain reserves. There were no borrowings outstanding under the facility at the end of fiscal year2011, and there were no borrowings outstanding under this facility during 2011 or 2010. The maximumaggregate borrowing amount available under the Australia/New Zealand Credit Agreement was $52.9 million(A$52.1 million) at the end of fiscal year 2011. At the end of fiscal year 2011, the subsidiaries in Australia andNew Zealand were in compliance with all covenants under the Australia/New Zealand Credit Agreement. TheAustralia/New Zealand Credit Agreement expires on March 15, 2013.
In October 2004, we sold our timberland assets in exchange for $15 million in cash plus credit-enhancedtimber installment notes in the amount of $1,635 million (the “Installment Notes”). The Installment Notes were
30

issued by single-member limited liability companies formed by affiliates of Boise Cascade, L.L.C (the “NoteIssuers”). In order to support the Installment Notes, the Note Issuers transferred $1,635 million in cash toLehman and Wachovia Corporation (“Wachovia”) ($817.5 million to each of Lehman and Wachovia) who issuedcollateral notes to the Note Issuers and guaranteed the Installment Notes. In December 2004, we completed asecuritization transaction in which the Company’s interests in the Installment Notes and related guarantees weretransferred to wholly-owned bankruptcy remote subsidiaries. The subsidiaries pledged the Installment Notes andrelated guarantees and issued securitized notes (the “Securitization Notes”) in the amount of $1,470 million.Recourse on the Securitization Notes is limited to the proceeds from the applicable pledged Installment Notesand underlying Lehman or Wachovia guaranty. As a result, there is no recourse against OfficeMax, and theSecuritization Notes have been reported as non-recourse debt in our Consolidated Balance Sheets.
On September 15, 2008, Lehman filed for bankruptcy. Lehman’s bankruptcy filing constituted an event ofdefault under the $817.5 million Installment Note guaranteed by Lehman (the “Lehman Guaranteed InstallmentNote”). We are required for accounting purposes to assess the carrying value of assets whenever circumstancesindicate that a decline in value may have occurred. After evaluating the situation, we concluded in late October2008 that as a result of the Lehman bankruptcy, it was probable that we would be unable to collect all amountsdue according to the contractual terms of the Lehman Guaranteed Installment Note. Accordingly, we evaluatedthe carrying value of the Lehman Guaranteed Installment Note and reduced it to the estimated amount we thenexpected to collect ($81.8 million) by recording a non-cash impairment charge of $735.8 million, pre-tax.
Measuring impairment of a loan requires judgment and estimates, and the eventual outcome may differ fromour estimate by a material amount. The Lehman Guaranteed Installment Note has been pledged as collateral forthe related Securitization Notes, and therefore it may not freely be transferred to any party other than theIndenture Trustee. Accordingly, the ultimate amount to be realized on the Lehman Guaranteed Installment Notedepends on the proceeds from the Lehman bankruptcy estate. Lehman’s disclosure statement on its Chapter 11Plan (the “Disclosure Statement”) was confirmed by the United States Bankruptcy Court for the Southern Districtof New York on December 6, 2011. The Disclosure Statement provides a range of estimated recoveries forvarious classes of unsecured creditors of Lehman. Pursuant to a stipulation entered into on October 7, 2011 andapproved by the bankruptcy court on December 14, 2011, the claim of the Securitization Note holders throughthe Note Issuers will be treated as a class 3 senior unsecured claim (estimated to recover at a rate ofapproximately 21.1% under the Chapter 11 Plan) rather than falling into any other class of guarantee claims(estimated to recover at a rate of approximately 11%-13% depending on the class under the Chapter 11 Plan).Due to this categorization, provisions of the stipulation that make certain funds unavailable to the claim thatwould otherwise be available to class 3 senior unsecured claimants, the status of the bankruptcy proceedings, andbased on information in the Disclosure Statement, it appears that Securitization Note holders may recover at apotential rate within the range of 17% to 20%. However, uncertainties exist as to the actual recovery that willultimately be received on the claim. The disposition of a related claim of the Securitization Note holders throughus on the guaranty may result in an additional recovery and the funds available for claimants will depend onLehman’s ongoing claims resolution process, the establishment of reserves for unresolved claims, and the valueof the assets Lehman is able to liquidate. Due to these uncertainties and other factors, we have not increased ourassumed recovery rate or the carrying value of the Lehman Guaranteed Installment Note. We expect that aninitial distribution may be made on the Securitization Note holders’ claim as early as March 30, 2012. Furtherdistributions are expected to occur over a several-year period. Going forward, we intend to adjust the carryingvalue of the Lehman Guaranteed Installment Note as further information regarding our share of the proceeds, ifany, from the Lehman bankruptcy estate becomes available.
Recourse on the Securitization Notes is limited to the proceeds from the applicable pledged InstallmentNotes and underlying Lehman or Wachovia guaranty, and any proceeds we receive from the bankruptcy will bedistributed to the Securitization Note holders. However, under current generally accepted accounting principles,we are required to continue to recognize the liability related to the Securitization Notes guaranteed by Lehmanuntil such time as the liability has been extinguished. The liability will be extinguished when the LehmanGuaranteed Installment Note and the related guaranty are transferred to and accepted by the Securitization Note
31

holders. We expect that this will occur when the remaining guaranty claim of the Securitization Note holders inthe bankruptcy is resolved and as the Lehman assets are in the process of distribution. Accordingly, we expect torecognize a non-cash gain equal to the difference between the carrying amount of the Securitization Notesguaranteed by Lehman ($735.0 million at December 31, 2011) and the carrying value of the Lehman GuaranteedInstallment Note ($81.8 million at December 31, 2011) in a later period when the liability is legally extinguished.The actual gain to be recognized in the future will be measured based on the carrying amounts of the LehmanGuaranteed Installment Note and the Securitization Notes guaranteed by Lehman at the date of settlement.
Any discussion of the Lehman bankruptcy in this document is strictly based on factual observations fromthe bankruptcy cases and should not be interpreted as constituting legal analysis of or admission as to theultimate allowances of our claim based on the Lehman Guaranteed Installment Note or any Note Issuers’ claimbased on Collateral Notes, or the interplay thereof.
At the time of the sale of our timberland assets in 2004, we generated a significant tax gain. As the timberinstallment notes structure allowed the Company to defer the resulting tax liability until 2020 ($529 million atDecember 31, 2011), the maturity date for the Installment Notes, we recognized a deferred tax liability related tothis gain in connection with the sale. The recognition of the Lehman portion of the tax gain will be triggeredwhen the Lehman Guaranteed Installment Note and the related guaranty are transferred to and accepted by theSecuritization Note holders . In estimating the cash taxes, we will consider our available alternative minimum taxcredits, to reduce the net tax payments.
Through December 31, 2011, we have received all payments due under the Installment Notes guaranteed byWachovia (the “Wachovia Guaranteed Installment Notes”), which have consisted only of interest due on thenotes, and have made all payments due on the related Securitization Notes guaranteed by Wachovia, againconsisting only of interest due. As all amounts due on the Wachovia Guaranteed Installment Notes are current,and we have no reason to believe that we will not collect all amounts due according to the contractual terms ofthe Wachovia Guaranteed Installment Notes, the notes are stated in our Consolidated Balance Sheet at theiroriginal principal amount of $817.5 million. Wachovia was acquired by Wells Fargo & Company in a stocktransaction in 2008. An additional adverse impact on our financial results presentation could occur if Wells Fargobecame unable to perform its obligations under the Wachovia Guaranteed Installment Notes, thereby resulting ina significant impairment impact.
The pledged Installment Notes and Securitization Notes are scheduled to mature in 2020 and 2019,respectively. The Securitization Notes have an initial term that is approximately three months shorter than theInstallment Notes. We expect that if the Securitization Notes are still outstanding in 2019, we will refinance themwith a short-term borrowing to bridge the period from initial maturity of the Securitization Notes to the maturityof the Installment Notes.
Other
We made capital contributions to Grupo OfficeMax, commensurate with our ownership percentage in thejoint venture of $6.0 million in 2009. We made no capital contributions to Grupo OfficeMax during 2011 or2010.
32

Contractual ObligationsIn the following table, we set forth our contractual obligations as of December 31, 2011. Some of the figures
included in this table are based on management’s estimates and assumptions about these obligations, includingtheir duration, the possibility of renewal, anticipated actions by third parties and other factors. Because theseestimates and assumptions are necessarily subjective, the amounts we will actually pay in future periods mayvary from those reflected in the table.
Payments Due by Period
2012 2013-2014 2015-2016 Thereafter Total
(millions)
Recourse debt . . . . . . . . . . . . . . . . . . . . . . . . . . . . . . . . . . . . $ 38.9 $ 5.6 $ 20.2 $ 204.0 $ 268.7Interest payments on recourse debt . . . . . . . . . . . . . . . . . . . 16.3 29.0 27.9 111.9 185.1Non-recourse debt . . . . . . . . . . . . . . . . . . . . . . . . . . . . . . . . — — — 1,470.0 1,470.0Interest payments on non-recourse debt . . . . . . . . . . . . . . . 39.8 79.7 79.7 119.5 318.7Operating leases . . . . . . . . . . . . . . . . . . . . . . . . . . . . . . . . . . 343.0 530.6 314.8 232.6 1,421.0Purchase obligations . . . . . . . . . . . . . . . . . . . . . . . . . . . . . . 35.7 9.1 2.1 — 46.9Pension obligations (estimated payments) . . . . . . . . . . . . . . 28.5 120.6 102.8 56.6 308.5
Total . . . . . . . . . . . . . . . . . . . . . . . . . . . . . . . . . . . . . . . $502.2 $774.6 $547.5 $2,194.6 $4,018.9
Debt includes amounts owed on our note agreements, revenue bonds and credit agreements assuming thedebt is held to maturity. The amounts above include both current and non-current liabilities. Not included in thetable above are contingent payments for uncertain tax positions of $21.2 million. These amounts are not includeddue to our inability to predict the timing of settlement of these amounts. The “Expected Payments” table underthe caption “Financial Instruments” in this Management’s Discussion and Analysis of Financial Condition andResults of Operations presents principal cash flows and related weighted average interest rates by expectedmaturity dates. For more information, see Note 10, “Debt,” of the Notes to Consolidated Financial Statements in“Item 8. Financial Statements and Supplementary Data” in this form 10-K.
There is no recourse against OfficeMax on the Securitization Notes as recourse is limited to proceeds fromthe applicable pledged Installment Notes receivable and underlying guarantees. The non-recourse debt remainsoutstanding until it is legally extinguished, which will be when the Installment Notes and related guaranties aretransferred to and accepted by the securitized note holders. For the Lehman Guaranteed Installment Note, weexpect that this will occur when the remaining guaranty claim of the Securitization Note holders in thebankruptcy is resolved and as the Lehman assets are in the process of distribution. Interest payments on non-recourse debt will be completely offset by interest income received on the Installment Notes.
We enter into operating leases in the normal course of business. We lease our retail store space as well ascertain other property and equipment under operating leases. Some of our retail store leases require percentagerentals on sales above specified minimums and contain escalation clauses. The minimum lease payments shownin the table above do not include contingent rental expense. Some lease agreements provide us with the option torenew the lease or purchase the leased property. Our future operating lease obligations would change if weexercised these renewal options and if we entered into additional operating lease agreements. As a result ofpurchase accounting from the 2004 acquisition of the U.S. retail business, we recorded an asset relating to storeleases with terms below market value and a liability for store leases with terms above market value. The assetwill be amortized through 2027 while the liability will be amortized through 2012. Since the acquisition date, thenet amortization of these items has reduced rent expense by approximately $7 million per year. Beginning in2013, the amortization of the asset will result in additional rent expense of approximately $4 million per year. Formore information, see Note 8, “Leases,” of the Notes to Consolidated Financial Statements in “Item 8. FinancialStatements and Supplementary Data” in this Form 10-K. Lease obligations for closed facilities are included inoperating leases and a liability equal to the fair value of these obligations is included in the Company’sConsolidated Balance Sheets. For more information, see Note 2, “Facility Closure Reserves,” of the Notes toConsolidated Financial Statements in “Item 8. Financial Statements and Supplementary Data” in this Form 10-K.
33

Our Consolidated Balance Sheet as of December 31, 2011 includes $393.3 million of long-term liabilitiesassociated with our retirement and benefit and other compensation plans and $362.4 million of other long-termliabilities. Certain of these amounts have been excluded from the above table as either the amounts are fully orpartially funded, or the timing and/or the amount of any cash payment is uncertain. Actuarially-determinedliabilities related to pension and postretirement benefits are recorded based on estimates and assumptions. Keyfactors used in developing estimates of these liabilities include assumptions related to discount rates, rates ofreturn on investments, future compensation costs, healthcare cost trends, benefit payment patterns and otherfactors. Changes in assumptions related to the measurement of funded status could have a material impact on theamount reported. Pension obligations in the table above represent the estimated, minimum contributions requiredper IRS funding rules.
In accordance with an amended and restated joint venture agreement, the minority owner of GrupoOfficeMax, our joint-venture in Mexico, can elect to require OfficeMax to purchase the minority owner’s 49%interest in the joint venture if certain earnings targets are achieved. Earnings targets are calculated quarterly on arolling four-quarter basis. Accordingly, the targets may be achieved in one quarter but not in the next. If theearnings targets are achieved and the minority owner elects to require OfficeMax to purchase the minorityowner’s interest, the purchase price is based on the joint venture’s earnings and the current market multiples ofsimilar companies. At the end of 2011, Grupo OfficeMax met the earnings targets and the estimated purchaseprice of the minority owner’s interest was $27.6 million. The decrease in the estimated purchase price from theprior year is attributable to lower market multiples for similar companies as of the measurement date. As theestimated purchase price was less than the carrying value of the noncontrolling interest as of the end of the year,the Company reduced the noncontrolling interest to the carrying value, with the offset recorded to additionalpaid-in capital. There is no impairment relating to the assets of the joint venture as the estimated future cashflows support the overall carrying value of its assets.
In addition to the contractual obligations quantified in the table above, we have other obligations for goodsand services entered into in the normal course of business. These contracts, however, are either not enforceableor legally binding or are subject to change based on our business decisions.
Off-Balance-Sheet Activities and Guarantees
Note 15, “Commitments and Guarantees,” of the Notes to Consolidated Financial Statements in “Item 8.Financial Statements and Supplementary Data” in this Form 10-K describes certain of our off-balance sheetarrangements as well as the nature of our guarantees, including the approximate terms of the guarantees, how theguarantees arose, the events or circumstances that would require us to perform under the guarantees and themaximum potential undiscounted amounts of future payments we could be required to make.
Seasonal Influences
Our business is seasonal, with Retail showing a more pronounced seasonal trend than Contract. Sales in thesecond quarter are historically the slowest of the year. Sales are stronger during the first, third and fourth quarterswhich include the important new-year office supply restocking month of January, the back-to-school period andthe holiday selling season, respectively.
Disclosures of Financial Market Risks
Financial Instruments
Our debt is predominantly fixed-rate. At December 31, 2011, the estimated current fair value of our debt,based on quoted market prices when available or then-current interest rates for similar obligations with likematurities, including the timber notes, was approximately $557 million less than the amount of debt reported inthe Consolidated Balance Sheets. As previously discussed, there is no recourse against OfficeMax on the
34

securitized timber notes payable as recourse is limited to proceeds from the applicable pledged Installment Notesreceivable and underlying guarantees. The debt and receivables related to the timber notes have fixed interestrates and are reflected in the tables below, along with the carry amounts and estimated fair values.
The estimated fair values of our other financial instruments, including cash and cash equivalents andreceivables are the same as their carrying values. Concentration of credit risks with respect to trade receivables islimited due to the wide variety of vendors, customers and channels to and through which our products aresourced and sold, as well as their dispersion across many geographic areas. In the fourth quarter of 2011, webecame aware of financial difficulties at one of our large Contract customers. We granted the customer extendedpayment terms and in exchange are requesting a security interest in their assets and are implementing creditoroversight provisions. The receivable from this customer was $27 million at December 31, 2011, and substantiallyall of that balance has been collected to date. Based on our ongoing sales to this customer, we continue to carrysimilar receivable balances, which we monitor closely.
Changes in foreign currency exchange rates expose us to financial market risk. We occasionally usederivative financial instruments, such as forward exchange contracts, to manage our exposure associated withcommercial transactions and certain liabilities that are denominated in a currency other than the currency of theoperating unit entering into the underlying transaction. We generally do not enter into derivative instruments forany other purpose. We do not speculate using derivative instruments.
During 2011, we entered into forward contracts in order to hedge our foreign currency exchange rateexposure related to purchases of paper by our Canadian subsidiary in accordance with a paper supply contractwith Boise White Paper, L.L.C. (“Boise Paper”). Under the paper supply contract, our subsidiary is obligated topurchase virtually of all its requirements for office paper from Boise Paper or its successor until December 2012,at prices approximating market levels. In accordance with the paper supply contract, the purchase price inCanadian dollars is indexed to the U.S. dollar up until the first business day of the month in which the purchase ismade. These forward contracts qualify as foreign currency cash flow hedges. The Company has determined thehedges to be effective but does not anticipate entering any new transactions. The fair value associated with thesehedges is not material to our financial statements.
We were not a party to any material derivative financial instruments in 2011 or 2010.
35

The following tables provide information about our financial instruments outstanding at December 31, 2011that are sensitive to changes in interest rates. For debt obligations, the table presents principal cash flows andrelated weighted average interest rates by expected maturity dates. For obligations with variable interest rates, thetable sets forth payout amounts based on rates as of December 31, 2011 and does not attempt to project futurerates. The following table does not include our obligations for pension plans and other post retirement benefits,although market risk also arises within our defined benefit pension plans to the extent that the obligations of thepension plans are not fully matched by assets with determinable cash flows. We sponsor noncontributory definedbenefit pension plans covering certain terminated employees, vested employees, retirees, and some activeOfficeMax employees. As our plans were frozen in 2003, our active employees and all inactive participants whoare covered by the plans are no longer accruing additional benefits. However, the pension plan obligations arestill subject to change due to fluctuations in long-term interest rates as well as factors impacting actuarialvaluations, such as retirement rates and pension plan participants’ increased life expectancies. In addition tochanges in pension plan obligations, the amount of plan assets available to pay benefits, contribution levels andexpense are also impacted by the return on the pension plan assets. The pension plan assets include OfficeMaxcommon stock, U.S. equities, international equities, global equities and fixed-income securities, the cash flows ofwhich change as equity prices and interest rates vary. The risk is that market movements in equity prices andinterest rates could result in assets that are insufficient over time to cover the level of projected obligations. Thisin turn could result in significant changes in pension expense and funded status, further impacting future requiredcontributions. Management, together with the trustees who act on behalf of the pension plan beneficiaries, assessthe level of this risk using reports prepared by independent external actuaries and take action, where appropriate,in terms of setting investment strategy and agreed contribution levels.
Expected Payments
(millions)2012 2013 2014 2015 2016 Thereafter Total
Recourse debt:Fixed-rate debt payments . . . . . . . . . . . . . . . . . $35.4 $0.4 $0.2 $0.1 $20.1 $204.0 $260.2
Weighted average interest rates . . . . . . . . 7.9% 7.2% 5.4% 3.8% 7.3% 6.3% 6.6%Variable-rate debt payments . . . . . . . . . . . . . . . $ 3.5 $3.5 $1.5 $ — $ — $ — $ 8.5
Weighted average interest rates . . . . . . . . 7.3% 7.3% 7.9% 7.4%Non-recourse debt:Securitization Notes
Wachovia(a) . . . . . . . . . . . . . . . . . . . . . . . $ — $ — $ — $ — $ — $735.0 $735.0Average interest rates . . . . . . . . . . . . 5.4% 5.4%
Lehman(a) . . . . . . . . . . . . . . . . . . . . . . . . . $ — $ — $ — $ — $ — $735.0 $735.0Average interest rates . . . . . . . . . . . . 5.5% 5.5%
(a) There is no recourse against OfficeMax on the Securitization Notes as recourse is limited to proceeds fromthe applicable pledged Installment Notes receivable and underlying guarantees. The debt remainsoutstanding until it is legally extinguished, which will be when the Installment Note and guaranty aretransferred to and accepted by the securitized note holders.
2011 2010
Carryingamount
Fairvalue
Carryingamount
Fairvalue
(millions)Financial assets:
Timber notes receivableWachovia . . . . . . . . . . . . . . . . . . . . . . . . . . . . . . . . . . . . . . . . . . . $817.5 $943.7 $817.5 $888.3Lehman . . . . . . . . . . . . . . . . . . . . . . . . . . . . . . . . . . . . . . . . . . . . . 81.8 81.8 81.8 81.8
Financial liabilities:Recourse debt . . . . . . . . . . . . . . . . . . . . . . . . . . . . . . . . . . . . . . . . . . . . $268.2 $240.8 $275.0 $255.5Non-recourse debt
Wachovia . . . . . . . . . . . . . . . . . . . . . . . . . . . . . . . . . . . . . . . . . . . $735.0 $858.8 $735.0 $811.1Lehman . . . . . . . . . . . . . . . . . . . . . . . . . . . . . . . . . . . . . . . . . . . . . 735.0 81.8 735.0 81.8
36

Asset Impairments
We are required for accounting purposes to assess the carrying value of other intangible assets annually orwhenever circumstances indicate that a decline in value may have occurred. No impairment was recorded relatedto other intangible assets in 2011, 2010 or 2009.
For other long lived assets, we are also required to assess the carrying value when circumstances indicatethat a decline in value may have occurred. Based on the operating performance of certain of our Retail stores dueto the macroeconomic factors and market specific change in expected demographics, we determined that therewere indicators of potential impairment relating to our Retail stores in 2011, 2010 and 2009. Therefore, weperformed the required impairment tests and recorded non-cash charges of $11.2, $11.0 and $17.6 million,respectively, to impair long-lived assets pertaining to certain Retail stores.
Facility Closure Reserves
We conduct regular reviews of our real estate portfolio to identify underperforming facilities, and closethose facilities that are no longer strategically or economically beneficial. We record a liability for the costassociated with a facility closure at its estimated fair value in the period in which the liability is incurred,primarily the location’s cease-use date. Upon closure, unrecoverable costs are included in facility closurereserves and include provisions for the present value of future lease obligations, less contractual or estimatedsublease income. Accretion expense is recognized over the life of the payments.
During 2011 we recorded charges of $5.6 million in our Retail segment related to the closing of sixunderperforming domestic stores prior to the end of their lease term, of which $5.4 million was related to thelease liability and $0.2 million was related to asset impairments. In 2010, we recorded charges of $13.1 million inour Retail segment related to facility closures, of which $11.7 million was related to the lease liability and othercosts associated with closing eight domestic stores prior to the end of their lease terms, and $1.4 million wasrelated to other items. In 2009, we recorded charges of $31.2 million related to the closing of 21 underperformingstores prior to the end of their lease terms, of which 16 were in the U.S. and five were in Mexico.
At December 31, 2011, the facility closure reserve was $49.1 million with $10.6 million included in currentliabilities, and $38.5 million included in long-term liabilities. The vast majority of the reserve represents futurelease obligations of $102.0 million, net of anticipated sublease income of approximately $52.9 million. Cashpayments relating to the facility closures were $22.3 million in both 2011 and 2010 and $24.6 million in 2009.We anticipate future annual payments to be similar in amount.
In addition, we were the lessee of a legacy, building materials manufacturing facility near Elma,Washington until the end of 2010. During 2006, we ceased operations at the facility, fully impaired the assets andrecorded a reserve, which is separate from the facility closure reserve above, for the related lease payments andother contract termination and closure costs. During 2010, we sold the facility’s equipment and terminated thelease. As a result, we recorded pre-tax income of approximately $9.4 million to adjust the associated reserve.This income is reported in other operating expense, net in our Consolidated Statements of Operations.
Environmental
As an owner and operator of real estate, we may be liable under environmental laws for the cleanup of pastand present spills and releases of hazardous or toxic substances on or from our properties and operations. We canbe found liable under these laws if we knew of, or were responsible for, the presence of such substances. In somecases, this liability may exceed the value of the property itself.
Environmental liabilities that relate to the operation of the paper and forest products businesses andtimberland assets prior to the closing of the sale of our paper, forest products and timberland assets in 2004continue to be our liabilities. We have been notified that we are a “potentially responsible party” under the
37

Comprehensive Environmental Response, Compensation and Liability Act (CERCLA) or similar federal andstate laws, or have received a claim from a private party, with respect to certain sites where hazardous substancesor other contaminants are or may be located. These sites relate to operations either no longer owned by theCompany or unrelated to its ongoing operations. For sites where a range of potential liability can be determined,we have established appropriate reserves. We cannot predict with certainty the total response and remedial costs,our share of the total costs, the extent to which contributions will be available from other parties, or the amountof time necessary to complete the cleanups. Based on our investigations; our experience with respect to cleanupof hazardous substances; the fact that expenditures will, in many cases, be incurred over extended periods oftime; and in some cases the number of solvent potentially responsible parties, we do not believe that the knownactual and potential response costs will, in the aggregate, materially affect our financial position, our results ofoperations or our cash flows.
Critical Accounting Estimates
The Securities and Exchange Commission defines critical accounting estimates as those that are mostimportant to the portrayal of our financial condition and results. These estimates require management’s mostdifficult, subjective or complex judgments, often as a result of the need to estimate matters that are inherentlyuncertain. The accounting estimates that we currently consider critical are as follows:
Vendor Rebates and Allowances
We participate in volume purchase rebate programs, some of which provide for tiered rebates based ondefined levels of purchase volume. We also participate in programs that enable us to receive additional vendorsubsidies by promoting the sale of vendor products. Vendor rebates and allowances are accrued as earned.Rebates and allowances received as a result of attaining defined purchase levels are accrued over the incentiveperiod based on the terms of the vendor arrangement and estimates of qualifying purchases during the rebateprogram period. These estimates are reviewed on a quarterly basis and adjusted for changes in anticipatedproduct sales and expected purchase levels. Vendor rebates and allowances earned are recorded as a reduction inthe cost of merchandise inventories and are included in operations (as a reduction of cost of goods sold) in theperiod the related product is sold.
Amounts owed to us under these arrangements are subject to credit risk. In addition, the terms of thecontracts covering these programs can be complex and subject to interpretations, which can potentially result indisputes. We provide an allowance for uncollectible accounts and to cover disputes in the event that ourinterpretation of the contract terms differ from our vendors’ and our vendors seek to recover some of theconsideration from us. These allowances are based on the current financial condition of our vendors, specificinformation regarding disputes and historical experience. If we used different assumptions to estimate the amountof vendor receivables that will not be collected due to either credit default or a dispute regarding the amountsowed, our calculated allowance would be different and the difference could be material. In addition, if actuallosses are different than those estimated, adjustments to the recorded allowance may be required.
Merchandise Inventories
Inventories consist of office products merchandise and are stated at the lower of weighted average cost ornet realizable value. We estimate the realizable value of inventory using assumptions about future demand,market conditions and product obsolescence. If the estimated realizable value is less than cost, the inventoryvalue is reduced to its estimated realizable value. If expectations regarding future demand and market conditionsare inaccurate or unexpected changes in technology or other factors affect demand, we could be exposed toadditional losses.
Throughout the year, we perform physical inventory counts at a significant number of our locations. Forperiods subsequent to each location’s last physical inventory count, an allowance for estimated shrinkage is
38

provided based on historical shrinkage results and current business trends. If actual losses as a result of inventoryshrinkage are different than management’s estimates, adjustments to the allowance for inventory shrinkage maybe required.
Pensions and Other Postretirement Benefits
The Company sponsors noncontributory defined benefit pension plans covering certain terminatedemployees, vested employees, retirees, and some active employees, primarily in Contract. The Company alsosponsors various retiree medical benefit plans. At December 31, 2011, the funded status of our defined benefitpension and other postretirement benefit plans was a liability of $351.8 million. Changes in assumptions relatedto the measurement of funded status could have a material impact on the amount reported. We are required tocalculate our pension expense and liabilities using actuarial assumptions, including a discount rate assumptionand a long-term asset return assumption. We base our discount rate assumption on the rates of return for atheoretical portfolio of high-grade corporate bonds (rated Aa1 or better) with cash flows that generally match ourexpected benefit payments in future years. We base our long-term asset return assumption on the average rate ofearnings expected on invested funds. We believe that the accounting estimate related to pensions is a criticalaccounting estimate because it is highly susceptible to change from period to period, based on the performance ofplan assets, actuarial valuations and changes in interest rates, and the effect on our financial position and resultsof operations could be material.
For 2012, our discount rate assumption used in the measurement of our net periodic benefit cost is 4.93%,and our expected return on plan assets is 8.2%. Using these assumptions, our 2012 pension expense will beapproximately $3.3 million. If we were to decrease our estimated discount rate assumption used in themeasurement of our net periodic benefit cost to 4.68% and our expected return on plan assets to 7.95%, our 2012pension expense would be approximately $5.7 million. If we were to increase our discount rate assumption usedin the measurement of our net periodic benefit cost to 5.18% and our expected return on plan assets to 8.45%, our2012 pension expense would be approximately $0.8 million.
Income Taxes
Income taxes are accounted for under the asset and liability method. Deferred tax assets and liabilities arerecognized for the future tax consequences attributable to differences between the financial statement carryingamounts of existing assets and liabilities and their respective tax basis and operating loss and tax creditcarryforwards. Deferred tax assets and liabilities are measured using enacted tax rates expected to apply totaxable income in the years in which those temporary differences are expected to be recovered or settled. Theeffect on deferred tax assets and liabilities of a change in tax rates is recognized in income in the period thatincludes the enactment date.
The Company is subject to tax audits in numerous jurisdictions in the U.S. and around the world. Tax auditsby their very nature are often complex and can require several years to complete. In the normal course ofbusiness, the Company is subject to challenges from the IRS and other tax authorities regarding amounts of taxesdue. These challenges may alter the timing or amount of taxable income or deductions, or the allocation ofincome among tax jurisdictions. We recognize the benefits of tax positions that are more likely than not of beingsustained upon audit based on the technical merits of the tax position in the consolidated financial statements;positions that do not meet this threshold are not recognized. For tax positions that are at least more likely than notof being sustained upon audit, the largest amount of the benefit that is more likely than not of being sustained isrecognized in the consolidated financial statements.
In assessing the realizability of deferred tax assets, management considers whether it is more likely than notthat some portion or all of the deferred tax assets will not be realized. The ultimate realization of deferred taxassets is dependent upon the generation of future taxable income during the periods in which those temporary
39

differences become deductible. Management considers the scheduled reversal of deferred tax liabilities, projectedfuture taxable income, and tax planning strategies in making the assessment of whether it is more likely than notthat some portion or all of the deferred tax assets will not be realized.
Significant judgment is required in determining our uncertain tax positions. We have established accrualsfor uncertain tax positions using management’s best judgment and adjust these liabilities as warranted bychanging facts and circumstances. A change in our uncertain tax positions, in any given period, could have asignificant impact on our results of operations and cash flows for that period.
The determination of the Company’s provision for income taxes requires significant judgment, the use ofestimates, and the interpretation and application of complex tax laws. Significant judgment is also required inassessing the timing and amounts of deductible and taxable items.
Facility Closure Reserves
The Company conducts regular reviews of its real estate portfolio to identify underperforming facilities, andcloses those facilities that are no longer strategically or economically beneficial. A liability for the costassociated with such a closure is recorded at its fair value in the period in which it is incurred, primarily thelocation’s cease-use date. These costs are included in facility closure reserves and include provisions for thepresent value of future lease obligations, less contractual or estimated sublease income. At December 31, 2011,the vast majority of the reserve represents future lease obligations of $102.0 million, net of anticipated subleaseincome of approximately $52.9 million. For each closed location, we estimate future sublease income based oncurrent real estate trends by market and location-specific factors, including the age and quality of the location, aswell as our historical experience with similar locations. If we had used different assumptions to estimate futuresublease income our reserves would be different and the difference could be material. In addition, if actualsublease income is different than our estimates, adjustments to the recorded reserves may be required.
Environmental and Asbestos Reserves
Environmental and asbestos liabilities that relate to the operation of the paper and forest products businessesand timberland assets prior to the sale of the paper, forest products and timberland assets continue to be liabilitiesof OfficeMax. We are subject to a variety of environmental laws and regulations. We estimate our environmentalliabilities based on various assumptions and judgments, as we cannot predict with certainty the total response andremedial costs, our share of total costs, the extent to which contributions will be available from other parties orthe amount of time necessary to complete any remediation. In making these judgments and assumptions, weconsider, among other things, the activity to date at particular sites, information obtained through consultationwith applicable regulatory authorities and third-party consultants and contractors and our historical experience atother sites that are judged to be comparable. Due to the number of uncertainties and variables associated withthese assumptions and judgments and the effects of changes in governmental regulation and environmentaltechnologies, the precision of the resulting estimates of the related liabilities is subject to uncertainty. Weregularly monitor our estimated exposure to our environmental and asbestos liabilities. As additional informationbecomes known, our estimates may change.
Indefinite-Lived Intangibles and Other Long-Lived Assets Impairment
Generally accepted accounting principles (“GAAP”) require us to assess intangible assets for impairment atleast annually in the absence of an indicator of possible impairment and immediately upon an indicator ofpossible impairment. In assessing impairment, we are required to make estimates of the fair values of the assets.If we determine the fair values are less than the carrying amount recorded on our Consolidated Balance Sheets,we must recognize an impairment loss in our financial statements. We are also required to assess our long-livedassets for impairment whenever an indicator of possible impairment exists. In assessing impairment, thestatement requires us to make estimates of the fair values of the assets. If we determine the fair values are lessthan the carrying values of the assets, we must recognize an impairment loss in our financial statements.
40

The measurement of impairment of indefinite life intangibles and other long-lived assets includes estimatesand assumptions which are inherently subject to significant uncertainties. In testing for impairment, we measurethe estimated fair value of our reporting units, intangibles and fixed assets based upon discounted futureoperating cash flows using a discount rate reflecting a market-based, weighted average cost of capital. Inestimating future cash flows, we use our internal budgets and operating plans, which include many assumptionsabout future growth prospects, margin rates, and cost factors. Differences in assumptions used in projectingfuture operating cash flows and in selecting an appropriate discount rate could have a significant impact on thedetermination of fair value and impairment amounts.
Recently Issued or Newly Adopted Accounting Standards
In June 2011, the FASB issued guidance which establishes disclosure requirements for other comprehensiveincome. The guidance requires the reporting of components of other comprehensive income and components ofnet income together as components of total comprehensive income, and is effective for periods beginning on orafter December 15, 2011. The guidance requires retrospective application and earlier application is permitted.The adoption of this guidance affects the presentation of certain elements of the Company’s financial statements,but these changes in presentation will not have a material impact on our financial statements.
ITEM 7A. QUANTITATIVE AND QUALITATIVE DISCLOSURES ABOUT MARKETRISK
Information concerning quantitative and qualitative disclosures about market risk is included under thecaption “Disclosures of Financial Market Risks” in “Item 7. Management’s Discussion and Analysis of FinancialCondition and Results of Operations” in this Form 10-K and is incorporated herein by reference.
41

ITEM 8. FINANCIAL STATEMENTS AND SUPPLEMENTARY DATA
OfficeMax Incorporated and Subsidiaries
Consolidated Statements of Operations
Fiscal year ended
December 31,2011
December 25,2010
December 26,2009
(thousands, except per-share amounts)
Sales . . . . . . . . . . . . . . . . . . . . . . . . . . . . . . . . . . . . . . . . . . . . . . . . . . . . $7,121,167 $7,150,007 $7,212,050Cost of goods sold and occupancy costs . . . . . . . . . . . . . . . . . . . . . . . . . 5,311,987 5,300,355 5,474,452
Gross profit . . . . . . . . . . . . . . . . . . . . . . . . . . . . . . . . . . . . . . . . . . . 1,809,180 1,849,652 1,737,598Operating expenses
Operating, selling, and general and administrative expenses . . . . . 1,690,967 1,689,130 1,674,711Asset impairments . . . . . . . . . . . . . . . . . . . . . . . . . . . . . . . . . . . . . . 11,197 10,979 17,612Other operating expenses, net . . . . . . . . . . . . . . . . . . . . . . . . . . . . . 20,530 3,077 49,263
Operating income (loss) . . . . . . . . . . . . . . . . . . . . . . . . . . . . . . . . . 86,486 146,466 (3,988)Interest expense . . . . . . . . . . . . . . . . . . . . . . . . . . . . . . . . . . . . . . . . . . . . (73,136) (73,333) (76,363)Interest income . . . . . . . . . . . . . . . . . . . . . . . . . . . . . . . . . . . . . . . . . . . . 44,000 42,635 47,270Other income (expense), net . . . . . . . . . . . . . . . . . . . . . . . . . . . . . . . . . . 287 (32) 2,748
Pre-tax income (loss) . . . . . . . . . . . . . . . . . . . . . . . . . . . . . . . . . . . . 57,637 115,736 (30,333)Income tax benefit (expense) . . . . . . . . . . . . . . . . . . . . . . . . . . . . . . . . . (19,517) (41,872) 28,758
Net income (loss) attributable to OfficeMax and noncontrollinginterest . . . . . . . . . . . . . . . . . . . . . . . . . . . . . . . . . . . . . . . . . . . . . 38,120 73,864 (1,575)
Joint venture results attributable to noncontrolling interest . . . . . . . . . . (3,226) (2,709) 2,242
Net income attributable to OfficeMax . . . . . . . . . . . . . . . . . . . . . . . . . . $ 34,894 $ 71,155 $ 667Preferred dividends . . . . . . . . . . . . . . . . . . . . . . . . . . . . . . . . . . . . . . . . . (2,123) (2,527) (2,818)
Net income (loss) available to OfficeMax common shareholders . . . . . $ 32,771 $ 68,628 $ (2,151)
Net income (loss) per common shareBasic . . . . . . . . . . . . . . . . . . . . . . . . . . . . . . . . . . . . . . . . . . . . . . . . $ 0.38 $ 0.81 $ (0.03)Diluted . . . . . . . . . . . . . . . . . . . . . . . . . . . . . . . . . . . . . . . . . . . . . . . $ 0.38 $ 0.79 $ (0.03)
See accompanying notes to consolidated financial statements
42

OfficeMax Incorporated and Subsidiaries
Consolidated Balance Sheets
December 31,2011
December 25,2010
(thousands)
ASSETS
Current assets:Cash and cash equivalents . . . . . . . . . . . . . . . . . . . . . . . . . . . . . . . . . . . . . . . . . . . . . . . $ 427,111 $ 462,326Receivables, net . . . . . . . . . . . . . . . . . . . . . . . . . . . . . . . . . . . . . . . . . . . . . . . . . . . . . . . 558,635 546,885Inventories . . . . . . . . . . . . . . . . . . . . . . . . . . . . . . . . . . . . . . . . . . . . . . . . . . . . . . . . . . . 821,999 846,463Deferred income taxes and receivables . . . . . . . . . . . . . . . . . . . . . . . . . . . . . . . . . . . . . 63,382 99,613Other current assets . . . . . . . . . . . . . . . . . . . . . . . . . . . . . . . . . . . . . . . . . . . . . . . . . . . . 67,847 58,999
Total current assets . . . . . . . . . . . . . . . . . . . . . . . . . . . . . . . . . . . . . . . . . . . . . . . . 1,938,974 2,014,286Property and equipment:
Land and land improvements . . . . . . . . . . . . . . . . . . . . . . . . . . . . . . . . . . . . . . . . . 40,245 41,317Buildings and improvements . . . . . . . . . . . . . . . . . . . . . . . . . . . . . . . . . . . . . . . . . 484,900 487,160Machinery and equipment . . . . . . . . . . . . . . . . . . . . . . . . . . . . . . . . . . . . . . . . . . . 783,492 818,081
Total property and equipment . . . . . . . . . . . . . . . . . . . . . . . . . . . . . . . . . . . . . . . . 1,308,637 1,346,558Accumulated depreciation . . . . . . . . . . . . . . . . . . . . . . . . . . . . . . . . . . . . . . . . . . . . . . . (943,701) (949,269)
Net property and equipment . . . . . . . . . . . . . . . . . . . . . . . . . . . . . . . . . . . . . . . . . . 364,936 397,289Intangible assets, net . . . . . . . . . . . . . . . . . . . . . . . . . . . . . . . . . . . . . . . . . . . . . . . . . . . 81,520 83,231Investment in Boise Cascade Holdings, L.L.C. . . . . . . . . . . . . . . . . . . . . . . . . . . . . . . . 175,000 175,000Timber notes receivable . . . . . . . . . . . . . . . . . . . . . . . . . . . . . . . . . . . . . . . . . . . . . . . . . 899,250 899,250Deferred income taxes . . . . . . . . . . . . . . . . . . . . . . . . . . . . . . . . . . . . . . . . . . . . . . . . . . 370,439 284,529Other non-current assets . . . . . . . . . . . . . . . . . . . . . . . . . . . . . . . . . . . . . . . . . . . . . . . . 239,156 225,344
Total assets . . . . . . . . . . . . . . . . . . . . . . . . . . . . . . . . . . . . . . . . . . . . . . . . . . . . . . . $4,069,275 $4,078,929
See accompanying notes to consolidated financial statements
43

OfficeMax Incorporated and Subsidiaries
Consolidated Balance Sheets
December 31,2011
December 25,2010
(thousands, except share andper-share amounts)
LIABILITIES AND SHAREHOLDERS’ EQUITY
Current liabilities:Current portion of debt . . . . . . . . . . . . . . . . . . . . . . . . . . . . . . . . . . . . . . . . . . . . . . . . . . $ 38,867 $ 4,560Accounts payable . . . . . . . . . . . . . . . . . . . . . . . . . . . . . . . . . . . . . . . . . . . . . . . . . . . . . . 654,918 686,106Income tax payable . . . . . . . . . . . . . . . . . . . . . . . . . . . . . . . . . . . . . . . . . . . . . . . . . . . . 9,553 11,055Accrued expenses and other current liabilities:
Compensation and benefits . . . . . . . . . . . . . . . . . . . . . . . . . . . . . . . . . . . . . . . . . . 101,516 145,911Other . . . . . . . . . . . . . . . . . . . . . . . . . . . . . . . . . . . . . . . . . . . . . . . . . . . . . . . . . . . 208,447 196,842
Total current liabilities . . . . . . . . . . . . . . . . . . . . . . . . . . . . . . . . . . . . . . . . . . 1,013,301 1,044,474Long-term debt, less current portion . . . . . . . . . . . . . . . . . . . . . . . . . . . . . . . . . . . . . . . 229,323 270,435Non-recourse debt . . . . . . . . . . . . . . . . . . . . . . . . . . . . . . . . . . . . . . . . . . . . . . . . . . . . . 1,470,000 1,470,000Other long-term items:
Compensation and benefits obligations . . . . . . . . . . . . . . . . . . . . . . . . . . . . . . . . . 393,293 250,756Deferred gain on sale of assets . . . . . . . . . . . . . . . . . . . . . . . . . . . . . . . . . . . . . . . . 179,757 179,757Other long-term liabilities . . . . . . . . . . . . . . . . . . . . . . . . . . . . . . . . . . . . . . . . . . . 182,685 213,496
Noncontrolling interest in joint venture . . . . . . . . . . . . . . . . . . . . . . . . . . . . . . . . . . . . . 31,923 49,246Shareholders’ equity:Preferred stock—no par value; 10,000,000 shares authorized; Series D ESOP: $.01stated value; 638,353 and 686,696 shares outstanding . . . . . . . . . . . . . . . . . . . . . . . 28,726 30,901
Common stock—$2.50 par value; 200,000,000 shares authorized; 86,158,662 and85,057,710 shares outstanding . . . . . . . . . . . . . . . . . . . . . . . . . . . . . . . . . . . . . . . . . . 215,397 212,644
Additional paid-in capital . . . . . . . . . . . . . . . . . . . . . . . . . . . . . . . . . . . . . . . . . . . . . . . 1,015,374 986,579Accumulated deficit . . . . . . . . . . . . . . . . . . . . . . . . . . . . . . . . . . . . . . . . . . . . . . . . . . . . (500,843) (533,606)Accumulated other comprehensive loss . . . . . . . . . . . . . . . . . . . . . . . . . . . . . . . . . . . . (189,661) (95,753)
Total OfficeMax shareholders’ equity . . . . . . . . . . . . . . . . . . . . . . . . . . . . . . . . . . 568,993 600,765
Total liabilities and shareholders’ equity . . . . . . . . . . . . . . . . . . . . . . . . . . . . . . . . $4,069,275 $4,078,929
See accompanying notes to consolidated financial statements
44

OfficeMax Incorporated and Subsidiaries
Consolidated Statements of Cash Flows
Fiscal year ended
December 31,2011
December 25,2010
December 26,2009
(thousands)
Cash provided by operations:Net income (loss) attributable to OfficeMax and noncontrollinginterest . . . . . . . . . . . . . . . . . . . . . . . . . . . . . . . . . . . . . . . . . . . . . . . . . $ 38,120 $ 73,864 $ (1,575)
Non-cash items in net income (loss):Dividend income from investment in Boise Cascade Holdings,L.L.C. . . . . . . . . . . . . . . . . . . . . . . . . . . . . . . . . . . . . . . . . . . . . . (7,846) (7,254) (6,707)
Depreciation and amortization . . . . . . . . . . . . . . . . . . . . . . . . . . . . 84,218 100,936 116,417Non-cash impairment charges . . . . . . . . . . . . . . . . . . . . . . . . . . . . . 11,197 10,979 17,612Non-cash deferred taxes on impairment charges . . . . . . . . . . . . . . (4,355) (4,271) (6,484)Pension and other postretirement benefits expense . . . . . . . . . . . . 8,328 4,965 11,537Other . . . . . . . . . . . . . . . . . . . . . . . . . . . . . . . . . . . . . . . . . . . . . . . . 19,296 2,530 9,131
Changes in operating assets and liabilities:Receivables . . . . . . . . . . . . . . . . . . . . . . . . . . . . . . . . . . . . . . . . . . . (14,674) 6,678 26,334Inventories . . . . . . . . . . . . . . . . . . . . . . . . . . . . . . . . . . . . . . . . . . . . 17,269 (27,606) 164,027Accounts payable and accrued liabilities . . . . . . . . . . . . . . . . . . . . (54,873) (51,515) (56,471)Current and deferred income taxes . . . . . . . . . . . . . . . . . . . . . . . . . 10,349 51,169 48,752Borrowings (payments) of loans on company-owned lifeinsurance policies . . . . . . . . . . . . . . . . . . . . . . . . . . . . . . . . . . . . — (44,442) 45,668
Other . . . . . . . . . . . . . . . . . . . . . . . . . . . . . . . . . . . . . . . . . . . . . . . . (53,350) (27,896) (9,297)
Cash provided by operations . . . . . . . . . . . . . . . . . . . . . . . . . . . . . . 53,679 88,137 358,944
Cash provided by (used for) investment:Expenditures for property and equipment . . . . . . . . . . . . . . . . . . . . . . . . (69,632) (93,511) (38,277)Distribution from escrow account . . . . . . . . . . . . . . . . . . . . . . . . . . . . . . — — 25,142Withdrawal from company-owned life insurance policies . . . . . . . . . . . — — 14,977Proceeds from sales of assets, net . . . . . . . . . . . . . . . . . . . . . . . . . . . . . . 259 6,173 980
Cash provided by (used for) investment . . . . . . . . . . . . . . . . . . . . . (69,373) (87,338) 2,822
Cash used for financing:Cash dividends paid - preferred stock . . . . . . . . . . . . . . . . . . . . . . . . . . . (3,286) (2,698) (3,089)Payments of short-term debt, net . . . . . . . . . . . . . . . . . . . . . . . . . . . . . . 20 (654) (11,035)Payments of long-term debt . . . . . . . . . . . . . . . . . . . . . . . . . . . . . . . . . . (6,136) (21,858) (52,936)Borrowings of long-term debt . . . . . . . . . . . . . . . . . . . . . . . . . . . . . . . . . — — 6,255Purchase of preferred stock . . . . . . . . . . . . . . . . . . . . . . . . . . . . . . . . . . . (2,125) (5,233) (6,079)Proceeds from exercise of stock options . . . . . . . . . . . . . . . . . . . . . . . . . 1,949 1,961 —Payments related to other share-based compensation . . . . . . . . . . . . . . . (4,854) — (990)Other . . . . . . . . . . . . . . . . . . . . . . . . . . . . . . . . . . . . . . . . . . . . . . . . . . . . (3,520) 13 7,316
Cash used for financing . . . . . . . . . . . . . . . . . . . . . . . . . . . . . . . . . . (17,952) (28,469) (60,558)
Effect of exchange rates on cash and cash equivalents . . . . . . . . . . . . . . (1,569) 3,426 14,583Increase (decrease) in cash and cash equivalents . . . . . . . . . . . . . . . . . . (35,215) (24,244) 315,791
Balance at beginning of the year . . . . . . . . . . . . . . . . . . . . . . . . . . . . . . . 462,326 486,570 170,779
Balance at end of the year . . . . . . . . . . . . . . . . . . . . . . . . . . . . . . . . . . . . $427,111 $462,326 $486,570
See accompanying notes to consolidated financial statements
45

OfficeMax Incorporated and Subsidiaries
Consolidated Statements of Equity
For the fiscal years ended December 31, 2011, December 25, 2010 and December 26, 2009
CommonShares
OutstandingPreferredStock
CommonStock
AdditionalPaid-InCapital
RetainedEarnings
(AccumulatedDeficit)
AccumulatedOther
ComprehensiveIncome(Loss)
TotalOfficeMaxShare-holders’Equity
Non-controllingInterest
(thousands, except per share)
75,977,152 Balance at December 27, 2008 . . . . . $42,565 $189,943 $ 925,328 $(600,095) $(267,738) $290,003 $ 21,871
Comprehensive income (loss):Net income (loss) . . . . . . . . . . . . . . . — — — 667 — 667 (2,242)Other comprehensive income:Cumulative foreign currencytranslation adjustment . . . . . . . . . . 47,477 47,477 1,157
Pension and postretirement liabilityadjustment, net of tax . . . . . . . . . . 87,746 87,746 —
Other comprehensive income . . . . . . 135,223 135,223 1,157
Comprehensive income (loss) . . . . . . $135,890 $ (1,085)
Preferred stock dividend declared . . . — — — (2,818) — (2,818) —313,517 Restricted stock unit activity . . . . . . . — 784 5,353 — — 6,137 —
8,331,722 Stock contribution to pension plan . . — 20,829 61,321 — — 82,150 —2,335 Other . . . . . . . . . . . . . . . . . . . . . . . . . (6,086) 6 (2,090) 4 — (8,166) 7,273
84,624,726 Balance at December 26, 2009 . . . . . $36,479 $211,562 $ 989,912 $(602,242) $(132,515) $503,196 $ 28,059
Comprehensive income:Net income . . . . . . . . . . . . . . . . . . . . — — — 71,155 — 71,155 2,709Other comprehensive income:Cumulative foreign currencytranslation adjustment . . . . . . . . . . 21,290 21,290 786
Pension and postretirement liabilityadjustment, net of tax . . . . . . . . . . 16,356 16,356 —
Unrealized hedge loss, net of tax . . . (884) (884) —
Other comprehensive income . . . . . . 36,762 36,762 786
Comprehensive income . . . . . . . . . . . $107,917 $ 3,495
Preferred stock dividend declared . . . — — — (2,527) (2,527) —950 Restricted stock unit activity . . . . . . . — — 7,972 — — 7,972 —
Non-controlling interest fair valueadjustment . . . . . . . . . . . . . . . . . . . — — (17,763) — — (17,763) 17,763
408,519 Stock options exercised . . . . . . . . . . . — 1,021 940 — — 1,961 —23,515 Other . . . . . . . . . . . . . . . . . . . . . . . . . (5,578) 61 5,518 8 — 9 (71)
85,057,710 Balance at December 25, 2010 . . . . . $30,901 $212,644 $ 986,579 $(533,606) $ (95,753) $600,765 $ 49,246
Comprehensive income:Net income . . . . . . . . . . . . . . . . . . . . — — — 34,894 — 34,894 3,226Other comprehensive income:Cumulative foreign currencytranslation adjustment . . . . . . . . . . (6,195) (6,195) (2,754)
Pension and postretirement liabilityadjustment, net of tax . . . . . . . . . . (88,754) (88,754) —
Unrealized hedge loss, net of tax . . . 1,041 1,041 —
Other comprehensive loss . . . . . . . . . (93,908) (93,908) (2,754)
Comprehensive income (loss) . . . . . . $ (59,014) $ 472
Preferred stock dividend declared . . . — — — (2,123) — (2,123) —685,373 Restricted stock unit activity . . . . . . . — 1,711 3,908 — — 5,619 —
Non-controlling interest fair valueadjustment . . . . . . . . . . . . . . . . . . . — — 17,763 — — 17,763 (17,763)
405,988 Stock options exercised . . . . . . . . . . . — 1,015 934 — — 1,949 —9,591 Other . . . . . . . . . . . . . . . . . . . . . . . . . (2,175) 27 6,190 (8) — 4,034 (32)
86,158,662 Balance at December 31, 2011 . . . . . $28,726 $215,397 $1,015,374 $(500,843) $(189,661) $568,993 $ 31,923
See accompanying notes to consolidated financial statements
46

Notes to Consolidated Financial Statements
1. Summary of Significant Accounting Policies
Nature of Operations
OfficeMax Incorporated (“OfficeMax,” the “Company” or “we”) is a leader in both business-to-businessand retail office products distribution. The Company provides office supplies and paper, print and documentservices, technology products and solutions and office furniture to large, medium and small businesses,government offices and consumers. OfficeMax customers are served by approximately 29,000 associates throughdirect sales, catalogs, the Internet and a network of retail stores located throughout the United States, Canada,Australia, New Zealand and Mexico. The Company’s common stock is traded on the New York Stock Exchangeunder the ticker symbol OMX. The Company’s corporate headquarters is located in Naperville, Illinois, and theOfficeMax website address is www.officemax.com.
The Company manages its business using three reportable segments: OfficeMax, Contract (“Contractsegment” or “Contract”); OfficeMax, Retail (“Retail segment” or “Retail”); and Corporate and Other. The Contractsegment markets and sells office supplies and paper, technology products and solutions, office furniture and printand document services directly to large corporate and government offices, as well as to small and medium-sizedoffices through field salespeople, outbound telesales, catalogs, the Internet and, primarily in foreign markets,through office products stores. The Retail segment markets and sells office supplies and paper, print and documentservices, technology products and solutions and office furniture to small and medium-sized businesses andconsumers through a network of retail stores. Management reviews the performance of the Company based on thesesegments. We present information pertaining to our segments in Note 14, “Segment Information”.
Consolidation
The consolidated financial statements include the accounts of OfficeMax and all majority ownedsubsidiaries, except our 88%-owned subsidiary that formerly owned assets in Cuba that were confiscated by theCuban government in the 1960’s which is accounted for as an investment due to various asset restrictions. Wealso consolidate the variable interest entities in which the Company is the primary beneficiary. All significantintercompany balances and transactions have been eliminated in consolidation.
Fiscal Year
The Company’s fiscal year-end is the last Saturday in December. Due primarily to statutory requirements,the Company’s international businesses maintain calendar years with December 31 year-ends, with our majority-owned joint venture in Mexico reporting one month in arrears. Fiscal year 2011 ended on December 31, 2011,fiscal year 2010 ended on December 25, 2010, and fiscal year 2009 ended on December 26, 2009. Fiscal year2011 included 53 weeks for our U.S. businesses. Fiscal years 2010 and 2009 included 52 weeks for our U.S.businesses.
Use of Estimates
The preparation of financial statements in conformity with accounting principles generally accepted in theUnited States of America (“GAAP”) requires management to make estimates and assumptions that affect thereported amounts of assets and liabilities and disclosures about contingent assets and liabilities at the date of thefinancial statements, and the reported amounts of revenues and expenses during the reporting period. Actualresults are likely to differ from those estimates, but management does not believe such differences will materiallyaffect the Company’s financial position, results of operations or cash flows. Significant items subject to suchestimates and assumptions include the recognition of vendor rebates and allowances; the carrying amount ofintangibles and long lived assets; inventories; income tax assets and liabilities; facility closure reserves; selfinsurance; environmental and asbestos liabilities; and assets and obligations related to employee benefitsincluding the pension plans.
47

Foreign Currency Translation
Local currencies are considered the functional currencies for the Company’s operations outside the UnitedStates. Assets and liabilities of foreign operations are translated into U.S. dollars at the rate of exchange in effectat the balance sheet date with the related translation adjustments reported in shareholders’ equity as a componentof accumulated other comprehensive loss. Revenues and expenses are translated into U.S. dollars at averagemonthly exchange rates prevailing during the year. Foreign currency transaction gains and losses related to assetsand liabilities that are denominated in a currency other than the functional currency are reported in theConsolidated Statements of Operations in the periods they occur.
Revenue Recognition
Revenue from the sale of products is recognized at the time both title and the risk of ownership aretransferred to the customer, which generally occurs upon delivery to the customer or third-party delivery servicefor contract, catalog and Internet sales, and at the point of sale for retail transactions. Service revenue isrecognized as the services are rendered. Revenue is reported less an appropriate provision for returns and net ofcoupons, rebates and other sales incentives. The Company offers rebate programs to some of its Contractcustomers. Customer rebates are recorded as a reduction in sales and are accrued as earned by the customer.
Revenue from the sale of extended warranty contracts is reported on a commission basis at the time of sale,except in a limited number of states where state law specifies the Company as the legal obligor. In such states,the revenue from the sale of extended warranty contracts is recorded at the gross amount and recognized ratablyover the contract period. The performance obligations and risk of loss associated with extended warrantycontracts sold by the Company are assumed by an unrelated third party. Costs associated with these contracts arerecognized in the same period as the related revenue.
Fees for shipping and handling charged to customers in connection with sale transactions are included insales. Costs related to shipping and handling are included in cost of goods sold and occupancy costs. Taxescollected from customers are accounted for on a net basis and are excluded from sales.
Cash and Cash Equivalents
Cash equivalents include short-term debt instruments that have an original maturity of three months or lessat the date of purchase. The Company’s banking arrangements allow the Company to fund outstanding checkswhen presented to the financial institution for payment. This cash management practice frequently results in a netcash overdraft position for accounting purposes, which occurs when total issued checks exceed available cashbalances at a single financial institution. The Company records its outstanding checks and the net change inoverdrafts in the accounts payable and the accounts payable and accrued liabilities line items within theConsolidated Balance Sheets and Consolidated Statements of Cash Flows, respectively.
Accounts Receivable
Accounts receivable relate primarily to amounts owed by customers for trade sales of products and servicesand amounts due from vendors under volume purchase rebate, cooperative advertising and various othermarketing programs. An allowance for doubtful accounts is recorded to provide for estimated losses resultingfrom uncollectible accounts, and is the Company’s best estimate of the amount of probable credit losses in theCompany’s existing accounts receivable. Management believes that the Company’s exposure to credit riskassociated with accounts receivable is limited due to the size and diversity of its customer and vendor base,which extends across many different industries and geographic regions. In the fourth quarter of 2011, we becameaware of financial difficulties at one of our large Contract customers. We granted the customer extended paymentterms and in exchange are requesting a security interest in their assets and are implementing creditor oversightprovisions. The receivable from this customer was $27 million at December 31, 2011, and substantially all of thatbalance has been collected to date. Based on our ongoing sales to this customer, we continue to carry similarreceivable balances, which we monitor closely.
48

At December 31, 2011 and December 25, 2010, the Company had allowances for doubtful accounts of$3.9 million and $6.5 million, respectively.
Vendor Rebates and Allowances
We participate in volume purchase rebate programs, some of which provide for tiered rebates based ondefined levels of purchase volume. We also participate in programs that enable us to receive additional vendorsubsidies by promoting the sale of vendor products. Vendor rebates and allowances are accrued as earned.Rebates and allowances received as a result of attaining defined purchase levels are accrued over the incentiveperiod based on the terms of the vendor arrangement and estimates of qualifying purchases during the rebateprogram period. These estimates are reviewed on a quarterly basis and adjusted for changes in anticipatedproduct sales and expected purchase levels. Vendor rebates and allowances earned are recorded as a reduction inthe cost of merchandise inventories and are included in operations (as a reduction of cost of goods sold) in theperiod the related product is sold.
Merchandise Inventories
Inventories consist of office products merchandise and are stated at the lower of weighted average cost ornet realizable value. The Company estimates the realizable value of inventory using assumptions about futuredemand, market conditions and product obsolescence. If the estimated realizable value is less than cost, theinventory value is reduced to its estimated realizable value.
Throughout the year, the Company performs physical inventory counts at a significant number of ourlocations. For periods subsequent to each location’s last physical inventory count, an allowance for estimatedshrinkage is provided based on historical shrinkage results and current business trends.
Property and Equipment
Property and equipment are recorded at cost. The Company calculates depreciation using the straight-linemethod over the estimated useful lives of the assets or the terms of the related leases. The estimated useful livesof depreciable assets are generally as follows: building and improvements, three to 40 years; machinery andequipment, which also includes delivery trucks, furniture and office and computer equipment, three to 15 years.Leasehold improvements are reported as building and improvements and are amortized over the lesser of theterm of the lease, including any option periods that management believes are probable of exercise, or theestimated lives of the improvements, which generally range from two to 20 years.
Long-Lived Asset Impairment
Long-lived assets, such as property, leasehold improvements, equipment, capitalized software costs andpurchased intangibles subject to amortization, are reviewed for impairment whenever events or changes incircumstances indicate that the carrying amount of an asset may not be recoverable. Recoverability of assets to beheld and used is measured by a comparison of the carrying amount of an asset to the estimated undiscountedfuture cash flows expected to be generated by the asset. If the carrying amount of an asset exceeds its estimatedfuture cash flows, an impairment charge is recognized equal to the amount by which the carrying amount of theasset exceeds the fair value of the asset, which is estimated based on discounted cash flows. In 2011, 2010 and2009 the Company determined that there were indicators of impairment, completed tests for impairment andrecorded impairment of store assets. See Note 5, “Intangible Assets and Other Long-lived Assets,” for furtherdiscussion regarding impairment of long-lived assets.
Intangible Assets
Intangible assets represent the values assigned to trade names, customer lists and relationships, noncompeteagreements and exclusive distribution rights of businesses acquired. Trade name assets have an indefinite life and
49

are not amortized. All other intangible assets are amortized on a straight-line basis over their expected usefullives, which range from three to 20 years. Intangible assets with indefinite lives are not amortized, but are testedfor impairment at least annually, or more frequently if events and circumstances indicate that the carryingamount of the asset might be impaired, using a fair-value-based approach. An impairment loss is recognized tothe extent that the carrying amount exceeds the asset’s fair value. No impairment was recorded related tointangible assets in 2011, 2010, or 2009.
Investment in Boise Cascade Holdings, L.L.C.
Investments in affiliated companies are accounted for under the cost method if the Company does notexercise significant influence over the affiliated company. At December 31, 2011 and December 25, 2010, theCompany held an investment in Boise Cascade Holdings, L.L.C. (“Boise Investment”) which is accounted forunder the cost method. See Note 9, “Investments in Boise Cascade Holdings, L.L.C.,” for additional informationrelated to the Company’s investments in affiliates.
Capitalized Software Costs
The Company capitalizes certain costs related to the acquisition and development of internal use softwarethat is expected to benefit future periods. These costs are amortized using the straight-line method over theexpected life of the software, which is typically three to seven years. Other non-current assets in the ConsolidatedBalance Sheets include unamortized capitalized software costs of $32.5 million and $32.4 million atDecember 31, 2011 and December 25, 2010, respectively. Amortization of capitalized software costs totaled$10.5 million, $17.5 million and $17.2 million in 2011, 2010 and 2009, respectively. Software development coststhat do not meet the criteria for capitalization are expensed as incurred.
Pension and Other Postretirement Benefits
The Company sponsors noncontributory defined benefit pension plans covering certain terminatedemployees, vested employees, retirees and some active employees, primarily in Contract. The Company alsosponsors various retiree medical benefit plans. The type of retiree medical benefits and the extent of coveragevary based on employee classification, date of retirement, location, and other factors. The Company explicitlyreserves the right to amend or terminate its retiree medical plans at any time, subject only to constraints, if any,imposed by the terms of collective bargaining agreements. Amendment or termination may significantly affectthe amount of expense incurred.
The Company recognizes the funded status of its defined benefit pension, retiree healthcare and otherpostretirement plans in the Consolidated Balance Sheets, with changes in the funded status recognized throughaccumulated other comprehensive loss, net of tax, in the year in which the changes occur. Actuarially-determinedliabilities related to pension and postretirement benefits are recorded based on estimates and assumptions. Keyfactors used in developing estimates of these liabilities include assumptions related to discount rates, rates of returnon investments, future compensation costs, healthcare cost trends, benefit payment patterns and other factors.
The Company measures changes in the funded status of its plans using actuarial models. Since the majorityof participants in the plans are inactive, the actuarial models use an attribution approach that generally spreadsrecognition of the effects of individual events over the life expectancy of the participants. Net pension andpostretirement benefit income or expense is also determined using assumptions which include discount rates andexpected long-term rates of return on plan assets. The Company bases the discount rate assumption on the ratesof return for a theoretical portfolio of high-grade corporate bonds (rated Aa1 or better) with cash flows thatgenerally match our expected benefit payments in future years. The long-term asset return assumption is basedon the average rate of earnings expected on invested funds, and considers several factors including the assetallocation, actual historical rates of return, expected rates of return and external data.
50

The Company’s policy is to fund its pension plans based upon actuarial recommendations and in accordancewith applicable laws and income tax regulations. Pension benefits are primarily paid through trusts funded by theCompany. All of the Company’s postretirement medical plans are unfunded. The Company pays postretirementbenefits directly to the participants.
See Note 12, “Retirement and Benefit Plans,” for additional information related to the Company’s pensionand other postretirement benefits.
Facility Closure Reserves
The Company conducts regular reviews of its real estate portfolio to identify underperforming facilities, andcloses those facilities that are no longer strategically or economically beneficial. The Company records a liabilityfor the cost associated with a facility closure at its fair value in the period in which the liability is incurred,primarily the location’s cease-use date. Upon closure, unrecoverable costs are included in facility closurereserves and include provisions for the present value of future lease obligations, less contractual or estimatedsublease income. Accretion expense is recognized over the life of the payments. See Note 2, “Facility ClosureReserves,” for additional information related to the Company’s facility closure reserves.
Environmental and Asbestos Matters
Environmental and asbestos liabilities that relate to the operation of the paper and forest products businessesand timberland assets prior to the sale of the paper, forest products and timberland assets continue to be liabilitiesof OfficeMax. The Company accrues for losses associated with these types of obligations when such losses areprobable and reasonably estimated.
Self-insurance
The Company is self-insured for certain losses related to workers’ compensation and medical claims as wellas general and auto liability. The expected ultimate cost for claims incurred is recognized as a liability in theConsolidated Balance Sheets. The expected ultimate cost of claims incurred is estimated based principally on ananalysis of historical claims data and estimates of claims incurred but not reported. Losses are accrued on adiscounted basis and charged to operations when it is probable that a loss has been incurred and the amount canbe reasonably estimated.
Income Taxes
Income taxes are accounted for under the asset and liability method. Deferred tax assets and liabilities arerecognized for the future tax consequences attributable to differences between the financial statement carryingamounts of existing assets and liabilities and their respective tax basis and operating loss and tax creditcarryforwards. Deferred tax assets and liabilities are measured using enacted tax rates expected to apply totaxable income in the years in which those temporary differences are expected to be recovered or settled. Theeffect on deferred tax assets and liabilities of a change in tax rates is recognized in income in the period thatincludes the enactment date.
The Company is subject to tax audits in numerous jurisdictions in the U.S. and around the world. Tax auditsby their very nature are often complex and can require several years to complete. In the normal course ofbusiness, the Company is subject to challenges from the IRS and other tax authorities regarding amounts of taxesdue. These challenges may alter the timing or amount of taxable income or deductions, or the allocation ofincome among tax jurisdictions. The benefits of tax positions that are more likely than not of being sustainedupon audit based on the technical merits of the tax position are recognized in the consolidated financialstatements; positions that do not meet this threshold are not recognized. For tax positions that are at least morelikely than not of being sustained upon audit, the largest amount of the benefit that is more likely than not ofbeing sustained is recognized in the consolidated financial statements. See Note 7, “Income Taxes,” for furtherdiscussion.
51

In assessing the realizability of deferred tax assets, management considers whether it is more likely than notthat some portion or all of the deferred tax assets will not be realized. The ultimate realization of deferred taxassets is dependent upon the generation of future taxable income during the periods in which those temporarydifferences become deductible. Management considers the scheduled reversal of deferred tax liabilities, projectedfuture taxable income, and tax planning strategies in making the assessment of whether it is more likely than notthat some portion or all of the deferred tax assets will not be realized.
Accruals for income tax exposures, including penalties and interest, expected to be settled within the nextyear are included in income tax payable with the remainder included in other long-term liabilities in theConsolidated Balance Sheets. Interest and penalties related to income tax exposures are recognized as incurredand included in income tax expense in the Consolidated Statements of Operations.
Advertising Costs
Advertising costs are either expensed the first time the advertising takes place or, in the case of direct-responseadvertising, capitalized and charged to expense in the periods in which the related sales occur. Advertising expensewas $225.3 million in 2011, $228.3 million in 2010 and $211.3 million in 2009, and is recorded in operating, sellingand general and administrative expenses in the Consolidated Statements of Operations.
Pre-Opening Expenses
The Company incurs certain non-capital expenses prior to the opening of a store. These pre-opening expensesconsist primarily of straight-line rent from the date of possession, store payroll and supplies, and are expensed asincurred and reflected in operating and selling expenses. The Company recorded approximately $1.0 million and$1.6 million in pre-opening costs in 2011 and 2009, respectively. No pre-opening costs were recorded in 2010.
Leasing Arrangements
The Company conducts a substantial portion of its business in leased properties. Some of the Company’s leasescontain escalation clauses and renewal options. The Company recognizes rental expense for leases that containpredetermined fixed escalation clauses on a straight-line basis over the expected term of the lease. The difference betweenthe amounts charged to expense and the contractual minimum lease payment is recorded in other long-term liabilities inthe Consolidated Balance Sheets. At December 31, 2011 and December 25, 2010, other long-term liabilities includedapproximately $52.3 million and $61.6 million, respectively, related to these future escalation clauses.
The expected term of a lease is calculated from the date the Company first takes possession of the facility,including any periods of free rent and any option or renewal periods management believes are probable of exercise.This expected term is used in the determination of whether a lease is capital or operating and in the calculation ofstraight-line rent expense. Rent abatements and escalations are considered in the calculation of minimum leasepayments in the Company’s capital lease tests and in determining straight-line rent expense for operating leases.Straight-line rent expense is also adjusted to reflect any allowances or reimbursements provided by the lessor.
Derivative Instruments and Hedging Activities
The Company records all derivative instruments on the balance sheet at fair value. Changes in the fair valueof derivative instruments are recorded in current earnings or deferred in accumulated other comprehensive loss,depending on whether a derivative is designated as, and is effective as, a hedge and on the type of hedgingtransaction. Changes in fair value of derivatives that are designated as cash flow hedges are deferred inaccumulated other comprehensive income loss until the underlying hedged transactions are recognized inearnings, at which time any deferred hedging gains or losses are also recorded in earnings. If a derivativeinstrument is designated as a fair value hedge, changes in the fair value of the instrument are reported in currentearnings and offset the change in fair value of the hedged assets, liabilities or firm commitments. The Companyhas no material outstanding derivative instruments at December 31, 2011 and did not have any material hedgetransactions in 2011, 2010 or 2009.
52

Recently Issued or Newly Adopted Accounting Standards
In June 2011, the FASB issued guidance which establishes disclosure requirements for other comprehensiveincome. The guidance requires the reporting of components of other comprehensive income and components ofnet income together as components of total comprehensive income, and is effective for periods beginning on orafter December 15, 2011. The guidance requires retrospective application and earlier application is permitted.The adoption of this guidance affects the presentation of certain elements of the Company’s financial statements,but these changes in presentation will not have a material impact on our financial statements.
2. Facility Closure Reserves
We conduct regular reviews of our real estate portfolio to identify underperforming facilities, and closethose facilities that are no longer strategically or economically beneficial. We record a liability for the costassociated with a facility closure at its fair value in the period in which the liability is incurred, primarily thelocation’s cease-use date. Upon closure, unrecoverable costs are included in facility closure reserves and includethe present value of future lease obligations, less contractual or estimated sublease income. Accretion expense isrecognized over the life of the required payments.
During 2011, we recorded facility closure charges of $5.6 million in our Retail segment related to closingsix underperforming domestic stores prior to the end of their lease terms, of which $5.4 million was related to thelease liability and $0.2 million was related to asset impairments.
During 2010, we recorded facility closure charges of $13.1 million in our Retail segment, of which $11.7million was related to the lease liability and other costs associated with closing eight domestic stores prior to theend of their lease terms, and $1.4 million was related to other items. In 2009, we recorded charges of$31.2 million related to the closing of 21 underperforming stores prior to the end of their lease terms, of which 16were in the U.S. and five were in Mexico.
These charges were included in other operating expenses, net in the Consolidated Statements of Operations.
Facility closure reserve account activity during 2011, 2010 and 2009 was as follows:
Total
(thousands)Balance at December 27, 2008 . . . . . . . . . . . . . . . . . . . . . . . . . . . . . . . . . . . . . . . . . . . . . . . . . . . . . . . . . $ 48,933
Charges related to stores closed in 2009 . . . . . . . . . . . . . . . . . . . . . . . . . . . . . . . . . . . . . . . . . . . . . 31,208Transfer of deferred rent balance . . . . . . . . . . . . . . . . . . . . . . . . . . . . . . . . . . . . . . . . . . . . . . . . . . . 3,214Changes to estimated costs included in income . . . . . . . . . . . . . . . . . . . . . . . . . . . . . . . . . . . . . . . . 9Cash payments . . . . . . . . . . . . . . . . . . . . . . . . . . . . . . . . . . . . . . . . . . . . . . . . . . . . . . . . . . . . . . . . . (24,594)Accretion . . . . . . . . . . . . . . . . . . . . . . . . . . . . . . . . . . . . . . . . . . . . . . . . . . . . . . . . . . . . . . . . . . . . . 2,802
Balance at December 26, 2009 . . . . . . . . . . . . . . . . . . . . . . . . . . . . . . . . . . . . . . . . . . . . . . . . . . . . . . . . . $ 61,572Charges related to stores closed in 2010 . . . . . . . . . . . . . . . . . . . . . . . . . . . . . . . . . . . . . . . . . . . . . 13,069Transfer of deferred rent and other balances . . . . . . . . . . . . . . . . . . . . . . . . . . . . . . . . . . . . . . . . . . 5,985Changes to estimated costs included in income . . . . . . . . . . . . . . . . . . . . . . . . . . . . . . . . . . . . . . . . (1,358)Cash payments . . . . . . . . . . . . . . . . . . . . . . . . . . . . . . . . . . . . . . . . . . . . . . . . . . . . . . . . . . . . . . . . . (22,260)Accretion . . . . . . . . . . . . . . . . . . . . . . . . . . . . . . . . . . . . . . . . . . . . . . . . . . . . . . . . . . . . . . . . . . . . . 4,665
Balance at December 25, 2010 . . . . . . . . . . . . . . . . . . . . . . . . . . . . . . . . . . . . . . . . . . . . . . . . . . . . . . . . . $ 61,673Charges related to stores closed in 2011 . . . . . . . . . . . . . . . . . . . . . . . . . . . . . . . . . . . . . . . . . . . . . 5,406Transfer of deferred rent and other balances . . . . . . . . . . . . . . . . . . . . . . . . . . . . . . . . . . . . . . . . . . 928Changes to estimated costs included in income . . . . . . . . . . . . . . . . . . . . . . . . . . . . . . . . . . . . . . . . 262Cash payments . . . . . . . . . . . . . . . . . . . . . . . . . . . . . . . . . . . . . . . . . . . . . . . . . . . . . . . . . . . . . . . . . (22,311)Accretion . . . . . . . . . . . . . . . . . . . . . . . . . . . . . . . . . . . . . . . . . . . . . . . . . . . . . . . . . . . . . . . . . . . . . 3,117
Balance at December 31, 2011 . . . . . . . . . . . . . . . . . . . . . . . . . . . . . . . . . . . . . . . . . . . . . . . . . . . . . . . . . $ 49,075
53

Reserve balances were classified in the Consolidated Balance Sheets as follows:
December 31,2011
December 25,2010
(thousands)
Accrued expenses and other current liabilities - Other . . . . . . . . . . . . . . . . . . . . . . . . . $10,635 $16,651Other long-term liabilities . . . . . . . . . . . . . . . . . . . . . . . . . . . . . . . . . . . . . . . . . . . . . . . 38,440 45,022
Total . . . . . . . . . . . . . . . . . . . . . . . . . . . . . . . . . . . . . . . . . . . . . . . . . . . . . . . . . . . . . . . . $49,075 $61,673
At December 31, 2011, the lease termination component of the facilities closure reserve consisted of thefollowing:
Total
(thousands)
Estimated future lease obligations . . . . . . . . . . . . . . . . . . . . . . . . . . . . . . . . . . . . . . . . . . . . . . . . . . . . . . $102,002Less: anticipated sublease income . . . . . . . . . . . . . . . . . . . . . . . . . . . . . . . . . . . . . . . . . . . . . . . . . . . . . . (52,927)
Total . . . . . . . . . . . . . . . . . . . . . . . . . . . . . . . . . . . . . . . . . . . . . . . . . . . . . . . . . . . . . . . . . . . . . . . . . . . . . $ 49,075
In addition, we were the lessee of a legacy building materials manufacturing facility near Elma, Washingtonuntil the end of 2010. During 2006, we ceased operations at the facility, fully impaired the assets and recorded areserve for the related lease payments and other contract termination and closure costs. This reserve balance wasnot included in the facilities closure reserve described above. During 2010, we sold the facility’s equipment andterminated the lease. As a result, we recorded income of approximately $9.4 million to adjust the associatedreserve. This income is reported in other operating expenses, net in our Consolidated Statements of Operations.
3. Severance and Other Charges
Over the past few years, we have incurred significant charges related to Company personnel restructuringand reorganizations. These charges were included in other operating expenses, net in the ConsolidatedStatements of Operations.
In 2011, we recorded $14.9 million of severance charges ($13.9 million in Contract, $0.3 million in Retailand $0.7 million in Corporate), related primarily to reorganizations in Canada ($8.6 million), Australia and NewZealand ($2.4 million) and the U.S., primarily in the sales and supply chain organizations ($3.3 million).
In 2009, we recorded $18.1 million of severance and other charges, principally related to reorganizations ofour U.S. and Canadian Contract sales forces, our customer fulfillment centers and our customer service centers,as well as a streamlining of our Retail store staffing. These charges were recorded by segment in the followingmanner: Contract $15.3 million, Retail $2.1 million and Corporate and Other $0.7 million.
As of December 31, 2011, $7.4 million of the severance charges remain unpaid and are included in accruedexpenses and other current liabilities in the Consolidated Balance Sheets.
4. Timber Notes/Non-Recourse Debt
In October 2004, we sold our timberland assets in exchange for $15 million in cash plus credit-enhancedtimber installment notes in the amount of $1,635 million (the “Installment Notes”). The Installment Notes wereissued by single-member limited liability companies formed by affiliates of Boise Cascade, L.L.C. (the “NoteIssuers”). The Installment Notes are 15-year non-amortizing obligations and were issued in two equal$817.5 million tranches bearing interest at 5.11% and 4.98%, respectively. In order to support the issuance of the
54

Installment Notes, the Note Issuers transferred a total of $1,635 million in cash to Lehman BrothersHoldings Inc. (“Lehman”) and Wachovia Corporation (“Wachovia”) (which was later purchased by WellsFargo & Company) ($817.5 million to each of Lehman and Wachovia). Lehman and Wachovia issued collateralnotes (the “Collateral Notes”) to the Note Issuers. Concurrently with the issuance of the Installment andCollateral Notes, Lehman and Wachovia guaranteed the respective Installment Notes and the Note Issuerspledged the Collateral Notes as security for the performance of the Installment Note obligations.
In December 2004, we completed a securitization transaction in which the Company’s interests in theInstallment Notes and related guarantees were transferred to wholly-owned bankruptcy remote subsidiaries. Thesubsidiaries pledged the Installment Notes and related guarantees and issued securitized notes (the“Securitization Notes”) in the amount of $1,470 million ($735 million through the structure supported by theLehman guaranty and $735 million through the structure supported by the Wachovia guaranty). As a result ofthese transactions, we received $1,470 million in cash. Recourse on the Securitization Notes is limited to theproceeds of the applicable pledged Installment Notes and underlying Lehman or Wachovia guaranty, andtherefore there is no recourse against OfficeMax. The Securitization Notes are 15-year non-amortizing, and wereissued in two equal $735 million tranches paying interest of 5.54% and 5.42%, respectively. The SecuritizationNotes are reported as non-recourse debt in the Company’s Consolidated Balance Sheets.
On September 15, 2008, Lehman, the guarantor of half of the Installment Notes and the SecuritizationNotes, filed a petition in the United States Bankruptcy Court for the Southern District of New York seeking reliefunder chapter 11 of the United States Bankruptcy Code. Lehman’s bankruptcy filing constituted an event ofdefault under the $817.5 million Installment Note guaranteed by Lehman. We are required for accountingpurposes to assess the carrying value of assets whenever circumstances indicate that a decline in value may haveoccurred. In 2008, we evaluated the carrying value of the Lehman Guaranteed Installment Note and reduced it tothe estimated amount we then expected to collect ($81.8 million) by recording a non-cash impairment charge of$735.8 million, pre-tax. The ultimate amount to be realized on the Lehman Guaranteed Installment Note dependsentirely on the proceeds from the Lehman bankruptcy estate.
Lehman’s disclosure statement on its Chapter 11 Plan (the “Disclosure Statement”) was confirmed by theUnited States Bankruptcy Court for the Southern District of New York on December 6, 2011. The DisclosureStatement provides a range of estimated recoveries for various classes of unsecured creditors of Lehman.Pursuant to a stipulation entered into on October 7, 2011 and approved by the bankruptcy court on December 14,2011, the claim of the Securitization Note holders through the Note Issuers will be treated as a class 3 seniorunsecured claim (estimated to recover at a rate of approximately 21.1% under the Chapter 11 Plan) rather thanfalling into any other class of guarantee claims (estimated to recover at a rate of approximately 11%-13%depending on the class under the Chapter 11 Plan). Due to this categorization, provisions of the stipulation thatmake certain funds unavailable to the claim that would otherwise be available to class 3 senior unsecuredclaimants, the status of the bankruptcy proceedings, and based on information in the Disclosure Statement, itappears that Securitization Note holders may recover at a potential rate within the range of 17% to 20%.However, uncertainties exist as to the actual recovery that will ultimately be received on the claim. Thedisposition of a related claim of the Securitization Note holders through us on the guaranty may result in anadditional recovery and the funds available for claimants will depend on Lehman’s ongoing claims resolutionprocess, the establishment of reserves for unresolved claims, and the value of the assets Lehman is able toliquidate. Due to these uncertainties and other factors, we have not increased our assumed recovery rate or thecarrying value of the Lehman Guaranteed Installment Note. We expect that an initial distribution may be madeon the Securitization Note holders’ claim as early as March 30, 2012. Further distributions are expected to occurover a several-year period. Going forward, we intend to adjust the carrying value of the Lehman GuaranteedInstallment Note as further information regarding our share of the proceeds, if any, from the Lehman bankruptcyestate becomes available. Recourse on the Securitization Notes is limited to the proceeds from the applicablepledged Installment Notes and underlying Lehman or Wachovia guaranty, and any proceeds we receive from thebankruptcy will be distributed to the Securitization Note Holders.. However, under current generally acceptedaccounting principles, we are required to continue to recognize the liability related to the Securitization Notes
55

guaranteed by Lehman until such time as the liability has been extinguished. The liability will be extinguishedwhen the Lehman Guaranteed Installment Note and the related guaranty are transferred to and accepted by theSecuritization Note holders. We expect that this will occur when the remaining guaranty claim of theSecuritization Note holders in the bankruptcy is resolved and as the Lehman assets are in the process ofdistribution. Accordingly, we expect to recognize a non-cash gain equal to the difference between the carryingamount of the Securitization Notes guaranteed by Lehman ($735.0 million at December 31, 2011) and thecarrying value of the Lehman Guaranteed Installment Note ($81.8 million at December 31, 2011) in a laterperiod when the liability is legally extinguished. The actual gain to be recognized in the future will be measuredbased on the carrying amounts of the Lehman Guaranteed Installment Note and the Securitization Notesguaranteed by Lehman at the date of settlement.
Any discussion of the Lehman bankruptcy in this document is strictly based on factual observations fromthe bankruptcy cases and should not be interpreted as constituting legal analysis of or admission as to theultimate allowances of our claim based on the Lehman Guaranteed Installment Note or any Note Issuers’ claimbased on Collateral Notes, or the interplay thereof.
At the time of the sale of the timberlands in 2004, we generated a tax gain and recognized the relateddeferred tax liability. The timber installment notes structure allowed the Company to defer the resulting taxliability until 2020 ($529 million at December 31, 2011), the maturity date for the Installment Notes. Due to theLehman bankruptcy and note defaults, the recognition of the Lehman portion of the gain will be triggered whenthe Lehman Guaranteed Installment Note and the related guaranty are transferred to and accepted by theSecuritization Note holders. At that time, we expect to reduce the estimated cash payment due by utilizing ouravailable alternative minimum tax credits.
Through December 31, 2011, we have received all payments due under the Installment Notes guaranteed byWachovia (the “Wachovia Guaranteed Installment Notes”), which have consisted only of interest due on thenotes, and made all payments due on the related Securitization Notes guaranteed by Wachovia, again consistingonly of interest due. As all amounts due on the Wachovia Guaranteed Installment Notes are current and we haveno reason to believe that we will not be able to collect all amounts due according to the contractual terms of theWachovia Guaranteed Installment Notes, the notes are stated in our Consolidated Balance Sheets at their originalprincipal amount of $817.5 million. The Installment Notes and Securitization Notes are scheduled to mature in2020 and 2019, respectively. The Securitization Notes have an initial term that is approximately three monthsshorter than the Installment Notes.
5. Intangible Assets and Other Long-lived Assets
Impairment Reviews and Charges
Intangible assets represent the values assigned to trade names, customer lists and relationships, noncompeteagreements and exclusive distribution rights of businesses acquired. Trade name assets have an indefinite life andare not amortized. All other intangible assets are amortized on a straight-line basis over their expected usefullives, which range from three to 20 years. Intangible assets with indefinite lives are not amortized but are testedfor impairment at least annually, or more frequently if events and circumstances indicate that the carryingamount of the asset might be impaired, using a fair-value-based approach. An impairment loss is recognized tothe extent that the carrying amount exceeds the asset’s fair value. No impairment was recorded related tointangible assets in 2011, 2010, or 2009.
In 2011, 2010 and 2009, the Company also performed impairment testing for the assets of individual retailstores (“store assets” or “stores”), which consist primarily of leasehold improvements and fixtures, due to theexistence of indicators of potential impairment of these other long-lived assets. We performed the first step ofimpairment testing for other long-lived assets on the store assets and determined that for some stores the
56

estimated future undiscounted cash flows derived from the assets was less than those assets’ carrying amount andtherefore impairment existed for those store assets. The second step of impairment testing was performed tocalculate the amount of the impairment loss. The loss was measured as the excess of the carrying value over the fairvalue of the assets, with the fair value determined based on estimated future discounted cash flows. As a result, wewrote off $11.2 million, $11.0 million and $17.6 million of store assets in 2011, 2010 and 2009, respectively.
Acquired Intangible Assets
Intangible assets represent the values assigned to trade names, customer lists and relationships, noncompeteagreements and exclusive distribution rights of businesses acquired. The trade name assets have an indefinite lifeand are not amortized. All other intangible assets are amortized on a straight-line basis over their expected usefullives. Customer lists and relationships are amortized over three to 20 years, noncompete agreements over theirterms, which are generally three to five years, and exclusive distribution rights over ten years. Intangible assetsconsisted of the following at year-end:
2011
GrossCarryingAmount
AccumulatedAmortization
NetCarryingAmount
(thousands)
Trade names . . . . . . . . . . . . . . . . . . . . . . . . . . . . . . . . . . . . . . . . . . . . . . . . . . . $ 66,000 $ — $66,000Customer lists and relationships . . . . . . . . . . . . . . . . . . . . . . . . . . . . . . . . . . . 27,676 (15,327) 12,349Exclusive distribution rights . . . . . . . . . . . . . . . . . . . . . . . . . . . . . . . . . . . . . . 7,287 (4,116) 3,171
Total . . . . . . . . . . . . . . . . . . . . . . . . . . . . . . . . . . . . . . . . . . . . . . . . . . . . . . . . . $100,963 $(19,443) $81,520
2010
GrossCarryingAmount
AccumulatedAmortization
NetCarryingAmount
(thousands)
Trade names . . . . . . . . . . . . . . . . . . . . . . . . . . . . . . . . . . . . . . . . . . . . . . . . . . . $ 66,000 $ — $66,000Customer lists and relationships . . . . . . . . . . . . . . . . . . . . . . . . . . . . . . . . . . . 27,807 (13,789) 14,018Exclusive distribution rights . . . . . . . . . . . . . . . . . . . . . . . . . . . . . . . . . . . . . . 7,302 (4,089) 3,213
Total . . . . . . . . . . . . . . . . . . . . . . . . . . . . . . . . . . . . . . . . . . . . . . . . . . . . . . . . . $101,109 $(17,878) $83,231
Intangible amortization expense totaled $1.7 million, $2.0 million and $1.6 million in 2011, 2010 and 2009respectively. The estimated amortization expense is approximately $1.4 to $1.7 million in each of the next five years.
The changes in the intangible carrying amounts were as follows:
Trade names
Customerlists and
relationships
Exclusivedistribution
rights Total
(thousands)Net carrying amount, December 27, 2008 . . . . . . . . . . . . . . . . $66,000 $12,919 $2,874 $81,793Amortization . . . . . . . . . . . . . . . . . . . . . . . . . . . . . . . . . . . . . . . — (1,271) (363) (1,634)Effect of foreign currency translation . . . . . . . . . . . . . . . . . . . . — 2,897 750 3,647
Net carrying amount, December 26, 2009 . . . . . . . . . . . . . . . . $66,000 $14,545 $3,261 $83,806Amortization . . . . . . . . . . . . . . . . . . . . . . . . . . . . . . . . . . . . . . . — (1,542) (413) (1,955)Effect of foreign currency translation . . . . . . . . . . . . . . . . . . . . — 1,015 365 1,380
Net carrying amount, December 25, 2010 . . . . . . . . . . . . . . . . $66,000 $14,018 $3,213 $83,231Amortization . . . . . . . . . . . . . . . . . . . . . . . . . . . . . . . . . . . . . . . — (1,649) (37) (1,686)Effect of foreign currency translation . . . . . . . . . . . . . . . . . . . . — (20) (5) (25)
Net carrying amount, December 31, 2011 . . . . . . . . . . . . . . . . $66,000 $12,349 $3,171 $81,520
57

6. Net Income (Loss) Per Common Share
Basic net income (loss) per share is calculated using net earnings available to holders of our common stockdivided by the weighted average number of shares of common stock outstanding during the year. Diluted netincome (loss) per share is similar to basic net income (loss) per share except that the weighted average number ofshares of common stock outstanding is increased to include, if their inclusion is dilutive, the number of additionalshares of common stock that would have been outstanding assuming the issuance of all potentially dilutiveshares, such as common stock to be issued upon exercise of options, the vesting of non-vested restricted shares,and the conversion of outstanding preferred stock. Net income (loss) per common share was determined bydividing net income (loss), as adjusted, by weighted average shares outstanding as follows:
2011 2010 2009
(thousands, except per-share amounts)
Net income (loss) available to OfficeMax common shareholders . . . . . . . . . . . . . . $32,771 $68,628 $ (2,151)Average shares—basic(a) . . . . . . . . . . . . . . . . . . . . . . . . . . . . . . . . . . . . . . . . . . . . . 85,881 84,908 77,483Restricted stock, stock options and other(b) . . . . . . . . . . . . . . . . . . . . . . . . . . . . . . 1,116 1,604 —
Average shares—diluted . . . . . . . . . . . . . . . . . . . . . . . . . . . . . . . . . . . . . . . . . . . . . 86,997 86,512 77,483Net income (loss) available to OfficeMax common shareholders per commonshare:Basic . . . . . . . . . . . . . . . . . . . . . . . . . . . . . . . . . . . . . . . . . . . . . . . . . . . . . . . . . $ 0.38 $ 0.81 $ (0.03)Diluted . . . . . . . . . . . . . . . . . . . . . . . . . . . . . . . . . . . . . . . . . . . . . . . . . . . . . . . $ 0.38 $ 0.79 $ (0.03)
(a) The assumed conversion of outstanding preferred stock was anti-dilutive in all periods presented, andtherefore no adjustment was required to determine diluted income (loss) from continuing operations oraverage shares-diluted.
(b) Options to purchase 3.7 million and 1.7 million shares of common stock were outstanding during 2011 and2010, respectively, but were not included in the computation of diluted income (loss) per common sharebecause the impact would have been anti-dilutive as the option price was higher than the average marketprice during the year. Outstanding options to purchase shares of common stock totaled 1.3 million at the endof 2009 but were not included in the computation of diluted income (loss) per common share because theimpact would have been anti-dilutive due to the loss reported for the period.
7. Income Taxes
The income tax (expense) benefit attributable to income (loss) from continuing operations as shown in theConsolidated Statements of Operations includes the following components:
2011 2010 2009
(thousands)
Current income tax (expense) benefit:Federal . . . . . . . . . . . . . . . . . . . . . . . . . . . . . . . . . . . . . . . . . . . . . . . . . . . . . $ (128) $ 9,507 $ 60,354State . . . . . . . . . . . . . . . . . . . . . . . . . . . . . . . . . . . . . . . . . . . . . . . . . . . . . . . (1,593) (2,735) 33,770Foreign . . . . . . . . . . . . . . . . . . . . . . . . . . . . . . . . . . . . . . . . . . . . . . . . . . . . . (10,377) (22,521) (9,999)
Total . . . . . . . . . . . . . . . . . . . . . . . . . . . . . . . . . . . . . . . . . . . . . . . . . . . $(12,098) $(15,749) $ 84,125Deferred income tax (expense) benefit:
Federal . . . . . . . . . . . . . . . . . . . . . . . . . . . . . . . . . . . . . . . . . . . . . . . . . . . . . $ (5,342) $(24,628) $(23,190)State . . . . . . . . . . . . . . . . . . . . . . . . . . . . . . . . . . . . . . . . . . . . . . . . . . . . . . . (4,056) (2,552) (29,593)Foreign . . . . . . . . . . . . . . . . . . . . . . . . . . . . . . . . . . . . . . . . . . . . . . . . . . . . . 1,979 1,057 (2,584)
Total . . . . . . . . . . . . . . . . . . . . . . . . . . . . . . . . . . . . . . . . . . . . . . . . . . . $ (7,419) $(26,123) $(55,367)
Total income tax (expense) benefit . . . . . . . . . . . . . . . . . . . . . . . . . . . . . . . . . . . $(19,517) $(41,872) $ 28,758
58

During 2011, 2010 and 2009, the Company made cash payments for income taxes, net of refunds received,as follows:
2011 2010 2009
(thousands)
Cash tax payments (refunds), net . . . . . . . . . . . . . . . . . . . . . . . . . . . . . . . . . . . . $13,524 $(5,026) $(71,026)
The income tax expense attributable to income (loss) from continuing operations for the years endedDecember 31, 2011, December 25, 2010 and December 26, 2009 differed from the amounts computed byapplying the statutory U.S. Federal income tax rate of 35% to pre-tax income (loss) from continuing operationsas a result of the following:
2011 2010 2009
(thousands)
Income tax (expense) benefit at statutory rate . . . . . . . . . . . . . . . . . . . . . . . . . . . . $(20,173) $(40,507) $10,617State taxes (expense) benefit, net of federal effect . . . . . . . . . . . . . . . . . . . . . . . . (723) (2,346) 2,516Foreign tax provision differential . . . . . . . . . . . . . . . . . . . . . . . . . . . . . . . . . . . . . 4,354 338 1,085Effect on deferreds due to tax restructuring . . . . . . . . . . . . . . . . . . . . . . . . . . . . . 5,960 — —Net operating loss valuation allowance and credits . . . . . . . . . . . . . . . . . . . . . . . (10,818) (590) (2,484)Change in tax contingency liability . . . . . . . . . . . . . . . . . . . . . . . . . . . . . . . . . . . . (695) (308) (3,390)Tax settlement, net of other charges . . . . . . . . . . . . . . . . . . . . . . . . . . . . . . . . . . . — — 14,880Repatriation of foreign earnings, net . . . . . . . . . . . . . . . . . . . . . . . . . . . . . . . . . . . (2,517) (2,291) 3,428ESOP dividend deduction . . . . . . . . . . . . . . . . . . . . . . . . . . . . . . . . . . . . . . . . . . . 743 885 944Other permanent items, net . . . . . . . . . . . . . . . . . . . . . . . . . . . . . . . . . . . . . . . . . . 4,352 2,947 1,162
Total income tax (expense) benefit . . . . . . . . . . . . . . . . . . . . . . . . . . . . . . . . $(19,517) $(41,872) $28,758
The tax effects of temporary differences that give rise to significant portions of the deferred tax assets anddeferred tax liabilities at year-end are presented in the following table:
2011 2010
(thousands)
Impairment of note receivable . . . . . . . . . . . . . . . . . . . . . . . . . . . . . . . . . . . . . . . . . . . . . . $ 278,269 $ 286,207Minimum tax and other credits carryover . . . . . . . . . . . . . . . . . . . . . . . . . . . . . . . . . . . . . 228,224 230,267Net operating loss carryovers . . . . . . . . . . . . . . . . . . . . . . . . . . . . . . . . . . . . . . . . . . . . . . . 151,787 109,423Deferred gain on Boise Investment . . . . . . . . . . . . . . . . . . . . . . . . . . . . . . . . . . . . . . . . . . 68,936 69,925Compensation obligations . . . . . . . . . . . . . . . . . . . . . . . . . . . . . . . . . . . . . . . . . . . . . . . . . 172,403 146,369Operating reserves and accrued expenses . . . . . . . . . . . . . . . . . . . . . . . . . . . . . . . . . . . . . 55,679 63,205Investments and deferred charges . . . . . . . . . . . . . . . . . . . . . . . . . . . . . . . . . . . . . . . . . . . 3,441 5,136Property and equipment . . . . . . . . . . . . . . . . . . . . . . . . . . . . . . . . . . . . . . . . . . . . . . . . . . . 1,558 4,937Allowances for receivables . . . . . . . . . . . . . . . . . . . . . . . . . . . . . . . . . . . . . . . . . . . . . . . . . 12,306 12,764Inventory . . . . . . . . . . . . . . . . . . . . . . . . . . . . . . . . . . . . . . . . . . . . . . . . . . . . . . . . . . . . . . . 4,216 4,167Tax goodwill . . . . . . . . . . . . . . . . . . . . . . . . . . . . . . . . . . . . . . . . . . . . . . . . . . . . . . . . . . . . 2,907 4,587Other . . . . . . . . . . . . . . . . . . . . . . . . . . . . . . . . . . . . . . . . . . . . . . . . . . . . . . . . . . . . . . . . . . 6,891 4,804
Total deferred tax assets . . . . . . . . . . . . . . . . . . . . . . . . . . . . . . . . . . . . . . . . . . . . . . . . . . . $ 986,617 $ 941,791Valuation allowance on NOLs and credits . . . . . . . . . . . . . . . . . . . . . . . . . . . . . . . . . . . . . $ (25,543) $ (14,726)
Total deferred tax assets after valuation allowance . . . . . . . . . . . . . . . . . . . . . . . . . . . . . . $ 961,074 $ 927,065Timberland installment gain related to Wachovia Note . . . . . . . . . . . . . . . . . . . . . . . . . . . $(260,040) $(266,798)Timberland installment gain related to Lehman Note . . . . . . . . . . . . . . . . . . . . . . . . . . . . (269,284) (276,965)Undistributed earnings . . . . . . . . . . . . . . . . . . . . . . . . . . . . . . . . . . . . . . . . . . . . . . . . . . . . (5,823) (5,817)
Total deferred tax liabilities . . . . . . . . . . . . . . . . . . . . . . . . . . . . . . . . . . . . . . . . . . . . . . . . $(535,147) $(549,580)
Total net deferred tax assets . . . . . . . . . . . . . . . . . . . . . . . . . . . . . . . . . . . . . . . . . . . . . . . . $ 425,927 $ 377,485
59

Deferred tax assets and liabilities are reported in our Consolidated Balance Sheets as follows:
2011 2010
(thousands)
Current deferred income tax assets . . . . . . . . . . . . . . . . . . . . . . . . . . . . . . . . . . . . . . . . . . . . $ 55,488 $ 92,956Long-term deferred income tax assets . . . . . . . . . . . . . . . . . . . . . . . . . . . . . . . . . . . . . . . . . 370,439 284,529
Total net deferred tax assets . . . . . . . . . . . . . . . . . . . . . . . . . . . . . . . . . . . . . . . . . . . . . $425,927 $377,485
In assessing the value of deferred tax assets, management considers whether it is more likely than not thatsome portion or all of the deferred tax assets will not be realized. The ultimate realization of deferred tax assets isdependent upon the generation of future taxable income during the periods in which those temporary differencesbecome deductible. Management considers the scheduled reversal of deferred tax liabilities, projected futuretaxable income, and tax planning strategies in making the assessment of whether it is more likely than not thatsome portion or all of the deferred tax assets will not be realized. Management believes it is more likely than notthat the Company will realize the benefits of these deductible differences, except for certain state net operatinglosses and other credit carryforwards as noted below. The amount of the deferred tax assets considered realizable,however, could be reduced if estimates of future taxable income during the carryforward period are reduced.During 2011, the Company restructured its domestic entities to better support operations resulting in a reductionin the tax rate related to certain deferred items which was offset by the impairment of state net operating losses.
The Company has a deferred tax asset related to net operating loss carryforwards for Federal income taxpurposes of approximately $104 million which expire in 2020, and alternative minimum tax credit carryforwardsof approximately $188 million, which are available to reduce future regular Federal income taxes, if any, over anindefinite period. The Company also has deferred tax assets related to various state net operating losses ofapproximately $26 million, net of the valuation allowance, that expire between 2012 and 2029.
As discussed in Note 4, “Timber Notes/Non-Recourse Debt,” at the time of the sale of the timberlands in2004, we generated a tax gain and recognized the related deferred tax liability. The timber installment notesstructure allowed the Company to defer the resulting tax liability of $543 million until 2020, the maturity date forthe Installment Notes. In 2011, a legal entity restructuring reduced the liability for the installment gain by $14million to $529 million. Due to the Lehman bankruptcy and note defaults, the recognition of the Lehman portionof the gain will be triggered when the Lehman Guaranteed Installment Note and the related guaranty aretransferred to and accepted by the Securitization Note holders At that time, we expect to reduce the estimatedcash payment due by utilizing our available alternative minimum tax credits.
The Company has established a valuation allowance related to net operating loss carryforwards and othercredit carryforwards in jurisdictions where the Company has substantially reduced operations becausemanagement believes it is more likely than not that these items will expire before the Company is able to realizetheir benefits. The valuation allowance was $25.5 million and $14.7 million at December 31, 2011 andDecember 25, 2010, respectively. In 2011, the Company increased the valuation allowances relating to severalstate net operating losses. The valuation allowance is reviewed and adjusted based on management’s assessmentsof realizable deferred tax assets.
Pre-tax income (loss) related to continuing operations from domestic and foreign sources is as follows:
2011 2010 2009
(thousands)
Domestic . . . . . . . . . . . . . . . . . . . . . . . . . . . . . . . . . . . . . . . . . . . . . . . . . . . . . . . . $21,202 $ 53,444 $(69,386)Foreign . . . . . . . . . . . . . . . . . . . . . . . . . . . . . . . . . . . . . . . . . . . . . . . . . . . . . . . . . 36,435 62,292 39,053
Total . . . . . . . . . . . . . . . . . . . . . . . . . . . . . . . . . . . . . . . . . . . . . . . . . . . . . . . . . . . $57,637 $115,736 $(30,333)
60

As of December 31, 2011, the Company had $21.2 million of total unrecognized tax benefits, $7.0 millionof which would affect the Company’s effective tax rate if recognized. Any adjustments would result from theeffective settlement of tax positions with various tax authorities. The Company does not anticipate any taxsettlements to occur within the next twelve months. The recorded income tax benefit for 2009 includes a$14.9 million decrease in unrecognized benefits due to the resolution of an issue under IRS appeal related to thedeductibility of interest on the Company’s industrial revenue bonds. The reconciliation of the beginning andending unrecognized tax benefits is as follows:
2011 2010 2009
(thousands)
Unrecognized gross tax benefits balance at beginning of year . . . . . . . . . . . . . . . . $20,863 $ 8,247 $ 20,380Increase related to prior year tax positions . . . . . . . . . . . . . . . . . . . . . . . . . . . . . . . 570 12,983 1,710Decrease related to prior year tax positions . . . . . . . . . . . . . . . . . . . . . . . . . . . . . . — — (14,369)Increase related to current year tax positions . . . . . . . . . . . . . . . . . . . . . . . . . . . . . — — 1,420Settlements . . . . . . . . . . . . . . . . . . . . . . . . . . . . . . . . . . . . . . . . . . . . . . . . . . . . . . . (261) (367) (894)
Unrecognized tax benefits balance at end of year . . . . . . . . . . . . . . . . . . . . . . . . . $21,172 $20,863 $ 8,247
The Company or its subsidiaries file income tax returns in the U.S. Federal jurisdiction, and multiple stateand foreign jurisdictions. Years prior to 2006 are no longer subject to U.S. Federal income tax examination. TheCompany is no longer subject to state income tax examinations by tax authorities in its major state jurisdictionsfor years before 2003, and the Company is no longer subject to income tax examinations prior to 2005 for itsmajor foreign jurisdictions.
The Company recognizes accrued interest and penalties associated with uncertain tax positions as part ofincome tax expense. As of December 31, 2011, the Company had approximately $1 million of accrued interestand penalties associated with uncertain tax positions.
Deferred taxes are not recognized for temporary differences related to investments in foreign subsidiariesbecause such earnings are considered to be indefinitely reinvested in the business. The determination of theamount of the unrecognized deferred tax liability related to the undistributed earnings is not practicable becauseof the complexities associated with its hypothetical calculation.
8. Leases
The Company leases its retail stores as well as certain other property and equipment under operating leases.These leases are noncancelable and generally contain multiple renewal options for periods ranging from three tofive years, and require the Company to pay all executory costs such as maintenance and insurance. Rentalpayments include minimum rentals plus, in some cases, contingent rentals based on a percentage of sales abovespecified minimums. Rental expense for operating leases included the following components:
2011 2010 2009
(thousands)
Minimum rentals . . . . . . . . . . . . . . . . . . . . . . . . . . . . . . . . . . . . . . . . . . . . . . . . $336,924 $338,924 $355,662Contingent rentals . . . . . . . . . . . . . . . . . . . . . . . . . . . . . . . . . . . . . . . . . . . . . . . 1,060 1,187 1,013Sublease rentals . . . . . . . . . . . . . . . . . . . . . . . . . . . . . . . . . . . . . . . . . . . . . . . . . (504) (422) (671)
Total . . . . . . . . . . . . . . . . . . . . . . . . . . . . . . . . . . . . . . . . . . . . . . . . . . . . . . . . . . $337,480 $339,689 $356,004
61
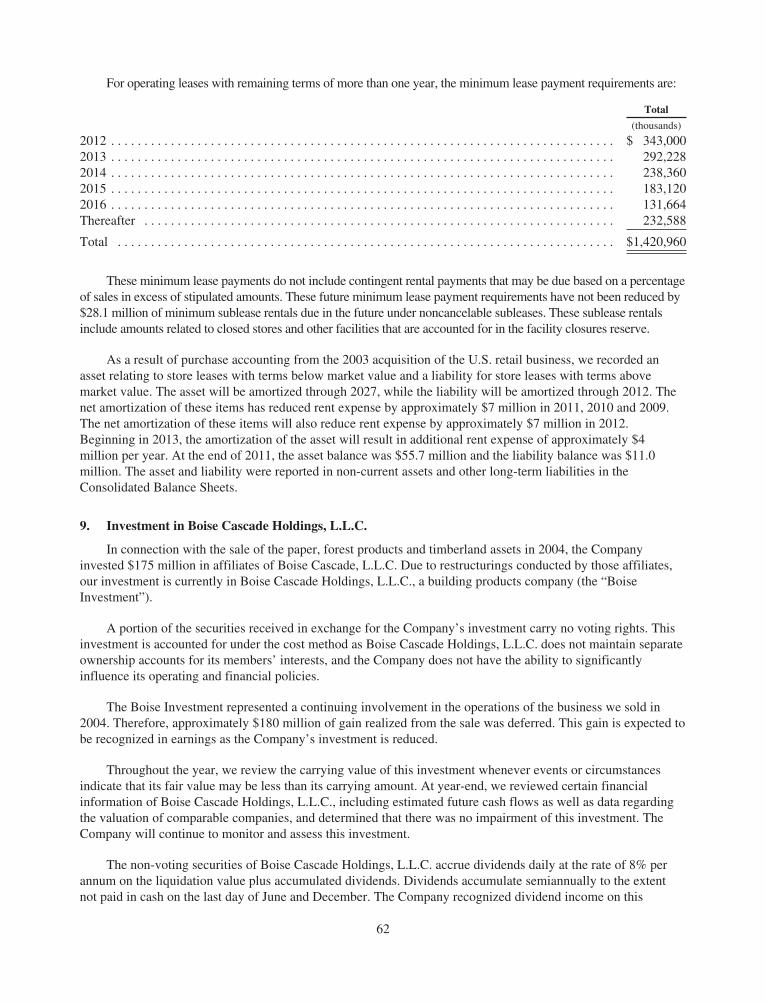
For operating leases with remaining terms of more than one year, the minimum lease payment requirements are:
Total
(thousands)
2012 . . . . . . . . . . . . . . . . . . . . . . . . . . . . . . . . . . . . . . . . . . . . . . . . . . . . . . . . . . . . . . . . . . . . . . . . . . . . $ 343,0002013 . . . . . . . . . . . . . . . . . . . . . . . . . . . . . . . . . . . . . . . . . . . . . . . . . . . . . . . . . . . . . . . . . . . . . . . . . . . . 292,2282014 . . . . . . . . . . . . . . . . . . . . . . . . . . . . . . . . . . . . . . . . . . . . . . . . . . . . . . . . . . . . . . . . . . . . . . . . . . . . 238,3602015 . . . . . . . . . . . . . . . . . . . . . . . . . . . . . . . . . . . . . . . . . . . . . . . . . . . . . . . . . . . . . . . . . . . . . . . . . . . . 183,1202016 . . . . . . . . . . . . . . . . . . . . . . . . . . . . . . . . . . . . . . . . . . . . . . . . . . . . . . . . . . . . . . . . . . . . . . . . . . . . 131,664Thereafter . . . . . . . . . . . . . . . . . . . . . . . . . . . . . . . . . . . . . . . . . . . . . . . . . . . . . . . . . . . . . . . . . . . . . . . 232,588
Total . . . . . . . . . . . . . . . . . . . . . . . . . . . . . . . . . . . . . . . . . . . . . . . . . . . . . . . . . . . . . . . . . . . . . . . . . . . $1,420,960
These minimum lease payments do not include contingent rental payments that may be due based on a percentageof sales in excess of stipulated amounts. These future minimum lease payment requirements have not been reduced by$28.1 million of minimum sublease rentals due in the future under noncancelable subleases. These sublease rentalsinclude amounts related to closed stores and other facilities that are accounted for in the facility closures reserve.
As a result of purchase accounting from the 2003 acquisition of the U.S. retail business, we recorded anasset relating to store leases with terms below market value and a liability for store leases with terms abovemarket value. The asset will be amortized through 2027, while the liability will be amortized through 2012. Thenet amortization of these items has reduced rent expense by approximately $7 million in 2011, 2010 and 2009.The net amortization of these items will also reduce rent expense by approximately $7 million in 2012.Beginning in 2013, the amortization of the asset will result in additional rent expense of approximately $4million per year. At the end of 2011, the asset balance was $55.7 million and the liability balance was $11.0million. The asset and liability were reported in non-current assets and other long-term liabilities in theConsolidated Balance Sheets.
9. Investment in Boise Cascade Holdings, L.L.C.
In connection with the sale of the paper, forest products and timberland assets in 2004, the Companyinvested $175 million in affiliates of Boise Cascade, L.L.C. Due to restructurings conducted by those affiliates,our investment is currently in Boise Cascade Holdings, L.L.C., a building products company (the “BoiseInvestment”).
A portion of the securities received in exchange for the Company’s investment carry no voting rights. Thisinvestment is accounted for under the cost method as Boise Cascade Holdings, L.L.C. does not maintain separateownership accounts for its members’ interests, and the Company does not have the ability to significantlyinfluence its operating and financial policies.
The Boise Investment represented a continuing involvement in the operations of the business we sold in2004. Therefore, approximately $180 million of gain realized from the sale was deferred. This gain is expected tobe recognized in earnings as the Company’s investment is reduced.
Throughout the year, we review the carrying value of this investment whenever events or circumstancesindicate that its fair value may be less than its carrying amount. At year-end, we reviewed certain financialinformation of Boise Cascade Holdings, L.L.C., including estimated future cash flows as well as data regardingthe valuation of comparable companies, and determined that there was no impairment of this investment. TheCompany will continue to monitor and assess this investment.
The non-voting securities of Boise Cascade Holdings, L.L.C. accrue dividends daily at the rate of 8% perannum on the liquidation value plus accumulated dividends. Dividends accumulate semiannually to the extentnot paid in cash on the last day of June and December. The Company recognized dividend income on this
62

investment of $7.8 million in 2011, $7.3 million in 2010 and $6.7 million in 2009 in the Corporate and Othersegment. The dividend receivable was $38.0 million and $30.2 million at December 31, 2011 and December 25,2010, respectively, and was recorded in the Corporate and Other segment in other non-current assets in theConsolidated Balance Sheets.
The Company receives distributions on the Boise Investment for the income tax liability associated with itsshare of allocated earnings. During 2009, the Company received a tax-related distribution of $2.6 million. Nodistributions were received in 2011 or 2010.
10. Debt
The Company’s debt, almost all of which is unsecured, consists of both recourse and non-recourseobligations as follows at year-end:
2011 2010
(thousands)
Recourse debt:7.35% debentures, due in 2016 . . . . . . . . . . . . . . . . . . . . . . . . . . . . . . . . . . . . . . . . . . . . $ 17,967 $ 17,967Medium-term notes, Series A, with interest rates averaging 7.9%, due in 2012 . . . . . . 35,000 36,900Revenue bonds, with interest rates averaging 6.4% , due in varying amountsperiodically through 2029 . . . . . . . . . . . . . . . . . . . . . . . . . . . . . . . . . . . . . . . . . . . . . . 185,505 185,505
American & Foreign Power Company Inc. 5% debentures, due in 2030 . . . . . . . . . . . . 18,526 18,526Grupo OfficeMax installment loans, due in monthly installments through 2014 . . . . . . 8,508 13,096Other indebtedness, with interest rates averaging 6.8%, due in varying amountsannually through 2016 . . . . . . . . . . . . . . . . . . . . . . . . . . . . . . . . . . . . . . . . . . . . . . . . . 3,188 3,536
$ 268,694 $ 275,530Less unamortized discount . . . . . . . . . . . . . . . . . . . . . . . . . . . . . . . . . . . . . . . . . . . . . . . (504) (535)
Total recourse debt . . . . . . . . . . . . . . . . . . . . . . . . . . . . . . . . . . . . . . . . . . . . . . . . . $ 268,190 $ 274,995Less current portion . . . . . . . . . . . . . . . . . . . . . . . . . . . . . . . . . . . . . . . . . . . . . . . . . . . . . (38,867) (4,560)
Long-term debt, less current portion . . . . . . . . . . . . . . . . . . . . . . . . . . . . . . . . $ 229,323 $ 270,435
Non-recourse debt:5.42% securitized timber notes, due in 2019 . . . . . . . . . . . . . . . . . . . . . . . . . . . . . . . . . $ 735,000 $ 735,0005.54% securitized timber notes, due in 2019 . . . . . . . . . . . . . . . . . . . . . . . . . . . . . . . . . 735,000 735,000
Total non-recourse debt . . . . . . . . . . . . . . . . . . . . . . . . . . . . . . . . . . . . . . . . . . $1,470,000 $1,470,000
Scheduled Debt Maturities
The scheduled payments of recourse debt are as follows:
Total
(thousands)
2012 . . . . . . . . . . . . . . . . . . . . . . . . . . . . . . . . . . . . . . . . . . . . . . . . . . . . . . . . . . . . . . . . . . . . . . . . . . . . . $ 38,8672013 . . . . . . . . . . . . . . . . . . . . . . . . . . . . . . . . . . . . . . . . . . . . . . . . . . . . . . . . . . . . . . . . . . . . . . . . . . . . . 3,8582014 . . . . . . . . . . . . . . . . . . . . . . . . . . . . . . . . . . . . . . . . . . . . . . . . . . . . . . . . . . . . . . . . . . . . . . . . . . . . . 1,6812015 . . . . . . . . . . . . . . . . . . . . . . . . . . . . . . . . . . . . . . . . . . . . . . . . . . . . . . . . . . . . . . . . . . . . . . . . . . . . . 1052016 . . . . . . . . . . . . . . . . . . . . . . . . . . . . . . . . . . . . . . . . . . . . . . . . . . . . . . . . . . . . . . . . . . . . . . . . . . . . . 20,153Thereafter . . . . . . . . . . . . . . . . . . . . . . . . . . . . . . . . . . . . . . . . . . . . . . . . . . . . . . . . . . . . . . . . . . . . . . . . . 204,030
Total . . . . . . . . . . . . . . . . . . . . . . . . . . . . . . . . . . . . . . . . . . . . . . . . . . . . . . . . . . . . . . . . . . . . . . . . . . . . . $268,694
63

Credit Agreements
On October 7, 2011, the Company entered into a Second Amended and Restated Loan and Security Agreement(the “North American Credit Agreement”) with a group of banks. The North American Credit Agreement amendedboth our existing credit agreement that we are a party to along with certain of our subsidiaries in the U.S. (the “U.S.Credit Agreement”) and our existing credit agreement to which our subsidiary in Canada is a party (the “CanadianCredit Agreement”) and consolidated them into a single credit agreement. The North American Credit Agreementpermits the Company to borrow up to a maximum of $650 million (U.S. dollars), of which $50 million is allocatedto the Company’s Canadian subsidiary and $600 million is allocated to the Company and its other participating U.S.subsidiaries, in each case subject to a borrowing base calculation that limits availability to a percentage of eligibletrade and credit card receivables plus a percentage of the value of eligible inventory less certain reserves. The NorthAmerican Credit Agreement may be increased (up to a maximum of $850 million) at the Company’s request andthe approval of lenders participating in the increase, or may be reduced from time to time at the Company’s request,in each case according to the terms detailed in the North American Credit Agreement. Letters of credit, which maybe issued under the North American Credit Agreement up to a maximum of $250 million, reduce availableborrowing capacity. At the end of fiscal year 2011, the Company was in compliance with all covenants under theNorth American Credit Agreement. The North American Credit Agreement will expire on October 7, 2016.
Borrowings under the U.S. Credit Agreement were subject to interest at rates based on either the prime rateor the London Interbank Offered Rate (“LIBOR”). Margins were applied to the applicable borrowing rates andletter of credit fees under the U.S. Credit Agreement depending on the level of average availability. Fees onletters of credit issued under the U.S. Credit Agreement were charged at a weighted average rate of 0.875%. TheCompany was also charged an unused line fee of 0.25% under the U.S. Credit Agreement on the amount bywhich the maximum available credit exceeded the average daily outstanding borrowings and letters of credit.
Borrowings under the North American Credit Agreement are subject to interest at rates based on either theprime rate, the federal funds rate, LIBOR or the Canadian Dealer Offered Rate. An additional percentage, whichvaries depending on the level of average borrowing availability, is added to the applicable rates. Fees on letters ofcredit issued under the North American Credit Agreement are charged at rates between 1.25% and 2.25%depending on the type of letter of credit (i.e., stand-by or commercial) the level of average borrowingavailability. The Company is also charged an unused line fee of between 0.375% and 0.5% on the amount bywhich the maximum available credit exceeds the average daily outstanding borrowings and letters of credit. Thefees on letters of credit were 1.75% and the unused line fee was 0.5% at December 31, 2011. Thereafter, the ratewill vary depending on the level of average borrowing availability and type of letters of credit.
On March 15, 2010, the Company’s five wholly-owned subsidiaries based in Australia and New Zealandentered into a Facility Agreement (the “Australia/New Zealand Credit Agreement”) with a financial institutionbased in those countries. The Australia/New Zealand Credit Agreement permits the subsidiaries in Australia andNew Zealand to borrow up to a maximum of A$80 million subject to a borrowing base calculation that limitsavailability to a percentage of eligible accounts receivable plus a percentage of the value of certain ownedproperties, less certain reserves. At the end of fiscal year 2011, the subsidiaries in Australia and New Zealandwere in compliance with all covenants under the Australia/New Zealand Credit Agreement. The Australia/NewZealand Credit Agreement expires on March 15, 2013.
64

Availability under the Company’s credit agreements at the end of fiscal year 2011 was as follows:
2011
NorthAmericanAgreement
Australia/New ZealandAgreement Total
(millions)
Maximum aggregate available borrowing amount . . . . . . . . . . . . . . . . . . . . . . $632.2 $52.9 $685.1Less: Stand-by letters of credit . . . . . . . . . . . . . . . . . . . . . . . . . . . . . . . . . . . . . . (51.9) — (51.9)
Amount available for borrowing at fiscal year-end . . . . . . . . . . . . . . . . . . . . . . $580.3 $52.9 $633.2
There were no borrowings under the Company’s credit agreements in 2011 or 2010.
Other
At the end of fiscal year 2011, Grupo OfficeMax, our 51%-owned joint venture in Mexico, had totaloutstanding borrowings of $8.5 million. This included $4.9 million outstanding under a 60-month installmentnote due in the first quarter of 2014 and $3.6 million outstanding under a 54-month installment note due in thethird quarter of 2014. Payments on the installment loans are made monthly. Recourse on the Grupo OfficeMaxloans is limited to Grupo OfficeMax. The installment loan maturing in the third quarter of 2014 is secured bycertain owned property of Grupo OfficeMax. All other Grupo OfficeMax loan facilities are unsecured.
Cash Paid for Interest
Cash payments for interest, net of interest capitalized and including interest payments related to the timbersecuritization notes, were $69.8 million in 2011, $68.9 million in 2010 and $71.8 million in 2009. Cash interestpayments made on the Securitization Notes are completely offset by interest payments received on theInstallment Notes.
11. Financial Instruments, Derivatives and Hedging Activities
Fair Value of Financial Instruments
The carrying amounts of cash and cash equivalents, trade accounts receivable, other assets (non-derivatives), short-term borrowings and trade accounts payable approximate fair value because of the shortmaturity of these instruments. The following table presents the carrying amounts and estimated fair values of theCompany’s other financial instruments at December 31, 2011 and December 25, 2010. The fair value of afinancial instrument is the amount at which the instrument could be exchanged in a current transaction betweenwilling parties.
December 31, 2011
Fair Value CarryingAmountLevel 1 Level 2 Level 3 Total
(thousands)
Financial assets:Timber notes receivable
Wachovia . . . . . . . . . . . . . . . . . . . . . . . . . . . . . $ — $943,706 $ — $943,706 $817,500Lehman . . . . . . . . . . . . . . . . . . . . . . . . . . . . . . . $ — $ — $81,750 $ 81,750 $ 81,750
Financial liabilities:Recourse debt . . . . . . . . . . . . . . . . . . . . . . . . . . . . . . $62,293 $178,461 $ — $240,754 $268,190Non-recourse debt
Wachovia . . . . . . . . . . . . . . . . . . . . . . . . . . . . . $ — $858,779 $ — $858,779 $735,000Lehman . . . . . . . . . . . . . . . . . . . . . . . . . . . . . . . $ — $ — $81,750 $ 81,750 $735,000
65

December 25, 2010
Fair Value CarryingAmountLevel 1 Level 2 Level 3 Total
(thousands)
Financial assets:Timber notes receivable
Wachovia . . . . . . . . . . . . . . . . . . . . . . . . . . . . . . . $— $888,288 $ — $888,288 $817,500Lehman . . . . . . . . . . . . . . . . . . . . . . . . . . . . . . . . $— $ — $81,750 $ 81,750 $ 81,750
Financial liabilities:Recourse debt . . . . . . . . . . . . . . . . . . . . . . . . . . . . . . . $— $255,519 $ — $255,519 $274,995Non-recourse debt
Wachovia . . . . . . . . . . . . . . . . . . . . . . . . . . . . . . . $— $811,093 $ — $811,093 $735,000Lehman . . . . . . . . . . . . . . . . . . . . . . . . . . . . . . . . $— $ — $81,750 $ 81,750 $735,000
In establishing a fair value, there is a fair value hierarchy that prioritizes the inputs to valuation techniquesused to measure fair value. The basis of the fair value measurement is categorized in three levels, in order ofpriority, described as follows:
Level 1: Unadjusted quoted prices in active markets that are accessible at the measurement date foridentical, unrestricted assets or liabilities.
Level 2: Quoted prices in markets that are not active, or financial instruments for which all significant inputsare observable either directly or indirectly.
Level 3: Prices or valuation techniques that require inputs are both significant to the fair value measurementand unobservable thus reflecting assumptions about the market participants.
The carrying amounts shown in the table are included in the Consolidated Balance Sheets under theindicated captions. The following methods and assumptions were used to estimate the fair value of each class offinancial instruments:
• Timber notes receivable: The fair value of the Wachovia Guaranteed Installment Notes is determinedas the present value of expected future cash flows discounted at the current interest rate for loans ofsimilar terms with comparable credit risk (Level 2 inputs). The fair value of the Lehman GuaranteedInstallment Note reflects the estimated future cash flows of the note considering the estimated effectsof the Lehman bankruptcy (Level 3 inputs).
• Recourse debt: The Company’s debt instruments are not widely traded. Recourse debt for which therewere trades on the last day of the period (the “measurement date”) was valued using the unadjustedquoted price from the last trade on the measurement date (Level 1 input). Recourse debt for whichthere were no transactions on the measurement date was valued based on quoted market prices near themeasurement date when available or by discounting the future cash flows of each instrument usingrates based on the most recently observable trade or using rates currently offered to the Company forsimilar debt instruments of comparable maturities (Level 2 inputs).
• Non-recourse debt: The fair value of the Securitization Notes supported by Wachovia is estimated bydiscounting the future cash flows of the instrument at rates currently available to the Company forsimilar instruments of comparable maturities (Level 2 inputs). The Securitization Notes supported byLehman is estimated based on the future cash flows of the Lehman Guaranteed Installment Note (theproceeds from which are the sole source of payment of this note) in a bankruptcy proceeding (Level 3inputs).
During 2011, there was no change in assets and liabilities measured at estimated fair value using Level 3inputs.
66

Derivatives and Hedging Activities
Changes in foreign currency exchange rates expose the Company to financial market risk. The Companyoccasionally uses derivative financial instruments, such as forward exchange contracts, to manage its exposureassociated with commercial transactions and certain liabilities that are denominated in a currency other than thecurrency of the operating unit entering into the underlying transaction. The Company does not enter intoderivative instruments for any other purpose. The Company does not speculate using derivative instruments. Thefair values of derivative financial instruments were not material at the end of fiscal year 2011 or 2010.
12. Retirement and Benefit Plans
Pension and Other Postretirement Benefit Plans
The Company sponsors noncontributory defined benefit pension plans covering certain terminatedemployees, vested employees, retirees and some active employees, primarily in Contract. In 2004 or earlier, theCompany’s qualified pension plans were closed to new entrants and the benefits of eligible participants werefrozen.
Under the terms of the Company’s qualified plans, the pension benefit for employees was based primarilyon the employees’ years of service and benefit plan formulas that varied by plan. The Company’s generalfunding policy is to make contributions to the plans in amounts that are within the limits of deductibility undercurrent tax regulations, and not less than the minimum contribution required by law.
The Company also sponsors various retiree medical benefit and life insurance plans. The type of retireebenefits and the extent of coverage vary based on employee classification, date of retirement, location, and otherfactors. All of the Company’s postretirement medical plans are unfunded. The Company explicitly reserves theright to amend or terminate its retiree medical and life insurance plans at any time, subject only to constraints, ifany, imposed by the terms of collective bargaining agreements. Amendment or termination may significantlyaffect the amount of expense incurred.
During 2009, based on the high level of inactive participants in the Company’s qualified pension plans aswell as the fact that all qualified plan participants were fully vested, the Company changed the estimatedamortization period for its unrecognized actuarial loss (which represents the difference between the actual fundedstatus and the expected funded status measured through 2009), from the average remaining service period of theparticipants to their average remaining life expectancy. The impact of the change in the amortization period wasa reduction in pension expense for 2009 of $11.2 million ($6.8 million after-tax), or $0.09 per diluted share.
67

Obligations and Funded Status
The changes in pension and other postretirement benefit obligations and plan assets during 2011 and 2010,as well as the funded status of the Company’s plans at December 31, 2011 and December 25, 2010, were asfollows:
Pension Benefits Other Benefits
2011 2010 2011 2010
(thousands)
Change in benefit obligation:Benefit obligation at beginning of year . . . . . . . . . . . . . . . . . . . $1,297,655 $1,260,676 $ 24,021 $ 20,337Service cost . . . . . . . . . . . . . . . . . . . . . . . . . . . . . . . . . . . . . . . . . 2,546 3,164 227 263Interest cost . . . . . . . . . . . . . . . . . . . . . . . . . . . . . . . . . . . . . . . . . 70,176 74,213 1,006 1,213Actuarial loss . . . . . . . . . . . . . . . . . . . . . . . . . . . . . . . . . . . . . . . 94,656 59,494 (1,334) 2,634Changes due to exchange rates . . . . . . . . . . . . . . . . . . . . . . . . . . — — (346) 792Benefits paid . . . . . . . . . . . . . . . . . . . . . . . . . . . . . . . . . . . . . . . . (99,752) (99,892) (1,322) (1,218)
Benefit obligation at end of year . . . . . . . . . . . . . . . . . . . . . . . . $1,365,281 $1,297,655 $ 22,252 $ 24,021
Change in plan assets:Fair value of plan assets at beginning of year . . . . . . . . . . . . . . $1,117,413 $1,050,514 $ — $ —Actual return on plan assets . . . . . . . . . . . . . . . . . . . . . . . . . . . . 14,746 163,342 — —Employer contributions . . . . . . . . . . . . . . . . . . . . . . . . . . . . . . . 3,324 3,449 1,322 1,218Benefits paid . . . . . . . . . . . . . . . . . . . . . . . . . . . . . . . . . . . . . . . . (99,752) (99,892) (1,322) (1,218)
Fair value of plan assets at end of year . . . . . . . . . . . . . . . . . . . . $1,035,731 $1,117,413 $ — $ —
Funded status . . . . . . . . . . . . . . . . . . . . . . . . . . . . . . . . . . . . . . . $ (329,550) $ (180,242) $(22,252) $(24,021)
The following table shows the amounts recognized in the Consolidated Balance Sheets related to theCompany’s defined benefit pension and other postretirement benefit plans at year-end:
Pension Benefits Other Benefits
2011 2010 2011 2010
(thousands)
Noncurrent assets . . . . . . . . . . . . . . . . . . . . . . . . . . . . . . . . . . . . . . $ — $ 4,581 $ — $ —Current liabilities . . . . . . . . . . . . . . . . . . . . . . . . . . . . . . . . . . . . . . (6,530) (6,683) (1,243) (1,445)Noncurrent liabilities . . . . . . . . . . . . . . . . . . . . . . . . . . . . . . . . . . . (323,020) (178,140) (21,009) (22,576)
Net amount recognized . . . . . . . . . . . . . . . . . . . . . . . . . . . . . . . . . $(329,550) $(180,242) $(22,252) $(24,021)
Amounts recognized in accumulated other comprehensive loss consist of:
Net loss . . . . . . . . . . . . . . . . . . . . . . . . . . . . . . . . . . . . . . . . . . . . . . . $548,212 $406,465 $ 4,486 $ 6,054Prior service cost (credit) . . . . . . . . . . . . . . . . . . . . . . . . . . . . . . . . . — — (22,138) (26,147)
Total . . . . . . . . . . . . . . . . . . . . . . . . . . . . . . . . . . . . . . . . . . . . . . . . . $548,212 $406,465 $(17,652) $(20,093)
The accumulated benefit obligation for all defined benefit pension plans was $1,365.3 million and $1,297.7million for December 31, 2011 and December 25, 2010, respectively.
68

Information for pension plans with an accumulated benefit obligation in excess of plan assets is as follows:
Pension Benefits
2011 2010
(thousands)Projected benefit obligation . . . . . . . . . . . . . . . . . . . . . . . . . . . . . . . . . . . . . . . . . . . . . . . . . . . $1,365,281 $1,263,206Accumulated benefit obligation . . . . . . . . . . . . . . . . . . . . . . . . . . . . . . . . . . . . . . . . . . . . . . . . 1,365,281 1,263,206Fair value of plan assets . . . . . . . . . . . . . . . . . . . . . . . . . . . . . . . . . . . . . . . . . . . . . . . . . . . . . . 1,035,731 1,078,383
Components of Net Periodic Benefit Cost (Income)
The components of net periodic benefit cost (income) are as follows:
Pension Benefits Other Benefits
2011 2010 2009 2011 2010 2009
(thousands)Service cost . . . . . . . . . . . . . . . . . . . . . . . . . . . . . . . . . $ 2,546 $ 3,164 $ 4,506 $ 227 $ 263 $ 184Interest cost . . . . . . . . . . . . . . . . . . . . . . . . . . . . . . . . . 70,176 74,213 75,858 1,006 1,213 1,137Expected return on plan assets . . . . . . . . . . . . . . . . . . . (79,289) (83,494) (76,623) — — —Recognized actuarial loss . . . . . . . . . . . . . . . . . . . . . . 17,371 13,239 10,330 220 224 147Amortization of prior service credits . . . . . . . . . . . . . . — — — (4,009) (4,006) (4,001)Other . . . . . . . . . . . . . . . . . . . . . . . . . . . . . . . . . . . . . . 80 149 — — — —
Net periodic benefit cost (income) . . . . . . . . . . . . . . . $ 10,884 $ 7,271 $ 14,071 $(2,556) $(2,306) $(2,533)
Other changes in plan assets and benefit obligations recognized in other comprehensive income are asfollows:
Pension Benefits Other Benefits
2011 2010 2011 2010
(thousands)Accumulated other comprehensive (income) loss at beginning ofyear . . . . . . . . . . . . . . . . . . . . . . . . . . . . . . . . . . . . . . . . . . . . . . . . . . . . $406,465 $440,206 $(20,093) $(26,627)
Net loss (gain) . . . . . . . . . . . . . . . . . . . . . . . . . . . . . . . . . . . . . . . . . . . . . . 159,118 (20,502) (1,334) 2,634Amortization of net loss . . . . . . . . . . . . . . . . . . . . . . . . . . . . . . . . . . . . . . (17,371) (13,239) (220) (224)Amortization of prior service credits . . . . . . . . . . . . . . . . . . . . . . . . . . . . . — — 4,009 4,006Canadian rate adjustment . . . . . . . . . . . . . . . . . . . . . . . . . . . . . . . . . . . . . — — (14) 118
Accumulated other comprehensive (income) loss at end of year . . . . . . . $548,212 $406,465 $(17,652) $(20,093)
The estimated net loss for the defined benefit pension plans that will be amortized from accumulated othercomprehensive loss into net periodic benefit cost over the next fiscal year is $18.0 million. There will be noestimated prior service cost for the defined benefit pension plans amortized from accumulated othercomprehensive loss into net periodic benefit cost over the next fiscal year. The estimated net loss and priorservice credit for the other postretirement benefit plans that will be amortized from accumulated othercomprehensive income (loss) into net periodic benefit cost over the next fiscal year is $0.2 million and$4.0 million, respectively.
Assumptions
The assumptions used in accounting for the Company’s plans are estimates of factors including, amongother things, the amount and timing of future benefit payments. The following table presents the key weightedaverage assumptions used in the measurement of the Company’s benefit obligations as of year-end:
Other Benefits
Pension Benefits United States Canada
2011 2010 2011 2010 2011 2010
Discount rate . . . . . . . . . . . . . . . . . . . . . . . . . . . . . . . . . . . . . . . . . . . 4.93% 5.64% 3.70% 4.50% 4.50% 5.30%
69

The following table presents the weighted average assumptions used in the measurement of net periodicbenefit cost as of year-end:
Other Benefits
Pension Benefits United States Canada
2011 2010 2009 2011 2010 2009 2011 2010 2009
Discount rate . . . . . . . . . . . . . . . . . . . . . 5.64% 6.15% 6.20% 4.50% 5.10% 6.10% 5.30% 6.40% 7.30%Expected long-term return on planassets . . . . . . . . . . . . . . . . . . . . . . . . . . 8.20% 8.20% 7.50% — — — — — —
In 2011 and 2010, the assumed discount rate (which is required to be the rate at which the projected benefitobligation could be effectively settled as of the measurement date) is based on the rates of return for a theoreticalportfolio of high-grade corporate bonds (rated Aa1 or better) with cash flows that generally match our expectedbenefit payments in future years. In selecting bonds for this theoretical portfolio, we focus on bonds that matchcash flows to benefit payments and limit our concentration of bonds by issuer. To the extent scheduled bondproceeds exceed the estimated benefit payments in a given period, the yield calculation assumes those excessproceeds are reinvested at an assumed forward rate. The implied forward rates used in the 2011 and 2010 bondmodels are based on the Citigroup Pension Discount Curve as of the last day of each year. In the 2009 bondmodel, the implied forward rates used were based on the forecasted three-month Treasury bill rates.
The expected long-term rate of return on plan assets assumption is based on the weighted average ofexpected returns for the major asset classes in which the plans’ assets are held. Asset-class expected returns arebased on long-term historical returns, inflation expectations, forecasted gross domestic product and earningsgrowth, as well as other economic factors. The weights assigned to each asset class are based on the Company’sinvestment strategy. The weighted average expected return on plan assets used in the calculation of net periodicpension benefit cost for 2012 is 8.2%.
Obligation and costs related to the Canadian retiree health plan are impacted by changes in trend rates.
The following table presents the assumed healthcare cost trend rates used in measuring the Company’spostretirement benefit obligations at December 31, 2011 and December 25, 2010:
2011 2010
Weighted average assumptions as of year-end:Healthcare cost trend rate assumed for next year . . . . . . . . . . . . . . . . . . . . . . . . . . . . . . . . . . . . . . 6.5% 7.0%Rate to which the cost trend rate is assumed to decline (the ultimate trend rate) . . . . . . . . . . . . . . 5.0% 5.0%Year that the rate reaches the ultimate trend rate . . . . . . . . . . . . . . . . . . . . . . . . . . . . . . . . . . . . . . 2015 2015
A one-percentage-point change in the assumed healthcare cost trend rates would impact operating incomeby approximately $1 million.
Plan Assets
The allocation of pension plan assets by category at December 31, 2011 and December 25, 2010 is asfollows:
2011 2010
OfficeMax common stock . . . . . . . . . . . . . . . . . . . . . . . . . . . . . . . . . . . . . . . . . . . . . . . . . . . . . . . . . 1.2% 5.0%U.S. equity securities . . . . . . . . . . . . . . . . . . . . . . . . . . . . . . . . . . . . . . . . . . . . . . . . . . . . . . . . . . . . . 27.0% 15.7%International equity securities . . . . . . . . . . . . . . . . . . . . . . . . . . . . . . . . . . . . . . . . . . . . . . . . . . . . . . 10.3% 9.2%Global equity securities . . . . . . . . . . . . . . . . . . . . . . . . . . . . . . . . . . . . . . . . . . . . . . . . . . . . . . . . . . . 15.8% 14.4%Fixed-income securities . . . . . . . . . . . . . . . . . . . . . . . . . . . . . . . . . . . . . . . . . . . . . . . . . . . . . . . . . . 45.7% 55.7%
100% 100%
70

The Company’s Retirement Funds Investment Committee is responsible for establishing and overseeing theimplementation of the investment policy for the Company’s pension plans. The investment policy is structured tooptimize growth of the pension plan trust assets, while minimizing the risk of significant losses, in order toenable the plans to satisfy their benefit payment obligations over time. Plan assets are invested primarily inOfficeMax common stock, U.S. equities, global equities, international equities and fixed-income securities. TheCompany uses benefit payments and Company contributions as its primary rebalancing mechanisms to maintainthe asset class exposures within the guideline ranges established under the investment policy.
The current asset allocation guidelines set forth an OfficeMax common stock range of 0% to 15%, a U.S.equity range of 20% to 40%, an international equity range of 6% to 16%, a global equity range of 11% to 22%and a fixed-income range of 35% to 55%. Asset-class positions within the ranges are continually evaluated andadjusted based on expectations for future returns, the funded position of the plans and market risks. Occasionally,the Company may utilize futures or other financial instruments to alter the pension trust’s exposure to variousasset classes in a lower-cost manner than trading securities in the underlying portfolios.
In 2009, we contributed 8.3 million shares of OfficeMax common stock to our qualified pension plans,which are managed by an independent fiduciary. At the end of 2011, the plan held 2.8 million shares with a valueof $12.6 million.
Generally, quoted market prices are used to value pension plan assets. Equities, some fixed-incomesecurities, publicly traded investment funds, and U.S. government obligations are valued by reference topublished market prices. Investments in certain restricted stocks are valued at the quoted market price of theissuer’s unrestricted common stock less an appropriate discount. If a quoted market price for unrestrictedcommon stock of the issuer is not available, restricted common stocks are valued at a multiple of current earningsless an appropriate discount. The multiple chosen is consistent with multiples of similar companies based oncurrent market prices.
The following table presents the pension plan assets by level within the fair value hierarchy as ofDecember 31, 2011.
Level 1 Level 2 Level 3
(thousands)
Money market funds . . . . . . . . . . . . . . . . . . . . . . . . . . . . . . . . . . . . . . . . . . . . . . . . $ — $ 19,280 $ —Equity securities:
OfficeMax common stock . . . . . . . . . . . . . . . . . . . . . . . . . . . . . . . . . . . . . . . 12,585 — —U.S. large-cap . . . . . . . . . . . . . . . . . . . . . . . . . . . . . . . . . . . . . . . . . . . . . . . . . 53,629 — —U.S. small and mid-cap . . . . . . . . . . . . . . . . . . . . . . . . . . . . . . . . . . . . . . . . . 13,529 — —International . . . . . . . . . . . . . . . . . . . . . . . . . . . . . . . . . . . . . . . . . . . . . . . . . . 84,647 — —
Fixed-Income:Corporate bonds . . . . . . . . . . . . . . . . . . . . . . . . . . . . . . . . . . . . . . . . . . . . . . . — 421,027 —Government securities . . . . . . . . . . . . . . . . . . . . . . . . . . . . . . . . . . . . . . . . . . — 7,785 —Other fixed-income . . . . . . . . . . . . . . . . . . . . . . . . . . . . . . . . . . . . . . . . . . . . — 24,907 —
Other:Equity mutual funds . . . . . . . . . . . . . . . . . . . . . . . . . . . . . . . . . . . . . . . . . . . . — 385,862 —Group annuity contracts . . . . . . . . . . . . . . . . . . . . . . . . . . . . . . . . . . . . . . . . . — 0 5,662Other, including plan receivables and payables . . . . . . . . . . . . . . . . . . . . . . . 5,665 1,153 —
$170,055 $860,014 $5,662
71

The following is a reconciliation of the change in fair value of the pension plan assets calculated based onLevel 3 inputs:
Total
(thousands)
Balance at December 31, 2010 . . . . . . . . . . . . . . . . . . . . . . . . . . . . . . . . . . . . . . . . . . . . . . . . . . . . . . . . . $5,357Benefit payments and administrative expenses . . . . . . . . . . . . . . . . . . . . . . . . . . . . . . . . . . . . . . . . . . . . (10)Investment income and net appreciation in investments . . . . . . . . . . . . . . . . . . . . . . . . . . . . . . . . . . . . . 315
Balance at December 31, 2011 . . . . . . . . . . . . . . . . . . . . . . . . . . . . . . . . . . . . . . . . . . . . . . . . . . . . . . . . . $5,662
Purchases and sales of securities are recorded on a trade-date basis. Interest income is recorded on theaccrual basis. Dividends are recorded on the ex-dividend date.
Cash Flows
Pension plan contributions include required statutory minimum amounts and, in some years, additionaldiscretionary amounts. During 2011, 2010 and 2009, the Company made cash contributions to its pension planstotaling $3.3 million, $3.4 million and $6.8 million, respectively. Pension contributions for 2012 are estimated tobe $28.5 million. The Company may elect at any time to make additional voluntary contributions.
Qualified pension benefit payments are paid from the assets held in the plan trust, while nonqualified pension andother benefit payments are paid by the Company. Future benefit payments by year are estimated to be as follows:
PensionBenefits
OtherBenefits
(thousands)
2012 . . . . . . . . . . . . . . . . . . . . . . . . . . . . . . . . . . . . . . . . . . . . . . . . . . . . . . . . . . . . . . . . . . . . . $101,662 $1,2432013 . . . . . . . . . . . . . . . . . . . . . . . . . . . . . . . . . . . . . . . . . . . . . . . . . . . . . . . . . . . . . . . . . . . . . 97,782 1,2022014 . . . . . . . . . . . . . . . . . . . . . . . . . . . . . . . . . . . . . . . . . . . . . . . . . . . . . . . . . . . . . . . . . . . . . 97,139 1,1702015 . . . . . . . . . . . . . . . . . . . . . . . . . . . . . . . . . . . . . . . . . . . . . . . . . . . . . . . . . . . . . . . . . . . . . 95,824 1,1422016 . . . . . . . . . . . . . . . . . . . . . . . . . . . . . . . . . . . . . . . . . . . . . . . . . . . . . . . . . . . . . . . . . . . . . 94,947 1,1212017-2021 . . . . . . . . . . . . . . . . . . . . . . . . . . . . . . . . . . . . . . . . . . . . . . . . . . . . . . . . . . . . . . . . . 458,868 5,549
Defined Contribution Plans
The Company also sponsors defined contribution plans for most of its employees. Through 2004, theCompany sponsored four contributory defined contribution savings plans for most of its salaried and hourlyemployees: a plan for Retail employees, a plan for non-Retail salaried employees, a plan for union hourlyemployees, and a plan for non-Retail, nonunion hourly employees. The plan for non-Retail salaried employeesincluded an employee stock ownership plan (“ESOP”) component and the Company’s Series D ESOPconvertible preferred stock were fully allocated to eligible participants in prior years. Total Companycontributions to the defined contribution savings plans were $7.0 million in 2011, $3.2 million in 2010 and$1.3 million in 2009.
13. Shareholders’ Equity
Preferred Stock
At December 31, 2011, 638,353 shares of 7.375% Series D ESOP convertible preferred stock wereoutstanding, compared with 686,696 shares outstanding at December 25, 2010. The Series D ESOP convertiblepreferred stock is shown in the Consolidated Balance Sheets at its liquidation preference of $45 per share. Allshares outstanding have been allocated to participants in the plan. Each ESOP preferred share is entitled to one
72

vote, bears an annual cumulative dividend of $3.31875 per share and is convertible at any time by the trustee to0.82168 share of common stock per share of preferred stock. The ESOP preferred shares may not be redeemedfor less than the liquidation preference.
Common Stock
The Company is authorized to issue 200,000,000 shares of common stock, of which 86,158,662 shares wereissued and outstanding at December 31, 2011. Of the unissued shares, 10,960,412 shares were reserved for thefollowing purposes:
Conversion or redemption of Series D ESOP preferred stock . . . . . . . . . . . . . . . . . . . . . . . . . . . . . . . . 524,521Issuance under 2003 OfficeMax Incentive and Performance Plan . . . . . . . . . . . . . . . . . . . . . . . . . . . . . 9,619,788Issuance under Key Executive Stock Option Plan . . . . . . . . . . . . . . . . . . . . . . . . . . . . . . . . . . . . . . . . . 744,000Issuance under Director Stock Compensation Plan . . . . . . . . . . . . . . . . . . . . . . . . . . . . . . . . . . . . . . . . 7,475Issuance under Director Stock Option Plan . . . . . . . . . . . . . . . . . . . . . . . . . . . . . . . . . . . . . . . . . . . . . . 5,000Issuance under 2001 Key Executive Deferred Compensation Plan . . . . . . . . . . . . . . . . . . . . . . . . . . . . 2,441Issuance under 2003 Director Stock Compensation Plan . . . . . . . . . . . . . . . . . . . . . . . . . . . . . . . . . . . . 57,187
Accumulated Other Comprehensive Income (Loss)
Accumulated other comprehensive income (loss) includes the following:
Pension andPostretirement
LiabilityAdjustment
ForeignCurrencyTranslationAdjustment
UnrealizedHedge LossAdjustment
AccumulatedOther
ComprehensiveIncome (Loss)
(thousands)
Balance at December 26, 2009 . . . . . . . . . . . . . . . . . . . $(253,179) $120,664 $ — $(132,515)Current-period changes, before taxes . . . . . . . . . . . . . . 27,263 21,290 (1,233) 47,320Income taxes . . . . . . . . . . . . . . . . . . . . . . . . . . . . . . . . . (10,907) — 349 (10,558)
Balance at December 25, 2010 . . . . . . . . . . . . . . . . . . . $(236,823) $141,954 $ (884) $ (95,753)Current-period changes, before taxes . . . . . . . . . . . . . . (144,236) (6,195) 1,435 (148,996)Income taxes . . . . . . . . . . . . . . . . . . . . . . . . . . . . . . . . . 55,482 — (394) 55,088
Balance at December 31, 2011 . . . . . . . . . . . . . . . . . . . $(325,577) $135,759 $ 157 $(189,661)
Share-Based Payments
The Company sponsors several share-based compensation plans, which are described below. The Companyrecognizes compensation expense from all share-based payment transactions with employees in the consolidatedfinancial statements at fair value. Compensation costs related to the Company’s share-based plans were$16.7 million, $13.2 million and $8.5 million for 2011, 2010 and 2009, respectively. Compensation expense isgenerally recognized on a straight-line basis over the vesting period of grants. The total income tax benefitrecognized in the income statement for share-based compensation arrangements was $6.5 million, $5.1 millionand $3.3 million for 2011, 2010 and 2009, respectively.
2003 Director Stock Compensation Plan and OfficeMax Incentive and Performance Plan
In February 2003, the Company’s Board of Directors adopted the 2003 Director Stock Compensation Plan(the “2003 DSCP”) and the 2003 OfficeMax Incentive and Performance Plan (the “2003 Plan,” formerly namedthe 2003 Boise Incentive and Performance Plan), which were approved by shareholders in April 2003. AtDecember 31, 2011, a total of 57,187 shares of common stock were reserved for issuance under the 2003 DSCP,and a total of 9,619,788 shares of common stock were reserved for issuance under the 2003 Plan.
73

The 2003 Plan was effective January 1, 2003, and replaced the Key Executive Performance Plan forExecutive Officers, Key Executive Performance Plan for Key Executives/Key Managers, Key Executive StockOption Plan (“KESOP”), Key Executive Performance Unit Plan (“KEPUP”) and Director Stock Option Plan(“DSOP”). No further grants or awards have been made under the Key Executive Performance Plans, KESOP,KEPUP, or DSOP since 2003.
The Company’s executive officers, key employees and nonemployee directors are eligible to receive awardsunder the 2003 Plan at the discretion of the Executive Compensation Committee of the Board of Directors. Eighttypes of awards may be granted under the 2003 Plan, including stock options, stock appreciation rights, restrictedstock, restricted stock units, performance units, performance shares, annual incentive awards and stock bonusawards.
Restricted Stock and Restricted Stock Units
Restricted stock is restricted until it vests and cannot be sold by the recipient until its restrictions havelapsed. Each restricted stock unit (“RSU”) is convertible into one share of common stock after its restrictionshave lapsed. No entries are made in the financial statements on the grant date of restricted stock and RSU awards.The Company recognizes compensation expense related to these awards over the vesting periods based on theclosing price of the Company’s common stock on the grant dates. The Company calculates the grant date fairvalue of the RSU awards by multiplying the number of RSUs by the closing price of the Company’s commonstock on the grant date. If these awards contain performance criteria the grant date fair value is set assumingperformance at target, and management periodically reviews actual performance against the criteria and adjustscompensation expense accordingly. In 2011, 2010 and 2009, the Company recognized $5.6 million, $8.0 millionand $6.1 million, respectively, of pre-tax compensation expense and additional paid-in capital related torestricted stock and RSU awards. The remaining compensation expense to be recognized related to outstandingrestricted stock and RSUs, net of estimated forfeitures, is approximately $2.0 million. The remainingcompensation expense is to be recognized through the first quarter of 2014.
A summary of restricted stock and RSU activity for fiscal years 2011, 2010 and 2009 is presented in thefollowing table:
Shares
Weighted-AverageGrant Date FairValue Per Share
Nonvested, December 27, 2008 . . . . . . . . . . . . . . . . . . . . . . . . . . . . . . . . . . . . . . . . 2,258,961 $31.07Granted . . . . . . . . . . . . . . . . . . . . . . . . . . . . . . . . . . . . . . . . . . . . . . . . . . . . . . . 800,828 5.08Vested . . . . . . . . . . . . . . . . . . . . . . . . . . . . . . . . . . . . . . . . . . . . . . . . . . . . . . . . (496,813) 5.65Forfeited . . . . . . . . . . . . . . . . . . . . . . . . . . . . . . . . . . . . . . . . . . . . . . . . . . . . . . (633,031) 5.24
Nonvested, December 26, 2009 . . . . . . . . . . . . . . . . . . . . . . . . . . . . . . . . . . . . . . . . 1,929,945 $16.24Granted . . . . . . . . . . . . . . . . . . . . . . . . . . . . . . . . . . . . . . . . . . . . . . . . . . . . . . . 872,534 13.81Vested . . . . . . . . . . . . . . . . . . . . . . . . . . . . . . . . . . . . . . . . . . . . . . . . . . . . . . . . (1,492) 33.70Forfeited . . . . . . . . . . . . . . . . . . . . . . . . . . . . . . . . . . . . . . . . . . . . . . . . . . . . . . (689,852) 20.34
Nonvested, December 25, 2010 . . . . . . . . . . . . . . . . . . . . . . . . . . . . . . . . . . . . . . . . 2,111,135 $13.89Granted . . . . . . . . . . . . . . . . . . . . . . . . . . . . . . . . . . . . . . . . . . . . . . . . . . . . . . . 648,224 12.17Vested . . . . . . . . . . . . . . . . . . . . . . . . . . . . . . . . . . . . . . . . . . . . . . . . . . . . . . . . (1,047,406) 15.77Forfeited . . . . . . . . . . . . . . . . . . . . . . . . . . . . . . . . . . . . . . . . . . . . . . . . . . . . . . (223,703) 11.64
Nonvested, December 31, 2011 . . . . . . . . . . . . . . . . . . . . . . . . . . . . . . . . . . . . . . . . 1,488,250 $12.15
Restricted stock and RSUs are not included as shares outstanding in the calculation of basic earnings pershare, but are included in the number of shares used to calculate diluted earnings per share as long as allapplicable performance criteria are met, and their effect is dilutive. When the restriction lapses on restricted
74

stock, the par value of the stock is reclassified from additional paid-in-capital to common stock. When therestriction lapses on RSUs, the units are converted to unrestricted shares of our common stock and the par valueof the stock is reclassified from additional paid-in-capital to common stock. Unrestricted shares are included inshares outstanding for purposes of calculating both basic and diluted earnings per share. Depending on the termsof the applicable grant agreement, restricted stock and RSUs may be eligible to accrue all dividends declared onthe Company’s common stock during the vesting period; however, such dividends are not paid until therestrictions lapse.
Stock Units
The Company previously had a shareholder approved deferred compensation program for certain of itsexecutive officers that allowed them to defer a portion of their cash compensation. Previously, these executiveofficers could allocate their deferrals to a stock unit account. Each stock unit is equal in value to one share of theCompany’s common stock. The Company matched deferrals used to purchase stock units with a 25% Companyallocation of stock units. The value of deferred stock unit accounts is paid in shares of the Company’s commonstock when an executive officer retires or terminates employment. There were 2,441 and 3,889 stock unitsallocated to the accounts of these executive officers at December 31, 2011 and December 25, 2010, respectively.As a result of an amendment to the plan, no additional deferrals can be allocated to the stock unit accounts.
Stock Options
The Company’s stock options generally are issued at a price equal to fair market value on the grant date andtypically expire within seven years of the grant date. Stock options granted under the OfficeMax Incentive andPerformance Plan generally vest over a three year period. In 2011, 2010 and 2009, the Company recognized$11.1 million, $5.2 million and $2.4 million, respectively, of pre-tax compensation expense and additionalpaid-in capital related to stock options. The remaining compensation expense to be recognized related tooutstanding stock options, net of estimated forfeitures, is approximately $8.3 million. The remainingcompensation expense is to be recognized through the first quarter of 2014.
A summary of stock option activity for fiscal years 2011, 2010 and 2009 is presented in the following table:
2011 2010 2009
SharesWtd. Avg.Ex. Price Shares
Wtd. Avg.Ex. Price Shares
Wtd. Avg.Ex. Price
Balance at beginning of year . . . . . . . . 4,313,290 $16.52 3,249,773 $15.14 1,495,795 $31.95Options granted . . . . . . . . . . . . . . . . . . 1,457,280 13.33 2,060,246 16.24 2,071,360 4.77Options exercised . . . . . . . . . . . . . . . . (405,988) 4.80 (408,519) 4.80 — —Options forfeited and expired . . . . . . . (548,030) 13.80 (588,210) 16.02 (317,382) 26.70
Balance at end of year . . . . . . . . . . . . . 4,816,552 $16.86 4,313,290 $16.52 3,249,773 $15.14
Exercisable at end of year . . . . . . . . . . 2,122,136 1,301,257 1,225,646
Weighted average fair value of optionsgranted (Black-Scholes) . . . . . . . . . $ 7.07 $ 8.08 $ 2.63
75

The following table provides summarized information about stock options outstanding at December 31,2011:
Options Outstanding Options Exercisable
Range of Exercise PricesOptions
Outstanding
WeightedAverage
ContractualLife (Years)
WeightedAverageExercisePrice
OptionsExercisable
WeightedAverageExercisePrice
$2.50 . . . . . . . . . . . . . . . . . . . . . . . . . . . . . . . . . . . . . 11,171 — $ 2.50 11,171 $ 2.50$4.00 – $7.00 . . . . . . . . . . . . . . . . . . . . . . . . . . . . . . . 1,192,317 4.8 4.99 506,227 4.72$10.00 – $16.00 . . . . . . . . . . . . . . . . . . . . . . . . . . . . . 813,274 5.2 14.13 264,738 14.51$16.00 – $17.00 . . . . . . . . . . . . . . . . . . . . . . . . . . . . . 809,790 6.1 16.86 — —$18.00 – $19.00 . . . . . . . . . . . . . . . . . . . . . . . . . . . . . 975,000 5.9 18.15 325,000 18.15$24.00 – $37.00 . . . . . . . . . . . . . . . . . . . . . . . . . . . . . 1,015,000 0.9 31.89 1,015,000 31.89
At December 31, 2011, the aggregate intrinsic value was less than $1.0 million for both outstanding stockoptions and exercisable stock options. The aggregate intrinsic value represents the total pre-tax intrinsic value(i.e. the difference between the Company’s closing stock price on the last trading day of the fourth quarter of2011 and the exercise price, multiplied by the number of in-the-money stock options at the end of the quarter).
In 2011, the Company granted stock options for 1,457,280 shares of our common stock and estimated thefair value of each stock option award on the date of grant using the Black-Scholes option pricing model with thefollowing weighted average assumptions: risk-free interest rate of 1.92%, expected life of 4.5 years and expectedstock price volatility of 65.17%.
In 2010, the Company granted stock options for 2,060,246 shares of our common stock and estimated thefair value of each stock option award on the date of grant using the Black-Scholes option pricing model with thefollowing weighted average assumptions: risk-free interest rate of 2.12%, expected life of 3.7 years and expectedstock price volatility of 67.21%. In 2009, the Company granted stock options for 2,071,360 shares of ourcommon stock and estimated the fair value of each stock option award on the date of grant using the Black-Scholes option pricing model with the following weighted average assumptions: risk-free interest rate of 2.2%,expected life of 3.0 years and expected stock price volatility of 87.3%. The risk-free interest rate assumptions arebased on the applicable Treasury bill rates over the options’ expected lives; the expected life assumptions arebased on the time period stock options are expected to be outstanding based on historical experience; and theexpected stock price volatility assumptions are based on the historical and implied volatility of the Company’scommon stock.
14. Segment Information
The Company manages its business using three reportable segments: Contract, Retail, and Corporate andOther. Management reviews the performance of the Company based on these segments.
Contract distributes a broad line of items for the office, including office supplies and paper, technologyproducts and solutions, print and document services and office furniture. Contract sells directly to large corporateand government offices, as well as to small and medium-sized offices in the United States, Canada, Australia andNew Zealand. This segment markets and sells through field salespeople, outbound telesales, catalogs, the Internetand in some markets, including Canada, Australia and New Zealand, through office products stores. Substantiallyall products sold by Contract are purchased from third-party manufacturers or industry wholesalers. Contractpurchases office papers primarily from Boise White Paper, L.L.C., under a paper supply contract entered into onJune 25, 2011. (For additional information related to the paper supply contract, see Note 15, “Commitments andGuarantees”.)
Retail is a retail distributor of office supplies and paper, print and document services, technology productsand solutions and office furniture. In addition, this segment contracts with large national retail chains to supplyoffice and school supplies to be sold in their stores. Retail office supply stores feature OfficeMax ImPress, an
76

in-store module devoted to print-for-pay and related services. Retail has operations in the United States, PuertoRico and the U.S. Virgin Islands. The retail segment also operates office products stores in Mexico through a51%-owned joint venture. Substantially all products sold by Retail are purchased from third-party manufacturersor industry wholesalers. Retail purchases office papers primarily from Boise White Paper, L.L.C., under thepaper supply contract described above.
Corporate and Other includes corporate support staff services and certain other legacy expenses as well asthe related assets and liabilities. The income and expense related to certain assets and liabilities that are reportedin the Corporate and Other segment have been allocated to the Contract and Retail segments.
Management evaluates the segments’ performances using segment income (loss) which is based onoperating income (loss) after eliminating the effect of certain operating items that are not indicative of our coreoperations such as severances, facility closures and adjustments, and asset impairments. These certain operatingitems are reported on the asset impairments and the other operating expenses, net lines in the ConsolidatedStatements of Operations.
The following table summarizes by geography, net sales for fiscal years 2011, 2010 and 2009, andnon-current assets at each year-end:
2011 2010 2009
(thousands)
Net salesUnited States . . . . . . . . . . . . . . . . . . . . . . . . . . . . . . . . . . . . . . . . . . . $5,671,738 $5,770,036 $5,952,714Foreign . . . . . . . . . . . . . . . . . . . . . . . . . . . . . . . . . . . . . . . . . . . . . . . 1,449,429 1,379,971 1,259,336
Total . . . . . . . . . . . . . . . . . . . . . . . . . . . . . . . . . . . . . . . . . . . . . $7,121,167 $7,150,007 $7,212,050
Non-current assetsUnited States . . . . . . . . . . . . . . . . . . . . . . . . . . . . . . . . . . . . . . . . . . . $1,992,674 $1,924,982 $1,909,754Foreign . . . . . . . . . . . . . . . . . . . . . . . . . . . . . . . . . . . . . . . . . . . . . . . 137,627 139,661 138,441
Total . . . . . . . . . . . . . . . . . . . . . . . . . . . . . . . . . . . . . . . . . . . . . $2,130,301 $2,064,643 $2,048,195
There is no single customer that accounts for 10% or more of consolidated trade sales.
Segment sales to external customers by product line are as follows:
2011 2010 2009
(thousands)
ContractOffice supplies and paper . . . . . . . . . . . . . . . . . . . . . . . . . . . . . . . . . $2,076,014 $2,086,628 $2,138,549Technology products . . . . . . . . . . . . . . . . . . . . . . . . . . . . . . . . . . . . . 1,142,196 1,185,462 1,173,956Office furniture . . . . . . . . . . . . . . . . . . . . . . . . . . . . . . . . . . . . . . . . . 405,867 362,154 344,180
Total . . . . . . . . . . . . . . . . . . . . . . . . . . . . . . . . . . . . . . . . . . . . . $3,624,077 $3,634,244 $3,656,685
RetailOffice supplies and paper . . . . . . . . . . . . . . . . . . . . . . . . . . . . . . . . . $1,489,800 $1,468,646 $1,446,934Technology products . . . . . . . . . . . . . . . . . . . . . . . . . . . . . . . . . . . . . 1,793,255 1,834,630 1,872,537Office furniture . . . . . . . . . . . . . . . . . . . . . . . . . . . . . . . . . . . . . . . . . 214,035 212,487 235,894
Total . . . . . . . . . . . . . . . . . . . . . . . . . . . . . . . . . . . . . . . . . . . . . $3,497,090 $3,515,763 $3,555,365
Total OfficeMaxOffice supplies and paper . . . . . . . . . . . . . . . . . . . . . . . . . . . . . . . . . $3,565,814 $3,555,274 $3,585,483Technology products . . . . . . . . . . . . . . . . . . . . . . . . . . . . . . . . . . . . . 2,935,451 3,020,092 3,046,493Office furniture . . . . . . . . . . . . . . . . . . . . . . . . . . . . . . . . . . . . . . . . . 619,902 574,641 580,074
Total . . . . . . . . . . . . . . . . . . . . . . . . . . . . . . . . . . . . . . . . . . . . . $7,121,167 $7,150,007 $7,212,050
77

The following tables contain details of the Company’s operations by segment:
SalesSegmentincome
Assetimpairments
Otheroperating
expenses, netOperating
income (loss)
(thousands)
Year ended December 31, 2011Contract . . . . . . . . . . . . . . . . . . . . . . . . . . . . . . $3,624,077 $ 77,681 $ — $(13,984) $ 63,697Retail . . . . . . . . . . . . . . . . . . . . . . . . . . . . . . . . 3,497,090 75,293 (11,197) (5,858) 58,238Corporate and Other . . . . . . . . . . . . . . . . . . . . . — (34,761) — (688) (35,449)
Total . . . . . . . . . . . . . . . . . . . . . . . . . . . . . $7,121,167 $118,213 $(11,197) $(20,530) $ 86,486
Year ended December 25, 2010Contract . . . . . . . . . . . . . . . . . . . . . . . . . . . . . . $3,634,244 $ 94,342 $ — $ (60) $ 94,282Retail . . . . . . . . . . . . . . . . . . . . . . . . . . . . . . . . 3,515,763 103,903 (10,979) (12,505) 80,419Corporate and Other . . . . . . . . . . . . . . . . . . . . . — (37,723) — 9,488 (28,235)
Total . . . . . . . . . . . . . . . . . . . . . . . . . . . . . $7,150,007 $160,522 $(10,979) $ (3,077) $146,466
Year ended December 26, 2009Contract . . . . . . . . . . . . . . . . . . . . . . . . . . . . . . $3,656,685 $ 58,022 $ — $(15,269) $ 42,753Retail . . . . . . . . . . . . . . . . . . . . . . . . . . . . . . . . 3,555,365 44,906 (17,612) (33,303) (6,009)Corporate and Other . . . . . . . . . . . . . . . . . . . . . — (40,041) — (691) (40,732)
Total . . . . . . . . . . . . . . . . . . . . . . . . . . . . . $7,212,050 $ 62,887 $(17,612) $(49,263) $ (3,988)
Interest expense, interest income, and other income (expense), net are not recorded by segments.
The following table contains details of other selected items by segment.
Other selected items
Depreciationand
amortizationCapital
expenditures Assets
Year ended December 31, 2011Contract . . . . . . . . . . . . . . . . . . . . . . . . . . . . . . . . . . . . . . . . . . . . . . . . . . $ 30,587 $25,964 $1,001,161Retail . . . . . . . . . . . . . . . . . . . . . . . . . . . . . . . . . . . . . . . . . . . . . . . . . . . . . 50,550 35,830 1,240,541Corporate and Other . . . . . . . . . . . . . . . . . . . . . . . . . . . . . . . . . . . . . . . . . 3,081 7,837 1,827,573
Total . . . . . . . . . . . . . . . . . . . . . . . . . . . . . . . . . . . . . . . . . . . . . $ 84,218 $69,632 $4,069,275
Year ended December 25, 2010Contract . . . . . . . . . . . . . . . . . . . . . . . . . . . . . . . . . . . . . . . . . . . . . . . . . . $ 51,630 $61,165 $1,039,800Retail . . . . . . . . . . . . . . . . . . . . . . . . . . . . . . . . . . . . . . . . . . . . . . . . . . . . . 49,283 32,346 1,209,635Corporate and Other . . . . . . . . . . . . . . . . . . . . . . . . . . . . . . . . . . . . . . . . . 23 — 1,829,494
Total . . . . . . . . . . . . . . . . . . . . . . . . . . . . . . . . . . . . . . . . . . . . . $100,936 $93,511 $4,078,929
Year ended December 26, 2009Contract . . . . . . . . . . . . . . . . . . . . . . . . . . . . . . . . . . . . . . . . . . . . . . . . . . $ 57,548 $17,939 $1,035,175Retail . . . . . . . . . . . . . . . . . . . . . . . . . . . . . . . . . . . . . . . . . . . . . . . . . . . . . 58,869 20,338 1,239,632Corporate and Other . . . . . . . . . . . . . . . . . . . . . . . . . . . . . . . . . . . . . . . . . — — 1,794,723
Total . . . . . . . . . . . . . . . . . . . . . . . . . . . . . . . . . . . . . . . . . . . . . $116,417 $38,277 $4,069,530
78

15. Commitments and Guarantees
Commitments
During the second quarter of 2011, we entered into a new paper supply contract with Boise White Paper,L.L.C. (“Boise”), under which we have agreed to purchase office papers from Boise, and Boise has agreed tosupply office papers to us, subject to the terms and conditions of the paper supply contract. The new paper supplycontract replaced the previous supply contract executed in 2004 with Boise.
The paper supply contract requires us to purchase from Boise and Boise to sell to us virtually all of ourNorth American requirements for office paper, subject to certain conditions. After 2012, the paper supplycontract provides us more flexibility to purchase paper from paper producers other than Boise. The paper supplycontract’s term will expire on December 31, 2017, followed by a gradual reduction of the Company’s purchaserequirements over a two year period thereafter. However, if certain circumstances occur, the term may beterminated earlier, beginning as early as December 31, 2012. If the term ends December 31, 2012, it will befollowed by a gradual reduction of the Company’s purchase requirements over a four year period. If the termends on a later date, the gradual reduction period will last two years. Purchases under the agreement were$630.1 million, $615.6 million and $633.9 million for 2011, 2010 and 2009, respectively.
In accordance with an amended and restated joint venture agreement, the minority owner of GrupoOfficeMax, our joint-venture in Mexico, can elect to require OfficeMax to purchase the minority owner’s 49%interest in the joint venture if certain earnings targets are achieved. Earnings targets are calculated quarterly on arolling four-quarter basis. Accordingly, the targets may be achieved in one quarter but not in the next. If theearnings targets are achieved and the minority owner elects to require OfficeMax to purchase the minorityowner’s interest, the purchase price is based on the joint venture’s earnings and the current market multiples ofsimilar companies. At the end of 2011, Grupo OfficeMax met the earnings targets and the estimated purchaseprice of the minority owner’s interest was $27.6 million. This represents a decrease in the estimated purchaseprice from the prior year which is attributable to lower market multiples for similar companies as of themeasurement date. As the estimated purchase price was less than the carrying value of the noncontrolling interestas of the end of the year, the Company reduced the noncontrolling interest to the carrying value, with the offsetrecorded to additional paid-in capital. There is no impairment relating to the assets of the joint venture as theestimated future cash flows support the overall carrying value of its assets.
Guarantees
The Company provides guarantees, indemnifications and assurances to others.
Indemnification obligations may arise from the Asset Purchase Agreement between OfficeMax Incorporated,OfficeMax Southern Company, Minidoka Paper Company, Forest Products Holdings, L.L.C. and Boise Land &Timber Corp. The Company has agreed to provide indemnification with respect to a variety of obligations. Theseindemnification obligations are subject, in some cases, to survival periods, deductibles and caps. At December 31,2011, the Company is not aware of any material liabilities arising from these indemnifications.
There are six operating leases that have been assigned to other parties but for which the Company remainscontingently liable in the event of nonpayment by the other parties. The lease terms vary and, assuming exerciseof renewal options, extend through 2019. Annual rental payments under these leases are approximately$3.0 million.
The Company and its affiliates enter into a wide range of indemnification arrangements in the ordinarycourse of business. These include tort indemnifications, tax indemnifications, officer and directorindemnifications against third-party claims arising out of arrangements to provide services to the Company andindemnifications in merger and acquisition agreements. It is impossible to quantify the maximum potentialliability under these indemnifications. At December 31, 2011, the Company is not aware of any materialliabilities arising from these indemnifications.
79

16. Legal Proceedings and Contingencies
OfficeMax Incorporated and certain of its subsidiaries are named as defendants in a number of lawsuits,claims and proceedings arising out of the operation of the paper and forest products assets prior to the closing ofthe 2004 sale transaction, for which OfficeMax agreed to retain responsibility. Also, as part of the sale, weagreed to retain responsibility for all pending or threatened proceedings and future proceedings alleging asbestos-related injuries arising out of the operation of the paper and forest products assets prior to the closing of the sale.We do not believe any of these retained proceedings are material to our business.
We have been notified that we are a “potentially responsible party” under the ComprehensiveEnvironmental Response Compensation and Liability Act (“CERCLA”) or similar federal and state laws, or havereceived a claim from a private party, with respect to certain sites where hazardous substances or othercontaminants are or may be located. These sites relate to operations either no longer owned by the Company orunrelated to its ongoing operations. For sites where a range of potential liability can be determined, we haveestablished appropriate reserves. We cannot predict with certainty the total response and remedial costs, ourshare of the total costs, the extent to which contributions will be available from other parties or the amount oftime necessary to complete the cleanups. Based on our investigations; our experience with respect to cleanup ofhazardous substances; the fact that expenditures will, in many cases, be incurred over extended periods of time;and in some cases, the number of solvent potentially responsible parties, we do not believe that the known actualand potential response costs will, in the aggregate, materially affect our financial position, results of operations orcash flows.
Over the past several years and continuing in the current year, we have been named a defendant in a numberof cases where the plaintiffs allege asbestos-related injuries from exposure to asbestos products or exposure toasbestos while working at job sites. The claims vary widely and often are not specific about the plaintiffs’contacts with the Company. None of the claimants seeks damages from us individually, and we are generally oneof numerous defendants. Many of the cases filed against us have been voluntarily dismissed, although we havesettled some cases. The settlements we have paid have been covered mostly by insurance, and we believe anyfuture settlements or judgments in these cases would be similarly covered. To date, no asbestos case against ushas gone to trial, and the nature of these cases makes any prediction as to the outcome of pending litigationinherently subjective. At this time, however, we believe our involvement in asbestos litigation is not material toeither our financial position or our results of operations.
80

17. Quarterly Results of Operations (unaudited)
Summarized quarterly financial data is as follows:
2011 2010
First Second(a) Third Fourth(b) First(c) Second(d) Third Fourth(e)
(millions, except per-share and stock price information)
Sales . . . . . . . . . . . . . . . $1,863.0 $1,647.6 $1,774.8 $1,835.8 $1,911.7 $1,653.2 $1,813.4 $1,766.2Gross Profit . . . . . . . . . . $ 474.5 $ 425.1 $ 459.7 $ 449.9 $ 505.5 $ 427.7 $ 470.4 $ 446.0
Percent of sales . . . 25.5% 25.8% 25.9% 24.5% 26.4% 25.9% 25.9% 25.3%Operating income . . . . . $ 28.6 $ 4.0 $ 41.3 $ 12.6 $ 49.4 $ 28.1 $ 40.9 $ 28.1Net income available toOfficeMax commonshareholders . . . . . . . $ 11.4 $ (3.0) $ 21.5 $ 2.9 $ 24.8 $ 11.8 $ 20.0 $ 12.1
Net income (loss) percommon shareavailable toOfficeMax commonshareholders(f)Basic . . . . . . . . . . . $ 0.13 $ (0.04) $ 0.25 $ 0.03 $ 0.29 $ 0.14 $ 0.23 $ 0.14Diluted . . . . . . . . . $ 0.13 $ (0.04) $ 0.25 $ 0.03 $ 0.29 $ 0.14 $ 0.23 $ 0.14
Common stockdividends paid pershare . . . . . . . . . . . . . — — — — — — — —
Common stock prices(g)High . . . . . . . . . . . $ 18.95 $ 14.36 $ 8.82 $ 5.93 $ 17.34 $ 19.79 $ 15.81 $ 19.20Low . . . . . . . . . . . . $ 12.24 $ 6.05 $ 4.46 $ 3.90 $ 12.60 $ 14.21 $ 9.67 $ 12.73
(a) Includes a $5.6 million pre-tax charge related to Retail store closures in the U.S., and $8.3 million of pre-taxcharges for severance related to Contract and Retail reorganizations.
(b) Includes an $11.2 million non-cash pre-tax charge to impair fixed assets associated with our Retail stores in theU.S. and $6.6 million of pre-tax charges for severance primarily related to Contract and Retail reorganizations.
(c) Includes a $13.4 million pre-tax charge related to Retail store closures in the U.S., and a $0.8 million pre-taxcharge for severance related to Contract reorganizations.
(d) Includes a $1.1 million pre-tax charge related to Retail store closures in the U.S., and a $3.9 million ofpre-tax income related to the adjustment of a reserve associated with our legacy building materialsmanufacturing facility near Elma, Washington.
(e) Includes an $11.0 million non-cash pre-tax charge to impair fixed assets associated with our Retail stores inthe U.S., $2.8 million of pre-tax income related to the adjustment of previously established reserves forseverance and store closures and a $5.5 million of pre-tax income related to the adjustment of a reserveassociated with our legacy building materials manufacturing facility near Elma, Washington.
(f) Quarters added together may not equal full year amount because each quarter is calculated on a stand-alone basis.(g) The Company’s common stock (symbol OMX) is traded on the New York Stock Exchange.
81

Report of Independent Registered Public Accounting Firm
The Board of Directors and ShareholdersOfficeMax Incorporated:
We have audited the accompanying consolidated balance sheets of OfficeMax Incorporated and subsidiaries(the Company) as of December 31, 2011 and December 25, 2010, and the related consolidated statements ofoperations, equity, and cash flows for each of the years in the three-year period ended December 31, 2011. Wealso have audited OfficeMax Incorporated’s internal control over financial reporting as of December 31, 2011,based on criteria established in Internal Control—Integrated Framework issued by the Committee of SponsoringOrganizations of the Treadway Commission (COSO). OfficeMax Incorporated’s management is responsible forthese consolidated financial statements, for maintaining effective internal control over financial reporting, and forits assessment of the effectiveness of internal control over financial reporting, included in Management’s Reporton Internal Control over Financial Reporting appearing under Item 9A(b) of the Company’s annual report onForm 10-K. Our responsibility is to express an opinion on these consolidated financial statements and an opinionon the Company’s internal control over financial reporting based on our audits.
We conducted our audits in accordance with the standards of the Public Company Accounting OversightBoard (United States). Those standards require that we plan and perform the audits to obtain reasonableassurance about whether the financial statements are free of material misstatement and whether effective internalcontrol over financial reporting was maintained in all material respects. Our audits of the consolidated financialstatements included examining, on a test basis, evidence supporting the amounts and disclosures in the financialstatements, assessing the accounting principles used and significant estimates made by management, andevaluating the overall financial statement presentation. Our audit of internal control over financial reportingincluded obtaining an understanding of internal control over financial reporting, assessing the risk that a materialweakness exists, and testing and evaluating the design and operating effectiveness of internal control based onthe assessed risk. Our audits also included performing such other procedures as we considered necessary in thecircumstances. We believe that our audits provide a reasonable basis for our opinions.
A company’s internal control over financial reporting is a process designed to provide reasonable assuranceregarding the reliability of financial reporting and the preparation of financial statements for external purposes inaccordance with generally accepted accounting principles. A company’s internal control over financial reportingincludes those policies and procedures that (1) pertain to the maintenance of records that, in reasonable detail,accurately and fairly reflect the transactions and dispositions of the assets of the company; (2) provide reasonableassurance that transactions are recorded as necessary to permit preparation of financial statements in accordancewith generally accepted accounting principles, and that receipts and expenditures of the company are being madeonly in accordance with authorizations of management and directors of the company; and (3) provide reasonableassurance regarding prevention or timely detection of unauthorized acquisition, use, or disposition of thecompany’s assets that could have a material effect on the financial statements.
Because of its inherent limitations, internal control over financial reporting may not prevent or detectmisstatements. Also, projections of any evaluation of effectiveness to future periods are subject to the risk thatcontrols may become inadequate because of changes in conditions, or that the degree of compliance with thepolicies or procedures may deteriorate.
In our opinion, the consolidated financial statements referred to above present fairly, in all material respects,the financial position of OfficeMax Incorporated and subsidiaries as of December 31, 2011 and December 25, 2010,and the results of their operations and their cash flows for each of the years in the three-year period endedDecember 31, 2011, in conformity with U.S. generally accepted accounting principles. Also in our opinion,OfficeMax Incorporated maintained, in all material respects, effective internal control over financial reporting as ofDecember 31, 2011, based on criteria established in Internal Control—Integrated Framework issued by (COSO).
KPMG LLP
Chicago, IllinoisFebruary 24, 2012
82

ITEM 9. CHANGES IN AND DISAGREEMENTS WITH ACCOUNTANTS ONACCOUNTING AND FINANCIAL DISCLOSURE
We have had no disagreements with our independent registered public accounting firm regarding accountingor financial disclosure matters.
ITEM 9A. CONTROLS AND PROCEDURES
(a) Evaluation of Disclosure Controls and Procedures
As of the end of the period covered by this report, the chief executive officer and chief financial officerdirected and supervised an evaluation of the design and operation of our disclosure controls and procedures(as defined in Rule 13a-15(e) of the Securities Exchange Act of 1934, as amended (the “Exchange Act”)).The evaluation was conducted to determine whether the Company’s disclosure controls and procedures wereeffective in bringing material information about the Company to the attention of senior management. Basedon this evaluation, our chief executive officer and chief financial officer concluded that the Company’sdisclosure controls and procedures were effective in alerting them in a timely manner to materialinformation that the Company is required to disclose in its filings with the Securities and ExchangeCommission.
(b) Management’s Report on Internal Control Over Financial Reporting
OfficeMax’s management is responsible for establishing and maintaining adequate internal control overfinancial reporting (as defined in Rules 13a-15(f) and 15d-15(f) under the Exchange Act, as amended). Ourinternal control system was designed to provide reasonable assurance to our management and Board ofDirectors regarding the preparation and fair presentation of published financial statements.
Our management, with the participation of our chief executive officer and chief financial officer, assessedthe effectiveness of our internal control over financial reporting as of December 31, 2011. In making thisassessment, management used the criteria set forth by the Committee of Sponsoring Organizations of theTreadway Commission (COSO) in Internal Control—Integrated Framework.
Based on this assessment, management concluded that as of December 31, 2011, OfficeMax’s internalcontrol over financial reporting was effective.
KPMG LLP, our independent registered public accounting firm, has issued an attestation report on theeffectiveness of our internal control over financial reporting. That report is included on page 88 of thisForm 10-K.
(c) Changes in Internal Control Over Financial Reporting
There was no change in the Company’s internal control over financial reporting, as defined in Rules 13a-15(f) and 15d-15(f) of the Exchange Act, during the most recent fiscal quarter that has materially affected,or is reasonably likely to materially affect, the Company’s internal control over financial reporting.
ITEM 9B. OTHER INFORMATION
(a) None.
83

PART III
ITEM 10. DIRECTORS, EXECUTIVE OFFICERS AND CORPORATE GOVERNANCE
Information concerning directors and nominees for director is presented under the caption “Board ofDirectors” in our proxy statement and is incorporated herein by reference.
Information concerning our executive officers is presented under the caption “Executive Officers of theRegistrant” in Part 1 of this Form 10-K and is incorporated herein by reference.
Information concerning our Audit Committee and our Audit Committee financial expert is set forth underthe caption “Audit Committee Report” in our proxy statement and is incorporated herein by reference.
Information concerning the procedures by which security holders may recommend nominees to our Boardof Directors is set forth under the caption “Other Information—Stockholder Nominations for Directors” in ourproxy statement and is incorporated herein by reference.
Information concerning compliance with Section 16 of the Securities Exchange Act of 1934 is set forthunder the caption “Stock Ownership—Section 16(a) Beneficial Ownership Reporting Compliance” in our proxystatement and is incorporated herein by reference.
We have adopted a Code of Ethics that applies to all OfficeMax employees and directors, including oursenior financial officers. The Code is available, free of charge, on our website at investor.officemax.com byclicking on “Code of Ethics.” You also may obtain copies of this Code, free of charge, by contacting our InvestorRelations Department, 263 Shuman Boulevard, Naperville, Illinois 60563, or by calling (630) 864-6800. If weamend or grant a waiver of one or more of the provisions of our Code of Ethics, we intend to disclose suchamendments or waivers by posting the required information on our website at the address above.
ITEM 11. EXECUTIVE COMPENSATION
Information concerning compensation of OfficeMax’s executive officers and directors for the year endedDecember 31, 2011, is presented under the captions “Executive Compensation,” and “Director Compensation” inour proxy statement. This information is incorporated herein by reference.
Information concerning compensation committee interlocks is presented under the caption “ExecutiveCompensation Committee Interlocks and Insider Participation” in our proxy statement and is incorporated hereinby reference.
The report of our Executive Compensation Committee can be found under the caption “ExecutiveCompensation Committee Report” in our proxy statement and is incorporated herein by reference.
ITEM 12. SECURITY OWNERSHIP OF CERTAIN BENEFICIAL OWNERS ANDMANAGEMENT AND RELATED STOCKHOLDER MATTERS
Information concerning the security ownership of certain beneficial owners as of December 31, 2011, is setforth under the caption “Stock Ownership—Ownership of More Than 5% of OfficeMax Stock” in our proxystatement and is incorporated herein by reference.
Information concerning the security ownership of our directors and executive officers as of December 31,2011, is set forth under the caption “Stock Ownership—Directors and Executive Officers” in our proxy statementand is incorporated herein by reference.
84

Our shareholders have approved all of the Company’s equity compensation plans, including the DirectorStock Compensation Plan (the “DSCP”), the 2003 Director Stock Compensation Plan (the “2003 DSCP”) and the2003 OfficeMax Incentive and Performance Plan (the “2003 Plan”), formerly the Boise Incentive andPerformance Plan. These plans are designed to further align our directors’ and management’s interests with theCompany’s long-term performance and the long-term interests of our shareholders. The following table providesinformation regarding the equity securities that may be issued under our equity compensation plans as ofDecember 31, 2011.
Equity Compensation Plan Information(a)
Plan Category
Number of Securities to BeIssued Upon Exercise ofOutstanding Options,
Warrants, and Rights(#)
Weighted-AverageExercise Price of
Outstanding Options,Warrants, and Rights($)
Number of Securities RemainingAvailable for Future IssuanceUnder Equity CompensationPlans (Excluding Securities
Reflected in the First Column)(#)
Equity compensation plansapproved by securityholders . . . . . . . . . . . . . . . . . . 6,302,361(b) $12.88 4,131,089(c)
Equity compensation plans notapproved by securityholders . . . . . . . . . . . . . . . . . . — — —
Total . . . . . . . . . . . . . . . . . . . . . . 6,302,361 $12.88 4,131,089
(a) Neither of the following are included in this table: (a) Series D Preferred Stock in the Employee StockOwnership Plan (ESOP) fund or (b) the deferred stock unit components of the Company’s 2001 KeyExecutive Deferred Compensation Plan.
(b) Includes 7,475 shares issuable under the DSCP, 3,696 shares issuable under the 2003 DSCP, 5,000 sharesissuable under the Director Stock Option Plan, 744,000 shares issuable under the Key Executive StockOption Plan, and 5,542,190 shares issuable under the 2003 Plan. The Director Stock Option Plan and KeyExecutive Stock Option Plan have been replaced by the 2003 Plan.
(c) As of December 31, 2011, 53,491 shares were issuable under the 2003 DSCP and 4,077,598 shares wereissuable under the 2003 Plan.
See Note 13, “Shareholders Equity,” of the Notes to Consolidated Financial Statements in “Item 8. FinancialStatements and Supplementary Data” of this form 10-K for additional information related to our equitycompensation plans.
ITEM 13. CERTAIN RELATIONSHIPS AND RELATED TRANSACTIONS, ANDDIRECTOR INDEPENDENCE
Information concerning the independence of our directors, certain relationships and related transactionsduring 2011 and our policies with respect to such transactions is set forth under the captions “Board ofDirectors—Director Independence” and “Board of Directors—Board of Directors Related Transactions” in ourproxy statement and is incorporated herein by reference.
ITEM 14. PRINCIPAL ACCOUNTANT FEES AND SERVICES
Information concerning principal accountant fees and services is set forth under the captions “Items YouMay Vote On—Appointment of Independent Registered Public Accounting Firm” and “Audit CommitteeReport—Audit, Audit Related, and Other Nonaudit Services” in our proxy statement and is incorporated hereinby reference.
85

PART IV
ITEM 15. EXHIBITS, FINANCIAL STATEMENT SCHEDULES
(a) The following documents are filed as a part of this Form 10-K:
(1) Consolidated Financial Statements.
The Consolidated Financial Statements, the Notes to Consolidated Financial Statements and the Reportof Independent Registered Public Accounting Firm are presented in “Item 8. Financial Statements andSupplementary Data” of this Form 10-K.
• Consolidated Balance Sheets as of December 31, 2011 and December 25, 2010.
• Consolidated Statements of Operations for the years ended December 31, 2011, December 25,2010 and December 26, 2009.
• Consolidated Statements of Cash Flows for the years ended December 31, 2011, December 25,2010 and December 26, 2009.
• Consolidated Statements of Equity for the years ended December 31, 2011, December 25, 2010and December 26, 2009.
• Notes to Consolidated Financial Statements.
• Report of Independent Registered Public Accounting Firm.
(2) Financial Statement Schedules.
All financial statement schedules have been omitted because they are inapplicable, not required orshown in the financial statements and notes in “Item 8. Financial Statements and Supplementary Data”of this Form 10-K.
(3) Exhibits.
A list of the exhibits required to be filed as part of this report is set forth in the Index to Exhibits, whichimmediately precedes such exhibits and is incorporated herein by reference.
(b) Exhibits.
See Index to Exhibits.
86

SIGNATURES
Pursuant to the requirements of Section 13 or 15(d) of the Securities Exchange Act of 1934, the registranthas duly caused this report to be signed on its behalf by the undersigned, thereunto duly authorized.
OfficeMax Incorporated
By /S/ RAVICHANDRA SALIGRAMRavichandra SaligramChief Executive Officer
Dated: February 24, 2012
Pursuant to the requirements of the Securities Exchange Act of 1934, this report has been signed below bythe following persons on behalf of the registrant and in the capacities indicated on February 24, 2012.
Signature Capacity
(i) Principal Executive Officer:
/s/ RAVICHANDRA SALIGRAMRavichandra Saligram
Chief Executive Officer
(ii) Principal Financial Officer:
/s/ BRUCE BESANKO
Bruce Besanko
Executive Vice President, Chief Financial Officer andChief Administrative Officer
(iii) Principal Accounting Officer:
/s/ DEBORAH A. O’CONNOR
Deborah A. O’Connor
Senior Vice President, Finance and Chief AccountingOfficer
(iv) Directors:
/s/ V. JAMES MARINO
V. James Marino
/s/ WARREN F. BRYANT
Warren F. Bryant
/s/ JOSEPH M. DEPINTOJoseph M. DePinto
/s/ WILLIAM J. MONTGORIS
William J. Montgoris
/s/ RAKESH GANGWAL
Rakesh Gangwal
/s/ RAVICHANDRA SALIGRAMRavichandra Saligram
/s/ FRANCESCA RUIZ DE LUZURIAGAFrancesca Ruiz de Luzuriaga
/s/ DAVID M. SZYMANSKI
David M. Szymanski
87

Consent of Independent Registered Public Accounting Firm
To the Board of Directors of OfficeMax Incorporated:
We consent to the incorporation by reference in the registration statement (No. 333-162866) on Form S-1;the registration statements (Nos. 2-72176, 33-28595, 33-21964, 33-31642, 333-105223, 333-105245, 333-37124,333-86425, 333-86427, 333-61106, 333-113648, 333-110397, 333-150957 and 333-166880) on Form S-8; andthe registration statements (Nos. 333-41033, 333-74450 and 333-86362) on Form S-3 of OfficeMax Incorporatedof our report dated February 24, 2012, with respect to the consolidated balance sheets of OfficeMax Incorporatedas of December 31, 2011 and December 25, 2010, and the related consolidated statements of operations, equity,and cash flows for each of the years in the three-year period ended December 31, 2011, and the effectiveness ofinternal control over financial reporting as of December 31, 2011, which report appears in the December 31,2011 annual report on Form 10-K of OfficeMax Incorporated.
/s/ KPMG LLP
KPMG LLP
Chicago, IllinoisFebruary 24, 2012
88

OFFICEMAX INCORPORATEDINDEX TO EXHIBITS
Filed with the Annual Report on Form 10-K for the fiscal year ended December 31, 2011
Incorporated by Reference
ExhibitNumber Exhibit Description Form File Number
ExhibitNumber
FilingDate
FiledHerewith
2.1 Asset Purchase Agreement datedJuly 26, 2004, between Boise CascadeCorporation (now OfficeMaxIncorporated), Boise SouthernCompany, Minidoka Paper Companyand Forest Products Holdings, L.L.C.,and Boise Land & Timber Corp.
8-K 001-05057 2 7/28/2004
3.1 Conformed Restated Certificate ofIncorporation, as restated to date
S-1 333-162866 3.1.1 11/4/2010
3.2 Amended and Restated Bylaws, asamended to February 12, 2009
8-K 001-05057 3.1 2/18/2010
4.1(1) Trust Indenture between BoiseCascade Corporation (now OfficeMaxIncorporated) and Morgan GuarantyTrust Company of New York, Trustee,dated October 1, 1985, as amended
S-3 33-5673 4 5/13/1986
4.2 Indenture dated as of December 21,2004 by and between OMX TimberFinance Investments II, LLC, as theIssuer and Wells Fargo BankNorthwest, N.A., as Trustee
8-K 001-05057 99.1 9/22/2009
4.3 Indenture dated as of December 21,2004 by and between OMX TimberFinance Investments I, LLC, as theIssuer and Wells Fargo BankNorthwest, N.A., as Trustee
S-1/A 333-162866 4.4 12/14/2010
9 Inapplicable
10.1 Paper Purchase Agreement datedJune 25, 2011 between Boise WhitePaper, L.L.C. and OfficeMaxIncorporated
10-Q/A 001-05057 10.8(10) 10/24/2011
10.2 Installment Note for $559,500,000between Boise Land & Timber, L.L.C.(Maker) and Boise CascadeCorporation (now OfficeMaxIncorporated) (Initial Holder) datedOctober 29, 2004
10-Q 001-05057 10.3 11/9/2004
10.3 Installment Note for $258,000,000between Boise Land & Timber, L.L.C.(Maker) and Boise Southern Company(Initial Holder) dated October 29, 2004
10-Q 001-05057 10.4 11/9/2004
89

Incorporated by Reference
ExhibitNumber Exhibit Description Form File Number
ExhibitNumber
FilingDate
FiledHerewith
10.4 Installment Note for $817,500,000 betweenBoise Land & Timber II, L.L.C. (Maker) andBoise Cascade Corporation (now OfficeMaxIncorporated) (Initial Holder) datedOctober 29, 2004
10-Q 001-05057 10.5 11/9/2004
10.5 Guaranty by Wachovia Corporation datedOctober 29, 2004
10-Q 001-05057 10.6 11/9/2004
10.6 Guaranty by Lehman Brothers Holdings Inc.dated October 29, 2004
10-Q 001-05057 10.7 11/9/2004
10.7 Registration Rights Agreement among BoiseCascade Corporation (now OfficeMaxIncorporated), Forest Products Holdings,L.L.C., and Boise Cascade Holdings, L.L.C.dated October 29, 2004
10-Q 001-05057 10.11 11/9/2004
10.8 Restructuring Agreement and AmendmentNo. 1 to Securityholders Agreement by andamong Boise Cascade Holdings, L.L.C.,Boise Cascade, L.L.C., Boise Land & TimberCorp., Forest Product Holdings, L.L.C.,OfficeMax Incorporated and KooskiaInvestment Corporation
8-K 001-05057 99.1 11/15/2006
10.9 Boise Cascade Holdings, L.L.C. SecondAmended and Restated Operating Agreement
8-K 001-05057 99.2 11/16/2006
10.10 Securityholders Agreement among BoiseCascade Corporation (now OfficeMaxincorporated), Forest Products Holdings,L.L.C., and Boise Cascade Holdings, L.L.C.,dated October 29, 2004
10-Q 001-05057 10.14 11/9/2004
10.11 Purchase Agreement dated December 13,2004, between OMX Timber FinanceInvestments I, LLC, OMX Timber FinanceInvestments II, LLC, OfficeMaxIncorporated, Wachovia CapitalMarkets, LLC, and Lehman Brothers Inc.
8-K 001-05057 10.1 12/17/2004
10.12 Indemnification Agreement datedDecember 13, 2004, between WachoviaCorporation, Lehman Brothers Holdings Inc.,OMX Timber Finance Investments I, LLC,OMX Timber Finance Investments II, LLC,OfficeMax Incorporated, Wachovia CapitalMarkets, LLC, Lehman Brothers Inc.
8-K 001-05057 10.2 12/17/2004
10.13† Executive Savings Deferral Plan 8-K 001-05057 10.2 12/15/2004
10.14† 2005 Deferred Compensation Plan 8-K 001-05057 10.3 12/15/2004
10.15† 2005 Directors Deferred Compensation Plan 8-K 001-05057 10.4 12/15/2004
90

Incorporated by Reference
ExhibitNumber Exhibit Description Form File Number
ExhibitNumber
FilingDate
FiledHerewith
10.16† Directors Compensation Summary Sheet X
10.17† Form of OfficeMax IncorporatedNonstatutory Stock Option Agreement
8-K 001-05057 10.1 1/6/2005
10.18† Executive Life Insurance Program 8-K 001-05057 10.1 2/16/2005
10.18(a)† Amendment to Executive Life InsuranceProgram
8-K 001-05057 — 4/21/2009
10.19† Officer Annual Physical Program 8-K 001-05057 10.2 2/16/2005
10.19(a)† Amendment to Officer Annual PhysicalProgram
8-K 001-05057 — 2/16/2010
10.20† Financial Counseling Program 8-K 001-05057 10.3 2/16/2005
10.20(a)† Amendment to Financial CounselingProgram
8-K 001-05057 — 2/16/2010
10.21† Executive Officer Mandatory RetirementPolicy
10-K 001-05057 10.31 3/16/2005
10.22† 1982 Executive Officer DeferredCompensation Plan, as amended throughSeptember 26, 2003
10-K 001-05057 10.4 3/2/2004
10.23† Nonbusiness Use of Corporate AircraftPolicy, as amended
10-K 001-05057 10.13 3/14/1994
10.24† Supplemental Early Retirement Plan forExecutive Officers, as amended throughSeptember 26, 2003
10-K 001-05057 10.6 3/2/2004
10.25† Boise Cascade Corporation (now OfficeMaxIncorporated) Supplemental Pension Plan, asamended through September 26, 2003
10-K 001-05057 10.7 3/2/2004
10.26† 1980 Split Dollar Life Insurance Plan, asamended through September 25, 2003
10-K 001-05057 10.10 3/2/2004
10.27† Form of Directors’ IndemnificationAgreement, as revised September 26, 2003
10-K 001-05057 10.15 3/2/2004
10.28(2)† Deferred Compensation and Benefits Trust,as amended for the Form of SixthAmendment dated May 1, 2001
10-Q 001-05057 10 11/13/2001
10.29† Director Stock Compensation Plan, asamended through September 26, 2003
10-K 001-05057 10.17 3/2/2004
10.30† Directors Stock Option Plan, as amendedthrough September 26, 2003
10-K 001-05057 10.18 3/2/2004
10.31† 2001 Key Executive Deferred CompensationPlan, as amended through September 26,2003
10-K 001-05057 10.23 3/2/2004
91

Incorporated by Reference
ExhibitNumber Exhibit Description Form File Number
ExhibitNumber
FilingDate
FiledHerewith
10.32† 2001 Board of Directors DeferredCompensation Plan, as amended throughSeptember 26, 2003
10-K 001-05057 10.24 3/2/2004
10.33† Key Executive Performance Unit Plan, asamended through September 26, 2003
10-K 001-05057 10.25 3/2/2004
10.34† 2003 Director Stock Compensation Plan, asamended through September 26, 2003
10-K 001-05057 10.26 3/2/2004
10.35 Amended and Restated Going PublicAgreement dated as of May 17, 2005
8-K 001-05057 10.1 5/23/2005
10.36† Amendment to the OfficeMax Incorporated2003 Director Stock Compensation Plan
8-K 001-05057 — 2/20/2007
10.37† Amendment to OfficeMax IncorporatedExecutive Savings Deferral Plan
8-K 001-05057 99.2 12/14/2005
10.38† Form of 2006 Restricted Stock Unit AwardAgreement
8-K 001-05057 10.2 2/15/2006
10.39† Form of 2007 Directors’ Restricted StockUnit Award Agreement
8-K 001-05057 99.3 8/1/2007
10.40 Nondisclosure and NoncompetitionAgreement between OfficeMax Incorporatedand Mr. Martin dated September 13, 2007
8-K 001-05057 99.4 9/19/2007
10.41† Form of 2008 Restricted Stock Unit AwardAgreement (Performance Based)
8-K 001-05057 99.2 2/26/2008
10.42† Form of 2008 Restricted Stock Unit AwardAgreement (Time Based)
10-Q 001-05057 10.3 5/7/2008
10.43† Form of 2008 Director Restricted Stock UnitAward Agreement
8-K 001-05057 99.2 7/29/2008
10.44† Executive Officer Severance Pay Policy 10-Q 001-05057 10.4 11/6/2008
10.45† Form of Executive Officer Change inControl Severance Agreement
10-Q 001-05057 10.5 11/6/2008
10.46† Amendment to OfficeMax Incorporated2005 Directors Deferred Compensation Plan
10-Q 001-05057 10.6 11/6/2008
10.47† Form of Amendment of OfficeMaxIncorporated Executive Savings DeferralPlan
8-K 001-05057 99.1 1/28/2010
10.48† Form of 2009 Annual Incentive AwardAgreement
8-K 001-05057 99.2 2/18/2009
10.49† Form of 2009 Restricted Stock Unit AwardAgreement (Performance Based)
8-K 001-05057 99.4 2/18/2009
10.50† Form of 2009 Nonqualified Stock OptionAward Agreement
8-K 001-05057 99.5 2/18/2009
92

Incorporated by Reference
ExhibitNumber Exhibit Description Form File Number
ExhibitNumber
FilingDate
FiledHerewith
10.51† Bruce Besanko Change in ControlAgreement dated February 16, 2009
8-K 001-05057 99.1 3/6/2009
10.52† Bruce Besanko Nondisclosure andNoncompetition Agreement datedMarch 2, 2009
8-K 001-05057 99.2 3/6/2009
10.53† Form of 2009 Director RestrictedStock Unit Award Agreement
8-K 001-05057 99.1 7/28/2009
10.54 Contribution Agreement betweenOfficeMax Incorporated andEvercore Trust Company, N.A., theindependent fiduciary of the MasterTrust, dated November 3, 2009
8-K 001-05057 99.1 11/4/09
10.55 Registration Rights Agreementbetween OfficeMax Incorporatedand Evercore Trust Company, N.A.,the independent fiduciary of theMaster Trust, dated as ofNovember 3, 2009
8-K 001-05057 10.1 11/4/09
10.56† Transition and RetirementAgreement between Mr. Duncan andOfficeMax Incorporated datedFebruary 11, 2010
8-K 001-05057 99.2 2/16/2010
10.57† Form of 2010 Nonqualified StockOption Award Agreement
8-K 001-05057 99.5 2/16/2010
10.58† 2003 OfficeMax Incentive andPerformance Plan as amended andrestated effective April 14, 2010
DEF14A 001-05057 Appendix A 3/4/2010
10.59† Form of 2010 Annual IncentiveAward Agreement and form ofAnnual Incentive Award Agreementissued to Mr. Duncan
10-Q 001-05057 10.3 4/30/2010
10.60† Form of 2010 Restricted Stock UnitAward Agreement (PerformanceBased)
10-Q 001-05057 10.4 4/30/2010
10.61† Form of 2010 Director RestrictedStock Unit Award Agreement
8-K 001-05057 99.2 8/3/2010
10.62† Form of 2010 Restricted Stock UnitAward Agreement (Time Based)
8-K 001-05057 99.1 8/18/2010
10.63† Employment Agreement betweenOfficeMax Incorporated and RaviSaligram dated October 13, 2010
8-K 001-05057 10.1 10/19/2010
10.64† Form of Annual Incentive AwardAgreement between OfficeMaxIncorporated and Ravi Saligram
8-K 001-05057 10.2 10/19/2010
93

Incorporated by Reference
ExhibitNumber Exhibit Description Form File Number
ExhibitNumber
FilingDate
FiledHerewith
10.65† Form of 2010 Nonqualified Stock OptionAward Agreement between OfficeMaxIncorporated and Ravi Saligram (first)
8-K 001-05057 10.3 10/19/2010
10.66† Form of 2010 Nonqualified Stock OptionAward Agreement between OfficeMaxIncorporated and Ravi Saligram (second)
8-K 001-05057 10.4 10/19/2010
10.67† Form of Restricted Stock Unit AwardAgreement—Time-Based betweenOfficeMax Incorporated and Ravi Saligram
8-K 001-05057 10.5 10/19/2010
10.68† Form of Change in Control Letter Agreementbetween OfficeMax Incorporated and RaviSaligram
8-K 001-05057 10.6 10/19/2010
10.69† Form of Nondisclosure and Fair CompetitionAgreement between OfficeMax Incorporatedand Ravi Saligram
8-K 001-05057 10.7 10/19/2010
10.70† Form of 2011 Annual Incentive AwardAgreement
8-K 001-05057 99.1 2/15/2011
10.71† Form of 2011 Restricted Stock Unit AwardAgreement – Performance Based
8-K 001-05057 99.2 2/15/2011
10.72† Form of 2011 Nonqualified Stock OptionAward Agreement
8-K 001-05057 99.3 2/15/2011
10.73† Change in Control Agreement dated as ofMay 2, 2011 between OfficeMaxIncorporated and Mr. Michael Lewis
8-K 001-05057 99.1 6/3/2011
10.74† Restricted Stock Unit Award Agreement –Time Based dated as of May 2, 2011 betweenOfficeMax Incorporated and Mr. MichaelLewis
8-K 001-05057 99.2 6/3/2011
10.75† Restricted Stock Unit Award Agreement –Performance Based dated as of May 2, 2011between OfficeMax Incorporated and Mr.Michael Lewis (first)
8-K 001-05057 99.3 6/3/2011
10.76† Restricted Stock Unit Award Agreement –Performance Based dated as of May 2, 2011between OfficeMax Incorporated and Mr.Michael Lewis (second)
8-K 001-05057 99.4 6/3/2011
10.77† Nonqualified Stock Option AwardAgreement dated as of May 2, 2011 betweenOfficeMax Incorporated and Mr. MichaelLewis
8-K 001-05057 99.5 6/3/2011
10.78† Nondisclosure and Fair CompetitionAgreement dated as of May 2, 2011 betweenOfficeMax Incorporated and Mr. MichaelLewis
8-K 001-05057 99.6 6/3/2011
94

Incorporated by Reference
ExhibitNumber Exhibit Description Form File Number
ExhibitNumber
FilingDate
FiledHerewith
10.79† Letter Agreement dated as of May 24, 2011issued by OfficeMax Incorporated to Mr.Michael Lewis
8-K 001-05057 99.7 6/3/2011
10.80† Form of 2011 Director Restricted Stock UnitAward Agreement
8-K 001-05057 99.2 8/2/2011
10.81† Change in Control Agreement dated as ofAugust 17, 2011 between OfficeMaxIncorporated and Mr. Michael MacDonald
8-K 001-05057 99.1 8/23/2011
10.82† Nondisclosure and Fair CompetitionAgreement dated as of August 15, 2011between OfficeMax Incorporated and Mr.Michael MacDonald
8-K 001-05057 99.2 8/23/2011
10.83 Second Amended and Restated Loan andSecurity Agreement, dated October 7, 2011,by and among the Company, certain of itssubsidiaries as borrowers and guarantors, thelender parties thereto, Wells Fargo Bank,National Association as AdministrativeAgent, Bank of America, N.A. asSyndication Agent and JP Morgan ChaseBank, N.A. as Documentation Agent
8-K 001-05057 99.1 10/14/2011
10.84† Change in Control Agreement dated as ofJuly 26, 2011 between OfficeMaxIncorporated and Mr. Steve Parsons
10-Q 001-05057 10.4 10/28/2011
10.85† Nondisclosure and Fair CompetitionAgreement dated as of July 25, 2011 betweenOfficeMax Incorporated and Mr. SteveParsons
10-Q 001-05057 10.5 10/28/2011
10.86† Waiver of Claims and General Release datedDecember 19, 2011 between Mr. Vero andOfficeMax Incorporated
8-K 001-05057 99.1 12/21/2011
10.87† Letter to Mr. Vero dated November 4, 2011 8-K 001-05057 99.2 12/21/201110.88† Change in Control Agreement dated as of
November 21, 2011 between OfficeMaxIncorporated and Mr. Jim Barr
X
10.89† Nondisclosure and Fair CompetitionAgreement dated as of November 14, 2011between OfficeMax Incorporated and Mr.Jim Barr
X
10.90† 2011 Nonqualified Stock Option AwardAgreement dated as of November 14, 2011between OfficeMax Incorporated and Mr.Jim Barr
X
11 Inapplicable12 Inapplicable13 Inapplicable14(3) Code of Ethics
95
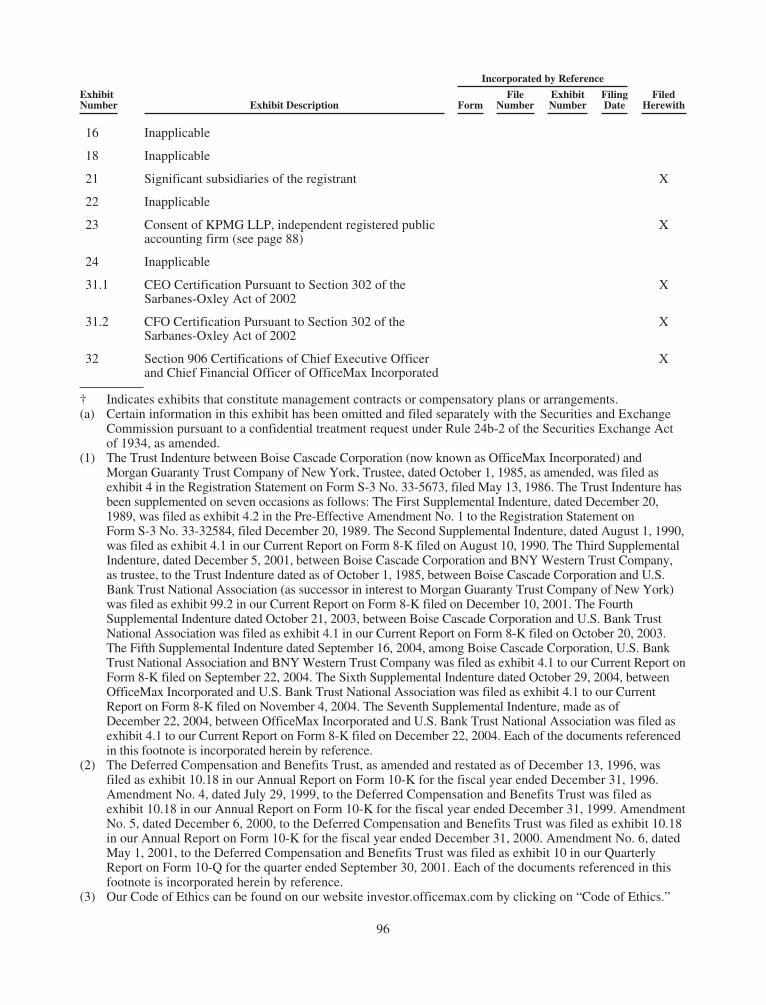
Incorporated by Reference
ExhibitNumber Exhibit Description Form
FileNumber
ExhibitNumber
FilingDate
FiledHerewith
16 Inapplicable
18 Inapplicable
21 Significant subsidiaries of the registrant X
22 Inapplicable
23 Consent of KPMG LLP, independent registered publicaccounting firm (see page 88)
X
24 Inapplicable
31.1 CEO Certification Pursuant to Section 302 of theSarbanes-Oxley Act of 2002
X
31.2 CFO Certification Pursuant to Section 302 of theSarbanes-Oxley Act of 2002
X
32 Section 906 Certifications of Chief Executive Officerand Chief Financial Officer of OfficeMax Incorporated
X
† Indicates exhibits that constitute management contracts or compensatory plans or arrangements.(a) Certain information in this exhibit has been omitted and filed separately with the Securities and Exchange
Commission pursuant to a confidential treatment request under Rule 24b-2 of the Securities Exchange Actof 1934, as amended.
(1) The Trust Indenture between Boise Cascade Corporation (now known as OfficeMax Incorporated) andMorgan Guaranty Trust Company of New York, Trustee, dated October 1, 1985, as amended, was filed asexhibit 4 in the Registration Statement on Form S-3 No. 33-5673, filed May 13, 1986. The Trust Indenture hasbeen supplemented on seven occasions as follows: The First Supplemental Indenture, dated December 20,1989, was filed as exhibit 4.2 in the Pre-Effective Amendment No. 1 to the Registration Statement onForm S-3 No. 33-32584, filed December 20, 1989. The Second Supplemental Indenture, dated August 1, 1990,was filed as exhibit 4.1 in our Current Report on Form 8-K filed on August 10, 1990. The Third SupplementalIndenture, dated December 5, 2001, between Boise Cascade Corporation and BNYWestern Trust Company,as trustee, to the Trust Indenture dated as of October 1, 1985, between Boise Cascade Corporation and U.S.Bank Trust National Association (as successor in interest to Morgan Guaranty Trust Company of New York)was filed as exhibit 99.2 in our Current Report on Form 8-K filed on December 10, 2001. The FourthSupplemental Indenture dated October 21, 2003, between Boise Cascade Corporation and U.S. Bank TrustNational Association was filed as exhibit 4.1 in our Current Report on Form 8-K filed on October 20, 2003.The Fifth Supplemental Indenture dated September 16, 2004, among Boise Cascade Corporation, U.S. BankTrust National Association and BNYWestern Trust Company was filed as exhibit 4.1 to our Current Report onForm 8-K filed on September 22, 2004. The Sixth Supplemental Indenture dated October 29, 2004, betweenOfficeMax Incorporated and U.S. Bank Trust National Association was filed as exhibit 4.1 to our CurrentReport on Form 8-K filed on November 4, 2004. The Seventh Supplemental Indenture, made as ofDecember 22, 2004, between OfficeMax Incorporated and U.S. Bank Trust National Association was filed asexhibit 4.1 to our Current Report on Form 8-K filed on December 22, 2004. Each of the documents referencedin this footnote is incorporated herein by reference.
(2) The Deferred Compensation and Benefits Trust, as amended and restated as of December 13, 1996, wasfiled as exhibit 10.18 in our Annual Report on Form 10-K for the fiscal year ended December 31, 1996.Amendment No. 4, dated July 29, 1999, to the Deferred Compensation and Benefits Trust was filed asexhibit 10.18 in our Annual Report on Form 10-K for the fiscal year ended December 31, 1999. AmendmentNo. 5, dated December 6, 2000, to the Deferred Compensation and Benefits Trust was filed as exhibit 10.18in our Annual Report on Form 10-K for the fiscal year ended December 31, 2000. Amendment No. 6, datedMay 1, 2001, to the Deferred Compensation and Benefits Trust was filed as exhibit 10 in our QuarterlyReport on Form 10-Q for the quarter ended September 30, 2001. Each of the documents referenced in thisfootnote is incorporated herein by reference.
(3) Our Code of Ethics can be found on our website investor.officemax.com by clicking on “Code of Ethics.”
96

Exhibit 31.1
CEO CERTIFICATION PURSUANT TO SECTION 302OF THE SARBANES OXLEY ACT OF 2002
I, Ravichandra Saligram, certify that:
1. I have reviewed this annual report on Form 10-K of OfficeMax Incorporated;
2. Based on my knowledge, this report does not contain any untrue statement of a material fact or omit to statea material fact necessary to make the statements made, in light of the circumstances under which suchstatements were made, not misleading with respect to the period covered by this report;
3. Based on my knowledge, the financial statements, and other financial information included in this report,fairly present in all material respects the financial condition, results of operations and cash flows of theregistrant as of, and for, the periods presented in this report;
4. The registrant’s other certifying officer(s) and I are responsible for establishing and maintaining disclosurecontrols and procedures (as defined in Exchange Act Rules 13a-15(e) and 15d-15(e)) and internal controlover financial reporting (as defined in Exchange Act Rules 13a-15(f) and 15d-15(f)) for the registrant andhave:
a. designed such disclosure controls and procedures, or caused such disclosure controls and procedures tobe designed under our supervision, to ensure that material information relating to the registrant,including its consolidated subsidiaries, is made known to us by others within those entities, particularlyduring the period in which this report is being prepared;
b. designed such internal control over financial reporting, or caused such internal control over financialreporting to be designed under our supervision, to provide reasonable assurance regarding thereliability of financial reporting and the preparation of financial statements for external purposes inaccordance with generally accepted accounting principles;
c. evaluated the effectiveness of the registrant’s disclosure controls and procedures and presented in thisreport our conclusions about the effectiveness of the disclosure controls and procedures, as of the endof the period covered by this report based on such evaluation; and
d. disclosed in this report any change in the registrant’s internal control over financial reporting thatoccurred during the registrant’s most recent fiscal quarter (the registrant’s fourth fiscal quarter in thecase of an annual report) that has materially affected, or is reasonably likely to materially affect, theregistrant’s internal control over financial reporting; and
5. The registrant’s other certifying officer(s) and I have disclosed, based on our most recent evaluation ofinternal control over financial reporting, to the registrant’s auditors and the audit committee of theregistrant’s board of directors (or persons performing the equivalent functions):
a. all significant deficiencies and material weaknesses in the design or operation of internal control overfinancial reporting which are reasonably likely to adversely affect the registrant’s ability to record,process, summarize and report financial information; and
b. any fraud, whether or not material, that involves management or other employees who have asignificant role in the registrant’s internal control over financial reporting.
Date: February 24, 2012 /s/ RAVICHANDRA SALIGRAMRavichandra SaligramChief Executive Officer

Exhibit 31.2
CFO CERTIFICATION PURSUANT TO SECTION 302OF THE SARBANES OXLEY ACT OF 2002
I, Bruce Besanko, certify that:
1. I have reviewed this annual report on Form 10-K of OfficeMax Incorporated;
2. Based on my knowledge, this report does not contain any untrue statement of a material fact or omit to statea material fact necessary to make the statements made, in light of the circumstances under which suchstatements were made, not misleading with respect to the period covered by this report;
3. Based on my knowledge, the financial statements, and other financial information included in this report,fairly present in all material respects the financial condition, results of operations and cash flows of theregistrant as of, and for, the periods presented in this report;
4. The registrant’s other certifying officer(s) and I are responsible for establishing and maintaining disclosurecontrols and procedures (as defined in Exchange Act Rules 13a-15(e) and 15d-15(e)) and internal controlover financial reporting (as defined in Exchange Act Rules 13a-15(f) and 15d-15(f)) for the registrant andhave:
a. designed such disclosure controls and procedures, or caused such disclosure controls and procedures tobe designed under our supervision, to ensure that material information relating to the registrant,including its consolidated subsidiaries, is made known to us by others within those entities, particularlyduring the period in which this report is being prepared;
b. designed such internal control over financial reporting, or caused such internal control over financialreporting to be designed under our supervision, to provide reasonable assurance regarding thereliability of financial reporting and the preparation of financial statements for external purposes inaccordance with generally accepted accounting principles;
c. evaluated the effectiveness of the registrant’s disclosure controls and procedures and presented in thisreport our conclusions about the effectiveness of the disclosure controls and procedures, as of the endof the period covered by this report based on such evaluation; and
d. disclosed in this report any change in the registrant’s internal control over financial reporting thatoccurred during the registrant’s most recent fiscal quarter (the registrant’s fourth fiscal quarter in thecase of an annual report) that has materially affected, or is reasonably likely to materially affect, theregistrant’s internal control over financial reporting; and
5. The registrant’s other certifying officer(s) and I have disclosed, based on our most recent evaluation ofinternal control over financial reporting, to the registrant’s auditors and the audit committee of theregistrant’s board of directors (or persons performing the equivalent functions):
a. all significant deficiencies and material weaknesses in the design or operation of internal control overfinancial reporting which are reasonably likely to adversely affect the registrant’s ability to record,process, summarize and report financial information; and
b. any fraud, whether or not material, that involves management or other employees who have asignificant role in the registrant’s internal control over financial reporting.
Date: February 24, 2012 /s/ BRUCE BESANKO
Bruce BesankoChief Financial Officer

Exhibit 32
SECTION 906 CERTIFICATIONS OF CHIEF EXECUTIVE OFFICER ANDCHIEF FINANCIAL OFFICER OFOFFICEMAX INCORPORATED
We are providing this Certificate pursuant to Section 906 of the Sarbanes-Oxley Act of 2002, 18 U.S.C.,Section 1350. It accompanies OfficeMax Incorporated’s annual report on Form 10-K (the “Report”) for the fiscalyear ended December 31, 2011.
I, Ravichandra Saligram, OfficeMax Incorporated’s chief executive officer, certify that:
(i) the Report fully complies with the requirements of Section 13(a) or Section 15(d) of the SecuritiesExchange Act of 1934 (15 U.S.C. 78m(a) or 78o(d)); and
(ii) the information contained in the Report fairly presents, in all material respects, OfficeMaxIncorporated’s financial condition and results of operations.
/s/ RAVICHANDRA SALIGRAMRavichandra SaligramChief Executive Officer
I, Bruce Besanko, OfficeMax Incorporated’s chief financial officer, certify that:
(i) the Report fully complies with the requirements of Section 13(a) or Section 15(d) of the SecuritiesExchange Act of 1934 (15 U.S.C. 78m(a) or 78o(d)); and
(ii) the information contained in the Report fairly presents, in all material respects, OfficeMaxIncorporated’s financial condition and results of operations.
/s/ BRUCE BESANKO
Bruce BesankoChief Financial Officer
Dated: February 24, 2012
A signed original of this written statement required by Section 906 has been provided to OfficeMaxIncorporated and will be retained by OfficeMax Incorporated and furnished to the Securities and ExchangeCommission or its staff upon request.

[THIS PAGE INTENTIONALLY LEFT BLANK]

[THIS PAGE INTENTIONALLY LEFT BLANK]

[THIS PAGE INTENTIONALLY LEFT BLANK]

BOARD OF DIRECTORS
Warren Bryant Former Chairman, President and Chief Executive Offi cer, Longs Drug Stores Corporation
Joseph DePintoPresident and Chief Executive Offi cer, 7-Eleven, Inc.
Rakesh GangwalChairman of the Board, Offi ceMax Incorporated; Former Chairman, President and Chief Executive Offi cer, Worldspan Technologies, Inc.;Former President and Chief Executive Offi cer, US Airways Group, Inc.
V. James MarinoFormer President and Chief Executive Offi cer, Alberto-Culver Company
William MontgorisFormer Chief Operating Offi cer and Chief Financial Offi cer,The Bear Stearns Companies Inc.
Francesca Ruiz de LuzuriagaIndependent Business Development Consultant; Former Chief Operating Offi cer, Mattel Interactive
Ravi Saligram President and Chief Executive Offi cer, Offi ceMax Incorporated
David Szymanski Dean, University of Cincinnati College of Business
SHAREHOLDER INFORMATION
Corporate HeadquartersOffi ceMax® Incorporated263 Shuman BoulevardNaperville, IL 60563Tel 630.438.7800
Annual Shareholders MeetingOur annual meeting of shareholders will be held at 2:00 p.m. Central Time on Monday, April 30, 2012, in Naperville, Illinois.
Stock Market ListingOffi ceMax common stock (symbol OMX) is listed on the New York Stock Exchange.
Transfer Agent and RegistrarCommon StockWells Fargo Bank Minnesota, N.A.South St. Paul, Minnesota
Stockholder InformationQuestions regarding stock holdings, certifi cate replacement/transfer, dividends and address changes should be addressed to:
Wells Fargo Bank Minnesota, N.A.Shareowner Services161 N. Concord ExchangeSouth St. Paul, MN 55075Tel 800.248.5784 or 651.450.4064Website: wellsfargo.com/com/shareowner_services/index.jhtml
Investor Relations DepartmentOffi ceMax Incorporated263 Shuman BoulevardNaperville, IL 60563Tel 630.864.6800 Email: investor@offi cemax.comWebsite: investor.offi cemax.com
General InformationThe Offi ceMax website at offi cemax.com contains additional information about the company and our businesses in the “Who We Are” section. The “Investors” section contains many of our fi nancial documents, including recent annual reports, proxy statements, fi nancial news releases and Securities and Exchange Commission fi lings. Information for shareholders is available under “Shareholder Services” in the “Investors” section.
Independent Registered Public Accounting Firm KPMG LLP, Chicago, Illinois
OFFICERS
Jim BarrExecutive Vice President and Chief Digital Offi cer
Bruce BesankoExecutive Vice President, Chief Financial Offi cer and Chief Administrative Offi cer
Matthew Broad Executive Vice President,General Counsel
Randy BurdickExecutive Vice President and Chief Information Offi cer
Tony GiulianoVice President, Treasurer and Investor Relations
John Kenning*Executive Vice President and President of Contract
Michael LewisExecutive Vice President and President of Retail
Deb O’ConnorSenior Vice President, Finance and Chief Accounting Offi cer
Steve ParsonsExecutive Vice President and Chief Human Resources Offi cer
Ravi Saligram President and Chief Executive Offi cer
Reuben Slone Executive Vice President, Supply Chain and General Manager, Services
Susan Wagner-FlemingSenior Vice President, Corporate Secretary and Associate General Counsel
*Effective April 2, 2012

The Ethisphere Institute has named Offi ceMax® one of the World’s Most Ethical Companies for 2012 in recognition of its outstanding commitment to ethical leadership, compliance practices and corporate social responsibility.


