25
1 Annual Report: Roma Social and economic changes in Queensland's gasfield communities in 2017 Report published: 28 May 2018

1
Annual Report: Roma Social and economic changes in Queensland's gasfield communities in 2017
Report published: 28 May 2018

2
Research Team Dr Katherine Witt, Simone Elias and Amy Hodson.
Acknowledgements This research report was prepared by the Centre for Coal Seam Gas, The University of Queensland. The research team would like to acknowledge the assistance from Queensland regional community members who participated in interviews as part of the research process.
Disclosure/Disclaimer This research was funded during Term 1 of the UQ Centre for Coal Seam Gas. During Term 1 the Centre was funded by The University of Queensland and the industry members— Arrow Energy, APLNG, Santos and Shell (QGC). Additional funding was also provided by industry members for research infrastructure costs. The Centre conducts research across Water, Geoscience, Petroleum Engineering and Social Performance themes. For more information about the Centre’s activities and governance, see: http://www.ccsg.centre.uq.edu.au/ Researchers within or working with the UQ Centre for Coal Seam Gas are bound by the same policies and procedures as other researchers within The University of Queensland, and these are designed to ensure the integrity of research. You can view the policies at: http://ppl.app.uq.edu.au/content/4.-research-and-research-training The Australian Code for the Responsible Conduct of Research outlines expectations and responsibilities of researchers to further ensure independent and rigorous investigations. This report has not been peer reviewed.
Contact
Dr Katherine Witt Research Fellow The University of Queensland Centre for Coal Seam Gas St Lucia Qld 4072 Australia E: [email protected] W: www.ccsg.uq.edu.au W: www.boomtown-indicators.org
UQ – CCSG Centre for Coal Seam Gas
UQ – CCSG Centre for Coal Seam Gas
Report published: 28 May 2018 CLX System ID: 149 365 ISBN: forthcoming

3
The Roma CSG Development Story
The ‘Roma CSG Development Story’ was developed in consultation with key members of the Roma and district community. These included representatives from community and business organisations, real estate agents, hotels, motels and other local businesses, police, school, employment agencies and local and state government staff.
The individuals participating in this consultation were asked to discuss and comment on statistical data on indicators of social and economic impact. These discussions provided a local point of view and insight into the Roma CSG Development Story, to be used in combination with the publicly available data. The following indicators were discussed:
1. Population 2. Unemployment 3. Income & business income
4. Housing 5. Top offences recorded by police 6. Rainfall
Those interviewed said Roma was a friendly town with a strong and stable economic base as a rural and government services centre. Referred to as “the gateway to the outback”, Roma is situated at the crossroads of two main transport routes and captures both recreational and commercial traffic heading east-west and north-south. Data shows Roma’s population has been increasing steadily at around 1% growth per annum. In the single year 2012-13, Roma experienced 3.4% growth in resident population. Total population growth (including non- resident workers (NRWs)) was 6%, which is considered “boom” level. The number of NRWs dropped from over 600 to less than 100 in 2014-15 (negative 6% total population growth). Since then, the resident population has been decreasing each year at less than 1%, except for 2016 with a drop of over 2.5%. In 2017, the number of NRWs is up to almost 100. In town, people reported noticing the turnover in population as people came and left, rather than a large net increase.
This turnover was in part due to changes in housing costs. Established residents are reported to have sold homes at inflated prices and moved away, sometimes to pick up fly-in/fly-out employment opportunities in the gas industry. House prices increased in two “bursts” - from 2003-2007 and from 2009-2012. Low income earners are said to have moved away as rents increased. Rents in Roma increased above the QLD median rental price in 2010 to 2015, peaking at $450 per week in 2013. Prices have fallen swiftly to $220 per week in 2017-below half of the 2013 peak. People moved to Roma for work, including a proportion of foreign workers sponsored by local employers. Low rents are now attracting a “new demographic” of low income households.
Demand for housing in Roma was heightened by major flood events in 2010, 2011 and 2012. The 2012 record-breaking flood damaged over 400 homes. Around 200 were left uninhabitable. The flood reconstruction period involved numerous road repair and insurance company building contractor crews from out of town and coincided with the peak of the CSG construction period. This created an acute demand for limited housing and accommodation (as well as supplies and services) which pushed prices up. There was an average of 23 residential building approvals per year from 2001 to 2010. This jumped to around 65 per year from 2011 to 2015, and evaporated to only 2 residential building approvals in 2016, and 8 in 2017. “There is now an oversupply of housing in Roma”.

4
Roma has an historically low unemployment rate (around 2.5 - 3%), well below the State average. During the peak of CSG construction, local employers said they found it difficult to retain employees. Foreign workers were brought in to fill labour shortages, mostly in the hospitality and agricultural industries. In 2017, unemployment rose to its highest level since monitoring began (2001), but still remains below the rate for QLD. Coinciding with rising unemployment, the number of wage earners decreased in the last reporting year (2015/16FY) and the total wage earnings has dropped by around 25%.
Some local businesses appear to have benefitted from CSG development. The total business income for the Roma postcode increased significantly from around $8M in 2010-11 to almost $45M in the 2012-2013 financial year. The number of businesses filing tax returns in this tripled to almost 800. However, from 2015, some businesses were said to be struggling as the procurement needs for the construction period ended. In the latest figures (FY15/16) business incomes continue to decline, but are still almost 4 times higher than the pre-CSG period.
Crime rates in Roma are slightly higher than for the whole of Queensland. At the crossroads of two major transport routes, Roma has a high rate of traffic offences. Traffic offences fluctuate and figures are said to reflect police effort. Good order and drugs offences increased from 2011 to 2014 which caused some local concern, but have since decreased. Police say it was mainly “locals” involved, not CSG workers. Drugs have become “too easy to get” and drugs offences spiked in 2016. This was reflected in reports of increased disruptive behaviour in schools, as well as lower academic scores. Local Strategies put in place by gas companies, local police and businesses to curb bad behaviour during the peak of construction were thought to be effective. There were no reports by our interviewees of an increased fear of crime in the community despite a rise in good order offences and offences against the person in 2017.
This booklet provides detail on the aspects of the ‘Roma story’ based on the range of priority indicators that we tracked. We would like to thank members of the Roma community their cooperation and the gift of their time. We hope that we have done justice to their contributions to this study.
The UQ ‘Cumulative Impacts’ Research Team, May 2018.
5
Contents
The Roma CSG Development Story ............................................................................................................................. 3
Introduction ................................................................................................................................................................. 6
General Insights ........................................................................................................................................................... 7
Indicators of Change ......................................................................................................................................................
1. Population .......................................................................................................................................................... 8
2. Employment ..................................................................................................................................................... 11
3. Income & Business ........................................................................................................................................... 13
4. Housing............................................................................................................................................................. 16
5. Safety & Wellbeing ........................................................................................................................................... 19
List of figures 1a. Roma population and projection ............................................................................................................................ 9
1b. Resident vs. non-resident population – Roma ..................................................................................................... 10
1c. Resident vs. non-resident population – Maranoa Region .................................................................................... 10
2a. Unemployment rate ............................................................................................................................................. 12
3a. Average taxable income ....................................................................................................................................... 14
3b. Total individual earnings ...................................................................................................................................... 14
3c. Total business income ........................................................................................................................................... 15
4a. Median house sale price ....................................................................................................................................... 17
4b. Median weekly rent .............................................................................................................................................. 17
4c. New building approvals ........................................................................................................................................ 18
5a. Total crime rate .................................................................................................................................................... 20
5b. Traffic and related offences ................................................................................................................................. 20
5c. Other relevant offences – Roma ........................................................................................................................... 21
5d. Other relevant offences – Queensland ................................................................................................................ 21
Appendices A. Spatial boundary maps (LGA, SA2 and postcode) .......................................................................................... 22
B. Non-resident population projections – Maranoa Region .............................................................................. 23
C. Roma rainfall (2002-2017) ............................................................................................................................. 24
D. Project information ........................................................................................................................................ 25

6
Introduction The University of Queensland commenced research into the social and economic impacts of coal seam gas (CSG) development in 2013. This research focused on the combined impacts of the multiple CSG developments in the Western Downs region of Queensland as an initial case study, and has now expanded to include other local government areas—Maranoa, Toowoomba, and Isaac. The research team uses publicly available statistical information regarding a number of key indicators that were selected in consultation with community members at the commencement of research. These statistics are combined with additional data gained through interviews with key community members, which provide insight into the factors that are influencing changes in the community. This information is gathered each year, and findings are reported for each town, sub-regions and the region as a whole. More information about the methodology is contained in Appendix D to this report. In this document we present the findings on the town of Roma. The following acronyms are used throughout this report:
CSG Coal seam gas
FIFO Fly-in fly-out
LGA Local Government Area
NRW Non-resident worker
SA2 Statistical Area Level 2
SA3 Statistical Area Level 3
SLA Statistical Local Area
UCL Urban Centre & Locality

7
2017 summary There is a general sense that the post-CSG construction situation is settling in Roma. Community spirit and local attitudes towards the CSG industry are perceived to be improving. While capability of some businesses have improved, other businesses are perceived to have suffered loss of capability.
Community spirit: • There is a general acceptance of ongoing CSG presence in Roma and the situation is stabilising. • Community spirit is improving; focus has shifted to “if this is what it is, then we’ve got to find a way to
live with it”. • Social cohesion is perceived to have somewhat diminished from a combination of non-English speaking
migrants, reluctance of established locals to embrace new ideas, and economic differences between residents who benefitted from CSG and those who did not.
• Attitudes to CSG have improved from initial expectations. One interviewee retrospectively predicted that 20% of community would have viewed CSG favourably in 2008; now 80% would be supportive.
Changed capability: • Improvements in the agriculture sector likely offset impacts from the decrease the CSG construction. • Although business capabilities are generally thought to have improved, community services are seen to
have decreased and it is perceived there is little government interest in community development. • Community capacity to address these issues is reported to have reduced. One person explained that a
sense of entitlement developed over the years when industry supported events, and the community is now less willing to contribute. One interviewee summarised it as “capability has decreased, while expectations have increased”.
• Particular businesses have increased capability by upskilling in individual capability and investing in "the way they do business". Several have used the CSG industry to expand outside the Maranoa region. Other businesses have decreased capacity as skilled workers moved to higher paying roles.
Lessons learned: • Going back a decade to when CSG activity began in the region, some community members would like to
have seen the state government slow CSG activity down. Marona Regional Council was caught by surprise on the magnitude of issues. They are now appropriately upscaled/upskilled, but a slower ramp up to allow them to do this methodocially would have been appreciated.
• Some interviewees recommended better forecasting and communication of expected numbers of NRWs including sub-contractors.
• Community engagement by the CSG industry should be phased throughout the construction and operation stages of the project. The current support from CSG was described as "astronomically disappointing" with no ongoing engagement and no flow-on benefits to the community.
General insights

8
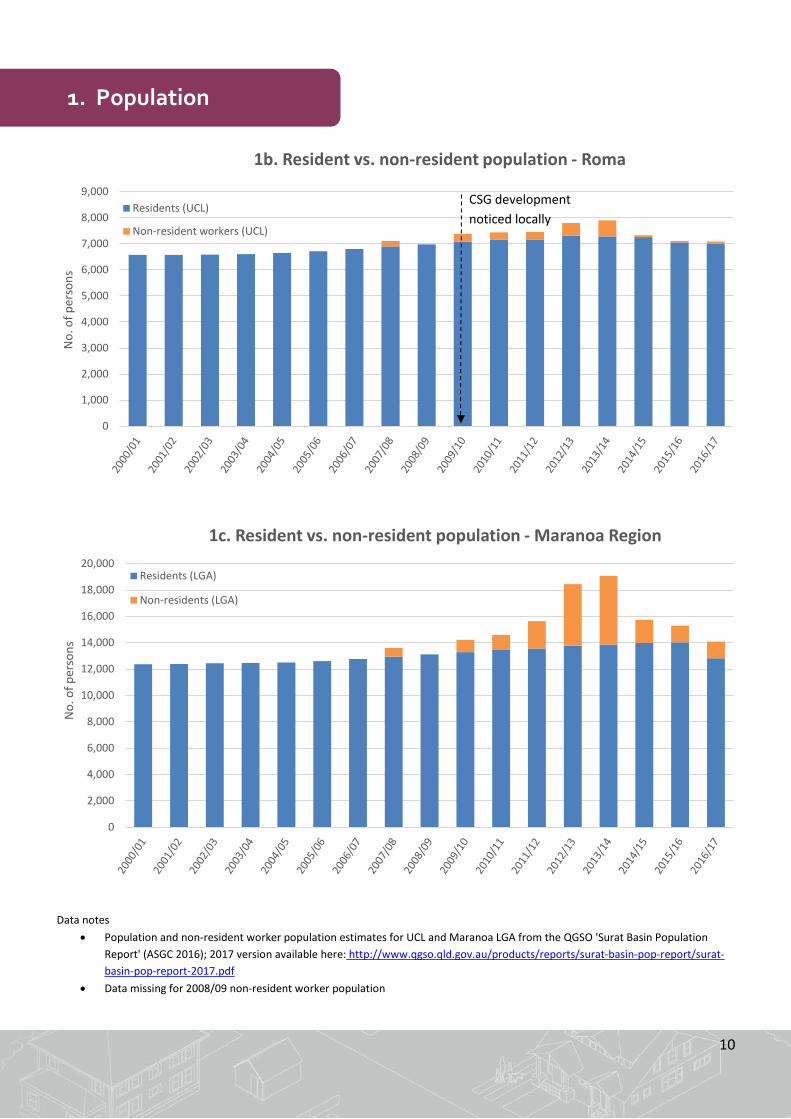
2017 summary Population growth has slowed to around 1% per annum. The number of non-resident workers (NRWs) dropped significantly in 2015 but rose slightly in 2017. Interviewees report the diversity in town has increased as businesses used non-salary innovations including 457 visas to attract workers during CSG construction.
Context • Over half of the Maranoa local government area (LGA) population resides in the town of Roma.
Trends reflected in the data Historical trend: Roma has always been a rural service centre with a stable government sector. Population growth has historically been slow and steady, averaging 1.1% per annum between 2004/05 and 2009/10. During CSG construction period (2011 – 2014): Roma saw an overall 7% increase in its full-time equivalent population (FTE; includes residents and non-residents), consistent with “boom town” growth patterns. This growth was largely due to an influx of NRWs; Roma’s resident population increased by less than 3% over this 5-year period. The number of NRWs staying in town peaked in 2013/14 at 8% of the town population. In the same year, after peak growth in 2012/13 (2.1%), Roma’s resident population began to decline. Since CSG construction period (2015 – 2017): Since the construction phase ended, Roma’s total population has decreased by 3.2%. The largest change was experienced in 2014/15, when NRWs dropped sharply from 610 to 70. NRWs have inincreased slightly in 2017. The resident population has continued to decline over this 3-year period, at an average of 1.3% per annum.
` Community insights and perceptions During CSG construction period (2011 – 2014): Roma experienced a greater population “influx” than was expected. This change was expressed through anecdotes such “the town was buzzing with people”and “you had to park blocks away from where you wanted to go”. Some interviewees suggested that population increase may have been minimised by Roma’s already established airport, which facilitated fly-in fly-out (FIFO) working conditions. People observed increased cultural diversity with international workers, as businesses utilised visa 457 workers to overcome elevated wages. It was noted that locals also left town, i.e. in-migration was coupled with out-migration. Since CSG construction period (2015 – now): Interviewees say the town is now very quiet and report that residents who left due to high rents in 2011-15 are returning. Views on social cohesion differ. Some feel cohesion decreased as long-term residents are reluctant to integrate with new residents, others feel there are no integration issues as Roma residents are use to transient residents as it is a service and training centre for the broader region. Future expectations: Local people expect that population will recover to steady growth. New projects announced by Santos may mean “it’s not all over yet”.
1. Population

9
Data notes
• UCL non-resident workers population estimate from QGSO 'Surat Basin Population Report' (ASGC 2016); 2017 version available here: http://www.qgso.qld.gov.au/products/reports/surat-basin-pop-report/surat-basin-pop-report-2017.pdf
• UCL resident population estimate from the QGSO table ‘Estimated resident population (a) by urban centre and locality (b), Queensland, 2006 to 2016pr’ (ASGS 2016), http://www.qgso.qld.gov.au/products/tables/erp-ucl-qld/index.php
• Population projection (2015 edition) from QGSO table 'Projected population (medium series), by statistical area level 2 (SA2), SA3 and SA4, Queensland, 2011 to 2036' (ASGC 2001), http://www.qgso.qld.gov.au/subjects/demography/population-projections/tables/proj-pop-medium-series-sa2-sa3-sa4-qld/index.php
• Note: Roma UCL and SA2 boundaries are the same
Residents projection
Residents (UCL)
Non-resident workers (UCL)0
2,000
4,000
6,000
8,000
10,000
12,000
Popu
latio
n (n
o. o
f per
sons
)
1a. Roma population and projections
CSG development noticed locally
1. Population
10
Data notes
• Population and non-resident worker population estimates for UCL and Maranoa LGA from the QGSO 'Surat Basin Population Report' (ASGC 2016); 2017 version available here: http://www.qgso.qld.gov.au/products/reports/surat-basin-pop-report/surat-basin-pop-report-2017.pdf
• Data missing for 2008/09 non-resident worker population
0
1,000
2,000
3,000
4,000
5,000
6,000
7,000
8,000
9,000
No.
of p
erso
ns
1b. Resident vs. non-resident population - Roma
Residents (UCL)
Non-resident workers (UCL)
CSG development noticed locally
0
2,000
4,000
6,000
8,000
10,000
12,000
14,000
16,000
18,000
20,000
No.
of p
erso
ns
1c. Resident vs. non-resident population - Maranoa Region
Residents (LGA)
Non-residents (LGA)
1. Population

11
2017 summary Unemployment rate has been increasing since 2013 and increased a further 60% to 4.3% in 2017. This remains well below the QLD unemployment rate of 6.1%. Interviewees relate this drop to decreases in CSG activity and report job security is now concerning the community, especially the youth of Roma.
Trends reflected in the data Historical trend: Roma has a low (around 2.5 - 3%) unemployment rate, and the trend does not follow the state-wide trend, suggesting local influences dominant. The unemployment rate dipped to 1.2% in 2009 but reverted to trend the following year. During CSG construction period (2011 – 2014): Unemployment averaged 1.7% during this period and was lowest in 2013 (1.1%). Very low unemployment rate indicated a severe skills shortage in both killed and unskilled labour. Since CSG construction period (2015 – 2017): Unemployment increased steadily from 2013 to 2016, averaging a 35% increase per year. In the last year, unemployment has jumped further from 2.7% to 4.3%. This is a 72% increase in one year. Unemployment is still below the QLD benchmark of 6.1%.
Community insights and perceptions During CSG construction period (2011 – 2014): Very low unemployment made it difficult for local employers to recruit and retain staff. Some local employers sponsored overseas workers. Local youth returned to town due to ability to gain apprenticeships or high paying employment. Interviewees reported unemployed people moved away as the cost of living rose. Since CSG construction period (2015 – now): In November 2015, the greater Maranoa-Western Downs region was reported to have the lowest unemployment rates in Queensland (Antrobus 2015). In contrast, interviewees report job insecurity is now concerning people and mainly effects Roma’s youth. Increase in unemployment linked to softening in CSG activity. Improvements in the agricultural economy due to favourable weather and commodity prices is drawing workers back to agriculture. Future expectations: Those interviewed expect that unemployment will continue to rise as local businesses adapt from the CSG construction phase to the operations phase. Santos has announced $700million commitments in Western Downs and Maranoa so some expect a decrease in unemployment again in the future. It is perceived that local businesses do not have capacity, or inclination, to take on long-term unemployed.
2. Employment

12
Data notes • 2001-2008 based on SLA statistical boundary; Source: QGSO Regional Database Archived dataset 'Labour Force - Small Area (Qtr
Ended 31 Dec 2002 to Qtr Ended 31 Dec 2008) [DEEWR, Small Area Labour Markets Australia] (ASGC 2001)', http://www.qgso.qld.gov.au/products/tables/qld-regional-database/index.php
• 2009-2010 data from DEEWR file 'Unemployment salm_data_files_2008-2013' • 2010-2017 based on SA2 (Roma) statistical boundary; Source: QGSO Regional Database dataset 'Labour Force - Small Area (Qtr
Ended 31 Dec 2010 to Qtr Ended 31 Dec 2017) [Department of Jobs and Small Business] (ASGS 2016)', http://www.qgso.qld.gov.au/products/tables/qld-regional-database/index.php
• Prior to 2017, unemployment data is reported for financial years; e.g. FY2016 corresponds to July 2015 to June 2016
Roma
Queensland (benchmark)
0
1
2
3
4
5
6
7
8
9
2001 2002 2003 2004 2005 2006 2007 2008 2009 2010 2011 2012 2013 2014 2015 2016 2017
Une
mpl
oym
ent R
ate
(%)
2a. Unemployment rate
CSG development noticed locally
2. Employment
13
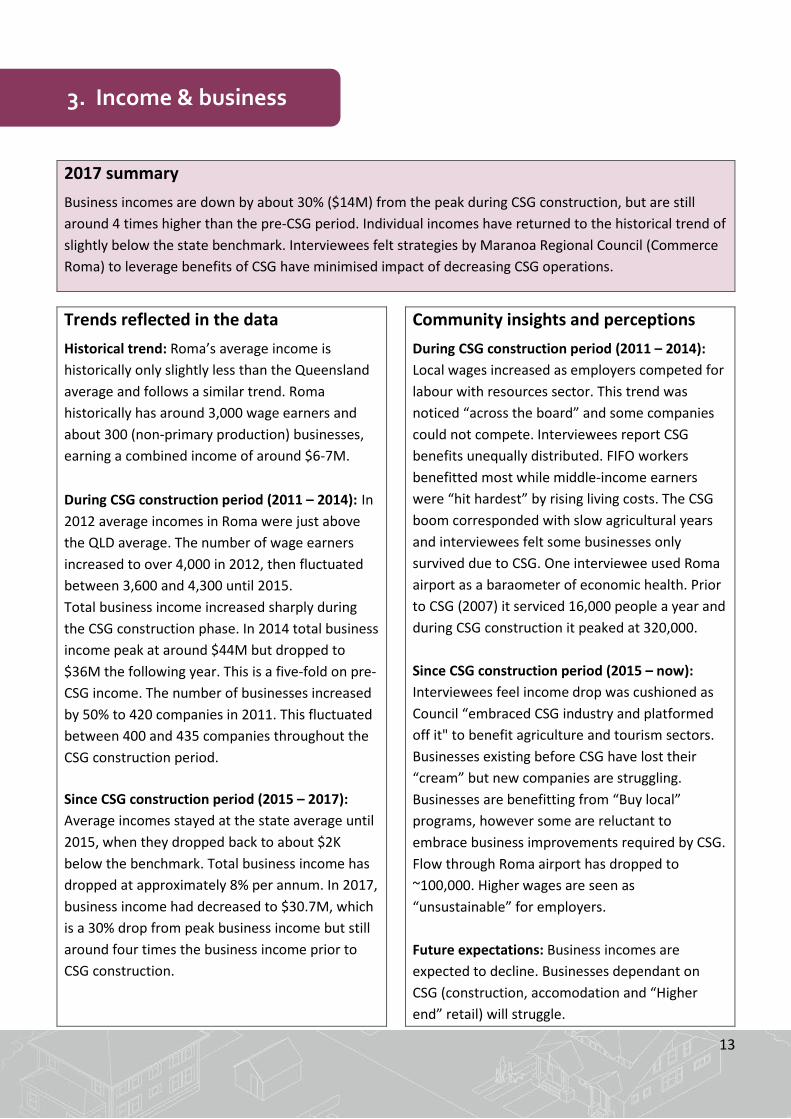
2017 summary Business incomes are down by about 30% ($14M) from the peak during CSG construction, but are still around 4 times higher than the pre-CSG period. Individual incomes have returned to the historical trend of slightly below the state benchmark. Interviewees felt strategies by Maranoa Regional Council (Commerce Roma) to leverage benefits of CSG have minimised impact of decreasing CSG operations.
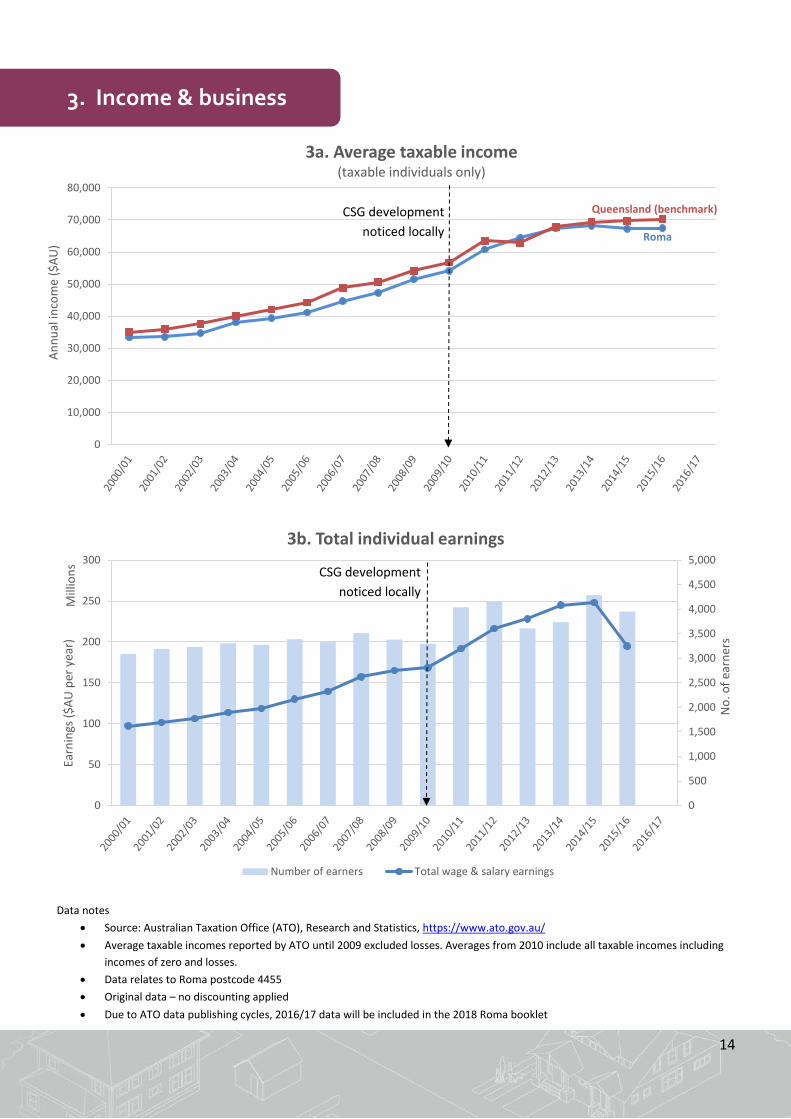
Trends reflected in the data Historical trend: Roma’s average income is historically only slightly less than the Queensland average and follows a similar trend. Roma historically has around 3,000 wage earners and about 300 (non-primary production) businesses, earning a combined income of around $6-7M. During CSG construction period (2011 – 2014): In 2012 average incomes in Roma were just above the QLD average. The number of wage earners increased to over 4,000 in 2012, then fluctuated between 3,600 and 4,300 until 2015. Total business income increased sharply during the CSG construction phase. In 2014 total business income peak at around $44M but dropped to $36M the following year. This is a five-fold on pre-CSG income. The number of businesses increased by 50% to 420 companies in 2011. This fluctuated between 400 and 435 companies throughout the CSG construction period. Since CSG construction period (2015 – 2017): Average incomes stayed at the state average until 2015, when they dropped back to about $2K below the benchmark. Total business income has dropped at approximately 8% per annum. In 2017, business income had decreased to $30.7M, which is a 30% drop from peak business income but still around four times the business income prior to CSG construction.
Community insights and perceptions During CSG construction period (2011 – 2014): Local wages increased as employers competed for labour with resources sector. This trend was noticed “across the board” and some companies could not compete. Interviewees report CSG benefits unequally distributed. FIFO workers benefitted most while middle-income earners were “hit hardest” by rising living costs. The CSG boom corresponded with slow agricultural years and interviewees felt some businesses only survived due to CSG. One interviewee used Roma airport as a baraometer of economic health. Prior to CSG (2007) it serviced 16,000 people a year and during CSG construction it peaked at 320,000. Since CSG construction period (2015 – now): Interviewees feel income drop was cushioned as Council “embraced CSG industry and platformed off it" to benefit agriculture and tourism sectors. Businesses existing before CSG have lost their “cream” but new companies are struggling. Businesses are benefitting from “Buy local” programs, however some are reluctant to embrace business improvements required by CSG. Flow through Roma airport has dropped to ~100,000. Higher wages are seen as “unsustainable” for employers. Future expectations: Business incomes are expected to decline. Businesses dependant on CSG (construction, accomodation and “Higher end” retail) will struggle.
3. Income & business
14
Data notes
• Source: Australian Taxation Office (ATO), Research and Statistics, https://www.ato.gov.au/ • Average taxable incomes reported by ATO until 2009 excluded losses. Averages from 2010 include all taxable incomes including
incomes of zero and losses. • Data relates to Roma postcode 4455 • Original data – no discounting applied • Due to ATO data publishing cycles, 2016/17 data will be included in the 2018 Roma booklet
Roma
Queensland (benchmark)
0
10,000
20,000
30,000
40,000
50,000
60,000
70,000
80,000
Annu
al in
com
e ($
AU)
3a. Average taxable income (taxable individuals only)
CSG development noticed locally
0
500
1,000
1,500
2,000
2,500
3,000
3,500
4,000
4,500
5,000
0
50
100
150
200
250
300
No.
of e
arne
rs
Earn
ings
($AU
per
yea
r)M
illio
ns
3b. Total individual earnings
Number of earners Total wage & salary earnings
CSG development noticed locally
3. Income & business

15
Data notes
• Source: Australian Taxation Office, Research and Statistics, https://www.ato.gov.au/ • Data relates to Roma postcode 4455 • Original data – no discounting applied • Due to ATO data publishing cycles, 2016/17 data will be included in the 2018 Roma booklet
0
50
100
150
200
250
300
350
400
450
500
0
5
10
15
20
25
30
35
40
45
No.
of b
usin
esse
s
Inco
me
($AU
per
yea
r)M
illio
ns
3c. Total business income(non-primary production)
Number of businesses Total business income
CSG development noticed locally
3. Income & Business
16
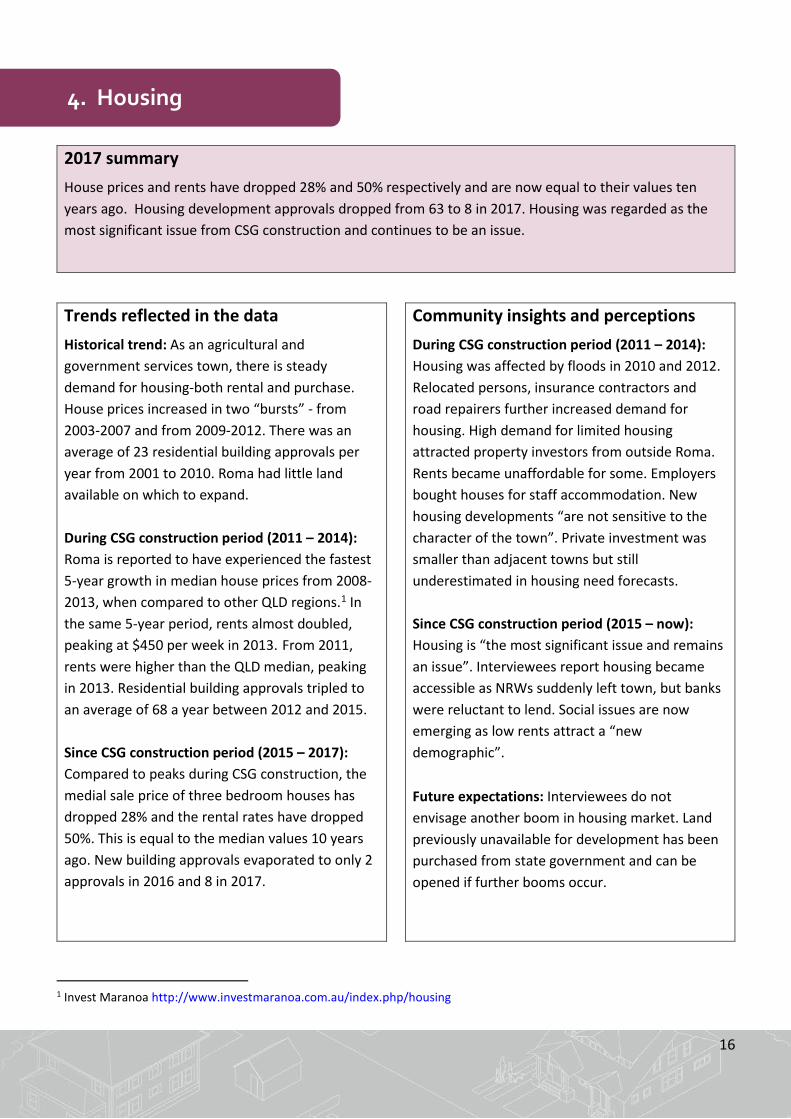
2017 summary House prices and rents have dropped 28% and 50% respectively and are now equal to their values ten years ago. Housing development approvals dropped from 63 to 8 in 2017. Housing was regarded as the most significant issue from CSG construction and continues to be an issue.
Trends reflected in the data Historical trend: As an agricultural and government services town, there is steady demand for housing-both rental and purchase. House prices increased in two “bursts” - from 2003-2007 and from 2009-2012. There was an average of 23 residential building approvals per year from 2001 to 2010. Roma had little land available on which to expand. During CSG construction period (2011 – 2014): Roma is reported to have experienced the fastest 5-year growth in median house prices from 2008-2013, when compared to other QLD regions.1 In the same 5-year period, rents almost doubled, peaking at $450 per week in 2013. From 2011, rents were higher than the QLD median, peaking in 2013. Residential building approvals tripled to an average of 68 a year between 2012 and 2015. Since CSG construction period (2015 – 2017): Compared to peaks during CSG construction, the medial sale price of three bedroom houses has dropped 28% and the rental rates have dropped 50%. This is equal to the median values 10 years ago. New building approvals evaporated to only 2 approvals in 2016 and 8 in 2017.
Community insights and perceptions During CSG construction period (2011 – 2014): Housing was affected by floods in 2010 and 2012. Relocated persons, insurance contractors and road repairers further increased demand for housing. High demand for limited housing attracted property investors from outside Roma. Rents became unaffordable for some. Employers bought houses for staff accommodation. New housing developments “are not sensitive to the character of the town”. Private investment was smaller than adjacent towns but still underestimated in housing need forecasts. Since CSG construction period (2015 – now): Housing is “the most significant issue and remains an issue”. Interviewees report housing became accessible as NRWs suddenly left town, but banks were reluctant to lend. Social issues are now emerging as low rents attract a “new demographic”. Future expectations: Interviewees do not envisage another boom in housing market. Land previously unavailable for development has been purchased from state government and can be opened if further booms occur.
1 Invest Maranoa http://www.investmaranoa.com.au/index.php/housing
4. Housing

17
Data notes • 4a source: QGSO Regional Database dataset 'Residential land and dwelling sales (Year Ended 30 Sep 2000 to Year Ended 30 Sept
2017) [DNRM] (ASGS 2016)', http://www.qgso.qld.gov.au/products/tables/qld-regional-database/index.php • 4b source: QGSO Regional Database dataset 'Median rent (Year Ended 30 Sep 1990 to Year Ended 31 Dec 2017) [RTA] (ASGS
2016)', http://www.qgso.qld.gov.au/products/tables/qld-regional-database/index.php • Data based on SA2 (Roma) statistical boundary • Prior to 2017, rent data is reported for financial years; e.g. FY2016 corresponds to July 2015 to June 2016
Roma
Brisbane (benchmark)
0
50
100
150
200
250
300
0
100,000
200,000
300,000
400,000
500,000
600,000
700,000
No.
hou
se sa
les
Pric
e ($
AU)
4a. Median house sale price
No. of house sales - Roma
CSG development noticed locally
140 140 140160
180195
240260 270
300
340
430450
420
380
240220
Queensland(benchmark)
0
50
100
150
200
250
300
350
400
450
500
2001 2002 2003 2004 2005 2006 2007 2008 2009 2010 2011 2012 2013 2014 2015 2016 2017
Wee
kly
rent
($AU
)
4b. Median weekly rent (3-bedroom house)
CSG development noticed locally
4. Housing

18
Data notes • Source: QGSO Regional Database dataset 'Building Approvals (Jul 2001 to Dec 2017) [ABS 8731.0] (ASGS 2016)',
http://www.qgso.qld.gov.au/products/tables/qld-regional-database/index.php • Data based on SA2 (Roma) statistical boundary • Approvals shown for private buildings only; public developments are excluded • Prior to 2017, building approvals are reported for financial years; e.g. FY2016 corresponds to July 2015 to June 2016
0
10
20
30
40
50
60
70
80
90
2002 2003 2004 2005 2006 2007 2008 2009 2010 2011 2012 2013 2014 2015 2016 2017
No.
of a
ppro
vals
4c. New building approvals
Residential building approvals Non-residential building approvals
CSG development noticed locally
4. Housing

19
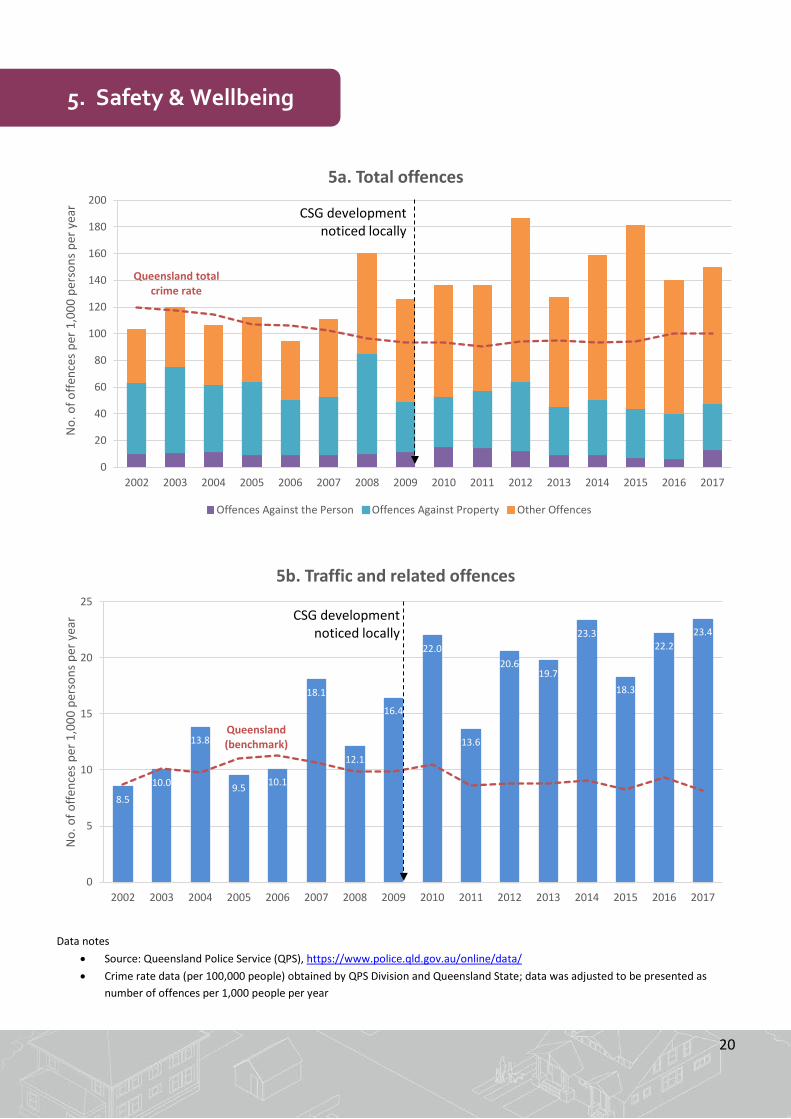
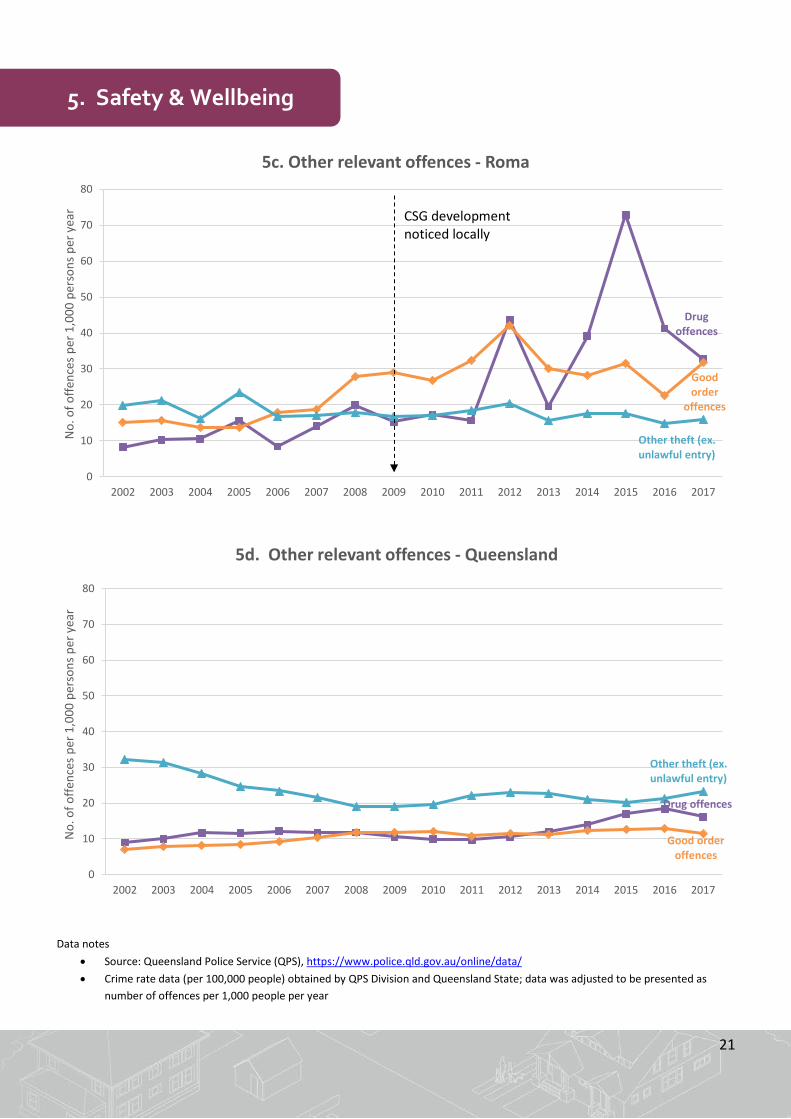
2017 summary Total offences in Roma are 50% higher than the rate for Queensland. Traffic offences remain high despite significant decreases in traffic volumes. Good order and drug offences have fluctuated recently but are currently 2 to 3 times higher than the QLD rate. Offences against the person are comparable to QLD rates and property offences are less. Interviewees reported decreased tolerance to drug use and flagged emerging issues of domestic violence and juvenile crime.
Trends reflected in the data Historical trend: Crime rates in Roma are historically similar to or above the Queensland benchmark. Offences increased significantly above this average in 2008, largely due to an increase in offences against Property and Good Order offences. During CSG construction period (2011 – 2014): Overall crime rates fluctuated during the CSG construction years. Offences were particularly elevated in 2012 and 2014. Drug offences spiked in 2012 and good order offences spiked in 2012 and 2014. Traffic offences fluctuate but were more than double the QLD benchmark for several of the CSG construction years. Since CSG construction period (2015 – 2017): The total crime rate is 50% higher than the QLD bench mark. This is slightly lower than the average during the CSG construction period. The rate of Traffic and Good Order offences dropped in 2016 but returned to rates seen during CSG construction in 2017. Traffic offences are nearly 3 times the benchmark. Theft is the only indicator tracked that is below the QLD benchmark.
Community insights and perceptions During CSG construction period (2011 – 2014): According to local police, “Good order and traffic are the main impacts of CSG” of interest to them. Local responses included a Liquor Accord, ID scanners in hotels, company in-vehicle monitoring systems, and school education programs. A spike in assaults in 2012 was linked by interviewees from as mainly “locals”. Interviewees did not report increased fear of crime in the community but did feel “drugs are too easy to get”. Traffic offences also reflect police activity.
Since CSG construction period (2015 – now): Some interviewees regard drugs as a major problem while others were surprised by the spike in drug offences. These offences were seen to be driven by mental health issues driven by the 2011/12 flood, high disposable incomes and decreased community tolerance (improved cooperation with QPS). Interviewees were surprised that traffic offences remained high as the volume of traffic through town is perceptibly lower. This could be associated with lack of congestion or “economic offences” (unregistered vehicles, roadworthiness). Increased disruptive behaviour is reported in schools, as well as lower academic scores.
Future expectations: Interviewees had mixed expectations of future crime rates. Domestic violence and crimes by juveniles are seen as emerging issues.
5. Safety & Wellbeing
20
Data notes • Source: Queensland Police Service (QPS), https://www.police.qld.gov.au/online/data/ • Crime rate data (per 100,000 people) obtained by QPS Division and Queensland State; data was adjusted to be presented as
number of offences per 1,000 people per year
Queensland total crime rate
0
20
40
60
80
100
120
140
160
180
200
2002 2003 2004 2005 2006 2007 2008 2009 2010 2011 2012 2013 2014 2015 2016 2017
No.
of o
ffenc
es p
er 1
,000
per
sons
per
yea
r
5a. Total offences
Offences Against the Person Offences Against Property Other Offences
CSG development noticed locally
8.510.0
13.8
9.5 10.1
18.1
12.1
16.4
22.0
13.6
20.619.7
23.3
18.3
22.223.4
Queensland (benchmark)
0
5
10
15
20
25
2002 2003 2004 2005 2006 2007 2008 2009 2010 2011 2012 2013 2014 2015 2016 2017
No.
of o
ffenc
es p
er 1
,000
per
sons
per
yea
r
5b. Traffic and related offences
CSG development noticed locally
5. Safety & Wellbeing
21
Data notes • Source: Queensland Police Service (QPS), https://www.police.qld.gov.au/online/data/ • Crime rate data (per 100,000 people) obtained by QPS Division and Queensland State; data was adjusted to be presented as
number of offences per 1,000 people per year
Drug offences
Good order
offences
Other theft (ex. unlawful entry)
0
10
20
30
40
50
60
70
80
2002 2003 2004 2005 2006 2007 2008 2009 2010 2011 2012 2013 2014 2015 2016 2017
No.
of o
ffenc
es p
er 1
,000
per
sons
per
yea
r
5c. Other relevant offences - Roma
Drug offences
Good order offences
Other theft (ex. unlawful entry)
0
10
20
30
40
50
60
70
80
2002 2003 2004 2005 2006 2007 2008 2009 2010 2011 2012 2013 2014 2015 2016 2017
No.
of o
ffenc
es p
er 1
,000
per
sons
per
yea
r
5d. Other relevant offences - Queensland
CSG development noticed locally
5. Safety & Wellbeing

22
Appendix A: Spatial boundary maps (SA2, UCL and postcode)
Roma statistical area 2 (SA2) boundary (2011, ASGS Code 307011176)
Roma UCL boundary
Roma postcode boundary 4455

23
Appendix B: Roma rainfall (2002 – 2017)
Data notes
• Source: Bureau of Meteorology Climate Data online, http://www.bom.gov.au/climate/data/ • Rainfall observations reported for Roma Airport Rainfall Station
Historic average
0
200
400
600
800
1,000
1,200
2002 2003 2004 2005 2006 2007 2008 2009 2010 2011 2012 2013 2014 2015 2016 2017
Rain
fall
(mm
)
Summer (Jan - Mar; Oct - Dec) Winter (Apr - Sept)

24
Appendix C: Non-resident population projections - Maranoa Region
Data notes
• Non-resident worker estimates by LGA from the QGSO 'Surat Basin Population Report' (ASGC 2016); 2017 version available here: http://www.qgso.qld.gov.au/products/reports/surat-basin-pop-report/surat-basin-pop-report-2017.pdf
• Non-resident worker projections (2018) by LGA from QGSO table 'Surat Basin: Non-resident population projections, by local government area (LGA), 2018 to 2024' (ASGS 2016), http://www.qgso.qld.gov.au/subjects/demography/population-projections/tables/surat-basin-non-resident-pop-proj-lga/index.php
• Non-resident workers projections (2014) by LGA from QGSO report 'Surat Basin non–resident population projections: 2014 to 2020', http://www.qgso.qld.gov.au/products/reports/surat-basin-non-resident-pop-proj/surat-basin-non-resident-pop-proj-2014-2020.pdf
• Series A projection is based on the number of non–resident workers on-shift who were engaged in existing resource operations and associated infrastructure activities in the area at June 2014. The projection takes into account future changes to those operational workforces as advised by resource company sources, as well as the estimated construction and operational workforces of Category A projects (i.e. those that are approved and have reached a financial close).
• Series B projection includes the Series A projection plus projected growth in the non-resident population arising from Category B projects (those that are approved but have yet to reach a financial close).
Non-residents (LGA) Projection A (2018)
Projection B (2018)
Projection A & B (2014)
0
1,000
2,000
3,000
4,000
5,000
6,000
No.
of n
on-r
esid
ent w
orke
rs

25
Appendix D: Project Information
The University of Queensland is conducting research into the social and economic impacts of coal seam gas (CSG) development. The project has focused on the combined impacts of the multiple CSG developments in the Western Downs region of Queensland as an initial case study. That focus has now expanded to include other local government areas – Maranoa, Toowoomba, and Isaac.
Research project history
• Engagement: People from the community, government and industry worked with researchers to identify the most important ‘indicators’ to monitor. This consultation process helped to develop a shared understanding of social and economic development in the community and created a framework for reporting and discussion.
• Indicator monitoring: The team identified ways to calculate and report the impact of multiple CSG projects against the agreed set of indicators.
The research team
Dr Kathy Witt, Centre for Coal Seam Gas, The University of Queensland has led this research since May 2017 and joined the original project team in 2014.
A large team of researchers has contributed to this project since 2013, including:
• Assoc. Prof. Will Rifkin, University of Newcastle (previously led this project while working at The University of Queensland from April 2012 – April 2017)
• Dr Jo-Anne Everingham, Senior Research Scientist, Centre for Social Responsibility in Mining, The University of Queensland (CSRM).
• Ms Sarah Choudhury, Research Assistant, CSRM (2017) and Bec Colvin, (2016). • Ms Sheryllee Johnson, Research Technician, CCSG (2013-2016). • Professor David Brereton, Associate Director, Sustainable Minerals Institute (2012-2016). • Dr Vikki Uhlmann, Research Manager, CSRM (2013 -2014). • Ms Kylie May, Research Analyst, CSRM (2013 – 2014).
Reporting timeframes: The data collection for the project has been occurring annually since 2013. Project outcomes, recommendations, and reports have been released periodically. The timeframe for some datasets, such as those from the Australian Taxation Office, lags behind the main data used in this report—this is due to unique data collection and reporting requirements of this agency.
Ethics approvals: This study has been cleared by the human research ethics committee of The University of Queensland in accordance with the National Health and Medical Research Council's guidelines (Research Ethics clearance approval no. 2013000587).
Questions: Contact the lead researcher, Dr Katherine Witt Centre for Coal Seam Gas, Faculty of Engineering, Information Technology and Architecture, The University of Queensland, Brisbane, QLD, 4072 M: 0418 619 341 | E: [email protected] | W: www.ccsg.uq.edu.au
If you would like to speak to an officer of the University not involved in the study, you may contact the Ethics Officer on 07 3365 3924.


