52
Annual Report to the San Francisco Health Commission (Fiscal Year 2015-16) Prepared by the SFDPH Office of Managed Care December 2016
Annual Report to the San Francisco Health Commission
(Fiscal Year 2015-16)
Prepared by the SFDPH Office of Managed Care December 2016
TABLE OF CONTENTS:
I. SUMMARY AND OVERVIEW OF PROGRAM ACCOMPLISHMENTS: HEALTHY
SAN FRANCISCO AND CITY OPTION .......................................................... 1
II. FY2015-16 PROGRAM ACTIVITIES ............................................................. 5
A. COMMUNICATIONS, OUTREACH, APPLICATIONS, AND ENROLLMENT ...................................... 5
B. PARTICIPANT DEMOGRAPHICS ................................................................................................... 9
C. PROVIDER AND PHARMACY NETWORK .................................................................................... 15
D. CLINICAL COMPONENT AND SERVICES UTILIZATION................................................................ 17
E. HEALTH IMPROVEMENT INITIATIVES ........................................................................................ 31
F. PARTICIPANT EXPERIENCE AND SATISFACTION ........................................................................ 32
G. HEALTH CARE SECURITY ORDINANCE AND THE EMPLOYER SPENDING REQUIREMENT .......... 35
H. EXPENDITURES AND REVENUES ................................................................................................ 40
III. FY2016-17 ANTICIPATED PROGRAM ACTIVITIES ..................................... 44
IV. DATA SOURCES AND LIMITATIONS ......................................................... 46
V. ACKNOWLEDGEMENTS .......................................................................... 47
VI. APPENDIX A ........................................................................................... 48
VII. APPENDIX B ........................................................................................... 49

1
I. SUMMARY AND OVERVIEW OF PROGRAM ACCOMPLISHMENTS: HEALTHY SAN FRANCISCO AND CITY OPTION
The Healthy San Francisco Program (Healthy SF or HSF) was designed by the San Francisco Department of Public Health (SFDPH) in 2007 to make health care services available and affordable to uninsured San Francisco residents. Today, Healthy SF primarily serves to: (1) provide health care services to uninsured San Francisco adults who are ineligible for public coverage; and (2) assist uninsured adult San Francisco residents who do not have access to affordable health insurance options. The program evolved in response to the changing needs of San Francisco residents against the backdrop of the enactment of the Patient Protection and Affordable Care Act (ACA). The ACA has expanded enrollment in Medi-Cal, California’s Medicaid program, and has created health insurance exchanges where residents can purchase health insurance. The sum of these changes has resulted in the provision of coverage to tens of thousands of previously uninsured former Healthy SF participants. Due to the increase in access to public and private health insurance, Healthy SF enrollment has steadily declined. However, FY2015-16 saw a more modest and less rapid decline in enrollment. This report provides Healthy San Francisco participants, providers, researchers, the general public, and others interested stakeholders with detailed information on how SFDPH operates Healthy SF in addition to how it monitors and tracks performance. A. 2015-16 Healthy San Francisco and City Option Policy Changes
In FY2015-16, a number of policy changes were made to create new health care options for San Francisco residents. These included:
• Healthy SF Program Eligibility Changes: Effective January 1, 2016, two new program eligibility changes were made:
1) Income limit increased from 400% to 500% federal poverty level (FPL); 2) The Healthy SF Transition Period was permanently extended. The Transition Period was implemented to address difficulties that individuals experienced when enrolling in private health insurance through Covered California (Covered CA), including the affordability of coverage. Individuals who are eligible for subsidized Covered CA plans will be able to enroll or remain in Healthy SF provided they meet other program eligibility.
Participants who are eligible for Healthy SF through City Option employer contributions were unaffected by these changes.
• City Option Modernization: In August 2015, the San Francisco Health Commission approved the SFDPH proposal to update City Option and ensure that all low- and moderate-income San Franciscans have access to affordable health care. The City Option Modernization included two components specifically designed to address affordability of health care: 1) permanent extension of the Healthy SF Transition Period, and 2) premium and cost-sharing assistance for eligible employees receiving employer contributions to the City Option; this option is now formally referred to as SF Covered MRA.

2
• SF Covered MRA Program Design: The San Francisco Department of Public Health worked closely with the San Francisco Health Plan (SFHP) to design the SF Covered MRA (formerly called the Bridge to Coverage Medical Reimbursement Account) program. Discussions were held throughout FY2015-16 to assess various implementation options, allocation of resources, and program rules.
• City Option Re-Branding: As the City Option Modernization project continues to take shape, program leadership have begun to build out a rebranding strategy that will more clearly communicate the relationship between City Option programs. To create a unified brand for City Option programs, each programs’ logos, names, and taglines will be revised. For example, the Medical Reimbursement Account program that was formerly called MRA is now referred to as SF MRA. The intent of the rebranding strategy is to strengthen public messaging that these three programs are interrelated under the San Francisco City Option umbrella. Furthermore, the City Option programs are intended to reflect a continuum of options that can assist San Franciscans with accessing health care. These changes and the new logos are illustrated below:
• SF MRA Deactivation: In May 2016, the program began the process to deactivate City Option medical reimbursement accounts (SF MRA accounts) that had been inactive. Inactivity has been defined as when an account does not have any deposit or claim activity for 24 months or more. Multiple notice letters and auto-calls were delivered to employees with inactive accounts prior to deactivation.
B. Provider and Pharmacy network Changes
The San Francisco Health Network (SFHN) initiated the process to transition its pharmacy benefit manager (PBM) to Walgreens. This change will take effect in the fall of 2016. This multi-year effort by the San Francisco Department of Public Health and Walgreens will affect Healthy SF participants as well as those who receive benefits through the sliding scale program. As part of the PBM transition, Healthy SF participants enrolled with an SFHN medical home will have their pharmacy network expanded to include thirty-two (32) Walgreens. The transition will only be programmatic and is not expected to affect the provision of primary care services to Healthy SF members. To ensure compliance with relevant 340B program regulations, the San Francisco Department of Public Health was unable to expand the pharmacy network to clinics outside of the San Francisco Health Network. Upon approval of the transition by the Health Resources and Services Administration, Healthy SF participants with SFHN medical homes will be able to fill prescriptions at any Walgreens location in the City and County of San Francisco.

3
C. Program Activities to Improve Participants’ Experience
In FY2015-16 Healthy SF focused on operational improvements to enrich participants’ and employers’ experiences with the program. A number of enhancements, trainings, and reports were instituted to help improve functionality. These developments are particularly helpful as the program prepares to accommodate new functionality with the roll out of the SF Covered MRA program in the fall of 2016. Application Audits Healthy SF reinstituted application audits on both a weekly and monthly basis in June 2016. The new process was approved by the Healthy SF Training Lead Committee. This audit process will help ensure the integrity of the program, making sure the program identifies any applications (1) without proper verification documents, (2) with incorrect verification documents, or (3) with any potential administrative errors. To date, the audits have only been performed on applications submitted by non-San Francisco Community Clinic Consortium (SFCCC) clinics. Healthy SF will implement an audit process that includes all Healthy SF enrollments sites in the fall of 2016. City Option System Enhancements In preparation for the SF Covered MRA implementation and SF MRA deactivation, additional projects were introduced in FY2015-16. These included:
• The creation of an online feedback form; • Generation of program change announcements to employees and SF Covered MRA welcome
letters; • System changes to identify employees who are eligible for SF MRA and transfers of eligible
employer contributions to SF MRA; and • The establishment of processes to fund and maintain updated employee demographic
information of SF Covered MRA participants with the SF MRA third party vendor Automatic Data Processing (ADP).
The City Option program also began an automated process to uniquely identify employees with multiple City Option employers. These individuals are assigned unique person identification numbers that will allow the program to track, view, update, and report employees’ participation across all employers and contributions made on those employees’ behalf.
Lastly, a User Experience Study for the City Option Employer Portal was instated towards the end of FY2015-16 to help determine how employers access and interact with the portal. The findings from this study will be used to inform future portal enhancements. D. Financial Summary
In FY2015-16, there was an estimated $74.39 million in total program expenditures. The SFDPH spent approximately $44 million, while Private community providers reported an estimated $30.32 million in net expenditures on behalf of the Healthy SF program. Healthy SF generated $16.9 million in revenue and $27.08 million was provided by a City and County of San Francisco General Fund subsidy. Overall, there was a per member per month (PMPM) General Fund expenditure of $159 based on 170,455 participant months.

4
E. Moving Forward With the passage of the Affordable Care Act, two primary challenges remain: shifting demographics within the Healthy SF participant population and limitations to attaining health care coverage for those who cannot afford health insurance exchange products. Since 2014, enrollment in Medi-Cal has increased by 4.15 million people. At the same time, approximately 145,000 San Franciscans have enrolled in new health insurance options since the launch of the ACA. This includes more than 93,000 residents who have enrolled in Medi-Cal and over 55,000 enrolled in Covered CA. Today the County provides coverage for 194,000 San Franciscans, an increase of nearly two hundred percent (200%) since 20131. However, SFDPH estimates that between twenty-five and thirty thousand residents still do not have health insurance.2 At the point of ACA’s implementation, 96.8% of San Francisco residents either had health care insurance or were enrolled in a comprehensive health access program.3 Healthy SF is committed to maintaining this trend and responding to shifts in an evolving health care landscape. The program will continue to advocate for and assist eligible individuals with signing up for and enrolling in subsidized insurance options. As changes within the health care delivery landscape have begun to settle, Healthy SF has a much clearer picture of the demographics and needs of its existing participant pool. The program also has a stronger grasp of the gaps it can fill as a safety net health access program to meet the needs of individuals who have not been reached through the means provided by the Affordable Care Act. While expansion of Medi-Cal enrollment has expanded access to health insurance, gaps in options for coverage remain for our most vulnerable populations. Some individuals who have become eligible for new public and private insurance products are still not able to afford the premiums or copays. These burdens are intensified in San Francisco where the cost of living is exceptionally higher than national and state averages. This discrepancy causes the eligibility standards and subsidies available to our residents to be relatively inadequate on average. In addition, health care reform has created new business demands for health care providers; as a result some providers have not remained in the Healthy SF. It is in the context of these complex realities, that Healthy SF has maintained a consistent level of quality and service despite a significant decline in program participation. Healthy SF strives to fill in gaps in the safety net where the Affordable Care Act has not been able to reach or meet the need for care.
1 Human Services Agency of San Francisco, internal communication, 2016. 2 San Francisco Department of Public Health, Office of Policy and Planning, internal communication 2016. 3 San Francisco Department of Public Health (2011). Healthy San Francisco Annual Report to the San Francisco Health Commission (Fiscal Year 2009-2010).
5
II. FY2015-16 PROGRAM ACTIVITIES
A. COMMUNICATIONS, OUTREACH, APPLICATIONS, AND ENROLLMENT
Healthy SF has relied heavily on public relations, community outreach, and word of mouth to spread awareness of the program. As the program continues to evolve and serve more narrowly defined populations, these modes of outreach have become even more important. The county is also committed to building partnerships between medical providers and entities not specifically focused on health or social services to expand the program’s outreach efforts.4 Healthy SF will continue to explore these types of collaborations to maximize service and cost-effectiveness. Website Activity The websites for Healthy San Francisco (http://healthysanfrancisco.org) and City Option (http://sfcityoption.org) serve as gateways for program participants as well as San Francisco employers and their employees to learn more about the resources available to them. The Healthy SF site provides information about the program’s application process, program fees and resources, and the Healthy SF medical home network amongst other information. The City Option site is a resource for frequently asked questions, program resources, documentation, and materials. It also serves as a portal to employers’ City Option accounts and employees’ SF Medical Reimbursement Accounts. During FY2015-16, there were 68,996 visits to the Healthy San Francisco Website. This reflected a nearly 20% drop in web traffic in comparison to the previous year when over 85,000 visits were made. The most commonly viewed pages on the website were about the program, how to apply, and eligibility requirements. Participant Outreach Certified Application Assistors (CAAs) perform all Healthy SF enrollments in person. Healthy SF has a one-year coverage period, so the need for timely renewals are a primary reason for participant outreach. The program’s renewal reminder outreach begins 60 days before participants’ current term concludes to encourage continuous enrollment. Outreach may consist of: • Mailed notice at 30 and 60 days before term end; • Automated phone call at 45 days before term end; • Live telephone call between 15-30 days before term end; and • E-mail reminder (in lieu of a live phone call if the preferred mode of contact is email). Once participants complete the renewal process, they do not receive additional renewal-related communications. In FY2015-16, the program attempted to reach 6,432 participants who had approached their enrollment termination. The program was successful in contacting 2,550 (40%) of those participants. Participants who could not be reached were subsequently flagged in the system and would be prompted for updated information during their next encounter with the program. Healthy SF excludes those participants from outbound calls and emails until their information is updated.
4 San Francisco Department of Public Health (2013). San Francisco Health Care Services Master Plan.

6
In addition to renewal outreach activities, the program distributed 13,541 brochures, participated in seven (7) events, and conducted fifteen (15) presentations in FY2015-16 to promote Healthy SF. Assistor Outreach and Training Healthy SF Application Assistor training is an ongoing aspect of the program that serves to ensure that our team is aware of current policies and best practices that affect their work. In FY2015-16, Healthy SF held fifteen application assistance orientation and refresher trainings. More than 40 new Assistors were trained and over 200 Assistors received refresher trainings. In addition to trainings, the program provides quarterly Assistor Update digital newsletters to ensure that all Application Assistors receive updates on changes to programs and share best practices. As of the end of FY2015-16, there were 136 active Healthy SF Application Assistors working in thirty of the program’s thirty-six medical homes. Mid-way through the FY2015-16, new training formats and testing systems were adopted by the program to increase Assistors’ exposure to the evolving health care landscape and as well as their knowledge of the Healthy SF program. The preliminary effects of these changes have been promising and will continue to be monitored. HSF Application Auditing Healthy SF carried out a first round of individual application audits for a subset of applications submitted in May 2016. The goals of individual application audits were to evaluate the completeness and correctness of submitted applications. Internal assessments help ensure that Healthy SF meets audit criteria that makes additional assistance programs available to participants (such as patient assistance programs for pharmaceutical products). Twenty-nine applications were audited and the program will use the findings to inform what and how future content and trainings are given to Assistors. Each audited application was reviewed based on the following criteria: completeness of the application form; presence of errors in the application; and a review of verification documents attached to the application. Applications In FY2015-16 13,652 applications were completed in One-e-App on behalf of 17,082 unique applicants. Of those applicants, 16,686 (98%) were determined to be eligible and those individuals’ applications were submitted to a health program. Only 396 (2%) applicants were deemed ineligible for any program. Additionally, 127 eligible applications were initiated but not submitted (Table A2). Of the 16,686 applications that were completed, 16,361 (98%) were enrolled into Healthy SF and 325 (2%) were submitted for Healthy Kids. All applicants are pre-screened for Medi-Cal and Covered CA before they are considered for any other programs; therefore One-e-App does not screen for these two programs.
Table A1: Application Volume – Number of HSF Complete Applications Processed
(July 2015 – June 2016)
One-e-App Applications by Type # of
Unique Applicants # of
Distinct Applications Completed and eligible 16,686 13,331 Determined Ineligible 396 321 Total e-applications 17,082 13,652
7
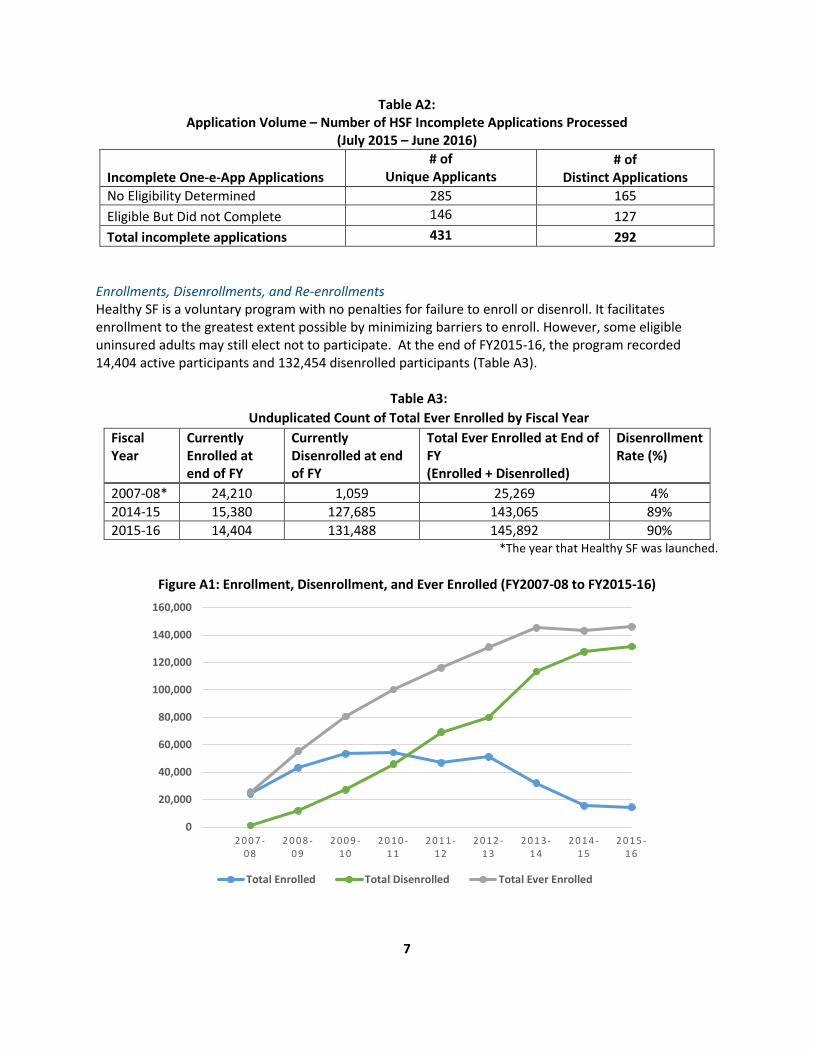
Table A2: Application Volume – Number of HSF Incomplete Applications Processed
(July 2015 – June 2016)
Incomplete One-e-App Applications # of
Unique Applicants # of
Distinct Applications No Eligibility Determined 285 165 Eligible But Did not Complete 146 127 Total incomplete applications 431 292
Enrollments, Disenrollments, and Re-enrollments Healthy SF is a voluntary program with no penalties for failure to enroll or disenroll. It facilitates enrollment to the greatest extent possible by minimizing barriers to enroll. However, some eligible uninsured adults may still elect not to participate. At the end of FY2015-16, the program recorded 14,404 active participants and 132,454 disenrolled participants (Table A3).
Table A3: Unduplicated Count of Total Ever Enrolled by Fiscal Year
Fiscal Year
Currently Enrolled at end of FY
Currently Disenrolled at end of FY
Total Ever Enrolled at End of FY (Enrolled + Disenrolled)
Disenrollment Rate (%)
2007-08* 24,210 1,059 25,269 4% 2014-15 15,380 127,685 143,065 89% 2015-16 14,404 131,488 145,892 90%
*The year that Healthy SF was launched.
Figure A1: Enrollment, Disenrollment, and Ever Enrolled (FY2007-08 to FY2015-16)
0
20,000
40,000
60,000
80,000
100,000
120,000
140,000
160,000
2 0 0 7 -0 8
2 0 0 8 -0 9
2 0 0 9 -1 0
2 0 1 0 -1 1
2 0 1 1 -1 2
2 0 1 2 -1 3
2 0 1 3 -1 4
2 0 1 4 -1 5
2 0 1 5 -1 6
Total Enrolled Total Disenrolled Total Ever Enrolled

8
There will be consistent enrollment fluctuation in Healthy SF as individuals continue to enroll, renew eligibility, and disenroll from the program. At the end of FY2015-16, 131,488 (90%) Healthy SF participants were disenrolled (see Figure A1). Aside from successful transitions to new insurance options, disenrollments occurred for various reasons. These included participants who: a) no longer met program eligibility criteria; b) chose voluntarily to disenroll; c) did not pay quarterly participation fees in a timely manner or; d) failed to renew enrollment during the annual renewal process. Healthy SF regularly monitors and analyzes participant disenrollment. Reasons for disenrollment in FY2015-16 are presented below:
Table A4: Total Disenrollment from Healthy SF by Reason
Current Disenrollments by Reason Number Percent Transitioned to SF PATH Program 11,141 9% Identified Enrollment into Medi-Cal 5,416 4% Program Eligibility 26,866 20% Participation Fee 10,251 8% Annual Renewal (Did Not Complete Renewal) 75,601 57% Other/Voluntary 439 0.3%
Multiple Enrollments and Disenrollments Part of Healthy SF’s retention efforts includes monitoring the multiple enrollments and disenrollments of program participants. Since the program began in July 2007, 55,498 individuals have disenrolled at least twice. Just over eight percent (8.5%) of individuals with multiple enrollments and disenrollments were currently enrolled in Healthy SF in FY2015-16.
Table A5: Enrollment Status of Individuals with Multiple Enrollments and Disenrollments
FY2012-13 FY2013-14 FY2014-15 FY2015-16
Number Percent Number Percent Number Percent Number Percent
Currently Enrolled 9,251 27% 5,916 13% 4,420 8% 4,731 8.5%
Currently Disenrolled 25,530 73% 41,323 88% 48,644 92% 50,767 91.5%
Total 34,781 100% 47,239 100% 53,064 100% 55,498 100%
The 55,498 individuals who churned through the program in FY2015-16 did so over the course of 136,150 total enrollment periods. An enrollment period is defined as the length of time a member stays enrolled

9
in Healthy SF until disenrollment. Seventy-nine percent (79%) of those enrollment periods lasted between 10-12 months, followed by 13% lasting between one to three months (see Figure A2). This indicates that participants either left Healthy SF fairly soon upon enrollment or elected to remain with the program through the entire course of their coverage. The most common disenrollment reasons were failure to renew or insufficient payment of participation fees.
Figure A2: Length of Enrollment Periods of Individuals with Two or More Disenrollments (Currently Enrolled and Disenrolled Participants)
Table A6: Disenrollment Reason for Individuals with Multiple Disenrollments
Disenrollment Reasons Number Percentage
Did Not Complete Renewal-Failure To Complete Rescreening 41,095 74% Insufficient Payment of Participation Fees 5,723 10% Transitioned to SF PATH Program 2,270 4% Enrolled in Public Coverage 1,446 3% Determined Eligible for Other Programs During Renewal or Modification 1,021 2% Enrolled in Employer-Sponsored Insurance 891 2% Enrolled in Medi-Cal 683 1% Other 2,369 4%
B. PARTICIPANT DEMOGRAPHICS
Overall, there was a six percent (6%) decline in the number of participants enrolled in Healthy SF in FY2015-16 as compared to the same point in the previous year (FY2015-16: 14,404; FY2014-15: 15,380). The demographics of the participant pool have remained relatively similar over the last two years. The
10
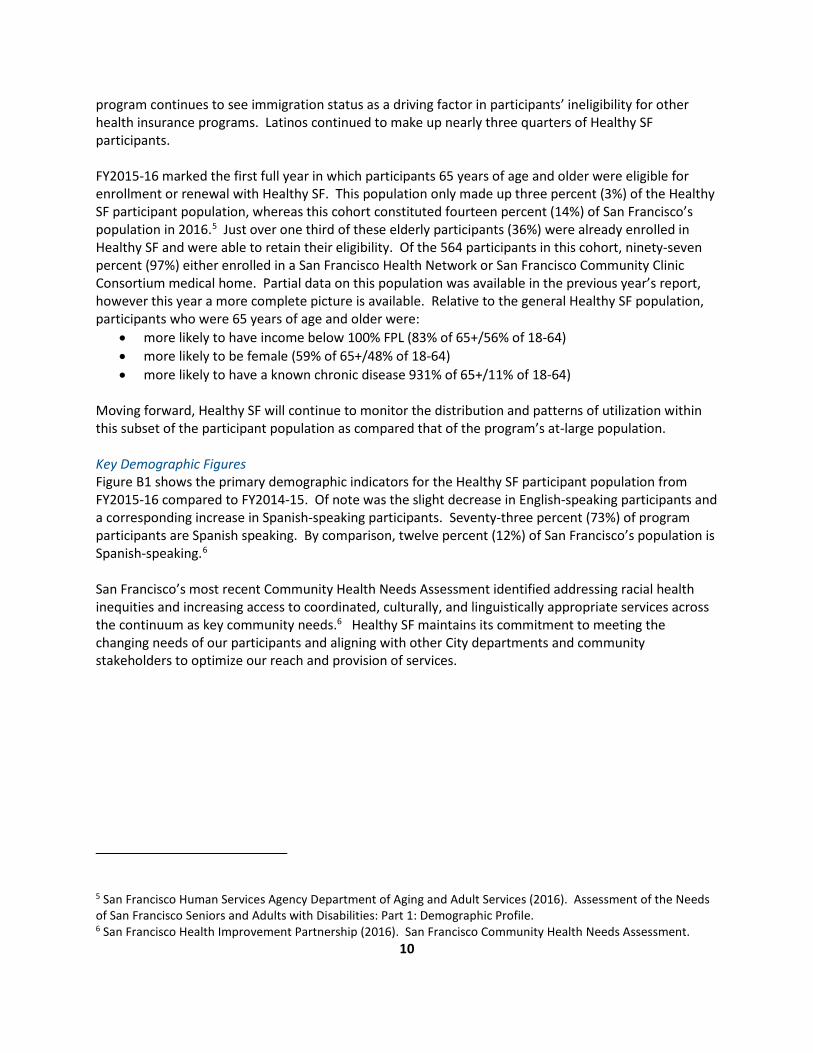
program continues to see immigration status as a driving factor in participants’ ineligibility for other health insurance programs. Latinos continued to make up nearly three quarters of Healthy SF participants. FY2015-16 marked the first full year in which participants 65 years of age and older were eligible for enrollment or renewal with Healthy SF. This population only made up three percent (3%) of the Healthy SF participant population, whereas this cohort constituted fourteen percent (14%) of San Francisco’s population in 2016.5 Just over one third of these elderly participants (36%) were already enrolled in Healthy SF and were able to retain their eligibility. Of the 564 participants in this cohort, ninety-seven percent (97%) either enrolled in a San Francisco Health Network or San Francisco Community Clinic Consortium medical home. Partial data on this population was available in the previous year’s report, however this year a more complete picture is available. Relative to the general Healthy SF population, participants who were 65 years of age and older were:
• more likely to have income below 100% FPL (83% of 65+/56% of 18-64) • more likely to be female (59% of 65+/48% of 18-64) • more likely to have a known chronic disease 931% of 65+/11% of 18-64)
Moving forward, Healthy SF will continue to monitor the distribution and patterns of utilization within this subset of the participant population as compared that of the program’s at-large population. Key Demographic Figures Figure B1 shows the primary demographic indicators for the Healthy SF participant population from FY2015-16 compared to FY2014-15. Of note was the slight decrease in English-speaking participants and a corresponding increase in Spanish-speaking participants. Seventy-three percent (73%) of program participants are Spanish speaking. By comparison, twelve percent (12%) of San Francisco’s population is Spanish-speaking.6 San Francisco’s most recent Community Health Needs Assessment identified addressing racial health inequities and increasing access to coordinated, culturally, and linguistically appropriate services across the continuum as key community needs.6 Healthy SF maintains its commitment to meeting the changing needs of our participants and aligning with other City departments and community stakeholders to optimize our reach and provision of services.
5 San Francisco Human Services Agency Department of Aging and Adult Services (2016). Assessment of the Needs of San Francisco Seniors and Adults with Disabilities: Part 1: Demographic Profile. 6 San Francisco Health Improvement Partnership (2016). San Francisco Community Health Needs Assessment.
11
Figure B1: Two-Year Demographic Comparison of HSF Participants
FY2014-15 FY2015-16
Age
Gender
Income

12
FY2014-15 FY2015-16 Spoken Language
Neighborhood Distribution In FY2015-16, approximately forty percent (40%) of Healthy SF participants resided in the Excelsior or Mission neighborhoods. Just under two percent (1.6%) of Healthy SF participants reported being homeless. It is possible that this number is underestimated as some homeless individuals may use their medical clinic or a transient housing address when applying for Healthy SF.
Figure B2: Healthy San Francisco by Neighborhood

13
Eighty-three percent (83%) of all Healthy SF participants resided in eight San Francisco neighborhoods in FY2015-16. Geographically, each of these neighborhoods touch upon another forming a corridor that runs through the middle of San Francisco. Healthy SF utilization by zip code data supports this pattern and illustrates that the highest concentrations of participant visits come from these areas as well. Zip codes 94112 and 94110 account for forty-four percent (44%) of the program’s member months.
Table B1: Healthy San Francisco Participants by Neighborhood and Zip Code
Neighborhood Approximate Zip Code
Total Participant
Months
% of Total Participant
Months
Avg. # of Participants in
FY2015-16
Excelsior 94112 34835 22% 2903 Mission 94110 35271 22% 2939 Bayview Hunters Point 94124 18679 12% 1557 Visitacion Valley 94134 13024 8% 1085 Tenderloin 94102 12408 8% 1034
South of Market 94103 9219 6% 768 Nob Hill 94109 9124 6% 760 All Other SF Neighborhoods 26636 17% 2220
Given their limitations, neither neighborhood nor zip code geographic designations can serve as perfect indicators of the overall health or utilization patterns of the residents who live there. They are, however, strong proxies that help identify the geographic concentrations of communities’ health needs. The limitations of zip code level data are readily observed where neighborhood boundaries overlap multiple zip codes. For example, the Tenderloin neighborhood constitutes a significant portion of zip code 94102, however it also blends over into zip code 94109. The Nob Hill neighborhood is one of the most affluent in San Francisco however and is also designated by zip code 94109. The concentration of HSF participants and utilization from 94109 is most likely due to participants who reside in the Tenderloin neighborhood at the southern end of the zip code.
14
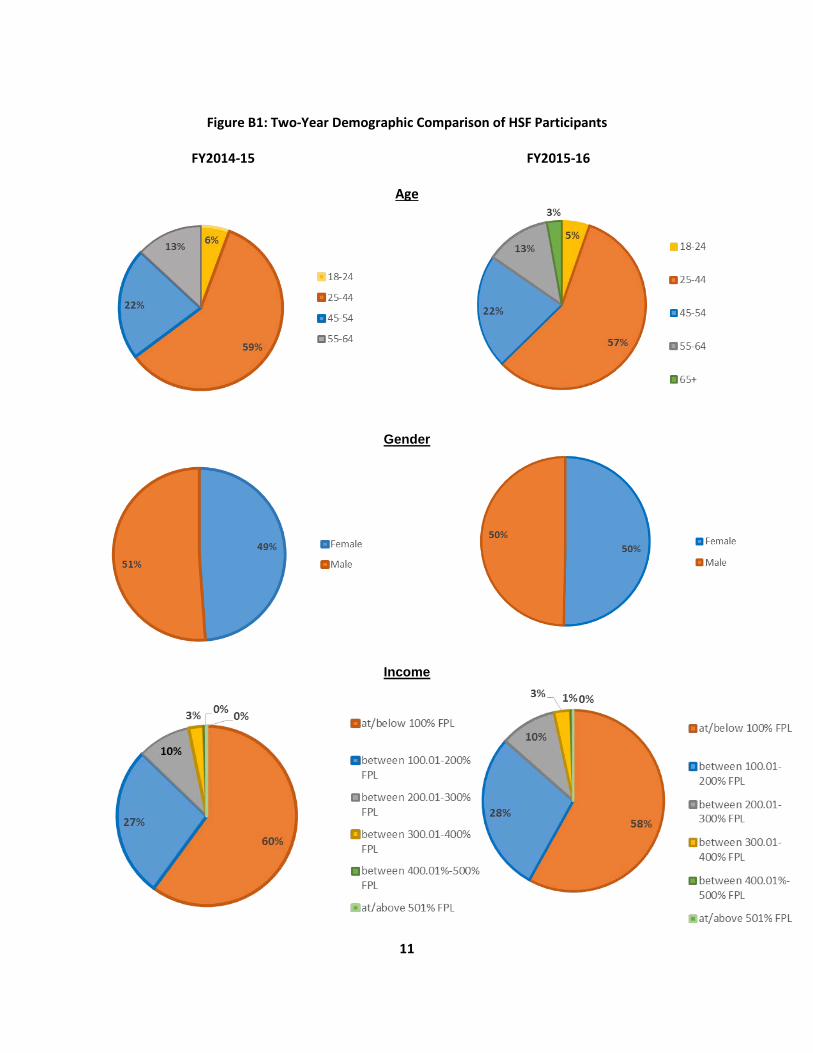
Figures B1 and B2 below highlight the geographic distribution of these zip codes as well as their relation to the census tracts in San Francisco with the highest concentrations of unmet health needs. Neighborhood and zip code designations can provide broader insights into access and utilization patterns. Figure B1 illustrates where the highest concentrations of Healthy SF participants reside by zip code. Figure B2 depicts the mapping of concentrations of unmet health needs in the City and County of San Francisco. The orange areas highlight where at least 25% of residents live below the Federal Poverty Level. The purple areas indicate where at least 25% of residents have not completed high school. The dark red areas depict where these two indicators overlap.
Figure B1: Figure B2:
*www.communitycommons.org Mapping census tract-level data such as percentage of residents living below the Federal Poverty Limit or who have not completed high school can provide a gauge of where health needs are greatest in a given region. These maps show that the highest concentrations of Healthy SF participants and the programs highest utilizers largely reside in sections of the city where health and social needs are greatest. The City and County of San Francisco has made the increase of availability of primary care in low-income areas with documented high rates of health disparities a priority.7 Healthy SF is committed to committing resources to increase access to preventive services and care for our most vulnerable populations.
7 San Francisco Department of Public Health (2013). San Francisco Health Care Services Master Plan.
15
C. PROVIDER AND PHARMACY NETWORK
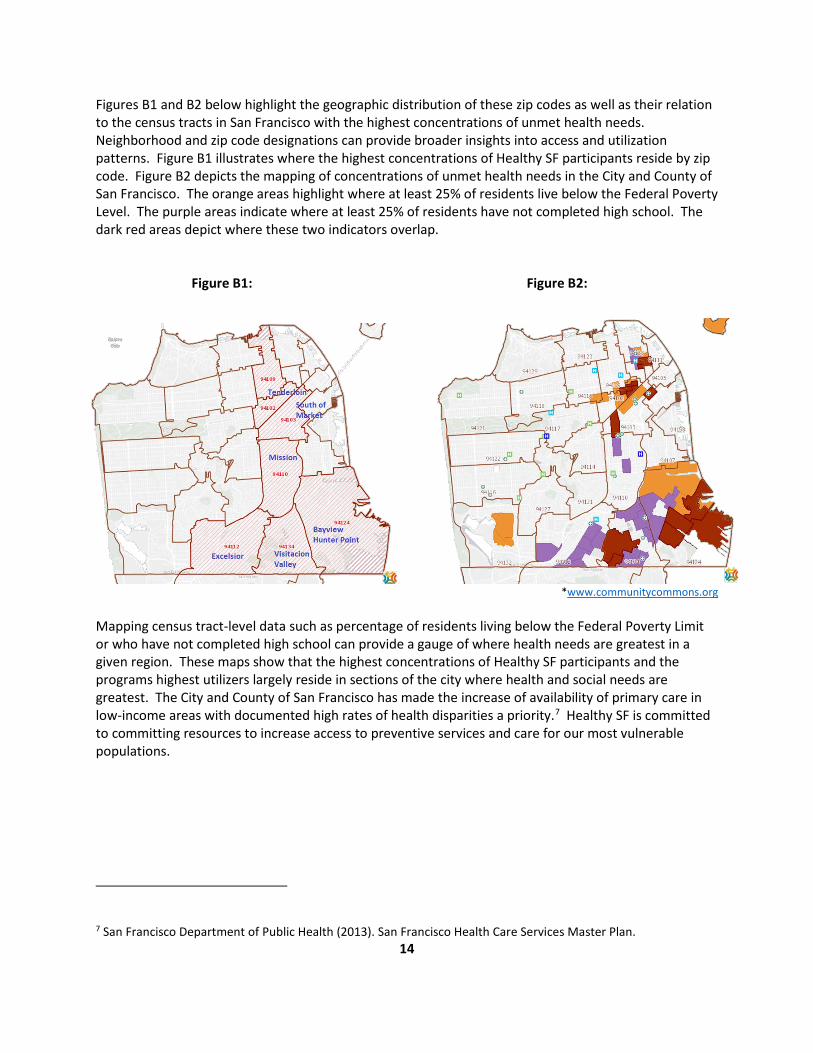
This section provides updates on Healthy SF’s delivery system in FY2015-16 including medical homes, hospitals as well as behavioral health and pharmacy services. Medical Home Distribution At the time of enrollment, Healthy SF participants select a medical home where they will receive primary and preventive care services. The medical home assists participants’ navigation through the health care delivery system and coordinates their access to specialty, inpatient, pharmacy, ancillary and behavioral health services. Figure C1 below illustrates the distribution of Healthy SF medical homes throughout San Francisco using Google Maps.
Figure C1: Map of Healthy San Francisco Medical Homes
Source: http://healthysanfrancisco.org/medical-home-map/ At the end of FY2015-16, sixty percent (60%) of Healthy SF participants selected a home within the San Francisco Health Network. SFHN is the integrated health delivery system of the San Francisco Department of Public Health. It consists of: a) several primary care and specialty care clinics throughout the San Francisco, b) Zuckerberg San Francisco Hospital and Trauma Center (ZSFG), c) Laguna Honda Hospital and Rehabilitation Center and d) behavioral health services. The next most commonly used medical home system was the San Francisco Community Clinic Consortium. This network of clinics was home to 33% of Healthy SF participants.

16
Medical Home Distribution The following provides the distribution of Healthy SF participants across the program’s five primary care medical home delivery systems as of June 30, 2016.
Delivery System # of HSF Participants % of HSF Participants San Francisco Health Network 8,598 60% San Francisco Community Clinic Consortium 4,803 33% Kaiser Permanente – San Francisco 700 5% Sister Mary Philippa Health Center 284 2% BAART Community HealthCare** 19 <1% Total 14,404 100%*
*Note that the sum of percentages per demographic category may not equal exactly to 100% due to rounding. **It was determined in June 2016 that BAART will terminate its participation in Healthy SF beginning FY2016-17.
Hospital Network Zuckerberg San Francisco General Hospital and Trauma Center provides a range of specialty, urgent care, diagnostic, emergency care, home health, pharmacy, durable medical equipment (DME), and inpatient services to all Healthy SF participants enrolled with a SFHN, SFCCC, and BAART affiliated medical home. ZSFG also provides services to Healthy SF participants with other medical homes for select Healthy SF covered services not offered at their assigned medical home. In addition to ZSFG, the following non-profit hospitals continue to play a vital role in Healthy SF:
• California Pacific Medical Center (CPMC) with four campuses – provides inpatient services to participants with North East Medical Services (NEMS) as their Healthy SF medical home;
• Kaiser Permanente San Francisco Medical Center – provides inpatient and other specialty services to participants with Kaiser as the Healthy SF medical home;
• Saint Francis Memorial Hospital (Dignity Health) – provides certain specialty services to participants with Tenderloin Health Services as their Healthy SF medical home;
• St. Mary’s Medical Center (Dignity Health) – provides inpatient and other specialty services to participants with Sister Mary Philippa as the Healthy SF medical home; and
• UCSF Medical Center – provides referral-based diagnostic imaging services at its Mission Bay site as well as services, such as cardiac surgery, that are not provided at ZSFG.
At the end of FY2015-16, the Healthy SF provider network had thirty-six medical homes and participating hospitals. Behavioral Health Services Most of the Healthy SF medical homes provide some form of mental health assessment, mental health services, or substance abuse disorder screening. However, SFDPH’s Community Behavioral Health Service (CBHS) provides all contracted behavioral health services for Healthy SF participants at all medical homes. CBHS specifically offers mental health and substance abuse disorder services. Healthy SF participants have access to a comprehensive array of community-based services offered by CBHS including, but not limited to:
• Information and referral services; • Prevention services;

17
• Full range of voluntary behavioral health services, including self-help, peer support, outpatient, case management, medication support, dual diagnosis treatment, and substance abuse disorder services; and
• 24-hour psychiatric emergency services and a crisis hotline. Pharmacy Network Change A number of changes occurred within the Healthy SF pharmacy network in FY2015-16. These changes include where participants with NEMS and Potrero Hill Health Center medical homes will fill their prescriptions. Healthy SF participants assigned to Potrero Hill Health Center were no longer able to fill prescriptions at A-G Pharmacy as of April 4, 2016. The pharmacy changed ownership and stopped serving Healthy SF participants. Affected participants can now access services at the Walgreens Pharmacy at 3400 Cesar Chavez. In addition, as of April 18, 2016, Healthy SF participants assigned to the NEMS Medical Home Network will only be able to fill prescriptions at the location where they were written. This means that participants who receive prescriptions at ZSFG must fill those prescriptions at the ZSFG Outpatient Pharmacy. Healthy SF participants with NEMS medical homes that have their prescriptions written by NEMS physicians can only fill those prescriptions at a NEMS pharmacy.
D. CLINICAL COMPONENT AND SERVICES UTILIZATION
This section examines Healthy SF participants’ clinical and service data to explore whether the program is meeting its goals with respect to improved health outcomes and appropriate utilization of services. The data represented in this section reports figures for the last three fiscal years. The data reported may have been updated in some instances where completed encounter data from the previous fiscal year was available. Medical encounters submitted by participating medical homes and facilities are used to capture the service utilization of Healthy SF participants. Office visits, emergency visits, and inpatient stays are primarily defined based on Healthcare Effectiveness Data and Information Set (HEDIS) value set definitions. Behavioral health-related encounters are reported by San Francisco’s Community Behavioral Health Services (CBHS) and visits are based on dates of service. Healthy SF outpatient pharmacy utilization is measured as prescriptions filled. Medications that are administered by participants’ physicians or that are related to inpatient stays are not reported here. It is important to note that these figures only reflect utilization of services provided to residents of these areas by the City and County of San Francisco through the Healthy SF program. These figures do not reflect the full scope of care received by these individuals which would also include care received outside of Healthy SF through other programs (public, private, charity care, etc.). The encounter data collected by the program to generate the findings here are assessed for completeness and quality on an on-going basis. This helps Heathy SF program management to continuously seek opportunities for operational and data collection improvement. Office visits, emergency department visits, inpatient stays, behavioral health visits and prescriptions filled are reported as the average number of participant visits per 1,000 member months (PMPM * 1000). The PMPM calculation is as follows:

18
# of Visits or Prescriptions x 1000 Total Member Months
Overall, Healthy SF participant service utilization increased in FY2015-16 from the previous year for office visits, emergency room use, and prescriptions filled. These changes may have been due to increased health care utilization by the lower number of participants that remain in Healthy SF. Inpatient visits remained constant and there was a decline in both substance abuse disorder and mental health service visits. As the program’s enrollment and utilization patterns continues to stabilize after implementation of the ACA, variations in how many participants access services and how they access health care are expected.
A comparison of two year data shows that the proportion of Healthy SF participants who had an office visit increased ten percent (10%) in FY2015-16 (Table D1). Despite the number of participants enrolled in Healthy SF dropping over this period, the proportion of individuals making an office visit increased over the same period. Of note was a thirty-three percent (33%) increase in emergency room use per 1,000 participants per month. There was also a significant increase in prescriptions filled by Healthy SF participants in FY2015-16 as compared to the year prior.
Table D1: HSF Utilization Rate by Service Type
FY14-15 FY15-16
Office Visits Percent Members with Office Visit 45% 55% Office Visits Per Member Per Year (PMPY) 3.2 3.6
Emergency Department
Percent Members with ED Visit 6% 9% ED Visits Per 1,000 Members Per Month (PMPM)*1000 12.02 16.07
Inpatient Percent Members with IP Visit 0.4% 0.4% IP Visits Per Member Per Year (PMPY) 0.01 0.01
Substance Abuse
Disorder Services
Percent Members with Substance Abuse Disorder Visit 0.7% 0.26%
Percentage Change in Number of Substance Abuse Disorder Visits from Previous Year -80% -73%
Mental Health Services
Percent Members with Mental Health Visit 2% 2% Percentage Change in Number of Mental Health Visits from Previous Year -70% -39%
Prescriptions Filled
Percent Members with Prescriptions Filled 27% 38% Prescriptions Filled PMPM*1000 351 467

19
The following breaks out utilization of these service categories by San Francisco neighborhoods from which the majority of Healthy SF participants reside.
Table D2: HSF Utilization Rate by Neighborhood
Exce
lsio
r (9
4112
)
Mis
sion
(9
4110
)
Bayv
iew
Hu
nter
s Poi
nt
(941
24)
Visi
taci
on V
alle
y (9
4134
)
Tend
erlo
in
(941
02)
Nob
Hill
* (9
4109
)
So. o
f Mar
ket
(941
03)
Tota
l Util
izat
ion
HSF
Prog
ram
% of total HSF Participants 28% 27% 15% 11% 10% 8% 7% 100%
Office Visits PMPY 3.38 3.72 3.34 3.75 3.79 3.58 3.54 3.61
% Members with ED Visit 9% 8% 8% 10% 9% 9% 10% 9%
ED Visits PMPM*1000 14.3 13.87 14 15.2 17.51 15.74 18.53 16.07
IP Visits PMPM*1000 0.44 0.45 0.42 0.29 0.39 0.4 1.29 0.56
Prescriptions Filled
PMPM*1000 402.53 458.53 384.98 467.87 650.07 572.2 510.34 467.27
*figures reported here are likely skewed by geographic proximity to Tenderloin neighborhood A neighborhood break out of office visits indicates that participants from all neighborhoods had between three to four office visits per year on average (3.61 visits per year). There were no significant outliers in outpatient service utilization by neighborhood. The Tenderloin and South of Market neighborhoods exhibited above average prescription drug utilization. Participants from South of Market also had more than twice the number of inpatient stays than any other neighborhood in San Francisco. Future analysis of the health and health care needs of participants from these particularly vulnerable populations would inform why there were higher inpatient and prescription drug utilization from these areas. Outpatient Service Utilization Healthy SF participants had over fifty thousand total office visits in FY2015-16. The percentages of participants who had an office visit was broken out by categories based on the type of application received by the program. Application types are categorized as either renewed, re-enrolled, or new. Renewed applications indicate that a participant has been enrolled in Healthy SF for an extended period of time and can serve as a proxy indicator for individuals who have had consistent access to health care. New and Re-enrolled applications indicate that the participant has either not accessed services through the program before or has not done so on a consistent basis. There is less certainty about the degree of access to health care that these individuals may have had before enrollment. Figure D1 shows that outpatient visits per member per year across participant categories over the last three years.

20
Figure D1: Outpatient Utilization PMPY by HSF Application Type
The number of office visits made by renewing Healthy SF participants per year has historically been higher than visits made by new or re-enrolling participants. The figure above shows that this trend held true in FY2015-16. Table D3 shows that the percentage of office visits made by new and re-enrolling Healthy SF participants increased in FY2015-16, yet did so at a lower rate than their renewing counterparts. It is possible that these patterns reflect a greater degree of health needs, and in turn utilization, by participants who chose to renew with Healthy SF. It also suggests that re-enrollment by participants is not necessarily a reflection of an increased need for health care services due to gaps in coverage.
Table D3: Outpatient Utilization Percentage by Application Type
Application Type FY13-14 FY14-15 FY15-16
% Members with Office Visit
Overall 56% 45% 55% New 42% 31% 39% Re-Enroll 49% 42% 48% Renewal 64% 51% 64%
There is wide variation amongst office visits across the Healthy SF medical home network. Yet, aside from Kaiser, all Healthy SF medical homes demonstrated an increase in office visits. The number of visits reported in FY2015-16 indicate a rebound from the decline seen in the previous year and are trending towards rates seen in FY2013-14. This may be due to a stabilized participant population and a lower impact of disenrollment from Healthy SF due to ACA-related changes.
Table D4: Outpatient Visit PMPY for participants with at Least one Office Visit by Medical Home Organization
Medical Home Organization FY13-14 FY14-15 FY15-16 BAART 3.67 2.28 2.68 Sister Mary Philippa 4.25 3.84 4.54 SFHN 5.78 4.99 5.32 KAISER 3.40 2.67 1.97 SFCCC (including NEMS) 4.12 2.72 2.88
2.89
2.29
2.993.03 3.013.27
3.61 3.483.82
00.5
11.5
22.5
33.5
4
FY201314 FY201415 FY201516
# of
Vis
its
New Re-Enroll Renewal
21
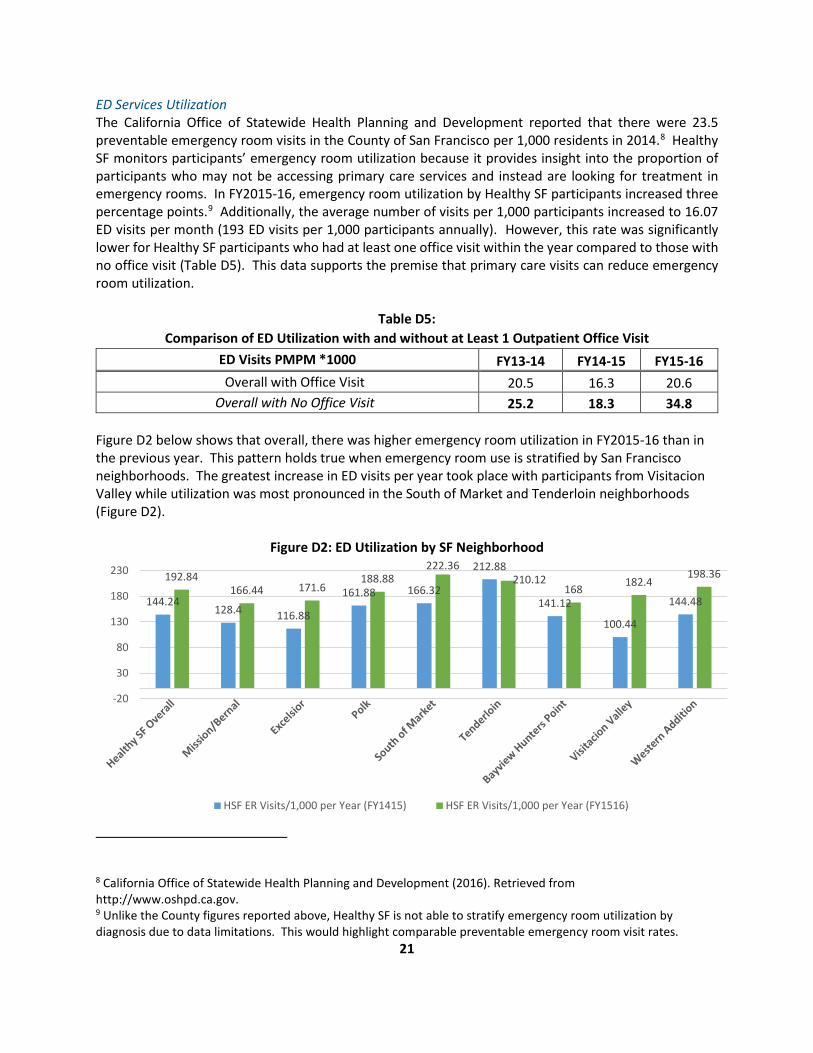
ED Services Utilization The California Office of Statewide Health Planning and Development reported that there were 23.5 preventable emergency room visits in the County of San Francisco per 1,000 residents in 2014.8 Healthy SF monitors participants’ emergency room utilization because it provides insight into the proportion of participants who may not be accessing primary care services and instead are looking for treatment in emergency rooms. In FY2015-16, emergency room utilization by Healthy SF participants increased three percentage points.9 Additionally, the average number of visits per 1,000 participants increased to 16.07 ED visits per month (193 ED visits per 1,000 participants annually). However, this rate was significantly lower for Healthy SF participants who had at least one office visit within the year compared to those with no office visit (Table D5). This data supports the premise that primary care visits can reduce emergency room utilization.
Table D5: Comparison of ED Utilization with and without at Least 1 Outpatient Office Visit
ED Visits PMPM *1000 FY13-14 FY14-15 FY15-16 Overall with Office Visit 20.5 16.3 20.6
Overall with No Office Visit 25.2 18.3 34.8 Figure D2 below shows that overall, there was higher emergency room utilization in FY2015-16 than in the previous year. This pattern holds true when emergency room use is stratified by San Francisco neighborhoods. The greatest increase in ED visits per year took place with participants from Visitacion Valley while utilization was most pronounced in the South of Market and Tenderloin neighborhoods (Figure D2).
Figure D2: ED Utilization by SF Neighborhood
8 California Office of Statewide Health Planning and Development (2016). Retrieved from http://www.oshpd.ca.gov. 9 Unlike the County figures reported above, Healthy SF is not able to stratify emergency room utilization by diagnosis due to data limitations. This would highlight comparable preventable emergency room visit rates.
144.24128.4 116.88
161.88 166.32
212.88
141.12
100.44
144.48
192.84166.44 171.6
188.88222.36
210.12168 182.4
198.36
-20
30
80
130
180
230
HSF ER Visits/1,000 per Year (FY1415) HSF ER Visits/1,000 per Year (FY1516)

22
SFHN and SFCCC serve as the medical homes for over ninety percent (90%) of Healthy SF participants. ED Visits per participant per year increased across both of these medical home groups and this likely accounts for the higher emergency room utilization seen in FY2015-16 than in the previous year. Despite this, Healthy SF participants enrolled with SFHN or SFCCC medical homes had the lowest rates of emergency room visits per year with 0.19 PMPY and 0.18 PMPY respectively (Figure D3). Sister Mary Philippa had the highest utilization of emergency room services with sixteen percent (16%) of participants having had an emergency room visit in FY2015-16 (Table D6).
Figure D3: ED Visits by Medical Home Per Member Per Year
Table D6: ED Utilization by Medical Home Organization for Participants
Medical Home Organization FY13-14 FY14-15 FY15-16
% Members with ED Visit
BAART 15% 7% 6% Sister Mary Philippa 16% 15% 16% SFHN 7% 7% 9% KAISER 8% 8% 9% SFCCC (including NEMS) 7% 5% 8%
Inpatient Utilization Since FY2013-14, the total number of inpatient visits by Healthy SF participants has decreased by eighty-four percent (84%). The decline was mostly due to the drop in enrollment that occurred over this period. The decrease seen in inpatient utilization was greater than any other utilization category measured by the Healthy SF program. Less than one percent (>1%) of all Healthy SF participants were admitted for inpatient care in FY2015-16. Inpatient utilization in FY2015-16 was similar to what was observed in FY2014-15 at just under 0.6 visits per 1,000 members per month (Table D7). In FY2015-16, there was no significant difference in hospital admissions between new, re-enrolling, or renewing participants. Many variables may have influenced the low inpatient utilization observed over the last two years, including: lower utilization of inpatient services by program participants and the possibility of participants receiving care under Medi-Cal’s Presumptive Eligibility program. Also, it is likely that participants receive health care services outside of the Healthy SF network which would mean that some portion of their utilization is not captured by the program.
0.55
0.24
0.11
0.35 0.37 0.35
0.190.15
0.190.15
0.21 0.20.180.12
0.18
0
0.1
0.2
0.3
0.4
0.5
0.6
FY201314 FY201415 FY201516
# of
Vis
its
BAART Sister Mary Philippa SFHN Kaiser SFCCC (including NEMS)

23
Table D7: Inpatient Utilization Rate by Application Type
FY13-14 FY14-15 FY15-16 % Members with IP Visit 0.9% 0.4% 0.4%
IP Visits PMPM*1000 1.28 0.58 0.56 IP Visits PMPY 0.02 0.01 0.01
It is noted here that Zuckerberg San Francisco General Hospital is the designated in-network hospital for participants assigned to BAART, SFHN and SFCCC medical homes and rates of inpatient stays varied widely across medical homes. Over the last three years, inpatient visits have dropped from 1.28 visits per year to 0.6 visits per year in FY2015-16. The total number of hospital admissions have dropped eighty-five percent (85%) from 639 to 96 over this same period. Inpatient service utilization decreased in FY15-16 for all active medical homes except NEMS and Sister Mary Philippa (Table D8).
Table D8: Inpatient Utilization by Medical Home Organization for Participants
Medical Home Organization FY13-14 FY14-15 FY15-16
% Members with IP Visit
BAART 2.1% 0.00% 0.00% Sister Mary Philippa 1.8% 0.6% 1% SFHN 0.9% 0.5% 0.5% KAISER 1.2% 1% 0.9% SFCCC (including NEMS) 0.9% 0.2% 0.2%
IP Visits PMPM*1000
BAART 3.37 0.00 0.00 Sister Mary Philippa 2.73 0.85 1.89 SFHN 1.32 0.63 0.61 KAISER 1.7 1.43 1.39 SFCCC (including NEMS) 1.18 0.39 0.29
Utilization of Participants 65 and Over Effective January 2015, participants age 65 and over can enroll or remain in Healthy SF if they meet all other program eligibility requirements. FY2015-16 was the first full year of which utilization data for Healthy SF participants age 65 and over was available. Through the end of FY2015-16, 564 Healthy SF participants had enrolled or aged into Healthy SF. This small group of participants reported more office visits annually than those who were ages 18-64 (Table D9). Utilization for Healthy SF participants was similar across genders with participants age 65 and over. By contrast, female participants ages 18-64 had higher rates of utilization as compared to the male participants from their age cohort. Healthy SF will continue to monitor differences in rates of utilization for participants aged 65 and older.

24
More than two thirds of Healthy SF participants 65 and older had an office visit in FY2015-16. Over eighty percent (80%) of those who renewed their enrollment had at least one office visit in FY2015-16. By comparison, only sixty-three percent (63%) of renewed Healthy SF participants age 18-64 had an office visit in FY2015-16. Additionally, women and men age 65 and older who were new to Healthy SF had at least fifty percent (50%) more office visits in FY2015-16 than their counterparts ages 18-64. Participants age 65 and older who were new to the Healthy SF program had more than five times the rate of inpatient visits per month than their younger counterparts. New participants 65 and older also had higher rates of inpatient visits compared to re-enrolled or renewed participants.
Table D9: FY2015-16 Utilization by Age, Application Type and Service Type
Application Type
18-64 65 and Over
Female Male Total Female Male Total Total Office Visits Overall 26,662 22,242 48,904 1,386 952 2,338
% Members with Office Visit
Overall 62% 48% 54% 75% 73% 74% New 42% 34% 37% 68% 67% 68% Re-Enroll 53% 42% 47% 72% 67% 69% Renewal 71% 56% 63% 82% 81% 82%
Office Visits PMPY New 3.27 2.49 2.82 5.34 6.49 5.8 Re-Enroll 3.43 3.02 3.22 5.21 4.66 4.95 Renewal 4.09 3.43 3.77 6.14 5.69 5.98
% Members with ED Visit
New 5% 8% 7% 4% 7% 5% Re-Enroll 6% 9% 8% 9% 6% 7% Renewal 10% 11% 10% 10% 10% 10%
ED Visits PMPY New 0.15 0.23 0.20 0.07 0.20 0.12 Re-Enroll 0.18 0.29 0.24 0.17 0.09 0.13 Renewal 0.16 0.21 0.18 0.17 0.15 0.16
IP Visits PMPM*1000
New 0.54 0.47 0.50 2.48 5.56 3.72 Re-Enroll 0.49 0.66 0.58 2.40 0 1.24 Renewal 0.42 0.63 0.53 0.60 0.93 0.73
% Members with Prescriptions Filled
New 21% 17% 18% 48% 42% 46% Re-Enroll 34% 29% 32%% 51% 61% 56% Renewal 50% 41% 46% 70% 72% 71%
25
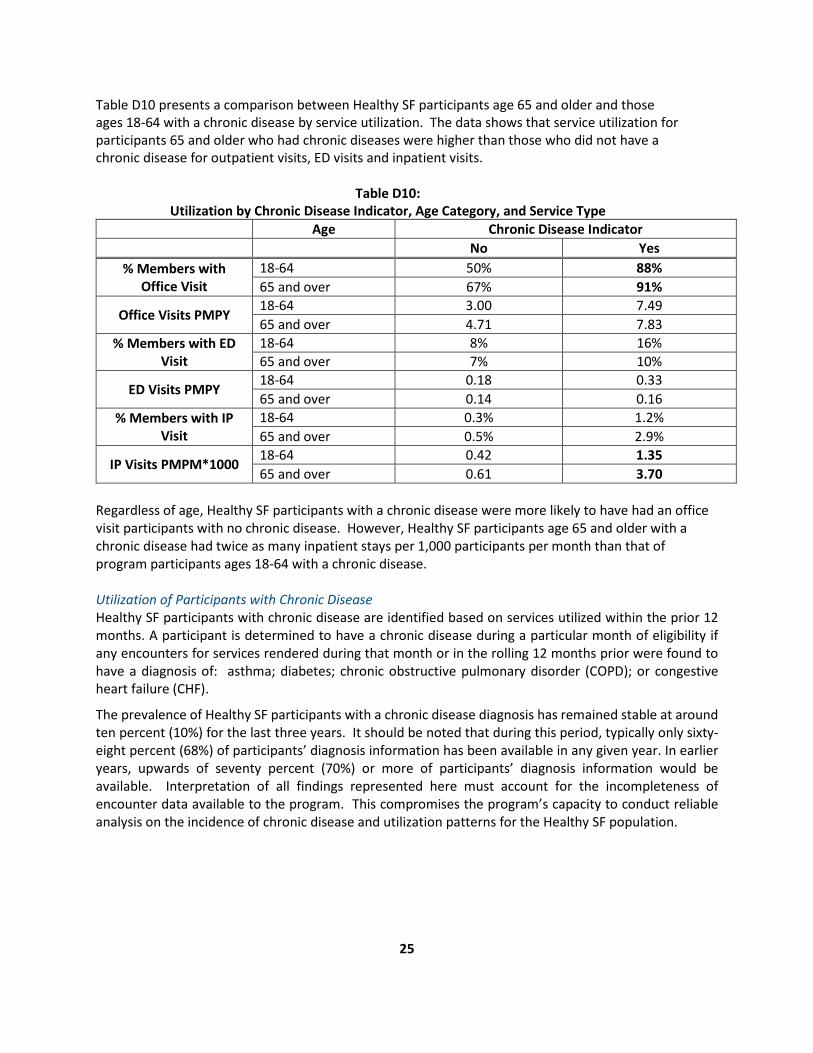
Table D10 presents a comparison between Healthy SF participants age 65 and older and those ages 18-64 with a chronic disease by service utilization. The data shows that service utilization for participants 65 and older who had chronic diseases were higher than those who did not have a chronic disease for outpatient visits, ED visits and inpatient visits.
Table D10: Utilization by Chronic Disease Indicator, Age Category, and Service Type
Age Chronic Disease Indicator No Yes
% Members with Office Visit
18-64 50% 88% 65 and over 67% 91%
Office Visits PMPY 18-64 3.00 7.49 65 and over 4.71 7.83
% Members with ED Visit
18-64 8% 16% 65 and over 7% 10%
ED Visits PMPY 18-64 0.18 0.33 65 and over 0.14 0.16
% Members with IP Visit
18-64 0.3% 1.2% 65 and over 0.5% 2.9%
IP Visits PMPM*1000 18-64 0.42 1.35 65 and over 0.61 3.70
Regardless of age, Healthy SF participants with a chronic disease were more likely to have had an office visit participants with no chronic disease. However, Healthy SF participants age 65 and older with a chronic disease had twice as many inpatient stays per 1,000 participants per month than that of program participants ages 18-64 with a chronic disease. Utilization of Participants with Chronic Disease Healthy SF participants with chronic disease are identified based on services utilized within the prior 12 months. A participant is determined to have a chronic disease during a particular month of eligibility if any encounters for services rendered during that month or in the rolling 12 months prior were found to have a diagnosis of: asthma; diabetes; chronic obstructive pulmonary disorder (COPD); or congestive heart failure (CHF).
The prevalence of Healthy SF participants with a chronic disease diagnosis has remained stable at around ten percent (10%) for the last three years. It should be noted that during this period, typically only sixty-eight percent (68%) of participants’ diagnosis information has been available in any given year. In earlier years, upwards of seventy percent (70%) or more of participants’ diagnosis information would be available. Interpretation of all findings represented here must account for the incompleteness of encounter data available to the program. This compromises the program’s capacity to conduct reliable analysis on the incidence of chronic disease and utilization patterns for the Healthy SF population.

26
Figure D4: HSF Participants with Chronic Disease by Fiscal Year
Figure D5 demonstrates the significant contrast between the amounts of office visits per 1,000 participants per month for those who were diagnosed with a chronic disease as opposed to those who were not. In FY2015-16, Healthy SF participants with a chronic disease diagnosis had more than 2.5 times as many office visits per 1,000 participants monthly than those without a diagnosis.
Figure D5: Outpatient Utilization by Chronic Disease Diagnosis
62%59% 58%
27%31% 31%
10% 10% 11%
0%
10%
20%
30%
40%
50%
60%
70%
FY1314 FY1415 FY1516
% M
embe
rs
Without Chronic Disease No Encounters/No Diagnosis Code With Chronic Disease
246 229 253
593 570626
0
100
200
300
400
500
600
700
FY1314 FY1415 FY1516
Offi
ce V
isits
PM
PM *
100
0
All Other HSF Office Visits PMPM*1000 Chronic Office Visits PMPM*1000

27
Table D11 shows the program’s three year trends for utilization of other services by Healthy SF participants. It compares utilization rates between those who had at least one office visit and were either diagnosed with a chronic disease or were not diagnosed with a chronic disease.
Table D11: Utilization by Service Type, Fiscal Year, and Chronic Disease Indicator for Participants with One
or More Office Visits Fiscal Year No Office Visit With Office Visit
Office Visits PMPY FY13-14 4.13 7.11 FY14-15 4.02 6.84 FY15-16 4.39 7.52
ED Visits PMPY FY13-14 0.24 0.37 FY14-15 0.19 0.25 FY15-16 0.25 0.32
IP Visits PMPM*1000 FY13-14 1.26 4.35 FY14-15 0.67 1.48 FY15-16 0.61 1.53
Prescriptions Filled PMPY FY13-14 3.76 14.19 FY14-15 3.86 15.57 FY15-16 4.85 20.17
Since FY2013-14, Healthy SF participants with a chronic disease diagnosis have had more office visits per year than those participants without a diagnosis. There has not been a significant difference in emergency room use of participants relative to chronic disease diagnosis. Healthy SF participants with a chronic disease diagnosis have historically had significantly higher rates of inpatient stays than participants without a diagnosis. While the difference has narrowed recently, participants with a chronic disease condition still had more than twice as many inpatient stays per 1,000 participants per month than those without a chronic disease diagnosis. It should also be noted that Healthy SF participants with a chronic disease diagnosis have had nearly four times the number of prescriptions filled in a fiscal year than their counterparts without a diagnosis; this trend persisted in FY2015-16. Mental Health and Substance Abuse Disorder Services Community Behavioral Health Services is the county’s mental health program and provides almost all mental health and substance abuse disorder services for Healthy SF participants. CBHS provides Healthy SF participants access to a network of behavioral health services. Behavioral health providers in the network submit encounter information to CBHS. As is the case with other data presented in this report, there may be a lag with when CBHS receives encounter data from their provider network. This affects the completeness of the data presented in this report for FY2015-16. In 2016, the City and County of San Francisco identified residents’ psychosocial health as a priority community health need. Lower income residents are 2.5 times more likely to experience distress than residents from wealthier households.10 In addition, many chronically homeless individuals acknowledge
10 UCLA Center for Health Policy Research (2016). California Health Interview Survey. 2011-14.
28
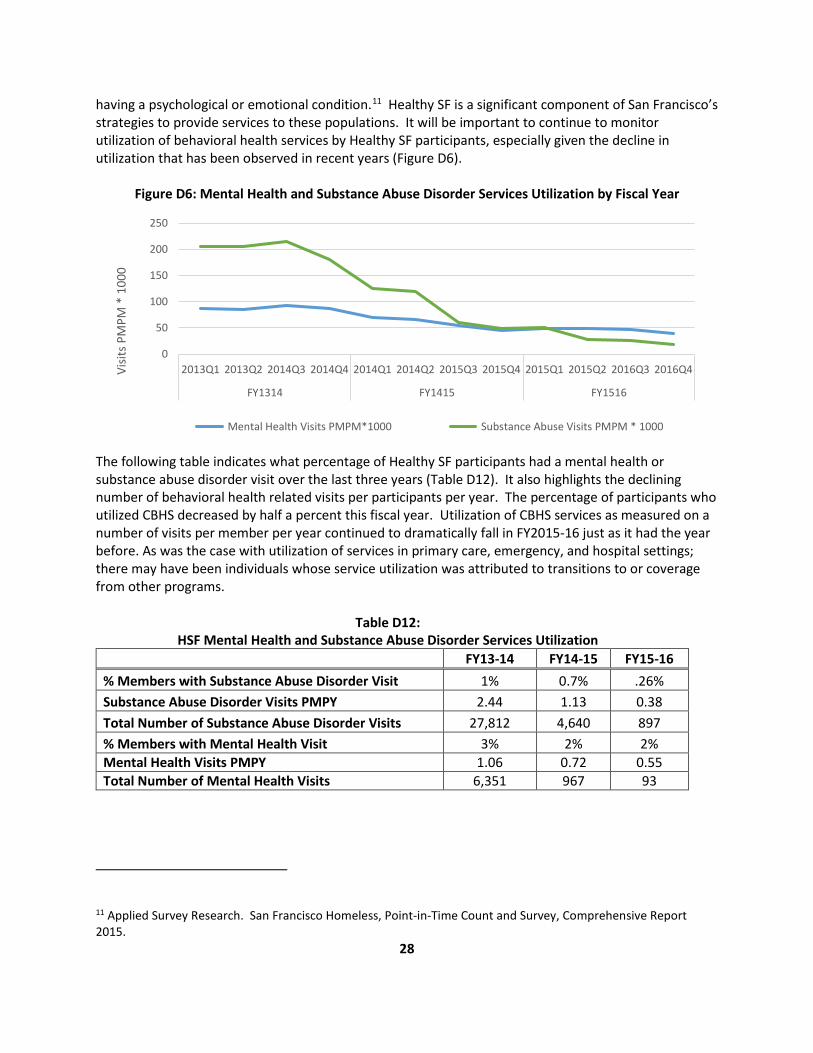
having a psychological or emotional condition.11 Healthy SF is a significant component of San Francisco’s strategies to provide services to these populations. It will be important to continue to monitor utilization of behavioral health services by Healthy SF participants, especially given the decline in utilization that has been observed in recent years (Figure D6).
Figure D6: Mental Health and Substance Abuse Disorder Services Utilization by Fiscal Year
The following table indicates what percentage of Healthy SF participants had a mental health or substance abuse disorder visit over the last three years (Table D12). It also highlights the declining number of behavioral health related visits per participants per year. The percentage of participants who utilized CBHS decreased by half a percent this fiscal year. Utilization of CBHS services as measured on a number of visits per member per year continued to dramatically fall in FY2015-16 just as it had the year before. As was the case with utilization of services in primary care, emergency, and hospital settings; there may have been individuals whose service utilization was attributed to transitions to or coverage from other programs.
Table D12: HSF Mental Health and Substance Abuse Disorder Services Utilization
FY13-14 FY14-15 FY15-16 % Members with Substance Abuse Disorder Visit 1% 0.7% .26% Substance Abuse Disorder Visits PMPY 2.44 1.13 0.38 Total Number of Substance Abuse Disorder Visits 27,812 4,640 897 % Members with Mental Health Visit 3% 2% 2% Mental Health Visits PMPY 1.06 0.72 0.55 Total Number of Mental Health Visits 6,351 967 93
11 Applied Survey Research. San Francisco Homeless, Point-in-Time Count and Survey, Comprehensive Report 2015.
0
50
100
150
200
250
2013Q1 2013Q2 2014Q3 2014Q4 2014Q1 2014Q2 2015Q3 2015Q4 2015Q1 2015Q2 2016Q3 2016Q4
FY1314 FY1415 FY1516
Visit
s PM
PM *
100
0
Mental Health Visits PMPM*1000 Substance Abuse Visits PMPM * 1000
29
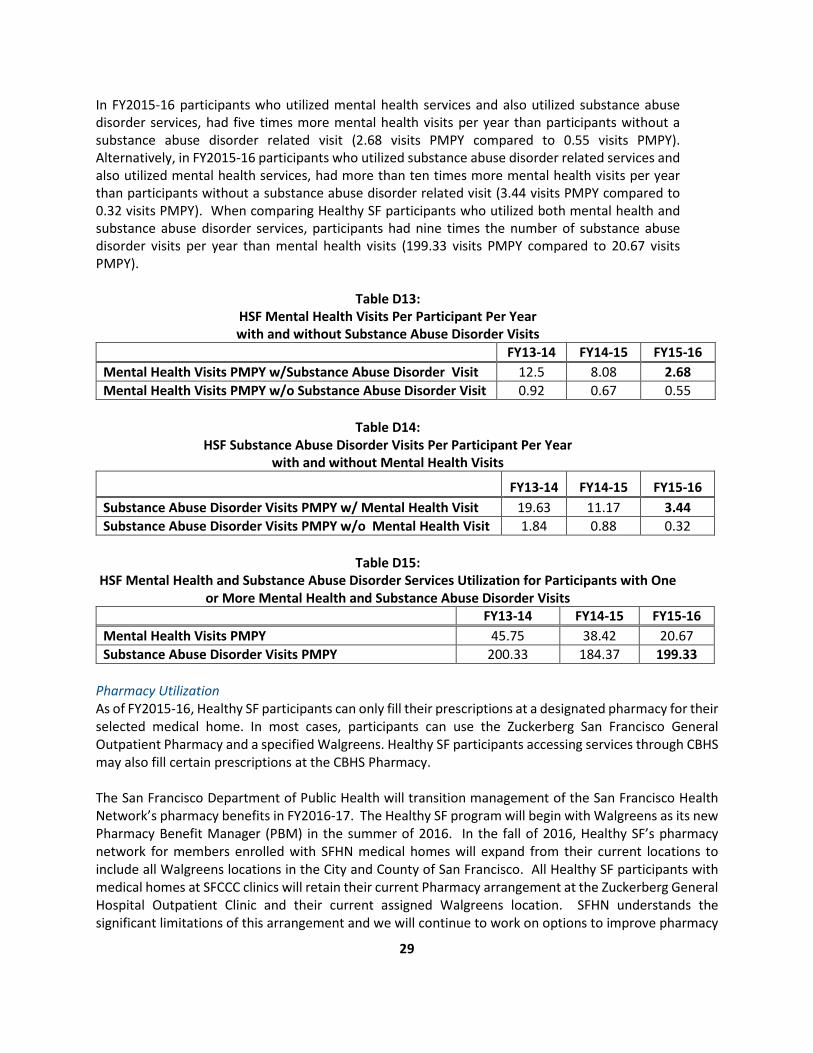
In FY2015-16 participants who utilized mental health services and also utilized substance abuse disorder services, had five times more mental health visits per year than participants without a substance abuse disorder related visit (2.68 visits PMPY compared to 0.55 visits PMPY). Alternatively, in FY2015-16 participants who utilized substance abuse disorder related services and also utilized mental health services, had more than ten times more mental health visits per year than participants without a substance abuse disorder related visit (3.44 visits PMPY compared to 0.32 visits PMPY). When comparing Healthy SF participants who utilized both mental health and substance abuse disorder services, participants had nine times the number of substance abuse disorder visits per year than mental health visits (199.33 visits PMPY compared to 20.67 visits PMPY).
Table D13: HSF Mental Health Visits Per Participant Per Year with and without Substance Abuse Disorder Visits
FY13-14 FY14-15 FY15-16 Mental Health Visits PMPY w/Substance Abuse Disorder Visit 12.5 8.08 2.68 Mental Health Visits PMPY w/o Substance Abuse Disorder Visit 0.92 0.67 0.55
Table D14:
HSF Substance Abuse Disorder Visits Per Participant Per Year with and without Mental Health Visits
FY13-14 FY14-15 FY15-16 Substance Abuse Disorder Visits PMPY w/ Mental Health Visit 19.63 11.17 3.44 Substance Abuse Disorder Visits PMPY w/o Mental Health Visit 1.84 0.88 0.32
Table D15:
HSF Mental Health and Substance Abuse Disorder Services Utilization for Participants with One or More Mental Health and Substance Abuse Disorder Visits
FY13-14 FY14-15 FY15-16 Mental Health Visits PMPY 45.75 38.42 20.67 Substance Abuse Disorder Visits PMPY 200.33 184.37 199.33
Pharmacy Utilization As of FY2015-16, Healthy SF participants can only fill their prescriptions at a designated pharmacy for their selected medical home. In most cases, participants can use the Zuckerberg San Francisco General Outpatient Pharmacy and a specified Walgreens. Healthy SF participants accessing services through CBHS may also fill certain prescriptions at the CBHS Pharmacy. The San Francisco Department of Public Health will transition management of the San Francisco Health Network’s pharmacy benefits in FY2016-17. The Healthy SF program will begin with Walgreens as its new Pharmacy Benefit Manager (PBM) in the summer of 2016. In the fall of 2016, Healthy SF’s pharmacy network for members enrolled with SFHN medical homes will expand from their current locations to include all Walgreens locations in the City and County of San Francisco. All Healthy SF participants with medical homes at SFCCC clinics will retain their current Pharmacy arrangement at the Zuckerberg General Hospital Outpatient Clinic and their current assigned Walgreens location. SFHN understands the significant limitations of this arrangement and we will continue to work on options to improve pharmacy
30
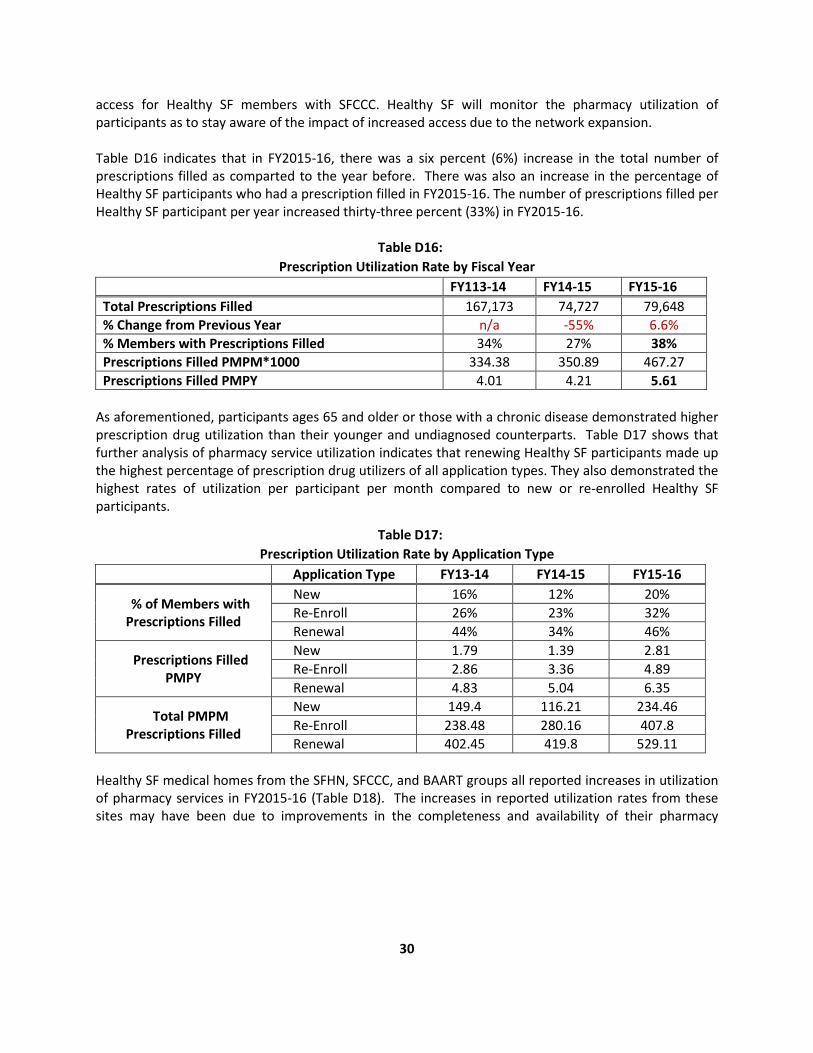
access for Healthy SF members with SFCCC. Healthy SF will monitor the pharmacy utilization of participants as to stay aware of the impact of increased access due to the network expansion. Table D16 indicates that in FY2015-16, there was a six percent (6%) increase in the total number of prescriptions filled as comparted to the year before. There was also an increase in the percentage of Healthy SF participants who had a prescription filled in FY2015-16. The number of prescriptions filled per Healthy SF participant per year increased thirty-three percent (33%) in FY2015-16.
Table D16: Prescription Utilization Rate by Fiscal Year
FY113-14 FY14-15 FY15-16 Total Prescriptions Filled 167,173 74,727 79,648 % Change from Previous Year n/a -55% 6.6% % Members with Prescriptions Filled 34% 27% 38% Prescriptions Filled PMPM*1000 334.38 350.89 467.27 Prescriptions Filled PMPY 4.01 4.21 5.61
As aforementioned, participants ages 65 and older or those with a chronic disease demonstrated higher prescription drug utilization than their younger and undiagnosed counterparts. Table D17 shows that further analysis of pharmacy service utilization indicates that renewing Healthy SF participants made up the highest percentage of prescription drug utilizers of all application types. They also demonstrated the highest rates of utilization per participant per month compared to new or re-enrolled Healthy SF participants.
Table D17: Prescription Utilization Rate by Application Type
Application Type FY13-14 FY14-15 FY15-16
% of Members with Prescriptions Filled
New 16% 12% 20% Re-Enroll 26% 23% 32% Renewal 44% 34% 46%
Prescriptions Filled PMPY
New 1.79 1.39 2.81 Re-Enroll 2.86 3.36 4.89 Renewal 4.83 5.04 6.35
Total PMPM Prescriptions Filled
New 149.4 116.21 234.46 Re-Enroll 238.48 280.16 407.8 Renewal 402.45 419.8 529.11
Healthy SF medical homes from the SFHN, SFCCC, and BAART groups all reported increases in utilization of pharmacy services in FY2015-16 (Table D18). The increases in reported utilization rates from these sites may have been due to improvements in the completeness and availability of their pharmacy

31
encounter data. BAART in particular reported a significant increase in prescription drug utilization which may have been due to improved data resulting from oversight by a new pharmacy benefit manager12.
Table D18: Prescription Filled PMPY for participants with at Least One Office Visit by Medical Home Organization
Medical Home Organization FY13-14 FY14-15 FY15-16 BAART 0.02 0.69 12.14* Sister Mary Philippa 0.02 0.05 0.2 SFHN 7.35 8.3 9.11 KAISER 5.96 6.38 3.74 SFCCC (including NEMS) 4.78 4.84 7.85
*there were 19 Healthy SF participants with BAART as their medical home in FY2015-16. E. HEALTH IMPROVEMENT INITIATIVES
Conclusion of the Diabetes Text Messaging Campaign Healthy SF ended the Diabetes Text Messaging (DMTxt) Campaign in June 2016. The DMTxt campaign promoted diabetes self-care habits, provided information on recommended diabetes screening, and provided other general wellness suggestions. The program functioned for two years with a total of 169 Healthy SF participants. It was available in English, Spanish, Chinese, and Vietnamese. There may be new health education campaigns in the future that include texting or other methods of outreach and engagement. Patient Experience Trainings – Access Improvement Trainings In February 2016, Healthy SF sponsored an Access Improvement Workshop. The workshop was a follow-up to an initial training held in November 2015 and was led by Coleman Associates, a consultant firm that specializes in process design. The training focused on increasing efficiencies and improving access to appointments. Trainers also helped Healthy SF staff with planning to implement and sustain efficiency-related tools at their respective sites. Twenty-three attendants from across the Healthy SF medical home network participated. The expected impact of the training are reductions in wait times and greater availability of appointments by reducing no-shows. Patient Experience – Customer Service Trainings Healthy SF sponsored two customer service trainings for providers in its network in FY2015-16. The San Francisco Health Plan, which sponsored the trainings reported the following training descriptions:13
12 BAART specializes in providing drug treatment services and there were only 19 Healthy SF participants with the site as a medical home the FY2015-16. It is expected that FY2015-16 reporting for this medical home will present more accurate utilization data than in years past. 13 San Francisco Health Plan (2016). Healthy San Francisco and City Option Programs Annual Report FY2015-16.

32
1. You Make the Difference! This two-hour training communicates the importance of establishing customer service standards, as well as provides easy to remember acronyms that help staff through patient encounters. One example of this is CLEAR: connect, listen, explain, ask and reconnect. The training guides participants through a series of activities and exercises, giving them an opportunity to practice newly learned customer service techniques.
2. Managing for Customer Service. This four-hour training is a customer service training designed for Office Managers and Supervisors. This skill-building workshop teaches an approach to motivate and manage others. The workshop provides the opportunity to do a self-assessment as well as group exercises and role plays to allow for practice.
A total of fifty-nine (59) providers attended either of these trainings. Participants reported their intent to institute a number of customer service-oriented techniques moving forward ranging from actively making patients feel more at ease to doing more to coach and recognize staff.
F. PARTICIPANT EXPERIENCE AND SATISFACTION
This section describes to Healthy SF’s efforts to obtain feedback from its participants about their health, health care, and program related experiences. Feedback is obtained from the program’s call center, various channels that track complaints, and the administration of surveys. Health Access Questionnaire Healthy SF administers a Health Access Questionnaire (HAQ) at the point of application and at annual renewals.14 The survey is available in English, Spanish, and Chinese. Participant responses to this questionnaire enable the program to gauge individuals’ experiences prior to enrolling in Healthy SF. The HAQ also serves to capture feedback about the experiences of participants who have either re-enrolled or renewed their enrollment. Responses are used to inform ongoing program improvement and evaluation. In FY2015-16, Healthy SF administered 11,987 surveys to 11,718 participants. A sample of the survey items can be found in Appendix B of this report. An unforeseen error in the data collection process for renewing participants occurred during the second quarter of FY2015-16. As a result, responses from renewed applicants were only available through the first four months of FY2015-16. The figures being reported subsequently underrepresent participants who renewed with Healthy SF and must be viewed in that context. FY2015-16 HAQ Responses Participant’s self-reported data indicates that their experiences with the program have either remained stable or improved since the program’s inception. Highlights of participants’ responses in FY2015-16 are listed in Figure F1:
14 This program feature was launched in December 2008 with 10 questions; in spring 2010, an eleventh question was added on program renewal.

33
Figure F1: Highlights from FY2015-16 Health Access Questionnaire
• Fifty-seven percent (57%) of participants who responded rated the care they received in the last twelve months as either excellent, very good, or good.
• Forty-four percent (44%) of respondents indicated that it was not difficult or not too difficult to access medical care when needed.
• Twenty-four percent (24%) of those who responded reported difficulty with accessing medical care.
Figure F2 Figure F3
Since 2008, the percentage of Healthy SF participants who have reported good to excellent health has increased. The percentage of respondents who reported delays with getting care or medicne in the last year has also decreased over this period.
• Fifty-six percent (56%) of respondents reported that they most often go to a community clinic,
health center, or hospital clinic for medical care. • Eleven percent (11%) of respondents reported visiting an emergency room in the last twelve
months.
0 10 20 30 40 50 60
% who rated the care they received in thelast twelve months as either excellent, very
good or good
% respondents that most often go to acommunity clinic, health center, or hospital
clinic for medical care
% of respondents that indicated it was notdifficult or not difficult to access care when
needed
% of respondents that reported difficultyaccessing medical care
% that reported visiting an emergency roomin the last twelve months
50
55
60
65
% of respondents who indicated their health was excellent, very good or good
05
1015
% of respondents reporting delayed getting care or did not get a medicne prescribed to them
during the past 12 months
34
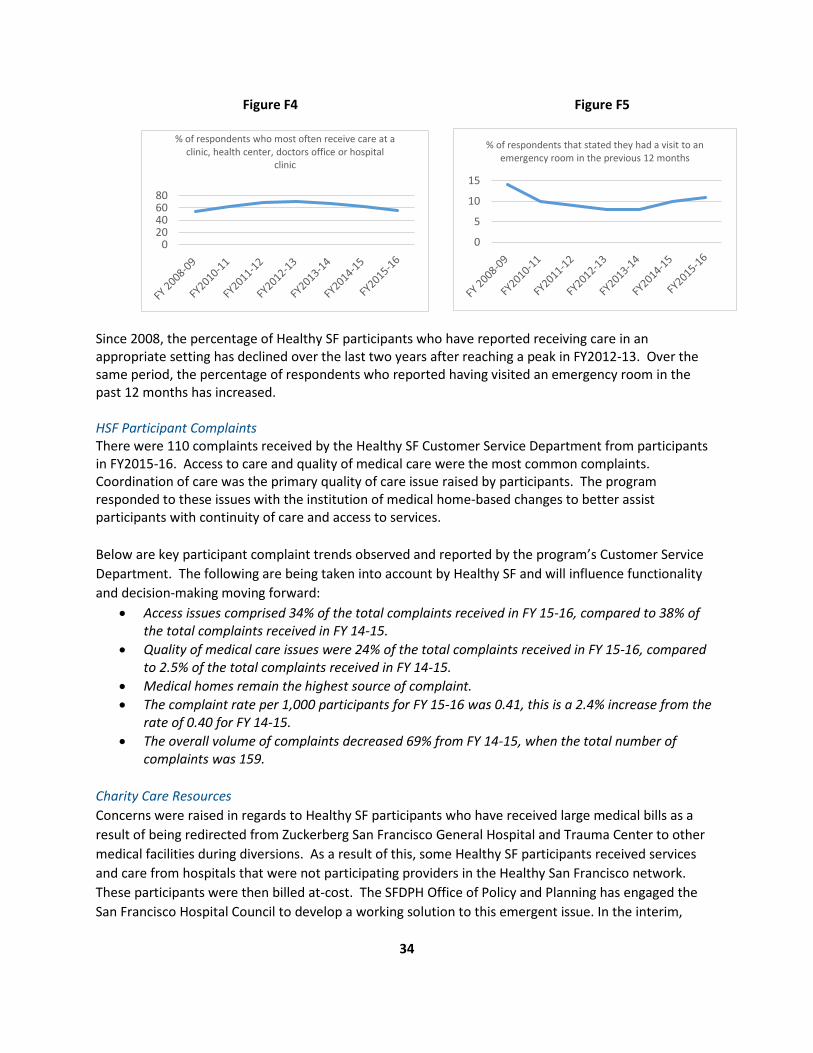
Figure F4 Figure F5
Since 2008, the percentage of Healthy SF participants who have reported receiving care in an appropriate setting has declined over the last two years after reaching a peak in FY2012-13. Over the same period, the percentage of respondents who reported having visited an emergency room in the past 12 months has increased. HSF Participant Complaints There were 110 complaints received by the Healthy SF Customer Service Department from participants in FY2015-16. Access to care and quality of medical care were the most common complaints. Coordination of care was the primary quality of care issue raised by participants. The program responded to these issues with the institution of medical home-based changes to better assist participants with continuity of care and access to services. Below are key participant complaint trends observed and reported by the program’s Customer Service Department. The following are being taken into account by Healthy SF and will influence functionality and decision-making moving forward:
• Access issues comprised 34% of the total complaints received in FY 15-16, compared to 38% of the total complaints received in FY 14-15.
• Quality of medical care issues were 24% of the total complaints received in FY 15-16, compared to 2.5% of the total complaints received in FY 14-15.
• Medical homes remain the highest source of complaint. • The complaint rate per 1,000 participants for FY 15-16 was 0.41, this is a 2.4% increase from the
rate of 0.40 for FY 14-15. • The overall volume of complaints decreased 69% from FY 14-15, when the total number of
complaints was 159. Charity Care Resources Concerns were raised in regards to Healthy SF participants who have received large medical bills as a result of being redirected from Zuckerberg San Francisco General Hospital and Trauma Center to other medical facilities during diversions. As a result of this, some Healthy SF participants received services and care from hospitals that were not participating providers in the Healthy San Francisco network. These participants were then billed at-cost. The SFDPH Office of Policy and Planning has engaged the San Francisco Hospital Council to develop a working solution to this emergent issue. In the interim,
020406080
% of respondents who most often receive care at a clinic, health center, doctors office or hospital
clinic
0
5
10
15
% of respondents that stated they had a visit to an emergency room in the previous 12 months
35
Healthy SF distributed informational fliers to its participants with suggestions and information on how to inquire about hospitals’ charity care policies and the importance of signing up for Restricted or Emergency Medi-Cal insurance that could cover emergency hospital expenses.
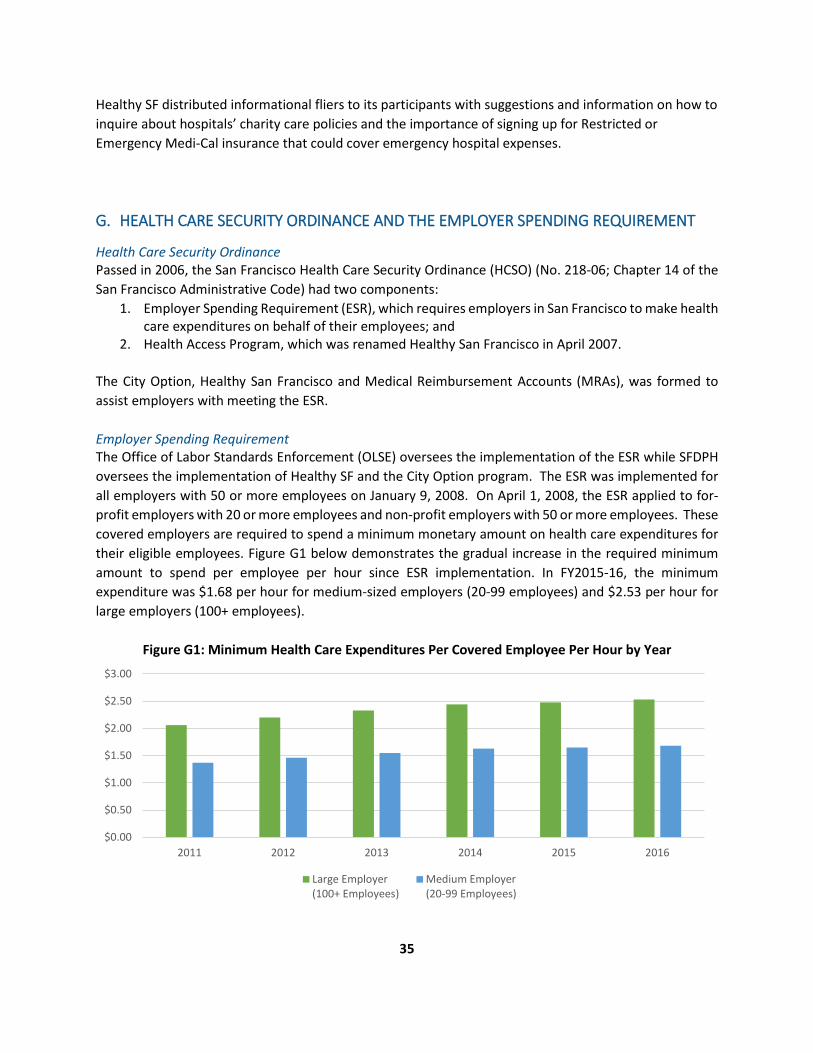
G. HEALTH CARE SECURITY ORDINANCE AND THE EMPLOYER SPENDING REQUIREMENT
Health Care Security Ordinance Passed in 2006, the San Francisco Health Care Security Ordinance (HCSO) (No. 218-06; Chapter 14 of the San Francisco Administrative Code) had two components:
1. Employer Spending Requirement (ESR), which requires employers in San Francisco to make health care expenditures on behalf of their employees; and
2. Health Access Program, which was renamed Healthy San Francisco in April 2007. The City Option, Healthy San Francisco and Medical Reimbursement Accounts (MRAs), was formed to assist employers with meeting the ESR. Employer Spending Requirement The Office of Labor Standards Enforcement (OLSE) oversees the implementation of the ESR while SFDPH oversees the implementation of Healthy SF and the City Option program. The ESR was implemented for all employers with 50 or more employees on January 9, 2008. On April 1, 2008, the ESR applied to for-profit employers with 20 or more employees and non-profit employers with 50 or more employees. These covered employers are required to spend a minimum monetary amount on health care expenditures for their eligible employees. Figure G1 below demonstrates the gradual increase in the required minimum amount to spend per employee per hour since ESR implementation. In FY2015-16, the minimum expenditure was $1.68 per hour for medium-sized employers (20-99 employees) and $2.53 per hour for large employers (100+ employees).
Figure G1: Minimum Health Care Expenditures Per Covered Employee Per Hour by Year
$0.00
$0.50
$1.00
$1.50
$2.00
$2.50
$3.00
2011 2012 2013 2014 2015 2016
Large Employer(100+ Employees)
Medium Employer(20-99 Employees)

36
City Option Most employers (89% in 2014) satisfy the ESR by providing health insurance to their employees. Employers can also satisfy the ESR though participation in the City Option by way of the ESR Portal at www.sfcityoption.org. As of June 2016, an employer that chooses to contribute to the City Option on behalf of their covered employees will make those employees eligible to participate in either Healthy SF at a reduced cost or be assigned a Medical Reimbursement Account.
• If the employee is eligible for Healthy SF, the employee will be notified and must initiate and complete the program’s application process in order to become a participant.
• If the employee is ineligible for Healthy SF, a Medical Reimbursement Account will be opened for the employee. All funds contributed on the employee’s behalf by the employer are deposited into this account. Subsequently, the employee can access these funds for reimbursement of eligible health care expenses.
Beginning in November 2016, SFDPH will launch an additional program under the City Option umbrella, called SF Covered MRA. SF Covered MRA is intended to cover a portion of the premium and out-of-pocket costs for insurance purchased through Covered CA. Specifically, the program offers premium assistance equal to sixty percent (60%) of an employee’s cost for premiums for the second-lowest Silver plan on Covered CA after applying for federal subsidies. Out-of-pocket health care cost-sharing assistance ensures that employees’ Silver plan deductible will be no more than 5% of an employee’s income. Based upon City Option eligibility criteria, employees with employer contributions will be assigned to one of the three City Option programs. SF Covered MRA resulted from a presentation to the San Francisco Health Commission on July 21st 2015. SFDPH proposed to increase access to affordable health care for all low and moderate-income residents of San Francisco. Called the City Option Modernization, the proposed actions leverage existing City Option and Healthy San Francisco infrastructures for two purposes: 1) to make health insurance more affordable for City residents and 2) to ensure that Healthy San Francisco remains available to individuals who cannot afford other options. The modernization of the City Option is expected to increase the affordability of Covered CA for 3,000 eligible city residents, and maintain the Healthy San Francisco safety net for those who are not eligible for the Affordable Care Act or do not have affordable insurance options. A number of enhancements were made with the City Option program to improve participants’ experiences and to prepare the program for the changes associated with the introduction of SF Covered MRA. These included but were not limited to:
• SF MRA deactivation implementation activities began in March 2016 with the development of outreach notices to SF MRA participants and identification of a new vendor to obtain the most recent contact information for SF MRA participants. A target date of November 2016 was set for the closure of inactive accounts that have no claims or deposits in over 24 months. In May, the City Option Program identified over 17K inactive accounts with balances of $25 or more for outreach. Outreach letters and calls to SF MRA participants with accounts that may be potentially closed were delivered in May and June 2016. Final notice letters to SF MRA participants with accounts that may be closed will be delivered in September 2016. SFHP has been working with the SF MRA vendor, ADP, to design and test files for the account closure process.

37
• The City Option program began automated processes to assign individuals unique person identification numbers in June 2016. For employees who receive contributions from multiple City Option employers, the unique identification numbers will help to track, view, update, and report on employee participation in the program. The unique identification numbers will also be used in the SF Covered MRA Program.
By the end of FY2015-2016:
• 1,805 of employers made at least one contribution to the City Option to meet the ESR. Of those, 148 employers made their first contributions. This represents a 3% increase in new employers contributing to the City Option program compared to the prior year. Since the program’s inception, 2,832 employers made at least one contribution to the City Option program. This was a 19.9% increase from the previous year. This is likely due in large part to changes under ACA which eliminated standalone Health Reimbursement Accounts (HRA) as an available mechanism to comply with the ESR. Employers have contributed to the City Option instead.
• Employers deposited $123.6 million to the City Option (including both Healthy SF and SF MRA) on behalf of their employees. This was approximately $23 million more than what was deposited in FY2014-15.
• Of the employer funds contributed to the City Option in FY2014-15, eighty-eight percent (or $108.5 million) was distributed to employees’ SF MRAs and twelve percent (or $15 million) was designated to employees who were potentially eligible for Healthy SF. This reflects an increase in individuals who were either eligible for new health care options or have indicated they were already enrolled in coverage.
• Employers have made City Option contributions on behalf of 227,948 eligible employees. This is a 25.9% increase from the year before. This number includes those employees who were counted more than once because they received contributions from multiple employers.
• Since the inception of the City Option Program, nearly 67% of employees who received contributions have had their contributions assigned to SF MRAs. Twenty-five percent (25%) of employees have had their contributions assigned to Healthy SF.
HSF to SF MRA Transfers Employees with employer contributions assigned to Healthy SF can have eligible funds transferred to their SF MRA’s upon request. In order to do so, employees must complete a Healthy SF to SF MRA Transfer Request Form. Only contributions that were not previously applied as an Employer Spending Requirement discount on Healthy SF participant fees are eligible to be transferred. In FY2015-16, the program recorded that 7,414 employer contributions for 1,583 individuals had a Healthy SF to SF MRA transfer. This represented an eighteen percent (18%) or $4.35 million decrease in funds and a thirty-three (33%) decrease in the number of individuals who had requested a similar transfer from the previous quarter. The following figure highlights Healthy SF to SF MRA transfers by quarter in FY2015-16.
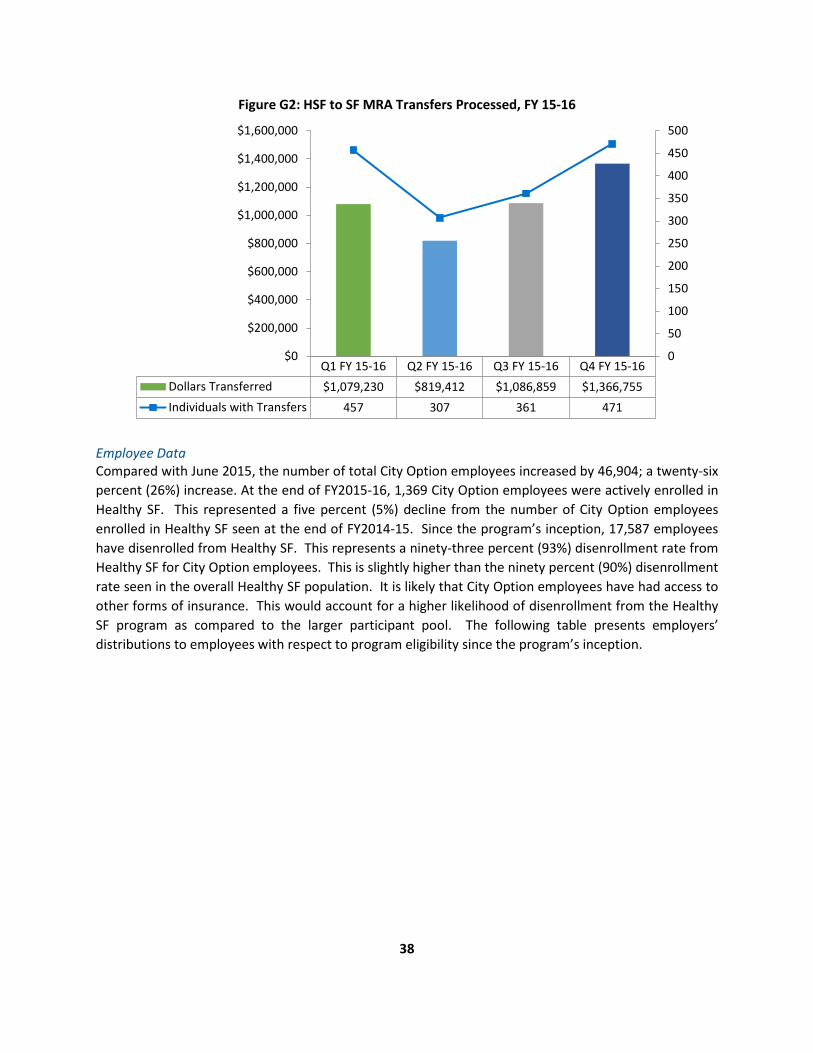
38
Figure G2: HSF to SF MRA Transfers Processed, FY 15-16
Employee Data Compared with June 2015, the number of total City Option employees increased by 46,904; a twenty-six percent (26%) increase. At the end of FY2015-16, 1,369 City Option employees were actively enrolled in Healthy SF. This represented a five percent (5%) decline from the number of City Option employees enrolled in Healthy SF seen at the end of FY2014-15. Since the program’s inception, 17,587 employees have disenrolled from Healthy SF. This represents a ninety-three percent (93%) disenrollment rate from Healthy SF for City Option employees. This is slightly higher than the ninety percent (90%) disenrollment rate seen in the overall Healthy SF population. It is likely that City Option employees have had access to other forms of insurance. This would account for a higher likelihood of disenrollment from the Healthy SF program as compared to the larger participant pool. The following table presents employers’ distributions to employees with respect to program eligibility since the program’s inception.
Q1 FY 15-16 Q2 FY 15-16 Q3 FY 15-16 Q4 FY 15-16Dollars Transferred $1,079,230 $819,412 $1,086,859 $1,366,755Individuals with Transfers 457 307 361 471
0
50
100
150
200
250
300
350
400
450
500
$0
$200,000
$400,000
$600,000
$800,000
$1,000,000
$1,200,000
$1,400,000
$1,600,000

39
Table G1: City Option Employees by Potential Program Eligibility
Category Description Number
HSF-Eligible Employees
City Option employee whose contributing employer has at some time in the past submitted these specific attributes: residency as "San Francisco;" other insurance flag as "no;" and age between 18 and 64, inclusive.
57,459
SF MRA Employees
City Option employee whose contributing employer has at some time in the past submitted any combination of the following information for this City Option employee: residency not in "San Francisco;" other insurance flag as "yes;" age between 0-17 inclusive; or age greater than or equal to 65.
154,165
HSF and SF MRA Employees
City Option employee whose contributing employer(s) has previously submitted contributions designating this employee as both HSF-eligible and SF MRA-eligible. These individuals count as either the "HSF-Eligible Employees" or "SF MRA Employees;" therefore, this figure is negative to eliminate duplicate counting of employees.
-16,324
All City Option Employees
Total number of employees with HSF contributions and employees with SF MRA contributions, less employees with both HSF and SF MRA contributions.
227,948
Through the end of FY2015-16, 9,571 program participants had transferred over $21.11 million in funds from a Healthy SF account to an SF MRA. The majority of those City Option participants actively enrolled in Healthy SF this year were below 200% of the FPL. Of those, only 2.5% were between 0-100% FPL while 54% were between 101-200% FPL. Compared to the general HSF population, those enrolled with employer contributions have relatively higher incomes. Despite this, fifty-seven (57%) of employees receiving employer contributions were still below 200% FPL. This a persistent trend observed by the program and may be an indicator that affordable health insurance remains a pressing issue for the City and County of San Francisco. Given the burden of obtaining affordable health care, it is likely that some individuals who are eligible for subsidies through Covered CA will continue to elect to remain in Healthy SF. Employer Data Table G3 summarizes information broken out by company size, as of June 2016, on employers that elected to use City Option for all or some of their employees. Employers may use City Option to supplement any existing health care expenditures that have been made if they do not meet required ESR expenditure levels. The data indicates that:
• There was a 27% decline in the overall number of employers contributing to City Option for FY2015-16.
• The number of employers and proportion of company sizes returned to those observed two years prior in FY2013-14.
• There was a large decrease in the number of employers who did not report in FY2015-16. • Ninety percent (90%) of participating employers were for-profit entities, while only 9% were
non-profit. The remaining employers did not report their profit status.

40
• The top three classified occupation categories that employers fell into for FY2015-16 were: ‘other services’, accommodation and food services, and retail trade.
Table G3:
City Option Employers by Company Size
Count by Company Size Number Jun 2014
Percent Jun 2014
Number Jun 2015
Percent Jun 2015
Number Jun 2016
Percent Jun 2016
0-19 employees 39 2% 67 3% 47 3%
20-49 employees 399 20% 532 22% 394 22%
50-99 employees 246 12% 314 13% 256 14%
100-499 employees 453 22% 557 23% 422 23% 500+ employees 486 38% 891 36% 682 38%
Not reported 119 6% 111 4% 4 0.2% H. EXPENDITURES AND REVENUES
This section provides estimated Healthy SF expenditures and revenues in FY2015-16. The San Francisco Department of Public Health tracks expenditures through a financial class created for Healthy SF. Expenditures from each SFDPH division are combined to provide an overview of the program’s finances. For FY2015-16, SFDPH costs and revenue calculations were estimates. The financial data below is comprised of the following components:
• Total Healthy SF revenues and expenses; • SFDPH expenditures; • Non-SFDPH expenditures; • Per participant per month expenditures, revenues and subsidy; and • Estimated SFDPH costs of serving the indigent and uninsured.
HSF Revenues The Healthy SF program had a total revenue $16.99 million for FY2015-16. This included contributions from employers using the City Option to fulfill the ESR and participant fees—both participation and SFHN point-of-service (POS) fees. ESR funding in FY2015-16 declined by only $1.01 million (6%) from the previous year. This is not as steep as the 32% decline observed the previous year when employees with ESR funds were either no longer eligible for Healthy SF or transferred their contributions from Healthy SF to SF MRA. Participants with income at or above 101% FPL were billed quarterly for participation fees to remain in the program. As of June 30, 2016, forty-two percent (42%) of participants were at or above 101% of FPL. In general, SFDPH only collects information on POS fees paid by Healthy SF participants accessing services within SFDPH’s SFHN. For the end of the fiscal year, SFDPH collected a total of $1.9 million Healthy SF participant and point-of-service fees. Healthy SF participant and POS fees accounted for 90% and 10% of that total respectively.

41
HSF Expenditures System-wide Healthy SF expenditures for FY2015-16 added up to approximately $74.39 million for private medical homes and SFDPH. The SFDPH expenditure calculation included reimbursement to non-SFDPH Healthy SF medical home providers. The average per participant per month fee decreased to $436, which was just under a two percent (1.6%) decrease from the previous year. There was a $27.72 million decline in total program expenditures in FY2015-16. This was a twenty-seven percent (27%) decline in expenditures which was comprised of a $41.85 million decline in SFDPH expenditures coupled with a $14.13 million increase in non-SFDPH expenditures. Revenue also decreased by $1.58 million (9%) as employees and former participants began to take advantage of new health insurance options.
Table H1: Estimated Total Revenues and Expenditures
2013-14 2014-15 2015-16
ENROLLMENT
Total Participant Months 537,045 230,568 170,455
REVENUE
General Fund $0 $0 $0
Health Care Coverage Initiative $0 $0 $0
Participation Fees and SFDPH POS $5,196,074 $2,496,768 $1,926,087
ESR (Employer Health Care Expenditures) $23,567,891 $16,082,324 $15,070,578
Reserve for Unearned Rev. (Enrollee & ESR) $0 $0 $0
Transfer of Unused SF MRA Funds $0 $0 $0
Philanthropic Grants (Evaluation) $0 $0 $0
TOTAL REVENUE $28,763,965 $18,579,092 $16,996,665
SFDPH EXPENDITURES
Administration
HSF Administration $874,025 $1,106,340 $333,054
Evaluation $0 $0 $0
Third-Party Administrator (SFHP) $6,671,181 $5,364,773 $5,812,446
Services
Cost of Services (ZSFG, Clinics, UCSF) $77,563,729 $70,387,794 $31,343,609
Behavioral Health $13,031,805 $4,875,860 $3,559,740
Non-SFDPH Provider Reimbursement $13,013,172 $3,845,497 $2,676,075
Information Systems
Eligibility/Enrollment System (One-e-App) $316,626 $349,616 $349,174
Siemens Information Technology $233,908 $0 $0
Capital
Capital Projects $0 $0 $0
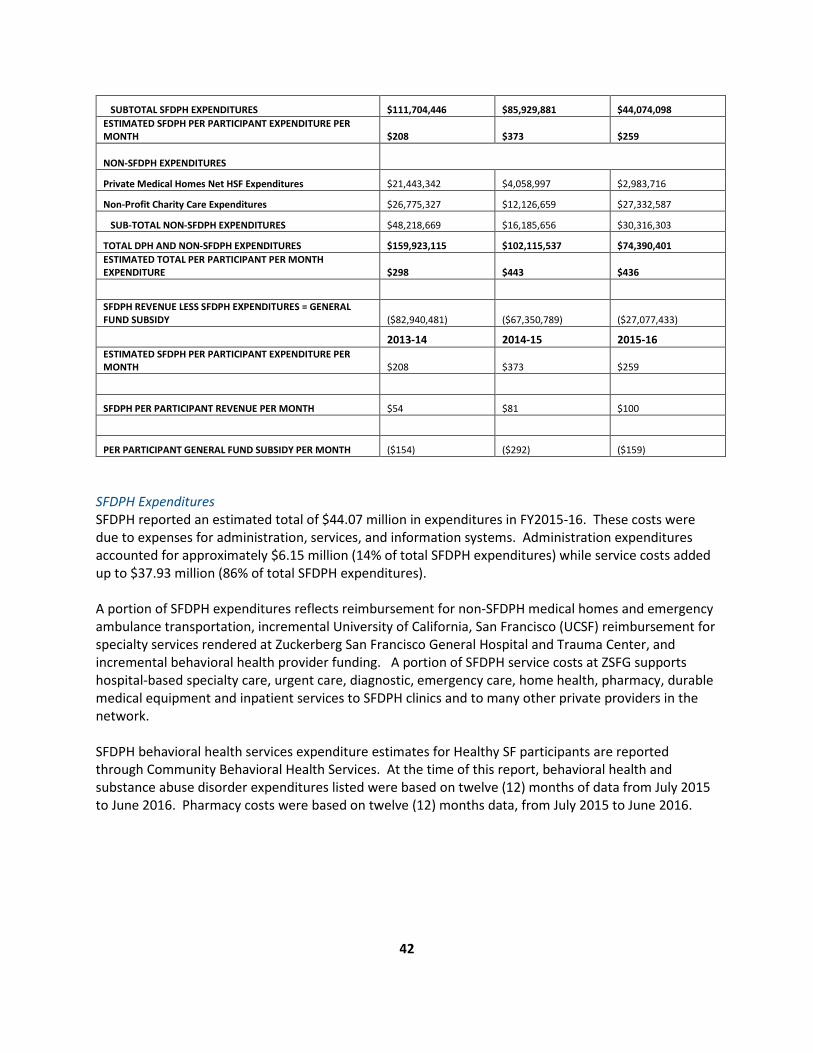
42
SUBTOTAL SFDPH EXPENDITURES $111,704,446 $85,929,881 $44,074,098 ESTIMATED SFDPH PER PARTICIPANT EXPENDITURE PER MONTH $208 $373 $259
NON-SFDPH EXPENDITURES
Private Medical Homes Net HSF Expenditures $21,443,342 $4,058,997 $2,983,716
Non-Profit Charity Care Expenditures $26,775,327 $12,126,659 $27,332,587
SUB-TOTAL NON-SFDPH EXPENDITURES $48,218,669 $16,185,656 $30,316,303
TOTAL DPH AND NON-SFDPH EXPENDITURES $159,923,115 $102,115,537 $74,390,401 ESTIMATED TOTAL PER PARTICIPANT PER MONTH EXPENDITURE $298 $443 $436
SFDPH REVENUE LESS SFDPH EXPENDITURES = GENERAL FUND SUBSIDY ($82,940,481) ($67,350,789) ($27,077,433)
2013-14 2014-15 2015-16 ESTIMATED SFDPH PER PARTICIPANT EXPENDITURE PER MONTH $208 $373 $259
SFDPH PER PARTICIPANT REVENUE PER MONTH $54 $81 $100
PER PARTICIPANT GENERAL FUND SUBSIDY PER MONTH ($154) ($292) ($159)
SFDPH Expenditures SFDPH reported an estimated total of $44.07 million in expenditures in FY2015-16. These costs were due to expenses for administration, services, and information systems. Administration expenditures accounted for approximately $6.15 million (14% of total SFDPH expenditures) while service costs added up to $37.93 million (86% of total SFDPH expenditures). A portion of SFDPH expenditures reflects reimbursement for non-SFDPH medical homes and emergency ambulance transportation, incremental University of California, San Francisco (UCSF) reimbursement for specialty services rendered at Zuckerberg San Francisco General Hospital and Trauma Center, and incremental behavioral health provider funding. A portion of SFDPH service costs at ZSFG supports hospital-based specialty care, urgent care, diagnostic, emergency care, home health, pharmacy, durable medical equipment and inpatient services to SFDPH clinics and to many other private providers in the network. SFDPH behavioral health services expenditure estimates for Healthy SF participants are reported through Community Behavioral Health Services. At the time of this report, behavioral health and substance abuse disorder expenditures listed were based on twelve (12) months of data from July 2015 to June 2016. Pharmacy costs were based on twelve (12) months data, from July 2015 to June 2016.
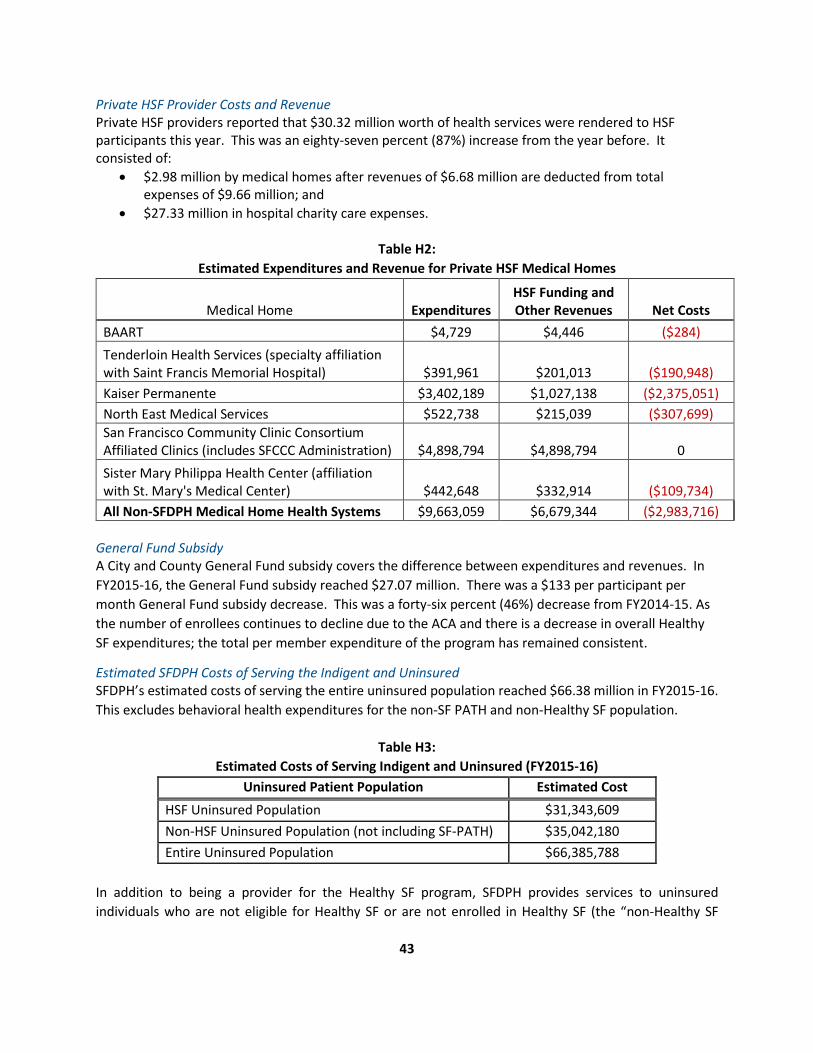
43
Private HSF Provider Costs and Revenue Private HSF providers reported that $30.32 million worth of health services were rendered to HSF participants this year. This was an eighty-seven percent (87%) increase from the year before. It consisted of:
• $2.98 million by medical homes after revenues of $6.68 million are deducted from total expenses of $9.66 million; and
• $27.33 million in hospital charity care expenses.
Table H2: Estimated Expenditures and Revenue for Private HSF Medical Homes
Medical Home Expenditures HSF Funding and Other Revenues Net Costs
BAART $4,729 $4,446 ($284) Tenderloin Health Services (specialty affiliation with Saint Francis Memorial Hospital) $391,961 $201,013 ($190,948) Kaiser Permanente $3,402,189 $1,027,138 ($2,375,051) North East Medical Services $522,738 $215,039 ($307,699) San Francisco Community Clinic Consortium Affiliated Clinics (includes SFCCC Administration) $4,898,794 $4,898,794 0 Sister Mary Philippa Health Center (affiliation with St. Mary's Medical Center) $442,648 $332,914 ($109,734) All Non-SFDPH Medical Home Health Systems $9,663,059 $6,679,344 ($2,983,716)
General Fund Subsidy A City and County General Fund subsidy covers the difference between expenditures and revenues. In FY2015-16, the General Fund subsidy reached $27.07 million. There was a $133 per participant per month General Fund subsidy decrease. This was a forty-six percent (46%) decrease from FY2014-15. As the number of enrollees continues to decline due to the ACA and there is a decrease in overall Healthy SF expenditures; the total per member expenditure of the program has remained consistent.
Estimated SFDPH Costs of Serving the Indigent and Uninsured SFDPH’s estimated costs of serving the entire uninsured population reached $66.38 million in FY2015-16. This excludes behavioral health expenditures for the non-SF PATH and non-Healthy SF population.
Table H3: Estimated Costs of Serving Indigent and Uninsured (FY2015-16)
Uninsured Patient Population Estimated Cost HSF Uninsured Population $31,343,609 Non-HSF Uninsured Population (not including SF-PATH) $35,042,180 Entire Uninsured Population $66,385,788
In addition to being a provider for the Healthy SF program, SFDPH provides services to uninsured individuals who are not eligible for Healthy SF or are not enrolled in Healthy SF (the “non-Healthy SF
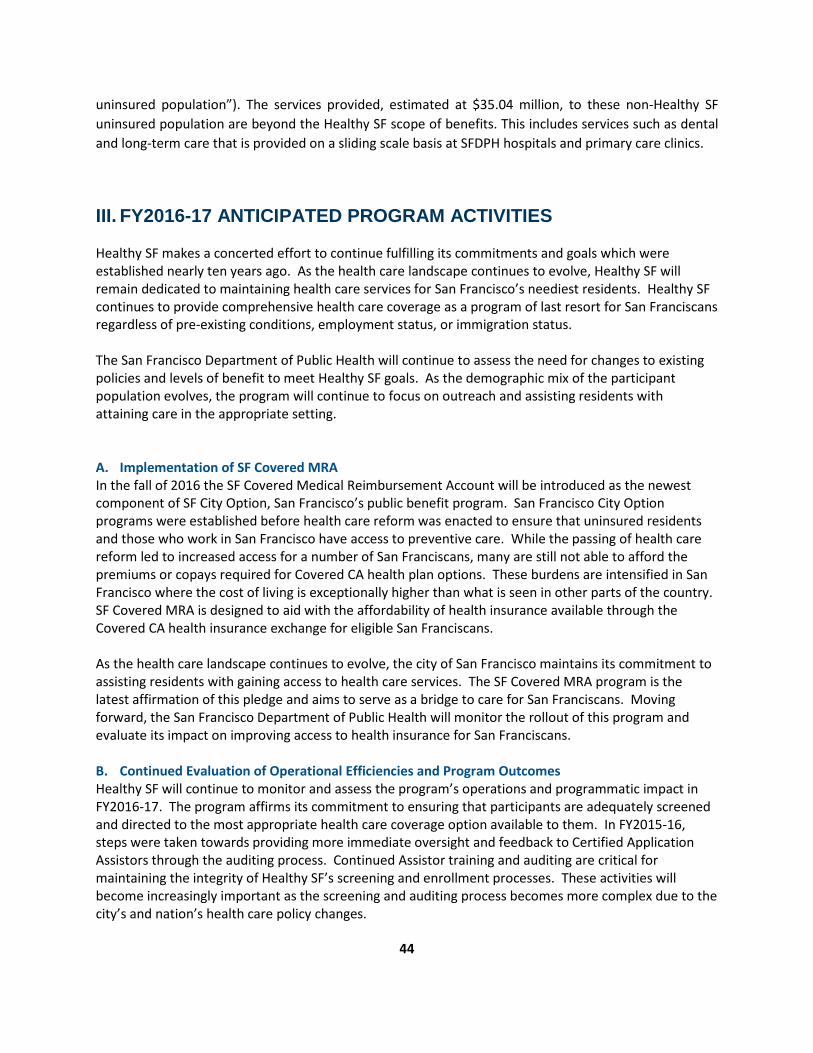
44
uninsured population”). The services provided, estimated at $35.04 million, to these non-Healthy SF uninsured population are beyond the Healthy SF scope of benefits. This includes services such as dental and long-term care that is provided on a sliding scale basis at SFDPH hospitals and primary care clinics.
III. FY2016-17 ANTICIPATED PROGRAM ACTIVITIES
Healthy SF makes a concerted effort to continue fulfilling its commitments and goals which were established nearly ten years ago. As the health care landscape continues to evolve, Healthy SF will remain dedicated to maintaining health care services for San Francisco’s neediest residents. Healthy SF continues to provide comprehensive health care coverage as a program of last resort for San Franciscans regardless of pre-existing conditions, employment status, or immigration status. The San Francisco Department of Public Health will continue to assess the need for changes to existing policies and levels of benefit to meet Healthy SF goals. As the demographic mix of the participant population evolves, the program will continue to focus on outreach and assisting residents with attaining care in the appropriate setting. A. Implementation of SF Covered MRA In the fall of 2016 the SF Covered Medical Reimbursement Account will be introduced as the newest component of SF City Option, San Francisco’s public benefit program. San Francisco City Option programs were established before health care reform was enacted to ensure that uninsured residents and those who work in San Francisco have access to preventive care. While the passing of health care reform led to increased access for a number of San Franciscans, many are still not able to afford the premiums or copays required for Covered CA health plan options. These burdens are intensified in San Francisco where the cost of living is exceptionally higher than what is seen in other parts of the country. SF Covered MRA is designed to aid with the affordability of health insurance available through the Covered CA health insurance exchange for eligible San Franciscans. As the health care landscape continues to evolve, the city of San Francisco maintains its commitment to assisting residents with gaining access to health care services. The SF Covered MRA program is the latest affirmation of this pledge and aims to serve as a bridge to care for San Franciscans. Moving forward, the San Francisco Department of Public Health will monitor the rollout of this program and evaluate its impact on improving access to health insurance for San Franciscans. B. Continued Evaluation of Operational Efficiencies and Program Outcomes Healthy SF will continue to monitor and assess the program’s operations and programmatic impact in FY2016-17. The program affirms its commitment to ensuring that participants are adequately screened and directed to the most appropriate health care coverage option available to them. In FY2015-16, steps were taken towards providing more immediate oversight and feedback to Certified Application Assistors through the auditing process. Continued Assistor training and auditing are critical for maintaining the integrity of Healthy SF’s screening and enrollment processes. These activities will become increasingly important as the screening and auditing process becomes more complex due to the city’s and nation’s health care policy changes.
45
C. Healthy SF Provider Network and the Bigger Picture The public-private partnership model of Healthy SF is an important aspect of the program that provides broader choices and points of access for participants. As has been the case in previous years, a key priority for the program will be to maintain the existing provider network. Our partner providers will periodically assess their respective participation in Healthy SF in this uncertain health care environment. SFDPH will continue to work with our provider partners to ensure that Healthy SF can be a source of reliable and seamless health care coverage for participants. Building and expanding on our partnerships with external providers will also help to better inform the program about what goes on with participants outside of Healthy SF. Numerous challenges remain with Healthy SF’s efforts to deliver care to hidden populations within San Francisco. Despite recent strides that have been made by the expansion of access to health care, there are a significant number of isolated populations that still seek care in inappropriate settings. Reaching these populations and improving their access to care is a critical health need for San Francisco. As 2017 approaches, Healthy SF will continue to explore ways to partner with community stakeholders and providers that can help deliver health services to our neediest residents. Healthy SF is only one program amongst a host of others that support SFDPH’s mission to protect and promote maintain the health of San Franciscans. In 2017, many of these strategies will aim to address issues and needs identified by residents, including but not limited to: homelessness; substance abuse disorders; psychosocial health; and access to appropriate services. The work of Healthy SF is a critical component of San Francisco’s efforts to maintain a safety net for residents affected by many of these issues. Healthy SF will continue to be a proactive community partner and coordinate where possible with other city departments or community-based agencies to help connect San Francisco’s vulnerable populations to care.

46
IV. DATA SOURCES AND LIMITATIONS
Data Sources The data used to generate the figures and findings in the 2015-16 Healthy SF Annual Report was drawn from three primary sources:
1. Healthy SF Participant Encounter and Prescription Drug Data (July 1, 2015 to June 30, 2016) 2. Health Access Questionnaire (July 1, 2015 to June 30, 2016) Source: • San Francisco Health Plan • Healthy SF Network Providers • County Behavioral Health Services
3. Healthy SF Participant Enrollment Data (July 1, 2015 to June 30, 2016) Source: • San Francisco Department of Public Health
Limitations The Healthy SF Annual Report provides a snapshot of available data that characterizes participants’ health care services utilization as of June of the last fiscal year. In order to accomplish this, Healthy SF relies on partner agencies to furnish the participant encounter and prescription drug utilization data needed to generate the report. The data received is not independently audited by Healthy SF. While processing Healthy SF participants’ service utilization data, some providers and partner agencies may encounter delays when validating and reporting the data to the program. Due to this, historically all relevant encounter and prescription drug-related data has not been available by the end of the fiscal year. In addition, a variable percentage of the encounter data received by Healthy SF may be incomplete due to errors in recording or reporting participants’ service utilization. The lack of complete data may have resulted in underreporting of Healthy SF participants’ utilization data at the time the annual report is written. However, in years past, comparative analysis of the partial to the complete encounter datasets has shown few discrepancies. Another noteworthy limitation of the program’s capacity to examine our participants’ health care services utilization is the inability to determine utilization outside of the program’s provider network. Many participants have potential access to Medi-Cal, charity care, and health care outside of the City and County of SF. Healthy SF is not able to determine where participants may seek care and it is possible that a segment of the participant population may only use Healthy SF for access to discrete services. The likelihood of participants seeking care in other settings obscures Healthy SF’s ability to fully account for the utilization patterns of Healthy SF participants. Therefore, the program’s analysis of participants’ encounters with health care providers is inherently limited to describing the use of services within the program.

47
V. ACKNOWLEDGEMENTS
Primary Contributors: Alice Kurniadi, Manager, San Francisco Health Network Office of Managed Care Colleen Chawla, Deputy Director, San Francisco Department of Public Health Jackie Haslam, Metrics and Data Analytics Supervisor, San Francisco Department of Public Health Jocelyn Highsmith, Junior Business Analyst, San Francisco Health Network Office of Managed Care Stanley Tan, Principal Business Analyst, San Francisco Health Network Office of Managed Care Stella Cao, Director, San Francisco Health Network Office of Managed Care Sumita Rao, Principal Programmer Analyst, San Francisco Department of Public Health Lead author: Reginauld Jackson, Program Officer, San Francisco Health Network Office of Managed Care Thank you to our key community stakeholder partners: San Francisco Health Network of the San Francisco Department of Public Health San Francisco Health Plan San Francisco Community Clinic Consortium and Consortium Clinics Saint Francis Memorial Hospital St. Mary’s Medical Center Kaiser Foundation Hospital, San Francisco University of California, San Francisco Medical Center Social Interest Solutions

48
VI. APPENDIX A
Healthy SF maintains a clinical data warehouse managed by the program’s Third Party Administrator, the San Francisco Health Plan. The SFHP defines encounter data submission standards, ensures the quality of data collected and processed, and analyzes and reports the data received by the SFDPH annually. Collection and analysis of encounter data is key to determining the extent to which Healthy SF meets its goals.
The source data for this report came from the Healthy SF data warehouse that includes records for all medical and pharmacy services, as well as from the Health Access Questionnaire. The HAQ is administered during the Healthy SF application process and incorporates membership data from the One-e-App system. Data for this report accounts for all services that were incurred from July 2011 through June 2016. It should be noted that the completeness of service and encounter data reported is not uniform across all participating Healthy SF providers. Services that are provided to Healthy SF participants but are billed to those participants directly or to other insurers are not captured within the encounter data.
SFHP monitors Healthy SF encounter data submissions by service category and total submissions received by providers on a monthly basis. Ongoing monitoring facilitates a better understanding of the total submissions received, loaded, and used for the development of utilization analysis.
Nonprofit hospitals might also provide charity care services to Healthy SF participants. Since FY2009-10, SFDPH has worked with these hospitals to obtain utilization data about the Healthy SF population that receives charity care services. In some cases, these hospitals do not consistently submit encounter data for Healthy SF participants. This means that it is likely that the encounter data for all services provided to this population has not been captured.
Hospital System Encounter Data for
HSF Population or HSF Service
Encounter Data for HSF Participants Receiving
Charity and/or Discounted Care
California Pacific Medical Center (4 campuses)
Inpatient encounters for NEMS HSF Participants
Encounters for any HSF participant, irrespective of medical home, that received services from hospital
Kaiser Permanente Encounters for Kaiser HSF Participants
Saint Mary’s Medical Center
Encounters for Sister Mary Philippa HSF Participants
St. Francis Hospital Encounters for Tenderloin Health Services HSF Participants
Zuckerberg San Francisco General Hospital and Trauma Center
Encounters for SFDPH HSF Participants; specialty, diagnostic, inpatient encounters for SFCCC HSF Participants at some medical homes; BAART HSF Participants
UCSF Medical Center Encounters for HSF Participants receiving diagnostic services at Mission Bay

49
VII. APPENDIX B
11,987 health access questionnaires (HAQ) were administered to 11,718 Healthy SF participants in FY2015-16. Of those surveys 11,449 participants took the survey only once over the course of the year. Another 269 participants took the survey twice. These participants were likely new applicants who renewed their eligibility before the end of their 12 month term. Due to an unforeseen error in the data collection process, responses from renewed applicants were only available through the first four months of FY2015-16. These surveys were included in the following analysis, but the figures being reported are subsequently skewed towards responses from new and re-enrolled Healthy SF participants.
# Question FY 2015-16
FY 2014-15
FY 2013-14
FY 2012-13
FY 2011-12
FY 2010-11
FY 2008-09
1 Would you say that in general your health is excellent, very good, fair, or poor?
% of respondents who indicated their health was excellent, very good or good
63 60 62 64 64 58 55
2 During the past 12 months, was there any time you had no health insurance at all?
% of respondents who indicated that they did not have health insurance for some time in the past 12 months
36 37 33 46 48 49 53
3 What is the main reason why you did not have health insurance?
% respondents that stated the most common reason for not having health insurance was HSF
NA 31 36 33 33 29 NA
4 In the last 12 months, did you visit a hospital emergency room for your own health?
% of respondents that stated they had a visit to an emergency room in the previous 12 months
11 10 8 8 9 10 14
5 What kind of place do you go to most often to get medical care? Is it a doctor’s office, a clinic, an emergency room, or some other place?
% of respondents who most often receive care at a clinic, health center, doctors office or hospital clinic
56 63 67 70 69 63 54
6 Overall, how difficult is it for you and/or your family to get medical care when you need it- extremely difficult, very difficult, somewhat difficult, not too difficult, or not at all difficult?
% of respondents who said it was not at all difficult or not too difficult to access care when they needed
44 39 46 46 47 45 NA

50
7 How do you rate the medical care that you received in the past 12 months – excellent, very good, good, fair, or poor?
% who rated the medical care they received in the past 12 months as excellent or very good
26 27 26 27 24 23 26
8 During the past 12 months, did you either delay getting care or not get a medicine that a doctor prescribed for you?
% of all respondents that said they had delayed getting care or did not get a medicine prescribed to them during the past 12 months
8 4 5 5 6 8 12
9 Was cost or lack of insurance a reason why you delayed getting care or did not get a prescription?
% of respondents that said cost or lack of insurance was a reason why they had delayed care
8 5 8 7 10 10 14
10 Do you now smoke cigarettes every day, some days, or not at all?
% of respondents who smoked (every day or some days)
5 5 9 10 9 11 16
11 Which of the following had the greatest influence in your decision to come in today to renew? Renewal notice, phone call from HSF, reminded when visited medical home, reminded when called medical home, or you remembered?
% of respondents that stated the renewal notice as the reason for coming in for a renewal
68 34 43 46 43 35 NA


