53
Annual Results 2002 Annual Results 2002 February 11, 2003 February 11, 2003

Annual Results 2002Annual Results 2002
February 11, 2003February 11, 2003

2
“Safe Harbor” Statement under the Private Securities Litigation Reform Act of October 1995
'Safe Harbor' Statement under the Private Securities Litigation Reform Act of 1995This document contains certain forward-looking statements with respect to the financial condition, results of operations and business of Philips and certain of the plans and objectives of Philips with respect to these items (including, but not limited to, cost savings).By their nature, forward-looking statements involve risk and uncertainty because they relate to events and depend on circumstances that will occur in the future. There are a number of factors that could cause actual results and developments to differ materially from those expressed or implied by these forward-looking statements. These factors include, but are not limited to, levels of consumer and business spending in major economies, changes in consumer tastes and preferences, changes in law, the performance of the financial markets, pension costs, the levels of marketing and promotional expenditures by Philips and its competitors, raw materials and employee costs, changes in future exchange and interest rates (in particular, changes in the euro and the US dollar can materially affect results), changes in tax rates and future business combinations, acquisitions or dispositions and the rate of technological changes.

3
Gerard KleisterleeGerard Kleisterlee
Jan Jan HommenHommen
Gerard KleisterleeGerard Kleisterlee

4
Performance of the Philips GroupEUR million
SalesSales
Income (loss) from operationsIncome (loss) from operations
Net income (loss)Net income (loss)
Cash flow from operationsCash flow from operations
Net capital expendituresNet capital expenditures
Inventories as % of salesInventories as % of sales
Net debt to group equityNet debt to group equity
EmployeesEmployees
32,33932,339
(1,395)(1,395)
(2,475)(2,475)
1,2481,248
(2,156)(2,156)
13.313.3
26 : 7426 : 74
188,643188,643
20012001
31,82031,820
420420
(3,206)(3,206)
2,2282,228
(940)(940)
11.111.1
27 : 7327 : 73
170,087170,087
20022002 20002000
37,86237,862
4,2584,258
9,6629,662
2,9962,996
(3,132)(3,132)
13.913.9
11 : 8911 : 89
219,429219,429

5
Product Divisions in 2002
•• Record results in DAP Record results in DAP -- delivering innovative marketing and product delivering innovative marketing and product leadershipleadership
•• Consumer Electronics, strong Q4 performance in Europe and the tuConsumer Electronics, strong Q4 performance in Europe and the turnrn--around in North America onaround in North America on--track track –– intensifying our customer and market intensifying our customer and market focusfocus
•• Medical Systems integration onMedical Systems integration on--track track –– well positioned for growth with well positioned for growth with new product introductionsnew product introductions
•• Lighting maintained strong margins and gained in market share Lighting maintained strong margins and gained in market share
•• Dissolved Components Dissolved Components –– repositioning the businessesrepositioning the businesses
•• Focus on turningFocus on turning--around Semiconductorsaround Semiconductors

6
Philips today – a more focused companySales per sector, as % of total
2002
100% = EUR 31.8B
ComponentsComponents
MedicalMedical
CECE
LightingLighting
DAPDAP
SemiSemi
15.2%15.2%
30.230.2
7.17.17.0
12.912.9
21.521.5
6.16.1
Misc.Misc.
1998
100% = EUR 30.5B
Comp.Comp.
MedicalMedical
CECE
LightingLighting
DAPDAP
SemiSemi
14.6%14.6%
37.337.3
5.75.7
13.8
10.610.6
6.46.48.18.1
Misc.Misc.OriginOrigin
3.5

7
Philips today – a more focused companyEmployment per sector, as % of total
100% = 170,000
ComponentsComponents
MedicalMedical
CECE
LightingLighting
DAPDAPSemiSemi
27.6%27.6%
11.811.8
7.618.418.4
18.218.2
8.78.7Misc.Misc.
Unallocated Unallocated (2.5)
5.25.2
2002
100% = 233,700
ComponentsComponents
MedicalMedical
CECE
LightingLighting
DAPDAP
SemiSemi
21.0%21.0%
18.218.2
4.04.020.5
11.411.4
8.28.24.5Misc.Misc.
OriginOrigin
7.2UnallocatedUnallocated
5.05.0
1998
8
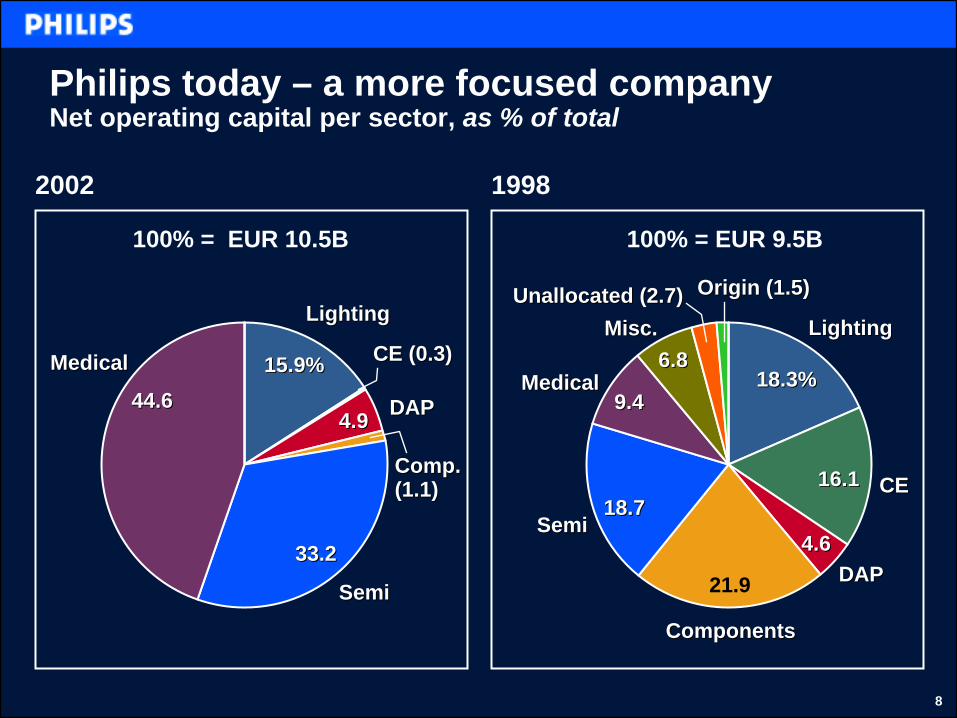
Philips today – a more focused companyNet operating capital per sector, as % of total
MedicalMedical CE (0.3)CE (0.3)
LightingLighting
DAPDAP
SemiSemi
15.9%15.9%
33.233.2
44.644.64.94.9
Comp.Comp.(1.1)(1.1)
100% = EUR 10.5B
2002
ComponentsComponents
MedicalMedical
CECE
LightingLighting
DAPDAP
SemiSemi
18.3%18.3%
16.116.1
4.64.6
21.9
18.718.7
9.49.4
6.86.8
Origin (1.5)Origin (1.5)Unallocated (2.7)Unallocated (2.7)Misc.Misc.
100% = EUR 9.5B
1998

9
Overview 2002
•• Simplified the organizationSimplified the organization
•• Drove down costsDrove down costs
•• Improved the quality and cycle time of our operational Improved the quality and cycle time of our operational processesprocesses
•• Lowered inventory levelsLowered inventory levels
•• Reduced our debtReduced our debt


11
Gerard KleisterleeGerard Kleisterlee
Jan Jan HommenHommen
Gerard KleisterleeGerard Kleisterlee

12
Agenda
•• 2002 Results and Cash Flow2002 Results and Cash Flow
•• Balance Sheet StrengthBalance Sheet Strength
•• Key Financial Management ActionsKey Financial Management Actions

13
Agenda
•• 2002 Results and Cash Flow2002 Results and Cash Flow
•• Balance Sheet StrengthBalance Sheet Strength
•• Key Financial Management ActionsKey Financial Management Actions

14
Profit & Loss - 4Q02EUR million
IFOIFO
Financial Income & ExpensesFinancial Income & Expenses
TaxTax
Unconsolidated companiesUnconsolidated companies
NET INCOME 4Q02NET INCOME 4Q02
NET INCOME 4Q01NET INCOME 4Q01
47 47
(153)(153)
(28)(28)
(1,391)(1,391)
(1,530)(1,530)
(1,062)(1,062)
P&L as P&L as publishedpublished
P&L excl. P&L excl. special items special items & impairment& impairment
301 301
(73)(73)
(176)(176)
11 11
58 58
(103)(103)
Special Special items & items & impairmentimpairment
(254)(254)
(80)(80)
148 148
(1,402)(1,402)
(1,588)(1,588)
(959)(959) 1)1)
1) Includes goodwill amortization charges of EUR 51M in IFO and 1) Includes goodwill amortization charges of EUR 51M in IFO and EUR 70M in EUR 70M in UCC’sUCC’s

15
Group SalesEUR million unless otherwise stated
Philips group salesPhilips group sales
% change from the previous year:% change from the previous year:
Nominal changeNominal change•• Consolidation changeConsolidation change•• Currency effectsCurrency effects
Comparable changeComparable change•• PricesPrices•• VolumeVolume
4Q024Q02 4Q014Q01
8,923 8,923
(4)(4)(2)(2)(7)(7)
5 5 (7)(7)1212
9,262 9,262
(16)(16)2 2
(2)(2)
(16)(16)(9)(9)(7)(7)

16
IFO per Sector – 4Q02EUR million
Special itemsSpecial items
(8)(8)
23 23
15 15
(236)(236)
2 2
(96)(96)
(156)(156)
(169)(169)
(16)(16)
(435)(435)
(289)(289)
(1)(1)
80 80
(3)(3)
4 4
5 5
(2)(2)
82 82
1 1
166166
2828
Acquisition Acquisition related related chargescharges
RestructuRestructu--ring and ring and impairmentimpairment
Gains / Gains / otherother
LightingLighting
CECE
DAPDAP
ComponentsComponents
SemiconductorsSemiconductors
Medical SystemsMedical Systems
MiscellaneousMiscellaneous
UnallocatedUnallocated
TOTAL 4Q02TOTAL 4Q02
TOTAL 4Q01TOTAL 4Q01
IFO as IFO as publishedpublished
183 183
130 130
183 183
(226)(226)
(312)(312)
239 239
(55)(55)
(95)(95)
4747
(458)(458)
IFO excl. IFO excl. Special Special itemsitems
182 182
146 146
186 186
(74)(74)
(140)(140)
218 218
(121)(121)
(96)(96)
301 301
39 39 1)1)
1) Includes EUR 51M goodwill amortization charges1) Includes EUR 51M goodwill amortization charges

17
Cash Flow – 4Q02EUR million
Net Income before impairmentNet Income before impairment
Depreciation / AmortizationDepreciation / Amortization
Net gain on sale of investmentsNet gain on sale of investments
Changes in Working CapitalChanges in Working Capital
OtherOther
CF FROM OPERATIONSCF FROM OPERATIONS
Net CAPEXNet CAPEX
Acquisitions/Divestments/OtherAcquisitions/Divestments/Other
CF BEFORE FINANCING ACTIVITIESCF BEFORE FINANCING ACTIVITIES
4Q024Q02 4Q014Q01
(170)(170)
664 664
(172)(172)
1,165 1,165
(45)(45)
1,442 1,442
(360)(360)
503 503
1,585 1,585
(515)(515)
721 721
(56)(56)
1,709 1,709
(172)(172)
1,687 1,687
(294)(294)
(1,288)(1,288)
105 105

18
1111
194
75
30
(104)
(24)(5)
Non-consolidated companies (excl. special items)EUR million
ANNUAL ANNUAL TOTALTOTAL
2Q022Q021Q021Q02
3Q013Q012Q012Q011Q011Q01
3Q023Q02 4Q024Q02
(103)(103)
20012001
4Q014Q01
291 291
20022002
Note: These numbers are excluding special items and amortizationNote: These numbers are excluding special items and amortization of goodwill.of goodwill.2001 figures are restated acc. US GAAP2001 figures are restated acc. US GAAP
INCL. INCL. SPECIALSSPECIALS (608)(608) (1,346)(1,346)
19
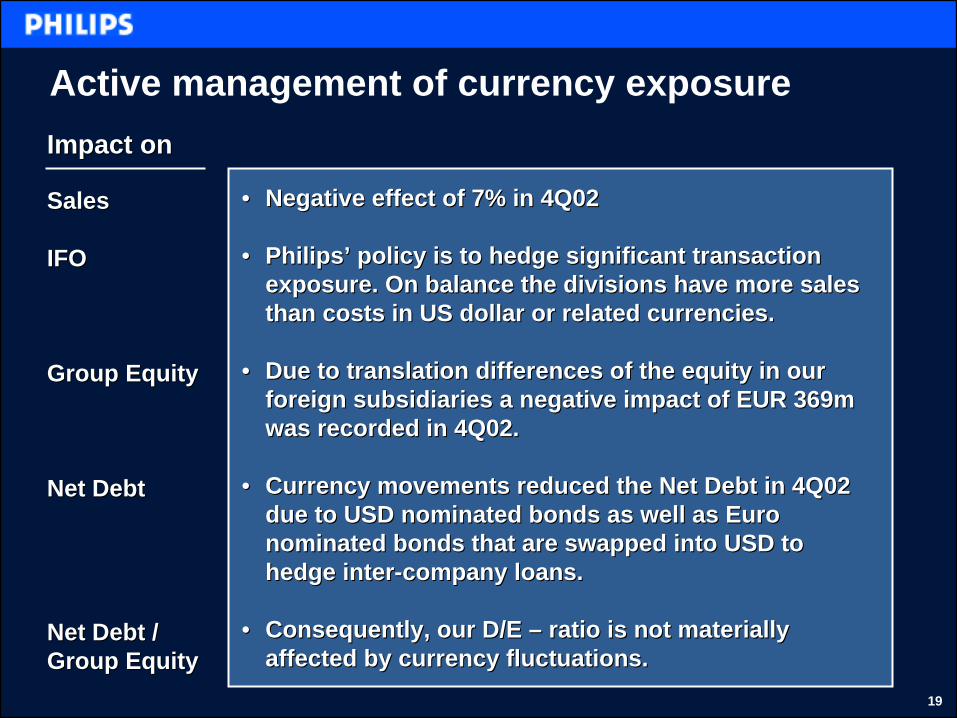
Active management of currency exposure
SalesSales
IFOIFO
Group EquityGroup Equity
Net DebtNet Debt
Net Debt /Net Debt /Group EquityGroup Equity
Impact onImpact on
•• Negative effect of 7% in 4Q02Negative effect of 7% in 4Q02
•• Philips’ policy is to hedge significant transaction Philips’ policy is to hedge significant transaction exposure. On balance the divisions have more sales exposure. On balance the divisions have more sales than costs in US dollar or related currencies.than costs in US dollar or related currencies.
•• Due to translation differences of the equity in our Due to translation differences of the equity in our foreign subsidiaries a negative impact of EUR 369m foreign subsidiaries a negative impact of EUR 369m was recorded in 4Q02.was recorded in 4Q02.
•• Currency movements reduced the Net Debt in 4Q02 Currency movements reduced the Net Debt in 4Q02 due to USD nominated bonds as well as Euro due to USD nominated bonds as well as Euro nominated bonds that are swapped into USD to nominated bonds that are swapped into USD to hedge interhedge inter--company loans.company loans.
•• Consequently, our D/E Consequently, our D/E –– ratio is not materially ratio is not materially affected by currency fluctuations.affected by currency fluctuations.

20
Profit & Loss – Full Year 2002EUR million
IFOIFO
Financial Income & ExpensesFinancial Income & Expenses
TaxTax
Unconsolidated companiesUnconsolidated companies
NET INCOME 2002NET INCOME 2002
NET INCOME 2001NET INCOME 2001
420 420
(2,227)(2,227)
(27)(27)
(1,346)(1,346)
(3,206)(3,206)
(2,475)(2,475)
P&L as P&L as publishedpublished
P&L excl. P&L excl. special items special items & impairment& impairment
460 460
(339)(339)
(154)(154)
267 267
208208
(779)(779)
Special Special items & items & impairmentimpairment
(40)(40)
(1,888)(1,888)
127 127
(1,613)(1,613)
(3,414)(3,414)
(1,696)(1,696)
1)1)
1) Includes goodwill amortization charges in 2002 of EUR 24M in 1) Includes goodwill amortization charges in 2002 of EUR 24M in UCC’s UCC’s and in 2001 of and in 2001 of EUR 180M in IFO and EUR 257M in EUR 180M in IFO and EUR 257M in UCC’sUCC’s

21
Major items in Net Income Swing 2001 vs. 2002 EUR million
NET INCOME 2002NET INCOME 2002
More special itemsMore special itemsLess pension creditsLess pension creditsLessLess goodwill amortizationgoodwill amortizationCost savings realized per Medical & TOPCost savings realized per Medical & TOPTax effect on above itemsTax effect on above items
Various improvements including the benefits of Various improvements including the benefits of earlier restructurings earlier restructurings
NET INCOME 2001NET INCOME 2001
––1,7181,718––541 541 +413 +413 +430+430––147147
(3,206)(3,206)
(1,476)(1,476)
745 745
(2,475)(2,475)

22
470(e)
130
(411)(422)
Pension costs / (credits)EUR million
CostsCosts
CreditsCredits
2001200120002000 20022002 20032003

23
IFO per Sector - 2002EUR million
Special itemsSpecial items
(12)(12)
(84)(84)
(96)(96)
(437)(437)
(13)(13)
(100)(100)
(9)(9)
(169)(169)
(169)(169)
(43)(43)
(10)(10)
(513)(513)
(1,093)(1,093)
(1)(1)
80 80
(3)(3)
84 84
19 19
1 1
388 388
1 1
569569
295295
Acquisition Acquisition related related chargescharges
RestructuRestructu--ring and ring and impairmentimpairment
Gains / Gains / otherother
LightingLighting
CECE
DAPDAP
ComponentsComponents
SemiconductorsSemiconductors
Medical SystemsMedical Systems
MiscellaneousMiscellaneous
UnallocatedUnallocated
TOTAL 2002TOTAL 2002
TOTAL 2001TOTAL 2001
IFO as IFO as publishedpublished
602 602
230 230
401 401
(329)(329)
(537)(537)
309 309
74 74
(330)(330)
420 420
(1,395)(1,395)
IFO excl. IFO excl. Special Special itemsitems
616 616
250 250
413 413
(244)(244)
(375)(375)
435 435
(304)(304)
(331)(331)
460 460
(160)(160)1)1)
1) Includes EUR 180M goodwill amortization charges1) Includes EUR 180M goodwill amortization charges

24
Cash Flow – Full Year 2002EUR million
Net Income before impairmentNet Income before impairment
Depreciation / AmortizationDepreciation / Amortization
Net gain on sale of investmentsNet gain on sale of investments
Changes in Working CapitalChanges in Working Capital
OtherOther
CF FROM OPERATIONSCF FROM OPERATIONS
Net CAPEXNet CAPEX
Acquisitions/Divestments/OtherAcquisitions/Divestments/Other
CF BEFORE FINANCING ACTIVITIESCF BEFORE FINANCING ACTIVITIES
20022002 20012001
54 54
2,184 2,184
(643)(643)
815 815
(182)(182)
2,228 2,228
(940)(940)
692 692
1,980 1,980
(1,830)(1,830)
2,671 2,671
(337)(337)
752 752
(8)(8)
1,248 1,248
(2,156)(2,156)
(2,408)(2,408)
(3,316)(3,316)

25
Impairments / GainsEUR million
Other non current fin. assetsOther non current fin. assets•• ASMLASML•• JDSUJDSU•• Great NordicGreat Nordic•• Vivendi Vivendi UniversalUniversal
UCC’sUCC’s•• AtosAtos OriginOrigin•• LG.Philips Displays JVLG.Philips Displays JV•• FEIFEI•• OtherOther
TOTALTOTAL
CASH IMPACTCASH IMPACT
67 67 (73)(73)(27)(27)
(1,855)(1,855)
(921)(921)(275)(275)
(109)(109)
(3,193)(3,193)
72 72
20022002
2,5952,5951,2071,207
1,1151,115
1,0721,072
5,9895,989
3,9823,982
20012001 20002000
(86)(86)(440)(440)
185 185 (119)(119)
(460)(460)
200 200

26
Employment ReductionPersonnel
At the beginning of the periodAt the beginning of the period
ConsolidationConsolidation
DeconsolidationDeconsolidation
Net reductionsNet reductions
AS AT DECEMBER 31, 2002AS AT DECEMBER 31, 2002
20022002
188,643188,643
254254
(9,768)(9,768)
(9,042)(9,042)
170,087170,087

27
(7)(17)
(25)
(35)(41)
(48)(50)
(52)(58)
(63)(63)(63)
(66)(68)
(72)(77)
(83)(85)
(87)(88)
(96)(98)
(100)
(30)
Total Return to Shareholders – 3 YearCAGR Jan 00’ – Dec ’02 - %
EMERSONWHIRLPOOLGILETTEIBMELECTROLUXSANYOROYAL PHILIPS ELECTRONICSSIEMENSGENERAL ELECTRICTYCOSHARPSAMSUNGINTELMATSUSHITANOKIASONYHITACHIMOTOROLANECLGTEXAS INSTRUMENTSERICSSONLUCENTMARCONI

28
Total Return to Shareholders – 1 YearCAGR Jan 02’ – Dec ’02 - %
ELECTROLUXSAMSUNGGILETTESONYEMERSONSHARPMATSUSHITAWHIRLPOOLSIEMENSIBMNOKIAGENERAL ELECTRICROYAL PHILIPS ELECTRONICSMOTOROLASANYOHITACHIINTELNECTYCOLGTEXAS INSTRUMENTSLUCENTERICSSONMARCONI
(7)(17)
(22)
(23)(30)
(35)(39)
(45)(46)(46)
(48)(48)
(51)(55)
(57)(58)
(69)(76)(76)
(81)(83)
(89)(96)
(23)
29
Agenda
•• 2002 Results and Cash Flow2002 Results and Cash Flow
•• Balance Sheet StrengthBalance Sheet Strength
•• Key Financial Management ActionsKey Financial Management Actions

30
7.05.3
9.7
14.8 15.1
22.219.4
14.1
2.6
(3.0)
1.02.9
21:7921:79
31.12.9731.12.97
:100:100
31.12.9831.12.98
6:946:94
31.12.9931.12.99
11:8911:89
31.12.0031.12.00
26:7426:74
31.12.0131.12.01
1)1)
31.12.0231.12.02
27:7327:73
Debt/Equity ratioEUR billion
1) Restated according to US GAAP1) Restated according to US GAAP
Net Net debtdebt
Group Group equityequity
1)1)

31
Financial AssetsMarket Value in EUR million (as of 31 Dec, 2002)
VivendiVivendi UniversalUniversal
TSMCTSMC
ASMLASML
FEIFEI
JDS JDS UniphaseUniphase
Great NordicGreat Nordic
AtosAtos OriginOrigin
TOTALTOTAL
589589
4,7384,738
217217
118118
117117
1919
495495
6,2936,293
Market Market valuevalue
589589
1,8541,854
217217
8080
117117
1919
495495
3,3713,371
BookBookvaluevalue
Unrealized Unrealized gainsgains
2,8842,884
3838
2,9222,922

32
7.05.3
9.7
14.8 15.1
22.219.4
14.1
2.6
(3.0)
1.02.9
21:7921:79
31.12.9731.12.97
:100:100
31.12.9831.12.98
6:946:94
31.12.9931.12.99 31.12.0031.12.00
26:7426:74
31.12.0131.12.01
1)1)
31.12.0231.12.02
27:7327:73
Debt/Equity ratioEUR billion
Unrealized Unrealized book gainsbook gains
14.114.1
2.92.9
1) Restated according to US GAAP1) Restated according to US GAAP
24:7624:76
Net Net debtdebt
Group Group equityequity
11:8911:89
1)1)

33
Agenda
•• 2002 Results and Cash Flow2002 Results and Cash Flow
•• Balance Sheet StrengthBalance Sheet Strength
•• Key Financial Management ActionsKey Financial Management Actions

34
Key Financial Management Actions
–– Sale of AssetsSale of Assets
–– Working Capital ManagementWorking Capital Management
–– Capital ExpendituresCapital Expenditures
–– Cost ReductionsCost Reductions

35
Sale of Assets
•• The divestment of 16 businesses has been announced, with a The divestment of 16 businesses has been announced, with a potential cash inflow of EUR 809M of which EUR 720M was potential cash inflow of EUR 809M of which EUR 720M was realized in 2002 realized in 2002
•• Plant, property and equipment have been sold with proceeds Plant, property and equipment have been sold with proceeds of EUR 60M in 4Q02 and EUR 370M for the whole yearof EUR 60M in 4Q02 and EUR 370M for the whole year
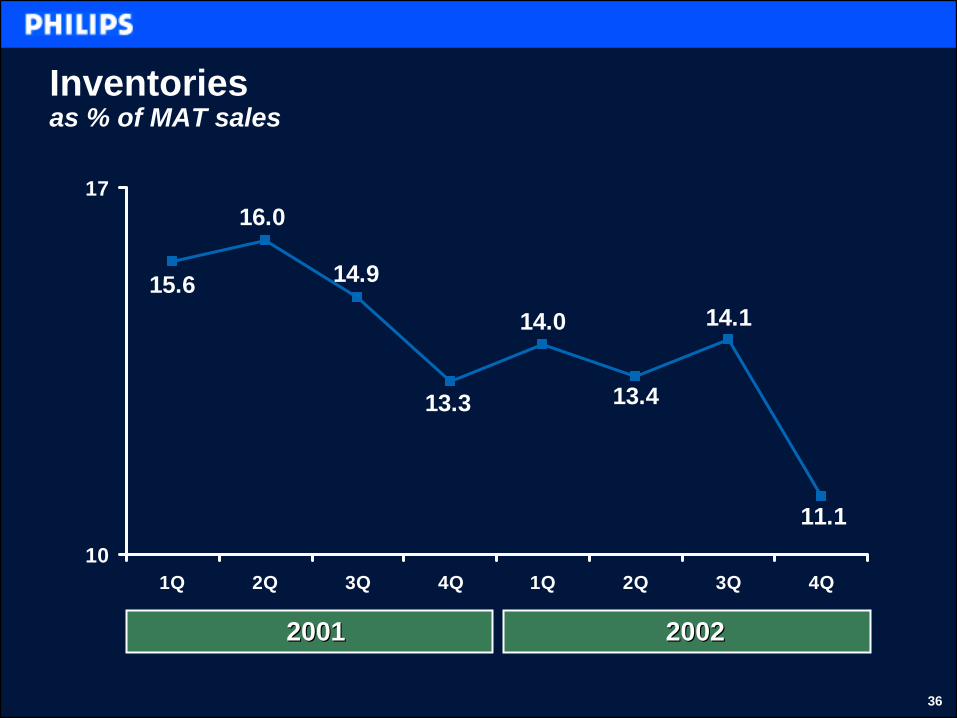
36
15.6
16.0
14.9
13.3
14.0
13.4
14.1
11.110
17
1Q 2Q 3Q 4Q 1Q 2Q 3Q 4Q
Inventoriesas % of MAT sales
2002200220012001

37
456599
829
1,248
757 746
359 294
44
218318 360
1Q001Q00 2Q002Q00 3Q003Q00 4Q004Q00
Capital Investments EUR million
200020001Q011Q01 2Q012Q01 3Q013Q01 4Q014Q01
200120011Q021Q02 2Q022Q02 3Q023Q02 4Q024Q02
20022002ANNUAL ANNUAL TOTALTOTAL 3,1323,132 2,1562,156 940940

38
Capital InvestmentsEUR million
20002000
SEMI %SEMI %
20012001 20022002
51%51% 46%46% 44%44%
456599
829
1,248
757 746
359 294
44
218318 360
1Q001Q00 2Q002Q00 3Q003Q00 4Q004Q00 1Q011Q01 2Q012Q01 3Q013Q01 4Q014Q01 1Q021Q02 2Q022Q02 3Q023Q02 4Q024Q02
ANNUAL ANNUAL TOTALTOTAL 3,1323,132 2,1562,156 940940

39
0
1,400
Capex and Depreciation
20002000 20012001 20022002
CapexCapexDepreciationDepreciation
1Q001Q00 2Q002Q00 3Q003Q00 4Q004Q00 1Q011Q01 2Q012Q01 3Q013Q01 4Q014Q01 1Q021Q02 2Q022Q02 3Q023Q02 4Q024Q02
Note: Note: Capex Capex and Depreciation refer only to tangible fixed assetsand Depreciation refer only to tangible fixed assets

40
Cost Reductions
Over EUR 1b in overall savings achievedOver EUR 1b in overall savings achievedby end of 2003by end of 2003
EUR 300m overhead EUR 300m overhead reductionreduction
EUR 257m realized and EUR 257m realized and EUR 324m on a runEUR 324m on a run--rate rate basis in 4Q02basis in 4Q02
EUR 350m cost synergies EUR 350m cost synergies Medical SystemsMedical Systems
EUR 173m realized in 2002EUR 173m realized in 2002
Additional EUR 350m for Additional EUR 350m for purchasing and other purchasing and other costscosts
e.g. Projects in NPR, Real e.g. Projects in NPR, Real Estate, R&D, M&SEstate, R&D, M&S


42
Gerard KleisterleeGerard Kleisterlee
Jan Jan HommenHommen
Gerard KleisterleeGerard Kleisterlee

43
PMSPMSDAPDAP
Towards One PhilipsTowards One Philips
CECESemi’sSemi’s CECELightingLighting
TechnologyTechnology HealthHealthCareCareLifestyleLifestyle
Operational Operational synergiessynergies
•• Confident to exceed the EUR 1B in overall savingsConfident to exceed the EUR 1B in overall savings•• Shared servicesShared services•• Reductions in working capitalReductions in working capital
Financials Financials synergiessynergies
• Access to capital markets• Asset and cash management
Strategic Strategic synergiessynergies
•• Display, Connectivity, Storage, & Digital Video Display, Connectivity, Storage, & Digital Video •• Brand and Channel ManagementBrand and Channel Management•• New Business DevelopmentNew Business Development

44
(9.3)(7.7) (7.6)
(4.6)
6.69.0
12.2
2.4
Quarterly Sales Volume growth 2001 – 2002In %, year-on-year
1Q011Q01 2Q022Q02 3Q023Q02 4Q024Q02
2Q012Q01 3Q013Q01 4Q014Q01 1Q021Q02
2002200220012001

45
Philips Management Framework
Strong Balance SheetStrong Balance Sheet
Product & Technology MomentumProduct & Technology Momentum
Building a Building a More Effective More Effective OrganizationOrganization
Portfolio Portfolio ManagementManagement
Customer IntimacyCustomer Intimacy

46
Soft
Bright
Special
Customer Intimacy

47
Product & Technology Momentum
The first 3D Ultrasound image of the heart

48
New Health Care Products for 2003
49
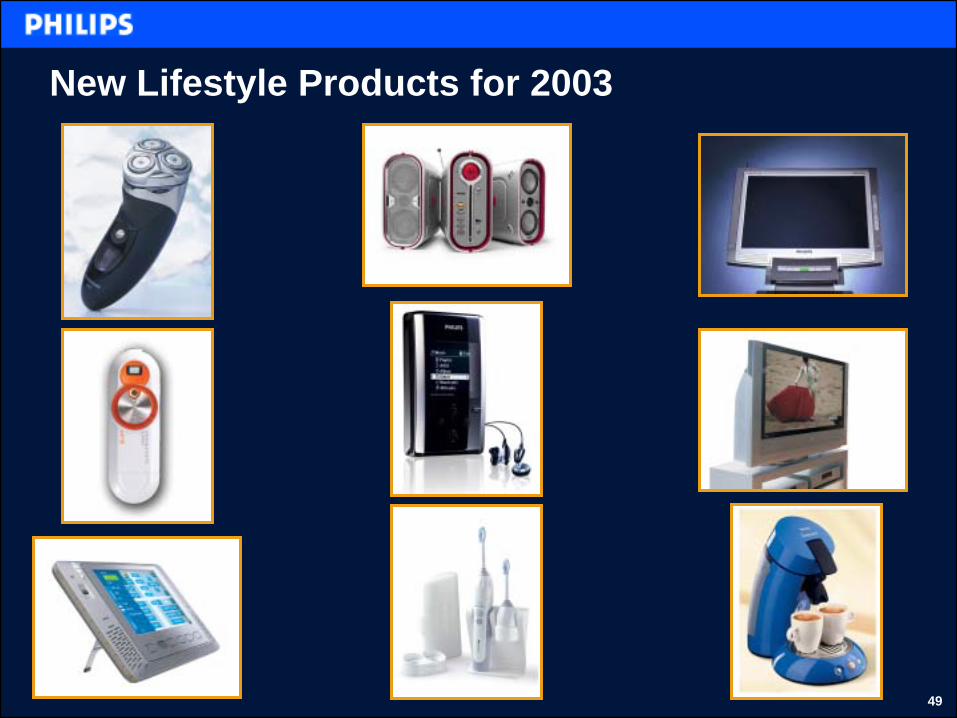
New Lifestyle Products for 2003

50
New Technology Products for 2003

51
Outlook for 2003
•• Operational improvements across all divisionsOperational improvements across all divisions
•• Continued cost reduction initiativesContinued cost reduction initiatives
•• BestBest--inin--class supply chain managementclass supply chain management
•• Negative impact of currency and pension expensesNegative impact of currency and pension expenses
•• No shortNo short--term economic improvementterm economic improvement

52
Agenda for 2003
•• Achieve the costAchieve the cost--savings target of EUR 1 billionsavings target of EUR 1 billion
•• Return Semiconductors to profitabilityReturn Semiconductors to profitability
•• Bring Consumer Electronics in the USA to full profitability Bring Consumer Electronics in the USA to full profitability from the fourth quarter onwardfrom the fourth quarter onward
•• Move Medical Systems forward to achieve 14% EBITA in Move Medical Systems forward to achieve 14% EBITA in 20042004
•• Make Philips a truly marketMake Philips a truly market--driven companydriven company
Towards One PhilipsTowards One Philips


