51
February 28, 2020 Annual Results 2019

February 28, 2020
Annual Results 2019

Annual Results 2019
Veolia Environnement is a corporation listed on the Euronext Paris. This document contains “forward-looking statements” within the meaning of the provisions of the U.S. Private Securities Litigation Reform Act of 1995. Such forward-looking statements are not guarantees of future performance. Actual results may differ materially from the forward-looking statements as a result of a number of risks and uncertainties, many of which are outside our control, including but not limited to: the risk of suffering reduced profits or losses as a result of intense competition, the risk that changes in energy prices and taxes may reduce Veolia Environnement’s profits, the risk that governmental authorities could terminate or modify some of Veolia Environnement’s contracts, the risk that acquisitions may not provide the benefits that Veolia Environnement hopes to achieve, the risks related to customary provisions of divesture transactions, the risk that Veolia Environnement’s compliance with environmental laws may become more costly in the future, the risk that currency exchange rate fluctuations may negatively affect Veolia Environnement’s financial results and the price of its shares, the risk that Veolia Environnement may incur environmental liability in connection with its past, present and future operations, as well as the other risks described in the documents Veolia Environnement has filed with the Autorités des Marchés Financiers (French securities regulator). Veolia Environnement does not undertake, nor does it have, any obligation to provide updates or to revise any forward-looking statements. Investors and security holders may obtain from Veolia Environnement a free copy of documents it filed (www.veolia.com) with the Autorités des Marchés Financiers.
This document contains "non‐GAAP financial measures". These "non‐GAAP financial measures" might be defined differently from similar financial measures made public by other groups and should not replace GAAP financial measures prepared pursuant to IFRS standards.
2
Disclaimer

Antoine Frérot, CEO
Annual ResultsDecember 2019
Highlights

Annual Results 2019
o CONTINUED SOLID REVENUE GROWTH : +4.3%(1) TO €27 189M
o EBITDA ABOVE OUR GUIDANCE: €4 022M , +4.5%(1)
o CURRENT EBIT OF €1 730M, +5.0%(1)
o CURRENT NET INCOME OF €760M, +13.5%(1)
o VERY STRONG NET FCF AFTER ALL INDUSTRIAL GROWTH CAPEX OF €868M
o NET FINANCIAL DEBT SIGNIFICANTLY DOWN (3) TO €10.7bn , DOWN €884M vs. 31/12/2018 � Leverage of 2.66x
� Excluding the disposal of TNAI, net debt flat at €11.7bn
2019 : SOLID REVENUE AND PROFIT GROWTH (1/2)KEY FIGURES
4
Proposal to increase the dividend by 8.7% to
€1 per share (2)
(1) At constant forex(2) Subject to approval of the AGM of April 22, 2020(3) Incl. financial investments and divestitures

Annual Results 2019
1. Strong organic growth of 3.2%, achieved despiteunsupportive weather, continued decrease ofrecycled paper prices and downsizing of VWTactivities
2. Fueled by commercial dynamism, good wastevolumes (+1.5%) and favorable pricing
o EBITDA of €4 022M , +4.5%(1) : cost cuttingahead of target1. Cost savings of €248M2. Approx. 40% retained in EBITDA
o Revenue of €27 189M , +4.3%(1)
5
2019 : SOLID REVENUE AND PROFIT GROWTH (2/2)KEY FIGURES
o Very strong revenue growth outside Franceand in fast growing businesses
1. France +2%; Europe excluding France+4.1%(1), Rest of the World +8.7%(1)
2. Double digit growth of Hazardous waste+14% to €2.5bn
3. Plastic Recycling +26% to €319M
o Very strong net FCF of €868M thanks tostrict capex and WCR discipline
(1) At constant forex

Annual Results 2019
o France� Water : Nîmes, Valenton, Nancy, Toulouse� Waste : Renewal of all our waste to energy contracts + new WTE and sorting facility in Bordeaux
o Europe� Waste : new C&I contracts in the UK, impact of tuck-ins in Belgium� Energy : new DHN in Slovakia (Levice), Energy Service contracts in Italy(Bergame,Trieste hospital) and Spain
o Asia� Water : JAPAN: 100% water O&M contracts renewed and new industrial water contracts: Lithium recycling facility for Toyota; Water
treatment for Coca Cola .CHINA : new industrial water contracts : Longmen and Hynix (WWTP BOT)
� Waste : hazardous waste treatment plants under construction (China, Singapore) and new plastic recycling facilities in China, SouthKorea (Doksan), Indonesia (Danone)
� Energy : BES : Kong Kong /Southa . DHN : Kedong heating in China
o Africa Middle East� Industrial water treatment: renewal of BP Khazzan WWTP and new WWTP of the refinery of KIPIC in Koweit (7 years)� Hazardous waste : construction of Sadara treatment facility in Saudi Arabia� Energy efficiency : O&M of the Cleveland clinic in Abu Dhabi (5 years)
o Global Business / Technology and construction :� Roll out of new cutting edge desalination technology (the Barrel)� 3 new desalination contracts in Saudi Arabia, Bahrein and the UAE (backlog €521m)
6
2019 : ANOTHER YEAR OF STRONG COMMERCIAL MOMENTUMStrong growth of new businesses adressing key environme ntal issues

Annual Results 20197
SUSTAINED PACE OF COST SAVINGS: €248M ACHIEVED IN 2019 AHEAD OF ANNUAL OBJECTIVE OF €220M
€ 1 050M cumulated cost savings achieved from 2016 to 201 9
28%
30%
28%
11% 2%
Savings by geography
France
Europe excl.France
Rest of World
Global Businesses
HQ
29%
57%
14%
Savings by lever
Purchasing
Operations
SG&A

Annual Results 20198
2016-2019 : SIGNIFICANT VALUE CREATION
15.9 15.8 15.6 15.8 16.2
7.4%7.8%
8.3%
8.8% 9.0%
6.3%6.1%
5.8%5.5%
5.3%
2015 2016 2017 2018 2019
Capital employed (€bn) ROCE after tax WACC Euro
+370 bp
Strong increase in ROCE from 2016-2019
2019 after tax ROCE
including IFRS 16
8.4%
Capital employed in €bn
ROCE after taxbefore IFRS 16

Annual Results 20199
2016-2019: STABLE NET FINANCIAL DEBT AND LEVERAGE RATIO OF 2.66X AT 31/12/2019
Leverage ratio
After IFRS 16: 2.66
9 622 9 264 9 285 9 748 8 949
1 816 1 731
Dec 2015 Dec 2016 Dec 2017 Dec 2018 Dec 2019
Net Financial debt including hybrid IFRS 16
In € million

Annual Results 201910
2016- 2019 : DIVIDEND UP 37% IN 4 YEARS
€0.73€0.80
€0.84
€0.92
€1.00
2015 2016 2017 2018 2019 (1)
+10%
+5%+10%
+8.7%
Proposed 2019 dividend of €1.00 (1) , up 8.7%
(1) Subject to approval of the AGM of April 22, 2020

Annual Results 2019
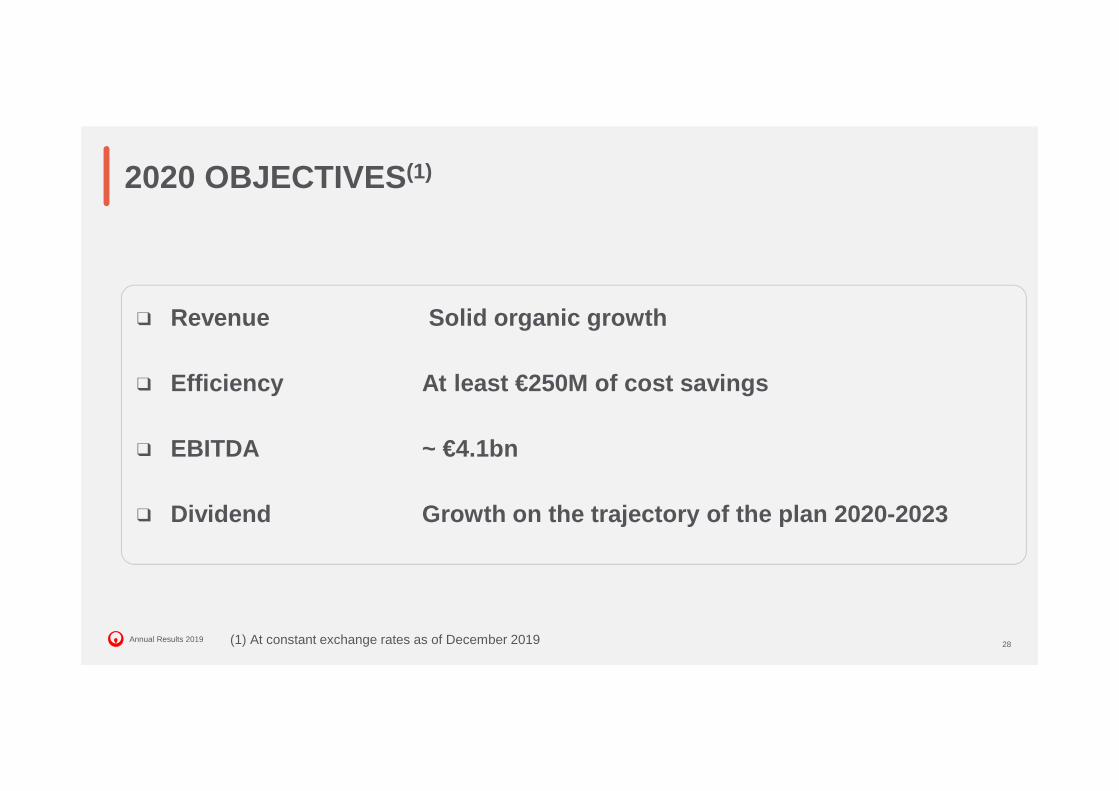
2020 OBJECTIVES (1)
11(1) At constant exchange rates as of December 2019
❑ Revenue Solid organic growth
❑ Efficiency At least €250M of cost savings
❑ EBITDA ~ €4.1bn
❑ Dividend Growth on the trajectory of the plan 2020-20 23

Claude Laruelle, CFO
Annual ResultsendingDecember 31, 2019

Annual Results 2019
(1) See Appendix 1(2) Like-for-like growth of +3.2% (3) Including the share of current net income of joint ventures and associates considered to be core Group activities
13
STRONG 2019 PERFORMANCE DRIVEN BY CONTINUED SOLID REVENUE AND EBITDA GROWTH
In €M 2018
published
2018 represented for IFRS16 and IFRS5 (1)
2019Var. Y-Y vs.
2018 represented
Var. at constant FX
vs. 2018 represented
Revenue 25 911 25 951 27 189 +4.8%(2) +4.3%(2)
EBITDA 3 392 3 843 4 022 +4.7% +4.5%
EBITDA margin 13.1% 14.8% 14.8%
Current EBIT (3) 1 604 1 644 1 730 +5.3% +5.0%
Current net income- Group share 675 672 760 +13.1% +13.5%
Net Income Group share 439 441 625 +41.8%
Net industrial Capex 1 752 2 189 2 201
Net Free Cash Flow after growth capex 568 536 868
Net financial debt (including lease debt) - 11 564 10 680
NFD excluding lease debt 9 750 9 748 8 949
Summary of FX impacts(vs. 2018)
€M %
Revenue 122 0.5%
EBITDA 6 0.2%
Current EBIT 5 0.3%
Current Net Income -3 -0.4%
Net financial debt -64 -0.6%

Annual Results 201914
CONTINUED SOLID REVENUE IN Q4, 2019DRIVEN BY INTERNATIONAL
2018 2019
Revenue growth at constant FX Q1 Q2 Q3 Q4 Year Q1 Q2 Q3 Q4 Year
France +0.6% -1.1% +2.6% +4.1% +1.6% +2.8% +5.0% +0.5% +0.1% +2.0%
Europe excl. France +6.9% +6.7% +7.4% +7.9% +7.2% +4.7% +7.2% +4.1% +1.1% +4.1%
Rest of the World +14.7% +13.2% +10.7% +9.4% +11.9% +6.6% +9.0% +9.0% +10.0% +8.7%
Global Businesses +3.5% -0.6% +11.4% +1.6% +3.7% +4.7% +2.6% -0.2% -2.6% +0.9%
TOTAL +7.0% +5.1% +7.8% +6.4% +6.5% +4.8% +6.3% +3.8% +2.6% +4.3%
Excl. Const & Energy prices +4.6% +5.3% +5.1% +6.4% +5.4% +3.6% +4.4% +3.7% +2.1% +3.4%
EBITDA growth at constant FX +5.3% +6.4% +9.4% +8.4% +7.3% +3.8%1 +7.3%1 +4.3%1 +3.0%1 +4.5%1
(1) Variation including IFRS16
� Strong momentum in ROW in Q4 - Slower growth in Euro pe due to mild weather and decrease of recycled pap er prices
� Good Q4 for French water : volumes up 0.7% , and prices up 1.4% as expected.
� Slowdown in France in Q4 in W ASTE : lower collection volumes (selectivity policy); recycled paper prices sharply down in Q4 .
� Rest of Europe: good dynamics in the UK and in Southern Europe . Central and Eastern Europe : moderate growth due to unfavorable weather conditions in the energy business. Northern Europe : impact of lower paper prices and mild weather in Germany
� Strong growth in Rest of the World (+10%) : notably in Asia (of which China +24% and Japan +12.4%). US : low Q4 in energy (weather related)
� Global Businesses : Solid hazardous waste - Construction down due to VWT decided downsizing

Annual Results 201915
REVENUE OF €27 189M, UP +4.3% AT CONSTANT FX AND +3.2% LIKE-FOR-LIKE - ANALYSIS BY SEGMENT
Variations vs. 2018 represented Variation
∆At constant
FX
∆At constant scope
and FX
Global business +1.5% +0.9% +0.8%
Rest of the World +10.3% +8.7% +5.8%
Europe excl. France +4.0% +4.1% +3.4%
France +2.0% +2.0% +1.8%
Total +4.8% +4.3% +3.2%
5 499 5 612
9 136 9 501
6 6207 303
4 6664 734
2018 represented 2019
25 951*27 189*
* Including other €30M in 2018 and €39M in 2019

Annual Results 201916
REVENUE OF €27 189M, UP +4.3% AT CONSTANT FX AND +3.2% LIKE-FOR-LIKE - ANALYSIS BY EFFECT
� FX : +€122M o/w : Argentinian Peso -€78M, USD +€127M
� SCOPE : +€282M o/w : CHPs in Slovakia, plastic Recycling in
China, BES in Hong Kong, waste assets in Portugal. Scopeincludes the 2018 SCVK disposal and contract evolution inwater in Czech Republic (impact -€130M)
� ENERGY & RECYCLATE PRICES : +€58M , o/w: €+134Menergy prices (after +€177m in 2018) : Europe +€170M(Germany and Poland), partially offset in the US (-€50M).Recycled material prices : -€76M (after -€90M in 2018) :average recycled paper prices down 17% in 2019 partiallyoffset by plastics ( +14%)
� WEATHER (ENERGY): -€68M (-€28M in 2018) o/w -€20M in
Northern Europe, -€29M in Central Europe, -€19M in the US
� VOLUMES/COMMERCE/WORKS : +€481M : Volumes :+€269M : o/w Waste : +1.5%. Commerce : +€111M : mostlyfrom Rest of World. Construction : +€101M (+€108M in 2018):higher works in Waste in France (incinerators renewals) ;rebound of Sade in France and downsizing of EPC business atVWT (revenue down 7.6% at constant forex)
� PRICE INCREASES : +€332M (+€243M in 2018) : WASTE
+2.4% mainly in France, the UK, Germany, Latin America, &Toxic Waste.
+0.5% +1.1%
+1.8% +1.3%-0.2%+0.2%
Like-for-like growth : +3.2%
In €M
+0.1%

Annual Results 201917
WASTE REVENUE OF €10 167M, UP +5.9% AT CONSTANT FX 2019
Recycled raw materials prices -0.8%
Volumes / activity levels +1.5%
Price increases +2.4%
Other +0.6%
Growth at constant scope & exchange rates +3.7%
Scope effect +2.2%
Growth at constant exchange rates +5.9%
Currency effect 0.0%
� Continued strong year for the Waste business : +5.9% growth a t constant FX�Strong year for hazardous waste, in Europe, Asia and the US => Revenue up 14% to €2.5bn�Continued high speed development of plastic recycling : Revenue up 26% to €319M
�Solid PFI performance in the UK : 94% utilization rate
�… Partially offset by decided reduction of municipal collection contracts and by sharp decline of recycled paper prices
� In Q4 : organic growth of 3.4 % excluding the -2.5% impact of re cycled paper price and volume� Average market paper price down 48% in Q4 => reduction of our exposure to recycled paper market (lower volumes)
� Lower Q4 2019 price increases due to first adoption of hyperinflation standard in Argentina in Q4, 2018
� Some waste treatment facilities reached their annual authorized capacity before year-end
� Scheduled maintenance outage on several sites in France and in the UK
Including -1.1% impact of recycled paper
prices and volumes

Annual Results 201918
-0.1% +2.4% -2.2%-1.4%-0.4%
Like-for-like growth : +4.8%
In €M
+6.4%
EBITDA OF €4 022M, UP +4.5% AT CONSTANT FX AND +4.8% LIKE-FOR-LIKECONTINUED IMPROVEMENT IN OPERATIONAL PERFORMANCE
� Forex: +€7M : o/w Arg Peso -€11M, USD +€14M
� Scope : -€12M : impact of 2018 & 2019 tuck-ins net of
SCVK disposal and contract evolution in North Bohemia
(impact -€71M)
� Commerce/Volumes/Works : +€91M : continued
growth in waste volumes (+1.5% YTD) and robust
commercial dynamism
� Weather (Energy) : -€17M , o/w CEE -€10M, Northern
Europe -€5M, USA -€5M, China +€3M
� Energy, recycled materials prices : -€53M (vs. -€69M
in 2018) . ENERGY: -€23M : in Europe, heat and
electricity prices to progressively offset fuel and CO2
costs; lower energy prices in the US vs. winter 2018 cold
peak. RECYCLED MATERIALS : -€30M (vs. -€16M in 2018)
due to paper prices
� Price effect, net of cost inflation : -€85M (vs. -€130M
in 2018) : lower price cost squeeze thanks to higher
indexation of water and waste contracts
� Favorable impact from cost reductions: +€248M largely ahead of the annual objective of >€220M

Annual Results 201919
FRANCE VOLUME GROWTH AND PRICE INCREASES IN WATER AND WAST E
� WATER : good revenue growth, and enhanced profitability, as planned� Revenue up 2.1%oVolumes : +0.7% (vs. -0.7% in 2018)oCommerce : renewal of Toulouse potable water, of Nancy Waste Water; gain of Nimes and confirmation of the restart of the Valenton waste water
treatment plant in Septembero Tariff increases: +1.4% vs. +0.7% in 2018, limiting price cost squeeze� EBITDA up due to efficiency gains of the Plan «Osons 20/20»
� WASTE : accelerated repositioning of traditional activiti es : lower municipal collection volumes and decline of paper recycling activity� Revenue up 2%�Volumes/Commerce flat (with a very high comparison basis : +5.3% in 2018). Municipal collection down 5% due to selectivity in contract renewal; solid
C&I collection (+3%) and successful renewal of our incinerator concessions (Nantes, Lille, Rouen, Orléans, etc.)�Service price increases : +1.6% but continued lower recycled paper prices (average price down 19% : impact -€32M on revenue)� EBITDA down due to continued depressed recycled paper prices (-€13M impact on EBITDA), higher maintenance and insurance costs, partially offset
by efficiency gains
2018 represented (1) 2019 ∆ ∆
At constant FX
5 499 5 612 +2.0% +2.0%(2)
2 942 3 004 +2.1% +2.1%
2 558 2 608 +2.0% +2.0%
900 900 +0.0% +0.0%
16.4% 16.0%
In €M
Revenue, of which
Water
Waste
EBITDA
EBITDA margin
(1) Proforma IFRS 5 & IFRS 9(2) Like-for-like growth of +1.8%

Annual Results 201920
REST OF EUROPEGOOD PERFORMANCE IN ALL REGIONS
� Central and Eastern Europe: good performance despite mild w eather� Revenue up +4.5% (3) : ENERGY revenue of €2 126M up 9.7% (3) due to and heat and electricity price increases, despite unfavorable weather impact of -€29M (-€47M
in Q1, +€39M in Q2 and -€22M in Q4). WATER revenue of €1 122M, up 6.5% (3) excluding the -€130M impact of the SCvK contract evolution, thanks to water tariffincreases in Prague, Sofia and Bucarest , and water volume increase of +3.6%.
� UK- Ireland : good performance� Revenue up 4.0% (3) o/w WASTE €1 896M, up 3.7%: good year for PFI (94% availability). Good landfills volume and pricing. Strong hazardous waste and
Plastic businesses. Service price increases (+3.2%) offset by lower selling prices of paper (-27%)� Northern Europe : slow growth due to mild weather and decreas ed paper prices� Revenue up +1.1% (3) : WASTE revenue of €1 433M, up 4.6% : service price increases offset lower recycled volume and prices. ENERGY (GERMANY): lower volumes
of energy sold and unfavorable weather partially offset by energy price increases (electricity +15%)� Italy- Iberia : double-digit growth and enhanced profitabi lity� Revenue up +11.0%: resumption of strong revenue growth in Italy (+10.1%) and in Iberia (+12.5%), with a high contract renewal rate (mostly energy efficiency
contracts). Integration of Renascimento waste assets in Portugal (annual revenue €23M)
2018 represented (1) 2019 ∆
∆At constant FX (2)
9 136 9 501 +4.0% +4.1%
3 172 3 296 +3.9% +4.5%
2 193 2 298 +4.8% +4.0%
2 718 2 738 +0.7% +1.1%
1 053 1 169 +11.0% +11.0%
1 472 1 501 +2.0% +2.1%
16.1% 15.8%
In €M
Revenue, of which
Central & Eastern Europe
UK – Ireland
Northern Europe
Italy- Iberia
EBITDA
EBITDA margin
(1) Proforma IFRS 5 & IFRS 9(2) Like-for-like growth of +3.4%(3) At constant FX
+6.9% excluding the SCVK
one off

Annual Results 201921
REST OF THE WORLD: SOLID GROWTH IN ALL GEOGRAPHIESCONTINUED EXCEPTIONAL DELIVERY IN ASIA
� Asia: continuation of very strong Revenue and EBITDA growth� Revenue up +16.2% (3) o/w WASTE revenue of €632M up 18.9% (3) notably in China (hazardous waste revenue up 16% vs. LY ; integration of Huafei Plastics);
numerous developments in Singapore, Hong Kong, Taïwan. ENERGY revenue of €481M, up 38.3% : Harbin (China) heating area extension and pursuit of growth inenergy efficiency contracts . WATER revenue of €1 022M, up 6.5%: strong growth of industrial water in China and of municipal and industrial water in Japan : 100%renewal rate of O&M contracts, new Hamamatsu concession, start up of the Lithium facility
� Latin America : continued strong growth : Revenue +16% (3) driven mostly by Grupo Sala in Columbia and tariff increases in Argentina
� North America : Revenue +1.2% (3) : ENERGY revenue down due to less severe winter vs. PY and lower energy prices. WASTE revenue up 6.6% thanks to hazardouswaste volume and price increases. WATER revenue up 3.1%
� Pacific: Revenue +7.9% (3) : WATER : Restart of the Sydney desalination plant - WASTE (revenue of €808M, +7%) : lower waste collection volumes partially offset bygood treatment volumes and industrial services
� Africa Middle East (+5.5%) growth driven by new contracts in Middle East and good volumes in Morocco
2018 represented (1) 2019 ∆
∆At constant FX (2)
6 620 7 303 +10.3% +8.7%
1 790 2 135 +19.3% +16.2%
795 853 +7.3% +16.0%
2 036 2 168 +6.5% +1.2%
1 025 1 087 +6.1% +7.9%
974 1 060 +8.9% +5.5%
1 062 1 160 +9.2% +8.2%
16.0% 15.9%
In €M
Revenue, of which
Asia
Latin America (Latam)
North America
Pacific
Africa Middle East (AME)
EBITDA
EBITDA margin
(1) Proforma IFRS 5 & IFRS 9(2) Like-for-like growth of +5.8%(3) At constant FX
EBITDA growth driven
by Asia (China +19%, Japan +14%),
AME and Latam

Annual Results 201922
GLOBAL BUSINESSSTRONG HAZARDOUS WASTE
� Construction : VWT downsizing offset by good level of activi ty of SADE in France� VWT : €1 501M, -7.6%(3) :
o Backlog of €2.1bn , up +12% vs. Dec. 2018, due to higher bookings (€2 149M in 2019 vs. €1 721M in 2018) with the 3 desalination facilities inSaudi Arabia and Bahrain and active French WWTP market
� SADE : €1 322M, +7.1% (3) : good level of activity in France in works and in telecom services
� Hazardous waste Europe : very strong revenue and EBITDA growt h� Volume growth (+2.8%) and price increases (+5% in incineration)� Good commercial momentum
� EBITDA up +10.6% (3) driven by repositioning actions in Construction and by the s trong growth of Hazardous waste
2018 represented (1) 2019 ∆
∆At constant FX (2)
4 666 4 734 +1.5% +0.9%
2 841 2 823 -0.6% -1.2%
1 248 1 311 +5.0% +4.6%
577 600 +4.1% +3.2%
361 396 +9.8% +10.6%
7.7% 8.4%
In €M
Revenue, of which
Construction
Hazardous waste Europe
Other (of which VIGS)
EBITDA
EBITDA margin
(1) Proforma IFRS 5 & IFRS 9(2) Like-for-like growth of +0.8%(3) At constant FX

Annual Results 201923
CURRENT EBIT UP +5.0% AT CONSTANT FX TO €1 730M
� D&A (excl. OFA reimbursements) of €2 057M include €440M of IFRS16 D&A (stable). D&A are up €69M at constant FX, mostly due to tuck ins and growth capex
� Share on net income from JVs and associates : €130M of which China €76M� 2018 net income from JV included a €16M capital gain in the US
In €M2018
published2018
represented (1)2019 Variation vs.
2018 represented
Var. vs. 2018 represented at
constant FX
EBITDA 3 392 3 843 4 022 +4.7% +4.5%
Renewal expenses -280 -280 -280
Depreciation & Amortization (including principal payments on OFAs)
-1 704 -2 117 -2 192
Provisions, fair value adjustment & other(1) +80 +82 +52
Share of current net income of joint ventures and associates (2)
+116 +116 +130
Current EBIT 1 604 1 644 1 730 +5.3% +5.0%
(1) Including capital gains on industrial divestitures(2) Excluding capital gains on financial divestitures

Annual Results 201924
CURRENT NET INCOME UP +13.5% AT CONSTANT FX TO €760M
� Cost of net financial debt of -€441M vs. -€414M in 2018: � Increased cost and volume of non-euro denominated debt combined with cost of carry of the bond issuances in anticipation of the April 2019 bond
redemption partially offset by active debt management� Stable net financing rate : 4.19% at 31/12/2019 vs. 4.18% at 31/12/2018
� Other financial income and expense of -€155M include : 1/ interest (cash) on IFRIC 12 concession liabilities of -€81M (vs. -€94M in 2018); 2/ IFRS 16 lease financial charges of -€41M (stable); 3/ non cash charges related to the unwinding of the discount of provisions of -€31M (stable); 4/ Net financial capital gains of +€24M (of which capital gain on the Foshan divestiture in China) vs. +€4M in 2018
� Current tax rate of 23% vs. 22% in 2018 represented
In €M2018
published2018
represented (1)2019 Variation vs.
2018 represented
Var. vs. 2018 represented at
constant FX
Current EBIT (1) 1 604 1 644 1 730 +5.3% +5.0%
Cost of net financial debt -414 -414 -441
Other financial income and expense -148 -192 -155
Income tax expense -205 -204 -227
Non-controlling interests -162 -162 -147
Current net income – Group share 675 672 760 +13.1% +13.5%
Current net income – Group share Excluding net financial capital gains (2)
679 676 734 +8.5% +8.8%
(1) Including the share of current net income of joint ventures and associates of entities viewed as core Company activities(2) Including related taxes and minorities

Annual Results 201925
NET INCOME GROUP SHARE UP +42% TO €625M
� Net income from discontinued operations and other i tems : in 2019 the impact of discontinued operations in construction, resulting from VWT decided downsizing.
� Non current capital gains include in 2019 the net capital gain on the divestiture of our municipal energy assets in the US
In €M2018
published2018
represented (1)2019 Variation vs.
2018 represented
Var. vs. 2018 represented at
constant FX
Current net income – Group share 675 672 760 +13.1% +13.5%
Non current items, net of tax
Non current impairments -38 -38 -67
Restructuring charges -109 -113 -121
Net income from discontinued operations and other items
-89 -81 -117
Capital gains 0 0 170
Net income – Group share 439 441 625 +41.8% +36.8%

Annual Results 2019
� Net industrial Capex of €2 201M, vs. €2 189M, ~flat� Gross industrial capex of €2 364M vs. €2 268M� Maintenance capex : €1 273M (o/w €398M IFRS16) vs. €1 253M
� Stable growth contractual capex : €729M� Discretionary growth capex sharply up from €309M to €362M
� Very strong progression of Net Free Cash Flow (1) to €868M
� Improvement of +€332M vs. 2018 due to EBITDA increase, strict capexcontrol, and another significant WCR reduction of €209M
� Net financial debt of €10 680M, down 884M vs. Dec. 2018
� Down €884M vs. December 2018 thanks to net FCF generation and positive net financial acquisitions due to the closing of the divestiture of municipal energy in the US in December 2019
� Excluding TNAI divestiture, NFD of 11.7bn and €10bn before IFRS 16, stable since 2015 (including hybrid)
� Leverage ratio of 2.66x
26
VERY STRONG NET FCF(1) OF €868M THANKS TO STRICT CAPEX AND WCR DISCIPLINE
536868
DEC 2018 (represented) DEC 2019
1 253 1 273
706 729
309 362
DEC 2018 (represented) DEC 2019
Discretionary growth capex
Contractual growth capex
Maintenance capex incl.IFRS16
2 3642 268
9748 8949
18161731
DEC 2018 (represented) DEC 2019
Lease Debt
NFD
10 68011 564
In €M
In €M
In €M
(1) Net free cash flow corresponds to the free cash flow of continuing operations, i.e. the sum of EBITDA,dividends received, operating cash flow from financing activities, and the variation of operating working capital,less all net industrial investments, net interest expense, tax expense, restructuring charges, other non currentexpenses and renewal expenses

Annual Results 2019
EVOLUTION OF NET FINANCIAL DEBT
27
(1) Financial acquisitions of -€619M net of divestments of +€1 490M(2) o/w €509M to shareholders
Annual Results 2019
2020 OBJECTIVES (1)
28(1) At constant exchange rates as of December 2019
❑ Revenue Solid organic growth
❑ Efficiency At least €250M of cost savings
❑ EBITDA ~ €4.1bn
❑ Dividend Growth on the trajectory of the plan 2020-20 23

Appendices
Annual ResultsendingDecember 31, 2019

Annual Results 201930
APPENDIX 1 : IFRS 16
� IFRS 16 / Leaseo Implemented from 01/01/2019o Objective : provide an economic approach of all lease contracts (operating lease similar to financial lease) in financial statements of the
lessee, and provide a better comparability whatever the financing option taken (acquisition or leasing)o Main leases are land and buildings, transport, equipment.
� Implication for the Groupo Full retrospective method : recalculation of the right of use and the financial debt as if IFRS16 had been implemented since the beginning
of the contractso Accounting treatment :
� Assets : Book an amortizable asset (=right of use). Liabilities : financial debt : present value of the discounted leases� P&L : amortization of the asset and interest charge recognition (decreasing)
� Higher EBITDA : elimination of the rental charge offset by D&A and interest expense
� Increased D&A in current EBIT
� Increased interest expense
� Globally neutral in current net income
� Higher capex
� Recognition of a financial debt
� Increased capital employed

Annual Results 201931
APPENDIX 2 : MAIN REPRESENTED FIGURES (1) AT DECEMBER 31, 2018
(1) Non audited figures
(2) Including the represented share of current net income of joint ventures and associates years ended December 31, 2018
(3) In order to ensure the comparability of periods, the accounts ending December 31, 2018 have been represented for the reclassification of Lituania fromdiscontinued operations to full consolidation in December 2018 represented.

Annual Results 201932
APPENDIX 2 : MAIN REPRESENTED FIGURES (1) AT DECEMBER 31, 2018REVENUE BY SEGMENT
(1) Non audited figures

Annual Results 201933
APPENDIX 2 : MAIN REPRESENTED FIGURES (1) AT DECEMBER 31, 2018EBITDA BY SEGMENT
(1) Non audited figures
December
2018
IFRS 5
Adjustment
IFRS 16
Adjustment
December
2018
published represented
France 802,0 0,0 97,6 899,5
Europe excluding France 1 354,1 3,0 114,6 1 471,8
Rest of the World 952,6 0,0 109,8 1 062,4
Global businesses 272,6 0,0 88,3 360,9
Other 10,7 0,0 37,6 48,3
EBITDA 3 392,0 3,0 447,8 3 842,9
In €m

Annual Results 201934
APPENDIX 2 : MAIN REPRESENTED FIGURES (1) AT DECEMBER 31, 2018CURRENT EBIT BY SEGMENT

Annual Results 201935
APPENDIX 3: CURRENCY MOVEMENTS
2019 2018 ∆ 2019 vs. 2018
US dollarAverage rateClosing rate
1.1201.123
1.1811.145
5.2%1.9%
UK pound sterlingAverage rateClosing rate
0.8770.851
0.8850.895
0.8%5.1%
Australian dollarAverage rateClosing rate
1.6101.600
1.5801.622
-1.9%1.4%
Chinese renminbi yuanAverage rateClosing rate
7.7397.795
7.8067.884
0.9%1.1%
Czech crownAverage rateClosing rate
25.66925.408
25.64525.724
-0.1%1.2%
Argentinian pesoAverage rateClosing rate
na67.221
na43.187
na-35.7%

Annual Results 201936
APPENDIX 4: QUARTERLY REVENUE BY SEGMENT
1st quarter 2019 2nd quarter 2019
In €M 2018represented
2019 ∆ at cst FX ∆ at cstscope & FX
2018represented 2019
∆ at cst FX ∆ at cst scope & FX
France 1 311 1 347 +2.8% +2.1% 1 345 1 412 +5.0% +4.7%
Europe excl. France 2 461 2 572 +4.7% +3.4% 2 079 2 217 +7.2% +5.8%
Rest of the World 1 613 1 758 +6.6% +4.1% 1 579 1 726 +9.0% +6.3%
Global Business 1 046 1 102 +4.7% +4.5% 1 140 1 174 +2.6% +2.2%
Other 8 6 - - 7 9 - -
Group 6 438 6 785 +4.8% +3.5% 6 150 6 539 +6.3% +5.0%
3rd quarter 2019 4th quarter 2019 Year 2019
In €M 2018Repr.
2019 ∆ at cstFX
∆ at cstscope & FX
2018represented
2019 ∆ at cstFX
∆ at cstscope & FX
2018represented
2019 ∆ at cstFX
∆ at cstscope & FX
France 1 409 1 416 +0.5% +0.5% 1 434 1 436 +0.1% +0.1% 5 499 5 612 +2.0% +1.8%
Europe excl. France 2 005 2 080 +4.1% +3.7% 2 591 2 631 +1.1% +1.2% 9 136 9 501 +4.1% +3.4%
Rest of the World 1 634 1 787 +9.0% +6.2% 1 794 2 032 +10.0% +6.4% 6 620 7 303 +8.7% +5.8%
Global Businesses 1 146 1 152 -0.2% -0.1% 1 334 1 306 -2.6% -2.5% 4 666 4 734 +0.9% +0.8%
Other 7 6 - - 9 18 - - 31 39 - -
Group 6 200 6 440 +3.8% +2.9% 7 163 7 424 +2.6% +1.7% 25 951 27 189 +4.3% +3.2%

Annual Results 201937
APPENDIX 5: QUARTERLY REVENUE BY BUSINESS
1st quarter 2019 2 nd quarter 2019
In €M2018
represented2019
∆ at cstFX
∆ at cstscope &
FX
2018represented
2019∆ at cst FX ∆ at cst
scope & FX
Water 2 562 2 645 +1.8% +2.7% 2 625 2 713 +2.6% +3.3%
Waste 2 268 2 443 +7.6% +5.0% 2 420 2 567 +6.9% +4.2%
Energy 1 608 1 697 +5.6% +2.5% 1 105 1 259 +14.1% +10.8%
Group 6 438 6 785 +4.8% +3.5% 6 150 6 539 +6.3% +5.0%
3rd quarter 2019 4th quarter 2019 Year 2019
In €M2018
represented2019
∆ at cst FX ∆ at cstscope &
FX
2018represented
2019
∆ at cstFX
∆ at cstscope &
FX
2018represented
2019
∆ at cstFX
∆ at cstscope &
FX
Water 2 726 2 736 -0.6% +0.4% 2 981 3 048 +1.4% +2.4% 10 894 11 142 +1.3% +2.2%
Waste 2 399 2 540 +6.7% +4.9% 2 511 2 616 +2.6% +0.9% 9 599 10 167 +5.9% +3.7%
Energy 1 075 1 164 +8.2% +4.8% 1 671 1 760 +4.7% +1.6% 5 459 5 880 +7.5% +4.3%
Group 6 200 6 440 +3.8% +2.9% 7 163 7 424 +2.6% +1.7% 25 951 27 189 +4.3% +3.2%

Annual Results 201938
APPENDIX 6 : REVENUE OF €27 189M, UP +4.3% AT CONSTA NT FX AND +3.2% LIKE-FOR-LIKE - ANALYSIS BY BUSINESS
Variations vs. 2018
representedVariation
∆At constant
FX
∆At constant
scope and FX
Energy +7.7% +7.5% +4.3%
Waste +5.9% +5.9% +3.7%
Water +3.3% +2.0% +3.0%
Technology & Construction -0.6% -1.2% -1.2%
Total +4.8% +4.3% +3.2%
2 841 2 822
8 053 8 320
9 599 10 167
5 4595 880
Dec 2018 represented Dec 2019
25 95127 189

Annual Results 2019
� WATER : Revenue up +2% at constant FX and +3.0% like-for-like to €8 320M� France: volumes up 0.7% and good commercial dynamics : renewal of Toulouse potable water, of Nancy Waste Water; gain of Nimes and
confirmation of the restart of the Valenton waste water treatment plant in September � Central Europe : volumes up +3.6% � Continued growth in Rest of the world, mainly Asia � Price effects (+0.9%) : Increases in Central Europe and in Latin America, better indexations in France (+1.4% vs.+0.7% in 2018)
� TECHNOLOGY AND CONSTRUCTION : Revenue down -1.2% to €2 822M� VWT : €1 501M, -7.6% at constant FX :
o Backlog of €2.1bn, up +12% vs. Dec. 2018, due to higher bookings (€2 149M in 2019 vs. €1 721M in 2018) with the 3 desalination facilities inSaudi Arabia and Bahrain and active French WWTP market
� SADE : €1 322M, +7.1% at constant FX : good level of activity in France in works and in telecom services
� WASTE : Strong revenue growth : +5.9% at constant FX and +3.7% like- for-like to €10 167M� Scope : +€208M (+2.2%): mainly Northern Europe, Asia and Latin America� Volumes/commerce : +1.5% � Price effects : +2.4% notably in France, UK, Latam, Asia and in Toxic Waste� Partially offset by decided reduction of municipal collection contracts and by sharp decline of recycled paper prices
� ENERGY : Revenue up +7.5% at constant FX and +4.3% like-for-like to €5 880M� Volumes / Commerce/Works: +2.8% : mostly new energy efficiency contracts� Weather effect : -0.9%� Energy price effects : +1.6% : higher heat and electricity prices in Central Europe mainly
39
APPENDIX 6 : REVENUE OF €27 189M, UP +4.3% AT CONST ANT FX AND +3.2% LIKE-FOR-LIKE - ANALYSIS BY BUSINESS

Annual Results 201940
APPENDIX 7: QUARTERLY WASTE REVENUE AND VOLUMES
+3.3%+2.5%+2.8%
-0.2%-0.9%-0.7% -0.2%
+3.5%+1.2%
-0.8%
+1.3%
-1.0%
+5.6%
+2.1%
+4.9%+6.1%
+4.3%+6.0%
+4.1%+5.4%
+4.9% +4.2%+4.9%
+0.9%
+2.8%+0.6%+1.1%
-2.2%
+1.0%+0.7%+0.8% +1.9%+1.6%+0.9%+0.3%
+0.2%
+1.2%+0%
+3.1% +3.0% +3.0%+4.9%+4.1%+2.5%
+2.6% +1.1% +2% +0.4%
Quarterly revenue growth at constant scope & FXQ4 organic growth : +3.4% excluding the
-2.5% impact of recycled paper price and volumes
Impact of recycled volumes of -0.6%
Y-Y Quarterly volume trends

Annual Results 2019
13%
18%
19%10%
8%
23%
9%
41
APPENDIX 8: WASTE – BREAKDOWN OF REVENUE BY ACTIVITY
2018 Revenue : €9 599M
13%
19%
17%10%
8%
24%
9%
Municipal collection & Streetcleaning
Commercial & Industrial collection
Sorting & Recycling & MBT
Energy recovery (incineration)
Landfill
Hazardous and Liquid Waste
Industrial Services / Waste
2019 Revenue : €10 167M

Annual Results 201942
APPENDIX 9: WASTE – REVENUE VS. INDUSTRIAL PRODUCTIO N
Weighted average industrial production indices for 4 key countries including SARP/SARPI: France, U.K. (excl. PFIs), Germany, and North America (excl. US Solid Waste and WTE)
Sources: Until December 2019 Data from OECD for the US and until November 2019 Data from OECD for France, Germany and the UKDecember 2019: same figures as November 2019 for France, Germany and the UK
Q4 organic growth : +3.4% excluding the
-2.5% impact of recycled paper price and volumes

Annual Results 201943
APPENDIX 10: RECYCLED PAPER : MARKET PRICES (1/2)

Annual Results 201944
APPENDIX 10: WASTE – EVOLUTION OF RAW MATERIALS PRIC ES (PAPER & CARDBOARD) (2/2)

Annual Results 201945
APPENDIX 11: STATEMENT OF CASH FLOWSIn €M 2018 represented 2019
EBITDA(1) 3 843 4 022
Net industrial investments -2 189 -2 201
WCR variation +60 +209
Dividends received +115 +98
Renewal expenses -280 -280
Restructuring and other non current charges -263 -155
Operating Free Cash Flow 1 286 1 693
Taxes paid -193 -242
Interest paid (including IFRS 16) -463 -501
Interest on concession liabilities (IFRIC 12) -94 -81
Net FCF before dividends, acquisitions & financial divestments 536 868
Dividends paid(2) -660 -661
Financial investments, net of divestitures(3) -286 871
Other -1 -130
Impact of exchange rates -75 -64
Variation of net financial debt -486 884
Opening net financial debt 11 078 11 564
Closing net financial debt 11 564 10 680
(1) Including principal payments on operating financial assets
(2) In 2019: Dividends paid to shareholders (-€509M) , non-controlling interests (-€152M)
(3) In 2019: Including acquisitions (-€619M) and divestments (+€1490M)

Annual Results 201946
APPENDIX 12: NET FINANCING RATE
o Cost of net financial debt up by €26M due the increased costof non euro-denominated debt (-€27M) linked to widening ofthe euro foreign currency rate spread and volume effect andeuro denominated debt management (-€6m), offset by activecash portfolio management (+€7M)
o Stability of net financing rate, from 4.18% in 2018 representedto 4.19% at 31/12/2019, relative to an average net debt(excluding IFRS 16) of €10 520M
▪ Gross cost of borrowing rate increased by 15 bps from
2.91% to 3.06% mainly with the non-euro denominated debt
impacts, despite an improvement of the euro denominated
debt, down by 16bps.
▪ Increase in the interest rate on cash balances.
In €M2018
represented2019
Average gross debt (1) 14 029 14 736
Gross cost of borrowing 2.91% 3.06%
Average cash balance 4 392 4 508
Interest rate 0.11% 0.22%
Average bank overdrafts 272 292
Average net financial debt (2) 9 909 10 520
Cost of debt -413.8 -440.5
Net financing rate 4.18% 4.19%
Closing net financial debt (3) 9 749 8 949
Average cash balance including commercial paper
948 1 213
Closing NFD incl. IFRS 16 11 566 10 682
(1) Excluding bank overdrafts and IFRS 16
(2) Average net financial debt represents the average of monthly net financial debt figures over the period
(3) Net financial debt represents gross financial debt (non current and current financial debt and bank overdrafts), net of cash and cash equivalents, liquid assets and assets related to financing and including the revaluation of debt hedging derivatives. Liquid assets are financial assets consisting of funds or securities with initial maturity of more than three months, easily convertible into cash, and managed as part of a liquidity objective, while maintaining a low risk of capital excluding IFRS 16 impacts,

Annual Results 201947
APPENDIX 13: DEBT MANAGEMENT (1/2)
Currency breakdown of gross debt (after hedges) at Dec.31, 2019
Fixed rate : 94%
Variable rate : 6%
NFD after hedges at Dec.31, 2019
� Issuance in January 2019 of €750M bonds maturing in January 2024 (5 years) bearing a coupon of 0.892%.
� Repayment of €462M bonds at maturity April 2019
� Refinancing in September 2019 of €700M convertible bonds (Oceane) maturing in January 2025 (5 years).
� Issuance in December 2019 of 1.5Md Renminbi (equivalent €192M) Panda bonds maturing in December 2020 (1 year) bearing a coupon of 3.70%
� Early repayment in December 2019 $100M (equivalent €89M) bonds maturing in 2038 bearing a coupon of 6.75%
� Group liquidity : €10.5bn including €4.1bn in undrawn confirmed credit lines (without disruptive covenants)
� Net Group liquidity: €4.3bn
� Average maturity of net financial debt: 6.9 years at 31/12/19 vs. 7.5 years at 31/12/18

Annual Results 201948
APPENDIX 13: DEBT MANAGEMENT (2/2)
Veolia Bond Maturity Schedule
RATING
• Moody’s : P-2/ Baa1 • stable outlook
• Standard & Poor’s : A-2 / BBB stable outlook

Annual Results 201949
APPENDIX 14: NET LIQUIDITY
December2018 represented December 2019
Syndicated credit lines 3 000.0 3 000.0
Bilateral credit lines 925.0 1 100.0
Lines of credit 64.7 86.8
Cash and cash equivalents 3 510.6 4 635.5
Total Veolia 7 500.3 8 822.3
Subsidiaries
Cash and cash equivalents(1) 1 238.7 1 675.5
Total Subsidiaries 1 238.7 1 675.5
Total Group liquidity 8 739.0 10 497.8
Current liabilities and bank overdrafts (2) 5 234.5 6 211.7
Total net Group liquidity 3 504.5 4 286.1
(1) including liquid assets
(2) Of which IFRS 16 impact (+€465,7m in 2019 and +€425,2m in 2018)

Annual Results 201950
APPENDIX 15: CONSOLIDATED STATEMENT OF FINANCIAL PO SITION
December 2018 represented
December 2019
Intangible Assets 9 691 10 018
Property, Plant & Equipment 7 857 7 680
Other non-current assets 5 032 4 964
Operating financial assets (current and non-current) 1 486 1 517
Cash and cash equivalents 4 557 5 843
Other current assets 10 671 10 997
Total Assets 39 294 41 019
Capital (including non-controlling interests) 7 021 7 078
Financial debt (current and non-current) 16 519 17 448
Other non-current liabilities 4 159 4 239
Other current liabilities 11 595 12 254
Total Liabilities & Shareholders Equity 39 294 41 019

Annual Results 201951
CONTACTS
http://www.finance.veolia.com
Analyst & Investor Relations
Ronald WasylecDeputy CFO, Senior Vice President, Investor
RelationsTelephone : +33 1 85 57 84 76
e-mail : [email protected]
Ariane de LamazeVice President, Investor RelationsTelephone : +33 1 85 57 84 80
e-mail : [email protected], rue Madeleine Vionnet93300 Aubervilliers, France
Media Relations
Laurent ObadiaTelephone : +33 1 85 57 89 43
e-mail: [email protected]
Sandrine GuendoulTelephone : +33 1 85 57 42 16
e-mail: [email protected], rue Madeleine Vionnet93300 Aubervilliers, France
http://www.veolia.com


