+ All Categories
Home > Documents > Annual SAFE Report for the Hawaii Archipelago FEP ...

Annual SAFE Report for the Hawaii Archipelago FEP ...

Date post: 04-Dec-2021
Category:
Upload: others
View: 1 times
Download: 0 times
Share this document with a friend
26
Annual SAFE Report for the Hawaii Archipelago FEP Ecosystem Considerations CLIMATE AND OCEANIC INDICATORS 2.5.1 Introduction Over the past few years, the Council has incorporated climate change into the overall management of the fisheries over which it has jurisdiction. This 2020 annual SAFE report includes a now standard chapter on indicators of climate and oceanic conditions in the Western Pacific region. These indicators reflect global climate variability and change as well as trends in local oceanographic conditions. The reasons for the Council’s decision to provide and maintain an evolving discussion of climate conditions as an integral and continuous consideration in their deliberations, decisions, and reports are numerous: Emerging scientific and community understanding of the impacts of changing climate conditions on fishery resources, the ecosystems that sustain those resources, and the communities that depend upon them; Recent Federal Directives including the 2010 implementation of a National Ocean Policy that identified Resiliency and Adaptation to Climate Change and Ocean Acidification as one of nine National priorities as well as the development of a Climate Science Strategy by NMFS in 2015 and the subsequent development of the Pacific Islands Regional Action Plan for climate science; and The Council’s own engagement with NOAA as well as jurisdictional fishery management agencies in American Samoa, CNMI, Guam, and Hawaii as well as fishing industry representatives and local communities in those jurisdictions. In 2013, the Council began restructuring its Marine Protected Area/Coastal and Marine Spatial Planning Committee to include a focus on climate change, and the committee was renamed as the Marine Planning and Climate Change Committee (MPCCC). In 2015, based on recommendations from the committee, the Council adopted its Marine Planning and Climate Change Policy and Action Plan, which provided guidance to the Council on implementing climate change measures, including climate change research and data needs. The revised Pelagic FEP (February 2016) included a discussion on climate change data and research as well as a new objective (Objective 9) that states the Council should consider the implications of climate change in decision-making, with the following sub-objectives: To identify and prioritize research that examines the effects of climate change on Council-managed fisheries and fishing communities. To ensure climate change considerations are incorporated into the analysis of management alternatives. To monitor climate change related variables via the Council’s Annual Reports. To engage in climate change outreach with U.S. Pacific Islands communities. Beginning with the 2015 report, the Council and its partners began providing continuing descriptions of changes in a series of climate and oceanic indicators. The MPCCC was disbanded in early 2019, re-allocating its responsibilities among its members already on other committees or teams, such as the Fishery Ecosystem Plan Teams This annual report focuses previous yearsefforts by refining existing indicators and improving communication of their relevance and status. Future reports will include additional indicators as
Transcript

Annual SAFE Report for the Hawaii Archipelago FEP Ecosystem Considerations

CLIMATE AND OCEANIC INDICATORS

2.5.1 Introduction

Over the past few years, the Council has incorporated climate change into the overall

management of the fisheries over which it has jurisdiction. This 2020 annual SAFE report

includes a now standard chapter on indicators of climate and oceanic conditions in the Western

Pacific region. These indicators reflect global climate variability and change as well as trends in

local oceanographic conditions.

The reasons for the Council’s decision to provide and maintain an evolving discussion of climate

conditions as an integral and continuous consideration in their deliberations, decisions, and

reports are numerous:

• Emerging scientific and community understanding of the impacts of changing climate

conditions on fishery resources, the ecosystems that sustain those resources, and the

communities that depend upon them;

• Recent Federal Directives including the 2010 implementation of a National Ocean

Policy that identified Resiliency and Adaptation to Climate Change and Ocean

Acidification as one of nine National priorities as well as the development of a Climate

Science Strategy by NMFS in 2015 and the subsequent development of the Pacific

Islands Regional Action Plan for climate science; and • The Council’s own engagement with NOAA as well as jurisdictional fishery

management agencies in American Samoa, CNMI, Guam, and Hawaii as well as

fishing industry representatives and local communities in those jurisdictions.

In 2013, the Council began restructuring its Marine Protected Area/Coastal and Marine Spatial

Planning Committee to include a focus on climate change, and the committee was renamed as

the Marine Planning and Climate Change Committee (MPCCC). In 2015, based on

recommendations from the committee, the Council adopted its Marine Planning and Climate

Change Policy and Action Plan, which provided guidance to the Council on implementing

climate change measures, including climate change research and data needs. The revised Pelagic

FEP (February 2016) included a discussion on climate change data and research as well as a new

objective (Objective 9) that states the Council should consider the implications of climate change

in decision-making, with the following sub-objectives:

• To identify and prioritize research that examines the effects of climate change on

Council-managed fisheries and fishing communities.

• To ensure climate change considerations are incorporated into the analysis of

management alternatives. • To monitor climate change related variables via the Council’s Annual Reports.

• To engage in climate change outreach with U.S. Pacific Islands communities.

Beginning with the 2015 report, the Council and its partners began providing continuing

descriptions of changes in a series of climate and oceanic indicators. The MPCCC was disbanded

in early 2019, re-allocating its responsibilities among its members already on other committees

or teams, such as the Fishery Ecosystem Plan Teams

This annual report focuses previous years’ efforts by refining existing indicators and improving

communication of their relevance and status. Future reports will include additional indicators as

Annual SAFE Report for the Hawaii Archipelago FEP Ecosystem Considerations

the information becomes available and their relevance to the development, evaluation, and

revision of the FEPs becomes clearer. Working with national and jurisdictional partners, the

Council will make all datasets used in the preparation of this and future reports available and

easily accessible.

2.5.2 Response to Previous Plan Team and Council Recommendations

There were no Council recommendations relevant to the climate and oceanic indicators section

of the annual SAFE report for the Hawaii Archipelago in 2020.

2.5.3 Conceptual Model

In developing this chapter, the Council relied on a number of recent reports conducted in the

context of the U.S. National Climate Assessment including, most notably, the 2012 Pacific

Islands Regional Climate Assessment (PIRCA) and the Ocean and Coasts chapter of the 2014

report on a Pilot Indicator System prepared by the National Climate Assessment and

Development Advisory Committee (NCADAC).

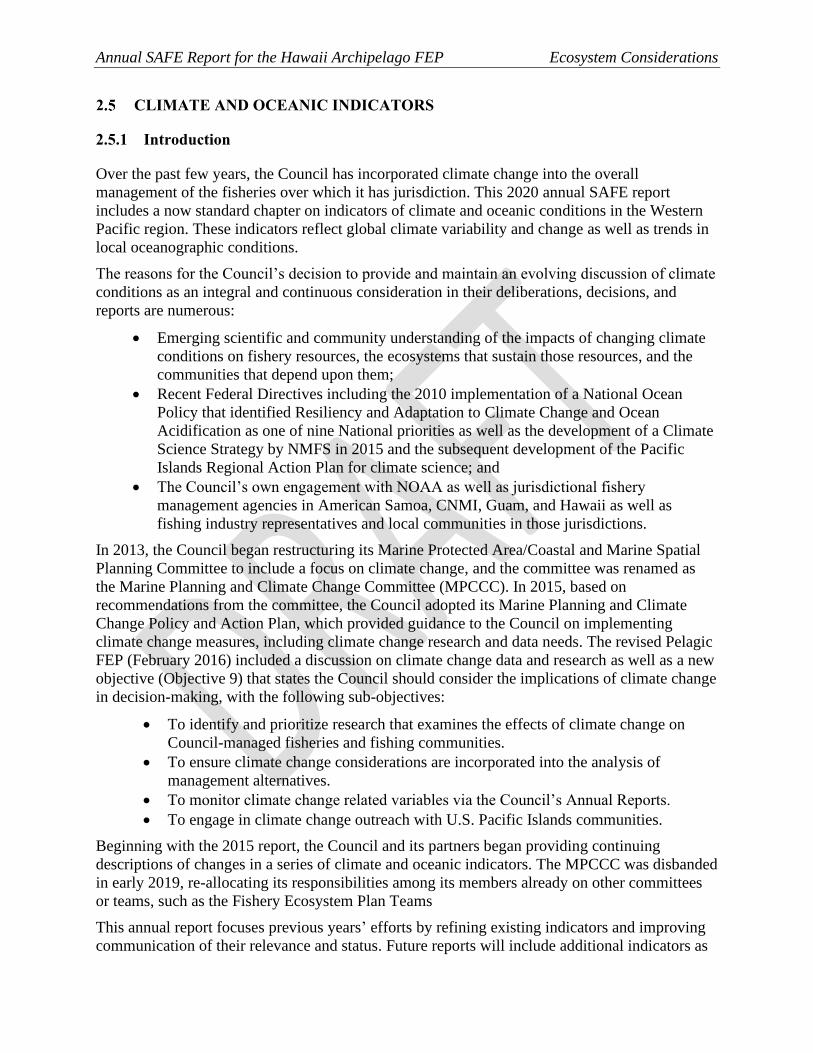
The Advisory Committee Report presented a possible conceptual framework designed to

illustrate how climate factors can connect to and interact with other ecosystem components to

ocean and coastal ecosystems and human communities. The Council adapted this model with

considerations relevant to the fishery resources of the Western Pacific Region (Figure 1).

As described in the 2014 NCADAC report, the conceptual model presents a “simplified

representation of climate and non-climate stressors in coastal and marine ecosystems.” For the

purposes of this Annual Report, the modified Conceptual Model allows the Council and its

partners to identify indicators of interest to be monitored on a continuing basis in coming years.

The indicators shown in red were considered for inclusion in the Annual SAFE Reports, though

the final list of indicators varied somewhat. Other indicators will be added over time as data

become available and an understanding of the causal chain from stressors to impacts emerges.

The Council also hopes that this Conceptual Model can provide a guide for future monitoring

and research. This guide will ideally enable the Council and its partners to move forward from

observations and correlations to understanding the specific nature of interactions, and to develop

capabilities to predict future changes of importance in the developing, evaluating, and adapting

of FEPs in the Western Pacific region

Annual SAFE Report for the Hawaii Archipelago FEP Ecosystem Considerations

Figure 1. Schematic diagram illustrating how indicators are connected to one another and

how they vary as a result of natural climate variability

2.5.4 Selected Indicators

The primary goal for selecting the Indicators used in this (and future reports) is to provide

fisheries-related communities, resource managers, and businesses with climate-related situational

awareness. In this context, Indicators were selected to:

• Be fisheries relevant and informative;

• Build intuition about current conditions in light of changing climate;

• Provide historical context; and

• Recognize patterns and trends.

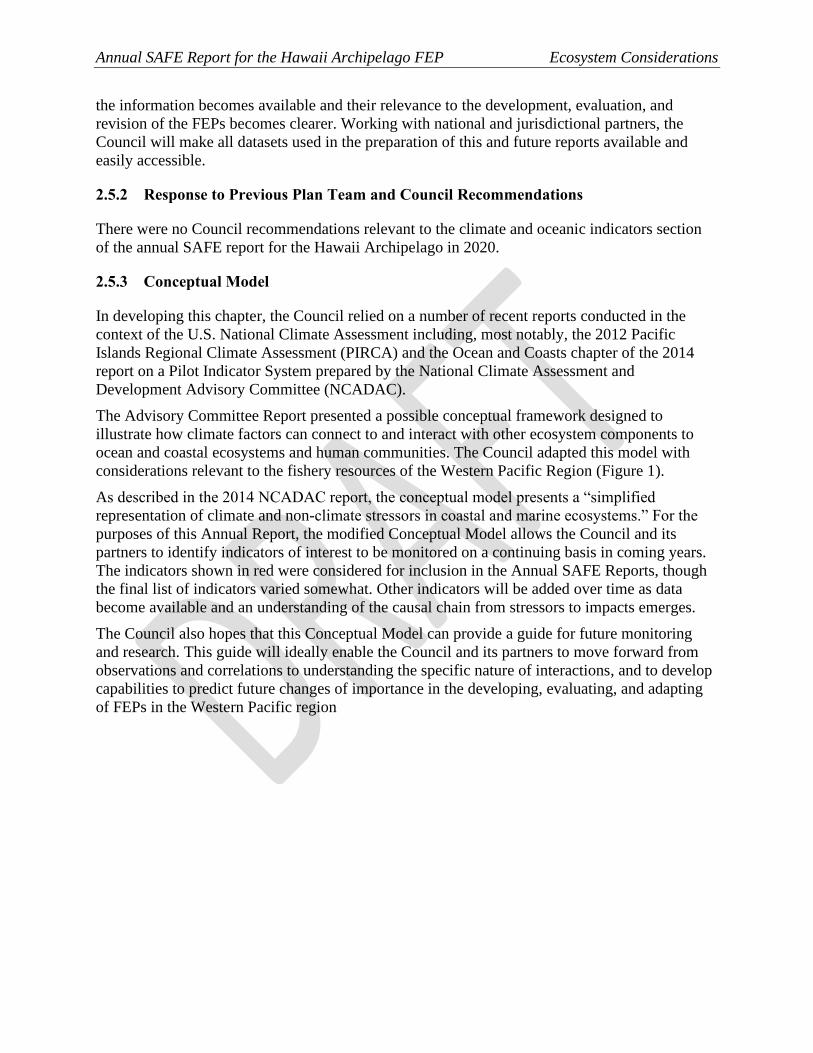
In this context, this section includes the following climate and oceanic indicators:

Annual SAFE Report for the Hawaii Archipelago FEP Ecosystem Considerations

• Atmospheric concentration of carbon dioxide (CO2)

• Oceanic pH at Station ALOHA; • Oceanic Niño Index (ONI);

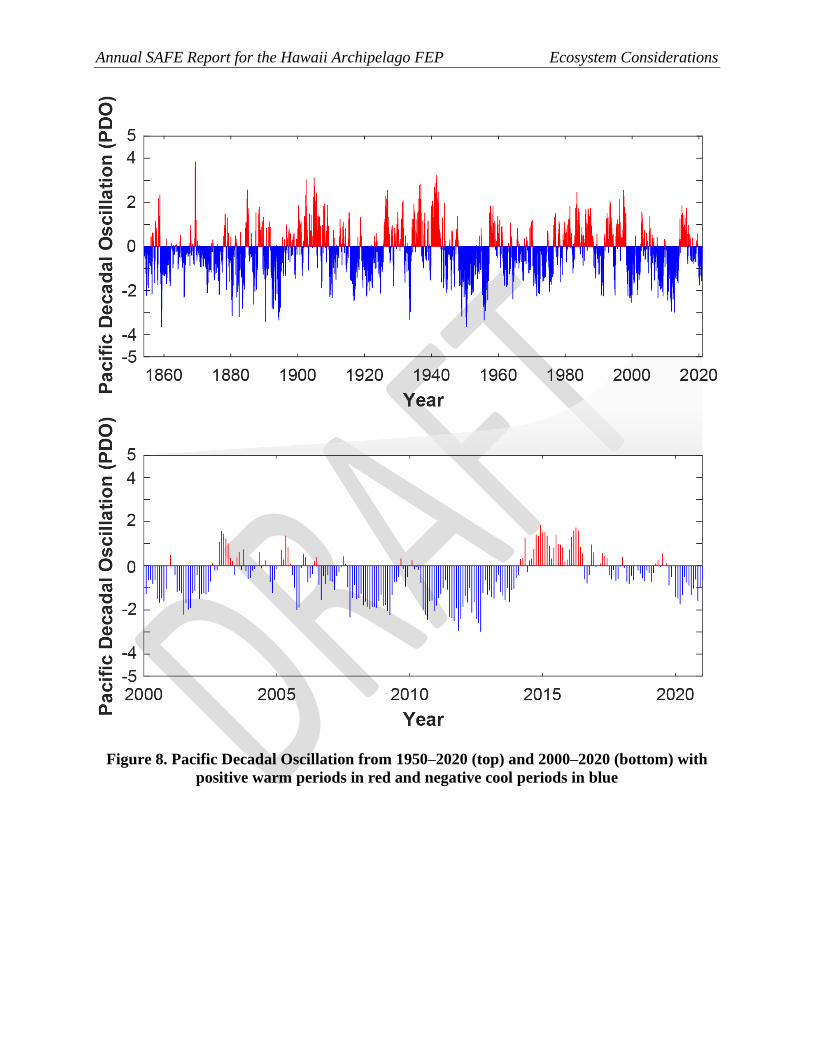
• Pacific Decadal Oscillation (PDO);

• Tropical cyclones;

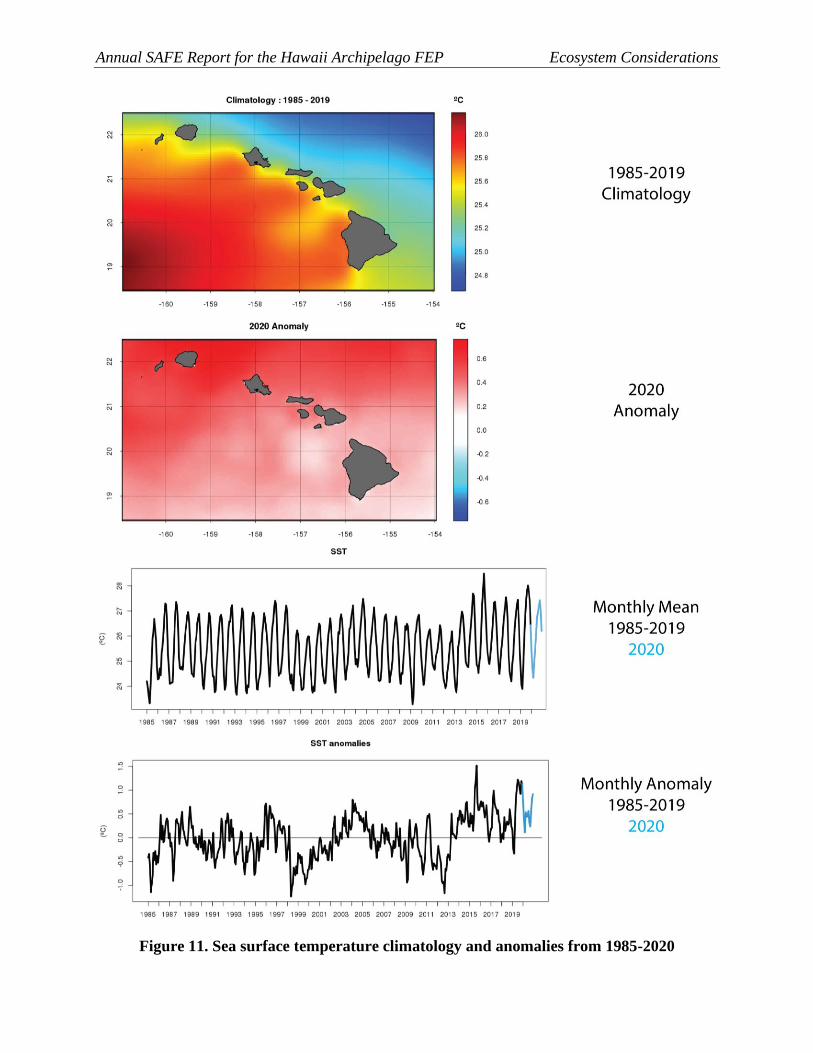
• Sea surface temperature (SST);

• Coral Thermal Stress Exposure
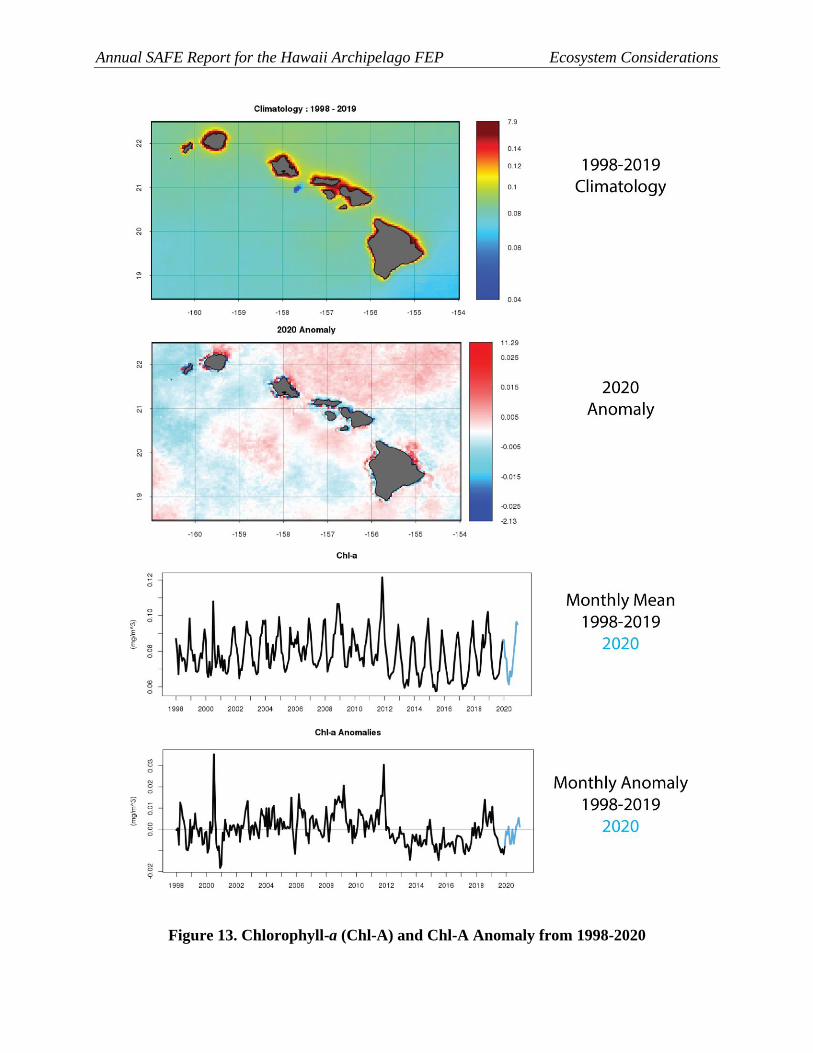
• Chlorophyll-A

• Rainfall

• Sea Level (Sea Surface Height)

Figure 2 and Figure 3 provide a description of these indicators and illustrate how they are

connected to each other in terms of natural climate variability and anthropogenic climate change.

Figure 2. Schematic diagram illustrating how indicators are connected to one another and

how they vary as a result of natural climate variability

Annual SAFE Report for the Hawaii Archipelago FEP Ecosystem Considerations

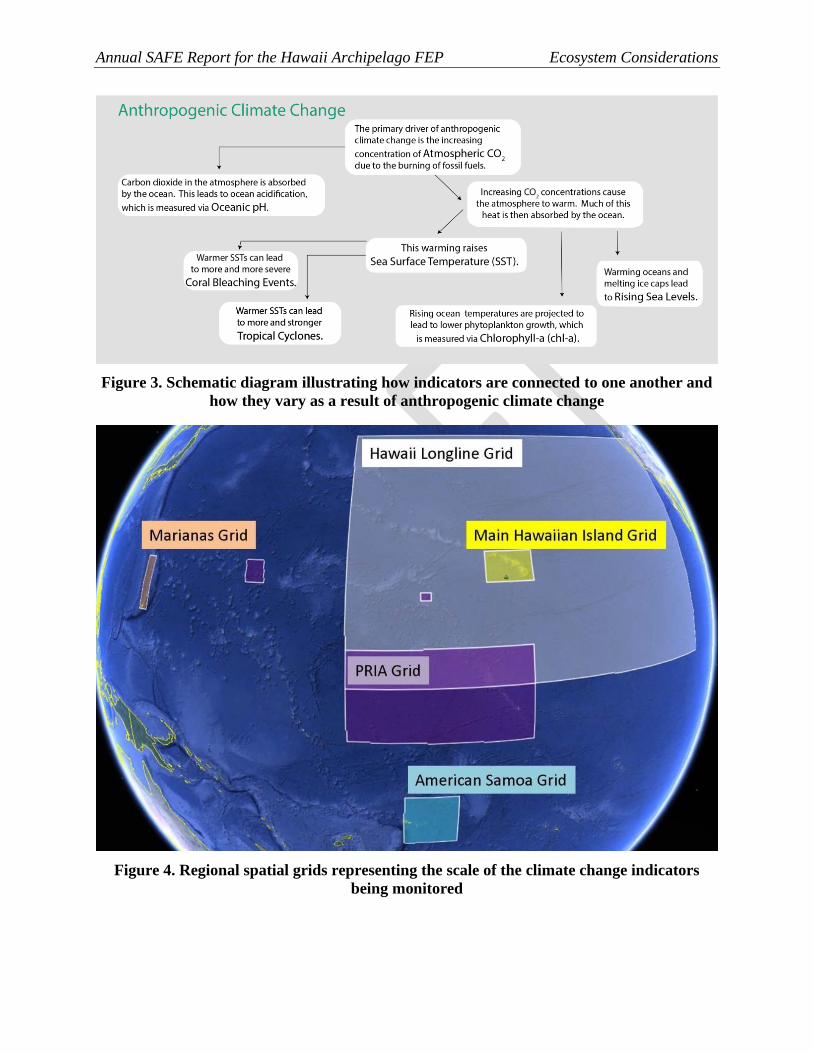
Figure 3. Schematic diagram illustrating how indicators are connected to one another and

how they vary as a result of anthropogenic climate change

Figure 4. Regional spatial grids representing the scale of the climate change indicators

being monitored

Annual SAFE Report for the Hawaii Archipelago FEP Ecosystem Considerations

Atmospheric Concentration of Carbon Dioxide at Mauna Loa

Rationale: Atmospheric carbon dioxide (CO2) is a measure of what human activity has already

done to affect the climate system through greenhouse gas emissions. It provides quantitative

information in a simplified, standardized format that decision makers can easily understand. This

indicator demonstrates that the concentration (and, in turn, warming influence) of greenhouse

gases in the atmosphere has increased substantially over the last several decades.

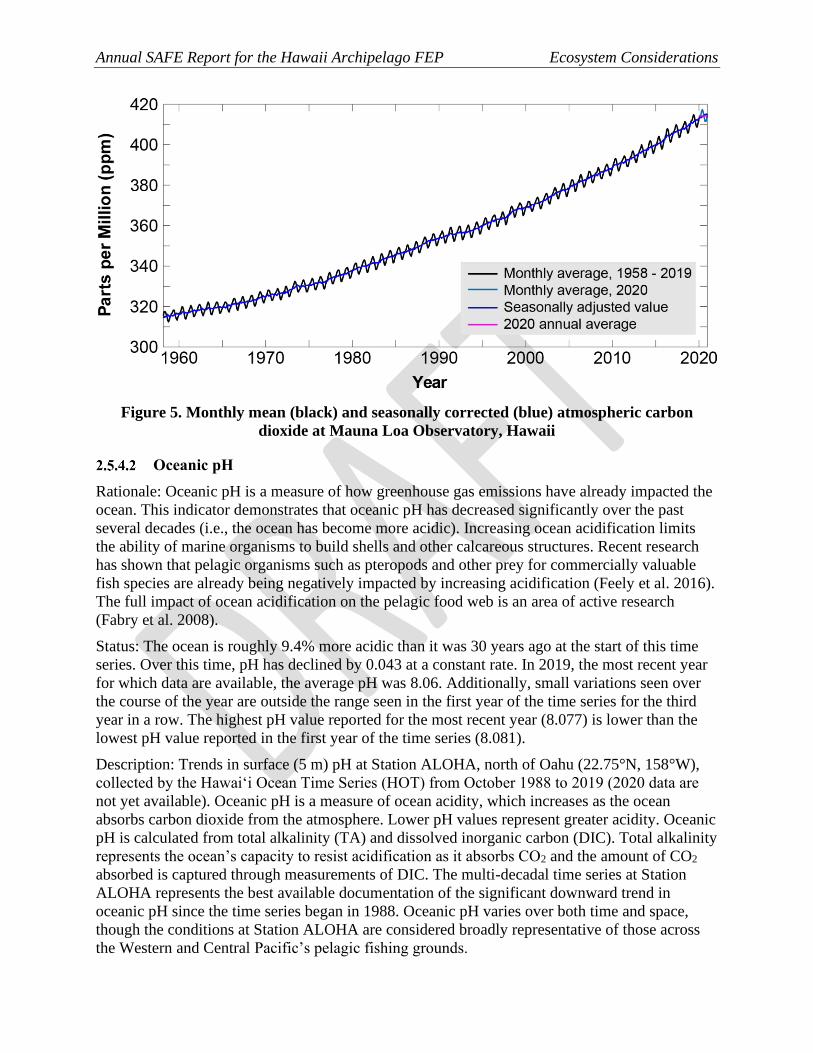
Status: Atmospheric CO2 is increasing exponentially. This means that atmospheric CO2 is

increasing at a faster rate each year. In 2020, the annual mean concentration of CO2 was 414

parts per million (ppm). In 1959, the first year of the time series, it was 316 ppm. The annual

mean passed 350 ppm in 1988, and 400 ppm in 2015.

Description: Monthly mean atmospheric carbon dioxide at Mauna Loa Observatory, Hawaiʻi in

ppm from March 1958 to present. The observed increase in monthly average carbon dioxide

concentration is primarily due to CO2 emissions from fossil fuel burning. Carbon dioxide

remains in the atmosphere for a very long time, and emissions from any location mix throughout

the atmosphere in approximately one year. The annual variations at Mauna Loa, Hawaiʻi are due

to the seasonal imbalance between the photosynthesis and respiration of terrestrial plants. During

the summer growing season, photosynthesis exceeds respiration, and CO2 is removed from the

atmosphere. In the winter (outside the growing season), respiration exceeds photosynthesis, and

CO2 is returned to the atmosphere. The seasonal cycle is strongest in the northern hemisphere

because of its larger land mass.

Timeframe: Annual, monthly.

Region/Location: Mauna Loa, Hawaii but representative of global atmospheric carbon dioxide

concentration.

Measurement Platform: In-situ station.

Sourced from: Keeling et al. (1976), Thoning et al. (1989), and NOAA (2021b).

NOAA (2021b) = Dr. Pieter Tans, NOAA/GML (www.esrl.noaa.gov/gmd/ccgg/trends/) and Dr.

Ralph Keeling, Scripps Institution of Oceanography (scrippsco2.ucsd.edu/)

Annual SAFE Report for the Hawaii Archipelago FEP Ecosystem Considerations

Figure 5. Monthly mean (black) and seasonally corrected (blue) atmospheric carbon

dioxide at Mauna Loa Observatory, Hawaii

Oceanic pH

Rationale: Oceanic pH is a measure of how greenhouse gas emissions have already impacted the

ocean. This indicator demonstrates that oceanic pH has decreased significantly over the past

several decades (i.e., the ocean has become more acidic). Increasing ocean acidification limits

the ability of marine organisms to build shells and other calcareous structures. Recent research

has shown that pelagic organisms such as pteropods and other prey for commercially valuable

fish species are already being negatively impacted by increasing acidification (Feely et al. 2016).

The full impact of ocean acidification on the pelagic food web is an area of active research

(Fabry et al. 2008).

Status: The ocean is roughly 9.4% more acidic than it was 30 years ago at the start of this time

series. Over this time, pH has declined by 0.043 at a constant rate. In 2019, the most recent year

for which data are available, the average pH was 8.06. Additionally, small variations seen over

the course of the year are outside the range seen in the first year of the time series for the third

year in a row. The highest pH value reported for the most recent year (8.077) is lower than the

lowest pH value reported in the first year of the time series (8.081).

Description: Trends in surface (5 m) pH at Station ALOHA, north of Oahu (22.75°N, 158°W),

collected by the Hawaiʻi Ocean Time Series (HOT) from October 1988 to 2019 (2020 data are

not yet available). Oceanic pH is a measure of ocean acidity, which increases as the ocean

absorbs carbon dioxide from the atmosphere. Lower pH values represent greater acidity. Oceanic

pH is calculated from total alkalinity (TA) and dissolved inorganic carbon (DIC). Total alkalinity

represents the ocean’s capacity to resist acidification as it absorbs CO2 and the amount of CO2

absorbed is captured through measurements of DIC. The multi-decadal time series at Station

ALOHA represents the best available documentation of the significant downward trend in

oceanic pH since the time series began in 1988. Oceanic pH varies over both time and space,

though the conditions at Station ALOHA are considered broadly representative of those across

the Western and Central Pacific’s pelagic fishing grounds.

Annual SAFE Report for the Hawaii Archipelago FEP Ecosystem Considerations

Timeframe: Monthly.

Region/Location: Station ALOHA: 22.75°N, 158°W.

Measurement Platform: In-situ station.

Sourced from: Fabry et al. (2008), Feely et al. (2016), and the Hawaiʻi Ocean Time Series as

described in Karl et al. (1996) and on its website (HOT, 2021).

HOT, 2021 = https://hahana.soest.hawaii.edu/hot/hot-dogs/bseries.html

Figure 6. Time series and long-term trend of oceanic pH measured at Station ALOHA

from 1989-2019

Oceanic Niño Index

Rationale: The El Niño – Southern Oscillation (ENSO) cycle is known to have impacts on

Pacific fisheries including tuna fisheries. The Oceanic Niño Index (ONI) focuses on ocean

temperature, which has the most direct effect on these fisheries.

Status: In autumn of 2020, the ONI transitioned from neutral to La Niña conditions. Over the

year, the ONI ranged from 0.5 to -1.3. This is within the range of values observed previously in

the time series.

Description: The three-month running mean of satellite remotely-sensed sea surface temperature

(SST) anomalies in the Niño 3.4 region (5°S – 5°N, 120° – 170°W). The ONI is a measure of the

ENSO phase. Warm and cool phases, termed El Niño and La Niña respectively, are based in part

on an ONI threshold of ± 0.5 °C being met for a minimum of five consecutive overlapping

seasons. Additional atmospheric indices are needed to confirm an El Niño or La Niña event, as

the ENSO is a coupled ocean-atmosphere phenomenon. The atmospheric half of ENSO is

measured using the Southern Oscillation Index.

Annual SAFE Report for the Hawaii Archipelago FEP Ecosystem Considerations

Timeframe: Every three months.

Region/Location: Niño 3.4 region, 5°S – 5°N, 120° – 170°W.

Measurement Platform: In-situ station, satellite, model.

Sourced from NOAA CPC (2021).

NOAA CPC (2021) =

https://origin.cpc.ncep.noaa.gov/products/analysis_monitoring/ensostuff/ONI_v5.php and

https://www.cpc.ncep.noaa.gov/data/indices/oni.ascii.txt

Figure 7. Oceanic Niño Index from 1950-2020 (top) and 2000–2020 (bottom) with El Niño

periods in red and La Niña periods in blue

Annual SAFE Report for the Hawaii Archipelago FEP Ecosystem Considerations

Pacific Decadal Oscillation

Rationale: The Pacific Decadal Oscillation (PDO) was initially named by fisheries scientist

Steven Hare in 1996 while researching connections between Alaska salmon production cycles

and Pacific climate. Like ENSO, the PDO reflects changes between periods of persistently warm

or persistently cool ocean temperatures, but over a period of 20 to 30 years (versus six to 18

months for ENSO events). The climatic fingerprints of the PDO are most visible in the

Northeastern Pacific, but secondary signatures exist in the tropics.

Status: The PDO hovered around zero in 2019. The year was nearly evenly split between values

that were slightly negative (seven months) and values that were slightly positive (5 months).

Description: The PDO is often described as a long-lived El Niño-like pattern of Pacific climate

variability. As seen with the better-known ENSO, extremes in the PDO pattern are marked by

widespread variations in the Pacific Basin and the North American climate. In parallel with the

ENSO phenomenon, the extreme cases of the PDO have been classified as either warm or cool,

as defined by ocean temperature anomalies in the northeast and tropical Pacific Ocean. When

SST is below average in the interior North Pacific and warm along the North American coast,

and when sea level pressures are below average in the North Pacific, the PDO has a positive

value. When the climate patterns are reversed, with warm SST anomalies in the interior and cool

SST anomalies along the North American coast, or above average sea level pressures over the

North Pacific, the PDO has a negative value NOAA (2020b).

Timeframe: Annual, monthly.

Region/Location: Pacific Basin north of 20°N.

Measurement Platform: In-situ station, satellite, model.

Sourced from: NOAA ESRL (2021a).

NOAA ESRL (2021a) = https://www.ncdc.noaa.gov/teleconnections/pdo/

Annual SAFE Report for the Hawaii Archipelago FEP Ecosystem Considerations

Figure 8. Pacific Decadal Oscillation from 1950–2020 (top) and 2000–2020 (bottom) with

positive warm periods in red and negative cool periods in blue

Annual SAFE Report for the Hawaii Archipelago FEP Ecosystem Considerations

Tropical Cyclones

Rationale: The effects of tropical cyclones are numerous and well known. At sea, storms disrupt

and endanger shipping traffic as well as fishing effort and safety. The Hawaiʻi longline fishery,

for example, has had serious problems with vessels dodging storms at sea, delayed departures,

and inability to make it safely back to Honolulu because of bad weather. When cyclones

encounter land, their intense rains and high winds can cause severe property damage, loss of life,

soil erosion, and flooding. Associated storm surge, the large volume of ocean water pushed

toward shore by cyclones’ strong winds, can cause severe flooding and destruction.

Status:

Eastern North Pacific. Overall, the 2020 eastern Pacific hurricane season featured an average

number of named storms, but below average hurricane and major hurricane activity. There were

sixteen named storms, of which four became hurricanes and three became major hurricanes -

category 3 or higher on the Saffir-Simpson Hurricane Wind Scale. This compares to the long-

term averages of fifteen named storms, eight hurricanes, and four major hurricanes. There were

also five tropical depressions that did not reach tropical storm strength. Two tropical storms,

Odalys and Polo, formed in the basin in November. Although the long-term (1981-2010)

average is one tropical storm forming in the basin every second or third year, this is the third

straight November with at least one named storm forming. In fact, named storms have formed in

November in six of the past seven years in the basin. In terms of Accumulated Cyclone Energy

(ACE), which measures the strength and duration of tropical storms and hurricanes, activity in

the basin for 2020 was below normal, more than 40 percent below the long-term average.

Summary inserted from https://www.nhc.noaa.gov/text/MIATWSEP.shtml.

Central North Pacific. Tropical cyclone activity in the central Pacific in 2020 was slightly below

average. While there was only one named storm, which is below the 1981 – 2010 average of

three, this storm was particularly noteworthy. July’s hurricane Douglas reached category 4

strength, making it a major hurricane. Its intensity fell prior to its passage just north of the main

Hawaiian Islands. On average, the central Pacific sees three named storms, two hurricanes, and

no major hurricanes. The 2020 ACE index was about an order of magnitude below the 1981 –

2010 average.

Western North Pacific. Tropical cyclone activity was below average in the western Pacific in

2020. There were 23 named storms, compared to an average of 26. Twelve of these developed

into typhoons, and seven of these typhoons were major. An average year would see 17

typhoons, nine of which would be major. The West Pacific was unusually quiet in 2020 with less

than half its normal ACE (third lowest since 1981). The West Pacific did have the strongest

storm of 2020, Super Typhoon Goni, which made landfall in the Philippines as a powerful

category 5 storm. The initial estimates of 195-mph winds during its landfall would be the

strongest on record. Portions of the summary inserted from

https://www.ncdc.noaa.gov/sotc/tropical-cyclones/202013.

South Pacific. Tropical cyclone activity in the south Pacific region was roughly average in 2020.

There were ten named storms, five of which developed into cyclones and one of which – Harold

– was major. The long-term average in this region is nine named storms, five cyclones, and two

major cyclones. The strongest cyclone of the Southern Hemisphere season was category-5

Tropical Cyclone Harold. Harold alone accounted for more than half of the Southwest Pacific's

ACE for 2020 (overall, the region’s ACE index was below average in 2020). It was the first

Annual SAFE Report for the Hawaii Archipelago FEP Ecosystem Considerations

category 5 storm in the Southern Hemisphere since Tropical Cyclone Gita in 2018. Harold

caused widespread damage throughout the South Pacific Islands, particularly in Vanuatu where it

achieved its peak intensity. Portions of the summary inserted from

https://www.ncdc.noaa.gov/sotc/tropical-cyclones/202013.

Description: This indicator uses historical data from the NOAA National Climate Data Center

(NCDC) International Best Track Archive for Climate Stewardship to track the number of

tropical cyclones in the western, central, eastern, and southern Pacific basins. This indicator also

monitors the Accumulated Cyclone Energy (ACE) Index and the Power Dissipation Index which

are two ways of monitoring the frequency, strength, and duration of tropical cyclones based on

wind speed measurements.

The annual frequency of storms passing through each basin is tracked and a bar plot shows the

representative breakdown of Saffir-Simpson hurricane categories.

Every cyclone has an ACE Index value, which is a number based on the maximum wind speed

measured at six-hourly intervals over the entire time that the cyclone is classified as at least a

tropical storm (wind speed of at least 34 knots; 39 mph). Therefore, a storm’s ACE Index value

accounts for both strength and duration. This plot shows the historical ACE values for each

hurricane/typhoon season and has a horizontal line representing the average annual ACE value.

Timeframe: Annual.

Region/Location:

Eastern North Pacific: east of 140° W, north of the equator.

Central North Pacific: 180° - 140° W, north of the equator.

Western North Pacific: west of 180°, north of the equator.

South Pacific: south of the equator.

Measurement Platform: Satellite.

Sourced from: Knapp et al. (2010), Knapp et al. (2018), https://www.ncdc.noaa.gov/ibtracs/,

https://www.ncdc.noaa.gov/sotc/tropical-cyclones/202007.

Annual SAFE Report for the Hawaii Archipelago FEP Ecosystem Considerations

Figure 9. 2020 Pacific basin tropical cyclone tracks

Figure 10. 2020 tropical storm totals by region

Annual SAFE Report for the Hawaii Archipelago FEP Ecosystem Considerations

Sea Surface Temperature & Anomaly

Rationale: Sea surface temperature (SST) is one of the most directly observable existing

measures for tracking increasing ocean temperatures. SST varies in response to natural climate

cycles such as the ENSO and is projected to rise as a result of anthropogenic climate change.

Both short-term variability and long-term trends in SST impact the marine ecosystem.

Understanding the mechanisms through which organisms are impacted and the time scales of

these impacts is an area of active research.

Status: Annual mean SST was 26.06ºC in 2020. Over the period of record, annual SST has

increased at a rate of 0.0176 ºC yr-1. Monthly SST values in 2020 ranged from 24.34 – 27.43 ºC,

outside the climatological range of 23.29 – 28.48 ºC. The annual anomaly was 0.51 ºC hotter

than average, with some intensification in the northern part of the region.

Note that from the top to bottom in Figure 11, panels show climatological SST (1985-2019),

2020 SST anomaly, time series of monthly mean SST, and time series of monthly SST anomaly.

Description: Satellite remotely-sensed monthly sea surface temperature (SST) is averaged across

the Main Hawaiian Island Grid (18.5° – 22.5°N, 161° – 154°W). A time series of monthly mean

SST averaged over the Main Hawaiian Island region is presented. Additionally, spatial

climatology and anomalies are shown.

Timeframe: Monthly.

Region/Location: Main Hawaiian Island Grid (18.5° – 22.5°N, 161° – 154°W).

Measurement Platform: Satellite.

Measurement Platform: AVHRR, POES Satellite, GOES 12 and 12 Satellites.

Sourced from: NOAA Coral Reef Watch CoralTemp v3.1 (NOAA 2021c).

Annual SAFE Report for the Hawaii Archipelago FEP Ecosystem Considerations

Figure 11. Sea surface temperature climatology and anomalies from 1985-2020

Annual SAFE Report for the Hawaii Archipelago FEP Ecosystem Considerations

Coral Thermal Stress Exposure: Degree Heating Weeks

Rationale: Degree heating weeks (DHW) are one of the most widely used metrics for assessing

exposure to coral bleaching-relevant thermal stress.

Status: After a series of stress events in 2014, 2015, and 2019, the main Hawaiian Islands

experienced little coral heat stress in 2020.

Description: Here we present a metric of exposure to thermal stress that is relevant to coral

bleaching. DHW measures time and temperature above a reference ‘summer maximum’,

presented as rolling sum weekly thermal anomalies over a 12-week period. Higher DHW

measures imply a greater likelihood of mass coral bleaching or mortality from thermal stress.

The NOAA Coral Reef Watch program uses satellite data to provide current reef environmental

conditions to quickly identify areas at risk for coral bleaching. Bleaching is the process by which

corals lose the symbiotic algae that give them their distinctive colors. If a coral is severely

bleached, disease and death become likely.

The NOAA Coral Reef Watch daily 5-km satellite coral bleaching DHW product presented here

shows accumulated heat stress, which can lead to coral bleaching and death. The scale goes from

0 to 20 °C-weeks. The DHW product accumulates the instantaneous bleaching heat stress

(measured by Coral Bleaching HotSpots) during the most-recent 12-week period. It is directly

related to the timing and intensity of coral bleaching. Significant coral bleaching usually occurs

when DHW values reach 4 °C-weeks. By the time DHW values reach 8 °C-weeks, widespread

bleaching is likely and significant mortality can be expected.

Timeframe: 2014-2019, daily data.

Region/Location: Global.

Sourced from: NOAA Coral Reef Watch v3.1 (2021).

https://coralreefwatch.noaa.gov/product/vs/data/hawaii.txt.

Annual SAFE Report for the Hawaii Archipelago FEP Ecosystem Considerations

Figure 12. Coral Thermal Stress Exposure, Main Hawaiian Island Virtual Station from

2014-2020, measured in Coral Reef Watch Degree Heating Weeks

Annual SAFE Report for the Hawaii Archipelago FEP Ecosystem Considerations

Chlorophyll-A and Anomaly

Rationale: Chlorophyll-a (Chl-A) is one of the most directly observable measures we have for

tracking increasing ocean productivity.

Status: Annual mean Chl-A was 0.077 mg/m3 in 2020. Over the period of record, annual Chl-A

has shown no significant temporal trend. Monthly Chl-A values in 2020 ranged from 0.061-

0.096 mg/m3, within the climatological range of 0.057 – 0.121 mg/m3. The annual anomaly was

0.0014 mg/m3 lower than average, with some intensification in the northeastern section of the

region.

Description: Chl-A concentration from 1998-2020 was derived from the ESA Ocean Color

Climate Change Initiative dataset, v5.0. A monthly climatology was generated across the entire

period (1998-2019) to provide both a 2020 spatial anomaly, and an anomaly time series.

ESA Ocean Color Climate Change Initiative dataset is a merged dataset, combining data from

SeaWIFS, MODIS-Aqua, MERIS, and VIIRS to provide a homogeneous time-series of ocean

color. Data was accessed from the OceanWatch Central Pacific portal.

Timeframe: 1998-2020, daily data available, monthly means shown.

Region/Location: Global.

Measurement Platform: SeaWIFS, MODIS-Aqua, MERIS, and VIIRS

Sourced from: NOAA OceanWatch Central Pacific; https://oceanwatch.pifsc.noaa.gov/

Annual SAFE Report for the Hawaii Archipelago FEP Ecosystem Considerations

Figure 13. Chlorophyll-a (Chl-A) and Chl-A Anomaly from 1998-2020

Annual SAFE Report for the Hawaii Archipelago FEP Ecosystem Considerations

Rainfall

Rationale: Rainfall may have substantive effects on the nearshore environment and is a

potentially important co-variate with the landings of particular stocks.

Description: The Climate Prediction Center (CPC) Merged Analysis of Precipitation (CMAP) is

a technique which produces pentad and monthly analyses of global precipitation in which

observations from rain gauges are merged with precipitation estimates from several satellite-

based algorithms, such as infrared and microwave (NOAA 2002). The analyses are on a 2.5 x

2.5-degree latitude/longitude grid and extend back to 1979. CMAP Precipitation data provided

by the NOAA/OAR/ESRL PSD, Boulder, Colorado, USA, from their Web site at

https://www.esrl.noaa.gov/psd/. The data are comparable (but should not be confused with)

similarly combined analyses by the Global Precipitation Climatology Project described

in Huffman et al. (1997).

It is important to note that the input data sources to make these analyses are not constant

throughout the period of record. For example, SSM/I (passive microwave - scattering and

emission) data became available in July 1987; prior to that the only microwave-derived estimates

available are from the MSU algorithm (Spencer 1993) which is emission-based thus precipitation

estimates are available only over oceanic areas. Furthermore, high temporal resolution IR data

from geostationary satellites (every 3-hr) became available during 1986; prior to that, estimates

from the OPI technique (Xie and Arkin 1997) are used based on OLR from orbiting satellites.

The merging technique is thoroughly described in Xie and Arkin (1997). Briefly, the

methodology is a two-step process. First, the random error is reduced by linearly combining the

satellite estimates using the maximum likelihood method, in which case the linear combination

coefficients are inversely proportional to the square of the local random error of the individual

data sources. Over global land areas the random error is defined for each time period and grid

location by comparing the data source with the rain gauge analysis over the surrounding area.

Over oceans, the random error is defined by comparing the data sources with the rain gauge

observations over the Pacific atolls. Bias is reduced when the data sources are blended in the

second step using the blending technique of Reynolds (1988).

Text inserted from

https://www.cpc.ncep.noaa.gov/products/global_precip/html/wpage.cmap.shtml.

Timeframe: Monthly.

Region/Location: Global.

Measurement Platform: In-situ station gauges and satellite data.

Sourced from: CMAP Precipitation data provided by the NOAA/OAR/ESRL PSD, Boulder,

Colorado, USA, from their web site at https://www.esrl.noaa.gov/psd/;

http://apdrc.soest.hawaii.edu/datadoc/cmap_month.php.

Annual SAFE Report for the Hawaii Archipelago FEP Ecosystem Considerations

Figure 14. CMAP precipitation (top) and anomaly (bottom) across the MHI Grid with 2020

values in blue

Annual SAFE Report for the Hawaii Archipelago FEP Ecosystem Considerations

Sea Level (Sea Surface Height and Anomaly)

Rationale: Coastal: Rising sea levels can result in a number of coastal impacts, including

inundation of infrastructure, increased damage resulting from storm-driven waves and flooding,

and saltwater intrusion into freshwater supplies.

Description: Monthly mean sea level time series of local and basin-wide sea surface height and

sea surface height anomalies, including extremes.

Timeframe: Monthly.

Region/Location: Observations from selected sites within the Hawaiian Archipelago.

Measurement Platform: Satellite and in situ tide gauges.

Sourced from: Aviso (2020) and https://tidesandcurrents.noaa.gov/datum_options.html,

https://bulletin.aviso.altimetry.fr/html/produits/indic/enso/welcome_uk.php

2.5.4.10.1 Basin-Wide Perspective

This image of the mean sea level anomaly for February 2020 compared to 1993-2013

climatology from satellite altimetry provides a glimpse into how the 2020 neutral ENSO

conditions affected sea level across the Pacific Basin. The image captures the fact that sea level

is slightly lower in the Western Pacific and slightly higher in the Central and Eastern Pacific (this

basin-wide perspective provides a context for the location-specific sea level/sea surface height

images that follow).

Figure 15a. Sea surface height and anomaly

Annual SAFE Report for the Hawaii Archipelago FEP Ecosystem Considerations

Figure 33b. Quarterly time series of

mean sea level anomalies during 2020

show no pattern of El Niño

throughout the year according to

satellite altimetry measurements of

sea level height.

Altimetry data are provided by the

NOAA Laboratory for Satellite

Altimetry, accessed from NOAA

CoastWatch:

https://coastwatch.noaa.gov/cw/sate

llite-data-products/sea-surface-

height/sea-level-anomaly-and-

geostrophic-currents-multi-mission-

global-optimal-interpolation-

gridded.html.

Annual SAFE Report for the Hawaii Archipelago FEP Ecosystem Considerations

2.5.4.10.2 Local Sea Level

These time-series from in situ tide gauges provide a perspective on sea level trends within each

Archipelago (Tide Station Time Series from NOAA Center for Operational Oceanographic

Products and Services, or CO-OPS).

The following figures and descriptive paragraphs were inserted from the NOAA Tides and

Currents website. Figure 16 shows the monthly mean sea level without the regular seasonal

fluctuations due to coastal ocean temperatures, salinities, winds, atmospheric pressures, and

ocean currents. The long-term linear trend is also shown, including its 95% confidence interval.

The plotted values are relative to the most recent Mean Sea Level datum established by CO-OPS.

The calculated trends for all stations are available as a table in millimeters/year and in

feet/century. If present, solid vertical lines indicate times of any major earthquakes in the vicinity

of the station and dashed vertical lines bracket any periods of questionable data or datum shift.

The relative sea level trend is 1.55 millimeters/year with a 95% confidence interval of +/- 0.21

mm/yr based on monthly mean sea level data from 1905 to 2020 which is equivalent to a change

of 0.51 feet in 100 years.

Source: https://tidesandcurrents.noaa.gov/sltrends/sltrends_station.shtml?id=1612340

Figure 16. Monthly mean sea level without regular seasonal variability due to coastal ocean

temperatures, salinities, winds, atmospheric pressures, and ocean currents

Annual SAFE Report for the Hawaii Archipelago FEP Ecosystem Considerations


Recommended