U.S. Securities and Exchange Commission Annual Staff Report Relating to the Use of Form PF Data This is a report of the Staff of the U.S. Securities and Exchange Commission. The Commission has expressed no view regarding the analysis, findings, or conclusions contained herein. October 16, 2017
Transcript
U.S. Securities and Exchange Commission
Annual Staff Report Relating to the Use of Form PF Data
This is a report of the Staff of the U.S. Securities and Exchange Commission.
The Commission has expressed no view regarding the analysis, findings, or conclusions contained herein.
October 16, 2017
1
Executive Summary
Beginning in July 2012, the Commission has collected data about hedge funds, private equity funds, and other private funds reported by certain registered investment advisers to private funds on Form PF. This collection is pursuant to amendments to the Investment Advisers Act of 1940 (“Advisers Act”), enacted in 2010, that provide that the Commission require registered investment advisers to maintain records and file reports regarding the private funds they advise, for use by the Commission and by the Financial Stability Oversight Council (“FSOC”). During the five years since the Form PF data was first received, the Commission staff has implemented programs designed to collect, secure, and analyze this data for use in support of the Commission’s investor protection and market monitoring missions. Today, the staff uses Form PF data in important mission-focused activities, including in conducting examinations, in identifying and monitoring private fund industry trends, in informing policymaking, and in pursuing potential wrongdoing. This bolsters the Commission’s commitment to investor protection and market integrity through enhanced data management and analytics capabilities that better support market monitoring, risk identification, uncovering misconduct, and informing policymaking. The following activities are highlighted in this fifth Annual Report Relating to the Use of Form PF Data.
• Managing Form PF Data and Improving Its Quality. Form PF data is maintained on an internal database for which access has been granted to a limited number of identified Commission employees, subject to systems and controls designed to protect the confidentiality of proprietary information of private fund advisers. Staff works to improve data quality by responding to filer inquiries and conducting outreach to filers.
• Industry Monitoring Using Analytical Toolsets. Commission staff analyzes Form PF data to identify trends and possible emerging risks in the private fund industry and develop analyses from Form PF data that deepen staff understanding of private funds and private fund advisers. Consistent with formal policies and procedures governing the access, use, and security of Form PF data, staff has developed a variety of analytical tools that combine Form PF data with other Commission databases to support the Commission’s monitoring and analysis activities.
• Informing the Public. Staff recently augmented its quarterly public report, Private Funds Statistics, with new analyses of Form PF data, including new aggregated information about private liquidity funds and the use of leverage by hedge funds. The most recent report is included in the Appendix. Staff also uses Form PF data to conduct research that is intended to deepen public understanding of private funds and their market activities and risks.
• Targeting and Expediting Exams and Enforcement. Staff reviews and analyzes Form PF data to identify potential compliance risk areas and prioritize the use of exam and enforcement resources. “Flag reports,” which can be rapidly and automatically generated using internally developed code and metrics, expedite staff’s preparation and conduct of exams by summarizing key information from Form PF and identifying potential reporting errors, compliance issues, and other issues of interest.
• Supporting Rulemaking. Commission staff’s experience implementing Form PF requirements and managing the data continues to inform proposed and final rulemakings, including recent amendments to Form ADV filing requirements and the development of new Form N-PORT for registered investment companies.
• Coordination with Other Regulators. The Commission adopted Form PF in part to obtain, on behalf of FSOC, data that FSOC can use to monitor systemic risk in the U.S. financial markets. Accordingly, the Commission makes Form PF data available to FSOC through the Office of Financial Research (“OFR”), subject to agreements regarding appropriate use of and confidentiality protections for Form PF data. Staff also uses Form PF data when coordinating with other federal regulators and international organizations in areas of mutual interest involving private fund advisers, subject to protections designed to maintain data security.
2
I. Introduction
Form PF and Advisers Act rule 204(b)–1, adopted by the Commission in 2011, require certain registered investment advisers to private funds (including hedge funds, private equity funds, private liquidity funds, and other private funds) to file Form PF to report information about the private funds they manage.1 Section 204(b) of the Advisers Act requires the Commission to report to Congress annually regarding how the Commission has used the Form PF data to monitor markets for the protection of investors and the integrity of the markets.2 This report is being submitted to Congress to satisfy that requirement. This is a report of the staff of the Commission, and the Commission has expressed no view regarding any analysis, findings, or conclusions contained herein.
II. Background
The Commission adopted Form PF in part to obtain, on behalf of FSOC, data that FSOC can use to monitor systemic risk in the U.S. financial markets. As required by statute, Form PF was designed by the Commission in consultation with FSOC and provides the Commission and FSOC with information about the operations and investment activities of private funds.3 Generally, Form PF must be filed by investment advisers registered (or required to be registered) with the Commission with at least $150 million in private fund assets under management. Most private fund advisers file Form PF annually to report general information such as the types of private funds advised (e.g., hedge funds, private equity, or liquidity funds), fund size, use of borrowings and derivatives, strategy, and types of investors. Certain larger advisers provide more information on a more frequent basis, including more detailed information on particular hedge funds and liquidity funds.
Consistent with provisions under the Advisers Act that provide for the confidentiality of any proprietary information of private fund advisers submitted on Form PF,4 Commission staff has implemented systems and controls designed to limit access to Form PF data and protect its confidentiality within and outside the agency.5 This includes procedures under which any Form PF data released to the public is reviewed 1 Reporting by Investment Advisers to Private Funds and Certain Commodity Pool Operators and Commodity
Trading Advisors on Form PF, Investment Advisers Act Release No. 3308 (Oct. 31, 2011) [76 Fed. Reg. 71128 (Nov. 16, 2011)], available at https://www.gpo.gov/fdsys/pkg/FR-2011-11-16/pdf/2011-28549.pdf (the “Adopting Release”); see also Money Market Fund Reform; Amendments to Form PF, Investment Advisers Act Release No. 3879 (July 23, 2014) [79 Fed. Reg. 47736 (Aug. 14, 2014)], available at https://www.gpo.gov/fdsys/pkg/FR-2014-08-14/pdf/2014-17747.pdf (amending certain reporting required by private liquidity funds) (the “Money Market Fund Reform Release”).
2 Advisers Act Section 204(b)(11), 15 U.S.C. § 80b-4(b)(11). 3 Section 204(b) of the Advisers Act requires the Commission to implement recordkeeping and reporting
requirements for private fund advisers to assist FSOC in monitoring systemic risk and for the Commission’s use for the protection of investors and the integrity of the markets. Section 204(b) was enacted as part of the Dodd-Frank Wall Street Reform and Consumer Protection Act, Public Law No. 111-203, § 404, 124 Stat. 1376 (the “Dodd-Frank Act”).
4 Advisers Act Section 204(b)(10), 15 U.S.C. § 80b-4(b)(10). 5 To implement the reporting requirements, the Commission developed an electronic filing system, the Private
Fund Reporting Depository (“PFRD”), through which advisers submit information required by Form PF. PFRD
before release so that the data is aggregated and/or masked to avoid public disclosure of proprietary information of private fund advisers. Senior staff members from various Divisions and Offices within the Commission are members of the Form PF Steering Committee tasked with overseeing these systems, controls, and procedures for access, use, and security of Form PF data.
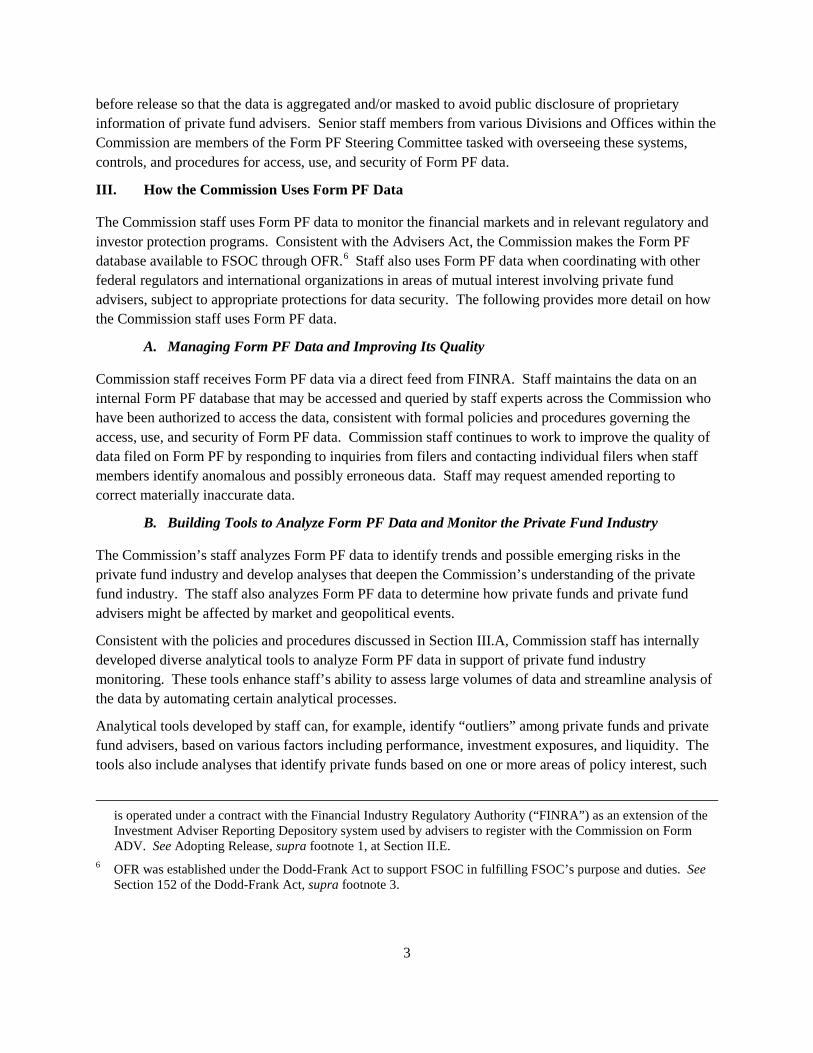
III. How the Commission Uses Form PF Data
The Commission staff uses Form PF data to monitor the financial markets and in relevant regulatory and investor protection programs. Consistent with the Advisers Act, the Commission makes the Form PF database available to FSOC through OFR.6 Staff also uses Form PF data when coordinating with other federal regulators and international organizations in areas of mutual interest involving private fund advisers, subject to appropriate protections for data security. The following provides more detail on how the Commission staff uses Form PF data.
A. Managing Form PF Data and Improving Its Quality
Commission staff receives Form PF data via a direct feed from FINRA. Staff maintains the data on an internal Form PF database that may be accessed and queried by staff experts across the Commission who have been authorized to access the data, consistent with formal policies and procedures governing the access, use, and security of Form PF data. Commission staff continues to work to improve the quality of data filed on Form PF by responding to inquiries from filers and contacting individual filers when staff members identify anomalous and possibly erroneous data. Staff may request amended reporting to correct materially inaccurate data.
B. Building Tools to Analyze Form PF Data and Monitor the Private Fund Industry
The Commission’s staff analyzes Form PF data to identify trends and possible emerging risks in the private fund industry and develop analyses that deepen the Commission’s understanding of the private fund industry. The staff also analyzes Form PF data to determine how private funds and private fund advisers might be affected by market and geopolitical events.
Consistent with the policies and procedures discussed in Section III.A, Commission staff has internally developed diverse analytical tools to analyze Form PF data in support of private fund industry monitoring. These tools enhance staff’s ability to assess large volumes of data and streamline analysis of the data by automating certain analytical processes.
Analytical tools developed by staff can, for example, identify “outliers” among private funds and private fund advisers, based on various factors including performance, investment exposures, and liquidity. The tools also include analyses that identify private funds based on one or more areas of policy interest, such
is operated under a contract with the Financial Industry Regulatory Authority (“FINRA”) as an extension of the Investment Adviser Reporting Depository system used by advisers to register with the Commission on Form ADV. See Adopting Release, supra footnote 1, at Section II.E.
6 OFR was established under the Dodd-Frank Act to support FSOC in fulfilling FSOC’s purpose and duties. See Section 152 of the Dodd-Frank Act, supra footnote 3.
4
as type of strategy, types of investments, use of derivatives, and extent of leverage. These tools also facilitate assessment of the operations and investment activities of private funds and private fund advisers reporting on Form PF.
C. Informing the Public about the Private Fund Industry
Since October 2015, Commission staff has published a quarterly report, Private Funds Statistics, which contains highly-aggregated private fund industry statistics derived from Form PF data. Private Funds Statistics is designed to enhance public understanding of the private fund industry and facilitate Commission staff participation in meetings and discussions with industry professionals, investors, and other regulators. The reports include, for example, statistics describing numbers and assets of private funds, the extent of private funds’ borrowing, derivatives holdings, and portfolio liquidity. Recently, the staff augmented this report with new statistics derived from aggregated Form PF data that provide additional information about hedge fund industry practices, including use of financial and economic leverage as well as types of investment exposures.7 In addition, new information about the characteristics of private liquidity funds may facilitate comparisons with data published by staff relating to registered money market funds.8 The most recent report can be found in the Appendix. To date, nine quarterly reports, including accessible versions, have been produced.9
Commission staff uses Form PF data to contribute to the Commission’s and investors’ understanding of the economic forces and dynamics underlying the private funds market by conducting research on various topics, such as characteristics of leverage used by hedge funds and consideration of self-reporting bias in commercial hedge fund databases. For example, a recently published staff white paper uses Form PF data to characterize private liquidity funds and compares them to registered money market funds.10
D. Assisting the Examinations and Enforcement Programs11
Commission staff’s analyses of Form PF data include risk-based analysis and monitoring initiatives that facilitate staff efforts to allocate limited exam resources efficiently in setting objectives and priorities for examinations of private fund advisers. For example, Commission staff uses Form PF data to identify as
7 See SEC Staff Supplements Quarterly Private Funds Statistics (May 3, 2017), available at
https://www.sec.gov/news/press-release/2017-92. 8 See Division of Investment Management, Money Market Fund Statistics, available at
https://www.sec.gov/divisions/investment/mmf-statistics.shtml. 9 Historical reports can be found at: https://www.sec.gov/divisions/investment/private-funds-statistics.shtml. 10 See Daniel Hiltgen, Division of Economic Risk and Analysis, Private Liquidity Funds: Characteristics and Risk
Indicators (Jan. 27, 2017), available at https://www.sec.gov/dera/staff-papers/white-papers/27jan17_hiltgen_private-liquidity-funds.html. The findings of the white paper indicate that, while most private liquidity funds and their parallel accounts did not formally commit to comply with the rule 2a-7 risk limits that apply to registered money market funds, the vast majority held portfolios that were consistent with those limits during the period studied.
11 Because examination and enforcement matters are generally non-public, this report only summarizes generally how Form PF data has been integrated into exam and enforcement matters. See Advisers Act Section 210(b).
potential examination candidates those private fund advisers whose activities involve areas of specific examination focus or that may present heightened compliance risks.
Before a private fund adviser examination begins, the staff generally reviews the adviser’s Form PF and ADV filings as part of a routine pre-examination evaluation. This review, in conjunction with other data sources, provides staff with an understanding of an adviser’s current business, operations, and investment strategy as well as an analysis of how this strategy has evolved.
Commission staff has developed automated analyses known as “flag reports” that summarize and combine key Form PF data with Form ADV data about an adviser’s private funds and advisory business. These reports are designed to assist staff in identifying potential reporting errors, compliance issues, or other issues of interest (i.e., “flags”) for the examination team to consider. Developed based on examiner insight and experiences, these reports distribute knowledge gained from exams and analysis to relevant staff on a need-to-know basis, which in turn informs monitoring programs. These reports are generated using custom code developed internally by staff to automate report production and deliver intuitive and timely output to examiners, using the most recently filed Form ADV data. The flag reports are designed to expedite staff preparation for examinations of a private fund adviser and its private funds and to help maximize the usefulness of those exams for other Commission initiatives.
Commission staff also obtains and reviews Form PF information of certain advisers in connection with enforcement investigations, including investigations of private fund advisers. For example, Commission staff used Form PF data together with other information to identify hedge fund advisers that reported returns that appeared inconsistent with the funds’ investment strategies or other benchmarks. These reviews have, in certain cases, led to examinations and enforcement investigations.
E. Supporting Rulemaking
Commission staff’s experience with Form PF has informed proposed and final Commission rulemakings, including the development of new Form N-PORT, a portfolio holdings reporting form for registered investment companies, and revisions to Form ADV.12 For example, Commission staff’s experience with the types and quality of data submitted on Form PF, as well as questions received from filers about reporting on Form PF, informed the staff’s recommendations to the Commission about the types of reporting recently adopted by the Commission on new Form N-PORT and amendments to Form ADV. Form PF data has also improved the Commission’s ability to analyze the impact of its rulemaking on markets and market participants. For example, during staff’s analysis of the effects of money market reform implementation,13 staff used Form PF data about private liquidity funds to help monitor for potential effects in short-term financing markets.
12 See Investment Company Reporting Modernization, Investment Company Act Release No. 32314 (Oct. 13, 2016)
[81 Fed. Reg. 81870 (Nov. 18, 2016)], available at https://www.gpo.gov/fdsys/pkg/FR-2016-11-18/pdf/2016-25349.pdf; Form ADV and Investment Advisers Act Rules, Investment Advisers Act Release No. 4509 (Aug. 25, 2016) [81 Fed. Reg. 60417 (Sept. 1, 2016)], available at https://www.gpo.gov/fdsys/pkg/FR-2016-09-01/pdf/2016-20832.pdf.
13 Money Market Fund Reform Release, supra footnote 1. The compliance date for money market reform was October 14, 2016.
F. Coordination and Consultation with Other Financial Regulators
As required by statute, and as described above, the Commission adopted Form PF in part to obtain, on behalf of FSOC, data for FSOC to use in monitoring systemic risk in the U.S. financial markets, and the Commission has made the Form PF database available to FSOC through OFR since 2013, subject to agreements regarding appropriate use of and confidentiality protections for Form PF data.
The Commission’s staff also uses Form PF data in its collaborations with other federal regulators on matters affecting the integrity of the markets and in communications with international organizations on areas of mutual interest regarding private funds and their investment advisers. For example, staff has used reports of data from Form PF in connection with participation in FSOC’s review of asset management products and activities.14 Additionally, staff has provided the Financial Stability Board (“FSB”) with certain aggregated and anonymized Form PF data related to an FSB work stream. Commission staff is also considering the extent to which it is appropriate to make the data more directly available to other federal regulators. In any instance where the staff shares information with an external regulatory entity, it is either subject to assurances of confidentiality or aggregated to avoid disclosure of any proprietary information.
IV. Conclusion
During the past year, the Commission’s staff has continued to use Form PF data for the protection of investors and the integrity of the markets in a variety of different ways across the agency, including for risk monitoring, to inform policy and regulation, in its examinations and investigations of private fund advisers, in working with other federal regulators and international organizations in areas of mutual interest concerning private funds and their investment advisers, and in research about private funds. Staff’s use of Form PF data reflects enhancements to the Commission’s data management and analytics capabilities that facilitate use of the data to identify and assess markets and market risks, identify potential reporting, compliance, and other issues of interest, and inform policy.
14 See, e.g., Remarks by Deputy Assistant Secretary Jonah Crane at a Meeting of the Financial Stability Oversight
Council (Nov. 16, 2016), available at https://www.treasury.gov/press-center/press-releases/Pages/jl0612.aspx; Financial Stability Oversight Council Releases Statement on Review of Asset Management Products and Activities (Apr. 18, 2016), available at https://www.treasury.gov/press-center/press-releases/Pages/jl0431.aspx.
Division of Investment Management Risk and Examinations Office
Private Funds Statistics
Fourth Calendar Quarter 2016
July 7, 2017
This is a report of the Staff of the Division of Investment Management’s Risk and Examinations Office (REO) of the U.S. Securities and Exchange Commission. The Commission has expressed no view regarding the analysis, findings, or conclusions contained herein.
July 7, 2017 Risk and Examinations Office
Introduction
This report provides a summary of recent private fund industry statistics and trends, reflecting data collected through Form PF and Form ADV filings.1 Form PF information provided in this report is aggregated, rounded, and/or masked to avoid potential disclosure of proprietary information of individual Form PF filers.
This report reflects data from First Calendar Quarter 2015 through Fourth Calendar Quarter 2016 as reported by Form PF filers.2 Please see the Appendix for information on the categories of Form PF filers, the definitions of capitalized terms, a description of the boxplots used in several figures, as well as other technical descriptions.
Form PF is still a relatively new reporting requirement for advisers to private funds. The Staff continues to work with the data and filers to identify and correct filing errors. In some instances, the Staff has made adjustments to the summary statistics presented here to correct what appear to be clear filing errors. In addition, the Staff has employed certain assumptions in aggregating the data. Future adjustments to these methodologies could lead to changes in reported statistics.
If you have any questions or comments about Fourth Calendar Quarter 2016 Private Funds Statistics, please contact:
Tim Dulaney, PhD, FRM or Tim Husson, PhD, FRM at [email protected] with subject line “Fourth Calendar Quarter 2016-Private Funds Statistics”.
1Only SEC-registered advisers with at least $150 million in private fund assets under management must report to the Commission on Form PF. SEC-registered investment advisers with less than $150 million in private fund assets under management, SEC exempt reporting advisers, and state-registered investment advisers are not required to file Form PF, but report general information about the private funds they manage on Form ADV. 2The Commission began receiving Form PF filings from Large Hedge Fund Advisers in July 2012. A full data set was
not received until March 2013. This report relies upon the Form PF database constructed and maintained by the Office of Research and Data Services in the Division of Economic and Risk Analysis.
Table 1: Number of Funds The “Total” row shows the total reported, and will not equal the sum of the preceding rows,
because the rows are not mutually exclusive.
Fund Type 2015Q1 2015Q2 2015Q3 2015Q4 2016Q1 2016Q2 2016Q3 2016Q4 Private Equity Fund 8,300 8,332 8,250 9,638 9,700 9,711 9,738 10,305 Hedge Fund 8,849 8,848 8,905 8,771 8,899 8,900 8,957 8,877 Other Private Fund 4,181 4,201 4,198 4,128 4,099 4,125 4,117 4,414 Section 4 Private Equity Fund 2,389 2,388 2,362 2,733 2,739 2,741 2,746 2,999 Real Estate Fund 1,800 1,801 1,806 2,056 2,093 2,091 2,108 2,420 Qualifying Hedge Fund 1,560 1,592 1,624 1,639 1,596 1,607 1,616 1,649 Securitized Asset Fund 1,345 1,347 1,349 1,406 1,421 1,418 1,417 1,451 Venture Capital Fund 505 506 508 636 635 646 651 754 Liquidity Fund 68 68 67 65 64 66 67 69 Section 3 Liquidity Fund 42 42 40 41 36 37 36 44 Total 25,048 25,103 25,083 26,700 26,911 26,957 27,055 28,290
Table 2: Number of Advisers Advising Each Fund Type The “Total” row shows the total reported, and will not equal the sum of the preceding rows,
because the rows are not mutually exclusive.
Fund Type 2015Q1 2015Q2 2015Q3 2015Q4 2016Q1 2016Q2 2016Q3 2016Q4 Private Equity Fund 922 924 923 1,015 1,017 1,017 1,016 1,076 Hedge Fund 1,669 1,667 1,665 1,687 1,690 1,684 1,679 1,677 Other Private Fund 557 558 557 570 561 564 565 571 Section 4 Private Equity Fund 208 208 208 241 242 242 242 247 Real Estate Fund 263 264 265 288 290 288 290 305 Qualifying Hedge Fund 525 528 537 535 525 525 515 531 Securitized Asset Fund 154 154 154 155 157 156 154 149 Venture Capital Fund 85 85 86 97 97 98 100 108 Liquidity Fund 35 35 34 37 37 37 37 39 Section 3 Liquidity Fund 22 22 21 21 19 19 19 24 Total 2,722 2,724 2,720 2,828 2,829 2,824 2,819 2,878
3In this report, “Funds” means all private funds reported on Form PF and “Advisers” means all SEC-registered investment advisers that file a Form PF to report private funds. Please see Appendix E for definitions of other capitalized terms used in this report.
4
July 7, 2017 Risk and Examinations Office
II Gross and Net Assets
A Aggregate Assets by Fund Type over Time
Table 3: Aggregate Private Fund Gross Asset Value (GAV) ($ Billions) As reported on Form PF, Question 8.
The “Total” row shows the total reported, and will not equal the sum of the preceding rows, because the rows are not mutually exclusive.
Fund Type 2015Q1 2015Q2 2015Q3 2015Q4 2016Q1 2016Q2 2016Q3 2016Q4 Hedge Fund 6,428 6,347 6,241 6,066 6,156 6,321 6,456 6,398 Qualifying Hedge Fund 5,312 5,278 5,193 4,988 4,989 5,099 5,240 5,214 Private Equity Fund 1,882 1,884 1,844 2,057 2,058 2,060 2,062 2,307 Section 4 Private Equity Fund 1,351 1,350 1,336 1,471 1,472 1,472 1,472 1,644 Other Private Fund 980 984 974 978 974 979 983 1,065 Securitized Asset Fund 382 384 382 416 420 420 420 448 Real Estate Fund 352 352 353 397 405 405 407 434 Liquidity Fund 289 265 274 286 273 287 292 293 Section 3 Liquidity Fund 287 263 267 283 247 258 249 274 Venture Capital Fund 39 39 39 55 55 56 55 62 Total 10,352 10,255 10,107 10,255 10,340 10,528 10,675 11,008
Table 4: Aggregate Private Fund Net Asset Value (NAV) ($ Billions) As reported on Form PF, Question 9.
The “Total” row shows the total reported, and will not equal the sum of the preceding rows, because the rows are not mutually exclusive.
Fund Type 2015Q1 2015Q2 2015Q3 2015Q4 2016Q1 2016Q2 2016Q3 2016Q4 Hedge Fund 3,578 3,588 3,475 3,452 3,402 3,429 3,488 3,484 Qualifying Hedge Fund 2,838 2,867 2,761 2,734 2,651 2,667 2,734 2,740 Private Equity Fund 1,741 1,742 1,704 1,882 1,881 1,883 1,884 2,064 Section 4 Private Equity Fund 1,273 1,272 1,258 1,376 1,377 1,377 1,377 1,492 Other Private Fund 878 880 871 876 873 878 883 973 Securitized Asset Fund 115 116 116 135 138 138 140 141 Real Estate Fund 280 280 281 319 323 323 324 339 Liquidity Fund 286 264 274 285 272 285 290 292 Section 3 Liquidity Fund 284 262 267 282 246 256 247 273 Venture Capital Fund 37 37 37 52 52 53 52 59 Total 6,916 6,908 6,758 7,001 6,940 6,988 7,061 7,354
5
July 7, 2017 Risk and Examinations Office
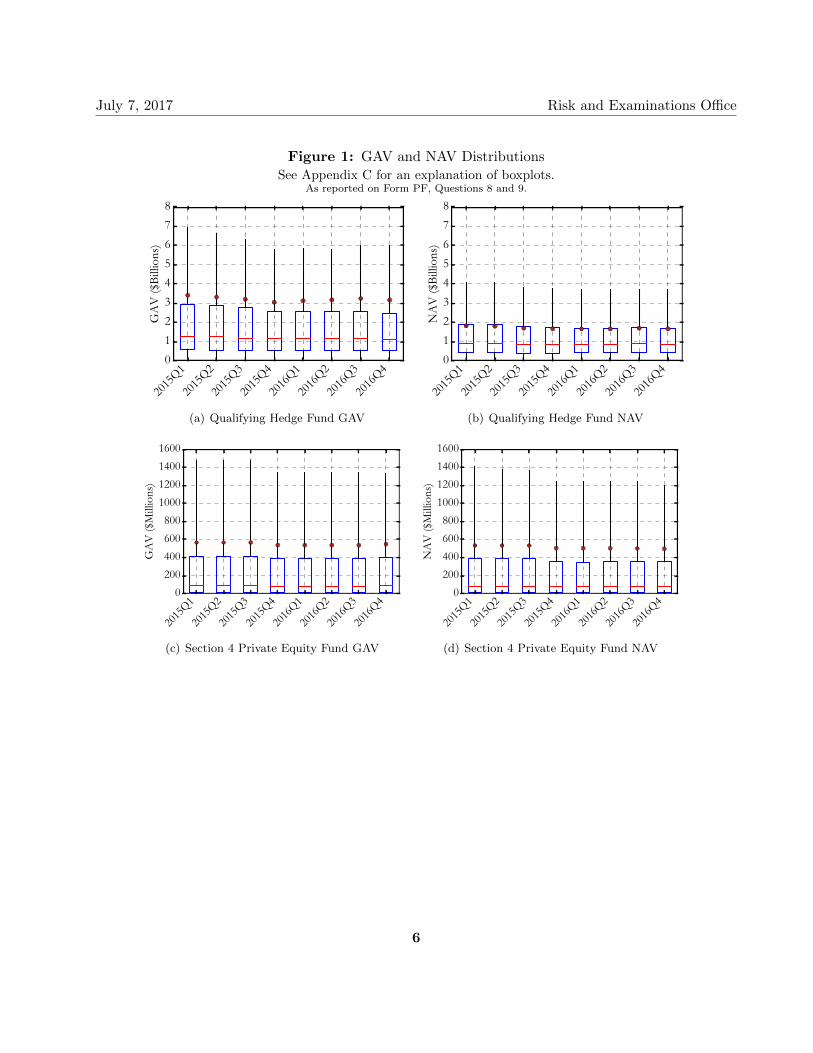
Figure 1: GAV and NAV Distributions See Appendix C for an explanation of boxplots.
As reported on Form PF, Questions 8 and 9.
2015
Q1
2015
Q2
2015
Q3
2015
Q4
2016
Q1
2016
Q2
2016
Q3
2016
Q4012345678
GA
V ($
Billi
ons)
2015
Q1
2015
Q2
2015
Q3
2015
Q4
2016
Q1
2016
Q2
2016
Q3
2016
Q4012345678
NA
V ($
Billi
ons)
(a) Qualifying Hedge Fund GAV (b) Qualifying Hedge Fund NAV
2015
Q1
2015
Q2
2015
Q3
2015
Q4
2016
Q1
2016
Q2
2016
Q3
2016
Q40
200400600800
1000120014001600
GA
V ($
Mill
ions
)
2015
Q1
2015
Q2
2015
Q3
2015
Q4
2016
Q1
2016
Q2
2016
Q3
2016
Q40
200400600800
1000120014001600
NA
V ($
Mill
ions
)
(c) Section 4 Private Equity Fund GAV (d) Section 4 Private Equity Fund NAV
6
July 7, 2017 Risk and Examinations Office
Figure 2: Ratio of GAV to NAV See Appendix C and Appendix D for an explanation of boxplots and winsorization.
As reported on Form PF, Questions 8, 9, and 10.
2015
Q1
2015
Q2
2015
Q3
2015
Q4
2016
Q1
2016
Q2
2016
Q3
2016
Q40.0
0.5
1.0
1.5
2.0
2.5
3.0
Ratio
of G
AV
to N
AV
Win
soriz
ed (l
imits
=[0
%,9
8%])
2015
Q1
2015
Q2
2015
Q3
2015
Q4
2016
Q1
2016
Q2
2016
Q3
2016
Q40.0
0.5
1.0
1.5
2.0
2.5
3.0
Ratio
of G
AV
to N
AV
Win
soriz
ed (l
imits
=[0
%,9
8%])
(a) All Private Funds (b) Qualifying Hedge Funds
7
July 7, 2017 Risk and Examinations Office
B Borrowings
Table 5: Aggregate Borrowings (Percent of Aggregate GAV) As reported on Form PF, Questions 8, 12, and 43 (Third Month).
Fund Type 2015Q1 2015Q2 2015Q3 2015Q4 2016Q1 2016Q2 2016Q3 2016Q4 Securitized Asset Fund 46.6 46.5 46.3 50.7 48.9 48.7 48.4 50.7 Qualifying Hedge Fund 38.1 38.8 39.2 38.2 39.2 38.2 39.9 39.7 Hedge Fund 35.4 36.1 36.5 35.7 36.8 36.2 38.1 37.3 Real Estate Fund 13.3 13.3 13.3 13.3 13.4 13.4 13.3 14.0 Private Equity Fund 3.9 4.0 4.0 4.8 4.8 4.9 4.9 5.1 Section 4 Private Equity Fund 2.3 2.3 2.3 3.4 3.4 3.4 3.4 4.0 Other Private Fund 2.9 2.8 2.8 2.3 2.2 2.2 2.1 2.8 Venture Capital Fund 0.6 0.6 0.6 0.4 0.4 0.4 0.4 0.4 Liquidity Fund 0.0 0.0 0.0 0.0 0.0 0.0 0.0 0.0 Section 3 Liquidity Fund 0.0 0.0 0.0 0.0 0.0 0.0 0.0 0.0
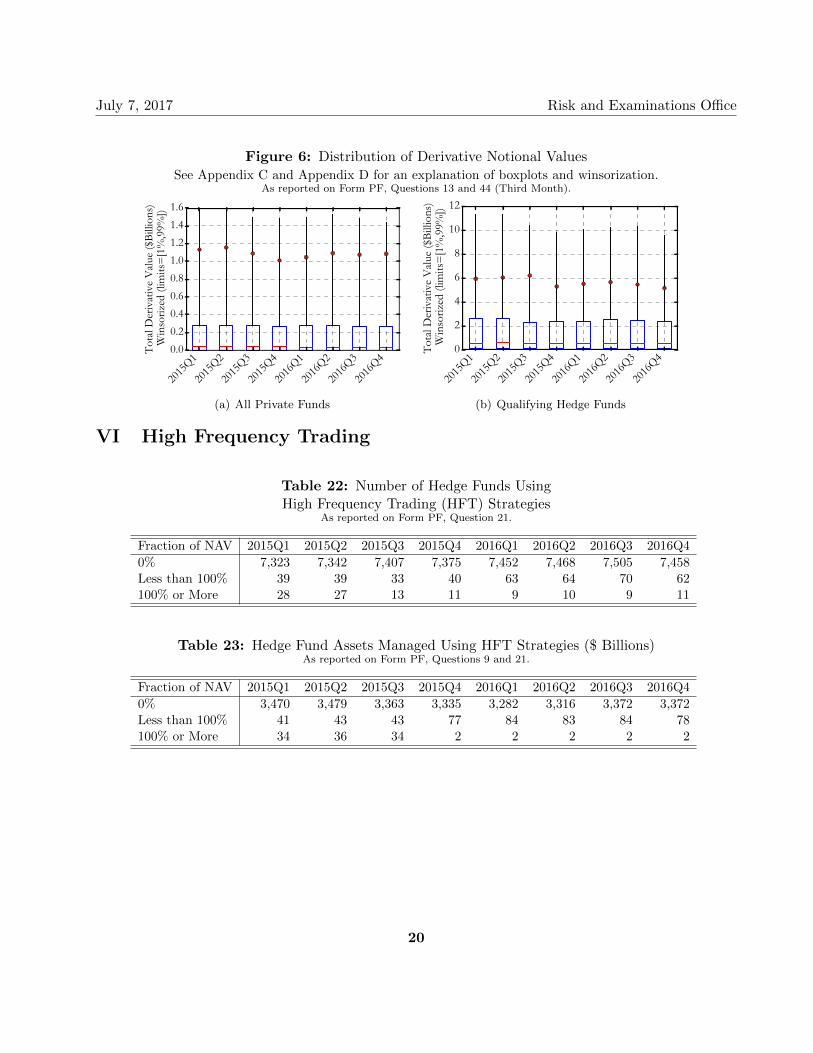
Figure 3: Distribution of Total Borrowings for All Private Funds and Qualifying Hedge Funds
See Appendix C for an explanation of boxplots. As reported on Form PF, Questions 12 and 43 (Third Month).
2015
Q1
2015
Q2
2015
Q3
2015
Q4
2016
Q1
2016
Q2
2016
Q3
2016
Q40
100
200
300
400
500
600
700
Tota
l Bor
row
ings
($M
illio
ns)
2015
Q1
2015
Q2
2015
Q3
2015
Q4
2016
Q1
2016
Q2
2016
Q3
2016
Q40.0
0.5
1.0
1.5
2.0
2.5
3.0
3.5
Tota
l Bor
row
ings
($Bi
llion
s)
(a) All Private Funds (b) Qualifying Hedge Funds
8
July 7, 2017 Risk and Examinations Office
Figure 4: Ratio of Borrowings to NAV See Appendix C and Appendix D for an explanation of boxplots and winsorization.
As reported on Form PF, Questions 9, 10, 12, and 43 (Third Month).
2015
Q1
2015
Q2
2015
Q3
2015
Q4
2016
Q1
2016
Q2
2016
Q3
2016
Q40.00.51.01.52.02.53.03.54.0
Ratio
of B
orro
win
gs to
NA
V W
inso
rized
(lim
its=
[0%
,98%
])
2015
Q1
2015
Q2
2015
Q3
2015
Q4
2016
Q1
2016
Q2
2016
Q3
2016
Q40.00.51.01.52.02.53.03.54.0
Ratio
of B
orro
win
gs to
NA
V W
inso
rized
(lim
its=
[0%
,98%
])
(a) All Private Funds (b) Qualifying Hedge Funds
9
July 7, 2017 Risk and Examinations Office
C Fair Value Hierarchy
Table 6: Assets According to Fair Value Hierarchy ($ Billions) As reported on Form PF, Question 14.
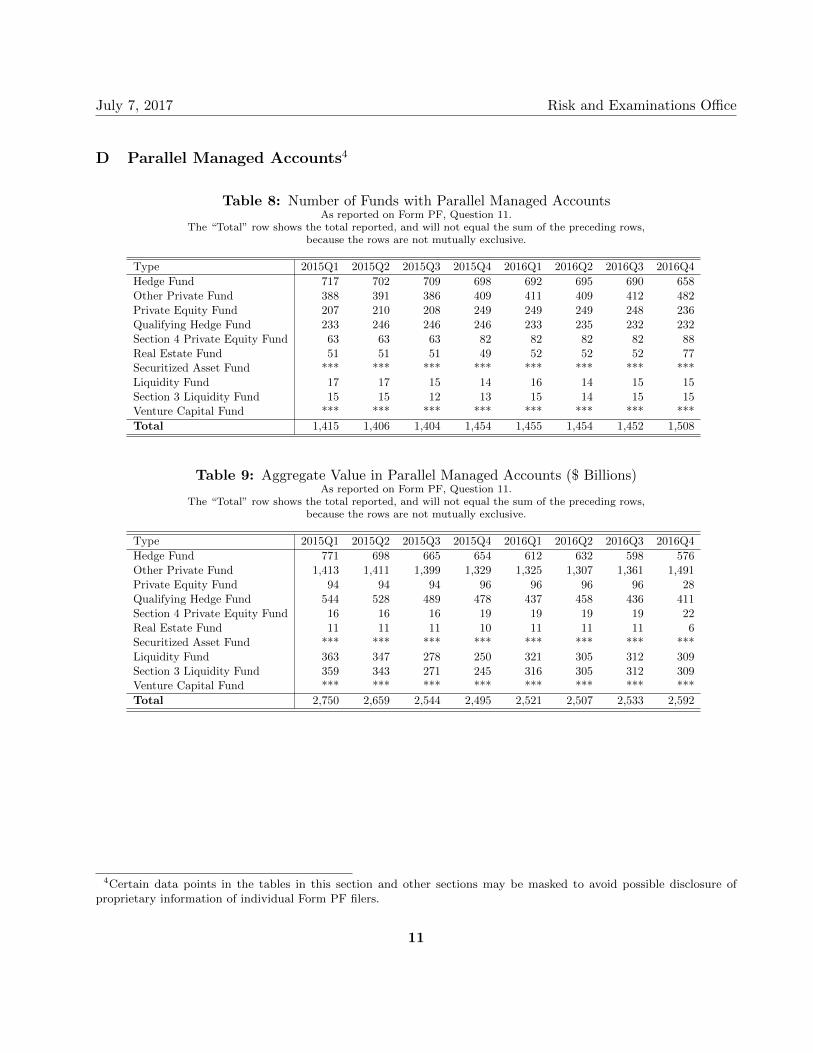
Table 8: Number of Funds with Parallel Managed Accounts As reported on Form PF, Question 11.
The “Total” row shows the total reported, and will not equal the sum of the preceding rows, because the rows are not mutually exclusive.
Type 2015Q1 2015Q2 2015Q3 2015Q4 2016Q1 2016Q2 2016Q3 2016Q4 Hedge Fund 717 702 709 698 692 695 690 658 Other Private Fund 388 391 386 409 411 409 412 482 Private Equity Fund 207 210 208 249 249 249 248 236 Qualifying Hedge Fund 233 246 246 246 233 235 232 232 Section 4 Private Equity Fund 63 63 63 82 82 82 82 88 Real Estate Fund 51 51 51 49 52 52 52 77 Securitized Asset Fund *** *** *** *** *** *** *** *** Liquidity Fund 17 17 15 14 16 14 15 15 Section 3 Liquidity Fund 15 15 12 13 15 14 15 15 Venture Capital Fund *** *** *** *** *** *** *** *** Total 1,415 1,406 1,404 1,454 1,455 1,454 1,452 1,508
Table 9: Aggregate Value in Parallel Managed Accounts ($ Billions) As reported on Form PF, Question 11.
The “Total” row shows the total reported, and will not equal the sum of the preceding rows, because the rows are not mutually exclusive.
Type 2015Q1 2015Q2 2015Q3 2015Q4 2016Q1 2016Q2 2016Q3 2016Q4 Hedge Fund 771 698 665 654 612 632 598 576 Other Private Fund 1,413 1,411 1,399 1,329 1,325 1,307 1,361 1,491 Private Equity Fund 94 94 94 96 96 96 96 28 Qualifying Hedge Fund 544 528 489 478 437 458 436 411 Section 4 Private Equity Fund 16 16 16 19 19 19 19 22 Real Estate Fund 11 11 11 10 11 11 11 6 Securitized Asset Fund *** *** *** *** *** *** *** *** Liquidity Fund 363 347 278 250 321 305 312 309 Section 3 Liquidity Fund 359 343 271 245 316 305 312 309 Venture Capital Fund *** *** *** *** *** *** *** *** Total 2,750 2,659 2,544 2,495 2,521 2,507 2,533 2,592
Certain data points in the tables in this section and other sections may be masked to avoid possible disclosure of proprietary information of individual Form PF filers.
11
4
July 7, 2017 Risk and Examinations Office
Figure 5: Parallel Managed Account Value Distributions See Appendix C for an explanation of boxplots.
As reported on Form PF, Question 11.
2015
Q1
2015
Q2
2015
Q3
2015
Q4
2016
Q1
2016
Q2
2016
Q3
2016
Q40.00.51.01.52.02.53.03.54.04.5
Para
llel M
anag
ed A
sset
s ($B
illio
ns)
2015
Q1
2015
Q2
2015
Q3
2015
Q4
2016
Q1
2016
Q2
2016
Q3
2016
Q40.00.51.01.52.02.53.03.54.0
Para
llel M
anag
ed A
sset
s ($B
illio
ns)
(a) All Private Funds (b) Qualifying Hedge Funds
12
July 7, 2017 Risk and Examinations Office
III Fund Domiciles and Adviser Main Offices
Table 10: Fund Domicile (Percent of NAV) As reported on Form PF, Question 9 and Form ADV.
VIII Information Reported by Large Hedge Fund Advisers
A Economic Leverage
Figure 7: Ratio of Hedge Fund Gross Notional Exposure to Net Asset Value See Appendix C and Appendix D for an explanation of boxplots and winsorization.
As reported on Form PF, Questions 3(a) and 26.
2015
-03
2015
-06
2015
-09
2015
-12
2016
-03
2016
-06
2016
-09
2016
-120
2
4
6
8
10
12
14
Ratio
of G
NE
to N
AV
Win
soriz
ed (l
imits
=[0
%,9
8%])
2015
-03
2015
-06
2015
-09
2015
-12
2016
-03
2016
-06
2016
-09
2016
-120
2
4
6
8
10
12
14
Ratio
of G
NE
(w/o
IRD
s) to
NA
V W
inso
rized
(lim
its=
[0%
,98%
])
(a) Gross Exposure with Interest Rate Derivatives (IRDs) (b) Gross Exposure without IRDs
23
July 7, 2017 Risk and Examinations Office
Figure 8: Ratio of Hedge Fund Long Notional Exposure (LNE) and Short Notional Exposure (SNE) to Net Asset Value Distribution
See Appendix C and Appendix D for an explanation of boxplots and winsorization. As reported on Form PF, Questions 3(a) and 26.
2015
-03
2015
-06
2015
-09
2015
-12
2016
-03
2016
-06
2016
-09
2016
-120
2
4
6
8
10
Ratio
of L
NE
to N
AV
Win
soriz
ed (l
imits
=[0
%,9
8%])
2015
-03
2015
-06
2015
-09
2015
-12
2016
-03
2016
-06
2016
-09
2016
-120
2
4
6
8
10
Ratio
of L
NE
(w/o
IRD
s) to
NA
V W
inso
rized
(lim
its=
[0%
,98%
])(a) Long Exposure with IRDs (b) Long Exposure without IRDs
2015
-03
2015
-06
2015
-09
2015
-12
2016
-03
2016
-06
2016
-09
2016
-120
2
4
6
8
10
Ratio
of S
NE
to N
AV
Win
soriz
ed (l
imits
=[0
%,9
8%])
2015
-03
2015
-06
2015
-09
2015
-12
2016
-03
2016
-06
2016
-09
2016
-120
2
4
6
8
10
Ratio
of S
NE
(w/o
IRD
s) to
NA
V W
inso
rized
(lim
its=
[0%
,98%
])
(c) Short Exposure with IRDs (d) Short Exposure without IRDs
24
July 7, 2017 Risk and Examinations Office
B Industry Concentration
Table 29: Large Hedge Fund Adviser Asset and Exposure Concentration
Figure 9: Distributions of Portfolio Turnover See Appendix C and Appendix D for an explanation of boxplots and winsorization.
As reported on Form PF, Questions 3(a) and 27.
2015
-03
2015
-06
2015
-09
2015
-12
2016
-03
2016
-06
2016
-09
2016
-120
10
20
30
40
50
60
Tota
l Tur
nove
r ($B
illio
ns)
Win
soriz
ed (l
imits
=[1
%,9
9%])
2015
-03
2015
-06
2015
-09
2015
-12
2016
-03
2016
-06
2016
-09
2016
-120
5
10
15
20
Ratio
of T
urno
ver t
o N
AV
Win
soriz
ed (l
imits
=[1
%,9
9%])
(a) Total Turnover (b) Total Turnover to NAV Ratio
26
July 7, 2017 Risk and Examinations Office
D Region and Country Exposure
Table 31: Large Hedge Fund Adviser Hedge Fund Region Exposure ($ Billions)
As reported on Form PF, Questions 3(a) and 28.
Region 2015Q1 2015Q2 2015Q3 2015Q4 2016Q1 2016Q2 2016Q3 2016Q4 North America 3,969 3,965 3,867 3,767 3,878 3,944 4,110 4,082 Europe EEA 1,234 1,197 1,186 1,095 1,216 1,197 1,219 1,222 Asia 605 611 575 578 619 600 611 530 South America 86 91 95 90 101 91 91 87 Europe Other 73 73 69 66 61 62 67 64 Supranational 41 34 35 33 30 30 33 46 Middle East 17 16 18 23 22 21 20 18 Africa 24 19 22 21 21 20 19 18
Region 2015Q1 2015Q2 2015Q3 2015Q4 2016Q1 2016Q2 2016Q3 2016Q4 North America 131.6 130.5 132.2 129.0 134.2 136.5 138.6 136.6 Europe EEA 40.9 39.4 40.5 37.5 42.1 41.4 41.1 40.9 Asia 20.0 20.1 19.7 19.8 21.4 20.8 20.6 17.8 South America 2.9 3.0 3.2 3.1 3.5 3.2 3.1 2.9 Europe Other 2.4 2.4 2.4 2.3 2.1 2.2 2.3 2.1 Supranational 1.4 1.1 1.2 1.1 1.0 1.0 1.1 1.5 Middle East 0.6 0.5 0.6 0.8 0.8 0.7 0.7 0.6 Africa 0.8 0.6 0.8 0.7 0.7 0.7 0.6 0.6
Table 32: Large Hedge Fund Adviser Hedge Fund Region Exposure (Percent of Aggregate NAV)
As reported on Form PF, Questions 3(a) and 28.
27
July 7, 2017 Risk and Examinations Office
Table 33: Large Hedge Fund Adviser Hedge Fund Country Exposure ($ Billions)
As reported on Form PF, Questions 3(a) and 28.
Country 2015Q1 2015Q2 2015Q3 2015Q4 2016Q1 2016Q2 2016Q3 2016Q4 United States 3,762 3,786 3,680 3,597 3,637 3,660 3,923 3,871 Japan 230 254 250 259 290 263 263 218 China (Inc. Hong Kong) 149 161 138 145 139 128 136 129 Brazil 41 39 45 41 42 35 36 37 India 33 33 31 30 28 30 35 30 Russia 9 9 7 8 11 13 15 14
Table 34: Large Hedge Fund Adviser Hedge Fund Country Exposure (Percent of Aggregate NAV)
As reported on Form PF, Questions 3(a) and 28.
Country 2015Q1 2015Q2 2015Q3 2015Q4 2016Q1 2016Q2 2016Q3 2016Q4 United States 124.7 124.6 125.8 123.2 125.8 126.7 132.3 129.5 Japan 7.6 8.3 8.5 8.9 10.0 9.1 8.9 7.3 China (Inc. Hong Kong) 5.0 5.3 4.7 5.0 4.8 4.4 4.6 4.3 Brazil 1.4 1.3 1.5 1.4 1.4 1.2 1.2 1.2 India 1.1 1.1 1.0 1.0 1.0 1.0 1.2 1.0 Russia 0.3 0.3 0.2 0.3 0.4 0.4 0.5 0.5
28
July 7, 2017 Risk and Examinations Office
IX Qualifying Hedge Fund Specific Information
A Economic Leverage
Figure 10: Ratio of Qualifying Hedge Fund Gross Notional Exposure to Net Asset Value See Appendix C and Appendix D for an explanation of boxplots and winsorization.
As reported on Form PF, Questions 9, 10, 26, and 30.
2015
-03
2015
-06
2015
-09
2015
-12
2016
-03
2016
-06
2016
-09
2016
-120
2
4
6
8
10
12
14
Ratio
of G
NE
to N
AV
Win
soriz
ed (l
imits
=[0
%,9
8%])
2015
-03
2015
-06
2015
-09
2015
-12
2016
-03
2016
-06
2016
-09
2016
-120
2
4
6
8
10
12
14
Ratio
of G
NE
(w/o
IRD
s) to
NA
V W
inso
rized
(lim
its=
[0%
,98%
])
(a) Including IRDs (b) Excluding IRDs
29
July 7, 2017 Risk and Examinations Office
Figure 11: Ratio of Qualifying Hedge Fund Long Notional Exposure (LNE) and Short Notional Exposure (SNE) to Net Asset Value
See Appendix C and Appendix D for an explanation of boxplots and winsorization. As reported on Form PF, Questions 9, 10, 26, and 30.
2015
-03
2015
-06
2015
-09
2015
-12
2016
-03
2016
-06
2016
-09
2016
-120
1
2
3
4
5
6
7
Ratio
of L
NE
to N
AV
Win
soriz
ed (l
imits
=[0
%,9
8%])
2015
-03
2015
-06
2015
-09
2015
-12
2016
-03
2016
-06
2016
-09
2016
-120
1
2
3
4
5
6
7
Ratio
of L
NE
(w/o
IRD
s) to
NA
V W
inso
rized
(lim
its=
[0%
,98%
])(a) LNE Including IRDs (b) LNE Excluding IRDs
2015
-03
2015
-06
2015
-09
2015
-12
2016
-03
2016
-06
2016
-09
2016
-120
1
2
3
4
5
6
7
Ratio
of S
NE
to N
AV
Win
soriz
ed (l
imits
=[0
%,9
8%])
2015
-03
2015
-06
2015
-09
2015
-12
2016
-03
2016
-06
2016
-09
2016
-120
1
2
3
4
5
6
7
Ratio
of S
NE
(w/o
IRD
s) to
NA
V W
inso
rized
(lim
its=
[0%
,98%
])
(c) SNE Including IRDs (d) SNE Excluding IRDs
30
July 7, 2017 Risk and Examinations Office
B Gross Exposure by Strategy5
Table 35: Exposures of Hedge Funds ($ Billions) As reported on Form PF, Questions 9 and 20.
Investment in other funds Subtotal 50 49 48 45 40 42 41 43
Total Total 4,544 4,576 4,458 4,327 4,424 4,484 4,539 4,487
5Form PF Question 20 requires advisers to indicate which strategies best describe the reporting fund’s strategies including a good faith estimate of the reporting fund’s allocation among strategies, and provides a list of investment strategies for this purpose. Form PF does not define the investment strategies listed by Question 20.
31
July 7, 2017 Risk and Examinations Office
Table 36: Exposures of Hedge Funds (Percent of NAV) As reported on Form PF, Questions 9 and 20.
Table 42: Investor Liquidity for Qualifying Hedge Funds (Percent of Aggregate NAV) As reported on Form PF, Questions 9 and 50.
Liquidation Period 2015Q1 2015Q2 2015Q3 2015Q4 2016Q1 2016Q2 2016Q3 2016Q4 At most 1 day 6.9 7.1 7.2 7.1 7.7 8.0 8.3 8.1 At most 7 days 13.0 13.3 13.6 13.3 14.0 14.1 14.3 14.1 At most 30 days 27.3 26.0 26.5 25.4 27.4 27.3 26.5 26.6 At most 90 days 46.7 45.9 46.9 45.4 47.1 46.6 47.3 49.7 At most 180 days 60.5 60.1 62.7 58.4 60.4 60.1 61.9 58.9 At most 365 days 75.3 74.9 74.8 72.9 75.4 75.6 74.7 74.2
Table 43: Portfolio Liquidity for Qualifying Hedge Funds (Percent of Aggregate NAV) As reported on Form PF, Questions 9, 26, 30, and 32.
Liquidation Period 2015Q1 2015Q2 2015Q3 2015Q4 2016Q1 2016Q2 2016Q3 2016Q4 At most 1 day 40.0 39.5 40.9 40.1 40.6 40.7 39.3 39.6 At most 7 days 63.8 63.3 63.7 63.3 64.4 64.0 62.9 62.6 At most 30 days 78.4 77.5 77.1 76.7 77.0 76.6 76.1 75.6 At most 90 days 85.8 85.0 84.4 83.4 83.2 82.5 82.5 81.9 At most 180 days 89.4 88.6 87.9 87.0 86.5 86.2 85.9 85.3 At most 365 days 92.5 92.0 91.3 90.5 90.1 89.9 89.6 89.1
Figure 12: Asset Weighted-Average Qualifying Hedge Fund Investor and Portfolio Liquidity
As reported on Form PF, Questions 9, 26, 30, 32, and 50 as of Fourth Calendar Quarter 2016.
At most
1 day
At most
7 day
s
At most
30 da
ys
At most
90 da
ys
At most
180 d
ays
At most
365 d
ays0
102030405060708090
Perc
ent o
f Fun
d N
et A
sset
s (%
)
Portfolio Liquidity Investor Liquidity
35
July 7, 2017 Risk and Examinations Office
Table 44: Restrictions on Qualifying Hedge Fund Assets ($ Billions) As reported on Form PF, Questions 48 and 49.
Total Total 2,411 2,409 2,387 2,260 2,291 2,247 2,426 2,375
37
July 7, 2017 Risk and Examinations Office
Figure 14: Ratio of Collateral Posted to Secured Borrowing for Qualifying Hedge Funds
See Appendix C and Appendix D for an explanation of boxplots and winsorization. As reported on Form PF, Question 43.
2015
-03
2015
-06
2015
-09
2015
-12
2016
-03
2016
-06
2016
-09
2016
-12012345678
Colla
tera
l/To
tal S
ecur
ed B
orro
win
g W
inso
rized
(lim
its=
[0%
,98%
])
(a) Total Secured Borrowing
2015
-03
2015
-06
2015
-09
2015
-12
2016
-03
2016
-06
2016
-09
2016
-12012345678
Colla
tera
l/Pr
ime
Brok
er B
orro
win
g W
inso
rized
(lim
its=
[0%
,98%
])
2015
-03
2015
-06
2015
-09
2015
-12
2016
-03
2016
-06
2016
-09
2016
-12012345678
Colla
tera
l/Re
vers
e Re
po B
orro
win
g W
inso
rized
(lim
its=
[0%
,98%
])
(b) Prime Broker Borrowing (c) Reverse Repo Borrowing
38
July 7, 2017 Risk and Examinations Office
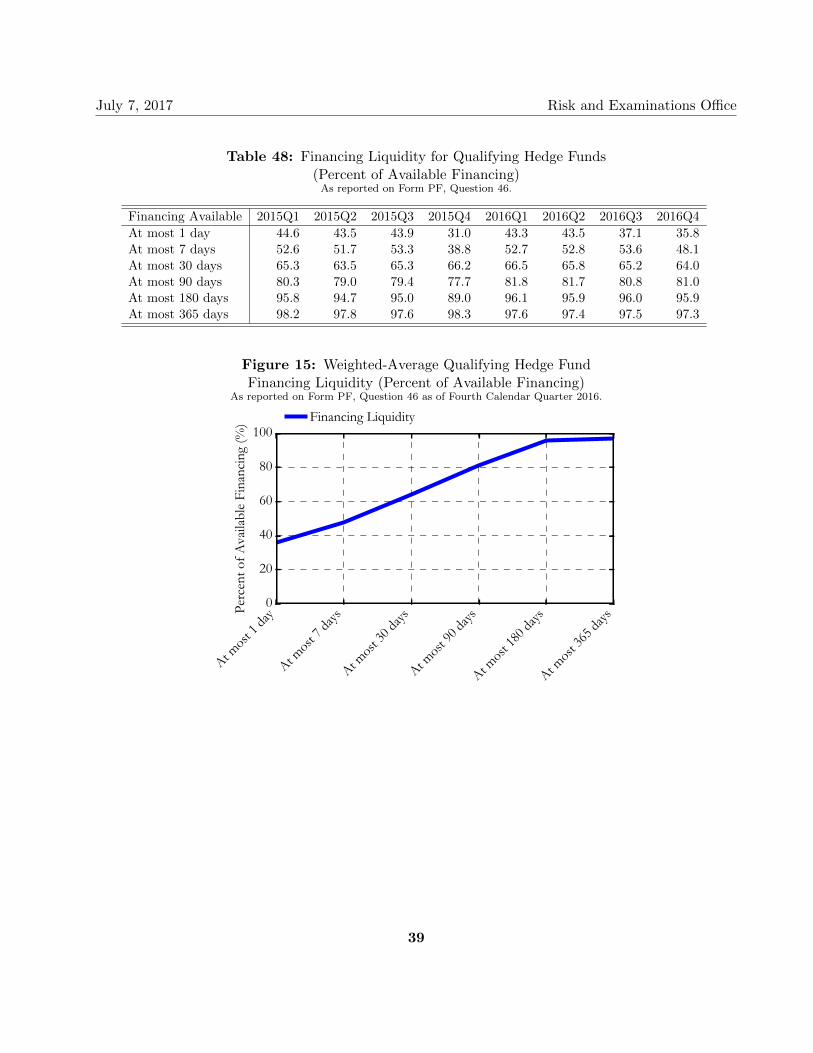
Table 48: Financing Liquidity for Qualifying Hedge Funds (Percent of Available Financing) As reported on Form PF, Question 46.
Financing Available 2015Q1 2015Q2 2015Q3 2015Q4 2016Q1 2016Q2 2016Q3 2016Q4 At most 1 day 44.6 43.5 43.9 31.0 43.3 43.5 37.1 35.8 At most 7 days 52.6 51.7 53.3 38.8 52.7 52.8 53.6 48.1 At most 30 days 65.3 63.5 65.3 66.2 66.5 65.8 65.2 64.0 At most 90 days 80.3 79.0 79.4 77.7 81.8 81.7 80.8 81.0 At most 180 days 95.8 94.7 95.0 89.0 96.1 95.9 96.0 95.9 At most 365 days 98.2 97.8 97.6 98.3 97.6 97.4 97.5 97.3
Figure 15: Weighted-Average Qualifying Hedge Fund Financing Liquidity (Percent of Available Financing)
As reported on Form PF, Question 46 as of Fourth Calendar Quarter 2016.
At most
1 day
At most
7 day
s
At most
30 da
ys
At most
90 da
ys
At most
180 d
ays
At most
365 d
ays0
20
40
60
80
100
Perc
ent o
f Ava
ilabl
e Fi
nanc
ing
(%) Financing Liquidity
39
July 7, 2017 Risk and Examinations Office
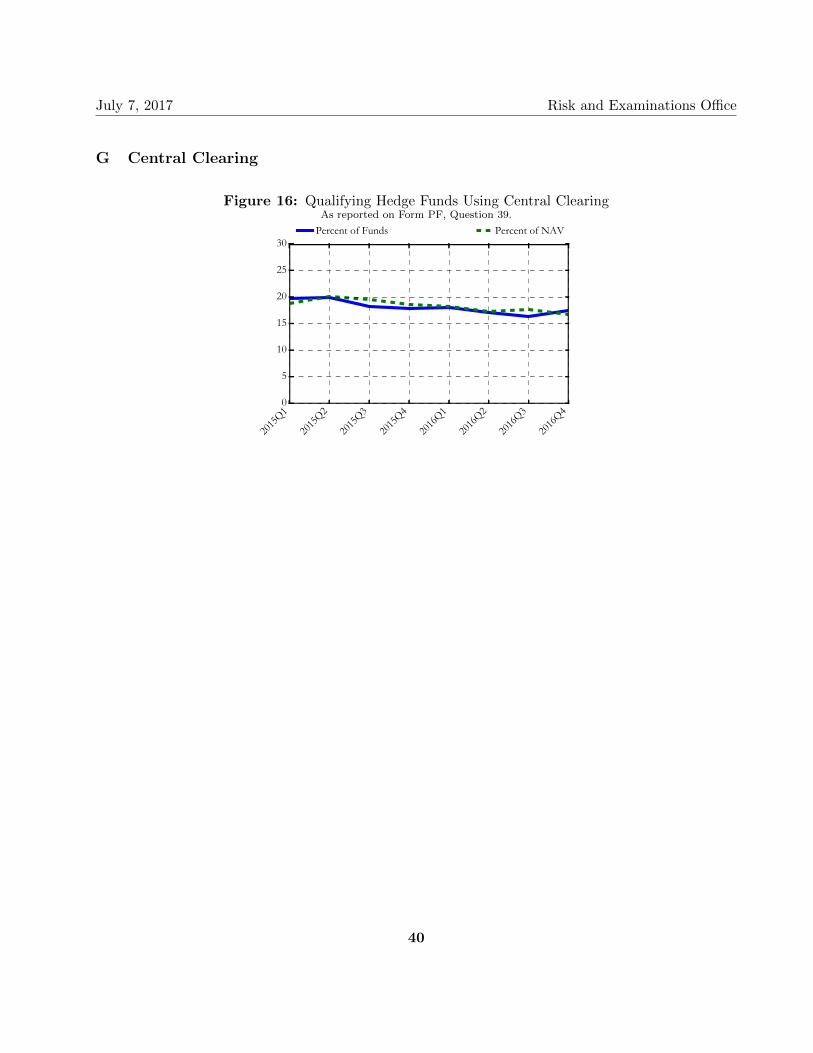
G Central Clearing
Figure 16: Qualifying Hedge Funds Using Central Clearing As reported on Form PF, Question 39.
2015
Q1
2015
Q2
2015
Q3
2015
Q4
2016
Q1
2016
Q2
2016
Q3
2016
Q40
5
10
15
20
25
30Percent of Funds Percent of NAV
40
July 7, 2017 Risk and Examinations Office
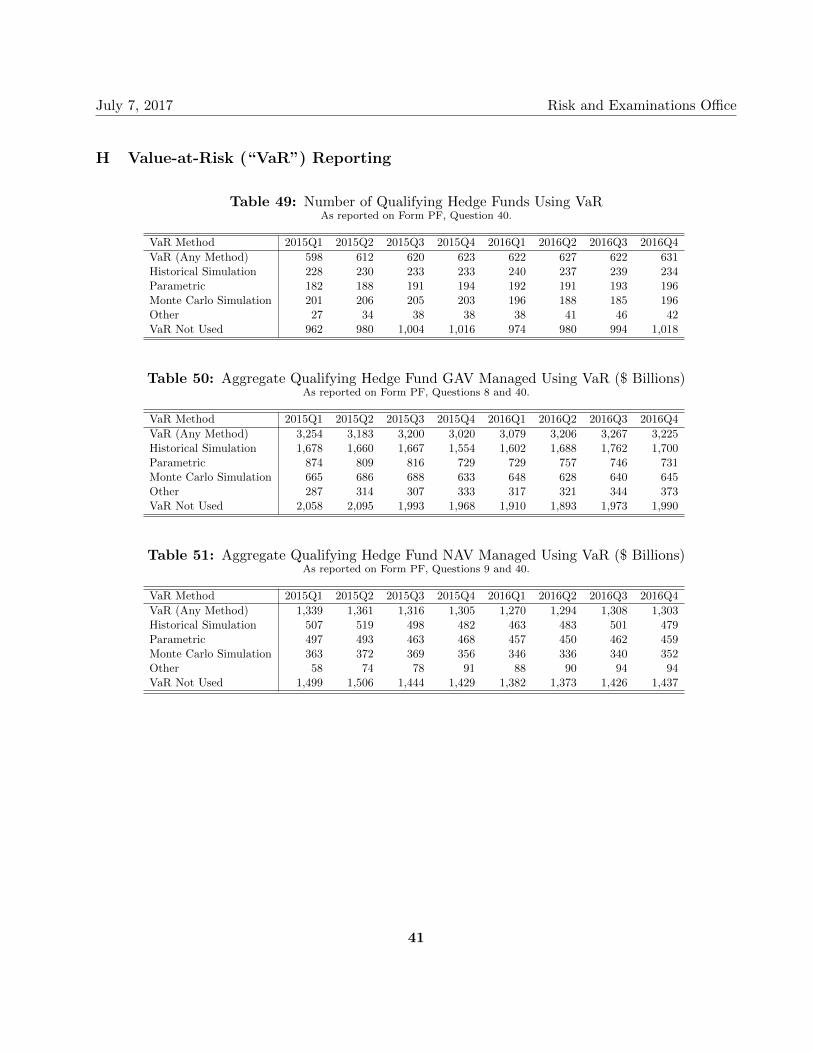
H Value-at-Risk (“VaR”) Reporting
Table 49: Number of Qualifying Hedge Funds Using VaR As reported on Form PF, Question 40.
VaR Method 2015Q1 2015Q2 2015Q3 2015Q4 2016Q1 2016Q2 2016Q3 2016Q4 VaR (Any Method) 598 612 620 623 622 627 622 631 Historical Simulation 228 230 233 233 240 237 239 234 Parametric 182 188 191 194 192 191 193 196 Monte Carlo Simulation 201 206 205 203 196 188 185 196 Other 27 34 38 38 38 41 46 42 VaR Not Used 962 980 1,004 1,016 974 980 994 1,018
Table 50: Aggregate Qualifying Hedge Fund GAV Managed Using VaR ($ Billions) As reported on Form PF, Questions 8 and 40.
VaR Method 2015Q1 2015Q2 2015Q3 2015Q4 2016Q1 2016Q2 2016Q3 2016Q4 VaR (Any Method) 3,254 3,183 3,200 3,020 3,079 3,206 3,267 3,225 Historical Simulation 1,678 1,660 1,667 1,554 1,602 1,688 1,762 1,700 Parametric 874 809 816 729 729 757 746 731 Monte Carlo Simulation 665 686 688 633 648 628 640 645 Other 287 314 307 333 317 321 344 373 VaR Not Used 2,058 2,095 1,993 1,968 1,910 1,893 1,973 1,990
Table 51: Aggregate Qualifying Hedge Fund NAV Managed Using VaR ($ Billions) As reported on Form PF, Questions 9 and 40.
VaR Method 2015Q1 2015Q2 2015Q3 2015Q4 2016Q1 2016Q2 2016Q3 2016Q4 VaR (Any Method) 1,339 1,361 1,316 1,305 1,270 1,294 1,308 1,303 Historical Simulation 507 519 498 482 463 483 501 479 Parametric 497 493 463 468 457 450 462 459 Monte Carlo Simulation 363 372 369 356 346 336 340 352 Other 58 74 78 91 88 90 94 94 VaR Not Used 1,499 1,506 1,444 1,429 1,382 1,373 1,426 1,437
41
I
July 7, 2017 Risk and Examinations Office
Stress Testing and VaR
Table 52: Number of Qualifying Hedge Funds Managed Using VaR or Market Factor Change Testing (“Stress Testing”)
As reported on Form PF, Questions 40 and 42.
Risk Tool Used 2015Q1 2015Q2 2015Q3 2015Q4 2016Q1 2016Q2 2016Q3 2016Q4 Stress and VaR 513 528 535 541 538 545 547 555 Stress, No VaR 428 428 461 455 443 453 446 452 No Stress, VaR 85 84 85 82 84 82 75 76 Neither 534 552 543 561 531 527 548 566
Table 53: Aggregate Qualifying Hedge Fund GAV Managed Using VaR or Stress Testing ($ Billions) As reported on Form PF, Questions 8, 40, and 42.
Risk Tool Used 2015Q1 2015Q2 2015Q3 2015Q4 2016Q1 2016Q2 2016Q3 2016Q4 Stress and VaR 3,028 2,971 2,985 2,799 2,861 3,001 3,088 3,045 Stress, No VaR 1,076 1,085 1,063 1,030 1,009 1,006 1,027 998 No Stress, VaR 226 212 215 221 218 205 179 179 Neither 982 1,010 930 938 901 887 946 992
Table 54: Aggregate Qualifying Hedge Fund NAV Managed Using VaR or Stress Testing ($ Billions) As reported on Form PF, Questions 9, 40, and 42.
Risk Tool Used 2015Q1 2015Q2 2015Q3 2015Q4 2016Q1 2016Q2 2016Q3 2016Q4 Stress and VaR 1,193 1,223 1,176 1,165 1,144 1,162 1,191 1,185 Stress, No VaR 718 712 712 692 666 664 664 658 No Stress, VaR 147 138 141 140 125 132 117 117 Neither 780 793 733 736 715 709 762 779
42
July 7, 2017 Risk and Examinations Office
X Section 3 Liquidity Fund Specific Information
A Liquidity
Table 55: Investor Liquidity For Section 3 Liquidity Funds (Percent of Aggregate NAV) As reported on Form PF, Questions 9 and 64.
Liquidation Period 2015Q1 2015Q2 2015Q3 2015Q4 2016Q1 2016Q2 2016Q3 2016Q4 At most 1 day 73.2 73.8 74.1 74.4 81.2 77.4 80.1 80.9 At most 7 days 92.0 92.1 92.3 92.2 96.0 96.0 98.3 97.3 At most 30 days 99.4 99.4 99.4 99.4 99.7 99.7 99.9 99.6 At most 90 days 100.0 100.0 100.0 100.0 100.0 100.0 100.0 99.8 At most 180 days 100.0 100.0 100.0 100.0 100.0 100.0 100.0 99.9 At most 365 days 100.0 100.0 100.0 100.0 100.0 100.0 100.0 100.0
Table 56: Suspensions and Gates of Section 3 Liquidity Funds ($ Billions) As reported on Form PF, Question 63.
XI Section 4 Private Equity Fund Specific Information
A CPC Industry Concentration
Table 63: Gross Assets in CPC Industries (Percent of Total) As reported on Form PF, Questions 8 and 77.
Type 2013Q4 2014Q4 2015Q4 2016Q4 Oil & Gas Extraction 7.9 7.8 5.8 6.7 Software Publishers 2.9 3.8 4.9 6.1 Electric Power Generation, Transmission & Distribution 3.8 3.9 3.7 4.1 Telecommunications Data Processing Services 2.6 2.5 2.7 2.3 Pipeline Transportation 2.5 2.6 2.4 2.2 Other Insurance Related Activities 0.9 1.0 1.0 2.0 Data Processing, Hosting, & Related Services 2.9 2.3 1.8 2.0 Other Information Services 2.0 2.1 1.9 1.8 Other Financial Vehicles 0.4 0.4 0.6 1.8 Other Financial Investment Activities 2.0 1.8 1.8 1.7 Custom Computer Programming Services 0.9 1.0 1.5 1.5 Pharmaceutical & Medicine Mfg 1.0 1.3 1.5 1.4 Management, Scientific, & Technical Consulting Services 1.0 1.2 1.1 1.3 Investigation & Security Services 0.5 0.5 0.7 1.2 Educational Services 1.1 1.1 1.3 1.2 Insurance Agencies & Brokerages 0.9 1.0 1.0 1.2 Activities Related to Credit Intermediation 1.2 1.2 1.4 1.0 Computer Systems Design Services 0.5 0.8 0.6 1.0
48
July 7, 2017 Risk and Examinations Office
B CPC Financial Leverage
Figure 22: Distribution of Ratio of Aggregate CPC Current Liabilities to Total Liabilities of Section 4 Private Equity Funds
See Appendix C for an explanation of boxplots. As reported on Form PF, Questions 71 and 72.
2013
Q4
2014
Q4
2015
Q4
2016
Q40
10
20
30
40
50
60Ra
tio o
f Por
tfolio
Com
pany
Cur
rent
L
iabili
ties t
o To
tal L
iabili
ties (
%)
Figure 23: Distribution of CPC Payment-in-Kind or Zero Coupon Borrowings to Total Borrowings Ratio
See Appendix C for an explanation of boxplots. As reported on Form PF, Question 73.
2013
Q4
2014
Q4
2015
Q4
2016
Q40
10
20
30
40
50
CPC
Paym
ent-i
n-K
ind
Borr
owin
gs
to T
otal
Borr
owin
gs R
atio
(%)
49
July 7, 2017 Risk and Examinations Office
C CPC Investments by Region and Country
Table 64: Aggregate Gross Value of Private Equity Investments by Region ($ Billions)
As reported on Form PF, Questions 70 and 78.
Region 2013Q4 2014Q4 2015Q4 2016Q4 North America 5,274 4,501 4,132 3,942 Europe EEA 1,423 1,259 941 848 Asia 571 462 447 406 South America 75 85 58 111 Supranational 65 67 23 37 Europe Other 25 9 21 22 Africa 20 12 12 18 Middle East 8 12 9 14
Table 65: Private Equity CPC Investments by Region (Percent of Aggregate CPC Gross Asset Value)
As reported on Form PF, Questions 70 and 78.
Region 2013Q4 2014Q4 2015Q4 2016Q4 North America 70.7 70.2 73.2 73.0 Europe EEA 19.1 19.6 16.7 15.7 Asia 7.6 7.2 7.9 7.5 South America 1.0 1.3 1.0 2.0 Supranational 0.9 1.0 0.4 0.7 Europe Other 0.3 0.1 0.4 0.4 Africa 0.3 0.2 0.2 0.3 Middle East 0.1 0.2 0.2 0.3
50
July 7, 2017 Risk and Examinations Office
Table 66: Aggregate Gross Asset Value of Private Equity CPC Investments by Country ($ Billions)
As reported on Form PF, Questions 70 and 78.
Country 2013Q4 2014Q4 2015Q4 2016Q4 United States 5,035 4,300 3,943 3,776 China and Hong Kong 171 186 173 114 India 63 83 89 92 Brazil 45 58 41 88 Japan 233 98 85 79 Russia 3 2 5 4
Table 67: Private Equity CPC Investments by Country (Percent of Aggregate CPC Gross Asset Value)
As reported on Form PF, Questions 70 and 78.
Country 2013Q4 2014Q4 2015Q4 2016Q4 United States 67.5 67.1 69.9 70.0 China and Hong Kong 2.3 2.9 3.1 2.1 India 0.8 1.3 1.6 1.7 Brazil 0.6 0.9 0.7 1.6 Japan 3.1 1.5 1.5 1.5 Russia 0.0 0.0 0.1 0.1
51
July 7, 2017 Risk and Examinations Office
XII Appendices
A Form PF Filer Categories
The amount of information an adviser must report and the frequency with which it must report on Form PF depends on the amount of the adviser’s private fund assets and the types of private funds managed. Reporting advisers must identify the types of private funds they manage on Form PF.
1 All Private Fund Advisers
SEC-registered investment advisers with at least $150 million in private fund assets under management are required to file Form PF. Registered investment advisers with less than $150 million in private funds assets under management, exempt reporting advisers, and state-registered advisers report general private fund data on Form ADV, but do not file Form PF.6 Not all Form PF filers report on a quarterly basis. Smaller private fund advisers and all private equity fund advisers file Form PF on an annual basis, while larger hedge fund advisers and larger liquidity fund advisers file the form quarterly.7 As a result of the difference in reporting frequency, information in this report related to funds that are reported annually may be dated by several months.8
2 Large Hedge Fund Advisers
Large Hedge Fund Advisers have at least $1.5 billion in hedge fund assets under management. A Large Hedge Fund Adviser is required to file Form PF quarterly and provide data about each hedge fund it managed during the reporting period (irrespective of the size of the fund).
Large Hedge Fund Advisers must report more information on Form PF about Qualifying Hedge Funds than other hedge funds they manage during the reporting period. A Qualifying Hedge Fund is any hedge fund advised by a Large Hedge Fund Adviser that had a NAV (individually or in combination with any feeder funds, parallel funds, and/or dependent parallel managed accounts) of at least $500 million as of the last day of any month in the fiscal quarter immediately preceding the adviser’s most recently completed fiscal quarter. This report provides information about all hedge funds reported by Large Hedge Fund Advisers, including Qualifying Hedge Funds and smaller hedge funds. This report also provides an overview of certain data reported solely for Qualifying Hedge Funds. 6Note that these thresholds are on a gross basis. Exempt reporting advisers are advisers that rely on the exemptions
from SEC registration in Advisers Act section 203(l) for venture capital fund advisers and section 203(m) for advisers managing less than $150 million in private fund assets in the U.S. 7An adviser may be a large hedge fund adviser that must file quarterly to report data about the hedge funds it manages
as well as a private equity fund adviser that must file only annually to report data about the private equity funds it manages. 8In addition, because some Form PF filers have fiscal year ends that are not December 31, not all Form PF data is filed
as of a single date.
52
July 7, 2017 Risk and Examinations Office
3 Large Liquidity Fund Advisers
Large Liquidity Fund Advisers have at least $1 billion in combined liquidity fund and money market fund assets under management. On a quarterly basis, such advisers report on Form PF data about the liquidity funds they managed during the reporting period (irrespective of the size of the fund). This report contains information about all liquidity funds reported by Large Liquidity Fund Advisers (referred to in this report as “Section 3 Liquidity Funds”).
4 Large Private Equity Fund Advisers
Large Private Equity Fund Advisers have at least a $2 billion in private equity fund assets under management. These advisers are required to file Form PF annually in connection with the private equity funds they managed during the reporting period. Smaller Private Equity Fund Advisers must file annually as well, but provide less detail regarding the private equity funds they manage. This report provides information about private equity funds managed by Large Private Equity Fund Advisers (referred to in this report as “Section 4 Private Equity Funds”).
5 Other Private Fund Advisers
All advisers required to file Form PF that are not Large Hedge Fund Advisers or Large Liquidity Fund Advisers must file Form PF annually to report data about each private fund managed by the adviser.9 These “annual filing advisers” include smaller fund advisers, Large Private Equity Fund advisers, and venture capital fund advisers. Annual filers must provide specific information about each of the private funds they manage on an annual basis.
9This includes “other private funds,” which are private funds that do not meet the Form PF definition of hedge fund, liquidity fund, private equity fund, real estate fund, securitized asset fund, or venture capital fund.
53
July 7, 2017 Risk and Examinations Office
B Handling Annual and Quarterly Data
Only a subset of filers (Large Hedge Fund Advisers and Large Liquidity Fund Advisers) are required to file Form PF quarterly; all other filings are made annually. Annual filings are typically, but not always, made at the end of the calendar year, as Form PF allows filings to be made at the end of an adviser’s fiscal year. In order to present the most complete and recent data possible, while accounting for differences in filing dates, we use the following procedure for determining which data to consider in any given quarter:
First, filings are grouped by their report date within their reported year:
• (Q1): February 15 to May 14
• (Q2): May 15 to August 14
• (Q3): August 15 to November 14
• (Q4): November 15 to February 14
Then, responses for funds that have no information are ‘filled forward’ — essentially, copied from last reported values — up to a maximum of three quarters. Any fund that has no data four quarters after its most recent date is no longer counted or included in any calculations.10
C How to Read a Boxplot
In these figures, the boxes extend from the twenty-fifth percentile to the seventy-fifth percentile, while the levels (the dashed vertical lines) extend from the tenth to the twenty-fifth percentile as well as the seventy-fifth to the ninetieth percentile. Also shown as a red line within the box is the median (the fiftieth percentile) and the horizontal dashed line is mean of the distribution. See Figure 24 for an explanation of each feature.
Figure 24: How to Read a Boxplot
10Form PF has no requirement to inform the SEC if a fund liquidates or otherwise terminates operations. Therefore, liquidations or terminations may not be reflected on this report for up to one year after ceasing operations.
54
July 7, 2017 Risk and Examinations Office
D Mitigating the Effects of Outliers
Form PF data occasionally contains spurious outliers. While REO staff actively engages in outreach to identify and correct such values, not all aberrant values have been corrected as of this writing. To reduce the effect of these outliers on the aggregate measures reported here, we have chosen to winsorize or trim some data sets.
Winsorization is a technique for reducing the effect of outliers by reducing the size of the largest and smallest values in a distribution.11 For example, to calculate a 95%/5% winsorized data set, all the values above the ninety-fifth percentile are set to the value of the ninety-fifth percentile, and all the values below the fifth percentile are set to the value of the fifth percentile. Effectively, this procedure makes the very largest values smaller (but still large), and all the smallest values larger (but still small). This approach can be more effective than trimming (simply removing the largest and/or smallest values) because it does not change the number of data points and does not change the median or other percentile values within the 95%/5% range. All instances of winsorization or trimming have been noted and include the affected percentiles.
11Such techniques are known as ‘robust statistics’, reviewed for example in Wilcox (2012), Introduction to Robust Estimation & Hypothesis Testing, 3rd Edition.
55
July 7, 2017 Risk and Examinations Office
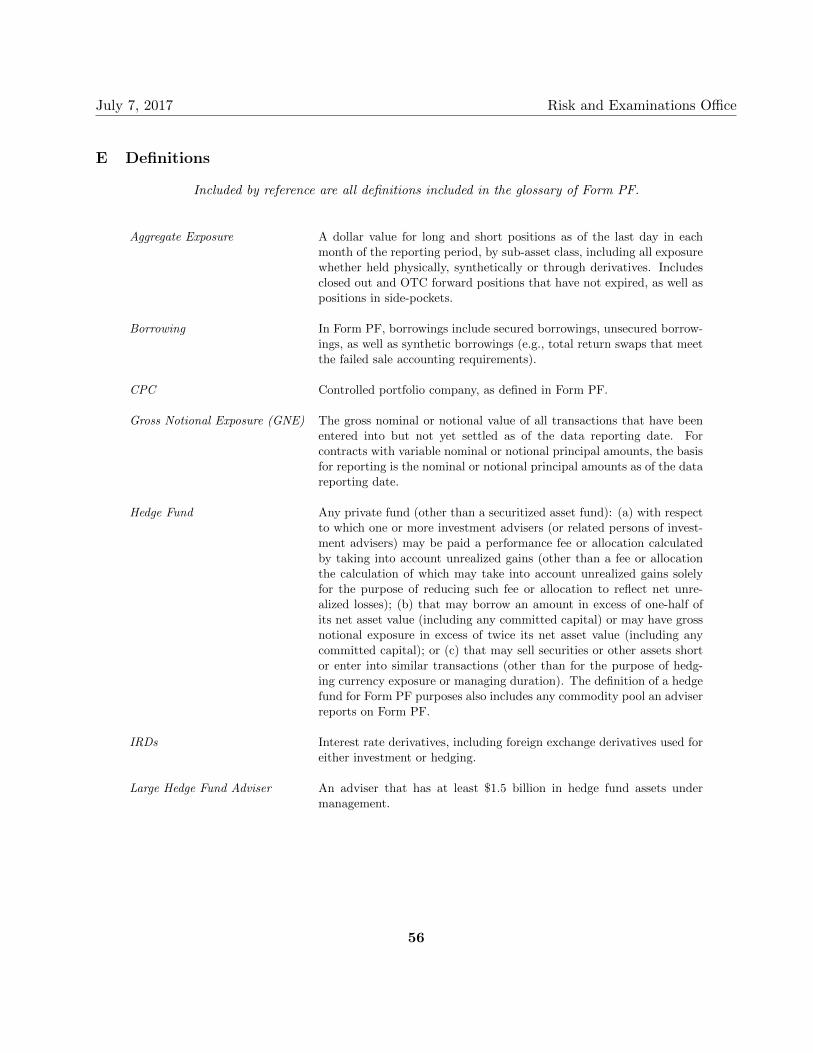
E Definitions
Included by reference are all definitions included in the glossary of Form PF.
Aggregate Exposure A dollar value for long and short positions as of the last day in each month of the reporting period, by sub-asset class, including all exposure whether held physically, synthetically or through derivatives. Includes closed out and OTC forward positions that have not expired, as well as positions in side-pockets.
Borrowing In Form PF, borrowings include secured borrowings, unsecured borrowings, as well as synthetic borrowings (e.g., total return swaps that meet the failed sale accounting requirements).
CPC Controlled portfolio company, as defined in Form PF.
Gross Notional Exposure (GNE) The gross nominal or notional value of all transactions that have been entered into but not yet settled as of the data reporting date. For contracts with variable nominal or notional principal amounts, the basis for reporting is the nominal or notional principal amounts as of the data reporting date.
Hedge Fund Any private fund (other than a securitized asset fund): (a) with respect to which one or more investment advisers (or related persons of investment advisers) may be paid a performance fee or allocation calculated by taking into account unrealized gains (other than a fee or allocation the calculation of which may take into account unrealized gains solely for the purpose of reducing such fee or allocation to reflect net unrealized losses); (b) that may borrow an amount in excess of one-half of its net asset value (including any committed capital) or may have gross notional exposure in excess of twice its net asset value (including any committed capital); or (c) that may sell securities or other assets short or enter into similar transactions (other than for the purpose of hedging currency exposure or managing duration). The definition of a hedge fund for Form PF purposes also includes any commodity pool an adviser reports on Form PF.
IRDs Interest rate derivatives, including foreign exchange derivatives used for either investment or hedging.
Large Hedge Fund Adviser An adviser that has at least $1.5 billion in hedge fund assets under management.
Large Liquidity Fund Adviser An adviser that has at least $1 billion in combined liquidity fund and money market fund assets under management.
Large Private Equity Fund Adviser An adviser that has at least a $2 billion in private equity fund assets under management.
Parallel Managed Account An account advised by an adviser that pursues substantially the same investment objective and strategy and invests side by side in substantially the same positions as the reporting fund.
Qualifying Hedge Fund A hedge fund advised by a Large Hedge Fund Adviser that has a net asset value (individually or in combination with any feeder funds, parallel funds, and/or dependent parallel managed accounts) of at least $500 million as of the last day of any month in the fiscal quarter immediately preceding the adviser’s most recently completed fiscal quarter.
Section 3 Liquidity Fund A liquidity fund advised by a Large Liquidity Fund Adviser.
Section 4 Private Equity Fund A private equity fund advised by a Large Private Equity Fund Adviser.
Value For derivatives (other than options), “value” means gross notional value; for options, “value” means delta adjusted notional value; for all other investments and for all borrowings where the reporting fund is the creditor, “value” means market value or, where there is not a readily available market value, fair value; for borrowings where the reporting fund is the debtor, “value” means the value you report internally and to current and prospective investors.