2019 Annual and
Summary Report
January 1 to December 31, 2019
Guelph Drinking Water System
Corporation of the City of Guelph
Gazer Mooney Subdivision Distribution System
Township of Guelph/Eramosa
Water Services
Environmental Services Department
Last Revision: May 21, 2020
As per the Accessibility for Ontarians with Disabilities Act (AODA), this document is available
in an alternate format by e-mailing [email protected] or by calling 519-837-5627;
TTY: 519-837-5688 or text 226-821-2132.
2019 Annual and Summary Report
i
Executive Summary
The purpose of this report is to provide information to system owners and stakeholders to
satisfy the regulatory requirements of the Safe Drinking Water Act (SDWA) including the
Drinking Water Quality Management Standard (DWQMS); Section 81 of the Clean Water Act
(CWA); and regulatory reporting required under O. Reg. 170/03 - Section 11 and Schedule
22.
This report is a compilation of information that helps to demonstrate the ongoing provision
of a safe, consistent supply of high quality drinking water to customers located within the
City of Guelph and the Gazer Mooney Subdivision (located in the Township of
Guelph/Eramosa).
Water Services is a municipally-owned and operated water utility, established in 1879. The
Guelph Drinking Water System (Guelph DWS) consists of water supply and treatment
facilities and a water distribution system. The Guelph DWS is a Class II Water Treatment
Subsystem and Class IV Water Distribution Subsystem.
The Gazer Mooney Subdivision Distribution System (Gazer Mooney SDS) is a Class I
Distribution System supplied with water from the Guelph DWS. Guelph Water Services is the
Operating Authority for this system owned by Guelph/Eramosa Township.
Both the Guelph DWS and the Gazer Mooney SDS are required to comply with the Safe
Drinking Water Act (SDWA) and other regulations as well as requirements contained in
Permits to Take Water (PTTW), Municipal Drinking Water Licences (MDWL), and Drinking
Water Works Permits (DWWP). Having met the quality management system requirements of
the SDWA, Guelph Water Services is an accredited Operating Authority with an up-to-date
Operational Plan (OP). The OP is available upon request from Guelph Water Services.
Guelph’s Source Water
The source of Guelph’s drinking water is a series of 21 operational groundwater wells and a
shallow groundwater collector system. These sources consists primarily of true groundwater
sources, with some “groundwater under the direct influence of surface water with effective
in-situ filtration” (GUDI-WEF) sources (Carter 1, Carter 2, Arkell 1, Arkell 15 and the Arkell
Springs Glen Collector System).
The water system is operated to meet daily, seasonal, and other operational demands
(including fire demands) with various combinations of supply sources in operation at any
given time. A total of 17,160,654 cubic meters (17.2 billion litres) of water was treated and
pumped to the system in 2019. The average daily water demand was 47,015 cubic metres
2019 Annual and Summary Report
ii
(47.0 million litres). The maximum daily production of water in 2019 was 58,441 cubic
metres (58.4 million litres) and occurred on November 30, 2019. A large watermain break
occurred on this day, resulting in an increased amount of water pumped. Please see the
Results of Emergency Response Testing section for more information. The minimum daily
production of water in the same time period was 32,477 cubic metres (32.5 million litres)
and occurred on December 26, 2019.
Water Treatment and Distribution
All water provided to the Guelph Drinking Water System and the Gazer Mooney Subdivision
Distribution System was treated with sodium hypochlorite (for chlorine disinfection) with
some sources also using UV treatment, two sites using sodium silicate for dissolved iron and
manganese sequestering and one site using green-sand filtration for manganese removal.
All of the water supplied was continually tested and met all regulatory standards. City of
Guelph Water Services maintained the drinking water system in a fit state of repair and
followed best industry practices during the repair and maintenance of the system.
The City of Guelph has approximately 44,000 fully metered water service connections,
557.3 kilometres of underground watermains, and a population of approximately 131,7941.
The Gazer Mooney Subdivision has approximately 72 fully metered water service
connections, 2 kilometres of underground watermains, and an approximate population of
200 people.
Complying with Regulations
As the Operating Authority for both the Guelph DWS and Gazer Mooney SDS, Guelph Water
Services is annually inspected by the Ministry of the Environment, Conservation and Parks
(MECP) for compliance with regulatory requirements. There were four incidents of non-
compliance associated with the Guelph DWS in 2019; the Gazer Mooney SDS had no
incidents of non-compliance. Through the 2018-2019 MECP inspection, Water Services
received an 89.42% score for the Guelph DWS and a 100% score for the Gazer Mooney
SDS.
In 2019, Guelph Water Services reported three Adverse Water Quality Incidents (AWQIs) in
the Guelph Drinking Water System – please refer to section b) Adverse Water Quality
Incidents.
1 Statistics Canada, 2016 Census of Population.
2019 Annual and Summary Report
iii
In conjunction with the Wellington-Dufferin-Guelph Public Health (WDGPH) and the MECP,
all appropriate corrective actions and required reporting were completed with no health-
based issues for the AQWIs.
There was one AWQI in the Gazer Mooney Subdivision Distribution System in 2019. Please
refer to section b) Adverse Water Quality Incidents, Table 2 for a description of the AWQI.
In conjunction with the MECP and WDGPH all appropriate corrective actions and required
reporting were completed with no health-based issues stemming from these AWQIs.
Water Services’ risk assessment updates, emergency response testing, internal and external
audits help facilitate continual improvement of Water Services’ processes and programs
through implementation of corrective actions.
Water Services continues to implement:
• Recommendations of the 2016 Water Efficiency Strategy.
• Source water protection based on a MECP approved Source Water Protection Plan.
• Arkell Springs Forest Stewardship Project investments (to protect the Arkell Wellfield’s
source water quality).
• The Lead Reduction Plan in accordance with the regulatory relief provisions of the
SDWA.
• Facility asset management and infrastructure reviews to optimize priority projects.
• A robust backflow prevention program overseeing 2,902 properties with 6,603
backflow prevention devices installed.
Details of ongoing and emerging water quality, supply/treatment, and distribution initiatives
are outlined in section h) of this report and include successful programs related to: water
conservation and efficiency, Arkell Springs forest stewardship, source water protection, lead
reduction and frozen services prevention and monitoring.
The City has completed this Annual & Summary Report to satisfy the regulatory
requirements of the Safe Drinking Water Act, O. Reg. 170/03 (Section 11 and Schedule 22).
For more information please contact Guelph Water Services at (519) 837-5627 or
2019 Annual and Summary Report
iv
Table of Contents
January 1 to December 31, 2019 ............................................................................... 0
Water Services ..................................................................................................... 0
Environmental Services Department ........................................................................ 0
Executive Summary .................................................................................................. i
Guelph’s Source Water ........................................................................................... i
Water Treatment and Distribution............................................................................ ii
Complying with Regulations .................................................................................... ii
Table of Contents ................................................................................................... iv
List of Tables ......................................................................................................... ix
List of Figures ........................................................................................................ xi
Purpose ................................................................................................................. 1
Scope.................................................................................................................... 1
Notice ................................................................................................................... 2
Systems Overview ................................................................................................... 3
Guelph Drinking Water System ............................................................................... 3
Water Distribution System ................................................................... 3
Guelph Source Water and Treatment Facilities ......................................... 4
Gazer Mooney Subdivision Distribution System .......................................................... 7
Water Services’ Annual and Summary Report .............................................................. 9
a) Incidents of Regulatory Non-Compliance ................................................................. 9
Guelph Drinking Water System ............................................................................... 9
Gazer Mooney Subdivision Distribution System ........................................................ 10
b) Adverse Water Quality Incidents .......................................................................... 10
Guelph Drinking Water System ............................................................................. 10
Gazer Mooney Subdivision Distribution System ........................................................ 13
c) Deviations from Critical Control Point (CCP) Limits and Response Actions ................... 14
d) The Effectiveness of the Risk Assessment Process ................................................... 14
e) Internal and Third-Party Audit Results .................................................................. 15
2019 Internal Audit ............................................................................................. 15
2019 External Audit ............................................................................................ 15
f) Results of Emergency Response Testing ................................................................. 17
g) Operational Performance and Statistics ................................................................. 19
2019 Totalized Pumpages and Instantaneous Flows .................................................. 19
Water Production, Consumption and Population ....................................................... 21
2019 Annual and Summary Report
v
Arkell Springs Glen Collector System Source Water .................................................. 22
Water Supply Capacity ........................................................................................ 24
System Maintenance and Updates ......................................................................... 27
SCADA System Improvements .............................................................................. 29
Form 1s, Form 2s and Form 3s ............................................................................. 31
Water Distribution Locates ................................................................................... 32
Status of Ongoing and Emerging Water Quality, Supply and Distribution Initiatives .......... 33
Water Efficiency Strategy ..................................................................................... 33
Source Water Protection Plan ................................................................................ 34
Arkell Springs Forest Stewardship Project ............................................................... 34
Lead Reduction Plan ............................................................................................ 35
Lead Sampling in the Guelph Drinking Water System ............................... 36
Lead Sampling in the Gazer Mooney Subdivision Distribution System .......... 36
Lead Sampling ................................................................................. 36
Lead Service Line Replacements .......................................................... 37
Frozen Water Pipe Prevention and Monitoring Program ............................................. 38
2019 Frozen Water Pipe Program Statistics ............................................ 39
h) Raw and Treated Water Quality and Drinking Water Quality Trends ........................... 40
Guelph Drinking Water System ............................................................................. 40
Water Quality Review – Guelph Drinking Water System ............................ 40
Microparticulate Analysis .................................................................... 43
Treated Water Quality Statistics – Guelph Drinking Water System .............................. 44
O. Reg. 170/03 Schedule 6-5 - Continuous Monitoring Results Summary ..... 44
O. Reg. 170/03 Schedule 13-6 and 13-7, “Three Month” Sampling Results
Summary ........................................................................................ 45
Operational VOC Scan Results Summary................................................ 48
O. Reg. 170/03 Schedule 23 Results Summary ....................................... 50
O. Reg. 170/03 Schedule 24 Results Summary ....................................... 52
O. Reg. 170/03 Schedule 13-8 and 13-9, “Five Year” Sampling Results
Summary ........................................................................................ 57
General Chemistry Results Summary .................................................... 59
Gazer Mooney Subdivision Distribution System ........................................................ 61
Water Quality Review - Gazer Mooney Subdivision Distribution System........ 61
Treated Water Quality Statistics – Gazer Mooney Subdivision Distribution System ......... 63
O. Reg. 170/03 Schedule 13-6, “Three Month” Sampling Results Summary .. 63
2019 Annual and Summary Report
vi
O. Reg. 170/03 Schedule 13-8 and 13-9, “Five Year” Sampling Results
Summary ........................................................................................ 64
General Chemistry Results Summary .................................................... 65
i) Follow-up on Action Items from Previous Management Reviews ................................. 67
Results of the Management Review, the identified deficiencies, decisions and action items
67
j) The Status of Management Action Items Identified Between Management Reviews ....... 68
k) Changes that Could Affect the Drinking Water System and the Quality Management
System ................................................................................................................ 68
Changes Affecting the Drinking Water System (DWS) - Licence Approvals and
Amendments ..................................................................................................... 68
Municipal Drinking Water Licence (MDWL) Renewal.................................. 68
Permits to Take Water (PTTW) Renewals ............................................... 69
Sentry Monitoring Wells ..................................................................... 70
Carter Monitoring Program – Operational Testing .................................... 70
Staff Certification ............................................................................. 70
Changes Affecting the Quality Management System (QMS) ........................................ 73
Ontario’s updated Drinking Water Quality Management Standard (DWQMS)
Version 2.0...................................................................................... 73
Quality Management System Implementation ......................................... 73
l) Consumer Feedback ........................................................................................... 73
m) The Resources Needed to Maintain the Drinking Water System and Quality Management
System ................................................................................................................ 75
n) Results of Infrastructure Review .......................................................................... 75
Distribution Infrastructure Needs ........................................................................... 75
Water Supply and Treatment Facilities Infrastructure Needs ...................................... 76
F.M. Woods Station Upgrades and Engine House and Pumping Station Build ing
Retrofit ........................................................................................... 77
Burke Well Station Upgrades ............................................................... 77
Clythe Well Treatment Upgrades and Zone 2 Environmental Assessment ...... 77
Paisley Pumping Station Upgrades........................................................ 77
Middle Reach of the Aqueduct ............................................................. 78
Calico Well Upgrades ......................................................................... 78
Membro Well Upgrades ...................................................................... 78
Guelph South Feasibility Study ............................................................ 79
Logan Well Feasibility Study ............................................................... 79
2019 Annual and Summary Report
vii
Backflow Prevention Program ............................................................................... 79
o) Operational Plan Currency, Content and Updates .................................................... 82
p) Staff Suggestions .............................................................................................. 85
q) New or Other Business ....................................................................................... 85
r) Next Meeting Dates ............................................................................................ 85
Appendix A: Summary of Critical Control Points and Critical Control Limits ..................... 86
Appendix B: Summary of Internal and External Audit Plans .......................................... 88
Appendix C: Total Water Pumped and Instantaneous Flows .......................................... 92
City of Guelph Water Services – Pumpages to System, January 1 – December 31, 2019 . 93
City of Guelph Water Services – Permit to Take Water Pumpages, January 1 – December
31, 2019 ........................................................................................................... 95
City of Guelph Water Services – Instantaneous Flows Summary (PTTW), January 1 –
December 31, 2019 ............................................................................................ 99
Appendix D: Treated Water Quality Statistics ........................................................... 103
O. Reg. 170/03 Schedule 23, 13-2b – “Three Year” Results Summary (Jan. 1 – Dec. 31,
2019) ............................................................................................................. 103
O. Reg. 170/03 Schedule 24, 13-4b – “Three Year” Results Summary (Jan. 1 – Dec. 31,
2019) ............................................................................................................. 104
Operational VOC Scan Results Summary (Jan. 1 – Dec. 31, 2019) ............................ 108
General Chemistry Results Summary (Jan. 1 – Dec. 31, 2019) ................................. 110
Appendix E: Legal and Other Requirements Table ..................................................... 115
Appendix F: Action Items from Management Review ................................................. 126
Appendix G: Status of Management Action Items Identified between Reviews ............... 128
Appendix H: Summary of Staff Suggestions ............................................................. 139
Appendix I: Water Efficiency Program – 2019 Annual Progress Report ......................... 147
Background ..................................................................................................... 147
Water Reduction Target Progress ........................................................................ 148
Water Efficiency Incentive and Rebate Programs .................................................... 151
Royal Flush Toilet Rebate Program ..................................................... 151
Residential Sub-Water Meter Rebate Program ....................................... 151
Water Use Home Visit and Audit Program ............................................ 152
Blue Built Home Water Efficiency Standards and Rebate Program ............. 153
Multi-Residential Water Audit Program ................................................ 153
Water Smart Business Program ......................................................... 154
Cooling Tower Research ................................................................... 156
Alliance for Water Efficiency Cooling Tower Research Project ................... 156
Legionella ..................................................................................... 157
2019 Annual and Summary Report
viii
Municipal Facility Water Efficiency ...................................................... 158
Leak Detection Program ..................................................................................... 158
Peak Season Water Demand Management ............................................................ 159
Outside Water Use Program .............................................................. 159
Healthy Landscapes ........................................................................ 160
Peak Season Water Demand Research ................................................. 161
Youth and Public Outreach and Education Programming .......................................... 161
Curriculum-Linked Education Programming .......................................... 161
Other Outreach and Engagement Programming ..................................................... 163
H2O Go Festival ............................................................................. 163
Waterloo Wellington Children’s Groundwater Festival ............................. 163
Outreach to New Canadians in Guelph................................................. 164
Water-Energy Nexus Research ........................................................... 164
Guelph Water Wagon ........................................................................................ 165
Water Softener Alternatives Testing and Market Research ....................................... 166
Appendix J: Water Services Committees ................................................................. 168
Water Conservation and Efficiency Public Advisory Committee – Annual Report ........... 168
Well Interference Committee .............................................................................. 169
Appendix K: Source Water Protection ..................................................................... 171
City of Guelph internationally recognized for Source Protection ................................ 171
Risk Management Official Update ........................................................................ 172
Threat Verification and Negotiating Risk Management Plans .................... 172
Policy Implementation ..................................................................... 174
Protecting Water Quantity ................................................................ 174
Education and Outreach ................................................................... 175
Private Well and Septic System Decommissioning and Sanitary Sewer Connection Grant
Program .......................................................................................................... 175
Moving Forward in 2020 .................................................................................... 176
Appendix L: Glossary ........................................................................................... 178
2019 Annual and Summary Report
ix
List of Tables
Table 1: Guelph Drinking Water System Adverse Water Quality Incidents, 2019 .............. 11
Table 2: Gazer Mooney Subdivision Distribution System Adverse Water Quality Incidents,
2019 ................................................................................................................... 13
Table 3: Emergency Response Tests ......................................................................... 18
Table 4: Permitted Rates and Point of Entry Firm Capacities of Water Supply Wells .......... 26
Table 5: Water Distribution Maintenance Activity ........................................................ 27
Table 6: Water Treatment Maintenance Activity, 2019 ................................................. 29
Table 7: SCADA and Security - Maintenance and Improvement Activities, 2019 ............... 30
Table 8: Summary of Form 1s, Form 2s and Form 3s, 2019 ......................................... 32
Table 9: Water Distribution Locates Requested and Responded to in 2019 ...................... 32
Table 10: Historical Locate Requests Received ........................................................... 33
Table 11: Lead Reduction Plan Lead Sampling - Guelph Drinking Water System, 2019 ...... 36
Table 12: Lead Reduction Plan – Gazer Mooney Subdivision Distribution System, 2019 ..... 36
Table 13: Private Lead Service Line Replacement Grant Programs (2010 – Dec. 31, 2019) 38
Table 11: O. Reg. 170/03 Schedule 7-2, City of Guelph - Distribution Manual Free Chlorine
Residual Summary, 2019 ....................................................................................... 41
Table 12: O. Reg. 170/03 Schedule 10-4, City of Guelph - Raw Bacteriological Sampling
Summary, 2019 .................................................................................................... 41
Table 13: O. Reg. 170/03 Schedule 10-2, 10-3 and 6-3, City of Guelph - Treated
Bacteriological Sampling Summary, 2019 .................................................................. 42
Table 14: O. Reg. 170/03 Schedule 7-3, City of Guelph - Raw Source Turbidity Sampling
Summary, 2019 .................................................................................................... 43
Table 15: O. Reg. 170/03 Schedule 7-3, City of Guelph - Raw Ultraviolet Transmittance
Sampling Summary, 2019 ...................................................................................... 43
Table 16: O. Reg. 170/03 Schedule 6-5, Continuous Monitoring Results Summary, 2019 .. 45
Table 17: O. Reg. 170/03 Schedule 13-6 and 13-7, City of Guelph – “Three Month”
Sampling Results Summary, 2019 ........................................................................... 47
Table 18: City of Guelph Operational VOC Scan Selected Results Summary, 2019 ........... 49
Table 19: O. Reg. 170/03 Schedule 23, 13-2a, City of Guelph - Annual Schedule 23
Sampling Results Summary, 2019 ........................................................................... 51
Table 20: O. Reg. 170/03 Schedule 24, 13-4a, City of Guelph - Annual Schedule 24
Sampling Results Summary, 2019 ........................................................................... 53
Table 21: O. Reg. 170/03 Schedule 13-8 and 13-9, City of Guelph – “Five Year” Sampling
Results Summary .................................................................................................. 58
Table 22: City of Guelph General Chemistry Selected Results Summary, 2019 ................ 60
Table 23: O. Reg. 170/03 Schedule 7-2, Gazer Mooney - Distribution Manual Free Chlorine
Residual Summary, 2019 ....................................................................................... 62
2019 Annual and Summary Report
x
Table 24: O. Reg. 170/03 Schedule 10-2, Gazer Mooney Treated Bacteriological Sampling
Summary, 2019 .................................................................................................... 62
Table 25: O. Reg. 170/03 Schedule 13-6, Gazer Mooney - "Three Month" Sampling Results
Summary, 2019 .................................................................................................... 64
Table 26: O. Reg. 170/03 Schedule 13-8 and 13-9, Gazer Mooney - "Five Year" Sampling
Results Summary .................................................................................................. 65
Table 27: Gazer Mooney General Chemistry Results Summary, 2019 ............................. 66
Table 31: Municipal Drinking Water Licensing Documents ............................................ 69
Table 32: Water Services Employees (Operators and Management Staff) with Drinking
Water Operator Certificates .................................................................................... 71
Table 33: Competency and Years of Experience for Certified Management Staff ............... 72
Table 34: Years of Experience of Certified Operational Staff ......................................... 72
Table 35: Number of Customer Calls Received, 2017-2019 .......................................... 74
Table 36: 2019 Backflow Report - Number of Letters Sent out for Annual Testing and Re-
survey ................................................................................................................. 81
Table 37: Backflow Devices Installed by Type in 2019 ................................................. 82
Table 38: Summary of Critical Control Points and Critical Control Limits ......................... 86
Table 39: Summary of Internal and External Audit Plans, 2018-2020 ............................ 88
Table 40: Pumpages (Discharge) to System, January 1 to December 31, 2019 ................ 93
Table 41: City of Guelph Permit to Take Water Pumpages, 2019 ................................... 95
Table 42: City of Guelph Permit to Take Water Pumpages, 2019 - Continued .................. 97
Table 43: City of Guelph - Instantaneous Flow Summary, 2019 .................................... 99
Table 44: Instantaneous Flow Summary, 2019 - Continued ........................................ 101
Table 45: O. Reg. 170/03 Schedule 23, 13-2b - "Three Year" Results Summary ............ 103
Table 46: O. Reg. 170/03 Schedule 24, 13-4b - "Three Year" Results Summary ............ 104
Table 47: Operational VOC Scan Results Summary ................................................... 108
Table 48: General Chemistry Results Summary ........................................................ 111
Table 49: Legal and Other Updates that Could Affect the Drinking Water System or the
Quality Management System, 2019 ........................................................................ 115
Table 50: Action Items from the 2019 (Items 1-12) and 2020 (Items 13-17) Management
Review Meetings ................................................................................................. 126
Table 51: Management Action Items Identified Between Management Review Meetings,
2019 ................................................................................................................. 128
Table 52: Suggestions Provided by Staff, 2019 ........................................................ 139
2019 Annual and Summary Report
xi
List of Figures
Figure 1: Guelph Drinking Water System .................................................................... 6
Figure 2: Gazer Mooney Water Distribution System ...................................................... 8
Figure 3: Totalized Pumpages, 2019 ......................................................................... 20
Figure 4: Guelph Water Production, Water Consumption, Population .............................. 22
Figure 5: 2019 Arkell Spring Grounds Glen Collector System Volumes ........................... 24
Figure 6: Water Supply Master Plan (2014) and Water Efficiency Strategy (2016) Production
Rates ................................................................................................................ 149
Figure 7: Residential Water Use ............................................................................. 150
Figure 8: City Staff Receiving AWWA Award along with Guelph Mayor and Councillors. ... 172
Figure 9: Risk Management Official Summary, 2019 ................................................. 173
Figure 10: Clean Water Act, Section 59 Summary .................................................... 174
Figure 11: Source Water Protection Advertisement to Reduce Your Winter Salt Use ....... 175
2019 Annual and Summary Report
Page 1 of 182
Purpose
The purpose of this report is to provide information to several stakeholders and to satisfy
the regulatory requirements of the Safe Drinking Water Act (SDWA) including the Drinking
Water Quality Management Standard (DWQMS), Clean Water Act (CWA) and regulatory
reporting required under O. Reg. 170/03 - Section 11 and Schedule 22. The report is a
compilation of information that helps to demonstrate the ongoing provision of a safe,
consistent supply of high quality drinking water to customers located within the City of
Guelph and the Gazer Mooney Subdivision, located in the Township of Guelph/Eramosa.
Scope
This Water Services Annual and Summary Report includes information from both the
Guelph Drinking Water System and the Gazer Mooney Subdivision Distribution
System for the period of January 1 to December 31, 2019, unless otherwise noted. The
information is required to be reported to the following:
• the Drinking Water System Owners:
▪ Guelph City Council, Chief Administrative Officer (CAO) and Deputy CAO –
Infrastructure, Development and Enterprise;
▪ Township of Guelph Eramosa (Council and CAO);
• Senior officials of Guelph Water Services and Township of Guelph/Eramosa; and
• the general public and interested stakeholders.
This report satisfies the requirements of both the Safe Drinking Water Act (SDWA) and
Ontario Regulation 170/03:
Section 11, Annual Reports which includes:
• a brief description of the drinking water systems;
• a list of water treatment chemicals used;
• a summary of the most recent water test results required under O. Reg. 170/03 or an
approval, Municipal Drinking Water Licence (MDWL) or order;
• a summary of adverse test results and other issues reported to the Ministry of the
Environment, Conservation and Parks (MECP) including corrective actions taken;
• a description of major expenses incurred to install, repair or replace required
equipment; and
• the locations where this report is available for inspection.
2019 Annual and Summary Report
Page 2 of 182
Schedule 22, Summary Report which includes:
• list the requirements of the Safe Drinking Water Act, the regulations, the system’s
approval, Drinking Water Works Permit (DWWP), MDWL, and any orders applicable to
the system that were not met at any time during the period covered by the report;
• for each requirement that was not met, the duration of the failure and the measures
that were taken to correct the failure;
• a summary of the quantities and flow rates of the water supplied during the period
covered by the report, including monthly average and maximum daily flows; and
• a comparison of this information to the rated capacity and flow rates approved in the
system’s approval, DWWP and/or MDWL.
This report satisfies applicable requirements for both the Guelph Drinking Water System and
the Gazer Mooney Subdivision Distribution System.
A copy of this report is available for viewing at:
• City of Guelph Water Services, 29 Waterworks Place, Guelph;
• Township of Guelph/Eramosa, 8348 Wellington Rd. 124, Rockwood; and
• Online at guelph.ca/water.
Any inquiries can be made to:
• City of Guelph Water Services by e-mailing [email protected] or
by calling 519-837-5627.
• Township of Guelph/Eramosa Public Works – Water / Wastewater
by e-mailing [email protected] or by calling 519-856-9596.
Notice
Please note that every reasonable effort is made to ensure the accuracy of this report. This
report is published with the best available information at the time of publication. In the
event that errors or omissions occur, the online report will be updated. Please refer to the
online version of the report for the most current version.
Please note that some hyperlinks in the document are linked to Guelph’s electronic
document management system (EDMS), which is available for internal City use only.
2019 Annual and Summary Report
Page 3 of 182
Systems Overview
Guelph Drinking Water System
Water Services at the City of Guelph is committed to providing consumers with a safe,
consistent supply of high quality drinking water while meeting or exceeding, and continually
improving on legal, operational and quality management system requirements. Water
Services strives to provide reliable and cost-effective water treatment and distribution
systems for the safe production and delivery of consistently high quality water. Established
in 1879, Water Services and is a municipally-owned and operated water utility.
The Guelph Drinking Water System is classified as a Class II Water Treatment Subsystem
and a Class IV Water Distribution Subsystem. All necessary licences have been obtained by
staff to operate the Guelph Drinking Water System. As of December 31, 2019 thirty-three
team members held drinking water certificates to operate and maintain the water system.
In 2019, Water Services maintained full scope accreditation to the Drinking Water Quality
Management Standard (DWQMS) Version 2.0 after a successful on-site verification audit,
conducted by the third-party accreditation body - NSF International Strategic Registrations.
This full accreditation satisfies part of the requirements under the Municipal Drinking Water
Licensing Program.
Water Distribution System
The distribution system (including watermains, valves, fire hydrants, services, and meters)
serves a population of approximately 131,7942 within the City of Guelph. All new system
components meet NSF 613 requirements or approved equivalents and are installed and
maintained in accordance with approved industry standards. Water system customers are
fully metered and billed in accordance with the Water and Wastewater Customer Rates and
Charges by-law.
The Guelph Drinking Water System distribution system is comprised of the following
infrastructure:
• 6.38 kilometres of 900-1,050 mm diameter water supply aqueduct;
2 Statistics Canada, 2016 Census of Population. 3 NSF/ANSI Standard 61: Drinking Water System Components - Health Effects
2019 Annual and Summary Report
Page 4 of 182
• five underground storage reservoirs with a combined approximate capacity of 48,000
cubic metres (48 million litres);
• three water towers with a combined approximate capacity of 11,200 cubic metres
(11.2 million litres);
• 557.3 kilometres of buried watermain with a diameter < 900 mm;
• 4,286 watermain valves;
• 2,809 fire hydrants; and
• approximately 44,000 water services and water meters.
Guelph Source Water and Treatment Facilities
The source of Guelph’s drinking water is a series of 21 operational groundwater wells and a
shallow groundwater collector system. The drinking water sources consist primarily of true
groundwater, with some “groundwater under the direct influence of surface water with
effective in-situ filtration” (GUDI-WEF) sources. The GUDI-WEF sources include: Carter Well
1 and 2; Arkell 1; Arkell 15; and the Arkell Springs Glen Collector System.
The Guelph Drinking Water System uses 12 per cent Sodium Hypochlorite (that is NSF 604
certified) for primary disinfection for the following 11 sources:
• Downey Well
• Burke Well
• Park Well 1 and 2
• Emma Well
• Dean Well
• University Well
• Queensdale Well
• Helmar Well
• Calico Well
• Water Street Well (UV treatment available on site)
12 per cent Sodium Hypochlorite along with ultraviolet light treatment is used as part of a
multi-barrier primary disinfection for the following ten sources:
• Arkell Wells 1, 6, 7, 8, 14 and 15
• Arkell Springs Glen Collector System
• Carter Wells 1 and 2
4 NSF/ANSI Standard 60: Drinking Water Treatment Chemicals - Health Effects
2019 Annual and Summary Report
Page 5 of 182
• Membro Well
NSF 60-certified Sodium Silicate, used for aesthetic purposes to sequester dissolved iron
and manganese is also used at Helmar Well and Queensdale Well.
In total, Water Services operates and maintains 31 facilities.
The replacement cost of the Guelph Drinking Water System is estimated to be $620.3
million or approximately $4,578 per capita (2019, based on 2017 projected population).
The Guelph Drinking Water System operations are funded directly from the sale of water,
with minor additional funding through government grant programs. Property taxes are not
used to fund the operation, maintenance or capital renewal of the system.
A total of 17,160,654 cubic meters (17.2 billion litres) of water was treated and pumped to
the system in 2019. The average daily water demand was 47,015 cubic metres (47.0 million
litres). The maximum daily production of water in 2019 was 58,441 cubic metres (58.4
million litres) and occurred on Nov 30, 2019. The minimum daily production of water in the
same time period was 32,477 cubic metres (32.5 million litres) and occurred on December
26, 2019.
In 2019, all regulatory microbiological and chemical quality samples were taken by certified
operators and tests on water samples collected throughout the drinking water system were
performed by accredited, licensed laboratories. These tests include both regulatory and
operational testing – in most cases only regulatory reporting is included in this report. In all
cases, the drinking water supplied to all customers was confirmed safe and the water was of
higher quality than all Ontario and Canadian health-related guidelines.
The Guelph Drinking Water System is defined as a large residential system operated under
the regulatory requirements of the Safe Drinking Water Act and the Ontario Water
Resources Act (accessed at Ontario e-laws). In 2019, the Guelph Drinking Water System
operated under Municipal Drinking Water Licence (MDWL) 017-101, Issue numbers 11 and
12 and the Drinking Water Works Permit (DWWP) 017-201, Issue numbers 7 and 8.
The MDWL and the DWWP describe system-specific requirements that are supplementary to
provincial regulations and act as licences for water supply and distribution operations. These
documents outline specific conditions and requirements regarding operation, maintenance
and upgrades that are required by the system and are considered regulatory in nature.
These documents are available by request for viewing at Water Services, 29 Waterworks
Place, Guelph.
2019 Annual and Summary Report
Page 6 of 182
Figure 1: Guelph Drinking Water System shows the locations of the Guelph Drinking Water
System facilities that were active in 2019.
Figure 1: Guelph Drinking Water System
2019 Annual and Summary Report
Page 7 of 182
Gazer Mooney Subdivision Distribution System
The Gazer Mooney Subdivision Distribution System is a Class 1 Distribution Subsystem that
serves approximately 200 people, and is owned by the Township of Guelph/Eramosa. The
system is operated by Guelph Water Services through a legal agreement that was signed by
representatives of the City of Guelph and the Township of Guelph/Eramosa. The current
agreement came into effect on March 1, 2019 and will continue until February 29, 2024 and
will be automatically renewed and extended to February 28, 2029, unless terminated
earlier.
All of the water for the Gazer Mooney Subdivision Distribution System is supplied from the
Guelph Drinking Water System. All water is treated to provincial standards in the Guelph
Drinking Water System and no further treatment chemicals are added to the Gazer Mooney
Subdivision Distribution System.
All new distribution infrastructure components meet NSF 61 requirements or approved
equivalents and are installed and maintained in accordance with approved industry
standards. The system is fully metered.
The Gazer Mooney Subdivision Distribution System is comprised of the following
infrastructure:
• approximately 720 meters of 200mm diameter watermain;
• approximately 600 meters of 150mm diameter watermain;
• six watermain valves;
• six fire hydrants;
• one sampling station; and
• approximately 72 water services and water meters.
The cost of construction of the Gazer Mooney Subdivision Distribution System in 1980 was
listed as $197,933.
The Gazer Mooney Subdivision Distribution System is considered a small residential system
and is operated under the regulatory requirements of the Safe Drinking Water Act and the
Ontario Water Resources Act which may be found at Ontario e-laws.
In 2019, the Gazer Mooney Subdivision Distribution System operated under Municipal
Drinking Water Licence No. 104-103, Issue number 2; and Drinking Water Works Permit No.
104-203, Issue number 2. These documents are available by request for viewing at Water
Services, 29 Waterworks Place, Guelph and at the Township of Guelph/Eramosa, 8348
Wellington Rd. 124, Rockwood.
2019 Annual and Summary Report
Page 8 of 182
Figure 2: Gazer Mooney Water Distribution System shows the location of the Gazer Mooney
Subdivision Distribution System.
Figure 2: Gazer Mooney Water Distribution System
2019 Annual and Summary Report
Page 9 of 182
Water Services’ Annual and Summary Report
a) Incidents of Regulatory Non-Compliance
This section describes all incidents of non-compliance.
Guelph Drinking Water System
There were four incidents of non-compliance associated with the Guelph Drinking Water
System in 2019. The four incidents are described below:
• Caps on the water level monitoring access points on two wells, located inside secure
buildings, were found to not be in place. This was immediately corrected at the time
of inspection.
• A Form 1 (Record of Watermains Authorized as a Future Alteration) was completed in
November 2019 for work on a watermain that occurred in September 2019. The City’s
DWWP requires the Form 1 to be completed prior to the watermain being placed into
service. Water Services is working with Engineering and Transportation Services to
develop a procedure to ensure that Form 1’s are completed prior to any watermain
additions, modification, replacement or extension being placed into service.
• A chlorine residual in a dead-end of the distribution system was found to be below
0.05mg/L, which is discussed further in section b) Adverse Water Quality Incidents.
Water Services is committed to ensuring that an acceptable chlorine residual is
maintained throughout the water distribution system and has implemented a regular
flushing program in this area.
• It was found that HPC analysis was not completed on two treated water samples
taken on February 6, 2019. This was caused by human error, where the treated water
samples were mistakenly recorded on the chain of custody as raw water samples;
HPC analysis is not required for raw samples. Water Services now has separate chains
of custody for raw and treated water samples to help eliminate the chance of this
reoccurring.
A score of 89.42% was achieved in the 2018-2019 Ministry of the Environment,
Conservation and Parks Annual Inspection Report for the Guelph Drinking Water System.
Water Services has corrected all issues of non-compliance identified during the MECP
inspection. Through the root-cause analysis process, Water Services initiates continual
improvement measures and implements new policies and procedures to prevent issues of
non-compliance from re-occurring.
2019 Annual and Summary Report
Page 10 of 182
Gazer Mooney Subdivision Distribution System
There were no incidents of non-compliance associated with the Gazer Mooney Subdivision
Distribution System in 2019.
A score of 100% was achieved in the 2018-2019 Ministry of the Environment, Conservation
and Parks Annual Inspection Report for the Gazer Mooney Subdivision Distribution System.
b) Adverse Water Quality Incidents
This section describes all Adverse Water Quality Incidents (AWQI’s). This term refers to any
unusual test result from treated water that does not meet a provincial water quality
standard, or a situation where disinfection of the water may be compromised. An adverse
water quality incident indicates that on at least one occasion and at a certain instance in
time, a water quality standard was not met. On average, the Guelph Drinking Water System
processes four to five AWQI’s annually.
Many AWQI’s have proven to be the result of water sampling and testing problems rather
than poor water quality. False positive results can be caused by: contaminated sampling
containers and equipment; improper sampling technique; handling and transportation; and
sampling analysis errors.
Please note: The City was granted regulatory relief from Schedule 15.1 of O. Reg. 170/03 in
favour of a Guelph specific Lead Reduction Plan (LRP). Residential sample results collected
under the LRP that have lead concentrations above 10 µg/L, are tracked and reported to
Wellington-Dufferin-Guelph Public Health, the Ministry of the Environment, Conservation and
Parks (as per MDWL 017-101, Schedule D) and the customer. See 0 Status of Ongoing and
Emerging Water Quality, Supply and Distribution Initiatives for more information on the
Lead Reduction Plan.
Guelph Drinking Water System
In 2019, there were three adverse water quality incidents (AWQI’s #144857, #144859 and
#148104) and a summary of these are included in Table 1.
2019 Annual and Summary Report
Page 11 of 182
Table 1: Guelph Drinking Water System Adverse Water Quality Incidents, 2019
# Date AWQI
# Location Description Corrective Action
Re-sample Results
Good
Deviation from
Critical Control
Point5
1
&
2
Feb.
25
144857
and
144859
Burkes
Well -
POE
(S002)
Sodium
result of 66
mg/L at
S002
Water Services was informed by the laboratory of two
sodium exceedances, both at a concentration of
66mg/L.
Wellington-Dufferin-Guelph Public Health (WDGPH),
MECP, and Spills Action Centre (SAC) were notified.
Re-samples were taken and results of 71 mg/L were
received on March 4, confirming Burke treated source
water is above the aesthetic objective lower limit of 20
mg/L. Resample results were communicated to the
WDGPH and the AQWI was closed.
No6 No
5 Please see Section c) Deviations from Critical Control Point (CCP) Limits and Response Actions of this report for a description of
“critical control points”. 6 The aesthetic objective for sodium in drinking water is 200 mg/L. The local Medical Officer of Health should be notified when
the sodium concentration exceeds 20 mg/L so that this information may be communicated to local physicians for their use with
patients on sodium restricted diets. Water Services communicated the sodium test results to the Wellington-Dufferin-Guelph
Public Health Unit.
2019 Annual and Summary Report
Page 12 of 182
# Date AWQI
# Location Description Corrective Action
Re-sample
Results
Good
Deviation from
Critical Control
Point5
3 Sept.
17 148104
Hydrant
H29-068
Distribution
system
chlorine
residual
below 0.05
mg/L
Hydrant H29-068 was flushed on Sept. 17 as part of a
Dead-End-Flushing Program and a chlorine residual of
0.00mg/L was recorded. After 35 minutes of flushing
at approximately 7 L/sec., a residual of 0.64 mg/L was
achieved.
Wellington-Dufferin-Guelph Public Health (WDGPH),
MECP, and Spills Action Centre (SAC) were notified.
Hydrant H29-068 is now part of the regular flushing
program and has scheduled flushings to maintain
acceptable secondary disinfection free chlorine
residuals. The AWQI is closed.
Yes Yes
2019 Annual and Summary Report
Page 13 of 182
Gazer Mooney Subdivision Distribution System
There was one adverse water quality incident in the Gazer Mooney Subdivision Distribution System in 2019.
Table 2: Gazer Mooney Subdivision Distribution System Adverse Water Quality Incidents, 2019
# Date AWQI
# Location Description Corrective Action
Re-sample
Results
Good
Deviation from
Critical Control
Point7
1 Mar.
26 145058
Gazer
Mooney
Lift
Station
(GM223)
Sodium
result of 26
mg/L at
GM223
Wellington-Dufferin-Guelph Public Health (WDGPH),
MECP, Spills Action Centre (SAC), and Guelph/Eramosa
Township staff were notified.
Re-samples were taken and results of 24 mg/L were
received on March 28, confirming Gazer Mooney treated
water is above the aesthetic objective lower limit of 20
mg/L. Resample results were communicated to the
WDGPH and the AQWI was closed.
No8 No
7 Please see Section c) Deviations from Critical Control Point (CCP) Limits and Response Actions of this report for a description of
“critical control points”. 8 The aesthetic objective for sodium in drinking water is 200 mg/L. The local Medical Officer of Health should be notified when
the sodium concentration exceeds 20 mg/L so that this information may be communicated to local physicians for their use with
patients on sodium restricted diets. Water Services communicated the sodium test results to the Wellington-Dufferin-Guelph
Public Health Unit.
2019 Annual and Summary Report
Page 14 of 182
c) Deviations from Critical Control Point (CCP) Limits
and Response Actions
A critical control point in the drinking water system is where control can be applied to
prevent or eliminate a drinking water hazard, or to reduce it to an acceptable level. Water
Services has identified three Critical Control Points (CCP) in the drinking water system:
1) Multi-Barrier Primary Disinfection - To remove or inactivate pathogens potentially
present in the source water.
2) Secondary Disinfection - To ensure the maintenance of a disinfectant residual
throughout the distribution system.
3) Backflow Prevention - To prevent cross-contamination that can result from the flowing
back of or reversal of the normal direction of flow of water.
Any deviations from the CCPs are reported to both the Owners and Top Management, and
are summarized in b) Adverse Water Quality Incidents in this report. There was one
deviation from the Critical Control Points in 2019. The deviation was related to secondary
disinfection. Information about this incident and actions taken to resolve the issue is
outlined in b) Adverse Water Quality Incidents under item 3.
Additional information (e.g. critical control limits and response actions) is included in
Appendix A: Summary of Critical Control Points and Critical Control Limits.
d) The Effectiveness of the Risk Assessment Process
This section confirms the occurrence of reviews of the risk assessment process. The risk
assessment process determines the effectiveness of identifying and appropriately assessing
the risk of hazards and hazardous events to the drinking water system. It also identifies the
appropriate control measures; critical control points (CCPs); and related critical control
limits (CCLs) related to the hazards and hazardous events. A description of the CCPs and
CCLs are included in Appendix A: Summary of Critical Control Points and Critical Control
Limits.
The annual risk assessment review was conducted by Water Services staff over several
meetings between August 15 and August 30, 2019. The updated risk assessment outcomes
was subsequently reviewed and approved at a management meeting on September 24,
2019. The results of the Risk Assessment are not made available to the public, but are made
available to internal staff and the Guelph DWS Owners.
2019 Annual and Summary Report
Page 15 of 182
Through the risk assessment process, the following Water Services program or process
aspects were added:
• Locates - Inability to properly locate due to no tracer wire installed or installed
incorrectly or not locatable material leading to watermain damage;
• Locates - Inability to properly locate due to inaccessible, incorrect or not updated
records resulting in damaged watermain.
e) Internal and Third-Party Audit Results
Internal auditing and third-party auditing is performed to fulfill the mandatory requirements
of the Drinking Water Quality Management Standard (DWQMS). The internal audit is
completed using trained internal Water Services staff as auditors. The purpose of audits are
to evaluate the level of conformance of Water Services to the DWQMS. Audits identify both
conformance and non-conformance with the Standard, as well as, opportunities for
improvement. Appendix B: Summary of Internal and External Audit Plans includes the past
two years’ internal and external audit plans and the plan for the upcoming year.
2019 Internal Audit
The internal audit was completed on April 1 to April 5, 2019 and looked at 17 processes at
Water Services. Many strengths were identified during the internal audit, including a sense
of pride, ownership and commitment to the DWQMS and processes outlined in the
Operational Plan. Participating staff at all levels are knowledgeable and aware of their duties
as it relates to providing safe drinking water to the water consumers.
There were no non-conformities identified during these internal audits.
Various opportunities for improvement, such as: improved document and records control;
training; communications; essential services; staffing levels; emergency management; and
standard operating procedure creation were also noted in the internal audit report. Water
Services strives to promptly address issues identified in internal audits as part of continuous
improvement of its procedures and processes. The next internal audit is scheduled to take
place between March 2 and 6, 2020.
2019 External Audit
The third-party external on-site verification audit was completed between November 25 and
November 27, 2019 by NSF International Strategic Registrations and looked at 24 processes
at Water Services. Accreditation to the DWQMS Version 2.0 was maintained.
2019 Annual and Summary Report
Page 16 of 182
The auditor noted that there continues to be strong evidence of ongoing commitment to the
DWQMS at the City of Guelph. System strengths observed during the audit include:
• Staff participation / engagement
• Ownership / pride
• DWQMS documentation
• Management review process
• Internal audit process
• Continual improvement
• Communication: internal and external
• Risk assessment process
• Leak detection program
• Emergency planning / testing processes
There were two minor non-conformities identified during this audit. The first minor non-
conformance related to Document and Records Control (DWQMS Element 5). The auditor
noted that: there was a standard operating procedure that does not reflect current practices
for calibration and verification of colorimeters; and an obsolete version of design
specifications was found to be available to operators.
The second minor non-conformance relates to Essential Supplies and Services (DWQMS
Element 13) and documentation around chemical receiving. Instances were identified where
the lot number was missing on the bill of lading from our chemical supplier.
In both minor non-conformances, immediate containment of the issues were taken. A root-
cause-analysis was completed to identify corrective and preventative actions to ensure that
the issues will not occur again. In both minor non-conformances, the auditor accepted our
corrective and preventative actions and the minor non-conformances are considered closed.
Noted opportunities for improvement by the auditor were related to improving the following
processes:
• Document and Records Control (DWQMS 5);
• Communications (DWQMS 12);
• Infrastructure Maintenance, Rehabilitation and Renewal (DWQMS 15);
• Sampling, Testing and Monitoring (DWQMS 16); and
• Continual Improvement (DWQMS 21).
Water Services maintains a culture of continual improvement and works towards
implementing improvements suggested by the external auditor. The minor non-
2019 Annual and Summary Report
Page 17 of 182
conformances and opportunities for improvement will be reviewed by the external auditor at
the next on-site audit, scheduled between November 23 and 25, 2020.
f) Results of Emergency Response Testing
Emergency response testing is regularly completed as part of the Water Services’ Quality
Management System (QMS) to ensure that Water Services maintains a reasonable readiness
to deal with emergencies and abnormal events. The ability to properly manage emergencies
and unplanned failures is critical in demonstrating that Water Services has taken a diligent
approach in its operations.
Water Services’ last emergency test exercise involved a mock scenario where a large
watermain break occurred on a section of 20 inch watermain that feeds the west end of the
city, which resulted in low pressure and/or no water for the affected customers, a boil water
advisory and a workplace incident where a car drove into the watermain trench, resulting in
an investigation by the Ministry of Labour. The emergency test exercise was held on
November 1, 2019 and included representatives from the Ministry of the Environment,
Conservation and Parks (Inspector), representatives from Wellington-Dufferin-Guelph Public
Health (WDGPH) as well as Water Services and other City staff. All other Water Services’
staff participated in sessions that took place between November 6 and 8, 2019.
Water Services had three actual emergency events in 2019.
The first one occurred on May 10, 2019. A contractor who was working on site at Water
Services punctured the gas main with a backhoe. Water Services staff evacuated the
building until the gas supply could be shut off. Fire Services were on scene to assess the
situation and determine when staff could return to work. The gas main was repaired by
Union Gas.
The second emergency involved four watermain breaks on a section of Silvercreek Parkway
on the weekend of September 13, 2019. Based on the poor structural condition of this
segment of watermain, an emergency replacement of that section of pipe was initiated on
September 16, 2019. Following completion of reconstruction of this segment of pipe it was
returned to regular service in early October.
The third emergency involved a large watermain break on a 16” watermain on Speedvale
Avenue between the Hanlon Parkway and Silvercreek Parkway on November 30, 2019. This
resulted in significant water loss from the Speedvale Tower; although pressure was
maintained throughout the north end of the city during the watermain break. Emergency
repairs were completed by a contractor, with Water Services staff overseeing the repairs.
2019 Annual and Summary Report
Page 18 of 182
Feedback from emergency testing and from actual emergency events is gathered during
debriefing sessions and improvement items are incorporated into the Emergency Plan,
standard operating procedures and/or daily operations.
Table 3 includes the dates of Completed Emergency Response Tests for the past three years
and planned tests for 2020.
Table 3: Emergency Response Tests
Hazardous Event /
Hazard9 2017 2018 2019 2020
Long-term impacts of climate
change
Dec. 8, 13
(2017 test)
Jan. 26
(2017 test)
Source water supply shortfall Jan. 20
(2016 test) Planned test
Extreme weather events
(e.g. tornado, ice storm,
flood)
Dec. 8, 13
(2017 test)
Jan. 26
(2017 test)
Sustained extreme temperatures
(e.g. heat wave, deep freeze)
Dec. 8, 13
(2017 test)
Jan. 26
(2017 test)
Chemical spill impacting
source water Planned test
Sustained pressure loss
Nov. 23, 28-30 (2018
test)
Nov. 1, 6-8
(2019 test)
Backflow / Cross-connection
Nov. 23, 28-30 (2018
test)
Terrorist threat Planned test
Vandalism
9 The Hazardous Event / Hazard list reflects the MECP’s mandated “Potential Hazardous
Events for Municipal Residential Drinking Water Systems to Consider in the Risk
Assessment” document.
2019 Annual and Summary Report
Page 19 of 182
Hazardous Event /
Hazard9 2017 2018 2019 2020
Sudden changes to raw water
characteristics
(e.g. turbidity, pH)
Dec. 8, 13
(2017 test)
Jan. 26
(2017 test) Planned test
Failure of equipment or process associated with
primary disinfection
(e.g. UV, chlorination)
Failure of equipment or process associated with
secondary disinfection
(e.g. chlorination)
Loss or contamination of
treated water supply
Nov. 23, 28-30 (2018
test)
Nov. 1, 6-8
(2019 test)
Sept. 13 and Nov.
30 (main
breaks)
Loss of monitoring system Nov. 3
(AWQI)
g) Operational Performance and Statistics
The following section describes Operational performance statistics within Water Services
that includes:
• 2019 Totalized Pumpages as per the Municipal Drinking Water Licence and Permits to
Take Water;
• 2019 Instantaneous Flows as per Permit to Take Water requirements;
• Water Production and Population;
• 2019 Arkell Springs Glen Collector Flows;
• Water Supply Capacity;
• System Maintenance and Updates; and
• Status of Ongoing and Emerging Water Quality, Supply and Distribution Incentives.
2019 Totalized Pumpages and Instantaneous Flows
2019 Annual and Summary Report
Page 20 of 182
The Safe Drinking Water Act and the Ontario Water Resources Act each require that
operating authorities record and report both water takings as governed by Permits-to-Take-
Water, and water being supplied to the City of Guelph.
Summaries of total water pumped, instantaneous flows and capacity (flows and volumes
compared to rated capacities) by the City of Guelph can be found in Appendix C: Total
Water Pumped and Instantaneous Flows.
Figure 3 below, depicts the water pumpage rate in cubic metres per day (m3/day) that is
averaged each week.
Figure 3: Totalized Pumpages, 2019
Water Services processed 17,160,654 cubic metres (17.2 billion litres) of water to the
distribution system in 2019, equivalent to 6,864 Olympic-sized swimming pools. This
represents 0.9 per cent less water being supplied to the distribution system in 2019 as
compared to the same time period in 2018 and 1.4 per cent more water than in 2017.
2019 Annual and Summary Report
Page 21 of 182
The average daily water demand was 47,015 cubic metres (47.0 million litres). The
maximum day production of water in 2019 was 58,411 cubic metres (58.4 million litres) and
occurred on November 30, 2019. The minimum day production of water in the same time
period was 32,477 cubic metres (32.5 million litres) and occurred on December 26, 2019.
Water Production, Consumption and Population
Figure 4 below shows the City of Guelph’s annual average daily water production, annual
average daily consumption, annual peak day demand, and population from 2009 to 2018.
Consumption data for 2019 was not available at the time of publication.
During this time, the City of Guelph’s population increased 12 per cent while at the same
time annual average daily water production and consumption demonstrate a downward
trend (3 per cent) based on linear regression.
Fluctuation in water production and consumption is anticipated to occur, year to year, based
on a number of factors, including seasonal temperatures and annual precipitation, system
demands (including planned and unplanned maintenance) and steady population growth.
2019 Annual and Summary Report
Page 22 of 182
Figure 4: Guelph Water Production, Water Consumption, Population
Arkell Springs Glen Collector System Source Water
The Arkell Springs Glen Collector System (Collectors), one of Guelph’s many water sources,
consists of a gravity-fed, under-drain system that collects shallow overburden groundwater.
This system has been in use since the early 1900’s and can represent as much as 40 per
cent of the total city-wide daily water production when in operation. When the output of this
source is reduced, Water Services is required to make up the difference from other water
supplies. Throughout the year, the production from this water supply varies from an
approximate low of 4,000 cubic metres (4 million litres) up to an approximate high of
20,000 cubic metres (20 million litres) per day.
Seasonally, between April 15 and November 15, the City has a Permit-to-Take-Water that
allows water to be pumped from the Eramosa River to a pond and trench-based Recharge
System. In the Recharge System, the river water enters the trench where it filters through
the ground and is later captured in the Arkell Springs Glen Collector System.
2019 Annual and Summary Report
Page 23 of 182
In 2016, the Recharge System was out of service to accommodate infrastructure
improvements including an extension of the trench system in an effort to capture more
water in the Collectors. The Recharge System was returned to service in May 2017 and
tested during 2017 and 2018 to determine the impact of the extended trench on the
Collector flows. In 2018, 1,368,766 m3 of raw water was pumped from the Eramosa River
(from April through November) and 1,119,787 m3 of raw water was pumped from Arkell
Well 7 (from March through September) to the Recharge System as part of a Collector
System capacity test. Recent modelling showed that approximately 52 per cent of this
volume was captured in the Collector system.
The productivity of the Collectors can be used as one of many predictive tools. If the
production volume from the Collectors is low, then it can be assumed that other water
supplies would be needed to make up the difference. This may alter how regular
maintenance is performed as well as the urgency with which repairs are made to supplies
that unexpectedly go off-line as they may be needed to supplement overall production for
the City when the Collector System is unable to produce a sufficient supply.
The Collectors have produced 3,853,004 cubic metres (3.9 billion litres) of water in 2019,
which is approximately 22 per cent of Guelph’s total water production. This represents 4.2
per cent less water as compared to the same time period in 2018 and 1.4 per cent more
water than in 2017.
For a visual representation, please refer to Figure 5, which depicts the Arkell Spring Grounds
Collector flow volumes in cubic metres per day (m3/day) that is averaged each week.
2019 Annual and Summary Report
Page 24 of 182
Figure 5: 2019 Arkell Spring Grounds Glen Collector System Volumes
Please note: Arkell Well 7 contributed 1,119,787 m3 to the Recharge System (from March
through September 2018) with approximately half (560,000 m3) captured in the Collector
flow post filtration through the ground.
Water Supply Capacity
Pumping stations are typically rated on their firm capacity, which is defined by the Ministry
of Environment, Conservation and Parks (MECP) Design Guidelines for the Design of
Drinking Water Distribution Systems (2008) by the following criteria:
• Capacity of the pumping station with the largest unit out of service if the station
supplies a pressure zone with adequate storage available for fire protection and
balancing;
• Capacity of the pumping station with the two largest units out of service if the
pumping station serves a pressure zone that does not have adequate floating storage
available and is the sole source of supply in the area.
2019 Annual and Summary Report
Page 25 of 182
This approach however, does not address the “system” firm capacity. Neither is it directly
applicable to a groundwater system with many sources. Firm Capacity assessment of a
water supply system is essentially an exercise in risk assessment, such that a municipality
will incorporate measures or strategies to minimize the risk of certain aspects of the system
being off-line, and will accept a level of risk that a portion of the system will not be available
due to maintenance, water quality issues or other.
A proposed approach to more accurately reflect system conditions for the City considers
equipment reliability (i.e. assumptions for percentage of inoperable wells or pumps) and
also potential future contamination issues. This will also take into consideration wells that
are presently shut down for water quality reasons and whether it would be acceptable to
bring these sources back online in emergency conditions.
Historically, City staff have assessed a safe, sustainable yield of existing groundwater
supplies through hydrogeological assessments conducted mainly through quadrant studies,
subsequent pumping tests and operational data. The groundwater flow model has also been
used to confirm sustainable capacity, however both of these methods reflect permitted
capacities, either takings allowed in the Permit to Take Water (PTTW) or those included in
Environmental Certificates of Approval (ECA) for each well or pumping station.
In order to more accurately address the questions of system firm capacity, Water Services
staff annually review the operational water demand data for water supply facilities under
maximum demands. Values used for permitted pumping rate and firm capacity calculations
by well are provided in Table 4. The permitted pumping rate is the rate of pumping allowed
as identified in the Permits to Take Water. The firm capacity rate is the actual rate of
pumping that can be achieved at each well.
2019 Annual and Summary Report
Page 26 of 182
Table 4: Permitted Rates and Point of Entry Firm Capacities of Water Supply Wells
Well Name
Permitted
Daily
Maximum
(m3/day)
Permitted
Rate
(L/s)
Point of Entry
Firm Capacity10
(m3/day)
Point of Entry
Firm Capacity
(L/s)
Arkell 1 3,273 37.9 1,640 19.0
Arkell Springs
Wellfield11 28,800 333.3 28,800 333.3
Burke 6,546 75.8 5,790 67.0
Carter 1 and Carter 2 7,855 75.8 5,184 60.0
Membro 6,050 78.0 3,200 37.0
Water St. 3,400 44.4 2,500 28.9
Dean 2,300 34.6 1,500 17.4
University 3,300 38.2 2,400 27.8
Downey 5,237 60.6 5,000 57.9
Park 1 and Park 2 10,300 119.2 9,500 110.0
Emma 3,100 35.9 2,330 27.0
Helmar 3,273 37.9 1,300 15.0
Paisley 3,200 37.0 1,300 15.0
Calico 5,237 60.6 1,040 12.0
Queensdale 5,237 60.6 1,210 14.0
10 The firm capacity rate is the actual rate of pumping that can be achieved at each well. 11 The Arkell Springs Wellfield consists of five (5) municipal drinking water production wells:
Arkell 6, Arkell 7, Arkell 8, Arkell 14 and Arkell 15. All of the aforementioned Arkell Wells are
contained within the same Permit to Take Water (No. 5061-9ZKKWV). Notwithstanding the
specified maximum permitted taken per day, any combination of these wells can be used to
obtain the permitted rate.
2019 Annual and Summary Report
Page 27 of 182
Water Services staff use the calculated firm capacity values in order to aid planning of
scheduled shutdowns and maintenance of the water supply wells. Staff hold monthly
meetings to review project statuses that affect firm capacity. At the meetings there are
discussions related to the progress of maintenance and upgrade operations. The purpose of
the monthly meeting is to ensure adequate servicing capacity is available to meet the City’s
water demands while maintenance and capital upgrades are undertaken to maintain the
system in a fit state of repair.
System Maintenance and Updates
The tables that follow summarize Water Services’ maintenance work – for Water Distribution
(Table 5) and for Water Treatment (Table 6).
Table 5: Water Distribution Maintenance Activity
Job Type 2017 Total 2018 Total 2019 Total
Acoustic Leak – Dry 1 0 5
Blow Off Install 0 0 0
Dig to find leak 0 0 1
Hi/Low Jumper Install 0 0 0
Hydrant Install (WW) 0 0 1
Hydrant Remove 0 0 1
Hydrant Repair 35 6 30112
Hydrant Repair Hit 2 7 2
Hydrant Replace (WW) 2 2 9
Hydrant Replace Hit 2 1 1
Main Break 47 72 58
12 Water Services has started tracking all repairs through a Work and Asset Management
Program, resulting in a more detailed accounting of the number of repairs completed.
2019 Annual and Summary Report
Page 28 of 182
Job Type 2017 Total 2018 Total 2019 Total
Other (e.g. exploratory excavations,
miscellaneous repairs, etc.) 2 11 1
Re-route Watermain 0 0 0
Sample Station Install 17 1 1
Sample Station Replace 10 0 1
Service Cut Off 3 5 3
Service Lowered 0 0 0
Service New Install 0 2 2
Service Repair 91 99 48913
Service Replace 7 11 14
Trench Repair 0 0 0
Valve Install (WW) 1 4 5
Valve Remove 0 0 0
Valve Repair 7 7 54
Valve Replace (WW) 22 25 20
Meters New 487 315 367
Meters Exchanged 712 950 4,61214
Watermains Cleaned (km) 150.65 225 15.6
Watermains Re-lined (m) 171 0 1,390
13 Water Services has started tracking all repairs through a Work and Asset Management
Program, resulting in a more detailed accounting of the number of repairs completed. 14 1,344 meters were exchanged by Water Services, 3,268 meters were exchanged through
the Water Meter Replacement Program.
2019 Annual and Summary Report
Page 29 of 182
The next table (Table 6) includes Water Treatment-related maintenance activities and
expenditures (may include programs that have a series of projects).
Table 6: Water Treatment Maintenance Activity, 2019
Maintenance Activity Location
Below Grade Well Inspections Arkell 15, Carter 1, Paisley, Park 1, and
Queensdale
Clair/Zone 3 Booster Testing Clair Booster Station
Contact Chamber/Reservoir Inspections Downey, Paisley, Park, Queensdale and
FM Woods Station
Electrical “as found” Drawings Arkell
Electrical and Instrumentation Upgrades Various Sites
Facility Lighting Upgrades Various Sites
Facility Repairs and Maintenance Various Sites
Fencing and Security Upgrades Arkell
Process and Monitoring Equipment Upgrades Various Sites
Process Piping Upgrades Queensdale
Pump Replacements Arkell 14, Park and Queensdale
Standby Power Generator Installation Arkell Well 8
Turbidimeter Installations and Removals Membro and Burke
Well Pump Discharge Pressure Transmitters Various Sites
Well Rehabilitations Paisley, Park 1 and Queensdale
SCADA System Improvements
The Supervisory Control and Data Acquisitions (SCADA) system is the computerized control
system that monitors and automatically controls the pumps, valves, water towers and online
instrumentation at the 25 water facilities located throughout the City and 8 water facilities
located in the Arkell Springs well field. SCADA also monitors 49 flowmeters and pressure
transmitters located throughout the water distribution system.
2019 Annual and Summary Report
Page 30 of 182
The SCADA system performs the vital role of monitoring/logging process data to ensure
regulatory compliance, and providing tools to the Operations team that enables them to run
the City’s water system in a consistent manner. Furthermore, the SCADA system is also
configured to automatically shut down facilities and/or notify an on-call operator in the case
of abnormal process conditions. The SCADA system also monitors the security systems at
all water facilities. Lastly, the SCADA system also provides process data reports and queries
that are used for compliance reporting, hydraulic system modelling, and long term planning.
In 2019, SCADA system uptime was over 99.995 per cent, due to SCADA network upgrades
that were undertaken in 2017 to add redundant auto-failover backup SCADA network links
to all facilities and due to SCADA backup system upgrades in 2018-2019.
Upgrades to the SCADA system in 2019 were focused around updating SCADA system
programming standards, modernizing control system programming, and updating backup
systems. In addition to incremental updates, all-new SCADA code and screens were
deployed at 2 facilities in conjunction with capital projects.
Table 7 below, provides a summary of improvements to SCADA and Security undertaken in
2019.
Table 7: SCADA and Security - Maintenance and Improvement Activities, 2019
SCADA / Security Maintenance & Improvement Activities Location(s)
Additional SCADA data-logging redundancy (with secondary data-
loggers) Various Sites
Process flow diagrams and piping & instrumentation diagrams
(P&ID’s) updates All Sites
Equipment layout drawings updates All Sites
Facility electrical drawings updates Various Sites
SCADA Input / Output Lists and standardized connection diagram
updates Various Sites
SCADA backup server upgrades Various Sites
New building temperature transmitters for facility monitoring All Sites
Updates to SCADA design and programming guidelines for capital
projects All Sites
2019 Annual and Summary Report
Page 31 of 182
SCADA / Security Maintenance & Improvement Activities Location(s)
SCADA programming standards updates All Sites
SCADA software code updates (multi-year program) Various Sites
New display screens to show current treatment chemical tank
inventories in terms of level, percentage, tank capacity, and volume
remaining
All Sites
Operator display screen updates to use high performance HMI
concepts Various Sites
Security systems upgrades All Sites
Form 1s, Form 2s and Form 3s
Form 1s and 2s are required by the MECP to document significant changes to the drinking
water system. Engineering Services staff complete the Form 1 – Record of Watermains
Authorized as a Future Alteration. Water Services’ staff complete the Form 2- Record of
Minor Modification or Replacements to the Drinking Water System. Form 3s are associated
with the addition of Emergency Stand-by Power. Water Services’ staff complete the Form 3
– Record of Addition, Modification or Replacement of Equipment Discharging a Contaminant
of Concern to the Atmosphere.
Table 8 below provides a summary of Form 1s, Form 2s and Form 3s completed over the
course of 2019.
2019 Annual and Summary Report
Page 32 of 182
Table 8: Summary of Form 1s, Form 2s and Form 3s, 2019
Form Type Total Number of
Completed Forms
Form 1 – Record of Watermains Authorized as a Future Alteration 3
Form 2 – Record of Minor Modification or Replacements to the
Drinking Water System 11
Form 3 – Record of Addition, Modification or Replacement of
Equipment Discharging a Contaminant of Concern to the
Atmosphere
1
Water Distribution Locates
In 2014, The City of Guelph registered its utility infrastructure with ON1Call, as mandated
by the Ontario Underground Infrastructure Notification System Act, 2012.
Since registering, the City experienced a significant increase in locate request volumes. This
increase in volume ensures that Water Services is notified of and attends all locate requests
for every excavation in proximity to water infrastructure. This prevents damage to City
infrastructure and protects the City’s water quality and quantity.
In order to provide efficient locate services across the corporation, the City has transitioned
all infrastructure locates into one corporate group which is housed at Water Services. This
includes water, sanitary and storm sewers, traffic signals, and fibre optics. Utility locators
now locate all infrastructure in one site visit rather than each department individually. Table
9 includes all water locate requests received and responded to in 2019 with a year to year
comparison below in Table 10.
Table 9: Water Distribution Locates Requested and Responded to in 2019
Jan Feb Mar Apr May June July Aug Sep Oct Nov Dec
289 382 538 837 1,408 925 862 952 818 842 546 198
2019 Annual and Summary Report
Page 33 of 182
Table 10: Historical Locate Requests Received
Year Total
2019 8,597
2018 8,275
2017 8,622
2016 7,979
2015 9,255
Status of Ongoing and Emerging Water Quality, Supply
and Distribution Initiatives
This includes summaries and updates related to the implementation of the:
• 2016 Water Efficiency Strategy;
• Arkell Springs Forest Stewardship Project,
• Source Water Protection Plan;
• Lead Reduction Plan; and
• Frozen Services Monitoring Program.
Water Efficiency Strategy
The City of Guelph strives to be a leader in water conservation and efficiency. As one of
Canada’s largest communities reliant on a finite groundwater source for drinking water
supply, the City’s ability to reclaim water and wastewater serving capacity through
conservation and efficiency initiatives offers numerous benefits to our community and local
ecosystem. Water Services continues to promote the ongoing sustainability of our finite
water resources through active water conservation and efficiency programming to meet the
water reduction targets as outlined in the 2014 Water Supply Master Plan.
Appendix I: Water Efficiency Program – 2019 Annual Progress Report presents the
achievements and progress made for the period of January 1 to December 31, 2019 in the
implementation of the 2016 Water Efficiency Strategy.
2019 Annual and Summary Report
Page 34 of 182
Source Water Protection Plan
The City of Guelph is committed to drinking water source protection and in 2016, Council
appointed risk management staff to implement the Source Water Protection program.
The City of Guelph falls under the Grand River Source Protection Plan, which was approved
by the MECP and became effective on July 1, 2016. Of the 72 policies identified in the Grand
River Source Protection Plan, the City of Guelph is the primary implementing body for 48 of
the 72 policies, with the remaining policies to be implemented by provincial ministries. As of
December 31, 2019, 28 of the 48 policies have been fully implemented, based on priority
basis or deadline.
Appendix K: Source Water Protection includes a highlight of the progress made for the
period of January 1 to December 31, 2019 in the implementation of the City of Guelph’s
Source Water Protection program. This third annual report summarizes information
requested from the Risk Management Official by the Source Protection Authorities, as
required under Section 81 of the Clean Water Act, 2006 (CWA).
For more information on Guelph’s Source Water Protection Program, visit
guelph.ca/sourcewater.
Arkell Springs Forest Stewardship Project
The Arkell Spring Grounds cover an area of 804 acres. The area is comprised of old and new
forested areas. The objective of the Arkell Springs Forest Stewardship Project has been to
protect the drinking water source supply by monitoring general forest health, managing tree
plantings and enhancing fallow areas with new plantings.
Managed forest stands require continued maintenance and observation to ensure the health
of the forest and prevent any unnecessary losses. The many benefits of this long-standing
Stewardship Project include:
• the creation and maintenance of a diverse and functioning forest cover;
• maintenance and re-generation of older forested areas on the property;
• protection and recharge of underground aquifers which supply the City’s water;
• prevention of undesirable surface water runoff and flooding into local waterways;
• localized temperature stabilization;
• retain precipitation to enhance infiltration and improve supply; and
• regulating water flow.
2019 Annual and Summary Report
Page 35 of 182
This property management approach results in the highest possible quality of water to
supply Guelph’s drinking water system.
To improve the overall health of the property, a tree planting program for fallow farm fields
has been ongoing since 2007. On a volunteer basis, the Community Environmental
Leadership Program (CELP) with the Upper Grand District School Board has planted 28,500
trees on 18 acres, and Bartram Woodlands (on-site contractor) has planted 39,240 trees on
another 16 acres.
In 2019, a five-year plan for forest management was developed to identify priorities at the
Arkell Spring Grounds. The plan identifies tree planting, maintenance and invasive
vegetation removal to ensure the health of this site. It further recommends a forest
inventory plan to guide the management of this important source protection measure.
Arkell Springs Forest Stewardship Project is an important part of the Arkell and Carter
Integrated Property Management Plan.
Lead Reduction Plan
The City has been working proactively to address the presence of lead service lines (LSLs) in
Guelph since 2007 through identification and replacement of both the private and public
portions of LSLs. Full LSL replacement has demonstrated to be effective in reducing lead
concentrations and achieving regulatory compliance as measured at the point to water
consumption.
The City of Guelph’s Lead Reduction Plan (LRP) was developed in lieu of a Corrosion Control
Plan (as outlined in Ontario Regulation 170/03 Schedule 15.1) and was formally approved
by the MECP on March 21, 2012. The LRP focuses on physical lead service line replacement
through verification sampling, financial incentives and public outreach.
As per the City of Guelph MDWL 017-101 - Schedule D, the City is required to submit all
lead sampling data every 6 months and an annual Evaluation Report to assess the
effectiveness of the Lead Reduction Plan.
2019 Annual and Summary Report
Page 36 of 182
Lead Sampling in the Guelph Drinking Water System
The following table presents summary results for lead sampling in the Guelph Drinking
Water System as per Schedule D for the period of January 1 to December 31, 2019.
Table 11: Lead Reduction Plan Lead Sampling - Guelph Drinking Water System,
201915
Number of
Locations Location Type
Number of
Samples
Lead Range
(mg/L)
95 Plumbing that Serves Private
Property 110 0.0000 – 0.038
10 Distribution System 20 < 0.0005
Lead Sampling in the Gazer Mooney Subdivision Distribution System
In the Gazer Mooney Subdivision Distribution System, all samples were below the Ontario
Drinking Water Quality Standards (ODWQS) for lead of 0.01 mg/L, as presented in the
following table.
Table 12: Lead Reduction Plan – Gazer Mooney Subdivision Distribution System,
2019
Number of
Locations
Location
Type
Number of
Samples
Lead Range
(mg/L) pH Range
Alkalinity
Range (mg/L)
1 Distribution 2 <0.0005 7.78 – 7.88 260 – 270
Lead Sampling
Over 5,000 homes/businesses have been sampled for lead to identify the presence of LSLs
and to monitor lead levels following a LSL replacement. For the period of January 1 to
December 31, 2019, 90 private plumbing locations were sampled for the purposes of
verifying the presence of a LSL. Of these locations, 11 locations were above 0.005 mg/L
indicating presence of a lead service line and 4 also exceeded the ODWQS of 0.01 mg/L.
15 Includes all samples as required by the MDWL or Lead Reduction Plan.
2019 Annual and Summary Report
Page 37 of 182
Lead samples are collected before and after a LSL replacement has been undertaken. There
were 5 locations resampled in order to monitor lead levels post-replacement. Based on
sample results to date, regulatory compliance is expected at individual sites that have
undergone a full LSL replacement or where there is no lead remaining in the service line.
Lead Service Line Replacements
Since 2007, there has been a total of 703 lead service lines replaced in the City. As a result,
91 per cent of these homes are now considered to be ‘lead-free’ service lines (i.e. either a
full replacement or a partial replacement that connected to a non-lead material). There were
14 LSL replacements undertaken in the City between January 1 to December 31, 2019. Of
these, there were 3 LSL replacements on City property and 2 LSLs were replaced on both
City and private property by coordinating the work with the homeowner. An additional 9 LSL
replacements were completed on private property by the homeowner.
Since 2010, the City initiated financial incentive programs to encourage replacement of
privately-owned LSL by reducing the financial burden to property owners. The grants cover,
on average, 75 per cent of the LSL replacement cost for homeowners. From 2010 to Dec.
31, 2019, 229 privately owned lead service lines were replaced through the grant program,
as presented in Table 13.
2019 Annual and Summary Report
Page 38 of 182
Table 13: Private Lead Service Line Replacement Grant Programs (2010 – Dec. 31,
2019)
Year Grant
Program Total
Cumulative
Total
2010 60 60
2011 62 122
2012 31 153
2013 20 173
2014 9 182
2015 12 194
2016 7 200
2017 13 213
2018 7 220
2019 9 229
Targeted outreach regarding the Grant Programs is directed at all properties with known or
suspected privately-owned LSLs. The main barriers to privately owned LSL replacement for
homeowners include financial costs, disruption to property, rental properties and people who
are unconcerned about the health risks of lead in drinking water. Direct communications
continued to be been tailored to address these barriers.
Frozen Water Pipe Prevention and Monitoring Program
Water Services takes a proactive approach in monitoring and preventing frozen water pipes.
The purpose of the 2015 Council-approved Frozen Water Pipe Policy is to prevent and
manage interruptions to the City’s supply of water, caused by the temporary freezing of City
and/or customer water pipes, so that customers maintain reliable, continuous access to
water.
Water Services monitors daily temperatures, frost levels, degree-days and water
temperature in the water distribution system. When certain thresholds are reached, the
freeze prevention program is initiated.
2019 Annual and Summary Report
Page 39 of 182
The Frozen Water Pipe Program requires customers to take specific actions to prevent the
freezing of water pipes. Water Services has identified two tiers for their frozen water pipe
prevention program. Tier 1 properties are most susceptible to freezing and have historically
frozen every year or are properties where running water will ensure the water mains in the
area do not freeze. Tier 2 properties are also at risk for freezing and have had frozen pipes
in the past during prolonged periods of severe winter temperatures. Through communication
with these customers, Water Services works hard to ensure that frozen water pipes are
prevented. The customers in both of these Tiers are registered in our notification program.
For more information on the Frozen Water Pipe Program, visit guelph.ca/frozenpipes.
2019 Frozen Water Pipe Program Statistics
Through the winter of 2018/2019 Guelph experienced fluctuating temperatures throughout
the early part of the winter (November and December). Early into 2019, nighttime
temperatures consistently remained below -10°C, dropping below -20°C and remaining
steady for over a week. The result of which pushed frost down into the ground creating a
scenario with high probability of frozen water pipes.
By late January, 3.5 feet of frost was noted in the ground – the lowest frost depth for the
season. With the addition in the cumulative mean daily temperature (i.e. the lower the
temperature, the quicker the approach to the cumulative temperature trigger) it was
decided to initiate the freeze prevention program.
On January 21, Tier 1 and Tier 2 customers began running water as per the actions set out
in this program to prevent water pipes from freezing. As temperatures warmed up in
February, the frost level in the ground rose and forecasted temperatures saw no return to
cooler temperatures. By late February, all customers were contacted to cease running their
water, as per the program.
Summary of 2018/2019 Winter Statistics
• Temperature hit cumulative low trigger amount of -400°C: February 19.
• Lowest temperature recorded for the season was on February 1: -25.58°C.
• Lowest frost depth recorded for the season was 3.5 feet was on January 29.
• No frozen calls were received during the season.
2019 Annual and Summary Report
Page 40 of 182
h) Raw and Treated Water Quality and Drinking Water
Quality Trends
Guelph Drinking Water System
This section describes the water quality monitoring, both regulatory and operational, that
has been completed in 2019.
Water Quality Review – Guelph Drinking Water System
Under the Safe Drinking Water Act, municipalities are required to monitor both the raw and
treated quality of the source water supplied. This monitoring is performed for both
regulatory compliance and due diligence and is expected to identify any changes within the
treated water, as well as, in raw source waters.
A note about all tables included in this section
1. All regulated chemicals detected in the City of Guelph’s treated water sources that are
above the lab’s MDL (minimum detection limit) are underlined indicating a hyperlink
to an Excel Workbook in Guelph’s electronic document management system (EDMS).
The workbook contains a definition of the parameter and an Excel worksheet for each
treated source where the parameter has been detected with values for all sample
results from January 1, 2007 to December 31, 2019. This database is used to closely
track the instances of the identified chemical parameters and therefore provide time
for planning and budgeting if treatment or an alternative supply is eventually required
due to the presence of a given parameter. The database is updated annually.
2. Tabulated data is from the best available information at the time of table creation.
3. If sampling for a particular schedule’s parameters (e.g. Schedule 23 and 24) did not
occur within the calendar year of the report, then the most recent values are included
in the report for reference.
4. All acronyms and initials included in tables are described in Appendix L: Glossary.
5. Please note that some hyperlinks in the tables are linked to Guelph’s electronic
document management system (EDMS). Note: EDMS is available for internal use
only.
The following section summarizes Distribution free chlorine residual test results (January 1
to December 31, 2019) required by O. Reg. 170/03 Schedule 7-2, where secondary
disinfection is provided.
2019 Annual and Summary Report
Page 41 of 182
Please note that the City of Guelph takes additional operational daily Distribution samples
and tests for free chlorine residual in order to better monitor the free residual in the
Distribution System and respond accordingly. There was no instance of an adverse result in
2019 associated with these sampling sites, as presented in Table 14.
Table 14: O. Reg. 170/03 Schedule 7-2, City of Guelph - Distribution Manual Free
Chlorine Residual Summary, 2019
Parameter ODWQS
Criteria
Total
Analyses
Total
Samples
above
Detection
Limit
Total
Outside
ODWQS
Criteria
Range
(mg/L)
Free Chlorine Residual –
Zone One 0.05 – 4.0 297 297 0 0.52 – 1.21
Free Chlorine Residual –
Zone Two 0.05 – 4.0 297 297 0 0.35 – 1.03
Table 15 below summarizes raw bacteriological sampling and test results required by
O. Reg. 170/03 Schedule 10-4 including investigative re-sampling for the period of January
1 to December 31, 2019. There were a total of 886 raw samples taken and 2,658 raw
analyses conducted.
Table 15: O. Reg. 170/03 Schedule 10-4, City of Guelph - Raw Bacteriological
Sampling Summary, 2019
Parameter ODWQS
Criteria
Total
Analyses
Total Outside
ODWQS
Criteria
Range
(cfu/100 mL)
Raw - E. coli n/a 886 n/a 0 – 4
Raw - Total Coliform n/a 886 n/a 0 – 78
Raw - Background n/a 886 n/a 0 – 480
Table 16 summarizes treated bacteriological sampling and test results required by O. Reg.
170/03 Schedule 10-3 and 6-3 including investigative re-sampling for 2019.
2019 Annual and Summary Report
Page 42 of 182
• Number of POE16 samples taken: 554
• Number of POE analyses: 2,209
• Number of Distribution samples taken: 1,534
• Number of Distribution analyses: 7,693
Table 16: O. Reg. 170/03 Schedule 10-2, 10-3 and 6-3, City of Guelph - Treated
Bacteriological Sampling Summary, 2019
Parameter ODWQS
Criteria
Total
Analyses
Total
Outside
ODWQS
Criteria
Range Units
POE - E. coli 0 554 0 0 cfu /100 mL
POE - Total Coliform 0 554 0 0 cfu /100 mL
POE – HPC n/a 547 n/a 0 – 1300 cfu /mL
POE – Background n/a 554 n/a 0 – 9 cfu /100 mL
POE – Free Chlorine
Residual
0.05 -
4.0 54917 0
0.53 –
1.44 mg/L
Distribution - E. coli 0 1,578 0 0 cfu /100 mL
Distribution - Total
Coliform 0 1,578 0 0 cfu /100 mL
Distribution – HPC n/a 703 n/a 0 – 280 cfu /mL
Distribution –
Background n/a 1,578 n/a 0 – 380 cfu /100 mL
Distribution – Free
Chlorine Residual
0.05 -
4.0 1,914 0
0.30 –
1.30 mg/L
16 Point of Entry - the point at or near which treated water enters the distribution system. 17 Total number of samples used specifically to satisfy the requirements of O. Reg. 170/03
Schedule 10-3 and 6-3 (Treated Source samples taken for Operational purposes are not
included).
2019 Annual and Summary Report
Page 43 of 182
Table 17 summarizes raw source turbidity sampling and test results required by O. Reg.
170/03 Schedule 7-3 for the period of January 1 to December 31, 2019. Schedule 7-3
requires monthly raw source turbidity sampling, but the City of Guelph samples all raw
sources and tests for turbidity on a weekly basis to better monitor this aspect of raw water
quality.
Table 17: O. Reg. 170/03 Schedule 7-3, City of Guelph - Raw Source Turbidity
Sampling Summary, 2019
Parameter ODWQS
Criteria
Total
Analyses
Total Outside
ODWQS Criteria Range (ntu)
Raw Source
Turbidity n/a 1036 n/a 0.05– 1.00
Table 18 summarizes raw source Ultraviolet Transmittance (UVT) sampling and test results
required by the City’s Municipal Drinking Water Licence (MDWL), where UV for primary
disinfection is used for the period of January 1 to December 31, 2019. The MDWL requires a
UVT test to be conducted and recorded on a weekly sampling schedule.
Table 18: O. Reg. 170/03 Schedule 7-3, City of Guelph - Raw Ultraviolet
Transmittance Sampling Summary, 2019
Parameter
MDWL
Criteria
(% UVT)
Total
Analyses
Total Outside
MDWL Criteria
Range
(% UVT)
Raw UVT F.M.
Woods Station 93.5 58 0 94.6 - 100
Raw UVT Membro
Well 90.0 102 0 90.0 – 99.8
Raw UVT Water St.
Well 87.0 52 0 88.1 – 98.1
Microparticulate Analysis
As a part of the Guelph Drinking Water System’s Municipal Drinking Water Licence, Guelph
Water Services is required, twice annually, to assess the Arkell Springs Glen Collector
System which is characterized as groundwater under the influence of surface water with
2019 Annual and Summary Report
Page 44 of 182
effective in situ filtration (GUDI-WEF). The purpose of the assessment is to ensure that the
source continues to meet the GUDI-WEF source water characteristics as outlined by the
MECP. Sampling was performed on this water source in the spring and fall of 2019. The
source continues to meet the GUDI-WEF source water characteristics.
Treated Water Quality Statistics – Guelph Drinking Water
System
O. Reg. 170/03 Schedule 6-5 - Continuous Monitoring Results
Summary
Water Services utilizes over forty regulatory and operational continuous monitoring devices
to measure water quality. Each regulatory device has controls associated with it such that in
the event that the device detects that a measured value is outside the acceptable
parameters for that location, the device causes an alarm to be sent to an Operator for
immediate response (24 hours per day, seven days per week) and either automatically
shuts down the station or activates a second alarm for immediate Operator response.
Both the minimum allowable levels (if applicable) and the target values for Water Services
regulatory continuous monitoring devices are listed in Table 19. The target values represent
a safety margin to ensure that regulatory requirements are satisfied at all times. Please note
that, continuous monitoring values all fell within acceptable regulatory standards in 2019.
2019 Annual and Summary Report
Page 45 of 182
Table 19: O. Reg. 170/03 Schedule 6-5, Continuous Monitoring Results Summary,
2019
Parameter ODWQS or
Regulatory Minimum Target Range Units
Point of Entry Free Chlorine
Residual 0.05 mg/L Greater than 0.4 mg/L
UV Dose F.M. Woods Station 24 mJ/cm2 Greater than 40 mJ/cm2
UV Dose Water St. Well 40 mJ/cm2 Greater than 45 mJ/cm2
UV Dose Membro Well 20 mJ/cm2 Greater than 40 mJ/cm2
O. Reg. 170/03 Schedule 13-6 and 13-7, “Three Month” Sampling
Results Summary
In 2019, all operational Treated Sources were sampled and analyzed for Schedule 13-6, 13-
16.1 and 13-7 parameters as per O. Reg. 170/03.
Regulation 170/03, Schedule 13-6 requires a minimum of one distribution sample taken
from the Distribution System where THM’s (trihalomethanes) are most likely to develop
(locations with high retention times). Water Services uses the Speedvale, Clair and Verney
Elevated Tanks for this purpose in the Guelph Drinking Water System. The Maximum
Allowable Concentration (MAC) for THM’s is 0.1 mg/L. However, for this parameter, the MAC
uses a running annual average of quarterly samples.
The results of the running annual average value for THMs for all related Distribution System
samples in each quarter of 2019 (Jan. 01 to Dec. 31) is below the half of the maximum
allowable concentration (½ MAC): Q1 = 0.023 mg/L; Q2 = 0.028 mg/L; Q3 = 0.034 mg/L
and Q4 = 0.039 mg/L.
Regulation 170/03, Schedule 13-6.1 requires a minimum of one distribution sample taken
from the Distribution System where HAAs (haloacetic acids) are most likely to develop.
Water Services uses Woods Sample Station, Ptarmigan Sample Station, Clair Tower Sample
Tap and Edinburgh South Sample Station for this purpose in the Guelph Drinking Water
System. The Maximum Allowable Concentration (MAC) for HAAs is 0.08 mg/L. However, for
this parameter, the MAC uses a running annual average of quarterly samples.
2019 Annual and Summary Report
Page 46 of 182
The results of the running annual average value for HAAs for all related Distribution System
samples in each quarter of 2019 (Jan. 01 to Dec. 31) is below the half of the maximum
allowable concentration (½ MAC): Q1 = 0.024 mg/L; Q2 = 0.021 mg/L; Q3 = 0.027 mg/L
and Q4 = 0.025 mg/L.
All operational Treated Sources were sampled and analyzed for Nitrates and Nitrites as per
Regulation 170/03, Schedule 13-7. There was no instance of an adverse result in 2019. Raw
sampling results are also presented in Table 20.
2019 Annual and Summary Report
Page 47 of 182
Table 20: O. Reg. 170/03 Schedule 13-6 and 13-7, City of Guelph – “Three Month” Sampling Results Summary,
2019
Parameter ODWQS
MAC ½ MAC
Total
Samples
Samples
Above
MDL
Total Above
ODWQS
Criteria
Min
(mg/L)
Max
(mg/L)
Average18
(mg/L)
Trihalomethanes 0.10019 n/a 23 23 0 0.0125 0.0712 0.0363
Haloacetic Acids 0.0820 n/a 14 12 0 < 0.005 .040 0.025
Nitrate + Nitrite (as
nitrogen) 10 5 47 33 0 < 0.10 2.14 1.08
Nitrate + Nitrite (as
nitrogen) - Woods' Raw
Sources (Operational
Sampling)
n/a n/a 35 35 n/a 0.36 4.65 1.29
Nitrate + Nitrite (as
nitrogen) - University Raw
Source (MDWL Sampling)
10 5 5 5 0 0.35 0.62 0.41
Nitrate + Nitrite (as
nitrogen) - Paisley Raw
Source (MDWL Sampling)
10 5 5 5 0 1.99 2.14 2.05
18 This is the average of values above the lab detection limit. 19 This standard is expressed as a running annual average. 20 This standard is expressed as a running annual average.
2019 Annual and Summary Report
Page 48 of 182
Operational VOC Scan Results Summary
Please note that Schedule 13-6, 13-6.1 and Schedule 24 parameters are also part of the
“Operational VOC Sampling Regime” and therefore the values in the “Operational VOC Scan
Results Summary” in Appendix D: Treated Water Quality Statistics include a repetition of the
relevant data from the Schedule 13-6, 13-6.1 and Schedule 24 tables. The “Operational
VOC Scan Results Summary” lists the total number of samples analyzed for these
parameters in 2019 (January 1 to December 31, 2019). Table 21 (below), highlights specific
VOC parameters due to their presence / significance within the water supply. There was no
instance of an adverse result in 2019.
2019 Annual and Summary Report
Page 49 of 182
Table 21: City of Guelph Operational VOC Scan Selected Results Summary, 2019
Parameter ODWQS
MAC ½ MAC
Total
Samples
Samples
Above
MDL
Total
Above
ODWQS
Criteria
Min
(mg/L)
Max
(mg/L)
Average
(mg/L)
Trichloroethylene 0.005 0.0025 148 54 0 < 0.0001 0.00199 0.00063
Trihalomethanes 0.10021 n/a 135 58 0 < 0.0002 0.0365 0.00835
21 This standard is expressed as a running annual average.
2019 Annual and Summary Report
Page 50 of 182
O. Reg. 170/03 Schedule 23 Results Summary
In 2019, all operational treated sources were sampled and analyzed for Schedule 23
parameters as per O. Reg. 170/03. All of the City of Guelph’s treated ground water sources
are on a three year sampling schedule. F.M. Woods’ Station is the exception and is sampled
on the annual surface water schedule due to the fact that five of the nine sources that
supply F.M. Woods are GUDI-WEF sources (the Carter Well 1 and 2, Arkell 1, Arkell 15 and
the Arkell Springs Glen Collectors).
The results of the Schedule 23 inorganic parameter analysis in 2019 were all under half of
the maximum allowable concentration (½ MAC) and the majority were under the
laboratory’s MDL (minimum detection level). Please refer to the section titled “O. Reg.
170/03 Schedule 23 Results Summary” included in Appendix D: Treated Water Quality
Statistics for more information.
2019 Annual and Summary Report
Page 51 of 182
Table 22: O. Reg. 170/03 Schedule 23, 13-2a, City of Guelph - Annual Schedule 23 Sampling Results Summary,
2019
Parameter ODWQS
MAC ½ MAC
Total
Samples
Samples
Above
MDL
Total
Above
ODWQS
Criteria
Min
(mg/L)
Max
(mg/L)
Average
(mg/L)
Antimony 0.014 0.007 24 5 0 < 0.0001 0.00092 0.00065
Arsenic 0.025 0.0125 24 5 0 < 0.0002 0.0043 0.002
Barium 1.0 0.5 24 24 0 0.035 0.11 0.0672
Boron 5.0 2.5 24 24 0 0.014 0.043 0.028
Cadmium 0.005 0.0025 24 5 0 0.00009 0.00013 0.00011
Chromium 0.05 0.025 24 2 0 0.008 0.015 0.0079
Mercury 0.001 0.0005 12 0 0 < 0.0001 < 0.0001 n/a
Selenium 0.01 0.005 24 0 0 < 0.002 < 0.002 n/a
Uranium 0.02 0.01 24 22 0 < 0.00010 0.0017 0.00107
2019 Annual and Summary Report
Page 52 of 182
O. Reg. 170/03 Schedule 24 Results Summary
In 2019, all operational Treated Sources were sampled and analyzed for Schedule 24
parameters as per O. Reg. 170/03. All of the City of Guelph’s treated ground water sources
are on a three year sampling schedule. F.M. Woods’ Station is the exception and is sampled
on the annual surface water schedule due to the fact that five of the nine sources that
supply F.M. Woods’ are GUDI-WEF sources (the Carter Well field, Arkell 1, Arkell 14 and the
Arkell Springs Glen Collectors).
The results of the Schedule 24 organic parameter analysis in 2019 were all under half of the
maximum allowable concentration (½ MAC) and the majority were under the laboratory’s
MDL (minimum detection level). Please refer to the section entitled “O. Reg. 170/03
Schedule 24 Results Summary” included in Appendix D: Treated Water Quality Statistics for
more information.
It should be noted that, before 2012, values for TCE (trichloroethylene) at Membro and
Emma occasionally crested the ½ MAC value of 0.0025 mg/L and as a result Water Services
moved to an “Increased Frequency Sampling Plan” as required by Regulation 170/03 - 13-5
which requires that sampling for this parameter be sampled every “three months” until two
consecutive sample results are below the ½ MAC value. As a precautionary measure, Water
Services samples on a monthly schedule at Membro and Emma wells. All other sources, are
sampled annually (minimally) for VOC’s (Volatile Organic Carbons) through a “Guelph VOC
Scan” in order to better track parameters such as TCE via more data. Currently, TCE is
above the MDL but below the ½ MAC at Membro, Water Street, Emma and Park treated
water samples.
2019 Annual and Summary Report
Page 53 of 182
Table 23: O. Reg. 170/03 Schedule 24, 13-4a, City of Guelph - Annual Schedule 24 Sampling Results Summary,
2019
Parameter ODWQS
MAC ½ MAC
Total
Samples
Samples
Above
MDL
Total
Above
ODWQS
Criteria
Min (mg/L) Max
(mg/L)
Average
(mg/L)
Alachlor 0.005 0.0025 12 0 0 < 0.0005 < 0.0005 n/a
Atrazine + N-dealkylated
metabolites 0.005 0.0025 12 0 0 < 0.001 < 0.001 n/a
Azinphos-methyl 0.02 0.01 12 0 0 < 0.002 < 0.002 n/a
Benzene 0.005 0.0025 66 0 0 < 0.0001 < 0.0001 n/a
Benzo(a)pyrene 0.00001 0.000005 12 0 0 < 0.000005 < 0.000005 n/a
Bromoxynil 0.005 0.0025 12 0 0 < 0.0005 < 0.0005 n/a
Carbaryl 0.09 0.045 12 0 0 < 0.005 < 0.005 n/a
Carbofuran 0.09 0.045 12 0 0 < 0.005 < 0.005 n/a
Carbon Tetrachloride 0.005 0.0025 66 0 0 < 0.0001 < 0.0001 n/a
Chlorpyrifos 0.09 0.045 12 0 0 < 0.001 < 0.001 n/a
Diazinon 0.02 0.01 12 0 0 < 0.001 < 0.001 n/a
Dicamba 0.12 0.06 12 0 0 < 0.001 < 0.001 n/a
2019 Annual and Summary Report
Page 54 of 182
Parameter ODWQS
MAC ½ MAC
Total
Samples
Samples
Above
MDL
Total
Above
ODWQS
Criteria
Min (mg/L) Max
(mg/L)
Average
(mg/L)
1,2-Dichlorobenzene 0.2 0.1 66 0 0 < 0.0002 < 0.0002 n/a
1,4-Dichlorobenzene 0.005 0.0025 66 0 0 < 0.0002 < 0.0002 n/a
1,2-Dichloroethane 0.005 0.0025 66 0 0 < 0.0002 < 0.0002 n/a
1,1-Dichloroethylene 0.014 0.007 66 0 0 < 0.0001 < 0.0001 n/a
Dichloromethane 0.05 0.025 66 0 0 < 0.0005 < 0.0005 n/a
2,4-Dichlorophenol 0.9 0.45 12 0 0 < 0.00025 < 0.00025 n/a
2,4-Dichlorophenoxy-
acetic acid (2,4-D) 0.1 0.05 12 0 0 < 0.0001 < 0.0001 n/a
Diclofop-methyl 0.009 0.0045 12 0 0 < 0.0009 < 0.0009 n/a
Dimethoate 0.02 0.01 12 0 0 < 0.0025 < 0.0025 n/a
Diquat 0.07 0.0035 12 0 0 < 0.007 < 0.007 n/a
Diuron 0.15 0.075 12 0 0 < 0.01 < 0.01 n/a
Glyphosate 0.28 0.14 12 0 0 < 0.01 < 0.01 n/a
Malathion 0.19 0.095 12 0 0 < 0.005 < 0.005 n/a
2019 Annual and Summary Report
Page 55 of 182
Parameter ODWQS
MAC ½ MAC
Total
Samples
Samples
Above
MDL
Total
Above
ODWQS
Criteria
Min (mg/L) Max
(mg/L)
Average
(mg/L)
2-Methyl-4-
chlorophenoxyacetic acid 0.1 0.05 12 0 0 < 0.00012 < 0.00012 n/a
Metolachlor 0.05 0.025 12 0 0 < 0.0005 < 0.0005 n/a
Metribuzin 0.08 0.04 12 0 0 < 0.005 < 0.005 n/a
Chlorobenzene 0.08 0.04 66 0 0 < 0.0001 < 0.0001 n/a
Paraquat 0.01 0.005 12 0 0 < 0.001 < 0.001 n/a
Pentachlorophenol (PCP) 0.06 0.03 12 0 0 < 0.0005 < 0.0005 n/a
Phorate 0.002 0.001 12 0 0 < 0.0005 < 0.0005 n/a
Picloram 0.19 0.095 12 0 0 < 0.005 < 0.005 n/a
Polychlorinated Biphenyls
(PCB) 0.003 0.0015 12 0 0 < 0.00005 < 0.00005 n/a
Prometryn 0.001 0.0005 12 0 0 < 0.00025 < 0.00025 n/a
Simazine 0.01 0.005 12 0 0 < 0.001 < 0.001 n/a
Terbufos 0.001 0.0005 12 0 0 < 0.0005 < 0.0005 n/a
Tetrachloroethylene (PCE) 0.03 0.015 66 0 0 < 0.0001 < 0.0001 n/a
2019 Annual and Summary Report
Page 56 of 182
Parameter ODWQS
MAC ½ MAC
Total
Samples
Samples
Above
MDL
Total
Above
ODWQS
Criteria
Min (mg/L) Max
(mg/L)
Average
(mg/L)
2,3,4,6-Tetrachlorophenol 0.1 0.05 12 0 0 < 0.0005 < 0.0005 n/a
Triallate 0.23 0.115 12 0 0 < 0.001 < 0.001 n/a
Trichloroethylene 0.005 0.0025 66 24 0 < 0.0001 0.00167 0.00046
2,4,6-Trichlorophenol 0.005 0.0025 12 0 0 < 0.0005 < 0.0005 n/a
Trifluralin 0.045 0.0225 12 0 0 < 0.001 < 0.001 n/a
Vinyl Chloride 0.002 0.001 66 0 0 < 0.0002 < 0.0002 n/a
2019 Annual and Summary Report
Page 57 of 182
O. Reg. 170/03 Schedule 13-8 and 13-9, “Five Year” Sampling Results
Summary
In 2019, all operational Treated Sources were sampled and analyzed for the Schedule 13-9
Fluoride parameter as per O. Reg. 170/03. In 2019, Fluoride (naturally present and not
added as part of the treatment process) was detected at all treated sources; the analytical
results were all under the maximum allowable concentration (MAC). The values in Table 24
reflect the 2019, Schedule 13-9 sampling regime.
Sodium, however, is sampled on a more frequent basis (annually) than the Schedule 13-8
requirement due to the fact that at every treated source, sodium levels are above the lower
reportable limit of 20 mg/L.
The increased frequency of sampling provides more data in order to better establish sodium
value trends. Sodium results for 2019 can be referenced in Table 24. This data is provided
to Wellington-Dufferin-Guelph Public Health, as required.
2019 Annual and Summary Report
Page 58 of 182
Table 24: O. Reg. 170/03 Schedule 13-8 and 13-9, City of Guelph – “Five Year” Sampling Results Summary
Parameter ODWQS
MAC ½ MAC
Total
Samples
Samples
Above MDL
Total
Above
ODWQS
Criteria
Min
(mg/L)
Max
(mg/L)
Average
(mg/L)
Sodium 20 and 20022 n/a 32 32 32 23 170 88.9
Fluoride 1.5 and 2.423 n/a 10 10 0 0.12 0.73 0.30
22 The aesthetic objective for sodium in drinking water is 200 mg/L. The local Medical Officer of Health should be notified when
the sodium concentration exceeds 20 mg/L so that this information may be communicated to local physicians for their use with
patients on sodium restricted diets. 23 Where supplies contain naturally occurring fluoride at levels higher than 1.5 mg/L but less than 2.4 mg/L, the Ministry of
Health and Long Term Care recommends an approach through local boards of health to raise public and professional awareness
to control excessive exposure to fluoride from other sources.
2019 Annual and Summary Report
Page 59 of 182
General Chemistry Results Summary
Water Services has initiated an “Annual General Chemistry” sampling event through RCAp
(Rapid Chemical Analysis Package). This body of data can be used to answer customer
inquiries, as well as, inquiries from Water Services staff and consultants in terms of
treatment upgrades.
Please note that Schedule 23 parameters are also part of the “Annual General Chemistry
Sampling Regime” and therefore the values in the “General Chemistry Results Summary”
section in Appendix D: Treated Water Quality Statistics include a repetition of the relevant
data from the Schedule 23 Table. The “General Chemistry Results Summary” lists the total
number of samples analyzed for these parameters in 2019.
In 2019, all operational Treated Sources were sampled and analyzed for general chemistry
parameters. Please refer to the “General Chemistry Results Summary” in Appendix D:
Treated Water Quality Statistics for the full list of parameters.
Table 25 highlights specific parameters due to their presence / significance within the water
supply.
2019 Annual and Summary Report
Page 60 of 182
Table 25: City of Guelph General Chemistry Selected Results Summary, 2019
Parameter ODWQS
MAC
ODWQS
AO
ODWQS
OG
Total
Samples
Samples
Above
MDL
Total
Above
Criteria
Min
(mg/L)
Max
(mg/L)
Average
(mg/L)
Ammonia-N n/a n/a n/a 12 2 n/a < 0.05 0.18 0.16
Chloride n/a 250 n/a 12 12 n/a 39 280 160
Hardness
(Calculated as
CaCO3)
n/a n/a 80-100 12 12 12 330 570 448
Iron n/a 0.3 n/a 24 6 2 < 0.005 1.8 0.56
Lead 0.01 n/a n/a 23 2 0 <0.0005 0.0014 <0.00073
Manganese n/a 0.05 n/a 24 19 0 <0.002 0.037 0.0088
Sodium n/a 20 and
200 n/a 38 38 38 23 170 91
2019 Annual and Summary Report
Page 61 of 182
Gazer Mooney Subdivision Distribution System
This section describes the regulatory water quality monitoring that has been collected in the
Gazer Mooney Subdivision Distribution System in 2019. For regulatory sampling schedules
that do not occur in 2019 related to the Gazer Mooney System, the most recent historical
data is listed.
Water Quality Review - Gazer Mooney Subdivision Distribution System
Under the Safe Drinking Water Act, municipalities are required to monitor both the raw and
treated quality of the source water supplied. This monitoring is performed for both
regulatory compliance and due diligence and is expected to identify any changes within the
treated water as well as in the raw source waters.
A note about all tables included in this section
1. All regulated chemical parameters where values above the lab’s MDL (minimum
detection limit) have been detected in the City of Guelph’s treated water sources are
underlined indicating a hyperlink to an Excel Workbook in Guelph’s EDMS. The
workbook contains a definition of the parameter, an Excel worksheet for each treated
source where the parameter has been detected with values for all sample results from
January 1, 2007 to December 31, 2019. This database is used to closely track the
instances of the identified chemical parameters and therefore provide time for
planning and budgeting if treatment or an alternative supply is eventually required
due to the presence of a given parameter. The database is updated quarterly.
2. Tabulated values are from best available information at the time of table creation.
While the values documented here satisfy the regulatory minimum regulatory
requirements, Water Services performs many additional operational tests not listed in
this report.
3. All acronyms and initialisms included in tables are described in Appendix L: Glossary.
4. Please note that some hyperlinks in the tables are linked to Guelph’s electronic
document management system (EDMS) which is available for internal City use only.
Table 26 summarizes daily Distribution free chlorine residual test results required by O. Reg.
170/03 Schedule 7-2 for the period of January 1 to December 31, 2019. There was no
instance of an adverse result in 2019.
2019 Annual and Summary Report
Page 62 of 182
Table 26: O. Reg. 170/03 Schedule 7-2, Gazer Mooney - Distribution Manual Free
Chlorine Residual Summary, 2019
Parameter ODWQS
Range
Total
Samples
Total Samples
Outside of
ODWQS Criteria
Min
(mg/L)
Max
(mg/L)
Average
(mg/L)
Free Chlorine
Residual
0.05 –
4.0 105 0 0.49 1.07 0.92
Table 27 summarizes bacteriological sampling and test results required by O. Reg. 170/03
Schedule 10 for the period of January 1 to December 31, 2019. There was no instance of an
exceedance for a Regulatory microbiological parameter in 2019. There were 52 Distribution
samples taken and 573 Distribution analyses completed in 2019.
Table 27: O. Reg. 170/03 Schedule 10-2, Gazer Mooney Treated Bacteriological
Sampling Summary, 2019
Parameter ODWQS
Criteria
Total
Analyses
Total
Outside
ODWQS
Criteria
Range Units
Distribution - E. coli 0 52 0 0 cfu/100
mL
Distribution - Total
Coliform 0 52 0 0
cfu/100
mL
Distribution – HPC n/a 52 n/a 0 - 3 cfu/mL
Distribution – Background n/a 52 n/a 0 - 3 cfu/100
mL
Distribution– Free Chlorine
Residual 0.05 – 4.0 105 0 0.49 – 1.07 mg/L
2019 Annual and Summary Report
Page 63 of 182
Treated Water Quality Statistics – Gazer Mooney Subdivision
Distribution System
O. Reg. 170/03 Schedule 13-6, “Three Month” Sampling Results
Summary
In 2019, Gazer Mooney Subdivision Distribution System was sampled and analyzed for
Schedule 13-6 and 13-6.1 parameters as per O. Reg. 170/03. Regulation 170/03, Schedule
13-6 requires a minimum of one distribution sample taken from the Distribution System
where THMs (trihalomethanes) are most likely to develop (points with high retention times).
The MAC for THMs is 0.1 mg/L. However, for this parameter the MAC uses a running annual
average of quarterly samples. These results are presented in Table 28.
The results of the running annual average value for THMs in the Gazer Mooney Subdivision
Distribution System samples in 2019 were below the half maximum allowable concentration
(½ MAC): Q1 = 0.020 mg/L; Q2 = 0.018 mg/L; Q3 = 0.018 mg/L and Q4 = 0.019 mg/L.
Regulation 170/03, Schedule 13-6.1 requires a minimum of one distribution sample taken
from the Distribution System where HAAs (haloacetic acids) are most likely to develop. The
MAC for HAAs is 0.08 mg/L. However, for this parameter the MAC uses a running annual
average of quarterly samples.
The results of the running annual average value for HAAs in the Gazer Mooney Subdivision
Distribution System samples in 2019 is below the half maximum allowable concentration (½
MAC): Q1 = not detected; Q2 = not detected; Q3 = not detected and Q4 = not detected.
2019 Annual and Summary Report
Page 64 of 182
Table 28: O. Reg. 170/03 Schedule 13-6, Gazer Mooney - "Three Month" Sampling Results Summary, 2019
Parameter ODWQS
MAC mg/L
½ MAC
mg/L
Total
Samples
Samples
Above MDL
# Above
ODWQS Criteria
Min
(mg/L)
Max
(mg/L)
Average
(mg/L)
Trihalomethanes 0.10024 n/a 4 4 0 0.013 0.020 0.019
Haloacetic Acids 0.0825 n/a 4 0 0 <0.005 <0.005 n/a
O. Reg. 170/03 Schedule 13-8 and 13-9, “Five Year” Sampling Results Summary
In 2019, Gazer Mooney Subdivision Distribution System was sampled and analyzed for the Schedule 13-9 Fluoride parameter as
per O. Reg. 170/03. In 2019, Fluoride (naturally present and not added as part of the treatment process) was detected; the
analytical result was under the maximum allowable concentration (MAC). The values in Table 29 reflect the 2019, Schedule 13-9
sampling regime.
Sodium, however, is sampled on a more frequent basis (annually) than the Schedule 13-8 requirement due to the fact that at
every treated source, sodium levels are above the lower reportable limit of 20 mg/L. The increased frequency of sampling
provides more data in order to better establish sodium value trends. Sodium results for 2019 can be referenced in Table 29. This
data is provided to Wellington-Dufferin-Guelph Public Health, as required.
24 This standard is expressed as a running annual average. 25 This standard is expressed as a running annual average.
2019 Annual and Summary Report
Page 65 of 182
Table 29: O. Reg. 170/03 Schedule 13-8 and 13-9, Gazer Mooney - "Five Year" Sampling Results Summary
Parameter ODWQS
MAC ½ MAC
Total
Samples
Samples
Above MDL
Total
Above
ODWQS
Criteria
Min
(mg/L)
Max
(mg/L)
Average
(mg/L)
Sodium 20 and 20026 n/a 2 2 2 24 26 25
Fluoride 1.5 and 2.427 n/a 1 1 0 0.17 0.17 0.17
General Chemistry Results Summary
In addition to the regulatory sampling and analysis required for the operation of the Gazer Mooney Subdivision, Water Services
samples for parameters as listed in Table 30 in order to gather additional data and answer common inquiries from the public.
26 The aesthetic objective for sodium in drinking water is 200 mg/L. The local Medical Officer of Health should be notified when
the sodium concentration exceeds 20 mg/L so that this information may be communicated to local physicians for their use with
patients on sodium restricted diets.
27 Where supplies contain naturally occurring fluoride at levels higher than 1.5 mg/L but less than 2.4 mg/L, the Ministry of
Health and Long Term Care recommends an approach through local boards of health to raise public and professional awareness to control excessive exposure to fluoride from other sources.
2019 Annual and Summary Report
Page 66 of 182
Table 30: Gazer Mooney General Chemistry Results Summary, 2019
Parameter ODWQS
MAC mg/L
ODWQS
AO
½ MAC
mg/L
Total
Samples
Samples
Above MDL
Total Above
ODWQS
Criteria
Min
(mg/L)
Max
(mg/L)
Average
(mg/L)
Sodium 20 and
20028 n/a n/a 3 3 3 24 26 25
Chloride n/a 250 n/a 1 1 0 40 40 40
28 The aesthetic objective for sodium in drinking water is 200 mg/L. The local Medical Officer of Health should be notified when
the sodium concentration exceeds 20 mg/L so that this information may be communicated to local physicians for their use with patients on sodium restricted diets.
2019 Annual and Summary Report
Page 67 of 182
i) Follow-up on Action Items from Previous
Management Reviews
A Management Review meeting was held on January 25, 2019 and January 29, 2020. The
following is a summary of results of the management review. Appendix F: Action Items
from Management Review includes the action items from the meetings. Items 1-12 are from
the January 25, 2019 Management Review meeting and items 13-17 are from the January
30, 2020 Management Review Meeting.
Results of the Management Review, the identified deficiencies,
decisions and action items
The summary below includes identified deficiencies and decisions from the meeting held on
January 30, 2020.
Deficiencies
• There were four identified non-compliance issues identified in the 2018-2019 Ministry
of the Environment, Conservation and Parks inspection. Through the Root-Cause
Analysis program, Water Services has worked to implement policies and procedures
to reduce the likelihood of these non-compliances re-occurring in the future.
• Three AWQI’s occurred in 2019 in the Guelph Drinking Water System and one in the
Gazer Mooney Subdivision Distribution System. Three of the AWQIs were related to
sodium exceedances and one related to an incident where the chlorine residual in a
dead-end watermain was found to be below 0.05mg/L.
• There was one deviation from a Critical Control Point relating to the low distribution
system (secondary) chlorine residual found in a dead-end section of watermain.
Corrective and preventive actions have been taken to prevent this from re-occurring
in the future.
• There were two minor non-conformance issues identified in the 2019 accreditation
(external) audit. A corrective action plan was sent to the accreditation body and was
accepted on December 15, 2019.
Decisions
• See section d) The Effectiveness of the Risk Assessment Process regarding decisions
made in the Risk Assessment process on September 24, 2019.
• Investigate using J-Plugs on the drop tubes in the production wells.
• Consider adding water loss data to the Annual and Summary Report for 2020.
2019 Annual and Summary Report
Page 68 of 182
• Perform additional analysis on the frozen services program, specifically the running
tap program, and how it relates to water consumption and water production.
• Look at adding a line for performance testing to Table 6 for next year’s annual report.
• Have the SCADA group provide C3 Water with copies of facility P&ID, PFD and
equipment layout drawings so that the hydraulic model can be adjusted to take into
account pipe friction factors within treatment facilities.
j) The Status of Management Action Items Identified
Between Management Reviews
Water Services is very committed to continually improving the drinking water system,
including improving on existing programs and processes. Throughout the year, continual
improvement suggestions (management action items) can be presented throughout many
different activities, such as: emergency tests, audits, staff suggestions, debrief sessions,
root-cause analysis meetings, etc. These items are logged into Water Services’ Continual
Improvement Database and the appropriate teams meet every other month to update on
the status of these items.
Appendix G: Status of Management Action Items Identified between Reviews is a list of
continual improvement items identified in 2019 for management follow-up.
k) Changes that Could Affect the Drinking Water System
and the Quality Management System
Appendix E: Legal and Other Requirements Table includes a summary of legislative and
regulatory updates from January 1 to December 31, 2019 that could affect the Drinking
Water System and/or the Quality Management System.
Changes Affecting the Drinking Water System (DWS) - Licence
Approvals and Amendments
Municipal Drinking Water Licence (MDWL) Renewal
The Municipal Drinking Water Licence was renewed in 2019 and expires in 2024. Table 31
below includes Licence documents’ dates of issue and expiry. Copies of the documents listed
in Table 31 are available by contacting Water Services at [email protected] or calling
519-837-5627.
2019 Annual and Summary Report
Page 69 of 182
As part of the MDWL renewal, the updated Financial Plan was submitted to Council for
approval in March 2019 and the Operational Plan was endorsed by Council in January 2019.
Table 31: Municipal Drinking Water Licensing Documents
Document Issue Date
(yyyy-mm-dd)
Expiry
(yyyy-mm-dd)
Municipal Drinking Water Licence (#017-101) 2019-07-26 2024-07-24
Drinking Water Works Permit (#017-201) 2019-07-26 2024-07-24
Municipal Long Range Financial Plan (#017-301) 2019-02 2024-07-24
DWQMS Certificate of Registration - Guelph
Drinking Water System
(017-OA1)
2018-12-20 2021-11-25
Operational Plan Re-endorsement Guelph Drinking
Water System (resolution) 2019-01-14 2023-10-31
Agreement Regarding Water Services for the
Gazer-Mooney Subdivision 2019-03-01 2029-02-28
Gazer Mooney Municipal Drinking Water Licence
(#104-103) 2016-01-28 2021-01-26
Gazer Mooney Drinking Water Works Permit
(#017-203) 2016-01-28 2021-01-26
Operational Plan Re-endorsement Gazer Mooney
Subdivision Dist. System (resolution) 2019-09-16 2023-10-31
DWQMS Certificate of Registration - Gazer Mooney
(104-OA2) 2018-12-20 2021-11-25
Permits to Take Water (PTTW) Renewals
The Water St. Wellfield PTTW and the Downey PTTW were both renewed in 2019 and expire
in 2029.
One PTTW is scheduled for renewal in 2020. The Arkell Bedrock PTTW expires on May 31,
2020.
2019 Annual and Summary Report
Page 70 of 182
Sentry Monitoring Wells
A consultant was retained in 2015 to develop a groundwater monitoring network in the area
of the Membro and Emma Production Wells. These particular wells were categorized as
having a drinking water quality issue for Trichloroethylene (TCE), a volatile organic
compound (VOC) under the Clean Water Act. The source(s) of the VOCs is (are) unknown
but there are potential sources in the vicinity of each well. The main objective of this project
was to review the potential contaminant sources and install monitoring wells (i.e. Sentry
Wells) between the potential VOC sources and the municipal wells that will be monitored
and used to document changes in groundwater quality. These wells can provide an early
warning of potential contamination moving toward the production well and also track
changes in existing groundwater quality.
As such, a sampling plan has been created to regularly collect water quality samples from
each of the eight (8) Sentry Wells, within their respective vertically discrete sampling
intervals. Review of the data collected thus far is ongoing and the retained consultant is
expected to deliver a final report on the status of this project in early 2020.
Carter Monitoring Program – Operational Testing
The Permit to Take Water for Carter Well 1 and 2 requires that the Carter Wells be operated
at increased levels in conjunction with monitoring in the Torrence Creek Subwatershed. This
monitoring was completed via consultant in 2019. The purpose of the monitoring is to
quantify impacts within this subwatershed.
Staff Certification
The following tables (Table 32, Table 33 and Table 34) describes all Operators and
Management staff with various classes of provincial Drinking Water Operator Certificates
and years’ experience, as of December 31, 2019. Due to the system reclassification in late
2018, there was an increase in Class I operators in 2019 to meet the new certification
requirements.
2019 Annual and Summary Report
Page 71 of 182
Table 32: Water Services Employees (Operators and Management Staff) with
Drinking Water Operator Certificates
Certificate Class Number of Certified Employees - -
2017 2018 2019
Operator-In-Training 3 7 8
Class I 0 1 11
Class II 3 3 2
Class III 8 7 5
Class IV 19 19 7
Total Certified Employees 33 37 33
2019 Annual and Summary Report
Page 72 of 182
Table 33: Competency and Years of Experience for Certified Management Staff
Role
Minimum
Competency
Required29
Competency
Achieved
Years’
Experience
Manager of Operations /
ORO -Overall Responsible
Operator
Class IV Certificate Class IV Certificate 30+
Supervisor of Distribution -
Construction
Class I Certificate or
higher Class IV Certificate 23
Supervisor of Distribution Class I Certificate or
higher Class IV Certificate 20
Supervisor Water Treatment
and Maintenance
Class I Certificate or
higher Class IV Certificate 10
Supervisor Meters and
Locates n/a Class IV Certificate 19
Table 34: Years of Experience of Certified Operational Staff
Role <5
years 5-9 years
10-14
years
15-19
years
20-24
years
25+
years
Distribution
Operators 5 3 6 1 0 2
Water Treatment
Operators 4 0 1 4 1 1
29 Minimum competency includes the certification requirements listed here, plus the
completion of ongoing training requirements of O. Reg. 128/04.
2019 Annual and Summary Report
Page 73 of 182
Changes Affecting the Quality Management System (QMS)
Ontario’s updated Drinking Water Quality Management Standard
(DWQMS) Version 2.0
Guelph Water Services implemented the requirements of the updated DWQMS Version 2.0,
released in February 2017, in its quality management system. Water Services was
accredited to DWQMS Version 2.0 in the 2018 external audit and maintained accreditation in
the 2019 audit.
Quality Management System Implementation
Guelph Water Services strives for continual improvement in all of its programs and
processes. Improvements made to the drinking water system and its process are evaluated
through: internal and external audits; staff suggestions; risk assessments; emergency
training and testing; consumer feedback and through the management review process.
Water Services at the City of Guelph is committed to providing consumers with a safe,
consistent supply of high quality drinking water while meeting or exceeding, and continually
improving on legal, operational and quality management system requirements.
Throughout 2020, we will continue with a proactive approach to the DWQMS by:
• Maintaining accreditation to the DWQMS 2.0;
• Identifying ways to improve the drinking water system and its related processes;
• Expanding knowledge and involvement of staff for collaboration and integration of the
quality management system;
• Ensuring that any deficiencies identified are responded to and corrected quickly and
efforts are taken to ensure that the problem does not reoccur;
• Collaborating with other municipalities to ensure that we are enhancing our
performance standards and operating practices; and
• Continuing advancements to emergency prevention and preparedness, including the
risk assessment process.
l) Consumer Feedback
Table 35 below represents the number of all customer calls received, but do not necessarily
reflect the number of individual issues (as more than one call could relate to a single issue).
2019 Annual and Summary Report
Page 74 of 182
Table 35: Number of Customer Calls Received, 2017-2019
Type of Call # Calls
2017
# Calls
2018
# Calls
2019
Discoloured Water 106 116 132
Distribution 54 21 14
Flushing 13 5 2
Frozen 3 51 54
Hydrant - Accident Report 5 5 1
Hydrant – Investigation 35 25 27
Hydrant Out-of-Service 137 98 133
Leak 83 73 57
Meter 8 9 29
Other 33 43 24
Pressure 92 102 74
Private Issue 5 12 14
Service Box Repairs 194 212 220
Swabbing 16 39 2
Trench Investigation 4 9 N/A30
Valve 19 28 26
Water Quality / Appearance 39 62 36
Watermain 6 5 3
Watermain Break Investigation 96 107 93
Well Interference Inquiries 3 5 0
30 As of 2019, trenches are maintained by the Operations Department.
2019 Annual and Summary Report
Page 75 of 182
m) The Resources Needed to Maintain the Drinking
Water System and Quality Management System
Water Services currently has one full-time Quality Management Specialist, who is also the
Quality Management System Representative. Everyone at Water Services plays a role in
ensuring the success of the Quality Management System. Beyond the work of all staff, the
Quality Management Specialist has access to a Water Compliance Specialist; five Water
Services Technicians; a Customer Service Clerk; and a seasonal Records Management
Assistant to ensure that reporting and documentation requirements of the QMS are met.
Operational challenges in the drinking water system continue to drive the need for additional
resources, such as:
• A changing staff profile, with experienced staff that have retired or are due to retire in
the next few years;
• Aging city infrastructure requiring increased capital budget considerations;
• Potential source water supply shortfall (e.g. current supplies not meeting future
demand, drought, contamination and demands of future growth) requiring increased
capital project and budget considerations;
• Distribution system issues (e.g. dead ends in the distribution system, frozen city-side
infrastructure, larger infrastructure failures and aging water meter infrastructure,
aging watermains, watermains located on easements); and
• Private property issues (e.g. substandard water services).
n) Results of Infrastructure Review
The identification of water infrastructure requirements are achieved by reviewing the needs
of existing and new infrastructure through the completion of asset management plans both
at Water Services and corporately.
Distribution Infrastructure Needs
Distribution infrastructure needs are outlined in the corporate Asset Management Plan,
which is developed using industry best management practices and completed by the
Corporate Asset Management group in the Engineering and Transportation Service Division
(Engineering Services). This linear plan is reviewed by Water Services who then assists in
developing a priority sequence for project completion.
2019 Annual and Summary Report
Page 76 of 182
During the annual budget preparation process, Engineering and Water Services review
infrastructure conditions, inventory age, CAPS (capital asset prioritisation system), and
system criticality. From this evaluation, Engineering and Water Services finalize the list of
priority projects that also considers the priorities of wastewater and road reconstruction
projects so that these projects can share the costs of excavation and rehabilitation. New
linear infrastructure reviews are primarily driven by Engineering Services.
Annual summaries of road reconstruction, sewer and watermain projects are identified on a
capital project infrastructure map that is released by Engineering and Transportation
Services early spring each year.
Water Supply and Treatment Facilities Infrastructure Needs
On July 28, 2014 Guelph City Council unanimously approved the Water Supply Master Plan
update, defining preferred water supply servicing alternatives in meeting the needs of
existing customers and future community growth.
In concert with the Water Supply Master Plan Update, the City’s Engineering and
Transportation Services Division completed an update to the linear water distribution
network model as part of the 2014 Development Charges Background Study to define water
distribution improvements needed for growth servicing.
As part of the above mentioned studies, a number of system upgrades have been identified
including: additional water supply sources; new pumping stations; storage facilities; and
new water distribution mains. To help integrate these complex works, the City completed
the Pressure Zone 1 and 2 studies in 2015 and 2017, respectively. These studies support
the implementation of capital projects as outlined in the Water and Wastewater Capital
Budget deliberations.
In 2017, Water Services completed the Water Facility and Property Asset Management Plan.
This Plan identifies and prioritizes capital projects and land acquisitions required to maintain
and renew its existing facility assets and associated operations over a 25 year planning
horizon in accordance with asset management industry best management practices as well
as current codes, guidelines and standards. A 10-year capital forecast for Facility and Water
Plant Upgrades was presented to and endorsed by Council as part of the 2020 Capital
Budget deliberations to address a backlog in infrastructure investment required to sustain
operation of the City’s critical water supply facilities and processes.
As a result of the above noted studies, key capital projects have been initiated/completed in
2019. The following provides the project name with a brief description of these key projects.
2019 Annual and Summary Report
Page 77 of 182
F.M. Woods Station Upgrades and Engine House and Pumping Station
Building Retrofit
In 2019, works were initiated on the F.M Woods Station Upgrades to address critical
infrastructure upgrades and retrofit of the Engine House and Pumping Station Building
(Heritage Building) to provide office space for staff, respectively. 2019 works included the
completion of architectural design of new office space for the Heritage Building, tendering
for consultant selection for the F.M. Woods Upgrades and completion of the reservoir
inspections. The Heritage Building is scheduled for completion in Q4 2020, with the F.M.
Woods Upgrades being completed in 2023.
Burke Well Station Upgrades
Originally built in 1975, Burke well is one of the largest individual wells in the City pumping
about six million litres of water and supplies about 13,000 Guelph households with water
each day. This water treatment plant, completed in Q2 2019, is the first of its kind for the
City, and was constructed to remove iron and manganese from groundwater. Removal of
these metals allow our pipes to stay cleaner longer; therefore, prolonging the life of this
important City asset while also reducing the need for flushing programs and conserving
water. For the community, this new treatment plant will improve overall water quality and
service delivery.
The upgrades include construction of a building to house a pressure filtration system. The
upgrades resulted in a reclassification of the Water System by the MECP for both treatment
and distribution on December 20, 2018. The Guelph Drinking Water System is now classified
as a Class 2 Water Treatment System and a Class 4 Water Distribution System.
Clythe Well Treatment Upgrades and Zone 2 Environmental
Assessment
The Environmental Assessment (EA) was completed for the Clythe Well station in 2018. As a
result, the City purchased a parcel of land in their preferred location, which will house the
new Water Treatment Plant. Design of this treatment plant is anticipated to be initiated in
2020 after the completion of the Zone 2 EA. The Zone 2 EA will determine the need for
future water storage requirements on the East Side of the City which may impact the design
criteria for the new Clythe Well station. The Zone 2 EA is anticipated to be completed in
2020.
Paisley Pumping Station Upgrades
2019 Annual and Summary Report
Page 78 of 182
Upgrades to the Paisley Pumping Station were initiated in 2018 and will be completed in
2021 to ensure asset life is maintained. The scope of this project includes assessment of the
reservoirs, re-alignment of the pipes to accommodate a new watermain connection from
Paisley Road, upgrades to ensure electrical efficiencies and upgrades to the SCADA and MCC
(electrical system). Work is also being completed in preparation for the new Paisley Road
Feeder Main Engineering Project, which will promote redundancy in water distribution to the
west side of the City. In 2019, design of the new pumping station was almost completed
with construction starting in 2020.
Middle Reach of the Aqueduct
In 2018, preliminary projects were completed in preparation for the condition assessment
and potential maintenance of the middle reach of the aqueduct. Studies included completion
of an Environmental Impact Study and key contingency planning for unplanned changes in
water quality including operational responses. Meetings were also held with various
stakeholders including the Township of Puslinch, site neighbours, the Health Unit and the
MECP. It is anticipated that inspection will occur in the summer/fall of 2020 to inform future
capital needs for aqueduct maintenance and renewal. A new laneway will be constructed to
provide operational access to the middle reach in early 2020.
Calico Well Upgrades
Calico Well was taken out of service in August 2018 for scheduled contact chamber cleaning
and inspection. During the cleaning process, the well casing that extends through the
contact chamber was found to be damaged due to material corrosion. The site remains non-
operational as consultant reports and recommendations are being reviewed to determine
the best approach to deal with several process and building related issues. As a result of this
supply being off-line, the section of the feedermain between the station and the City’s
distribution system has been isolated and taken out of service.
Membro Well Upgrades
Upgrades to the Membro Well station were initiated in 2019 to bring the new replacement
well online after receiving the final Permit to Take Water from the Ministry of the
Environment, Conservation and Parks in October 2019. Design of the upgraded facility was
initiated in late 2019 with completion in Q1 2020. Upgrades, in addition to the addition of
the new replacement well, may include the realignment of the UV system and energy
upgrades such as VFDs and lighting. The main upgrades will include the building of an
2019 Annual and Summary Report
Page 79 of 182
addition to the existing well house, pumps and piping to connect the new well to the
distribution system and SCADA programming modifications.
In Q1 2020, a pumping test will be completed at the replacement well to confirm pumping
capacity. This is required to inform the upgrades as noted above. During this test, dye
tracer testing from the nearby sewage lift station will also be completed to determine a
potential bacteria source pathway. This testing will occur for the duration of the pumping
test which is anticipated to be completed in Q2 2020. If the dye is detected before Q2 2020,
the pumping test will continue to determine the influence of this increased water taking on
nearby wells.
Guelph South Feasibility Study
In 2019, the City initiated the feasibility study at the Guelph South test well in order to
evaluate the potential availability of new water supply for future use, as per the Water
Supply Master Plan. Further, the City has also partnered with the University of Guelph on
this project to better understand interactions between the shallow groundwater and surface
water in the area. Works include the installation of a new well in the proximity of the test
well, pumping tests and installation of groundwater and surface water monitoring
equipment. The majority of the work will be completed in 2020.
Logan Well Feasibility Study
In 2019 the City initiated the feasibility study at the Logan well in order to evaluate the
potential availability of new water supply for future use, as per the Water Supply Master
Plan. Works included tree clearing and maintenance of the access laneway in 2019.
Preliminary tests of the well were conducted to determine the condition of the well. The full
work plan will be implemented in 2020 which includes rehabilitation of the well and pumping
tests.
Backflow Prevention Program
Preservation of drinking water quality within Guelph’s infrastructure is supported by the City
of Guelph’s Building Services Division through administration of the Guelph Backflow
Prevention Program and By-law (By-law Number 2016 - 20028). As defined under the By-
law, Backflow means the flowing back of or reversal of the normal direction of flow of water.
The By-law requires that no connections are made to the City’s water supply where a
private premise risk may exist without the installation of an approved backflow prevention
2019 Annual and Summary Report
Page 80 of 182
device to isolate premises, sources, and zones to prevent cross-connections in every
building or structure where a City water supply or other potable water supply exists.
Annually, Building Services provides a Backflow Report, included in Table 36 below, that
tracks the number of letters sent out regarding backflow device annual testing and re-
surveying requirements of the By-law. In accordance with the by-law, failure by property
owners to maintain or replace the backflow prevention would result in the shut-off of water
servicing to the premise to protect the integrity of the City’s water supply.
2019 Annual and Summary Report
Page 81 of 182
Table 36: 2019 Backflow Report - Number of Letters Sent out for Annual Testing and Re-survey
Letter Type Jan Feb Mar Apr May June July Aug Sept Oct Nov Dec Total
1st Letter Annual Testing 147 159 177 210 273 185 143 172 120 135 164 118 2003
2nd Letter Annual Testing 60 85 114 109 128 138 133 97 125 41 93 98 1221
Disconnect Letter Annual Testing 68 33 44 39 53 63 67 72 49 36 37 60 621
1st Letter re-survey 34 30 39 36 32 25 30 22 18 5 41 7 319
2nd Letter re-survey 14 23 14 24 28 22 20 24 16 16 4 18 223
Disconnect Letter re-survey 12 7 12 10 15 15 16 15 20 11 7 4 144
Water service disconnected 0 0 0 0 0 0 0 0 0 0 0 0 0
2019 Annual and Summary Report
Page 82 of 182
As presented in Table 37, the City of Guelph has a total of 2,902 properties (2,746 active
and 156 inactive properties) that have a total of 6,603 backflow prevention devices
installed. Of the total, 1,708 buildings have premise isolation and 1,022 buildings are
without premise isolation (e.g. residential irrigation systems, plaza facility – plaza owner has
premise isolation). From January 1 to December 31, 2019, of the 31 new properties that
have a backflow prevention device, 12 are with premise and 19 are without premise
isolation.
Table 37: Backflow Devices Installed by Type in 2019
Devices Installed by Type # of Devices
New Backflow Permits 43
Total Number of New Devices Installed 125
New Properties 31
Active Properties 2,746
Inactive Properties 156
Total Properties with Backflow Prevention Devices 2,902
Active Buildings with Premise Isolation 1,708
Active Buildings without Premise Isolation 1,022
Total Active Backflow Prevention Devices 6,603
o) Operational Plan Currency, Content and Updates
On an ongoing basis, the Operational Plan is updated by the Quality Management Specialist
with the help of additional Water Services Staff. The Operational Plan was presented to
Council on January 14, 2019 for endorsement. Updates to the Operational Plan were
communicated to Water Services management and staff via email on September 10, 2019.
Notable updates include:
• Element 2 – Quality Management System Policy
▪ Added the new Supervisor of Distribution.
• Element 3 – Commitment and Endorsement
▪ Added the new Supervisor of Distribution.
2019 Annual and Summary Report
Page 83 of 182
• Element 5 – Document and Records Control
▪ QMS 05: Added “T” for Water Treatment and “SW” for Source Water to the list
of the naming conventions used for our procedures.
▪ QMS 05-01: Added the water bylaw and backflow bylaws to QMS 05-01
Document Master List.
▪ QMS 05-02: Added the online retention time for the Annual & Summary Report,
as per discussions with the MECP.
▪ QMS 05-04: Updated the hyperlinks to the following new documents: lab
agreement, meter agreement, DWWP, MDWL, Membro Raw Water Assessment,
Operational Plan Endorsement, Downey PTTW, and chemical contract.
• QMS 06 – Drinking Water System
▪ QMS 06: Updated the Burke Section, distribution section and added Clair
Booster Station to Table 1.
▪ QMS 06-01: Added the schematics for the new Burke Treatment facility. Added
information about utilizing one or multiple cells in reservoirs and the reservoirs
at Woods, Park, University and Paisley. Updated the treated sample locations at
Water and Emma. Changed the title from "Sample Process Schematics" to
"Treatment System Process Schematics".
▪ QMS 06-03: Added the section on the responsibilities of Water Services as per
the Gazer Mooney Agreement.
• QMS 07 – Risk Assessment
▪ QMS 07: Updated the control & response measures section.
▪ QMS 07-01: Updated the Consequence section to include the affect on fire flow
capabilities based on the amount of water loss in each section.
▪ QMS 07-02: Added rationale sections to each risk score. Separated into 2
sections: contributing factors of the hazard event occurring and possible
consequences if the hazardous event occurred. Added fire flow impact to the
consequence section. Added additional control measures and response
measures.
• QMS 08 – Risk Assessment Outcome
▪ QMS 08-02: Added the corresponding risk numbers to the critical control points.
▪ QMS 08-03: Revised the control measures and their descriptions to match our
current programs and processes.
• QMS 09 – Organizational Structure, Roles, Responsibilities and Authorities
▪ QMS 09-01: The organizational structure was updated to more clearly define
Owner, Owner Representative and Top Management Responsibilities.
▪ City Council is defined as the Owner of the Guelph Drinking Water System. The
CAO, DCAO, General Manager of Engineering and Transportation Services and
2019 Annual and Summary Report
Page 84 of 182
General Manager of Environmental Services form the Senior Management Team.
Water Services Managers and Supervisors (the Management Team) and the
General Manager Environmental Services make up Top Management.
• QMS 10 – Competencies
▪ Revised licence requirements for treatment operators, distribution operators,
the ORO and acting ORO to reflect requirements based on our new system
classification.
▪ Removed the separate on-the-job training form for Maintenance as they are
now classified as Treatment Operators as well.
▪ Created 10-04 Administration On-the-Job Training Form.
• QMS 11 – Personnel Coverage
▪ Updated the section for licence requirements for the ORO now that we are
classified as a Class 2 Treatment and a Class 4 Distribution system.
• QMS 12 – Communications
▪ QMS 12: Revised section 2 to better describe the current practices.
▪ QMS 12-01: Updated the A&S Report section to match the 2018 A&S Report.
Added section 4 Operational Plan.
▪ QMS 12-03: Updated meeting information for the functional areas. Deleted the
section on Procedure Review Meetings as these are often done alone by staff
and not in a meeting format.
▪ QMS 12-04: Updated Appendix A, removed names and only listed positions.
▪ QMS 12-05: Added more information around the Financial Plan requirements
and council endorsement process for both the Financial Plan and Operational
Plan. Updated the next renewal date.
• QMS 13 – Essential Supplies and Services
▪ QMS 13: Updated the Gazer-Mooney Agreement (March 1, 2019)
▪ QMS 13-01: Added: Tower climbs, confined space, valves.
• QMS 14 – Review and Provision of Infrastructure
▪ QMS 14: Updated Gazer Mooney agreement date.
• QMS 15 – Infrastructure Maintenance, Rehabilitation and Renewal
▪ QMS 15: Updated the table to list the priority capital projects for 2019-2020.
• QMS 16 – Sampling, Testing and Monitoring
▪ QMS 16: Updated the section about sampling the Glen as per the MDWL.
▪ QMS 16-01: Updated to include latest sample map from August 2019. Includes
new sample location in Zone 3.
• QMS 17 – Measurement and Recording Equipment Calibration and Maintenance
▪ Updated Operational Checks section to reflect current colorimeter verification
schedule.
2019 Annual and Summary Report
Page 85 of 182
• QMS 18 – Emergency Management
▪ QMS 18-01: Added "cannot utilize GUDI-wef sources” as a disadvantage in
Appendix B.
• QMS 21 – Continual Improvement
▪ Rearranged the order of the steps so that Root-Cause Analysis is before other
OFIs. Added "debriefs" to section 2. Added that root cause analysis' will be
scheduled at least 10 working days after the incident.
p) Staff Suggestions
Staff suggestions are identified during: staff and operational meetings; internal and external
audits; debriefs and are taken into account during annual budget processes and continual
improvement meetings.
Appendix H: Summary of Staff Suggestions includes a listing of various improvement items
that were presented by staff from January 1 to December 31, 2019.
q) New or Other Business
There is no further new or other business to report in 2019.
r) Next Meeting Dates
The Management Review Meeting scheduled to review the updated 2019 Annual and
Summary Water Services Report was held on January 29, 2020. Review of the Internal
Audit findings will take place in March 2020, review of the Risk Assessment outcomes in
September 2020 and review of the External Audit findings in November 2020. Monthly QMS
updates are scheduled with the management team and the Quality Management Specialist.
Monthly QMS updates are communicated to all staff at scheduled staff meetings.
2019 Annual and Summary Report
Page 86 of 182
Appendix A: Summary of Critical Control Points and Critical Control Limits
Table 38: Summary of Critical Control Points and Critical Control Limits
Critical Control Point (CCP) Hazard Description Critical Control Limit (CCL) Monitoring Process and/or Procedures Response Procedures
Multi-Barrier Primary Disinfection To remove or inactivate pathogens potentially present in the source water.
Low Chlorine Dosage • Chlorination system failure (e.g. pump,
line, fitting, power, PLC, flow meter) • Failure of analyzers (POE or process) to
alarm • Poor chemical quality High Turbidity • Sudden changes to raw water quality
characteristics • Failure of aqueduct infrastructure Inadequate UV Dosage • UV Treatment system failure (e.g. UV,
UVT and Turbidity analyzers, high flow, reactor, PLC, power, flow meters)
• High turbidity event Operating a Station in Manual • Inadequate CT (Concentration x Time)
o Low reservoir level o Insufficient chlorine residual
• Low contact time due to POE pump flow rate
Free Chlorine • Low Low and High High alarm limit range
for all stations: o 0.40 to 1.9 mg/L
• Programmed Auto Shutdown range for all stations: o 0.40 to 2.5 mg/L
Turbidity • Turbidity alarm ranges for all stations
that monitor turbidity: o 0.3 to 0.8 ntu
• Auto diversion at the Glen Diversion Chamber based on turbidity o 0.2 ntu
UV Dose UV Dose auto shutdown alarm setpoints: • FM Woods
o <30 mJ/cm2 (Trojan controller programmed low)
• Water Street well o <45 mJ/cm2 (Trojan controller
programmed low) o 42 mJ/cm2 (redundant PLC
programmed low)
• Certified and competent operators • Continuous monitoring of control limits
through SCADA • Daily operational sampling, testing and
monitoring of control limits by Operators • Redundancy of system components
(including equipment) & monitoring (operators, instruments); stand-by power
• Monitoring and alarming of control limits • Calibration, maintenance and preventive
maintenance – equipment • Robust communication systems • Receiving process for chemicals
o Certificates of Analysis required for essential chemicals
• Free Chlorine Analyzer auto well shut off limits: o Programmed low o Programmed high o Analog signal error o Power loss o Analyzer malfunction
• Treatment Standard Operating Procedures
• Water Services Emergency Plan procedures
• Facility Setpoint Labels (identify specific ranges and shutdowns for each station)
2019 Annual and Summary Report
Page 87 of 182
Critical Control Point (CCP) Hazard Description Critical Control Limit (CCL) Monitoring Process and/or Procedures Response Procedures
• Membro o <25 mJ/cm2 (Trojan controller
programmed low) o <22 mJ/cm2 (redundant PLC
programmed) CT Calculations • Manual calculations must show that the
minimum CT achieved is 4
• Chlorine Pump alarms o Tube leak detection o Low speed feedback o Motor run/fail
• Each station has the identified reservoir level, POE flow rate and minimum chlorine needed to meet CT
• Manual CT calculations
Secondary Disinfection To ensure the maintenance of a disinfectant residual throughout the distribution system.
Deterioration of Chlorine Residual • Reduced water flows based on demand,
pipe size, etc. • Occurrence of dead ends and District
Metered Areas • Increased water temperature
(temporary mains) • Reaction with organic matter in
watermains • Water age in the distribution system • Water age in storage facilities
Free Chlorine Target Residual in the Distribution System: • >0.20 mg/L (operational minimum) Reportable under the SDWA: • 0.05 mg/L Customer Complaints • Related to water quality characteristics (taste, odour, colour, other)
• Certified and competent operators • Sampling, testing and monitoring of control
limits, as applicable • Watermain flushing and swabbing
programs • Installation of blow-offs in dead ends • Regular samples taken and analyzed for
chlorine residual • Rechlorination at booster stations • Mixing systems in Speedvale and Clair
Towers
• Treatment Standard Operating Procedures
• Distribution Standard Operating Procedures
• Response to customer calls • Service Request tracking and
monitoring • Repair and system rehabilitation • Use of appropriately certified and
competent contractors and suppliers
Backflow Prevention To prevent cross-contamination that can result from the flowing back of or reversal of the normal direction of flow of water.
System contamination from negative or reduced pressure • Lack of backflow prevention device • Main breaks or blow-outs • Large services • Temporary connections • Firefighting drawdown • Depressurization from residential usage • Pipe failure (deterioration)
System pressure Alarm setpoint ranges for pressure: • 210 to 900 kPa Consumer complaints • Related to system pressure or water
characteristics (taste, odour, colour, other)
• Backflow Prevention program • Where possible, implementation of
backflow prevention devices and small mains
• Proactive Watermain and substandard service replacement program
• Pressure monitoring though pressure transmitters on hydrants and at stations
• Distribution Standard Operating Procedures
• Response to customer calls • Service Request tracking and
monitoring • Water Services Emergency Plan
procedures
2019 Annual and Summary Report
Page 88 of 182
Appendix B: Summary of Internal and External Audit
Plans
Table 39: Summary of Internal and External Audit Plans, 2018-2020
Guelph Water Services Process or Program 2018
Audit Plan
2019
Audit Plan
2020
Audit Plan
- I31 E32 I E I E
Source Water – Source Water Protection Program X X
Source Water – Outdoor Water Use Program X X
Source Water – Tap Water Promotion, Education &
Outreach X
Source Water – Water Smart Business Program X X
Water Supply – Source & Treated Water Sampling,
Testing, Monitoring X X X X X
Water Supply – Operational Control: Disinfection,
Minimum Storage, SCADA / Security X X X
Water Supply – SCADA Design, Maintenance &
Upgrades X X X
Water Supply – Water Supply Master Plan Program
(new water sources) X
Maintenance – Instrumentation Calibration /
Verification X X X X X
Maintenance – Well Inspection & Rehabilitation
Program X X X X
Maintenance – Preventative & Reactive
Maintenance Program X X
31 I = Internal Audit
32 E = External Audit
2019 Annual and Summary Report
Page 89 of 182
Guelph Water Services Process or Program 2018
Audit Plan
2019
Audit Plan
2020
Audit Plan
- I31 E32 I E I E
Maintenance – Infrastructure (facility and tower)
Inspections Program X X X
Distribution Construction – Watermain
Maintenance & Service Connections Improvement X X
Distribution Construction – Leak Detection & Water
Loss Management X X
Distribution Construction – No Water Response
(e.g. frozen pipes) X X
Distribution Construction – New Watermain
Construction & Reconstruction X X
Distribution Construction – Temporary Watermains
& Service Connections X X
Distribution Appurtenance Maintenance –Hydrant
Inspection Program X X
Distribution Appurtenance Maintenance –
Watermain Flushing & Swabbing Program X X X X
Distribution Appurtenance Maintenance – Valve
Turning Program X X
Distribution Appurtenance Maintenance – DMAs X X
Distribution Appurtenance Maintenance – Water
Meter Program X X X
Distribution Appurtenance Maintenance –
Infrastructure Locates Program X X
Infrastructure Programs – Tech Services: New
Facility Construction X X
Infrastructure Programs – Tech Services: Major
Facility Upgrades X X X X
2019 Annual and Summary Report
Page 90 of 182
Guelph Water Services Process or Program 2018
Audit Plan
2019
Audit Plan
2020
Audit Plan
- I31 E32 I E I E
Infrastructure Programs – Engineering:
Infrastructure Planning X X
Infrastructure Programs – Engineering: Water
Asset Planning & Condition Assessments X
Infrastructure Programs – Engineering/Water:
Review of Infrastructure and Specifications X X
Infrastructure Programs – Engineering:
Infrastructure Reconstruction & Planning X X X X
Infrastructure Programs – Engineering: New
Construction (new subdivisions) X
Infrastructure Programs – Building Services:
Backflow Prevention Program X
Management – Compliance Program X X X
Management – Certification Program X X X
Management – Owner Standard of Care X X
Management – Customer Services (Administration,
Distribution & Supply) X X
Management – Human Resources & Supplier X X X
Management – Communications X X X X
Management – Review and Provision of
Infrastructure X X X X
QMS – Internal Audit Program X X X X X
QMS – Risk Assessments X X X X X X
QMS – Continual Improvement X X X X X X
QMS – Emergency Management X X X X X X
QMS – Management Review X X X X X
2019 Annual and Summary Report
Page 91 of 182
Guelph Water Services Process or Program 2018
Audit Plan
2019
Audit Plan
2020
Audit Plan
- I31 E32 I E I E
QMS – Document & Records Control X X X X X X
QMS – Drinking Water System X X X
2019 Annual and Summary Report
Page 92 of 182
Appendix C: Total Water Pumped and Instantaneous Flows
This section summarizes the amount of water pumped and instantaneous flows in 2019.
Capacity is calculated by comparing the average pumped or flow value against the MDWL
allowable volume or PTTW flow. Capacity is representative of the conditions of pumping for that
year which may be influenced by other testing programs, maintenance or special operational
conditions. Additionally, the actual capacity of the source may not be achievable with current
infrastructure. Optimization efforts are included as a component of the Water Supply Master Plan
with the intent to match the actual capacity of the water source with the appropriate
infrastructure. Section g) Water Supply Capacity describes capacity in further detail.
2019 Annual and Summary Report
Page 93 of 182
City of Guelph Water Services – Pumpages to System, January 1 – December 31, 2019
Table 40 below shows the amount of water pumped to system from each facility in 2019 in cubic meters.
Table 40: Pumpages (Discharge) to System, January 1 to December 31, 2019
-
Facility
Units
Regulatory Limit
Burke
m3
6,546
Calico
m3
5,237
Dean
m3
2,300
Downey
m3
5,237
Emma
m3
3,100
Helmar
m3
3,273
Membro
m3
6,050
Paisley Net
m3
13,738)
Park
m3
10,300
Queensdale
m3
5,273
University Net
m3
5,108
Water Street
m3
3,400
F.M. Woods
m3
65,000
Total System
Discharge
m3
n/a Jan- Average 0 0 1,347 4,593 2,405 792 2,183 861 4,230 0 1,522 1,872 25,750 46,297 Jan Maximum 0 0 1,350 4,670 2,520 800 2,337 864 5,075 752 2,323 1,915 29,066 49,815 -Jan Total 0 0 41,764 142,383 74,556 24,549 67,678 26,695 131,126 23,008 47,170 58,027 798,249 1,435,204 -Feb Average 51 0 1,348 4,442 2,365 789 1,962 854 4,398 722 1,403 1,884 26,392 46,611 Feb Maximum 577 0 1,352 4,654 2,436 794 2,060 859 5,088 736 2,351 1,934 29,805 49,237 -Feb Total 1,428 0 37,748 124,388 66,229 22,088 54,947 23,920 123,132 20,220 39,296 52,750 738,963 1,305,109 Mar- Average 5,216 0 1,392 4,427 2,400 779 1,424 843 3,530 439 1,206 1,804 24,282 47,741 Mar Maximum 6,243 0 1,438 4,466 2,536 790 2,252 848 4,991 897 2,368 1,940 28,582 51,438 -Mar Total 161,684 0 43,154 137,222 74,390 24,149 44,156 26,122 109,429 13,610 37,398 55,916 752,736 1,479,966 -Apr Average 6,120 0 1,408 4,414 2,485 737 0 416 3,203 0 1,654 1,893 23,586 45,917 Apr Maximum 6,236 0 1,429 4,448 2,564 776 0 883 3,438 0 2,386 1,971 28,652 50,526 -Apr Total 183,606 0 42,239 132,415 74,563 22,099 0 12,473 96,101 0 49,633 56,802 707,579 1,377,510 -May Average 6,117 0 1,406 4,392 2,391 792 0 0 2,150 384 1,414 1,686 26,173 46,905 May Maximum 6,234 0 1,430 4,432 2,610 797 0 0 3,539 674 2,381 1,971 30,992 52,991 -May Total 189,618 0 43,591 136,161 74,108 24,550 0 0 66,649 11,911 43,831 52,277 811,353 1,454,048 -Jun Average 6,092 0 4,336 4,336 4,336 740 0 325 1,867 652 1,578 1,567 27,035 52,863 Jun Maximum 6,220 0 4,424 4,424 4,424 816 0 833 5,750 693 2,360 1,965 32,296 57,804 -Jun Total 182,775 0 130,066 130,066 130,066 22,185 0 9,758 56,004 19,569 47,330 47,021 811,047 1,585,886 Jul- Average 6,022 0 1,121 3,772 2,546 794 0 808 1,881 565 1,554 1,565 29,566 50,194 Jul Maximum 6,289 0 1,439 4,439 2,619 816 0 1,090 3,545 704 2,000 1,917 32,772 54,193 -Jul Total 186,695 0 34,762 116,937 78,919 24,607 0 25,042 58,316 17,509 48,165 48,519 916,552 1,556,023 -Aug Average 5,767 0 1,299 3,616 2,540 662 0 965 1,899 0 1,374 1,535 28,924 48,580
2019 Annual and Summary Report
Page 94 of 182
-
Facility
Units
Regulatory Limit
Burke
m3
6,546
Calico
m3
5,237
Dean
m3
2,300
Downey
m3
5,237
Emma
m3
3,100
Helmar
m3
3,273
Membro
m3
6,050
Paisley Net
m3
13,738)
Park
m3
10,300
Queensdale
m3
5,273
University Net
m3
5,108
Water Street
m3
3,400
F.M. Woods
m3
65,000
Total System
Discharge
m3
n/a Aug Maximum 6,284 0 1,432 4,466 2,580 803 0 1,057 6,193 0 2,298 1,904 35,817 53,634 -Aug Total 178,775 0 40,265 112,090 78,731 20,524 0 29,914 58,855 0 42,601 47,586 896,643 1,505,984 -Sep Average 6,221 0 1,679 2,977 2,192 757 0 1,053 2,296 0 1,355 1,833 27,550 47,913 Sep Maximum 6,274 0 1,988 3,379 2,615 784 0 1,055 7,944 0 2,319 1,868 31,221 52,743 Sep- Total 186,634 0 50,369 89,309 65,766 22,721 0 31,594 68,867 0 40,646 54,995 826,495 1,437,396 -Oct Average 6,157 0 1,256 3,186 2,481 752 0 1,049 1,773 0 580 1,842 25,530 44,607 Oct Maximum 6,272 0 1,407 4,274 2,600 767 0 1,054 6,529 0 2,374 1,886 32,882 55,452 -Oct Total 190,872 0 38,926 98,779 76,923 23,299 0 32,514 54,970 0 17,994 57,107 791,423 1,382,806 -Nov Average 6,195 0 1,235 3,084 2,572 726 0 1,044 839 111 1,732 1,810 26,064 45,413 Nov Maximum 6,267 0 1,402 4,012 2,707 783 0 1,093 5,841 736 2,361 1,933 34,903 58,441 -Nov Total 185,862 0 37,053 92,524 77,148 21,782 0 31,323 25,177 3,342 51,958 54,296 781,924 1,362,390 -Dec Average 6,185 0 1,387 2,783 2,494 739 0 1,046 1,481 673 927 1,861 21,659 41,236 Dec Maximum 6,254 0 1,397 3,244 2,596 747 0 1,055 5,997 706 2,352 1,921 26,766 46,749 -Dec Total 191,726 0 42,993 86,278 77,308 22,911 0 32,435 45,922 20,865 28,748 57,706 671,438 1,278,330 - Average 5,012 0 1,601 3,835 2,600 755 464 772 2,462 357 1,358 1,763 26,043 47,023 2019 Maximum 6,289 0 4,424 4,670 4,424 816 2,337 1,093 7,944 897 2,386 1,971 35,817 58,441 Year Total 1,839,674 0 582,930 1,398,552 948,705 275,464 166,781 281,792 894,547 130,035 494,769 643,003 9,504,401 17,160,654
- Average Process Capacity 77% 0% 69% 73% 84% 23% 8% n/a 24% 7% n/a 52% 40% n/a
2019 Annual and Summary Report
Page 95 of 182
City of Guelph Water Services – Permit to Take Water Pumpages, January 1 – December 31, 2019
Table 41 and Table 42 presented below, outline the Permit to Take Water Pumpages for 2019. Table 41 includes the following sources: Admiral Well, Arkell Well 1, Arkell Well 6, Arkell Well 7, Arkell Well 8, Arkell Well 14, Arkell Well 15, Arkell Recharge Pump, Arkell Springs Glen Collector System, Burke Well, Calico Well, Carter Well 1 and 2 and Clythe Well. Table 42 includes the following sources: Dean Well, Downey Well, Edinburgh Well, Emma Well, Helmar Well, Membro Well, Paisley Well, Park Wells 1 and 2, Queensdale Well, Sacco Well, Smallfield Well, University Well and Water Street Well
Table 41: City of Guelph Permit to Take Water Pumpages, 2019
-
Facility
Units
Regulatory limit
Admiral Well
m3
N/O33
Arkell Well #1
m3
3,273
Arkell Well #6
m3
9,600
Arkell Well #7
m3
9,600
Arkell Well #8
m3
9,600
Arkell Well #14
m3
9,600
Arkell Well #15
m3
9,600
Arkell Wellfield (#6, 7, 8, 14, 15) Total
m3
28,800
Arkell - Recharge
Pump
m3
9,092
Arkell Springs Glen
Collector System
m3
25,000
Burke Well
m3
6,546
Calico Well
m3
5,237
Carter Wells #1 and
#2
m3
6,547
Clythe Well
m3
N/O
Jan Average N/O 95 3,587 7,478 1,799 2,776 4,529 20,171 0 5,604 0 0 0 N/O Jan Maximum N/O 706 5,543 7,610 5,371 6,722 6,398 23,166 0 5,725 0 0 0 N/O -Jan Total N/O 2,941 111,207 231,832 55,778 86,064 140,408 625,289 0 173,712 0 0 0 N/O - Average N/O 41 3,585 7,450 780 6,102 2,974 20,890 0 5,547 63 0 0 N/O
Feb Maximum N/O 356 5,636 7,537 3,847 7,439 5,934 24,401 0 5,591 657 0 0 N/O - Total N/O 1,157 100,376 208,591 21,829 170,866 83,262 584,922 0 155,319 1,754 0 0 N/O - Average N/O 79 3,371 7,498 853 5,683 951 18,356 0 6,059 5,328 0 0 N/O
Mar Maximum N/O 663 5,259 7,602 3,333 6,780 3,014 21,769 0 7,221 6,364 0 0 N/O - Total N/O 2,463 104,509 232,428 26,452 176,168 29,466 569,022 0 187,833 165,182 0 0 N/O - Average N/O 96 1,987 7,592 300 4,431 1,099 15,409 1,791 8,132 6,252 0 0 N/O
Apr Maximum N/O 499 4,737 7,678 2,160 6,631 5,491 20,936 8,364 11,126 6,368 0 0 N/O - Total N/O 2,876 59,624 227,751 9,014 132,920 32,969 462,278 53,718 243,972 187,558 0 0 N/O - Average N/O 96 1,153 7,685 9 2,193 1,098 12,138 8,184 14,496 6,254 0 0 N/O
May Maximum N/O 722 3,565 7,834 150 5,889 3,476 17,926 8,350 16,673 6,364 0 0 N/O - Total N/O 2,974 35,731 238,239 294 67,981 34,026 376,272 253,705 449,372 193,874 0 0 N/O - Average N/O 108 7,720 664 36 587 1,322 10,330 7,691 17,384 6,239 0 0 N/O
Jun Maximum N/O 763 7,873 2,596 815 4,133 4,668 14,435 7,947 17,760 6,364 0 0 N/O
33 N/O – not operational
2019 Annual and Summary Report
Page 96 of 182
-
Facility
Units
Regulatory limit
Admiral Well
m3
N/O33
Arkell Well #1
m3
3,273
Arkell Well #6
m3
9,600
Arkell Well #7
m3
9,600
Arkell Well #8
m3
9,600
Arkell Well #14
m3
9,600
Arkell Well #15
m3
9,600
Arkell Wellfield (#6, 7, 8, 14, 15) Total
m3
28,800
Arkell - Recharge
Pump
m3
9,092
Arkell Springs Glen
Collector System
m3
25,000
Burke Well
m3
6,546
Calico Well
m3
5,237
Carter Wells #1 and
#2
m3
6,547
Clythe Well
m3
N/O
- Total N/O 3,254 231,613 19,929 1,086 17,616 39,646 309,890 230,734 521,512 187,167 0 0 N/O - Average N/O 1,113 388 7,114 665 2,387 1,503 12,058 7,316 16,873 6,176 0 1,330 N/O
Jul Maximum N/O 1,203 7,665 7,907 4,020 7,495 4,099 15,647 7,627 17,685 6,440 0 6,275 N/O - Total N/O 34,511 12,043 220,524 20,629 74,006 46,608 373,810 226,781 523,051 191,468 0 41,229 N/O - Average N/O 844 7,034 1,054 945 2,747 1,057 12,837 6,919 15,493 5,918 0 6,504 N/O
Aug Maximum N/O 1,193 7,860 7,448 3,213 5,672 7,793 20,921 7,358 16,153 6,440 0 7,793 N/O - Total N/O 26,175 218,054 32,681 29,305 85,149 32,759 397,949 214,496 480,277 183,445 0 201,632 N/O - Average N/O 66 5,607 5,327 1,331 2,692 0 14,957 4,172 12,676 6,386 0 6,852 N/O
Sep Maximum N/O 346 7,830 7,596 3,694 6,079 0 18,805 7,282 14,974 6,440 0 7,759 N/O - Total N/O 1,967 168,196 159,822 39,939 80,752 0 448,709 125,147 380,293 191,574 0 205,553 N/O - Average N/O 63 6,209 4,939 2,134 2,777 275 16,335 2,234 9,950 6,324 0 1,757 N/O
Oct Maximum N/O 751 7,678 7,536 5,392 7,128 3,028 23,674 7,475 11,599 6,440 0 6,333 N/O - Total N/O 1,962 192,481 153,113 66,166 86,084 8,531 506,375 69,266 308,453 196,059 0 54,458 N/O - Average N/O 37 5,066 6,010 3,197 3,507 965 18,745 0 7,549 6,364 0 0 N/O
Nov Maximum N/O 333 8,017 7,517 5,897 6,417 5,341 28,272 0 8,595 6,439 0 0 N/O - Total N/O 1,099 151,980 180,294 95,921 105,209 28,956 562,360 0 226,478 190,927 0 0 N/O - Average N/O 61 4,346 7,585 887 2,362 990 16,170 0 6,540 6,356 0 0 N/O
Dec Maximum N/O 359 6,824 7,820 5,100 5,900 5,039 21,177 0 6,811 6,427 0 0 N/O - Total N/O 1,893 134,724 235,127 27,502 73,229 30,695 501,278 0 202,733 197,032 0 0 N/O - Average N/O 225 4,171 5,866 1,078 3,187 1,397 15,700 3,192 10,525 5,138 0 1,370 N/O
2019 Maximum N/O 1,203 8,017 7,907 5,897 7,495 7,793 28,272 8,364 17,760 6,440 0 7,793 N/O Year Total N/O 83,271 1,520,537 2,140,330 393,915 1,156,045 507,326 5,718,153 1,173,847 3,853,004 1,886,039 0 502,871 N/O - Average Pumped N/O 7% 43% 61% 11% 33% 14% 54% 11% 37% 79% 0% 21% N/O
2019 Annual and Summary Report
Page 97 of 182
Table 42: City of Guelph Permit to Take Water Pumpages, 2019 – Continued
-
Facility
Units
Regulatory limit
Dean Well
m3
2,300
Downey Well
m3
5,273
Edinburgh Well
m3
N/O
Emma Well
m3
3,100
Helmar Well
m3
3,273
Membro Well
m3
6,050
Paisley Well
m3
3,200
Park Wells #1 and #2
m3
10,300
Queensdale Well
m3
5,237
Sacco Well
m3
N/O
Smallfield Well
m3
N/O
University Well
m3
3,300
Water Street Well
m3
3,400
Jan Average 1,338 4,705 N/O 2,405 772 2,156 861 4,189 744 N/O N/O 1,522 1,872 Jan Maximum 1,374 4,780 N/O 2,520 795 2,315 864 5,063 782 N/O N/O 2,323 1,915 Jan Total 41,482 145,855 N/O 74,556 23,942 66,837 26,695 129,847 23,079 N/O N/O 47,170 58,027 -Feb Average 1,339 4,551 N/O 2,365 770 1,939 854 4,356 725 N/O N/O 1,403 1,884 Feb Maximum 1,388 4,765 N/O 2,436 782 2,037 859 5,064 747 N/O N/O 2,351 1,934 -Feb Total 37,500 127,419 N/O 66,229 21,572 54,295 23,920 121,960 20,293 N/O N/O 39,296 52,750 -Mar Average 1,383 4,533 N/O 2,400 760 2,120 843 3,499 438 N/O N/O 1,206 1,804 Mar Maximum 1,460 4,572 N/O 2,536 780 2,432 848 4,955 936 N/O N/O 2,368 1,940 -Mar Total 42,878 140,514 N/O 74,390 23,559 65,720 26,122 108,464 13,570 N/O N/O 37,398 55,916 -Apr Average 1,403 4,522 N/O 2,485 737 2,321 416 3,181 0 N/O N/O 1,654 1,893 Apr Maximum 1,471 4,559 N/O 2,564 776 2,369 883 3,425 0 N/O N/O 2,386 1,971 -Apr Total 42,102 135,672 N/O 74,563 22,099 69,630 12,473 95,443 0 N/O N/O 49,633 56,802 -May Average 1,419 4,503 N/O 2,391 774 2,343 0 2,129 385 N/O N/O 1,414 1,686 May Maximum 1,470 4,543 N/O 2,610 791 2,370 0 3,496 700 N/O N/O 2,381 1,971 -May Total 43,986 139,592 N/O 74,108 23,986 72,625 0 65,996 11,948 N/O N/O 43,831 52,277 -Jun Average 1,349 4,445 N/O 2,418 726 2,297 325 1,859 650 N/O N/O 1,578 1,567 Jun Maximum 1,453 4,536 N/O 2,644 795 2,343 833 5,712 700 N/O N/O 2,360 1,965 -Jun Total 40,456 133,338 N/O 72,532 21,773 68,908 9,758 55,766 19,489 N/O N/O 47,330 47,021 Jul Average 1,119 3,867 N/O 2,546 776 2,253 808 1,860 560 N/O N/O 1,173 1,565 Jul Maximum 1,460 4,554 N/O 2,619 807 2,306 1,090 3,496 697 N/O N/O 2,404 1,917 -Jul Total 34,687 119,868 N/O 78,919 24,067 69,858 25,042 57,663 17,345 N/O N/O 36,352 48,519
2019 Annual and Summary Report
Page 98 of 182
-
Facility
Units
Regulatory limit
Dean Well
m3
2,300
Downey Well
m3
5,273
Edinburgh Well
m3
N/O
Emma Well
m3
3,100
Helmar Well
m3
3,273
Membro Well
m3
6,050
Paisley Well
m3
3,200
Park Wells #1 and #2
m3
10,300
Queensdale Well
m3
5,237
Sacco Well
m3
N/O
Smallfield Well
m3
N/O
University Well
m3
3,300
Water Street Well
m3
3,400
Aug- Average 1,307 3,709 N/O 2,540 646 2,216 965 1,881 0 N/O N/O 1,374 1,535 Aug Maximum 1,450 4,583 N/O 2,580 792 2,274 1,057 6,008 0 N/O N/O 2,298 1,904 -Aug Total 40,509 114,968 N/O 78,731 20,019 68,685 29,914 58,303 0 N/O N/O 42,601 47,586
-Sep Average 1,380 3,062 N/O 2,192 739 2,186 1,053 2,283 0 N/O N/O 1,355 1,833 Sep Maximum 1,418 3,469 N/O 2,615 779 2,192 1,055 7,879 0 N/O N/O 2,319 1,868 -Sep Total 41,400 91,858 N/O 65,766 22,179 65,594 31,594 68,483 0 N/O N/O 40,646 54,995 -Oct Average 1,275 3,295 N/O 2,481 734 2,182 1,049 1,759 0 N/O N/O 580 1,842 Oct Maximum 1,433 4,418 N/O 2,600 755 2,190 1,054 6,346 0 N/O N/O 2,374 1,886 -Oct Total 39,515 102,148 N/O 76,923 22,761 67,627 32,514 54,544 0 N/O N/O 17,994 57,107 -Nov Average 1,251 3,192 N/O 2,572 709 2,188 1,044 829 116 N/O N/O 1,732 1,810 Nov Maximum 1,428 4,150 N/O 2,707 768 2,289 1,093 5,662 737 N/O N/O 2,361 1,933 -Nov Total 37,532 95,757 N/O 77,172 21,275 65,644 31,323 24,867 3,482 N/O N/O 51,958 54,296 -Dec Average 1,409 2,879 N/O 2,494 722 1,156 1,046 1,474 673 N/O N/O 927 1,861 Dec Maximum 1,438 3,355 N/O 2,596 739 2,197 1,055 6,098 724 N/O N/O 2,352 1,921 -Dec Total 43,668 89,244 N/O 77,308 22,372 35,823 32,435 45,684 20,867 N/O N/O 28,748 57,706 2019
year Average 1,331 3,938 N/O 2,441 739 2,113 772 2,442 358 N/O N/O 1,327 1,763
2019 Maximum 1,471 4,780 N/O 2,707 807 2,432 1,093 7,879 936 N/O N/O 2,404 1,971 Year Total 485,715 1,436,233 N/O 891,195 269,604 771,245 281,792 887,019 130,073 N/O N/O 482,956 643,003
-2019
year Average Pumped 58% 75% N/O 79% 23% 35% 24% 24% 7% N/O N/O 40% 52%
2019 Annual and Summary Report
Page 99 of 182
City of Guelph Water Services – Instantaneous Flows Summary (PTTW), January 1 – December 31, 2019
Table 43 and Table 44 presented below, outline the Instantaneous Flow Summary for 2019. Table 43 includes the following sources: Admiral Well, Arkell Well 1, Arkell Well 6, Arkell Well 7, Arkell Well 8, Arkell Well 14, Arkell Well 15, Arkell Recharge Pump, Arkell Springs Glen Collector System, Burke Well, Calico Well, Carter Well 1 and 2 and Clythe Well. Table 44 includes the following sources: Dean Well, Downey Well, Edinburgh Well, Emma Well, Helmar Well, Membro Well, Paisley Well, Park Wells 1 and 2, Queensdale Well, Sacco Well, Smallfield Well, University Well and Water Street Wel
Table 43: City of Guelph - Instantaneous Flow Summary, 2019
-
Facility
Units
Regulatory limit
Admiral Well
L/s
n/a
Arkell Well #1
L/s
37.9
Arkell Well #6
L/s
111.0
Arkell Well #7
L/s
111.0
Arkell Well #8
L/s
111.0
Arkell Well #14
L/s
111.0
Arkell Well #15
L/s
111.0
Arkell Wellfield (#6, 7, 8, 14, 15)
L/s
n/a
Arkell -Recharge System
L/s
157.8
Arkell Springs Glen
Collector System
L/s
290.0
Burke Well
L/s
83.7
Calico Well
L/s
60.6
Carter Wells
L/s
90.9
Clythe Well
L/s
n/a
Jan Average N/O 1.1 41.6 86.4 20.8 32.1 52.4 234.5 0.0 0.3 0.0 0.0 0.0 N/O
- Maximum N/O 13.1 91.2 89.5 86.2 92.5 93.6 466.0 0.0 64.1 0.0 0.0 0.0 N/O
Feb Average N/O 0.5 41.4 86.1 9.1 70.6 34.5 242.1 0.0 64.2 1.2 0.0 0.0 N/O
- Maximum N/O 12.9 89.9 89.4 84.9 93.2 93.1 463.5 0.0 66.4 69.6 0.0 0.0 N/O
Mar Average N/O 0.9 87.0 39.2 9.9 65.8 11.0 213.8 0.0 68.8 61.7 0.0 0.0 0.9
- Maximum N/O 12.9 90.0 90.1 84.8 94.0 92.7 464.5 0.0 85.6 75.5 0.0 0.0 12.9
Apr Average N/O 1.1 23.0 88.3 3.5 51.3 12.7 180.1 20.7 94.1 72.3 0.0 0.0 N/O
- Maximum N/O 13.0 91.3 90.2 87.2 94.8 94.3 470.9 115.8 132.6 74.3 0.0 0.0 N/O
May Average N/O 1.1 13.4 89.3 0.1 25.4 12.7 142.0 94.8 163.9 72.4 0.0 0.0 N/O
- Maximum N/O 14.6 96.9 90.4 86.4 93.6 94.6 476.5 97.3 197.0 75.7 0.0 0.0 N/O
Jun Average N/O 1.3 7.7 89.5 0.4 6.8 15.3 121.0 89.0 195.3 72.2 0.0 0.0 N/O
- Maximum N/O 14.5 91.2 90.3 86.4 92.1 94.0 468.6 92.7 211.5 74.4 0.0 0.0 N/O
Jul Average N/O 12.6 82.5 4.5 7.5 27.6 17.4 152.2 84.7 193.0 71.5 0.0 15.4 N/O
- Maximum N/O 14.3 92.3 91.0 86.1 91.5 93.3 468.5 89.0 208.8 75.2 0.0 75.8 N/O
Aug Average N/O 9.8 81.8 12.2 10.9 31.8 12.3 158.7 80.1 179.3 68.5 0.0 75.3 N/O
2019 Annual and Summary Report
Page 100 of 182
-
Facility
Units
Regulatory limit
Admiral Well
L/s
n/a
Arkell Well #1
L/s
37.9
Arkell Well #6
L/s
111.0
Arkell Well #7
L/s
111.0
Arkell Well #8
L/s
111.0
Arkell Well #14
L/s
111.0
Arkell Well #15
L/s
111.0
Arkell Wellfield (#6, 7, 8, 14, 15)
L/s
n/a
Arkell -Recharge System
L/s
157.8
Arkell Springs Glen
Collector System
L/s
290.0
Burke Well
L/s
83.7
Calico Well
L/s
60.6
Carter Wells
L/s
90.9
Clythe Well
L/s
n/a
- Maximum N/O 14.1 91.3 92.1 85.9 90.9 92.2 466.6 85.8 191.1 75.3 0.0 90.7 N/O
Sep Average N/O 0.8 65.2 61.8 15.4 31.1 0.0 174.3 48.3 146.7 73.9 0.0 79.3 N/O
- Maximum N/O 19.6 91.4 91.4 85.5 88.7 0.0 376.7 85.6 177.6 75.2 0.0 92.2 N/O
Oct Average N/O 0.7 72.0 56.7 24.7 32.1 3.2 189.4 24.8 107.4 73.2 0.0 20.3 N/O
- Maximum N/O 13.7 91.9 91.5 86.8 89.3 85.6 458.8 87.6 136.6 75.6 0.0 73.5 N/O
Nov Average N/O 0.4 58.5 69.4 37.1 40.5 11.1 217.0 0.0 85.7 73.7 0.0 0.0 N/O
- Maximum N/O 13.5 91.7 92.5 88.9 88.4 87.1 462.0 0.0 102.3 75.3 0.0 0.0 N/O
Dec Average N/O 0.7 50.4 88.1 10.3 27.3 11.5 188.3 0.0 63.6 73.5 0.0 0.0 N/O
- Maximum N/O 13.4 91.0 91.0 85.9 86.5 86.4 454.1 0.0 81.4 75.3 0.0 0.0 N/O
2019 Annual and Summary Report
Page 101 of 182
Table 44: Instantaneous Flow Summary, 2019 – Continued
-
Facility
Units
Regulatory limit
Dean Well
L/s
39.9
Downey Well
L/s
90.9
Edinburgh Well
L/s
n/a
Emma Well
L/s
40.9
Helmar Well
L/s
37.9
Membro Well
L/s
105.0
Paisley Well
L/s
42.0
Park Wells
L/s
127.2
Queensdale Well
L/s
60.6
Sacco Well
L/s
n/a
Smallfield Well
L/s
n/a
University Well
L/s
57.3
Water Street Well
L/s
59.0
Jan Average 15.6 55.6 N/O 27.9 9.1 24.9 10.0 48.4 10.9 N/O N/O 17.6 21.7
- Maximum 19.3 61.0 N/O 27.5 9.1 22.4 9.9 50.4 10.5 N/O N/O 27.9 26.7
Feb Average 15.6 53.8 N/O 30.4 12.9 30.2 10.0 60.5 13.0 N/O N/O 16.2 21.9
- Maximum 19.3 61.6 N/O 37.5 14.0 0.0 10.0 111.3 17.6 N/O N/O 28.6 25.5
Mar Average 16.1 53.7 N/O 27.9 8.9 24.6 9.8 40.7 6.4 N/O N/O 14.0 20.9
- Maximum 20.9 59.0 N/O 30.2 12.9 29.8 10.2 61.8 16.0 N/O N/O 28.2 28.4
Apr Average 16.3 53.5 N/O 28.9 8.7 26.9 4.7 36.9 0.0 N/O N/O 19.2 21.9
- Maximum 20.0 55.7 N/O 31.1 15.6 28.8 10.3 62.3 0.0 N/O N/O 28.6 26.9
May Average 16.3 53.3 N/O 27.9 9.1 27.1 0.0 24.7 5.6 N/O N/O 16.4 22.1
- Maximum 20.2 60.2 N/O 32.4 12.7 28.7 0.0 82.8 14.9 N/O N/O 28.8 37.6
Jun Average 15.6 52.6 N/O 28.1 8.5 26.6 3.8 21.5 9.5 N/O N/O 19.0 18.1
- Maximum 20.1 54.9 N/O 32.5 12.7 27.2 10.1 119.5 12.7 N/O N/O 28.5 31.3
Jul Average 12.9 45.8 N/O 29.5 9.1 26.1 9.3 21.5 8.2 N/O N/O 13.6 18.1
- Maximum 20.2 60.6 N/O 31.8 12.6 26.8 13.2 118.6 15.0 N/O N/O 28.7 31.0
Aug Average 15.1 44.0 N/O 29.5 7.6 25.6 11.2 21.8 0.0 N/O N/O 15.9 17.8
- Maximum 29.1 60.1 N/O 31.3 13.2 26.9 13.2 117.7 0.0 N/O N/O 29.0 29.2
Sep Average 15.9 36.3 N/O 25.5 8.7 25.3 12.2 26.4 0.0 N/O N/O 15.7 21.3
- Maximum 19.0 59.5 N/O 32.1 11.8 25.4 13.0 118.2 0.0 N/O N/O 28.8 24.7
Oct Average 14.7 39.0 N/O 28.9 8.6 25.2 12.1 20.2 0.0 N/O N/O 20.2 21.4
2019 Annual and Summary Report
Page 102 of 182
-
Facility
Units
Regulatory limit
Dean Well
L/s
39.9
Downey Well
L/s
90.9
Edinburgh Well
L/s
n/a
Emma Well
L/s
40.9
Helmar Well
L/s
37.9
Membro Well
L/s
105.0
Paisley Well
L/s
42.0
Park Wells
L/s
127.2
Queensdale Well
L/s
60.6
Sacco Well
L/s
n/a
Smallfield Well
L/s
n/a
University Well
L/s
57.3
Water Street Well
L/s
59.0
- Maximum 18.4 61.8 N/O 31.7 11.7 25.5 12.3 117.6 0.0 N/O N/O 28.5 29.9
Nov Average 14.4 37.9 N/O 29.9 8.3 25.3 12.1 9.6 1.7 N/O N/O 15.9 21.0
- Maximum 27.5 56.6 N/O 32.1 11.8 25.7 12.9 118.8 30.6 N/O N/O 27.7 25.5
Dec Average 16.3 34.1 N/O 29.0 8.5 13.4 12.1 17.0 9.9 N/O N/O 10.7 21.6
- Maximum 20.1 60.7 N/O 32.2 11.7 25.6 13.4 117.8 13.7 N/O N/O 28.4 25.5
2019 Annual and Summary Report
Page 103 of 182
Appendix D: Treated Water Quality Statistics
O. Reg. 170/03 Schedule 23, 13-2b – “Three Year” Results Summary (Jan. 1 – Dec. 31,
2019)
Table 45: O. Reg. 170/03 Schedule 23, 13-2b - "Three Year" Results Summary
Parameter
ODWQS
MAC
mg/L
½ MAC
mg/L
Total
Samples
Samples
Above
MDL
# Above
ODWQS
Criteria
Min
(mg/L)
Max
(mg/L)
Average
(mg/L)
Antimony 0.014 0.007 24 5 0 < 0.0001 0.00092 0.00065
Arsenic 0.025 0.0125 24 5 0 < 0.0002 0.0043 0.002
Barium 1.0 0.5 24 24 0 0.035 0.11 0.0672
Boron 5.0 2.5 24 24 0 0.014 0.043 0.028
Cadmium 0.005 0.0025 24 5 0 0.00009 0.00013 0.00011
Chromium 0.05 0.025 24 2 0 0.008 0.015 0.0079
Mercury 0.001 0.0005 12 0 0 < 0.0001 < 0.0001 n/a
Selenium 0.01 0.005 24 0 0 < 0.002 < 0.002 n/a
Uranium 0.02 0.01 24 22 0 < 0.00010 0.0017 0.00107
2019 Annual and Summary Report
Page 104 of 182
O. Reg. 170/03 Schedule 24, 13-4b – “Three Year” Results Summary (Jan. 1 – Dec. 31,
2019)
Table 46: O. Reg. 170/03 Schedule 24, 13-4b - "Three Year" Results Summary
Parameter
ODWQS
MAC
mg/L
½ MAC
mg/L
Total
Samples
Samples
Above
MDL
# Above
ODWQS
Criteria
Min (mg/L) Max (mg/L) Average
(mg/L)
Alachlor 0.005 0.0025 12 0 0 < 0.0005 < 0.0005 n/a
Atrazine + N-
dealkylated metabolites 0.005 0.0025 12 0 0 < 0.001 < 0.001 n/a
Azinphos-methyl 0.02 0.01 12 0 0 < 0.002 < 0.002 n/a
Benzene 0.005 0.0025 66 0 0 < 0.0001 < 0.0001 n/a
Benzo(a)pyrene 0.00001 0.000005 12 0 0 < 0.000005 < 0.000005 n/a
Bromoxynil 0.005 0.0025 12 0 0 < 0.0005 < 0.0005 n/a
Carbaryl 0.09 0.045 12 0 0 < 0.005 < 0.005 n/a
Carbofuran 0.09 0.045 12 0 0 < 0.005 < 0.005 n/a
Carbon Tetrachloride 0.005 0.0025 66 0 0 < 0.0001 < 0.0001 n/a
Chlorpyrifos 0.09 0.045 12 0 0 < 0.001 < 0.001 n/a
Diazinon 0.02 0.01 12 0 0 < 0.001 < 0.001 n/a
Dicamba 0.12 0.06 12 0 0 < 0.001 < 0.001 n/a
2019 Annual and Summary Report
Page 105 of 182
Parameter
ODWQS
MAC
mg/L
½ MAC
mg/L
Total
Samples
Samples
Above
MDL
# Above
ODWQS
Criteria
Min (mg/L) Max (mg/L) Average
(mg/L)
1,2-Dichlorobenzene 0.2 0.1 66 0 0 < 0.0002 < 0.0002 n/a
1,4-Dichlorobenzene 0.005 0.0025 66 0 0 < 0.0002 < 0.0002 n/a
1,2-Dichloroethane 0.005 0.0025 66 0 0 < 0.0002 < 0.0002 n/a
1,1-Dichloroethylene 0.014 0.007 66 0 0 < 0.0001 < 0.0001 n/a
Dichloromethane 0.05 0.025 66 0 0 < 0.0005 < 0.0005 n/a
2,4-Dichlorophenol 0.9 0.45 12 0 0 < 0.00025 < 0.00025 n/a
2,4-Dichlorophenoxy-
acetic acid (2,4-D) 0.1 0.05 12 0 0 < 0.0001 < 0.0001 n/a
Diclofop-methyl 0.009 0.0045 12 0 0 < 0.0009 < 0.0009 n/a
Dimethoate 0.02 0.01 12 0 0 < 0.0025 < 0.0025 n/a
Diquat 0.07 0.0035 12 0 0 < 0.007 < 0.007 n/a
Diuron 0.15 0.075 12 0 0 < 0.01 < 0.01 n/a
Glyphosate 0.28 0.14 12 0 0 < 0.01 < 0.01 n/a
Malathion 0.19 0.095 12 0 0 < 0.005 < 0.005 n/a
2-Methyl-4-
chlorophenoxyacetic
acid
0.1 0.05 12 0 0 < 0.00012 < 0.00012 n/a
2019 Annual and Summary Report
Page 106 of 182
Parameter
ODWQS
MAC
mg/L
½ MAC
mg/L
Total
Samples
Samples
Above
MDL
# Above
ODWQS
Criteria
Min (mg/L) Max (mg/L) Average
(mg/L)
Metolachlor 0.05 0.025 12 0 0 < 0.0005 < 0.0005 n/a
Metribuzin 0.08 0.04 12 0 0 < 0.005 < 0.005 n/a
Chlorobenzene 0.08 0.04 66 0 0 < 0.0001 < 0.0001 n/a
Paraquat 0.01 0.005 12 0 0 < 0.001 < 0.001 n/a
Pentachlorophenol (PCP) 0.06 0.03 12 0 0 < 0.0005 < 0.0005 n/a
Phorate 0.002 0.001 12 0 0 < 0.0005 < 0.0005 n/a
Picloram 0.19 0.095 12 0 0 < 0.005 < 0.005 n/a
Polychlorinated
Biphenyls (PCB) 0.003 0.0015 12 0 0 < 0.00005 < 0.00005 n/a
Prometryn 0.001 0.0005 12 0 0 < 0.00025 < 0.00025 n/a
Simazine 0.01 0.005 12 0 0 < 0.001 < 0.001 n/a
Terbufos 0.001 0.0005 12 0 0 < 0.0005 < 0.0005 n/a
Tetrachloroethylene
(PCE) 0.03 0.015 66 0 0 < 0.0001 < 0.0001 n/a
2,3,4,6-
Tetrachlorophenol 0.1 0.05 12 0 0 < 0.0005 < 0.0005 n/a
Triallate 0.23 0.115 12 0 0 < 0.001 < 0.001 n/a
2019 Annual and Summary Report
Page 107 of 182
Parameter
ODWQS
MAC
mg/L
½ MAC
mg/L
Total
Samples
Samples
Above
MDL
# Above
ODWQS
Criteria
Min (mg/L) Max (mg/L) Average
(mg/L)
Trichloroethylene 0.005 0.0025 66 24 0 < 0.0001 0.00167 0.00046
2,4,6-Trichlorophenol 0.005 0.0025 12 0 0 < 0.0005 < 0.0005 n/a
Trifluralin 0.045 0.0225 12 0 0 < 0.001 < 0.001 n/a
Vinyl Chloride 0.002 0.001 66 0 0 < 0.0002 < 0.0002 n/a
2019 Annual and Summary Report
Page 108 of 182
Operational VOC Scan Results Summary (Jan. 1 – Dec. 31, 2019)
Table 47: Operational VOC Scan Results Summary
Parameter
ODWQS
MAC
mg/L
½ MAC
mg/L
Total
Samples
Samples
Above
MDL
# Above
ODWQS
Criteria
Min
(mg/L)
Max
(mg/L)
Average
(mg/L)
1,1-Dichloroethane n/a n/a 135 0 n/a < 0.0001 < 0.0001 n/a
1,1-Dichloroethylene 0.014 0.007 148 0 0 < 0.0001 < 0.0001 n/a
1,1,1-Trichloroethane n/a n/a 135 0 n/a < 0.0001 < 0.0001 n/a
1,1,2-Trichloroethane n/a n/a 135 0 n/a < 0.0002 < 0.0002 n/a
1,1,2,2-
Tetrachloroethane n/a n/a 135 0 n/a < 0.0001 < 0.0001 n/a
Ethylene Dibromide n/a n/a 135 0 n/a < 0.0002 < 0.0002 n/a
1,2-Dichlorobenzene 0.2 0.1 148 0 0 < 0.0002 < 0.0002 n/a
Cis-1,2-Dichloroethylene n/a n/a 135 54 n/a < 0.0001 0.00361 0.00162
Trans-1,2-
Dichloroethylene n/a n/a 135 0 n/a < 0.0001 < 0.0001 n/a
1,2-Dichloropropane n/a n/a 135 0 n/a < 0.0001 < 0.0001 n/a
2019 Annual and Summary Report
Page 109 of 182
Parameter
ODWQS
MAC
mg/L
½ MAC
mg/L
Total
Samples
Samples
Above
MDL
# Above
ODWQS
Criteria
Min
(mg/L)
Max
(mg/L)
Average
(mg/L)
1,3-Dichlorobenzene n/a n/a 135 0 n/a < 0.0002 < 0.0002 n/a
1,4-Dichlorobenzene 0.005 0.0025 148 0 0 < 0.0002 < 0.0002 n/a
Acetone n/a n/a 135 0 n/a < 0. 01 < 0. 01 n/a
Benzene 0.005 0.0025 148 0 0 < 0.0001 < 0.0001 n/a
Bromodichloromethane 0.1 0.05 135 47 0 < 0.0001 0.0103 0.00283
Bromoform 0.1 0.05 135 45 0 < 0.0002 0.00484 0.00119
Carbon Tetrachloride 0.005 0.0025 148 0 0 < 0.0001 < 0.0001 n/a
Chloroethane n/a n/a 135 0 n/a < 0.0002 < 0.0002 n/a
Chloroform 0.1 0.05 135 65 0 < 0.0001 0.0143 0.00266
Dibromochloromethane 0.1 0.05 135 49 0 < 0.0002 0.0103 0.00328
Dichloromethane 0.05 0.025 148 0 0 < 0.0005 < 0.0005 n/a
Ethylbenzene 0.0024 n/a 148 2 0 < 0.0001 < 0.00035 0.00029
2019 Annual and Summary Report
Page 110 of 182
Parameter
ODWQS
MAC
mg/L
½ MAC
mg/L
Total
Samples
Samples
Above
MDL
# Above
ODWQS
Criteria
Min
(mg/L)
Max
(mg/L)
Average
(mg/L)
Methyl Ethyl Ketone n/a n/a 135 0 n/a < 0.0005 < 0.0005 n/a
Styrene n/a n/a 135 0 n/a < 0.0002 < 0.0002 n/a
Tetrachloroethylene
(PCE) 0.03 0.015 148 0 0 < 0.0001 < 0.0001 n/a
Tolulene 0.024 n/a 148 0 0 < 0.0002 < 0.0002 n/a
Trichloroethylene 0.005 0.0025 148 54 0 < 0.0001 0.00199 0.00063
Trichlorofluoromethane n/a n/a 135 0 0 < 0.0002 < 0.0002 n/a
Vinyl Chloride n/a n/a 148 0 0 < 0.0002 < 0.0002 n/a
o-Xylene n/a n/a 148 3 0 < 0.0001 0.00051 0.00033
m- + p- Xylene n/a n/a 148 3 0 < 0.0001 0.00144 0.00090
Total Xylene 0.09 n/a 147 2 0 <0.0001 0.00195 0.00126
Trihalomethanes 0.100 n/a 135 58 0 < 0.0002 0.0365 0.00835
General Chemistry Results Summary (Jan. 1 – Dec. 31, 2019)
2019 Annual and Summary Report
Page 111 of 182
Table 48: General Chemistry Results Summary
Parameter ODWQS
MAC
ODWQS
AO
ODWQS
OG
Total
Samples
Samples
Above
MDL
# Above
Criteria
Min
(mg/L)
Max
(mg/L)
Average
(mg/L)
Aluminum n/a n/a 0.1 14 0 0 < 0.005 < 0.005 n/a
Alkalinity (as CaCO3) n/a n/a 30-500 12 12 0 250 330 286
Ammonia-N n/a n/a n/a 12 2 n/a < 0.05 0.18 0.16
Anion Sum n/a n/a n/a 12 12 n/a 7.0234 16.124 12.424
Antimony 0.014 n/a n/a 24 5 0 <0.0001 0.00092 0.00065
Arsenic 0.025 n/a n/a 24 5 0 <0.001 0.002 0.0043
Barium 1.0 n/a n/a 24 24 0 0.035 0.11 0.0672
Beryllium n/a n/a n/a 23 0 n/a <0.0005 <0.0005 n/a
Boron 5.0 n/a n/a 24 24 0 0.014 0.043 0.028
Cadmium 0.005 n/a n/a 24 5 0 0.00009 0.00013 0.00011
Calcium n/a n/a n/a 23 23 n/a 90 160 120.9
Cation Sum n/a n/a n/a 12 12 n/a 7.2421 16.121 12.421
Chloride n/a 250 n/a 12 12 0 39 280 160
Chromium 0.05 n/a n/a 24 2 0 0.0008 0.015 0.0079
34 Units in Milliequivalents Per Litre (mEq/L)
2019 Annual and Summary Report
Page 112 of 182
Parameter ODWQS
MAC
ODWQS
AO
ODWQS
OG
Total
Samples
Samples
Above
MDL
# Above
Criteria
Min
(mg/L)
Max
(mg/L)
Average
(mg/L)
Cobalt n/a n/a n/a 23 12 n/a <0.0005 0.0023 0.00145
Copper n/a 1 n/a 23 11 0 < 0.001 0.2 0.0470
Dissolved Organic
Carbon (DOC) n/a 5 n/a 12 12 0 0.65 2.9 1.36
1,4 Dioxane n/a n/a n/a 12 0 n/a <0.0001 <0.0001 n/a
Hardness (Calculated
as CaCO3) n/a n/a 80-100 12 12 12 330 570 448
Ion Balance (%
difference) n/a n/a n/a 12 12 n/a 0.1235 3.1325 1.63425
Iron n/a 0.3 n/a 24 6 6 < 0.005 1.8 0.56
Langalier’s Index at
4C n/a n/a n/a 12 12 n/a 0.39136 0.89426 0.62326
Langalier’s Index at
20C n/a n/a n/a 12 12 n/a 0.63926 1.1426 0.8726
Lead 0.01 n/a n/a 23 2 0 0.00006 0.0014 0.00073
Magnesium n/a n/a n/a 23 23 n/a 26 48 39.196
35 Units in % 36 Units in Langalier’s Index
2019 Annual and Summary Report
Page 113 of 182
Parameter ODWQS
MAC
ODWQS
AO
ODWQS
OG
Total
Samples
Samples
Above
MDL
# Above
Criteria
Min
(mg/L)
Max
(mg/L)
Average
(mg/L)
Manganese n/a 0.05 n/a 24 19 0 0.0006 0.037 0.0088
Molybdenum n/a n/a n/a 23 21 n/a <0.0005 0.0039 0.00189
Nickel n/a n/a n/a 23 21 n/a <0.001 0.013 0.0056
o-Phosphate n/a n/a n/a 12 0 n/a <0.01 <0.01 n/a
pH n/a n/a 6.5-8.5 12 12 0 7.69 8.20 7.85
Phosphorus n/a n/a n/a 22 0 n/a <0.1 <0.1 n/a
Potassium n/a n/a n/a 23 23 n/a 1.5 3.1 2.130
Saturation pH at 4C n/a n/a n/a 12 12 n/a 7.13 7.33 7.22
Saturation pH at 20C n/a n/a n/a 12 12 n/a 6.88 7.08 6.98
Selenium 0.01 n/a n/a 24 1 0 <0.002 0.002 0.002
Silicon n/a n/a n/a 14 14 n/a 3.7 8.8 5.2
Silver n/a n/a n/a 23 0 n/a <0.0001 <0.0001 n/a
Sodium n/a 20 and
200 n/a 38 38 14 23 170 91
Strontium n/a n/a n/a 23 23 n/a 0.178 5.2 2.657
Sulphate n/a 550 n/a 12 12 0 43 220 102
Thallium n/a n/a n/a 23 5 n/a <0.00005 0.000068 0.000064
2019 Annual and Summary Report
Page 114 of 182
Parameter ODWQS
MAC
ODWQS
AO
ODWQS
OG
Total
Samples
Samples
Above
MDL
# Above
Criteria
Min
(mg/L)
Max
(mg/L)
Average
(mg/L)
Titanium n/a n/a n/a 23 0 n/a <0.005 <0.005 n/a
Total Dissolved Solids n/a n/a n/a 12 12 n/a 390 920 692
Uranium 0.02 n/a n/a 24 22 0 <0.0001 0.0017 0.00107
Vanadium n/a n/a n/a 23 0 n/a <0.0005 <0.0005 n/a
Zinc n/a 5 n/a 23 21 0 <0.005 0.15 0.0675
2019 Annual and Summary Report
Page 115 of 182
Appendix E: Legal and Other Requirements Table
Table 49: Legal and Other Updates that Could Affect the Drinking Water System or the Quality Management System,
2019
Date
-
2019
Source Title of Legal & Other Requirement
Highlights of posting
Action and
Status Update
Jan.
21 MECP Email
2015 Watermain Disinfection Procedure
The first regulation proposal (ERO #013-1840) is being made under the
Safe Drinking Water Act, 2002.
A second proposal (ERO #013-1839) outlines proposed amendments to
the 2015 Watermain Disinfection Procedure are due by January 24, 2019.
Email sent to the Supervisors
of Distribution, Water
Compliance Specialist,
Manager of Operations and
distribution staff.
Jan.
21
City of
Guelph
News
Release
The City has received silver level recognition from the Alliance for Water
Efficiency (AWE) for its water efficiency programs. Guelph is the first
Canadian municipality to achieve such recognition.
No action required.
Feb. 1 MECP Email
The Ministry released the draft Terms of Reference: Determination of
Minimum Treatment for Residential Drinking Water Systems using
Subsurface Raw Water Supplies for comments. If adopted, this will
replace the 2001 GUDI Terms of Reference document. Comments are due
by April 3, 2019.
Email sent to Water Services
Management team.
2019 Annual and Summary Report
Page 116 of 182
Date
-
2019
Source Title of Legal & Other Requirement
Highlights of posting
Action and
Status Update
Feb.
19
Guelph
Today.com
Schreiner to table Guelph drinking water protection as first-ever Green
legislation in Ontario.
The news story was sent to
Water Services Management.
Mar. 8 Gov’t of
Canada
Based on the latest science, Health Canada has updated the drinking
water guideline to reduce the maximum acceptable concentration of lead
from 0.01 mg/L, which was set in 1992, to 0.005 mg/L. The guideline
was updated in collaboration with the provinces, territories and other
federal departments.
Guideline sent to the Water
Services Management team
and the Water Supply
Technician.
Mar.
22
Ontario
News Ontario Convening Leaders to Discuss Great Lakes, Water Protection. No action required.
Apr. 2
City of
Guelph
News
Release
The City of Guelph has won an Exemplary Source Water Protection
Award from the American Water Works Association (AWWA). The City
received this award for its excellent work to protect local water sources.
The AWWA will present the award to the City at this year’s AWWA Annual
Conference and Exposition in Denver, Colorado in June.
No action required.
2019 Annual and Summary Report
Page 117 of 182
Date
-
2019
Source Title of Legal & Other Requirement
Highlights of posting
Action and
Status Update
Apr. 5 ERO
The MECP is proposing to introduce amendments to the Conservation
Authorities Act, which if passed, would help conservation authorities focus
and deliver on their core mandate, and to improve governance.
Sent the EBR posting to the
Source Water Protection
Program Manager and
Manager of Technical
Services.
Apr.
25
Ontario
News email
The government has released a discussion paper that outlines a more
modern environmental assessment process, including immediate, short-
term fixes to reduce burden and serve the interest of Ontario families and
communities.
Email sent to Project
Managers and Manager of
Technical Services.
Apr.
29 Guelph.ca
The City has hired Neptune Technology Group Inc. to complete
mandatory replacements of residential water meters in about 8,000
homes. Water meter replacements begin May 6, 2019.
No action required.
Apr.
29 Guelph.ca
The City has announced that Jennifer Rose is the new General Manager of
Environmental Services, replacing Peter Busatto who is retiring after 35
years with the City.
No action required.
2019 Annual and Summary Report
Page 118 of 182
Date
-
2019
Source Title of Legal & Other Requirement
Highlights of posting
Action and
Status Update
May 2 Ontario
News email
Ontario is proposing to introduce changes that will make it safer and
easier for more excess soil to be reused locally. This will be achieved
through a new excess soil regulation and consequential amendments to
O. Reg. 153/04 (Record of Site Condition Regulation) and Regulation 347
(General - Waste Management) under the Environmental Protection Act
(EPA). Ontario is also introducing changes O. Reg. 153/04 under the EPA
to clarify rules and remove unnecessary barriers to redevelopment and
revitalization of historically contaminated lands.
Email sent to Water
Compliance Specialist,
Supervisor of Distribution,
Distribution Technician and
the Manager of Operations.
May
10
Health
Canada
Health Canada has released the Guidelines for Canadian Drinking Water
Quality: Guideline Technical Document – Manganese. The maximum
acceptable concentration (MAC) for total manganese in drinking water is
0.12 mg/L (120 µg/L). The aesthetic objective (AO) for total manganese
in drinking water is 0.02 mg/L (20 µg/L).
New guideline sent to the
Management Team, the
Water Compliance Specialist
and the Water Supply
Technician.
May
15 Guelph.ca
Security upgrades at Arkell Spring grounds begin May 20
The City is making security upgrades at the Arkell Spring grounds to
enhance the protection of Guelph’s drinking water source and to improve
public safety.
No action required.
2019 Annual and Summary Report
Page 119 of 182
Date
-
2019
Source Title of Legal & Other Requirement
Highlights of posting
Action and
Status Update
May
16 MECP
The Ministry of the Environment, Conservation and Parks has recently
released an updated version of “Taking Care of Your Drinking Water”: A
Guide for Members of Municipal Councils”.
Updated Guide was sent to
Members of Guelph Council.
June 5 OMWA
Newswire
'Lackadaisical,' 'Inefficient' Vaughan water services uncovered by city
auditor
32 recommendations cite poor oversight, lack of accountability but city
says water is safe.
Report sent to Management
Team for information.
Quality Management
Specialist incorporated
relevant recommendations
as a Best Management
Practice for Guelph Water
Services.
June 5 Guelph.ca
Burke well upgrades improve water service to 13,000 homes
City staff and council celebrated the opening of the upgraded Burke well
house last week. The City made upgrades to remove iron and manganese
from the water, and to improve service delivery and reliability of the 44-
year-old well located on the north side of Arkell Road near Summerfield
Drive.
No action required.
2019 Annual and Summary Report
Page 120 of 182
Date
-
2019
Source Title of Legal & Other Requirement
Highlights of posting
Action and
Status Update
July 5 Guelph.ca
Sleeman Saves Over 5,000 Kegs Worth of Water a Day with Upgrades
The Sleeman Brewery in Guelph is saving about 298,000 litres, or over
5,000 kegs worth of water every day, thanks to the results of a Water
Smart Business audit from the City of Guelph.
No action required.
July
30 Guelph.ca
Dry conditions move outside water use level up to yellow
The City is enforcing watering restrictions for level 1 yellow of the outside
water use program because a sustained period of no steady rain and little
relief is anticipated in the forecast ahead.
No action required.
Aug. 2 Guelph.ca
The City of Guelph is offering rebates to help property owners
decommission (permanently remove and seal) unused, private water
wells and septic systems on residential and agricultural lands in Guelph.
Property owners can apply for rebates that would include $1,500 per
private well (to a maximum of two per property) and $15,000 per septic
system decommissioned.
No action required.
Aug.
23
TheRecord.
com
New drinking water protections in place for Grand River watershed
The updated Grand River Source Protection Plan was approved by
Environment Minister Jeff Yurek on Aug. 16 and took effect that day.
No action required.
2019 Annual and Summary Report
Page 121 of 182
Date
-
2019
Source Title of Legal & Other Requirement
Highlights of posting
Action and
Status Update
Sept.
20 ERO
The Ministry of Natural Resources and Forestry is proposing changes to
the Aggregate Resources Act, which would strengthen protection of water
resources by creating a more robust application process for existing
operators that want to expand to extract aggregate within the water
table, allowing for increased public engagement on applications that may
impact water resources. This would allow municipalities and others to
officially object to an application and provide the opportunity to have
their concerns heard by the Local Planning Appeal Tribunal.
ERO posting sent to the
Water Supply Program
Manager, Manager of
Technical Services and
Hydrogeologist.
Sept.
23 Guelph.ca
The inspection and maintenance of the Arkell aqueduct, where 60 to 80
per cent of Guelph’s water comes from, is underway. No action required.
Oct. 1 Guelph.ca
City and Dolime Quarry owners reach proposal to protect Guelph’s
drinking water.
Proposed solution would replace quarry with residential neighbourhood.
No action required.
Oct. 3 Wellington
Advertiser
Puslinch Township is considering options to provide water and wastewater
services to residents in Aberfoyle. One of the options is to connect to the
Guelph Water System.
News article forwarded to
top management for
information.
2019 Annual and Summary Report
Page 122 of 182
Date
-
2019
Source Title of Legal & Other Requirement
Highlights of posting
Action and
Status Update
Oct. 7 Guelph.ca
The City has initiated a Schedule B Municipal Class Environmental
Assessment (EA) for Robertson booster pump station (Robertson station)
upgrades. As part of the 2008 Water and Wastewater Servicing Master
Plan, upgrades are required to bring the station to current standards and
increase the pump’s capacity in anticipation of future demands.
No action required.
Oct. 8 CBC
Dolime Quarry in Guelph may close early, become residential neighbourhood. The city says the quarry uses roughly 11 million litres of water on a daily basis. It says it would build a system to protect the
groundwater from exposure to surface water contamination that could damage the aquitard.
No action required.
Oct.
24
Orangeville
Today
Orangeville to explore water softener rebate to cut salt discharge into the
Credit River.
News story forwarded to the
Manager of Technical
Services, Supervisor of
Water Efficiency, Source
Water Protection Program
Manager and Coordinator.
2019 Annual and Summary Report
Page 123 of 182
Date
-
2019
Source Title of Legal & Other Requirement
Highlights of posting
Action and
Status Update
Oct.
31
Ontario
News email
Ontario taking action to protect the environment and hold polluters
accountable
Environmental violations where administrative monetary penalties may
be used under the new proposal include illegal sewage discharges into
waterways, selling pesticides without a permit, failing to have a certified
operator when operating a drinking water system, or violating terms of a
permit to take water.
News release sent to the GM
Environmental Services,
Manager of Operations,
Manager of Technical
Services and Water
Compliance Specialist.
Oct.
31 Guelph.ca
Notice of study commencement: City of Guelph Municipal Class
Environmental Assessment for the Water Supply Master Plan Update.
The City of Guelph is updating the 2014 Water Supply Master
Plan (WSMP) to review our municipal water supply sources and identify
priorities, including sustainable water supply options from now until 2041.
No action required.
Nov. 7 ERO This proposal is to renew Permit To Take Water No. 5142-AQ2L8Q for
Victoria Park Village Inc. for dewatering purposes in Guelph, Ontario.
Link sent to the Manager of
Technical Services, Water
Supply Program Manager
and Hydrogeologist.
2019 Annual and Summary Report
Page 124 of 182
Date
-
2019
Source Title of Legal & Other Requirement
Highlights of posting
Action and
Status Update
Nov.
14
Canadian
Council of
Ministers of
the
Environ.
Draft Canadian Groundwater Quality Guidelines for the Protection of
Environmental and Human Health for 101 contaminants of concern are
available for public review and comment until January 10, 2020.
Email forwarded by the
Manager of Technical
Services to the Water
Compliance Specialist,
Quality Management
Specialist, Supervisor of
Water Treatment, Water
Supply Program Manager.
Dec. 4 ERO
Excess Soil Management Regulatory Proposal
Ontario has finalized and is implementing new regulatory changes that
will make it safer and easier for more excess soil to be reused locally and
will reduce barriers to revitalize historically contaminated lands.
Link sent to the Supervisors
of Distribution, Distribution
Technician, Hydrogeologist
and Water Compliance
Specialist.
Dec. 9 ERO
Amendment to the Record of Site Condition (Brownfields) Regulation
related to the Requirement to Sample Ground Water
Ontario is proposing changes to O. Reg. 153/04 that would provide
flexibility for a qualified person (a licensed professional engineer or
geoscientist) to exercise professional judgement regarding the need for
ground water testing where there is no soil and under key conditions.
Link sent to the Manager of
Technical Services,
Hydrogeologist and Source
Water Protection Program
Manager.
2019 Annual and Summary Report
Page 125 of 182
Date
-
2019
Source Title of Legal & Other Requirement
Highlights of posting
Action and
Status Update
Dec.
19 ERO
Final Decision: Ministry is holding polluters accountable by expanding the
use of administrative monetary penalties for environmental
contraventions.
Link sent to Management
Team.
Dec.
20 MECP Email
Today, the Ministry of the Environment, Conservation and Parks released
the Minister’s Annual Report on Drinking Water 2019 and the 2018-2019
Chief Drinking Water Inspector Annual Report.
Report emailed to the Water
Services Management Team.
Dec.
20 ERO Amendments to the Wells Regulation to come in effect January 1, 2020.
Updates forwarded to
Supervisor of Water
Treatment, Hydrogeologist
and Water Compliance
Specialist.
2019 Annual and Summary Report
Page 126 of 182
Appendix F: Action Items from Management Review
Table 50: Action Items from the 2019 (Items 1-12) and 2020 (Items 13-17)
Management Review Meetings
Item
# Status Description
1
CIR #878
Closed:
2019-03-28
For the A&S Report: Include 2018 consumption data in Figure 4
when it is available.
2
CIR # 879
Closed:
2019-01-25
For the A&S Report: Consider well field permits for Arkell in Table 3
(as we often pump more than 66l/s).
3
CIR #880
Closed:
2019-01-25
For the A&S Report: For the Table 5, remove Logan and Speedvale
should be Verney.
4
CIR #881
Closed:
2019-01-25
For the A&S Report: Add Calico work to the infrastructure section.
5
CIR #882
Closed:
2019-05-22
For the A&S Report: Review if we should add information describing
that the water quality values may be an average and can depend on
the location of the sample.
6 CIR #883 The procedure for documenting calls needs to be reviewed as a lot
of calls aren’t being logged properly.
7
CIR #884
Closed:
2019-01-25
For the A&S Report: Add Arkell 14 generator section to section n.
8
CIR #885
Closed:
2019-01-25
For the A&S Report: Add Emma and Water contact chamber projects
to the infrastructure section.
2019 Annual and Summary Report
Page 127 of 182
Item
# Status Description
9
CIR #886
Closed:
2019-11-22
For the A&S Report: Add Energy work being done in 2019 report
(reported in 2020).
10
CIR #887
Closed:
2019-01-25
For the A&S Report: Confirm the backflow numbers are accurate.
11
CIR #888
Closed:
2019-01-25
Put the Water Efficiency Communications Strategy on EDMS.
12
CIR #889
Closed:
2019-01-25
For the A&S Report: Change the picture of the water wagon picture
frame to one with people in it.
13 CIR #1089 Investigate using J-Plugs on the drop tubes in the production wells.
14 CIR #1090 Consider adding water loss data to the Annual and Summary Report
for 2020.
15 CIR #1091
Perform additional analysis on the frozen services program,
specifically the running tap program, and how it relates to water
consumption and water production.
16 CIR #1092 Look at adding a line for performance testing to Table 6 for next
year’s annual report.
17 CIR #1093
Have the SCADA group provide C3 Water with copies of facility
P&ID, PFD and equipment layout drawings so that the hydraulic
model can be adjusted to take into account pipe friction factors
within treatment facilities.
2019 Annual and Summary Report
Page 128 of 182
Appendix G: Status of Management Action Items Identified between Reviews
Action items identified through internal audits, external audits, emergency debriefs and root-cause analysis meetings are
described below.
Table 51: Management Action Items Identified Between Management Review Meetings, 2019
Item
# Status Description
1 CIR #895 Closed: 2019-05-22
Look at the minimum UVT value at Woods – is it really 93.5% or could it be lower? Verify the setpoints for UVT on SCADA.
2 CIR #894
Closed: 2019-07-25
Consider adding more of the “whys” to SOPs to link the relationships for example, the
relationship between UV dosage, UVT, etc.
3 CIR #893
Consider prioritizing SOPs (for example all SOPs for disinfection get more attention). Consider
adding a physical component to the review of Priority SOPs (i.e. go to the stations and see how the work is done).
4 CIR #892
Closed: 2019-11-28
Review with the Management Team the need for an annual SOP review. Could we review priority SOPs every year and go to a less frequent schedule for the other SOPs, WIs, Reference Documents?
5 CIR #891 Closed: 2019-05-22
Put the UVT values on the station tags and taped onto the UVT meter. (UVT value requirements have already been added to the logbooks and WaterTrax.)
2019 Annual and Summary Report
Page 129 of 182
Item #
Status Description
6 CIR #890
Consider having more technical training for Operators from internal staff. For example, have the Hydrogeologist give a presentation on Membro and talks with the Ministry, etc. and the importance of the data that is being collected by Operators. Have the Water Compliance
Specialist give training on compliance requirements for primary disinfection. Consider developing an annual training session on primary disinfection and how the Operator’s duties relate to
achieving primary disinfection. Include on-site manual operations in this training.
7 CIR #925
Closed: 2019-03-25 The well level low shutdown interlock for Queensdale is set too low.
8 CIR #942
Closed: 2019-05-22
In order to ensure that records are easily accessible and protected, consider adding the Reference Document: “Supply Maintenance Critical Equipment Inventory” to EDMS.
Consideration could be given to combining the information from the draft “Standardized Equipment List” on what supplier is used to obtain each part listed in the RD. Consider removing
the “available stock” section to a working document for inventory tracking.
9 CIR #941
With the implementation and increased use of WAM in both Maintenance and Distribution,
consideration could be given to looking at increasing staff support to help with the implementation and development of the program for the whole department.
10 CIR #940
Closed: 2019-10-03
Consider reviewing the process for prioritizing SCADA Work Orders to include Operational staff in
determining the priority.
11 CIR #939
Closed: 2019-05-22
Consideration should be given to determine the need for the date field on each training topic on
the Operator On-the-Job training record as it is not being consistently recorded.
2019 Annual and Summary Report
Page 130 of 182
Item #
Status Description
12 CIR #938
Closed: 2019-05-22
The training program for new Operators as identified in QMS 10-03 should include training on chemical receiving as it is a high risk activity from both a treatment perspective and a health and safety perspective.
13 CIR #937 Closed: 2019-07-19
In order to ensure that documents are properly stored and easily accessible, consider putting the Source Water Protection Risk Management Plans on EDMS. This will also help with version
control.
14 CIR #936 Conduct an assessment (gap analysis) of the Emergency Plan to ensure that it is up-to-date and
captures all of the potential emergencies that could impact Water Services.
15 CIR #935
In order to ensure that Water Services maintains a state of emergency preparedness at all
times, consideration should be given to conducting an annual review and update (if necessary) of the Emergency Plan. This review schedule should be captured in the QMS 18 document of the Operational Plan. This is a best management practice as recommended by Emergency
Management Ontario.
16 CIR #934 Closed: 2019-12-12
When the External Auditor arrives on site to perform the annual audit, past OFIs are reviewed to
determine if they have been implemented or are on their way to implementation. If they have not, it generally leads to a non-conformance. As identified as an OFI in the 2017 Internal Audit and as an OFI in the 2018 External Audit, Meter Shop SOPs and WIs need to be finalized from
draft form, properly stored in EDMS and reviewed by staff. The development of a formalized SOP for installation of backflow devices used at hydrants was also identified in the 2018 External
Audit. This has yet to be completed.
2019 Annual and Summary Report
Page 131 of 182
Item #
Status Description
17 CIR #933
If there is a deviation to an already approved construction plan, the changes to the plan need to be properly reviewed and approved by Water Services staff to ensure that risks are identified and monitored throughout the construction project. Consider developing a communication plan
with Engineering so that Water Services staff are kept aware of the changes to plans. For example, on Starwood Drive, the location of the dig changed and contractors were digging
dangerously close to a 12” watermain requiring an emergency response from a Distribution Operator.
18 CIR #932 Closed: 2019-11-28
Standardize a commissioning plan for all contractors to use. Detail out the procedure for disinfection and commissioning and what is required by the contractor. Include in this a requirement of tracking and/or measuring wasted water. This will ensure disinfection and
commissioning consistency among contractors and will benefit Water Services staff to confirm that everything has been done properly.
19 CIR #931
Closed: 2019-07-25
A concern was expressed to determine if hydrants should be used to feed temporary watermains in reconstruction projects. If the drain holes in a hydrant aren’t sealed properly, and if there was a low pressure event causing a backflow/back-siphonage, it may be possible that contaminants
(groundwater) could enter the distribution system from the drain holes in the hydrant. It is suggested that a review of using hydrants to supply water to temporary watermains is
conducted to determine the risk to water quality.
20 CIR #930
Consider modifying the warranty checklist for new construction so that it includes locate
verification of tracer wire. Currently a checklist exists for valves, hydrants, etc. The Locate department can perform Continuity Testing and sign off at the same time that Distribution Operators complete the warranty inspections on new infrastructure.
2019 Annual and Summary Report
Page 132 of 182
Item #
Status Description
21 CIR #929
Closed: 2019-07-25
Consider upgrading the quality of service boxes specified (i.e. stainless steel) for new construction and service line maintenance. They will last longer and reduce maintenance requirements on broken infrastructure.
22 CIR #928
Closed: 2019-12-09
To ensure that customer service training for new administration employees is consistent amongst all employees and covers all pertinent work instructions and procedures, consider
creating an on-the-job training checklist similar to what exists for Operators, Locators and Meter Installers, which is documented in QMS 10 - Competencies.
23 CIR #927 Closed: 2019-09-27
To improve communications between administration staff and other Water Services work areas, the “on-call” phone for each work area (Distribution, Meters and Locates) should assigned during normal business hours to ensure that someone can always be easily reached. This would also
help with the facilitation of work requests, or general inquiries within the department. For example, the “treatment on-call” phone number is answered 24/7, so if someone from Water
Services needs help from a Water Treatment Operator, they will be assured that they will always reach someone when they call that number regardless of who is on vacation, away at training, or out of the office.
24 CIR #1007 Closed: 2019-07-16
From the Emergency Evacuation Debrief: Investigate the possibility of having an emergency beacon somewhere on site.
25 CIR #1006 Closed: 2019-11-22
From the Emergency Evacuation Debrief: Add the org chart to the emergency binder and keep it updated.
26 CIR #1005
Closed: 2019-12-12
From the Emergency Evacuation Debrief: Determine what supplies and equipment are needed for the sheds. Put all required supplies and information in the sheds for Marshalling Areas A and
B. Add a flashlight/chem line and safety vest to the box, or some other location.
2019 Annual and Summary Report
Page 133 of 182
Item #
Status Description
27 CIR #1004 Closed: 2019-07-23
From the Emergency Evacuation Debrief: Add our safety and evacuation procedures to the Safety Meetings with contractors pre-construction. Provide them with a printed copy. Have a “safety minute” at ongoing meetings during construction. This will be added to the kick-off
meeting agenda templates.
28 CIR #1003
Closed: 2019-12-12
From the Emergency Evacuation Debrief: Add transit information to the plan to get a bus to use
as shelter.
29 CIR #999
Closed: 2019-12-12
From the Emergency Evacuation Debrief: Add TSSA, Spills Action, Owens Corning, Utilities,
Outdoor School, Lyon’s Pool contact information to the Emergency Evacuation (Fire) Plan.
30 CIR #1011
Closed: 2019-09-26
Verify each reservoir/tower's overflow elevation and communicate to the SCADA Specialist to
update the iFix screens.
31 CIR #1009 Closed: 2019-05-27
Modify the T-RD Reservoir Cleaning Form to detail out a protocol for filling a reservoir/elevated tank to overflow.
32 CIR #1000 Closed: 2019-10-03
From the Emergency Evacuation Debrief: Add the process to transfer the phones to Extend to the Emergency Binders.
33 CIR #1036 Closed: 2019-07-25
Supervisor of Water Treatment needs to review the S-SOP Procedure for Returning Wells to Service with the Treatment Operators at a morning meeting.
34 CIR #1035
Closed: 2019-09-26
Add to the S-SOP Procedure for Returning Wells to Service a box to ensure that the sampling record has been updated to reflect when samples were taken when a well is being put back into
service.
35 CIR #1034 Closed: 2019-09-26
Separate out the tasks in Section 7 of the S-SOP Procedure for Returning Wells to Service so each task has its own box and sign off.
2019 Annual and Summary Report
Page 134 of 182
Item #
Status Description
36 CIR #1033 Closed: 2019-09-26
Add the Water Compliance Specialist to the S-SOP Procedure for Returning Wells to Service for final review and sign off.
37 CIR #1032 Closed: 2019-07-25
Look at eliminating reminder WaterTrax alerts, as there are WOs that are generated as well to remind operators to take samples.
38 CIR #1031
Closed: 2019-09-26
Explore other (better) software options to replace WaterTrax that has better solutions for
sampling schedules, possibly alerts before we’re out of compliance.
39 CIR #1029 Closed: 2019-09-26
Ensure that the WaterTrax response process is being followed consistently by reviewing the
process and updating. Consider looking at the type of alert and what response that generates. Also, look at how many alerts are being received.
40 CIR #1028 Closed 2019-07-25
Separate the raw and treated samples onto their own Chains of Custodies.
41 CIR #1038
Closed: 2019-09-26
Add information to the Woods Generator SOP that details out the procedure if the generator is not working, is in fault mode, etc. as this is deemed an emergency and requires immediate response.
42 CIR #1041 Closed: 2019-09-26
Update the job planning form to include a new checkbox if there was a new valve installation or watermain re-route and that a Form 2 needs to be filled out.
43 CIR #1052 Work with the Health unit to come up with a communications plan for emergencies.
44 CIR #1051
Have an identified plan for setting up temporary water lines in an emergency. Work with
customers so they have their own plans for these situations (may include having an emergency waterline setup inside their business).
2019 Annual and Summary Report
Page 135 of 182
Item #
Status Description
45 CIR #1050 Identify the most critical mains in the system to ensure we are prepared if they fail.
46 CIR #1049 Closed: 2019-09-27
Have a meeting before major works like this to go over the plan, ensuring staff are trained in
the plan, emergency contingencies, etc. and ensure that all appropriate staff are included from treatment, distribution, compliance, etc. Consideration should also be given to staffing (extra on-call staff) during the works.
47 CIR #1047 Closed: 2019-10-02
Review the M-SOP Incident Notification Procedure to determine if it will be used in incidents like the Silvercreek main breaks.
48 CIR #1046 Closed: 2019-11-27
Update after-hours contact information (home phone numbers, personal cell numbers) for all staff. Ensure that all management staff know where to find the information.
49 CIR #1045 Consider installing soft-starts on the Paisley ATL pumps
50 CIR #1044 Add to the SOP for Operating Zone 2 as a closed pressure system: Check that the DMAs are
open prior to taking the Speedvale Tower offline.
51 CIR #1073
Sampling and monitoring processes were found to be effectively implemented. An opportunity exists to clarify the required sampling in the event of a category 2 watermain break, i.e.:
- D-SOP Watermain Disinfection (Rev. 2019-11-08) - states 3 samples required - S-WI Category 2 Watermain Repair Sampling (Rev. 2018-07-24) - states 2 samples required.
(See also OFI relating to document linkages.)
52 CIR #1071
Processes to record watermian breaks were found to be generally effective. An opportunity
exists to review the use of multiple watermain break forms to track operator hours and materials. E.g. September 13-16, 2019 - Silvercreek.
2019 Annual and Summary Report
Page 136 of 182
Item #
Status Description
53 CIR #1067
Consideration could be given to: 1) referencing EDMS Document numbers within controlled documents 2) clearly linking related documents (e.g. Operation Plan - element 12 reference to
"Administration's instructions" - could specify "SD-104165 To Monitor and Close Calls in Access") 3) clearly indicating / highlighting details of most recent revision within controlled documents
54 CIR #1064
Customer complaint / response processes were found to be generally effective. An opportunity exists to ensure follow-up activities are promptly recorded in the Service Request (SR) database.
E.g.: SR 10162 - September 19, 2019 SR 10183 - September 24, 2019
55 CIR #1063 The continual improvement process was found to be effectively implemented. An opportunity exists to expedite closure of Continual Improvement Reports (CIRs). At the time of the audit,
there were more than 30 CIRs which have been open for more than one year.
56 CIR #1070
Closed: 2019-12-10
T-WI Treatment Chemical Delivery (Rev. October 3, 2019)
"Receiving Sodium Hypochlorite at Woods Station from Flo-Chem...The Operator is to: - Confirm on the paperwork provided by the driver that the delivery is for 12% sodium hypochlorite.
- CONFIRM THERE IS A CERTIFICATE OF ANALYSIS provided by the driver and verify that the lot numbers are the same; sign the lot number on the bill of lading.
- Confirm the NSF Certification; sign the NSF indication on the bill of lading…" Processes to ensure the quality of essential supplies are not fully effective.
57 CIR #1069
Closed: 2019-12-10
An obsolete version of "Region of Waterloo and Area Municipalities - Design Guidelines and
Supplemental Specifications for Municipal Services" was available for use by operators (Revision January 2017 - hardcopy binder); current version is January 2019 (updated annually).
2019 Annual and Summary Report
Page 137 of 182
Item #
Status Description
58 CIR #1068 Closed: 2019-12-10
S-WI - Calibration / Verification of Colorimeters (rev. 2016-05-16) does not reflect current practices, e.g. references "Tested" sticker which is no longer used.
59 CIR #1066 Closed: 2019-12-10
Hand-held colorimeters in the stations have old green verification tags on them (from 2017). Recommend removing all old tags from all hand-held colorimeters.
60 CIR #1065
The Standby Power Generator Maintenance Log sheet was found to be out of date. The
generator ranges were from 2012 and it was questioned what the ranges are for the new Burkes generator and the Downey generator was not listed.
61 CIR #1055 Update the D-WI Hydrant-Checking to include the WAM process.
62 CIR #1056 Complete the Draft Valve Truck Operation WI.
63 CIR #1053 Add a revision date to the Training Handbook. Add page # of page # as well.
64 CIR #1086 Add to the WS-SOP Procedure Creation, Update, Review that Technicians will check for edits
required on the review sheets prior to uploading them to EDMS annually.
65 CIR #1083 Closed: 2019-12-10
Have an on-the-job training session during the next chlorine delivery (Wednesday Dec. 4, 2019).
66 CIR #1082 Closed: 2019-12-10
Post the chemical receiving reference document on the wall in the hypo receiving area.
67 CIR #1081 Closed: 2019-12-10
Separate the Chemical Receiving WI into a SOP and a posted reference document. Ensure the instructions are more clear and easier to follow. Paperwork will be handed into the supervisor for
review and then to the technician for payment and filing. Add this to the WI.
2019 Annual and Summary Report
Page 138 of 182
Item #
Status Description
68 CIR #1080
Closed: 2019-12-10
Add an Outlook appointment requirement to the QMS 05-04 Table of Essential Documents for the Design Specifications (Regional and City). Include in this the requirement for upload onto EDMS.
69 CIR #1078 Closed: 2019-11-29
Put Design Specifications in EDMS (maybe in a folio), filed by year and have the title page indicate that they are for projects for that year.
70 CIR #1077 Closed: 2019-12-10
Operators will use/reference the digital (online) copy of the Design Specifications and will dispose of the 2017 printed copy. There is no need to have a printed copy.
71 CIR #1076
Closed: 2019-12-10
The Revision Log that is located at the bottom of our procedures is not working. Transcription errors have been noted and there are times when the revision log is missed during updates.
Recommend removing the revision log from the procedures as the log is kept on EDMS as part of the version control.
72 CIR #1075 Should the analyzer at Burkes and Clair Booster Station have a tag that outlines the alarm
setpoints?
73 CIR #1074 The Turbidimeter Maintenance Kit at Burkes has expired calibration vials.
2019 Annual and Summary Report
Page 139 of 182
Appendix H: Summary of Staff Suggestions
Table 52: Suggestions Provided by Staff, 2019
Item
# Status Description of Staff Suggestion
1 CIR #998
Closed: 2019-05-16
For the Procedure Review Form, add comments/edits provided (Y/N) and comments/edits incorporated (Y/N) columns.
2 CIR #960
Closed: 2019-07-19
Consider including more front line staff in the annual Risk Assessment process and rotate staff
through the process.
3 CIR #961
Closed: 2019-07-19
Consideration should be given to adding the following risks to the annual Risk Assessment
process for the Locate section: the risk of tracer wire not being installed, or not being installed
properly; and incorrect or not updated GIS data.
4 CIR #962
Closed: 2019-05-22
The process to which the QMS rep is notified of changes to the drinking water system needs to
be re-evaluated.
5 CIR #963
For the Operational Plan endorsement, create a “top risk background and synopsis” similar to
what was created in 2019 to accompany the Risk Assessment element of the Operational Plan to
help facilitate understanding amongst Councilors.
6 CIR #964
Closed: 2019-09-26
Compare the risks identified in the Water Supply Master Plan to ensure they are captured in the
Risk Assessment.
7 CIR #965 Consider providing more computer training to Distribution Operators, such as: Excel, Outlook
(including Calendar), GIS and WAM.
2019 Annual and Summary Report
Page 140 of 182
Item
# Status Description of Staff Suggestion
8 CIR #966
Closed: 2019-07-31 There is a need to revisit the value of the printed map books for when the GIS is not accessible.
9 CIR #967
Closed: 2019-12-03
Consider establishing a centralized storage location in Distribution for all of the on-call required
resources (laptop, map book, SOP binder, etc.).
10 CIR #968
Closed: 2019-09-26
Create a checklist of what should be included in the Distribution on-call bag so that Operators
can quickly verify they have everything they need when they go on-call.
11 CIR #969
Closed: 2019-09-26
A request has been made for more consistently scheduled Distribution meetings to improve
communication. Have the Leads from each work area in distribution provide updates on their
programs and any issues or interesting events that are happening.
12 CIR #970
Closed: 2019-07-31
Consider getting Distribution Operators certified in Backflow Prevention, which would be helpful
for new watermain construction projects.
13 CIR #971
Closed: 2019-07-31
During the new watermain construction season, consider allotting one Lead Hand and two
Operators to the projects to ensure there is coverage for vacations. Consider a training program
for all Distribution staff in New Construction.
14 CIR #972
Closed: 2019-07-31
Backflow prevention devices used at new construction sites are double check valves. It would be
beneficial to consider upgrading the requirement to reduced pressure zones (RPZs) which are
rated for high hazards.
2019 Annual and Summary Report
Page 141 of 182
Item
# Status Description of Staff Suggestion
15 CIR #973
Closed: 2019-12-01
New Construction progress reports should be created and shared with Distribution staff at an
appropriate frequency that allows for transition into the role when necessary (e.g. vacations,
sick, etc.).
16 CIR #974
Closed: 2019-09-26
A post-construction meeting should be held to bring everyone up to speed on the new
infrastructure, which will ensure that Operators know where the infrastructure is and can operate
the system.
17 CIR #975
Closed: 2019-04-24
For the new construction process, tender drawings should be made available as early as possible
in the process to ensure that maintenance of the system has been fully considered, for example
ensuring there are enough valves and their placement to accommodate maintenance. Perhaps a
pre-construction meeting to compliment the post-construction meeting.
18 CIR #976
Closed: 2019-07-25
Consider requiring locking-out access to super chlorinated water during the disinfection process
on new watermains for health and safety and to prevent the failure of the disinfection process.
19 CIR #977
It would be helpful if there was a way to see customer history in one place and know which
addresses must be kept off due to backflow non-compliance or meter non-compliances after
hours. Further to this, consideration should be given to ensuring Distribution staff are notified
that these turn-offs have happened and for health and safety reasons, a second Operator should
attend if staff are responding to these calls.
20 CIR #978
Closed: 2019-09-26
Staff need clarification on how to track time in WAM dealing with investigations because this is
not asset work.
2019 Annual and Summary Report
Page 142 of 182
Item
# Status Description of Staff Suggestion
21 CIR #979
Closed: 2019-07-25
Engineering has identified that Water Services representation is important at monthly
Engineering coordination meetings and project meetings. It was suggested that attendance be
assured via a designate if the Supervisor or Lead Hand of new construction is not available. To
help ensure required attendance, it is suggested that each project have an assigned Distribution
Operator to attend the meetings.
22 CIR #980
Closed: 2019-11-28
Engineering has suggested that construction standards at Water Services mirror the same
standards that Engineering has, when applicable. For example, the use of Denso tape to wrap
valves.
23 CIR #981
Closed: 2019-09-26
In the summer months, it is very difficult for Locate staff to attend the monthly staff meetings
due to the volume of work. It is suggested that the Supervisor review the meeting minutes with
staff who are unable to attend the monthly meeting so that they are kept informed of what is
happening at Water Services.
24 CIR #982
Closed: 2019-12-12
Basic water courses would be beneficial for Locators for them to understand the criticality of the
infrastructure that they are locating.
25 CIR #983 Consider having Locators shadow a Distribution dig crew so that they can better understand how
underground infrastructure is laid out.
26 CIR #984 It was suggested that there should be a requirement for tracer wire to be installed on sanitary
and storm sewers. This could be captured in tenders.
2019 Annual and Summary Report
Page 143 of 182
Item
# Status Description of Staff Suggestion
27 CIR #985
Closed: 2019-07-25
Consider sending the Lead Hand of Locates along with a Locator to the quarterly Ontario
Regional Common Ground Alliance meetings, as they are very beneficial to share best
management practices among municipalities.
28 CIR #986 Consider having locate vendors (e.g. Vivax) come in to give the Locators training in the field on
our own infrastructure.
29 CIR #987
Closed: 2019-12-12
Locators would benefit from more computer training: EDMS, Outlook (including calendar), Excel
and PowerPoint.
30 CIR #988
Closed: 2019-04-19
It was noted that the hydro database is very difficult to use. A suggestion was made to
implement our own database for meters.
31 CIR #989
Closed: 2019-09-25 Look at increasing social media presence to further promote Source Water Protection.
32 CIR #990
Closed: 2019-07-19
Review the information that is being shared with the public at water wagon events around water
supply and treatment to ensure that it is accurate with all of the recent changes.
33 CIR #991 It was suggested that Maintenance receive more training on specialized valves (e.g. pressure
sustaining and pressure reducing), such as the training offered by Cla-Val.
34 CIR #992
Closed: 2019-07-25
Consider adding critical station valves to the PM Program, as currently only POE valves are
included.
35 CIR #993
Closed: 2019-05-22
Consider cross-training tradespeople, for example: millwright and electricians cross-trained with
instrumentation. Consider Instrumentation training and licencing for Maintenance Operators.
2019 Annual and Summary Report
Page 144 of 182
Item
# Status Description of Staff Suggestion
36 CIR #943
Create “speaking notes” for the Customer Service Reps on typical customer inquiries (e.g.
discoloured water, water with odour, curb stop maintenance, lead, etc.) so that messaging to the
public is consistent and correct.
37 CIR #944 Consider more front-line training for Customer Service Clerks, specifically Dealing with Difficult
Customers.
38 CIR #945 Emails from Administration that involve mainbreak investigations should also be accompanied by
a phone call to ensure there is a timely response from Distribution Operators.
39 CIR #946
Communicate with Distribution staff the flat-fee charge for after-hours call-outs and include a list
of all activities that would be charged back to the customer (i.e. turn offs, frozen meter, etc.).
This should also be posted on the website along with the water rates for transparency.
40 CIR #947
Verify that Distribution Operators can still help Treatment Operators in an emergency based on
the new drinking water system classifications and the different licences that the Operators have.
For example, there are times (i.e. a SCADA outage) where Distribution staff are used to help
take chlorine residuals at treatment facilities. Are there certain activities that a Distribution
Operator could not perform at a treatment facility? Should Distribution staff obtain Treatment
OIT licences for these situations? Is there a compliance risk if a Distribution only certified
Operator is helping at a treatment facility?
41 CIR #948 The On-the-Job training forms, as documented in QMS 10 require updating to ensure that they
are up-to-date and accurate and are being consistently used for new staff.
2019 Annual and Summary Report
Page 145 of 182
Item
# Status Description of Staff Suggestion
42 CIR #949
Consider sending the Incident Report and Status Update Form to all Water Services staff during
an incident (unless it contains personal information or is confidential) to promote staff awareness
of issues/emergencies happening in the department and to promote learning of other work areas
and processes.
43 CIR #950
Closed: 2019-05-24
Consider if all Operations staff should be included in the annual review of the critical SOPs for
each work area to promote learning amongst all staff.
44 CIR #951 A suggestion was made to bring back the staff suggestion box so that people can make
suggestions anonymously.
45 CIR #952
Closed: 2019-12-12
SOPs/WIs for Health and Safety should be kept in one place (i.e. EDMS folio) and the formal WS-
SOP for creation and review of procedures should be used. This includes all relevant Corporate
Health and Safety Policies and Procedures.
46 CIR #953
It would be beneficial for non-operational staff to participate in training to increase awareness of
our facility and its functions. For example, basic treatment, primary vs. secondary disinfection,
etc.
47 CIR #954
Closed: 2019-07-03
The current Contractor Evaluation Form is construction based. It would be very beneficial if there
was a similar form that would be service based to properly evaluate consultants or other
agencies providing services.
48 CIR #955
Closed: 2019-07-03
Consider having a designated alternate Risk Management Official (RMO), as appointed by the
DCAO, to be available for Source Water Protection issues when the RMO is absent (holidays or
other extended absences).
2019 Annual and Summary Report
Page 146 of 182
Item
# Status Description of Staff Suggestion
49 CIR #956
Closed: 2019-07-31 Look into artificial recharge projects as part of the Water Supply Master Plan.
50 CIR #957
Closed: 2019-11-26
Consider a way to improve data management for water quality and environmental monitoring
data.
51 CIR #958
Closed: 2019-07-23
Consider adding a training session for Distribution when facility upgrades change where
distribution infrastructure is. For example: the new valves at Water and Emma since the contact
chamber installation; and the new landscape at Burkes, as Distribution’s current drawings are
measured off of the old building. This could be added to the Project Management Project Map
process.
52 CIR #959
Closed: 2019-07-03 It was suggested that Water Services consider purchasing a hydro-vac truck.
53 CIR #923
Closed: 2019-04-23
Now that Burkes Treatment System is up and running, we should consider draining and cleaning
the Clair Tower to remove all manganese that has settled in the tower.
54 CIR #924
Now that Burkes Treatment Plant is up and running, consideration should be given to ensuring
that watermain cleaning occurs in the Burke zone of influence in the distribution system this
spring to remove any built up iron and manganese in the distribution system.
55 CIR #1087
It was recommended that a formal procedure be developed that outlines Operator's
responsibilities when overseeing Contractors working on the drinking water system, specifically
repairing watermain breaks.
2019 Annual and Summary Report
Page 147 of 182
Appendix I: Water Efficiency Program – 2019 Annual
Progress Report
Background
The City of Guelph is a leader in water conservation and efficiency. As one of Canada’s
largest communities reliant on a finite groundwater supply for our drinking water needs, our
ability to reclaim water and wastewater serving capacity through conservation initiatives
offers numerous benefits to our community and local ecosystem.
Between 2006 and 2014, 9,520 cubic metres per average day of water and wastewater
capacity was reclaimed due to the successful uptake of the City’s 2009 Water Conservation
and Efficiency Strategy. This reclaimed supply allowed the City to delay the need for over
$41 million in additional water and wastewater infrastructure with an investment of
approximately $11.3 million in water conservation programming, during that timeframe.
Further, the reduction in water use across the city has resulted in a cumulative daily
operational savings of over $625,000 per year in electricity and treatment chemical costs,
creating a significant financial benefit to water rate payers, over the same period. As a
result, the City’s water and wastewater rates remain close to the median of Council-
approved Ontario comparator municipalities responsible for the provision of water and
wastewater services.
In July 2014, Guelph City Council endorsed an updated Water Supply Master Plan (WSMP).
Water servicing capacity reclaimed through conservation and efficiency continued to be a
top priority in achieving a sustainable and cost effective community water supply. The
WSMP established a new reduction target of 9,147 cubic metres in average daily production
by 2038 to guide the City’s water efficiency programming.
In support of the new reduction target, staff initiated an update in 2015 to the 2009 Water
Conservation and Efficiency Strategy, which was later approval by Guelph City Council in
2016. The 2016 Water Efficiency Strategy defines the programs, policies and resources that
will help Guelph meet WSMP reduction targets.
The following sections provide an update of the water conservation and efficiency program
activities and successes of the 2016 Water Efficiency Strategy for the period of January 1
to December 31, 2019. For more information on the City’s Water Efficiency Program and
individual program resources please visit guelph.ca/ourstoconserve.
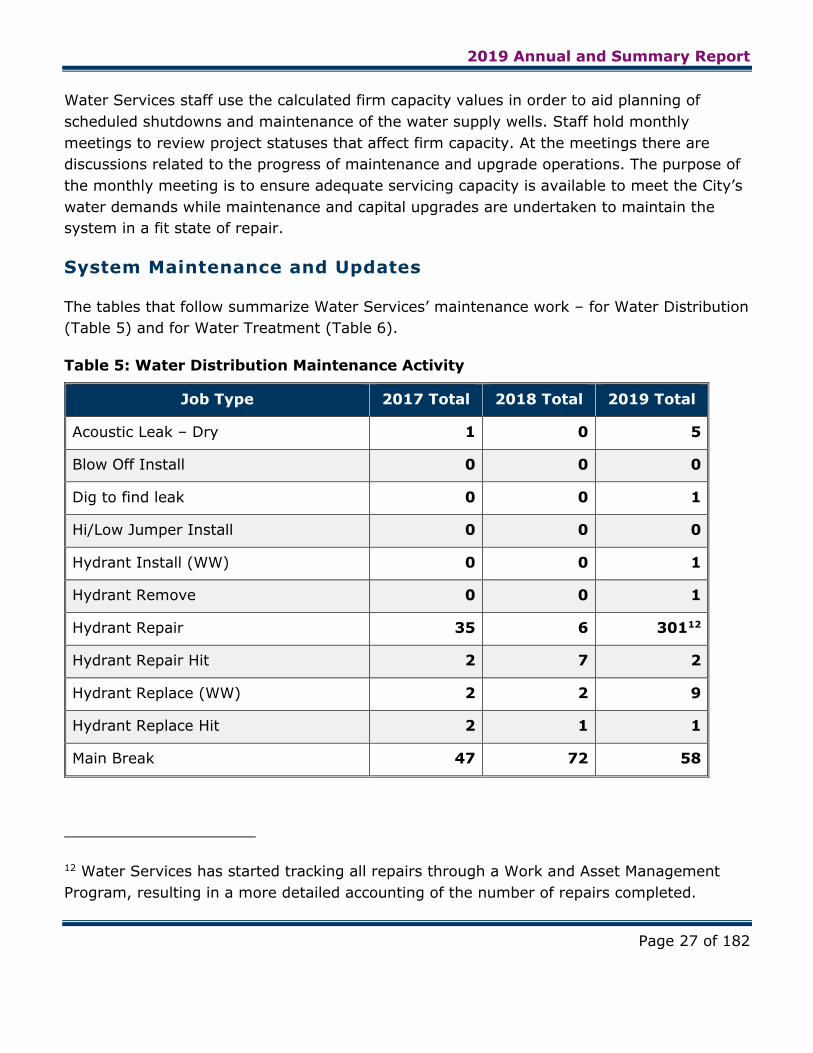
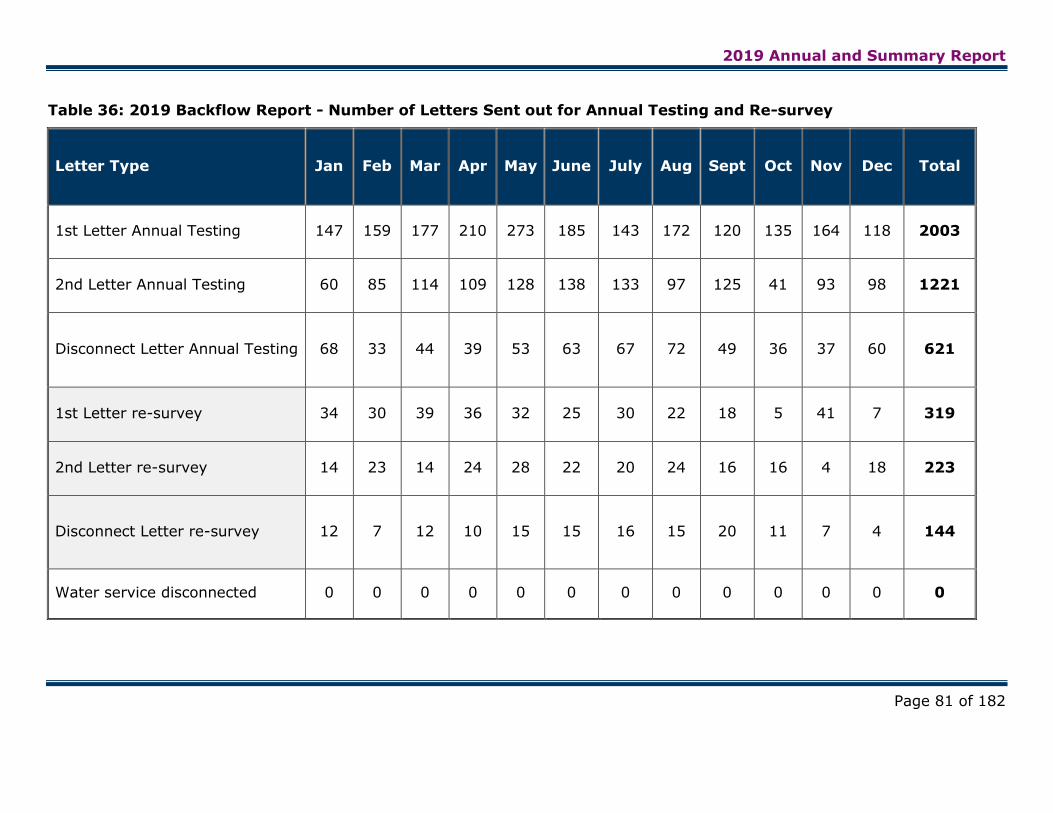
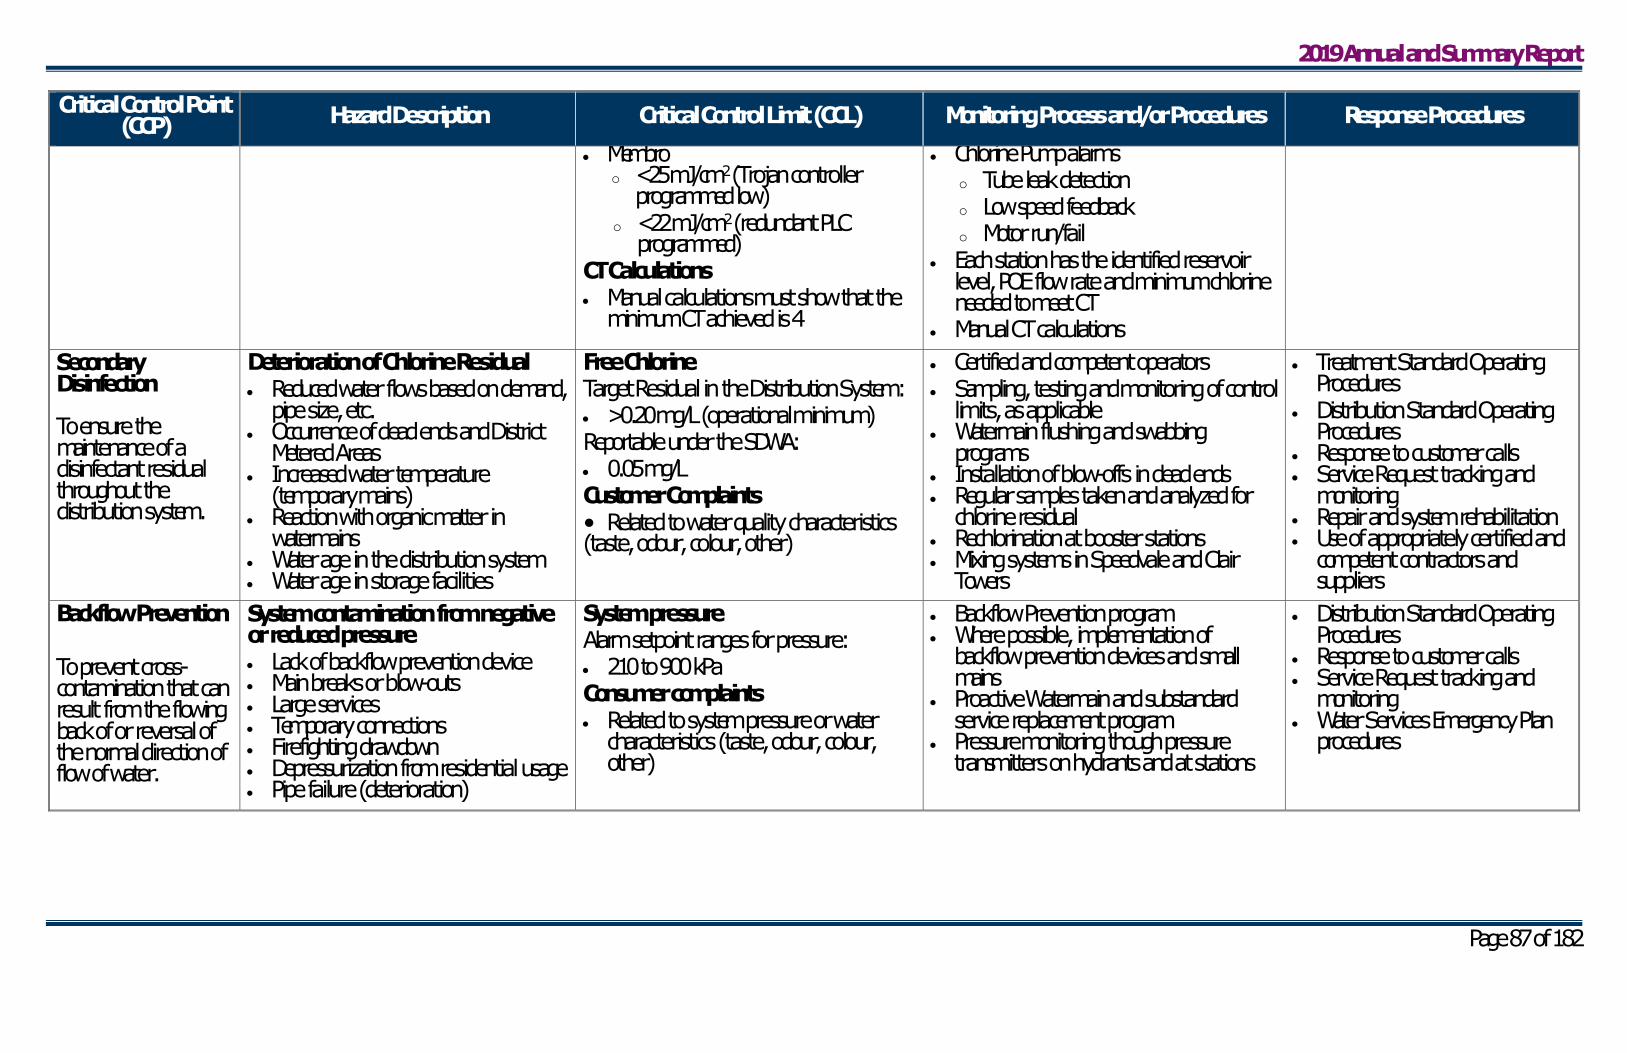
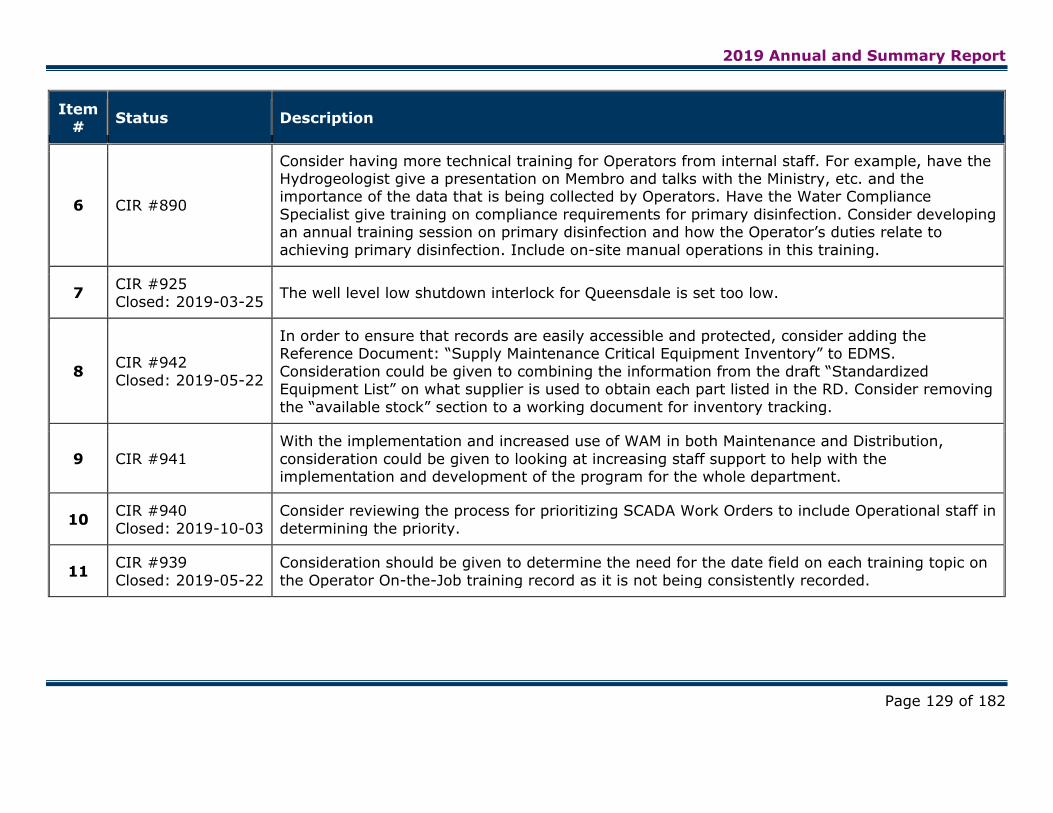
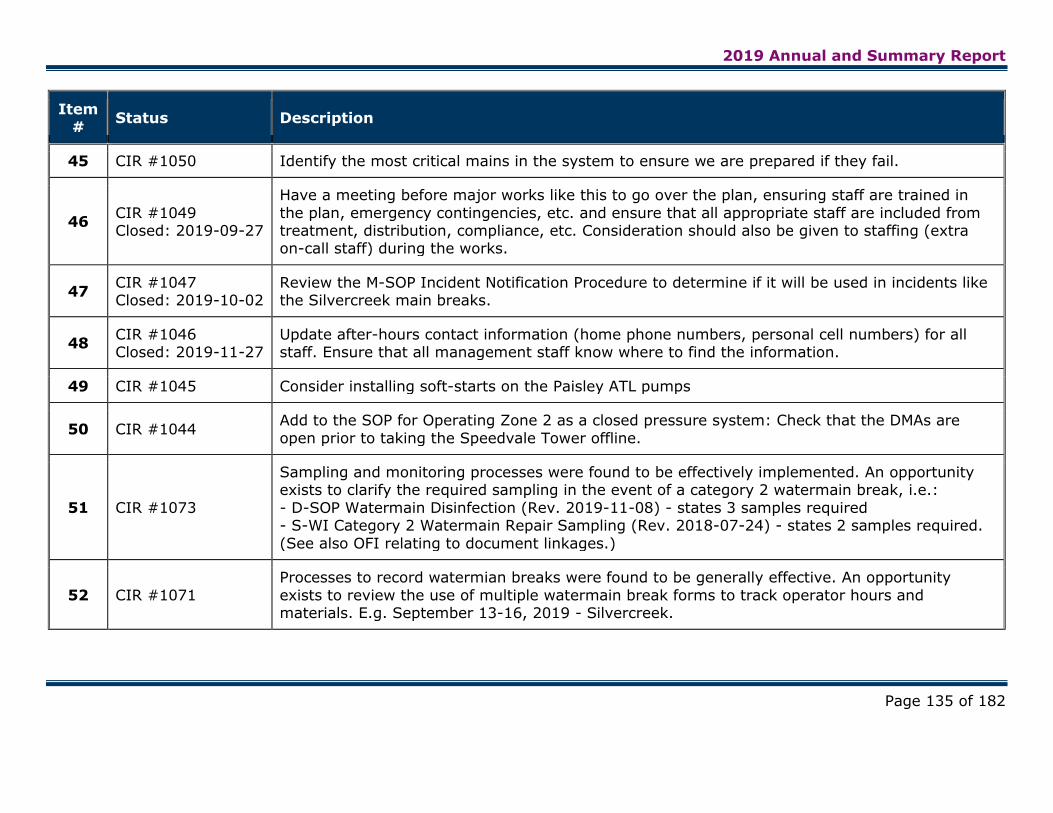
2019 Annual and Summary Report
Page 148 of 182
Water Reduction Target Progress
Building off the data analysis completed for the 2014 Water Supply Master Plan, the 2016
Water Efficiency Strategy (WES) identified a ten-year water savings goal of 6,265 cubic
metres per day between 2017 and 2026. The updated Strategy anticipates a considerable
amount of supply capacity can be reclaimed through water loss management (i.e. Leak
Detection and District Metered Areas) and efficiencies realized within the industrial,
commercial and institutional sector.
Based on community uptake and participation in new and enhanced water efficiency
programs, the total water savings achieved for 2019 was 658.5 cubic metres per day,
surpassing this year’s target set in the WES. Based on reductions in energy needed for
water treatment and distribution, it is anticipated that 47.7 tonnes of greenhouse gas
emissions and over $48,000 in electricity costs will be avoided through this year’s water
savings. Since the implementation of the 2016 WES, the cumulative water savings achieved
to date is 1,105 cubic metres per day.
Figure 6 presents the anticipated volumetric production values as presented in the 2014
Water Supply Master Plan and the 2016 Water Efficiency Strategy. The City continues to
experience a positive differential between projected and actual production values. Actual
average daily production tracks below that expected through the Water Supply Master Plan.
This is due, in part, to the successful implementation of the 2016 WES and 2009 Water
Conservation and Efficiency Strategy Update.
2019 Annual and Summary Report
Page 149 of 182
Figure 6: Water Supply Master Plan (2014) and Water Efficiency Strategy (2016)
Production Rates
Figure 7 presents the City of Guelph's residential water use between 2014 and 2018,
calculated using the volumetric consumption of water of all residential properties – low,
medium and high density. During this period the City of Guelph’s residential water use has
been on a downwards trend, at an approximate rate of 3.25 litres per person per day
annually. That is enough water to fill 66 Olympic swimming pools each year.
Average daily residential water use in Guelph continues to remain below the provincial and
national averages. In 2018, the average water use was 156 litres per person per day,
whereas the most recently published average for Ontario is 184 and Canada is 220 litres per
person per day.
2019 Annual and Summary Report
Page 151 of 182
The following sections outline the individual program successes for 2019, as identified in the
2016 WES.
Water Efficiency Incentive and Rebate Programs
During 2019, 984 rebate applications and audits were completed through the City’s
residential rebate programs. An additional 38 incentives for municipal and business
upgrades were processed. For more information on the individual water efficiency programs
available, visit guelph.ca/rebates.
Royal Flush Toilet Rebate Program
The Royal Flush Toilet Rebate Program offers households a $50 rebate per toilet (up to two
toilets) when 6 litre per flush or higher flush volume toilets are replaced with a model using
only 4.8 litres per flush or less. This program encourages residents to upgrade older homes
to meet current building code standards and reduce their actual water use permanently
through fixture exchanges. A total 668 toilet rebates were claimed in 2019, achieving an in-
year water savings of 26 cubic metres per day. This meets the Strategy’s 2019 goal for the
program savings.
Residential Sub-Water Meter Rebate Program
Sub-water meters identify water leaks and high water-using behaviours, creating awareness
of water use and potential cost savings for property owners (i.e. homeowners, landlords,
property managers). Sub-water meters provide specific information on water use at
properties and help in creating measurable conservation challenges and goals for property
owners and tenants. This offers significant opportunities for motivating behaviour change
since a knowledge gap often exists in regards to how much water residents actually use.
The Residential Sub-Water Meter Rebate program offers up to half the cost of a qualified
meter to a maximum of $100 per sub-meter installed. In 2019 the program participation
rates were low, seeing only four eligible applications. Of the participants, three were for
multi-residential buildings and one for single family detached home.
Since January 2018, associated water savings for program participants is on average a 12
per cent reduction in total water use. These measured savings are in range with industry
expectations (ten per cent) and significantly above the three per cent average savings
witnessed in the program pilot. While program participation was down in through 2019, the
2019 Annual and Summary Report
Page 152 of 182
program has saved approximately 7.8 cubic metres per day. This is ahead of the five-year
target of five cubic metres per day.
A robust and innovative approach to program promotion is scheduled for Spring 2020 to
increase enrollment and meet program water-saving goals.
Water Use Home Visit and Audit Program
The home audit program provides a unique opportunity to engage Guelph residents one-on-
one to understand water using behaviours and habits. These visits assist homeowners in
verifying water use of fixtures and appliances and provide individualized feedback on tools,
techniques and behaviour changes to become more water efficient in their home.
Since November 2013, eMERGE has made the Home Tune-up program available to Guelph
residents. The Home Tune-up program is an innovative collaboration between eMERGE
Guelph Sustainability, the City of Guelph and other local partners. This service offers a free
one-hour home audit by trained advisors, a complimentary retrofit of common home water
use fixtures (such as water efficient showerheads and faucet aerators), and toilet leak
detection. Each participating household receives an Action Plan; a personalized electronic
report that provides information and suggestions to help reduce home resource use. The
action plan directs Home Tune-up participants to further resources and tools, including City
programs, to assist with the implementation of recommended improvements.
In verifying the household water consumption data, homeowners who receive the visit have
reduced their average water consumption by up to 10 per cent depending on the retrofit
measures taken. To date, eMERGE home visits have engaged 1,659 households with a home
audit since 2013.
The eMERGE Home Visit service engaged 109 single-family households and eight multi-
residential buildings, comprised of a total 185 units in 2019, for a total 292 Home Tune-ups.
The single-family homes achieved an average in-year household water savings of 4.73 cubic
metres per day. This value is down from the 13 cubic metre per day goal outlined in the
Strategy. However, this does not account for savings from multi-residential properties. As
Home Tune-up’s for multi-residential properties occurred later in the year, work is ongoing
to determine water savings from these property types.
In 2020, staff will continue to promote the Home Tune-up program alongside Blue Built
Home to boost both programs by feeding off each other’s success.
2019 Annual and Summary Report
Page 153 of 182
Blue Built Home Water Efficiency Standards and Rebate Program
The Blue Built Home (BBH) Water Efficiency Standards and Rebate Program is a voluntary
construction and retrofit standard designed to outperform the plumbing and water–using
fixture requirements of the Ontario Building Code. The installation of water efficient
technologies contributes to reduced water use in single-family detached homes and multi-
residential properties. Residents with certified Blue Built Homes will save water and reduce
utility bills by 15 to 62 per cent. From launch in 2010 until year-end 2017, 50 new homes
were Blue Built Home certified in one of three tiers: 44 Bronze, 4 Silver and 2 Gold.
In 2018, Blue Built Home was updated and relaunched. Program changes included a
transition to a single-tier program and certification and associated rebates were made
available to existing, new homes and the multi-residential community. With these program
modifications, eleven single-family homes (ten retrofit and one new build) were Blue Built
Home certified within the year.
In 2019, six single-family homes (two new build and four retrofits) were Blue Built Home
certified. Together these homes are saving 0.27 cubic metres per day or 97.8 cubic metres
each year. However, significant water savings are achieved by an additional four new multi-
residential buildings that were Blue Built Home certified as a pilot, which together save a
total of 6.9 cubic metres per day. This makes the total water savings for Blue Built Home in
2019 7.17 cubic metres per day, more than triple our water savings goal for 2019.
In Q1 2020, it is planned that staff will officially launch the Blue Built Home program for
new-build multi-residential properties and continue to pursue the significant savings
associated with sustainable growth.
Multi-Residential Water Audit Program
The Multi-Residential Water Audit program offers a no-cost water audit of Guelph’s multi-
residential apartment and condominium buildings completed by a third party consultant. The
audit includes an assessment of the whole building’s water use and verification of specific
water using processes, such and pools, central cooling and irrigation systems. A
proportionate number of units of each building are audited to identify water saving
opportunities across the remainder of the suites.
Building owners or property managers are provided a final report cataloguing all water using
fixtures, appliances and processes with tailored recommendations to help reduce their water
bill. Staff meet with property owners and/or condominium boards to review available
rebates to achieve the noted savings. In 2019, eligibility for the Multi-Residential Water
2019 Annual and Summary Report
Page 154 of 182
Audit Program was updated to expand eligibility to properties using an average of 130 cubic
metres or more per unit, per year.
This year, the Multi-Residential Water Audit Program had ten participants, an increase from
three the previous year. The main findings from all audits performed in 2019 were as
follows:
Leaks
• Detected in 90 per cent of buildings audited
• Accounted for 2.5 to 16.3 per cent of buildings’ total water use
• 9,130 cubic metres of leaks detected collectively in 2019
• Estimate 25.0 cubic metres per day in water savings would result from
implementation of audit recommendations
Water Savings Opportunities (including leaks)
• Account for 13.9 to 31.8 per cent of total building water use
• 22,258 cubic metres of water savings potential was identified across ten participating
properties in 2019
• Estimate 61.0 cubic metres per day in water savings would result from
implementation of audit recommendations
In order to calculate savings associated with the program, an annual assessment of
consumption is completed, which requires data from the following year. With this in mind,
the three program participants of 2018 achieved a verified water savings of 24.3 per cent,
or 15.84 cubic metres per day. This significant savings may be attributable to “early
adopters” and may not reflect the true average of all possible multi-residential building
potential.
Staff have taken a conservative approach to estimating savings associated with 2019
program participants. Assuming a ten per cent decrease in water use (as per the WES),
29.4 cubic metres of water per day have been reclaimed through 2019 participation. This
provides a combined water savings of 45.24 cubic metres per day since launch of the
program in 2018, eight cubic metres more than the anticipate program goal to-date. The
estimated savings will be confirmed and reflected in subsequent annual reports.
Water Smart Business Program
The Water Smart Business program offers support to local businesses toward completion of
a detailed water efficiency review, and offers incentives for the completion of third-party
water audits and funding for capital retrofits that permanently reduce water demand. The
2019 Annual and Summary Report
Page 155 of 182
audit benchmarks the water consumption of the businesses and provides a report with
recommendations that include estimated payback on investment in upgrades. Once the
business undertakes a recommendation that achieves water savings, the savings are then
verified and an incentive is issued (where qualifications met).
In 2019, Water Smart Business program actively engaged seven program participants
through either a water review, audit and/or capital project incentive. The following are the
summarized results:
Leaks
• Detected in 29 per cent of businesses visited
• Accounted for 17.5 to 53.5 per cent of business’ total water use
• 3,910 cubic metres of leaks detected collectively in 2019
• Estimate 10.2 cubic metres per day in water savings
Water Savings Opportunities (including leaks)
• Account for 6.9 to 25.3 per cent of total facility’s water use
• 10,442 cubic metres of water savings potential was identified across seven
participating businesses in 2019
• Estimate 28.6 cubic metres per day in water savings would result
One program participant in 2019 was incentivized through the Water Smart Business
program for an ice-machine upgrade, which has resulted in 3.5 cubic metres per day of
verified water savings through process upgrades.
Outside the formal scope of the Water Smart Business program, two additional program
touch-points realized significant water savings associated with leaks for two industrial
facilities in Guelph. These included:
• Sourcing a ten-year private side leak resulted in a 47.1 cubic metres per day in
consumptive savings; and
• Cooling tower leak that, had it gone unresolved, would have resulted 4.98 cubic
metres of water per day.
Further to that, staff hosted an event for local businesses in December to learn more about
the Water Smart Business program. Water Smart for Guelph Restaurants and Hospitality
Sector lunch-and-learn was hosted at a local restaurant. Twenty-one representatives
spanning various hospitality businesses confirmed their attendance despite this busy time of
year for the sector. Meetings with those who expressed interest but could not attend will be
held in Q1 2020 and indicate a high probability of sector interest in program participation
through 2020.
2019 Annual and Summary Report
Page 156 of 182
Staff continue to consider enhancements to the program to entice businesses, including
commercial plaza water users – a sector typically bulk-metered where by individual
businesses within are not accountable for their water use directly. Since the launch of the
Residential Sub-Water Meter Rebate program staff have received inquiries and requests
related to sub-water metering primarily from the commercial sector. In 2019, staff
commenced preliminary research to evaluate the water saving potential (if any) of this
technology within this sector. Evaluation includes assessing municipal examples of similar
programs, determining value for parties involved, participation and program costs to
establish a business case for Guelph to pursue. This research will be completed by Q2 2020.
Overall, Water Smart Business program water savings since the 2016 Water Efficiency
Strategy have resulted in 65.87 cubic metres per day; 15 per cent of the cumulative five-
year program goal. Staff are committed to finding new and unique ways to see water saving
projects come to fruition. In 2020, staff will be focusing efforts on key business and industry
types in the community (i.e. food, beverage, hospitality and commercial plazas) where
messaging can be tailored to increase program participation.
Cooling Tower Research
The 2016 Water Efficiency Strategy recommended City staff assess participation, cost and
water savings associated with a cooling tower audit, conductivity censor and meter rebate
pilot. A sample size of at least five buildings were recommended to be studied in order to
verify savings and costs effectiveness of the program. The following sections describe
research conducted in 2019 in support of program development:
The Water Efficiency Strategy includes a proposed multi-year budget of $120,000 CAD
(2021 to 2026) to establish the parameters of a program as well as fund the completion of
cooling tower audits and offer an incentive for upgrading.
Alliance for Water Efficiency Cooling Tower Research Project
In 2017, the Alliance for Water Efficiency (AWE) commenced a Cooling Tower Research
project. The overall purpose of this study is to gain foundational knowledge needed to
create an effective, targeted, and appealing incentive and outreach program to achieve
greater efficiency in industrial cooling systems. As part of AWE’s broader effort to explore
the potential for water conservation in urban areas, the research effort is intended to have
multiple phases.
Phase I has five broad goals:
2019 Annual and Summary Report
Page 157 of 182
• Develop best practices for identifying water-cooled facilities in urban areas.
• Develop best practices for estimating consumptive and non-consumptive water
demands for cooling.
• Determine the conservation potential for improvements to traditional cooling
technologies, such as cooling towers.
• Determine the conservation potential of alternative cooling technologies.
• Develop practical guides to increase understanding of cooling technologies.
Thirteen municipalities and utilities from across North America have signed on including
Denver Water, Southern Nevada Water Authority and San Antonio Water System in this
multi-tasked project.
In 2019, initial data collection was completed and modelling commenced to develop best
practices for identifying water cooled facilities in urban centres. This research component is
intended to be available for the municipal and utility project team to test in early 2020.
The results of this research will provide the framework for the proposed cooling tower audit
and rebate program. While the timeline has been accelerated from that outlined in the WES,
the City’s total investment of $28,000 in this leading North American research project will
provide a well-researched, value-for-dollar scope for local programming (a total project
budget of $530,000CAD; $400,000USD). Due to issues in sourcing a research facility to
complete the work, this project is now scheduled for completion in early 2021 in line with
the WES update and timing for recommended program roll-out.
Legionella
Further to the research being completed through the Alliance for Water Efficiency, industry-
leading technical associations and working groups are beginning to explore the implications
of properly managed cooling towers, reuse and concerns around public health related to
stagnant heated water. As such, staff commenced preliminary research related to the
effects of cooling tower water efficiency, specifically water age and quality, in industrial,
commercial and institutional buildings. These two things can be contributing factors that
lead to micro bacterial growth with one of those being Legionella.
Staff attended the National Legionella Conference (United States of America) to provide a
clearer definition of the municipal role in managing for Legionella bacteria, the relationship
between water efficiency and legionella, and any potential nexuses that exists. Through the
update to the Water Efficiency Strategy commencing in 2021, a larger evaluation will need
to be considered related to water reuse in cooling towers to ensure program
recommendations appropriately evaluate risk and protect public health.
2019 Annual and Summary Report
Page 158 of 182
Municipal Facility Water Efficiency
In support of the Water Efficiency Strategy, the City continues to lead by example with
water efficiency within its own facilities. Recreation centre and facility managers and
maintainers participated with staff in seven water use reviews, audits and capital
infrastructure upgrades to improve the efficiency of their buildings.
In 2019, the River Run Centre, Guelph Farmer’s Market, John McCrae House and the Civic
Museum each completed a water review with program staff. In support of facility upgrades
completed by Parks and Recreation and Corporate Energy program staff completed two
additional water-using process reviews: Norm Jary Splash Pad and West End Recreation
Centre. Lastly, a third-party engineering consulting firm was hired to complete a water audit
of the Sleeman Centre. The following are the cumulative results:
Leaks
• Detected in 50 per cent of municipal facilities visited
• Accounted for 7.1 to 11.1 per cent of buildings’ total water use
• 1,167 cubic metres of leaks detected collectively in 2019
• Estimate 3.1 cubic metres per day in water savings
Water Savings Opportunities (including leaks):
• Account for 6.1 to 60.1 of total facilities water use
• 7,553.7 cubic metres of water savings potential per year was identified across seven
municipal locations
• Estimate 65.69 cubic metres per day in water savings would result if audit
recommendations were implemented.
In 2019, 46.22 cubic metres per day of verified water savings through process upgrades
were achieved across four of the municipal facilities and locations. 2019’s municipal water
efficiency upgrades were:
• Norm Jary Splash Pad recirculation system
• West End Recreation Centre pool heat recovery system
• River Run Centre toilet and faucet aerator upgrades
• Guelph Farmer’s Market faucet aerator installation.
These upgrades have exceeded the annual program savings goal for 2019, and the program
is on track to exceed the five-year goal.
Leak Detection Program
2019 Annual and Summary Report
Page 159 of 182
The City’s leak detection program started in the spring of 2011 and aims to reduce the
amount of water lost between the point of treatment and delivery to customers. The 2019
Leak Detection Program included sounding and correlation of all 342 kilometers of metallic
watermains within the City’s distribution system. In total, 33 possible leaks were identified
through this survey, including 14 main breaks and the rest consisting of hydrant, service, or
valve repair/replacements, or no leaks were found. The average daily volume of servicing
capacity reclaimed through the location and remediation of these leaks equate to
approximately 534 cubic metres per day, enough to fill almost 78 Olympic swimming pools
in 2019. The water loss management program savings goal for the year was exceeded.
It is anticipated that further recoveries in reclaimed treated water lost to the distribution
system will be achieved with the continued optimization of the City’s district metered areas
(DMAs). The objective of the DMA program is enhance operational understanding of water
demand patterns and to recognize water demand changes early to address non-revenue
water loss in the water distribution system. In recognition of benefits offered through
continuous water demand monitoring as proactive water loss management, staff will be
continuing to refine the DMAs and develop associated trend analysis tools through 2020.
Peak Season Water Demand Management
Reduction of peak season (summer) water demand continues to be a primary objective of
the City’s water efficiency programming. The ability to reduce or minimize variations in
seasonal water use limits the impact on our finite groundwater supply during times of
environmental stress and creates operational efficiencies by reducing capital and operational
investment to service our community for only a few days a year.
Outside Water Use Program
Since 2002, the City’s Outside Water Use Program (OWUP) has helped to manage peak
season (summer) water use through regulatory controls with complementary programs,
such as Healthy Landscapes, working to proactively manage potential peak demands by
assisting residents and local businesses in establishing low outdoor water use environments.
The following activities were completed as part of this program in 2019.
There was limited precipitation in June and July of 2019. Even with the large rain event on
July 17, precipitation was 60 per cent of 30 year precipitation average for the month.
Because of this sustained dry spell, the Outside Water Use Program moved to Level 1
(Yellow) on July 29. The remainder of the summer was dry, however conditions improved
into the fall season, which finished the season in Level 0 (Blue) on October 2.
2019 Annual and Summary Report
Page 160 of 182
Rain barrels offer homeowners the benefit of capturing free volumes of water for outside use
but also assist in managing stormwater impacts on private property. This year’s annual rain
barrel truckload sale was held at Water Services’ open house in May and yielded the sale of
950 rain barrels – the largest number of rain barrels sold during any of the previous years.
This year’s sale was in partnership with Stormwater Engineering. The Engineering
department through the Stormwater utility subsidized the cost of the barrels and the first
850 barrels were sold to residents for $10.
Please visit the City of Guelph Webpage for more information on the Outside Water Use
Program.
Healthy Landscapes
The Healthy Landscapes Program continues to offer various public resources to proactively
manage peak season demand.
The annual Healthy Landscapes Workshops and Seminar Series featured numerous free
talks on time–of–year appropriate outdoor water conservation topics including water
efficient landscape design, plant selection, and proactive maintenance best practices to
manage the impact of drought and common turf pests. It is estimated over 500 Guelph
residents took part in this Workshop and Seminar series. Further, 100 individuals
participated in the annual four-part Landscape Design Course.
Healthy Landscapes visits continue to be a popular resource, with 300 complimentary
one hour visits completed by trained staff this year. This service offers a complementary
site-based consultation aiming to educate residents on garden design and maintenance
practices to significantly curb outdoor water demand at their home.
Healthy Landscapes visits continued to add the Blue Built Home Landscape Visit to the
programming. Homeowners sign up for this specialized visit to complete one of three
qualifying water saving options to become Blue Built Home certified. Twenty Healthy
Landscape visits of this type were completed in 2019.
In 2019, Healthy Landscapes also collaborated with the Stormwater Engineering to pilot a
Residential Rain Garden Rebate program. Two workshops were organized that required
participants to attend to be a part of the program. A total of 50 participants attended the
workshops. Through the workshop, 30 residents were prequalified for the pilot program and
given a rain garden visit with a professional landscape consultant. With this site visit, a
resident could determine how best to install his or her own rain garden. Once the rain
garden was completed and a final verification visit was given, a one-time rebate from the
2019 Annual and Summary Report
Page 161 of 182
City was awarded. Out of these 30 residents, 16 completed the installation of a rain garden
and received their rebates. This resulted in:
• a combined capacity of over 39,800L of stormwater captured with an average rain
gardens capacity of approximately 2,490L;
• the potential garden and lawn watering offset typically relied on for municipal supply;
• over $13,800 in rebates provided with an average rebate of $867.
In anticipation for the program to be offered again in 2020, there are 71 residents on a
contact list. It is anticipated for the program to be offered again in 2020.
Visit the City of Guelph webpage for more information on the Healthy Landscapes Program.
Peak Season Water Demand Research
Staff continue to pursue collaborative research opportunities where resources can be
leveraged to garner greater products. This year, staff collaborated in a project with the
University of Guelph to find alternative plants to use as groundcover to traditional grass
seed and sod. This three-year research project will evaluate alternative groundcovers and
varieties of turf grass to determine their water use requirements and suitability for use in
local urban residential lawn areas. The first season (2019) of research results were
inconclusive due to weed encroachment, low germination rate of some species, and a rain-
out shelter was not constructed in time for the growing season. These issues will be
addressed moving forward, data collected and reported to inform future peak season
demand programming for Guelph. This research project will be ongoing until 2022.
Youth and Public Outreach and Education Programming
Education is a fundamentally important tool to engage and motivate action. The
commitment to increasing local water literacy is a complimentary piece to changing toilets,
or completing water audits, or installing water meters, to ensure the wise use of the
resource. Staff continue to offer a variety of very successful programs to increase
awareness, influence people’s attitudes and habits regarding water use, and inform public
on how the City invests their rate dollars. Investment in Guelph’s water future includes
education and outreach programming.
Curriculum-Linked Education Programming
The City’s curriculum-based Grade 2 and Grade 8 in-class, water conservation programming
continues to be a popular resource for local educators in both the Upper Grand District
2019 Annual and Summary Report
Page 162 of 182
School Board and the Wellington Catholic District School Board. In 2019, staff provided 70
interactive school presentations to 1,459 students. Since the inception of this in-class,
curriculum-linked program eight years ago, the City has provided a total of 411 school
presentations to over 14,620 students.
In addition to in-class presentations, Water Services hosted 32 classes and over 690
students and teachers to tour the F.M. Woods Water Treatment Plant in 2019.
H2Awesome
After a one-year break, this award-winning water event for Guelph’s Grade 8 students
reconvened in 2019. This curriculum-based learning event hosted in partnership with the
local school boards is an opportunity to celebrate water, encourage conservation of the
resource, and provide focus to the importance of water in our daily lives.
The 2019 event saw H2Awesome take place in 2 phases. Phase 1 took place on April 30,
gathering approximately 570 students and teachers to War Memorial Hall on the University
of Guelph campus. The event was co-hosted by two students representing both the Catholic
and Public School Boards. Local Anishinaabe Metis, Jan Sherman, opened and closed the
event with a traditional aboriginal acknowledgement, followed by keynote speakers Emily De
Sousa, marine conservation educator, and The Water Brothers, Tyler and Alex Mifflin.
Phase 2 of H2Awesome included a half-day workshop hosted in their schools from May 1
through May 15, for each of the 222 classes registered for the event. Workshops were
designed for grade 8 students and were participatory activities linked to water through art,
science and technology.
Splitting this event into separate phases was a departure from past H2Awesome events
typically held over the course of a single school day at one venue. The planning committee
felt that the logistics and delivery of the water conservation and protection message was
well suited to this approach. The event received positive feedback from participating
teachers.
Planning has begun for H2Awesome in 2020, and will look to use the same format.
Planet Protectors
Since 2016, Water Services has partnered with Engineering and Transportation Services and
the Office of Climate Change to offer a curriculum-focused, interactive and activity-based
online program called Planet Protectors. This program helps students understand the basics
of climate change, the impact of our actions, as well as the importance of energy and water
2019 Annual and Summary Report
Page 163 of 182
conservation, and transportation choices. Through ‘missions’, Planet Protectors solicits
personal commitments from students and encourages sharing them with their family
members - commitments such as shortening shower time.
The 2018/19 school-year witnessed a reduction in participation, however still saw the
program utilized in 26 classrooms, reaching 566 students in both the Upper Grand District
School Board and the Wellington Catholic District School Board.
As program use stagnates it will be prudent to determine whether the program offers the
best value per dollar spent. At this time other educational program offerings have not
demonstrated additional value or capacity above and beyond what Planet Protectors
Academy offers. Staff continue to evaluate value for dollar.
In 2019 Planet Protectors created H2Whoa, a four part program focusing solely on water –
decoupling water content from the broader program offering. Water Services will continue
their relationship with the Planet Protectors through the H2Whoa program in 2019/2020
school year, with the intent of monitoring appetite and delivery of the new, water focused
material.
Other Outreach and Engagement Programming
H2O Go Festival
2019 H2O Go Festival (hosted by the City) celebrated its seventh year of programming. This
Festival is a community celebration of water, hosting a variety of educational and interactive
displays aimed at connecting audiences of all ages with water. The Festival runs in tandem
with the eMERGE Guelph EcoMarket – a sustainability expo.
This year’s H2O Go hosted nine organizations, collaborating with local not-for-profits,
businesses and institutions. Hosted at the Old Quebec Street Shoppes, attendance has
continued to grow each year. This year’s event attracted over 3,000 participants of all ages
(800 more than the year prior).
Coordinated planning for the 2020 event has begun with the event to take place at the Old
Quebec Street Shoppes in downtown Guelph on Saturday, March 21, 2020.
Waterloo Wellington Children’s Groundwater Festival
Celebrating its 24th year, the long-standing Waterloo Wellington Children’s Groundwater
Festival was held from May 24 to May 30 in 2019. Water Services is proud to be an ongoing
2019 Annual and Summary Report
Page 164 of 182
partner, sponsor, contributor and organizer of the Festival. In 2019, the Festival engaged
4,898 students Grades 2 through 5 from the City of Guelph, Wellington County, and the
Region of Waterloo. Upwards of 900 students participate from Guelph on an annual basis.
Since 1996, over 95,000 students have participated in the Festival, which features fun and
interactive activities designed to inform students of the importance of water protection and
conservation in their daily lives. In partnership with Guelph’s school boards, staff have
worked to increase local awareness and participation in this Festival annually.
Outreach to New Canadians in Guelph
To build trust in governments’ management of drinking water amongst new Canadians and
introduce new Guelph residents to the City’s unique water supply and constraints, continued
public education programming is encouraged within the community.
Two Linamar facilities implemented an initiative to reduce the amount of disposable plastic
water bottles purchased and used by their staff in 2019. Reducing plastic water bottle use
minimizes Linamar’s environmental impact and promotes a safe and clean working
environment by eliminating workstation clutter within the plants due to empty, or partially
empty, plastic bottle accumulation. Linamar approached Water Services about providing an
educational presentation about Guelph’s water to support this project. Linamar staff
demographics are highly multicultural and are largely comprised of new community
members to Canada and Guelph. Linamar believed this educational component would be a
key to the success of their project.
The two locations installed additional water fountains to improve accessibility to tap water
and provided each staff member with their own reusable, stainless-steel water bottle. To
enhance the initiative’s success, Water Services gave a 15-minute presentation to all staff
members at participating facilities on Guelph’s water supply during their monthly staff
meetings. Presentation content included the role of Water Services in the community and
our drinking water’s source, treatment, safety, and quality. In total, 840 staff members
received the presentation.
Our tap water presentation built confidence in our tap water’s safety and quality and was an
important component in the success of Linamar’s initiative. There is significant potential for
this initiative to have spillover effects into the personal lives of Linamar’s staff. Ideally,
Linamar staff will confidently choose to drink tap over bottled water at home as well as at
work, and encourage family members and friends to do so.
Water-Energy Nexus Research
2019 Annual and Summary Report
Page 165 of 182
Collectively, Water and Wastewater utilities (i.e. treatment and conveyance) are among the
largest energy consumers by sector in Ontario. Water requires energy intensive treatment
and pumping to maintain a reliable water supply while protecting public health and the
environment. Consequently, water conservation and efficiency presents significant energy
saving opportunities. Furthermore, the cost to expand water and energy infrastructure
emphasizes that conservation and efficiency are among the most cost effective sources of
water and energy. As electricity costs continue to rise and population growth increases
water resource demands, conservation is important for Ontario municipalities to limit the
increasing cost to produce safe clean drinking water and meet energy needs in a time when
climate resilience is required. The water-energy nexus offers new opportunities to save
water, energy and money through reduced infrastructure costs, greenhouse gas emissions,
and operational and maintenance costs.
In 2019, Water Services began to apply the water-energy nexus concept to communicate
associated water, energy and cost savings as identified in the Water Efficiency Strategy. The
intent in doing so could lead to further decreases in water use.
Further to this, staff commenced the practical assessment of renewable energy applications
to the infrastructure related to pumping, treating and distributing water, in alignment with
the City’s Community Energy Initiative. Renewable energy applications for water
infrastructure are rapidly evolving and have the potential to reduce the water sector’s
dependency on fossil fuel–based electricity use.
As a continuation from the 2018 work, Water Services continued to assess energy
optimization opportunities within the drinking water system. In doing so, this information
informs budget forecasting, proposed water rate changes, and to assess the efficacy of
water conservation and efficiency programs. The Water Efficiency Strategy challenges staff
to evaluate opportunities to strategically implement technologies to maximize the use of
available water supply. Staff currently utilize a suite of tools such as water audits, acoustic
leak detection and district metered areas to recover water losses. Water loss management is
known to be a highly cost effective water conservation and efficiency measure for
municipalities as they defer the associated costs of water infrastructure expansion. This
evaluation is anticipated to continue through the 2020 Water Supply Mater Plan update
process.
Guelph Water Wagon
In support of the City’s 2009 Public Promotion Action Plan for City Drinking Water
Consumption, the Guelph Water Wagon has been providing tap water to attendees of large,
2019 Annual and Summary Report
Page 166 of 182
outdoor community events during the summer months for seven years. The Water Wagon
provides access to tap water where water fountains or taps are not readily available.
Continually growing in demand year-after-year, the Water Wagon attended 33 events in
2019 and provided 22,332 litres of water to event attendees. The Water Wagon continues to
provide staff an excellent opportunity to engage with the public. Staff engage with Guelph
residents about:
• the value of Guelph’s water;
• the need for water conservation and source protection;
• questions and concerns regarding municipal tap water;
• Water Services-based public processes, programs and studies; and
• promote tap water consumption over other beverages.
In 2019, staff developed a Water Wagon Communication Plan that will undergo
implementation in 2020. The Communication Plan was developed using insights from the
2018 Water Efficiency Public Education and Communication Strategy and associated market
research, as well as Community Based Social Marketing principles. The Communication Plan:
• identifies specific goals and objectives for public engagement at the Water Wagon,
• clarifies key messages and target audiences,
• details how the Water Wagon Program Coordinator interacts with the public and set-
up their display,
• outlines communication material development, and
• provides direction for monitoring public engagement.
This formal, strategically developed communication plan will be an important guide moving
forward to ensure public engagement efforts via the Water Wagon program remain
consistent, on-point, and contribute to our overarching goals. This resource will be
especially advantageous for assisting the Water Wagon Program Assistant, who is a new
staff member each summer, quickly and successfully navigate their role.
Water Softener Alternatives Testing and Market Research
With high levels of naturally occurring hardness in the City’s groundwater source, the use of
residential ion-exchange (salt-based) water softener technologies is quite common amongst
Guelph households. It is estimated that approximately 77 per cent of local households, as
part of a 2009 residential call survey, use a water softener.
The Region of Waterloo and the City of Guelph financed ground-breaking research in 2015
to assess the performance of an alternative to ion-exchange softening technology that
treats hard water without the need for salt and recharge water. This technology referred to
2019 Annual and Summary Report
Page 167 of 182
as salt and water free technology through the use of: media induced crystallization
(nucleation assisted crystallization (NAC) and template assisted crystallization (TAC));
electromagnetic water treatment (MWT); chemical conditioning with complexing; or
chelating agents. Salt and water free technology employs a combination of processes to
prevent scale buildup in household water heaters and appliances. However, these
technologies do not allow for the same lathering effect as salt-based water softeners
provide.
In June 2017, the City of Guelph again collaborated with the Region of Waterloo to continue
the research, trialling the NAC/TAC technology in real life scenarios. The aim of this study
was to assess the field performance and user benefits associated with salt and water free
residential water softener treatment technology.
Through this study, social research in both communities were completed (phone surveys,
focus groups) to generate a technology test group of 18 homes, to install a single
technology in their home for testing of user experience.
The technology was installed in participating homes by December 2017. Use of the systems
continued throughout 2018. Participants were engaged to provide feedback through
subsequent focus groups and an online discussion board. The final focus group concluded in
January 2019.
The final report was completed in September. The results of the Water Conditioner Study
were posted to the joint website, watersoftenerfacts.ca in November. The results of the
study will be used to inform the update to the Water Efficiency Strategy moving forward.
2019 Annual and Summary Report
Page 168 of 182
Appendix J: Water Services Committees
Water Conservation and Efficiency Public Advisory Committee –
Annual Report
The Water Conservation and Efficiency Public Advisory Committee (WCEPAC) – a Guelph
Committee of Council – was formed in 2009 through Council approval. Council recommitted
to this Committee in 2016 with the approval of the Water Efficiency Strategy update. This
committee provides a forum for community input and guidance throughout the City’s
implementation of the Water Efficiency Strategy.
The WCEPAC met four times in 2019. The WCEPAC continues to provide valued insights on
opportunities for continued enhancement of current and developing water conservation
programming, policy and education, engagement and outreach resources. In alignment with
Council reporting requirements outlined in the committee’s Terms of Reference, this Annual
Report details activities of the WCEPAC within 2019.
Water Conservation and Efficiency Public Advisory Committee continued to provide
invaluable citizen feedback and recommendations to enhance the City of Guelph’s successful
water efficiency program, including:
• Feedback on the following water efficiency programs that were updated or developed
as directed through the 2016 Water Efficiency Strategy:
▪ Blue Built Home Water Efficiency Standard and Rebate Program,
▪ Residential Sub-meter Rebate Program,
▪ Integrated Water Mapping Project, including key performance indicators, and
▪ Residential Rain Garden Pilot Project
• Comment on various innovative research, study and pilots including the residential
water conditioner study (related to residential water softener impacts) and the
Assimilative Capacity and Reclaimed Water Feasibility Studies which were conducted
in partnership with Wastewater and Source Water Protection.
• Participation in discussions on how best to utilize and enhance the committee’s
capacity to provide advantageous and quality input.
• Learning opportunities to support member’s role on the committee. This was
especially important in 2019 with four new members joining the committee, and a
new member and City Staff who had joined the committee in 2018. Members received
presentations on WCEPAC roles, responsibilities, policies and procedures; 2016 Water
Efficiency Strategy; Water Supply Master Plan update; Stormwater Management
2019 Annual and Summary Report
Page 169 of 182
Master Plan update; Water and Wastewater Servicing Master Plan update; Guelph’s
Wastewater Treatment operations; and Water Services’ operations.
In 2020, the WCEPAC will continue to be engaged to solicit input throughout continued
implementation of the 2016 Water Efficiency Strategy recommendations including, but not
limited to the following:
• Present an updated Terms of Reference for the Committee, in line with Clerk’s policies
and procedures for Committees of Council (last update in 2009);
• Commencing an update to the Water Efficiency Strategy, contingent upon completing
the Water Supply Master Plan in 2020;
• Outreach and engagement strategies for City of Guelph’s conservation programming
and tap water promotion;
• Development, update, or enhancement to Water Efficiency programs;
• Feedback on the pursuit and application of study results in regards to water reuse,
water energy nexus, and alternative water softening technology; and
• Water Supply Master Plan update.
Visit the Water Conservation and Efficiency Public Advisory Committee webpage for a full list
of the WCEPAC members, meeting minutes and agendas.
The WCEPAC possesses no annual budget. Funding for the City’s Water Efficiency Program is
provided within the Council-approved Non-Tax Supported Water and Wastewater Services
Capital and Operating Budgets as well as through Development Charges.
Well Interference Committee
The Well Interference Committee is a specially arranged—or ad hoc—committee that is
brought together to address well interference complaints resulting from the City’s water
takings.
The committee was established in 2004 to address concerns voiced during the City’s Class
Environmental Assessment for the Arkell Springs Ground Water Supply Strategy. During the
Environmental Assessment, private well owners expressed concern that City water taking
may interfere with or reduce the amount of water available for their wells.
No complaints have gone to the Well Interference Committee since it was established. It is
worth nothing that the Committee convened on May 29, 2019 in order to facilitate an
overview of the City’s Well Interference Standard Operating Procedure, Permit to Take
Water Requirements, upcoming water supply projects and the Terms of Reference for the
Committee. The purpose of the review was to inform new members who may not have been
2019 Annual and Summary Report
Page 170 of 182
familiar with the duties or function of the Committee as these members were recently
elected to council.
Visit the Well Interference Committee webpage for more information.
2019 Annual and Summary Report
Page 171 of 182
Appendix K: Source Water Protection
The third annual report summarizes information requested from the Risk Management
Official by the Source Protection Authorities, as required under section 81 of the Clean
Water Act, 2006 (CWA). The report outlines activities undertaken by the City of Guelph in
2019 to protect municipal drinking water sources. Source Protection is one component of
the multi-barrier approach to ensure clean safe drinking water.
The Lake Erie Source Protection Region is one of 19 in Ontario created to implement
drinking water source protection planning under the Clean Water Act, 2006. The region
includes four watersheds, called Source Protection Areas (SPAs) in the Act:
• Catfish Creek
• Grand River
• Kettle Creek
• Long Point Region
The City of Guelph is part of the Grand River SPA and has a representative who sits on the
24 member Lake Erie Region Source Protection Committee (SPC). The SPC meets about four
times a year to discuss and implement matters related to program implementation. The City
of Guelph is an active participant along with other municipal representative who have a
stake in drinking water issues.
The Grand River Source Protection Authority will receive this information in the format they
have requested by February 1, 2020. This information may also be requested by the
Director of the Ministry of Environment, Conservation and Parks (MECP).
City of Guelph internationally recognized for Source Protection
In 2019, the City of Guelph was awarded the American Water Works Association Exemplary
Source Water Protection Award. Award winners “establish and maintain source water
protection programs that account for their unique local conditions, incorporate the interests
of local stakeholders, and reflect sustainable long-term commitments to the process by all
parties.” Established in 1881, the American Water Works Association (AWWA) is the largest
and oldest non-profit, scientific and educational association dedicated to managing and
treating water. There are approximately 50,000 members worldwide.
2019 Annual and Summary Report
Page 172 of 182
Figure 8: City Staff Receiving AWWA Award along with Guelph Mayor and
Councillors.
Risk Management Official Update
The RMO represents the City of Guelph as a municipal member of the Grand River Source
Protection Committee. The Risk Management Official (RMO), Peter Rider, was appointed
under subsection 47(6) of the Clean Water Act on May 27, 2016. The Risk Management
Inspector (RMI) Kristin Pressey, was appointed on December 19, 2017.
Threat Verification and Negotiating Risk Management Plans
The City of Guelph continued to work with a number of property owners and businesses to
verify and manage threat activities at their sites. Threats identified in the 2010 Assessment
Report total 942 within the City of Guelph. Threat verification has been completed for 409
sites, resulting in the completion of 12 Risk Management Plans (RMPs) and an additional 4
in progress. City staff continue to develop RMPs for sites with threats, including evaluating
existing practices and identifying potential missing gaps in drinking water protection. A
template developed by the City was used to make the Risk Management Plan negotiation
process less onerous for business and property owners.
2019 Annual and Summary Report
Page 173 of 182
Information related to the Source Protection Program is managed in the Local Source Water
Information Management System (LSWIMs), a data management system. This program is
used by several other municipalities in southern Ontario to manage data associated with the
Source Protection Program. The application is being updated regularly with additional
functionality as requested by the collaborating partners.
Figure 9: Risk Management Official Summary, 2019
The CWA requires a section 59 Notice for development within the Wellhead Protection Areas
(WHPAs) to determine if an application has a potential to introduce a new threat to drinking
water. A notice is required before planning and building applications can be deemed
complete. In 2019, Source Water Protection staff reviewed 361 applications and issued 167
Section 59 Notices.
2019 Annual and Summary Report
Page 174 of 182
Figure 10: Clean Water Act, Section 59 Summary
Policy Implementation
The City of Guelph is the implementing body responsible for a range of Source Protection
Policies, from prohibition to negotiating Risk Management Plans (RMPs) and providing
education and outreach. There are 72 policies in the City of Guelph’s section of the Grand
River Source Protection Plan. Of these, 48 are identified as the City’s responsibility to
implement. As of January 2019, we currently have 28 policies fully implemented and 18 that
we have made some progress on. Efforts are underway to implement the remaining policies,
however, there may be certain triggers required (e.g. upon the next Official Plan update)
which will determine the pace at which some of the policies will be implemented.
Protecting Water Quantity
The City of Guelph is working closely with the Townships and staff from the Lake Erie Region
Source Protection Authority to develop a set of water quantity threat policies for the
identified WHPAs. Meetings are ongoing and it is anticipated that public consultation will be
completed by the end of 2020. The draft policies will then be submitted to the Minister of
Environment, Conservation and Parks for approval before implementation.
2019 Annual and Summary Report
Page 175 of 182
Education and Outreach
In the second half of 2019 moving into 2020, Source Water started an ad campaign to bring
awareness to the program. The campaign consisted of Guelph Transit advertisements: both
on the back and side of the bus; along with posters up at various bus shelters throughout
the City. Advertisements were also posted through various social media sites and the
Guelph Chamber of Commerce. Figure 11 below is an example of source water public
communication.
Figure 11: Source Water Protection Advertisement to Reduce Your Winter Salt Use
Staff from the Sourcewater Protection Team have worked collaboratively with the City of
Guelph Operations department staff to sponsor and support the purchase of new and
enhanced road salting equipment. The goal of this initiative is to improve the management
of road salt application within the City and to obtain a better understanding of how much
road salt is being applied throughout the City. The purchase of this state-of–the-art
equipment will allow the Operations department to develop more accurate records. This will
greatly assist both departments in developing a better understanding of water quality trends
and potential impacts to our drinking water system.
Staff from the Source Water Protection Team have also been actively involved in providing
input to a joint committee lead by Ontario Good Roads Association and Conservation
Ontario, whose mandate is to raise awareness at the provincial level of increasing chloride
trends in groundwater and the need to evaluate the effectiveness of current legislation and
best practices for winter maintenance.
Private Well and Septic System Decommissioning and Sanitary
Sewer Connection Grant Program
A primary objective of City of Guelph’s Source Water Protection Program is to protect our
existing and future municipal drinking water supplies. There are several threats to drinking
2019 Annual and Summary Report
Page 176 of 182
water that can be managed; however, unused water wells and septic systems can act as
conduits for contaminants to migrate to deeper aquifers that supply water to the
community.
The goal of this program is to provide eligible residents with grant funding to offset the costs
of decommissioning unused wells and septic systems on their property. There are several
benefits to initiating such a program, including the reduction of risk that contaminants can
enter such infrastructure and move downwards and impair or contaminate drinking water
supplies.
The grant program is comprised of two parts: A well decommissioning grant component and
a septic system decommissioning grant component. This program is intended for private
domestic residential wells and septic systems. Developers are not eligible for the grant.
Residents are welcome to apply for one or both programs depending upon their situation. All
applicants must complete and submit a Decommissioning Grant Application Form. City staff
will arrange to inspect the well or septic system before decommissioning and approve any
work to be eligible for the grant. Property owners can apply for rebates that would include
$1,500 per private well (to a maximum of two per property) and $15,00037 per septic
system decommissioned.
The Grant Program was approved by Council and initiated in the summer of 2019. Program
uptake was voluntary and dependent on citizens taking the initiative to inquire about
funding and eligibility. To date, uptake has been minimal with only one septic system and
one well decommissioned at two separate properties. More information on this program is
available for reference at the Well and Septic Decommissioning Rebate Program webpage.
Moving Forward in 2020
Efforts will continue to develop Risk Management Plans and carry out threat verifications, as
required. We anticipate ramping up efforts to educate the public about road salting and how
everyone can play a part in reducing the amount of road salt that is applied to hard
surfaces.
The Source Water Protection team will continue to pursue opportunities to educate the
public and various stakeholders on the benefits of protecting our water resources. This will
37 Includes a provision for a sanitary connection to existing sanitary sewer (if construction
and installation costs are greater than $15,000, the property owner will be responsible for
additional costs).
2019 Annual and Summary Report
Page 177 of 182
be accomplished through meetings, seminars and conferences when opportunities present
themselves.
2019 Annual and Summary Report
Page 178 of 182
Appendix L: Glossary
Included below is an index of terms used throughout this report.
Term Description
< Less than (used in reference: less than lower detection limit shown)
µg/L Micrograms per litre = 1 part per billion
½ MAC half of the maximum allowable concentration
Above
Detection
Limit
Means the result can be detected using the current level of technology.
AMP Adaptive Management Plan
AO Aesthetic Objective
AODA Accessibility for Ontarians with Disabilities Act
A&S Annual and Summary
AWQI Adverse Water Quality Incident
Background Indicator bacteria group used to monitor general water quality (non -
regulatory)
BBH Blue Built Home program
CAO Chief Administrative Officer
CAPS Capital Asset Prioritization System
CCL Critical Control Limit. The point at which a Critical Control Point response
procedure is initiated.
CCP
Critical Control Point. An essential step or point in the Subject System at
which control can be applied by the Operating Authority to prevent or
eliminate a Drinking Water Health Hazard or to reduce it to an acceptable
level.
CELP Community Environmental Leadership Program
CIR # Continual Improvement Report Number. Refers to the number assigned to
an item in the Continual Improvement Database.
cfu colony forming unit
Cubic metre
(m3) 1 Cubic metre = 1,000 litres water
2019 Annual and Summary Report
Page 179 of 182
Term Description
Distribution
Samples Samples taken within the distribution system, post primary disinfection.
Distribution
System
The part of a drinking water system that is used in the distribution,
storage or supply of water and that is not part of a treatment system.
DMA District Metered Area
Drinking
Water
System
A system of works, excluding plumbing, that is established for the
purpose of providing users of the system with drinking water and
includes,
(a) any thing used for the collection, production, treatment, storage,
supply or distribution of water,
(b) any thing related to the management of residue from the treatment
process or the management of the discharge of a substance into the
natural environment from the treatment system, and
(c) a well or intake that serves as the source or entry point of raw water
supply for the system.
DWQMS Drinking Water Quality Management Standard
DWS Drinking Water System
DWWP Drinking Water Works Permit
EC E. coli (Escherichia coli)
E. coli Escherichia coli, indicator bacteria used to determine the presence of fecal
contamination
EDMS Electronic Document Management System
EHV Efficient Home Visit
Eng. Engineering Services
EOCG Emergency Operations Control Group
EPA Environmental Protection Act
ERO Environmental Registry of Ontario
Form 1 Form 1 – Record of Watermains Authorized as a Future Alteration
Form 2 Form 2 – Record of Minor Modification or Replacements to the Drinking
Water System
2019 Annual and Summary Report
Page 180 of 182
Term Description
GUDI-WEF Groundwater Under the Direct Influence of surface water – With Effective
Filtration
HAAs
Haloacetic acids (HAAs) are a type of chlorination disinfection by-product
that are formed when the chlorine used to disinfect drinking water reacts
with naturally occurring organic matter in water.
HPC Heterotrophic Plate Count, indicator bacteria group used to monitor
general water quality (non-regulatory).
ICI Industrial, Commercial, Institutional
In-situ
filtration
Refers to the filtration achieved as river water migrates through the
ground and into the Arkell Springs Glen Collector System.
km Kilometre
Langelier
Index
An approximate indicator of the degree of saturation of calcium carbonate
in water. It is calculated using the pH, alkalinity, calcium concentration,
total dissolved solids, and water temperature of a water sample collected
at the tap.
LESP Lake Erie Source Protection
LRP Lead Reduction Plan
LSL Lead Service Lines
LSWIMs Local Source Water Information Management System
L/s Litres per second
m Metres
m3 Cubic metres = 1 m3 = 1,000 litres water
m3/day Cubic metres per day = 1 m3/day = 1,000 litres per day
MAC Maximum Allowable Concentration
MCC Motor Control Centre
MDL Minimum Detection Limit
MDWL Municipal Drinking Water Licence
MECP Ontario Ministry of the Environment, Conservation and Parks
mEq/L Milliequivalents Per Litre
mg/L Milligrams per litre = 1 part per million
2019 Annual and Summary Report
Page 181 of 182
Term Description
n/a Not Applicable
NDOG Non-Detect Overgrown
N/O Non-Operational
NSF 60 NSF/ANSI Standard 60: Drinking Water Treatment Chemicals -- Health
Effects
NSF 61 NSF/ANSI Standard 61: Drinking Water System Components -- Health
Effects
ntu nepholometric turbidity unit
O. Reg.
170/03 Ontario Regulation 170/03 Drinking Water Systems
OA Operating Authority
ODWQS O. Reg. 169/03 Ontario Drinking Water Quality Standards
ODWSP Ontario Drinking Water Stewardship Program
OG Operational Guideline
OIC Operator-in-Charge
OP Operational Plan
ORO Overall Responsible Operator
OTP Operational Testing Plan
OWRA Ontario Water Resources Act
OWUP Outside Water Use Program
OWWCO Ontario Water Wastewater Certification Office
Pb Lead
PDDW Procedure for Disinfection of Drinking Water in Ontario
PLC Programmable Logic Controller
POE Point of Entry, the point at or near which treated water enters the
distribution system.
ppm Parts per million (mg/L)
ppb Parts per billion (µg/L)
PTTW Permit to Take Water
2019 Annual and Summary Report
Page 182 of 182
Term Description
Q1 Quarter One (aka first quarter), Q2 (second quarter), etc.
QMS Quality Management System
Raw water Water in its natural state, prior to any treatment for drinking.
RMPs Risk Management Plans
RCAp Rapid Chemical Analysis Package
SAC Spills Action Centre
SAN Storage Area Network
SCADA Supervisory Control and Data Acquisition
SDS Subdivision Distribution System (as in Gazer Mooney SDS)
SDWA Safe Drinking Water Act, 2002
TC Total Coliform, indicator bacteria group used to determine presence of
contamination.
TCE Trichloroethylene
THM Trihalomethane
TOMRMS The Ontario Municipal Records Management System
Total Coliform Indicator bacteria group used to determine presence of contamination.
Treated Refers to samples that have received disinfection, for example treated
sources.
UGDSB Upper Grand District School Board
UV Ultraviolet
VOC volatile organic compound
WCDSB Wellington Catholic District School Board
WCES Water Conservation and Efficiency Strategy
WCWC Walkerton Clean Water Centre
WDGPH Wellington-Dufferin-Guelph Public Health
WES Water Efficiency Strategy
WHPA Wellhead Protection Area
WSMP Water Supply Master Plan