Page 1
An o-Toluidine Method for Body-Fluid
Glucose Determination
Kurt M. Dubowski*
o-Toluidine, 6% (v/v) in glacial acetic acid, is used to determine glucose in biologic
material after deproteinization with 3% (w/v) trichloracetic acid. A stable green
color develops after heating at 1000 for 10 mm., and the absorbance is determined at
630 or 635 mp. The reagent is stable for many months at room temperature, and the
reaction follows Beer’s Law over a very wide range of concentrations. The develop-
ment of the procedure is discussed, as is the specificity of the method for glucose.
\�MTH THE CURRENT EMPHASIS 0fl more frequent and more intensive
around-the- clock performance of clinical chemical determinations,
there is need for a simple, rapid, reliable, and economical method for
glucose determination that is equally adaptable to routine multiple or
single analyses of any body fluid and is capable of serving as a com-
patible manual stand-by and emergency test method in laboratories
using automatic glucose analysis. Preferably, such a method should
require only a single stable reagent, be adaptable to several of the
common methods of preparing protein-free filtrates which may al-
ready be employed in a given laboratory for other determinations, and
should possess considerable flexibility in its other operating charac-
teristics.
Colorimetric or spectrophotometric methods based upon the con-
densation of glucose with primary aromatic amines in glacial acetic
acid, which probably leads to formation of an equilibrium mixture of
From the Clinical Chemistry and Toxicology Laboratories, University of Florida Teaching
Hospital and Clinics, Gainesville, Fla.
Presented at the Thirteenth Annual Meeting of the American Association of Clinical Chem-
ists, New York, N. Y., August 1961.
The author is indebted to Natalie A. Green and Darcus A. Horsley for technical assistance.
Received for publication July 6, 1961.
*presellt address: Department of Biochemistry, University of Oklahoma School of Medicine,
Oklahoma City 4, OkIa.
215
Page 2
216 DUBOWSKI CHnica� Chemistry
a glycosylarnine and the corresponding Schiff base, have been em-
ployed in the past with varying degrees of success. The benzidine
method of Jones and Pridham (1) yielded a nonlinear color at low
glucose concentrations and employed an unstable reagent. lJse of 2-
aminobiphenyl (C10H11N) was suggested by Timell et al. (2); and the
modified procedures of Athanail and Cabaud (3) and Forsell and
Palva (4) based upon this reaction met some of the above requirements
and have given us moderate satisfaction. However, the reagent proved
difficult to purify, was unstable, and required frequent recalibration.
Further, 2-aminobiphenyl is now believed to be markedly carcinogenic
(.5) and is consequently no longer readily available commercially.
Ortho-Toluidine (2-aminotoluene, C7H9N),whose structural formula is
CH3
7L/NHS
is structurally similar to 2-aminohiphenyl and might be expected to re-
act reasonably selectively with glucose. Its use in blood-glucose deter-
mination as a substitute for 2-aminobiphenyl was suggested to us by
0. M. Forsell (6) ; and the procedure we developed has beeii in routine
use in our laboratories for approximately 18 months and in several
other laboratories in OUI institution for lesser periods.
o-Toluidine, a primary aromatic amine, in acetic acid solution reacts
relatively selectively with glucose, yielding a stable green color which
adheres to the Beer-Lambert law over a wide range of concentration.
The reagent is compatible with several common protein-free filtrates
of blood and other body fluids, and the reaction conditions are readily
adjustable for the desired selisitivity, final reaction volume, concentra-
tion range, and the like.
Method
Reagents
1. o-Toluidine, 6.0% v/v in C. P. glacial acetic acid. Prepare
the reagent by dissolving the o-toluidine in the acid and allow it to
age for 1 week, durilig which time the initial yellow color changes
to amber. Store at room temperature in brown borosilicate glass bottle
or otherwise protected from light. J. T. Baker Chemical Co. reagent-
grade glacial acetic acid (Cat. No. 9506) and Eastman Organic Chemi-
Page 3
Vol. 8, No. 3, 1962 BODY.FLUID GLUCOSE 217
cals o-toluidine (Eastman Grade, Cat. No. 253) have proved most suit-
able and can be used without further purification.
2. Trichloracetic acid, 3.0% w/v
Equipment
1. Automatic pipets. For efficiency, reproducibility, aiid con-
venience, the trichloracetic acid is dispensed from a 1.80-mi. automatic
pipet fitted with Teflon stopcock plug. (Cat. No. JP-6380 (Special),
Scientific Glass Apparatus Co., Inc., Bloomfield, N. J.) The o-toluidine
is delivered from a 3.00-ml. amber automatic pipet with Teflon stop-
cock plug, connected in series with a 1.00-ml. Thomas-Seligson auto-
matic pipet with Teflon stopcock plug (Cat. No. 8209-B2, Arthur H.
Thomas Co., Philadelphia 5, Pa.) which is used to measure the flitrate.
2. Fluid bath, 1000, thermostatically controlled. The bath liquid
may be a water-soluble polyalkalene glycol (Cat. No. 50-HB-280X
UCON Lubricant, Union Carbide Chemicals Co., New York 17, N. Y.).
3. Coleman Model 6D Junior Spectrophotometer (narrow band),
or equivalent
Calibration
Prepare aqueous standards containing 25-300 mg. of glucose per 100
ml. in steps of 25 mg., by appropriately diluting (with 0.2% benzoic
acid) a standard containing 1.00 gm. of anhydrous reagent-grade glu-
cose per 100 ml. in 0.2% ben�oic acid. Substitute 0.20 ml. of each stand-
ard for the body fluid sample in Step 1 of the procedure (see below)
and continue the analysis as outlined. Prepare a new calibration curve
for each new batch of reagent and check the curve periodically.
Procedure
1. Prepare a 1-in-lO protein-free filtrate of whole blood or other
body fluid by adding 0.20 ml. of well-mixed specimen to 1.80 ml. of 3.0%
trichloracetic acid; allow to stand for 5-10 mm. and filter through a
5.5-cm. Whatman No. 2 filter paper.
2. Into two 15 X 125-mm. borosilicate culture tubes with Teflon-
lined screw caps, place respectively 1.00 ml. of distilled water (Reagent
Blank) and 1.00 ml. of protein-free filtrate (Test). Add 3.00 ml. of
o-toluidine reagent to each tube, cap, and mix well by repeated inver-
sion.
3. Immerse tubes in a 100#{176}fluid bath for 10 miii.; remove and coo].
4. Measure the transmittance of the test specimen in a Coleman
Page 4
218 DUBOWSKI Clinical Chemistry
Model 6D Jr. Spectrophotometer at 630 or 635 m� in 19-mm. cuvettes,
against the reagent blank adjusted to 100 per cent transmittance.
5. if the test specimen measures less than 10 per cent transmittance,
dilute both reagent blank and test specimen with equal volumes of gla-
cial acetic acid, mix well, and again measure as in Step 4 above.
6. Obtain the body-fluid-glucose level in milligrams per 100 ml. di-
rectly from the calibration table (multiplying the table values by the
dilution factor, if any).
Experimental
Development of Procedure and Determination of Optimal Conditions
For reasolls of laboratory convenience it was desired to employ a 1-
111-10 protein-free filtrate of all body fluid specimens, and to effect a
compromise between single-analysis range and sensitivity which al-
lowed the direct measurement of glucose concentrations of at least 250
l)ut not more than 300 mg./100 ml. of specimen. Preliminary tests of
reaction conditiolls were conducted to develop a temporary working
method adapted to use of the Coleman Model 6D Jr. Spectrophotome-
ter, and experimental findings were confirmed with use of the final pro-
cedure described above, where indicated. During this study, all volume
measurements were made manually, with the use of pipets and volu-
metric ware conforming to National Bureau of Standards Class A
specifications.
Effect of Protein-Free Filtrate Preparation
A pooled serum specimen, found to contain 93 mg. of glucose per
1.00 ml. by triplicate automatic glucose analysis with the AutoAna-
lyzer (7, 8), was deproteinized by six commonly used methods, and
the protein-free filtrates subjected to duplicate glucose determination
by the proposed o-toluidine method. The resulting absorbances were
converted to glucose levels with the use of individual calibration
curves established by diluting aqueous glucose standards with the re-
spective protein-precipitating reagents. The results, shown in Table
1, demonstrate interference with the proposed analysis by the per-
chioric acid filtrate, which preveiited formation of the usual green
color in the reaction mixture. The Abrahamson (9) tungstic acid fil-
trate yielded slightly higher serum glucose levels, and the Folin-Wu
(10) tungstic acid filtrate and the Somogyi (ii) barium-zinc filtrate
approximately the same levels, as the automatic reference method.
Page 5
Vol. 8, No. 3 1962 BODY.FLUID GLUCOSE 219
Table 1. EFFECT OF PROTEIN-FREE FILTRATE PREPARATION ON GLUCOSE DETERMINATION BY
THE 0-TOLUIDINE METHOD
Teat No. Protein-free filtrate reageota
Serum glueoae fan fld�
(mg/I 00 ml.)
Filtrate ��rote in
(mg/I 00 ml.)
1 Abrahamson (9) 98 7.0
2 Folin-wu (10) 90 6.0
3 Perchloric acid, 10% -t -�
4 Somogyi (11) 92 7.0
5 Trichloracetic acid, 3% 94 4.0
6 Tiichloracetic acid, 10e/�� 93 -�
*Duplicate determinations by the o-toluidine method on a serum specimen found by the
reference automatic glucose method7 8 to contain 93 mg. glucose per 100 ml.
tAtypical pink color of equal absorbance in reagent blank and test developed.
�Biuret color destroyed by filtrate; protein determination not completed.
Both 3% w/v and 10% �v/v trichloracetic acid filtrates yielded the
same glucose level as the reference method; and deproteinization with
3% w/v trichioracetic acid, which yields an essentially protein-free
filtrate compatible with several other routine clinical chemistry deter-
millatiolls, was therefore selected as the method of choice.
Whole blood deproteillized with 3% w/v trichioracetic acid pro-
duced a filtrate having a pH of 1.3; and trichloracetic acid yielded
slightly greater volumes of protein-free filtrates than the tungstic aci(l
reagents, as also 1lOted by Sunderman et al. (12). The mixtures of
blood and protein precipitants were filtered through Whatman No. 2
filter paper; and control determinations with glucose-free materials
demonstrated that this filter paper did not contribute to the trichlor-
acetic acid filtrates any substances reacting with the o-toluidine re-
agent.
Determination of Spectral Characteristics of the Reaction Mixture
A series of aqueous standard glucose solutions (0-3 mg./ml. concen-
tration) was prepared from anhydrous National Bureau of Standards
certified standard glucose (Sample No. 41) and subjected to the entire
body-fluid-gluose procedure outlined above. Absorption spectra of the
resulting reaction mixtures were determined against reagent blanks
with a Beckman Model DU spectrophotometer and with a Coleman 61)
Jr. spectrophotometer. Figure 1 shows the data obtained for concen-
trations corresponding to body-fluid-glucose levels of 100 and 200
mg./100 ml., illustrating absorption maxima at 480 m� and 630 m� with
the Beckman instrument. The reaction mixture adheres to the Beer-
Lambert relation at both points, for body-fluid concentrations up to
Page 6
400 425 450 475 500 525 550 575 600 625 650 675 700
220 DUBOWSKI Clinical Chemistry
‘.5
WAVE LENGTH, MILLIMICRONS
Fig. 1. Absorption spectra of o-toluidine reaction with glucose.
2000 mg./100 ml.; the absorption maximum at 630 m�is preferred for
the general procedure because of the greater sensitivity, the net ab-
sorbance being about 18 per cent greater than at 480 m�. On three of
our Coleman Model 6D spectrophotometers, maximal absorbance was
equal between 625 mj.t and 635 mp�, and the latter wavelength was
adopted for use with that instrument during the study.
Figure 2 shows a typical calibration curve for the procedure out-
lined above in which the Coleman 6D (“Narrow Band”) Jr. Spectro-
photometer was used at 635 mj�; compliance with the Beer-Lambert
relation over the range 0-300 mg. of glucose per 100 ml. of body fluid
is illustrated. Calibration curves prepared simultaneously for three
different Coleman Model 6D instruments in our laboratory were iden-
tical and corresponded to the equation
Body-Fluid-Glucose (mg./100 ml.) = Absorbance635 X 265.
In the preparation of the calibration curve, the aqueous glucose stand-
ards must be diluted with 3% trichloracetic acid as in deproteinization,
Page 7
Vol. 8, No. 3, 1962 BODY.FLUID GLUCOSE 221
“.5
�0
GLUCOSE MG./IOO ML.
Fig. 2. Typical calibration curve for o-toluidine body-fluid-glucose determination with
Coleman Jr. Spectrophotometer.
since dilution with water produces a curve substantially different from
that applying to deproteinized body fluids.
Reagent and Reaction - Mixture Composition
Aqueous glucose standards containing 1, 2, and 3 mg./ml. were car-
ried through the entire Procedure, the o-toluidine reagent concentra-
tion being varied from 0 to 10% v/v in steps of 1 or 2%. The effect of
these changes in reagent concentration upon the color developed in the
reaction mixture is shown in Fig. 3, which indicates that linearity of
color intensity with glucose concentration in the final reaction mixture
is maintained at increasing o-toluidine concentrations up to 8% v/v.
The sensitivity of the reaction can therefore be increased within limits
by employing a more concentrated reagent and/or by decreasing the
Page 8
160
140
120
‘DO
G80
0.60
0.40
0.20
00
Fig. 3. Effect of o-toluidine reagent concentration on color development in o-toluidine-
glucose method.
0 I 2 3 4 5 6 7 8 9
o-TOLUIDINE CONCENTRATION, % v/v
222
‘C,5.5
DUBOWSKI Clinical Chemistry
dilution of the final reaction mixture by reducing the initial reagent
volume.
The 19-mm. round cuvette we wished to employ with a slightly modi-
fied adapter in our Coleman Model 6D Jr. spectrophotometers requires
a minimal sample volume of 3.2 ml. to cover the light path aperture, as
compared with a 5.8-ml. minimal volume for the unmodified instru-
ment. For convenience and accuracy in sample measurement, 1.0 ml.
of protein-free filtrate is used, and 3.0 ml. of o-toluidine reagent then
yield the desired minimal total reaction mixture volume. To achieve
the desired compromise between optimal single-analysis conicentra-
tion range and sensitivity and maximal precision and resolution, the
calibration curve had to cover the glucose range 25-250 mg./100 in the
photometric scale region of approximately 0.100-100 absorbance (�10-80 per cent transmittance), to minimize relative analysis errors per
unit photometric reading error, as pointed out by Ayres (13) and
Archibald (14). It is apparent in Fig. 3 that a 6% v/v o-toluidine re-
Page 9
Vol. 8, No. 3, 1962 BODY.FLUID GLUCOSE 223
agent best meets these several requirements in the proposed analysis
scheme. On the calibration curve for this reagent concentration (Fig.
2), the region of least relative analysis error caused by photometry,
0.30-0.50 absorbance units, also corresponds to the most frequently
encountered glucose levels.
The 6.0% v/v o-toluidine reagent can react with sample glucose con-
centrations up to at least 2000 mg./100 ml., and it was determined that
the Beer-Lambert relation still applies to the reaction at this level.
Consequently, body-fluid-glucose concentrations up to 2000 mg./100
ml. can be determined by a single unknown analysis; for concentra-
tions greater than 300 mg./100 ml., both the reagent blank and the re-
action mixture are appropriately diluted with glacial acetic acid to
bring the final color intensity within the upper calibration limit, and
the calibration table values multiplied by the dilution factor. o-Tolui-
dime obtained from different sources shows some differences in reac-
tivity, the Eastman Organic Chemicals reagent being more sensitive
in our hands than a Matheson, Coleman & Bell reagent (Cat. No. 2714).
Various o-toluidine reagent batches prepared with the Eastman prod-
uct remained stable at room temperature, in the dark, for periods of
4.3-6 months without detectable changes in the calibration curves after
an initial 3- to 5-day ageing period. It was further unnecessary to re-
calibrate for reagent batches prepared from a single lot of Eastman
o-toluidine and a single lot of glacial acetic acid.
Time Effects: Color Intensity and Stability
The effect of heating time at 100#{176}on the color developed in the re-
action mixture was investigated with standard glucose solutions con-
taining 1, 2, and 3 mg./ml. and carried through the entire analysis. The
reaction mixtures and reagent blanks were heated for periods from 0
to 20 mm. inn steps of 2 mm., with the results shown in Fig. 4. Mixtures
of 1 ml. of glucose-containing fluid or filtrate and 3 ml. of 6% v/v o-
toluidine reached maximal absorbance in 12-14 miii., depending upon
the glucose concentration; heating for periods greater than 16 mm.
produced slightly lower absorbances. A compromise between reaction
sensitivity and minimal total analysis time was effected by choosing a
10-mm. period at 100#{176},which produces stable color intensities propor-
tional to glucose concentration. As illustrated in Fig. 4, the sensitivity
of the reaction can be increased approximately 12 per cent by prolong-
ing the heating time from 10 to 15 mm.Color stability in the final reaction mixtures was investigated in
Page 10
224 DUBOWSKI Clinical Chemistry
1.60
1.40
120
‘4
� 1.00
080
0.60
0.40
0.20
010 12 14
TIME AT 100#{176}C., MINUTES
Fig. 4. Effect of heating time at 1000 on color development in o-toluidine-glueose method.
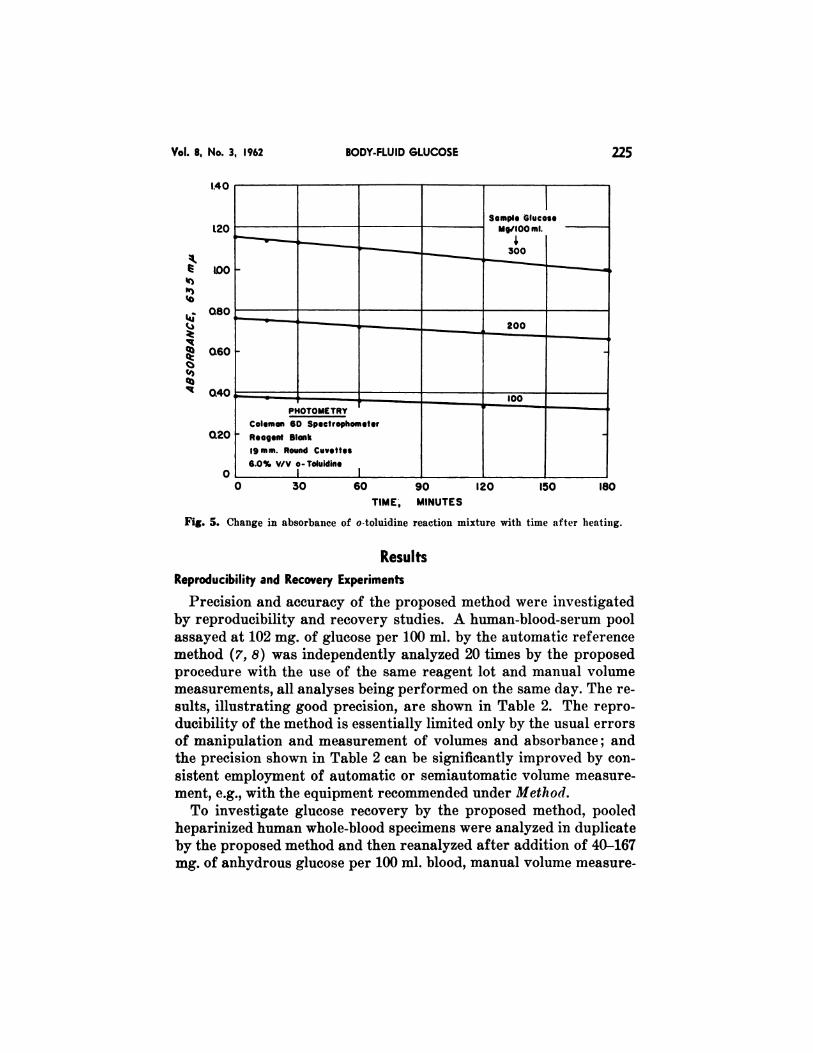
standard glucose solutions containing 1, 2, and 3 mg./ml., subjected to
the entire Procedure, rapidly cooled in a 4#{176}mechanical cooling bath to
room temperature (23#{176})after removal from the heating bath, and then
kept in ordinary room light (combined fluorescent illumination and
daylight) for periods up to 180 mm., with periodic photometric meas-
urement against reagent blanks similarly treated. The results are
shown in Fig. 5, illustrating that the color does not rapidly fade to an
appreciable extent. After 15 mm. of standing, approximately 98 per
cent of the original maximal absorbance remained; while 92-95 per
cent of maximal absorbances for various sample concentrations re-
mained 60 mm. after removal from the heating bath. Consequently, no
special precautions to prevent fading of the final reaction-mixture
colors appear necessary if photometric measurement is made reason-
ably promptly after termination of the heating period; and this factor
poses no problem in the analysis and photometric measurement of a
series of specimens.
Page 11
1.40
1.20
too
080
060
0.40
0.20
0
Sample GlucoseMgIIOO ml.
�
300
�-_
�-
.
�-..
-�-
-__ 200- - -
PHOTOMETRY
Coleman 60 Sp.ctrophomet.r
Reagent Blank
19 mm. Round Cuvettes
6.0% V/V o-ToluidineI
0 30 60 90 120
TIME, MINUTES
ISO 180
Vol. 8, No. 3. 1962
“.5
5.5�0
‘41�‘.5
BODY.FLUID GLUCOSE 225
Fig. 5. Change in absorbance of o-toluidiime reaction mixture with time after heating.
Results
Reproducibility and Recovery Experiments
Precision and accuracy of the proposed method were investigated
by reproducibility and recovery studies. A human-blood-serum pool
assayed at 102 mg. of glucose per 100 ml. by the automatic ref ei’ence
method (7, 8) was independently analyzed 20 times by the proposed
procedure with the use of the same reagent lot and manual volume
measurements, all analyses being performed on the same day. The re-
sults, illustrating good precision, are shown in Table 2. The repro-
ducibility of the method is essentially limited only by the usual errors
of manipulation and measurement of volumes and absorbance; and
the precision shown in Table 2 can be significantly improved by con-
sistent employment of automatic or semiautomatic volume measure-
ment, e.g., with the equipment recommended under Method.
To investigate glucose recovery by the proposed method, pooled
heparinized human whole-blood specimens were analyzed in duplicate
by the proposed method and then reanalyzed after addition of 40-167
mg. of anhydrous glucose per 100 ml. blood, manual volume measure-
Page 12
226 DUBOWSKI Clinical Chemistry
Table 2. RESULTS OF 20 CONSECUTIVE REPLICATE ANALYSES OF A SERUM POOL FOR GLUCOSE
BY THE O-TOLUIDINE METHOD
Serum glucose (mg./I00 ml.)
.4liquot No. Glucose found Difference from mean
1 103 +2.8
2 100 -0.2
3 100 -0.2
4 104 +3.8
5 97 -3.2
6 100 -0.2
7 102 +1.8
8 101 +0.8
9 101 +0.8
10 98 -2.2
11 98 -2.2
12 100 -0.2
13 103 +2.8
14 100 -0.2
15 97 -3.2
16 100 -0.2
17 100 -0.2
18 97 -3.2
19 100 -0.2
20 102 +1.8
Mean 100.2 ±1.5
S.D. ±2.0
*SD = , where d stands for difference from mean (15).
N-i
ments being employed throughout. The results, shown in Table 3, il-
lustrate good recovery.
Specificity Investigations
Most glucose-determination methods yield variable but significant
apparent glucose concentrations when applied to the analysis of blood
and some other body fluids from which glucose has been removed by
fermentation or enzymatic removal. The various copper-reduction
methods most commonly employed show such “saccharoid” values of
15-30 mg./100 ml. in glucose-free fasting blood specimens (12, 16-18);
the Folin-Wu method in which a tungstic acid filtrate is used (19)
when applied to blood is usually believed to include a fairly constant
nonglucose “saccharoid” concentration of about 20 mg./100 ml., al-
though occasional levels of 35 mg./100 ml. or more, calculated as glu-
Page 13
*Duplicate determinations.
Vol. 8, No. 3, 1962 BODY-FLUID GLUCOSE 227
Table 3. RECOVERY Of ADDED GLUCOSE BY O-TOLUIDINE METHOD FROM BLOOD
Glucose (nuf 1100 sal.)
RecoveryInitial Glucose Total Glucose
Sample No. blood glucose* added glucase present found (%)
1 84 160 244 233 95.5
2 80 160 240 232 96.7
3 95 40 135 135 100.0
4 85 167 252 251 99.6
5 100 167 267 260 97.4
6 109 91 200 198 99.0
7f 100 40 140 142 101.4
Mean 98.5
�Duplicate determinations.
tAverage of 20 replicate recovery tests.
cose, are encountered (12, 16, 20). The reaction of nonglucose compo-
nents of blood, cerebrospinal fluid, and urine with the o-toluidine re-
agent was investigated by analysis of random fasting blood serum,
CSF, and urine specimens by the proposed method before and after re-
moval of glucose by yeast fermentation. One milliliter respectively of
serum, cerebrospinal fluid, and urine, each previously analyzed for
glucose by the o-toluidine procedure outlined, was incubated at 37#{176}for
45 mm. with 0.3 ml. of commercial dry granulated baker’s yeast which
had been repeatedly washed. The ability of the yeast to ferment glu-
cose was established by total removal of glucose from a 210 mg./100 ml.
aqueous standard under the same conditions. Following incubation,
the yeast was removed by centrifugation, and glucose determinations
were performed by subjecting the supernatant body fluid specimens to
the entire o-toluidine procedure outlined. A similar series of experi-
ments with the same specimens, with yeast incubation at 23#{176}for 45
mm., yielded identical findings. The results shown in Table 4 demon-
Table 4. BLANK VALUES FOR SERUM, CEREBROSPINAL FLUID, AND URINE BY O-TOLUIDINE
METHOD
Test No. Specimen
Glucose (mg/ZOO ml.)*
Rla,,k �
(osgluco�e, mg/ZOO ml.)IniZkit After fermentation
1 Yeast - 1 1
2 Glucose Std. 210 1 0
3 Serum 174 5 4
4 C.S.F. 118 2 1
S Urine 203 6 5
Page 14
228 DUBOWSKI Clinical Chemistry
strate the relative lack of response of the o-toluidine method to the
nonglucose components of serum, cerebrospinal fluid, and urine and
the correspondingly low blank values for glucose-free body fluids.
The proposed o-toluidine method was further tested for specificity
by investigating the possibility of interference by certain physio-
logically occurring substances. Possible color production by some
relevant carbohydrates and polysaccharides was tested by subjecting
aqueous standard solutions of 8 substances, each containing 160 mg./
100 ml., to the complete procedure outlined and obtaining the glucose
equivalent corresponding to the color intensity developed. The fol-
lowing apparent glucose levels were obtained:
Substance tested Glucose equivalent (rng./100 ml.)
Arabinose 26
Chondroitin sulfuric acid A 1
Galactose 160
Glucosamine 3
ilyaluronidase 0
Lactose 52
Maltose 14
Mannose 158
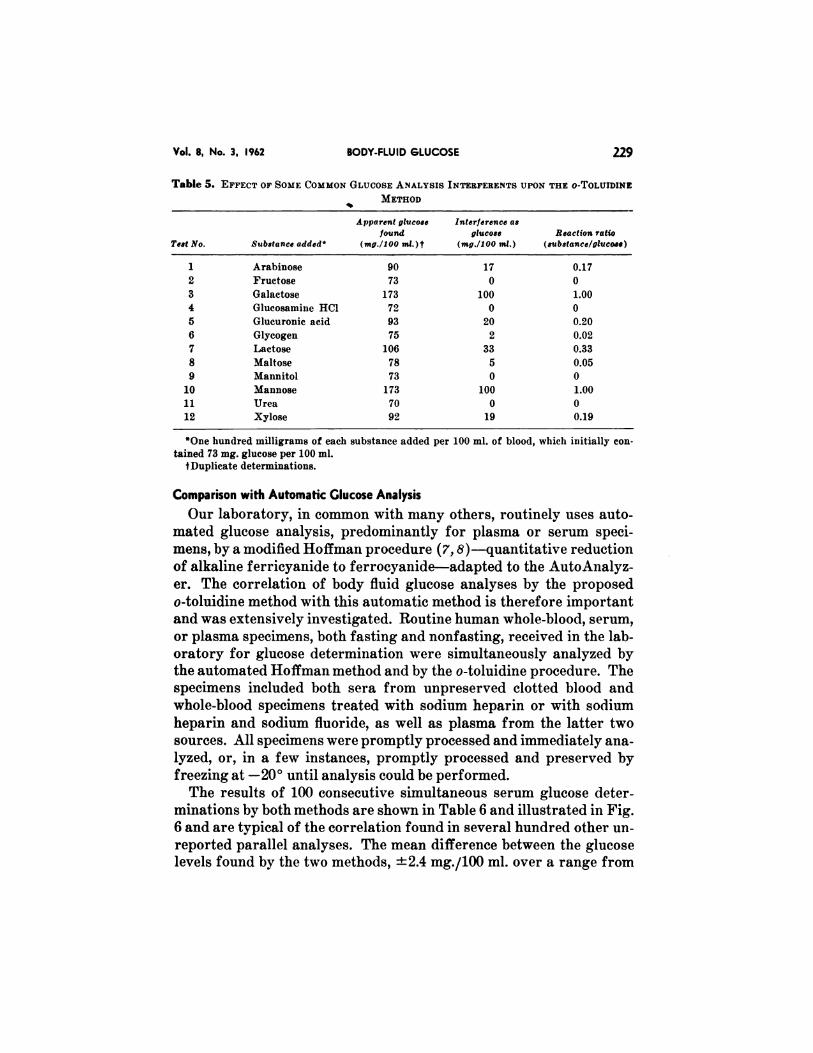
A fiuial specificity investigation was concerned with the effect of high
added concentrations of some relevant compounds on the recovery of
glucose from blood. Twelve substances, including mono-, di-, and
polysaccharicles, aldopentoses, and aldo- and ketohexoses, were addedto a pooled whole blood specimen of known glucose level to yield con-
centrations of 100 mg./100 ml. for each compound. The resulting blood
specimens were analyzed by the entire procedure outlined and the ab-
sorbances converted to apparent glucose concentrations from the glu-
cose calibration curve. The results are shown in Table 5, which in-
cludes for each substance a quantitative “interference” estimate rep-
resenting the difference between the initial blood glucose level and the
apparent blood glucose level after addition of the compound being
tested. From these interferences and the known 100 mg./100 ml. con-
centration of each compound in the blood sample, a reaction ratio for
each substance as compared to glucose was calculated (Table 5). Of
the 12 substances tested, only galactose and mannose react with o-tolui-
dine equimolecularly with glucose, as is to be expected; and the pro-
posed method, therefore, cannot distinguish between these three stereo-
isomers. No significant interference should exist in this method from
physiologic concentrations of the other substances shown in Table 5.
Page 15
Vol. 8. No. 3. 1962 BODY-FLUID GLUCOSE 229
Table 5. EFFECT OF SOME COMMON GuJoosE ANALYSIS INTERFERENTS UPON THE O-TOLUIDINE
METHOD�.
Test No. Substance added0
Appa rent glucose
found
(mg./100 ml.)f
Interference 08
glucose
(mg./100 ml.)
Reaction ratio
(substance/glucose)
1 Arahinose 90 17 0.17
2 Fructose 73 0 0
3 Galactose 173 100 1.00
4 Glucosainiiie HC1 72 0 0
5 Glucuronic acid 93 20 0.20
6 Glycogeit 75 2 0.02
7 Lactose 106 33 0.33
8 Maltose 78 5 0.05
9 Mannitol 73 0 0
10 Mannose 173 100 1.00
11 Urea 70 0 0
12 Xylose 92 19 0.19
8One hundred milligrams of each substance added per 100 ml. of blood, which initially con-
tained 73 mg. glucose per 100 ml.
tDuplieate determinations.
Comparison with Automatic Glucose Analysis
Our laboratory, in common with many others, routinely uses auto-
mated glucose analysis, predominantly for plasma or serum speci-
mens, by a modified Hoffman procedure (7, 8)-quantitative reduction
of alkaline ferricyanide to ferrocyanide-adapted to the AutoAnalyz-
er. The correlation of body fluid glucose analyses by the proposed
o-toluidine method with this automatic method is therefore important
and was extensively investigated. Routine human whole-blood, serum,
or plasma specimens, both fasting and nonfasting, received in the lab-
oratory for glucose determination were simultaneously analyzed by
the automated Hoffman method and by the o-toluidine procedure. The
specimens included 1)0th sera from unpreserved clotted blood and
whole-blood specimens treated with sodium heparin or with sodium
heparin and sodium fluoride, as well as plasma from the latter two
sources. All specimens were promptly processed and immediately ana-
lyzed, or, in a few instances, promptly processed and preserved by
freezing at -20#{176}until analysis could be performed.
The results of 100 consecutive simultaneous serum glucose deter-
minations by both methods are shown in Table 6 and illustrated in Fig.
6 and are typical of the correlation found in several hundred other un-
reported parallel analyses. The mean difference between tile glucose
levels found by the two methods, ±2.4 mg./100 ml. over a range from
Page 16
Specimen
1
3
4
5
6
7
8
9
10
11
12
13
14
15
16
17
18
19
20
210�)
23
24
25
26
27
28
29
30
31
32
33
34
35
36
37
38
39
40
41
42
43
44
45
46
47
48
49
50
51
Table 6. COMPARISON OF 100 CONSECUTIVE S�aUM GLUCOSE ANALYSES BY AUTOANALYZEB
AND BY THE O-TOLUIDINE METHOD
Serum glucose (mg./iOO sal.) Serum gluco8e (mg./100 ml.)
AuloAnalyzer o-Taluidine Difference Specimen AutoAnalyzer o-Toluidine
178 176 2 52 #{149} 84 82
115 110 5 53 94 97
55 53 2 54 102 102
93 89 4 55 84 82
72 68 4 56 84 89
58 56 2 57 87 87
103 105 2 58 86 87
146 151 5 59 86 91
94 95 1 60 87 86
114 117 3 61 112 109
52 47 5 62 106 103
64 63 1 63 86 84
89 88 1 64 92 90
77 78 1 65 82 80
99 95 4 66 102 103
116 120 4 67 91 91
92 95 3 68 200 198
81 78 3 69 88 88
84 79 5 70 91 91
80 83 3 71 100 100
61 65 4 72 127 124
78 79 1 73 129 127
76 78 2 74 60 62
90 93 3 75 86 86
102 103 1 76 252 255
80 85 5 77 83 83
80 76 4 78 99 97
200 196 4 79 67 70
123 119 4 80 172 174
102 98 4 81 130 132
110 114 4 82 92 92
145 145 0 83 100 100
94 89 5 84 79 75
101 100 1 85 92 87
114 114 0 86 81 76
85 90 5 87 75 75
70 74 4 88 84 84
104 103 1 89 87 89
131 132 1 90 64 65
132 129 3 91 139 144
82 82 0 92 147 149
92 90 2 93 135 138
68 64 4 94 71 70
76 80 4 95 19 22
80 78 2 96 89 86
68 64 4 97 93 88
94 95 1 98 84 84
112 116 4 99 124 122
106 110 4 100 70 70
96 99 3 Mean
112 113 1 S.D.8
S.D. = , where d stands for difference between results by the two methods.N-i
Difference
2
3
0‘)
5
0
1
5
1
3
30
2
1
0
2
0
0
0
3
2
2
0
3
0
2
3
2
2
0
0
4
5
50
0
2
1
5
2
3
1
3
3
5
0
2
0
±2.4
±2.9
Page 17
0 25 50 75 100 125 150 175 200
BLOOD GLUCOSE, MG./IOOML.-AUTOANALYZER
Vol. 8, No. 3, 1962 BODY-FLUID GLUCOSE 231
200
175
“U
150
125
-J� 100
� 75
50
0� 25
0
Fig. 6. Comparison of 100 consecutive routine blood-serum-glucose determinations by auto.
mated Hoffman and o-toluidine methods.
52 to 252 mg./100 ml., with a standard deviation of ±2.9 mg./100 ml.,
compares very favorably with other reported correlations between the
automated Hoffman method and manual glucose procedures (8, 21-
23), and with tile ±1.3 mg./100 ml. average difference from the mean
with a standard deviation of ±2.0 mg./100 ml. of replicate glucose
analyses by the o-toluidine method (Table 2). For all pi�actical pur-
poses, the proposed o-toluidine method can be regarded as fully com-
patible with the automated Hoffman procedure, and results obtained
by either procedure may be considered interchangeable.
Glucose Values Obtained with the o-Toluidine Method
After the development and complete investigation of the final o-
toluidine procedure described above, it was routinely employed in our
Page 18
25
1330 �Fasting�
Blood Plasma Specimens
0
0 0 20 30 40 50 60 70 80 90 100 PlO 120 30 140 ISO 160 ITO 180 90 200 200300 400 500’500
BLOOD PLASMA GLUCOSE. MG/IOO ML
232 DUBOWSKI Clinical Chemistry
Fig. 7. Distribution of “fasting” blood plasma glucose levels in 1330 consecutive routine
hospital specimens analyzed by o-toluidine method.
laboratory for body-fluid-glucose determination for a period of ap-
proximately 18 months, to date. To illustrate the range and distribu-
tion of glucose levels encountered in blood and cerebrospinal fluid, a
portion of these routine laboratory data were examined further.
Figure 7 is a histogram of 1330 consecutive blood plasma glucose
levels from this group of data. The data were obtained on plasma
promptly separated upon receipt in the laboratory from whole-blood
samples treated with sodium heparin and designated as “fasting”
specimens and immediately analyzed or preserved by freezing at -20#{176}
until analyzed; specimens from an unselected general university hos-
pital patient population including adult and pediatric inpatients and
outpatients are included. Plasma glucose levels between 70 and 120
mg./100 ml. were found most frequently and represent 71.6 per cent of
all results. The histogram shows a skewed distribution toward the
higher levels as compared to the usual normal distribution for healthy
subjects, because of the substantial number of specimens from diabetic
patients included in our group. Normal plasma glucose levels are ap-
Page 19
Vol. 8, No. 3, 1962 BODY-FLUID GLUCOSE 233
proximately 10-20 mg./100 ml. higher than whole-blood levels in the
same specimens (16, 20, 23) since the intracellular glucose concentra-
tions are lower than the extracellular ones. In view of this factoi’ and
the nature of the hospital population sampled, the most frequently
occurring range in this plasma series, 70-120 mg./100 ml., corresponds
well with the commonly cited 65-110 mg./100 ml. fasting whole-blood
glucose value for 95 per cent of “normal healthy subjects” by the
Nelson-Somogyi method (11, 24, 25).
A similar analysis of 210 consecutive cerebrospinal-fluid-glucose
levels in histogram form is shown in Fig. 8. Again, the specimens rep-
resent unpreserved routine samples from general university hospital
adult and pediatric inpatient services, processed and analyzed prompt-
ly upon receipt in the laboratory, or preserved by freezing at -20#{176}un-
til analyzed. The values occurring most frequently, 50-80 mg./100 ml.,
represent 74.3 per cent of all values in this group and correspond well
to the most frequently found plasma levels, which are usually 20-40
mg./100 ml. higher than simultaneous CSF concentrations in the same
patient (26, 27). Normal human cerebrospinal-fluid-glucose levels are
commonly given as 45-100 mg./100 ml. for adults (27,28), presumably
40
210 CSF.Specimens
Fig. 8. Distribution of cere- � 30
brospinal-fluid-glucose levels in
210 consecutive routine hospital �
specimens analyzed by o-tolui- � 25
dine method. :
K�2O
Lu IS0. 1/ 7
I /
�I0
0
0 10 20 30 40 50 60 70 80 90 100>100
CEREBROSPINAL FLUID GLUCOSE, MG/IOOML.
Page 20
234 DUBOWSKI Clinical Chemistry
when determined by copper-reduction methods, and this range paral-
lels the values occurring most frequently in our series of CSF speci-
mens from hospitalized patients analyzed by the o-toluidine method.
Discussion
Arising out of a need for an adequate manual glucose determination
method compatible with the automated Hoffman procedure, a method
was developed which, in its final form, has these favorable major char-
acteristics: With respect to reliability, it has adequate accuracy, ade-
quate precision, good sensitivity and resolution, good selectivity for
glucose, with low biologic blank values, and freedom from interference
by the most common relevant substances. With respect to practicabili-
ty, it has simplicity and economy, reasonable rapidity of analysis, good
reagent stability, ready commercial availability in pure form of the
single reagent components, adherence to the Beer-Lambert law
throughout a wide range, compatibility with various filtrates, a good
range-and-sensitivity compromise, and comparability of results with
the automated glucose method.
In any analytical method, reliability considerations govern accept-
ability for a specific purpose and situation, while practicability con-
siderations affect the choice among acceptable procedures. The allow-
able error for manual body-fluid-glucose determinations has been pro-
posed variously as from 5.4 to 27.0 per cent by different investigators
(29-al). The proposed method amply meets these requirements, and
its performance appears adequate with respect to the other reliability
criteria listed.
Three of the practicability characteristics would seem to merit brief
discussion. The several adjustments in reagent and reaction mixture
composition and in reaction conditions resulted in a method combining
sufficient sensitivity and chemical resolution to permit� adequate dis-
crimination between closely adjacent glucose levels for special clinical
studies, with an adequately wide concentration range to cover approxi-
mately 95 per cent of all fasting blood glucose levels in a single un-
known analysis, without need for dilution of final reaction mixtures or
repetition of the analysis. The exceptionally wide glucose range over
which the Beer-Lambert law is followed further permits the determi-
nation of virtually all physiologic glucose levels in every body material
by simple dilution of the final reaction mixture for levels over 275 mg./
100 ml. Simplicity of test performance and concurrent economy are
combined with reasonable rapidity; and a single determination can be
completed within 20 mm., which makes the procedure practical for
casual and emergency single analyses. For most effective integration
into laboratories employing automated glucose determination by the
Page 21
Vol. 8, No. 3, 1962 BODY-FLUID GLUCOSE 235
Hoffman method, a stand-by manual procedure should yield identical
results and be capable of operating on the same specimens normally
analyzed automatically to minimize problems of specimen procure-
ment and interpretation of results. The proposed o-toluidine proce-
dure fulfills this requirement and additionally employs a protein-free
filtrate which can be readily utilized for several other major clinical
chemical analyses, including urea nitrogen determination.
References
1. Jones, J. K. N., and Pridham, J. B., Biochem. J. 58, 288 (1954).
2. Timell, T. E., Glaudemans, C. P. J., and Currie, A. L., Anal. Chem. 28, 1916 (1956).
3. Athanail, 0., and Cabaud, P. 0., J. Lab. Ctin. Med. 51, 321 (1958).
4. Forsell, 0. M., and Palva, I. P., Scand. J. Gun. 4� Lab. Invest. 11, 409 (1959).
5. Fuess, J. T., Manager, Eastman Organic Chemicals Department, Distillation Products
Industries Division, Eastman Kodak Co., personal communication, Mar. 13, 1959.
6. Forsell, 0. M., personal communication, Mar. 13, 1960.
7. Hoffman, W. S., J. Biol. Chem. 120, 51 (1937).
8. Grady, H. J., and Lamar, M. A., Clin. Chem. 5, 542 (1959).
9. Abrahamson, E. M., Am. J. Clin. Path. (Tech Suppl.) 4, 75 (1940).
10. Fohin, 0., and Wu, H., J. Biol. CViem. 38, 81(1919).
11. Somogyi, M., J. Biol. Chem. 160, 69 (1945).
12. Sunderman, F. W., MacFate, R. P., Evans, G. T., and Fuller, J. B., Am. J. Gun. Path.
21, 901 (1951).
13. Ayres, G. H., Anal. Chem. 21, 652 (1949).
14. Archibald, R. M., Anal. C7iem. 22, 639 (1950).
15. Youden, W. J., Statistical Methods for Chemists. Wiley, New York, 1951.
16. Ackerman, I. P., “Diseases of carbohydrate metabolism,” in A Syllabus of Laboratory
Examinations in Clinical Diagnosis, rev. ed., edited by L. B. Page and P. J. Culver.
Harvard, Cambridge, Mass., 1960, pp. 466-474.
17. Mosenthal, H. 0., Ann. Internal Med. 33, 1175 (1950).
18. Young, N. F., “Glucose,” in Standard Methods of Clinical Chemistry, edited by M. Ruiner,
Academic Press, New York, 1953, vol. 1, pp. 60-64.
19. Folin, 0., and Wu, H., J. Biol. Chem. 41, 367 (1920).
20. Kugelmass, I. N., Biochemistry of Blood in Health and Disease. Thomas, Springfield, Ill.,
1959.
21. Anon., “Blood sugar results (Hand method: Nelson-Somogyi) ;“ information from North-
ern Div., Albert Einstein Medical Center, Philadelphia, 1957; distributed by Technicon
Instruments Corp., Chauncey, N. Y.
22. Anon., “Comparison of Folin-Wu sugar with AutoAnalyzer;” information from Colum-
bia-Presbyterian Medical Center, New York, undated; distributed by Technicon In.
s�ruinents Corp., Chauncey, N. Y.
23. Hill, J. B., and Kessler, G., J. Lab. Clin. Med. 57, 970 (1961).
24. Nelson, N., J. Biol. Chem. 153, 375 (1944).
25. Reinhold, J. G., “Glucose,” in Standard Methods of Clinical Chemistry, edited by M.
Reiner. Academic Press, New York, 1953, vol. 1, pp. 65-70.
26. Shafer, W. H., Adams, R. P., and Calkins, E., “Extravascular fluids,” in A Syllabus of
Laboratory Examinations in Clinwal Diagnosis, edited by L. B. Page and P. J. Culver.
Harvard, Cambridge, 1960, pp. 265-291.
27. Hoeprich, P. D., and Ward, J. R., J�he Fluids of the Parenteral Body Cavities. Grune,
New York, 1959.
28. Handbook of Biological Data, edited by W. S. Spector, Saunders, Philadelphia, 1956, p.
57.
29. Henry, R. J., Bcrkman, S., Golub, 0. J., and Segalove, M., Am. J. Gun. Path. 23, 285
(1953).30. Kingsley, G. R., The Filter 18, 1-9 (1956).
31. Freier, E. F., and Rausch, V. L., Univ. of Minn. Med. Bull. 24, 190 (1958).