Page 1
Int. J. Electrochem. Sci., 10 (2015) 209 - 222
International Journal of
ELECTROCHEMICAL SCIENCE
www.electrochemsci.org
Anodic Dissolution in Sulfuric Acid Pickling Solutions of the
API Pipeline X70 Grade Steel
El-Sayed M. Sherif1,2,*
and Asiful H. Seikh1
1College of Engineering, King Saud University, P.O. Box - 800, Riyadh 11421, Saudi Arabia
2 Electrochemistry and Corrosion Laboratory, Department of Physical Chemistry, National Research
Centre (NRC), Dokki, 12622 Cairo, Egypt *E-mail: [email protected] ; [email protected]
Received: 14 August 2014 / Accepted: 13 October 2014 / Published: 17 November 2014
The anodic dissolution of API X70 pipeline grade steel was investigated after different exposure
periods of time and different temperatures in 1.0 M H2SO4 pickling solutions using optical microscopy,
electrochemical impedance spectroscopy (EIS), and potentiodynamic polarization measurements. The
EIS and polarization measurements showed clearly that the increase of immersion time increases the
anodic and cathodic currents and corrosion current density decreased both the solution and polarization
resistances for the steel in the sulfuric acid solution. It was also found that increasing the solution
temperature in the range from 20 ºC to 60 ºC highly increased the corrosion of the API X70 pipeline
steel due to the faster and contentious dissolution of X70 steel with temperature. Results together were
in good agreement with each other confirming that X70 steel suffers sever corrosion in H2SO4 solution
and that effect increases with increasing the exposure period and temperature.
Keywords: Acidic pickling solutions, API steels, Corrosion, EIS, Polarization
1. INTRODUCTION
API pipeline steels are high-strength low alloy (HSLA) steel grades due to its high strength and
toughness, good weldability and formability [1-3]. These steels have wide range of applications in
chemical processing such as chemical and allied industries for the handling of acid, alkali and salt
solutions, construction materials and metal processing equipment, oil / gas storage tanks, marine
applications and transportation pipelines [4-6]. Oil and gas transport pipelines are manufactured by
welding segments of carbon steel pipe. This process alters the microstructure of the materials causing
local variations in the composition and phases. These changes increase the dissimilarity of the
base/weld metal combination and can cause galvanic corrosion [7].
Page 2
Int. J. Electrochem. Sci., Vol. 10, 2015
210
Henthorne and Parkins [8] observed that corrosion occurs along grain boundaries in the
absence of stress, and that anodic polarization can cause virtual disintegration of unstressed carbon
steel by intergranular corrosion. Furthermore, this work [8] indicated that the corrosion is related to the
presence of carbon or carbides at the ferrite grain boundaries. The temperature and holding times
influence the ferrite carbon solubility and carbon segregation to grain boundaries [9]. The service life
of pipeline steels is affected not only by the transferred fluid or gas but also by the environmental
conditions under which they operate. Corrosion is a serious problem in steel pipelines and is one of the
main reasons in affecting the service life of the pipeline. This is due to its extremely expensive cost
and the time lost in repairing or replacing or even maintaining these pipes [10-15]. The corrosion of
steel in acidic solutions is an industrial concern that has received a considerable amount of attention
[16,17].
Several investigators have reported [18-21] that the pipeline failure usually occurs not only as a
result of uniform corrosion but also in the form of localized attack, generally as pitting or galvanic
corrosion of welds. These forms of attack can cause pipeline degradation that can lead to spillage of
products resulting in environmental catastrophes. The water content associated with the oil production
process has been found to be a significant factor in the internal corrosion of steel pipelines because the
water contains many corrosive agents such as carbon dioxide, hydrogen sulphides, organic acids and
salts [20,21].
In this work, we reported the electrochemical corrosion behaviour of the API 5L X70 pipeline
steel in 1.0 M H2SO4 pickling solutions after different exposure periods of time, namely 10 min, 60
min, and 24 h. The aim was also extended to investigate the effect of raising the temperature of the
pickling solution from 20 ºC to 60 ºC on the activation of the X70 steel surface. Optical microscopy,
electrochemical impedance spectroscopy, and potentiodynamic polarization measurements were
employed to achieve this investigation.
2. EXPERIMENTAL DETAILS
2.1. Materials and Chemicals
A hot-rolled plate of 15 mm thickness sheet of API X70 5 L pipeline steel was supplied by the
Saudi Arabian Basic Industries Corporation (SABIC). The typical chemical compositions of the
elements present in the steel sheet in wt. % are listed in Table 1. For the electrochemical
measurements, the X70 rods with dimensions of 1×1×0.5 cm were cut from the delivered steel sheet. A
stock solution of 1.0 M sulfuric acid was prepared from the concentrated acid solution (96%) that was
purchased from Merck and was used as received.
Table 1. Chemical compositions (in wt. %) for the employed API X70 5L pipeline steel.
Element C Si Mn P S Al Ti Cu Cr Mo Nb + V Ni
Wt. % 0.05 0.25 1.5 0.01 0.002 0.04 0.018 0.05 0.014 0.2 < 0.09 0.02
Page 3
Int. J. Electrochem. Sci., Vol. 10, 2015
211
2.2. Electrochemical cell
A conventional three-electrode cell accommodates for 200 mL solution was employed in this
study to perform the electrochemical measurements. The API X70 5L pipeline steel, Ag/AgCl (in
saturated KCl), and a platinum foil were used as the working, reference, and counter electrode,
respectively. One face of the steel working electrode was drilled and welded with copper wire and was
then embedded into two-component epoxy resin and mounted in a glass holder. Where, the other face
was left to be polished and exposed to the acid solution. Prior to each experimental measurement, the
exposed surface of the steel electrode (of area 100 mm2) was wet ground with silicon carbide abrasive
papers up to 1000 grit, rinsed with ethanol and air dried.
2.3. Optical microscopy investigations
One of the surfaces of the API X70 5L pipeline steel was mechanically ground on the silicon
carbide abrasive papers sequentially on 60, 120, 240, 320, 400, 600, and 1000 grit silicon carbide
papers and polished on a Sylvet cloth using coarse and fine Geosyn- Grade I slurry of Al2O3. This
surface was cleaned, washed by water, alcohol, dried in air and then etched in 2 Nital solution (2
HNO3 in ethyl alcohol). The etched specimen was observed by XJL-03 model metallographic
microscope and the microstructure was taken with the help of a Camera fitted with the microscope.
Figure 1. Optical micrograph of the API X70 5L pipeline steel employed in this investigation.
2.4. Electrochemical measurement techniques
Electrochemical experiments were performed using an Autolab Potentiostat (PGSTAT20,
computer controlled) operated by the general purpose electrochemical software (GPES) version 4.9.
The electrochemical impedance spectroscopy (EIS) tests were performed at corrosion potentials over a
frequency range of 100 kHz to 100 mHz, with an ac wave of±5 mV peak-to-peak overlaid on a dc bias
Page 4
Int. J. Electrochem. Sci., Vol. 10, 2015
212
potential, and the impedance data were collected using Powersine software at a rate of 10 points per
decade change in frequency. The best equivalent circuit of Nyquist plots was obtained by fit and
simulation method. The potentiodynamic polarization curves were obtained by scanning the potential
in the forward direction against the Ag/AgCl reference electrode and at a scan rate of 0.001 V/s. All
measurements were recorded at the free corrosion potential that was obtained after immersing the
working electrode for 10 min, 60 min, and 24 h in the sulfuric acid test solutions. All electrochemical
experiments were recorded in fresh solution and new steel surface and were repeated for three times to
ensure the reliability and reproducibility of the obtained data.
3. RESULTS AND DISCUSSION
3.1. Optical microscopy and microstructure investigations
The microstructure of API steel X70 was investigated using the optical microscopy image
shown in Fig. 1. It is clearly seen from the micrograph that the microstructure of the X70 steel is
composed of acicular ferrite (AF) with polygonal ferrite (PF) and quasi polygonal ferrite (QPF) matrix
(α). Moreover, there are some grain boundary carbides in which the acicular ferrite is the dominant
phase.
3.2. Electrochemical impedance spectroscopy (EIS) measurements
0 6 12 18 24 30 36-3
0
3
6
9
12
15
18
32
-Z"
/
.cm
2
Z' / .cm2
1
Figure 2. Typical Nyquist plots obtained for X70 5L pipeline steel samples after (1) 10 min, (2) 60
min and (3) 24 h immersion in 1.0 M H2SO4 solutions at room temperature.
In order to report the kinetic parameters for electron transfer reactions at the interface of the
X70 pipeline steel and the sulfuric acid corrosive test solution, the EIS measurements were carried out
after varied exposure periods of time and different temperatures. Where, the EIS technique has been
successfully used to explain the mechanism of corrosion and corrosion control for metals and alloys in
different aggressive environments [22-24]. Fig. 2 shows the typical Nyquist plots obtained for the API
Page 5
Int. J. Electrochem. Sci., Vol. 10, 2015
213
X70 steel after its immersion at room temperature in 1.0 M H2SO4 solution for (1) 10 min, (2) 60 min
and (3) 24 h, respectively. The Nyquist plots depicted in Fig. 2 showed only one depressed semicircle
whose diameter decreased with increasing the time from 10 min to 60 min and further to 24 h. This
decrease in the diameter of the semicircle with increasing the immersion time was resulted due to the
increase of the corrosiveness attack of the sulfuric acid solution towards the steel surface, which in turn
increased its dissolution. It has been reported [25,26] that the deviation of the semicircle from the ideal
shape is due to the dispersion of the frequency and the heterogeneities of the surface as well as the
resistant to mass transport. The capacitance loop intersects the real axis at higher and lower
frequencies. Where, at high frequency end the intercept corresponds to the solution resistance (Rs) and
at lower frequency end corresponds to the sum of Rs and the polarization resistance (Rp).
10-2
10-1
100
101
102
103
104
105
100
101
102
(b)
(a)
3 3
|Z| /
cm2
21
21
10-2
10-1
100
101
102
103
104
105
0
20
40
60
80
Ph
ase
An
gle
/ d
eg.
Frequency / Hz
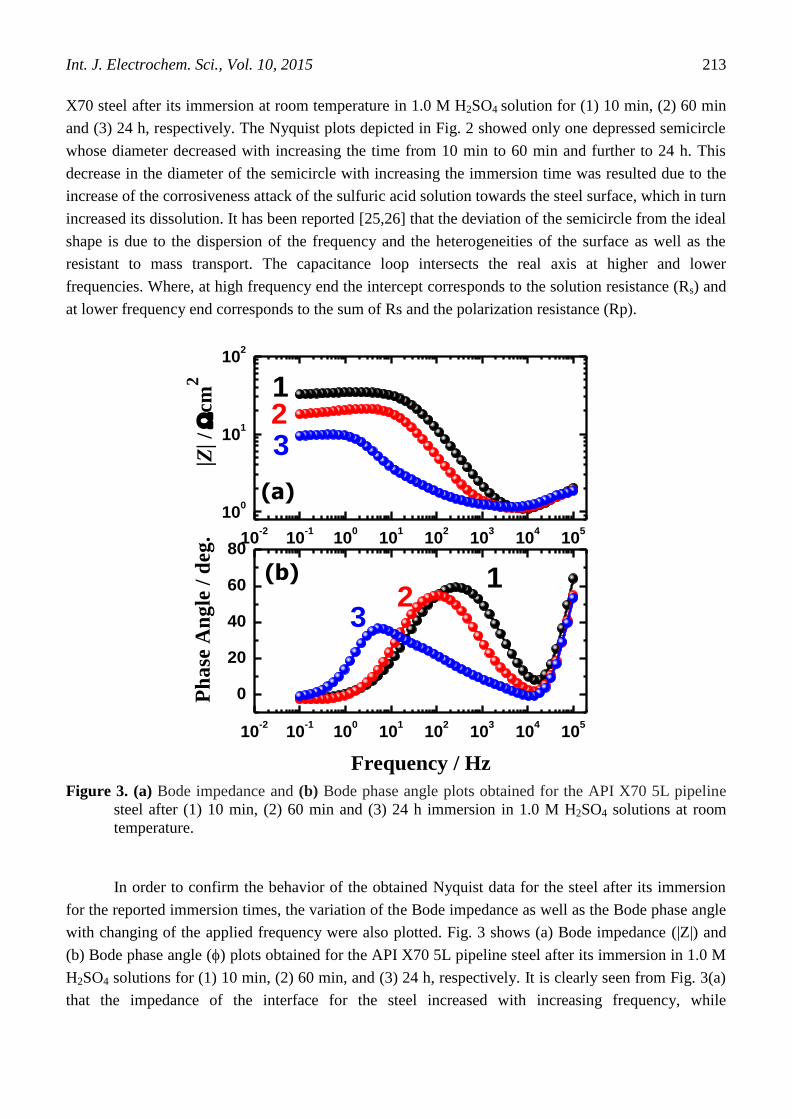
Figure 3. (a) Bode impedance and (b) Bode phase angle plots obtained for the API X70 5L pipeline
steel after (1) 10 min, (2) 60 min and (3) 24 h immersion in 1.0 M H2SO4 solutions at room
temperature.
In order to confirm the behavior of the obtained Nyquist data for the steel after its immersion
for the reported immersion times, the variation of the Bode impedance as well as the Bode phase angle
with changing of the applied frequency were also plotted. Fig. 3 shows (a) Bode impedance (|Z|) and
(b) Bode phase angle () plots obtained for the API X70 5L pipeline steel after its immersion in 1.0 M
H2SO4 solutions for (1) 10 min, (2) 60 min, and (3) 24 h, respectively. It is clearly seen from Fig. 3(a)
that the impedance of the interface for the steel increased with increasing frequency, while
Page 6
Int. J. Electrochem. Sci., Vol. 10, 2015
214
significantly decreased with increasing the immersion time. It has been reported [27-29] that the high
impedance at lower frequency values indicates on the passivation of the surface; this means that the
decrease of the impedance of the interface with increasing the immersion time was due to the
decreased corrosion resistance and in turn the increased dissolution of the steel with time in the acid
solution.
0 6 12 18 24 30 36-3
0
3
6
9
12
15
18
5
43
2
-Z"
/
.cm
2
Z' / .cm2
1
Figure 4. Nyquist plots obtained for the API X70 steel in 1.0 M H2SO4 solutions at (1) 20
ºC, (2) 30
ºC, (3) 40
ºC, (4) 50
ºC and (5) 60
ºC, respectively.
As well as, Fig. 3(b) indicates that the increase of immersion time decreased the maximum
degree of the phase angle, which confirms the data recorded in Fig. 2 and Fig. 3(a) that the increase of
immersion time increases the dissolution of the X70 steel in the sulfuric acid pickling solutions under
investigations.
10-2
10-1
100
101
102
103
104
105
100
101
102
(b)
(a)
54
3
|Z| /
cm
2 21
5
1
10-2
10-1
100
101
102
103
104
105
0
20
40
60
80
Ph
ase
An
gle
/ d
eg
.
Frequency / Hz
Figure 5. (a) Bode impedance and (b) Bode phase angle plots obtained for the API X70 steel in 1.0 M
H2SO4 solutions at (1) 20 ºC, (2) 30
ºC, (3) 40
ºC, (4) 50
ºC and (5) 60
ºC, respectively.
Page 7
Int. J. Electrochem. Sci., Vol. 10, 2015
215
The EIS technique was also used to report the effect of increasing the temperature of the
sulfuric acid solution on the electrochemical corrosion behavior of the API X70 pipeline steel. Typical
Nyquist plots obtained for X70 steel in 1.0 M H2SO4 solutions at (1) 20 ºC, (2) 30
ºC, (3) 40
ºC, (4) 50
ºC and (5) 60
ºC, respectively are shown in Fig. 4. These Nyquist spectra were followed by drawing the
change of the Bode impedance of the interface and the Bode phase angle at the same solutions
temperature and the data are depicted in Fig. 5(a) and Fig. 5(b), respectively. It is obviously seen from
the EIS results that increasing the solution temperature from 20 ºC to 60
ºC decreased the diameter of
the obtained semicircle, Fig. 4. This effect also decreased the values of |Z|, as well as the maximum
degree of . This indicates that the increase of temperature decreases the corrosion resistance of the
X70 steel and thus increases its dissolution in the acid test solution, where the increase of temperature
increases the reactivity of the steel surface and thus accelrates its corrosion as has been reported
previously for similar studies on pipeline steels [12,15,17,30].
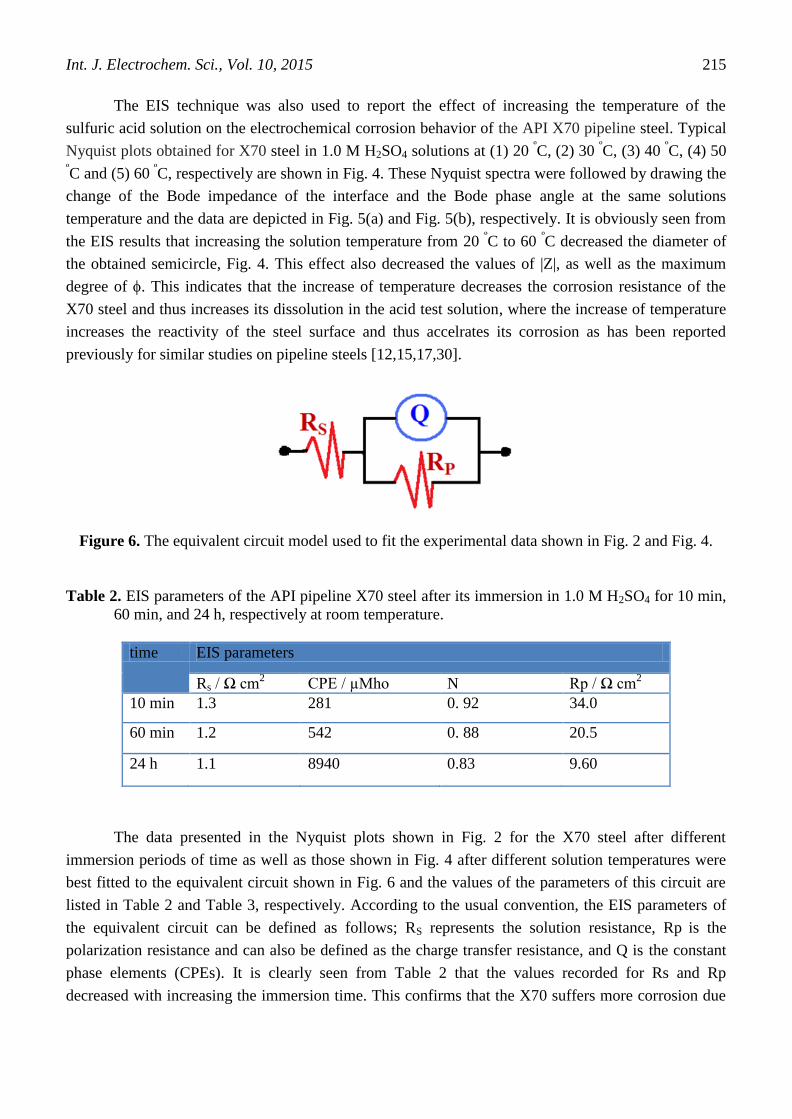
Figure 6. The equivalent circuit model used to fit the experimental data shown in Fig. 2 and Fig. 4.
Table 2. EIS parameters of the API pipeline X70 steel after its immersion in 1.0 M H2SO4 for 10 min,
60 min, and 24 h, respectively at room temperature.
time EIS parameters
Rs / Ω cm2 CPE / µMho N Rp / Ω cm
2
10 min 1.3 281 0. 92 34.0
60 min 1.2 542 0. 88 20.5
24 h 1.1 8940 0.83 9.60
The data presented in the Nyquist plots shown in Fig. 2 for the X70 steel after different
immersion periods of time as well as those shown in Fig. 4 after different solution temperatures were
best fitted to the equivalent circuit shown in Fig. 6 and the values of the parameters of this circuit are
listed in Table 2 and Table 3, respectively. According to the usual convention, the EIS parameters of
the equivalent circuit can be defined as follows; RS represents the solution resistance, Rp is the
polarization resistance and can also be defined as the charge transfer resistance, and Q is the constant
phase elements (CPEs). It is clearly seen from Table 2 that the values recorded for Rs and Rp
decreased with increasing the immersion time. This confirms that the X70 suffers more corrosion due
Page 8
Int. J. Electrochem. Sci., Vol. 10, 2015
216
to the decreased corrosion resistance and confirm also the decrease of the diameter of the semicircle
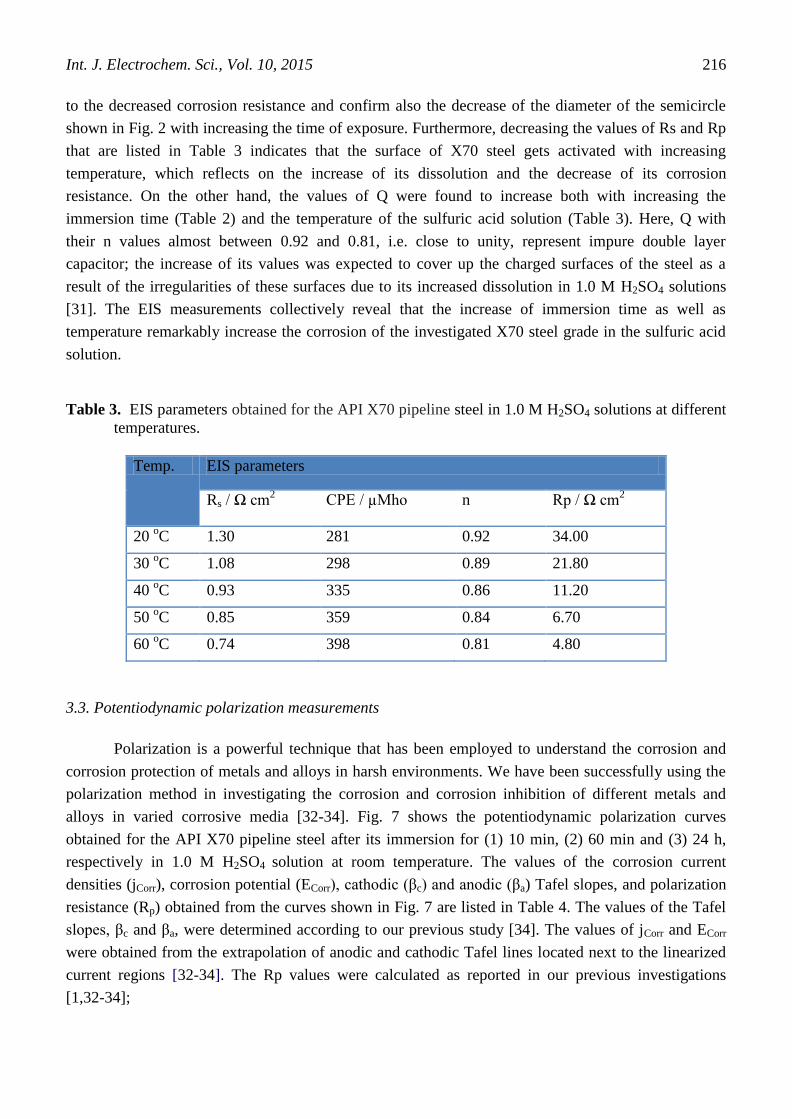
shown in Fig. 2 with increasing the time of exposure. Furthermore, decreasing the values of Rs and Rp
that are listed in Table 3 indicates that the surface of X70 steel gets activated with increasing
temperature, which reflects on the increase of its dissolution and the decrease of its corrosion
resistance. On the other hand, the values of Q were found to increase both with increasing the
immersion time (Table 2) and the temperature of the sulfuric acid solution (Table 3). Here, Q with
their n values almost between 0.92 and 0.81, i.e. close to unity, represent impure double layer
capacitor; the increase of its values was expected to cover up the charged surfaces of the steel as a
result of the irregularities of these surfaces due to its increased dissolution in 1.0 M H2SO4 solutions
[31]. The EIS measurements collectively reveal that the increase of immersion time as well as
temperature remarkably increase the corrosion of the investigated X70 steel grade in the sulfuric acid
solution.
Table 3. EIS parameters obtained for the API X70 pipeline steel in 1.0 M H2SO4 solutions at different
temperatures.
Temp. EIS parameters
Rs / Ω cm2 CPE / µMho n Rp / Ω cm
2
20 oC 1.30 281 0.92 34.00
30 oC 1.08 298 0.89 21.80
40 oC 0.93 335 0.86 11.20
50 oC 0.85 359 0.84 6.70
60 oC 0.74 398 0.81 4.80
3.3. Potentiodynamic polarization measurements
Polarization is a powerful technique that has been employed to understand the corrosion and
corrosion protection of metals and alloys in harsh environments. We have been successfully using the
polarization method in investigating the corrosion and corrosion inhibition of different metals and
alloys in varied corrosive media [32-34]. Fig. 7 shows the potentiodynamic polarization curves
obtained for the API X70 pipeline steel after its immersion for (1) 10 min, (2) 60 min and (3) 24 h,
respectively in 1.0 M H2SO4 solution at room temperature. The values of the corrosion current
densities (jCorr), corrosion potential (ECorr), cathodic (βc) and anodic (βa) Tafel slopes, and polarization
resistance (Rp) obtained from the curves shown in Fig. 7 are listed in Table 4. The values of the Tafel
slopes, βc and βa, were determined according to our previous study [34]. The values of jCorr and ECorr
were obtained from the extrapolation of anodic and cathodic Tafel lines located next to the linearized
current regions [32-34]. The Rp values were calculated as reported in our previous investigations
[1,32-34];
Page 9
Int. J. Electrochem. Sci., Vol. 10, 2015
217
Fig. 7 shows that the increase of potential in the anodic side regularly increased the anodic
current due to the dissolution of iron (Fe0), which is the base metal in the API X70 steel to iron cations
(Fe2+
) as follows;
Fe = Fe2+
+ 2e‒ (1)
The ferrous cations, Fe2+
, further oxidized under the increase of potential and the
aggressiveness action of the sulfuric acid solution in ferric cations, Fe3+
, according the following
reaction;
Fe2+
= Fe3+
+ e‒ (2)
The electrons produced from the previous reactions were consumed at the cathode as a result of
the hydrogen evolution reaction as follows;
2H+ + 2e
−= H2 (3)
-550
-500
-450
-400
-350
10-5
10-4
10-3
10-2
10-1
2 3
jCorr
/ A cm-2
E /
mV
(A
g/A
gC
l)
1
Figure 7. Potentiodynamic polarization curves obtained for X70 5L pipeline steel samples after (1) 10
min, (2) 60 min and (3) 24 h immersion in 1.0 M H2SO4 solutions at room temperature.
Table 4. Potentiodynamic polarization parameters obtained for the API X70 steel after 10 min, 60 min
and 24 h immersion in 1.0 M H2SO4 at room temperature.
time Polarization parameters
βc / mVdec-1
βa / mV/dec-1
ECorr / mV jCorr / µA cm-2
Rp Ω cm2
10 min 20.24 27.65 -438 157.8 32.15
60 min 30.15 42.28 -425 288.3 26.51
24 h 22.23 25.73 -405 421.3 12.29
Page 10
Int. J. Electrochem. Sci., Vol. 10, 2015
218
It is also seen from Fig. 7 that the lowest anodic and cathodic currents were recorded for the
steel after its immersion for 10 min in the acid solutions at room temperature. Increase the time of
immersion to 60 min and further to 24 h led to increasing the cathodic and anodic currents as a result
of the increased corrosiveness action of the acid with time. Table 4 also depicts that the increase of
immersion time increased the values of jCorr and RCorr as well as decreased the values of Rp, which
confirms that the dissolution of X70 increases with increasing the exposure time. The values of ECorr
were also shifted to the less negative direction with the increase of immersion time before
measurements. The positive shift in the values of ECorr indicates that the anodic process is much more
affected than the cathodic one [35]. It was also reported [36] that the increased dissolution of the steel
was due to the ability of the sulfuric acid molecules in preventing the steel surface to form layers of
oxide and/or corrosion products that in turn allows the surface to suffer a continuous corrosion.
-550
-500
-450
-400
-350
10-5
10-4
10-3
10-2
5
423
jCorr
/ A cm-2
E /
mV
(A
g/A
gC
l)
1
Figure 8. Potentiodynamic polarization curves obtained for the API X70 5L pipeline steel in 1.0 M
H2SO4 solutions (1) 20 ºC, (2) 30
ºC, (3) 40
ºC, (4) 50
ºC and (5) 60
ºC, respectively.
Table 5. Corrosion parameters obtained for the potentiodynamic polarization for the API X70 pipeline
steel in 1.0 M H2SO4 at different temperature.
Polarization parameters
Temp βc / mVdec-1
βa / mVdec-1
ECorr / mV jCorr / µA cm-2
Rp Ω cm2
20 oC 20.24 27.65 -443 157.8 32.15
30 oC 23.54 40.42 -439 294.5 21.94
40 oC 22.97 29.37 -436 498.9 11.22
50 oC 20.76 29.27 -434 711.2 7.42
60 oC 15.39 22.84 -430 967.9 4.12
Page 11
Int. J. Electrochem. Sci., Vol. 10, 2015
219
In order to shed more light on the effect of increasing the temperature of the 1.0 M H2SO4
solution on the corrosion of X70, the polarization measurements were also carried out. Fig. 8 shows
the potentiodynamic polarization curves obtained for the API X70 5L pipeline steel in 1.0 M H2SO4
solutions (1) 20 ºC, (2) 30
ºC, (3) 40
ºC, (4) 50
ºC and (5) 60
ºC, respectively. The corrosion parameters
obtained from Fig. 8 are listed in Table 5. It is obvious from Fig. 8 and Table 5 that the increase of
temprature significantly increased the anodic and cathodic currents and the values of jCorr and RCorr.
This effect was found to also decreased the values of Rp and slightly shifted the values of ECorr toward
the less negative direction. The increase of the anodic and cathodic currents and the values of jCorr and
RCorr and conjunctly the decrease of Rp indicate that the steel suffers more corrosion with increasing
temperature. Furthermore, the little change of βa and βc values listed in Table 5 with increasing
temperature of the acid solution proves that there was a little change in the mechanism of corrosion of
X70 with increasing temperature.
3.4. Effect of temperature on the activation energy of steel
In addition to the data obtained from the EIS and polarization measurements, we also
calculated the activation energy (Ea) for the API X70 pipeline steel in the acid solution (1.0 M H2SO4)
at the different temperature from the Arrhenius equation as follows [37],
Corrln(j ) = B aE
RT
(4)
Figure 9. (a) Arrhenius and (b) ln(jCorr/T) vs. 1/T plots for the dissolution of the API X70 5L pipeline
steel after its immersion for 30 min in 1.0 M sulphuric acid solutions after different
temperatures.
Page 12
Int. J. Electrochem. Sci., Vol. 10, 2015
220
Here, B is a constant that depends on the metal type and R is the universal gas constant. The
plot of ln(jCorr) versus the reciprocal of absolute temperature (1/T) gives a straight line whose slope = -
(Ea / R), from which the activation energy values for the corrosion process were calculated. The
Arrhenius plot for the API 5L X70 pipeline steel rode is shown in Fig. 9a. The values for the enthalpy
(ΔH) of activation and the entropy (ΔS) of activation were calculated from transition state theory
according to the following equation [37]; - H
R RTCorrj = exp exp
SRT
Nh
(5)
According to universal definition, h is the Planck's constant and N is the Avogadro's number.
The relation between ln (jCorr/T) and 1/T for the API 5L X70 pipeline steel electrode was also
plotted as depicted in Fig. 9b. It is clearly seen from Fig. 9b that the plotted data show a straight line;
the slope value of this line represents -ΔH/R. Moreover, the intercept represents a value equal to
ln(R/Nh) + ΔS/R. The values of Ea, ΔH, and ΔS were calculated to be 36.76, 34.16, and -85.38
Kj/mol, respectively. The value of 36.76 kJ/mol obtained for the X70 steel as activation energy, Ea
confirms that the whole corrosion process is controlled by surface reaction [38]. Furthermore, the
negative value recorded ΔS, -85.38 reveal also that the activated complex in the rate-determining step
represents is under an associative mechanism and there is a decrease in randomness takes place on
going from reactants to the activated complex [39]. This confirms that the increase of the sulfuric acid
temperature from 20 ºC to 60
ºC increases the activation parameters of X70 pipeline steel, which lead
to increasing its surface reactivity and in turn increases its dissolution. These results of activation
energy are thus in good agreement with the data obtained from EIS and polarization measurements; all
confirm that the increase of temperature increases the corrosion of the steel in 1.0 M H2SO4 solutions.
4. CONCLUSIONS
The electrochemical corrosion behavior of the API X70 5L pipeline steel grade after its
immersion for 10 min to 60 min and further to 24 h in 1.0 M sulfuric acid (H2SO4) pickling solutions
was investigated. The effect of increasing the temperature of the acid solution from 20 ºC to 60 ºC on
the anodic dissolution of the X70 steel was also reported. The work was performed using different
experimental techniques such as optical microscopy, electrochemical impedance spectroscopy (EIS),
and potentiodynamic polarization measurements. The study was also complemented by calculating the
activation (Ea), enthalpy (ΔH) and entropy (ΔS) of activation resulted from the corrosion of X70
versus the reciprocal of the absolute temperature. It has been found that the increase of time of
immersion decreases the resistance of the steel surface against corrosion and indicated by EIS plots.
The polarization data confirmed also that the corrosion of X70 in 1.0 M H2SO4 solutions increases
with time due to increasing the anodic and cathodic currents and corrosion current density (jCorr).
Where, this effect also decreased the values of polarization resistance (Rp). The increase of the acid
temperature from 20 ºC to 60 ºC was found to significantly increasing the corrosion of the X70 steel as
a result of the accelerated and contentious dissolution of the surface with temperature as indicated from
the calculated values of Ea, ΔH, and ΔS. All measurements were in good agreement confirming that
Page 13
Int. J. Electrochem. Sci., Vol. 10, 2015
221
the X70 steel corrodes faster in 1.0 M H2SO4 solutions with increasing the immersion time to 24 h and
raising the temperature of the acid to 60 ºC.
ACKNOWLEDGEMENTS
The authors would like to extend their sincere appreciation to the Deanship of Scientific Research at
King Saud University for its funding of this research through the Research Group Project No. RGP-
160.
References
1. B.Y. Fang, A. Atrens, J.Q. Wang, E.H. Han, Z.Y. Zhu and W. Ke, J. Mater. Sci., 38 (2003) 127.
2. E.-S. M. Sherif and Abdulhakim A. Almajid, J. Chem., 2014 (2014) 1.
3. T. Poornima, J. Nayak, A.N. Shetty, Port. Electrochimi. Acta, 28 (2010) 173.
4. A. Guenbour, M.A. Hajji, E.M. Jallouli and A. Ben Bachir, Appl. Surf. Sci., 253 (2006) 2362.
5. B. Gu, W. Z. Yu, J.L. Luo, and X. Mao, Corrosion, 55 (1999) 312.
6. E.-S.M. Sherif, A.A. Almajid, A.K. Khalil, H. Junaedi and F.H. Latief, Int. J. Electrochem. Sci., 8
(2013) 9360.
7. T. Hemmingsten, H. Hovdan, P. Sanni, and N.O.Aagotnes, Electrochim. Acta, 47(2002) 3949.
8. M. Henthorne and R.N. Parkins, Brit. Corros. J. 7 (1967) 186.
9. J.Y. Lee and S. M. Lee, Surf. Coat. Technol., 28 (1986) 301.
10. N. Muthukumar, S. Maruthamuthu and N. Palaniswamy, Colloids Surf. B: Biointerf., 53 (2006)
260.
11. B. Gu, J. Luo, and X. Mao, Corrosion, 55 (1999) 96.
12. M. A. Migahed, Prog. Org. Coat., 54 (2005) 91.
13. J. W. Graves and E. H. Sullivan, Mater. Prot., 5 (1996) 33.
14. M.C. Zhao, K. Yang and Y.Y. Shan, Mater. Lett., 57 (2003) 1496.
15. S. Nešic´, Corros. Sci., 49 (2007) 4308.
16. S. Ghareba and S. Omanovic, Corros. Sci., 52 (2010) 2104.
17. M.A. Hegazy, H.M. Ahmed and A.S. El-Tabei, Corros. Sci., 53 (2011) 671.
18. C.T. Kwok, S.L. Fong, F.T. Cheng and H.C. Man, J. Mater. Proc. Technol., 176 (2006) 168.
19. F.Y. M and W.H. Wang, Mater. Sci. Eng. A, 430 (2006) 1.
20. D. Hardie, E. A. Charles and A. H. Lopez, Corros. Sci., 48 (2006) 4378.
21. X. Jiang, Y.G. Zheng and W. Ke, Corros. Sci., 47 (2005) 2636.
22. E.-S. M. Sherif, J. Mater. Eng. Performance, 19 (2010) 873.
23. E.-S. M. Sherif, Int. J. Electrochem. Sci., 6 (2011) 2284.
24. E.-S. M. Sherif, Mater. Chem. Phys., 129 (2011) 961.
25. P. Bommersbach, C. Alemany-Dumont, J.P. Millet and B. Normand, Electrochim. Acta, 51 (2005)
1076.
26. H.H. Hassan, E. Abdelghani and M.A. Amin, Electrochim. Acta, 52 (2007) 6359.
27. F. Mansfeld, S. Lin, S. Kim and H. Shih, Corros. Sci., 27 (1987) 997.
28. D. Gopi, E.-S. M. Sherif, V. Manivannan, D. Rajeswari, M. Surendiran and L. Kavitha, Ind. Eng.
Chem. Res., 53 (2014) 4286.
29. Z. Zhang , Shenhao Chen, Yanhui Li, Shuhuan Li and Liang Wanga, Corros. Sci., 51 (2009) 291.
30. A. Hernández-Espejel and M.A. Domínguez-Crespo, Corros. Sci., 53 (2010) 2258.
31. W.B. Johnson and J.R. Macdonald, “Theory in impedance Spectroscopy, experiments and
applications,” John Wiley & Sons, New York, 2005.
32. E.-S.M. Sherif, Appl. Surf. Sci., 292 (2014) 190.
33. E.-S.M. Sherif, Ind. Eng. Chem. Res., 52 (2013) 14507.
Page 14
Int. J. Electrochem. Sci., Vol. 10, 2015
222
34. E.-S. M. Sherif, H.R. Ammar and A.K. Khalil, Appl. Surf. Sci., 301 (2014) 142.
35. A. El- Sayed, J. Appl. Electrochem., 27 (1997) 193.
36. El-Sayed M. Sherif and A.H. Ahmed, Synthesis and Reactivity in Inorganic, Metal-Organic, and
Nano-Metal Chemistry, 40 (2010) 365.
37. F. Bentiss, M. Lebrini and M. Lagrenée, Corros. Sci., 47 (2005) 2915.
38. K.K. El-Neami, A.K. Mohamed, I.M. Kenawy and A.S. Fouda, Monatshefte für Chemie / Chemical
Monthly, 126 (1995) 369.
39. S.S. Abd El-Rehim, M.A.M. Ibrahim and K.F. Khaled, J. Appl. Electrochem., 29 (1999) 593.
© 2015 The Authors. Published by ESG (www.electrochemsci.org). This article is an open access
article distributed under the terms and conditions of the Creative Commons Attribution license
(http://creativecommons.org/licenses/by/4.0/).