Anomalous Negative Fluorescence Anisotropy in Yellow Fluorescent Protein(YFP 10C): Quantitative Analysis of FRET in YFP Dimers†
Xinghua Shi,‡ Jaswir Basran,§ Harriet E. Seward,§ William Childs,‡ Clive R. Bagshaw,§ and Steven G. Boxer*,‡
Department of Chemistry, Stanford UniVersity, Stanford, California 94305-5080, and Department of Biochemistry, UniVersity ofLeicester, Leicester LE1 9HN, U.K.
ReceiVed August 6, 2007; ReVised Manuscript ReceiVed October 7, 2007
ABSTRACT: Yellow fluorescent protein (YFP) is widely used as a genetically encoded fluorescent markerin biology. In the course of a comprehensive study of this protein, we observed an unusual, negativefluorescence anisotropy at pH 6.0 (McAnaney, T. B., Zeng, W., Doe, C. F. E., Bhanji, N., Wakelin, S.,Pearson, D. S., Abbyad, P., Shi, X., Boxer, S. G., and Bagshaw, C. R. (2005)Biochemistry 44, 5510-5524). Here we report that the fluorescence anisotropy of YFP 10C depends on protein concentration inthe low micromolar range that was not expected. We propose that the negative anisotropy is a result ofunidirectional Fo¨rster resonance energy transfer (FRET) in a dimer of YFP, with the donor chromophorein the neutral form and the acceptor chromophore in the anionic form. This unusual mechanism is supportedby studies of a monomeric YFP (A206K YFP) and transient-absorption spectroscopy of YFP 10C. Adetailed analysis of the chromophore transition dipole moment direction is presented. The anisotropy andrate constant of this energy transfer are consistent with values produced by an analysis of the dimerstructure observed in crystals.
Green fluorescent protein (GFP1) variants constitute a largefamily of valuable tools (1) that have revolutionized the fieldof biological imaging (2). Yellow fluorescent proteins (YFPs)that contain a T203Y or T203F mutation are importantmembers of this family, and they exhibit fluorescenceemission red-shifted from that of wild-type GFP. A particularYFP construct, YFP 10C (EYFP), containing substitutionsS65G/V68L/S72A/T203Y, has been widely used as a resultof its commercial availability. The crystal structure of YFP10C reveals aπ-stacking interaction between the side-chainphenol of Tyr203 and the chromophore, and this feature hasbeen proposed to be responsible for the spectral shifts inYFPs (3). YFPs also exhibit a tendency to dimerize at highconcentrations with the dissociation constant,Kd, reportedto be on the order of 110µM at physiological pH (4).Zacharias et al. introduced an A206K mutation on thebackground of Q69K YFP 10C and discovered that thismutation, which is at the surface contact of crystallographicdimers of GFP (5) and YFP (3), increases the dissociationconstant,Kd, to a value on the order of 74 mM (4), making
this mutant essentially monomeric atµM concentrations andbelow.
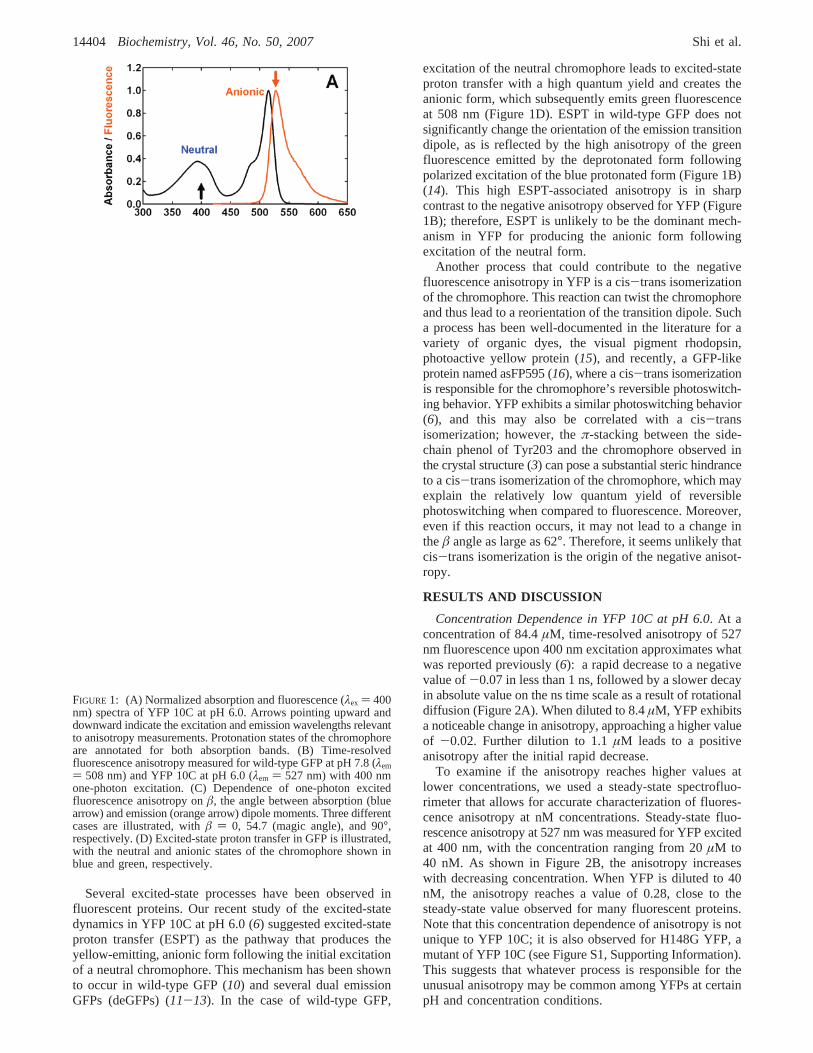
The absorption spectrum of YFP 10C contains two bandsthat correspond to the neutral (λmax ) 394 nm) and anionic(λmax ) 514 nm) forms of the chromophore (Figure 1A),with an apparent pKa of 6.3 in the presence of 44 mMchloride (6). In the course of a comprehensive study of thisprotein (6), we observed that excitation of the neutral format pH 6.0 produces yellow fluorescence at 527 nm, whichexhibits a rapid decrease in anisotropy from an initial positivevalue to a negative value on the picosecond time scale(Figure 1B). This unusual negative anisotropy is not observedfor wild-type GFP (Figure 1B). Fluorescence anisotropy isan intensity ratiometric measurement that describes the extentof polarization of emission upon excitation with polarizedlight. Anisotropy originates from the existence of transitionmoments of absorption and emission that lie in the chro-mophore structure along certain specific directions (7). Giventhe dependence of anisotropy on the angle between absorp-tion and emission transition dipole moments (7), â (seeFigure 1C):
the decrease in YFP anisotropy to a negative value suggestsa large change in theâ angle, approximately 62°, but themechanism was unknown. Understanding how this apparentlarge reorientation of the transition dipole moment occursin YFP may impact the design and improvement of FRET-based biosensors that involve YFP, since the efficiency ofFRET depends on the transition moment orientation of thechromophores involved (8, 9) through the orientation factor(7), κ2.
† This work was supported in part by a grant from the NIH(GM27738 to S.G.B.) and the Leverhulme Trust (to C.R.B.). Thefluorescence upconversion facilities are supported by the Medical FreeElectron Laser Program of the Air Force Office of Scientific Research(Grant No. F49620-00-1-0349). X.S. acknowledges a William R. andSara Hart Kimball Stanford Graduate Fellowship.
* Author to whom correspondence should be addressed. E-mail:[email protected]. Phone: (650) 723-4482. Fax: (650) 723-4817.
‡ Stanford University.§ University of Leicester.1 Abbreviations: YFP, yellow fluorescent protein; FRET, Fo¨rster
resonance energy transfer; GFP, green fluorescent protein; ESPT,excited-state proton transfer; IR, infrared; HBDI, 4′-hydroxyben-zylidene-2,3-dimethyl-imidazolinone.
Several excited-state processes have been observed influorescent proteins. Our recent study of the excited-statedynamics in YFP 10C at pH 6.0 (6) suggested excited-stateproton transfer (ESPT) as the pathway that produces theyellow-emitting, anionic form following the initial excitationof a neutral chromophore. This mechanism has been shownto occur in wild-type GFP (10) and several dual emissionGFPs (deGFPs) (11-13). In the case of wild-type GFP,
excitation of the neutral chromophore leads to excited-stateproton transfer with a high quantum yield and creates theanionic form, which subsequently emits green fluorescenceat 508 nm (Figure 1D). ESPT in wild-type GFP does notsignificantly change the orientation of the emission transitiondipole, as is reflected by the high anisotropy of the greenfluorescence emitted by the deprotonated form followingpolarized excitation of the blue protonated form (Figure 1B)(14). This high ESPT-associated anisotropy is in sharpcontrast to the negative anisotropy observed for YFP (Figure1B); therefore, ESPT is unlikely to be the dominant mech-anism in YFP for producing the anionic form followingexcitation of the neutral form.
Another process that could contribute to the negativefluorescence anisotropy in YFP is a cis-trans isomerizationof the chromophore. This reaction can twist the chromophoreand thus lead to a reorientation of the transition dipole. Sucha process has been well-documented in the literature for avariety of organic dyes, the visual pigment rhodopsin,photoactive yellow protein (15), and recently, a GFP-likeprotein named asFP595 (16), where a cis-trans isomerizationis responsible for the chromophore’s reversible photoswitch-ing behavior. YFP exhibits a similar photoswitching behavior(6), and this may also be correlated with a cis-transisomerization; however, theπ-stacking between the side-chain phenol of Tyr203 and the chromophore observed inthe crystal structure (3) can pose a substantial steric hindranceto a cis-trans isomerization of the chromophore, which mayexplain the relatively low quantum yield of reversiblephotoswitching when compared to fluorescence. Moreover,even if this reaction occurs, it may not lead to a change intheâ angle as large as 62°. Therefore, it seems unlikely thatcis-trans isomerization is the origin of the negative anisot-ropy.
RESULTS AND DISCUSSION
Concentration Dependence in YFP 10C at pH 6.0. At aconcentration of 84.4µM, time-resolved anisotropy of 527nm fluorescence upon 400 nm excitation approximates whatwas reported previously (6): a rapid decrease to a negativevalue of-0.07 in less than 1 ns, followed by a slower decayin absolute value on the ns time scale as a result of rotationaldiffusion (Figure 2A). When diluted to 8.4µM, YFP exhibitsa noticeable change in anisotropy, approaching a higher valueof -0.02. Further dilution to 1.1µM leads to a positiveanisotropy after the initial rapid decrease.
To examine if the anisotropy reaches higher values atlower concentrations, we used a steady-state spectrofluo-rimeter that allows for accurate characterization of fluores-cence anisotropy at nM concentrations. Steady-state fluo-rescence anisotropy at 527 nm was measured for YFP excitedat 400 nm, with the concentration ranging from 20µM to40 nM. As shown in Figure 2B, the anisotropy increaseswith decreasing concentration. When YFP is diluted to 40nM, the anisotropy reaches a value of 0.28, close to thesteady-state value observed for many fluorescent proteins.Note that this concentration dependence of anisotropy is notunique to YFP 10C; it is also observed for H148G YFP, amutant of YFP 10C (see Figure S1, Supporting Information).This suggests that whatever process is responsible for theunusual anisotropy may be common among YFPs at certainpH and concentration conditions.
FIGURE 1: (A) Normalized absorption and fluorescence (λex ) 400nm) spectra of YFP 10C at pH 6.0. Arrows pointing upward anddownward indicate the excitation and emission wavelengths relevantto anisotropy measurements. Protonation states of the chromophoreare annotated for both absorption bands. (B) Time-resolvedfluorescence anisotropy measured for wild-type GFP at pH 7.8 (λem) 508 nm) and YFP 10C at pH 6.0 (λem ) 527 nm) with 400 nmone-photon excitation. (C) Dependence of one-photon excitedfluorescence anisotropy onâ, the angle between absorption (bluearrow) and emission (orange arrow) dipole moments. Three differentcases are illustrated, withâ ) 0, 54.7 (magic angle), and 90°,respectively. (D) Excited-state proton transfer in GFP is illustrated,with the neutral and anionic states of the chromophore shown inblue and green, respectively.
14404 Biochemistry, Vol. 46, No. 50, 2007 Shi et al.
Several concentration-dependent processes can affect theobserved fluorescence anisotropy. Trivial emission-reab-sorption can depolarize the fluorescence and lead to a lowanisotropy, but not a negative value. FRET can occur amongidentical chromophores in a well-defined system, such as aprotein oligomer, and we will call thishomo-FRET. As wasdemonstrated in an early study on chlorophyllide-substitutedhemoglobin (17), fluorescence anisotropy decreases as aresult of energy transfer unless the transition dipole momentshappen to be parallel. In the case of two identical chro-mophores, the fluorescence should exhibit the followinganisotropy:
wherekFREThomo and kf are the rate constants forhomo-FRET
and all the other decay processes, respectively;r0 andrFRET
are the anisotropy values for the monomer and energytransfer in the dimer, respectively. According to eq 2, theoverall anisotropy should be betweenr0 (whenkf . kFRET
homo)and (rFRET + r0)/2 (when kf , kFRET
homo). The monomeranisotropy typically assumes a value between 0.3 and 0.4,while the lowest value of FRET anisotropy is-0.2; thus, anegative anisotropy would not be expected forhomo-FRETin a dimer with two identical chromophores. In fact,dimerization has been observed for GFP (18) and YFP (4,19) at high concentrations. Jung et al. reported a finalanisotropy of 0.28( 0.02 following an ultrafast fluorescencedepolarization in YFP upon direct excitation of theanionic
chromophore, as a result ofhomo-FRET between twoidentical, anionic chromophores in a YFP dimer (20). Asidefrom emission-reabsorption andhomo-FRET, other con-centration-dependent processes may also exist and cannotbe ruled out.
In addition to the unusual negative anisotropy observedhere, the effect of protein concentration occurs in a region(Figures 2A and B) that is much lower than expected. Aprevious study using analytical ultracentrifugation has shownthat YFP dimerizes at pH 7.4 with aKd of 110 µM (4) (weobtained a similar value of 100µM (19) at pH 7.5 underour buffer conditions). Assuming this value for YFP 10C atpH 6.0 (see below and Appendix I), the monomer shouldhave dominated the equilibrium at a total concentration of8.4µM. However, the anisotropy observed at this concentra-tion still exhibits a rapid decrease to a negative value (Figure2A) and the transition in anisotropy from a negative to apositive value is evident at concentrations that are even lower(Figure 2B). Therefore, whatever process is responsible forthe unusual anisotropy (see below), the value ofKd at pH6.0 should be much lower than the aforementioned literaturevalues obtained by analytical ultracentrifugation at physi-ological pH (seeConcentration Dependence of Steady-StateExcitation Spectra).
In the experiments described here, the yellow fluorescenceis observed from the anionic chromophore following excita-tion of the neutral form. Therefore, we look more closely atthe protonation states involved for the chromophore at thispH. When illuminated with 400 nm light, the neutral form(λmax ) 394 nm) is excited much more than the anionic form(λmax ) 514 nm), as a result of the at least 20-fold difference
FIGURE 2: (A) Time-resolved and (B) steady-state anisotropy of 527 nm fluorescence, measured for YFP 10C at pH 6.0 with 400 nmone-photon excitation. The protein concentrations, except the highest one in both panels, are calculated from the dilution factors. The errorbars of steady-state anisotropy, calculated from the standard deviation of 5 measurements at each concentration, are smaller than the sizeof the markers in panel B and thus not shown. (C) Excitation (λem ) 527 nm) and (D) absorption spectra of YFP 10C at pH 6.0 as afunction of concentration, which are normalized to the intensity at 450 and 514 nm, respectively. The three lowest concentrations in panelC are calculated from the corresponding dilution factors.
r )kFRET
homorFRET + (kf + kFREThomo)r0
kf + 2kFREThomo
(2)
Negative Anisotropy and Unidirectional FRET in YFP 10C Biochemistry, Vol. 46, No. 50, 200714405
in molar extinction coefficient. This is confirmed by compar-ing the excitation spectra for 527 nm fluorescence at pH 6.0and 9.0 (Figure S2A, Supporting Information) which showsthat, following excitation at 400 nm, most of the yellowfluorescence at pH 6.0 comes from excitation of the neutralform, rather than the high-energy tail of the anionic form’sabsorption band or the low-energy tail of the near-UV band.As has been shown previously (6), the neutral YFP chro-mophore fluoresces blue (λmax ) 465 nm), thus, it can serveas an energy-transfer donor to an anionic chromophore,which absorbs between 400 and 550 nm and subsequentlyfluoresces yellow (λmax ) 527 nm). Besides sufficient spectraloverlap for FRET between the neutral and anionic chro-mophores, the relatively large molar extinction coefficientfor the latter (21) (ε514 ) 83400 M-1 cm-1) can make it agood antenna for harvesting energy from the former whenthey are located in close proximity. Conversely, emissionfrom the anionic form has very poor overlap with absorptionof the neutral form. Therefore, in a YFP dimer that has onechromophore in the neutral form and the other in the anionicform, excitation can migrate only from the neutral donor tothe anionic acceptor chromophore in a unidirectional fashion,while the FRET in the reverse direction has a very lowprobability. Since two chromophores with distinct charac-teristics are involved here, we will call thishetero-FRET.
If hetero-FRET is the dominant process at high concentra-tions that leads to the yellow fluorescence from an anionicchromophore following excitation of the neutral form, thisprocess should have a rate constant much greater than thatof ESPT, i.e., kFRET
hetero . kESPT. Otherwise ESPT woulddominate, leading to the rapid formation of the anionic stateon the donor and a positive fluorescence anisotropy. FRETin a YFPhetero-dimer is unidirectional so the final anisot-ropy reflectsrFRET only, rather than the average ofrFRET andr0 as is the case for a rapid, bidirectionalhomo-FRET. Thus,if a large angle exists between the two transition dipolemoments, a negative value can be observed for the finalanisotropy in a unidirectionalhetero-FRET but not in ahomo-FRET.
Concentration Dependence of Steady-State ExcitationSpectra. Hetero-FRET in YFP 10C at pH 6.0 can also explainthe concentration dependence of fluorescence excitationspectra of this protein. The excitation spectra for 527 nmfluorescence shown in Figure 2C are normalized to theintensity at 450 nm instead of 514 nm, the peak position ofthe anionic form, so that the region around 394 nm is morevisible. As the YFP concentration is lowered, the excitationefficiency at 394 nm is decreased dramatically (Figure 2C).This concentration dependence in excitation spectra is theopposite of the trend seen in absorption spectra (Figure 2D).Thus, the quantum yield for 527 nm fluorescence followingexcitation of the neutral chromophore is much greater athigher concentrations than at lower concentrations. Thisobservation is indicative of a channel that is present only inthe high-concentration form of YFP; unidirectional FRETis consistent with such a channel, since it exists only in aYFP dimer, but not in a monomer. On the other hand, theconcentration dependence of the quantum yield from excitingthe neutral form is not predicted by other mechanisms thatcan produce the yellow fluorescence, including ESPT anddirect excitation of the anionic form at 394 nm. Therefore,
these mechanisms are not as efficient as the unidirectionalhetero-FRET in YFP 10C at pH 6.0. A more quantitativeanalysis of the various competing processes, including FRET,ESPT and all the other channels, is provided below. Thisconcentration dependence of the excitation spectra was alsoused to obtain a value of 10-15 µM for Kd, as shown inAppendix I. Note that the YFP concentration correspondingto a 50% change in anisotropy (Figure 2B) cannot be useddirectly as a measure ofKd, because of the differentfluorescence quantum yields of the low- and high-anisotropyforms. After a correction for this difference, the value ofKd
is in reasonable agreement with that obtained from theexcitation spectra.
Monomeric YFP. The unidirectionalhetero-FRET dis-cussed thus far is proposed to result from the formation ofa YFP dimer at pH 6.0, with one YFP chromophore in aneutral form and the other an anionic form. In addition tothis neutral-anionic type of dimer, other combinations, i.e.,neutral-neutral and anionic-anionic, certainly exist in YFPat pH 6.0 given the apparent pKa of 6.3 for the chromophore;however, the contribution of these species to the yellowfluorescence with 394 nm excitation is very small due tothe relatively poor quantum yield from ESPT (see thequantitative analysis of competing processes below) and lowdirect excitation efficiency for the anionic chromophore at394 nm.
The importance of dimerization is supported by the datafor a monomeric YFP, the A206K variant (4) of YFP 10Cat pH 6.0. The absorption spectrum of A206K YFP at pH6.0 is essentially the same as YFP 10C, with a similarapparent pKa for the chromophore (Figure 3A). As Figure3B shows, for 527 nm fluorescence low excitation efficiencyis observed for the neutral chromophore at 400 nm, and thisis consistent with the absence of the FRET mechanism inthis monomeric protein. The excitation spectrum of A206KYFP is comparable to that of YFP 10C at low concentrations(Figure 2C). In both cases, only ESPT and the possible directexcitation of other underlying bands at 400 nm are contribut-ing to the fluorescence at 527 nm; thus, a very low quantumyield is observed when exciting at 400 nm. The 527 nmfluorescence of A206K YFP at steady state exhibits a highanisotropy with 400 nm excitation (Figure 3C), and this isin sharp contrast to the anisotropy of YFP 10C at similarconcentrations (Figures 2B and 3C). In addition, time-resolved fluorescence at 527 nm following 400 nm excitationalso shows high and positive anisotropy for A206K YFPthroughout the entire time window (Figure 3D), which isconsistent with the high anisotropy observed in steady-stateexperiments (Figure 3C).
The results for A206K YFP demonstrate that whendimerization is eliminated, following excitation of the neutralchromophore both the negative anisotropy and most of theyellow fluorescence observed in YFP 10C are gone. Thissupports the proposed mechanism for producing the negativeanisotropy in YFP 10C as unidirectionalhetero-FRET froma neutral donor chromophore to an anionic acceptor chro-mophore in a dimer. Other processes that also requiredimerization cannot be ruled out, including those involvingan energy transfer from a higher excited state or a differentconformation of the chromophore in one of the two proteinmolecules; however, we do not have evidence for theexistence of these states. In particular, high anisotropy, i.e.,
14406 Biochemistry, Vol. 46, No. 50, 2007 Shi et al.
close to 0.4, is observed following excitation of YFP 10C at400 nm for the 460 nm fluorescence over its short lifetimein upconversion experiments (6) and for the weak, blueemission band below 500 nm in steady-state experiments(data not shown). These observations are consistent with thedonor state in thehetero-FRET being the neutral chro-mophore’s first excited state, rather than a higher excitedstate or a different chromophore conformation, which maylead to a lower anisotropy for the donor as well.
Given the important role of YFP dimerization establishedhere and previous suggestions that high salt conditions duringcrystallization seem to favor dimerization (3, 22), weexamined the influence of increased ionic strength onspectroscopic observables (Figures 3A-C). As these absorp-tion, fluorescence excitation and anisotropy data indicate,increasing the Na2SO4 concentration in the pH 6.0 bufferfrom 0 to 400 mM has only minor and negligible effects onthe spectra of YFP 10C and A206K YFP, respectively. Thisis not surprising, since it is likely that the hydrophobicresidues at the dimer interface are mostly responsible forthe dimerization in YFP 10C; therefore, a change in the bulkelectrostatics does not significantly affect the dimerization.
Pump-Probe Spectra: ESPTVersus FRET.Unidirectionalhetero-FRET in YFP dimers would not have appearedwithout the existence of two YFP populations, one with thechromophore in the neutral form and the other anionic.Another process, ESPT, was originally considered as theprocess that is responsible for the yellow fluorescencefollowing 400 nm excitation of YFP 10C at pH 6.0 (6);however, the negative anisotropy clearly does not supportthis argument. ESPT and FRET have the similarity that both
are associated with a large shift in energy from absorptionto emission. However, a key distinction exists between thesetwo processes in terms of the number of chromophoresinvolved, aside from the fortuitous difference in anisotropy(fortuitous in the sense that this only occurs for certainorientations of the transition moments (see below)). ForESPT, only one chromophore is involved (Figure 4A).Initially, the neutral form, called A (10), occupies the groundstate (left panel). After absorbing a blue photon, it is raisedto the first excited state, A*, and this leads to a bleach inthe ground-state absorption of the neutral form (middlepanel). Subsequently, ESPT deprotonates the neutral formand the anionic form, called I*, is created (right panel) andthe ground-state bleach of the neutral form is not recoveredat this moment. For FRET, two chromophores are involved(Figure 4B). Initially, the donor chromophore 1 exists in theneutral form and the acceptor chromophore 2 in the anionicform on the ground state (left panel). Note that thesenotations are used here instead of the conventional languagefor FRET, i.e., D and A for the donor and acceptor,respectively, to avoid the confusion with the A form of thechromophore described above. After absorbing a blue photon,chromophore 1 is raised to its first excited state, 1*, andthis leads to a bleach in the ground-state absorption (middlepanel). When FRET occurs between 1* and 2, 1* is deexcitedand 2 is simultaneously raised to its first excited state, 2*(right panel). As a result, the ground-state bleach of chro-mophore 1 is now recovered while a new bleach band shouldappear for chromophore 2.
We obtained the transient-absorption spectra for both wild-type GFP and YFP 10C at∼450 ps, following excitation of
FIGURE 3: (A) Absorption and (B) normalized excitation (λem ) 527 nm) spectra of YFP 10C (blue) and A206K YFP (red) at pH 6.0.Dashed lines are spectra of proteins in normal pH 6.0 buffer (40 mM NaCl, 1 mM MgCl2, and 20 mM MES). Solid lines are spectra ofproteins in pH 6.0 buffer with the components above plus 400 mM Na2SO4, added to increase the ionic strength. (C) The correspondingsteady-state anisotropy for 527 nm fluorescence, with unfilled and filled circles representing the buffer conditions without and with 400mM Na2SO4, respectively. (D) Time-resolved anisotropy measured for YFP and A206K YFP at 527 nm in normal pH 6.0 buffer with 400nm one-photon excitation.
Negative Anisotropy and Unidirectional FRET in YFP 10C Biochemistry, Vol. 46, No. 50, 200714407
the neutral chromophore with femtosecond pulses at 390 nm.In pump-probe experiments, both bleach in the ground-stateabsorption and stimulated emission from the excited statelead to more light in the probe beam reaching the detectorwith the pump on than off; therefore, they can both giverise to a negative transient-absorption feature. In contrast,absorption from a state transiently present leads to less lightin the probe beam reaching the detector with the pump onthan off; therefore, this can result in a positive transient-absorption feature. For GFP (Figure 4C), the ground-state
bleach of the neutral form is clearly visible as a negativeband near 400 nm and no such bleach is observed for theanionic form at 475 nm. These features agree well with thosereported previously (23), where a more complete band shapewas shown for the neutral form including the region below400 nm that is beyond the spectral window of our instrument.Therefore, the transient-absorption spectrum of GFP at∼450ps is consistent with the ESPT scenario shown in Figure 4A(right panel). For YFP at pH 6.0, in contrast, we found noevidence for a ground-state bleach of the neutral chro-
FIGURE 4: Illustration of the states and processes involved in the excited-state proton transfer (A) and Fo¨rster resonance energy transfer(B). Blue and green circles represent neutral and anionic states, respectively. Filled and unfilled circles represent occupied states andtransient absorption bleaches, respectively. Pump-probe spectra at∼450 ps following 390 nm femtosecond excitation pulses are shown forwild-type GFP at pH 7.8 (C) and YFP 10C at pH 6.0 (D), respectively. The band assignment for GFP by Kennis et al. (23) is followed inpanel C. The spectra in C and D are consistent with the models shown in the rightmost panels of A and B, respectively. (E) Illustration ofthe contributions from the bleached absorption and stimulated emission of the anionic chromophore 2 to the transient absorption signalbetween 450 and 600 nm. Steady-state absorption and fluorescence spectra (see Figure 1A) with equal peak intensity are inverted in signto model these two contributions (dashed lines), respectively.
14408 Biochemistry, Vol. 46, No. 50, 2007 Shi et al.
mophore (Figure 4D), and this is clearly different from thesituation shown for GFP in Figure 4C. Furthermore, anegative feature at∼480 nm is well resolved in the∆Aspectrum (Figure 4D), and this feature is likely due to thevibronic shoulder of bleached ground-state absorption of theanionic chromophore (see Figure 1A). Stimulated emissionfrom the anionic chromophore and absorption of excitedstate(s) can contribute to the signal detected at this wave-length; however, the former should have little intensity below500 nm (Figure 1A), and the latter has a positive sign for∆A. Thus, these two should not contribute to the negative∆A at∼480 nm, so we assigned the negative feature at∼480nm to the ground-state bleach of the anionic chromophore.We were unable to resolve a bleach band with a maximumat 514 nm in Figure 4D, which would be expected for theanionic form; however, it is likely that this is due to spectraloverlap with the stimulated emission peaked at 527 nm dueto the small Stokes shift, as illustrated in Figure 4E.Therefore, both the absence of ground-state bleach for theneutral chromophore and the presence of such bleach forthe anionic chromophore are consistent with the FRETscenario shown in Figure 4B (right panel).
The pump-probe data are also in good agreement withthe argument that, instead of ESPT,hetero-FRET is thedominant process producing the anionic, excited state in YFP10C at pH 6.0 following excitation of the neutral form athigh concentrations. IfkESPT . kFRET
hetero, features similar tothose seen in Figure 4C would be expected for YFP. Thetransient-absorption experiment described here provides auseful way to differentiate FRET from ESPT (Figures 4Aversus 4B), and this approach should also be applicable evenin a case without the fortuitous negative anisotropy.
Kinetics of Competing Processes. With steady-state andtime-resolved fluorescence experiments on YFP 10C andA206K YFP and pump-probe experiments on YFP 10C andGFP, we have demonstrated qualitatively thathetero-FRET,instead of ESPT, is the dominant pathway producing theanionic form of the YFP chromophore in the excited state,following excitation of the neutral form in YFP 10C at highconcentrations. In the following we compare the kinetics ofthe relevant competing processes in a more quantitative way.
As shown in the minimal model, Scheme 1, followingexcitation of the neutral form, YFPHD, the excited state,YFPHD*, is first created and subsequently undergoes radia-tive decay, hetero-FRET, ESPT and other nonradiativedecays with the rate constantskr,1, kFRET
hetero, kESPT and knr,1,respectively.Hetero-FRET and ESPT are assumed to be theonly two processes following excitation of YFPHD that canproduce the anionic form in the excited state, YFP-*, which
can be either YFPA-* or YFPD-*. They subsequently
undergo radiative and nonradiative decays with the rateconstantskr,2 andknr,2, respectively. In addition, the connec-tion between YFPHD and YFPD
- in the ground state isrelatively slow; this has been investigated previously (6) withstopped-flow and pressure-jump techniques.
The expressions for the quantum yields of yellow fluo-rescence from YFP-* following excitation of YFPHD in theabsence and presence ofhetero-FRET can be derived as
respectively. For YFP 10C at low concentrations (Figure 2C,blue curve) and the monomeric YFP (Figure 3B, red curve),eq 3 can be applied becausehetero-FRET is absent. In eq 3,the first term in the product on the right side can be assumedto equal the quantum yield of the directly excited anionicform. Thus, we divide the intensity at 394 nm by that at 450nm and correct it for 1- 10-Aλ at these two wavelengths,and the result should equal the second term in the producton the right side of eq 3. Using the data from A206K YFP(Figure 3B, red curve), we obtainedkESPT/(kr,1 + knr,1 + kESPT)) 0.0058 and, thus,kESPT/(kr,1 + knr,1) ) 0.0058. Similarly,using eq 4 and the data for YFP 10C at high concentrations(Figure 2C, red curve), we obtained (kFRET
0.041. As a result,kFREThetero/kESPT ) 7, and this supports the
previous conclusion thathetero-FRET is the dominantchannel producing YFP-* following excitation of YFPHD
at high concentrations. Based on the average lifetime ofYFPHD*, 1.4 ( 0.1 ps, as previously measured by upcon-version experiments (6), we obtainkFRET
hetero ) (2.8 ( 0.2) ×1010 s-1.
Note that the ratiokESPT/(kr,1 + knr,1) above has beenoverestimated because the contribution from the directexcitation of YFP- is relatively significant at 394 nm. Atthe same time, the ratiokFRET
hetero/(kr,1 + knr,1) has beenunderestimated because even at high concentrations of YFP10C there still exists a large percentage of neutral-neutraldimer, which contributes also to the absorption at 394 nm,but little fluorescence at 527 nm, due to the slow ESPT rate.Therefore, kFRET
hetero/kESPT should be even greater than theaforementioned value, 7. After the percentage of neutral-neutral dimer is accounted for, we obtain the correctedkFRET
hetero ) (8.1 ( 0.6) × 1010 s-1.Structural Analysis Requirements. Given that at high
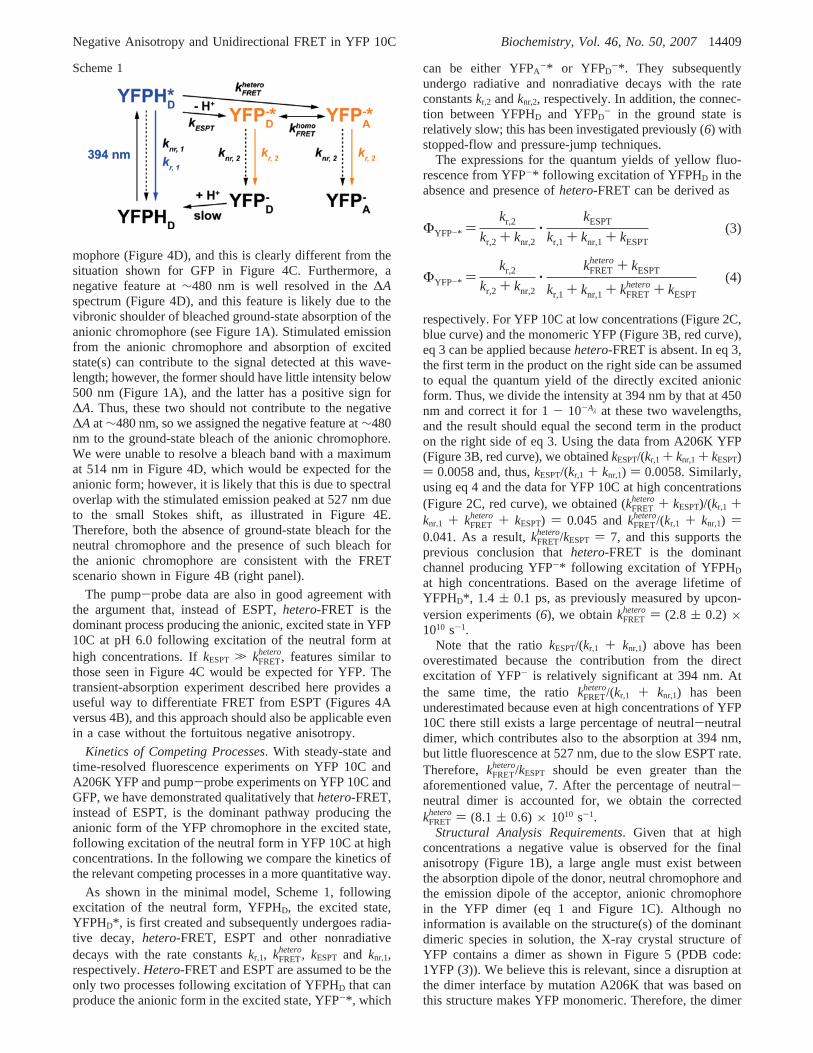
concentrations a negative value is observed for the finalanisotropy (Figure 1B), a large angle must exist betweenthe absorption dipole of the donor, neutral chromophore andthe emission dipole of the acceptor, anionic chromophorein the YFP dimer (eq 1 and Figure 1C). Although noinformation is available on the structure(s) of the dominantdimeric species in solution, the X-ray crystal structure ofYFP contains a dimer as shown in Figure 5 (PDB code:1YFP (3)). We believe this is relevant, since a disruption atthe dimer interface by mutation A206K that was based onthis structure makes YFP monomeric. Therefore, the dimer
Scheme 1
ΦYFP-* )kr,2
kr,2 + knr,2‚
kESPT
kr,1 + knr,1 + kESPT(3)
ΦYFP-* )kr,2
kr,2 + knr,2‚
kFREThetero+ kESPT
kr,1 + knr,1 + kFREThetero+ kESPT
(4)
Negative Anisotropy and Unidirectional FRET in YFP 10C Biochemistry, Vol. 46, No. 50, 200714409
structure in crystals is considered a reasonable model forthe solution structure, and it allows us to analyze thestructural basis of the transfer angle and estimate the rateconstant of unidirectional FRET from the relevant distanceand orientations. In order to perform a quantitative analysiswe need to know the transition dipole moment orientationof the chromophore in the framework of the molecular axes.Although this is not directly available in literature for YFP,recent studies on wild-type GFP (24-27) provide an op-portunity to obtain this information for the GFP chromophorewhich is a reasonable model for the YFP chromophore, giventheir similar chemical structures except theπ-stackingobserved only for YFP (3).
Transition Moment Orientation. Previously, polarizedabsorption spectra of orthorhombic GFP crystals withP212121
symmetry were measured to obtain the direction of electronicabsorption moment of the chromophore relative to themolecular axes of the protein (28). The analysis presentedthere (28) has flaws, and a correction is provided in AppendixII. Recently, time-resolved mid-infrared (IR) experiments onwild-type GFP using the visible pump/IR probe technique(24-27) have provided new opportunities to obtain informa-tion on the transition moment orientation in the context ofthe orientations of local IR oscillators. As demonstrated byStoner-Ma et al. (26, 27) and van Thor et al. (24, 25), theseexperiments yield valuable information regarding the changesto vibrational modes in the chromophore and surrounding
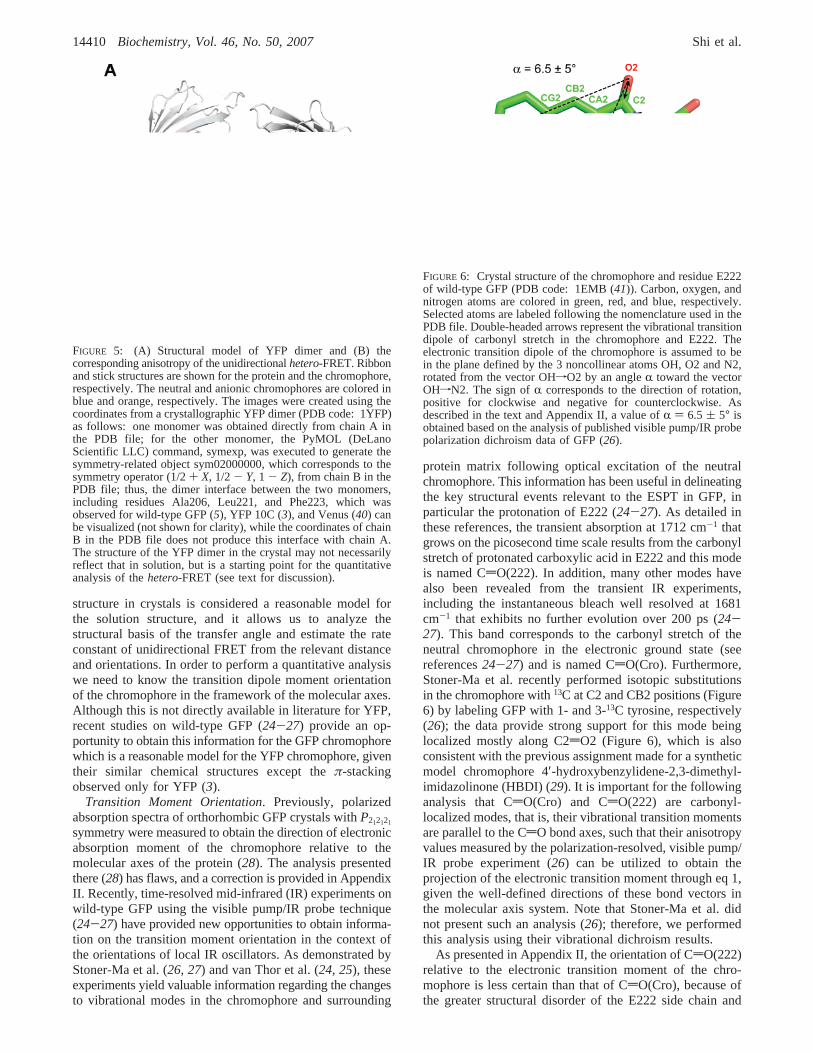
protein matrix following optical excitation of the neutralchromophore. This information has been useful in delineatingthe key structural events relevant to the ESPT in GFP, inparticular the protonation of E222 (24-27). As detailed inthese references, the transient absorption at 1712 cm-1 thatgrows on the picosecond time scale results from the carbonylstretch of protonated carboxylic acid in E222 and this modeis named CdO(222). In addition, many other modes havealso been revealed from the transient IR experiments,including the instantaneous bleach well resolved at 1681cm-1 that exhibits no further evolution over 200 ps (24-27). This band corresponds to the carbonyl stretch of theneutral chromophore in the electronic ground state (seereferences24-27) and is named CdO(Cro). Furthermore,Stoner-Ma et al. recently performed isotopic substitutionsin the chromophore with13C at C2 and CB2 positions (Figure6) by labeling GFP with 1- and 3-13C tyrosine, respectively(26); the data provide strong support for this mode beinglocalized mostly along C2dO2 (Figure 6), which is alsoconsistent with the previous assignment made for a syntheticmodel chromophore 4′-hydroxybenzylidene-2,3-dimethyl-imidazolinone (HBDI) (29). It is important for the followinganalysis that CdO(Cro) and CdO(222) are carbonyl-localized modes, that is, their vibrational transition momentsare parallel to the CdO bond axes, such that their anisotropyvalues measured by the polarization-resolved, visible pump/IR probe experiment (26) can be utilized to obtain theprojection of the electronic transition moment through eq 1,given the well-defined directions of these bond vectors inthe molecular axis system. Note that Stoner-Ma et al. didnot present such an analysis (26); therefore, we performedthis analysis using their vibrational dichroism results.
As presented in Appendix II, the orientation of CdO(222)relative to the electronic transition moment of the chro-mophore is less certain than that of CdO(Cro), because ofthe greater structural disorder of the E222 side chain and
FIGURE 5: (A) Structural model of YFP dimer and (B) thecorresponding anisotropy of the unidirectionalhetero-FRET. Ribbonand stick structures are shown for the protein and the chromophore,respectively. The neutral and anionic chromophores are colored inblue and orange, respectively. The images were created using thecoordinates from a crystallographic YFP dimer (PDB code: 1YFP)as follows: one monomer was obtained directly from chain A inthe PDB file; for the other monomer, the PyMOL (DeLanoScientific LLC) command, symexp, was executed to generate thesymmetry-related object sym02000000, which corresponds to thesymmetry operator (1/2+ X, 1/2- Y, 1 - Z), from chain B in thePDB file; thus, the dimer interface between the two monomers,including residues Ala206, Leu221, and Phe223, which wasobserved for wild-type GFP (5), YFP 10C (3), and Venus (40) canbe visualized (not shown for clarity), while the coordinates of chainB in the PDB file does not produce this interface with chain A.The structure of the YFP dimer in the crystal may not necessarilyreflect that in solution, but is a starting point for the quantitativeanalysis of thehetero-FRET (see text for discussion).
FIGURE 6: Crystal structure of the chromophore and residue E222of wild-type GFP (PDB code: 1EMB (41)). Carbon, oxygen, andnitrogen atoms are colored in green, red, and blue, respectively.Selected atoms are labeled following the nomenclature used in thePDB file. Double-headed arrows represent the vibrational transitiondipole of carbonyl stretch in the chromophore and E222. Theelectronic transition dipole of the chromophore is assumed to bein the plane defined by the 3 noncollinear atoms OH, O2 and N2,rotated from the vector OHfO2 by an angleR toward the vectorOHfN2. The sign ofR corresponds to the direction of rotation,positive for clockwise and negative for counterclockwise. Asdescribed in the text and Appendix II, a value ofR ) 6.5 ( 5° isobtained based on the analysis of published visible pump/IR probepolarization dichroism data of GFP (26).
14410 Biochemistry, Vol. 46, No. 50, 2007 Shi et al.
the possibility of a change in its orientation upon opticalexcitation and subsequent ESPT. With the assumption thatthe electronic transition moment of GFP lies in the chro-mophore plane defined by 3 noncollinear atoms, OH, O2and N2 (Figure 6), we constructed a vector representing theorientation of electronic transition moment that is rotatedfrom the vector OHfO2 by an angleR toward the vectorOHfN2 (Figure 6). In this definition,R can range from-180 to 180°; however, the region from-90 to 90° containsall the unique line directions. Thus, only this region isconsidered. The sign ofR corresponds to the direction ofrotation, positive for clockwise and negative for counter-clockwise. As shown in Figures 7A and B and Appendix II,the vibrational dichroism data by Stoner-Ma et al. (26) wereused to obtain a value of 6.5( 5° for R that defines theabsorption moment orientation in the plane of the neutralGFP chromophore (Figure 6).
Structural Analysis of Unidirectional FRET. To utilize thisinformation about the transition dipole orientation in GFPto evaluate the fluorescence anisotropy associated withunidirectional FRET in the YFPhetero-dimer, we make anumber of simplifying assumptions: (i) The availablestructure of YFP dimer in crystals (Figure 5, PDB code:1YFP (3)) represents the structure in solution. This isconsistent with the fact that the YFP dimerization tendencyis essentially eliminated by mutation A206K (4) (Figure 3),
which is at the surface contact of a crystallographic YFPdimer (3). Furthermore, mixtures of YFP 10C and an excessof A206K YFP at pH 6.0 exhibited intermediate values ofanisotropy (data not shown) that are consistent with the YFP10C molecules forming independent face-to-face dimers atA206, with no indication of a dimer being formed betweenthe A206 face of a YFP 10C molecule and anotherhydrophobic patch on a A206K YFP molecule. (ii) Theabsorption dipole orientation obtained as described abovefor the neutral chromophore in GFP applies to YFP as well.This is reasonable given the close similarity in the chemicalstructures of the chromophore, despite theπ-stacking featureobserved for YFP (3) only. It is not likely that this featurewould appreciably affect the transition dipole orientation,but this could be tested by polarization-resolved, visiblepump/IR probe measurements on YFP. (iii) For the neutralchromophore of YFP, the orientation of the absorptiontransition dipole approximates that of the emission dipole.This is supported by the high anisotropy, 0.38( 0.03,observed for the 460 nm fluorescence from the neutral YFPchromophore (6). In addition, such an approximation canalso be made for the anionic chromophore. (iv) For a YFPchromophore, the transition dipole orientation of the neutralform approximates that of the anionic form. This is supportedby the observation for GFP that, upon excitation of theneutral form, high anisotropy is observed for the green
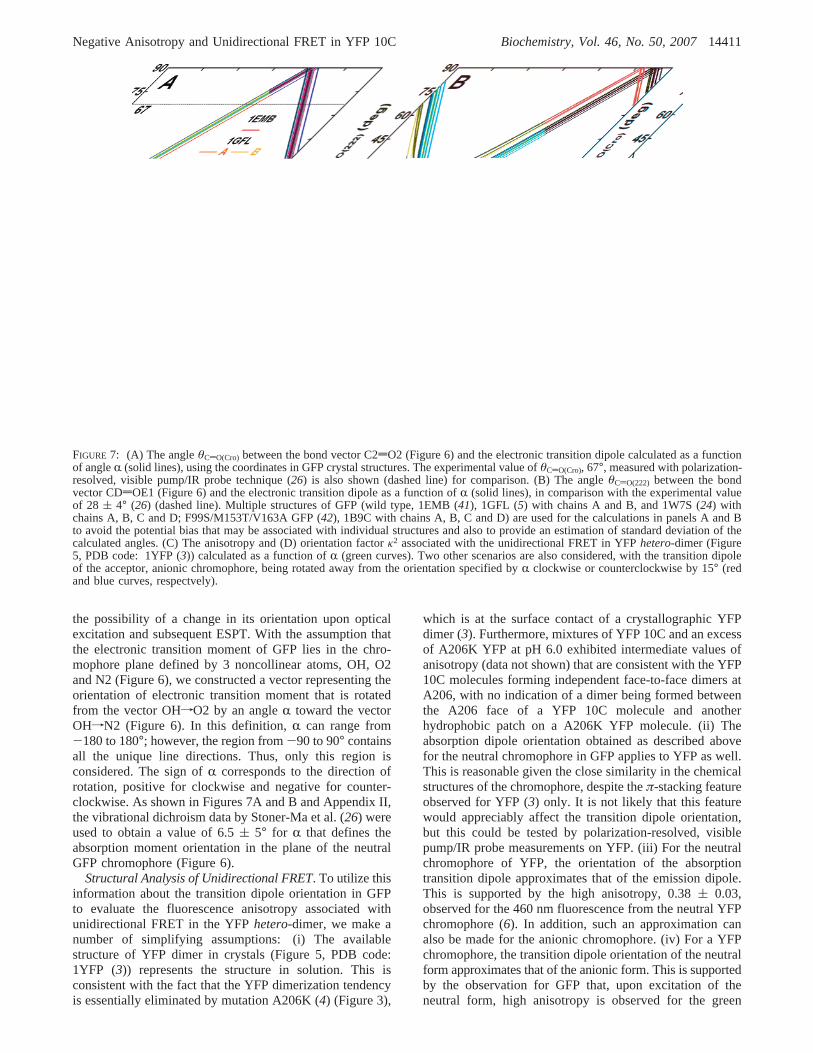
FIGURE 7: (A) The angleθCdO(Cro) between the bond vector C2dO2 (Figure 6) and the electronic transition dipole calculated as a functionof angleR (solid lines), using the coordinates in GFP crystal structures. The experimental value ofθCdO(Cro), 67°, measured with polarization-resolved, visible pump/IR probe technique (26) is also shown (dashed line) for comparison. (B) The angleθCdO(222) between the bondvector CDdOE1 (Figure 6) and the electronic transition dipole as a function ofR (solid lines), in comparison with the experimental valueof 28 ( 4° (26) (dashed line). Multiple structures of GFP (wild type, 1EMB (41), 1GFL (5) with chains A and B, and 1W7S (24) withchains A, B, C and D; F99S/M153T/V163A GFP (42), 1B9C with chains A, B, C and D) are used for the calculations in panels A and Bto avoid the potential bias that may be associated with individual structures and also to provide an estimation of standard deviation of thecalculated angles. (C) The anisotropy and (D) orientation factorκ2 associated with the unidirectional FRET in YFPhetero-dimer (Figure5, PDB code: 1YFP (3)) calculated as a function ofR (green curves). Two other scenarios are also considered, with the transition dipoleof the acceptor, anionic chromophore, being rotated away from the orientation specified byR clockwise or counterclockwise by 15° (redand blue curves, respectvely).
Negative Anisotropy and Unidirectional FRET in YFP 10C Biochemistry, Vol. 46, No. 50, 200714411
fluorescence from the anionic form (14) (Figure 1B). Notethat this assumption can also be tested by polarization-resolved, visible pump/IR probe experiments.
With these assumptions, we calculated the FRET anisot-ropy in the YFPhetero-dimer as a function of angleR (Figure7C, green curve). ForR ) 6.5 ( 5°, the anisotropy fallswithin the range from-0.17 to-0.06, with the boundariescorresponding to theR values that are one standard deviationaway from the center. In addition, we also considered twoscenarios with the transition dipole of the acceptor, anionicchromophore being rotated away from the orientation speci-fied by the aboveR angle clockwise or counterclockwiseby 15° (Figure 7C, red and blue curves). Note that this angleof 15° is provided here only to examine the sensitivity ofthis anisotropy analysis. For these two scenarios, the corre-sponding anisotropy ranges are (-0.2, -0.15) and (-0.09,0.05), respectively. Besides the possible deviation in thetransition dipole of the acceptor considered above, it is alsoconceivable that YFP’s transition dipole may not be rigor-ously in the chromophore plane. For this reason, weexamined two more scenarios with the transition dipole beingrotated out of the plane by 15 or-15°, where the positivesign corresponds to the out-of-plane component pointingfrom the plane of the paper (Figure 6) toward the readerand a negative sign pointing away from the reader. Tosimplify the discussion, we let the in-plane component bedefined by the same angle ofR ) 6.5° for both the donorand the acceptor and obtained 0.05 and-0.19 for theanisotropy in the two scenarios, respectively. These scenariosall produce a low or negative value for the FRET anisotropyin a YFP hetero-dimer, consistent with the experimentalfluorescence anisotropy measured for YFP 10C at highconcentrations (Figure 1B). Therefore, this analysis isconsistent with the crystal structure of YFP dimer being agood model for the solution structure, and is consistent withthe unidirectional FRET being responsible for the anomalousnegative anisotropy in YFP 10C at pH 6.0.
We also estimated the rate constant of unidirectional FRETin a YFPhetero-dimer based on the Fo¨rster dipole-dipoleenergy transfer theory (30), in addition to the structuralinformation described above and the spectroscopic param-eters discussed earlier. The prediction of the Fo¨rster theorycan be expressed in a convenient form,
wherekFREThetero is the first-order, energy-transfer rate constant,
R0 is the Forster critical distance that is characteristic of thechromophore pair,R is the interchromophore distance, andkf,1 is the excited-state decay rate observed for the donor inthe absence of the acceptor. The Fo¨rster critical distanceR0
is given by (7)
whereκ2 is the orientation factor that describes the relativeorientation of the transition dipoles of the donor and acceptor,Φ1* is the fluorescence quantum yield of the donor in theabsence of the acceptor,Jλ is the overlap integral depicting
the degree of spectral overlap between the donor emissionand acceptor absorption,NA is Avogadro’s number, andn isthe refractive index of the medium.
As detailed in Appendix III, we obtained the parametersin eqs 5 and 6 (see Figure 7D for the orientation factorκ2)and, thus, the rate constant for FRET in YFPhetero-dimer,kFRET
hetero(calc)) 8.4× 10¹⁰ s-1. Note that the largest source oferror inkFRET
hetero(calc) is likely to be the distanceR that is notwell defined as a result of the sixth power dependence ineq 5. That is, even a small error inR, e.g. 5%, can lead toa rather large deviation inkFRET
hetero(calc) on the order of 30%.Nevertheless, the value produced by the prediction of theForster theory is in good agreement with the experimentalvalue we obtained earlier, (8.1( 0.6) × 1010 s-1, fromfluorescence quantum yield measurements (seeKinetics ofCompeting Processes). This agreement further supports ourfinding of the unidirectional FRET in ahetero-dimer of YFP10C at pH 6.0 and validates the analyses we performed abovefor this process. We emphasize that the YFPhetero-dimerstudied here provides one of the few FRET systems basedon fluorescent proteins that can be studied in detail, asstructural models are often unavailable in fusion pairs offluorescent proteins (9, 31) and a full analysis of the transitionmoment direction has not been available before. The oligo-merization state (dimer) present in this minimal system alsoallows for a straightforward assignment of the donor andacceptor chromophores, which is often unavailable influorescent protein systems involving higher oligomer states(32, 33).
Potential Biological Applications. The concentration de-pendence of the YFP anisotropy might be useful in somebiological applications, e.g., the proteomic analysis ofindividual living cells. This type of analysis has become avaluable tool for quantitatively assessing cellular behavior(34-38). Since YFP 10C is often fused genetically to a targetprotein, one could measure the concentration of the targetprotein conveniently by monitoring the YFP or H148G YFPanisotropy with sensitive fluorescence techniques (Figure2B). This method can be attractive compared to otherfluorescence methods, because fluorescence anisotropy doesnot require a nontrivial intensity calibration, as in othermethods that depend on measuring the absolute fluorescenceintensity (34, 35). Therefore this approach may provide aconvenient way of specifically characterizing protein abun-dance in single living cellsin situ, without the need to lysethe cell (38). In addition, the temporal information yieldedby this real-time approach can also provide further detailsof cellular dynamics and thus be useful to cell biologyresearch. With a careful design of the linker region, theimpact of the target protein on the anisotropy of YFP tagmay be minimized. Remaining challenges may include theinterference of intracellular autofluorescence, the concentra-tion tag’s applicable pH range, and the effective concentrationrange. Periasamy et al. demonstrated that advanced imagingtechniques such as two-photon excitation microscopy canprovide good spatial resolution and autofluorescence rejection(39). To explore the possibility of acquiring fluorescenceanisotropy with two-photon excitation for YFP 10C at pH6.0, we collected time-resolved data at 527 nm using 5.7 nJ,focused femtosecond 800 nm pulses (Figure S3, SupportingInformation). The result clearly shows a negative anisotropy
kFREThetero)
R06
R6kf,1 (5)
R06 )
9000(ln 10)κ2Φ1*Jλ
128π5NAn4(6)
14412 Biochemistry, Vol. 46, No. 50, 2007 Shi et al.
in YFP 10C at pH 6.0. Given the result we obtained for GFPunder the same conditions (Figure S3), we expect that a curvesimilar to the one shown in Figure 2B can be found for YFP10C, but with different asymptotic values. Wachter et al.determined the pKa for the chromophore in H148G YFP tobe one pH unit higher than YFP 10C (3), making the formermore suitable for potential applications at physiological pH.
CONCLUSION
As the current study has demonstrated, the presences ofprotein dimerization, two protonation states and unidirec-tional FRET contribute together to the negative anisotropyobserved in YFP 10C. Compared to the essentially negligibleESPT, FRET is much faster, but it is still slower thanradiative and nonradiative decays of the neutral form in theexcited state. Therefore, an appreciable amount of yellowfluorescence is observed for YFP 10C at high concentrationsthrough the FRET mechanism following excitation of theneutral chromophore, but the quantum yield is still about20-fold lower than direct excitation of the anionic chro-mophore.
ACKNOWLEDGMENT
We are very grateful to D. Ben Spry, Alexei Goun andProfessor Michael D. Fayer for collecting the transient-absorption data and Karen Kallio and Professor S. JamesRemington at the University of Oregon for generouslyproviding some of the YFP 10C and H148G YFP samplesused in this study. We thank Ilya Finkelstein and JayakumarRajadas for useful discussions and Wei Zeng and CamilleDoe for providing the YFP 10C sample used in initialexperiments.
APPENDIX I: ANALYSIS OF DISSOCIATIONCONSTANT
In order to obtain the YFP dissociation constantKd fromthe concentration dependence of excitation spectra (Figure2C), we analyzed the contributions of the various componentsof our system, which involves two oligomerization states ofthe protein and two protonation states of the chromophore.Combinations of these two properties result in the multiplespecies present in YFP at pH 6.0 as listed below (Table 1).
Assuming a monomer-dimer equilibrium independent ofthe protonation states of YFP chromophore involved, thedissociation constant can be expressed as
where [mYFP] and [dYFP] are the total monomer and dimerconcentrations, respectively. Letting the total YFP concentra-tion be c, it is straightforward to obtain from eq A.1 the
following dimensionless concentrations:
For either the monomer or dimer, the ratio of neutral toanionic chromophore is subject to the corresponding acid-base equilibrium. Letting the fraction of neutral form beAm
and Ad for the monomer and dimer, respectively, theconcentrations of the species in the mixture are
For the yellow fluorescence at 527 nm, the excitationefficiency at 450 nm is proportional to the total concentrationof anionic form including mYFPB, dYFPBB, and dYFPAB,while the efficiency at 394 nm is only proportional todYFPAB’s concentration due to thehetero-FRET. Therefore,the ratio of these two efficiencies is
wherem andd can be substituted by the expressions in eqsA.2 and A.3 andf is a scaling factor. The ratio in eq A.9can be compared with the one calculated from excitationspectra (Figure 2C), and its concentration dependence is ofinterest here.
Concentration Dependence and Kd Estimation. Using eqA.9, we analyze several scenarios that are relevant to theestimation ofKd. At a concentration that is extremely high,limcf∞
m ) 0 and limcf∞
d ) 1/2. Here the ratio in eq A.9
becomes
At an intermediate concentration wherec ) Kd, m ) 1/2andd ) 1/4. From eq A.9, we obtain
Therefore,Kd should equal the YFP concentration, whereE394/E450 is equal to the value at infinite concentration
Table 1
name definition
mYFPA monomeric YFP with a neutral chromophoremYFPB monomeric YFP with an anionic chromophoredYFPAA dimeric YFP with two neutral chromophoresdYFPBB dimeric YFP with two anionic chromophoresdYFPAB dimeric YFP with a neutral and an anionic chromophore
Kd )[mYFP]2
[dYFP](A.1)
m )[mYFP]
c)
-Kd
c+ x(Kd
c )2
+ 8Kd
c4
(A.2)
d )[dYFP]
c) 1
2+
Kd
c- x(Kd
c )2
+ 8Kd
c8
(A.3)
[mYFPA] ) [mYFP] × Am (A.4)
[mYFPB] ) [mYFP] × (1 - Am) (A.5)
[dYFPAA] ) [dYFP] × Ad2 (A.6)
[dYFPBB] ) [dYFP] × (1 - Ad)2 (A.7)
[dYFPAB] ) [dYFP] × 2Ad(1 - Ad) (A.8)
E394
E450) f × [dYFPAB]
[mYFPB] + [dYFPBB] × 2 + [dYFPAB]) f ×
d × 2Ad(1 - Ad)
m× (1 - Am) + d × 2(1 - Ad)(A.9)
limcf∞
E394
E450) f ×
12
× 2Ad(1 - Ad)
12
× 2(1 - Ad)) f × Ad (A.10)
E394
E450) f × Ad(1 - Ad)
(1 - Am) + (1 - Ad))
limcf∞
E394
E450× 1 - Ad
(1 - Am) + (1 - Ad)(A.11)
Negative Anisotropy and Unidirectional FRET in YFP 10C Biochemistry, Vol. 46, No. 50, 200714413
multiplied by a scaling factor, which is a function of onlytwo parameters,Am andAd. As a first-order approximation,Am ) Ad is assumed and this gives
and the excitation spectra in Figure 2C would suggest a valueof ∼9 µM.
Note the analysis above is based on the assumption thatAm ) Ad, that is, the oligomerization state does not affectthe ratio of the two protonation states of YFP chromophore.This assumption simplifies the estimation forKd, but is notrigorously correct. This is clearly reflected by the concentra-tion dependence of absorption spectra as shown in Figure2D, where it can be seen thatAm > Ad. Since the differenceis noticeable, we take this effect into account and estimatea slightly larger value of 10-15 µM for Kd.
It should be cautioned that the analysis performed aboveis based on a few assumptions: (i) The monomer-dimerequilibrium is not affected by the protonation states of YFPchromophore involved. (ii) Different forms of the anionicstate, i.e., mYFPB, dYFPBB, and dYFPAB, contribute the sameto the yellow fluorescence if they are at the same effectiveconcentration. (iii) The scaling factorf in eq A.9 isindependent of YFP concentration. If one or more of theseassumptions are not valid, the estimate of YFP dimerdissociation constant may deviate from the true value.
APPENDIX II: ANALYSIS OF TRANSITIONMOMENT ORIENTATION
Visible Pump/IR Probe Polarization Dichroism of GFP.Using the coordinates in GFP crystal structures, we calculatedthe angleθCdO(Cro) between the bond vector C2dO2 (Figure6) and the electronic transition dipole as a function ofR(Figure 7A, solid lines), in comparison with the experimentalresult of 67( 4° (26) (Figure 7A, dashed line). Similarexperimental values have been found for the correspondingcarbonyl mode in HBDI (62( 4° (26); 68 ( 3° or 66( 3°(43)). Based on this value,R is found to be 8( 3° or 54(3° (the points where the solid lines cross the dashed line).Note that for this calculation, multiple structures of GFP(wild type, 1EMB (41), 1GFL (5) with chains A and B, and1W7S (24) with chains A, B, C and D; F99S/M153T/V163AGFP (42), 1B9C with chains A, B, C and D) are surveyedto avoid the potential bias that may be associated withindividual structures and also to provide an estimation ofstandard deviation in the calculated angles. As the relativelysmall error inR reflects, these GFP structures are very similarfor the chromophore.
A similar calculation is performed for the angleθCdO(222)
between the bond vector CDdOE1 (the name OE1 is usedhere to simplify the discussion; the corresponding atoms arelabeled as OE2 in 1B9C for chains A and B) and theelectronic transition dipole as a function ofR (Figure 7B,solid lines), in comparison with the experimental result of28 ( 4° (26) (Figure 7B, dashed line). Note that the vectorCDdOE1 is calculated from the crystal structures coordinatesof GFP in the electronic ground state, while the transient IRexperiments measure the angle between the electronic absorp-tion dipole and the transient CdO(222) mode in theelectronic excited state. With the assumption that no major
change occurs in the orientation of CDdOE1 followingoptical excitation of the chromophore and subsequent ESPTto E222, we consider the ground-state structure a reasonablemodel for that of the excited state. Given the experimentalvalue mentioned above,R is found to be 5( 9° or -42 (5° from all the GFP structures surveyed (Figure 7B). Therelatively large uncertainty inR reflects the structural disorderof the E222 side chain, which has been noticed previously(24, 25).
By comparing the two sets of possibleR values providedabove by the analyses forθCdO(Cro) andθCdO(222), only 8 (3° and 5 ( 9° are statistically indistinguishable and cansatisfy both experimental observations of the correspondingvibrational dichroism. Therefore, we take the average, 6.5( 5°, as the value ofR defining the absorption momentorientation in the plane of the neutral GFP chromophore(Figure 6).
Correction: Analysis of Absorption Dichroism in GFPSingle Crystals (28). Previously, polarized absorption spectraof orthorhombic GFP crystals withP212121 symmetry weremeasured to obtain the direction of electronic absorptionmoment of the chromophore relative to the molecular axesof the protein (28). However, the trigonometric analysis ofthe absorption dichroism data presented there contains severalmistakes, which are corrected below. In addition, becauseof the space group of the crystals, these dichroism measure-ments on single crystals generate multiple projections of thetransition dipole moment along the principal dichroic axesof the crystal, in contrast to the analysis presented above ofthe visible pump/IR probe dichroism data which is naturallyevaluated in the molecular axis system.
In the orthogonal coordinate system (ø, ψ, z) constructedby Rosell and Boxer (28), thezaxis is defined as the normalto the chromophore plane and theø axis is defined as theintersection of the chromophore plane and the crystal-lographicac plane. With the direction cosines ofø alongthe crystallographic axes (a, b, c) defined as
we obtain the rest of the direction cosines
Note that none of the expressions in eq 3 in ref28 is correct.For instance, since theø axis is in theacplane, the directioncosine ofø alongb should equal zero as shown in eq A.14,instead of a nonzero value. In addition, as shown in eq A.14the direction cosine ofø alongc should not equal zero butwas taken incorrectly as zero.
These mistakes in direction cosines further propagated intothe expressions of absorption dichroism in eqs 4-6 of ref
E394
E450|c)Kd
) limcf∞
E394
E450× 1
2(A.12)
za ≡ ea‚ z zb ≡ eb‚ z zc ≡ ec‚ z (A.13)
ea‚ ø ) -zc
x1 - zb2
eb‚ ø ) 0
ec‚ ø )za
x1 - zb2
(A.14)
ea‚ ψ )zazb
x1 - zb2
eb‚ ψ ) - x1 - zb2
ec‚ ψ )zbzc
x1 - zb2
(A.15)
14414 Biochemistry, Vol. 46, No. 50, 2007 Shi et al.
28. With the simplifying assumption that the transitionmoment of GFP lies in the chromophore plane, at some angleθ relative to theø axis, the normalized transition momentvector can be expressed as
The absorption dichroism is then expressed as a function ofθ:
The number of distinct solutions for the transition momentorientation relative to the molecular axes yielded by thisanalysis was eight for each protonation state prior to furtherscrutiny. Note that half of these solutions are not genuine,because for each value of theθ angle, two directions in thechromophore plane that are symmetric about theø axis areallowed. In addition, the corrected trigonometric analysis isstill not straightforward: the direction of theø axis needs tobe mapped first; the direction of transition moment definedby the θ angle is then converted to that defined by theRangle in Figure 6. It is thus desirable to simplify thisessentially two-step approach into a more straightforward,one-step approach, in which the absorption dichroism shownin eqs A.17-19 is calculated as a function ofR directly(Figure S4, Supporting Information). The 2-fold redundancyin the number of solutions mentioned above is also avoided.
Based on the crystal structure of wild-type GFP (PDB:1EMB (41)), the R angle of the neutral chromophoreconsistent with the data is found to be 1.5, 63,-21, or 76°(the points where the solid lines cross the dashed line inFigure S4). By comparing these values with the one obtainedabove from the vibrational dichroism analysis,R ) 6.5 (5°, only R ) 1.5° is statistically indistinguishable from thelatter value.
APPENDIX III: ANALYSIS OF HETERO-FRETRATE CONSTANT
The orientation factorκ2 in eq 6 is expressed as
whereθFRET is the angle between the emission dipole of thedonor and the absorption dipole of the acceptor, andθ1 andθ2 are the angles between these dipoles and the vectorconnecting the donor and the acceptor (7). The overlapintegralJλ is given by
where f1(λ) is the corrected fluorescence spectrum of thedonor, andε2(λ) is the molar extinction coefficient of the
acceptor at wavelengthλ. With λ expressed in nm andε2(λ)in M-1 cm-1, eq 6 becomes (7)
in Å6. Substituting eq A.22 into eq 5 yields
where kr,1 is the radiative decay rate of the neutral chro-mophore, which can be approximated by that of the anionicchromophorekr,2 (see Scheme 1), 1.9× 10⁸ s-1, calculatedpreviously for YFP 10C (6).
To estimate the anglesθ1 and θ2 in eq A.20 and thedistanceR in eq A.23, we assume that the interchromophorevector 1f2 connects the midpoint of the vector CG2fCA2in the donor and that in the acceptor. With the same set ofassumptions as made above for anisotropy, we calculatedthe orientation factorκ2 as a function of angleR (Figure7D, green curve). ForR ) 6.5 ( 5°, κ2 ) 2.6 ( 0.3. In theother two scenarios discussed for anisotropy with thetransition dipole of the anionic acceptor chromophore rotatedaway from this value clockwise or counterclockwise by 15°,we foundκ2 ) 2.0 ( 0.3 or 2.9( 0.3, respectively (Figure7D, red and blue curves). In addition, the length of theinterchromophore vector 1f2 is calculated to be 25.5 Å.An alternative approach to estimating the distanceR is tocalculate all the 169 (13 by 13) separations between anyheavy atom that is part of the conjugation (see Figure 1D)in the donor and another such atom in the acceptor. Thisapproach yields an interchromophore distance of 24.3( 2.9Å, consistent with the value above.
To calculate the overlap integralJλ, it would be desirableto use the fluorescence spectrum of the neutral chromophorein YFP 10C; however, this is difficult to obtain due to thelack of appreciable blue fluorescence from the neutralchromophore under normal conditions. Using the fluores-cence spectrum of a T203F GFP mutant that exhibits anemission peak at∼460 nm (not shown), we obtained a valueof 1.0 × 10¹⁵ M-1 cm-1 nm4 for Jλ; however, there existsuncertainty in the red region of the spectrum due to theoverlapping emission from the anionic chromophore. In thepresence of thiocyanate, YFP 10C itself exhibits strong bluefluorescence with a peak at∼480 nm (not shown), whichyields a value of 1.5× 10¹⁵ M-1 cm-1 nm4 for Jλ. This likelyprovides an upper limit, because the spectrum is red-shiftedfrom the one observed in the absence of thiocyanate.Therefore, an intermediate value of 1.25× 10¹⁵ M-1 cm-1
nm4 is used instead, which is comparable to the one for theEBFP-EGFP pair (44). This value is considered to ap-proximate that for the YFPHD-YFPA
- pair (Scheme 1),given the spectroscopic similarity between the two pairs andthe fact that theJλ for YFPHD-YFPA
- should be smallerthan the value for the ECFP-EYFP pair (44), 1.55× 10¹⁵
M-1 cm-1 nm4, where the spectral overlap between the donoremission and acceptor absorption is better.
With the parameters obtained above and a refractive indexof 1.33 (45), we calculated the rate constant for FRET inYFP hetero-dimer, kFRET
hetero ) (8.4 ( 3.0) × 1010 s-1. Note
MB ) ø cosθ + ψ sin θ (A.16)
ODc
ODa) (za cot θ + zbzc
zc cot θ - zazb)2
(A.17)
ODc
ODb) (za cot θ + zbzc
1 - zb2 )2
(A.18)
ODa
ODb) (zc cot θ - zazb
1 - zb2 )2
(A.19)
κ2 ) (cosθFRET - 3 cosθ1 cosθ2)
2 (A.20)
Jλ )∫0
∞f1(λ) ε2(λ)λ4 dλ
∫0
∞f1(λ) dλ
(A.21)
R06 ) 8.79× 10⁻⁵ × κ
2Φ1*Jλ
n4(A.22)
kFREThetero) 8.79× 10⁻⁵ × κ
2Jλ
R6n4kr,1 (A.23)
Negative Anisotropy and Unidirectional FRET in YFP 10C Biochemistry, Vol. 46, No. 50, 200714415
that only the largest source of error, the interchromophoredistanceR, was considered for the estimation of error inkFRET
hetero, as a result of the sixth power dependence in eq 5. A5% error, e.g., 1.2 Å, was assumed forR, which is not welldefined.
MATERIALS AND METHODS
Sample Preparation. Recombinant H148G YFP and YFP10C were expressed and purified as described previously (3).Mutagenesis (A206K) was performed using the QuikChangekit (Stratagene, La Jolla, CA) on the background of the YFP10C construct previously used (6). Proteins were exchangedinto a buffer solution by concentrating the sample to aminimum volume, followed by resuspension in the desiredbuffer, and repeating this process three times. Buffer solu-tions were prepared with 40 mM NaCl, 1 mM MgCl2, and20 mM buffer (citric acid, MES, MOPS, HEPES, TAPS orBis-tris propane as appropriate). A pH 6.0 buffer with thecomponents above, i.e., in MES, plus 400 mM Na2SO4 wasprepared to examine the effect of ionic strength. Here Na2-SO4 was chosen over NaCl as the reagent for increasing theionic strength, due to the known effect of halide binding tothe YFP chromophore and the lack of such an effect forsulfate (46).
Absorption and Steady-State Fluorescence. Absorptionspectra were collected with a Cary 6000i spectrophotometer(Varian, Palo Alto, CA) using a 1-mm path length quartzcuvette. Corrected excitation spectra for fluorescence at 527nm were collected with the same cuvette using front-facegeometry on a Spex FluoroLog-3 spectrofluorimeter (HOR-IBA Jobin Yvon, Edison, NJ) equipped with a cooled PMTdetector. The spectra collected with the buffer only weresubtracted out. Steady-state fluorescence anisotropy at 527nm with 400 nm excitation was measured using a 10-mmpath length quartz cuvette with right-angle geometry. Thesignal of buffer only was subtracted out. The properG-factorwas determined and applied to anisotropy calculation.
YFP 10C Concentration. YFP 10C’s molar extinctioncoefficient at 280 nm, 21800 M-1 cm-1, was obtained bymeasuring the absorption spectrum at pH 9.2, and dividingthe absorbance at 280 nm by that at 514 nm, multiplied bythe published molar extinction coefficient of YFP at 514 nm,83400 M-1 cm-1. YFP concentration was calculated usingthis molar extinction coefficient at 280 nm, except in dilutionexperiments where the dilution factors and the concentrationof the stock solution were used for calculation.
Time-ResolVed Fluorescence. Time-resolved fluorescencewas measured for YFP and H148G YFP at 527 nm, using atime-correlated single photon counting setup equipped withan R3809U-50 MCP detector (Hamamatsu, Japan) and anSPC-630 module (Becker & Hickl, Germany) as describedpreviously (6). In brief, samples were excited by 400 nmpulses generated from the second harmonic of an argon-ionlaser pumped titanium-sapphire laser operating at 82 MHz(Spectra Physics, Mountain View, CA). The instrumentresponse function measured with scattered excitation lighthas a typical fwhm of 30 ps. The detector was cooled tosuppress the dark count rate and black boards were used toblock scattered light for the experiments using very dilutesamples. 1.0 mW of excitation light was used to illuminatethe sample which was rapidly stirred in a quartz cuvette with
1-mm path length, and the motorizedλ/2-plate that controlledthe excitation polarization was rotated constantly betweenthe parallel and perpendicular positions, relative to emissionwith a Glan-Thompson polarizer. Time-resolved anisotropywas obtained by summing the data at each polarization andcalculating with the formula in eq A.24 (7):
Two-Photon Excitation. Time-resolved two-photon excitedfluorescence was acquired for wild-type GFP and YFP onthe same setup for the one-photon experiments; however,the 400 nm second harmonic of titanium-sapphire pulseswas not generated. Instead, the unamplified 800 nm funda-mental pulses with pulse energy of 5.7 nJ were focused intothe sample to induce fluorescence. No detectable photo-bleaching of the sample was observed under this condition.
Pump-Probe. Transient absorption spectra were collectedfor wild-type GFP and YFP, using a pump-probe setupequipped with a titanium-sapphire regenerative amplifiedsource (Spectra Physics, Mountain View, CA) and a CCDdetection system (Princeton Instruments, Trenton, NJ). Thepump at 390 nm was generated from the second harmonicof amplified fundamental pulses and was used to excite thesample which was rapidly stirred in a quartz cuvette with1-mm path length. A white-light continuum was generatedby focusing the 780 nm pulses with pulse energy of 4µJinto the water in a 1-mm cuvette, and this white light wasthen separated into two beams: one was used as the probebeam which crossed with the pump in the sample, and theother was used as a reference beam to correct for the intensityand spectral fluctuations of the continuum generation. Thesetwo beams were focused into two separate optical fibers,the outputs of which were connected to a 0.3-m monochro-mator and a 1340× 100 pixel CCD detector. Differenceabsorption spectra were obtained with the pump on and off.
SUPPORTING INFORMATION AVAILABLE
Figures to illustrate the time-resolved anisotropy of H148GYFP and its concentration dependence, the pH dependenceof fluorescence excitation spectrum and corresponding an-isotropy of YFP 10C, the time-resolved anisotropy with 800nm two-photon excitation of wild-type GFP and YFP 10C,and the absorption dichroism of GFP crystal calculated as afunction of angleR, respectively. This material is availablefree of charge via the Internet at http://pubs.acs.org.
REFERENCES
1. Shaner, N. C., Steinbach, P. A., and Tsien, R. Y. (2005) A guideto choosing fluorescent proteins,Nat. Methods 2, 905-909.
2. Giepmans, B. N. G., Adams, S. R., Ellisman, M. H., and Tsien,R. Y. (2006) Review - The fluorescent toolbox for assessingprotein location and function,Science 312, 217-224.
3. Wachter, R. M., Elsliger, M. A., Kallio, K., Hanson, G. T., andRemington, S. J. (1998) Structural basis of spectral shifts in theyellow-emission variants of green fluorescent protein,Structure6, 1267-1277.
4. Zacharias, D. A., Violin, J. D., Newton, A. C., and Tsien, R. Y.(2002) Partitioning of lipid-modified monomeric GFPs intomembrane microdomains of live cells,Science 296, 913-916.
5. Yang, F., Moss, L. G., and Phillips, G. N. (1996) The molecularstructure of green fluorescent protein,Nat. Biotechnol. 14, 1246-1251.
r(t) )I|(t) - I⊥(t)
I|(t) + 2I⊥(t)(A.24)
14416 Biochemistry, Vol. 46, No. 50, 2007 Shi et al.
6. McAnaney, T. B., Zeng, W., Doe, C. F. E., Bhanji, N., Wakelin,S., Pearson, D. S., Abbyad, P., Shi, X. H., Boxer, S. G., andBagshaw, C. R. (2005) Protonation, photobleaching, and photo-activation of yellow fluorescent protein (YFP 10C): A unifyingmechanism,Biochemistry 44, 5510-5524.
7. Lakowicz, J. R. (2006)Principles of Fluorescence Spectroscopy,3rd ed., pp 353-361 and 443-451, Springer, New York.
8. Nagai, T., Yamada, S., Tominaga, T., Ichikawa, M., and Miyawaki,A. (2004) Expanded dynamic range of fluorescent indicators forCa2+ by circularly permuted yellow fluorescent proteins,Proc.Natl. Acad. Sci. U.S.A. 101, 10554-10559.
9. Shimozono, S., Hosoi, H., Mizuno, H., Fukano, T., Tahara, T.,and Miyawaki, A. (2006) Concatenation of cyan and yellowfluorescent proteins for efficient resonance energy transfer,Biochemistry 45, 6267-6271.
10. Chattoraj, M., King, B. A., Bublitz, G. U., and Boxer, S. G. (1996)Ultra-fast excited state dynamics in green fluorescent protein:Multiple states and proton transfer,Proc. Natl. Acad. Sci. U.S.A.93, 8362-8367.
11. Hanson, G. T., McAnaney, T. B., Park, E. S., Rendell, M. E.,Yarbrough, D. K., Chu, S., Xi, L., Boxer, S. G., Montrose, M.H., and Remington, S. J. (2002) Green fluorescent protein variantsas ratiometric dual emission pH sensors. 1. Structural characteriza-tion and preliminary application,Biochemistry 41, 15477-15488.
12. McAnaney, T. B., Park, E. S., Hanson, G. T., Remington, S. J.,and Boxer, S. G. (2002) Green fluorescent protein variants asratiometric dual emission pH sensors. 2. Excited-state dynamics,Biochemistry 41, 15489-15494.
13. McAnaney, T. B., Shi, X., Abbyad, P., Jung, H., Remington, S.J., and Boxer, S. G. (2005) Green fluorescent protein variants asratiometric dual emission pH sensors. 3. Temperature dependenceof proton transfer,Biochemistry 44, 8701-8711.
14. Volkmer, A., Subramaniam, V., Birch, D. J. S., and Jovin, T. M.(2000) One- and two-photon excited fluorescence lifetimes andanisotropy decays of Green Fluorescent Proteins,Biophys. J. 78,1589-1598.
15. Dugave, C., and Demange, L. (2003) Cis-trans isomerization oforganic molecules and biomolecules: Implications and applica-tions,Chem. ReV. 103, 2475-2532.
16. Andresen, M., Wahl, M. C., Stiel, A. C., Grater, F., Schafer, L.V., Trowitzsch, S., Weber, G., Eggeling, C., Grubmuller, H., Hell,S. W., and Jakobs, S. (2005) Structure and mechanism of thereversible photoswitch of a fluorescent protein,Proc. Natl. Acad.Sci. U.S.A. 102, 13070-13074.
17. Kuki, A., and Boxer, S. G. (1983) Chlorophyllide-substitutedhemoglobin tetramers and hybrids: preparation, characterization,and energy transfer,Biochemistry 22, 2923-2933.
18. Wiehler, J., Jung, G., Seebacher, C., Zumbusch, Z., and Steipe,B. (2003) Mutagenic stabilization of the photocycle intermediateof green fluorescent protein (GFP),ChemBioChem 4, 1164-1171.
19. Zeng, W., Seward, H. E., Malnasi-Csizmadia, A., Wakelin, S.,Woolley, R. J., Cheema, G. S., Basran, J., Patel, T. R., Rowe, A.J., and Bagshaw, C. R. (2006) Resonance energy transfer betweengreen fluorescent protein variants: complexities revealed withmyosin fusion proteins,Biochemistry 45, 10482-10491.
20. Jung, G., Ma, Y. Z., Prall, B. S., and Fleming, G. R. (2005)Ultrafast fluorescence depolarisation in the yellow fluorescentprotein due to its dimerisation,ChemPhysChem 6, 1628-1632.
21. Cubitt, A. B., Woollenweber, L. A., and Heim, R. (1999)Understanding structure-function relationships in the Aequoreavictoria green fluorescent protein,Methods Cell Biol. 58, 19-30.
22. Palm, G. J., Zdanov, A., Gaitanaris, G. A., Stauber, R., Pavlakis,G. N., and Wlodawer, A. (1997) The structural basis for spectralvariations in green fluorescent protein,Nat. Struct. Biol. 4, 361-365.
23. Kennis, J. T., Larsen, D. S., van Stokkum, I. H., Vengris, M., vanThor, J. J., and van Grondelle, R. (2004) Uncovering the hiddenground state of green fluorescent protein,Proc. Natl. Acad. Sci.U.S.A. 101, 17988-17993.
24. van Thor, J. J., Georgiev, G. Y., Towrie, M., and Sage, J. T. (2005)Ultrafast and low barrier motions in the photoreactions of the greenfluorescent protein,J. Biol. Chem. 280, 33652-33659.
25. van Thor, J. J., Zanetti, G., Ronayne, K. L., and Towrie, M. (2005)Structural events in the photocycle of green fluorescent protein,J. Phys. Chem. B 109, 16099-16108.
26. Stoner-Ma, D., Melief, E. H., Nappa, J., Ronayne, K. L., Tonge,P. J., and Meech, S. R. (2006) Proton relay reaction in green
fluorescent protein (GFP): Polarization-resolved ultrafast vibra-tional spectroscopy of isotopically edited GFP,J. Phys. Chem. B110, 22009-22018.
27. Stoner-Ma, D., Jaye, A. A., Matousek, P., Towrie, M., Meech, S.R., and Tonge, P. J. (2005) Observation of excited-state protontransfer in green fluorescent protein using ultrafast vibrationalspectroscopy,J. Am. Chem. Soc. 127, 2864-2865.
28. Rosell, F. I., and Boxer, S. G. (2003) Polarized absorption spectraof green fluorescent protein single crystals: Transition dipolemoment directions,Biochemistry 42, 177-183.
29. He, X., Bell, A. F., and Tonge, P. J. (2002) Isotopic labeling andnormal-mode analysis of a model green fluorescent proteinchromophore,J. Phys. Chem. B 106, 6056-6066.
30. Forster, T. (1948) Zwischenmolekulare Energiewanderung UndFluoreszenz,Ann. Phys. 2, 55-75.
31. Fehr, M., Frommer, W. B., and Lalonde, S. (2002) Visualizationof maltose uptake in living yeast cells by fluorescent nanosensors,Proc. Natl. Acad. Sci. U.S.A. 99, 9846-9851.
32. Hosoi, H., Mizuno, H., Miyawaki, A., and Tahara, T. (2006)Competition between energy and proton transfer in ultrafastexcited-state dynamics of an oligomeric fluorescent protein redKaede,J. Phys. Chem. B 110, 22853-22860.
33. Heikal, A. A., Hess, S. T., Baird, G. S., Tsien, R. Y., and Webb,W. W. (2000) Molecular spectroscopy and dynamics of intrinsi-cally fluorescent proteins: Coral red (dsRed) and yellow (Citrine),Proc. Natl. Acad. Sci. U.S.A. 97, 11996-12001.
34. Wu, J. Q., and Pollard, T. D. (2005) Counting cytokinesis proteinsglobally and locally in fission yeast,Science 310, 310-314.
35. Newman, J. R., Ghaemmaghami, S., Ihmels, J., Breslow, D. K.,Noble, M., DeRisi, J. L., and Weissman, J. S. (2006) Single-cellproteomic analysis of S. cerevisiae reveals the architecture ofbiological noise,Nature 441, 840-846.
36. Yu, J., Xiao, J., Ren, X., Lao, K., and Xie, X. S. (2006) Probinggene expression in live cells, one protein molecule at a time,Science 311, 1600-1603.
37. Cai, L., Friedman, N., and Xie, X. S. (2006) Stochastic proteinexpression in individual cells at the single molecule level,Nature440, 358-362.
38. Huang, B., Wu, H., Bhaya, D., Grossman, A., Granier, S., Kobilka,B. K., and Zare, R. N. (2007) Counting low-copy number proteinsin a single cell,Science 315, 81-84.
39. Periasamy, A., Skoglund, P., Noakes, C., and Keller, R. (1999)An evaluation of two-photon excitation versus confocal and digitaldeconvolution fluorescence microscopy imaging in Xenopusmorphogenesis,Microsc. Res. Tech. 47, 172-181.
40. Rekas, A., Alattia, J. R., Nagai, T., Miyawaki, A., and Ikura, M.(2002) Crystal structure of Venus, a yellow fluorescent proteinwith improved maturation and reduced environmental sensitivity,J. Biol. Chem. 277, 50573-50578.
41. Brejc, K., Sixma, T. K., Kitts, P. A., Kain, S. R., Tsien, R. Y.,Ormo, M., and Remington, S. J. (1997) Structural basis for dualexcitation and photoisomerization of the Aequorea victoria greenfluorescent protein,Proc. Natl. Acad. Sci. U.S.A. 94, 2306-2311.
42. Battistutta, R., Negro, A., and Zanotti, G. (2000) Crystal structureand refolding properties of the mutant F99S/M153T/V163A ofthe green fluorescent protein,Proteins 41, 429-437.
43. Usman, A., Mohammed, O. F., Nibbering, E. T. J., Dong, J.,Solntsev, K. M., and Tolbert, L. M. (2005) Excited-state structuredetermination of the green fluorescent protein chromophore,J.Am. Chem. Soc. 127, 11214-11215.
44. Hink, M. A., Visser, N. V., Borst, J. W., van Hoek, A., and Visser,A. J. W. G. (2003) Practical use of corrected fluorescenceexcitation and emission spectra of fluorescent proteins in Forsterresonance energy transfer (FRET) studies,J. Fluoresc. 13, 185-188.
45. Moog, R. S., Kuki, A., Fayer, M. D., and Boxer, S. G. (1984)Excitation transport and trapping in a synthetic chlorophyllidesubstituted hemoglobin: orientation of the chlorophyll S1 transi-tion dipole,Biochemistry 23, 1564-1571.
46. Wachter, R. M., Yarbrough, D., Kallio, K., and Remington, S. J.(2000) Crystallographic and energetic analysis of binding ofselected anions to the yellow variants of green fluorescent protein,J. Mol. Biol. 301, 157-171.
BI701575N
Negative Anisotropy and Unidirectional FRET in YFP 10C Biochemistry, Vol. 46, No. 50, 200714417