BOUSTEAD CONSULTING & ASSOCIATES “FINAL REPORT” Life Cycle Assessment for Three Types of Grocery Bags - Recyclable Plastic; Compostable, Biodegradable Plastic; and Recycled, Recyclable Paper Prepared for the Progressive Bag Alliance Chet Chaffee and Bernard R. Yaros Boustead Consulting & Associates Ltd.
Transcript
BO
UST
EA
D C
ON
SULT
ING
& A
SSO
CIA
TES
“FINAL REPORT” Life Cycle Assessment for Three Types of Grocery Bags - Recyclable Plastic; Compostable, Biodegradable Plastic; and Recycled, Recyclable Paper
Prepared for the Progressive Bag Alliance Chet Chaffee and Bernard R. Yaros Boustead Consulting & Associates Ltd.
BCAL LCA Grocery Bags 2
TABLE OF CONTENTS TABLE OF CONTENTS ............................................................................................................................. 2 EXECUTIVE SUMMARY .......................................................................................................................... 3 Introduction .................................................................................................................................................. 5 Study Goal..................................................................................................................................................... 6 Scope .............................................................................................................................................................. 6 Methodological Approach............................................................................................................................ 9
Calculations of LCAs ................................................................................................................................. 9 Using LCA data …BCAL scientific viewpoint........................................................................................ 10 Data Sources and Data Quality................................................................................................................. 11
Data reporting............................................................................................................................................. 11 LCA Results Tables .................................................................................................................................... 13
RECYCLABLE PAPER BAG SYSTEM ................................................................................................ 13 RECYCLABLE PLASTIC BAG SYSTEM............................................................................................. 18 THE COMPOSTABLE PLASTIC BAG SYSTEM................................................................................. 30
Final Disposal Solid Waste Options: Recycling, Combustion with Energy Recovery, Landfill and Composting ................................................................................................................................................. 41
Recycling.................................................................................................................................................. 41 Solid Waste Combustion With Energy Recovery..................................................................................... 41 Solid Waste to Landfill............................................................................................................................. 42 Scenario 1 for Paper Bags ........................................................................................................................ 43 Scenario 2 for Paper Bags ........................................................................................................................ 43 Solid Waste Composting .......................................................................................................................... 44
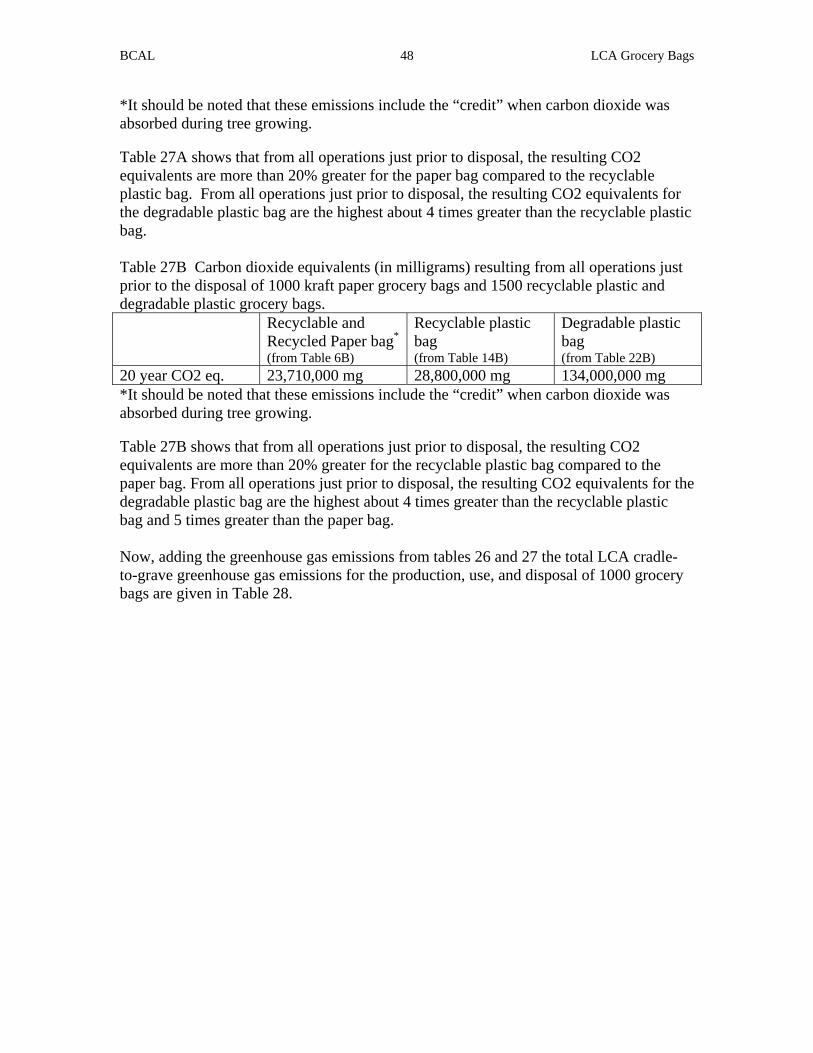
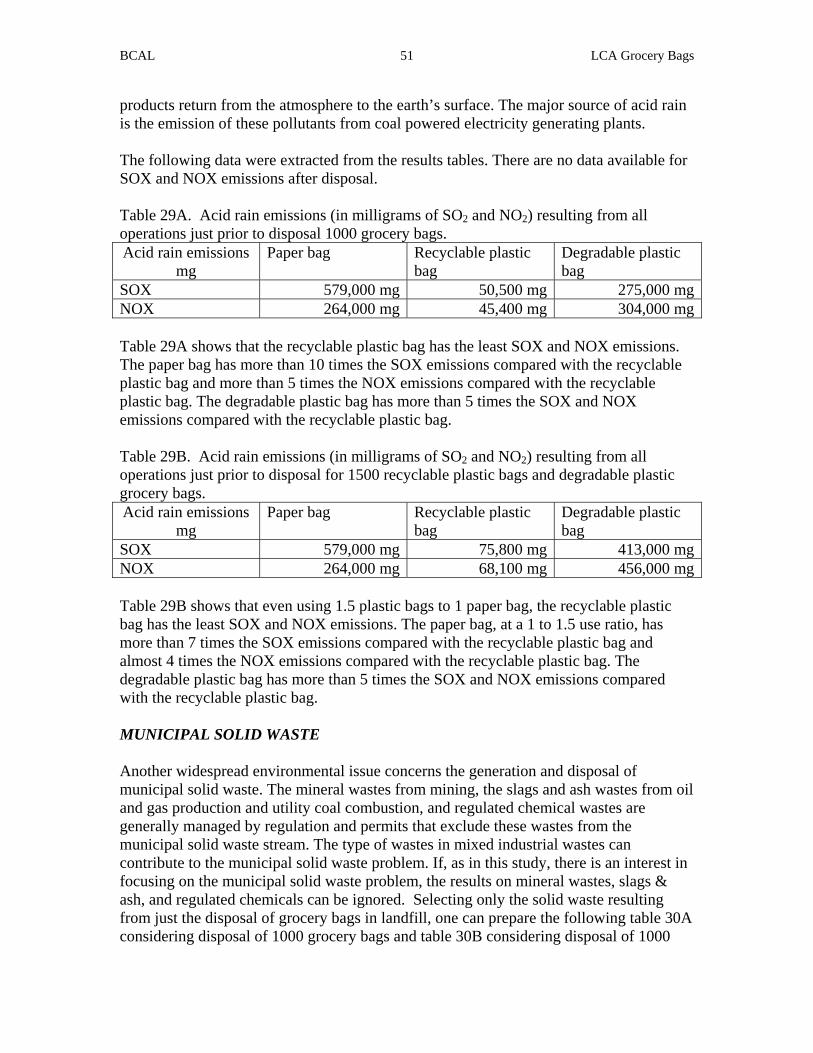
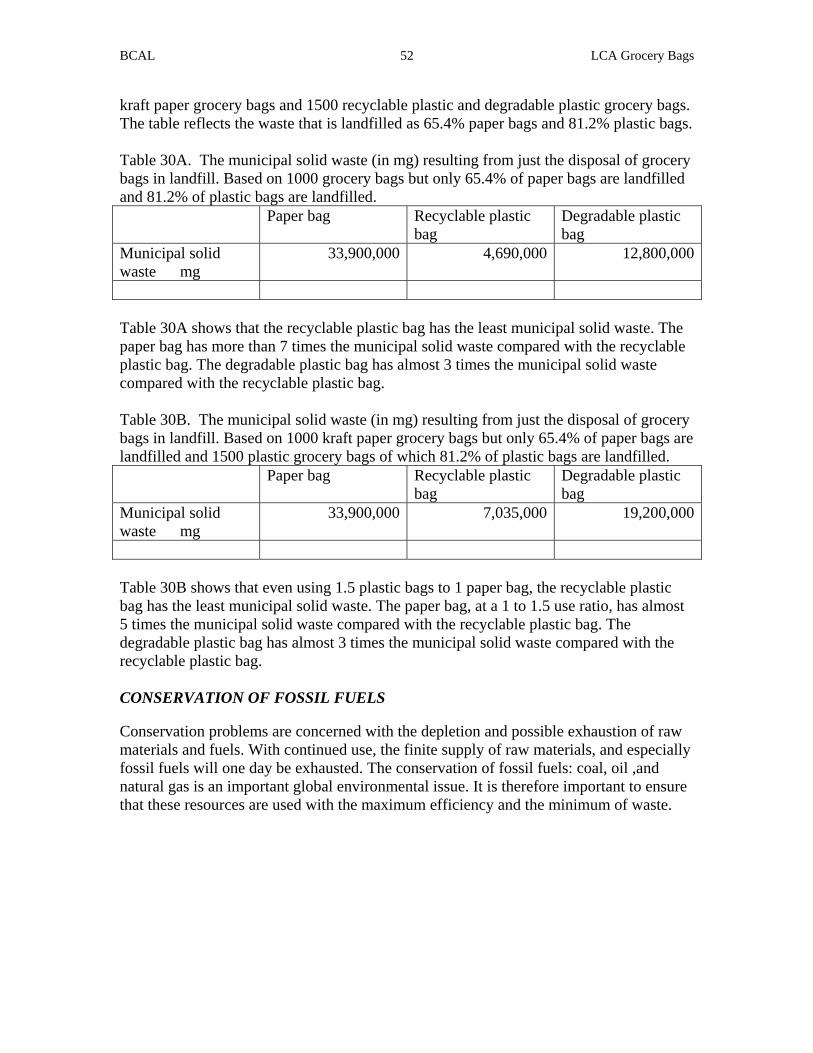
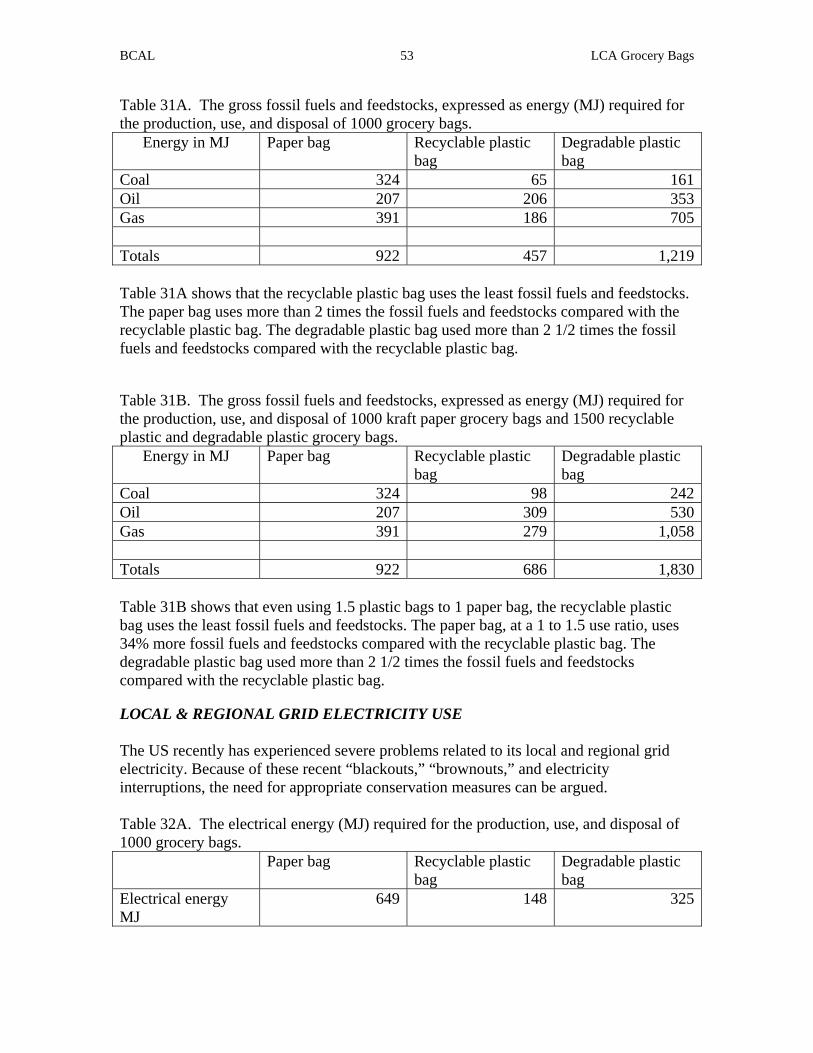
LCA Calculations of Environmental Impacts.......................................................................................... 44 GLOBAL WARMING............................................................................................................................. 45 STRATOSPHERIC OZONE DEPLETION............................................................................................. 50 ACID RAIN ............................................................................................................................................. 50 MUNICIPAL SOLID WASTE ................................................................................................................ 51 CONSERVATION OF FOSSIL FUELS.................................................................................................. 52 LOCAL & REGIONAL GRID ELECTRICITY USE.............................................................................. 53 WATER USE & PUBLIC SUPPLY ........................................................................................................ 54
Summary and Conclusions ........................................................................................................................ 55 Literature References................................................................................................................................. 61 Referencs Regarding the Boustead Model ............................................................................................... 62 Appendix 1 – Peer Review ......................................................................................................................... 63
BCAL LCA Grocery Bags 3
EXECUTIVE SUMMARY In the pursuit to eliminate all that is not green, plastic seems to be a natural target. Its widespread use in products and packaging, some say, has contributed to environmental conditions ranging from increased pollution to overloaded landfills to the country’s dependence on oil. In response, some cities have adopted legislation that bans plastic grocery bags made from polyethylene in favor of bags made from materials such as cloth, compostable plastics, or paper. But will switching from grocery bags made from polyethylene to bags made from some other material guarantee the elimination of unfavorable environmental conditions? We know that every product—through its production, use, and disposal—has an environmental impact. This is due to the use of raw materials and energy during the production process and the emission of air pollutants, water effluents, and solid wastes. More specifically, are grocery bags made other materials such as paper or compostable plastics really better for the environment than traditional plastic grocery bags? Currently, there is no conclusive evidence supporting the argument that banning single use plastic bags in favor of paper bags will reduce litter, decrease the country’s dependence on oil, or lower the quantities of solid waste going to landfills. In addition, there is limited information on the environmental attributes of compostable plastics and how they fare against traditional plastic grocery bags or paper bags. To help inform the debate about the environmental impacts of grocery bags, the Progressive Bag Alliance contracted with Boustead Consulting & Associates (BCAL) to conduct a life cycle assessment (LCA) on three types of grocery bags: a traditional grocery bag made from polyethylene, a grocery bag made from compostable plastics (a blend of 65% EcoFlex, 10% polylactic acid or PLA, and 25% calcium carbonate), and a paper grocery bag made using at least 30% recycled fibers. The life cycle assessment factored in every step of the manufacturing, distribution, and disposal stages of these grocery bags. It was recognized that a single traditional plastic grocery bag may not have the same carrying capacity as a paper bag, so to examine the effect of carrying capacity, calculations were performed both on a 1:1 basis as well as an adjusted basis (1:1.5) paper to plastic. BCAL compiled life cycle data on the manufacture of polyethylene plastic bags and compostable plastic bags from the Progressive Bag Alliance. In addition, BCAL information on the compostable plastic resin EcoFlex from the resin manufacturer BASF. BCAL completed the data sets necessary for conducting life cycle assessments using information extracted from The Boustead Model and Database as well as the technical literature. BCAL used the Boustead Model for LCA to calculate the life cycle of each grocery bag, producing results on energy use, raw material use, water use, air emissions, water effluents, and solid wastes.
BCAL LCA Grocery Bags 4
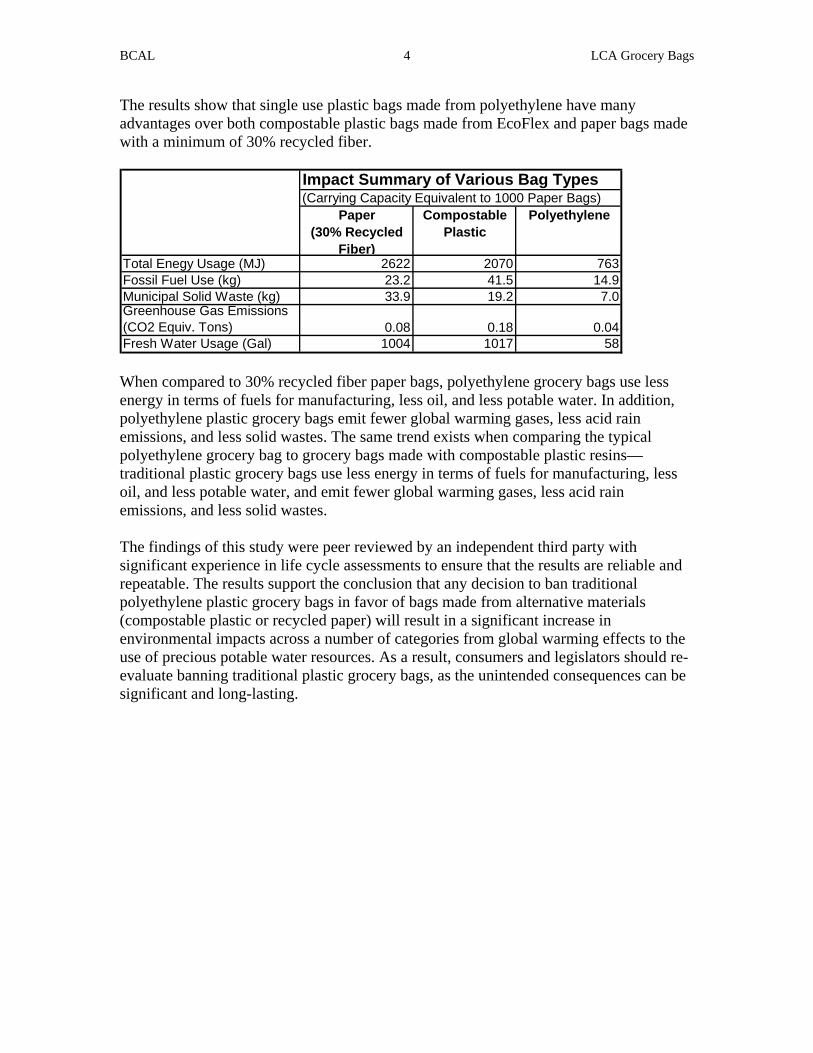
The results show that single use plastic bags made from polyethylene have many advantages over both compostable plastic bags made from EcoFlex and paper bags made with a minimum of 30% recycled fiber.
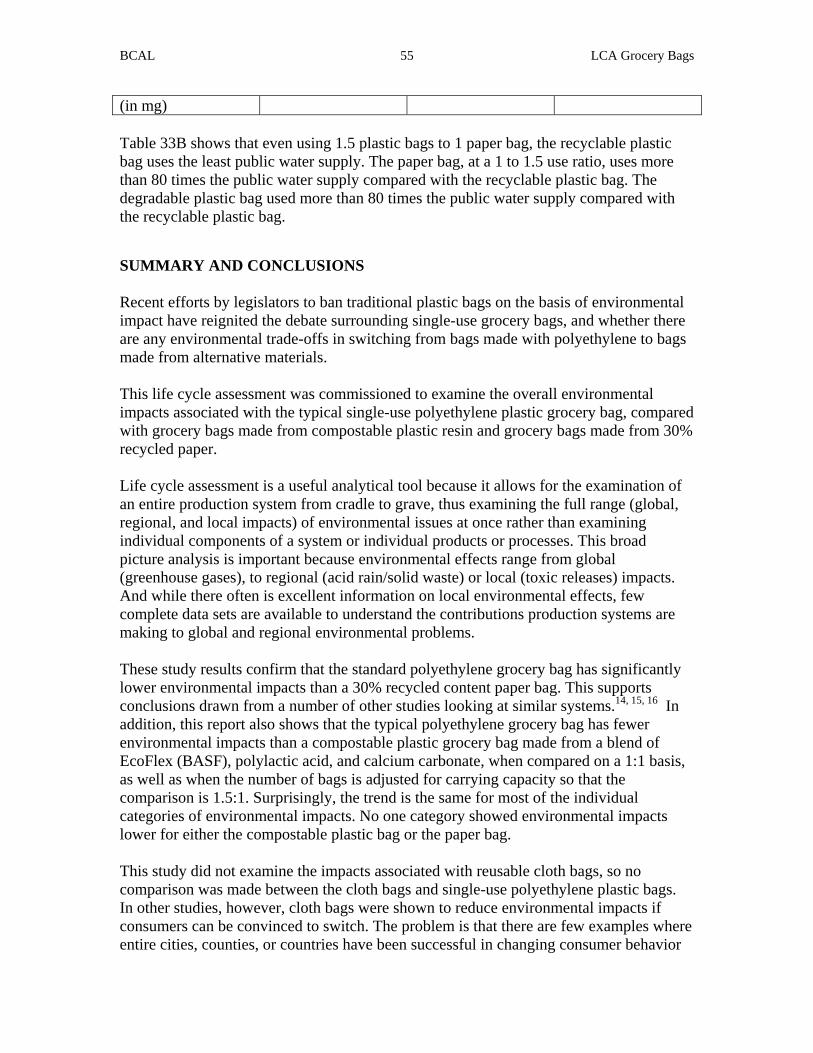
Impact Summary of Various Bag Types(Carrying Capacity Equivalent to 1000 Paper Bags)
Paper(30% Recycled
Fiber)
Compostable Plastic
Polyethylene
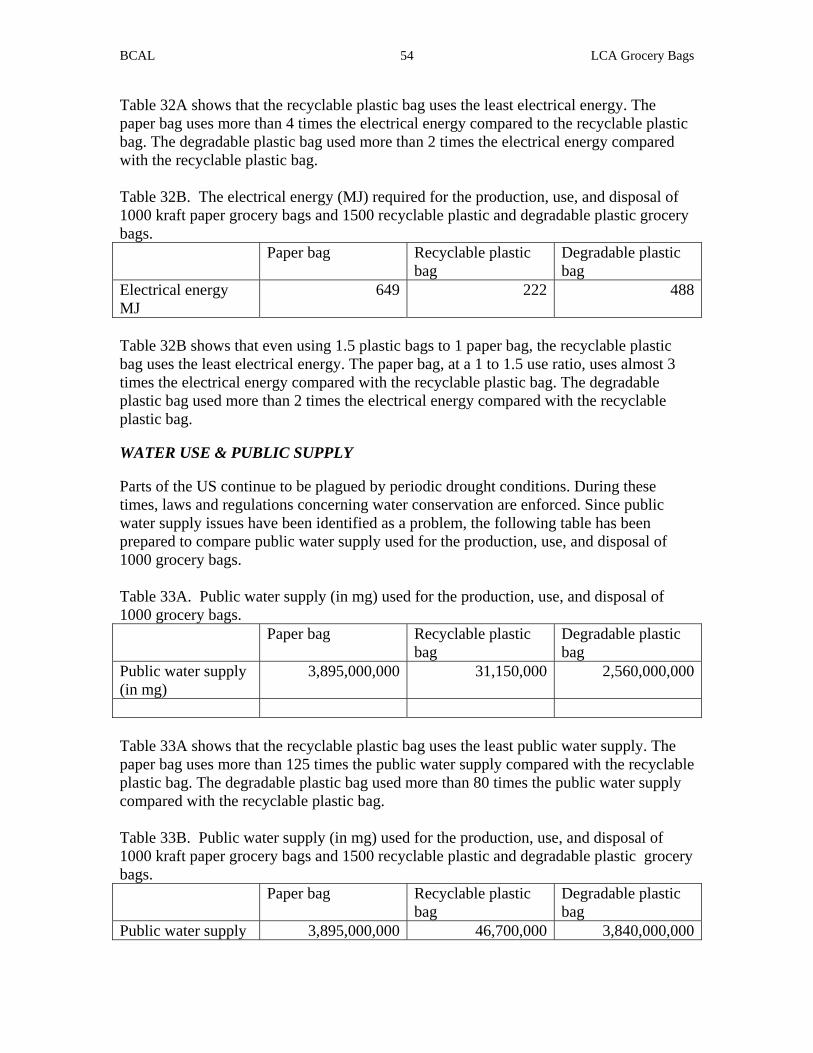
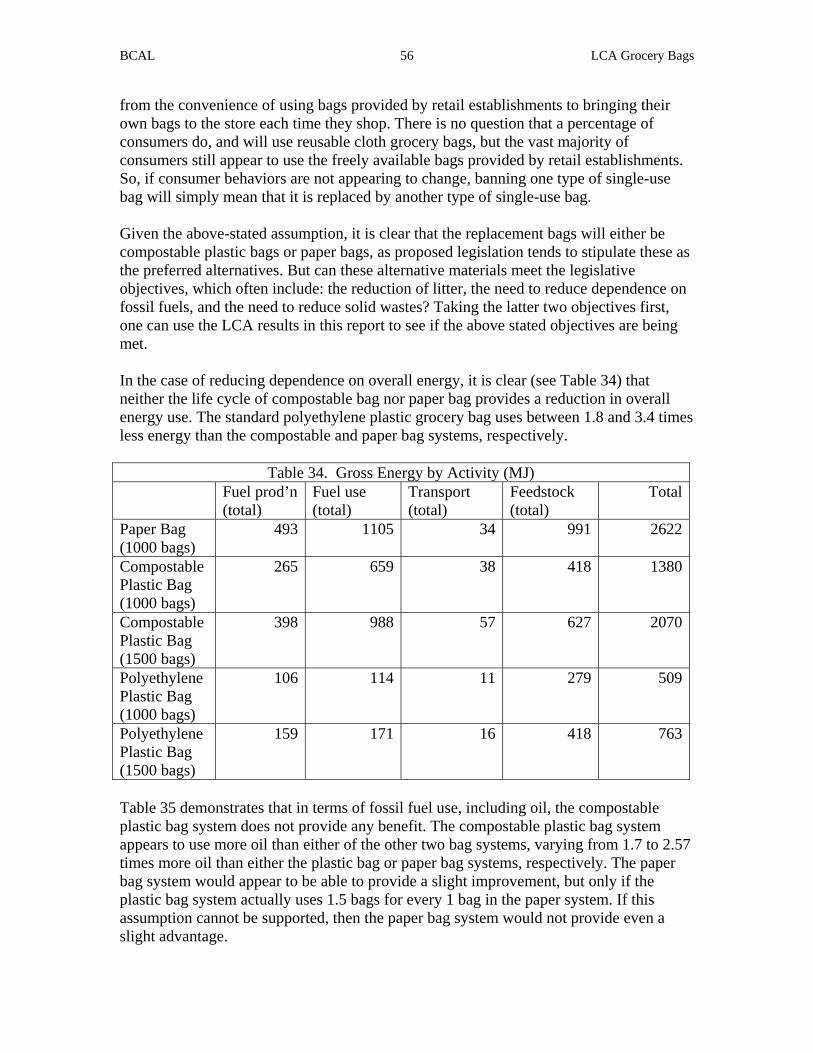
Total Enegy Usage (MJ) 2622 2070 763Fossil Fuel Use (kg) 23.2 41.5 14.9Municipal Solid Waste (kg) 33.9 19.2 7.0Greenhouse Gas Emissions(CO2 Equiv. Tons) 0.08 0.18 0.04Fresh Water Usage (Gal) 1004 1017 58
less
The findings of this study were peer reviewed by an independent third party with significant experience in life cycle assessments to ensure that the results are reliable and repeatable. The results support the conclusion that any decision to ban traditional polyethylene plastic grocery bags in favor of bags made from alternative materials (compostable plastic or recycled paper) will result in a significant increase in environmental impacts across a number of categories from global warming effects to the use of precious potable water resources. As a result, consumers and legislators should re-evaluate banning traditional plastic grocery bags, as the unintended consequences can be significant and long-lasting.
When compared to 30% recycled fiber paper bags, polyethylene grocery bags use energy in terms of fuels for manufacturing, less oil, and less potable water. In addition, polyethylene plastic grocery bags emit fewer global warming gases, less acid rain emissions, and less solid wastes. The same trend exists when comparing the typicalpolyethylene grocery bag to grocery bags made with compostable plastic resins—traditional plastic grocery bags use less energy in terms of fuels for manufacturing, less oil, and less potable water, and emit fewer global warming gases, less acid rain emissions, and less solid wastes.
BCAL LCA Grocery Bags 5
Introduction In the national effort to go green, several states, counties, and cities are turning their attention to plastic grocery bags made from polyethylene because of the perception that plastic bags contribute to local and global litter problems that affect marine life, occupy the much needed landfill space with solid waste, and increase U.S. dependence on oil. To address these environmental issues, and perhaps in seeking to follow the example of other countries such as Australia and Ireland, legislators in several cities across the United States have proposed or have already passed ordinances banning single use polyethylene plastic grocery bags in favor of bags made from alternative materials such as cloth, paper, or compostable plastic. Legislators state that they believe that these new laws and proposals will reduce litter, reduce the use of fossil fuels, and improve the overall environmental impacts associated with packaging used to transport groceries. Before we examine whether plastic bags cause more environmental impacts than the alternative materials proposed, we should first consider the most commonly proposed alternatives, which tend to include: cloth bags, compostable plastic bags, and paper bags. Reusable cloth bags may be the preferred alternative, but in reality, there is no evidence that most, or even a majority of, customers will reliably bring reusable bags each time they go shopping. Compostable plastic bags, although available, are in short supply as the technology still is new, and therefore cannot currently meet market demand. So it appears that the proposed laws banning plastic grocery bags may simply cause a shift from plastic bags to the only alternative that can immediately supply the demand—paper bags. Therefore, is legislation that mandates one packaging material over another environmentally responsible given that all materials, products, and packaging have environmental impacts? The issue is whether the chosen alternatives will reduce one or several of the identified environmental impacts, and whether there are any trade-offs resulting in other, potentially worse, environmental impacts. To help inform the debate on the environmental impacts of grocery bags, and identify the types and magnitudes of environmental impacts associated with each type of bag, the Progressive Bag Alliance contracted Boustead Consulting & Associates (BCAL) to conduct a life cycle assessment (LCA) on single use plastic bags as well as the two most commonly proposed alternatives: the recyclable paper bag made in part from recycled fiber and the compostable plastic bag. Life cycle assessment is the method being used in this study because it provides a systems approach to examining environmental factors. By using a systems approach to analyzing environmental impacts, one can examine all aspects of the system used to produce, use, and dispose of a product. This is known as examining a product from cradle (the extraction of raw materials necessary for producing a product) to grave (final
BCAL LCA Grocery Bags 6
disposal of the product). LCA has been practiced since the early 1970s, and standardized through several organizations including SETAC (Society of Environmental Toxicology and Chemistry) and ISO (International Standards Organization). LCA studies examine the inputs (resources and energy) and outputs (air emissions, water effluents, and solid wastes) of each system and thus identifies and quantifies the effects of each system, providing insights into potential environmental impacts at local, regional, and global levels. To compile all the information and make the calculations, BCAL uses the Boustead Model and Database. The Boustead Model and Database is an LCA software model with a database built over the past 25 years, containing a wide variety of data relevant to the proposed study. Dr. Boustead has pioneered the use of life-cycle methods and has conducted hundreds of studies, including those for the plastics industry; which have been reviewed by US and European industry as well as life-cycle practitioners. Study Goal According to ISO 14040, the first steps in a life cycle project are defining the goal and scope of the project to ensure that the final results meet the specific needs of the user. The purpose of this study is to inform the debate on the environmental impacts of grocery bags, and identify the types and magnitudes of environmental impacts associated with each type of bag. In addition, the study results aim to inform the reader about the potential for any environmental trade-offs in switching from grocery bags made from one material, plastic, to another, paper. The life cycle assessment was conducted on three types of grocery bags: a traditional grocery bag made from polyethylene, a grocery bag made from compostable plastics (a blend of 65% EcoFlex, 10% polylactic acid or PLA, and 25% calcium carbonate), and a paper grocery bag made using at least 30% recycled fibers. It is important to note that the study looked at only one type of degradable plastic used in making grocery bags, which is the bag being studied by members of the Progressive Bag Alliance. Since this is only one of a number of potential blends of plastic that are marketed as degradable or compostable, the results of this study cannot be used to imply that all compostable bags have the same environmental profile. Scope The scope of the study is a cradle to grave life cycle assessment which begins with the extraction of all raw materials used in each of the bags through to the ultimate disposal of the bags after consumer use, including all the transport associated with the delivery of raw materials and the shipping and disposal of final product. The function of the product system under study is the consumer use and disposal of a grocery bag. The functional unit is the capacity of the grocery bag to carry consumer purchases. A 1/6 BBL (Barrel) size bag was selected for all three bags in this study because that is the commonly used bag in grocery stores. Although the bags are of equal size, previous studies (Franklin, 1990) pointed out that the use of plastic bags in grocery
BCAL LCA Grocery Bags 7
stores was not equal to the use of paper bags. According to Franklin (1990), bagging behavior showed that plastic to paper use ranged from 1:1 all the way to 3:1, depending on the situation. In contrast, data collected by the Progressive Bag Alliance shows that plastic and paper bags are somewhat equal in use once the baggers have been properly trained. In this study BCAL used both 1:1 and 1.5:1 plastic to paper ratios, allowing for the possibility that it still takes more plastic bags to carry the same amount of groceries as a paper bag. The 1.5:1 ratio equates to 1500 plastic bags for every 1000 paper bags. BCAL prepared LCA’s for the three types of grocery bags. The data requirements for BCAL and for the Progressive Bag Alliance are outlined below.
1. Recyclable Paper Bag LCA………The following operations are to be included in the analysis: To start, BCAL provided data on the extraction of fuels and feedstocks from the earth, including tree growing, harvesting, and transport of all materials. BCAL added process operations in an integrated unbleached kraft pulp & paper mill including recycling facility for old corrugated containers; paper converting into bags; closed-loop recycling of converting bag waste; packaging and transport to distribution and grocery stores; consumer use; and final disposal. Data for most of the above operations in one form or another are in the Boustead Model and Database. Weyerhaeuser reported that its unbleached kraft grocery bag contains about 30% post consumer recycled content and the use of water-based inks1. Therefore, in this study BCAL used 30% recycled material. This is also somewhat reflective of current legislation where minimum recycled content in paper bags is required (see Oakland City Council Ordinance requiring 40% recycled material). In the operations leading to final disposal BCAL estimated data for curbside collection and generation and recovery of materials in MSW from government agencies and EPA data, which for 2005 showed paper bag recycling at 21%, paper bag MSW for combustion with energy recovery at 13.6%, resulting in 65.4% to landfill2. The following final disposal options will also be considered: composting and two landfill scenarios.
2. Recyclable Plastic Bag LCA………The following operations are to be included
in the analysis: The extraction of fuels and feedstocks from the earth; transport of materials; all process and materials operations in the production of high and low density polyethylene resin3; converting PE resin into bags; packaging and transport of bags to distribution centers and grocery stores; consumer use; and final disposal. In the operations leading to final disposal, BCAL estimated data for curbside collection and generation and recovery of materials in MSW from government agencies and EPA data, which for 2005 showed plastic bag recycling at 5.2 %, plastic bag MSW for combustion with energy recovery at 13.6%, resulting in 81.2% to landfill2. The following final disposal options will also consider two landfill scenarios.
Data for the converting operation was collected specifically from a member of the Progressive Bag Alliance that makes only plastic grocery bags. The data obtained, represents the entire annual production for 2006. All waste is
BCAL LCA Grocery Bags 8
reprocessed on site, so that is how the calculations were conducted. All inks are water-based, and the formulas provided. The production and supply of all PE resin is based on materials produced and transported from a Houston based supplier. The corrugated boxes were included as made from recycled material to reflect the fact that the supplier to the PBA member reported using between 30% and 40% post consumer recycled fiber1.
3. Degradable Plastic Bag (EcoFlex and PLA mix) LCA………The following operations are to be included in the analysis: The extraction of fuels and feedstocks from the earth; production and transport of materials for all process and materials operations in the production of polylactide resin; EcoFlex from BASF (data provided by BASF)4; and calcium carbonate, converting the EcoFlex/PLA resin mixture into bags; packaging and transport of bags to distribution centers and grocery stores; consumer use; and final disposal. Again, most of the above operations are contained in the Boustead Model and Database. The production data for PLA was obtained from NatureWorks5 and the data for EcoFlex was obtained from BASF4. Both NatureWorks and BASF use the Boustead Model for their LCA calculations, so the data BCAL requested and received was compatible with other data used in the study. In addition, BCAL sent its calculated results to BASF for confirmation that the data and the calculations on bags made from the EcoFlex compostable resin was accurate. BASF engineers confirmed that BCAL’s use of the data and the calculated results were appropriate. In the operations leading to final disposal, BCAL estimated data for curbside collection and generation and recovery of materials in MSW from government agencies and EPA data3, which for 2005 showed plastic bag recycling at 5.2 %, plastic bag MSW for combustion with energy recovery at 13.6%, resulting in 81.2% to landfill2. The following final disposal options will be also be considered: composting and two landfill scenarios.
Data for the converting operation of the EcoFlex/PLA resin mixture was collected at the same PBA member facility during a two-week period at the end of May 2007. The production and supply of the PLA polymer is from Blair, NE. The production and supply of Ecoflex polymer is from a BASF plant in Germany. The trial operations at the PBA member’s facility indicate that the overall energy required to produce a kilogram of EcoFlex/PLA bags may be lower than the overall energy required to produce a kilogram of PE bags, based on preliminary in-line electrical measurements conducted by plant engineers. However, these results still are preliminary, and need to be confirmed when full scale operations are implemented. As a result, this study will assume that the overall energy required to produce a kilogram of EcoFlex/PLA bags is the same as the overall energy required to produce a kilogram of PE bags. The plastic bag recycling at 5.2 %, will be assumed to go to composting. The inherent energy of the degradable bags has been estimated from NatureWorks and BASF sources.
BCAL LCA Grocery Bags 9
The following are some detailed specifications for the LCA study: Recyclable Plastic Degradable Plastic Recyclable Paper Size/type 1/6 BBL 1/6 BBL 1/6 BBL Length (inches) 21.625 22.375 17 Width (inches) 12 11.5 12 Gusset (inches) 7.25 7.25 6.75 Gauge (Mil) 0.51 0.75 20 lb /1000 sq ft Film Color White White Kraft Material HDPE (film grade
blend) Degradable Film Compound (EcoFlex/PLA mix)
Unbleached Kraft Paper
Jog Test (strokes) 45 20 n/a Tensile Strength (lb) 50 35 n/a Weight per 1000 bags in lbs
13.15 (5.78 kg) 34.71 (15.78 kg) 114 (51.82 kg)
Human energy and capital equipment will not be included in the LCA; detailed arguments for this decision are presented in the proposal appendix. Methodological Approach BCAL followed the sound scientific practices as described in ISO 14040, 14041, and 14042 to produce the project results. BCAL is well versed in the requirements of the ISO standards as Dr. Ian Boustead has and continues to be one of the leading experts participating in the formation of the ISO standards. The procedures outlined below are consistent with the ISO standards and reflect BCAL’s approach to this project. Calculations of LCAs The Boustead database contains over 6000 unit operations on the processes required to extract raw materials from the earth, process those materials into useable form, and manufacture products. These operations provide data on energy requirements, emissions and wastes. The “Boustead Model” software was used to calculate the consumption of energy, fuels, and raw materials, and generation of solid, liquid, and gaseous wastes starting from the extraction of primary raw materials. The model consists of a calculating engine that was developed 25 years ago and has been updated regularly based on client needs and technical innovations. One important consequence of the modeling is that a mass balance for the entries system is calculated. Therefore, the resource use and the solid waste production are automatically calculated. Fuel producing industry data are available for all of the OECD countries and some non-OECD countries. The United States and Canada are further analyzed by region; the US is
BCAL LCA Grocery Bags 10
divided into 9 regions and Canada is sub-divided in 5 regions, corresponding to the Electric Reliability Council. For both the US and Canada, there also is a national average. Since the whole of the Model database can be switched from one country to another, any operation with data from outside the US can be adjusted for energy from non-US energy inputs to “USA adjusted” energy inputs. Assuming that the technology is the same, or very similar, this allows BCAL to fill any data gaps with data from similar operations in non-US locations.
Another important aspect of calculating LCAs is the use of allocation procedures when differentiating the use of energy and raw materials associated with individual products within a single system. In many cases, allocation methods that defy or at the very least, ignore sound scientific practice (such as economics) have been used when they benefit clients. These types of errors or biases are important to avoid as they are easily discovered by peer reviewers or technical experts seeking to use the results in subsequent studies (such as building applications), which unfortunately can cause the rest of the work to be discounted due to unreliability. BCAL has considerable experience in this arena having published several technical papers on the appropriate allocation principles in the plastics industry. Utilizing sound scientific principles and objective measures to the greatest extent possible, BCAL has been able to avoid most problems associated with allocation decisions and produce accurate and reliable LCA data for a wide variety of plastics. Proof of this is the widespread use of PlasticsEurope data (produced by Boustead Consulting) in almost every life cycle database available worldwide as well as in life cycle studies in numerous product and building applications. Calculated data are readily aggregated and used to produce the final LCA data set which includes the impact assessment step of LCA. These resulting data sets address specific environmental problems. Using LCA data.…BCAL scientific viewpoint
Life cycle assessment modeling allows an examination of specific problems as well as comparisons between systems to determine if there are any serious trade-offs between systems. In every system there are multiple environmental parameters to be addressed scaling from global to local issues. No single solution is likely to address all of the issues simultaneously. More importantly, whenever choices are being made to alter a system or to utilize an alternative system, there are potential trade-offs. Understanding those trade-offs is important when trying to identify the best possible environmental solution. Hopefully, decisions to implement a change to an existing system will consider the potential trade-offs and compromises. While LCA can identify the environmental factors and trade-offs, choosing the solution that is optimal is often subjective and political. Science can only help by providing good quality data from which decisions can be made. The strength of the proposed LCA assessment system is that these unwanted side effects can be identified and quantified. A life cycle assessment can: 1. Quantify those parameters likely to be responsible for environmental effects (the
inventory component of life cycle analysis).
BCAL LCA Grocery Bags 11
2. Identify which parameters are likely to contribute to a specific environmental problem (characterization or interpretation phase of impact assessment). An example would be identifying that carbon dioxide (CO2), methane (CH4), and nitrous oxide (N2O) are greenhouse gases.
3. Aggregate the parameters relating to a specific problem (the valuation or interpretation phase of impact assessment). An example would be producing carbon dioxide equivalents for the components of greenhouse gases.
LCA derived data provide a compilation of information from which the user can address specific problems, while also examining potential trade-offs. For example, if interested in addressing specific conservation issues such as the conservation of fossil fuels, the user would examine the mass and energy data for only coal, oil, and natural gas; and ignore the other information. If the user would like to examine the potential impacts the grocery bag system has on global warming, acid rain, and municipal solid waste one can address these issues both individually and cooperatively by examining the specific parameters which are likely to contribute to each. In so doing, the user can strive to achieve the optimum reduction in each parameter because of a better understanding of how these parameters change in association with the grocery bag system as a whole and each other individually. Data Sources and Data Quality As noted above, data sources included published reports on similar materials, technical publications dealing with manufacturing processes, and data incorporated into the Boustead Model and Database, most of which has been generated through 30 years of industrial studies on a wide range of products and processes. ISO standards 14040, 14041, and 14042 each discuss aspects of data quality as it pertains to life cycle assessments. In general, data quality can be evaluated using expert judgment, statistics, or sensitivity analysis. In LCA studies, much of the data do not lend itself to statistical analyses as the data are not collected randomly or as groups of data for each input variable. Instead, most LCA data are collected as single point estimates (i.e., fuel input, electricity input, product output, waste output, etc). Single point estimates are therefore only able to be evaluated through either expert judgment or sensitivity analysis. Since the reliability of data inevitably depends upon the quality of the information supplied by individual operators, BCAL used its expert judgment to carry out a number of elementary checks on quality. BCAL checked mass and energy balances to ensure that the data did not violate any of the basic physical laws. In addition, BCAL checked data from each source against data from other sources in the Boustead Model and Database to determine if any data fell outside the normal range for similar products or processes. Data reporting To enhance the comparability and understanding of the results of this study, the detailed LCA results are presented in the same presentation format that was used for the series of eco-profile reports published by the Association of Plastics Manufacturers in Europe
BCAL LCA Grocery Bags 12
(APME). A set of eight tables, each describing some aspect of the behavior of the system, shows the results of the study. Five tables in the data set are useful in conservation arguments and three tables are indications of the potential pollution effects of the system. The performance of the grocery bag systems is described by quantifying the inputs and outputs to the system. The calculation of input energy and raw materials quantifies the demand for primary inputs to the system and these parameters are important in conservation arguments because they are a measure of the resources that must be extracted from the earth in order to support the system. Calculation of the outputs is an indication of the potential pollution effects of the system. Note that the analysis is concerned with quantifying the emissions; it does not make any judgments about deleterious or beneficial properties. The inputs and outputs depend on the definition of the system—they are interrelated. Therefore, any changes to the components of the system means that the inputs and outputs will likely change as well. One common misconception is that it is possible to change a single input or output while leaving all other parameters unchanged. In fact, the reverse is true; because a new system has been defined by changing one input or output, all of the inputs and outputs are expected to change. If they happen to remain the same, it is a coincidence. This again illustrates the fact that common perceptions about environmental gains from simple changes may be misleading at best, and detrimental to the environment at worst. Increasingly there is a demand to have the results of eco-profile analyses broken down into a number of categories, identifying the type of operation that gives rise to them. The five categories that have been identified are: 1. Fuel production 4. Biomass 2. Fuel use 5. Process 3. Transport Fuel production operations are defined as those processing operations which result in the delivery of fuel, or energy; to a final consumer whether domestic or industrial. For such operations all inputs, with the sole exception of transport, are included as part of the fuel production function. Fuel use is defined as the use of energy delivered by the fuel producing industries. Thus fuel used to generate steam at a production plant and electricity used in electrolysis would be treated as fuel use operations. Only the fuel used in transport is kept separate. Transport operations are easily identified and so the direct energy consumption of transport and its associated emissions are always separated. Biomass refers to the inputs and outputs associated with the use of biological materials such as wood or wood fiber.
BCAL LCA Grocery Bags 13
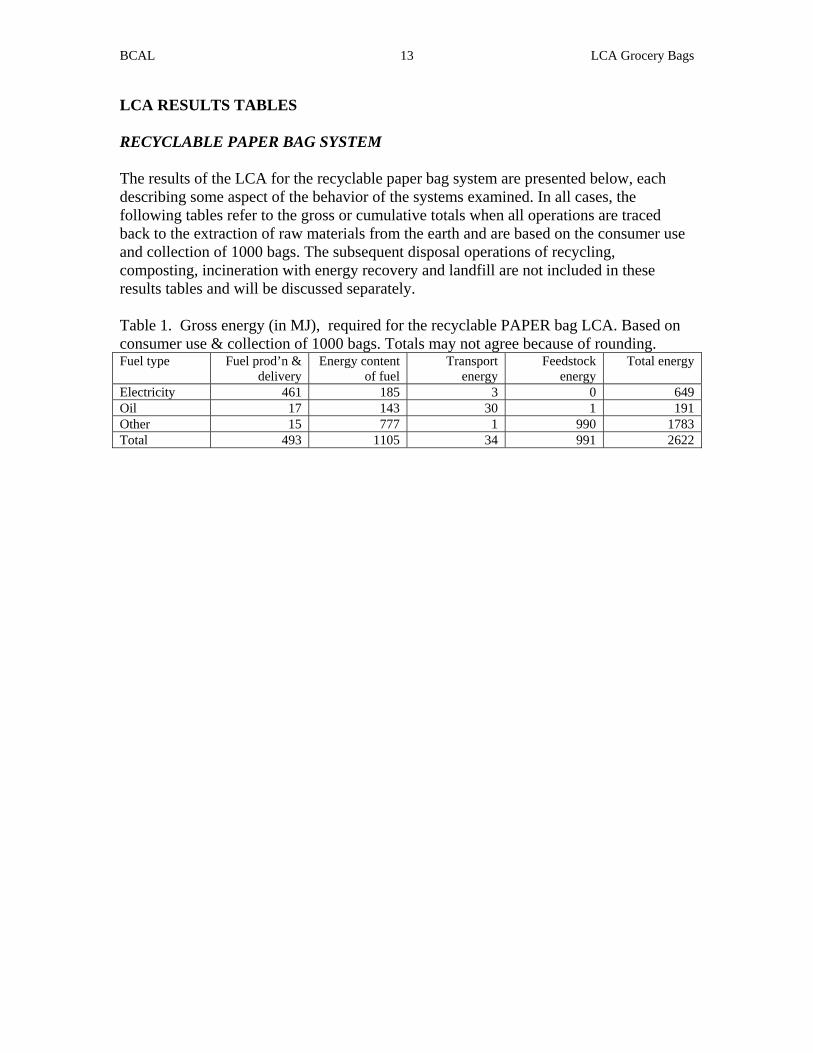
LCA RESULTS TABLES RECYCLABLE PAPER BAG SYSTEM The results of the LCA for the recyclable paper bag system are presented below, each describing some aspect of the behavior of the systems examined. In all cases, the following tables refer to the gross or cumulative totals when all operations are traced back to the extraction of raw materials from the earth and are based on the consumer use and collection of 1000 bags. The subsequent disposal operations of recycling, composting, incineration with energy recovery and landfill are not included in these results tables and will be discussed separately. Table 1. Gross energy (in MJ), required for the recyclable PAPER bag LCA. Based on consumer use & collection of 1000 bags. Totals may not agree because of rounding. Fuel type Fuel prod’n &
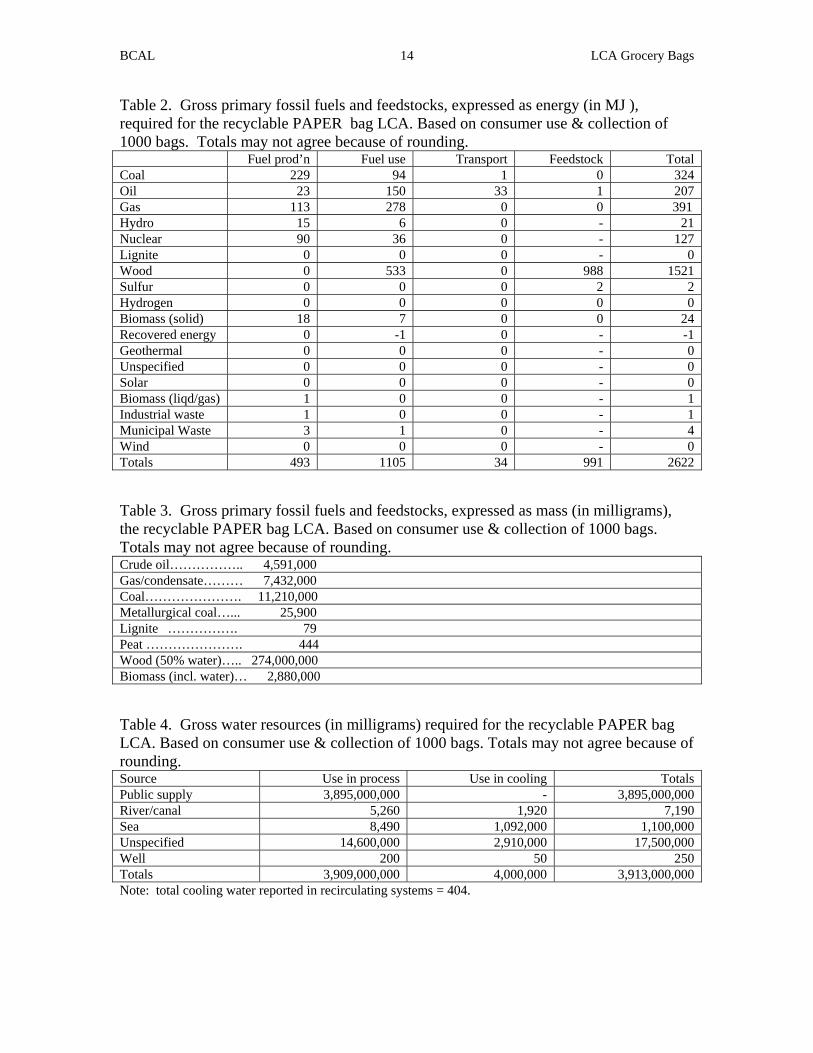
Table 2. Gross primary fossil fuels and feedstocks, expressed as energy (in MJ ), required for the recyclable PAPER bag LCA. Based on consumer use & collection of 1000 bags. Totals may not agree because of rounding. Fuel prod’n Fuel use Transport Feedstock Total Coal 229 94 1 0 324 Oil 23 150 33 1 207 Gas 113 278 0 0 391 Hydro 15 6 0 - 21 Nuclear 90 36 0 - 127 Lignite 0 0 0 - 0 Wood 0 533 0 988 1521 Sulfur 0 0 0 2 2 Hydrogen 0 0 0 0 0 Biomass (solid) 18 7 0 0 24 Recovered energy 0 -1 0 - -1 Geothermal 0 0 0 - 0 Unspecified 0 0 0 - 0 Solar 0 0 0 - 0 Biomass (liqd/gas) 1 0 0 - 1 Industrial waste 1 0 0 - 1 Municipal Waste 3 1 0 - 4 Wind 0 0 0 - 0 Totals 493 1105 34 991 2622 Table 3. Gross primary fossil fuels and feedstocks, expressed as mass (in milligrams), the recyclable PAPER bag LCA. Based on consumer use & collection of 1000 bags. Totals may not agree because of rounding. Crude oil…………….. 4,591,000 Gas/condensate……… 7,432,000 Coal…………………. 11,210,000 Metallurgical coal…... 25,900 Lignite ……………. 79 Peat …………………. 444 Wood (50% water)….. 274,000,000 Biomass (incl. water)… 2,880,000 Table 4. Gross water resources (in milligrams) required for the recyclable PAPER bag LCA. Based on consumer use & collection of 1000 bags. Totals may not agree because of rounding. Source Use in process Use in cooling Totals Public supply 3,895,000,000 - 3,895,000,000 River/canal 5,260 1,920 7,190 Sea 8,490 1,092,000 1,100,000 Unspecified 14,600,000 2,910,000 17,500,000 Well 200 50 250 Totals 3,909,000,000 4,000,000 3,913,000,000 Note: total cooling water reported in recirculating systems = 404.
BCAL LCA Grocery Bags 15
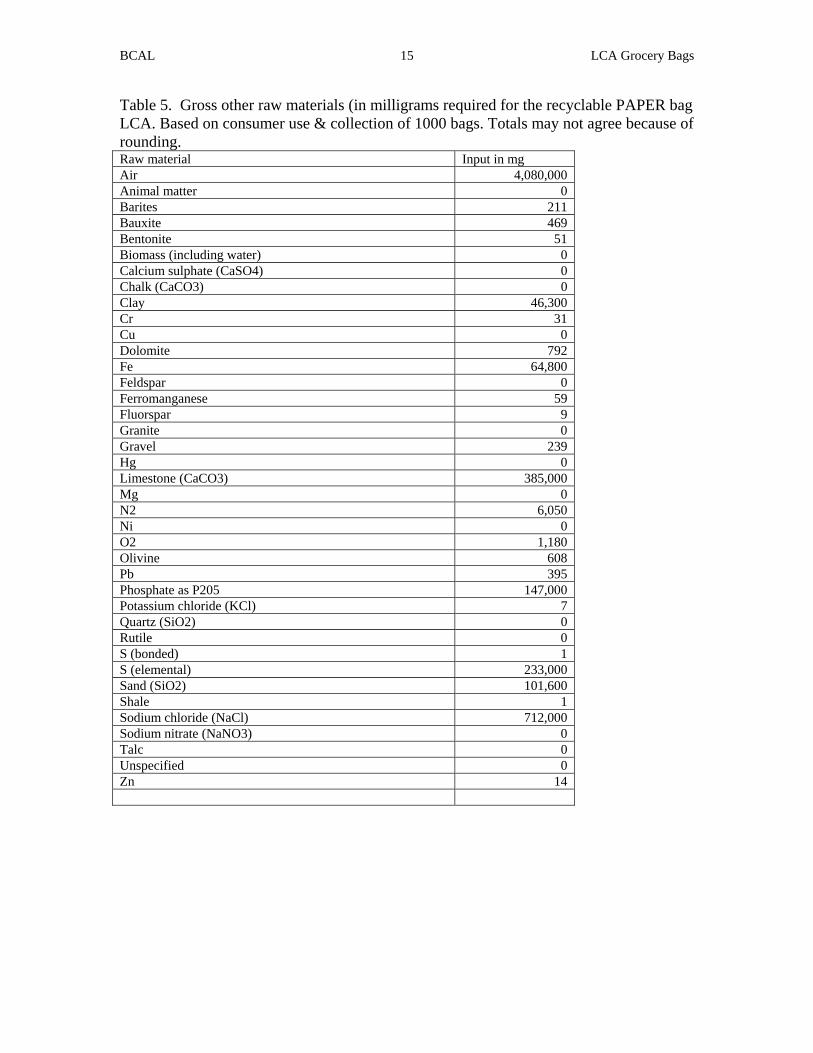
Table 5. Gross other raw materials (in milligrams required for the recyclable PAPER bag LCA. Based on consumer use & collection of 1000 bags. Totals may not agree because of rounding. Raw material Input in mg Air 4,080,000 Animal matter 0 Barites 211 Bauxite 469 Bentonite 51 Biomass (including water) 0 Calcium sulphate (CaSO4) 0 Chalk (CaCO3) 0 Clay 46,300 Cr 31 Cu 0 Dolomite 792 Fe 64,800 Feldspar 0 Ferromanganese 59 Fluorspar 9 Granite 0 Gravel 239 Hg 0 Limestone (CaCO3) 385,000 Mg 0 N2 6,050 Ni 0 O2 1,180 Olivine 608 Pb 395 Phosphate as P205 147,000 Potassium chloride (KCl) 7 Quartz (SiO2) 0 Rutile 0 S (bonded) 1 S (elemental) 233,000 Sand (SiO2) 101,600 Shale 1 Sodium chloride (NaCl) 712,000 Sodium nitrate (NaNO3) 0 Talc 0 Unspecified 0 Zn 14
BCAL LCA Grocery Bags 16
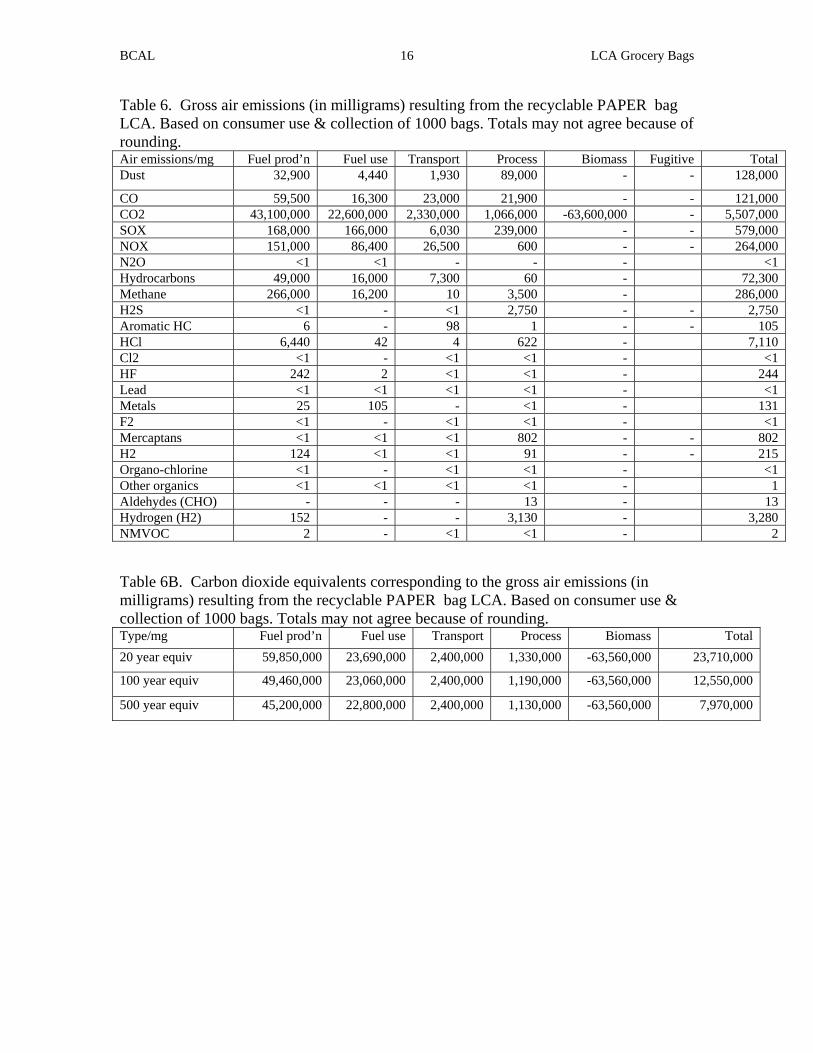
Table 6. Gross air emissions (in milligrams) resulting from the recyclable PAPER bag LCA. Based on consumer use & collection of 1000 bags. Totals may not agree because of rounding. Air emissions/mg Fuel prod’n Fuel use Transport Process Biomass Fugitive Total Dust 32,900 4,440 1,930 89,000 - - 128,000
CO 59,500 16,300 23,000 21,900 - - 121,000 CO2 43,100,000 22,600,000 2,330,000 1,066,000 -63,600,000 - 5,507,000 SOX 168,000 166,000 6,030 239,000 - - 579,000 NOX 151,000 86,400 26,500 600 - - 264,000 N2O <1 <1 - - - <1 Hydrocarbons 49,000 16,000 7,300 60 - 72,300 Methane 266,000 16,200 10 3,500 - 286,000 H2S <1 - <1 2,750 - - 2,750 Aromatic HC 6 - 98 1 - - 105 HCl 6,440 42 4 622 - 7,110 Cl2 <1 - <1 <1 - <1 HF 242 2 <1 <1 - 244 Lead <1 <1 <1 <1 - <1 Metals 25 105 - <1 - 131 F2 <1 - <1 <1 - <1 Mercaptans <1 <1 <1 802 - - 802 H2 124 <1 <1 91 - - 215 Organo-chlorine <1 - <1 <1 - <1 Other organics <1 <1 <1 <1 - 1 Aldehydes (CHO) - - - 13 - 13 Hydrogen (H2) 152 - - 3,130 - 3,280 NMVOC 2 - <1 <1 - 2 Table 6B. Carbon dioxide equivalents corresponding to the gross air emissions (in milligrams) resulting from the recyclable PAPER bag LCA. Based on consumer use & collection of 1000 bags. Totals may not agree because of rounding. Type/mg Fuel prod’n Fuel use Transport Process Biomass Total 20 year equiv 59,850,000 23,690,000 2,400,000 1,330,000 -63,560,000 23,710,000
100 year equiv 49,460,000 23,060,000 2,400,000 1,190,000 -63,560,000 12,550,000
500 year equiv 45,200,000 22,800,000 2,400,000 1,130,000 -63,560,000 7,970,000
BCAL LCA Grocery Bags 17
Table 7. Gross water emissions (in milligrams), resulting from the recyclable PAPER bag LCA. Based on consumer use & collection of 1000 bags.. Totals may not agree because of rounding. Fuel prod’n Fuel use Transport Process Total COD 55 - 35 396,000 396,000 BOD 14 - <1 75,000 75,000 Acid (H+) 11 - <1 1 13 Al+compounds as Al <1 - <1 <1 <1 Ammonium compounds as NH4 19 - 2 <1 22 AOX <1 - <1 <1 <1 As+compounds as As - - <1 <1 <1 BrO3-- <1 - <1 <1 <1 Ca+compounds as Ca <1 - <1 19 20 Cd+compounds as Cd - - <1 - <1 Cl- 25 - 35 10,400 10,400 ClO3-- <1 - <1 97 97 CN- <1 - <1 <1 <1 CO3-- - - 3 30 34 Cr+compounds as Cr <1 - <1 <1 <1 Cu+compounds as Cu <1 - <1 <1 <1 Detergent/oil <1 - 2 3 6 Dichloroethane (DCE) <1 - <1 <1 <1 Dioxin/furan as Teq - - <1 - <1 Dissolved chlorine <1 - <1 <1 <1 Dissolved organics (non-HC) 23 - <1 <1 23 Dissolved solids not specified 1 - 9 3,700 3,710 F- <1 - <1 <1 <1 Fe+compounds as Fe <1 - 2 <1 3 Hg+compounds as Hg <1 - <1 <1 <1 Hydrocarbons not specified <1 <1 2 <1 3 K+compounds as K <1 - <1 <1 <1 Metals not specified elsewhere 3 - <1 3,060 3,060 Mg+compounds as Mg <1 - <1 <1 <1 Mn+compounds as Mn - - <1 <1 <1 Na+compounds as Na 10 - 22 7,510 7,540 Ni+compounds as Ni <1 - <1 <1 <1 NO3- 1 - <1 76 78 Organo-chlorine not specified <1 - <1 6 6 Organo-tin as Sn - - <1 - <1 Other nitrogen as N 3 - <1 7,950 7,950 Other organics not specified <1 - <1 <1 <1 P+compounds as P <1 - <1 879 880 Pb+compounds as PB <1 - <1 <1 <1 Phenols <1 - <1 <1 <1 S+sulphides as S <1 - <1 344 344 SO4-- <1 - 8 1536 1,544 Sr+compounds as Sr - - <1 <1 <1 Suspended solids 2,850 - 3,870 219,800 226,500 TOC <1 - <1 <1 <1 Vinyl chloride monomer <1 - <1 <1 <1 Zn+compounds as Zn <1 - <1 <1 <1
BCAL LCA Grocery Bags 18
Table 8. Generation of solid waste (in milligrams resulting from the recyclable PAPER bag LCA. Based on consumer use & collection of 1000 bags. Totals may not agree because of rounding. Solid waste (mg) Fuel prod’n Fuel use Transport Process Total Construction waste <1 - <1 <1 <1 Inert chemical <1 - <1 275 276 Metals <1 - <1 1,350 1,350 Mineral waste 2,590 - 38,500 1889,000 230,000 Mixed industrial -26,300 - 1,550 22,900 -1,860 Municipal solid waste -383,000 - - - -383,000 Paper <1 - <1 <1 <1 Plastic containers <1 - <1 - <1 Plastics <1 - <1 389 390 Putrescibles <1 - 11 <1 11 Regulated chemicals 67,500 - 3 85 67,600 Slags/ash 921,000 5,290 15,000 5,380 947,000 Tailings 81 - 1,290 4 1,380 Unregulated chemicals 51,200 - 51 820 52,040 Unspecified refuse 55,300 - <1 282,000 337,000 Waste returned to mine 2,202,000 - 1,420 345 2,203,000 Waste to compost - - - 1,290,000 1,290,000 Waste to incinerator 1 - 18 16 35 Waste to recycle <1 - <1 2,544,000 2,544,000 Wood waste <1 - <1 306,000 306,000 Wood pallets to recycle
<1 - <1 - <1
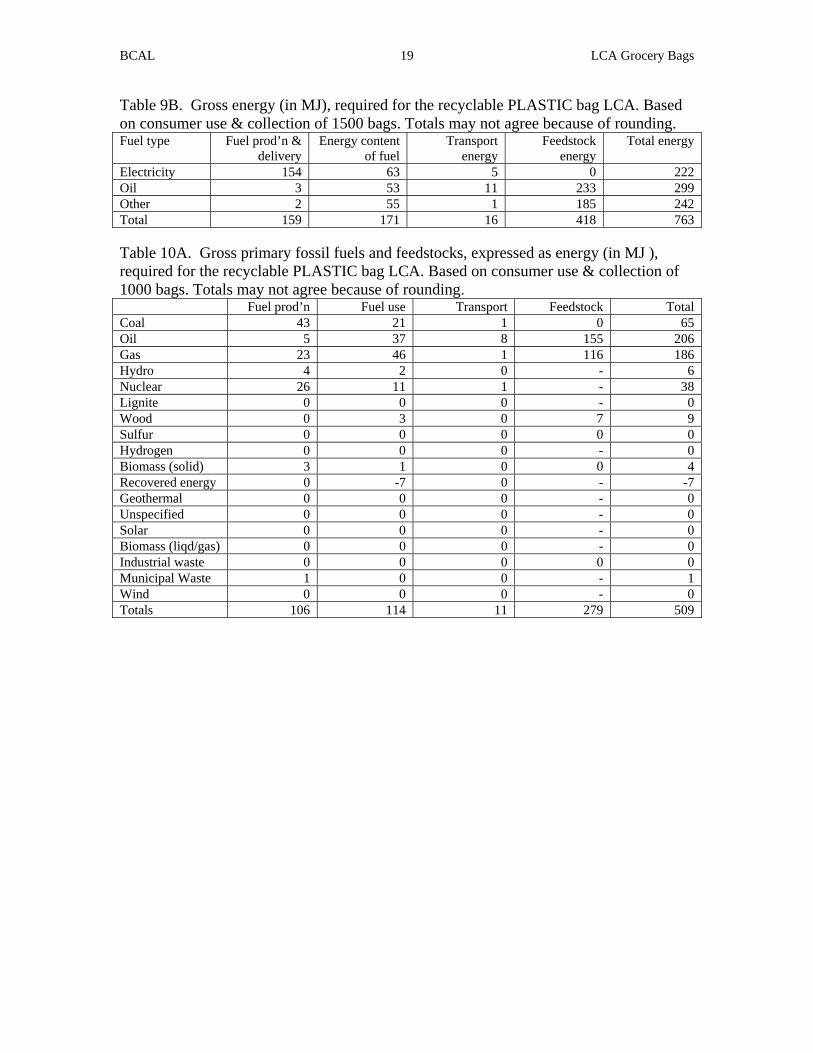
RECYCLABLE PLASTIC BAG SYSTEM The results of the LCA for the recyclable plastic bag system are presented below, each describing some aspect of the behavior of the systems examined. In all cases, the following tables refer to the gross or cumulative totals when all operations are traced back to the extraction of raw materials from the earth and are based on the consumer use and collection of 1000 bags and 1500 bags. The subsequent disposal operations of recycling, composting, incineration with energy recovery and landfill are not included in these results tables and will be discussed separately. Table 9A. Gross energy (in MJ), required for the recyclable PLASTIC bag LCA. Based on consumer use & collection of 1000 bags. Totals may not agree because of rounding. Fuel type Fuel prod’n &
Table 9B. Gross energy (in MJ), required for the recyclable PLASTIC bag LCA. Based on consumer use & collection of 1500 bags. Totals may not agree because of rounding. Fuel type Fuel prod’n &
delivery Energy content
of fuel Transport
energy Feedstock
energy Total energy
Electricity 154 63 5 0 222 Oil 3 53 11 233 299 Other 2 55 1 185 242 Total 159 171 16 418 763 Table 10A. Gross primary fossil fuels and feedstocks, expressed as energy (in MJ ), required for the recyclable PLASTIC bag LCA. Based on consumer use & collection of 1000 bags. Totals may not agree because of rounding. Fuel prod’n Fuel use Transport Feedstock Total Coal 43 21 1 0 65 Oil 5 37 8 155 206 Gas 23 46 1 116 186 Hydro 4 2 0 - 6 Nuclear 26 11 1 - 38 Lignite 0 0 0 - 0 Wood 0 3 0 7 9 Sulfur 0 0 0 0 0 Hydrogen 0 0 0 - 0 Biomass (solid) 3 1 0 0 4 Recovered energy 0 -7 0 - -7 Geothermal 0 0 0 - 0 Unspecified 0 0 0 - 0 Solar 0 0 0 - 0 Biomass (liqd/gas) 0 0 0 - 0 Industrial waste 0 0 0 0 0 Municipal Waste 1 0 0 - 1 Wind 0 0 0 - 0 Totals 106 114 11 279 509
BCAL LCA Grocery Bags 20
Table 10B. Gross primary fossil fuels and feedstocks, expressed as energy (in MJ ), required for the recyclable PLASTIC bag LCA. Based on consumer use & collection of 1500 bags. Totals may not agree because of rounding. Fuel prod’n Fuel use Transport Feedstock Total Coal 65 31 2 0 98 Oil 8 56 12 233 309 Gas 35 69 2 175 279 Hydro 6 3 0 - 9 39 16 1 1 - 57 Lignite 0 0 0 - 0 Wood 0 4 0 10 14 Sulfur 0 0 0 0 0 Hydrogen 0 0 0 - 0 Biomass (solid) 4 2 0 0 6 Recovered energy 0 -11 0 - -11 Geothermal 0 0 0 - 0 Unspecified 0 0 0 - 0 Solar 0 0 0 - 0 Biomass (liqd/gas) 0 0 0 - 0 Industrial waste 0 0 0 0 0 Municipal Waste 1 0 0 - 1 Wind 0 0 0 - 0 Totals 159 171 16 418 763 Table 11A. Gross primary fossil fuels and feedstocks, expressed as mass (in milligrams), required the recyclable PLASTIC bag LCA. Based on consumer use & collection of 1000 bags. Totals may not agree because of rounding. Crude oil…………….. 4,571,000 Gas/condensate……… 3,065,000 Coal…………………. 2,259,000 Metallurgical coal…... 6,060 Lignite ……………. 670 Peat …………………. 7,920 Wood (50% water)….. 809,000 Biomass (incl. water)… 498,000 Table 11B. Gross primary fossil fuels and feedstocks, expressed as mass (in milligrams), required the recyclable PLASTIC bag LCA. Based on consumer use & collection of 1500 bags. Totals may not agree because of rounding. Crude oil…………….. 6,857,000 Gas/condensate……… 4,598,000 Coal…………………. 3,388,000 Metallurgical coal…... 9,100 Lignite ……………. 1,010 Peat …………………. 11,900 Wood (50% water)….. 1,212,000 Biomass (incl. water)… 746,000
BCAL LCA Grocery Bags 21
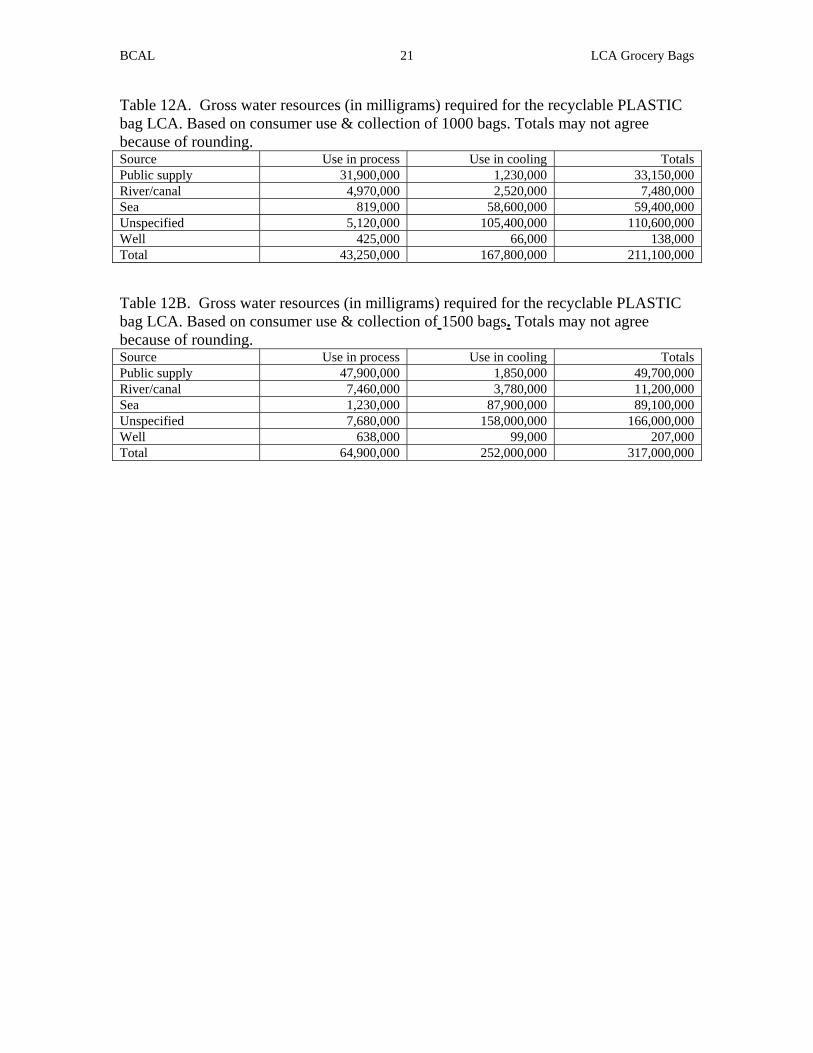
Table 12A. Gross water resources (in milligrams) required for the recyclable PLASTIC bag LCA. Based on consumer use & collection of 1000 bags. Totals may not agree because of rounding. Source Use in process Use in cooling Totals Public supply 31,900,000 1,230,000 33,150,000 River/canal 4,970,000 2,520,000 7,480,000 Sea 819,000 58,600,000 59,400,000 Unspecified 5,120,000 105,400,000 110,600,000 Well 425,000 66,000 138,000 Total 43,250,000 167,800,000 211,100,000 Table 12B. Gross water resources (in milligrams) required for the recyclable PLASTIC bag LCA. Based on consumer use & collection of 1500 bags. Totals may not agree because of rounding. Source Use in process Use in cooling Totals Public supply 47,900,000 1,850,000 49,700,000 River/canal 7,460,000 3,780,000 11,200,000 Sea 1,230,000 87,900,000 89,100,000 Unspecified 7,680,000 158,000,000 166,000,000 Well 638,000 99,000 207,000 Total 64,900,000 252,000,000 317,000,000
BCAL LCA Grocery Bags 22
Table 13A. Gross other raw materials (in milligrams required for the recyclable PLASTIC bag LCA. Based on consumer use & collection of 1000 bags. Totals may not agree because of rounding. Raw material Input in mg Air 1,436,000 Animal matter <1 Barites 343 Bauxite 111 Bentonite 231 Calcium sulphate (CaSO4) 22 Clay 235 Cr 7 Cu <1 Dolomite 184 Fe 15,000 Feldspar <1 Ferromanganese 14 Fluorspar 3 Granite <1 Gravel 56 Hg <1 Limestone (CaCO3) 542,000 Mg <1 N2 823,000 Ni <1 O2 110,000 Olivine 141 Pb 87 Phosphate as P205 743 Potassium chloride (KCl) 252 Quartz (SiO2) 0 Rutile 272,000 S (bonded) 13 S (elemental) 1,520 Sand (SiO2) 935 Shale 63 Sodium chloride (NaCl) 51,200 Sodium nitrate (NaNO3) 0 Talc <1 Unspecified <1 Zn 266
BCAL LCA Grocery Bags 23
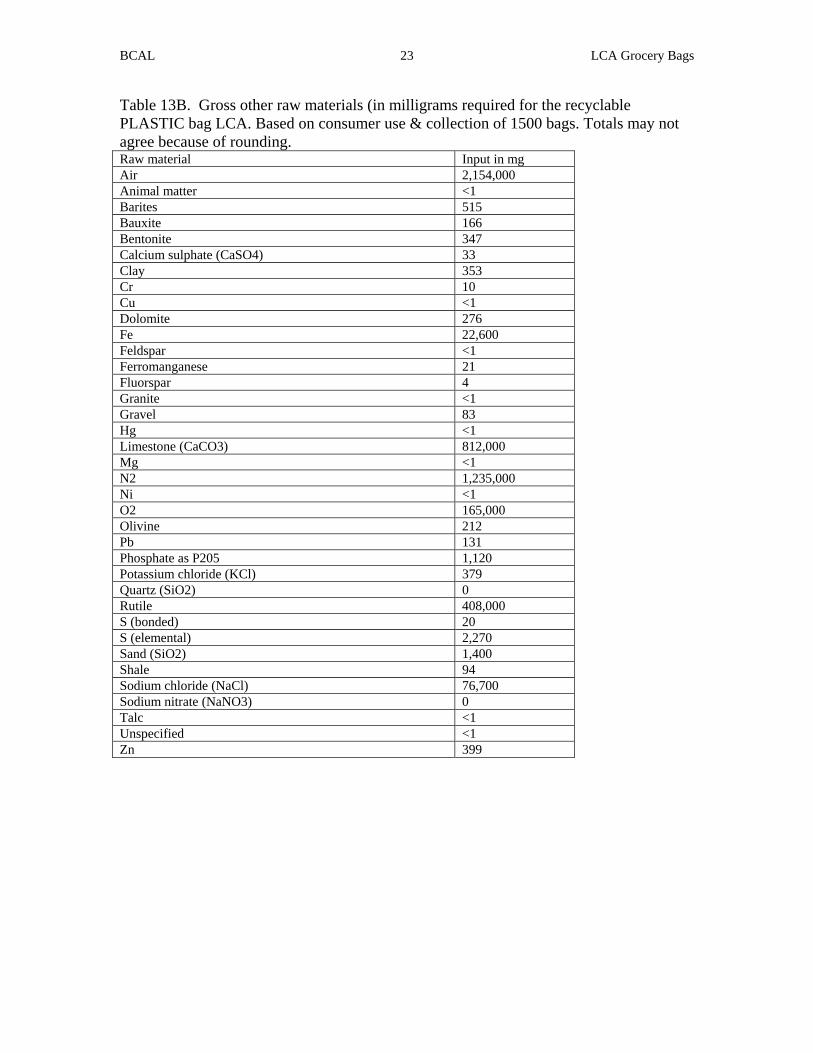
Table 13B. Gross other raw materials (in milligrams required for the recyclable PLASTIC bag LCA. Based on consumer use & collection of 1500 bags. Totals may not agree because of rounding. Raw material Input in mg Air 2,154,000 Animal matter <1 Barites 515 Bauxite 166 Bentonite 347 Calcium sulphate (CaSO4) 33 Clay 353 Cr 10 Cu <1 Dolomite 276 Fe 22,600 Feldspar <1 Ferromanganese 21 Fluorspar 4 Granite <1 Gravel 83 Hg <1 Limestone (CaCO3) 812,000 Mg <1 N2 1,235,000 Ni <1 O2 165,000 Olivine 212 Pb 131 Phosphate as P205 1,120 Potassium chloride (KCl) 379 Quartz (SiO2) 0 Rutile 408,000 S (bonded) 20 S (elemental) 2,270 Sand (SiO2) 1,400 Shale 94 Sodium chloride (NaCl) 76,700 Sodium nitrate (NaNO3) 0 Talc <1 Unspecified <1 Zn 399
BCAL LCA Grocery Bags 24
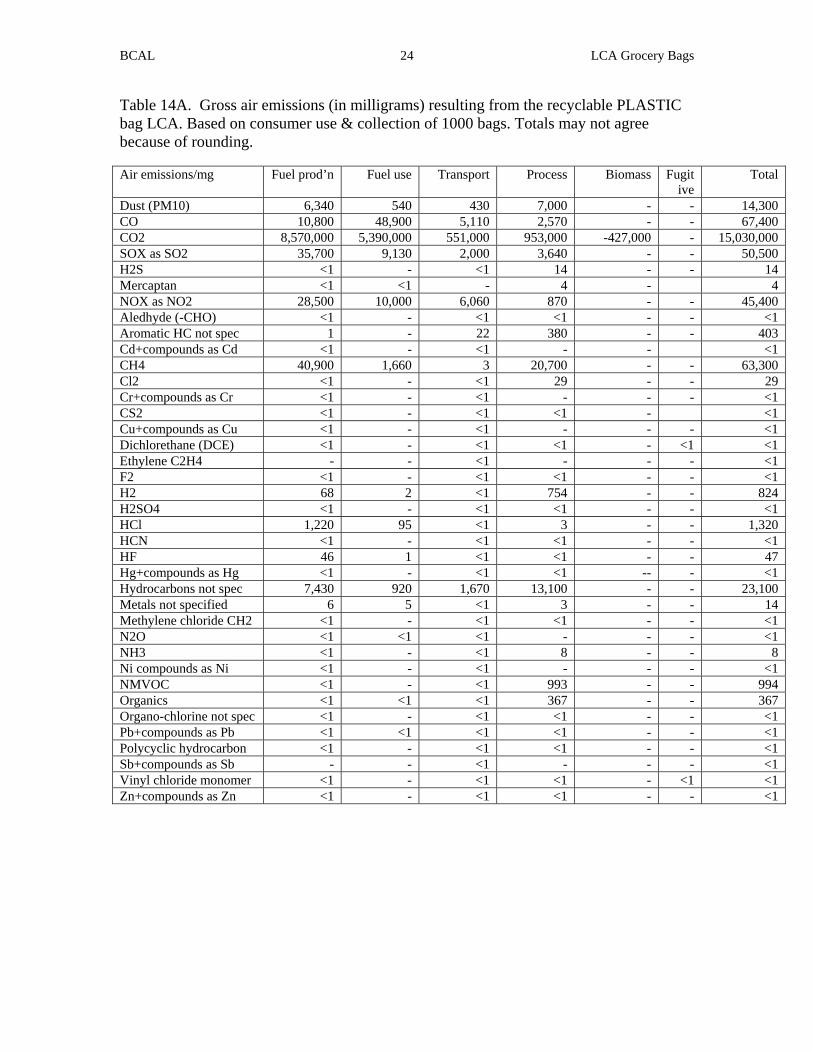
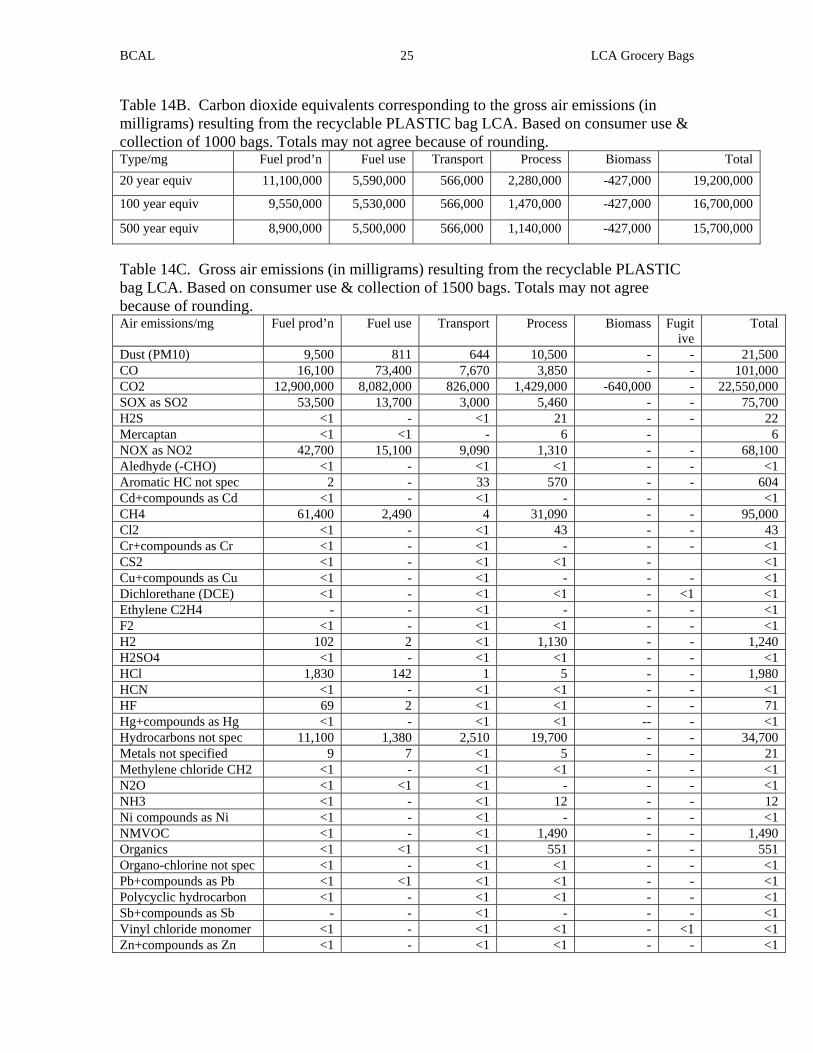
Table 14A. Gross air emissions (in milligrams) resulting from the recyclable PLASTIC bag LCA. Based on consumer use & collection of 1000 bags. Totals may not agree because of rounding. Air emissions/mg Fuel prod’n Fuel use Transport Process Biomass Fugit
Table 14B. Carbon dioxide equivalents corresponding to the gross air emissions (in milligrams) resulting from the recyclable PLASTIC bag LCA. Based on consumer use & collection of 1000 bags. Totals may not agree because of rounding. Type/mg Fuel prod’n Fuel use Transport Process Biomass Total 20 year equiv 11,100,000 5,590,000 566,000 2,280,000 -427,000 19,200,000
100 year equiv 9,550,000 5,530,000 566,000 1,470,000 -427,000 16,700,000
500 year equiv 8,900,000 5,500,000 566,000 1,140,000 -427,000 15,700,000
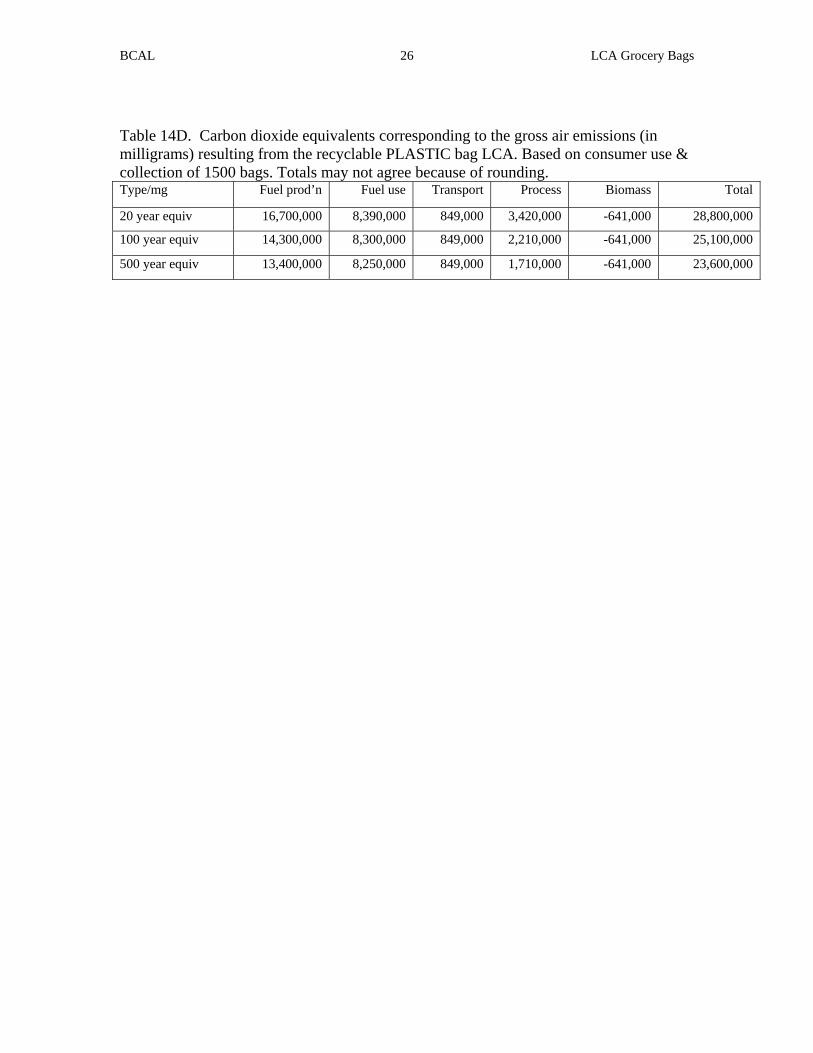
Table 14C. Gross air emissions (in milligrams) resulting from the recyclable PLASTIC bag LCA. Based on consumer use & collection of 1500 bags. Totals may not agree because of rounding. Air emissions/mg Fuel prod’n Fuel use Transport Process Biomass Fugit
Table 14D. Carbon dioxide equivalents corresponding to the gross air emissions (in milligrams) resulting from the recyclable PLASTIC bag LCA. Based on consumer use & collection of 1500 bags. Totals may not agree because of rounding. Type/mg Fuel prod’n Fuel use Transport Process Biomass Total
20 year equiv 16,700,000 8,390,000 849,000 3,420,000 -641,000 28,800,000
100 year equiv 14,300,000 8,300,000 849,000 2,210,000 -641,000 25,100,000
500 year equiv 13,400,000 8,250,000 849,000 1,710,000 -641,000 23,600,000
BCAL LCA Grocery Bags 27
Table 15A. Gross water emissions (in milligrams), resulting from the recyclable PLASTIC bag LCA. Based on consumer use & collection of 1000 bags. Totals may not agree because of rounding. Fuel prod’n Fuel use Transport Process Total COD 9 - 8 5390 5,410 BOD 2 - <1 543 545 Acid (H+) 4 - <1 9 13 Al+compounds as Al <1 - <1 4 4 Ammonium compounds as NH4 5 - <1 11 17 AOX <1 - <1 <1 <1 As+compounds as As - - <1 <1 <1 BrO3-- <1 - <1 <1 <1 Ca+compounds as Ca <1 - <1 20 20 Cd+compounds as Cd - - <1 - <1 Cl- 3 - 8 3,060 3,070 ClO3-- <1 - <1 15 15 CN- <1 - <1 <1 <1 CO3-- - - <1 181 182 Cr+compounds as Cr <1 - <1 <1 <1 Cu+compounds as Cu <1 - <1 1 1 Detergent/oil <1 - <1 39 40 Dichloroethane (DCE) <1 - <1 <1 <1 Dioxin/furan as Teq - - <1 - <1 Dissolved chlorine <1 - <1 <1 <1 Dissolved organics (non-HC) 3 - <1 44 47 Dissolved solids not specified 2 - 2 947 952 F- <1 - <1 <1 <1 Fe+compounds as Fe <1 - <1 <1 <1 Hg+compounds as Hg <1 - <1 <1 <1 Hydrocarbons not specified 26 <1 <1 3 30 K+compounds as K <1 - <1 11 11 Metals not specified elsewhere <1 - <1 54 55 Mg+compounds as Mg <1 - <1 <1 <1 Mn+compounds as Mn - - <1 <1 <1 Na+compounds as Na 2 - 5 3,136 3,143 Ni+compounds as Ni <1 - <1 <1 <1 NO3- 1 - <1 13 13 Organo-chlorine not specified <1 - <1 <1 <1 Organo-tin as Sn - - <1 - <1 Other nitrogen as N <1 - <1 46 47 Other organics not specified <1 - <1 <1 <1 P+compounds as P <1 - <1 7 7 Pb+compounds as PB <1 - <1 <1 <1 Phenols <1 - <1 10 10 S+sulphides as S <1 - <1 2 2 SO4-- <1 - 2 4,097 4,098 Sr+compounds as Sr - - <1 <1 <1 Suspended solids 573 - 861 78,300 79,800 TOC <1 - <1 60 60 Vinyl chloride monomer <1 - <1 <1 <1 Zn+compounds as Zn <1 - <1 <1 <1
BCAL LCA Grocery Bags 28
Table 15B. Gross water emissions (in milligrams), resulting from the recyclable PLASTIC bag LCA. Based on consumer use & collection of 1500 bags. Totals may not agree because of rounding. Fuel prod’n Fuel use Transport Process Total COD 14 - 12 8,080 8,110 BOD 3 - <1 814 817 Acid (H+) 6 - <1 13 19 Al+compounds as Al <1 - <1 5 5 Ammonium compounds as NH4 7 - <1 17 25 AOX <1 - <1 <1 <1 As+compounds as As - - <1 <1 <1 BrO3-- <1 - <1 <1 <1 Ca+compounds as Ca <1 - <1 30 30 Cd+compounds as Cd - - <1 - <1 Cl- 5 - 11 4,590 4,610 ClO3-- <1 - <1 22 22 CN- <1 - <1 <1 <1 CO3-- - - 1 272 273 Cr+compounds as Cr <1 - <1 <1 <1 Cu+compounds as Cu <1 - <1 2 2 Detergent/oil <1 - <1 59 60 Dichloroethane (DCE) <1 - <1 <1 <1 Dioxin/furan as Teq - - <1 - <1 Dissolved chlorine <1 - <1 1 1 Dissolved organics (non-HC) 4 - <1 66 70 Dissolved solids not specified 3 - 3 1,420 1,430 F- <1 - <1 <1 <1 Fe+compounds as Fe <1 - <1 <1 <1 Hg+compounds as Hg <1 - <1 <1 <1 Hydrocarbons not specified 39 <1 <1 4 45 K+compounds as K <1 - <1 16 16 Metals not specified elsewhere 1 - <1 81 83 Mg+compounds as Mg <1 - <1 <1 <1 Mn+compounds as Mn - - <1 <1 <1 Na+compounds as Na 3 - 8 4,700 4,710 Ni+compounds as Ni <1 - <1 <1 <1 NO3- <1 - <1 19 19 Organo-chlorine not specified <1 - <1 <1 <1 Organo-tin as Sn - - <1 - <1 Other nitrogen as N 1 - <1 69 70 Other organics not specified <1 - <1 <1 <1 P+compounds as P <1 - <1 10 10 Pb+compounds as PB <1 - <1 <1 <1 Phenols <1 - <1 15 15 S+sulphides as S <1 - <1 3 3 SO4-- <1 - 3 6,150 6,150 Sr+compounds as Sr - - <1 <1 <1 Suspended solids 860 - 1,290 117,500 119,600 TOC <1 - <1 90 90 Vinyl chloride monomer <1 - <1 <1 <1 Zn+compounds as Zn <1 - <1 1 1
BCAL LCA Grocery Bags 29
Table 16A. Generation of solid waste (in milligrams resulting from the recyclable PLASTIC bag LCA. Based on consumer use & collection of 1000 bags. Totals may not agree because of rounding. Solid waste (mg) Fuel prod’n Fuel use Transport Process Total Construction waste <1 - <1 <1 <1 Inert chemical <1 - <1 3,446 3,446 Metals <1 - <1 301 301 Mineral waste 974 - 8,564 324,200 333,700 Mixed industrial -11,800 - 345 5,520 -5,950 Municipal solid waste -79,800 - - 22,500 -57,300 Paper <1 - <1 <1 <1 Plastic containers <1 - <1 - <1 Plastics <1 - <1 53,600 53,600 Putrescibles <1 - 2 7 10 Regulated chemicals 9,040 - <1 4,720 13,800 Slags/ash 180,000 4,460 3,330 1,660 189,000 Tailings 16 - 287 1,048 1,350 Unregulated chemicals 6,810 - 11 7,190 14,000 Unspecified refuse 7,350 - <1 62,900 70,200 Waste returned to mine 443,000 - 316 872 444,400 Waste to compost - - - 9,290 9,290 Waste to incinerator <1 - 4 4,370 4,380 Waste to recycle <1 - <1 33,200 33,200 Wood waste <1 - <1 2,330 2,330 Wood pallets to recycle
<1 - <1 298,000 298,000
Table 16B. Generation of solid waste (in milligrams resulting from the recyclable PLASTIC bag LCA. Based on consumer use & collection of 1500 bags. Totals may not agree because of rounding. Solid waste (mg) Fuel prod’n Fuel use Transport Process Total Construction waste <1 - <1 <1 <1 Inert chemical <1 - <1 5,170 5,170 Metals <1 - <1 452 452 Mineral waste 1,460 - 12,800 486,000 501,000 Mixed industrial -17,700 - 517 8,280 -8,930 Municipal solid waste 1119,700 - - 33,800 -85,900 Paper <1 - <1 <1 <1 Plastic containers <1 - <1 - <1 Plastics <1 - <1 80,400 80,400 Putrescibles <1 - 4 11 14 Regulated chemicals 13,600 - <1 7,080 20,600 Slags/ash 270,000 6,680 4,990 2,480 284,000 Tailings 24 - 430 1,570 2,030 Unregulated chemicals 10,200 - 17 10,800 21,000 Unspecified refuse 11,030 - <1 94,300 105,400 Waste returned to mine 665,000 - 475 1,310 667,000 Waste to compost - - - 13,900 13,900 Waste to incinerator <1 - 6 6,560 6,560 Waste to recycle <1 - <1 49,800 49,800 Wood waste <1 - <1 3,500 3,500 Wood pallets to recycle
<1 - <1 447,000 447,000
BCAL LCA Grocery Bags 30
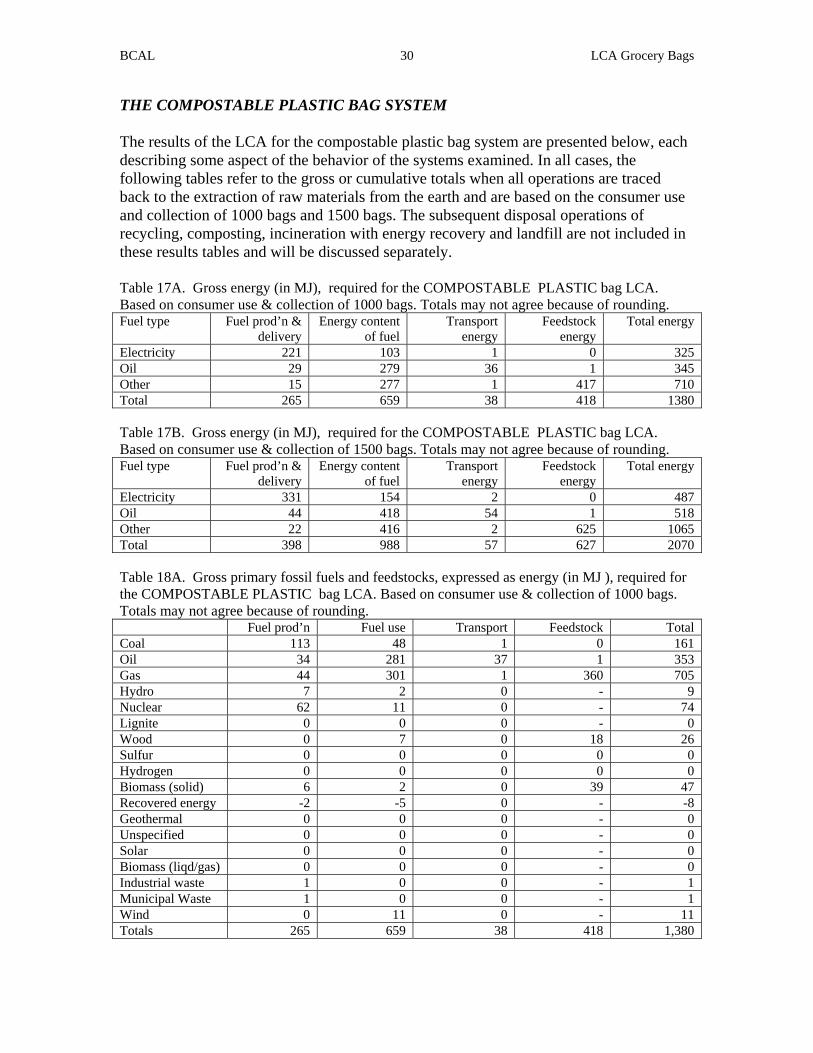
THE COMPOSTABLE PLASTIC BAG SYSTEM The results of the LCA for the compostable plastic bag system are presented below, each describing some aspect of the behavior of the systems examined. In all cases, the following tables refer to the gross or cumulative totals when all operations are traced back to the extraction of raw materials from the earth and are based on the consumer use and collection of 1000 bags and 1500 bags. The subsequent disposal operations of recycling, composting, incineration with energy recovery and landfill are not included in these results tables and will be discussed separately. Table 17A. Gross energy (in MJ), required for the COMPOSTABLE PLASTIC bag LCA. Based on consumer use & collection of 1000 bags. Totals may not agree because of rounding. Fuel type Fuel prod’n &
delivery Energy content
of fuel Transport
energy Feedstock
energy Total energy
Electricity 221 103 1 0 325 Oil 29 279 36 1 345 Other 15 277 1 417 710 Total 265 659 38 418 1380 Table 17B. Gross energy (in MJ), required for the COMPOSTABLE PLASTIC bag LCA. Based on consumer use & collection of 1500 bags. Totals may not agree because of rounding. Fuel type Fuel prod’n &
delivery Energy content
of fuel Transport
energy Feedstock
energy Total energy
Electricity 331 154 2 0 487 Oil 44 418 54 1 518 Other 22 416 2 625 1065 Total 398 988 57 627 2070 Table 18A. Gross primary fossil fuels and feedstocks, expressed as energy (in MJ ), required for the COMPOSTABLE PLASTIC bag LCA. Based on consumer use & collection of 1000 bags. Totals may not agree because of rounding. Fuel prod’n Fuel use Transport Feedstock Total Coal 113 48 1 0 161 Oil 34 281 37 1 353 Gas 44 301 1 360 705 Hydro 7 2 0 - 9 Nuclear 62 11 0 - 74 Lignite 0 0 0 - 0 Wood 0 7 0 18 26 Sulfur 0 0 0 0 0 Hydrogen 0 0 0 0 0 Biomass (solid) 6 2 0 39 47 Recovered energy -2 -5 0 - -8 Geothermal 0 0 0 - 0 Unspecified 0 0 0 - 0 Solar 0 0 0 - 0 Biomass (liqd/gas) 0 0 0 - 0 Industrial waste 1 0 0 - 1 Municipal Waste 1 0 0 - 1 Wind 0 11 0 - 11 Totals 265 659 38 418 1,380
BCAL LCA Grocery Bags 31
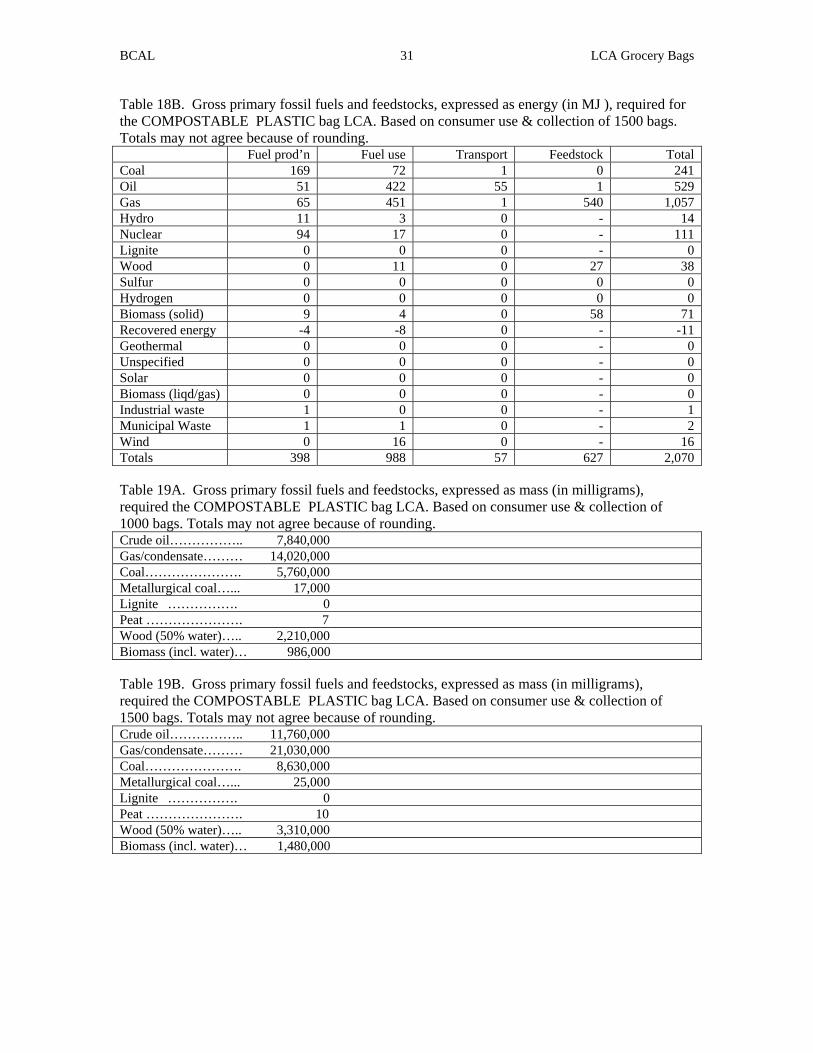
Table 18B. Gross primary fossil fuels and feedstocks, expressed as energy (in MJ ), required for the COMPOSTABLE PLASTIC bag LCA. Based on consumer use & collection of 1500 bags. Totals may not agree because of rounding. Fuel prod’n Fuel use Transport Feedstock Total Coal 169 72 1 0 241 Oil 51 422 55 1 529 Gas 65 451 1 540 1,057 Hydro 11 3 0 - 14 Nuclear 94 17 0 - 111 Lignite 0 0 0 - 0 Wood 0 11 0 27 38 Sulfur 0 0 0 0 0 Hydrogen 0 0 0 0 0 Biomass (solid) 9 4 0 58 71 Recovered energy -4 -8 0 - -11 Geothermal 0 0 0 - 0 Unspecified 0 0 0 - 0 Solar 0 0 0 - 0 Biomass (liqd/gas) 0 0 0 - 0 Industrial waste 1 0 0 - 1 Municipal Waste 1 1 0 - 2 Wind 0 16 0 - 16 Totals 398 988 57 627 2,070 Table 19A. Gross primary fossil fuels and feedstocks, expressed as mass (in milligrams), required the COMPOSTABLE PLASTIC bag LCA. Based on consumer use & collection of 1000 bags. Totals may not agree because of rounding. Crude oil…………….. 7,840,000 Gas/condensate……… 14,020,000 Coal…………………. 5,760,000 Metallurgical coal…... 17,000 Lignite ……………. 0 Peat …………………. 7 Wood (50% water)….. 2,210,000 Biomass (incl. water)… 986,000 Table 19B. Gross primary fossil fuels and feedstocks, expressed as mass (in milligrams), required the COMPOSTABLE PLASTIC bag LCA. Based on consumer use & collection of 1500 bags. Totals may not agree because of rounding. Crude oil…………….. 11,760,000 Gas/condensate……… 21,030,000 Coal…………………. 8,630,000 Metallurgical coal…... 25,000 Lignite ……………. 0 Peat …………………. 10 Wood (50% water)….. 3,310,000 Biomass (incl. water)… 1,480,000
BCAL LCA Grocery Bags 32
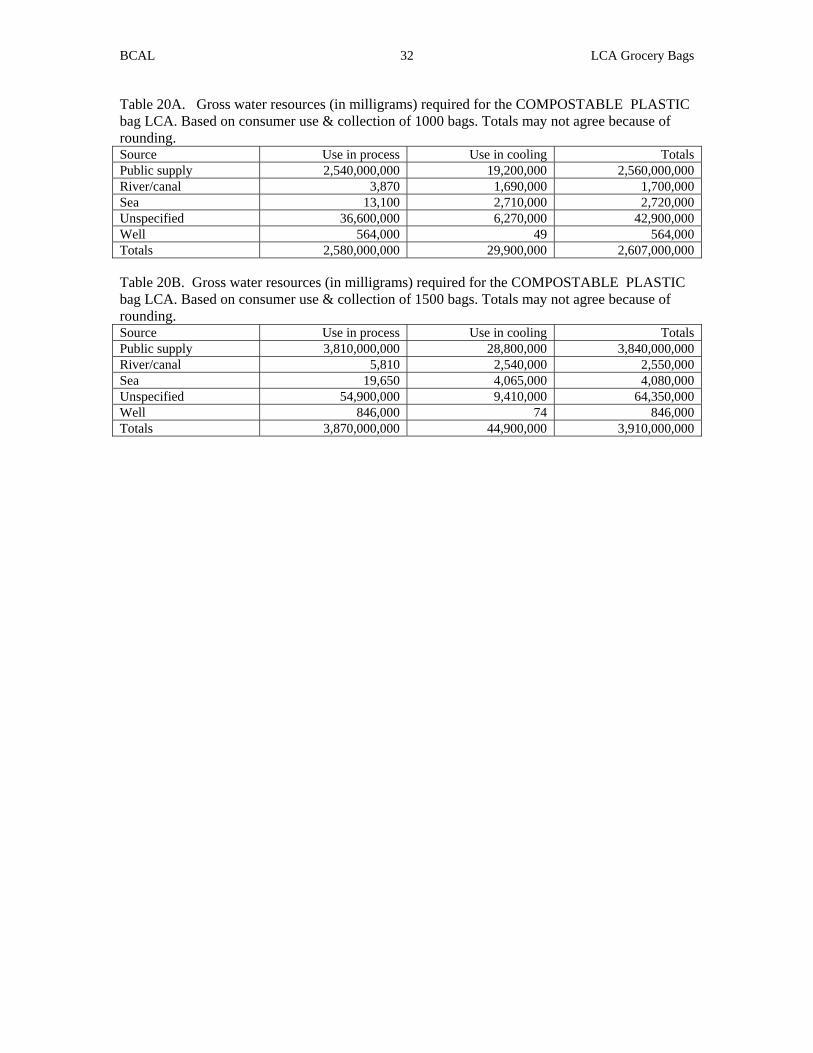
Table 20A. Gross water resources (in milligrams) required for the COMPOSTABLE PLASTIC bag LCA. Based on consumer use & collection of 1000 bags. Totals may not agree because of rounding. Source Use in process Use in cooling Totals Public supply 2,540,000,000 19,200,000 2,560,000,000 River/canal 3,870 1,690,000 1,700,000 Sea 13,100 2,710,000 2,720,000 Unspecified 36,600,000 6,270,000 42,900,000 Well 564,000 49 564,000 Totals 2,580,000,000 29,900,000 2,607,000,000 Table 20B. Gross water resources (in milligrams) required for the COMPOSTABLE PLASTIC bag LCA. Based on consumer use & collection of 1500 bags. Totals may not agree because of rounding. Source Use in process Use in cooling Totals Public supply 3,810,000,000 28,800,000 3,840,000,000 River/canal 5,810 2,540,000 2,550,000 Sea 19,650 4,065,000 4,080,000 Unspecified 54,900,000 9,410,000 64,350,000 Well 846,000 74 846,000 Totals 3,870,000,000 44,900,000 3,910,000,000
BCAL LCA Grocery Bags 33
Table 21A. Gross other raw materials (in milligrams) required for the COMPOSTABLE PLASTIC bag LCA. Based on consumer use & collection of 1000 bags. Totals may not agree because of rounding. Raw material Input in mg Air 1,460,000 Animal matter 0 Barites 1,700 Bauxite 4,000 Bentonite 99 Calcium sulphate (CaSO4) <1 Clay 34,200 Cr 19 Cu 0 Dolomite 513 Fe 47,300 Feldspar 0 Ferromanganese 38 Fluorspar 3 Granite 0 Gravel 155 Hg 0 Limestone (CaCO3) 4,230,000 Mg 0 N2 for reaction 17,900 Ni 0 O2 for reaction 1,030 Olivine 394 Pb 260 Phosphate as P205 12,300 Potassium chloride (KCl) 23,000 Quartz (SiO2) 0 Rutile 0 S (bonded) 401,000 S (elemental) 23,700 Sand (SiO2) 22,400 Shale 2 Sodium chloride (NaCl) 261,000 Sodium nitrate (NaNO3) 0 Talc 0 Unspecified 0 Zn 9
BCAL LCA Grocery Bags 34
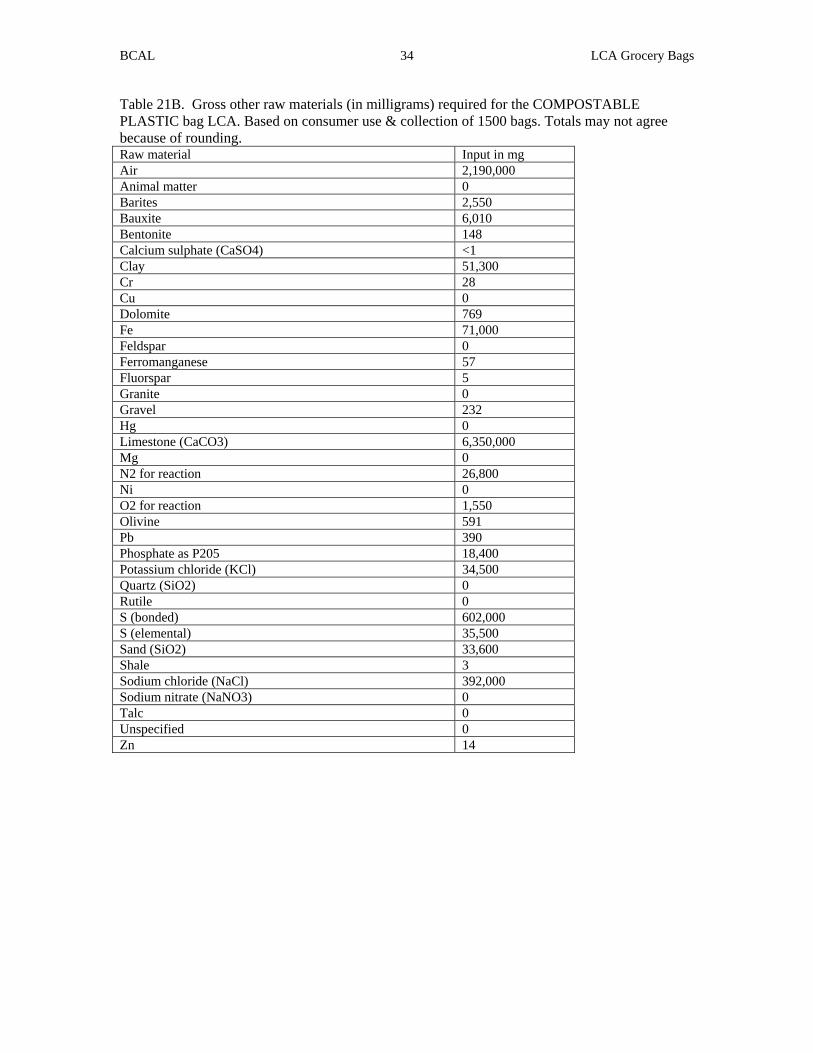
Table 21B. Gross other raw materials (in milligrams) required for the COMPOSTABLE PLASTIC bag LCA. Based on consumer use & collection of 1500 bags. Totals may not agree because of rounding. Raw material Input in mg Air 2,190,000 Animal matter 0 Barites 2,550 Bauxite 6,010 Bentonite 148 Calcium sulphate (CaSO4) <1 Clay 51,300 Cr 28 Cu 0 Dolomite 769 Fe 71,000 Feldspar 0 Ferromanganese 57 Fluorspar 5 Granite 0 Gravel 232 Hg 0 Limestone (CaCO3) 6,350,000 Mg 0 N2 for reaction 26,800 Ni 0 O2 for reaction 1,550 Olivine 591 Pb 390 Phosphate as P205 18,400 Potassium chloride (KCl) 34,500 Quartz (SiO2) 0 Rutile 0 S (bonded) 602,000 S (elemental) 35,500 Sand (SiO2) 33,600 Shale 3 Sodium chloride (NaCl) 392,000 Sodium nitrate (NaNO3) 0 Talc 0 Unspecified 0 Zn 14
BCAL LCA Grocery Bags 35
Table 22A. Gross air emissions (in milligrams) resulting from the COMPOSTABLE PLASTIC bag LCA. Based on consumer use & collection of 1000 bags. Totals may not agree because of rounding. Air emissions/mg Fuel prod’n Fuel use Transport Process Biomass Fugit
ive Total
Dust (PM10) 9,120 520 1,500 42,200 - - 53,400 CO 16,000 4,900 16,900 4,100 - - 41,900 CO2 13,860,000 2,620,000 2,580,000 41,800,000 -4,230,000 - 56,600,000 SOX as SO2 54,900 7,210 21,100 192,000 - - 275,000 H2S 0 0 1 40 - - 41 Mercaptan 0 0 0 11 - 11 NOX as NO2 50,000 8,260 24,500 221,500 - - 304,000 Aledhyde (-CHO) 0 0 0 0 - - 0 Aromatic HC not spec 2 - 67 4 - - 74 Cd+compounds as Cd 0 - 0 - - 0 CFC/HCFC/HFC not sp 0 - 0 0 - 0 CH4 59,600 1,060 98 224,000 - - 284,000 Cl2 0 - 0 0 - - 0 Cr+compounds as Cr 0 - 0 - - - 0 CS2 0 - 0 0 - 0 Cu+compounds as Cu 0 - 0 - - - 0 Dichlorethane (DCE) 0 - 0 0 - 0 0 Ethylene C2H4 - - 0 - - - 0 F2 0 - 0 0 - - 0 H2 38 0 0 226 - - 264 H2SO4 0 - 0 0 - - 0 HCl 2,140 6 3 871 - - 3,020 HCN 0 - 0 0 - - 0 HF 81 0 0 0 - - 81 Hg+compounds as Hg 0 - 0 0 -- - 0 Hydrocarbons not spec 13,800 1,720 6,400 100 - - 22,000 Metals not specified 8 4 0 0 0 - 12 Molybdenum - - - 1 - - 1 N2O 0 0 0 53,100 - - 53,100 NH3 0 - 0 39 - - 39 Ni compounds as Ni 0 - 0 - - - 0 NMVOC 0 72 410 46,400 - - 46,900 Organics 0 0 0 119 - - 119 Organo-chlorine not spec 0 - 0 16 - - 16 Pb+compounds as Pb 0 0 0 0 - - 0 Polycyclic hydrocarbon 0 - 0 0 - - 0 Titanium - - - 119 - - 119 Vinyl chloride monomer 0 - 0 0 - - 0 Zn+compounds as Zn 0 - 0 0 - - 0 Table 22B. Carbon dioxide equivalents corresponding to the gross air emissions (in milligrams) from the COMPOSTABLE PLASTIC bag LCA. Based on consumer use & collection of 1000 bags. Totals may not agree because of rounding. Type/mg Fuel prod’n Fuel use Transport Process Biomass Total 20 year equiv 17,630,000 2,700,000 2,640,000 70,200,000 -4,230,000 89,000,000
100 year equiv 15,300,000 2,660,000 2,640,000 62,640,000 -4,230,000 79,000,000
500 year equiv 14,300,000 2,640,000 2,400,000 51,600,000 -4,230,000 67,000,000
BCAL LCA Grocery Bags 36
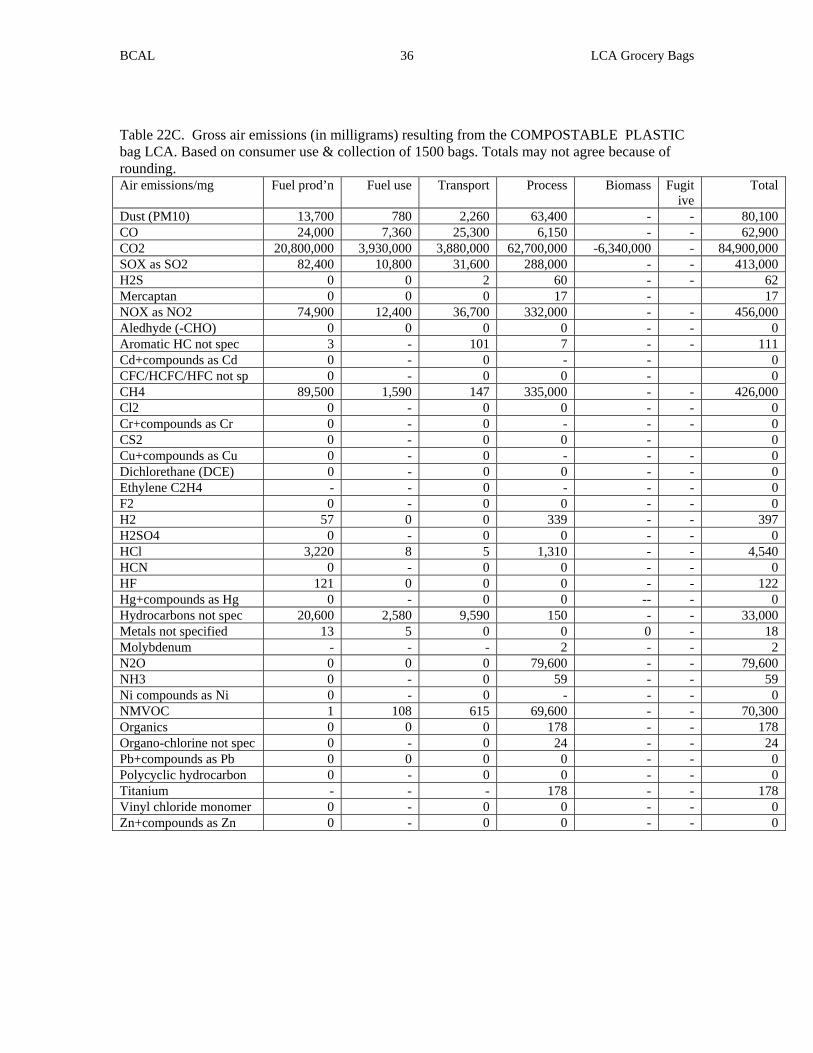
Table 22C. Gross air emissions (in milligrams) resulting from the COMPOSTABLE PLASTIC bag LCA. Based on consumer use & collection of 1500 bags. Totals may not agree because of rounding. Air emissions/mg Fuel prod’n Fuel use Transport Process Biomass Fugit
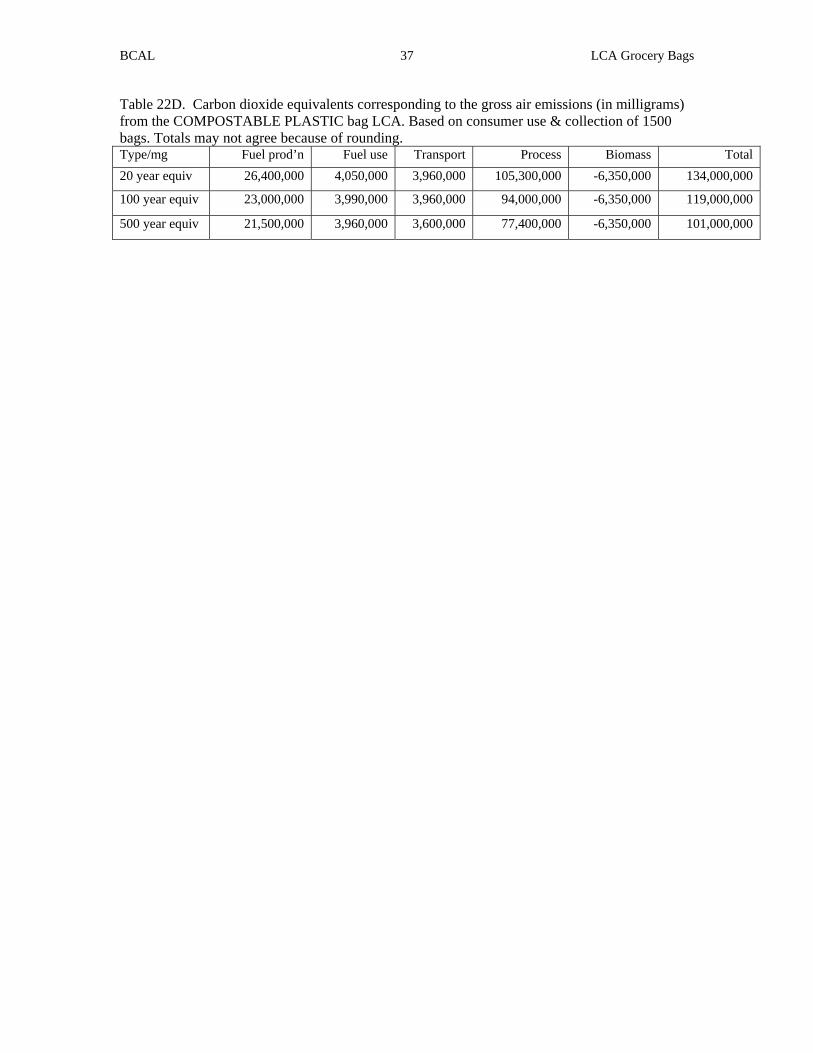
Table 22D. Carbon dioxide equivalents corresponding to the gross air emissions (in milligrams) from the COMPOSTABLE PLASTIC bag LCA. Based on consumer use & collection of 1500 bags. Totals may not agree because of rounding. Type/mg Fuel prod’n Fuel use Transport Process Biomass Total 20 year equiv 26,400,000 4,050,000 3,960,000 105,300,000 -6,350,000 134,000,000
100 year equiv 23,000,000 3,990,000 3,960,000 94,000,000 -6,350,000 119,000,000
500 year equiv 21,500,000 3,960,000 3,600,000 77,400,000 -6,350,000 101,000,000
BCAL LCA Grocery Bags 38
Table 23A. Gross water emissions (in milligrams), resulting from the COMPOSTABLE PLASTIC bag LCA. Based on consumer use & collection of 1000 bags. Totals may not agree because of rounding. Fuel prod’n Fuel use Transport Process Total COD 15 2 57 59,700 59,800 BOD 4 - 4 3,190 3,200 Acid (H+) 2 - 0 0 4 Al+compounds as Al 0 - 0 2 2 Ammonium compounds as NH4 5 - 2 0 7 AOX 0 - 0 10 10 As+compounds as As - - 0 0 0 BrO3-- 0 - 0 0 0 Ca+compounds as Ca 0 - 0 201 201 Cd+compounds as Cd - - 0 - 0 Cl- 7 - 670 27,500 28,100 ClO3-- 0 - 0 2 2 CN- 0 - 0 0 0 CO3-- - - 2 5 7 Cr+compounds as Cr 0 - 0 0 0 Cu+compounds as Cu 0 - 0 0 0 Detergent/oil 0 - 2 3 5 Dichloroethane (DCE) 0 - 0 0 0 Dioxin/furan as Teq - - 0 - 0 Dissolved chlorine 0 - 0 0 0 Dissolved organics (non-HC) 6 - 0 0 6 Dissolved solids not specified 2 - 6 59 67 F- 0 - 6 0 6 Fe+compounds as Fe 0 - 1 20 22 Hg+compounds as Hg 0 - 0 0 0 Hydrocarbons not specified 0 0 1 334 337 K+compounds as K 0 - 0 2 2 Metals not specified elsewhere 0 - 0 52 52 Mg+compounds as Mg 0 - 0 2 2 Mn+compounds as Mn - - 0 0 0 Na+compounds as Na 3 - 15 1,270 1,290 Ni+compounds as Ni 0 - 0 0 0 NO3- 0 - 0 1,910 1,910 Organo-chlorine not specified 0 - 0 0 0 Organo-tin as Sn - - 0 - 0 Other nitrogen as N 0 - 0 4,300 4,300 Other organics not specified 0 - 0 0 0 P+compounds as P 0 - 0 41 41 Pb+compounds as PB 0 - 0 0 0 Phenols 0 - 0 0 0 S+sulphides as S 0 - 0 5 5 SO4-- 0 - 5 6,287 6,290 Sr+compounds as Sr - - 0 0 0 Suspended solids 945 - 2,660 396,000 399,000 TOC 0 - 15 2,460 2,480 Vinyl chloride monomer 0 - 0 0 0 Zn+compounds as Zn 0 - 0 0 0
BCAL LCA Grocery Bags 39
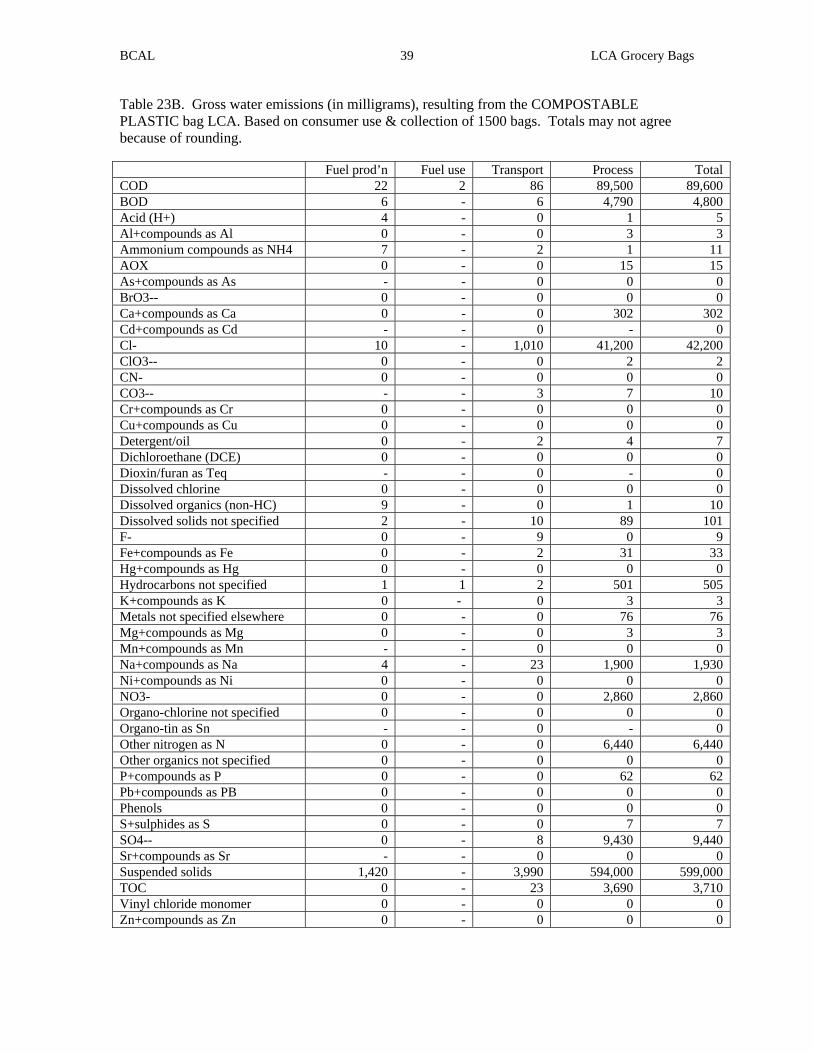
Table 23B. Gross water emissions (in milligrams), resulting from the COMPOSTABLE PLASTIC bag LCA. Based on consumer use & collection of 1500 bags. Totals may not agree because of rounding. Fuel prod’n Fuel use Transport Process Total COD 22 2 86 89,500 89,600 BOD 6 - 6 4,790 4,800 Acid (H+) 4 - 0 1 5 Al+compounds as Al 0 - 0 3 3 Ammonium compounds as NH4 7 - 2 1 11 AOX 0 - 0 15 15 As+compounds as As - - 0 0 0 BrO3-- 0 - 0 0 0 Ca+compounds as Ca 0 - 0 302 302 Cd+compounds as Cd - - 0 - 0 Cl- 10 - 1,010 41,200 42,200 ClO3-- 0 - 0 2 2 CN- 0 - 0 0 0 CO3-- - - 3 7 10 Cr+compounds as Cr 0 - 0 0 0 Cu+compounds as Cu 0 - 0 0 0 Detergent/oil 0 - 2 4 7 Dichloroethane (DCE) 0 - 0 0 0 Dioxin/furan as Teq - - 0 - 0 Dissolved chlorine 0 - 0 0 0 Dissolved organics (non-HC) 9 - 0 1 10 Dissolved solids not specified 2 - 10 89 101 F- 0 - 9 0 9 Fe+compounds as Fe 0 - 2 31 33 Hg+compounds as Hg 0 - 0 0 0 Hydrocarbons not specified 1 1 2 501 505 K+compounds as K 0 - 0 3 3 Metals not specified elsewhere 0 - 0 76 76 Mg+compounds as Mg 0 - 0 3 3 Mn+compounds as Mn - - 0 0 0 Na+compounds as Na 4 - 23 1,900 1,930 Ni+compounds as Ni 0 - 0 0 0 NO3- 0 - 0 2,860 2,860 Organo-chlorine not specified 0 - 0 0 0 Organo-tin as Sn - - 0 - 0 Other nitrogen as N 0 - 0 6,440 6,440 Other organics not specified 0 - 0 0 0 P+compounds as P 0 - 0 62 62 Pb+compounds as PB 0 - 0 0 0 Phenols 0 - 0 0 0 S+sulphides as S 0 - 0 7 7 SO4-- 0 - 8 9,430 9,440 Sr+compounds as Sr - - 0 0 0 Suspended solids 1,420 - 3,990 594,000 599,000 TOC 0 - 23 3,690 3,710 Vinyl chloride monomer 0 - 0 0 0 Zn+compounds as Zn 0 - 0 0 0
BCAL LCA Grocery Bags 40
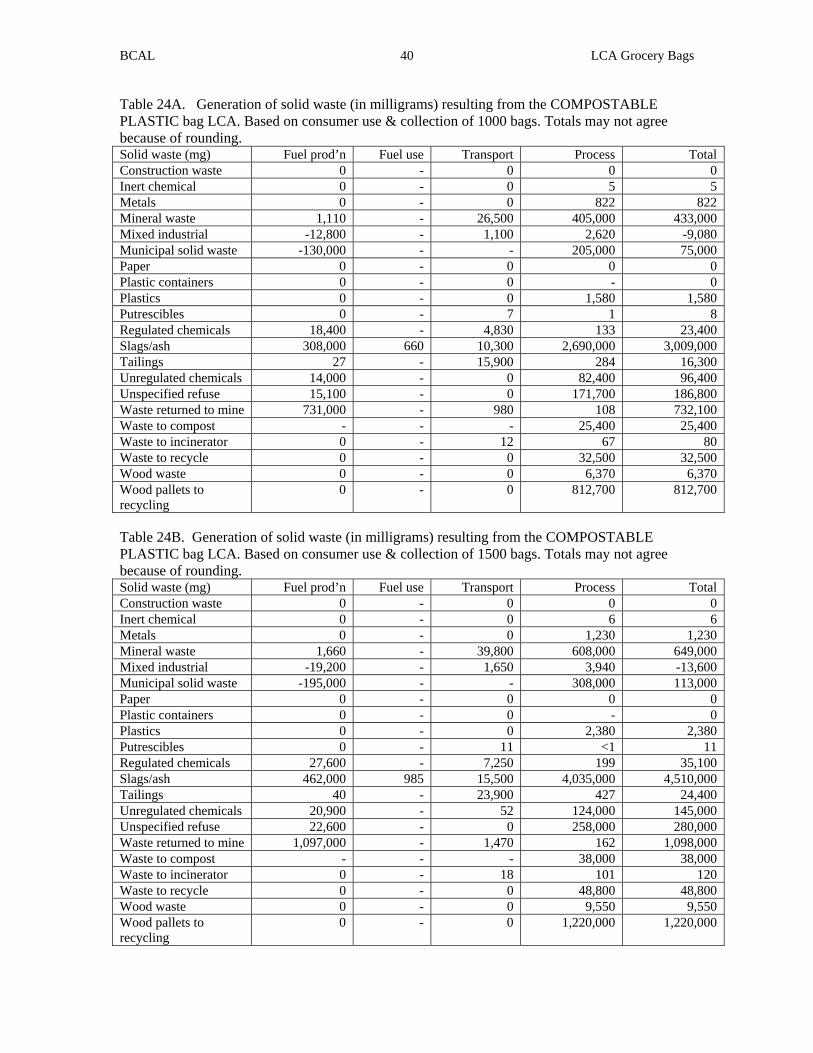
Table 24A. Generation of solid waste (in milligrams) resulting from the COMPOSTABLE PLASTIC bag LCA. Based on consumer use & collection of 1000 bags. Totals may not agree because of rounding. Solid waste (mg) Fuel prod’n Fuel use Transport Process Total Construction waste 0 - 0 0 0 Inert chemical 0 - 0 5 5 Metals 0 - 0 822 822 Mineral waste 1,110 - 26,500 405,000 433,000 Mixed industrial -12,800 - 1,100 2,620 -9,080 Municipal solid waste -130,000 - - 205,000 75,000 Paper 0 - 0 0 0 Plastic containers 0 - 0 - 0 Plastics 0 - 0 1,580 1,580 Putrescibles 0 - 7 1 8 Regulated chemicals 18,400 - 4,830 133 23,400 Slags/ash 308,000 660 10,300 2,690,000 3,009,000 Tailings 27 - 15,900 284 16,300 Unregulated chemicals 14,000 - 0 82,400 96,400 Unspecified refuse 15,100 - 0 171,700 186,800 Waste returned to mine 731,000 - 980 108 732,100 Waste to compost - - - 25,400 25,400 Waste to incinerator 0 - 12 67 80 Waste to recycle 0 - 0 32,500 32,500 Wood waste 0 - 0 6,370 6,370 Wood pallets to recycling
0 - 0 812,700 812,700
Table 24B. Generation of solid waste (in milligrams) resulting from the COMPOSTABLE PLASTIC bag LCA. Based on consumer use & collection of 1500 bags. Totals may not agree because of rounding. Solid waste (mg) Fuel prod’n Fuel use Transport Process Total Construction waste 0 - 0 0 0 Inert chemical 0 - 0 6 6 Metals 0 - 0 1,230 1,230 Mineral waste 1,660 - 39,800 608,000 649,000 Mixed industrial -19,200 - 1,650 3,940 -13,600 Municipal solid waste -195,000 - - 308,000 113,000 Paper 0 - 0 0 0 Plastic containers 0 - 0 - 0 Plastics 0 - 0 2,380 2,380 Putrescibles 0 - 11 <1 11 Regulated chemicals 27,600 - 7,250 199 35,100 Slags/ash 462,000 985 15,500 4,035,000 4,510,000 Tailings 40 - 23,900 427 24,400 Unregulated chemicals 20,900 - 52 124,000 145,000 Unspecified refuse 22,600 - 0 258,000 280,000 Waste returned to mine 1,097,000 - 1,470 162 1,098,000 Waste to compost - - - 38,000 38,000 Waste to incinerator 0 - 18 101 120 Waste to recycle 0 - 0 48,800 48,800 Wood waste 0 - 0 9,550 9,550 Wood pallets to recycling
0 - 0 1,220,000 1,220,000
BCAL LCA Grocery Bags 41
Final Disposal Solid Waste Options: Recycling, Combustion with Energy Recovery, Landfill and Composting Recycling A major goal of recycling is to reduce the generation of solid waste. The bag making process for grocery bags generates paper and plastic waste. The majority of this waste, known as mill waste, is recycled internally. Therefore, in this study BCAL treated mill waste as a closed loop recycling effort that returned the waste to the production process. All of the grocery bags are recyclable to other paper and plastic products. EPA data from 2005 show that 21% of the kraft paper grocery bags are recycled and 5.2 % of the plastic grocery bags are recycled. The allocation decision for these recycled materials is that the recycled materials are not burdened with any inputs or outputs associated with their previous manufacture, use, disposal prior to recycling. BCAL used this allocation approach, and treated the recycled materials as diverted waste. Diverted waste, like raw materials, are burdened with their intrinsic feedstock value and are subsequently burdened with the resource use, energy consumption, and environmental releases associated with their collection, cleaning and reprocessing, use, and disposal. Therefore, the inherent feedstock energy value of the recycled material is assigned to the diverted waste. With respect to the degradable plastic bags, BCAL assumed that initially the same rate that applies to recycling of standard plastic bags (5.2%) would be appropriate for the rate sent to composting. This reflects a conservative approach using only data that currently reflect consumer behavior with regard to plastic bags. It is expected that the percentage of degradable plastic bags sent to composting will actually be higher once they are made available and collection can occur within municipalities, making it easier for the general consumer to send these bags through a different route of disposal. Recycling of plastic bags is currently low. This may be for a number of reasons, not the least of which appears to be the lack of infrastructure and poor consumer awareness about the inherent recycleability of plastic bags. Solid Waste Combustion With Energy Recovery In previous years, a controlled burning process called combustion or incineration was used solely to reduce volume of solid waste. However, energy recovery became more prevalent in the 1980s. Therefore, today, most of the municipal solid waste combustion in the US incorporates recovery of energy. EPA data from 2005 show that 13.6% of MSW was combusted with energy recovery. The gross calorific values for the various grocery bags are estimated as follows: For kraft paper bags 17.7 MJ/kg For recyclable plastic bag 40.0 MJ//kg For degradable plastic bag 19.6 MJ/kg
BCAL LCA Grocery Bags 42
These materials are used as fuels in the waste to energy plants, however the thermal efficiencies for mass-burn WTE plants varies from 15% to 23% in the newer plants.6 This study used 23% thermal efficiency for energy recovery. Assuming complete combustion, the resulting estimated CO2 emissions are: For kraft paper bags 1,650,000 mg/kg paper bag For recyclable plastic bags 3,150,000 mg/kg recyclable plastic bag For degradable plastic bags 1,360,000 mg/kg degradable plastic bag The recovered energy (23% thermal efficiency) is as follows: For kraft paper bags 4.07 MJ/kg paper bag For recyclable plastic bags 9.20 MJ/kg recyclable plastic bag For degradable plastic bags 4.51 MJ/kg degradable plastic bag Therefore, using the above information, the following table is prepared on the basis of 1000 grocery bags and shows the recovered energy and resulting carbon dioxide emissions when 13.6% of the 1000 grocery bags are combusted with energy recovery. Table 25. Recovered energy (MJ) and resulting carbon dioxide emissions (mg) when 13.6% of the 1000 grocery bags are combusted with energy recovery. Kraft Paper Bag Recyclable Plastic
Bag Degradable Plastic Bag
Recovered energy 28.7 MJ 7.2 MJ 9.7 MJCO2 emissions 11,640,000 mg 2,150,000 mg 2,920,000 mg Table 25 shows that the kraft paper bag has the highest recovered energy and the highest CO2 emissions. The recyclable and compostable plastic bags have significantly lower recovered energy and CO2 emissions. Solid Waste to Landfill A landfill has various phases of decomposition. Initially, aerobic decomposition will take place where oxygen is consumed to produce carbon dioxide gas and other by-products. During the first phase of anaerobic decomposition, carbon dioxide is the principal gas generated. As anaerobic decomposition proceeds toward the second phase, the quantity of methane generated increases until the methane concentration reaches 50% to 60%. The landfill will continue to generate methane at these concentrations for 10 or 20 years, and possibly longer7. Methane emissions from landfills in the United States were estimated at 8.0 million metric tons in 2001. In addition, 2.5 million tons were recovered for energy use and 2.4 million tons were recovered and flared. Therefore, more than 60% of the methane produced in landfills is not recovered.8
BCAL LCA Grocery Bags 43
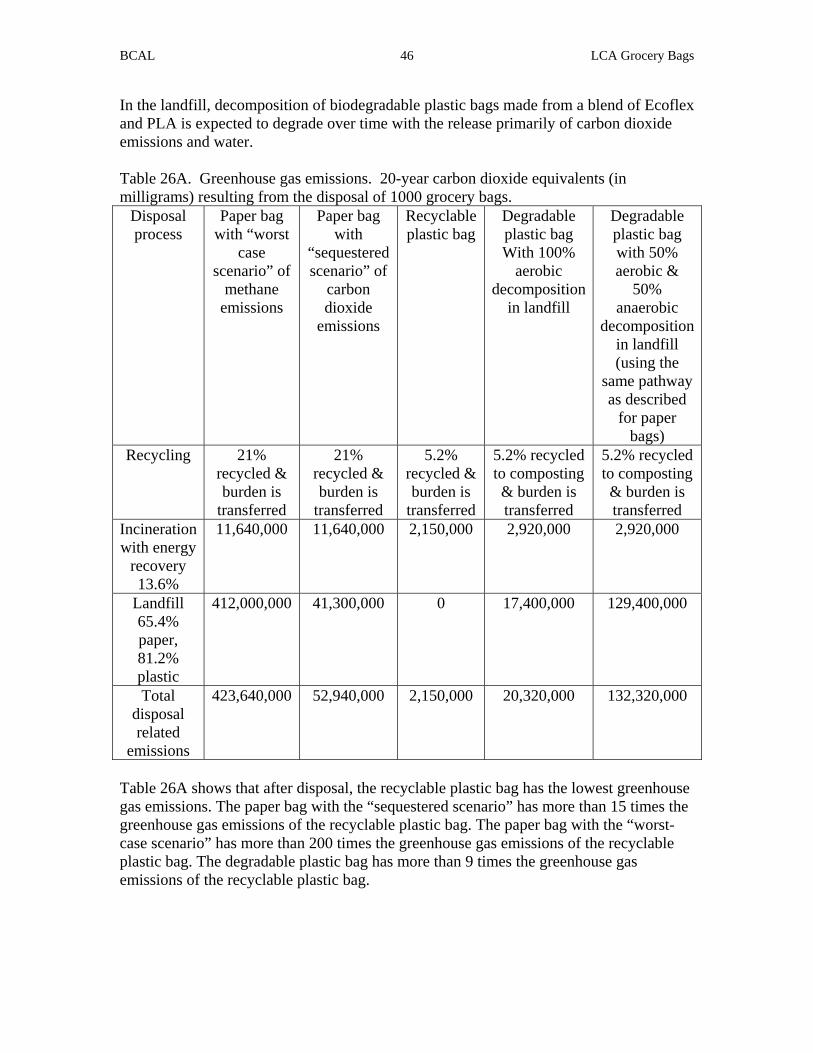
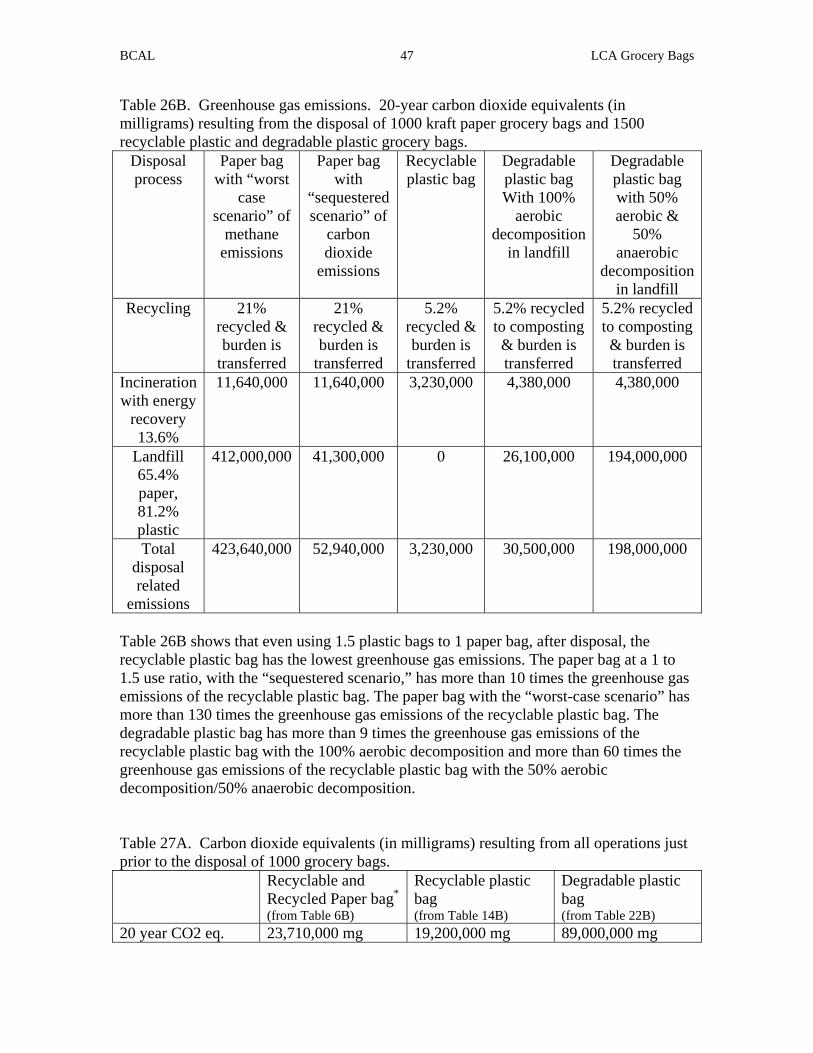
The precise fate of paper deposited in a landfill site is unknown. Paper may decompose entirely in a short space of time or it may remain intact for long periods.9 This depends on a variety of factors such as temperature, pH, the presence of bacteria and nutrients, the composition of the waste and the form of the paper-shredded paper is much more likely to decompose than is a whole telephone book. To account for this variability, two scenarios were used to calculate emissions associated with the disposal of paper bags (both adjustment for 40% of the recovered methane noted above). The first scenario is a worst-case scenario that follows the basic decomposition reaction for cellulose and the second scenario is one that estimates carbon sequestration for paper in MSW landfills. Scenario 1 for Paper Bags The basic decomposition reaction for cellulose is well known and follows the form of: C6H10O5 + H2O = 3CH4 + 3CO2 (1) It is therefore expected that only one half of the carbon present in kraft paper bags will result in methane formation during decomposition. Typically carbon represents 45% of the mass of paper. Thus, the carbon content of 1 kg of paper will be 0.45 kg. That proportion giving rise to methane, assuming 100 % decomposition, would then be 0.225 kg. Based on this, the mass of methane produced would be 0.30 kg and the corresponding mass of the coproduct carbon dioxide would be 0.83 kg. Scenario 2 for Paper Bags Although cellulose decomposition in landfill is well documented, there remains significant uncertainty in the maximum extent of cellulose decomposition that can be realized under landfill conditions. Several studies indicate that significant carbon sequestration occurs in landfills because of the limited degradation of wood products. In one study10 a carbon storage factor (CSF) was calculated that represented the mass of carbon stored (not degraded) per initial carbon mass of the component. For the following MSW paper refuse components the CSF was calculated: old newsprint = 0.42 kg C sequestered, coated paper = 0.34 kg C sequestered, and old corrugated = 0.26 kg C sequestered. For this scenario the partial decomposition that the paper bags go through is assumed to be aerobic or the initial anaerobic phase, resulting principally in carbon dioxide emissions. In this scenario, we have assumed that the paper bags are similar to old corrugated, and therefore have assigned the same value of 0.26 kg C sequestered. Given that 0.26 kg of the kraft paper bag is assumed to be sequestered, 0.74 kg of the kraft paper bag results in carbon dioxide emissions of 1.23 kg. Recyclable plastic bags are not considered to degrade in landfills, suggesting that all the inherent feedstock energy and emissions will be sequestered. Therefore, there are no carbon dioxide or methane emissions associated with the recyclable plastic bags sent to landfills.
BCAL LCA Grocery Bags 44
Many types of biodegradable polymers are available to degrade in a variety of environments, including soil, air, or compost. The biodegradable products degrade under aerobic conditions to carbon dioxide and water in the presence of oxygen. The biodegradable, compostable plastic bags in this study are made from a blend of Ecoflex and PLA. Ecoflex is made from aliphatic-aromatic copolyester blended with equal amounts of starch. According to information provided by BASF, Ecoflex meets the requirements for biodegradable polymer classification based on European, US, and Japanese standards because Ecoflex can be degraded by micro-organisms.11 PLA is a biodegradable polymer made from corn and is converted completely to carbon dioxide and water by micro-organisms. In addition, compostable plastic bags have been found to degrade as designed within an allowable timeframe in appropriate composting facilities13. In composting facilities, decomposition of biodegradable plastic bags made from a blend of Ecoflex and PLA are expected to release primarily carbon dioxide emissions and water. However, if sent to a landfill, biodegradable plastic will either not degrade at all, or may follow similar pathways as paper bags (a combination of both aerobic and anaerobic degradation). BCAL treated these bags in both ways in this study to examine all possibilities. Solid Waste Composting The biodegradable, compostable plastic bags in this study have demonstrated biodegradation in several standardized tests in several countries. Ecoflex and PLA meet US, European, Australian, and Japanese standards by degrading in 12 weeks under aerobic conditions in a compost environment and by breaking down to carbon dioxide and water. The extent of the degradation for Ecoflex was 2 to 6 months in compost depending upon temperature, and for PLA was 1 to 3 months in compost depending upon temperature. 11 Therefore, in the composting environment, decomposition of biodegradable plastic bags made from a blend of Ecoflex and PLA is expected to degrade over time with the release primarily of carbon dioxide emissions and water.
LCA Calculations of Environmental Impacts
As noted under the section on LCA methodology, life cycle assessment modeling allows an examination of specific problems as well as comparisons to determine if there are any serious side effects to any of the systems under study. In every system there are multiple environmental parameters to be addressed scaling from global to local issues, and no single solution is likely to address all of the issues simultaneously. In addition, almost every change to a system creates trade-offs, and it is the identification of these trade-offs that is important when trying to determine the best solution for any given problem. To reiterate, a life cycle assessment can:
1. Quantify those parameters likely to be responsible for environmental effects (the inventory component of life cycle analysis).
2. Identify which parameters are likely to contribute to a specific environmental problem (characterization or interpretation phase of impact assessment). An
BCAL LCA Grocery Bags 45
example would be identifying that carbon dioxide (CO2), methane (CH4), and nitrous oxide (N2O) are greenhouse gases.
3. Aggregate the parameters relating to a specific problem (the valuation or interpretation phase of impact assessment). An example would be producing carbon dioxide equivalents for the components of greenhouse gases.
The LCA calculations provide a compilation of information from which the user can address specific problems such as the conservation of fossil fuels, global warming, acid rain, and municipal solid waste. In addition, the user also is able to determine what trade-offs exist between systems and to examine the specific parameters which are likely to contribute to these problems. In so doing, the user can strive to achieve the optimum reduction in each parameter because of a better understanding of how these parameters change in association with each grocery bag system. GLOBAL WARMING One important issue that is currently being addressed using LCA studies is an examination of the contribution that industrial systems make to climate change. The work of the Intergovernmental Panel on Climate Change (IPCC)12 provides a framework for aggregating data on those air emissions that are thought to be significant contributors to global warming. The aggregated effect of any system can be summarized as a parameter known as Global Warming Potential (GWP) or carbon dioxide equivalent. Any gaseous emission that is thought to contribute to global warming is assigned a value equal to the equivalent amount of CO2 that would be needed to produce the same effect. Multiplying each gaseous emission by its CO2 equivalent allows the separate effects of different emissions to be summed to give an overall measure of global warming potentials. The major greenhouse gases of importance in this eco-profile are carbon dioxide, methane and nitrous oxide. The results tables provided previously (see Section on LCA Results) showed the global warming impacts (with carbon dioxide equivalents) up to the collection of the grocery bags. The following table estimates the global warming impacts just from the collection and disposal of the grocery bags. As discussed previously, two scenarios will be considered for the kraft paper bags, the first is a worst-case scenario that follows the basic decomposition reaction for cellulose and the second scenario is one that estimates carbon sequestration for paper in MSW landfills. The recyclable plastic bags will not degrade in the landfill; all the inherent feedstock energy and emissions will be sequestered. Therefore, there are no carbon dioxide emissions from recyclable plastic bags in landfills.
BCAL LCA Grocery Bags 46
In the landfill, decomposition of biodegradable plastic bags made from a blend of Ecoflex and PLA is expected to degrade over time with the release primarily of carbon dioxide emissions and water. Table 26A. Greenhouse gas emissions. 20-year carbon dioxide equivalents (in milligrams) resulting from the disposal of 1000 grocery bags.
Disposal process
Paper bag with “worst
case scenario” of
methane emissions
Paper bag with
“sequestered scenario” of
carbon dioxide
emissions
Recyclable plastic bag
Degradable plastic bag With 100%
aerobic decomposition
in landfill
Degradable plastic bag with 50% aerobic &
50% anaerobic
decomposition in landfill (using the
same pathway as described
for paper bags)
Recycling 21% recycled & burden is
transferred
21% recycled & burden is
transferred
5.2% recycled & burden is
transferred
5.2% recycled to composting & burden is transferred
5.2% recycled to composting & burden is transferred
Table 26A shows that after disposal, the recyclable plastic bag has the lowest greenhouse gas emissions. The paper bag with the “sequestered scenario” has more than 15 times the greenhouse gas emissions of the recyclable plastic bag. The paper bag with the “worst-case scenario” has more than 200 times the greenhouse gas emissions of the recyclable plastic bag. The degradable plastic bag has more than 9 times the greenhouse gas emissions of the recyclable plastic bag.
BCAL LCA Grocery Bags 47
Table 26B. Greenhouse gas emissions. 20-year carbon dioxide equivalents (in milligrams) resulting from the disposal of 1000 kraft paper grocery bags and 1500 recyclable plastic and degradable plastic grocery bags.
Disposal process
Paper bag with “worst
case scenario” of
methane emissions
Paper bag with
“sequestered scenario” of
carbon dioxide
emissions
Recyclable plastic bag
Degradable plastic bag With 100%
aerobic decomposition
in landfill
Degradable plastic bag with 50% aerobic &
50% anaerobic
decomposition in landfill
Recycling 21% recycled & burden is
transferred
21% recycled & burden is
transferred
5.2% recycled & burden is
transferred
5.2% recycled to composting & burden is transferred
5.2% recycled to composting & burden is transferred
Table 26B shows that even using 1.5 plastic bags to 1 paper bag, after disposal, the recyclable plastic bag has the lowest greenhouse gas emissions. The paper bag at a 1 to 1.5 use ratio, with the “sequestered scenario,” has more than 10 times the greenhouse gas emissions of the recyclable plastic bag. The paper bag with the “worst-case scenario” has more than 130 times the greenhouse gas emissions of the recyclable plastic bag. The degradable plastic bag has more than 9 times the greenhouse gas emissions of the recyclable plastic bag with the 100% aerobic decomposition and more than 60 times the greenhouse gas emissions of the recyclable plastic bag with the 50% aerobic decomposition/50% anaerobic decomposition.
Table 27A. Carbon dioxide equivalents (in milligrams) resulting from all operations just prior to the disposal of 1000 grocery bags. Recyclable and
Recycled Paper bag*
(from Table 6B)
Recyclable plastic bag (from Table 14B)
Degradable plastic bag (from Table 22B)
20 year CO2 eq. 23,710,000 mg 19,200,000 mg 89,000,000 mg
BCAL LCA Grocery Bags 48
*It should be noted that these emissions include the “credit” when carbon dioxide was absorbed during tree growing. Table 27A shows that from all operations just prior to disposal, the resulting CO2 equivalents are more than 20% greater for the paper bag compared to the recyclable plastic bag. From all operations just prior to disposal, the resulting CO2 equivalents for the degradable plastic bag are the highest about 4 times greater than the recyclable plastic bag. Table 27B Carbon dioxide equivalents (in milligrams) resulting from all operations just prior to the disposal of 1000 kraft paper grocery bags and 1500 recyclable plastic and degradable plastic grocery bags. Recyclable and
Recycled Paper bag*
(from Table 6B)
Recyclable plastic bag (from Table 14B)
Degradable plastic bag (from Table 22B)
20 year CO2 eq. 23,710,000 mg 28,800,000 mg 134,000,000 mg *It should be noted that these emissions include the “credit” when carbon dioxide was absorbed during tree growing. Table 27B shows that from all operations just prior to disposal, the resulting CO2 equivalents are more than 20% greater for the recyclable plastic bag compared to the paper bag. From all operations just prior to disposal, the resulting CO2 equivalents for the degradable plastic bag are the highest about 4 times greater than the recyclable plastic bag and 5 times greater than the paper bag. Now, adding the greenhouse gas emissions from tables 26 and 27 the total LCA cradle-to-grave greenhouse gas emissions for the production, use, and disposal of 1000 grocery bags are given in Table 28.
BCAL LCA Grocery Bags 49
Table 28A. Total LCA cradle-to-grave CO2 equivalents (in milligrams) for the production, use, and disposal of 1000 grocery bags:
Table 28A shows that the recyclable plastic bag has the lowest the total cradle-to-grave CO2 equivalents. The paper bag with the “sequestered scenario” has more than 3.5 times the total cradle-to-grave CO2 equivalents of the recyclable plastic bag. The paper bag with the “worst-case scenario” has more than 20 times the total cradle-to-grave CO2 equivalents of the recyclable plastic bag. The degradable plastic bag has more than 5 times the total cradle-to-grave CO2 equivalents of the recyclable plastic bag.
BCAL LCA Grocery Bags 50
Table 28B. Total LCA cradle-to-grave CO2 equivalents (in milligrams) for the production, use, and disposal of 1000 kraft paper grocery bags and 1500 recyclable plastic and degradable plastic grocery bags.
Table 28B shows that even using 1.5 plastic bags to 1 paper bag, the recyclable plastic bag has the lowest the total cradle-to-grave CO2 equivalents. The paper bag, at a 1 to 1.5 use ratio, with the “sequestered scenario,” has about 2.3 times more total cradle-to-grave CO2 equivalents of the recyclable plastic bag, depending upon the time horizon. The paper bag with the “worst-case scenario” has more than 20 times the total cradle-to-grave CO2 equivalents of the recyclable plastic bag. The degradable plastic bag has more than 5 times the total cradle-to-grave CO2 equivalents of the recyclable plastic bag. STRATOSPHERIC OZONE DEPLETION The stratospheric ozone layer occurs at an altitude of between 10-40 km. The maximum generation of ozone (O3) occurs at the outer layer, where oxygen molecules (O2) react with atomic oxygen. The presence of other compounds, particularly halogenated compounds, promotes the decomposition of this ozone in the presence of strong ultra-violet radiation. In this study there were no identified ozone depleting chemicals associated with the bag systems studied, and therefore no contributions to stratospheric ozone depletion. ACID RAIN The production of acid rain in the northeastern United States is recognized as a regional problem. Acid rain results when sulfur and nitrogen oxides and their transformation
BCAL LCA Grocery Bags 51
products return from the atmosphere to the earth’s surface. The major source of acid rain is the emission of these pollutants from coal powered electricity generating plants. The following data were extracted from the results tables. There are no data available for SOX and NOX emissions after disposal. Table 29A. Acid rain emissions (in milligrams of SO2 and NO2) resulting from all operations just prior to disposal 1000 grocery bags. Acid rain emissions
mg Paper bag Recyclable plastic
bag Degradable plastic bag
SOX 579,000 mg 50,500 mg 275,000 mgNOX 264,000 mg 45,400 mg 304,000 mg Table 29A shows that the recyclable plastic bag has the least SOX and NOX emissions. The paper bag has more than 10 times the SOX emissions compared with the recyclable plastic bag and more than 5 times the NOX emissions compared with the recyclable plastic bag. The degradable plastic bag has more than 5 times the SOX and NOX emissions compared with the recyclable plastic bag. Table 29B. Acid rain emissions (in milligrams of SO2 and NO2) resulting from all operations just prior to disposal for 1500 recyclable plastic bags and degradable plastic grocery bags. Acid rain emissions
mg Paper bag Recyclable plastic
bag Degradable plastic bag
SOX 579,000 mg 75,800 mg 413,000 mgNOX 264,000 mg 68,100 mg 456,000 mg Table 29B shows that even using 1.5 plastic bags to 1 paper bag, the recyclable plastic bag has the least SOX and NOX emissions. The paper bag, at a 1 to 1.5 use ratio, has more than 7 times the SOX emissions compared with the recyclable plastic bag and almost 4 times the NOX emissions compared with the recyclable plastic bag. The degradable plastic bag has more than 5 times the SOX and NOX emissions compared with the recyclable plastic bag. MUNICIPAL SOLID WASTE Another widespread environmental issue concerns the generation and disposal of municipal solid waste. The mineral wastes from mining, the slags and ash wastes from oil and gas production and utility coal combustion, and regulated chemical wastes are generally managed by regulation and permits that exclude these wastes from the municipal solid waste stream. The type of wastes in mixed industrial wastes can contribute to the municipal solid waste problem. If, as in this study, there is an interest in focusing on the municipal solid waste problem, the results on mineral wastes, slags & ash, and regulated chemicals can be ignored. Selecting only the solid waste resulting from just the disposal of grocery bags in landfill, one can prepare the following table 30A considering disposal of 1000 grocery bags and table 30B considering disposal of 1000
BCAL LCA Grocery Bags 52
kraft paper grocery bags and 1500 recyclable plastic and degradable plastic grocery bags. The table reflects the waste that is landfilled as 65.4% paper bags and 81.2% plastic bags. Table 30A. The municipal solid waste (in mg) resulting from just the disposal of grocery bags in landfill. Based on 1000 grocery bags but only 65.4% of paper bags are landfilled and 81.2% of plastic bags are landfilled.
Paper bag Recyclable plastic bag
Degradable plastic bag
Municipal solid waste mg
33,900,000 4,690,000 12,800,000
Table 30A shows that the recyclable plastic bag has the least municipal solid waste. The paper bag has more than 7 times the municipal solid waste compared with the recyclable plastic bag. The degradable plastic bag has almost 3 times the municipal solid waste compared with the recyclable plastic bag. Table 30B. The municipal solid waste (in mg) resulting from just the disposal of grocery bags in landfill. Based on 1000 kraft paper grocery bags but only 65.4% of paper bags are landfilled and 1500 plastic grocery bags of which 81.2% of plastic bags are landfilled.
Paper bag Recyclable plastic bag
Degradable plastic bag
Municipal solid waste mg
33,900,000 7,035,000 19,200,000
Table 30B shows that even using 1.5 plastic bags to 1 paper bag, the recyclable plastic bag has the least municipal solid waste. The paper bag, at a 1 to 1.5 use ratio, has almost 5 times the municipal solid waste compared with the recyclable plastic bag. The degradable plastic bag has almost 3 times the municipal solid waste compared with the recyclable plastic bag. CONSERVATION OF FOSSIL FUELS Conservation problems are concerned with the depletion and possible exhaustion of raw materials and fuels. With continued use, the finite supply of raw materials, and especially fossil fuels will one day be exhausted. The conservation of fossil fuels: coal, oil ,and natural gas is an important global environmental issue. It is therefore important to ensure that these resources are used with the maximum efficiency and the minimum of waste.
BCAL LCA Grocery Bags 53
Table 31A. The gross fossil fuels and feedstocks, expressed as energy (MJ) required for the production, use, and disposal of 1000 grocery bags.
Table 31A shows that the recyclable plastic bag uses the least fossil fuels and feedstocks. The paper bag uses more than 2 times the fossil fuels and feedstocks compared with the recyclable plastic bag. The degradable plastic bag used more than 2 1/2 times the fossil fuels and feedstocks compared with the recyclable plastic bag. Table 31B. The gross fossil fuels and feedstocks, expressed as energy (MJ) required for the production, use, and disposal of 1000 kraft paper grocery bags and 1500 recyclable plastic and degradable plastic grocery bags.
Table 31B shows that even using 1.5 plastic bags to 1 paper bag, the recyclable plastic bag uses the least fossil fuels and feedstocks. The paper bag, at a 1 to 1.5 use ratio, uses 34% more fossil fuels and feedstocks compared with the recyclable plastic bag. The degradable plastic bag used more than 2 1/2 times the fossil fuels and feedstocks compared with the recyclable plastic bag. LOCAL & REGIONAL GRID ELECTRICITY USE
The US recently has experienced severe problems related to its local and regional grid electricity. Because of these recent “blackouts,” “brownouts,” and electricity interruptions, the need for appropriate conservation measures can be argued. Table 32A. The electrical energy (MJ) required for the production, use, and disposal of 1000 grocery bags.
Paper bag Recyclable plastic bag
Degradable plastic bag
Electrical energy MJ
649 148 325
BCAL LCA Grocery Bags 54
Table 32A shows that the recyclable plastic bag uses the least electrical energy. The paper bag uses more than 4 times the electrical energy compared to the recyclable plastic bag. The degradable plastic bag used more than 2 times the electrical energy compared with the recyclable plastic bag. Table 32B. The electrical energy (MJ) required for the production, use, and disposal of 1000 kraft paper grocery bags and 1500 recyclable plastic and degradable plastic grocery bags.
Paper bag Recyclable plastic bag
Degradable plastic bag
Electrical energy MJ
649 222 488
Table 32B shows that even using 1.5 plastic bags to 1 paper bag, the recyclable plastic bag uses the least electrical energy. The paper bag, at a 1 to 1.5 use ratio, uses almost 3 times the electrical energy compared with the recyclable plastic bag. The degradable plastic bag used more than 2 times the electrical energy compared with the recyclable plastic bag. WATER USE & PUBLIC SUPPLY Parts of the US continue to be plagued by periodic drought conditions. During these times, laws and regulations concerning water conservation are enforced. Since public water supply issues have been identified as a problem, the following table has been prepared to compare public water supply used for the production, use, and disposal of 1000 grocery bags. Table 33A. Public water supply (in mg) used for the production, use, and disposal of 1000 grocery bags.
Paper bag Recyclable plastic bag
Degradable plastic bag
Public water supply (in mg)
3,895,000,000 31,150,000 2,560,000,000
Table 33A shows that the recyclable plastic bag uses the least public water supply. The paper bag uses more than 125 times the public water supply compared with the recyclable plastic bag. The degradable plastic bag used more than 80 times the public water supply compared with the recyclable plastic bag. Table 33B. Public water supply (in mg) used for the production, use, and disposal of 1000 kraft paper grocery bags and 1500 recyclable plastic and degradable plastic grocery bags.
Paper bag Recyclable plastic bag
Degradable plastic bag
Public water supply 3,895,000,000 46,700,000 3,840,000,000
BCAL LCA Grocery Bags 55
(in mg) Table 33B shows that even using 1.5 plastic bags to 1 paper bag, the recyclable plastic bag uses the least public water supply. The paper bag, at a 1 to 1.5 use ratio, uses more than 80 times the public water supply compared with the recyclable plastic bag. The degradable plastic bag used more than 80 times the public water supply compared with the recyclable plastic bag. SUMMARY AND CONCLUSIONS Recent efforts by legislators to ban traditional plastic bags on the basis of environmental impact have reignited the debate surrounding single-use grocery bags, and whether there are any environmental trade-offs in switching from bags made with polyethylene to bags made from alternative materials. This life cycle assessment was commissioned to examine the overall environmental impacts associated with the typical single-use polyethylene plastic grocery bag, compared with grocery bags made from compostable plastic resin and grocery bags made from 30% recycled paper. Life cycle assessment is a useful analytical tool because it allows for the examination of an entire production system from cradle to grave, thus examining the full range (global, regional, and local impacts) of environmental issues at once rather than examining individual components of a system or individual products or processes. This broad picture analysis is important because environmental effects range from global (greenhouse gases), to regional (acid rain/solid waste) or local (toxic releases) impacts. And while there often is excellent information on local environmental effects, few complete data sets are available to understand the contributions production systems are making to global and regional environmental problems. These study results confirm that the standard polyethylene grocery bag has significantly lower environmental impacts than a 30% recycled content paper bag. This supports conclusions drawn from a number of other studies looking at similar systems.14, 15, 16 In addition, this report also shows that the typical polyethylene grocery bag has fewer environmental impacts than a compostable plastic grocery bag made from a blend of EcoFlex (BASF), polylactic acid, and calcium carbonate, when compared on a 1:1 basis, as well as when the number of bags is adjusted for carrying capacity so that the comparison is 1.5:1. Surprisingly, the trend is the same for most of the individual categories of environmental impacts. No one category showed environmental impacts lower for either the compostable plastic bag or the paper bag. This study did not examine the impacts associated with reusable cloth bags, so no comparison was made between the cloth bags and single-use polyethylene plastic bags. In other studies, however, cloth bags were shown to reduce environmental impacts if consumers can be convinced to switch. The problem is that there are few examples where entire cities, counties, or countries have been successful in changing consumer behavior
BCAL LCA Grocery Bags 56
from the convenience of using bags provided by retail establishments to bringing their own bags to the store each time they shop. There is no question that a percentage of consumers do, and will use reusable cloth grocery bags, but the vast majority of consumers still appear to use the freely available bags provided by retail establishments. So, if consumer behaviors are not appearing to change, banning one type of single-use bag will simply mean that it is replaced by another type of single-use bag. Given the above-stated assumption, it is clear that the replacement bags will either be compostable plastic bags or paper bags, as proposed legislation tends to stipulate these as the preferred alternatives. But can these alternative materials meet the legislative objectives, which often include: the reduction of litter, the need to reduce dependence on fossil fuels, and the need to reduce solid wastes? Taking the latter two objectives first, one can use the LCA results in this report to see if the above stated objectives are being met. In the case of reducing dependence on overall energy, it is clear (see Table 34) that neither the life cycle of compostable bag nor paper bag provides a reduction in overall energy use. The standard polyethylene plastic grocery bag uses between 1.8 and 3.4 times less energy than the compostable and paper bag systems, respectively.
Table 34. Gross Energy by Activity (MJ) Fuel prod’n
(total) Fuel use (total)
Transport (total)
Feedstock (total)
Total
Paper Bag (1000 bags)
493 1105 34 991 2622
Compostable Plastic Bag (1000 bags)
265 659 38 418 1380
Compostable Plastic Bag (1500 bags)
398 988 57 627 2070
Polyethylene Plastic Bag (1000 bags)
106 114 11 279 509
Polyethylene Plastic Bag (1500 bags)
159 171 16 418 763
Table 35 demonstrates that in terms of fossil fuel use, including oil, the compostable plastic bag system does not provide any benefit. The compostable plastic bag system appears to use more oil than either of the other two bag systems, varying from 1.7 to 2.57 times more oil than either the plastic bag or paper bag systems, respectively. The paper bag system would appear to be able to provide a slight improvement, but only if the plastic bag system actually uses 1.5 bags for every 1 bag in the paper system. If this assumption cannot be supported, then the paper bag system would not provide even a slight advantage.
These results may appear to some to be counterintuitive, but both compostable plastic and paper bags require more material per bag in their manufacture. This results in greater use of fuels in the extraction and transport of raw materials for the manufacture of the bags, as well as greater energy in bag manufacturing and greater fuel use in the transport of the finished product from the manufacturer to retail establishments. Although standard polyethylene plastic bags are made from oil, the added requirements of manufacturing energy and transport for the compostable and paper bag systems far exceed the raw material use in the standard plastic bag system. The results of this study also show that the standard polyethylene single-use plastic grocery bag’s contribution to the solid waste stream is far lower than either the paper bag system or the compostable bag system. This is not surprising considering both the compostable bag and paper bag systems require more material per bag. The increase in solid wastes has become an important global issue as populations multiply and developing countries become wealthier, consuming more material goods. Currently, more land is being devoted to the disposing of solid wastes, and the lack of proper containment in solid waste facilities is causing problems in terms of soil contamination and water pollution.
BCAL LCA Grocery Bags 58
Table 36. Municipal Solid Waste (kg)
Paper Bag
(1000 bags)
Compostable Plastic Bag (1000 bags)
Compostable Plastic Bag (1500 bags)
Polyethylene Plastic Bag (1000 bags)
Polyethylene Plastic Bag (1500 bags)
33.9 12.8 19.2 4.7 7.0 This study was not designed to address the issue of litter, so no specific calculations were conducted on the effect of the various bag systems on litter. However, there are some interesting points that can be made with regard to meeting the objective of reducing litter by switching to alternative materials in the grocery bag system. The summary of results discussed above on energy use and solid waste already illustrate that reducing litter through a change in the grocery bag system will lead to greater use in energy and greater amounts of solid wastes. Those who believe that this is an acceptable trade-off must also understand that there are additional, and perhaps far more serious, environmental impacts that will result if plastic bags are supplanted by either compostable plastic bags or paper. One of these serious environmental impacts is global warming. The study showed that switching from single-use polyethylene plastic grocery bags to either paper or compostable plastic grocery bags may increase the emission of greenhouse gases and therefore contribute to global warming (See Table 37). Based on these results, it appears that the trade-off for reducing litter is an increase in global warming, which if not curbed, is expected to cause problems for decades and to affect marine, freshwater, and terrestrial habitats, and species globally. If one of the major concerns about litter is its accumulation in marine habitats and its negative effect on sea life, it would hardly seem justified to address the effects of litter with a grocery bag system that can cause significant harm to not only the same habitats, but to all other habitats as well.
BCAL LCA Grocery Bags 59
Table 37. Global Warming Potential (CO2 Equivalents in tons)
Paper bag with
“sequestered scenario” of
carbon dioxide
emissions (1000 bags)
Compostable plastic bag
With 100% aerobic
decomposition in landfill
(1500 bags)
Compostable plastic bag with 50% aerobic &
50% anaerobic
decomposition in landfill
(1500 bags)
Polyethylene Plastic Bag (1500 bags)
Production 0.03 0.15 0.15 0.03 Disposal 0.05 0.03 0.22 0.00
Total 0.08 0.18 0.37 0.04 Another increasingly important issue is the protection of water sources around the globe. Concerns have been raised over the long-term availability of water to support the expanding population’s need for drinking, manufacturing, and agriculture. Table 38 shows the use of freshwater resources for each of the grocery bag systems studied. The standard polyethylene plastic bag uses significantly less water, compared with the paper or compostable grocery bag systems. Paper grocery bags use approximately 1 gallon of water for every bag, compared with the plastic bag system, which uses only .008 gallons per bag or 1 gallon for every 116 bags. Compostable grocery bags do not appear to provide any improvement over paper bags, and use far more water than the standard polyethylene plastic bag. It appears, therefore, that in switching to a paper bag or compostable plastic bag system to combat a litter problem, consumers will have to accept another significant trade-off—the increase in use of valuable water resources.
Other environmental factors that show similar trends are the emission of acid rain gases and water pollutants. In both cases, paper bag and compostable bag systems show larger amounts of pollutants emitted into the environment than those emitted by the plastic grocery bag system. Similarly, there are other environmental matters that are important to
BCAL LCA Grocery Bags 60
consider when making a decision on which systems to implement. Paper bag systems use a completely different resource base—wood fiber—than the plastic bag system. If the wood fiber does not come from sustainably managed forest systems or from agricultural wastes, it may cause a trade-off that is unacceptable to consumers. Forests are important ecosystems that support a wide variety of life, and disrupting these ecosystems in the name of reducing litter is an effect that deserves further contemplation. The study results support the conclusion that any decision to ban traditional polyethylene plastic grocery bags in favor of bags made from alternative materials (compostable plastic or recycled paper) will be counterproductive and result in a significant increase in environmental impacts across a number of categories from global warming effects to the use of precious potable water resources. Addressing the issue of increasing litter with bans on plastic grocery bags may be counterproductive as this study has not considered many other mitigating circumstances that may lead to even greater differentials between plastic grocery bags and those made from either paper or compostable plastics. Increased recycling rates for plastic bags, better bagging techniques at retail, and secondary uses of plastic grocery bags such as waste disposal could all further reduce the environmental impacts of plastic grocery bags. In addition, getting consumers to change their behavior so that plastic bags are kept out of the litter stream would appear to be more productive in reducing the overall environmental impact of plastic bags including litter. This study supports the conclusion that the standard polyethylene grocery bag has significantly lower environmental impacts than a 30% recycled content paper bag and a compostable plastic bag. An LCA report and its findings can be used to demonstrate that an environmental impact analysis needs to take into account the entire picture, and when dealing with a product that is likely to be replaced by another, the trade-offs in the environmental impact of the replaced alternative should also be given a critical analysis.
BCAL LCA Grocery Bags 61
LITERATURE REFERENCES 1 Private communication between PBA member and Weyerhauser, June 2007. 2 Municipal Solid Waste in the USA: 2005 Facts & Figures, USEPA, Office of Solid Waste, EPA530-R-06-011, October 2006. 3 Boustead, I. Eco-profiles of the European plastics industry: Report 3 – polyethylene and polypropylene. A report for the European Centre for Plastics in the Environment (PWMI), Brussels, May 1993. Revised 1999. 4 Private communications with BASF, Edwards, K. and Bradlee, C., May-July 2007. 5 Vink, E. T. H., Rabago, K. R., Glassner, D. A., Gruber, P. R, Applications of life cycle assessment to NatureWorks TM polylactide (PLA) production. Polymer Degradation and Stability 80 (2003) Elsevier, The Netherlands. 6 Stodolsky, F., and Mintz, M. .M, Energy Life-Cycle Analysis of Newspaper, Energy Systems Division Argonne National Laboratory, Argonne, IL , May 1993. 7 Robinson, W. D., The Solid Waste Handbook, John Wiley & Sons, New York, 1986. 8Methane Emissions, Energy Information Administration/Emissions of Greenhouse Gases in the United States 2001. 9Rathje, W., Excavating Landfills, Presentation at GRCDA 13’th Annual Landfill Gas Symposium. Lincolnshire, IL, 1990. 10Barlaz, M. A. Carbon storage during biodegradation of municipal solid waste components in laboratory scale landfills. Global Biochem. Cycles, 12(2):373-380, 1998. 11Evaluation of the Performance of Rigid Plastic Packaging Containers, Bags, and Food Service Packaging in Full-Scale Commercial Composting, A report to the Integrated Waste Management Board, California Environmental Protection Agency, Sacramento, CA, March 2007 12Houghton, J. T., Meira Filho, L.G., Callander, B.A., Harris, N., Kattenberg, A. & Maskell, K. (eds). Climate Change 1995 – Contribution of WGI to the Second Assessment Report of the Intergovernmental Panel on Climate Change, Cambridge University Press, 1996. 13Evaluation of the Performance of Rigid Plastic Packaging Containers, Bags, and Food Service Packaging in Full Scale Commercial Composting. California State University, Chico Research Foundation. 2007. Prepared for the California Integrated Waste Management Board under Contract IWM-C2061.
BCAL LCA Grocery Bags 62
14 EPA of Polyethylene and Unbleached Paper Grocery Sacks, Prepared for the Solid Waste Council, Franklin Associates Report, June 1990.
15 Life Cycle Inventory of Packaging Options For Shipment of Retail Mail-order Soft Goods, Prepared For Oregon Dept. of Environmental Quality (DEQ) and U.S. EPA Environmentally Preferable Purchasing Program, Franklin Associates, 2004. 16 Evaluation des impacts environnementaux des sacs de caisse Carrefour. Analyse du cycle de vie de sacs decaisse en plastique, papier, et materriau biodegradable. Rapport prepare pour Carrefour. Fevrier 2004.
REFERENCES REGARDING THE BOUSTEAD MODEL
1. Boustead, I., Boustead Model V5.0 Operating Manual, Boustead Consulting Ltd., 2003.
2. Boustead, I., Boustead Model V5.0 Code Book & Conversion Factors,Boustead Consulting Ltd., 2003.
3. Boustead, I., An Introduction to Life Cycle Assessment,Boustead Consulting Ltd., 2003.
4. Boustead, I., The Boustead Model Information Book, pages 1 – 500, Boustead Consulting Ltd.
BCAL LCA Grocery Bags 63
APPENDIX 1 – PEER REVIEW Background Dr. Overcash conducted the peer review and is a Professor of Chemical Engineering, as well as a Professor of Biological and Agricultural Engineering at North Carolina State University. Dr. Overcash has developed an in-depth national research program in life cycle research, developing the new areas for utilization of the life cycle tools. Dr. Overcash has led the effort in life cycle inventory techniques for manufacturing improvement and product change. Dr. Overcash has contributed to life cycle studies in energy production, electroplating, solvent selection, pharmaceutical processes, life cycle assessment comparisons, paper industry, and textiles. He has been active in European life cycle efforts and reviews of research in this field. All of the suggestions and recommendations made by Dr. Overcash have been reviewed and incorporated in this report. Below is the Peer Review Report provided by Dr. Overcash.
Review of Draft Report Life cycle assessment for three types of grocery bags – recyclable plastic; compostable,
biodegradable plastic; and recycled, recyclable paper
By Dr. Michael Overcash September 2, 2007
This report provides both a sound technical descriptions of the grocery bag products and the processes of life cycle use. The functional unit has a range to accommodate differences in customer use found to exist. These differences did not prove to change the resulting low environmental impact choice. The discussion of the limitations of the life cycle impact assessment is very important and the readers should use these observations. The following detailed review is divided into technical and editorial segments. The conclusions regarding the relative environmental impact when using a life cycle view are consistent with previous studies and need to be reinforced in the policy arena. The policies to discourage plastic bags may have more to do with litter than the overall environment. Whatever the goals of the policy makers, these need to be far more explicit than general environmental improvement, since the life cycle story is consistent in favor of recyclable plastic bags. It is possible that the emphasis of another report might be that the full benefit of plastic bags is even higher when large recycling is in place. Technical
1) p.3 last paragraph BBL is not defined 2) Table 3 at 5.78 kg functional unit this mass reflects the 50% water in wood.
However this wood is lignin and cellulose and so only about 50% of the solid material ends up in paper bag, so this should be 274,000,000 mg
BCAL LCA Grocery Bags 64
3) Table 5 These occur in all the raw material Tables a. Biomass is double counted as it appears also in Table 3 while wood
does not appear both places b. Limestone is listed twice, here and as chalk c. N2 and O2 are listed twice as air and constituents of air
4) Table 7 This is an unusually high COD:BOD ratio, it might need to be checked 5) Table 9B Elec = 103 This did not change from Table 9A, while all the other
values did change reflecting the differences in number of bags. 6) p.34 line 4 under Solid Waste This identifies steam or electricity as possible
energy recovery mechanisms, but Table 25 is only electricity. Steam would have a much higher recovery value
7) p.41 2nd line From the data in Table 28A this ratio is more like 3.5 and not 2.5
8) p. 42 3rd line From the data in Table 28B it is hard to see any ratio as high as 13
Editorial 1) p1 2nd line world for governments 2) p4 last para, 3rd line represent 3) whole document the conventional style is that data are plural, but throughout
this documents that is mostly not followed. A search for the word data and inserting the correct verb will fix this.