ENCLOSURE2
TENNESSEE VALLEY AUTHORITYSEQUOYAH NUCLEAR PLANT (SQN)
UNIT 2
SEQUOYAH NUCLEAR PLANT UNIT 2REALISTIC LARGE BREAK
LOSS OF COOLANT ACCIDENT ANALYSIS.ANP-2655(NP)
REVISION 1FEBRUARY 2008
E2-1
AREVA NP Inc.
ANP-2655(NP)Revision 1
Sequoyah Nuclear Plant Unit 2Realistic Large Break LOCA Analysis
February 2008
0
Sequoyah Nuclear Plant Unit 2Realistic Large Break LOCA Analysis
ANP-2655(NP)Revision 1
Page i
Copyright © 2008AREVA NP Inc.
.All Rights Reserved
AREVA NP Inc.
Sequoyah Nuclear Plant Unit 2Realistic Large Break LOCA Analysis
ANP-2655(NP)Revision 1
Page ii
Item
1.2.
Page
All
All
Nature of Changes
Description and Justification
This is a new document.
This revision replaces Revision 0 for Sequoyah Unit 2 completely.
AREVA NP Inc.
Sequoyah Nuclear Plant Unit 2Realistic Larqe Break LOCA Analysis
ANP-2655(NP)Revision 1
Paqe iii
Contents
1.0 Introduction .................................................................................................................... 1-1
2.0 Sum m ary ....................................................................................................................... 2-1
3.0 Analysis, ......................................................................................................................... 3-13.1 Description of the LBLOCA Event ....................................... 3-13.2 Description of Analytical Models ..... ............... ........ ..... 3-33.3 Plant Description and Sum m ary of Analysis Parameters ................................... 3-63.4 SER Com pliance ................................................................................................ 3-93.5 Realistic Large Break LOCA Results ............................................................... 3-11
4.0 Conclusions .................................................................................................................... 4-1
5.0 References ..................................................................................................................... 5-1
6.0 Addendum - Additional Inform ation Supporting EM F-2103 Revision 0 .......................... 6-16.1 Reactor Power ............................................................................................. * ...... 6-16.2 Rod Q uench ..................................................................................................... 6-26.3 Rod-to-Rod Therm al Radiation .......................................................................... 6-26.4 Film Boiling Heat Transfer Lim it ........................................................................ 6-96.5 Downcom er Boiling ............................................................................................ 6-96.6 Break Size ........................................................................................................ 6-256.7 ICECON Model ................................................................................................ 6-366.8 Cross-References to North Anna ..................................................................... 6-366.9 Containment Model ............................................. ...... 6-386.10 GDC 35 - LOO P and No-LOOP Case Sets ..................................................... 6-436.11 Statem ent ......................................................................................................... 6-44
AREVA NP Inc.
ANP-2655(NP)Sequoyah Nuclear Plant Unit 2 Revision 1Realistic Large Break LOCA Analysis Page iv
Tables
Table 2-1 Summary of Major Parameters for Limiting Transient .............................................. 2-1
Table 3-1 Additional Non-Limiting Cases Exhibiting Blowdown Quench ................................ 3-10
Table 3-2 Sampled LBLOCA Parameters ............................................................................... 3-12
Table 3-3 Plant Operating Range Supported by the LOCA Analysis ...................................... 3-13
Table 3-4 Statistical Distributions Used for Process Parameters ........................................... 3-15
Table 3-5 S ER C onditions and Lim itations ............................................................................ 3-16
Table 3-6 Summary of Results for the Limiting PCT Case ......................................... ........... 3-18
Table 3-7 Calculated Event Times for the Limiting PCT Case ................................................ 3-19
Table 3-8 Heat Transfer Parameters for the Limiting Case .................................................... 3-20
Table 3-9 Containment Initial and Boundary Conditions ........................... 3-21
Table 3-10 Passive Heat Sinks in Containment ...................................................................... 3-22
Table 6-1 Typical Measurement Uncertainties and Local Peaking Factors .............. 6-5
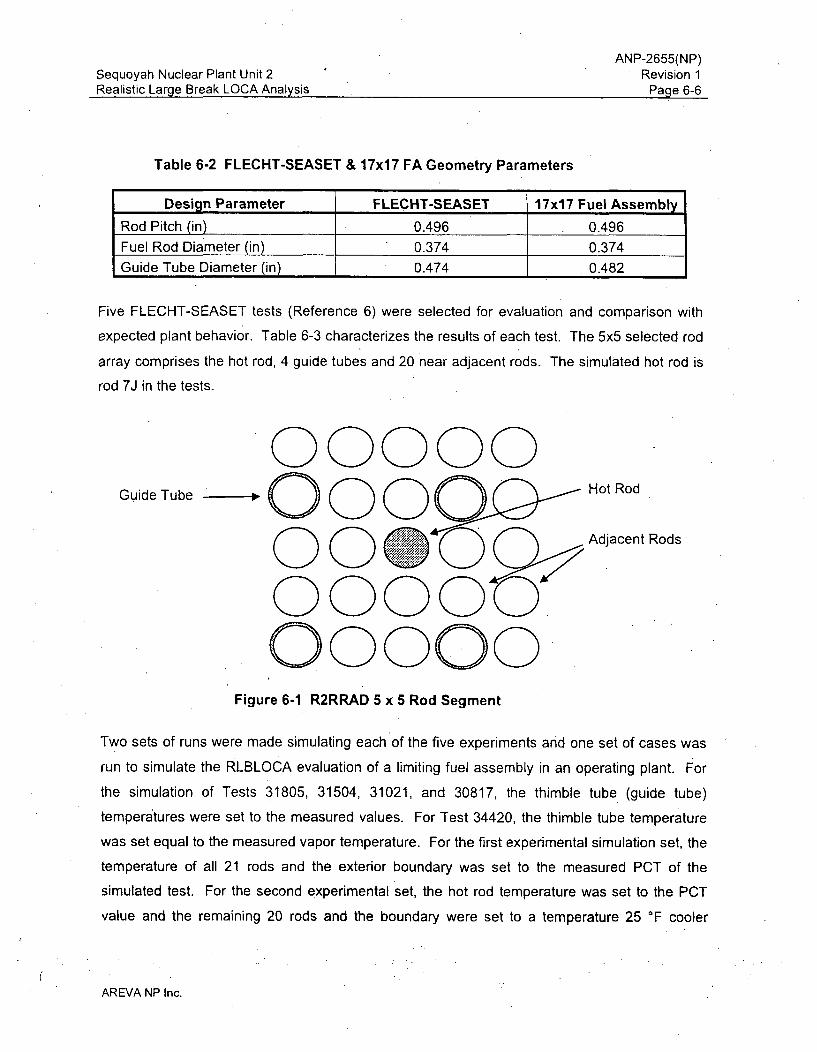
Table 6-2 FLECHT-SEASET & 17x17 FA Geometry Parameters........................................... 6-6
Table 6-3 FLECHT-SEASET Test Parameters ....................... I ................................................. 6-7
Table 6-4 Minimum Brea,k Area for Large Break LOCA Spectrum ......................................... 6-27
Table 6-5 Minimum PCT Temperature Difference - True Large and IntermediateB re a k s .................................................................................................................... 6 -2 9
AREVA NP Inc.
ANP-2655(NP)Sequoyah Nuclear Plant Unit 2 Revision 1Realistic Large Break LOCA Analysis Page v
Figures
Figure 3-1 P rim ary System N oding ......................................................................................... 3-23
Figure 3-2 Secondary System Noding ............................................................................ ....... 3-24
Figure 3-3 R eactor V essel N oding .......................................................................................... 3-25
Figure 3-4 C ore N oding D etail ................................................................................................ 3-26
Figure 3-5 U pper Plenum Noding D etail ................................................................................ 3-27
Figure 3-6 Containment Noding Diagram ................................... 3-28
Figure 3-7 Scatter Plot of Operational Parameters ................................................................. 3-29
Figure 3-8 PCT versus PCT Time Scatter Plot from 59 Calculations ..................................... 3-31
Figure 3-9 PCTversus Break Size Scatter Plot from 59 Calculations .................................... 3-32
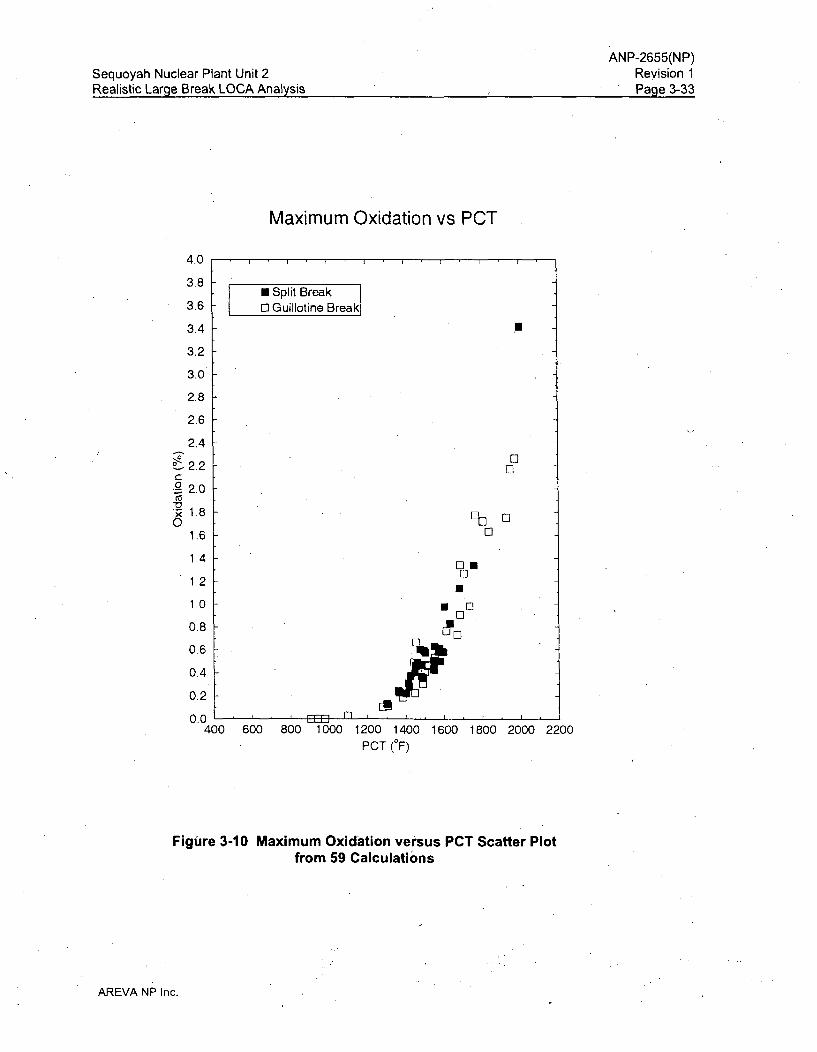
Figure 3-10 Maximum Oxidation versus PCT Scatter Plot from 59 Calculations ................... 3-33
Figure 3-1 1 Total Oxidation versus PCT Scatter Plot from 59 Calculations ............................ 3-34
Figure 3-12 Peak Cladding Temperature (Independent of Elevation) for theL im itin g C a s e ............................................................................................................... 3 -3 5
Figure 3-13 Break Flow for the Limiting Case ........................................ ................................. 3-36
Figure 3-14 Core Inlet Mass Flux for the Limiting Case .......................................................... 3-37
Figure 3-15 Core Outlet Mass Flux for the Limiting Case ....................................................... 3-38
Figure 3-16 Void Fraction at RCS Pumps for the Limiting Case ............................................. 3-39
Figure 3-17. ECCS Flows (Includes Accumulator, Charging, SI and RHR) for theL im itin g C a se .............................................................................................................. 3 -4 0
Figure 3-18 Upper Plenum Pressure for the Limiting Case .................................................... 3-41
Figure 3-19 Collapsed Liquid Level in the Downcomer for the Limiting Case ........................ 3-42
Figure 3-20 Collapsed Liquid Level in the Lower Plenum for the Limiting Case ..................... 3-43
Figure 3-21 Collapsed Liquid Level in the Core for the Limiting Case ................................... 3-44
Figure 3-22 Containment and Loop Pressures for the Limiting Case ..................................... 3-45
Figure 3-23 GDC 35 LOOP versus No-LOOP Cases ............................................................. 3-46
Figure 6-1 R2RRAD 5 x 5 Rod Segment .................................................................................. 6-6
Figure 6-2 Rod Thermal Radiation in FLECHT-SEASET Bundle and in a !7x17F A ................................................................................................................................... 6 -8
Figure 6-3 Reactor Vessel Downcomer Boiling Diagram ........................................................ 6-10
* Figure 6-4 S-RELAP5 versus Closed Form Solution .............................................................. 6-13
Figure 6-5 Downcomer Wall Heat Release - Wall Mesh Point Sensitivity .............................. 6-14
Figure 6-6 PCT Independent of Elevation - Wall Mesh Point Sensitivity ................................ 6-15
AREVA NP Inc.
ANP-2655(NP)Sequoyah Nuclear Plant Unit 2 Revision 1Realistic Large Break LOCA Analysis Page vi
Figure 6-7 Downcomer Liquid Level - Wall Mesh Point Sensitivity ........................................ 6-16
Figure 6-8 Core Liquid Level - Wall Mesh Point Sensitivity ......................... 6-17
Figure 6-9 A zim uthal N oding .................................................................................................. 6-19
Figure 6-10 Lower Compartment Pressure versus Time ........................................................ 6-20
Figure 6-11 Downcomer Wall Heat Release - Axial Noding Sensitivity Study ....................... 6-21
Figure 6-12 PCT Independent of Elevation -Axial Noding Sensitivity Study ......................... 6-22
Figure 6-13 Downcomer Liquid Level - Axial Noding Sensitivity Study .................................. 6-23
Figure 6-14 Core Liquid Level - Axial Noding Sensitivity Study .................. .... 6-24
Figure 6-15 Plant A - Westinghouse 3-Loop Design ................................... 6-30
Figure 6-16 Plant B - W estinghouse 3-Loop Design .............................................................. 6-31
Figure 6-17 Plant C - W estinghouse 3-Loop Design .............................................................. 6-32
Figure 6-18 Plant D - Combustion Engineering 2x4 Design ................................................. 6-33
Figure 6-19 Plant E -Combustion Engineering 2x4 Design ................................................... 6-34
Figure 6-20 Plant F - W estinghouse 4-Loop Design .............................................................. 6-35
Figure 6-21 Energy Addition in Lower Compartment .............................. 6-39
Figure 6-22 Energy Rates in Lower Compartment ............................... 6-39
Figure 6-23 Energy Removal Rates in Lower Compartment ........................ 6-40
Figure 6-24 Energy Removal Rates in Upper Compartment .................................................. 6-40
Figure 6-25 H eat Rem oval R ates (log) ................................................................................... 6-41
Figure 6-26 Fraction of Ice R em aining .................................................................................... 6-41
Figure 6-27 Mass Addition to Lower Compartment .. ................................................ 6-42
Figure 6-28 Upper Compartment versus Lower Compartment Pressure ............................... 6-42
Figure 6-29 Temperature of Upper and Lower Compartments ............................................... 6-43
This document contains a total of 104 pages.
AREVA NP Inc.
.ANP-2655(NP)Sequoyah Nuclear Plant Unit 2 Revision 1Realistic Large Break LOCA Analysis Page vii
Nomenclature
AFD Axial Flux Difference
BLEU Blended Low Enriched Uranium
CFR Code of Federal RegulationsCCTF Cylindrical Core Test FacilityCSAU Code Scaling, Applicability, and Uncertainty
DEGB Double-Ended Guillotine BreakDNB Departure from Nucleate Boiling
ECCS Emergency Core Cooling SystemEFPH Effective Full Power HoursEM Evaluation Model
F Q Total Peaking Factor
FAH Nuclear Enthalpy Rise Factor
HFP Hot Full Power
LBLOCA Large Break Loss of Coolant AccidentLANL Los Alamos National LaboratoryLEFM Leading Edge Flow MeterLOCA Loss of Coolant Accident
MSIV Main Steam Isolation ValveMTC Moderator Temperature Coefficient
NRC U. S. Nuclear Regulatory CommissionNSSS Nuclear Steam Supply System
PCT Peak Clad TemperaturePIRT Phenomena Identification and Ranking TablePLHGR Planar Linear Heat Generation RatePWR Pressurized Water Reactor
RAS Recirculation Actuation SignalRCP Reactor Coolant PumpRCS Reactor Coolant SystemRLBLOCA Realistic Large Break LOCARV Reactor VesselRHR Residual Heat RemovalRWST Refueling Water Storage Tank
AREVA NP Inc.
Sequoyah Nuclear Plant Unit 2Realistic Larcge Break LOCA Analysis
ANP-2655(NP)Revision 1
Paqe viii
SERSISIAS
TVA
UHI
Nomenclature (cont'd)
Safety Evaluation ReportSafety InjectionSafety Injection Actuation Signal
Tennessee Valley Authority
Upper Head Injection
AREVA NP Inc.
ANP-2655(NP)Sequoyah Nuclear Plant Unit 2 Revision 1Realistic Large Break LOCA Analysis Page 1-1
1.0 Introduction
This report describes and provides results from a RLBLOCA analysis for the Sequoyah Unit 2
Station. Revision 1 of the report replaces Revision 0 and includes the responses to the NRC's
request for additional information sent by TVA on December 21, 2007 to the NRC in Section 6.
The plant is a Westinghouse 4-loop design with a rated thermal power of 3455 MWt and ice
condenser containment. The loops contain four RCPs, four U-tube steam generators and a
pressurizer. The ECCS is provided by two independent injection trains and four accumulators.
The analysis supports operation for Cycle 16 and beyond with AREVA NP's Mark-BW fuel
design using either BLEU or standard U0 2 fuel and M5 cladding, unless changes in the
Technical Specifications, Core Operating Limits Report, core design, fuel design, plant
hardware, or plant operation invalidate the results presented herein. The analysis was
performed in compliance with the NRC-approved RLBLOCA EM (Reference 1) with exceptions
noted below. Analysis results confirm the 10CFR50.46(b) acceptance criteria presented in
Section 3.0 are met and serve as the basis for operation of the Sequoyah Unit 2 Station with
AREVA NP fuel.
The non-parametric statistical methods inherent in the AREVA NP RLBLOCA methodology
provide for the consideration of a full spectrum of break sizes, break configuration (guillotine or
split break), axial shapes, and plant operational parameters. A conservative single-failure
assumption is applied in which the loss of one train of the pumped ECCS injection is simulated.
Regardless of the single-failure assumption, all containment pressure-reducing systems are
assumed fully functional. The effects of Gadolinia-bearing fuel rods and peak fuel rod
exposures are considered.
The following are deviations from the approved RLBLOCA EM (Reference 1) that were
requested by the NRC.
The assumed reactor core power for the Sequoyah realistic large break loss-of-coolant accident
is 3479 MWt. This value represents the plant rated thermal power of 3455 MWt with a
maximum power measurement uncertainty of 0.7 percent (24 MWt) added to the rated thermal
power. The power measurement uncertainty assumption discussed in 10CFR50, Appendix K
was previously reduced for Sequoyah from 2.0 percent of the plant rated thermal power to
0.7 percent based on the installation of a LEEM system to measure main feedwater flow. The
AREVA NP Inc.
ANP-2655(NP)Sequoyah Nuclear Plant Unit 2 Revision 1Realistic Large Break LOCA Analysis Page 1-2
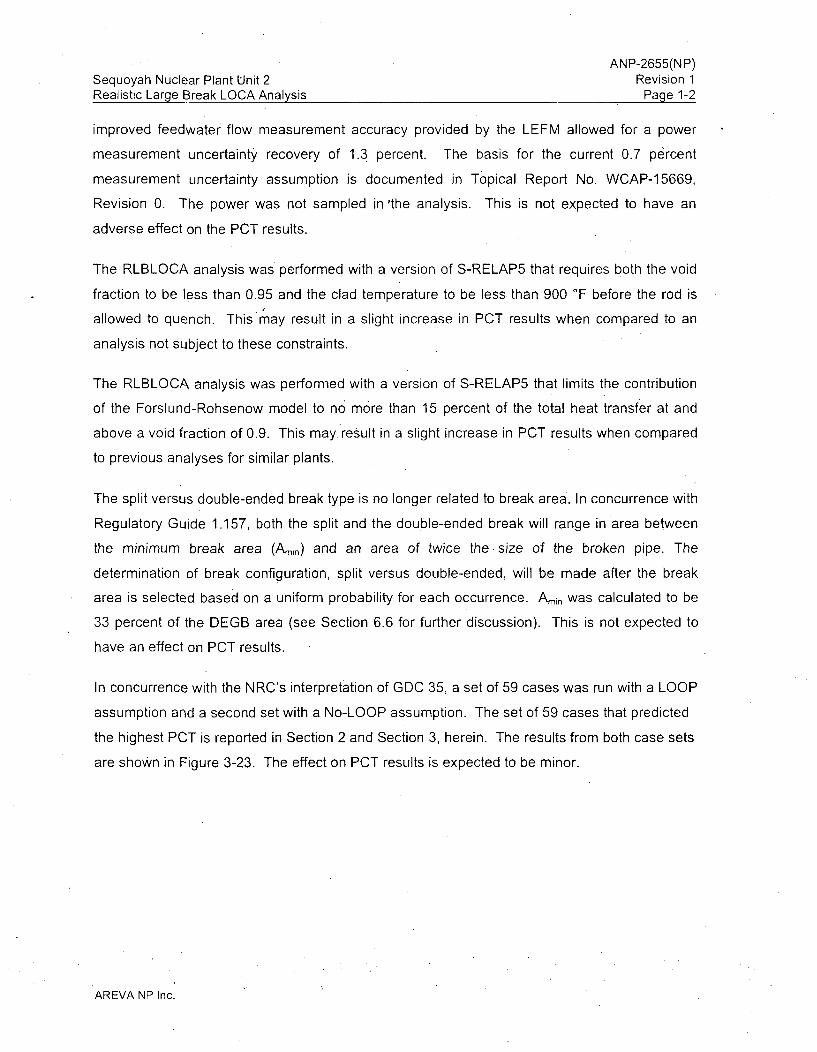
improved feedwater' flow measurement accuracy provided by the LEFM allowed for a power
measurement uncertainty recovery of 1.3 percent. The basis for the current 0.7 percent
measurement uncertainty assumption is documented in Topical Report No. WCAP-15669,
Revision 0. The power was not sampled in 'the analysis. This is not expected to have an
adverse effect on the PCT results.
The RLBLOCA analysis was performed with a version of S-RELAP5 that requires both the void
fraction to be less than 0.95 and the clad temperature to be less. than 900 'F before the rod is
allowed to quench. This may result in a slight increase in PCT results when compared to an
analysis not subject to these constraints.
The RLBLOCA analysis was performed with a version of S-RELAP5 that limits the contribution
of the Forslund-Rohsenow model to no more than 15 percent of the total heat transfer at and
above a void fraction of 0.9. This may result in a slight increase in PCT results when compared
to previous analyses for similar plants.
The split versus double-ended break type is no longer related to break area. In concurrence with
Regulatory Guide 1.157, both the split and the double-ended break will range in area between
the minimum break area (Amin) and an area of twice the size of the broken pipe. The
determination of break configuration, split versus double-ended, will be made after the break
area is selected based on a uniform probability for each occurrence. Amin was calculated to be
33 percent of the DEGB area (see Section 6.6 for further discussion). This is not expected to
have an effect on PCT results.
In concurrence with the NRC's interpretation of GDC 35, a set of 59 cases was run with a LOOP
assumption and a second set with a No-LOOP assumption. The set of 59 cases that predicted
the highest PCT is reported in Section 2 and Section 3, herein. The results from both case sets
are shown in Figure 3-23. The effect on PCT results is expected to be minor.
AREVA NP Inc.
ANP-2655(NP)Sequoyah Nuclear Plant Unit 2 Revision 1Realistic Large Break LOCA Analysis Page 2-1
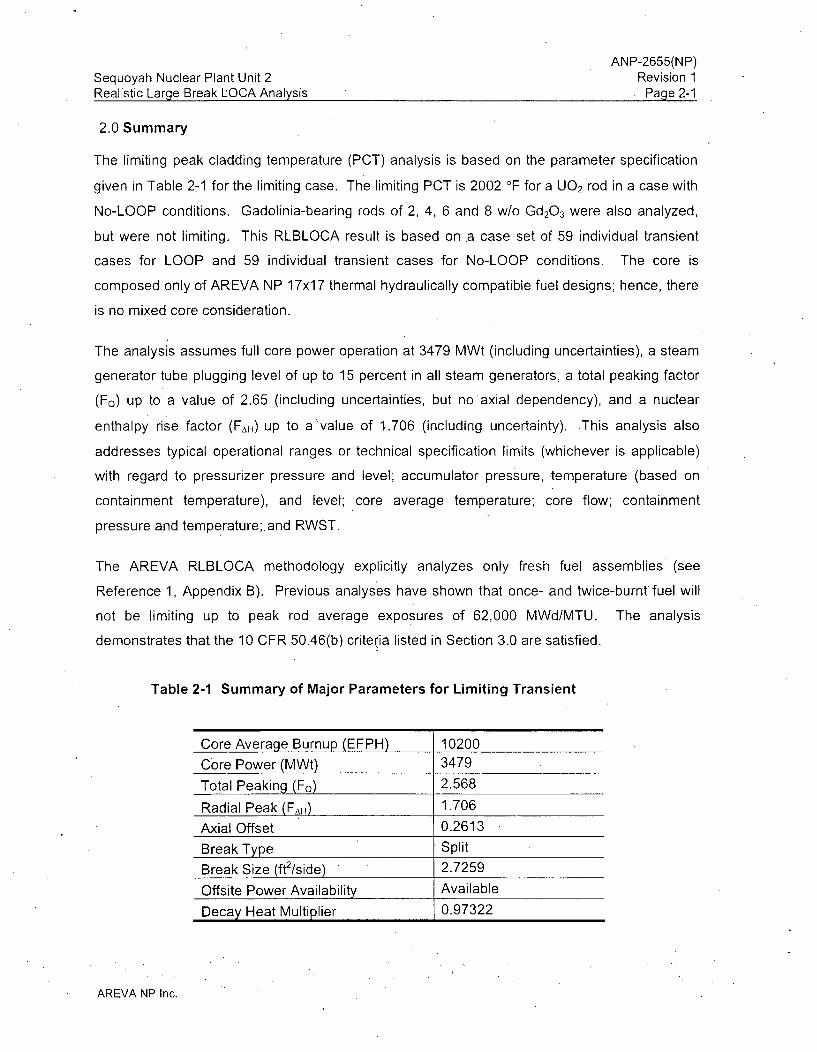
2.0 Summary
The limiting peak cladding temperature (PCT) analysis is based on the parameter specification
given in Table 2-1 for the limiting case. The limiting PCT is 2002 OF for a U0 2 rod in a case with
No-LOOP conditions. Gadolinia-bearing rods of 2, 4, 6 and 8 w/o Gd 20 3 were also analyzed,
but were not limiting. This RLBLOCA result is based on a case set of 59 individual transient
cases for LOOP and 59 individual transient cases for No-LOOP conditions. The core is
composed only of AREVA NP 17x17 thermal hydraulically compatible fuel designs; hence, there
is no mixed core consideration.
The analysis assumes full core power operation at 3479 MWt (including uncertainties), a steam
generator tube plugging level of up to 15 percent in all steam generators, a total peaking factor
(FQ) up to a value of 2.65 (including uncertainties, but no axial dependency), and a nuclear
enthalpy rise factor (FAH) up to a'value of 1.706 (including uncertainty). This analysis also
addresses typical operational ranges or technical specification limits (whichever is applicable)
with regard to pressurizer pressure and level; accumulator pressure, temperature (based on
containment temperature), and level; core average temperature; core flow; containment
pressure and temperature;. and RWST.
The AREVA RLBLOCA methodology explicitly analyzes only fresh fuel assemblies (see
Reference 1, Appendix B). Previous analyses have shown that once- and twice-burnt' fuel will
not be limiting up to peak rod average exposures of 62,000 MWd/MTU. The analysis
demonstrates that the 10 CFR 50.46(b) criteria listed in Section 3.0 are satisfied.
Table 2-1 Summary of Major Parameters for Limiting Transient
Core Average Burnup (EFPH) 10200
Core Power (MWt) 3479
Total Peaking (Fo) 2.568
Radial Peak (FAH) 1.706
Axial Offset 0.2613
Break Type Split
Break Size (ft2/side) 2.7259
Offsite Power Availability Available
Decay Heat Multiplier 0.97322
AREVA NP Inc.
ANP-2655(NP)Sequoyah Nuclear Plant Unit 2 Revision 1Realistic Large Break LOCA Analysis' Page 3-1
3.0 Analysis
The purpose of the analysis is to verify typical technical specification peaking factor limits and
the adequacy of the ECCS by demonstrating that the following 10CFR 50.46(b) criteria are met:
* The calculated maximum fuel element cladding temperature shall not exceed 2200 'F.
* • The calculated total oxidation of the cladding shall nowhere exceed 0.17 times the totalcladding thickness before oxidation.
The calculated total amount of hydrogen generated from the chemical reaction of thecladding with water or steam shall not exceed 0.01 times the hypothetical amount thatwould be generated if all of the metal in the cladding cylinders surrounding the fuelexcluding the cladding surrounding the plenum volume were to react.
The calculated changes in core geometry shall be such that the core remains amenable
to cooling.
* Long-term cooling is established and maintained after the LOCA.
The analysis did not evaluate core coolability due to seismic events, nor did it consider the
10CFR 50.46(b) long-term cooling criterion. The RLBLOCA analysis conservatively considers
blockage effects due to clad swelling and rupture in the prediction of the hot fuel rod PCT.
Since the analysis purpose is solely to change the LBLOCA licensing basis (from deterministic.
to realistic) of Unit 2, prior coolable geometry (LOCA-seismic loads) and long-term cooling
licensing bases remain unaffected and valid. Therefore, compliance with Criteria 4 and 5 is
assured.
Section 3.1 of this report describes the postulated LBLOCA event. Section 3.2 describes the
models used in the analysis. Section 3.3 describes the 4-loop PWR plant and summarizes the
system parameters used in the analysis. Compliance to the SER is addressed in Section 3.4.
Section 3.5 summarizes the results of the RLBLOCA analysis.
3.1 Description of the LBLOCA Event
A LBLOCA is initiated by a postulated rupture of the RCS primary piping. Based on
deterministic studies, the worst break location is in the cold leg piping between the reactor
coolant pump and the reactor vessel for the RCS loop containing the pressurizer. The break
initiates a rapid depressurization of the RCS. A reactor trip signal is initiated when the low
AREVA NP Inc.
ANP-2655(NP)Sequoyah Nuclear Plant Unit 2 Revision 1Realistic Large Break LOCA Analysis Page 3-2
pressurizer pressure trip setpoint is reached; however, reactor trip is conservatively neglected in
the analysis. The reactor is shut down by coolant voiding in the core.
The plant is assumed to be operating normally at full power prior to the accident. The cold leg
break is assumed to open instantaneously. For this break, a rapid depressurization occurs;
along with a core flow stagnation and reversal. This causes the fuel rods to experience DNB.
Subsequently, the limiting fuel rods are cooled by film boiling and convection to steam. The
coolant voiding creates a strong negative reactivity effect and core fission ends. As heat
transfer from the fuel rods is reduced, the cladding temperature rises.
Coolant in all regions of the RCS begins to flash. At the break plane, the loss of subcooling in
the coolant results in substantially reduced break flow. This reduces the depressurization rate,
and leads to a period of positive core flow or reduced downflow as the reactor coolant pumps in
the intact loops continue to supply water to the vessel (in No-LOOP conditions). Cladding
temperatures may be reduced and some .portions of the core may rewet during this period. The
positive core flow or reduced downflow period ends as two-phase conditions occur in the reactor
coolant pumps, reducing their effectiveness. Once again, the core flow reverses as most of the
vessel fluid mass flows out through the broken cold leg.
Mitigation of the LBLOCA begins when the SIAS is tripped. This signal is initiated by either high
containment pressure or low pressurizer pressure. Regulations require that a worst
single-failure be considered. This single-failure has been determined to be the loss of one
ECCS pumped injection train. The AREVA RLBLOCA methodology conservatively assumes an
on-time start and normal lineups of the containment spray to conservatively reduce containment
pressure and increase break flow. Hence, the analysis assumes that one charging pump, one
SI pump, one RHR pump and two containment spray pumps are operating.
When the RCS pressure falls below the accumulator pressure, fluid from the accumulators is
injected into the cold legs. In the early delivery of accumulatorwater, high pressure and high
break flow will drive some of this fluid to bypass the core. During this bypass period, core heat
transfer remains poor and fuel rod cladding temperatures increase. As RCS and containment
pressures equilibrate, ECCS water begins to fill the lower plenum and eventually the lower
portions of the core; thus, core heat transfer improves and cladding temperatures decrease.
Eventually, the relatively large volume of accumulator water is exhausted and core recovery
must rely on pumped ECCS coolant delivery alone. As the accumulators empty, the nitrogen
AREVA NP Inc.
ANP-2655(NP)Sequoyah Nuclear Plant Unit 2 Revision 1Realistic Large Break LOCA Analysis Page 3-3
gas used to pressurize the accumulators exits through the break. This gas release may result in
a short period of improved core heat transfer as the nitrogen gas displaces water in the
downcomer. After the nitrogen gas has been expelled, the ECCS temporarily may not be able to
sustain full core cooling; because of the core decay heat and the higher steam temperatures
created by quenching in the lower portions of the core. Peak fuel rod cladding temperatures
may.increase for a short period until more energy is removed from the core by the charging, SI
and RHR while the decay heat continues to fall. Steam generated from fuel rod rewet will
entrain liquid and pass through the core, vessel upper plenum, the hot legs, the steam
generator, and the reactor coolant pump before it is vented out the break. Some steam may
flow to the upper head and pass through the spray nozzles, which provide a vent path to the
break. The resistance of this flow path to the steam flow is balanced by the driving force of
water filling the downcomer. This resistance may act to retard the progression of.the core
reflood and postpone core wide cooling. Eventually (within a few minutes of the accident), the
core reflood will progress sufficiently to ensure core wide cooling. Full core quench occurs
within a few minutes after core wide cooling. Long-term cooling is then sustained with the RHR
system.
3.2 Description of Analytical Models
The RLBLOCA methodology is documented in EMF-2103 Realistic Large Break LOCA
Methodology (Reference 1). The methodology follows the Code Scaling, Applicability, and
Uncertainty (CSAU) evaluation methodology (Reference 2). This method outlines an approach
for defining and qualifying a best-estimate thermal-hydraulic code and quantifies the
uncertainties in a LOCA analysis.
The RLBLOCA rethodology consists of the following computer codes:
RODEX3A for computation of the initial fuel stored energy, fission gas release, andfuel-cladding gap conductance.
S-RELAP5 for the system calculation (includes ICECON for containment response).
AUTORLBLOCA for generation of ranged parameter values, transient input, transientruns, and general output documentation.
The governing two-fluid (plus non-condensibles) model with conservation equations for mass,
energy, and momentum transfer is used. The reactor core is modeled in S-RELAP5 with heat
AREVA NP Inc.
ANP-2655(NP)Sequoyah Nuclear Plant Unit 2 Revision 1Realistic Large Break LOCA Analysis Page 3-4
generation rates determined from reactor kinetics equations (point kinetics) with reactivity
feedback, and with actinide and decay heating.
The two-fluid formulation uses a separate set of conservation equations and constitutive
relations for each phase. The effects of one phase on the other are accounted for by interfacial
friction, and heat and mass transfer interaction terms in the equations. The conservation
equations have the same form for each phase; only the constitutive relations and, physical
properties differ.
The modeling of plant components is performed by following guidelines developed to ensure
accurate accounting for physical dimensions and that the dominant phenomena expected during
the LBLOCA event are captured. The basic building blocks for modeling are hydraulic volumes
for fluid paths and heat structures for heat transfer. In addition, special purpose components
exist to represent specific components such as the RCPs or the steam generator separators.
All geometries are modeled at the resolution necessary to best resolve the flow field and the
phenomena being modeled within practical computational limitations.
System nodalization details are shown in Figures 3-1 through 3-5. A point of clarification: in
Figure 3-1, break modeling uses two junctions regardless of break type-split or guillotine; for
guillotine breaks, Junction 151 is deleted, it is retained fully open for split breaks. Hence, total
break area is the sum of the areas of both break junctions.
A typical calculation using S-RELAP5 begins with the establishment of a steady-state initial
condition with all loops intact. The input parameters and initial conditions for this steady-state
calculation are chosen to reflect plant technical specifications or to match measured data.
Additionally, the RODEX3A code provides initial conditions for the S-RELAP5 fuel models.
Specific parameters are discussed in Section 3.3.
Following the establishment of an acceptable steady-state condition, the transient calculation is
initiated by introducing a break into one of the loops (specifically, the loop with the pressurizer).
The evolution of the transient through blowdown, refill and reflood is computed continuously
using S-RELAP5. Containment pressure is also calculated by S-RELAP5 using containment
models derived from ICECON (Reference 4), which is based on the CONTEMPT-LT code
(Reference 3) and has been updated for modeling ice condenser containments.
AREVA NP Inc.
ANP-2655(NP)Sequoyah Nuclear Plant Unit 2 Revision 1Realistic Large Break LOCA Analysis Page 3-5
The methods used in the application of S-RELAP5 to the LBLOCA are described in
Reference 1. A detailed assessment of this computer code was made through comparisons to
experimental data, many benchmarks with cladding temperatures ranging from 1,700 *F (or
less) to above 2,200 'F. These assessments were used to develop quantitative estimates of the
ability of the code to predict key physical phenomena in a PWR LBLOCA. Various models-for
example, the core heat transfer, the decay heat model and the fuel cladding oxidation
correlation-are defined based on code-to-data comparisons and are, hence, plant
independent.
The RV. internals are modeled in detail (Figures 3-3 through 3-5) based on specific inputs
supplied by TVA. Nodes and connectivity, flow areas, resistances and heat structures are all.
accurately modeled. The location of the hot assembly/hot pin(s) is unrestricted; however, the
channel is always modeled to restrict appreciable upper plenum liquid fallback.
The final step of the best-estimate methodology is to combine all the uncertainties related to the
code and plant parameters, and estimate the PCT at a high probability level. The steps taken to
derive the PCT uncertainty estimate are summarized below:
1. Base Plant Input File Development
First, base RODEX3A and S-RELAP5 input files for the plant (including the containmentinput file) are developed. Code input development guidelines are applied to ensure that
model nodalization is consistent with the model nodalization used in the code validation.
2. Sampled Case Development
The non-parametric statistical approach requires that many "sampled" cases be createdand processed. For every set of input created, each "key LOCA parameter" is randomlysampled over a range established through, code uncertainty assessment or expectedoperating limits (provided by plant technical specifications or data). Those parametersconsidered "key LOCA parameters" are listed in Table 3-2. This list includes bothparameters related to LOCA phenomena (based on the PIRT provided in Reference 1)and to plant operating parameters.
3. Determination of Adequacy of ECCS
The RLBLOCA methodology uses a non-parametric statistical approach to determinevalues of PCT at the 95 percent probability level. Total oxidation and total hydrogen arebased on the limiting PCT case. The adequacy of the ECCS is demonstrated whenthese results satisfy the criteria set forth in Section 3.0.
AREVA NP Inc.
ANP-2655(NP)Sequoyah Nuclear Plant Unit 2 Revision 1Realistic Large Break LOCA Analysis Page 3-6
3.3 Plant Description and Summary of Analysis Parameters
The plant analysis presented in this report is for a Westinghouse-designed PWR, which has four
loops, each with a hot leg, a U-tube steam generator, and a cold leg with a RCP 1 . The RCS
also includes one pressurizer connected to a hot leg. The core contains (193) 17x17
thermal-hydraulic compatible AREVA Mark-BW fuel assemblies. The ECCS includes one
charging and one accumulator/Sl/RHR injection path per RCS loop. The SI and RHR feed into
common headers which are connected to the accumulator lines. The charging pumps are also
cross-connected. The break is modeled in the same loop as the pressurizer, as directed by the
RLBLOCA methodology. The RLBLOCA transients are of sufficiently short duration that the
switchover to sump cooling water (i.e., RAS) for ECCS pumped injection need not be
considered
The S-RELAP5 model explicitly describes the RCS, RV, pressurizer, and accumulator lines.
The charging injection flows are connected to the RCS, and the SI and RHR injection flows are
connected to the accumulator lines, consistent with the plant layout. This model also describes
the secondary-side steam generator that is instantaneously isolated (closed MSIV and
feedwater trip) at the time of the break. A symmetric steam generator tube plugging level of
15 percent per steam generator was assumed.
Plant input modeling parameters were provided by TVA specifically for the Sequoyah Unit 2
Station. By procedure, TVA maintains plant documentation current, and directly communicates
with AREVA on plant design and operational issues regarding reload cores. TVA and AREVA
will continue to interact in that fashion regarding the use of AREVA fuel in the Sequoyah Unit 2
Station. Both entities have ongoing processes that assure the ranges and values of input
parameters for the Sequoyah Unit 2 Station RLBLOCA analysis bound those of the as-operated
plant.
As described in the AREVA RLBLOCA methodology, many, parameters associated with
LBLOCA phenomenological uncertainties and plant operation ranges are sampled. A summary
of those parameters is given in Table 3-2. The LBLOCA phenomenological uncertainties are
provided in Reference 1. Values for process or operational parameters, including ranges of
sampled process parameters, and fuel design parameters used in the analysis are given in
Table 3-3. Plant data are analyzed to develop uncertainties for the process parameters
AREVA NP Inc.
ANP-2655(NP)Sequoyah Nuclear Plant Unit 2 Revision 1Realistic Large Break LOCA Analysis Page 3-7
sampled in the analysis. Table 3-4 presents a summary of the uncertainties used in the
analysis. Two parameters, RWST temperature for ECCS flows and diesel start time, are set at
conservative bounding values for all calculations. Where applicable, the sampled parameter
ranges are based on technical specification limits or supporting plant calculations that provide
more bounding values.
For the AREVA NP RLBLOCA EM, dominant containment parameters, as well as NSSS
parameters, were established via a PIRT process. Other model inputs are generally taken as.
nominal or conservatively biased. The PIRT outcome yielded two important (relative to PCT)
containment parameters-containment pressure and temperature. In many instances, the
conservative guidance of CSB 6-1 (Reference 5) was used in setting the remainder ofthe
containment model input parameters. As noted in Table 3-4, containment temperature is a
sampled parameter. Containment pressure response is indirectly ranged by sampling the upper
containment volume (Table 3-4). The minimum value is carried over from use in the long-term
containment integrity analysis of record for Sequoyah. The maximum value is a simplified value
computed as the volume available within the upper dome of the containment and within the
crane wall above the control rod drive missile shield with no accounting for internal structures
and the volumes of the refueling canal and the annular region separating the ice compartments
neglected. This volume is maximized by neglecting the volume of internal structures. The lower
compartment volume is biased low in order to promote flow through the ice baskets. In
accordance with Reference 1, the condensing heat transfer coefficient is intended to be closer
to a best-estimate instead of a bounding high value. A [ ] Uchida heat transfer coefficient
multiplier was specifically validated for use in Sequoyah through application of the process used
in the RLBLOCA EM (Reference 1) sample problems. The ice condenser containment noding is
shown in Figure 3-6. In the ice compartment, the water formed by melted ice and condensed
steam flows to the lower ice compartment sump where it accumulates, if the ice bay drains are
not large enough to accommodate the rate of water production. When the water level in the
lower ice compartment sump rises above the bottom of the lower doors, water spillage through
the lower doors occurs in addition to flow through the drain ports. The water drainage (spillage
plus drainage) from the ice compartment falls through the lower compartment vapor. This
condenses steam and reduces the containment pressure. The ice compartment drainage flow
is treated as a 100 percent efficient spray during the post-blowdown period of the transient.
1 The RCPs are Westinghouse 93A type pumps. The homologous pump performance curves for this type
of pump were input to the S-RELAP5 plant model.
AREVA NP Inc.
ANP-2655(NP)Sequoyah Nuclear Plant Unit 2 Revision 1Realistic Large Break LOCA Analysis Page 3-8
The initial conditions and boundary conditions are given in Table 3-9. The building spray is
modeled at maximum heat removal capacity. While there is an option within the computer code
model to deliver spray to the lower compartment, this option is not applicable to Sequoyah
Unit 2. All spray flow is delivered to the upper compartment. Because the start time for the
recirculation fan is 600 seconds, forced flow from the upper compartment to the lower
compartment is not likely to occur during the time period analyzed. The flow of steam or air,
from the lower compartment to the upper compartment, backwards through the back draft
dampers, is not modeled (no reverse direction flow). This approach is conservative in that no
bypass of the ice beds (from lower to upper compartments) is allowed, and all flow from the
lower compartment is directed through the ice beds. The passive flow of air and steam, from
the upper compartment to the lower compartment, is modeled however. This is a passive flow,
which is only a function of the excess pressure of the upper compartment compared to the lower
compartment, the flow area of the recirculation fan back draft dampers, and the loss coefficient
of the dampers. The back draft dampers are designed such that reverse flow from the lower to
the upper compartment is prevented. However, when the upper compartment pressure is at
least 0.5 psi greater than the lower compartment, the dampers open and allow flow from the
upper compartment to the lower compartment. Flow..in this manner, from the upper to lower
compartment, is modeled without this minimum pressure difference, i.e. any excess pressure is
modeled as resulting in flow.
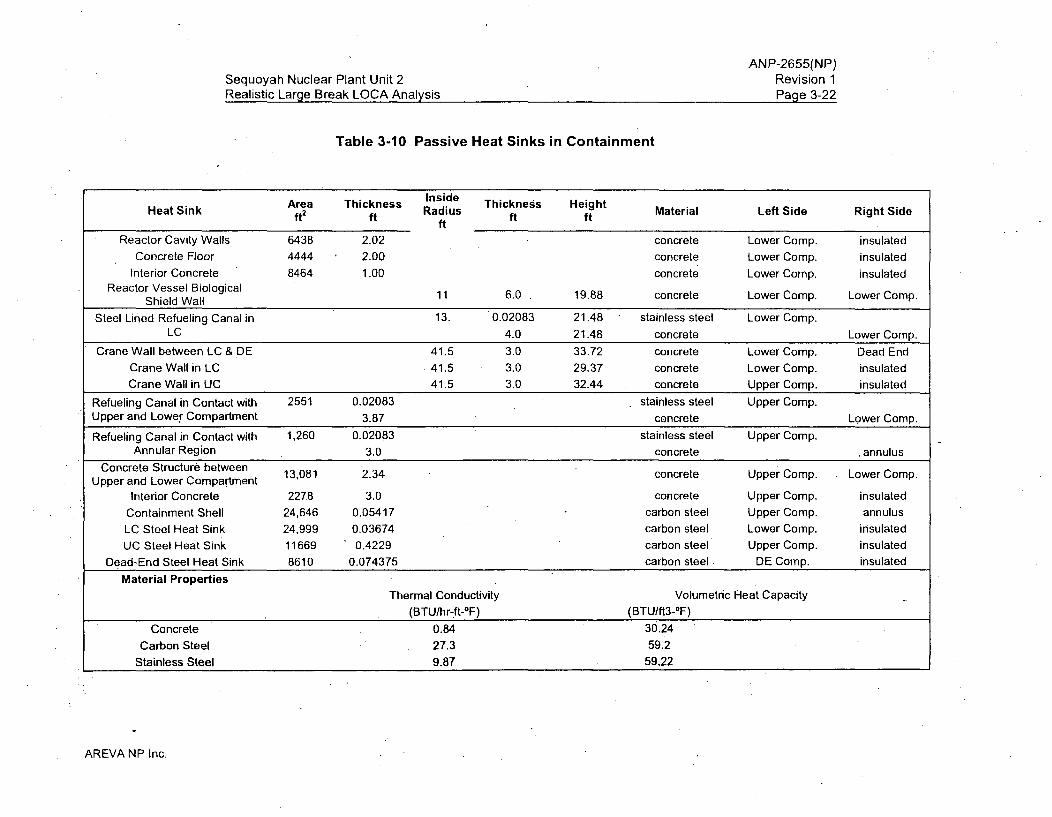
Passive heat sink parameters.are listed in Table 3-10. Surface coatings, where they existed,
were incorporated as *an equivalent thickness of base material in order to eliminate any
insulating effects on the exposed surfaces of the heat structures. Because the original basis for
the size of each heat sink was biased low (for a different application), the values listed in
Table 3-10 reflect a 10 percent increase in heat transfer surface area as compensation.
Passive heat sinks were added to the lower containment to represent new sump screens being
installed in the Sequoyah Unit 2 plant (17 ft3 of steel). Additionally, all heat structure exposed
surfaces remain available for condensing steam, even when they may become covered by ice
melt or condensate_
AREVA NP Inc.
ANP-2655(NP)Sequoyah Nuclear Plant Unit 2 Revision 1Realistic Large Break LOCA Analysis Page 3-9
3.4 SER Compliance
A number of requirements on the methodology are stipulated in the conclusions section of the
SER for the RLBLOCA methodology (Reference 1). These requirements have all been fulfilled
during the application of the methodology as addressed in Table 3-5.
Six non-limiting PCT cases were potential candidates for blowdown quench (SER Item 7). The
applicable heat structure temperature stays well above the local saturation temperature prior to
accumulator injection in all of these cases. For this set of calculations, no evidence of
blowdown'quench was found and compliance to the SER restriction has been demonstrated.
Case 21 and Case 40 did exhibit blowdown quench at the end of blowdown. The applicable
features for the cases that exhibited a quench of the PCT node before the end of blowdown are:
- relatively small break area,
- offsite power continues to be available to power Reactor Coolant Pumps, and,
- the temporary quench occurs at the time of the end of blowdown, when accumulators
start injecting into the intact loops.
Prior to being quenched the two cases exhibited a relatively small heatup during blowdown.
This compares to the limiting case which exhibited a heatup of over 1000 'F during blowdown.
This reduced heatup for the two cases shows that these rods were more susceptible to being
quenched. Mechanistically, the observed quench occurs because the small break area limits
break flow. This reduces the rates at which pressure and flow decrease at the PCT location
compared with the limiting case. In addition, the time of the quench coincides with the moment
when accumulators start injecting into the intact loops, adding liquid mass into the system at a
significant. rate and possibly helping the quench through increased availability of the liquid at the
quench location.
The void fraction at the PCT locations indicates that liquid is available for cooling. Both
blowdown quench cases had off site power available. Thus the continued operation of the
Reactor Coolant Pumps provides .increased forced- convection cooling. The resulting
combination of higher core flow and pressure cools the cladding sufficiently to enable a return to
nucleate boiling.
AREVA NP Inc.
ANP-2655(NP)Sequoyah Nuclear Plant Unit 2 Revision 1Realistic Large Break LOCA Analysis Page 3-10
It is therefore concluded that the predicted blowdown quench is appropriate for these non-
limiting cases and also that this behavior is not applicable in any way to the limiting case. The
blowdown quench for these cases is justified and compliance to. the SER restriction has been
demonstrated.
Table 3-1 Comparison of Limiting Case to Non-Limiting Cases ExhibitingBlowdown Quench
PCT PCT Tmin Break Peak OffsiteCase PCT (°F) Elevation Time Sampled Break Size LHGR Power
(ft) (s) (K) Type (ft2/side) Skw/ft) Available
20 (limiting 2002 9.83 130.7 652.97 split 2.7259 14.6133 Yescase)
21 940 9.83 107.7 638.92 guillotine 1.4005 13.8788 Yes
40 1282 9.83 129.2 637.01 guillotine 1.3839 14.8103 Yes
Several measures have been taken to prevent the top-down quench (SER Item 8). The upper
plenum nodalization features include:
" the homogenous option is selected for the junction that connects the first axial level .nodeabove the hot channel to the second axial level node above the hot channel;
" no 'cross-flow is allowed between the first axial level Upper Plenum nodes above the hotchannel to the average channel;
* the CCFL model is applied on all core exit junctions.
Seven non-limiting cases were closely examined for top-down quench. These cases exhibit
short periods of decrease in the integrated mass flux at the hot assembly exit, indicating the
possibility of a net downward flow, however this is happening after the PCT has occurred. The
heat structure temperature displays a drop to saturation temperature starting at the bottom and
sequentially progresses upward through the PCT elevation, the nodes above the PCT node
experiencing the quench at times later than at the PCT node. In three of these cases, some of
the nodes situated right above the PCT node are being quenched slightly earlier than the PCT
location. For one case the net downward flow occurs right at the end of the transient, after the
PCT location and the entire core have already quenched, and thus it does not raise any concern
of top-down quench. For the other two cases, liquid down flow occurs well past PCT time due
to the reduction in steam production in the hot assembly. The modeling precautions taken to
prevent top-down quench are sufficient, therefore compliance to the SER restriction has been
demonstrated.
AREVA NP Inc.
ANP-2655(NP)Sequoyah Nuclear Plant Unit 2 Revision 1Realistic Large Break LOCA Analysis Page3-11
3.5 Realistic Large Break LOCA Results
Two case sets of 59 transient calculations were performed sampling the parameters listed in
Table 3-2. For each transient calculation, PCT was calculated for a U0 2 rod and for Gadolinia
bearing rods with concentrations, of 2, 4, 6 and 8 w/o Gd 20 3. The limiting case set, that
contained the PCT, was the set with offsite power available. The limiting PCT (2002 OF)
occurred in Case 20 for a U0 2 rod. The major parameters for the limiting transient are
characterized in Table 2-1. Table 3-6 lists the results of the limiting case. The fraction of total
hydrogen generated was not directly calculated; however, it is conservatively bounded by the
calculated total percent oxidation, which is well below the 1 percent limit. A nominal best
estimate PCT case was identified as Case 14, which corresponded to the median case out of
the 59-case set with offsite power available. The nominal PCT was 1514 OF. This result can be
used to quantify the relative conservatism in the limiting case result. In this analysis, it was
488 OF.
The case results, event times and analysis plots for the limiting PCT case are shown in
Table 3-6, Table 3-7, and in Figures 3-12 through 3-22. Figure 3-7 shows linear scatter plots of
the key parameters sampled for the 59 calculations. Parameter labels appear to the left of each
individual plot. These figures show the parameter ranges used in the analysis. Figures 3-8 and
3-9 show the time of PCT and break size versus PCT scatter plots for the 59 calculations,
respectively. Figures 3-10 and 3-11 show the maximum oxidation and total oxidation versus
PCT scatter plots for the 59 calculations, respectively. Key parameters for the lirmliting PCT
case are shown in Figures 3-12 through 3-22. Figure 3-12 is the plot of PCT independent of
elevation; this figure clearly indicates that the transient exhibits a sustained and stable quench.
A comparison of PCT results from both case sets is shown in Figure 3-23.
AREVA NP Inc.
ANP-2655(NP)Sequoyah Nuclear Plant Unit 2 Revision 1Realistic Large Break LOCA Analysis Page 3-12
Table 3-2 Sampled LBLOCA Parameters
Phenomenological
Time in cycle (peaking factors, axial shape, rodproperties, burnup)
Break type (guillotine versus split)
Critical flow discharge coefficients (break)
Decay heat
Critical flow discharge coefficients (surgeline)
Initial upper head temperature
Film boiling heat transfer
Dispersed film boiling heat transfer
Critical heat flux
Tmin (intersection of film and transition boiling)
Initial stored energy
Downcomer hot wall effects
Steam generator interfacial drag
Condensation interphase heat transfer
Metal-water reaction
Plant'
Offsite power availability2
Break size
Pressurizer pressure
Pressurizer liquid level
Accumulator pressure
Accumulator liquid level
Accumulator temperature (based on lower compartmentcontainment temperature)
Containment temperature
Containment volume
Initial RCS flow rate
Initial operating RCS temperature
Diesel start (for loss of offsite power only)
Uncertainties for plant parameters are based on typical plant-specific data with the exception of
"Offsite power availability" which is a binary result that is specified by the analysis methodology.2 Not sampled, see Section 6.10.
AREVA NP Inc.
Sequoyah Nuclear Plant Unit 2Realistic Large Break LOCA Analysis
Table 3-3 Plant Operating Range Supported by the LOCA Analysis
ANP-2655(NP)Revision 1Page 3-13
Event Operating Range1.0 Plant Physical Description
1.1 Fuel
a) Cladding outside diameter 0.374 in.b) Cladding inside diameter 0.326 in.c) Cladding thickness 0.024 in.
d) Pellet outside diameter 0.3195 in.e) Pellet density 96 percent of theoretical
f) Active fuel length 144 in.g) Resinter densification I Ih) Gd 20 3 concentrations 2, 4, 6, 8 w/o
1.2 RCS
a) Flow resistance Analysis
b) Pressurizer location Analysis assumes location givingmost limiting PCT (broken loop)
c) Hot assembly location Anywhere in cored) Hot assembly type 17x17
e) SG tube plugging < 15 percent
2.0 Plant Initial Operating Conditions
2.1 Reactor Powera) Nominal reactor power 3479 MWt'b) FQ < 2.652
C) FAH _ 1.7063
d) MTC < 0 at HFP
2.2 Fluid Conditionsa) Loop flow 131.6 Mlbm/hr _<M _ 152.8 MIbm/hr
b) RCS average temperature 578.2 F _< T _< 583 OFc) Upper head temperature -Tcold Temperature 4
1
2
3
4
Includes uncertaintiesEnsures that a minimum 7 percent peaking margin is maintained to the Fq limits when operating atthe positive or negative AFD limit
Includes 4 percent measurement uncertaintyUpper head temperature will change based on sampling of RCS temperature
AREVA NP Inc.
Sequoyah Nuclear Plant Unit 2Realistic Large Break LOCA Analysis
ANP-2655(NP)Revision 1Page 3-14
Table 3-3 Plant Operating Range Supported by the LOCA Analysis (Continued)
d) Pressurizer pressure 1859.7 psia _ P _< 2459.7 psiae) Pressurizer level 57 percent _ L _< 95 percentf) Accumulator pressure 614.7 psia _ P _< 697.7 psiag) Accumulator liquid volume 1004.6 ft 3 < V _< 1095.4 ft3
h) Accumulator temperature 95 OF • T _ 130 OF (coupled tocontainment lower volume temperature)
i) Accumulator fL/D As-built piping configurationj) Minimum ECCS boron > 2400 ppm
3.0 Accident Boundary Conditionsa) Break location Any RCS piping locationb) Break type Double-ended guillotine or splitc) Break size (each side, relative to 0.33 _ A _ 1.0 full pipe area (split)cold leg pipe area). 0.33 < A < 1.0 full pipe area (guillotine)d) Worst single-failure Loss of one train of ECCSe) Offsite power On or Off
mflow Bounding minimum of current pumpf) Charging pump fdelivery
Bounding minimum of current pumpg) SI pump flow delivery
Bounding minimum of current pumph) RHR pump flow delivery
h) ECCS pumped injection temperature 110 OFi) Charging pump -delay 37 s (w/ offsite power)
27 s (w/o offsite power)j) Sl pump delay 37 s (w/ offsite power)
27 s (w/o offsite power)k) RHR pump delay 37 s (w/ offsite power)
27 s (w/o offsite power)I) Containment pressure 14.3 psia, nominal valuem) Containment upper compartment 80 0F < T < 110 0Ftemperaturen)Containment lower compartment 95 OF < T < 130 OFtemperature0) Containment sprays delay 8 sp) Containment spray water 55 OFtemperature I
AREVA NP Inc.
/
Sequoyah Nuclear Plant Unit 2Realistic Larqe Break LOCA Analysis
ANP-2655(NP)Revision 1Paqe 3-15
Table 3-4 Statistical Distributions Used for Process Parameters1
Operational Measurement StandardParameter Uncertainty Parameter Range Uncertainty2 Deviation
Distribution Distribution Deviation
Pressurizer Pressure (psia) Uniform 1859.7- 2459.7 N/A N/A
Pressurizer Liquid Level (percent) Uniform 57 - 95 N/A N/A
Accumulator Liquid Volume (ft) Uniform 1004.6 - 1095.4 N/A N/A
Accumulator Pressure (psia) Uniform 614.7 - 697.7 N/A N/A
Containment Lower Compartment -130/Accumulator Temperature (.F) Uniform 95 N/A N/A
Containment Upper Compartment Uniform 80 - 110Temperature (fF)
Containment Upper Volume ( ft3) Uniform 651,000 - 692,600 N/A N/A
Initial RCS Flow Rate (Mlbm/hr) Uniform 131.6 - 152.8 N/A N/A
Initial RCS Operating Temperature Uniform 578.2- 583 N/A N/A(Tavg) (fF)
RWST Temperature for ECCS ('F) Point 110 N/A N/A
RWST Temperature forContainment Sprays (fF)
Offsite Power Availability3 Binary 0,1 N/A N/A
Delay for Containment Cooling (s) Point 8.0 N/A N/A
Charging Pump Delay (s) Point 37 (w/ offsite power) N/A N/A27 (w/o offsite power)
LHSI Pump Delay (s) Point 37 (w/ offsite power) N/A N/A27 (w/o offsite power)
RHR Pump Delay (s) Point 37 (w/ offsite power) N/A N/A27 (w/o offsite power) N/A_ N/A
1
2
3
Note that core power is not sampled, see Section 1.0
All measurement uncertainties were incorporated into the operational ranges
This is no longer a sampled parameter. One set of 59 cases is run with LOOP and one set of 59cases is run with No-LOOP.
AREVA NP Inc.
Sequoyah Nuclear Plant Unit 2Realistic Large Break LOCA Analysis
ANP-2655(NP)Revision 1Pacie 3-16
Table 3-5 SER Conditions and Limitations
SER Conditions and Limitations I Response
1. A CCFL violation warning will be added to alert the analyst There was no significant occurrence of CCFL violation in theto CCFL violation in the downcomer should such occur. downcomer for this analysis. Violations of CCFL were noted
in a statistically insignificant number of time steps.
2. AREVA NP has agreed that it is not to use nodalization Hot leg nozzle gaps were not modeled.with hot leg to downcomer nozzle gaps.
3. If AREVA NP applies the RLBLOCA methodology to plants The PLHGR for Sequoyah Unit 2 is lower than that used inusing a higher planar linear heat generation rate (PLHGR) the development of the RLBLOCA EM (Reference 1). Anthan used in the current analysis, or if the methodology is end-of-life calculation was not performed; thus, the need forto be applied to an end-of-life analysis for which the pin a blowdown cladding rupture model was not reevaluated.pressure is significantly higher, then the need for ablowdown clad rupture model will be reevaluated. Theevaluation may be based on relevant engineeringexperience and should be documented in either theRLBLOCA guideline or plant specific calculation file.
4. Slot breaks on the top of the pipe have not been evaluated. The evaluation of slot breaks is documented in the AREVAThese breaks could cause the loop seals to refill during late RLBLOCA analysis guidelines.reflood and the core to uncover again. These breaklocations are an oxidation concern as opposed to a PCTconcern since the top of the core can remain uncovered forextended periods of time. Should an analysis beperformed for a plant with loop seals with bottom elevationsthat are below the top elevation of the core, AREVA NP willevaluate the effect of the deep loop seal on the slot breaks.The evaluation may be based on relevant engineeringexperience and should be documented in either theRLBLOCA guideline or plant-specific calculation file.
5. The model applies to 3 and 4 loop Westinghouse- and Sequoyah Unit 2 is a Westinghouse 4-loop plant.CE-designed nuclear steam systems.
6. The model applies to bottom reflood plants only (cold side Sequoyah Unit 2 is a bottom reflood plant.injection into the cold legs at the reactor coolant dischargepiping).
7. The model is valid as long as blowdown quench does not The limiting case did not show any evidence of a blowdownoccur. If blowdown quench occurs, additional justification quench. The possibility of Blowdown quench was observedfor the blowdown heat transfer model and-.uncertainty -are. in-sevyen .cases-which..are-ediscussed-inSection_3.4...- ...needed or the calculation is corrected. A blowdownquench is characterized by a temperature reduction of thepeak cladding temperature (PCT) node to saturationtemperature during the blowdown period.
8. The reflood model applies to bottom-up quench behavior. Core quench initiated at the bottom of the core andIf a top-down quench occurs, the model is to be justified or proceeded upward.corrected to remove top quench. A top-down quench ischaracterized by the quench front moving from the top tothe bottom of the hot assembly.
AREVA NP Inc.
Sequoyah Nuclear Plant Unit 2Realistic Large Break LOCA Analysis
ANP-2655(NP)Revision 1Page 3-17
Table 3-5 SER Conditions and Limitations (Continued)
SER Conditions and Limitations Response
9. The model does not determine whether Long-term cooling was not evaluated in this analysis.Criterion 5 of 10 CFR 50.46, long termcooling, has been satisfied. This will bedetermined by each applicant or licensee aspart of its application of this methodology.
10. Specific guidelines must be used to develop The nodalization in the plant model is consistent with the Westinghouse
the plant-specific nodalization. Deviations 4-loop sample calculation that was submitted to the NRC for review.
from the reference plant must be addressed. Figure 3-1 shows the loop noding used in this analysis. (Note only Loop 1is shown in the figure; Loops 2, 3 and 4 are identical to loop 1, except thatonly Loop 1 contains the pressurizer and the break.) Figure 3-2 showsthe steam generator model. Figures 3-3, 3-4, and 3-5 show the reactorvessel noding diagrams. Some minor differences that are included in theplant specific model include:
1) The RV upper internals are of the inverted top-hat type, therefore anadditional node was added to the upper head volume in order to modelthe region situated below the top hat brim and above the upper supportplate;2) The plant was designed to use Upper Head Injection which utilizedcolumns. However it was modified and the upper head safety injectionwas disconnected and capped. The flow path of the UHI Columns wasmodeled with an extra set of pipe components connecting the lower mostvolume of the upper head to the inlet into the corresponding radial regionof the upper plenum;3) The pumped piping branches into the accumulator discharge pipingslightly differently;4) The hydraulic model of the core employs 22 axial nodes instead of 23;5) There are no standpipes present in the Sequoyah Unit 2 RV upperplenum;6).The plant has safety grade charging which is included in the model;7) The lower support plate that separates the lower plenum from the lowerhead of the reactor vessel is curved;8) Sequoyah Unit 2 is a cold upper head type plant.9) The ICECON noding is representative for an ice condenser plant andrepresents a change from Reference 1.10) Component 154 has only one cell instead of the two in Reference 1.
11. A table that contains the plant-specific Simulation of clad temperature response is a function ofparameters and the range of the values phenomenological correlations that have been derived either analyticallyconsidered for the selected parameter during or experimentally. The important correlations have been validated for thethe topical report approval process must be RLBLOCA rhethodology and a statement of the range of applicability hasprovided. When plant-specific parameters been documented. The correlations of interest are the set of heat transferare outside the range used in demonstrating correlations as described in Reference 1. Table 3-8 presents theacceptable code performance, the licensee or summary of the full range of applicability for the important heat transferapplicant will submit sensitivity studies to correlations, as well as the ranges calculated in the limiting case of thisshow the effects of that deviation, analysis. Calculated values for other parameters of interest are also
provided. As is evident, the plant-specific parameters fall within themethodology's range of applicability.
AREVA NP Inc.
Sequoyah Nuclear Plant Unit 2Realistic Large Break LOCA Analysis
ANP-2655(NP)Revision 1Page 3-18
Table 3-5 SER Conditions and Limitations (Continued)
SER Conditions and Limitations Response
12. The licensee or applicant using the approved Analysis results are discussed in Section 3.5.methodology must submit the results of theplant-specific analyses, including thecalculated worst break size, PCT, and localand total oxidation.
13. The licensee or applicant wishing to apply The Sequoyah Unit 2 plant has previously been operating with M5 cladAREVA NP realistic large break loss-of- fuel and thus this restriction has been satisfied.coolant accident (RLBLOCA) methodology toM5 clad fuel must request an exemption forits use until the planned rulemaking to modify10 CFR 50.46(a)(i) to include M5 claddingmaterial has been completed.
Table 3-6 Summary of Results for the Limiting PCT Case
Case# #
PCT
Temperature 2002 OF
Time 130.7 s
Elevation 9.831 ft
* Metal-Water Reaction
percent Oxidation Maximum 3.4199
percent Total Oxidation 0.0200
AREVA NP Inc.
Sequoyah Nuclear Plant Unit 2Realistic Large Break LOCA Analysis
ANP-2655(NP)Revision 1Page 3-19
Table 3-7 Calculated Event Times for the Limiting PCT Case
Event Time (s)
Break Opened 0.0RCP Trip N/A1
SIAS Issued 0.1Start of Broken Loop Accumulator Injection 12.8
Start of Intact Loop Accumulator Injection (Loop 2, 3 14.7, 14.8, 14.8and 4 respectively)
Start of Charging 37-1SI/RHR Available 37.1
Broken Loop SI Delivery Began 37.1
Intact Loop SI Delivery Began (Loop 2, 3 and 4 371371 37.1respectively)
Broken Loop RHR Delivery Began 37.1
Intact Loop RHR Delivery Began (Loop 2, 3 and 4 37.1, 37.1, 37.1respectively) 3
Beginning of Core Recovery (Beginning of Reflood) 50.2Broken Loop Accumulator Emptied 84.1
Intact Loop Accumulators Emptied 84.4, 84.6, 84.2(Loop 2, 3 and 4 respectively)
PCT Occurred 130.7
Transient Calculation Terminated 501.2
Notes: 1. The limiting 59-case set had offsite power available.
AREVA NP Inc.
Sequoyah Nuclear Plant Unit 2Realistic Large Break LOCA Analysis
ANP-2655(NP)Revision 1Page 3-20
Table 3-8 Heat Transfer Parameters. for the Limiting Case
AREVA NP Ind.
Sequoyah Nuclear Plant Unit 2Realistic Larqe Break LOCA Analysis
ANP-2655(NP)Revision 1Paqe 3-21
Table 3-9 Containment Initial and Boundary Conditions
Containment Net Free Volume Volume (ft3)
Upper Compartment 651,000- 692,600Lower Compartment (minimum) 248,500Ice Condenser 181,400Dead Ended Compartments 129,900
Initial Mass of Ice 2.448 x 10⁶ Ibm
Initial Conditions
Containment Pressure (nominal) 14.3 psiaUpper Containment Temperature 80 OF - 110 OFLower Containment Temperature 95 OF - 130 OFHumidity 100 percent
Containment Spray
Maximum Total Flow 2 x 7700 = 15,400 gpmMinimum Spray Temperature 55 OFFastest Post-LOCA initiation of 10 s (ramped to full floyspray between 8 and 10 s)
Containment Air ReturnFan"
Post-LOCA initiation at 600 sTotal Flow = 120,000 cfm
Due to the relatively late start of the recirculation fan, it is not modeled in this analysis.
d
AREVA NP Inc.
ANP-2655(NP)Sequoyah Nuclear Plant Unit 2 Revision 1Realistic Large Break LOCA Analysis Page 3-22
Table 3-10 Passive Heat Sinks in Containment
InsideArea Thickness Thickness HeightHeat Sink Areaft2 Thicknessft Radius ft ft Material Left Side Right Side
ft
Reactor Cavity Walls 6438 2.02 concrete Lower Comp. insulatedConcrete Floor 4444 2.00 concrete Lower Comp. insulated
Interior Concrete 8464 1.00 concrete Lower Comp. insulatedReactor Vessel Biological 11 6.0 19.88 concrete Lower Comp. Lower Comp.
Shield WallSteel Lined Refueling Canal in 13. 0.02083 21.48 stainless steel Lower Comp.
LC 4.0 21.48 concrete Lower Comp.
Crane Wall between LC & DE 41.5 3.0 33.72 concrete Lower Comp. Dead EndCrane Wall in LC 41.5 3.0 29.37 concrete Lower Comp. insulatedCrane Wall in UC 41.5 3.0 32.44 concrete Upper Comp. insulated
Refueling Canal in Contact with 2551 0.02083 stainless steel Upper Comp.Upper and Lower Compartment 3.87 concrete Lower Comp.
Refueling Canal in Contact with 1,260 0.02083 stainless steel Upper Comp.Annular Region 3.0 concrete annulus
Concrete Structure betweenUpper and Lower Compartment 13,081 2.34 concrete Upper Comp. Lower Comp.
Interior Concrete 2278 3.0 concrete Upper Comp. insulatedContainment Shell 24,646 0.05417 carbon steel Upper Comp. annulusLC Steel Heat Sink 24,999 0.03674 carbon steel Lower Comp. insulatedUC Steel Heat Sink 11669 0.4229 carbon steel Upper Comp. insulated
Dead-End Steel Heat Sink 8610 0.074375 carbon steel. DE Comp. insulated
Material PropertiesThermal Conductivity Volumetric Heat Capacity
(BTU/hr-ft-*F) (BTU/ft3--F)Concrete 0.84 30.24
Carbon Steel 27.3 59.2Stainless Steel 9.87 59.22
AREVA NP Inc.
Sequoyah Nuclear Plant Unit 2Realistic Large Break LOCA Analysis
ANP-2655(NP)Revision 1Paae 3-23
Figure 3-1 Primary System Noding
AREVA NP Inc.
Sequoyah Nuclear Plant Unit 2Realistic Lame Break LOCA Analysis
ANP-2655(NP)Revision 1Paqe 3-24
Figure 3-2 Secondary System Noding
AREVA NP Inc.
Sequoyah Nuclear Plant Unit 2Realistic Larme Break LOCA Analysis
ANP-2655(NP)Revision 1Page 3-25
Figure 3-3 Reactor Vessel Noding
AREVA NP Inc.
Sequoyah Nuclear Plant Unit 2Realistic Large Break LOCA Analysis
ANP-2655(NP)Revision 1Page 3-26
Figure 3-4 Core Noding Detail
AREVA NP Inc.
Sequoyah Nuclear Plant Unit 2Realistic Large Break LOCA Analysis
ANP-2655(NP)Revision 1Paqe 3-27
Figure 3-5 Upper Plenum Noding Detail
AREVA NP Inc.
Sequoyah Nuclear Plant Unit 2Realistic Large Break LOCA Analysis
ANP-2655(NP)Revision 1Page 3-28
Figure 3-6 Containment Noding Diagram
AREVA NP Inc.
Sequoyah Nuclear Plant Unit 2Realistic Large Break LOCA Analysis
ANP-2655(NP)Revision 1Page 3-29
One-Sided jBreak Area • .. I •• :.
(fe2/side)
1.0 2.0 3.0 4.0 5.0
Time
(hours) .
0.00e+00 5.00e+03 1.00e+04 1.50e+04
Core , ,Power(MW)
3478.0 3478.5 3479.0 3479.5 3480.0 3480.5 3481.0
Fq F . •m i mPeaking
1.5 1.7 1.9 2.1 2.3 2.5 2.7 2.9
AO lO
-0.4 -0.2 0.0 0.2 0.4
PressurizerPressure c oo e m mom mIo(psia)
1800.0 2000.0 2200.0 2400.0 2600.0
Pressurizer .
Liquid Level m mo• mnm g m m(%)
50.0 60.0 70.0 80.0 90.0 100.0
Temperature c * a m l c m. m oo. a(*F)
578.0 579.0 580.0 581.0 582.0 583.0
Figure 3-7 Scatter Plot of Operational Parameters
AREVA NP Inc.
Sequoyah Nuclear Plant Unit 2Realistic Large Break LOCA Analysis
ANP-2655(NP)Revision 1Page 3-30
TotalLoop Flow oio * oea m ia oo
(Mlb/hr)
130.0 140.0 150.0 160.0
Accumulator E ' '' '
Liquid Volume me m mO eoo e o m o we(Wf3)
1000.0 1020.0 1040.0 1060.0 1080.0 1100.0
AccumulatorPressure *-OO *O O si l
(psia).
600.0 620.0 640.0 660.0 680.0, 700.0
Upper Compartment . I I
Containment Volume [11•lIIO O•IOo
(if3) • I '"
6.50e+05 6.60e+05 6.70e+05 6.80e+05 6.90e+05 7.00e+05
Upper Compartment I
Containment Temperaturq em emma cam e emO a ie ma em( °F ) r
80.0 90.0 100.0 110.0
Lower Compartment . I I
(Accumulator) a--mm s aee awm ma mContainment Temperature -
(OF) 90 0. 11. 100 100.0 110.0 120.0 130.0
Figure 3-7 Scatter Plot of Operational Parameters (Continued)
AREVA NP Inc.
Sequoyah Nuclear Plant Unit 2Realistic Large Break LOCA Analysis
ANP-2655(NP)Revision 1Page 3-31
PCT vs Time of PCT
2200
2000
1800
1600
1400
U
E53
U0
0 Split BreakO Guillotine Break
I.L
I-o
a_1200
1000
800 I
600
4000 100 200 300
Time of PCT (s)400 500
Figure 3-8 PCT versus PCT Time Scatter Plot from 59 Calculations
AREVA NP Inc.
Sequoyah Nuclear Plant Unit 2Realistic Larme Break LOCA Analysis
ANP-2655(NP)Revision 1Paae 3-32
PCT vs One-sided Break Area
2200
2000 F U
El El
1800 F ElM F
1600
El~
El LLJ
EEil
El*M
IL
0
(L
1400
1200
El
El
1000
800
ElEl 0lEl
600 F .Split BreakEl Guillotine Break
400 '1.0 2.0 S3.0
Break Area (ft2/side)4.0 5.0
Figure 3-9 PCT versus Break Size Scatter Plot from 59 Calculations
AREVA NP Inc.
ANP-2655(NP)Sequoyah Nuclear Plant Unit 2 Revision 1Realistic Large Break LOCA Analysis Page 3-33
Maximum Oxidation vs PCT
4 .0 . . . . . .
3.8U Split Break
3.6 [3 Guillotine Break
3.4 i
3.2
3.0
2.8
2.6
2.4
v2.2
o• 2.0
"• 1.8 000
1.6 0l
1.4
1.2 El
1.0 U El
0.8
0.6
0.40.2
0.0 . IEITJ, ,400 600 800 1000 1200 1400 1600 1800 2000 2200
PCT (°F)
Figure 3-10 Maximum Oxidation versus PCT Scatter Plotfrom 59 Calculations
AREVA NP Inc.
Sequoyah Nuclear Plant Unit 2Realistic Large Break LOCA Analysis
ANP-2655(NP)Revision 1Page 3-34
Total Oxidation vs PCT
0.10
0.08
0.06
X0
0 Split BreakE Guillotine Break
0
C C
El]
0
&: 0
Eq p a
* C
rmr r•
0.04 1-
0.02
0.00400 600 800 1000 1200 1400 1600 1800 2000
PCT (0F)2200
Figure 3-11 Total Oxidation versus PCT Scatter Plot from 59 Calculations
AREVA NP Inc.
Sequoyah Nuclear Plant Unit 2Realistic Large Break LOCA Analysis
ANP-2655(NP)Revision 1Page 3-35
PCT Trace for Case #20PCT = 2001.7 OF, at Time = 130.73 s, on Hot U02 Rod
2000
1500
E 1000
0)
t--
500
0
0 200 400Time (s)
600
Figure 3-12 Peak Cladding Temperature (Independent of Elevatiop) for theLimiting Case
AREVA NP Inc.
Sequoyah Nuclear Plant Unit 2Realistic Large Break LOCA Analysis
ANP-2655(NP)Revision 1Page 3-36
Break Flow
80
60
CC
3:
0FL
40
20
Vessel SidePump SideTotal
ir'
0
-200 200 400 600
Time (s)
Figure 3-13 Break Flow for the Limiting Case
AREVA NP Inc.
Sequoyah Nuclear Plant Unit 2Realistic Large Break LOCA Analysis
ANP-2655(NP)Revision IPage 3-37
Core Inlet Mass Flux
1000
500
U-Cl)
0
-5000 200 400 600
Time (s)
Figure 3-14 Core Inlet Mass Flux for the Limiting Case
AREVA NP Inc.
Sequoyah Nuclear Plant Unit 2Realistic Larqe Break LOCA Analysis
ANP-2655(NP)Revision 1Page 3-38
Core Outlet Mass Flux
1000
500
U)
0
-5000 200 400 600
Time (s)
Figure 3-15 Core Outlet Mass Flux for the Limiting Case
AREVA NP Inc.
Sequoyah Nuclear Plant Unit 2Realistic Large Break LOCA Analysis
ANP-2655(NP)Revision 1Page 3-39
Pump Void Fraction
1.0
0.8
0.6
Broken Loop 1
InatLoIntact Loop 2
Intact Loop 4
0U-
V__.5
0.4
0.2
0.00 200 400 600
Time (s)
Figure 3-16 Void Fraction at RCS Pumps for the Limiting Case
AREVA NP Inc.
Sequoyah Nuclear Plant Unit 2Realistic Large Break LOCA Analysis
ANP-2655(NP)Revision 1Paqe 3-40
ECCS Flows
1500
1000
E:2
T,
0
u-
500
'00 200 400 600
Time (s)
Figure 3-17 ECCS Flows (Includes Accumulator, Charging, SI and RHR) for theLimiting Case
AREVA NP Inc.
Sequoyah Nuclear Plant Unit 2Realistic Large Break LOCA Analysis
ANP-2655(NP)Revision 1Page 3-41
Upper Plenum Pressure
2000
1500
1000
500
00 200 400 600
Time (s)
Figure 3-18 Upper Plenum Pressure for the Limiting Case
AREVA NP Inc.
Sequoyah Nuclear Plant Unit 2Realistic Larme Break LOCA Analysis
ANP-2655(NP)Revision 1Paae 3-42
Downcomer Liquid Level
30
20
()-_J
.-_
10
00 200 400 600
Time (s)
Figure 3-19 Collapsed Liquid Level in the Downcomerfor the Limiting Case
AREVA NP Inc.
Sequoyah Nuclear Plant Unit 2Realistic Large Break LOCA Analysis
ANP-2655(NP)Revision 1Page 3-43
Lower Vessel Liquid Level
14
12
10
a,.- I
8
6
4
2
00 200 400
Time (s)600
Figure 3-20 Collapsed Liquid Level in the Lower Plenumfor the Limiting Case
AREVA NP Inc.
Sequoyah Nuclear Plant Unit 2Realistic Large Break LOCA Analysis
ANP-2655(NP)Revision 1Page 3-44
Core Liquid Level
15
10
a)
._J
5
00 200 400
time (s)600
Figure 3-21 Collapsed Liquid Level in the Corefor the Limiting Case
AREVA NP Inc.
Sequoyah Nuclear Plant Unit 2Realistic Large Break LOCA Analysis
ANP-2655(NP)Revision 1Paqe 3-45
Containment and Loop Pressures
100
90
80
70
(D
U)U)
C)
60
50
40
30
20
10
00 200 400 600
Time (s)
Figure 3-22 Containment and Loop Pressures for the Limiting Case
AREVA NP Inc.
ANP-2655(NP)Sequoyah Nuclear Plant Unit 2 Revision 1Realistic Large Break LOCA Analysis Page 3-46
2100 ------------------------------------------------------------------------------------- 2100
*LOOP n No LOOP
2000 ---------------------------- ------------------------------ ---------------- 2000
M
!3 *1900 ---------------------------------------- ------------------------------------------- 1900
18 0 0 -- - - - - - - - - -- - - - - - - - - -- - - - - - - - - -- -- - -- - -- - 18 0 0
1700 ---- 1700
1600 - - -- 1600
001500 1500
U r*1 -- - - - - -
1400 -- - - - - - - - - D- - - - - - - - - - - - -- - - - - - - - - --- 1400
900 ,9, 1400
0010 20 30 40 50 60
Case Number
Figure 3-23 GDC 35 LOOP versus No-LOOP Cases
AREVA NP Inc.
ANP-2655(NP)Sequoyah Nuclear Plant Unit 2 Revision 1Realistic Large Break LOCA Analysis Page 4-1
4.0 Conclusions
The results of the RLBLOCA analysis show that the limiting LOOP case has a PCT of 2002 OF,
and a maximum oxidation thickness and hydrogen generation that fall well within regulatory
requirements.
The analysis supports operation at a nominal power level of 3479 MWt (including uncertainty), a
steam generator tube plugging level of up to 15 percent in all steam generators, a total peaking
factor (Fq) of 2.65 (including uncertainty) and a nuclear enthalpy rise factor (FaH).of 1.706
(including uncertainty) with no axial or burnup dependent power peaking limit.
AREVA NP Inc.
ANP-2655(NP)Sequoyah Nuclear Plant Unit 2 Revision 1Realistic Large Break LOCA Analysis Page 5-1
5.0 References
1. EMF-2103(P)(A) Revision 0, Realistic Large Break LOCA Methodology, FramatomeANP, Inc., April 2003.
2. Technical Program Group, Quantifying Reactor Safety Margins, NUREG/CR-5249,EGG-2552, October 1989.
3. Wheat, Larry L., "CONTEMPT-LT A Computer Program for Predicting ContainmentPressure-Temperature Response to a Loss-Of-Coolant-Accident," Aerojet NuclearCompany, TID-4500, ANCR-1219, June 1975.
4. XN-CC-39 (A) Revision 1, "ICECON: A Computer Program to Calculate ContainmentBack Pressure for LOCA Analysis (Including Ice Condenser Plants)," Exxon NuclearCompany, October 1978.
5. U. S. Nuclear Regulatory Commission, NUREG-0800, Revision 2, Standard ReviewPlan, June 1987.
6. NUREG/CR-1532, EPRI NP-1459, WCAP-9699, "PWR FLECHT SEASET Unblocked'Bundle, Forced and Gravity Reflood Task Data Report," June 1980.
7. Letter from Ronald W. Hernan, U.S. NRC, to J. A. Scalice, Tennessee Valley Authority,"Sequoyah Nuclear Plant, Units 1 and 2 Issuance of Amendments RE: 1.3-PercentPower Uprate (TAC NOS. MB3435, AND MB3436) (TSC NO. 01-08)," April 30, 2002(US NRC ADAMS Accession # ML021220060)
8. NUREG/CR-0994, "A Radiative Heat Transfer Model for the TRAC Code" November1979.
9. J.P. Holman, Heat Transfer, 4 th Edition, McGraw-Hill Book Company, 1976
10. EMF-CC-1 30, "H UXY: A Generalized Multirod Heatup Code for BWR Appendix K LOCAAnalysis Theory Manual," Framatome ANP, May 2001.
11. D. A. Mandell, "Geometric View Factors for Radiative Heat Transfer within Boiling WaterReactor Fuel Bundles," Nucl. Tech., Vol. 52, March 1981.
12. EMF-2102(P)(A) Revision 0,. S-RELAP5: Code Verification and Validation, FramatomeANP, Inc., August 2001.
13. Letter from Pedro Salas, Tennessee Valley Authority to U.S. NRC, TVA-SQN-TS-01-08,Sequoyah Nuclear Plant (SQN), Units 1 & 2, Technical Specification (TS) Change No.01-08, "Increase, Maximum Allowed Reactor Power Level to 3455 Mega-Watt Thermal(MWt)," November 15, 2001 (US NRC ADAMS Accession # ML01 3470345)
AREVA NP Inc.
ANP-2655(NP)Sequoyah Nuclear Plant Unit 2 Revision 1Realistic Large Break LOCA Analysis Page 6-1
6.0 Addendum - Additional Information Supporting EMF-2103 Revision 0
The following sections are responses to typical RAI questions posed by the NRC on EMF-2103
Revision 0 plant applications. In some instances, these requests cross-referenced
documentation provided on dockets other than those for which the request is made. AREVA
discussed these and similar questions from the NRC draft SER for Revision 1 of EMF-2103 in a
meeting with the NRC on December 12, 2007. AREVA agreed to provide the following
additional information within new submittals of a Realistic Large Break LOCA report.
6.1 Reactor Power
Question: Reactor Power - Table 3-3, Item 2. 1, and its associated Footnote 1 indicate that the
assumed reactor core power "includes uncertainties." The use of a reactor power assumption
other than 102 percent, regardless of BE or Appendix K methodology, is permitted by Title 10 of
the Code of Federal Regulations (10 CFR), Part 50, Appendix K.I.A, "Required and Acceptable
Features of The Evaluation Models, 'Sources of Heat During a LOCA." However, Appendix
K.I.A also stbtes: "... An assumed power level lower than the level specified in this paragraph
[1.02 times the licensed power level], (but not less than the licensed power level) may be used
provided...
Response: As indicated in Item 2.1 of Table 3-3 herein, the assumed reactor core power for the
Sequoyah realistic large break loss-of-coolant accident is 3479 MWt. This value represents the
plant rated thermal power (i.e., total reactor core heat transfer rate to the reactor coolant
system) of 3455 MWt with a maximum power measurement uncertainty of 0.7 percent (24 MWt)
added to the rated thermal power.
The power measurement uncertainty assumption discussed in 10CFR50, Appendix K was
previously reduced for Sequoyah from 2.0 percent of the plant rated thermal power to 0.7
percent based on the installation of a leading edge flow meter (LEFM) system to measure main
feedwater flow. The improved feedwater flow measurement accuracy provided by the LEFM
allowed for a power measurement uncertainty recovery of 1.3 percent. This power level
assumption is a change to theapproved RLBLOCA EM (Reference 1).
AREVA NP Inc.
ANP-2655(NP)Sequoyah Nuclear Plant Unit 2 Revision 1Realistic Large Break LOCA Analysis Page 6-2
The basis for the current 0.7 percent measurement uncertainty assumption is documented in
Topical Report No. WCAP-15669, Revision 0. This report was submitted to NRC in Reference
13. NRC review and acceptance of the current power measurement uncertainty has been
documented in Reference 7.
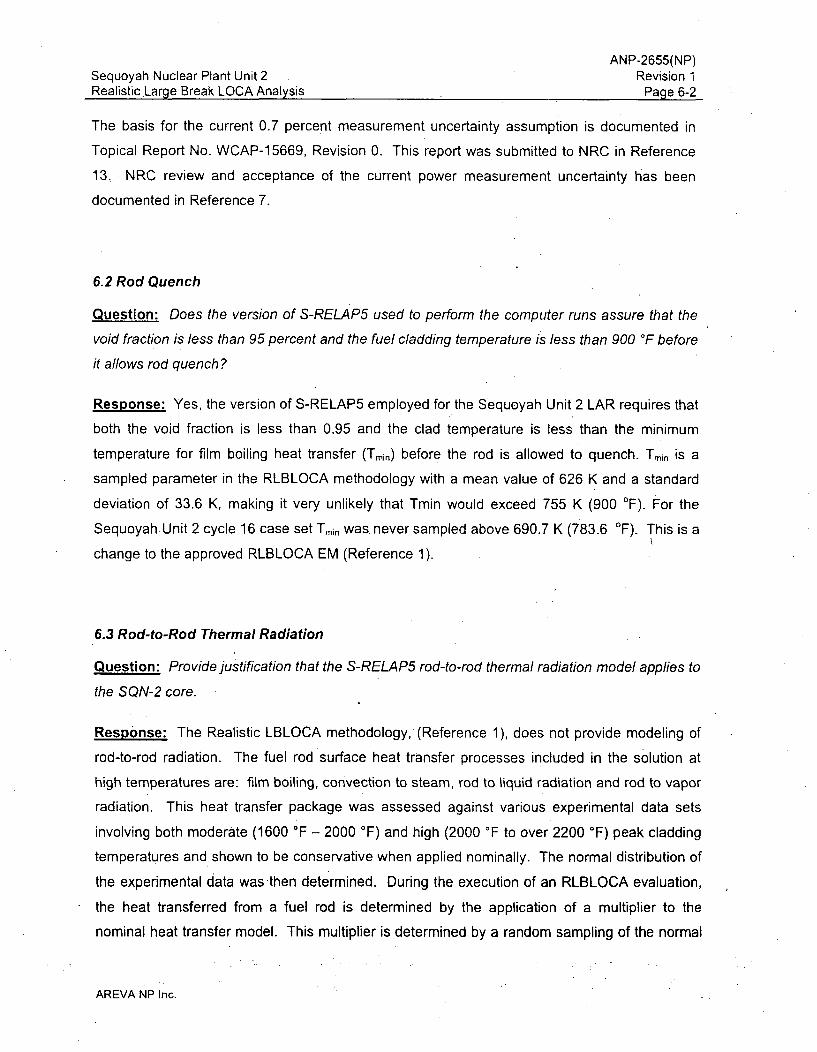
6.2 Rod Quench
Question: Does the version of S-RELAP5 used to perform the computer runs assure that the
void fraction is less than 95 percent and the fuel cladding temperature is less than 900 OF before
it allows rod quench?
Response: Yes, the version of S-RELAP5 employed for the Sequoyah Unit 2 LAR requires that
both the void fraction is less than 0.95 and the clad temperature is less than the minimum
temperature for film boiling heat transfer (Tmin) before the rod is allowed to quench. Tmin is a
sampled parameter in the RLBLOCA methodology with a mean value of 626 K and a standard
deviation of 33.6 K, making it very unlikely that Tmin would exceed 755 K (900 OF). For the
Sequoyah Unit 2 cycle 16 case set Tmin was never sampled above 690.7 K (783.6 OF). This is a
change to the approved RLBLOCA EM (Reference 1).
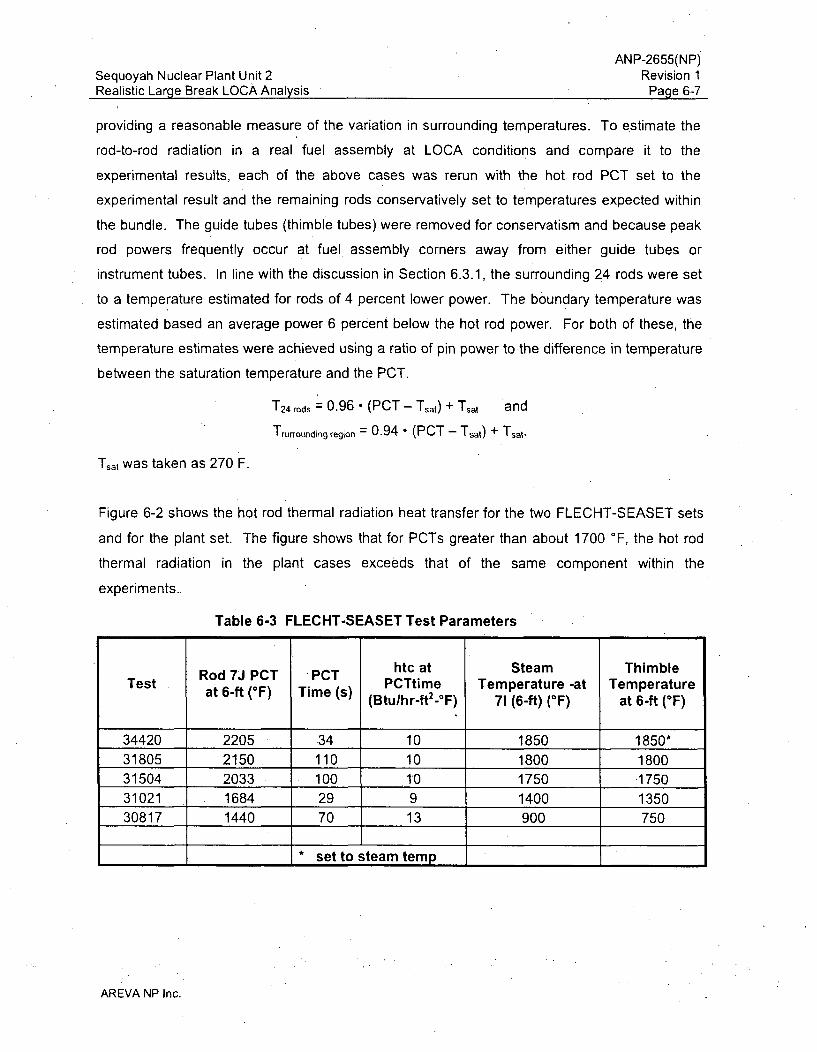
6.3 Rod-to-Rod Thermal Radiation
Question: Provide justification that the S-RELAP5 rod-to-rod thermal radiation model applies to
the SQN-2 core.
Response: The Realistic LBLOCA methodology, (Reference 1), does not provide modeling of
rod-to-rod radiation. The fuel rod surface heat transfer processes included in the solution at
high temperatures are: film boiling, convection to steam, rod to liquid radiation and rod to vapor
radiation. This heat transfer package was assessed against various experimental data sets
involving both moderate (1600 OF - 2000 OF) and high (2000 OF to over 2200 OF) peak cladding
temperatures and shown to be conservative when applied nominally. The normal distribution of
the experimental data was-then determined. During the execution of an RLBLOCA evaluation,
the heat transferred from a fuel rod is determined by the application of a multiplier to the
nominal heat transfer model. This multiplier is determined by a random sampling of the normal
AREVA NP Inc.
ANP-2655(NP)Sequoyah Nuclear Plant Unit 2 Revision 1Realistic Large Break LOCA Analysis Page 6-3
distribution of the experimental data benchmarked. Because the data include the effects of rod-.
to-rod radiation, it is reasonable to conclude that the modeling implicitly includes an allocation
for rod-to-rod radiation effects. As will be demonstrated, the approach is reasonable because
the conditions within actual limiting fuel assemblies" assure that the actual rod-to-rod radiation is
larger than the allocation provided through normalization to the experiments.
The FLECHT-SEASET tests evaluated covered a range of PCTs from 1,651 to 2,239 OF and the
THTF tests covered-a range of PCTs from 1,000 to 2,200 °F . Since the test bundle in either
FLECHT-SEASET or THTF is surrounded by a test vessel, which is relatively cool compared to
the heater rods, substantial radiation from the periphery rods to the vessel wall can occur. The
rods selected for assessing the RLBLOCA reflood heat transfer package were chosen from the
interior of the test assemblies to minimize the impact of radiation heat transfer to the test vessel.
The result was that the assessment rods comprise a set which is primarily isolated from cold
wall effects by being surrounded by powered rods. at reasonably high temperatures.
As a final assessment, three benchmarks independent of THTF and FLECHT-SEASET were
performed. These benchmarks were selected from the Cylindrical Core Test Facility (CCTF),
LOFT, and the Semiscale facilities. Because these facilities are more integral tests and
together cover a wide range of scale, they also serve to show that scale effects are
accommodated within the code calculations.
The results of these calculations are provided in Section 4.3.4, Evaluation of Code Biases, page
4-100, of Reference 1. The CCTF results are shown in Figures 4.180 through 4.192, the LOFT
results in Figures 4.193 through 4.201, and the Semiscale results in Figures 4.202 through
4.207. As expected, these figures demonstrate that the comparison between the code
calculations and data is improved with the application of the derived biases. The CCTF, LOFT,
and Semiscale benchmarks further indicate that, whatever, consideration of rod-to-rod radiation
is implicit in the S-RELAP5 reflood heat transfer modeling, it does not significantly effect code
predictions under conditions where radiation is minimized. The measured PCTs in these
assessments ranged from approximately 1,000 to 1,540 OF. At these temperatures, there is little
rod-to-rod radiation. Given the good agreement between the biased code calculations and the
CCTF, LOFT, and Semiscale data, it can be concluded that there is no significant over
prediction of-the total heat transfer coefficient.
AREVA NP Inc.
ANP-2655(NP)Sequoyah Nuclear Plant Unit 2 Revision 1-Realistic Large Break LOCA Analysis Page 6-4
Notwithstanding any conservatism evidenced by experimental benchmarks, the application of
the model to commercial nIuclear power plants provides some additional margins due to
limitations within the experiments. The benchmarked experiments, FLECHET SEASET and
ORNL Thermal Hydraulic Test Facility (THTF), used to assess the S-RELAP5 heat transfer
model, Reference 1, incorporated constant rod powers across- the experimental assembly.
Temperature differences that occurred were the result of guide tube, shroud or local heat
transfer effects. In the operation of a pressurized water reactor (PWR) and in the RLBLOCA
evaluation, a radial local peaking factor is present, creating power differences that tend to
enhance the temperature differences between rods. In turn, these temperature differences lead
to increases in net radiation heat transfer from the hotter rods. The expected rod-to-rod
radiation will likely exceed that embodied within the experimental results.
6.3.1 Assessment of Rod-to-Rod Radiation Implicit in the RLBLOCA Methodology
As discussed above, the FLECHT-SEASET and THTF tests were selected to assess and
determine the S-RELAP5 code heat transfer bias and uncertainty. Uniform radial power
distribution was used in these test bundles. Therefore, the rod-to-rod temperature variation in
the rods away from the vessel wall is caused primarily by the variation in the sub-channel fluid
conditions. In the real operating fuel bundle, on the other hand, there can be 5 to 10 percent
rod-to-rod power variation. In addition, the methodology includes a provision to apply the
uncertainty measurement to the hot pin. Table 6-1 provides the hot pin measurement
uncertainty and a representative local pin peaking factor for several plants. These factors,
however, relate the pin to the assembly average. To more properly assess the conditions under
which rod-to-rod radiation heat -transfer occurs, a more local peaking assessment is required.
Therefore, the plant rod-to-rod radiation assessments herein set the average pin power -for
those pins surrounding the hot pin at 96 percent of that of the peak pin. For pins further
removed the average power is set to 94 percent.
AREVA NP Inc.
Sequoyah Nuclear Plant Unit 2RealisticLarge Break LOCA Analysis
ANP-2655(NP)Revision 1Page 6-5
Table 6-1 Typical Measurement Uncertainties and Local Peaking Factors
FH Measurement Local Pin PeakingPlant Uncertainty
-_ _ _ (percent) Factor_(-)
1 4.0 1.0682 4.0 1.0503 6.0 1.1494 4.0 1.1135 4.25 1.1356 4.0 1.058
6.3.2 Quantification of the Impact of Thermal Radiation using R2RRAD Code
The R2RRAD radiative heat transfer model was developed by Los Alamos National Laboratory
(LANL) to be incorporated in the BWR version of the TRAC code. The theoretical basis for this
code is given in References 8 and 11 and is similar to that developed in the HUXY rod heatup
code (Reference 10, Section 2.1.2) used by AREVA for BWR LOCA applications. The version
of R2RRAD used herein was obtained from the NRC to examine the rod-to-rod radiation
characteristics of a 5x5 rod segment of the 161 rod FLECHT-SEASET bundle. The output
provided by the R2RRAD code includes an estimate of the net radiation heat transfer from each
rod in the defined array. The code allows the input of different temperatures for each rod as well
as for a boundary surrounding the pin array. No geometry differences between pin locations are
allowed. Even though, this limitation affects the view factor calculations for guide tubes,
R2RRAD is a reasonable tool to estimate rod-to-rod radiation heat transfer.
The FLECHT-SEfASET test series was intended to simulate a 17x17 fuel assembly and there is
a close similarity, Table 6-2, between the test bundle and a modern 17x17 assembly.
AREVA NP Inc.
Sequoyah Nuclear Plant Unit 2Realistic Large Break LOCA Analysis
ANP-2655(NP)Revision 1Page 6-6 i
Table 6-2 FLECHT-SEASET & 17x17 FA Geometry Parameters
Design Parameter FLECHT-SEASET 17x17 Fuel Assembly
Rod Pitch (in) 0.496 0.496Fuel Rod Diameter (in) 0.374 0.374Guide Tube Diameter (in) 0.474 0.482
Five FLECHT-SEASET tests (Reference 6) were selected for evaluation and comparison with
expected plant behavior. Table 6-3 characterizes the results of each test. The 5x5 selected rod
array comprises the hot rod, 4 guide tubes and 20 near adjacent rods. The simulated hot rod is
rod 7J in the tests.
Guide Tube -*
00000
00000
00000 Hot Rod
0 0 CAdjacent Rods
000000
Figure 6-1 R2RRAD 5 x 5 Rod Segment
Two sets of runs were made simulating each of the five experiments and one set of cases was
run to simulate the RLBLOCA evaluation of a limiting fuel assembly in an operating plant. For
the simulation of Tests 31805, 31504, 31021, and 30817, the thimble tube (guide tube)
temperatures were set to the measured values. For Test 34420, the thimble tube temperature
was set equal to the measured vapor temperature. For the first experimental simulation set, the
temperature of all 21 rods and the exterior boundary was set to the measured PCT of the
simulated test. For the second experimental set, the hot rod temperature was set to the PCT
value and the remaining 20 rods and the boundary were set to a temperature 25 *F cooler
AREVA NP Inc.
ANP-2655(NP)Sequoyah Nuclear Plant Unit 2 Revision 1Realistic Large Break LOCA Analysis Page 6-7
providing a reasonable measure of the variation in surrounding temperatures. To estimate the
rod-to-rod radiation in a real fuel assembly at LOCA conditions and compare it to the
experimental results, each of the above cases was rerun with the hot rod PCT set to the
experimental result and the remaining rods conservatively set to temperatures expected within
the bundle. The guide tubes (thimble tubes) were removed for conservatism and because peak
rod powers frequently occur at fuel assembly corners away from either guide tubes or
instrument tubes. In line with the discussion in Section 6.3.1, the surrounding 24 rods were set
to a temperature estimated for rods of 4 percent lower power. The boundary temperature was
estimated based an average power 6 percent below the hot rod power. For both of these, the
temperature estimates were achieved using a ratio of pin power to the difference in temperature
between the saturation temperature and the PCT.
T24 rods = 0.96 (PCT - Tsat) + Tsat and
Trurrounding region = 0.94 " (PCT - Tsat) + Tsar.
Tsat was taken as 270 F.
Figure 6-2 shows the hot rod thermal radiation heat transfer for the two FLECHT-SEASET sets
and for the plant set. The figure shows that for PCTs greater than about 1700 'F, the hot rod
thermal radiation in the plant cases exceeds that of the same component within the
experiments..
Table 6-3 FLECHT-SEASET Test Parameters
htc at Steam ThimbleTest Rod 7J PCT PCT hcaPCTtime Temperature -at Temperatureat 6-ft (*F) Time (s) (Btu/hr~ft2 -OF) 71 (6-ft) (°F) at 6-ft (°F)
34420 2205 -34 10 1850 1850*31805 2150 110 10 1800 180031504 2033 100 10 1750 .175031021 1684 29 9 1400 135030817 1440 70 13 900 750
• set to steam temp
AREVA NP Inc.
Sequoyah Nuclear Plant Unit 2Realistic Larcie Break LOCA Analysis
ANP-2655(NP)Revision 1
Paqe 6-8
4.5
I,-
I,-C1
0o
0 i - s
1400 1500 1600 1700 1800 1900
PCT (TF)2000 2100 2200 2300 2400
Figure 6-2 Rod Thermal Radiation in FLECHT-SEASET Bundle and in a 17x17FA
6.3.3 Rod-to-Rod Radiation Summary
In summary, the conservatism of the heat transfer modeling established by benchmark can be
reasonably extended to plant applications, and the plant local peaking provides a physical
reason why rod-to-rod radiation should be more substantial within a plant environment than in
the test environment. Therefore, the lack of an explicit rod-to-rod radiation model, in the version
of S-RELAP5 applied for realistic LOCA calculations, does not invalidate the conclusion that the
cladding temperature and local cladding oxidation have been demonstrated to meet the criteria
of 10 CFR 50.46 with a high level of probability.
AREVA NP Inc.
ANP-2655(NP)Sequoyah Nuclear Plant Unit 2 Revision 1Realistic Large Break LOCA Analysis Page 6-9
6.4 Film Boiling Heat Transfer Limit
Question: In the SQN-2 calculations, is the Forslund-Rohsenow model contribution to the heat
transfer coefficient limited to less thgn or equal to 15 percent when the void fraction is greater
than or equal to 0.9?
Response: Yes, the version of S-RELAP5 employed for the Sequoyah Unit 2 RLBLOCA
analysis limits the contribution of the Forslund-Rohsenow model to no more than 15 percent of
the total heat transfer at and above a void fraction of 0.9. Because the limit is applied at a void
fraction of 0.9, the contribution of Forslund-Rohsenow within the 0.7 to 0.9 interpolation range is
limited to 15 percent or less. This is a change to the approved RLBLOCA EM (Reference 1).
6.5 Downcomer Boiling
Question: If the PCT is greater than 1800'F or the containment pressure is less than 30 psia,
has the Sequoyah Unit 2 downcomer model been rebenchmarked by performing sensitivity
studies, assuming adequate downcomer noding in the water volume, vessel wall and other heat
structures?
Response: The downcomer model for Sequoyah Unit 2 has been established generically as
adequate for the computation. of downcomer phenomena including the prediction of potential
local boiling effects. The model was benchmarked against the UPTF tests and the LOFT facility
in the RLBLOCA methodology, Revision 0 (Reference 1). Further, AREVA addressed the
effects of boiling in the downcomer in a letter, from James Malay to U.S. NRC, April 4, 2003.
The letter cites the lack of direct experimental evidence but contains sensitivity studies on high
and low pressure containments, the impact of additional azimuthal noding within the
downcomer, and the influence of flow loss coefficients. Of these, the study on azimuthal noding
is most germane to this question; indicating that additional azimuthal nodalization allows higher
liquid buildup-in portions of the downcomer~away from the broken cold leg and increases the
liquid driving head. Additionally, AREVA has conducted downcomer axial noding and wall heat
release studies. Each of these studies supports the Revision 0 methodology and is
documented later in this section.
This question is primarily concerned with. the phenomena of downcomer boiling and the
extension of the Revision 0 methodology and sensitivity studies to plants with low containment
pressures and high cladding temperatures. Boiling, wherever it occurs, is a phenomenon that
AREVA NP Inc.
Sequoyah Nuclear Plant Unit 2Realistic Large Break LOCA Analysis
ANP-2655(NP)Revision 1Page 6-10
codes like S-RELAP5 have been developed to predict. Downcomer boiling is the result of the
release of energy stored in vessel metal mass. Within S-RELAP5, downcomer boiling is
simulated in the nucleate boiling regime with the Chen correlation. This modeling has been
validated through the prediction of several assessments on boiling phenomenon provided in the
S-RELAP5 Code Verification and Validation document (Reference 12).
'EcC
Az0ý mbý.c0re
oo Ic0+0
A:q
Figure 6-3 Reactor Vessel Downcomer Boiling Diagram
Hot downcomer walls penalize PCT by two mechanisms: by reducing subcooling of coolant
entering the core and through the reduction in downcomer hydraulic head which is the driving
force for core reflood. Although boiling in the downcomer occurs during blowdown, the biggest
potential for impact on clad temperatures is during late reflood following the end of accumulator
injection. At this time, there is a large step reduction in coolant flow from the ECC systems. As
a result, coolant entering the downcomer may be less subcooled. When the downcomer
AREVA NP Inc.
.ANP-2655(NP)Sequoyah Nuclear Plant Unit 2 Revision 1Realistic Large Break LOCA Analysis Page 6-11
coolant approaches saturation, boiling on the walls initiates, reducing the downcomer hydraulic
static level.
With the reduction of the downcomer level, the core inlet flow rate is reduced which, depending
on the existing core inventory, may result in a cladding temperature excursion or a slowing of
the core cooldown rate.
While downcomer boiling may impact clad temperatures, it is somewhat of a self-limiting
process. If cladding temperatures increase, less energy is transferred in the core boiling process
and the loop steam flows are reduced. This reduces the required driving head to support
continued core reflood and reduces the steam available to heat the ECCS water within the cold
legs resulting in greater subcooling of the water entering the downcomer.
The impact of downcomer boiling is primarily dependent on the wall heat release rate and on
the ability to slip steam up the downcomer and out of the break. The higher the downcomer wall
heat release, the more steam is generated within the downcomer and the larger the impact on
core reflooding. Similarly, the quicker the passage of steam up the downcomer, the less
resident volume within the downcomer is occupied by steam and the lower the impact on the
downcomer average density. Therefore, the ability to properly simulate downcomer boiling
depends on both the heat release (boiling) model and on the ability to track steam rising through
the downcomer. Consideration of both of these is provided in the following text. The heat
release modeling in S-RELAP5 is validated by a sensitivity study on wall mesh point spacing
and through benchmarking against a closed form solution. Steam tracking is validated through
both an axial and an azimuthal fluid control volume sensitivity study done at low pressures. The
results indicate that the modeling accuracy within the RLBLOCA methodology is sufficient to
resolve the effects of downcomer boiling and that, to the extent that boiling occurs, the
methodology properly resolves the impact on the cladding temperature and cladding oxidation
rates.
AREVA NP Inc.
ANP-2655(NP)Sequoyah Nuclear Plant Unit 2 Revision 1Realistic Large Break LOCA Analysis Page 6-12
6.5.1 Wall Heat Release Rate
The downcomer wall heat release rate during reflood is conduction limited. and depends on the
vessel wall mesh spacing used in the S-RELAP5 model. The following two approaches are used
to evaluate the adequacy of the downcomer vessel wall mesh spacing used in the S-RELAP5
model.
6.5.1.1 Exact Solution
In this benchmark, the downcomer wall is considered as a semi-infinite plate. Because the
benchmark uses a closed form solution to verify the wall mesh spacing used in S-RELAP5, it is
assumed that the material has constant thermal properties, is initially at temperature Ti, and, at
time zero, has one surface, the surface simulating contact with the downcomer fluid, set to a
constant temperature, To, representing the fluid temperature. Section 4.3 of Reference 9 gives
the exact solution for the temperature profile as a function of time as
(T(x,t) - To) / (Ti - TO) = erf {x / (2*(a t)0.5)}, (1)
where, a is the thermal diffusivity of the material given by
a = kI(p Cp),
k = thermal conductivity,
p = density,
Cp = specific heat, and
erf{} is the Gauss error function (given in Table A-1 of Reference 9).
The conditions of the benchmark are T, = 500 OF and To = 300 OF. The mesh spacing in S-
RELAP5 is the same as that used for the downcomer vessel wall in the RLBLOCA model.
Figure 6-4 shows the temperature distributions in the metal at 0.0, 100 and 300 seconds as
calculated by using Equation 1 and S-RELAP5, respectively. The solutions are identical
confirming the adequacy of the mesh spacing used in the downcomer wall.
AREVA NP Inc.
K
Sequoyah Nuclear Plant Unit 2Realistic Larce Break LOCA Analysis
ANP-2655(NP)Revision 1Paqe 6-13
550
500
u- 450
CL 400Ea)
3-
S350
C..-
300
250 K0.0 0.1 0.2 0.3 0.4 0.5 0.6 0.7
Distance from Inner Wall, feet
0.8
Figure 6-4 S-RELAP5 versus Closed Form Solution
AREVA NP Inc.
ANP-2655(NP)Sequoyah Nuclear Plant Unit 2 Revision 1Realistic Large Break LOCA Analysis Page 6-14
6.5.1.2 Plant Model Sensitivity Study
As additional verification, a typical 4-loop plant case was used to evaluate the adequacy of the
mesh spacing within the downcomer wall heat structure. Each mesh interval in the base case
downcomer vessel wall was divided into two equal intervals. Thus, a new input model was
created by increasing the number of mesh intervals from 9 to 18. The following four figures
show the total downcomer metal heat release rate, PCT independent of elevation, downcomer
liquid level, and the core liquid level, respectively, for the base case and the modified case.
These results confirm the conclusion from the exact solution study that the mesh spacing used
in the plant model for-the downcomer vessel wall is adequate.
"0• '0:).(. ;_- -T -- _ ........... .~l. - ri ............................................ ..............................................................
....* Base VSL Wall (q7-meshý,, . -Mesh 'JSL Wall
...... ~~~~~~~~~ ~~..... •....... i........ ' - .. . . . .. . .. . . . . . . . . . ..........................
311...... _ __ 1. .. .'
-7d- ,)e , .................. ... ...... ......... . -: .)ii ..~ ..... ' •! .=1' .......... --------:'
W¶_• :, .• .. . ....................... ........................ ..... .. . ........ ... .............. ..'.....
0 240.0
Time (sec)
Figure 6-5 Downcomer Wall Heat Release - Wall Mesh Point Sensitivity
AREVA NP Inc.
Sequoyah Nuclear Plant Unit 2Realistic Larme Break LOCA Analysis
ANP-2655(NP)Revision 1Page 6-15
u-0
E.EI-
... ...........
7_0
----------.-.. . . . .
k-,
____ . . .. . . . . . . . . . . .... __......
0.00 ---------- ...2. ..0. .... .... .... ... ..
Time (sec)
Figure 6-6 PCT Independent of Elevation - Wall Mesh Point Sensitivity
AREVA NP Inc.
Sequoyah Nuclear Plant Unit 2Realistic Large Break LOCA Analysis
ANP-2655(NP)Revision 1Page 6-16
30ý'N - ------------------------- ................. . .....
0)0)
0)
-J
h~
lii'IIf
~ CO00 COt
Time (sec)
Figure 6-7 Downcomer Liquid Level -Wall Mesh Point Sensitivity
AREVA NP Inc.
Sequoyah Nuclear Plant Unit 2Realistic Larcae Break LOCA Analysis
ANP-2655(NP)Revision 1Page 6-17
............. .... . .. .................. ....... .......... ..........
------------------------------- ...................
a,a,
a,-JV
0~-j
Time (sec)
Figure 6-8 Core Liquid Level - Wall. Mesh Point Sensitivity
AREVA NP Inc.
ANP-2655(NP)Sequoyah Nuclear Plant Unit 2 Revision 1Realistic Large Break LOCA Analysis Page 6-18
6.5.2 Downcomer Fluid Distribution
To justify the adequacy of the downcomer nodalization in calculating the fluid distribution in the
downcomer, two studies varying separately the axial and the azimuthal resolution with which the
downcomer is modeled have been conducted.
6.5.2.1 Azimuthal Nodalization
In a letter to the NRC dated April, 2003 (Reference 1), AREVA documented several studies on
downcomer boiling. Of significance here is the study on further azimuthal break up of the
downcomer noding. The study, based on a 3-loop plant with a containment pressure of
approximately 30 psia during reflood, consisted of several calculations examining the affects on
clad temperature and other parameters. The base model, with 6 axial by 3 azimuthal regions,
was expanded to 6 axial by 9 azimuthal regions (Figure 6-9). The base calculation simulated
the limiting PCT calculation given in the EMF-2103 three-loop sample problem. This case was
then repeated with the revised 6 x 9 downcomer noding. The change resulted in an alteration of
the blowdown evolution of the transient with little evidence of any affect during reflood. To
isolate any possible reflood impact that might have an influence on downcomer boiling, the case
was repeated with a slightly adjusted vessel-side break flow. Again, little evidence of impact on
the reflood portion of the transient was observed. The study concluded that blowdown or near
blowdown events could be impacted by refining the azimuthal resolution in the downcomer but
that reflood would not be impacted. Although the study was performed for a somewhat elevated
system pressure, the flow regimes within the downcomer will not differ for pressures as low as
atmospheric. Thus, the azimuthal downcomer modeling employed for the RLBLOCA
methodology is reasonably converged in its ability to represent downcomer boiling phenomena.
AREVA NP Inc.
Sequoyah Nuclear Plant Unit 2Realistic Large Break LOCA Analysis
ANP-2655(NP)Revision 1Page 6-19
Base model
Q-9p C~i~ L
Revised 9 Region Model
•IZ -II~2 ._[.
(H9 CHL7)0
Figure 6-9 Azimuthal Noding
6.5.2.2 Axial Nodalization
The RLBLOCA methodology divides the downcomer into' six nodes'axially. In both 3-loop and
4-loop models, the downcomer segment at the active core elevation is represented by two equal
length nodes. For most operating plants, the active core length is 12 feet and the downcomer
segments at the active core elevation are each 6-feet high. (For a 14 foot core, these nodes
would be 7-feet high.) The model for the sensitivity study presented here comprises a 4-loop-
plant with an ice condenser containment and a 12 foot core. For the study, the two nodes
spanning the active core height are divided in half, revising the model to include eight axial
nodes. Further, the refined noding is located within the potential boiling region of the
AREVA NP Inc.
Sequoyah Nuclear Plant Unit 2Realistic Larqe Break LOCA Analysis
ANP-2655(NP)Revision 1Page 6-20
downcomer where, if there is an axial resolution influence, the sensitivity to that impact would be
greatest.
The results show that the axial noding used in the base methodology is sufficient for plants
experiencing the very low system pressures characteristic of ice condenser containments.
Figure 6-10 provides the containment back pressure for the base modeling. Figures 6-11
through 6-14 show the total downcomer metal heat release rate, PCT independent of elevation,
downcomer liquid level, and the core liquid level, respectively, for the base case and the
modified case. The results demonstrate that the axial resolution provided in the base case, 6
axial downcomer node divisions with 2 divisions spanning the core active region, are sufficient
to accurately resolve void distributions within the downcomer. Thus, this modeling is sufficient
for the prediction of downcomer driving head and the resolution of downcomer boiling effects.
3 .......
. ... .. .. ... - .
...............
........... -------------C/3
(1)
(L
- -....................... ...... .........-
.. ..... . ............ . .. ......... ........................ [................... •
-: . Baeoxfs
4•-----O- ~ ~ ~ _ --•-O-0 --- •-4-• • • --- W-0 •
1 S0,0 240.D 32.0 400.'
Time (sec)
- - ....... ........... ----------------- -- - -
-----------..............
-Z0.0 - - - -----
Figure 6-10 Lower Compartment Pressure versus Time
AREVA NP Inc.
Sequoyah Nuclear Plant Unit 2Realistic Large Break LOCA Analysis
ANP-2655(NP)Revision 1Page 6-21
U)
CO)
CM,
a,
aO
/d3Ot,
Time (sec)
Figure 6-11 Downcomer Wall Heat Release - Axial Noding Sensitivity Study
AREVA NP Inc.
Sequoyah Nuclear Plant Unit 2Realistic Lare Break LOCA Analysis
ANP-2655(NP)Revision 1Page 6-22
V =
2I0040
. ..... ............ --- .....................................
... ... . ... .. ..
.. ............. - - - - - - --- - - - -
Iii
,•
L_0
EC-
I 200.1ne ..... ............. - -.............................
............................ .................... -... : -......--- L ----.................. i....
., 4;. '00 4C,0
T ( 24ke.0
Time (sec)
..........(,
3.('.'1I_.,
Figure 6-12 PCT Independent of Elevation - Axial Noding Sensitivity Study
AREVA NP Inc.
Sequoyah Nuclear Plant Unit 2Realistic Large Break LOCA Analysis
ANP-2655(NP)Revision 1Page 6-23
a,
a,~1
.50~
-J
.......... ......... ......... .....
.. ... ..
Time (sec)
Figure 6-13 Downcomer Liquid Level - Axial Noding Sensitivity Study
AREVA NP Inc.
Sequoyah Nuclear Plant Unit 2Realistic Larme Break LOCA Analysis
ANP-2655(NP)Revision 1Pace 6-24
-J
72
Time (sec)
Figure 6-14 Core Liquid Level - Axial Noding Sensitivity Study
6.5.3 Downcomer Boilinq Conclusions
To further justify the ability of the RLBLOCA methodology to predict the potential for and impact
of downcomer boiling, stu~dies were performed on the downcomer wall heat release modeling
within the methodology and on the ability of S-RELAP5 to predict the migration of steam through
the downcomer. Both azimuthal and axial noding sensitivity studies were performed. The axial
noding study was based on an ice condenser plant that is near atmospheric pressure during
reflood. These studies demonstrate that S-RELAP5 delivers energy to the downcomer liquid'
volumes at an appropriate rate and that the downcomer noding detail is sufficient to track the
distribution of any steam formed. Thus, the required methodology for the prediction of
downcomer boiling at system pressures approximating those achieved in plants with pressures
as low as ice condenser containments has been demonstrated.
AREVA NP Inc.
ANP-2655(NP)Sequoyah Nuclear Plant Unit 2 Revision 1Realistic Large Break LOCA Analysis Page 6-25
6.6 Break Size
Question: Were all break sizes assumed greater than or equal to 1.0 ft2?
Response: Yes.
The NRC has requested that the break spectrum for the realistic LOCA evaluations be limited to
accidents that evolve through a range of phenomena similar to those encountered for the larger
break area accidents. This is a change to the approved RLBLOCA EM (Reference 1). The
larger break area LOCAs are typically characterized by the occurrence of dispersed flow film
boiling at the hot spot, which sets them apart from smaller break LOCAs. This occurs generally
in the vicinity of 0.2 DEGB (double-ended guillotine break) size (i.e., 0.2 times the total flow area
of the pipe on both sides of the break). However, this transitional break size varies from plant to
plant and is verified only after the break spectrum has been executed. AREVA NP has sought
to develop sufficient criteria for defining the minimum large break flow area prior to performing
the break spectrum. The purpose for doing so is to assure a valid break spectrum is performed.
6.6.1 Break / Transient Phenomena
In determining the AREVA NP criteria, the characteristics of larger break area LOCAs are
examined. These LOCA characteristics involve a rapid and chaotic depressurization of the
reactor coolant system (RCS) during which the three historical approximate states of the system
can be identified.
Blowdown The blowdown phase is defined as the time period from initiation of the break
until flow from the accumulators begins. This definition is somewhat different from the
traditional definition of blowdown which extends .the blowdown until the RCS pressure
approaches containment pressure. The blowdown phase typically lasts about 12 to 25
seconds, depending on the break size.
Refill is that period that starts with the end of blowdown, whichever definition is used,
and ends when water is first forced upward into the core. During this phase the core
experiences a near adiabatic heatup.
Reflood is that portion of the transient that starts with the end of refill, follows through the
filling of the core with water and ends with the achievement of complete core quench.
AREVA NP Inc.
ANP-2655(NP)Sequoyah Nuclear Plant Unit 2 Revision 1Realistic Large Break LOCA Analysis Page 6-26
Implicit in this break-down is that the core liquid inventory has been completely, or nearly so,
expelled from the primary system leaving the core in a state of near core-wide dispersed flow
film boiling and subsequent adiabatic heatup prior to the reflood phase. Although this break
down served as the basis forthe original deterministic LOCA evaluation approaches and is valid
for most LOCAs that would classically be termed large breaks, as the break area decreases the
depressurization rate decreases such that these three phases, overlap substantially. During
these smaller break events, the core liquid inventory is not reduced as much as that found in
larger breaks. Also, the adiabatic core heatup is not as extensive as in the larger breaks which
results in much lower cladding temperature excursions.
6.6.2 New Minimum Break Size Determination
No determination of the lower limit can be exact. The values of critical phenomena, that control
the evolution of a LOCA transient will overlap and interplay. This is especially true in a
statistical evaluation where parameter values are varied randomly with a strong expectation that
the variations will affect results. In selecting the lower area of the RLBLOCA break spectrum,
AREVA sought to preserve the generality of a complete or nearly complete core dry out
accompanied by a substantially reduced lower plenum liquid inventory. It was reasoned that
such conditions would be unlikely if the break flow rate was reduced to less than the reactor
coolant pump flow. That is, if the reactor coolant pumps are capable of forcing more coolant
toward the reactor vessel than the break can extract from the reactor vessel, the downcomer
and core must maintain some degree of positive flow (positive in the normal operations sense).
The circumstance is, of course, transitory. Break flow is altered as the RCS blows down and
the RC pump flow may decrease as the rotor and flywheel slow down if power is lost. However,
if the core flow was reduced to zero or became negative immediately after the break initiation,
then the event was quite likely to proceed with sufficient inertia to expel most of the reactor
vessel liquid to the break. The criteria base, thus established, consists of comparing the break
flow to the initial flow through all reactor coolant pumps and setting the minimum break area
such that these flows match. This is done as follows:
Wbreak = Abreak * Gbreak = Npump * WRCP.
This gives
AREVA NP Inc.
Sequoyah Nuclear Plant Unit 2Realistic Large Break LOCA Analysis
ANP-2655(NP)Revision 1Paqe 6-27
Abreak = (Npump * WRcP)/Gbreak.
The break mass flux is determined from critical flow. Because the RCS pressure in the broken
cold leg will decrease rapidly during the first few seconds of the transient, the critical mass flux
is averaged between that appropriate for the initial operating conditions and that appropriate for
the initial cold leg enthalpy and the saturation pressure of coolant at that enthalpy.
Gbreak = (Gbreak(PO, HCLO) + Gbreak(PCLsat, HcLO))/ 2..
The estimated minimum LBLOCA break area, Amin, is 2.76 ft2 and the break area percentage,•
based on the full double-ended guillotine break total area, is 33 percent.
Table 6-4 provides a listing of the plant type, initial condition, and the fractional minimum
RLBLOCA break area, for all the plant types presented as generic representations in the next
section.
Table 6-4 Minimum Break Area for Large Break LOCA Spectrum
Saturated Spectrum Spectrum
Plant System Cold Leg Subcooled Gbreak No. RCP Minimum MinimumDescription Pressure Enthalpy Gbreak (HEM) of flow Break Break
(ib)(tuIm Ib/t_) m/ft2.s) RCPs (Ibm/s) Area Area(lbft 2 (DEGB)
A 3-Loop W 2250 555.0 23190 5700 3 31417 2.18 0.26Design
B 3-Loop W 2250 544.5 23880 5450 4 28124 1.92 0.23Design I
C 3-Loop W 2250 550.0 '23540 5580 4 29743 2.04 0.25Design2x4 CE
D Des C 2100 538.8 22860 5310 4 21522 1.53 0.24DesignII
E 2x4 CE 2055 535.8 22630 5230 3 37049 2.66 0.27Design
F 4-Loop W 2160 540.9 23290 5370 3 39500 2.76 0.33Design
The split versus double-ended break type is no longer related to break area. In concurrence with
Regulatory Guide 1.157, both the split and the double-ended break will range in area between
the minimum break area (Amin) and an area of twice the size of the broken pipe. The
determination of break configuration, split versus double-ended, is made after the break area is
ýselected based on a uniform probability for each occurrence.
AREVA NP Inc.
ANP-2655(NP)Sequoyah Nuclear Plant Unit 2 Revision 1Realistic Large Break LOCA Analysis Page 6-28
6.6.3 Intermediate Break Size Disposition
With the revision of the smaller break area for the RLBLOCAanalysis, the break range for small
breaks and large breaks are no longer contiguous. Typically the lower end of the large break
spectrum occurs at between 0.2 to 0.3 times the total area of a 100 percent double-ended
guillotine break (DEGB) and the upper end of the small break spectrum occurs at approximately
0.05 times the area of a 100 percent DEGB. This leaves a range of breaks that are not
specifically analyzed during a LOCA licensing analysis. The premise for allowing this gap is that
these breaks do not comprise accidents that develop high cladding temperature and thus do not
comprise, accidents that critically challenge the emergency core cooling systems (ECCS).
Breaks within this range remain large enough to blowdown to low pressures. Resolution is
provided by the large break ECC systems and the pressure-dependent injection limitations that
determine critical small break performance are avoided. Further, these accidents develop
relatively slowly, assuring maximum effectiveness of those ECC systems.
A variety of plant types for which analysis within the intermediate range have been completed
were surveyed. Although statistical determinations are extracted from the consideration of
breaks with areas above the intermediate range, the AREVA best-estimate methodology
remains suitable to characterize the ECCS performance of breaks within the intermediate range.
Table 6-4 provides a listing of the plant type, initial condition, and the fractional minimum
RLBLOCA break area. Figures 6-15 through 6-20 provide the enlarged break spectrum results
with the upper end of the small break spectrum and the lower end of the large break spectrum
indicated by bars. Table 6-5 provides differences between the true large break region and the
intermediate break region (break areas between that of the largest SBLOCA and the smallest
RLBLOCA). The minimum difference is 141' OF; however, this case is not representative of the
general trend shown by the other comparisons. The next minimum difference is 704 OF (see
Figure 6-15). Considering this point as an outlier, the table shows the minimum difference
between the highest intermediate break spectrum PCT and large break spectrum PCT, for the
six plants, as at least 463 °F, and including this point would provide an average difference of
427 OF and a maximum difference of 840 OF.
AREVA NP Inc.
Sequoyah Nuclear Plant Unit 2Realistic Large Break LOCA Analysis
ANP-2655(NP)Revision 1Page 6-29'
Thus, by both measures, the peak cladding temperatures within the intermediate break range
will be several hundred degrees below those in the true large break range. Therefore, these
breaks will not provide a limit or a critical measure of the ECCS performance. Given that the
large break spectrum bounds the intermediate spectrum, the use of only the large break
spectrum meets the requirements of 10CFR50.46 for breaks within the intermediate break
LOCA spectrum, and the method demonstrates that the ECCS for a plant meets the criteria of
10CFR50.46 with high probability.
Table 6-5 Minimum PCT Temperature Difference - True Large and IntermediateBreaks
Generic Maximum Maximum
Plant Plant PCT (°F) PCT (°F) Delta PCT Average Delta
Description Label Intermediate Large Size (OF) PCT (OF)
(Table 6-4) Size Break Break
A 1746' 1887 141'
3-LoopW B 1273 1951 678 4271Design
C 1326 1789 463
2x4CE D 984 1751 767 767Design E 869 1636 767
4-LoopW F 1127 1967 840 840Design
Note: 1. The 2 nd highest PCT was 1183 OF.
average delta increases to 615 OF.
This changes the Delta PCT to 704 0F and the
AREVA NP Inc.
Sequoyah Nuclear Plant Unit 2Realistic Large Break LOCA Analysis
ANP-2655(NP)Revision 1Page 6-30
2000 .- -
1800
1600
1400 .---
I-
Upper End of
SBLOCABreak Size
_ _ Spectrum
,I
.I
I
Large Break
Spectnrm
Minimum
Break Area
1200 ....
, •
4
I.1 _
I
4'41
-~I.
4 i
4 I
----- F
I-,.I 41
•
I
i
t
• I
I
I
i
i
i
i
,'
•
+-
•.*1I 4 I
I 4-
~4I
4'
-I----L -
I I
I I
I I
I I
I I
4 4
4
4
1000 +---
800 .---
600 1
0.00'
-I. * I
00 0.1000 0.2000 0.3000 0.4000 0.5000 0.6000 0.7000 0.8000 0.9000 1.0000
Break Area Normalized to Double Ended Guillotine
Figure 6-15 Plant A- Westinghouse 3-Loop Design
AREVA NP Inc.
Sequoyah Nuclear Plant Unit 2Realistic Larqe Break LOCA Analysis
ANP-2655(NP)Revision 1Paqe 6-31
2000 ,
1800
1600
1400 -
o
Upper End ofSBLOCABreak SizeSpectrum
I
-
Large BreakSpectrumMinimum
- - Break Area
9,I.'*
+ --* * 9
.. ~ **~ 9 9
91
91 9
9
I 919 9
9
-?ii -9-------
iI*
9
-+
* 9
I 9
*1
9'
*1
9
9
I.
91
- .L -1200 +-- - -.J.. -. i
L -
1000 +---.
800 .--- I
I I I
I I II I II I I
I .1I I -
I I
I I I II I I I
I I I I
600
0.0000 0.1000 0.2000 0.3000 0.4000 0.5000 0.6000 0.7000 0.8000 0.9000 1.0000
Break Area Normalized to Double Ended Guillotine
Figure 6-16 Plant B-, Westinghouse 3-Loop Design
AREVA NP Inc.
Sequoyah Nuclear Plant Unit 2.Realistic Larae Break LOCA Analvsis
ANP-2655(NP)Revision 1Paae 6-32
2000 ----
1800 --.-
1600 -
1400 +---
U
Upper End ofSBLOCABreak Size
_ Spectrum
-'t -
-- * ----
1200
1000 -
i
-L_
Large BreakSpectrumMinimum
--.- Break Area
~~1
I.
I -
*1
__ • ...*
*
-I• -_
* - • .. .
I
L
I I
I I
*tI. *1
-- - I
I o
I I
I ~ I
800 +---
600
0.0000 0.1000 0.2000 0.3000 0.4000 0.5000 0.6000 0.7000 0.8000 0.9000 1.0000
Break Area Normalized to Double Ended Guillotine
Figure 6-17 Plant C - Westinghouse 3-Loop Design
AREVA NP Inc.
Sequoyah Nuclear Plant Unit 2Realistic Large Break LOCA Analysis
ANP-2655(NP)Revision 1Page 6-33
2000 T - -
1800 +---
1600 +---
1400 +
o-
(-)
Upper End ofSBILOCA
Break Size- - Spectrum
-i
- -r - - -
- .4 - - -
~~1~~~
I..
Large Break
SpectrumA. Minimum
Break Area
1200,
- - - - --r- --
- -- . . . . .L- -
i,
44
--4
I I
44
*1
4444
44.
J
I I
I I
- -----.----
-I- - -
44'I
I.
4
--I
*#1
441
1000 +---
800 +
600 00.2000
00.3000 0.4000 0.5000 0.6000 0.7000 0.8000 0.9000 1.00000.0000 0.1000
Break Area Normalized to Double Ended Guillotine
Figure 6-18 Plant D - Combustion Engineering 2x4 Design
AREVA NP Inc.
Sequoyah Nuclear Plant Unit 2Realistic Larae Break LOCA Analysis
ANP-2655(NP)Revision 1Page 6-34
2000
1900
1600
1400
1200
1000
800
600 4--
0.0000
Upper End of,SBLOCABreak SizeSpectrum
I I
I I
i I ,
I I
_ I
i ,
i . I
'I
* I
rLarge BreakSpectrumMinimum
I - - - - - - - - T - - - - - - - - - - - - - - -
---------- ------
- --- - - - - - -T - - - - -- -- -- - -- - -- -- - - -- -- - - - - -- -
- - - - -- ---- - - -- - -- - -- - -- - -- -I
0.1000 0.2000 0.3000 0,4000 0.5000 0.6000 .0.7000 0.8000 0.9000 1.0000Break Area Normalized to Double Ended Guillotine
Figure 6-19 Plant E - Combustion Engineering 2x4 Design
AREVA NP Inc.
Sequoyah Nuclear Plant Unit 2Realistic Large Break LOCA Analysis
ANP-2655(NP)Revision 1Page 6-35
2200.0000 T
2000.0000 +Upper End of
SBLOCABreak SizeSpectrum
II1800.0000 +--
1600.0000 .---
Z-0~U9L.
1400.0000 +
1200.0000 .- - -
4
4 I. **1
.1
I.
Minimumr' Break Area.
-- - - - -
Large BreakSpectrum
-rT
I.
*1
* I
* I
*4
*
-- .L --
* .1
-I
-- 4-- -
4
I
I
-I44
*
1000.0000 4----
-J
.1....
I I
I I
I I
I I
800.0000 + - -
600.0000 4-1
0.0000 0.1000 0.2000 0.3000 0.4000 0.5000 0.6000 0.7000 0.8000 0.9000 1.0000
Break Area Normalized to Double Ended Guillotine
Figure 6-20 Plant F - Westinghouse 4-Loop Design
AREVA NP Inc.
ANP-2655(NP)Sequoyah Nuclear Plant Unit 2 Revision 1Realistic Large Break LOCA Analysis Page 6-36
6.7 ICECON Model
Question: Verify that the SQN-2 ICECON model is that shown in Figure 5.1 of EMF-CC-39(P)
Revision 2, "ICECON: A Computer Program Used to Calculate Containment Back Pressure for
LOCA Analysis (Including Ice Condenser Plants)."
See Section 3.3.
6.8 Cross-References to North Anna
Question: In order to conduct its review of the SQN-2 application of AREVA's realistic LBLOCA
methods in an efficient manner, the NRC staff would like to make reference to the responses to
NRC staff requests for additional information that were developed for the application of the
AREVA methods to the North Anna Power Station, Units 1 and 2, and found acceptable during
that review. The NRC Staff safety evaluation was issued on April 1, 2004 (Agency-wide
Documentation and Management System (ADAMS) accession number ML040960040). The
staff would like to make use of the information that was provided by the North Anna licensee
that is not applicable only to North Anna or only to subatmospheric containments. This
information is contained in letters to the NRC from the North Anna licensee dated. September
26, 2003 (ADAMS accession number ML032790396) and November 10, 2003 (ADAMS
accession number ML033240451). The specific responses that the staff would like to reference
are:
September 26, 2003 letter: NRC Question 1
NRC Question 2
NRC Question 4
NRC Question 6
November 10, 2003 letter: NRC Question 1
Please verify that the information in these letters is applicable to the AREVA model applied to
SQN-2 except for that information related specifically to North Anna and to sub-atmospheric
containments.
AREVA NP Inc.
ANP-2655(NP)Sequoyah Nuclear Plant Unit 2 Revision 1Realistic Large Break LOCA Analysis Page 6-37
Response: The responses provided to questions 1, 2, 4, and 6 are for the most part generic
and related to the ability of ICECON to calculate containment pressures. Excepting as follows
they are applicable to the Sequoyah Unit 2 RLBLOCA submittal.
Question 1 - Completely Applicable
Question 2 - Completely Applicable
Question 4 - Completely Applicable (the reference to CSB 6-1 should now be to CSB
Technical Position 6-2). The NRC altered the identification of this branch technical position in
Revision 3 of NUREG-0800.
Question 6 - The direct response. is completely applicable excepting that the reference to
"North Anna Units 1 and 2" should be deleted. The statement in which the North Anna units are
referenced is equally valid without identification of any specific plant.
The supplemental request and response are specific to North Anna and are not applicable to
Sequoyah Unit 2..
The response provided to question 1 contains both generic and plant specific content. The
portions that are generic remain applicable to Sequoyah Unit 2. However, the North Anna Units
use sub-atmospheric containment designs and Sequoyah Unit 2 is of the ice condenser type.
This leads to several differences in the way the information would be presented.
AREVA NP Inc.
ANP-2655(NP)Sequoyah Nuclear Plant Unit 2 Revision 1Realistic Large Break LOCA Analysis Page 6-38
6.9 Containment Model
Question: ANP-2695(P) shows that the containment parameters treated statistically are: (1)
upper compartment containment volume, (2) upper compartment containment temperature, and
(3) lower compartment containment temperature. ANP-2695(P) states that "in many instances"
the guidance of NRC Branch Technical Position CSB 6-1 was used in determining the other
containment parameters.
[AREVA NP: Note that the same Containment System Branch Technical Position is now
designated 6-2 instead of 6-1 .]
(a) How is the mixing of containment steam and ice melt modeled so as to minimize the
containment pressure?
See Section 3.3.
(b) Verify that all containment spray and fan coolers are assumed operating at maximum heat
removal capacity.
See Section 3.3.
(c) Describe how the limits on the volume of the upper containment were determined.
See Section 3.3.
(d) How are the containment air return fans modeled and what is the effect of this modeling on
the containment pressure?
See Section 3.3.
(e) Describe how passive heat sink areas and heat capacities are modeled so as to minimize
containment pressure.
See Section 3.3.
The following are a set of containment plots that are produced to supplement the NRC's review
of the Sequoyah Unit 2 RLBLOCA analysis.
AREVA NP Inc,
ANP-2655(NP)Sequoyah Nuclear Plant Unit 2 Revision 1Realistic Large Break LOCA Analysis Page 6-39
4500Energy Additon from RCS break
4000 -"-0 steam---- liquid
3500 Ototat
3000
z 2500
'6 2000
1500E
1000
500
0
-500 ........ .0 10 20 30 40 50 60 70 80 90 100 110 120
ID.S5" ZJwi2O6 19:37:46 RSMX iTime (s)
Figure 6-21 Energy Addition in Lower Compartment4500
4500 Total hieat removal
4000 -- 0 Energy addition by steam
3500
3000
2500
10
1500E
1000
500
0
-5000 10 20 30 40 50 60 .70 80 90 100 11.0 120
0551e Z5e59, 0 1 P,.c•t9:3740 RSOX: I Time (s)
Figure 6-22 Energy Rates in Lower Compartment
AREVA NP Inc.
Sequoyah Nuclear Plant Unit 2Realistic Large Break LOCA Analysis
ANP-2655(NP)Revision 1Paoe 6-40
4500-- Heat removal by slabs
4000 -- 0 Pool condensation
----{Liquid energy dropout
3500 -OChest sump drainage----A-Total removal
3000 <total:
2500M0 2000
- 1500
1000
500
.0
-500-0 10 20 30 40 50 60 70 80 90 100 110
1)5ZUW 2JarWO6 19:37:-•f•R5MX ITime (s)
Figure 6-23 Energy Removal Rates in Lower Compartment
120
I-
oE
0 10.11:5540 2Jan2MOe 19.37 46 f5M5.r
20 30 40 50 60 70 80 90 100 110 120
Time (s)
Figure 6-24 Energy Removal Rates in Upper Compartment
AREVA NP Inc.
Sequoyah Nuclear Plant Unit 2Realistic Larae Break LOCA Analysis
ANP-2655(NP)Revision 1Paqe 6-41
15.0
10.0
570
0.0 .0
ID 5,5 2JW208 19:37:W RSOCX:i
5 10 15 20 25 30 35 40
Time (s)
Figure 6-25 Heat Removal Rates (log)
1.0
0.9
i 0.8
.2
LL 0.7
0.6
0.50
0.56400 24062006 1.37 46 RSDMX:I
100 200 300 400Time (s)
Figure 6-26 Fraction of Ice Remaining
500 600
AREVA NP Inc.
Sequoyah Nuclear Plant Unit 2Realistic Larae Break LOCA Analysis
ANP-2655(NP)Revision 1Pace 6-42
11000-+ Break
10000 ----0 SteamL-0Liquid
9000 OTotal
8000
7000
6000
5000
4000
3000
2000
1000
01 0 10 20 30 40 50 60 70 80 90 1001DO55402JiýOWe0 19g37:4e RSOMX I
Time (s)
Figure 6-27 Mass Addition to Lower Compartment
22,0
21.0
20.0
1 19.0
18.0a.
17.0
16.0
0 10
ID -00243rI20019 37AS 50M I
20 30 40 50 60 70 80 90 100 110 120Time (s)
Figure 6-28 Upper Compartment versus Lower Compartment Pressure
AREVA NP Inc.
Sequoyah Nuclear Plant Unit 2Realistic Large Break LOCA Analysis
ANP-2655(NP)Revision 1Page 6-43
.
250.0
200.0
150.0
100.0
50.0'0 10 20 30 40 50 60 70 80 90 100. 110 120
03.490 24an0008 19:37:48 RSDMX :( Time (s)
Figure 6-29 Temperature of Upper and Lower Compartments
6.10 GDC 35- LOOP and No-LOOP Case Sets
In concurrence with the NRC's interpretation of GDC 35, a set of 59 cases each was run with a
LOOP and No-LOOP assumption. The set of 59 cases that predicted the highest figure of merit,
PCT, is reported in Section 2 and Section 3, herein. The results from both case sets are shown
in Figure 3-23. This is a change to the approved RLBLOCA EM (Reference 1).
AREVA NP Inc.
ANP-2655(NP)Sequoyah Nuclear Plant Unit 2 Revision 1Realistic Large Break LOCA Analysis Page 6-44
6.11 Statement
Question: Provide a statement confirming that TVA and its LBLOCA analyses vendor have
ongoing processes that assure that the input variables and ranges of parameters for the SQN-2
LBLOCA analyses conservatively bound the values and ranges of those parameters for the as
operated SQN-2 plant. This statement addresses certain programmatic requirements of 10
CFR 50.46, Section (c).
Response: TVA and the LBLOCA Analysis Vendor have an ongoing process to ensure that all
input variables and parameter ranges for the Sequoyah Unit 2 realistic large break loss-of-
coolant accident are verified as conservative with respect to plant operating and design
conditions. In accordance with TVA Quality Assurance program requirements, this process
involves 1) definition of the required input variables and parameter ranges by the Analysis
Vendor, 2) compilation of the specific values from existing plant design input and output
documents by TVA and Vendor personnel in a formal analysis input summary document issued
by the Analysis Vendor and 3) formal review and approval of the input summary document by
TVA. Formal TVA approval of the input document serves as the release for the Vendor to
perform the analysis.
Continuing review of the input summary document is performed by TVA as part of the plant
design change process and cycle-specific core design process. Changes to the input summary
required to support plant modifications or cycle-specific core altemations are formally
communicated to the Analysis Vendor by TVA. Revisions and updates to the analysis
parameters are documented and approved in accordance with the process described above for
the initial analysis.
AREVA NP Inc.
ENCLOSURE 3
TENNESSEE VALLEY AUTHORITYSEQUOYAH NUCLEAR PLANT (SQN)
UNIT 2
PROPRIETARY INFORMATION WITHHOLDING AFFIDAVIT
E3-1
AFFIDAVIT
COMMONWEALTH OF VIRGINIA )) ss.
CITY OF LYNCHBURG
1. My name is Gayle F. Elliott. I am Manager, Product Licensing, for AREVA
NP lnc. and as such I am authorized to execute this Affidavit.
2. I am familiar with the criteria applied by AREVA NP to determine whether
certain AREVA NP information is proprietary. I am familiar with the policies established by
AREVA NP to ensure the proper application of these criteria.
3. I am familiar with the AREVA NP information contained ih the report ANP-
2655(P), Revision 1, "Sequoyah Nuclear Plant Unit 2 Realistic Large Break LOCA Analysis,"
dated February 2008, and referred to herein as "Document." Information contained in this
Document has been classified by AREVA NP as proprietary in accordance with the policies
established by AREVA NP for-the control and protection of proprietary and confidential
information.
4. This Document contains information of a proprietary and confidential nature
and is of the type customarily held in confidence by AREVA NP and not made available to the
,public. Based on my experience, I am aware that other companies regard information of the
kind contained in this Document as proprietary and confidential.
5. This Document has been made available to the U.S. Nuclear Regulatory
Commission in confidence with the request that the information contained in this Document be
withheld from public disclosure. The request for withholding of proprietary information is made in
accordance with 10 CFR 2.390. The information for which withholding from disclosure is
requested qualifies under 10 CFR 2.390(a)(4) "Trade secrets and commercial or financial
information."
6. The following criteria are customarily applied by AREVA.NP to determine
whether information should be classified as proprietary:
(a) The information reveals details of AREVA NP.'s research and development
plans and programs or their results.
(b) Use of the information by a competitor would permit the competitor to
significantly reduce its expenditures, in time or resources, to design, produce,
or market a similar product or service.
(c) The information includes test data or analytical techniques concerning a
process, methodology, or component, the application of which results in a
competitive advantage for AREVA NP.
(d) The information reveals certain distinguishing aspects of a process,
methodology, or component, the exclusive use of which provides a
competitive advantage for AREVA NP .in product optimization or marketability.
(e) The information is vital to a competitive advantage held by AREVA NP, would
be helpful to competitors to AREVA NP, and would likely cause substantial
harm to the competitive position of AREVA NP.
The information in the Document is considered proprietary for the reasons set forth in
paragraphs 6(b) and 6(c) above.
7. In accordance with AREVA NP's policies governing the protection and control
of information, proprietary information contained in this Document have been made available,
on a limited basis, to others outside AREVA NP only as required and under suitable agreement
providing for nondisclosure and limited use of the information.
8. AREVA NP policy requires that proprietary information be kept-in a secured
file or area and distributed on a need-to-know basis.
9. The foregoing.statements are true and correct to the best of my knowledge,
information, and belief.
SUBSCRIBED before me this ZOV-
day of o--IQ( (C':,j) ,2008.
Sherry L. McFadenNOTARY PUBLIC, COMMONWEALTH OF VIRGINIAMY COMMISSION EXPIRES: 10/31/10Reg. # 7079129
CUM"Woo Of Vhg~nh@
7079129k" Comrhbson bpitSOct 31, 2010n~Wc -rrrrrrrrrrrrI