Hubbell Power Systems, Inc. 8711 Wadsworth Road Wadsworth, OH 4 4244 Tel: (330) 335-2361 Fax: (330) 336-9252 Document: G12-06-04 ANSI/IEEE Design Test Report Polymer Distribution Elbow & Parkingstand Arresters This design test report records the results of laboratory tests performed on Elbow and Parkingstand Arresters which met or exceeded all applicable requirements of these standards: ANSI/IEEE Standard C62.11-2005, "IEEE Standard for Metal-Oxide Surge Arresters for Alternating Current Power Circuits" ANSI/IEEE Standard 386-2006, "IEEE Standard for Separable Insulated Connector Systems for Power Distribution Systems Above 600 V" ANSI/IEEE Standard 592-1990, "IEEE Standard for Exposed Semiconducting Shields on High-Voltage Cable Joints and Separable Insulated Connectors" Bas van Besouw Principal Engineer David E. Crotty Senior Product Specialist Peter Swales Business Unit Manager
Transcript
Hubbell Power Systems, Inc.
8711 Wadsworth Road Wadsworth, OH 4 4244
Tel: (330) 335-2361 Fax: (330) 336-9252
Document: G12-06-04
ANSI/IEEE Design Test Report
Polymer Distribution
Elbow & Parkingstand Arresters
This design test report records the results of laboratory tests performed on Elbow and Parkingstand Arresters which met or exceeded all applicable requirements of these standards: ANSI/IEEE Standard C62.11-2005, "IEEE Standard for Metal-Oxide Surge Arresters for Alternating Current Power Circuits" ANSI/IEEE Standard 386-2006, "IEEE Standard for Separable Insulated Connector Systems for Power Distribution Systems Above 600 V" ANSI/IEEE Standard 592-1990, "IEEE Standard for Exposed Semiconducting Shields on High-Voltage Cable Joints and Separable Insulated Connectors"
Bas van Besouw Principal Engineer
David E. Crotty Senior Product Specialist
Peter Swales Business Unit Manager
Hubbell Power Systems, Inc.
8711 Wadsworth Road Wadsworth, OH 4 4244
Tel: (330) 335-2361 Fax: (330) 336-9252
Document: G12-06-04
Design Test Report Reports provide details of the tests according to the following table:
Introduction and Sample Preparation The test was conducted in accordance with Section 8.1 of ANSI/IEEE Standard C62.11-2005. Insulating inserts were used in place of MOV block modules. Test Results Table 1 summarizes the polymer housing minimum dielectric test requirements for each arrester rating. Each arrester housing exceeded the listed 60 Hz and impulse withstand requirements summarized in table 1.
DISCHARGE VOLTAGE TEST: ELBOW & PARKINGSTAND ARRESTER
Sample Preparation The discharge voltage tests were performed on a prorated sample consisting of a single 32mm diameter MOV disc element. Test Procedure The test was conducted in accordance with Section 8.3 of ANSI/IEEE Standard C62.11-2005 "IEEE Standard for Metal-Oxide Surge Arresters for Alternating Current Power Circuits". The disc was subjected to 8/20 µs current waves with magnitudes ranging from 1.5 kA through 20 kA. In addition, Front-of-wave and switching surge discharge voltage tests were performed. Test Results The following oscillograms show the results of the individual discharge voltage tests. At the end of this section, a summary table compares the catalog protective characteristics versus the measured values extrapolated from the test data.
Hubbell Power Systems, Inc.
8711 Wadsworth Road Wadsworth, OH 4 4244
Tel: (330) 335-2361 Fax: (330) 336-9252
Document: G12-06-04
4
A.) 8/20 µs Discharge Voltage Oscillograms: Tests were performed per Section 8.3.1 for
nominal 8/20 µs discharge current wave shapes.
1.501 kA 12.328 kV 8.2/19.6 µs
10.173 kA 15.950 kV 8.3/18.9 µs
Hubbell Power Systems, Inc.
8711 Wadsworth Road Wadsworth, OH 4 4244
Tel: (330) 335-2361 Fax: (330) 336-9252
Document: G12-06-04
5
20.099 kA 18.424 kV 8.5/19.6 µs
40.19 kA 23.054 kV 8.1/19.6 µs
B.) Front-of-wave Oscillograms: Tests were performed per Section 8.3.2.1 for a nominal 5kA
current surge with a time to voltage crest of 0.5 microseconds.
Hubbell Power Systems, Inc.
8711 Wadsworth Road Wadsworth, OH 4 4244
Tel: (330) 335-2361 Fax: (330) 336-9252
Document: G12-06-04
6
5.120 kA 14.804 kV 2.1/4.5 µs
5.030 kA 15.119 kV 1.0/2.5 µs
Hubbell Power Systems, Inc.
8711 Wadsworth Road Wadsworth, OH 4 4244
Tel: (330) 335-2361 Fax: (330) 336-9252
Document: G12-06-04
7
C.) Switching Surge Oscillograms: Tests were performed per Section 8.3.2.2 for switching surge current magnitude of 500A.
Introduction This test is performed to measure the MOV disc aging characteristic. The measured watts values are used to develop elevated voltage ratios Kc and Kr which are used in the duty cycle and discharge current withstand tests to simulate the performance of arresters that have a service life equivalent to 2000 hours at 115°C. Sample Preparation Three 32 mm diameter x 28 mm long discs and three 32 mm diameter x 43 mm long discs were selected for testing. The three 43 mm long discs were designated as samples #1, 2, & 3 while the 28 mm long discs were designated as samples #4, 5, & 6. The discs, which represent the longest and shortest manufactured discs, were assembled inside fiberglass-epoxy wraps and inserted inside polymer housings prior to testing. Test Procedure The test was performed per Section 8.5 of ANSI/IEEE C62.11-2005 Standard. The six test samples were placed inside a 115°C ±2°C. oven and energized at MCOV for 2000 hours. The watts loss for each sample was measured at MCOV and duty cycle rated voltage two hours after energization and at the completion of the 2000 hour test duration. Table 4 summarizes the results of the 2000 hour accelerated aging tests. All watts values were measured with the samples at 115°C.
For each test sample, the final watts loss at MCOV and rating is less than the initial watts measured. Therefore, the KC and K, factors equal 1.0. These values will be used in the duty cycle and discharge-current withstand tests.
Hubbell Power Systems, Inc.
8711 Wadsworth Road Wadsworth, OH 4 4244
Tel: (330) 335-2361 Fax: (330) 336-9252
Document: G12-06-04
12
SECTION IV
HIGH CURRENT, SHORT DURATION TEST: ELBOW & PARKINGSTAND ARRESTER
Sample Preparation This test was performed per Section 8.12 of IEEE Standard C62.11-2005. The test was performed on a thermally insulated full size 8.4kV MCOV arrester. Test Procedure Before and after the high current, short duration test, the 5 kA 8/20 µs discharge voltage of the test sample was measured. The test sample was subjected to two 65 kA 4/10 µs discharges. Sufficient time was allowed between discharges for the sample to cool to ambient temperature (21°C). Within 5 minutes after the second high current discharge, the sample was energized at recovery voltage. The sample watts loss was monitored until thermal stability was demonstrated. Test Results The arrester was subjected to two nominal 65 kA 5.2/12.4 µs high current discharges. Table 5 summarizes the results of the 2 high current discharges.
The following traces show the actual current values.
Sample 1
Shot 1 Discharge Current = 68.64 kA Discharge Voltage = 57.01 kV
Hubbell Power Systems, Inc.
8711 Wadsworth Road Wadsworth, OH 4 4244
Tel: (330) 335-2361 Fax: (330) 336-9252
Document: G12-06-04
14
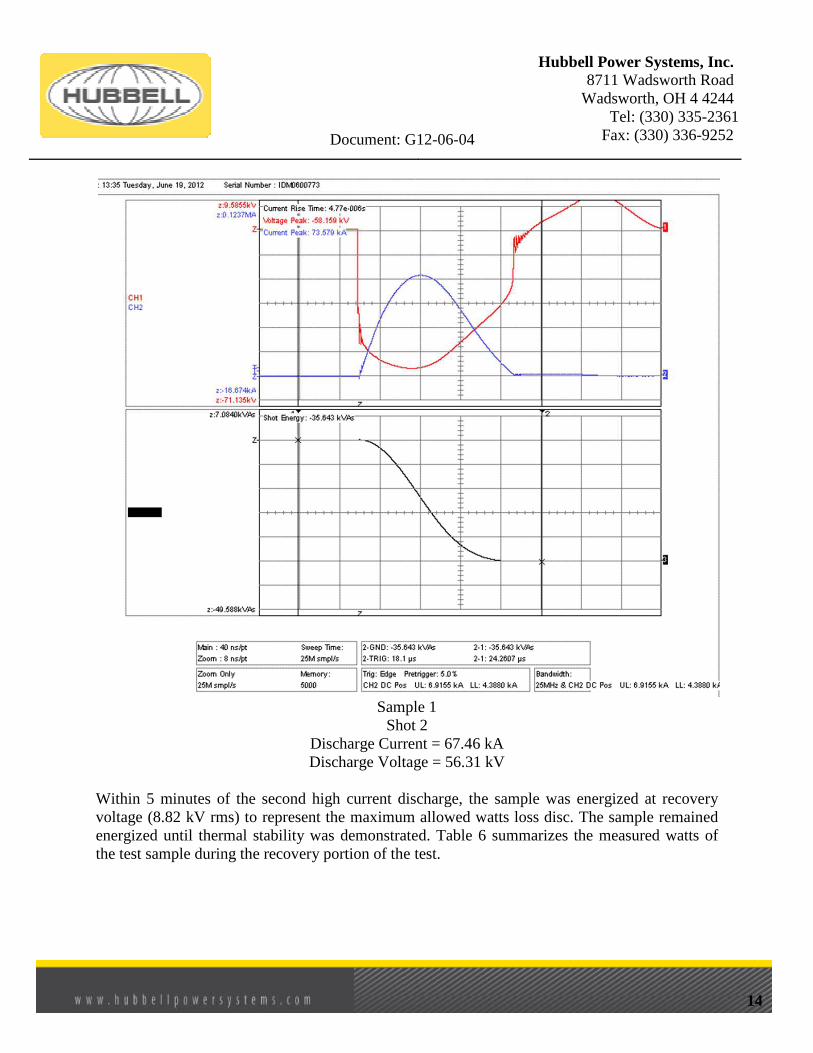
Sample 1
Shot 2 Discharge Current = 67.46 kA Discharge Voltage = 56.31 kV
Within 5 minutes of the second high current discharge, the sample was energized at recovery voltage (8.82 kV rms) to represent the maximum allowed watts loss disc. The sample remained energized until thermal stability was demonstrated. Table 6 summarizes the measured watts of the test sample during the recovery portion of the test.
The following traces show the actual current, voltage values and wave shapes during the
Sample #2Ch1: 1kV/V
Sample #3Ch1: 1kV/V
The sample 5 kA 8/20 µs discharge voltage was measured before and after the high current test. The measured values are summarized
Hubbell Power Systems, Inc.8711 Wadsworth
Wadsworth, OH 4 4244
Fax: (330) 336
Document: G12-06-04
Sample #2 Recovery @ Time 1 Min. Ch1: 1kV/V Ch2: 2.508 mA/V
Sample #3 Recovery @ Time 30 Min. Ch1: 1kV/V Ch2: 2.508 mA/V
The sample 5 kA 8/20 µs discharge voltage was measured before and after the high current test. The measured values are summarized in table 7.
Hubbell Power Systems, Inc. 8711 Wadsworth Road
Wadsworth, OH 4 4244 Tel: (330) 335-2361
Fax: (330) 336-9252
16
The sample 5 kA 8/20 µs discharge voltage was measured before and after the high current test.
Hubbell Power Systems, Inc.
8711 Wadsworth Road Wadsworth, OH 4 4244
Tel: (330) 335-2361 Fax: (330) 336-9252
Document: G12-06-04
17
Sample No. Shot Time Date IR (KVc) I (kA)
Chg KV Result
Before 1 1 11:27:52 6/20/2012 29.643 5.003 37.7 Pass After 1 1 11:31:50 4/14/2012 30.986 5.037 37.2 Pass
Table 7 Test Summary The test sample successfully completed the high current test and demonstrated thermal stability during the recovery test. The 5 kA 8/20 µs discharge voltage changed by an acceptable +4.5%, within the allowable 10% acceptance limit. Disassembly revealed no evidence of physical damage to the test sample. Therefore, the test sample has successfully fulfilled the high current, short duration requirements of the Dead-Front Type Arrester.
Hubbell Power Systems, Inc.
8711 Wadsworth Road Wadsworth, OH 4 4244
Tel: (330) 335-2361 Fax: (330) 336-9252
Document: G12-06-04
18
SECTION V LOW CURRENT, LONG DURATION TEST: ELBOW & PARKINGSTAND
ARRESTER
Sample Preparation This test was performed per Section 8.12 of IEEE Standard C62.l1-2005. The test was performed on a thermally insulated 8.4kV MCOV Arrester. Test Procedure Before and after the low current, long duration test, the 5 kA 8/20 µs discharge voltage of the test sample was measured. The test sample was subjected to three groups of six consecutive operations followed by one group of two operations with a time interval between consecutive operations of 50-60 seconds. Sufficient time was allowed between groups of discharges for the sample to cool to ambient temperature (21°C). Prior to the l9th operation, the sample was heated to 85 °C. Within 5 minutes after the 20th low current discharge, the sample was energized at recovery voltage. The samples watts loss was monitored until thermal stability was demonstrated. Test Results The arrester was subjected to twenty long duration surges of 2000 microseconds. Current magnitude ranged from 75.4 to 83.8 amps during the 20 shot test. Table 8 summarizes the results of the 20 discharges.
Shot No. Spec No. Time Date KVc Amps KJ/Shot Result Trace 1 3 15:22:30 07 May 12 21.572 83.8 4.39 Pass 2 3 15:23:16 07 May 12 21.613 80.0 4.22 Pass 1 3 3 15:24:01 07 May 12 21.655 77.5 4.11 Pass 4 3 15:24:47 07 May 12 21.738 77.9 4.12 Pass 5 3 15:25:32 07 May 12 21.842 80.4 4.26 Pass 6 3 15:26:18 07 May 12 21.822 78.6 4.16 Pass
7 3 16:40:12 07 May 12 21.655 81.5 4.28 Pass 8 3 16:40:57 07 May 12 21.717 79.4 4.19 Pass 9 3 16:41:43 07 May 12 21.759 76.5 4.07 Pass
10 3 16:42:28 07 May 12 21.801 78.2 4.15 Pass 11 3 16:43:13 07 May 12 21.863 78.2 4.14 Pass 12 3 16:43:59 07 May 12 21.884 75.9 4.05 Pass
Hubbell Power Systems, Inc.
8711 Wadsworth Road Wadsworth, OH 4 4244
Tel: (330) 335-2361 Fax: (330) 336-9252
Document: G12-06-04
19
13 3 09:15:47 08 May 12 21.655 81.4 4.28 Pass 14 3 09:16:32 08 May 12 21.738 79.3 4.19 Pass 15 3 09:17:18 08 May 12 21.759 78.4 4.16 Pass 16 3 09:18:03 08 May 12 21.801 78.6 4.18 Pass 17 3 09:18:48 08 May 12 21.842 78.4 4.17 Pass 18 3 09:19:34 08 May 12 21.863 78.2 4.18 Pass
Within 5 minutes of the twentieth long duration discharge, the sample was energized at the recovery voltage (8.66 kV rms) to represent the maximum allowed watts loss disc. The sample remained energized until thermal stability was demonstrated. Table 9 summarizes the measured watts loss of the test sample during the recovery portion of the test.
Table 9 The following traces show the actual current, voltage values and wave shapes during the recovery period:
Trace 3
Recovery @ Time 0 – 1kV/V 2.508mA/V
Hubbell Power Systems, Inc.
8711 Wadsworth Road Wadsworth, OH 4 4244
Tel: (330) 335-2361 Fax: (330) 336-9252
Document: G12-06-04
22
Trace 4
Recovery @ 1 Min. – 1kV/V 2.508mA/V
Trace 5
Recovery @ 30 Min. – 1kV/V 2.508mA/V
Hubbell Power Systems, Inc.
8711 Wadsworth Road Wadsworth, OH 4 4244
Tel: (330) 335-2361 Fax: (330) 336-9252
Document: G12-06-04
23
The sample’s 5 kA 8/20 µs discharge voltage was measured before and after the high current test. The measured values are summarized in table 10.
Sample No. Shot Time Date IR (KVc) I (kA)
Chg KV Result
Before 1 1 10:58:17 4/25/2012 29.374 5.182 37.25 Pass After 1 1 15:15:07 5/11/2012 29.180 5.116 37.25 Pass
Table 10 Test Summary The test sample successfully completed the low current, long duration test and demonstrated thermal stability during the recovery test. The 5 kA 8/20 µs discharge voltage changed an acceptable -0.7%, within the allowable 10% acceptance limit. Disassembly revealed no evidence of physical damage to the test sample. Therefore, the test sample successfully fulfilled the low current, long duration requirements of the Dead-Front Type Arrester.
Hubbell Power Systems, Inc.
8711 Wadsworth Road Wadsworth, OH 4 4244
Tel: (330) 335-2361 Fax: (330) 336-9252
Document: G12-06-04
24
SECTION VI
DUTY CYCLE TEST: ELBOW & PARKINGSTAND ARRESTER
Sample Preparation This test was performed per Section 8.14 of IEEE Standard C62.11-2005. The test was performed on a thermally insulated full size 8.4kV MCOV arrester. Test Procedure Before and after the duty cycle test, the 5 kA 8/20 µs discharge voltage of the test sample was measured. The test sample was then energized at duty cycle rated voltage and subjected to (20) 5 kA 8/20 µs discharges spaced one minute apart. Per the standard, these 5 kA discharges were electrically timed to occur at approximately 60° before 60-Hz voltage crest. The test sample was preheated to 85 °C and was subjected to two additional 5 kA 8/20 µs duty cycle operations while energized at MCOV. After the twenty-second duty cycle operation, the sample was energized at recovery voltage. The sample’s watts loss was monitored until thermal stability was demonstrated.
Hubbell Power Systems, Inc.
8711 Wadsworth Road Wadsworth, OH 4 4244
Tel: (330) 335-2361 Fax: (330) 336-9252
Document: G12-06-04
25
Test Results The arrester was energized at duty cycle rated voltage (14.2 kV rms ) and subjected to (20) 5 kA surges spaced one minute apart. Table 11 summarizes the results of the 20 surges.
Table 11 After successful completion of the (20) shot test, the sample was preheated to 85 °C and subjected to an additional two 5 kA surges spaced one minute apart with the sample energized at MCOV (8.5 kV rms). Table 12 summarizes the results of the 2 additional surges.
The sample was energized after the 22nd 5 kA surge at recovery voltage until thermal stability was demonstrated. The recovery voltage represents the maximum allowed watts loss disc. Table 13 summarizes the results of the recovery voltage test.
The following traces show the actual current, voltage values and wave shapes during the recovery period:
Sample #Ch1: 1kV/V
Hubbell Power Systems, Inc.8711 Wadsworth
Wadsworth, OH 4 4244
Fax: (330) 336
Document: G12-06-04
The sample was energized after the 22nd 5 kA surge at recovery voltage until thermal stability was demonstrated. The recovery voltage represents the maximum allowed watts loss disc. Table
summarizes the results of the recovery voltage test.
The sample was energized after the 22nd 5 kA surge at recovery voltage until thermal stability was demonstrated. The recovery voltage represents the maximum allowed watts loss disc. Table
The following traces show the actual current, voltage values and wave shapes during the
Sample #Ch1: 1kV/V
Sample #Ch1: 1kV/V
The sample 5 kA 8/20 µs discharge voltage was measured before and after the duty cThe measured values are summarized in Table 1
Hubbell Power Systems, Inc.8711 Wadsworth
Wadsworth, OH 4 4244
Fax: (330) 336
Document: G12-06-04
Sample #1 Recovery @ Time 1 Min. Ch1: 1kV/V Ch2: 2.508 mA/V
Sample #1 Recovery @ Time 30 Min. Ch1: 1kV/V Ch2: 2.508 mA/V
discharge voltage was measured before and after the duty cThe measured values are summarized in Table 14.
Hubbell Power Systems, Inc. 8711 Wadsworth Road
Wadsworth, OH 4 4244 Tel: (330) 335-2361
Fax: (330) 336-9252
27
discharge voltage was measured before and after the duty cycle test.
Hubbell Power Systems, Inc.
8711 Wadsworth Road Wadsworth, OH 4 4244
Tel: (330) 335-2361 Fax: (330) 336-9252
Document: G12-06-04
28
Sample No. Shot Time Date IR (KVc) I (kA)
Chg KV Result
Before 1 1 11:27:52 4/09/2012 29.553 4.962 37.2 Pass After 1 1 10:05:38 4/14/2012 30.986 5.037 37.2 Pass
Table 5 Conclusion The test sample successfully completed the duty cycle test and demonstrated thermal stability while being energized at recovery voltage. The 5 kA 8/20 µs discharge voltage changed an acceptable +4.8%, within the allowable 10% acceptance limit. Disassembly revealed no evidence of physical damage to the test sample. Therefore, the test sample has successfully fulfilled the duty cycle requirements of the Dead-Front Type Arrester.
Introduction This test was performed per Section 8.15 of IEEE Standard C62.11-2005. The tests were performed on (5) prorated test samples, selected to represent the most severe design conditions, i.e., the minimum allowed discharge voltage level. Test Procedure Per Section 8.15.1, each prorated sample is tested in (5) different time ranges ranging from (.01-.1 seconds) to (1,001-10,000 seconds). Per Section 8.15.3.1, the test is performed to demonstrate the temporary overvoltage (TOV) capability of the design under "no prior duty" conditions. For each TOV voltage setting, the test circuit applies the voltage to the sample (preheated to 85°C) for time duration sufficient to exceed that claimed on the "no prior duty" curve. Within 100 milliseconds after the TOV, a recovery voltage is applied for (30) minutes to demonstrate thermal stability. The recovery voltage level takes into account the maximum allowed watts loss for the sample. Prior to and after the TOV application, the 5 kA discharge voltage of each sample is measured. Test Results Tests were successfully completed on (5) prorated samples in (5) specified time ranges. Each sample demonstrated thermal stability after TOV exposure. Table 15 summarizes the TOV values for the Normal Duty Elbow/Parkingstand arrester for "no prior" conditions.
Table 16 Conclusion The 5 kA 8/20 µs discharge voltage of each sample changed less than 1.43% as a result of the TOV duty. Disassembly revealed no evidence of physical damage caused by the TOV testing. The individual test points successfully confirmed the claimed TOV capability curve. The following curve plots the individual "no prior duty" TOV data points on the TOV capability curve.
Hubbell Power Systems, Inc.
8711 Wadsworth Road Wadsworth, OH 4 4244
Tel: (330) 335-2361 Fax: (330) 336-9252
Document: G12-06-04
31
Hubbell Power Systems, Inc.
8711 Wadsworth Road Wadsworth, OH 4 4244
Tel: (330) 335-2361 Fax: (330) 336-9252
Document: G11-12-01
32
SECTION VIII
ACCELERATED SEALING LIFE TEST: ELBOW & PARKINGSTAND ARRESTER
Introduction This test was performed per Section 7.12 of IEEE/ANSI Standard 386-2006, "IEEE Standard for Separable Insulated Connector Systems for Power Distribution Systems Above 600V". Test Setup Per section 7.12 the four arresters were placed in an oven having l2l°C temperature for three weeks. The four samples were then removed and operated once using the operating eye. The four arresters were then subjected to 50 cycles of being placed for l hour in a l21°C temperature oven then removed and submerged in 25°C ± l0°C conductive water for l hour. At the completion of the 50th cycle the samples were measured for watts loss and subjected to the design impulse test (section 7.5.3 of IEEE/ANSI Standard 386-2006). Test Results No change in watts loss was observed and no puncture or flashover occurred when the samples were subjected to impulse. Table 17 summarizes the watts loss @ 8.4 kV before and after the Accelerated Sealing Life Test
Table 17 Conclusion The four samples successfully completed the accelerated sealing life test. They did not demonstrate an appreciable change in watts loss and did not flashover or puncture when subjected to impulse testing.
Introduction This test was performed per Section 8.20 of IEEE Standard C62.1 1-2005. Test Setup Per section 8.20, the arresters were prefauled. An open-circuit test voltage was then applied within 5 minutes of the prefault mode. Three arresters were tested with a fault current of 500 A for a minimum duration of 0.3 s (20 c), three additional arresters were tested at a fault current of 10,000 A for a minimum duration of 0.17 s (10 c). Test Results Each of the samples subjected to fault current expelled the valve elements intact with release of the bottom grounded cap. Conclusion None of the samples tested fractured or ejected valve elements through the body of the arrester, therefore demonstrating conformance to the test standard. Oscillographic recordings showed conformance with the current magnitude and duration specified.
Introduction This test was performed per Section 7.4 of ANSI/IEEE Standard 386-2006 "IEEE Standard for Separable Insulated Connector Systems for Power Distribution Systems Above 600 V". Test Setup The equipment and test methods conformed to ANSI/IEEE Standard 386-2006 "IEEE Standard for Separable Insulated Connector Systems for Power Distribution Systems Above 600 V" requirements. Prior to the test, the CDO 77A Corona Detector was calibrated by the Calibrator Type CDO-Cl. Test Results A background noise level of 0.5 pC was measured prior to energization of the arrester housing. The arrester housing noise level met the requirements of IEEE 386 -2006. Conclusion The Arresters successfully passed the internal ionization and PD tests by not exceeding the allowed 3 pC test limit. Internal ionization tests are routinely performed on all arresters.
Introduction This test was performed per Section 7.14 of IEEE/ANSI Standard 386-2006 “IEEE Standard for Separable Insulated Connector Systems for Power Distribution Systems Above 600 V". The tests were performed on (4) assembled arresters. Test Procedure Per Section 7.14 each of the assembled elbow arresters were tested at -20°C, +25°C and + 65°C. Each test consisted of closing the connector and then reopening it within 10 min. The force was applied to the operating eye parallel to the axis of the probe at a rate of 5 in/min. Test Results Table 18 summarizes the results of the operating-force tests.
Table 18 Conclusion The arresters performed within the 50 lbf — 200 lbf force requirement of IEEE/ANSI 386-2006 Standard.
Hubbell Power Systems, Inc.
8711 Wadsworth Road Wadsworth, OH 4 4244
Tel: (330) 335-2361 Fax: (330) 336-9252
Document: G11-12-01
36
SECTION XII
OPERATING-EYE TEST: ELBOW ARRESTER
Introduction This test was performed per Section 7.15 of IEEE/ANSI Standard 386-2006 “IEEE Standard for Separable Insulated Connector Systems for Power Distribution Systems Above 600 V". Setup Two separate tests were run on the operating-eye. For both tests, the elbow arresters were tested at ambient temperature. Four elbow arresters were used in each of the two tests. For the first test, four elbow arresters were pulled in tension until they broke. The purpose of this test was to obtain maximum load values for the operating-eye. For the second test, four elbow arresters were tested for partial discharge. Then the operating-eye was loaded with both a tensile force and a rotational force using a live-line tool. The purpose of this test was to demonstrate that the operating-eye could support a 14 N-m (120 lbf-in) rotational force, along with a static operating force of 2,224 N (500 lbf). Procedure Test 1: Average Maximum Load
a. Using the large cantilever, the 1,500 lb. tensile load cell, and the Omega meter, a tensile force was gradually applied to the operating-eye of each elbow arrester in the direction of normal operation.
b. The tensile force was gradually applied until the operating-eye failed by pulling away from the elbow arrester.
c. The maximum load was then recorded from the Omega meter for each elbow arrester and an average load was calculated.
Summary Each of the operating-eyes was able to hold more than the required 2,224 N-m (500 lbf). Table 19 summarizes the results of the operating eye maximum force tests.
Sample Number
Maximum Force (lbf)
1 822.4 2 896.2 3 896.2 4 892.5
Table 19
Hubbell Power Systems, Inc.
8711 Wadsworth Road Wadsworth, OH 4 4244
Tel: (330) 335-2361 Fax: (330) 336-9252
Document: G11-12-01
37
Test 2: Static Force and Rotational Force Test Partial discharge levels were obtained for four elbow arrester housings. A tensile load of 500 lbf was applied to each of the elbow arresters normal to the operating eye for 60 seconds. Using the Chance live line tool a rotational force of 120 lbf-in (14 N-m) was applied in both clockwise and counterclockwise directions. Partial discharge levels were then obtained for all four elbow arresters and compared to the initial values.
Summary Some distortion of the operating-eye was evident, however, this was acceptable because the elbow was still serviceable and passed partial discharge requirements of the standard.
Hubbell Power Systems, Inc.
8711 Wadsworth Road Wadsworth, OH 4 4244
Tel: (330) 335-2361 Fax: (330) 336-9252
Document: G11-12-01
38
SECTION XIII
SHIELDING TEST: ELBOW & PARKINGSTAND ARRESTER
Introduction This test was performed per Section 7.18 of ANSI/IEEE Standard 386-2006, "IEEE Standard for Separable Insulated Connector Systems for Power Distribution Systems Above 600 V”. Section 7.18 states that the test procedure shall be in accordance with IEEE Std. 592-1990, “IEEE Standard for Exposed Semiconducting Shields on High Voltage Cable Joints and Separable insulated Connectors”. Test Setup The equipment and test methods conformed to IEEE Std. 592-1990, "IEEE Standard for Exposed Semiconducting Shields on High-Voltage Cable Joints and Separable insulated Connectors". Shield Resistance Test: Arrester shield resistance measurements were performed on unaged samples and air oven aged samples (121°C ±5°C for 504 hours). The measurements were taken with the test specimen temperature at 20°C ±5°C and at 90°C ±5°C. Fault-Current Initiation Test: Test samples were prepared in accordance with section 4.3 of IEEE Std. 592-1990. Test Results Each sample, before and after aging, measured less than 5000Ω shield resistance. Samples also successfully initiated two consecutive fault-current arcs to ground as specified in 4.3. Table 20 summarizes the results of the shielding tests.
Table 20 Conclusion The housings meet the requirements of IEEE Std. 592-1990 by demonstrating shield resistance less than 5000Ω and capability of initiating two consecutive fault-current arcs to ground as specified in 4.3.