Abstract Two-tier heterogeneous networks (HetNets) composed of a conventional macro-cellular network and small cell networks (SCNs) have been proposed in the literature withthe aim to extend indoor coverage and realize efficient radio resource usage. As SCN sharesthe same frequency band with the underlying macrocell, the cross tier interference needs tobe mitigated since the inter-SCN and cross tier interference at the SCN boundary may resultin undesirable network performance degradation. In this paper, we propose an intelligentphysical resource block (PRB) allocation as a solution to mitigate the downlink intra-SCNinterference as well as the inter-tier interference in OFDM-based systems. The allocation ofthe PRBs to the network users is formulated as a graph coloring problem, and solved usingan ant colony optimization (ACO)-based approach. Simulation results are provided, showingthat our ACO-based algorithm outperforms the Received Power-based Allocation (RPA) andReceived SINR-based Allocation (RSA) algorithms in terms of average SINR experiencedby network users, outage probability, and number of required PRBs.
Keywords HetNet · Heterogeneous network · Interference mitigation · Small cellnetworks · Ant colony optimization
1 Introduction
The link performance of current cellular systems such as long term evolution (LTE) is alreadyquite close to the Shannon limit [1]. From the link-budget perspective, in order to achievehigher data rate one needs to boost signal-to-noise plus interference (SINR) experienced bynetwork users. Hence, it is imperative to innovate the technologies that can improve the SINRperformance. The desired SINR performance and coverage enhancement can be achieved by
R. Siddavaatam · A. Anpalagan (B) · I. WoungangRyerson University, Toronto, ON, Canadae-mail: [email protected]
S. MisraIndian Institute of Technology, Kharagpur, India
123
R. Siddavaatam et al.
deploying a two-tiered heterogeneous network (HetNet) composed of small cell base stationsdistributed across the macrocellular network. The small cell base stations can be micro eNBs,pico eNBs, home eNBs (femtocells), relays, and distributed antenna systems. These shortrange nodes can be used to enhance the network performance at low cost and low power.
The interference mitigation and management problem has been identified as a predominantchallenge in the performance of HetNets. Since the small cell network (SCN) tier of HetNetoperates on the same spectrum as that of the macrocell tier, an intelligent choice of spectrumsharing among SCN and macrocell users could be an efficient solution. In the consideredwireless communication system that is based on OFDM, transmission is scheduled by usinga physical resource block (PRB), which is a set of 12 consecutive sub-carriers. An intelligentallocation of available PRBs could be a potential solution for the inter-cell interferencemitigation problem.
As discussed in Sect. 2 in detail, various techniques have been proposed in the literature inorder to improve the performance of small cell networks through radio resource management.Specifically, we are focusing on the small cell base stations with plug-and-play operation likefemtocells. Due to their dynamically varying interference environment, they need faster andadaptive resource allocation algorithms. However, the conventional slow responsive/staticallocation methods can not deliver such performance. The proposed algorithm is much fasteras it does not need extensive communication among network components compared to themethods such as in [9,11]. Moreover, it is cost efficient as its deployment does not need anyextra hardware like the method proposed in [10].
In this paper, we present the PRB allocation problem as an interference graph coloringproblem, which is solved using an ant colony optimization based PRB allocation algorithm(ACA). The proposed algorithm is compared against the received power based allocation(RPA) and received SINR based allocation (RSA) algorithms, using predefined performancemetrics. With the presented empirical evidence, we can state that the proposed radio resourceallocation algorithm outperforms other considered allocation techniques.
The rest of the paper is organized as follows. Section 2 describes some related work inthe area of small cell networks. In Sect. 3, the network model is presented. In Sect. 4, themathematical model of the considered sub-channel allocation problem is described. In Sects.5 and 6, the algorithms that are used as benchmarks for comparison purpose with our proposedACA, are presented. In Sect. 7, ACA is compared against the aforementioned benchmarkalgorithms. Finally, Sect. 8 concludes our work.
2 Interference Management in a HetNet Containing Small Cell Networks
Due to the ever increasing need for data applications, achieving an extended indoor coveragewith higher data rate is critical for a promising wireless communication network [2]. Indeed,in the enhanced LTE-advanced (LTE-A) standard, a significant performance leap is expectedfrom SCN in terms of spectral efficiency and extended indoor coverage. Therefore, SCNshave recently attracted a lot of interest in the research community.
Various techniques have been proposed in the area of SCN focusing on the improvementof several performance parameters. Few representative ones [2–5] are described as follows. In[2], a class of SLEEP mode algorithms to boost energy efficiency of SCNs is proposed, whichallow the hardware components in the small cell base stations to be astutely switched off inidle conditions, such that the energy consumption is modulated over the variations in trafficload. Authors of [3] proposed a distributed algorithm, which focuses on the optimization oftransmit power and user association to adaptively update the system parameters and achieve
123
Ant Colony Optimization Based Sub-channel Allocation Algorithm
a global optimality by measuring the SINR and the interference. It is shown that the proposedalgorithm provides better delay performance as well as an improved service fairness amongnetwork users. In [4], the uplink interference problem is investigated, and the exact cumulativedistribution function expressions for the SINR distributions for co-channel and orthogonalchannel assignment schemes in LTE HetNet is derived. It is shown that the orthogonal channelassignment between femtocells and macrocell provides a higher throughput per femtocellthan the co-channel allocation. It is suggested that the resource allocation ratio between tiersand the distances among base-stations be optimized.
The problem of cooperative power control in stand-alone SCNs is considered in [5]. Anovel algorithmic framework is introduced, which is based on repeated games and interac-tions among different base stations for the downlinks. It is shown that this method can yield abetter performance with increased stability. With respect to the interference mitigation prob-lem, several contributions have been made in the literature, among which representative ones[6–12], are as follows. In [6], a spectrum sharing technique called multi-user Vandermonde-subspace frequency division multiplexing is proposed, which allows the coexistence of adownlink OFDMA macrocell and a cognitive small cell network in TDD mode. This tech-nique uses a channel estimation protocol which eliminates overhead communication betweenthe two systems while maintaining the required rates for small-cells. Authors of [7] proposedsome distributed coordination mechanisms for controlling the co-channel interference gen-erated by standalone femtocells in two-tier HetNets. These techniques reuse the availableresources without compromising the ongoing transmissions on overlaid macrocells whilestill guaranteeing quality of service in both tiers. It is shown by simulation that the proposedtechniques substantially improve network performance.
In [8], a SINR based selection resource partitioning scheme for HetNets composed ofsmall and macro cells is proposed. The designed partitioning technique is shown to increasethe throughput for large number of users, thereby improving the edge, median and meanthroughputs. A resource management architecture for HetNets [so-called complementarytri-control loops (CTRL)] is proposed in [9] in order to reduce the cross-tier interferencein a HetNet. The proposed framework consists of three control loops, capable of enablingthe spatial reuse of channel resources within femtocells without degrading macrocell user’sperformance regardless of the number of femtocells operating in a network. Authors of[10] proposed a cognitive communication technique for the interference mitigation in aHetNet consisting of macrocell and SCNs, which exploits the interference alignment (IA)across multiple antennas to mitigate the interference of small cell user terminals towardsthe macrocell base station equipped with MIMO transceivers. It is shown that the highestsystem rate is achieved without interference mitigation, but the primary protection degradeswith the number of small cells. On the other hand, the coordinated IA perfectly protectsthe primary transmission while achieving the system rate of the resource division. In [11],a space time coded cooperative diversity protocol that achieves improved quality of servicefor mobile users in the downlink of small cells is developed. The proposed protocol isimplemented between adjacent base-stations in two phases. In the first phase, each basestation communicates with its user on the dedicated frequency band, while listening to thesymbols intended to the users of interfering base stations. In the second phase, cognitivecooperation is implemented. This protocol yields considerable performance improvement interms of bit error rate and outage probability.
In our work, a two-tier network that consists of femto-cells is expected to experience amore dynamically varying environment due to the plug-and-play operations of femtocell basestations. This leads to a more complex sub-channel allocation problem. Unlike deterministictechniques, which have extensively been used for solving the interference mitigation problem
123
R. Siddavaatam et al.
10 20 30 40 50 60 70 8010
20
30
40
50
60
70
80
FAP locuser locmacro BS loc
Fig. 1 Network model with four macro and nine femto base stations
(thereby the sub-channel allocation problems) in HetNets made of small femtocells andunderlying macrocellular network, our focus here is on using heuristics-based techniques[12] as alternative approach. In this paper, we propose an ant colony optimization basedevolutionary algorithm for the sub-channel allocation in two-tiered network.
3 Network Model
In the OFDMA technology, a number of users communicate using multiple narrow band sub-carriers spread over a wider channel bandwidth. These subcarriers are orthogonal to eachother, which eliminates inter-symbol interference (ISI). Each of these sub-carriers experiencesflat fading as they usually have a bandwidth smaller than the mobile channel coherencebandwidth.
The number of available sub-carriers (N totalSC ) ranges from 128 to 2048 with a total channel
bandwidth of 1.25 to 20 MHz. Also, approximately 10 % of the subcarriers are used as guardband. The transmission is scheduled by the physical resource block (PRB), which is a set ofN PRB
SC = 12 consecutive subcarriers. Since the sub-carrier spacing is 15 kHz, each PRB is180 kHz. In this work, we consider a channel bandwidth of 1.25 MHz where as per the LTE-Aspecifications, the total subcarriers N total
SC are 120. Therefore, the available subcarriers formodulation are calculated to be 10.
A network model as shown in Fig. 1 is a two-tier small heterogeneous network. It iscomposed of 9 femtocells, which are the type of a SCN randomly deployed in 3×3 apartmentcluster where each apartment is of 10 m × 10 m size and the underlying macrocell networktier consists of 4 macrocells deployed at fixed locations. The apartment block has been chosento be located at center location of four macro base stations. The objective of this choice is tosimulate the scenario with poor indoor coverage. Femtocells are deployed in an open accessmode where service access can be granted to any network user. We assume that there are59 network users; among which 27 users are indoor users and the rest of users are locatedoutdoor. A femtocell and its three users are uniformly distributed within each apartmentwhile outdoor users are uniformly distributed around the apartment cluster. We deal with theinterference mitigation problem in the downlink of two-tier wireless network. To summarizethe PRB allocation problem, the 10 available PRBs needs to be allocated to 59 total networkusers intelligently in order to improve the network performance.
123
Ant Colony Optimization Based Sub-channel Allocation Algorithm
The aforementioned network model is used for the performance analysis. Four differentchannel models used for system simulation are derived from the channel model introducedin [13]. Ptx is the transmit power and Pr x is the received power by a user. The path loss PLis calculated using Eqs. (3)–(6) depending on the location of the user and the type of basestation.
P̂ = Ptxm − P L (dB) (for macro base station) (1)
P̂ = Ptx f − P L (dB) (for femto base station) (2)
The path loss between indoor users and femtocell BS is calculated as
P Lindoorf = 37 + αin × 10 × log10 (d) + 18.3d
d2f +3d f +1.54
f (dB) (3)
The path loss between indoor users and macrocell BS is calculated as
Here, d is the distance between a user and the base station, plbp is the building penetrationloss and d f is the indoor penetration factor between nodes, determined by the number ofblocking and scattering objects. The indoor and outdoor path loss exponents are respectivelydenoted as αin and αout . We assume BPSK modulation is used for the transmission.
The benefits of cell association based on minimum path loss over the one based on max-imum received power when applied to heterogeneous LTE-A cellular networks were high-lighted in [14]. In our work, we follow the association based on minimum path loss, whereina user associates itself with the nearest femtocell, regardless of the higher received powerfrom macrocell.
4 Mathematical Model and Graphical Representation of the PRB AssignmentProblem
As per the meta heuristics described in [15], the sub-channel allocation problem that wedeal with in our work can be formulated as the following assignment type problem. Given anumber of users (N total
u ) and a number of PRBs (N avaPRBs), the sub-channel allocation problem
consists in determining an assignment of sub-channels to the network users, i.e.,
max f (x) = Ex̂ (γi ) (7)
such that (8)∑
jε Ji
xi j = C 1 ≤ i ≤ N totalu (9)
xi j = 0 or 1, 1 ≤ i ≤ N totalu , jε Ji (10)
x̂ =(
x11, x12, . . . x21, . . . , xN totalu N ava
PRBs
)(11)
X = (x̂1, . . . , x̂s
)(12)
123
R. Siddavaatam et al.
30 35 40 45 50 55 6030
35
40
45
50
55
60
a20 30 40 50 60 70
20
25
30
35
40
45
50
55
60
65
70
b20 25 30 35 40 45 50 55 60 65 70
20
25
30
35
40
45
50
55
60
65
70
c
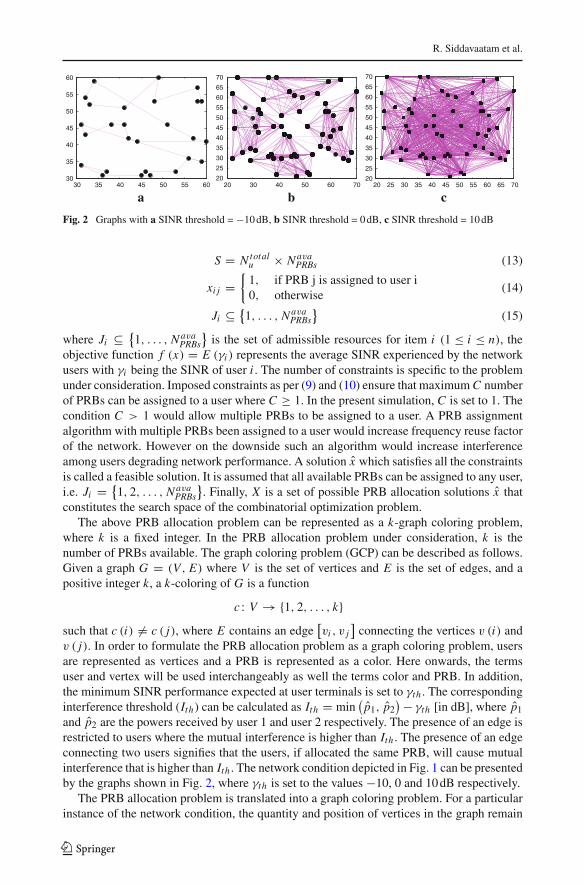
Fig. 2 Graphs with a SINR threshold = −10 dB, b SINR threshold = 0 dB, c SINR threshold = 10 dB
S = N totalu × N ava
PRBs (13)
xi j ={
1, if PRB j is assigned to user i0, otherwise
(14)
Ji ⊆ {1, . . . , N ava
PRBs
}(15)
where Ji ⊆ {1, . . . , N ava
PRBs
}is the set of admissible resources for item i (1 ≤ i ≤ n), the
objective function f (x) = E (γi ) represents the average SINR experienced by the networkusers with γi being the SINR of user i . The number of constraints is specific to the problemunder consideration. Imposed constraints as per (9) and (10) ensure that maximum C numberof PRBs can be assigned to a user where C ≥ 1. In the present simulation, C is set to 1. Thecondition C > 1 would allow multiple PRBs to be assigned to a user. A PRB assignmentalgorithm with multiple PRBs been assigned to a user would increase frequency reuse factorof the network. However on the downside such an algorithm would increase interferenceamong users degrading network performance. A solution x̂ which satisfies all the constraintsis called a feasible solution. It is assumed that all available PRBs can be assigned to any user,i.e. Ji = {
1, 2, . . . , N avaPRBs
}. Finally, X is a set of possible PRB allocation solutions x̂ that
constitutes the search space of the combinatorial optimization problem.The above PRB allocation problem can be represented as a k-graph coloring problem,
where k is a fixed integer. In the PRB allocation problem under consideration, k is thenumber of PRBs available. The graph coloring problem (GCP) can be described as follows.Given a graph G = (V, E) where V is the set of vertices and E is the set of edges, and apositive integer k, a k-coloring of G is a function
c : V → {1, 2, . . . , k}such that c (i) �= c ( j), where E contains an edge
[vi , v j
]connecting the vertices v (i) and
v ( j). In order to formulate the PRB allocation problem as a graph coloring problem, usersare represented as vertices and a PRB is represented as a color. Here onwards, the termsuser and vertex will be used interchangeably as well the terms color and PRB. In addition,the minimum SINR performance expected at user terminals is set to γth . The correspondinginterference threshold (Ith) can be calculated as Ith = min
(p̂1, p̂2
) − γth [in dB], where p̂1
and p̂2 are the powers received by user 1 and user 2 respectively. The presence of an edge isrestricted to users where the mutual interference is higher than Ith . The presence of an edgeconnecting two users signifies that the users, if allocated the same PRB, will cause mutualinterference that is higher than Ith . The network condition depicted in Fig. 1 can be presentedby the graphs shown in Fig. 2, where γth is set to the values −10, 0 and 10 dB respectively.
The PRB allocation problem is translated into a graph coloring problem. For a particularinstance of the network condition, the quantity and position of vertices in the graph remain
123
Ant Colony Optimization Based Sub-channel Allocation Algorithm
constant, but the number of edges varies with the value of the SINR threshold γth . In fact,the number of edges increases with an increase in γth as inferred from the Fig. 2. The highernumber of edges means more constraints on the PRB allocation. Hence, the complexity ofthe PRB allocation problem increases with an increase in the value of the SINR threshold.
5 Proposed ACO-Based PRB Allocation Algorithm
5.1 Basics of the ACO Algorithm
The main idea behind using the ant colony optimization (ACO)-based algorithm [16] is toparallelize the search over several constructive computational threads. A dynamic memorystructure is used, which incorporates the information about the success of previous actions ofthe computational agents, and guides the construction process of ants in subsequent cycles(or iterations). The main element of this algorithm is an artificial ant. Artificial ants areunsophisticated computational agents which probabilistically and iteratively construct thesolution to the current problem. The intermediary partial solutions are referred to as states.Each ant moves from one state to another, eventually constructing a complete solution. At eachstep, every ant computes a set of feasible extensions to the current state and probabilisticallychooses one of them to form a new state. For an ant, the probability of moving from state pto state p + 1 depends on two factors:
• A-priori desirability of move from state p to state p+1, computed by the problem specificheuristic.
• A trail factor of the move indicating how proficient had this particular move been in thepast to build an optimal solution.
The trails are updated at the end of each iteration, by incrementing the weight of thosemoves, which leads to an optimal or sub-optimal solution while decrementing the weight ofother solutions (Table 1).
5.2 ACO-Based PRB Allocation Algorithm
The adaptation of the ACO algorithm for the assignment type problem [15] to our PRBallocation problem is summarized as follows. We have NPRB number of PRBs availablewhich need to be efficiently assigned to N total
u . An ant colony consists of Nants numberof ants and the algorithm runs for Ncycles number of iterations. Each ant builds a feasiblesolution during each cycle. Two decisions have to be taken at each step: (1) to which userthe resource should be assigned, and (2) which resource should be assigned to the chosenuser. The solutions are built probabilistically on the basis of the knowledge gained fromthe past experience of building the solutions through the concept of trail factor. At eachstep of the solution composition, an ant chooses an unassigned item i with the probabilitypruser (p, i) and assigns the resource j to item i with the probability prPRB
user (i, j, p) as perthe metaheuristics described in [15],
pruser (p, i) = τ1 (s [p − 1] , i) × ζ1 (s [p − 1] , i)∑q /∈{o(1),...,o(p−1)} τ1 (s [p − 1] , q) × ζ1 (s [p − 1] , q)
(16)
prPRBuser (p, i, j) = τ2 (s [p − 1] , i, j) × ζ2 (s [p − 1] , i, j)∑
r∈Jiτ2 (s [p − 1] , i, r) × ζ2 (s [p − 1] , i, r)
(17)
123
R. Siddavaatam et al.
Table 1 Description of variables used
Variable Description
p Solution state counter
s[p] Partial solution at state p
i User counter
j PRB counter 1
r PRB counter 2
τ1 Trail factor of user’s selection priority for the PRB allocation
τ2 Trail factor of the PRB allocation between a pair of user and PRB
O = o(1) . . . o(p − 1) users with already assigned PRBs as part of the partial solution
ζ1 Desirability of the user’s selection priority for the PRB allocation
ζ2 Desirability of the PRB allocation between a pair of user and PRB
Ji A set of PRBs admissible to the i th user
pruser (p, i) In the given partial solution, this is the probability of choosingthe user i for allocation
prPRBuser (p, i, j) In the given partial solution, this is the probability of allocating
PRB j to user i for allocationBestSolutionAlgo Final solution of the ACA algorithm
A = V − O Set of users in the current partial solution to whom the PRBshave not been assigned
N j (s [p − 1] , i) Number of times the PRB j has already been assigned to usersadjacent to user i
C Maximum number of PRBs that can be assigned to a user
B A set users adjacent to a user
In (16) and (17)
• i is a user index, j is a PRB index, q is a user index, r is a PRB index.• pruser (p, i, j) means, given a partial solution s [p − 1], the probability of choosing user
i for PRB assignment at the stage p of allocation procedure.• prPRB
user (p, i, j) means, given a partial solution s [p − 1], the probability of assigning PRBj to the user i at the stage p of allocation procedure.
• ζ1 (s [p − 1] , i) is the desirability of choosing user i for the PRB allocation with a partialsolution s [p − 1].
• ζ2 (s [p − 1] , i, j) is the desirability of assigning PRB j to the user i at the step p of theallocation procedure.
• τ1 (s [p − 1] , o) is the trail factor of choosing user i for PRB assignment at the step p ofthe allocation procedure.
• τ2 (s [p − 1] , i, r) is the trail factor of assigning PRB j to the user i at the step p of theallocation procedure.
• o is a set of users who have already been assigned a PRB as a part of the partial solutions [p − 1].
• Ji is a set of permissible PRBs for the user i .
At each step p of the construction process, an ant calculates the probability pruser (p, i)as per (16) for all unassigned users. Given a partial solution s (p − 1) in which the userso (1) , . . . , o (p − 1) have already been assigned PRBs, an ant chooses the user with themaximum value of pruser (p, i) and considers this user for PRB assignment. Using that
123
Ant Colony Optimization Based Sub-channel Allocation Algorithm
chosen user i , an ant calculates prPRBuser (p, i, j) for all available PRBs using (17), then assigns
a PRB j with the maximum value of prPRBuser (p, i, j).
5.3 Definition of the Trail Factor
The SINR experienced by an average network user is used as a parameter to quantify theoptimality of the solution. The partial solution at step p is quantified as the number ofusers that have already been assigned PRBs in s [p − 1] and the number of times the PRBj has already been used in the partial solution. A dynamic memory structure referred toas trail factor matrix is introduced to incorporate the information regarding how effectivehad been a particular move (i.e. an assignment of PRB j to a user i), given a partial solu-tion s [p − 1]. A trail factor is a matrix with N total
u rows and N totalu columns, where the
columns represent the number of times the PRB has already been assigned in the given par-tial solution, and the rows represent the number of users that have already been assigned thePRBs.
Initially, all the trails (i.e. all the elements of the trail factor matrix) are set to null. Duringeach step p by each ant, in order to calculate prPRB
user (p, i, j), the parameters indicating thenumber of times PRB j has been used in the current partial solution and the number of usersthat have already been assigned PRB are determined. The corresponding entry in the trailfactor matrix is used in the calculation as per (17). At the end of each cycle, an ant with thebest solution updates the trail factor matrix. For all the moves constituting the best solution,the corresponding entries in the trail factor matrix are updated. The updated value of a matrixelement is an average of the previous values and SINR experienced by the implementationof the best solution from the current cycle.
5.4 Workings of ACA
The algorithm iterates for Ncycles number of cycles.
• During each cycle, Nants the number of ants generates Nants number of solutions.• Each ant will randomly choose the first vertex which will lead to diverse solutions.• For the assignment of the first user, a PRB is selected randomly which adds more diversity
to the solution space.• The ordering of vertices can be static or dynamic. An ordering of vertices is called static if
it can be decided before any assignment. The ordering of vertices is dynamic if the choiceof next vertex depends on the previous assignments. After the first PRB assignment iscompleted, vertices are dynamically selected for PRB allocation by a procedure (so-calledDSATUR [17]). In this procedure, A ⊂ V where A is a set of users to whom PRB has notbeen assigned yet. The user i ∈ A with the maximum degree of saturation degA (i) hasbeen selected. For an unassigned user i , the degree of saturation is the number of differentPRBs that have already been assigned to the users adjacent to the user i . The users aresaid to be adjacent to each other if there exists an edge between them. This determines thedesirability factor ζ1 (s [p − 1] , i) in (16). In the algorithm, we are not considering thetrail factor (τ1 (s [p − 1] , i)) while ordering users to be considered for coloring priority.In other words, the vertices will be considered for the PRB allocation in the descendingorder of their degree of saturation at the present step p and the experience of verticesordering from previous cycles will not be taken into consideration while ordering thevertices.
123
R. Siddavaatam et al.
Algorithm 1 ACO algorithm (ACA) for the PRB allocationSet system parameters to the suitable values as per Table 3 and Niter = 100.for iteration counter=0 to Niter do
Set ACO parameters Nants and Ncycles , set the trail factors to nullfor cyclecounter = 0 to Ncycles do
for antcounter = 0 to Nants doindex1 = U
(1, N total
u
)
userP RB (index1) = U (1, NP RB )
while userP RB (indexuser ) �= 0; ∀indexuser = 1, 2, . . . , N totalu do
)while index2user �= userP RB {the order of vertices to be considered
for coloring as per the DSATUR procedure 17.}for index3user to N total
u − 1 doCalculate PrP RB (index3user , indexP RB ) ; ∀indexP RB = 1, 2, . . . NP RBuserP RB (index3user ) = C number of PRBs with the highest (PrP RB (p, i, j)(index3user , indexP RB )) values;
end forend while
end forcalculate γave(index4) ; ∀ index4 = 1, 2, . . . , Nants {Perform the system simulation with the appli-cation of all PRB solutions generated by the ants and calculate the corresponding γave}bestSolutionOfCycle(cycle counter) = solution with “max (γave(index4); ∀index4 = 1, 2, . . . , Nants )”
Update the trail factor matrix τ2 (s [p − 1] , i, r) as per the procedure mentioned in 5.3 with bestSolu-tionOfCycle.
end forγ cycleave (cyclecounter ) = max (γave(index4); ∀index4 = 1, 2, . . . , Nants )
Calculate the performance index for BestSolutionAlgo.end forAverage performance index over the number of Monte-Carlo simulation cycles
Table 2 Ant colony allocationparameters
Abbreviation Parameter description Value
N totalu Number of total network users 59
Nants Number of ants 10
Ncycles Number of cycles 15
NPRB Number of physical resource blocks 10
U Uniform random variable(
1, N totalu
)
• Determine the desirability factor ζ2 (s [p − 1] , i) in the calculation of PrPRB (p, i, j)using (17).
ζ2 (s [p − 1] , i, j) = 1
N j (s [p − 1] , i)(18)
where the given partial solution is s [p − 1]. N j (s [p − 1] , i) is the number of times thePRB j has been already assigned to users adjacent to user i (Table 2).
123
Ant Colony Optimization Based Sub-channel Allocation Algorithm
6 Received Power and Received SINR Based Allocation Algorithms
In this section, we describe the received power based allocation (RPA) and received SINRbased allocation (RSA) algorithms based on the algorithmic framework of the greedy algo-rithm for the graph coloring problem [18]. The RPA and RSA algorithms follow exactly thesame procedure as in Algorithm 2, except the ordering of vertices to be considered for thePRB allocation.
In the RPA algorithm, the vertices are considered for the PRB allocation accordingto the descending order of the power received by their respective serving base stations.This means that the user with the maximum received power from its serving base stationwould be considered first for PRB allocation. The serving base station of a network useris the base station with minimum path loss between the user and base station as describedin Sect. 3.
The RSA algorithm also considers the interference experienced by an individual user. Theordering of users considered for the PRB allocation is performed in the descending orderof the SINR experienced by an individual user. The SINR experienced by a network user iscalculated based on the assumption that all the base stations in the network transmit on thesame PRB, using (19). This assumption means that the user experiences interference fromall of the base stations in the network.
γi = P̂i(∑N totalBS
j=1, j �=BSiserving
P̂ ji
)× [1 + (η ÷ 100)]
, (19)
where P̂i = Ptx × P L.
The weight of an edge calculation procedure is a part of the graphical representation ofthe network condition. The weight of an edge connecting two vertices
(vi , v j
)is calculated
as max(Ii , I j
), where Ii is the interference caused by the serving BS of user vi to user v j ,
whereas I j is the interference caused by the serving base station of user v j to user vi . Itis assumed that user vi , user v j and their serving BSs are the sole elements present in thenetwork. Under this assumption, the interference between two users is the lowest possibleone in the network. If the interference obtained under this assumption is higher than thedesired interference threshold, then the interference under the normal network operation willbe higher than the interference threshold by all odds. Niter is the number of iterations run bythe algorithm. In order to nullify the effect of random variables in the system simulation, theMonte-Carlo method was utilized.
If weight of the edge(vi , v j ) is greater than Ith , there exists an edge[vi , v j ] in E . Thepresence of an edge between two users signifies that if the same PRB is assigned to theconsidered users, the interference between these users will be higher than the acceptableinterference threshold.
The network condition shown in Fig. 1 is transformed into the graphical representationand has been colored by the RPA algorithm as illustrated in Fig. 3. In this figure, users arerepresented as vertices. The presence of an edge between a pair of vertices means that if thesame PRB is assigned to them, the SINR experienced by them will be lower than γth . Theavailable PRBs (NP RB ) = 10 are represented by 10 different colors. This figure depicts k-colouring of the graph where k = NP RB = 10. The vertices (i.e. users) to whom the algorithmcould not assign a PRB due to the imposed constraints have been colored in black, whichrepresents the outage probability of the allocation. The vertices colored with the same colorother than black represents the users who have been assigned a same PRB.
123
R. Siddavaatam et al.
Algorithm 2 Received power based allocation (RPA)/ received SINR based allocation (RSA)algorithms for PRB allocation
Set the system parameters to the suitable values as per Table 3 and Niter = 100.for iteration counter=0 to Niter do
Perform the system simulation and determine the cell association for all network users.Determine the graph presentation of the network condition.Determine vertexorder (1,2, …, N total
u ) {the order of vertices to be considered for coloring as per thetype of algorithm (RPA/SINRA).}Determine verticesad j (index3) ; ∀index3 = 1, 2, . . . N total
uSet UserP RB (index3) = 0 ; ∀index3 = 1, 2, . . . N total
u {set the initial PRB allocation to null}for userindex = 0 to N total
u doDetermine B ⊂ G, where B = verticesad j (userindex )
for P RBindex = 0 to NP RB doif P RBindex �= UserP RB (index3) ; ∀index3 ∈ B then
UserP RB (userindex ) = P RBindex {If P RBindex has not already been assigned to any of thevertices connected to the vertex under consideration}BREAK the for loop
end ifend for
end forcalculate the performance index for the current PRB allocation
end forAverage performance index over the number of Monte-Carlo simulation cycles
20 25 30 35 40 45 50 55 60 65 7020
25
30
35
40
45
50
55
60
65
70
Fig. 3 Graphical representation of solution by the RPA algorithm with a SINR threshold of 0 dB. (Colorfigure online)
7 Performance Analysis and Comparison
7.1 Convergence Analysis of ACA
ACA algorithm is a type of evolutionary algorithm. The convergence of ACA algorithm isplotted in Fig. 4. The average BER experienced by the network users at the end of the cycle isplotted against the number of cycles the algorithm has been executed for. It can be observedthat ACA converges within 15 cycles. Thus, for our simulation purpose, we have executedACA algorithm for 15 cycles in the following sections.
123
Ant Colony Optimization Based Sub-channel Allocation Algorithm
0 5 10 15 20 250.08
0.09
0.1
0.11
0.12
0.13
0.14
0.15
0.16
no of cycles
Ave
rage
bit
erro
r ra
te e
xper
ienc
ed b
y us
ers
Fig. 4 Convergence of ant colony optimization algorithm
7.2 Comparison of the Different Algorithms
We have compared the performances of ACA against that of the RPA and RSA algorithms,using the mean SINR (γavg), the outage probability, the number of utilized PRBs, the SINRper PRB, and the coverage per PRB as performance metrics. The numerical values of systemparameters used for simulation purpose are described in Table 3. The users and FAPs areconsidered to be static for the duration of the simulation.
The available PRBs are allocated as per the procedural details of an allocation algorithm.The algorithm generates a PRB allocation solution which is deployed in the simulated HetNetenvironment. The SINR (γi ) experienced by an individual user i is determined using (19).The mean value of SINR (γavg) is calculated by averaging γi over all network users, wherei = 1, 2, . . . , N total
u . The mean values of BER is calculated using (20) for a range of valuesof γth , and plotted in Fig. 5.
γavg =∑N total
ui=0 γi
N totalu
, (20)
where P̂i is the power received by user i from its serving base-station, BSiserving is the
serving base-station of user i and P̂ ji is the power received by user i from the j th base-
station. P L is the path loss between user and base station calculated as described in Sect. 3.∑N total
BS
j=1, j �=BSiserving
P̂ ji is the interference experienced by a user and we consider an additive
noise equal to 5 % of the interference i.e. η = 5 in (19).Another performance parameter being considered is the outage probability σ which can
be calculated using (21):
σ = 1 − N allocatedusers
N totalusers
, (21)
where N totalusers is the total number of users in the network out of which N allocated
users users havebeen allocated a PRB.
123
R. Siddavaatam et al.
Table 3 System parameters Abbreviation Parameter description Value
Ptxm Transmit power of macrocell BS 94 dBm
Ptx f Transmit power of femtocell BS 55 dBm
η Noise experienced by a user (%of total interference)
5 %
NSC Number of available subcarriers 128
N P RBSC Number of subcarriers per PRB 12
NP RB Number of PRBs 10
Bch Channel bandwidth 1.25 MHz
N totalSC Number of total sub-carriers in
the channel128
N guardSC Number of guard bands 13
Ninu Number of indoor users 27
N outu Number of outdoor users 32
N totalu Number of total users 59
Nm Number of macrocells 4
NF APs Number of femtocells 9
d f Indoor penetration factor 1
αout Outdoor path loss exponent 3.5
αin Indoor path loss exponent 2.5
γth SINR threshold −5 dB
C Maximum number of PRBs thatcan be assigned to a user
1
−10 −5 0 52.2
2.3
2.4
2.5
2.6
2.7
2.8
2.9
3
3.1
SINR threshold (dB)
Ave
rage
SIN
R e
xper
ienc
ed b
y al
l use
rs
RPAACASINRA
Fig. 5 SINR versus SINR threshold comparison of the three algorithms
7.3 Performance Using the SINR Threshold
In this section, the performance parameters are determined and plotted for various values ofγth in the range −10 to 5 dB.
For a particular value of γth , with all other system simulation parameters kept constantat suitable values, the PRB allocation is determined by the allocation algorithm. The PRB
123
Ant Colony Optimization Based Sub-channel Allocation Algorithm
−10 −5 0 50
0.01
0.02
0.03
0.04
0.05
0.06
0.07
0.08
0.09
0.1
SNR Threshold (dB)
Out
age
Pro
babi
lity
RPA
ACA
RSA
Fig. 6 Outage probability versus SINR threshold comparison of the three algorithms
allocation is implemented on the network and the SINR experienced by all network usersis calculated. The mean value of the SINR is calculated over all network users. The valueof the SINR threshold (γth) is directly proportional to the complexity of the PRB allocationproblem. The number of edges in the graph representing the allocation problem increaseswhen γth increases. This introduces an increase in the number of constraints of the problem.As observed in Fig. 5, the ACA provides better and consistent performance compared to theRPA and RSA algorithms when the complexity of the problem increases. Indeed, an increasein γth leads to increased co-channel constraints on the PRB allocation problem, hence theperformance of the RPA and RSA algorithms degrades. In contrast, the results obtained fromusing ACA can be attributed to its learning nature.
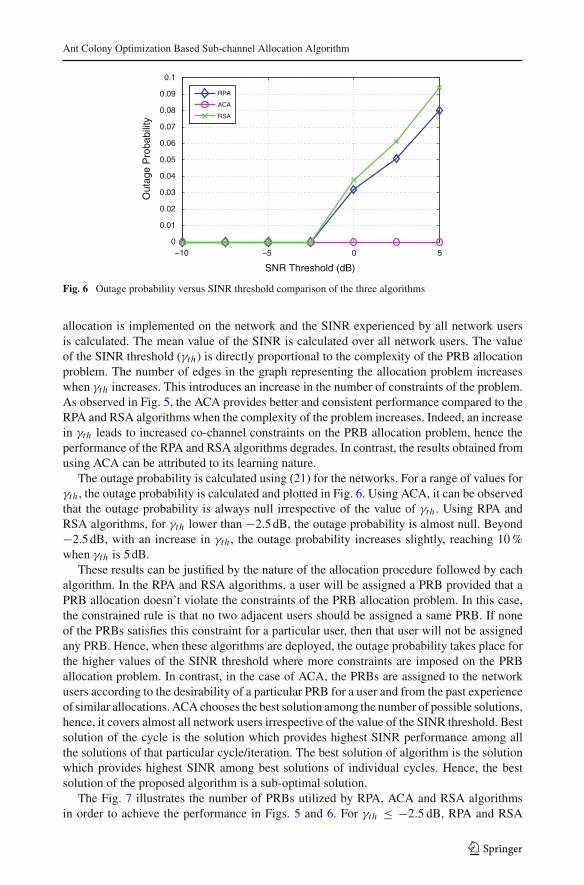
The outage probability is calculated using (21) for the networks. For a range of values forγth , the outage probability is calculated and plotted in Fig. 6. Using ACA, it can be observedthat the outage probability is always null irrespective of the value of γth . Using RPA andRSA algorithms, for γth lower than −2.5 dB, the outage probability is almost null. Beyond−2.5 dB, with an increase in γth , the outage probability increases slightly, reaching 10 %when γth is 5 dB.
These results can be justified by the nature of the allocation procedure followed by eachalgorithm. In the RPA and RSA algorithms, a user will be assigned a PRB provided that aPRB allocation doesn’t violate the constraints of the PRB allocation problem. In this case,the constrained rule is that no two adjacent users should be assigned a same PRB. If noneof the PRBs satisfies this constraint for a particular user, then that user will not be assignedany PRB. Hence, when these algorithms are deployed, the outage probability takes place forthe higher values of the SINR threshold where more constraints are imposed on the PRBallocation problem. In contrast, in the case of ACA, the PRBs are assigned to the networkusers according to the desirability of a particular PRB for a user and from the past experienceof similar allocations. ACA chooses the best solution among the number of possible solutions,hence, it covers almost all network users irrespective of the value of the SINR threshold. Bestsolution of the cycle is the solution which provides highest SINR performance among allthe solutions of that particular cycle/iteration. The best solution of algorithm is the solutionwhich provides highest SINR among best solutions of individual cycles. Hence, the bestsolution of the proposed algorithm is a sub-optimal solution.
The Fig. 7 illustrates the number of PRBs utilized by RPA, ACA and RSA algorithmsin order to achieve the performance in Figs. 5 and 6. For γth ≤ −2.5 dB, RPA and RSA
123
R. Siddavaatam et al.
−10 −5 0 52
3
4
5
6
7
8
9
10
SINR Threshold (dB)
No
of P
RB
s ut
ilise
d
RPAACARSA
Fig. 7 No. of PRBs versus SINR threshold comparison of the three algorithms
−10 −5 0 50.2
0.3
0.4
0.5
0.6
0.7
0.8
0.9
1
1.1
1.2
SNIR Threshold (dB)
SN
IR p
er P
RB
RPAACARSA
Fig. 8 SINR per PRB versus SINR threshold of the three algorithms
algorithms utilize only 3 PRBs. This means that the rest of available PRBs can be re-assignedto the network users. With the multiple PRBs available for a user, they can support datacommunication at higher rate. In contrast, ACA utilizes very few PRBs. Indeed, for γth ≤−2.5 dB, it needs only 1 PRB and above that threshold, the PRB requirement increasesslowly, up to 7 for γth = 5 dB. For all of the algorithms, as γth increases, the number ofedges in the graph representing the PRB allocation problem increases, thereby enhancing therestrictions on the PRB allocation. This phenomenon results in a more complex allocationproblem, consequently, increasing the number of PRBs required to solve it.
To summarize, we have plotted the SINR per PRB and coverage per PRB performanceparameters derived from the previous graphs. In the graph depicted in Fig. 8, the X axis rep-resents the γth values ranging from −10 to 5 dB, and the Y axis represents the correspondingSINR per PRB performance. As observed in Fig. 8, the RSA and RPA algorithms exhibitequivalent SINR per PRB, which decreases when γth increases. It can be concluded thatACA outperforms the RPA and RSA algorithms for all of the examined γth values.
123
Ant Colony Optimization Based Sub-channel Allocation Algorithm
−10 −5 0 55
10
15
20
25
30
35
40
45
50
SINR threshold (dB)
Cov
erag
e pe
r P
RB
RPA
ACA
RSA
Fig. 9 Coverage per PRB versus SINR threshold comparison of the three algorithms
50 51 52 53 54 55 56 57 58 59 600
1
2
3
4
5
6
7
FAP Tx power(dBm)
Ave
rage
SN
IR e
xper
ienc
ed b
y al
l use
rs
comparison of ave SNIR of PRB allocation by RA, GA,
RPA
ACA
RSA
SINRA and ACA algorithms
Fig. 10 SINR versus FAP Tx power comparison of the three algorithms
Similar to Fig. 8, Fig. 9 plots the coverage per PRB performance. In Fig. 9, it can beobserved that for the three studied algorithms, the coverage per PRB performance decreaseswhen γth increases.
From Figs. 8 and 9, it can be concluded that the three algorithms perform well whenγth ≤ −2.5 dB. Therefore, in the sequel, the allocation algorithm performance is analyzedwhen the FAP transmit power is varied.
7.4 Performance with Transmit Power of FAPs
For a particular value of the FAP transmit power with all other system simulation parametersheld constant at suitable values which includes γth of −5 dB, the PRB allocation is determinedby the allocation algorithm.
The X axis of the graph in Fig. 10 represents the FAP transmit power at which all FAPsin the network transmit. The Y axis represents the SINR experienced by an average network
123
R. Siddavaatam et al.
50 51 52 53 54 55 56 57 58 59 600
0.5
1
1.5
2
2.5
3
FAP transmit power (dBm)
SN
IR p
er P
RB
RPA
ACA
RSA
Fig. 11 SINR per PRB versus FAP Tx power comparison of the three algorithms
50 51 52 53 54 55 56 57 58 59 600
10
20
30
40
50
60
70
80
90
100
FAP transmit power (dBm)
Cov
erag
e pe
r P
RB
RPA
ACA
RSA
Fig. 12 Coverage per PRB versus FAP Tx power comparison of the three algorithms
Table 4 Summary of theperformance analysis of ourproposed algorithm
Allocationalgorithm
SINR Outage No. of PRBs Complexity
ACA H L L H
RSA M M M M
RPA M L M M
user (γavg). The SNIR experienced by network users increases linearly with an increase inPf . In Fig. 10, it can be observed that the SINR performances of all proposed algorithmsare similar. It was observed from empirical results that the number of required PRBs andpercentage of users served are insensitive to variation of the FAP transmit power.
The graph of Fig. 11 depicts the SINR per PRB performance when the FAP transmitpower varies from 50 to 60 dBm. It can be observed that the SINR per PRB performanceimproves when FAP transmit power increases. Also, ACA exhibits the best SINR per PRBperformance among all considered algorithms.
From Fig. 12, it can be concluded that ACA exhibits the best coverage per PRB perfor-mance compared to other considered algorithms.
123
Ant Colony Optimization Based Sub-channel Allocation Algorithm
7.5 Summary of Results
The performances of the ACA, RPA and RSA algorithms are investigated when the SINRthreshold value γth is varied, while other system parameters are kept constant at suitablevalues. For lower values of γth , i.e. for the PRB allocation problems with lower complexity,RPA and RSA are found to be better than ACA in terms of SINR performances. However,ACA provides a better and consistent SINR performance with increasing complexity of PRBallocation problem. Indeed, both the RPA and RSA algorithms provide very a low outageprobability whereas ACA provides near zero outage probability irrespective of the value ofγth . Moreover, ACA provides an efficient allocation of PRBs, exhibiting better SINR andnear zero outage probability with less number of PRBs utilized. Therefore, we can say thatACA outperforms the RPA and RSA algorithms as far as the percentage of coverage per PRBand SINR per PRB parameters are concerned. Similar conclusions prevail for the graphsshowing the allocation algorithm performance when the FAP transmit power is varied. Allthese results are captured in Table 4.
In Table 4, H means high performance, M means medium performance and L meanslow performance. These are quantitative relative measures used to compare ACO algorithmwith other algorithms under consideration. From the table, it can be concluded that ACAoutperforms RPA and RSA in terms of average SINR experienced by the network users,outage probability, and number of required PRBs. The side effect of this advantage of ACAover RPA and RSA is its increased complexity (due to its heuristic nature), which may leadto an inefficient usage of computational resources.
8 Conclusion
We have presented mathematical formulation of physical resource block allocation problemin a small cell network and transformed into interference graph coloring problem. As wellwe have proposed an ACO based algorithm (so-called ACA) for solving the same problem.Simulation results have demonstrated the performance of ACA over the RPA and RSAalgorithms in terms of average SINR experienced by all network users, outage probabilityand number of required PRBs. In this work, we have considered the simple ACO-basedheuristic algorithm. In future, we will investigate other existing ACO-based heuristic models[16] and apply them to the same PRB allocation problem, with the goal to compare theirperformances against that of our proposed ACA solution, with the hope to determine the bestpossible optimal solution to the PRB allocation problem.
References
1. Parkvall, S., Dahlman, E., Furuskar, A., Jading, Y., Olsson, M., Wanstedt, S., et al. (2008). LTE-advanced—Evolving lte towards IMT-advanced. In IEEE 68th vehicular technology conference (VTC) (pp. 1–5),September 2008.
2. Ashraf, I., Boccardi, F., & Ho, L. (2011). Sleep mode techniques for small cell deployments. Communi-cations Magazine, IEEE, 49, 72–79.
3. Chen, C. S., & Baccelli, F. (2010). Self-optimization in mobile cellular networks: Power control and userassociation. In IEEE international conference on communications (ICC) (pp. 1–6), May 2010.
4. Peng, M., Zhang, X., & Wang, W. (2011). Performance of orthogonal and co-channel resource assignmentsfor femto-cells in long term evolution systems. The Institute of Engineering and Technology Communi-cations (IET), 5, 996–1005.
5. Le Treust, M., Tembine, H., Lasaulce, S., & Debbah, M. (2010). Coverage games in small cells networks.In Future network and mobile summit, 2010 (pp. 1–8), June 2010.
123
R. Siddavaatam et al.
6. Maso, M., Cardoso, L., Debbah, M., & Vangelista, L. (2012). Channel estimation impact for lte small cellsbased on mu-vfdm. In IEEE wireless communications and networking conference (WCNC), Shanghai,China (pp. 2560–2565), April 2012.
7. de Lima, C., Bennis, M., & Latva-aho, M. (2012). Coordination mechanisms for self-organizing femtocellsin two-tier coexistence scenarios. IEEE Transactions on Wireless Communications, 11, 2212–2223.
8. Balachandran, K., Kang, J., Karakayali, K., & Rege, K. (2011). Cell selection with downlink resourcepartitioning in heterogeneous networks. In IEEE international conference on communications workshops(ICC), Kyoto, Japan (pp. 1–6), June 2011.
9. Yun, J.-H., & Shin, K. (2011). Adaptive interference management of ofdma femtocells for co-channeldeployment. IEEE Journal on Selected Areas in Communications, 29, 1225–1241.
10. Chatzinotas, S., & Ottersten, B. (2012). Cognitive interference alignment between small cells and amacrocell. In 19th international conference on telecommunications (ICT), Jounieh, Lebanon, April 2012.
11. Akoum, S., Zwingelstein-Colin, M., Heath, R., & Debbah, M. (2010). Cognitive cooperation for the down-link of frequency reuse small cells. In 2nd international workshop on cognitive information processing(CIP) (pp. 111–115), June 2010.
12. Sandalidis, H., Stavroulakis, P., & Rodriguez-Tellez, J. (1998). An efficient evolutionary algorithm forchannel resource management in cellular mobile systems. IEEE Transactions on Evolutionary Computa-tion, 2, 125–137.
13. Tan, L., Feng, Z., Li, W., Jing, Z., Gulliver, T. A. (2011). Graph coloring based spectrum allocation forfemtocell downlink interference mitigation. In IEEE wireless communications and networking conference(WCNC) (Vol. 3, pp. 12–48), March 2011.
14. Madan, R., Borran, J., Sampath, A., Bhushan, N., Khandekar, A., & Ji, T. (2010). Cell association andinterference coordination in heterogeneous lte-a cellular networks. IEEE Journal on Selected Areas inCommunications, 28, 1479–1489.
15. Costa, D., & Hertz, A. (1997). Ants can colour graphs. Journal of the operational research society, 48(3),295–305.
16. Engelbrecht, A. P. (2007). Computational intelligence: An introduction (2nd ed.). New York: Wiley.17. Brélaz, D. (1979). New methods to color the vertices of a graph. Communications of the ACM, 22,
251–256.18. Hamblin, J. (2012). Math for liberal studies. Scotts Valley, CA: CreateSpace.
Author Biographies
Richa Siddavaatam is a Ph.D. candidate with Communications andSignal Processing Applications Laboratory (CASPAL) at Ryerson Uni-versity. She received her BEng degree in Electronics and Telecommuni-cation Engineering from Pune University, India. Thereafter she workedwith Siemens AG and Blackberry before joining RRM Research Groupof WINCORE Lab at Ryerson University and completed her MAScdegree in 2012. Her research interests include wireless communica-tions and signal processing specifically radio resource management andmachine learning.
123
Ant Colony Optimization Based Sub-channel Allocation Algorithm
Alagan Anpalagan received B.A.Sc., M.A.Sc. and Ph.D. degrees inElectrical Engineering from the University of Toronto, Canada. Hejoined the Department of Electrical and Computer Engineering at Ryer-son University in 2001 and was promoted to Full Professor in 2010.He served the department as Graduate Program Director (2004-09) andthe Interim Electrical Engineering Program Director (2009-10). Dur-ing his sabbatical (2010-11), he was a Visiting Professor at Asian Insti-tute of Technology and Visiting Researcher at Kyoto University. Dr.Anpalagan’s industrial experience includes working at Bell Mobility on1xRTT system deployment studies (2001), at Nortel Networks on SEC-ORE R&D projects (1997) and at IBM Canada as IIP Intern (1994).
Dr. Anpalagan directs a research group working on radio resourcemanagement (RRM) and radio access & networking (RAN) areaswithin the WINCORE Lab. His current research interests include cog-nitive radio resource allocation and management, wireless cross layerdesign and optimization, collaborative communication, green commu-
nications technologies, machine-to-machine communication, and small cell networks. He is co-author/editorof the books Small Cell Networks (Cambridge Press, 2014), Handbook of Green Information and Commu-nication Systems (Academic Press, 2012) and Routing in Opportunistic Networks (Springer-Verlag, 2013).Dr. Anpalagan has published more than 200 technical papers in his research areas.
Dr. Anpalagan serves as Associate Editor for the IEEE Communications Surveys & Tutorials (2012-),IEEE Communications Letters (2010-13) and Springer Wireless Personal Communications (2009-), and pastEditor for EURASIP Journal of Wireless Communications and Networking (2004-2009). He also served asGuest Editor for special issues in ACM/Springer MONET Green Cognitive and Cooperative Communica-tion and Networking (2012), EURASIP Radio Resource Management in 3G+ Systems (2006) and EURASIPFairness in Radio Resource Management for Wireless Networks (2008). Dr. Anpalagan served as TPC Co-Chair of: IEEE WPMC’12 Wireless Networks, IEEE PIMRC’11 Cognitive Radio and Spectrum Manage-ment, IEEE IWCMC’11 Workshop on Cooperative and Cognitive Networks, IEEE Canadian Conference onElectrical and Computer Engineering, CCECE 2004 and 2008 and WirelessCom’05 Symposium on RadioResource Management; Local Arrangements Chair, IEEE ICME’04.
Dr. Anpalagan held various positions within IEEE Canada including Chair, IEEE Central Canada, Chair(2013-), IEEE Canada Professional Activities Committee (2009-11), IEEE Toronto Section Chair (2006-07),ComSoc Toronto Chapter Chair (2004-05),. He is the recipient of the Dean’s Teaching Award (2011), Fac-ulty Scholastic, Research and Creativity Award (2010), Faculty Service Award (2010) at Ryerson University.Dr. Anpalagan also completed a course on Project Management for Scientist and Engineers at the Universityof Oxford CPD Center. He is a registered Professional Engineer in the province of Ontario, Canada.
Isaac Woungang received his M.S. and Ph. D degrees, in Mathemat-ics from the Université de la Méditerranée-Aix Marseille II, France,and Université du Sud, Toulon & Var, France, in 1990 and 1994respectively. In 1999, he received a M.S from the INRS-Materials andTelecommunications, University of Quebec, Montreal, Canada. From1999 to 2002, he worked as a software engineer at Nortel Networks.Since 2002, he has been with Ryerson University, where he is now anAssociate Professor of Computer Science.
123
R. Siddavaatam et al.
Sudip Misra is an Associate Professor in the School of Informa-tion Technology at the Indian Institute of Technology Kharagpur. Hereceived his Ph.D. degree in Computer Science from Carleton Univer-sity, in Ottawa, Canada. His current research interests include algorithmdesign for emerging communication networks. Dr. Misra is the authorof over 170 scholarly research papers. He has won eight research paperawards in different conferences. Recently, he has been awarded theIEEE ComSoc Asia Pacific Outstanding Young Researcher Award atIEEE GLOBECOM 2012, Anaheim, California, USA. He was also therecipient of several academic awards and fellowships such as the YoungScientist Award (National Academy of Sciences, India), Young SystemsScientist Award (Systems Society of India), Young Engineers Award(Institution of Engineers, India), (Canadian) Governor General’s Aca-demic Gold Medal at Carleton University, the University Outstand-ing Graduate Student Award in the Doctoral level at Carleton Univer-sity and the National Academy of Sciences, India – Swarna Jayanti
Puraskar (Golden Jubilee Award). He was also awarded the Canadian Government’s prestigious NSERCPost Doctoral Fellowship and the Humboldt Research Fellowship in Germany. Dr. Misra is the Editor-in-Chief of the International Journal of Communication Networks and Distributed Systems (IJCNDS), Inder-science, U.K.. He has also been serving as the Associate Editor of the Telecommunication Systems Journal(Springer SBM), Security and Communication Networks Journal (Wiley), International Journal of Commu-nication Systems (Wiley), and the EURASIP Journal of Wireless Communications and Networking. He isalso an Editor/Editorial Board Member/Editorial Review Board Member of the IET Communications Jour-nal, IET Wireless Sensor Systems, and Computers and Electrical Engineering Journal (Elsevier).
Dr. Misra has edited 6 books published by reputed publishers such as Springer, Wiley, and World Scien-tific. He was invited to chair several international conference/workshop programs and sessions. Dr. Misrawas also invited to deliver keynote/invited lectures in over 20 international conferences in USA, Canada,Europe, Asia and Africa.