Journal of Glaciology, Vo!. 37, No. 125,1991 The use of tiltmeters to study the dynamic s of Antarctic ice-shelf grounding lines A. M. SMITH British Antarctic Survey, Natural Environment Research Council, Cambridge CB3 OET, England ABSTRACT. New tiltmeter data are presented from Doake Ice Rumpl es on Ronne Ice Shelf, Antarctica. Five sites which showed a tidal ice-shelf flexure have been analysed using an elastic beam model to investigate the var iation of flexure amplitude with distance from the grounding line. An earlier study on Rutford Ice Stream which also used an elastic model required an ice thickness much less th an that obs erved. Reworking the Rutford Ice Stream data suggests that this gre atly reduced ice thickness is not required, given the current sparse data coverage. Th e clastic mod el is used to improve the estimated grounding- line position on Rutf o rd Ice Str eam. Some of the difficulties in modelling ice-shelf flexure and locatin g grounding lines are discussed. INTRODUCTION The aims of tiltmeter surveys on Antarctic ice-shelf grounding l ines are two-fold: first, to investigate the vari- at ion of tilting with distance from the grounding line and to locate t he ground ing line more precisely; secondly, to indicate climatica ll y ind u ced changes in ice-sheet thick- ness or sea level by providing a bas is for long-term mon- itor ing of gro unding-line posit ions. Doake Ice Rumpl es (7()044' S, 67°21' W) arc an area of grounded ice covering 1700 km 2 between Korff and Henry Ice Rises on Ronne Ice Shelf, Antarctica (Fig. 1). The ice shelf is sliding over a bedrock obstruction which is insufficient to form an in- dependent ice-flow regime, as is the case on the adjacent ice rises. A stake scheme was established on the ice rum- pIes for a movement survey in 1983 and was re-surveyed in 1()84. Velocity, surface elevation and ice th ickness were described by Smith (1986). Ice surface from op- ticallevelling, ice bottom from radio-echo sounding, and bedrock beneath the floating ice from seismic sounding a rc shown in Figure 2, which also indicates the sites oc- cupied by tiltmeters . The approximate position of the grounding line between the ice rumpl es and the ice shelf up s tream was located initially from the surface-elevation profile and from the identification of strand cracks. T ilt- meters were operated at 12 sites on the stake scheme, W E // ('/' o 200 km ANTARCTIC --_ PEN I NSULA " '- .. "" I """" 0". RONN E I CE -- BO"S '" RUTFORD ICE STREAM II ENRY ICE RISE Fig. 1. Location map of Doake Ice Rumples and Rut f ord I ce Stream. W >- OE ID - <{ o-J Z W oGi i=o-J 160 · <{<{ >w 120 W 80 o E 700 ID> I W b:: 800 W UJ OU) 3 5 TILTMETER SITE NUMBERS 12 ICE 21 25 2829 ICE- Bon o M PROFILE BEDR6c K 900 WATER o 2 4 6 8 10 12 14 16 18 20 DOWNSTR EA M DISTANCE (k m) Fig. 2. Surface and bottom profiles over D oake I ce Rumples showing sites occupied by tilt - met ers , D ashed line below the ice surf ace shows the surf ace which would be required for hydr'ostatic equilibrium . Ice flow is from left to right. 51
Transcript
Journal of Glaciology, Vo!. 37, No. 125,1991
The use of tiltmeters to study the dynamics of Antarctic ice-shelf grounding lines
A. M. SMITH
British Antarctic Survey, Natural Environment Research Council, Cambridge CB3 OET, England
ABSTRACT. New tiltmeter data are presented from Doake Ice Rumples on Ronne Ice Shelf, Antarctica. Five sites which showed a tidal ice-shelf flexure have been analysed using an elastic beam model to investigate the variation of flexure amplitude with distance from the grounding line. An earlier study on Rutford Ice Stream which also used an elastic model required an ice thickness much less than that observed. Reworking the Rutford Ice Stream data suggests that this grea tly reduced ice thickness is not required, given the current sparse data coverage. The clastic model is used to improve the estimated grounding-line position on Rutford Ice Stream . Some of the difficulties in modelling ice-shelf flexure and locating grounding lines are discussed .
INTRODUCTION
The aims of tiltmeter surveys on Antarctic ice-shelf grounding lines are two-fold: first, to investigate the variation of tilting with distance from the grounding line and to locate t he grounding line more precisely; secondly, to indicate climatically induced changes in ice-sheet thickness or sea level by providing a basis for long-term monitoring of grounding-line positions. Doake Ice Rumples (7()044' S, 67°21' W) arc an area of grounded ice covering 1700 km2 between Korff and Henry Ice Rises on Ronne Ice Shelf, Antarctica (Fig. 1). The ice shelf is sliding over a bedrock obstruction which is insufficient to form an independent ice-flow regime, as is the case on the adjacent ice rises. A stake scheme was established on the ice rum-
pIes for a movement survey in 1983 and was re-surveyed in 1()84. Velocity, surface elevation and ice thickness were described by Smith (1986). Ice surface from opticallevelling, ice bottom from radio-echo sounding, and bedrock beneath the floating ice from seismic sounding a rc shown in Figure 2, which also indicates the sites occupied by tiltmeters. The approximate position of the grounding line between the ice rumples and the ice shelf upstream was located initially from the surface-elevation profile and from the identification of strand cracks. T iltmeters were operated at 12 sites on the stake scheme,
W E
~~"--- 70' S
// ('/' o 200
km
ANTARCTIC --_ PEN INSULA " '- .. "" I
"""" 0". RONN E ICE -- BO" S
'"
RUTFORD ICE STREAM
II ENRY ICE RISE
Fig. 1. Location map of Doake I ce Rumples and Rutf ord I ce Stream.
o 2 4 6 8 10 12 14 16 18 20 DOWN STR EA M DI STANCE (km)
Fig. 2. Surface and bottom profiles over D oake I ce Rumples showing sites occupied by tiltmeters , D ashed line below the ice surf ace shows the surf ace which would be required for hydr'ostatic equilibrium. Ice flow is from left to right.
51
Journal of Glaciology
600 I
en 400 -c C'O
"D 200 -C'O '-
2 0-u
I ~ 'E -200 f---l -400 f=
-600 I 200
I I I 800
1" 1000 0 400 600
TIME (hours)
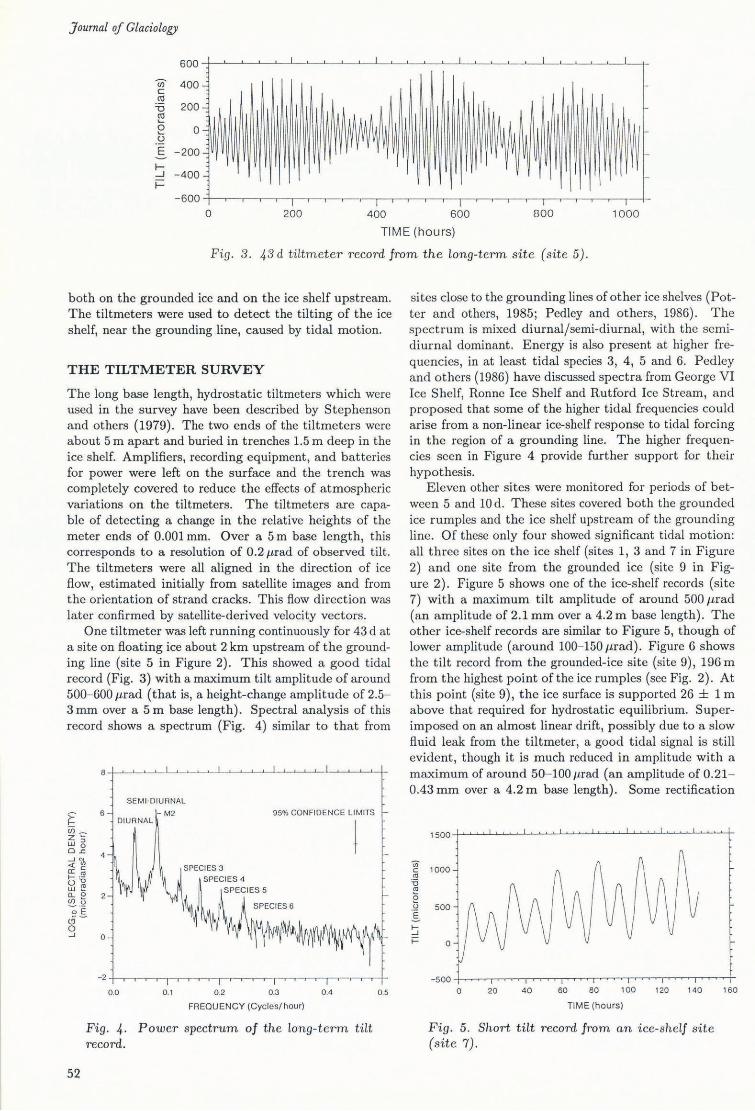
Fig. 3. 43 d tiltmeter record from the long-term site (site 5).
both on the grounded ice and on the ice shelf upstream. The tiltmeters were used to detect the tilting of the ice shelf, near the grounding line, caused by tidal motion.
THE TILTMETER SURVEY
The long base length, hydrostatic tiltmeters which were used in the survey have been described by Stephenson and others (1979). The two ends of the tiltmeters were about 5 m apart and buried in trenches 1.5 m deep in the ice shelf. Amplifiers, recording equipment, and batteries for power were left on the surface and the trench was completely covered to reduce the effects of atmospheric variations on the tilt meters. The tiltmeters are capable of detecting a change in the relative heights of the meter ends of 0.001 mm. Over a 5 m base length, this corresponds to a resolution of 0.2 J.Lrad of observed tilt. The tiltmeters were all aligned in the direction of ice flow, estimated initially from satellite images and from the orientation of strand cracks. This flow direction was later confirmed by satellite-derived velocity vectors.
One tiltmeter was left running continuously for 43 d at a site on floating ice about 2 km upstream of the grounding line (site 5 in Figure 2). This showed a good tidal record (Fig. 3) with a maximum tilt amplitude of around 500- 600 J.Lrad (that is, a height-change amplitude of 2.5-3 mm over a 5 m base length). Spectral analysis of this record shows a spectrum (Fig. 4) similar to that from
52
SEMI -DIURNAL
6 95% CONFIDENCE LIMITS -
~PECIES3
~PECIES4
\SPECIES 5
~~I o
0.0 0 .1 0 .2 0.3 0.4 0.5
FREQUENCY (Cycles/ hour)
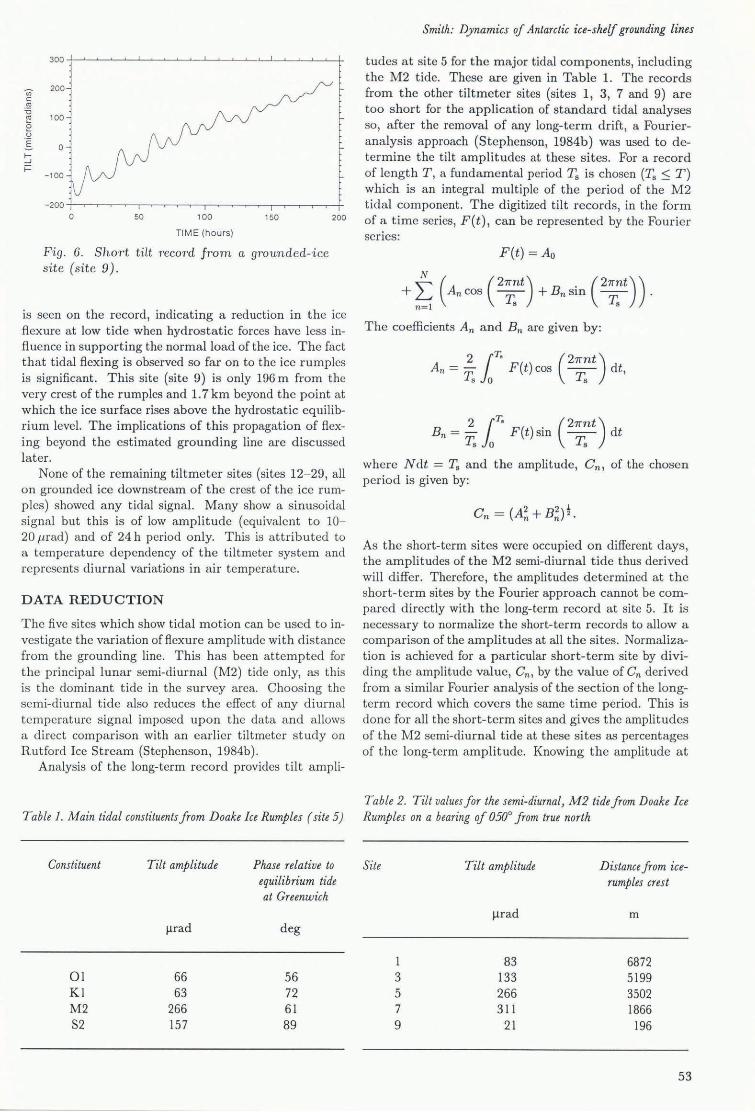
Fig . 4. Power spectrum of the long-term tilt record.
sites close to the grounding lines of other ice shelves (Potter and others, 1985; Pedley and others, 1986). The spectrum is mixed diurnal/semi-diurnal, with the semidi urnal dominant. Energy is also present at higher frequencies, in at least tidal species 3, 4, 5 and 6. Pedley and others (1986) have discussed spectra from George VI Ice Shelf, Ronne Ice Shelf and Rutford Ice Stream, and proposed that some of the higher tidal frequencies could arise from a non-linear ice-shelf response to tidal forcing in the region of a grounding line. The higher frequencies seen in Figure 4 provide further support for their hypothesis.
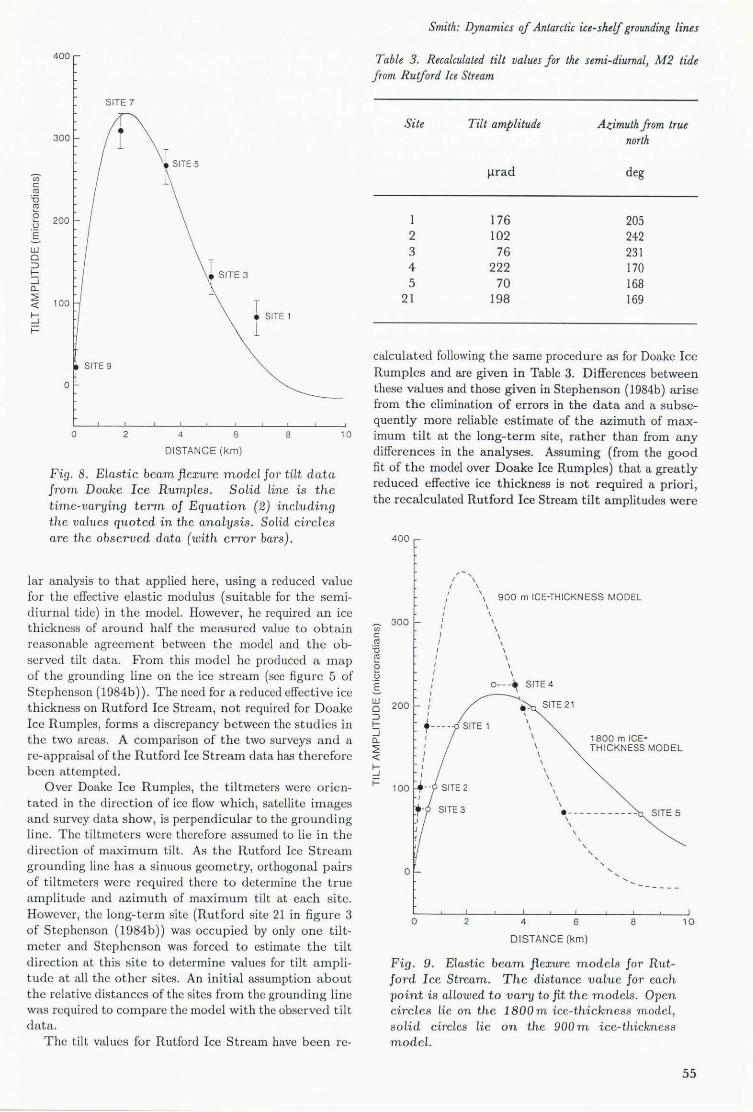
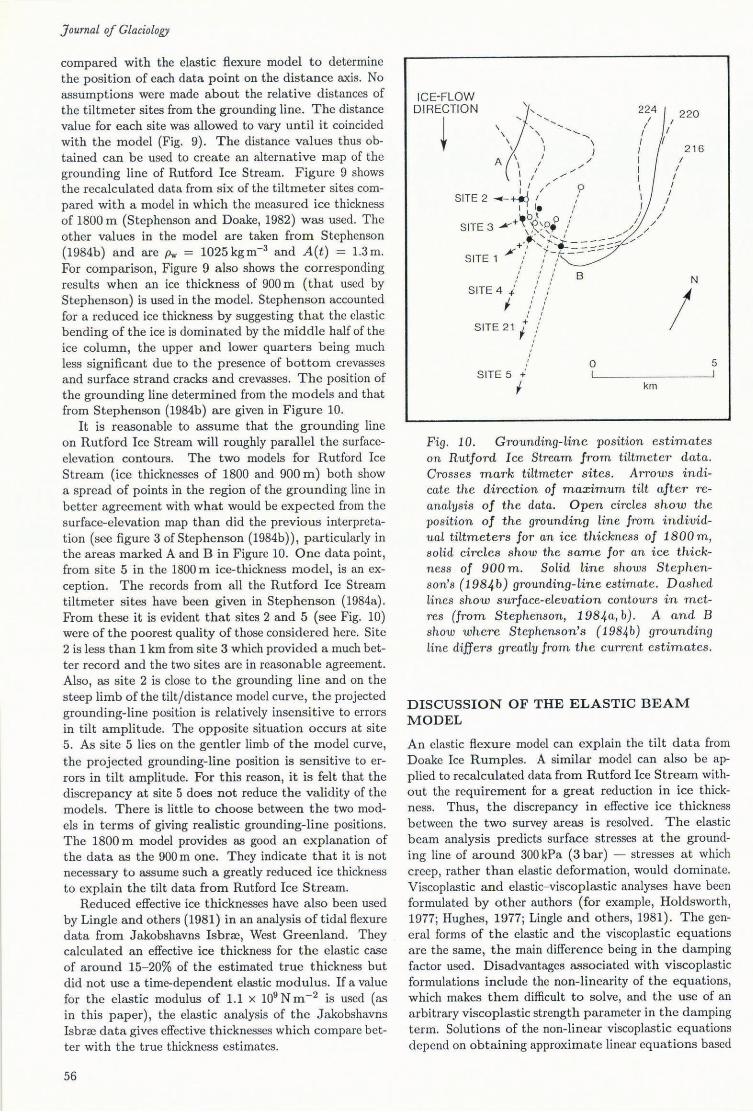
Eleven other sites were monitored for periods of between 5 and 10 d. These sites covered both the grounded ice rumples and the ice shelf upstream of the grounding line. Of these only four showed significant tidal motion: all three sites on the ice shelf (sites 1, 3 and 7 in Figure 2) and one site from the grounded ice (site!) in Figure 2). Figure 5 shows one of the ice-shelf records (si te 7) with a maximum tilt amplitude of around 500 J.Lrad (an amplitude of 2.1 mm over a 4.2 m base length). The other ice-shelf records are similar to Figure 5, though of lower amplitude (around 100- 150 J.Lrad). Figure 6 shows the tilt record from the grounded-ice site (site 9), 196 m from the highest point of the ice rumples (see Fig. 2). At this point (site 9), the ice surface is supported 26 ± 1 m above that required for hydrostatic equilibrium. Superimposed on an almost linear drift, possibly due to a slow fluid leak from the tiltmeter, a good tidal signal is still evident, though it is much reduced in amplitude with a maximum of around 50- 100 p,rad (an amplitude of 0.21-0.43 mm over a 4.2 m base length). Some rectification
Fig. 5. Short tilt record from an ice-shelf site (site 7) .
Vi' c
. ~ "0
'" 0 t; E f--' i=
300 I
20J
100
0
-1 00
-200
0 50 100
TIME (hours)
150
Fig. 6. Shor·t tilt record jTOm a grounded-ice site (site [)).
200
is seen on the record, indicating a reduction in the ice flexure at low tide when hydrostatic forces have less influence in supporting the normal load of the ice. The fact that tidal flexing is observed so far on to the ice rumples is significant. This site (site 9) is only 196 m from the very crest of the rumples and 1. 7 km beyond the point at which the ice surface rises above the hydrostatic equilibrium level. The implications of this propagation of flexing beyond the estimated grounding line are discussed later.
None of the remaining tiltmeter sites (sites 12- 29, all on grounded ice downstream of the crest of the ice rumples) showed any tidal signal. Many show a sinusoidal signal but this is of low amplitude (equivalent to 10-20/Lrad) and of 24 h period only. This is attributed to a temperature dependency of the tiltmcter system and represents diurnal variations in air temperature.
DATA REDUCTION
The five sites which show tidal motion can be used to investigate the variation of flexure amplitude with distance from the grounding line. This has been attempted for the principal lunar semi-diurnal (M2) tide only, as this is the dominant tide in the survey area. Choosing the semi-diurnal tide also reduces the effect of any diurnal temperature signal imposed upon the data and allows a direct comparison with an earlier tiltmeter study on Rutford Ice Stream (Stephenson, 1984b).
Analysis of the long-term record provides tilt ampli-
Table 1. Main tidal constituentsjrom Doake Ice Rumples (site 5)
tudes at site 5 for the major tidal components, including the M2 tide. These are given in Table 1. The records from the other tiltmeter sites (sites 1, 3, 7 and 9) are too short for the application of standard tidal analyses so, after the removal of any long-term drift, a Fourieranalysis approach (Stephenson, 1984b) was used to determine the tilt amplitudes at these sites. For a record of length T, a fundamental period Ts is chosen (Ts :s: T) which is an integral multiple of the period of the M2 tidal component. The digitized tilt records, in the form of a time series, F(t), can be represented by the Fourier series:
F(t) = Ao
+ ~ (An cos (2;~t) + Bn sin (2;~t) ) . The coefficients An and Bn are given by:
2 {T, ( 27rnt) An = Ts lo F(t) cos T dt,
Bn = :s iT. F(t) sin (2;~t) dt
where Ndt = T. and the amplitude, Cn , of the chosen period is given by:
As the short-term sites were occupied on different days, the amplitudes of the M2 semi-diurnal tide thus derived will differ. Therefore, the amplitudes determined at the short-term sites by the Fourier approach cannot be compared directly with the long-term record at site 5. It is necessary to normalize the short-term records to allow a comparison of the amplitudes at all the sites. Normalization is achieved for a particular short-term site by dividing the amplitude value, Cn , by the value of Cn derived from a similar Fourier analysis of the section of the longterm record which covers the same time period. This is done for all the short-term sites and gives the amplitudes of the M2 semi-diurnal tide at these sites as percentages of the long-term amplitude. Knowing the amplitude at
Table 2. Tilt valuesJor the semi-diurnal, M2 tideJrom Doake Ice Rumples on a bearing oJ 0500 jrom true north
Site Tilt amplitude Distance jrom ice-rumples crest
the long-term site (266 j.lrad, see Table 1) leads to the normalized tilt amplitudes for the M2 semi-diurnal tide at all the sites. These values are given in Table 2 along with the distance of each site from the crest of the ice rumples.
Errors in the values given in Table 2 arise mainly from the calculation of the amplitudes from the short tidal records and are difficult to estimate. These records are too short for the relative phase values of the tidal constituents to be calculated accurately enough to allow a comparison between the observed tilt record at a site and a corresponding record reconstructed from the tidal constituents obtained from the Fourier-analysis approach. However, the total power of a record (the sum of the squared tilt-record amplitude values, divided by the record length) is relatively insensitive to small variations in the phase values. The percentage difference in total power between observed and reconstructed records at a site was calculated. This percentage of the calculated M2 tidal amplitude at a site is taken to be an estimate of the error. This approach will also include errors due to factors other than just the M2 tidal amplitude. In particular, errors in the amplitudes of the other tidal constituents and the effects of instrument jumps and drift will be of a similar magnitude to the error in the M2 tidal amplitude. The record from site 3 shows the highest error using this approach and this value (±23 J.Lrad) is taken as the error on all the tilt-amplitude values. This is believed to be the maximum likely error on the data.
FLEXURE ANALYSIS
A number of authors have treated ice-shelf flexure in the region of the grounding line using either elastic or viscoplastic models (for example, Robin, 1D58; Holdsworth, 1969, 1977; Hughes, 1977; Lingle and others, 1981; Stephenson, 1984b). The ice shelf is modelled here as a two-dimensional elastic beam of constant thickness, resting on an elastically deforming foundation - the sea. Elastic- viscoplastic behaviour is discussed later. Onc end of the beam rises and falls freely with the tide whilst the other end rests on bedrock of slope Ba. The critical assumption is made that the junction between grounded
Z
ICE
54
Za L~ --==============----- x -- -- --~ h-i- ---1-:-BEDROCK - - - -!..--
WATER
Fig. 7. Model of an elastic beam resting on the sea and on bedrock of slope Ba. The beam is damped at x = O. Dashed line shows the position of the centre line at maximum, mean and minimum tidal height. Zo is the position of the centre line at x = O. Tidal range = 2A (exaggerated), ice thickness = 2h.
and floating ice (the grounding line) is clamped rigid at distance, x = 0 (Fig. 7). The end conditions arc:
at x = 0, Z = Zo
at x = 0, dz/dx = Ba
where Zo is the position of the centre line at x = 0 (where the ice is not in hydrostatic equilibrium). The deflection, W, of the centre line of the beam from the mean value, with distance, x, is given by:
w = -A(t)
+e-.8x ((zo + A(t)) cos{3x + (~ + Zo + A(t)) sin (3x) .
(1) Here, A(t) is the tidal amplitude (maximum value 1.3 m) determined approximately by gravimeter observations at site 5, and {3 is an elastic damping factor given by:
Here, Pw is the density of sea water (1030 kg m -3), 9 is the gravitational constant, v is Poissons ratio for ice (0.3), E is the elastic modulus, and I is the second moment of the ice shelf of thickness 2h (1000 m):
The surface slope is the derivative, with respect to x, of Equation (1) and is given by:
dw .8 (Ba Ba ) dx = {3e- x 73 cos {3x - (73 + 2zo + 2A(t)) sin (3x
= B(x) - 2A(t){3e-.8x sin {3x. (2)
The tiltmeters measure the time-varying component of the surface slope, that is, the second term on the right of Equation (2), rather than the absolute value of the slope. The effect of the first term is to impart a "d. c." component to the surface slope which is not detected by the tiltmeters.
The effective elastic modulus of polycrystalline ice decreases with the frequency of the applied force (Sinha, 1978). For the semi-diurnal tidal frequency this modulus is 1.1 x 10⁹ N m- 2
. Substituting this value in the time-varying term in Equation (2) gives the model curve shown in Figure 8, which also shows the observed data from the tiltmeter sites. The model appears to be a reasonable explanation of the available data.
RUTFORD ICE STREAM TILTMETER SURVEY
Stephenson (1984b) described a tiltmeter survey on Rutford Ice Stream which flows into Ronne Ice Shelf (Fig. I). The exact position of the grounding line on Rutford Ice Stream is more difficult to locate than on Doake Ice Rumples because the ice and bedrock topographies are much more variable, both above and below the grounding-line region. Stephenson followed a simi-
U'i c
.~ "0
'" 0 .~ E w 0 :J t:: -1 0... 2 « r--1 f=
400
SITE 7
300
200
100
SITE 9
o
o 2
I SITE 3
.e
4 6
DISTANCE (km)
r SITE 1
1
8
Fig. 8. Elastic beam fiexure model for tilt data from DOQ,ke I ce Rumples. Solid Line is the time-varying term of Equation (2) including the values quoted in the analysis . Solid circles are the observed data (with error bars) .
10
lar analysis to that applied here, using a reduced value for the effective elastic modulus (suitable for the semidiurnal tide) in the model. However, he required an ice thickness of around half the measured value to obtain reasonable agreement between the model and the observed tilt data. From this model he produced a map of the grounding line on the ice stream (see figure 5 of Stephenson (1984b)). The need for a reduced effective ice thickness on Rutford Ice Stream, not required for Doake Ice Rumples, forms a discrepancy between the studies in the two areas. A comparison of the two surveys and a re-appraisal of the Rutford Ice Stream data has therefore been attempted.
Over Doake Ice Rumples, the tilt meters were orientated in the direction of ice flow which, satellite images and survey data show, is perpendicular to the grounding line. The tiltmeters were therefore assumed to lie in the direction of maximum tilt . As the Rutford Ice Stream grounding line has a sinuous geometry, orthogonal pairs of tiltmeters were required there to determine the true amplitude and azimuth of maximum tilt at each site. However, the long-term site {Rutford site 21 in figure 3 of Stephenson (1984b)) was occupied by only one tiltm eter and Stephenson was forced to estimate the tilt direction at this site to determine values for tilt amplitude at all the other sites. An initial assumption about the relative distances of the sites from the grounding line was required to compare the model with the observed tilt data.
The tilt values for Rutford Ice Stream have been re-
Smith: Dynamics of Antarctic ice-shelf grounding lines
Table 3. Recalculated tilt values for the semi-diurnal, M2 tide from Ruiford Ice Stream
Site Tilt amplitude Azimuth from true
1 2 3 4 5
21
Ilrad
176 102 76
222 70
198
north
deg
205 242 231 170 168 169
calculated following the same procedure as for Doake Ice Rumples and are given in Table 3. Differences between these values and those given in Stephenson (1984b) arise from the elimination of errors in the data and a subsequently more reliable estimate of the azimuth of maximum tilt at the long-term site, rather than from any differences in the analyses. Assuming (from the good fit of the model over Doake Ice Rumples) that a greatly reduced effective ice thickness is not required a priori, the recalculated Rutford Ice Stream tilt amplitudes were
400
' - , / \
I \ I \
I \ 900 m ICE-THICKNESS MODEL I \ I \
(i) 300 c
I \ I \ I \
.~ '0 C\l (;
. ~ E
I \ I \ I \
\ \
o-- -~ SITE 4
~ 200 :J
I I I I
+----e- SITE21
\
\ t:: -.J 0... 2 « I-.J
SITE 1 \
\ \ \ \
1800 m ICETHICKNESS MODEL
f= 100
\ \
\
o
o 2
\ \
e--- -------- SITES \
4
\
\ \ , ,
6
DISTANCE (km)
, " " "
8
Fig. 9. ELastic beam fiexure models for Rutford Ice Stream. The distance value for each point is allowed to vary to fit the modeLs. Open circles Lie on the 1800 m ice-thickness model, solid circles lie on the 900 m ice-thickness mode L.
10
55
Journal of Glaciology
compared with the elastic flexure model to determine the position of each data point on the distance axis. No assumptions were made about the relative distances of the tiltmeter sites from the grounding line. The distance value for each site was allowed to vary until it coincided with the model (Fig. 9). The distance values thus obtained can be used to create an alternative map of the grounding line of Rutford Ice Stream. Figure 9 shows the recalculated data from six of the tiltmeter sites compared with a model in which the measured ice thickness of 1800 m (Stephenson and Doake, 1982) was used. The other values in the model are taken from Stephenson (1984b) and are Pw = 1025kgm-3 and A(t) = l.3m. For comparison, Figure 9 also shows the corresponding resul ts when an ice thickness of 900 m (that used by Stephenson) is used in the model. Stephenson accounted for a reduced ice thickness by suggesting that the elastic bending of the ice is dominated by the middle half of the ice column, the upper and lower quarters being much less significant due to the presence of bottom crevasses and surface strand cracks and crevasses. The position of the grounding line determined from the models and that from Stephenson (1984b) are given in Figure 10.
It is reasonable to assume that the grounding line on Rutford Ice Stream will roughly parallel the surfaceelevation contours. The two models for Rutford Ice Stream (ice thicknesses of 1800 and DOO m) both show a spread of points in the region of the grounding line in better agreement with what would be expected from the surface-elevation map than did the previous interpretation (see figure 3 of Stephenson (1984b)), particularly in the areas marked A and B in Figure 10. One data point, from site 5 in the 1800 m ice-thickness model, is an exception. The records from all the Rutford Ice Stream tiltmeter sites have been given in Stephenson (1984a). From these it is evident that sites 2 and 5 (see Fig. 10) were of the poorest quality of those considered here. Site 2 is less than 1 km from site 3 which provided a much better record and the two sites are in reasonable agreement. Also, as site 2 is close to the grounding line and on the steep limb of the tilt/distance model curve, the projected grounding-line position is relatively insensitive to errors in tilt amplitude. The opposite situation occurs at site 5. As site 5 lies on the gentler limb of the model curve, the projected grounding-line position is sensitive to errors in tilt amplitude. For this reason, it is felt that the discrepancy at site 5 does not reduce the validity of the models. There is little to choose between the two models in terms of giving realistic grounding-line positions. The 1800 m model provides as good an explanation of the data as the 900 m one. They indicate that it is not necessary to assume such a greatly reduced ice thickness to explain the tilt data from Rutford Ice Stream.
Reduced effective ice thicknesses have also been used by Lingle and others (1981) in an analysis of tidal fiexure data from Jakobshavns Isbrre, West Greenland. They calculated an effective ice thickness for the elastic case of around 15- 20% of the estimated true thickness but did not use a time-dependent elastic modulus. If a value for the elastic modulus of 1.1 x 10⁹ N m-2 is used (as in this paper), the elastic analysis of the Jakobshavns Isbrre data gives effective thicknesses which compare better with the true thickness estimates.
Fig . 10. Grounding-line position estimates on Rutford Ice Stream from tiltmeter data. Crosses mark tiltmeter sites. Arrows indicate the direction of maximum tilt after reanalysis of the data. Open circles show the position of the grounding line from individual tiltmeters for an ice thickness of 1800 m, solid circles show the same for an ice thickness of 900 m. Solid line shows Stephenson's (1984b) grounding-line estimate. Dashed lines show surface-elevation contours in metres (from Stephenson, 1984a,b). A and B show where Stephenson's (1984b) grounding line differs greatly from the current estimates.
DISCUSSION OF THE ELASTIC BEAM MODEL
5
An elastic flexure model can explain the tilt data from Doake Ice Rumples. A similar model can also be applied to recalculated data from Rutford Ice Stream without the requirement for a great reduction in ice thickness. Thus, the discrepancy in effective ice thickness between the two survey areas is resolved. The elastic beam analysis predicts surface stresses at the grounding line of around 300 kPa (3 bar) - stresses at which creep, rather than elastic deformation, would dominate. Viscoplastic and elastic-viscoplastic analyses have been formulated by other authors (for example, Holdsworth, 1977; Hughes, 1977; Lingle and others, 1(81). The general forms of the elastic and the viscoplastic equations are the same, the main difference being in the damping factor used. Disadvantages associated with viscoplastic formulations include the non-linearity of the equations, which makes them difficult to solve, and the use of an arbitrary viscoplastic strength parameter in the damping term. Solutions of the non-linear viscoplastic equations depend on obtaining approximate linear equations based
on assumptions from the elastic analysis (Hughes, 1977; Lingle and others, 1981). For these reasons, and because of the success in applying the elastic analysis to the tiltmeter data from Doake Ice Rumples and Rutford Ice Stream, a viscoplastic analysis is not attempted here.
In addition to the influence of vis co plastic creep, there are a number of other possible limitations in the elastic analysis. These include assuming that the neutral surface lies in the centre of the ice column, that the temperature profiles are uniform, and that the grounding line is linear and two-dimensional (which for Rutford Ice Stream is clearly not the case) . In both survey areas, the greatest differences between model and observed data occur at sites farthest from the grounding line, suggesting either unrecognized inaccuracies in the data or that the model may require modifying at distances greater than around 6 km. Elastic beam modelling has been applied to data from the two survey areas, but the greatest problems in analysing tidal flexing of ice shelves arise from not knowing the correct rheology for ice at tidal frequencies. More field data are required to investigate the limitations of the elastic model and to support a more stringent approach to studying ice-shelf flexure .
WHERE IS THE GROUNDING LINE?
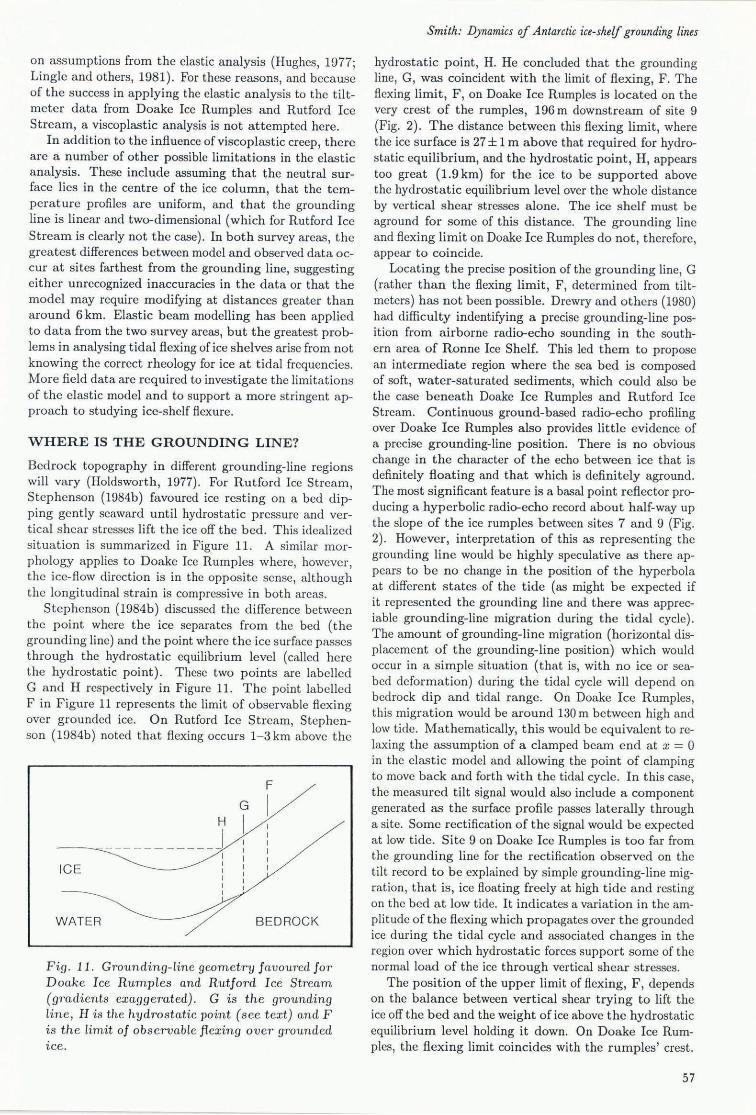
Bedrock topography in different grounding-line regions will vary (Holdsworth, 1977). For Rutford Ice Stream, Stephenson (1984b) favoured ice resting on a bed dipping gently seaward until hydrostatic pressure and vertical shear stresses lift the ice off the bed. This idealized situation is summarized in Figure 11. A similar morphology applies to Doake Ice Rumples where, however, the ice-flow direction is in the opposite sense, although the longitudinal strain is compressive in both areas.
Stephenson (1984b) discussed the difference between the point where the ice separates from the bed (the grounding line) and the point where the ice surface passes through the hydrostatic equilibrium level (called here the hydrostatic point) . These two points are labelled G and H respectively in Figure 11. The point labelled F in Figure 11 represents the limit of observable flexing over grounded ice. On Rutford Ice Stream, Stephenson (1984b) noted that flexing occurs 1- 3 km above the
F
G I H I
~. ___________ J ICE
WATER BEDROCK
Fig. 11. Grounding-line geometT1J favoured for Doake Ice Rumples and Rutford Ice Stream (gradients exaggerated). G is the grounding line, H is the hydrostatic point (s ee t ext) and F is the limit of obseT'IJable fl exing over grounded ice.
Smith: Dynamics of Antarctic ice-shelf grounding lines
hydrostatic point, H. He concluded that the grounding line, G, was coincident with the limit of flexing, F . The flexing limit, F, on Doake Ice Rumples is located on the very crest of the rumples, 196 m downstream of site 9 (Fig. 2). The distance between this flexing limit, where the ice surface is 27 ± 1 m above that required for hydrostatic equilibrium, and the hydrostatic point, H, appears too great (1.9 km) for the ice to be supported above the hydrostatic equilibrium level over the whole distance by vertical shear stresses alone. The ice shelf must be aground for some of this distance. The grounding line and flexing limit on Doake Ice Rumples do not, therefore, appear to coincide.
Locating the precise position of the grounding line, G (rather than the flexing limit, F, determined from tiltmeters) has not been possible. Drewry and others (1980) had difficulty indentifying a precise grounding-line position from airborne radio-echo sounding in the southern area of Ronne Ice Shelf. This led them to propose an intermediate region where the sea bed is composed of soft, water-saturated sediments, which could also be the case beneath Doake Ice Rumples and Rutford Ice Stream. Continuous ground-based radio-echo profiling over Doake Ice Rumples also provides little evidence of a precise grounding-line position. There is no obvious change in the character of the echo between ice that is definitely floating and that which is definitely aground. The most significant feature is a basal point reflector producing a hyperbolic radio-echo record about half-way up the slope of the ice rumples between sites 7 and 9 (Fig. 2). However, interpretation of this as representing the grounding line would be highly speculative as there appears to be no change in the position of the hyperbola at different states of the tide (as might be expected if it represented the grounding line and there was appreciable grounding-line migration during the tidal cycle). The amount of grounding-line migration (horizontal displacement of the grounding-line position) which would occur in a simple situation (that is, with no ice or seabed deformation) during the tidal cycle will depend on bedrock dip and tidal range. On Doake Ice Rumples, this migration would be around 130 m between high and low tide. Mathematically, this would be equivalent to relaxing the assumption of a clamped beam end at x = 0 in the clastic model and allowing the point of clamping to move back and forth with the tidal cycle. In this case, the measured tilt signal would also include a component generated as the surface profile passes laterally through a site. Some rectification of the signal would be expected at low tide. Site 9 on Doake Ice Rumples is too far from the grounding line for the rectification observed on the tilt record to be explained by simple grounding-line migration, that is, ice floating freely at high tide and resting on the bed at low tide. It indicates a variation in the amplitude of the flexing which propagates over the grounded ice during the tidal cycle and associated changes in the region over which hydrostatic forces support some of the normal load of the ice through vertical shear stresses.
The position of the upper limit of flexing, F, depends on the balance between vertical shear trying to lift the ice off the bed and the weight of ice above the hydrostatic equilibrium level holding it down. On Doake Ice Rumples , the flexing limit coincides with the rumples' crest .
57
Journal oJ Glaciology
A change in ice thickness or sea level would change the grounding-line position and the stress field in the ice, and would be reflected in a change in the position of the rumples' crest and the flexing limit. Tiltmeter surveys of the kind described here are monitoring grounding-line positions, G, by locating the flexing limit, F. The tiltmeter surveys have located the position of flexing limits to within 500m or better. For the flexing limit (and, therefore, the grounding line in the simple case where the distance between G and F remains constant at a site) to move a detectable distance (500 m) over Doake Ice Rumples would require an ice-thickness change of 10 m (less than 1 %) or, conversely, a 9 m change in sea level. Sealevel changes of this magnitude are unlikely to occur over a period of a few years but changes in ice thickness of 10 m are possible and could be monitored by tiltmeter surveys.
ACKNOWLEDGEMENTS
Dr C.S.M. Doake has provided much helpful advice throughout this work. R. M. Frolich and D. G. Vaughan provided useful comment on the manuscript. D. Carrivick and R. Webb helped with the field work.
REFERENCES
Drewry, D. J., D. T. Meldrum and E. Jankowski. 1980. Radio echo and magnetic sounding of the Antarctic ice sheet, 1978- 79. Polar Rec., 20(124), 43- 5l.
Holdsworth, G. 1969. Flexure of a floating ice tongue. J. Glaciol., 8(54), 385- 397.
Holdsworth, G. 1977. Tidal interaction with ice shelves. Ann. Geophys., 33(1/2), 133- 146.
Hughes, T. J. 1977. West Antarctic ice streams. Rev. Geophys. Space Phys., 15(1), 1- 46.
Lingle, C. S., T. J. Hughes and R. C. Kollmeyer. 1981. Tidal flexure of Jakobshavns Glacier, West Greenland. J. Geophys. Res., 86(B5), 3960- 3968.
Pedley, M., J. G. Paren and J. R. Potter. 1986. The tidal spectrum beneath Antarctic ice shelves. J. Geophys. Res., 91(Cll), 13,001- 13,009.
Potter, J. R., J. G. Paren and M. Pedley. 1985. Tidal behaviour under an Antarctic ice shelf. Br. Antarct. Surv. Bull. 68, 1- 18.
Robin, G . de Q. 1958. Seismic shooting and related investigations. N orwegian-British-Swedish Antarctic Expedition 1949- 52. Sci. Results 5. (Glaciology 3.)
Sinha, N. K. 1978. Short-term rheology of polycrystalline ice. J . Glacial., 21(85), 457- 473.
Smith, A. M. 1986. Ice rumples on Ronne Ice Shelf, Antarctica. Br. Antarct. Surv. Bull., 72, 47- 52.
Stephenson, S. N. 1984a. The dynamic behaviour of ice streams and ice shelves (with specific reference to Rutford Ice Stream, Antarctica). (M.Phil. thesis, Council for National Academic Awards.)
Stephenson, S. N. 1984b. Glacier flexure and the position of grounding lines: measurements by tiltmeter on Rutford Ice Stream, Antarctica. Ann. Glacial., 5, 165-169.
Stephenson, S. N. and C. S. M. Doake. 1982. Dynamic behaviour of Rutford Ice Stream. Ann. Glacial., 3, 295-299.
Stephenson, S. N., C. S. M. Doake and J. C. Horsfall. 1979. Tidal flexure of ice shelves measured by tiltmeter. Nature, 282(5738), 496- 497.
The accuracy of references in the test and in this list is the responsibility of the author, to whom queries should be addressed.
MS received 17 January 1990 and in revised form 23 July lDDD