659 www.metla.fi/silvafennica · ISSN 0037-5330 The Finnish Society of Forest Science · The Finnish Forest Research Institute Silva Fennica 42(4) research articles Antecedents and Barriers to Product Innovation – a Comparison between Innovating and Non-Innovating Strategic Business Units in the Wood Industry Matti Stendahl and Anders Roos Stendahl, M. & Roos, A. 2008. Antecedents and barriers to product innovation – a comparison between innovating and non-innovating strategic business units in the wood industry. Silva Fennica 42(4): 659–681. Increased competitive pressure from low-cost economies and substituting materials has raised the need for new strategies focusing on product differentiation in the Nordic wood industry. With the aim to identify factors that can facilitate increased product innovation activity, this study compared organizational characteristics and perceived barriers to product development among innovating and non-innovating strategic business units (SBUs) in the Swedish and Finnish wood industry. Multivariate analysis of data from a cross-sectional sample of 110 SBUs suggested that organizational size and educational level among white-collar workers are significant antecedents of product innovation activity. Furthermore, the difficulty of giving practical priority to development work in the everyday stress was identified as the most important perceived barrier to product development among managers in both innovat- ing and non-innovating SBUs. A low competence level among the personnel and a low need to innovate was perceived to be the second most important barriers to product development among managers in, respectively, innovating and non-innovating SBUs. Practitioners who wish to increase product innovation activity in the wood industry are advised to promote an increased educational level in wood industry companies. They are further encouraged to seek ways to reduce the perceived barriers to product innovation identified in this study. Keywords product development, obstacles for innovation, innovation strategy, organization Addresses Swedish University of Agricultural Sciences, Department of Forest Products, P.O. Box 7008, SE-750 07 Uppsala, Sweden E-mail [email protected]Received 12 February 2008 Revised 5 May 2008 Accepted 16 May 2008 Available at http://www.metla.fi/silvafennica/full/sf42/sf424659.pdf
Transcript
659
www.metla.fi/silvafennica · ISSN 0037-5330The Finnish Society of Forest Science · The Finnish Forest Research Institute
Silva Fennica 42(4) research articles
Antecedents and Barriers to Product Innovation – a Comparison between Innovating and Non-Innovating Strategic Business Units in the Wood Industry
Matti Stendahl and Anders Roos
Stendahl, M. & Roos, A. 2008. Antecedents and barriers to product innovation – a comparison between innovating and non-innovating strategic business units in the wood industry. Silva Fennica 42(4): 659–681.
Increased competitive pressure from low-cost economies and substituting materials has raised the need for new strategies focusing on product differentiation in the Nordic wood industry. With the aim to identify factors that can facilitate increased product innovation activity, this study compared organizational characteristics and perceived barriers to product development among innovating and non-innovating strategic business units (SBUs) in the Swedish and Finnish wood industry. Multivariate analysis of data from a cross-sectional sample of 110 SBUs suggested that organizational size and educational level among white-collar workers are significant antecedents of product innovation activity. Furthermore, the difficulty of giving practical priority to development work in the everyday stress was identified as the most important perceived barrier to product development among managers in both innovat-ing and non-innovating SBUs. A low competence level among the personnel and a low need to innovate was perceived to be the second most important barriers to product development among managers in, respectively, innovating and non-innovating SBUs. Practitioners who wish to increase product innovation activity in the wood industry are advised to promote an increased educational level in wood industry companies. They are further encouraged to seek ways to reduce the perceived barriers to product innovation identified in this study.
Keywords product development, obstacles for innovation, innovation strategy, organizationAddresses Swedish University of Agricultural Sciences, Department of Forest Products, P.O. Box 7008, SE-750 07 Uppsala, Sweden E-mail [email protected] 12 February 2008 Revised 5 May 2008 Accepted 16 May 2008Available at http://www.metla.fi/silvafennica/full/sf42/sf424659.pdf
660
Silva Fennica 42(4), 2008 research articles
1 Introduction The Nordic wood industry has traditionally focused on efficient production of standard products. In recent years, however, increased competitive pressure from low-cost economies and substitute materials has raised the need for new strategies focusing on product differentia-tion (European Confederation of Woodworking Industries (ed.) 2004, NRA-Sweden 2006 (www.nra-sweden.se, accessed 4/2/08)). Accordingly, various product development initiatives can now be seen in the industry (Timber Trade Journal 2005). Product development projects range from laminated blanks to multi-material composite building components and do-it-yourself system solutions, and include service-related aspects such as logistic solutions, vendor managed inventories and sales promotion. Target customers are prima-rily found in the joinery/furniture industry, in the construction industry and in the retailing sector (Stendahl et al. 2007).
The increased interest in differentiation in the wood industry has resulted in a need to under-stand the innovation process in this industry con-text better. Accordingly, the topic has earned increased interest from researchers in recent years (Rametsteiner et al. 2006). However, while pre-vious research primarily has dealt with process innovation, product innovation has received less attention (Hansen et al. 2006). Consequently, exploratory research on product innovation in the wood industry is needed.
According to Hansen et al. (2006), research on innovation can be organized according to three broad categories: organizational innovativeness, new product development, and innovation sys-tems. Organizational innovativeness is concerned with identifying what factors influence an organi-zation’s innovativeness and with the effect of innovativeness on financial performance. This category also includes diffusion research. New product development deals with description of the product development process, identification of its challenges, and finding suitable remedies to those challenges. The central research ques-tion is: how can a successful new product best be developed? Innovation systems research sees innovation as a product of the interplay between actors (e.g. companies) and institutions (e.g., reg-
ulations and policies). The main research question of this research stream is: what composition of, and interaction between, actors and institutions best facilitates innovation? Research on product innovation in the wood industry to date has pri-marily analysed the structure of the new product development process and the mechanisms and effects of adoption of new products. Hansen et al. (2006) provide a comprehensive review of past and present findings.
Innovativeness, i.e. the propensity to create and adopt new products, and especially the factors that facilitate innovativeness in organizations, is an important topic for academics, practitioners, and policy-makers (Hansen et al. 2006). Recent exam-ples of research on organizational innovativeness in the wood industry include Korhonen (2006) and Crespell et al. (2006). Korhonen (2006) found that a lack of slack resources, lean centralized organizational designs, and an inward commu-nication climate hinder organizational renewal in major forest industry companies. Crespell et al. (2006) showed that a structured product development process and a market-oriented cul-ture promote innovativeness in North American sawmilling companies. To our knowledge, how-ever, no investigation of the factors that distin-guish innovating from non-innovating companies and actually drive innovativeness in the Nordic wood industry context has been carried out. The present article reports on a study that continues the exploratory research stream on organizational innovativeness in the wood industry and fills this gap. With the aim to identify factors that could facilitate increased product innovation activity in the wood industry, this study compares organi-zational characteristics and perceived barriers to product development among innovating and non-innovating strategic business units (SBUs) 1 in the Swedish and Finnish wood industry. The specific research questions are:1) What organizational characteristics influence
organizational innovativeness, as manifested in product development activity, in the wood indus-try?
2) What factors do managers in the wood industry perceive to be the most important barriers to prod-uct development?
661
Stendahl and Roos Antecedents and Barriers to Product Innovation – a Comparison between Innovating and Non-Innovating …
2 Theory2.1 Innovation and Product Development
Innovation is the generation, acceptance and imple-mentation of new ideas, processes, products or services (Thompson 1967). This study is concerned with product innovation, i.e., new products and the organizational processes that precede their launch. What is then to be considered ‘new’? When is it ‘new enough’ to be considered an innovation? The literature provides several frameworks to classify product newness, e.g., from incremental to radi-cal innovations (see, e.g., Garcia and Calantone 2002). This study, however, is concerned with product innovation as a phenomenon, rather than with product innovations with a certain degree of newness. Therefore, in line with the basic definition of innovation in the Oslo Manual (OECD/Eurostat 2005), we consider a product innovation to be the introduction of a good or service that is new or significantly improved with respect to its charac-teristics or intended uses in the eyes of the focal company. This includes significant improvements in technical specifications, components, and materials, incorporated software, user friendliness, or other functional characteristics. Product development is used as a term for the span of innovation activities leading to, or that are intended to lead to, product innovations (OECD/Eurostat 2005).
2.2 Organizational Innovativeness
Because innovation can be a strong contribu-tor to company performance (Subramanian and Nilakanta 1996, Calantone et al. 2002, Hult et al. 2004) and essential for company survival in a dynamic environment (Teece et al. 1997, Eisen-hardt and Martin 2000), it is a process of interest to both practitioners and academics. For example, a need for new strategies focusing on differ-entiation has increased the interest for product innovation in the Nordic wood industry. Organi-zational innovativeness was used in this study as a concept to describe the propensity to adopt or create, develop, and implement innovations (Hansen et al. 2006). According to many innova-tion researchers, the organizational innovative-ness of companies is affected by factors such as
the characteristics of organizational members, the characteristics of the organization, and the environment of the organization (Hadjimanolis 2000). Presupposing that this is true, and that it is desirable to increase organizational innovative-ness in the wood industry, it is of great interest to identify the factors that could facilitate increased innovativeness in wood industry companies.
Research on the determinants of organizational innovativeness have often been accused of produc-ing conflicting results, and one reason might be the lack of precision and consistency in the definition and measurement of innovation and innovative-ness (Hansen et al. 2007). This lack of precision and consistency might be a consequence of the difficulties associated with the measurement of such a complex concept as innovativeness. After all, because “[innovativeness] is a strategic, cul-tural, social, and managerial issue” (Välimäki et al. 2004) it leaves a lot of possibilities for differ-ent approaches in operationalization. And perhaps Rogers (1998) has a point when he states that because innovativeness is such a multifaceted and complex organizational trait, there is no single measure that can capture the concept. Hansen et al. (2007) state that five main approaches, all with their specific strengths and weaknesses, have been used by aca-demics to measure organizational innovativeness: current technology adoption (most common in the forest sector literature), various methods of self-evaluation, intellectual property (typically patents), R&D funding, and the number of new products. Practitioners in the industry, however, have few concrete measures for innovativeness (Hansen et al. 2007).
In this study, we aimed to maximize validity and reliability in the measurement of innovative-ness through the use of a simple and concrete measure that was easy for managers to grasp and give a valid answer to. As described in the method section of this article, the lack of existing meas-ures for innovativeness among wood industry practitioners was made visible in the pre-testing of the questionnaire, where managers had prob-lems providing information on more sophisticated innovativeness indicators such as R&D funding and percentage of sales from new products. As a consequence, we narrowed our operationalization of the concept to focus on the occurrence of inno-vation activity and the identification of innovating
662
Silva Fennica 42(4), 2008 research articles
and non-innovating business units. In line with the procedures of the Community Innovation Survey outlined in the Oslo Manual (OECD/Eurostat 2005), we defined an innovating SBU as an SBU that has implemented a product innovation during the last five years 2. This operationalization of innovativeness, however, has some limitations. Firstly, it is based on product newness to the SBU and does not say anything about product newness to the market. Secondly, it misses the point of time of innovation and the innovation consist-ency over time, which are important aspects of innovativeness according to the literature (Subra-manian and Nilakanta 1996). Finally, it does not contain information about the specific amount of innovation activity conducted by the SBUs. This operationalization is, therefore, an imprecise tool to identify the industry’s product innovation leaders. Still, it distinguishes between innovat-ing and non-innovating SBUs. To summarize, strictly speaking this study is concerned more with innovation activity than with innovativeness. However, because innovation activity is a major element of innovativeness (Hansen et al. 2007), we maintain that our survey is relevant also for an increased understanding of the wider concept of innovativeness.
2.3 Antecedents to Innovativeness
The classical model in the antecedents-to-innova-tion literature includes several types of predictors for innovativeness: characteristics of organiza-
tional members, characteristics of the organiza-tion, and environmental factors (Hadjimanolis 2000). Because of the multitude of possible ante-cedent variables, a model capturing all variables of all types would be too extensive. In this study, we are interested in variables that can, at least partly, be manipulated by managers, and there-fore we chose to concentrate on the characteris-tics of the organization. Even with the limitation to include only organizational characteristics, a choice among this type of variables must be made. The selection of variables in this study was based on a literature review and the results of previous qualitative research. Pre-tests of the questionnaire (including discussions with industry experts and potential respondents) influenced the final choice of variables.
General innovation management literature pro-vides comprehensive lists of factors that drive innovativeness among companies. Summaries of these findings can be found in both review articles (e.g., Hansen et al. 2006, Becheikh et al. 2006) and textbooks (e.g., Trott 2005). Recent research in the forest industry has also produced evidence on factors that facilitate innovativeness in this context (e.g., Korhonen 2006, Crespell et al. 2006, Wagner and Hansen 2005). Antecedents to organizational innovativeness according to the literature are summarized in Tables 1 and 2.
The following organizational characteristics were included as independent variables and pos-sible antecedents to innovativeness in this study: market orientation, educational level among white-collar workers, export share, organization
Table 1. Antecedents to organizational innovativeness according to general innovation management literature.
Hansen et al. (2006) Becheikh et al. (2006) Trott (2005)
Specialization and professionalism among managers
Managerial support for innovationMarket- and learning-oriented
organizational culture Internal and external communica-
tion ability Company size Slack resources Formality, centrality and complexity
of organizational structure (neg.) Industry maturity (neg.)
Strategic focus on differentiation, inno-vation and continuous improvement
Share of exports Flexible and informal organizational
structureWell-educated personnelMarket orientation Optimal size and location of the firm
Growth orientationVigilanceCommitment to technologyAcceptance of risksCross-functional cooperationReceptivitySlack resourcesAdaptabilityA diverse range of skills
663
Stendahl and Roos Antecedents and Barriers to Product Innovation – a Comparison between Innovating and Non-Innovating …
size, integration structure (mix of business activi-ties), and raw material mix. The rationale for this selection is described in the following sections.
Because idea-creation and problem solving are believed to be facilitated by cross-fertilization of different types of knowledge (Trott 2005), infor-mation flows and knowledge interaction are of great interest to innovation research. One obvious source of information is the market environment of the company. A “market orientation” has been described as an organization-wide generation of market intelligence (Kohli and Jaworski 1990) and as a culture that places the highest priority on customer value (Narver and Slater 1990). Desh-pande and Farley (1998) define market orienta-tion as “the set of cross-functional processes and activities directed at creating and satisfying cus-tomers through continuous needs-assessment”. Hult et al. (2004) define market orientation as “…an aspect of culture and a latent construct whose indicators are values, beliefs and symbols that demonstrate a concern for markets” and state “Culture reflects norms, values and beliefs that reinforce behaviors ultimately related to busi-ness performance. When specific orientations are embedded in organizational culture, the intensity and consistency of resultant behaviors are aug-mented across situations, groups, and persons within the firm.” Market orientation has widely been positively associated with innovativeness (e.g. Hult et al. 2004, Han et al. 1998) and was therefore included as a predictor of innovativeness in this study.
Also the positive influence of export share on innovativeness is believed to be a result of the increased inflow of new ideas to which interna-tionalization might contribute. There is also evi-dence that increased innovativeness contributes to increased export intensity, mainly as a result of increased market power and marketing needs
(Pla-Barber and Alegre 2007). Therefore, export share was also included as an independent vari-able in the study.
Another source of idea creation and problem solving is diversity of knowledge and skills among the personnel (Trott 2005). Stendahl et al. (2007) found that managers in the sawmilling industry perceive that a mix of personnel with academic- based knowledge and personnel with experience-based knowledge is an important key factor of successful product development. The share of personnel with higher education is generally very low in the Swedish wood industry (Staland et al. 2002) and there is no cause to believe the situ-ation is much different in Finland. The addition of academic knowledge should, presumably, lead to a greater diversity of knowledge types in the business unit. Educational level among white collar-workers was, therefore, included in the study as a predictor of innovativeness.
Past research on the relationship between organizational size and innovativeness has pro-duced conflicting results. There are theoretical arguments and empirical findings supporting a positive relationship between the two. Large companies have better access to important inno-vation resources such as money, people and facili-ties (Damanpour 1992). Korhonen and Niemelä (2004) also found that large forest industry com-panies turn their focus towards innovation in order to secure knowledge creation and sustainable growth. However, there are a number of fac-tors that suggest small firms may have several advantages over large firms – for example, better flexibility (Rogers 2004). In addition, it appears that the relationship between firm size and inno-vation depends on the specific technological and market conditions (Rogers 2004). In a study of the North American softwood sawmilling industry, Crespell et al. (2006) found a positive, but non-
Table 2. Antecedents to organizational innovativeness identified in recent forest industry research.
Korhonen (2006) Crespell et al. (2006) Wagner and Hansen (2005)
A diverse range of skillsOrganizational slackA management team that encourages
exploration and tolerates mistakes
A structured product development process
Market orientation
Organizational size
664
Silva Fennica 42(4), 2008 research articles
significant, relationship between size and inno-vativeness. Despite the fact that size is one of the most common variables to be included in studies of innovativeness, it seems that the relationship with innovativeness still is somewhat unclear. In this study, we include organizational size as an independent variable and assume a positive rela-tionship with innovativeness, especially because large firms have more personnel, products, and customers, and, therefore, more possibilities for idea creation, than small ones.
Finally, to control for the influence of contex-tual differences in integration structure and raw material mix, these two variables were included as control variables in the study.
A hypothetical antecedent-to-innovation model for the wood industry is displayed in Fig. 1. Bold parts are included in this study.
2.4 Barriers to Product Innovation
In contrast to the facilitating factors in the ante-cedent model of innovation, there are also factors that can impede innovation activities: so-called innovation barriers. Some can be reasons for not starting innovation activities at all and some can have a negative effect on expected results. Some examples of potential company-external barriers are difficulties in obtaining raw materials, lack of demand for innovations, and government regula-
tions or policies. Some examples of potential company-internal barriers are lack of competence, resistance to change among the personnel, lack of management time, and lack of technical or finan-cial resources. Also, uncertainties, i.e., factors that are difficult to determine beforehand, influ-ence the perceived risks with product develop-ment and can therefore act as barriers to product development.
Ajzen’s Theory of Planned Behavior, TPB (Ajzen 1991), has been widely applied to model antecedents of human action. According to TPB, human action can be modelled as a function of perceived behavioral control factors (PBC factors, i.e., perceptions about what factors constrain the possibilities for action), subjective norms (per-ceptions about what others think about a certain action), and attitudes (subjective attitudes about a certain action). In a meta-study, Armitage et al. (2001) found that PBC factors account for a significant amount of variance in intention and behavior, whereas attitudes and subjective norms are weaker predictors. The TPB model was origi-nally developed for psychological enquiries, but has also been applied in business studies, e.g., to model entrepreneurship (Krueger et al. 2001). Although our analysis is not strictly organized according to the TPB model, most barriers to innovation mentioned in the literature can be characterized as PBC factors (mainly) or as atti-tude factors. Because PBC factors are important
Fig. 1. A hypothetical antecedent-to-innovation model for the wood industry. Bold parts are included in this study.
Characteristics of organizational members
Characteristics of the organization
• Market orientation • Educational level of white collar-
workers • Export share • Size • Integration structure • Raw material mix
Characteristics of the environment
Organizational innovativeness
665
Stendahl and Roos Antecedents and Barriers to Product Innovation – a Comparison between Innovating and Non-Innovating …
predictors of action, a change in these factors should result in a change in behavior. If, for exam-ple, barriers to innovation are removed, it can be assumed that innovation activity will increase. Therefore, a better knowledge about what factors are perceived as barriers to innovation by wood industry managers is a first step towards eliminat-ing those factors and, in the long run, improving the climate for innovation in the wood industry.
Research on barriers to innovation has produced impressive lists of potential barriers to innovation (see, e.g., OECD/Eurostat 1997). The research on innovation barriers specific to the wood industry is, however, more sparse. Stendahl et al. (2007) found that resource constraints (such as lack of time, money and knowledge), process uncertain-ties (such as raw-material supply, product yield, and market development) weaknesses of the wood material, and structural shortcomings of supply chains to some market segments work as barriers to product innovation in the Swedish and Finnish sawmilling industry. Nord (2005) states that the availability and cost of raw material, yield of the production process, and development of customer needs and the market structure are important uncer-tainties in the sawmilling industry. Finally, the wood industry is commonly judged to be traditional and captured in old core competences. According to the literature, core competences can function as bases for organizational development, but also as constraints to further development (Danneels 2002, Leonard-Barton 1992), which can be assumed to be the case for the wood industry.
In this study, managers’ perceptions about the importance of a number of potential barriers to product innovation were examined. The potential barriers were chosen based on a synthesis of general innovation barriers identified in OECD/Eurostat (1997), and uncertainties and innovation barriers typical for the wood industry identified in Nord (2005) and Stendahl (2007). See Table 4 for the list of potential barriers used in this study.
3 Method
In this study, one objective was to identify ante-cedents to product innovation in the wood industry. This objective was addressed by a comparison of
organizational characteristics among innovating and non-innovating business units. Another objective of this study was to identify and analyze barriers to product innovation in the wood industry. This objective was addressed by the analysis of per-ceptions among wood industry managers about the importance of some hypothetical barriers to product innovation. A quantitative method, includ-ing a telephone-based cross-sectional survey, was chosen as the research strategy for this study.
3.1 Population and Sample
The empirical setting of this study was the wood industry in Sweden and Finland. The SIC code industry classification system, which is based on a classification of the main activities of companies, was used to frame the population. SIC codes are similar to SNI codes in Sweden and TOL codes in Finland. Companies with the following main activities were targeted in this study: – Sawmilling: SNI 20101/TOL 20100 – Planing: SNI 20102/TOL 20100– Impregnation/wood treatment: SNI 20103/TOL
20100
In Sweden and Finland, all registered companies must be classified according to the SNI/TOL code systems. The official lists of companies belonging to SNI 20101, 20102, 20103, and TOL 20100, which was obtained from national statistic bureaus in both countries, was therefore used as the basic list of companies in the population. We limited the lists to contain companies with at least 20 employees. The basic lists were cross-checked against the member lists of the wood products industry organizations in both countries to assure inclusion of as many relevant companies as possible.
Because the survey contained both strategic and operational questions, strategic business units (SBUs) within each company were chosen as study units. An initial contact with all companies was taken to verify that they had their main activ-ities within the intended SNI/TOL categories. Furthermore, the SBU structure in middle-sized (50–249 employees) and large (250– employees) companies was examined to obtain a list of SBUs in these companies. No examination of SBU
666
Silva Fennica 42(4), 2008 research articles
structure in small (20–49 employees) companies was made since small companies in the wood industry normally only consist of one SBU (Juslin and Hansen 2003). The resulting list of SBUs was used as the total sample frame. In order to secure a sufficient number of responding SBUs, the initial sample consisted of the total sample frame. The total number of SBUs included in the initial sample was 110 (Sweden) and 59 (Finland), making a total of 169 units.
To maximize reliability and response rate, established methods (Dillman 2000) guided the design of the study and the construction of the survey questionnaire. In Sweden, responses from 87 SBUs were received, giving a response rate of 79%. In Finland, responses from 23 SBUs were received, giving a response rate of 39%. The final sample thus consisted of 110 SBUs. A non-respondent analysis revealed that small SBUs with sawmilling as main activity were slightly underrepresented in the final sample. The compo-sition of the final sample is reported in Table 3.
3.2 Data Collection
Data was collected through telephone interviews with the managing directors of each SBU or with other members of each SBU’s management group. The interviews were carried out during the fall of 2006. In Sweden, bookings and interviews were carried out by one of the researchers. In Finland, bookings and interviews were carried out by a commercial data collection agency.
The interviews followed a structured question-naire. To improve the clarity and content validity of the questions, the questionnaire was pre-tested on three potential respondents in each country. The results of the pre-tests led to some valuable adjustments of the questions and the structure of the questionnaire. For example, it was indicated that information required for more sophisticated indicators of innovativeness, e.g., “R&D invest-ment’” and “share of new products from total turnover” (Välimäki et al. 2004) was difficult for managers to provide. The questionnaire was
Table 3. Composition of the final sample.
Characteristic Type Number of SBUs Share of SBUs (%)
Country of origin Sweden 87 79Finland 23 21Total 110 100
Size a) Micro and small 22 20Medium 60 55Large 24 22Missing data 4 3Total 110 100
Integration structure Production of… …sawn goods only 14 13…sawn and furtherprocessed b) goods 75 68…furtherprocessed goods only 21 19Total 110 100
Raw material mix c) Spruce focus 48 43Pine focus 36 33Hardwood focus 2 2No focus 23 21Missing data 1 1Total 110 100
a) Micro and small = turnover 2005 up to EUR 9 999 999; medium = turnover 2005 EUR 10 000 000 – 49 999 999; large = turnover 2005 more than EUR 49 999 999.
b) Furtherprocessed goods = impregnated goods, poles, panelling, mouldings, floorings, planed construction wood, blanks for joinery or furni-ture industry, engineered wood products, building modules
c) Spruce focus = a raw material mix consisting of more than 66% spruce; pine focus = a raw material mix consisting of more than 66% pine; hardwood focus = a raw material mix consisting of more than 66% hardwood (in subsequent analyses where data about raw material mix were used, SBUs with a hardwood focus were excluded from analysis due to the small size of this group); no focus = neither a spruce, pine nor hardwood share of more than 66%.
667
Stendahl and Roos Antecedents and Barriers to Product Innovation – a Comparison between Innovating and Non-Innovating …
originally in English but was translated to Finn-ish and Swedish for the surveys in the respective countries. Translation to Finnish was made sepa-rately by two persons that were fluent in Swed-ish, Finnish and English. The translations were then compared, differences were discussed and a consensus was reached. The translation was then confirmed by a third person that also was fluent in the three languages. Translation to Swedish was made by the researchers. The questionnaire was sent to most respondents before the interview (typically in connection with the booking of the interview).
The variables displayed in Table 4 were gath-ered for this particular study. Data from the survey was saved in a data base and analyzed with a computer program for statistical analysis (SPSS 14.0).
3.3 Methods of Analysis
To describe the difference between innovating and non-innovating SBUs with regard to size, integra-tion structure and raw material mix, observed and expected frequencies of innovating and non-innovating SBUs in descriptive categories of these variables were compared (the descriptive categories for these variables have previously been displayed in Table 3). The expected fre-quency of innovating SBUs in each category of each variable was calculated based on the share of innovating SBUs among the SBUs that pro-vided data on the respective variable (106 SBUs provided data on the variable ‘size’ and among these the share of innovating SBUs was 63.2%; integration structure: N = 110, share of innovating SBUs = 63.6%; raw material mix: N = 107, share of innovating SBUs = 62.6%). To arrive at an expected frequency of innovating SBUs in each category of each variable the share of innovating SBUs were multiplied with the number of SBUs in each category of each variable. The expected frequency was then compared with the observed frequency of innovating SBUs in each category of each variable, and significance of the differ-ences was determined through chi-square tests (p = 0.05).
Differences between innovating and non-inno-vating SBUs with regard to market orientation,
educational level among white-collar workers, and export share were determined through com-parison of mean values among innovating and non-innovating SBUs. The significance of differ-ences was tested with t-tests and Mann-Whitney U-tests.
To examine group differences more closely, binary logistic regression was applied. Similar to discriminant analysis, this is a multivariate technique that can be used either as a type of profile analysis or as an analytical predictive technique (Hair et al. 1998). In our case, we were interested in profiling the innovating SBUs and to determine the influence of each individual organizational characteristic on the probability of being an innovating SBU. Logistic regression can assist in this process through examination of the increase or decrease in the probability of group membership as an effect of the presence or increase of an organizational characteristic, while simultaneously controlling for the effect of other organizational characteristics in the model. The forced-entry method, in which all predictor variables are tested in one block (Pallant 2001), was used in the analysis. For determination of significance of differences, an alpha (p) value of 0.05 was used.
Information about barrier perceptions was obtained through calculation of the means of agreement with each ‘barrier statement’ for all respondents and for innovating and non-innovat-ing SBUs, respectively. In addition, answers to the open-ended question about additional barriers were scrutinized.
Finally, to investigate multidimensional rela-tionships among barrier perceptions and to pro-vide a more concise picture of these perceptions, a principal component factor analysis was con-ducted (Hair et al. 1998). The Oblique Rotation method was chosen since this method is most appropriate when the primary goal is to obtain theoretically meaningful constructs (ibid.). Aver-age factor scores in the individual factors were then extracted and compared between innovat-ing and non-innovating SBUs. Also the means of the significant variables for each factor was calculated and compared between innovating and non-innovating SBUs. The significance of differ-ences was tested with t-tests and Mann-Whitney U-tests.
668
Silva Fennica 42(4), 2008 research articles
Table 4. Variables in the study and how they were operationalized.
1) Organizational innovativenessOrganizational innovativeness was assessed with a dichotomous measured that measures whether an SBU has or has not operated a product development project within the last five years. To improve validity of the assessment respondents were given the definition of product development used in this article. Only projects that at least had reached the phase of trial sales (or market introduction) were accepted as valid projects.
Has your SBU operated a product development project within the last five years? (yes/no)•
2) SizeWhat was the turnover of this SBU in year 2005? (EUR)•
3) Educational level among white-collar workersWhat is the current share of white-collar workers in this SBU with university education? (%)•
4) Market orientationMeasured with a multiple-item 1–5 Likert scale a) (1: strongly disagree…5: strongly agree) adapted from Deshpande and Farley (1998). The scale originally contained ten items. Due to practical restrictions and to improve clarity, five items (of which two were slightly reworded) were chosen for use in this study. In line with common practice in this type of management research, we assumed equal distance between the alter-natives in the scale. Accordingly, mean scores could be calculated for each respondent (Hair et al. 1998). Reliability (internal consistency) of the scale was good with a Cronbach’s alpha exceeding the recom-mended threshold level 0.70 (Nunnally 1978).
We communicate information about our contacts with customers across the whole business unit • Our main competitive advantage is our superior understanding of customer needs • We measure customer satisfaction systematically and frequently • We are more customer focused than our competitors • Data on customer satisfaction are disseminated at all levels in this business unit on a regular basis •
5) Export shareWhat was the export share of this SBU in year 2005? (%)•
6) Integration structureDo you currently produce sawn wood in this SBU? (yes/no)•Do you currently produce impregnated wood, poles, panelling, mouldings, floorings, planed construction •wood, blanks for joinery or furniture industry, engineered wood products, or building modules in this SBU? (yes/no)
Three discrete classes of integration structure were created for analysis: “only sawmilling”, “sawmilling and further-processing”, and “only further-processing”.
7) Raw material mixWhat is your current consumption of spruce in this SBU? (cbm round wood and sawn wood, resp.)•What is your current consumption of pine in this SBU? (cbm round wood and sawn wood, resp.)•What is your current consumption of hardwood in this SBU? (cbm round wood and sawn wood, resp.)•
Three discrete classes of raw material mix were created for analysis: “no focus”, “spruce > 66%”, “pine > 66%”.
8) Perceived importance of some hypothetical barriers to product developmentMeasured with single-item 1–5 Likert scales (1: strongly disagree…5: strongly agree)Considering the situation in our business unit, I think that…
The need for product development is very low•There are too few ideas for new products•Product development is not prioritized in the daily work•Product development is not prioritized in investment decisions•Too much variation in raw material quality makes product development difficult•Too insecure raw material supply makes product development difficult•Current process technology in the market gives no new possibilities for product development•Too low level of competence among personnel makes product development difficult•Too little knowledge about customer needs makes product development difficult•Too little knowledge about process technology makes product development difficult•Too little knowledge about wood properties makes product development difficult•Product development is considered difficult and expensive•The personnel dislikes change and development work•
669
Stendahl and Roos Antecedents and Barriers to Product Innovation – a Comparison between Innovating and Non-Innovating …
4 Results
When analyzing SBUs with regard to their inno-vation activity, it was found that 57 (66%) of all SBUs in Sweden (N = 87) were innovating SBUs and that 13 (57%) of all SBUs in Finland (N = 23) were innovating SBUs. In total, 70 (64%) of all SBUs in both countries (N = 110) were innovat-ing SBUs.
The analysis of innovation activity among SBUs in different classes of size, showed that among micro, small, and medium SBUs, the fre-quencies of innovating SBUs are approximately the same as in the total sample. The frequency of innovating SBUs among large SBUs is, however, significantly larger than in the total sample. See Table 5.
The analysis of innovation activity among SBUs in different classes of integration struc-ture showed that among SBUs with sawmilling and further-processing or only further-processing activities, the frequencies of innovating SBUs are approximately the same as in the total sample. The frequency of innovating SBUs among SBUs with only sawmilling activity is, however, significantly lower than in the total sample. See Table 6.
The analysis of innovation activity among SBUs in different classes of raw material mix showed that the innovation frequency did not significantly differ within classes compared to the frequencies in the total sample. See Table 7.
Furthermore, the univariate analyses showed that innovating SBUs had a significantly higher share of university educated white-collar workers in comparison to non-innovating SBUs. Innovat-ing SBUs also had a higher market orientation score in comparison to non-innovating SBUs, but the significance of the difference is weak. The share of exports, finally, did not significantly
differ between innovating and non-innovating SBUs. See Table 8.
To examine group differences more closely, binary logistic regression was applied. The inde-pendent variables that entered the equation are displayed in Table 10. Ninety-eight cases were included in the analysis and 12 were excluded due to missing data in one or more independent variables.
For assessment of the logistic regression equa-tion model, there are several measures of model fit available from the SPSS output. Several of them are based on a comparison of a base model in which no independent variables are included (and prediction of group membership is based on group size), with a new model including the inde-pendent variables. If the independent variables have any discriminating power, the new model will be better in predicting group membership than the base model. The omnibus test of model coefficients provides indication of whether there is a significant difference between the prediction accuracy of the base model and the new model. A significant result indicates a good model fit (Hair et al. 1998). The omnibus test of model coef-ficients in our case indicated a chi-square value of 48.361 with 8 degrees of freedom (p < 0.001). The Hosmer and Lemeshow test indicates if there is a significant difference between observed and predicted classifications. A non-significant result indicates a good model fit (Hair et al. 1998). The chi-square value of the Hosmer and Lemeshow test in our case was 11.151 (p = 0.193). Two meas-ures, Cox and Snell R2 and Nagelkerke R2, that provide an indication of the amount of variation in the dependent variable explained by the model are also available (Hair et al. 1998). These two measures are comparable to the R2 measure in multiple regression. In our case, the former was
Suppliers of raw material are not susceptible for change•The market is not susceptible for change•Imitation of new products from competitors makes product development unprofitable•Difficulties to find external financing makes product development difficult•
In addition, information about the existence of possible additional barriers was collected through an open-ended question.
a) The idea with multiple-item Likert scales is to capture a latent construct through the use of several indicator questions. Likert scales com-monly present an item as a declarative sentence, followed by response options that indicate varying degrees of agreement with the statement (De Vellis 1991).
670
Silva Fennica 42(4), 2008 research articles
Table 5. Innovation activity in classes of size.
Turnover 2005 EUR Observed N Expected N Asymp Sig
a)No 1 1.5Yes 3 2.5 Total 4
Micro and Small (EUR 0 – 9 999 999)
No 11 8.1 Yes 11 13.9Total 22 0.199
Medium (EUR 10 000 000–49 999 999)
No 27 22.1Yes 33 37.9
Total 60 0.188
Large (>EUR 49 999 999)
No 1 8.8Yes 23 15.2Total 24 0.001
a) Missing data
Table 7. Innovation activity in classes of raw material mix.
Raw material mix Observed N Expected N Asymp Sig
a) Yes 3 Total 3
No focus Yes 13 14.4Total 23No 10 8.6 0.547
Spruce > 66% Yes 27 30.0Total 48No 21 18 0.363
Pine > 66% Yes 27 22.5Total 36No 9 13.5 0.124
a) Missing data
Table 6. Innovation activity in classes of integration structure.
Integration structure Observed N Expected N Asymp Sig
Only sawmilling No 9 5.1 Yes 5 8.9 Total 14 0.030
Sawmilling and furtherprocessing
No 24 27.3 Yes 51 47.7
Total 75 0.428
Only furtherprocessing No 7 7.6 Yes 14 13.4 Total 21 0.770
671
Stendahl and Roos Antecedents and Barriers to Product Innovation – a Comparison between Innovating and Non-Innovating …
0.390 and the latter was 0.530 which indicate that the model explains between 39–53 percent of the variance of the dependent variable. Finally, the classification table (see Table 9) shows that the new model, on average, correctly predicted which group an SBU belonged to 81.6% of the time. This is an improvement compared to the base model, which predicted correctly 62.2% of the time. Hair et al. (1998, p. 270) advocates that the prediction accuracy of the new model should be at least 25% better than the base model. In our case it was 31% better. Table 9 also shows that
the model correctly predicted 70.3% of the non-innovators and 88.5% of the innovators. Overall, the three tests and the classification table indicate a good model fit.
Table 10 displays the influence of each organi-zational characteristic on the probability of being an innovating SBU. From Table 10, it can be con-cluded that WCUNIV (educational level among white-collar workers) and TMEUR (turnover 2005 million EUR) were the two organizational characteristics that significantly contributed to the discriminating power of the model. The results
Legend: MORTN = Market orientation (score 1–5); W-C UNIV = White-collar workers with university education (%); EXP-SHARE = Export share (%). (*) = Significantly different at the 0.1 level; * = Significantly different at the 0.05 level; ** = Signifi-cantly different at the 0.01 level; *** = Significantly different at the 0.001 level.
Table 10. Variables in the equation.
B S.E. Wald df Sig. Exp (B) 95.0% C.I. for Exp(B) Lower Upper
a) Variables entered on step 1: MORTN = Market orientation score (1–5); WCUNIV = Share of white collars with university education (%); EXPSHARE = Export share (%); TMEUR = Turnover 2005 (million EUR); ONLYSAW = Only sawmilling (yes/no); ONLYFP = Only furtherprocessing (yes/no); SPRUCE = Raw material mix with more than 66% spruce (yes/no); PINE = Raw material mix with more than 66% pine (yes/no).
672
Silva Fennica 42(4), 2008 research articles
show that, after accounting for the influence of the other organizational characteristics in the model, an increase of 1% in the share of white-collar workers with university education results in an increase of 3.9% (95% CI = 1.3 to 6.6%) in the probability that an SBU is an innovating SBU, and that an increase of one million Euro in turnover results in an increase of 6.3% (95% CI = 2.5 to 10.2%) in the probability that an SBU is an innovating SBU. Table 10 also shows that, after accounting for the influence of the other organizational characteristics in the model, raw material mix also has an influence on the prob-ability of being an innovating SBU. It is more likely that an SBU is an innovating SBU if it has a PINE focus (raw material mix with more than 66% pine) compared to SBUs with no focus in their raw material mix. However, this influence was only statistically significant at the 0.1 level (exact p = 0.06). MORTN (market orientation), EXPSHARE (export share), ONLYSAW (only sawmilling), ONLYFP (only further-processing), and SPRUCE (raw material mix with more than 66% spruce) appeared not to have an individual influence of the probability of being an innovat-ing SBU.
Because binary logistic regression is sensi-tive to outliers (Hair et al. 1998), and that the sample contained a few SBUs with significantly larger size than the majority of SBUs, the equa-tion was rerun without these very large SBUs. However, no changes in significance or direction of relationships compared to the runs where all SBUs were included were found. Furthermore, logistic regression can be sensitive to the influ-ence of the residuals (i.e., the cases not very well explained by the model; Pallant 2001). Based on the information achieved from SPSS 14.0 regard-ing residuals, the regression was rerun without the “worst” residuals (ZResid > |2.5| according to Pal-lant 2001). Neither in this case were any changes in significance or direction of relationships found in comparison to the runs where all SBUs were included. Finally, the calculation of correlations between the continuous independent variables in the model showed that no critical levels of multicollinearity existed (all r2s were below the recommended threshold 0.7; Pallant 2001).
To summarize, it can be concluded that among the examined variables, ‘size’ and ‘educational
level among white-collar workers’ are the only two organizational characteristics that seem to give a clear and isolated contribution to an increased probability of being an innovating SBU.
Respondents’ perceptions about barriers for product development are reported in Table 11. The top five rated barriers to product development among all SBUs were the following (in order of importance): – product development is not prioritized in the daily
operations– product development is considered difficult and
costly– there are few ideas for new products– low knowledge of customer needs– raw material suppliers are not open to change
Examination of answers to the open-ended ques-tion about additional perceived barriers revealed that “lack of time and resources” was the most common theme (9 occurrences) among those respondents that provided an answer to this ques-tion (28 respondents). The only other theme that was mentioned consistently (> 3 occurrences) was “it is a traditional industry” (4 occurrences). When comparing non-innovating SBUs with innovating SBUs, a significant difference was found in scores with regard to the following barrier perceptions: – product development is not prioritized in daily
operations– product development is considered difficult and
costly– product development is not prioritized in invest-
ment decisions– imitation makes product development unprofit-
able– there is little need for product development
To investigate further multidimensional relation-ships and to provide a more concise picture of the perceptions of barriers, a principal component factor analysis was conducted (Hair et al. 1998, p. 91). The original dataset included the 17 variables displayed in Table 11. The ratio of the number of variables to sample size was acceptable, if not completely ideal. Inspection of a correlation table supported the assumption that the dataset was suitable for analysis (eight Pearson correlations coefficients exceeding 0.3).
The Oblique Rotation method was chosen since
673
Stendahl and Roos Antecedents and Barriers to Product Innovation – a Comparison between Innovating and Non-Innovating …
Table 11. Perceptions about barriers to product development (PD).
Barrier Mean value, all SBUsn = 109 a)
Std dev. Mean value, Innovating
SBUsn = 69
Std dev. Mean value, Non-innovating
SBUsn = 40
Std dev.
PD not prioritized in daily operations
3.59 1.056 3.39* 1.06 3.93* 0.971
PD considered difficult and costly
3.30 1.014 3.12* 1.037 3.63* 0.897
Few ideas for PD 3.22 1.083 3.20 1.065 3.25 1.127
Low knowledge about cus-tomer needs
3.14 1.023 3.20 1.051 3.03 0.974
Raw material suppliers not open to change
2.94 1.129 2.93 1.089 2.98 1.209
Low knowledge about tech-nology
2.85 1.017 2.83 0.954 2.90 1.128
PD not prioritized in invest-ment decisions
2.81 1.058 2.58** 1.035 3.20** 0.992
Variation of raw material supply
2.74 1.265 2.80 1.301 2.65 1.210
Employees do not like change 2.7 1.101 2.67 1.133 2.75 1.056
Low competence level in general
2.66 1.164 2.81 1.204 2.40 1.057
Variation of raw material quality
2.56 1.218 2.62 1.296 2.44 1.071
Low knowledge about wood 2.47 1.110 2.58 1.156 2.28 1.012
Imitation makes PD unprofit-able
2.46 1.151 2.29* 1.113 2.75* 1.171
Market not open to change 2.43 0.956 2.42 0.976 2.45 0.932
Difficult to find external financing
2.36 1.098 2.24 1.094 2.58 1.083
Little need for PD 2.28 1.170 1.93** 0.896 2.88** 1.343
No further possibilities with existing technology
2.10 0.849 2.12 0.814 2.08 0.917
Legend: Degree of agreement that each factor is a barrier to product development in the SBU. (*) = Significantly different at the 0.1 level; * = Significantly different at the 0.05 level; ** = Significantly different at the 0.01 level; *** = Significantly different at the 0.001 level.a) One SBU was left out because of missing data.
this method is most appropriate when the primary goal is to obtain theoretically meaningful con-structs (Hair et al. 1998, p. 110 and 127). The Varimax method was also tried and produced factors with very similar features. Three alterna-tive solutions, with five, six and seven factors, were considered. A six-factor solution was chosen based on eigenvalues and possibilities to make reasonable interpretations of the factors (Hair et al. 1998, p. 104). The variable ‘market not open to change’ was removed because it did not
load significantly on any of the factors. These evaluation procedures left us with 16 variables for the analysis. The measure of sampling adequacy (MSA) measures the appropriateness of applying factor analysis on the data set. Values above 0.50 indicate appropriateness (Hair et al. 1998, p. 99). In our six-factor solution, MSA ranged from 0.53 to 0.80 and overall MSA was 0.68. The six-factor solution proved to account for 64% of the varia-tion. The factor pattern matrix is shown in Table 12 where the significant factor loadings were set
674
Silva Fennica 42(4), 2008 research articles
at |0.55| for a 0.05 significance level. However, loadings exceeding |0.4| are also indicated (Hair et al. 1998).
The factor analysis highlights general patterns in the respondents’ answers:
Factor 1, ‘Lack of competence’, captures the view that product development is constrained by a lack of knowledge; especially about the wood material,
processing technology and customers’ needs. A perception that there are no further possibilities with existing processing technology is also weakly associated with this theme.
Factor 2 is here named ‘Innovation not a priority’ and it represents a view that product development is constrained by the fact that it is given low priority in the daily operations and in investment decisions, seemingly connected to the fact that product devel-
Little need for PD –0.05603 0.18499 –0.15571 0.84001 0.14853 –0.14148
Raw material suppliers not open to change
–0.02926 0.13252 0.05050 0.47969 –0.16400 0.41453
No further possibilities with existing tech.
0.43212 –0.24191 0.01045 0.44024 0.16018 0.15873
Imitation makes PD unprofitable
–0.01361 –0.02062 0.00113 0.44103 0.69842 0.05376
Difficult to find external financing
0.11392 0.15650 0.31225 –0.06700 0.69800 –0.24483
Few ideas for PD 0.31199 0.17198 0.14142 0.16896 –0.52392 –0.19797
Employees do not like change
0.03126 0.12944 0.08218 –0.05513 0.00799 0.82905
Eigenvalue 3.26 1.90 1.54 1.28 1.16 1.04
Percent explained 20 12 10 8 7 7
Total percent explained
64
Legend: Bold = loading > |0.55|; Normal = loading |0.54| to |0.40|; Italics = Loading < |0.40|
675
Stendahl and Roos Antecedents and Barriers to Product Innovation – a Comparison between Innovating and Non-Innovating …
opment is seen as difficult and costly.Factor 3, ‘Raw material problems’, blames the variabil-
ity in raw material supply and quality as barriers to product development.
Factor 4, ‘No need to innovate’, captures the opinion that the need for product innovation is very low. A perception that raw material suppliers are not open to change, that there are no further possibili-ties with existing processing technology and that innovations can be copied is also weakly associated with this theme.
Factor 5, here labelled ‘Innovation is risky’, describes a situation where the risk of imitation and problems finding external financing constrains the innova-tion process. It is interesting to notice that there is an almost significant negative loading on the ‘Few ideas for PD’-variable, indicating that at the same time as the aforementioned barriers exist, there is no shortage of ideas for innovation.
Finally, Factor 6, ‘Reluctance to change’, depicts a situation where the main issue is a reluctance to change among the personnel. This factor is further weakly connected to a perception that also raw material suppliers are reluctant to change.
To achieve a better understanding about the perception of barriers among innovating and non-innovating SBUs, factor scores and mean scores for the significant variables of each factor for innovating and non-innovating SBUs were calculated and compared. The differences were tested with t-tests and Mann-Whitney U tests. The results are displayed in Table 13. Mean scores for the significant variables of each factor for all SBUs are also displayed in Table 13.
Table 13 shows that the ‘Innovation not a prior-ity’ factor has the highest mean importance rating
among all SBUs, with ‘Lack of competence’ and ‘Reluctance to change’ in second and third place. The ‘No need to innovate’ factor has the lowest mean rating. Among innovating SBUs, the ‘Inno-vation not a priority’ factor has the highest mean importance rating, with ‘Lack of competence’ and ‘Raw-material problems’ in second and third place. The ‘No need to innovate’ factor has the lowest mean rating. Among non-innovating SBUs, the ‘Innovation not a priority’ factor has the highest mean importance rating, with ‘No need to innovate’ and ‘Reluctance to change’ in second and third place. The ‘Raw material prob-lems’ factor has the lowest mean rating.
Table 13 also shows that for the ‘Lack of compe-tence’, ‘Raw material problems’ and ‘Reluctance to change’ factors there are no significant differ-ences in perceived importance among innovating and non-innovating SBUs. On the ‘Innovation not a priority’ and the ‘Innovation is risky’ factors, however, non-innovating SBUs perceived these to be significantly stronger barriers compared to innovating SBUs. Finally, factor scores for factor four, ‘No need to innovate’ presented almost significant differences between the two groups in the study at the 0.1 level (t-test p = 0,07; Mann-Whitney U test p = 0,101), and very significant differences for the mean of significant factor vari-ables. Non-innovating SBUs ranked this barrier as more important than innovating SBUs.
5 Limitations of the StudyEven though it was pointed out for the poten-tial respondents that the survey was a part of a Swedish-Finnish collaborative research project,
Table 13. Comparison of barrier perceptions among innovating and non-innovating SBUs.
Factor Mean of sig. factor variables, All
SBUs
Factor score, Innovating SBUs
Mean of sig. factor variables, Innovat-
ing SBUs
Factor score, Non-innovating
SBUs
Mean of sig. factor variables, Non-
innovating SBUs
‘Lack of competence’ 2.78 0.052 2.86 –0.091 2.65‘Innovation not a priority’ 3.23 –0.252** 3.03*** 0.438** 3.58***‘Raw material problems’ 2.66 0.077 2.71 –0.134 2.56‘No need to innovate’ 2.28 –0.143(*) 1.93*** 0.250(*) 2.88***‘Innovation is risky’ 2.43 –0.157* 2.27* 0.274* 2.66*‘Reluctance to change’ 2.70 0.041 2.67 –0.071 2.75
Legend: (*) = Significantly different at the 0.1 level; * = Significantly different at the 0.05 level; ** = Significantly different at the 0.01 level; *** = Significantly different at the 0.001 level.
676
Silva Fennica 42(4), 2008 research articles
the response rate in Finland (39%) was signifi-cantly lower than the response rate in Sweden (79%). This might be due to a lower personal commitment to participate in the study among Finnish managers because a person from an infor-mation collection agency, and not the researcher (as was the case in Sweden), contacted them. The non-respondent analysis revealed that small sawmilling SBUs are underrepresented in both the Swedish and Finnish sample. This limits the external validity (generalizability) of findings.
The individual influence of an independent variable on a dependent variable can be cor-rectly determined with multivariate techniques if the model is correctly specified, i.e., all rel-evant variables are included in the model. The selection of variables in this study was based on a literature review and the results of previous qualitative research. Pre-tests of the questionnaire (including discussions with industry experts and potential respondents) influenced the final choice of variables. Because some variables must be omitted, however, some uncertainty regarding their influence, and the validity of the model, still remains.
Self-evaluation by single key respondents at each SBU was used to collect factual data (e.g., size, educational level among white-collar work-ers, export share) as well as behavioral and per-ceptional data (e.g., market orientation, agreement with statements about innovation barriers). This is a common method used in management research but creates a possibility for incorrect assessment of the variables because of respondent bias (Pod-sakoff and Organ 1986). We adopt a humble per-spective regarding the measurement of complex social phenomena through the use of structured self-report questions, and the reader is encouraged to carefully evaluate the operationalization of variables as a part of the interpretation of findings. Furthermore, organizational innovativeness was measured with a simple dichotomous measure of the occurrence of recent product innovation activ-ity. This operationalization was applied to achieve a straightforward and clear measure that could be easily understood by respondents. Innovativeness is, however, a complex construct and this opera-tionalization hardly catches all its dimensions.
Finally, only projects in which the product had at least reached the stage of full-scale trial deliver-
ies qualified as product development projects for examination in this study. Since the categoriza-tion of innovating and non-innovating SBUs was based on the occurrence of one or more qualifying product development projects during the last five years, SBUs with on-going or terminated product development projects during the last five years were considered to be non-innovating SBUs.
6 Discussion and Conclusions
The result from our survey suggests that the total share of SBUs in the Swedish and Finnish wood industry that was active in product innovation during 2002–2006 was 64%. Because small SBUs with only sawmilling activity, that were slightly underrepresented in our sample, showed a signifi-cantly lower frequency of innovating SBUs than what was found in the total sample, this figure might be somewhat overestimated. However, the figure can be compared to the findings of the Swedish and Finnish CIS 2004 where, respec-tively, 39% and 34% of all industry companies were found to be active in product innovation during 2002–2004 (Statistics Sweden 2006, Sta-tistics Finland 2007). Because of the different time periods and study units, the possibility for comparison of the results from our study with the CIS study is limited. However, the relatively large share of innovating SBUs found in the wood industry gives an indication of the increased inter-est for innovation even in this traditionally seen ‘low-innovation’ industry.
However, because further product innovation is needed in the wood industry (see, e.g., Euro-pean Confederation of Woodworking Industries (ed.) 2004), it is important for managers and policy-makers to identify and take measures that facilitate this. This study has approached the problem from two angles: First, the influence on innovativeness of a number of organizational characteristics that are pointed out as innova-tion facilitators in the literature was examined. The underlying rationale is that enhancement of these organizational characteristics will lead to increased innovativeness among companies. Second, perceptions about barriers to product development among SBU managers were ana-
677
Stendahl and Roos Antecedents and Barriers to Product Innovation – a Comparison between Innovating and Non-Innovating …
lyzed. In this case, it is assumed that removal of the most important barriers is another way to increase innovativeness.
When analyzing organizational characteristics, the results from the univariate analysis showed that organizational size, integration structure, educational level among white-collar workers, and market orientation were significantly corre-lated to innovation activity in the wood industry. Our multivariate model, which correctly predicted the innovation activity of 82% of the SBUs in the sample, revealed that organizational size and educational level among white-collar workers were the only two variables that had a significant independent influence on innovation activity. This finding suggests that these two variables might be significant facilitators of innovativeness in the wood industry. The multivariate analysis also showed that a focus on pine in the raw-material mix positively influences innovativeness. This influence was, however, only statistically signifi-cant at the 0.1 level.
Although there are a number of possible explanations for the positive influence of size on innovation, e.g., that large companies have more resources available or that they want to secure sustainable growth through innovation and knowledge creation, one likely explanation in our case is the ‘law of large numbers’. This principle states that the likelihood of an event, e.g., start-up of a product development project, increases with the number of possibilities for the event to occur. Accordingly, because large SBUs in the wood industry have more products and custom-ers, the likelihood of the occurrence of innova-tion increases with organizational size. However, because company behavior, at least partly, is a result of active management (Ansoff 1961), prob-ability laws can not fully explain the occurrence of innovation. Decisions about business strategy, including resource allocation and product mix, will also contribute to the explanation. We can conclude that an investigation of the relationship between size and innovativeness would be better of using intensity of innovation (e.g., share of new products) rather than occurrence of innovation (e.g., number of new products) as the dependent variable. The possible influence of the law of large numbers would then be eliminated and a clearer understanding of the relationship between
size and innovativeness would be reached. The positive influence of educational level among white-collar workers, however, is a more inter-esting finding which might be explained by the increased idea flow and problem-solving capabil-ity resulting from a better mix of experience- and academically-based knowledge among the per-sonnel. Finally, the positive influence of a pine focus on innovativeness might be explained partly by a more efficient use of resources in an SBU focusing on only one wood species, and partly by a stronger need for innovation in the pine segment compared to the spruce segment.
The lack of individual influence (and in the case of export share even correlation) of some well-known facilitators of innovation might be due to the specific context of the wood industry. The lack of relation between export share and innovativeness, for example, might be explained by a commonly used business model in the wood industry in which commodity products are sold to export markets via company-external agents. These agents handle the direct communication with the customers, something that can disturb the flow of market information. Because market orientation widely is pointed out as a facilitator of innovation in the literature, the lack of influence on innovativeness in our study is a surprising find-ing. However, as Korhonen and Niemelä (2004) found in a study of the leading forest industry companies, “a strong customer orientation could counteract the innovation benefit resulting from improved internal information flow”, i.e., being too focused on customers might stifle innovation and only produce gradual improvement of exist-ing products. Another possible explanation for the lack of influence of some organizational char-acteristics is that these can have different impact on different types of innovations (Subramanian and Nilakanta 1996). This study concentrated on product innovation, i.e., new or significantly changed goods and services, and left out other basic types of innovation, e.g., process and busi-ness system innovation (Hovgaard and Hansen 2004). Factors found to have no influence on product innovation in this study might instead have influence on other types of innovation in the wood industry.
The survey produced interesting information about perceptions among managers about bar-
678
Silva Fennica 42(4), 2008 research articles
riers to product development work. Although the theory of planned behavior (Ajzen 1991) suggests that perceptions can be used to predict behavior, we excluded barrier perceptions from the antecedent model and remained content with identification and interpretation of barriers. One reason is that we believe that the effect of percep-tions on behavior is difficult to capture in stud-ies applying tests of cross-sectional correlations. For example, barrier perceptions might not be as stable as factors such as educational level, size, and organizational culture (Hadjimanolis 1999, Hult et al. 2004) which are normally studied in this type of research designs.
Managers’ ratings of hypothetical barriers show that low priority of the difficult and costly devel-opment work is the most important barrier to product development, both among innovating and non-innovating SBUs. The low rating of the ‘No need to innovate’ factor (suggesting that product innovation in fact is considered to be strategically important) together with the fact that “lack of time and resources” was the most common theme among the answers to the open-ended question about additional barriers suggests that the ‘Inno-vation not a priority’ factor should be interpreted as that low practical, and not low strategic, prior-ity is given to product development. This is also indicated by the different loadings of ‘product development is not prioritized in the daily opera-tions/in investment’ and ‘the need for innovation is very low’ in the factor analysis. This suggests that despite the strategic importance of product development work, companies have problems finding the time and resources for it. Low com-petence level among personnel is another impor-tant factor that impedes development work. The importance of competence is also visible in the previous identification of educational level among white-collar workers as an important driver of innovation activity.
There are differences between how innovat-ing and non-innovating business units perceive the importance of barriers. These differences are important because the perceptions among inno-vating business units are based, to a larger degree, on experience, and among non-innovating busi-ness units, to a larger degree, on preconceptions. Among innovating SBUs, the ‘Innovation not a priority’ factor has the highest mean importance
rating, with ‘Lack of competence’ in second place. This suggests that to facilitate continued innovation among innovating SBUs, finding ways to put more priority on product development and elevate the educational level among the person-nel are important measures to take. Among non-innovating SBUs, the ‘Innovation not a priority’ factor has the highest mean importance rating, with ‘No need to innovate’ in second place. This suggests that to initiate product innovation among non-innovating SBUs, promotion of the strategic importance of product development is a valuable complement to the challenge of finding ways to give more practical priority to development work.
Barriers to innovation as perceived by managers in a wide spectrum of industry sectors within the EU countries are recorded and presented in Euro-stat (2008, p. 136–140). Even though this publica-tion is based on the CIS 4, which is differently designed compared to this study, a comparison of results is still interesting. The CIS results points towards the importance of a lack of internal and external funding and high costs for innovation as innovation barriers in the general European industry context. In our study, managers in inno-vating SBUs perceived that product development was not prioritized in investment decisions, a perception that can be connected to a scarcity of financial resources. Lack of external funding, however, was not perceived to be a major barrier among the respondents of this study. Finally, lack of knowledge was a higher rated barrier in this study than in the CIS, and for market resistance the situation was the opposite.
7 Implications for Practitioners and Academics
With the support of the data and theory in this study, managers and policy-makers who wish to increase product innovation in the wood industry are advised to promote an increased educational level in wood industry companies. They are further encouraged to seek ways to reduce the barriers to innovation identified by managers in this study. Giving practical priority to product development work in the everyday stress, for example, can be
679
Stendahl and Roos Antecedents and Barriers to Product Innovation – a Comparison between Innovating and Non-Innovating …
facilitated through allocation of human resources especially for product development work, support from senior management for product development work, tolerance from senior management for mis-takes, and an organizational structure based on market segments (Stendahl et al. 2007).
Further exploration of innovation strategies and practices should be of great interest to both wood industry researchers and practitioners. Recent studies of large North-American and European forest companies have highlighted the need to combine innovativeness with cost-efficiency (Korhonen 2006). Therefore, from a business strategy point-of-view, further studies of innova-tiveness and its connection to performance in the wood industry should be of great interest. From an organizational and operations management point-of-view, the key success factors of the prod-uct development process in the wood industry should be interesting to study. In a qualitative study, Stendahl et al. (2007) identified hypotheti-cal success factors for product development in the Nordic pine sawmilling industry, e.g., designation of human resources especially for development work, running structured but speedy develop-ment projects led by strong leaders, and design of a specific strategy for product launch. As a complement to this research, quantitative studies of the same phenomenon should contribute to further understanding of this important topic. To understand the mechanisms behind the percep-tions of barriers to product innovation, it would be interesting to analyze the influence of organiza-tional characteristics (including degree of product development experience) on the perception of barriers. Finally, our measure of organizational innovativeness was simple and clear but also had its limitations. Development and validation of more sophisticated measures of organizational innovativeness that are suitable for forest industry research has started (Hansen et al. 2007, Knowles et al. 2008), and further work is encouraged.
Acknowledgements
We would like to thank two anonymous reviewers for their valuable comments and suggestions. We also express our gratitude to the Finnish Ministry
of Agriculture and Forestry and the Department of Forest Products at the Swedish University of Agricultural Sciences whose funding made this research possible.
Notes
1 An SBU was defined as an organizational unit which has responsibility for its profitability and, within given frames, formulates its own strategy. Similar definitions are used in the literature, see, e.g., Narver et al. (2004) and Juslin and Hansen (2003).
2 The OECD/Eurostat measure includes on-going projects in which the product has not reached the market and terminated projects in which the project was terminated before launch. Because of project evaluation-needs, our measure only includes projects in which the project has, at least, reached the phase of trial sales. Furthermore,
OECD/Eurostat recommends a review period of one to three years. This study, however, uses a review period of five years. Finally, the OECD/Eurostat measure uses the company as the unit of analysis, whereas this study uses strategic business units.
References
Ansoff, I. 1965. Corporate strategy. McGraw-Hill, New York. 261 p.
Ajzen, I. 1991. The theory of planned behavior. Organi-zational Behavior and Human Decisions Processes 50: 179–211.
Armitage, C.J. & Conner, M. 2001. Efficacy of the theory of planned behavior: a meta-analytic review. British Journal of Social Psychology 40: 471–499.
Becheikh, N., Landry, R. & Amara, N. 2006. Les-sons from innovation empirical studies in the manufacturing sector: a systematic review of the literature from 1993–2003. Technovation 26(5–6): 644–664.
Crespell, P., Knowles, C. & Hansen, E. 2006. Innova-tiveness in the North American softwood sawmill-
680
Silva Fennica 42(4), 2008 research articles
ing industry. Forest Science 52(5): 568–578. Damanpour, F. 1992. Organizational size and innova-
tion. Organization Studies 13(3): 375–403.Danneels, E. 2002. The dynamics of product innova-
tion and firm competences. Strategic Management Journal 23(12): 1095–1121.
De Vellis, R.E. 1991. Scale development: theory and applications. Sage, Newbury, Calif. 121 p.
Deshpande, R. & Farley, J. 1998. Measuring market orientation: generalization and synthesis. Journal of Market-Focused Management 2(3): 213–232.
Dillman, D.A. 2000. Mail and Internet surveys: the tailored design method. 2 ed. Wiley, New York. 464 p.
Eisenhardt, K.M. & Martin, J. A. 2000. Dynamic capa-bilities: what are they? Strategic Management Jour-nal 21(10–11): 1105–1121.
European Confederation of Woodworking Industries. (ed.). 2004. Roadmap 2010 for the European Wood-working Industries. CEI-Bois. Bruxelles. 34 p.
Eurostat 2008. Science, technology and innovation in Europe. Office for Official Publications of the European Communities, Luxemburg. 233 p.
Garcia, R. & Calantone, R. 2002. A critical look at tech-nological innovation typology and innovativeness terminology: a literature review. Journal of Product Innovation Management 19(2): 110–132.
Hadjimanolis, A. 1999. Barriers to innovation for SMEs in a small less developed country (Cyprus). Technovation 19(9): 561–570.
— 2000. An investigation of innovation antecedents in small firms in the context of a small developing country. R & D Management 30(3): 235–245.
Hair, J.F. 1998. Multivariate data analysis. 5th ed. Prentice Hall, Englewood Cliffs, N.J. 730 p.
Han, J.K., Kim, N. & Srivastava, R.K. 1998. Market orientation and organizational performance: Is innovation a missing link? Journal of Marketing 62(4): 30–45.
Hansen, E., Korhonen, S., Rametsteiner, E. & Shook, S. 2006. Current state-of-knowledge: innovation research in the global forest sector. Journal of Forest Products Business Research 3(4): 1–27.
— , Juslin, H. & Knowles C. 2007. Innovativeness in the global forest products industry: exploring new insights. Canadian Journal of Forest Research 37(8): 1324–1335.
Hovgaard, A. & Hansen E. 2004. Innovativeness in the forest products industry. Forest Products Journal 54(1): 26–33.
Hult, G.T.M., Hurley, R.F. & Knight G.A. 2004. Inno-vativeness: its antecedents and impact on business performance. Industrial Marketing Management 33(5): 429–438.
Juslin, H. & Hansen, E. 2003. Strategic marketing in the global forest industries. Authors Academic Press, Corvallis, Oregon. 610 p.
Kohli, A. & Jaworski, B. 1990. Market orientation: the construct, research propositions, and managerial Implications. Journal of Marketing 54(2): 1–18.
Knowles, C., Hansen, E., & Shook, S. 2008. Measuring innovativeness in the North American softwood sawmilling industry using three methods. Canadian Journal of Forest Research. (In press).
Korhonen, S. & Niemelä, J.S. 2004. Guidelines for sustainable, external corporate growth: a case study of the leading European and North American com-panies in the wood industry. Journal of Forest Products Business Research 1(2): 1–27.
— 2006. A capability-based view of organizational renewal – combining opportunity- and advantage-seeking growth in large, established European and North American wood-industry companies. Doc-toral dissertation. University of Helsinki, Faculty of Agriculture and Forestry, Department of Forest Economics and Marketing. 74 p.
Krueger, N.F., Reilly, M.D. & Carsrud, A.L. 2000. Competing models of entrepreneurial intentions. Journal of Business Venturing 15(5–6): 411–432.
Leonard-Barton, D. 1992. Core capabilities and core rigidities – a paradox in managing new product development. Strategic Management Journal 13(Sp. Iss. SI): 111–125.
Narver, J.C. & Slater, S.F. 1990. The effect of a market orientation on business profitability. Journal of Marketing 54(4): 20–35.
— , Slater, S.F. & MacLachlan, D.L. Responsive and proactive market orientation and new-product suc-cess. Journal of Product Innovation Management 21(5): 334–347.
Nord, T. 2005. Structure and developments in the solid wood value chain. Licentiate thesis. Luleå University of Technology, Department of Civil Environmental Engineering, Division of Structural Engineering – Timber Structures. 255 p.
NRA-Sweden. 2008. [Internet site]. NRA-Sweden. Available at: http://www.nra-sweden.se. [Cited 4 Feb 2008].
Nunnally, J.O. 1978. Psychometric theory. McGraw-Hill, New York. 701 p.
681
Stendahl and Roos Antecedents and Barriers to Product Innovation – a Comparison between Innovating and Non-Innovating …
OECD/Eurostat. 2005. Oslo manual – guidelines for collecting and interpreting innovation data. OECD, Paris.
OECD/Eurostat. 1997. OECD proposed guidelines for collecting and interpreting technological innova-tion data – Oslo manual. OECD, Paris.
Pallant, J. 2001. SPSS survival manual: a step by step guide to data analysis using SPSS for Windows (Version 10 and 11). Open University Press, Buck-ingham. 286 p.
Pla-Barber, J. & Alegre, J. 2007. Analysing the link between export intensity, innovation and firm size in a science-based industry. International Business Review 16(3): 275–293.
Podsakoff, P.M., & Organ, D.W. 1986. Self-reports in organizational research: Problems and prospects. Journal of Management 12(4): 531–544.
Rametsteiner, E., Hansen, E., & Niskanen A. 2006. Introduction to the special issue on innovation and entrepreneurship in the forest sector. Forest Policy and Economics 8(7): 669–673.
Rogers, M. 1998. The definition and measurement of innovation. Melbourne Institute Working Paper 10/98. Melbourne Institute of Applied Economic and Social Research, University of Melbourne.
Rogers, M. 2004. Networks, firm size and innovation. Small Business Economics 22(2): 141–153.
Staland, J., Navrén, M. & Nylinder, M. 2002. Såg 2000. Resultat från sågverksinventeringen 2000. Report. Swedish University of Agricultural Sci-ences. Department of Forest Products and Markets. 104 p.
Statistics Sweden. 2006. Innovation activity in Swedish enterprises 2002–2004. Statistics Sweden, Stock-holm. 111 p.
Stendahl, M., Roos, A. & Hugosson, M. 2007. Product development in the Swedish and Finnish sawmill-ing industry – a qualitative study of managerial perceptions. Journal of Forest Products Business Research 4(4). 24 p.
Subramanian, A. & Nilakanta, S. 1996. Organizational innovativeness: Exploring the relationship between organizational determinants of innovation, types of innovations, and measures of organizational performance. Omega-International Journal of Man-agement Science 24(6): 631–647.
Teece, D., Pisano, G. & Shuen, A. 1997. Dynamic capabilities and strategic management. Strategic Management Journal 18(7): 509–533.
Thompson, J. 1967. Organizations in action. McGraw-Hill, New York. 192 p.
Timber Trade Journal. 2005. Special feature: Nordic countries 415(6553): 21–27.
Trott, P. 2005. Innovation management and new prod-uct development. Financial Times Prentice Hall, Harlow, England. 426 p.
Wagner, E., & Hansen, E. 2005. Innovation in large versus small companies: insights from the U.S. wood products industry. Management Decision 43(6): 837–850.
Välimäki, H., Niskanen, A., Tervonen, K., & Laurila, I. 2004. Indicators of innovativeness and enterprise competitiveness in the wood products industry in Finland. Scandinavian Journal of Forest Research 19(suppl. 5): 1–7.


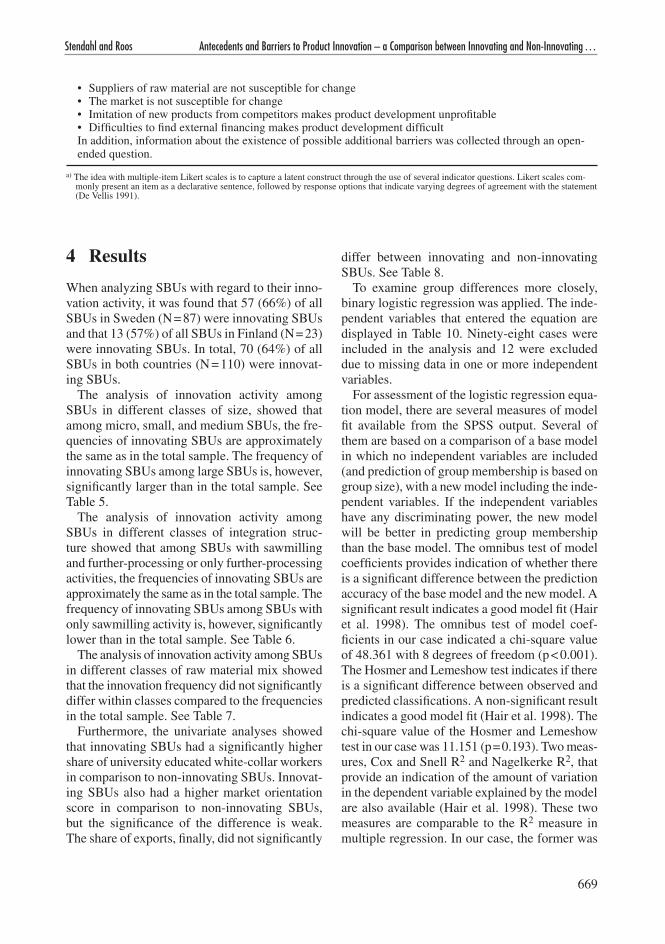
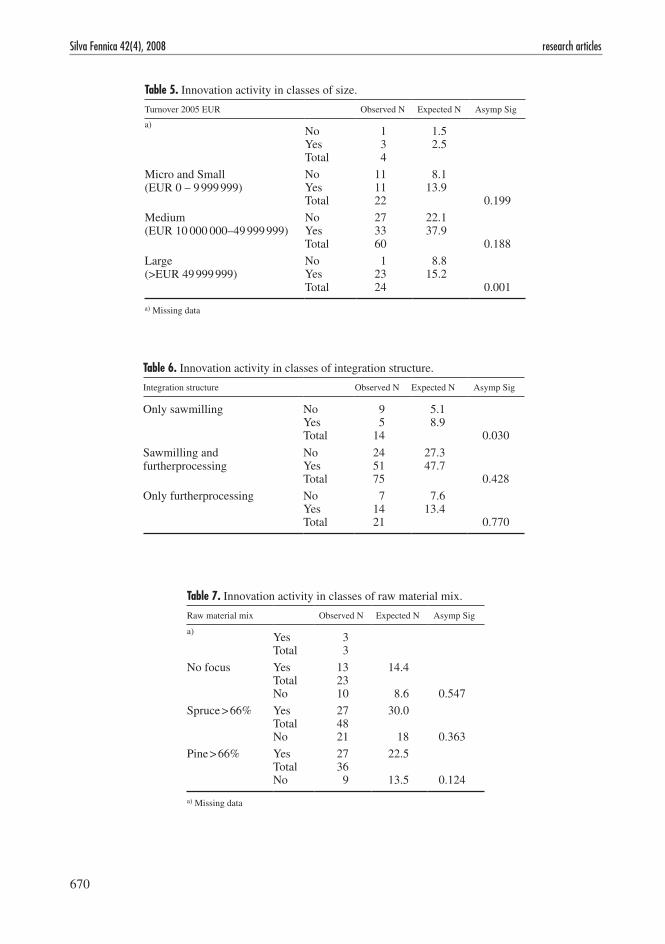


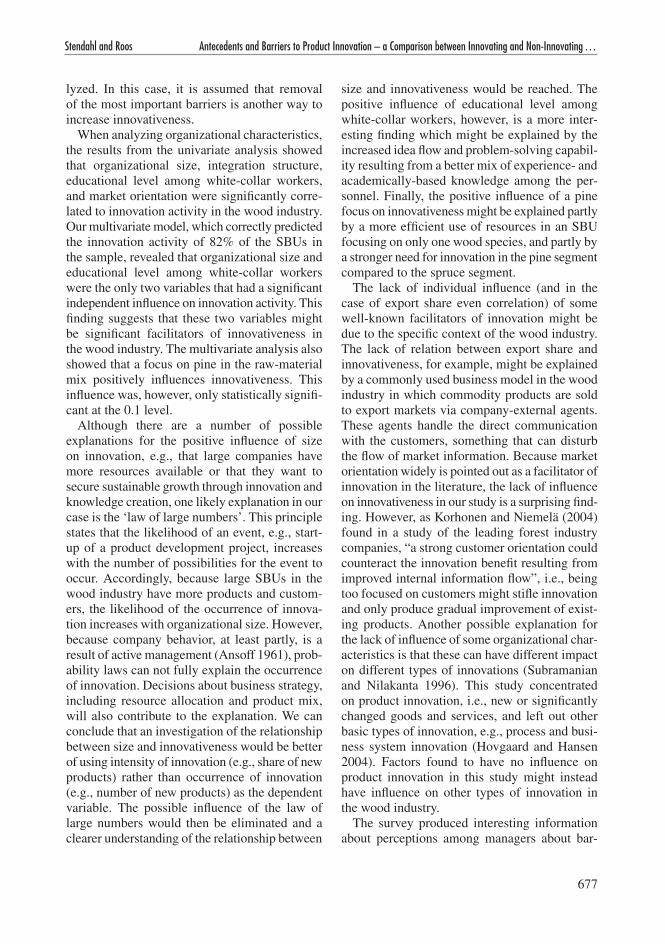


![Antecedents, Moderators[1]](https://static.documents.pub/doc/80x56/577d21911a28ab4e1e95844d/antecedents-moderators1.jpg)


