932 IEEE TRANSACTIONS ON INSTRUMENTATION AND MEASUREMENT, VOL. 62, NO. 5, MAY 2013
Antenna Parametrization for theDetection of Partial Discharges
Guillermo Robles, Senior Member, IEEE, Matilde Sánchez-Fernández, Ricardo Albarracín Sánchez,Mónica V. Rojas-Moreno, Eva Rajo-Iglesias, Senior Member, IEEE, and Juan Manuel Martínez-Tarifa
Abstract—Partial discharge (PD) detection is a widely extendedtechnique for electrical insulation diagnosis. Ultrahigh-frequencydetection techniques appear as a feasible alternative to traditionalmethods owing to their inherent advantages such as the capabilityto detect PDs online and to locate the piece of equipment withinsulation problems in substations and cables. In this paper, fourantennas are thoroughly studied by means of their theoretical andexperimental behavior when measuring electromagnetic pulsesradiated by PD activity. The theoretic study of the band of fre-quencies in which the pulse emits and the measurement of theparameters S11 are complemented with the frequency responseand wavelet transform of a set of 500 time signals acquired by theantennas, and the results are analyzed in detail.
E LECTRICAL INSULATION is a key issue in powersystem reliability. It is well known that oil-impregnated
paper in power transformers, epoxy resins in generators, andpolyethylene in power cables are subjected to several mechani-cal, thermal, and electrical stresses that degrade their behavior,leading to unexpected failures of these expensive assets andto power outages [1]. A well-known aging mechanism ofelectrical stress is partial discharge (PD) activity [2]. PDs arelow-energy ionizations that take place in microscopic sites ofelectrical insulation due to its lack of homogeneity in permit-tivity and dielectric strength. This is typical in air voids withinsolid and liquid insulations where, even rated voltages appliedto the power apparatus, provoke ionizations of the air. PDsdo not cause an immediate failure of electrical insulation butdegrade its properties due to chemical and physical attack [3].Moreover, PDs can be a symptom of other aging mechanismsmentioned previously [4]. For all these reasons, PD measure-ments have been standardized as tests for electrical equipment
Manuscript received June 22, 2012; revised August 14, 2012; acceptedSeptember 19, 2012. Date of publication October 23, 2012; date of currentversion April 3, 2013. This work was supported by the Spanish Science andTechnology Ministry under Contracts DPI 2009-14628-C03-02 and TEC 2011-29006-C03-03. The Associate Editor coordinating the review process for thispaper was Dr. Edoardo Fiorucci.
G. Robles, R. Albarracín Sánchez, M. V. Rojas-Moreno, and J. M. Martínez-Tarifa are with the Departamento de Ingeniería Eléctrica, Universidad CarlosIII de Madrid, 28911 Leganés, Spain (e-mail: [email protected]).
M. Sánchez-Fernández and E. Rajo-Iglesias are with the Departamento deTeoría de la Señal y Comunicaciones, Universidad Carlos III de Madrid, 28911Leganés, Spain.
Color versions of one or more of the figures in this paper are available onlineat http://ieeexplore.ieee.org.
Digital Object Identifier 10.1109/TIM.2012.2223332
maintenance [5]. In these classical tests, a capacitive branch isconnected to the equipment terminals to detect high-frequencypulses created from PD. The pulse amplitude is representedsuperimposed to the phase of the applied voltage (phase re-solved PD patterns) in order to distinguish between differentkinds of PDs [2]. However, PD measurements are usually madein industrial facilities where high levels of electrical noise arealways present. This makes difficult the interpretation of the PDpattern and the diagnosis of the insulation. PD recognition isdone by analyzing PD pulse waveforms acquired with inductivedevices as high-frequency current transformers (HFCTs), Ro-gowski coils, or inductive loops [6]–[8]. In any case, thesemeasurements require the disconnection of electrical equip-ment before installing the measurement setup. In addition, allthese techniques cannot locate PD sources geometrically, whichcould be useful for power equipment maintenance. Electroa-coustic and ultrahigh-frequency (UHF) emissions from PDs canbe measured to overcome these limitations [9]. The first optionuses piezoelectric sensors to detect pressure waves propagatingthrough oil, which rejects any electrical noise coupling to theacquired signals [10]. However, these sensors cannot detect PDoccurring inside solid dielectrics; they have typically low sen-sitivity and narrow band, which makes it difficult to detect PDsthat are close in time [9]. As mentioned before, another newresearch trend for PD detection is the use of antennas for UHFdetection of PDs. This technique is based on noncontact mea-surements, so its application to online measurements is appro-priate [11]–[13]. These sensors can also be used for any kind ofinsulating material and give excellent results in PD location inlarge facilities such as substations [14]. Moreover, the increas-ing number of high-voltage (HV) dc applications in power gridsrequires that PDs are detected without synchronization signals[15], which can be solved with antennas. The main drawback ofPD detection through antennas is the presence of noise sourcesdue to FM, television (TV), Global System for Mobile Commu-nications (GSM), and WiFi emissions, so the antenna responseto both PD and noise is an interesting research topic for PDdetection [16], [17]. The comparison of several antennas hadbeen presented before [12], but a deeper analytical backgroundfor these devices (monopole, zigzag, cone shaped, etc.) wasmissing in order to model PD and noise detection capability. Agood theoretical model for patch antennas is found in [18] and[19], but the response to PD and noise sources is not presented.
This paper is an important step forward in the modeling ofthe antennas and the study of the PD power with respect to theresults presented in [17], where the authors compared the powerspectra for different types of antennas when measuring internal
ROBLES et al.: ANTENNA PARAMETRIZATION FOR THE DETECTION OF PARTIAL DISCHARGES 933
PDs without any further analysis on the antenna design andparametrization. First, through a typical Gaussian pulse modelfor PD, the spectrum of the signal derived in the antenna is ana-lytically obtained. Furthermore, a relationship between the half-amplitude PD pulsewidth and the PD placing in frequency andits bandwidth is given. Second, S11 parameters are measured tovalidate the antenna design and the antenna matching, to ensurethat the manufacturing has been correct, and to guarantee thatthe antennas will measure in the band of frequencies of interest.Additionally, the S11 is measured for antennas with and withoutground plane. Third, a new test object is designed to create acylindrical hollow inside a stack of transformer paper layersand to control the PD activity and the results derived from theirstudy. Fourth, new energy studies are done based on the wavelettransform and representing the energy in different bands offrequency to compare the behavior of the antennas.
In summary, in this paper, four different types of antennas,i.e., two monopoles with different lengths, a trapezoidal zigzagantenna, and a commercial logperiodic antenna, are studied ascandidates to measure PDs. In Section II, PD electromagneticemission is characterized in order to find the target band offrequencies where the manufactured antennas should work;also, the design and important parameters of the antennas areshown, and the S11 parameter is measured for all of them.Section III explains the measuring setup to generate and detectPDs. Finally, Section IV shows the measurements and thestudy in the frequency domain of the pulses acquired with theantennas to conclude that theoretical and experimental resultsmatch and, specifically, monopole antennas are good candidatesas sensors for PD detection.
II. MODELING OF THE ANTENNAS
When designing an antenna for sensing purposes, one ofthe key issues to take into account is the type of signal thatthis antenna should detect, specifically the bandwidth that thesignal occupies. A simplified model for the PD pulses can befound in the literature [18], where the waveform is modeledwith a Gaussian shape and the half-amplitude width is givenby a parameter Th. The response of the antenna follows thetime derivative of the PD current I(t), and therefore, underthis model, the spectrum SPD(f) of the signal that the antennashould detect can be easily obtained. If the normalized (I0 = 1)PD waveform is given by
I(t) = I0e−(
tt0
)2
(1)
where t0 = Th/2√log 2, then the amplitude of the spectrum
sensed would have the form
|SPD(f)| = 2π√πft0e
− (2πft0)2
4 (2)
also plotted in Fig. 1.It should be noticed that, through that formulation, the
spectrum has been characterized in terms of the normalizedfrequency fn = f × Th. This allows, by solving numericallyfor the 3-dB bandwidth, to obtain the PD bandwidth in terms
Fig. 1. Approximate bandwidth of the detected PD generated signal.
Fig. 2. Range of Th values that fall within the UHF band.
of the Th parameter. For that, it is necessary to obtain the twosolutions fmin
n and fmaxn for fn ≥ 0 from this equation
1
2maxfn
|SPD(fn)| =π√π√
log 2fne
− π2f2n
4 log 2 . (3)
The solutions are fminn = 0.12 and fmax
n = 0.72. Conse-quently, the signal would be approximately located in the bandof 0.12/Th–0.72/Th Hz, as shown marked with a thicker tracein Fig. 1. The relationship obtained given those values for the3-dB bandwidth and considering that the typical values of Th
for internal discharges are below 1 ns will locate the detectedsignal in the UHF band. Those are shown in Fig. 2, wherethe PD bandwidth is plotted versus the Th parameter and, asa reference, the UHF band is also given. Thus, all the antennasproposed should at least cover part of this band.
Once the antenna working frequencies are located, there aresome other antenna characteristics that should be defined tospecifically match our sensing environment, and those are theradiation pattern, which also characterizes the antenna directiv-ity, and the antenna efficiency by means of the S11 parameter.
The radiation pattern needed is determinant in the designof an antenna, and our focus for the application addressedshould be radiation patterns with medium to low directivity,
934 IEEE TRANSACTIONS ON INSTRUMENTATION AND MEASUREMENT, VOL. 62, NO. 5, MAY 2013
for instance, omnidirectional ones. The reason for that is that,although, in our case study, the measurement environmentis controlled and, therefore, we have information about theposition of the PD source, it is still interesting to cover as manydirections for incoming power as possible, showing this way thesuitability of the proposed designs where the source of PD isnot clearly located. Also, simple designs are of interest, since,once we had shown the validity of the proposed antennas inthe testing scenario, large deployment of elements is typicallyneeded for monitoring and location leveraging the importanceof inexpensive sensors.
The antenna efficiency is the second parameter to be takeninto account when designing antennas. Efficiency depends onthe antenna losses given by the ohmic losses of materials(metals and dielectric) and also on the mismatching losses,i.e., the S11 parameter. In simple resonant antennas and inthe low-frequency range, we are targeting, the ohmic lossesare negligible, and the antenna efficiency can be defined ase = 1− |S11|2. Thus, the S11 parameter would be the refer-ence measurement to determine the resonant frequency of theantenna, the range of frequencies where the antenna is wellmatched (antenna bandwidth),1 and also the key parameterto determine the antenna efficiency for each of the workingfrequencies of the antenna.
Monopole antennas hold the design needs mentioned so far:They are simple and have omnidirectional patterns, and inaddition to that, it is relatively simple to tune the antenna towork in a particular range of frequencies [13]. The monopoleantenna in its basic design consists of a wire with a length ofapproximately λ/4, with λ being the wavelength of the mainfrequency tuned [20]. Compared to a dipole, this antenna doesnot need a balun, and this makes it much more convenientand, therefore, more used in practice. In theory, this antennashould have an “infinite” ground plane to have a good behaviorand also to achieve the omnidirectional radiation pattern with amaximum directivity of around 5 dB.
Thus, the radiation pattern of an ideal λ/4 monopole antennahas a shape as
r(θ, φ) =cos2
(π2 cos(θ)
)
sin2(θ)(4)
where φ (0 ≤ φ ≤ 2π) is the azimuth angle defined in the (xy)plane, θ (0 ≤ θ ≤ π/2) is the elevation angle, and we assumethat the monopole antenna has its axis along the z-direction, asit is shown in Fig. 3. It should be noted that the radiation patterndoes not depend on φ, leading to the omniazimuthal (radiationall around the wire with rotational symmetry) radiation pattern,and also that, given the infinite ground plane, it radiates only inhalf-space.
When the monopole has a truncated ground plane of notmany wavelengths, the directivity is reduced. We must re-member here that the directivity gives the limit value for theantenna gain, which is the product of directivity and efficiency.Nevertheless, it should also be said that it is always possible to
1The reference value to consider that the antenna is well matched is typicallybelow −10 dB.
Fig. 3. Theoretical normalized radiation pattern for a λ/4 monopole.
do a monopole antenna without ground plane. In this case, allsurrounding objects act as ground plane, and we can see howthe antenna still works. However, the efficiency is reduced, andsometimes, the operating frequency is shifted with respect tothe theoretical one. Also, different manufacturing methods ofmonopole antennas could lead to slights variations with respectto the ideal radiation pattern, but in general terms, all of themkeep the zero radiation in the direction of the axis z and asimilar level of radiation in all the azimuthal directions.
We suggest then to use three different monopoles that havebeen manufactured with this aim with and without groundplane. Two of them will have different lengths to cover the tar-get range of frequencies, and for the last one, a zigzag geometryis proposed, which is known to help as well in matching and,therefore, could be more efficient. The first monopole design is5 cm in length. With that, the theoretical resonant frequencyis at 1.5 GHz, and its directivities are around 2 dB for thedeployment without ground plane and 5 dB for the infiniteground plane. The second monopole is 10 cm in length, and thisagain leads to a 750-MHz resonating frequency and the samedirectivities as those for the 5-cm case. The zigzag geometryantenna has a maximum length of 10 cm (16.5 cm when it isstraightened), and therefore, its behavior is supposed to be inbetween the one of the 10-cm monopole and that correspondingto a monopole with 16.5 cm (which has a 450-MHz resonancefrequency). The zigzag geometry can have advantages in termsof efficiency (matching) when the antenna has no ground plane.
A fourth antenna is also proposed to be used in the testingenvironment, and this is a commercial logperiodic antennaUHALP 91088A [21], which is a wideband antenna. Thisantenna is physically much bigger than the previous proposeddipoles (the largest dimension is 54 cm) and, therefore, does notmatch our requirement for simple designs. However, it is alsointeresting to measure with this antenna for comparison pur-poses and with the idea of scanning a large number of frequen-cies for PD detection. In the working band of the antenna, itsgain is around 6–7 dB according to the manufacturer. Anotherimportant consideration is that the antenna has a “pencil-type”radiation pattern pointing in the direction of its axis.
In order to validate the proposed antenna designs and todetermine the real matching frequencies, the S11 parameterhas been measured for the manufactured antennas and also
ROBLES et al.: ANTENNA PARAMETRIZATION FOR THE DETECTION OF PARTIAL DISCHARGES 935
Fig. 4. Measured S11 parameter for the manufactured antennas withoutground plane.
Fig. 5. Measured S11 parameter for the manufactured antennas with groundplane.
Fig. 6. Measured S11 parameter for the commercial antenna.
for the commercial one with an Agilent Technologies E8364B(10 MHz–50 GHz) programmable network analyzer in a labo-ratory facility (unshielded environment). The results are shownin Figs. 4–6.
Fig. 7. Test object particularly designed to have internal discharges inside acylindric void which is 1 mm in diameter and 1.75 mm in height.
If we observe the resonant frequencies and compare themwith the theoretical frequencies given previously in this samesection, we can detect a slight deviation in some of the valuesthat is mainly due to the antenna manufacturing process. In anycase, these deviations do not reduce the validity of the study,given that the working frequencies of the manufactured anten-nas are still within the target range of frequencies. Moreover,comparing Figs. 4 and 5, we can observe the benefit in terms ofbetter adaptation of the antennas with ground plane. It shouldbe noted that the manufactured antennas also work in harmonicfrequencies as all type of resonant antennas.
III. EXPERIMENTAL SETUP
Due to the fact that PDs are stochastic processes dependingon several factors such as applied voltage level, insulationaging status, and environmental conditions [3], the setup hasto be carefully designed to obtain repetitive results. Moreover,receptivity in the UHF band depends on the metallic structuresaround the antennas and, as tests were carried out in an HVlaboratory, there were plenty of them, so the antennas had to bedeployed close to the test object.
A. Test Object Design
PDs were generated in a controlled test object to ensure aconstant and predictable PD activity (Fig. 7). Eleven sheetsof transformer paper were cut into 8 cm × 8 cm squaresand stacked, placing three sheets on top, piercing five with aneedle, and placing the remaining three sheets at the bottom.The stack was introduced in a plastic bag, the air was removedwith a vacuum machine, and, then, the stack was sealed. Thislayout creates a cylindric hole measuring 1 mm in diameter and1.75 mm in height, where the dielectric permittivity is lower
936 IEEE TRANSACTIONS ON INSTRUMENTATION AND MEASUREMENT, VOL. 62, NO. 5, MAY 2013
Fig. 8. Setup displaying the layout of the four antennas, the test object, andthe coupling capacitor in parallel with the test object.
than the paper’s. Then, the sealed stack is placed between twoelectrodes and immersed in transformer oil to minimize theappearance of surface discharges along the plastic bag. One ofthe electrodes is connected to HV, and the other is connected toground. When HV is applied to the stack, the electric field willbe larger inside the cylinder than in the rest of the homogeneousdielectric, and most of internal PDs will occur in that region.
According to standard IEC 60270, a coupling capacitoris connected in parallel to the test object to provide a pathto ground for the high-frequency current pulses created byPDs (see Fig. 8). These conducted pulses are measured withan HFCT with a bandwidth up to 40 MHz connected to anoscilloscope to confirm that the detected UHF pulses are aconsequence of PD activity.
The HV source is a Schleich BV 702210 transformer witha GLP1-e HV control module that can reach up to 18 kV. Ithas been found that PD activity starts around 10 kV and it isstable. Hence, the HV source is slowly set slightly above theinception voltage, and the measuring campaign starts. Pulseswere acquired at 11 kV.
B. Antenna Deployment
As explained previously, different antennas with differentfrequency ranges were used to measure the radiation of PDs:a logperiodic antenna UHALP 91088A with a range from250 MHz to 2.4 GHz, two monopole antennas which are 5and 10 cm long, and a trapezoidal zigzag antenna. As shownin Section II, monopolar antennas with an appropriate groundplane improve the reception due to the better matching of the
Fig. 9. Background noise spectra in volts for all the antennas.
resonant frequency and the augmented directivity. Under thisassumption, two monopoles 10 cm long were manufactured,one with ground plane and the other without ground planeto measure the differences when detecting PDs. The trape-zoidal zigzag antenna also had ground plane, but the monopole5 cm long has no ground plane because it is so short that theconnector behaves as ground plane.
The antennas are deployed around the test object, and theiroutputs are connected to an oscilloscope with RG-223 coaxialcables. The position of the antennas in the measurement envi-ronment is an important issue that should be taken into account,since the distance between the antenna and the source of the PDshould force the antennas to work in the far-field region. Thereason for that is to assure that we are working in a distancewhere the radiation pattern does not change with distance.Since the three manufactured antennas have dimensions smallerthan λ/2, it is convenient that they are placed at a distance ofapproximately 1–2 λ (40–80 cm for the monopole 10 cm long).In the case of the logperiodic antenna, this distance must belonger as the antenna size is larger. At the same time, it shouldbe noted that the radiated field decays inversely proportional
ROBLES et al.: ANTENNA PARAMETRIZATION FOR THE DETECTION OF PARTIAL DISCHARGES 937
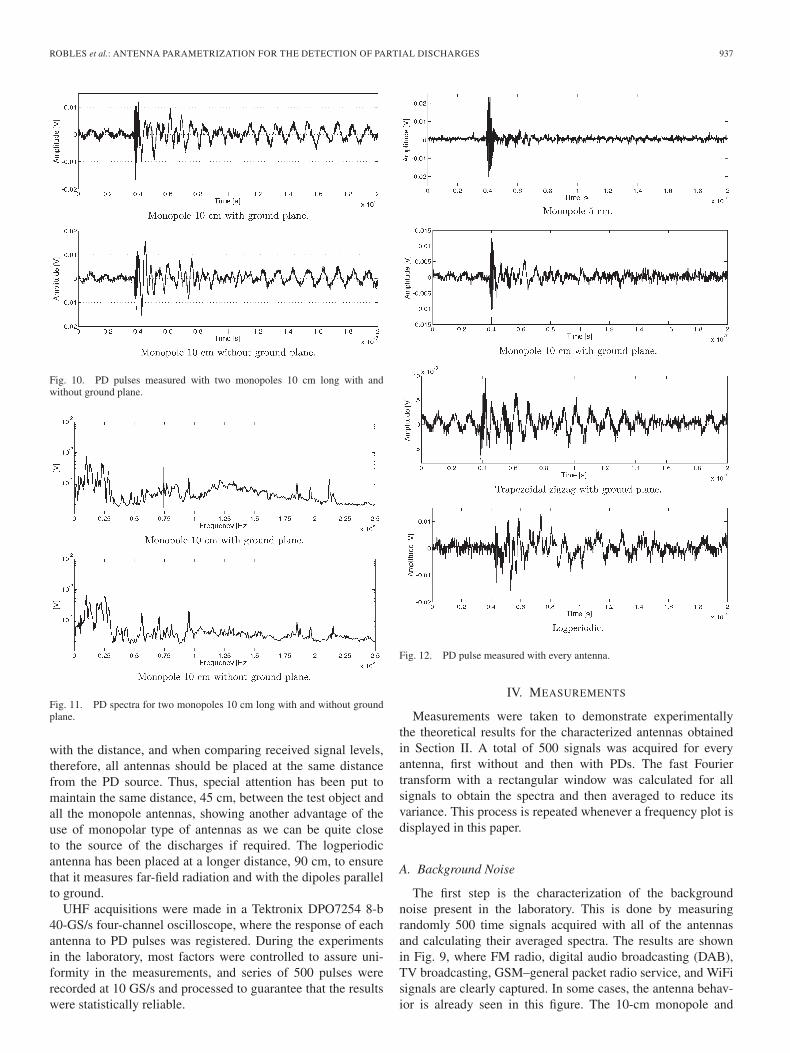
Fig. 10. PD pulses measured with two monopoles 10 cm long with andwithout ground plane.
Fig. 11. PD spectra for two monopoles 10 cm long with and without groundplane.
with the distance, and when comparing received signal levels,therefore, all antennas should be placed at the same distancefrom the PD source. Thus, special attention has been put tomaintain the same distance, 45 cm, between the test object andall the monopole antennas, showing another advantage of theuse of monopolar type of antennas as we can be quite closeto the source of the discharges if required. The logperiodicantenna has been placed at a longer distance, 90 cm, to ensurethat it measures far-field radiation and with the dipoles parallelto ground.
UHF acquisitions were made in a Tektronix DPO7254 8-b40-GS/s four-channel oscilloscope, where the response of eachantenna to PD pulses was registered. During the experimentsin the laboratory, most factors were controlled to assure uni-formity in the measurements, and series of 500 pulses wererecorded at 10 GS/s and processed to guarantee that the resultswere statistically reliable.
Fig. 12. PD pulse measured with every antenna.
IV. MEASUREMENTS
Measurements were taken to demonstrate experimentallythe theoretical results for the characterized antennas obtainedin Section II. A total of 500 signals was acquired for everyantenna, first without and then with PDs. The fast Fouriertransform with a rectangular window was calculated for allsignals to obtain the spectra and then averaged to reduce itsvariance. This process is repeated whenever a frequency plot isdisplayed in this paper.
A. Background Noise
The first step is the characterization of the backgroundnoise present in the laboratory. This is done by measuringrandomly 500 time signals acquired with all of the antennasand calculating their averaged spectra. The results are shownin Fig. 9, where FM radio, digital audio broadcasting (DAB),TV broadcasting, GSM–general packet radio service, and WiFisignals are clearly captured. In some cases, the antenna behav-ior is already seen in this figure. The 10-cm monopole and
938 IEEE TRANSACTIONS ON INSTRUMENTATION AND MEASUREMENT, VOL. 62, NO. 5, MAY 2013
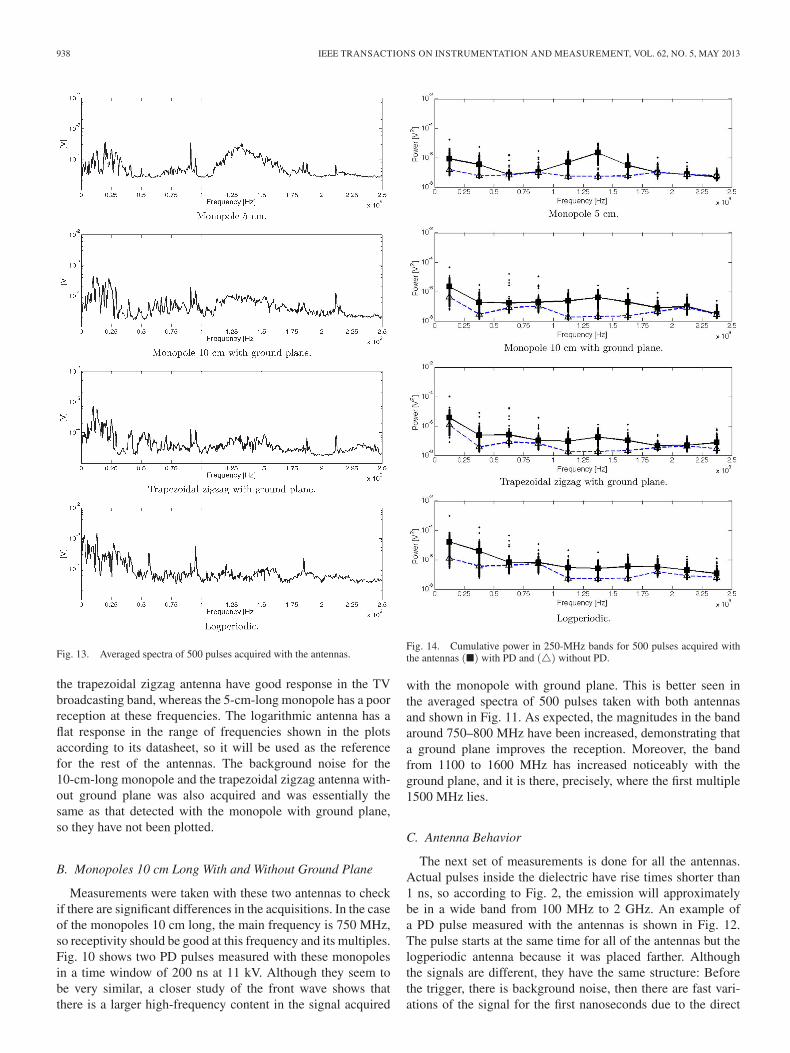
Fig. 13. Averaged spectra of 500 pulses acquired with the antennas.
the trapezoidal zigzag antenna have good response in the TVbroadcasting band, whereas the 5-cm-long monopole has a poorreception at these frequencies. The logarithmic antenna has aflat response in the range of frequencies shown in the plotsaccording to its datasheet, so it will be used as the referencefor the rest of the antennas. The background noise for the10-cm-long monopole and the trapezoidal zigzag antenna with-out ground plane was also acquired and was essentially thesame as that detected with the monopole with ground plane,so they have not been plotted.
B. Monopoles 10 cm Long With and Without Ground Plane
Measurements were taken with these two antennas to checkif there are significant differences in the acquisitions. In the caseof the monopoles 10 cm long, the main frequency is 750 MHz,so receptivity should be good at this frequency and its multiples.Fig. 10 shows two PD pulses measured with these monopolesin a time window of 200 ns at 11 kV. Although they seem tobe very similar, a closer study of the front wave shows thatthere is a larger high-frequency content in the signal acquired
Fig. 14. Cumulative power in 250-MHz bands for 500 pulses acquired withthe antennas (�) with PD and (�) without PD.
with the monopole with ground plane. This is better seen inthe averaged spectra of 500 pulses taken with both antennasand shown in Fig. 11. As expected, the magnitudes in the bandaround 750–800 MHz have been increased, demonstrating thata ground plane improves the reception. Moreover, the bandfrom 1100 to 1600 MHz has increased noticeably with theground plane, and it is there, precisely, where the first multiple1500 MHz lies.
C. Antenna Behavior
The next set of measurements is done for all the antennas.Actual pulses inside the dielectric have rise times shorter than1 ns, so according to Fig. 2, the emission will approximatelybe in a wide band from 100 MHz to 2 GHz. An example ofa PD pulse measured with the antennas is shown in Fig. 12.The pulse starts at the same time for all of the antennas but thelogperiodic antenna because it was placed farther. Althoughthe signals are different, they have the same structure: Beforethe trigger, there is background noise, then there are fast vari-ations of the signal for the first nanoseconds due to the direct
ROBLES et al.: ANTENNA PARAMETRIZATION FOR THE DETECTION OF PARTIAL DISCHARGES 939
TABLE IAVERAGE CUMULATIVE POWER IN V 2 × 10⁻⁹ FOR THE FOUR TYPES OF ANTENNAS MEASURING
PDS AND BACKGROUND NOISE. THE COLUMNS ARE THE FREQUENCY BANDS IN MEGAHERTZ
wave propagation of the pulse and multipath propagation, andthen there is radiation at lower frequencies due to the impulsivenature of the PD. Again, 500 time signals were acquired,and their spectra were calculated and averaged to obtain thefrequency response of the antennas. The results are shown inFig. 13. The differences with the plots in Fig. 9 are evidentsince there is energy in all the measured band up to 2.5 GHz thateven hides strong broadcasting emissions of radio and TV. Asexpected, the monopole 5 cm long has an outstanding behaviorin the band from 1100 to 1700 MHz and shows that PDs emit,at least, in that band. The monopole 10 cm long with groundplane has also good reception in this band but also at lowerfrequencies centered in 700 MHz where the 5-cm monopoleis not so good. The trapezoidal zigzag antenna with groundplane has more sensitivity around 500 MHz, although it canalso measure energy in the higher frequency band as the firsttwo antennas. Finally, the logperiodic antenna captures energyin all the band as expected.
The cumulative power in bands of 250 MHz has been calcu-lated and is plotted in Fig. 14 to have a better understanding ofthe power distribution in frequency. In this case, the magnitudeat every frequency of the spectra is divided into
√2 to obtain
the root mean square and then squared to calculate the power.The powers are summed in bands of 250 MHz, and the result isthe cumulative power in that band.
The cumulative power of the background noise in Fig. 9 isshown in Fig. 14 as triangles joined by a dashed line. Theaveraged cumulative power of the signals with PDs is presentedas squares joined by a solid line. Finally, every cumulativemagnitude is shown as a dot per spectrum to have a measureof the dispersion of the acquisitions.
The logperiodic antenna can be considered as the referencebecause it has almost a flat response up to 2.5 GHz. Then, it canbe clearly seen in its frequency response that PD pulses haveenergy in all bands up to 1750 MHz. From this frequency, thedifferences between noise and PD power are negligible in allthe antennas. The plot for the logperiodic antenna also showsthat the increments in power compared to the background noiseare quite constant in the rest of the bands. Considering thispremise, the specific antenna behavior in frequency can beeasily deduced from the rest of the plots. In those bands wherethe increment in power is larger, the antenna has better responsethan when the increment is lower. Then, the 5-cm monopole hasan outstanding response in the band from 1250 to 1500 MHz,a good response from 1000 to 1250 MHz and from 1500 to1750 MHz, and a very poor response in the band from 500to 1000 MHz. The 10-cm monopole with ground plane has
TABLE IISEVEN DETAIL LEVELS AND APPROXIMATION OF THE WAVELET
DECOMPOSITION AND THEIR FREQUENCY INTERVALS IF fs = 10 GHz.THE THIRD COLUMN RELATES THE BANDS WITH THE
CORRESPONDING ENVIRONMENTAL NOISE
an overall good response from 1000 to 1750 MHz, and forthe rest of the band, it is very similar to the zigzag antenna.Compared to the rest of the monopoles, the behavior of thetrapezoidal zigzag antenna with ground plane is not so good inthe UHF band, and it seems to be only remarkable in the lowestfrequency bands from 0 to 500 MHz, although this is clarifiedin Table I.
This table gives the same information as Fig. 14 but specifiesthe numerical values. The light gray shaded cells correspond tothe last columns where the differences between noise and PDsare negligible. The dark gray shaded cells are frequencies wherethe differences are remarkable (10 dB or more), whereas themedium gray shade represents changes of at least 7 dB. In thecase of the trapezoidal zigzag antenna, the effect of the PDs isnot so noticeable, and two cells have been shaded with mediumgray: One of them is at low frequencies, and the other is from1250 to 1500 MHz.
This study shows that the zigzag antenna is not a goodcandidate to measure PDs and, therefore, monopoles with longlengths should be discarded. However, the choice between theother two monopoles remains unclear because they seem tohave similar behavior in frequency. An additional study basedon the wavelet transform has been made to find out the bestoption. The wavelet transform decomposes the time signals intoN levels of details Dn and an approximation A1 using a filterbank. Then, the details are calculated by filtering the originalsignal in frequency intervals from fs/2
n+1 to fs/2n, where fs
is the sampling frequency and n is the number of the detail.The discrete wavelet transform was done using a Daubechieswavelet with order 5 and seven levels of decomposition to coverthe most important frequency intervals. These are shown forevery detail in Table II. The approximation level is the signalthat remains in the lower frequency interval of 0–39.0625 MHz.
940 IEEE TRANSACTIONS ON INSTRUMENTATION AND MEASUREMENT, VOL. 62, NO. 5, MAY 2013
Fig. 15. Percentage of the averaged energy in the details and approximationof the discrete wavelet transform when measuring PDs.
The discrete wavelet decomposition was applied to all 500signals from the monopole antennas when measuring PD, thenthe energy of the signals in the details and the approximationwas calculated, and, finally, the average energy per detail andapproximation was calculated. This is shown in Fig. 15 for thethree monopoles. The horizontal axis of the plot contains theapproximation and the details ordered in the bands of frequencyin Table II, and the vertical axis represents the average energypercentage. The zigzag antenna, white bars, captures more than40% of the energy in the band of detail 6 which is where FMradio is. The energy in detail 5, mostly corresponding to DABradio, and the approximation, HF band, is also significative.Therefore, the zigzag antenna is working in bands where theenvironmental noise is important and which hide the PD pulse.In the case of the monopole 10 cm in length, more than 50%of the energy is in the very high frequency band, whereasthe monopole 5 cm in length captures more than 60% of theenergy in the UHF band. This energy share is expected fromthe results obtained for the parameter S11 and allows us to con-clude that the shorter tested monopole is the most adequate tomeasure PD.
V. CONCLUSION
The theoretical analysis of the electromagnetic radiation ofPD pulses done shows that sensors in the UHF range can de-tect them. Under this assumption, four antennas with differentfrequency behavior have been chosen to measure PDs. A deepexperimental study concludes that the two monopoles 5 and10 cm long have good responses at frequencies above1000 MHz which corresponds to their λ/4 condition. Thezigzag antenna is not so sensitive as the monopoles, but it ismore appropriate for measuring at lower frequencies (below500 MHz) because its behavior is that of a monopole with16.5 cm in length. The logperiodic antenna is a good referenceto compare the results, although its response is not so good asthe monopoles for frequencies above 750 MHz. An additionalstudy based on the wavelet transform corroborates these resultsand shows that the monopole 5 cm in length receives more than60% of the energy of the radiated signal in the UHF band,
designating it as the best option to measure PDs. Therefore,this phenomenon can be measured with simple and inexpensivemonopoles in an efficient manner.
ACKNOWLEDGMENT
Tests were done in the High Voltage Research and TestLaboratory of Universidad Carlos III de Madrid.
REFERENCES
[1] P. Gill, Electrical Power Equipment Maintenance and Testing. NewYork: Marcel Dekker, 1998.
[2] F. H. Kreuger, Partial Discharge Detection in High-Voltage Equipment.London, U.K.: Butterworths, 1989.
[3] P. Morshuis, “Degradation of solid dielectrics due to internal partial dis-charge: Some thoughts on progress made and where to go now,” IEEETrans. Dielectr. Electr. Insul., vol. 12, no. 5, pp. 905–913, Oct. 2005.
[4] G. Stone, E. Boutler, I. Culbert, and H. Dhirani, Electrical Insulationfor Rotating Machines: Design, Evaluation, Ageing, Testing and Repair.Piscataway, NJ: IEEE Press, 2004, ser. Series on Power Engineering.
[5] High Voltage Test Techniques. Partial Discharge Measurements, IEC60270, 2000.
[6] G. Robles, J. M. Martínez, M. Rojas, and J. Sanz, “Inductive sensor formeasuring high frequency partial discharges within electrical insulation,”IEEE Trans. Instrum. Meas., vol. 58, no. 11, pp. 3907–3913, Nov. 2009.
[7] D. Ward and J. Exon, “Using Rogowski coils for transient current mea-surements,” Eng. Sci. Educ. J., vol. 2, no. 3, pp. 105–103, Jun. 1993.
[8] M. Argüeso, G. Robles, and J. Sanz, “Implementation of a Rogowski coilfor the measurement of partial discharges,” Rev. Sci. Instrum., vol. 76,no. 6, p. 065107, Jun. 2005.
[9] S. M. Markalous, S. Tenbohlen, and K. Feser, “Detection and locationof partial discharges in power transformers using acoustic and electro-magnetic signals,” IEEE Trans. Dielectr. Electr. Insul., vol. 15, no. 6,pp. 1576–1583, Dec. 2008.
[10] J. Ramírez-Niño and A. Pascacio, “Acoustic measuring of partial dis-charge in power transformers,” Meas. Sci. Technol., vol. 20, no. 11,p. 115 108, Nov. 2009.
[11] S. Tenbohlen, D. Denissov, S. Hoek, and S. Markalous, “Partial dischargemeasurement in the ultra high frequency (UHF) range,” IEEE Trans.Dielectr. Electr. Insul., vol. 15, no. 6, pp. 1544–1552, Dec. 2008.
[12] J. López-Roldán, T. Tang, and M. Gaskin, “Optimisation of a sensor foronsite detection of partial discharges in power transformers by the UHFmethod,” IEEE Trans. Dielectr. Electr. Insul., vol. 15, no. 6, pp. 1634–1639, Dec. 2008.
[13] C.-H. Jin, J.-Y. Lee, D.-W. Park, and G.-S. Kil, “Detection of partialdischarges by a monopole antenna in insulation oil,” in Proc. 11th/12thWSEAS Int. Conf. IMMURO, Stevens Point, Wisconsin, 2012, pp. 27–30.
[14] I. Portugués, P. Moore, I. Glover, C. Johnstone, R. McKosky, M. Goff, andL. van der Zel, “RF-Based partial discharge early warning system for air-insulated substations,” IEEE Trans. Power Del., vol. 24, no. 1, pp. 20–29,Jan. 2009.
[15] A. Cavallini, G. Montanari, M. Tozzi, and X. Chen, “Diagnostic of HVDCsystems using partial discharges,” IEEE Trans. Dielectr. Electr. Insul.,vol. 18, no. 1, pp. 275–284, Feb. 2011.
[16] P. Moore, I. Portugues, and I. Glover, “A nonintrusive partial dischargemeasurement system based on RF technology,” in Proc. IEEE Power Eng.Soc. Gen. Meet., Jul. 2003, vol. 2, pp. 1–6.
[17] G. Robles, J. Martínez-Tarifa, M. Rojas-Moreno, R. Albarracín, andJ. Ardila-Rey, “Antenna selection and frequency response study forUHF detection of partial discharges,” in Proc. IEEE I2MTC, May 2012,pp. 1496–1499.
[18] Y. Shibuya, S. Matsumoto, M. Tanaka, H. Muto, and Y. Kaneda, “Elec-tromagnetic waves from partial discharges and their detection using patchantenna,” IEEE Trans. Dielectr. Electr. Insul., vol. 17, no. 3, pp. 862–871,Jun. 2010.
[19] Y. Shibuya, S. Matsumoto, T. Konno, and K. Umezu, “Electromagneticwaves from partial discharges in windings and their detection by patchantenna,” IEEE Trans. Dielectr. Electr. Insul., vol. 18, no. 6, pp. 2013–2023, Dec. 2011.
[20] C. Balanis, Antenna Theory: Analysis and Design. New York: Wiley,2005.
[21] Schwarzbeck Mess-Elektronik, UHALP 9108 A Data Sheet, Schönau,Germany. [Online]. Available: http://www.schwarzbeck.de
ROBLES et al.: ANTENNA PARAMETRIZATION FOR THE DETECTION OF PARTIAL DISCHARGES 941
Guillermo Robles (SM’12) was born in Madrid,Spain, in 1969. He received the M.Sc. and Ph.D. de-grees in electronic engineering from the UniversidadPontificia de Comillas de Madrid, Madrid, Spain, in1993 and 2002, respectively.
In 2002, he joined the Departamento de IngenieríaEléctrica, Universidad Carlos III de Madrid, Madrid,where he has been an Associate Professor since 2009and is also with the High-Voltage Research and TestsLaboratory (LINEALT). He has coauthored morethan 50 papers in international journals and confer-
ences. His research interests include the design of sensors, instrumentationand measurement techniques for high frequency currents, particularly due topartial discharges in noisy environments, and the study and characterizationof magneto-optic sensors based on the Faraday effect for the measurement ofcurrents and the characterization of the behavior of magnetic materials at highfrequencies.
Matilde Sánchez-Fernández received the M.Sc.degree in telecommunications engineering and thePh.D. degree from Polytechnic University of Madrid,Madrid, Spain, in 1996 and 2001, respectively.
In 2000, she joined the Universidad Carlos III deMadrid, Madrid, where she has been an AssociateProfessor since 2009 teaching several undergraduateand graduate courses (M.Sc. and Ph.D.) related tocommunication theory and digital communications.Previously, she was a Telecommunication Engineerwith Telefónica. She performed several research
stays at the Information and Telecommunication Technology Center, TheUniversity of Kansas, Lawrence (1998), Bell Laboratories, Crawford Hill,NJ (2003–2006), Centre Tecnològic de Telecomunicacions de Catalunya,Barcelona, Spain (2007), and Princeton University, Princeton, NJ (2011).Her current research interests are multiple-input–multiple-output techniques,wireless communications, and simulation and modeling of communicationsystems, and in these fields, she has (co)authored more than 40 contributionsto international journals and conferences.
Ricardo Albarracín Sánchez was born in Madrid,Spain, in 1983. He received the B.Sc. degree intechnical electrical engineering and the M.Sc. degreein industrial electrical engineering from the Univer-sidad Carlos III de Madrid (UC3M), Madrid, in 2005and 2010, respectively, where he is currently workingtoward the Ph.D. degree in electrical engineering.
Since 2008, he has been an Assistant Profes-sor with the Departamento de Ingeniería Eléctrica,UC3M. His subject was power grids with distributedgeneration and integration of renewable sources in
power systems, mainly photovoltaic energy sources. In 2011, he joined theHigh-Voltage Research and Tests Laboratory (LINEALT), UC3M, where heis working on insulation systems diagnosis within power cables and electricalmachines.
Mónica V. Rojas-Moreno was born in Duitama,Colombia, in 1979. She received the B.Sc. degreein electrical engineering from Universidad Indus-trial de Santander (UIS), Bucaramanga, Colombia,in 2003 and the M.Sc. and Ph.D. degrees in electri-cal engineering from the Universidad Carlos III deMadrid (UC3M), Madrid, Spain, in 2009 and 2011,respectively.
From 2003 to 2007, she was an Assistant Professorwith the Escuela de Ingenierías Eléctrica, Electrónicay Telecomunicaciones, UIS. She is currently with the
Departamento de Ingeniería Eléctrica and the High-Voltage Research and TestsLaboratory (LINEALT), UC3M. Her research interests include electromagneticfields, partial discharges, instrumentation, high-frequency signals, and model-ing of circuits.
Eva Rajo-Iglesias (SM’08) was born in Monfortede Lemos, Spain, in 1972. She received the M.Sc.degree in telecommunication engineering from theUniversity of Vigo, Vigo, Spain, in 1996 and thePh.D. degree in telecommunication from the Univer-sidad Carlos III de Madrid (UC3M), Madrid, Spain,in 2002.
From 1997 to 2001, she was a Teacher Assis-tant with UC3M. In 2001, she joined the Poly-technic University of Cartagena, Cartagena, Spain,as Teacher Assistant for a year. She came back to
UC3M as a Visiting Lecturer in 2002, and since 2004, she has been an AssociateProfessor with the Departamento de Teoría de la Señal y Comunicaciones,UC3M. Since 2009, she has been an Affiliate Professor with the AntennaGroup, Signals and Systems Department, Chalmers University of Technology,Gothenburg, Sweden, where she was a Guest Researcher during autumn 2004,2005, 2006, 2007, and 2008. Her main research interests include microstrippatch antennas and arrays, metamaterials and periodic structures, and optimiza-tion methods applied to electromagnetism. She has (co)authored more than40 contributions in international journals and more than 80 in internationalconferences.
Dr. Rajo-Iglesias was a recipient of the 2007 Loughborough Antennas andPropagation Conference Best Paper Award and the “Best Poster Award in thefield of Metamaterial Applications in Antennas” sponsored by The Institutionof Engineering and Technology Antennas and Propagation Network, at Meta-materials 2009: Third International Congress on Advanced ElectromagneticMaterials in Microwaves and Optics. She currently serves as Associate Editorfor the IEEE ANTENNAS AND PROPAGATION MAGAZINE and for IEEEANTENNAS AND WIRELESS PROPAGATION LETTERS.
Juan Manuel Martínez-Tarifa was born in Lorca,Spain, in 1975. He received the M.Sc. degree in elec-tronic engineering and the M.Sc. degree in physicsfrom the Universidad de Granada, Granada, Spain,in 1999 and 2000, respectively, and the Ph.D. degreein electrical engineering from the Universidad CarlosIII de Madrid (UC3M), Madrid, Spain, in 2005.
He is currently an Associate Professor with theDepartamento de Ingeniería Eléctrica, UC3M, wherehe was an Assistant Professor from 2000 to 2012. Hehas been a Visiting Researcher with Laboratoire de
Génie Électrique, Université Paul Sabatier–Centre National de la RechercheScientifique, Toulouse, France, and with Laboratorio di Ingegneria dei Materialied Alte Tensioni, Università di Bologna, Bologna, Italy. He is also currentlya Technical Supervisor with the High-Voltage Research and Tests Laboratory(LINEALT), UC3M, where he is working on insulation systems diagnosiswithin power cables and electrical machines. He has published more than 20articles in international journals and conferences. He has joined several researchteams to work in more than ten research projects financed by public and privatefunds.