46
Mike Bullock [email protected] 760-754-8025 Anthropogenic Climate Change Literacy & Light- Duty Vehicle (LDV) Requirements

Mike Bullock
760-754-8025
Anthropogenic Climate Change Literacy & Light-
Duty Vehicle (LDV) Requirements

Climate Literacy
2Paper 2014-A-30793-AWMA
THEREFORE BE IT RESOLVED, that the California Democratic Party reinforces the need for all high school students to know, before they graduate, and elected officials to know, acknowledge, and address, as soon as possible, (1) both the existence of and the reason for anthropogenic climate change; (2) its potential for harm; (3) the difference between stabilizing the climate at a livable level and destabilization; (4) science-based, climate-stabilizing, GHG reduction targets; (5) the primary variables and considerations in identifying those targets and (6) the approximate amount of life style and technology change required to achieve those climate-stabilizing targets.
Item 6 will be shown for cars and light-duty trucks, in
terms of Requirements, or Enforceable Measures

Climate Data• Keeling Curve:
http://en.wikipedia.org/wiki/An_Inconvenient_Truth#Scientific_basis
3Paper 2014-A-30793-AWMA
Currently
400 PPM!
*
Burning a gallon of gasoline releases about 19 #’s of CO2!
LikewiseA barrel of oil, about 700 #’sA ton of coal, about 3 tons
Etc.

Climate Change, Mostly Normal
4
This spike is not normal. It is anthropogenic (man made)
*Currently over 410 PPM !!
Mike Bullock, 2012
3

Let’s Zero In on that Spike• Earth & Space Research (ESR) website:
http://www.esr.org/outreach/climate_change/mans_impact/man1.html
5
*
Current level over 410 PPM
Paper 2014-A-30793-AWMA
Start of Industrial Revolution 4

Why is there a Climate Problem?
• Atmospheric CO2 traps heat – CO2 Molecules absorb and then emit, in a random direction,
infrared radiation, heat given off by the Earth’s surface– This effect is significant
• Combustion of fossil fuels adds great quantities of CO2 to our Earth’s atmosphere– The amount of C02 in the atmosphere is well known– Our yearly emissions are well known
6Paper 2014-A-30793-AWMA
Any Earth Science text book* contains the following facts:
* For example, Page 539 of Earth Science, Tarbuck and Lutgens, Tenth Edition, published by Prentice Hall, 2003.
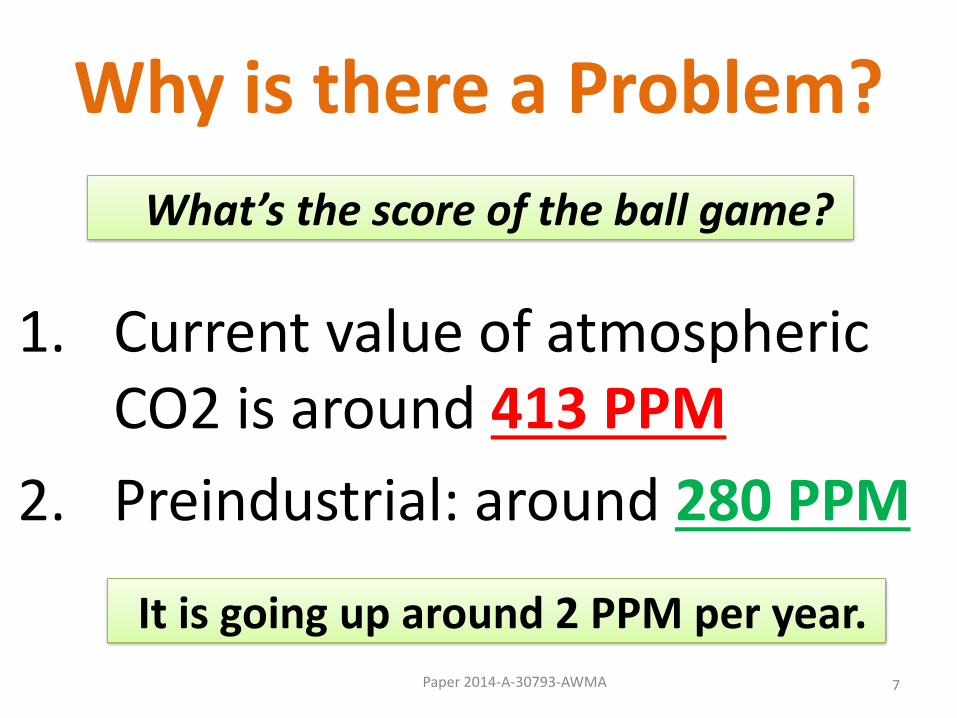
Why is there a Problem?
1. Current value of atmospheric CO2 is around 413 PPM
2. Preindustrial: around 280 PPM
7Paper 2014-A-30793-AWMA
What’s the score of the ball game?
It is going up around 2 PPM per year.

Governor Brown to the Pope:
8Paper 2014-A-30793-AWMA
Humanity must
Reverse Course*
Face Extinction
or
* Must be quantified
How Bad Could It Get?
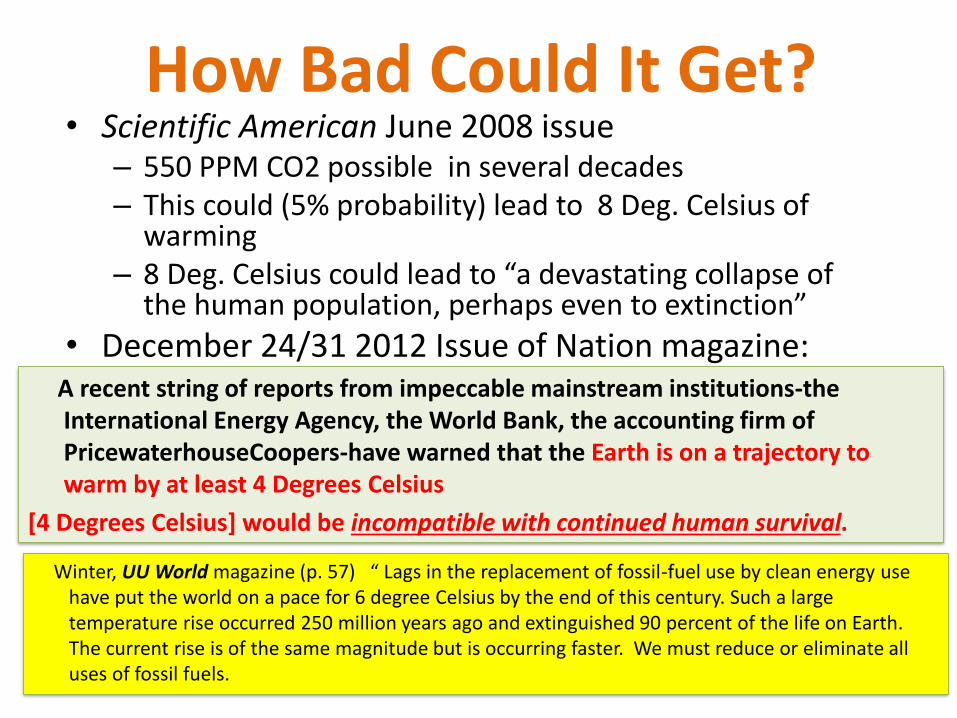
How Bad Could It Get?• Scientific American June 2008 issue
– 550 PPM CO2 possible in several decades– This could (5% probability) lead to 8 Deg. Celsius of
warming– 8 Deg. Celsius could lead to “a devastating collapse of
the human population, perhaps even to extinction”
• December 24/31 2012 Issue of Nation magazine:
9Paper 2013-A-13309-AWMA
A recent string of reports from impeccable mainstream institutions-the International Energy Agency, the World Bank, the accounting firm of PricewaterhouseCoopers-have warned that the Earth is on a trajectory to warm by at least 4 Degrees Celsius
[4 Degrees Celsius] would be incompatible with continued human survival.
Winter, UU World magazine (p. 57) “ Lags in the replacement of fossil-fuel use by clean energy use have put the world on a pace for 6 degree Celsius by the end of this century. Such a large temperature rise occurred 250 million years ago and extinguished 90 percent of the life on Earth. The current rise is of the same magnitude but is occurring faster. We must reduce or eliminate all uses of fossil fuels.

10Paper 2014-A-30793-AWMA
We must stabilize the value of the earth’s atmospheric CO2_e
EN
Fixing the Problem
+ EA EWFB+
CO2_e Emissions
Natural: rotting,
fire, digestion.
respiration
Anthropogenic:
combustion of
fossil fuel,
methane, other
S>
=
<
Sequestration
(Photosynthesis)
Warming Feed
Back: such as
methane from
melting permafrost
Growth of
plants on Earth
→ Positive Slope
→ Zero Slope
→ Negative Slope
If Anthropogenic emissions were to be
sufficiently low (80% below 1990 levels has
been allocated to industrialized countries),
the slope would be zero, thus capping the
value of the Earth’s atmospheric CO2_e The Warming Feed Back term is the wild
card. It must not become dominant.

11Paper 2014-A-30793-AWMA
We must stabilize the value of the earth’s atmospheric CO2_e
Fixing the Problem
If Anthropogenic emissions were to be
sufficiently low (80% below 1990 levels
has been allocated to industrialized
countries), the slope would be zero,
thus capping the value of the Earth’s
atmospheric CO2_e
The Warming Feed Back term is the wild card.
It must not become dominant.

Greenhouse Gas (GHG) Emissions, SD CountySource: Energy Policy Initiatives Center (EPIC, USD)
Electricity 25%
CIVIL AVIATION 5%
INDUSTRIAL PROCESSES AND PRODUCTS
5%
OTHER FUELS/OTHER 4%
OFF-ROAD EQUIPMENT AND VEHICLES
4% WASTE 2%
AGRICULTURE/FORESTRY/LAND USE
% 2RAIL 1%
WATER-BORNE NAVIGATION
0.4%
On Road Transportation: 46%
Cars and light-duty trucks: 41%
Heavy Duty Vehicles: 5%
http://www.sandiego.edu/EPIC/ghginventory/GHG-On-Road1.pdf.pdf
Natural Gas End Users 9%
Why pick on cars?

https://www.cadem.org/our-party/standing-committees/body/CDP-Platform-2018.pdf
2018 California Democratic Party Platform
Transportation
• Demand Regional Transportation Plan (RTP) driving-reduction targets, shown by science to support climate stabilization;
• Demand a state plan showing how cars and light-duty trucks can hit climate-stabilizing targets by defining enforceable measures to achieve necessary fleet efficiency and per-capita driving
limits;

Mike Bullock
Climate Stabilizing Light-Duty Vehicle (LDV)
RequirementsVersus Air Resource Board Goals
2016 AWMA Conference, New OrleansOnly 23 of 37 Slides Plus Climate Literacy Slides

• My math:
– 15% means a factor of 0.85, year after year
– Consider the 10 years from 2020 to 2030
– (.85)10 = .20, which is 80% down
– Other articles, describing Hansen’s work: “decarbonization by 2030”
15Paper 2014-A-30793-AWMA
From the Climate Scientists From Page 21: . . . the required rate of emissions
reduction would have been about 3.5% per year if
reductions had started in 2005, while the required rate of
reduction, if commenced in 2020, will be approximately
15% per year.
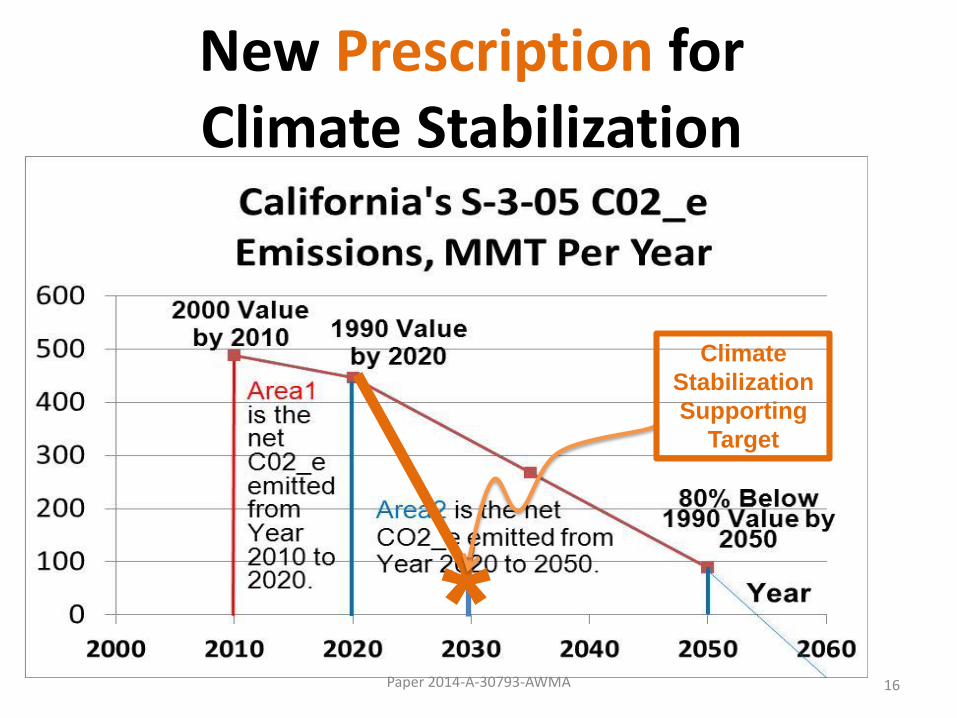
New Prescription for Climate Stabilization
16Paper 2014-A-30793-AWMA
*
Climate
Stabilization
Supporting
Target

Notes on Methods
• Base year 2005
• Intermediate year 2015
• Car Efficiency Factor from 2005 to 2015
– Steve Winkelman’s data
– http://www.nrdc.org/globalWarming/sb375/files/sb375.pdf
• Car Efficiency Factor, 2015 to 2030
– Derived in paper
– Results in car-efficiency requirements
• Cars last 15 yearsPaper 2013-A-13309-AWMA 17
From a California law (SB 375)
giving per-capita driving
reduction targets to be achieved
in Regional Transportation Plans
Report on SB 375
See its Table 1.
Older cars are so few in number that
they can be ignored.

Figure 1, from: http://www.ecovote.org/sites/default/files/pdf/sb375.pdf
Data Relating 1990, 2005, & 2015 Data
18
S-3-05
Purple (Low carbon fuel),
Green (C02/Mile), & Gold (S-3-05)
Paper 2013-A-13309-AWMA

Variables
19Paper 2014-A-30793-AWMA
Definitions
LDV Emitted C02, in Year “k”
Low Carbon Fuel Standard (LCFS) Factor that reduces thePer-Gallon CO2 emissions, in Year “k” (k is denotes Year 2030)
LDV CO2 emitted per mile driven, average, in Year “k”, notaccounting for the Low Carbon Fuel Standard (LCFS) Factor
LDV CO2 emitted per mile driven, average, in Year “k”, accountingfor the Low Carbon Fuel Standard (LCFS) Factor
Population, in Year “k”
Per-capita LDV driving, in Year “k”
LDV Driving, in Year “k”
LDV Mileage, miles per gallon, in Year “k”
LDV Equivalent Mileage, miles per gallon, in Year “k” accounting for the Low Carbon Fuel Standard (LCFS) Factor, so this is Mk/Lk
N Number of pounds of CO2 per gallon of fuel but not accounting forthe Low Carbon Fuel Standard (LCFS) Factor
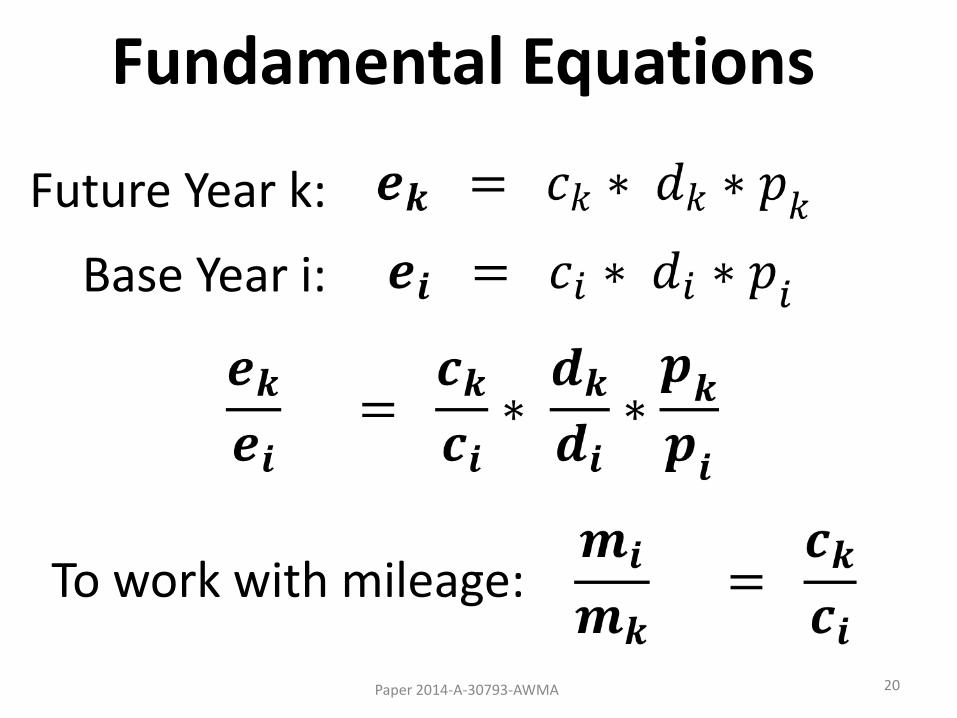
Fundamental Equations
Future Year k:
20Paper 2014-A-30793-AWMA
Base Year i:
To work with mileage:

Solution Overview
21Paper 2014-A-30793-AWMA
From the known 1990-to-
2005 factor and the
Climate-Stabilizing-
Target, which is the
factor of 2030 emissions
to 1990 emissions
Car Efficiency Factor
From existing mileage
requirements and the
requirements defined herein
The Independent Variable
It becomes the required per-capita
driving reduction with respect to
2005 driving
From existing and
predicted population
“k” denotes Year 2030
“i” denotes Year 2005

Mike Bullock
9 slides of math derivation and EXCEL Tables are moved
to the “skipped slides” section, to quickly get to the
answer

Computing the Ratio of Per-Capita 2030 Driving to Per-Capita 2005 Driving
23Paper 2014-A-30793-AWMA
2015 Fleet Mileage was computed
= “DENOMINATOR MILEAGE”
d2030
Equivalent Mileage in 2030 is what we
made it. It is as high as possible,
because a large driving reduction will
be difficult.
= “NUMERATOR MILEAGE”
d2005
= .1689 *111.03
27.30= .68
The factor of 0.68 means there is a 32% reduction in
per-capita driving, from 2005 to 2030.

24Paper 2014-A-30793-AWMA
Calculation of Net Driving Decrease
with Respect to 2005 Driving
for the Heroic Measures Case
(Per-Capita Driving Factor) x (Population Factor) =
Net Driving Factor
(.68) x (1.23) = .84
Even though the population will grow 23%,
net driving must decrease by 16%.
Therefore, why add highway lanes?
This factor
corresponds to
the 32%
reduction in per-
capita driving

25Paper 2013-A-13309-AWMA
Fractions of Fleets Sold in California that
are Zero Emission Vehicles AND Required
Driving Reduction, For 2 Different Cases
Zero Emission Vehicle (ZEV) Fleet Per-Cent
& Required Driving Reduction, Per-Cent"Heroic Measures" Case Versus the "Extra Heroic Measures"
Year 2016 2017 2018 2019 2020 2021 2022
Heroic Measures 4% 7% 12% 18% 24% 34% 48%
Extra Heroic Measures 4% 12% 24% 40% 62% 90% 93%
Year 2023 2024 2025 2026 2027 2028 to 2030
Heroic Measures 62% 76% 90% 95% 98% 99%
Extra Heroic Measures 96% 97% 98% 99% 99% 99%
% Reduction in Per-Capita
Driving, with Respect to 2005
Heroic Measures 32%Extra Heroic Measures 0%

26Paper 2013-A-13309-AWMA
Comparison With Air Resources Stated Goals
Air Resources EUEC Report
Board Chair Climate
Statement Stabilizing
Year Bloomberg News1
"Heroic Measures" Case2
2016 2.7% 4.0%
2017 2.7% 7.0%
2018 5.1% 12.0%
2019 7.5% 18.0%
2020 9.9% 24.0%
2021 12.4% 34.0%
2022 14.8% 48.0%
2023 17.2% 62.0%
2024 19.6% 76.0%
2025 22.0% 90.0%
2026 37.6% 95.0%
2027 53.2% 98.0%
2028 68.8% 99.0%
2029 84.4% 99.0%
2030 100.0% 99.0%1August 8, 2015
2Also requires a 32% reduction in per-capta driving with respect to 2005
The CARB Plan
Regulations on the books in
California, set in 2012,
require that 2.7 percent of
new cars sold in the state
this year be, in the regulatory
jargon, ZEVs. The quota
rises every year starting in
2018 and reaches 22 percent
in 2025. Nichols wants 100
percent of the new vehicles
sold to be zero- or almost-
zero-emissions by 2030
The CARB Plan results in an equivalent 2030 Fleet Mileage of only 69.2 MPG,
which would require a per-capita driving reduction of 58%, compared to 2005
driving, to achieve the climate-stabilizing target.

Measures to Get 32%• Predictions, Regional Transportation Plans
• Stop expanding most roads and all freeways
– No need, Eliminate congestion with less driving
• Reallocate freeway-expansion $$$ to transit
• Pricing, to increase fairness & choice
– Demonstration projects: unbundle parking cost
– Legislation
• Unbundle the cost of most “free” or underpriced parking
• Equitable and environmentally-sound road-use fees
• Smarter growth, complete streets, bike classes
27Paper 2014-A-30793-AWMA
Estimated
Reduction
2%
2%
8%
2%
32%
8%
10%

An Important Pricing Strategy
THEREFORE, BE IT RESOLVED, that DEMCCO supports a road-usage charge (RUC) pricing and payout system that (1) would cover all road-use costs, including the environmental and health costs caused by driving; (2) could still include a fuel tax or fee; (3) would mitigate impacts on low-income users; (4) would protect privacy; (5) would include congestion pricing when that technology becomes feasible; (6) would keep the per-mile price incentive to drive energy-efficient cars at least as large as it is with today’s fuel excise tax; and (7) would send its earnings to all citizens and institutions that are losing money under the current system, with the goal being to achieve a full and just compensation.
28Paper 2014-A-30793-AWMA
A Privacy-Protecting, Road-Usage-Charge (RUC) Pricing & Payout System to Help Solve Climate,
Congestion, Deferred Road Maintenance, and the Social Inequity of Using General Funds to Maintain
Roads, Since that Money is Needed for Such Things as Transit, Food Stamps, and Education

Another Important Pricing Strategy
THEREFORE, BE IT RESOLVED, that DEMCCO supports funding the development and prototype installation of car-parking systems with at least the last two features (numbered 7 and 8), so as to demonstrate useful feasibility, with the full set of features as follows: (1) have full-cost base pricing; (2) have congestion pricing; (3) have charge and payout policies that will minimize money lost by non-drivers, due to parking facilities; (4) will support sharing of parking facilities; (5) will provide retrievable knowledge of the use of each parking space; (6) have a data interface that will support on-demand predictions of parking-space price and availability; (7) have automatic car detection; and (8) will do efficient mailing of invoices, containing both parking charges and parking earnings.
29Paper 2014-A-30793-AWMA
Funding for a Demonstration Project of an Equitable and Environmentally-
Sound Car-Parking Policy

Solution Using Intermediate Year of 2015
31Paper 2014-A-30793-AWMA
Taken from the
Winkelman data: the
known 1990-to-2005
factor of emissions
(the light blue line)
Car Efficiency
Factor
From existing
mileage
requirements and
the requirements
defined herein
The Independent Variable
It becomes the required 2030 per-
capita driving reduction with
respect to 2005 driving
From
known and
predicted
populations
From the Climate-
Stabilizing-Target,
which is the factor
of 2030 emissions
to 1990 emissions
From Winkelman.
It is the product of
the factor from the
green line and the
purple line.

Putting In the Easy-to-Get Values
32Paper 2014-A-30793-AWMA
Taken from the
Winkelman data: the
known 1990-to-2005
factor of emissions
(the light blue line)
Car Efficiency
Factor
From existing
mileage
requirements and
the requirements
defined herein
The Independent Variable
It becomes the required per-capita
2030 driving reduction with
respect to 2005 driving
From
known and
predicted
populations
From the Climate-
Stabilizing-Target,
which is the factor
of 2030 emissions
to 1990 emissions
From Winkelman.
It is the product of
the factor from the
green line and the
purple line.

Combining the Easy-to-Get Values, Solving for the Independent Variable, and Changing the 2015-to-2030 Car Efficiency from CO2-Per-Mile to Equivalent-Miles-Per-Gallon
33Paper 2014-A-30793-AWMA
2015 Fleet Mileage is computed
= “DENOMINATOR MILEAGE”
The required per-capita 2030 driving
with respect to 2005 driving
Equivalent Mileage in 2030 is what
we make it. It better be as high as
possible, because a large driving
reduction will be difficult.
= “NUMERATOR MILEAGE”

Some Requirements Defined to Achieve 2030 Fleet Equivalent-Mileage
• Low-Carbon Fuel Standards (LCFS)
• Corporate Average Fuel Efficiency (CAFÉ) Standards from 2015 to 2030
• Driving Reduction Factors (fn) for bad-mileage years (Year n)
Paper 2014-A-30793-AWMA 34
• For example, 0.75
means 25% less
driving
• Cash for Gas-
guzzlers?
Both California’s
existing and
extended, “Lk”
Existing, to 2025
Specified to 2030

Three More RequirementsDefined to Achieve 2030 Fleet Equivalent-Mileage
• CAFÉ Standards only apply to Internal Combustion Engine (ICE) LDVs
• New Requirement: Fraction of fleet sold that must be Zero Emission Vehicles (ZEVs)
• In 2030, only 20% of electricity is from fossil fuels
Paper 2014-A-30793-AWMA 35
Define “z” to be the fraction of
fleet sold that must be ZEVs

36Paper 2014-A-30793-AWMA
Fleet Mileage for Intermediate Year 2015
LDV
Set
Years
Old
Model
Year
CAFE
MPG
LCFS
Factor
LYear
Factor
Driven
f
Gallons
Used Per
f*100
Miles
1 14-15 2001 24.0 1.0 1.0 4.17
2 13-14 2002 24.0 1.0 1.0 4.17
3 12-13 2003 24.0 1.0 1.0 4.17
4 11-12 2004 24.0 1.0 1.0 4.17
5 10-11 2005 25.0 1.0 1.0 4.00
6 9-10 2006 25.7 .9933 1.0 3.87
7 8-9 2007 26.3 .9867 1.0 3.75
8 7-8 2008 27.0 .9800 1.0 3.63
9 6-7 2009 28.0 .9733 1.0 3.48
10 5-6 2010 28.0 .9667 1.0 3.45
11 4-5 2011 29.1 .9600 1.0 3.30
12 3-4 2012 29.8 .9533 1.0 3.20
13 2-3 2013 30.6 .9467 1.0 3.09
14 1-2 2014 31.4 .9400 1.0 2.99
15 0-1 2015 32.6 .9333 1.0 2.86
Sum of Gallons: 54.29
Miles = 100*Sum(f’s): 1500
MPG = Miles/(Sum of Gallons): 27.63 27.3
Computed DENOMINATOR MILEAGE

ZEV Derivation Variables
37Paper 2014-A-30793-AWMA
Variable DefinitionZEV Equivalent mileage (miles per equivalent gallon)
ZEV Equivalent mileage if the electricity is from renewables
ZEV Equivalent mileage if the electricity is from fossil fuels
rfraction of electricity generated from sources not
emitting CO2
G Gallons of equivalent fuel used
D Arbitrary distance travelled
Num
Den

ZEV Derivation
38Paper 2014-A-30793-AWMA
𝒎𝒛𝒓 𝒎𝒛𝒇 r 1-r Num Den 𝒎𝒛
5000 70 0.8 0.2 350000.00 1056.00 331.44

39Paper 2014-A-30793-AWMA
“Heroic Measures” Assumptions & MileageICE Parameters and Calculations ZEVs Yearly Totals
CAFÉ Eq. Total Total 2030
Year MPG LCFS MPG f Di Gi z Dz Gz Miles Gallons MPG
2016 34.3 0.9267 37.01 0.3 28.8 0.7781 0.04 4 0.012 32.80 0.7901 41.51
2017 35.1 0.9200 38.15 0.4 37.2 0.9750 0.07 7 0.021 44.20 0.9962 44.37
2018 36.1 0.9133 39.53 0.5 44.0 1.1132 0.12 12 0.036 56.00 1.1494 48.72
2019 37.1 0.9067 40.92 0.6 49.2 1.2024 0.18 18 0.054 67.20 1.2567 53.47
2020 38.3 0.9000 42.56 0.7 53.2 1.2501 0.24 24 0.072 77.20 1.3225 58.37
2021 40.3 0.8500 47.41 0.8 52.8 1.1136 0.34 34 0.103 86.80 1.2162 71.37
2022 42.3 0.8000 52.88 0.9 46.8 0.8851 0.48 48 0.145 94.80 1.0299 92.05
2023 44.3 0.8000 55.38 1.0 38.0 0.6862 0.62 62 0.187 100.00 0.8733 114.51
2024 46.5 0.8000 58.13 1.0 24.0 0.4129 0.76 76 0.229 100.00 0.6422 155.71
2025 48.7 0.8000 60.88 1.0 10.0 0.1643 0.90 90 0.272 100.00 0.4358 229.46
2026 51.2 0.8000 64.00 1.0 5.0 0.0781 0.95 95 0.287 100.00 0.3648 274.16
2027 53.7 0.8000 67.13 1.0 2.0 0.0298 0.98 98 0.296 100.00 0.3255 307.24
2028 56.2 0.8000 70.25 1.0 1.0 0.0142 0.99 99 0.299 100.00 0.3129 319.56
2029 58.7 0.8000 73.38 1.0 1.0 0.0136 0.99 99 0.299 100.00 0.3123 320.18
2030 61.2 0.8000 76.50 1.0 1.0 0.0131 0.99 99 0.299 100.00 0.3118 320.75
Sum of Miles and then Gallons of equivalent fuel: 1259.00 11.34
Equivalent MPG of LDV Fleet in 2030: 111.03ZEV Miles Driven = 865.0 Fraction of Miles Driven by ZEVs = 68.7%
Computed
NUMINATOR
MILEAGE

Our Climate Crisis• From: http://en.wikipedia.org/wiki/An_Inconvenient_Truth#Scientific_basis
40
Current Level of C02 is 400 PPM
*S-3-05’s goal is to cap
C02 at 450 PPM
Paper 2014-A-30793-AWMA
S-3-05 Achievement OutcomesX% chance > 4 (Extinction?)
30% chance > 3 (very bad)50% chance > 2 (bad)
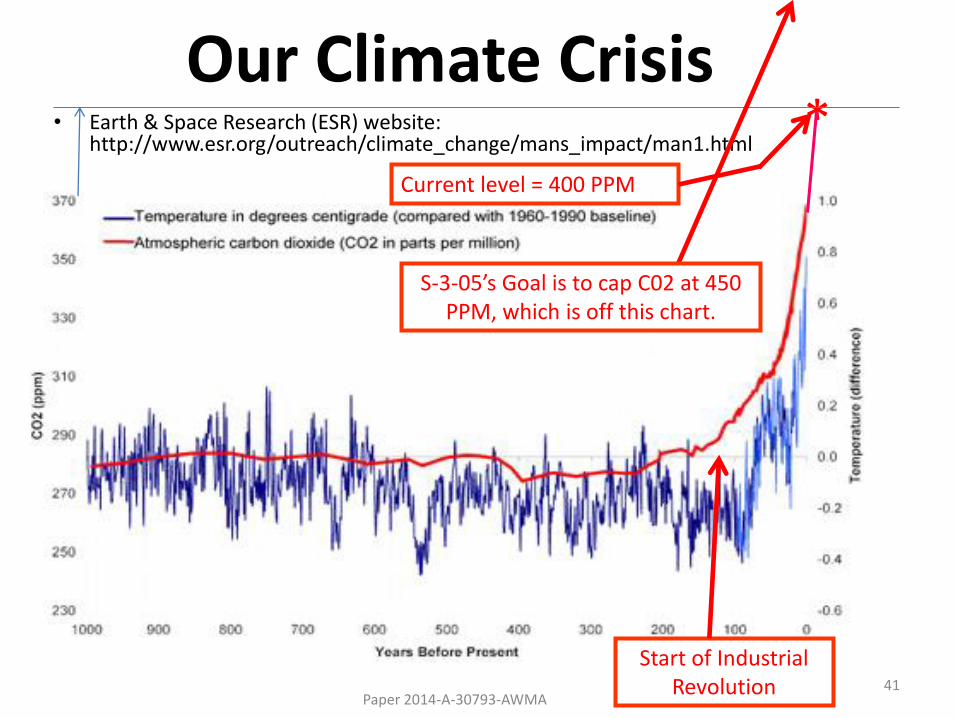
Our Climate Crisis• Earth & Space Research (ESR) website:
http://www.esr.org/outreach/climate_change/mans_impact/man1.html
41
*Current level = 400 PPM
S-3-05’s Goal is to cap C02 at 450 PPM, which is off this chart.
Paper 2014-A-30793-AWMA
Start of Industrial Revolution

California’s “Climate Mandate”
42Paper 2014-A-30793-AWMA
2005, Governor’s Executive Order, Schwarzenegger, 3 GHG emission targets, one in 2010, 2020, and 2050The 2050 target was designed to cap CO2_e at 450 PPM
S-3-05
AB 322006, Cap and Trade. It caps GHG emissions, by sector, including fuel for vehicles. It ensures achieving the 2nd and 3rd (this is disputed) targets of S-3-05. Tasks CARB with writing “Scoping Plans” to detail how this will be done.
2008, Steinberg. Tasks CARB with setting VMT-reduction targets for Metropolitan Planning Organizations (MPOs, such as SANDAG), for cars and light-duty trucks (Light-duty vehicles, or LDVs), for the years 2020 and 2035. These should have been at least sufficient to achieve the climate mandates, but CARB gave the MPOs whatever they wanted.
SB 375
B-30-152015, Governor’s Executive Order, Brown, 1 GHG emission target, 2030. This target is the same value as the 2035 target of S-3-05, found by connecting the 2020 and 2050 targets by a straight line.
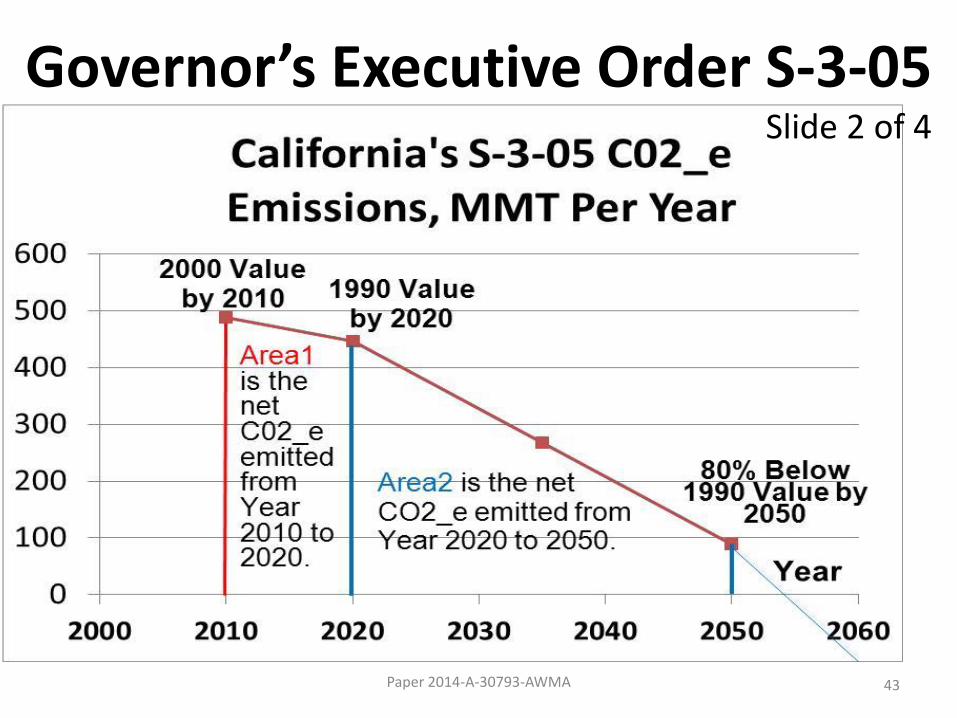
Governor’s Executive Order S-3-05Slide 2 of 4
43Paper 2014-A-30793-AWMA

Atmospheric Levels of CO2_e
44Paper 2014-A-30793-AWMA
1From the First Update to the California Air Resources Board (CARB) work pursuit to California’s AB
32 (Cap and Trade law) Climate Change Scoping Plan, Building on the Framework, Subsection
“Climate Stabilization”
http://www.arb.ca.gov/cc/scopingplan/2013_update/first_update_climate_change_scoping_plan.pdf
300
350
400
450
Pa
rts
pe
r M
illio
n (
PP
M)
280 PPM. Pre-industrial-revolution value
300 PPM. For over 800,000 years, this value was never exceeded, until around 1860, due to our emissions
350 PPM. Dr. James Hansen said this would be safe; hence the name of internationally-known “350.org”
400 PPM. Many studies say that stabilizing here would cause the increase in temperature to be around 2 Degrees Celsius1. Atmospheric CO2_e is now over 400 PPM.
450 PPM. California’s 2005 Climate Mandate, Executive Order S-3-05, was based on studies suggesting that capping to this value would likely keep the temperature change below 2 degree Celsius1.

45
BRIEF OF SCIENTISTS AMICUS GROUP AS AMICI CURIAE IN
SUPPORT OF PLAINTIFFS-APPELLANTS SEEKING REVERSAL
Paper 2014-A-30793-AWMA
DANIEL M. GALPERN
Law Offices of Charles M. Tebbutt, P.C.
941 Lawrence St. Eugene, OR 97401-2815
USCA Case #13-5192 Document #1465822 Filed: 11/12/2013
A. Parties and Amici. Except for the following, all parties, intervenors, and amici
appearing before the district court and in this Court are listed in the Brief for
Plaintiffs-Appellants. James Hansen, David Beerling, Paul J. Hearty, Ove Hoegh-
Guldberg, Pushker Kharecha, Valérie Masson-Delmotte, Camille Parmesan, Eelco
Rohling, Makiko Sato, Pete Smith, and Lise Van Susteren are amici curiae in this
appeal (referred to hereinafter as “Amici Scientists.”).

46Paper 2014-A-30793-AWMA
The Development of California Light-Duty Vehicle (LDV)
Requirements to Support Climate Stabilization: Fleet-Emission Rates
& Per-Capita Driving
Paper 2014-A-30793-AWMA
How, for LDVs:


