Page 1
12
International Journal of Modern Anthropology
Int. J. Mod. Anthrop. (2011) 4 : 12 - 27 Available online at www.ata.org.tn ; doi: 10.4314/ijma.v1i4.1
Original Synthetic Report
Anthropological significance of dermatoglyphic trait variation: an intra-Tunisian population analysis.
Imene Namouchi
Imene Namouchi obtained her doctorate in Genetics from the Faculty of Sciences of Tunis. She’s Department Director at ISAJC, University of Tunis. She has contributed to research in
Human Genetics particularly on dermatoglyphics and on the socio-epidemiology of the autism. E-mail: [email protected]
Laboratory of Human Genetics and Anthropology, Faculty of Pharmacy, University of Monastir, Tunisia
& ISAJC of Tunis, University of Tunis, Tunisia
Abstract – Background: The human dermatoglyphic traits present variations within
and between populations and could be used for estimating the genetic distances between
populations. Aim: This study aims to characterize the dermatoglyphic traits in the
Tunisian population and to analyze eventual differences between men and women and
between individuals according to their geographical distribution. Subjects and
Methods: Several dermatoglyphic traits have been determined and analysed for 343
Tunisians belonging to six groups distributed on different Tunisian regions. For
statistical analysis, the percent frequency, chi square test and t-test were used. The
cluster analysis was applied on D2 Mahalanobis distance matrix. Results: The chi-
square test revealed high significant differences between the sexes for the frequencies of
arches in the case of the fifth finger and for the frequencies of loops in the case of the
fourth left finger and the first left finger. The difference of the distribution of whorl type
between men and women was statistically significant for the fourth left finger. While no
significant differences were found between sexes in finger ridge counts. Conclusion:
The intra-Tunisian population analysis shows that Tunisians living in the North and the
expanded East Centre of Tunisia are genetically very close, while Tunisians from the
extreme East Center and the South of Tunisia are relatively less close to them. This
conclusion agrees with that deduced from recent molecular marker analyses and shows
that the multivariate analysis of a high number of quantitative digito-palmar
dermatoglyphic traits represents a powerful and shrewd tool in intra-population
analyses.
Key words: Dermatoglyphics, Fingerprints, Tunisian population, Cluster analysis,
Intra-population analysis
Page 2
13
International Journal of Modern Anthropology (2011)
Introduction
Dermatoglyphics attracted a great number of scientists from all sections of
biology, medicine and biological anthropology (Chen Yao-Fong et al., 2008) and links
between dermatoglyphics and diseases or congenital abnormalities have also been
explored (Tarca, 2001; Kumar et al., 2003; Miliĉiċ et al., 2003; Saha et al., 2003). In
fact, dermatoglyphs are used as easily accessible tool to assess genetically determined
diseases (Miliĉiċ et al., 2003; Temaj et al., 2009). Moreover, dermatoglyphics have been
used extensively to characterize human populations and most studies have focused on
dermatoglyphic variables within and between various populations across the world
(Crawford and Duggirala, 1992; Demarchi et al., 1997; Reddy et al., 2001; Weisensee
and Siváková, 2003; Arrieta, 2003) or between sexes (Esteban and Moral, 1993;
Kusuma et al., 2002). In the latter and in more recent studies, the dermatoglyphic traits
are used for estimating the genetic distances between populations (Temaj et al., 2009;
Cheng et al., 2009).
Fingerprints or dermatoglyphs consist of patterns formed by parallel ridges on
bare skin of fingertips. They are typical for higher primates, but occur sporadically in
other mammals (Henneberg et al., 1997). The dermatoglyphic patterns of dermal ridges
that constitute human fingerprint are formed during early intrauterine life, between the
7th and 21st week of gestation (Miliĉiċ et al., 2003) and are fully formed at about seven
months of foetus development (Maltoni et al., 2003; Sharma et al., 2008). It has been
reported that ridges are influenced by blood vessel-nerve pairs at the border between the
dermis and epidermis during prenatal development (Kahn et al., 2008). Factors such as
inadequate oxygen supply, unusual distribution of sweat glands and alterations of
epithelial growths could influence ridge patterns (Schaumann and Alter, 1976).
The finger ridge configurations do not change throughout the life of individuals
by environment or age factors except in events such as bruises and cuts of the fingertips
(Henneberg et al., 1997). This property makes fingerprints a very attractive biometric
identifier (Maltoni et al., 2003; Karmakar et al., 2009). Finger ridge counts and
frequencies of all palm patterns follow the genetic modes of major genes. The
distribution of interdigital patterns has been proven to follow a multi-allelic major gene
mode of inheritance (Meenakshi et al., 2006; Bhasin, 2007; Cheng et al., 2009).
Page 3
14
Dermatoglyphic trait variation: an intra- Tunisian population analysis / Imène Namouchi
A similar mode of inheritance has also been observed for finger ridge counts in
which significant genomic linkage has been found on chromosomes 5 and 1 (Medland
et al., 2007). However, no Mendelian modes of inheritance have been discovered for
most dermatoglyph characteristics in pedigree studies because of either low inheritance
or a too large number of contributing genes (Sengupta and Karmakar, 2004).
In the present study, I investigate for the first time several dermatoglyphic traits in
a representative sample of the Tunisian population in order to analyze eventual
differences between men and women and between individuals according to their
geographical distribution and to compare the obtained data with those found in other
studied populations.
The current general Tunisian population is composed mainly by Berbers, natives
of North Africa, mixed with some peoples from the different civilizations that have
settled this region in historical times, particularly Arabs who, unlike the precedents,
settled permanently in Tunisia following their substantial expansion in the 7th
century.
Berbers and Arabs accepted mixed marriages until became a common unique
population except for few Berber groups. These Berber groups are small, often not
exceeding 4000 individuals. Although known as Berber communities, they only
remember some words of their ancestral Berber language and are slightly mixed with
others outside the group. The general Tunisian population was studied according to
several genetic and molecular markers (eg. Chaabani and Cox, 1988; El Moncer et al.,
2010).
Here I will confront the deduced conclusion with that emanating from the most
important recent molecular study in order to estimate the anthropological significance of
dermatoglyphic trait variation. In addition of this anthropological contribution present
data will be used in future studies as control data for comparison with those obtained in
sick Tunisians.
Subjects and Methods
The sample included 343 unrelated healthy Tunisians: 233 men and 110 women,
of different ages (ranging from 18 to 58 years) and randomly-chosen. All individuals
are divided according to their geographical membership in 6 groups.
Page 4
15
International Journal of Modern Anthropology (2011)
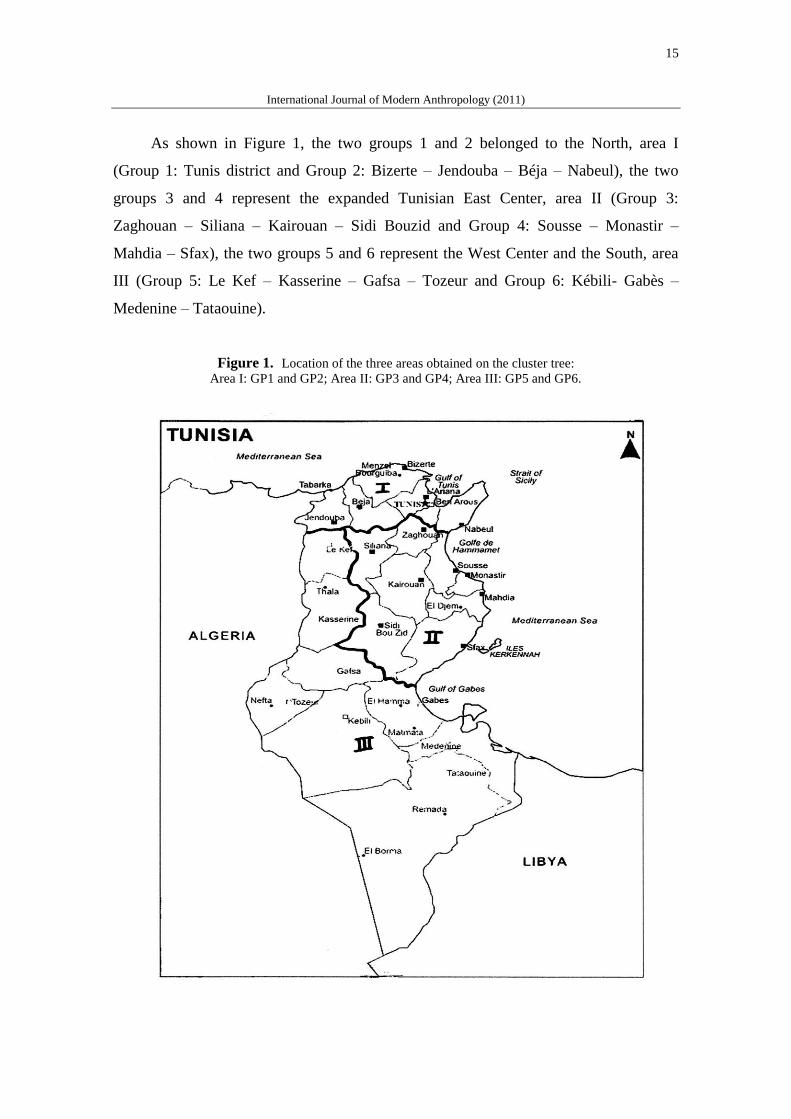
As shown in Figure 1, the two groups 1 and 2 belonged to the North, area I
(Group 1: Tunis district and Group 2: Bizerte – Jendouba – Béja – Nabeul), the two
groups 3 and 4 represent the expanded Tunisian East Center, area II (Group 3:
Zaghouan – Siliana – Kairouan – Sidi Bouzid and Group 4: Sousse – Monastir –
Mahdia – Sfax), the two groups 5 and 6 represent the West Center and the South, area
III (Group 5: Le Kef – Kasserine – Gafsa – Tozeur and Group 6: Kébili- Gabès –
Medenine – Tataouine).
Figure 1. Location of the three areas obtained on the cluster tree:
Area I: GP1 and GP2; Area II: GP3 and GP4; Area III: GP5 and GP6.
Page 5
16
Dermatoglyphic trait variation: an intra- Tunisian population analysis / Imène Namouchi
Finger and palmar prints of both hands were collected and analyzed according to
the Cummins and Midlo (1961). The number of ridges counted on each finger consisted
of 10 variables of the finger ridge count FRC : finger ridge count right for each finger
on the right hand (FRC R1 – FRC R5) and the finger ridge count left for each finger on
the left hand (FRC L1 – FRC L5). The counting was carried according to Holt (1968)
(Figure 2).
According to Holt (1968), the ridge count consists of the number of ridges which
cut or touch a straight line running from the triradius to the core or center of the pattern.
Between-sex comparisons were carried out by means of chi-square contingency analysis
for qualitative variables and t-test was used to examine quantitative variables for sexual
comparisons. Discriminant analysis was carried out with the six groups according to
their geographical distribution and the cluster analysis was applied on D2 Mahalanobis
distance matrix.
Results
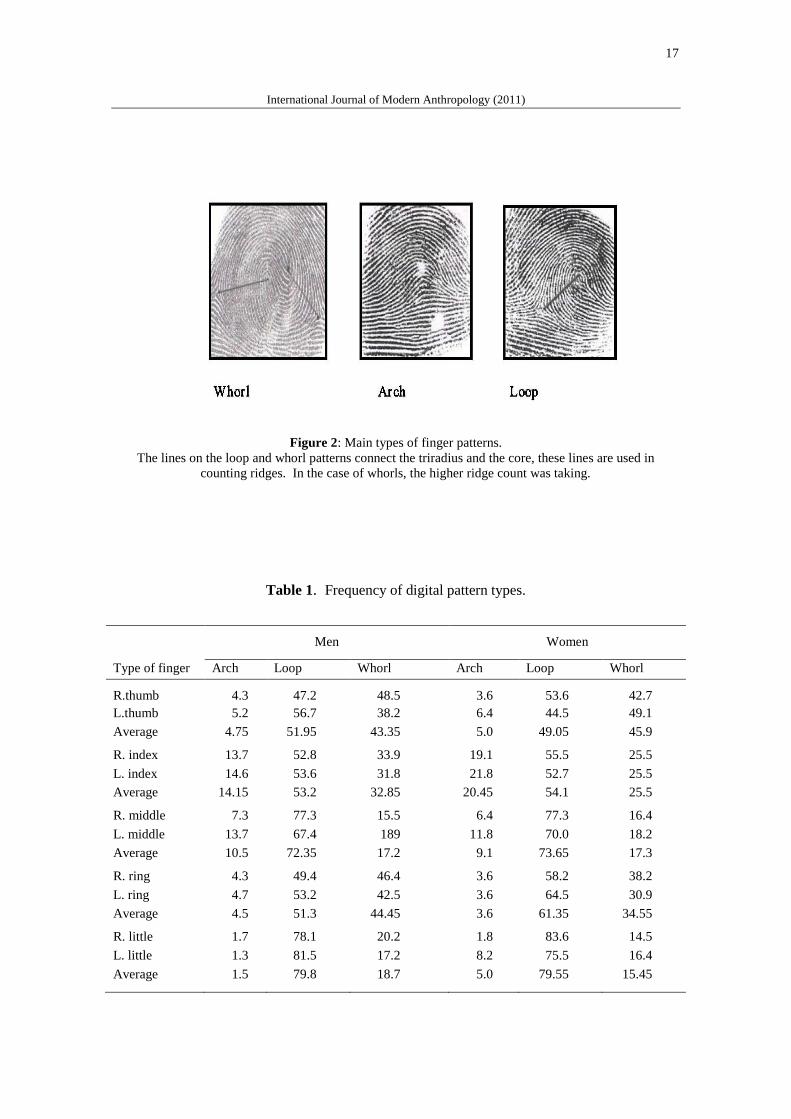
The different pattern types are broadly classified into three principal patterns
namely whorls, loops and arches and their frequencies are given in Table 1. In both
sexes, loops were the most predominant pattern type followed by whorls and arches.
The percentage of arches varied from 1.5 % to 14.15 % for men and from 3.6 % to
20.45 % for women. The chi-square test revealed high significant differences between
the sexes (² = 10.520; P = 0,001) for the frequencies of arches for the little left (the
fifth) finger. The percentage of loops varied from 51.3 % to 79.8 % for men and from
49.05 % to 79.55 % for women. The chi-square test revealed significant differences
between the sexes for the frequencies of loops for the fourth left finger (² = 3.908;
P= 0.048) and for the first left finger (² = 4.395; P = 0.036).
The percentage of whorls varied from 17.2 % to 44.45 % for men and from 15.45
% to 45.9 % for women. The difference of the distribution of whorl type between the
sexes was statistically significant (² = 4.221; P = 0.04) for the fourth left finger.
Page 6
17
International Journal of Modern Anthropology (2011)
Figure 2: Main types of finger patterns.
The lines on the loop and whorl patterns connect the triradius and the core, these lines are used in
counting ridges. In the case of whorls, the higher ridge count was taking.
Table 1. Frequency of digital pattern types.
Men Women
Type of finger Arch Loop Whorl Arch Loop Whorl
R.thumb 4.3 47.2 48.5 3.6 53.6 42.7
L.thumb 5.2 56.7 38.2 6.4 44.5 49.1
Average 4.75 51.95 43.35 5.0 49.05 45.9
R. index 13.7 52.8 33.9 19.1 55.5 25.5
L. index 14.6 53.6 31.8 21.8 52.7 25.5
Average 14.15 53.2 32.85 20.45 54.1 25.5
R. middle 7.3 77.3 15.5 6.4 77.3 16.4
L. middle 13.7 67.4 189 11.8 70.0 18.2
Average 10.5 72.35 17.2 9.1 73.65 17.3
R. ring 4.3 49.4 46.4 3.6 58.2 38.2
L. ring 4.7 53.2 42.5 3.6 64.5 30.9
Average 4.5 51.3 44.45 3.6 61.35 34.55
R. little 1.7 78.1 20.2 1.8 83.6 14.5
L. little 1.3 81.5 17.2 8.2 75.5 16.4
Average 1.5 79.8 18.7 5.0 79.55 15.45
Page 7
18
Dermatoglyphic trait variation: an intra- Tunisian population analysis / Imène Namouchi
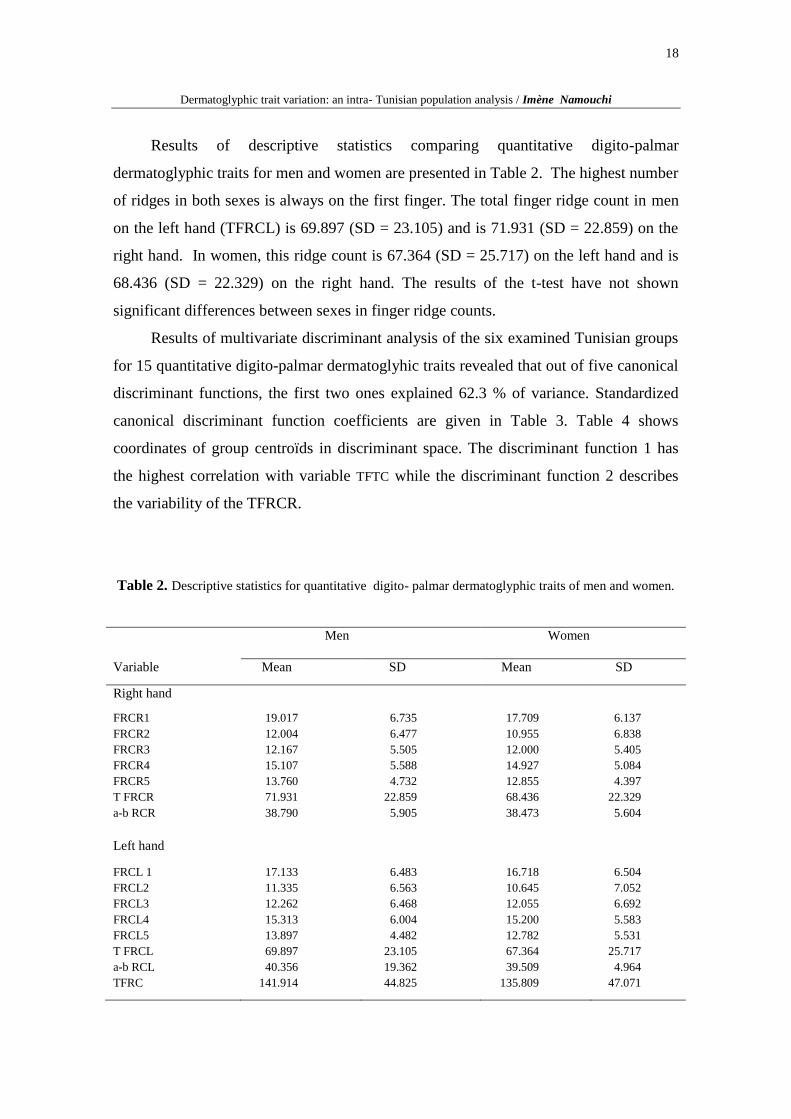
Results of descriptive statistics comparing quantitative digito-palmar
dermatoglyphic traits for men and women are presented in Table 2. The highest number
of ridges in both sexes is always on the first finger. The total finger ridge count in men
on the left hand (TFRCL) is 69.897 (SD = 23.105) and is 71.931 (SD = 22.859) on the
right hand. In women, this ridge count is 67.364 (SD = 25.717) on the left hand and is
68.436 (SD = 22.329) on the right hand. The results of the t-test have not shown
significant differences between sexes in finger ridge counts.
Results of multivariate discriminant analysis of the six examined Tunisian groups
for 15 quantitative digito-palmar dermatoglyhic traits revealed that out of five canonical
discriminant functions, the first two ones explained 62.3 % of variance. Standardized
canonical discriminant function coefficients are given in Table 3. Table 4 shows
coordinates of group centroïds in discriminant space. The discriminant function 1 has
the highest correlation with variable TFTC while the discriminant function 2 describes
the variability of the TFRCR.
Table 2. Descriptive statistics for quantitative digito- palmar dermatoglyphic traits of men and women.
Men Women
Variable Mean SD Mean SD
Right hand
FRCR1 19.017 6.735 17.709 6.137
FRCR2 12.004 6.477 10.955 6.838
FRCR3 12.167 5.505 12.000 5.405
FRCR4 15.107 5.588 14.927 5.084
FRCR5 13.760 4.732 12.855 4.397
T FRCR 71.931 22.859 68.436 22.329
a-b RCR 38.790 5.905 38.473 5.604
Left hand
FRCL 1 17.133 6.483 16.718 6.504
FRCL2 11.335 6.563 10.645 7.052
FRCL3 12.262 6.468 12.055 6.692
FRCL4 15.313 6.004 15.200 5.583
FRCL5 13.897 4.482 12.782 5.531
T FRCL 69.897 23.105 67.364 25.717
a-b RCL 40.356 19.362 39.509 4.964
TFRC 141.914 44.825 135.809 47.071
Page 8
19
International Journal of Modern Anthropology (2011)
Table 3. Standardized canonical discriminant functions of original variables.
Variables 1 2 3 4 5
FRCLI 3.094 0.640 1.645 1.636 0.558
FRCLII 2.849 0.934 1.738 0.362 0.238
FRCLIII 2.815 -0.138 1.723 0.966 -0.112
FRCLIV 2.505 -0.368 1.523 1.475 0.060
FRCLV 1.935 0.690 1.784 0.810 -0.098
FRCRI -0.124 -2.457 5.763 -2.083 1.797
FRCRII 0.090 -3.135 5.017 -1.842 1.834
FRCRIII 1.162 -1.720 4.524 -1.686 1.346
FRCRIV 0.652 -1.866 3.978 -2.589 2.211
FRCRV 0.633 -1.828 3.487 -1.011 1.370
TFRCL -4.493 0.607 -5.253 -1.076 1.183
TFRCR 3.514 12.531 -15.922 8.993 -6.065
TFTC -11.126 -5.644 -3.140 -4.516 -2.781
PRCL -0.322 0.040 0.052 -0.084 -0.335
PRCR -0.183 -0.062 -0.025 0.077 0.824
Abbreviations: FRCL : Finger ridge count left; FRCR : Finger ridge count right; TFRCL: Total of finger
ridge count left; TFRCR : Total of finger ridge count right; TFRC : Total of finger ridge count of both
hands; PRCL : Palmar ridge count left; PRCR : Palmar ridge count right.
Table 4. Canonical scores of group means
Group 1 2 3 4 5
1 0.220 -0.156 -0.215 0.034 -0.116
2 0.028 -0.190 0.227 0.178 0.069
3 -0.034 0.213 -0.189 0.051 0.254
4 0.167 0.377 0.145 -0.004 -0.137
5 -0.563 -0.038 -0.012 -0.090 -0.072
6 0.332 -0.175 0.149 -0.498 0.137
Page 9
20
Dermatoglyphic trait variation: an intra- Tunisian population analysis / Imène Namouchi
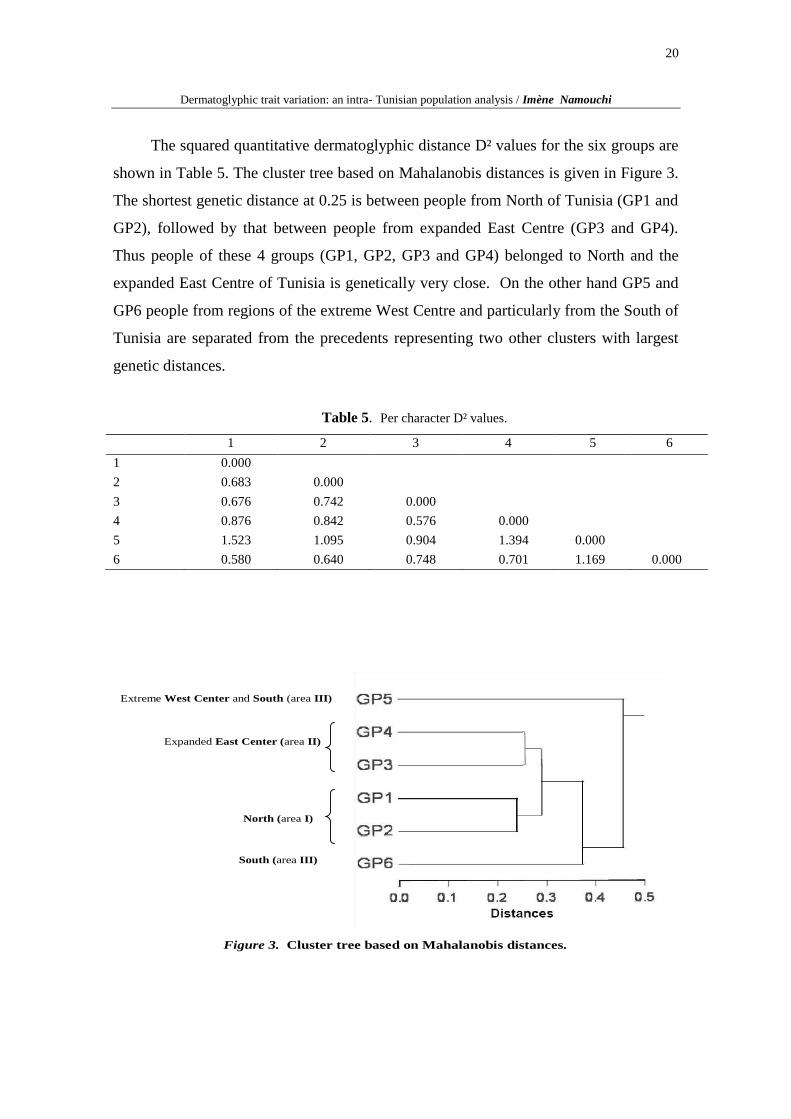
The squared quantitative dermatoglyphic distance D² values for the six groups are
shown in Table 5. The cluster tree based on Mahalanobis distances is given in Figure 3.
The shortest genetic distance at 0.25 is between people from North of Tunisia (GP1 and
GP2), followed by that between people from expanded East Centre (GP3 and GP4).
Thus people of these 4 groups (GP1, GP2, GP3 and GP4) belonged to North and the
expanded East Centre of Tunisia is genetically very close. On the other hand GP5 and
GP6 people from regions of the extreme West Centre and particularly from the South of
Tunisia are separated from the precedents representing two other clusters with largest
genetic distances.
Table 5. Per character D² values.
1 2 3 4 5 6
1 0.000
2 0.683 0.000
3 0.676 0.742 0.000
4 0.876 0.842 0.576 0.000
5 1.523 1.095 0.904 1.394 0.000
6 0.580 0.640 0.748 0.701 1.169 0.000
Extreme West Center and South (area III)
Expanded East Center (area II)
North (area I)
South (area III)
Figure 3. Cluster tree based on Mahalanobis distances.
Page 10
21
International Journal of Modern Anthropology (2011)
Discussion
The present study provided the first data on the dermatoglyphic trait variation in
the Tunisian population. The analysis of finger pattern type showed that in both sexes,
loops were the most common pattern followed by whorls and arches and that
differences between sexes are significant for the frequencies of arches for the fifth left
finger and for the frequencies of loops for the fourth left finger. Similarly, finger
patterns studied in the Berber population of the high Atlas (Marrakesh, Morocco) have
shown a higher frequency of loops followed by whorls and arches in both sexes but this
Moroccan Berber population is particularized by greater arch frequencies when
compared to data describing the other North African populations (Algeria, Libya,
Tunisia) (Sabir et al., 2005).
An eastern Andalusia population was described by more whorls and radial loops
in males and by more arches and ulnar loops in females (Luna and Pons, 1987). The
South African populations were well investigated with regard to digital patterns. In
Zimbabwean subjects, ulnar loops were the most predominant pattern type in both
sexes, followed by whorls in males and arches in females; however the sex differences
between the digital pattern types were not statistically significant (Igbigbi and Msamati,
2002).
Similarly, a higher frequency of loops was also seen in both sexes among the
Kenyans and Tanzanians. (Igbigbi and Msamati, 2005). However, in Malawians, arches
were found to be the most predominant digital pattern in both sexes, followed by radial
loops in men and whorls in women and it was demonstrated that the sex differences
between these digital patterns were not statistically significant (Igbigbi and Msamati,
1999).
The reasons for sexual dimorphism observed in the dermatoglyphic patterns, can
be supported by the fact that differences in heritability and developmental variation
among sexes might account for these patterns (Meier, 1980). On the other hand,
bimanual differences have been attributed to developmental instability, measured by
fluctuating asymmetry of bilateral traits which in the particular case of dermatoglyphics,
must result from environmental assaults during early embryonary (Cummins and Midlo,
1961).
Page 11
22
Dermatoglyphic trait variation: an intra- Tunisian population analysis / Imène Namouchi
Differences in total ridge count frequencies between different populations may be
expected, since the frequencies of arches, loops and whorls vary between populations.
In our present study, the TFRC has not shown significant sexual dimorphism. In both
sexes, the highest number of ridges was always observed on the first finger. The total
finger ridge count in men and women (TFRCL) was higher on the right hand than on
the left one.
In the Murcia, a Spanish population, it was reported that the highest mean of ridge
counts was shown by the thumb of each hand in males and females, as a result of both
elevated frequency of whorls and pattern width while the lowest number of ridges
corresponded to index finger in both right and left hands for males and females which
can be explained by the high frequency of arches and radial loops in this finger as well
as the small pattern width (Esteban and Moral, 1992).
Another study on sub-Saharan Africans has also shown that the values of TFRC
found among the Zimbabweans were higher in men than in women (Igbigbi and
Msamati, 2002). These results were also comparable to those obtained in the Zulus of
South Africa (Grace and Ally, 1973). The Southern Nigerians have a significantly
higher TFRC than those previously reported for the Zulu. In Malawian subjects, women
had significantly higher TFRC than men (Igbigbi and Msamati, 1999). This conclusion
is contrary to that reported in Kenyans and Tanzanians (Igbigbi and Msamati, 2005).
Hajn and Gasiorowski (1999) have shown in their study of the Czech and Polish
populations, that men had higher TFRC than women. In agreement with these results,
TFRC of the Araucanian Indians from Patagonia, showed sexual differences and were
most important in men (Arquimbau et al., 1993). The mean total ridge count for the
Chibcha-speaking Amerindian tribes, for males and females, and both hands was lower
in these groups compared to other North, Central and South American Indians (Garruto
et al., 1979; Segura-Wang and Barrantes, 2009).
Page 12
23
International Journal of Modern Anthropology (2011)
The study of the quantitative dermatoglyphic traits in Albanian and Turkish
populations living in the South-West Kosovo showed significant differences between
the Albanian and the Turkish males for two fingers, and on palms for a-b RC, b-c RC
and c-d RC on both hands and b-c RC on the left hand, and between females for six
fingers and almost all palmar traits. The differences found between the two populations
show that although Albanian and Turkish populations share the same territory, they
have different origins and customs, and the marriages between these two communities
are extremely rare (Temaj et al., 2009).
The intra-Tunisian population analysis was done applying a higher level of
differentiation based on the multivariate discriminant analysis of the six examined
Tunisian groups for 15 quantitative digito-palmar dermatoglyphic traits and was
represented in a cluster tree based on Mahalanobis distances. This tree shows that
Tunisians living in the North and the expanded East Centre of Tunisia are genetically
very close, while Tunisians from the extreme East Center and the South of Tunisia are
relatively less close to them.
This conclusion agrees with that deduced from molecular marker analyses and
shows that the multivariate analysis of several quantitative digito-palmar
dermatoglyphic traits represents a powerful and shrewd tool in intra-population genetic
differentiation. In fact in a molecular recent study (El Moncer et al. 2010) a set of 16
Alu and 3 Alu/STR compound systems has been analysed in 268 autochthonous
Tunisians from the north-centre and the south. The two sampled populations showed no
significant differentiation from one another in any of the three Alu/STR systems while
the analysis of the 16 Alu markers reveals a significant genetic differentiation between
them. In addition Alu/STR system analyses explain the major causes of this slight
genetic differentiation between North-Center and the South of Tunisia reflecting a
mixed origin of Tunisian population: The presence of a sub-Saharan component
revealed by three specific Alu/STR combinations is more noticeable in the north-centre
sample than in that of the south. While analysis of two Alu/STR combinations, specific
to North African ancestral populations, suggests that the ancient Berber component is
relatively more substantial in the north and centre regions than in the south.
Page 13
24
Dermatoglyphic trait variation: an intra- Tunisian population analysis / Imène Namouchi
Acknowledgements
Our deep gratitude goes to Pr. Saida Ben Arab for her help and assistance during
our collaboration. We would like to express our special thanks to Pr. Hassen Chaabani
for his critics, corrections and suggestions and also for his encouragements. We are also
extremely grateful to Pr. Esther Esteban Torne for her critics and suggestions. We thank
all persons in charge in the ―Police Technique et Scientifique de Tunis‖ for their help
particularly Mr. Mohamed Mostapha.
References
Arquimbau R., Esteban E., Fananas L., 1993. Finger dermatoglyphics in Delta de
l'Ebre: a Mediterranean population, Anthropol. Anz 51:267-274.
Arrieta I., 2003. Dermatoglyphic variation in Spanish Basque populations. Human
Biology, 75: 265-91.
Bhasin M. K., 2007. Genetics of Castes and Tribes of India: Dermatoglyphics. Int. J.
Hum. Genet., 7 2: 175-215.
Chaabani H. and Cox D. W., 1988. Genetic characterisation and origin of Tunisian
Berbers. Hum. Hered. 38 : 308-316.
Chen Y.-F., Zhang H.G., Shen C.-Fu., LAI Chun-Hung., 2008. A dermatoglyphic study
of the Amis aboriginal population of Taiwan. Sci. China Ser. C-Life Sci., 51 (1):80-85.
Cheng Xu, Hui Li, Sameer Gupta, Shangling Pan, Jingrong Hou, Li Jin. 2OO9.
Dermatoglyphic changes during the population admixture between Kam and Han
Chinese. HOMO—Journal of Comparative Human Biology 60 (2009) 143–157.
Crawford M.H., Duggirala A.R., 1992. Digital dermatoglyphic patterns of Eskimo and
Amerindian populations: relationships between geographic, dermatoglyphic, genetic
and linguistic distances. Human Biology, 64: 683-704.
Cummins, H. & C. Midlo. 1961. Fingerprints, Palms and Soles. An Introduction to
Dermatoglyphics. Dover Publications, New York, USA.
Demarchi D.A., Giordano A.R., Marcellino A.J., 1997. Dermatoglyphics in Araucanian
Indians from Patagonia and multivariate comparisons with other Argentinian aboriginal
populations. Human Biology, 69: 227-39.
Page 14
25
International Journal of Modern Anthropology (2011)
Esteban E., Moral P., 1992. Quantitative finger dermatoglyphics in the Mediterranean
region of Murcia, Spain. International Journal of Anthropology, 7(2); 17-25.
Esteban E., Moral P., 1993. Finger dermatoglyphics in a Mediterranean population
(Murcia, Spain); pattern types and pattern intensity index. Anthropologischer
Anzeiger, 51:159-167.
El Moncer W., Esteban E., Bahri R., Gayà-Vidal
M., Carreras-Torres
R., Athanasiadis
G. , Moral P., Chaabani
. H., 2010. Mixed origin of the current Tunisian population
from the analysis of Alu and Alu/STR compound systems. Journal of Human Genetics,
55: 827–833.
Garruto R., Plato C., Hoff C., Newman M., Gajdusek D., Baker P., 1979.
Characterization and distribution of dermatoglyphic features in Eskimo and North,
Central and South American Indian populations. Birth Defects-Orig. 15: 277-334.
Grace H.J., Ally F.E., 1973. Dermatoglyphics of the South African Negro. Human
Heredity, 23: 53-58.
Hajn V., Gasiorowski A., 1999. Quantitative values on fingers and palms in Czech and
Polish populations. Biologica, 37: 107- 115.
Henneberg M.J., Lambert K.M., Leigh C.M., 1997. Fingerprint homoplasy: Koalas
and humans. Natural Science.
Holt S.B., 1968. The genetics of dermal ridges. Thomas, Spingfield, Illinois, 195 p.
Igbigbi P.S., Msamati B.C., 1999. Palmar and digital dermatoglyphic patterns in
Malawian subjects. East Afr. Med. J., 76: 668-671.
Igbigbi P.S., Msamati B.C., 2002. Palmar and digital dermatoglyphics of indigenous
black Zimbabweans. Med. Sci. Monit., 8:757-761.
Igbigbi P. S., Msamati B.C., 2005. Palmar and digital dermatoglphic traits of Kenyan
and Tanzanian subjects. W.A.J.M., 24 (1): 26 – 30.
Karmakar B., Malkin I., Kobyliansky E., 2009. Genetic Determinants of 22 Quantitative
Dermatoglyphic Traits in the Chuvashian Population of Russia: Complex Segregation
Analysis. The Open Anthropology Journal, 2, 64-73.
Kumar A., Manou S. J., 2003. Palmar dermatoglyphics as diagnostic tool: Mayer-
rokintansky-Kuster- hauser syndrome. Indian J. Dermatol. Venereol. Leprol., 69: 95-96.
Kahn H.S., Graff M., Stein A.D., Zybert P.A., Mckeague I.W. and Lumey L.H., 2008.
A Fingerprinr Characteristic Associated with the early prenatal environment. American
Journal of Human Biology, 20: 59- 65
Page 15
26
Dermatoglyphic trait variation: an intra- Tunisian population analysis / Imène Namouchi
Kusuma Y.S., Babu B.V., Naidu J.M., 2002. Finger ridge count correlations among
four tribes of Andhra Pradesh, India. Collegium Antropologicum , 26:319-323.
Luna F., Pons J., 1987. The dermatoglyphics of the eastern Andalusia. International
Journal of Anthropology, 2 (2): 183- 190.
Maltoni D., Maio D., Jain A.K., Prabhakar S., 2003. Handbook of Fingerprint
Recognition. Springer Verlag. New York.
Medland, S.E., Loesch, D.Z., Mdzewski, B., Zhu, G., Montgomery, G.W., Martin, N.G.,
2007. Linkage analysis of a model quantitative trait in humans: finger ridge count
shows significant multivariate linkage to 5q14.1. PLoS Genet. 3, 1736–1744.
Meenakshi S., Balasubramanyam V. and Rajangam S., 2006. Dermatoglyphics in
amenorrhea- qualitative analysis. The Journal of Obstetrics and Gynecology of India, 56
(3): 250-254.
Meier, R. 1980. Anthropological dermatoglyphics: a review.Yearbook Phys. Anthropol.
23: 147-178.
Miliĉiċ J., Petković Z. B., Božikov J., 2003. Dermatoglyphs of Digito-Palmar
Complex in Autistic Disorder: Family Analysis. Croatian Medical Journal, 44: 469-
476.
Reddy B.M., Pfeffer A., Crawford M.H., Langstieh B.T., 2001. Population substructure
and patterns of quantitative variation among the Gollas of Southern Andhra Pradesh,
India. Human Biology, 2:291-306.
Sabir B., Cherkaoui M., Baali A., Lemaire O., Dugoujon J.M., Boetsch G.,
2005.Characterisation of the digital dermatoglyphic in a berber population of the high
Atlas (Marrakesh, Morocco). International Journal of Anthropology, 20 (3-4): 277- 289.
Saha S., Loesch D., Chant D. et al., 2003. Directional and fluctuating asymmetry in
finger and a-b ridge counts in psychosis: a case-control study. BMC Psychiatry, 3.
Schaumann B., Alter M., 1976. Dermatoglyphics in medical disorders. Springer-
Verlag. New York, 258 p.
Segura-Wang M., Barrantes R. 2009. Dermatoglyphic traits of six Chibcha-speaking
Amerindians of Costa Rica, and an assessment of the genetic affinities among
populations. Int. J. Trop. Biol. 57 (1): 357-369.
Sengupta M., Karmakar B., 2004. Mode of inheritance of finger dermatoglyphic traits
among Vaidyas of West Bengal, India. Annals of Human Biology, 31:526-540.
Page 16
27
International Journal of Modern Anthropology (2011)
Sharma P. R., Gautam A. K., Tiwari P. K., 2008. Dermatoglyphic variations in five
ethno-geographical cohorts of Indian populations: A Pilot study. The Internet Journal of
Biological Anthropology, 2 (1).
Tarca A., 2001. Contribution à l'étude de la pathologie des dermatoglyphes. Antropo,
1:51-60.
Temaj G., Milicic J., Skaric Jurié T., Behluli I., Smolej Narancic N., Hadziselimovic R.,
Nefic H., 2009. Comparative Analysis of Dermatoglyphic Traits in Albanian and
Turkish Population Living in Kosovo. Coll. Antropol., 33 (4): 1001–1005.
Weisensee K. E., Siváková D., 2003. A comparison of Slovakian Haban Populations
using Finger Ridge Count data. Stud. Tribes Tribals, 1:73-76.