Computers and Electronics in Agriculture 74 (2010) 59–65
Contents lists available at ScienceDirect
Computers and Electronics in Agriculture
journa l homepage: www.e lsev ier .com/ locate /compag
riginal paper
nti-clogging performance evaluation and parameterized design ofmitters with labyrinth channels
un Zhang ∗, Wanhua Zhao, Yiping Tang, Bingheng Lutate Key Laboratory for Manufacturing Systems Engineering, Xi’an Jiaotong University, Xi’an 710049, China
r t i c l e i n f o
rticle history:eceived 3 May 2009eceived in revised form 22 April 2010ccepted 20 June 2010
a b s t r a c t
The anti-clogging performance of emitters with labyrinth channels is a key factor affecting their long-term service. Considering the limitation of evaluation on emitter’s anti-clogging performance at present,a new method using passage rate of particles as the evaluation index was proposed based on stochastictrajectory model in a Lagrangian reference frame. Using orthogonal design, the passage rates of particles
eywords:mitterabyrinth channelnti-clogging performanceassage rate of particles
of 16 trapezoidal labyrinth channels with various geometries were calculated, where 4 dimensionlessparameters were taken as the factors. The results obtained from analysis of range and variance showedthat the influence degree on passage rate of particles ranks as follows: ˛ > D/W > S/H > H/D. A mathematicmodel was established between the particle passage rate and 4 key parameters according to the multi-variable regression method, which can be used to predict and compare the anti-clogging performance of
nnels
trapezoidal labyrinth cha
. Introduction
The emitters with labyrinth channels are widely applied in driprrigation system for their simply structures and low manufactur-ng cost compared with pressure compensating emitters. The watersed for drip irrigation system often comes from the rivers andells nearby, especially in the arid area of north-west China. Some
esidual solid particles and microbes can still enter the emitterslthough the irrigation water has been filtrated or treated by somehemical methods, leading to the clogging if those particles can notass the labyrinth channels (Padmakumari and Sivanappan, 1985).herefore, clogging has been considered as one of the most annoy-ng problems inhibiting the long-term application of emitters.
Due to the reason above, the clogging problem of emitters haseen the hot topic of many researchers. Bucks et al. (1979) dividedhe clogging into three main categories: physical clogging, chemicallogging and biological clogging. Dekreij et al. (2003) and Gilbertt al. (1977) coped with clogging problems by virtue of treatinghe irrigation water with chemical methods. Adin and Sacks (1991)onducted farmland experiments to study the clogging problem ofmitters in wastewater irrigation system. They found that the clog-
ing was closely related to the channel structure and suggestedhannel design should be improved by: shortening and widen-ng the flow path; rounding the straight edges on the protrudingeeth and so on. Taylor et al. (1995) experimentally investigated
several factors causing emitter clogging and pointed out that emit-ter design was the most important factor of causing the cloggingproblem. Wu et al. (2004) carried out an investigation on the sub-surface drip irrigation system which had been run for 8 years, theyascribed emitter clogging to the attached granules and suggestedto optimize the channel structure to solve this problem.
From those investigations above, the researchers were con-vinced that structural optimization of emitter channels was alsoa good way to solve the clogging problem besides improving thefiltration device of drip irrigation system, so more and more stud-ies on flow characteristic inside the channels were published.Wang et al. (2000) employed the Galerkin Penalty FEM to sim-ulate the 2D flow in the emitter, and optimized the structure ofthe channels according to the numerical simulation results. Wei etal. (2005) carried out a 3D simulation on arc-channel emitter andthen proposed an anti-clogging optimization method for labyrinthchannels. Zhang et al. (2007a) uncovered the clogging mechanismin labyrinth channels of the emitter by a numerical analysis onliquid–solid two phases flow.
Although the studies on emitter’s clogging are more and morein-depth, the evaluation methods of anti-clogging performance areless reported except in an ISO draft named Clogging Test Methodsfor Emitters (2003). There are 8 phases where the total load ofmacrogrits in test water is increased by adding a fraction of coarser
macrogrits in the “short term clogging test procedure” of this draft.The emitters are declared clogged when the discharge is less than75% of the initial discharge under the condition of clear water, andthe diameter of the particle in this situation can be regarded as thelimit dimension to pass the emitters, which is taken as the refer-
60 J. Zhang et al. / Computers and Electronics in Agriculture 74 (2010) 59–65
Nomenclature
CD drag coefficientdp particle diameter (m)D channel width (m)FD drag force acting on the particleFM difference of gravity and buoyancy of particleH channel tooth height (m)k turbulent kinetic energy (m2 s−2)mp mass of the particle (kg)np particle number passing the labyrinth channelsnt particle number entering the inlet of labyrinth chan-
nelsp pressure (Pa)P possibilityRep particle’s Reynolds numberS width of tooth top (m)t time (s)u fluid velocity (m s−1)up, vp, wp particle velocity (m s−1)u* averaged tangential velocity (m s−1)u mean fluid phase velocity (m s−1)u′, v′, w′ fluctuating fluid phase velocity (m s−1)u� wall friction velocity (m s−1)W channel depth (m)X four factorsy distance from the wall (m)y+ friction length (m)
Greek letters˛ turning angle of toothˇ regression coefficients� passage rate of particles� density of fluid (kg m−3)�p density of particle (kg m−3)� fluid molecular viscosity (kg m−1 s−1)� normally distributed random number�p relaxation time of the particle (s)Pij exact production term�ij pressure-strain termε dissipation rate (m2 s−3)�w wall-shear stress (Pa)
Subscripts
eitpm(pp
oCUpgblw
mpdup
dt= FD + FM (2)
FD = ��dp
8CDRep(u − up) (3)
i, j, k Cartesian coordinates�, , tangential, normal, binormal coordinate
nce to choose the filter-screen size of drip irrigation system. Thiss the first criterion in the clogging test of emitters, and still haswo disadvantages: (1) anti-clogging performance of new emitterroducts cannot be predicted in the design phase; (2) although theaximum diameter of particles can be tested during 1–8 phases
Li et al., 2006), it is not appropriate to compare the anti-cloggingerformance of emitters with different geometries due to differentarticle concentration in each phase.
In this study, a new evaluation method was proposed basedn the passage rate of particles calculated by the commercialFD code FLUENT® (Version 6.2, FLUENT Co., New Hampshire,SA), which is convenient for the anti-clogging performance com-
arison of emitters with the same channel shape but differenteometries under the same conditions. The qualitative relationshipetween the passage rate of particles and the key parameters of the
abyrinth channels was analyzed and then a parameterized modelas regressed between them.
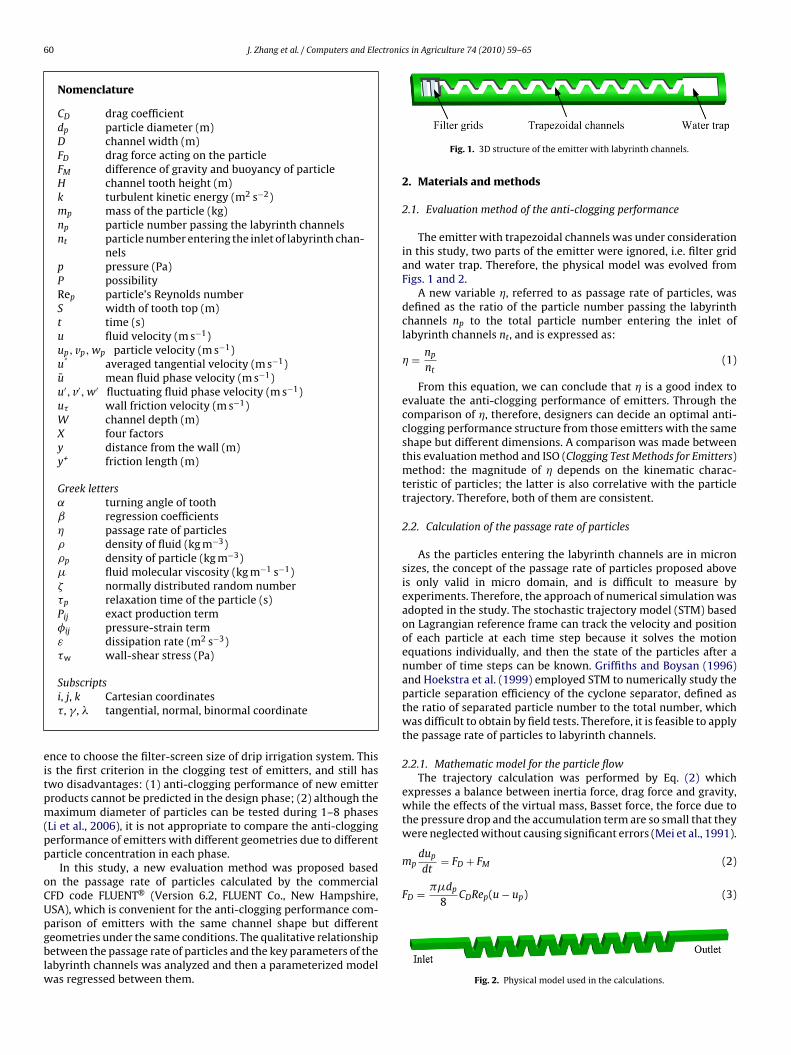
Fig. 1. 3D structure of the emitter with labyrinth channels.
2. Materials and methods
2.1. Evaluation method of the anti-clogging performance
The emitter with trapezoidal channels was under considerationin this study, two parts of the emitter were ignored, i.e. filter gridand water trap. Therefore, the physical model was evolved fromFigs. 1 and 2.
A new variable �, referred to as passage rate of particles, wasdefined as the ratio of the particle number passing the labyrinthchannels np to the total particle number entering the inlet oflabyrinth channels nt, and is expressed as:
� = np
nt(1)
From this equation, we can conclude that � is a good index toevaluate the anti-clogging performance of emitters. Through thecomparison of �, therefore, designers can decide an optimal anti-clogging performance structure from those emitters with the sameshape but different dimensions. A comparison was made betweenthis evaluation method and ISO (Clogging Test Methods for Emitters)method: the magnitude of � depends on the kinematic charac-teristic of particles; the latter is also correlative with the particletrajectory. Therefore, both of them are consistent.
2.2. Calculation of the passage rate of particles
As the particles entering the labyrinth channels are in micronsizes, the concept of the passage rate of particles proposed aboveis only valid in micro domain, and is difficult to measure byexperiments. Therefore, the approach of numerical simulation wasadopted in the study. The stochastic trajectory model (STM) basedon Lagrangian reference frame can track the velocity and positionof each particle at each time step because it solves the motionequations individually, and then the state of the particles after anumber of time steps can be known. Griffiths and Boysan (1996)and Hoekstra et al. (1999) employed STM to numerically study theparticle separation efficiency of the cyclone separator, defined asthe ratio of separated particle number to the total number, whichwas difficult to obtain by field tests. Therefore, it is feasible to applythe passage rate of particles to labyrinth channels.
2.2.1. Mathematic model for the particle flowThe trajectory calculation was performed by Eq. (2) which
expresses a balance between inertia force, drag force and gravity,while the effects of the virtual mass, Basset force, the force due tothe pressure drop and the accumulation term are so small that theywere neglected without causing significant errors (Mei et al., 1991).
here the constants a1, a2 and a3 are given in Table 1 (Triesch andohnet, 2001).
It should be noted that the particle trajectories calculated abovedopt a deterministic track model, but the fluctuating velocityf the fluid due to the turbulence cannot be ignored, for it alsoffects the motion of the particles. Therefore, the instantaneousuid velocity can be expressed as follows:
u = u + u′
v = v + v′
w = w + w′(7)
u′ = �√
u′u′
v′ = �√
v′v′
w′ = �√
w′w′(8)
Substituting Eq. (7) into Eq. (2), the stochastic tracking model ofhe particles can be obtained:
dup
dt= 1
�p
(u + u′ − up
)dvp
dt= 1
�p
(v + v′ − vp
)dwp
dt= 1
�p
(w + w′ − wp
)+(
1 − �
�p
)g
(9)
In addition, the sand with a physical density of 2500 kg/m3 anddiameter of 100 �m was used as the particle and was assumed toe spherical in shape. The sands were released from the inlet planeith a uniform velocity. On the wall surface, a restitution coefficient
qual to 0.545 (Asakura et al., 1997) in the water was used for theand. At the outlet, the sands were assumed as “escape” and thenhe trajectory calculations were terminated.
.2.2. Mathematic model for the fluid flowThe fluid in the emitter is water, as a result, it can be assumed
o be viscous, steady, incompressible and at room temperature. Forhis kind of labyrinth channel with rectangular cross-section, theritical Reynolds number (Recr), which is difficult to calculate usingxisting hydromechanics theory, differs from that inside a straighthannel with a circle cross-section and smooth wall when the flows transited to turbulence. Through experiments and simulationsishimura et al. (1984) found that the Recr is about 350 for the wavyhannel used in their study, much lower than 2300, and Zhang etl. (2007b) also got a more accurate result in predicting the flow
ates of emitters with turbulence model. Therefore, a turbulenceodel was employed in this research to simulate the continuous
hase. Considering the rotary flow and variation of surface curva-ure along the channel, Reynolds Stress Model (RSM) was adopted,hich can accounts for the effects of streamline curvature, swirl,
s in Agriculture 74 (2010) 59–65 61
rotation, and rapid changes in strain rate in a more rigorous man-ner than one-equation and two-equation models. The motion ofthe fluid can be described by the continuity equation (Eq. (10)),momentum equation (Eq. (11)), the exact transport equation forthe Reynolds stress tensor, turbulent kinetic energy (k) equationand turbulence dissipation (ε) equation (Warsi, 1993).
∂
∂xi(�ui) = 0 (10)
∂
∂xj(�uiuj) = − ∂p
∂xi+ ∂
∂xj
(�
∂ui
∂xj− �u′
iu′
j
)(11)
where u′iu′
jis the Reynolds stress tensor. The differential equation
(Eq. (12)) for each component of the Reynolds stress is developedto provide each stress component, allowing for anisotropy in tur-bulent stress terms.
∂
∂xk
(�uk∂uiuj
)= Pij + �ij + ∂
∂xk
(�t
k
∂u′iu′
j
∂xk+ �
∂u′iu′
j
∂xk
)− 2
3�εıij
(12)
Pij = −�
(u′
iu′
k
∂uj
∂xk+ u′
ju′
k
∂ui
∂xk
)(13)
�ij is decomposed into two components that are given as
�ij,1 = −C1�ε
k
(u′
iu′
j− 2
3kıij
)(14)
�ij,2 = −C2
(Pij − 2
3Pkıij
)(15)
where the constants C1 and C2 are 1.8 and 0.6 respectively, �t islinked to k and ε via the relation.
�t = �C�k2
ε(16)
The values for k and ε come directly from the differential trans-port equations:
∂(�kui)∂xi
= ∂
∂xj
[(� + �t
k
)∂k
∂xj
]+ 1
2Pij − �ε (17)
∂(�εui)∂xi
= ∂
∂xj
[(� + �t
ε
)∂ε
∂xj
]+ 1
2C1εPij − C2ε�
ε2
k(18)
where the constants are:
C� = 0.09, C1ε = 1.44, C2ε = 1.92,
k = 0.82 and ε = 1.0.
The governing equations which have been described above werediscretised by the control volume numerical technique, and thenthe SIMPLE pressure–velocity coupling algorithm with a second-order upwind scheme for the convection terms was employed inorder to solve the discretised equations over the computationaldomain.
At the wall boundaries, the fluid velocity was constrained to bezero and a standard wall function was used to bridge viscosity-affected region between the wall and the fully-turbulent region,where acute changes in the fluid velocity were expected, and thismay be defined as follows (Warsi, 1993):
u∗
u�= 1
�ln(Ey+) (19)√
u� = �w
�(20)
y+ = �u�y
�(21)
62 J. Zhang et al. / Computers and Electronics in Agriculture 74 (2010) 59–65
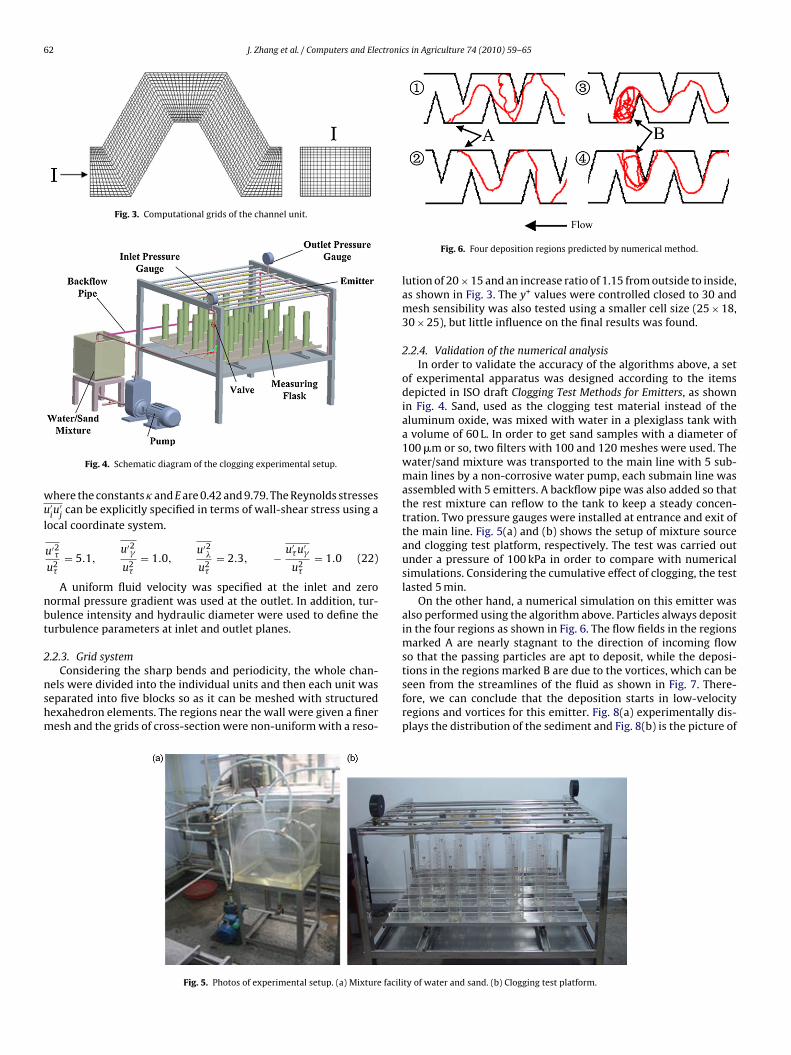
Fig. 3. Computational grids of the channel unit.
wu
l
nbt
2
nshm
Fig. 4. Schematic diagram of the clogging experimental setup.
here the constants � and E are 0.42 and 9.79. The Reynolds stresses′iu′
jcan be explicitly specified in terms of wall-shear stress using a
ocal coordinate system.
u′2�
u2�
= 5.1,u′2
u2�
= 1.0,u′2
u2�
= 2.3, − u′�u′
u2�
= 1.0 (22)
A uniform fluid velocity was specified at the inlet and zeroormal pressure gradient was used at the outlet. In addition, tur-ulence intensity and hydraulic diameter were used to define theurbulence parameters at inlet and outlet planes.
.2.3. Grid system
Considering the sharp bends and periodicity, the whole chan-
els were divided into the individual units and then each unit waseparated into five blocks so as it can be meshed with structuredexahedron elements. The regions near the wall were given a fineresh and the grids of cross-section were non-uniform with a reso-
Fig. 5. Photos of experimental setup. (a) Mixture facili
Fig. 6. Four deposition regions predicted by numerical method.
lution of 20 × 15 and an increase ratio of 1.15 from outside to inside,as shown in Fig. 3. The y+ values were controlled closed to 30 andmesh sensibility was also tested using a smaller cell size (25 × 18,30 × 25), but little influence on the final results was found.
2.2.4. Validation of the numerical analysisIn order to validate the accuracy of the algorithms above, a set
of experimental apparatus was designed according to the itemsdepicted in ISO draft Clogging Test Methods for Emitters, as shownin Fig. 4. Sand, used as the clogging test material instead of thealuminum oxide, was mixed with water in a plexiglass tank witha volume of 60 L. In order to get sand samples with a diameter of100 �m or so, two filters with 100 and 120 meshes were used. Thewater/sand mixture was transported to the main line with 5 sub-main lines by a non-corrosive water pump, each submain line wasassembled with 5 emitters. A backflow pipe was also added so thatthe rest mixture can reflow to the tank to keep a steady concen-tration. Two pressure gauges were installed at entrance and exit ofthe main line. Fig. 5(a) and (b) shows the setup of mixture sourceand clogging test platform, respectively. The test was carried outunder a pressure of 100 kPa in order to compare with numericalsimulations. Considering the cumulative effect of clogging, the testlasted 5 min.
On the other hand, a numerical simulation on this emitter wasalso performed using the algorithm above. Particles always depositin the four regions as shown in Fig. 6. The flow fields in the regionsmarked A are nearly stagnant to the direction of incoming flowso that the passing particles are apt to deposit, while the deposi-
tions in the regions marked B are due to the vortices, which can beseen from the streamlines of the fluid as shown in Fig. 7. There-fore, we can conclude that the deposition starts in low-velocityregions and vortices for this emitter. Fig. 8(a) experimentally dis-plays the distribution of the sediment and Fig. 8(b) is the picture of
ty of water and sand. (b) Clogging test platform.
J. Zhang et al. / Computers and Electronics in Agriculture 74 (2010) 59–65 63
cr
2
meadoak
2
naitooa
Fig. 9. Characteristic parameters of the trapezoidal labyrinth channel unit.
Fig. 10. Two special structures evolved from normal trapezoidal channel unit. (a)Sawtooth trapezoidal channel unit. (b) Rectangular channel unit.
Table 2L16(45) orthogonal design matrix with the calculated passage rate of particles (�).
lean emitter, which is reasonably consistent with the numericalesults.
.3. Selection of key parameters of labyrinth channels
Fig. 9 shows the structure and characteristic parameters of nor-al trapezoidal labyrinth channels. There are two special samples
volved from Fig. 9 when S = 0 as shown in Fig. 10(a) and ˛ = 90◦
s shown in Fig. 10(b), these structures are also widely adopted toesign the channels. Furthermore, in order to avoid the influencef detailed dimensions, dimensionless parameters were employednd the ratios between characteristic parameters were taken as theey parameters as follows: D/W, H/D, S/H and ˛.
.4. Orthogonal design
According to the structural dimensions of the labyrinth chan-els, the orthogonal table L16(45) with 4 factors (key parameters)t 4 levels was used to design the numerical experiments. 16 phys-cal models with 10 channel units were built up by 3D software in
erms of those parameter combinations, and then the associated �f each combination was calculated. Table 2 lists the assignmentsf the experimental factors and levels for the 16 trials as well asnalytical results.
15 1.3 2 1/3 �/2 0.69616 1.3 2.5 0 5�/12 0.502
Fig. 8. Emitter’s clogging experiment. (a) Deposit regions of particles at the initial stage. (b) Clean picture of emitter.
64 J. Zhang et al. / Computers and Electronics in Agriculture 74 (2010) 59–65
Table 3Analytical results of passage rate of particle (�) by ANOVA.
Source of variation Sum of squares Degree of freedom Mean square F-Value Significant level
Table 4Stepwise regression analysis of passage rate of particles (�).
of fre
3
3p
wracrtttcc˛cearta0
TC
R Source of variation Sum of squares Degree
0.9Regression 0.193 5Residual 0.043 10
. Results and discussion
.1. Qualitative analysis of the relationship between � and keyarameters
In the first stage, range analysis method (Hedayat et al., 1999)as employed to investigate the importance of a given factor. If the
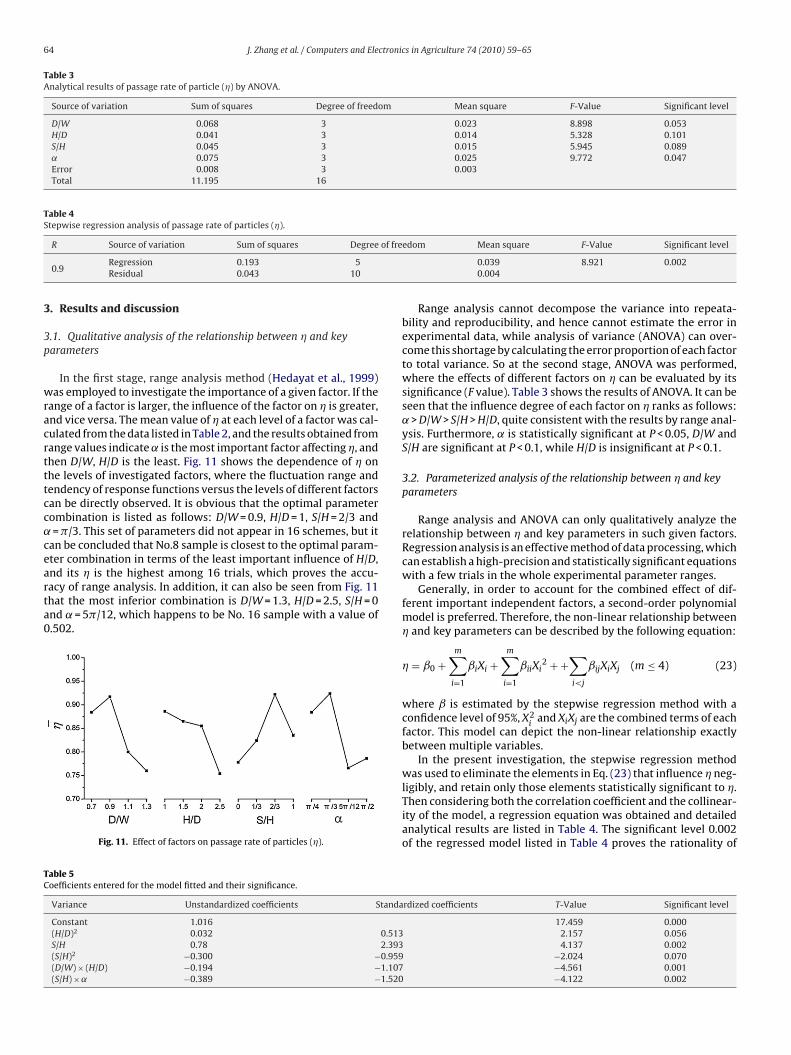
ange of a factor is larger, the influence of the factor on � is greater,nd vice versa. The mean value of � at each level of a factor was cal-ulated from the data listed in Table 2, and the results obtained fromange values indicate ˛ is the most important factor affecting �, andhen D/W, H/D is the least. Fig. 11 shows the dependence of � onhe levels of investigated factors, where the fluctuation range andendency of response functions versus the levels of different factorsan be directly observed. It is obvious that the optimal parameterombination is listed as follows: D/W = 0.9, H/D = 1, S/H = 2/3 and= �/3. This set of parameters did not appear in 16 schemes, but it
an be concluded that No.8 sample is closest to the optimal param-ter combination in terms of the least important influence of H/D,
nd its � is the highest among 16 trials, which proves the accu-acy of range analysis. In addition, it can also be seen from Fig. 11hat the most inferior combination is D/W = 1.3, H/D = 2.5, S/H = 0nd ˛ = 5�/12, which happens to be No. 16 sample with a value of.502.
Fig. 11. Effect of factors on passage rate of particles (�).
able 5oefficients entered for the model fitted and their significance.
Range analysis cannot decompose the variance into repeata-bility and reproducibility, and hence cannot estimate the error inexperimental data, while analysis of variance (ANOVA) can over-come this shortage by calculating the error proportion of each factorto total variance. So at the second stage, ANOVA was performed,where the effects of different factors on � can be evaluated by itssignificance (F value). Table 3 shows the results of ANOVA. It can beseen that the influence degree of each factor on � ranks as follows:˛ > D/W > S/H > H/D, quite consistent with the results by range anal-ysis. Furthermore, ˛ is statistically significant at P < 0.05, D/W andS/H are significant at P < 0.1, while H/D is insignificant at P < 0.1.
3.2. Parameterized analysis of the relationship between � and keyparameters
Range analysis and ANOVA can only qualitatively analyze therelationship between � and key parameters in such given factors.Regression analysis is an effective method of data processing, whichcan establish a high-precision and statistically significant equationswith a few trials in the whole experimental parameter ranges.
Generally, in order to account for the combined effect of dif-ferent important independent factors, a second-order polynomialmodel is preferred. Therefore, the non-linear relationship between� and key parameters can be described by the following equation:
� = ˇ0 +m∑
i=1
ˇiXi +m∑
i=1
ˇiiXi2 + +
∑i<j
ˇijXiXj (m ≤ 4) (23)
where ˇ is estimated by the stepwise regression method with aconfidence level of 95%, X2
iand XiXj are the combined terms of each
factor. This model can depict the non-linear relationship exactlybetween multiple variables.
In the present investigation, the stepwise regression methodwas used to eliminate the elements in Eq. (23) that influence � neg-
ligibly, and retain only those elements statistically significant to �.Then considering both the correlation coefficient and the collinear-ity of the model, a regression equation was obtained and detailedanalytical results are listed in Table 4. The significant level 0.002of the regressed model listed in Table 4 proves the rationality of
rdized coefficients T-Value Significant level
17.459 0.0002.157 0.0564.137 0.002
−2.024 0.070−4.561 0.001−4.122 0.002
ctronic
ttts
�
catf
4
tnImd
ri˛Hbm
pmocg
A
H(mfs
investigation of the clogging mechanism in labyrinth channel of the
J. Zhang et al. / Computers and Ele
he regression model. Table 5 lists the regression coefficients andheir significance, where the unstandardized coefficients are usedo establish the regression model expressed as Eq. (24), and theignificant level shows the importance of each term.
= 1.016 + 0.032(H/D)2 + 0.780(S/H) − 0.3(S/H)2
− 0.194(D/W) × (H/D) − 0.389(S/H) × ˛ (24)
Compared with the 16 analytical results, the relative error of �alculated by Eq. (24) almost ranges from 1% to 4%, so the predictionccuracy of the regression model is acceptable and can be used inhe prediction and comparison of the anti-clogging performanceor trapezoidal labyrinth channels with different geometries.
. Conclusions
A new evaluation method of anti-clogging performance of emit-ers was proposed using passage rate of particles based on theumerical simulation. Compared with the method proposed by
SO draft Clogging Test Methods for Emitters, this new method isore feasible and convenient to be implemented, especially for the
esign of emitters with excellent anti-clogging performance.For emitters with normal trapezoidal labyrinth channels, the
esults of 16 schemes from range analysis and ANOVA show thenfluence of key parameters on passage rate of particles ranks as> D/W > S/H > H/D, the first three parameters are significant while/D is insignificant. Therefore, those significant parameters shoulde considered firstly in order to improve the anti-clogging perfor-ance of emitters during the design phase.A reasonable mathematical model was developed between the
assage rate of particles and key parameters using a non-linearultivariable regression method, and it can be applied in prediction
r comparison of passage rate of particles of trapezoidal labyrinthhannels and taken as the design foundation for the emitters withood anti-clogging performance.
cknowledgements
The authors acknowledged the financial support from a National
igh Technology Research and Development Program of China
“863” Program, No. 2002AA2Z4081, 2005AA2Z4040), the Funda-ental Research Funds for the Central Universities and the Program
or Changjiang Scholars and Innovative Research Team in Univer-ity (No. IRT0646).
s in Agriculture 74 (2010) 59–65 65
References
Adin, A., Sacks, M., 1991. Dripper clogging factors in waste water irrigation. Journalof Irrigation Drainage Engineering 117, 813–826.
Asakura, K., Asari, T., Nakajima, I., 1997. Simulation of solid–liquid flows in a verticalpipe by a collision model. Powder Technology 94, 201–206.
Bucks, D.A., Nakayama, F.S., Gilbert, R.G., 1979. Trickle irrigation waterquality and prevention maintenance. Agricultural Water Management 2,149–162.
Dekreij, C., Van, D.B., Runia, W.T., 2003. Drip irrigation emitter clogging in dutchgreenhouses as affected by methane and organic acids. Agricultural Water Man-agement 60, 73–85.
Gilbert, R.G., Nakayama, F.S., Bucks, D.A., 1977. Trickle irrigation: prevention of clog-ging. Transactions of the ASAE 24, 26–29.
Griffiths, W.D., Boysan, F., 1996. Computational fluid dynamics (CFD) and empiricalmodeling of the performance of a number of cyclone samplers. Journal of Aerosolscience 27, 281–304.
Hedayat, A.S., Sloane, N.J.A., Stufken, J., 1999. Orthogonal Arrays: Theory and Appli-cations. Springer-Verlag, New York.
Hoekstra, A.J., Derksen, J.J., Vandenakker, H.E.A., 1999. An experimental and numer-ical study of turbulent swirling flow in gas cyclones. Chemical EngineeringScience 54, 2055–2065.
ISO Committee, 2003. Clogging Test Methods for Emitters. ISO /TC 23/SC 18.Li, G.Y., Wang, J.D., Alam, M., Zhao, Y.F., 2006. Influence of geometrical parameters of
labyrinth flow path of drip emitters on hydraulic and anti-clogging performance.Transactions of the ASAE 49, 637–643.
Mei, R.W., Adrian, R.J., Hanratty, T.J., 1991. Particle dispersion in isotropic turbulenceunder stokes drag and basset force with gravitational settling. Journal of FluidMechanics 225, 481–495.
Nishimura, T., Ohori, Y., Kawamura, Y., 1984. Flow characteristics in a channel withsymmetric wavy wall for steady flow. Journal of Chemical Engineering of Japan17, 466–471.
Padmakumari, O., Sivanappan, R.K., 1985. Study of clogging of emitters in drip sys-tems. In: Proceedings of the Third International Drip/Trickle Irrigation Congress,ASAE, San Francisco, USA, pp. 80–83.
Taylor, H.D., Bastos, R.K.X., Pearson, H.W., Mara, D.D., 1995. Drip irrigation withwaste stabilization pond effluents: solving the problem of emitter fouling. WaterScience Technology 31, 417–424.
Triesch, O., Bohnet, M., 2001. Measurement and CFD prediction of velocity andconcentration profiles in a decelerated gas–solids flow. Power Technology 115,101–113.
Wang, S.J., Liu, X.M., Xi, G., Guo, B.A., 2000. Flow characteristics in labyrinth emitterused for agricultural irrigation. Transactions of the CSAE 16, 61–63.
emitter. International Journal for Numerical Methods in Engineering 70,1598–1612.
Zhang, J., Zhao, W.H., Wei, Z.Y., Tang, Y.P., Lu, B.H., 2007b. Numerical and experi-mental study on hydraulic performance of emitters with arc labyrinth channels.Computers and Electronics in Agriculture 56, 120–129.