ab0cd Anti-corruption programmes in post-communist transition countries and changes in the business environment, 1999-2002 Franklin Steves and Alan Rousso Abstract This paper analyses the anti-corruption activities of 24 transition countries in the period 1999-2002. These activities are divided into omnibus anti-corruption programmes, legislative reform aimed at tackling corruption, and adherence to international anti-corruption conventions. The paper presents a new measure for determining the extent of anti-corruption activity undertaken in these three categories during 1999-2002. Using the results of a large survey of firms across the region, the paper shows that countries with low levels of administrative corruption were more likely to adopt intensive anti-corruption programmes than countries with high levels of administrative corruption, independent of the level of state capture Across the transition countries, omnibus anti-corruption programmes and membership in international anti-corruption conventions have not led to reductions in the level of either administrative corruption or state capture – at least in this relatively short time period – while new or amended laws aimed at tackling corruption have led to reductions in administrative corruption, but not in levels of state capture. Finally, the paper finds that perceptions of corruption – measured in terms of the degree to which firms consider corruption to be an obstacle to the operation and growth of their business – are positively correlated with the intensity of anti-corruption programmes. This finding suggests that by launching high-profile anti-corruption initiatives, governments may be more likely to heighten managers’ perceptions of the problem rather than to reduce the impact of corruption on firms. Keywords: business environment, law, governance, corruption, state capture, anti-corruption, legislative reform JEL Classification Number: H26, H32, H41, K42, P30, P31, P33, P37 Address for Correspondence: European Bank for Reconstruction and Development, One Exchange Square, London EC2A 2JN, UK. Phone: +44 20 7338 6211; Fax: +44 20 7338 6110; E-mail: [email protected], [email protected]Franklin Steves is a Political Analyst and Alan Rousso is a Senior Political Counsellor in the Office of Chief Economist, EBRD. * The authors are grateful to Alan Doig, Steven Fries, Joel Hellman, Peter Sanfey and Robin Theobald for comments. All errors remain our own. The working paper series has been produced to stimulate debate on the economic transformation of central and eastern Europe and the CIS. Views presented are those of the authors and not necessarily of the EBRD. Working paper No. 85 Prepared in October 2003
Transcript
ab0cd
Anti-corruption programmes in post-communist transition countries and changes in the business
environment, 1999-2002
Franklin Steves and Alan Rousso Abstract
This paper analyses the anti-corruption activities of 24 transition countries in the period 1999-2002. These activities are divided into omnibus anti-corruption programmes, legislative reform aimed at tackling corruption, and adherence to international anti-corruption conventions. The paper presents a new measure for determining the extent of anti-corruption activity undertaken in these three categories during 1999-2002. Using the results of a large survey of firms across the region, the paper shows that countries with low levels of administrative corruption were more likely to adopt intensive anti-corruption programmes than countries with high levels of administrative corruption, independent of the level of state capture Across the transition countries, omnibus anti-corruption programmes and membership in international anti-corruption conventions have not led to reductions in the level of either administrative corruption or state capture – at least in this relatively short time period – while new or amended laws aimed at tackling corruption have led to reductions in administrative corruption, but not in levels of state capture. Finally, the paper finds that perceptions of corruption – measured in terms of the degree to which firms consider corruption to be an obstacle to the operation and growth of their business – are positively correlated with the intensity of anti-corruption programmes. This finding suggests that by launching high-profile anti-corruption initiatives, governments may be more likely to heighten managers’ perceptions of the problem rather than to reduce the impact of corruption on firms.
Keywords: business environment, law, governance, corruption, state capture, anti-corruption, legislative reform
Franklin Steves is a Political Analyst and Alan Rousso is a Senior Political Counsellor in the Office of Chief Economist, EBRD.
* The authors are grateful to Alan Doig, Steven Fries, Joel Hellman, Peter Sanfey and Robin Theobald for comments. All errors remain our own.
The working paper series has been produced to stimulate debate on the economic transformation of central and eastern Europe and the CIS. Views presented are those of the authors and not necessarily of the EBRD.
Working paper No. 85 Prepared in October 2003
1
INTRODUCTION Over the past decade a host of major bilateral and multilateral donors, international organisations, non-governmental organisations and academic experts on corruption have advocated an integrated, comprehensive approach to fighting corruption around the globe.1 Typically, there are three key aspects of such an approach: introducing new or amended legislation aimed at reducing public officials’ opportunities for rent-seeking in those areas most prone to corrupt practices, such as political party finance, the civil service, money-laundering and financial regulation; building alliances with other governments in the struggle against corruption by signing international anti-corruption covenants and participating in transnational organisations committed to fighting corruption; and the implementation of an omnibus anti-corruption programme. These omnibus anti-corruption programmes generally entail some combination of the following: a concept document, an anti-corruption law, a dedicated agency or inter-ministerial commission, an action plan to implement the programme, and a monitoring mechanism.
The justification for encouraging countries to adopt these comprehensive anti-corruption programmes has been not only to develop an integrated framework for policy and institutional reforms, but also to launch a process whereby key stakeholders – both domestic and international – can build a consensus on a strategy for fighting corruption and hold governments accountable for implementing that strategy. For governments, a strong part of the appeal of such programmes has been the signal that they are intended to send to domestic and foreign audiences that the government is committed to getting tough on corruption. Anti-corruption programmes are thus supposed to build momentum for change across a wide range of constituencies, to demonstrate the government’s commitment to change and to serve as a benchmark for measuring the government’s success in the long-term struggle to reduce the incidence and impact of corruption.
Numerous developing and transition countries have adopted various combinations of these three types of anti-corruption programmes, often with the technical and financial support of the multilateral donor agencies. However, despite the proliferation of anti-corruption programmes around the world, there has been little systematic research into their impact as a signal of the government’s commitment to anti-corruption efforts or, more importantly, their effectiveness in reducing corruption. The increased attention to governance and corruption by development institutions and donor agencies in the past ten years has spawned numerous diagnostic studies of the causes of corruption and led to the creation of various corruption and governance indicators.2 While this is a welcome development, it has not necessarily brought us much closer to understanding the causes of corruption, much less the effectiveness of alternative measures used to combat it.
1 See, for example, Charlick (1993), Clarke (1983), Doig (1995), Findlay and Stewart (1992), Harsch (1993), IRIS (1996), Klitgaard (1988), Langseth and Stapenhurst (1997), Larrea-Santos (1997), New South Wales Independent Commission against Corruption (1999), Pope (2000), Riley (1993, 1998), Theobald et al. (2002), United Nations Development Programme (1998), World Bank (1997a, 1997b, 2000). 2 For example, the most high profile of these include Transparency International’s “Bribe Payers Index” and “Corruption Perceptions Index,” available at www.transparency.org/surveys/index; the World Bank’s “Governance Indicators,” available at www.worldbank.org/wbi/governance/data; the Heritage Foundation’s “Index of Economic Freedom,” at www.heritage.org/research/features/index; and the World Economic Forum’s “Global Competitiveness Report,” at www.weforum.org/gcr.
2
In many transition countries, the development and implementation of anti-corruption programmes are still at an early stage. But because these programmes have become the focal point of anti-corruption efforts in many countries of the region, it is important to continually assess their impact on different dimensions of corruption and to adjust these strategies accordingly. Anti-corruption programmes that prove ineffective in achieving demonstrable results in a reasonable time frame or, in the worst case, that serve as a rhetorical cover for government inaction undermine public confidence in all future government anti-corruption efforts. Consequently, frequent tracking of the progress and performance of anti-corruption programmes is critical.
This paper analyses the effectiveness of the anti-corruption activities of 24 of the 27 transition countries, dividing them into three groups: omnibus anti-corruption programmes, legislative measures to strengthen institutions of governance and accountability, and adherence to international anti-corruption conventions.3 The central questions the paper addresses are: Have these three types of anti-corruption programmes been associated with reductions in the levels of administrative corruption and state capture in the period 1999-2002?4 What types of anti-corruption programmes have been most closely associated with reductions in levels of both administrative and grand corruption?
The paper is outlined as follows: in Section 1, we review the existing literature on the effectiveness of anti-corruption programmes and outline the methodology employed in this paper to make a preliminary judgment about the effectiveness of omnibus programmes, new anti-corruption legislation and participation in international anti-corruption conventions. We then provide a detailed explanation of the indices of anti-corruption programmes and describe the variable weighting used to construct the anti-corruption index. In Section 2, we describe the patterns in anti-corruption programming across the transition countries, and in the following section we provide tentative explanations of the observed variations in the design and implementation of anti-corruption strategies across the transition countries. In Section 4, we describe the correlations between the various types of anti-corruption programmes and changes in our measures of the ‘objective’ levels of corruption, and propose some tentative explanations for these observed variations. This leads us, in Section 5, to describe and attempt to explain the correlations between the levels of anti-corruption programming and changes in the perception of corruption in the transition countries. We conclude in Section 6 with a summary of the policy implications of these early, and still tentative, findings. Throughout the paper we draw on empirical examples from specific transition countries’ experiences with anti-corruption programmes, and provide three short country case studies in Annex 1.
This paper does not reach any firm conclusions on the impact of national anti-corruption programmes in the transition countries. Because we only have data on corruption from 1999 and 2002, the paper is limited to the role of anti-corruption programmes in this period. Naturally, anti-corruption initiatives launched prior to 1999 could be expected to influence corruption trends in the 1999-2002 period, especially as anti-corruption programmes are understood to be medium- to long-term rather than quick fix solutions. However, this problem is partially offset by the fact that most anti-corruption programmes that have been introduced since the onset of transition have been developed only in the last few years. 3 Tajikistan and Serbia and Montenegro were excluded from the 1999 BEEPS sample, and Turkmenistan from the 2002 BEEPS sample. These countries are therefore excluded from our analysis (with the exceptions of Table 1 and Chart 1, which have been included for information but do not form part of the substantive analysis in the paper). 4 “State capture” refers to the “capture” of the state by private firms or individuals, i.e., the establishment of conditions of undue influence over the institutions of the state by private entities in order to serve the private interests of those entities at the expense of the broader polity. See Hellman (1998).
3
Moreover, the credibility of even long-term anti-corruption programmes often depends on defining manageable short-term benchmarks to demonstrate progress and build the government’s support in this area. Our goal in this paper is to identify key trends in anti-corruption efforts in the transition countries and to relate them to observed changes in both perceptions of corruption and reported levels of bribery and payments to secure influence over agents of the state.
4
1. ASSESSING THE VALUE-ADDED OF ANTI-CORRUPTION PROGRAMMES
Drawing from international experience beyond the post-communist transition countries, there are several examples where anti-corruption programmes of the type described above have worked effectively. The anti-corruption agencies in Hong Kong, Singapore and Botswana are often cited as models in which independent bodies with firm political backing and oversight by the legislature were able to root out corruption at the highest level of government.5 However, applications of this model in other regions have had mixed results: for example, this approach has had far less success in countries where corruption problems were of a more systemic nature.6
In fact, previous studies have suggested that anti-corruption agencies, ombudsman offices and similar institutions work best where they are needed least – that is, in countries where initial levels of corruption are less severe.7 In countries where corruption is endemic, the effect of these same institutions has generally been either neutral or, in some cases, counterproductive when the agency itself becomes discredited, further deepening public scepticism about the government’s anti-corruption efforts. It has proven difficult to build anti-corruption institutions which operate independently from the weak governance structures that characterise countries with systemic corruption, including the legal system, mechanisms of political accountability and financial and regulatory institutions. Anti-corruption commissions, ombudsman offices and ethics codes have rarely functioned effectively in these environments without substantial government actions to make corresponding changes in the broader institutional context. Whether the development of a national anti-corruption programme with a comprehensive strategy, action plan and independent commission is more likely to enhance the government’s commitment to a multi-pronged reform agenda has not been studied systematically with evidence from existing anti-corruption programmes.
To measure the effectiveness of these alternative forms of anti-corruption activity, we use data from the EBRD/World Bank Business Environment and Enterprise Performance Surveys (BEEPS), conducted in 1999 and 2002. These data provide important insights into the dynamics of corruption in the region. The two rounds of the BEEPS asked a large sample of firms in 24 transition countries a series of questions about the nature and effects of corruption on their business and the country’s business climate. The changes in firms’ responses in the three year period between these two rounds allow us to estimate changes in the overall level of corruption in these countries over this period.8
The structure and results of the two rounds of the BEEPS have been described at length.9 In brief, the two surveys found that the levels of both state capture and administrative corruption varied significantly across the region. By and large, the countries of the Commonwealth of Independent States (CIS) were subject to higher levels of both aspects of corruption than south-eastern European (SEE) and central and eastern European and Baltic (CEB) countries. The surveys also found that there is a strong association between the level of corruption and
5 See Quah (1982, 1989), de Speville (1995), Doig and Riley (1998), Frimpong (1997), Tan (1995). 6 See Pope (1999). 7 See Huther and Shah (2000). 8 While all survey-based measures of corruption are inherently perceptions based, and therefore the results of the two BEEPS rounds will to a certain extent reflect changes in perceptions of corruption rather than any objective measure of corruption, the surveys attempted to minimise the impact of perceptions by asking questions specifically about levels of bribes. In addition respondents were asked about their perceptions of corruption as an obstacle to the operation and growth of their businesses. We examine both of these measurements in this paper. See below for further detail. 9 See EBRD (1999, 2002), and World Bank (2000, 2003).
5
the degree of obstacles to the operation and growth of businesses. In addition, the surveys found that state capture significantly boosts the investment and real revenue growth rates of firms that engage in this activity, but holds back the growth performance of other firms. Finally, the second round of the BEEPS found that in virtually all transition economies the business environment improved significantly between 1999 and 2002.10
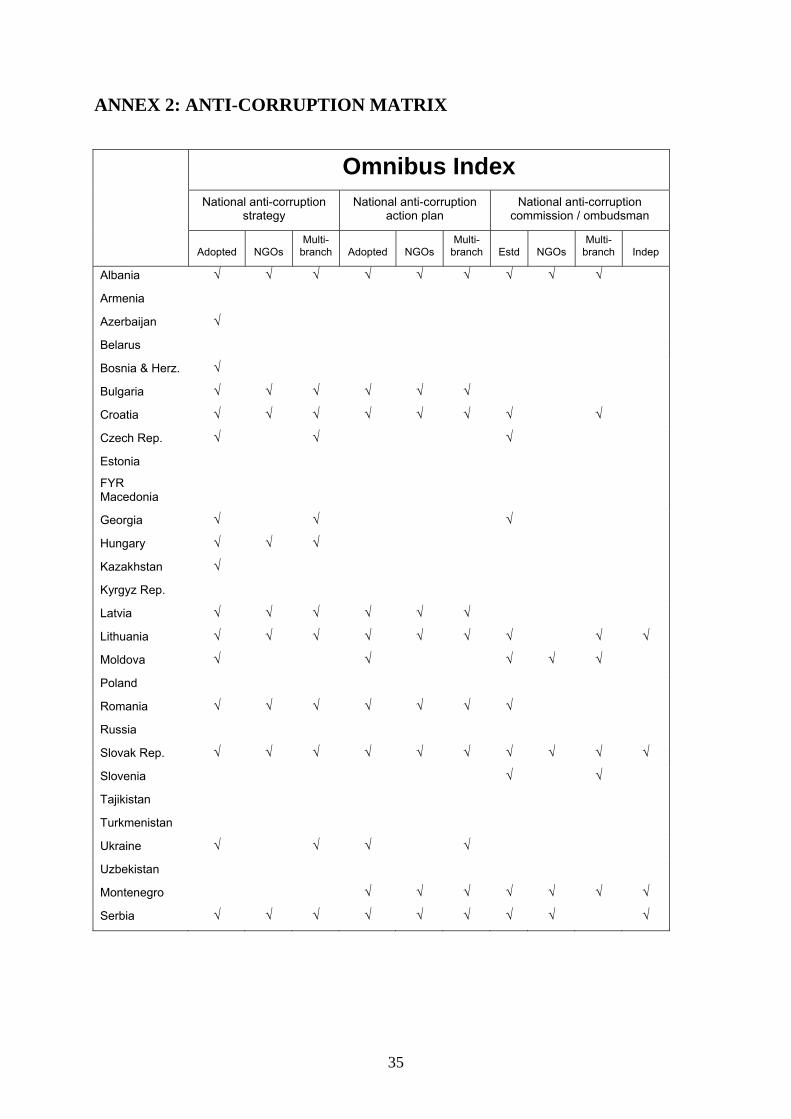
In order to classify anti-corruption activity, we surveyed initiatives that have been put in place in all countries between the first and second BEEPS rounds, and coded them in a matrix of anti-corruption activity. These activities are divided into the three broad categories outlined above: omnibus reform programmes, new legislation targeted at anti-corruption, and accession to international covenants and membership in international anti-corruption coalitions. In each area, a scoring system has been developed to serve as the basis of an index that can be used to compare the extent of anti-corruption activities across countries.
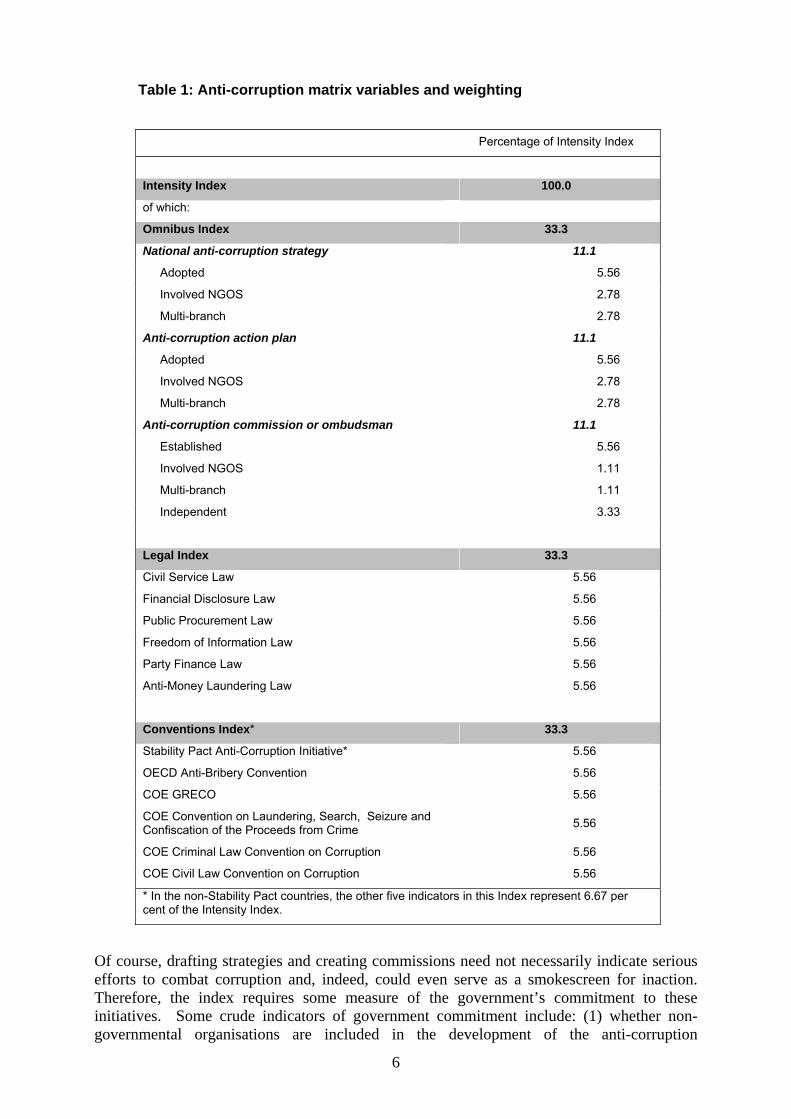
In the area of omnibus activities, we examine whether any of the following initiatives have been undertaken: (1) the design and publication of an anti-corruption strategy; (2) the development of an implementing anti-corruption action plan; and (3) the establishment of a national anti-corruption commission, ombudsman or similar authority. For each of these three initiatives each country in the matrix was coded ‘1’ if it had introduced the anti-corruption measures and a ‘0’ if it had not. These three major components of the omnibus anti-corruption index are all weighted equally in the omnibus index, as outlined in Table 1.
10 For a more detailed synopsis of these findings and a more explicit argument about how corruption affects firm performance, see Fries et al. (2003).
6
Of course, drafting strategies and creating commissions need not necessarily indicate serious efforts to combat corruption and, indeed, could even serve as a smokescreen for inaction. Therefore, the index requires some measure of the government’s commitment to these initiatives. Some crude indicators of government commitment include: (1) whether non-governmental organisations are included in the development of the anti-corruption
Table 1: Anti-corruption matrix variables and weighting
Percentage of Intensity Index
Intensity Index 100.0
of which:
Omnibus Index 33.3
National anti-corruption strategy 11.1
Adopted 5.56
Involved NGOS 2.78
Multi-branch 2.78
Anti-corruption action plan 11.1
Adopted 5.56
Involved NGOS 2.78
Multi-branch 2.78
Anti-corruption commission or ombudsman 11.1
Established 5.56
Involved NGOS 1.11
Multi-branch 1.11
Independent 3.33
Legal Index 33.3
Civil Service Law 5.56
Financial Disclosure Law 5.56
Public Procurement Law 5.56
Freedom of Information Law 5.56
Party Finance Law 5.56
Anti-Money Laundering Law 5.56
Conventions Index* 33.3
Stability Pact Anti-Corruption Initiative* 5.56
OECD Anti-Bribery Convention 5.56
COE GRECO 5.56
COE Convention on Laundering, Search, Seizure and Confiscation of the Proceeds from Crime 5.56
COE Criminal Law Convention on Corruption 5.56
COE Civil Law Convention on Corruption 5.56
* In the non-Stability Pact countries, the other five indicators in this Index represent 6.67 per cent of the Intensity Index.
7
strategy/action plan and in the operation of the anti-corruption commission; (2) whether multiple government branches or ministries, i.e., the judiciary, law enforcement, and various government ministries, were involved in the elaboration and implementation of these programmes; and (3) whether the anti-corruption commission is granted formal independence from the government. These aspects of each of the three ‘core’ omnibus anti-corruption measures are also coded ‘1’ and ‘0,’ while the weighting of the combined sub-components equals that of the core measures, as detailed in Table 1.
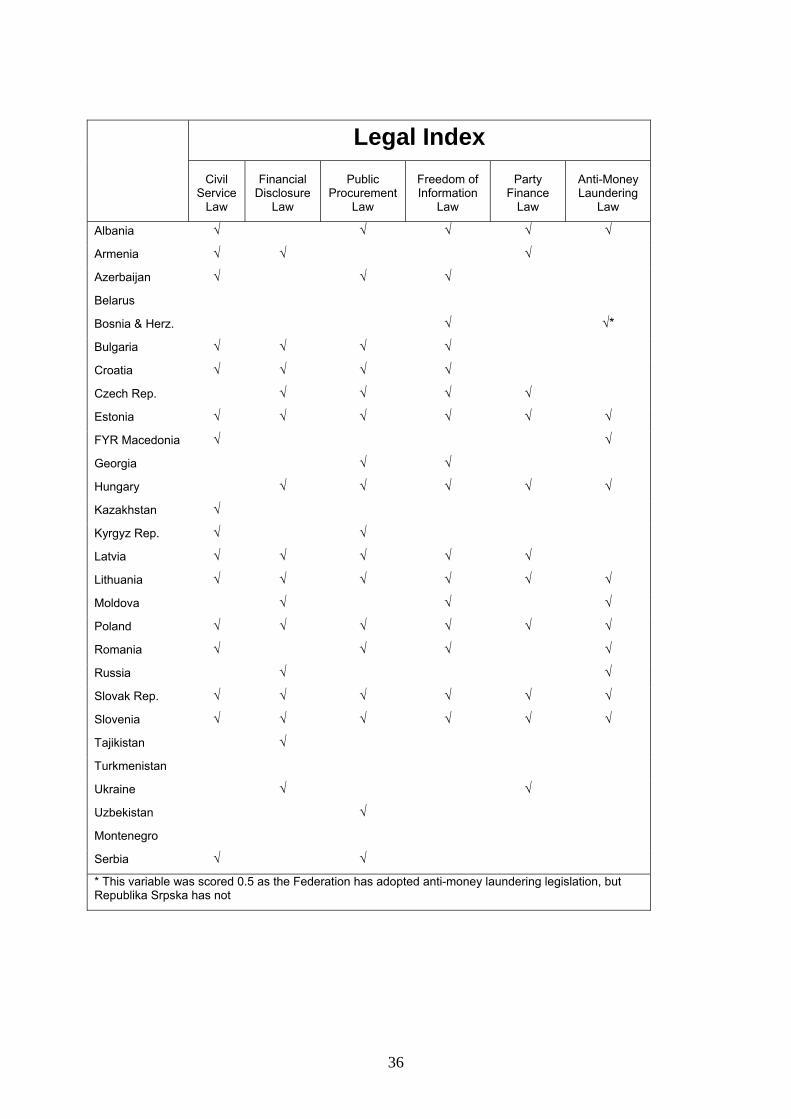
In terms of new anti-corruption legislation, we have developed an index based on the implementation of, or amendments to, six key laws: (1) a civil service law; (2) a financial disclosure law, which regulates both public officials and private investors; (3) a public procurement law; (4) a freedom of information law; (5) a political party financing law; and (6) an anti-money laundering law.11 Although introducing other forms of anti-corruption legislation is without doubt also significant in terms of reducing corruption, these six areas have been chosen because they are areas in which the transition countries typically did not have effective legislation in place at the start of transition and in which the regulatory framework during the first half of the 1990s typically remained weak. These key legislative reforms have thus consistently been highlighted by bodies such as the OECD, international financial institutions, and domestic and international non-governmental organisations as the areas most likely to reduce the incentives and opportunities for both administrative corruption and state capture. Each of these six legislative reforms are weighted equally: the introduction or amendment of each of these six laws during the 1999-2002 period would generate a score on the legal index of 100 per cent, in three of these areas 50 per cent, and so on. We call this the ‘legal index’ for short.
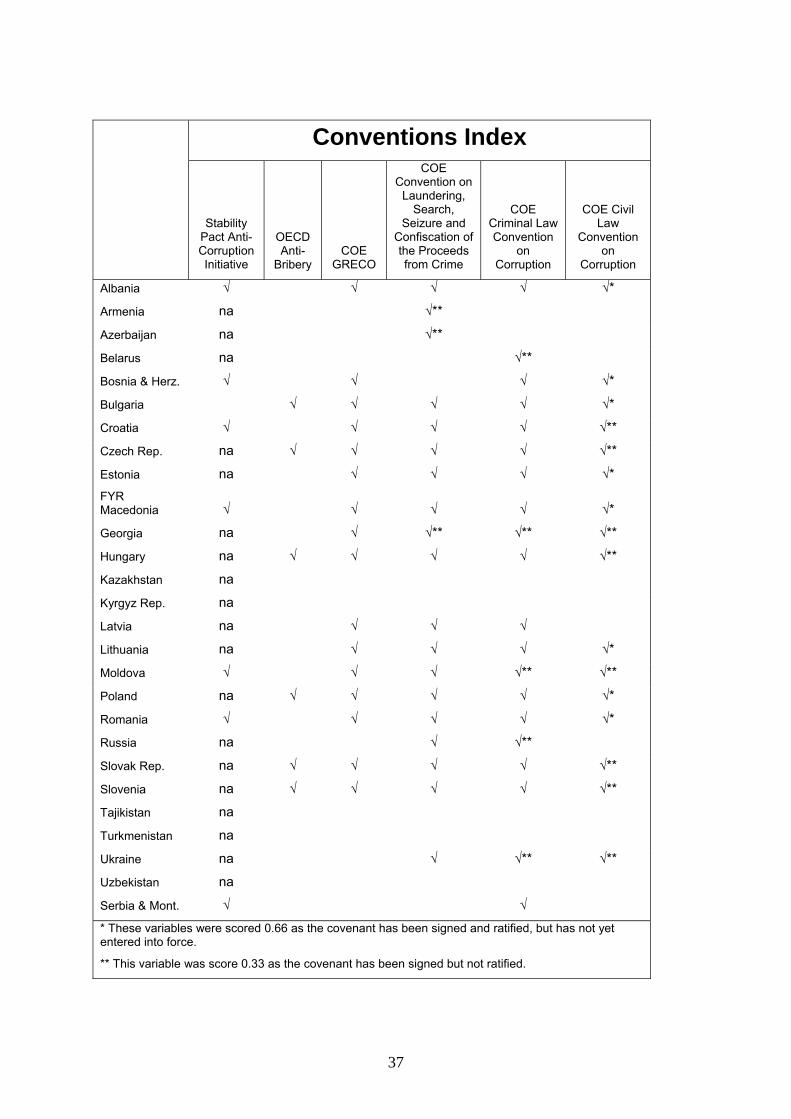
Finally, in order to assess the transition countries’ commitment to international anti-corruption conventions and standards, we created an index measuring whether countries are signatories to and have ratified the Stability Pact Anti-Corruption Initiative (SPAI), the OECD Anti-Bribery Convention, the Council of Europe’s (COE) Criminal and Civil Law Conventions on Corruption, the COE’s Convention on Laundering, Search, Seizure and Confiscation of the Proceeds from Crime, and the COE’s Group of States against Corruption (GRECO).12 As with the legal index, membership in or signing of each of these international instruments is weighted equally. Those countries that are not eligible for any one of these instruments, for example the SPAI, were assessed on their participation in the others alone. To further refine this index, on each of the conventions for which countries were eligible, countries were given 1/3 for signing the instrument, 2/3 for signing and ratifying, and a ‘1’ if the convention had been signed, ratified by the legislature, and had entered into force both domestically and within the context of the international organisation which sponsored it.13
By aggregating these three component indicators, we create an overall index measuring the extent of anti-corruption activities in the transition countries, which we call the ‘intensity of anti-corruption index.’ The intensity index is weighted evenly on the omnibus, legal and international conventions indices.
In the section that follows we describe the patterns in anti-corruption programming across the 27 transition countries, before going on to make a preliminary assessment of the effectiveness of omnibus programmes, new anti-corruption legislation and participation in international conventions in changing both perceptions and actual levels of corruption.
11 On the importance of freedom of information for general good governance, see Islam (2003). 12 Countries were only scored on membership in the organisations or conventions for which they are eligible. 13 The highest score any country could receive on the COE’s Civil Law Convention on Corruption was 2/3, as the Convention has not yet received sufficient signatories to enter into force.
8
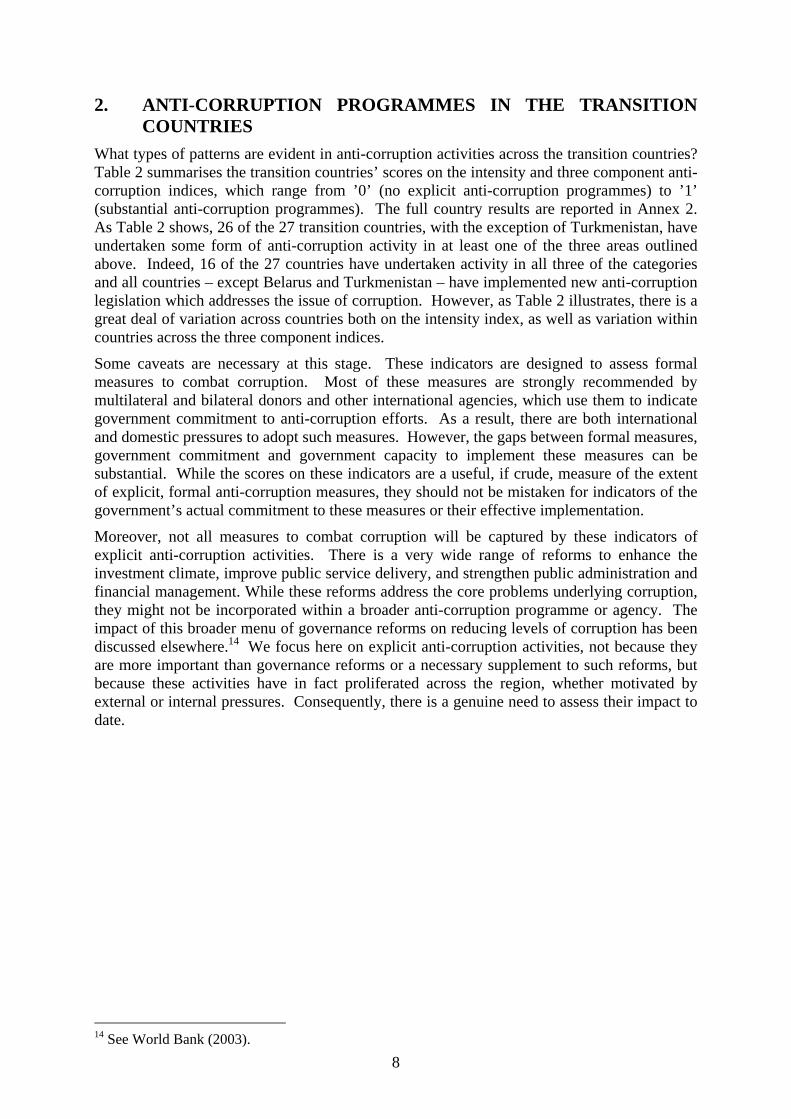
2. ANTI-CORRUPTION PROGRAMMES IN THE TRANSITION COUNTRIES What types of patterns are evident in anti-corruption activities across the transition countries? Table 2 summarises the transition countries’ scores on the intensity and three component anti-corruption indices, which range from ’0’ (no explicit anti-corruption programmes) to ’1’ (substantial anti-corruption programmes). The full country results are reported in Annex 2. As Table 2 shows, 26 of the 27 transition countries, with the exception of Turkmenistan, have undertaken some form of anti-corruption activity in at least one of the three areas outlined above. Indeed, 16 of the 27 countries have undertaken activity in all three of the categories and all countries – except Belarus and Turkmenistan – have implemented new anti-corruption legislation which addresses the issue of corruption. However, as Table 2 illustrates, there is a great deal of variation across countries both on the intensity index, as well as variation within countries across the three component indices.
Some caveats are necessary at this stage. These indicators are designed to assess formal measures to combat corruption. Most of these measures are strongly recommended by multilateral and bilateral donors and other international agencies, which use them to indicate government commitment to anti-corruption efforts. As a result, there are both international and domestic pressures to adopt such measures. However, the gaps between formal measures, government commitment and government capacity to implement these measures can be substantial. While the scores on these indicators are a useful, if crude, measure of the extent of explicit, formal anti-corruption measures, they should not be mistaken for indicators of the government’s actual commitment to these measures or their effective implementation.
Moreover, not all measures to combat corruption will be captured by these indicators of explicit anti-corruption activities. There is a very wide range of reforms to enhance the investment climate, improve public service delivery, and strengthen public administration and financial management. While these reforms address the core problems underlying corruption, they might not be incorporated within a broader anti-corruption programme or agency. The impact of this broader menu of governance reforms on reducing levels of corruption has been discussed elsewhere.14 We focus here on explicit anti-corruption activities, not because they are more important than governance reforms or a necessary supplement to such reforms, but because these activities have in fact proliferated across the region, whether motivated by external or internal pressures. Consequently, there is a genuine need to assess their impact to date.
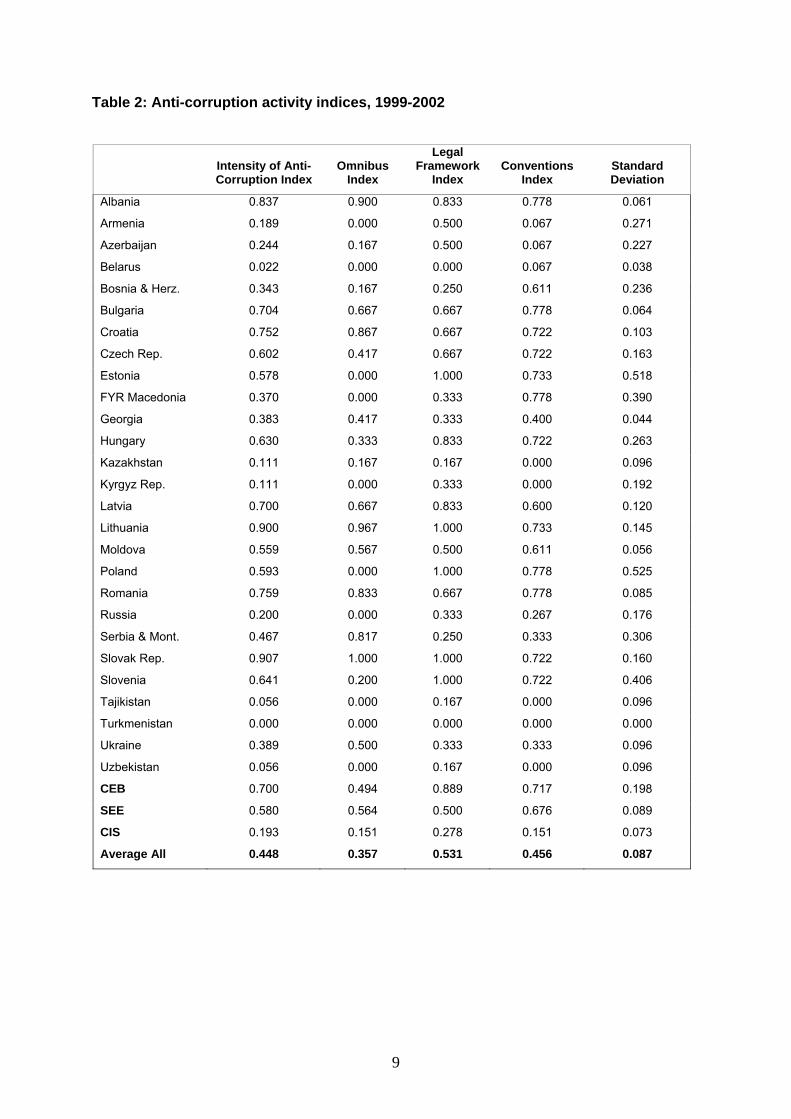
As one might expect, the advanced transition countries in CEB score higher than the countries of SEE and the CIS on the intensity index (see Chart 1).15 Indeed, both CEB and SEE have undertaken a great deal more anti-corruption programming in all three areas than have the countries of the CIS, although it must be noted that there is a great deal of variation within each of the regional groups. However, a striking feature of the anti-corruption programming in the transition countries is that the south-eastern European countries have undertaken more omnibus initiatives than the advanced transition countries of CEB, while the countries of CEB score much higher on the legal index than SEE. Estonia, Slovenia and Poland, for example, score among the highest countries on the legal index but have implemented very little omnibus anti-corruption programming.
Chart 1: Regional patterns of anti-corruption activity
0.0
0.1
0.2
0.3
0.4
0.5
0.6
0.7
0.8
0.9
1.0
Intensity of Anti-Corruption Index
Omnibus Index Legal Index Conventions Index
CEBSEECIS
In SEE, by contrast, countries such as Romania, Bulgaria and, most remarkably, Serbia and Montenegro have been very active in the area of omnibus anti-corruption initiatives, while their legislative anti-corruption initiatives lag behind in the intermediate to low range. This can be explained, at least in part, by the perception of far higher levels of corruption in the south-eastern European countries, and pressures under the Stability Pact and from other international bodies to make visible efforts to tackle widespread corruption. In contrast, in CEB in 1999, corruption was generally believed to be a less acute problem than in SEE, and the main outstanding legal and institutional issues for meeting the European Union’s acquis
15 The countries of central and eastern Europe and the Baltic states (CEB) include Croatia, the Czech Republic, Estonia, Hungary, Latvia, Lithuania, Poland, the Slovak Republic and Slovenia. South-eastern Europe (SEE) includes Albania, Bosnia and Herzegovina, Bulgaria, FYR Macedonia, Romania and Serbia and Montenegro. The Commonwealth of Independent States (CIS) includes Armenia, Azerbaijan, Belarus, Georgia, Kazakhstan, the Kyrgyz Republic, Moldova, Russia, Tajikistan, Turkmenistan, Ukraine and Uzbekistan.
11
communautaire were better addressed through specific anti-corruption legislative measures than through high profile anti-corruption campaigns.
The overall intensity index divides into four rough groups: the high intensity reformers include the Baltic states of Lithuania and Latvia, as well as the Slovak Republic, Albania, Croatia, Bulgaria and Romania. These countries are characterised by high scores across all three indices, although of the seven Lithuania and the Slovak Republic score particularly high on the omnibus index. The next group of medium-high intensity anti-corruption countries includes most of the accession countries – the Czech Republic, Poland, Estonia, Slovenia and Hungary, as well as Moldova, and Serbia and Montenegro. These countries are characterised by relatively high scores on the legal and conventions indices and average scores on omnibus activities. The exceptions include Serbia and Montenegro, which scores high on new legislative reforms and low on the conventions index, and Poland and Estonia, which both score ‘0’ on the omnibus index and ‘1’ on the legal index. The medium-low reform group includes the three Caucasian states – Georgia, Armenia and Azerbaijan – as well as Bosnia and Herzegovina, FYR Macedonia, Ukraine and Russia. The countries in this group tend to score low on omnibus reforms and closer to average on the legal and conventions indices. Finally, the low reform group of countries includes Belarus and the five Central Asian countries. The low anti-corruption intensity countries tend to score higher on the legal index than on the omnibus or conventions indices, although they generally tend to be amongst the lowest scoring countries on all of the three component indices.
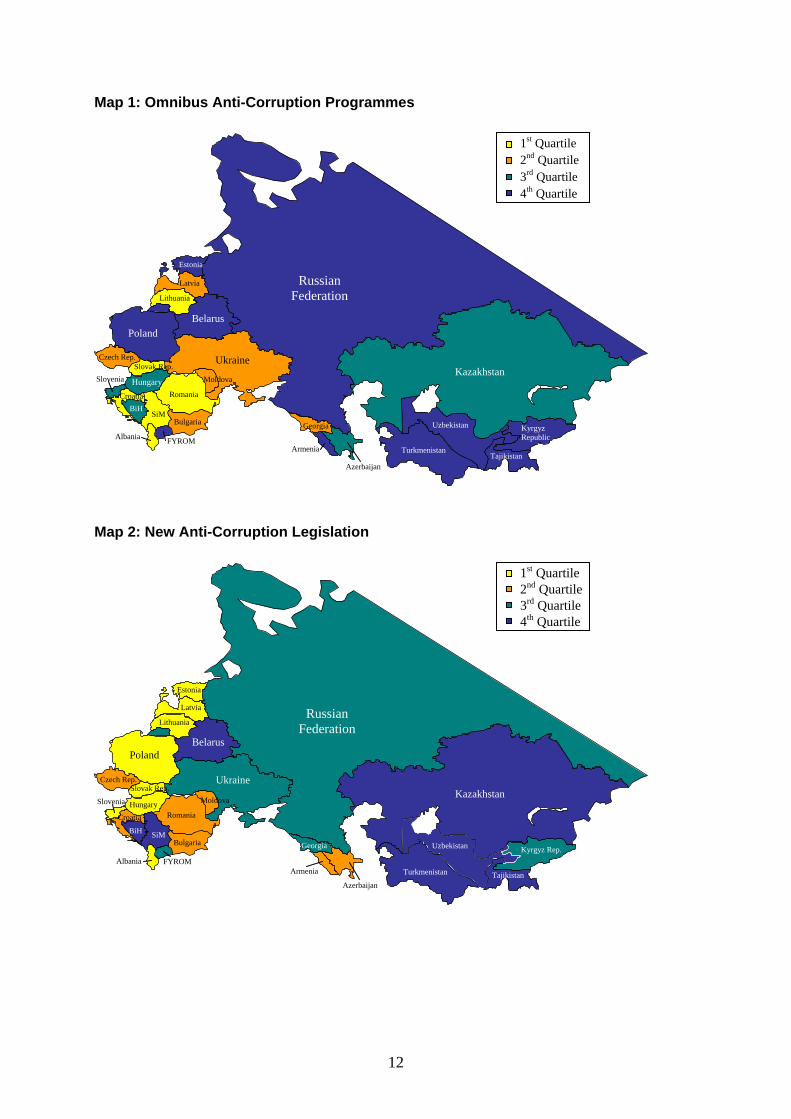
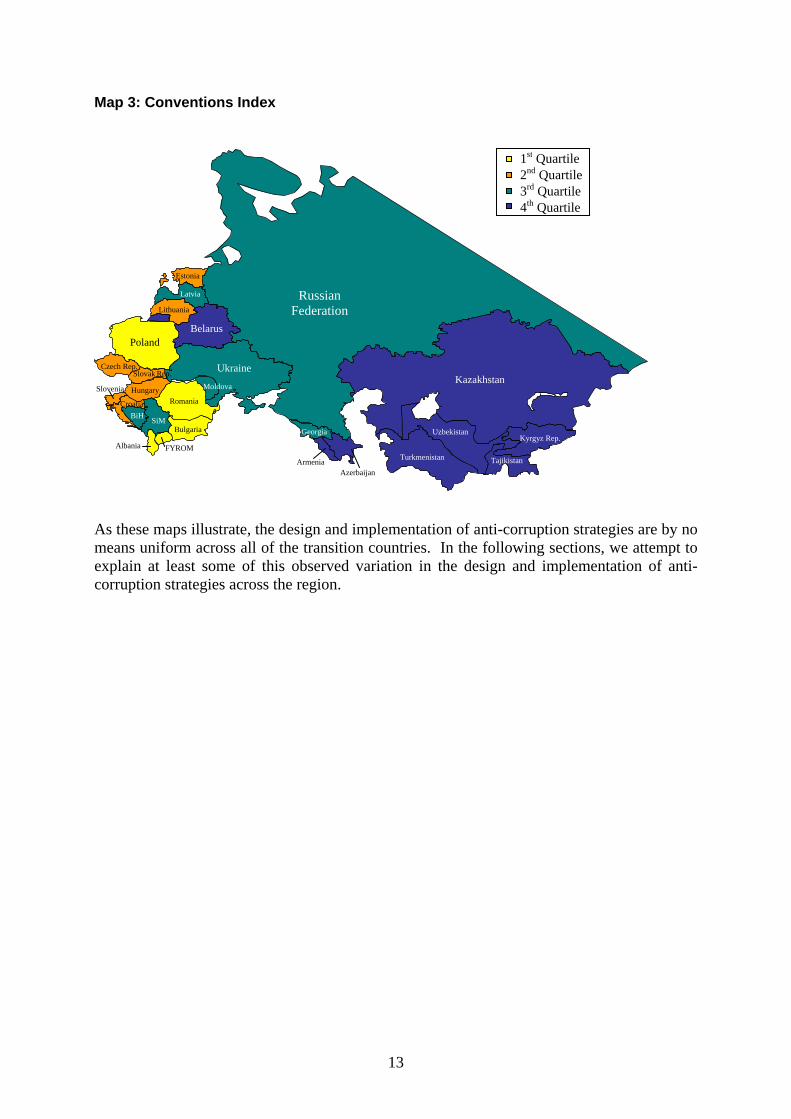
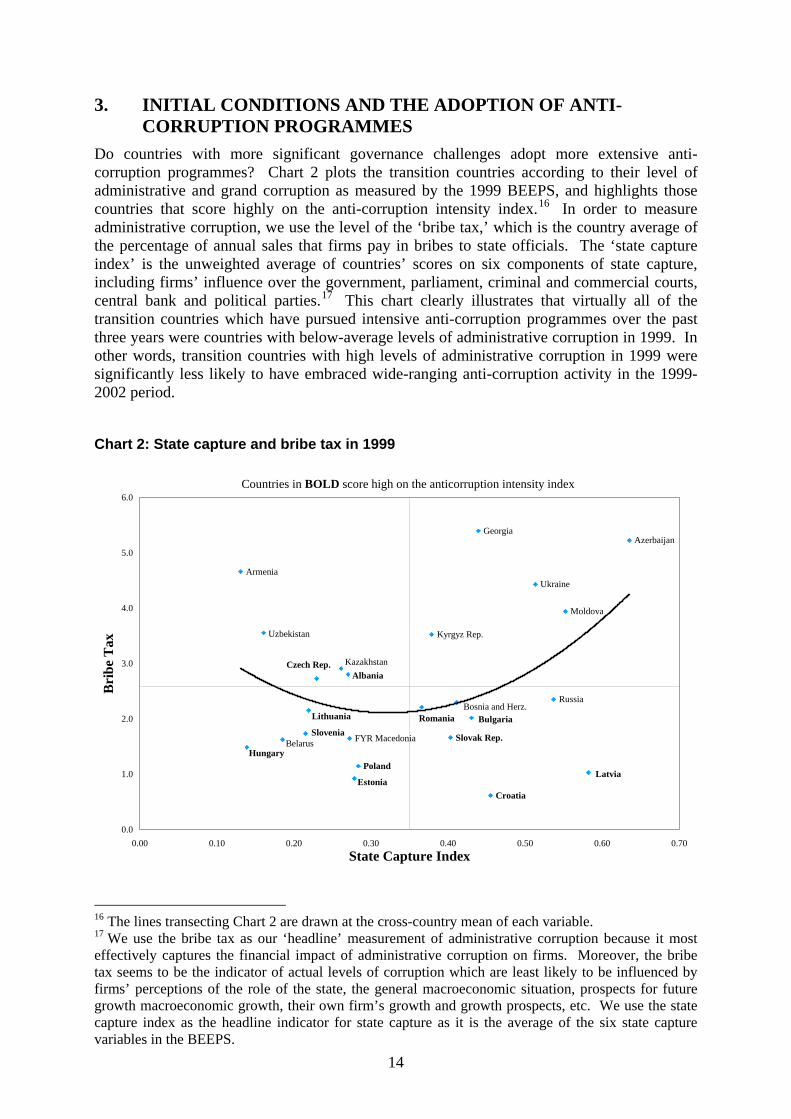
On the conventions index, CEB and SEE are again quite close together, and both score almost five times as high as the CIS. Thus, Albania, Bulgaria, FYR Macedonia, Romania and Poland top the conventions index followed very closely by all of the remaining SEE and CEB countries. The countries of the CIS are much lower down the scale, with Moldova the only country scoring more than 40 per cent – largely a result of Moldova’s membership in the Stability Pact. In the remainder of the CIS, only Georgia, Russia and Ukraine have made any significant international commitments to combating corruption. The maps below demonstrate graphically the extent of regional variation across the omnibus, legal and conventions indices.
As these maps illustrate, the design and implementation of anti-corruption strategies are by no means uniform across all of the transition countries. In the following sections, we attempt to explain at least some of this observed variation in the design and implementation of anti-corruption strategies across the region.
3. INITIAL CONDITIONS AND THE ADOPTION OF ANTI-CORRUPTION PROGRAMMES
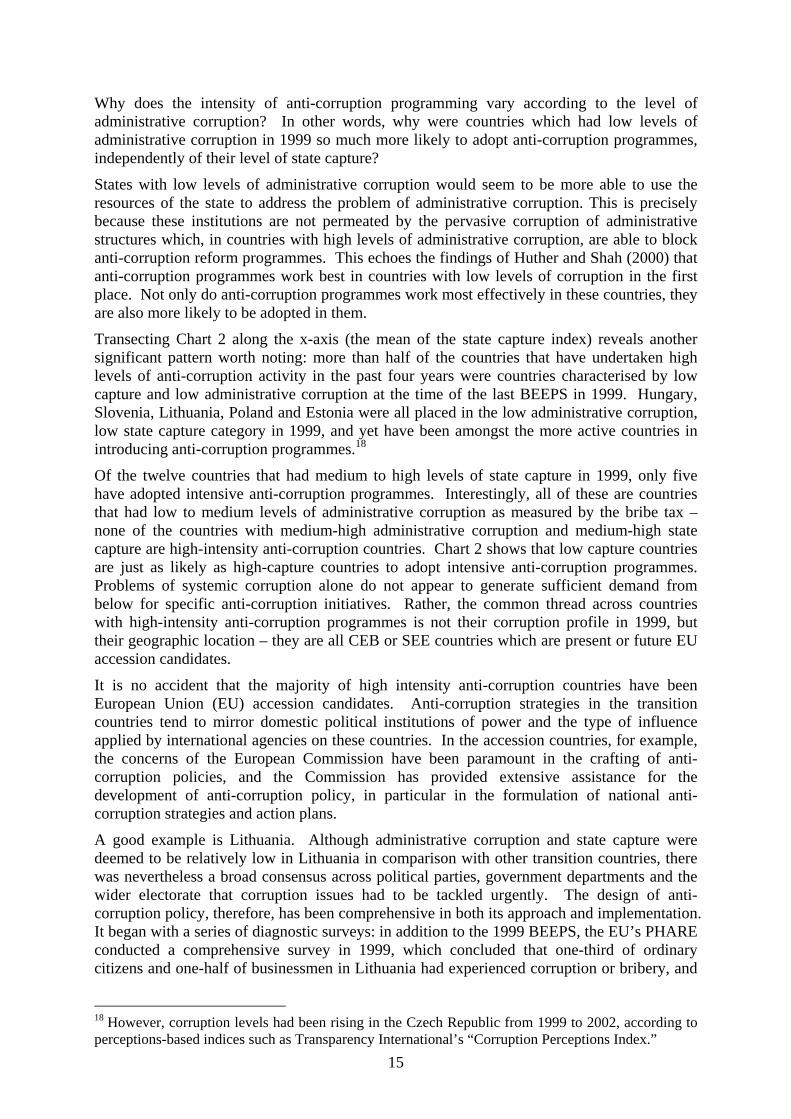
Do countries with more significant governance challenges adopt more extensive anti-corruption programmes? Chart 2 plots the transition countries according to their level of administrative and grand corruption as measured by the 1999 BEEPS, and highlights those countries that score highly on the anti-corruption intensity index.16 In order to measure administrative corruption, we use the level of the ‘bribe tax,’ which is the country average of the percentage of annual sales that firms pay in bribes to state officials. The ‘state capture index’ is the unweighted average of countries’ scores on six components of state capture, including firms’ influence over the government, parliament, criminal and commercial courts, central bank and political parties.17 This chart clearly illustrates that virtually all of the transition countries which have pursued intensive anti-corruption programmes over the past three years were countries with below-average levels of administrative corruption in 1999. In other words, transition countries with high levels of administrative corruption in 1999 were significantly less likely to have embraced wide-ranging anti-corruption activity in the 1999-2002 period.
Chart 2: State capture and bribe tax in 1999
Poland
FYR Macedonia
Czech Rep. Kazakhstan
Armenia
Uzbekistan
HungaryBelarus
Slovenia
Lithuania
Albania
Estonia
Romania
Kyrgyz Rep.
Bosnia and Herz.Bulgaria
Georgia
Croatia
Ukraine
Russia
Moldova
Latvia
Slovak Rep.
Azerbaijan
0.0
1.0
2.0
3.0
4.0
5.0
6.0
0.00 0.10 0.20 0.30 0.40 0.50 0.60 0.70State Capture Index
Bri
be T
ax
Countries in BOLD score high on the anticorruption intensity index
16 The lines transecting Chart 2 are drawn at the cross-country mean of each variable. 17 We use the bribe tax as our ‘headline’ measurement of administrative corruption because it most effectively captures the financial impact of administrative corruption on firms. Moreover, the bribe tax seems to be the indicator of actual levels of corruption which are least likely to be influenced by firms’ perceptions of the role of the state, the general macroeconomic situation, prospects for future growth macroeconomic growth, their own firm’s growth and growth prospects, etc. We use the state capture index as the headline indicator for state capture as it is the average of the six state capture variables in the BEEPS.
15
Why does the intensity of anti-corruption programming vary according to the level of administrative corruption? In other words, why were countries which had low levels of administrative corruption in 1999 so much more likely to adopt anti-corruption programmes, independently of their level of state capture?
States with low levels of administrative corruption would seem to be more able to use the resources of the state to address the problem of administrative corruption. This is precisely because these institutions are not permeated by the pervasive corruption of administrative structures which, in countries with high levels of administrative corruption, are able to block anti-corruption reform programmes. This echoes the findings of Huther and Shah (2000) that anti-corruption programmes work best in countries with low levels of corruption in the first place. Not only do anti-corruption programmes work most effectively in these countries, they are also more likely to be adopted in them.
Transecting Chart 2 along the x-axis (the mean of the state capture index) reveals another significant pattern worth noting: more than half of the countries that have undertaken high levels of anti-corruption activity in the past four years were countries characterised by low capture and low administrative corruption at the time of the last BEEPS in 1999. Hungary, Slovenia, Lithuania, Poland and Estonia were all placed in the low administrative corruption, low state capture category in 1999, and yet have been amongst the more active countries in introducing anti-corruption programmes.18
Of the twelve countries that had medium to high levels of state capture in 1999, only five have adopted intensive anti-corruption programmes. Interestingly, all of these are countries that had low to medium levels of administrative corruption as measured by the bribe tax – none of the countries with medium-high administrative corruption and medium-high state capture are high-intensity anti-corruption countries. Chart 2 shows that low capture countries are just as likely as high-capture countries to adopt intensive anti-corruption programmes. Problems of systemic corruption alone do not appear to generate sufficient demand from below for specific anti-corruption initiatives. Rather, the common thread across countries with high-intensity anti-corruption programmes is not their corruption profile in 1999, but their geographic location – they are all CEB or SEE countries which are present or future EU accession candidates.
It is no accident that the majority of high intensity anti-corruption countries have been European Union (EU) accession candidates. Anti-corruption strategies in the transition countries tend to mirror domestic political institutions of power and the type of influence applied by international agencies on these countries. In the accession countries, for example, the concerns of the European Commission have been paramount in the crafting of anti-corruption policies, and the Commission has provided extensive assistance for the development of anti-corruption policy, in particular in the formulation of national anti-corruption strategies and action plans.
A good example is Lithuania. Although administrative corruption and state capture were deemed to be relatively low in Lithuania in comparison with other transition countries, there was nevertheless a broad consensus across political parties, government departments and the wider electorate that corruption issues had to be tackled urgently. The design of anti-corruption policy, therefore, has been comprehensive in both its approach and implementation. It began with a series of diagnostic surveys: in addition to the 1999 BEEPS, the EU’s PHARE conducted a comprehensive survey in 1999, which concluded that one-third of ordinary citizens and one-half of businessmen in Lithuania had experienced corruption or bribery, and
18 However, corruption levels had been rising in the Czech Republic from 1999 to 2002, according to perceptions-based indices such as Transparency International’s “Corruption Perceptions Index.”
16
which recommended the development of a corruption prevention strategy. In 2001, Transparency International Lithuania produced the Map of Corruption in Lithuania: 2001, which likewise found that a relatively large proportion of Lithuanians believed corruption to be a large and growing problem.
In response to these and other surveys conducted by international and local NGOs and donor organisations, the government in 2000 began drafting a comprehensive National Anti-corruption Programme. The first pillar – the National Anti-Corruption Strategy – was put in place in the autumn of 2001, followed in January 2002 by the National Anti-Corruption Programme. The latter included the Action Plan for the implementation of the Strategy and included specific, targeted laws and policies including revised laws on political party funding, conflict of interest regulations for MPs, a Code of Ethics for lobbyists, as well as measures designed to improve administrative structures by reducing and capping the number of political appointments in the civil service and by developing ministry-specific anti-corruption programmes, including training in anti-corruption for all civil servants. The Programme set out clear deadlines for the implementation of these measures and assigned responsibility for their achievement to specific government departments and specialised agencies.
Thus, Lithuania’s anti-corruption strategy and action plan were planned, targeted, comprehensive, and designed to address the country-specific problems highlighted by a series of diagnostic surveys. Moreover, anti-corruption programmes in Lithuania were specifically designed to incorporate the ‘third sector,’ civil society, as well as to involve as many branches of government as had a role in fighting corruption. Although there is of course some inter-country variation, the same broadly holds for most of the central European and Baltic countries; Estonia and Poland are the only exceptions.
By contrast, in those countries where EU accession is not a near-term prospect, and political power is both more concentrated and less accountable, the process of introducing anti-corruption measures has been largely ‘top down,’ based primarily on presidential decree, and the implementation of the supporting legislation has been delayed by legislative wrangling. In Azerbaijan, for example, in 1999 President Heidar Aliev issued the presidential decree “On Combating Corruption in the Republic of Azerbaijan,” which set out a series of goals and objectives to reduce corruption and instructed the Prime Minister and head of the presidential administration to prepare a draft anti-corruption law and a detailed action plan. However, during the intervening four years little progress has been made in implementing the decree: the law on corruption has been drafted and has gone though one reading in parliament and the action plan has also been drafted, but the implementation of the latter has been postponed until the anti-corruption law is passed. This pattern generally holds across those remaining CIS countries which have implemented omnibus anti-corruption programmes: in Kazakhstan and Georgia presidential decrees were used to launch omnibus strategies, while in Ukraine President Leonid Kuchma instructed the government to promulgate an Anti-Corruption Concept in 1998. As a result, these strategies have often lacked the broad political and popular support necessary to lead to any detailed action plans, and have therefore rarely been followed by any supporting legislation or regulatory reforms.
17
4. ANTI-CORRUPTION PROGRAMMES AND CHANGES IN CORRUPTION
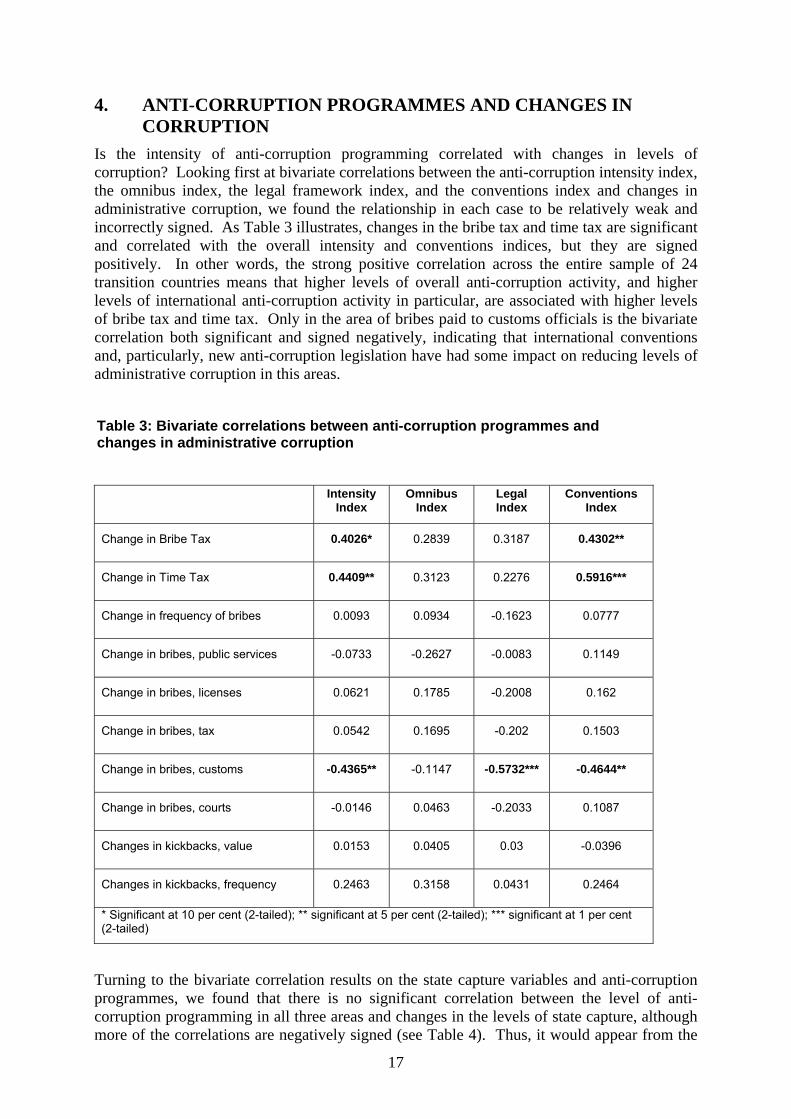
Is the intensity of anti-corruption programming correlated with changes in levels of corruption? Looking first at bivariate correlations between the anti-corruption intensity index, the omnibus index, the legal framework index, and the conventions index and changes in administrative corruption, we found the relationship in each case to be relatively weak and incorrectly signed. As Table 3 illustrates, changes in the bribe tax and time tax are significant and correlated with the overall intensity and conventions indices, but they are signed positively. In other words, the strong positive correlation across the entire sample of 24 transition countries means that higher levels of overall anti-corruption activity, and higher levels of international anti-corruption activity in particular, are associated with higher levels of bribe tax and time tax. Only in the area of bribes paid to customs officials is the bivariate correlation both significant and signed negatively, indicating that international conventions and, particularly, new anti-corruption legislation have had some impact on reducing levels of administrative corruption in this areas.
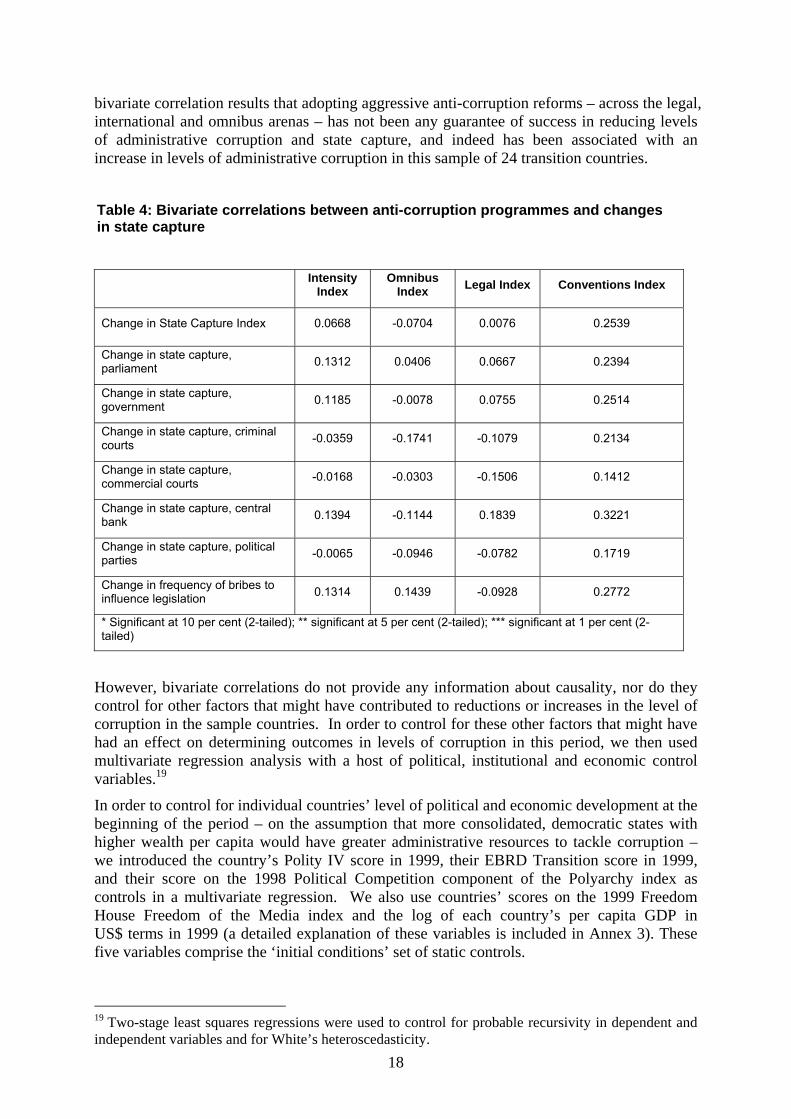
Turning to the bivariate correlation results on the state capture variables and anti-corruption programmes, we found that there is no significant correlation between the level of anti-corruption programming in all three areas and changes in the levels of state capture, although more of the correlations are negatively signed (see Table 4). Thus, it would appear from the
Table 3: Bivariate correlations between anti-corruption programmes and changes in administrative corruption
Intensity Index
Omnibus Index
Legal Index
Conventions Index
Change in Bribe Tax 0.4026* 0.2839 0.3187 0.4302**
Change in Time Tax 0.4409** 0.3123 0.2276 0.5916***
Change in frequency of bribes 0.0093 0.0934 -0.1623 0.0777
Change in bribes, public services -0.0733 -0.2627 -0.0083 0.1149
Change in bribes, licenses 0.0621 0.1785 -0.2008 0.162
Change in bribes, tax 0.0542 0.1695 -0.202 0.1503
Change in bribes, customs -0.4365** -0.1147 -0.5732*** -0.4644**
Change in bribes, courts -0.0146 0.0463 -0.2033 0.1087
Changes in kickbacks, value 0.0153 0.0405 0.03 -0.0396
Changes in kickbacks, frequency 0.2463 0.3158 0.0431 0.2464
* Significant at 10 per cent (2-tailed); ** significant at 5 per cent (2-tailed); *** significant at 1 per cent (2-tailed)
18
bivariate correlation results that adopting aggressive anti-corruption reforms – across the legal, international and omnibus arenas – has not been any guarantee of success in reducing levels of administrative corruption and state capture, and indeed has been associated with an increase in levels of administrative corruption in this sample of 24 transition countries.
However, bivariate correlations do not provide any information about causality, nor do they control for other factors that might have contributed to reductions or increases in the level of corruption in the sample countries. In order to control for these other factors that might have had an effect on determining outcomes in levels of corruption in this period, we then used multivariate regression analysis with a host of political, institutional and economic control variables.19
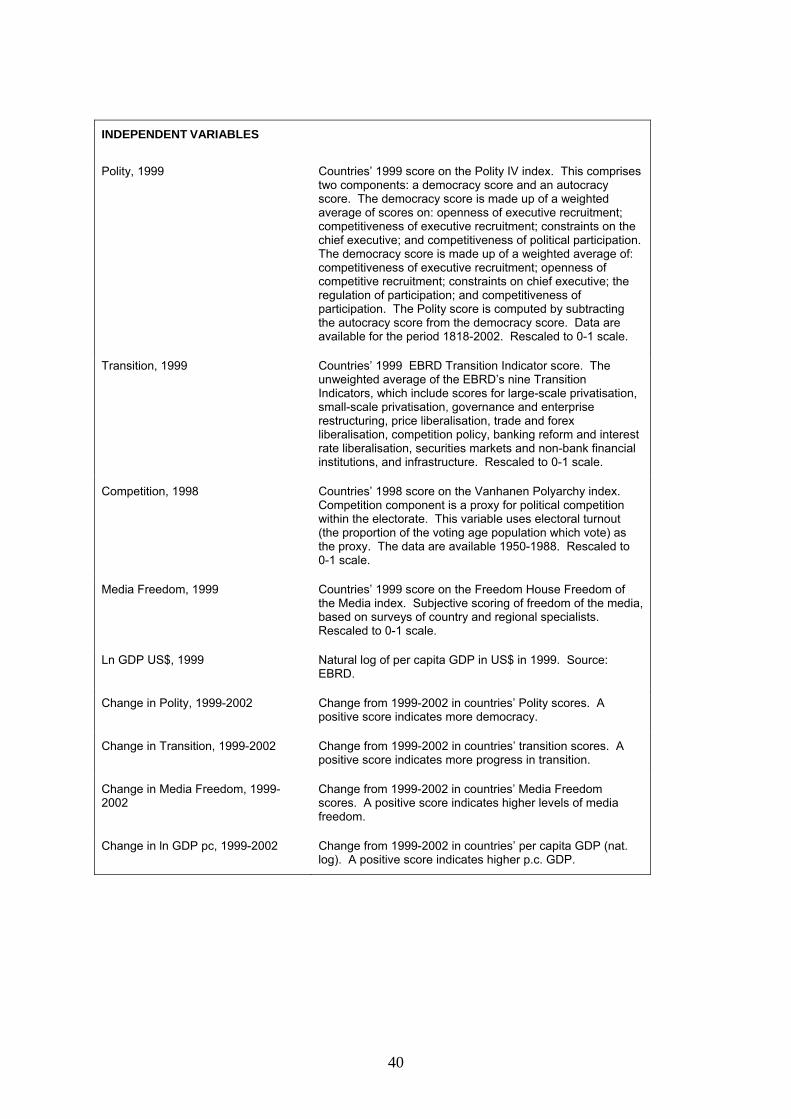
In order to control for individual countries’ level of political and economic development at the beginning of the period – on the assumption that more consolidated, democratic states with higher wealth per capita would have greater administrative resources to tackle corruption – we introduced the country’s Polity IV score in 1999, their EBRD Transition score in 1999, and their score on the 1998 Political Competition component of the Polyarchy index as controls in a multivariate regression. We also use countries’ scores on the 1999 Freedom House Freedom of the Media index and the log of each country’s per capita GDP in US$ terms in 1999 (a detailed explanation of these variables is included in Annex 3). These five variables comprise the ‘initial conditions’ set of static controls.
19 Two-stage least squares regressions were used to control for probable recursivity in dependent and independent variables and for White’s heteroscedasticity.
Table 4: Bivariate correlations between anti-corruption programmes and changes in state capture
Intensity Index
Omnibus Index Legal Index Conventions Index
Change in State Capture Index 0.0668 -0.0704 0.0076 0.2539
Change in state capture, parliament 0.1312 0.0406 0.0667 0.2394
Change in state capture, government 0.1185 -0.0078 0.0755 0.2514
Change in state capture, criminal courts -0.0359 -0.1741 -0.1079 0.2134
Change in state capture, commercial courts -0.0168 -0.0303 -0.1506 0.1412
Change in state capture, central bank 0.1394 -0.1144 0.1839 0.3221
Change in state capture, political parties -0.0065 -0.0946 -0.0782 0.1719
Change in frequency of bribes to influence legislation 0.1314 0.1439 -0.0928 0.2772
* Significant at 10 per cent (2-tailed); ** significant at 5 per cent (2-tailed); *** significant at 1 per cent (2-tailed)
19
In addition, we also use the dynamic components of these indices to control for the possibility that rapid changes (whether improvements or worsening) in the areas of institutional democracy, political competition, media freedom or economic growth might have a significant impact on levels of reported corruption in these countries.20 Thus, we use the change in these four indicators’ scores over the same 1999-2002 period for which we have data from the BEEPS, and for which we have constructed the anti-corruption indices.
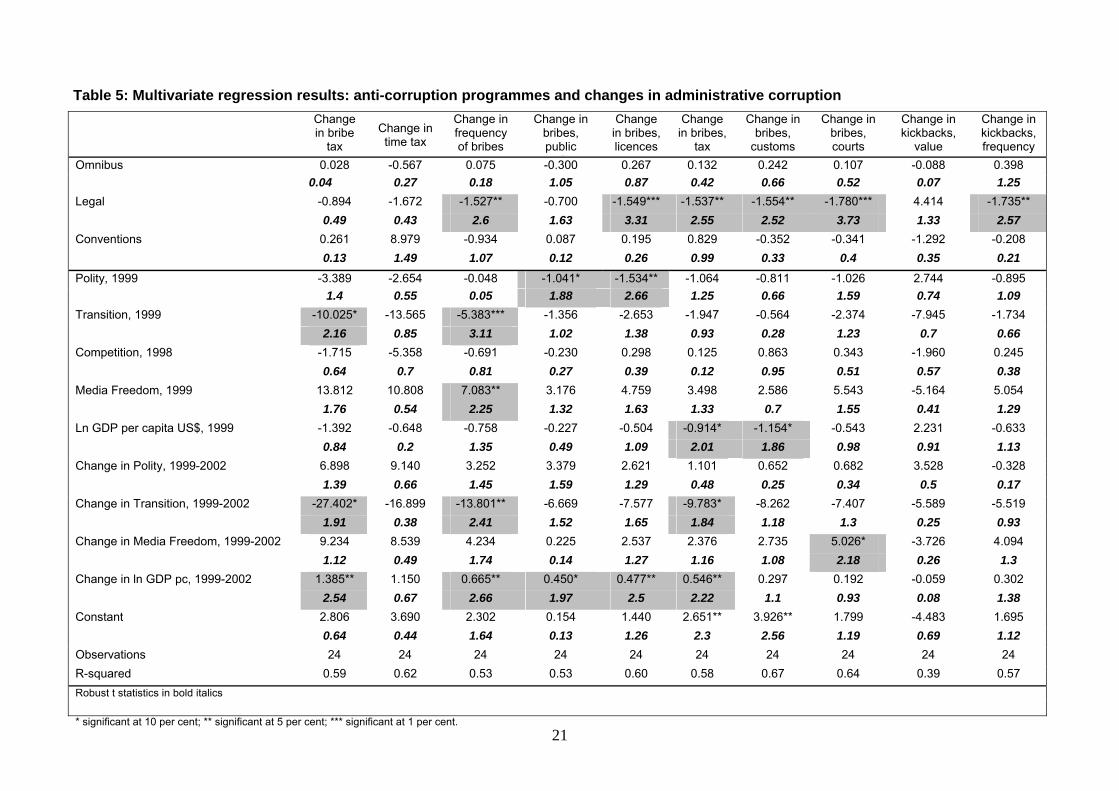
Introducing these controls in multivariate regression analysis significantly changes the overall picture of the relationship between anti-corruption programmes and changes in levels of administrative corruption. It also confirms the relationship between anti-corruption programmes and changes in state capture in the transition countries. Looking first at administrative corruption, as Table 5 illustrates, undertaking intensive anti-corruption reforms in the legal area has a significant and negative effect on the frequency of bribes and kickbacks, as well as on countries’ levels of bribes in the areas of licenses, taxes, customs and the courts. However, none of the three forms of anti-corruption programming has a significant effect on our ‘headline’ measures of administrative corruption: the bribe tax and the time tax. Moreover, neither participation in international anti-corruption campaigns nor the widely publicised omnibus anti-corruption programmes have had a significant effect on reducing administrative corruption in any of these ten dimensions assessed by the BEEPS.21
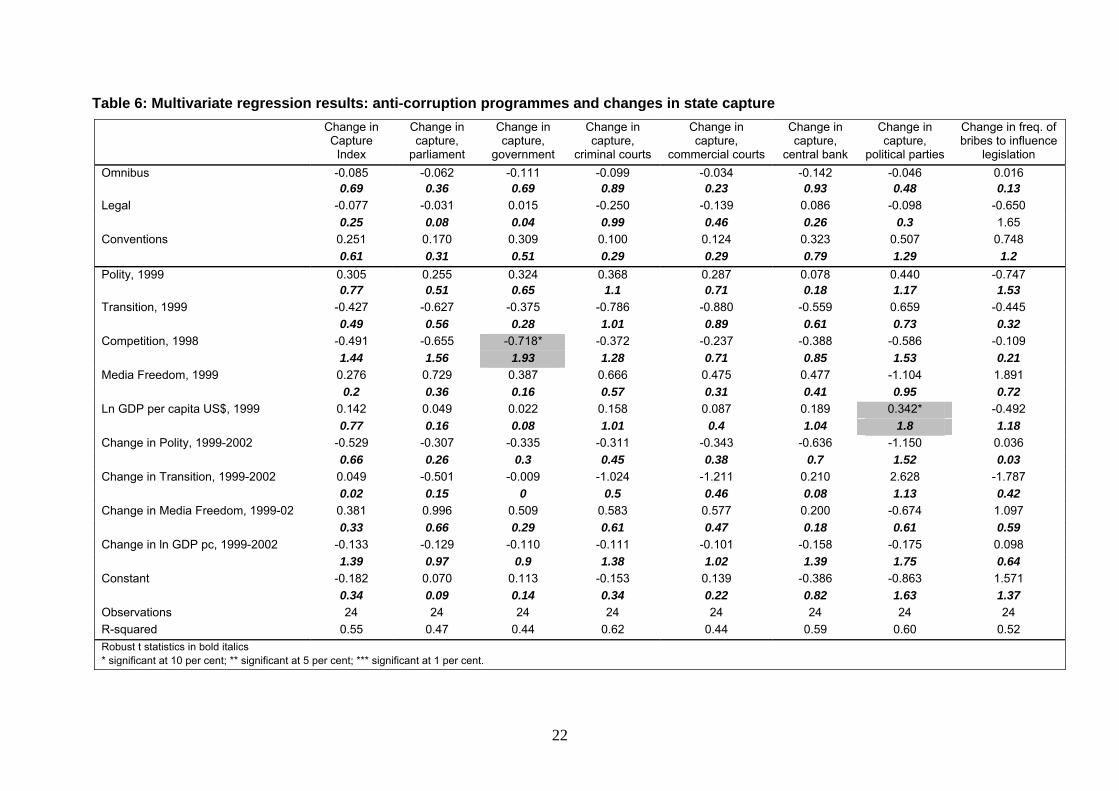
Turning once again to changes in the level of state capture, even when introducing a causal direction in the regression equation and controlling for both initial conditions and changes in the 1999-2002 period, the lack of correlation between intensive anti-corruption programmes and levels of state capture reported in Table 4 remain true. As Table 6 shows, when controlling for other potential institutional, political and economic influences on the levels of state capture, the effects of our indices of anti-corruption activity are not significant in reducing levels of state capture. Only the level of per capita GDP in 1999 and the level of political competition in 1998 had a significant effect on capture variables – the level of capture of political parties and government, respectively – and these variables were only significant at the 10 per cent level. Moreover, per capita GDP is positively signed, meaning that higher levels of per capita wealth in 1999 are associated with higher levels of capture of political parties in the 1999-2002 period.
Thus, while the introduction or amendment of legislation aimed at reducing levels of corruption has had a significant impact on reducing certain forms of administrative corruption, omnibus anti-corruption programmes and international commitments on anti-corruption have had no effect on administrative reform. In addition, none of our three measures of anti-corruption activity have had a significant effect on state capture in the 1999-2002 period. In
20 The Polyarchy database, which includes the competition variable, terminates in 1998. Hence, we cannot use the change in this variable for the 1998-2002 period. However, the nature of this variable indicates that it is unlikely to change significantly over a short time period anyway. See Annex 3 for details. 21 These relationships hold whether we include all three anti-corruption indices as simultaneous independent variables to control for multicollinearity, whether we use control variables, or whether we introduce the static and dynamic control variables separately. Results are available from the authors.
20
sum, as the bivariate correlations have also shown, undertaking high profile anti-corruption activities is no guarantee that actual levels of corruption will be reduced in the short term. For an illustration using one country’s experience of the apparent ineffectiveness of anti-corruption programmes, see Annex 1.
In the section that follows the tables, we examine the effects of omnibus, legal and international anti-corruption programmes on the perception of corruption problems in the transition countries.
21
Table 5: Multivariate regression results: anti-corruption programmes and changes in administrative corruption
5. ANTI-CORRUPTION PROGRAMMES AND CHANGES IN PERCEPTIONS OF CORRUPTION
Corruption is inherently difficult to measure, and for understandable reasons: people who engage in corrupt activities, whether as bribe suppliers or bribe takers, are reluctant to admit that they do so. Those who try to measure quantitatively the level of corruption in a given country therefore rely heavily on the perception of corruption among various social groups – households, government officials, foreign and/or domestic businesses, or experts. Transparency International’s Corruption Perceptions Index (CPI), for example, measures a combination of expert and business perceptions of how corrupt public officials and businessmen are, rather than, for example, how much corruption costs in either real terms or in terms of the impact that corruption has on growth.22
The question of what generates changes in perceptions of corruption, however, is complex. Anti-corruption programmes could be expected to play a role in the public’s perception of corruption, but in what way is unclear. 23 On the one hand, we might expect that the perception of corruption as an obstacle to the normal functioning of social and economic life would decline as the intensity of anti-corruption programming increases, since this would increase managers’ optimism that something is being done to combat corruption. On the other hand, higher profile anti-corruption programmes may only serve to draw attention to the severity of the problem, driving perceptions in the opposite direction.
As outlined above, the BEEPS includes several questions that relate to the perception of corruption. We focus here on two questions which ask firms to score and rank a number of potential obstacles, including corruption, to the operation and growth of their businesses. We examine both the change in the absolute scores on the ‘corruption as obstacle’ question, as well as the change in the rank of corruption among the 21 different potential obstacles, which include issues such as access to finance, infrastructure, policy uncertainty, crime and a host of other potential obstacles.
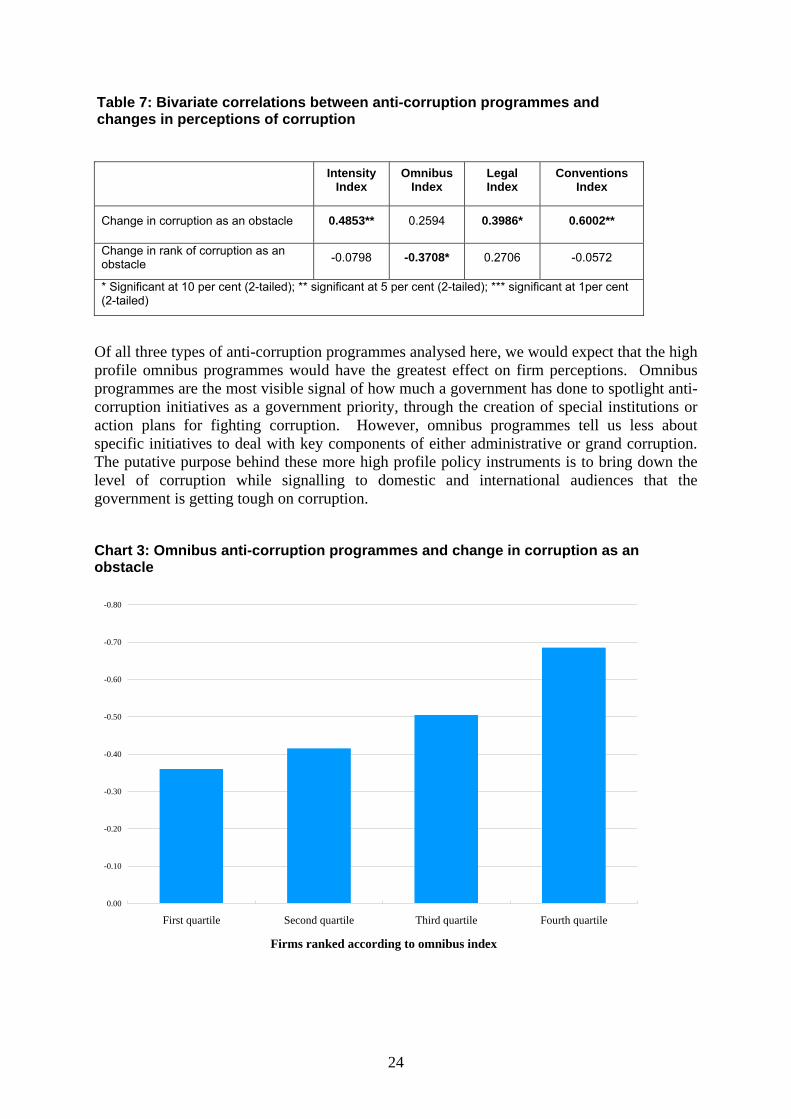
We find that across the whole sample of transition countries there is a relatively strong, significant positive correlation between anti-corruption activities and perceptions of corruption (see Table 7). The composite intensity index, the legal index and the conventions index are significantly and positively correlated with the scoring of corruption as an obstacle to the operation and growth of businesses. In other words, an increase in the overall intensity of anti-corruption programmes seems to heighten firms’ perception of corruption as an obstacle to the operation and growth of their businesses.
22 One attempt to quantify the effects of corruption, by estimating the cost of corruption to national economies, is the Price Waterhouse Cooper “Opacity Index,” which nevertheless uses data from a survey of business leaders about their perceptions of corruption in their country to reach conclusions about the economic costs and risk premium attributed to corrupt officials. 23 For a discussion of the various factors that may influence perceptions of corruption, see World Bank (2003).
24
Of all three types of anti-corruption programmes analysed here, we would expect that the high profile omnibus programmes would have the greatest effect on firm perceptions. Omnibus programmes are the most visible signal of how much a government has done to spotlight anti-corruption initiatives as a government priority, through the creation of special institutions or action plans for fighting corruption. However, omnibus programmes tell us less about specific initiatives to deal with key components of either administrative or grand corruption. The putative purpose behind these more high profile policy instruments is to bring down the level of corruption while signalling to domestic and international audiences that the government is getting tough on corruption.
Chart 3: Omnibus anti-corruption programmes and change in corruption as an obstacle
-0.80
-0.70
-0.60
-0.50
-0.40
-0.30
-0.20
-0.10
0.00
First quartile Second quartile Third quartile Fourth quartile
Firms ranked according to omnibus index
Table 7: Bivariate correlations between anti-corruption programmes and changes in perceptions of corruption
Intensity
Index Omnibus
Index Legal Index
Conventions Index
Change in corruption as an obstacle 0.4853** 0.2594 0.3986* 0.6002**
Change in rank of corruption as an obstacle -0.0798 -0.3708* 0.2706 -0.0572
* Significant at 10 per cent (2-tailed); ** significant at 5 per cent (2-tailed); *** significant at 1per cent (2-tailed)
25
Despite the lack of a statistically significant correlation, there is a clear effect of omnibus anti-corruption programmes on firms’ perceptions of the importance of corruption as an obstacle to their operation and growth. This relationship is illustrated graphically in Chart 3, which shows that the decline in the perception of corruption as an obstacle to firms’ operation and growth has been greatest in the lowest quartile of countries ranked according to the omnibus index, while it has declined least in the top quartile of countries on this index. In other words, high-profile omnibus anti-corruption programmes do not appear to reduce perceptions of corruption as an obstacle to business. Instead, they appear to raise them.
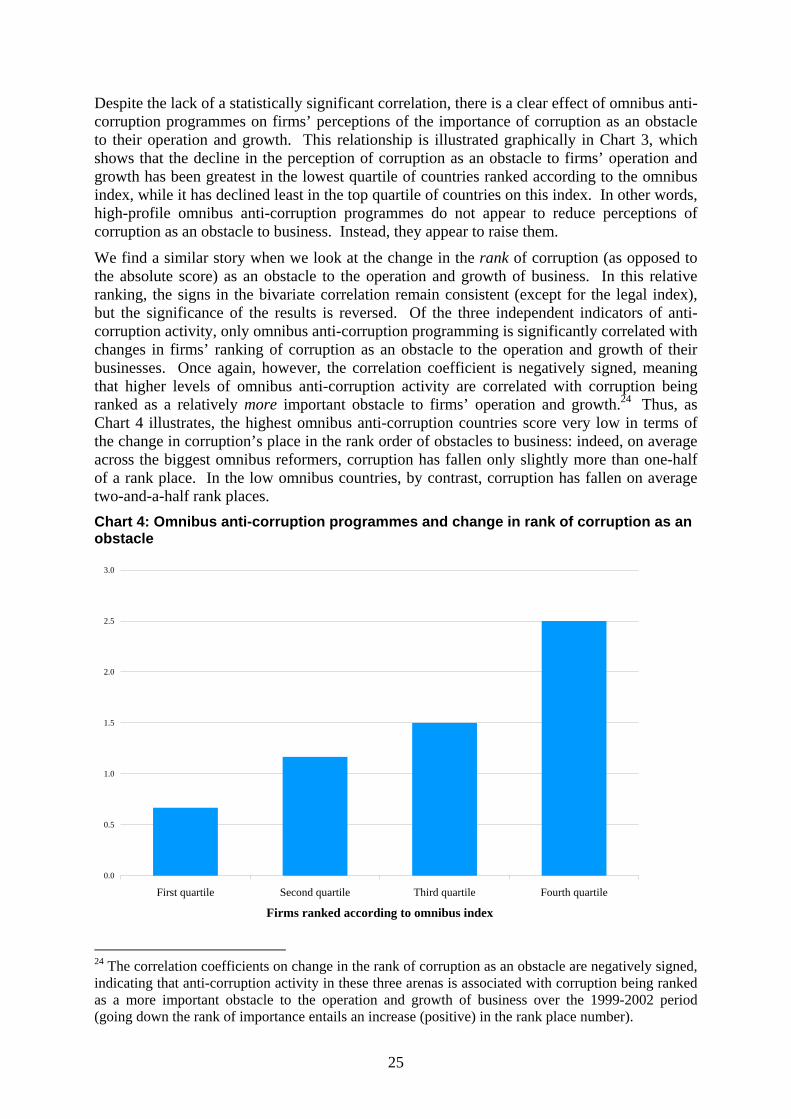
We find a similar story when we look at the change in the rank of corruption (as opposed to the absolute score) as an obstacle to the operation and growth of business. In this relative ranking, the signs in the bivariate correlation remain consistent (except for the legal index), but the significance of the results is reversed. Of the three independent indicators of anti-corruption activity, only omnibus anti-corruption programming is significantly correlated with changes in firms’ ranking of corruption as an obstacle to the operation and growth of their businesses. Once again, however, the correlation coefficient is negatively signed, meaning that higher levels of omnibus anti-corruption activity are correlated with corruption being ranked as a relatively more important obstacle to firms’ operation and growth.24 Thus, as Chart 4 illustrates, the highest omnibus anti-corruption countries score very low in terms of the change in corruption’s place in the rank order of obstacles to business: indeed, on average across the biggest omnibus reformers, corruption has fallen only slightly more than one-half of a rank place. In the low omnibus countries, by contrast, corruption has fallen on average two-and-a-half rank places. Chart 4: Omnibus anti-corruption programmes and change in rank of corruption as an obstacle
0.0
0.5
1.0
1.5
2.0
2.5
3.0
First quartile Second quartile Third quartile Fourth quartile
Firms ranked according to omnibus index
24 The correlation coefficients on change in the rank of corruption as an obstacle are negatively signed, indicating that anti-corruption activity in these three arenas is associated with corruption being ranked as a more important obstacle to the operation and growth of business over the 1999-2002 period (going down the rank of importance entails an increase (positive) in the rank place number).
26
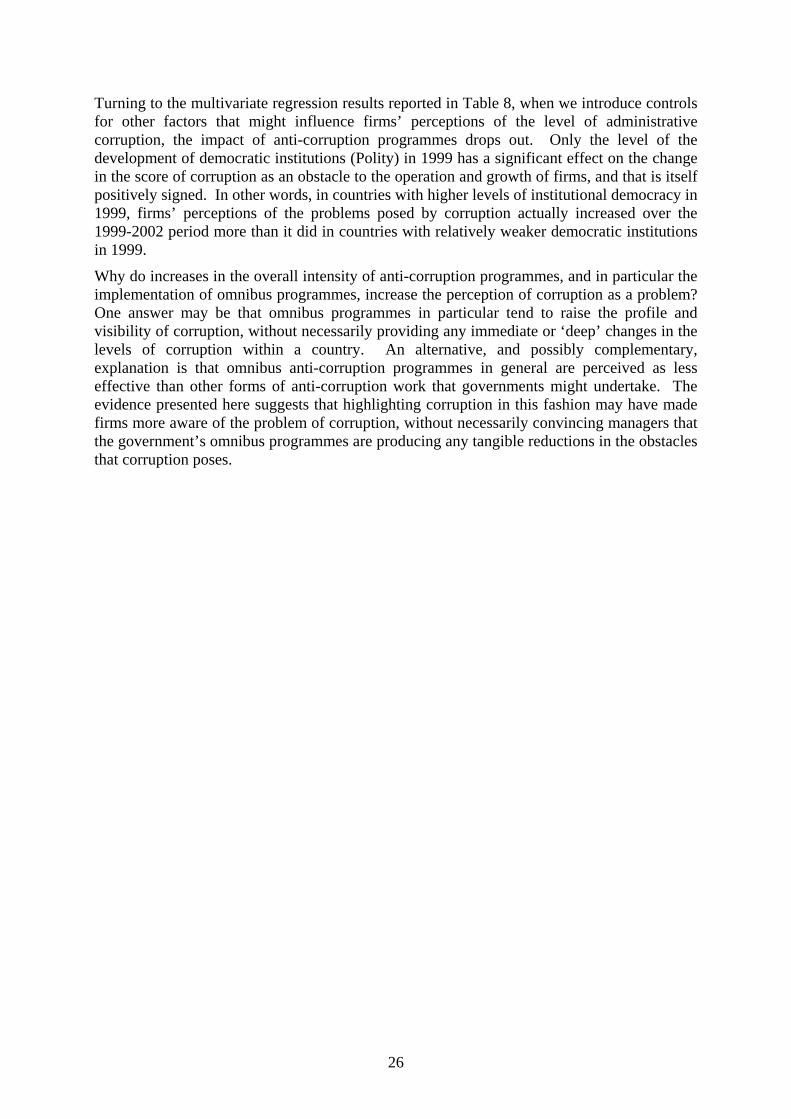
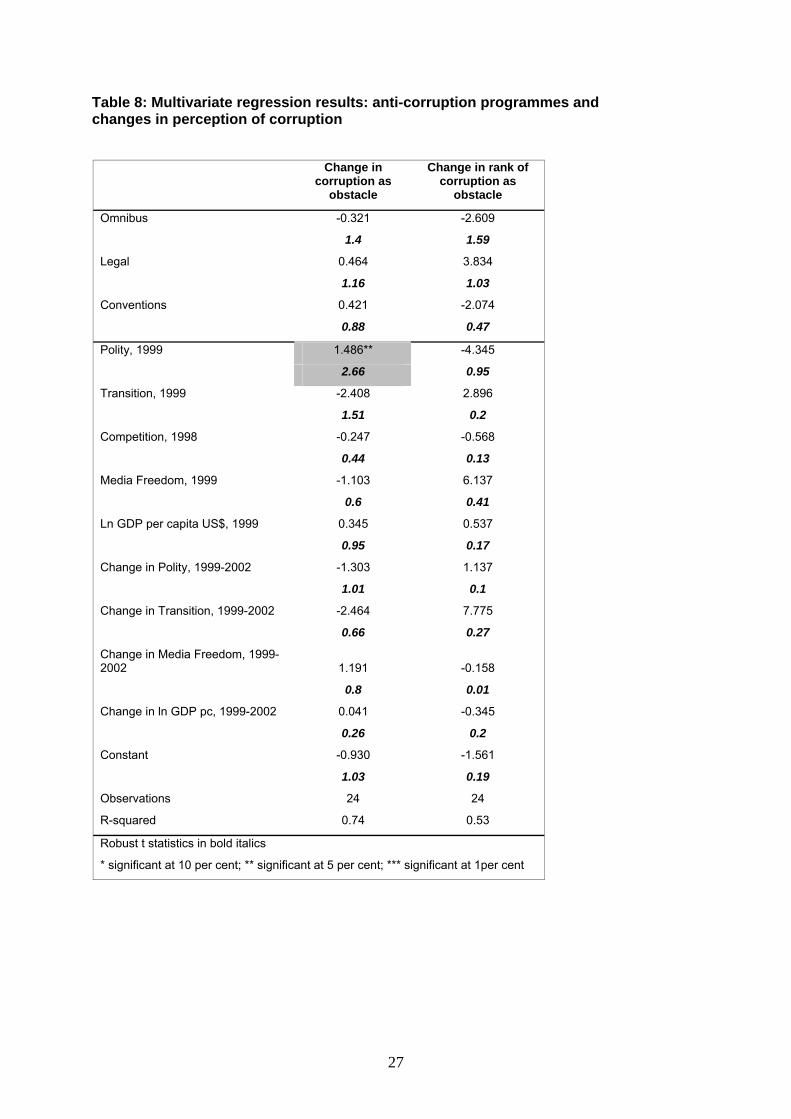
Turning to the multivariate regression results reported in Table 8, when we introduce controls for other factors that might influence firms’ perceptions of the level of administrative corruption, the impact of anti-corruption programmes drops out. Only the level of the development of democratic institutions (Polity) in 1999 has a significant effect on the change in the score of corruption as an obstacle to the operation and growth of firms, and that is itself positively signed. In other words, in countries with higher levels of institutional democracy in 1999, firms’ perceptions of the problems posed by corruption actually increased over the 1999-2002 period more than it did in countries with relatively weaker democratic institutions in 1999.
Why do increases in the overall intensity of anti-corruption programmes, and in particular the implementation of omnibus programmes, increase the perception of corruption as a problem? One answer may be that omnibus programmes in particular tend to raise the profile and visibility of corruption, without necessarily providing any immediate or ‘deep’ changes in the levels of corruption within a country. An alternative, and possibly complementary, explanation is that omnibus anti-corruption programmes in general are perceived as less effective than other forms of anti-corruption work that governments might undertake. The evidence presented here suggests that highlighting corruption in this fashion may have made firms more aware of the problem of corruption, without necessarily convincing managers that the government’s omnibus programmes are producing any tangible reductions in the obstacles that corruption poses.
27
Table 8: Multivariate regression results: anti-corruption programmes and changes in perception of corruption
Change in corruption as
obstacle
Change in rank of corruption as
obstacle
Omnibus -0.321 -2.609
1.4 1.59
Legal 0.464 3.834
1.16 1.03
Conventions 0.421 -2.074
0.88 0.47
Polity, 1999 1.486** -4.345
2.66 0.95
Transition, 1999 -2.408 2.896
1.51 0.2
Competition, 1998 -0.247 -0.568
0.44 0.13
Media Freedom, 1999 -1.103 6.137
0.6 0.41
Ln GDP per capita US$, 1999 0.345 0.537
0.95 0.17
Change in Polity, 1999-2002 -1.303 1.137
1.01 0.1
Change in Transition, 1999-2002 -2.464 7.775
0.66 0.27
Change in Media Freedom, 1999-2002 1.191 -0.158
0.8 0.01
Change in ln GDP pc, 1999-2002 0.041 -0.345
0.26 0.2
Constant -0.930 -1.561
1.03 0.19
Observations 24 24
R-squared 0.74 0.53
Robust t statistics in bold italics
* significant at 10 per cent; ** significant at 5 per cent; *** significant at 1per cent
28
6. SUMMARY AND POLICY IMPLICATIONS This paper has formulated a new way of measuring the intensity of anti-corruption activity and conducted a range of preliminary tests to assess the short-term impact of anti-corruption programmes in reducing levels of both administrative and grand corruption as well as perceptions of corruption as an obstacle to business in the transition countries in the period 1999-2002. We find that transition countries with low levels of administrative corruption have been more likely to adopt intensive anti-corruption programmes than countries with high levels of administrative corruption. This confirms previous research which showed that anti-corruption measures tend to be adopted where they are needed least: in countries which do not have particularly serious corruption problems. However, we also found that countries with high levels of state capture are almost as likely to adopt anti-corruption programmes as low capture countries.
Our findings from both bivariate and multivariate analysis then showed that omnibus anti-corruption activity and membership in international anti-corruption conventions have not resulted in reductions in the level of administrative corruption. In fact, the results of the bivariate correlations showed that the international conventions index and the overall intensity index are correlated significantly and positively with changes in the bribe tax and time tax. This indicates that countries which have undertaken more intense work in these areas have actually experienced an increase in reported levels of administrative corruption. However, not all anti-corruption activities aimed at eradicating administrative corruption in the transition countries in this period were fruitless. We found that new anti-corruption legislation aimed at reducing the opportunities for rent-seeking in areas such as financial transactions and political party finance are correlated with lower levels of some forms of administrative corruption.
The findings presented in the paper also suggest that omnibus and legal anti-corruption programmes and membership in international anti-corruption conventions are not linked to reductions in state capture. This relationship holds for both bivariate correlations and multivariate regressions with a host of political, economic and institutional controls. However, this lack of a causal relationship between anti-corruption programmes and state capture does not arise because state capture has been more resistant to change in the 1999-2002 period. State capture, as measured by the BEEPS, has declined as significantly in this period as has administrative corruption. However, neither anti-corruption programmes nor the other institutional, political, or economic variables surveyed in this paper seem to have brought about the observed reduction in levels of capture across the region.
It is important to reiterate that these initial conclusions are based on only two surveys covering a relatively short time period, and so must remain preliminary. A great deal more empirical work must be conducted on the effectiveness of various types of anti-corruption programmes before reaching firmer conclusions. Still, some tentative policy implications can be drawn from the preceding analysis.
First, the evidence presented above indicates that of the three types of anti-corruption programmes assessed in the paper, omnibus initiatives and adherence to international conventions may be of less importance than the implementation of specific legislative reforms for reducing the incidence and perception of corruption by businesses. This adds further impetus to the importance of drafting and implementing effective laws regulating the civil service, public procurement, financial disclosure, money laundering, and political party financing and promoting freedom of information.
29
Second, the evidence analysed in the paper indicates that signing international covenants and joining anti-corruption related transnational organisations is unlikely to have a direct, near-term impact on levels and perceptions of corruption. However, the indirect effect of participation in these bodies, particularly for a country’s reputation in the international community and among foreign investors (whose views are not surveyed in the BEEPS) could still be significant. One way to increase the potency of international organisations in reducing actual levels of corruption would be to better coordinate the existing analytical work to diagnose corruption problems, as well as commissioning new surveys, and to build in stronger incentives for governments to comply with the anti-corruption principles on which such organisations are founded.
Finally, if further research confirms that high profile omnibus programmes are not particularly effective in reducing levels of administrative corruption and state capture, bilateral and multilateral donors will need to adjust their lending strategies and policy advice accordingly. Where anti-corruption programmes are applied from the top-down, without adequate transparency and sufficient participation of civil society groups in both the formulation and monitoring of the initiatives, they may be a smokescreen for inaction rather than a sincere attempt to reduce levels of corruption.
30
REFERENCES R. Charlick (1993), “Corruption in Political Transition: A Governance Perspective,” Corruption and Reform, Vol. 7, No. 3, pp. 177-87.
M. Clarke, ed. (1983), Corruption: Causes, Consequences and Control, London, Frances Pinter.
A. Doig (1995), “Good Government and Sustainable Anti-Corruption Strategies: A Role for Independent Anti-Corruption Agencies?,” Public Administration and Development, Vol. 15, No. 2, pp. 151-65.
A. Doig and S. Riley (1998), “Corruption and Anti-Corruption Strategies: Issues and Case Studies from Developing Countries,” in Corruption and Integrity Improvement Initiatives in Developing Countries, New York, United Nations Development Programme, pp. 45-62.
EBRD (1999), Transition Report, London, European Bank for Reconstruction and Development.
EBRD (2002), Transition Report, London, European Bank for Reconstruction and Development.
M. Findlay and A. Stewart (1992), “Implementing Corruption Prevention Strategies through Codes of Conduct,” Corruption and Reform, Vol. 7, No. 1, pp. 67-85.
S. Fries, T. Lysenko and S. Polanec (2003), “The 2002 Business Environment and Enterprise Performance Survey: Results from a survey of 6,100 firms,” EBRD Working Paper No. 84.
K. Frimpong (1997), “An Analysis of Corruption in Botswana,” presented at UNDP-PACT and OECD Development Centre Workshop on Corruption and Integrity Improvement Initiatives in the Context of Developing Economies, Paris.
E. Harsch (1993), “Accumulators and Democrats: Challenging State Corruption in Africa,” Journal of Modern African Studies, Vol. 31, No. 1, pp. 31-48.
J. Hellman (1998), “Winners Take All: The Politics of Partial Reform in Post-Communist Transition,” World Politics, Vol. 50, No. 2, pp. 203-234.
J. Huther and A. Shah (2000), “Anti-Corruption Policies and Programs: A Framework for Evaluation,” World Bank Working Paper 2501, Washington, D.C., World Bank.
R. Islam (2003), “Do More Transparent Governments Govern Better?,” World Bank Policy Research Working Paper 3077, Washington, D.C., World Bank.
IRIS (1996), Governance and the Economy in Africa: Tools for Analysis and Reform of Corruption, Baltimore, Center for Institutional Reform and the Informal Sector, University of Maryland.
R. Klitgaard (1988), Controlling Corruption, Berkeley, University of California Press.
P. Langseth and R. Stapenhurst (1997), “The Role of the National Integrity System in Fighting Corruption,” EDI Staff Working Paper, Washington, D.C., World Bank.
R. Larrea-Santos (1997), “Corruption and Integrity Initiatives Implemented in Developing Countries,” presented at UNDP-PACT and OECD Development Centre Workshop on Corruption and Integrity Improvement Initiatives in the Context of Developing Economies, Paris.
New South Wales Independent Commission against Corruption (1999), Practical Guide to Corruption Prevention, Sydney, ICAC.
31
J. Pope (1999), “The Need for, and Role of, an Independent Anti-Corruption Agency,” Berlin, Transparency International Working Paper, 13 August 1999.
J. T. Quah (1982), “Bureaucratic Corruption in the ASEAN Countries: A Comparative Analysis of their Anti-Corruption Strategies,” Journal of Southeast Asian Studies, Vol. 13, No. 1, pp. 153-77.
J. T. Quah (1989), “Singapore's Experience in Curbing Corruption,” in A. J. Heidenheimer et al, eds., Political Corruption: A Handbook, New Brunswick, Transaction Publishers.
J. T. Quah (2000), Confronting Corruption: The Elements of a National Integrity System, Berlin, Transparency International.
S. Riley (1993), “Post-Independence Anti-Corruption Strategies and the Contemporary Effects of Democratisation,” Corruption and Reform, Vol. 7, No. 3, pp. 249-61.
S. Riley (1998), “The Political Economy of Anti-Corruption Strategies in Africa,” European Journal of Development Research, Vol. 10, No. 1, pp. 129-59.
G. Satarov (2002), Diagnostics of Russian Corruption: A Sociological Analysis, Moscow, Indem Foundation.
B. E. D. de Speville (1995), “The Experience of Hong Kong in Combating Corruption,” presented at the Second Integrity in Government Seminar, Amman, Jordan, 16-17 December.
Tan A. L (1995), “The Experience of Singapore in Combating Corruption,” paper presented to the Second Integrity in Government Seminar held in Amman, Jordan, 16-17 December.
R. Theobald, P. Hutchcroft, S. Rose-Ackerman, and K. Elliott (2002), “Containing Corruption,” New Political Economy, Vol. 7, No. 3, pp. 435-49.
United Nations Development Programme (1998), Corruption and Integrity Improvement Initiatives in Developing Countries, New York, United Nations.
World Bank (1997a), Helping Countries Combat Corruption: The Role of the World Bank: Report by the Poverty Reduction and Economic Management (PREM) Network. Washington DC: World Bank.
World Bank (1997b), World Development Report: The State in a Changing World, Oxford, Oxford University Press.
World Bank (2000), Anticorruption in Transition: A Contribution to the Policy Debate, Washington, D.C., World Bank.
World Bank (2003), Anticorruption in Transition II, Washington, D.C., World Bank.
32
ANNEX 1: ANTI-CORRUPTION PROGRAMMES AND CHANGES IN THE BUSINESS ENVIRONMENT IN ALBANIA, RUSSIA AND ARMENIA There are a number of cases, particularly in south-eastern Europe, where governments have pursued intensive anti-corruption programmes in the past several years but administrative corruption and state capture levels as reported by in the BEEPS have remained unchanged or even increased. Albania is a strong case in point, and below we look in more detail at this country’s experience. At the same time, there is a relatively large group of countries that, according to the BEEPS, have made substantial progress in reducing both actual and perceived levels of corruption without developing omnibus anti-corruption policies. Armenia, Belarus, Estonia, FYR Macedonia, the Kyrgyz Republic, Poland, Russia, and Uzbekistan have not developed any of the three major components of omnibus anti-corruption strategies. However, of these Armenia, Estonia and Russia were successful in reducing levels of both administrative corruption and state capture between 1999 and 2002, while Uzbekistan and FYR Macedonia were successful in bringing down levels of administrative corruption (although levels of state capture increased over this period). It is therefore useful to look in more detail at what has, and what has not, been done in these countries to reduce administrative corruption and state capture. Below we look at the cases of Russia and Armenia.
Albania The Albanian government has implemented numerous anti-corruption programmes since 1999, but levels of both administrative and grand corruption rose between 1999 and 2002. In the 1999 BEEPS, Albania was rated as a low capture, high administrative corruption country. As Table 2 in the main text illustrates, Albania has been among the highest intensity countries in terms of its overall anti-corruption strategy, surpassed on the intensity index by only Lithuania and the Slovak Republic. Albania has been extremely active on the omnibus anti-corruption front, as well as in signing up to international anti-corruption conventions and participating actively in international anti-corruption initiatives. In terms of legal reform, Albania ranks among the ‘second tier’ countries in terms of the amount and quality of substantive anti-corruption legislation it has adopted since 1999.
In April 2000, after numerous revisions and inputs from the World Bank, Council of Europe and European Commission, an anti-corruption plan was adopted which addressed institutional reform, including civil service reform; the strengthening of legislation and consolidation of the rule of law; reform of public finance management; the promotion of transparency and integrity in business transactions; and the development of an effective public information framework. In substance this plan emphasised heavily public administration reform, the drafting of new legislation and the filling of gaps in the legal framework. In addition, the government in 1999 set up the Anti-Corruption Monitoring Group (ACMG) in the Office of the Minister of State. The task of the ACMG (which consists of high ranking civil servants from different governmental institutions and independent state bodies) is to ensure the implementation of the anti-corruption plan through monitoring and advice.
In addition, Albania has passed legislation in a number of crucial anti-corruption areas. In 1999 the government adopted a new civil service law, which greatly increased the opportunities for corruption within the public services. In 2000 the government also amended Albania’s public procurement legislation, the laws “On Public Procurement” and “On the Rules of Public Procurement”. The government passed a new freedom of information law in
33
1999 and in 2000 passed a new political party finance law that prohibits any kind of financial support to political parties from the business community. Furthermore, article 9 of the 1998 Constitution requires parties to declare their sources of financing.
Finally, Albania has been extremely active on the international anti-corruption front: Albania is an active member of both the Stability Pact Anti-Corruption Initiative (SPAI) and the Council of Europe’s Group of States against Corruption (GRECO); it has signed and ratified all of the Council of Europe’s Conventions on corruption: the criminal and civil law conventions on corruption and the convention on laundering, search, seizure and confiscation of the proceeds of crime.
However, despite this extremely high level of activity across virtually all areas of possible anti-corruption programming, Albania is the only country in which both state capture and administrative corruption have increased in the 1999-2002 period. Moreover, the frequency of bribes also increased in Albania in this period.
Russia According to the 1999 BEEPS, Russia was ranked as a high capture country with mid-range levels of administrative corruption. By 2002, the level of both state capture and administrative corruption had come down, significantly in the case of state capture. At the same time, Russia has undertaken very little in the way of high profile anti-corruption programmes, but has implemented a series of quite important reforms which, policymakers claim, were part of a more implicit corruption fighting agenda. This includes legal reform to improve the fairness and effectiveness of the judiciary and court system, reform of the political party system and public sector management (especially tax reform), and reform to increase competitiveness of the private sector (de-bureaucratisation laws, breaking up natural monopolies, corporate governance code, joint stock company law).
Moreover, since Vladimir Putin came to office in 2000, there have been significant changes in the relationship between big business and the state, which under the previous administration were seen as fuelling the problem of state capture by vested interests. These reforms have been accompanied by some aggressive and very public steps by the Audit Chamber to investigate corrupt practices at the highest level of government. The Russian case would seem to offer evidence that tackling corruption can be done effectively without resorting to the creation of new anti-corruption bodies and formulating specific anti-corruption laws.
Although implementation of some of these measures remains incomplete, there is both direct evidence (from tax receipts) and indirect evidence (from monitoring surveys) that tax and de-bureaucratisation reforms have been effective thus far.25 Also, a multi-pronged approach even without a devoted anti-corruption commission has been effective in changing public perceptions of corruption – both the absolute rating and the ranking of corruption as an obstacle to business has come down among Russian firms according to the BEEPS, and Russia’s ranking and overall score according to the TI Corruption Perceptions Index improved for the past two years.
Of course, corruption remains a serious problem in Russia, as both the TI rating and Russian corruption surveys illustrate, but, even in the absence of high profile omnibus anti-corruption programmes, the authorities’ multi-pronged efforts to strengthen institutions of governance
25 On monitoring surveys, see the Centre for Economic and Financial Research work on Monitoring Administrative Barriers to Small Business Development in Russia (www.cefir.ru).
34
and improve the business climate have seen corresponding declines in the level of corruption, especially state capture.26
Armenia According to the 1999 BEEPS, Armenia had a serious problem with administrative corruption but was ranked as a low capture country. Like Russia, Armenia achieved significant reductions in corruption in the 1999-2002 period, according to the BEEPS, without the benefit of omnibus anti-corruption initiatives.
Armenia has received assistance from the World Bank to formulate an anti-corruption strategy, and several donors and international organisations have joined with government officials to get a strategy approved and adopted, but with little success. Numerous surveys by the World Bank, the International Finance Corporation (IFC), the Foreign Investors Advisory Service (FIAS), Transparency International and others supplied Armenian officials with extensive information on the business climate, administrative barriers, and corruption.
Since that time, the Armenian authorities have failed to agree on and implement a national anti-corruption strategy but have adopted a public administration reform law in 2001, a financial disclosure law, and a law on licensing that reduces the scope for bureaucratic interventions and bribe-seeking. Both perceptions of corruption and reported absolute values of bribes and time spent dealing with regulators have come down over the past three years. In fact, Armenia saw the largest reduction in the bribe tax among the 27 countries surveyed in the 2002 BEEPS. Surveys by the World Bank in 2002 also report improvements in the business climate. There is more to be done to improve the business climate and reduce administrative corruption in Armenia, which experts continue to describe as “rampant” and “widespread.” Strengthening rule of law is a particularly important area of reform. However, the evidence available in the BEEPS suggests that the problem of administrative corruption is becoming less severe, and this progress has been achieved in the absence of a national anti-corruption strategy.
26 See Satarov (2002). According to the results of this survey, the problem of state capture is turned on its head: firms are no longer the main protagonists in capturing the state, but rather the state and its extensive bureaucracy are seen to be capturing private business.
35
ANNEX 2: ANTI-CORRUPTION MATRIX
Omnibus Index National anti-corruption
strategy National anti-corruption
action plan National anti-corruption
commission / ombudsman
Adopted NGOs Multi-
branch Adopted NGOs Multi-
branch Estd NGOs Multi-
branch Indep
Albania √ √ √ √ √ √ √ √ √
Armenia
Azerbaijan √
Belarus
Bosnia & Herz. √
Bulgaria √ √ √ √ √ √
Croatia √ √ √ √ √ √ √ √
Czech Rep. √ √ √
Estonia FYR Macedonia
Georgia √ √ √
Hungary √ √ √
Kazakhstan √
Kyrgyz Rep.
Latvia √ √ √ √ √ √
Lithuania √ √ √ √ √ √ √ √ √
Moldova √ √ √ √ √
Poland
Romania √ √ √ √ √ √ √
Russia
Slovak Rep. √ √ √ √ √ √ √ √ √ √
Slovenia √ √
Tajikistan
Turkmenistan
Ukraine √ √ √ √
Uzbekistan
Montenegro √ √ √ √ √ √ √
Serbia √ √ √ √ √ √ √ √ √
36
Legal Index
Civil
Service Law
Financial Disclosure
Law
Public Procurement
Law
Freedom of Information
Law
Party Finance
Law
Anti-Money Laundering
Law
Albania √ √ √ √ √
Armenia √ √ √
Azerbaijan √ √ √
Belarus
Bosnia & Herz. √ √*
Bulgaria √ √ √ √
Croatia √ √ √ √
Czech Rep. √ √ √ √
Estonia √ √ √ √ √ √
FYR Macedonia √ √
Georgia √ √
Hungary √ √ √ √ √
Kazakhstan √
Kyrgyz Rep. √ √
Latvia √ √ √ √ √
Lithuania √ √ √ √ √ √
Moldova √ √ √
Poland √ √ √ √ √ √
Romania √ √ √ √
Russia √ √
Slovak Rep. √ √ √ √ √ √
Slovenia √ √ √ √ √ √
Tajikistan √
Turkmenistan
Ukraine √ √
Uzbekistan √
Montenegro
Serbia √ √
* This variable was scored 0.5 as the Federation has adopted anti-money laundering legislation, but Republika Srpska has not
37
Conventions Index
Stability Pact Anti-Corruption Initiative
OECD Anti-
Bribery COE
GRECO
COE Convention on
Laundering, Search,
Seizure and Confiscation of the Proceeds from Crime
COE Criminal Law Convention
on Corruption
COE Civil Law
Convention on
Corruption
Albania √ √ √ √ √*
Armenia na √**
Azerbaijan na √**
Belarus na √**
Bosnia & Herz. √ √ √ √*
Bulgaria √ √ √ √ √*
Croatia √ √ √ √ √**
Czech Rep. na √ √ √ √ √**
Estonia na √ √ √ √* FYR Macedonia √ √ √ √ √*
Georgia na √ √** √** √**
Hungary na √ √ √ √ √**
Kazakhstan na
Kyrgyz Rep. na
Latvia na √ √ √
Lithuania na √ √ √ √*
Moldova √ √ √ √** √**
Poland na √ √ √ √ √*
Romania √ √ √ √ √*
Russia na √ √**
Slovak Rep. na √ √ √ √ √**
Slovenia na √ √ √ √ √**
Tajikistan na
Turkmenistan na
Ukraine na √ √** √**
Uzbekistan na
Serbia & Mont. √ √
* These variables were scored 0.66 as the covenant has been signed and ratified, but has not yet entered into force.
** This variable was score 0.33 as the covenant has been signed but not ratified.
38
ANNEX 3: VARIABLES DEFINITIONS
DEPENDENT VARIABLES
Administrative Corruption
Change in bribe tax Change from 1999-2002 in the country average of the percentage of firms’ annual sales paid in unofficial payments or gifts to public officials.
Change in time tax Change from 1999-2002 in the country average of the percentage of firms’ senior management’s time spent in dealing with public officials about the application and interpretation of laws and regulations and to get or to maintain access to public services.
Change in frequency of bribes Change from 1999-2002 in the country average of the frequency of firms’ payments of additional payments or gifts to get things done with regard to customs, taxes, licences, regulations, services, etc.
Change in bribes, public services Change from 1999-2002 in the country average of the frequency of firms’ payments of unofficial payments or gifts to get connected to and maintain public services (electricity and telephone).
Change in bribes, licences Change from 1999-2002 in the country average of the frequency of firms’ payments of unofficial payments or gifts to obtain business licences and permits.
Change in bribes, tax Change from 1999-2002 in the country average of the frequency of firms’ payments of unofficial payments or gifts to deal with taxes and tax collection.
Change in bribes, customs Change from 1999-2002 in the country average of the frequency of firms’ payments of unofficial payments or gifts to deal with customs/imports.
Change in bribes, courts Change from 1999-2002 in the country average of the frequency of firms’ payments of unofficial payments or gifts to deal with courts.
Change in kickbacks, value Change from 1999-2002 in the country average of the percentage of the contract value paid in additional or unofficial payments or gifts by firms to secure the typical government contract.
Change in kickbacks, frequency Change from 1999-2002 in the country average of the frequency of firms’ payments of unofficial payments or gifts to secure government contracts.
39
State Capture
Change in capture index Change from 1999-2002 in the unweighted average of the six component indicators of capture (parliament, government, criminal courts, commercial courts, central bank, political parties).
Change in capture, parliament Change from 1999-2002 in the country average of the impact on firms of the payment of unofficial or private payments or gifts to parliamentarians to affect their votes.
Change in capture, government Change from 1999-2002 in the country average of the impact on firms of the payment of unofficial or private payments or gifts to government officials to affect the content of government decrees.
Change in capture, criminal courts Change from 1999-2002 in the country average of the impact on firms of the payment of unofficial or private payments or gifts to judges to affect the decisions of criminal court cases.
Change in capture, commercial courts Change from 1999-2002 in the country average of the impact on firms of the payment of unofficial or private payments or gifts to judges to affect the decisions in commercial courts.
Change in capture, central bank Change from 1999-2002 in the country average of the impact on firms of the payment of unofficial or private payments or gifts to central bank officials to affect central bank policies and decisions.
Change in capture, political parties Change from 1999-2002 in the country average of the impact on firms of the illegal payment of unofficial or private payments or gifts to political parties and/or election campaigns to affect the decisions of elected officials.
Change in frequency of bribes to influence legislature
Change from 1999-2002 in the country average of the frequency of firms’ payments of unofficial payments or gifts to influence legislature.
Perception of Corruption
Change in corruption as obstacle Change from 1999-2002 in the country average of the score of corruption as an obstacle to firms’ operation and growth.
Change in rank of corruption as obstacle Change from 1999-2002 in the country average of the rank of corruption as an obstacle to firms’ operation and growth, out of 21 potential obstacles.
40
INDEPENDENT VARIABLES
Polity, 1999 Countries’ 1999 score on the Polity IV index. This comprises
two components: a democracy score and an autocracy score. The democracy score is made up of a weighted average of scores on: openness of executive recruitment; competitiveness of executive recruitment; constraints on the chief executive; and competitiveness of political participation. The democracy score is made up of a weighted average of: competitiveness of executive recruitment; openness of competitive recruitment; constraints on chief executive; the regulation of participation; and competitiveness of participation. The Polity score is computed by subtracting the autocracy score from the democracy score. Data are available for the period 1818-2002. Rescaled to 0-1 scale.
Transition, 1999 Countries’ 1999 EBRD Transition Indicator score. The unweighted average of the EBRD’s nine Transition Indicators, which include scores for large-scale privatisation, small-scale privatisation, governance and enterprise restructuring, price liberalisation, trade and forex liberalisation, competition policy, banking reform and interest rate liberalisation, securities markets and non-bank financial institutions, and infrastructure. Rescaled to 0-1 scale.
Competition, 1998 Countries’ 1998 score on the Vanhanen Polyarchy index. Competition component is a proxy for political competition within the electorate. This variable uses electoral turnout (the proportion of the voting age population which vote) as the proxy. The data are available 1950-1988. Rescaled to 0-1 scale.
Media Freedom, 1999 Countries’ 1999 score on the Freedom House Freedom of the Media index. Subjective scoring of freedom of the media, based on surveys of country and regional specialists. Rescaled to 0-1 scale.
Ln GDP US$, 1999 Natural log of per capita GDP in US$ in 1999. Source: EBRD.
Change in Polity, 1999-2002 Change from 1999-2002 in countries’ Polity scores. A positive score indicates more democracy.
Change in Transition, 1999-2002 Change from 1999-2002 in countries’ transition scores. A positive score indicates more progress in transition.
Change in Media Freedom, 1999-2002
Change from 1999-2002 in countries’ Media Freedom scores. A positive score indicates higher levels of media freedom.
Change in ln GDP pc, 1999-2002 Change from 1999-2002 in countries’ per capita GDP (nat. log). A positive score indicates higher p.c. GDP.