Anti-SIRPa antibodies as a potential new tool for cancer immunotherapy Tadahiko Yanagita, … , Takahide Komori, Takashi Matozaki JCI Insight. 2017; 2(1):e89140. https://doi.org/10.1172/jci.insight.89140. Tumor cells are thought to evade immune surveillance through interaction with immune cells. Much recent attention has focused on the modification of immune responses as a basis for new cancer treatments. SIRPa is an Ig superfamily protein that inhibits phagocytosis in macrophages upon interaction with its ligand CD47 expressed on the surface of target cells. Here, we show that SIRPa is highly expressed in human renal cell carcinoma and melanoma. Furthermore, an anti-SIRPa Ab that blocks the interaction with CD47 markedly suppressed tumor formation by renal cell carcinoma or melanoma cells in immunocompetent syngeneic mice. This inhibitory effect of the Ab appeared to be mediated by dual mechanisms: direct induction of Ab-dependent cellular phagocytosis of tumor cells by macrophages and blockade of CD47-SIRPa signaling that negatively regulates such phagocytosis. The antitumor effect of the Ab was greatly attenuated by selective depletion not only of macrophages but also of NK cells or CD8 + T cells. In addition, the anti-SIRPa Ab also enhances the inhibitory effects of Abs against CD20 and programmed cell death 1 (PD- 1) on tumor formation in mice injected with SIRPa-nonexpressing tumor cells. Anti-SIRPa Abs thus warrant further study as a potential new therapy for a broad range of cancers. Research Article Immunology Oncology Find the latest version: http://jci.me/89140-pdf
Transcript
Anti-SIRPaa antibodies as a potential new toolfor cancer immunotherapy
Tumor cells are thought to evade immune surveillance through interaction with immunecells. Much recent attention has focused on the modification of immune responses as abasis for new cancer treatments. SIRPa is an Ig superfamily protein that inhibitsphagocytosis in macrophages upon interaction with its ligand CD47 expressed on thesurface of target cells. Here, we show that SIRPa is highly expressed in human renal cellcarcinoma and melanoma. Furthermore, an anti-SIRPa Ab that blocks the interaction withCD47 markedly suppressed tumor formation by renal cell carcinoma or melanoma cells inimmunocompetent syngeneic mice. This inhibitory effect of the Ab appeared to be mediatedby dual mechanisms: direct induction of Ab-dependent cellular phagocytosis of tumor cellsby macrophages and blockade of CD47-SIRPa signaling that negatively regulates suchphagocytosis. The antitumor effect of the Ab was greatly attenuated by selective depletionnot only of macrophages but also of NK cells or CD8+ T cells. In addition, the anti-SIRPa Abalso enhances the inhibitory effects of Abs against CD20 and programmed cell death 1 (PD-1) on tumor formation in mice injected with SIRPa-nonexpressing tumor cells. Anti-SIRPaAbs thus warrant further study as a potential new therapy for a broad range of cancers.
Anti-SIRPα antibodies as a potential new tool for cancer immunotherapyTadahiko Yanagita,1,2 Yoji Murata,1 Daisuke Tanaka,1 Sei-ichiro Motegi,3 Eri Arai,4,5 Edwin Widyanto Daniwijaya,1 Daisuke Hazama,1 Ken Washio,1 Yasuyuki Saito,1 Takenori Kotani,1 Hiroshi Ohnishi,6 Per-Arne Oldenborg,7 Noel Verjan Garcia,8 Masayuki Miyasaka,8,9 Osamu Ishikawa,3 Yae Kanai,4,5 Takahide Komori,2 and Takashi Matozaki1
1Division of Molecular and Cellular Signaling, Department of Biochemistry and Molecular Biology, 2Department of Oral and
Maxillofacial Surgery, Kobe University Graduate School of Medicine, Kobe, Japan. 3Department of Dermatology, Gunma
University Graduate School of Medicine, Gunma, Japan. 4Division of Molecular Pathology, National Cancer Center Research
Institute, Tokyo, Japan. 5Department of Pathology, Keio University School of Medicine, Tokyo, Japan. 6Department of
Laboratory Sciences, Gunma University Graduate School of Health Sciences, Gunma, Japan. 7Department of Integrative
Medical Biology, Section for Histology and Cell Biology, Umeå University, Umeå, Sweden. 8Laboratory of Immunodynamics,
Department of Microbiology and Immunology, Osaka University Graduate School of Medicine, Osaka, Japan. 9MediCity Research Laboratory, University of Turku, Turku, Finland.
IntroductionThe tumor microenvironment consists of a variety of stromal cell types including fibroblasts, immune cells, and endothelial cells, as well as soluble and insoluble factors such as cytokines, chemokines, and extracel-lular matrix (1, 2). This microenvironment plays an important role in the regulation of tumor progression by promoting tumor cell survival, invasion, and metastasis as well as angiogenesis (1–3). Crosstalk between tumor and immune cells in the tumor microenvironment is also thought to contribute to the evasion of tumor cells from immune surveillance. For instance, binding of programmed cell death 1 (PD-1) on cyto-toxic T lymphocytes to its ligand PD-L1 on tumor cells prevents killing of the latter cells by the former (4). Indeed, Abs against PD-1 are now in clinical use for the treatment of cancers including advanced mela-noma, renal cell carcinoma, and non–small-cell lung cancer (5). Moreover, the binding of tumor-derived soluble MHC class I–related chain A (MICA) to its receptor NKG2D on NK cells and T cells results in the downregulation of NKG2D and impairs the responsiveness of such cells specific for tumor antigens (6, 7). Molecules that participate in negative regulation of the antitumor response of immune cells are thus promising targets for cancer therapy.
Signal regulatory protein α (SIRPα) is a transmembrane protein with an extracellular region compris-ing three Ig-like domains and a cytoplasmic region containing immunoreceptor tyrosine–based inhibition motifs that mediate binding of the protein tyrosine phosphatases SHP1 and SHP2 (8, 9). Tyrosine phos-phorylation of SIRPα is regulated by various growth factors and cytokines as well as by integrin-mediated
Tumor cells are thought to evade immune surveillance through interaction with immune cells. Much recent attention has focused on the modification of immune responses as a basis for new cancer treatments. SIRPα is an Ig superfamily protein that inhibits phagocytosis in macrophages upon interaction with its ligand CD47 expressed on the surface of target cells. Here, we show that SIRPα is highly expressed in human renal cell carcinoma and melanoma. Furthermore, an anti-SIRPα Ab that blocks the interaction with CD47 markedly suppressed tumor formation by renal cell carcinoma or melanoma cells in immunocompetent syngeneic mice. This inhibitory effect of the Ab appeared to be mediated by dual mechanisms: direct induction of Ab-dependent cellular phagocytosis of tumor cells by macrophages and blockade of CD47-SIRPα signaling that negatively regulates such phagocytosis. The antitumor effect of the Ab was greatly attenuated by selective depletion not only of macrophages but also of NK cells or CD8+ T cells. In addition, the anti-SIRPα Ab also enhances the inhibitory effects of Abs against CD20 and programmed cell death 1 (PD-1) on tumor formation in mice injected with SIRPα-nonexpressing tumor cells. Anti-SIRPα Abs thus warrant further study as a potential new therapy for a broad range of cancers.
2insight.jci.org doi:10.1172/jci.insight.89140
R E S E A R C H A R T I C L E
cell adhesion to extracellular matrix proteins. SIRPα is especially abundant in myeloid cells such as mac-rophages and DCs, whereas it is expressed at only low levels in T, B, NK, and NKT cells (10–13). The extracellular region of SIRPα interacts with its ligand CD47, which is expressed in most cell types (14) and is also a member of the Ig superfamily (8, 9, 14).
The interaction of SIRPα on macrophages with CD47 on rbc prevents phagocytosis of Ig-opsonized rbc by macrophages in vitro (15) and in vivo (16). Such negative regulation of macrophages is thought to be mediated by the binding of SHP1 to the cytoplasmic region of SIRPα (15). We previously showed that prevention of the CD47-SIRPα interaction with an Ab against SIRPα in vitro enhanced the killing by phagocytes of human epidermal growth factor receptor 2–positive (HER2-positive) breast cancer cells opsonized with the HER2-specific mAb trastuzumab (17), suggesting that such blockade of the CD47-SIRPα interaction is a promising new approach to cancer treatment. An Ab against CD47 that blocks the binding of CD47 to SIRPα was shown to promote both Ab-dependent cellular phagocytosis (ADCP) of human non-Hodgkin lymphoma cells by macrophages in vitro and eradication of xenografts of these cancer cells induced by the CD20-specific mAb rituximab in immunodeficient mice (18). Moreover, the same Ab against CD47 was found to inhibit the growth of various human tumor xenografts including solid tumors (19). However, given that CD47 is ubiquitously expressed at a high level in normal tis-sues, efficient targeting of CD47 specifically on cancer cells is problematic. Moreover, Abs against CD47 might trigger Ab-dependent cellular cytotoxicity (ADCC) in healthy cells, such as rbc, which is not a desirable response (20).
To further explore the potential of cancer therapy based on Abs against SIRPα, we first examined which types of human cancers express this protein at a high level. We then tested the effect of such Abs on the growth of renal cell carcinoma and melanoma, both of which were found to express SIRPα at a high level. Finally, we investigated whether the combination of an Ab against SIRPα and other anticancer Abs, such as those specific for CD20 or PD-1, might suppress tumor growth in vivo in a synergistic manner.
ResultsHuman renal cell carcinoma and melanoma express SIRPα at a high level. To investigate the potential antitumor effect of Abs against SIRPα, we first examined which types of human cancer or cancer cell lines express this protein at a high level by consulting a human protein atlas (21) and The Cancer Cell Line Encyclope-dia (22). Database searches indicated that SIRPα mRNA or protein might be moderately or highly abun-dant in human renal cell carcinoma and melanoma. Microarray analysis preformed previously (23) indeed revealed that the levels of SIRPA mRNA in clear cell renal cell carcinoma (n = 95 patients) was markedly higher than those in matched normal kidney tissue (Figure 1A). Immunohistochemical staining with poly-clonal Abs (pAbs) against human SIRPα — the specificity of which was confirmed by immunofluorescence and immunoblot analyses (Supplemental Figure 1, A–C; supplemental material available online with this article; doi:10.1172/jci.insight.89140DS1) — also showed that SIRPα protein was expressed at a high level in tumor sections from 4 patients randomly selected from the 95 patients with clear cell renal cell carci-noma (Figure 1B, Supplemental Figure 1D, and Table 1). In addition, SIRPα immunoreactivity, which was determined by a mAb against human SIRPα (040 mAb), was detected at a high level in sections of mela-noma from 4 of 8 patients and at a moderate or low level in the remaining 4 patients, with such staining corresponding well to that of the melanoma marker melanoma antigen recognized by T cells 1 (MART-1) (24) (Figure 1C, Supplemental Figure 2A, and Table 2). Although the 040 mAb could react with SIRPα as well as the SIRP family members SIRPβ1 or SIRPγ (25) (Supplemental Figure 3), the immunoreactivity of SIRPβ1 or of SIRPγ in human melanoma was undetectable (Supplemental Figure 2B). It is thus likely that the expression of SIRPα is specifically increased in these melanoma samples. Consistent with these results, SIRPα was found to be abundant in human renal cell carcinoma (ACHN, 786-O, A498, Caki-1) and mela-noma (WM239a, SK-MEL-28, SK-MEL-5) cell lines, although it was present at only a low level in A375 melanoma cells (Supplemental Figure 4). Taken together, these results thus suggested that SIRPα is highly expressed in human renal cell carcinoma and melanoma.
Abs against SIRPα attenuate the growth of tumors formed by SIRPα-expressing renal cell carcinoma or melanoma cells in syngeneic mice. We next investigated the effects of 2 different mAbs against mouse SIRPα — MY-1 (rat IgG2a) (26) and P84 (rat IgG1) (27, 28) — on the growth of tumors formed by mouse renal cell carcinoma or melanoma cells implanted into syngeneic mice. MY-1 binds to the NH2-terminal Ig-V–like domain of SIRPα and thereby blocks the interaction with CD47, whereas P84 has little effect on the CD47-SIRPα interaction
3insight.jci.org doi:10.1172/jci.insight.89140
R E S E A R C H A R T I C L E
(a detailed characterization of these two mAbs is provided in Supplemental Figures 5 and 6). In addition, MY-1 reacted with SIRPα or the SIRP family member SIRPβ (29) overexpressed in HEK293A cells, whereas P84 only reacted with SIRPα (Supplemental Figure 5B). Immunoblot and flow cytometric analyses showed that mouse RENCA renal cell carcinoma and B16BL6 melanoma cells express SIRPα at a high level on the cell surface (Figure 2A). In contrast, flow cytometric analysis also revealed that expression of SIRPβ was minimal on the cell surface of both cell lines (Supplemental Figure 7), suggesting that immunoreactivity for MY-1 or P84 on these tumor cells is attributable to SIRPα expression on their cell surface. Syngeneic BALB/c mice at 8 weeks of age were injected s.c. with RENCA cells and then i.p. with either normal rat IgG (control), MY-1, or P84 three times a week (Figure 2B). Treatment with MY-1 resulted in marked attenuation of tumor formation by RENCA cells compared with that seen in mice treated with control IgG, whereas P84 manifested a smaller but still significant inhibitory effect on tumor growth (Figure 2B). Consistent with these findings, mice treated with MY-1 exhibited prolonged survival compared with those treated with either control IgG or P84 when the treatment was discontinued after 3 weekly cycles (Figure 2B). Moreover, the inhibitory effect of MY-1 on tumor growth as well as its beneficial effect on survival rates were also apparent when treatment was delayed until the tumor volume had achieved an average size of 100 mm3 (Figure 2C). By contrast, such delayed treatment with P84 had no significant effect on either tumor growth or survival compared with the effect observed with control IgG (Figure 2C). We then examined the effects of the Abs against SIRPα on metastatic tumor formation by B16BL6 cells in C57BL/6J mice.
Figure 1. High level of SIRPα expres-sion in human renal cell carcinoma and melanoma. (A) Microarray analysis of signal regulatory protein α (SIRPA) mRNA abundance in tumor and adjacent normal tissue from patients with clear cell renal cell carcinoma. Individual values (n = 95) are shown. Bars indicate the median values. ***P < 0.001, by 2-tailed Student’s t test. (B) Paraffin-embedded tumor sections prepared from a patient with clear cell renal cell carcinoma (case 1) were subjected to H&E staining as well as immunohistochemical staining (brown) with polyclonal Abs (pAbs) against human SIRPα and counterstaining with hema-toxylin. Boxed regions in the top panels are shown at higher magnification in the bottom panels. Scale bars: 500 μm (top panel) and 100 μm (bottom panel). (C) Fresh-frozen tumor sections from a patient with melanoma (case 1) were subjected to immunofluorescence staining with mAbs against melanoma antigen recognized by T cells 1 (MART-1) (magenta) and human SIRPα (040 mAb) (green). Nuclei were also stained with DAPI (blue). Scale bar: 100 μm.
Table 1. Characteristics of the 4 patients with clear cell renal cell carcinoma
Case Age (yr) Sex Source TNM Stage1 50 Male Kidney T1bN0M0 I2 56 Female Kidney T3aN0M0 III3 43 Male Kidney T3aN0M0 III4 70 Male Kidney T3bN0M0 III
TNM, tumor, node, metastasis system.
4insight.jci.org doi:10.1172/jci.insight.89140
R E S E A R C H A R T I C L E
B16BL6 cells were injected i.v. into 8-week-old mice, which were then treated with either con-trol IgG, MY-1, or P84 three times a week. MY-1 significantly reduced the number of metastatic nodules formed in the lungs compared with either control IgG or P84 (Figure 2D). Togeth-er, these results thus suggested that Abs against SIRPα that block the CD47-SIRPα interaction markedly attenuate tumor formation by SIRPα-expressing cancer cells in vivo.
We also examined possible adverse effects of treatment with MY-1 in mice. Hematologic and blood biochemical analyses showed that treatment of C57BL/6J mice with MY-1 result-
ed in a small increase in the number of reticulocytes in the blood, but no other adverse effects (including anemia), compared with treatment with vehicle or control IgG (Supplemental Table 1).
Importance of macrophages for the antitumor effect of MY-1 in vivo. We next investigated whether macro-phages contribute to the inhibitory effect of MY-1 on tumor formation by SIRPα-expressing cancer cells. We depleted mice of macrophages by administering clodronate liposomes beginning before injection of cancer cells. Effective depletion of F4/80+CD11b+ macrophages in the spleen was apparent as early as 3 days after the first i.v. injection of clodronate liposomes (Figure 3A). Such macrophage depletion was associated with a marked attenuation of the inhibitory effect of MY-1 on the growth of tumors formed by RENCA cells (Figure 3B), suggesting that macrophages indeed contribute, at least in part, to the antitumor effect of MY-1.
Given that SIRPα is expressed at a high level in RENCA and B16BL6 cells, it appeared likely that MY-1 inhibited tumor formation by these cells in vivo at least in part by directly promoting ADCP of tumor cells by macrophages. Indeed, compared with control IgG, MY-1 markedly promoted the phagocytosis of CFSE-labeled RENCA cells by BM-derived macrophages (BMDMs) (Figure 3, C and D). In addition, the
Figure 2. Abs against SIRPα attenuate the growth of tumors formed by SIRPα-expressing renal cell carcinoma or melanoma cells in syngeneic mice. (A) Whole lysates of RENCA or B16BL6 cells were subject-ed to immunoblot analysis with mAbs against mouse signal regulatory protein α (SIRPα) (P84) and against β-tubulin as a loading control (left panel). RENCA and B16BL6 cells were also subjected to flow cytometric analysis of SIRPα expression on the surface of viable cells after staining with propidium iodide (PI), a biotin-conjugated mAb against mouse SIRPα (P84) (or isotype control), and allophycocyanin-conjugated (APC-conjugated) streptavidin (right panel). Data are representative of 3 separate experiments. (B and C) Tumor volume (left panels) and survival curves (right panels) for BALB/c mice injected s.c. with RENCA cells and treated i.p. with control IgG or mAbs against mouse SIRPα (MY-1 or P84) according to the indicated schedule, beginning either immediately after injec-tion of tumor cells (B) or after tumor volume had achieved an average size of 100 mm3 (C). (D) Number of tumor nodules in the lungs of C57BL/6J mice 14 days after i.v. injection of B16BL6 cells and the onset of i.p. administration of control IgG or mAbs against mouse SIRPα (MY-1 or P84) according to the indicated schedule. Data represent the mean ± SEM for n = 8 (B), n = 11 (C), or n = 10 (D) mice per group examined in 2 separate experiments. *P < 0.05, **P < 0.01, and ***P < 0.001, by 2-way ANOVA with Tukey’s test (left panels in B and C) or log-rank test (right panels in B and C), or by 1-way ANOVA with Tukey’s test (D).
5insight.jci.org doi:10.1172/jci.insight.89140
R E S E A R C H A R T I C L E
stimulatory effect of F(ab′)2 fragments of MY-1 on such phagocytosis was significantly smaller than that of the intact Ab (Figure 3E). Knockdown of SIRPα in CFSE-labeled RENCA cells markedly attenuated the MY-1–promoted phagocytosis by BMDMs (Figure 3F). Moreover, coculture of CFSE-labeled RENCA cells with BMDMs preincubated with either intact MY-1 or F(ab′)2 fragments of MY-1 failed to stimulate the phagocytosis of the tumor cells by BMDMs (Supplemental Figure 8A), suggesting that opsonization of RENCA cells by intact MY-1 contributes to the promotion of macrophage-mediated ADCP. On the other hand, the effect of MY-1 on phagocytosis was much greater than that of P84 (Figure 3, C and D). Moreover, F(ab′)2 fragments of MY-1 retained the inhibitory effect of the intact Ab on the CD47-SIRPα interaction (Supplemental Figure 6C) and had a significant stimulatory effect on phagocytosis compared with control IgG (Figure 3E). By contrast, incubation of BMDMs with CFSE-labeled RENCA cells prein-cubated with either intact MY-1 or F(ab′)2 fragments of MY-1 did not promote phagocytosis of the tumor cells by BMDMs (Supplemental Figure 8B). These results thus suggested that blockade of the inhibitory signal provided by the interaction of CD47 (on cancer cells) with SIRPα (on macrophages) also contributes to the promotion of phagocytosis in macrophages by MY-1. In contrast, treatment of RENCA cells with MY-1 did not influence cell viability (Supplemental Figure 9).
Macrophages are broadly classified into M1 and M2 types, which are thought to have antitumori-genic and protumorigenic functions, respectively (30, 31). We found that the frequency of macrophages in tumors formed by RENCA cells 14 days after cell injection did not differ between mice treated with MY-1 or control IgG (Figure 4A). However, the ratio of M1 to M2 macrophages in the tumors of MY-1–treated mice was significantly higher than that in the tumors of control IgG–treated mice (Figure 4A), suggesting that MY-1 treatment does not affect the number of macrophages in tumors but rather increases the M1/M2 ratio.
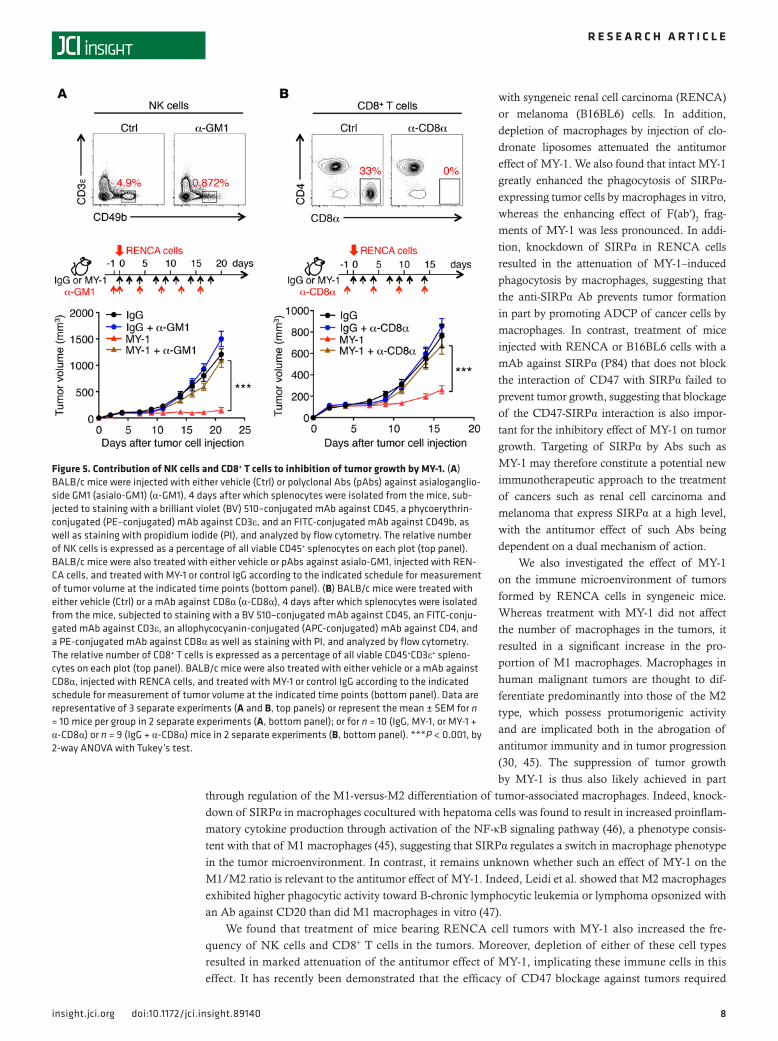
Contribution of NK cells and CD8+ T cells to MY-1–induced inhibition of tumor growth. To investigate wheth-er other types of immune cells participate in the inhibition of tumor growth by MY-1 in vivo, we first examined the effect of MY-1 on the population of immune cells in tumors formed by implanted RENCA cells. Fourteen days after tumor cell injection, the numbers of both NK cells and T cells in the tumors were markedly increased in mice treated with MY-1 compared with those treated with control IgG (Figure 4B). In particular, the number of CD8+ T cells, but not that of CD4+ T cells, was significantly increased in the tumors of MY-1–treated mice (Figure 4B). By contrast, the number of CD11b+Gr-1+ cells including tumor-associated neutrophils, which possess protumourigenic or antitumour activity (32), in the tumors of MY-1–treated mice was similar to that in the tumors of mice treated with control IgG (Figure 4C). Moreover, CD3+CD4+Foxp3+ Tregs, which are thought to suppress tumor immunosurveillance (33), in the tumors of MY-1–treated mice were increased compared with those in the tumors of mice treated with control IgG (Figure 4C). We therefore next examined whether NK cells or CD8+ T cells contribute to the inhibition of tumor growth by MY-1. Treatment of BALB/c mice with Abs against asialoganglioside GM1 (asialo-GM1) (34) effectively depleted NK cells from the spleen as well as markedly attenuated the antitu-mor effect of MY-1 for RENCA cells (Figure 5A). In addition, treatment with a mAb against CD8α (2.43) (35) eliminated CD8+ T cells from the spleen as well as inhibited the antitumor effect of MY-1 (Figure 5B). By contrast, depletion of CD4+ Τ cells with a mAb against CD4 failed to influence the inhibitory effect of
Table 2. Expression of SIRPα in tumor samples from patients with malignant melanoma
Case Age (yr) Sex Source TNM Stage Type SIRPα expression1 55 F Right upper arm T4aN1M0 IIIA NM ++2 76 M Right sole T2aN0M0 IB ALM ±3 80 M Toe of left foot T3bN0M0 IIB NM ++4 55 M Left upper arm T4bN0M0 IIC NM ++5 39 F Head T4bN3M0 IIIC SSM ±6 49 F Right lower back T4bN3M0 IIIC NM +7 67 M Abdomen T4bN0M0 IIC NM +8 66 M Left heel T2aN0M0 IB NM ++
MY-1 on tumor formation by RENCA cells (Supplemental Figure 10). We also found that treatment of BALB/c mice bearing established RENCA tumors with Abs against asialo-GM1 or a mAb against CD8α effectively depleted NK cells or CD8+ T cells from the spleen and tumors as well as markedly reduced the antitumor effect of MY-1 (Supplemental Figure 11). Together, these results thus suggested that both NK cells and CD8+ T cells, but not CD4+ T cells, participate in the suppressive effect of MY-1 on tumor forma-tion and growth by SIRPα-expressing cancer cells in vivo.
Enhancement by MY-1 of rituximab-induced inhibition of tumor formation by Burkitt’s lymphoma (Raji) cells. Given that Abs against SIRPα were previously shown to enhance the killing of trastuzumab-opsonized HER2-positive breast cancer cells by phagocytes in vitro (17), we next examined the effects of mAbs against SIRPα on ADCP-dependent inhibition of tumor growth in vivo. Human CD47 was shown to bind to SIRPα from NOD mice but not to that from other mouse strains such as C57BL/6 (36). CD47 expressed on Raji cells, a human Burkitt’s lymphoma cell line that does not express SIRPα, would thus be expected to bind to SIRPα on NOD mouse macrophages. We therefore transplanted Raji cells s.c. into 6-week-old NOD/SCID mice. Beginning 1 week after cell injection, the animals were treated i.p. twice a week with the anti-CD20 mAb rituximab (37) either alone or together with MY-1 or P84. Treatment with MY-1 alone had little effect on the growth of tumors formed by Raji cells (Supplemental Figure 12), whereas the combination of MY-1 with a suboptimal dose of rituximab greatly attenuated tumor growth compared with the effect of rituximab alone (Figure 6A). In addition, this potentiating effect of MY-1 was mark-edly greater than that of P84 (Figure 6A), suggesting that disruption of the CD47-SIRPα interaction is
Figure 3. Importance of macrophages for the antitumor effect of the MY-1 mAb against mouse SIRPα in vivo. (A) BALB/c mice were injected i.v. with either PBS liposomes as a control (Ctrl) or clodro-nate liposomes (Clodronate). Splenocytes isolated from the mice 3 days later were stained with propidium iodide (PI), a brilliant violet (BV) 510–conjugated mAb against CD45, a BV 421–conjugated mAb against CD11b, and a phycoerythrin-conjugated (PE-conjugated) mAb against F4/80 for analysis by flow cytometry. The relative number of F4/80+CD11b+ cells (macrophages) is expressed as a per-centage of all viable CD45+ cells on each plot. (B) BALB/c mice were injected with PBS liposomes or clodronate liposomes, RENCA cells, and either MY-1 or control IgG according to the indicated schedule. Tumor volume was measured at the indicated time points. (C and D) CFSE-labeled RENCA cells were incubated for 4 hours with BALB/c mouse BM-derived macrophages (BMDMs) in the presence of the indicated Abs, after which cells were harvested, stained with a biotin-conjugated mAb against F4/80 and allophycocyanin-conjugated (APC-conjugated) streptavidin as well as with PI, and analyzed by flow cytometry. The relative number of CFSE+F4/80+ BMDMs (BMDMs that had phagocytosed CFSE-labeled RENCA cells) is expressed as a percentage of all viable F4/80+ cells in the representative plots (C) as well as for a representative experiment (D). (E) CFSE-labeled RENCA cells were incubated for 4 hours with BMDMs in the presence of control IgG or of intact or F(ab′)2 frag-ments of MY-1. The percentage of CFSE+F4/80+ BMDMs among viable F4/80+ cells was then determined as in C. (F) RENCA cells were transfected with signal regulatory protein α (Sirpa) or control siRNAs, after which cells were labeled with CFSE and stained with PI, a biotin-conjugated mAb against mouse SIRPα (P84) (or iso-type control), and APC-conjugated streptavidin for analysis by flow cytometry (left panel). The CFSE-labeled RENCA cells were also incubated for 4 hours with BMDMs in the presence of the indicated Abs. The percentage of CFSE+F4/80+ BMDMs among viable F4/80+ cells was then determined as in C (right panel). Data are represen-tative of 3 separate experiments (A and C–F); the mean ± SEM of triplicate determinations (n = 3) (D, E, and right panel in F), or the mean ± SEM for n = 8 mice per group in 2 separate experiments (B). ***P < 0.001, by 2-way (B) or 1-way (D, E, and right panel in F) ANOVA with Tukey’s test.
7insight.jci.org doi:10.1172/jci.insight.89140
R E S E A R C H A R T I C L E
likely important for this effect of MY-1. MY-1 also enhanced the inhibitory effect of rituximab on tumor growth when treatment was delayed, until tumors had achieved an average size of 150 to 200 mm3 (Figure 6B). Furthermore, rituximab promot-ed the phagocytosis of CFSE-labeled Raji cells by BMDMs from NOD mice, and MY-1 markedly enhanced this effect of rituximab (Supplemental Figure 13). P84 also enhanced such rituximab-induced phagocytosis, albeit to a lesser extent than did MY-1 (Supplemental Figure 13).
Impact of combination therapy with MY-1 and a mAb against PD-1 on tumor growth in vivo. Immuno-therapy with Abs against PD-1 that block the inhib-itory PD-1/PD-L1 axis has recently been found to provide substantial clinical benefit in patients with a wide range of cancer types (5). Such Abs also exert antitumor activity in immunocompetent mice implanted with various types of mouse cancer cells including colon cancer cells (38, 39). We therefore examined the impact of combination therapy with MY-1 and an Ab against PD-1 (4H2) that blocks the PD-1–PD-L1 interaction (39) on the growth of tumors formed by mouse CT26 colon cancer cells in BALB/c mice. Flow cytometry with a mAb against PD-L1 revealed that CT26 cells express PD-L1 on the cell surface, whereas flow cytometry with either P84 or MY-1 revealed that these cells do not express SIRPα (Figure 6C). The expression level of SIRPα on tumors in mice transplanted with CT26 cells was also minimal (data not shown). Whereas MY-1 alone had no effect on the growth of tumors formed by CT26 cells, it markedly enhanced the suppressive effect of the Ab against PD-1 on tumor growth (Figure 6D).
DiscussionBoth renal cell carcinoma and advanced or meta-static melanoma have a poor prognosis (40–42). Immunotherapy with either IFN-α or IL-2 or che-motherapy with dacarbazine is thus largely inef-fective for patients with these cancers, and these therapies are also associated with serious adverse effects (42–44). In contrast, immunotherapy with ipilimumab (a mAb against CTLA-4) or nivolum-
ab (a mAb against PD-1), both of which are thought to abrogate the inhibitory checkpoint for cytotoxic T cell activity, has recently been approved as a promising treatment for both advanced melanoma and renal cell carcinoma (42–44). Effective immunotherapy with Abs that target tumor-specific antigens on the cell surface of these carcinomas and thereby kill the cancer cells (by ADCC or ADCP) has yet to be developed.
We have now shown that the amount of SIRPA mRNA in tumor tissue from patients with renal cell car-cinoma was significantly increased compared with that in matched normal tissue. The expression of SIRPα protein was also prominent in the tumor tissue from patients with renal cell carcinoma or melanoma as well as in corresponding cancer cell lines. Treatment with the MY-1 mAb against SIRPα, which blocks the binding of CD47 to SIRPα, resulted in a marked reduction in the tumor burden of immunocompetent mice injected
Figure 4. Impact of MY-1 on the proportion of immune cells in RENCA tumors. (A–C) BALB/c mice were injected s.c. with RENCA cells and treated with control IgG or MY-1 as in Figure 2B. Tumors were harvested 14 days after cell injection for isolation of infiltrating cells. The isolated cells were stained with propidium iodide (PI) and a brilliant violet (BV) 510–conjugated mAb against CD45 as well as with either a phycoerythrin-conjugated (PE-conjugated) mAb against F4/80 and an allophycocyanin-conjugated (APC-conjugated) mAb against Ly6C (A, left panel), a PE-conjugated mAb against F4/80, an APC-conjugated mAb against Ly6C, an FITC-conju-gated mAb against mouse CD206, a biotin-conjugated mAb against MHC class II, and PE- and Cy7-conjugated streptavidin (A, right panel), a PE-conjugated mAb against CD3ε and an FITC-conjugated mAb against CD49b (B, left top panel), an FITC-conjugated mAb against CD3ε (B, right top panel), an FITC-conjugated mAb against CD3ε, an APC-conjugated mAb against CD4, and a PE-conjugated mAb against CD8α (B, bottom panels), a BV 421–conjugated mAb against CD11b and a PE-conjugated mAb against Ly6G/Ly6C (C, top panel), or an FITC-conjugated mAb against CD3ε, an APC-conjugated mAb against CD4, and a PE-conjugated mAb against Foxp3 (C, bottom panel). The cells were then subjected to flow cytometry for determination of the frequencies of F4/80+Ly6Clo cells (Macrophages) (A, left panel), CD3ε–CD49b+ (NK) cells, CD3ε+ (T) cells, CD3ε+CD4+CD8α– (CD4+ T) cells, and CD3ε+CD4–CD8α+ (CD8+ T) cells (B), or of CD11b+Gr-1+ cells and CD3ε+CD4+Foxp3+ cells (Tregs) (C), as well as the ratio of F4/80+Ly6CloMHC IIhiCD206lo cells (M1 macrophages) to F4/80+Ly6CloMHC IIloCD206hi cells (M2 macrophages) (A, right panel), among all viable CD45+ cells. Data represent the mean ± SEM for n = 6 (IgG) or n = 7 (MY-1) mice in 2 separate experiments (A and B); or for n = 8 (IgG) or n = 9 (MY-1) mice in 2 separate experiments (C). *P < 0.05 and **P < 0.01, by 2-tailed Student’s t test.
8insight.jci.org doi:10.1172/jci.insight.89140
R E S E A R C H A R T I C L E
with syngeneic renal cell carcinoma (RENCA) or melanoma (B16BL6) cells. In addition, depletion of macrophages by injection of clo-dronate liposomes attenuated the antitumor effect of MY-1. We also found that intact MY-1 greatly enhanced the phagocytosis of SIRPα-expressing tumor cells by macrophages in vitro, whereas the enhancing effect of F(ab′)2 frag-ments of MY-1 was less pronounced. In addi-tion, knockdown of SIRPα in RENCA cells resulted in the attenuation of MY-1–induced phagocytosis by macrophages, suggesting that the anti-SIRPα Ab prevents tumor formation in part by promoting ADCP of cancer cells by macrophages. In contrast, treatment of mice injected with RENCA or B16BL6 cells with a mAb against SIRPα (P84) that does not block the interaction of CD47 with SIRPα failed to prevent tumor growth, suggesting that blockage of the CD47-SIRPα interaction is also impor-tant for the inhibitory effect of MY-1 on tumor growth. Targeting of SIRPα by Abs such as MY-1 may therefore constitute a potential new immunotherapeutic approach to the treatment of cancers such as renal cell carcinoma and melanoma that express SIRPα at a high level, with the antitumor effect of such Abs being dependent on a dual mechanism of action.
We also investigated the effect of MY-1 on the immune microenvironment of tumors formed by RENCA cells in syngeneic mice. Whereas treatment with MY-1 did not affect the number of macrophages in the tumors, it resulted in a significant increase in the pro-portion of M1 macrophages. Macrophages in human malignant tumors are thought to dif-ferentiate predominantly into those of the M2 type, which possess protumorigenic activity and are implicated both in the abrogation of antitumor immunity and in tumor progression (30, 45). The suppression of tumor growth by MY-1 is thus also likely achieved in part
through regulation of the M1-versus-M2 differentiation of tumor-associated macrophages. Indeed, knock-down of SIRPα in macrophages cocultured with hepatoma cells was found to result in increased proinflam-matory cytokine production through activation of the NF-κB signaling pathway (46), a phenotype consis-tent with that of M1 macrophages (45), suggesting that SIRPα regulates a switch in macrophage phenotype in the tumor microenvironment. In contrast, it remains unknown whether such an effect of MY-1 on the M1/M2 ratio is relevant to the antitumor effect of MY-1. Indeed, Leidi et al. showed that M2 macrophages exhibited higher phagocytic activity toward B-chronic lymphocytic leukemia or lymphoma opsonized with an Ab against CD20 than did M1 macrophages in vitro (47).
We found that treatment of mice bearing RENCA cell tumors with MY-1 also increased the fre-quency of NK cells and CD8+ T cells in the tumors. Moreover, depletion of either of these cell types resulted in marked attenuation of the antitumor effect of MY-1, implicating these immune cells in this effect. It has recently been demonstrated that the efficacy of CD47 blockage against tumors required
Figure 5. Contribution of NK cells and CD8+ T cells to inhibition of tumor growth by MY-1. (A) BALB/c mice were injected with either vehicle (Ctrl) or polyclonal Abs (pAbs) against asialoganglio-side GM1 (asialo-GM1) (α-GM1), 4 days after which splenocytes were isolated from the mice, sub-jected to staining with a brilliant violet (BV) 510–conjugated mAb against CD45, a phycoerythrin-conjugated (PE–conjugated) mAb against CD3ε, and an FITC-conjugated mAb against CD49b, as well as staining with propidium iodide (PI), and analyzed by flow cytometry. The relative number of NK cells is expressed as a percentage of all viable CD45+ splenocytes on each plot (top panel). BALB/c mice were also treated with either vehicle or pAbs against asialo-GM1, injected with REN-CA cells, and treated with MY-1 or control IgG according to the indicated schedule for measurement of tumor volume at the indicated time points (bottom panel). (B) BALB/c mice were treated with either vehicle (Ctrl) or a mAb against CD8α (α-CD8α), 4 days after which splenocytes were isolated from the mice, subjected to staining with a BV 510–conjugated mAb against CD45, an FITC-conju-gated mAb against CD3ε, an allophycocyanin-conjugated (APC-conjugated) mAb against CD4, and a PE-conjugated mAb against CD8α as well as staining with PI, and analyzed by flow cytometry. The relative number of CD8+ T cells is expressed as a percentage of all viable CD45+CD3ε+ spleno-cytes on each plot (top panel). BALB/c mice were also treated with either vehicle or a mAb against CD8α, injected with RENCA cells, and treated with MY-1 or control IgG according to the indicated schedule for measurement of tumor volume at the indicated time points (bottom panel). Data are representative of 3 separate experiments (A and B, top panels) or represent the mean ± SEM for n = 10 mice per group in 2 separate experiments (A, bottom panel); or for n = 10 (IgG, MY-1, or MY-1 + α-CD8α) or n = 9 (IgG + α-CD8α) mice in 2 separate experiments (B, bottom panel). ***P < 0.001, by 2-way ANOVA with Tukey’s test.
9insight.jci.org doi:10.1172/jci.insight.89140
R E S E A R C H A R T I C L E
adaptive immune responses in immu-nocompetent mouse tumor models (48–50). The inhibition of the CD47-SIRPα interaction by SIRPα or CD47 blockage is thus probably impor-tant for enhancing T cell–mediated destruction of tumors. The mecha-nism by which treatment with MY-1 promotes the antitumor immune response mediated by NK cells and CD8+ T cells remains unclear, how-ever. We found that MY-1 did not promote NK cell–mediated cytotoxic activity toward RENCA cells in vitro (Supplemental Figure 14). Given that macrophages are likely the pri-mary effector cells for the antitumor activity of MY-1, it is possible that they participate in the promotion of NK cell–dependent killing of tumor cells by the Ab. Indeed, NK cells are thought to be primed by interac-tion with activated M1 macrophages or DCs mediated either directly through cell-cell contact or indirectly by cytokines, and the primed cells are then thought to contribute to the eradication of tumor cells (51, 52). Macrophages or DCs also recognize N-glycan structures on tumor cells through the innate immune receptor Dectin 1, resulting in enhancement of NK cell–meditated killing of tumor cells (53). In addition, macrophages engulf tumor cells and then cross-present tumor antigens to CD8+ T cells via the MHC class I route, there-by enhancing the activity of tumor antigen–specific T cells toward tumor cells. CD169+ macrophages were thus shown to engulf dead tumor cells and
to cross-present tumor antigens to CD8+ T cells, thereby inducing antitumor immunity (54). Moreover, CD47 blockage enhanced the cross-priming of CD8+ T cell responses by DCs, but not by macrophages, and thereby contributed to tumor control in mice injected with syngeneic tumor cells (48). DCs might participate in CD8+ T cell–mediated antitumor effects of Abs against SIRPα.
Our study has shown that Abs against SIRPα in combination with other anticancer Abs may be effec-tive even for the treatment of tumors that do not express SIRPα. We thus found that MY-1, but not P84, markedly enhanced the suppressive effect of rituximab on the growth of tumors formed by human Burkitt’s lymphoma Raji cells in immunodeficient mice. Consistent with this finding, MY-1 also enhanced the phagocytosis of rituximab-opsonized Raji cells by macrophages, suggesting that disruption of the CD47-SIRPα interaction by MY-1 promotes rituximab-induced ADCP, resulting in enhanced inhibition of tumor growth. We also found that the combination of MY-1 with an Ab against PD-1 yielded a syn-ergistic antitumor effect against SIRPα-negative mouse colon cancer cells in vivo. In addition, such anti-tumor activity induced by the combination of MY-1 with an Ab against PD-1 was not affected by the
Figure 6. Impact of combination therapy with MY-1 and either rituximab or a mAb against PD-1 on tumor growth in vivo. (A and B) NOD/SCID mice were injected s.c. with Raji cells and then treated with the indicated combinations of Abs according to the indicated schedule, beginning either when the tumors became palpable (on day 7) (A) or when they had achieved an average size of 150 to 200 mm3 (B). (C) CT26 cells were incubated with a biotin-conjugated mAb against PD-L1 (anti–PD-L1) (or isotype control) or with mAbs against mouse signal regulatory protein α (SIRPα) (P84 or MY-1) (or an isotype con-trol). The cells were then stained with propidium iodide (PI) and with either allophycocyanin-conjugated (APC-conjugated) streptavidin or Alexa Fluor 488–conjugated polyclonal Abs (pAbs) against rat IgG for determination of cell-surface expression of PD-L1 and SIRPα by flow cytometry. (D) Tumor volume for BALB/c mice injected s.c. with CT26 cells and treated with control IgG, MY-1, or a mAb against PD-1 (α–PD-1), beginning after tumors had achieved an average size of 100 mm3. Data represent the mean ± SEM for n = 5 (A and B) or n = 6 (D) mice per group or are representative of 3 separate experiments (C). **P < 0.01 and ***P < 0.001, by 2-way ANOVA with Tukey’s test.
1 0insight.jci.org doi:10.1172/jci.insight.89140
R E S E A R C H A R T I C L E
depletion of macrophages in mice bearing CT26 cell tumors (data not shown), suggesting that MY-1 synergizes the efficacy of the PD-1 Ab without the promotion of macrophage-mediated ADCP toward SIRPα-nonexpressing tumor cells. Interestingly, it was recently demonstrated that CD47 blockage syner-gized with PD-L1 antagonism to potentiate the attenuation of tumor growth in immunocompetent mice injected s.c. with syngeneic B16F10 melanoma cells, whereas CD47 blockage alone or in combination with a tumor-specific Ab failed to prevent the tumor formation (49). Together, these findings suggest that targeting both the CD47/SIRPα and PD-1/PD-L1 axes provides a new approach to immunotherapy for a broad range of cancers. Further investigation is warranted to elucidate the mechanism underlying these antitumor effects of the anti-SIRPα Ab, however.
Finally, we confirmed that MY-1 had no marked adverse effects on hematologic or blood biochemical parameters in mice. Although Abs against CD47 are thought to hold promise for the treatment of various types of cancer (55), they have also been shown to have undesired effects such as a marked reduction in the number of rbc (anemia), probably as a result of their triggering of ADCC or ADCP directed toward rbc, which express CD47 at a high level (56). With regard to adverse effects, therefore, Abs against SIRPα may be a better choice for the development of anticancer drugs that target the CD47/SIRPα axis.
MethodsAdditional details on methods can be found in the supplemental methods and figures.
Abs and reagents. Rat mAbs against mouse SIRPα (MY-1 [rat IgG2a] and P84 [rat IgG1]; provided by Carl F. Lagenaur, University of Pittsburgh, Pittsburgh, Pennsylvania, USA) and against mouse SIRPβ were gener-ated and purified as described previously (26–29). Α mouse mAb against the Myc epitope tag (clone 9E10) was from Santa Cruz Biotechnology Inc. Rituximab (mAb against human CD20) was obtained from Chugai Pharmaceutical. A mAb against mouse PD-1 (4H2, a chimeric rat Ab with a murine IgG1 constant region) was from Ono Pharmaceutical. A rabbit mAb against MART-1 (clone EP1422Y) and rabbit pAbs against SIRPα (ab53721 and ab139698), which were generated against the cytoplasmic region of human SIRPα, were from Abcam. An FITC-conjugated mAb against mouse CD8α (clone 53-6.7), a phycoerythrin-conjugated (PE-conjugated) mAb against mouse CD3ε (clone 145-2C11), an allophycocyanin-conjugated (APC-conjugated) mAb against mouse CD4 (clone RM4-5), and a biotin-conjugated rat IgG2bκ isotype control (clone A95-1) were from BD Biosciences. A PE-conjugated mAb against F4/80 (clone BM8), a rat mAb against mouse CD16/CD32 (clone 93), a biotin-conjugated mAb against MHC class II (clone M5/114.15.2), a biotin-con-jugated mAb against SIRPα (clone P84), an APC-conjugated mAb against human CD47 (clone B6H12), and an APC-conjugated mouse IgG1κ isotype control (clone P3.6.2.8.1) were from eBioscience. APC-conjugated streptavidin, FITC-conjugated streptavidin, an FITC-conjugated mAb against mouse CD49b (clone DX5), an FITC-conjugated mAb against SIRPα (clone P84), PE- and Cy7-conjugated streptavidin, a brilliant violet 421–conjugated mAb against mouse CD11b (clone M1/70), a brilliant violet 510–conjugated mAb against mouse CD45 (clone 30-F11), an Alexa Fluor 488–conjugated mAb against mouse CD3ε (clone 145-2C11), a PE-conjugated mAb against mouse CD8α (clone 53-6.7), an FITC-conjugated mAb against mouse CD206 (clone C068C2), a biotin-conjugated mAb against F4/80 (clone BM8), a biotin-conjugated mAb against PD-L1 (clone 10F.9G2), an APC-conjugated mAb against mouse Ly6C (clone HK1.4), a PE-conjugated mAb against Ly6G/Ly6C (clone RB6-8C5), a PE-conjugated mAb against mouse Foxp3 (clone 150D), a mAb against human CD172b (SIRPβ, clone B4B6), a mAb against CD172g (SIRPγ, clone LSB2.20), a PE- and Cy7-conjugated mouse IgG1κ isotype control (clone MOPC-21), and a biotin-conjugated rat IgG1κ isotype control (clone RTK-2071) were from BioLegend. HRP-conjugated goat pAbs against rabbit, mouse, or rat IgG; Cy3-conjugated goat pAbs against rabbit, rat, or mouse IgG, as well as normal rat or mouse IgG were from Jackson ImmunoResearch Laboratories. A mouse IgG1 isotype control (clone G3A1) was from Cell Signal-ing Technology. Rat IgG1 (clone 43414) and IgG2 (clone 54447) isotype controls were from R&D Systems. A mouse mAb against β-tubulin and propidium iodide (PI) were from Sigma-Aldrich. Rat mAbs against mouse CD8α (clone 2.43) and against CD4 (clone GK1.5) were from Bio X cell. Rabbit pAbs against mouse asialo-GM1 were from Wako. Alexa Fluor 488–conjugated goat pAbs against rat, mouse, or rabbit IgG and Alexa Fluor 647–conjugated goat pAbs against rat IgG as well as CFSE were from Thermo Fisher Scientific.
Animals. NOD, NOD/ShiLtJ-Prkdcscid (NOD/SCID), C57BL/6J, and BALB/c mice, which were obtained from Charles River Laboratories Japan, Japan SLC (Shizuoka, Japan), or CLEA Japan (Tokyo, Japan), were maintained in the Institute for Experimental Animals at the Kobe University Graduate School of Medicine under specific pathogen–free conditions.
1 1insight.jci.org doi:10.1172/jci.insight.89140
R E S E A R C H A R T I C L E
Patients and tissue samples. Paired tumor and noncancerous renal cortex tissue specimens were obtained from material surgically resected from 95 patients with primary clear cell renal cell carcinoma at the National Cancer Center Hospital (Tokyo, Japan). Noncancerous renal cortex tissue consisted mostly of proximal tubules, which are the origin of clear cell renal cell carcinoma. Tissue specimens were provided by the National Cancer Center Biobank (Tokyo, Japan). Human melanoma tissue was obtained during surgical resection from 8 patients treated at the Department of Dermatology, Gunma University Hospital (Gunma, Japan).
Analysis of SIRPA mRNA abundance in human clear cell renal cell carcinoma. Total RNA was isolated from paired cancerous tissue and noncancerous renal cortex specimens from 95 patients with clear cell renal cell carcinoma using TRIzol reagent (Thermo Fisher Scientific) and was subjected to expression microarray analysis as described previously (23). In brief, fluorescent complementary RNA (cRNA) was produced from the total RNA (200 ng) and subjected to hybridization with a SurePrint G3 Human Gene Expression 8 × 60 K microarray (Agilent Technologies). The signal for the probe correspond-ing to SIRPA (ID: A_23_P210708) was extracted with the use of Feature Extraction software (Agilent Technologies). Microarray analysis data were deposited in the publicly available Integrative Disease Omics Database (http://gemdbj.ncc.go.jp/omics/biomart/martform/#!/Analysis/summary_mRNA_array?datasets=cancer_kidney), as previously described (23).
Generation of mouse mAbs against human SIRPα. BALB/c mice were injected with a fusion protein consisting of the extracellular portion of human SIRPα fused to the Fc portion of human IgG1, and hybridomas were selected on the basis of positive staining by the released Abs of human neutrophils, monocytes, or THP-1 or U937 cells as detected by flow cytometry (57). The mAbs were purified from serum-free culture supernatants of the selected hybridoma cells by column chromatography with protein G Sepharose 4 Fast Flow (GE Healthcare). The 040 mAb thus generated was used in the present study.
H&E staining and immunostaining. Tumor tissue from patients with clear cell renal cell carcinoma was fixed with formalin, embedded in paraffin, sectioned at a thickness of 3 μm, and stained with H&E. Par-affin-embedded sections were also subjected to immunohistochemical staining with the use of EnVision+ System-HRP (Agilent Technologies). In brief, sections were depleted of paraffin, rehydrated, immersed in 10 mM citrate buffer (pH 6.0), and heated in a pressure cooker for 3 minutes to facilitate antigen retrieval. They were then washed with TBS-T (20 mM Tris, pH 7.5, 140 mM NaCl, 0.01% Tweeen-20), treated for 5 minutes with Peroxidase Block (EnVision+ System-HRP) to quench endogenous peroxidase activity, exposed for 30 minutes to TBS-T containing 1% BSA, and incubated for 30 minutes with primary Abs diluted in TBS-T. The sections were again washed with TBS-T, incubated for 30 minutes with peroxidase-labeled polymer conjugated to goat Abs against rabbit IgG (EnVision+ System-HRP), and washed further with TBS-T, after which immune complexes were detected by exposure to 3,3′-diaminobenzidine chromo-gen solution (EnVision+ System-HRP). The sections were finally counterstained with Mayer’s hematoxylin before observation with a BX51 microscope (Olympus).
Fresh-frozen sections (4 μm thickness) prepared from human melanoma tissue were fixed with 4% paraformaldehyde in PBS, exposed for 1 hour to PBS containing 3% nonfat dried milk and 5% normal goat serum, and then incubated overnight with primary Abs. The sections were then washed with PBS, incubated for 1 hour with corresponding Cy3- or Alexa Fluor 488–conjugated secondary Abs, and stained with DAPI. Fluorescence images were acquired with a BX51 fluorescence microscope (Olympus). For immunofluorescence staining of cultured cells, the cells were fixed for 10 minutes with 4% paraformalde-hyde, incubated for 30 minutes with buffer G (PBS containing 5% goat serum and 0.1% Triton X-100), and stained with primary Abs in the same buffer. Immune complexes were detected with dye-labeled secondary Abs in buffer G, and the cells were then examined with an Olympus BX51 fluorescence microscope.
Cell culture. A human Burkitt’s lymphoma cell line (Raji), human melanoma cell lines (A375, SK-MEL-5, and SK-MEL-28), human renal cell carcinoma cell lines (ACHN, 786-O, A498, and Caki-1), a mouse renal carcinoma cell line (RENCA), and a mouse colon cancer cell line (CT26) were obtained from American Type Culture Collection (ATCC). HEK293A and FreeStyle 293-F cells were obtained from Thermo Fisher Scientific. The human melanoma cell line WM239a and the mouse melanoma cell line B16BL6 were provided by Meenhard Herlyn (The Wistar Institute, Philadelphia, Pennsylvania, USA) and Kazuyoshi Takeda and Ko Okumura (Juntendo University, Tokyo, Japan), respectively. Raji, 786-O, REN-CA, CT26, and B16BL6 cells were maintained in RPMI 1640 medium (Wako) supplemented with 10% FBS. A375 cells were cultured in DMEM (Wako) supplemented with 10% FBS. SK-MEL-5, SK-MEL-28,
1 2insight.jci.org doi:10.1172/jci.insight.89140
R E S E A R C H A R T I C L E
ACHN, and A498 cells were maintained in Eagle’s minimum essential medium (Wako) supplemented with 10% FBS. Caki-1 cells were cultured in McCoy’s 5A medium (Thermo Fisher Scientific) supplemented with 10% FBS. WM239a cells were maintained in medium W489, a 4:1 (v/v) mixture of MCDB153 (Sigma-Aldrich), and L15 (Thermo Fisher Scientific), supplemented with 2 mM CaCl2, 2% FBS, and bovine insulin (5 μg/ml). CHO cells stably expressing an active form of H-Ras (CHO-Ras cells) were provided by Sane-take Shirahata (Kyushu University, Fukuoka, Japan), and CHO-Ras cells stably expressing mouse SIRPα, mouse CD47, or human SIRPα were provided by Nakayuki Honma (Kyowa Hakko Kirin, Tokyo, Japan) (58, 59). CHO-Ras cells and their derivatives were cultured in α-modified minimum essential medium (Sigma-Aldrich) supplemented with 2 mM L-glutamine, 10 mM HEPES-NaOH (pH 7.4), and 10% FBS.
Immunoblot analysis. Cells were washed with ice-cold PBS and then homogenized in a solution con-taining 50 mM Tris-HCl (pH 8.0), 150 mM NaCl, 1 mM EDTA, and 1% SDS. The lysates were heated at 95°C for 5 minutes and then centrifuged at 17,500 g for 30 minutes at room temperature, and the resulting supernatants were subjected to immunoblot analysis as previously described (59).
Cell preparation and flow cytometry. For isolation of tumor-infiltrating cells, tumors were harvested, minced with forceps, and then digested with HBSS containing collagenase (400 U/ml; Wako), trypsin inhibitor (50 μg/ml; Wako), and DNase I (40 μg/ml; Roche). The undigested material was removed by filtration through a 70-μm cell strainer (BD Biosciences), and the remaining cells were washed twice with PBS, suspended in 6.4 ml of DMEM containing 46% OptiPrep (Alere Technologies) and 3% FBS, and then overlaid consecutively with 3 ml DMEM containing 26% OptiPrep and 7.4% FBS and with 500 μl DMEM containing 10% FBS. The resulting gradient was centrifuged at 800 g for 25 minutes at 20°C, after which cells at the interface of the top 2 layers were collected, washed twice with PBS, and subjected to flow cyto-metric analysis. For isolation of splenocytes, mouse spleen was ground gently with autoclaved frosted-glass slides in PBS, fibrous material was removed by filtration through a 70-μm cell strainer, and rbc in the filtrate were lysed with BD Pharm Lyse (BD Biosciences). The remaining cells were washed twice with PBS and then subjected to flow cytometric analysis.
For flow cytometric analysis, cells were first incubated with a mAb specific for mouse CD16/CD32 to prevent nonspecific binding of labeled mAbs against FcγR and were then labeled with specific mAbs. For staining of Foxp3, cells were labeled with a PE-conjugated mAb against mouse Foxp3 with the use of a Tran-scription Factor Staining Kit (TONBO Biosciences). Labeled cells were analyzed by flow cytometry using a FACSVerse instrument (BD Biosciences), and all data were analyzed with FlowJo 9.9.3 software (Tree Star).
For determination of the expression of SIRPα on mouse cancer cell lines, cells were incubated with a mAb against mouse CD16/CD32, washed with PBS, and then incubated first with a biotin-conjugated mAb against SIRPα (P84) or isotype control and then with APC-conjugated streptavidin and PI. Alterna-tively, mouse cancer cells were treated with a mAb against mouse CD16/CD32 and then stained with PI as well as with the MY-1 mAb (or an isotype control) followed by dye-labeled secondary Abs. Stained cells were subjected to flow cytometry, and data were analyzed with FlowJo software.
Tumor cell engraftment and treatment. RENCA cells (5 × 10⁵ in 50 μl of PBS) were mixed with an equal volume of Matrigel (Corning) and injected s.c. into the flanks of 8-week-old female BALB/c mice. Mice were injected i.p. with normal rat IgG, MY-1, or P84 (each at 200 μg) 3 times a week beginning immediately after tumor cell injection or with these same Abs (each at 400 μg) 3 times a week beginning when the tumor volume had achieved an average of 100 mm3. Raji cells (3 × 10⁶ in 50 μl of PBS) were mixed with an equal volume of Matrigel and injected s.c. into the flanks of 6-week-old female NOD/SCID mice. The mice were injected i.p. with normal rat IgG (100 μg), MY-1 (100 μg), or P84 (100 μg), each with or without rituximab (40 μg), twice a week beginning when the tumors became palpable (on day 7), or with normal rat IgG (200 μg) or MY-1 (200 μg), each with or without rituximab (150 μg), twice a week beginning after tumor volume had achieved an average of 150 to 200 mm3. CT26 cells (5 × 10⁵ in 50 μl of PBS) were injected s.c. into the flanks of 8-week-old female BALB/c mice. The mice were injected i.p. with normal rat IgG (200 μg) or MY-1 (200 μg), each with or without anti–PD-1 Ab (100 μg), twice a week beginning when tumors had achieved an average size of 100 mm3. Tumors were measured with digital calipers, and tumor volume was calculated as: a × b2/2, where a is the largest diameter and b the smallest diameter. For the B16BL6 model, female C57BL/6J mice at 8 weeks of age were injected i.v. with B16BL6 cells (5 × 10⁴ in 100 μl of PBS) as described previously (12) and then injected i.p. with normal rat IgG, MY-1, or P84 (each at 200 μg) 3 times a week. Mice were sacrificed on day 14, and the number of tumor colonies formed in the lungs was counted with the use of a dissection microscope (MZ9.5; Leica).
1 3insight.jci.org doi:10.1172/jci.insight.89140
R E S E A R C H A R T I C L E
Hematologic and blood biochemical analyses. Female C57BL/6J mice at 8 weeks of age were injected i.p. with PBS or with normal rat IgG or MY-1 (each at 100 μg) 3 times a week. On day 14, hematologic and blood biochemical parameters were analyzed with an ADVIA 2120 Hematology Analyzer (Siemens) or an Auto Analyzer 7070 (Hitachi), respectively.
ADCP assay. For preparation of BMDMs, BM cells were isolated from the femur and tibia of mice using a syringe fitted with a 27-gauge needle as described previously (13), with slight modifications. The cells (1 × 10⁶/ml) were seeded on culture plates in Iscove’s modified Dulbecco’s medium (Nacalai Tesque) supplemented with recombinant murine macrophage CSF (10 ng/ml; PeproTech) and 10% FBS in order to obtain BMDMs. For ADCP assays, BMDMs were plated at a density of 1 × 10⁵ per well in 6-well plates and allowed to adhere overnight. Target cells (4 × 10⁵ RENCA cells) were labeled with CFSE, added to the BMDMs (effector cells), and incubated for 4 hours in the presence of Abs (10 μg/ml). Alternatively, CFSE-labeled target cells and effector cells, both of which had been preincubated with either Abs (10 μg/ml) or F(ab′)2 fragments (10 μg/ml) for 30 minutes, were washed with PBS and mixed with effector cells and CFSE-labeled target cells, respectively, and incubated for 4 hours. Cells were then harvested, stained for F4/80 as well as PI, and analyzed by flow cytometry. The percentage of phagocytosis by BMDMs was calculated as: 100 × F4/80+CFSE+PI– cells/F4/80+CFSE+PI– cells + F4/80+CFSE–PI– cells.
RNAi. RNAi for endogenous mouse SIRPα was performed with the siRNA sequence 5′-CAAGCAU-UGAGACAGGCAATT-3′ (Sirpa siRNA). The MISSION siRNA universal negative control (Sigma-Aldrich) was also used. RENCA cells were transfected with siRNAs using Lipofectamine RNAiMAX (Thermo Fisher Scientific).
Depletion of macrophages, NK cells, CD4+ T cells, and CD8+ T cells in vivo. Depletion of macrophages in 8-week-old female BALB/c mice was performed as described previously (60), with minor modifications. In brief, mice were injected i.v. with 200 μl of either clodronate liposomes or PBS liposomes (Formu Max) 1 day before injection of tumor cells as well as with 100 μl of the respective liposomes every 3 days thereafter. For NK cell depletion, 8-week-old female BALB/c mice were injected i.p. with pAbs against asialo-GM1 (50 μl) 1 day before and on the day of tumor cell injection and then every 4 days thereafter. For depletion of CD4+ or CD8+ T cells, 8-week-old female BALB/c mice were injected i.p. with a mAb against CD4 (GK1.5, 400 μg) or against CD8α (2.43, 400 μg) 1 day before injection of tumor cells and then every 5 days thereafter. For depletion of NK cells or CD8+ T cells in mice with established tumors, 8-week-old female BALB/c mice were injected i.p. with pAbs against asialo-GM1 (50 μl) and a mAb against CD8α (400 μg) 3 days after injection of tumor cells and then every 4 and 5 days thereafter, respectively. The effectiveness of macrophage, NK cell, CD4+ T cell, or CD8+ T cell depletion was determined by flow cytometric analysis of CD45+F4/80+CD11b+, CD45+CD3ε–CD49b+, CD45+CD3ε+CD4+, or CD45+CD3ε+CD8α+ cells among splenocytes or tumor-infiltrating cells from the treated animals.
Statistics. Data are presented as the mean ± SEM and were analyzed by a 2-tailed Student’s t test, ANOVA followed by Tukey’s test, or a long-rank test. A P value of less than 0.05 was considered statisti-cally significant. Analysis was performed using GraphPad Prism 6.0 (GraphPad Software).
Study approval. All animal experiments were performed according to the guidelines of the Animal Care and Experimentation Committee of Kobe University. All patients included in this study provided informed consent. The study was also approved by the IRB of Gunma University and the Ethics Committee of the National Cancer Center and was performed in accordance with the tenets of the Declaration of Helsinki.
Author contributionsTY, YM, and TM designed research studies. TY, YM, DT, SM, DH, and EA conducted experiments, acquired data, and analyzed data. EWD, KW, and NVG performed research studies. YS, T. Kotani, HO, MM, YK, PAO, OI, T. Komori, and TM analyzed data. TY, YM, and TM wrote the manuscript.
AcknowledgmentsWe thank C.F. Lagenaur for the rat mAbs against mouse SIRPα, M. Herlyn for WM239a cells, K. Takeda and K. Okumura for B16BL6 cells, S. Shirahata for CHO-Ras cells, and N. Honma for the plasmid encod-ing human SIRPαv2 protein and CHO-Ras cells stably expressing human or mouse SIRPα or mouse CD47. We also thank S. Hara (Kobe University, Kobe, Japan) and T. Shibata (Kyowa Hakko Kirin) for their technical advice and helpful discussions. This work was supported in part by a Grant-in-Aid for Scientific Research (B) from the Japan Society for the Promotion of Science (JSPS); the Program for Development of
1 4insight.jci.org doi:10.1172/jci.insight.89140
R E S E A R C H A R T I C L E
Innovative Research on Cancer Therapeutics (P-Direct) from the Japan Agency for Medical Research and Development (AMED); the Program for Promotion of Fundamental Studies in Health Sciences (10-43) of the National Institute of Biochemical Innovation (NiBio); and by grants from the Princess Takamatsu Cancer Research Fund (14-24626), the Suzuken Memorial Foundation, and the Hyogo Science and Tech-nology Association. The National Cancer Center Biobank is supported by the National Cancer Center Research and Development Fund (26-A-1).
Address correspondence to: Takashi Matozaki or Yoji Murata, Division of Molecular and Cellular Signal-ing, Department of Biochemistry and Molecular Biology, Kobe University Graduate School of Medicine, 7-5-1 Kusunoki-cho, Chuo-ku, Kobe 650-0017, Japan. Phone: 81.78.382.5600. E-mail: [email protected] (T. Matozaki); [email protected] (Y. Murata).
NVG’s present address is: Laboratorio de Inmunología y Biología Molecular, Facultad de Medicina Veteri-naria y Zootecnia, Universidad del Tolima, Ibagué, Columbia.
1. Hanahan D, Coussens LM. Accessories to the crime: functions of cells recruited to the tumor microenvironment. Cancer Cell. 2012;21(3):309–322.
2. Quail DF, Joyce JA. Microenvironmental regulation of tumor progression and metastasis. Nat Med. 2013;19(11):1423–1437. 3. Munn DH, Bronte V. Immune suppressive mechanisms in the tumor microenvironment. Curr Opin Immunol. 2016;39:1–6. 4. Okazaki T, Chikuma S, Iwai Y, Fagarasan S, Honjo T. A rheostat for immune responses: the unique properties of PD-1 and
their advantages for clinical application. Nat Immunol. 2013;14(12):1212–1218. 5. Kohrt HE, et al. Immunodynamics: a cancer immunotherapy trials network review of immune monitoring in immuno-oncology
clinical trials. J Immunother Cancer. 2016;4:15. 6. Groh V, Wu J, Yee C, Spies T. Tumour-derived soluble MIC ligands impair expression of NKG2D and T-cell activation. Nature.
2002;419(6908):734–738. 7. Raffaghello L, et al. Downregulation and/or release of NKG2D ligands as immune evasion strategy of human neuroblastoma.
Neoplasia. 2004;6(5):558–568. 8. Matozaki T, Murata Y, Okazawa H, Ohnishi H. Functions and molecular mechanisms of the CD47-SIRPα signalling pathway.
Trends Cell Biol. 2009;19(2):72–80. 9. Barclay AN, Van den Berg TK. The interaction between signal regulatory protein alpha (SIRPα) and CD47: structure, function,
and therapeutic target. Annu Rev Immunol. 2014;32:25–50. 10. Seiffert M, et al. Signal-regulatory protein alpha (SIRPα) but not SIRPβ is involved in T-cell activation, binds to CD47 with high
affinity, and is expressed on immature CD34+CD38– hematopoietic cells. Blood. 2001;97(9):2741–2749. 11. Ishikawa-Sekigami T, et al. SHPS-1 promotes the survival of circulating erythrocytes through inhibition of phagocytosis by
splenic macrophages. Blood. 2006;107(1):341–348. 12. Okajo J, et al. Regulation by Src homology 2 domain-containing protein tyrosine phosphatase substrate-1 of α-galactosylceramide-
induced antimetastatic activity and Th1 and Th2 responses of NKT cells. J Immunol. 2007;178(10):6164–6172. 13. Saito Y, et al. Regulation by SIRPα of dendritic cell homeostasis in lymphoid tissues. Blood. 2010;116(18):3517–3525. 14. Oldenborg PA. CD47: A cell surface glycoprotein which regulates multiple functions of hematopoietic cells in health and dis-
ease. ISRN Hematol. 2013;2013:614619. 15. Okazawa H, et al. Negative regulation of phagocytosis in macrophages by the CD47-SHPS-1 system. J Immunol.
2005;174(4):2004–2011. 16. Oldenborg PA, Zheleznyak A, Fang YF, Lagenaur CF, Gresham HD, Lindberg FP. Role of CD47 as a marker of self on red
blood cells. Science. 2000;288(5473):2051–2054. 17. Zhao XW, et al. CD47-signal regulatory protein-α (SIRPα) interactions form a barrier for antibody-mediated tumor cell destruc-
tion. Proc Natl Acad Sci U S A. 2011;108(45):18342–18347. 18. Chao MP, et al. Anti-CD47 antibody synergizes with rituximab to promote phagocytosis and eradicate non-Hodgkin lympho-
ma. Cell. 2010;142(5):699–713. 19. Willingham SB, et al. The CD47-signal regulatory protein alpha (SIRPa) interaction is a therapeutic target for human solid
tumors. Proc Natl Acad Sci U S A. 2012;109(17):6662–6667. 20. Zhao XW, Kuijpers TW, van den Berg TK. Is targeting of CD47-SIRPα enough for treating hematopoietic malignancy? Blood.
2012;119(18):4333–4; author reply 4334. 21. Uhlén M, et al. A human protein atlas for normal and cancer tissues based on antibody proteomics. Mol Cell Proteomics.
2005;4(12):1920–1932. 22. Barretina J, et al. The Cancer Cell Line Encyclopedia enables predictive modelling of anticancer drug sensitivity. Nature.
2012;483(7391):603–607. 23. Arai E, et al. Alterations of the spindle checkpoint pathway in clinicopathologically aggressive CpG island methylator pheno-
type clear cell renal cell carcinomas. Int J Cancer. 2015;137(11):2589–2606. 24. Ohsie SJ, Sarantopoulos GP, Cochran AJ, Binder SW. Immunohistochemical characteristics of melanoma. J Cutan Pathol.
2008;35(5):433–444. 25. van Beek EM, Cochrane F, Barclay AN, van den Berg TK. Signal regulatory proteins in the immune system. J Immunol.
2005;175(12):7781–7787. 26. Verjan Garcia N, et al. SIRPα/CD172a regulates eosinophil homeostasis. J Immunol. 2011;187(5):2268–2277.
1 5insight.jci.org doi:10.1172/jci.insight.89140
R E S E A R C H A R T I C L E
27. Chuang W, Lagenaur CF. Central nervous system antigen P84 can serve as a substrate for neurite outgrowth. Dev Biol. 1990;137(2):219–232.
28. Ohnishi H, et al. Differential localization of Src homology 2 domain-containing protein tyrosine phosphatase substrate-1 and CD47 and its molecular mechanisms in cultured hippocampal neurons. J Neurosci. 2005;25(10):2702–2711.
29. Hayashi A, et al. Positive regulation of phagocytosis by SIRPβ and its signaling mechanism in macrophages. J Biol Chem. 2004;279(28):29450–29460.
30. Mills CD, Lenz LL, Harris RA. A Breakthrough: macrophage-directed cancer immunotherapy. Cancer Res. 2016;76(3):513–516. 31. Guiducci C, Vicari AP, Sangaletti S, Trinchieri G, Colombo MP. Redirecting in vivo elicited tumor infiltrating macrophages and
dendritic cells towards tumor rejection. Cancer Res. 2005;65(8):3437–3446. 32. Bronte V, et al. Recommendations for myeloid-derived suppressor cell nomenclature and characterization standards. Nat Com-
mun. 2016;7:12150. 33. Liu C, Workman CJ, Vignali DA. Targeting regulatory T cells in tumors. FEBS J. 2016;283(14):2731–2748. 34. Kasai M, Yoneda T, Habu S, Maruyama Y, Okumura K, Tokunaga T. In vivo effect of anti-asialo GM1 antibody on natural
killer activity. Nature. 1981;291(5813):334–335. 35. Sriram S, Carroll L. In vivo depletion of Lyt-2 cells fails to alter acute and relapsing EAE. J Neuroimmunol. 1988;17(2):147–157. 36. Takenaka K, et al. Polymorphism in Sirpa modulates engraftment of human hematopoietic stem cells. Nat Immunol.
2007;8(12):1313–1323. 37. Reff ME, et al. Depletion of B cells in vivo by a chimeric mouse human monoclonal antibody to CD20. Blood. 1994;83(2):435–445. 38. Iwai Y, Terawaki S, Honjo T. PD-1 blockade inhibits hematogenous spread of poorly immunogenic tumor cells by enhanced
recruitment of effector T cells. Int Immunol. 2005;17(2):133–144. 39. Li B, VanRoey M, Wang C, Chen TH, Korman A, Jooss K. Anti-programmed death-1 synergizes with granulocyte macrophage
colony-stimulating factor-secreting tumor cell immunotherapy providing therapeutic benefit to mice with established tumors. Clin Cancer Res. 2009;15(5):1623–1634.
40. Motzer RJ, et al. Overall survival and updated results for sunitinib compared with interferon alfa in patients with metastatic renal cell carcinoma. J Clin Oncol. 2009;27(22):3584–3590.
41. Motzer RJ, Mazumdar M, Bacik J, Berg W, Amsterdam A, Ferrara J. Survival and prognostic stratification of 670 patients with advanced renal cell carcinoma. J Clin Oncol. 1999;17(8):2530–2540.
42. Finn L, Markovic SN, Joseph RW. Therapy for metastatic melanoma: the past, present, and future. BMC Med. 2012;10:23. 43. Bedke J, Kruck S, Gakis G, Stenzl A, Goebell PJ. Checkpoint modulation- a new way to direct the immune system against renal
cell carcinoma. Hum Vaccin Immunother. 2015;11(5):1201–1208. 44. Davey RJ, van der Westhuizen A, Bowden NA. Metastatic melanoma treatment: combining old and new therapies. Crit Rev
Oncol Hematol. 2016;98:242–253. 45. Komohara Y, Niino D, Ohnishi K, Ohshima K, Takeya M. Role of tumor-associated macrophages in hematological malignan-
cies. Pathol Int. 2015;65(4):170–176. 46. Pan YF, et al. Signal regulatory protein α is associated with tumor-polarized macrophages phenotype switch and plays a pivotal
role in tumor progression. Hepatology. 2013;58(2):680–691. 47. Leidi M, et al. M2 macrophages phagocytose rituximab-opsonized leukemic targets more efficiently than M1 cells in vitro.
J Immunol. 2009;182(7):4415–4422. 48. Liu X, et al. CD47 blockade triggers T cell-mediated destruction of immunogenic tumors. Nat Med. 2015;21(10):1209–1215. 49. Sockolosky JT, et al. Durable antitumor responses to CD47 blockade require adaptive immune stimulation. Proc Natl Acad Sci
USA. 2016;113(19):E2646–E2654. 50. Soto-Pantoja DR, et al. CD47 in the tumor microenvironment limits cooperation between antitumor T-cell immunity and radio-
therapy. Cancer Res. 2014;74(23):6771–6783. 51. Mattiola I, et al. Priming of human resting NK cells by autologous M1 macrophages via the engagement of IL-1β, IFN-β, and
IL-15 pathways. J Immunol. 2015;195(6):2818–2828. 52. Bodduluru LN, Kasala ER, Madhana RM, Sriram CS. Natural killer cells: the journey from puzzles in biology to treatment of
cancer. Cancer Lett. 2015;357(2):454–467. 53. Chiba S, et al. Recognition of tumor cells by Dectin-1 orchestrates innate immune cells for anti-tumor responses. Elife.
2014;3:e04177. 54. Asano K, et al. CD169-positive macrophages dominate antitumor immunity by crosspresenting dead cell-associated antigens.
Immunity. 2011;34(1):85–95. 55. Chao MP, Weissman IL, Majeti R. The CD47-SIRPα pathway in cancer immune evasion and potential therapeutic implica-
tions. Curr Opin Immunol. 2012;24(2):225–232. 56. Liu J, et al. Pre-clinical development of a humanized anti-CD47 antibody with anti-cancer therapeutic potential. PLoS One.
2015;10(9):e0137345. 57. Stenberg Å, et al. Signal regulatory protein ɑ is present in several neutrophil granule populations and is rapidly mobilized to the
cell surface to negatively fine-tune neutrophil accumulation in inflammation. J Innate Immun. 2014;6(4):553–560. 58. Motegi S, et al. Essential roles of SHPS-1 in induction of contact hypersensitivity of skin. Immunol Lett. 2008;121(1):52–60. 59. Motegi S, et al. Role of the CD47-SHPS-1 system in regulation of cell migration. EMBO J. 2003;22(11):2634–2644. 60. Weisser SB, van Rooijen N, Sly LM. Depletion and reconstitution of macrophages in mice. J Vis Exp. 2012;(66):4105.


![S.I.R.P Shrink Insulated Resin Protected Joint (12kV)...S.I.R.P MEDIUM VOLTAGE RESIN FILLED JOINTS 12kV Our Ref SIRP-1 SIRP-2 SIRP-3 L [mm] 1320 1470 2500 OD [mm] 150 180 180 D-1 [mm]](https://static.documents.pub/doc/80x56/60fb3558d6942a233d55f02b/sirp-shrink-insulated-resin-protected-joint-12kv-sirp-medium-voltage.jpg)


