Anticyclones Cause Weather Too: An Understanding of Worldwide Strong Anticyclones and Anticyclogenesis Matthew L. Doody, Lance Bosart and Daniel Keyser Department of Earth and Atmospheric Sciences, University at Albany, State University of New York, Albany, New York NROW VIII 1-2 November, 2006 NSF ATM-0434189
Transcript
Anticyclones Cause Weather Too: An Understanding of Worldwide
Strong Anticyclones and Anticyclogenesis
Matthew L. Doody, Lance Bosart and Daniel Keyser
Department of Earth and Atmospheric Sciences, University at Albany, State University of New York, Albany, New York
NROW VIII 1-2 November, 2006
NSF ATM-0434189
Purposes
• Examine global regions where strong anticyclones and anticyclogenesis occur.
• Determine various thresholds and timescales to enhance the climatology.
• Find any possible interannual variability.
• Link strong anticyclones to geographical features.
• Lead into a study of predictability of strong anticyclones and anticyclogenesis.
Data and Methodology• Data used consisted of:
NCEP/NCAR Global Reanalysis at 2.5° resolution.ECMWF ERA-40 Global Reanalysis at
2.5° resolution.Both data sets were used from 1958–
2000• Thresholds were set for the MSLP.• At each gridpoint a counter was used to sum
the number of times the MSLP ≥ the threshold.• Counts were only done at 0000 and 1200 UTC
to mitigate double counting.
Data and Methodology
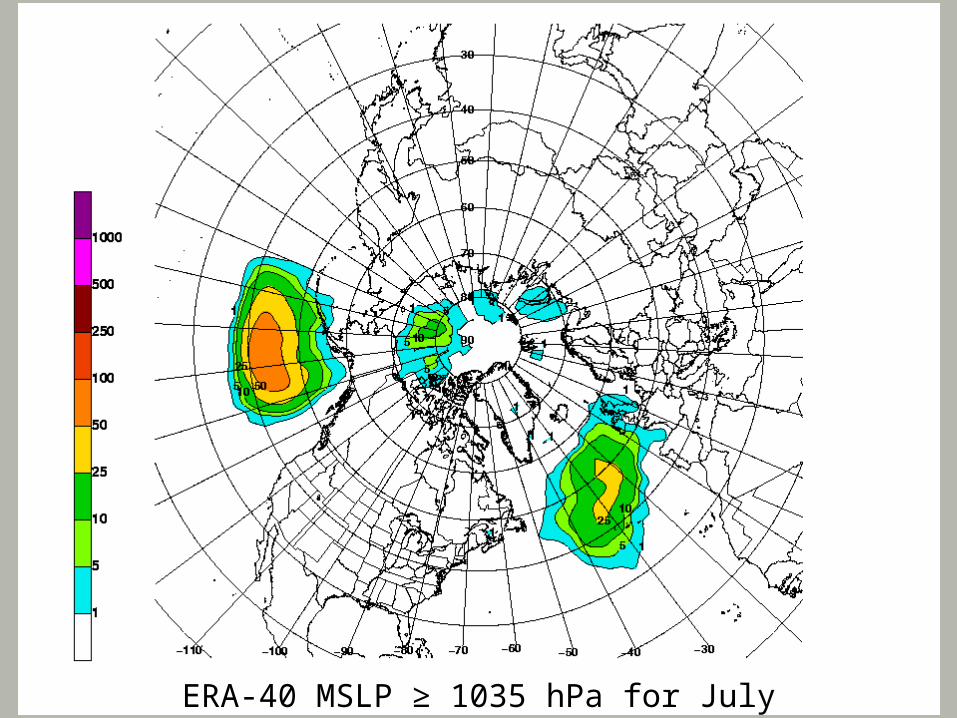
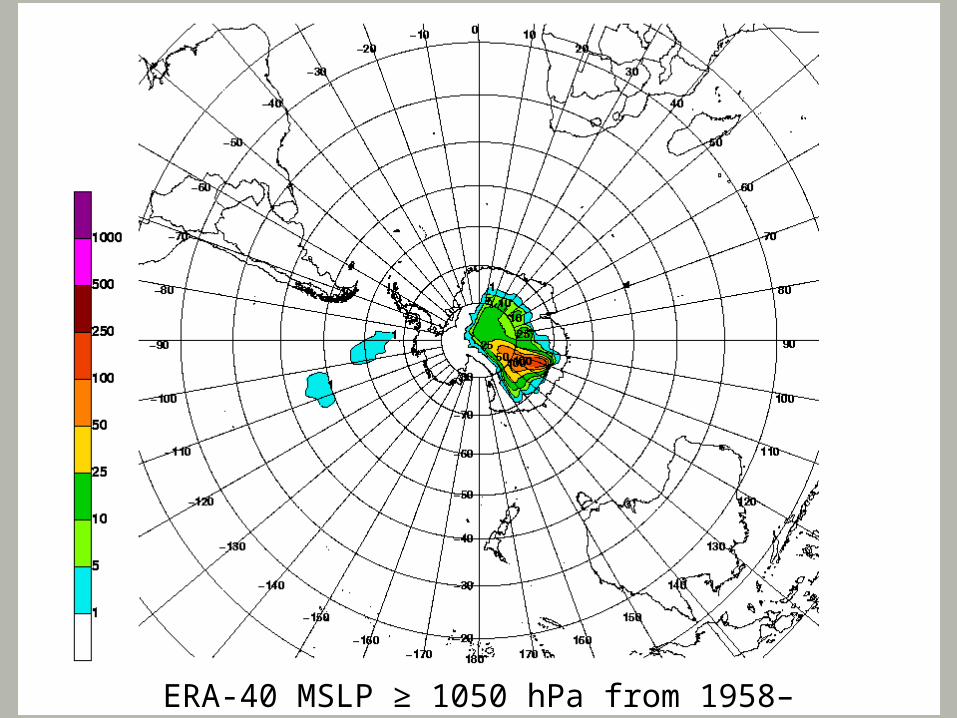
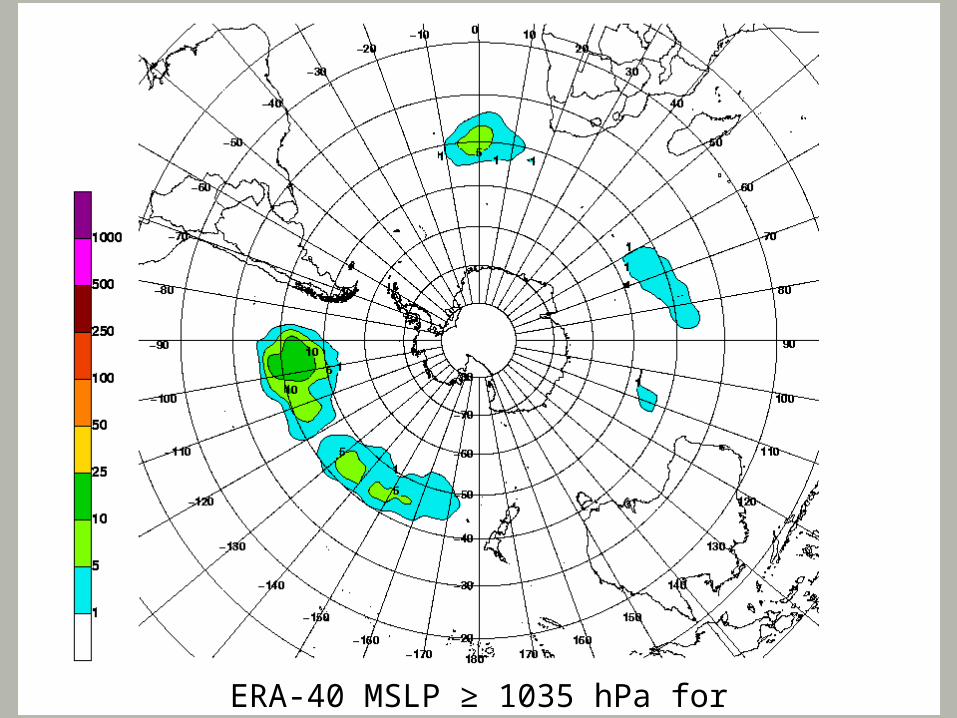
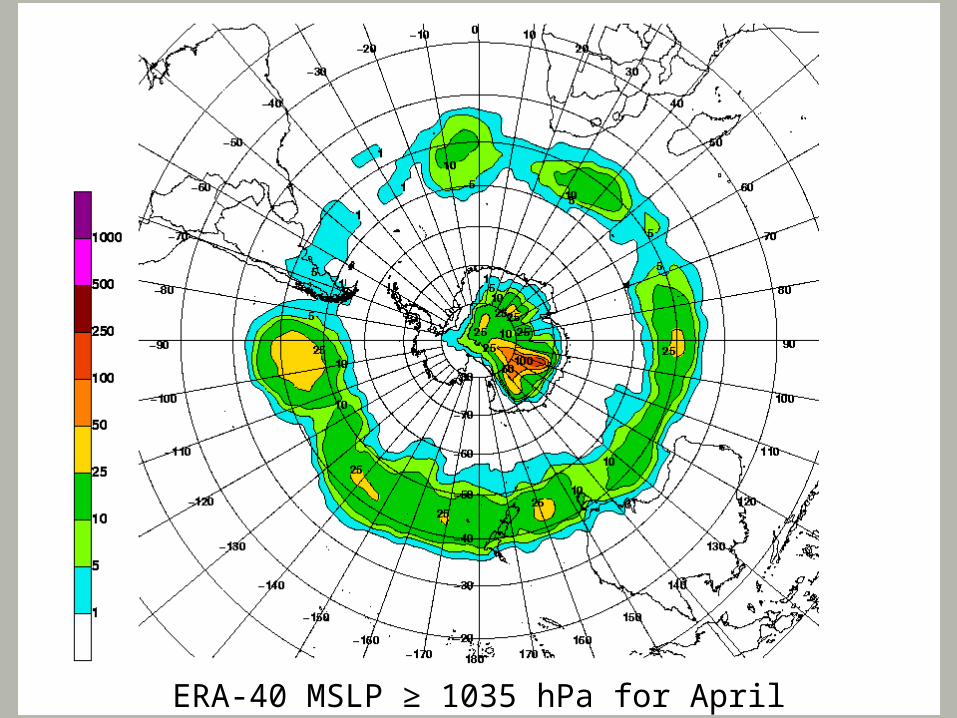
• After tabulation of the data it was then contoured objectively to show the regions where the threshold was met or exceeded.
• It is important to note that the figures that follow do not count coherent closed anticyclones, but simply the number of times the MSLP met or exceeded the defined threshold.
Outline
• Compare and contrast the two datasets.
• Examine the Northern Hemisphere (NH) at various thresholds as well as at monthly timescales.
• Same as above for the Southern Hemisphere (SH).
• Interannual variability.
• Time series of maximum count for ≥ 1050 hPa for each year throughout the datasets.