56
Joel Gallant, MD, MPH Southwest CARE Center Santa Fe, NM University of New Mexico School of Medicine Johns Hopkins University School of Medicine Antiretroviral Therapy in 2016

Joel Gallant, MD, MPH
Southwest CARE Center
Santa Fe, NM
University of New Mexico School of Medicine
Johns Hopkins University School of Medicine
Antiretroviral Therapy in 2016

Disclosures
Consulting, Advisory Boards, and DSMBs
Bristol-Myers Squibb
Gilead Sciences
Janssen Therapeutics
Merck & Co.
ViiV Healthcare
Research Support
AbbVie
Bristol-Myers Squibb
Gilead Sciences
Janssen Therapeutics
Merck & Co.
Sangamo BioSciences
ViiV Healthcare

When to Start

START: Immediate vs Deferred Therapy
for Asymptomatic, ART-Naive Pts
International, randomized trial
Composite 1o endpoint: Serious AIDS-related (AIDS-related death or AIDS-defining event) or non-AIDS–related event (non-AIDS–related death, CVD, end-stage renal disease, decompensated liver disease, non-AIDS–defining cancer)
Median follow-up: 3.0 yrs; med. baseline CD4: 651; med. baseline VL: 12,759
Med. CD4 at initiation of ART for deferred group: 408
Immediate ART
ART initiated immediately
following randomization
(n = 2326)
Lundgren J, et al. N Engl J Med. 2015
Deferred ART
Deferred until CD4 ≤ 350,
AIDS, or event requiring ART
(n = 2359)
HIV+, ART-naive
adults with CD4 > 500
(N = 4685)
Study closed by DSMB
following interim analysis

START: 57% Reduced Risk of Serious Events or
Death With Immediate ART
1.8% vs 4.1% in deferred vs immediate arms experienced serious AIDS or non-AIDS related event or death: HR = 0.43 (95% CI: 0.30 to 0.62); P < .001
10
8
6
4
2
0
Cum
ula
tive
Pe
rcen
t W
ith E
ve
nt
0 6 12 18 24 30 36 42 48 54 60
Month
Deferred ART
Immediate ART
Lundgren J, et al. N Engl J Med. 2015
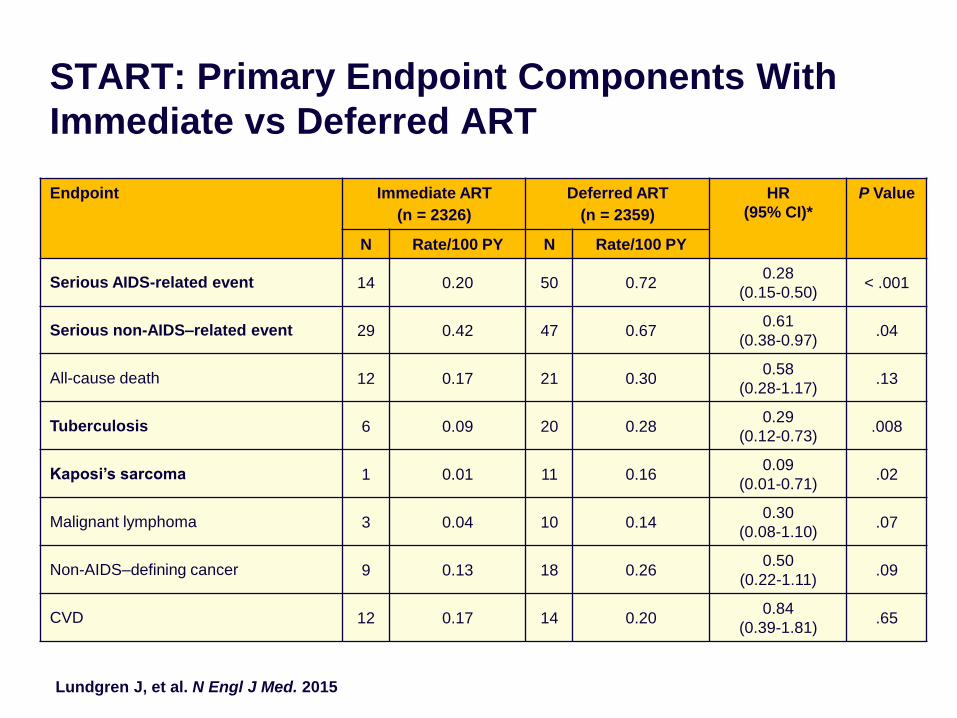
START: Primary Endpoint Components With
Immediate vs Deferred ART
Endpoint Immediate ART
(n = 2326)
Deferred ART
(n = 2359)
HR
(95% CI)*
P Value
N Rate/100 PY N Rate/100 PY
Serious AIDS-related event 14 0.20 50 0.72 0.28
(0.15-0.50) < .001
Serious non-AIDS–related event 29 0.42 47 0.67 0.61
(0.38-0.97) .04
All-cause death 12 0.17 21 0.30 0.58
(0.28-1.17) .13
Tuberculosis 6 0.09 20 0.28 0.29
(0.12-0.73) .008
Kaposi’s sarcoma 1 0.01 11 0.16 0.09
(0.01-0.71) .02
Malignant lymphoma 3 0.04 10 0.14 0.30
(0.08-1.10) .07
Non-AIDS–defining cancer 9 0.13 18 0.26 0.50
(0.22-1.11) .09
CVD 12 0.17 14 0.20 0.84
(0.39-1.81) .65
Lundgren J, et al. N Engl J Med. 2015

START: Cancer Events With Immediate vs
Deferred ART
Cancer Event, n
Immediate
ART
(n = 2326)
Deferred
ART
(n =
2359)
Total 14 39
Kaposi’s sarcoma 1 11
Lymphoma, NHL +
HL 3 10
Prostate cancer 2 3
Lung cancer 2 2
Anal cancer 1 2
Cervical or testis
cancer 1 2
Other types* 4 9
Time to Cancer Event
10
8
6
4
2
0 Cu
mu
lative
% W
ith
Eve
nt
0 12 24 36 48 60
Months
*Immediate ART: squamous cell carcinoma, plasma cell myeloma, bladder cancer, fibrosarcoma.
Deferred ART: gastric adenocarcinoma, breast cancer, ureteric cancer, malignant melanoma, myeloid leukemia, thyroid
cancer, leiomyosarcoma, liver cancer, squamous cell carcinoma of head and neck.
Lundgren J, et al. N Engl J Med. 2015
Deferred ART
Immediate ART
Rate/100 PY: immediate, 0.20; delayed, 0.56
HR (immediate vs delayed):
0.36 (95%CI: 0.19 to 0.66, P = .001)
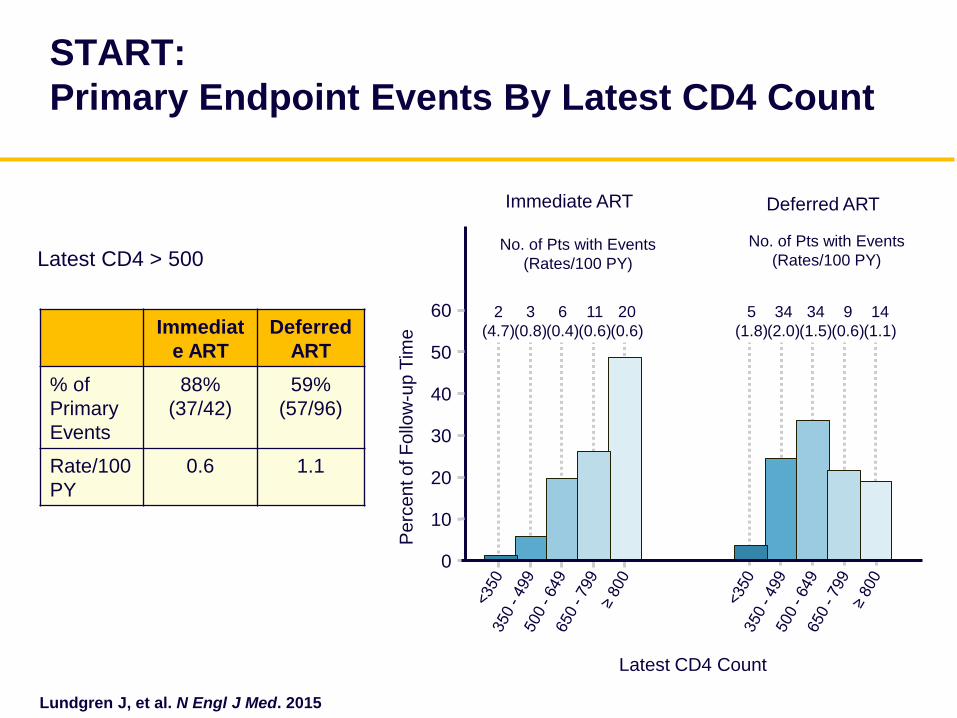
START:
Primary Endpoint Events By Latest CD4 Count
Latest CD4 > 500
Immediat
e ART
Deferred
ART
% of
Primary
Events
88%
(37/42)
59%
(57/96)
Rate/100
PY
0.6 1.1
Immediate ART Deferred ART
Pe
rce
nt o
f F
ollo
w-u
p T
ime
Latest CD4 Count
60
50
40
30
20
10
0
2
(4.7)
No. of Pts with Events
(Rates/100 PY)
No. of Pts with Events
(Rates/100 PY)
3
(0.8)
6
(0.4)
11
(0.6)
20
(0.6)
5
(1.8)
34
(2.0)
34
(1.5)
9
(0.6)
14
(1.1)
Lundgren J, et al. N Engl J Med. 2015

When to Start: DHHS Guidelines, January 2016
US DHHS Guidelines, January 2016
ART recommended for all HIV+ individuals to reduce risk of disease
progression. Strength and evidence for recommendation vary by pre-
treatment CD4 count (AI)
ART recommended for HIV-infected individuals for prevention of HIV
transmission (AI)

When to Start?: Guidelines
AIDS/
symptoms
CD4
<200
CD4
200-350
CD4
350-500
CD4
>500
US DHHS YES YES YES YES YES
IAS-USA YES YES YES YES YES
EACS YES YES YES YES YES
BHIVA (UK) YES YES YES YES YES
WHO YES YES YES YES YES

What to Start

DHHS Guidelines, January 2016
What to Start
Recommended regimens
Boosted PI-based DRV/r + FTC/TDF
INSTI-based RAL + FTCTDF
EVG/COBI/FTC/TDF
DTG + FTC/TDF
DTG/3TC/ABC
EVG/COBI/FTC/TAF
Alternative regimens
NNRTI-based EFV/FTC/TDF
RPV/FTC/TDF (VL <100,000; CD4 >200)
PI-based ATV/c + FTC/TDF (CrCl >70)
ATV/r + FTC/TDF
(DRV/c or DRV/r) + 3TC/ABC
DRV/c + FTC/TDF (CrCl >70)
DHHS Guidelines for Antiretroviral Therapy in Adults and Adolescents, January 2016

The 5 most common initial regimens we’ll
now be using in the U.S.
INSTI-based EVG/COBI/FTC/TAF (Genvoya)
DTG + FTC/TAF (Tivicay + Descovy)
DTG/3TC/ABC (Triumeq)
PI-based DRV/c + FTC/TAF (Prezcobix + Descovy)
NNRTI-based RPV/FTC/TAF (Odefsey)
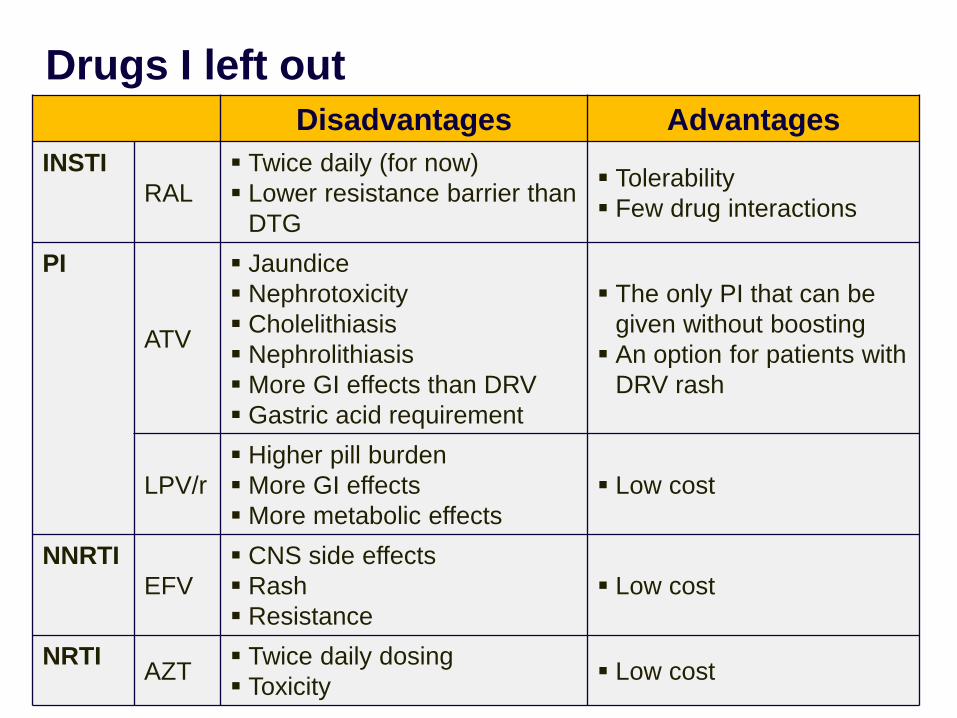
Drugs I left out
Disadvantages Advantages
INSTI
RAL
Twice daily (for now)
Lower resistance barrier than
DTG
Tolerability
Few drug interactions
PI
ATV
Jaundice
Nephrotoxicity
Cholelithiasis
Nephrolithiasis
More GI effects than DRV
Gastric acid requirement
The only PI that can be
given without boosting
An option for patients with
DRV rash
LPV/r
Higher pill burden
More GI effects
More metabolic effects
Low cost
NNRTI
EFV
CNS side effects
Rash
Resistance
Low cost
NRTI AZT
Twice daily dosing
Toxicity Low cost

SINGLE: Dolutegravir + ABC/3TC vs.
EFV/TDF/FTC
Week
EFV/TDF/FTC QD
DTG 50 mg + ABC/3TC QD
BL 2 4 8 12 16 24 32 40 48
0
10
20
30
40
50
60
70
80
90
100
Pro
po
rtio
n (
%)
wit
h <
50
c/m
L
DTG+ABC/3TC: 88%
EFV/TDF/FTC: 81%
WK 48 difference in response (95% CI):
+7.4% (+2.5% to +12.3%); p=0.003
● DTG + ABC/3TC QD superior to EFV/TDF/FTC at Wk 48 (1o endpoint)
Walmsley S, et al. N Engl J Med 2013;369:1807-18

STRIIVING:
Switch to DTG/ABC/3TC
Ongoing randomized, open-label phase IIIB study
– Primary endpoint: VL < 50 at Wk 24
VL < 50 on stable ART ≥ 6
mos; no previous virologic
failure; HLA-B*5701
negative
(N = 551)
DTG/ABC/3TC (n = 274)
Wk 48 Wk 24
Trottier B, et al. ICAAC 2015.
*Containing 2 NRTIs plus NNRTI, PI, or INSTI.
Baseline ART* (n = 277)
DTG/ABC/3TC (n = 277)
PI NNRTI INSTI TDF/FTC
BL ART use, % 42 31 26 77

STRIIVING: Study Disposition at Wk 24
Trottier B, et al. ICAAC 2015.
13% of subjects withdrawn (n = 35)
Adverse event 10 (4%)
Lack of efficacy (virologic failure) 0
Protocol deviation 15 (5%)
Stopping criteria met 0
Lost to follow-up 3 (1%)
Investigator discretion 3 (1%)
Withdrew consent 4 (1%)
87% completed (n = 239)
Screened
(N = 841)
12% of subjects withdrawn (n = 32)
Adverse event 0
Lack of efficacy (virologic failure) 0
Protocol deviation 17 (6%)
Stopping criteria met 0
Lost to follow-up 3 (1%)
Investigator discretion 3 (1%)
Withdrew consent 9 (3%)
Randomized and treated Baseline ART (n = 277)
88% completed (n = 244) 1 with missing information
Randomized and treated DTG/ABC/3TC (n = 274)

5 2
STRIIVING: Virologic Outcomes at Wk 24
Switch noninferior to maintaining baseline ART
No protocol-defined virologic failure
– 3 pts in DTG/ABC/3TC arm (1%) and 4 pts in BL ART arm (1%) had VL 50-100 through Wk 24
Trottier B, et al. ICAAC 2015.
Primary Efficacy Analysis: ITT-Exposed and Per Protocol Populations
100
80
60
40
20
0 Virologic
Success
Virologic
Nonresponse
No Virologic
Data
VL <
50 (
%)
DTG/ABC/3TC (ITT-E, n = 274)
Baseline ART (ITT-E, n = 277)
DTG/ABC/3TC (PP, n = 220)
Baseline ART (PP, n = 215)
85 88 93 93
14 10 6 1 1 < 1
12 -12 -8 -4 0 4 8
12 -12 -8 -4 0 4 8
-4.9
-0.3
4.4
2.3 -9.1
ITT-E Population
PP Population
-3.4
DTG/ABC/3TC Baseline ART

STRIIVING: Adverse Events and Treatment
Satisfaction
10 pts discontinued for AEs in DTG/ABC/3TC arm vs 0 in baseline ART arm
Greater increase in treatment satisfaction score from baseline to Wk 24 in DTG/ABC/3TC arm
vs baseline ART arm: adjusted mean difference: 2.4 (P < .001)
Trottier B, et al. ICAAC 2015.
AEs in 10 Pts Who Withdrew* Grade
Insomnia 2
Diarrhea, flatulence, rash
Abdominal pain, anxiety, nausea, body ache
1
2
Euphoric mood
Headache
1
2
Abdominal cramps, chills, diarrhea,
dizziness,
headache
2
Pruritus 2
Abdominal pain, diarrhea, flulike syndrome,
profuse sweating, change in body odor
Fatigue,† malaise, depression
1
2
Nasal congestion
Worsening fatigue
Nausea
1
2
3
Alopecia 1
Fatigue† 1
Homicide† N/A
*None serious AEs except homicide. †Not drug related.
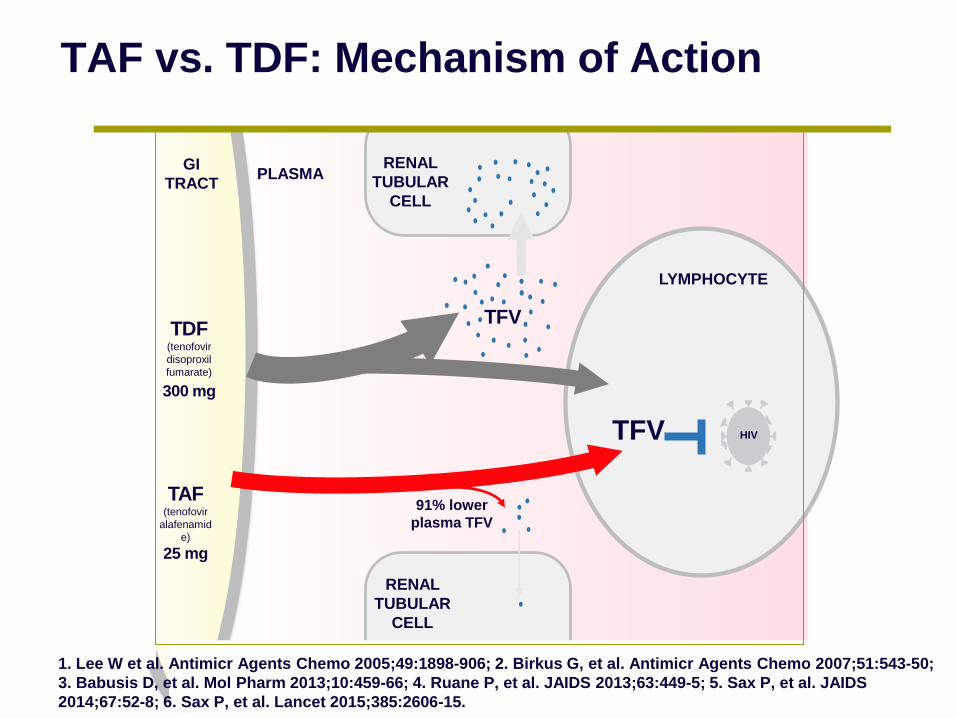
LYMPHOCYTE
TFV
TFV
RENAL
TUBULAR
CELL
RENAL
TUBULAR
CELL
91% lower
plasma TFV
HIV
PLASMA GI
TRACT
TDF (tenofovir
disoproxil
fumarate)
300 mg
TAF (tenofovir
alafenamid
e)
25 mg
TAF vs. TDF: Mechanism of Action
1. Lee W et al. Antimicr Agents Chemo 2005;49:1898-906; 2. Birkus G, et al. Antimicr Agents Chemo 2007;51:543-50;
3. Babusis D, et al. Mol Pharm 2013;10:459-66; 4. Ruane P, et al. JAIDS 2013;63:449-5; 5. Sax P, et al. JAIDS
2014;67:52-8; 6. Sax P, et al. Lancet 2015;385:2606-15.
Virologic
Success*
Virologic
Failure
No Data
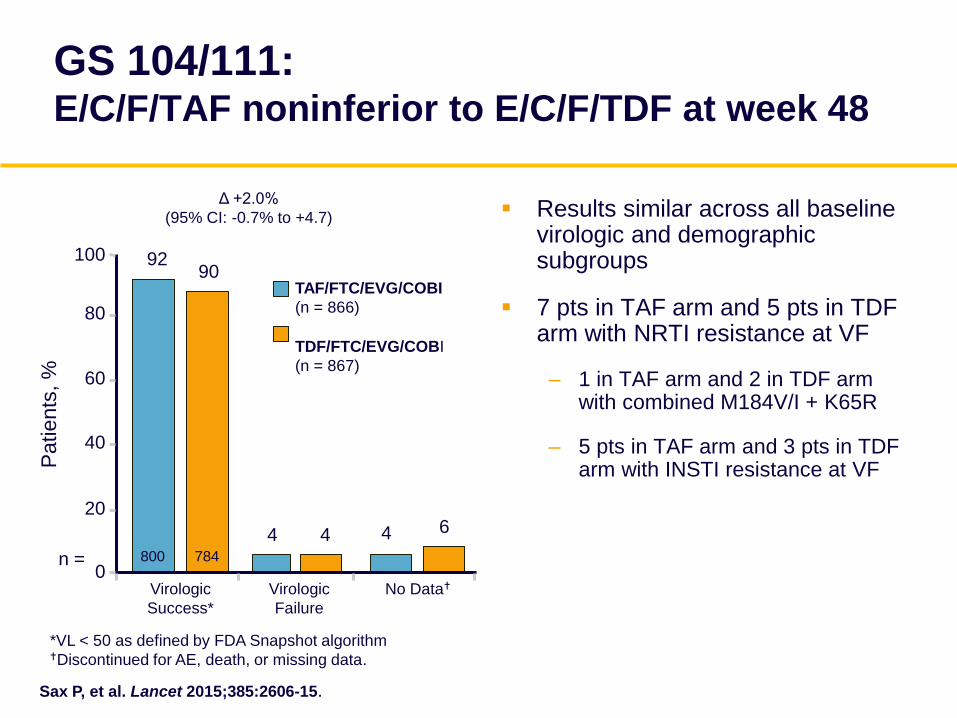
GS 104/111: E/C/F/TAF noninferior to E/C/F/TDF at week 48
Results similar across all baseline virologic and demographic subgroups
7 pts in TAF arm and 5 pts in TDF arm with NRTI resistance at VF
– 1 in TAF arm and 2 in TDF arm with combined M184V/I + K65R
– 5 pts in TAF arm and 3 pts in TDF arm with INSTI resistance at VF P
atients
, %
92 90
Δ +2.0%
(95% CI: -0.7% to +4.7)
TAF/FTC/EVG/COBI
(n = 866)
TDF/FTC/EVG/COBI
(n = 867)
0
20
40
60
80
100
4 4 4 6
n =
*VL < 50 as defined by FDA Snapshot algorithm Discontinued for AE, death, or missing data.
800 784
Sax P, et al. Lancet 2015;385:2606-15.
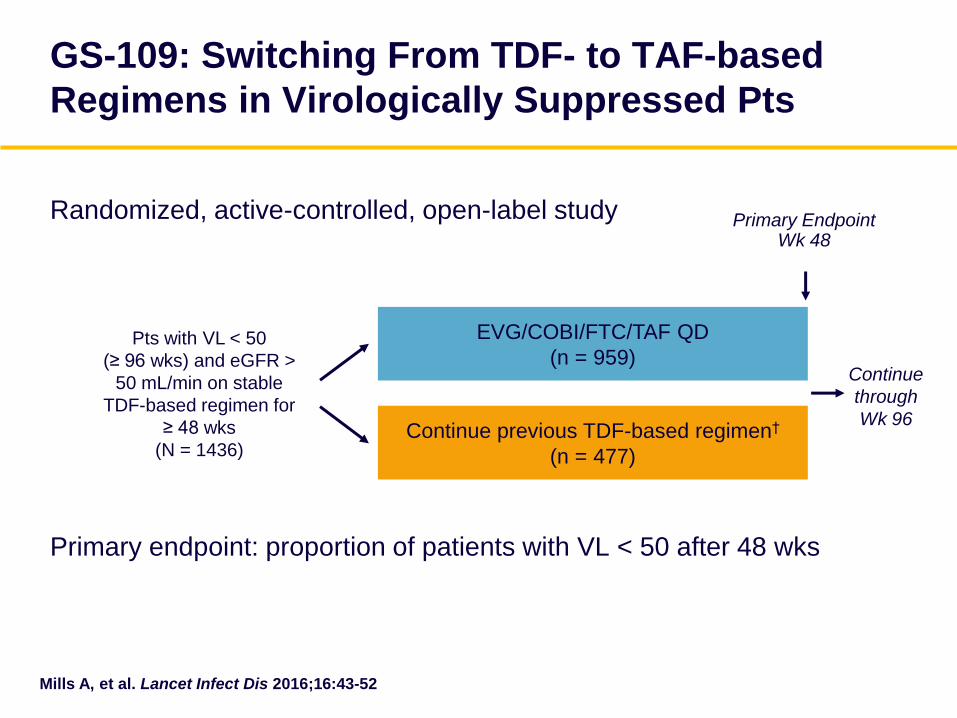
Randomized, active-controlled, open-label study
Primary endpoint: proportion of patients with VL < 50 after 48 wks
GS-109: Switching From TDF- to TAF-based
Regimens in Virologically Suppressed Pts
Mills A, et al. Lancet Infect Dis 2016;16:43-52
Pts with VL < 50
(≥ 96 wks) and eGFR >
50 mL/min on stable
TDF-based regimen for
≥ 48 wks
(N = 1436)
EVG/COBI/FTC/TAF QD
(n = 959)
Continue previous TDF-based regimen†
(n = 477)
Primary Endpoint Wk 48
Continue
through
Wk 96

GS-109: Switching to E/C/F/TAF from TDF-
based regimens
Mills A, et al. Lancet Infect Dis 2016;16:43-52
100
80
60
40
20
0
Wk 4
8 V
L <
50
, %
All Prior
Regimens
Prior
EFV/TDF/FTC
Prior
Boosted
ATV + TDF/FTC
Prior
EVG/COBI/
FTC/TDF
EVG/COBI/FTC/TAF TDF-Based Regimen Primary Endpoint
P < .001 P = .02 P = .02 P = NS
97 93
96 90
97 92
98 97
932/
959
444/
477
241/
251
112/
125
390/
402
183/
199
301/
306 149/
153 n/N =

GS 1089: Switch from F/TDF to F/TAF
Randomized, double-blind, double-dummy, active-controlled study
*F/TAF Dose:
• 200/10 mg with boosted PIs
• 200/25 mg with unboosted third agents
Secondary
Endpoint
n=333
n=330
Primary Endpoint
HIV-1 RNA <50 c/mL
BL Wk 96 Wk 48
F/TAF (200/10 or 200/25 mg)* QD
F/TDF Placebo QD
Continue Third Agent
F/TDF (200/300 mg) QD
F/TAF* Placebo QD
Continue Third Agent
VL <50 on F/TDF + Third
Agent
eGFR ≥50 mL/min
Gallant J, et al. Lancet HIV 2016;3:e158-65

GS 1089: Efficacy at Week 48 (Snapshot)
F/TDF F/TAF
0
VL <
50,
%
‒10% +10%
5.1 -2.5
1.3
Non-success
Treatment Difference (95% CI) Virologic Outcome
Gallant J, et al. Lancet HIV 2016;3:e158-65
TAF: Renal safety

GS104/111: E/C/F/TAF vs. E/C/F/TDF: Renal Safety
n (%) E/C/F/TAF
n=866
E/C/F/TDF
n=867
Events
Renal adverse events leading to
discontinuation 0 4 (0.5)
Tubulopathy/Fanconi syndrome 0 0
Me
an
(S
D)
Ch
an
ge
fr
om
Ba
se
lin
e e
GF
R*
Time (Weeks)
E/C/F/TAF
E/C/F/TDF
0 0 12 24 36 48
20
10
0
-10
-20
-6.6 p <0.001
-11.2
Sax P, et al. Lancet 2015;385:2606-15.

GS 104/111: TAF vs. TDF: Quantitative
Proteinuria
Me
dia
n %
Ch
an
ge
fro
m B
as
eli
ne
(Q
1, Q
3) Protein
(UPCR) Albumin (UACR)
RBP Beta2-
microglobulin
p <0.001 for all
Urine [protein]:Creatinine Ratio
-3 -5
9
-32
20
7
51
24
-50
-25
0
25
50
75
76 133 168 E/C/F/TAF
E/C/F/TDF
Baseline 44
mg/g
44
mg/g
5
mg/g
5
mg/g
64
μg/g
67
μg/g
101
μg/g
103
μg/g
Sax P, et al. Lancet 2015;385:2606-15
Protein (UPCR)
Albumin (UACR)
RBP
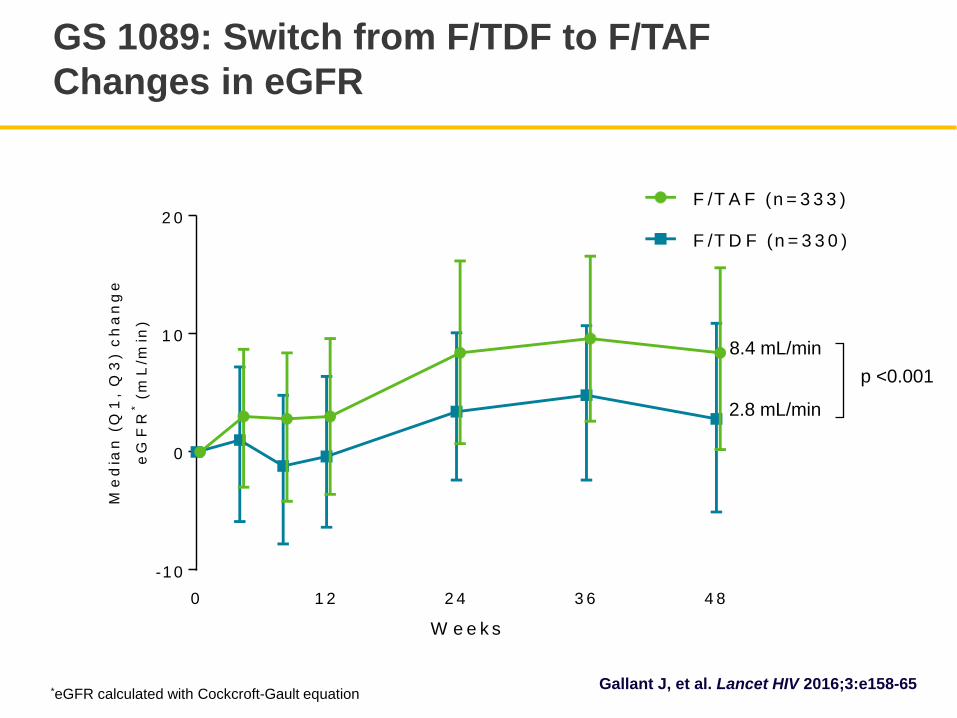
GS 1089: Switch from F/TDF to F/TAF
Changes in eGFR
*eGFR calculated with Cockcroft-Gault equation
0 1 2 2 4 3 6 4 8
0
1 0
2 0F /T A F (n = 3 3 3 )
F /T D F (n = 3 3 0 )
W e e k s
Me
dia
n (
Q1
, Q
3)
ch
an
ge
eG
FR
* (
mL
/min
)
-10
8.4 mL/min
2.8 mL/min
p <0.001
Gallant J, et al. Lancet HIV 2016;3:e158-65

RBP, retinol-binding protein; β2M, β2-microglobulin.
GS 1089: Switch from F/TDF to F/TAF Change in Renal Biomarkers at Week 48
All differences between treatments statistically significant (p <0.001)
F/TAF
F/TDF
Albumin Protein β2M RBP
Urine Protein to Creatinine Ratio
Me
dia
n %
ch
an
ge
Gallant J, et al. Lancet HIV 2016;3:e158-65

GS-112: Switching to E/C/F/TAF in patients
with kidney disease (eGFR 30-60)
Changes in eGFR to Wk 48
Pozniak A, et al. J Acquir Immune Defic Syndr. 2016;71:530-7
Total TDF Non-TDF
Med
ian
Cha
ng
e
fro
m B
ase
line
10
0
-10
-0.6
+0.2
-1.8 -1.8* -1.5 -2.7*
Baseline: 56 58 53 54 56 50
eGFRCG
mL/min
eGFRCKD-EPI Cr
mL/min/1.73m2
*P < 0.05.
Multicenter, open-label phase III trial, N=242 (158 on TDF, 84 on non-TDF-based regimen)
TAF: Bone safety
3
2

GS104/111: E/C/F/TAF vs. E/C/F/TDF
Bone mineral density changes
0 24 48 0 24 48 0
-6
-4
-2
0
2
Wk Wk
0
-6
-4
-2
0
2
=845
=850
797
816
784
773
836
848
789
815
780
767
-1.30 -2.86
-0.66
-2.95
P < .001 P < .001
Me
an
% C
ha
nge
Fro
m B
L
Sax P, et al. Lancet 2015;385:2606-15
n
n
TAF/FTC/EVG/COBI (n = 866)
TDF/FTC/EVG/COBI (n = 867)

GS-109: Switch from TDF to TAF
Changes in bone density (spine)
Hip BMD similarly increased for pts treated with Genvoya
Mills A, et al. Lancet Infect Dis 2016;16:43-52
4
3
2
1
0
-1
-2
-3 Me
dia
n %
Ch
an
ge
(sp
ine
)
in B
MD
(Q
1, Q
3)
Baseline Week 24
EVG/COBI/FTC/TAF
TDF-Based Regimen
Week 48
1.79
-0.28
P < .001
B L 2 4 4 8
0
2
4
B L 2 4 4 8
0
2
4
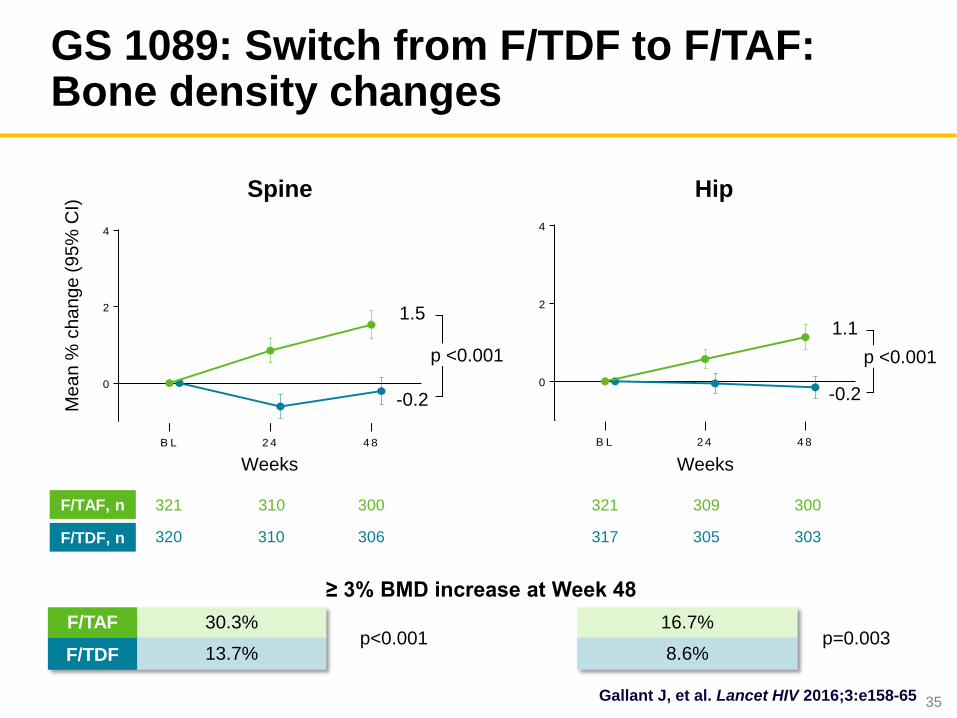
GS 1089: Switch from F/TDF to F/TAF: Bone density changes
35
≥ 3% BMD increase at Week 48
F/TAF 30.3% p<0.001
16.7% p=0.003
F/TDF 13.7% 8.6%
321 310 300
320 310 306
321 309 300
317 305 303
F/TAF, n
F/TDF, n
Me
an
% c
ha
ng
e (
95
% C
I) Spine
1.5
-0.2
1.1
-0.2
Weeks Weeks
p <0.001
Hip
p <0.001
Gallant J, et al. Lancet HIV 2016;3:e158-65

What to Start: My Choices (no baseline resistance)
Regimen PROS CONS
EVG/COBI/FTC/TAF Single tablet
Advantages of TAF
Drug interactions
Potential for INSTI resistance
DTG/3TC/ABC Single tablet
High resistance barrier
Few drug interactions
HLA B*5701 testing
MI risk?
ABC: more AEs than TDF
DTG + FTC/TAF Advantages of DTG
Advantages of TAF
2-pill regimen
DRV/c + FTC/TAF No PI resistance with
failure
Advantages of TAF
2-pill regimen
More side effects than with
INSTIs
RPV/FTC/TAF Single tablet
Excellent tolerability
Advantages of TAF
Meal requirement
VL, CD4 requirement
Avoid acid-reducing agents

Choosing ART in special populations
Adherence concerns: – DRV/c + FTC/TAF – DTG/ABC/3TC (?)
Baseline genotype pending: – Avoid NNRTI-based regimens
HCV coinfection: – INSTI + either FTC/TAF or 3TC/ABC
HBV coinfection: – FTC/TAF-based regimens
Pregnancy: – Consult perinatal guidelines

New Drugs and Treatment Strategies

LATTE-2: IM Cabotegravir + Rilpivirine for
Long-Acting Maintenance Therapy
Multicenter, open-label phase IIb study
Primary endpoints: VL <50 by FDA snapshot, PDVF, and safety at maintenance Wk 32
Margolis DA, et al. CROI 2016. Abstract 31LB.
CAB 400 mg IM + RPV 600 mg IM Q4W (n = 115)
CAB 600 mg IM + RPV 900 mg IM Q8W (n = 115)
*Pts with VL < 50 from Wk 16 to Wk 20 continued to maintenance phase. 6 pts discontinued for AEs or
death in induction analysis.
ART-naïve
pts with
CD4 > 200
(N = 309) CAB 30 mg PO + ABC/3TC PO QD
(n = 56)
CAB 30 mg PO QD + ABC/3TC
Wk 32
primary analysis;
dose selection
Wk 20
Induction Phase* Maintenance Phase
Wk 1 Wk 96 Wk 16: RPV
PO added
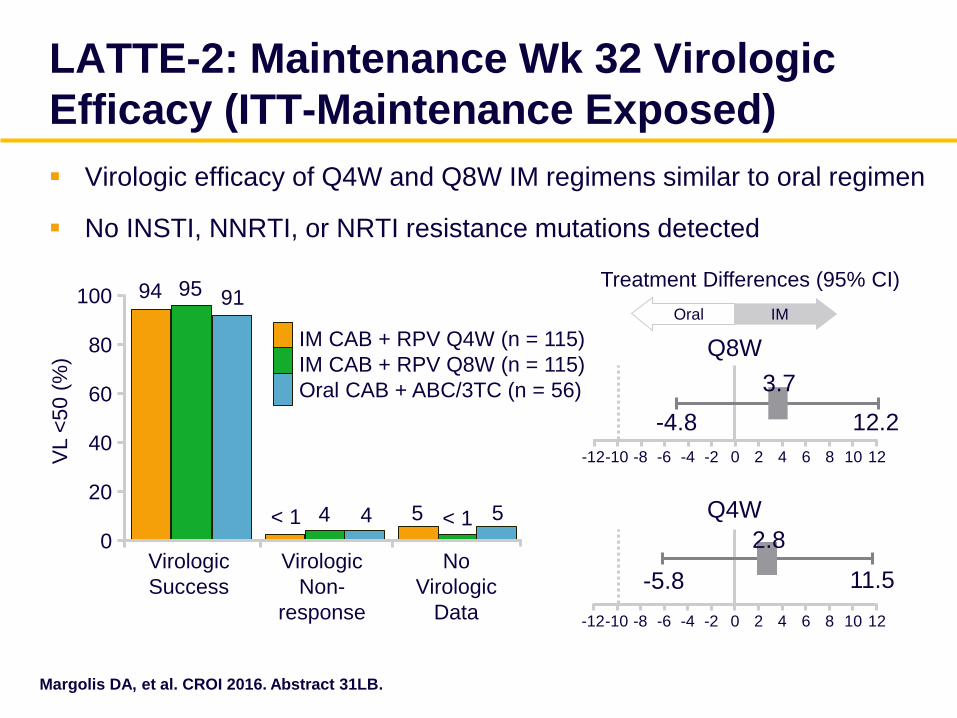
LATTE-2: Maintenance Wk 32 Virologic
Efficacy (ITT-Maintenance Exposed)
Virologic efficacy of Q4W and Q8W IM regimens similar to oral regimen
No INSTI, NNRTI, or NRTI resistance mutations detected
Margolis DA, et al. CROI 2016. Abstract 31LB.
95 94 91
4 < 1 4 < 1 5 5
Virologic
Success
Virologic
Non-
response
No
Virologic
Data
VL <
50 (
%)
100
80
60
40
20
0
IM CAB + RPV Q4W (n = 115)
IM CAB + RPV Q8W (n = 115)
Oral CAB + ABC/3TC (n = 56)
Treatment Differences (95% CI)
Q8W
-4.8
3.7
12.2
IM Oral
-12 -10 -8 -6 -4 -2 0 2 4 6 8 10 12
Q4W
-5.8
2.8
11.5
-12 -10 -8 -6 -4 -2 0 2 4 6 8 10 12
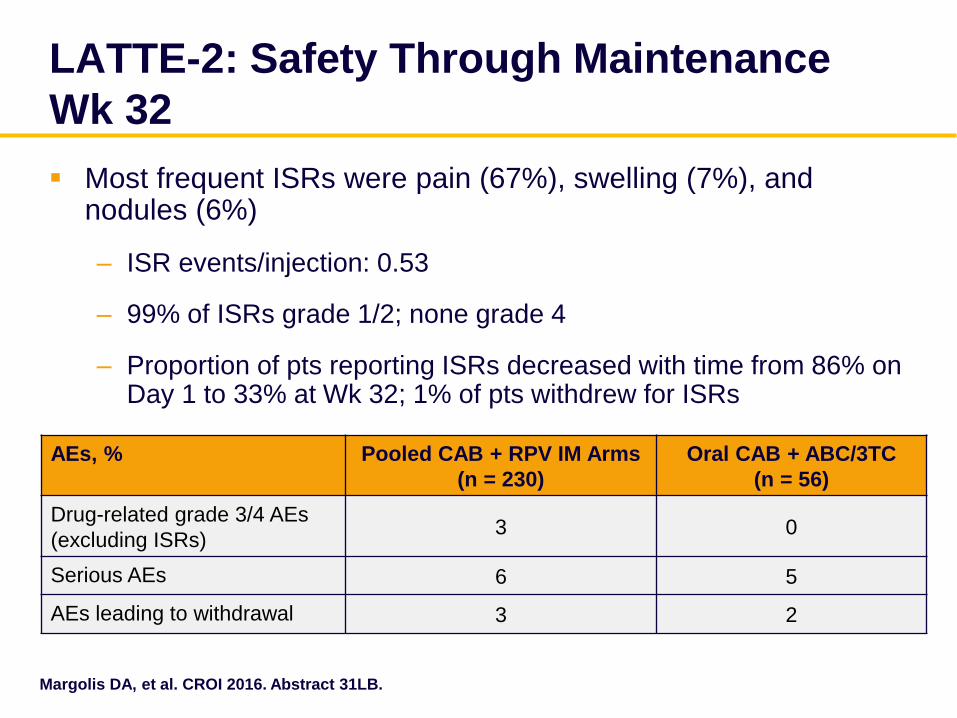
LATTE-2: Safety Through Maintenance
Wk 32
Most frequent ISRs were pain (67%), swelling (7%), and nodules (6%)
– ISR events/injection: 0.53
– 99% of ISRs grade 1/2; none grade 4
– Proportion of pts reporting ISRs decreased with time from 86% on Day 1 to 33% at Wk 32; 1% of pts withdrew for ISRs
Margolis DA, et al. CROI 2016. Abstract 31LB.
AEs, % Pooled CAB + RPV IM Arms
(n = 230)
Oral CAB + ABC/3TC
(n = 56)
Drug-related grade 3/4 AEs
(excluding ISRs) 3 0
Serious AEs 6 5
AEs leading to withdrawal 3 2

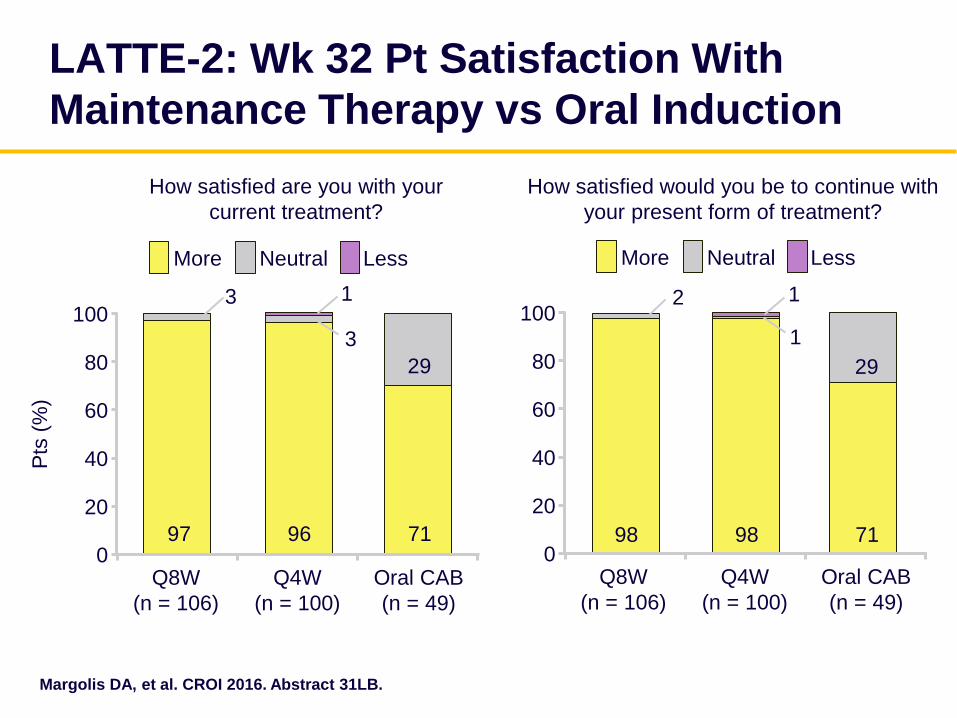
LATTE-2: Wk 32 Pt Satisfaction With
Maintenance Therapy vs Oral Induction
Margolis DA, et al. CROI 2016. Abstract 31LB.
Pts
(%
)
How satisfied are you with your
current treatment?
100
80
60
40
20
0 Q8W
(n = 106)
Q4W
(n = 100)
Oral CAB
(n = 49)
More Neutral Less
100
80
60
40
20
0 Q8W
(n = 106)
Q4W
(n = 100)
Oral CAB
(n = 49)
More Neutral Less
How satisfied would you be to continue with
your present form of treatment?
97 96 71
29
3 1
3
98 98 71
29
2 1
1

MK-1439-007: Doravirine + TDF/FTC vs
EFV + TDF/FTC In Treatment-Naive Pts
Doravirine: investigational NNRTI with activity against common NNRTI resistance mutations, QD dosing, no PPI drug–drug interactions, improved CNS safety vs EFV in early studies
Part 2 of 2-part randomized, double-blind phase II study
– Primary endpoint: VL < 40 c/mL at Wk 48
ART-naive HIV+ pts
with VL ≥ 1000,
CD4 ≥ 100
(N = 132)*
Wk 48
DOR 100 mg QD + TDF/FTC
(n = 66)
EFV 600 mg QD + TDF/FTC
(n = 66)
Wk 96
*42 pts receiving DOR 100 mg QD + TDF/FTC and 43 pts receiving EFV 600 mg QD + TDF/FTC
in part 1 of this study were included in this analysis.
Gatell JM, et al. CROI 2016. Abstract 470.

MK-1439-007: Primary Endpoint
Gatell JM, et al. CROI 2016. Abstract 470.
78.7
77.8 77.8
81.5 73.1
72.9
57.5
63.0
42.1
26.9
47.2
27.8
12.0
15.7
6.5 3.7
0 4 8 12 16 20 24 28 32 36 40 44 48
100
80
60
40
20
0
Doravirine 100 mg
Efavirenz 600 mg
Wk 48 VL < 40 c/mL n/N (%)
Doravirine 84/108 (77.8)
Efavirenz 85/108 (78.7)
Difference (95% CI): -1.1 (-12.2 to 10.0)
Treatment Wk
VL <
40
(N
C =
F),
%
(95%
CI)

MK-1439-007: Clinical Adverse Events
Gatell JM, et al. CROI 2016. Abstract 470.
Clinical AEs, % DOR + TDF/FTC
(n = 108)
EFV + TDF/FTC
(n = 108)
Difference,
DOR–EFV (95% CI)
≥ 1 AE 87.0 88.9 -1.9 (-10.9 to 7.1)
Serious AEs 6.5 8.3 -1.9 (-9.5 to 5.6)
Death 0 0
D/c for AEs 2.8 5.6 -2.8 (-9.2 to 3.0)
Drug-related AEs* 31.5 56.5 -25.0 (-37.3 to 11.8)
Diarrhea 0.9 6.5
Nausea 7.4 5.6
Dizziness 6.5 25.9
Headache 2.8 5.6
Abnormal dreams 5.6 14.8
Insomnia 6.5 2.8
Nightmares 5.6 8.3
Sleep disorder 4.6 6.5
*Specific AEs occurring in ≥ 5% of pts included.

PADDLE: All Pts Virologically Suppressed
by Wk 8 of DTG + 3TC
Included 4 pts with VL > 100,000 at BL
Figueroa MI, et al. EACS 2015. Abstract 1066.
Pt #
HIV-1 RNA (copies/mL)
Screen BL Day 2 Day 4 Day 7 Day 10 Wk 2 Wk 3 Wk 4 Wk 6 Wk 8 Wk 12 Wk 24
1 5584 10,909 3701 383 101 71 < 50 < 50 < 50 < 50 < 50 < 50 < 50
2 8887 10,233 5671 318 < 50 < 50 < 50 < 50 < 50 < 50 < 50 < 50 < 50
3 67,335 151,569 37,604 1565 1178 266 97 53 < 50 < 50 < 50 < 50 < 50
4 99,291 148,370 11,797 3303 432 179 178 55 < 50 < 50 < 50 < 50 < 50
5 34,362 20,544 4680 1292 570 168 107 < 50 < 50 < 50 < 50 < 50 < 50
6 16,024 14,499 3754 1634 162 < 50 < 50 < 50 < 50 < 50 < 50 < 50 < 50
7 37,604 18,597 2948 819 61 < 50 < 50 < 50 < 50 < 50 < 50 < 50 < 50
8 25,071 24,368 6264 1377 Not done 268 105 < 50 < 50 < 50 < 50 < 50 < 50
9 14,707 10,832 Not done 516 202 < 50 < 50 < 50 < 50 < 50 < 50 < 50 < 50
10 10,679 7978 5671 318 < 50 < 50 < 50 < 50 < 50 < 50 < 50 < 50 < 50
11 50,089 273,676 160,974 68,129 3880 2247 784 290 288 147 < 50 < 50 < 50
12 13,508 64,103 3496 3296 135 351 351 84 67 < 50 < 50 < 50 < 50
13 28,093 33,829 37,350 26,343 539 268 61 < 50 < 50 < 50 < 50 < 50 < 50
14 15,348 15,151 3994 791 198 98 < 50 61 64 < 50 < 50 < 50 < 50
15 23,185 23,500 15,830 4217 192 69 < 50 < 50 < 50 Not done < 50 < 50 < 50
16 11,377 3910 370 97 143 < 50 < 50 < 50 < 50 < 50 < 50 < 50 < 50
17 39,100 25,828 11,879 1970 460 147 52 < 50 < 50 < 50 < 50 < 50 < 50
18 60,771 73,069 31,170 2174 692 358 156 < 50 < 50 < 50 < 50 < 50 < 50
19 82,803 106,320 35,517 2902 897 352 168 76 < 50 < 50 < 50 < 50 < 50
20 5190 7368 3433 147 56 < 50 < 50 < 50 < 50 < 50 < 50 < 50 < 50

Switch From Suppressive ART to
DTG Monotherapy
97% maintained virologic suppression at Wk 24[1]
Reasons for switch improved in most pts from BL to 24 wks[1]
– T-scores unchanged in 2 pts with osteoporosis
– In single pt with renal disease, eGFR ↓ from 59 mL/min at BL to 52 mL/min/ at Wk 24; urine protein:creatinine ratio ↓ from 330 to 146 mg/mg
In separate study of switch from suppressive ART to DTG monotherapy, 89% of pts maintained virologic suppression 24 wks after switch[2]
1. Rojas J, et al. EACS 2015. Abstract 1108. 2. Katlama C, et al. EACS 2015. Abstract 714.
Reason for Switch Pts at Risk, n Outcome Improved/ Avoided, n
DDIs 13 13
GI symptoms 11 9
Dyslipidemia 9 9
High Framingham score 3 3

Evolution of Integrase Mutations in 2
DTG Monotherapy Switch Studies
All 4 pts with virologic failure had history of INSTI use before switch
1 pt had previous RAL failure but no INSTI resistance
1. Rojas J, et al. EACS 2015. Abstract 1108. 2. Katlama C, et al. EACS 2015. Abstract 714.
VL at VF,
c/mL
INSTI Resistance by Timepoint (Detection Source)
Day 0 Wk 4 Wk 12/13 Wk 24
155[1] - None (DNA) - 118R (DNA)
469[2]
L74I (DNA) - L74I, E92Q (RNA)
R: EVG RAL -
291[2] None (DNA) - -
155H (RNA)
R: EVG RAL
2220[2]
None (DNA) None (RNA) None (DNA)
E138K / G140A,
Q148R (RNA)
R: DTG EVG RAL

More in the pipeline
Ibalizumab: entry inhibitor
– monoclonal antibody binds CD4
– being studied for treatment and prevention
BMS 6630681: entry inhibitor
– Blocks attachment by binding to gp120
BMS 9551762: maturation inhibitor
– Disrupts processing of gag protein
– Trial in naïve pts planned
GS9883: integrase inhibitor
– Unboosted
– Potential for coformulation with TAF/FTC
1. Lalezari J et al. CROI 2014, Abstract 86.
2. Hwang C et al. CROI 2015, Abstract 114LB

Reasons to consider switching
therapy in suppressed patients
Older PIs:
– Reduce pill burden
– Decrease metabolic effects
– Decrease GI side effects
Older NRTIs:
– d4T, ddI: SWITCH! (toxicity)
– AZT: consider switch (toxicity, side effects, simplification)
TDF:
– If price the same, no advantage of TDF over TAF
Nevirapine:
– Reduce pill burden
– Not toxicity (most toxicity occurs with initiation)
Efavirenz:
– CNS side effects
– No TAF-based coformulation

Recent switch studies in suppressed pts Trial From To Outcome
GS-123 TDF/FTC + RAL EVG/COBI/FTC/TDF ✔
GS-264 TDF/FTC/EFV RPV/FTC/TDF ✔
Strategy-NNRTI TDF/FTC + NNRTI EVG/COBI/FTC/TDF ✔
Strategy-PI TDF/FTC + PI/r EVG/COBI/FTC/TDF ✔
SPIRIT 2 NRTI + PI/r RPV/FTC/TDF ✔
SPIRAL 2 NRTI + PI/r (exp’d pts) 2 NRTI + RAL ✔
SALT ATV/r + 2 NRTI ATV/r + 3TC ✔
OLE LPV/r + 2 NRTIs LPV/r + 3TC ✔
GS-109 TDF-based ART EVG/COBI/FTC/TAF ✔
STRIIVING Suppressive ART DTG/ABC/3TC ✔
ATLAS-M ATV/r + 2 NRTIs ATV/r + 3TC ✔
GS-119 “Salvage regimen” EVG/COBI/FTC/TAF + DRV ✔
LATTE CAB or EFV + 2 NRTIs CAB + RPV ✔
GS-1089 TDF/FTC + 3rd agent TAF/FTC + 3rd agent ✔
SWITHCMRK 2 NRTI + LPV/r (exp’d pts) 2 NRTI + RAL ✗
HARNESS 2 NRTI + 3rd Agent ATV/r + RAL ✗
Adapted from David Wohl
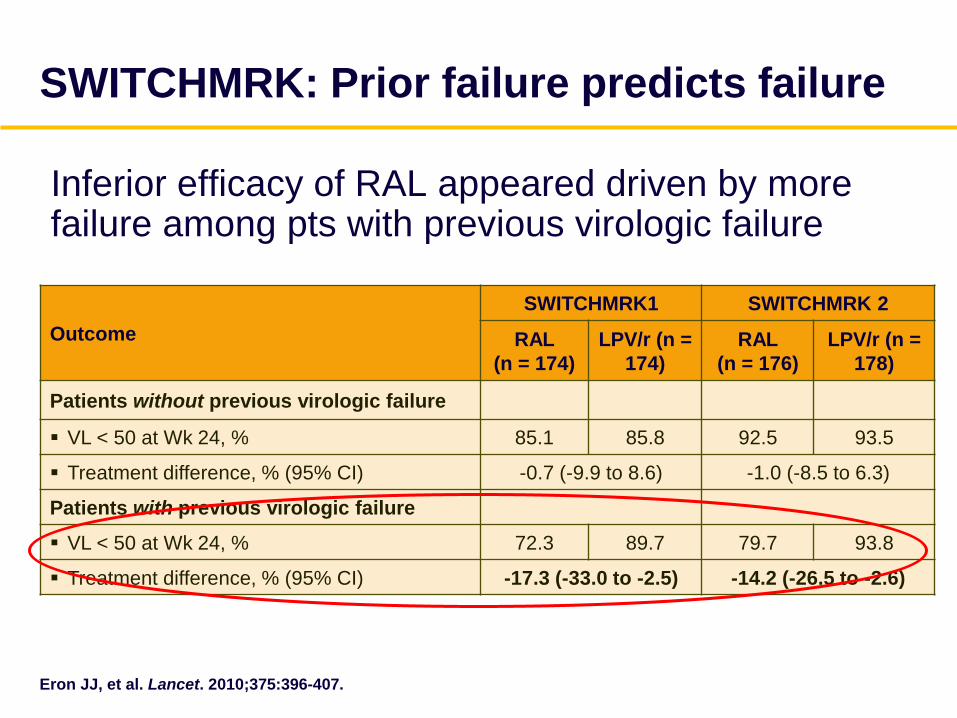
Inferior efficacy of RAL appeared driven by more failure among pts with previous virologic failure
SWITCHMRK: Prior failure predicts failure
Eron JJ, et al. Lancet. 2010;375:396-407.
Outcome
SWITCHMRK1 SWITCHMRK 2
RAL
(n = 174)
LPV/r (n =
174)
RAL
(n = 176)
LPV/r (n =
178)
Patients without previous virologic failure
VL < 50 at Wk 24, % 85.1 85.8 92.5 93.5
Treatment difference, % (95% CI) -0.7 (-9.9 to 8.6) -1.0 (-8.5 to 6.3)
Patients with previous virologic failure
VL < 50 at Wk 24, % 72.3 89.7 79.7 93.8
Treatment difference, % (95% CI) -17.3 (-33.0 to -2.5) -14.2 (-26.5 to -2.6)
Switching: Caveats
Know the treatment and resistance history
Avoid switching from high barrier to lower barrier agents when you don’t
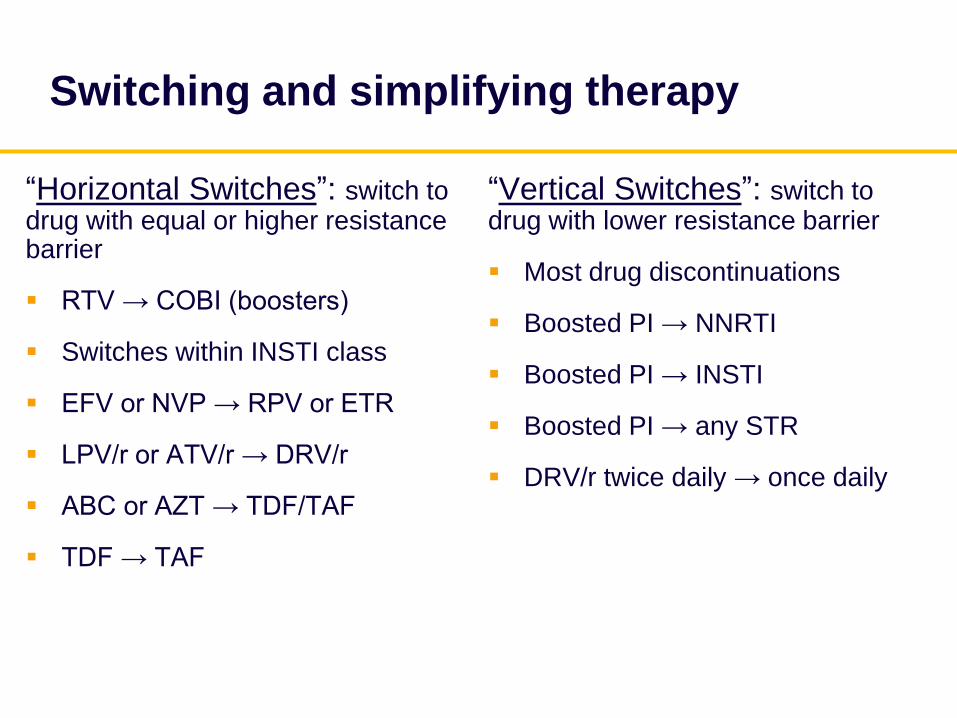
Switching and simplifying therapy
“Vertical Switches”: switch to drug with lower resistance barrier
Most drug discontinuations
Boosted PI → NNRTI
Boosted PI → INSTI
Boosted PI → any STR
DRV/r twice daily → once daily
“Horizontal Switches”: switch to drug with equal or higher resistance barrier
RTV → COBI (boosters)
Switches within INSTI class
EFV or NVP → RPV or ETR
LPV/r or ATV/r → DRV/r
ABC or AZT → TDF/TAF
TDF → TAF


![InIntegrating Recent Data When Selecting First-line Antiretroviral Therapy.2015 [DHHS recommendations for first-line antiretroviral therapy ]](https://static.documents.pub/doc/80x56/55b63997bb61ebe10f8b46d1/inintegrating-recent-data-when-selecting-first-line-antiretroviral-therapy2015-dhhs-recommendations-for-first-line-antiretroviral-therapy-.jpg)


