Antitrust Issues in International Comparisons of Market Structure 1 Joseph G. Hirschberg Department of Economics University of Melbourne Esfandiar Maasoumi and Daniel Slottje Department of Economics Southern Methodist University, And Augustine C. Arize Texas A&M University Commerce, Texas February, 2002 Abstract The analysis and definition of markets, their structure, and concentration, especially for international comparisons, are complicated by a lack of adequate and comparable data. This is particularly so for multi-product and multinational firms. For instance, the U.S. Department of Commerce reports measures of industry concentration which do not embody either the control of subsidiary firms or the possible multinational nature of their ownership. Nor are these reported measures consistently based on sales data. Other countries produce similar reports, but these studies are generally not comparable to U.S. due, in part, to incompatible sector definitions. Few government- sponsored studies provide firm-level detail or timely information. Also, given the widespread multinational nature of many larger firms, an international analysis of ownership and operations is necessary. This paper addresses the issues encountered in the construction of international market data from the existing financial reports, and provides methods for the comparison of measures of market concentration and industry diversity across countries. Using 1991 financial data, a firm level data set is constructed and used to compute comparable measures of market concentration and industry diversity in the food industries for the U.S. and European Community (EC). One innovation is to impute the distribution of sales of sub-code products by a firm based on simulations as well as nonparametric estimates of an existing data set. 1 We wish to acknowledge the help of Peter Voros for his efforts in collecting the data on which much of this analysis is based. We also wish to thank Dennis Henderson, Ian Sheldon and Michael Ferrantino for their comments on an earlier version of this paper. Support for Hirschbergs research came from the USDA NC-194 Project.
Transcript
Antitrust Issues in International Comparisons of Market Structure1
Joseph G. Hirschberg
Department of EconomicsUniversity of Melbourne
Esfandiar Maasoumi and Daniel SlottjeDepartment of Economics
Southern Methodist University,
And
Augustine C. ArizeTexas A&M University
Commerce, Texas
February, 2002
Abstract
The analysis and definition of markets, their structure, and concentration, especiallyfor international comparisons, are complicated by a lack of adequate and comparable data. This is particularly so for multi-product and multinational firms. For instance, the U.S.Department of Commerce reports measures of industry concentration which do not embodyeither the control of subsidiary firms or the possible multinational nature of their ownership.Nor are these reported measures consistently based on sales data. Other countries producesimilar reports, but these studies are generally not comparable to U.S. due, in part, toincompatible sector definitions. Few government- sponsored studies provide firm-level detailor timely information. Also, given the widespread multinational nature of many larger firms,an international analysis of ownership and operations is necessary. This paper addresses theissues encountered in the construction of international market data from the existing financialreports, and provides methods for the comparison of measures of market concentration andindustry diversity across countries.
Using 1991 financial data, a firm level data set is constructed and used to computecomparable measures of market concentration and industry diversity in the food industries forthe U.S. and European Community (EC). One innovation is to impute the distribution of salesof sub-code products by a firm based on simulations as well as nonparametric estimates of anexisting data set.
1 We wish to acknowledge the help of Peter Voros for his efforts in collecting the data on which much of thisanalysis is based. We also wish to thank Dennis Henderson, Ian Sheldon and Michael Ferrantino for their commentson an earlier version of this paper. Support for Hirschberg�s research came from the USDA NC-194 Project.
2
Introduction
With the increasing globalization of the world�s economies, antitrust concerns for
industries within a given country become increasingly complex. Traditional analysis of
antitrust, market definition, and market power is focused on the �structure� of industries under
scrutiny. One important component of the market power puzzle is the degree of concentration
within an industry.
Applied economists have understood for some time that measuring market power is
not a one dimensional issue. Even before the advent of the so-called �New Empirical
Industrial Organization� (henceforth NEIO) in the early 1980s, economists working on these
matters understood well that one could not simply look at any one aspect of industrial
behavior in a given industry, and draw meaningful conclusions about the level of
competitiveness therein. Bresnahan (1989,1997) refers to the traditional empirical approach
to analyzing competitiveness in a given market as the Structure, Conduct and Performance
Paradigm (or the SCPP). That is, the traditional approach has been to define the relevant
product and geographic markets, and then to examine structure by looking at the degree of
concentration in the market and to look at pricing behavior to see if the firm(s) is (are) indeed
pricing their outputs close to marginal cost. The implicit assumption in this body of work is
that marginal cost is observable and measurable and that a reduced form analysis of structure
and performance on cross-section data is sufficient, cf. Church and Ware (1997) for an initial
critique of this approach. Church and Ware (1999, p. 239) note that under the SCP strategy,
knowledge of market share is an important element in ascertaining the degree of market power
within a given market.
The NEIO approach emphasizes the fact that in general, economic marginal cost is not
observable. In addition, each industry has its own nuances which distinguish it from others
and a �conduct parameter� is an unknown to be estimated, not assumed in a cross-section
3
model, cf. Bresnahan (1989, pp. 952-953). Bresnahan further notes that the NEIO approach
focuses on the use of an econometric model for an individual industry, NOT on its reduced
form and using data over time.
The NEIO approach has been applied in practice in several applications. Ellison
(1994) builds on work by Porter (1983) to show that demand for a given product (they focus
on railroads) can be assumed to be log-linear in price and takes the form,
0 1 2log ( ) = + log ( ) + log ( )Q P L� � �
in this model α1 is the elasticity of own price demand. The supply relationship can take the
form,
� �11 + / = i iP S w MC�
Where Si is the market share of the ith firm and wi is a �conduct� parameter. As in Church
and Ware (2000, p. 441), let = i iS w� in the expression above. Then,
� �11 + / = P MC� �
Thus, within the NEIO framework, the elasticity of demand for the product and a firm�s
market share are important determinants of conduct and, ultimately, of a given firm�s market
power within that industry. It should be clear that regardless of one�s beliefs about how to
econometrically ascertain market power, a firm�s market share, and ultimately the degree of
concentration in an industry, are important considerations in the determination of market
power in that industry.
Unfortunately, the paradigm of a firm controlled locally producing one product in a
single market is rarely found and would most likely never be the case for all the firms in a
market in a country that is integrated into the World Economy. In addition, even if the level
of concentration is determined for the market of a particular product within a country, this
would only result in a particular value for the concentration statistic. The important question
4
for that market is: How does this compare to equivalent markets in other countries where the
same technology and multinational firms compete? Thus, an important aspect of any analysis
of the concentration of a particular market is the ability to make international comparisons so
that the local conditions for competition can be put in a relative position.
The purpose of this paper is to make international comparisons of market
concentration and diversity from multi-product firm data. Thus we examine the measurement
of concentration and diversity in a set of multinational multiproduct firms and demonstrate the
comparisons that can be made between markets in different countries. In particular, we study
firms in the food processing industry in the U.S. and the EC. Due to problems of data
compatibility, cross-country comparisons of industrial structure are far less common
(Yamawaki, Sleuwaegen and Weiss 1989). Furthermore, the majority of market structure
studies used in antitrust analysis and elsewhere, employ �establishment-level� data that do not
reveal the possibility of interrelated and multinational ownership that characterizes many of
the larger firms. This paper presents a strategy for using firm-level data to estimate market
structure variables that can be compared across countries. Our method provides not only
point estimate comparisons of various market structure measures, but also probability
statements on the computed differences.
One method for avoiding potential data incompatibilities is to use firm-level data, such
as that collected by private investment information services, or from direct contact with the
firms. This is the approach taken in Sutton (1991) for the four largest food-producing firms in
France, West Germany, Italy, Japan, the United Kingdom and the U.S. In contrast, the present
work examines many of the larger firms, in all countries, and attempts to trace the impact of
multinational ownership. Furthermore, because this is a larger group of firms, it relies
exclusively on the information available from private investor data.
An innovation of the present study is to employ a Monte Carlo method to simulate a
5
firm�s distribution of sales and employment over sub-product categories (SIC codes). Several
statistical distributions were studied for the generation of �imputed sales/employment
distributions�. These were chosen either on the basis of stylized empirical facts (e.g., log
normal and Pareto), or to examine bounds and sensitivities (various normal distributions). A
particularly more detailed data set (Trinet) was also employed to verify and calibrate. Log
Normal and Pareto receive further support from this latter exercise. The imputed shares and
characteristics are then used to compute measures of industrial concentration and diversity
that are subsequently compared across industry and country.
Given the global nature of the data it is also possible to define markets among groups
of countries, allowing comparisons between trade groups and specific nations. Due to data
limitations, we examine only major firms (with total sales in all lines of production over $150
million), with at least one product in the food processing industry (SIC 20) as reported in the
Dunn & Bradstreet computer data base. These data limitations also restrict the concentration
indices reported here to a class of Herfindahl-Hirschman measures as opposed to measures
based on shares of the total market.
It should be noted that the definition of the market (i.e. the assumption of a 4 digit SIC
and the entire EC as a single market) may be flawed for the direct application of the
conclusions from this work into a particular legal proceeding. However, we present this
method of analysis for consideration as a tool for acquiring sufficient information for the
allocation of resources for a more complete investigation by authorities in a particular
jurisdiction.
The paper is outlined as follows. In Section 1, the steps in constructing the data set are
outlined. A description of the simulation analysis is given in Section 2, along with a
comparison to results obtained from a similar source of these data for the U.S. alone. Then
sample-size independent (weighted) measures of industrial concentration and diversity are
6
developed and computed using the imputed shares. The concluding sections discuss the
results of the comparisons of these measures both across sectors and across countries or
country groups.
1. Firm Data
A firm's sales and employment data by SIC are often difficult to obtain. The most
readily available source for this information is a firm's annual report. However, there are at
least three reasons why annual reports are frequently inadequate for this purpose:
1. Private firms and producer cooperatives often issue noreport and a significant segment of many industries may becomposed of these types of organizations.
2. Very rarely do annual reports provide a decomposition ofsales or employment by product or country.
3. Annual reports often fail to identify the full set of subsidiaryfirms they hold, or if they are subsidiaries they may not identifyany other similar subsidiaries or the parent firm.
Commercial investment data base vendors such as Dunn & Bradstreet, Ward's
Business Directory (Gale Research), and Trinet are examples of readily accessible sources that
include information for both public and private firms; see Hirschberg, Dayton and Voros,
(1992) for more details concerning these and other data sources. Some of the data series also
identify firms that are subsidiaries to other firms and the level of investment involved.
Furthermore, these data sets list a standardized set of product line classifications as well as
sales and employment information.
The information from the Dunn & Bradstreet's interactive computer data base service
provides the most complete source for the U.S. and foreign firms. However, these data do not
indicate the intensity or level of production in any particular product line. The Trinet and
Ward's data do, however, for the U.S. firms. In the Who Owns Whom published data source,
Dunn & Bradstreet provide a means for identifying both the U.S. and foreign parent firms for
7
each data entry. Unfortunately the only market-specific information available is a ranking of
up to six 4-digit SIC product codes. An example of the entries for the Dunn & Bradstreet
data is given in the Appendix. The information extracted from these data is:
Name of the firm, address of the firm, country where the firm is located, up to 6 4-digit SICs in order of importance, total annual sales (as of 9/91), the total number of employees (as of 9/91), whether the firm imports and/or
exports, the name of the parent firm if the firm is a subsidiary.
An important element in the construction of our data set is the identification of the
subsidiaries. Because of the incomplete nature of ownership correspondences in the
electronic data sets, it was necessary to verify this information with two other sources: Who
Owns Whom that contains the parent firm for subsidiaries located in North America, the
United Kingdom, Ireland, and continental Europe, and the available annual reports that
contain information on subsidiary. The data set contains information for 1,695 firms and
subsidiaries which have total sales of over $150 million or more, and that sell at least one
product in a SIC 20 market. In addition, because the entry for a parent firm may include the
sales and employment from its subsidiaries (which also appear in the data set) it was necessary
to subtract the sales of these subsidiaries from the parent firm to avoid possible double
counting.
Table 1 shows the number of firms that are included from each country with
combined sales of $150 million that do business in at least one industry in the SIC=20 (food)
group. Thus, a firm may only do some business in a food category and have the majority of its
sales in a sector other than food processing. Table 2 provides an alternate view of the same
data where the sales and employment are allocated by the country of the parent firms. Note
that the ranking of the countries changes when �total sales by ultimate ownership� is used. In
Table 2 Switzerland moves to the 5th position (from 9th in Table 1). This shift is due mainly
8
to the influence of the Nestle Company. The net differences in the sales totals reflect the net
balance of foreign ownership in each country for firms in this size group. In the U.S.
American-held firms account for 89 percent of domestic sales. For Switzerland, almost 2.5
times the domestic market sales are sold by Swiss held firms world-wide. The Netherlands is
another net owner nation with a relative world market of almost 1.7 times domestic sales.
Note that these are sales by firms owned in the parent country and do not reflect the export
sales. The sales are allocated to the country in which the firm is headquartered, not by country
in which the goods are sold. Thus, some small countries may have totals that are larger than
their domestic markets. Also, these sales are for the firms in the data set, thus they include
sales in industries other than SIC=20. In the next section, the method for imputing an
allocation of these sales by SIC will be described.
2. Simulated Diversity of Sales and Employment.
A model of firm diversity may rely on the ordering of the SICs given for each firm or
subsidiary, along with a distribution for the shares of the sales and/or employment over these
SICs.2 Lacking detailed technological data, it is assumed that the types of distributions for
firms' sales over SICs is the same as those for employment. Although technical factors may
differ by industry, scale and country, this procedure assumes that firms that produce similar
products employ roughly similar technologies. Let the number of SICs be denoted by k. In
order to generate a distribution of the sales or employment, k random draws are made from a
particular statistical distribution (the choice of distribution is discussed below) so that they
form non-negative ordered weights that sum to one. The total sales and employment of the
firm is then distributed over its SICs using these weights.
The statistical distribution chosen to generate the random values will determine the
form of the weights chosen. Five distributions were employed. Three widely employed
2 Here we will use the definition of 4 digit SIC for the market although we recognize that in some cases this is
9
statistical distributions were used for sales by SIC; the uniform, the lognormal, and the Pareto.
For verification and calibration purposes, two additional distributions were derived from a
particular data set (Trinet) describing the distribution of sales by SIC for particular US firms.
One of these two is a nonparametric multivariate kernel density function. The other is based
on a shuffling technique based on the empirical distribution of the Trinet data.
2.1 Distributions of Firms Sales.
If it is assumed that each firm's product is produced by an independent subsidiary then
the size distribution of subsidiaries within firms may be regarded as similar to distribution of
firms without regard to ownership. While the reality may differ within a given firm, it is
virtually impossible to test or analyze this assumption due to insufficient data. The
assumption is quite innocuous, however, since relative ordering is the crucial factor, not the
absolute size distribution. Our paper does, in fact, discuss firm specific diversity when
ownership is explicitly accounted for. For example, a number of firms have purchased
existing companies that produce a product that they had not previously sold in any
corresponding market. Thus the size distribution of the firms that are owned by other firms is
considered to be the same as the distribution of the firms without regard to ownership.
Drawing from a uniform or rectangular distribution is here similar to a non-
informative prior. It results in the least difference between the weights as it represents the
situation where a firm in an industry has an equal probability of having any size between the
limits of the distribution (a = lower bound and b = upper bound). The weights from this
distribution are generated by
1 , where ~ U( , ) for all .
kik i i i
iu a b i ku ur
�
� ��
The limits of the distribution (a,b) do not affect the weights computed so they where set to 0
and 1 respectively. These values are then sorted in descending order. The number of sectors
not completely accurate in every case. Unfortunately, this the only level of detail that may be available.
10
in which the firms sell is given as k. Thus if 4 SICs are given in the data entry, four values are
drawn from the random number generator3. They are then sorted by size and divided by their
total. The average value taken over the simulated runs from the uniform distribution are given
in Table 3. From this table it can be seen that the average weights decline according to a
linear relationship.
Weights were also drawn from the lognormal distribution. This choice reflects a long
standing stylized empirical fact that the lognormal often well represents the size distribution
of firms (e.g., Quandt, 1966, and Silberman, 1967). The values are drawn in the same manner
as for the uniform, then sorted and weighted to form the sample weights by using
N(0,1) ~ .eiu 4 The average weights from the lognormal distribution are listed in Table 4.
Another distribution that is suggested by stylized empirical evidence is the Pareto of
the first kind (see Quandt, 1966). The cumulative distribution function of the Pareto is given
by
F( ) 1 where 1 and > 0 .cx = - x , x c�
� � �
The weights generated by this distribution will depend on the shape parameter c. To calibrate
to available data, this parameter was estimated as .9124 using the data described below. A
Pareto distributed pseudo-random value is then generated by the following well known
inversion process:
1/(1/ , where ~ U(0,1).) cik i i x u u�
The resulting average values of the weights are given in Table 5.
An alternative to the previous parametric, simulated weight distributions, is to use a
nonparametric density estimation. In order to use a nonparametric method, it is necessary to
3 All the uniform random numbers were generated by the SAS routine RANUNI.
4 The lognormal was generated by using the SAS RANNOR routine by raising e to the power of the pseudo-randomvalue generated.
11
have observations on the proportion of sales in various markets. The advantage of
nonparametric method is that it is based on some observed data; the disadvantage is that these
distributions will always reflect the data that were used to create them, thus anomalies in the
data will be treated as information, and generalized to yet unobserved markets.
The data used in this estimation are from a market-oriented data base that lists the
sales of the 50 largest firms by four digit SIC in the U.S. These data are for 1991 and are
compiled by the Trinet Corporation (1991). To combine the sales of one firm across markets,
a new dataset was created where all the listings for a particular firm are combined with sales
in each four digit SIC (using only SIC=20). To compute the weights implied by these values
for firms that sell in two markets, all those firms that sell in at least two markets are used to
estimate the weights; the same for those that sell in at least three, on up to six markets. In this
way, the largest sample of firms in each category is used.
The first nonparametric technique employed is a multivariate kernel density estimate.
This technique uses a weighing scheme (the kernel) to compute a continuous function as an
estimate of the density function. This type of estimate may be viewed as a smoothed
histogram with the possibility of tails that extend beyond the range of the data. In particular a
modified multivariate Epanechnikov kernel estimator (see Silverman 1986) was used to
generate a set of riks, for values of k between 2 and 6. The modification was based on the two
properties of the proportions that helps to simplify estimation: 1
1 ,k
iki
r�
��
and , when .ik jkr r i j� � Using these distributions a series of random numbers was
generated using a look-up table of the cumulative density distribution and a uniform random
number generator. The average weights are given in Table 6.
The second nonparametric method used for generating weights was an empirical
random number generator based on the Trinet data. This is equivalent to randomly selecting
12
the weights from the data. To construct this type of random number generator it was first
necessary to replicate the weights from the data a number of times (the number depends on
how many weights need to be generated). To assure that the weights are independent from
each, a random shuffle is implemented. Table 7 reports the average values obtained from the
Trinet data generated by this procedure.
2.2 An Evaluation of the Statistical Distributions of Sales.
In order to evaluate these and other possible distributions from which the weights
could be drawn, the average weights computed from various distributions were compared to
weights computed from the Trinet data set that estimates the largest (in sales) fifty U.S. firms
by four digit SIC5. A modified goodness-of-fit statistic or distance measure (D) for discrete
multivariate distributions (see Read and Cressie 1988), based on Kullback's (1958) concept of
directed diversity, was calculated as follows:
6
2 1 = ln( / ) ln( / ) � � �
kik ik ik ik ik ikk
k iD w r r r r r r
� �
� ��� �� �
� �
where wk is the proportion of the firms in the Dunn & Bradstreet data that report selling in k
average prediction of the proportion of sales in the ith largest market for a firm selling in k
markets (as given in Tables 3, 4, 5 and 6), and ikr is the average observed value from the
Trinet data set (as given in Table 7). Note that where k=1, 11 11� 1r r� � , the predicted and
actual values of proportions are equal to one by definition, thus they are excluded from the
computation of D. The smaller the value of D, the smaller the distance, and the greater the
similarity between the distributions that generated the weights. Comparing samples of size
1000, the following results were obtained from the mean and the median of the generated
5 The Trinet data were created by a combination of market research and an economic model of firm diversityapplied to aggregate firm data. Thus in using these distributions in this study it important to qualify the inferencesdrawn from these data. Note that because the Trinet data do not provide empolyment we use only the sales values.
These values show that the kernel estimate and the lognormal distributions are very close,
while the uniform distribution produces values that are an order of magnitude further away.
The furthest distribution investigated was a normal raised to the fourth power; this is a highly
skewed distribution. Note that all the candidate distributions were chosen so that they
generate positive sales values and thus the normal was not used because it would require the
assumption of a mean and a standard deviation that affects the distribution of the resulting
weights. The lognormal, half-normal, and the normal distributions raised to even powers
were functions of standard normals. As mentioned above, the Pareto was located with a shape
parameter that minimized the value of D by estimating D under a series of values for c, thus,
this value depends on the sample and is dependent to a small degree on the quality of the data.
The comparisons with and the calibration to the Trinet data are not meant to be
necessarily definitive, nor is the use of a distribution based on the Trinet data necessarily the
best alternative. The uniform appears to make the least informative assumption about sales
distributions and may be considered a benchmark. The lognormal and Pareto, besides
appearing to fit the Trinet data the best, are generally regarded as suitable size distributions in
a variety of contexts. The multivariate kernel estimate is intended to be more general than the
6 The choice of seed for the random number generator and the size of the sample drawn for the simulation will resultin slight variations in the orders listed here. Those values that are close to each other in magnitude may change orderin a different experiment.
14
empirical distribution because it allows for values that never occurred in the Trinet data while
retaining the shape of the empirical distribution. However, as noted above, the empirical
distribution may be too closely based on the Trinet sample. Yet, unlike any of the other
distributions, it only reflects observed distributions (see Dagpunar, 1988). All the analysis
that follows was performed with each of these five distributions to offer a degree of
robustness.
The coverage of the Dunn & Bradstreet International data allows the computation of
comparable measures of firm concentration by SIC and by country or group of countries. In
the remainder of this paper the combination of SIC and region will be used to define a market.
Because the sample of firms chosen in this study is determined by a size factor and the
allocation of sales is done via a random selection criteria, the analysis that follows
concentrates on the differences between the parameters computed for various regions and
SICs. First we define measures of concentration which are independent of sample size, then
comparisons are made between international regions.
3. Sample Size Independent Measures of Concentration.
A widely used index of market concentration is the Herfindahl-Hirschman index (Hij)
(Hirschman, 1945 and Herfindahl, 1950) for SIC j and region i:
2
1
ijnij ijk
kH P
�
� �
Where Pijk is the proportion of total sales (or employment) in SIC i and region j for firm k, and
nij is the number of firms in the i-th SIC and region j (market ij). As the value of Hij increases
the level of concentration increases.
In order to make international comparisons of market concentration, it is necessary to
construct Hijs which are based on a comparable number of firms. Here nij varies by market,
thus direct cross-market comparisons of Hij will be contaminated by differences in sample
15
size.
Hij can be written as:
-22
1 1 = ,
ij ijn nij ijkijk
k kH X X
� �
� �� �� �
� �
where Xijk are the level of sales or employment and Hij can be rewritten as
2
1 1 1 , where and .
2 ij ij ijn n nij
ij ij ij ijk ijqijkk k q kij ij
AH A X B X X
A B � � � �
� � �� � ��
Thus if Hij is computed from data with the same distribution but from a different size sample
(nij), Hij will fall with increasing values of nij because, all else being equal, Bij will be larger
for larger nij. In order to compute a comparable Hij it is necessary to define a sample size
independent Hij. One way of doing this is by weighing the average of Aij and Bij by sample
size. Thus, one can compute:
22 , and , where ( ) / 2 is the number of terms in .
( ) / 2ij ij
ijijijij ijij ijij
A Bn n BA B
n n n� � �
�
These averages can then be weighted to compute an equivalent Aij and Bij for a hypothetical
sample size using the formulae given below
*2 *** *
2
( - ) , and .
( - )ijij ij
ij ij ij ijij ijij
n nnA A B B
n n n
� �� �� � � �� �� � � �� � � �
From these values we can compute a new Hij based on these modified values of Aij and Bij.
This index will be referred to as the means equivalent (me) value of Hij.
* *( 1 )
.( ) 1
ijijmeij
ijij ij ij
n HH
n n nH
�
�
� � �
For example, if n = 25, n* = 50, and H = .2000 then Hme = .1091, the sample-size-
compensated H is almost half the computed value.
An alternative method for creating a sample size compensated value of Hij is to use the
numbers equivalent (neij) interpretation of the Herfindahl-Hirschman Index. For any Hij it is
16
possible to determine the number of equal size firms (neij) that would have resulted in the
same Hij,
2
1
1 1 , or .ijne
ij ijk ij ij
H Hne ne�
� �� �� � �� �
� �
This number of firms can be compared to the sample size used to construct the Hij. A relative
equivalent number of firms can be defined as
1 , or , where 0 1.
ijij ij
ijij ij
nen nH
� � � �� �
Hij written as a function of αij is Hij = 1 / nij αij. Under the assumption that αij is constant
across sample size, a sample-size-equivalent Hij can be defined that will be referred to as the
numbers equivalent (ne) Hij
* *1 = , or .
ijne neijij ij
ijijij
nH H H
n n
� �� � �� �� � �
Using the same example as above where n = 25, n* = 50, and H = .2000 then Hne = .1000.
Both transformations of Hij result in smaller values for Hij when the hypothetical
sample is larger than the actual sample. Because the values of Hij are often based on samples
sizes of 50 (c.f. U. S. Census Bureau 1992) n* = 50 was used in this paper to construct the
sample-size-equivalent Hij. In all but one SIC, the sample size observed was smaller than 50.
It must be cautioned that both of these methods attempt to capture the shape of a
distribution based on either one parameter (αij), or two (Aij,Bij). While the means equivalent
transformation is based on more information, the numbers equivalent transformation has a
more intuitive form. The numbers equivalent transformation will weight both H with the
same values if both samples are of the equal size, while the means equivalent transformation
for the same case would use weights that depend on the H as well. In most cases Hme > Hne.
This can be seen in Figure 1 which is a contour plot of the percent difference (PDIFF, where
17
PDIFF = 100 ( Hme - Hne ) / Hne ) between the two sample-size-equivalent methods when n* =
50. The percent increase of Hme to Hne is at most 30 percent for a case in the lower right-hand
corner where n = 10 and H = .3, but the percentage difference diminishes as H falls and n
approaches 50. In the results discussed below both the me and the ne measures are reported.
4. A Comparison of Market Concentration in the U.S. and the EC.
For each SIC a set of Hij were computed and weighted using both the means and
numbers equivalent methods. These values were then used to form the differences between
the Hij for the EC and the Hij for the U.S. The differences are defined as
E E and .me me me ne ne nei ii C i US i C i USDH H H DH H H� � � �
These differences were computed using the five distributions of the weights (uniform,
lognormal, Pareto, multivariate kernel, and empirical) in a series of five hundred experiments
each7. Five hundred values of the DHs were computed by SIC, distribution and equivalence
method (ne or me). Those SICs in which 90 percent or more of all the DHs are either greater
than or less than zero were are reported below. This amounts to a test under the assumption
that the total sales or employment is correctly given but uncertainty existed as to the
distribution of the weights for each firm's sales by SIC.
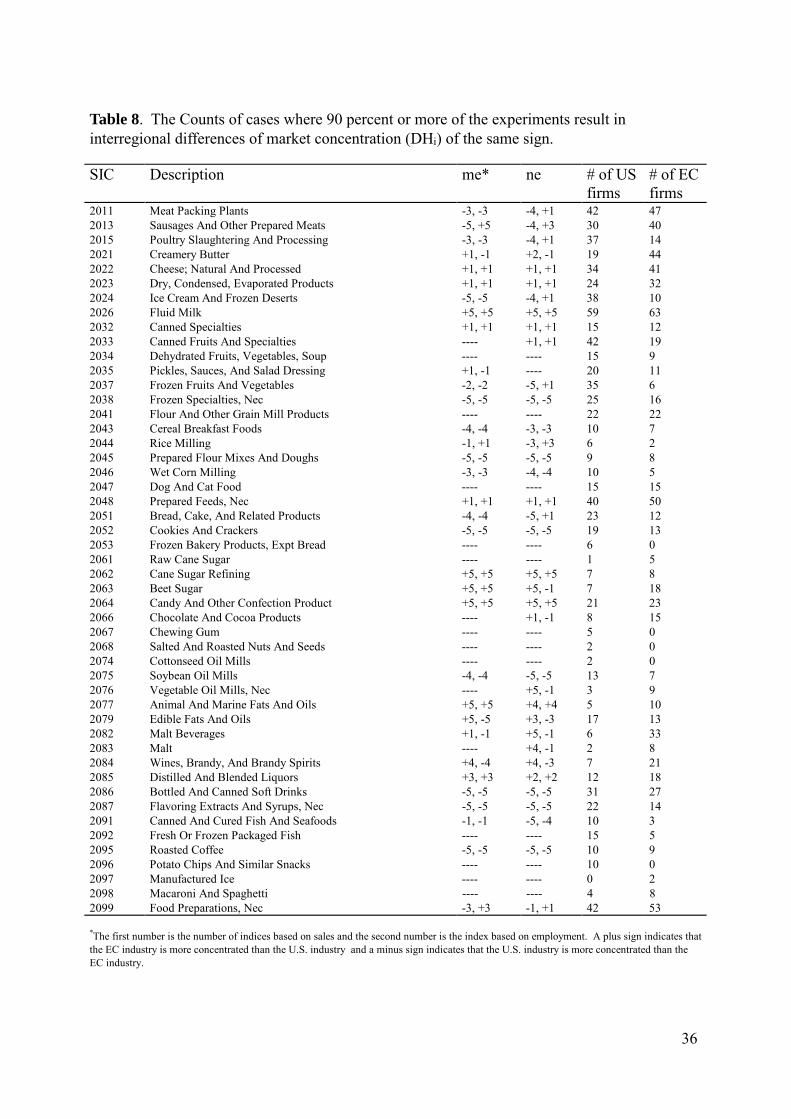
Table 8 reports a number of cases where a smaller number of firms in a market sample
result in a lower market concentration than the market in the other region which has a larger
sample size. This can be seen in SICs 2015, 2037, 2038, 2051, 2052, 2085, 2087. Obviously
these results would not have been obtained without the application of an equivalence method.
The SICs which consistently indicate a higher concentration in the U.S. are 2024 (ice
(prepared flour mixes and doughs), 2052 (cookies and crackers), 2086 (bottled and caned soft
7 In comparisons with experiments of differing size, little variation in the results were observed except for theexperiments drawing from the empirical based distributions.
18
drinks), 2087 (flavoring extracts and syrups), and 2095 (roasted coffee). The industries with
less uniform results which indicate higher U.S. concentration are 2011 (meat packing plants),
2015 (poultry slaughtering), 2046 (wet corn milling), 2051 (bread cake and related products),
and 2075 (soybean oil mills).
The EC only showed consistency higher concentration in the industries 2026 (fluid
milk), 2062 (cane sugar refining), and 2064 (candy and other confection products). Less
conclusive indications of higher EC concentration were found for 2063 (beet sugar) 2077
(animal and marine fats and oils), and 2085 (distilled and blended liquors).
For a number of SICs, sales and employment data imply contrary results. The most
dramatic of these cases is SIC 2013 (sausages and other prepared meats) where the sales data
infer higher concentration in the U.S. and the employment data infers a higher concentration
for the EC. In both 2079 (edible fats and oils) and 2084 (wines brandy and brandy spirits)
these results are reversed. Although these differences may indicate a technological
differences, it is more probable, given the inconsistency of the reporting for employment data,
that these conflicts are data artifacts.
Of further interest are those markets where in both the EC and the U.S. the number of
firms is about equal, and under no distribution or equivalence method are there significant
differences between concentration measures. This observation appears to confirm the
assumption of a common distribution for the same industry no matter where it is located. The
industry with the greatest number of firms where this occurs is 2041 (flour and other grain
mill products) followed by 2047 (dog and cat food), 2034 (dehydrated fruits, vegetables,
soups), and 2098 (macaroni and spaghetti). In a number of markets only one analysis method
led to significant differences, for example, 2024 (creamery butter), 2022 (cheese; natural and
of the number of SICs for which over 90 percent of the 100 experiments8 result in differences
in market diversity of the same sign. This table shows that the number of SICs in which a
significant number of differences in diversity are recorded is greater than those for which
concentration was high. Again, as with the comparison of concentration, it is the uniform
distribution that results in the highest level of significant results compared to the other
distributions; the Pareto is the lowest. The EC markets appear to have firms that are less
diverse than the comparable U.S. markets.
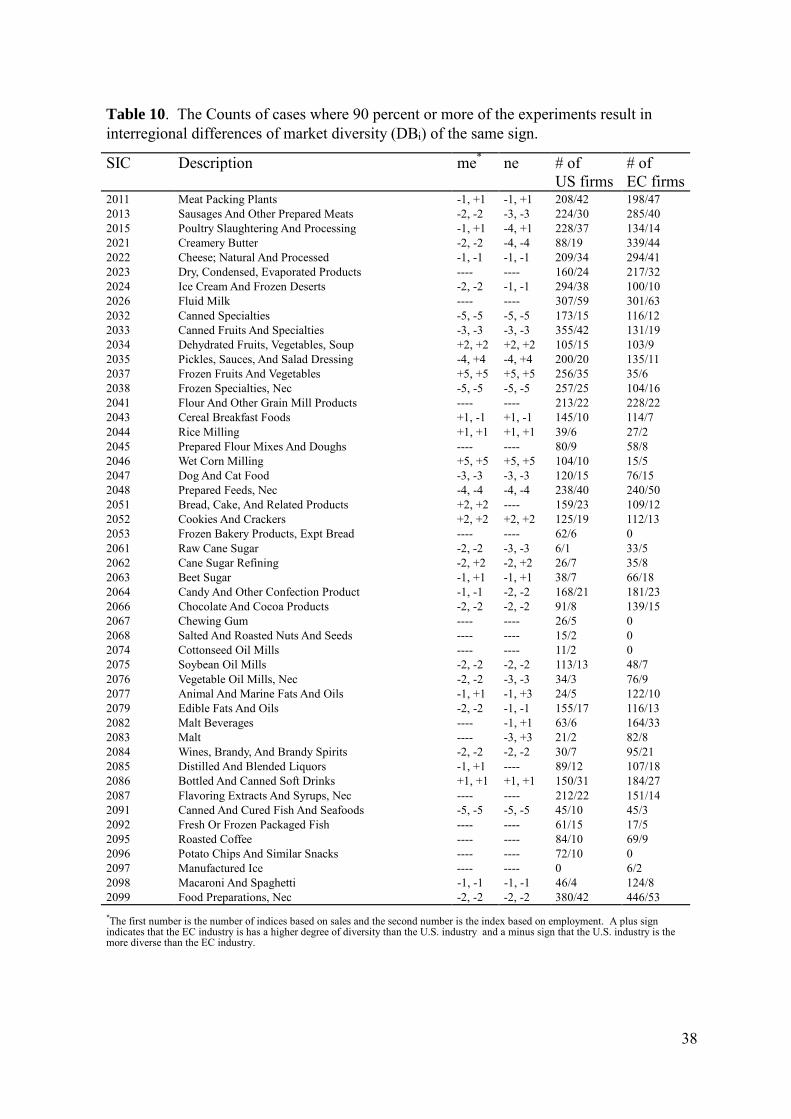
Table 10 gives the breakdown of the diversity results by SIC. This table corresponds
8 Due to the larger scale of the diversity computations only 100 experiments could be performed without the needfor a completely restructured method for their computation.
24
to Table 8 for the concentration ratios in that it lists the counts of distributions in which 90
percent or more of the experiments lead to differences of the same sign. In this case a positive
sign indicates that the EC market is more diverse than the U.S. market and a negative value
indicates the opposite. Again, the first number is the comparison based on sales and the
second is the number based on employment. The "number of firms" column lists the total
number of other firms-markets that are sold to by the firms in the market over the number of
firms in the market. Thus, for industry 2091 the 3 firms in this sample that sell in the EC have
45 other industries and regions in which they or their parent also sell.
From Table 10 it can be seen that the U.S. markets are made up of more diverse firms
than the corresponding EC markets, although there are only three industries in which the U.S.
is more diverse under all comparisons; 2032 (canned specialties), 2038 (frozen specialties)
and 2091 (canned and cured fish and seafoods). Definitive results were obtained for greater
diversity in the EC in only 2037 (frozen fruits and vegetables) and 2046 (wet corn milling). A
majority of the diversity differences are not significant and in general these results are not as
strong as the concentration results; these results are based on only one hundred experiments
versus the five hundred on concentration. Yet, the one hundred experiment results for the
concentration values did not result in markedly fewer significant results.
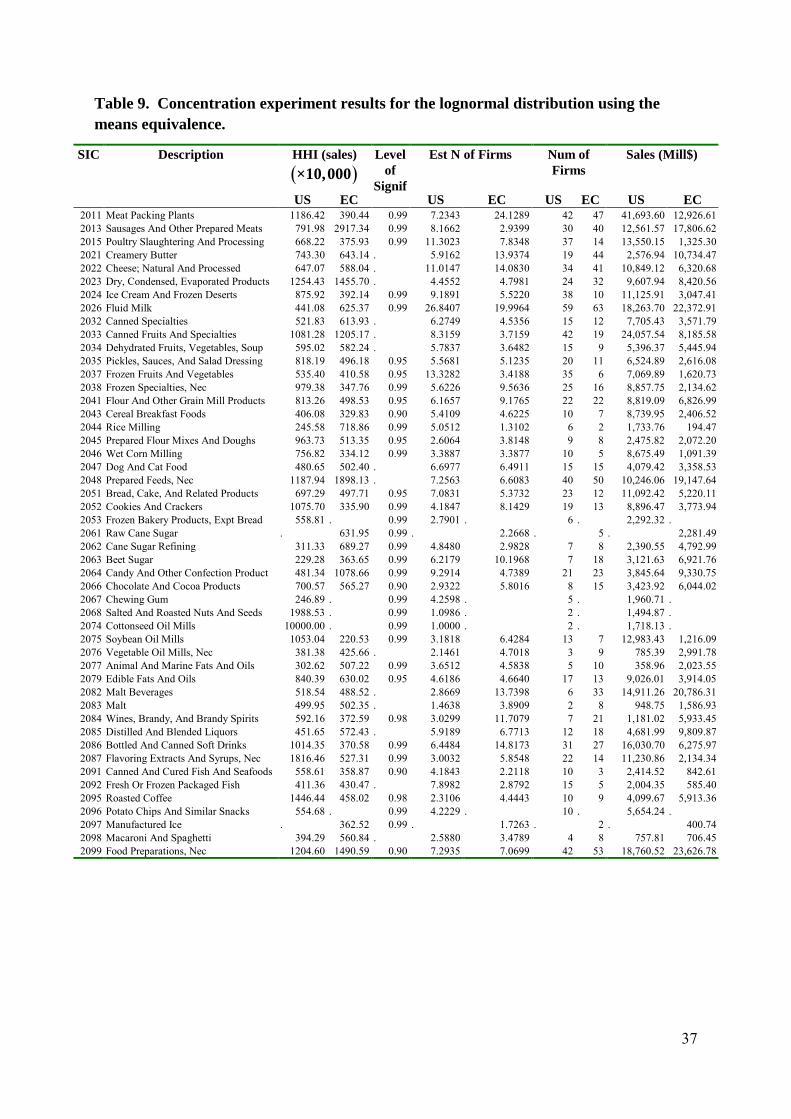
Table 11 is the corresponding table to Table 9. These are the experimental results for
the diversity computations using the lognormal firm diversity distribution, the mean
equivalent comparison method and the sales as the indicator of size. The sales totals are for
all the firms that sell in a particular market; this means that a firm's total sales may be
included in both the EC and the U.S. total if it sells in both.
6. Conclusion
This research demonstrates the quality of the inferences available from a data set that
is solely constructed from financial report data supplemented with a set of market
25
participation ordered by importance. The concentration differences can be made a function of
other variables that capture the taste and technological aspects of the SICs. The inclusion of
all the countries in the EC in a single market may not be very reasonable for a number of
industries - such as 2051 (bread, cakes and related products), 2082 (malt beverages) and 2084
(wines, brandy, and brandy spirits) - where individual EC countries have long histories of
special tastes for these products. However, the EC is moving to develop true integration
among these markets.
Furthermore, some of the EC/U.S. comparisons may not be very meaningful due to the
limit of the size of the firm included in the sample. In a number of cases the $150 million
limit mean that a large proportion of firms (especially for the EC) were excluded. This will
result in an over-statement of the concentration. This may well be the reason for the high
relative concentration of SIC=2082 (malt beverages) and SIC=2064 (candy and other
confection products) of the EC over the equivalent U.S. data. The malt beverage
concentration may reflect the presence of only the large UK brewers which dominate the
market as constructed because the smaller firms in the German market are not included.
Careful attention should be paid to many of the comparisons made here.
However, under the objective to study the potential for U.S. firms competing abroad
and for EC firms competing in the U.S., the limitation to only large firms may prove to be
very useful. If an argument can be made that scale economy is needed to consider competition
in foreign markets, then limiting the analysis to large firms may be reasonable. However, the
argument that concentration translates into potential ability to compete abroad may not be a
viable argument, especially in light of the highly concentrated U.S. car market and the
relatively low propensity for U.S. food producers to export (see Handy and Henderson(1992)).
Future directions for this research include the verification of these results using
simulated data for smaller firms that would be sampled under the $150 million sales level.
26
Another future topic would be to differentiate the diversity measures to account for upward
and downward vertical integration as well as other horizontal integration by region.
Furthermore, the simulations used here could be extended to include simulations of data used
in a second level econometric analysis. This could involve the use of the simulated data along
with other information in regression analysis. A first step in this direction was the
interregional correlation of the concentration measures.
27
References
Bain, J., 1966, International Differences in Industrial Structure, Yale University Press, NewHaven.
Berry, Charles H., 1971�, Corporate Growth and Diversification�, Journal of Law andEconomics, October, 371-384.
Bresnahan. T., 1989 �Empirical Studies and of Industries with Market Power.� Handbook ofIndustrial Organization. Ed. R. Schmalensee and R. Willig. Amsterdam: North-Holland,1011-1057
Bresnahan. T. 1997. �Testing and Measurement in Competition Models. �Advances ineconomics and Econometrics: Theory and Applications. ed. D. Kreps and K. Wallis.Cambridge: Cambridge University Press, 61-81
Bresnahan. T., and R. Schmalensee, ed.. 1987. The Empirical Renaissance in IndustrialEconomics Oxford: Basil Blackwell.
Buschena. D.. and J. Perloff. 1991. �The Creation of Dominant Firma Market Power in theCoconut Oil Export Market. �American Journal of Agricultural Economics 73: 1000-1008.
Church, J. and Ware, R., (1997) �Identifying and Measuring Market Power. �IndustrialOrganization 12: 423-456
Church, J. and Ware, R. (1999) Industrial Organization: A Strategic Approach, McGraw-Hill,New York.
Clarke, R. and S. W. Davies, 1983�, Aggregate Concentration, Market Concentration andDiversification", The Economic Journal, 182-192.
Dagpunar, John, 1988, Principles of Random Variate Generation, Clarendon Press, Oxford,UK.
Dun & Bradstreet International, 1991, Dun's Marketing Services, Parsippany, NJ. Dun &Bradstreet, 299 Park Ave., New York, NY.
Ellison. G., 1994. �Theories of Cartel Stability and the Joint Executive Committee�. RANDJournal of Economics 25: 37-57.
Gasmi. F.. J.-J. Laffont. And Q. Vuong., 1992 �Econometric Analysis of Collusive Behaviorin a Soft Drink Market. �Journal of Economics and Management Strategy 1: 277 - 311.
Geroski. P., 1988. �In Pursuit of Monopoly Power: Recent Quantitative Work in Industrialeconomics. �Journal of Applies Econometrics 3: 107-123.
28
Handy, Charles R. and Dennis R. Henderson, 1992�, Foreign Direct Investment inFood Manufacturing Industries", Organization and Performance of World FoodSystems: NC-194, Department of Agricultural Economics, Ohio StateUniversity.
Herfindahl, Orris C., 1950�, Concentration in the U.S. Steel Industry", Unpublished doctoraldissertation, Columbia University.
Hirschberg, Joseph G., James Dayton and Peter Voros, 1992�, Firm Level Data: ACompendium of International Data Sources for the Food Processing Industries", OP-34, Organization and Performance of World Food Systems: NC-194, Department ofAgricultural Economics, Ohio State University.
Hirschman, Albert O., 1945, National Power and the Structure of Foreign Trade, Berkeley.
Hyde. C., and J. Perloff., 1995. �Can Market Power Be Estimated?, �Review of IndustrialOrganization 10: 465-485.
Kullback, S., 1959, Information Theory and Statistics, John Wiley, New York.
Martin, S. 1993. Advanced Industrial Economics. Oxford: Blackwell
Pindyck, R., and D. Rubinfeld., 1998. Econometric Models and Economic Forecast. 4th ed.New York: Irwin/Mcgraw-Hill
Porter, R., 1983. �A Study of Cartel Stability: the Joint Executive Committee, 1880-1886.�Bell Journal of Economics 14: 301-314.
Porter, R., 1994. �Recent Developments in Empirical Industrial Organization. �Journal ofEconomic Education 25: 149-161
Quandt, Richard E., 1966�, On the Size Distribution of Firms", American Economic Review,56, 416-432.
Read, T. R. C. and N. A. C. Cressie, 1988, Goodness-of-Fit Statistics for DiscreteMultivariate Data, Springer-Verlag, New York.
Schmalensee, R., 1989. �Inter-Industry Studies of Structure and Performance. �Handbook ofIndustrial Organization. ed. R. Schmalensee and R. Willing. Amsterdam: North-Holland,951-1009.
Silberman, Irwin H., 1967�, On Lognormality as a Summary Measure of Concentration",American Economic Review, 57, 807-31.
Slade, M., 1995, �Empirical Games: the Oligopoly Case.�, Canadian Journal of Economics28: 368-402
29
Silverman, Bernard W., 1986, Density Estimation for Statistics and Data Analysis, Chapmanand Hall, New York, NY.
Sutton, John, 1991, Sunk Costs and Market Structure: Price Competition, Advertising, andthe Evolution of Concentration, MIT Press, Cambridge, MA.
Trinet Line of Business Database, 1991 Trinet Inc., Parsippany, NJ. Trinet Inc., (ContactsInfluential Inc.), Parsippany, NJ.
U. S. Bureau of the Census, 1992, Concentration Ratios In Manufacturing, Census ofManufacturing (1987), Subject Series, MC87-S-6, GPO, Washington. DC.
Utton, M. A., 1977�, Large Firm Diversification in British Manufacturing Industry", TheEconomic Journal, 87, 96-113.
Who Owns Whom, 1991, Dun's Market Services, Parsippany, NJ.
Yamawaki, Hideki, Leo Sleuwaegen and Leonard W. Weiss, 1989�, Industry Competition andthe Formation of the European Common Market", in Concentration and Price, ed. byLeonard W. Weiss, MIT Press, Cambridge MA.
30
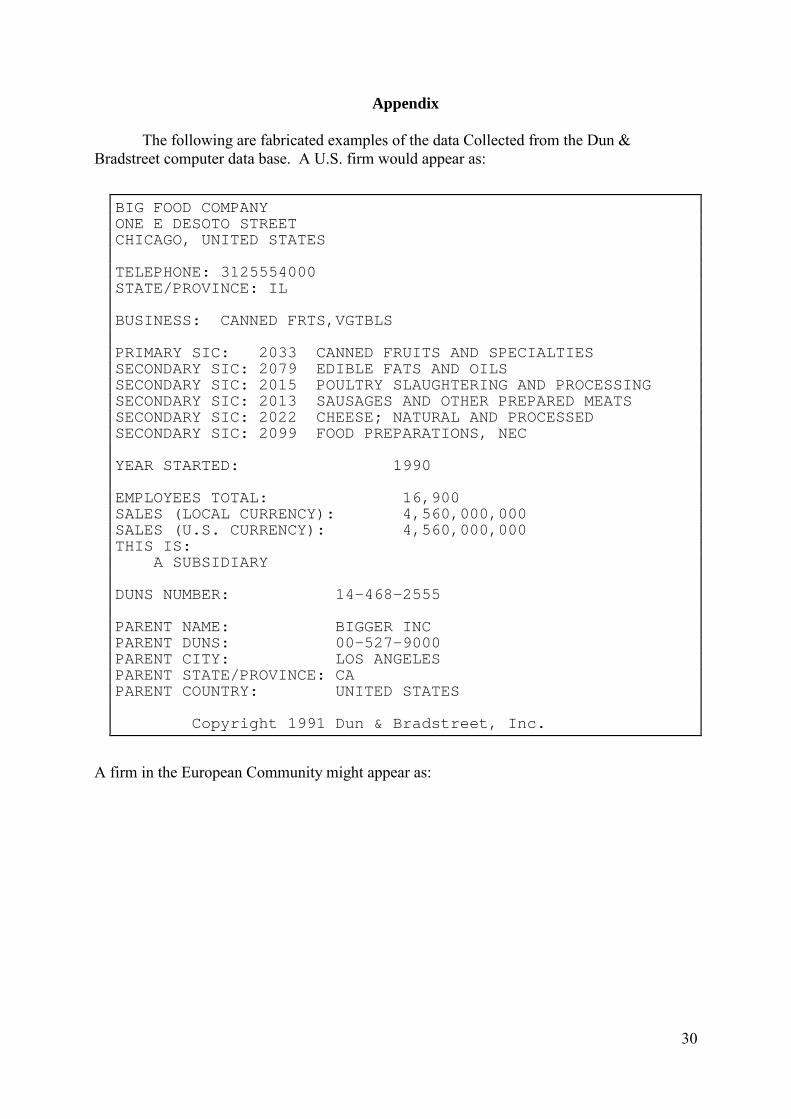
Appendix
The following are fabricated examples of the data Collected from the Dun &Bradstreet computer data base. A U.S. firm would appear as:
A firm in the European Community might appear as:
BIG FOOD COMPANYONE E DESOTO STREETCHICAGO, UNITED STATES
TELEPHONE: 3125554000STATE/PROVINCE: IL
BUSINESS: CANNED FRTS,VGTBLS
PRIMARY SIC: 2033 CANNED FRUITS AND SPECIALTIESSECONDARY SIC: 2079 EDIBLE FATS AND OILSSECONDARY SIC: 2015 POULTRY SLAUGHTERING AND PROCESSINGSECONDARY SIC: 2013 SAUSAGES AND OTHER PREPARED MEATSSECONDARY SIC: 2022 CHEESE; NATURAL AND PROCESSEDSECONDARY SIC: 2099 FOOD PREPARATIONS, NEC
YEAR STARTED: 1990
EMPLOYEES TOTAL: 16,900SALES (LOCAL CURRENCY): 4,560,000,000SALES (U.S. CURRENCY): 4,560,000,000THIS IS:
A SUBSIDIARY
DUNS NUMBER: 14-468-2555
PARENT NAME: BIGGER INCPARENT DUNS: 00-527-9000PARENT CITY: LOS ANGELESPARENT STATE/PROVINCE: CAPARENT COUNTRY: UNITED STATES
Copyright 1991 Dun & Bradstreet, Inc.
31
GROSSE-BRAUEREIJOSEFSBERGSTR 25XBURG, GERMANY FED REP OF
Table 3. The Average weights from a Uniform distribution.
Number ofSICs (k)
r1 r2 r3 r4 r5 r6
2 .697 .303
3 .522 .321 .157
4 .418 .300 .190 .092
5 .348 .270 .194 .126 .062
6 .296 .239 .188 .139 .092 .045
Table 4. The Average weights from a Lognormal Distribution.
Number ofSICs (k)
r1 r2 r3 r4 r5 r6
2 .719 .281
3 .596 .273 .131
4 .520 .256 .147 .078
5 .461 .239 .150 .096 .053
6 .424 .225 .145 .100 .067 .039
Table 5. The Average weights from a Pareto Distribution (c = .9124).
Number ofSICs (k)
r1 r2 r3 r4 r5 r6
2 .704 .296
3 .614 .237 .149
4 .564 .213 .129 .094
5 .506 .201 .127 .094 .072
6 .509 .183 .113 .081 .063 .051
Table 6. The Average weights from a Multivariate Estimated Kernel Distribution.
Number ofSICs (k)
r1 r2 r3 r4 r5 r6
2 .665 .335
3 .571 .281 .148
4 .549 .252 .131 .068
5 .533 .235 .125 .070 .038
6 .517 .235 .127 .067 .035 .018
35
Table 7. The Average weights as Estimated from the Trinet data for U.S. Food Processing Firms.Number ofSICs (k)
r1 r2 r3 r4 r5 r6
2 .706 .294
3 .592 .267 .141
4 .540 .245 .136 .079
5 .510 .228 .130 .079 .053
6 .478 .222 .127 .081 .055 .038
36
Table 8. The Counts of cases where 90 percent or more of the experiments result ininterregional differences of market concentration (DHi) of the same sign.
*The first number is the number of indices based on sales and the second number is the index based on employment. A plus sign indicates thatthe EC industry is more concentrated than the U.S. industry and a minus sign indicates that the U.S. industry is more concentrated than theEC industry.
37
Table 9. Concentration experiment results for the lognormal distribution using themeans equivalence.
Table 10. The Counts of cases where 90 percent or more of the experiments result ininterregional differences of market diversity (DBi) of the same sign.
SIC Description me* ne # ofUS firms
# ofEC firms
2011 Meat Packing Plants -1, +1 -1, +1 208/42 198/472013 Sausages And Other Prepared Meats -2, -2 -3, -3 224/30 285/402015 Poultry Slaughtering And Processing -1, +1 -4, +1 228/37 134/142021 Creamery Butter -2, -2 -4, -4 88/19 339/442022 Cheese; Natural And Processed -1, -1 -1, -1 209/34 294/412023 Dry, Condensed, Evaporated Products ---- ---- 160/24 217/322024 Ice Cream And Frozen Deserts -2, -2 -1, -1 294/38 100/102026 Fluid Milk ---- ---- 307/59 301/632032 Canned Specialties -5, -5 -5, -5 173/15 116/122033 Canned Fruits And Specialties -3, -3 -3, -3 355/42 131/192034 Dehydrated Fruits, Vegetables, Soup +2, +2 +2, +2 105/15 103/92035 Pickles, Sauces, And Salad Dressing -4, +4 -4, +4 200/20 135/112037 Frozen Fruits And Vegetables +5, +5 +5, +5 256/35 35/62038 Frozen Specialties, Nec -5, -5 -5, -5 257/25 104/162041 Flour And Other Grain Mill Products ---- ---- 213/22 228/222043 Cereal Breakfast Foods +1, -1 +1, -1 145/10 114/72044 Rice Milling +1, +1 +1, +1 39/6 27/22045 Prepared Flour Mixes And Doughs ---- ---- 80/9 58/82046 Wet Corn Milling +5, +5 +5, +5 104/10 15/52047 Dog And Cat Food -3, -3 -3, -3 120/15 76/152048 Prepared Feeds, Nec -4, -4 -4, -4 238/40 240/502051 Bread, Cake, And Related Products +2, +2 ---- 159/23 109/122052 Cookies And Crackers +2, +2 +2, +2 125/19 112/132053 Frozen Bakery Products, Expt Bread ---- ---- 62/6 02061 Raw Cane Sugar -2, -2 -3, -3 6/1 33/52062 Cane Sugar Refining -2, +2 -2, +2 26/7 35/82063 Beet Sugar -1, +1 -1, +1 38/7 66/182064 Candy And Other Confection Product -1, -1 -2, -2 168/21 181/232066 Chocolate And Cocoa Products -2, -2 -2, -2 91/8 139/152067 Chewing Gum ---- ---- 26/5 02068 Salted And Roasted Nuts And Seeds ---- ---- 15/2 02074 Cottonseed Oil Mills ---- ---- 11/2 02075 Soybean Oil Mills -2, -2 -2, -2 113/13 48/72076 Vegetable Oil Mills, Nec -2, -2 -3, -3 34/3 76/92077 Animal And Marine Fats And Oils -1, +1 -1, +3 24/5 122/102079 Edible Fats And Oils -2, -2 -1, -1 155/17 116/132082 Malt Beverages ---- -1, +1 63/6 164/332083 Malt ---- -3, +3 21/2 82/82084 Wines, Brandy, And Brandy Spirits -2, -2 -2, -2 30/7 95/212085 Distilled And Blended Liquors -1, +1 ---- 89/12 107/182086 Bottled And Canned Soft Drinks +1, +1 +1, +1 150/31 184/272087 Flavoring Extracts And Syrups, Nec ---- ---- 212/22 151/142091 Canned And Cured Fish And Seafoods -5, -5 -5, -5 45/10 45/32092 Fresh Or Frozen Packaged Fish ---- ---- 61/15 17/52095 Roasted Coffee ---- ---- 84/10 69/92096 Potato Chips And Similar Snacks ---- ---- 72/10 02097 Manufactured Ice ---- ---- 0 6/22098 Macaroni And Spaghetti -1, -1 -1, -1 46/4 124/82099 Food Preparations, Nec -2, -2 -2, -2 380/42 446/53*The first number is the number of indices based on sales and the second number is the index based on employment. A plus signindicates that the EC industry is has a higher degree of diversity than the U.S. industry and a minus sign that the U.S. industry is themore diverse than the EC industry.
39
Table 11. Diversity experiment results for the lognormal distribution using the meansequivalence.
B(sales) N of Inds Num of Firms Sales (Mill $)SIC DescriptionUS EC