AntShrink: Ant colony optimization for image shrinkage Jing Tian a , Weiyu Yu b, * , Lihong Ma c a BLK 523, Jelapang Road, Singapore 670523, Singapore b School of Electronic and Information Engineering, South China University of Technology, Guangzhou 510641, PR China c Guangdong Key Lab. of Wireless Network and Terminal, School of Electronic and Information Engineering, South China University of Technology, Guangzhou 510641, China article info Article history: Available online 7 January 2010 Keywords: Image denoising Ant colony optimization Wavelet abstract Wavelet shrinkage is an image denoising technique based on the concept of thresholding the wavelet coefficients. The key challenge of wavelet shrinkage is to find an appropriate threshold value, which is typically controlled by the signal variance. To tackle this challenge, a new image shrinkage approach, called AntShrink, is proposed in this paper. The proposed approach exploits the intra-scale dependency of the wavelet coefficients to estimate the signal variance only using the homogeneous local neighboring coefficients. This is in contrast to that all local neighboring coefficients are used in the conventional shrinkage approaches. Furthermore, to determine the homogeneous local neighboring coefficients, the ant colony optimization (ACO) technique is used in this paper to classify the wavelet coefficients. Exper- imental results are provided to show that the proposed approach outperforms several image denoising approaches developed in the literature. Ó 2010 Elsevier B.V. All rights reserved. 1. Introduction Images are often corrupted with noise during image acquisition and image transmission. Wavelet-based algorithms have been proved to be effective for tackling the image denoising problem (Donoho and Johnstone, 1995; Chang et al., 2000; Sendur and Sel- esnick, 2002; Luisier et al., 2007; Pizurica and Philips, 2006). Moti- vated by the fact that the wavelet transform packs the energy of the image into a few large coefficients, the simple shrinkage of the coefficients can offer an effective reduction in the corrupting noise. The key challenge is to estimate the signal variance, since it plays a key role to control the degree of shrinkage, consequently controls the quality of the denoised image. The signal variance va- lue is usually estimated based on a local neighborhood of the wavelet coefficient; this local neighborhood could be all of the coefficients in its neighborhood in the same subband (Chang et al., 2000; Sendur and Selesnick, 2002), or the local neighborhood of the wavelet coefficient within the same subband (Eom and Kim, 2004; Mihcak et al., 1999; Shui, 2005). The estimation of the signal variance from the noisy wavelet coefficients is a critical issue in image shrinkage. Most of the above-mentioned algorithms assume that the wavelet coefficients are locally independent and identically distributed; therefore, the energy distribution of the image in each subband is isotropic. In view of this, they use the isotropic (more specifically, a square- shaped) window for all subbands in each level. However, this is not true for most images, since the signal variances in the wavelet domain exhibit strong intra-scale dependency (Portilla et al., 2003). To tackle the above challenge, a new image shrinkage approach is proposed in this paper to exploit the intra-scale dependency of the wavelet coefficients for estimating the signal variance only using the homogeneous local neighboring coefficients, rather than using all local neighboring coefficients in the conventional ap- proaches. To determine the homogeneous local neighboring coeffi- cients, the ant colony optimization (ACO) technique is considered as a promising technique to classify the wavelet coefficients in this paper. ACO is a nature-inspired optimization algorithm (Dorigo and Thomas, 2004) motivated by the natural collective behavior of real-world ant colonies. The major collective behavior is the for- aging behavior that guides ants on short paths to their food sources, since ants can deposit pheromone on the ground in order to mark some favorable path that should be followed by other members of the colony. Despite that ACO has been widely applied to tackle numerous optimization problems (Dorigo et al., 2000; Cordon et al., 2002; Dorigo et al., 2002), its application in image processing is quite a few (Ouadfel and Batouche, 2003; Hegarat- Mascle et al., 2007; Ghanbarian et al., 2007; Malisia and Tizhoosh, 2006; Tian et al., 2008). In this paper, the proposed image denoising approach, called AntShrink, has two stages, which are sequentially applied for all wavelet coefficients of the noisy image. The first stage of the pro- posed approach exploits the ACO technique to classify the wavelet coefficients. The second stage of the proposed approach shrinks the 0167-8655/$ - see front matter Ó 2010 Elsevier B.V. All rights reserved. doi:10.1016/j.patrec.2010.01.004 * Corresponding author. Tel./fax: +86 20 87114709. E-mail addresses: [email protected](J. Tian), [email protected](W. Yu), [email protected](L. Ma). Pattern Recognition Letters 31 (2010) 1751–1758 Contents lists available at ScienceDirect Pattern Recognition Letters journal homepage: www.elsevier.com/locate/patrec
AntShrink: Ant colony optimization for image shrinkage
Jing Tian a, Weiyu Yu b,*, Lihong Ma c
a BLK 523, Jelapang Road, Singapore 670523, Singaporeb School of Electronic and Information Engineering, South China University of Technology, Guangzhou 510641, PR Chinac Guangdong Key Lab. of Wireless Network and Terminal, School of Electronic and Information Engineering, South China University of Technology, Guangzhou 510641, China
Wavelet shrinkage is an image denoising technique based on the concept of thresholding the waveletcoefficients. The key challenge of wavelet shrinkage is to find an appropriate threshold value, which istypically controlled by the signal variance. To tackle this challenge, a new image shrinkage approach,called AntShrink, is proposed in this paper. The proposed approach exploits the intra-scale dependencyof the wavelet coefficients to estimate the signal variance only using the homogeneous local neighboringcoefficients. This is in contrast to that all local neighboring coefficients are used in the conventionalshrinkage approaches. Furthermore, to determine the homogeneous local neighboring coefficients, theant colony optimization (ACO) technique is used in this paper to classify the wavelet coefficients. Exper-imental results are provided to show that the proposed approach outperforms several image denoisingapproaches developed in the literature.
� 2010 Elsevier B.V. All rights reserved.
1. Introduction
Images are often corrupted with noise during image acquisitionand image transmission. Wavelet-based algorithms have beenproved to be effective for tackling the image denoising problem(Donoho and Johnstone, 1995; Chang et al., 2000; Sendur and Sel-esnick, 2002; Luisier et al., 2007; Pizurica and Philips, 2006). Moti-vated by the fact that the wavelet transform packs the energy ofthe image into a few large coefficients, the simple shrinkage ofthe coefficients can offer an effective reduction in the corruptingnoise. The key challenge is to estimate the signal variance, sinceit plays a key role to control the degree of shrinkage, consequentlycontrols the quality of the denoised image. The signal variance va-lue is usually estimated based on a local neighborhood of thewavelet coefficient; this local neighborhood could be all of thecoefficients in its neighborhood in the same subband (Changet al., 2000; Sendur and Selesnick, 2002), or the local neighborhoodof the wavelet coefficient within the same subband (Eom and Kim,2004; Mihcak et al., 1999; Shui, 2005).
The estimation of the signal variance from the noisy waveletcoefficients is a critical issue in image shrinkage. Most of theabove-mentioned algorithms assume that the wavelet coefficientsare locally independent and identically distributed; therefore, theenergy distribution of the image in each subband is isotropic. Inview of this, they use the isotropic (more specifically, a square-
shaped) window for all subbands in each level. However, this isnot true for most images, since the signal variances in the waveletdomain exhibit strong intra-scale dependency (Portilla et al.,2003).
To tackle the above challenge, a new image shrinkage approachis proposed in this paper to exploit the intra-scale dependency ofthe wavelet coefficients for estimating the signal variance onlyusing the homogeneous local neighboring coefficients, rather thanusing all local neighboring coefficients in the conventional ap-proaches. To determine the homogeneous local neighboring coeffi-cients, the ant colony optimization (ACO) technique is considered asa promising technique to classify the wavelet coefficients in thispaper. ACO is a nature-inspired optimization algorithm (Dorigoand Thomas, 2004) motivated by the natural collective behaviorof real-world ant colonies. The major collective behavior is the for-aging behavior that guides ants on short paths to their foodsources, since ants can deposit pheromone on the ground in orderto mark some favorable path that should be followed by othermembers of the colony. Despite that ACO has been widely appliedto tackle numerous optimization problems (Dorigo et al., 2000;Cordon et al., 2002; Dorigo et al., 2002), its application in imageprocessing is quite a few (Ouadfel and Batouche, 2003; Hegarat-Mascle et al., 2007; Ghanbarian et al., 2007; Malisia and Tizhoosh,2006; Tian et al., 2008).
In this paper, the proposed image denoising approach, calledAntShrink, has two stages, which are sequentially applied for allwavelet coefficients of the noisy image. The first stage of the pro-posed approach exploits the ACO technique to classify the waveletcoefficients. The second stage of the proposed approach shrinks the
Assign one ant at each coefficient position, initialize thepheromone matrix and the heuristic matrix
Randomly select one ant and move it for a number of steps, according to the transition probability matrix (6)
N iterations have beenperformed?
All ants have been moved?
Update the pheromone function via (7)
Update Process : Update the pheromone function via (8)
Perform image classificationusing the pheromone matrix
N
Y
N
Y
Fig. 1. A summary of the implementation of the proposed ACO-based imageclassification approach.
1752 J. Tian et al. / Pattern Recognition Letters 31 (2010) 1751–1758
noisy wavelet coefficients based on the signal variance that is esti-mated only considering the homogeneous neighboring coefficients,which belong to the same category with that of the central coeffi-cient. Since the neighborhood shape used in the proposed ap-proach automatically adapts to the image segment, the proposedapproach has fundamental difference with that the conventionalfixed-form neighborhoods (i.e., all neighboring coefficients) con-sidered in the conventional image shrinkage approaches, and theproposed approach is expected to yield superior performance.
The proposed approach yields fundamental difference with theconventional image shrinkage approaches in the following two as-pects. First, the proposed approach estimates the signal varianceonly using the homogeneous local neighboring coefficients. Onthe contrary, the conventional approaches use all local neighboringcoefficients. Second, to determine the homogeneous local neigh-boring coefficients, the ACO technique is used in this paper to clas-sify the wavelet coefficients. This is the first time to apply the ACOto tackle the image denoising problem in the wavelet domain, de-spite its extensive use in various areas in the past.
The rest of this paper is organized as follows. A brief introduc-tion to the ACO technique and the conventional image shrinkageare provided in Section 2 and Section 3, respectively. Then the pro-posed AnrShrink approach is presented in Section 4, which first ex-ploits the ACO technique to perform image classification and thenperforms wavelet coefficients shrinkage. Extensive experimentalresults are provided in Section 5 to compare the proposed ap-proach with a number of image denoising approaches. Finally, Sec-tion 6 concludes this paper.
2. Ant colony optimization
In this section, a brief introduction to ACO is proposed. ACOaims to iteratively find the optimal solution of the target problemthrough a guided search (i.e., the movements of a number of ants)over the solution space, by constructing the pheromone informa-tion. To be more specific, suppose totally K ants are applied to findthe optimal solution in a space v that consists of M1 �M2 nodes,the procedure of ACO can be summarized as follows (Dorigoet al., 2006).
� Initialize the position of each ant, as well as the pheromonematrix sð0Þ.
� For the construction-step index n ¼ 1 : N,– Consecutively move each ant for L steps, according to a prob-
abilistic transition matrix pðnÞ (with a size of M1M2 �M1M2).– Update the pheromone information matrix sðnÞ.
� Make the solution decision according to the final pheromoneinformation matrix sðNÞ.
There are two fundamental issues in the above ACO process;that is, the establishment of the probabilistic transition matrixpðnÞ and the update of the pheromone information matrix sðnÞ, eachof which is presented in detail as follow, respectively.
First, at the nth construction step of ACO, each ant moves fromthe node i to the node j according to a probabilistic action rule,which is determined by Dorigo et al. (2006)
pðnÞi;j ¼sðn�1Þ
i;j
� �agi;j
� �b
Pj2Xi
sðn�1Þi;j
� �agi;j
� �b ; ð1Þ
where sðn�1Þi;j is the pheromone information value of the arc linking
the node i to the node j; Xi is the neighborhood nodes for the antak given that it is on the node i; the constants a and b representthe influence of the pheromone information and the heuristic infor-mation, respectively; gi;j represents the heuristic information for
going from node i to node j, which is fixed to be same for each con-struction step.
Second, the pheromone information matrix needs to be updatedtwice during the ACO procedure. The first update is performedafter the movement of each ant within each construction step.More specifically, after the movement of each ant within the nthconstruction step, the pheromone information matrix is updatedas (Dorigo et al., 2006)
sðn�1Þi;j ¼
sðn�1Þi;j þ DðkÞi;j ; if ði; jÞ belongs to the best tour;
sðn�1Þi;j ; otherwise:
8<: ð2Þ
Furthermore, the determination of best tour is subject to the user-defined criterion, it could be either the best tour found in the cur-rent construction step, or the best solution found since the startof the algorithm, or a combination of both of the above two (Dorigoet al., 2006). The second update is performed after the move of all Kants within each construction step; and the pheromone informationmatrix is updated as (Dorigo et al., 2006)
sðnÞ ¼ ð1� wÞ � sðn�1Þ þ w � sð0Þ; ð3Þ
where w is the pheromone decay coefficient.
3. Conventional image shrinkage approach
A noisy image in wavelet domain can be mathematically mod-eled as (Mihcak et al., 1999)
y ¼ sþ n; ð4Þ
where y is the observed noisy coefficients, s is the unknown original(noise-free) coefficients, and n is assumed to be a white Gaussiannoise with a zero mean and a variance r2
n. The goal of image deno-
J. Tian et al. / Pattern Recognition Letters 31 (2010) 1751–1758 1753
ising is to recover the signal s from the noisy observation y. Giventhe signal variance r2
i for a wavelet coefficient si, which is assumedto be an independent Gaussian variable, the minimum mean squareerror (MMSE) estimator of si is given by Mihcak et al. (1999).
si ¼r2
i
r2i þ r2
n
yi: ð5Þ
The key issue of the above method is to estimate the signal var-iance (i.e., r2
i in (5)). Non-exact estimation of signal values wouldresult in non-exact estimation of the denoised signal value; conse-quently, the denoised image would suffer from non-satisfied per-ceptual visual quality. More specifically, for the coefficients thathave a large signal content, that is, r2
i � r2n; this results in a neg-
ligible shrinkage of these coefficients. On the other hand, for anoise-dominated coefficient, that is, r2
i � r2n; that results in a large
shrinkage of the corresponding coefficient.
4. AntShrink: the proposed image denoising approach
In view of estimating the signal variance is a key challenge ofimage shrinkage, an AntShrink approach is proposed in this sectionto exploit the intra-scale dependency of the wavelet coefficientsfor estimating the signal variance only using the homogeneousneighboring coefficients, rather than using all neighboring coeffi-cients in the conventional approaches. The proposed AntShrink ap-proach has two stages: (i) exploit the ACO technique to classify thewavelet coefficients; and (ii) shrink the noisy wavelet coefficientaccording to a locally-adapted signal variance value. To be morespecific, for each coefficient position, the signal variance value isestimated using the neighboring coefficients yielding the same cat-egory (as determined by the proposed ACO-based classificationmethod) as that of the center coefficient under consideration. Thisis in contrast to the conventional image shrinkage approaches thatuse all neighboring coefficients. Both of these two stages are pre-sented in detail in the following.
Table 1The PSNR performance comparison.
Algorithm Additive white Gaus
rn ¼ 10
Test image BarbaraSureShrink (Donoho and Johnstone, 1995) 30.98OracleShrink (Chang et al., 2000) 31.26BayesShrink (Chang et al., 2000) 30.85BiShrink (Sendur and Selesnick, 2002) 32.06SURELet (Luisier et al., 2007) 31.54ProbShrink (Pizurica and Philips, 2006) 31.47Proposed AntShrink 32.55
Test image BoatSureShrink (Donoho and Johnstone, 1995) 31.81OracleShrink (Chang et al., 2000) 31.94BayesShrink (Chang et al., 2000) 31.71BiShrink (Sendur and Selesnick, 2002) 32.25SURELet (Luisier et al., 2007) 32.30ProbShrink (Pizurica and Philips, 2006) 31.65Proposed AntShrink 32.66
Test image WindowSureShrink (Donoho and Johnstone, 1995) 30.35OracleShrink (Chang et al., 2000) 30.46BayesShrink (Chang et al., 2000) 30.30BiShrink (Sendur and Selesnick, 2002) 30.80SURELet (Luisier et al., 2007) 30.58ProbShrink (Pizurica and Philips, 2006) 29.92Proposed AntShrink 31.21
4.1. First stage—classify wavelet coefficients using the ACO technique
The proposed ACO-based image classification approach aims toutilize a number of ants to move on a 2-D image for constructing apheromone matrix, each entry of which represents certain featureat each pixel location of the image. Furthermore, the movements ofthe ants are steered by the amplitude information of the waveletcoefficient.
The proposed approach starts from assigning one ant on an im-age with a size of M1 �M2, each pixel of which can be viewed as anode. Furthermore, the initial value of each component of thepheromone matrix sð0Þ is set to be a constant sinit . Then the pro-posed algorithm runs for N iterations, in each iteration, each antmoves to neighboring coefficients and the pheromone content ofthe coefficient on the ant’s path are updated. Finally, an image clas-sification is performed at each wavelet coefficient by consideringthe normalized pheromone matrix using the K-means clusteringalgorithm, where K ¼ 2 in our context.
4.1.1. Ant movementAt the nth iteration, one ant is randomly selected, and this ant
will consecutively move on the image for L steps. This ant movesfrom the node ðl;mÞ to its neighboring node ði; jÞ according to atransition probability that is defined as
pðnÞðl;mÞ;ði;jÞ ¼sðn�1Þ
i;j
� �agi;j
� �b
Pði;jÞ2Xðl;mÞ sðn�1Þ
i;j
� �agi;j
� �b ; ð6Þ
where sðn�1Þi;j is the pheromone value of the node ði; jÞ, Xðl;mÞ is the
neighborhood nodes of the node ðl;mÞ, gi;j represents the heuristicinformation at the node ði; jÞ. The constants a and b represent theinfluence of the pheromone matrix and the heuristic matrix,respectively.
There are two crucial issues in the construction process. The firstissue is the determination of the heuristic information gi;j in (6). Inthis paper, it is proposed to be determined by the local statistics at
1754 J. Tian et al. / Pattern Recognition Letters 31 (2010) 1751–1758
the pixel position ði; jÞ as the inverse of the absolute value of the dif-ference between the wavelet coefficient ði; jÞ and the mean of thecurrent path. The second issue is to determine the permissable rangeof the ant’s movement (i.e., Xðl;mÞ in (6)) at the position ðl;mÞ. In thispaper, it is proposed to be 8-connectivity neighborhood.
4.1.2. Pheromone updateThe proposed approach performs two updates operations for
updating the pheromone matrix.
� The first update is performed after the movement of each antwithin each construction-step. Each component of the phero-mone matrix is updated according to
sðn�1Þi;j ¼
ð1� qÞ � sðn�1Þi;j þ q � DðkÞi;j ; if ði; jÞ is visited by the curren
sðn�1Þi;j ; otherwise:
8<:
ð7Þ
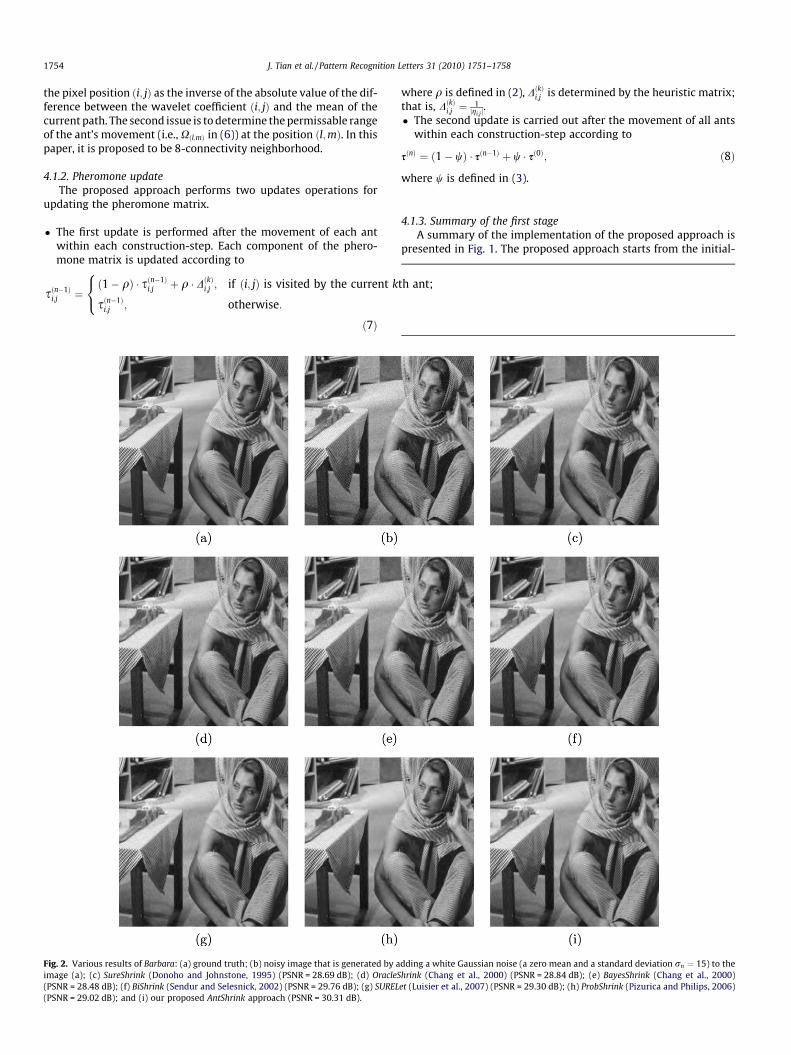
Fig. 2. Various results of Barbara: (a) ground truth; (b) noisy image that is generated by aimage (a); (c) SureShrink (Donoho and Johnstone, 1995) (PSNR = 28.69 dB); (d) OracleS(PSNR = 28.48 dB); (f) BiShrink (Sendur and Selesnick, 2002) (PSNR = 29.76 dB); (g) SUREL(PSNR = 29.02 dB); and (i) our proposed AntShrink approach (PSNR = 30.31 dB).
where q is defined in (2), DðkÞi;j is determined by the heuristic matrix;that is, DðkÞi;j ¼ 1
jgi;j j.
� The second update is carried out after the movement of all antswithin each construction-step according to
sðnÞ ¼ ð1� wÞ � sðn�1Þ þ w � sð0Þ; ð8Þ
where w is defined in (3).
4.1.3. Summary of the first stageA summary of the implementation of the proposed approach is
presented in Fig. 1. The proposed approach starts from the initial-
dding a white Gaussian noise (a zero mean and a standard deviation rn ¼ 15) to thehrink (Chang et al., 2000) (PSNR = 28.84 dB); (e) BayesShrink (Chang et al., 2000)et (Luisier et al., 2007) (PSNR = 29.30 dB); (h) ProbShrink (Pizurica and Philips, 2006)
J. Tian et al. / Pattern Recognition Letters 31 (2010) 1751–1758 1755
ization process, and then runs for N iterations to construct thepheromone matrix by performing both the construction processand the update process. Finally, the category of each wavelet coef-ficient is determined according to the above-constructed phero-mone matrix.
4.2. Second stage—shrinkage
The proposed method first estimates each signal variance basedon its homogeneous neighboring coefficients, which belong to thesame category with that of the central coefficient, and finally incor-porates the estimated variance values into the conventional MMSEestimator (5) to obtain the denoised signal. More specifically, theproposed approach is summarized as follows.
� Perform a 2-D discrete wavelet decomposition on a noisy imageto get the noisy wavelet coefficients.
� Perform the ACO-based classification using the method pre-sented in Section 4.1.
Fig. 3. Various parts of the results of Barbara; which are the corresponding parts of imagewhite Gaussian noise (a zero mean and a standard deviation rn ¼ 15) to the image (a)(Chang et al., 2000) (PSNR = 28.84 dB); (e) BayesShrink (Chang et al., 2000) (PSNR = 28.48et al., 2007) (PSNR = 29.30 dB); (h) ProbShrink (Pizurica and Philips, 2006) (PSNR = 29.03
� Estimate the signal variance r2i for each coefficient excluding
those of the LL subband via
r2i ¼
1jcðiÞj
Xyj2cðyiÞ
y2j � r2
n
0@
1Aþ
; ð9Þ
where cðyiÞ is defined as the coefficients within a local squarewindow and have the same category as that is centered at thecoefficient yi, and jcðyiÞj is the cardinality (i.e., the number ofcoefficients) of cðyiÞ, the output of the function ðxÞþ is 1, ifx > 0; otherwise, the output is 0. Note that the proposed ap-proach differs with the conventional image shrinkage methods,where all local neighboring coefficients are used in cðyiÞ. Further-more, the noise variance r2
n is estimated via rn ¼ medianjyij=0:6745 (Donoho and Johnstone, 1995), where the coefficient yi
belongs to the highest HH subband.� Compute the MMSE estimation for each coefficient excluding
those of the LL subband, by substituting the noise variance esti-mated via (9) into (5).
s presented in Fig. 2: (a) ground truth; (b) noisy image that is generated by adding a; (c) SureShrink (Donoho and Johnstone, 1995) (PSNR = 28.69 dB); (d) OracleShrinkdB); (f) BiShrink (Sendur and Selesnick, 2002) (PSNR = 29.76 dB); (g) SURELet (LuisierdB); and (i) our proposed AntShrink approach (PSNR = 30.31 dB).
Fig. 4. Various results of Boat: (a) ground truth; (b) noisy image that is generated by adding a white Gaussian noise (a zero mean and a standard deviation rn ¼ 15) to theimage (a); (c) SureShrink (Donoho and Johnstone, 1995) (PSNR = 29.80 dB); (d) OracleShrink (Chang et al., 2000) (PSNR = 29.87 dB); (e) BayesShrink (Chang et al., 2000)(PSNR = 29.77 dB); (f) BiShrink (Sendur and Selesnick, 2002) (PSNR = 30.35 dB); (g) SURELet (Luisier et al., 2007) (PSNR = 30.36 dB); (h) ProbShrink (Pizurica and Philips, 2006)(PSNR = 30.03 dB); and (i) our proposed AntShrink approach (PSNR = 30.70 dB).
1756 J. Tian et al. / Pattern Recognition Letters 31 (2010) 1751–1758
� Finally, perform the inverse wavelet transform to obtain thedenoised image.
5. Experimental results
Experiments are conducted to explore the performance of theproposed method using the well-known test images512� 512 Barbara, 512� 512 Boat and 512� 512 Window, whichserve as the ground truth and compared with the denoised imagesfor performance comparison, respectively. The noisy images aregenerated by adding the ground truth image with an additivewhite Gaussian noise with a zero mean and a standard deviationrn, respectively. The wavelet decomposition is implemented via afive-level decomposition using a Daubechies’s wavelet with eightvanishing moments. The window size used in (9) for estimatingthe signal variance is set to be 5� 5. Furthermore, the parameters
of the proposed ACO-based classification approach are experimen-tally set as follows: sinit ¼ 0:0001, a ¼ 1, b ¼ 2, L ¼ 15, and w ¼ 0:3.
The first experiment is to compare the proposed method withother six denoising methods; they are SureShrink (Donoho andJohnstone, 1995), OracleShrink (Chang et al., 2000), BayesShrink(Chang et al., 2000), BiShrink (Sendur and Selesnick, 2002), SURELet(Luisier et al., 2007), and ProbShrink (Pizurica and Philips, 2006).Table 1 compares the PSNR performances of the above mentionedmethods, where the output PSNRs have been averaged over tennoise realizations. Figs. 2–5 provide the subjective performancecomparison. As seen from the above table and figures, the pro-posed algorithm always outperforms the above six denoisingmethods to yield the best objective performance as well as the bestsubjective performance.
The second experiment is to explore the computational com-plexity of the proposed approach. The above denoising approachesare implemented using the Matlab programming language and run
Fig. 5. Various results of Window: (a) ground truth; (b) noisy image that is generated by adding a white Gaussian noise (a zero mean and a standard deviation rn ¼ 15) to theimage (a); (c) SureShrink (Donoho and Johnstone, 1995) (PSNR = 27.78 dB); (d) OracleShrink (Chang et al., 2000) (PSNR = 27.83 dB); (e) BayesShrink (Chang et al., 2000)(PSNR = 27.77 dB); (f) BiShrink (Sendur and Selesnick, 2002) (PSNR = 28.27 dB); (g) SURELet (Luisier et al., 2007) (PSNR = 28.18 dB); (h) ProbShrink (Pizurica and Philips, 2006)(PSNR = 27.92 dB); and (i) our proposed AntShrink approach (PSNR = 28.71 dB).
J. Tian et al. / Pattern Recognition Letters 31 (2010) 1751–1758 1757
on a PC with a Pentium 2.6 GHz CPU and a 4096 MB RAM. One hun-dred experiments are conducted for each of the above-mentionedapproaches. Furthermore, the computational complexity (in termsof the run time) of the proposed approach is compared with that ofthe above six denoising approaches, and their respective averagerun-times are presented in Table 2.
Table 2The run-time comparison (in seconds).
Algorithm Run time
SureShrink (Donoho and Johnstone, 1995) 0.93OracleShrink (Chang et al., 2000) 1.14BayesShrink (Chang et al., 2000) 0.87BiShrink (Sendur and Selesnick, 2002) 0.91SURELet (Luisier et al., 2007) 1.13ProbShrink (Pizurica and Philips, 2006) 1.16Proposed AntShrink 28.50
6. Conclusions
An AntShrink approach has been proposed in this paper to per-form image denoising. The proposed approach exploits the ACOtechnique to classify the wavelet coefficients for constructing theneighborhood shape that automatically adapts to the image seg-ment (i.e., the neighboring coefficients belonging to the same cat-egory with that of the central coefficient). This has been shown tobe superior to the conventional fixed-form neighborhoods (i.e., allneighboring coefficients) considered in the conventional imageshrinkage approaches, as verified in our experiments.
There are several directions could be considered for future re-search. First, the proposed approach is independently applied foreach high-pass filtered subband of the noisy image. It could be fur-ther improved by considering the inter-scale correlation amongthe wavelet coefficients (Sendur and Selesnick, 2002) to performclassifying. Second, the parallel ACO algorithm (Randall and Lewis,
1758 J. Tian et al. / Pattern Recognition Letters 31 (2010) 1751–1758
2002) can be exploited to further reduce the computational load ofthe proposed image classification algorithm; consequently, shortenthe execution time of the proposed approach.
Acknowledgements
The authors thank the authors of Donoho and Johnstone (1995);Chang et al. (2000); Sendur and Selesnick (2002); Luisier et al.(2007); Pizurica and Philips (2006) for providing their respectiveimage denoising programs available online. This work was sup-ported by National Natural Science Foundation of China (GrantNo. 60972133) and Guangdong Science Fund (Grant No.9351064101000003), the National Natural Science Foundation ofChina (Grant No. 60872123), the Joint Fund of the National NaturalScience Foundation and the Guangdong Provincial Natural ScienceFoundation (Grant No. U0835001), the Fund of Provincial Key Lab-oratory for Computer Information Processing Technology, Suzhou,(Grant No. KJS0922).
Cordon, O., Herrera, F., Stutzle, T., 2002. Special issue on ant colony optimization:models and applications. Mathware and Soft Computing 9.
Donoho, D.L., Johnstone, I.M., 1995. Adapting to unknown smoothness via waveletshrinkage. J. Am. Statist. Assoc. 90, 1200–1224.
Dorigo, M., Thomas, S., 2004. Ant Colony Optimization. MIT Press, Cambridge.Dorigo, M., Caro, G.D., Stutzle, T., 2000. Special issue on ant algorithms. Future
Generation Computer Systems 16.Dorigo, M., Gambardella, L.M., Middendorf, M., Stutzle, T., 2002. Special issue on ant
Dorigo, M., Birattari, M., Stutzle, T., 2006. Ant colony optimization. IEEE Comput.Intell. Mag. 1, 28–39.
Eom, I.K., Kim, Y.S., 2004. Wavelet-based denoising with nearly arbitrarily shapedwindows. IEEE Signal Process. Lett. 11, 937–940.
Ghanbarian, A.T., Kabir, E., Charkari, N.M., 2007. Color reduction based on antcolony. Pattern Recognition Lett. 28, 1383–1390.
Hegarat-Mascle, S.L., Kallel, A., Descombes, X., 2007. Ant colony optimization forimage regularization based on a nonstationary Markov modeling. IEEE Trans.Image Process. 16, 865–878.
Luisier, F., Blu, T., Unser, M., 2007. A new SURE approach to image denoising:interscale orthonormal wavelet thresholding. IEEE Trans. Image Process. 16,593–606.
Malisia, A.R., Tizhoosh, H.R., 2006. Image thresholding using ant colonyoptimization. In: Proc. Canadian Conf. on Computer and Robot Vision, Quebec,Canada, pp. 26–26.
Mihcak, M.K., Kozintsev, I., Ramchandran, K., Moulin, P., 1999. Low-complexityimage denoising based on statistical modeling of wavelet coefficients. IEEESignal Process. Lett. 6, 300–303.
Ouadfel, S., Batouche, M., 2003. Ant colony system with local search for Markovrandom field image segmentation. In: Proc. IEEE Internat. Conf. on ImageProcessing, Barcelona, Spain, pp. 133–136.
Pizurica, A., Philips, W., 2006. Estimating the probability of the presence of a signalof interest in multiresolution single- and multiband image denoising. IEEETrans. Image Process. 15, 654–665.
Portilla, J., Strela, V., Wainwright, M.J., Simoncelli, E.P., 2003. Image denoising usingscale mixtures of Gaussians in the wavelet domain. IEEE Trans. Image Process.12, 1338–1351.
Randall, M., Lewis, A., 2002. A parallel implementation of ant colony optimization. J.Parallel Distributed Comput. 62, 1421–1432.
Sendur, L., Selesnick, I.W., 2002. Bivariate shrinkage with local variance estimation.IEEE Signal Process. Lett. 9, 438–441.
Shui, P.-L., 2005. Image denoising algorithm via doubly local Wiener filtering withdirectional windows in wavelet domain. IEEE Signal Process. Lett. 12, 681–684.
Tian, J., Yu, W., Xie, S., 2008. An ant colony optimization algorithm for image edgedetection. In: Proc. IEEE Congress on Evolutionary Computation, Hongkong,China, pp. 751–756.